
Hadronic Vacuum PolarisaNon in (g-‐2)
42
Hadronic Vacuum Polarisa0on in (g2) μ Thomas Teubner • Introduc0on • Radia0ve correc0ons; VP and FSR • Data combina0on, fits, models • Ongoing puzzles, new data and new results • Outlook, discussion Workshop `Highprecision QCD at low energy’, Benasque, Spain 4 th August 2015
-
Upload
khangminh22 -
Category
Documents
-
view
0 -
download
0
Transcript of Hadronic Vacuum PolarisaNon in (g-‐2)
Hadronic Vacuum Polarisa0on in (g-‐2)μ
Thomas Teubner
• Introduc0on • Radia0ve correc0ons; VP and FSR • Data combina0on, fits, models • Ongoing puzzles, new data and new results • Outlook, discussion
Workshop `High-‐precision QCD at low energy’, Benasque, Spain 4th August 2015
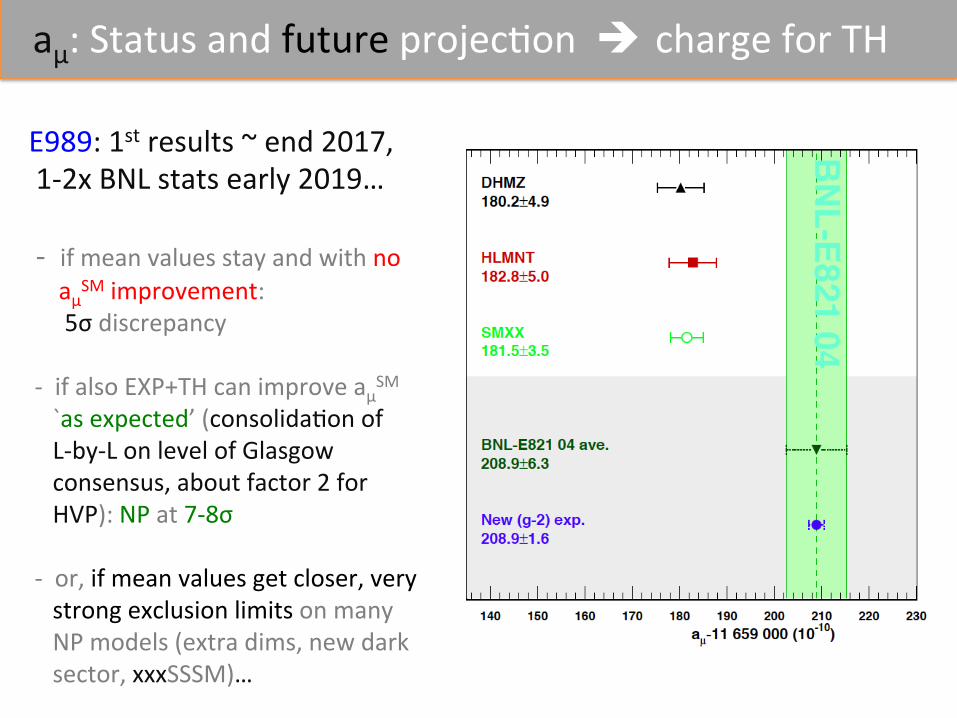
aμ: Status and future projec0on è charge for TH
E989: 1st results ~ end 2017, 1-‐2x BNL stats early 2019… -‐ if mean values stay and with no aμSM improvement: 5σ discrepancy -‐ if also EXP+TH can improve aμSM
`as expected’ (consolida0on of L-‐by-‐L on level of Glasgow consensus, about factor 2 for HVP): NP at 7-‐8σ -‐ or, if mean values get closer, very strong exclusion limits on many NP models (extra dims, new dark sector, xxxSSSM)…
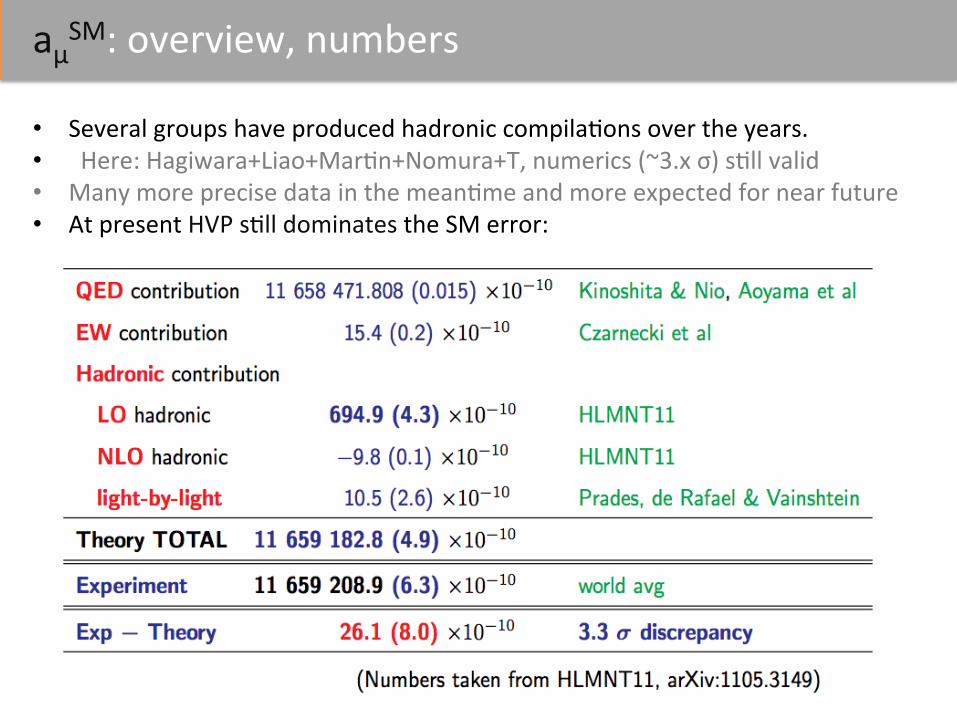
aμSM: overview, numbers • Several groups have produced hadronic compila0ons over the years. • Here: Hagiwara+Liao+Mar0n+Nomura+T, numerics (~3.x σ) s0ll valid • Many more precise data in the mean0me and more expected for near future • At present HVP s0ll dominates the SM error:
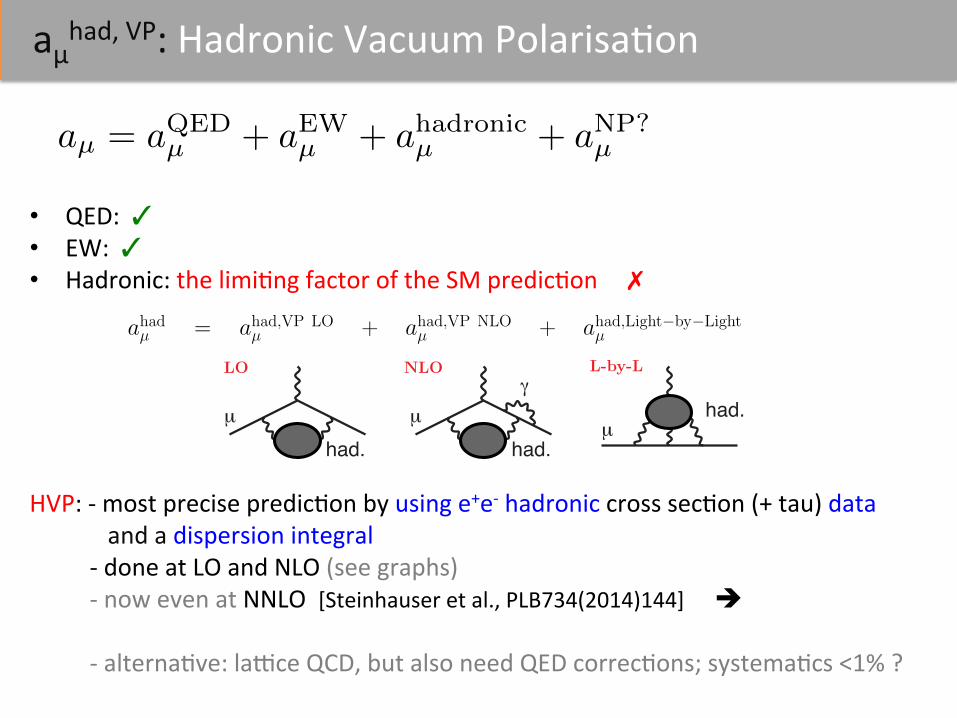
aμhad, VP: Hadronic Vacuum Polarisa0on
• QED: ✓ • EW: ✓ • Hadronic: the limi0ng factor of the SM predic0on ✗
HVP: -‐ most precise predic0on by using e+e-‐ hadronic cross sec0on (+ tau) data and a dispersion integral -‐ done at LO and NLO (see graphs) -‐ now even at NNLO [Steinhauser et al., PLB734(2014)144] è
-‐ alterna0ve: lalce QCD, but also need QED correc0ons; systema0cs <1% ?
aµ = aQED
µ + aEW
µ + ahadronicµ + aNP?
µ
ahadµ = ahad,VP LOµ + ahad,VP NLO
µ + ahad,Light!by!Lightµ
had.
LO
µ
had.
NLO
µ
ahad.
L-by-L
µ
aμhad, VP: Hadronic Vacuum Polarisa0on
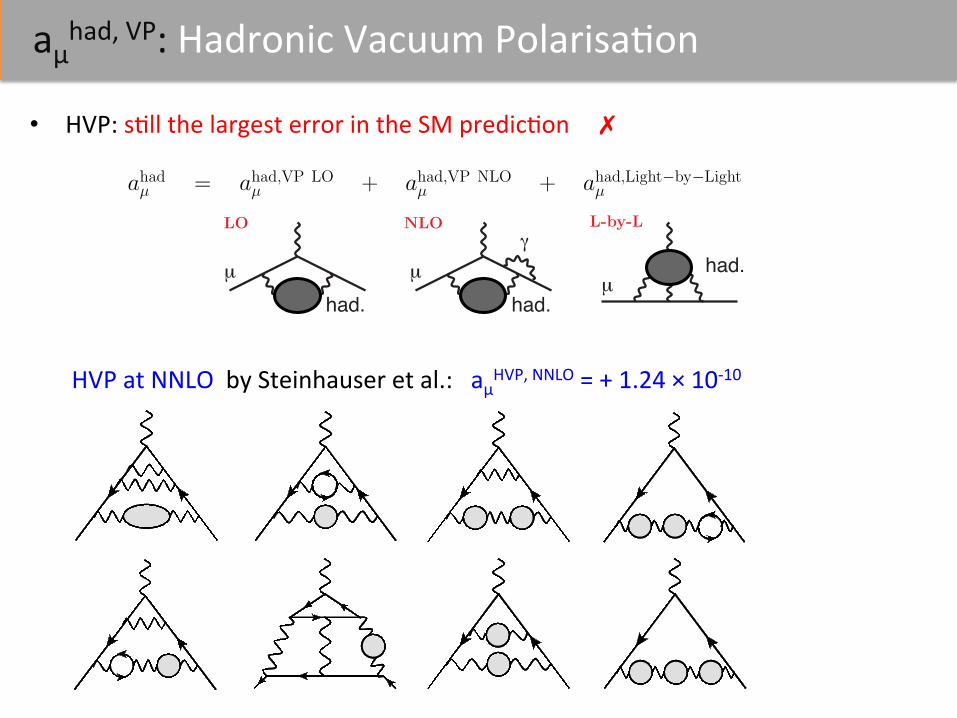
• HVP: s0ll the largest error in the SM predic0on ✗
HVP at NNLO by Steinhauser et al.: aμHVP, NNLO = + 1.24 × 10-‐10
ahadµ = ahad,VP LOµ + ahad,VP NLO
µ + ahad,Light!by!Lightµ
had.
LO
µ
had.
NLO
µ
ahad.
L-by-L
µ
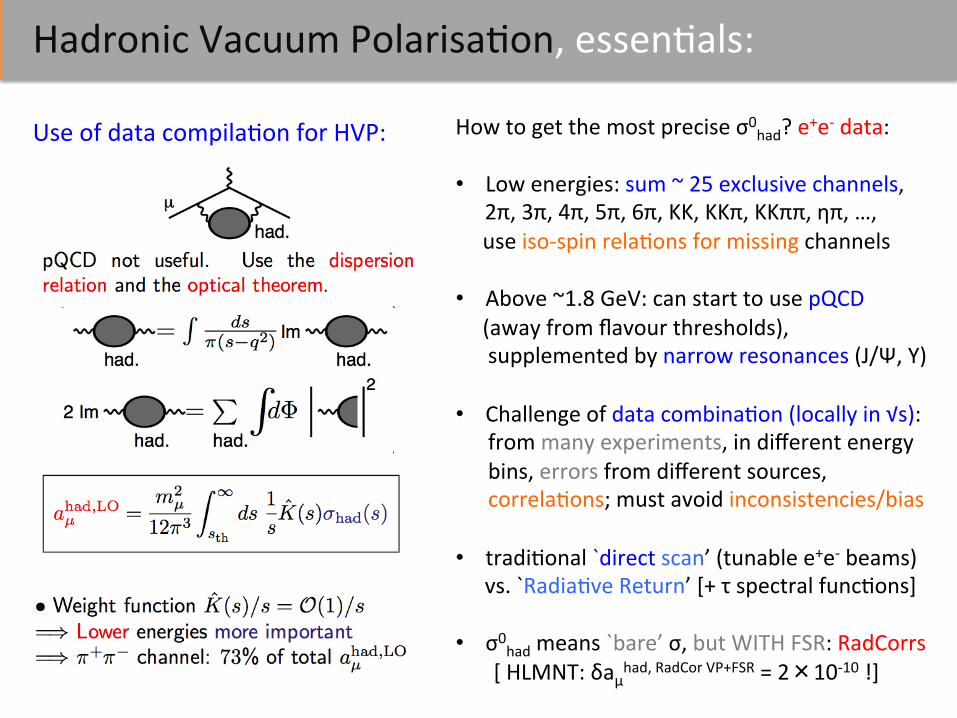
Hadronic Vacuum Polarisa0on, essen0als:
Use of data compila0on for HVP: How to get the most precise σ0had? e+e-‐ data: • Low energies: sum ~ 25 exclusive channels,
2π, 3π, 4π, 5π, 6π, KK, KKπ, KKππ, ηπ, …, use iso-‐spin rela0ons for missing channels • Above ~1.8 GeV: can start to use pQCD (away from flavour thresholds), supplemented by narrow resonances (J/Ψ, Υ) • Challenge of data combina0on (locally in √s): from many experiments, in different energy bins, errors from different sources, correla0ons; must avoid inconsistencies/bias • tradi0onal `direct scan’ (tunable e+e-‐ beams)
vs. `Radia0ve Return’ [+ τ spectral func0ons]
• σ0had means `bare’ σ, but WITH FSR: RadCorrs [ HLMNT: δaμhad, RadCor VP+FSR = 2×10-‐10 !]

Radia0ve Correc0ons: HVP for running α(q2)
• Dyson summation of Real part of one-particle irreducible blobs ! into the e!ective, real
running coupling !QED:
! =q
γ∗
Full photon propagator ! 1 + ! + ! · ! + ! · ! · ! + . . .
! !(q2) =!
1" Re!(q2)= ! /
!
1""!lep(q2)""!had(q
2)"
• The Real part of the VP, Re!, is obtained from the Imaginary part, which via the Optical
Theorem is directly related to the cross section, Im! ! "(e+e" # hadrons):
"!(5)had(q
2) = "q2
4#2!P
# $
m2#
"0had(s) ds
s" q2, "had(s) =
"0had(s)
|1" !|2
[# "0 requires ‘undressing’, e.g. via ·(!/!(s))2 ! iteration needed]
• Observable cross sections "had contain the |full photon propagator|2, i.e. |infinite sum|2.# To include the subleading Imaginary part, use dressing factor 1
|1"!|2.
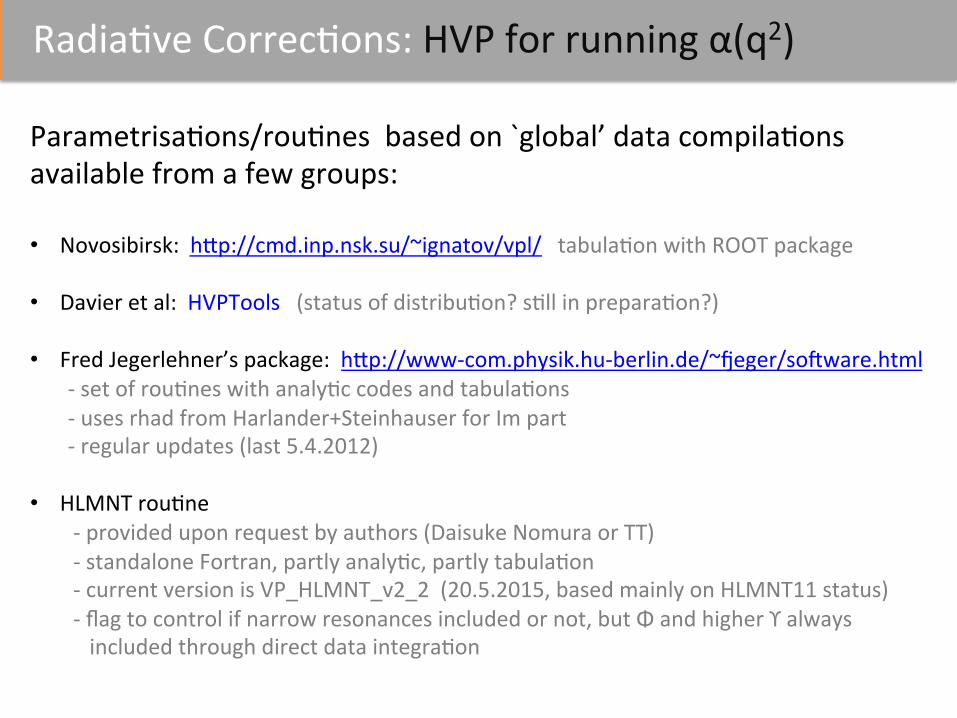
Radia0ve Correc0ons: HVP for running α(q2) Parametrisa0ons/rou0nes based on `global’ data compila0ons available from a few groups: • Novosibirsk: h�p://cmd.inp.nsk.su/~ignatov/vpl/ tabula0on with ROOT package
• Davier et al: HVPTools (status of distribu0on? s0ll in prepara0on?)
• Fred Jegerlehner’s package: h�p://www-‐com.physik.hu-‐berlin.de/~�eger/so�ware.html -‐ set of rou0nes with analy0c codes and tabula0ons -‐ uses rhad from Harlander+Steinhauser for Im part -‐ regular updates (last 5.4.2012) • HLMNT rou0ne -‐ provided upon request by authors (Daisuke Nomura or TT) -‐ standalone Fortran, partly analy0c, partly tabula0on -‐ current version is VP_HLMNT_v2_2 (20.5.2015, based mainly on HLMNT11 status) -‐ flag to control if narrow resonances included or not, but Φ and higher ϒ always included through direct data integra0on
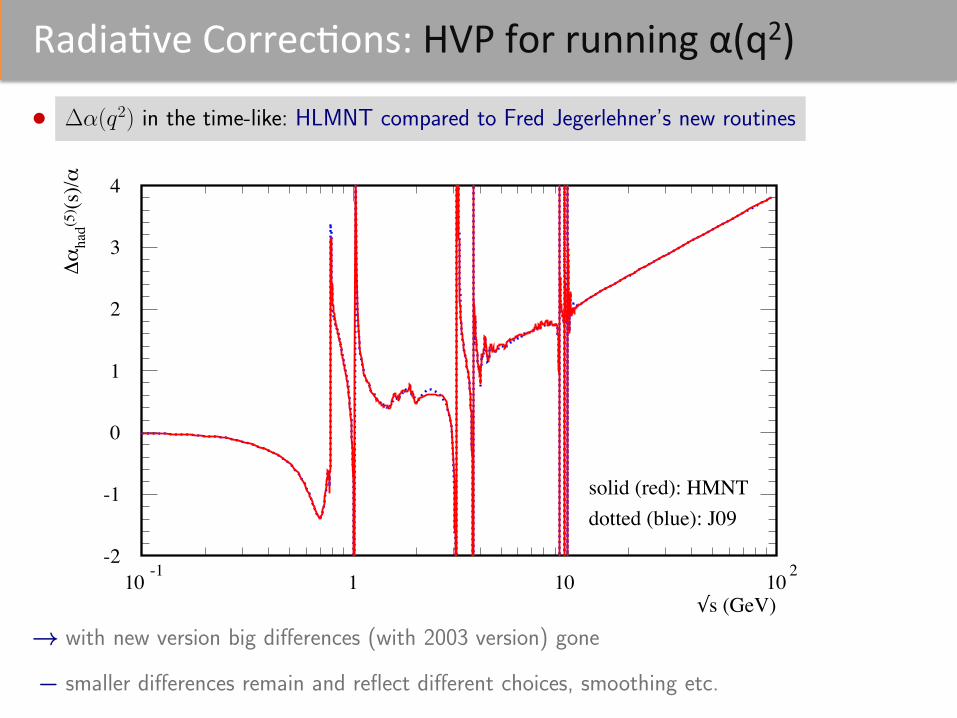
Radia0ve Correc0ons: HVP for running α(q2) • !!(q2) in the time-like: HLMNT compared to Fred Jegerlehner’s new routines
√s (GeV)
Δα
had(5
) (s)/α
solid (red): HMNTdotted (blue): J09
-2
-1
0
1
2
3
4
10 -1 1 10 10 2
! with new version big di!erences (with 2003 version) gone
" smaller di!erences remain and reflect di!erent choices, smoothing etc.
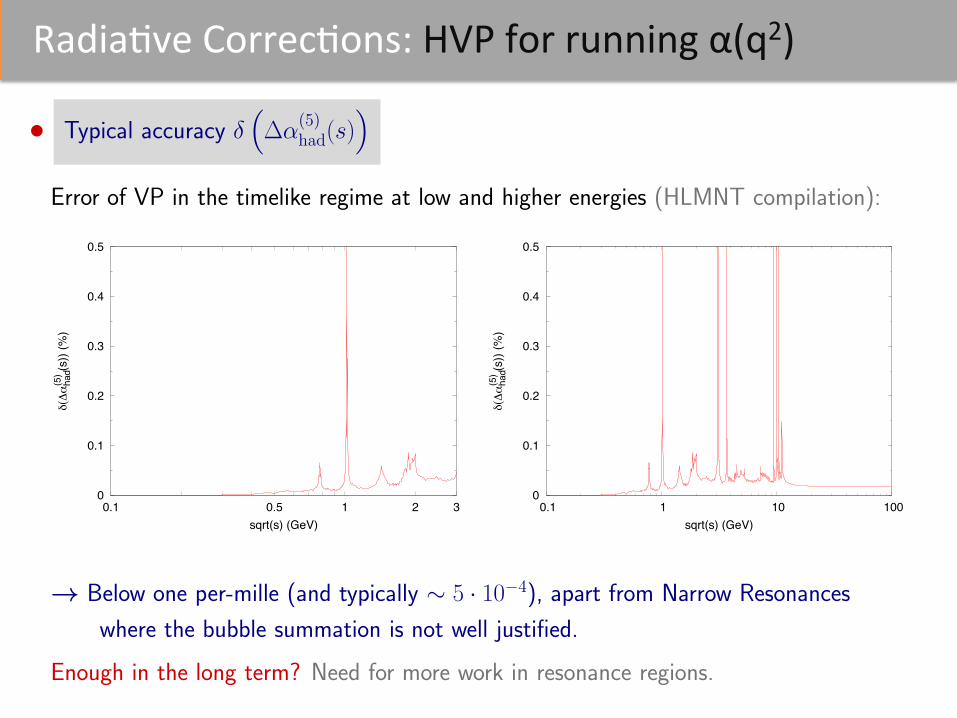
Radia0ve Correc0ons: HVP for running α(q2) • Typical accuracy !
!
!"(5)had(s)
"
Error of VP in the timelike regime at low and higher energies (HLMNT compilation):
0
0.1
0.2
0.3
0.4
0.5
0.1 0.5 1 2 3
δ(Δα
had
(5) (s
)) (%
)
sqrt(s) (GeV)
0
0.1
0.2
0.3
0.4
0.5
0.1 1 10 100δ(Δα
had
(5) (s
)) (%
)
sqrt(s) (GeV)
! Below one per-mille (and typically ! 5 · 10"4), apart from Narrow Resonances
where the bubble summation is not well justified.
Enough in the long term? Need for more work in resonance regions.
Radia0ve Correc0ons: Final State Radia0on
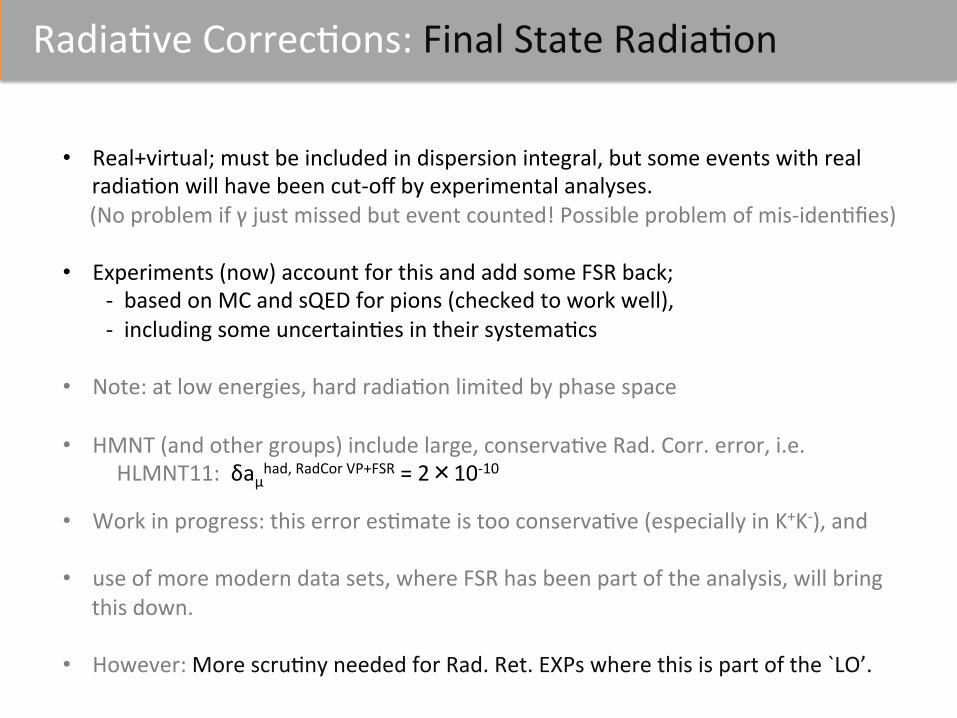
• Real+virtual; must be included in dispersion integral, but some events with real radia0on will have been cut-‐off by experimental analyses.
(No problem if γ just missed but event counted! Possible problem of mis-‐iden0fies) • Experiments (now) account for this and add some FSR back; -‐ based on MC and sQED for pions (checked to work well), -‐ including some uncertain0es in their systema0cs • Note: at low energies, hard radia0on limited by phase space
• HMNT (and other groups) include large, conserva0ve Rad. Corr. error, i.e. HLMNT11: δaμhad, RadCor VP+FSR = 2×10-‐10
• Work in progress: this error es0mate is too conserva0ve (especially in K+K-‐), and • use of more modern data sets, where FSR has been part of the analysis, will bring
this down.
• However: More scru0ny needed for Rad. Ret. EXPs where this is part of the `LO’.
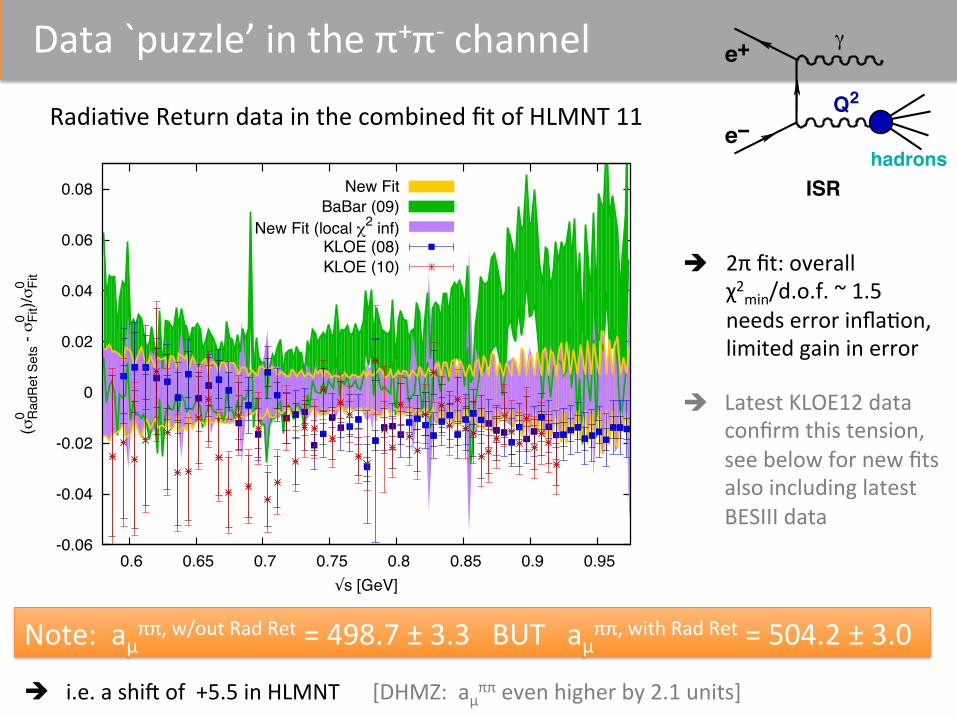
Data `puzzle’ in the π+π-‐ channel Radia0ve Return data in the combined fit of HLMNT 11
-0.06
-0.04
-0.02
0
0.02
0.04
0.06
0.08
0.6 0.65 0.7 0.75 0.8 0.85 0.9 0.95
(m0 R
adR
et S
ets -
m0 Fi
t)/m
0 Fit
3s [GeV]
New FitBaBar (09)
New Fit (local r2 inf)KLOE (08)KLOE (10)
Note: aμππ, w/out Rad Ret = 498.7 ± 3.3 BUT aμππ, with Rad Ret = 504.2 ± 3.0
è i.e. a shi� of +5.5 in HLMNT [DHMZ: aμππ even higher by 2.1 units]
2π fit: overall χ2min/d.o.f. ~ 1.5 needs error infla0on, limited gain in error
Latest KLOE12 data confirm this tension, see below for new fits also including latest BESIII data
hadrons
Q2
hadrons
s
ISR FSR
a ae+
e−
e+
e−
è
è
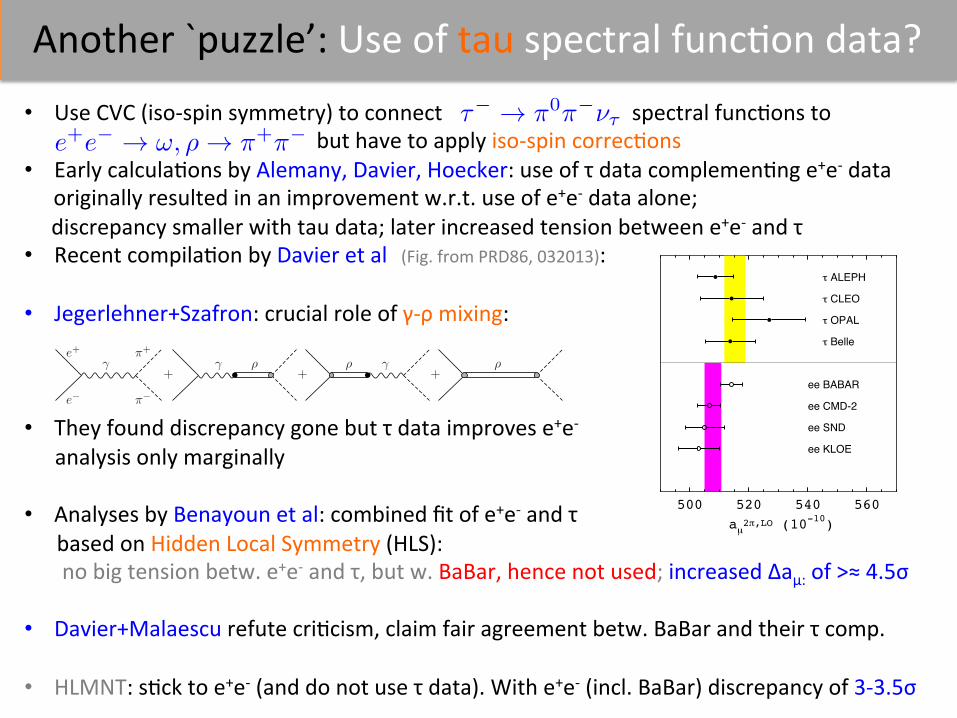
Another `puzzle’: Use of tau spectral func0on data?
• Use CVC (iso-‐spin symmetry) to connect spectral func0ons to but have to apply iso-‐spin correc0ons • Early calcula0ons by Alemany, Davier, Hoecker: use of τ data complemen0ng e+e-‐ data
originally resulted in an improvement w.r.t. use of e+e-‐ data alone; discrepancy smaller with tau data; later increased tension between e+e-‐ and τ • Recent compila0on by Davier et al (Fig. from PRD86, 032013): • Jegerlehner+Szafron: crucial role of γ-‐ρ mixing:
• They found discrepancy gone but τ data improves e+e-‐ analysis only marginally • Analyses by Benayoun et al: combined fit of e+e-‐ and τ based on Hidden Local Symmetry (HLS): no big tension betw. e+e-‐ and τ, but w. BaBar, hence not used; increased Δaμ: of >≈ 4.5σ • Davier+Malaescu refute cri0cism, claim fair agreement betw. BaBar and their τ comp. • HLMNT: s0ck to e+e-‐ (and do not use τ data). With e+e-‐ (incl. BaBar) discrepancy of 3-‐3.5σ
+ + +
e+
e!
!+
!!
" #" # " #
⌧� ! ⇡0⇡�⌫⌧e+e� ! !, ⇢ ! ⇡+⇡�
500 520 540 560aµ2/,LO (10
-10)
o ALEPH
o CLEO
o OPAL
o Belle
ee BABAR
ee CMD-2
ee SND
ee KLOE
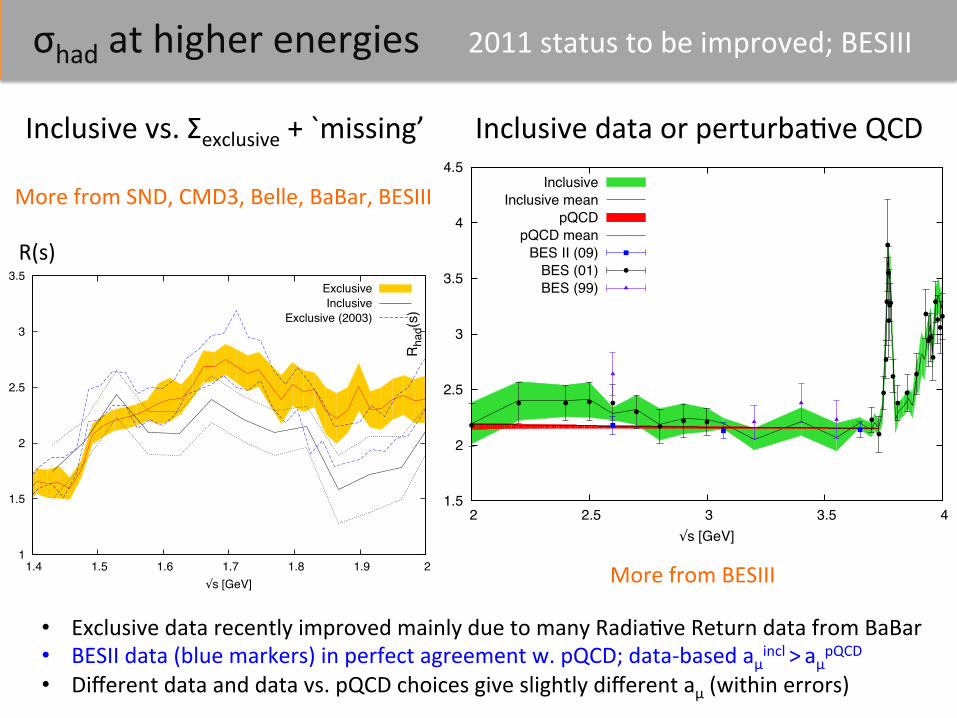
σhad at higher energies 2011 status to be improved; BESIII
1
1.5
2
2.5
3
3.5
1.4 1.5 1.6 1.7 1.8 1.9 2
R(s
)
3s [GeV]
ExclusiveInclusive
Exclusive (2003)
1.5
2
2.5
3
3.5
4
4.5
2 2.5 3 3.5 4
Rha
d(s)
3s [GeV]
InclusiveInclusive mean
pQCDpQCD mean
BES II (09)BES (01)BES (99)
• Exclusive data recently improved mainly due to many Radia0ve Return data from BaBar • BESII data (blue markers) in perfect agreement w. pQCD; data-‐based aμincl > aμpQCD • Different data and data vs. pQCD choices give slightly different aμ (within errors)
Inclusive vs. Σexclusive + `missing’ Inclusive data or perturba0ve QCD
R(s)
More from BESIII
More from SND, CMD3, Belle, BaBar, BESIII
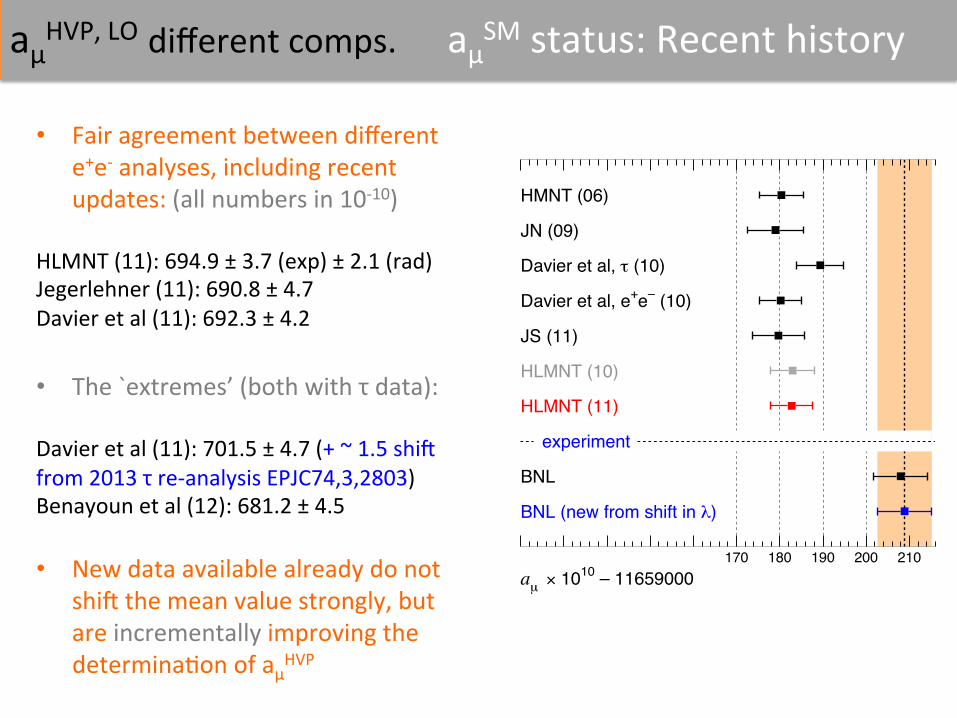
aμHVP, LO different comps. aμSM status: Recent history
170 180 190 200 210aµ × 1010 – 11659000
HMNT (06)
JN (09)
Davier et al, o (10)
Davier et al, e+e– (10)
JS (11)
HLMNT (10)
HLMNT (11)
experiment
BNL
BNL (new from shift in h)
• Fair agreement between different e+e-‐ analyses, including recent updates: (all numbers in 10-‐10)
HLMNT (11): 694.9 ± 3.7 (exp) ± 2.1 (rad) Jegerlehner (11): 690.8 ± 4.7 Davier et al (11): 692.3 ± 4.2 • The `extremes’ (both with τ data): Davier et al (11): 701.5 ± 4.7 (+ ~ 1.5 shi� from 2013 τ re-‐analysis EPJC74,3,2803) Benayoun et al (12): 681.2 ± 4.5 • New data available already do not
shi� the mean value strongly, but are incrementally improving the
determina0on of aμHVP
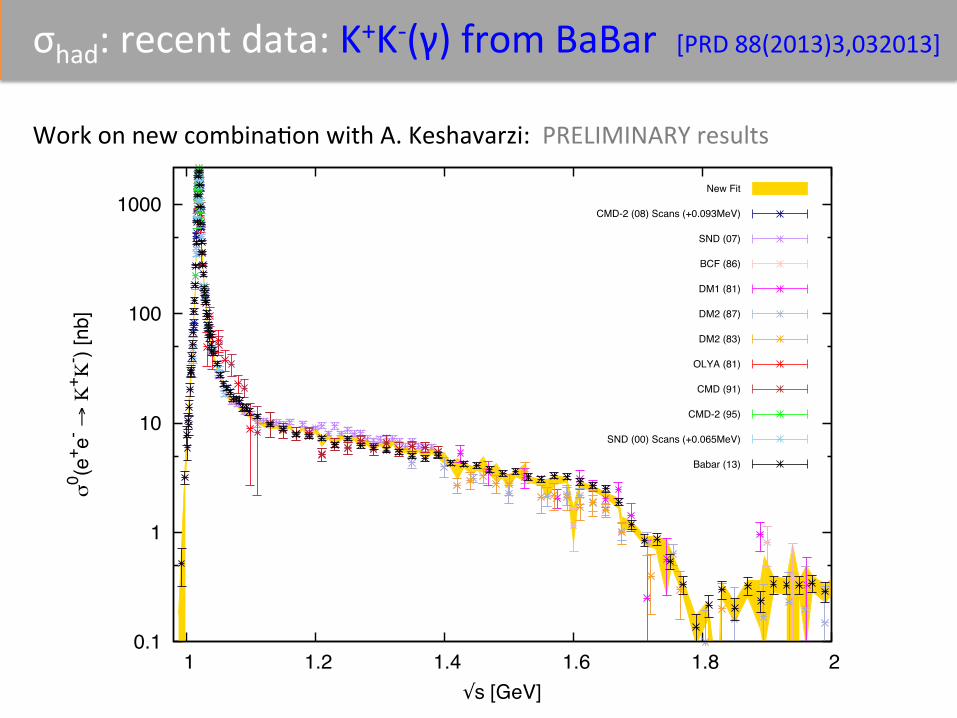
σhad: recent data: K+K-‐(γ) from BaBar [PRD 88(2013)3,032013]
Work on new combina0on with A. Keshavarzi: PRELIMINARY results
0.1
1
10
100
1000
1 1.2 1.4 1.6 1.8 2
m0 (e
+ e- A Q
+ Q- ) [
nb]
3s [GeV]
New Fit
CMD-2 (08) Scans (+0.093MeV)
SND (07)
BCF (86)
DM1 (81)
DM2 (87)
DM2 (83)
OLYA (81)
CMD (91)
CMD-2 (95)
SND (00) Scans (+0.065MeV)
Babar (13)
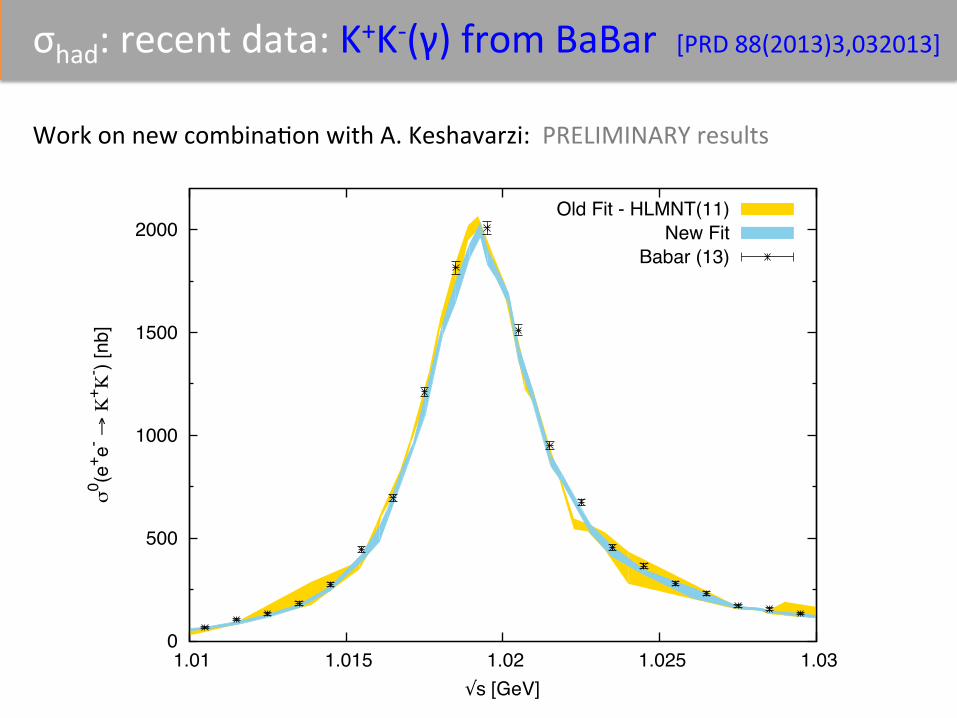
σhad: recent data: K+K-‐(γ) from BaBar [PRD 88(2013)3,032013]
Work on new combina0on with A. Keshavarzi: PRELIMINARY results
0
500
1000
1500
2000
1.01 1.015 1.02 1.025 1.03
m0 (e
+ e- A Q
+ Q- ) [
nb]
3s [GeV]
Old Fit - HLMNT(11)New Fit
Babar (13)

σhad: recent data: K+K-‐(γ) from BaBar [PRD 88(2013)3,032013]
Problem of data combina0on between BaBar and older sets: another puzzle?
• Energy dependent difference; fi�ed Φ mass is different betw. BaBar and CMD-‐2, SND • study to combine including energy (and normalisa0on) shi�s • χ2min/dof improved through energy shi�s, but s0ll not very good; (locally) inflated error ΔaμKK only marginally improved when BaBar data are included, and worse for all sets combined compared to BaBar only ( -‐> χ2min infla0on of error) • In total we get aμK+K-‐ = 21.74 ± 0.45 (HLMNT11) à 21.69 ± 0.36 (preliminary!)
-0.4
-0.2
0
0.2
0.4
1.015 1.02 1.025 1.03 1.035 1.04m
0 /fit -
13s [GeV]
Fitted Data - All Sets
Renormalised CMD-2(08) Scan 1 (0.96824)
Renormalised CMD-2(08) Scan 2 (1.00936)
Renormalised SND (00) PHI9801 (0.93757)
Renormalised SND (00) PHI9802 (0.99474)
Renormalised BaBar (13)
-0.3
-0.2
-0.1
0
0.1
0.2
0.3
1.01 1.015 1.02 1.025 1.03 1.035 1.04
m0 /fi
t -1
3s [GeV]
Fitted Babar(13) DataShifted CMD-2 (08) (+0.093Mev)
Original CMD-2 (08)
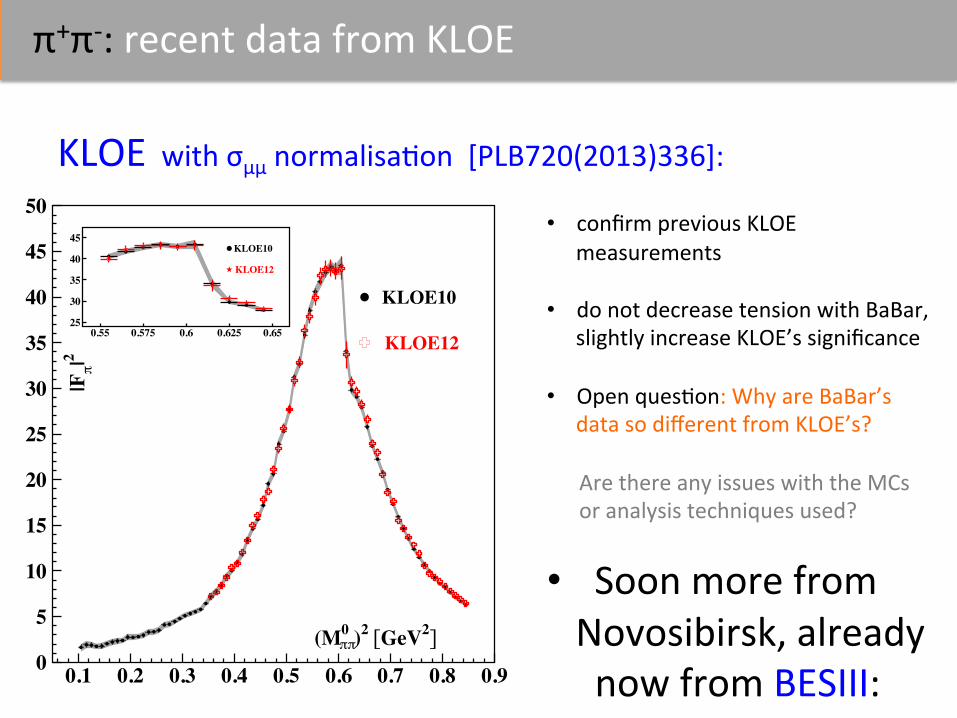
π+π-‐: recent data from KLOE
KLOE10
(M0 // )
2 [GeV2]
|F/|2
KLOE12
0
5
10
15
20
25
30
35
40
45
50
0.1 0.2 0.3 0.4 0.5 0.6 0.7 0.8 0.9
KLOE10
KLOE12
25
30
35
40
45
0.55 0.575 0.6 0.625 0.65
• confirm previous KLOE
measurements • do not decrease tension with BaBar,
slightly increase KLOE’s significance • Open ques0on: Why are BaBar’s
data so different from KLOE’s? Are there any issues with the MCs or analysis techniques used?
• Soon more from Novosibirsk, already now from BESIII:
KLOE with σμμ normalisa0on [PLB720(2013)336]:
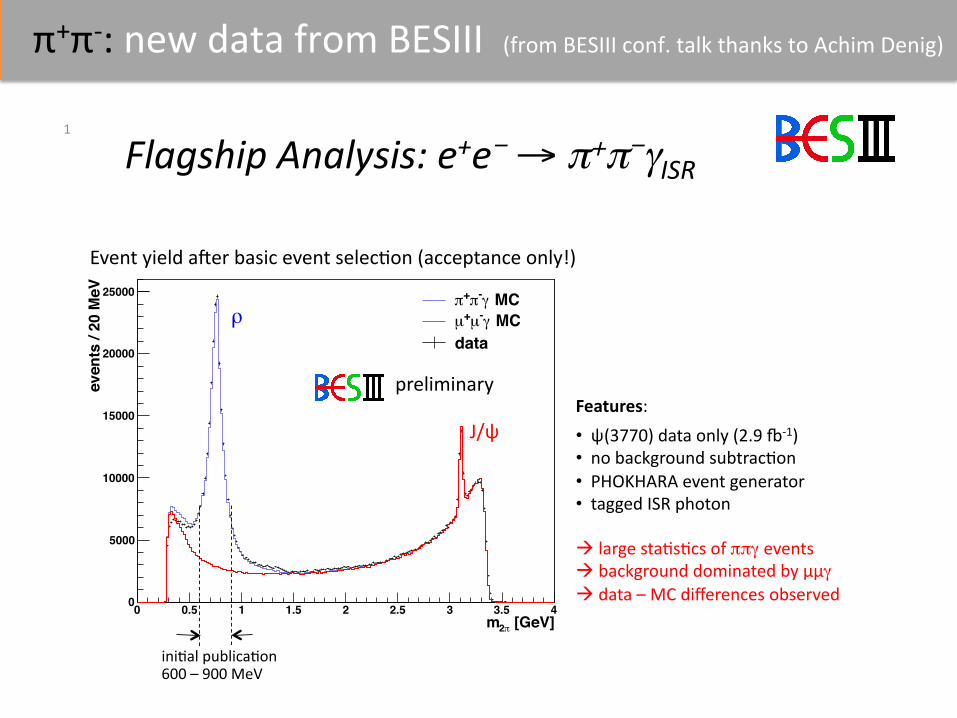
π+π-‐: new data from BESIII (from BESIII conf. talk thanks to Achim Denig)
Flagship)Analysis:)e+e�)→)π+π�γISR)))
[GeV]π2m0 0.5 1 1.5 2 2.5 3 3.5 4
even
ts /
20 M
eV
0
5000
10000
15000
20000
25000 MCγ-π+π MCγ-µ+µ
data
Event&yield&a,er&basic&event&selec1on&(acceptance&only!)&
Features:&
• &&ψ(3770)&data&only&(2.9&?@1)&• &&no&background&subtrac1on&• &&PHOKHARA&event&generator&• &&tagged&ISR&photon&
&large&sta1s1cs&of&ππγ events&&background&dominated&by&µµγ$&data&–&MC&differences&observed&
ini1al&publica1on&600&–&900&MeV&
preliminary&
J/ψ&
ρ$
1&
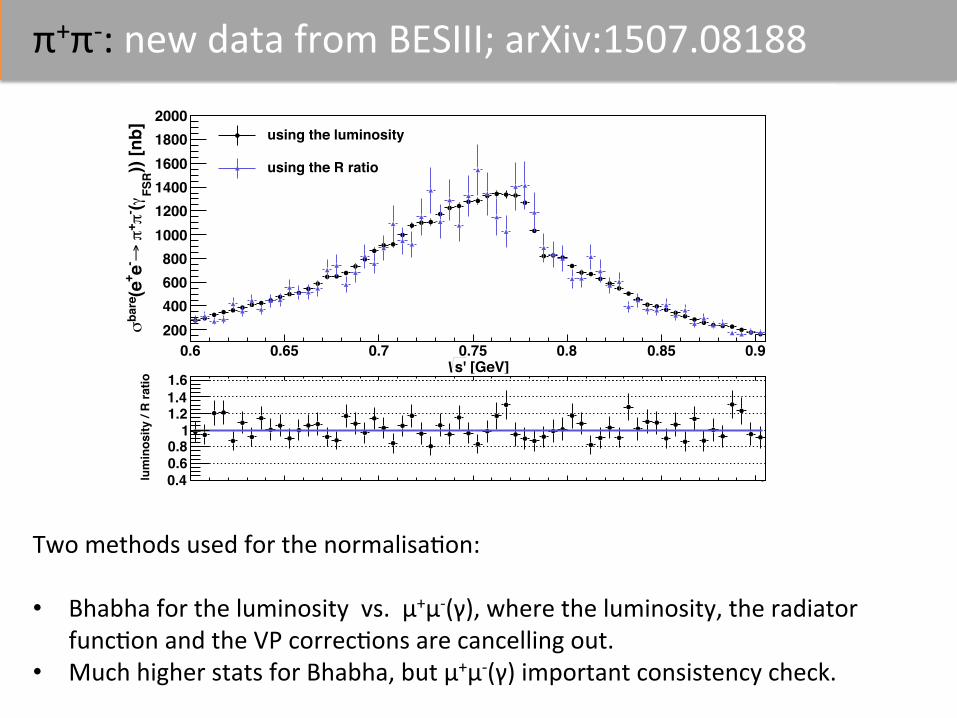
π+π-‐: new data from BESIII; arXiv:1507.08188
[GeV]s'0.6 0.65 0.7 0.75 0.8 0.85 0.9
)) [n
b]FS
Rγ(- π+ π
→- e+(e
bare
σ 200400600800
100012001400160018002000
using the luminosity
using the R ratiolu
min
osity
/ R
ratio
0.40.60.8
11.21.41.6
Two methods used for the normalisa0on: • Bhabha for the luminosity vs. μ+μ-‐(γ), where the luminosity, the radiator
func0on and the VP correc0ons are cancelling out. • Much higher stats for Bhabha, but μ+μ-‐(γ) important consistency check.
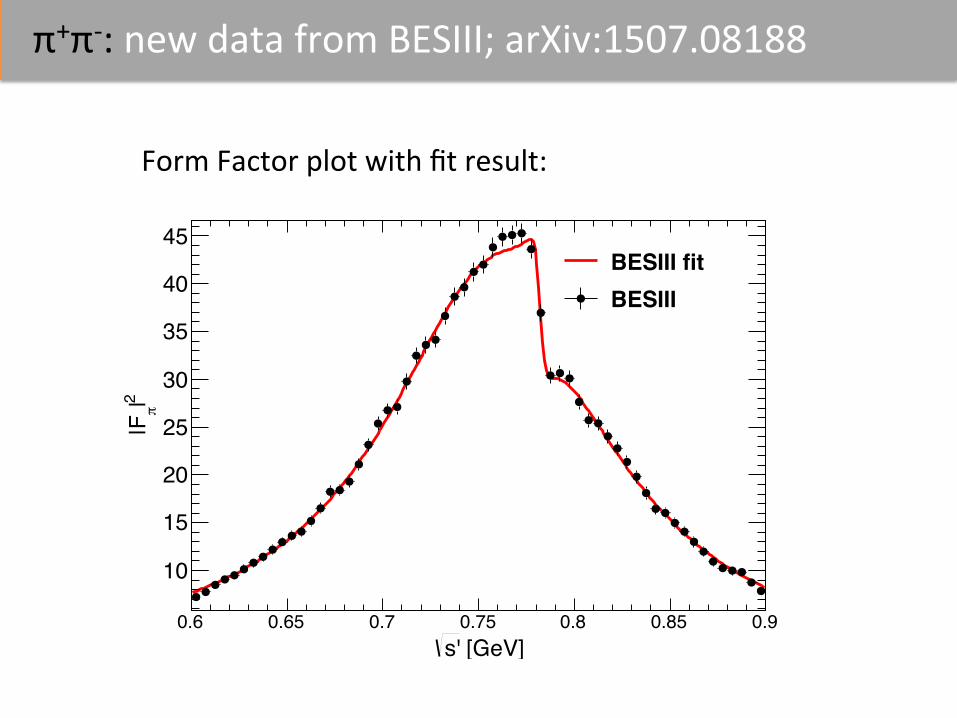
π+π-‐: new data from BESIII; arXiv:1507.08188
[GeV]s'0.6 0.65 0.7 0.75 0.8 0.85 0.9
2 | π|F
10
15
20
25
30
35
40
45 BESIII fit BESIII
Form Factor plot with fit result:

π+π-‐: new data from BESIII; arXiv:1507.08188
[GeV]s'0.6 0.65 0.7 0.75 0.8 0.85 0.9
/ BE
SIII
fit -
12 | π
|F
-0.15
-0.1
-0.05
0
0.05
0.1
0.15 BESIII fit KLOE 08 KLOE 10 KLOE 12
[GeV]s'0.6 0.65 0.7 0.75 0.8 0.85 0.9
/ BE
SIII
fit -
12 | π
|F
-0.15
-0.1
-0.05
0
0.05
0.1
0.15
BESIII fit BaBar BESIII
Good agreement with previous KLOE results, marginally consistent with BaBar; BESIII `interpolates’ between the two:
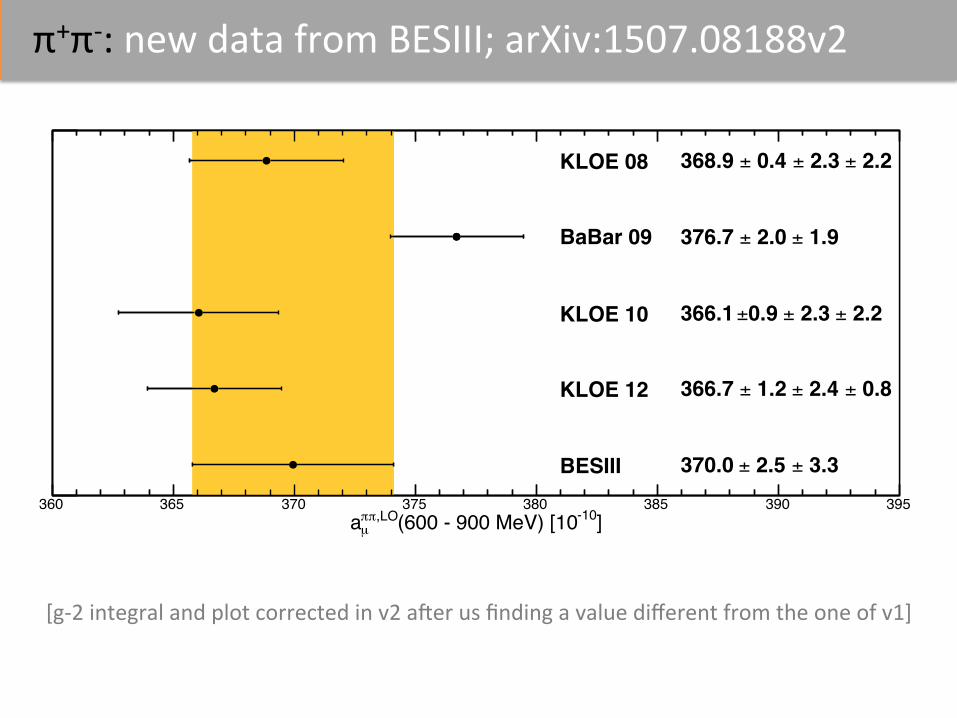
π+π-‐: new data from BESIII; arXiv:1507.08188v2
]-10(600 - 900 MeV) [10,LOππµa
360 365 370 375 380 385 390 395
BaBar 09
KLOE 12
KLOE 10
KLOE 08
BESIII
1.9± 2.0 ±376.7
0.8± 2.4 ± 1.2 ±366.7
2.2± 2.3 ±0.9 ±366.1
2.2± 2.3 ± 0.4 ±368.9
3.3± 2.5 ±370.0
[g-‐2 integral and plot corrected in v2 a�er us finding a value different from the one of v1]

π+π-‐: Effect of KLOE12 + BESIII data in `global’ 2π fit
Very preliminary first results (this Monday) from my PhD student Alex Kheshavarzi: ISR data comparison in ρ peak region and new fit band:
0
200
400
600
800
1000
1200
1400
0.6 0.65 0.7 0.75 0.8 0.85 0.9 0.95
m0 (e
+ e- A /
+ /- ) [
nb]
3s [GeV]
BaBar (09)
New Fit
KLOE (12)
KLOE (10)
KLOE (08)
BESIII (15)
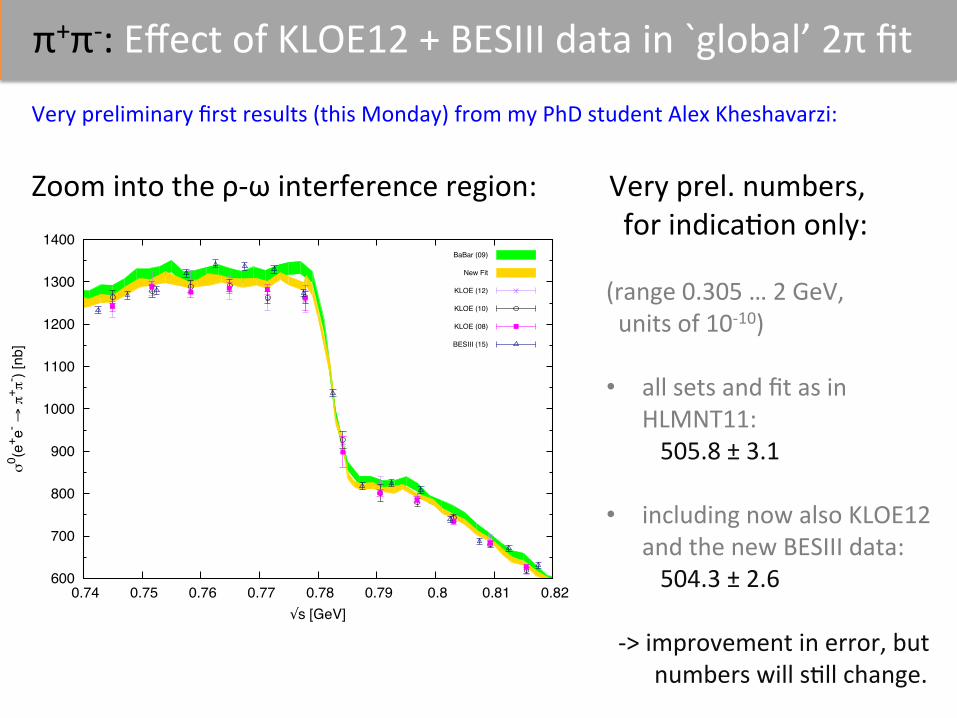
π+π-‐: Effect of KLOE12 + BESIII data in `global’ 2π fit
Very preliminary first results (this Monday) from my PhD student Alex Kheshavarzi: Zoom into the ρ-‐ω interference region: Very prel. numbers, for indica0on only:
(range 0.305 … 2 GeV, units of 10-‐10) • all sets and fit as in
HLMNT11: 505.8 ± 3.1 • including now also KLOE12
and the new BESIII data: 504.3 ± 2.6 -‐> improvement in error, but numbers will s0ll change.
600
700
800
900
1000
1100
1200
1300
1400
0.74 0.75 0.76 0.77 0.78 0.79 0.8 0.81 0.82
m0 (e
+ e- A /
+ /- ) [
nb]
3s [GeV]
BaBar (09)
New Fit
KLOE (12)
KLOE (10)
KLOE (08)
BESIII (15)

Hot from the arXiv: Benayoun et al., 1507.02943
Updated anal. (now with fi�ed normal. factors) in global fit based on HLS model: ç `preferred’ has 5σ already, from both aggressive errors and shi�s due to the HLS model (and the fit?) !10 40 90 140
! Data + [" + # + $] (PDG)
!(A+B+C) [39.89 ± 6.23] [4.5 %]
Individual && Data Sets + !NSK (CMD2+SND) [35.97 ± 4.63] [4.6 %] ['2/N!! 0.96] [99.5%]
KLOE 08 [38.78 ± 5.16] [4.8 %] ['2/N!! 1.64] [58.9%]
KLOE 10 [39.21 ± 5.15] [4.8 %] ['2/N!! 0.96] [96.6%]
KLOE 12 [38.33 ± 4.33] [5.0 %] ['2/N!! 1.02] [96.9%]
BaBar (Trunc.) [29.15 ± 4.07] [3.9 %] ['2/N!! 1.15] [73.8%]
BaBar (Full) [27.40 ± 4.03] [3.7 %] ['2/N!! 1.25] [40.1%]scan && Data
NSK (CMD2+SND)+! [35.97 ± 4.63] [4.6 %] ['2/N!! 0.96] [99.5%]
NSK [37.94 ± 4.95] [4.7 %] ['2/N!! 0.97] [99.8%]
DHea09 (e+e!) [28.56 ± 5.8] [3.4 %]scan +ISR && Data
NSK+KLOE (10&12)&! [38.34 ± 4.19] [5.1 %] ['2/N!! 1.06] [97.0%]
NSK+KLOE(10&12) [39.13 ± 4.31] [5.1 %] ['2/N!! 1.06] [98.5%]
DHMZ10 (e+e! + !) [17.96 ± 5.4] [2.2 %]
DHMZ10 (e+e!) [27.16 ± 4.9] [3.3 %]
HLMNT11(e+e!) [24.56 ± 4.9] [3.1 %]
JS11(e+e! + !) [27.66 ± 6.0] [3.2 %]
Global (ISR & scan&!) [33.72 ± 4.08] [4.5 %] ['2/N!! 1.28] [11.3%]
Global (ISR & scan) [33.63 ± 4.03] [4.5 %] ['2/N!! 1.59] [15.4%]experiment
BNL-E821(avrg) [0 ± 6.3]
(aexpµ ! ath
µ )"1010
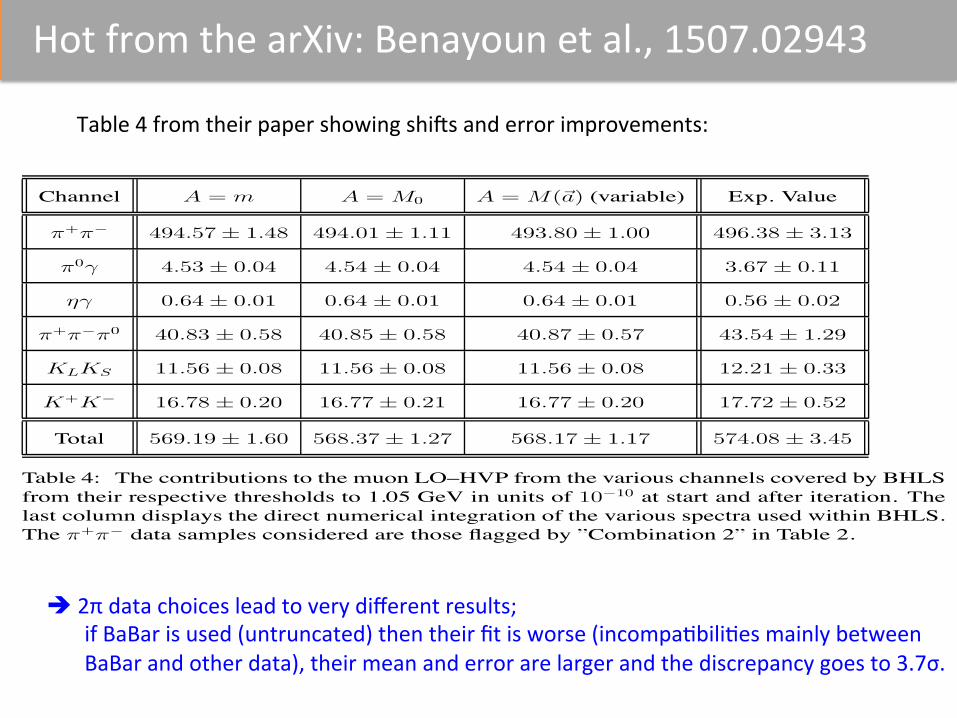
Hot from the arXiv: Benayoun et al., 1507.02943
Table 4 from their paper showing shi�s and error improvements:
Channel A = m A = M0 A = M(!a) (variable) Exp. Value
"+"! 494.57± 1.48 494.01± 1.11 493.80± 1.00 496.38± 3.13
"0# 4.53± 0.04 4.54± 0.04 4.54± 0.04 3.67± 0.11
$# 0.64± 0.01 0.64± 0.01 0.64± 0.01 0.56± 0.02
"+"!"0 40.83± 0.58 40.85± 0.58 40.87± 0.57 43.54± 1.29
KLKS 11.56± 0.08 11.56± 0.08 11.56± 0.08 12.21± 0.33
K+K! 16.78± 0.20 16.77± 0.21 16.77± 0.20 17.72± 0.52
Total 569.19± 1.60 568.37± 1.27 568.17± 1.17 574.08± 3.45
Table 4: The contributions to the muon LO–HVP from the various channels covered by BHLSfrom their respective thresholds to 1.05 GeV in units of 10!10 at start and after iteration. Thelast column displays the direct numerical integration of the various spectra used within BHLS.The "+"! data samples considered are those flagged by ”Combination 2” in Table 2.
in Table 8 of [34] and smaller by a factor of 2 ÷ 2.5 than the errors estimated using the directnumerical integration of the data.
As for the "+"! channel, all these fits – which include the % spectra – provide values inagreement with the direct estimate within the quoted error; one could however note that the –possibly – ”biased” estimate (namely, the A = m result) is the closest to the “experimental”value24. If the A = m solution were (inherently) exhibiting a bias, comparing the first threenumbers in the first line of Table 4 indicates that this does not exceed ! 0.5 " 10!10 – e.g.half a standard deviation. Therefore, real experimental data samples confirm the gain providedby a global fit procedure when samples with normalization errors small compared to theirstatistical accuracies are included; exploring this effect is the purpose of Subsection A.2.3 inthe Appendix.
One should also remark that the unbiasing iterative procedure lessens significantly the un-certainty on aµ("+"!) compared with theA = m solution and, over the whole range of validityof BHLS (up to 1.05 GeV), one ends up with a factor of 3 reduction of the uncertainty com-pared to the direct numerical integration. The same kind of effect is reported in [46] concerningthe spread of the parton density functions25.
Therefore, relying on the iterative procedure, one observes that the global fit does not pro-24 As for the central value of the experimental estimate which is the present concern, one can legitimately expect
that it should be affected by some bias (a priori, of unknownmagnitude) of the same nature than theA = m result.Indeed, roughly speaking, the experimental cross section !exp(s) is related with the underlying theoretical crosssection !th(s) by a relation of the form !exp(s) = !th(s) + "!(s) and the "!(s) correction depends on thenormalization uncertainties which just motivate the iterative method! Actually, this "!(s) is exactly the scaledependent term in Eqs. (5) and (8). Obviously it cannot be estimated without some fitting procedure.
25In particular, Figure 5 in this Reference, is quite informative about the variety of correction kinds revealed byunbiasing procedures.
24
è 2π data choices lead to very different results; if BaBar is used (untruncated) then their fit is worse (incompa0bili0es mainly between BaBar and other data), their mean and error are larger and the discrepancy goes to 3.7σ.

σhad: recent new data: 2π+2π-‐(γ) from BaBar
PRD85(2012)112009 • shi� of +0.3 × 10-‐10 for aμ • error down to a third • combina0on?
0
5
10
15
20
25
30
35
40
1000 1500 2000 2500 3000 3500ECM (MeV)
m(e
+ e- A /
+ /- /
+ /- ) (
nb)
ND
OLYA
CMD
SND
M3NDM1
GG2
DM2CMD2
BaBar 2005this work
0
1
2
3
4
600 800 1000
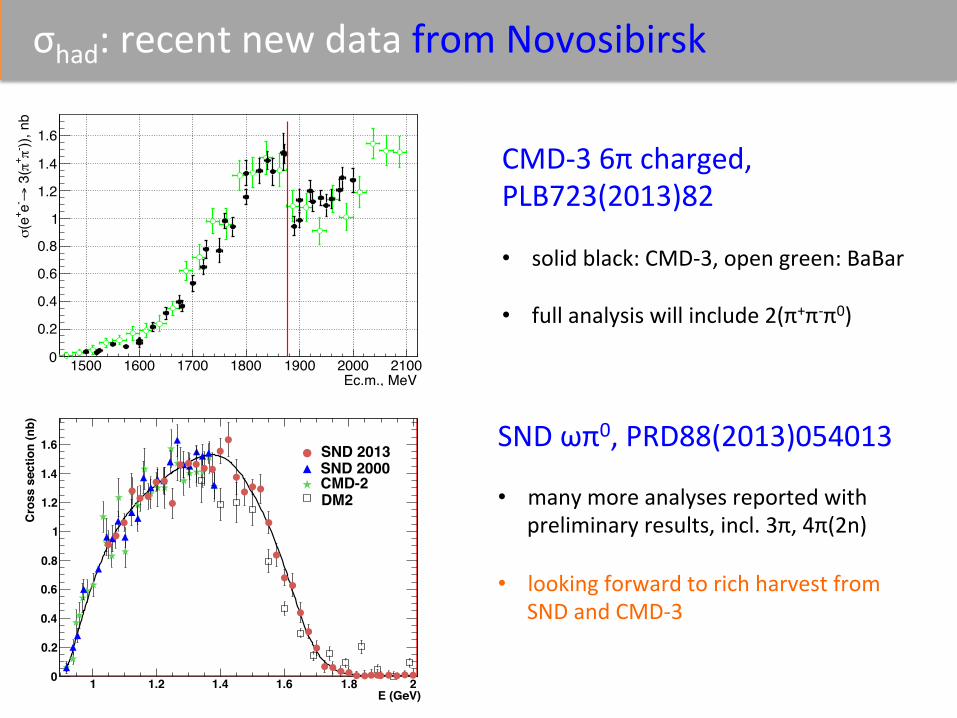
σhad: recent new data from Novosibirsk
Ec.m., MeV1500 1600 1700 1800 1900 2000 2100
)), n
b- /+ /
3(
A- e+(e
m
0
0.2
0.4
0.6
0.8
1
1.2
1.4
1.6
CMD-‐3 6π charged, PLB723(2013)82 • solid black: CMD-‐3, open green: BaBar • full analysis will include 2(π+π-‐π0)
E (GeV)1 1.2 1.4 1.6 1.8 2
Cro
ss s
ectio
n (n
b)
0
0.2
0.4
0.6
0.8
1
1.2
1.4
1.6 SND 2013SND 2000CMD-2DM2
SND ωπ0, PRD88(2013)054013 • many more analyses reported with
preliminary results, incl. 3π, 4π(2n) • looking forward to rich harvest from
SND and CMD-‐3
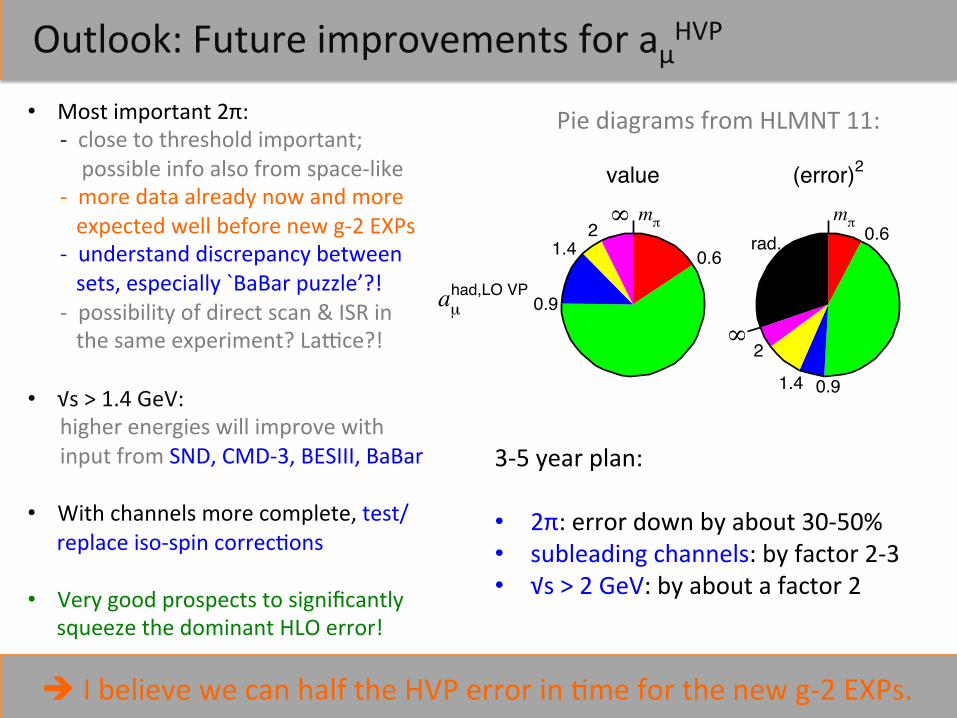
Outlook: Future improvements for aμHVP • Most important 2π: -‐ close to threshold important; possible info also from space-‐like -‐ more data already now and more expected well before new g-‐2 EXPs -‐ understand discrepancy between sets, especially `BaBar puzzle’?! -‐ possibility of direct scan & ISR in the same experiment? Lalce?! • √s > 1.4 GeV: higher energies will improve with input from SND, CMD-‐3, BESIII, BaBar • With channels more complete, test/
replace iso-‐spin correc0ons • Very good prospects to significantly
squeeze the dominant HLO error!
Pie diagrams from HLMNT 11:
3-‐5 year plan: • 2π: error down by about 30-‐50% • subleading channels: by factor 2-‐3 • √s > 2 GeV: by about a factor 2
aµhad,LO VP
6_(5)had (M 2
Z)
value (error)2
m/
0.6
0.9
1.42'
rad.m/
0.6
0.91.4
2'
m/ 0.60.9
1.42
4
11
'rad.
m/ 0.60.91.4
2
411'
è I believe we can half the HVP error in 0me for the new g-‐2 EXPs.

Conclusions:
• All sectors of the Standard Model predic0on of g-‐2 have been scru0nised a lot in recent years
• No major changes recently, but discrepancy > 3σ consolidated
• With the next round of hadronic data it should be possible to push the error down significantly, hopefully halfing ΔaμHVP
• For this much more work will be needed (solve some puzzles) • though Benayoun et al. already claim 5σ now
• But where is the NP?
Thank you!

Extras
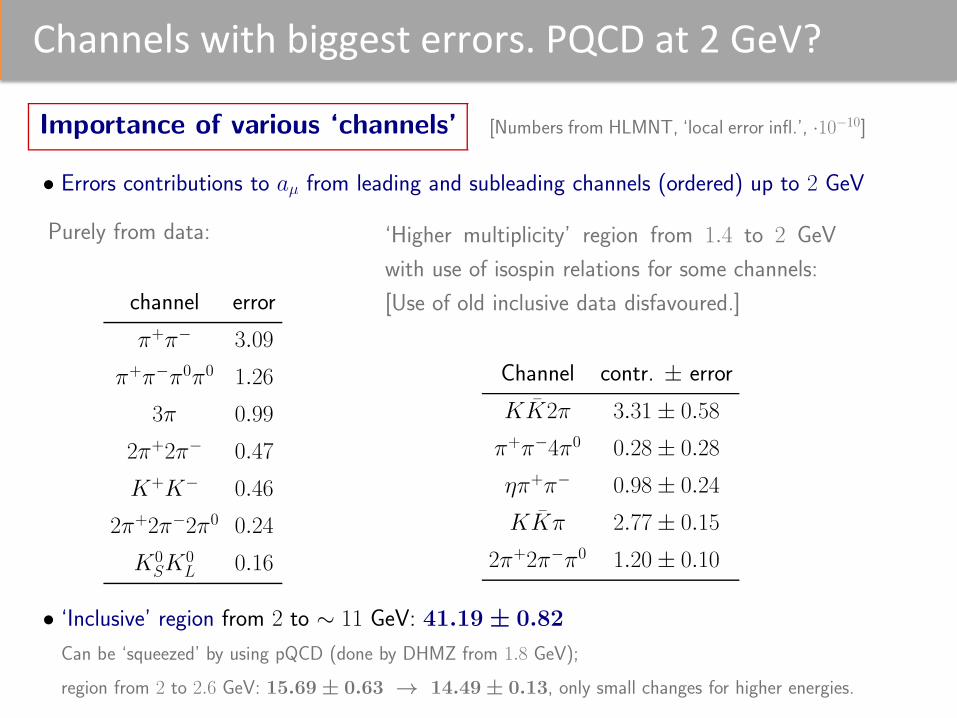
Channels with biggest errors. PQCD at 2 GeV?
Importance of various ‘channels’ [Numbers from HLMNT, ‘local error infl.’, ·10!10]
• Errors contributions to aµ from leading and subleading channels (ordered) up to 2 GeV
Purely from data:
channel error
!+!! 3.09
!+!!!0!0 1.26
3! 0.99
2!+2!! 0.47
K+K! 0.46
2!+2!!2!0 0.24
K0SK
0L 0.16
‘Higher multiplicity’ region from 1.4 to 2 GeV
with use of isospin relations for some channels:
[Use of old inclusive data disfavoured.]
Channel contr. ± error
KK̄2! 3.31± 0.58
!+!!4!0 0.28± 0.28
"!+!! 0.98± 0.24
KK̄! 2.77± 0.15
2!+2!!!0 1.20± 0.10
• ‘Inclusive’ region from 2 to " 11 GeV: 41.19 ± 0.82
Can be ‘squeezed’ by using pQCD (done by DHMZ from 1.8 GeV);
region from 2 to 2.6 GeV: 15.69 ± 0.63 ! 14.49± 0.13, only small changes for higher energies.
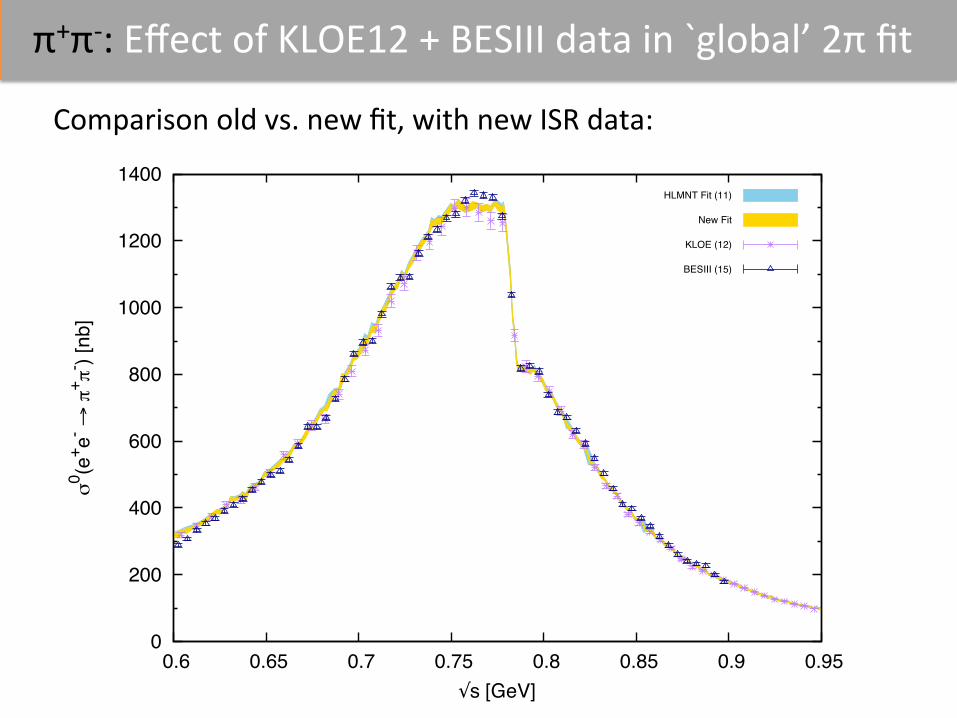
π+π-‐: Effect of KLOE12 + BESIII data in `global’ 2π fit
Comparison old vs. new fit, with new ISR data:
0
200
400
600
800
1000
1200
1400
0.6 0.65 0.7 0.75 0.8 0.85 0.9 0.95
m0 (e
+ e- A /
+ /- ) [
nb]
3s [GeV]
HLMNT Fit (11)
New Fit
KLOE (12)
BESIII (15)
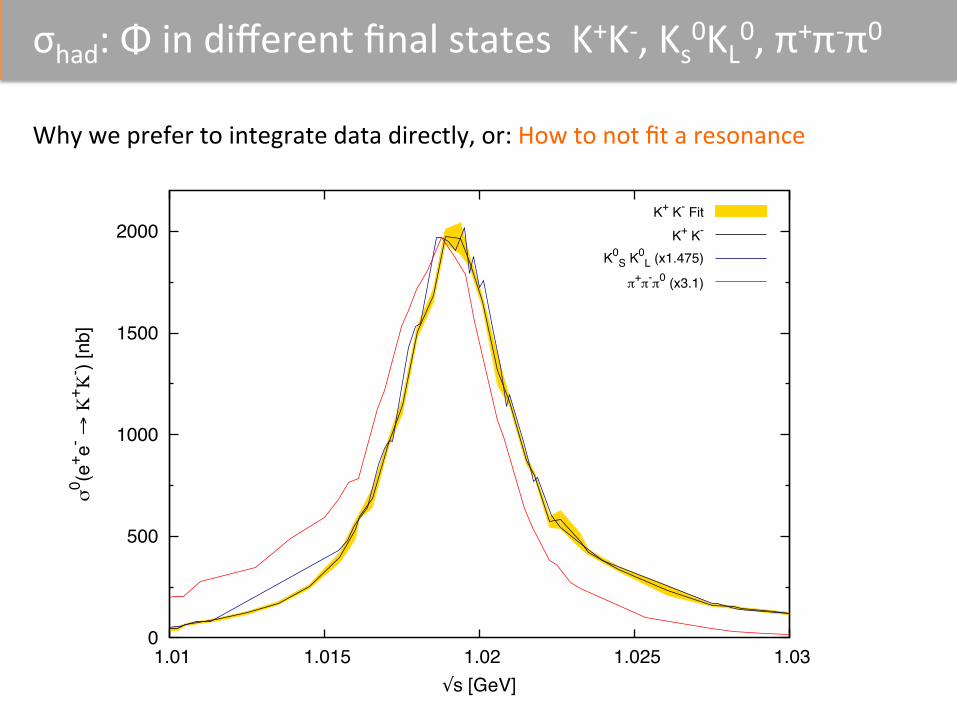
σhad: Φ in different final states K+K-‐, Ks0KL0, π+π-‐π0
Why we prefer to integrate data directly, or: How to not fit a resonance
0
500
1000
1500
2000
1.01 1.015 1.02 1.025 1.03
m0 (e
+ e- A Q
+ Q- ) [
nb]
3s [GeV]
K+ K- FitK+ K-
K0S K0
L (x1.475)
/+/-/0 (x3.1)
HLMNT fit strategy:
Computing ahad,V P LOµ Minimisation
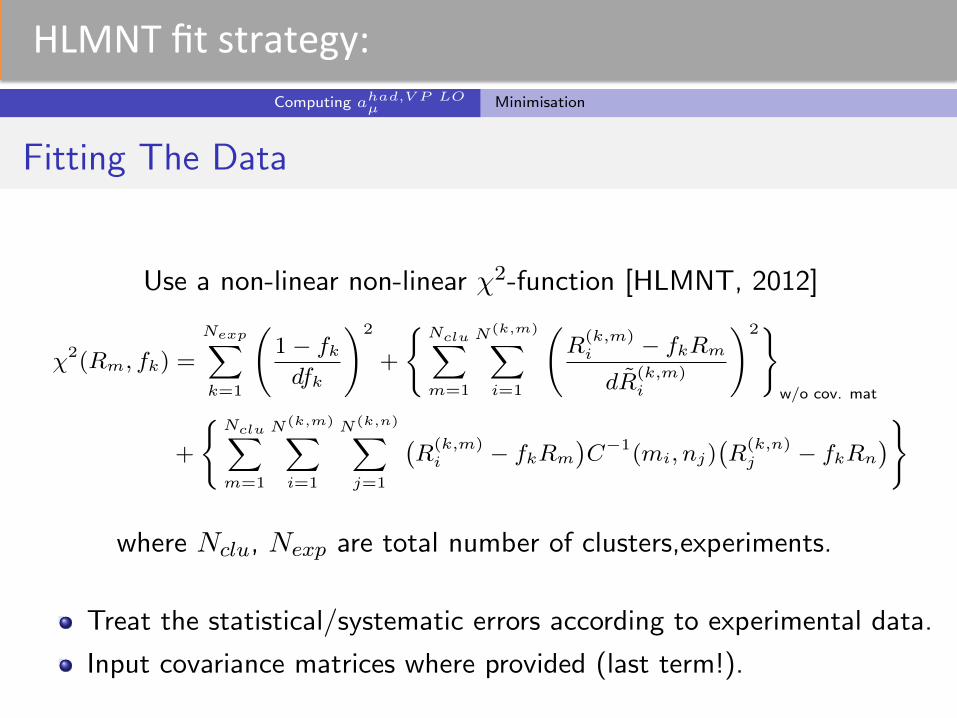
Fitting The Data
Use a non-linear non-linear �2-function [HLMNT, 2012]
�2(Rm, fk) =
NexpX
k=1
1� fkdfk
!2
+
(NcluX
m=1
N(k,m)X
i=1
R(k,m)
i � fkRm
dR̃(k,m)i
!2)
w/o cov. mat
+
(NcluX
m=1
N(k,m)X
i=1
N(k,n)X
j=1
�R(k,m)
i � fkRm
�C�1(mi, nj)
�R(k,n)
j � fkRn
�)
where Nclu, Nexp are total number of clusters,experiments.
Treat the statistical/systematic errors according to experimental data.
Input covariance matrices where provided (last term!).
Alex Keshavarzi (UoL) Calculating ahad,V P LOµ May 13, 2015 10 / 17
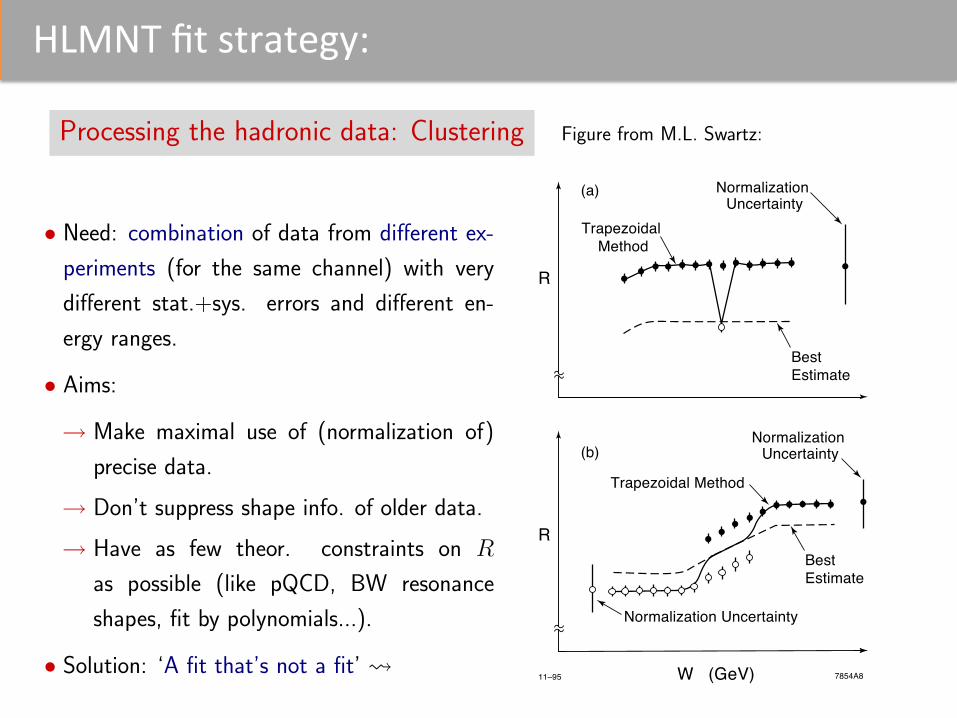
HLMNT fit strategy: Processing the hadronic data: Clustering Figure from M.L. Swartz:
• Need: combination of data from di!erent ex-
periments (for the same channel) with very
di!erent stat.+sys. errors and di!erent en-
ergy ranges.
• Aims:
! Make maximal use of (normalization of)
precise data.
! Don’t suppress shape info. of older data.
! Have as few theor. constraints on R
as possible (like pQCD, BW resonance
shapes, fit by polynomials...).
• Solution: ‘A fit that’s not a fit’ ! W (GeV)
R
Normalization Uncertainty
Normalization Uncertainty
Normalization Uncertainty
BestEstimate
(b)
(a)
Trapezoidal Method
11–95 7854A8
BestEstimate
R
Trapezoidal Method
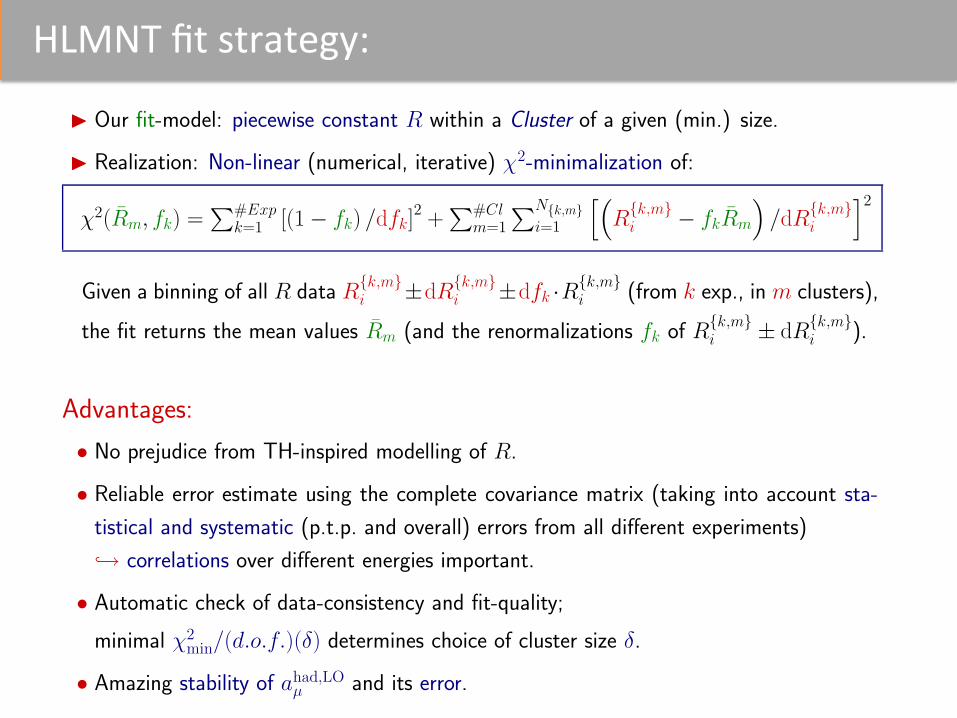
HLMNT fit strategy: ! Our fit-model: piecewise constant R within a Cluster of a given (min.) size.
! Realization: Non-linear (numerical, iterative) !2-minimalization of:
!2(R̄m, fk) =!#Exp
k=1 [(1 ! fk) /dfk]2 +
!#Clm=1
!N{k,m}i=1
"#R{k,m}
i ! fkR̄m
$/dR{k,m}
i
%2
Given a binning of all R data R{k,m}i ±dR{k,m}
i ±dfk ·R{k,m}i (from k exp., in m clusters),
the fit returns the mean values R̄m (and the renormalizations fk of R{k,m}i ± dR{k,m}
i ).
Advantages:
• No prejudice from TH-inspired modelling of R.
• Reliable error estimate using the complete covariance matrix (taking into account sta-
tistical and systematic (p.t.p. and overall) errors from all di!erent experiments)
"" correlations over di!erent energies important.
• Automatic check of data-consistency and fit-quality;
minimal !2min/(d.o.f.)(#) determines choice of cluster size #.
• Amazing stability of ahad,LOµ and its error.

HLMNT fit strategy: How does it work? A few examples:
• Artificial ‘demo’ data for illustration:
Δ = 5 MeV, 16 clusters
χ2 min/d.o.f. = 0.02
aµ = (0.90 ± 0.27) ⋅ 10 -10
√s (GeV)
σ (n
b)
0
0.5
1
1.5
2
2.5
3
3.5
1.3 1.4 1.5 1.6 1.7 1.8 1.9
Δ = 50 MeV, 9 clusters
χ2 min/d.o.f. = 0.61
aµ = (0.65 ± 0.10) ⋅ 10 -10
√s (GeV)
σ (n
b)
0
0.5
1
1.5
2
2.5
3
3.5
1.3 1.4 1.5 1.6 1.7 1.8 1.9
The two green ‘high quality’ points have 1% sys. error, the other set 30%
!! ‘maximal’ adjustment of normalization of the latter by 1/1.35;
!! smaller aµ value and error, fit still good, "2min/d.o.f. < 1.
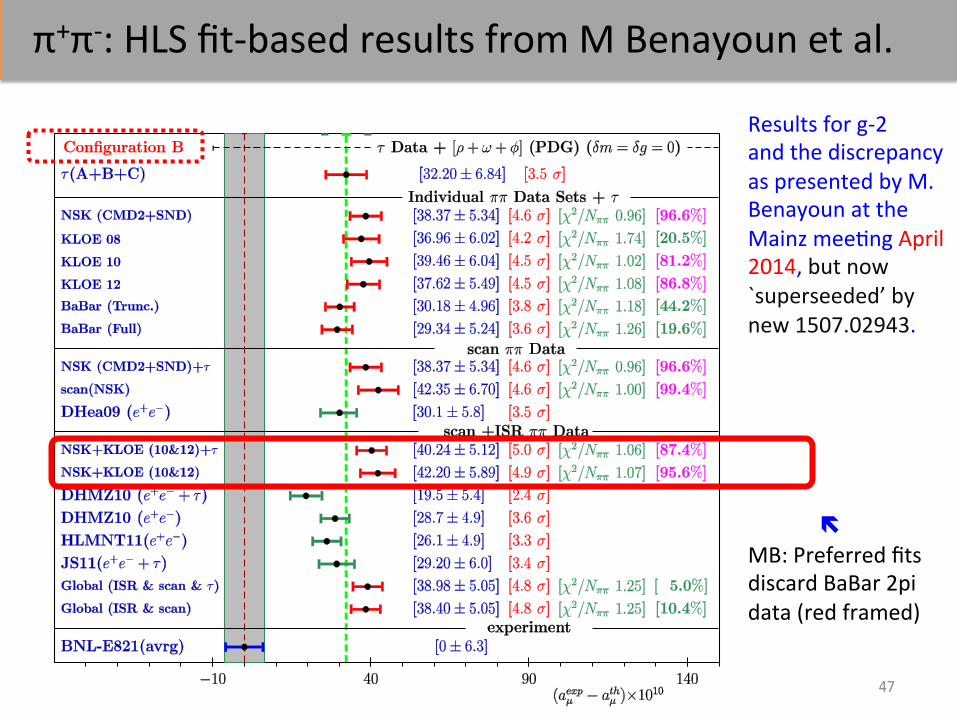
π+π-‐: HLS fit-‐based results from M Benayoun et al.
47
g-2 Estimates & Discrepancy Results for g-‐2 and the discrepancy as presented by M. Benayoun at the Mainz mee0ng April 2014, but now `superseeded’ by new 1507.02943. ë MB: Preferred fits discard BaBar 2pi data (red framed)
π+π-‐: diff. betw. HLMNT & Benayoun et al (as of 2014) • Taking only direct scan as baseline: • Benayoun et al: -‐3.1 from HLS-‐based fit, -‐4.3 from KLOE10+12 • HLMNT: +5.5 from KLOE and BaBar (compared to scan only) • So the big difference (~13×10-‐10, 3.3 è 5σ) comes to a big part
from the data input, i.e. if BaBar’s 2π is used or not. (If used: error rela0vely poor despite stats due to infla0on) • Future SND, CMD-‐3, BELLE and BESIII 2π data may dilute the
strong significance of BaBar [also more data from BaBar to be analysed!] • Ideally find out why the different data sets are not consistent. If this could be achieved the 2π channel would be great!