V. 8, n. 3 - Brazilian Journal of Radiation Sciences
241
Brazilian Journal of Radiation Sciences V. 8, n. 3 2020
-
Upload
khangminh22 -
Category
Documents
-
view
3 -
download
0
Transcript of V. 8, n. 3 - Brazilian Journal of Radiation Sciences

Brazilian Journal of Radiation Sciences V. 8, n. 3
2020

Thorium as a nuclear material: physics features and a safety analysis due to insertion of ThO2 in a PWR
nuclear reactor fuel
Clóves Júnior da Fonseca, Cláudio Luiz De Oliveira, Marcos Paulo Cavaliere De Medeiros, Eduardo Henrique
Fernandes Fonseca, Camila Oliveira Baptista
CALIBRAÇÃO DE DOSÍMETROS TERMOLUMINESCENTES (TLD-100) PARA UTILIZAÇÃO EM
DOSIMETRIA AMBIENTAL
SABRINA DONATO DA SILVA, PETERSON LIMA SQUAIR, CARLOS MANOEL DE ASSIS SOARES,
KELLEN MILENE CAMARGOS, RUGLES CÉSAR BARBOSA
Solução das equações da cinética pontual de nêutrons via Método de Fator de Integração Implícito com fonte
externa
Jaime Conte Zandoná, Natália Barros Schaun, Claudio Zen Petersen, Fernanda Tumelero, Marcelo Schramm
Determinação da dose em pacientes submetidos a exames de tomografia computadorizada de abdome em um
serviço de radiologia e diagnóstico por imagem
Fabricio Maia Torres Alves, Linda Viola Ehlin Caldas
Manufacture and characterization of a Bolus composed of water, bi-distilled glycerin, gelatin and
formaldehyde
Carlla da Motta Oliveira, Fábio Fernandes Brüning, Jessé Gevezier Prado Lyra, Susan Yamamoto Zanetti, Melissa
Funchal, Tatiane Cristina de Oliveira Fernandes
Definição de Níveis de Referência em Diagnóstico do Serviço de Medicina Nuclear do Hospital de Clínicas de
Porto Alegre
Daniel Molena Seraphim, Andréia Caroline Fischer da Silveira Fischer
Estudo da distribuição de dose de feixes clínicos de elétrons em meios heterogêneos
Eder Aguirre, Carlos Eduardo de Almeida, Mariano David, Daniel Venencia
Neutronic evaluation of CANDU-6 core using reprocessed fuels.
Clarysson Alberto Mello da Silva, Carlos Eduardo Velasquez Cabrera, Michel Cleberson Bernardo de Almeida,
Rochkhudon Batista de Faria, Claubia Pereira
Dose profile evaluation of a 137Cs source using a solid water phantom
Caio Fernando Teixeira Portela, Thêssa Cristina Alonso, Arnado Prata Mourão
Avaliação do PETG como material para imobilizadores utilizados em radioterapia para cabeça e pescoço.
Heitor Ribeiro Birnfeld, Gabriela Corati Touguinha, Romulo Rocha Santos, Mirko Salomón Alva Sánchez, Luzia
Fernandes Millão
Criação de um indicador eletrônico para acompanhamento de dose no setor de Tomografia
Computadorizada.
Diana Rodrigues Pina, Francielen Barreto Hortencio, José Carlos Souza Trindade Filho, Raul Lopes Ruiz Junior,
Allan Felipe Fattori Alves
Determination of dose rate during the inspection of spent fuel element in the testing cell
Amr Abdelhady
Irradiação de alimentos no Brasil: revisão histórica, situação atual e desafios futuros
Denise Levy, Gian M. A. A. Sordi, Anna Lucia C. H. Villavicencio
Computer Simulator for the Research Reactor IPEN/MB-01
Marcelo da Silva Rocha, Delvonei Alves de Andrade, Ulysses d´Utra Bitelli, Marcelo Casorla
A study on trace elements in fingernails and toenails from adult individuals by instrumental neutron
activation analysis
Thalita Pinheiro Sanches, Frederico Antonio Genezini, Mitiko Saiki
Image quality evaluation for two different positron emitters in a preclinical PET scanner
Rodrigo Modesto Gadelha, Andréa Vidal Ferreira, Guilherme Albuquerque Cavalcante Souza, Juliana Batista Silva,
Marcelo Mamede

BJRS
BRAZILIAN JOURNAL
OF
RADIATION SCIENCES 08-03 (2020) 01-12
ISSN: 2319-0612
Accepted: 2020-09-02
Thorium as a nuclear material: physics features and
a safety analysis due to insertion of ThO2 in a PWR
nuclear reactor fuel
Fonseca1 C.Jr., Oliveira1 C.L., Fonseca1 E.H.F., Medeiros1 M.P.C.,
Baptista1 C. O.E.
1Instituto Militar de Engenharia / Seção de Engenharia Nuclear (SE/7)
ABSTRACT
On this paper it is presented the main physics features of the thorium as a nuclear material and a security
analysis due to insertion of ThO2 in a PWR nuclear reactor fuel by the determination and assessment of
the sensitivity coefficients through the Standardized Computer Analyses for Licensing Evaluation -
SCALE 6.1 nuclear code system. This work was motivated by the world tendencies to research and
development of nuclear fuels based on thorium, because the limitations of uranium resources and the
importance of nuclear energy to the humanity.
Keywords: Thorium Dioxide, Physics Features of Thorium, Thorium As a Nuclear Material.

Fonseca et al. ● Braz. J. Rad. Sci. ● 2020 2
1. INTRODU’CTION
The human development it is closely related to the level and type of power supply by us
dominated. At the beginning of the last century it was discovered and controlled the nuclear
fission energy the most productive source of energy available, anytime, anywhere.
The progress of nuclear energy research and development of the study about the
exploitation of thorium as another nuclear material, besides the uranium, was initialized at the
Oak Ridge National Laboratories - ORNL on EUA at mid 50’s years [1]. In Brazil, the first
approach to the researchs about thorium as a nuclear material occurred during the commercial
agreement between Brazil and France at the mid of the 60’s years and last, with the project
codenamed Toruna, until the end of 60’s years and the 70’s beginning. The research continued
under the cooperative agreement between Brazil and Germany [2]. The researches about
thorium were interrupted until the 90’s years, when many countries resumed the research and
development about the thorium utilization in nuclear power plants.
Currently there are 448 nuclear power reactors in operation and 59 under construction. Of
the reactors in operation: 292 are of the Pressurized Water Reactor (PWR) type; 75 of the
Boiling Water Reactor (BWR) type; 14 Gas Cooled Reactor (GCR); 49 Pressurized Heavy
Water Reactor (PHWR); 15 Light Water Graphite Reactor (LWGR) and 3 of the Feast Breeder
Reactor (FBR) type. Already under construction: 49 are PWR; 4 BWR; 4 PHWR; 1 FBR and
1 Hight Temperature Gas Cooled Reactor (HTGR), according to International atomic Energy
Agency - IAEA [3]. In 2017, nuclear energy represented 11% of the world's energy matrix. In
an extrapolated perspective, this percentage would be 12.4% in 2030, 13.4% in 2040 and 13.7%
in 2050 [4].
Most power reactors, in operation or under construction, use uranium as fuel. With the
implementation of new reactors and the increase in energy demand, especially clean energy
generation, the demand for uranium is expected to continue to grow. With the 2017 reserve
estimates and the level of demand for U in 2016, it is assumed that uranium resources will be
sufficient to supply its global demand for another 130 years according to Organization for
Economic Co-operation and Development - OECD [5].
The need for nuclear power coupled with the perspective of a horizon for uranium reserves
leads to research and exploration of new resources. The most direct solution is thorium, which
in addition to having facilitated exploration, due to the intrinsic characteristics of its ore, mainly
thorium, is more abundant than uranium in the earth's crust and also presents complicating
factors for proliferation. In Brazil, thorium natural reserves are among the largest in the world,
IAEA – Nuclear Energy Agency - NEA [6].

Fonseca et al. ● Braz. J. Rad. Sci. ● 2020 3
1.1. Torium as nuclear material
Thorium (Th) is the first nuclear material of natural occurrence, besides followed by
uranium, and its natural abundance is on average 3.4 times greater than that of U. Its most
recurrent isotope is 𝑇ℎ90232 , a fertile isotope that when fertilized by a neutron, in a reaction of
neutron-nuclear absorption, is transmuted into the fissile isotope o 𝑈92233 [7].
An illustration of the transmutation process of the 𝑇ℎ90232 to the 𝑈92
233 can be seen at the
Figure 1.
Figure 1: Simplified fertilization process of the 𝑇ℎ232 to fission of the 𝑈233 .
Source: Adapted, [8].
Thorium dioxide is one of the most chemically stable solid substances, its melting point is
one of the highest among the known, 2,023K - elementary and 3,643K - dioxide, specific mass
9,86g/cc, resistant to oxidation, thermal conductivity 43W⁄(m.K) - elementary or (6.2 W)⁄(m.K)
at 773K - dioxide and 2.4W⁄(m.K) at 1773 K – dioxide [9] [10].
In order to perform a comparative analysis, Table 1 presents the neutronic properties of the
main nuclear materials.

Fonseca et al. ● Braz. J. Rad. Sci. ● 2020 4
Table 1: Neutronic properties of the main fissile and fertile isotopes.
Nuclears Data 𝑻𝒉𝟐𝟑𝟐 𝑼𝟐𝟑𝟑 𝑼𝟐𝟑𝟓 𝑼𝟐𝟑𝟖 𝑷𝒖𝟐𝟑𝟗 𝑷𝒖𝟐𝟒𝟏
Thermal Region
Cross Sections
[barns]
Absortion 𝜎𝑎 4.62 364 405 1.73 1,045 1,121
Fission 𝜎𝑓 0 332 346 0 695.0 842
𝛼 = 𝜎𝑐 𝜎𝑓⁄ - 0.096 0.171 0.504 0.331
𝜂𝑡ℎ - 2.26 2.08 1.81 2.23
Region of Resonance
Integral Epitermal (RI) [barns]
(∝ 𝑑𝑖𝑙𝑢𝑡𝑖𝑜𝑛)
0 764 275 0 301 -
𝑅𝐼𝑎 85.6 882 405 278 474 740
𝑅𝐼𝑓 - 746 272 293 571
𝛼 = 𝑅𝐼𝑎 𝑅𝐼𝑓⁄ - 0.182 0.489 0.618 0.296
𝜂𝑒𝑝𝑖 - 2.10 1.63 1.77 2.29
Neutronic Yield 𝜈 - 2.43 2.43 2.87 2.97
Delay Neutronic
Yield 𝛽 - 0.0031 0.0069 0.0026 0.0050
Capture:
2.200 𝑚 𝑠⁄ 7.6 54 100 2.7 267 -
Integral Resonance 85 140 144 275 200 -
Average neutrons
by fission 2.5 2.4 - - 2.9
Source: Adapted, [7]
Analyzing Table 1 it can be verified that the absorption cross section of 𝑇ℎ232 is two times
greater than that of 𝑈238 indicating that in regenerative reactors the probability of conversion
of 𝑇ℎ232 to 𝑈233 is greater than 𝑈238 to 𝑃𝑢239 . The behaviour of the 𝑇ℎ232 and 𝑈238 neutron
capture cross sections with respect to the energy of the incident neutron is shown in Figure 2.
Figure 2: Behaviour of the . 𝑇ℎ232 and 𝑈238 𝑛𝑒𝑢𝑡𝑟𝑜𝑛 𝐶𝑎𝑝𝑡𝑢𝑟𝑒 Cross sections.

Fonseca et al. ● Braz. J. Rad. Sci. ● 2020 5
Source: Adapted, [8].
For comparative purposes, the behavior of the fissile isotope neutron capture cross sections
𝑈233 , 𝑈235 and 𝑃𝑢239 is presented in Figure 3.
Figure 3: Cross section spectrum for the isotopes 𝑈233 , 𝑈235 and 𝑃𝑢239 .
Source: Adapted, [8].
One approach to determine how to a perturbation or change in some specific parameter or
feature of the nuclear reactor affects the stead state of its operation, for example the response
of the neutron multiplication factor due to a change in the coolant/moderator temperature of a
PWR nuclear reactor, is to evaluate the so called sensitivity coefficients. According to this, the
well stablished linear perturbation theory can be used to determine the effects of a perturbation
in the reactivity and, therefore in the safety of a nuclear reactor due to that perturbation, [11].
A simplified theoretical approach to the linear perturbation theory is presented by
DUDERSTADT (1976) [12].

Fonseca et al. ● Braz. J. Rad. Sci. ● 2020 6
2. MATERIALS AND METHODS
To perform the sensitivity analysis of the neutron multiplication factor, in this work the
infinite neutron multiplication factor - 𝑘𝑖𝑛𝑓, it was used the nuclears code system SCALE 6.1.
One of its control modules, the TSUNAMI – Tools for Sensitivity and UNcertainty
Methodology Implementation, accomplishes the sensitivity analysis.
TSUNAMI modules, by allowing the analysis of a system intrinsically, performs an
internal computational analysis with its own method. However, it is possible to repeat the
simulations with changes in some of the data parameters of the input file allowing an analysis
of the influence of this change in the sensitivity and uncertainty due to the variable object of
the study [8]. The extrinsic factor chosen to be varied in this work is the temperature of the
refrigerant, maintaining constant the temperatures of the other components of the fuel, and it
was performed the analysis of the behavior of the 𝑘𝑖𝑛𝑓, the sensitivity and the uncertainty for
all the materials and regions and fuel due to the change.
For this work just the sensitivity will be considered in the analysis, disregarding the fuel
burn-up. It was chosen the nuclear power plant data of Angra II, wich has three levels of fuel
enrichment, in terms of the isotopic concentration of 𝑈235 , 1.95%, 2.5% and 3.2% and for this
work was take just the 2.5% and 3.2% of levels of enrichment, considering the first FSAR –
“Final Safety Analyses Report” [13].
As the fuel to be analyzed is a mix of UO2 and ThO2 it was verified that it should be
necessary to calculate the relative quantities of each elements from the fuel mix, as presented
on Tables 2 and 3 at the Chapter 3 of this paper results. To achieve this goal it was selected an
approach by stoichiometric balance, which one was done by the following equations, where
the parameter ‘𝑥’is the weight percent (%wt) of ThO2 at the fuel mix, ‘𝑒’ is the enrichment of
uranium and ‘M’ is the molar mass of the dioxides.
M𝑡𝑜𝑡 = 𝑥. M𝑇ℎ𝑂2
+ (1 − 𝑥). M𝑈𝑂2. (1)
x. M𝑇ℎ𝑂2= x. M𝑇ℎ + .2 𝑥. (0,997. M𝑂16 + 0,003. M𝑂17) (2)
(1 − x). M𝑈𝑂2
= (1 − 𝑥). 𝑒. M𝑈235 + (1 − x). (1 − 𝑒). M𝑈238
+ (1 − 𝑥). 2. (0,997. M𝑂16 + 0,003. M𝑂17) (3)
At the end of the Eq. (3) it was specified the percent of each isotopes of the fuel mix.
To calculate the density of the different full mix was choose a weighted averaged by the
%wt 𝑇ℎ𝑂2.

Fonseca et al. ● Braz. J. Rad. Sci. ● 2020 7
ρ [𝑔
𝑐𝑚3⁄ ] = 𝑥. ρ𝑇ℎ𝑂2+ (1 − 𝑥). ρ𝑈𝑂2
(4)
Considering the input data of the fuel composition it was chosen the temperature range
from 280K to 345K to perform the simulations, and the range of %wt of ThO2 from 0%wt to
40%wt. The SAMS, the SCALE functional modules to evaluate the sensitivity and uncertainty,
as a subroutine of TSUNAMI, generate two different sensitivity coefficients: one explicit, due
to the perturbations inserted, and the other came from the statistical analyses of the error
propagation on the calculation of the 𝑘𝑖𝑛𝑓. The sum of the two coefficients results in the total
sensitivity coefficients estimated for each region characterized material or mixture. These
results are presented in the form of graphics and tables on Chapter 3.
3. RESULTS AND DISCUSSION
Tables 2 and 3 below presents the composition of the fuel mix to both levels of enrichment
including different percent mass of ThO2.
Table 2: Fuel mix composition in [%wt] to 2.5% of enrichment.
%ThO2
Comp. 0 5 10 15 20 25 30 35 40
Total Mass [g] 269.93 269.63 269.34 269.04 268.75 268.45 268.15 267.86 267.56
Mix Density
[g/cc] 10.96 10.91 10.85 10.80 10.74 10.69 10.63 10.58 10.52
%U-235 2.18 2.07 1.96 1.86 1.75 1.64 1.53 1.43 1.32
%U-238 85.97 81.76 77.54 73.31 69.08 64.83 60.58 56.31 52.04
%O-16 11.82 11.83 11.85 11.86 11.87 11.88 11.90 11.91 11.92
%O-17 0.04 0.04 0.04 0.04 0.04 0.04 0.04 0.04 0.04
%Th-232 0.00 4.30 8.61 12.93 17.27 21.61 25.96 30.31 34.68
Source: Authors.
Table 3: Fuel mix composition in [%wt] to 3.2% of enrichment.
%ThO2
Comp. 0 5 10 15 20 25 30 35 40
Total Mass [g] 269.93 269.63 269.34 269.04 268.75 268.45 268.15 267.86 267.56
Mix Density
[g/cc] 10.90 10.91 10.85 10.80 10.74 10.69 10.63 10.58 10.52
%U-235 2.79 2.65 2.51 2.38 2.24 2.10 1.96 1.82 1.69
%U-238 85.35 81.17 76.98 72.79 68.58 64.37 60.14 55.91 51.66
%O-16 11.82 11.83 11.85 11.86 11.87 11.88 11.90 11.91 11.92
%O-17 0.04 0.04 0.04 0.04 0.04 0.04 0.04 0.04 0.04

Fonseca et al. ● Braz. J. Rad. Sci. ● 2020 8
%Th-232 0.00 4.30 8.61 12.93 17.27 21.61 25.96 30.31 34.68
Source: Authors.
Analyzing Tables 2 and 3 it is observed that the fuel mix compositions in terms of relative
percent mass was satisfactorily estimated. Once that the sum of each one relative mass for each
one elements and setup it is total in 100.
In order to optimize the results presentation, it was chosen only the fuel compositions that
results in kinf values above, approximately, 1.2 once that in the Wichrowski (2017) works it
was observed that the criticality just is achieved according to this condition. An evolutive
assessment of the kinf evolution according to the rise of the %wtThO2 at the fuel mix it is
presented in Table 4.
Table 4: Evolutive analyzes of kinf behavior due to the increase of %wtThO2 at the fuel mix.
k_inf a 2.5% de Enr. k_inf a 3.2% de Enr. %wt ThO2
K_inf_ford K_inf_adj K_inf_ford K_inf_adj
1.343392 1.343375 1.403479 1.403462 0
1.297416 1.297401 1.360942 1.360925 5
1.260836 1.260820 1.320820 1.328066 10
1225671 1.225656 1.296750 1.296735 15
1.190128 1.190113 1.265090 1.265076 20
1.153330 1.153318 1.232198 1.232185 25 ...... ....... 1.197450 1.197437 30
Source: Authors.
In the Table 4, kinf-ford is the one calculated by one of the modules of TSUNAMI and kinf_adj
is the, also calculated by one module of TSUNAMI, one used by the General Perturbation
Theory to determine the sensitivity of the system.
It should be observed in the Table 4 that are values of kinf highlighted in red, they represent
the maximum value, at the level of enrichment, that make possible to achieve the reactor
criticality. Based on these values, Tables 5 and 6 present the results for the sensitivity of the
fuel mix to the thorium dioxide insertion in the PWR fuel mix. The results in red are for the
temperature used as the basis for the study.

Fonseca et al. ● Braz. J. Rad. Sci. ● 2020 9
Table 5: Sensitivity Coefficients to the Fuel Mix at 2.5% of Enrichment.
Temp. [K]
%wtThO2 at the Fuel Mix
0 5 10 15 20 25
280 -2.04E-02 -2.87E-02 -3.06E-02 -3.05E-02 -2.89E-02 -2.61E-02
290 -2.04E-02 -2.87E-02 -3.06E-02 -3.05E-02 -2.89E-02 -2.61E-02
300 -2.03E-02 -2.87E-02 -3.05E-02 -3.05E-02 -2.88E-02 -2.60E-02
310 -2.02E-02 -2.85E-02 -3.04E-02 -3.03E-02 -2.87E-02 -2.59E-02
320 -2.01E-02 -2.84E-02 -3.03E-02 -3.02E-02 -2.85E-02 -2.57E-02
330 -2.00E-02 -2.83E-02 -3.02E-02 -3,00E-02 -2.84E-02 -2.56E-02
340 -1.99E-02 -2.82E-02 -3.00E-02 -2.99E-02 -2.82E-02 -2.54E-02
345 -1.98E-02 -2.81E-02 -3.00E-02 -2.98E-02 -2.81E-02 -2.53E-02
Source: Authors.
Table 6: Sensitivity Coefficients to the Fuel Mix at 3.2% of Enrichment.
Temp. [K]
%wtThO2 at the Fuel Mix
0 5 10 15 20 25 30
280 -3.49E-02 -4.34E-02 -4.57E-02 -4.60E-02 -4.47E-02 -4.23E-02 -3.92E-02
290 -3.49E-02 -4.34E-02 -4.57E-02 -4.60E-02 -4.47E-02 -4.23E-02 -3.92E-02
300 -3.49E-02 -4.34E-02 -4.56E-02 -4.59E-02 -4.46E-02 -4.23E-02 -3.91E-02
310 -3.48E-02 -4.33E-02 -4.55E-02 -4.58E-02 -4.45E-02 -4.21E-02 -3.90E-02
320 -3.47E-02 -4.32E-02 -4.54E-02 -4.57E-02 -4.44E-02 -4.20E-02 -3.89E-02
330 -3.46E-02 -4.31E-02 -4.53E-02 -4.56E-02 -4.43E-02 -4.19E-02 -3.87E-02
340 -3.46E-02 -4.30E-02 -4.52E-02 -4.55E-02 -4.42E-02 -4.18E-02 -3.89E-02
345 -3.45E-02 -4.30E-02 -4.52E-02 -4.55E-02 -4.41E-02 -4.17E-02 -3.85E-02
Source: Authors.
Graphically the behavior due to the fuel sensitivity coefficients can be plotted and studied.
Figure 4 and 5 are examples.

Fonseca et al. ● Braz. J. Rad. Sci. ● 2020 10
Figure 4: Behaviour of the sensitivity coeficients for the fuel at 2.5% enriched whitout ThO2.
Source: Authors.
Figure 5: Behaviour of the sensitivity coeficients for the fuel 3.2% enriched and
25%wtThO2.
Source: Authors.
It is should be noted that the sensitivity coefficients rise up whith the increase of
the %wtThO2 in the fuel mix likewise for the increase on the moderator temperature. These
facts combined demonstrate that the insertion of ThO2 on the PWR fuel mix increase the
intrinsic safety of the nuclear reactor. From Graphs 3 and 4 it is possible to see that the
sensitivity coefficients presented a polynomial quadratic behavior, according to the increase in
the moderator temperature, confirmed by the correlation coefficient tending to one.
y = 8E-08x2 - 4E-05x - 0,0157
R² = 0,991
-2,0500E-02
-2,0400E-02
-2,0300E-02
-2,0200E-02
-2,0100E-02
-2,0000E-02
-1,9900E-02
-1,9800E-02
-1,9700E-02
275 285 295 305 315 325 335 345
Sen
siti
vit
y ∆
k/k
[%
]
Temperature[K]
Fuel 2.5 Enri. and 0%wtThO2
y = 8E-08x2 - 4E-05x - 0,0373
R² = 0,9907-4,2500E-02
-4,2400E-02
-4,2300E-02
-4,2200E-02
-4,2100E-02
-4,2000E-02
-4,1900E-02
-4,1800E-02
-4,1700E-02
-4,1600E-02
275 285 295 305 315 325 335 345
Sen
siti
vit
y ∆
k/k
[%
]
Temperature [K]
Fuel 3.2% Enri. and 25%wtThO2

Fonseca et al. ● Braz. J. Rad. Sci. ● 2020 11
4. CONCLUSION
According to the results obtained by the simulations, it can be verified that the 𝑘𝑖𝑛𝑓 is very
sensitive to the variation in the ratio moderator/coolant of a PWR nuclear reactor, at least in
the temperature range studied, as was also noticed by Neto (2015). Another point to be
observed is that in the evolutive assessment of the behavior of the 𝑘𝑖𝑛𝑓, due to the increase of
ThO2 at the fuel mix (Table 4), it is possible to confirm that is necessary an increase at the
enrichment as the %wtThO2 on the fuel composition increases, due to the behavior of the
thorium, that, initially, acts like an absorber in the process of conversion in 𝑈233 .
In terms of the safety assessment by the sensitivity analyses, it is shown that the increase
of thorium dioxide at the fuel composition of a PWR has not a linear behavior with the
sensitivity, once that the sensitivity initially increases with the increase of ThO2 and, after a
certain amount of ThO2, it starts to decreases. Although all of the sensitivity coefficients whit
the addiction os ThO2 are higher than those fuel mix without thorium insertion. Another point
that needs attention is the 𝑘𝑖𝑛𝑓 behavior and values, presented on Table 4, it shows that it is
not possible to apply this configuration of fuel since that the 𝑘𝑖𝑛𝑓 is less than 1.2 even in the
absence of the absorbers or burnable poisons, like the settings used in the setup of the
simulations.
This work shows that it is perfectly possible to use thorium and uranium oxides in a mix
as fuel material in a Pressurized Water Reactor.
REFERENCES
[1] WICHROWSKI, C. Caio. Análise do tório como combustível para reatores nucleares.
Instituto Militar de Engenharia (IME)- EB, Brasil, Dissertação de Mestrado, 2017.
[2] PINHEIRO, B. Ricardo. Brazilian Experience on Thoriun Cycle Investigations, Centro de
Desenvolvimento da Tecnologia Nuclear, Belo Horizonte, Brazil, THORIUN FUEL
UTILIZATION: OPTIONS AND TRENDS, Proceeeding of tree IAEA meeetings held in
Vienna in 1997, 1998 and 1999. IAEA – TECDOC – 1319.
[3] AIEA. Nuclear Power Reactors in the World. International Atomic Energy Agency,
Vienna. Disponível em: < https://www-pub.iaea.org/MTCD/Publications/PDF/RDS-2-
38_web.pdf>, 2018.
[4] IAEA. International Satatus and Prospects for Nuclear Power 2017. Bord of Governors
General Conference, 2017.

Fonseca et al. ● Braz. J. Rad. Sci. ● 2020 12
[5] OECD. Uranium 2018 Resources, Production and Demand. Nuclear Energy Agency Or-
ganization for Economic Co-Operation and Development. OECD iLibrary, 2018.
[6] NEA. Uranium 2016: Resources, Production and Demand. A Joint Report by the Nuclear
Energy Agency and the International Atomic Energy Agency. Avaible in: <
https://www.oecd-nea.org/ndd/pubs/2016/7301-uranium-2016.pdf>, 2016.
[7] IAEA. Thorium fuel cycle — Potential Benefits and Challenges. Nuclear Fuel Cycle and
Materials Section International Atomic Energy Agency. Viena, Áustria, 2005,
TECDOC-1450. ISBN 92–0–103405–9. ISSN 1011–4289.
[8] GONÇALVES, C. Isadora.Tório e suas aplicações nucleares. Instituto Militar de Enge-
nharia (IME)- EB, Brasil ,Dissertação de Mestrado, 2017.
[9] BELLE, J.; Berman, R. M.. Thorium dioxide: Properties and Nuclear Applications. Naval
Reactors Office, Washington, D.C.:, United States Dept. of Energy, 1984.
[10] LIDE, David R.. CRC Handbook of Chemistry and Physics 71ST Edition. A Ready Refer-
ence Book of Chemical and Physical Data, Boston EUA, .1990-1991. CRC Press, Boca
Raton ann Arbor.
[11] LAMARSH R. John. Introduction to Nuclear Reactor Theory, Addison-Wesley Publish-
ing Company, Inc. Reading, Massachusetts. New York University, 1966.
[12] DUDERSTADT J. James, HAMILTON J. Louis. Nuclear Reator Analysis. Departmnet
of Nuclear Engineering, University of Michigan, Ann Arbor, Michigan. Jonh Wiley &
Sons, Inc. New York, , 1976.
[13] NETO, G. Ilson. Análise das Simulações de Perturbações em Reatores Nucleares Usando
o Código SCALE 6.1. Instituto Militar de Engenharia (IME)- EB, Brasil, Dissertação
de Mestrado, 2018.
BJRS
BRAZILIAN JOURNAL
OF
RADIATION SCIENCES 08-03 (2020) 01-18
ISSN: 2319-0612 Accepted: 2020-07-08
Solução das equações da cinética pontual de nêutrons
via Método de Fator de Integração Implícito com fonte
externa
Zandonáa J. C., Petersena C. Z., Tumeleroa F., Schauna N., Schramma M.
aUniversidade Federal de Pelotas, Campus Capão do Leão, Programa de Pós-Graduação em Modelagem Matemática
Caixa Postal 354 - CEP 96001-970, Capão do Leão - RS, Brasil, Prédio 05 - 3º andar - Sala 302.
RESUMO
Os autores apresentam uma abordagem semi-analítica para obter soluções para as equações da cinética pontual
de nêutrons. A reatividade dependente do tempo é aproximada por aproximação constante por partes em tempo
discretizado, e o sistema de equações diferenciais é resolvido por um fator de integração. O termo de fonte
externa na solução possui uma integral, que é resolvida numericamente pela interpolação de polinômios de
Lagrange e uma fórmula simples de quadratura. Mesmo que a fonte externa apresente não linearidade nas
equações, a metodologia é apropriada. A metodologia proposta é utilizada em casos de referência padrão e seus
resultados são comparados com os da literatura.
Palavras-Chave: Cinética pontual de nêutrons, Fator integrante, Aproximação constante por partes, Fonte
externa.
ABSTRACT
The authors present a semi-analytical approach to obtain solutions to the neutron point kinetics equations. The
time dependent reactivity is approximated by piecewise constant approximation in discretized time, and the
system of differential equations is solved by an integrating factor. The external source term in the solution has
an integral, which is numerically solved by Lagrange polynomials interpolation and a simple quadrature
formula. Even if the external source presents nonlinearity in the equations, the methodology is appropriate. The
proposed methodology is used in benchmark cases and its results are compared with the ones in the literature.
Keywords: Neutron point kinetics, Integrating factor, Piecewise constant approximation, External source.

Zandoná et al. ● Braz. J. Rad. Sci. ● 2020 2
1. INTRODUCÃO
A energia nuclear tem um espaço importante na matriz energética mundial devido à crescente
demanda por energia e as inúmeras vantagens proporcionadas. Dentre as mais relevantes, vale
destacar a sua aplicação na área da medicina e indústria com a produção de radioisótopos por reatores
de pesquisa. Além disso, os reatores nucleares de potência, que geram energia elétrica, utilizam pouco
material para produzir grandes quantidades de energia e atendem aos objetivos do Protocolo de Kyoto
e, mais recentemente, o Acordo de Paris [1], por não emitir dióxido de carbono (CO2), provocando
pouco ou quase nenhum impacto sobre a biosfera. Entretanto, a sustentabilidade ainda é o maior
desafio no desenvolvimento de tecnologias nucleares inovadoras como opção em longo prazo.
A utilização de regeneração e ciclos fechados para assegurar o suprimento de combustível para
geração de eletricidade com energia nuclear tem sido o principal alvo no desenvolvimento de reatores
rápidos e permanece como um importante objetivo a ser atingido.
Para tornar a energia nuclear uma fonte sustentável de energia, com relação aos recursos naturais
e rejeitos nucleares deve ser considerada a utilização de ciclos fechados de Plutônio em reatores
rápidos, bem como a transmutação/incineração de actinídeos menores (AM) e produtos de fissão de
longa vida (PFLV) em vários tipos de reatores nucleares, tais como os Accelerator driven system
(ADS). Nesse contexto surgiu o conceito de ADS, que são sistemas dedicados à transmutação de
resíduos de alta atividade para reduzi-los dos repositórios geológicos [2-5]. Uma razão importante
para o interesse na utilização destes sistemas é a possibilidade de geração de energia da fissão e, ao
mesmo tempo, incinerar rejeitos radioativos. Além disso, outras vantagens são: ausência de acidentes
de reatividade (trabalham num sistema subcrítico), alta capacidade de transmutação, baixa produção
de rejeitos e melhor utilização dos recursos naturais em longo prazo. Os sistemas acionados por fonte
consistem num sistema rápido subcrítico mantido em estado estacionário por uma fonte externa de
nêutrons.
A Equação de Transporte de Boltzmann dependente do tempo que leva em conta além dos
nêutrons prontos também os nêutrons atrasados [6,7] define de forma íntegra a população de nêutrons,
mas possui o obstáculo de ser uma equação de difícil resolução. Uma aproximação usada é a Equação
da Difusão de Nêutrons (EDN) que é adequada para cálculos globais em física de reatores quando
ocorrem mudanças espaciais e temporais na distribuição de nêutrons.

Zandoná et al. ● Braz. J. Rad. Sci. ● 2020 3
Nos últimos anos, vários algoritmos foram desenvolvidos para lidar, tanto com a Equação da
Difusão, como com a Equação de Transporte de Nêutrons. Observa-se também que os tempos de
simulação foram continuamente reduzidos graças ao desenvolvimento de recursos computacionais.
No entanto, para situações mais realistas, a solução da Equação de Transporte e Difusão de Nêutrons
considerando meio heterogêneo, problema multidimensional, multigrupo de energia, coeficientes
dependentes do tempo e inclusão de precursores de nêutrons atrasados, ainda é um desafio do ponto
de vista computacional e uma aproximação é uma alternativa. Isso se torna mais evidente no caso de
simulações que levam em consideração a termohidráulica do problema, em que o cálculo se torna
cada vez mais custoso, devido ao feedback de temperatura, que torna o problema não linear. Em
alguns casos de interesse prático (grandes reatores de potência), a evolução da potência de um reator
nuclear pode ser suficientemente bem aproximada usando a Equação da Cinética Pontual de Nêutrons
(ECPN).
O modelo da Cinética Pontual de Nêutrons ainda desempenha um papel muito importante em
física de reatores, à medida que pode ser usado, quando resolvido adequadamente, para uma previsão
quase em tempo real do transiente de potência do reator. Isso permite controle e intervenção
oportunos na usina, a fim de evitar a ocorrência de acidentes graves. Como é sabido, o problema
clássico da ECPN é a rigidez decorrente da diferença entre as ordens de grandeza dos tempos de
geração dos nêutrons prontos e atrasados após uma fissão, o que resulta na exigência de incrementos
muito pequenos no intervalo de tempo para soluções numéricas às equações cinéticas.
Assumindo total separabilidade do tempo e espaço é possível chegar às ECPN, que é um sistema
de equações diferenciais ordinárias (EDO) acopladas que descrevem a densidade de nêutrons e
concentração de precursores de nêutrons atrasados.
Certamente, se as equações têm coeficientes constantes, soluções analíticas exatas são facilmente
estabelecidas, mas são pouco efetivas quando os coeficientes variam com o tempo. Tem havido
muitas pesquisas focadas em eliminar o problema da rigidez ao longo dos anos e vários métodos
foram especialmente adaptados para resolver o problema de valor inicial para sistemas rígidos de
equações diferenciais ordinárias.
Como ilustração, podemos citar os que seguem: Chao & Attard desenvolveram o Método do
Confinamento da Rigidez que desacopla a rigidez das equações diferenciais para precursores e
confina na equação da densidade de nêutrons, que pode ser resolvida analiticamente [3]; Sánchez

Zandoná et al. ● Braz. J. Rad. Sci. ● 2020 4
utiliza o Método de Runge-Kutta Generalizado de quarta ordem [8]; Aboanber & Nahla utilizam
aproximações de Padé para encontrar a função exponencial das equações e as raízes da fórmula de
Inhour são usadas como autovalores da matriz da cinética pontual [2]; Aboanber & Nahla apresenta
uma solução em séries de potências, obtendo-se a solução recursivamente [1]; o algoritmo CORE de
Quintero-Leyva utiliza transformada de Laplace e Teorema de expansão de Heaviside com as raízes
da equação de Inhour [9]; em Nahla apresenta-se o Método Exponencial Analítico Generalizado que
baseia-se nos autovalores e autovetores da matriz dos coeficientes [10]; no Método Numérico Integral
de Li et al., utilizando a Melhor Função Base (BBF), é feita a integração exata nas equações para a
densidade de nêutrons em cada passo de tempo com uma formulação totalmente implícita [11]; Nahla
apresenta o método New Analytic Method (NAM), baseado nas raízes da Equação de Inhour, usando
o Método da Eliminação Gaussiana para resolver as Equações da Cinética Pontual de Nêutrons [12];
Método da Decomposição de Petersen et al., é um método analítico que separa a matriz dos
coeficientes em duas, uma com a dependência temporal e a outra com as constantes, transformando
as equações em um conjunto de problemas recursivos semelhantes as equações com reatividade
constante [13]; em Ganapol [5], Ganapol&Picca [6] e Ganapol [7], apresenta-se a Técnica de Alta
Precisão baseada na aproximação constante por partes feita por Kinard & Allen [14]. A alta precisão
é alcançada pela introdução de uma submalha para a avaliação numérica das integrais, corrigindo o
termo fonte; Picca et al., desenvolvem a Aproximação Constante por Partes Melhorado (EPCA) com
a vantagem que possibilita, através de um ciclo iterativo, a correção do pressuposto básico do método
PCA [15]; no método de Silva et al., aplica-se o procedimento semelhante à Petersen [13], mas a
solução pode ser determinada sem a dependência de tempos anteriores [16]; Tumelero et al., aplica o
Método da Aproximação Polinomial (PAM) que consiste em expandir as variáveis em séries de
potências, considerando a reatividade como uma função constante em um intervalo de tempo
relativamente pequeno em torno de um ponto ordinário, na qual no primeiro intervalo aplicam-se as
condições iniciais do problema e utiliza-se a continuação analítica para determinar as soluções dos
próximos passos [17].
Com o referencial apresentado percebe-se que muitos métodos já foram implementados para
resolver a ECPN, entretanto o acoplamento de fontes de spallation em modelos ADS com núcleos
subcríticos ainda é um assunto pouco explorado e precisa ser melhor entendido e estudado. Com o
passar do tempo, novos modelos, métodos e parâmetros nucleares são propostos para estimar a

Zandoná et al. ● Braz. J. Rad. Sci. ● 2020 5
população de nêutrons dentro do núcleo de um reator nuclear de potência, por isso deve-se sempre
realizar testes para verificar, tanto a capacidade do modelo, quanto a do método a ser empregado, a
fim de prever situações específicas, definindo limites de validade (qualificação do modelo e método).
Esses testes são realizados utilizando-se problemas de referência (padrões) em física de reatores
chamados de problemas benchmark. Mais recentemente uma atenção especial tem sido dada aos ADS
[18-19].
Portanto, neste trabalho resolve-se as ECPN, considerando 6 grupos de precursores de nêutrons
atrasados, reatividade constante e dependente do tempo com um termo fonte definido de forma
genérica, podendo depender até da própria densidade de nêutrons.
2. METODOLOGIA
Partindo das ECPN, considerando seis grupos de nêutrons atrasados com fonte externa tem-se:
6
1
( ) ( )( ) ( ) ( ( ))
( )( ) ( ) ,
i i
i
i ii i
dn t tn t C t S n t
dt
dC tn t C t
dt
=
−= + +
= −
(1)
com as seguintes condições iniciais
0
0
(0)
(0) ,ii
i
n n
C n
=
=
(2)
para i=1:6, onde, ( )n t dado em 3[ ]cm−
é a densidade de nêutrons no tempo t, ( )iC t dado em 3[ ]cm−
é a concentração de precursores de nêutrons atrasados para o grupo i de precursores no tempo t, ( )t
é a reatividade no instante t, é a fração de nêutrons atrasados, i são as frações de nêutrons
atrasados para o grupo i de precursores, i dado em 1[ ]s− são as constantes de decaimento para o

Zandoná et al. ● Braz. J. Rad. Sci. ● 2020 6
grupo i de precursores, dado em [s] é o tempo médio de geração entre o nascimento dos nêutrons
e posterior absorção e ( ( ))S n t dado em [ 3cm− ] é o termo fonte, podendo representar uma fonte externa
de nêutrons genérica.
Assim, reescrevendo a equação (1) na forma matricial, tem-se:
( )
( ) ( ) ( ( )) ,d t
t t tdt
= +y
y S yA (3)
onde
1 6
0
111
6
66
( )
( ) ( ( ))0 0
( ) 0( ) ( ) ( ( )) .0
0( ) 0
0 0
t
n t S n t
C tt t t
C t
−
− =
−
y y , A = e S = (4)
Para resolver a equação (3) utiliza-se a ideia do método Fator de Integração Implícito (FII)[5].
Esse método é obtido a partir da multiplicação de um fator de integração apropriado, a fim de manter
a parte não homogênea em uma forma implícita, na qual é aproximado por um método de
interpolação.
Para evitar trabalhar com o fator de integração t
e− A(t)d
na equação (3), utiliza-se a ideia do
piecewise constant approximation (PCA) presente em [15]. Ou seja, considera-se a reatividade, único
termo dependente do tempo da matriz ( )tA , como uma função constante por partes. Em outras
palavras, discretiza-se o tempo em n+1 pontos da forma 0 1 2 st t t t e aproxima-se a
reatividade por 1( ) ( )nt t += , na qual (0 : 1)n s= − para cada subintervalo. Aqui n é o número de
pontos discretizados no domínio que depende do tamanho do espaçamento da malha ( )t e do ponto

Zandoná et al. ● Braz. J. Rad. Sci. ● 2020 7
final do intervalo a ser escolhido st . Com isso, utiliza-se a solução no ponto nt como condição inicial
para o próximo, fazendo uso da continuação analítica.
Assim, para cada subintervalo do domínio, tem-se uma matriz constante associada a cada ponto
final dos subintervalos, ou seja, para cada subintervalo tem-se a reatividade constante. Logo, tem-se
o fator integrante te− A de forma genérica para todos os subintervalos. Multiplicando a equação (3)
por este fator integrante, tem-se:
( )
( ) ( ( )) .t td te e t e t
dt= +
yy S y
-At -A -AA (5)
Reescrevendo a equação (5) e utilizando a regra do produto, tem-se:
( ( ))
( ( )) .d e t
e tdt
=y
S y-At
-At (6)
Integrando entre 1 e , n nt t + sendo 1n nt t t+ = + , em ambos os lados desta equação, obtém-se:
11( ( ))
( ( )) .n
n
nn
tt
tt
d e tdt e t dt
dt
++
=
y
S y-At
-At
(7)
Fazendo uma mudança de variável, nt t = − , tem-se:
1
0( ) ( ( )) .|
n
n
tt
nte t e t d
+
= +y S y-At -At (8)
Aplicando os limites de integração em (8), fica-se com:
)
0( ) ( ) ( ( )) .n n n
tt
n n ne t t e t e e t d
++ − = +y y S y
-A(t -At -At -A (9)

Zandoná et al. ● Braz. J. Rad. Sci. ● 2020 8
Multiplicando a equação (9) por )n t
e+A(t
, tem-se:
0
( ) ( ) ( ( )) .t
t t
n n nt t e t e e t d
−+ − = +y y S yA A A (10)
Assim:
10
( ( ) ,t
t t
n n ne e e t d
−
+ = + +y y S yA A A
(11)
onde ( )n nt =y y é utilizado, usualmente, para aproximação de ( )nty . Aqui cabe ressaltar que 0( )ty é
a condição inicial do problema e os demais ny são soluções conhecidas do passo anterior. Quer tratar-
se a parte não homogênea de forma implícita construindo um esquema que se baseia em aproximar
( ( ))ne t − +S yA
através de uma interpolação polinomial que envolva 1nt + , por isso define-se:
( ) ( ( )) .nG e t −= +S yA
(12)
Para construir um esquema de integração de ordem r de erro de truncamento, aproxima-se ( )G por
um polinômio de Lagrange de ordem (r-1), com pontos de interpolação 1 2, ,...,n n n rt t t+ + − .
Figura1: Ilustração genérica de uma interpolação por Lagrange considerando 3 pontos

Zandoná et al. ● Braz. J. Rad. Sci. ● 2020 9
Na mudança de variáveis trabalha-se com os pontos de interpolação ,0, ,..., (2 ) :t t r t − −
então:
2
, ,
1 1
( ) ( ) ((2 ) ) ( ) (( ) ) ,r r
r i r i
i i
P L G i t L G i t −
= =−
= − = − (13)
onde ,r iL são os polinômios de Lagrange, dados por:
2 2
,
1 1
( )( ) .
( ( ) ( )
r r
r i
j jj i j i
j t j tL
i t j t j i t
− −
=− =−
− − + = =
− − − − (14)
Considerando em particular r = 3 tem-se que:
1
3, 3, 1 3,0 3,1
1
( ) ( ) (( ) ) ( ) ( ) ( ) (0) ( ) ( ) ,i
i
P L G i t L G t L G L G t −
=−
= − = + + −
(15)
onde
1
1 1
( ) ( ( )) ( )
(0) ( ( )) ( ) .
( ) ( ( )) ( ( )) ( )
t t
n n
n n
t t t
n n n
G t e t t e
G t
G t e t t e t e
− −
+
− −
= + =
= =
− = − = =
S y S y
S y S y
S y S y S y
A A
A A A
(16)
Assim, para o esquema de ordem r, tem-se:
22
1 1
( ) ( ) ; 0 .( )
rri t
n i
i jj i
j tP e t
j i t
−−
−
=− =−
+ =
− S y
A (17)
Portanto, da equação (11), fica-se com:

Zandoná et al. ● Braz. J. Rad. Sci. ● 2020 10
22
1
1 10
( ) ; 0 .( )
trr
t t i t
n n n i
i jj i
j te e e d t
j i t
−−
+ −
=− =−
+ = +
−
y y S yA A A (18)
Desta forma, obtém-se o esquema do método FII geral como:
2
1 1 1
0
( )+ ( ) ,r
t
n n n n n i n i
i
e t −
+ + + − −
=
= +
y y S y S y
A (19)
onde:
( 1) 2
10
; 1 2 .( )
ti t r
n i
kk i
e k td i r
t k i t
+ −
−
=
+ = − −
−
A
(20)
Assim, utilizando o método de Lagrange de segunda ordem, ou seja, r=3, o que resulta em
1
1 e ,
2 2
A t
n n
e
+ = = logo:
1 1( ) ( ) .2 2
t
n n n n
t te
+ +
= + +
y y S y S yA
Termo ImplícitoTermo Explícito
(21)
Para resolver a exponencial da matriz utiliza-se, neste trabalho, a aproximação pela
decomposição espectral da matriz A, uma vez que a matriz A é diagonalizável. Então, existe uma
matriz P dos autovetores inversível, tal que:
1 ,−=A PΛP (22)
onde Λ é uma matriz diagonal dos autovalores da matriz A, P é a matriz associada dos autovetores
e 1−P é a matriz inversa dos autovetores da matriz A, respectivamente. Logo, em vez de determinar
te A , avalia-se 1.te −ΛP P

Zandoná et al. ● Braz. J. Rad. Sci. ● 2020 11
Aqui cabe uma observação da solução encontrada na equação (21). Ela está na forma implícita o
que garante uma maior estabilidade para superar a rigidez do problema proposto. Além disso, a
solução é genérica para qualquer tipo de fonte, inclusive não lineares.
3. RESULTADOS E DISCUSSÃO
Nesta seção, apresentam-se os resultados numéricos para a metodologia proposta e comparam-se
com resultados existentes na literatura. São obtidos os resultados para seis grupos de precursores de
nêutrons atrasados para as reatividades do tipo: rampa, zig-zag, senoidal, fonte pulsada e, por fim,
testa-se uma fonte externa para a reatividade do tipo rampa negativa. Para cada caso de reatividade
estudado é apresentada uma tabela com os resultados obtidos para a densidade de nêutrons e para o
caso da fonte externa os resultados são apresentados na forma de gráfico.
Para todos os casos testes foram utilizados os parâmetros cinéticos estudados na obra Tumelero
[17]. Considera-se a densidade de nêutrons inicial com 3
0 1n cm= . O software utilizado para
implementação do algoritmo foi o Scilab 6.0.1 juntamente com um computador que possui essas
configurações: Intel(R) Core(TM) i5-7200U 2.5GHz, 8GB de RAM, Sistema operacional de 64 bits
e processador com base em x64.
Essas diferentes reatividades podem simular a retirada e inserção de barras de controle, afim de
controlar a reação em cadeia, possibilitando um aumento ou diminuição da potência do reator. Para
o caso com fonte externa, simula-se uma possível configuração subcrítica, ao qual necessita-se de
uma fonte externa para manter-se a reação em cadeia.
3.1 Inserção de Reatividade Rampa
Para o primeiro caso teste considera-se uma inserção de reatividade linear ( )t at = , onde
0,1a = . Usa-se como passo de tempo 710t s− = . Comparam-se os resultados em 3cm− com os
métodos PAM, com o passo de tempo 0,0001t s = , e o BEFD mostrados na tabela 1 até 11s.

Zandoná et al. ● Braz. J. Rad. Sci. ● 2020 12
Tabela 1: Densidade de nêutrons em 3cm− para inserção de reatividade rampa com 0,1 t = .
t(s) FII
0,0000001t s =
PAM 0,0001t s =
BEFD
2 1, 338200178 1, 33820005 1, 338200050
4 2, 228441527 2, 228441895 2, 228441897
6 5, 582050683 5, 582052438 5, 582052449
8 42, 78626045 42, 78629544 42, 78629573
10 451166, 4074 451164, 0975 451163, 6239
11 1,792248361E+16 1,792327126E+16 1, 792213607E + 16
De acordo com a tabela percebe-se que o método FII aproxima-se bem dos resultados quando
comparado com o método PAM [17] e o BEFD [4], concordando de quatro a seis casas decimais,
sendo os melhores resultados no tempo 2s e 4s, concordando seis casas decimais, o que pode-se
considerar um ótimo resultado em física de reatores.
3.2 Inserção de Reatividade Zig-Zag
No segundo caso, resolvem-se as ECPN com reatividade do tipo zig-zag, dada por:
0,0075 , 0 0,5,
0,0075( 0,5) 0,00375, 0,5 1,( )
0,0075( 1), 1 1,5,
0,00375, 1,5 .
t t
t tt
t t
t t
− − +
= −
(23)
Utiliza-se o passo de tempo 0,0000001t s = e comparam-se com os métodos PAM, com o passo
de tempo 0,0001t s = , e o Enhanced Piecewise Constante Approximation (EPCA) apresentado em
[15]. Os resultados são apresentados para a densidade de nêutrons em até 2s na tabela 2.
Tabela 2: Densidade de nêutrons em 3cm− para inserção de reatividade zig-zag.
t(s) FII 7t =10 s−
PAM 0,0001t s =
EPCA
0, 5 1,7214222816 1, 721422393 1, 721422422
1 1,2111273441 1, 211127399 1, 211127415
1, 5 1,8922259882 1, 892226104 1, 892226140
2 2,5216004927 2, 521600526 2, 521600530

Zandoná et al. ● Braz. J. Rad. Sci. ● 2020 13
Analisando a tabela deste caso, pode-se concluir que os resultados encontrados assemelham-se
com os métodos PAM e BEFD, concordando de cinco a seis casas decimais, sendo no tempo 1,5s o
maior erro concordando em cinco casas, o que pode-se considerar um ótimo resultado em física de
reatores.
3.3 Inserção de Reatividade Senoidal
Para o terceiro caso, considera-se a seis grupos de precursores de nêutrons atrasados e uma
inserção periódica de reatividade 0( ) ( )t sen t = , onde 0 0,00073 = . A densidade de nêutrons em
3cm− até 10s, com o passo de tempo 0,0000001t s = . Os resultados são apresentados na tabela 3 e
comparados com os métodos PAM, com o passo de tempo 0,0001t s = , e o Método de
Decomposição presente em [13].
Tabela 3: Densidade de nêutrons em 3cm− para inserção de reatividade senoidal com seis grupos de
precursores de nêutrons atrasados.
Reatividade t(s) FII 7t =10 s−
PAM 0,0001t s =
Decomposição
0,0073 ( )sen t=
1 1, 123940513 1, 123940509 1, 12394
2 1, 168889591 1, 168889590 1, 16884
3 1, 074484697 1, 074484703 1, 07442
4 0, 953829286 0, 953829290 0, 95380
5 0.9073534913 0, 907353490 0, 90737
6 0,9615395724 0, 961539576 0, 96158
7 1,0874589051 1, 087458911 1, 08749
8 1,1716712729 1, 171671274 1, 17164
9 1,1113044428 1, 111304437 1, 11124
10 0,9846803186 0, 984680323 0, 98464

Zandoná et al. ● Braz. J. Rad. Sci. ● 2020 14
Ao observar a tabela deste caso, pode-se notar que os resultados encontrados aproximam-se dos
métodos PAM e Decomposição, concordando de seis a oito casas decimais com o método PAM,
sendo no tempo 2s o menor erro, concordando em oito casas e no tempo 3s o maior erro, concordando
em seis casas, o que pode ser considerado um ótimo resultado em física de reatores. Em comparação
com o método de Decomposição, concorda de três a cinco casas decimais, sendo no tempo 1s o menor
erro, concordando em todas as casas e, no tempo 9s, o maior erro, concordando três casas, o que pode
ser considerado um bom resultado em física de reatores.
3.4 Inserção de Reatividade Fonte Pulsada
Para o quarto caso de reatividade do tipo fonte pulsada, considera-se um grupo de precursores de
nêutrons atrasados em um reator térmico com 006502,0= , s/077,0= , s410.5 −= e reatividade
dada por :
24 exp( 2 ), 1 ,( )
0, 1 .
t t st
t s
− =
(24)
Utiliza-se para o FII o passo de tempo 0,0000001t s = . A tabela 4 mostra os resultados obtidos
para a densidade de nêutrons em 3−cm até 3s comparados com os métodos PAM, com o passo de
tempo 0,0001t s = , e o BEFD.
Tabela 4: Densidade de nêutrons em 3cm− para inserção de reatividade fonte pulsada.
t(s) FII 7t =10 s−
PAM 0,0001t s =
BEFD
0,5 9380053, 842 9380592, 423 9380044, 272 0,8 169477960, 3 169487791, 0 169477616, 1 1 107513351, 0 107519618, 5 107513170, 4 2 4834116, 024 4834396, 081 4834106, 369 3 4833901, 992 4834182, 039 4833892, 339

Zandoná et al. ● Braz. J. Rad. Sci. ● 2020 15
Examinando a tabela percebe-se que o método FII aproxima-se bem dos resultados dos métodos
PAM e BEFD, concordando de três a cinco dígitos com o método PAM, sendo em 1s o menor erro,
concordando cinco dígitos e em 3s o maior erro, concordando três dígitos. Em comparação com o
BEFD tem-se que o método FII concorda de quatro a seis casas decimais, sendo em 0,8s o menor
erro, concordando seis casas e em 3s o maior erro, quatro casas, que pode ser considerado em ambas
comparações um bom resultado em física de reatores.
3.5 Inserção de Reatividade tipo Rampa negativa com Fonte Externa
Para o quinto caso considera-se a inserção de uma reatividade do tipo rampa negativa dada por
( )t at = , sendo 0,001a = − , e uma fonte externa constante 330S cm−= ligada aos 4s. Os resultados
foram calculados até o tempo de 100s e são apresentados na Figura 2.
Pode-se observar um salto na densidade logo após o ligamento da fonte, atingindo o máximo em
aproximadamente 31,28 cm− no tempo de 40s, seguido de um decréscimo lento a partir desse ponto.
Comportamento esse esperado devido a inserção negativa de reatividade do tipo rampa negativa.

Zandoná et al. ● Braz. J. Rad. Sci. ● 2020 16
Figura 2 : Densidade de nêutrons para ( ( ) 0,001 )t t = − e uma fonte externa constante ligada
330S cm−= em 4 segundos
4 CONCLUSÕES
Neste trabalho as ECPN foram resolvidas com sucesso pelo Método de Fator de Integração
Implícito, considerando 6 grupos de precursores de nêutrons atrasados, reatividade constante e
variável com o tempo com adição de um termo fonte. O método se tornou robusto e eficiente para o
cálculo da densidade para diferentes reatividades e tempos, considerando interpolação por Lagrange
de baixa ordem para gerar resultados com boa concordância com resultados apresentados na
literatura. A rigidez foi superada com certa facilidade, não só pela formulação implícita do método,

Zandoná et al. ● Braz. J. Rad. Sci. ● 2020 17
mas pelo auxílio da continuação analítica. Além disso, a dependência temporal na reatividade foi
tratada com a aproximação constante por partes, seguindo a ideia clássica do método PCA.
Os resultados apresentados sem fonte externa serviram para mostrar a viabilidade do método para
posterior simulação e testes com fontes. Nesse sentido, o método apresentado neste trabalho torna-se
viável para resolver as Equações da Cinética Pontual de Nêutrons, incluindo termos fontes. Mesmo
não simulando casos não lineares, a metodologia é geral, podendo incluir não linearidades.
Cabe ressaltar que existe muita pouca referência na literatura para resolver as ECPN, incluindo
termos fontes. Os autores estão cientes que essas fontes precisam ser melhor investigadas para
modelar de forma mais realística esses sistemas subcríticos acionados por fontes externas. Entretanto,
o método proposto se torna viável para simulações futuras, inclusive considerando fontes não lineares.
Portanto, os autores pretendem expandir essa metodologia para modelos mais realísticos
acionados por fontes externas que incluam: feedback de temperatura e venenos absorvedores de
nêutrons, a fim de mostrar a viabilidade desses novos reatores regeneradores de rejeitos radioativos.

Zandoná et al. ● Braz. J. Rad. Sci. ● 2020 18
AGRADECIMENTOS
Os autores agradecem à FAPERGS e à Universidade Federal de Pelotas pelo apoio financeiro e
suporte, em especial ao Programa de Pós-Graduação em Modelagem Matemática da referida
universidade.
REFERÊNCIAS
[1] ABOANBER, A. E.; HAMADA, Y. M. Power series solution (PWS) of nuclear reactor dynamics
with newtonian temperature feedback. Annals of Nuclear Energy, p. 1111–1122, 2003.
[2] ABOANBER, A. E.; HAMADA, Y. M. On Pade' Approximations to the Exponential Function
and Application to the Point Kinetics Equations. Progress in Nuclear Energy, v. 44, No. 4, p.
347–368, 2004.
[3] CHAO, Y.; ATTARDT, A. A resolution of the stiffness problem of reactor kinetics. Nuclear
Science and Engineering. p. 40–46, 2017.
[4] DUDERSTADT J. J.; HAMILTON, L. J. Nuclear Reactor Analysis, John Wiley & Sons, New
York, 1976.
[5] GANAPOL, B. D. The refined way to solve the reactor point kinetics equations for imposed
reactivity insertions. Nuclear Technology and Radiation Protection, v. 24, p. 157–166, 2009.
[6] GANAPOL, B. D.; PICCA, P. A highly accurate benchmark for reactor point kinetics with
feedback. In: 2010. Annals of Nuclear Energy, The 17th Pacific Basin Nuclear Conference: 17th
PBNC: Cancun: México, 2010.
[7] GANAPOL, B. D. A highly accurate algorithm for the solution of the point kinetics equations.
Annals of Nuclear Energy, v.62, p.564–571, 2013.
[8] SÁNCHEZ, J. On the numerical solution of the point reactor kinetics equations by generalized
Runge-Kutta methods. Nuclear Science and Engineering, v. 103, p. 94–99, 1989.
[9] QUINTERO-LEYVA, B. CORE: a numerical algorithm to solve the point kinetics equations.
Annals of Nuclear Energy, v. 35, p. 2136–2138, 2008.

Zandoná et al. ● Braz. J. Rad. Sci. ● 2020 19
[10] NAHLA, A. A. Generalization of the analytical exponential model to solve the point kinetics
equations of Be- and D2O-moderated reactors. Nuclear Engineering and Design, v. 238, p.
2648–2653, 2008.
[11] LI, H.; CHEN, W.; LUO, L.; ZHU, Q. A new integral method for solving the point reactor
neutron kinetics equations. Annals of Nuclear Energy, v. 36, p. 427–432, 2009.
[12] NAHLA, A. A. An efficient technique for the point reactor kinetics equations with Newtonian
temperature feedback effects. Annals of Nuclear Energy, v. 38, p. 2810–2817, 2011.
[13] PETERSEN, C. Z.; DULLA, S.; VILHENA, M. T. B.; RAVETTO, P. An analytical solution
of the point kinetics equations with time-variable reactivity by the decomposition method.
Progress in Nuclear Energy, v. 53, p. 1091–1094, 2011.
[14] KINARD, M.; ALLEN, E. Efficient numerical solution of the point kinetics equations in
nuclear reactor dynamics. Annals of Nuclear Energy, v. 31, p. 1039–1051, 2004.
[15] PICCA, P.; FURFARO, R.; GANAPOL, B. A highly accurate technique for the solution of
the non-linear point kinetics equations. Annals of Nuclear Energy, v. 58, p. 43–53, 2013.
[16] SILVA, J. J. A.; ALVIM, A. C. M.; VILHENA, M. T. M. B.; BODMANN, B. E. J.;
PETERSEN, C. Z. On a closed-form solution of the point kinetics equations with reactivity
feedback of temperature. International Journal of Nuclear Energy, Science and Technology
(Print), v. 8, p. 131-145, 2014.
[17] TUMELERO, F.; PETERSEN, C. Z.; GONÇALVES, G. A. and SCHRAMM, M. Polynomial
approach method to solve the neutron point kinetics equations with use of the analytic
continuation. KERNTECHNIK, v. 81, p. 662–670, 2016.
[18] XOUBI, N. Neutronic design study of accelerator driven system (ADS) for Jordan subcritical
reactor as a neutron source for nuclear research. Applied Radiation and Isotopes, v. 131, p. 71–
76, 2018.
[19] AL QAAOD, A. A.; GULIK, V. 226Ra irradiation to produce 225Ac and 213Bi in an accelerator-
driven system reactor. Nuclear Science and Techniques, v. 31, 44, 2020.

BJRS
BRAZILIAN JOURNAL
OF
RADIATION SCIENCES 08-03 (2020) 01-18
ISSN: 2319-0612 Accepted: 2020-07-22
Determinação da dose em pacientes submetidos a exa-
mes de tomografia computadorizada de abdome em um
serviço de radiologia e diagnóstico por imagem
Alvesa,b F. M. T., Caldasb L. V. E.
aClínica São Judas Tadeu, Rua Uberlândia 240, Ipatinga, MG, Brasil
b Instituto de Pesquisas Energéticas e Nucleares / Comissão Nacional de Energia Nuclear (IPEN/CNEN-SP),
Av. Prof. Lineu Prestes 2242, São Paulo, SP, Brasil
RESUMO
A incorporação de novas tecnologias nos últimos anos proporcionou um aumento expressivo no número de
exames de tomografia computadorizada (TC) realizados no mundo e no Brasil e consequentemente seus efeitos
deletérios relacionados à radiação ionizante. O objetivo foi verificar a dose dos exames de tomografia
computadorizada do abdome realizados em um serviço de radiologia e diagnóstico por imagem para determinar
as ações técnicas que visam diminuí-la, bem como suas consequências. Foram analisados os relatórios de dose
(emitidos automaticamente pelo próprio aparelho) dos exames de TC de abdome realizados no ano de 2018. As
doses estimadas dos exames foram correlacionadas com a indicação clínica, de acordo com o pedido médico,
anexado ao cadastro do paciente e ao número de fases realizadas em cada exame. Os resultados dos indicadores
avaliados dos exames estavam dentro dos níveis de referência recomendados pela American College of Radiology.
Em todas as indicações clínicas foi possível observar uma variabilidade grande no número de fases executadas.
Foi possível observar a urgente necessidade de se readequar e padronizar os protocolos de exames dirigidos
para a suspeita clínica, permitindo o uso racional com imediata redução no número de fases realizadas e
consequentemente minimizar a dose que os pacientes estão recebendo na realização destes exames.
Palavra-chave: Tomografia computadorizada, Abdome, Estimativa de dose específica de tamanho, Dose
ABSTRACT

Alves e Caldas ● Braz. J. Rad. Sci. ● 2020 2
The incorporation of new technologies in recent years has led to a significant increase in the number of computed
tomography (CT) exams performed in the world and in Brazil and, consequently, their deleterious effects
related to ionizing radiation. The objective was to verify the dose of abdominal computed tomography exams
performed in a radiology and diagnostic imaging department to determine the technical actions that aim to
decrease it, as well as its consequences. The dose reports (automatically issued by the device) of the abdominal
CT examinations performed in 2018 were analyzed. The estimated doses of the examinations were correlated
with the clinical indication, according to the medical request, attached to the records of the patient and the
number of phases performed in each exam. The results of the assessed indicators were within the reference
levels recommended by the American College of Radiology. In all clinical indications, it was possible to observe
a great variability in the number of phases performed. It was possible to observe the urgent need to readjust
and standardize the examination protocols aimed at clinical suspicion, allowing for rational use with immediate
reduction in the number of phases performed and consequently minimizing the dose that patients receive during
these exams.
Keywords: Computed tomography, Abdomen, Size specific dose estimate, Dose.
INTRODUÇÃO
A radiologia diagnóstica é uma área de atuação médica que utiliza a radiação ionizante para a
elaboração de informações anatômicas e funcionais do corpo humano e representa uma das principais
fontes de exposição à radiação de origem artificial [1 - 4].
A tomografia computadorizada (TC) é um método de diagnóstico complementar que utiliza a
radiação ionizante e, desde a sua criação, na década de 70, apresenta um papel fundamental na
compreensão, detecção e acompanhamento de várias doenças [2,3,5,6,7,8]. A dose de um exame de
TC representa cerca de 75% da radiação proveniente dos exames da radiologia [3].
A incorporação de novas tecnologias nos últimos anos, o crescente número de indicações clínicas
e a facilidade de acesso ao método de diagnóstico proporcionaram um aumento expressivo no número
de exames de TC realizados no Brasil e no mundo e, consequentemente, da exposição à radiação
[5,7,8,9,10].
Um exame de TC tem uma dose muito variada de acordo com a região estudada, o número de
fases, o tipo de equipamento utilizado e o biotipo do paciente, que pode variar entre 5 mSv e

Alves e Caldas ● Braz. J. Rad. Sci. ● 2020 3
100 mSv. Existem evidências epidemiológicas de um pequeno aumento estatisticamente significativo
no risco de desenvolvimento de câncer nos sobreviventes da bomba atômica de Hiroshima e
Nagasaki, que receberam doses de corpo inteiro de 5 a 150 mSv, equivalentes às recebidas em um
exame de TC [6,8].
O maior desafio da TC nos dias de hoje é desenvolver estratégias para minimizar os riscos da
radiação ionizante[4,8].
A dose na TC pode ser quantificada por meio do kerma no ar [1]. No entanto, na área de física
médica, a dose na TC é quantificada por meio dos valores de índice de dose na TC (CTDIvol) e do
produto dose-comprimento (DLP), que são considerados hoje como níveis orientadores e serão ado-
tados como referência neste trabalho [2,11,12].
O método índice de dose de TC (CTDI) cria um índice para refletir a dose média na região central
de um simulador cilíndrico em apenas um corte tomográfico de uma série de rotações. A palavra
índice foi incluída especificamente no nome do CTDI para distinguir da quantidade da dose absorvida
por um paciente. O CTDI é uma medida padronizada da dose emitida por um tomógrafo que permite
comparar a dose emitida de diferentes tomógrafos [13]. Para TC helicoidais em uso atual, o parâmetro
CTDIvol é o índice mais comumente usado e sua unidade é mGy.
O produto dose-comprimento (DLP) representa a quantidade de radiação emitida para o paciente
em um exame de TC, e é calculado multiplicando-se a dose de um corte de TC (CTDIvol) pelo com-
primento do campo de radiação, sendo apresentado em mGy.cm, determinando a quantidade total de
radiação recebida pelos pacientes durante uma ou várias varreduras [2].
A estimativa de dose específica de tamanho (SSDE) é um método utilizado para estimar a dose
na TC que leva em consideração uma correção baseada no tamanho do paciente, utilizando dimensões
lineares medidas nas imagens axiais dos pacientes [14].
O SSDE é o resultado do produto do CTDIvol por um fator de conversão baseado no tamanho do
paciente (diâmetro ântero-posterior ou lateral, soma das duas dimensões ou diâmetro efetivo):
SSDE = f 16 ou 32 x CTDI 16 ou 32

Alves e Caldas ● Braz. J. Rad. Sci. ● 2020 4
onde (16 ou 32) indica o diâmetro, em centímetros, do objeto simulador de acrílico de referência para
o fator de conversão.
O nível de referência diagnóstica recomendado pela American College of Radiology (ACR) nos
estudos de TC de abdome e pelve para a população adulta é do CTDI vol de 15 mGy a 16 mGy, SSDE
de 18 mGy a 19 mGy e DLP de 705 mGy.cm a 781 mGy.cm, variando com o tamanho do paciente,
enquanto que na população pediátrica os níveis recomendados de CTDI vol são de 5 mGy a 14 mGy,
SSDE de 12 mGy a 19 mGy e DLP entre 106 mGy.cm a 651 mGy.cm, também variando com o
tamanho do paciente [15].
De acordo com a indicação clínica, um exame de abdome pode ter até cinco fases, sendo uma sem
contraste e outras quatro após a injeção endovenosa do meio de contraste. Infelizmente, a falta de
consenso nos protocolos utilizados para a realização dos exames de TC de abdome, que são
dependentes da indicação clínica, faz com que exista uma grande variabilidade na quantidade de fases
realizadas e consequentemente na dose recebida pelos pacientes.
Vários trabalhos da literatura vêm concluindo que a supressão de uma ou mais fases dos exames
de abdome não trazem prejuízo à acurácia do diagnóstico. Iannaccone et al. concluíram que a fase
sem contaste não dificultava a identificação de hepatocarcinomas em pacientes com cirrose hepática,
podendo ser suprimida do protocolo [16]. Imbriaco et al. analisaram exames com suspeita de câncer
de pâncreas e demonstraram que a realização de apenas uma fase pós-contraste era o suficiente para
um diagnóstico e estadiamento desta neoplasia [17]. Leite et al. concluíram que a fase sem contraste
não era fundamental para o diagnóstico em várias indicações clínicas [18]. Metser et al. comprovaram
que para detecção de tumores do trato urinário alto e baixo, a fase portal é mais eficiente que a fase
de equilíbrio, sendo esta última desnecessária para o seu diagnóstico [19].
Os objetivos deste trabalho foram analisar a dose estimada em pacientes que realizaram TC de
abdome em um serviço de radiologia e diagnóstico por imagem, comparar a dose dos exames com a
indicação clínica e os dados da literatura e apresentar um conjunto de recomendações que permitam
subsidiar propostas de redução de dose nos exames a serem realizados.

Alves e Caldas ● Braz. J. Rad. Sci. ● 2020 5
METODOLOGIA
A casuística foi composta por todos os pacientes que compareceram a um serviço de radiologia e
diagnóstico por imagem na cidade de Ipatinga, Minas Gerais, para realizar exames de TC de abdome
em 2018.
Foram avaliados os relatórios de dose de exames de TC de abdome superior ou abdome total
emitidos de dois tomógrafos Multislice, sendo um da marca Siemens de 16 canais (Unidade A) e
outro da marca Philips de 6 canais (Unidade B), armazenados no PACS (Picture Archivind and
Communication System), no ano de 2018. Foram realizadas medições lineares dos maiores diâmetros
lateral e ântero-posterior do abdome dos pacientes. Também foram coletados os dados que constam
na ficha de cadastro do paciente como idade, gênero e os pedidos médicos dos exames com as
indicações clínicas.
Foi utilizado um objeto simulador de acrílico de 32 cm de diâmetro e 15 cm de comprimento,
com uma câmara de ionização do tipo lápis da marca Raysafe, com comprimento de 15,0 cm, modelo
8202041-D / 205028, e um eletrômetro da marca Raysafe, modelo 8201021-H / 167289 (calibrados
no LabPROSAUD, incerteza 1,9%) para medição da dose nos equipamentos de TC.
RESULTADOS E DISCUSSÃO
Valores de dose dos equipamentos de TC
Os valores de dose de CTDI da radiação emitida pelos equipamentos de TC foram avaliados por
medição da dose no objeto simulador de acrílico, com a câmara de ionização e o eletrômetro, com os
parâmetros técnicos dos protocolos dos exames de abdome.
O valor de CDTI100 foi medido três vezes no centro e em quatro pontos na periferia do objeto
simulador, a partir dos quais se calculou a média ponderada, o CTDIw, o CTDIvol e o DLP. Os
resultados do CTDIvol e o DLP estão expressos na Tabela 1.

Alves e Caldas ● Braz. J. Rad. Sci. ● 2020 6
Tabela 1: Relatório de medida de dose dos equipamentos Siemens (Unidade A) e Philips (Uni-
dade B)
Unidade de Radiologia e
Grandeza
Valor estimado pelo
equipamento de TC
Valor medido pelo
eletrômetro
Diferença
(%)
Unidade A
(Siemens)
CTDI vol (mGy) 10,41 10,20 2,02
DLP (mGy.cm) 20,00 19,59 2,05
Unidade B
(Philips)
CTDI vol (mGy) 22,4 24,2 -8,04
DLP (mGy.cm) 20,1 21,8 -8,46
As diferenças percentuais entre os valores de CTDIvol e DLP medidos pela câmara de ionização
e eletrômetro e os mostrados nos equipamentos foram de 2,02% e 2,05%, respectivamente, no equi-
pamento Siemens da Unidade A, e de - 8,04% e - 8,46% no equipamento Philips da Unidade B. Os
resultados obtidos indicam que os equipamentos de TC apresentaram resultados satisfatórios às con-
dições aplicadas. No entanto, a pequena diferença encontrada no equipamento da Philips indica que
pode haver uma discrepância entre a dose produzida e a informada no comando do equipamento.
Caracterização da amostra
Foram analisados 1432 exames realizados entre os dias 01/01/2018 e 31/12/2018, sendo que 1211
atendiam aos critérios de inclusão. Dos 221 exames que não atendiam aos critérios e foram excluídos
do estudo, 72 não tinham dados referentes à indicação clínica, sendo 13 da Unidade A e 59 da Unidade
B. Os demais exames excluídos, 149, não tinham o relatório de dose armazenado no PACS, sendo
148 da Unidade A e 1 da Unidade B.
Foram avaliados 1211 pacientes, sendo 58,5% do sexo feminino. A idade média dos pacientes
nos exames realizados foi de 49,4 anos, sendo realizados 33 exames em crianças de até 11 anos, 66
em adolescentes de 12 a 19 anos, 723 em adultos entre 20 e 59 anos e 389 em idosos acima de 60
anos, demonstrando que a população adulta (cerca de 92 % dos exames) realiza muito mais exames
de tomografia que a população pediátrica. Pouco mais da metade dos exames foram realizados na
Unidade A (52,3%). A grande maioria dos exames (90,8%) era abdome total ou UroTC e 39,7% eram
protocolo contraste com fase única. A Tabela 2 apresenta esta caracterização da amostra.

Alves e Caldas ● Braz. J. Rad. Sci. ● 2020 7
Tabela 2: Caracterização dos pacientes por gênero, idade, Unidade de realização do exame, tipo de
exame (n=1211)
n Percentual
Gênero
Masculino 502 41,5
Feminino 709 58,5
Idade
Média ± desvio-padrão 49,4 ± 20,3
Mediana (Mínimo – Máximo) 49 (0 – 99)
Unidade
B 578 47,7
A 633 52,3
Exame
Abdome superior 112 9,2
Abdome total 1099 90,8
A Tabela 3 apresenta o número de exames realizados por indicações clínicas.
Os resultados revelam que a maior parte dos exames realizados, cerca de 67%, tinham como
indicação clínica alguma dor abdominal, sendo as mais frequentes litíase renal (20,6%) e dor
abdominal não especificada (20,5%), mostrando um perfil mais emergencial nas duas Unidades,
como apresentados na Tabela 3.
Poucos exames realizados, cerca de 5,2%, tiveram como indicação clínica estadiamento ou rees-
tadiamento de câncer, corroborando para o perfil mais emergencial dos serviços e menos oncológico
(Tabela 3).
O CTDIVOL médio foi de 9,2 mGy, variando de 2,6 mGy a 23,1 mGy. O DLP médio foi de
411,3 mGy.cm, variando de 24,6 mGy.cm a 1236,6 mGy.cm. O DLP total teve média de
967,9 mGy.cm com mínimo de 68,8 mGy.cm e máximo de 3737,7 mGy.cm. O SSDE médio foi de
12,6 mGy, variando de 0,0 mGy a 40,0 mGy.
Verificou-se que os resultados de percentil 75 de CTDIvol, SSDE e DLP dos exames realizados
foram 11,2 mGy, 15,0 mGy e 501,7 mGy.cm, respectivamente, ficando dentro dos níveis de referên-
cia recomendados pela ACR [15].

Alves e Caldas ● Braz. J. Rad. Sci. ● 2020 8
Tabela 3: Caracterização dos exames realizados por indicação clínica (n=1211)
Indicações Clinicas n %
Litíase renal (cálculo renal/nefrolitíase) 249 20,6
Dor abdominal não especificada 248 20,5
Dor na Fossa Ilíaca Direita - apendicite 66 5,5
Contraindicação ao contraste 58 4,8
Dor em flanco direito ou esquerdo 55 4,5
Obstrução intestinal 49 4,0
Dor no Fossa Ilíaca Esquerda - diverticulite 49 4,0
Dor abdominal aguda (não localizada) 45 3,7
Urotomografia - nódulo / cisto / hematúria 44 3,6
Nódulo hepático 41 3,4
Pancreatite aguda 39 3,2
Icterícia/Colestase 35 2,9
Massa abdominal palpável ou vista em US prévio 34 2,8
Outros 32 2,6
Estadiamento de outros cânceres 26 2,1
Doença hepática crônica (cirrose) 21 1,7
Trauma abdominal 20 1,7
Suspeita de neoplasia abdominal 18 1,5
Pielonefrite (infecção do trato urinário) 17 1,4
Dor no hipocôndrio direito 15 1,2
Estadiamento de câncer colorretal 7 0,6
Sangramento do trato gastrointestinal 6 0,5
Estadiamento de câncer pancreático 6 0,5
Doença de Crohn 6 0,5
AngioTC aorta abdominal e ilíacas 5 0,4
Nódulo adrenal 5 0,4
Angio TC Venosa Abdome Total 5 0,4
Reestadiamento de câncer 4 0,3
Isquemia mesentérica 3 0,2
Suspeita de metástase hepática 2 0,2
Disfagia 1 0,1
Foi observado que apenas 138 pacientes (11%) apresentaram doses acima das recomendadas. A
média da soma dos diâmetros abdominais destes pacientes foi de 61,9 cm, enquanto que a média da
amostra foi de 54,5 cm, demonstrando a relação direta da dose com os diâmetros abdominais.

Alves e Caldas ● Braz. J. Rad. Sci. ● 2020 9
Foram evidenciados em dois pacientes doses de SSDE muito altas, sendo 36,6 mGy e 40,0 mGy,
comparativamente aos demais pacientes da amostra, onde o percentil 75 foi de 15 mGy. Na verifica-
ção dos respectivos exames, observou-se que eram pacientes pediátricos, que realizaram exames no
equipamento Philips da Unidade B, e o valor do produto corrente tempo permaneceu estável em 200
mAs durante toda a aquisição do exame, demonstrando que o modulador de dose automático não
funcionou. O modulador de dose automático permite alterar a corrente do tubo de acordo com as
dimensões dos pacientes ao longo da varredura, reduzindo a dose recebida por eles [20,21].
Análise de associações com os indicadores avaliados nos exames
Foram observadas maiores médias e medianas de CTDI, DLP total, SSDE e dose efetiva na Uni-
dade B se comparado à Unidade A, como apresentados na Tabela 4.
Apesar do protocolo dos exames do equipamento da Unidade B apresentar menor tensão em re-
lação ao da Unidade A (120 kVp versus 130 kVp), o produto corrente tempo é bem maior (200 mAs
versus 110 mAs), o que poderia explicar estes maiores valores medidos.
A análise dos resultados dos valores obtidos dos exames realizados por gênero não demonstrou
nenhuma diferença significativa (p>0,05).
As Figuras 1 e 2 apresentam os gráficos de dispersão entre as medições de CTDI, SSDE e
distâncias (lateral + AP). Em todas as comparações as correlações podem ser consideradas
significativas (p<0,05).

Alves e Caldas ● Braz. J. Rad. Sci. ● 2020 10
Tabela 4: Descrição dos indicadores resultantes dos exames realizados por Unidade
Unidade
CTDI
mGy
DLP Total
mGy.cm
Distância
Lateral + AP
cm
SSDE
mGy
Dose
efetiva
mSv
Total de
fases
realizadas
B
Média 11,1 1173,1 53,3 15,4 17,6 2,7
Desvio-padrão 4,1 717,2 9,3 4,1 10,8 1,3
Mínimo 2,9 68,8 26,6 0,0 1,0 1,0
Máximo 23,1 3737,7 79,3 37,1 56,1 5,0
Percentil 25 8,0 553,0 46,6 12,7 8,3 1,0
Mediana 10,3 1088,4 53,2 14,8 16,3 3,0
Percentil 75 13,6 1634,5 59,4 18,0 24,5 4,0
A
Média 7,5 780,5 55,7 10,1 11,7 2,5
Desvio-padrão 2,6 494,1 8,4 2,5 7,4 1,4
Mínimo 2,6 92,0 23,1 5,3 1,4 1,0
Máximo 19,8 2866,6 89,3 40,0 43,0 5,0
Percentil 25 5,9 352,5 50,5 8,7 5,3 1,0
Mediana 7,0 731,0 55,7 9,7 11,0 3,0
Percentil 75 8,5 1070,0 61,4 10,9 16,1 4,0
Valor-p* <0,001 <0,001 <0,001 <0,001 <0,001 0,140
*Teste Mann-Whitney

Alves e Caldas ● Braz. J. Rad. Sci. ● 2020 11
Figura 1: Dispersão dos valores de CTDIvol e distância lateral+AP
Figura 2: Dispersão dos valores de distância lateral+AP e SSDE

Alves e Caldas ● Braz. J. Rad. Sci. ● 2020 12
No estudo da relação entre o CTDI vol e a distância lateral + AP observa-se correlação direta e
forte (r = 0,62). Ou seja, quanto maiores os diâmetros abdominais, maior é a dose nos exames
realizados, corroborando com os dados da literatura [22].
Também foi evidenciada uma relação direta entre a distância lateral + AP e SSDE; no entanto,
esta foi moderada (r = 0,30) , demonstrando o efeito do fator de correção aplicado ao cálculo da dose
desta grandeza.
O número de fases realizados é um indicador que apresenta relação linear com a dose que os
pacientes recebem durante os exames realizados como apresentado na Figura 3.
Figura 3: Box-plot dos valores de DLP total por número de fases realizadas
Os resultados revelaram uma relação direta e significativa entre DLP total e o número de fases,
isto é, há um aumento nos valores de DLP total à medida que aumenta o número de fases, com
coeficiente de correlação igual 0,75 (p<0,01).

Alves e Caldas ● Braz. J. Rad. Sci. ● 2020 13
A Figura 4 é um Box-plot que ilustra a relação do número de fases realizadas nos exames
segundo as indicações clínicas.
Figura 4: Box-plot do número total de fases segundo as principais indicações
Houve uma média de três fases por exame, sem diferença estatisticamente significativa entre as
Unidades ou por gênero.
38,3 % dos pacientes realizou o exame com uma fase, sendo que 5 % deles fizeram apenas uma
fase por apresentarem contraindicação ao uso do contraste, o que impedia a realização de mais de
uma fase.
Um exame com quatro fases foi realizado por 33,3 % dos pacientes. Apenas 3,4% dos pacientes
fizeram o exame com duas fases e 21,8% o fizeram com 3 fases.
Na grande maioria dos exames de tomografia computadorizada de abdome e pelve, a realização
de apenas uma fase é o suficiente para se chegar ao diagnóstico nosológico. Estudos com múltiplas
fases devem ser reservados para alguns casos com indicações específicas que otimizam a detecção e
caracterização de lesões [3,23,24,25].

Alves e Caldas ● Braz. J. Rad. Sci. ● 2020 14
Em algumas indicações clínicas como dor na fossa ilíaca direita (apendicite aguda), dor na fossa
ilíaca esquerda (diverticulite) e litíase renal, geralmente uma fase sem contraste é o suficiente para se
concluir o exame e chegar a um diagnóstico final. No entanto, o que se pode observar foi que apenas
50% dos pacientes com estas indicações clínicas realizaram uma fase, 25% de duas a três fases e 25%
mais de três fases.
Foi observado que quase todas as indicações clínicas tiveram pacientes que realizaram cinco fa-
ses, demonstrando um excesso de fases realizadas.
Um grande número de pacientes, cerca de 50%, realizou três ou mais fases, indicando a execução
da fase de equilíbrio. Já existem dados suficientes na literatura de que esta fase pode ser suprimida
do protocolo sem prejuízo na capacidade diagnóstica do método, principalmente nas indicações on-
cológicas, abdome agudo e traumas abdominais quando não há suspeita de lesão renal [23,24].
Em todas as indicações clínicas foram realizadas fases sem contraste seguidas de fases contrasta-
das. Dados na literatura sugerem que, em algumas indicações clínicas específicas, a fase sem contraste
pode ser suprimida do protocolo e as fases pós-contraste podem ser realizadas como as primeiras
fases, sem detrimento do diagnóstico, como nos casos de nódulos hepáticos (hipo ou hipervasculares),
estadiamento tumoral, carcinoma pancreático, pancreatite aguda, pielonefrite, apendicite, diverticu-
lite, linfoma e pesquisa de coleções intracavitárias [3,23,25].
Em todas as indicações clínicas foi possível observar uma variabilidade muito grande no número
de fases executadas, demonstrando a falta de critério e consenso nos protocolos executados pela
equipe de técnicos orientada pelos radiologistas. Todas as indicações tiveram exames com quatro
fases executadas e em apenas duas indicações clínicas das mais prevalentes (trauma abdominal e dor
nos flancos), não tiveram exames com cinco fases, revelando uma situação contrária ao que a litera-
tura mais recente preconiza, ou seja, reduzir o número de fases e consequentemente reduzir a dose
dos pacientes [3,23,24,25].
CONCLUSÕES
Os resultados permitem concluir que a dose de radiação recebida pelos pacientes nos exames
realizados está diretamente relacionada com algumas características inerentes ao paciente, como o

Alves e Caldas ● Braz. J. Rad. Sci. ● 2020 15
diâmetro abdominal, o que não pode ser mudado, e ao número de fases realizadas, o que é dependente
de protocolos estabelecidos pela equipe médica.
Protocolos pré-estabelecidos em exames de TC de abdome de acordo com a indicação clínica
permitem pouca variação no número de fases realizadas em um serviço. Para isso é necessário um
consenso entre os médicos radiologistas, que fazem os relatórios, e um treinamento com a equipe de
técnicos de radiologia, para que não realizem fases demasiadas nem deixem de realizar fases impres-
cindíveis, para o diagnóstico de patologias importantes. A grande variabilidade no número de fases e
em excesso, que pode ser observado em todas as indicações clínicas, demonstra a falta de protocolo
nos exames dos serviços. Isso implica diretamente em uma maior dose nos pacientes.
Foi possível observar a urgente necessidade de se readequar e padronizar os protocolos de exames
dirigidos para a suspeita clínica, permitindo o uso racional com imediata redução no número de fases
realizadas e consequentemente minimizar a dose que os pacientes estão recebendo na realização des-
tes exames.
AGRADECIMENTOS
Os autores agradecem às duas Unidades de radiologia e diagnóstico por imagem pelo apoio ao
trabalho e à agência de fomento CNPq (Projeto 301335/2016-8)
REFERÊNCIAS
[1] IAEA, INTERNATIONAL ATOMIC ENERGY AGENCY. Dosimetry in Diagnostic Radi-
ology: an International Code of Practice. Relatorio Tecnico IAEA TRS 457, IAEA, Vienna,
2007.
[2] HUDA, W.; OGDEN, K. M.; KHORASANI, M. R. Converting dose-length product to
effective dose at CT. Radiology, v. 248, n. 3, p. 995-1003, 2008.
[3] COSTA, D. M. C.; SALVADORI, P. S. S.; MONJARDIM, R. F.; BRETAS, E. A. S.; TOR-
RES, L. R.; CALDANA, R. P.; SHIGUEOKA, D. C.; MEDEIROS, R. B.; D`IPPOLITO, G.
Quando a fase sem contraste intravenoso é desnecessária nos exames de tomografia
Alves e Caldas ● Braz. J. Rad. Sci. ● 2020 16
computadorizada do abdome? Análise retrospectiva de 244 casos. Radiologia Brasileira, v.
46, n. 4, p.197-202, 2013.
[4] KIKUTI, C.F.; SALVADORI, P. S.; COSTA, D.M.C.; D'IPPOLITO, G.; MEDEIROS, R.B.
Estimativa da dose em exames de tomografia de abdome com base nos valores de DLP. IX
Latin American IRPA Regional Congress on Radiation Protection and Safety – IRPA
2013, Rio de Janeiro, RJ, Brasil, 15-19 de abril, 2013.
[5] PARAKH, A.; KORTESNIEMI, M.; SCHINDERA, S. T. CT radiation dose management: a
comprehensive optimization process for improving patient safety. Radiology, v. 280, n. 3, p.
663-673, 2016.
[6] BRENNER, D. J.; HALL, E. J. H. Computed Tomography - An increasing source of radiation
exposure. The New England Journal of Medicine, v. 357, n. 22, p. 2277-2284, 2007.
[7] SMITH-BINDMAN, R.; LIPSON, J.; MARCUS, R.; KIM, K. P.; MAHESH, M.; GOULD,
R.; BERRINGTON DE GONZÁLEZ, A.; MIGLIORETTI, D. L. Radiation dose associated
with common computed tomography examinations and the associated lifetime attributable
risk of cancer. Archives of Internal Medicine, v. 169, n. 22, p. 2078-2086, 2009.
[8] BRENNER, D. J. Slowing the increase in the population dose resulting from CT scans. Ra-
diation Research Society, v. 174, p. 809-815, 2010.
[9] RODRIGUES, S. I.; ABRANTES, A. F.; RIBEIRO, L. P.; ALMEIDA R. P. P. Estudo da dose
nos exames de tomografia computadorizada abdominal em um equipamento de 6 cortes.
Radiologia Brasileira, v. 45, n. 6, p. 326-333, 2012.
[10] DOVALES, A.C.M.; ROSA, L.A.R.; KESMINIENE, A.; PEARCE, M.S.; VIEGA L.H.
Patterns and trends of computed tomography usage in outpatients of the Brazilian public
healthcare system, 2001-2011. Journal of Radiological Protection, v. 36, n. 3, p. 547-560,
2016.
[11] SHRIMPTON, P.C.; HILLIER, M.C.; LEWIS, M.A.; DUNN, M. Doses from computed
tomography (CT) examinations in the UK: 2003 review. Chilton, UK: National Radiological
Protection Board, Report NRPB-W67, 2005.
[12] McCOLLOUGH, C.; BRANHAM, T.; HERLIHY, V.; BHARGAVAN, M.; ROBBINS,
L.; BUSH, K.; McNITT-GRAY, M.; PAYNE, T.; RUCKDESCHEL, T.; PFEIFFER, D.;

Alves e Caldas ● Braz. J. Rad. Sci. ● 2020 17
CODY, D.; ZEMAN, R. Diagnostic reference levels from the ACR CT Accreditation Pro-
gram. Journal of the American College of Radiology, v. 8, n. 11, p. 795–803, 2011.
[13] O’NEILL, S.; KAVANAG, R.G.; CAREY, B.W.; MOORE, M.; MAHER, M.; O’CON-
NOR, O. J.; Using body mass index to estimate individualised patient radiation dose in ab-
dominal computed tomography. European Radiology Experimental, v. 38, n. 2, p. 1-8 ,
2018.
[14] AAPM, AMERICAN ASSOCIATION OF PHYSICISTS IN MEDICINE, Use of Water
Equivalent Diameter for Calculating Patient Size and Size-Specific Dose Estimates
(SSDE) in CT. The report of AAPM task group n. 220, 2014.
[15] ACR, AMERICAN COLLEGE OF RADIOLOGY, AMERICAN ASSOCIATION OF
PHYSICISTS IN MEDICINE, SOCIETY FOR PEDIATRIC RADIOLOGY, Practice Pa-
rameter for Diagnostic Reference Levels and Achievable Doses in Medical x-Ray Imag-
ing. Practice Guideline, 2018. Disponível em: https://www.acr.org/-/media/ACR/Files/Prac-
tice-Parameters/Diag-Ref-Levels.pdf. Acesso em: 30/04/2019.
[16] IANNACCONE, R.; LAGHI, A.; CATALANO, C.; ROSSI, P.; MANGIAPANE, F.;
MURAKAMI, T.; HORI, M.; PIACENTINI, F.; NOFRONI, I.; PASSARIELLO, R.
Hepatocellular carcinoma: role of unenhanced and delayed phase multi–detector row helical
CT in patients with cirrhosis. Radiology, v. 234, n. 2, p. 460–467, 2005.
[17] IMBRIACO, M.; MEGIBOW, O.J.; RAGOZZINO, A.; LIUZZI, R.; MAINENTI, P.;
BORTONE, S.; CAMERA, L.; SALVATORE, M. Value of the single-phase technique in
MDCT assessment of pancreatic tumors. American Journal of Radiology, v. 184, p. 1111-
1117, 2005.
[18] LEITE, A.P.K.; MATTOS, L.A.; PINTO, G.A.D.H.; SCACIOTA, A.P.; FRANCO,
R.M.A.M.M.; ANDREONI, C.; LEDERMAN, H.M.; D’IPPOLITO, G. O valor da fase sem
contraste na tomografia computadorizada do abdome. Radiologia Brasileira, v. 41, n. 5, p.
289–296, 2008.
[19] METSER, U.; GOLDSTEIN, M.A.; CHAWLA, T.P.; FLESHNER, N.E.; JACKS, L.M.;
O’MALLEY, M. E. Detection of urothelial tumors: comparison of urothelial phase with ex-
cretory phase CT urography – a prospective study. Radiology, v. 264, n. 1, p.110–118, 2012.

Alves e Caldas ● Braz. J. Rad. Sci. ● 2020 18
[20] TACK, D.; MAERTELAE, V.; GEVENOIS, P. A.; Dose reduction in multidetector CT
using attenuation-based onlinetube current modulation. American Journal of Radiology, v.
181, p. 331-334, 2003.
[21] CAPAVERDE, A.S.; PIMENTEL, J.; FRONER, A.P.P.; SILVA, A.M.M.
Relacao entre
a estimativa de dose de radiacao em pacientes submetidos a exames de tomografia computa-
dorizada do abdomen e o indice de massa corporal. International Joint Conference RADIO
2014, Gramado, RS, Brazil, Agosto, 26-29, 2014.
[22] RODRIGUES, S. I.; ABRANTES, A. F.; RIBEIRO, L. P.; ALMEIDA R. P. P. Estudo da
dose nos exames de tomografia computadorizada abdominal em um equipamento de 6 cortes.
Radiologia Brasileira, v. 45, n. 6, p. 326-333, 2012.
[23] JOHNSON, P.; FISHMAN, E.K.; Routine use of precontrast and delayed acquisitions in
abdominal CT: time for change. Abdominal Imaging, v. 38, p. 215-223, 2013.
[24] SALVADORI, P. S.; COSTA, D. M. C.; ROMANO, R. F. T.; GALVÃO, B. V. T.; MON-
JARDIM, R. F.; BRETAS, E. A. S.; RIOS, L. T.; SHIGUEOKA, D. C.; CALDANA, R. P.;
D’IPPOLITO, G. Quando a fase de equilíbrio pode ser suprimida nos exames de tomografia
computadorizada de abdome? Radiologia Brasileira, v. 46, n. 2, p. 65-70, 2013.
[25] ROMANO, R. F. T.; SALVADORI, P. S.; TORRES L. R.; BRETAS, E. A. S.; BEKHOR,
D.; CALDANA, R. P.; MEDEIROS, R. B.; D’IPPOLITO G. Readequacao de protocolos de
exames de tomografia computadorizada de abdome em um hospital universitário: impacto na
dose de radiação. Radiologia Brasileira, v. 48, n. 5, p. 292-297, 2015.

BRAZILIAN JOURNAL
OF
RADIATION SCIENCES
08-03 (2020) 01-14
ISSN: 2319-0612 Accepted: 2020-07-16
BJRS
Manufacture and characterization of a Bolus composed
of water, bi-distilled glycerin, gelatin and formaldehyde
Oliveiraa C.M., Brüningb F.F., Lyrab J.G.P., Zanettic S.Y.,
Funchalb M., Fernandesb T.C.O.
a Medical Physics Resident/Erasto Gaertner Hospital/Radiotherapy Department, 81520-060, Curitiba, Paraná, Brazil
b Medical Physicist/Erasto Gaertner Hospital/Radiotherapy Department, 81520-060, Curitiba, Paraná, Brazil
c Radiotherapy Technologist/Erasto Gaertner Hospital/Radiotherapy Department, 81520-060, Curitiba, Paraná, Brazil
ABSTRACT
In years the bolus is used as human tissue compensator in treatments of superficial tumors using photons and
electrons in the radiotherapy. In order to obtain a low cost and noncommercial bolus, it is proposed in this work
to find an optimized bolus recipe composed of water, bi-distilled glycerin, gelatin and formaldehyde. It was
manufactured 14 samples and it was evaluated their mass densities, homogeneity and malleability which M and
N samples was classified for dosimetric analyses. The percentage depth dose (PDD) curves of M and N samples
were measured and compared to the PTW RW3 solid water PDD curve for three energies, 6 MV, 6 MeV and 18
MeV. The PDDs comparisons results showed good agreement and differences smaller than 6% in the percentage
depth values for depths smaller than 1,5 cm, except to 6 MeV electron energy which the sample N had difference
of 17%. The M sample presented better results for the three measured energies and it was defined as the best
recipe to a bolus between the analyzed samples in this work.
Keywords: medical physics; radiotherapy; bolus; material characterization.

Oliveira et al. ● Braz. J. Rad. Sci. ● 2020 2
1. INTRODUCTION
Radiotherapy is an efficient method for the destruction of cells, using ionizing radiation.
Therefore, can be used for oncological treatments [1,2]. The radiation dose prescribed by the radio
oncologist doctor must be delivered with precision [3]. For this diagnostic imaging techniques, as
computed tomography (CT), magnetic resonance (MR), ultrasound and positron emission
tomography (PET) assist the radio oncologist in locating the target volume. Cancer patients who
treat with radiotherapy have a contribution in 40% of the all cancer cures cases [3-5].
The choice of external beam unit can be made depending on the tumor depth. For example,
tumors relatively shallow or moderately deep at the skin distance, as in the cases of head and neck,
breast and body ends, x-ray units, with low energy megavoltage beam, are used (e.g. 60Co, 4 MV or
6 MV). For treatment of deep tumors in abdomens and pelvis it could be medium and high energy
(between 10 MV to 25 MV). Moreover, for superficial tumors, at most 5 cm deep, is used beams of
charge particles, like electrons with energy between 4 MeV to 20 MeV [2].
In treatment of superficial tumors with photons or electrons, usual it is necessary the use of a
bolus, in order to superficialize the dose and (or) regularize the patients’ surface. The bolus is a
human tissue compensator [2,6-8], that is, a material whose density should be approximately that of
water. Because water presents a similar behavior, from the perspective of the interaction of
radiation with matter and it correspond to 60% of the adult human body [9].
The bolus is positioned in direct contact with the patients’ surface, or inside an cavity of the
body. It can be made of various materials such as moistened gauze, “red wax” dentistry, “vaseline
gauze” or synthetic oil gel with density very close to that of water, marketed as bolus superflab,
among others [2, 6-8].
Radiotherapy services can use self-made bolus, noncommercial and manufactured using water,
bi-distilled glycerin, gelatin and formalin. This bolus has low cost and can be manufactured easily
[10]. This article proposes a detailed study of this bolus, optimized his recipe, analyzed his
characteristics and tried to find the recipe with better cost benefit, homogeneous and with
dosimetric characteristics of a beam in water.

Oliveira et al. ● Braz. J. Rad. Sci. ● 2020 3
2. MATERIALS AND METHODS
In this study different bolus samples were analyzed, which were manufactured by varying the
proportions of part of their components: water and bi-distilled glycerin (density 1.25 g / cm3) and
10% formaldehyde solution. In order to know the influence, the materials that compose it and check
the materials resulting from the different proportions.
Table 1 shows the manufactured samples and their proportions. The amounts of gelatin were
kept fixed.
Table 1: Samples analyzed in this paper.
Sample Water (cm3) Bi-distilled glycerin (ml) Gelatin (g) Formaldehyde (ml)
A 0 100 75 5
B 100 0 75 5
C 100 0 75 0
D 200 0 75 5
E 0 200 75 5
F 100 100 75 5
G 100 200 75 5
H 200 100 75 5
I 200 200 75 5
J 300 100 75 5
K 300 200 75 5
L 300 300 75 5
M 400 300 75 5
N 400 400 75 5
2.1. Samples Manufacturing
Bolus was manufactured in the mold's room of the Erasto Gaertner Hospital in Curitiba, Paraná,
Brazil. Samples A to E were made to verify the effect of water and glycerin concentrations on the

Oliveira et al. ● Braz. J. Rad. Sci. ● 2020 4
bolus. The gelatin was mixed with each component and then the mixture was heated in a pot on a
stove until completely dissolved. Everything mixed with a spoon. After 10 min, the foam that forms
due to gelatin is removed, also with the spoon and then the 10% formaldehyde solution is added
except for sample C.
The samples from F to N were manufactured as follows: the gelatin was hydrated with water,
after the mixture was homogeneous, it was heated in a pot on a stove until completely liquefied,
when the glycerin was then added and after 10 min the 10% formaldehyde solution. Everything
mixed with a spoon. The foam formed should be removed during the process with a spoon to obtain
a smooth and homogeneous bolus.
The mixture becomes liquid and can be placed in containers of different sizes and thicknesses.
Allow 12 hours for the bolus to solidify completely.
2.2. Mass density and homogeneity
The mass density of the samples was calculated by direct mass and volume measurement, as
well as an analysis of the Hounsfield units (HU) values was performed. The computed tomography
of each sample was acquired by a standardized clinical tomograph (GE Hispeed), with the
technique of 120 kVp, 130 mA and 3 mm slices. The tomograph is evaluated according to current
legislation. The images resulting from the acquisition were later imported into Varian Medical
Systems' Eclipse™ version 13.5 treatment planning system to determine sample HUs using a tool
available in the system. The region of interest (ROI) analyzed for each image was 20 x 20 pixels, in
order to not have a punctual reading, nor a large area.
2.3. Dosimetric Characteristics
The percentage depth dose (PDD) of two samples were measured and compared to the same
curve obtained with a solid water phantom (PTW RW3 slab phantoms, density 1.045 g /cm3). This
measurement was performed with a parallel plate chamber (PPC05, IBA dosimetry) at a distance
from the source to the surface of 100 cm, with a field size of 10 x 10 cm2. A 6 MV photon beam of
a CX linear accelerator (Varian Medical Systems) was used to measure PDD. And two clinical
electron beams with 6 and 18 MeV energies were also used, representing two extremes of the
energies clinically used in our radiotherapy department. For the measurement of electron PDD

Oliveira et al. ● Braz. J. Rad. Sci. ● 2020 5
curves, measurements were made at a distance from the source to the surface of 100 cm with a 10 x
10 cm2 applicator with the parallel plate chamber. We use a parallel plate chamber with PTW RW3
as it has more consistent results for low depths [10].
3. RESULTS
3.1. Qualitative malleability analysis of the samples
The samples were qualitatively analyzed at in order to know the behavior of his constituents in
the final product and verified the malleability of the material. It is necessary that the bolus be
malleable, to fit the shape of the patient. For a quantitative measure of the malleability, can be made
using a Shore durometer 00. In the absence of such instrument was created a qualitatively scale.
The samples were evaluated by three researchers and the malleability was rated on a scale from
0 to 5, where 0 is a non-malleable material and 5 is a very malleable material. The results of this
analysis it is show in Table 2.
Table 2: Qualitative malleability analysis results.
Samples results by each research Samples results
Scale Research 1 Research 2 Research 3 Final
0 A A A A
1 B, E B, E B, E B, E
2 C, D, F, G, H C, D, F, G, H C, D, F, G, H C, D, F, G, H
3 I, J, K I, J I, J, K I, J, K
4 L, M K, L, M L, M L, M
5 N N N N
3.2. Mass density and homogeneity
The mass densities were obtained with measures of mass and volume, as show in Table 3, where
is also shown the values of density obtain by the average of the mean values of HU [11, 12]. This
was measured using ROI's of 20x20 pixels. Moreover, the measures were analyzed in three
different slices, of the bolus tomography images. Two in regions close to the extremity of the
samples, and one in the central region.

Oliveira et al. ● Braz. J. Rad. Sci. ● 2020 6
Table 3: Mass densities values measured and obtained by average of the mean HU values in three
different slices of the bolus tomography images.
Samples Densities (± 0,01 g/cm³) Densities by HU values (g/cm³)
A 1,20 1,20
B 0,99 1,03
C 1,02 1,08
D 1,02 1,02
E 1,19 1,25
F 0,96 1,07
G 1,12 1,19
H 1,11 1,16
I 1,14 1,19
J 1,11 1,12
K 1,14 1,17
L 1,21 1,19
M 1,13 1,16
N 1,13 1,18
For the homogeneity analysis the averaged of the mean values of HU were evaluated, as well as
the maximum, the minimum and the standard deviation values, also obtained by the software. The
results are show in the Figure 1. Samples with the standard deviation values in all measurements
below 10%, i.e., which had the smallest variation in HU values and also graphically, were
considered homogeneous. These were: I, J, K, L, M and N.

Oliveira et al. ● Braz. J. Rad. Sci. ● 2020 7
Figure 1: Averages of the mean HU values. The upper limit is the average of the maximum HU
values and the lower limit is the average of the minimum HU values.
Through the density values obtained and the homogeneity and malleability analysis, the bolus
chosen to perform the dosimetric measurements were M and N. Sample L would also be a good
one, since it was homogeneous, malleable and the density by HU was close to the chosen ones.
However, the mass density measured showed a greater difference compared to the solid water plate.
3.3. Dosimetric characteristics
Samples of various thicknesses from each bolus were made and the PDD of samples M and N
were measured. The results were compared with the same curve obtained for the solid water
phantom. Figure 2 shows the measurements for a 6 MV clinical photon beam, Figure 3 and 4 for the
6 and 18 MeV clinical electron beams, respectively.

Oliveira et al. ● Braz. J. Rad. Sci. ● 2020 8
Figure 2: Percent depth dose measured for a 6 MV clinical photon beam energy.
Figure 3: Percent depth dose measured for a 6 MeV clinical electron beam energy.

Oliveira et al. ● Braz. J. Rad. Sci. ● 2020 9
Figure 4: Percent depth dose measured for a 18 MeV clinical electron beam energy.
4. DISCUSSION
The advantage of using non-commercial bolus is its low cost, but the challenge is to obtain a
homogeneous, malleable and durable material with comparable density to water. First, different
recipes was investigated, in order to know the effects of the materials that composed the bolus.
After the manufacture of samples A, B, C, D and E it was concluded that glycerin and
formaldehyde are components that influence the bolus hardness, since samples A and E were more
rigid and, when samples B and C were compared, it was noted that after the formaldehyde was
added, sample B hardened rapidly.
The amount of gelatin was not altered, since preliminary tests showed that if the amount of
gelatin increased, the resulting bolus is less flexible and with greater hardness. Thus, with less
gelatin there is a bolus with lower hardness and higher flexibility.
When a bolus without formaldehyde was manufactured, its degradation was observed within 5
days. The bolus with formaldehyde lasted a minimum of four weeks. Some, after two months of

Oliveira et al. ● Braz. J. Rad. Sci. ● 2020 10
manufacture, sealed in PVC film and kept in a controlled environment (e.g. room of a linear
accelerator) showed no signs of degradation, such as the presence of fungal colonies.
The foam formed during bolus manufacture is due to gelatin and is proportional to how much
gelatin and water are mixed during heating and in the liquefaction process. The foam should be
removed as it generates heterogeneity in the final bolus and may result in air bubbles. As the
amount of water increased, foam formation decreased. Therefore, less material is lost as foam.
The malleability analysis was performed qualitatively. It was observed that the increase of water
and bi-distilled glycerin generated more malleable and flexible materials. When comparing the
samples M and N, it was noted that glycerin influences malleability, as sample N was more flexible
and transparent.
Mass density values resulting from direct mass per volume measurements and the averaged of
the mean values of HU were less than 10% apart for all samples, except for sample F, that presented
11%. The difference between these values is due to the heterogeneities present in the bolus that can
be observed in the measurements of HU values. Moreover, the heterogeneities can't be evaluated by
direct mass per volume measurements.
For samples M and N the mass density values resulting from direct mass per volume
measurements were 13% different from water mass density (0.997 g / cm3) and 8% when compared
to solid water PTW RW3. The averaged of the mean values of HU varied 16% and 18% in relation
to the water mass density for samples M and N, respectively. In relation to solid water PTW RW3
the values varied 11% for sample M and 13% for sample N. The following equation was used:
Deviation = |Valuereference – Valueobtained| x 100 (1)
Valuereference
Observing Figure 1, the samples that obtained the smallest variation in HU values were I, J, K,
L, M and N, whereas the sample B was the one that varied the most in HU values. However, its
density directly measured obtained an excellent value. Therefore, it is concluded that only directly
measured density values are not sufficient to analyze the bolus material.

Oliveira et al. ● Braz. J. Rad. Sci. ● 2020 11
After studying the malleability, homogeneity and mass density values for the mentioned
samples, it is concluded that the materials M and N would be dosimetrically evaluated, as they
obtained expected results in all analyzes.
With the manufacture of different thicknesses, it was found that bolus N is not suitable for use
when thicknesses greater than 3 cm are required. Increasing the thickness results in a sample with
high "sagging" so that gravity squashes the sample after its manufacture, changing the initially
fabricated thickness.
Bolus M is less malleable than N, but its properties are preserved after drying of the samples. In
the bolus thickness range used in the radiotherapy service, up to 1.5 cm, both samples showed
reproducibility.
The PDD curves were established for the M and N samples and compared to the PDD obtained
with the PTW RW3 solid water plate, it was observed in Figure 2, that the sample M presented a
maximum difference of 3% up to 1.5 cm depth, while sample N had a maximum difference of 5% at
the same depth, both for a 6 MV photon beam. In Figure 3, the results of the PDDs obtained with a
6 MeV electron beam showed an even greater difference for regions smaller than 1.5 cm, 6% for
sample M and 17% for N.
For an 18 MeV electron beam, as shown in Figure 4, both M and N samples distinguished from
the PTW RW3 solid water plate after depths greater than 5 cm with differences greater than 50%
for bolus N and 20% for bolus M. For depths less than 1.5 cm, good agreement of PDD curves with
differences less than 1.5% was found.
The results show that PDDs from sample M obtained a smaller difference than those from
sample N when compared to PDDs from solid water PTW RW3 in depths below 1.5 cm. We
associate this with the fact that N has a higher amount of glycerin and thus a higher density.
5. CONCLUSIONS
The results of the malleability analysis concomitantly with the mass densities data measured
directly and by the Hounsfield mean values, defined the M and N samples for the dosimetric
characteristics verification. The evaluated PDDs for the M and N samples showed agreement and

Oliveira et al. ● Braz. J. Rad. Sci. ● 2020 12
little difference in the percentage depth dose values at depths less than 1.5 cm, excepted for electron
beam of 6 MeV, which difference was 17 % for the sample N. M sample presented better results for
the 3 energies measured and was defined the best recipe between the samples studied in this work.
The recipe offers a low cost, durability, malleability, homogeneity and good dosimetric results in
most used thicknesses in a radiotherapy department.

Oliveira et al. ● Braz. J. Rad. Sci. ● 2020 13
ACKNOWLEDGMENT
We thank Erasto Gaertner Hospital for providing the locations and equipment for making and
measuring.
REFERENCES
[1] INCA – Instituto Nacional do Câncer. Tratamento do câncer: Radioterapia. Rio de Janeiro,
Rio de Janeiro, Brazil. 2019. Available at: <https://www.inca.gov.br/tratamento/radioterapia>.
Last accessed: 09 Dec. 2019.
[2] KHAN, F.M.; GIBBISON, J.P.; SPERDUTO, P.W. Treatment planning in Radiation
Oncology. 4th ed. Philadelphia: Wolters Kluwer, 2016.
[3] RINGBORG, U; et al. The Swedish Council on Technology Assessment in Health Care (SBU)
Systematic Overview of Radiotherapy for Cancer including a Prospective Survey of
Radiotherapy Practice in Sweden 2001 - Summary and Conclusions The Swedish Council on
Technology Assessment. Acta Oncologica, v. 42, p.357–365, 2003.
[4] DOROTHY, A.; MATTHEW, K. L. The Evolution of Radiation Therapy in Treating Cancer.
Seminars in Oncology Nursing, v. 34(2), p. 151-157, 2018.
[5] Radiation Oncology. Targeting Cancer. Sydney. 2017. Available at:
<https://www.targetingcancer.com.au/about-radiation-oncology/benefits-and-effectiveness/>.
Last accessed: 10 Dec. 2019.
[6] SCRIPES, P. G.; MORAES, S.; ROCHA; J. R. O. Verificação da Densidade Eletrônica e da
Equivalência a Água dos Materiais Utilizados como Bólus (Cera e Gaze Vaselinada) em
Radioterapia. 2006.
[7] SPEZZIA, S. O uso do bolus na radioterapia. Revista da Faculdade de Ciências Médicas de
Sorocaba, v. 18(4). p. 183-186, 2016.
[8] WHITE, D. R. Tissue substitutes in experimental radiation physics. Medical physics, v. 5(6), p.
467-479, 1978.

Oliveira et al. ● Braz. J. Rad. Sci. ● 2020 14
[9] WATSON, P.E.; WATSON, I.D; BATT, R.D. Total body water volumes for adult males and
females estimated from simple anthropometric measurements. Am J Clin Nutr. v. 33(1), p. 27-
39, 1980.
[10] VYAS, V.; PALMER, L.; MUDGE, R.; JIANG, R.; FLECK, A.; SCHALY, B.; OSEI, E;
CHARLAND, P. On bolus for megavoltage photon and electron radiation therapy. Medical
Dosimetry, v. 38(3), p. 268-273, 2013.
[11] ADAMSON, J. D.; COONEY, T.; DEMEHRI, F.; STALNECKER, A.; GEORGAS, D.;
YIN, F. F.; KIRKPATRICK, J. Characterization of water-clear polymeric gels for use as
radiotherapy bolus. Technology in cancer research & treatment. v. 16(6), p. 923-929, 2017.
[12] FEEMAN, T. G. The Mathematics of Medical Imaging: A Beginner’s Guide. Springer
Undergraduate Texts in Mathematics and Technology. 2010.

BJRS
BRAZILIAN JOURNAL
OF
RADIATION SCIENCES 08-03 (2020) 01-13
ISSN: 2319-0612
Accepted: 2020-07-08
Definição de Níveis de Referência em Diagnóstico do
Serviço de Medicina Nuclear do Hospital de Clínicas de
Porto Alegre
Seraphim D. M., Fischer A. C. F. da S.
Serviço de Medicina Nuclear do Hospital de Clínicas de Porto Alegre, 90035-007, Rua Ramiro
Barcelos, 2350 – Bairro Santa Cecília, Porto Alegre - RS
RESUMO
A medicina nuclear (MN) é uma especialidade médica que faz uso de radiação ionizante para fins diagnósticos
e terapêuticos. A segurança dos pacientes submetidos aos procedimentos da MN se dá a partir de dois princípios
básicos de proteção radiológica: o da justificação e o da otimização de dose. Pautada nesses princípios, a ICRP
(International Commission on Radiological Protection) introduziu o conceito de DRLs (Diagnostic Reference
Levels) como uma ferramenta de otimização das exposições médicas. Neste trabalho foram identificados os
exames mais realizados pelo SMN (Serviço de Medicina Nuclear) de um hospital público e universitário, e
calculados para eles os respectivos DRLs, definidos como o terceiro quartil da distribuição de atividade
administrada (Aadm). Para isso foram utilizados dados de procedimentos realizados entre julho de 2017 e junho
de 2019, disponíveis nos bancos de dados do hospital. Os valores de DRL obtidos foram comparados a protocolos
e guias nacionais e internacionais, além de DRLs de outros países incluindo um estudo propondo valores para
o Brasil. Constatou-se que em 8 dos 14 exames analisados, os valores de DRL obtidos estão acima dos valores
máximos de Aadm sugeridos nos guias consultados, sendo recomendada, para estes casos, a reavaliação dos
protocolos adotados. Devido à simplicidade de obtenção e análise dos dados, recomenda-se a revisão periódica
desses valores para que se cumpra seu propósito enquanto ferramenta de otimização das práticas conduzidas.
Palavras-chave: Medicina Nuclear, DRL, Diagnostic Reference Levels, Níveis de Referência em Diagnóstico.

Seraphim et al. ● Braz. J. Rad. Sci. ● 2020 2
ABSTRACT
Nuclear Medicine (NM) is a medical specialty that makes use of ionizing radiation for both diagnostic and
therapeutic purposes. Patient safety undergoing NM procedures is guaranteed by two radiological protection
basic principles: justification and dose optimization. Based on these principles the International Commission on
Radiological Protection – ICRP - introduced the concept of Diagnostic Reference Levels – DRLs - as a tool of
medical exposure optimization for patients undergoing diagnostic procedures. The present work identified the
most common procedures conducted at a Nuclear Medicine Department of a public university hospital and
established their DRL Values, defined as the third quartile of the administered activity distribution. Data from
exams conducted between July 2017 to June 2019, available at the Hospital’s data centers was used. The DRL
Values obtained were compared to national and international guidelines, other countries’ DRLs and with values
suggested for Brazil in a previous publication. It was found that in 8 of the 14 procedures analyzed the DRL
Values were above the maximum activity values suggested by the consulted guidelines. Further analysis is
advised for these procedures. To fulfill its purpose as an optimization tool the DRL Values must be periodically
revisited.
Keywords: Nuclear Medicine, DRL, Diagnostic Reference Levels.
1. INTRODUÇÃO
A medicina nuclear diagnóstica é uma especialidade médica não invasiva que faz uso de fármacos
marcados com material radioativo (radiofármacos) como traçadores para processos metabólicos in
vivo. Nas cintilografias, como são chamados os exames de medicina nuclear, a farmacocinética dos
traçadores e a captação seletiva de órgãos e tecidos são utilizadas para obter informações funcionais
dos organismos [1]. Existem ainda, dentro da medicina nuclear (MN), modalidades híbridas de
diagnóstico, como o PET-CT, que alia a tomografia computadorizada (CT) à tomografia por emissão
de pósitrons (PET), permitindo o corregistro anatômico de imagens metabólicas e funcionais [2].
Nas exposições médicas, diferentemente das exposições ocupacionais à radiação ionizante, onde
existem limites de dose definidos [3], a segurança dos indivíduos se dá pela observância de dois
princípios básicos de proteção radiológica: o da justificação, que estabelece que nenhuma prática
deve ser conduzida sem que produza benefícios, tanto para os indivíduos expostos quanto para a

Seraphim et al. ● Braz. J. Rad. Sci. ● 2020 3
sociedade, suficientes para compensar o detrimento correspondente; e o da otimização, que preconiza
que seja utilizada somente uma quantidade suficiente e necessária de radiação para atingir o objetivo
a que se destina [3]. Visando a segurança dos pacientes e, a partir desses princípios universais, a
Comissão Internacional de Proteção Radiológica - ICRP, do inglês International Commission on
Radiological Protection - introduziu nos anos 1990 o conceito de Níveis de Referência em
Diagnóstico ou DRLs (do inglês Diagnostic Reference Levels) [4]. Atualmente, os DRLs são
definidos como valores de uma quantidade mensurável, ligada à prática ou protocolo da
imagenologia, a partir dos quais uma investigação é necessária, a fim de averiguar se alguma medida
de otimização ou de segurança se faz necessária [5]. Assim, os DRLs são uma ferramenta de
monitoração que visa despertar a atenção de profissionais e autoridades responsáveis sobre a dose
entregue aos pacientes, ajudando a identificar oportunidades de otimização de protocolos e práticas.
Este estudo, produto do Trabalho de Conclusão da Residência (TCR) em Área Profissional da
Saúde (Física Médica, ênfase em Medicina Nuclear), buscou definir os DRLs para os exames
cintilográficos mais realizados pelo Serviço de Medicina Nuclear (SMN) do Hospital de Clínicas de
Porto Alegre (HCPA), um hospital público, universitário e de porte especial (com mais de 800 leitos),
tendo sido aprovado pelo Comitê de Ética e Pesquisa do Hospital pelo parecer de nº 3.203.127.
2. MATERIAIS E MÉTODOS
O SMN do HCPA realizou, em média, nos últimos três anos, cerca de 6.200 exames por ano,
atendendo pacientes provenientes do Sistema Único de Saúde (SUS) (91,86%), convênios (6,02%),
solicitações particulares (0,71%) e procedimentos voltados para pesquisas (1,42%). Para atender a
essa demanda, o SMN conta com três câmaras cintilográficas, um equipamento híbrido de PET-CT,
além de dois medidores de atividade e quadro funcional composto por: 2 farmacêuticos, 4 físicos (2
contratados e 2 residentes), 8 técnicos em radiologia, 2 técnicos em enfermagem, 1 enfermeiro, 5 mé-
dicos nucleares, 3 médicos residentes e 1 médico cardiologista. As principais características dos equi-
pamentos disponíveis no SMN estão listadas na Tabela 1.

Seraphim et al. ● Braz. J. Rad. Sci. ● 2020 4
Tabela 1: Instrumentação do SMN HCPA.
Tipo de Equipamento Marca Modelo
(Ano de instalação) Detalhes
Medidor de Atividade Biodex Atomlab 100 MN convencional
Capintec CRC-25PET PET-CT
Câmara Cintilográfica GE
Millennium MPR (1998) 1 detector de NaI(Tl)
Ventri (2009) 2 detectores NaI(Tl)
Infinia (2011) 2 detectores NaI(Tl)
PET-CT GE Discovery 710 (2014) Detectores LYSO,
ToF e PSF
Cristal cintilador de NaI(Tl): Iodeto de Sódio dopado com Tálio. LYSO: cristal cintilador de Ortosilicato de
Lutécio e Ítrio. ToF (Time of Flight): tecnologia que permite medir a diferença entre o tempo de detecção dos
dois fótons de aniquilação. PSF (Point Spread Function): método de reconstrução que incorpora a função de
resposta a um ponto para melhoria da resolução do equipamento.
Para a definição dos DRLs no SMN foram seguidas as recomendações dadas pela ICRP em seu
documento Publication 135 – Diagnostic Reference Levels in Medical Imaging [5], de 2017. Assim,
ficam definidos: Quantidade de DRL como a atividade administrada aos pacientes; Valor de DRL
como o terceiro quartil (ou percentil de número 75, que separa 75% dos valores mais baixos da
distribuição dos 25% mais altos) da distribuição da Quantidade de DRL; e Processo de DRL como o
processo cíclico de estabelecimento dos Valores de DRL enquanto ferramenta de otimização,
atualizando os Valores de DRL antigos sempre que novos forem obtidos.
O Processo de DRL no SMN foi iniciado através da coleta de dados existentes nos bancos de
dados do hospital, através de um sistema de BI (Business Intelligence) [6] 1 da empresa Agfa (IMPAX
BI). Este sistema busca informações solicitadas pelo usuário no banco de dados do programa QDoc-
RIS (Radiology Information System), software utilizado pelos serviços de diagnóstico por imagem do
HCPA para registro de informações relacionadas à execução de exames. Foram coletados os seguintes
dados do sistema: data do exame, atividade do radiofármaco administrada (aferida pré-injeção e sem
1 Conceito de estruturação e tratamento de dados brutos de modo a extrair deles todo o seu potencial de in-
formação.
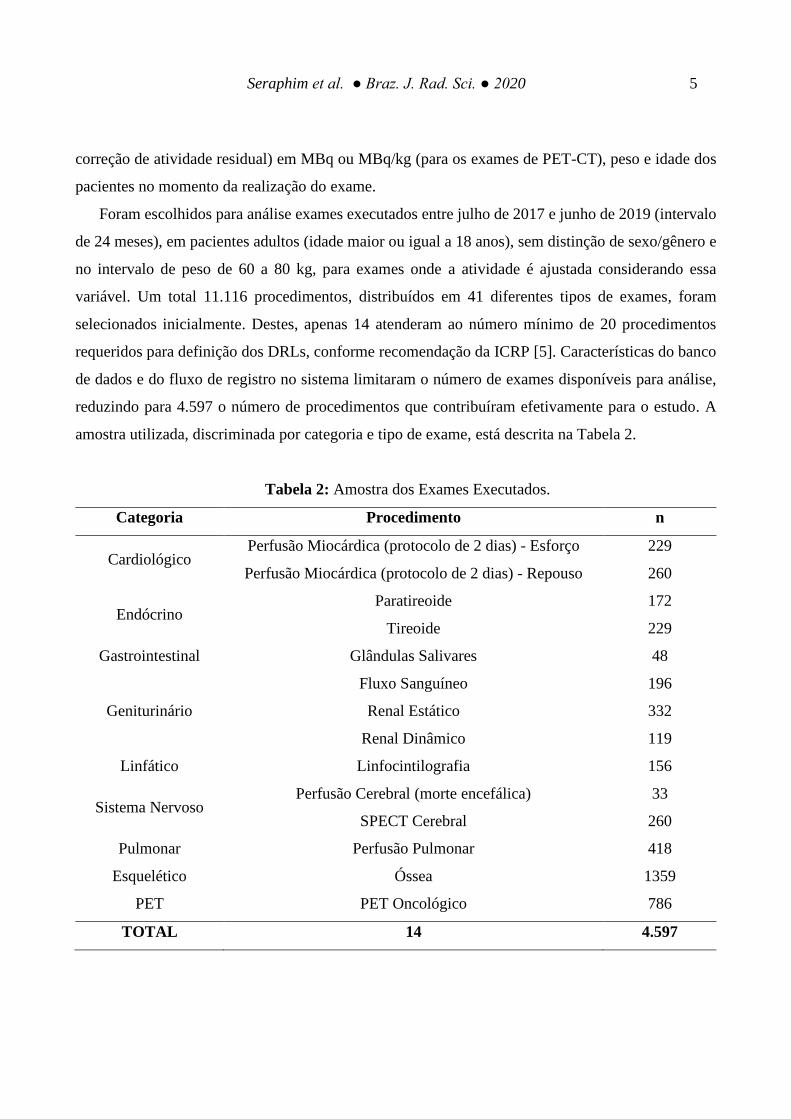
Seraphim et al. ● Braz. J. Rad. Sci. ● 2020 5
correção de atividade residual) em MBq ou MBq/kg (para os exames de PET-CT), peso e idade dos
pacientes no momento da realização do exame.
Foram escolhidos para análise exames executados entre julho de 2017 e junho de 2019 (intervalo
de 24 meses), em pacientes adultos (idade maior ou igual a 18 anos), sem distinção de sexo/gênero e
no intervalo de peso de 60 a 80 kg, para exames onde a atividade é ajustada considerando essa
variável. Um total 11.116 procedimentos, distribuídos em 41 diferentes tipos de exames, foram
selecionados inicialmente. Destes, apenas 14 atenderam ao número mínimo de 20 procedimentos
requeridos para definição dos DRLs, conforme recomendação da ICRP [5]. Características do banco
de dados e do fluxo de registro no sistema limitaram o número de exames disponíveis para análise,
reduzindo para 4.597 o número de procedimentos que contribuíram efetivamente para o estudo. A
amostra utilizada, discriminada por categoria e tipo de exame, está descrita na Tabela 2.
Tabela 2: Amostra dos Exames Executados.
Categoria Procedimento n
Cardiológico Perfusão Miocárdica (protocolo de 2 dias) - Esforço 229
Perfusão Miocárdica (protocolo de 2 dias) - Repouso 260
Endócrino Paratireoide 172
Tireoide 229
Gastrointestinal Glândulas Salivares 48
Geniturinário
Fluxo Sanguíneo 196
Renal Estático 332
Renal Dinâmico 119
Linfático Linfocintilografia 156
Sistema Nervoso Perfusão Cerebral (morte encefálica) 33
SPECT Cerebral 260
Pulmonar Perfusão Pulmonar 418
Esquelético Óssea 1359
PET PET Oncológico 786
TOTAL 14 4.597

Seraphim et al. ● Braz. J. Rad. Sci. ● 2020 6
Um tratamento inicial dos dados foi feito programa Microsoft Excel com o objetivo de organizá-
los em tabelas e identificar erros de digitação ou inserção no sistema QDoc-RIS, posteriormente os
dados foram importados para o programa PASW Statistics 18, onde foram calculados para cada exame
os descritores estatísticos da sua distribuição (valores mínimo, máximo e quartis).
3. RESULTADOS E DISCUSSÃO
Os Valores de DRL obtidos para os exames da medicina nuclear e de PET-CT se encontram na
Tabela 3. Nela é possível constatar grande variação entre as atividades mínimas e máximas
administradas. Pode-se atribuir tais diferenças à falta de padronização ou comunicação entre a equipe
executora. Em um serviço de medicina nuclear, cada etapa da realização de um exame pode ser feita
por diferentes membros do quadro técnico: prescrição da atividade (médico nuclear), fracionamento
e preparo dos radiofármacos (farmacêutico), administração do radiofármaco e aquisição das imagens
(equipe técnica). Assim, é de grande importância garantir que os protocolos clínicos estabelecidos na
instituição sejam claros e conhecidos por todos. Programas de treinamento e reciclagem de
conhecimentos periódicos são a melhor maneira de se manter a uniformidade das práticas conduzidas.
No Brasil, embora haja estudos e levantamentos de dados [7-9] sobre as diferentes práticas
adotadas por SMNs, ainda não há valores oficiais de DRL publicados por órgãos ou agências
reguladoras. Por este motivo e, considerando que os protocolos utilizados no SMN HCPA foram
definidos a partir de referências nacionais e internacionais, os resultados obtidos foram comparados,
na Figura 1, aos valores (ou faixa) de atividade propostos em protocolos e guias de diferentes
instituições. A Figura 1 mostra uma ampla variação entre as atividades apresentadas pela EANM
(European Association of Nuclear Medicine) [10], SBMN (Sociedade Brasileira de Medicina
Nuclear) [11] e SNMMI (Society of Nuclear Medicine and Molecular Imaging) [12]. Para a
cintilografia óssea, por exemplo, os valores diferem em 3,7 vezes, de 300 MBq [10] a 1110 MBq
[11]. Já, para a cintilografia de tireoide, a amplitude é ainda maior, 5 vezes, variando de 74 a 370
MBq em uma mesma recomendação [12]. Além disso, ao comparar os valores propostos com os
DRLs obtidos no SMN, verifica-se que, com exceção dos exames de cintilografia de perfusão
miocárdica de repouso, linfocintilografia, cintilografia óssea e PET oncológico, além da cintilografias

Seraphim et al. ● Braz. J. Rad. Sci. ● 2020 7
de glândulas salivares e fluxo sanguíneo renal (para as quais não há menção nos guias consultados),
todos os outros exames possuem valores de DRL maiores que o valor máximo de atividade sugerida
nos guidelines.
Tabela 3: Valores de Referência em Diagnóstico (DRL) para os exames do HCPA.
Categoria Procedimento Radiofármaco Atividade [MBq]
Mín Mediana Máx DRL
Cardiológico
Miocárdica
(2 dias) Esforço [99mTc]MIBI 580,9 1239,5 1480,0 1313,5
Miocárdica
(2 dias) Repouso [99mTc]MIBI 640,1 962,0 1184,0 1032,3
Endócrino Paratireoide [99mTc]MIBI 370,0 962,0 1184,0 1073,0
Tireoide [99mTc]Pertecnetato 259,0 388,3 518,0 444,0
Gastrointestinal Glândulas
Salivares [99mTc]Pertecnetato 148,0 388,5 518,0 444,0
Geniturinário
Fluxo Sanguíneo [99mTc]DTPA 333,0 999,0 1295,0 1110,0
Renal Estático [99mTc]DMSA 122,8 161,3 296,0 166,5
Renal Dinâmica [99mTc]DTPA 222,0 296,0 629,0 344,1
Linfático Linfocintilografia [99mTc]DEXTRAN 37,0 74,0 148,0 74,0
Sistema
Nervoso
Morte Encefálica [99mTc]ECD 543,9 1080,4 1295,0 1145,2
SPECT Cerebral [99mTc]ECD 854,7 1139,6 1298,7 1224,7
Pulmonar Perfusão
Pulmonar [99mTc]MAA 74,0 148,0 259,0 153,6
Esquelético Óssea [99mTc]MDP 666,0 1110,0 1332,0 1110,0
PET PET Oncológico [18F]FDG 2,7/kg 4,6/kg 6,9/kg 4,8/kg
DMSA = Ácido dimercaptossuccínico; DTPA = Ácido dietilenotriaminopentacético; ECD = Etilcisteinato
dímero; FDG = Flúordeoxiglicose; MAA = Macroagregado de albumina; MDP = Metilenodifosfonato; MIBI
= Sestamibi.

Seraphim et al. ● Braz. J. Rad. Sci. ● 2020 8
Figura 1: Comparação entre Valores de DRL obtidos para o HCPA e atividades sugeridas em
Guias e Protocolos Nacionais e Internacionais.
Na Figura 2 os DRLs obtidos no HCPA são apresentados junto a valores estabelecidos na
Austrália (AU) [13], Coréia do Sul (KR) [14], valores recomendados para o Brasil (BR) em uma
publicação [7], além de um levantamento abrangendo vários países europeus (EU) [15], de modo que,
neste caso, preferiu-se apresentar faixas de valores ao invés de um valor único. Uma característica
fundamental dos valores de DRL é que eles são, por definição, indicadores do cenário de prática de
onde foram definidos (instituições, cidades, estados, países ou regiões) e a sua comparação deve ser
feita com critério. É necessário considerar a realidade técnica e socioeconômica nas quais as
instituições estão inseridas, uma vez que a tecnologia disponível para aquisição dos exames afeta
diretamente a quantidade de atividade necessária para se atingir uma qualidade de imagem adequada
[16]. Assim, a heterogeneidade dos dados mostrados na Figura 2 se torna compreensível quando se
consideram as realidades dos diferentes países envolvidos.
Quando são considerados apenas os valores de DRL propostos para o Brasil, no entanto, há uma
tendência: dos quatorze exames apresentados, sete possuem valores de DRL acima daqueles
sugeridos no levantamento nacional, três apresentam valores abaixo, em dois os valores são iguais e
para outros dois não há valor de DRL proposto naquele estudo [7]. Embora esse resultado também

Seraphim et al. ● Braz. J. Rad. Sci. ● 2020 9
possa ser atribuído à multiplicidade de realidades técnicas e tecnológicas de um país de proporções
continentais, esse fato, associado às observações obtidas da análise da Figura 1, corroboram a
indicação de que uma reavaliação dos valores praticados no SMN do HCPA se faz necessária.
Figura 2: Comparação entre Valores de DRL.
Outro aspecto que pode influenciar na qualidade da imagem e, consequentemente, quantidade de
atividade utilizada é a performance da instrumentação utilizada, que deve ser avaliada através de um
programa de garantia de qualidade (GQ). De acordo com Vassileva e Rehani (2015), o
estabelecimento de um programa de GQ é o primeiro passo para a otimização da exposição de
trabalhadores e pacientes [17], dado que equipamentos bem calibrados e com bom desempenho
entregarão a melhor relação entre a atividade administrada e a qualidade de imagem. Neste estudo,
erros e variações nos resultados provenientes da performance dos equipamentos podem ser

Seraphim et al. ● Braz. J. Rad. Sci. ● 2020 10
desconsiderados, uma vez que o desempenho da instrumentação utilizada estava em conformidade
com um rigoroso programa de GQ, estabelecido conforme a legislação nacional [18,19].
Por fim, deve-se frisar ainda que os Valores de DLR não são e nem devem ser vistos como limites
para procedimentos individuais, já que cada paciente terá suas particularidades e necessidades
próprias. Deve-se evitar, também, considerar os Valores de DRL como um limiar entre boas e más
práticas, uma vez que mesmo protocolos conduzidos abaixo desses parâmetros podem carecer de
melhorias e otimizações.
4. CONCLUSÕES
Este estudo deu início a um importante processo de otimização e, consequentemente, melhoria no
atendimento prestado aos usuários do SMN do HCPA. Foram definidos aqui DRLs para 14 exames
executados no serviço. Destes, oito apresentaram valores mais altos que a atividade máxima sugerida
em guias e protocolos nacionais e internacionais. Este resultado é indicativo de que os protocolos
seguidos no SMN precisam ser reavaliados, buscando neles oportunidades de aprimoramento. O
próximo passo deste tipo de estudo é a avaliação da qualidade diagnóstica das imagens, uma vez que
este parâmetro é o fator limitante para a otimização da atividade utilizada.
Os valores de DRL são indicadores de tendência e servem para avaliações do desenvolvimento
temporal das práticas conduzidas, sendo o Processo de DRL dinâmico, por definição. Assim, dada a
relativa simplicidade de obtenção e cálculo desses valores, fica sugerida a sua reavaliação periódica
e sempre que houver mudanças na rotina ou tecnologia envolvida nos processos. Sugere-se também
a ampliação do estudo para incluir procedimentos conduzidos em outros grupos de pacientes, sejam
estes divididos por faixa etária, peso e sexo.
Este trabalho evidencia, também, a importância de se ter parâmetros locais, regionais e nacionais
de DRL, publicados por instituições ou associações de referência, para que possam ser tomados como
parâmetros mais representativos da realidade que os serviços de medicina nuclear estão inseridos.

Seraphim et al. ● Braz. J. Rad. Sci. ● 2020 11
REFERÊNCIAS
[1] ZIESSMAN, H.; O'MALLEY, J.; THRALL, J. Medicina Nuclear, 2ª. ed. Rio de Janeiro:
Guanabara Koogan S.A., 2003.
[2] BUCHSPIGUEL, C. A. et al. Medicina Nuclear: princípios e aplicações, São Paulo: Editora
Atheneu, 2012.
[3] CNEN - Comissão Nacional de Energia Nuclear. CNEN NN 3.01 - Diretrizes Básicas de
Proteção Radiológica. Rio de Janeiro, 2014. Available at:
<http://appasp.cnen.gov.br/seguranca/normas/pdf/Nrm301.pdf>. Last accessed: 12 Jun. 2020.
[4] ICRP - International Commission on Radiological Protection. Radiological Protection and
Safety in Medicine. ICRP Publication 73, Ann. ICRP 26 (2), 1996.
[5] ICRP - International Commission on Radiological Protection. Diagnostic Reference Levels
in medical imaging. ICRP Publication 135, Ann. ICRP 46(1), 2017.
[6] S. COOK, T.; NAGY, P. Business Intelligence for the Radiologist: Making Your Data Work
for You. Journal of the American College of Radiology, v. 11, n. 12, p. 1238-1240, 2014.
[7] WILLEGAIGNON, J. et al. Atividades de radioisótopos administradas em medicina nuclear e
proposta de nível de referência em diagnóstico (DRL) para pacientes adultos e pediátricos no
Brasil. Alasbimn Journal, 2015. Available at:
<http://www.alasbimnjournal.net/contenidos/atividades-de-radioisotopos-administradas-em-
medicina-nuclear-e-proposta-de-nivel-de-refer-ncia-em-diagnostico-drl-para-pacientes-
adultos-e-pediatricos-no-brasil-156>. Last acessed: 12 Jun. 2020.
[8] OLIVEIRA, C. M. et al. Sugestão de nível de referência em diagnóstico nacional para 18F-
FDG/PET em procedimentos oncológicos adultos no Brasil. Radiol Bras, v. 46, n. 5, p. 284-
289, 2013.
[9] DE SOUZA RIBEIRO, J. C. Avaliação de dose e estabelecimento de níveis de referência
em atividade para a medicina nuclear. Rio de Janeiro: IRD, 2017.
[10] EANM - European Association of Nuclear Medicine. Guidelines. Available at:
<https://www.eanm.org/publications/guidelines/>. Last accessed: 06 Jun. 2020.

Seraphim et al. ● Braz. J. Rad. Sci. ● 2020 12
[11] SBMN - Sociedade Brasileira de Medicina Nuclear. Guidelines e Orientações. Sociedade
Brasileira de Medicina Nuclear, 2019. Availabe at: <https://sbmn.org.br/educacao/guidelines-
e-orientacoes/>. Last accessed: 04 Jun. 2020.
[12] SNMMI - Society of Nuclear Medicine & Molecular Imaging. Procedure Standards.
Available at: <http://www.snmmi.org/ClinicalPractice/content.aspx?ItemNumber=6414>.
Last accessed: 06 Jun. 2020.
[12] ARPANSA - Australian Radiation Protection and Nuclear Safety Agency. Current
Australian diagnostic reference levels for nuclear medicine. Availabe at:
<https://www.arpansa.gov.au/research-and-expertise/surveys/national-diagnostic-reference-
level-service/current-australian-drls-update/nm>. Last accessed: 01 Novembro 2019.
[14] H.C., S.; M., N.; AL., K. J. E. Diagnostic Reference Levels for Adult Nuclear Medicine
Imaging Established from the National Survey in Korea. Nucl Med Mol Imaging, v. 53, n. 1,
p. 64-70, 2019.
[15] EUROPEAN COMISSION. Diagnostic Reference Levels in Thirty-six European
Countries. Luxemburg: Publications Office of the European Union, v. 2, 2014.
[16] LIU, C.-J. et al. A performance comparison of novel cadmium–zinc–telluride camera and
conventional SPECT/CT using anthropomorphic torso phantom and water bags to simulate
soft tissue and breast attenuation. Ann Nucl Med, v. 29, n. 4, p. 342-350, 2015. Available at:
<https://link.springer.com/article/10.1007%2Fs12149-015-0952-z>. Last accessed: 06 Jun.
2020.
[17] VASSILEVA J, R. M. Diagnostic Reference Levels. American Journal of Roentgenology,
v. 204, p. W1-W3, 2015.
[18] ANVISA - Agência Nacional de Vigilância Sanitária. Resolução da diretoria colegiada - RDC
nº38, de 4 de Julho de 2008. Brasília, 2008.
[19] CNEN - Comissão Nacional de Energia Nuclear. CNEN NN 3.05 - Requisitos de Segurança
e Proteção Radiológica para Serviços de Medicina Nuclear. Rio de Janeiro. 2013.
Available at: <http://appasp.cnen.gov.br/seguranca/normas/pdf/Nrm301.pdf>. Last accessed:
12 Jun. 2020.

Seraphim et al. ● Braz. J. Rad. Sci. ● 2020 13

BJRS
BRAZILIAN JOURNAL
OF
RADIATION SCIENCES 08-03 (2020) 01-18
ISSN: 2319-0612 Accepted: 2020-07-20
Estudo da distribuição de dose de feixes clínicos de
elétrons em meios heterogêneos
Aguirrea E., Davida M., Venenciab D., de Almeidaa C.E.
a Laboratório de Ciências Radiolôgicas LCR-UERJ, 20550-900, Rio de Janeiro, Rio de Janeiro, Brasil
b Instituto Zunino, Córdoba, Argentina.
RESUMO
Este trabalho estuda o comportamento da distribuição de dose de feixes de elétrons de uso clínico utilizando o
método Monte Carlo, através do código PENELOPE na presença de heterogeneidades. O método Monte Carlo
é considerado em diferentes áreas das ciências exatas, como um importante método para simulações e cálculos
na área de física médica. O primeiro objetivo do trabalho é de validar as simulações através da comparação
com as distribuições de dose medidas ao longo do eixo central (curvas de PDP) de feixes de elétrons de uso
clínico. Uma primeira aproximação é feita considerando o feixe de elétrons monoenergético para construir os
espectros que melhor reproduzam parâmetros relevantes que caracterizam, por exemplo, as curvas de PDP
(Porcentagem de Dose na Profundidade). Os espectros foram modelados de forma a reproduzir com boa
concordância as curvas de PDP experimentais tendo sido usado como critério que a qualidade do feixe e o
alcance entre os valores medidos e os simulados ficassem com um nível de concordância de 1mm. O segundo
visou simular a inserção de materiais com diferentes densidades, e o efeito nas curvas de PDP e isodose. As
heterogeneidades simuladas apresentaram resultados que variam de superdosagem a subdosagem que tem que
ser levados em consideração ao momento de planejar e administrar a dose ao paciente.
Palavras chave: Radioterapia, Feixe clínico de elétrons, Simulações Monte Carlo.

Aguirre et al. ● Braz. J. Rad. Sci. ● 2020 2
ABSTRACT
This work studies the behavior of electron beam dose distribution for clinical use applying Monte Carlo method,
using the PENELOPE code in heterogeneous medium. This method is considered in different areas of the exact
sciences as an important method for simulation and calculation in the field of medical physics. The first objective
of this work is to validate the simulations by comparing the dose distribution measured along the central axis (PDD
curves) of electron beams for clinical use. A first approximation is made by considering the electron beam as
monoenergetic, and then, building its spectra that best reproduce relevant parameters that characterize, for
example, the PDD (Percentage Depth Dose) curves. The spectra are modeled in order to they reproduce with good
agreement the experimental PDD curves, having been established as criterion that the beam quality and the range
between the measured and the simulated values were with a 1 mm agreement level. The next objective was to
simulate the insertion of materials with different densities and their effect on PDD and isodose curves. The
simulated heterogeneities presented results ranging from overdose and underdose that have to be taken into
account when planning and administering the dose to the patient.
Keywords: Radiotherapy, Clinical electron beam, Monte Carlo simulation.

Aguirre et al. ● Braz. J. Rad. Sci. ● 2020 3
1. INTRODUÇÃO
O feixe de elétrons de alta energia tem sido utilizado desde o início dos anos 1950 na radioterapia
[1], sendo a faixa de energia de uso clínico mais frequente entre 6 MeV e 25 MeV. Os tratamentos
exclusivos com elétrons mais comuns são empregados em casos de tumores superficiais, embora, em
muitos casos, feixes mistos de fótons e elétrons sejam usados em um tratamento de radioterapia. As
aplicações principais são: O tratamento de cânceres de pele e lábios, irradiação da parede torácica
para câncer de mama, administração de dose na forma de boost especialmente em nódulos e
tratamento de câncer de cabeça e pescoço.
Nos aceleradores lineares utilizados na Radioterapia, o feixe de elétrons pode ser considerado
numa primeira aproximação como monoenergético antes de passar pela janela de vácuo. Em seguida,
são usadas folhas espalhadoras, que servem para homogeneizar a fluência produzindo um tamanho
de campo clinicamente homogêneo. Logo depois da saída do feixe de elétrons do cabeçote do
acelerador, é utilizado um colimador de elétrons que tem como finalidade limitar o tamanho de campo
do feixe. Como o feixe de elétrons passa por diferentes materiais (janela, folhas espalhadoras, câmaras
de ionização de transmissão, camada de ar, colimadores de fótons e de elétrons), sua fluência de
energia é modificada, cujo resultado final é um espectro de energia não mais monoenergético na
superfície e tornando-se de espectro ainda mais amplo com a profundidade. Para um feixe de elétrons
específico, pode-se determinar o alcance prático (Rp) a partir da curva de dose medida para o feixe
num dado meio, por exemplo, água.
Desde o ponto de vista físico, a tarefa principal no planejamento dos tratamentos de Radioterapia
é a determinação da distribuição de doses de radiação dentro da anatomia do paciente. Para isso
existem vários métodos analíticos e numéricos. Porém, tem-se demonstrado que o método mais
confiável para determinar essas distribuições em anatomias reais é o Método Monte Carlo [2]. As
simulações Monte Carlo (MC) têm sido amplamente utilizadas na Física Médica durante as últimas
décadas [3].
Especialmente em elétrons, as distribuições de dose em meios não homogêneos são uma realidade
e devem ser avaliadas, quantitativamente, de forma a se obter condições reais de irradiação e entregar
a dose final correta ao paciente [4]. Existem casos onde são utilizados blocos de cerrobend ou
chumbo, para definir campos de tratamento com formas especiais e pacientes portadores de algum

Aguirre et al. ● Braz. J. Rad. Sci. ● 2020 4
tipo de prótese na região de tratamento que modificam também a distribuição de dose. A influência
das heterogeneidades nas distribuições de doses na irradiação do paciente é principalmente causada
pelas variações na densidade eletrônica do meio como pulmão, osso e prótese metálicas, uma vez que
a penetração dos elétrons é uma função da densidade de átomos no material [5]. Documentos
internacionais recomendam uma forma de corrigir as distribuições de dose mediante a utilização do
CET (Coefficient of equivalent thickness), definido, para um feixe paralelo, como a razão entre as
densidades eletrônicas da heterogeneidade e da água [6]. Porém, existem pesquisas que demonstram
o fato desta recomendação não ter uma boa concordância com a realidade e pouco avanço tem sido
feito para a melhoria da sua implementação clínica.
Devido à necessidade em se determinar de forma fisicamente correta essas situações, este trabalho
se propõe ao utilizar o método Monte Carlo no transporte da radiação de feixes clínicos de elétrons
em algumas situações clínicas que envolvam heterogeneidades e estudar o comportamento das
distribuições de dose naqueles meios. Este trabalho é dividido em duas partes: A validação das
aproximações dos espectros usados nas simulações MC através da comparação com resultados
experimentais de PDP (Curvas de Porcentagem de Dose em Profundidade) e o estudo dos efeitos dos
meios heterogêneos na deposição de dose pelo feixe a ser utilizado clinicamente.
2. MATERIAIS E MÉTODOS
Para a primeira parte, foram utilizadas as medições realizadas com diferentes instrumentos de
medida para validar os resultados e definir o grau de confiabilidade dos resultados. Na segunda parte
do trabalho foram simulados arranjos experimentais incluindo diferentes energias, heterogeneidades
e tamanhos de campo.

Aguirre et al. ● Braz. J. Rad. Sci. ● 2020 5
2.1. Aquisição de dados do feixe
Figura 1: Arranjo experimental para as medidas de PDP.
Todas as medidas foram realizadas num acelerador linear NovalisTx (do Instituto Zunino). Na
aquisição das curvas de PDP (Curvas de Porcentagem de Dose em Profundidade) foram utilizados os
seguintes materiais (Figura 1).
(a) Fantoma modelo Blue Phantom da empresa IBA;
(b) Câmara de ionização (CI) CC04 da IBA;
(c) Câmara de ionização modelo semiflex 3D da PTW;
(d) Câmara de ionização modelo de placas paralelas ROOS da PTW;
(e) Barômetro e termômetro;
(f) Software Omnipro
Diferentes câmaras de ionização foram utilizadas para obter a curva de PDP no fantoma de água,
empregando-as de acordo às especificações do fabricante para medidas de dose relativa. O Blue Phantom
usa o software Omnipro para o tratamento e análise dos dados adquiridos, exportando em formato ASCII

Aguirre et al. ● Braz. J. Rad. Sci. ● 2020 6
ao TPS Eclipse [7]. O acelerador Linear NovalisTx tem 5 energias de elétrons disponíveis: 6, 9, 12, 15 e
25 MeV, sendo utilizadas as três energias menores para o presente estudo.
2.2. Simulação
Foi utilizado o código PENELOPE versão 2008 [8] para as simulações de feixes de elétrons
usando o cluster do LCR-UERJ.
Foram implementados diferentes códigos na linguagem de programação Python 2.7 para a
geração das curvas a serem analisadas. Para a compilação dos códigos foi empregado o compilador
Canopy, que é um ambiente de análise Python.
As simulações iniciais foram feitas utilizando feixes monoenergétivos com energia 6, 9 e 12 MeV
e em seguida com diferentes espectros. Os valores dos parâmetros de transporte intrínsecos do código
PENELOPE, como energia limiar de absorção das partículas, energia de corte para colisão inelástica
e de tipo Bremsstrahlung, utilizados em todas as simulações foram: Eabs=10 keV, C1=C2=0.1 w
Wcc=Wcr=100 keV. As simulações foram realizadas através de processos isolados, levando em
média 15 horas para cada simulação. Como o espectro de interesse é na superfície do paciente, foram
utilizadas as seguintes equações para estimar os valores de energia média, εk, e mais provável, εpk,
respectivamente, a partir dos valores de R50 e Rp estimados nas curvas de PDP medidas previamente:
εk(0) = CR50 (1)
εpk(0) = C1 + C2Rp + C3(Rp)
2 (2)
Onde, C=2.33 MeV/cm, C1=0.22 MeV, C2=1.98 MeV/cm, C3=0.0025 MeV/cm2.
Em seguida foi construído um espectro de base onde encontram-se valores discretos de energias,
atribuindo-se a cada um deles diferentes valores de probabilidade de modo que a forma do espectro
seja parecida com a relatada na literatura para o espectro na superfície. Cada um deles foi simulado
de maneira rápida para ir modificando-os e obter uma PDP similar com as experimentais, adicionando
ou diminuindo pesos às energias baixas, para obter boa concordância na região de build-up. A seguir,
usou-se o mesmo critério para a região após o máximo de dose. Dessa maneira, foram modelados os
espectros das energias nominais mais utilizadas na clínica, ou seja: 6, 9 e 12 MeV com 6 simulações
para cada energia.

Aguirre et al. ● Braz. J. Rad. Sci. ● 2020 7
2.3. Meios heterogêneos
Foram simulados três alvos com diferentes heterogeneidades: Água-ar, campo hemi-bloqueado
com chumbo e um caso de mama (Figura 2). Todas as geometrias foram feitas através das superfícies
quadráticas do pacote PENELOPE. Foram empregados todos os feixes validados anteriormente das
energias supracitadas, tanto monoenergético quanto o espectro de cada energia. No segundo caso do
campo hemi-bloqueado, encontra-se relatado na literatura um feixe monoenergético de 25 MeV [9],
sendo, por isso, de interesse simular aquele feixe para a comparação com a respectiva referência.
a) b)
c)
Figura 2: Geometria das Heterogeneidades a) Água-ar; b) Campo hemi-bloqueado; c) Mama.

Aguirre et al. ● Braz. J. Rad. Sci. ● 2020 8
3. RESULTADOS E DISCUSSÃO
3.1 Validação das simulações
Os espectros dos feixes de elétrons foram otimizados da maneira definida anteriormente (Figura
3), resultando nos gráficos cujos espectros finais apresentaram melhor concordância com os PDP
experimentais.
Figura 3: Valores relativo dos espectros em energia de elétrons otimizados.
Considerando que as curvas de PDP do feixe monoenergético apresentaram uma maior diferença
em relação às medidas, sobretudo na região de build-up, não serão apresentadas aquelas curvas, mas
os valores de alcance prático e da qualidade do feixe daquelas simulações são informados nas tabelas
I-VI para fins de comparação. As figuras 4, 5 e 6 são as curvas de PDP obtidas por simulação
empregando o espectro (E) junto com as medidas no fantoma de água (M) para cada tamanho de
campo. As incertezas estatísticas relativas para as grandezas apresentadas nas tabelas I-IV foram
inferiores a 0.2% para um nível de confiança de aproximadamente 95%.
0
20
40
60
80
100
120
0 2 4 6 8 1 0 1 2 1 4
NO
RM
ALI
ZAÇ
ÃO
(%
)
Energia (MeV)
ESPECTROS DE ELÉTRONS
6 MeV
9 MeV
12 MeV

Aguirre et al. ● Braz. J. Rad. Sci. ● 2020 9
Figura 4: Comparação das curvas de PDP calculadas e experimentais para o campo 6x6 cm2.
Figura 5: Comparação das curvas de PDP calculadas e experimentais para o campo 10x10 cm2.
Figura 6: Comparação das curvas de PDP calculadas e experimentais para o campo 15x15 cm2.
0 20 40 60 80
0102030405060708090
100110
Profundidade (mm)
PD
D (
%)
6 MeV (M)
6 MeV (E)
9 MeV (M)
9 MeV (E)
12 MeV (M)
12 MeV (E)
0 20 40 60 80
0102030405060708090
100110
Profundidade (mm)
PD
D (
%)
6 MeV (M)
6 MeV (E)
9 MeV (M)
9 MeV (E)
12 MeV (M)
12 MeV (E)
0 20 40 60 80
0102030405060708090
100110
Profundidade (mm)
PD
P (
%)
6 MeV (M)
6 MeV (E)
9 MeV (M)
9 MeV (E)
12 MeV (M)
12 MeV (E)

Aguirre et al. ● Braz. J. Rad. Sci. ● 2020 10
Tabela I: Valores dos parâmetros relevantes do feixe de energia nominal de 6 MeV
Tamanho de
Campo (cm2)
Medidas
R50 (mm) Rp (mm)
Monoenergético
R50 (mm) Rp (mm)
Espectro
R50 (mm) Rp (mm)
6x6 23,50 29,50 24,18 29,67 23,50 29,50
10x10 23,50 29,40 24,40 29,71 23,50 29,50
15x15 23,50 29,40 24,40 29,71 23,50 29,50
Tabela II: Valores dos parâmetros relevantes do feixe de energia nominal de 9 MeV
Tamanho de
Campo (cm2)
Medidas
R50 (mm) Rp (mm)
Monoenergético
R50 (mm) Rp (mm)
Espectro
R50 (mm) Rp (mm)
6x6 35,6 43,6 37,28 44,87 36,50 44,70
10x10 35,7 43,7 37,25 44,89 36,50 44,70
15x15 35,8 43,7 37,30 44,77 36,50 44,70
Tabela III: Valores dos parâmetros relevantes do feixe de energia nominal de 12 MeV
Tamanho de
Campo (cm2)
Medidas
R50 (mm) Rp (mm)
Monoenergético
R50 (mm) Rp (mm)
Espectro
R50 (mm) Rp (mm)
6x6 49,6 60 50,50 60,43 49,70 60,7
10x10 49,6 59,7 50,30 60,24 49,80 60,2
15x15 49,7 59,9 50,30 60,17 49,80 60,3
Tabela IV: Diferença entre os valores obtidos para os parâmetros usados nas simulações e as
medidas para o feixe de 6 MeV
Tamanho de
Campo (cm2)
Monoenergético
ΔR50 (mm) ΔRp (mm)
Espectro
ΔR50 (mm) ΔRp (mm)
6x6 -0,68 -0,17 0 0
10x10 -0,90 -0,31 0 -0,10
15x15 -0,79 -0,31 0 -0,10

Aguirre et al. ● Braz. J. Rad. Sci. ● 2020 11
Tabela V: Diferença entre os valores obtidos para os parâmetros usados nas simulações e as
medidas para o feixe de 9 MeV
Tamanho de
Campo (cm2)
Monoenergético
ΔR50 (mm) ΔRp (mm)
Espectro
ΔR50 (mm) ΔRp (mm)
6x6 -1,68 -1,27 -0,90 -1,10
10x10 -1,55 -1,19 -0,80 -1,00
15x15 -1,50 -1,07 -0,70 -1,00
Tabela VI: Diferença entre os valores obtidos para os parâmetros usados nas simulações e as
medidas para o feixe de 12 MeV
Tamanho de
Campo (cm2)
Monoenergético
ΔR50 (mm) ΔRp (mm)
Espectro
ΔR50 (mm) ΔRp (mm)
6x6 -0,90 -0,43 -0,10 -0,70
10x10 -0,70 -0,54 -0,20 -0,50
15x15 -0,60 -0,27 -0,10 -0,40
Uma melhoria importante se observa na concordância entre os valores calculados com os
medidos, utilizando os espectros. O resultado era esperado devido ao fato de o espectro na superfície
ser mais próximo à realidade. Como a resolução encontrada das medidas foi de 1 mm, esse valor foi
considerado como tolerância na comparação dos parâmetros relevantes apresentados nas tabelas
anteriores.
3.2 Simulação do feixe de elétrons em meios heterogêneos
Foram definidos três tipos de heterogeneidades: Água-ar, campo hemi-bloqueado com chumbo,
e um caso de mama.
A. Caso 1: Água-ar
Para o caso da cavidade de ar, a profundidade da camada de ar foi escolhida tentando-se aproximar
a profundidade de uma típica laringe, ou seja, a 2 cm de profundidade, sendo que neste caso foi
utilizado apenas o feixe de 6 MeV. O que se destaca nos resultados é o deslocamento quase do mesmo
valor da cavidade de ar (2 cm) nas curvas de isodose e nos PDP (figura 7), isso devido à pouca
interação e correspondente entrega de dose nessa região do ar. Também pode-se apreciar uma

Aguirre et al. ● Braz. J. Rad. Sci. ● 2020 12
diminuição de dose nas laterais da interfase água-ar, levando a uma subdosagem no tratamento nesta
região. A comparação entre os dois tipos de feixes, apresentada na figura 7b, indica que existe um
deslocamento da maior parte do PDP do feixe monoenergético, chegando a ter uma interseção em
aproximadamente 20% da dose após do máximo. Isso ocorre devido à absorção dos componentes de
energias mais baixas do espectro na região mais próxima da superfície do alvo.
a)
b) c)
Figura 7: a) Curvas de isodose do espectro de energia nominal de 6 MeV para um campo
quadrado de 10 cm2; b) Curvas de isodose entre os dois tipos de feixe de 6MeV; c) PDP entre os
dois tipos de feixe de 6 MeV.
B. Caso 2: Campo hemi-bloqueado com chumbo
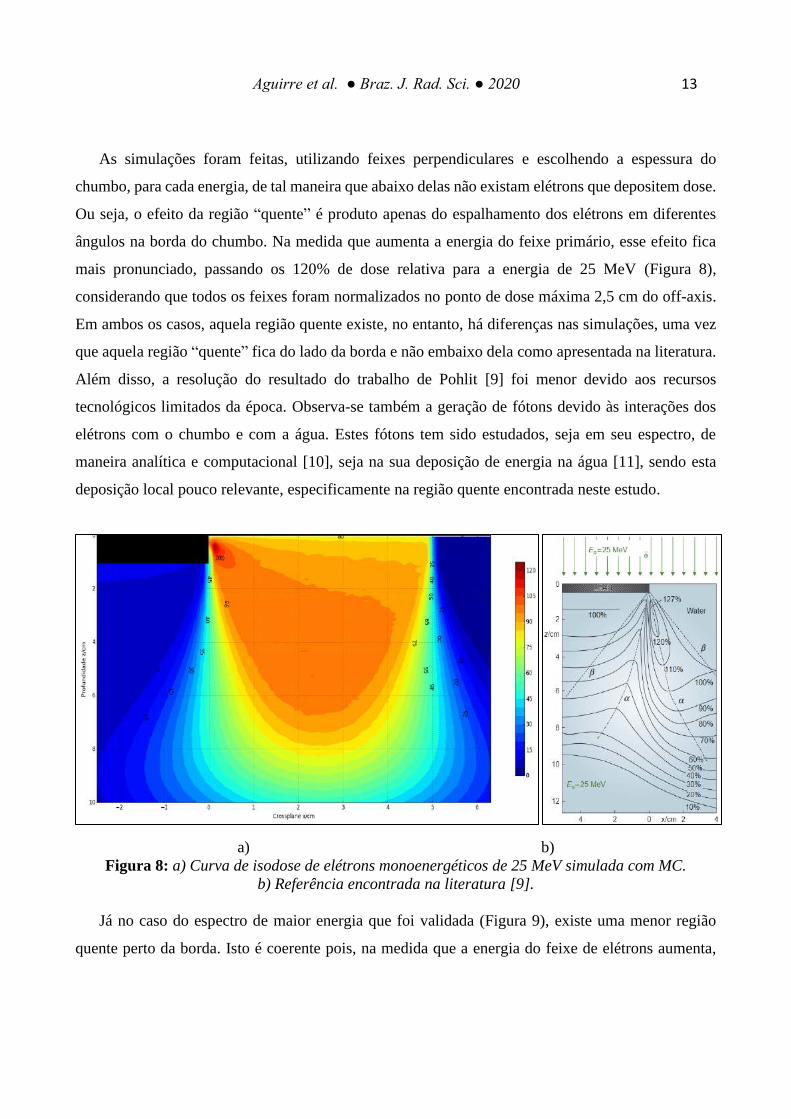
Aguirre et al. ● Braz. J. Rad. Sci. ● 2020 13
As simulações foram feitas, utilizando feixes perpendiculares e escolhendo a espessura do
chumbo, para cada energia, de tal maneira que abaixo delas não existam elétrons que depositem dose.
Ou seja, o efeito da região “quente” é produto apenas do espalhamento dos elétrons em diferentes
ângulos na borda do chumbo. Na medida que aumenta a energia do feixe primário, esse efeito fica
mais pronunciado, passando os 120% de dose relativa para a energia de 25 MeV (Figura 8),
considerando que todos os feixes foram normalizados no ponto de dose máxima 2,5 cm do off-axis.
Em ambos os casos, aquela região quente existe, no entanto, há diferenças nas simulações, uma vez
que aquela região “quente” fica do lado da borda e não embaixo dela como apresentada na literatura.
Além disso, a resolução do resultado do trabalho de Pohlit [9] foi menor devido aos recursos
tecnológicos limitados da época. Observa-se também a geração de fótons devido às interações dos
elétrons com o chumbo e com a água. Estes fótons tem sido estudados, seja em seu espectro, de
maneira analítica e computacional [10], seja na sua deposição de energia na água [11], sendo esta
deposição local pouco relevante, especificamente na região quente encontrada neste estudo.
a) b)
Figura 8: a) Curva de isodose de elétrons monoenergéticos de 25 MeV simulada com MC.
b) Referência encontrada na literatura [9].
Já no caso do espectro de maior energia que foi validada (Figura 9), existe uma menor região
quente perto da borda. Isto é coerente pois, na medida que a energia do feixe de elétrons aumenta,

Aguirre et al. ● Braz. J. Rad. Sci. ● 2020 14
ocorre maior retroespalhamento dos elétrons e, por tanto, maior deposição de energia perto da
superfície, aumentando, dessa maneira, a chance de que uma maior quantidade de elétrons na
superfície seja lateralizada perto da borda.
Figura 9: Curva de isodose de elétrons de energia nominal de 12 MeV simulada com MC.
C. Caso 3: Mama
No caso de mama, em particular, foram simulados os espectros de duas energias nominais: 6 MeV
e 9 MeV. O meio heterogêneo era composto por 4 componentes: água (0.5 cm), tecido adiposo (1.5
cm), osso (0.5 cm), e pulmão. Dessa maneira, foram feitas simulações para cada feixe em um fantoma
homogêneo de água que servirá como padrão para a comparação dos PDP. Nas interfaces entre os
diferentes meios foram observadas mudanças relevantes para as duas energias simuladas, sendo mais
significativa para a energia de 9 MeV. Mostramos nas figuras 10 e 11 os gráficos de isodose e de PDP
apenas para a energia de 9 MeV com tamanho de campo de 6x6 cm2.

Aguirre et al. ● Braz. J. Rad. Sci. ● 2020 15
Figura 10: a) Curva de Isodose do espectro de energia nominal de 9 MeV e campo quadrado de
6 cm2 no meio heterogêneo que simularia um caso de mama.
Figura 11: Curvas de PDP do espectro de energia nominal de 9 MeV e campo quadrado de 6 cm2
no meio heterogêneo e no meio homogêneo (água).
As curvas de isodose para o caso 3 apresentam uma forma pouco comum, pois a partir da interação
dos elétrons com o osso, eles são retroespalhados pela mudança de densidade, gerando um aumento
de dose, que pode ser melhor apreciado nas curvas de PDP. No entanto, ao atravessar a região de

Aguirre et al. ● Braz. J. Rad. Sci. ● 2020 16
pulmão, se observa uma menor interação e, assim, um maior alcance na deposição de dose, gerando
uma “cauda” que fica mais pronunciada para o feixe de energia nominal de 9 MeV. A influência do
tamanho de campo nas curvas de PDP não é muito apreciável, embora implique em deslocamento da
profundidade de dose máxima. Em relação às curvas de isodoses, na medida que aumenta o tamanho
de campo, estas curvas se aproximam das isodoses apresentadas na literatura para o caso de um
fantoma de água homogêneo. Finalmente, os PDPs das duas energias foram comparados na figura
12, destacando um impacto maior na energia do feixe de 9 MeV devido às heterogeneidades.
Figura 12: Curvas de PDP dos espectros de energia nominal de de 6 e 9 MeV e campo quadrado
de 10 cm2 no meio heterogêneo.

Aguirre et al. ● Braz. J. Rad. Sci. ● 2020 17
4. CONCLUSÕES
Este estudo apresenta uma alternativa metodológica importante para reproduzir medidas de PDP,
através da modificação do espectro de elétrons seguindo fórmulas empíricas da literatura e os valores
dos parâmetros de qualidade do feixe e seu alcance. A modificação dos espectros foi realizada por
tentativas, avaliando-se os erros e os acertos nos resultados de forma que permitissem boa
aproximação com os valores de referência. Inclusive a região de build-up que não é caracterizada por
parâmetros relevantes, apresentou boa concordância com os valores medidos, sendo isso produto da
adição das energias baixas no espectro, embora com uma probabilidade pequena associada a elas. É
importante mencionar que tanto os parâmetros R80 ou R90, quanto o R100, ficaram mais próximos das
medidas, em comparação com o feixe monoenergético. Um ajuste fino dos espectros considerando a
contribuição de fótons produzidos por Bremsstrahlung demandaria um nível de modelagem mais
complexo e não teria muita relevância clínica, pois levariam a diferenças de cerca de 2 a 5% da dose
de prescrição, dependendo da energia.
Diferentes meios heterogêneos foram estudados no presente trabalho, encontrando-se
deslocamentos das doses, existência de regiões quentes que poderiam aumentar ou diminuir
dependendo da localização do ponto de normalização e casos mais complexos na medida que são
acrescentados meios de diferentes densidades. Dessa maneira, as heterogeneidades simuladas
apresentaram resultados interessantes e abrem critérios que tem que ser levados em consideração
quando do planejamento do tratamento envolvendo elétrons e heterogeneidades de tecidos.

Aguirre et al. ● Braz. J. Rad. Sci. ● 2020 18
REFERÊNCIAS
[1] KHAN, F. The Physics of radiation therapy. 5. ed. Philadelphia, PA: Lippincott Williams &
Wilkins, 2014.
[2] ANDREO, P. Monte Carlo technique in medical radiation physics. Phys. Med. Biol. 36, 861-
920,1991.
[3] ROGERS, D. Fifty years of Monte Carlo simulations for medical physics. Phys. Med. Biol.
51(13), R287-R301, 2006.
[4] De ALMEIDA, C.E.; ALMOND, P. R. Comparison of Electron Beam Characteristics from
Siemens Betraton (6.0 to 18.0 MeV) and Saggitaire Linear Accelerator (7.0 to 32.0 MeV)
Radiothterapy Machines. RADIOLOGY, v. III, n.2, p. 439-445, 1974.
[5] CARRON, N. J. An introduction to the Passage of Energetic Particles through Matter. 1. ed.
New York, USA: Taylor & Francis Group, 2006.
[6] ICRU (1984). International Comissioning on Radiation Units and Measurements. Radiation
dosimetry: Electrons with Initial Energies between 1 and 50 MeV, ICRU Report 35
(International Comissioning on Radiation Units and Measurement, Bethesda, Maryland).
[7] VARIAN MEDICAL SYSTEM. Eclipse Photon and Electron Reference Guide. v. 15.1. Palo
Alto, CA, 2016.
[8] SALVAT, F.; FERNANDEZ-VAREA, J. M.; SEMPAU, J. PENELOPE: A Code System for
Monte Carlo Simulation of Electron and Photon Transport. Issy-les-Moulineaux, France.,
2008.
[9] De POHLIT, W.; MANEGOLD, K. H. Electron-beam dose distribution in inhomogeneous media.
In: Kramer S, Suntharalingam N, Zinninger GF, eds. High Energy Photons and Electrons. New
York, NY: John Wiley & Sons; 1976:243.
[10] NAKAMURA, T.; HIRAYAMA, H. Spectra of Bremsstrahlung Produced in Very Thick
Lead Targets by 15-, 20-, and 25-MeV Electrons. Nuclear Science and Engineering, 59:3, 237-
245. Taylor & Francis Group, 1976.
[11] SORCINI, B. B.; HYÖDYNMAA, S.; BRAHME, A. Quantification of mean energy and
photon contamination for accurate dosimetry of high-energy electron beams. Phys. Med.
Biol. 42 1849-73, 1997.

BJRS
BRAZILIAN JOURNAL
OF
RADIATION SCIENCES 08-03 (2020) 01-22
ISSN: 2319-0612 Accepted: 2020-07-24
Neutronic evaluation of CANDU-6 core using
reprocessed fuels
Silvaa C. A. M., Velasqueza C. E., Almeidaa M. C. B., Fariaa R. B., Pereiraa C.
aUniversidade Federal de Minas Gerais, Departamento de Engenharia Nuclear, Av. Antônio Carlos, 6627, Campus
UFMG PCA 1 – Anexo Engenharia, Pampulha, 31270-901, Belo Horizonte, MG
ABSTRACT
The spent fuel from a PWR still contains some amount of fissile materials depending on their initial enrichment
and the burnup. Thus, spent fuel from PWRs containing about 1.5% of fissile material could be used as fuel for
CANDU reactors after some fission products are removed from it. Thus, an important proposal is the DUPIC
cycle, where spent fuels from a PWR are packaged into a CANDU fuel bundle using mechanical reprocessing but
without the need of chemical reprocessing. When it is refueled with reprocessed fuel, the reactivity of the system
increases, and this behavior may affect the safety parameters of the reactor. Therefore, this work studies the
neutronic parameters of two reprocessing fuel techniques: AIROX and OREOX, which are evaluated for two
different cores configuration. The first one considers heavy water as a moderator and coolant. The second one
considers heavy water and light water as moderator and coolant, respectively. These studies evaluate the core
behavior based on the different number of reprocessed fuels channels and compare them with the reference core.
To perform the simulation, MCNPX was used to calculate the effective multiplication factor, void reactivity
coefficient, and neutron flux, which were evaluated at steady state condition for the different cases. The results
show that the presence of parasitic absorbers in the reprocessed fuels hardens the neutron spectrum. This
behavior provokes an increase in the core reactivity, and in the void reactivity coefficient. Among these
parameters, the use of light water reduces the core reactivity but does not improve the void reactivity coefficient.
Keywords: CANDU reactor, DUPIC cycle, AIROX, OREOX, MCNPX 2.6.0

Silva et al. ● Braz. J. Rad. Sci. ● 2020 2
1. INTRODUCTION
Nowadays, LWRs (Light Water Reactors) and HWRs (Heavy Water Reactors) represent a great
share of the total nuclear power plants in the world, about 65% and 11%, respectively [1]. The
CANDU (CANada Deuterium Uranium reactor) is an HWR type that uses natural uranium as fuel.
On the other hand, LWRs use enriched uranium as fuel and after burnup have some percentage of
fissile isotope which depends on the initial enrichment and the fuel burnup conditions. The
development of the fuel cycle technology for recycling the SF (Spent Fuel) of nuclear reactors has
particular importance to improve the uranium utilization, to reduce the high-level nuclear waste.
Several studies verify the use of reprocessing LWR fuel into the CANDU fuel cycle [2-13].
Then, SF from LWRs could be used as fuel for CANDU, if some fission products are removed
from it. Nonetheless, the most important process is the DUPIC (Direct Use of spent PWR fuel In
CANDU), which reuses SF from a LWR into an HWR core, using a direct re-fabrication method
without separating fissile materials. Among the reprocessing techniques there are two dry
pyrochemical process proposed: AIROX (Atomics International Reduction Oxidation) and OREOX
(Oxidation and REduction of OXide fuel). The AIROX is a precursor of the DUPIC concept,
developed by Atomic International, by recycling LWR spent fuels retaining most of the fission-
product inventory in reconstituted fuel assemblies. This method avoids the generation of high-level
liquid waste streams, recycling the fertile 238U and unburned fissile transuranics. The OREOX
oxidation is performed at a temperature higher than the AIROX process, resulting in more effective
removal of the volatile fission products. In fact, the OREOX is an improvement of AIROX process
that present maximum flexibility in fuel design and satisfy the requirement of compatibility with
existing CANDU system. Regardless of the two techniques, the DUPIC fuel cycle offers attractive
possibilities for saving natural uranium fuel from CANDU and for a substantial reduction of spent
fuel compared with the once-through cycle. The main purpose of the DUPIC fuel cycle is
improving the utilization of uranium fuels while at the same time reducing the volume of
radioactive waste.
This work evaluates the insertion of two reprocessed fuels, FRA (Fuel Reprocessed by AIROX
technique) and FRO (Fuel Reprocessed by OREOX technique), into the CANDU-6 core. These

Silva et al. ● Braz. J. Rad. Sci. ● 2020 3
fuels have a higher percent of fissile isotopes than natural uranium. Thus, their insertion into the
core will increase the reactor reactivity, which may affect the safety core parameters. The CANDU
uses heavy water as moderation/coolant, which has higher moderation ratio than light water. Thus,
if H2O is used as a coolant, the reactivity drops off to a level that could improve the safety core
parameters using the FRA and FRO fuels.
Thereby, two core configurations were simulated: the first one considers the CANDU using
D2O as coolant and moderator. The second one evaluates the use of D2O and H2O as moderator and
coolant, respectively. The goal is to study the neutronic behavior of core with different number of
RFC (Reprocessed Fuel Channels) in the two configurations and compare them to the reference
core loaded with FNU (Fresh Natural Uranium). This core was based on preceding works [13,14],
which evaluates a hypothetical extreme condition considering all CANDU fuel channels with a
fresh fuel bundle. Therefore, the FNU comprises a fuel bundle at zero burnup. The MCNPX 2.6.0
(Monte Carlo N-Particle eXtended - version 2.6.0) code is used in the simulations where the
effective multiplication factor, void reactivity coefficient, and neutron flux were evaluated at steady
state condition.
Since nuclear power plants can play an important role in future power generation and
considering that spent fuel is a challenge for the nuclear industry, the current paper contributes to
study the use of reprocessed fuels. The DUPIC cycle, considered in the simulations has highlights
among the advanced fuel cycles due to its synergism and non-proliferation characteristics.
Furthermore, the current work links the neutronic analysis of reprocessed fuels and light water as
coolant in the CANDU core. These studies may contribute to future analyzes of advanced CANDU
reactors which aims inherent safety and reduced capital cost construction.
2. METHODOLOGY
2.1. Configuration of CANDU-6 core
This work simulates the full-core reactor and considers the dimensions, geometric
characteristics and composition of main structural components from previous studies [13-16]. Two
models were simulated to evaluate the neutronic behavior due to different coolant types. The first

Silva et al. ● Braz. J. Rad. Sci. ● 2020 4
one uses heavy water (D2O) as a moderator and coolant. The second one uses heavy water as a
moderator and light water (H2O) as coolant. Table 1 shows the main features of the simulated cores
and Table 2 presents the temperature of the principal components from the evaluated system.
Table 1: Main dimensions of simulated CANDU-6 core [14-17].
Reactor Zone Description Value (cm)
Core
Sub-calandria inner radius 3.378 × 10²
Main calandria inner radius 3.797 × 10²
Fuel channel length 5.944 × 10²
Lattice pitch 2.857 × 10²
Calandria tube inner radius 6.448
Calandria tube outer radius 6.587
Pressure tube inner radius 5.169
Pressure tube outer radius 5.603
Fuel Bundle
End plate radius 5.100
Fuel pin radius 6.103 × 10⁻¹
Fuel pin height 4.820 × 10²
Clad radius 6.522 × 10⁻¹
Clad height 4.953 × 101
Fuel pins rings
Inner radius 1.448
Middle radius 2.875
Outer radius 4.330
Table 2: HFP temperature of the principal components.
Description Temperature (K)
Uranium Dioxide Pellets 1.000 × 10³
Zircaloy Fuel Sheath 1.000 × 10³
Coolant 5.630 × 10²
Moderator 3.430 × 10²

Silva et al. ● Braz. J. Rad. Sci. ● 2020 5
The present work simulates the full-core reactor, which consists of 380 horizontal fuel channels,
each one comprises of 12 bundles arranged in a square lattice. Figure 1 illustrates the radial and
axial view of the reactor core, which is simulated at HFP (Hot Full Power).
Figure 1: Full-core CANDU-6 configuration.
The fuel cell corresponds to a bundle column surrounded by a moderator (D2O). Each fuel
bundle has 37 fuel pins with zircaloy cladding, the bundle has a central pin surrounded by three
rings of fuel pins and the coolant (D2O or H2O) flows between these fuel pins. Figure 2 illustrates
the CANDU fuel bundle, which has several components. Due to the complexity of this bundle
geometry, the simulations take into considerations the zircaloy fuel sheath, uranium dioxide pellets
and the end plates. The end plate is represented by a homogenized disk consisting of 29% zircaloy
and 71% heavy water by volume.

Silva et al. ● Braz. J. Rad. Sci. ● 2020 6
Figure 2: Standard fuel bundle of CANDU-6.
Source: Garland, W.J., 2014. The Essential CANDU.
The reactivity devices in CANDU reactors are the Reactor Regulating System (RRS) and two
independent Shutdown Systems (SDS1 and SDS2). These devices comprise:
• RRS: 14 liquid zone controller compartments (ZCU) which can be filled with H2O;
• RRS: 04 mechanical control absorber (MCA) rods;
• RRS: 21 adjuster (ADJ) rods;
• SDS1: 28 shutoff rods (SOR) which fall into the core from above; and
• SDS2: 06 poison-injection nozzles, horizontally oriented, that inject gadolinium nitrate
(Gd(NO3)3) into the moderator in the event of SDS1 failure.
The simulated core comprises three types of reactivity control: SOR, ADJ and MCA rods,
which are placed symmetrically on the axial and radial planes, as shown in Figure 1. The SORs and
MCAs are tubes of cadmium enclosed by two concentric steel cylinders and inserted into guide
tubes. The ADJs rods consist of a solid stainless-steel cylinder that is centered in a stainless-steel
tube. All reactivity control rods are introduced into zirconium guide tubes, which are permanently

Silva et al. ● Braz. J. Rad. Sci. ● 2020 7
located in the low-pressure moderator region. These guide tubes are situated interstitially between
the calandria tubes where heavy water fills the gaps between the absorber material and the inner
steel tube and between the inner steel tube and outer guide tube. Table 3 present the material of the
control rods used in the simulations. The safety analysis of this work was focus on evaluating the
behavior of the CANDU core under the insertions of different control rods without using the H2O in
the zone controller compartment or Gd(NO3)3 addition into moderator.
Table 3: Material of the reactivity control.
Component SOR ADJ MCA
Absorber Natural Cadmium Stainless Steel 316 Natural Cadmium
Cladding Stainless Steel 316 Stainless Steel 316 Stainless Steel 316
Guide tube Natural Zirconium Natural Zirconium Natural Zirconium
2.2. Evaluated Fuels
As mentioned before, this works comprises three fuel types, FNU, FRA and FRO. The FNU
comprises only fresh fuel bundles (zero burnup) while FRA and FRO contain reprocessed fuels
which take into consideration the DUPIC cycle concept. In this cycle, after five cooling years of the
Spent Fuel (SF) into the pool, it is shipped to a special plant for fuel bundles fabrication using dry
processing, such as, AIROX or OREOX [12,18,19]. In this work, the composition of the spent fuel
was obtained by previous studies [20], considering a typical PWR fuel with initial enrichment of
4.5% and a 50 GWd/MTU of burnup. A calculation was made to obtain the recovering fuel
composition taking into consideration the percentage of fission product removal by AIROX [21]
and OREOX [22]. The results comprise two reprocessed fuel that was used in the simulations
namely: FRA (Fuel Reprocessed by AIROX technique) and FRO (Fuel Reprocessed by OREOX
technique). Table 4, presents the isotopic composition of the simulated fuels, FRA, FRO and FNU
(Fresh Natural Uranium).

Silva et al. ● Braz. J. Rad. Sci. ● 2020 8
Table 4: Weight fraction of simulated fuel types.
Isotope FRA FRO Isotope FRA FRO FNU
He4 1.1995E-06 1.2007E-06 Sm150 4.4670E-04 4.4718E-04 —
C14 0.0000E+00 4.7355E-09 Sm151 2.3929E-05 2.3954E-05 —
Cl36 6.5925E-06 6.5995E-06 Eu151 2.9740E-06 2.9772E-06 —
Ca41 7.5074E-06 7.5154E-06 Sm152 1.7605E-04 1.7624E-04 —
Ni59 1.0798E-05 1.0810E-05 Eu153 1.8570E-04 1.8590E-04 —
Y90 1.4377E-07 1.4393E-07 Gd155 1.5513E-07 1.5530E-07 —
Zr90 2.4713E-04 2.4739E-04 Th230 1.1431E-08 1.1444E-08 —
Zr93 1.0838E-03 1.0850E-03 U233 8.0252E-09 8.0338E-09 —
Nb93m 6.0214E-09 6.0279E-09 U234 2.4100E-04 2.4126E-04 5.4082E-05
Mo95 1.0577E-03 2.1177E-04 U235 1.0758E-02 1.0769E-02 7.1079E-03
Tc99 1.2095E-03 1.2108E-03 U236 6.5140E-03 6.5210E-03 —
Ru101 1.2135E-04 2.4297E-04 U238 9.5765E-01 9.5868E-01 9.9284E-01
Rh103 6.5462E-04 6.5532E-04 Np237 8.8084E-04 8.8178E-04 —
Pd107 3.6255E-04 3.6294E-04 Pu238 3.6255E-04 3.6294E-04 —
Ag109 1.2125E-04 1.2138E-04 Pu239 8.0352E-03 8.0439E-03 —
Sn126 2.9660E-05 2.9691E-05 Pu240 3.2012E-03 3.2047E-03 —
I129 0.0000E+00 2.4246E-06 Pu241 1.0275E-03 1.0286E-03 —
Cs133 1.7022E-04 1.7040E-05 Pu242 8.4324E-04 8.4414E-04 —
Cs135 8.5621E-05 8.5713E-06 Am241 1.1753E-03 1.1766E-03 —
Cs137 1.3332E-04 1.3346E-05 Am242m 2.1687E-06 2.1710E-06 —
Ba137 5.5217E-04 5.5276E-04 Am243 2.4954E-04 2.4981E-04 —
Nd143 1.2196E-03 1.2209E-03 Cm242 5.6625E-09 5.6685E-09 —
Nd145 1.0104E-03 1.0115E-03 Cm245 6.2597E-06 6.2664E-06 —
Sm147 1.2678E-04 1.2692E-04 Cm246 6.2536E-07 6.2604E-07 —
Sm149 3.7683E-06 3.7723E-06 FM (%) 2.1877 2.1900 0.7108
In the present study, the reference CANDU core considers all channels loaded with fresh FNU
bundle [13,14]. This methodology aims calculate the maximum criticality configuration using the
traditional uranium fuel and to compare it with the insertion of reprocessed fuels. Therefore, the

Silva et al. ● Braz. J. Rad. Sci. ● 2020 9
number of Reprocessed Fuel Channels (RFC) was increased gradually in the core, where the 12 fuel
bundles into these channels have the same isotopic composition present in Table 4. Ten cases were
simulated to each reprocessed fuel type, FRA and FRO. Table 5 presents the evaluated cases with
the respective RFC number. Five of them use D2O as the coolant and the others use H2O.
Table 5: Number of RFC in the simulated cases.
Moderator D2O
Coolant D2O H2O
RFC Number 00 04 08 12 16 20 20 80 84 88 96
Fuel Type FNU FRA
FRO
FRA
FRO
FRA
FRO
FRA
FRO
FRA
FRO
FRA
FRO
FRA
FRO
FRA
FRO
FRA
FRO
FRA
FRO
Due to the reference CANDU model has all fuel channels with FNU, the neutron flux tends to
be maximum in the central core region and decreases toward the boundaries. Radial flux (and
power) flattening can be achieved by differential fueling, i.e. taking the fuel with a higher content of
fissile nuclides in outer core regions than in inner core regions. Considering that reprocessed fuels
has higher percentage of fissile isotopes than fresh FNU (see Table 4), the FRA and FRO were
placed in the outer region of the core. This methodology aims to increase the fission number in this
region to flat the core neutron flux. Figure 3 illustrates a radial view of the simulated cores where
the white and the black cells represent the channels with FNU and reprocessed fuel respectively.
2.3. Evaluated Parameters
The MCNPX estimates the effective multiplication factor (keff) with the respective standard
deviation (σST) of the simulated model. This work evaluates the criticality and the neutron flux of
the simulated system at steady state condition to FRA, FRO and FNU fuel types.

Silva et al. ● Braz. J. Rad. Sci. ● 2020 10
Figure 3: Radial position of RFC (black cell) in simulated CANDU-6 core.

Silva et al. ● Braz. J. Rad. Sci. ● 2020 11
The use of reprocessed fuel increases the percentage of fissile isotopes increasing the keff of the
reactor. The device of reactivity control must assure a critical system. Thus, the effectiveness of the
main regulating and shutdown system was evaluated. Although, the ADJs rods are fully inserted
into the core, during normal operations [17], the simulations comprise the insertion and withdrawn
of all rods aiming evaluates severe core conditions. First, the SORs, ADJs and MCAs were
individually inserted in the core. After, all rods were inserted to evaluate the total negative
reactivity contribution. In these studies, the keff variation ( k ) was calculated considering the rods
withdraw and the rods fully-inserted into CANDU-6 core, through the equation:
310)()( −= FW kkmkk (1)
The Wk and Fk are the respective keff when the control rods are withdrawn (W) and fully-inserted (F)
in the reactor core.
The criticality analysis was considered at work temperatures, as shown in Table 2. However, the
pre-defined library set of MCNPX 2.6.0 does not have the nuclear cross section for all the nuclides
at different temperatures desired for representing the reprocessed fuels. Thus, nuclear data was
downloaded from ENDF/BVII-1 (Evaluated Nuclear Data File) website [23], then processed with
NJOY99 (Nuclear Data Processing System) [24] at the desired temperatures. After that, the data
was added to the MCNPX 2.6.0 library.
In addition, in the criticality analysis, to study the influence of coolant density variation in the
reactivity, the CVR (Coolant Void Reactivity) was calculated at the operating temperature condition
(Table 2). It is important to know this effect in the reactor safety analysis that was calculated by:
31011
)(
−=
PS kkmkCVR (2)
where Sk and Pk is the keff calculated at standard (S) and perturbed (P) coolant condition
respectively. For simulate an extreme core condition, the CVR was calculated with all control rods
withdrawn of the core. In the simulations, the Pk was calculated by changing the coolant
composition and density from the nominal value to the perturbed condition. Therefore, different
values of VF (Void Fraction) were considered. The density variation was calculated as:
)1( VFdd SP −= (3)

Silva et al. ● Braz. J. Rad. Sci. ● 2020 12
where Sd and Pd are the standard and perturbed coolant densities; VF is the void fraction.
In order to estimate the neutron flux inside the fuel cells that provides the neutron flux profile, a
squared mesh was configured into MCNPX model of CANDU core. This mesh tally particles on
each squared cell independent on the geometry problem [25]. In the model, there are 12 axial planes
with 22 x 22 squared cells which have the same dimensions of the fuel cells. The absolute value of
flux does not match the actual neutron source of the reactor. Thus, it is necessary to normalize the
flux values initially calculated by MCNPX. In the simulations, this normalization was performed
using the following equation [25]:
=
eff
MCNPXNkQ
P (4)
where N is the normalized flux; MCNPX is the flux estimated by MCNPX; P is the reactor power
level; is the average number of fission neutrons and Q is the recoverable energy per fission event.
The values of , Q and keff are calculated by the MCNPX. The power level is defined at P = 2158.5
MW which is the fission power of the CANDU-6 [16,17].
3. RESULTS AND DISCUSSION
The simulations were performed in MCNPX code using 50,000 particles with 200 active cycles
which results in low standard deviation of the keff around 210–4. For the neutron flux calculations,
the maximum relative error estimated by the code is around 4% and according to the MCNPX
manual, results with errors less than 10% are reliable [25].
Both reprocessed fuel types (FRA and FRO) with the same RFC number, present similar keff
values because these fuels present similar isotopic composition. Table 6 shows their keff values for
the evaluated cases. The keff increase as the augment of RFC owing to reprocessed fuels have a
higher percentage of fissile material than the natural uranium (Table 4).
Similarly, considering the same RFC number (i.e. 20) for two different coolant types (D2O and
H2O), the D2O presents higher keff than H2O, because the heavy water has greater moderation ratio
than light water. Under steady state conditions, the use of H2O provides a negative reactivity in the

Silva et al. ● Braz. J. Rad. Sci. ● 2020 13
core enabling the increase on the number of RFC to reach the same reactivity than D2O. If
compared with the reference core (FNU), the increase of keff due to the insertion of reprocessed
fuels, leads to increase in the number of control devices on the core.
Table 6: keff to reprocessed fuel channels.
Moderator Coolant RFC
Number
Fuel
Type
Rods
Withdraw
Type of inserted rod
MCA ADJ SOR ALL
D2O D2O
00 FNU 1.01139 1.00263 0.99624 0.93721 0.91760
04 FRA 1.01421 1.00555 0.99926 0.94118 0.92095
FRO 1.01452 1.00571 0.99865 0.94170 0.92069
08 FRA 1.01682 1.00747 1.00166 0.94438 0.92369
FRO 1.01679 1.00754 1.00160 0.94409 0.92340
12 FRA 1.01968 1.01025 1.00469 0.94808 0.92674
FRO 1.01977 1.01030 1.00456 0.94799 0.92713
16 FRA 1.02094 1.01085 1.00572 0.94965 0.92820
FRO 1.02079 1.01124 1.00611 0.94981 0.92864
20 FRA 1.02564 1.01644 1.01022 0.95333 0.93245
FRO 1.02530 1.01654 1.01015 0.95380 0.93315
D2O H2O
20 FRA 0.94453 0.93719 0.93141 0.88625 0.86869
FRO 0.94499 0.93733 0.93169 0.88618 0.86904
80 FRA 1.00775 0.99898 0.99550 0.95379 0.93535
FRO 1.00860 1.00000 0.99608 0.95480 0.93648
84 FRA 1.01168 1.00404 0.99918 0.95667 0.93959
FRO 1.01270 1.00518 0.99988 0.95723 0.93979
88 FRA 1.01285 1.00470 1.00041 0.95825 0.94036
FRO 1.01377 1.00569 1.00131 0.95915 0.94113
96 FRA 1.01510 1.00647 1.00301 0.96121 0.94297
FRO 1.01598 1.00765 1.00426 0.96207 0.94391

Silva et al. ● Braz. J. Rad. Sci. ● 2020 14
Table 7 presents the variation of keff ( k ) for each type of device control inserted in the core:
shutoff (SOR), adjuster (ADJ), mechanical (MCA) and all rods (ALL).
Table 7: Variation of the effective multiplication factor ( k ).
Moderator Coolant Number
RFC Fuel Type
Type of inserted rod
MCA ADJ SOR ALL
D2O D2O
00 FNU 8.76 15.15 74.18 93.79
04 FRA 8.66 14.95 73.03 93.26
FRO 8.81 15.87 72.82 93.83
08 FRA 9.35 15.16 72.44 93.13
FRO 9.25 15.19 72.70 93.39
12 FRA 9.43 14.99 71.60 92.94
FRO 9.47 15.21 71.78 92.64
16 FRA 10.09 15.22 71.29 92.74
FRO 9.55 14.68 70.98 92.15
20 FRA 9.20 15.42 72.31 93.19
FRO 8.76 15.15 71.50 92.15
D2O H2O
20 FRA 7.34 13.12 58.28 75.84
FRO 7.66 13.30 58.81 75.95
80 FRA 8.77 12.25 53.96 72.40
FRO 8.60 12.52 53.80 72.12
84 FRA 7.64 12.50 55.01 72.09
FRO 7.52 12.82 55.47 72.91
88 FRA 8.15 12.44 54.60 72.49
FRO 8.08 12.46 54.62 72.64
96 FRA 8.63 12.09 53.89 72.13
FRO 8.33 11.72 53.91 72.07

Silva et al. ● Braz. J. Rad. Sci. ● 2020 15
In Table 7, the k was calculated by Equation (1) and using Table 6 values, where the largest
k represents the high effectiveness of the control rods. The function of SOR rods in the reactor
core is to provide a large amount of negative reactivity for reactor shutdown. Then, among the
cases, the insertion of SOR generates more negative reactivity than MCA and ADJ because the
different isotopic composition of the control rods (Table 3) and owing to the different number of
these rods. The absorber material of SOR and MCA is cadmium, while for the ADJ is stainless-
steel. As the neutron absorption cross section from cadmium is higher than the one for stainless-
steel, the insertion of SORs causes a greater reduction of keff than MACs rods. Moreover, in the
CANDU core, the number of SOR is higher than the number of MCA and ADJ (Figure 1).
In the simulations, the cases with 04, 08, 80 and 84 RFC number, present similar keff to case
FNU (Table 6). In fact, the insertion of reprocessed fuels increases the quantity of transuranic
elements in the core hardening the neutron spectrum due to the presence of absorbers and Pu on the
reprocessed fuels [26, 27]. Therefore, as the RFC increases, the concentration of parasitic absorbers
and Pu augment inducing an increase of the αTF.
Figures 4 and 5 present the flux profiles for thermal neutrons on the reactor core for the
different cases. As expected, these flux profiles are similar between the FRA and FRO owing to the
isotopic composition comes from the same reprocessed fuels. Considering the same RFC number,
the largest difference in the thermal neutron flux between FRA and FRO is about 6.6 %.
Since the neutron flux is not homogeneous in the reactor core, its distribution or shape is very
important because it will determine the distribution of power generated in the core. When the FNU
is used the flux has a maximum at the centre of the core and reduces toward the boundaries. The
plant’s operating license typically puts limits not only on the total reactor power, but also on the
maximum channel and bundle powers. The restrictions may not be possible with a peaked flux
shape to generate the reactor power desired without exceeding the licensed maximum channel and
bundle powers. However, the thermal neutron flux reduces when reprocessed fuels are inserted into
the core tending to flatten it as the RFC number increase (Figure 4 and 5). This flattening provides
better power distribution through the core, because the peak flux in the central region is reduced and
more channels can generate more power. For maximum power output from a given reactor, it is
desirable that each fuel bundle contribute equally to the total power output. This behaviour may

Silva et al. ● Braz. J. Rad. Sci. ● 2020 16
reduce the reactor capital cost, by reducing the number of channels required to produce the same
power with safe operation.
Figure 4: Thermal neutron flux in central plane of reactor to FRA cases.
Figure 5: Thermal neutron flux in central plane of reactor to FRO cases.
To evaluate the CVR parameter, the reactor core was simulated with different coolant densities
to calculate the keff due to this perturbed physical condition. Thus, MCNPX calculated the keff and

Silva et al. ● Braz. J. Rad. Sci. ● 2020 17
the CVR values were determined by Equation (2). Table 8, presents the keff for different coolant VF
and Figure 6 shows the behaviour of CVR as a function of VF. All cases present positive CVR that
increase as VF augment, this is a typical behaviour of CANDU core. As known, the coolant is
inside the pressure tubes while the moderator surrounds these tubes inside the calandria. The
coolant and the moderator are placed in different regions in the core and a reduction in the coolant
density does not affect the moderator density. Then, as the coolant density decrease, the neutron
flux inside the pressure tube tends to harden and the fast fission probability increases generating a
positive CVR.
Table 8: keff as a function of void fraction (VF) values.
Moderator D2O D2O
Coolant D2O H2O
RFC 0 4 8 80 84
Fuel Type FNU FRA FRO FRA FRO FRA FRO FRA FRO
VF
0.0 1.01139 1.01421 1.01452 1.01682 1.01679 1.00775 1.00860 1.01168 1.01270
0.1 1.01317 1.01648 1.01638 1.02529 1.02551 1.01265 1.01335 1.01689 1.01774
0.2 1.01517 1.01804 1.01816 1.02771 1.02729 1.01786 1.01861 1.02179 1.02273
0.3 1.01642 1.02037 1.01951 1.02953 1.02979 1.02372 1.02463 1.02718 1.02861
0.4 1.01875 1.02162 1.02163 1.03188 1.03154 1.02938 1.03030 1.03329 1.03387
0.5 1.02049 1.02384 1.02346 1.03390 1.03385 1.03590 1.03700 1.04024 1.04089
0.6 1.02252 1.02517 1.02554 1.03594 1.03611 1.04342 1.04456 1.04691 1.04792
0.7 1.02435 1.02715 1.02741 1.03809 1.03872 1.05136 1.05237 1.05504 1.05575
0.8 1.02666 1.02959 1.02991 1.04095 1.04076 1.06052 1.06150 1.06442 1.06541
0.9 1.02879 1.02899 1.02912 1.04354 1.04338 1.07143 1.07271 1.07524 1.07641
1.0 1.03100 1.03382 1.03409 1.04558 1.04550 1.08505 1.08555 1.08842 1.08923
The FNU case present higher CVR than values cited in some references (e.g. [17, 27-31]),
because the FNU case considers all fuel channels loaded with fresh natural uranium. These core
conditions contribute to CVR increases. Moreover, this parameter was evaluated with all control

Silva et al. ● Braz. J. Rad. Sci. ● 2020 18
rods withdrawn from the core, as explained in methodology. In normal CANDU operation the
Adjuster Rods (ADJ) are fully inserted in the core [17], which contributes to CVR reduction.
In the simulations, the insertion of the reprocessed fuels increases the CVR, i.e., as the RFC
number increase, the CVR augment (Figure 6). The reprocessed fuel has several fissionable isotopes
that are not present in the uranium fuel (Table 4). The hardening neutron spectrum due to the
coolant density reduction may produce more fast fission reaction in reprocessed fuel than uranium
fuel. Then, in void fraction conditions, the reprocessed fuels present higher core reactivity than
traditional fuel (Table 8).
Figure 6: Coolant Void Reactivity to void fraction values.
In the simulations, the insertion of the reprocessed fuels increases the CVR values, i.e., as the
RFC number increase, the CVR augment (Figure 6). The reprocessed fuel has several fissionable
isotopes that are not present in the uranium fuel (Table 4). The hardening neutron spectrum due to
the coolant density reduction may produce more fast fission reaction in reprocessed fuel than
uranium fuel. Then, in void fraction condition, the reprocessed fuels present higher core reactivity
than traditional fuel (Table 9).

Silva et al. ● Braz. J. Rad. Sci. ● 2020 19
It is important to note that the use of reprocessed fuels linked with light water reduces the initial
core reactivity when VF=0 (Table 9). However, it does not reduce the CVR (Figure 6), because as
VF augment, the coolant density decreases and the absorption effectiveness of H2O also decreases.
4. CONCLUSIONS
The simulations show that FRA and FRO present similar behavior due to the small difference
between their isotopic compositions. Comparing with natural uranium, these fuels have a higher
percentage of fissile isotopes and absorber isotopes. The insertion of these reprocessed fuels in
CANDU-6 core increases the keff of CANDU-6 and reduce the thermal neutron flux in the reactor
core. The use of H2O allows increasing in the number of RFC than the ones used with D2O, because
light water has lower moderation ratio than heavy water. When is used H2O as a coolant on the
CANDU, about 1/4 of core (80 or 84 RFC) should be loaded with FRA and FRO, this produces
similar criticality results than standard fuel core. However, the insertion of the control devices
provides a negative core reactivity. Nevertheless, as the RFC increase, the effectiveness of control
rods decreases because the reprocessed fuels increase the core reactivity. The use of reprocessed
fuel associated/coupled with the coolant H2O could present the advantage in the fuel cycle of
CANDU and the economic advantage of the light water. However, the increase of RFC provokes
augment in the Coolant Void Reactivity which tends to be positive. Then, although the FRA and
FRO have absorptive isotopes, the use of these reprocessed fuels requires the insertion of burnable
poison in the fuel bundle. Dysprosium, Erbium and Boron present as promising burnable poison to
be used in FRA and FRO fuel bundles. The present work evaluates the CANDU-6 at steady-state
condition but future studies will analyses the influence of burnable poisons in the core parameter at
steady-state and during the burnup. Furthermore, the simulations were based on a reference core in
which all fuel channels are loaded with fresh natural uranium. Considering that each fuel channel of
CANDU is refueled online, there is always a burnup distribution across the core. Thus, subsequent
works will be developed to simulate the insertion of FRA and FRO in an equilibrium core.

Silva et al. ● Braz. J. Rad. Sci. ● 2020 20
ACKNOWLEDGMENTS
The authors are grateful to the following Brazilian research funding agencies: Fundação de
Amparo à Pesquisa do Estado de Minas Gerais (FAPEMIG), Coordenação de Aperfeiçoamento de
Pessoal de Nível Superior (CAPES), Conselho Nacional de Desenvolvimento Científico e
Tecnológico (CNPq) and Comissão Nacional de Energia Nuclear (CNEN).
REFERENCES
[1] IAEA – International Atomic Energy Angency. Nuclear power reactor in the world.
Reference Data Series No. 2, IAEA, Vienna, 2018.
[2] KO, W.I., GAO, F., 2012. Economic analysis of different nuclear fuel cycle options. Science
and Technology of Nuclear Installations, v. 2012, p. 1-10, 2012.
[3] PARK, B. H.; GAO, F.; KWON, E.; KO, W. I. Comparative study of different nuclear fuel
cycle options: quantitative analysis on material flow. Energy Policy, v. 39, p. 6916-6924, 2011.
[4] LEE J.; RYU H.; PARK G.; SONG K. Recent progress on the DUPIC fuel fabrication
technology at KAERI, In: ATALANTE 2008 – NUCLEAR FUEL CYCLES FOR A
SUSTAINABLE, 2008, Montpellier. Proceedings of Atalante 2008, 2008, p. 1-4.
[5] YANG, M. S.; CHOI, H.; JEONG, C. J.; SONG, K. C.; LEE, J. W.; PARK, G. I.; KIM, H. D.;
KO, W. I.; PARK, J. J.; KIM, K. H.; LEE, H. H.; JOO HWAN PARK, J. H. The status and
prospect of DUPIC fuel technology. Nuclear Engineering and Technology, v. 38, p. 359-374,
2006.
[6] KO, W. I., KIM, H. D. Analysis of nuclear proliferation resistance of DUPIC fuel cycle.
Journal of Nuclear Science and Technology, v. 38, p. 757-765, 2001.
[7] HONG, J.S.; KIM, H. D.; YANG, M. S.; PARK, H. S.; MENLOVE, H.; ABOU-SAHARA, A.;
ALSTON, W. Safeguards experience on the DUPIC fuel cycle process. LANL Report LA-
UR-01-0936. New Mexico: LANL, 2001. 9p.
[8] KANG, K. H.; SONG, K. C.; PARK, H. S.; MOON, J. S.; YANG, M. S. 2000. Fabrication of
simulated DUPIC fuel. Metals and Materials, v. 6, p. 583-588, 2012.

Silva et al. ● Braz. J. Rad. Sci. ● 2020 21
[9] SULLIVAN, J.D.; RYZ, M.A.; LEE, J.W. Aecl's Progress in DUPIC Fuel Development.
Atomic Energy of Canada Limited (AECL), v. 31, p. 300-306, 1997.
[10] KANG, J.; SUZUKI, A. Analysis on DUPIC Fuel Cycle in Aspect of Overall Radioative
Waste Management. Nuclear Fuel Cycle and Materials, v. 4, p. 19-27, 1997.
[11] TUMINI, L. L. P.; FLORIDO, P.C.; SBAFFONI, M. M.; ABBATE, M. J.; MAI, L. A.;
MAIORINO, J. R. Study of a TANDEM fuel cycle between a Brazilian PWR (Angra-I) and
Argentinean CANDU (Embalse). Annals of Nuclear Energy, v. 22, p. 1-10, 1995.
[12] SULLIVAN J.D.; COX D.S. Aecl’s progress in developing the DUPIC fuel fabrication
process, In: 4TH INTERNATIONAL CONFERENCE ON CANDU FUEL, 1995, Pembroke.
Proceedings of 4th International Conference on CANDU Fuel, Canadian Nuclear Society, 1995,
p. 300-310.
[13] SILVA, C. A. M.; PEREIRA, C.; VELOSO, M. A. F.; GALLARDO, S.; VERDÚ, G.
Analysis of DUPIC fuel cycle using the MCNPX code, In: TOP FUEL 2015 - REACTOR
FUEL PERFORMANCE, 2015, Zurich. Proceedings of Top Fuel 2015, European Nuclear
Society, 2015. p. 85-94.
[14] POUNDERS, J. M.; RAHNEMA, F.; SERGHIUTA, D.; THOLAMMAKKIL, J. 2011. A 3d
stylized half-core CANDU benchmark problem. Annals of Nuclear Energy, v. 38, p. 876-896,
2011.
[15] PARK C.J., CHOI H. Benchmarking WIMS/RFSP against Measurement Data of Wolsong
Nuclear Power Plants. In: JOINT INTERNATIONAL TOPICAL MEETING ON
MATHEMATICAL AND SUPERCOMPUTING IN NUCLEAR APPLICATIONS, 2007,
Monterey. Proceedings of a Meeting Held. American Nuclear Society, 2007. p. 2-11.
[16] CHOI, H.; ROH, G.; PARK, D. Benchmarking WIMS/RFSP against measurement data II:
Wolsong Nuclear Power Plants 2, Nuclear Science and Engineering, v. 150, p. 37-55, 2005.
[17] GARLAND, W. J. The Essential CANDU, 1st ed. Canada: UNENE. Hamilton, 2014.
[18] LEE, J. W.; KIM, W. K.; LEE, J. W.; PARK, G. I.; YANG, M. S.; SONG, K. C. Remote
fabrication of DUPIC fuel pellets in a hot cell under quality assurance program. Journal of
Nuclear Science and Technology, v. 44, p. 597-606, 2007.
[19] SULLIVAN, J. D.; COX, D.S., 1997. Aecl’s progress in developing the DUPIC fuel
fabrication process. AECL Report CA9800574. Toronto: AECL, 1997. 10p.

Silva et al. ● Braz. J. Rad. Sci. ● 2020 22
[20] RADULESCU, G.; WAGNER, J. C. Burn-up Credit Criticality Benchmark. Phase VII -
UO2 Fuel: Study of Spent Fuel Compositions for Long-Term Disposal. NEA Report 6998,
Issy-les-Moulineaux: NEA, 2012. 182p.
[21] MAJUMDAR, D.; JAHSHAN, S. N.; ALLISON, C. M.; KUAN, P.; THOMAS, T. R. Re-
cycling of nuclear spent fuel with AIROX processing. DOE Report 10423, Idaho: DOE,
1992. 68p.
[22] PARENT, E. Nuclear Fuel Cycles for Mid-Century Deployment - Master Thesis,
Massachusetts: Institute of Technology, Department of Nuclear Engineering, 2003.
[23] ENDF Data - LANL. ENDF/B-VII.1 Incident-Neutron Data. Los Alamos, New Mexico,
USA. Available at: <https://t2.lanl.gov/nis/data/endf/endfvii.1-n.html>. Last accessed: 15
November 2019.
[24] MACFARLANE, R. E.; MUIR, D. W.; BOICOURT, R. M.; KAHLER, A. C. NJOY - The
NJOY nuclear data processing system, version 2012. Los Alamos National Laboratory: Los
Alamos, 2012. 810p.
[25] HENDRICKS, J. S.; MCKINNEY, G. W.; FENSIN, M. L.; JAMES, M. R.; JOHNS, R. C.;
DURKEE, J. W.; FINCH, J. P.; PELOWITZ, D. B.; WATERS, L. S.; JOHNSON, M. W.
MCNPX user’s manual, version 2.6.0. Los Alamos National Laboratory: Los Alamos, 2008.
636p.
[26] DUDERSTADT, J. J.; HAMILTON, L. J. Nuclear Reactor Analysis, 1st ed. New York:
John Wiley & Sons, 1976.
[27] ROUBEN, B. Reactivity Coefficients - Nuclear Reactor Analysis. Hamilton: McMaster
University, 2015
[28] TALEBI, F.; MARLEAU, G.; KOCLAS, J. A model for coolant void reactivity evaluation
in assemblies of CANDU cells. Annals of Nuclear Energy, v. 33, p. 975–983, 2006.
[29] CANDU Owners Group Inc. Reactor Physics - Science and Reactor Fundamentals.
CNSC training course, Toronto: CANTEACH Project, 2003.
[30] GROH, J. L. Nuclear Theory II (Kinetics). Toronto: CANTEACH Document,
Chulalongkorn University, 1996.
[31] MOHAMED, N. M. A. Direct reuse of spent nuclear fuel. Nuclear Engineering and
Design, v. 278, p. 182–189, 2017.

BJRS
BRAZILIAN JOURNAL
OF
RADIATION SCIENCES 08-03 (2020) 01-11
ISSN: 2319-0612 Accepted: 2020-07-27
Dose profile evaluation of a 137Cs source using a solid
water phantom
Portelaa C. F. T., Alonsob T. C., Mourãoa A. P.
aDepartment Nuclear Engineering, Federal University of Minas Gerais (UFMG), Belo Horizonte, MG, Brazil.
bNuclear Technology Development Center (CDTN), National Commission of Nuclear Energy (CNEN), Belo Horizonte,
MG, Brazil.
ABSTRACT The precision in the dose values delivered in irradiation processes is essential for the efficiency and quality con-
trol of these processes. The planning and control of the radiation released in a process allows to adjust the de-
sired dose in the irradiated object. The photons in the primary beam interact with the matter of the object and
the beam energy is attenuated due to these interactions. The attenuation depends on the characteristics of the
beam and the com-position of the irradiated matter. When a beam of photons propagates on an object, it tends
to deposit more energy close to the surface and after reaching the maximum dose value, it decreases with depth.
Radiochromic films can be used to record doses and the calibration of these films must be performed so that they
can be used as dosimeters. These films used in this work are of the Gafchromic External Beam Therapy (EBT)
type, insensitive to visible light and can be prepared in places where sunlight and artificial light exists. Like
many other dosimeters, which follow certain protocols, radiochromic films can provide an absolute dose meas-
urement. In this work, irradiations of a solid water phantom were performed using a source of cesium-137 with
the deposition of a maximum absorbed dose value of 2.0 ± 0.04 Gy. The phantom was placed 1.0 m far from the
source collimator. The objective of this work is to evaluate the percentage dose depth (PDD) of the beam in small
fields and the measurement of the field, using radiochromic films and a solid water phantom for the characteri-
zation of the cesium-137 source in high doses in the OB85/1 irradiator. The dose variation profile in depth al-
lowed to verify that the maximum dose value happened at a depth between 10 and 13 mm, very close to the sur-
face due to the beam energy range (keV). The axial profiles presented a flatness of about 9.4 cm with a total field
of 12 cm in diameter.
Keywords: depth dose profile, cesium-137, solid water phantom.

Portela et al. ● Braz. J. Rad. Sci. ● 2020 2
1. INTRODUCTION
It is rarely possible to measure dose distribution directly in patients treated with radiation. Dose
distribution data is almost entirely derived from measurements made in solid water phantoms,
through measurements similar soft tissues or in phantoms that has equivalence to human tissues.
These are materials, usually large enough in volume to provide full scattering conditions for the
specified beam [1-3].
Whenever the irradiation beam focuses on water phantom or anthropomorphic phantom, the ab-
sorbed dose varies according to depth. This variation depends on many conditions, such as: radia-
tion quality, beam energy, depth, size of the irradiated field, distance from the source and the colli-
mation system of the beam. Thus, dose calculation involves considerations in relation to these pa-
rameters and others, as they affect the dose distribution in depth [1-3].
The depth dose curve determines the attenuation that occurs when the beam passes through the
material. This attenuation and the dose deposition depend mainly on the characteristics of the beam,
the energy of the photons or particles and the composition of the attenuating matter. The values of
the depth dose curves are normalized at the maximum dose reference value on the central axis or at
a fixed distance along the central axis of the irradiated medium. The region where the highest dose
deposition occurs receives the indication of 100% and, depending on this value, values with lower
dose deposition are defined [1-3].
The percentage depth dose profile (PDD) is the quotient of the dose at a specific depth and the
maximum dose measured in the direction of the central axis of the beam [1-4].
The percentage depth dose decreases with the depth from the maximum value. However, there
is increase in the initial dose between the surface of the irradiated object and the maximum dose
value. Beams with lower energy photons have the maximum dose value very close to the entrance
surface. The maximum dose value of photon beams with higher energy occurs more deeply. The
region between the surface and the maximum dose value is called Buildup region [1-4].
In this work, a source of cesium-137 was used to evaluate a maximum dose of 2.0 ± 0.04 Gy in
a solid water phantom. A collimator was used as accessories responsible for limiting the incidence

Portela et al. ● Braz. J. Rad. Sci. ● 2020 3
area of the beam, being composed of movable blocks that are made of materials that have high radi-
ation absorption [4-6].
Radiochromic film sheets were placed inside the phantom to obtain dose profile curves.
Radiochromic films can be used to make dose measurements for different photon beams. They can
be handled in ambient light and are used with solid water phantoms. EBT dosimetric film is made
by laminating a sensitive layer between two layers of polyester. In particular, radiochromic films
are characterized by their linearity, reproducibility, uniformity, sensitivity, and stability after
irradiation [7-9].
2. MATERIALS AND METHODS
In this work, it was used a cesium-137 irradiator, a solid water phantom, radiochromic film
sheets for the recording profile doses, a scanner for the generation of digital images of the irradiated
film sheets and a software for manipulating scanned images and obtaining dose variation curves.
2.1. 137Cs Irradiator
The OB85/1 irradiator (cesium-137 source) is located in the Calibration and Dosimetry
Laboratory (LCD) at the Nuclear Technology Development Center (CDTN). The irradiator is 1.1 m
high, 0.815 m in diameter, weighing 100 kg. A pneumatic control circuit allows expose the source
and release the beam through a conical collimator with output diameter of 2.6 cm. The cesium-137
source is encapsulated in a spherical shape, has an activity of 740 Bq, and 200 mm in diameter [10].
Cesium-137 is a radioisotope originated from nuclear fissions, has a beta decay (β-) and gamma
photons associated. It is used as a gamma source with a half-life of 30.07 years and emits gamma
photons of 661.7 keV and 283.5 keV, with the occurrence of 85.1% and 5.8x10⁻⁴% of decays,
respectively. Figure 1 presents two images of the irradiator containing the source of cesium-137
[11].

Portela et al. ● Braz. J. Rad. Sci. ● 2020 4
Figure 1: Irradiator OB85/1.
2.2. Solid Water Phantom
The solid water phantom used in the tests was built with two solid water plates with
dimensions of 30x30x1 and 30x30x2.5 cm³. This phantom has to response similar irradiation
beams corresponding to water, with a 1% error. This feature allows working with solid material
for tests with water phantoms using radioactive sources and linear particle accelerators [12].
Figure 2 presents a frontal image of the solid water phantom with the light marking of the
central point of beam incidence.
Figure 2: Solid water phantom. Frontal (a) and Longitudinal (b).

Portela et al. ● Braz. J. Rad. Sci. ● 2020 5
2.3. Radiochromic Films
Radiochromic films when exposed to radiation show a darkening proportional to the dose
received. As higher is the absorbed dose, as darker they become. The calibration curves of the
films are produced to allow the conversion of the darkening values into absorbed dose values.
The film used for dose recordings was GAFCHROMIC EBT QD+ which is composed of an
active layer with 25 μm thickness.
These films work in a recorded range of 1 mGy just 10 Gy and have a low dependence on
beam energy. The film, after being irradiated, were stored in a place without humidity and away
from sunlight, so that there was no interference in the chemical reactions of diacetylene
compounds [5-7].
2.4. Radiation Tests
The experiments consisted of two process of the solid water phantom irradiation with
radiochromic films placed inside. In both processes were realized with a maximum dose value
of 2.0 Gy and using a collimator with 2.6 cm keeping the loaded phantom at 1.0 m from the
source.
The first test was a frontal irradiation of the phantom with the radiochromic film placed
at a depth of 1.0 cm. In the second test, the phantom was irradiated laterally with the film sheet
placed in the middle of the plates, to record PDD profile. The central ray of the beam is directed
with the help of a laser light.
After the tests, the irradiated films record the dose variation in the center of the field,
representing the axial profile of the beam and the size of the field, in order to describe the dose
variation. In particular, the variation in beam intensity can occur from the central axis to the
edges of the field, according to the beam quality and the collimator opening size and shape.
The calculations about dose were performed based on the half-life of the cesium-137
source in the Calibration and Dosimetry Laboratory (LCD/CDTN), credited by the regulatory
agency.

Portela et al. ● Braz. J. Rad. Sci. ● 2020 6
3. RESULTS AND DISCUSSION
3.1. Dose Profile Graphs
After recording the films in the experiments with the cesium-137 source, the images
were properly treated and from them the axial dose profiles were obtained on the x and y axes for
the frontal irradiation of the phantom.
The Figure 3a indicates the position of the axes in relation to the axial image of the field.
The Figure 3b shows the longitudinal recording film with the positioning of the y-axis at a depth of
1.0 cm. This is the depth at which the film was placed in the frontal irradiation.
The frontal irradiation allows the measurement of the irradiation field size when the gamma
beam crosses the collimator hole, and longitudinal irradiation allows to find the dose curve in depth
(z-axis).
Figure 3: Scanned films. Frontal (a) and longitudinal (b).
3.2. Percentual Depth Dose (PDD)
Longitudinal irradiation showed that the dose delivered by the cesium-137 source reached its
maximum dose between 1.0 and 1.3 mm, from the target (radiochromic film) and at this point a
dose peak was performed as shown in Figure 4. Th reference [13] mentioned a maximum dose in
1.5 mm. The decay of the absorbed dose values occurs with the increase of the distance reached by
the gamma beam. The maximum absorbed dose occurred a few millimeters from the surface due to
the average photon beam energy being in the keV range. The absorbed dose at a depth of 5.0 cm
was 31.7% and at a depth of 10 cm 25.0% of the maximum dose value. The depth dose value

Portela et al. ● Braz. J. Rad. Sci. ● 2020 7
represents the attenuation of photon beam and the dose delivered to the surface, so that there is a
sharp drop in the dose with depth. The Figure 4a shows a PDD of cesium-137 source and Figure 4b
show a Buildup region.
Figure 4: Relative dose profile in water depth for the source of cesium-137 (a), detail next to the
surface (b).

Portela et al. ● Braz. J. Rad. Sci. ● 2020 8
3.3. Axial Irradiation
Axial irradiation showed, according to the curves in the Figure 5, a dose variation occurred on
the plateaus of axial graphs for x and y axes. These values indicate that the average dose value in
the plateau region is 94.58% for the x-axis and 95.81% for the y-axis. The average dose on the
plateau, at 1.0 cm depth, is 95.20% of the maximum dose value.
Figure 5: Axial relative dose profiles to 1.0 cm depth in water for the cesium-137 source.
The axial graphs are 12 cm wide and, due to the initial variation in the rise of the curves and
the final variation in the descent of the curves, they present a plateau of 9.4 cm. Considering the
diver-gent propagation of the beam and the distance from the collimator opening to the
phantom, the image generated in the film results in 12 cm in diameter.
Comparing the x and y curves, it is possible to observe the differences in the slope of the
curve on the ascent and descent, which is greater on the y-axis. The plateau is slightly concave
on the x-axis and convex in the y-axis. These variations could occur due to the source shape, a
wire of 1 cm inside a spherical encapsulation, and the distribution of the radionuclide on the
wire support, or due to inhomogeneities in the phantom material.
The differences results in relation to the axial graphs of the cesium-137 source field, present
an encapsulated source with a possible displacement. The wire is in vertical positions inside the

Portela et al. ● Braz. J. Rad. Sci. ● 2020 9
sphere, which was registered in the output beam. The source is less punctual in the vertical
direction, so the climb on the Y axis is steeper.
4. CONCLUSIONS
The photon beam of the cesium-137 irradiator was tested for a collimator with circular
opening of 2.6 cm in diameter. The depth variation chart shows that the maximum absorbed
dose value occurs very close to the surface of the solid water phantom. This penetration
characteristic showed a decrease in dose deposition in the solid water.
These results are a complement to the calibration work of the cesium source previously
performed, according to the reference [13], for presentation of the cesium source of the
Calibration and Dosimetry Laboratory (LCD) of the Center for the Development of Nuclear
Technology (CDTN).
With the irradiations, it was possible to verify the size of the field generated by the cesium-
137 source and the depth dose curve and the decay of the gamma beam. It was noticed that, for
longitudinal irradiation, the maximum of the dose (2.0 Gy) occurred at a depth between 1.0 and
1.3 mm, being considered as very close to the phantom surface. The axial curves, generated at
1.0 cm depth, demonstrated that the average dose value in the plateau was 95.20% (1.90 Gy).
ACKNOWLEDGMENT
Thanks to the team of Calibration and Dosimetry Laboratory (LCD) of the Nuclear Technology
Development Center (CDTN), where the tests were carried out. Thanks to the Radiology
Laboratory of the Federal Center for Technological Education of Minas Gerais (CEFET-MG) for
the scanner and radiochromic films available. Thanks to CNPq, FAPEMIG, CAPES and CNEN for
funding the research.

Portela et al. ● Braz. J. Rad. Sci. ● 2020 10
REFERENCES
[1] KHAN, FAIZ M., GIBBONS, JOHN P. The Physics of Radiation Therapy. Fifth Edition.
Wolters Kluwer Health. Philadelphia, EUA. 2014.
[2] BALAGAMWALA, Ehsan H., STOCKHAM, Abigail, MACKLIS, Roger, SINGH, Arun D.
Introduction to Radiotherapy and Standard Teletherapy Techniques. Ophthalmic
Radiation Therapy. Techniques and Applications. Dev Ophthalmol. Basel, Karger, 2013, vol 52,
pp 1-14. 2013.
[3] SCAFF, LUIZ A. M. Física da Radioterapia. 1 ed. Sarvier Editora de Livros Médicos Ltda.
São Paulo. 1997. 84-86 p.
[4] MOURÃO, A. P.; OLIVEIRA, F. A. Fundamentos de radiologia e imagem. 1 ed. São
Caetano do Sul, SP: Difusão, 2009. 343-365 p.
[5] THOMADSEN, Bruce R., KARELLAS, Andrew. Clinical 3D Dosimetry in Modern
Radiation Therapy - Imaging in Medical Diagnosis and Therapy. Edited by Ben Midjeen.
CRC PRESS. 2018.
[6] IAEA - International Atomic Energy Agency. Dosimetry of Small Static Fields Used in
External Beam Radiotherapy - An International Code of Practice for Reference and
Relative Dose Determination. Vienna: IAEA, 2017. Technical Reports Series 483. 228 p.
[7] DEVIC, Slobodan. Radiochromic film dosimetry: Past, present, and future. Department of
Radiation Oncology, Jewish General Hospital, McGill University. Physica Medica. 122-134.
2011.
[8] DEVIC, Slobodan.; ALDELAIJAN, Saad.; ALZORKANY, Faisal.; MOFTAH, Belal.;
BUZUROVIC, SEUNTJENS, Jan.; TOMIC, Nada. Use of a control film piece in
radiochromic film dosimetry. Associazione Italiana di Fisica Medica. Elsevier. 2016.
[9] DEVIC, Slobodan, TOMIC, Nada, LEWIS, David. Reference radiochromic film dosimetry:
Review of technical aspects. Department of Radiation Oncology, Jewish General Hospital,
McGill University. Physica Medica. 541-556. 2016.
Portela et al. ● Braz. J. Rad. Sci. ● 2020 11
[10] STS Steuerungstechnik & Strahlenschutz GmbH. Irradiators - OB85, OB85/1, 85/3.
Harxburtteler StraBe 2. 1993.49 p.
[11] CHUL, S. Y. F.; Ekström, L. P.; Firestone, R. B. LBNL nuclear data search. Available at:
<http://nucleardata.nuclear.lu.se/toi>. Last accessed: 30.10.2019.
[12] SUN NUCLEAR. Available at: <https://www.sunnuclear.com>. Last accessed: 30.10.2019.
[13] THORAEUS, R. Cesium 137 and its Gamma Radiation in Teleradiotherapy. Acta
Radiologica. p 385-395. 1961.
[14] PORTELA C. F. T.; SANTOS F. S.; ALONSO T. C.; MOURÃO A. P. Caracterização e
Calibração de Filme Radiocrômicos para Dosimetria de Feixe Gama. In: Quarta Semana de
Engenharia Nuclear e Ciências das Radiações – IV SENCIR, 2018, Belo Horizonte, MG.
Escola de Engenharia – Universidade Federal de Minas Gerais, 2018. p. 45-50.

BJRS
BRAZILIAN JOURNAL
OF
RADIATION SCIENCES 08-03 (2020) 01-16
ISSN: 2319-0612 Accepted: 2020-08-19
Evaluation of PETG as a material for immobilization
device used in radiation therapy for head and neck
Birnfelda H., Touguinhab G.C., Santosc R.R., Alva-Sánchezd M.S., Millãoe L.
aMaster Programme in Health Education, Federal University of Health Sciences of Porto Alegre, CEP 90050-170,
Porto Alegre, Rio Grande do Sul, Brazil
bBachelor’s degree programme in Medical Physics, Federal University of Health Sciences of Porto Alegre, CEP 90050-
170, Porto Alegre, Rio Grande do Sul, Brazil
cRadiotherapy Department, Irmandade da Santa Casa da Misericórdia of Porto Alegre, CEP 90035-072, Porto Alegre,
Rio Grande do Sul, Brazil
dExact and SocialApplied Sciences Department, Federal University of Health Sciences of Porto Alegre, CEP 90050-
170, Porto Alegre, Rio Grande do Sul, Brazil
eNursing Department, Federal University of Health Sciences of Porto Alegre, CEP 90050-170, Porto Alegre, Rio
Grande do Sul, Brazil
ABSTRACT
In planning the radiotherapy treatment of head and neck cancer, the oncologist can indicate the use of an intraoral
prosthesis to facilitate the radiation therapy planning and reduce the toxicity of the treatment. These devices are
commonly fabricated with dental acrylic resin, the polymethylmethacrylate (PMMA), yet there are reports about
manufacture in thermoplastic materials. The polyethylene terephthalate glycol (PETG) is a compound used for
the fabrication of dental appliances, which could be used at intraoral prosthesis manufacture. The main objective
of the present work was to evaluate the potential use of PETG at intraoral prosthesis for radiotherapy of head and
neck cancer. Materials and methods: Circular forms of PMMA and PETG of thicknesses of 1, 2 and 3 mm were
used with the dimensions of a head phantom, which allowed the insertion of a radiochromic film. The irradiations

Birnfeld et al. ● Braz. J. Rad. Sci. ● 2020 2
occurred at a linear accelerator with photons of 6 MeV energy. Results: The percentage depth dose differences of
the materials PMMA and PETG were of 3%, 8% and 4%, respectively for the thicknesses of 1, 2 and 3 mm, around
the position of the circular forms. Conclusion: Based on the results obtained, it can be inferred that PETG is
suitable for manufacturing the intraoral prosthesis for radiotherapy treatment, replacing existing materials.
Keywords: Immobilizers, radiotherapy, PETG.
1. INTRODUCTION
Head and neck cancer have a multimodal treatment, being surgery followed by radiotherapy the
most common one amongst all therapeutic modalities [1]. As primary therapy, radiotherapy could be
used in the first stages of the disease (T1 and T2 injury) with excellent local control and survival rate
(85% to 90%) [2]. However, this treatment technique has some level of toxicity, what may affect
basic functions such as chewing, swallowing, breathing, phonation and the senses (taste, smell, vision,
and hearing). It also can alter one’s physiognomy either transiently or permanently [3-5]. The most
common oral adverse effects in patients submitted to radiotherapy are xerostomy, mucositis,
dysgeusia, hypogeusia, opportunistic infections, trismus, radiation caries, dysphagia, and
osteoradionecrosis [6,7].
For oral cavity, paranasal sinuses and pharynx cancer, the radiation oncologist may request the
dental surgeon the production of intraoral prosthesis in order to facilitate the radiation therapy
planning and may diminish treatment toxicity [3,4,8]. Immobilizers have the function of improving
positional reproducibility and preventing patient movement during the application of radiotherapy
[9], as in Figure 1.

Birnfeld et al. ● Braz. J. Rad. Sci. ● 2020 3
Figure 1: Intraoral prosthesis for radiotherapy in 3d design in grey.
According to Kaanders [10], intraoral prosthesis for radiotherapy can be categorized in two types:
protective or positioning. Protective devices reduce the dose of radiation on healthy tissues,
incorporating blocking materials in its structure. On the other hand, positioning devices can rearrange
the tissues into a radiation field or move healthy tissues away, decreasing the volume of the radiation
dose.
Most of intraoral prosthesis for radiotherapy are made of polymethylmethacrylate (PMMA), an
acrylic resin used for laboratory techniques for dental prosthesis, presenting an atomic number close
to that of the water, with excellent structural resistance [11-15]. Some authors have already described
the use of thermoplastics to produce such devices, as ethylene vinyl acetate [16,17], polyester [18]
and polyethylene terephthalate (PET) [19,20].
The PETG is a thermoplastic commonly used in odontology in the technique of vacuum
thermoforming for the production of protective devices [21,22] and orthodontic devices [23,24],
being biocompatible, resistant, easy to finish, low cost and with a simpler technique application when
compared to PMMA. Despite clinical reports of the use of PET as intraoral radiotherapy positioners,
no study was found regarding the use of PETG through a dosimetry evaluation.
A way of evaluating the usage behaviour of PETG in radiotherapy treatments is through an
analysis of the percentage depth dose variations by using dosimeters with high spatial resolution, as
radiochromic films.
A radiochromic film is a dosimeter that fits the method used in this experimental study once it
has characteristics such as insensitivity to light, non-dependence on energy, high spatial resolution,
amongst other characteristics [25,26]. When exposed to ionizing radiation, the structure of its
sensitive crystalline material will modify in the form of polymerization of the monomers elements
present in the film, resulting in alteration of the material’s rate of visible light transmission. Such
colour modification may be related to the exposed radiation dose [27-29].
The objective of the study is to verify the dosimetry behaviour of PETG, aiming its usage as a
material for intraoral prosthesis in radiotherapy using radiochromic films.

Birnfeld et al. ● Braz. J. Rad. Sci. ● 2020 4
2. MATERIALS AND METHODS
This experimental study occurred in the radiotherapy service of an oncology reference school-
hospital in Porto Alegre, Rio Grande do Sul - Brazil.
For the study, two sets of circular disc plates containing three different thicknesses – 1, 2 and 3
mm – were used. One set of plates was manufactured using PETG (crystal plate – Bioart, Brazil) and
the other set was manufactured using PMMA (self-curing jet – Clássico, Brazil), both obtained by
using the following laboratory technique: the manufacture of PMMA plates was realized by
duplicating PETG plates with 130 mm of diameter and thicknesses of 1, 2 and 3 mm – two plates of
each – using the technique of inclusion in plaster.
Such technique was executed using type III plaster (Herodent – Coltene, Brazil). The PETG plates
with thicknesses of 1, 2 and 3 mm were placed over a plain surface inside three 200 mm tubes of
polyvinyl chloride (PVC) cut at the height of 6 cm. The plaster was poured over the three plates at
the height of 2 cm. Finishing the total plaster setting (3 hours), the opposite part of the plate was
turned up and isolated with solid Vaseline; the other portion of plaster was then poured at the height
of 2 cm. After completing the plaster setting, the PETG plates were removed, a plaster mould being
obtained as a result. That plaster mould, then, was isolated (Cel-Lac – SSWhite, Brazil) and the acrylic
resin (PMMA) was elaborated following the manufacturer’s guidance, being rested on the mould,
pressed and put under the pressure of 20 psi using a polymerizing pot (Essence Dental – VH, Brazil).
After 20 minutes, the resulting acrylic plate was removed from the plaster and sanded with 150, 200
and 400 grit finishing sandpaper, having its thickness confirmed by an analogue calliper (Vonder,
Brazil). Thus, three plates corresponding to the PETG plates were obtained. The study was structured
according to the following steps. The table 1 shows the physics properties from the materials studies
and, also, soft tissue and water.
Table I: Table physics properties of PMMA and PETG [30-34].
PETG1 PMMA SOFT TISSUE WATER

Birnfeld et al. ● Braz. J. Rad. Sci. ● 2020 5
Density (g/cm3) 1.27 1.19 1.04 1.00
Atomic effective number 6.62* 6,47 7.64 7.42
* The atomic effective number was calculated by the authors following the formulation proposed by
Singh, V. P. et al [33].
1 ttps://www.medicalexpo.com/pt/prod/bio-art-equipamentos-odontologicos/product-71548-866461.html
2.1. Experimental irradiation
The reference percentage depth dose in water was assessed using clinical dosimetry reference
conditions obtained from the commissioning process applied to a Varian Unique Linear Accelerator
present in the hospital, as in Figure 2. The reference conditions are photons beams of 6MV, 10x10
cm² field and distance of 100 cm from the source and the surface, irradiating a 30x30x30 cm³ water
phantom. Since the commissioning, a periodic institutional quality assurance program ensures the
dosimetry qualities of the equipment.

Birnfeld et al. ● Braz. J. Rad. Sci. ● 2020 6
Figure 2: Prepared phantom over the Varian Unique linear accelerator table.
The PMMA head-simulating object – 21 cm high and 17 cm wide – has 1 cm high cuts divided
in half, which facilitates the insertion parallel to the central axis of beam of the radiochromic film.
The PMMA and PETG plates were placed between the cuts of the simulator object 3 cm depth.
For each irradiation, a type of immobilizer plate material was used, being the thickness of each one
evaluated individually.
GafChromic® EBT 2 radiochromic films with 10x5 cm approximately were positioned in the
central region of the irradiation field along the propagation of the irradiation beam. Figure 3 shows
the setup of the irradiation with the film positioned parallelly along the beam axis.
The setup showed in Figure 2, contenting the film, was irradiated in same irradiation conditions
as the reference percentage depth dose in water used in this work.
Figure 3: Position of the radiochromic film in the head-simulating object.
After the experimental irradiation, radiochromic films were digitized – within 24 hours after
irradiation – in a personal use HP Photosmart D110 printer, following Marini’s recommendations
[35].
2.2. Data analysis process
The processing of the film's sign strength was realized using a software from Phyton platform –
with a spatial resolution of 0.05 cm – that created curves from which profiles of percentage depth

Birnfeld et al. ● Braz. J. Rad. Sci. ● 2020 7
dose (PDD) were generated in the central axis of the radiation beam. To achieve such result only in
the central axis, the mean of its 7 central columns was calculated to decrease errors.
Aside from determining dose profiles in the central axis, films sign strength data was used to
calculate the percentage of relative dose, as in equation (1).
%𝐷 =𝐷
𝐷𝑚𝑎𝑥100% (1)
In which PDD is the percentage depth dose relative to the ratio between dose D in certain depth
and dose Dmax – dose maximum value.
For the central column, standard deviation calculations were made using a function from Phyton
software – std – and of associated uncertainty at each point from the uncertainty propagation equation,
as in equation (2).
𝜎𝑓 = √(𝜕𝑓
𝜕𝑥)
2
𝜎𝑥2 + (𝜕𝑓
𝜕𝑦)
2
𝜎𝑦2 (2)
Considering f as a function that depends on variables x and y; 𝜕𝑓
𝜕𝑥 and
𝜕𝑓
𝜕𝑦 as partial derivatives
from function f in relation to each one of its variables; and σf, σx and σy as the uncertainties of each
variable.
The function used in the uncertainty propagation calculation was the percentage dose, as in
equation (1).
This way, a variation of equation (1) was made and applied in the uncertainty propagation
equation – equation (2). Lastly, σf represents the uncertainty of each point of the matrix.
With a code done for each radiochromic film, Microsoft® Office Excel was used to plot
comparative charts. Those charts contain percentage depth dose information of plates with the same
thickness of PMMA and PETG, so it becomes possible to evaluate all information and determine if
there is any difference between materials. Yet, charts contain the parameter information, whose
material is water.

Birnfeld et al. ● Braz. J. Rad. Sci. ● 2020 8
3. RESULTS AND DISCUSSION
As a result for each of the 6 codes of each plate, a chart for 1, 2 and 3 mm thick plates was created
– see Figure 4 for the chart corresponding to plates of 1 mm thick, Figure 5 for plates of 2 mm thick,
and Figure 6 for plates of 3 mm thick.
Figure 4: Comparative chart for 1 mm thick PMMA and PETG plates.

Birnfeld et al. ● Braz. J. Rad. Sci. ● 2020 9
Figure 5: Comparative chart for 2 mm thick PMMA and PETG plates.

Birnfeld et al. ● Braz. J. Rad. Sci. ● 2020 10
Figure 6: Comparative chart for 3 mm thick PMMA and PETG plates.
When the PMMA and PETG plates were positioned in the simulator object, the behaviour of the
PDD curves obtained using radiochromic film is similar to all evaluated thicknesses. Yet, the curves
have the same behaviour of water related PDD, which were obtained from the radiotherapy service,
where the experiment occurred, in conditions like ours.
The maximum uncertainty value associated with each point of PDD found for PETG plates with
1, 2 and 3 mm thick were, respectively, 3%, 6% and 3%; for plates of PMMA, those values were,
respectively, 5%, 7% and 9%.
To analyse collected data and compare them, one of the used methods was identifying the
maximum and minimum intervals of each plate PDD. This way, it was possible to study if the

Birnfeld et al. ● Braz. J. Rad. Sci. ● 2020 11
interval of each PETG plate suits the interval found for the material that had already been used.
Table 2 displays data from such intervals in relation to the material that had been used.
Table 2: Table of percentage depth dose (PDD) intervals.
PDD Intervals
Plates Maximum (%) Minimum (%)
1 mm PETG 100 71
1 mm PMMA 95 64
2 mm PETG 98 54
2 mm PMMA 97 53
3 mm PETG 98 66
3 mm PMMA 98 63
Considering the maximum uncertainty values, it could be noticed that the minimum and
maximum percentage depth dose of the 2 and 3 mm thick PETG plates are closer to those of PMMA
plates. With this analysis, it is possible to observe that the usage of PETG in intraoral prosthesis will
not result in dose excess not even in dose loss. Throughout the comparison, maximum and minimum
values were superior in 1 mm thick PETG plates than in 1 mm thick PMMA plates.
Aiming to study the behaviour in the depth mark where PMMA and PETG plates were positioned
– 3 cm deep –, analysis of the percentage dose was made in an interval between 1 mm before and
after each plate. To do so, the simple mean of percentages dose of 5 points was calculated, being
those points between 2.9 cm and 3.1 cm. In 1 mm thick plates, a difference of 3% was found; in 2
mm thick plates, a difference of 8% was found; and in 3 mm thick plates, a difference of 4% dose
was found.
In the last paragraph, percentage dose differences may identify increase/decrease with a positive
or negative percentage value of the mean for percentage depth dose in points close to the plates.
Results show that uncertainties are of 6%, 9% and 9% for 1, 2 and 3 mm thick plates, respectively.
Therefore, the different percentage dose found in the depth in which plates are located is appropriate.

Birnfeld et al. ● Braz. J. Rad. Sci. ● 2020 12
4. CONCLUSION
The study demonstrated similarity up to 7% between PMMA and PETG materials regarding dose
distribution in depth when submitted to a 6 MV beam, despite its similar characteristics, as shown in
table 1.
The percentage depth dose value surrounding the position of the plates in the simulator object
showed values up to 8% of difference between plates within the same dimensions. From the data
collected it became possible to infer the existence of similarity in dosimetry behaviour when using
PETG for manufacturing intraoral prosthesis for radiotherapy treatments due to its simple handling
and low cost, being a substitute to PMMA.
Study limitations: This study compared circular disc plates without analysing dosimetry behaviour
in the equipment design, what depends on the anatomic area that will be irradiated.
REFERENCES
[1] NUTTING, C. Radiotherapy in head and neck cancer management: United Kingdom National
Multidisciplinary Guidelines. J Laryngol Otol, v. 130, n. S2, p. S66-S67, 2016.
[2] MENDENHALL, W. M.; FOOTE, R. L.; SANDOW, P. L.; FERNANDES, R. P. Oral Cavit. In:
GUNDERSON, L. L.; TEPPER, J. E. (Eds.) Clinical Radiation Oncology. Philadelphia: Elsevier,
2016. p. 570-596.
[3] NEKHLYUDOV, L.; LACCHETTI, C.; DAVIS, N. B.; GARVEY, T. Q.; GOLDSTEIN, D. P.;
NUNNINK, J. C.; NINFEA, J. I. R.; SALNER, A. L.; SALZ, T.; SIU, L. L. Head and Neck Cancer
Survivorship Care Guideline: American Society of Clinical Oncology Clinical Practice Guideline
Endorsement of the American Cancer Society Guideline. J Clin Oncol, v. 35, n. 14, p. 1606-1621,
2017.
[4] SAMSON, D. J.; RATKO, T. A.; ROTHENBERG, B. M.; BROWN, H. M.; BONNELL, C. J.;
ZIEGLER, K. M.; ARONSON, N. Comparative effectiveness and safety of radiotherapy treatments
for head and neck cancer. AHQR Comparative Effectiveness Reviews, n. 20, 2010.

Birnfeld et al. ● Braz. J. Rad. Sci. ● 2020 13
[5] SHELLENBERGER, T. D.; WEBER, R. S. Multidisciplinary team planning for patients with
head and neck cancer. Oral Maxillofac Surg Clin North Am, v. 30, n. 4, p. 435-444, 2018.
[6] MIGLIORATI, C. A.; SENEDA, L. M.; BURTON, E. L. Oral complications of cancer therapy: a
summary guide for the clinician. J Tenn Dent Assoc, v. 95, n. 1, p. 24-32; quiz 33-4, 2015.
[7] SROUSSI, H. Y.; EPSTEIN, J. B.; BENSADOUN, R.; SAUNDERS, D. P.; LALLA, R. V.;
MIGLIORATI, C. A.; HEAIVILIN, N.; ZUMSTEG, Z. S. Common oral complications of head and
neck cancer radiation therapy: mucositis, infections, saliva change, fibrosis, sensory dysfunctions,
dental caries, periodontal disease, and osteoradionecrosis. Cancer Med, v. 6, n. 12, p. 2918-2931,
2017.
[8] KUFTA, K.; FORMAN, M.; SWISHER-MCCLURE, S.; SOLLECITO, T. P.; PANCHAL, N.
Pre-radiation dental considerations and management for head and neck cancer patients. Oral
Oncology, v. 76, p. 42-51, 2018.
[9] OLSON, A.; PHILLIPS, K.; ENG, T.; LENARDS, N.; HUNZEKER, A.; LEWIS, D.;
BAUMANN, D. Assessing dose variance from immobilization devices in VMAT head and neck
treatment planning: a retrospective case study analysis. Med Dosim, v. 43, n. 1, p. 39-45, 2018.
[10] KAANDERS, J. H.; FLEMING, T. J.; ANG, K. K.; MAOR, M. H.; PETERS, L. J. Devices
valuable in head and neck radiotherapy. Int J Radiat Oncol Biol Phys, v. 23, n. 3, p. 639-45, 1992.
[11] WESSON, R. A.; GARDEN, A. S.; CHAMBERS, M. S. Fabrication of an unconventional bolus-
type stent for a combined intraoral/extraoral defect treated with proton radiation therapy. J Prosthet
Dent, v. 117, n. 4, p. 563-565, 2017.
[12] APPENDINO, P.; FERRERA, F. D.; NASSISI, D.; BLANDINO, G.; GINO, E.; SOLLA, S. D.;
REDDA, M. G. R. Are intraoral customized stents still necessary in the era of Highly Conformal
Radiotherapy for Head & Neck cancer? Case series and literature review. Rep Pract Oncol
Radiother, v. 24, n. 5, p. 491-498, 2019.
[13] MARTINS, L. J. O.; BORGES, A. F. S.; FERREIRA, G. Z.; SANSAVINO, S. Z.; SIOSAKI, A.
T. F.; TABATA, A.; SANTOS, P. S. S. Material selection for constructing an intraoral stent used in
radiotherapy: analysis of density and structure. Br J Med Med Res, v. 16, n. 9, p. 1-6, 2016.
[14] NGUYEN, C. T.; LEE, V. S.; WU, J. An acrylic immobilization bite block for use during
radiation therapy: description of a new technique. Int J Prosthodont, v. 31, n. 4, p. 338-341, 2018.

Birnfeld et al. ● Braz. J. Rad. Sci. ● 2020 14
[15] VERRONE, J. R.; ALVES, F. A.; PRADO, J. D.; MARCICANO, A. D.; PELLIZZON, A. C.
A.; DAMASCENA, A. S.; JAGUAR, G. C. Benefits of an intraoral stent in decreasing the irradiation
dose to oral healthy tissue: dosimetric and clinical features. Oral Surg Oral Med Oral Path Oral
Radiol, v. 118, n. 5, p. 573-578, 2014.
[16] HOLLOWS, P.; HAYTER, J. P.; VASANTHAN, S. The Leicester radiotherapy bite block: an
aid to head and neck radiotherapy. Br J Oral Maxillofac Surg, v. 39, n. 1, p. 49-51, 2001.
[17] IKAWA, H.; KOTO, M.; EBNER, D. K.; TAKAGI, R.; HAYASHI, K.; TSUJI, H.; KAMADA,
T. A custom-made mouthpiece incorporating tongue depressors and elevators to reduce radiation-
induced tongue mucositis during carbon-ion radiation therapy for head and neck cancer. Pract Radiat
Oncol, v. 8, n. 2, p. e27-e31, 2018.
[18] FENG, Z.; WANG, P.; GONG, L.; XU, L.; ZHANG, J.; ZHENG, J.; ZHANG, D.; TIAN, T.;
WANG, P. Construction and clinical evaluation of a new customized bite block used in radiotherapy
of head and neck cancer. Cancer Radiother, v. 23, n. 2, p. 125-131, 2019.
[19] BODARD, A. G.; RACADOT, S.; SALINO, S.; POMMIER, P.; ZROUNBA, P.;
MONTBARBON, X. A new, simple maxillary-sparing tongue depressor for external mandibular
radiotherapy: a case report. Head Neck, v. 31, n. 11, p. 1528-30, 2009.
[20] DOI, H.; TANOOKA, M.; ISHIDA, T.; MORIDERA, K.; ICHIMIYA, K.; TARUTANI, K.;
KITAJIMA, K.; FUJIWARA, M.; KISHIMOTO, H.; KAMIKONYA, N. Utility of intraoral stents in
external beam radiotherapy for head and neck cancer. Rep Pract Oncol Radiother, v. 22, n. 4, p.
310-318, 2017.
[21] BOCHNIG, M. S.; OH, M. J.; NAGEL, T.; ZIEGLER, F.; JOST-BRINKMANN, P. G.
Comparison of the shock absorption capacities of different mouthguards. Dent Traumatol, v. 33, n.
3, p. 205-213, 2017.
[22] SARAC, R.; HELBIG, J.; DRAGER, J.; JOST-BRINKMANN, P. G. A comparative study of
shock absorption capacities of custom fabricated mouthguards using a triangulation sensor. Materials
(Basel), v. 12, n. 21, 2019.
[23] AHN, H. W.; HA, H. R.; LIM, H. N.; CHOI, S. Effects of aging procedures on the molecular,
biochemical, morphological, and mechanical properties of vacuum-formed retainers. J Mech Behav
Biomed Mater, v. 51, p. 356-66, 2015.

Birnfeld et al. ● Braz. J. Rad. Sci. ● 2020 15
[24] ELKHOLY, F.; MIKHAIEL, B.; REPKY, S.; SCHMIDT, F.; LAPATKI, B. G. Effect of
different attachment geometries on the mechanical load exerted by PETG aligners during derotation
of mandibular canines: an in vitro study. J Orofac Orthop, v. 80, n. 6, p. 315-326, 2019.
[25] AMARAL, L. L. Programa de controle de qualidade dosimétrico, validado com auxílio de
filme radiocrômico, aplicado à Radioterapia Estereotáxica. 2012. 84f. Dissertação (pós-
graduação em Física Aplicada à Medicina e Biologia) – Universidade de São Paulo, Ribeirão Preto,
2012.
[26] LUVIZOTTO, J. Caracterização do filme radiocrômico Gafchromictm modelo EBT3 para
uso em braquiterapia. 2015. 103f. Dissertação (mestrado em Ciências na Área de Tecnologia
Nuclear – Reatores) – Instituto de Pesquisas Energéticas e Nucleares, São Paulo, 2015.
[27] CASOLARO, P.; CAMPAJOLA, L.; BREGLIO, G.; BUONTEMPO, S.; CONSALES, M.;
CUSANO, A.; CUTOLO, A.; CAPUA, F. D.; FIENGA, F.; VAIANO, P. Real-time dosimetry with
radiochromic films. Sci Rep, v. 9, art. n. 5307, 2019.
[28] DEVIC, S.; SEUNTJENS, J.; SHAM, E.; PODGORSAK, E. B.; SCHMIDTLEIN, C. R.;
KIROV, A. S.; SOARES, C. G. Precise radiochromic film dosimetry using a flat-bed document
scanner. Rev Bras Fis Med, v. 12, n. 3, p. 7-14, 2005.
[29] NIROOMAND-RAD, A.; BLACKWELL, C. R.; COURSEY, B. M.; GALL, K. P.; GALVIN,
J. M.; MCLAUGHLIN, W. L.; MEIGOONI, A. S.; NATH, R.; RODGERS, J. E.; SOARES, C. G.
Radiochromic film dosimetry: recommendations of AAPM Radiation Therapy Committee Task
Group 55. American Association of Physicists in Medicine. Med Phys, v. 25, n. 11, p. 2093-115,
1998.
[30]ALSSABBAGH, M.; TAJUDDIN, A. A.; MANAP, M. B. A.; ZAINON, R. (2017). Evaluation
of nine 3D printing materials as tissue equivalent materials in terms of mass attenuation coefficient
and mass density. Ijaas, v.4, n9, p. 168-173, 2017.
[31] ALVA-SÁNCHEZ, M. S.; DE OLIVEIRA, L. N. ; PETCHEVIST, P. C.; MOREIRA, M. V. ;
DE ALMEIDA, A. Beta planar source quality assurance with the Fricke xylenol gel dosimeter.
Radiat. Phys. Chem, v. 96, p. 56-59, 2014.

Birnfeld et al. ● Braz. J. Rad. Sci. ● 2020 16
[32] BIRNBACHER, L.; WILLNER, M.; MARSCHNER, M.; PFEIFFER, D.; PFEIFFER, F.;
HERZEN, J. Accurate effective atomic number determination with polychromatic grating-based
phase-contrast computed tomography. Opt Express. v.26, n.12, p. 15153-15166, 2018.
[33] SINGH, V. P.; BADIGER,N. M. ; KUCUK, N. Determination of Effective Atomic Numbers
Using Different Methods for Some Low-Z Materials. J Inorg Nucl Chem, v. 2014, Article ID
725629, p. 1-7, 2014.
[34] Alva, M; PIANOSCHI, T ; Marques, T ; M, M Santanna ; Baffa, O ; Nicolucci, P . Monte Carlo
Simulation of MAGIC- f gel for Radiotherapy using PENELOPE. J Phys Conf Ser, v. 250, p.
012067, 2010.
[35] MARINI, G. Avaliação de distribuições de dose em tratamentos radioterápicos utilizando
filmes radiocrômicos. 2013. 75f. Dissertação (mestrado em Física Aplicada à Medicina e Biologia)
– Universidade de São Paulo, Ribeirão Preto, 2013.

BJRS
BRAZILIAN JOURNAL
OF
RADIATION SCIENCES 08-03 (2020) 01-14
ISSN: 2319-0612
Accepted: 2020-08-26
Criação de um indicador eletrônico para
acompanhamento de dose no setor de Tomografia
Computadorizada
Diana Rodrigues de Pina (DRP)1, Francielen Barreto Hortencio (FBH)2, José
Carlos Souza Trindade Filho (JCSTF)3, Raul Lopes Ruiz Junior (RLRJ)4, Allan
Felipe Fattori Alves (AFFA)5
1Departamento de Doenças Tropicais e Diagnóstico por Imagem - UNESP, Botucatu-SP, Brasil
1Faculdade de Medicina de Botucatu - UNESP, Botucatu-SP, Brasil
3Chefe de Gabinete no Hospital das Clínicas da Faculdade de Medicina de Botucatu - UNESP, Botucatu-SP,
Brasil
4Hospital das Clínicas da Faculdade de Medicina de Botucatu - UNESP, Botucatu-SP, Brasil
5Núcleo de Física Médica e Radioproteção do Hospital das Clínicas da Faculdade de Medicina de Botucatu –
UNESP, Botucatu-SP, Brasil
RESUMO O objetivo deste trabalho foi desenvolver um indicador de dose eletrônico para a otimização da proteção
radiológica no setor de Tomografia Computadorizada do Hospital das Clínicas de Botucatu. Foram estimadas
doses efetivas utilizando o parâmetro DLP (do inglês Dose-Length Product). Estas doses efetivas foram comparadas
com valores da literatura. O indicador de dose foi inserido no sistema de gestão hospitalar e contribuiu com o
princípio da justificativa e proteção radiológica. Os valores de doses efetiva, para os protocolos da instituição são
semelhantes aos referenciados na literatura, a maior diferença encontrada foi de 3,2%. O indicador de dose,
carrega informações, sobre: a) dose acumulada pelo paciente em todos os exames de TC, b) O risco benefício de
exames que envolvem radiação ionizante e c) um termo que representa a ciência do solicitante quanto à dose
acumulada e o risco-benefício. Este estudo vem corroborar com o princípio da justificação junto ao solicitante do
exame. Essa ferramenta, contribui para orientação da equipe médica sobre a indicação excessiva de um exame
considerado com alta taxa de dose. Essa metodologia pode ser implementada em qualquer serviço que realiza
exames, envolvendo radiações ionizantes promovendo a melhor relação risco-benefício para o paciente custo-
benefício para a instituição.
Palavras-chave: Tomografia computadorizada; Dose Efetiva; Proteção Radiológica; Indicador de dose; Radiologia

Pina et al. ● Braz. J. Rad. Sci. ● 2020 3
ISSN: 2319-0612
Accepted: 2020-08-26
ABSTRACT
The objective this work was to develop an electronic dose indicator for the optimization of radiological protection in
the Computed Tomography sector Botucatu Medical Hospital. Effective doses were estimated using the Dose-Length
Product. These effective doses were compared with values in the literature. The dose indicator was inserted in the
hospital management system and contributed to the principle of justification and radiological protection. The
effective dose values for the institution's protocols are similar to those referenced in the literature where the
difference found was 3.2%. The dose indicator carries information about: a) dose accumulated by the patient in all
CT exams, b) the risk benefit of tests involving ionizing radiation and c) a term that represents the applicant's
acknowledgment about the accumulated dose. This study corroborates the principle of justification with the exam
applicant. This tool contributes to the guidance of the medical team on the excessive indication of an exam considered
to deliver high radiation doses. This methodology can be implemented in any service that performs exams, involving
ionizing radiation, promoting the best risk-benefit ratio for patient and for cost-benefit for the institution.
Keywords: Computed tomography; Effective dose; Radiological protection; Dose indicator; Radiology

Pina et al. ● Braz. J. Rad. Sci. ● 2020 4
ISSN: 2319-0612
Accepted: 2020-08-26
1. INTRODUÇÃO
A radiação ionizante é classificada como agente de potencial risco de desenvolvimento de câncer
pelo subcomitê intitulado “Biological Effects of Ionizing Radiation (BEIR)” do US National Institute
of Science. [1]. Estudos apontam que não existe um limiar de dose para os efeitos estocásticos de
baixas doses. O risco de desenvolver mutações carcinogênicas provém de qualquer exposição ao
tecido, dependendo da radio sensibilidade deste por unidade de dose equivalente [1,2]. O uso da
radiação em procedimentos médicos para o diagnóstico e tratamento é considerada a principal fonte
artificial de exposição no mundo. Dentre as tecnologias utilizadas para detectar o câncer
precocemente, dados dos Estados Unidos indicam que em aplicações médicas os exames de
Tomografia Computadorizada (TC) contribuem atualmente com 24% da dose coletiva total
proveniente da radiologia [3].
Desde 1972 quando foi apresentada a modalidade de TC, a qualidade de imagem tem crescido
constantemente com atualizações e aprimoramentos destas tecnologias que visam facilitar e aprimorar
o diagnóstico médico [4, 5, 6]. Esses desenvolvimentos tecnológicos permitem realizar uma imagem
de alta qualidade em um período de tempo reduzido. Isso levou a um aumento considerável na
solicitação dessa modalidade de exames e, consequentemente, o aumento da exposição à radiação
para os pacientes e para a população [7]. Uma TC de crânio, por exemplo, expõe os pacientes à
equivalência de um ano de radiação quando comparadas com radiações provenientes de fontes
naturais [8]. Outros exames de TC envolvem doses de radiação ainda mais altas, variando até oito
vezes a dose recebida da radiação de fundo em um ano [7].
No período de 2008 a 2018 no Brasil, houve um rápido crescimento no número de exames de TC.
Segundo dados do Departamento de Informática do Sistema Único de Saúde (DataSUS), estima-se
que houve um aumento de aproximadamente 24% do total de exames de TC, com um aumento
significativo para as regiões, Sul de 41%, Sudeste de 30% e Centro-Oeste de 25% [9].
Para minimizar a dose a qual os pacientes estão expostos é importante que a equipe
multiprofissional crie parâmetros de proteção radiológica baseados nos princípios básicos da
radioproteção: justificação, otimização e limitação de dose [10].
De acordo com o princípio da justificação, qualquer atividade envolvendo radiação ionizante ou

Pina et al. ● Braz. J. Rad. Sci. ● 2020 5
ISSN: 2319-0612
Accepted: 2020-08-26
exposição deve ser fundamentada em relação a outras possíveis alternativas. O benefício do uso da
radiação ionizante deve ser maior em comparação ao detrimento que possa ser causado [11], ou seja
as doses provenientes aos exames devem ser tão baixas quanto razoavelmente exequíveis conforme
prescreve o princípio ALARA (do inglês As Low As Reasonably Achievable) [11].
No Brasil o princípio da limitação de dose é definido pela Comissão Nacional de Energia Nuclear
(CNEN) a qual estabelece limites de dose individual para exposições ocupacionais e para o indivíduo
do público. Quanto à (exames) diagnósticos, não há limites de restrição, pois nestes casos utiliza-se
o princípio da justificação [6, 12]. Existe o estabelecimento de níveis de referência de dose (do inglês
Diagnostic reference levels - DRL) que foram atribuídos como guia na construção de protocolos nas
diferentes modalidades do radiodiagnóstico, de modo a minimizar as exposições [13].
Esta pesquisa teve como objetivo desenvolver um indicador de dose para acompanhamento da
exposição à radiação proveniente de exames tomográficos realizados no setor de TC do Hospital das
Clínicas de Botucatu (HCB-UNESP). Este estudo vem corroborar com o princípio da justificação
junto ao solicitante do exame. O indicador contém informações da Dose Efetiva referente a todos os
exames realizados no setor. Essa ferramenta, quando inserida no sistema hospitalar pode contribuir
para orientação da equipe médica sobre a indicação excessiva de um exame considerado de alta taxa
de dose.
2. MATERIAIS E MÉTODOS
Foram utilizados dois equipamentos tomográficos do setor de TC do HCB da marca Toshiba
(Canon) modelo Activion, 16 canais. Os tomógrafos foram avaliados de acordo com os testes de
controle de qualidade previstos na RDC 330/2019 [21] e na Instrução Normativa Nº55/2019 [22] para
equipamentos de tomografia computadorizada. Todos os protocolos de exames empregados neste
estudo apresentam valores representativos de dose em tomografia computadorizada médica dentro
daqueles previstos no Anexo II na Instrução Normativa Nº55/2019 [22]. Os relatórios de dose foram
obtidos a partir de exames retrospectivos do banco de dados do HCB, com a devida aprovação junto
ao Comitê de Ética em Pesquisa (CAAE 54284616.0.0000.5411).

Pina et al. ● Braz. J. Rad. Sci. ● 2020 6
ISSN: 2319-0612
Accepted: 2020-08-26
- Desenvolvimento do Indicador de dose Eletrônico
A Figura 1 apresenta o fluxograma para desenvolvimento do indicador de dose desenvolvido neste
estudo, o qual apresenta os seguintes passos:
Figura 1: Fluxograma com as etapas A, B e C que compõem o indicador eletrônico de dose.
A) Informativo de Dose
O informativo de dose contém uma estimativa da Dose Efetiva associada a cada protocolo de
exame em tomografia computadorizada (TC). As doses efetivas foram estimadas para um paciente
padrão (1,75 cm e 70 kg) [14]. Esta grandeza é extensivamente utilizada em estudos de doses
provenientes de exames radiológicos [15], proporcionando uma ferramenta de proteção radiológica e
conscientização para os profissionais que solicitam os exames.
A estimativa da Dose Efetiva foi realizada baseando-se nas etapas descritas a seguir. Realizou- se
um levantamento de 100 relatórios de dose retrospectivos, de cada protocolo de exames realizados na
rotina clínica do setor de TC do HCB-UNESP. Dentre estes foram selecionados os protocolos mais
frequentes na instituição (crânio, abdômen, abdômen 3 fases, sendo a pré-contraste, arterial e portal,
e tórax). Os relatórios foram utilizados para determinação do DLP, Dose Length Product (Produto
Dose-Comprimento), estimado em unidades de: miliGray multiplicado por unidade de comprimento
(mGy.cm). A grandeza DLP foi utilizada no processo de obtenção da Dose Efetiva (E), a partir da
equação 1:
E = k x DLP (1)
Onde k (mSv / (mGy × cm) é o coeficiente de conversão estimado a partir de simulações
computacionais para uma dada região anatômica irradiada [16]. Esta equação assim como os valores
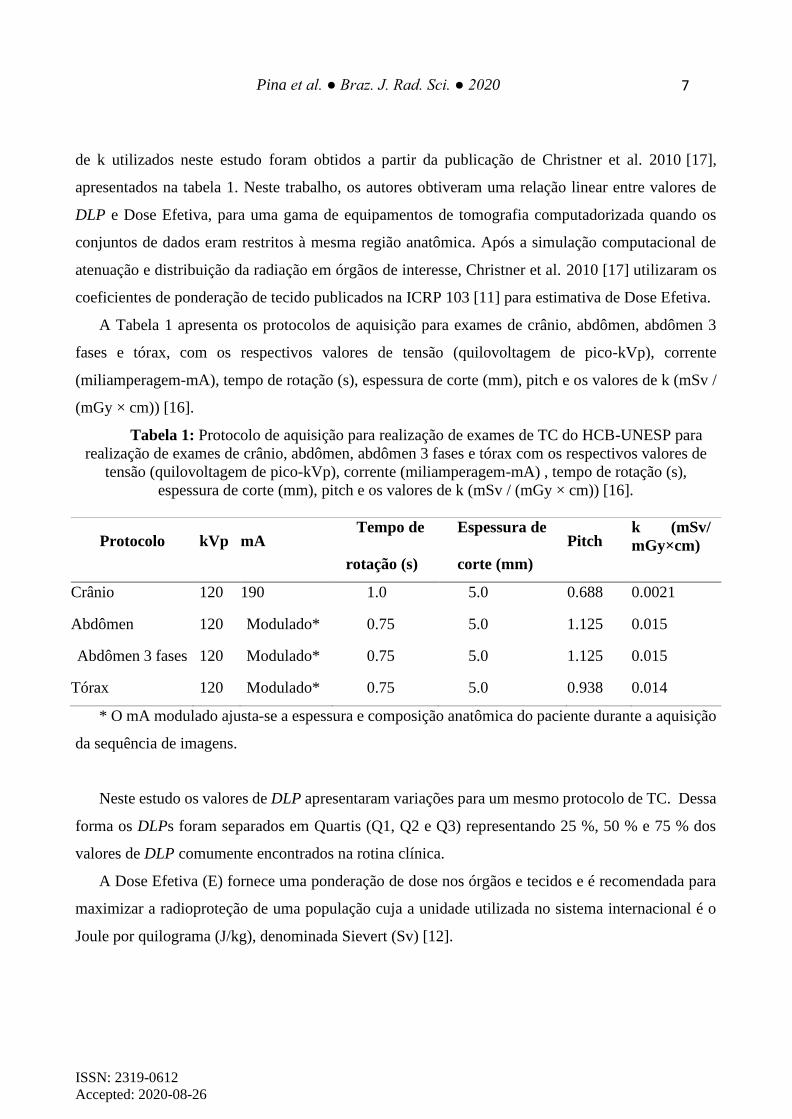
Pina et al. ● Braz. J. Rad. Sci. ● 2020 7
ISSN: 2319-0612
Accepted: 2020-08-26
de k utilizados neste estudo foram obtidos a partir da publicação de Christner et al. 2010 [17],
apresentados na tabela 1. Neste trabalho, os autores obtiveram uma relação linear entre valores de
DLP e Dose Efetiva, para uma gama de equipamentos de tomografia computadorizada quando os
conjuntos de dados eram restritos à mesma região anatômica. Após a simulação computacional de
atenuação e distribuição da radiação em órgãos de interesse, Christner et al. 2010 [17] utilizaram os
coeficientes de ponderação de tecido publicados na ICRP 103 [11] para estimativa de Dose Efetiva.
A Tabela 1 apresenta os protocolos de aquisição para exames de crânio, abdômen, abdômen 3
fases e tórax, com os respectivos valores de tensão (quilovoltagem de pico-kVp), corrente
(miliamperagem-mA), tempo de rotação (s), espessura de corte (mm), pitch e os valores de k (mSv /
(mGy × cm)) [16].
Tabela 1: Protocolo de aquisição para realização de exames de TC do HCB-UNESP para
realização de exames de crânio, abdômen, abdômen 3 fases e tórax com os respectivos valores de
tensão (quilovoltagem de pico-kVp), corrente (miliamperagem-mA) , tempo de rotação (s),
espessura de corte (mm), pitch e os valores de k (mSv / (mGy × cm)) [16].
Protocolo kVp mA Tempo de
rotação (s)
Espessura de
corte (mm)
Pitch k (mSv/
mGy×cm)
Crânio 120 190 1.0 5.0 0.688 0.0021
Abdômen 120 Modulado* 0.75 5.0 1.125 0.015
Abdômen 3 fases 120 Modulado* 0.75 5.0 1.125 0.015
Tórax 120 Modulado* 0.75 5.0 0.938 0.014
* O mA modulado ajusta-se a espessura e composição anatômica do paciente durante a aquisição
da sequência de imagens.
Neste estudo os valores de DLP apresentaram variações para um mesmo protocolo de TC. Dessa
forma os DLPs foram separados em Quartis (Q1, Q2 e Q3) representando 25 %, 50 % e 75 % dos
valores de DLP comumente encontrados na rotina clínica.
A Dose Efetiva (E) fornece uma ponderação de dose nos órgãos e tecidos e é recomendada para
maximizar a radioproteção de uma população cuja a unidade utilizada no sistema internacional é o
Joule por quilograma (J/kg), denominada Sievert (Sv) [12].

Pina et al. ● Braz. J. Rad. Sci. ● 2020 8
ISSN: 2319-0612
Accepted: 2020-08-26
Além das doses efetivas estimadas neste estudo foram incluídas doses efetivas obtidas da
literatura incluindo dados dos Estados Unidos, Canadá, Japão, Austrália e Europa Ocidental [15].
Dessa forma estabeleceu-se uma comparação entre as doses efetivas praticadas na instituição com
aquelas encontradas em publicações de outros países.
B) Informativo Médico
Nesse procedimento foram coletadas informações do comitê organizado por órgãos dos Estados
Unidos da América responsáveis pelo relatório de riscos a exposições para baixos níveis de radiação
[1]. Dentre as informações, são apresentados níveis de radiação associados aos riscos para pacientes
adultos e pediátricos [18].
C) Termo de Ciência
Esse procedimento foi inserido, de modo que o solicitante do exame tenha ciência dos efeitos da
radiação antes de solicitar um novo exame. O solicitante terá disponível, diretrizes baseadas em
evidências para auxiliar a tomada de decisão de modo a contribuir para o uso mais eficaz da radiação
ionizante. A ordem das etapas descritas no fluxograma deve ser obedecida sendo condicionada a
ciência de cada etapa para a solicitação dos exames. Se mesmo após avaliar a Dose Efetiva recebida
pelo paciente, o solicitante confirmar a ciência sobre o risco-benefício e optar por um novo exame é
necessário que descreva justificativa adequada em conjunto com a hipótese diagnóstica de cada caso.
Este protocolo pode evitar fases de aquisição desnecessárias durante o protocolo de exibição dos
exames.
3. RESULTADOS E DISCUSSÃO
A Tabela 2 apresenta os valores das grandezas DLP obtidos em protocolos de exames
retrospectivos de TC do HCB-UNESP. Cada grandeza utilizada para estimar a Dose Efetiva encontra-
se representada por Quartis (Q1, Q2 e Q3), os quais correspondem à 25 %, 50 % e 75 % da distribuição

Pina et al. ● Braz. J. Rad. Sci. ● 2020 9
ISSN: 2319-0612
Accepted: 2020-08-26
de valores de DLP encontrados. A Tabela 3 apresenta ainda as estimativas de Doses Efetiva (mSv)
utilizando os fatores de conversão k, para cada região anatômica em estudo.
Tabela 2: Distribuição dos valores de DLP (mGy.cm) e Dose Efetiva (mSv) em Quartis para
os quatro protocolos mais frequentes utilizados no HCB-UNESP. A Dose Efetiva é obtida
através de multiplicação de cada DLP pelo fator de conversão k (mSv/mGy x cm).
Exame
DLP (mGy.cm)
K (mSv / (mGy × cm)
Dose Efetiva (mSv)
Q1 Q2 Q3 Q1 Q2 Q3
Abdômen 354,1 540,4 859,7 0,015 5,31 8,10 12,89
Abdômen 3 fases 909,4 1593 2642 0,015 13,6 23,9 39,6
Crânio 1240 1344 1428 0,0021 2,61 2,82 3,00
Tórax 42,35 322,5 1065 0,014 0,59 4,51 14,9
*Coeficiente de conversão k fornecido por NRPB = National Radiological Protection Board.
Os valores de Q3 foram escolhidos para representar a Dose Efetiva, pois, representam 25% dos
valores mais elevados, com intuito de superestimar as doses apresentadas.
A Tabela 3 apresenta os dados de Dose Efetiva (mSv) obtidos utilizando os dados referenciados
pela literatura [7, 14-17] e as doses estimadas utilizando a grandeza DLP. Foram selecionados doze
dos procedimentos mais frequentes no setor de TC do HCB-UNESP. Algumas publicações trazem
também a distribuição da DLP para estes protocolos.
Com base no fluxograma da Figura 1, criou-se uma tela de acesso para prescrição de exames de
tomografia computadorizada no sistema de gestão hospitalar. As informações disponibilizadas são
direcionadas ao médico solicitante, que deverá tomar ciência da Dose Efetiva acumulada de cada
paciente, como forma de avaliar o risco-benefício para cada exame, e então deverá decidir no
prosseguimento da solicitação. Esta tela de acesso está apresentada na Figura 2.

Pina et al. ● Braz. J. Rad. Sci. ● 2020 10
ISSN: 2319-0612
Accepted: 2020-08-26
Tabela 3: Ilustra os valores de Dose Efetiva (mSv), encontrados na literatura brasileira e
internacional.
EXAMES
Dose Efetiva (mSv)
Dados Literatura Estimada
ANGIO TC DE CORONARIAS 16 -
ANGIO TC PESCOÇO (ARTERIAL) 7 -
ANGIO TC PESCOÇO (VENOSO) 8 -
TC ABDÔMEN 3 FASES (INCLUI PELVE) - 38,6
TC ABDÔMEN 13 12,8
TC COLUNA CERVICAL 3 -
TC COLUNA LOMBAR/LOMBO-SACRA 3 -
TC COLUNA TORÁCICA 3 -
TC CORACAO E VASOS 15 -
TC ENCÉFALO/CRÂNIO 3 3,04
TC PELVE 6 -
TC TÓRAX 14 14,45

Pina et al. ● Braz. J. Rad. Sci. ● 2020 11
ISSN: 2319-0612
Accepted: 2020-08-26
Figura 2: Layout do Indicador de dose radiológica, contendo informativo de dose, informativo
médico e termo de ciência para o solicitante do exame de TC no sistema eletrônico do HCB-
UNESP.
*As doses de exames em tomografia computadorizada, que são realizados atualmente nos
protocolos do HCB-UNESP podem ter valores entre 3 mSv (exames de extremidades) até 16 mSv
(exames de angiografia corona

Pina et al. ● Braz. J. Rad. Sci. ● 2020 12
ISSN: 2319-0612
Accepted: 2020-08-26
Neste trabalho desenvolveu-se um indicador de dose radiológica para acompanhamento da
exposição à radiação ionizante proveniente de exames de tomografia computadorizada. O indicador
contém informações da Dose Efetiva associada a cada protocolo empregado no setor, e acompanha o
prontuário do paciente. O médico solicitante tem acesso a Dose Efetiva acumulada daquele paciente,
assim como instruções de proteção radiológica. Nos casos em que o médico prossegue com a
solicitação deve indicar a justificativa e hipóteses diagnósticas adequadas. Isto proporciona um alerta
e necessidade de reflexão do solicitante para com o paciente, gerando criticismo do solicitante e
minimizando solicitações exageradas, consequentemente, diminuição de custos para a instituição.
Os valores de Dose Efetiva foram estimados a partir da conversão do produto dose- comprimento
registrada nos exames do setor e um fator k obtido na literatura. Os valores de DLP e fator de
conversão k proporcionam resultados que podem variar de acordo com o tomógrafo utilizado, a
anatomia do paciente e com a otimização de protocolos. Dessa forma é necessário que a etapa de
informativo de dose seja revisada periodicamente, a fim de aproximar os valores das possíveis
atualizações ou modificações de tecnologia.
Quando comparados com valores de Dose Efetiva da literatura internacional, os protocolos da
instituição apresentaram diferença inferior a 3,2%, proporcionando seguridade na utilização do
método adotado. Sabe-se que as variações nos valores de Dose Efetiva podem aumentar com o
aumento da massa corporal, massa gorda, massa magra, total de água corporal e IMC, Índice de Massa
Corporal [1]. Isto proporciona uma grande variabilidade nos resultados de dose para um mesmo
exame. Dessa forma, a separação por Quartis, adotadas neste estudo, proporcionou resultados para
pacientes com características anatômicas diferentes, porém comumente encontrados na rotina clínica
da instituição, de forma mais analítica e distributiva, representando melhor a interpretação do que a
apresentação puramente por média com respectivos desvios padrão.
4. CONCLUSÕES
Nesta pesquisa desenvolvemos um indicador eletrônico de dose que constitui uma importante
ferramenta de orientação e proteção radiológica hospitalar [20]. Os resultados oriundos desta pesquisa

Pina et al. ● Braz. J. Rad. Sci. ● 2020 13
ISSN: 2319-0612
Accepted: 2020-08-26
trazem informações quanto a justificativa do exame associada ao corpo clínico, o histórico de doses
num mesmo paciente e os possíveis efeitos biológicos da radiação ionizante para o exame em estudo.
Essas informações integram os procedimentos implantados, em termos de proteção radiológica,
constituinte do programa efetivo de Programa de Proteção Radiológica na instituição, promovendo a
melhor relação risco-benefício para o paciente e um maior esclarecimento para os profissionais que
solicitam os exames. Além de proporcionar maior reflexão na solicitação de exames desnecessários,
minimizando doses de radiação nos pacientes e diminuindo custos para a instituição. Essa
metodologia pode ser estendida e implementada em qualquer serviço que realiza exames de
tomografia computadorizada e demais modalidades envolvendo radiações ionizantes.
AGRADECIMENTOS
Ao Conselho Nacional de Desenvolvimento Científico e Tecnológico – CNPq.
Ao Hospital das Clínicas de Botucatu, em especial a equipe do CIMED.
REFERÊNCIAS
[1] NATIONAL RESEARCH COUNCIL. Health risks from exposure to low levels of ionizing
radiation: BEIR VII Phase 2. The National Academies Press. Washington, DC. 2006.
[2] LINET, M. S.; SLOVIS, T. L.; MILLER D. L. Cancer risks associated with external radiation
from diagnostic imaging procedures. CA Cancer Journal for Clinicians, v. 62(2), p. 75-100,
2012.
[3] NCRP- National Council on Radiation Protection and Measurements. Ionizing radiation exposure
of the population of the United States: recommendations of the National Council on Radiation
Protection and Measurements. NCRP Report 160, Bethesda, Maryland, USA. 2009. 28p.
[4] BUSHBERG, J. T.; SEIBERT, J. A.; LEIDHOLDT, E. M.; BOONE, J. M. The essential
physics of medical imaging, 3th ed., Philadelphia: Lippincott Williams & Wilkins, 2011, p.
1048.
[5] CURRY, T.S.; DOWDEY. J.E., MURRY, R.C. Christensen's physics of diagnostic
radiology, 4th, Philadelphia: Lea & Febiger, 1990, p. 522.

Author et al. ● Braz. J. Rad. Sci. ● 20xx 14
ISSN: 2319-0612
Accepted: 2020-08-26
[6] HUHN, A.; VARGAS M. A. O. Radiological protection plan and ethical responsibility.
Brazilian Journal of Radiation Sciences, v. 4 (1), p. 1-7, 2016. Available from:
<http://www.bjrs.org.br/revista/index.php/REVISTA/article/view/184.2016>.
[7] AMIS, E. S. J. R.; BUTLER, P. F.; APPLEGATE, K. E. American College of Radiology
white paper on radiation dose in medicine. Journal of the American College of Radiology,
v. 4(5), p. 272-84, 2007.
[8] DE JONG P. A.; MAYO J. R.; GOLMOHAMMADI K. Estimation of cancer mortality
associated with repetitive computed tomography scanning. American Journal of
Respiratory and Critical Care Medicine, v. 173(2), p. 199-203, 2006.
[9] DATASUS.GOV.BR. Departamento de Informática do Sistema Único de Saúde. 2019.
Disponível em: <http://www2.datasus.gov.br/DATASUS/index.php?area=02>.
[10] REHANI. CIRAJ-BJELAC. CT Dose perspectives and initiatives of the IAEA, In Radiation
Dose from Multidetector CT. Springer. p. 495-508, 2011.
[11] ICRP - International Commission on Radiological Protection. Recommendations of the
International Commission on Radiological Protection. ICRP Publication 103. Ann
ICRP, v. 37(2.4), 2007. 2p.
[12] PROTECTION, Safety in Medicine. ICRP publication, 1996, v. 73, p. 1-47, 1996.
[13] MCCOLLOUGH. Strategies for reducing radiation dose in CT. Radiologic Clinics, v. 47(1),
p. 27-40, 2009.
[14] SHRIMPTON, P. C.; JANSEN, J. T. M.; HARRISON, J. D. Updated estimates of typical
effective doses for common CT examinations in the UK following the 2011 national review.
The British Journal of Radiology, v. 89(1057), p. 20150346, 2016.
[15] METTLER, F. A. J. R.; HUDA, W.; YOSHIZUMI, T. T.; MAHESH, M. Effective doses in
radiology and diagnostic nuclear medicine: a catalog. Radiology, v.248(1), p.254-263, 2008.
[16] SHRIMPTON. Doses from computed tomography (CT) examinations in the UK-2003 review.
NRPB Chilton. Vol. 67. 2005.

Author et al. ● Braz. J. Rad. Sci. ● 20xx 15
ISSN: 2319-0612
Accepted: 2020-08-26
[17] CHRISTNER, J. A.; KOFLER, J. M.; MCCOLLOUGH, C.H. Estimating effective dose for
CT using dose– length product compared with using organ doses: consequences of adopting
International Commission on Radiological Protection Publication 103 or dual-energy
scanning. American Journal of Roentgenology, v. 194(4), p. 881-9, 2010.
[18] BAKER. ACR Appropriateness Criteria® acute pancreatitis. Ultrasound quarterly, v 30(4),
p. 267-73, 2014.
[19] RODRIGUES, S. I.; ABRANTES, A. F.; RIBEIRO, L. T.; ALMEIDA, R. P. P. Estudo da
dose nos exames de tomografia computadorizada abdominal em um equipamento de 6 cortes.
Radiologia Brasileira, v. 45(6), p. 326-33, 2012.
[20] ABILIO, V. HCFMB implanta primeiro sistema de indicador de dose radiológica do
Brasil. 2019. Disponível em: <http://www.hcfmb.unesp.br/hcfmb-implanta-primeiro-
sistema-de- indicador-de-dose-radiologica-do-brasil/>.
[21] AGÊNCIA NACIONAL DE VIGILÂNCIA SANITÁRIA. Instrução Normativa n° 55, de 20
de dezembro de 2019, Diário Oficial da União, Edição: 249, Seção: 1, Página: 129,
Publicado em: 26/12/2019.
[22] AGÊNCIA NACIONAL DE VIGILÂNCIA SANITÁRIA. Resolução - RDC nº 330, de 20 de
dezembro de 2019, Diário Oficial da União, Edição: 249, Seção: 1, Página: 92, Publicado
em: 26/12/2019.

BJRS
BRAZILIAN JOURNAL
OF
RADIATION SCIENCES 08-03 (2020) 01-10
ISSN: 2319-0612 Accepted: 2020-09-15
Determination of dose rate during the inspection of
spent fuel element in the testing cell
Abdelhady a A.
a Reactors Dept., Nuclear Research Center, Atomic Energy Authority,13759 Cairo, Egypt
ABSTRACT
Testing cell is a multi-purpose shielded hot cell in open pool type reactor and one of its uses is inspecting the
irradiated fuel element. Inspecting the irradiated fuel element may rise the radiation dose around the testing cell
to level might be higher than the permissible limit. So, evaluating the predicted dose rate around the cell must be
determined before the inspecting process. The dose rate level depends mainly on the decay time of the irradiated
fuel element and the fuel burn-up. In this regard, a MCNP5 model was performed to simulate the irradiated fuel
element inside the testing cell to estimate the radiation dose level around it during the inspection process. The
dose rate would be estimated for different fuel burn-up and decay times. The calculations determine the minimal
decay times required to manipulate the irradiated fuel element for burn-up ranging between 18745 and 101224.4
MWD/TU.
Keywords: MCNP code; spent fuel inspection; dose rate; hot cell; ORIGEN2.1 code; open pool reactor.

Abdelhady A. ● Braz. J. Rad. Sci. ● 2020 2
1. INTRODUCTION
Testing cell is a multi-purpose hot cell in open pool type reactor and one of its important
purposes is inspecting the spent fuel elements due to the high radioactivity associated with them [1].
Testing cell has heavy concrete walls that provided with lead glass window and tele manipulators to
enable the worker to manipulate the irradiated fuel element (FE) during the inspection process.
The inspected fuel element is removed from the core and transported from the main pool to the
testing cell via transfer channels, as shown in figure 1, to avoid increasing the dose rate level in the
reactor hall.
Figure 1: Transporting the irradiated FE from the core to the testing cell.
Inspecting fuel element may result in rising the radiation dose rate level around the testing cell
depending on its burn-up (BU) and decay time. So, a previous calculation must be carried out to
ensure the radiological safety for the workers who located around the cell during the inspection
process.
The calculation would introduce a relationship between the dose rate and the decay time of the
inspected fuel element for different burn-up. This relationship would determine the corresponding

Abdelhady A. ● Braz. J. Rad. Sci. ● 2020 3
decay times that verify the radiological safety condition for the worker located outside the cell.
MCNP5 [2] model was performed to simulate the irradiated fuel element inside the hot cell to carry
out the relationship between the dose rate outside the cell with the decay time for different burn up
of FE.
2. MATERIALS AND METHODS
2.1. Feature of the testing cell and the fuel element
The reactor is open pool type of 22 MW power and fueled by flat-plate material testing reactor
(MTR) fuel. It contains main and auxiliary pools connected with transfer channel to enable
transporting radioactive materials and spent fuel elements between them under water surface. The
core was built on a supporting grid having 6×5 positions available for placing fuel element or
irradiation boxes. The core consists of 29 fuel elements and cobalt device box. Each fuel element
has 19 aluminum fuel plates; each plate has a meat made by a dispersion of U3O8 particles with an
enrichment of 19.7% (in weight of 235U) in a matrix of pure aluminum [3]. The plate active zone is
80 cm×6.4 cm with a meat and cladding aluminum thicknesses of 0.7 and 0.4 mm respectively.
The testing cell is located at the second floor beside the auxiliary pool as shown in figure 1. It is
connected to the auxiliary pool by means of a conduct provided with a sample holding cart. The
testing cell, as shown in figure 2, has dimensions of 2.5 × 2.5 m and a height of 3 m. The shielding
walls of the testing cell are made of heavy concrete of 80 cm thickness with a lead glass view
window of 45.7 cm wide by 45.7 cm height and a thickness equivalent to 80 cm of heavy concrete.
The testing cell is provided with an iron shielded door of 30 cm thickness for access of personnel
and containers. It is provided with master and slave tele manipulators to enable the correct handling
of fuel elements, as well as to accomplish the tasks that carried out in this cell [1]. Figure 2 shows a
layout for the spent FE located vertically above the working table at distance of 100 cm from the
lead glass window during the inspection process.

Abdelhady A. ● Braz. J. Rad. Sci. ● 2020 4
Figure 2: a cross section of the testing cell shows the FE during the inspection.
2. 2. Photons spectrum of the spent fuel element
ORIGEN2.1 [4] is a time dependent source term code was developed to determine the nuclides
concentrations considering radioactive disintegration and neutron absorption (capture and fission)
processes. The fission products and actinides photons source is one of the outputs of the
ORIGEN2.1 code. The photons spectrum was determined for FE (235U mass of 404.7 g) that
irradiating to a power of 0.759 MW for a time ranging between 50 to 270 days equivalent to BU
ranging between 18745 to 101224.4 MWD/TU. The cross sections for the fission products nuclides
were obtained from ENDF/B-IV and the cross sections for the actinides and structural material
elements were obtained from ENDF/B-V. The photons spectrum was determined using the
ORIGEN2.1 18-group photon energy structure for decay times ranging to 5 years after irradiation as
shown in figure 3. Then, the photon spectrum source data was introduced into an MCNP5 model to
calculate the dose rate. The neutron source, that was contributed from spontaneous fission and
(alpha,n) reaction, has intensity of 106 n/s per spent FE.

Abdelhady A. ● Braz. J. Rad. Sci. ● 2020 5
Figure 3: Photon spectrums at different FE burn-up.
2.3. MCNP model of the testing cell and the spent fuel element
As shown in figure 4, MCNP5 code [2] was used to simulate the testing cell and the spent fuel
element during the inspection process, implementing point detector tallies in the four directions
around the cell, and applying ICRP-74 [5] gamma rays flux-to-dose conversion coefficients to
determine the effective dose rate. ICRP-74 was used instead of the updated ICRP-116 because there
is no significant difference in the gamma conversion coefficient values between them. The testing
cell was represented by rectangular parallelepiped surfaces and the SDEF, SI, and SP cards were

Abdelhady A. ● Braz. J. Rad. Sci. ● 2020 6
used together to define a volumetric source inside the testing cell. The source is defined as a
rectangular parallelepiped with dimensions, of 8 cm×8 cm×80 cm, inside the testing cell. The
source is isotropic with a tabulated energy distribution resulting from the ORIGEN2.1 code
calculations. The densities of air, heavy concrete, lead glass, and iron are 0.00121, 3.2, 6.22, and
7.86 g/cm3 respectively. The compositions of heavy concrete, iron, lead glass, and air are shown in
table 1.
Table 1: the compositions of heavy concrete, iron, lead glass, and air.
Element
atomic density
(at/b.cm)
Weight fraction
(%)
Weight fraction
(%)
Weight fraction
(%)
Heavy concrete Iron Lead glass Air
H 9.893 x 10-03 --- --- ---
O 4.564 x 10-02 --- 15.6453 23.1781
N --- --- --- 75.5267
Mg 6.242 x 10-05 2.14 --- ---
Ca 1.178 x 10-03 0.29 --- ---
Fe 1.448 x 10-02 94.052 --- ---
Si 1.643 x 10-03 0.046 8.0866 ---
Al 4.438 x 10-04 0.051 --- ---
S 2.002 x 10-05 0.011 --- ---
Ar --- --- --- 1.2827
Ti 7.717 x 10-03 --- 0.8092 ---
C 9.280 x 10-06 3.41 --- 0.0124
As --- --- 0.2651 ---
Pb --- --- 75.1938 ---
The F5 tallies were modified by ICRP-74 [5] gamma rays flux-to-dose conversion dose function
and a FM multiplier card representing the total photon intensity of the spent FE was used to
determine the dose rates. The spent FE would be located vertically at a distance of 100 cm from the
lead glass window.
Because the testing cell has shielded with heavy concrete (hydrogenous material) of 80 cm
thickness and the aforementioned neutron intensity from the spent FE is 106 n/s, the neutron flux
would be attenuated before reaching the outer surface of the cell depending on previous
calculations. So, the neutron dose calculation was ignored to avoid the waste of time.

Abdelhady A. ● Braz. J. Rad. Sci. ● 2020 7
(X-Y) cross section of the testing cell and the fuel
element.
(Y-Z) cross section of the testing cell and the fuel
element.
Figure 4: MCNP model of the inspected FE inside the testing cell.
RESULTS AND DISCUSSION
All the dose rates calculations were of highest accuracy required for proper MCNP code results.
Dose rate was calculated for spent FE with the maximum discharge of burn-up (270 days) because
it represents the majority of the spent FEs. Figure 5 shows the dose rate distributions versus the
decay time for the four directions around the testing cell. The horizontal line represents the
permissible dose rate limit (10 μSv/h) derived from the annual permissible dose for the worker (20
mSv/yr) as referenced in [6]. The intersecting points between the dose rate distribution curves and
the horizontal line represent the minimal decay times for each direction. The minimal decay times
would be 270, 300, 720, and 1800 d for the following directions; in front of the cell window; in the
west of the cell; in the east of the cell; and in front of the iron door of the cell.
Since the worker, who stands in front of the cell window, would spend a proper time to
manipulate with the inspected fuel element, the dose rate in this location must be carried out as a
function of decay time for different burn-up. Figure 6 shows a relationship between the dose rates,
in front of lead glass window, with the decay time for different FE burn-up. The intersecting points

Abdelhady A. ● Braz. J. Rad. Sci. ● 2020 8
between the dose rate distribution curves and the horizontal line, in figure 6, would introduce the
minimal decay times that verifying the permissible dose rate limit. It is shown that the minimal
decay times would be 120, 150, 210, 240, and 270 days for BU of 18745, 37490, 56235, 74981, and
101224.4 MWD/TU respectively.
200 400 600 800 1000 1200 1400 1600 1800
1E-6
1E-5
1E-4
1E-3
in front of window
in front of the door
in the east side of the cell
in the west side of the cell
permissible dose rate limit
Dose
rat
e, S
v/h
Decay time, days
Minimal decay times for each position
Figure 5: dose rate around the testing cell versus decay time for FE
of the maximum BU of discharge.

Abdelhady A. ● Braz. J. Rad. Sci. ● 2020 9
Figure 6: dose rate in front of the cell window versus decay time for different BU of FE.
3. CONCLUSIONS
Ensuring the radiological safety condition for the worker located outside the testing cell during
inspection of irradiated fuel element is a priority principle. So, the aim of this study was determined
a relationship between the irradiated FE activity (representing in decay time and burn-up) and the
predicted dose rate around the cell. The relationship was developed in order to determine the
minimum decay time, that verifying the radiological permissible limit for the inspector, as a
function of FE burn-up as presented in the following table:

Abdelhady A. ● Braz. J. Rad. Sci. ● 2020 10
Table 2: Minimum decay time as a function of FE burn-up
BU of FE
(MWD/TU)
Decay time
(days)
18745 120
37490 150
56235 210
74981 240
101224.4 270
REFERENCES
[1] ABDELHADY, A.; Determination of the maximum individual dose exposure resulting from
a hypothetical LEU plate-melt accident. Ann. Nucl. Energy 56, 189–193, 2013.
[2] X-5 MONTE CARLO TEAM; MCNP- A General Monte Carlo N-Particle Transport Code,
Version 5, Vol. 1 & 2, LANL, 2003.
[3] ABDELHADY, A. Radiological effect of cask‑drop accident in open‑pool spent fuel storage,
Radiation Protection and Environment | Volume 41 | Issue 4 | October-December, 2018.
[4] CROFF, A. G.; A User's manual for the ORIGEN2 computer code," ORNL/TM-7175, Oak
Ridge National Laboratory, Oak Ridge, TN, 1980.
[5] ICRP (International Committee on Radiological Protection); Conversion coefficients for use in
radiological protection against external radiation. Report 74, Annals of the ICRP, volume 26,
number 3, Pergamon Press, Oxford, England, 1997.
[6] ICRP (International Commission on Radiation Protection); Recommendations of the Interna
tional Commission on Radiation Protection, Pergamon Press, Oxford, England, ICRP Publica
tion 60, 1991.

BJRS
BRAZILIAN JOURNAL
OF
RADIATION SCIENCES 08-03 (2020) 01-16
ISSN: 2319-0612 Accepted: 2020-07-17
Irradiação de alimentos no Brasil: revisão histórica,
situação atual e desafios futuros
Levya,b D., Sordia G.M.A.A., Villavicencioa A.L.C.H.
a Instituto de Pesquisas Energética e Nucleares, São Paulo, Brasil
b Omiccron Tecnologia e Informação LTDA, Atibaia, Brasil
RESUMO
O presente artigo apresenta um panorama histórico da evolução do processo de irradiação de alimentos no
Brasil, analisando questões regulatórias nacionais, técnicas utilizadas e aportes nos cenários social, sanitário e
econômico. Esta revisão tem por objetivo fornecer à comunidade científica uma perspectiva abrangente sobre a
atual situação da irradiação de alimentos no Brasil, proporcionando novas reflexões sobre eventos passados,
limitações atuais e possibilidades futuras. São analisados e discutidos atuais fatores que limitam uma mais ampla
utilização da irradiação de alimentos no país, dentre os quais, a carência de irradiadores que possam atender às
distintas regiões do país. Finalmente, o artigo apresenta a equivocada percepção de risco por parte da população
e a necessidade de ações para impulsionar a aceitação pública, dentre as quais, o desenvolvimento de programas
de comunicação e informação junto ao público leigo que desconhece as contribuições das aplicações pacíficas da
tecnologia nuclear.
Keywords: tecnologia nuclear, irradiação de alimentos, aceitação pública.

Levy et al. ● Braz. J. Rad. Sci. ● 2020 2
ABSTRACT
This article presents a historical overview of the evolution of the food irradiation process in Brazil, analyzing
national regulatory issues, techniques used and contributions in the social, health and economic scenarios. This
review aims to provide the scientific community a comprehensive perspective on the current situation of food
irradiation in Brazil, providing new reflections on past events, current limitations and future possibilities.
Current factors which limit the wider use of food irradiation throughout the country are analyzed and discussed,
including the lack of irradiators to serve the different regions of the country. Finally, the article presents the
mistaken public perception of risk and the need for actions to boost public acceptance, including the
development of communication and information programs for the population, that most often seem to be
unaware of the beneficial applications of nuclear technology.
Keywords: nuclear technology, food irradiation, public acceptance
INTRODUÇÃO
O Brasil é um grande produtor e exportador de alimentos: soja, açúcar, café, carne de frango,
carne bovina e frutas estão entre os principais produtos exportados. Entretanto, apesar da
capacidade de produção de alimentos em grande quantidade, uma parcela substancial da população
brasileira ainda enfrenta questões de fome, insegurança alimentar e desnutrição [1]. A questão do
suprimento alimentar com quantidade, qualidade nutricional e segurança não se deve à quantidade
de alimentos produzidos no país, mas sim ao baixo poder aquisitivo de grande parte da população
brasileira. É sabido que, da agricultura à mesa do consumidor, grande parte dos alimentos é perdida
nos processos de pós-colheita, transporte, armazenagem e comercialização, devido à deterioração
dos produtos oferecidos [2]. Esses fatores contribuem para diminuição da oferta e acréscimo do
preço dos produtos alimentares no mercado interno. A questão da pobreza não apenas leva grande
parte da população à insuficiência da alimentação, como também à aquisição de alimentos em
condições impróprias à saúde. O combate à fome e à desnutrição são duas das principais questões
brasileiras [1]. Nesses quesitos, as técnicas nucleares despontam como alternativas viáveis para
responder à emergência esta demanda, tanto em questões econômicas quanto de saúde pública.

Levy et al. ● Braz. J. Rad. Sci. ● 2020 3
A irradiação de alimentos é uma técnica para preservação e desinfestação de alimentos,
submetidos a doses controladas de radiação para eliminação de insetos ou redução de
microrganismos que contribuem para deterioração e comprometem a segurança do alimento. Podem
ser utilizadas fontes de 60Co, 137Cs1, raios X e elétrons acelerados. O processo de irradiação não
deixa resíduos no alimento nem libera material radioativo no meio ambiente e todo o processo é
monitorado para garantir a qualidade do alimento e preservação de suas qualidades sensoriais e
nutricionais. Uma grande vantagem desta tecnologia é que pode ser realizada após o alimento já
embalado, reduzindo significativamente o risco de recontaminação durante as fases de transporte,
armazenamento e comércio dos produtos alimentícios.
O alimento não se torna radioativo, pois as doses são muito pequenas para provocar reações em
nível atômico. A radiação ionizante, sejam partículas ou ondas eletromagnéticas, possuem energia
suficiente tão somente para alterar a estrutura da matéria, na obtenção da finalidade desejada, como
inibição do brotamento, atraso no processo de maturação, desinfecção de insetos, desinfecção de
parasitas, redução da carga microbiana e redução de fungos. Grande parte dessas finalidades podem
ser obtidas com baixas doses [3], como demonstrado na TABELA 1. Importante ressaltar que, em
se tratando de irradiação de alimentos, são consideradas baixas doses aquelas até 1 kGy; médias
doses acima de 1 até 10 kGy e altas doses são aquelas acima de 10 kGy.
Tabela 1 – Doses suficientes para alcançar as finalidades almejadas
Finalidade Dose absorvida Alimento
Inibição do brotamento 0,03 a 0,12 kGy Cebola, alho, batata
Atraso na maturação 0,03 a 0,12 kGy Cenoura, banana, morango
Desinfecção de insetos 0,2 a 0,8 kGy Pêssego, maçã, manga
Desinfecção de parasitas 0,1 a 3 kGy Ostras, marisco, salmão
Redução da carga microbiana 1 a 5 kGy Carne, frango, peixe
Redução de fungos 1 a 10 kGy Café, farinha, milho
Todo o processo é empreendido de acordo com as recomendações internacionais da Agência
Internacional de Energia Atômica, assim como os padrões de segurança estabelecidos pelo Codex
Alimentarius, Organização Mundial da Saúde (OMS) e Organização das Nações Unidas para
1 Na última década as fontes de césio para fins de irradiação de alimentos em escala industrial foi, aos poucos, caindo em desuso. A escolha tem sido preferencialmente por fontes de cobalto e, atualmente, há forte tendência para a escolha da irradiação por raios X, produzidos, por exemplo, nos modernos Rodotrons.

Levy et al. ● Braz. J. Rad. Sci. ● 2020 4
Agricultura e Alimentação (FAO), que estabelecem normas internacionais e fornecem os padrões de
Boas Práticas e Avaliação de Segurança e Eficácia. No Brasil, os órgãos competentes para
regulamentação e inspeção dos alimentos são: Agência Nacional de Vigilância Sanitária (ANVISA)
e Ministério da Agricultura, Pecuária e Abastecimento (MAPA). A irradiação de alimentos é
devidamente regulamentada no Brasil desde a década de 60, por meio de leis, decretos e normas
emitidos por diversas entidades. Nas últimas décadas os avanços foram inúmeros e atualmente a
irradiação de alimentos amplia as possibilidades de comércio entre países para controle
fitossanitário quarentenário.
Apesar das contribuições ao mercado interno (em relação ao abastecimento alimentar e à saúde
pública) e das contribuições ao comércio exterior (como medida fitossanitária no controle de pragas
quarentenárias) e apesar de ser atividade prevista em lei e devidamente regulamentada, a população
tem pouca ou nenhuma informação a respeito. O presente artigo tem por objetivo fornecer uma
perspectiva ampla e abrangente sobre a irradiação de alimentos no Brasil, proporcionando novas
reflexões sobre eventos passados, limitações atuais e possibilidades futuras.
1. REVISÃO HISTÓRICA
1.1. Histórico da legislação, leis, normas, decretos e resoluções no Brasil
A técnica da irradiação de alimentos foi introduzida na legislação sanitária do Brasil desde a dé-
cada de 60 [4], no Decreto-Lei n° 986/PR, de 21/10/1969, instituído pelos Ministros da Marinha de
Guerra, do Exército e da Aeronáutica Militar, tendo como objetivo a defesa e a proteção da saúde
individual ou coletiva, no tocante a alimentos, desde a sua obtenção até o seu consumo, em todo o
território nacional. Já nesse ato legal, a irradiação de alimentos é contemplada em duas instâncias:
(1) sua definição, finalidades e a instituição do Ministério da Saúde como órgão competente para
elaboração de normas; e (2) indicação na rotulagem, conforme consta em seu art. 19:
“Os rótulos dos alimentos enriquecidos e dos alimentos dietéticos e de alimentos irradiados de-
verão trazer a respectiva indicação em caracteres facilmente legíveis.”
Em 1973, é publicado o decreto presidencial n° 72718, que estabelece normas gerais sobre irra-
diação de alimentos no Brasil [5]. O decreto regulamenta elaboração, armazenamento, transporte,

Levy et al. ● Braz. J. Rad. Sci. ● 2020 5
distribuição, importação, exportação e exposição à venda ou entrega ao consumo de alimentos irra-
diados. O ato legal legitima e oficializa a utilização da técnica de irradiação, explicitando o cuidado
e a seriedade com a saúde do cidadão, como exemplificado abaixo:
• Art. 3.º Poderão ser utilizadas nos alimentos as irradiações ionizantes em geral, cuja energia
seja inferior ao limiar das reações nucleares que poderiam induzir radioatividade no material
irradiado.
• Art. 5.º Somente será autorizado a irradiação de alimentos ou grupos de alimentos sobre os
quais se disponha de trabalhos técnicos e científicos, desenvolvidos por instituições de pes-
quisa, nacionais ou internacionais, devidamente aprovados pela Comissão Nacional de Ener-
gia Nuclear (...).
• Art. 8.º Os alimentos irradiados, quando expostos à venda, ou entregues ao consumo deverão
trazer na respectiva embalagem e nos cartazes afixados nos locais de venda ou entrega ao
consumo a indicação: "Alimento Tratado por Processo de Irradiação" e a declaração: "Este
produto foi processado em estabelecimento sob controle da Comissão Nacional de Energia
Nuclear".
Este Decreto, emitido pela Presidência da República em 1973, não sofre alterações ao longo dos
anos e continua vigente. Sete anos depois, a Comissão Deliberativa da Comissão Nacional de Ener-
gia Nuclear – CNEN, emite a Resolução n° 5/CNEN, de 10/09/1980 que aprova, em caráter expe-
rimental o Anteprojeto da Norma "Irradiação de Alimentos" [6]. O objetivo desta Norma é estabe-
lecer as condições para o funcionamento das instalações destinadas à irradiação de alimentos, de
acordo com o Decreto nº 72718, de 1973. A Norma trata, pois, da Licença para Construção de insta-
lação destinada à irradiação de alimentos, Autorização para Operação, implicações das pessoas jurí-
dicas responsáveis e fontes de radiação permitidas, a saber: cobalto-60; césio-137; aceleradores de
elétrons com energia não-superior a 10 MeV; e aparelhos emissores de raios X com energia não-
superior a 5 MeV. No mais, a Norma contempla para cada fonte de radiação usada, os registros de
irradiação, e indicações detalhadas para cada lote de alimentos processado (números de série, data,
natureza do alimento, controles e medidas, dentre outros requisitos). Fica ainda estabelecido que a
CNEN procederá as inspeções na instalação, durante as fases de construção e de operação. A Porta-
ria n° 59 de 2 de junho de 1998 cancela o anteprojeto que trata especificamente do funcionamento

Levy et al. ● Braz. J. Rad. Sci. ● 2020 6
das instalações destinadas à irradiação de alimentos e o tema passa a ser tratado na CNEN-NE-6 02,
que dispõe sobre licenciamento de instalações radiativas [7].
Em 1985, a Portaria n° 9/SVS, de 08/03/1985, relativa às áreas de alimentação e meio ambiente,
aprova a relação de alimentos cuja irradiação é autorizada, indicando para cada caso: o tipo, nível e
dose média e de energia de radiação que pode ser empregada, o objetivo da irradiação e o tratamen-
to prévio, conjunto ou posterior. O documento é emitido pela Divisão Nacional de Vigilância Sani-
tária de Alimentos - DINAL, da Secretaria Nacional de Vigilância Sanitária do Ministério da Saúde
[8]. São discutidos e aprovados neste documento os Requisitos Gerais do Processo, os requisitos
tecnológicos, requisitos de qualidade, embalagem, armazenamento, rotulagem e de comercialização.
Apesar de constar nas Normas Gerais uma dose média global absorvida por um alimento submetido
a um processo de irradiação não superior a 10 kGy, visando assegurar a inocuidade do alimento
irradiado, sob os pontos de vistas toxicológico, nutricional e microbiológico, em seu ANEXO II, a
Portaria estabelece uma relação de alimentos que podem ser submetidos a tratamento por irradiação,
detalhando objetivos, tipo e nível de energia e dose média aceitável em cada caso. Dentre muitos
exemplos, podemos tomar a cebola (Alliam cepa L.) que, segundo a publicação, poderia ser irradia-
da por raios gama de 60Co e 137Cs, a uma dose média de 0,15 kGy, com o objetivo de inibir a germi-
nação durante o armazenamento. A lista de alimentos indicados para irradiação é vasta e para cada
alimento, a publicação recomenda a observação das boas práticas e atenção às mesmas precauções
higiênicas, condições de manipulação e tratamento que são adotadas para os produtos não irradia-
dos. Este ato legal, entretanto, não está em vigência, tendo sido revogado e substituído pela Resolu-
ção n° 21/ANVISA, de 26/01/2001 [9].
Efetivamente, a partir do ano 2000, várias são as publicações que trataram da irradiação de ali-
mentos, em seus diversos aspectos: requisitos gerais, trabalhadores autorizados, instalações e obje-
tivos diferentes daqueles inicialmente propostos. Precisamente no ano 2000, a ANVISA lança a
Consulta Pública n° 83/ANVISA, de 18/10/2000 visando aprovar o Regulamento Técnico para Irra-
diação de Alimentos considerando o alimento, já embalado ou a granel, submetido a doses contro-
ladas de radiação ionizante, com finalidades sanitária, fitossanitária e/ou tecnológica [10]. A Reso-
lução, que em seu artigo Art. 5º revoga a Portaria nº 9 - DINAL/MS, de 8 de março de 1985 e a
Portaria nº 30, de 25 de setembro de 1989 [8] –[11], considera:

Levy et al. ● Braz. J. Rad. Sci. ● 2020 7
• a necessidade de constante aperfeiçoamento das ações de controle sanitário na área de alimen-
tos visando a proteção à saúde da população;
• a necessidade de atualizar, harmonizar e consolidar as normas e regulamentos técnicos relaci-
onados a alimentos;
• os estudos atualizados sobre aplicação da irradiação no tratamento sanitário de alimentos.
A nova resolução reafirma e completa as orientações sobre instalações licenciadas e autoridades
competentes (em âmbito municipal, estadual e federal), assim como a Comissão Nacional de Ener-
gia Nuclear, que autoriza a atividade, e o órgão competente do Ministério da Saúde, responsável
pelo cadastramento. A publicação reforça ainda as boas práticas de irradiação, segurança radiológi-
ca, eficácia, capacitação do trabalhador e adequada comunicação de que o alimento foi irradiado.
Nesse quesito, conforme artigo 5º, a indústria que irradiar alimentos deve fazer constar ou garantir
que conste a indicação de que o alimento foi tratado pelo processo de irradiação nas Notas Fiscais
(alimentos a granel), Notas Fiscais e embalagens (alimentos já embalados), e cartaz ou placa com a
informação: "ALIMENTO TRATADO POR PROCESSO DE IRRADIAÇÃO" (nos locais de expo-
sição e venda de produtos a granel irradiados). Quanto às fontes de radiação e suas especificidades,
permanecem tal qual publicadas no Decreto de 1973 e Portaria de 1985. Quanto ao tipo de alimento,
objetivos da irradiação e doses recomendadas, a ANVISA não elabora orientações específicas, co-
mo apresentava o ANEXO II da DINAL n 9. A orientação, de caráter geral, se apresenta em seu
item 4.3 da seguinte forma:
“Qualquer alimento poderá ser tratado por radiação desde que sejam observadas as seguintes
condições:
a. A dose mínima absorvida deve ser suficiente para alcançar a finalidade pretendida;
b. A dose máxima absorvida deve ser inferior àquela que comprometeria as propriedades fun-
cionais e ou os atributos sensoriais do alimento.”
Essas foram as bases para a aprovação e publicação da Resolução-RDC Nº 21, que foi finalmen-
te emitida em 26 de janeiro de 2001 [9]. Dadas as considerações que nortearam a revogação da Por-
taria nº 9 - DINAL/MS, de 8 de março de 1985 e a elaboração da RDC 21, é compreensível que os
relatores se abstiveram de informações detalhadas que poderiam cair em desuso ou serem rapida-
mente suplantadas por novos resultados de pesquisas e aplicações das radiações ionizantes. É sabido

Levy et al. ● Braz. J. Rad. Sci. ● 2020 8
que no mundo globalizado as pesquisas e inovações tecnológicas avançam a passos largos, apon-
tando novos caminhos, possibilidades e aplicações. Exemplo disso é a Resolução n° 9/CONTER, de
25/04/2001 que, apesar de não mais vigente, de não se relacionar nem ser citada por nenhum outro
documento, merece um olhar, por sua importância na época [12]. A referida Resolução institui e
normatiza as atribuições exclusivas do Técnico e Tecnólogo em Radiologia, considerando justa-
mente o avanço da tecnologia radiológica nos diversos setores da sua área na irradiação de Alimen-
tos e Esterilização de Material. Ora, o foco no trabalhador vem ao encontro das recomendações da
RDC n° 21/ANVISA, de 26/01/2001, que além das especificidades de técnicas e de processos,
aborda a questão da capacitação e segurança radiológica [9]. Caberia a esse profissional, por exem-
plo, acionar e operar os equipamentos emissores de radiação; delimitar e sinalizar áreas restritas;
exigir e fiscalizar o uso de dosímetros e EPI'S; monitorar com medidores portáteis; e verificar as
condições de funcionamento dos equipamentos e fontes radioativas, dentre outras atribuições.
Outra evolução importante nos objetivos da técnica da irradiação de alimentos pode ser vista na
Portaria n° 28/SDA, de 14/04/2004, que submete à consulta pública os procedimentos específicos
para uso da radiação ionizante como tratamento quarentenário e fitossanitário, como tratamento
único ou em combinação com outros tratamentos em operações de embalagem e em produtos a gra-
nel ou embalados, com o objetivo de prevenir a introdução ou disseminação de pragas, mediante a
obtenção de respostas de mortandade, prevenção do desenvolvimento saudável, inabilidade repro-
dutiva e inativação das mesmas e desvitalização de vegetais [13]. Este documento se relaciona com
a Lei nº 7802, de 11/07/1989 e o Decreto nº 4074, de 04/01/2002, ambas com foco na regulamenta-
ção, inspeção e fiscalização de agrotóxicos, seus componentes e afins [14] - [15] . A Portaria Nº 28,
DE 14 de abril de 2004, emitida pelo Ministério da Agricultura, Pecuária e Abastecimento [16],
trata então do regulamento para habilitação e credenciamento de estabelecimentos para a realização
de tratamentos quarentenários e fitossanitários, no trânsito de vegetais e suas partes, mediante a
utilização de processos que fazem uso de técnicas de irradiação com radiação ionizante. Diferente-
mente da ANVISA que opta por publicações de caráter mais abrangente, o MAPA é específico e,
em seu ANEXO V descreve as pragas alvo e as respectivas dosagens autorizadas. Finalmente, em
2011, é publicada no Diário Oficial da União a Instrução Normativa Nº 9, vigente até a presente
data. Este ato legal adota as diretrizes da Norma Internacional para Medidas Fitossanitárias como

Levy et al. ● Braz. J. Rad. Sci. ● 2020 9
orientação técnica para o uso da irradiação como medida fitossanitária, com o objetivo de prevenir a
introdução ou disseminação de pragas quarentenárias regulamentadas no território brasileiro.
A TABELA 2 apresenta um resumo dos atos legais emitidos no Brasil que tratam sobre a irradi-
ação de alimentos e que permanecem vigentes.
Tabela 2: Atos legais que permanecem em vigor
Ato legal Origem Data de publicação Ementa Situação
Decreto-Lei n° 986/PR
Poder Executivo 21/10/1969 Institui normas bási-cas sobre alimentos.
Não consta revoga-ção expressa
Decreto n° 72.718 Poder Executivo 29/08/1973 Estabelece normas gerais sobre irradia-ção de alimentos
Não consta revoga-ção expressa
Resolução RDC n° 21 Agência Nacional de Vigilância Sanitária
26/01/2001 Aprova o Regula-mento Técnico para Irradiação de Ali-mentos
Vigente
Instrução Normativa Nº 9
Ministério da Agri-cultura, Pecuária e Abastecimento
24/02/2011 Medidas fitossanitá-rias
Vigente
1.2. Escolha das fontes para a irradiação de alimentos
A legislação regulamenta e corrobora os aportes da irradiação de alimentos em seus diversos as-
pectos, a saber: preservação, saúde pública e tratamentos quarentenários e fitossanitários. Entretan-
to, se a técnica não é amplamente utilizada em nosso país, uma das principais causas é o desconhe-
cimento, tanto por parte da população, como dos interessados envolvidos na produção e comércio
de alimentos. As leis, decretos e normas supramencionados repetem a cada vez as fontes de radia-
ção permitidas, a saber: 60Co; 137Cs; aceleradores de elétrons com energia não-superior a 10 MeV; e
aparelhos emissores de raios X com energia não-superior a 5 MeV. Essas orientações, estabelecidas,
porém não explicadas, suscitam dúvidas e incertezas.
Com efeito, duas das principais radiações utilizadas são os raios X e gama, isto é, radiação ele-
tromagnética como a luz solar, porém com comprimento de onda muito menor e, portanto, com
muito mais energia. A radiação eletromagnética é uma escolha porque não possui a capacidade de
produzir reações nucleares e, portanto, não altera as propriedades físicas e químicas do produto ir-
radiado. A quantidade de radiação que incide e é absorvida por um alimento tem um limite, pois

Levy et al. ● Braz. J. Rad. Sci. ● 2020 10
assim como a radiação solar recebida em excesso por um indivíduo produz queimaduras de primei-
ro, segundo e terceiro grau, a radiação em quantidade excessiva pode modificar as propriedades do
alimento de maneira não desejada. Por esta razão, existem determinados intervalos de quantidades
de radiação para cada tipo de alimento, em virtude de suas características naturais, e também da
finalidade almejada.
No caso da irradiação de alimentos para a redução da carga microbiana, como é o caso das es-
peciarias particularmente, são irradiados grandes volumes com as especiarias já embaladas para
transporte e os volumes chegam a medir 1 m3, dependendo do tipo de equipamento utilizado para o
processo de irradiação. Nesses casos em que os volumes são grandes, a densidade é considerada
como a da água, igual a 1. A radiação gama é monoenergética na dexitação do núcleo do átomo,
mas dificilmente encontramos emissores com energias próximas de 4 MeV. Por esta razão são esco-
lhas possíveis para a finalidade de irradiação de alimentos:
Cobalto-60: possui 2 raios gama com rendimento de 100% cada por dexitação do núcleo
com energias respectivamente de 1,17 MeV e 1,33 MeV e com uma meia-vida de 5,26 anos.
Césio-137: possui um raio gama de 0,66 MeV com rendimento de 100% por dexitação
do núcleo com uma meia-vida de 30 anos. Essas fontes são, entretanto, cada vez menos utilizadas
nos processos industriais de irradiação de alimentos [16].
Outra opção viável para a irradiação de alimentos são os raios X. A vantagem do uso dos raios
X é que existem aceleradores de partículas que produzem raios X de energias grandes e, portanto,
podemos chegar muito próximos dos 10 MeV, nosso limite energético de feixe de radiação útil.
Diferentemente dos raios gama, o acelerador é uma fonte de radiação que pode ser desligada, o que
alguns consideram uma vantagem. A radiação proveniente de elétrons acelerados tem baixo poder
de penetração, irradiando o alimento até alguns centímetros abaixo da superfície. O feixe de elé-
trons pode ser eficaz na irradiação de alguns tipos de alimento, como por exemplo: sementes, flores
comestíveis, hamburgueres e filés de frango. Existem diferentes tipos de aceleradores de elétrons,
dependendo de sua energia (MeV ou KeV), da sua corrente (mA) e potência (kW) que determinarão
a taxa de transferência do produto. Assim, a utilização de fonte única, ou duplas de feixes de
elétrons de 10 Mev, será definida de acordo com diferentes espessuras do produto (densidade de
área). Uma possibilidade para um futuro próximo é a utilização de aceleradores de tamanhos meno-
res e a preço mais acessível, que permitirão a utilização dos feixes de elétrons para alimentos que

Levy et al. ● Braz. J. Rad. Sci. ● 2020 11
demandam radiação com baixo poder de penetração e o aproveitamento dos raios X para finalidades
que demandam alto poder de penetração, atravessando o alimento por inteiro.
Foram muitos os avanços tecnológicos nas últimas décadas e muitos os benefícios da irradiação
de alimentos. Entretanto no Brasil, com a desinformação de produtores, indústria, comerciantes e
consumidores, a irradiação de alimentos em escala industrial ainda caminha a passos lentos.
1.3. Irradiação de alimentos para fins comerciais e industriais no Brasil
A técnica da irradiação de alimentos foi introduzida no Brasil na década de 60. Durante as dé-
cadas posteriores, as pesquisas sobre irradiação de alimentos proporcionaram avanços em escala
mundial. Desde 1974 o IPEN possui equipamentos para irradiação (tanto 60Co como acelerador de
elétrons), desenvolvendo e assessorando produtores com pesquisas e testes de seus produtos em
uma escala semi-industrial em alimentos e produtos agrícolas.
Com o transcorrer dos anos, as exigências do mercado consumidor impulsionaram o comércio
de alimentos na busca de técnicas mais saudáveis. Os novos paradigmas de cuidados à saúde cla-
mavam pela preservação e segurança do alimento, mantendo o máximo de suas características nu-
tricionais e sensoriais, com pouco ou nenhum dano em seus biocompostos naturais. Desde então, o
processamento por radiação cresce no Brasil e no mundo [18].
O primeiro irradiador comercial foi implantado em São Paulo pela EMBRARAD em 1980. A
empresa iniciou suas operações para diversos ramos da indústria, incluindo a área médica e farma-
cêutica, irradiação de alimentos e produtos para a agroindústria de alimentos. Em 1999, a EM-
BRARAD inaugurou seu segundo irradiador. Outra indústria de irradiação se estabeleceu em São
Paulo em 1999, a CBE (Companhia Brasileira de Esterilização) com um irradiador de 60Co constru-
ído com tecnologia brasileira, também com a mesma finalidade da EMBRARAD. Em 2002, inici-
ou-se a irradiação comercial com aceleradores de elétrons. Em 2015 todos irradiadores comerciais
de alimentos foram comprados pela Sterigenics, uma multinacional canadense. Até a presente data,
a Sterigenics detém o monopólio da irradiação de alimentos em escala industrial no Brasil.

Levy et al. ● Braz. J. Rad. Sci. ● 2020 12
2. DISCUSSÃO
O Brasil ainda investe em grande parte na preservação dos alimentos fazendo uso de
agroquímicos e inseticidas que sabidamente deixam resíduos nos alimentos [19]. O tratamento com
produtos químicos promove a resistência dos insetos e microrganismos patógenos, libera resíduos
no meio ambiente, podendo ainda comprometer o equilíbrio ecológico e a saúde do trabalhador. A
irradiação de alimentos apresenta vantagem em todos esses quesitos, podendo ser utilizada em
muitos casos como alternativa ou conjuntamente com outros tratamentos de medidas fitossanitárias
[16], [20]. Entretanto, no Brasil, a técnica não é amplamente utilizada.
Um primeiro ponto de discussão é a escassez de irradiadores que atendam em escala comercial
este país com dimensões continentais. O Brasil é um dos 5 maiores países do globo, o maior país da
América Latina e um dos países mais populosos do mundo. O país tem 8,5 milhões de quilômetros
quadrados, divididos geopoliticamente em 5 regiões, com 3 fusos horários e conta com 26 estados e
Distrito Federal. Como vimos, até os dias de hoje apenas uma empresa na região sudeste oferece o
serviço de irradiação de alimentos em escala industrial. Fica claro que uma única instalação não
atende às demandas de um mercado produtor espalhado nas diversas regiões do país onde, além da
grande distância entre estados, conta com um sistema de transporte predominantemente rodoviário.
Seria preciso o investimento na construção de irradiadores nos diferentes estados, para que se possa
tratar os alimentos antes de serem transportados durante dias pelos caminhões, evitando perdas
desnecessárias sobretudo durante as fases de transporte rodoviário e armazenamento. Uma
vantagem da irradiação de alimentos – em nível nacional – é que, uma vez construídas as
instalações, o custo desta técnica no longo prazo é bastante baixo, comparado ao tratamento com
agroquímicos.
Porém, há um fator complicador para a implantação da técnica de maneira ampla e efetiva: a
quase total desinformação da população, incluindo produtores, indústria, comércio e público
consumidor. Sobretudo este último, cuja percepção de risco é prejudicada por preconceitos e medos
infundados sobre as radiações, levando as pessoas a falsas conclusões, associando a radiação
ionizante a riscos ambientais, perigo à saúde ou contaminação do alimento. Com efeito, uma
pesquisa presencial realizada na capital de São Paulo, uma das maiores do país, traz resultados

Levy et al. ● Braz. J. Rad. Sci. ● 2020 13
preocupantes [21]. 55% dos entrevistados associou radiações ionizantes a guerras, contaminação,
acidentes nucleares, doenças, cânceres ou mortes. 67% dos entrevistados alegaram nunca ter visto o
símbolo da Radura e os 21% que alegaram reconhecer o símbolo, não sabiam o que representava.
No geral, os entrevistados não sabiam a diferença entre "alimentos irradiados" e "alimentos
contaminados" e confundiam “alimento irradiado” com “alimento radioativo”. Ao final da
entrevista, os entrevistados receberam uma brevíssima explicação sobre esta técnica de preservação
para eliminar insetos e reduzir microrganismos causadores de doenças. Convidados a responder
novamente sobre suas intenções de compra de alimentos irradiados, as opiniões mudaram
significativamente: 70% respondeu que compraria esses alimentos, informaria a amigos e parentes e
sugerira a compra para outras pessoas. A pesquisa é repetida a cada ano com novos respondentes e a
experiência se repete. O medo por parte da população deve-se, sobretudo, à falta de informação
acessível, confiável e cientificamente correta.
A ampla implantação da técnica da irradiação de alimentos no Brasil depende, pois, desses dois
fatores igualmente importantes: da oferta de instalações que atendam em escala industrial os
diversos estados do Brasil e de uma comunicação efetiva junto à população em todas as suas
esferas.
3. CONSIDERAÇÕES FINAIS
O Brasil é um grande produtor e exportador de alimentos, porém uma parcela substancial da
população brasileira ainda enfrenta questões de fome, insegurança alimentar e desnutrição. A
irradiação de alimentos é uma das alternativas viáveis que vem ao encontro da demanda social
brasileira de abastecimento de alimentos com quantidade e segurança, além do combate ao
desperdício. A irradiação de alimentos contribui para a redução das perdas no pós-colheita,
transporte e armazenamento, prolongando o tempo de prateleira, reduzindo o desperdício de
alimentos no mercado e na casa do consumidor. A irradiação de alimentos responde também a uma
demanda de saúde pública, como medida preventiva para a redução dos riscos causados por agentes
patogênicos causadores de surtos alimentares e danos à saúde humana. Nesse quesito, as medidas
preventivas incluem a eliminação de insetos e larvas ou redução de microrganismos indesejáveis a
níveis apropriados para o consumo humano. Responde ainda a uma demanda econômica, tornando

Levy et al. ● Braz. J. Rad. Sci. ● 2020 14
o país competitivo diante do mercado externo, uma vez que em muitos casos a irradiação de
alimentos para fins fitossanitários é uma exigência para a exportação de frutas e carnes [16], [22].
Diante de todas essas questões, a irradiação de alimentos é uma necessidade e um desafio. Se por
um lado a irradiação de alimentos pode contribuir para responder a algumas das demandas sociais,
econômicas e sanitárias do país, por outro lado isso só seria possível com a implementação de
diversas instalações radiativas em diversos estados, com a capacidade de irradiar alimentos em
escala industrial.
Para além do desenvolvimento tecnológico, é necessário ainda investir na aceitação pública,
uma vez que um dos grandes entraves em relação às técnicas nucleares é a percepção equivocada do
público leigo em relação à percepção de risco das radiações ionizantes, notadamente em relação aos
efeitos maléficos à saúde humana [23] - [24]. Pesquisas realizadas na década de 80, em diversos
países na América, África, Ásia e Europa demonstram que programas de informação e comunicação
à população influenciam a confiança no processo e as intenções de compra do consumidor e que o
envolvimento da mídia, de organismos governamentais e das agências reguladoras potencializam a
aceitação pública [25].
No Brasil, faz-se necessário um maior envolvimento da esfera pública, no sentido de rever e
completar a regulamentação, além de promover o treinamento de pessoal apto à fiscalização. A
complementação da regulamentação é essencial para conferir transparência e confiabilidade no
processo, por parte do público, do mercado de alimentos e dos processos de fiscalização. Toma-se
como exemplo a RDC n° 21/ANVISA, ainda vigente, que substitui a DINAL n° 9/SVS, suprimindo
a relação de alimentos que podem ser submetidos a tratamento por irradiação, detalhando objetivos,
tipo e nível de energia e dose média aceitável em cada caso. Hoje essa relação oficial apenas pode
ser obtida por meio de publicações internacionais [3],[8],[9]. A atuação ativa de organismos
reguladores pode fortalecer a aceitação de tecnologias inovadoras e conferir segurança ao processo.
Apenas com amplas ações de educação à população, a irradiação de alimentos deixará de
representar uma ameaça e poderá oferecer todo o seu potencial de contribuições no combate à fome
e redução do desperdício, na segurança do alimento e saúde pública, no fortalecimento do mercado
interno e do comércio exterior.

Levy et al. ● Braz. J. Rad. Sci. ● 2020 15
REFERÊNCIAS
[1] Maitra C. A review of studies examining the link between food insecurity and malnutrition.
Technical Paper. Food and Agriculture Organization of the United Nations FAO, Rome, 2018.
[2] Lana M. M. Perdas e Desperdicio de Hortaliças no Brasil In: Perdas e desperdício de alimentos:
estratégias para redução. Câmara dos Deputados, Edições Câmara, Brasília, 2018.
[3] Food and Agriculture Organization of the United Nations - FDA. 21CFR179.26 in US Code of
Federal Regulations, Title 21, Volume 3. Revised as of April 1, 2019.
[4] BRASIL. Decreto-Lei n° 986/PR, de 21 de outubro de 1969. Institui normas básicas sobre ali-
mentos.
[5] BRASIL. Decreto nº 72718, de 29 de agosto de 1973. Estabelece normas gerais sobre irradiação de
alimentos.
[6] Comissão Nacional de Energia Nuclear - CNEN. Resolução n° 5 de 10 de setembro de 1980. Apro-
va em caráter experimental a Anteprojeto da Norma Irradiação de Alimentos.
[7] Diario Oficial da União – D.O.U. Seção 1, Edição 107, 8 de junho de 1998, pp 8.
[8] Divisão Nacional de Vigilância Sanitária de Alimentos – DINAL. Portaria n° 9/SVS, de 08 de
março de 1985. Aprova a Relação de Alimentos cuja irradiação é autorizada, indicando para cada
caso: o tipo, nível e dose média de energia de radiação que pode ser empregada, o objetivo da irra-
diação e o tratamento prévio, conjunto ou posterior.
[9] Agência Nacional de Vigilância Sanitária - ANVISA. Resolução RDC nº 21, de 26 de janeiro de
2001. Aprova o Regulamento Técnico para Irradiação de Alimentos.
[10] Agência Nacional de Vigilância Sanitária – ANVISA. Consulta Pública n° 83/ANVISA, de 18 de
outubro de 2000
[11] Divisão Nacional de Vigilância Sanitária de Alimentos – DINAL. Portaria nº 30, de 25 de setembro
de 1989. Autoriza o uso de tratamento por irradiação a determinados alimentos.
[12] Conselho Nacional de Técnicos em Radiologia – CONTER. Resolução n° 9/CONTER, de 25 de
abril de 2001. Institui e normatiza as atribuições exclusivas do Técnico e Técnólogo em Radiologia
na área de Irradiação de Alimentos e Esterilização de Material.
[13] Ministério da Agricultura, Pecuária e Abastecimento – MAPA. Portaria n° 28/SDA, de 14/04/2004,
Submete à consulta pública, por um prazo de 60 (sessenta) dias, que dispõe sobre os procedimentos
específicos para uso da radiação ionizante como tratamento quarentenário e fitossanitário, como tra-
tamento único ou em combinação com outros tratamentos em operações de embalagem e em produ-
tos a granel ou embalados, com o objetivo de prevenir a introdução ou disseminação de pragas, me-
diante a obtenção de respostas de mortandade, prevenção do desenvolvimento saudável, inabilidade
reprodutiva e inativação das mesmas e desvitalização de vegetais.
[14] BRASIL. Lei nº 7802, de 11 de julho de 1989. Dispõe sobre a Pesquisa, a Experimentação, a Pro-
dução, a Embalagem e Rotulagem, o Transporte, o Armazenamento, a Comercialização, a Propa-
ganda Comercial, a Utilização, a Importação, a Exportação, o Destino Final dos Resíduos e Emba-

Levy et al. ● Braz. J. Rad. Sci. ● 2020 16
lagens, o Registro, a Classificação, o Controle, a Inspeção e a Fiscalização de Agrotóxicos, seus
Componentes e Afins, e dá outras Providências.
[15] BRASIL. Decreto nº 4074, de 04 de janeiro de 2002. Regulamenta a Lei no 7.802, de 11 de julho de
1989, que dispõe sobre a pesquisa, a experimentação, a produção, a embalagem e rotulagem, o
transporte, o armazenamento, a comercialização, a propaganda comercial, a utilização, a importa-
ção, a exportação, o destino final dos resíduos e embalagens, o registro, a classificação, o controle, a
inspeção e a fiscalização de agrotóxicos, seus componentes e afins, e dá outras providências.
[16] Ministério da Agricultura, Pecuária e Abastecimento – MAPA. Instrução Normativa Nº 9, de 24
de fevereiro de 2011. Adota as diretrizes da Norma Internacional para Medidas Fitossanitárias -
NIMF nº 18 como orientação técnica para o uso da irradiação como medida fitossanitária com o
objetivo de prevenir a introdução ou disseminação de pragas quarentenárias regulamentadas no
território brasileiro.
[17] International Atomic Energy Agency IAEA, Dosimetry for Food Irradiation in Technical Reports
Series No. 409, Viena, 2002.
[18] Kume,T., Furuta, M., Todoriki, S., Uenoyama, N., Kobayashi, Y. Status of food irradiation in the
world in Radiation Physics and Chemistry Vol.78, 222–226, 2009.
[19] Agência Nacional de Vigilância Sanitária - ANVISA. Resolução RDC nº 295, de 29 de julho de
2019. Dispõe sobre os critérios para avaliação do risco dietético decorrente da exposição humana
a resíduos de agrotóxicos, no âmbito da Anvisa, e dá outras providências.
[20] Centro de Gestão e Estudos Estratégicos (CGEE); Estudo da Cadeia de Suprimento do Programa
Nuclear Brasileiro - Panorama - Análise de oportunidades e desafios para o segmento de Irradia-
dores e Aplicações na Cadeia Produtiva do Agronegócio, Brasília, Novembro, 2010
[21] Levy, D., Sordi, G.M.A.A., Villavicencio, A. Construindo pontes entre ciência e sociedade: divul-
gação científica sobre irradiação de alimentos in Brazilian Journal of Radiation Sciences, Vol 6,
No1, 2018.
[22] Eustice R. F. Acceptance, use of food irradiation reached new levels in 2017, 2018. Avaiable
at: http://www.foodsafetynews.com/2018/01/acceptance-use-of-food-irradiation-reached-new-
levels-in-2017/#.WsklbYjwbDc Last accessed: 30 June 2020.
[23] Guimarães L. S. O desafio da aceitação pública da energia nuclear in Revista Marítima Brasilei-
ra Volume 135 n. 10/12 pp.115-116, 2015.
[24] Behrens J. H., Barcellos M. N., Frewer L. J., Nunes T. P., Landgraf M. Brazilian consumer views
on food irradiation in Innovative Food Science and Emerging Technologies, vol.10 383–389,
2009.
[25] Bruhn C. M. Consumer Attitudes and Market Response to Irradiated Food in Journal of Food
Protection, Vol. 58. No.2 Pages 175·181, 1994.

BJRS
BRAZILIAN JOURNAL
OF
RADIATION SCIENCES 08-03 (2020) 01-12
ISSN: 2319-0612 Accepted: 2020-07-17
Computer simulator for the research reactor
IPEN/MB-01
Casorlaa M., Bitellia U. D., Andradea D. A, Rochaa M. S.
aNuclear and Energy Research Institute – IPEN/CNEN, Nuclear Engineering Center – CEENG, 05508-000,
Prof. Lineu Prestes Av. 2242, São Paulo, SP, Brazil
ABSTRACT
A computer simulator for the Nuclear Research Reactor IPEN / MB-01 was developed to be a tool for teaching,
training, and recycling professionals. The simulator was developed on a SCADA platform (Supervision and Data
Acquisition System) with support calculation software, where mathematical models, and graphical interface
configurations form a friendly platform, which allows the trainee to be identified with the physical systems of the
research reactor. Simplified modeling of the main physical phenomena related to the operation of the reactor,
and the reactivity control systems, reactor cooling and reactor protection was used. The Simulator allows an
HMI (Human-Machine Interaction) by manipulating system variables and monitoring trends in quantities
during the operation of the reactor, showing an interactive tool for teaching, training and recycling for
professionals in the Nuclear Reactor IPEN / MB -01, allowing simulations of the start, power and stop
operations.
Keywords: nuclear research reactor, computational simulator, operator training.

Casorla et al. ● Braz. J. Rad. Sci. ● 2020 2
1. INTRODUCTION
The use of computer simulators has become more common in different areas of human activity.
They are more necessary the greater the complexity of systems and their interactions with operators.
The level of security required, depending on the possible consequences of the wrong operation, is a
key factor for using training and retraining policies of the operators of those systems. Clear
examples are the necessary policies for training and retraining aircraft pilots, ships, automobiles,
complex industrial plants, and, mainly, nuclear reactors.
The safety requirements of a nuclear reactor, from its planning to its decommissioning through
its operation, are reasons for much study and debate among the experts responsible for establishing
the standards that govern this industry. Several institutions are performing this function in the
world, but the International Atomic Energy Agency (IAEA) [1-3] is the main international
institution that develops and recommends such standards. In Brazil, the Brazilian Nuclear Energy
Commission (Comissão Nacional de Energia Nuclear - CNEN) is the governmental institution that
regulates nuclear activities, including nuclear reactor operation.
Nuclear reactors are highly complex systems, containing several subsystems operating under the
supervision of a hierarchical structure composed of directors, supervisors, and operators trained and
trained over a long period. Be nuclear power reactors, be research nuclear reactors, the requirements
of operation safety are also severe. Thus, the training of these operators is a key factor in ensuring
the safety of these facilities.
For nuclear research reactors, the IAEA has developed a safety guide on training and
qualification aiming for the good training of operators [4]. It includes the nature of the operational
organization, and guidance on its establishment; the recruitment process for reactor personnel,
including the required qualifications; the initial training and recycling programs of personnel and
the authorization process for individuals whose functions were an immediate relationship with
safety. According to the guide, the training methods cover, among other recommendations, training
in simulators.
The IAEA [4] reinforces the need to use computational tools that satisfactorily simulate the
behavior of the systems and subsystems of a nuclear reactor as a way of training operators under

Casorla et al. ● Braz. J. Rad. Sci. ● 2020 3
various operating conditions. The focus of that document is to present up-to-date information on
classification, selection, and use of simulators for education and training.
Besides, nuclear power reactor operators around the world make use of high-capacity computer
simulators to reproduce from those facilities. The same effort has been made for research reactor
operators around the world, coordinated by the IAEA [3].
In this context, a research project was carried out to develop a computational simulator that
reproduces the operational behavior of the IPEN/MB-01nuclear research reactor, seen at Fig. 1.
Figure 1: Control room of the Nuclear Research Reactor IPEN/MB-01.
The IPEN/MB-01 research reactor is a zero-power reactor, whose function is to allow
researchers to conduct experimental neutronic studies for comparison with theoretical calculations,
performance and characteristics of core configuration, and operator training. It is located at the
Nuclear and Energy Research Institute (IPEN-CNEN/SP), in the city of São Paulo, Brazil [12].
The IPEN/MB-01 reactor core, for which the simulator was developed, has a rectangular shape
with active dimensions of 390 x 420 x 546 mm, with an arrangement of 28 x 26 positions of fuel
rods and 48 guide tubes, intended for the insertion of control and safety rods, responsible for the
control of the reaction chain, and reactor SCRAM. For this core configuration, there are a total of
680 fuel rods with an excess reactivity of approximately 2400 pcm. The fuel rods are made up of

Casorla et al. ● Braz. J. Rad. Sci. ● 2020 4
stainless steel tubes, containing inside 52 fuel tablets of uranium dioxide (UO2) enriched at 4.3 %.
The reactor core is installed inside a tank that can have the water level controlled. Other
characteristics can be obtained in [12].
It is noteworthy that, currently, the IPEN/MB-01 reactor core was changed and it is composed
of fuel elements of the parallel plate type.
2. MATERIALS AND METHODS
2.1. Nuclear Reactors Computer Simulators
Nuclear reactor computer simulators are numerical codes (which may contain multiple codes) to
provide an insight and understanding of the plants, as well as a clear understanding of the
operational characteristics of the reactors. Simulators are educational tools for training. They seek
to provide general response characteristics of selected types of reactors systems.
Simulators can be classified into basic training and training simulators and professional
simulators. According to [6], the basic training and training simulators present general concepts,
demonstrating and exhibiting the fundamental physical processes of the reactors. These simulators
are sometimes called basic principle simulators and are available for all major types of facility
projects. They do not always faithfully reflect a particular plant. Its goal is to help users to
understand fundamental physical processes, basic operation, and layout of NPP's, general operating
systems, and procedures. They are used in primary and higher education programs, and can be as
follows:
- Simulators of partial tasks: they deal with a specific part of the plant operations (systems or
components) or specific phenomena;
- Complete simulators: describe an overview of plant behavior, focusing on the main systems,
with or without auxiliary systems.
Several part computer simulators have been developed to simulate specific part-task or full
reactors systems or to training specifi skills on operators [5-8].
Professional simulators represent complete plant components and systems and their functions,
comprehensive operation processes, or internal effects at several levels and system parameters of a

Casorla et al. ● Braz. J. Rad. Sci. ● 2020 5
specific plant, during normal, transient or accident conditions. For such characteristic, they are
intended for the specific representation of a particular type of reactor, and they are developed by
manufacturers for training their operators [4].
The main technical characteristics of a training simulator are:
- Good human-machine interface;
- Well-defined modeling scopes for each objective and simulator components faithful to the real
ones;
- Clear and timely information output (graphics, data, and warnings);
- Simulator developer must provide operation information with a manual;
- Other considerations such as interlocking systems are important.
This work aims to develop a computational simulator of basic training, using data and
characteristics obtained during the actual operations of the IPEN/MB-01 research reactor. The
simulator was developed according to the control design techniques [9-10]
2.2. The IPEN/MB-01 Research Reactor Computational Simulator
The IPEN/MB-01 research reactor computer simulator was developed based on two distinct and
complementary platforms. The first is a SCADA (Data Acquisition and Supervision System)
platform, which serves as a human graphical interface (HGI) and control between the operator and
the reactor systems, and a data processing platform (DPP).
On the HGI platform it is possible:
- Positioning of the control bars, and safety of the reactor;
- Control the moderator temperature;
- Control the moderator level;
- Change the core configuration;
- To do intervention of the interlock in the reactor control;
- Run SCRAM when it is needed.
Thus, the behavior of the following physical parameters and reactor operation is verified:
- Operation, intervention and shutdown of the reactor;

Casorla et al. ● Braz. J. Rad. Sci. ● 2020 6
- Operation of radiation detectors;
- Determination of the 1/M curve versus position of the control bars;
- Obtaining calibration curves for each reactor core configuration;
- Influence of the level and temperature of the moderator on the reactivity of the reactor core;
- The measure of the coefficient of reactivity to empty of the reactor;
- Future ones that may be introduced by experts.
The simulator focuses on synoptic panels such as HGI being, therefore, limited to the
performance of data processing that efectively simulates the actual reactor operations. Thus, for
mathematical modeling, the resources of software that performs the calculation quickly and
accurately enough to give the operator the feeling of real-time operation was used. In this simulator
was used the software Matlab (Simulink Module) (DPP), allowing direct links with Indusoft, a
Microsoft SCADA system (HGI). The communication between this two software established via an
Ole for Process Control (OPC) port, enabling the integration between the two proposed systems.
For this, it was necessary to insert two blocks in the DPP environment: OPC (OPC Configuration)
and OPC (Client Manager) and make the proper configuration of the two software to ensure the
sending and receiving of the operation information in real-time.
The simulator can be installed on a server, running the software. The trainees or students will be
held in a laboratory where students will have access to the internet through a browser on each PC.
The operation of the simulator is done remotely with restricted access for each objective currently
proposed.
The simulator is based on data obtained from hundreds of real operations over the years, whose
data has been stored in a database [11]. This database contains all the information provided by the
Data Acquisition System (SAD) of the research reactor IPEN/MB-01, which contains data from
nuclear channels, detectors, positioning of control bars, level, temperature, and water quality in the
core water tank, among others. These data were organized into tables.
It was necessary to transform each variable stored in the table into valid data for the DPP
software that does the data processing. In this way, the variables created were imported to be used
as data to be used by the System Identification Toolbox. After performing the entire data acquisition
and preparation procedure, each data set was approximated to a transfer function by specific models

Casorla et al. ● Braz. J. Rad. Sci. ● 2020 7
for each existing function. The tool has several models that can be used, from the simplest as a
transfer function to the most complex ones as nonlinear models. When choosing a particular model
to be estimated, the developer must pre-determine iteratively, or with some prior knowledge of the
process, coefficients, and other parameters of the model. For example, in a transfer function model,
it must choose the number of poles and zeros, and in polynomial models, the user has to determine
the order of arbitrary polynomials.
In Figure 2 it is possible to check two examples of supervisory HMI screens built for the
simulator.
Figure 2: Supervisory HMI screens built for the simulator.
By activating both software (HGI and DPP) one gets the presented outputs in the HGI as a
function of the inputs, such as results of the reverse and Inhour reactivity and the alpha coefficient
of the chosen configuration. There is also the possibility of obtaining dynamic information, such as
responses from the PID control (Proportional-Integral-Derivative, as observed in Fig. 3.

Casorla et al. ● Braz. J. Rad. Sci. ● 2020 8
Figure 3: PID control response example.
It must be pointed out that this first version of the computer simulator of the IPEN/MB-01 can
reproduce just one of the various kernel configurations. The other configurations will be
implemented.
3. RESULTS
Results of the experiments carried out in the reactor such as inverse and Inhour reactivity and
the alpha coefficient as a function of the moderator's temperature are some of the parameters
presented by the simulator, as can be seen in Fig. 4.

Casorla et al. ● Braz. J. Rad. Sci. ● 2020 9
Figure 4: Inhour, inverse, and reactivity coefficient responses for configuration 338.
Results can also be obtained from the nuclear channels obtained in the reactor experiments, as
shown in Fig. 5.
Figure 5: Results of channels 1, 5, and 6 for configuration 338.

Casorla et al. ● Braz. J. Rad. Sci. ● 2020 10
Another system represented by the simulator is the reactor water treatment system (STAA).
Knowledge of this subsystem is fundamental for operator training. The screen shown in Fig. 6
shows the STAA.
Figure 6: STAA Treatment System Screen.
4. CONCLUSIONS
A computational simulator was developed for the IPEN/MB-01 nuclear research reactor,
developed for mono or multi-user systems. It performs a simulation of the main operational
variables of the reactor, also allows easy navigation between HMI screens providing globalized
supervision of neutronic, thermal, and hydraulic processes if implemented. It was possible to show
the feasibility of integrating a supervisory system and software to perform mathematical
calculations with the data obtained from real experiments. The system identification and Matlab
resource for SCADA was used through OPC. The benefits and advantages of using the simulator
based on personal computers during the training programs of operators and undergraduate and
graduate students were shown. Improvements to human-machine interfaces can be implemented to
make the simulator more effective in training.

Casorla et al. ● Braz. J. Rad. Sci. ● 2020 11
ACKNOWLEDGEMENTS
The authors thank the management of the IPEN/MB-01 reactor for supporting and providing the
experimental data. They also thank IPEN/CNEN for allowing the development of the work.
REFERENCES
[1] INTERNATIONAL ATOMIC ENERGY AGENCY. Experience in the use of systematic
approach to training (SAT) for nuclear power plant personnel, Vienna, 1999. Technical
Document Series, 1057p.
[2] INTERNATIONAL ATOMIC ENERGY AGENCY. Safety of nuclear power plants:
operation, Vienna, 2000. Safety Standards Series, NS-R-2.
[3] INTERNATIONAL ATOMIC ENERGY AGENCY. Recruitment, qualification and training
of personnel for nuclear power plants, Vienna, 2002. (Safety Standards Series, NS-G-2.8).
[4] INTERNATIONAL ATOMIC ENERGY AGENCY. The operating organization and
recruitment, training and qualification of personnel for research reactor, Vienna, 2002.
Safety Standards Series, NS-G-2.8.
[5] CARVALHO, R. P.; MAIORINO, J. R.. A Research Reactor Simulator for Operators Training
and Teaching, PHYSOR-2006, ANS Topical Meeting on Reactor Physics, Vanvouver, 2006.
p. 1-7.
[6] LAGE, A. M. F.; FELIPPE, A. A. M.; MESQUITA, A. Z.. Design of a digital system for
operational parameters simulation of IPR-R1 Triga nuclear research reactor. Brazilian Journal
of Radiation Sciences, v. 07-02B, 2019, p. 01-13. DOI: https://doi.org/10.15392/bjrs.v7i2B.
[7] ARAFA, A.; SALEH, H. I.; ASHOUB, N.. Design and implementation progress of multi-
purpose simulator for nuclear research reactor using LabVIEW. Kerntechnik, v. 80, 2015, p. 1-
11. DOI: 10.3139/124.110535.
[8] ARAFA, A.; SALEH, H. I.; ASHOUB, N.. Development of an educational nuclear research
reactor simulator. Kerntechnik, v. 79, 2014, p. 518-527.
https://doi.org/10.3139/124.110446.

Casorla et al. ● Braz. J. Rad. Sci. ● 2020 12
[9] BANKS, J.. Handbook of Simulation: Principles, Methodology, Advances, Applications,
and Practice. N.Y.: JOHN WILEY & SONS, 1998. 849p.
[10] OGATA, K.. Engenharia de Controle Moderno. São Paulo: PEARSON – Prentice Hall,
2010. 824p.
[11] BITELLI, U. D., Experimentos na Fase de Comissionamento - Comparação com a
Metodologia de Cálculo. Relatório Interno RELT 003.R00, São Paulo. Outubro, 1998.
[12] Available at <https://www.ipen.br/portal_por/portal/interna.php?secao_id=723>. Last ac-
cessed: 10 July 2020.

BJRS
BRAZILIAN JOURNAL
OF
RADIATION SCIENCES 08-03 (2020) 01-12
ISSN: 2319-0612 Accepted: 2020-07-06
A study on trace elements in fingernails and toenails
from adult individuals by instrumental neutron
activation analysis
Sanchesa T. P., Genezinia, F. A., Saikia M.
aInstituto de Pesqusas Energéticas e Nucleares, IPEN-CNEN/SP, Centro do Reator de Pesquisas, CEP 05508-000,
Cidade Univesitária, São Paulo, SP, Brazil
ABSTRACT
This study presents results of instrumental neutron activation analysis (INAA) of nails from healthy adult
individuals living in São Paulo city, Brazil. Concentrations of As, Br, Ca, Co, Cr, Fe, K, La, Na, Sb, Se and Zn
were determined in fingernails and toenails and their variations with gender, age, body mass index among
individuals and inter-element correlations were evaluated. These results indicated that several factors might
affect in the nail element composition. In addition, there are few published data for finger and toenails analyses.
However, comparisons made between the concentrations of elements obtained in fingernails were reasonable
within the range of literature values. The findings of this study may contribute to establish an appropriate
protocol to obtain data of nail element composition to be used as reference values.
Keywords: fingernails, toenails, neutron activation analysis, trace elements.

Sanches et al. ● Braz. J. Rad. Sci. ● 2020 2
1. INTRODUCTION
Analyses of human nails for their trace element contents have been studied for several decades
to assess nutritional status, to estimate environmental or occupational exposure to contaminants and
for clinical investigations [1-4]. However, until today, clinical laboratories and physicians have
sought the reference ranges or control values of nail element concentrations to use nails in the
assessment of exposure to toxic elements or of deficiencies of certain elements to human health.
The interest in the nail tissue analyses is due to its easy sampling, the collection is considered
less invasive, more convenient for storage and less trouble to transport to the laboratory for the
analyses and much less hazardous to handle. Unlike blood, saliva or urine samples, nails reflect the
health events or exposures occurring over the past 6-10 months. They represent element contents in
the human body over a long period of time [5, 6]. Moreover, human nails retain the highest
concentrations of elements due to the content of keratin which incorporate trace elements in
proportion to their dietary intakes and exposures. Nail tissues can contain information about
metabolic events occurred during the time of their formation, that is, the elements are removed from
metabolic processes and after nail formation may be stable markers of past exposure [7]..These
attributes make nails an attractive tissue for evaluation of trace element concentrations and to use as
biomarkers. Additionally, several studies have been conducted to prove that trace element
concentrations in nails can be changed by several pathological, physiological, nutritional and
environmental factors [8-16].
However, published data of nail analyses to be used as reference values are very limited.
Besides, the wide variability of element concentrations in nails from a relatively homogeneous
population has made it difficult to use this tissue as a biomarker for trace element status.
Within this context, the purpose of this study was to analyze fingernails and toenails of an adult
group of individuals living in São Paulo city, Brazil, in order to examine factors that can affect its
element composition.
In this study instrumental neutron activation analysis (INAA) was applied to analyze nail
tissues. This method has been applied in the analyses of this tissue in several studies [12, 16-19].
INAA is known as a highly sensitive, precise and accurate analytical technique and very suitable for

Sanches et al. ● Braz. J. Rad. Sci. ● 2020 3
trace element determinations in biological tissues due to its multielement nature and small mass of
sample required. In this case of human nails is particularly important since it is not always possible
to obtain large sample amounts.
2. MATERIALS AND METHODS
2.1. Nail sample collection
The Ethics Committee of the Department of Public Health of the University of São Paulo
approved this research. The nail sample donors were adult subjects considered healthy and living in
São Paulo city, SP, Brazil. They were informed about the aim of the study and a written consent
was obtained from each donor prior to sample collection. Those who agreed to take part in the study
had to answer questions concerning residential and medical history, gender, age, eating and
smoking habits, use of drugs, mineral supplement intakes and occupation. The answers of these
questions were used to select the population group for this study. Subjects were excluded when they
were pregnant and drug users, had mental diseases, apparent infections in their nails or hands or
feet, when they did not have sufficient quantity of nails for analysis and patients with systemic or
metabolic disorders.
Nail samples were collected from 27 individuals (12 males and 15 females) aged between 19
and 75 years (Mean = 38 ± 16 y) using stainless steel clippers. The donors themselves collected
some samples. The fingernails and toenails collected separately were from 10 fingers and 10 toes.
These samples were stored in small plastic zip bags securely closed, until their treatment for the
analyses.
2.2 Nail sample cleaning
Nail sample cleaning was performed according to previous study [20]. To begin with, the
samples were immersed in a solution of 70 % ethanol for 10 min to avoid eventual contamination
by infectious fungi and bacteria during the handling to obtain small sample fragments. The visible
dirt on the surface of nails was removed manually. The nail clippings were then cut in small
fragments using titanium coated scissors. These samples were placed in polyethylene vials and

Sanches et al. ● Braz. J. Rad. Sci. ● 2020 4
washed to minimize external surface contamination. This cleaning was performed in these vials and
it consisted of three consecutive washings with acetone Merck pa stirring for 1 min, three
consecutive washings with 2.0 % TritonX100 solution also stirring for 1 min, and finally two
washes with Milli-Q purified water with a 20 s stirring each. Following washing, the samples were
obtained by filtration on Whatman filter paper. Then the sample was dried at room temperature
inside a laminar flow hood. During sample handling procedures talc-free gloves were used.
2.3 Preparation of synthetic element standards
The synthetic standards were prepared by pipetting 50 L of the element standard solutions onto
sheets of Whatman No. 40 filter paper. These solutions containing one or more elements were
prepared using certified standard solutions provided by SpexCertiprep Chemical, USA. All
calibrations of the pipettors and volumetric flasks were verified before use. These filter sheets were
dried at room temperature inside a desiccator and, then were placed into clean polyethylene bags
which were then sealed. In these standards the quantities of each element, in g (in parentheses)
were the following: As(1.5), Br(4.9), Ca(500.6), Co(0.150), Cr(2.01), Fe(360.3), K(500.5),
La(0.599), Na(200.2), Sb(0.600), Se(8.003) and Zn(36.0).
2.4 Instrumental neutron activation analysis procedure
For each donor, about 170 mg of fragmented and homogenized nail sample were weighted in
polyethylene bags and irradiated in the IEA-R1 nuclear research reactor along with the synthetic
standards of the elements. Sixteen-hour irradiations with a thermal neutron flux of about 4.5 x 10¹²
n cm-2 s-1 were performed for As Br, Ca, Co, Cr, Fe, K, La, Na, Sb, Se and Zn determinations. After
adequate decay times, the activities of the irradiated samples and standards were measured by a
Model GEM20190-P hyper pure Ge detector coupled to a gamma ray spectrometer, both from
EG&G ORTEC. The resolution (FWHM) of the system was 0.81 keV for 122 keV gamma-ray peak
of 57Co and 1.97 keV for 1332 keV gamma ray of 60Co. Each sample and standard were measured at
least twice for different decay times. Counting times from 5,400 to 50,000 seconds were used,
depending on the half-lives or activities of the radioisotopes considered. The gamma spectra were
acquired using MAESTRO MCA software from EG&G ORTEC and were processed using

Sanches et al. ● Braz. J. Rad. Sci. ● 2020 5
VISPECT software developed in our laboratory by Dennis Piccot from Saclay, France. The
radionuclides measured were identified according to their half-lives and gamma-ray energies. The
concentrations of elements were calculated by comparative method. The radionuclides used were:
76As, 82Br, 47Ca, 60 Co, 51Cr, 59Fe, 42K, 140La, 24Na, 122Sb, 75Se and 65Zn.
The quality control of the analytical results was evaluated by analyzing certified reference
materials, NIST 1577b Bovine Liver and NIST 1566b Oyster Tissue both from National Institute of
Standards and Technology (NIST), USA.
3. RESULTS AND DISCUSSION
3.1. Quality control of analytical results
The certified reference materials, NIST 1577b Bovine Liver and NIST 1566b Oyster Tissue
were analyzed by applying the same experimental conditions used for nail analyses and the results
were evaluated on a dry weight basis, as recommended in their certificates. These results presented
in Table 1 indicate good accuracy and precision with relative standard deviations and relative errors
lower than 11.6 %. The standardized difference or Z-score values [23] obtained for elements
quantified in these reference materials were Z-score2, indicating that the results are satisfactory
and are within the ranges of certified data at the significance level of 5 %.
3.2. Variation of element concentrations in fingernails and toenails
Some of our experimental data presented outliers (values that are very different from the data
values for the majority of the cases in the data set), so the normalized residual method [24] was
used to obtain robust averages with minimum interference of outliers. Table 2 shows the results of
mean ± standard deviation and range of element concentrations obtained in fingernails and toenails.
Comparisons between fingernail and toenail element concentrations were carried out by
applying one-way ANOVA test (p < 0.05). In the lines of Table 2, results followed with same lower
case letters indicate that this element concentration does not present significant difference between
fingernails and toenails. Concentrations of Br, Co, Fe, Sb, Se and Zn obtained in fingernails were
higher than those found in toenails.

Sanches et al. ● Braz. J. Rad. Sci. ● 2020 6
Table 1: Element concentrations in the NIST 1577b Bovine Liver and 1566b Oyster Tissue
certified reference materials. Results in mg kg-1
Elements
NIST 1577b Bovine Liver
This study Certificate values [21]
M ± SD (n) RSD, % RE, % Z-score
Br 10.10 ± 0.33(7) 3.3 (9.7)*
Co 0.243 ± 0.012(7) 5.0 (0.25)*
Fe 189 ± 10(6) 5.3 2.9 0.3 184 ± 15
Na 2473 ± 63(7) 2.5 2.2 0.1 2420 ± 60
Rb 13.07 ± 0.41(6) 3.1 4.5 - 0.5 13.7 ± 1.1
Se 0.749 ± 0.027 3.6 2.7 0.3 0.73 ± 0.06
Zn 123.9 ± 3.1(6) 2.5 2.4 - 0.2 127 ± 16
Elements
NIST 1566b Oyster Tissue
This study Certificate values [22]
M ± SD (n) RSD, % RE, % Z-score
As 7.35 ± 0.34(6) 4.6 3.9 - 0.9 7.65 ± 0.65
Br 52.8 ± 1.7(7) 3.2
Ca 875 ± 102(5) 11.6 4.4 0.3 838 ± 20
Co 0.356 ± 0.011(7) 3.3 3.9 1.2 0.371 ± 0.009
Fe 196.6 ± 7.6(5) 3.9 4.4 - 0.9 205.8 ± 6.8
K 6181± 499(4) 8.0 5.1 - 0.6 6520 ± 90
Na 3362 ± 76(6) 2.3 1.9 0.8 3297 ± 53
Rb 3.20 ± 0.13(6) 4.1 1.8 - 0.4 3.262 ± 0.145
Se 2.068 ± 0.056(6) 2.7 0.4 0.08 2.06 ± 0.15
Zn 1378 ± 61(7) 4.4 3.2 -0.7 1424± 46
M ± SD = Arithmetic mean and standard deviation; n = Number of determinations;
RSD = Relative standard deviation; RE =Relative error; * - Number in parentheses are informative
values.
According to Gulson samples of toenails are superior to fingernails because of the reduced
chance of contamination of toenails from various sources, including nails polish in the case of
females, and due to the observation that toenails grow at a slower rate than fingernails and hence

Sanches et al. ● Braz. J. Rad. Sci. ● 2020 7
provide a longer integration of exposure [25]. Fingernails and toenails grow at different rates, this
may affect concentration comparisons and exposure estimates. Fingernails of young adults grow at
an average of 3.47mm/month and toenails grow 1.62 mm/month [26].
In Table 2, the overall values, fingernail and toenail variability and interpersonal variability are
also presented. The interpersonal variability was calculated as the mean of relative standard
deviations (RSDs) representative of different individuals. These variations depended on the
element. Elements As and Cr were distributed more homogeneously between fingernails and
toenails than the other elements. The most heterogeneously distributed element was Co.
Interpersonal variability results demonstrated the following sequence for the elements: Co >K > La
> Na >Fe > Sb >Cr >Br >Ca >As >Se>Zn.
Table 2: Mean element concentrations in the fingernails and toenails from all individuals. Results
are given in mg.kg-1
Elements Fingernails Toenails Overall value
Finger and
toenail
variability,
%
Interper
sonal
variabilit
y, %
M ± SD M ± SD
As 0.044 ± 0.013 a 0.047 ± 0.015 a 0.046 ± 0.002 4.7 30.8
Br 1.46 ± 0.50 a 1.15 ± 0.43 b 1.31 ± 0.22 16.8 35.6
Ca 647 ± 225 a 795 ± 273 b 721 ± 104 14.5 34.5
Co 0.042 ± 0.050 a 0.019 ± 0.009 b 0.031 ± 0.016 53.3 96.7
Cr 0.243 ± 0.094 a 0.240 ± 0.140 a 0.242 ± 0.002 0.88 48.4
Fe 29.0 ± 15.3 a 19.6 ±9.7 b 24.3 ± 6.6 27.3 51.4
K 114 ± 102 a 182.1 ± 127.9 a 148.1 ± 48.1 32.5 77.6
La 0.024 ± 0.016 a 0.034 ± 0.027 a 0.029 ± 0.007 24.4 74.1
Na 143.6 ± 90.1 a 230.7 ± 155.0 a 187.2 ± 61.6 32.9 65.5
Sb 0.040 ± 0.017 a 0.025 ± 0.015 b 0.032 ± 0.011 32.5 49.2
Se 0.540 ± 0.210 a 0.402 ± 0.053 b 0.0471 ± 0.098 20.7 27.9
Zn 114.2 ± 20.2 a 87.4 ± 11.9 b 100.8 ± 19.0 18.8 15.9
M ± SD =Arithmetic mean and standard deviation. Results with same lower-case letters of the
same line indicate that they do not present statistically significant differences (p<0.05, 1-way
ANOVA).

Sanches et al. ● Braz. J. Rad. Sci. ● 2020 8
3.3. Variations of element concentrations in relation to gender
The t Student test was applied to assess the effect of gender on mean element concentrations in
fingernails and toenails. Results showed that most of the elements in toenails and fingernails are not
affected by gender. The exceptions were for Sb, Se and Zn of fingernails that showed significant
differences (p = 0.05), as can be seen in Figure 1. These three elements showed higher
concentrations in female fingernails than those presented in males. The mean concentrations and
standard deviations obtained for these elements were (in mg.kg-1): Sb = 0.046 ± 0.019; Se = 0.62 ±
0.24; Zn = 123 ± 19 for females and Sb = 0.033 ± 0.011; Se = 0.45 ± 0.10; Zn = 104 ± 17 for males.
Figure 1: Concentrations of Sb, Se and Zn in female and male fingernails
3.4. Variation of element concentrations in relation to age
Age dependence with element concentrations in fingernails and toenails was not found for the
19 and 71 year range. A similar result was observed by Chaundhary et al. for Br, Co, Cr, Fe, Na and
Sb in fingernails [27].
3.5. Variations of element concentrations in relation to body mass index
Body mass index (BMI) is an index of weight (mass, in kg) to square height (in m2) ratio
commonly used to classify underweight, suitable weight, overweight and obesity in adults.
Sb Se Zn
0,000
0,025
0,050
0,45
0,60
0,75
0,90
100
125
Co
ncen
trati
on
(m
g k
g-1)
Element
Female
Male

Sanches et al. ● Braz. J. Rad. Sci. ● 2020 9
According to the Ministério da Saúde do Brasil [28] for BMI, 17 individuals presented adequate
weight within the range from 18.5 to 25 kg m-2 and 10 were overweight with BMI from 25 to
30. Most of elements did not presented significant variation of element concentrations with the
increasing of BMI. Only Br and Se concentrations from fingernails presented a slightly growth
trend with BMI values as can be seen in Figure 2.
Figure 2: Variation of the fingernail Br and Se concentrations with de body mass index (BMI)
3.6. Inter-element correlation
To evaluate potential inter-element correlation, Pearson correlation coefficients were calculated,
and these results are presented in Table 3. For fingernails, very strong positive correlation (r) was
obtained for the pair of elements K–Na (0.90) and moderate positive correlations for Cr-Co (r =
0.55), Cr-Fe (r=0.51), and Se-Zn (r=0.53). In the case of toenails, significant strong correlations
were obtained for Cr–Fe (0.70), K-Na (0.64) and La-Cr (0.61) and La-Zn (0.69) and moderate
correlations for Fe–Se (0.59), La-Co (0.50), La-Fe (0.50). Positive correlations between K and Na
found in fingernails and toenails can be related to these two electrolytes responsible to maintain
0.00
0.25
0.50
0.75
1.00
1.25
1.50
20 22 24 26 28
0.0
0.5
1.0
1.5
2.0
2.5
Se
Co
nc
en
tra
tio
n (
mg
kg
-1)
Br
BMI

Sanches et al. ● Braz. J. Rad. Sci. ● 2020 10
homeostasis within the body. Sodium influences many of the same bodily functions as potassium
and this correlation was also verified by some authors [27, 29-31]. The positive correlations found
in this study for Se-Zn and for Cr-Fe in fingernails were also obtained by Chaudhary et al. [27] and
Carneiro et al. [32]. Correlations of Cr-Co and of Se-Zn were found only in fingernails. On the
other hand, the positive correlations of Fe-Se, La-Co, La-Cr, La-Fe and La-Zn were obtained only
in toenails. These findings are of interest because there are no reports of possible differences in the
interrelationships of these elements in fingernails and toenails.
Table 3: Positive strong correlation coefficients for fingernail and toenail elements (Only
significant Pearson correlation coefficients r for p< 0.05 are presented)
Fingernails Toenails
Inter-elements r Inter-elements r
Co - Cr 0.55 La - Co 0.50
Cr - Fe 0.51 Cr - Fe 0.70
K - Na 0.90 La - Cr 0.61
Se - Zn 0.53 La - Fe 0.50
K - Na 0.64
La - Zn 0.69
Fe - Se 0.59
3.7. Concentration ranges of elements in fingernails and toenails
Although the element concentrations in nails vary due to geographical differences, nutritional
status and environmental factors, the results obtained were compared with some reported values for
healthy adult groups. Most of fingernails results (Table 4) are reasonably within the range of
literature values presented in Table 5. For As, the result obtained is lower than that published value
[33] and also for Cr result was lower than those reported for this element [27, 34, 35].
Results obtained in this study for toenails are presented in Table 6. There are few reported data
(Table 7) in order to make any comparison with the results of this study. The toenail Se and Zn
concentrations obtained are within the reported values. However, for As, the result obtained is again
lower. Furthermore, the results obtained for Co, Cr and Fe are lower than those presented by
Menezes et al. [39]. In the absence of reported data for the toenail K, La and Sb comparisons were
not possible.

Sanches et al. ● Braz. J. Rad. Sci. ● 2020 11
Table 4: Element concentrations in fingernails from adult individuals living in São Paulo city
Elements Element concentrations (in mg.kg-1) obtained for fingernails in this study
M ± SD (n) MG ×/÷ SDG Range Median
As 0.044 ± 0.013 (23) 0.042 ×/÷ 1.36 0.036 - 0.064 0.0415
Br 1.46 ± 0.50 (25) 1.37 ×/÷ 1.44 0.70 – 2.42 1.45
Ca 647 ± 225 (26) 600 ×/÷ 1.54 161 - 1045 682
Co 0.042 ± 0.050 (26) 0.031 ×/÷ 1.94 0.016 – 0.25 0.0254
Cr 0.243 ± 0.094 (25) 0.225 ×/÷ 1.49 0.11 – 0.46 0.255
Fe 29.0 ± 15.3 (25) 25.7 ×/÷ 1.64 10 – 66 23.6
K 102.1 ± 88.4(18) 64.5 ×/÷ 3.13 5.46 – 291.0 74.7
La 0.024 ± 0.016 (23) 0.0148×/÷ 4.37 0.00015 – 0.060 0.207
Na 143.6 ± 90.1 (26) 108.2 ×/÷ 2.49 9.4 – 324.0 142.4
Sb 0.040 ± 0.017 (23) 0.037 ×/÷ 1.46 0.019 – 0.086 0.0331
Se 0.541 ± 0.206 (25) 0.509 ×/÷ 1.41 0.27 – 1.11 0.479
Zn 114.2 ± 20.2(26) 112.4 ×/÷ 1.20 72 – 148 113.8
M ± SD = Arithmetic mean and standard deviation; n= number of individuals; MG ×/÷ SDG =
Geometric mean and standard deviation
Table 5: Reported values of element concentrations in fingernails from adult individuals
Elements Reported values (in mg.kg-1) for fingernails
M ± SD[34] MG ×/÷ SDG [35] M ± SD[33] M[27] M ± SD[16]
As 0.029 ± 0.190 0.0307×/÷ 1.16 0.61± 0.21 0.0545 0.40 ± 0.13
Br 23 ±14 2.10 ×/÷ 1.05 1.65 ± 0.71 2.11 0.92 ± 0.39
Ca 670 ± 240 522 ×/÷ 1.06 926 ± 383 665
Co 0.035 ± 0.031 0.0275 ×/÷ 1.10 0.0421 0.12 ± 0.07
Cr 1.16 ± 1.05 1.760 ×/÷ 1.10 0.898 0.62 ± 0.28
Fe 42 ± 30 13.5 ×/÷ 1.08 77.8 ± 67.2 19.5 68.56± 23.40
K 210 ± 260 45.8 ×/÷ 1.16 91.1 ± 41.0 94.6
La 0.120 ± 0.180
Na 240 ± 240 133 ×/÷ 1.07 157
Sb 0.053 ± 0.054 0.0243 ×/÷ 1.10 0.0366 0.068 ± 0.032
Se 0.940 ± 0.210 1.06 ×/÷ 1.03 1.28 ± 0.34 1.003 0.80 ± 0.40
Zn 120 ± 29 149 ×/÷ 3.3 113 ± 20 147 103.24 ± 38.96
M ± SD = Arithmetic mean and standard deviation; MG ×/÷ SDG = Geometric mean and standard
deviation; M = Arithmetic mean

Sanches et al. ● Braz. J. Rad. Sci. ● 2020 12
Table 6: Element concentrations in toenails from adult individuals living in São Paulo city
Elements Element concentrations (in mg.kg-1) obtained for toenails in this study
M ± SD (n) MG ×/÷ SDG Range Median
As 0.047 ± 0.015 (24) 0.045 ×/÷ 1.41 0.022 - 0.072 0.0456
Br 1.15 ± 0.43 (25) 1.077 ×/÷ 1.47 0.49 – 2.00 1.046
Ca 795 ± 273 (26) 743 ×/÷ 1.47 254 - 1363 794
Co 0.019 ± 0.009 (25) 0.0176 ×/÷ 1.58 0.0098 – 0.416 0.0168
Cr 0.239 ± 0.142 (24) 0.191 ×/÷ 2.09 0.035 – 0.48 0.230
Fe 19.6 ±9.7 (21) 17.6 ×/÷1.61 7.2 – 43.0 18.6
K 182.1 ± 127.9 (23) 129.3 ×/÷ 2.84 4.8 – 506.0 152.0
La 0.034 ± 0.027 (21) 0.0241 ×/÷ 2.46 0.0027 – 0.1064 0.0274
Na 230.7 ± 155.0 (25) 177.0 ×/÷ 2.27 25.9 – 585.0 191.0
Sb 0.025 ± 0.015 (23) 0.021×/÷ 1.73 0.0094 – 0.057 0.084
Se 0.402 ± 0.053 (22) 0.417 ×/÷ 1.13 0.32 – 0.54 0.411
Zn 87.4 ± 11.9 (23) 86.6 ×/÷ 1.14 63.8 – 111.0 88.6
M ± SD = Arithmetic mean and standard deviation; n= number of individuals; MG ×/÷ SDG =
Geometric mean and standard deviation
Table 7: Reported values of element concentrations in toenails from adult individuals
Elements Reported values (in mg.kg-1) for toenails
M ± SD [36] M ± SD [37] M ± SD [2] Range [38]
As 0.12 ± 0.13 0.12 ± 0.27
Br 0.96 ± 3.56 2.41 ± 1.22
Ca 714 ± 303 968 ± 4361
Co 0.02 ± 0.04 0.037 ± 0.032 0.042 ± 0.023 0.2 - 0.3
Cr 0.58 ± 0.5 0.97 ± 0.91 2.39 ± 2.91 1.6 - 4
Fe 25.2 ± 20.4 42.5 ± 26.3 78 - 323
Na 25.2 ± 40.2
Se 0.52 ± 0.10 0.83 ± 0.23 0.92 ± 0.15
Zn 70.1 ± 18.5 111 ± 29.9 110 ± 28.9 57 - 290
M ± SD = Arithmetic mean and standard deviation

Sanches et al. ● Braz. J. Rad. Sci. ● 2020 13
4. CONCLUSIONS
From the results obtained, it can be concluded that there were differences between mean
element concentrations of fingernails and toenails depending on the element. The mean
concentrations of some elements varied with gender and body mass index but not with age of the
adult individuals aged 19-71 years. In addition, Pearson correlation coefficients revealed significant
strong associations between K-Na (for fingernails) and Cr-Fe and La-Zn in toenails. The
determinations of these correlations can be useful to help understand how the elements enter the
body and the mechanisms of its actions.
The knowledge of the factors that affects in the nail element composition can contribute to
obtain reliable ranges of concentrations in nails to be used as reference values.
A comparison between nail results obtained in this study with reported values was not so easy
since there are few published data for a control population, distinct procedures used for cleaning the
nails and the population differences that are influenced by environmental, geographical and
nutritional factors. However, most of data obtained are within the range of reported values.
Concerning the methodology, results of analytical quality control demonstrated the viability of
using the procedure of INAA adopted in this study to obtain reliable fingernail and toenail element
concentrations.
ACKNOWLEDGMENT
Authors thank the São Paulo Research Foundation (FAPESP) and the Brazilian National
Council for Scientific and Technological Development (CNPq), from Brazil for financial support.
The author T. P. Sanches is grateful for a fellowship from the Brazilian Nuclear Energy
Commission
REFERENCES

Sanches et al. ● Braz. J. Rad. Sci. ● 2020 14
[1] OYOO-OKOTH, E.; ADMIRAAL, W.; OSANO, O.; KRAAK, M. H. S. Element profiles in
hair and nails of children reflect the uptake from food and the environment. Environ Toxicol
Chem, v. 31, p. 1461-1469, 2012.
[2] GARLAND, M.; MORRIS, J. S.; ROSNER, B. A.; STAMPFER, M. J.; SPATE, V. L.;
BASKETT, C. J.; WILLETT, W. C.; HUNTER, D. J. Toenail trace element levels as
biomarkers: reproducibility over a 6-year period. Cancer Epidemiol Biomarkers Prev, v. 2, p.
493-497, 1993.
[3] HE, K. Trace elements in nails as biomarker in clinical research. Eur J Clin Invest, v. 41, p.
98-102, 2011.
[4] TRUC PHUONG, H.; PHAM NGOC TRINH, T.; THANH BINH, D.; THI TRUC LINH, N.;
THI HONG LOAN, T.; TUAN ANH, T.; MANH DUNG, H.; VAN DONG N. Determination of
the concentration of Fe, Se, and Zn elements in nails of Vietnamese women with breast cancer
using k0-INAA method. Sci Tech Dev J, v. 22, p.370-377, 2019.
[5] DANIEL, C.R.; PIRACCINI, B.M.; TOSTI, A. The nail and hair in forensic science. J Am
Acad Dermatol, v. 50, p. 258-261, 2004.
[6] PALMERI, A.; PICHINI, S.; PACIFICI, R.; ZUCCARO, P.; LOPEZ, A. Drugs in nails. Clin
Pharmacokinet, v. 38, p. 95–110, 2000.
[7] HOPPS, H. C. The biologic bases for using hair and nail analyses of trace elements. Sci Total
Environ, v. 7, p. 71-89, 1977.
[8] ILYAS, A.; AHMAD, H.; SHAH, M. H. Comparative study of elemental concentrations in the
scalp hair and nails of myocardial infarction patients versus controls from Pakistan. Biol Trace
Elem Res, v.166, p. 123-135, 2015.
[9] MOMEN, A. B.; KHALID, M. A. A.; ELSHEIKLH, M. A. A.; ALI, D. M. H. Trace elements in
scalp hair and fingernails as biomarkers in clinical studies. J Health Spec, v. 3, p.28-34, 2015.
[10] MORESCO, M. B.; FLEEK, A. S.; CARNEIRO, M. F. H.; BARBOSA JUNIOR, F.;
AMANTEA, S. L.; RHODEN, C. R. Trace elements concentration in nail and association with
airway inflammation in adolescents. Biol Trace Elem Res, v. 161, p. 161-166, 2014.

Sanches et al. ● Braz. J. Rad. Sci. ● 2020 15
[11] GHAZALI, A. R.; KAMARULZAMAN, F.; NORMH, C. D.; AHMD, M.; GHAZALI, S.
E.; IBRAHIM, N.; SAID, Z.; SHAHAR, S.; ANGKAT, N.; RAZALI, R. Levels of metallic
elements and their potential relationships to cognitive function among elderly from federal Land
Development Authority (FELDA) settlement in Selangor Malaysia. Biol Trace Elem Res, v.
153, p. 16-21, 2013.
[12] BROCKMANN, J.D.; GUTHRIE, J. M.; MORRIS, J. S.; DAVIS, J.; MADSEN, R.;
ROBERTSON, J. D. Analysis of the toenail as a biomonitor of supranutritional intake of Zn, Cu
and Mg. J Radioanal Nucl Chem, v. 279, p. 405-410, 2009.
[13] NORWAK, B.; CHMIELNICKA, J. Relationship of lead and cadmium to essential elements
in hair, teeth, and nails of environmentally exposed people. Ecotoxicol Environ Safe, v. 46 p.
265-274, 2000.
[14] KUCERA, J.; BENCKO, V.; TEJRAL J.; BORSKÁ, L.; SOUKAL, L.; RANDA Z.
Biomonitoring of occupational exposure: Neutron activation determination of selected metals in
the body tissues and fluids of workers manufacturing stainless steel vessels. J Radioanal Nucl
Chem, v. 259, p. 7-11, 2004.
[15] SAVINOVA, S. S.; SHARYPOVAA, R. M.; DROBYSHEVA, A. I. Determination of the
trace element composition of human nails. J Anal Chem, v.75, p.409-415, 2020.
[16] HUYNH, P.; DINH, B. ; TRAN, A.; HO, D. Analysis of trace elements in the fingernails of
breast cancer patients using instrumental neutron activation analysis. J Radioanal Nucl Chem,
v. 324, p. 663-671, 2020.
[17] MORRIS, J.S.; SPATE, V. L.; NGWENYAMA, R. A.; WALTERS, D. J. Determination of
selenium status using the nail biologic monitor in a canine model. J Radioanal Nucl Chem, v.
291, p. 439-444, 2012.
[18] KARAGAS, M. R.; TOSTESON, T. D.; BLUM, J.; KLAUE, B.; WEISS, J. E.;
STANNARD, V.; SPATE, V.; MORRIS, S. Measurement of low levels of arsenic exposure: a
comparison of water and toenail concentrations. Am J Epidemol, v. 152, p. 84-90, 2000.

Sanches et al. ● Braz. J. Rad. Sci. ● 2020 16
[19] ZUKOWSKA, J.; BODE, P.; BIZIUK, M. Toenail selenium level among healthy residents
of two Polish Districts. J Radioanal Nucl Chem, v. 280, p. 621-627, 2009.
[20] SANCHES, T.P.; SAIKI, M. Establishing a protocol for element determinations in human
nail clippings by neutron activation analysis. In: INTERNATIONAL NUCLEAR
ATLANTIC CONFERENCE, INAC 2011, Belo Horizonte. Annals …, Comissão Nacional de
Energia Nuclear, 2011. Available at: https://www.ipen.br/biblioteca/2011/inac/17078.pdf . Last
acessed: 27 jun 2020.
[21] NIST - National Institute of Standards and Technology. Standard reference material
1577b Bovine Liver, 1991, 4p.
[22] NIST - National Institute of Standards and Technology. Standard reference material
1566b Oyster Tissue, 2001, 8p.
[23] KONIECZKA, P.; NAMIESNIK, J. Quality assurance and analytical control in the
Analytical laboratory: a practical approach, New York: CRC Press, 2009.
[24] JAMES, M.F.; MILLST, R. W.; WEAVER, D. R. The use of the normalized residual in
averaging experimental data and in treating outliers. Nucl Instrum Meth, v. 313, p. 277-282,
1992.
[25] GULSON, B. L. Nails: concern over their use in lead exposure assessment. Sci Total
Environ, v. 177, p. 323-327, 1996.
[26] YAEMSIRI, S.; HOU, N.; SLINING, M. M.; HE, K. Growth rate of human fingernails and
toenails in healthy American young adults. J Eur Acad Dermatol Venereol, v. 24, p. 420-423,
2010.
[27] CHAUDRARY, K.; EHAMANN, W. D.; RENGAN, K.; MASESBERY, W. R. Trace
element correlation with age and sex in human fingernails. J Radioanal Nucl Chem, v. 195, p.
51-56, 1955.
[28] BRASIL – Ministério da Saúde. IMC em adultos, 2017. Available at:
http://www.saude.gov.br/component/content/article/804-imc/40509-imc-em-adultos. Last
acessed: 20 Jan. 2020.

Sanches et al. ● Braz. J. Rad. Sci. ● 2020 17
[29] NOWAK, B. Occurrence of heavy metals, sodium, calcium, and potassium in human hair,
teeth, and nails. Biol Trace Elem Res, v. 52, p. 11-22, 1996.
[30] HOSSEINIMAKAREM, Z.; TAVASSOLI, S. H. Analysis of human nails by laser-induced
breakdown spectroscopy. J Biom Opt, v. 16, p. 057002-1-057002-8, 2011.
[31] BAHREINI, M.; HOSSEINIMAKAREM, Z.; TAVASSOLI, S. H. A study of association
between fingernail elements and osteoporosis by laser-induced breakdown spectroscopy, J Appl
Phys, v. 112, p. 054701- 1-054701-9, 2012.
[32] CARNEIRO, M. F. H.; RODEN, C. R.; AMANTÉA, S. L.; BARBOSA-JUNIOR, F. Low
concentrations of selenium and zinc in nails are associated with childhood asthma. Biol Trace
Elem Res, v. 144, p. 244-252, 2011.
[33] BISWAS, S. K.; ABDULLAH, M.; AKHTER, S.; TARAFDAR, S. A.;
KHALIQUZZAMAN, M.; KHAN, A. H. Trace element in human fingernails measurement by
proton-induced X-ray emission. J Radional Nucl Chem, v. 82, p. 111-124, 1984.
[34] RODUSHKIN, I.; AXELSSON, M. Application of double focusing sector field ICP-MS for
multielemental characterization of human hair and nails, Part II. A study of the inhabitants of
northern Sweden. Sci Total Environ, v. 262, p. 21-36, 2000.
[35] VANCE, D. E.; EHMANN, W. D.; MARKESBERY, W. R. Trace element content in
fingernails and hair of a nonindustrialized US control population. Biol Trace Elem Res, v. 17,
p. 109-121, 1988.
[36] O´RORKE, M.; CANTWELL, M. M.; ABNET, C. C.; BROCKMAN, J. D.; MURRAY, L.
J. Toenail trace element status and risk of Barrett´s study oesophagus and oesophageal
adenocarcinoma: Results from the FINBAR study. Int J Cancer, v. 131, p. 1882-1891, 2012.
[37] CHENG, T. P.; MORRIS, J. S; KOIRTYOHANN, S. R.; SPATE, V. L.; BASKETT, C. K.
The analysis of human nails for 24 elements via Ko and cyclic neutron activation analysis. Nucl
Instr Meth Phys Res A, v. 353, p. 457-460, 1994.

Sanches et al. ● Braz. J. Rad. Sci. ● 2020 18
[38] MENEZES, M. Â. B. C.; MAIA, E. C. P.; ALBINATI, C. C. B.; SABINO, C. V. S.;
BATISTA, J. R. How suitable are scalp hair and toenail as biomonitor? J Radioanal Nucl
Chem, v. 259, p. 81-86, 2004.

BJRS
BRAZILIAN JOURNAL
OF
RADIATION SCIENCES 08-03 (2020) 01-13
ISSN: 2319-0612 Accepted: 2020-08-19
Image quality evaluation for two different positron
emitters in a preclinical PET scanner
1,2Gontijo, R.M.G., 1Ferreira, A.V., 1,2Souza, G.A.C., 1Silva, J.B., 1,2Mamede, M.
1Centro de Desenvolvimento da Tecnologia Nuclear/CDTN
Av. Presidente Antônio Carlos, 6.627
31270-901 Belo Horizonte, MG, Brazil
2Departamento de Anatomia e Imagem/ IMA
Universidade Federal de Minas Gerais
31270-901 Belo Horizonte, MG, Brazil
ABSTRACT
Positron emission tomography (PET) is widely used in preclinical trials, generating molecular images applied to
biochemical, metabolic and functional investigation of organs and tissues. The positron emitters 11C and 18F are
relevant for different diseases studies. However, they have different positron energies, ranges, and branching
ratio. This could result in a distinct quality between the acquired PET images. Thus, the aim of this study was to
evaluate differences in the image quality performance of the PET scanner (LabPET 4, GE) at Molecular Imaging
Laboratory (LIM/CDTN) depending on the use of18F or 11C. The study followed the guidelines of the NEMA NU
4-2008 standards and the recommended specific phantom was used in experimental procedures. The NEMA
image-quality (IQ) phantom consists of 3 different regions to analyze distinct characteristics: uniformity,
recovery coefficients (RCs) and spill-over rations (SOR) in air and water. The IQ phantom was filled with two
different aqueous solutions (18F-FDG and 11C-PK11195), both activities calibrated at the beginning of acquisition
(3.7MBq). The IQ phantom was placed in the center of the field-of-view (FOV) and measured with the
LIM/CDTN typical whole body imaging protocol. The images were reconstructed following the LIM/CDTN
standard protocol: MLEM-3D algorithm, 20 iterations, no high-resolution mode, no attenuation or scatter
corrections, no post-filtering. PMOD® software was used to perform images post-processing. Uniformity test
revealed that 11C PET image roughness is about twice 18F PET image roughness. SOR tests indicated around
15% more counts in cold volumesin 11C PET image than in 18F PET image. The RCs for 11C were systematically
lower and with higher percentage standard deviations than those for 18F. This study demonstrated and
quantified the best performance of PET images with 18F when compared to 11C. This fact must be taken into
account in laboratorial practice, especially when quantitative analyzes are performed.
Keywords: image quality, preclinical PET scanner, 18F, 11C.

Author et al. ● Braz.J.Rad. Sci. ● 2020 2
1. INTRODUCTION
Positron emission tomography (PET) is widely used in preclinical trials, generating molecular
images applied to biochemical, metabolic and functional investigation of organs and tissues. This
imaging modality of nuclear medicine is important in the development of new radiopharmaceuticals
or in studies of new applications of traditional radiopharmaceuticals [1]. Because of widespread use
and commercial availability of small-animal PET scanners, the National Electrical Manufactures
Association (NEMA) published its NU 4/2008 standards [2], a consistent and standardized
methodology for measuring scanner performance parameters for small animal PET imaging. The
publication covers the parameters spatial resolution, scatter fraction, count losses and random
coincidence measurements, sensitivity, image quality, accuracy of attenuation and scatter
corrections. In this sense, results of standardized measurements make possible to compare
performances of different small animal PET scanners and can be used for acceptance tests of
equipment [2].
Currently in Brazil, there are six centers of preclinical molecular imaging using PET routinely
[3], one of them installed in the Molecular Imaging Laboratory (LIM) of Nuclear Technology
Development Center (CDTN). Although most studies conducted at LIM/CDTN involve 18F-labeled
radiopharmaceuticals [4-9], some effort has been made in studies with 11C-labeled
radiopharmaceuticals [10, 11]. In this context, it is important to keep in mind that differences in
physical and chemistry properties of radionuclides can results in different performances of the PET
scanner [12]. For example, the positron maximum energy is about 0.6 MeV for 18F and about 1.0
MeV for 11C. Since the positron range increases with positron energy, the use of 11C in PET studies
results in a reduction of spatial resolution when compared with 18F studies, which can be observed
from increased blurring of images reconstructed with fixed reconstruction settings [12].
NEMA 4-2008 publication possesses an entire section (section 6) dedicated to evaluating the
image capabilities of the scanner including image quality, accuracy of attenuation and scatter
corrections. The purpose of these tests is to produce PET images simulating those obtained in a
typical total body study of a small rodent by using a specific phantom [2]. The publication
establishes that these tests shall be performed with 100 μCi (3.7 MBq) of 18F during 20 min.

Author et al. ● Braz.J.Rad. Sci. ● 2020 3
Therefore, the standard measurements procedures permit comparison of image capabilities of
different scanners in a well stablished condition.
However, in the laboratorial practice, differences of performance of a particular PET scanner
can occur due to the use of different radionuclides. So, the dependence of PET scanner performance
with the radionuclide must be known to assure a correct image interpretation. Thus, the aim of this
work was to evaluate, based in the NEMA NU 4-2008 standards, image capabilities of the PET
scanner at LIM/CDTN using 18F and 11C positron emitters. The choice of these radionuclides was
due to their use in the LIM/CDTN experimental preclinical studies.
2. MATERIALS AND METHODS
The experiments were carried out at the Molecular Imaging Laboratory (LIM/CDTN) and with
collaboration of the Radiopharmaceutical Research and Production Unit (UPPR/CDTN), which
made the 18F-FDG and 11C-PK1195 radiopharmaceuticals available. These radiopharmaceuticals
were used in this work as sources of 18F or 11C positron emitters. Table 1 presents the main
parameters of these two radionuclides.
Table 1: Main physical, chemical and nuclear properties of 18F and 11C radionuclides [13].
Radionuclide Half-Life
(min)
β+Branch Ratio
(%)
β+ Energy (keV) β+ Range in water (mm)
Maximum Mean Maximum Mean
11C 20.4 min 99.8 0.960 0.386 4.2 1.2 18F 109.7 min 96.9 0.634 0.250 2.4 0.6
2.1. PET scanner
The Triumph™ platform is a preclinical system dedicated for rodents imaging. The subsystem
LabPET 4 consists of a stationary gantry with 1536 detectors. It employs an Avalanche Photo Diode
(APD) detector ring incorporating an assembly of LYSO (Lutetium yttrium oxyorthosilicate –
Lu1.9Y0.1SiO5) and LGSO (Lutetium gadolinium oxyorthosilicate – Lu0.4Gd1.6SiO5)
scintillators optically coupled one after the other [14]. LabPET 1.12.1 software, provided by the
scanner manufacturer, controls acquisition and reconstruction of PET images [15].

Author et al. ● Braz.J.Rad. Sci. ● 2020 4
LabPET 4 images are acquired using a 250-650 keV energy window and 22 ns coincidence
timing window. It provides axial field of view (FOV) of 3.7 cm and can operate in a dynamic or
static mode. Coincident data are saved in list mode and can be sorted out as sinograms. More details
about the LabPET 4 design and architecture are presented elsewhere [16, 17].
2.2. Image quality phantom
For imaging capabilities evaluation, the NEMA NU 4/2008 recommends a specific Image
Quality (IQ) phantom. This phantom (Figure 1) is made up of polymethylmethacrylate (PMMA)
with internal dimensions of 50 mm length and 30 mm diameter. It has a main chamber that
communicates with five different diameters auxiliary rods (1, 2, 3, 4, and 5mm), all of which are
expected to be filled with radiopharmaceutical water solution. Thus, activity concentration in any
rod is the same that the one in main chamber. In addition, the IQ phantom possesses two cold
chambers - one of them to be filled with air and the other one with water, both no radioactive.
Details of IQ phantom are presented at NEMA 4-2008 publication [2].
A
B
C
Figure 1: Image Quality phantom.A: Photo gallery of authors; B: schematic representation
where blue indicates radiopharmaceutical fillable volumes; C: phantom positioned on PET scanner
FOV.
2.1. Image Acquisition and Image Reconstruction Procedures
For 18F studies, acquisition procedure and also the image analysis procedure followed the
recommendation of NEMA NU 4-2008 publication (3.7 MBq at the beginning of acquisition, 20
min acquisition time). The activity in the phantom was measured with a Capintec CRC®-25R

Author et al. ● Braz.J.Rad. Sci. ● 2020 5
activimeter. For 11C studies, NEMA recommendations were adapted (3.7 MBq at the beginning of
acquisition, 30 min acquisition time) in order to assure the same number of positrons during the
image acquisition - considering half-life and branching ratio of each radionuclide.
The IQ phantom filled with radiopharmaceutical was placed in the center of the axial FOV
(Figure 1C) and measured with the LIM/CDTN typical whole-body imaging protocol which uses
three bed positions in order to cover the phantom length. Decay corrections were automatically
done by LabPET 1.12.1 software in order to adjust the acquisition time for each bed position.
After acquisition, PET images were reconstructed following the LIM/CDTN standard protocol:
MLEM-3D algorithm, 20 iterations, no high-resolution mode, no attenuation or scatter corrections,
no post-filtering. IQ phantom image acquisition and reconstruction were performed with the
LabPET 1.12.1 software, provided by the small-animal PET scanner manufacturer [15].
2.2. Image Analysis
After image reconstruction, scanner image capabilities tests recommended by the NEMA 4-
2008 publication (section 6) were performed, namely Uniformity, Spill-Over Ratio (SOR) and
Recovery Coefficient (RC):
(i) The Uniformity test consists of to obtain mean (ACmean), maximum (ACmax), minimum
(ACmin) and standard deviation (ACSD) of the activity concentration in the main chamber. To
perform this test, a central cylindrical volume of interest (VOI) with 22.5 mm diameter and 10mm
height was analyzed. The number of counts per second (CPS) in the VOI were converted in activity
concentration (kBq.ml-1) using a previous calculated conversion coefficient. The percentage
standard deviation (%SD), also named image roughness (%IR) [18], was evaluated according the
equation (1):
%𝑆𝐷 = %𝐼𝑅 = 100 × 𝐴𝐶𝑆𝐷
𝐴𝐶𝑚𝑒𝑎𝑛 (1)
where: ACmean is the mean activity concentration measured in VOI positioned in the uniform region
of the IQ phantom and ACSD is the respective standard deviation. The uniformity in the main

Author et al. ● Braz.J.Rad. Sci. ● 2020 6
chamber is an indicative of attenuation and scatter correction performance of the PET scanner [2].
(ii) The ratio between the mean activity measured in a cold chamber (filled with air or water)
and the mean activity measured in the main chamber provides the Spill-Over Ratio. To perform this
test, a central cylindrical VOI (4 mm diameter, 7.5 mm height) in each cold chamber was analyzed.
SOR test results are an indicative of scatter correction performance of the PET scanner [2].
(iii) The ratios between the mean activity measured in each one of the five auxiliary rods and
the mean activity measured in the main chamber provides the image Recovery Coefficients. To
perform this test, the 10 mm length central region of each rod was average to obtain a single image
in which the coordinates of the highest value pixel were determined. Then, for each rod, the mean
activity concentration was determined considering a 10 mm axial line passing through the highest
value pixel. The RCs are indicative of the spatial resolution of the PET scanner [2].
More details of analysis for image quality tests are provided in NEMA 4-2008 and also in a
previous work [9]. Image quantitative analyses were performed using PMOD® software, v3.7 [19] -
software designed for research in the field of molecular imaging that allows quantitative data
processing. Activity concentration in specific VOI was achieved using PMOD® PBAS tool. This
tool supports viewing and processing of molecular images and allows quantitative approaches as
statistics of VOI pixels [19].
3. RESULTS AND DISCUSSION
Figure 2 presents a comparison of typical images of IQ phantom for the two positrons emitters,
11C and 18F. Qualitatively, it is possible to see that 18F PET image (Figure 2B) presents less image
roughness and also a better IQ phantom contours definition than 11C PET image (Figure 2A). This
finding will be discussed further below.
Figure 3 illustrates the methodology of analysis of the PET image. In figure it is possible to see
VOIs positioned in regions that were analyzed: a single cylindrical VOI in the main chamber to
uniformity test (Figure 3A); three cylindrical VOIs (in main and in cold chambers) to Spill-Over
Ratio tests (Figure 3B). The recovery coefficient test is illustrated for the 5mm auxiliary rod (Figure
3C).

Author et al. ● Braz.J.Rad. Sci. ● 2020 7
A
B
Figure 2: PET image (sagittal plane) of the Image Quality phantom using 11C (A) e 18F (B).
Note that scales indicate same color definition in both images.
A
B
C
Figure 3: 18F PET image of IQ phantom. A: cylindrical VOI positioned in the main chamber for
Uniformity test; B: cylindrical VOIs positioned in main and cold chambers for Spill-Over Ratio
tests; C: Recovery Coefficient test: (left) red line indicates the 10mm length central region of the
5mm rod; (right) orange circle indicates the average image of the 10mm length central region of
5mm rod and central cross indicates the hottest pixel.
3.1. Uniformity test
Figure 4 presents the activity concentration in the main chamber of the IQ phantom for the two
radionuclides, 11C and 18F.

Author et al. ● Braz.J.Rad. Sci. ● 2020 8
Figure 4: Concentration of activity in
IQ phantom main chamber for 11C e 18F.
11C PET image presented highest percentage standard deviation of the activity concentration in
the main chamber of IQ phantom than18F PET image: 14.5%STD for 11C and 7.7%STD for 18F.
Considering that this parameter measures the image roughness, uniformity analysis demonstrated
that 11C image was twice as rough as 18F image. This finding confirms the qualitative analysis of
Figure 2. This fact may be explained by the higher range of 11C positron when compared to 18F
positron range. Positron range generates an error in the localization of the true position of the
positron emission since coincidence detection is related to the location of positron annihilation.
The value of image roughness for 18F radionuclide obtained in this study, 7.7%, is in accordance
with that published for the LabPET 8™ scanner, where the authors obtained a value of 7.0% [20].
The lack of studies using11C in literature makes comparison of the performance of the PET scanner
for this radionuclide with other authors and other small animal PET scanners impossible.
3.2. Spill-over ratio
Figure 5 presents the spill-over ratio in the two non-radioactive chambers (air and water) for 18F
and 11C radioisotopes.

Author et al. ● Braz.J.Rad. Sci. ● 2020 9
Figure 5: Spill-over ratio for 11C e 18F.
In air, the mean SOR values obtained for 11C and 18F were 0.33 and 0.29, respectively. In water,
the mean SOR values obtained for 11C and 18F were 0.22 and 0.19. For both cold chambers, 11C
SOR values are around 15% higher than 18F SOR values, indicating the worst performance of the
image quality of this radionuclide. Once again, this finding is due to differences in radionuclides
physical properties, since positron from 11C possesses the higher positron range.
For both radionuclides, SOR values for air chamber is higher than those for water chamber.
Figure 6 shows the count rates obtained from the linear profile traced in the 18F PET image (axial
plane) at the region containing the two cold chambers. In this figure is possible to see the difference
in counting rate between water chamber and air chamber where count rates in air chamber is higher
than those in water chamber.
Figure 6: 18F Linear profile at the region of non-radioactive chambers.

Author et al. ● Braz.J.Rad. Sci. ● 2020 10
18F SOR value obtained for the cold chamber filled with water (SORWater: 0.19) are compatible
with the value reported by Prasad et al. for the LabPET 8™ scanner (SORWater: 0.20)[20]. However,
the18F SOR value obtained for the cold chamber filled with air (SORAir: 0.29) are significantly
higher than those reported by the authors (SORAir: 0.11) [20]. This fact may be explained by
different characteristics between the scanners. LabPET4 scanner used in this study is not able to
quantify and correct the scattered coincidence events, unlike the upper model (LabPET 8™) used
by the authors [20].
The lack of studies using 11C in literature makes comparison of the scanner performance of this
radionuclide with other authorsand other PET scanners impossible.
3.3. Recovery coefficients
Figure 7 presents,for the two radionuclides,the recovery coefficients from the 5 auxiliary rods
with different diameters (1-5mm) and respective standard deviations. Results indicate that RCs for
11C were systematically lower and with higher percentage standard deviations than those for 18F.
Figure 7: Recovery coefficients from the 5 rods (1-5mm) for 11C e 18F.
Author et al. ● Braz.J.Rad. Sci. ● 2020 11
For the 1-mm-diameter rod, the respective RC values obtained for 11C and 18F were 0.10 ± 80%
and 0.10 ± 30%, while for the 5-mm-diameter rod the values were 0.77 ± 60% and 0.85 ± 24%. The
worst performance of 11C image was expected since the RC test is an indicative of the PET scanner
spatial resolution [2] and this parameter is dependent of positron range [12]. These quantitative
results must be considered in PET image analysis, especially in the analysis of small structures in
preclinical experiments.
RC results for 18F radionuclide are in accordance with those published by Prasad et al. [20] for
the LabPET 8 model: 1 mm - 0.13; 2 mm - 0.32; 3 mm - 0.58; 4 mm - 0.83; 5 mm - 0.96. The lack
of studies using 11C in literature makes impossible comparison of the scanner performance for this
radionuclide with other authors and other small animal PET scanners.
4. CONCLUSION
The results obtained in this work using IQ phantom defined by NEMA NU 4/2008 revealed that
the system LabPET 4 of LIM/CDTN produces 18F PET images with performance according to the
literature. The assessment of PET image quality using 11C radionuclide was not found in the
literature until now and makes comparison with other authors and other scanners impossible.
In a general way, it was observed that 18F PET image presents better results for image quality
tests when compared to 11C PET image. This fact was expected due differences in radionuclides
positron ranges. The present work allowed quantifying the differences in performance of the PET
scanner when using these two different radionuclides. The results are important to laboratorial
practice and may be taken in account in experimental preclinical study designer and also in
quantitative PET image analysis.
ACKNOWLEDGMENT
This work was supported and financed by FAPEMIG, CNPq, UFMG and CDTN/CNEN. The
authors would like to thank the UPPR / CDTN team for providing the radiopharmaceuticals used in
the experiments.

Author et al. ● Braz.J.Rad. Sci. ● 2020 12
REFERENCES
[1] R. YAO, R.; LECOMTE, R.; CRAWFORD, E. Small-Animal PET: What is it, and why do we
need it?Journal of Nuclear Medicine Technology. Vol. 40 nº3, pp.157-165. 2011.
[2] National Electrical Manufacturers Association. Performance Measurements of Small Animal
Positron Emission Tomographs. Rosslyn VA; 2008 Standards Publication NU 4- 2008.
[3] GONTIJO, R. M. G.; FERREIRA, A. V.; SILVA, J, B.; MAMEDE, M. Quality control of small
animal PET scanner: The Brazilian Scenario. Brazilian Journal of Radiation Sciences. v. 8. p.
01-09. 2020.
[4] SILVEIRA, M. B. et al., Preclinical acute toxicity, biodistribution, pharmacokinetics, radiation
dosimetry and microPET imaging studies of [18F]Fluorocholine in mice. Applied Radiation
and Isotopes, v. 116, p. 92-101. 2016.
[5] SILVEIRA, et al., 18 F-Fluorocholine Uptake and Positron Emission Tomography Imaging in
Rat Peritoneal Endometriosis. Reproductive Sciences. v. 1. 2017.
[6] MENDES, B. M et al., New Radiation Dosimetry Estimates for [18F]FLT based on Voxelized
Phantoms. Radiation Research. v. 190. p. 37-44. 2018.
[7] SCHIRMER, B. G. A. et al. Comparison of [18F]Fluorocholine and [18F]Fluordesoxyglucose for
assessment of progression, lung metastasis detection and therapy response in murine 4T1 breast
tumor model. Applied Radiation and Isotopes. v. 140. p. 278-288. 2018.
[8] GONTIJO, R.M.G., et al. Image quality assessment using NEMA NU 4/2008 standards in small
animal PET scanner. Brazilian Journal of Radiation Sciences. v. 7, p. 1-13. 2019
[9] GONTIJO, R. M. G., et al. Image quality evaluation of a small animal PET scanner. Brazilian
Journal of Radiation Sciences. v. 8. p. 01-13, 2020.
[10] ALMEIDA, F. A. F., et al. Synthesis and characterization of [11C]PK11195 as a PET
radiopharmaceutical. In: INTERNATIONAL NUCLEAR ATLANTIC CONFERENCE,
2017, Belo Horizonte.
[11] OLIVEIRA, K. E. M.; MALAMUT, C.; SILVEIRA, M. B.; GONTIJO, R.M.G. Aquisição e
análise quantitativa de imagens PET em camundongos sadios utilizando o radiofármaco 11C-
Metionina. Curie&Roentgen. v. 2. p. 16, 2019.

Author et al. ● Braz.J.Rad. Sci. ● 2020 13
[12] IAEA - International Atomic Energy Agency. PET/CT atlas on quality control and image
artefacts. IAEA Human Health Series no 27 (2014).
[13] IAEA - International Atomic Energy Agency. Live Chart of Nuclides. https://www-
nds.iaea.org/relnsd/vcharthtml/VChartHTML.html. 2020.
[14] GE Healthcare Technologies, “Triumph Service Guide Technical Publication”. Revision
Draft 6, Copyright. http://www.gehealthcare.com 2011.
[15] Gamma Medica-Ideas. User Manual: Positron Emission Tomography (PET) Scanner
Software - Manual for Acquisition and Processing of PET Images from the LABPET
System. Software version: LABPET 1.12.0. 2010.
[16] TRETAULT, M. A. et al., System architecture of the LabPET small animal PET
scanner.IEEE Transactions on Nuclear Science. v. 55. p. 2546-2550. 2008.
[17] FONTAINE, R. et al. The hardware and signal processing architecture of LabPETTM, a
small animal APD-based digital PET scanner.IEEE Transactions on Nuclear Science, v. 56.
p. 3-9, 2009.
[18] BELCARI, N. et al., NEMA NU-4 Performance Evaluation of the IRIS PET/CT Preclincial
Scanner. IEEE Transactions on Nuclear Science. 2017. v. 1. p. 301-309. 2017.
[19] PMOD Tecnologies LCC, PMOD v.3.7. User Manual. 2015.
[20] Prasad et al., NEMA NU-04 based Performance Characteristics of the LabPET-8TM Small
Animal PET Scanner. Phys. Med. Biol. v56, p. 6649-6664. 2011.