Extremely Preterm Infant Mortality Rates and Cesarean Deliveries in the United States
Upload
independentCategory
view
1download
0
Utilization of Village Midwives and Other Trained DeliveryAttendants for Home Deliveries in Indonesia: Results of IndonesiaDemographic and Health Survey 2002/2003 and 2007
Christiana R. Titaley • Michael J. Dibley •
Christine L. Roberts
Published online: 10 October 2010
� Springer Science+Business Media, LLC 2010
Abstract This study aimed to examine factors associated
with utilization of village midwife and other trained delivery
attendants for home deliveries. Information from 14,672
cases of the most recent home deliveries of mothers in the
5 year-period prior to the Indonesia Demographic and
Health Survey 2002/2003 and 2007 were analysed. Multi-
nomial logistic regression analysis was performed. The
association between 26 factors categorised into external
environment, predisposing, enabling, need and previous
utilization of maternal health services, and utilization of
village midwife and other trained delivery attendants, such
as nurses, other midwives and doctors, for home deliveries
was examined. The population attributable risk of selected
significant predictors was calculated. The odds of using
village midwives and other trained delivery attendants at
childbirth for home deliveries increased with increasing
household wealth index and levels of parental education.
The odds increased among first birth, mothers who were
exposed to mass media, mothers with knowledge of delivery
complications, and mothers who had any delivery compli-
cations. However, mothers who attended less than four
antenatal care visits, who had high parity, or who reported
distance and transportation to health facilities was a major
problem, had significantly reduced odds for utilizing any
trained delivery attendants. Health promotion strategies to
raise community awareness about the importance of safe
delivery should target low educated parents, mothers from
low household economic status, as well as high parity
mothers. Efforts to promote antenatal care visits are likely to
increase utilization of trained delivery attendants for home
deliveries in Indonesia.
Keywords Midwives � Trained delivery attendants �Home deliveries � Indonesia
Introduction
Most of maternal and neonatal deaths occur outside health
facilities, without the assistance of trained delivery atten-
dants [1]. The rate of skilled attendance and institutional
delivery rates have been reported to be lowest in countries
with the highest rate of both maternal and neonatal mor-
tality [2, 3]. Approximately 35% of deliveries, worldwide,
are attended by untrained health workers [4]. This pro-
portion ranged from less than one percent in developed
regions to 65% in least developed countries [4]. Approxi-
mately 50 million mothers in developing countries have a
home delivery without any professional health care [5].
Interventions to reduce maternal and neonatal deaths
have included the provision of skilled birth attendants at
childbirth and the improvement of obstetric services in
health care facilities [1, 6]. It has been argued that 20–30%
of all-cause neonatal mortality rates could be reduced [7]
C. R. Titaley (&)
Sydney School of Public Health, University of Sydney,
Room 128C Edward Ford Building (A27), Sydney,
NSW 2006, Australia
e-mail: [email protected]
M. J. Dibley
Sydney School of Public Health, University of Sydney,
Room 307A Edward Ford Building (A27), Sydney,
NSW 2006, Australia
e-mail: [email protected]
C. L. Roberts
The Kolling Institute of Medical Research, University of
Sydney, Royal North Shore Hospital, St Leonards,
NSW 2065, Australia
e-mail: [email protected]
123
Matern Child Health J (2011) 15:1400–1415
DOI 10.1007/s10995-010-0697-1

and 74% of mothers lives could be saved [5] by imple-
menting skilled birth care. The proportion of deliveries
attended by skilled health personnel also has been included
as an indicator to monitor the progress towards the Mil-
lennium Development Goals 5 of maternal health [8].
A recent review on maternal survival reported the pro-
portion of deliveries assisted by health professionals has
been increasing [9]. This has likely contributed to the
global progress in reducing maternal mortality rates [10].
However, in some regions including Southeast Asia, a large
proportion of women are still left without professional care
at delivery [9]. The disparity in professional care at
delivery between urban and rural areas has also widened,
which is mainly due to the slower increase in professional
delivery care in rural areas [9, 11].
Several frameworks have been developed to analyze the
use of health care services. One of the most frequently used
is the behavioural model developed by Andersen in the late
1960 [12, 13]. The emerging model of this framework has
incorporated a range of factors categorized into some
groups of variables [12]. These groups include environ-
mental factors referring to the characteristics of health care
system and community; predisposing factors, the charac-
teristics that existed prior to the need to use health services;
enabling factors that allow an individual to use health
services; need factors which are reasons to use health
services; personal health practices and perceived health
status [12]. This framework was adapted in this study to
answer our research question.
Earlier studies have shown the relationship between
demographic, socio-economic factors and the uptake of
health care services. Maternal education, [14–19] parity
[19–21] and economic factors [19, 21–25] were shown to
be associated with health care seeking behaviour. Studies
have also reported an increased likelihood of the uptake of
delivery care services, which included the use of trained
attendants at childbirth and institutional deliveries, among
mothers attending antenatal care services [20, 26, 27]. The
positive influence of access to health care services have
also been reported [25, 28, 29]. An Indonesian study
reported distance and poor road conditions as part of the
reasons for mothers to prefer home delivery and to not use
trained delivery attendants at childbirth [30].
In 1989, the Indonesian Government embraced the
concept of the Safe Motherhood Initiative by implementing
the ‘‘village midwife’’ program which aimed at assigning a
midwife in every village [11, 31, 32]. By 1996, more than
50,000 village midwives had been placed in villages
around the country [11, 31, 32]. This intervention has
increased the proportion of deliveries attended by trained
attendants from 43% in 1997 [33] to 79% in 2007 [34].
Although this achievement is still below the national target
of 90% deliveries assisted by health professionals by 2010,
the village midwife program has successfully reduced the
socio-economic inequalities related to use of professional
attendants at delivery [35].
Despite numerous attempts made to increase utilization
of trained delivery attendants, the Indonesia Demographic
and Health Survey (IDHS) 2007 data reported a wide range
in the proportion of deliveries attended by trained health
professionals across provinces, from only 33% in Maluku
to 97% in DKI Jakarta Province [34]. Although the pro-
portion of home deliveries has declined, [33, 34] the 2007
IDHS reported more than half of all deliveries occurred at
home. This study aimed to determine factors associated
with utilization of village midwife and other trained
delivery attendants for home delivery.
Methods
Study Population
Data from two nationally representative surveys, the IDHS
2002/2003 and 2007 were used in this analysis. The IDHS
collects demographic and health-related information, such
as fertility, family planning and maternal and children
health [34]. The two surveys included information from
62,378 ever-married women aged 15–49 years, 29,483
from the IDHS 2002/2003 and 32,895 from the IDHS 2007
[33, 36]. Three questionnaires were used in these surveys—
the Household, Women’s, and Men’s questionnaires.
Variables included in this study were derived from the
Household and the Women’s questionnaires. The average
response rates of eligible households and women were 99
and 97%, respectively [33, 36]. The detailed sampling
method of the IDHS has been reported elsewhere [37].
Our study included information from 14,672 (7,457
from the IDHS 2002/2003 and 7,215 from the 2007 IDHS)
cases of the most recent home deliveries of mothers in the
5 year-period prior to each survey. By combining two
IDHS datasets, a large sample size could be obtained to
produce estimates with better precision. The demographic
information for study population is presented in Table 1.
We chose only the woman’s most recent delivery since the
most detailed health services information was available for
these births and to minimize recall bias of mothers about
their history of pregnancy and delivery.
Variables and Theoretical Framework
To identify factors associated with utilization of village
midwives and other trained delivery attendants for home
births, an outcome variable with three mutually exclusive
categories was constructed, (a) home deliveries without
any trained delivery attendants; (b) home deliveries with a
Matern Child Health J (2011) 15:1400–1415 1401
123
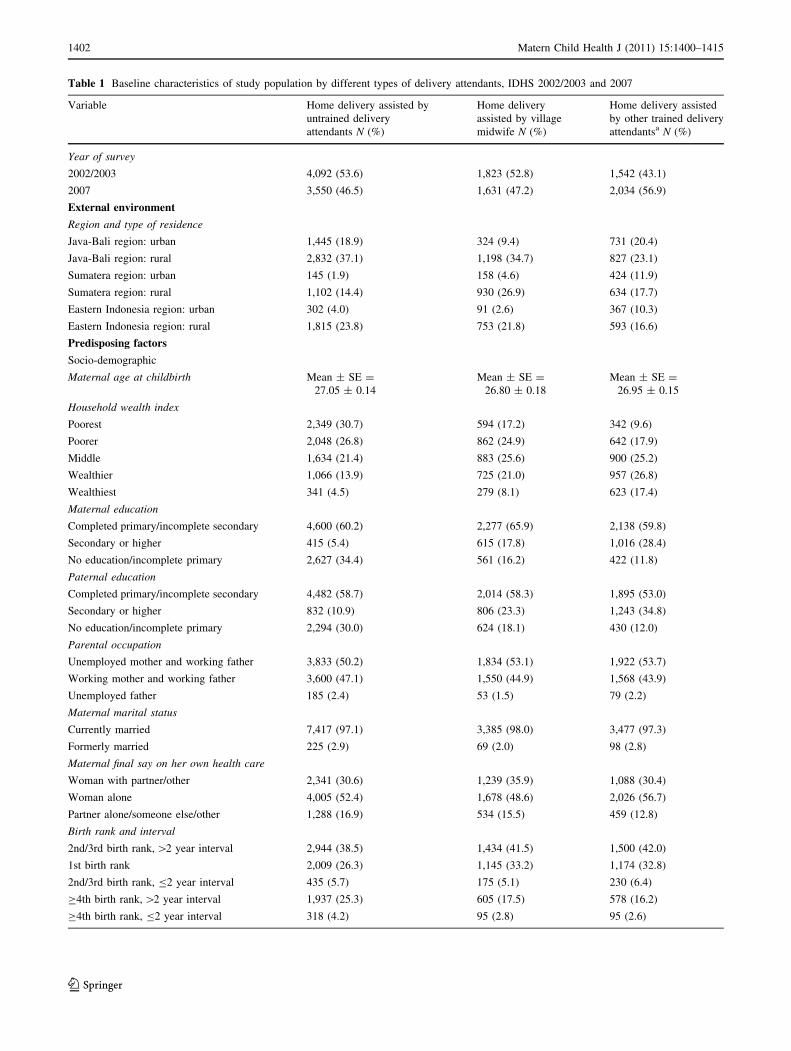
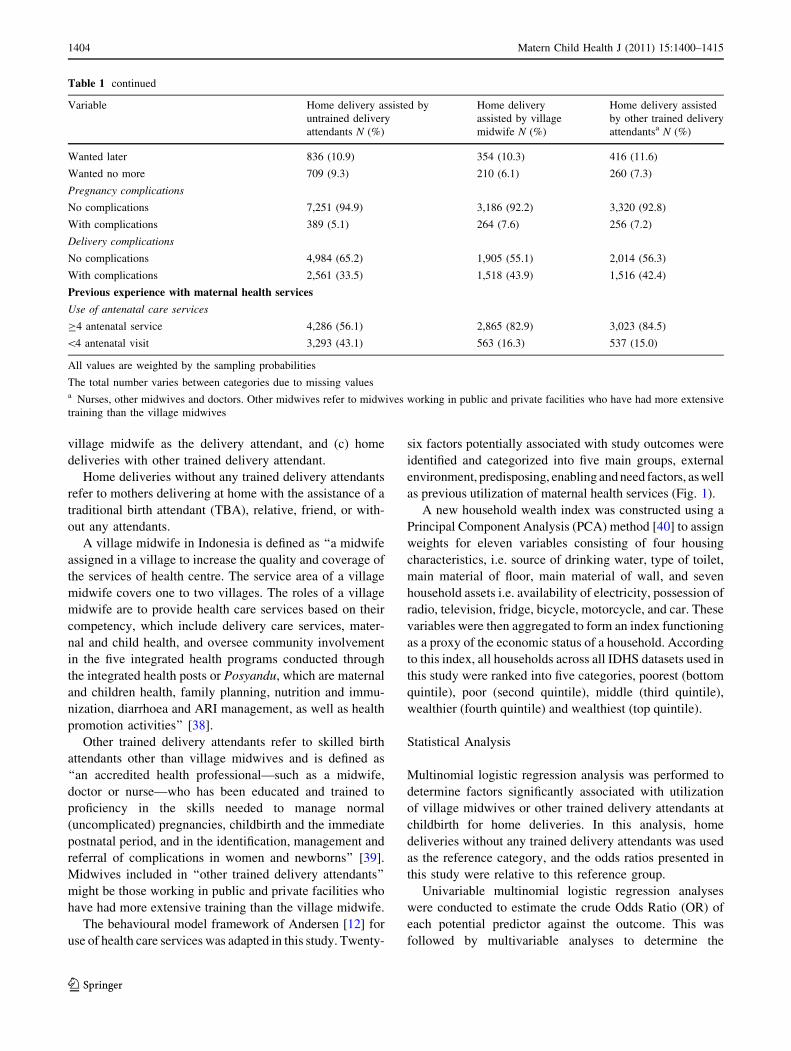
Table 1 Baseline characteristics of study population by different types of delivery attendants, IDHS 2002/2003 and 2007
Variable Home delivery assisted by
untrained delivery
attendants N (%)
Home delivery
assisted by village
midwife N (%)
Home delivery assisted
by other trained delivery
attendantsa N (%)
Year of survey
2002/2003 4,092 (53.6) 1,823 (52.8) 1,542 (43.1)
2007 3,550 (46.5) 1,631 (47.2) 2,034 (56.9)
External environment
Region and type of residence
Java-Bali region: urban 1,445 (18.9) 324 (9.4) 731 (20.4)
Java-Bali region: rural 2,832 (37.1) 1,198 (34.7) 827 (23.1)
Sumatera region: urban 145 (1.9) 158 (4.6) 424 (11.9)
Sumatera region: rural 1,102 (14.4) 930 (26.9) 634 (17.7)
Eastern Indonesia region: urban 302 (4.0) 91 (2.6) 367 (10.3)
Eastern Indonesia region: rural 1,815 (23.8) 753 (21.8) 593 (16.6)
Predisposing factors
Socio-demographic
Maternal age at childbirth Mean ± SE =
27.05 ± 0.14
Mean ± SE =
26.80 ± 0.18
Mean ± SE =
26.95 ± 0.15
Household wealth index
Poorest 2,349 (30.7) 594 (17.2) 342 (9.6)
Poorer 2,048 (26.8) 862 (24.9) 642 (17.9)
Middle 1,634 (21.4) 883 (25.6) 900 (25.2)
Wealthier 1,066 (13.9) 725 (21.0) 957 (26.8)
Wealthiest 341 (4.5) 279 (8.1) 623 (17.4)
Maternal education
Completed primary/incomplete secondary 4,600 (60.2) 2,277 (65.9) 2,138 (59.8)
Secondary or higher 415 (5.4) 615 (17.8) 1,016 (28.4)
No education/incomplete primary 2,627 (34.4) 561 (16.2) 422 (11.8)
Paternal education
Completed primary/incomplete secondary 4,482 (58.7) 2,014 (58.3) 1,895 (53.0)
Secondary or higher 832 (10.9) 806 (23.3) 1,243 (34.8)
No education/incomplete primary 2,294 (30.0) 624 (18.1) 430 (12.0)
Parental occupation
Unemployed mother and working father 3,833 (50.2) 1,834 (53.1) 1,922 (53.7)
Working mother and working father 3,600 (47.1) 1,550 (44.9) 1,568 (43.9)
Unemployed father 185 (2.4) 53 (1.5) 79 (2.2)
Maternal marital status
Currently married 7,417 (97.1) 3,385 (98.0) 3,477 (97.3)
Formerly married 225 (2.9) 69 (2.0) 98 (2.8)
Maternal final say on her own health care
Woman with partner/other 2,341 (30.6) 1,239 (35.9) 1,088 (30.4)
Woman alone 4,005 (52.4) 1,678 (48.6) 2,026 (56.7)
Partner alone/someone else/other 1,288 (16.9) 534 (15.5) 459 (12.8)
Birth rank and interval
2nd/3rd birth rank, [2 year interval 2,944 (38.5) 1,434 (41.5) 1,500 (42.0)
1st birth rank 2,009 (26.3) 1,145 (33.2) 1,174 (32.8)
2nd/3rd birth rank, B2 year interval 435 (5.7) 175 (5.1) 230 (6.4)
C4th birth rank, [2 year interval 1,937 (25.3) 605 (17.5) 578 (16.2)
C4th birth rank, B2 year interval 318 (4.2) 95 (2.8) 95 (2.6)
1402 Matern Child Health J (2011) 15:1400–1415
123

Table 1 continued
Variable Home delivery assisted by
untrained delivery
attendants N (%)
Home delivery
assisted by village
midwife N (%)
Home delivery assisted
by other trained delivery
attendantsa N (%)
Health knowledge
Frequency of reading newspaper
Never 5,460 (71.5) 1,899 (55.0) 1,701 (47.6)
Less than once a week 1,852 (24.2) 1,247 (36.1) 1,408 (39.4)
At least once a week 314 (4.1) 301 (8.7) 462 (12.9)
Frequency of listening to radio
Never 3,013 (39.4) 1,213 (35.1) 1,126 (31.5)
Less than once a week 2,463 (32.2) 1,156 (33.5) 1,230 (34.4)
At least once a week 2,151 (28.2) 1,077 (31.2) 1,207 (33.7)
Frequency of watching television
Never 1,283 (16.8) 345 (10.0) 201 (5.6)
Less than once a week 1,559 (20.4) 625 (18.1) 428 (12.0)
At least once a week 4,788 (62.7) 2,478 (71.7) 2,938 (82.2)
Knowledge on pregnancy complications
None 5,399 (70.7) 2,063 (59.7) 2,003 (56.0)
Yes 2,242 (29.3) 1,392 (40.3) 1,572 (44.0)
Knowledge on delivery complications
None 5,133 (67.2) 1,881 (54.5) 1,735 (48.5)
Yes 2,507 (32.8) 1,573 (45.5) 1,839 (51.4)
Knowledge on post-delivery complications
None 6,084 (79.6) 2,464 (71.3) 2,354 (65.8)
Yes 1,557 (20.4) 990 (28.7) 1,216 (34.0)
Enabling factors
Know where to go to seek health services
Small problem 7,002 (91.6) 3,236 (93.7) 3,424 (95.8)
Big problem 632 (8.3) 217 (6.3) 146 (4.1)
Permission to visit health services
Small problem 7,118 (93.2) 3,253 (94.2) 3,419 (95.6)
Big problem 516 (6.8) 199 (5.8) 151 (4.2)
Money to pay health services
Small problem 4,659 (61.0) 2,398 (69.4) 2,677 (74.9)
Big problem 2,978 (39.0) 1,055 (30.5) 893 (25.0)
Distance to health services
Small problem 5,632 (73.7) 2,809 (81.3) 3,137 (87.7)
Big problem 2,005 (26.2) 643 (18.6) 432 (12.1)
Transportation to health services
Small problem 5,778 (75.6) 2,875 (83.2) 3,205 (89.6)
Big problem 1,859 (24.3) 577 (16.7) 365 (10.2)
Presence of companion
Small problem 6,535 (85.5) 3,075 (89.0) 3,259 (91.2)
Big problem 1,099 (14.4) 377 (10.9) 311 (8.7)
Availability of care by female health workers
Small problem 6,898 (90.3) 3,156 (91.4) 3,254 (91.0)
Big problem 733 (9.6) 289 (8.4) 315 (8.8)
Need factors
Desire for pregnancy
Wanted then 6,085 (79.6) 2,888 (83.6) 2,899 (81.1)
Matern Child Health J (2011) 15:1400–1415 1403
123
village midwife as the delivery attendant, and (c) home
deliveries with other trained delivery attendant.
Home deliveries without any trained delivery attendants
refer to mothers delivering at home with the assistance of a
traditional birth attendant (TBA), relative, friend, or with-
out any attendants.
A village midwife in Indonesia is defined as ‘‘a midwife
assigned in a village to increase the quality and coverage of
the services of health centre. The service area of a village
midwife covers one to two villages. The roles of a village
midwife are to provide health care services based on their
competency, which include delivery care services, mater-
nal and child health, and oversee community involvement
in the five integrated health programs conducted through
the integrated health posts or Posyandu, which are maternal
and children health, family planning, nutrition and immu-
nization, diarrhoea and ARI management, as well as health
promotion activities’’ [38].
Other trained delivery attendants refer to skilled birth
attendants other than village midwives and is defined as
‘‘an accredited health professional—such as a midwife,
doctor or nurse—who has been educated and trained to
proficiency in the skills needed to manage normal
(uncomplicated) pregnancies, childbirth and the immediate
postnatal period, and in the identification, management and
referral of complications in women and newborns’’ [39].
Midwives included in ‘‘other trained delivery attendants’’
might be those working in public and private facilities who
have had more extensive training than the village midwife.
The behavioural model framework of Andersen [12] for
use of health care services was adapted in this study. Twenty-
six factors potentially associated with study outcomes were
identified and categorized into five main groups, external
environment, predisposing, enabling and need factors, as well
as previous utilization of maternal health services (Fig. 1).
A new household wealth index was constructed using a
Principal Component Analysis (PCA) method [40] to assign
weights for eleven variables consisting of four housing
characteristics, i.e. source of drinking water, type of toilet,
main material of floor, main material of wall, and seven
household assets i.e. availability of electricity, possession of
radio, television, fridge, bicycle, motorcycle, and car. These
variables were then aggregated to form an index functioning
as a proxy of the economic status of a household. According
to this index, all households across all IDHS datasets used in
this study were ranked into five categories, poorest (bottom
quintile), poor (second quintile), middle (third quintile),
wealthier (fourth quintile) and wealthiest (top quintile).
Statistical Analysis
Multinomial logistic regression analysis was performed to
determine factors significantly associated with utilization
of village midwives or other trained delivery attendants at
childbirth for home deliveries. In this analysis, home
deliveries without any trained delivery attendants was used
as the reference category, and the odds ratios presented in
this study were relative to this reference group.
Univariable multinomial logistic regression analyses
were conducted to estimate the crude Odds Ratio (OR) of
each potential predictor against the outcome. This was
followed by multivariable analyses to determine the
Table 1 continued
Variable Home delivery assisted by
untrained delivery
attendants N (%)
Home delivery
assisted by village
midwife N (%)
Home delivery assisted
by other trained delivery
attendantsa N (%)
Wanted later 836 (10.9) 354 (10.3) 416 (11.6)
Wanted no more 709 (9.3) 210 (6.1) 260 (7.3)
Pregnancy complications
No complications 7,251 (94.9) 3,186 (92.2) 3,320 (92.8)
With complications 389 (5.1) 264 (7.6) 256 (7.2)
Delivery complications
No complications 4,984 (65.2) 1,905 (55.1) 2,014 (56.3)
With complications 2,561 (33.5) 1,518 (43.9) 1,516 (42.4)
Previous experience with maternal health services
Use of antenatal care services
C4 antenatal service 4,286 (56.1) 2,865 (82.9) 3,023 (84.5)
\4 antenatal visit 3,293 (43.1) 563 (16.3) 537 (15.0)
All values are weighted by the sampling probabilities
The total number varies between categories due to missing valuesa Nurses, other midwives and doctors. Other midwives refer to midwives working in public and private facilities who have had more extensive
training than the village midwives
1404 Matern Child Health J (2011) 15:1400–1415
123

adjusted Odds Ratio (aOR) of factors significantly associ-
ated with each study outcome. Missing cases were exclu-
ded from all univariable and multivariable analyses.
In the multivariable method, a hierarchical modelling
strategy [41] were conducted by entering more distal fac-
tors—year of survey and the external environment factor
into the model. A backward elimination technique was then
employed to remove factors not significantly associated
with the study outcome using a significance level of 0.05.
The year of survey variable was selected a priori and
retained in the models irrespective of its significance level.
In the second model, all predisposing factors were entered
simultaneously, and backward elimination procedure was
conducted. Only factors significantly associated with the
study outcomes were retained in the model. This procedure
was repeated until all variables were entered into the model.
To calculate the population attributable risk (PAR), [24,
42, 43] binomial logistic regression models were per-
formed using selected factors retained in the final model.
The outcome variable was utilization of untrained delivery
attendants for home delivery. The PAR was used to esti-
mate the proportion of home deliveries without any trained
delivery attendants, which were attributable to the selected
risk factors. Using the adjusted odds ratio (aOR), the PAR
was calculated as follows:
PAR ¼ Proportion of home delivery with
untrained delivery attendants associated
with the factoraOR� 1ð Þ
aOR
All ORs, aORs and 95% confidence intervals (CI) were
weighted for the sampling probabilities. The STATA/MP
version 10.0 (2007) (Stata Corporation, College Station,
TX, USA) was used for all statistical analyses. Survey
commands were employed for all logistic regression
models to take into account the sampling weight and
cluster sampling design.
Results
Our study found that of 14,672 home deliveries included in
our analysis, 52% (n = 7,641) were attended by untrained
birth attendants including traditional birth attendants and
family relatives, 24% (n = 3,454) by a village midwife and
24% (n = 3,576) by other trained delivery attendants such
as nurses, other midwives and doctors. Approximately 94%
(n = 7,188) of mothers attended by untrained delivery
attendants were attended by a traditional birth attendant
(TBA); whereas 98% (n = 3,500) of mothers attended by
trained attendants were assisted by a nurse or midwife.
Amongst mothers with no education/incomplete pri-
mary, i.e. 25% of the entire sample, 73% (95% CI:
70.0–75.4%) delivered at home with untrained attendants.
Amongst 20% of mothers from poorest households, 72%
(95% CI: 68.7–74.2%) used untrained delivery attendants
at childbirth. For antenatal care use, of the 30% infants
whose mothers attended less than four antenatal services,
only 13% (95% CI: 11.3–14.5%) used village midwives
EXTERNAL ENVIRONMENT
PREDISPOSING FACTORS
ENABLING FACTORSUTILIZATION OF
DELIVERY ATTENDANT
Socio-demographic:- Maternal age at
childbirth- Household wealth index
- Maternal education
- Paternal education
- Parental occupation
- Maternal marital status
- Maternal final say on her own health care
- Birth rank and interval
Health knowledge:- Frequency of reading
newspapers- Frequency of listening to
radio- Frequency of watching
television- Knowledge on
pregnancy complications- Knowledge on delivery
complications- Knowledge on post
delivery complications
- Region and type of residence
- Know where to go to seek health services
- Permission to visit health services
- Money to pay health services
- Distance to health services
- Transportation to health services
- Presence of companion
- Availability of care by female health workers
PREVIOUS EXPERIENCE WITH
MATERNAL HEALTH SERVICES
- Use of antenatal care services
- Desire for pregnancy
- Pregnancy complications
- Delivery complications
NEED FACTORS
Fig. 1 Theoretical framework of factors associated with utilization of delivery attendants for home deliveries in Indonesia. Note: Framework
adapted from Andersen behavioural model [12]
Matern Child Health J (2011) 15:1400–1415 1405
123

and 12% (95% CI: 10.8–13.9%) used other trained atten-
dants. Figure 2 shows a decreasing trend of deliveries
attended by untrained birth attendants, from 63% in 1997
to 46% in 2007.
The detailed characteristics of variables used in these
analyses are presented in Table 1. A high proportion of
deliveries of mothers from poorest households (30.7%),
and/or mothers with low levels of education (34.4%) were
not assisted by trained delivery attendants. The proportion
of deliveries by the village midwife or other trained
attendants was higher in mothers from wealthier and
wealthiest households, with high education levels, having
first births, or attending four or more antenatal care visits.
Table 2 shows the results of bivariate and multivariable
analyses. As shown in Fig. 2, our analysis also found an
increased likelihood of using nurses, midwives and other
midwives rather than untrained attendants in the 2007
IDHS compared to the 2002/2003 IDHS (OR = 1.64,
P \ 0.001). The odds of using a village midwife versus the
untrained attendants, mainly the traditional birth atten-
dants, were generally higher among mothers living in rural
areas. In contrast, higher odds of using other types of
trained delivery attendants (i.e. nurses, other midwives, and
doctors) versus untrained delivery attendants were con-
stantly found in urban areas. Our study demonstrated that
the likelihood of using any type of trained delivery atten-
dants increased along with increasing household economic
status. Mothers from the wealthiest households were two
times and four times more likely to use a village midwife
and other type of trained delivery attendants, respectively,
compared to those from the poorest households. In the two
wealthiest groups, we found a higher increase of odds ratio
for using other types of trained attendants compared to the
increase of odds for using village midwife services.
A significant association between maternal and paternal
education and the use of delivery attendants was shown.
Parents with no/incomplete primary education had lower
odds of utilization of any trained birth attendants compared
to those with completed primary/incomplete secondary
education, whereas those with secondary or higher educa-
tion had the highest odds. The results also showed a
stronger relationship with maternal than paternal education.
Other predisposing factors that increased the likelihood of
using trained attendants included first born infants, mothers
with exposure to mass media, and mothers with knowledge
of any delivery complications.
Among the enabling factors, mothers reporting that
distance and transportation to health services were major
problems were less likely to use any trained delivery
attendants. Of the need factors, mothers with delivery
complications had an increased likelihood of using both
village midwife and any trained delivery attendants.
A significant association between antenatal care visits
and utilization of trained delivery attendants was confirmed
in our study. The odds of using a village midwife versus
untrained attendants was reduced by 70% for mothers who
had less than four antenatal visits compared to mothers
with four or more antenatal visits.
The PARs for selected significant predictors of utili-
zation of untrained delivery attendants are shown in
Table 3. The results showed that 45% (PAR = 0.45; 95%
CI: 0.36–0.53) of the total risk for utilizing untrained
attendants was attributable to low maternal education
level. The importance of antenatal care visits was also
reflected by its high PAR (30%) among mothers attending
less than four antenatal visits. The PAR values presented
in Table 3 should not be added, to avoid misinterpretation
[43].
0
10
20
30
40
50
60
70
1997 1998 1999 2000 2001 2002 2003 2004 2005 2006 2007
Year of birthUntrained delivery attendant Village midwife as delivery attendant Other trained attendants as delivery attendant
Per
cent
Fig. 2 Trend of home deliveries assisted by untrained delivery
attendants, village midwives or other trained delivery attendants,
IDHS 2002/2003 and 2007. Note: Other trained delivery attendants
include nurses, other midwives and doctors. Other midwives refer to
midwives working in public and private facilities who have had more
extensive training than the village midwives; The information of
1997–2001 deliveries was derived from the 2002/2003 IDHS; 2002
and 2003 deliveries from both surveys, i.e. the 2002/2003 and 2007
IDHS, and 2004–2007 deliveries from the 2007 IDHS
1406 Matern Child Health J (2011) 15:1400–1415
123

Ta
ble
2C
rud
eo
dd
sra
tio
(OR
),ad
just
edo
dd
sra
tio
(aO
R)
of
fact
ors
asso
ciat
edw
ith
uti
liza
tio
no
fv
illa
ge
mid
wiv
esan
do
ther
trai
ned
del
iver
yat
ten
dan
tsfo
rh
om
ed
eliv
erie
sin
Ind
on
esia
,ID
HS
20
02
/20
03
and
20
07
Var
iab
leU
niv
aria
ble
anal
ysi
sM
ult
ivar
iab
lean
aly
sis
Ho
me
del
iver
yas
sist
ed
by
vil
lag
em
idw
ife
Ho
me
del
iver
yas
sist
ed
by
oth
ertr
ain
edd
eliv
ery
atte
nd
ants
aH
om
ed
eliv
ery
assi
sted
by
vil
lag
em
idw
ife
Ho
me
del
iver
yas
sist
edb
y
oth
ertr
ain
edd
eliv
ery
atte
nd
ants
OR
(95
%C
I)b
Pc
OR
(95
%C
I)P
aOR
(95
%C
I)P
aOR
(95
%C
I)P
Yea
ro
fsu
rvey
20
02
/20
03
(Ref
)d1
.00
1.0
01
.00
20
07
1.0
6(0
.86
–1
.30
)0
.61
1.5
1(1
.20
–1
.90
)\
0.0
11
.01
(0.8
2–
1.2
4)
0.9
21
.64
(1.3
1–
2.0
5)
\0
.00
1
Ex
tern
al
env
iro
nm
ent
Reg
ion
an
dty
pe
of
resi
den
ce
Jav
a-B
ali
reg
ion
:u
rban
(Ref
)1
.00
1.0
01
.00
1.0
0
Jav
a-B
ali
reg
ion
:ru
ral
1.8
0(1
.15
–2
.82
)0
.01
0.5
5(0
.36
–0
.84
)0
.01
1.8
0(1
.14
–2
.83
)0
.01
0.5
2(0
.34
–0
.79
)\
0.0
1
Su
mat
era
reg
ion
:u
rban
4.2
2(2
.33
–7
.65
)\
0.0
01
5.4
6(3
.24
–9
.21
)\
0.0
01
4.2
2(2
.33
–7
.66
)\
0.0
01
5.3
8(3
.22
–8
.99
)\
0.0
01
Su
mat
era
reg
ion
:ru
ral
3.6
2(2
.35
–5
.58
)\
0.0
01
1.0
9(0
.72
–1
.67
)0
.69
3.6
2(2
.34
–5
.60
)\
0.0
01
1.0
2(0
.67
–1
.55
)0
.92
Eas
tern
Ind
on
esia
reg
ion
:u
rban
1.2
7(0
.72
–2
.24
)0
.41
2.2
9(1
.46
–3
.60
)\
0.0
01
1.2
7(0
.72
–2
.24
)0
.41
2.2
5(1
.45
–3
.50
)\
0.0
01
Eas
tern
Ind
on
esia
reg
ion
:ru
ral
1.8
1(1
.20
–2
.73
)0
.01
0.6
3(0
.43
–0
.92
)0
.02
1.8
0(1
.19
–2
.74
)0
.01
0.5
7(0
.39
–0
.83
)\
0.0
1
Pre
dis
po
sin
gfa
cto
rs
So
cio
-dem
og
rap
hic
Ma
tern
al
ag
ea
tch
ild
bir
th0
.99
(0.9
8–
1.0
0)
0.1
11
.00
(0.9
9–
1.0
1)
0.4
41
.04
(1.0
2–
1.0
5)
\0
.00
11
.03
(1.0
2–
1.0
5)
\0
.00
1
Ho
use
ho
ldw
ealt
hin
dex
Po
ore
st(R
ef)
1.0
01
.00
1.0
01
.00
Po
ore
r1
.68
(1.4
1–
2.0
2)
\0
.00
12
.23
(1.7
8–
2.7
9)
\0
.00
11
.53
(1.2
7–
1.8
3)
\0
.00
11
.67
(1.3
4–
2.0
9)
\0
.00
1
Mid
dle
2.1
6(1
.74
–2
.69
)\
0.0
01
3.8
4(3
.04
–4
.86
)\
0.0
01
1.9
5(1
.55
–2
.43
)\
0.0
01
2.4
8(1
.94
–3
.18
)\
0.0
01
Wea
lth
ier
2.7
3(2
.10
–3
.54
)\
0.0
01
6.4
1(4
.92
–8
.33
)\
0.0
01
2.4
9(1
.92
–3
.23
)\
0.0
01
3.4
5(2
.63
–4
.53
)\
0.0
01
Wea
lth
iest
3.3
7(2
.44
–4
.65
)\
0.0
01
13
.08
(9.5
4–
17
.93
)\
0.0
01
2.7
6(1
.93
–3
.94
)\
0.0
01
5.2
9(3
.69
–7
.60
)\
0.0
01
Ma
tern
al
edu
cati
on
Co
mp
lete
dp
rim
ary
/in
com
ple
te
seco
nd
ary
(Ref
)
1.0
01
.00
1.0
01
.00
Sec
on
dar
yo
rh
igh
er2
.98
(2.4
5–
3.6
1)
\0
.00
15
.14
(4.2
2–
6.2
5)
\0
.00
11
.63
(1.3
2–
2.0
2)
\0
.00
12
.00
(1.6
0–
2.5
0)
\0
.00
1
No
edu
cati
on
/in
com
ple
tep
rim
ary
0.4
2(0
.35
–0
.50
)\
0.0
01
0.3
3(0
.27
–0
.39
)\
0.0
01
0.5
5(0
.46
–0
.66
)\
0.0
01
0.5
2(0
.42
–0
.65
)\
0.0
01
Pa
tern
al
edu
cati
on
Co
mp
lete
dp
rim
ary
/in
com
ple
te
seco
nd
ary
(Ref
)
1.0
01
.00
1.0
01
.00
Sec
on
dar
yo
rh
igh
er2
.25
(1.9
1–
2.6
5)
\0
.00
13
.56
(3.0
3–
4.1
9)
\0
.00
11
.39
(1.1
6–
1.6
7)
\0
.00
11
.52
(1.2
5–
1.8
4)
\0
.00
1
No
edu
cati
on
/in
com
ple
tep
rim
ary
0.5
8(0
.48
–0
.70
)\
0.0
01
0.4
4(0
.36
–0
.54
)\
0.0
01
0.9
0(0
.74
–1
.09
)0
.29
0.8
3(0
.67
–1
.03
)0
.09
Matern Child Health J (2011) 15:1400–1415 1407
123

Ta
ble
2co
nti
nu
ed
Var
iab
leU
niv
aria
ble
anal
ysi
sM
ult
ivar
iab
lean
aly
sis
Ho
me
del
iver
yas
sist
ed
by
vil
lag
em
idw
ife
Ho
me
del
iver
yas
sist
ed
by
oth
ertr
ain
edd
eliv
ery
atte
nd
ants
aH
om
ed
eliv
ery
assi
sted
by
vil
lag
em
idw
ife
Ho
me
del
iver
yas
sist
edb
y
oth
ertr
ain
edd
eliv
ery
atte
nd
ants
OR
(95
%C
I)b
Pc
OR
(95
%C
I)P
aOR
(95
%C
I)P
aOR
(95
%C
I)P
Pa
ren
tal
occ
up
ati
on
Un
emp
loy
edm
oth
eran
dw
ork
ing
fath
er(R
ef)
1.0
01
.00
Wo
rkin
gm
oth
eran
dw
ork
ing
fath
er0
.90
(0.7
7–
1.0
4)
0.1
40
.87
(0.7
6–
1.0
0)
0.0
5
Un
emp
loy
edfa
ther
0.5
6(0
.35
–0
.89
)0
.02
0.8
4(0
.54
–1
.29
)0
.43
Ma
tern
al
ma
rita
lst
atu
s
Cu
rren
tly
mar
ried
(Ref
)1
.00
1.0
0
Fo
rmer
lym
arri
ed0
.56
(0.3
5–
0.8
9)
0.0
20
.94
(0.6
5–
1.3
6)
0.7
3
Ma
tern
al
fin
al
say
on
her
ow
nh
ealt
hca
re
Wo
man
wit
hp
artn
er/o
ther
(Ref
)1
.00
1.0
0
Wo
man
alo
ne
0.8
0(0
.68
–0
.93
)\
0.0
11
.08
(0.9
2–
1.2
8)
0.3
5
Par
tner
alo
ne/
som
eon
eel
se/o
ther
0.7
7(0
.61
–0
.99
)0
.04
0.7
7(0
.60
–0
.99
)0
.04
Bir
thra
nk
an
din
terv
al
2n
d/3
rdb
irth
ran
k,[
2y
ear
inte
rval
(Ref
)1
.00
1.0
01
.00
1.0
0
1st
bir
thra
nk
1.2
2(1
.04
–1
.44
)0
.02
1.1
7(1
.01
–1
.36
)0
.04
1.5
5(1
.27
–1
.89
)\
0.0
01
1.4
0(1
.15
–1
.69
)\
0.0
1
2n
d/3
rdb
irth
ran
k,
B2
yea
rin
terv
al0
.85
(0.6
5–
1.1
1)
0.2
21
.08
(0.8
2–
1.4
2)
0.5
90
.88
(0.6
6–
1.1
8)
0.4
01
.07
(0.7
9–
1.4
4)
0.6
7
C4
thb
irth
ran
k,[
2y
ear
inte
rval
0.6
4(0
.54
–0
.77
)\
0.0
01
0.6
0(0
.49
–0
.72
)\
0.0
01
0.6
4(0
.52
–0
.79
)\
0.0
01
0.6
3(0
.49
–0
.81
)\
0.0
01
C4
thb
irth
ran
k,
B2
yea
rin
terv
al0
.63
(0.4
6–
0.8
8)
0.0
10
.60
(0.4
4–
0.8
3)
\0
.01
0.5
9(0
.42
–0
.83
)\
0.0
10
.58
(0.4
0–
0.8
4)
\0
.01
Hea
lth
kn
ow
led
ge
Fre
qu
ency
of
rea
din
gn
ewsp
ap
er
Nev
er(R
ef)
1.0
01
.00
1.0
01
.00
Les
sth
ano
nce
aw
eek
2.0
1(1
.72
–2
.36
)\
0.0
01
2.4
2(2
.08
–2
.83
)\
0.0
01
1.3
7(1
.16
–1
.62
)\
0.0
01
1.1
9(1
.00
–1
.42
)0
.04
At
leas
to
nce
aw
eek
2.8
8(2
.21
–3
.75
)\
0.0
01
4.7
5(3
.72
–6
.05
)\
0.0
01
1.5
4(1
.16
–2
.04
)\
0.0
11
.50
(1.1
4–
1.9
8)
\0
.01
Fre
qu
ency
of
list
enin
gto
rad
io
Nev
er(R
ef)
1.0
01
.00
Les
sth
ano
nce
aw
eek
1.1
6(0
.98
–1
.38
)0
.09
1.3
7(1
.15
–1
.63
)\
0.0
1
At
leas
to
nce
aw
eek
1.2
8(1
.04
–1
.56
)0
.02
1.5
6(1
.31
–1
.86
)\
0.0
01
Fre
qu
ency
of
wa
tch
ing
tele
visi
on
Nev
er(R
ef)
1.0
01
.00
1.0
01
.00
Les
sth
ano
nce
aw
eek
1.5
1(1
.19
–1
.92
)\
0.0
11
.92
(1.4
5–
2.5
4)
\0
.00
11
.19
(0.9
3–
1.5
4)
0.1
71
.26
(0.9
3–
1.6
9)
0.1
3
At
leas
to
nce
aw
eek
1.9
2(1
.55
–2
.39
)\
0.0
01
4.0
2(3
.13
–5
.18
)\
0.0
01
1.1
2(0
.89
–1
.42
)0
.34
1.4
1(1
.07
–1
.85
)0
.01
1408 Matern Child Health J (2011) 15:1400–1415
123

Ta
ble
2co
nti
nu
ed
Var
iab
leU
niv
aria
ble
anal
ysi
sM
ult
ivar
iab
lean
aly
sis
Ho
me
del
iver
yas
sist
ed
by
vil
lag
em
idw
ife
Ho
me
del
iver
yas
sist
ed
by
oth
ertr
ain
edd
eliv
ery
atte
nd
ants
aH
om
ed
eliv
ery
assi
sted
by
vil
lag
em
idw
ife
Ho
me
del
iver
yas
sist
edb
y
oth
ertr
ain
edd
eliv
ery
atte
nd
ants
OR
(95
%C
I)b
Pc
OR
(95
%C
I)P
aOR
(95
%C
I)P
aOR
(95
%C
I)P
Kn
ow
led
ge
on
pre
gn
an
cyco
mp
lica
tio
ns
No
ne
(Ref
)1
.00
1.0
0
Yes
1.6
4(1
.40
–1
.93
)\
0.0
01
1.8
8(1
.62
–2
.18
)\
0.0
01
Kn
ow
led
ge
on
del
iver
yco
mp
lica
tio
ns
No
ne
(Ref
)1
.00
1.0
01
.00
1.0
0
Yes
1.7
3(1
.50
–2
.01
)\
0.0
01
2.1
8(1
.88
–2
.53
)\
0.0
01
1.3
1(1
.13
–1
.52
)\
0.0
01
1.4
0(1
.19
–1
.64
)\
0.0
01
Kn
ow
led
ge
on
po
st-d
eliv
ery
com
pli
cati
on
s
No
ne
(Ref
)1
.00
1.0
0
Yes
1.5
8(1
.34
–1
.87
)\
0.0
01
2.0
1(1
.72
–2
.35
)\
0.0
01
En
ab
lin
gfa
cto
rs
Kn
ow
wh
ere
tog
oto
seek
hea
lth
serv
ices
Sm
all
pro
ble
m(R
ef)
1.0
01
.00
Big
pro
ble
m0
.77
(0.5
9–
0.9
9)
0.0
50
.43
(0.3
3–
0.5
7)
\0
.00
1
Per
mis
sio
nto
visi
th
ealt
hse
rvic
es
Sm
all
pro
ble
m(R
ef)
1.0
01
.00
Big
pro
ble
m0
.86
(0.6
7–
1.1
2)
0.2
60
.59
(0.4
5–
0.7
6)
\0
.00
1
Mo
ney
top
ay
hea
lth
serv
ices
Sm
all
pro
ble
m(R
ef)
1.0
01
.00
Big
pro
ble
m0
.68
(0.5
8–
0.7
8)
\0
.00
10
.51
(0.4
3–
0.6
0)
\0
.00
1
Dis
tan
ceto
hea
lth
serv
ices
Sm
all
pro
ble
m(R
ef)
1.0
01
.00
1.0
01
.00
Big
pro
ble
m0
.65
(0.5
4–
0.7
8)
\0
.00
10
.39
(0.3
3–
0.4
7)
\0
.00
10
.84
(0.6
2–
1.1
2)
0.2
30
.73
(0.5
4–
1.0
0)
0.0
5
Tra
nsp
ort
ati
on
toh
ealt
hse
rvic
es
Sm
all
pro
ble
m(R
ef)
1.0
01
.00
1.0
01
.00
Big
pro
ble
m0
.63
(0.5
3–
0.7
5)
\0
.00
10
.36
(0.3
0–
0.4
3)
\0
.00
10
.86
(0.6
4–
1.1
5)
0.3
10
.70
(0.5
2–
0.9
4)
0.0
2
Pre
sen
ceo
fco
mp
an
ion
Sm
all
pro
ble
m(R
ef)
1.0
01
.00
Big
pro
ble
m0
.74
(0.6
0–
0.9
1)
0.0
10
.56
(0.4
4–
0.7
1)
\0
.00
1
Ava
ila
bil
ity
of
care
by
fem
ale
hea
lth
wo
rker
s
Sm
all
pro
ble
m(R
ef)
1.0
01
.00
Big
pro
ble
m0
.86
(0.6
7–
1.1
2)
0.2
60
.90
(0.6
9–
1.1
8)
0.4
6
Matern Child Health J (2011) 15:1400–1415 1409
123

Ta
ble
2co
nti
nu
ed
Var
iab
leU
niv
aria
ble
anal
ysi
sM
ult
ivar
iab
lean
aly
sis
Ho
me
del
iver
yas
sist
ed
by
vil
lag
em
idw
ife
Ho
me
del
iver
yas
sist
ed
by
oth
ertr
ain
edd
eliv
ery
atte
nd
ants
aH
om
ed
eliv
ery
assi
sted
by
vil
lag
em
idw
ife
Ho
me
del
iver
yas
sist
edb
y
oth
ertr
ain
edd
eliv
ery
atte
nd
ants
OR
(95
%C
I)b
Pc
OR
(95
%C
I)P
aOR
(95
%C
I)P
aOR
(95
%C
I)P
Nee
dfa
cto
rs
Des
ire
for
pre
gn
an
cy
Wan
ted
then
(Ref
)1
.00
1.0
0
Wan
ted
late
r0
.93
(0.7
3–
1.1
8)
0.5
61
.04
(0.8
5–
1.2
7)
0.7
2
Wan
ted
no
mo
re0
.63
(0.4
6–
0.8
6)
\0
.01
0.7
7(0
.60
–1
.00
)0
.05
Pre
gn
an
cyco
mp
lica
tio
ns
No
com
pli
cati
on
s(R
ef)
1.0
01
.00
Wit
hco
mp
lica
tio
ns
1.6
4(1
.26
–2
.13
)\
0.0
01
1.4
7(1
.13
–1
.91
)\
0.0
1
Del
iver
yco
mp
lica
tio
ns
No
com
pli
cati
on
s(R
ef)
1.0
01
.00
1.0
01
.00
Wit
hco
mp
lica
tio
ns
1.5
6(1
.33
–1
.84
)\
0.0
01
1.4
9(1
.26
–1
.77
)\
0.0
01
1.5
7(1
.33
–1
.86
)\
0.0
01
1.5
1(1
.26
–1
.80
)\
0.0
01
Pre
vio
us
exp
erie
nce
wit
hm
ate
rna
lh
ealt
hse
rvic
es
Use
of
an
ten
ata
lca
rese
rvic
es
C4
ante
nat
alse
rvic
e(R
ef)
1.0
01
.00
1.0
01
.00
\4
ante
nat
alv
isit
0.2
6(0
.22
–0
.30
)\
0.0
01
0.2
3(0
.20
–0
.28
)\
0.0
01
0.3
0(0
.26
–0
.36
)\
0.0
01
0.3
4(0
.29
–0
.40
)\
0.0
01
All
val
ues
are
wei
gh
ted
by
the
sam
pli
ng
pro
bab
ilit
ies
and
90
9m
issi
ng
case
sw
ere
excl
ud
edfr
om
the
anal
ysi
sa
Nu
rses
,o
ther
mid
wiv
esan
dd
oct
ors
.O
ther
mid
wiv
esre
fer
tom
idw
ives
wo
rkin
gin
pu
bli
can
dp
riv
ate
faci
liti
esw
ho
hav
eh
adm
ore
exte
nsi
ve
trai
nin
gth
anth
ev
illa
ge
mid
wiv
esb
95
%C
I=
95
%co
nfi
den
cein
terv
alc
P=
Pv
alu
ed
(Ref
)=
refe
ren
ceg
rou
p
1410 Matern Child Health J (2011) 15:1400–1415
123
Discussion
Main Findings
This study aimed to explore factors associated with utili-
zation of village midwives and other trained delivery
attendants for home delivery. Results of the study found a
significant association between utilization of trained
delivery attendants and the external environment, predis-
posing, enabling and need factors as well as previous
experience with maternal health care. The odds for using
village midwife services was generally higher in rural
areas; whereas for other type of delivery attendants the
odds were constantly higher in urban areas. Among pre-
disposing factors, the odds of using any trained delivery
attendants increased for mothers from wealthier house-
holds, mothers and fathers with higher education levels,
first birth rank infants, and mothers with knowledge about
delivery complications. Among enabling factors, mothers
reporting distance and transportation to health services as
major problems had a reduced likelihood of using trained
delivery attendants. Among need factors, the odds for using
any trained delivery attendants increased for mothers who
had delivery complications. A reduced likelihood of using
any trained delivery attendants was also observed among
mothers attending less than four antenatal care visits,
compared to those with four or more antenatal visits. The
likelihood of utilizing nurses, other midwives and doctors
at childbirth for home delivery services was significantly
higher in the 2007 IDHS than the 2002/2003 IDHS.
Utilization of Trained Delivery Attendants for Home
Deliveries
Our study found an increased use of nurses, other midwives
and doctors at childbirth in the 2007 survey compared to
2002/2003 survey. This finding reflects the improvement of
maternal and child health care in Indonesia, one of which is
the increased ratio of all midwives, including village
midwives and health centre midwives, from 29 in 2004
[44] to 43 per 100,000 populations in 2008 [45].
We found a significant association between both
maternal and paternal education on the use of trained
delivery attendants for home delivery, with a stronger
relationship for maternal compared to paternal education.
This was also reflected by the high PAR value of parental
education, particularly maternal education. The relation-
ship between education and maternal and children health
has been long recognized [14–18, 21, 29]. A recent
review of maternal mortality stated that the increase of
maternal educational attainment was one of the main
drivers for the global reduction in maternal mortality rates
[10]. Education provides a greater understanding about
the importance of health, [16, 18] and a greater decision
making power for women about their own, and other
family members’ health [14, 15]. Education also leads to
better health seeking behaviour, [14] and higher socio-
economic status [15]. In the present study, the importance
of education was also reflected by an increased utilization
of trained delivery attendants among mothers with
knowledge on delivery complications. Community-based
participatory interventions, such as women’s groups or
community facilitators, have been shown to increase uti-
lization of maternal health services [46, 47] and could be
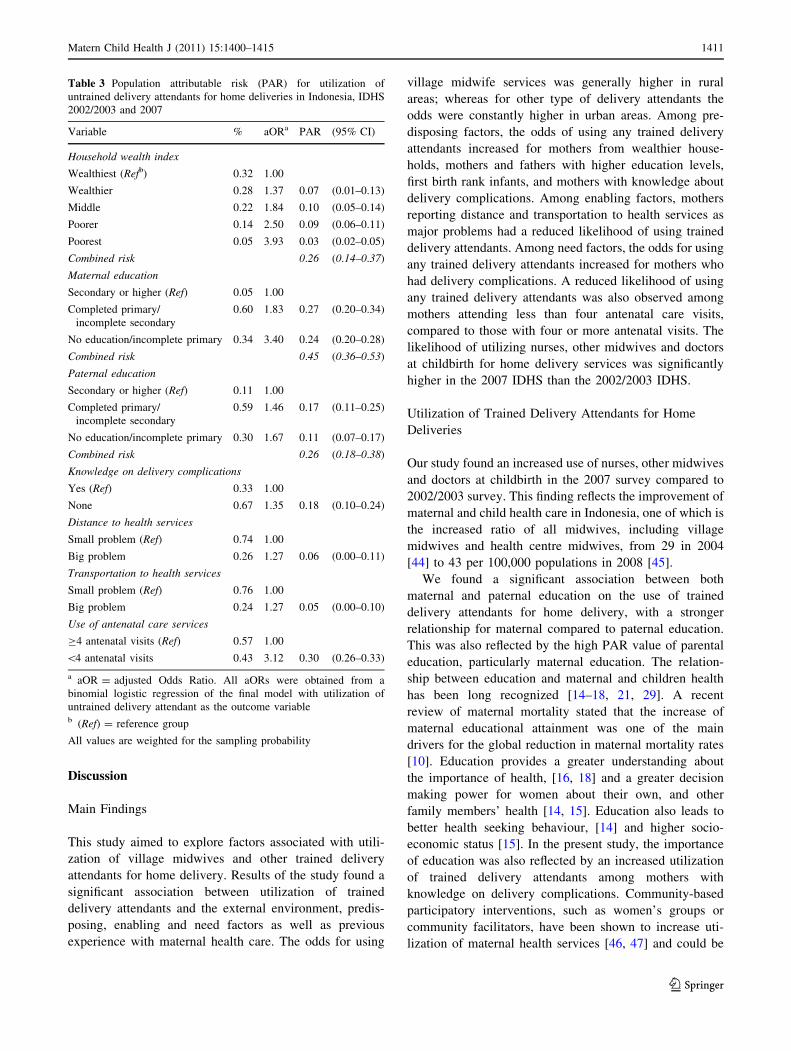
Table 3 Population attributable risk (PAR) for utilization of
untrained delivery attendants for home deliveries in Indonesia, IDHS
2002/2003 and 2007
Variable % aORa PAR (95% CI)
Household wealth index
Wealthiest (Refb) 0.32 1.00
Wealthier 0.28 1.37 0.07 (0.01–0.13)
Middle 0.22 1.84 0.10 (0.05–0.14)
Poorer 0.14 2.50 0.09 (0.06–0.11)
Poorest 0.05 3.93 0.03 (0.02–0.05)
Combined risk 0.26 (0.14–0.37)
Maternal education
Secondary or higher (Ref) 0.05 1.00
Completed primary/
incomplete secondary
0.60 1.83 0.27 (0.20–0.34)
No education/incomplete primary 0.34 3.40 0.24 (0.20–0.28)
Combined risk 0.45 (0.36–0.53)
Paternal education
Secondary or higher (Ref) 0.11 1.00
Completed primary/
incomplete secondary
0.59 1.46 0.17 (0.11–0.25)
No education/incomplete primary 0.30 1.67 0.11 (0.07–0.17)
Combined risk 0.26 (0.18–0.38)
Knowledge on delivery complications
Yes (Ref) 0.33 1.00
None 0.67 1.35 0.18 (0.10–0.24)
Distance to health services
Small problem (Ref) 0.74 1.00
Big problem 0.26 1.27 0.06 (0.00–0.11)
Transportation to health services
Small problem (Ref) 0.76 1.00
Big problem 0.24 1.27 0.05 (0.00–0.10)
Use of antenatal care services
C4 antenatal visits (Ref) 0.57 1.00
\4 antenatal visits 0.43 3.12 0.30 (0.26–0.33)
a aOR = adjusted Odds Ratio. All aORs were obtained from a
binomial logistic regression of the final model with utilization of
untrained delivery attendant as the outcome variableb (Ref) = reference group
All values are weighted for the sampling probability
Matern Child Health J (2011) 15:1400–1415 1411
123

used to increase awareness about safe delivery services in
Indonesia.
Significant associations between antenatal care visits
and the use of trained delivery attendants have been
reported in previous studies [20, 26, 27]. Our results
demonstrated that mothers who attended four or more
antenatal care visits [34, 45] had an increased likelihood to
use trained delivery attendants than mothers with less than
four antenatal care visits. Several factors have been sug-
gested for this association. Health education messages
delivered during antenatal care visits increase women’s
awareness about the importance of safe delivery care as
well as the potential risks that might be associated with not
having this type of delivery care [26, 27]. Frequent contact
between health professionals and expectant mothers usu-
ally facilitates good rapport between women and health
workers [27]. This evidence suggests that efforts to
increase utilization of antenatal care services in Indonesia
will be beneficial and likely led to an increased use of
trained birth attendants. Our previous study using the IDHS
2002/2003 and 2007 demonstrated that women from rural
areas, households of low economic status and low maternal
education level were more likely to underutilize antenatal
care services [19]. Public health interventions, such as
community-based education using women’s groups or
traditional birth attendants, to promote antenatal and
delivery services targeting these vulnerable groups should
be a priority. The outreach health services currently
implemented in Indonesia, such as the integrated health
post or Pusat Pelayanan Terpadu (Posyandu) play a vital
role in providing basic maternal and child care including
antenatal care services [48]. These outreach services are
beneficial in reaching communities residing in rural and
remote areas. However, careful planning about the location
of the Posyandu is important to improve access and cov-
erage of health services especially among those commu-
nities reporting distance and geographical constraints as
major barriers.
Access to health services emerged as significant pre-
dictor of utilization of delivery attendants, shown by
reduced odds among mothers reporting distance and
transportation to health services as major problems. The
relationship between access to health services, either due to
the distance to health services or lack of transportation, and
utilization of health services have been demonstrated in
other studies [25, 28, 29]. In Indonesia a policy of bringing
maternal health care services closer to the community has
been implemented through the village midwife program.
Although this strategy has minimized the issue of access to
health care, studies showed that maternal health services
were still underutilized for those residing in rural and
remote areas [11, 19, 23, 30]. This is partly due to the
shortage of health professionals, particularly when the
village midwife is the solo health provider in the village,
and the absenteeism if she frequently travels out of the
village or prefers to reside outside the village in a nearby
town [11, 19, 49]. The provision of adequate supports,
protection, opportunities for career development as well as
incentives to the village midwives will be beneficial to
retain them in rural areas [5].
The role of economic factors on utilization of maternal
health care services has been reported in several studies
[19, 21–23, 25, 29]. Although a study using pooled IDHS
data from 1986 to 2002/2003 [35] showed that the village
midwife program had reduced socio-economic inequalities
in utilizing health professionals at delivery, the present
study still found a reduced likelihood for using both village
midwife and other trained delivery attendants for home
delivery amongst women from poorer households. Another
Indonesian study reported that maternal mortality rate was
the highest for women in the lowest household wealth
index, among which only 10% were assisted by health
professionals at childbirth [50]. Our results also have been
confirmed by a qualitative study from West Java Province,
Indonesia, that reported financial difficulties as one of the
major reasons for community members to utilize the ser-
vices of TBA at childbirth, as the services of village
midwives were perceived to be costly [30]. Although
the health insurance scheme for the poor and near poor
population, called the Health Insurance Scheme for the
Population or Jaminan Kesehatan Masyarakat, has been
developed by the Indonesia Government [51] to enable
financially deprived populations to access health services
for free, misconceptions about its eligibility have also been
reported by some women [19, 30]. A regular monitoring
and evaluation system should be established to ensure its
effectiveness for the target population. The conditional
cash transfer program reported to have a positive impact on
the uptake of health care services in low and middle
income countries [52, 53] has been piloted in seven prov-
inces in Indonesia [54]. This scheme could be expanded to
increase delivery service utilization among financially
disadvantaged mothers. Additionally, strengthening com-
munity-based finance mechanisms such as the pregnant
mother saving scheme or social funds for pregnant women
may benefit women. In Indonesia, these communal
financing schemes are available through the Village Alert
program as part of the Safe Motherhood Initiative and aim
at helping mothers access safe delivery care services [55].
Another significant predictor found in this study was the
birth rank of infants. An increased likelihood of using
trained attendants at childbirth was found among firstborn
infants; whereas a reduced likelihood was observed among
high rank infants. This has also been reported in other
studies [20, 21]. Women maybe more anxious about their
first birth and seek assistance from a trained attendant [21].
1412 Matern Child Health J (2011) 15:1400–1415
123

They might also not be aware of the increased risks asso-
ciated with higher rank births and they may mainly rely on
their experiences with their previous pregnancies [20, 21].
Health promotion strategies should be developed to reach
these women, particularly since they have also been found
to underutilize antenatal care services [19]. Mass media
such as television that was found in our study to be highly
utilized by the community can also be used to convey
health information including messages about the impor-
tance of maternal and child health services.
Strengths and Limitations
The data used in this study were derived from two
nationally representative surveys, with a high individual
and household response rate [34, 36]. The large sample size
used in this analysis allowed the examination of different
potential predictors, covering external environment, pre-
disposing, enabling, need and previous utilization of health
services. Furthermore, the restriction of the samples to the
most recent birth of mothers within the last 5 years of each
survey minimized the potential of recall bias and maxi-
mised the amount of available information.
Several limitations should be noted. Since the data used
in this analysis were derived from a cross-sectional study,
it is not possible to infer causality for the factors associ-
ated with the use of birth attendant. All the information is
also self-reported. Possible misclassification of health
centre facilities and village midwives might have occurred.
Furthermore, some potential predictors, such as cultural
factors, which were not available in the survey question-
naires, were not included in the analysis. However, these
limitations are unlikely to impact on the validity of the
analyses.
Conclusion
Our study showed a significant association between
external environment, predisposing, enabling and need
factors, as well as previous utilization of maternal health
services and utilization of village midwives and other
trained delivery attendants for home delivery in Indonesia.
Health promotion strategies to raise community awareness
about the importance of safe delivery will be beneficial to
increase utilization of trained delivery attendants for home
delivery. This strategy should target parents with low levels
of education, high parity mothers, and those from poorer
households. The importance of an adequate attendance at
antenatal care indicates the need to promote utilization of
antenatal care services among those women who are least
likely to use them. Strengthening current health financing
through health insurance, conditional cash transfer, or
communal financing schemes will help women from
financially disadvantaged families to utilize delivery health
services. This should be accompanied by a regular moni-
toring system to evaluate its effectiveness in reaching poor
populations. Improving availability and accessibility of
maternal health services should also be considered.
Acknowledgments We thank the Australian Agency for Interna-
tional Development (AusAID) for funding Christiana R Titaley PhD
scholarship in International Public Health at the Sydney School of
Public Health, University of Sydney, Australia. Christine L Roberts is
supported by a NHMRC Research Fellowship.
Conflict of interests None declared.
References
1. Costello, A., Osrin, D., & Manandhar, D. (2004). Reducing
maternal and neonatal mortality in the poorest communities.
BMJ, 329(7475), 1166–1168.
2. Lawn, J. E., Cousens, S., Zupan, J., & Lancet Neonatal Survival
Steering Team. (2005). 4 million neonatal deaths: When? Where?
Why? Lancet, 365(9462), 891–900.
3. World Health Organization. (2005). The world health report:2005: Make every mother and child count. Geneva: World Health
Organization.
4. World Health Organization—Department of Reproductive Health
and Research. Proportion of births attended by a skilled healthworker—2008 updates. 2008. Available at http://www.who.int/
reproductivehealth/publications/maternal_perinatal_health/2008_
skilled_attendant.pdf. Accessed 6 April 2010.
5. Save the Children. (2010). Women on the front lines of healthcare: State of the world’s mothers 2010. Westport, Connecticut:
Save the Children.
6. Maine, D., & Rosenfield, A. (1999). The safe motherhood ini-
tiative: Why has it stalled? American Journal of Public Health,89(4), 480–482.
7. Darmstadt, G. L., Bhutta, Z. A., Cousens, S., Adam, T., Walker,
N., de Bernis, L., et al. (2005). Evidence-based, cost-effective
interventions: How many newborn babies can we save? Lancet,365(9463), 977–988.
8. United Nations. (2001). Road map towards the implementation ofthe United Nations Millennium Declaration: Report of the sec-retary-general. New York: United Nations.
9. Koblinsky, M., Matthews, Z., Hussein, J., Mavalankar, D.,
Mridha, M. K., Anwar, I., et al. (2006). Going to scale with
professional skilled care. The Lancet, 368(9544), 1377–1386.
10. Hogan, M. C., Foreman, K. J., Naghavi, M., Ahn, S. Y., Wang, M.,
Makela, S. M., et al. (2010). Maternal mortality for 181 countries,
1980–2008: A systematic analysis of progress towards millennium
development goal 5. The Lancet, 375(9726), 1609–1623.
11. Makowiecka, K., Achadi, E., Izati, Y., & Ronsmans, C. (2008).
Midwifery provision in two districts in Indonesia: How well are
rural areas served? Health Policy Plan, 23(1), 67–75.
12. Andersen, R. M. (1995). Revisiting the behavioral model and
access to medical care: Does it matter? Journal of Health andSocial Behavior, 36(1), 1–10.
13. Phillips, K. A., Morrison, K. R., Andersen, R., & Aday, L. A.
(1998). Understanding the context of healthcare utilization:
Assessing environmental and provider-related variables in
the behavioral model of utilization. Health Services Research,33(3 Pt 1), 571–596.
Matern Child Health J (2011) 15:1400–1415 1413
123

14. Ware, H. (1984). Effects of maternal education, women’s roles,
and child care on child mortality. Population and DevelopmentReview, 10(Supplement), 191–214.
15. Rajna, P. N., Mishra, A. K., & Krishnamoorthy, S. (1998). Impact of
maternal education and health services on child mortality in Uttar
Pradesh, India. Asia-Pacific Population Journal, 13(2), 27–38.
16. Mellington, N., & Cameron, L. (1999). Female education and
child mortality in Indonesia. Bulletin of Indonesian EconomicStudies, 35(3), 115–144.
17. Elo, I. T. (1992). Utilization of maternal health-care services in
Peru: The role of women’s education. Health Transition Review,2(1), 49–69.
18. Caldwell, J. C. (1979). Education as a factor in mortality decline
an examination of Nigerian data. Population Studies, 33(3),
395–413.
19. Titaley, C. R., Dibley, M. J., & Roberts, C. L. (2010). Factors
associated with underutilization of antenatal care services in
Indonesia: Results of Indonesia demographic and health survey
2002/2003 and 2007. BMC Public Health, 10, 485.
20. Paul, B. K., & Rumsey, D. J. (2002). Utilization of health facil-
ities and trained birth attendants for childbirth in rural Bangla-
desh: An empirical study. Social Science and Medicine, 54(12),
1755–1765.
21. Navaneetham, K., & Dharmalingam, A. (2002). Utilization of
maternal health care services in Southern India. Social Scienceand Medicine, 55(10), 1849–1869.
22. Titaley, C. R., Dibley, M. J., & Roberts, C. L. (2009). Factors
associated with non-utilization of postnatal care services in Indo-
nesia. Journal of Epidemiology and Community Health, 63,
827–831.
23. Thind, A., & Banerjee, K. (2004). Home deliveries in Indonesia:
Who provides assistance? Journal of Community Health, 29(4),
285–303.
24. Steenland, K., & Armstrong, B. (2006). An overview of methods
for calculating the burden of disease due to specific risk factors.
Epidemiology, 17(5), 512–519.
25. Mrisho, M., Schellenberg, J. A., Mushi, A. K., Obrist, B.,
Mshinda, H., Tanner, M., et al. (2007). Factors affecting home
delivery in rural Tanzania. Tropical Medicine and InternationalHealth, 12(7), 862–872.
26. Ram, F., & Singh, A. (2006). Is antenatal care effective in
improving maternal health in rural Uttar Pradesh? Evidence from
a district level household survey. Journal of Biosocial Science,38(04), 433–448.
27. Bloom, S., Lippeveld, T., & Wypij, D. (1999). Does antenatal
care make a difference to safe delivery? A study in urban Uttar
Pradesh, India. Health Policy Plan, 14(1), 38–48.
28. Tann, C., Kizza, M., Morison, L., Mabey, D., Muwanga, M.,
Grosskurth, H., et al. (2007). Use of antenatal services and
delivery care in Entebbe, Uganda: A community survey. BMCPregnancy and Childbirth, 7(1), 23.
29. Raghupathy, S. (1996). Education and the use of maternal health
care in Thailand. Social Science and Medicine, 43(4), 459–471.
30. Titaley, C. R., Hunter, C. L., Dibley, M. J., & Heywood, P.
(2010). Why do some women still prefer traditional birth atten-
dants and home delivery?: A qualitative study on delivery care
services in West Java Province, Indonesia. BMC Pregnancy andChildbirth, 10, 43.
31. Geefhuysen, C. J. (1999). Safe motherhood in Indonesia: A task
for the next century. In M. Berer & T. S. Ravindran (Eds.), SafeMotherhood initiatives: Critical issues (pp. 62–72). Oxford,
England: Blackwell Science.
32. Ronsmans, C., Achadi, E., Gunawan, S., Zazri, A., McDermott,
J., Marge, K., et al. (2001). Evaluation of a comprehensive home-
based midwifery programme in South Kalimantan, Indonesia.
Tropical Medicine and International Health, 6(10), 799–810.
33. Badan Pusat Statistik-Statistics Indonesia (BPS), & National
Family Planning Coordinating Board, Ministry of Health, ORC
Macro. (1998). Indonesia demographic and health survey 1997.
Calverton, Maryland: BPS and ORC Macro.
34. Badan Pusat Statistik-Statistics Indonesia (BPS), & National
Family Planning Coordinating Board, Ministry of Health, ORC
Macro. (2008). Indonesia demographic and health survey 2007.
Calverton, Maryland: BPS and ORC Macro.
35. Hatt, L., Stanton, C., Makowiecka, K., Adisasmita, A., Achadi,
E., & Ronsmans, C. (2007). Did the strategy of skilled attendance
at birth reach the poor in Indonesia? Bulletin of the World HealthOrganization, 85(10), 774–782.
36. Badan Pusat Statistik-Statistics Indonesia (BPS), & National
Family Planning Coordinating Board, Ministry of Health, ORC
Macro. (2003). Indonesia demographic and health survey2002–2003. Calverton, Maryland: BPS and ORC Macro.
37. Macro International Inc. (1996). Sampling manual. DHS-III basicdocumentation No. 6. Maryland: Calverton.
38. Ministry of Health Republic of Indonesia -Center for Data,
Information. (2006). Glosarium: Data & Informasi Kesehatan(Glossarium: Health data and information). Jakarta: Ministry of
Health Republic of Indonesia—Center for Data and Information.
39. World Health Organization. (2004). Making pregnancy safer:The critical role of the skilled attendant: A joint statement byWHO, ICM and FIGO. Geneva: World Health Organization.
40. Filmer, D., & Pritchett, L. H. (2001). Estimating wealth effects
without expenditure data—or tears: an application to educational
enrollments in states of India. Demography, 38(1), 115–132.
41. Victora, C. G., Huttly, S. R., Fuchs, S. C., & Olinto, M. T. (1997).
The role of conceptual frameworks in epidemiological analysis:
A hierarchical approach. International Journal of Epidemiology,26(1), 224–227.
42. Rockhill, B., Newman, B., & Weinberg, C. (1998). Use and
misuse of population attributable fractions. American Journal ofPublic Health, 88(1), 15–19.
43. Rowe, A. K., Powell, K. E., & Flanders, W. D. (2004). Why
population attributable fractions can sum to more than one.
American Journal of Preventive Medicine, 26(3), 243–249.
44. Ministry of Health Republic of Indonesia. (2006). Indonesiahealth profile 2004. Jakarta: Ministry of Health Republic of
Indonesia.
45. Ministry of Health Republic of Indonesia. (2007). Indonesiahealth profile 2007. Jakarta: Ministry of Health Republic of
Indonesia.
46. Shankar, A. V., Asrilla, Z., Kadha, J. K., Sebayang, S., Apriatni, M.,
Sulastri, A., Sunarsih, E., & Shanka, A. H. (2009). Programmatic
effects of a large-scale multiple-micronutrient supplementation
trial in Indonesia: Using community facilitators as intermediaries
for behavior change. Food and Nutrition Bulletin, 30(2).
47. Manandhar, D. S., Osrin, D., Shrestha, B. P., Mesko, N., Morri-
son, J., Tumbahangphe, K. M., Tamang, S., Thapa, S., Shrestha,
D., Thapa, B., Shrestha, J. R., Wade, A., Borghi, J., Standing, H.,
Manandhar, M., & de L Costello, A. M. (2004). Effect of a
participatory intervention with women’s groups on birth out-
comes in Nepal: Cluster-randomised controlled trial. The Lancet,364(9438), 970–979.
48. World Health Organization Regional Office for South-East Asia.
(2008). Revitalizing primary health care: Country experience:Indonesia. In WHO Regional Office for South-East Asia (Ed.),
Regional conference on ‘‘Revitalizing Primary Health Care’’.WHO Regional Office for South-East Asia: Jakarta, Indonesia.
49. Ensor, T., Quayyum, Z., Nadjib, M., & Sucahya, P. (2009). Level
and determinants of incentives for village midwives in Indonesia.
Health Policy Plan, 24(1), 26–35.
50. Ronsmans, C., Scott, S., Qomariyah, S. N., Achadi, E., Braun-
holtz, D., Marshall, T., et al. (2009). Professional assistance
1414 Matern Child Health J (2011) 15:1400–1415
123

during birth and maternal mortality in two Indonesian districts.
Bulletin of the World Health Organization, 87, 416–423.
51. Rokx, C., Schieber, G., Harimurti, P., Tandon, A., & Somana-
than, A. (2009). Health financing in Indonesia: A reform roadmap. Jakarta: The World Bank.
52. Lagarde, M., Haines, A., & Palmer, N. (2007). Conditional cash
transfers for improving uptake of health interventions in low- and
middle-income countries: A systematic review. JAMA, 298(16),
1900–1910.
53. Morris, S. S., Flores, R., Olinto, P., & Medina, J. M. (2004).
Monetary incentives in primary health care and effects on use and
coverage of preventive health care interventions in rural Hon-
duras: Cluster randomised trial. The Lancet, 364(9450),
2030–2037.
54. Hutagalung, S., Arif, S., & Suharyo, W. I. (2009). Problems andchallenges for the Indonesian conditional-cash transfer pro-gramme-program keluarga harapan (PKH). Jakarta.
55. JHPIEGO. (2004). Indonesia’s SIAGA campaign promotesshared responsibility. Mobilizing for Impact 2004. Available at
http://www.jhuccp.org/pubs/cp/mnh/Indonesia.pdf. Accessed 1
Oct 2009.
Matern Child Health J (2011) 15:1400–1415 1415
123
Copyright © 2022 FDOKUMEN