Utilisation of traditional and indigenous foods and potential ...
227
Utilisation of traditional and indigenous foods and potential contribution to consumers’ nutrition and vendors’ income in Botswana SN KASIMBA orcid.org/0000-0003-0561- 3255 Thesis submitted for the degree Doctor philosophiae in Nutrition at the North-West University Promoter: Dr N Covic Co-promoter: Dr BS Motswagole Co-promoter: Dr N Claasen Graduation: May 2018 Student number: 25646826
-
Upload
khangminh22 -
Category
Documents
-
view
0 -
download
0
Transcript of Utilisation of traditional and indigenous foods and potential ...

Utilisation of traditional and indigenous foods and potential contribution to consumers’ nutrition and
vendors’ income in Botswana
SN KASIMBA
orcid.org/0000-0003-0561- 3255
Thesis submitted for the degree Doctor philosophiae in Nutrition at the North-West
University
Promoter: Dr N Covic
Co-promoter: Dr BS Motswagole
Co-promoter: Dr N Claasen
Graduation: May 2018
Student number: 25646826

i
DEDICATION
This thesis is dedicated to my family who sacrificed a lot to make my studies possible and
have been an amazing support system. To my husband, Elijah, I am grateful for your love,
perseverance, support, patience and understanding during the entire study period.
To my children, Joshua and Vanessa - being away from you was the most challenging thing
that I had to cope with during my studies, but glory goes to the Almighty God for His great
care upon your lives. Words fail to express my appreciation and love to all of you.

ii
ACKNOWLEDGEMENTS
I am greatly indebted to the following people who contributed towards successful completion
of this study:
To Dr Covic, my promoter, I am thankful for your immense support, technical and valuable
guidance throughout my research. Thank you.
To Dr Motswagole, my co-promoter, thank you for your endurance, endless patience during
data collection and constant guidance throughout the study period. You are highly
appreciated.
To Dr Nicole, my other co-promoter, I appreciate you for your dedication, expertise and
profound guidance; your constant motivation and hard work during the course of my studies.
I will forever be grateful for your determination and the role you played.
Professor Johann and Professor Marius, your expertise in leadership ensured a very
conducive learning environment and for that, I thank you.
To Henriëtte Claasen and Ronel Benson, your sincere concern for me, friendliness and
professionalism in providing logistic support made a world of difference. Without your
assistance, the process would have been difficult and for that, I appreciate you.
A special thank you goes to the research participants who made this research possible. Your
participation was priceless. To the enumerators who assisted in data collection, you made
the process easier. I will forever be grateful.
To all my office colleagues, your support and encouragement was just what I needed to plod
me on. Thank you.
Above all, a special appreciation goes to the Almighty God for His immense grace. He made
everything possible. Holy Bible (KJV), Proverbs 16:3 says; “Commit thy works unto the lord,
and thy thoughts shall be established”.

iii
ABSTRACT
Utilisation of traditional and indigenous foods and potential contribution to
consumers’ nutrition and vendors’ income in Botswana
Background
Food systems are changing due to drivers such as urbanisation, nutrition transition and
globalisation. As a result, there is reduced utilisation of traditional and indigenous foods (TIF)
towards westernised diets. Food insecurity and all forms of malnutrition co-exist in different
regions of the world, including Botswana. Traditional or indigenous foods are believed to
provide better quality diets. There is, however, limited information on extent of access to and
consumption of (TIF) in Botswana.
Aim
The aim of the study was to explore access to and consumption of TIF among rural and
urban households in Botswana. In addition, the study sought to investigate the importance of
TIF among street vendors of TIF in Gaborone.
Methods
The first component of this study determined household access to TIF and their association
to household food security (access), household dietary diversity (HDD) and women BMI
through a sequential explanatory mixed methods design; including a random household
cross-sectional survey on household food insecurity (access), household dietary diversity
(HDD) and women’s BMI; followed by eight focus group discussions (FGDs) among
purposefully selected participants on their perceptions of TIF. The study involved 400
households and 253 women in these households.
The second component determined consumption of TIF and their contribution to dietary
nutrients intake of energy, protein, iron, zinc and vitamin A among children 2-5 and women
18-49 years old in Botswana. This was part of a cross-sectional study mentioned in the first
component of this study. A 30-day quantitative food frequency questionnaire was
administered to the sample which comprised of 173 children and 253 women.
The last component explored the relationship between vending TIF and vendors’ overall
household income, vendors’ household food security (access) and vendors’ household
dietary diversity. The study made use of sequential explanatory mixed methods design. Face
to face interviews were conducted with purposively selected street vendors of TIF (n=27) in
Gaborone, followed by three focus group discussions (FGDs), each with 6 participants (18

iv
participants in total) to get an in-depth insight on the contribution of TIF to household income
and perceived challenges in sourcing and vending TIF.
Results
Study 1: Almost two thirds of households experienced moderate or severe food insecurity
(28.8 and 37.3%, respectively) while more than half of women were overweight or obese
(26.9 and 26.9%, respectively). Median HDD score was 6 (5, 7) out of a total of 12 while the
majority of households (81.0%) fell into the medium HDD category (5-8 food groups). A
positive correlation was found between the number of TIF accessed and HDD scores (r =
0.457; P < 0.001) while a negative correlation between the number of TIF accessed and
HFIA scores (r = - 0.272; P < 0.001) was found. TIF were perceived as healthy, yet their
consumption was reported to be declining due to convenience, easy accessibility to and a
growing preference for modern foods.
Study 2: TIF accounted for relatively high percentages of energy intake in children and
women (41 % and 36%, respectively). The intake of vitamin A in children was higher from
TIF mean 234 (184 - 299) compared to non-TIF mean 176 (138-224) P = 0.0851. In women,
the intake of vitamin A and zinc were significantly higher from TIF compared to non-TIF (zinc
from TIF mean 4.9 (4.6 - 5.3), non-TIF mean 4.2 (3.9 - 4.5) P = 0.0033, vitamin A from TIF
mean 409 (332 - 503), non-TIF mean 295 (240 - 362) P = 0.0286. Across quartiles of
increasing TIF energy intake, children in the third quartile consumed a significantly higher
intake of energy compared to children in the first quartile P < 0.05. Further, children in the
second quartile consumed a significantly higher intake of zinc compared to children in the
first quartile P < 0.05.
Study 3: It was observed that 74.0% of the vendors’ households were food insecure, with
18.5%, 33.3% and 22.2% being mildly, moderately and severely food insecure, respectively.
Vendors’ median HDD score was 4 (3, 6) out of a total of 12 while slightly more than half of
the households (51.9%) fell into the lowest group of HDD score (0-4 food groups). A positive
correlation was found between monthly income from sale of TIF and vendors’ overall
household income (r = 0.594 P = 0.004) and between the number of TIF varieties for sale
and vendors’ HDD (r = 558, P = 0.002). No correlation was found between the number of TIF
varieties for sale and HFIA scores (r = 0.136, P = 0.498). FGDs confirmed that vending of
TIF contributed substantially to vendors’ household income. A supply chain of TIF crossing
boarders also emerged.

v
Conclusion
Food insecurity in terms of access and low diversified diets was found to be highly prevalent
in the two urban and two rural areas of Botswana that were under study and among the
vendors’ households. Large proportions of the study population in the two rural and two
urban areas were found to have access to TIF. This study highlights that TIF may present a
useful potential to contribute to household food security (access), household dietary diversity
and nutrients intake, especially of energy, vitamin A and zinc. In addition, it also highlights
that vending of TIF may contribute significantly to vendors’ households’ income. However,
there is a need to explore the potential benefits of optimal use of TIF in contributing to
household food security (access), household dietary diversity, improved nutrients intake and
vendors’ household income. This should also include attention to related energy
consumption and physical activity as these factors may influence overall nutrition status
outcomes.
Key words: Traditional foods, indigenous foods, food security, dietary diversity, income,
vendors, Botswana.

vi
TABLE OF CONTENTS
DEDICATION ......................................................................................................................... i
ACKNOWLEDGEMENTS ......................................................................................................ii
ABSTRACT ........................................................................................................................... iii
LIST OF DEFINITIONS ........................................................................................................ xii
CHAPTER 1: INTRODUCTION ............................................................................................. 1
1.1 Background and motivation ............................................................................................. 1
1.2 Aim and objectives .......................................................................................................... 4
1.3 Research setting and design ........................................................................................... 5
1.4 Structure of this thesis ..................................................................................................... 6
1.5 Ethical considerations ..................................................................................................... 8
1.6 Authors contributions ...................................................................................................... 8
1.7 References.................................................................................................................... 10
CHAPTER 2: LITERATURE REVIEW ................................................................................. 16
2.1. Introduction .................................................................................................................. 16
2.2 Food security and malnutrition ...................................................................................... 16
2.2.1 Definition and concepts of food security and malnutrition ........................................... 17
2.2.2 The global state food security and malnutrition .......................................................... 19
2.2.3 Food insecurity and malnutrition in Africa and Botswana ............................................ 20
2.3 Traditional and indigenous foods ................................................................................... 22
2.3.1 Concept and definition of traditional and indigenous foods ......................................... 22
2.3.2 Utilisation of traditional and indigenous foods in Africa and Botswana ........................ 24
2.4 Nutritional value and health aspects of traditional and indigenous foods ....................... 27
2.5 Contribution of traditional and indigenous foods to dietary diversity and food security ... 29
2.6 Contribution of traditional and indigenous foods to local food biodiversity ..................... 30
2.7 Nutrient composition of traditional and indigenous foods and encountered challenges . 31
2.8 Traditional and indigenous foods contribution to nutrients intake ................................... 33

vii
2. 9 Vitamin A, iron and zinc importance ............................................................................. 34
2.9.1 Vitamin A.................................................................................................................... 34
2.9.2 Iron ............................................................................................................................. 34
2.9.3 Zinc ............................................................................................................................ 36
2.10 Potential contribution of traditional and indigenous foods to household income .......... 36
2.11 Marketing and supply chain of traditional and indigenous foods .................................. 37
2.12 Reasons attributed to decline in the use of traditional and indigenous foods ............... 38
CHAPTER 3 ........................................................................................................................ 56
Household access to traditional and indigenous foods positively associated with food
security and dietary diversity in Botswana ........................................................................... 56
CHAPTER 4 ........................................................................................................................ 78
Consumption of traditional and indigenous foods and their contribution to nutrients intake
among children and women in Botswana ............................................................................ 78
CHAPTER 5 ...................................................................................................................... 106
Street vending of traditional and indigenous food and the potential contribution to household
income, food security and dietary diversity: The case of Gaborone, Botswana ................. 106
CHAPTER 6: CONCLUSION AND RECOMMENDATIONS .............................................. 129
6.1 Introduction ................................................................................................................. 129
6.2.1 Household access to traditional and indigenous foods positively associated with food
security and dietary diversity in urban and rural areas in Botswana. ................................. 129
6.2.2 Consumption of traditional and indigenous foods and their contribution to nutrient
intake among children 2-5 years and women 18-49 years old in Botswana ....................... 130
6.2.3 Street vending of traditional and indigenous food and the potential contribution to
household income, food security and dietary diversity: The case of Gaborone, Botswana 131
6.3 Study limitations .......................................................................................................... 131
6.4 Conclusion .................................................................................................................. 133
6.5 Recommendations ...................................................................................................... 133
Addendum 1: Instructions for authors Journal of Public Health nutrition ............................. 136
Addendum 3: Content and style guidelines for the Journal of Hunger and Environmental
Nutrition ............................................................................................................................. 148

viii
Addendum 4: Ethics PhD study .......................................................................................... 156
Addendum 5: Editors certificate ......................................................................................... 159
Addendum 6: TIF foods substituted with other foods from the MRC FoodFinder ................ 160
Addendum 7: list of traditional and indigenous foods (TIF) and non-TIF ............................. 161
Addendum 8: Study questionnaires .................................................................................... 165
Addendum 9: Consent forms .............................................................................................. 194

ix
LIST OF ABBREVIATIONS
AFSUN African Food Security Urban Network
BBS Botswana Building Society
BMI Body Mass Index
BWP Botswana Pula
CEN Centre of Excellence for Nutrition
CVDs Cardiovascular Diseases
FAO Food and Agricultural Organization
FGDs Focus Group Discussions
GDP Gross Domestic Product
HDD Household Dietary Diversity
HFIA Household Food Insecurity Access
HFIAS Household Food Insecurity Access Scale
IFPRI International Food Policy Research Institute
IMF International Monetary Fund
IPIGRI International Plant Generic Resource
IQR Interquartile range
NCDs Non Communicable Diseases
NFTRC National Food Technology Research Centre
r Correlation coefficient
SSA Sub Saharan Africa
SSPS Statistical Package for Social Sciences
TIF Traditional and Indigenous Foods
UNICEF United Nations International Children's Emergency Fund
WHO World Health Organization

x
LIST OF TABLES
Chapter 1 Page
Table 1: Study objectives and manuscripts developed………………………………………5
Table 2: Research team and their contributions………………………………………….......9
Chapter 2
Table 1: Some edible wild fruit plants in Shorobe village, Northern Botswana ………….26
Table 2: Composition of some selected indigenous fruits of Botswana ...........................32
Table 3: Mineral contents of some indigenous fruits of Botswana…………………………33
Chapter 3
Table 1: Demographic and socioeconomic characteristics of households, food security,
dietary diversity number of TIF accessed and women BMI…………………………….......62
Table 2: TIF items per food group as derived from quantitative and qualitative
data………………………………………………………………………………………………..64
Chapter 4
Table 1: Intake of selected nutrients from TIF and non- TIF……….................................. 86
Table 2: Differences in the intake of selected nutrients from TIF and non-TIF
adjusted for age sex and area in women and children…………………………………… 87
Table 3: Selected nutrient intake of the study participants (children and women) by
quartile of TIF energy intake mean ± SD…………………………………........................... 89
Table 4: Top five TIF consumed that contributed to the selected nutrients in children…. 90
Table 5: Top five TIF consumed that contributed to the selected nutrients in women…...92
Chapter 5
Table 1: Characteristics of street vendors of TIF in Gaborone ……………………………120
Table 2: Types of TIF displayed for sale by TIF vendors in Gaborone ………………......122
Table 3: Spearman correlations of income from sale of TIF, household income, HFIA
scores, TIF items displayed for sale, household income HFIA and HDD scores…........ 123

xi
LIST OF FIGURES
Chapter 2 page
Figure 1: UNICEF; conceptual framework on causes of malnutrition……...................19

xii
LIST OF DEFINITIONS AND CONCEPTS
Consumers within food systems, “consumers eat the food produced by the
system” (Global Panel on Agriculture and Food Systems for
Nutrition, 2016: 82). This study focuses on consumers of TIF
referring to households, women and children.
Consumers’
nutrition in this study, this concept summarises the study variables
measured which included household food security (access),
household’s dietary diversity, women BMI, dietary nutrients
intake of energy, protein, iron, zinc and vitamin A among
consumers of TIF.
Food security “ a situation that exists when all people, at all times, have
physical, social and economic access to sufficient, safe,
nutritious food to meet their dietary needs and food
preferences for an active and healthy life” (FAO, 2009:1). In
this thesis only one dimension of food security was
measured and will be referred to- the access component.
Food systems comprise all the processes involved in keeping us fed:
growing, harvesting, packing, processing, transforming,
transporting, marketing, consuming and disposing of food
(Global Panel on Agriculture and Food Systems for Nutrition,
2016: 82).
Market foods are “foods that enter communities often through global
industrially sponsored retail outlets and which must be
purchased.
Indigenous foods are “foods that originate and grow in a particular area. They
are known locally in an area with respect to the country or
region” (Maunder & Meaker 2007: 403).

xiii
Street vendors marketing is one among the processes within the food system,
which comprises of the actors who move products through the
market into the hands of the consumers. This is done in
markets, in informal retail, by street vendors, in supermarkets
and in small stores (Global Panel on Agriculture and Food
Systems for Nutrition, 2016). In this study we focussed on the
street vendors of TIF as distributors of TIF in Gaborone and
also we explored them as consumers of TIF.
Traditional foods are “foods that indigenous people have access to locally
without having to purchase them, and within traditional
knowledge and the natural environment from farming or wild
harvesting” (Kuhnlein et al., 2009: 3).
Traditional and in this study TIF were defined as; foods that are native or
Indigenous Foods introduced into Botswana a long time ago, including plant
(TIF) and animal sources whether locally produced (either
domesticated, cultivated) or accessed from the wild.
Considering globalisation of food systems, these foods
may also be purchased from retail outlets, irrespective of
their origin but recognised as part of country’s traditional
food culture.
TIF access to determine household access to TIF, a 1-point value was
given to each individual traditional or indigenous food item
reported by all household members in the previous 24 hours
(HDD component). The sum of points indicated the
household’s access to TIF.

xiv
References
FAO (Food and Agricultural Organization). 2009. World Summit on Food Security. Draft
declaration of the world summit on food security; 16-18 November. Rome, Italy: FAO.
Global Panel on Agriculture and Food Systems for Nutrition. 2016. Food systems and diets:
Facing the challenges of the 21st century. London, UK.
https://glopan.org/sites/default/files/ForesightReport.pdf. Date accessed 20 July 2017.
Kuhnlein, H.V., Erasmus, B. & Spigelski, D. 2009. Indigenous peoples' food systems: the
many dimensions of culture, diversity and environment for nutrition and health: Food and
Agriculture Organization of the United Nations Rome.
Maunder, E.M.W. and Meaker, J.L., 2007. The current and potential contribution of home-
grown vegetables to diets in South Africa. Water SA, 33(3).

1
CHAPTER 1: INTRODUCTION
1.1 Background and motivation
Over the past few decades, there has been a decrease in the consumption of traditional
foods enabled by a shift towards the increased consumption of westernised diets - referred
to as nutrition transition. This transition is described as a shift away from consumption of
traditional foods which are believed to provide better quality diets compared to westernised
diets which are highly refined, with lots of added sugar, fat and decreased fibre (Popkin et
al., 2001; Satia-Abouta, 2003; Popkin, 2006; Monda et al., 2007; Anand et al., 2015; Hawkes
& Popkin, 2015). This has happened in both developed and developing countries (Anand et
al., 2015), spurred by globalisation, industrialisation, socio-economic changes and rapid
increases in immigration (Satia-Abouta, 2003; Monda et al., 2007; Damman et al., 2008;
Ruel et al., 2010; Hawkes & Popkin, 2015). The effect of nutrition transition has been cited
among the major factors contributing to increased non-communicable diseases (NCDs) such
as hypertension, diabetes, obesity and other cardiovascular diseases (CVDS) (Frison et al.,
2005; Damman et al., 2008; Hu, 2011; Anand et al., 2015; Hawkes & Popkin, 2015).
Additionally, the World Health Organization (WHO) observed that traditional diets play a
significant role in preventing and controlling morbidity and premature mortality resulting from
NCDs (WHO, 2003).
Food systems have transformed globally as food and food products have become
commodities, produced and traded in a market that has expanded from an essentially local
base to an increasingly global one (Anand et al., 2015), a change described as unhealthy
and equally unsustainable pattern of food production and consumption (Hawkes & Popkin,
2015). Consequently, the changes in the global food system are linked to nutrition transition,
reflecting a shift away from consumption of traditional and indigenous foods to the increased
consumption of energy-dense diets foods that are mostly packaged and processed with a
limited variety of nutrient-dense foods that provide dietary fibre such as fruits, vegetables,
legumes, diverse healthy coarse cereals, roots and tuber crops (Hawkes & Popkin, 2015). In
addition, there is a global trend towards dietary simplification (Charrondière et al., 2013).
This encourages the loss of local food biodiversity of both plant and animal sources due to
the over-reliance on a limited number of staple crops, mainly wheat, maize and rice from the
modern and high input agricultural industry (Charrondière et al., 2013; Stadlmayr et al.,
2013; Ebert, 2014), which delivers more than half of human calorie intake (Stamp et al.,
2012). Nutrition transition and transforming food systems are believed to lead to the reduced
utilisation of traditional and indigenous foods that have, over time, served to sustain

2
populations in Africa and elsewhere; as well as to a loss of livelihood for many families that
are engaged in related economic activities such as farmers and vendors. If no specific efforts
are targeted at conserving the existing food biodiversity (crop or animal) and related
knowledge, the capacity of achieving more healthy and sustainable diets will be
compromised (FAO, 2010).
Recently, there has been a growing awareness on the need to recognise the potential value
of traditional and indigenous foods in the face of transition and the transforming food
systems as a way of addressing food insecurity and poor diets. Food security is defined as a
situation that exists “when all people, at all times, have physical, social and economic access
to sufficient, safe and nutritious food to meet their dietary needs and food preferences for an
active and healthy life” (FAO, 2009:1). Besides increasing rates of overweight, obesity and
other non-communicable diseases, food insecurity remains a major global challenge
(Godfray et al., 2010; Grote, 2014); with 795 million people being undernourished in 2015
(FAO, 2015); while an estimated more than 2 billion people in the world are considered to be
deficient in key vitamins and minerals, particularly vitamin A, iodine, iron and zinc (Geleta et
al., 2012).
In Sub-Saharan Africa (SSA), a current review on obesity and nutrition transition indicated
that the same phenomenon of nutrition transition is emerging as people shift from their
traditional diets to westernised diets (Steyn & Mchiza, 2014). For example, the South African
population is consuming diets containing more animal origin foods that are high in total fat
and saturated fat, as well as foods with a high content of added sugar, causing negative
health outcomes (Vorster et al., 2011). Botswana is among the countries that are rapidly
urbanising, with about 60% of the population residing in urban centres (Nnyepi et al., 2015).
It is also a country undergoing nutrition transition, characterised by the shift from the use of
traditional foods to refined and processed foods such as rice, savoury snacks, fried meat,
cheese, pies, potato chips, hot dogs, candy, biscuits, fizzy drinks and sweetened beverages
(Maruapula et al., 2011).
Food security in Botswana has been a major concern at both national and household level
due to the country’s low performing agricultural sector and recurring droughts (Lado, 2001;
Raboloko, 2016). The climate is semi-arid with an erratic, unreliable rainfall pattern while the
drought is endemic, contributing to low agricultural food production (Lado, 2001;
Mojeremane & Tshwenyane, 2004; Brinkhurst, 2010). The contribution of the agriculture
sector to Gross Domestic Product (GDP) in 2015 was 2.2 % (Statistics Botswana, 2015).
Given that, the country follows a national food security strategy that focuses on food imports

3
rather than domestic food production (Crush et al., 2011; Raboloko, 2016) to ensure the
physical availability of food supplies to its population, with more than 80% of the food being
imported from South Africa (Crush et al., 2011).
Nutrient deficiencies, under-nutrition and micronutrient deficiencies are prevalent in
Botswana as overweight and obesity are also becoming recognised health problems. FAO
indicated that the prevalence of undernourished people in Botswana in 2010-2012 was 27.9
% (FAO, 2012) while according to WHO global nutrition report, in 2014, 31.4% of children
under 5 years of age were stunted, 11.2% were underweight, 7.2% were wasted and 11.2%
were overweight. On the other hand, the prevalence of obesity among adults 18 years and
older for men and women was 12.7% and 32.3% respectively while the prevalence of
anaemia among women 15-49 years of age was 29.0% (WHO, 2015).
The potential contribution of traditional and indigenous foods to food security due to their
believed nutritional benefits has been gaining recognition in the recent years (Ebert, 2014:
FAO, 2013: FAO, 2014). Traditional or indigenous foods are described as foods that can be
accessed locally within the local environments without purchase (Kuhnlein et al., 2009;
Maunder & Meaker 2007). However, due to increased globalisation and widespread
supermarkets as pointed out by Reardon and Gulati (2008), some of the traditional foods
such as maize meal are being purchased locally, although they may be imported from the
surrounding regions and countries. In this study, traditional and indigenous foods (TIF) were
defined as foods that are native or were introduced into Botswana a long time ago, including
plant and animal sources, whether locally produced (either domesticated, cultivated) or
accessed from the wild. Considering globalisation of food systems, these foods may also be
purchased from retail outlets, irrespective of their origin but recognised as part of country’s
traditional food culture. The definition of TIF was arrived at by a panel consisting of local
nutrition experts, field assistants and the research team, in a consultative process prior to the
study. Traditional or indigenous foods have been integral part of diets for many communities,
for instance, East Africa, according to Muhanji et al. (2011), offers a diverse range of
traditional and indigenous leafy vegetables and fruits which can play a significant role in
providing food security in both urban and rural settings. In Ethiopia, traditional and
indigenous food sources have played a major role in rescuing the lives of people during
times of famine and war (Fentahun & Hager, 2009). Further studies elsewhere have reported
that traditional green leafy vegetables and fruits are rich sources of micronutrients such as
vitamin A, C, folic acid, thiamine, vitamin B2, niacin, calcium, potassium, sodium,
phosphorus, iron and zinc (Orech et al., 2007; Kwenin et al., 2011; Penafiel et al., 2011).
According to Ebert (2014), there is a wider range of traditional and indigenous foods that

4
have been neglected and underutilised, but they could potentially improve agricultural
systems and be a valuable component in contributing to food security due to their resilience
and owing to their potential as sources of essential macro and micronutrients.
Against this background, previous studies in Botswana show that it is a country which is
diverse in traditional or indigenous foods (Ohiokpehai, 2003; Mojeremane & Tshwenyane,
2004; Flyman & Afolayan, 2006a; Flyman & Afolayan, 2006b; Legwaila et al., 2011). In
addition, there are some street pockets where indigenous plant foods and animal foods are
sold. However, currently, there is a lack of documented data to show extent of access to
these traditional or indigenous foods and their potential contribution to household food
security (access), household dietary diversity, specific dietary nutrient intake and household
income. Hence, this study explored access to and consumption of traditional and indigenous
foods in two rural and two urban areas in Botswana and the vending of TIF among street
vendors of TIF in Gaborone.
1.2 Aim and objectives
The aim of the study was to explore access to and consumption of TIF in rural and urban
households in Botswana (part A). In addition, the study focussed on street vendors of TIF in
Gaborone in terms of household income, household food security (access), household
dietary diversity and their in-depth views on vending of TIF (part B).
Specific objectives are:
PART A: Household survey
1. To determine TIF access among low socio-economic households in two rural and two
urban study sites.
2. To determine the association between household access to TIF and household food
security (access), household dietary diversity and women BMI in these households.
3. To investigate participants’ perceptions on TIF regarding their health importance,
availability and access trends.
4. To determine the consumption of TIF and the contribution of reported TIF consumed
to dietary nutrient intake of energy, protein, vitamin A, iron and zinc based on a 30
day quantitative food frequency questionnaire among children 2-5 and women 18-49
years.

5
PART B: Vendors
5. To determine the monthly income from vending TIF among street vendors of TIF in
Gaborone.
6. To determine the relationship between monthly income from vending TIF and
vendors’ overall household income, household food security (access) and household
dietary diversity.
7. To explore in-depth vendors’ perceptions on challenges and opportunities when
sourcing and vending TIF.
The various study objectives and the manuscripts developed from the study objectives are
presented in table 1.
Table1: study objectives and manuscripts developed
1.3 Research setting and design
The study in this thesis was conducted in two parts;
Part A; Household survey
This was a cross-sectional study conducted in two urban areas (Old Naledi and Area W) and
two rural areas (Maun and Tsabong) in Botswana. These areas were purposively selected to
include predominantly low socio-economic areas and to accommodate the possible
variations in availability of TIF in the country. Old Naledi and Area W are situated in
Gaborone and Francistown, respectively. Gaborone is the country’s largest city and its
capital. Francistown is the second largest city. Tsabong is in the Kgalagadi District, a region
which covers a vast area of the Kalahari Desert. Maun is located in the North-West District. A
Article Manuscript Title Objectives
Article 1: Household access to traditional and indigenous foods
positively associated with food security and dietary diversity in
Botswana.
Objectives 1, 2, 3
Article 2: Consumption of traditional and indigenous foods and their
contribution to nutrients intake among children 2-5 years and
women 18-49 years old in Botswana.
Objective 4
Article 3: Street vending of traditional and indigenous foods and the
potential contribution to household income, food security and
dietary diversity: The case of Gaborone, Botswana.
Objectives 5, 6, 7

6
mixed methods research approach was followed, applying a sequential explanatory design
which involved quantitative data collection in the form of a household survey, followed by a
qualitative phenomenological approach, collecting data with FGDs (Creswell, 2008). In this
study, data on TIF access at household level, household food security (access), household
dietary diversity and women BMI were collected. In addition, data on consumption of TIF
based on a 30 day quantitative food frequency questionnaire among children 2-5 and women
18-49 years were collected. Furthermore, participants’ perceptions were also investigated to
get in-depth insights on various aspects of TIF as described in the study objectives (part A).
Part B vendors
In this component of the study, the research applied the food systems approach that
considers various processes in the food system until the food reaches to the consumer.
These processes include food production, processing, storage, transportation, trade,
transformation and retailing (Global Panel on Agriculture and Food Systems for Nutrition,
2016). In this context, street vendors of TIF were purposively selected as the study
participants in part B of this study as they were perceived as consumers and distributors of
TIF in Gaborone. The study was conducted in Gaborone City along the streets of three
malls, the Botswana Building Society Mall, the Main Mall and the Rail Park Mall at the bus
rank. Gaborone was purposively selected because it is Botswana’s largest city and the
nation’s capital that accommodates the largest number of rural- urban migrants. It is highly
urbanising and facing the challenge of urban food insecurity. It is also common to observe
TIF being sold along the streets and alleys around some shopping malls. A mixed methods
research approach was followed, applying a sequential explanatory study design which
involved quantitative data collection in the form of structured interviews with TIF street
vendors, followed by qualitative data collection in the form of focus group discussions
(FGDs). Data on monthly household income, types of TIF the vendors sold, monthly income
earned from selling TIF, household food security (access) and household dietary diversity
were collected. Additionally, vendors’ perspectives on TIF as described in the objective
section of part B was investigated through FGDs.
1.4 Structure of this thesis
The structure of this thesis is presented in an article format and it comprises of six chapters.
References used in chapters 1, 2 and 6 are provided at the end of each chapter according to
the North-West University required style. Articles presented in chapters 3, 4 and 5 are
formatted and referenced according to the required style of the respective journals.

7
Chapter 1: The introductory chapter provides background information, the aim and objectives
of the study, structure of the thesis and the research team.
Chapter 2: Presents the relevant literature on TIF in relation to consumers’ nutrition
(household food security, household dietary diversity, women BMI, and nutrients intake) and
vendors’ household income). This chapter presents an overview of literature required for the
interpretation of the data from the article manuscripts in this thesis.
Chapter 3: An article entitled, ‘Household access to traditional and indigenous foods
positively associated with food security and dietary diversity in Botswana’. This manuscript
determines household access to traditional and indigenous foods (TIF) and the association
to household food security, household dietary diversity and women BMI in low socio-
economic households in two urban and two rural areas in Botswana. It also covers study
participants’ perspectives on various aspects of TIF as described in the study objectives (part
A). The article has been published in the Journal of Public Health Nutrition.
http://dx.doi.org/10.1017/S136898001700369X. The content and style guidelines for Journal
of Public Health Nutrition are presented in Addendum 1.
Chapter 4: An article entitled, ‘Consumption of traditional and indigenous foods and their
contribution to nutrients intake among children 2-5 years and women 18-49 years old in
Botswana’. It determines the consumption of traditional and indigenous foods and their
contribution to energy, protein, vitamin A, iron and zinc intake among children 2-5 years and
women 18-49 years old in two urban and two rural areas in Botswana. This manuscript will
be submitted for publication to the Journal of Ecology of Food and Nutrition. The content and
style guidelines for Journal of Ecology of Food and Nutrition are presented in Addendum 2.
Chapter 5: An article entitled, ‘Street vending of traditional and indigenous foods and the
potential contribution to household income, food security and dietary diversity: The case of
Gaborone, Botswana’. This manuscript explores the potential contribution of vending TIF to
vendors’ overall household income, vendors’ household food security (access) and
household dietary diversity. It also determines vendors’ perspectives on TIF as described in
the study objectives (part B). This manuscript has been submitted for publication to the
Journal of Hunger and environmental Nutrition. The content and style guidelines for Journal
of Hunger and environmental Nutrition are presented in Addendum 3.
Chapter 6: The last chapter comprises of summary of the findings, conclusions and
recommendations.

8
1.5 Ethical considerations
Ethical clearance for this study was obtained from the Faculty of Health Sciences, Health
Research Ethics Committee, Potchefstroom Campus, North–West University, South Africa;
(NWU -00206-14-S1) and the Botswana Health Research and Development Division of the
Ministry of Health. Signed informed consent was obtained from the participants after being
given adequate explanation in their local language. Participants had the choice to withdraw
from the study at any point.
1.6 Authors contributions
This study involved several research team members. Their names and roles are as listed in
Table 2. Co- authors’ statement is included, confirming the roles they played in this study as
well as their written consent to include the articles in this thesis. The statement is as follows:
“I declare that as co-author, I have approved the above-mentioned articles, that my role in
the study, as indicated below is representative of my actual contribution and that I hereby
give my consent that the articles may be published as part of the PhD thesis of Mrs SN
Kasimba.”

9
Table 2: Research team and their contributions
Name Affiliation Role
Salome Kasimba
PhD student
Centre of Excellence for
Nutrition, North-West University
Responsible for conception and
designing of the protocol,
formulating the research
questions, study design and
literature review. Also involved in
data collection, data entry and
statistical analysis as well as
drafting the three manuscripts in
this thesis (Chapters 3, 4 and 5)
and writing up of the thesis.
Dr Namukolo Covic Poverty, Health and Nutrition
Division, International Food and
Policy Research Institute, Addis
Ababa, Ethiopia
Supervised this thesis. Involved in
conception designing of the
protocol, formulating the research
questions, study design,
interpretation of results and co-
authored the three manuscripts in
this thesis (Chapters 3, 4 and 5).
Dr Boitumelo, S. Motswagole National Food Technology
Research Centre, Botswana
Co-supervised this thesis. Involved
in conception and designing of the
protocol, formulating the research
questions, study design, involved
in data collection, interpretation of
results and co-authored the three
manuscripts in this thesis
(Chapters 3, 4 and 5).
Dr Nicole Claasen Africa Unit for Transdisciplinary
Health Research (AUTHeR),
North-West University, South
Africa
Co-supervised this thesis. Involved
in interpretation of results and co-
authored the three manuscripts in
this thesis (Chapters 3, 4 and 5).
Maricke Cockran Medicine Usage in South Africa,
Faculty of Health Sciences
North-West University
Statistician who guided analysis
for the first and third manuscripts.
Ria Laubscher Biostatics Unit, South African
Medical Research Council
Statistician who guided analysis
for the second manuscript.

10
1.7 References
Anand, S.S., Hawkes, C., De Souza, R.J., Mente, A., Dehghan, M., Nugent, R., Zulyniak,
M.A., Weis, T., Bernstein, A.M. & Krauss, R.M. 2015. Food consumption and its impact on
cardiovascular disease: importance of solutions focused on the globalized food system: a
report from the Workshop Convened by the World Heart Federation. Journal of the American
College of Cardiology, 66(14):1590-1614.
Brinkhurst, M. 2010. Fruit of sand: complexities of Botswana’s veld plant resources. Studies
by Undergraduate Researchers at Guelph, 3(2).
Charrondière, U.R., Stadlmayr, B., Rittenschober, D., Mouille, B., Nilsson, E., Medhammar,
E., Olango, T., Eisenwagen, S., Persijn, D. & Ebanks, K. 2013. FAO/INFOODS food
composition database for biodiversity. Food Chemistry, 140(3):408-412.
Creswell JW. Qualitative, Quantitative, and mixed methods approaches. 2008. SAGE
publications, inc. Asia pacific.
Crush, J., Hovorka, A. & Tevera, D. 2011. Food security in Southern African cities. The place
of urban agriculture. Progress in Development Studies, 11(4):285-305.
Damman, S., Eide, W.B. & Kuhnlein, H.V. 2008. Indigenous peoples’ nutrition transition in a
right to food perspective. Food Policy, 33(2):135-155.
Ebert, A.W. 2014. Potential of underutilized traditional vegetables and legume crops to
contribute to food and nutritional security, income and more sustainable production systems.
Sustainability, 6(1):319-335.
FAO (Food and Agricultural Organization). 2009. World Summit on Food Security. Draft
declaration of the world summit on food security; 16-18 November. Rome, Italy: FAO.
FAO (Food and Agricultural Organization). 2010. Expert Consultation on Nutrition Indicators
for Biodiversity. Rome, Italy. http://www.fao.org/docrep/010/a1582e/a1582e00.htm. Date
accessed 18 July 2017.

11
FAO (Food and Agricultural Organization). 2012. The State of Food Insecurity in the World:
Economic Growth is necessary but not sufficient to Accelerate Reduction of Hunger and
Malnutrition. Rome, Italy. http://www.fao.org/docrep/016/i3027e/i3027e.pdf. Date accessed
17 July 2017.
FAO (Food and Agricultural Organization). 2013. Linkages between Biodiversity, Foods and
Nutrition. Rome, Italy.
http://www.bioversityinternational.org/uploads/tx_news/Chpt7_Linking_biodiversity_and_nutri
tion.pdf. Date accessed 13 July, 2017.
FAO (Food and Agricultural Organization). 2014. Promotion of underutilized indigenous food
resources for food security and nutrition in Asia and the Pacific. Bangkok, Thailand.
http://www.fao.org/3/a-i3685e.pdf. Date accessed 15 September, 2016.
FAO (Food and Agricultural Organization). 2015. The State of Food Insecurity in the World
2015. Meeting the 2015 international hunger targets: taking stock of uneven progress.
Rome, Italy. http://www.fao.org/3/a-i4671e.pdf. Date accessed 18 July 2017.
Fentahun, M.T. & Hager, H. 2009. Exploiting locally available resources for food and
nutritional security enhancement: wild fruits diversity, potential and state of exploitation in the
Amhara region of Ethiopia. Food Security, 1(2):207-219.
Flyman, M. & Afolayan, A. 2006a. The suitability of wild vegetables for alleviating human
dietary deficiencies. South African Journal of Botany, 72(4):492-497.
Flyman, M.V. & Afolayan, A.J. 2006b. A survey of plants used as wild vegetables in four
districts of Botswana. Ecology of Food and Nutrition, 45(6):405-415.
Frison, E., Smith, I.F., Cherfas, J., Eyzaguirre, P. & Johns, T. 2005. Using biodiversity for
food, dietary diversity, better nutrition and health. South African Journal of Clinical Nutrition,
18(2):112-114.
Geleta, B., Ameri, G., Amdemariam, K., Fan, S., Stein, A.J. & Olofinbiyi, T. 2012. Reducing
the risk of food and nutrition insecurity among vulnerable populations: International Food
Policy Research Institute. http://www.ifpri.org/publication/reducing-risk-food-and-nutrition-
insecurity-among-vulnerable-populations. Date accessed 17 July 2017.

12
Global Panel on Agriculture and Food Systems for Nutrition. 2016. Food systems and diets:
Facing the challenges of the 21st century. London, UK.
https://glopan.org/sites/default/files/ForesightReport.pdf. Date accessed 20 July 2017.
Godfray, H.C., Beddington, J.R., Crute, I.R., Haddad, L., Lawrence, D., Muir, J.F., Pretty, J.,
Robinson, S., Thomas, S.M. & Toulmin, C. 2010. Food Security: the challenge of feeding 9
billion people. Science (New York, N.Y.), 327(5967):812-818.
Grote, U. 2014. Can we improve global food security? A socio-economic and political
perspective. Food Security, 6(2):187-200.
Hawkes, C. & Popkin, B.M. 2015. Can the sustainable development goals reduce the burden
of nutrition-related non-communicable diseases without truly addressing major food system
reforms? BMC Medicine, 13(1):143.
Hu, F.B. 2011. Globalization of diabetes: the role of diet, lifestyle, and genes. Diabetes Care,
34(6):1249-1257.
Kwenin, W.K.J., Wolli, M. & Dzomeku, B.M. 2011. Assessing the nutritional value of some
African indigenous green Leafy Vegetables in Ghana. Journal of Animal & Plant Sciences,
10 (2):1300-1305.
Lado, C. 2001. Environmental and socio-economic factors behind food security policy
strategies in Botswana. Development Southern Africa, 18(2):141-168.
Legwaila, G.M., Mojeremane, W., Madisa, M.E., Mmolotsi, R.M. & Rampart, M. 2011.
Potential of traditional food plants in rural household food security in Botswana. Journal of
Horticulture and Forestry, 3(6):171-177.
Maunder, E. & Meaker, J. 2007. The current and potential contribution of home-grown
vegetables to diets in South Africa. Water SA, 33(3): 401-405.
Maruapula, S.D., Jackson, J.C., Holsten, J., Shaibu, S., Malete, L., Wrotniak, B., Ratcliffe,
S.J., Mokone, G.G., Stettler, N. & Compher, C. 2011. Socio-economic status and
urbanization are linked to snacks and obesity in adolescents in Botswana. Public Health
Nutrition, 14(12):2260-2267.

13
Mojeremane, W. & Tshwenyane, S.O. 2004. Azanza garckeana: A Valuable Edible
Indigenous Fruit Tree of Botswana. Pakistan Journal of Nutrition 3(5):264.
Monda, K.L., Gordon-Larsen, P., Stevens, J. & Popkin, B.M. 2007. China's transition: the
effect of rapid urbanization on adult occupational physical activity. Social Science &Medicine,
64(4):858-870.
Muhanji, G., Roothaert, R.L., Webo, C. & Stanley, M. 2011. African indigenous vegetable
enterprises and market access for small-scale farmers in East Africa. International Journal of
Agricultural Sustainability, 9(1):194-202.
Nnyepi, M.S., Gwisai, N., Lekgoa, M. & Seru, T. 2015. Evidence of nutrition transition in
Southern Africa. The Proceedings of the Nutrition Society: 74(4): 476-86.
Ohiokpehai, O. 2003. Promoting the nutritional goodness of traditional food products.
Pakistan Journal of Nutrition, 2(4):267-270.
Orech, F.O., Christensen, D.L., Larsen, T., Friis, H., Aagaard-Hansen, J. & Estambale, B.A.
2007. Mineral content of traditional leafy vegetables from western Kenya. International
Journal of Food sciences and Nutrition, 58(8):595-602.
Penafiel, D., Lachat, C., Espinel, R., Van Damme, P. & Kolsteren, P. 2011. A Systematic
Review on the Contributions of Edible Plant and Animal Biodiversity to Human Diets. Eco
Health, 8(3):381-399.
Popkin, B.M. 2006. Global nutrition dynamics: the world is shifting rapidly toward a diet
linked with non-communicable diseases: American Journal for Clinical Nutrition, Inc.
84(2):289-98.
Popkin, B.M., Horton, S.H. & Kim, S. 2001. The nutrition transition and prevention of diet-
related diseases in Asia and the Pacific: Asian Development Bank Manila.
http://www.fao.org/library/library-home/en/. Date accessed 17 July 2017.
Raboloko, M. 2016. Determinants of Urban Household Food Security In Botswana. Academy
of Biomedical and Clinical Science Journal, 1(1).

14
Reardon, T. & Gulati, A. 2008. The rise of supermarkets and their development implications.
International experience relevant for India. International Food Policy Research Institute
Washington, DC USA.
Ruel, M.T., Garrett, J.L., Hawkes, C. & Cohen, M.J. 2010. The food, fuel, and financial
crises affect the urban and rural poor disproportionately: a review of the evidence. The
Journal of Nutrition, 140(1):170S-176S.
Satia-Abouta, J. 2003. Dietary acculturation: definition, process, assessment, and
implications. International Journal of Human Ecology, 4(1):71-86.
Stadlmayr, B., Charrondiere, U.R., Eisenwagen, S., Jamnadass, R. & Kehlenbeck, K. 2013.
Nutrient composition of selected indigenous fruits from Sub‐Saharan Africa. Journal of the
Science of Food and Agriculture, 93(11):2627-2636.
Stamp, P., Messmer, R. & Walter, A. 2012. Competitive underutilized crops will depend on
the state funding of breeding programmes: an opinion on the example of Europe. Plant
Breeding, 131(4):461-464.
Statistics Botswana. 2015. Gross Domestic Product. Gaborone. Botswana.
http://www.statsbots.org.bw/sites/default/files/publications/GDP%20Q3%20December%2020
16.pdf. Date accessed 18 July 2017.
Steyn, N.P. & Mchiza, Z.J. 2014. Obesity and the nutrition transition in Sub-Saharan Africa.
Annals of the New York Academy of Sciences, 1311:88-101.
Vorster, H.H., Kruger, A. & Margetts, B.M. 2011. The nutrition transition in Africa: can it be
steered into a more positive direction? Nutrients, 3(4):429-441.
WHO (World Health Organization). 2003. Diet, nutrition and the prevention of chronic
diseases. Geneva, Switzerland.
http://apps.who.int/iris/bitstream/10665/42665/1/WHO_TRS_916.pdf. Date accessed 15 July
2017.
WHO (World Health Organization). 2015. World Health Statistics; Global health indicators
Part 11. Geneva Switzerland.

15
http://www.who.int/gho/publications/world_health_statistics/2015/en/. Date accessed 23 July
2017.

16
CHAPTER 2: LITERATURE REVIEW
2.1. Introduction
According to Food and Agricultural Organization (FAO), food insecurity remains a global
concern with an unacceptably large number of people still lacking the food they need for an
active and healthy life (FAO, 2015). Malnutrition of all forms, including under-nutrition, over
nutrition and micronutrient deficiencies persist globally despite an abundance of diverse
healthy foods within our surrounding environments, International Food Policy Research
Institute (IFPRI, 2016). Food systems are rapidly transforming towards commercialisation
and globalisation, adversely affecting diets in both developed and developing countries.
There is a change in traditional food consumption towards westernised diets which are
characterised by lots of added sugar, fat as well as highly refined foods with decreased fibre
(Anand et al., 2015). Traditional and indigenous foods are increasingly neglected and their
access has been declining over the years (Bharucha & Pretty, 2010).
Botswana is a country which is diverse in its traditional and indigenous foods, including
plants which grow annually, despite erratic and unreliable rainfall, used for food by rural
communities during dry spells (Legwaila et al., 2011; Neudeck et al., 2012). Nevertheless,
there is limited information available on access to and consumption of TIF and their
contribution to household food security, household dietary diversity and specific dietary
nutrients intake. Their contribution to vendors’ household income also remains unclear. In
light of this, the chapter will provide a review of current literature related to food security and
malnutrition, TIF utilisation in Africa and Botswana. It will also focus on TIF nutritional value
and health aspects, TIF potential contribution to household food security and household
dietary diversity. Additionally, in this chapter, the nutrient composition of TIF and
encountered challenges, potential contribution of TIF to specific dietary nutrients intake and
the importance of vitamin A, iron and zinc will be presented. Furthermore, the chapter will
also present literature on marketing, supply chain of TIF and TIF potential contribution to
household income. Lastly, the reasons attributed to the decline in use of TIF will be
presented.
2.2 Food security and malnutrition
In this section, the definition and concepts of food security and malnutrition will be described,
followed by an analysis of the state of food security and malnutrition in the world. Thereafter,
food security in the African context and with a specific focus on Botswana, will be discussed.

17
2.2.1 Definition and concepts of food security and malnutrition
Food security is a concept whose definition and concept of operationalisation has developed
over time. However, the definition from the 1996 World Food Summit is the commonly used
one and it defines food security as;
Food security ‘‘exists when all people, at all times, have physical and economic
access to sufficient, safe and nutritious food to meet their dietary
needs and food preferences for an active and healthy life”(FAO,1996:
4).
With time, the definition of food security was revised and the social aspect was added, thus
the definition of food security as describe by FAO now states that;
Food security is “a situation that exists when all people, at all times, have physical
social and economic access to sufficient, safe, nutritious food to meet
their dietary needs and food preferences for an active and healthy life”
(FAO 2009: 1).
In the current definition of food security, the nutrition dimension is integral to the concept of
food security that evolved over time (FAO, 2009). Nutrition security is a broader concept than
food security. It differs from food security in that it also considers the aspects of adequate
caring practices, health and hygiene in addition to dietary adequacy (FAO, 2012). It is
defined as;
Nutrition security “a situation that exists when secure access to an appropriately
nutritious diet is coupled with a sanitary environment, adequate health services and care, in
order to ensure a healthy and active life for all household members” (FAO, 2012: 57).
According to FAO (2009), food security has four dimensions;
Food availability- which is achieved when there is consistent sufficient quantities of
food of appropriate quality.
Access to food- this presumes physical access and depends on the purchasing
power of households to have adequate resources for acquiring appropriate foods for a
nutritious diet from different sources which include market, household gardens or in-kind
transfers of food.

18
Food utilisation- which is the individuals’ ability to derive the greatest nutritional
benefit from food. This is a biological process that comprises of intake of adequate nutritious
diet and the individuals overall health status. It is influenced by several factors which include
clean water and sanitation, food safety, food preservation and storage, adequate health
care, the manner in which the food is prepared and cultural and individual food preferences.
Stability- which emphasises the importance of having to reduce the risk of adverse
effects on the other three dimensions: food availability, access to food or food utilisation
(FAO, 2008).
Other terms used within the concept of food security and malnutrition as defined by FAO
(2012:57) include the following;
Malnutrition “an abnormal physiological condition caused by deficiencies, excesses
or imbalances in energy, protein and/or other nutrients”.
Stunting “low height for age, reflecting a sustained past episode or episodes of
under-nutrition”.
Undernourishment “food intake that is insufficient to meet dietary energy requirements
continuously. This term is used interchangeably with chronic hunger,
or, in this report, hunger”.
Undernutrition “the result of undernourishment, poor absorption and/or poor biological
use of nutrients consumed”.
Underweight “low weight for age in children, and BMI <18.5 in adults, reflecting a
current condition resulting from inadequate food intake, past episodes
of undernutrition or poor health conditions”.
Wasting “low weight for height, generally the result of weight loss associated
with a recent period of starvation or disease”.

19
According to UNICEF, several factors exhibit complex interaction to determine the nutritional
status of children as shown in Figure 1.
Basic causes
Figure 1: Adapted from UNICEF; conceptual framework on causes of malnutrition (UNICEF,
1998).
2.2.2 The global state food security and malnutrition
Malnutrition, referring to overnutrition, undernutrition and micronutrient deficiencies, is a
growing concern globally. FAO’s estimates show that about 805 million people were
chronically undernourished in 2014, the vast majority of them living in developing countries
(FAO, 2015). About 791 million were estimated to be chronically hungry with the highest
prevalence of undernourishment reported in Sub-Saharan Africa, which remains the world’s
most food-insecure region (FAO, 2015). Hunger and the consequences of hunger cause the
death of approximately 40 million people each year, around 13 million of them being children
(Bokeloh et al., 2009). It was estimated that over 500 million people were obese and about 2
billion were overweight (Ng et al., 2014). More than 40% of the world’s population suffer from
micronutrient deficiencies, also called the “hidden hunger” (Bokeloh et al., 2009). Roughly 2
billion people, especially women, are affected by iron deficiency, about 1.6 billion people live
in regions where iodine deficiency is endemic and approximately 230 million children
worldwide suffer from vitamin A deficiency (Bokeloh et al., 2009). Stunting, wasting and
Diseases
Underlying causes
Immediate causes Inadequate dietary
intake
Manifestation Malnutrition
Inadequate
maternal
/Childcare
Potential resources
Human, economic and organizational
resources
Insufficient
health care
Inadequate
access to
food

20
micronutrient deficiencies were estimated to be the cause of death in nearly 3.1 million
children annually (Black et al., 2013).
Nearly half of all deaths in children under the age of 5 are attributable to undernutrition which
translates into the unnecessary loss of about 3 million young lives per year, United Nations
International Children's Emergency Fund (UNICEF, 2016). Undernutrition subjects children
to a greater risk of dying from common infections, increases the frequency and severity of
such infections, and contributes to delayed recovery. In addition, the interaction between
under nutrition and infection can create a potentially lethal cycle of worsening illness and
deteriorating nutritional status (UNICEF, 2016). In 2014, 23.8% of children under the age of
5 years worldwide were stunted, 95 million children were underweight, 50 million were
wasted and 41 million children were overweight, with Asia and Africa having the highest
number of wasted children 69% and Africa 29% respectively (UNICEF, 2016).
Modern agricultural technologies focus on commercial large scale production of limited
staple foods, specifically cereals which include rice, wheat and maize to address global food
security and hunger, while neglecting the diverse foods available in our environments (IFPRI,
2016). Current debates on food security do not take full account of the potential of
indigenous and traditional foods (Power, 2008). It was not until recently, however, that
research has been underscored to explore the potential role of traditional and indigenous
foods in mitigating the impact of climate change, increased prevalence of NCDs and food
insecurity (Hawkes & Popkin, 2015). It has also been highlighted that there is need for food
security conceptualisation, policies and programmes to be tailored along incorporating
traditional and indigenous foods in the food market systems in improving food security
(Power, 2008).
2.2.3 Food insecurity and malnutrition in Africa and Botswana
In Africa, food insecurity is one of the key development challenges of the 21st Century
(Crush & Frayne, 2010). This is due to factors such as exploding population growth and
climate change, therefore, producing adequate food for combating poverty and hunger is
seen as a huge challenge (Garrity et al., 2010). Projections are that higher temperatures and
lower rainfall in parts of Africa, coupled with the doubling population, will lead to a 43%
increase in food insecurity, and will induce a 60% increase in food aid expenditures during
the next two decades (Funk & Brown, 2009). Garrity et al. (2010) project an increase of
undernourished people in Sub-Saharan African to almost 600 million by 2030. Another factor
contributing to food insecurity is the soaring food prices (Sasson, 2012). According to Crush

21
and Frayne (2010), evidence is also available that indicates that factors directly constraining
food supply, access, distribution and consumption can no longer be marginalised. Rapid
urbanisation has produced an invisible crisis of urban food security. Despite this, much of the
food security interventions focus on rural food security while the plight of urban food security
has been neglected. At present, the evidence is so fragmentary and inadequate that it can
only lead to misguided interventions at municipal and national level (Crush & Frayne, 2010).
Urban dwellers depend on cash income for food purchase as well as for all their other basic
needs such as fuel, water, sanitation, housing and transport, and have little access to other
safety nets like agriculture or land to ensure food access in times of crisis and this makes
them more vulnerable to food insecurity (Ruel et al., 2010). Furthermore, with respect to
foods that are culturally preferable, people living in urban areas present significant
challenges to food security because access to traditional foods is more difficult as they
depend on market food which is even more expensive (Power, 2008). The issue is
complicated by the fact that it is not only access to non-traditional foods but the variety
aspect is also compromised for the urban poor due to limited economic access (Ruel et al.,
2010).
Food security has been a major concern in Botswana both at national and household level
due to the country’s low performing agricultural sector and recurring droughts (Lado, 2001;
Raboloko, 2016). The climate is semi-arid, with erratic and unreliable rainfall patterns and
drought is endemic, contributing to low agricultural food production (Lado, 2001;
Mojeremane & Tshwenyane, 2004; Brinkhurst, 2010). However, small scale farming remains
the dominant livelihood activity in the rural areas and a substantial source of employment,
food and income (Statistics Botswana, 2012), despite persistent under-performance due to
harsh agro-ecological and erratic weather conditions that are characterised by poor soil,
recurrent droughts and unpredictable weather patterns associated with climate change
(Statistics Botswana, 2012). Botswana, in spite of being a middle-income economy, is faced
with income inequality (Sekwati et al., 2013; Botlhale, 2015) and consequently, incidences of
poverty have been reported both in urban and rural areas - but more rampant in rural areas
compared to the urban areas (Sekwati et al., 2013). The number of poor people living in rural
areas faced with poverty was 54.3% and of that number, 37.0% lived in urban villages while
8.6% lived in the cities in 2010 (World Bank, 2015).
FAO indicated that the prevalence of undernourished people in Botswana in 2012 was
27.9% (FAO, 2012). African Food Security Urban Network (AFSUN) also reported on urban
household food insecurity, specifically in Gaborone, the capital city of Botswana, among low

22
socio-economic households with 88% of them being food insecure (Acquah et al., 2014) in
2008. According to Raboloko (2016), the determinants of urban household food insecurity in
urban Gaborone included: (1) wage income: the higher the wage income the more food
secure the households were; (2) household size: the larger the household size, the more
increased the competition for limited resources and therefore, such large-sized households
were more food insecure compared to smaller-sized households; (3) head of the household:
male-headed households were more food secure compared to female-headed households.
Concurrently, all forms of malnutrition, including overnutrition, undernutrition and
micronutrient deficiencies are present in Botswana. According to World Health
Organization’s (WHO), global nutrition report, the prevalence of underweight, wasting,
stunting and overweight among children under five years of age in Botswana, was 11.2%,
7.2%, 31.4% and 11.2% respectively, while the prevalence of obesity among adults 18 years
and older was 12.7% and 32.3% for men and women respectively, and the prevalence of
anaemia among women 15-49 years of age was reported to be 29% (WHO, 2015). Against
this background, little is known about the role of TIF in mitigating food insecurity and
malnutrition in Botswana. In relation to this, the study presented attempted to investigate the
potential role of TIF among the urban and rural low socioeconomic households in Botswana.
2.3 Traditional and indigenous foods
This section begins by describing traditional and indigenous foods as were conceptualised in
the present study. Their utilisation globally as well as in Africa and in Botswana follows and
thereafter, their various uses in Africa, including Botswana, are described.
2.3.1 Concept and definition of traditional and indigenous foods
The concepts and definitions of traditional and indigenous foods is widely used and varied.
There is no agreed universal definition of traditional or indigenous foods, however, the
acceptable definition, especially of what can be termed as traditional or indigenous to people
has to be confined within a certain origin and culture (Kuhnlein et al., 2009). Some
researchers have used the two terms interchangeably while others have come up with
different definitions that are applicable within the context of their research.

23
According to Maunder and Meaker (2007: 403);
Indigenous foods are defined as those “foods that originate and grow in a particular
area. They are known locally in an area with respect to the country or
region”.
With respect to traditional foods according to Kuhnlein et al. (2009: 3);
Traditional foods are defined as “foods that indigenous people have access to locally
without having to purchase them, and within traditional knowledge and
the natural environment from farming or wild harvesting”.
While according to Ogoye-Ndegwa (2003); Orech et al.(2005);
Traditional foods are foods that have been integrated into a community’s culture and
used over a long period of time, more than a century ago.
According to these researchers, it is clearly acknowledged that for food to be termed as
indigenous or traditional to people, it has to be originating in a certain area, been integrated
long enough in that community and become part of the culture of those people and has to be
obtained locally from the local environment either from farming or harvested from the wild
and not purchased. In contrast to definitions of indigenous and traditional foods, Kuhnlein et
al. defined the concept of market foods as;
Market foods “are foods that enter communities often through global industrially-sponsored
retail outlets and which must be purchased. In some circumstances,
indigenous people may purchase some of their culturally based traditional
foods e.g. wild meat and local cereal varieties from others with land or time to
harvest them” (Kuhnlein et al., 2009: 4).
In our study, it was important to integrate and adapt the concept of market foods in to the
definition of indigenous and traditional foods because of increasingly globalised food
systems, urbanisation, and Botswana being heavily dependent on food imports (Crush &
Frayne, 2010). Research shows that supermarkets, mainly South African brands such as,
Pick and Pay and Shoprite, are widely spread in both urban and rural areas of Botswana and
act as the major food distributors (Acquah et al., 2014). As a result, some of the foods
believed to be traditional have become commodities accessed from these supermarkets,

24
irrespective of their origin. Examples of these foods include sorghum meal, maize, beans,
peanuts, sweet potatoes, Setswana (cooked pounded beef), mopane moth caterpillars etc.
In this thesis, TIF are therefore defined as;
Foods that are native or were introduced into Botswana a long time ago,
including plant and animal sources, whether locally produced (either
domesticated, cultivated) or accessed from the wild. Considering globalisation
of food systems, these foods may also be purchased from retail outlets,
irrespective of their origin but recognised as part of country’s traditional food
culture.
Our definitions were arrived through a consultative process by a panel of nutrition experts,
local field assistants and the research team prior to the study. The panel came up with a list
of foods differentiating indigenous, traditional and non-indigenous/traditional foods. A list of
these foods is presented in Addendum 7.
2.3.2 Utilisation of traditional and indigenous foods in Africa and Botswana
African countries are endowed with variety of traditional or indigenous foods that many rural
communities commonly consume (Oiye et al., 2009; Molla et al., 2011). With particular
regard to plant food sources, their utilisation is widely reported throughout African
communities. For example, according to Cloete and Idsardi (2013), approximately 52% of
households use traditional or indigenous foods crops in their diets in South Africa. In Kenya,
black nightshade, spider plant and Amaranthus are some of the indigenous leafy vegetables
commonly consumed (Kimiywe et al., 2007). In most parts of Ethiopia, indigenous foods,
especially from the wild, form an integral part of the diet for the population. Some of those
commonly utilised by households include Tamarindus indica L., Syzygium guineense (Wild.)
DC., Cordia africana Lam. and Utrica simensis (Molla et al., 2011). Indigenous vegetables
play a common role as a relish (sauce) (Oniang'o et al., 2004; Neudeck et al., 2012), that is,
they are used as a complement for staple diets made mainly from maize meal. Relish is an
indispensable part of the African diet (Oniang'o et al., 2004; Smith & Eyzaguirre, 2007) as
the main staple cereal is not normally eaten in the absence of relish. In rural parts of South
Africa, wild vegetables are an important source of main food (Voster et al., 2007). When
several wild vegetable species are cooked together in one meal, they contribute to dietary
diversity due to the many vegetable types (Mavengahama et al., 2013). In Uganda, a study
on the utilisation of indigenous food plants found that indigenous fruits and vegetables were
mainly used in the form of snacks and as a relish (Musinguzi et al., 2006). Other studies
have reported that some indigenous food plants have been used for medicinal purposes

25
(Musinguzi et al., 2006; Acipa et al., 2013; Anywar et al., 2014; Tumwet et al., 2014).
Consumption patterns of traditional or indigenous vegetables and fruits differ across
countries due to various factors. For example, in South Africa, the consumption pattern of
traditional leafy vegetables depends on factors such as the population’s indigenous
knowledge, poverty levels, urbanisation, and seasons of the year (Dweba & Mearns, 2011;
Mavengahama et al., 2013). In Kenya, Kimiywe et al. (2007) reported that traditional leafy
vegetables availability increases during rainy season, so they become plenteous and cheap.
In another study conducted by Musinguzi et al. (2006) in Uganda, respondents indicated that
they use indigenous vegetables when other relishes are in short supply or there is shortage
of food. Despite the varied use of indigenous or traditional vegetables as indicated by
previous studies, the use of traditional green leafy vegetables is declining (Voster et al.,
2007; Dweba & Mearns, 2011; Matenge et al., 2012; van der Hoeven et al., 2013).
A review by Legwaila et al. (2011) reported that Botswana is rich in a wide variety of
traditional or indigenous foods, both cultivated and from the wild, and are used by both rural
and urban communities for food. These foods are commonly used, especially during the dry
spells or during famine as a buffer against food shortages and to sustain livelihoods
(Legwaila et al., 2011). Available research reports mostly on traditional or indigenous fruits
and vegetables. Some of the indigenous vegetables in Botswana include: Cleome,
Amaranthus, Corchorus and Vigna spp; examples of fruit are: Azanza garckeana, Adansonia
digitata, Sclerocarya birrea, Strychnos spinosa, Vangueria infausta and Grewia spp
(Legwaila et al., 2011; Neudeck et al., 2012). Traditional leafy vegetables in Botswana are
reported as being plentiful during the rainy season but become scarce during the dry season
(Legwaila et al., 2011).
According to Legwaila et al. (2011), some of the traditional or indigenous fruits and
vegetables and other foods like mushroom and bush meat in Botswana are sourced from the
wild. These foods are believed to contribute to rural household food basket but are usually
not recognised in the national food basket. The use of traditional or indigenous plant foods in
Botswana is no different from the rest of Africa. Traditional food plants have been reported
as being used for food, snacks, medicine, building materials, fuel and as a beverage
(Ohiokpehai, 2003; Legwaila et al., 2011; Neudeck et al., 2012). Some indigenous fruits are
also used for income generation by rural communities (Legwaila et al., 2011; Neudeck et al.,
2012). Animal skins are processed to make traditional rugs and ostrich eggs can be used in
crafts or just as a natural decoration with their inherent beauty (Motlhanka et al., 2008). In
addition, in traditional Botswana, wild fruits were collected and given as offerings during
wedding ceremonies and some fruits served as ingredients for local traditional brews

26
(Motlhanka et al., 2008). Furthermore, a selection of wild plants were also used for spiritual
and recreational purposes (Neudeck et al., 2012). Literature shows that there are a lot of
studies that consider one type/species of traditional or indigenous food. Research that
explores household access to and consumption of TIF from dietary intake perspective hardly
exists.
Some of the indigenous edible wild fruit plants from Shorobe village in Botswana are
depicted in Table 1.
Table 1: Some edible wild fruit plants in Shorobe village, Northern Botswana
Species Local Name
Amaranthus Thepe
Azanza garckeana (F. Hoffm.) Exell & Hillc. Morojwa
Berchemia discolor (Klotzsch) Hemsl Motsenstela
Ceropegia sp. Serowa
Cleome gynandra L. Leketla/Rothwe
Corchorus olitorius L. Delele
Cyperus fulgens C.B. Clark. Monakaladi
Diospyros mespiliformis Hochst. ex A.DC. Mokutsumo
Ficus sycomorus L. Mochaba
Fockea angustifolia K. Schum. Leruswha
Garcinia livingstonei T. Anderson Motsaodi
Grewia bicolor Juss. Mogwana
Grewia flava DC. Moretlwa
Grewia flavescens Juss Mokgomphatha
Grewia retinervis Burret Motsotsojane
Hyphaene petersiana Klotzsch ex Mart Mokolowane
Nymphaea nouchali Burm.f. Tswii
Rhus quartiniana A. Rich Moropaphiri
Sclerocarya birrea (A. Rich.) Hochst. Morula
Urochloa mosambicensis (Hack.) Dandy Phoka
Vangueriopsis lanciflora (Hiern.) Robyns
ex R.D. Good
Mmupudu
Ximenia americana L. Moretologa

27
Species Local Name
Unidentified sp. Lehubala
Unidentified sp Mokgothwane
Unidentified sp Natshwa
Unidentified sp Tshetlha
Source (Neudeck et al., 2012).
2.4 Nutritional value and health aspects of traditional and indigenous foods
This section presents information on the nutritional value and health aspects attached to
traditional or indigenous foods. There is limited data that has reported on the nutritional value
of traditional or indigenous foods from animal sources. A lot of the research that has
explored this aspect has focussed mainly on traditional or indigenous fruits and vegetables
and this will be presented.
Traditional or indigenous leafy vegetables and fruits have been reported as an important
source of micronutrients, such as iron, vitamin A (β-carotene) and zinc (Uusiku et al., 2010).
Consequently, their consumption has been suggested as one of the sustainable ways of
reducing and controlling micronutrient deficiencies (Frison et al., 2011; Penafiel et al., 2011;
Mavengahama et al., 2013). In Cameroon, it was reported that five African indigenous
vegetables that were selected and analysed for their nutritional value were all found to be
rich in Calcium, Magnesium, pottasium, zinc, iron, protein and carotenoids. These included
amaranth (Amaranthus cruentus), nightshade (Solanum scabrum), African eggplant
(Solanum aethiopicum), jute mallow (Corchorus olitorius) and okra (Abelmoschus callei)
(Kamga et al., 2013). Other studies reported that African nightshade and the spider plant
contain micronutrients such as iron, protein, vitamin C, carotene, magnesium, calcium, fibre,
flavonoids and phenols (Yang & Keding, 2009; Mibei et al., 2012). Furthermore, a study
conducted in Uganda found that some wild food plant species which included Amaranthus
graecizansSolanum nigrum Crotalaria brevidens Ficus sur and Bridelia scleroneura had a
higher protein content in comparison to their cultivated counterparts. This same study
reported that the highest concentration of calcium (867.59 mg/100g) was found in Acalypha
bipartita leaves, compared to 294.18 mg/100g in Cleome gynandra(Acipa et al., 2013).
For some micro-nutrient deficiencies such as vitamin A and iron, food-based strategies such
as the promotion of production and consumption of indigenous fruits and vegetables, has
been recommended (Aphane et al., 2002). According to Oiye and colleagues (2009),

28
increasing the consumption of African indigenous vegetables (AIVs) in Kenya, and possibly
using them instead of kales and cabbages, would go a long way in improving vitamin A
intake. When AIVs are prepared properly, in order to maintain the nutritional value and are
consumed frequently, they can release micronutrients and make them available, as well as
increase the bio-availability and effective absorption of micronutrients in other staple food
crops (Musotsi et al., 2005). However, despite the enumerated macro and micronutrient
values associated with indigenous and traditional vegetables and fruits, specifically the
micronutrient potential, WHO reveals that fruit and vegetable consumption in Sub-Saharan
Africa (SSA) is below the recommendation of 400 g/day (Ruel et al., 2005). Additionally,
according to the Lancet series 2013, deficiencies of essential vitamins and minerals,
especially of vitamin A, iron, zinc and iodine are widespread (Black et al., 2013). Therefore,
effort is needed to identify ways of promoting and embracing the use of traditional and
indigenous fruits and vegetables as a strategy to alleviate micronutrient deficiencies among
populations. Indigenous animal food sources such as caterpillars have also been reported as
rich in nutrients. For instance, in Nigeria, Solomon and Prisca (2012), in their analysis of
processed edible caterpillars, showed that caterpillars are rich in protein and fat, high in
caloric value and contain mineral elements which include sodium, chloride, iron, zinc,
calcium and phosphorus.
Research remains scanty on the health aspects of traditional or indigenous animal food
sources. Most of the available research has explored the health aspect of some traditional
and indigenous plants. With respect to this, research shows that some traditional and
indigenous plants have a high potential in improving the immune function of people due to
their health-protecting properties (Gupta et al., 2005; Kimiywe et al., 2007; Smith &
Eyzaguirre, 2007a). African black nightshade (S.nigrum) is a highly valued indigenous
vegetable which is consumed for its flavour and perceived health benefits. For instance,
black nightshade leaves are consumed to manage diabetes, high blood pressure, anaemia,
peptic ulcers, colds, coughs and sight problems (Keding et al., 2007; Kimiywe et al., 2007).
According to Tumwet et al., (2014), African indigenous leafy vegetables are associated with
various medicinal and immune boosting claims, however, proof of principle studies has not
been done and the active ingredients in immune boosting have not been isolated by any
study. In Addition, Acipa et al. (2013) highlighted that some of the food plants in Uganda
were considered by the local community to have medicinal properties such as the African
spider flower, and the Rattle pod. Some edible wild plants have abundant phenolic
compounds and other natural anti-oxidants (including vitamins and minerals) that have been
associated with protection from and/or treatment for medical conditions such as malnutrition,
heart disease, cancer and diabetes (Neudeck et al., 2012). In Kenya it was observed that

29
some phytochemicals in some of the African leafy vegetables may pose toxicity problems
when consumed in large quantities or over a long period of time (Orech et al., 2005).
However, it is important to investigate their chemical, nutritional, toxicological properties and
their bioavailability of micronutrients before they are recommended as an alternative dietary
source (Orech et al., 2005).
2.5 Contribution of traditional and indigenous foods to dietary diversity and food
security
Dietary diversity is a simple count of food groups consumed over a 24 hour reference period
that can be measured at household or an individual level (FAO, 2010). Dietary diversity at
household level measures the economic ability of a household to consume variety of foods,
and acts as a proxy for household food security while dietary diversity at individual level can
be used as an indicator of diet quality (FAO, 2010; Vakili et al., 2013). Previously, it has been
documented that increasing sustainable productivity, which integrates indigenous foods, can
be one of the strategies to alleviate food insecurity through dietary diversification (Kunyanga
et al., 2013). On the other hand, dietary diversification is believed to be one of strategies of
ensuring adequate intake of nutrients (Kunyanga et al., 2013). Consideration of access to a
variety of indigenous wild foods enhances the diversity of diets and can ensure continuous
supply of food throughout the year (Bharucha & Pretty, 2010). Production and promoting the
use of traditional and indigenous fruits and vegetables consumption provides diets rich in
micronutrients and helps alleviate food insecurity and micronutrient deficiencies
(Mavengahama et al., 2013). It is believed that in Sub-Saharan African countries, indigenous
leafy vegetables could play an important role in the WHO global initiative to drive increased
consumption of vegetables and fruits as a way of alleviating food insecurity (Smith &
Eyzaguirre, 2007). There is substantial evidence that both traditional and indigenous foods
which comprise of foods from the wild such as vegetables, fruits, mushrooms and bush meat
among others, can contribute greatly as part of the global food basket (Bharucha & Pretty,
2010; Legwaila et al., 2011). For instance, wild vegetables are reported to have been the
mainstay of human diets for centuries, providing millions of households with important
micronutrients, such as vitamins and minerals needed to maintain health and promote
immunity against infections (Bharucha & Pretty, 2010). Many traditional indigenous plant
foods are comparable to those available in an average market today in terms of nutrient
content. With climate variability and uncertainty, there is need to diversify the food systems
by including local crops that are adapted to local environments for greater system resilience
(Lin, 2011). The promotion of traditional or indigenous foods cannot be overemphasised as

30
they are less damaging to the environment and address cultural needs and in addition they
also preserve the cultural heritage of local communities (FAO, 2014).
It was reported in Uganda that wild food plants, such as swamp hibiscus, African spider
flowers, tamarind, black night shade and Jews mallow contribute to local household food
security in times of food shortage, especially for the economically disadvantaged children
and the elderly (Acipa et al., 2013). A similar observation was noted by Tabuti (2007) who
found that the use of wild food plants is significant, especially during periods of acute food
shortages and these foods provide nutritional security by adding essential nutrients as well
as variety to diets, making staples more appealing to the taste. In Southern Africa, Akinnifesi
et al. (2006) noted that 60% to 85% of the rural people can face food shortages for 3 to 4
months in a year and use indigenous foods, especially plant sources, to sustain their
livelihoods. Edible wild fruit trees in Botswana play an important role in food security,
especially to rural households, and are reported to produce high yields, even with little
rainfall (Neudeck et al., 2012).
Some of the wild African indigenous vegetables mature early, usually within 3 to 4 weeks,
and can be used to fight hunger before other cultivated food crops mature (Mavengahama et
al., 2013). Mavengahama et al. (2013) further acknowledged that although wild vegetables
may be consumed in small quantities, they influence the intake of cereal staples, manage
hunger and play a central role in household food security for the poorer rural groups. Wild
vegetables are reported to be hardy, require less care and are a rich source of
micronutrients (Flyman & Afolayan, 2006). Mavengahama et al. (2013) recommend that
there is a need to determine the abundance and diversity of indigenous vegetables as a
preliminary step towards their domestication.
2.6 Contribution of traditional and indigenous foods to local food biodiversity
As part of the global agenda to tackle food insecurity and malnutrition, an international
initiative was launched to promote and conserve local food biodiversity (Boutrif et al., 2008;
Maes et al., 2012), which also encompasses indigenous and traditional foods both cultivated
and from the wild (Bharucha & Pretty, 2010; Tscharntke et al., 2012). This initiative was
initiated in light of dietary simplification attributed to globalisation and modernisation in
agriculture, contributing to suboptimal diets, especially in the developing countries (Boutrif et
al., 2008; Martins et al., 2011; Vorster et al., 2011; Charrondière et al., 2013). At the same
time, it sought to address the emerging wide spread of non-communicable diseases (NCDs)
linked to poor, energy rich diets that are highly refined, undiversified and low in nutrient

31
density (Popkin, 2006; Boutrif et al., 2008; Popkin, 2014). Additionally, it also sought to
minimise neglect in the use, loss and the decline of indigenous and traditional nutritionally
rich foods (Boutrif et al., 2008; Maes et al., 2012). It has been internationally acknowledged
that local food biodiversity can provide sustainable solutions for combating food insecurity
and malnutrition through programmes on biodiversity for food and nutrition, sustainable diets
initiatives and many national, regional and international programmes and policies (FAO,
2013). Nevertheless, due to its importance, the linkages between biodiversity, food and
nutrition should be more widely studied, researched and publicised, and more efforts should
be made to mainstream the concept into food, agriculture, health, trade and nutrition sector
policies and programmes (FAO, 2013).
Despite this, the worldwide trend is still towards dietary simplification and a loss of food
biodiversity due to reliance on a limited number of varieties of staple and other crops,
therefore, households continue to be faced with food insecurity and malnutrition
(Charrondière et al., 2013). Biodiversity of local foods could be used to reduce rural
household’s vulnerability to food insecurity through their resilience, sustainable use and as a
way of diversifying diets (Boutrif et al., 2008).
2.7 Nutrient composition of traditional and indigenous foods and encountered
challenges
Traditional or indigenous foods have long been part of diets in communities worldwide.
However, research shows that they are underutilised and their nutritional value is unknown,
especially indigenous food crops (Keatinge et al., 2011; Kamga et al., 2013). Data on
nutrient composition of traditional or indigenous foods is very limited (Kunyanga et al., 2013).
Nutrient food composition data provides detailed information on the nutritional composition of
foods (Egan et al., 2007). Food composition data is useful in epidemiological studies on
nutrition and disease; food labelling; assessing the nutritional status of population with food
consumption surveys; calculating nutrient intakes; diet formulation; development of food-
based dietary guidelines; food fortification; policy making for both agriculture, nutrition and
food security; and is also needed by the food industry for product development (Egan et al.,
2007; Bharucha & Pretty, 2010; Burlingame et al., 2012).
Both single food ingredients and composite foods are major dietary items that should be
analysed for their nutritional content (Reinivuo et al., 2009). A composite food contains one
or more ingredients (Reinivuo et al., 2009). However, due to wide and ever-changing variety

32
in ways of making these composite dishes, it is practically impossible to carry out chemical
analyses for all composite dishes as it would prove to be very expensive. It is in this light that
Reinivuo et al., (2009) suggested analyses of nutrient values for the ingredients of composite
foods may be a plausible option as their values can be used for calculating the nutrient
values of composite foods.
Environmental factors, genetics, fortification, storage conditions and processing are some of
the major factors that influence the composition of foods and this in turn causes variations in
the nutrient content of the different varieties of the same food (Charrondière et al., 2013).
Uusiku et al. (2010) stated that the amount of nutrients reported for the same species from
different studies varied widely due to factors like soil type, effect of fertiliser amount and
stage of harvesting. Limited data exists regarding the nutritional content of Botswana
traditional or indigenous foods. In addition, limited data is available on some of the nutritional
contents of a few of the indigenous fruits of Botswana (Amarteifio & Mosase, 2006).
From a global perspective, it is noted with concern that most of the food composition
databases do not count local food biodiversity, which also encompasses indigenous and
traditional foods (Charrondière et al., 2013). This poses a major challenge in the
identification and monitoring of nutrition indicators for local food biodiversity which is critical
in promoting local traditional and indigenous foods towards sustainable diets (Charrondière
et al., 2013). It is therefore emphasised that nutrient analysis and data dissemination of
various local food biodiversity is important and has to be undertaken systematically and used
to inform policies that target food security and agriculture using local food biodiversity
(Bharucha & Pretty, 2010). Research is needed to increase the documentation on nutrient
composition of foods that have been neglected and underutilised for decades (Toledo &
Burlingame, 2006). Table 2 and 3 presents some of the nutritional composition of some
indigenous fruits of Botswana.
Table 2: Composition (%) and pH (25° C) of some selected indigenous fruits in Botswana
Fruit Dry
matter
Ash Crude
protein
Acid detergent fibre PH Acidity Vitamin C
mg/100g
A. digitate 86 4.6 1.3 16.2 3.06 7.85 141.3
S.birriea 11.6 4.9 3.7 16.3 3.98 0.88 128.3
S. spinose 19.7 4.6 3.3 6.1 3.96 0.77 88.0
V.invausta 23.5 3.9 3.0 39.5 3.38 1.71 67.7
Source (Amarteifio & Mosase, 2006).

33
Table 3: Mineral content of some indigenous fruits of Botswana
Fruit Mineral (mg/100g)
Ca K Mg Na P Fe Zn
A. digitata 128 1866 121 13.3 50 0.10 0.14
S. birriea 94 2183 158 13.0 0.07 0.88 0.13
S. spinose 56 1370 49 21.7 0.11 0.77 0.22
V. invausta 124 1683 99 13.7 0.09 1.71 0.02
Source (Amarteifio & Mosase, 2006).
2.8 Traditional and indigenous foods contribution to nutrients intake
Consumption of a variety of traditional or indigenous foods is recognised as an important
mode of dietary diversification and a direct food-based intervention to address nutrient
deficiencies (Frison et al., 2006; Misra et al., 2008). Some previous studies in arctic
Canadians among pre-schoolers and adults showed that traditional local animal foods
contributed to high levels of micro nutrients intake such as vitamins A and D, iron,
magnesium, and zinc (Kuhnlein & Receveur, 2007; Johnson-Down & Egeland, 2010).
It is widely documented that traditional or indigenous foods contribute to various nutrients by
several studies from different countries. In Alaska, a study that aimed to determine whether
dietary westernisation is associated with intake of selected nutrients among Alaskan natives
living in remote communities reported that traditional foods accounted for 22 % of the overall
energy intake (Bersamin et al., 2007). The same study also reported that participants in the
highest quintile of traditional food intake consumed significantly more vitamin A, D, E, iron,
and n-3fatty acids than participants in the lowest quintile, while the intake of vitamin C,
calcium, and total dietary fibre decreased with increased consumption of traditional foods
(Bersamin et al., 2007). In a related study on traditional food systems and dietary quality for
women and children for the Awaju´n tribe in the Peruvian Amazon, higher traditional food
diversity was reported and associated with greater protein, fibre, iron, thiamine, riboflavin
and vitamin A among women and children; while higher dietary calcium, phosphorus, niacin,
vitamin C and folate were correlated with greater diversity scores for the women only. There
was no relationship between the total energy intake in either group (Roche et al., 2008).
Another study that investigated hunting of wildlife in tropical forests reported that about 20%
of protein in many developing countries came from bush meat and fish (Bennett & Robinson,
2000). Ghosh-Jerath et al. (2016b) found that many indigenous foods had high levels of

34
micronutrients like calcium, iron, vitamin A as beta carotene and folate among the Santhal
tribal community of Jharkhand, India.
Nevertheless, even with the widely documented contribution of nutrients from traditional or
indigenous foods, some studies have reported contradictory findings. A study on the
contribution of indigenous foods towards nutrient intake and nutritional status of women in
the Santhal tribal community of Jharkhand, India, reported that there was wide variety of
indigenous foods reported but dietary recalls revealed low intakes of some nutrients; women
consumed adequate energy and protein but micronutrient intake was inadequate for calcium,
iron, vitamin B2, folate and vitamin B12. However, the same study reported that women
consuming indigenous foods in the past 2 days had significantly higher intakes of calcium
and iron than those who did not consume these foods (Ghosh-Jerath et al., 2016a).
Literature search shows that in Africa there is limited research that has been undertaken to
investigate the potential contribution of traditional or indigenous foods to nutrients intake
among populations.
2. 9 Vitamin A, iron and zinc importance 2.9.1 Vitamin A
Vitamin A is required for vision, reproduction, immune function, cellular differentiation and
proliferation throughout life (West Jr & Darnton-Hill, 2008). Dietary provitamin A consumed
by humans are mainly b-carotene, a-carotene and b-cryptoxanthin and these are commonly
found in carrots, sweet potatoes, green leafy vegetables and other fruits and vegetables
characterised by their orange to red colour (Courraud et al., 2013). Vitamin A deficiency is
defined as plasma retinol concentration <0.70 lmol/L (WHO, 2009), and is a major cause of
premature death in developing nations, particularly among children (Maiani et al., 2009).
According to the Lancet series 2008, vitamin A deficiency is the greatest cause of mortality in
children less than 5 years of age in Sub-Saharan Africa (Black et al., 2008). FAO indicated
that although foods of animal origin are the best sources of vitamin A, they are expensive to
the majority of poor households, thus, plant food sources such as yellow fruits and
vegetables and dark green leafy vegetables act as the major sources of pro-vitamin A
(Aphane et al., 2002). The three main strategies used to fight against vitamin A deficiency
are supplementation with vitamin A capsules, food fortification with retinyl and dietary
diversification through consumption of provitamin A-rich foods which is suggested as a long
term strategy (Courraud et al., 2013).
2.9.2 Iron
Iron is an essential trace element which is an intrinsic component of haemoglobin and
myoglobin as well as a constituent of heme and non-heme enzymes that participate in

35
oxidation reduction reactions (La Frano et al., 2014). Iron deficiency is the most widespread
micronutrient deficiency in humans (Meng et al., 2005; Zimmermann et al., 2005). Nutritional
iron deficiency arises when physiological requirements cannot be met by iron absorption
from diet (Zimmermann et al., 2005). Iron bioavailability in plant foods is fairly low due to the
inhibitory factors that impair the absorption of iron such as polyphenols (tannins in tea and
coffee), oxalic acid, phytates, dietary fibre and calcium phosphate, which becomes an
insoluble salt with iron (Hurrell & Egli, 2010). Phytates are commonly found in cereals, bran
and legumes, while oxalates are common in chocolate, tea and spinach (Hurrell & Egli,
2010). Iron and zinc inhibit each other’s absorption, but only when they are in the same
solution, not when they are in the same meal (Whittaker, 1998). Bioavailability of iron is
influenced by enhancers of absorption such as ascorbic and citric acid, meat, fish and
poultry along with their digestion products (La Frano et al., 2014). The organic acids such as
ascorbic and citric acid reduce iron to its ferrous state and produce a soluble iron chelate in
the small intestine that improves absorption (La Frano et al., 2014). There are several
suggested potential approaches to increasing the bioavailability of iron in plant crops,
including conventional breeding and genetic engineering (Hotz & Gibson, 2007). Food
processing also increases iron bioavailability by reducing antinutrients. In addition,
fermentation increases the concentration of promoters such as citric and lactic acid (Teucher
et al., 2004). Iron supplementation, iron fortification of foods, dietary diversification and
disease reduction can control iron deficiency in populations (Zimmermann et al., 2005).
However, there are technical challenges that limit the amount of bioavailable iron
compounds that can be used in food fortification, but according to Zimmermann et al. (2005),
iron fortification can be an effective strategy against nutritional iron deficiency. Investigating
the bioavailability of the nutrient and minerals content of traditional vegetables, both raw and
cooked, is important towards a better understanding of their contribution to dietary intake of
iron (Kamga et al., 2013; Mavengahama et al., 2013).
In developing countries, most populations subsist on plant-based diets of which the dietary
iron is non-haem iron that is less well absorbed compared to heme iron (Hurrell & Egli,
2010). Regarding traditional leafy vegetables, it has been observed that wild vegetables,
especially dark green leafy vegetables, contain oxalates, phytates, nitrates, tannins and
saponins that reduce the absorption of certain micronutrients such as iron in the body
(Flyman & Afolayan, 2006). The low absorption rate of iron is considered to be the main
cause for iron deficiency anaemia, especially in the developing countries that subsist on
monotonous plant-based diets (Meng et al., 2005). Iron deficiency has substantial health and
economic implications, including poor pregnancy outcome, impaired school performance and
decreased productivity (Zimmermann et al., 2005).

36
2.9.3 Zinc
Zinc is an essential micronutrient for enzyme function, DNA and RNA metabolism, protein
synthesis, gene expression, cell growth and differentiation, and cell-mediated immunity
(Lowe et al., 2009). Some of the major sources of zinc include animal source foods, such as
the organs, flesh of beef, pork, poultry, fish and shellfish, and with lesser amounts in eggs
and dairy products (Lowe et al., 2009). Plant sources such as cereals and legumes are also
considered zinc sources, although the zinc is less bioavailable because of the presence of
phytic acid that binds to zinc-forming insoluble complexes which thus inhibit zinc absorption
(Gibson et al., 2010). Another dietary component that has a substantial impact on the
absorption of zinc is dietary calcium, which inhibits zinc absorption, and protein which
enhances absorption (Lestienne et al., 2005).
Other factors that affect zinc absorption include physiological factors such as quantity of zinc
ingested which in turn determines the quantity of zinc absorbed and the efficiency of
absorption. Other factors are age and the time over which zinc is ingested (Hambidge et al.,
2010). The efficiency of absorption of zinc from supplements is much higher than it is from
meals (Tran et al., 2004), even in the absence of a dietary inhibitor of zinc absorption
(Hambidge et al., 2010). Severe zinc deficiency in humans is associated with stunted growth,
immune dysfunction, and poor wound healing (Lowe et al., 2009). Some traditional food
processing methods such as soaking, germination and fermentation help in reducing the
phytic content in cereals and legumes (Lestienne et al., 2005).
2.10 Potential contribution of traditional and indigenous foods to household income
Although it is evident that selling traditional or indigenous foods could have potential in
contributing to household income this aspect is not widely researched and documented.
Limited research in this regard is available on traditional or indigenous fruits and vegetables.
It is believed that harvesting of wild fruits from forests and semi-domesticated trees, growing
on farms and homesteads can substantially boost rural household incomes and employment
opportunities in Africa (Ruiz-Pérez et al., 2004; Leakey et al., 2005). The cultivation of home
gardens and the collection of wild foods and herbs is generally viewed as rural women’s
responsibilities and plays an important role in income generation by producing some crops
that complement household income (Frison et al., 2011). For example, a study that
investigated African indigenous vegetables recipe documentation and their role in food
security, reported that indigenous vegetable production, especially leafy vegetables, acted
as the only source of income among women that helped them sustain welfare of their
families (Musotsi et al., 2005). Additionally, a review by Adebooye and Opabode (2005)

37
showed that trading of indigenous leafy vegetables and fruits plays a key role in income
generation especially among rural households. Similarly, according to a study done in Kenya
by Mwema et al., (2012) on the contribution of selected indigenous fruits on household
income and food security, it was reported that besides indigenous fruit acting as a source of
household food especially during the dry seasons, they are also traded for income among
the households. Another review by Legwaila et al., (2011) on the potential of traditional food
plants in rural households food security in Botswana showed that some indigenous
vegetables are traded as an alternative source of income. In Nigeria, it was observed that
trading on processed caterpillar can be a good source of additional income for families, and
if properly harnessed and produced on a large scale for commercial purposes, can be a
good source of livelihoods, thereby alleviating poverty (Solomon & Prisca, 2012). In Uganda,
it was reported that selling of some of the indigenous foods provide employment
opportunities, especially in rural areas where employment is scarce (Musinguzi et al., 2006).
2.11 Marketing and supply chain of traditional and indigenous foods
Traditional or indigenous foods are marketable, however, their markets are seasonal,
especially African leafy vegetables (Musotsi et al., 2005; Legwaila et al., 2011; Neudeck et
al., 2012). This is partly due to their increasingly low cultivation and rainfall shortage.
(Musotsi et al., 2005). At the same time, farmers involved fail to meet consumer demands
due to limited access to a wide variety of clean and certified seeds (Musotsi et al., 2005). It
has also been reported that edible wild plants are collected and consumed directly and are
not often traded in the markets. They are also undervalued and ignored by government
decision makers (Neudeck et al., 2012). Additionally, research shows that indigenous foods,
especially the wild foods, despite their value; have been excluded from official statistics on
economic values of natural resources (Bharucha & Pretty, 2010). Despite this, Temple and
Steyn (2016) highlighted that one of the ways to promote increased consumption of
traditional foods is promoting their marketing.
In Botswana, traditional or indigenous foods such as wild fruits, dried leafy vegetables,
peanuts and caterpillar worms among others, are sold mainly in informal markets by women
and children in rural and urban areas (Legwaila et al., 2011). In urban and peri-urban areas,
sales are mostly conducted near shopping centres while in rural areas, sales are conducted
from home, door to door, at bus stops and at roadside markets (Legwaila et al., 2011). This
observation points out that the market for traditional and indigenous foods is not formalised
and well organised and this would be one of the reasons why these foods are not physically
available and accessible to most of the people. Formalisation of markets is important

38
towards their promotion and would also encourage varieties of these foods being sold
(Motlhanka et al., 2008). Wild fruits are among the major indigenous foods sold by street
vendors in Botswana (Motlhanka et al., 2008).
Despite the market potential of traditional or indigenous foods in Botswana, they have
received little attention in terms of research, development and promotion (Legwaila et al.,
2011). Research shows that the promotion of use and marketing of these foods would help
in creating employment to small scale farmers at the same time, increase food security by
promoting the underutilised traditional food species that are more sustainable to local
climatic conditions (Moore & Raymond, 2006; FAO, 2014). As part of our study, we
attempted to identify the various TIF sold by purposively selected street vendors and their
contribution to vendors’ households’ income in Gaborone.
2.12 Reasons attributed to decline in the use of traditional and indigenous foods
It is widely recognised that traditional and indigenous foods are declining in their use
(Flyman & Afolayan, 2006; Bharucha & Pretty, 2010; Gotor & Irungu, 2010). Some of the
reported reasons attributing to the decline include negligence by researchers, lack of policy
in conserving traditional and indigenous foods and shortage of funding towards their
promotion (Yang & Keding, 2009; Gotor & Irungu, 2010; Tumwet et al., 2014). In South
Africa, their consumption is affected by the degree of urbanisation, distance to fresh produce
markets and season of the year (Vorster et al., 2011), while in Kenya, with regard to leafy
vegetables it has been observed that ethnicity influences the choice made to buy and
consume traditional leafy vegetables (Kimiywe et al., 2007). Additionally, the introduction of
exotic vegetable varieties is also believed to contribute to the decline in production and
consumption of indigenous vegetables (Aphane et al., 2002; Musinguzi et al., 2006;
Weinberger & Swai, 2006; Smith & Eyzaguirre, 2007).
According to Acipa et al. (2013), in a study done on documentation and the nutritional profile
of some selected wild food plants of Otwal and Ngai sun counties, Oyam District, Northern
Uganda, it was reported that despite the high nutritional values, a general decline in the
consumption of wild plants was found. The same study reported that although many families
still relied heavily on those plant species, there is a lack of consistent transfer of indigenous
knowledge to the younger generations. Other factors contributing to decline in use is the
scanty knowledge that is available on their nutritional content and their preparation
(Musinguzi et al., 2006; Ayua et al., 2016), as well as their nature of harvesting which,
according to Mavengahama et al., (2013), is seen as exploitative. The taste of indigenous
foods vegetables has also been identified as a factor contributing to declining utilisation. It is

39
believed that exotic vegetables are less bitter, hence preferred by younger generations,
while other people view African leafy vegetables as inferior in their taste and nutritional value
compared to exotic vegetables such as spinach (Spinacea oleracea) and cabbage
(Brassicaolearacea) (Weinberger & Swai, 2006; Ayua et al., 2016). The availability of
indigenous vegetables has declined drastically because of excessive cultivation of field
crops, which includes chemical elimination of wild vegetables and habitat change (Odhav et
al., 2007). In South Africa, it was reported that there is a growing ignorance among young
people on the use of traditional leafy vegetables (Odhav et al., 2007).
Nutrition transition is another factor believed to have contributed to the decline in use of
traditional foods. In Tanzania for example, Weinberger and Swai (2006) reported that the
transition is characterised by a decline in the consumption of traditional food crops and
increased consumption of refined and processed foods, fats, sugars and animal foods. The
same study added that changing attitudes towards traditional foods, coupled with neglect in
research, is affecting the significance of African traditional vegetables in production systems,
contributing to neglect and genetic erosion (Weinberger & Swai, 2006). Furthermore, wild
food plants are ignored and are associated with poverty. As a result, little effort is geared
towards promoting their use (Balemie & Kebebew, 2006).
Indigenous vegetables have, with time, been under-utilised, considered old-fashioned, poor
man’s food and therefore shameful to consume (Gotor & Irungu, 2010). On the other hand,
Adebooye and Opabode(2005) also observed that the diversity of indigenous vegetables and
fruits has been eroded as a result of many factors, including environmental, political and
socio-economic factors. Consequently, some of the neglected and under-exploited
indigenous traditional food plants are becoming extinct as more and more foreign plants are
brought under cultivation (Musinguzi et al., 2006). This decline in the use of indigenous
vegetables by many rural communities has resulted in poor diets and the increased
incidence of nutritional deficiency disorders and diseases in many parts of Africa (Odhav et
al., 2007). It is therefore recommended that research is needed to increase the evidence
base and fill knowledge gaps with better inventories and more data on the consumption of
indigenous foods (Bharucha & Pretty, 2010). FAO highlighted that production and promotion
of the germplasm of indigenous vegetable crops in Africa is important to maintain the
existing diversity and prevent genetic erosion of suitable traits in many species (Aphane et
al., 2002).

40
Conclusion
Food insecurity and malnutrition in all its forms (under nutrition, over nutrition and hidden
hunger) are prevalent globally and in Africa, including in Botswana. Food systems are
transforming and there is decreased use of traditional and indigenous foods from the local
food environments to increased access of non-traditional foods from supermarkets due to
globalisation. At the same time, supermarkets are increasingly becoming outlets for
traditional or indigenous foods that may be purchased locally but may also have been
imported from the surrounding regions and countries. Diet patterns are changing among
populations, consumption patterns are shifting from traditional food based foods towards the
westernised diets.
Globally, the world is diverse in traditional and indigenous foods with respect to different agro
ecological and regional environments, however, they are on the decline in use. A lot of
research that has been done on various aspects of traditional or indigenous foods has
focused only on vegetables and fruits and Botswana is no exception. The use of traditional
or indigenous foods in Botswana is also declining in use due to nutrition transition and
globalisation. Globally, data on nutrient composition of indigenous foods hardly exists. There
is limited research on the contribution of traditional or indigenous foods to specific nutrients
intake, especially in Africa, and this aspect has never been investigated in Botswana. Data
on the economic significance of traditional or indigenous foods to households’ income
remains scanty. In light of this background, the present study focussed on exploring access
to and consumption of TIF and their potential contribution to household food security
(access), household dietary diversity, women BMI and their contribution to specific dietary
nutrients intake (energy, protein, iron, vitamin A and zinc) among women and children. The
present study also investigated the importance of vending TIF with regards to their overall
households’ income and also the vendors’ perceptions of TIF on challenges and
opportunities when sourcing and vending TIF. The various aspects investigated in our study
considered TIF of all food categories which included fruits, vegetables cereals, milk and milk
products, oils and fats, fish and other sea animals, legumes and nuts and seeds, white roots
and tubers, meats, sweets, eggs and spices condiment and beverages.

41
2.13 References
Acipa, A., Kamatenesi-Mugisha, M. & Oryem-Origa, H. 2013. Documentation and Nutritional
profile of some selected food plants of Otwal and Ngai sun counties Oyam District, Northern
Uganda. African Journal of Food, Agriculture, Nutrition and Development, 13(2).7428-7450.
Acquah, B., Kapunda, S. & Legwegoh, A. 2014. The dimensions of urban food insecurity in
Gaborone, Botswana. Urban Forum 25, 217–226.
Adebooye, O.C. & Opabode, J.T. 2005. Status of conservation of the indigenous leaf
vegetables and fruits of Africa. African Journal of Biotechnology, 3(12):700-705.
Akinnifesi, F., Kwesiga, F., Mhango, J., Chilanga, T., Mkonda, A., Kadu, C., Kadzere, I.,
Mithofer, D., Saka, J. & Sileshi, G. 2006. Towards the development of miombo fruit trees as
commercial tree crops in southern Africa. Forests, Trees and Livelihoods, 16(1):103-121.
Amarteifio, J.O. & Mosase, M.O. 2006. The chemical composition of selected indigenous
fruits of Botswana. Journal of Applied Sciences and Environmental Management, 10 (2) 43 -
47.
Anand, S.S., Hawkes, C., De Souza, R.J., Mente, A., Dehghan, M., Nugent, R., Zulyniak,
M.A., Weis, T., Bernstein, A.M. & Krauss, R.M. 2015. Food consumption and its impact on
cardiovascular disease: importance of solutions focused on the globalized food system: a
report from the Workshop Convened by the World Heart Federation. Journal of the American
College of Cardiology, 66(14):1590-1614.
Anywar, G., Oryem-Origa, H. & Mugisha, M.K. 2014. Wild plants used as nutraceuticals from
Nebbi district, Uganda. European Journal of Medicinal Plants, 4(6):641-660.
Aphane, J., Chadha, M. & Oluoch, M. 2002. Increasing the consumption of micronutrient -
rich foods through production and promotion of indigenous foods.
http://www203.64.245.61/web_docs/proceedings/indigenous.pdf. Date accessed 17 June,
2017.
Ayua, E., Mugalavai, V., Simon, J., Weller, S., Obura, P. & Nyabinda, N. 2016. Ascorbic acid
content in leaves of Nightshade (Solanum spp.) and spider plant (Cleome gynandra)

42
varieties grown under different fertilizer regimes in Western Kenya. African Journal of
Biotechnology, 15(7):199-206.
Balemie, K. & Kebebew, F. 2006. Ethnobotanical study of wild edible plants in Derashe and
Kucha Districts, South Ethiopia. Journal of Ethnobiology and Ethnomedicine, 2(1):1.
Bennett, E.L. & Robinson, J.G. 2000. Hunting of wildlife in tropical forests: implications for
biodiversity and forest peoples.
http://documents.worldbank.org/curated/en/101611468780290485/Hunting-of-wildlife-in-
tropical-forests-implications-for-biodiversity-and-forest-peoples. Accessed 25 January, 2017.
Bersamin, A., Zidenberg-Cherr, S., Stern, J.S. & Luick, B.R. 2007. Nutrient intakes are
associated with adherence to a traditional diet among Yupik Eskimos living in remote Alaska
Native communities: the CANHR Study. International Journal of Circumpolar Health, 66(1).
Bharucha, Z. & Pretty, J. 2010. The roles and values of wild foods in agricultural systems
(pp. 2913): The Royal Society., 365 (1554): 2913–2926.
Black, R.E., Allen, L.H., Bhutta, Z.A., Caulfield, L.E., De Onis, M., Ezzati, M., Mathers, C. &
Rivera, J. 2008. Maternal and child undernutrition: global and regional exposures and health
consequences. The lancet, 371(9608):243-260.
Black, R.E., Victora, C.G., Walker, S.P., Bhutta, Z.A., Christian, P., de Onis, M., Ezzati, M.,
Grantham-McGregor, S., Katz, J., Martorell, R. & Uauy, R. 2013. Series: Maternal and child
undernutrition and overweight in low-income and middle-income countries. The Lancet,
382:427-451.
Botlhale, E. 2015. The Political Economy of Poverty Eradication in Botswana. Poverty &
Public Policy, 7(4):406-419.
Boutrif, E., Murphy, S., Charrondière, U.R., Burlingame, B.A., Kuhnlein, H.V. & Smith, I.F.
2008. Expert Consultation on Nutrition Indicators for Biodiversity: Food Composition: Food &
Agriculture Org. http://www.fao.org/3/a-a1582e.pdf. Date accessed 17 July, 2017.
Brinkhurst, M. 2010. Fruit of sand: complexities of Botswana’s veld plant resources. Studies
by Undergraduate Researchers at Guelph, 3 (2) 10-22.

43
Burlingame, B., Charrondiere, U.R., Dernini, S., Stadlmayr, B. & Mondovì, S. 2012. Food
biodiversity and sustainable diets: implications of applications for food production and
processing. Green technologies in food production and processing. Springer. p. 643-657.
Charrondière, U.R., Stadlmayr, B., Rittenschober, D., Mouille, B., Nilsson, E., Medhammar,
E., Olango, T., Eisenwagen, S., Persijn, D. & Ebanks, K. 2013. FAO/INFOODS food
composition database for biodiversity. Food Chemistry, 140(3):408-412.
Cloete, P. & Idsardi, E. 2013. Consumption of indigenous and traditional food crops:
perceptions and realities from South Africa. Agroecology and Sustainable Food Systems,
37(8):902-914.
Courraud, J., Berger, J., Cristol, J.P. & Avallone, S. 2013. Stability and bio accessibility of
different forms of carotenoids and vitamin A during in vitro digestion. Food Chemistry,
136(2):871-877.
Crush, J. & Frayne, B. 2010. “The Invisible Crisis: Urban Food Security in Southern Africa.”
Urban Food Security Series No. 1. Queen’s University and AFSUN: Kingston and Cape
Town. http://www.afsun.org/wp-content/uploads/2013/09/AFSUN_1.pdf. Date accessed 17
July, 2017.
Crush, J., Hovorka, A. & Tevera, D. 2011. Food security in Southern African cities the place
of urban agriculture. Progress in Development Studies, 11(4):285-305.
Dweba, T. & Mearns, M. 2011. Conserving indigenous knowledge as the key to the current
and future use of traditional vegetables. International Journal of Information Management,
31(6):564-571.
Egan, M., Fragodt, A., Raats, M., Hodgkins, C. & Lumbers, M. 2007. The importance of
harmonizing food composition data across Europe. European Journal of Clinical Nutrition,
61(7):813-821.
FAO (Food and Agricultural Organization).1996. World Food Summit: Rome Declaration on
World Food Security and World Food Summit Plan of Action. Rome, Italy.
http://www.fao.org/docrep/003/w3613e/w3613e00.htm. Date accessed 15 July, 2017.

44
FAO (Food and Agricultural Organization). 2009. World Summit on Food Security. Draft
declaration of the world summit on food security; 16-18 November. Rome, Italy: FAO.
FAO (Food and Agricultural Organization). 2012. World Food Programme, International Fund
for Agricultural Development. The State of Food Insecurity in the World: Economic Growth is
necessary but not sufficient to Accelerate Reduction of Hunger and Malnutrition. Rome, Italy.
http://reliefweb.int/report/world/state-food-insecurity-world-2012-economic-growth-necessary-
not-sufficient-accelerate. Date accessed 12 July, 2017.
FAO (Food and Agricultural Organization). 2014. Promotion of underutilized indigenous food
resources for food security and nutrition in Asia and the Pacific. Bangkok, Thailand.
http://www.fao.org/3/a-i3685e.pdf. Date accessed 28 September, 2016.
FAO (Food and Agricultural Organization). 2008. An introduction to the Basic Concepts of
Food Security. Food Security Information for Action. Practical Guides.
http://www.fao.org/docrep/013/al936e/al936e00.pdf. Date accessed 4 August, 2016.
FAO (Food and Agricultural Organization). 2010. Guidelines for measuring household and
individual dietary diversity. Rome, Italy. http://www.fao.org/docrep/014/i1983e/i1983e00.pdf.
Date accessed 15 July, 2017.
FAO (Food and Agricultural Organization). 2012. The State of Food Insecurity in the World:
Economic Growth is necessary but not sufficient to Accelerate Reduction of Hunger and
Malnutrition. Rome, Italy. http://www.fao.org/docrep/016/i3027e/i3027e.pdf. Date accessed
17 July, 2017.
FAO (Food and Agricultural Organization). 2013. Linkages between Biodiversity, Foods and
Nutrition.http://www.Bioversityinternational.org/uploads/tx_news/Chpt7_Linking_biodiversity_
and_nutrition.pdf. Date accessed 13 July, 2017.
FAO (Food and Agricultural Organization). 2014. Promotion of underutilized indigenous food
resources for food security and nutrition in Asia and the Pacific. http://www.fao.org/3/a-
i3685e.pdf. Date accessed 15 September, 2016.
FAO (Food and Agricultural Organization). 2015. The State of Food Insecurity in the World
2015. Meeting the 2015 international hunger targets: taking stock of uneven progress.
Rome, Italy. http://www.fao.org/3/a-i4646e.pdf. Date accessed 22 July, 2017.

45
FAO (Food and Agriculture Organization). 2015. The state of food insecurity in the world
2014: strengthening the enabling environment for food security and nutrition: Rome, Italy.
http://www.fao.org/3/a-i4030e.pdf. Date accessed 19 July, 2017.
Flyman, M. & Afolayan, A. 2006. The suitability of wild vegetables for alleviating human
dietary deficiencies. South African Journal of Botany, 72(4):492-497.
Frison, E.A., Cherfas, J. & Hodgkin, T. 2011. Agricultural biodiversity is essential for a
sustainable improvement in food and nutrition security. Sustainability, 3(1):238-253.
Frison, E.A., Smith, I.F., Johns, T., Cherfas, J. & Eyzaguirre, P.B. 2006. Agricultural
biodiversity, nutrition, and health: making a difference to hunger and nutrition in the
developing world. Food and Nutrition Bulletin, 27(2):167-179.
Funk, C.C. & Brown, M.E. 2009. Declining global per capita agricultural production and
warming oceans threaten food security. Food Security, 1(3):271-289.
Garrity, D.P., Akinnifesi, F.K., Ajayi, O.C., Weldesemayat, S.G., Mowo, J.G., Kalinganire, A.,
Larwanou, M. & Bayala, J. 2010. Evergreen Agriculture: a robust approach to sustainable
food security in Africa. Food Security, 2(3):197-214.
Ghosh-Jerath, S., Singh, A., Magsumbol, M.S., Lyngdoh, T., Kamboj, P. & Goldberg, G.,
2016a. Contribution of indigenous foods towards nutrient intakes and nutritional status of
women in the Santhal tribal community of Jharkhand, India. Public Health Nutrition, 19(12),
pp.2256-2267.
Ghosh-Jerath, S., Singh, A., Magsumbol, M.S., Kamboj, P. & Goldberg, G., 2016b. Exploring
the Potential of Indigenous Foods to Address Hidden Hunger: Nutritive Value of Indigenous
Foods of Santhal Tribal Community of Jharkhand, India. Journal of Hunger & Environmental
Nutrition, 11(4), pp.548-568.
Gibson, R.S., Bailey, K.B., Gibbs, M. & Ferguson, E.L. 2010. A review of phytate, iron, zinc,
and calcium concentrations in plant-based complementary foods used in low-income
countries and implications for bioavailability. Food and Nutrition Bulletin, 31(2 suppl2):S134-
S146.

46
Bokeloh, G., Maria Gerster-Bentaya, S. & Lioba Weingärtner, R. 2009. Achieving Food and
Nutrition Security. InWEnt – Internationale Weiterbildung und Entwicklung gGmbH. Capacity
Building International, Germany.
Gotor, E. & Irungu, C. 2010. The impact of Bioversity International's African leafy vegetables
programme in Kenya. Impact Assessment and Project Appraisal, 28(1):41-55.
Gupta, S., Jyothi Lakshmi, A., Manjunath, M.N. & Prakash, J. 2005. Analysis of nutrient and
antinutrient content of underutilized green leafy vegetables. LWT-Food Science and
Technology, 38(4):339-345.
Hambidge, K.M., Miller, L.V., Westcott, J.E., Sheng, X. & Krebs, N.F. 2010. Zinc
bioavailability and homeostasis. The American Journal of Clinical Nutrition, 91(5):1478S-
1483S.
Hawkes, C. & Popkin, B.M. 2015. Can the sustainable development goals reduce the burden
of nutrition-related non-communicable diseases without truly addressing major food system
reforms? BMC Medicine, 13(1):143.
Hotz, C. & Gibson, R.S. 2007. Traditional food-processing and preparation practices to
enhance the bioavailability of micronutrients in plant-based diets. The Journal of Nutrition,
137(4):1097-1100.
Hurrell, R. & Egli, I. 2010. Iron bioavailability and dietary reference values. The American
Journal of Clinical Nutrition, 91(5):1461S-1467S.
IFPRI (International Food Policy Research Institute). 2016. Global Nutrition Report 2016:
From Promise to Impact: Ending Malnutrition by 2030. Washington, DC.
http://www.ifpri.org/publication/global-nutrition-report-2016-promise-impact-ending-
malnutrition-2030. Date accessed 16 September, 2016.
Johnson-Down, L. & Egeland, G.M. 2010. Adequate nutrient intakes are associated with
traditional food consumption in Nunavut Inuit children aged 3–5 years. The Journal of
Nutrition, 140(7):1311-1316.

47
Jones, A.D., Ngure, F.M., Pelto, G. & Young, S.L. 2013. What are we assessing when we
measure food security? A compendium and review of current metrics. Advances in Nutrition:
An International Review Journal, 4(5):481-505.
Kamga, R.T., Kouamé, C., Atangana, A.R., Chagomoka, T. & Ndango, R. 2013. Nutritional
Evaluation of Five African Indigenous Vegetables. Journal of Horticultural Research,
21(1):99-106.
Keatinge, J., Yang, R.-Y., Hughes, J.d.A., Easdown, W. & Holmer, R. 2011. The importance
of vegetables in ensuring both food and nutritional security in attainment of the Millennium
Development Goals. Food Security, 3(4):491-501.
Keding, G., Weinberger, K., Swai, I. & Mndiga, H. 2007. Diversity, traits and use of traditional
vegetables in Tanzania: AVRDC-World Vegetable Center.
Kimiywe, J., Waudo, J., Mbithe, D. and Maundu, P., 2007. Utilization and medicinal value of
indigenous leafy vegetables consumed in urban and peri-urban Nairobi. African Journal of
Food, Agriculture, Nutrition and Development, 7(4), pp.1-15.
Kuhnlein, H.V. & Receveur, O. 1996. Dietary change and traditional food systems of
indigenous peoples. Annual Review of Nutrition, 16(1):417-442.
Kuhnlein, H.V. & Receveur, O. 2007. Local cultural animal food contributes high levels of
nutrients for Arctic Canadian Indigenous adults and children. The Journal of Nutrition,
137(4):1110-1114.
Kuhnlein, H.V., Erasmus, B. & Spigelski, D. 2009. Indigenous peoples' food systems: the
many dimensions of culture, diversity and environment for nutrition and health: Food and
Agriculture Organization of the United Nations, Rome.
Kunyanga, C.N., Imungi, J.K. & Vellingiri, V. 2013. Nutritional evaluation of indigenous foods
with potential food-based solution to alleviate hunger and malnutrition in Kenya. Journal of
Applied Biosciences, 67:5277-5288.

48
La Frano, M.R., de Moura, F.F., Boy, E., Lönnerdal, B. & Burri, B.J. 2014. Bioavailability of
iron, zinc, and provitamin A carotenoids in biofortified staple crops. Nutrition Reviews,
72(5):289-307.
Lado, C. 2001. Environmental and socio-economic factors behind food security policy
strategies in Botswana. Development Southern Africa, 18(2):141-168.
Leakey, R.R., Tchoundjeu, Z., Schreckenberg, K., Shackleton, S.E. & Shackleton, C.M.
2005. Agroforestry tree products (AFTPs): targeting poverty reduction and enhanced
livelihoods. International Journal of Agricultural Sustainability, 3(1):1-23.
Legwaila, G.M., Mojeremane, W., Madisa, M.E., Mmolotsi, R.M. & Rampart, M. 2011.
Potential of traditional food plants in rural household food security in Botswana. Journal of
Horticulture and Forestry, 3(6):171-177.
Lestienne, I., Icard-Vernière, C., Mouquet, C., Picq, C. & Trèche, S. 2005. Effects of soaking
whole cereal and legume seeds on iron, zinc and phytate contents. Food Chemistry,
89(3):421-425.
Lin, B.B. 2011. Resilience in agriculture through crop diversification: adaptive management
for environmental change. Bioscience, 61(3):183-193.
Lowe, N.M., Fekete, K. & Decsi, T. 2009. Methods of assessment of zinc status in humans: a
systematic review. The American Journal of Clinical Nutrition, 89(6):2040S-2051S.
Maes, J., Egoh, B., Willemen, L., Liquete, C., Vihervaara, P., Schägner, J.P., Grizzetti, B.,
Drakou, E.G., Notte, A.L. & Zulian, G. 2012. Mapping ecosystem services for policy support
and decision making in the European Union. Ecosystem Services, 1(1):31-39.
Maiani, G., Periago Castón, M.J., Catasta, G., Toti, E., Cambrodón, I.G., Bysted, A.,
Granado‐Lorencio, F., Olmedilla‐Alonso, B., Knuthsen, P. & Valoti, M. 2009. Carotenoids:
actual knowledge on food sources, intakes, stability and bioavailability and their protective
role in humans. Molecular Nutrition & Food Research, 53(S2):S194-S218.
Maunder, E. & Meaker, J. 2007. The current and potential contribution of home-grown
vegetables to diets in South Africa. Water SA, 33(3): 401-405.

49
Martins, D., Barros, L., Carvalho, A.M. & Ferreira, I.C.F.R. 2011. Nutritional and invitro
antioxidant properties of edible wild greens in Iberian Peninsula traditional diet. Food
Chemistry, 125(2):488-494.
Matenge, S.T., van der Merwe, D., De Beer, H., Bosman, M.J. & Kruger, A. 2012.
Consumers’ beliefs on indigenous and traditional foods and acceptance of products made
with cow pea leaves. African Journal of Agricultural Research, 7(14):2243-2254.
Mavengahama, S., de Clercq, W. & McLachlan, M. 2013. The role of wild vegetable species
in household food security in maize based subsistence cropping systems. Food Security,
5(2):227-233.
Meng, F., Wei, Y. & Yang, X. 2005. Iron content and bioavailability in rice. Journal of Trace
Elements in Medicine and Biology, 18(4):333-338.
Mibei, E.K., Ojijo, N., Karanja, S.M. & Kinyua, J.K. 2012. Phytochemical and antioxidant
analysis of methanolic extracts of four African indigenous leafy vegetables. Annals Food
Science and Technology, 13:37-42.
Misra, S., Maikhuri, R., Kala, C., Rao, K. & Saxena, K. 2008. Wild leafy vegetables: A study
of their subsistence dietetic support to the inhabitants of Nanda Devi Biosphere Reserve,
India. Journal of Ethnobiology and Ethno medicine, 4(1):1.
Mojeremane, W. & Tshwenyane, S.O. 2004. Azanza garckeana: A Valuable Edible
Indigenous Fruit Tree of Botswana. Pakistan Journal of Nutrition, 3 (5): 264-267.
Molla, E.L., Asfaw, Z., Kelbessa, E. & Van Damme, P. 2011. Wild edible plants in Ethiopia: a
review on their potential to combat food insecurity. Afrika Focus, 24(2):71-121.
Moore C, Raymond RD. 2006. Back by popular demand: the benefits of traditional
vegetables: one community's story: Bioversity International.
Motlhanka, D.M.T., Motlhanka, P. & Selebatso, T. 2008. Edible indigenous wild fruit plants
of Eastern Botswana. International Journal of Poultry Science, 7(5):457-460.
Musinguzi, E., Kikafunda, J.K. & Kiremire, B.T. 2006. Utilization of indigenous food plants in
Uganda: a case study of South-western Uganda. African Journal of Food, Agriculture,
Nutrition and Development, 6(2):1-12.

50
Musotsi, A.A., Sigot, A.J. and Onyango, M.A. 2005. African indigenous vegetables recipe
documentation and their role in food security. Sustainable Horticultural Production in the
Tropics, p 105.
Mwema, C.M., Mutai, B.K., Lagat, J.K., Kibet, L.K. & Maina, M.C. 2012. Contribution of
selected indigenous fruits on household income and food security in Mwingi, Kenya. Current
Research Journal of Social Sciences, 4(6):425-430.
Neudeck, L., Avelino, L., Bareetseng, P., Ngwenya, B.N., Teketay, D. & Motsholapheko, M.
2012. The contribution of edible wild plants to food security, dietary diversity and income of
households in Shorobe Village, northern Botswana. Ethnobotany Research & Applications,
10:449-462.
Ng, M., Fleming, T., Robinson, M., Thomson, B., Graetz, N., Margono, C., Mullany, E.C.,
Biryukov, S., Abbafati, C. & Abera, S.F. 2014. Global, regional, and national prevalence of
overweight and obesity in children and adults during 1980–2013: a systematic analysis for
the Global Burden of Disease Study 2013. The Lancet, 384(9945):766-781.
Odhav, B., Beekrum, S., Akula, U.S. & Baijnath, H. 2007. Preliminary assessment of
nutritional value of traditional leafy vegetables in KwaZulu-Natal, South Africa. Journal of
Food Composition and Analysis, 20(5):430-435.
Ogoye-Ndegwa, C. 2003. Traditional gathering of wild vegetables among the luo of Western
Kenya-a nutritional anthropology project1. Ecology of Food and Nutrition, 42(1):69-89.
Ohiokpehai, O. 2003. Promoting the nutritional goodness of traditional food products.
Pakistan Journal of Nutrition, 2(4):267-270.
Oiye, S., Shiundu, K. & Oniang’o, R. 2009. The contribution of African Leafy Vegetables
(ALVs) to vitamin A intake and the influence of income in rural Kenya. African Journal of
Food, Agriculture, Nutrition and Development, 9(6): 1309-1324.
Oniang'o, R., Allotey, J. & Malaba, S.J. 2004. Contribution of indigenous knowledge and
practices in food technology to the attainment of food security in Africa. Journal of Food
Science, 69(3):87-91.

51
Orech, F.O., Akenga, T., Ochora, J., Friis, H. & Aagaard-Hansen, J. 2005. Potential toxicity
of some traditional leafy vegetables consumed in Nyang’oma Division, Western Kenya.
African Journal of Food, Agriculture, Nutrition and Development, 5(1):1-13.
Penafiel, D., Lachat, C., Espinel, R., Van Damme, P. & Kolsteren, P. 2011. A Systematic
Review on the Contributions of Edible Plant and Animal Biodiversity to Human Diets.
EcoHealth, 8(3):381-399.
Popkin, B.M. 2006. Global nutrition dynamics: the world is shifting rapidly toward a diet
linked with non-communicable diseases. American Journal of Clinical Nutrition, 84(2):289-
298.
Popkin, B.M., 2014. Nutrition, agriculture and the global food system in low and middle
income countries. Food Policy, 47, pp.91-96.
Power, E.M. 2008. Conceptualizing food security for Aboriginal people in Canada. Canadian
Journal of Public Health, 99 (2):95-7.
Raboloko, M. 2016. Determinants of Urban Household Food Security in Botswana. Academy
of Biomedical and Clinical Science Journal, 1, pp17–21.
Reinivuo, H., Bell, S. & Ovaskainen, M. L. 2009. Harmonisation of recipe calculation
procedures in European food composition databases. Journal of Food Composition and
Analysis, 22(5):410-413.
Roche, M., Creed-Kanashiro, H., Tuesta, I. & Kuhnlein, H. 2008. Traditional food diversity
predicts dietary quality for the Awajun in the Peruvian Amazon. Public Health Nutrition,
11(05):457-465.
Ruel, M.T., Garrett, J.L., Hawkes, C. & Cohen, M.J. 2010. The food, fuel, and financial crises
affect the urban and rural poor disproportionately: a review of the evidence. The Journal of
Nutrition, 140(1):170S-176S
Ruel, M.T., Minot, N. & Smith, L. 2005. Patterns and determinants of fruit and vegetable
consumption in sub-Saharan Africa: a multicounty comparison: Geneva, Switzerland. WHO.

52
http://www.who.int/dietphysicalactivity/publications/f&v_africa_economics.pdf. Date accessed
18 July, 2017.
Ruiz-Pérez, M., Belcher, B., Achdiawan, R., Alexiades, M., Aubertin, C., Caballero, J.,
Campbell, B., Clement, C., Cunningham, T. & Fantini, A. 2004. Markets drive the
specialization strategies of forest peoples. pp 2-9.
Sasson, A. 2012. Food security for Africa: an urgent global challenge. Agriculture & Food
Security, 1(1), p.2.
Sekwati, L., Narayana, N. & Raboloko, M. 2013. Understanding the nature of household
poverty in Botswana. Pula: Botswana Journal of African Studies, 26(1):71-82.
Smith, F.I. & Eyzaguirre, P. 2007. African leafy vegetables: their role in the world health
organization’s global fruit and vegetables initiative. African Journal of Food Agriculture
Nutrition and Development, 7(3):1-17.
Solomon, M. & Prisca, N. 2012. Nutritive value of Lepidoptara litoralia (edible caterpillar)
found in Jos Nigeria: implication for food security and poverty alleviation. African Journal of
Food Agriculture Nutrition and Development, 12 (6):6738-6747.
Statistics Botswana. 2012. Annual agricultural survey report. Gaborone, Botswana:
http://www.statsbots.org.bw/sites/default/files/publications/Agriculture%20Main%20Report%2
02012.pdf. Date accessed 20 July, 2017.
Steyn, N.P. and Temple, N., 2008. Community based nutrition textbook for South Africa: A
right based approach. Cape Town: South African Medical Research Council FAO/MRC,
pp.101-160.
Tabuti, J.R.S. 2007. Status of non-cultivated food plants in Bulamogi County, Uganda.
African Journal of Ecology, 45(1):96-101.
Teucher, B., Olivares, M. & Cori, H. 2004. Enhancers of iron absorption: ascorbic acid and
other organic acids. International Journal for Vitamin and Nutrition Research, 74(6):403-419.
Temple, N.J. & Steyn, N. eds., 2016. Community nutrition for developing countries.
Athabasca University Press and UNISA Press.

53
Toledo, Á. & Burlingame, B. 2006. Biodiversity and nutrition: A common path toward global
food security and sustainable development. Journal of Food Composition and Analysis
19(6):477-483.
Tran, C.D., Miller, L.V., Krebs, N.F., Lei, S. & Hambidge, K.M. 2004. Zinc absorption as a
function of the dose of zinc sulfate in aqueous solution. The American Journal of Clinical
Nutrition, 80(6):1570-1573.
Tscharntke, T., Clough, Y., Motzke, I., Wanger, T.C., Jackson, L., Perfecto, I., Vandermeer,
J. & Whitbread, A. 2012. Global food security, biodiversity conservation and the future of
agricultural intensification. Biological Conservation, 151(1):53-59.
Tumwet, T.N., Kang’ethe, E.K., Kogi-Makau, W. & Mwangi, A.M. 2014. Diversity and immune
boosting claims of some African indigenous leafy vegetables in western Kenya. African
Journal of Food, Agriculture, Nutrition and Development, 14(1):8529-8544.
UNICEF (United Nations International Children's Emergency Fund). 1998. State of the
world’s children.1998. https://www.unicef.org/sowc98/silent4.htm. Date accessed 20
September, 2016.
UNICEF (United Nations International Children's Emergency Fund). 2016. Undernutrition
contributes to nearly half of all deaths in children under 5 and is widespread in Asia and
Africa. http://data.unicef.org/nutrition/malnutrition.html#sthash.CFTMMWab.dpuf
Date accessed 3 October, 2016.
Uusiku, N.P., Oelofse, A., Duodu, K.G., Bester, M.J. & Faber, M. 2010. Nutritional value of
leafy vegetables of sub-Saharan Africa and their potential contribution to human health: A
review. Journal of Food Composition and Analysis, 23(6):499-509.
Vakili, M., Abedi, P., Sharifi, M. & Hosseini, M. 2013. Dietary diversity and its related factors
among adolescents: a survey in Ahvaz-Iran. Global Journal of Health Science, 5(2):181.
Van der Hoeven, M., Osei, J., Greeff, M., Kruger, A., Faber, M. & Smuts, C.M. 2013.
Indigenous and traditional plants: South African parents’ knowledge, perceptions and uses
and their children’s sensory acceptance. Journal of Ethnobiology and Ethnomedicine,
9(78):1-12.

54
Vorster, H.H., Kruger, A. & Margetts, B.M. 2011. The nutrition transition in Africa: can it be
steered into a more positive direction? Nutrients, 3(4):429-441.
Voster, I.H., van Rensburg Willem, J., Van Zijl, J. & Venter, S.L. 2007. The importance of
traditional leafy vegetables in South Africa. African Journal of Food, Agriculture, Nutrition and
Development. 3 (4): 1-8.
Weinberger, K. & Swai, I. 2006. Consumption of traditional vegetables in Central and North-
eastern Tanzania. Ecology of Food and Nutrition, 45(2):87-103.
West Jr, K.P. & Darnton-Hill, I., 2008. Vitamin A deficiency. In Nutrition and health in
developing countries (pp. 377-433). Humana Press. Vitamin A deficiency. Nutrition and
health in developing countries. Springer. p. 377-433.
Whittaker, P. 1998. Iron and zinc interactions in humans. The American Journal of Clinical
Nutrition, 68(2 Suppl):442S-446S.
WHO (World Health Organization). 2009. Global prevalence of vitamin A deficiency in
populations at risk 1995-2005: WHO global database on vitamin A deficiency. Geneva,
Switzerland. http://apps.who.int/iris/bitstream/10665/44110/1/9789241598019_eng.pdf. Date
accessed 11 July, 2017.
WHO (World Health Organization). 2015. World Health Statistics; Global health indicators
Part 11. Geneva, Switzerland.
http://www.who.int/gho/publications/world_health_statistics/2015/en/. Date accessed 17 July,
2017.
World Bank. 2015. Botswana Poverty Assessment. (88473-BW).
http://www.worldbank.org/en/country/botswana/publication/botswana-poverty-assessment-
december-2015. Date accessed 13 July, 2017.
Yang, R.-Y. & Keding, G.B. 2009a. Nutritional contributions of important African indigenous
vegetables. African Indigenous Vegetables in Urban Agriculture. Earthscan, London: 105-
144.

55
Zimmermann, M.B., Chaouki, N. & Hurrell, R.F. 2005. Iron deficiency due to consumption of
a habitual diet low in bioavailable iron: a longitudinal cohort study in Moroccan children. The
American Journal of Clinical Nutrition, 81(1):115-121.

56
CHAPTER 3
Household access to traditional and indigenous foods positively associated with food
security and dietary diversity in Botswana
Salome Nduku Kasimba1,*, Boitumelo Stokie Motswagole2, Namukolo Margaret Covic3
and Nicole Claasen4
1Centre of Excellence for Nutrition (CEN), North-West University, Potchefstroom Campus,
Private Bag X6001, Potchefstroom 2520, South Africa
2National Food Technology Research Centre (NFTRC), Kanye, Botswana
3Poverty, Health and Nutrition Division, International Food and Policy Research Institute,
Addis Ababa; Ethiopia
4Africa Unit for Transdisciplinary Health Research (AUTHeR), North-West University,
Potchefstroom, South Africa
This manuscript is formatted according to guidelines of Journal of Public Health Nutrition
(see addendum one.) with exception of the line numbers and line spaces. This manuscript
has been published in the Journal of Public Health Nutrition:
doi:10.1017/S136898001700369X
Submitted 5 April 2017: Final revision received 12 October 2017: Accepted 9
November 2017.
Abstract
Objective: To determine access to traditional and indigenous foods (TIF) and the
association with household food security, dietary diversity and women’s BMI in low socio-
economic households.
Design: Sequential explanatory mixed-methods design, including a random household
cross-sectional survey on household food insecurity access (HFIA), household dietary
diversity (HDD) and women’s BMI, followed by focus group discussions.
Setting: Two rural and two urban areas of Botswana.

57
Subjects: Persons responsible for food preparation or an adult in a household (n 400); for
BMI, non-pregnant women aged 18–49 years (n 253).
Results: Almost two-thirds of households experienced moderate or severe food insecurity
(28·8 and 37·3%, respectively), but more than half of women were overweight or obese
(26·9 and 26·9%, respectively). Median HDD score was 6 (interquartile range 5–7) out of a
total of 12. A positive correlation was found between number of TIF accessed and HDD
score (r=0·457; P <0·001) and a negative correlation between number of TIF accessed and
HFIA score (r= − 0·272; P<0·001). There was no correlation between number of TIF
accessed and women’s BMI (r= − 0·066; P =0·297). TIF were perceived as healthy but with
declining consumption due to preference for modern foods.
Conclusions: TIF may potentially have an important role in household food security and
dietary diversity. There is need to explore potential benefits that may be associated with their
optimal use on food security and nutrition outcomes.
Key words: Traditional and indigenous foods, food security, dietary diversity, food access.
Introduction
Food security, as defined by the FAO, is a situation that exists when ‘all people, at all times,
have physical, social and economic access to sufficient, safe, nutritious food to meet their
dietary needs and food preferences for inactive and healthy life’(1). For many years,
traditional foods from local environments, that include plants and animals, formed part of
diets linked to specific regional ecosystems and offered sustainable food and nutrition
security(2,3). Major dietary shifts are occurring globally, from consumption of traditional diets,
likely to be more nutrient dense, towards consumption of Westernised diets, which are more
energy-dense, with high contents of sugar, salt and saturated fats. This dietary shift, driven
by globalisation and urbanisation, is described as ‘nutrition transition’ and is associated with
considerable health consequences, such as obesity and non-communicable diseases like
diabetes and high blood pressure(2,4). Food security has been a major concern in Botswana,
both at national and household level, in part due to the country’s low performance from the
agricultural sector, the arid nature of the climate and recurring droughts(5,6). Subsistence
farming dominates the agricultural sector in Botswana and is depended upon for food,
income and employment, especially by the majority of rural dwellers(5). Foods produced by
local farmers include, among others, maize, sorghum, millet, groundnuts, beans and
pulses(5). However, the agricultural production sector is on a downward trend. The 2013
agricultural survey showed that the number of farmers dropped from 121 766 in 2012 to 119

58
134 in 2013(5). The sector does not produce enough food to feed the nation and,
consequently, the population relies on food imports and purchase of foods(5–7). The country
follows a national food security policy that focuses on food imports instead of domestic food
production(8).It imports more than 80% of the national food supply to ensure physical
availability of food supplies to its population(9). Supermarkets are the major food distributors
in Botswana and there is increased physical availability of imported, processed and
packaged foods(7,10). Supermarkets handle about 50–60% of food retail in cities and major
urban villages in Botswana(7). In 2008, a survey by the African Food Security Urban Network
showed that 92% of urban poor households depended on supermarkets as their food
source(11). The heavy reliance on imported, often processed, foods may adversely impact on
the country’s diverse local traditional and indigenous diets and food security, and may
promote an upsurge of overweight and obesity and related non-communicable diseases. The
country’s prevalence of undernourished people (with energy intake below the minimum
dietary energy requirement) stated by the FAO in 2015 was 28·7%, while in the whole of
Southern Africa it was 6·1%(12). The decrease in the prevalence of undernourishment in
Botswana was only 4% for the period 1990–92 to 2014–15 compared with 28·0% for the
Southern African region(12). The low decrease was attributed to low agricultural
productivity(12). Notwithstanding, the country has diverse local traditional and indigenous
foods (TIF), both cultivated and growing wildly(13,14), but often overlooked for food security(14).
Little is known about household access to these TIF and their importance in achieving food
and nutrition security. With increased ‘supermarketisation globally(15), some of the foods that
are acknowledged by locals to be TIF may be purchased from supermarkets and may also
be imported from the surrounding regions and countries(16). In our research, therefore, TIF
were defined as foods that are native or were introduced into Botswana a long time ago,
including plant and animal sources, whether locally produced (either domesticated or
cultivated) or accessed from the wild. Considering the globalisation of food systems, these
foods may also be purchased from retail outlets, irrespective of their origin, but recognised
as part of the country’s traditional food culture. This definition of TIF was arrived at in a
consultative process by a panel of nutrition experts, local field assistants and the research
team prior to the present study. The objective of our study was to determine access to TIF
and the association with household food security (in terms of access), household dietary
diversity and women’s BMI in low socio-economic households. In the current paper, we first
present quantitative results on access to TIF in Botswana households and the association of
TIF use with food security (in terms of access), dietary diversity and women’s BMI.
Qualitative narratives of participants from focus group discussions (FGDs) are then used to
provide a more in-depth view into perceptions on access and use of TIF. Merging these

59
components, the discussion focuses on the role that TIF may play in promoting food security
and nutrition and future public health in Botswana.
Methodology
Research setting
Two urban areas (Old Naledi and Area W) and two rural areas (Maun and Tsabong) of
Botswana were purposively selected to include predominantly low socio-economic areas and
to accommodate the possible variations in availability of TIF in the country. Old Naledi and
Area W are situated in Gaborone and Francistown, respectively. Gaborone, the country’s
largest city and capital, is situated in the South-East District with a population of 227 333(17).
Francistown, located in the North-East District, is the second largest city with a population of
about 100 079(17) .Tsabong is situated in the Kgalagadi District and covers a vast area of the
Kalahari Desert with a population of 7869(17). It is characterised by a hot semi-arid climate,
low rainfall and a predominantly savannah landscape of grasslands interspersed with
woodland. It has sandy soils, not well suited for cultivation but supporting considerable
numbers of cattle, goats, other livestock and wildlife(18). Maun is one of the largest villages in
the North-West District with a population of 55 784(17). It is the tourism capital of Botswana
and lies on the southern fringes of the Okavango Delta that presents a different landscape:
vast areas of open water and lush, green wetlands with an abundance of wildlife(18).
Study design and sampling
A mixed-methods research approach was followed, applying a sequential explanatory design
which involved quantitative data collection in the form of a household survey followed by a
qualitative phenomenological approach, collecting data with FGDs(19). Data were collected
between July and September 2015 (winter – dry season). The quantitative data collection
involved a cross-sectional household survey, applying a multistage sampling: first, a
purposive selection of the four settings (Old Naledi, Area W, Maun and Tsabong); second,
five enumeration areas per setting were randomly selected; third, a random selection of
twenty plots per area; and finally, one household was selected from each plot. In cases
where household members were absent, we revisited the household at a later time. When
household members were not willing to participate (n 2), another household was randomly
selected in the same plot. The target respondent was the person mostly responsible for food
preparation or, if absent, any other adult household member who had eaten in the house the
previous day answered on behalf of the other household members. This guideline was
adopted from the household dietary diversity instrument of the FAO(20), which was one
section of the household survey. If available, one non-pregnant woman, aged 18–49 years,

60
was selected for weight and height measurements from each of the selected households. In
total, 400 households and 253 women were sampled. In the current paper, a household
refers to a person or group of persons related or unrelated by blood, residing in the same
plot, under the same roof and eating from the same pot(21). For qualitative data collection, a
sub-sample (n 64) was purposively selected from the sample of the household survey to
participate in FGDs. Inclusion criteria for participation in both the survey and FGDs were:
aged 18 years or older; resident of the study area for at least 3 months prior to the survey;
interest in and familiarity with TIF; and willingness to participate. Data saturation was
achieved when themes of answers recurred(22) with two FGDs in each setting, resulting in a
total of eight FGDs.
Quantitative data collection and analysis
A researcher-administered questionnaire was administered during household visits,
composed of three sections:(i) household demographic and socio-economic characteristics,
including questions on household size and monthly household income; (ii) household food
insecurity access (HFIA), including nine occurrence questions on experienced food
insecurity within the past 30 d(23); and (iii) household dietary diversity (HDD), a non-
quantitative 24 h recall to capture foods (meals and snacks) that were prepared in the home
and consumed in the home or outside the home; or purchased or gathered outside the home
and consumed in the home by household members during the previous day and night(20).
The HFIA scores were categorised into four levels of food security: secure, mildly insecure,
moderately insecure and severely insecure(23). The HDD scores were calculated by summing
up the number of food groups consumed by all members of the household, from the
following twelve groups: (i) cereals;(ii) white tubers and roots; (iii) fruits; (iv) vegetables;(v)
legumes, nut and seeds; (vi) fish and other seafood; (vii) meat; (viii) eggs; (ix) oils and fats;
(x) sweets; (xi) milk and milk products; and (xii) spices, condiments and beverages(20). The
households were then categorised into three HDD score categories defined by the research
team for the purpose of determining the distribution of the HDD scores: low (0–4 food
groups), medium (5–8 food groups) and high (9–12 food groups). Median HDD score was
also calculated. To determine household access to TIF, a 1-point value was given to each
individual traditional or indigenous food reported by any of the household members in the
HDD component. The sum of points indicated the household’s access to TIF. Mixed foods
were disaggregated, so the traditional or indigenous ingredients were included. Weight was
measured using a Seca Robusta 813 calibrated digital scale (graduation 100 g) without
shoes and in minimal clothing to the nearest 0·1 kg. Height was measured with the subject
standing upright without shoes and with the head in the Frankfort plane position, using a
Seca calibrated stadiometer to the nearest 0·1 cm(24). Based on the WHO cut-offs, the

61
following BMI classifications were used: underweight (<18·5 kg/m2), normal (18·5–24·9
kg/m2), overweight (25–29·9 kg/m2) and obese (≥30 kg/m2)(25). Descriptive statistics were
applied to summarise demographic and socio-economic household characteristics, food
insecurity, household dietary diversity, household access to TIF and women’s BMI.
Spearman correlations were used to determine the associations of household access to TIF
with HDD score, HFIAS score and women’s BMI. Statistical significance was set at P<0·05
for all analyses.
Qualitative data collection and analysis
FGDs were conducted in Setswana, the local language, led by a moderator and two
facilitators who were taking notes. Guiding questions were: ‘What do you consider as TIF in
this area?’ ‘What are the different types of TIF that are found in this area?’ ‘Are TIF used to
the same extent throughout the year?’ ‘Where do you find these foods in this area? ‘What
influences the use of TIF in the area?’ The FGDs were audio-recorded and the recordings
were first transcribed verbatim in Setswana and then translated into English, comparing
them with the notes taken to ensure that the meaning of the data was preserved(19). The
software ATLAS.ti was used for thematic analysis based on the main research questions,
resulting in three main themes and related sub-themes(26,27). Co-coding was carried out with
an independent researcher, ensuring increased validity of the coded themes.
Results
Table 1 summarises household characteristics, including demographic and socio-economic
characteristics, household food insecurity, household dietary diversity, number of TIF
accessed and women’s BMI. Food insecurity, in terms of access, was experienced by 80·1%
of households, with 14·0, 28·8 and 37·3% being mildly, moderately and severely food
insecure, respectively. Severe food insecurity was significantly higher in rural areas
compared with urban areas, 51·0 v. 23·5%, respectively (P<0.001). Median HDD score was
6 (interquartile range 5–7) out of a total of 12 and the majority of households (81·0%) fell into
the medium HDD category (5–8 food groups) with no significant differences between urban
and rural areas (P=0·153). The most commonly consumed food groups were cereals (98·2
%); spices, condiments and beverages (97·2 %); oils and fats (92·5 %); sweets (85·7 %);
and vegetables (68·0%; data not shown). A large share of households (56·3%) reported
having accessed between three and five TIF the previous day. Households in urban areas
had access to a significantly bigger variety of TIF compared with rural areas (P=0·001).
Among the participating women, 26·9% were overweight and an equal percentage (26·9%)
were obese.

62
Table 1 Demographic and socio-economic characteristics, food security, dietary diversity, number of traditional and indigenous foods (TIF) accessed and women’s BMI, in low socio-economic households from two rural and two urban areas of Botswana, July–September 2015
Household characteristics Urban (n=200) Rural (n=200) Total (n=400) P-value n % n % n %
Household size median; (IQR) * 4(2,6) 5.5 (4,9) 5(3,7) <0.001
Household income category per month† (BWP)
0-3000 107 53.5 145 72.5 252 63.0 <0.001 3001-6000 52 26.0 15 7.5 67 16.8 >6000 21 10.5 18 9.0 39 9.8 Unknown 20 10.0 22 11.0 42 10.5
HFIA categories† Food secure 55 27.5 25 12.5 80 20.0 <0.001 Mildly insecure 33 16.5 23 11.5 56 14.0 Moderately insecure 65 32.5 50 25.0 115 28.8 Severely insecure 47 23.5 102 51.0 149 37.3
HDD scores categories† 0-4 food groups (low) 17 8.5 29 14.5 46 11.5 0.109 5-8 food groups (medium) 165 82.5 159 79.5 324 81.0 9-12 food groups (high) 18 9.0 12 6.0 30 7.5
HDD score; median (IQR)* 6 (5,7) 6 (5,7) 6 (5,7) 0.153
Mean HDD score* 6.3 6.1 6.2 0.153 Number of TIF accessed†
0-2 items 58 29.0 94 47.0 152 38.0 0.001 3-5 items 128 64.0 97 48.5 225 56.3 6-8 items 14 7.0 9 4.5 23 5.8
BMI categories† n =117 n =136 n = 253 Normal weight 45 38.5 54 39.7 99 39.1 0.651 Underweight 6 5.1 12 8.8 18 7.1 Overweight 34 29.1 34 25.0 68 26.9 Obese 32 27.4 36 26.5 68 26.9
BWP, Botswana Pula (1 BWP=£0·0632); HFIA, household food insecurity access; HDD, household dietary diversity. † Pearson χ2 test was used to test the association of categorical data, urban v. rural areas. * Independent- Samples T test was used to test the differences for continuous data, urban v. rural areas.

63
Diversity of foods (traditional and indigenous/non-traditional and non-indigenous) per
food group as derived from quantitative and qualitative data
Table 2 presents the number of TIF and non-TIF per food group reported to have been
consumed during the previous day (based on HDD data), as well as the number of TIF found
in the areas as identified from the FGDs. A total number of forty TIF types was reported from
the HDD questionnaire, covering eight out of the twelve food groups, with cereals (n 16) and
meats (n 13) having the highest number of reported types. On the other hand, fifty-six non-
TIF were reported, representing eleven out of the possible twelve food groups, with cereals
(n 16) and spices, condiments and beverages (n 10) being the largest groups in terms of
types consumed the previous day. During FGDs, the total number of TIF types identified was
130, covering all food groups, with meats (n 31), fruits (n 23), cereals (n 17) and vegetables
(n 14) having the highest reported number of TIF.
Spearman correlation of access to traditional and indigenous foods with household
food insecurity status, household dietary diversity and women’s BMI
Our findings showed a positive correlation between the number of TIF accessed and HDD
score (r=0·457; P<0·001) and a negative correlation between the number of TIF accessed
and HFIA score (r= − 0·272; P<0·001). No correlation was found between accessed TIF and
women’s BMI (r= −0·066; P=0·297).

64
Table 2 Traditional and indigenous foods (TIF) per food group as identified from quantitative and qualitative data, with examples, and non-TIF
per food group as identified from quantitative data, with examples, accessed by low socio-economic households from two rural and two urban
areas of Botswana, July–September 2015
TIF per food
group from quantitative (HDD) data
TIF per food group from qualitative data (FGDs)
Non-TIF per food group
from quantitative (HDD)
data
Food group*
N % N % Examples of TIF per food group (local name with English description in parentheses)
N % Examples of non-TIF per food group (English name)
Cereals 16 40 17 13.0 Paleche ( stiff mealie meal porridge) Motogo (unfermented stiff sorghum porridge) Magunya (deep fried flour dough)
16 28.5 Rice Macaroni Spaghetti
Meats 13 32.5 31 23.8 Nama ya kgomo (beef meat) Nama ya koko (chicken meat) Phane (Mopane caterpillar worms)
5 8.9 Vienna (processed beef) Polony (processed chicken meat) Boerewors (processed beef
Eggs 1 2.5 2 1.5 Mae a koko (chicken eggs) Mae a ntshe (ostrich eggs)
0 0.0 -
Milk and milk products
1 2.5 5 3.8 Madila (sour milk) Mowana yoghurt (baobab yogurt) Masi a tonki (donkey milk)
3 5.3 Yogurt Cremora (powdered milk) Powdered milk
Vegetable 1 2.5 14 10.8 Delele (okra leaves) Morogo wa dinawa (dried bean leaves) Thepe (amaranth leaves)
8 14.2 Cauliflower Lettuce Cucumber
Legumes nuts and seeds
2 5.0 9 6.9 Dinawa (beans) Manoko (peanuts) letlhodi (lentils)
2 3.5 Baked beans Peanut butter

65
Fruits 3 7.5 23 17.6 Moretlwa (wild raisin berry) Makatane (wild melon) Moretologa (monkey orange)
2 3.5 Grapes Apples
Spices, condiments and beverages
2 5.0 9 6.9 Morula beer (fermented morula beer) Motlopi coffee (shepherds tree coffee) Mmilo (wild medlar juice)
10 17.8 Coffee Coca-Cola drink Chilli sauce
Whites roots and tubers
0 0 9 6.9 Tswii (sweet potato from water lily plant) Mahupu (truffles) Leruswa (wild potatoes)
2 3.5 Potatoes Crips
Fish and other sea products
0 0 4 3.0 Twene (catfish) Tilhapi (tilapia sp) Nyeru (fish, species unidentified)
1 1.7 Canned fish
Oils and fats
0 0 4 3.0 Ondondivi (fat from cow’s neck) Dikgadika (fat from sheep) Lebebe (cow’s milk cream fat )
3 5.3 Sunflower oil Olive oil Margarine
Sweets 0 0 3 2.3 Borekhu (gum from acacia tree) Ntšhê (dried sweet reed) Ntšhê (fresh sweet reed)
4 7.1 Sweets
Sugar
Cake
Total number of food items
40 100 130 100 56 100
HDD, household dietary diversity; FGDs, focus group discussion. *TIF groups are based on the twelve FAO food groups for calculating household dietary diversity (20)

66
Participants’ perceptions on traditional and indigenous foods: health, availability and
access, and consumption
Three main themes emerged during qualitative analysis, namely: (i) health perceptions; (ii)
availability and access; and (iii) declining consumption of TIF and attributed factors. We
present the results here under these thematic areas.
Health perceptions of traditional and indigenous foods.
Participants perceived TIF to be healthy, often comparing TIF with modern foods (e.g. cakes,
rice, sugar-sweetened beverages), which were perceived as unhealthy. TIF were described
as natural foods that do not require chemicals or additives besides salt during the production
and processing stages. TIF were also perceived to be positively related to satiety. The
following quotes exemplify these perceptions:
‘Our indigenous foods do not have any added preservatives; these foods are natural.’
(Group 1, Old Naledi, 30.07.2015)
‘These modern foods are not grown properly. They use chemicals for them to grow
faster and this might be the reason why we are so sick.’ (Group 1, Area W,
07.08.2015)
‘These modern foods, they are so light. We are not full when we eat them. These rice
and spices make us sick.’(Group 1, Tsabong, 28.08.2015)
Availability of and access to traditional and indigenous foods
Participants indicated that TIF were accessed from different sources. TIF could be collected
or hunted from the wild, they can be cultivated at home, sold by street vendors, or bought
from shops:
‘We also eat mosulthwane [dehulled sorghum] and mmilo [wild medlar]. We get them
from the wild. (Group 1, Old Naledi, 30.07.2015)
’They [indigenous foods] are sold by street vendors and in shops.’ (Group 2, Old
Naledi, 30.07.2015)
Availability of TIF in relation to seasonality was discussed with similar perceptions among
participants of all four study areas. Participants indicated TIF were mainly found during three

67
seasons (summer, autumn and winter). Some participants mentioned that some leafy
vegetables like morogo wa dinawa (bean leaves) were commonly available during the rainy
season (summer). Some foods such as beans and bean leaves, sweet reed, green leafy
vegetables and watermelon were often dried after harvest and preserved for use during the
winter (dry period):
‘We only have melons in autumn and that we like to dry, and we call
themlengangale.’ (Group 1, Maun, 14.08.2015)
Declining consumption of traditional and indigenous foods
Participants described societal progress as a contributing factor to the decline in
consumption of TIF. Terms such as ‘civilisation, ‘globalisation’ and ‘modernisation’
were used and mainly associated with the consumption of modern foods. The young
generation particularly was perceived to prefer modern foods and to not show much interest
in TIF and traditional meals:
‘Things have definitely changed; globalisation has taken over. People are so interested
in things that are preserved and advertised than to grow their own food and have small
gardens at their homes.’ (Group 2, Old Naledi, 30.07.2015)
‘My grandchild said he won’t eat these indigenous foods when I cooked them last
week. He only tasted and then went to the shop to buy bread and coke.’(Group 1,
Tsabong, 28.08.2015)
An increased presence of modern foods in supermarkets, shops and fast-food outlets was
also perceived to have caused a reduction in the use of TIF because almost all food
products are purchased:
‘Yes, we also used legalalatshwene [herbal tea] but now we buy tea from the
supermarket.’ (Group 2, Old Naledi, 30.07.2015)
With regard to lifestyle changes, participants mainly described full-time jobs and lack of time
as a reason why TIF are not eaten as often as in the past:

68
‘For us to eat these [traditional] foods, we have to plough. But due to other obligations,
like working, we cant. So, we go and buy food that is easy to prepare like rice and
other easy food.’ (Group 1, Area W, 07.08.2015)
Climate conditions with little and unreliable rain was another reason perceived by the
participants to have led to the decline in consumption of TIF:
‘The rain is very scarce, so people are not planting any more. Planting these foods will
be waste of money and seeds.’ (Group 2, Old Naledi, 30.07.2015)
Some participants mentioned that government restrictions on hunting to protect wild animals
were seen as a barrier to consuming wild meat:
‘In the past we ate a lot of meat. It did not matter if they were dead or slaughtered as
the law was not so strict with hunting. But now, we have laws that forbid people from
hunting.’ (Group 1, Maun, 14.08.2015)
Discussion
The objective of the present study was to determine access to TIF and the association with
household food security (in terms of access), dietary diversity and women’s BMI in low socio-
economic households in rural and urban Botswana. Compared with the average monthly
household income at national level of BWP 3936·12 (Botswana Pula; 1 BWP= £0·0632) in
2010(28), most households in our study earned an income of less than BWP 3000·00 per
month. This is in line with the high levels of food insecurity (in terms of access) found among
the households, with rural households being more severely affected than urban households.
This is confirmed by national statistics of 2010, indicating that 50·6 and 28·8% of rural and
urban households, respectively, reported being worried about having enough food during the
past 4 weeks that preceded the survey(28). Food insecurity seems highly prevalent at
household level despite the country being classified as nationally food secure(8). While
Botswana’s national food strategy that focuses on economic access to ensure food security
can be said to be largely successful at national level(8), this is not the case at household
level. Economic access to food requires that households have adequate incomes to access
this food. The large number reporting food insecurity both from the present study and
national statistics may be an indication of difficulties for a substantial part of the population to
attain adequate income to make economic food access a reality, as demonstrated by
previous studies(6,29). This may warrant a dual strategy that promotes production of local

69
foods adapted to the arid environment of Botswana while at the same time addressing the
shortfall in food supply through economic access(30). The majority of households in the
present study presented a relatively low dietary diversity. Median HDD score was 6
(interquartile range 5–7) out of a total of 12, with the largest number of households falling
into the medium HDD category (5–8 food groups). Other studies in Botswana confirmed poor
dietary diversity in both urban and rural households(7,31,32). In our study, data were collected
during winter (dry period), a time when some foods, especially traditional vegetables and
fruits, including those from the wild, have been reported to be in low supply compared with
the rainy season(33) a possible reason that could have led to the relatively low dietary
diversity. While food insecurity and low to medium dietary diversity have been shown to
reflect limited economic access to food(16), overweight and obesity were found in more than
half of participating women. Limited economic resources of households in the present study
may pose challenges to accessing a variety of nutrient-dense healthy foods, as omnipresent
convenience stores may offer cheaper but less healthy food options and lack a variety of
fresh and nutrient-dense foods needed for optimal nutrition(34,35). In Botswana, urbanisation
was further linked to unhealthy eating patterns (snacking), fewer servings of traditional foods
and overweight and obesity among adolescents(32).The coexistence of all three forms of
malnutrition, including undernutrition, overnutrition and micronutrient deficiencies, is a
phenomenon increasingly found in developing or transforming countries due to changes in
consumption patterns(36). In our study, more than half of households consumed three to five
foods that were classified as indigenous or traditional, indicating that TIF consumption is an
integral part of the Botswana diet. The importance of TIF for healthier and more sustainable
diets has received increasing attention in the recent past(37,38). However, it needs to be
highlighted that cereals and meat, both reported as TIF and non-TIF, were the most
consumed food groups derived from the HDD data. This may contribute to the high
prevalence of over nutrition among the participating women as previously alluded. It is
important for future studies to further investigate traditional diets by clearly differentiating
between various traditional or indigenous foods according to their nutritional value, level of
processing, preparation methods and portion sizes. To our surprise, urban households had
access to a significantly bigger variety of TIF than those in rural areas. Research suggests
that people living in urban areas have limited access to traditional foods as they depend on
food retail outlets such as supermarkets, while rural communities are believed to have
access to more natural resources(39). The smaller proportion of people in the lowest income
bracket in the urban areas suggests better economic access for these foods in urban areas.
In our study, we acknowledged current global food structures and increased
‘supermarketisation’ in the definition of TIF, resulting in the fact that some of the foods

70
that are referred by locals to be traditional may be purchased from supermarkets and may
also be imported from the surrounding regions or countries. For example, some of the
reported TIF, such as unprocessed meat of all types, maize meal, sorghum meal and eggs,
are available in supermarkets and easily accessible in urban areas. It would be useful to
explore the extent to which TIF are channelled from rural to urban areas through both formal
and informal markets. Our qualitative findings showed that the knowledge of TIF is high
among the participants, who recalled and described 130 different TIF during group
discussions. Findings of the quantitative dietary diversity questionnaire revealed only forty
TIF items. This may be because the HDD questionnaire only addressed what was consumed
in the past 24 h, while the FGDs list was based on general recall of what is available and
could be accessed over a broader and undefined time period. The shorter list from the HDD
data may therefore in part also reflect what was accessible during the dry season when the
data were collected. Variations in seasonal availability of traditional vegetables and fruits
have been reported from research done in Botswana(33). The FGDs participants also a
decline in TIF consumption, stating globalisation and urbanisation as possible reasons and
the related increased availability of processed and convenience foods distributed by
supermarkets and fast-food restaurants. This finding supports other researchers(40,41), who
highlighted that decreased consumption of traditional foods was associated with
globalisation, modernisation, supermarkets and fast-food restaurants, and increased
availability of modern foods. The FGDs participants perceived the young generation, in
particular, as preferring modern foods. Because these‘modern foods’are characterised as
energy-dense and nutrient-poor foods which increase the risk of obesity and chronic
diseases(42,43), the dietary shift towards modern foods may pose future public health
challenges to Botswana as signified by the high prevalence of overweight and obesity
observed in the women of this study population. Our findings further showed that access to
TIF was positively associated with food security in terms of access and dietary diversity,
hence highlighting the potential role of TIF in the context of food security in Botswana. In
2012, the FAO(44) observed that traditional foods are crucial for food and nutrition security,
especially for poor families in rural, peri-urban and urban areas, because of their nutritional
benefits, affordability, resilience to local growing conditions and cultural acceptability. Other
studies in African countries, such as Ethiopia and Kenya, also reported that indigenous food
crops are particularly resilient to adverse local environments, highlighting their important role
as food alternatives particularly during dry spells(45,46).

71
Limitations of our study
One limitation of the present study is that there is no unified definition on TIF. While a group
of local experts decided on selection criteria for TIF, it is difficult to make a clear distinction
between traditional and indigenous foods, particularly in instances where an introduced food
has been part of cultural dishes for a long time but yet may be purchased from retail outlets.
Hence, we had to define a new concept of TIF, considering global changes in food systems.
Furthermore, access to TIF, as collected by means of a household dietary diversity
questionnaire, was captured only once; hence, neglecting seasonal availability of TIF. Our
study did not quantify the dietary intake of TIF among individual women, but looked at the
association between the number of TIF accessed at household level and the women’s BMI.
Individual TIF consumption and associations with BMI may require more research, taking
account of related energy consumption that is in part influenced by food preparation
methods, physical activity and other important variables that are determinants of BMI.
Conclusion
Food insecurity and limited access to diversified diets were found to be highly prevalent in
the two urban and two rural areas of Botswana. Large proportions of the study population in
rural and urban areas were found to have access to TIF. TIF access increased as HFIA
score decreased. Participants demonstrated knowledge of TIF, perceiving them to have
health benefits, but also reporting declining consumption trends due to preference for and
convenience of modern foods. Although the study found associations between greater
access to TIF and better household food security (in terms of access) and higher dietary
diversity, there is a need to explore the potential benefits of optimal use of TIF in contributing
to food security and nutrition. This should include a focus on the nutrient density of TIF,
consumption patterns and portion sizes. Attention should also be given to related energy
consumption and physical activity as these may influence nutritional status outcomes.
Acknowledgements
Acknowledgements: The authors wish to thank the study participants and fieldworkers.
Financial support: The North-West University in South Africa and National Food Technology
Centre (NFTRC) of Botswana are gratefully acknowledged for providing financial support.
The funders had no role in the design, analysis or writing of this article. Conflict of interest:
The authors declare that they have no competing interest. Authorship: S.N.K. participated in
conception and designing of the protocol, formulating the research questions, study design,
data collection and data analysis, and is the primary writer of the manuscript. B.S.M.
participated in formulating the research questions, study design, data collection,

72
interpretation of data and reviewing of the manuscript. N.M.C. participated in conception and
designing of the protocol, formulating the research questions, study design, guiding the
study, interpretation of data and reviewing of the manuscript. N.C. participated in guiding the
study, interpretation of the data and critically reviewed the manuscript. Ethics of human
subject participation: This study was conducted according to the guidelines laid down in the
Declaration of Helsinki and all procedures involving human subjects were approved by the
Faculty of Health Sciences, Health Research Ethics Committee, Potchefstroom Campus,
North-West University, South Africa (ethics number NWU-00206-14-A1) and the Botswana
Health Research and Development Division, Ministry of Health. Written informed consent
was obtained from all subjects.

73
References
1. Food and Agriculture Organization of the United Nations (2009) Draft Declaration of the
World Summit on Food Security. World Summit on Food Security, Rome, 16–18 November
2009. Rome: FAO.
2. Johns T, Powell B, Maundu P et al. (2013) Agricultural biodiversity as a link between
traditional food systems and contemporary development, social integrity and ecological
health. J Sci Food Agric 93, 3433–3442.
3. Johns T & Eyzaguirre PB (2006) Linking biodiversity, diet and health in policy and
practice. Proc Nutr Soc 65, 182–189.
4. Popkin BM, Adair LS & Ng SW (2012) Global nutrition transition and the pandemic of
obesity in developing countries. Nutr Rev 70, 3–21.
5. Statistics Botswana (2015) Annual Agricultural Survey Report 2013. Gaborone: Statistics
Botswana; available at
http://www.statsbots.org.bw/sites/default/files/publications/agricreport2013.pdf.
6. Raboloko M (2016) Determinants of urban household food security in Botswana. J Biomed
Clin Sci 1, 17–21.
7. Acquah B, Kapunda S & Legwegoh A (2014) The dimensions of urban food insecurity in
Gaborone, Botswana. Urban Forum 25, 217–226.
8. Botswana Ministry of Agriculture (2016) National Agricultural Policy: 1991. Gaborone:
Botswana Ministry of Agriculture.
9. Moseley WG (2016) Agriculture on the brink: climate change, labor and smallholder
farming in Botswana. Land 5, 21.
10. Jackson MD, Motswagole BS, Kwape LD et al. (2013) Validation and reproducibility of an
FFQ for use among adults in Botswana. Public Health Nutr 16, 1995–2004.
11. Crush J & Frayne B (2011) Supermarket expansion and the informal food economy in
southern African cities: implications for urban food security. J South Afr Stud 37,

74
781–807.
12. Food and Agriculture Organization of the United Nations, International Fund for
Agricultural Development & World Food Programme (2015) The State of Food Insecurity in
the World 2015. Meeting the 2015 International Hunger Targets: Taking Stock of Uneven
Progress. Rome: FAO.
13. Flyman M & Afolayan A (2006) The suitability of wild vegetables for alleviating human
dietary deficiencies. S Afr J Bot 72, 492–497.
14. Legwaila GM, Mojeremane W, Madisa ME et al. (2011) Potential of traditional food plants
in rural household food security in Botswana. J Hortic For 3, 171–177.
15. Reardon T & Gulati A (2008) The Rise of Supermarkets and Their Development
Implications. International Experience Relevant for India. IFPRI Discussion Paper no. 00752.
Washington, DC: International Food Policy Research Institute.
16. Kuhnlein HV, Erasmus B & Spigelski D (2009) Indigenous Peoples’ Food Systems: The
Many Dimensions of Culture, Diversity and Environment for Nutrition and Health.
Rome: FAO.
17. Botswana Census Report (2011) Botswana Population and Housing Census. Gaborone:
Department of Printing and Publishing Services.
18. Food and Agricultural Organization of the United Nations (2005) AQUASTAT database.
Botswana: Geography, climate and population. http://www.fao.org/nr/water/aquastat/
countries_regions/Profile_segments/BWA-GeoPop_fra.stm (accessed October 2017).
19. Creswell JW (2008) Qualitative, Quantitative, and Mixed Methods Approaches.
Thousand Oaks, CA: SAGE Publications, Inc.
20. Food and Agricultural Organization of the United Nations (2010) Guidelines for
Measuring Household and Individual Dietary Diversity. Rome: FAO; available at
http://www.fao.org/fileadmin/user_upload/wa_workshop/docs/FAO-guidelines-dietary-
diversity2011.pdf

75
21. Action Against Hunger (2014) ACF Nutrition Small Scale SMART Survey Report: Twic
East County, Jonglei State, Southern Sudan. New York: ACF.
22. Guest G, Bunce A & Johnson L (2006) How many interviews are enough? An experiment
with data saturation and variability. Field Method 18, 59–82.
23. Coates J, Swindale A & Bilinsky P (2007) Household Food Insecurity Access Scale
(HFIAS) for Measurement of Food Access: Indicator Guide. Washington, DC: Food and
Nutrition Technical Assistance Project, Academy for Educational Development; available at
http://www.fao.org/fileadmin/user_upload/eufao-fsi4dm/doc-training/hfias.pdf
24. Lohman T, Roche A & Martorell R (1988) Anthropometric Standardization Reference
Manual Assessment. Champaign, IL: Human Kinetics Books.
25. World Health Organization (1995) Physical Status: The Use of and Interpretation of
Anthropometry. Report of WHO Expert Committee. WHO Technical Report Series no. 854.
Geneva: WHO.
26. Vaismoradi M, Turunen H & Bondas T (2013) Content analysis and thematic analysis:
implications for conducting a qualitative descriptive study. Nurs Health Sci 15, 398–405.
27. Braun V & Clarke V (2006) Using thematic analysis in psychology. Qual Res Psychol 3,
77–101.
28. Statistics Botswana (2013) Botswana Core Welfare Indicators Survey 2009/10.
Gaborone: Statistics Botswana; available at
http://www.statsbots.org.bw/sites/default/files/BCWIS%202009%2010%20MAIN%20REPOR
T.pdf.
29. Bashir MK, Naeem MK & Niazi SAK (2010) Rural and peri urban food security: a case of
district Faisalabad of Pakistan. World Appl Sci J 9, 403–411.
30. Penafiel D, Termote C, Lachat C et al. (2016) Barriers to eating traditional foods vary by
age group in Ecuador with biodiversity loss as a key Issue. J Nutr Educ Behav 48, 258–268.

76
31. Maruapula S & Chapman-Novakofski K (2007) Health and dietary patterns of the elderly
in Botswana. J Nutr Educ Behav 39, 311–319.
32. Maruapula SD, Jackson JC, Holsten J et al. (2011) Socioeconomic status and
urbanization are linked to snacks and obesity in adolescents in Botswana. Public Health Nutr
14, 2260–2267.
33. Maruapula SD & Novakofski C (2010) Nutrient intake and adequacy of Batswana elderly.
Afr J Food Agric Nutr Dev 10, 1–12.
34. Frongillo EA & Bernal J (2014) Understanding the coexistence of food insecurity and
obesity. Curr Pediatr Rep 2, 284–290.
35. Drewnowski A (2009) Obesity, diets, and social inequalities. Nutr Rev 67, Suppl. 1, S36–
S39.
36. Hawkes C & Popkin BM (2015) Can the sustainable development goals reduce the
burden of nutrition-related non-communicable diseases without truly addressing major food
system reforms? BMC Med 13, 143.
37. Food and Agriculture Organization of the United Nations (2010) Expert Consultation on
Nutrition Indicators for Biodiversity. 2. Food Consumption. Rome: FAO; available at
http://www.fao.org/3/a-i1951e.pdf.
38. Burlingame BA & Dernini S (editors) (2010) Sustainable Diets and Biodiversity.
Directions and Solutions for Policy, Research and Action. Rome: FAO; available at
http://www.fao.org/docrep/016/i3004e/i3004e.pdf.
39. Power EM (2008) Conceptualizing food security for Aboriginal people in Canada. Can J
Public Health 99, 95–97.
40. Vorster HH, Kruger A & Margetts BM (2011) The nutrition transition in Africa: can it be
steered into a more positive direction? Nutrients 34, 29–41.
41. Anand SS, Hawkes C, De Souza RJ et al. (2015) Food consumption and its impact on
cardiovascular disease: importance of solutions focused on the globalized food system: a

77
report from the Workshop Convened by the World Heart Federation. J Am Coll Cardiol 66,
1590–1614.
42. Sharma S, De Roose E, Cao X et al. (2009) Dietary intake in a population undergoing a
rapid transition in diet and lifestyle: the Inuvialuit in the Northwest Territories of Arctic
Canada. Can J Public Health 100, 442–448.
43. Erber E, Beck L, De Roose E et al. (2010) Prevalence and risk factors for self‐reported
chronic disease amongst Inuvialuit populations. J Hum Nutr Diet 23, 43–50.
44. Food and Agriculture Organization of the United Nations (2012) Traditional Foods: Better
Livelihoods, Dietary Diversity and Health. Rome: FAO; available at Italy:
http://teca.fao.org/technology/traditional-foods-better-livelihoods-dietary-diversity-and-health.
45. Kunyanga CN, Imungi JK & Vellingiri V (2013) Nutritional evaluation of indigenous foods
with potential food-based solution to alleviate hunger and malnutrition in Kenya. J Appl
Biosci 67, 5277–5288.
46. Fentahun MT & Hager H (2009) Exploiting locally available resources for food and
nutritional security enhancement: wild fruits diversity, potential and state of exploitation in the
Amhara region of Ethiopia. Food Secur 1, 207–219.

78
CHAPTER 4
Consumption of traditional and indigenous foods and their contribution to nutrients
intake among children and women in Botswana
Salome Kasimba 1, Namukolo Covic2, Boitumelo Motswagole3, Ria Laubscher4, Nicole
Claasen5
1 Centre of Excellence for Nutrition (CEN), North-West University, South Africa
2 Poverty, Health and Nutrition Division, International Food and Policy Research Institute,
Addis Ababa, Ethiopia
3 National Food Technology Research Centre (NFTRC), Botswana
4 Biostatics’ Unit, Medical Research, Tygerberg, South Africa
5 Africa Unit for Transdisciplinary Health Research (AUTHeR), North-West University, South
Africa
This manuscript is formatted according to the guidelines of Journal of Ecology of Food and
Nutrition

79
Abstract
Little is known about the contribution of traditional and indigenous foods (TIF) towards
nutrients intake in Botswana. This study determined the consumption of TIF and their
contribution to nutrients intake among children 2-5 and women 18-49 years in Botswana. TIF
accounted for relatively high percentages of energy intake (41%, 36%) in children and
women, respectively. The mean intake of vitamin A in children and vitamin A and zinc in
women was high from TIF compared non-TIF. Research attention is warranted towards
determining the full potential of TIF in contributing to nutrition and health.
Key words: Traditional and indigenous foods, energy, vitamin A, iron and zinc.

80
Introduction
Traditional foods from local environments have received global attention due to their
perceived potential in contributing to better quality and more sustainable diets (FAO, 2013).
They are considered healthy and palatable (Trichopoulou et al. 2006), and enhance dietary
diversity (Frison, Cherfas and Hodgkin 2011, Misra et al. 2008, Stadlmayr et al. 2011,
Burlingame and Dernini 2012), if taken advantage of optimally. Among the arctic Canadians,
significant differences in micronutrient intake were reported for households who consumed
traditional foods, compared to non-traditional foods (Kuhnlein and Receveur 2007, Johnson-
Down and Egeland 2010). Bersamin et al. (2007) reported from their study in Alaska, that
participants in the highest quintile of traditional food intake consumed significantly more
vitamin A, vitamin D, vitamin E and iron than participants in the lowest quintile. Furthermore,
Roche et al. (2008) in Peru and Ghosh-Jerath et al. (2016) in India demonstrated that
consumption of diverse indigenous foods was associated with greater consumption of
protein, fibre, iron, calcium, thiamine, riboflavin, vitamin A as beta carotene and folate. In
Africa, some previous studies reported that traditional foods such as vegetables are rich in
nutrients such as calcium, magnesium, potassium, carotenoids, zinc, iron, and protein (Mibei
et al. 2012, Yang and Keding 2009, Kamga et al. 2013). However, there is limited research
that explores the potential of traditional or indigenous foods to impact dietary nutrients intake
among different age categories in Africa.
Botswana is a semi-arid country and drought is endemic (Batisani and Yarnal 2010). Despite
this, it is diverse in traditional food plants which grow across seasons (Legwaila et al. 2011).
Research shows that these foods are commonly used by rural communities and their
importance increases during times of drought and food shortage as a hunger coping strategy
(Flyman and Afolayan 2006). Some of the traditional Tswana diets include, sorghum
porridge, maize meal, samp (dehulled corn), dehulled corn with beans, seswaa (pounded
beef), phane (caterpillar) and pumpkin leaves (Clausen et al. 2005, Maruapula and
Chapman-Novakofski 2007). Nutrient deficiency, especially in vitamins and minerals,
remains among the main indicators of malnutrition in children and women in Botswana. The
prevalence of vitamin A and anaemia among preschool children (26% and 38%,
respectively) and pregnant women (19% and 21%, respectively) is of high concern (WHO
2008 and UNICEF 2009). Maruapula et al. (2011) reported that due to urbanisation in
Botswana, traditional foods are being abandoned, with increased reliance on non-traditional
westernised foods which include ultra-processed foods characterised by high energy and low
nutritional quality (Hawkes and Popkin 2015) such as savoury snacks, sweet snacks, and
fizzy drinks. Continued consumption of such westernised foods may pose a greater risk of
increased nutrient deficiency in Botswana. Inspite of this, information on the consumption of

81
traditional and indigenous foods (TIF) and their contribution to specific dietary nutrient intake
in Botswana remains scanty. This would provide valuable context of determining their
potential to contribute towards improved nutrients intake and reduced specific nutrient
deficiencies. Hence, this paper aims to determine the consumption and contribution of TIF to
dietary intake of energy, protein, vitamin A, iron and zinc among children and women in
Botswana. Due to increased global supermaketisation Reardon and Gulati (2008), some of
the traditional foods such as maize meal may be purchased locally but may also have been
imported from the surrounding regions and countries (Kuhnlein, Erasmus and Spigelski
2009). In this paper therefore, traditional and indigenous foods (TIF) are defined as foods
that are native or were introduced into Botswana a long time ago, including plant and animal
sources, whether locally produced (either domesticated, cultivated) or accessed from the
wild. Considering globalisation of food systems, these foods may also be purchased from
retail outlets, irrespective of their origins, but recognised as part of country’s traditional food
culture. The definition of TIF was arrived at by a panel consisting of local nutrition experts,
field assistants and the research team, in a consultative process prior to the study.
Methodology
Study area
The present study was part of a larger, cross-sectional study that explored access to and
consumption of traditional and indigenous food (TIF) in low socio-economic households in
two urban areas (Old Naledi and Area W) and two rural areas (Maun and Tsabong) in
Botswana. The two urban and rural areas were purposively chosen to cater for possible
variations in traditional food variety and diversity in the different settings. Old Naledi and
Area W are situated in the two major cities in Botswana – Gaborone and Francistown,
respectively. Tsabong covers a vast area of the Kalahari Desert while Maun is part of the
Okavango Delta (Mwakikagile, 2010).
Study design and sampling
Data was collected between July and September (winter season) 2015. A cross-sectional
household survey design was employed with a multistage sampling method to select the
households. The first stage was the purposive selection of the four study areas. Then, within
each study area, five enumeration areas were randomly selected. This was then followed by
a random selection of 20 plots and finally, one household was selected from each plot. One
woman aged 18-49 years, if available, and all children 2-5 years in each of the selected
households were sampled. A total of 400 households which comprised of 253 women and
173 children were sampled. Women and children were targeted because research shows

82
that they are among the vulnerable groups to malnutrition partly due to inadequate intake of
nutrients resulting from poor food consumption patterns (Girma and Genebo, 2002).
Data collection
A Quantitative Food Frequency Questionnaire (QFFQ) used was adapted from (Jackson et
al. 2013). This was a validated questionnaire which consisted of commonly consumed foods
among adults in Botswana. It was adapted to include TIF that were not in the list. Trained
fieldworkers administered the QFFQ in Setswana, the local language. Participants were
asked to report the frequency of consumption for all foods listed on the QFFQ over the
previous 30 days, with 8 frequency categories (almost never, once per month, 2- 3 times per
month, once per week, 2-4 times per week, 5-6 times per week, once per day, and 2 or more
times per day).
Mothers or legal guardians answered the questionnaire on behalf of their children. Coloured
photo-books with three different portion sizes of foods developed and validated by the
National Food Technology Research Centre (NFTRC) Botswana were used as a guide in
estimating the food portion sizes. Pretesting of the QFFQ was done prior to the study in
Kanye, a different location which was not part of the four study areas and the results showed
that the portion sizes given in the photo-books were suitable for children as well. Foods that
were missing in the NFTRC photo-book were estimated using photo-books validated and
used by Centre of Excellence for Nutrition (CEN), North-West University, Potchefstroom,
South Africa. Since Botswana depends heavily on food imports from South Africa, these
were appropriate to use. Standardised household measures such as spoons and cups were
also available in the photo-books to help standardise some of the portion sizes.
Statistical Analyses
The FoodFinder software programme, based on South African Food Composition Tables,
was used to convert food intake into nutrient intake (Wolmarans 2010). Some of the foods
that were not available in the FoodFinder were substituted by others in the South African
Medical Research Council (MRC) FoodFinder. In this study unfortified maize meal and bread
were considered during analysis. Foods substituted for others in the MRC FoodFinder are
presented in addendum 6. Statistical analysis was done in SAS version 9.4. Kolmogorov-
smirnov was used to check for normality of data. Data not normally distributed were reported
as the median and interquartile range (IQR) while data normally distributed means and
standard deviations were reported. Foods consumed were categorised into two groups: TIF
and non-TIF based on the TIF definition used in this study. Differences in the intake of the

83
selected nutrients (energy, protein, iron, zinc and vitamin A) from TIF and non-TIF in women
and children were determined using generalised linear models, adjusting for age, sex and
area in children and for age and area in women. Variables under analysis were log
transformed if skewed. P value for difference was performed considering Bonferroni
adjustment. Least geometric squares means and 95% confidence intervals were reported by
group. Quartile cut-offs were calculated as the proportion of energy intake from TIF over the
overall energy intake for children and women separately in order to compare nutrient intake
of diets from lower to higher proportions of TIF. ANOVA and Bonferroni’s post hoc was used
to test the differences in the intake of the selected nutrients among the quartiles. The top five
TIF that contributed to energy, protein, iron, zinc and vitamin A were determined by ranking
the mean amount of nutrients provided. Ranks were made separate for children and women.
In all the analyses, P value <0.05 was considered significant. The present study focussed on
only five nutrients, namely energy, protein and micronutrients (vitamin A, iron and zinc) which
are of public health significance and of concern, especially vitamin A and iron, among
preschool children and women in Botswana (WHO 2008, UNICEF 2009).
Ethical considerations
Ethical clearance for this study was obtained from the Faculty of Health Sciences, Health
Research Ethics Committee, Potchefstroom Campus, North–West University, South Africa;
(NWU -00206-14-S1) and the Botswana Health Research and Development Division,
Ministry of Health. Signed informed consent was obtained from the participants after being
given adequate explanation of the study in their local language. Permission to conduct the
study was obtained from community leaders in each study area. Participants had a choice to
withdraw from the study at any point.
Results
Demographic characteristics
The study sample composed of 173 children; of which 67 children were aged 2-3 years while
106 were aged between 3-5 years, including boys (n=79) and girls (n=94). More children
(116) resided in rural areas compared to urban areas (57). In total, 253 women participated,
126 of them were aged between 18 – 30 years while 127 were aged between 31 - 49 years
old. Of all the women, 136 resided in rural areas and 117 in urban areas.
Intake of selected nutrients
Table 1 summarises the intake of selected nutrients from TIF and non-TIF. Our findings
show that TIF accounted for relatively high percentages of energy intake (41%, 36%) in

84
children and women respectively. The findings also show that TIF contributed to more than
50% of vitamin A and zinc in children and women in the overall diet.
Differences in the intake of selected nutrients from TIF and non-TIF
Table 2 summarises the results on the differences in the intake of the selected nutrients from
TIF and non-TIF, adjusting for age, gender and area in children, and adjusting for age and
area in women. The findings of this study show that children consumed significantly less
energy, protein and iron from TIF compared to non-TIF (mean energy from TIF 1480 (1374 –
1594), from non- TIF 2006 (1862 – 2161) P < 0.0001, mean protein from TIF 14.0 (12.8 -
15.3), from non-TIF 16.9 (15.5- 18.5) P = 0.0021, mean iron from TIF 2.7 (2.5 - 3.0), from
non-TIF 3.8 (3.5 - 4.2) P < 0.0001). Further, our results show that the consumption of vitamin
A mean intake from TIF in children was higher from TIF compared to non- TIF (mean vitamin
A from TIF 234 (184 - 299) and from non- TIF 176 (138 - 224) P = 0.0851). The findings in
Table 2 further show that children from rural areas consumed significantly higher protein and
zinc compared to children from urban areas (mean protein from rural areas 16.5 (15.3 -
17.8), urban areas 14.4 (12.9 -16.0) P = 0.0352 while mean zinc from rural areas 3.0 (2.8 -
3.3) and from urban areas 2.5 (2.2 - 2.8) P = 0.016). Age and gender did not influence the
intake of the selected nutrients in children. With respect to women in Table 2, findings show
that women consumed significantly higher zinc and vitamin A from TIF compared to non -TIF
(mean zinc from TIF 4.9 (4.6 - 5.3), from non- TIF 4.2 (3.9 - 4.5) P = 0.0033, mean vitamin A
from TIF 409 (332 - 503) and from non-TIF 295 (240 - 362) P = 0.0286). The results further
show that women consumed significantly less energy mean 2023 (1917- 2135), P < 0.0001,
less protein mean 24.1 (22.6 - 25.8), P = 0.0476 and less iron mean 4.5 (4.3- 4.9), P <
0.0001 from TIF compared to non TIF. Additionally, the results show that women from rural
areas consumed significantly less energy mean 2389 (2269 – 2516), P < 0.0001, protein
mean 22.8 (21.4 - 24.3), P < 0.0001, iron mean 4.5 (4.3 - 4.8), P < 0.0001, zinc mean 4.0
(3.8 - 4.3), P < 0.0001 and vitamin A mean 251 (206 – 307), P < 0.0001 compared to women
in urban areas. Our findings show that the age of the women showed no effect on the
consumption of the selected nutrients.
Intake of selected nutrients across diets with lower to higher proportions of TIF
In Table 3, Bonferroni post-hoc results showed that across quartiles of increasing TIF energy
intake (as a percentage of overall diet), significant differences occurred with regard to energy
and zinc intake in children’s diets. Findings in the same Table 3 show that children in the
third quartile, consumed significantly more intake of energy compared to children in the first
quartile (P <0.05). Further, children in the second quartile consumed a significantly higher
intake of zinc compared to children in the first quartile (P <0.05). In women, our results

85
showed no difference in the consumption of the selected nutrients across quartiles of
increasing TIF energy intake.
TIF consumed that contributed to the selected nutrients (energy protein, iron zinc and
vitamin A) in children and women
Table 4 and 5 presents the findings for children and women respectively. Cereals
contributed the highest amount of energy in both children and women. Examples of them
included maize meal and sorghum which were also among the foods consumed by a larger
number of people. Some foods such as peanuts and pumpkin in children and peanuts in
women ranked among the top five foods that contributed to energy and vitamin A
respectively albeit being consumed by small numbers. Animal foods such as beef, liver, goat
and chicken meat among children and women were shown to be rich in diverse nutrients;
they provided protein, iron, zinc and vitamin A. TIF fruits consumed by children included wild
raisins, consumed by 7%, wild meddler (1%) and prickly pear (1%). Examples of fruits
consumed by women were watermelon, consumed by 9%, wild raisins (4%), wild meddler
(2%), prickly pears (0.8%). However, they did not rank among the top five TIF contributors to
nutrient intake (Data not shown on the Tables).

86
Table 1: Intake of selected nutrients from TIF and non-TIF
Nutrients TIF Non- TIF % TIF nutrient intake
Median (Q1,Q3) Median (Q1,Q3)
CHILDREN
Energy (kJ) 1514 (2135,1095) 2257(1489, 2755) 41
Protein (g) 15.3 (10.1, 21.1) 18.5 (12.0, 25.1) 46.3
Iron (mg) 2.8 (1.8, 4.0) 4.1 (2.5, 6.1) 41.5
Zinc (mg) 3.0 (2.1, 4.2) 3.0 (1.6, 4.3) 51.7
Vitamin A (µg) 180 (59, 1377) 166 (96, 422) 57
WOMEN
Energy (kJ) 2060 (1511, 2569) 3652 (2710, 4837) 36
Protein (g) 25.2 (17.5, 33.7) 28.7 (18.9, 40.2) 47.7
Iron (mg) 4.7 (3.1, 6.4) 5.9 (3.9, 8.3) 44.9
Zinc (mg) 5.1 (3.5, 6.8) 4.2 (2.7, 6.7) 54.5
Vitamin A (µg) 1010 (43, 3690) 300 (175, 525) 70
Q1 first quartile, Q3 third quartile

87
Table 2: Differences in the intake of selected nutrients from TIF and non-TIF adjusted for age, sex and area in children, and adjusted for age
and area in women.
Model parameters Energy(kJ) Protein (g) Iron (mg) Zinc (mg) Vitamin A (µg)
Mean (95% CI) P
value
Mean (95% CI) P
value
Mean (95% CI) P
value
Mean (95% CI) P
value
Mean (95% CI) P
value
CHILDREN
Food source
TIF 1480 (1374–1594) 14.0 (12.8-15.3) 2.7 (2.5-3.0) 2.7 (2.5-3.0) 234 (184-299)
Non-TIF
2006 (1862–2161) <
0.0001
16.9 (15.5-18.5)
0.0021 3.8 (3.5-4.2) <0.0001 2.8 (2.5-3.1) 0.8794 176 (138-224) 0.0851
Age
2-3 years 1747 (1608-1897) 15.6 (14.1-17.2) 3.3 (3.0-3.6) 2.8 (2.5-3.1) 197 (151-259)
4-5 years
1700 (1589-1818)
0.6026
15.2 (14.1-16.5)
0.7438 3.2 (3.0-3.5) 0.7468 2.7 (2.5-2.9) 0.5026 209 (167-260) 0.7449
Gender
Male 1745 (1614-1886) 15.9 (14.5-17.5) 3.4 (3.1- 3.7) 2.9 (2.6-3.2) 235 (182-303)
Female
1702 (1584-1827)
0.6263
14.9 (13.7- 16.2)
0.276 3.1 (2.9 - 3.4) 0.2034 2.6 (2.4-2.9) 0.1603 175 139-222) 0.0843
Area
Urban 1638 (1498–1790) 14.4 (12.9-16.0) 3.1 (2.8-3.4) 2.5 (2.2-2.8) 204 (152-273)
Rural
1813 (1703–1930)
0.0641
16.5 (15.3-17.8)
0.0352 3.4 (3.2-3.7) 0.0883 3.0 (2.8-3.3) 0.016 202 (164-248) 0.9537

88
Model parameters Energy(kJ) Protein (g) Iron (mg) Zinc (mg) Vitamin A (µg)
Mean (95% CI) P
value
Mean (95% CI) P
value
Mean (95% CI) P
value
Mean (95% CI) P
value
Mean (95% CI) P
value
WOMEN
Food source
TIF 2023 (1917-2135) 24.1 (22.6-25.8) 4.5 (4.3-4.9) 4.9 (4.6-5.3) 409 (332-503)
Non- TIF 3455 (3274–3645)
<0.0001
26.6 (24.8-28.4)
0.0476 5.8 (5.4-6.2) <0.0001 4.2 (3.9-4.5) 0.0033 295 (240-362) 0.0286
Age
18-30 years 2670 (2529-2820) 26.0 (24.3-27.9) 5.2 (4.9-5.6) 4.7 (4.4-5.1) 359 (291- 444)
31-49 years
2617 (2483- 2759)
0.6033
24.7 (23.1-26.3)
0.263 5.0 (4.7-5.4) 0.4767 4.3 (4.0-4.7) 0.0904
335 (273 -411)
0.6381
Area
Urban 2925 (2767-3093) 28.2 (26.3-30.2) 5.8 (5.4-6.2) 5.1 (4.7-5.5) 479 (387-594)
Rural
2389 (2269-2516) <
0.0001
22.8 (21.4-24.3)
<0.0001
4.5 (4.3-4.8) <
0.0001 4.0 (3.8-4.3) <0.0001
251 (206–307)
<0.0001
P value for difference was performed considering Bonferroni adjustment.

89
Table 3: Selected nutrient intake of the study participants (children and women) by quartile of TIF energy intake (mean± SD)
TIF energy intake
quartiles (as % of
overall diet)
1 2 3 4
CHILDREN
N 43 44 43 43 P-value
Energy (kcal) 3268±1102* 3941±1451 4219±1379* 4113±1611 0.017
Protein (g) 31.0±13.3 38.7±17.5 39.7±15.8 36.8± 17.6 0.064
Iron (mg) 7.0±2.9 8.1±13.8 8.2±3.7 7.6± 3.3 0.388
Zinc (mg) 5.7±2.8* 7.7± 4.1* 7.2±3.0 6.8±3.2 0.045
Vitamin A (µg) 842±1004 1053±1009 1236±1099 1481±1613 0.093
WOMEN
N 63 64 63 63 p-value
Energy (kcal) 6269±2070 6288±1872 5653±2016 5564±2528 0.101
Protein (g) 58.6±20.4 60.5±24.0 55.4±22.7 56.3±33.6 0.681
Iron (mg) 12.6±6.1 12.8±5.3 10.7±3.9 11.2±6.0 0.086
Zinc (mg) 0.4±0.3 0.5±0.3 0.4±0.3 0.5±0.2 0.769
Vitamin A (µg) 1672±1675 2261±1777 2270±2048 2017±1796 0.219
One way Anova -Bonferroni’s post hoc tested the quartile groups which differed (significance at P <0.05).
* Shows groups in which significant differences occurred.

90
Table 4: Top 5 TIF consumed that contributed to selected nutrients (energy, protein, vitamin A, iron and zinc) in children
Food
Total population/mean ± SD
individual daily intake
Mean ± SD daily food
consumption (g)
Number of children who
consumed foods (maximum
n=173)
Energy
Maize meal 53273/319±305 430±207 167
Sorghum 41223/273±148 407±265 151
Chicken 35376/268±260 104±179 132
Beef 22500/150±97 103±56 150
Peanuts 14100/300±38 81±75 47
Protein
Beef 585/3.9±1.1 103±56 150
Liver 333/4.7±1.3 123±80 71
Maize meal 283/1.7±7.8 430±207 167
Sorghum 271/1.8±1.1 407±265 151
Chicken 250/1.9±1.3 104±87 132
Iron
Chicken 224/1.7±0.1 104±87 132
Sorghum 45/0.3±0.1 407±265 151
Maize meal 33/0.2±0.0 430±207 167
Beef 30/0.2±0.0 103/56 150
Samp and beans 9/0.1±0.0 208±71 95

91
Food
Total population/mean ± SD
individual daily intake
Mean ± SD daily food
consumption (g)
Number of children who
consumed foods (maximum
n=173)
Zinc
Maize meal 668/4.0±0.0 430±207 167
Sorghum 90/0.6±0.2 407±265 151
Beef 51/0.3±0.0 103±56 150
Liver 25/0.3±0.0 123±33 71
Goat 4/0.07±0.0 96±7 55
Vitamin A
Chicken 11413/86±0.0 104±87 132
Goat 622/11±0.8 96±7 55
Liver 345/4±0.1 123±33 71
Pumpkin 327/6.8±0.0 133±0.0 48
Peanuts 122/2.5±3 81±3 47
Means* calculated using as n the number of children who consumed the foods.

92
Table 5: Top 5 TIF consumed that contributed to selected nutrients (energy, protein, vitamin A, iron and zinc) in women
Food
Total population/mean ± SD
individual daily intake
Mean ± SD daily food
consumption (g)
Number of women who
consumed foods (maximum
n=253)
Energy
Maize meal 116106/523±173 704±234 222
Sorghum 74860/380±205 565±302 19
Chicken 73485/345±235 134±123 213
Beef 56680/260± 133 179±92 218
Peanuts 41385/465±430 125±116 89
Protein
Beef 1308/6±3.5 179±92 218
Liver 1008/8±2.6 199±130 126
Goat 720/8±9.3 197±213 90
Maize meal 666/3± 1.3 704±234 222
Chicken 426/2±1.7 134±92 213
Iron
Beef 872/4±0.7 179±92 218
Chicken 426/2±0.2 134±123 213
Sorghum 79/0.4±0.3 565±302 197
Liver 75/0.6±0.1 199±130 126
Maize meal 66/0.3±0.1 704±234 222

93
Food
Total population/mean ± SD
individual daily intake
Mean ± SD daily food
consumption (g)
Number of women who
consumed foods (maximum
n=253)
Zinc
Goat 450/5.0±1.8 197±213 90
Chicken 234/1.1±0.6 134±123 213
Beef 152/0.7±1.1 179±92 218
Liver 37/0.3±0.5 199±130 126
Maize meal 9/0.04±0.2 704±234 222
Vitamin A
Amaranth leaves 29165/307±70 109±78 95
Chicken 25892/121±8 134±123 213
Liver 756/6±0.0 199±130 126
Water melon seeds 684/76±0.0 100±0.0 9
Sorghum 487/2.7±0.0 565±302 197
Means* calculated using n as the number of women who consumed the food.

94
Discussion
Our study determined the consumption of TIF and their contribution to energy, protein,
vitamin A, iron and zinc among children 2-5 years and women 18-49 years, living in low
socio-economic households in Botswana. The findings show that participants’ overall nutrient
intake relied on both TIF and non-TIF. In times of increased presence of westernised, often
highly processed foods in supermarkets and shops (Popkin, Adair, and Ng 2012, Johns et al.
2013), the Batswana diet still shows a relatively high percentage of nutrient intake from TIF
(TIF accounting for 41% and 36% energy intake in children and women, respectively). The
study was unable to compare with intakes in other similar settings because this, to the
research team’s knowledge, was the first time that this type of analysis has been done in
such settings within the Southern African region.
Our results show that in children, the consumption of vitamin A was higher from TIF while
women consumed significantly higher zinc and vitamin A from TIF, indicating the role TIF
may play in contributing to selected micronutrients intake. This also emphasises the
importance of such research in contributing to appropriate and contextualised nutrition
education on food choices. A higher intake of protein, iron and zinc was reported among
children who consumed traditional foods, compared to non-consumers of traditional foods in
Canada (Gagne et al. 2012, Johnson-Down and Egeland 2010). In contrast, another study
done in India reported insignificant differences in macronutrient and micronutrient intake in
women who consumed indigenous foods, compared to those who did not (Ghosh-Jerath et
al. 2016).
The results of this study showed that age category among children and women did not
influence the consumption of the selected nutrients. A study among Alaskan Natives
however reported that across quintiles of increasing traditional food intake, significant
increase in age was observed (Bersamin et al. 2007). In this study, women in rural areas
consumed significantly less energy, protein, iron, zinc and vitamin A when compared to
women in urban areas. This could be explained due to general lower household income in
rural areas and infrastructural challenges in availability and access to food (Ruel et al. 2010).
On the other hand, children in rural areas consumed significantly higher protein and zinc.
This may point out the importance of investigating intra household food distribution in rural
areas that this study did not investigate. Unequal distribution of food within households has
been cited as one of the major factors related to inadequate intake of some nutrients among
some of the household members (Akerele, 2011). When comparing diets with increasing
proportions of TIF (as percentage of energy), children in the third quartile, consumed a

95
significantly higher intake of energy compared to children in the first quartile while children in
the second quartile consumed a significantly higher intake of zinc compared to children in
the first quartile, an indication that some nutrients intake may increase with higher
proportions of TIF in the diet. This study did not assess differences in nutrients intake when
comparing subsamples of the study populations consuming more of particular groups of
foods than others - and doing this would generate more useful information. Burlingame and
Dernini (2012) emphasized the potential role of traditional and indigenous foods to food
security among populations in the context of availability and access to food, especially for
poor households. This is confirmed by findings in a recent study in Botswana on households’
access to traditional and indigenous foods and the association with food security and dietary
diversity which showed that as the number of TIF accessed by households increased, food
security (access) increased (Kasimba et al. 2017).
In children and women, TIF cereals were the major energy contributors. Our results showed
that maize meal and sorghum were the foods consumed in large quantities and by the
largest number of children and women which could be attributed to the high energy. Previous
research pointed out that populations subsists on staple cereal based high energy giving
foods (Arimond et al. 2010, Lowe et al 2007).
Plant food sources such as cereals and legumes are considered poor sources of zinc and
iron due to their low bioavailability as a result of the presence of phytates that inhibit their
absorption (Meng, Wei, and Yang 2005, Weinberger and Swai 2006, Hunt 2003). However in
the present study, maize meal and sorghum appeared among the first five foods that
contributed to iron and zinc. As previously alluded, this could be ascribed to the large
quantities consumed and also due the large number of people consuming them compared to
the other foods. On the other hand, in Botswana, some of the traditional food preparation
methods involve fermentation or in recent times, the addition of acid (vinegar or tartaric acid)
to mimic the sourness of the fermented foods. Such preparation methods have the potential
to positively impact iron bioavailability and the extent to which this might be the case
warrants research attention.
Our results further showed that animal and animal products including, beef, chicken, goat
meat and liver were the major contributors of protein, iron, zinc and vitamin A in both children
and women. The people of Botswana are predominantly pastoral and therefore, meat
consumption, is a traditional Tswana practice (Legwegoh and Riley 2014). In our view, this
may explain the observed high vitamin A intake from TIF. Previous studies have also shown

96
that animals and animal products are good sources of iron, zinc and vitamin A, as compared
to plant food sources (Lowe, Fekete, and Decsi 2009, La Frano et al. 2014, Aphane,
Chadha, and Oluoch 2002).
Some of the TIF were shown to contribute to various nutrients even though they were
consumed in small amounts and by fewer people. Examples are peanuts, water melon
seeds and pumpkins. This may indicate a lack of awareness on the potential nutritional
benefits of these foods or on the other hand, the access not being regular enough or in
sufficient quantities. Research shows that consumption of fruits and vegetables contributes
greatly to micronutrients intake. In the present study, although there were some TIF fruits
and vegetables consumed by women and children, only amaranth and pumpkin featured
among the top five foods that contributed to vitamin A. None of the fruits appeared among
the top five foods that contributed to micronutrients. A possible explanation could be due to
insignificant quantities consumed and due to lack of their availability and access. Seasonality
could have influenced the low consumption of fruits and vegetables. The data was collected
during winter (dry season) when traditional vegetables and fruits, including those from the
wild, have been reported to be low in supply compared to the rainy season, when they have
been shown to be plentiful and more readily accessible to more households (Maruapula and
Novakofski 2010). Studies also suggest that there are concerns regarding bioavailability and
bio accessibility of certain micronutrients, especially in traditional dark green leafy vegetables
and fruits due oxalates and phytates (Flyman and Afolayan 2006, Palafox‐Carlos,
Ayala‐Zavala, and González‐Aguilar 2011), which makes them unavailable for absorption
(Gupta et al. 2005). This study did not determine bio accessibility or bioavailability of
nutrients together with determination of micronutrient status since the focus was on intake.
The study does however recognise the importance of both bioavailability and bio
accessibility in impacting the resulting nutrition status. Previous studies have indeed
demonstrated the need for more research on the bioavailability and bio accessibility of
micronutrients for both raw and cooked forms of traditional leafy vegetables, towards better
understanding their contribution to the dietary intake of micronutrients (Mavengahama,
McLachlan, and De Clercq 2013, Kamga et al. 2013). Elsewhere in America, studies
demonstrated inadequate intake of fruits and vegetables among children (Heim, Stang, and
Ireland 2009, Guenther et al. 2006). In Sub-Saharan Africa (SSA) WHO revealed that the
consumption of fruits and vegetables was below the recommendation of 400 g/day (Ruel,
Minot and Smith 2005).

97
Study limitations
Limitations of the present study include that the QFFQ adapted and used showed that the
relative validity for iron, and vitamin A (retinol), fruits and dark green leafy vegetables was
poor (Jackson et al. 2013). Therefore, results for these micronutrients and foods should be
interpreted with caution. We also acknowledge the fact that participants were required to
report all the foods they consumed in a month. As such, recall bias due to greater time lapse
may have influenced dietary intake information to either over- or underestimations. However,
this is a standard method of estimating dietary intake. We also collected the dietary intake
data for children; responses were given by their parents or caregivers, which was second
hand information and therefore subject to some inaccuracies. In addition, due to food
composition tables not being available for Botswana, South African food composition tables
were used for nutrient analyses. Botswana relies heavily on food imported from South Africa
and therefore, the South African food composition food table was appropriate for use. We
do, however, acknowledge that there were some foods that were traditional or indigenous to
Botswana that were missing from the South African food composition food table that had to
be substituted with others of the same type, again an approach we considered in order due
to the absence of nutrient composition of traditional or indigenous foods globally as
highlighted by (Charrondière et al., 2013). With respect to maize meal, there is probably
some people who consumed fortified maize meal as some of it comes fortified from South
Africa thus the micronutrient value of this food should be done with caution. The QFFQ was
only administered once and hence did not consider seasonal differences which may have
been important in capturing seasonality of TIF.
Conclusion and future research
Our study shows that TIF are an important part of the diet of Batswana children and women;
and that they may present useful potential to contribute to nutrients intake such as energy,
vitamin A and zinc. We found that traditional meat and other animal products contributed to
both macro- and micro-nutrient intake among children and women while nutrient intake from
traditional and indigenous vegetables and fruits were found to be low. Selected TIF such as
peanuts, water melon seeds and pumpkin seemed to have a high potential to impact some
micronutrients intake, albeit being consumed by few participants and in small quantities. This
pioneering study in determining the quantitative consumption and dietary nutrients intake
from TIF in Botswana poses several aspects needing consideration. It calls for further
research in exploring the full potential of TIF towards improved nutrients intake. Longitudinal
studies that take into account seasonality and wider categories of age and other

98
geographical regions are recommended. Further research is needed to determine nutrient
content of TIF towards developing food composition tables that include TIF.
Acknowledgements
Acknowledgements: The authors wish to thank the field workers and all the participants in
the study. Financial support: This was a collaborative study between North-West University
Potchefstroom Campus, South Africa and National Food Technology Centre (NFTRC)
Botswana. The two institutions are gratefully acknowledged for providing financial support for
the study. Conflict of interest: The authors declare that they have no competing interest.
Authorship: S.N.K participated in conception and designing of the protocol, formulation of the
research question, study design, data collection, data analysis and was the primary writer of
the manuscript. N.M.C. participated in conception and designing of the protocol, formulation
of the research question, study design, guided the study as well as by interpretation of data
and reviewing of the manuscript. N.C. participated in interpretation of data, gave guidance in
writing and reviewing of the manuscript. R. L participated in statistical analysis. B.S.M.
participated in the formulation of the research question, study design, data collection,
interpretation of data and reviewing of the manuscript. Ethics of human subject participation:
This study was conducted according to the guidelines laid down in the Declaration of
Helsinki and all procedures involving human subjects/patients were approved by the Faculty
of Health Sciences, Health Research Ethics Committee, Potchefstroom Campus, North–
West University South Africa- Ethics number (NWU -00206-14-S1). Written informed consent
was obtained from all subjects.

99
References
Aphane, J., M. Chadha, and M. Oluoch 2002. Increasing the consumption of micronutrient -
rich foods through production and promotion of indigenous foods.
http://www203.64.245.61/web_docs/proceedings/indigenous.pdf (accessed July 17, 2017).
Arimond, M., D. Wiesmann, E. Becquey, A. Carriquiry, M. C. Daniels, M. Deitchler, and N.
Fanou-Fogny. 2010. "Simple Food Group Diversity Indicators Predict Micronutrient
Adequacy of Women's Diets in 5 Diverse, Resource-Poor Settings–."The Journal of
Nutrition140, no. 11: 2059S-2069S. doi.org/10.3945/jn.110.123414.
Akerele, D. 2011. Intra‐household food distribution patterns and calorie inadequacy in South‐
Western Nigeria. International Journal of Consumer Studies 35(5):545-551. doi:
10.1111/j.1470-6431.2010.00981.x.
Batisani, N., and B. Yarnal. 2010. "Rainfall variability and trends in semi-arid Botswana:
implications for climate change adaptation policy." Applied Geography 30 (4):483-489.
doi:10.1016/j.apgeog.2009.10.007.
Bersamin, A., S. Zidenberg-Cherr, J. S. Stern, and B. R., Luick. 2007. "Nutrient intakes are
associated with adherence to a traditional diet among Yupik Eskimos living in remote
Alaska Native communities: the CANHR Study." International Journal of Circumpolar
Health 66 (1): 62-70. doi.org/10.3402/ijch.v66i1.18228.
Burlingame, A. B., and S. Dernini. 2012. "Sustainable diets and biodiversity." International
Scientific Symposium Biodiversity and Sustainable Diets United against Hunger : Rome,
Italy.
Charrondière, U. R., B. Stadlmayr, D. Rittenschober, B. Mouille, E. Nilsson, E. Medhammar,
T. Olango, S. Eisenwagen, D. Persijn, and K. Ebanks. 2013. FAO/INFOODS food
composition database for biodiversity. Food Chemistry, 140(3):408-412.
doi.org/10.1016/j.foodchem.2012.08.049.
Clausen, T., K. E. Charlton, K. S. M. Gobotswang, and G. Holmboe-Ottesen. 2005.
"Predictors of food variety and dietary diversity among older persons in Botswana."
Nutrition 21 (1):86-95. doi: 10.1016/j.nut.2004.09.012.

100
FAO (Food and Agricultural Organization). 2013. Linkages between Biodiversity, Foods and
Nutrition. Rome. Italy. http://www.fao.org/docrep/meeting/027/mg285e.pdf (accessed May
2017).
Flyman, M. V., and A. J. Afolayan. 2006. "The suitability of wild vegetables for alleviating
human dietary deficiencies." South African Journal of Botany 72 (4):492-497.
doi:10.1016/j.sajb.2006.02.003.
Frison, E. A., J. Cherfas, and T. Hodgkin. 2011. "Agricultural biodiversity is essential for a
sustainable improvement in food and nutrition security." Sustainability 3 (1):238-253.
doi.org/10.3390/su3010238.
Gagne, D., R. Blanchet, J. Lauziere, É. Vaissière, C. Vézina, P. Ayotte, S. Déry, and H.T.
O'Brien. 2012. "Traditional food consumption is associated with higher nutrient intakes in
Inuit children attending childcare centres in Nunavik." International Journal of Circumpolar
Health 71:1-9. doi:10.3402/ijch.v71i0.18401.
Ghosh-Jerath, S., A. Singh, M.S., Magsumbol, T. Lyngdoh, P. Kamboj, and G. Goldberg.
2016. "Contribution of indigenous foods towards nutrient intakes and nutritional status of
women in the Santhal tribal community of Jharkhand, India." Public Health Nutrition1-12.
doi:10.1017/S1368980016000318.
Ghosh-Jerath, S., Suparna, A., Singh, Melina, S. Magsumbol, Preeti Kamboj, and G.
Goldberg. 2016. "Exploring the Potential of Indigenous Foods to Address Hidden Hunger:
Nutritive Value of Indigenous Foods of Santhal Tribal Community of Jharkhand, India."
Journal of Hunger & Environmental Nutrition:11 (4): 548-568. doi:
10.1080/19320248.2016.1157545.
Girma, W., and T.Genebo. 2002. Determinants of Nutritional Status of Women and Children
in Ethiopia. Calverton, Maryland, USA: ORC Macro.
Guenther, P. M., K.W. Dodd, J. Reedy, and S. M. Krebs-Smith. 2006. "Most Americans eat
much less than recommended amounts of fruits and vegetables." Journal of the American
Dietetic Association 106 (9):1371-1379. doi:10.1016/j.jada.2006.06.002.

101
Gupta, S., A. J. Lakshmi, M. N. Manjunath, and J. Prakash. 2005. "Analysis of nutrient and
antinutrient content of underutilized green leafy vegetables." LWT-Food Science and
Technology 38 (4):339-345. doi:10.1016/j.lwt.2004.06.012.
Hawkes, C., and B. M. Popkin. 2015. "Can the sustainable development goals reduce the
burden of nutrition-related non-communicable diseases without truly addressing major food
system reforms?" BMC Medicine 13 (1):143. doi:10.1186/s12916-015-0383-7.
Heim, S., J. Stang, and M. Ireland. 2009. "A garden pilot project enhances fruit and
vegetable consumption among children." Journal of the American Dietetic Association 109
(7):1220-1226. doi.org/10.1016/j.jada.2009.04.009.
Hunt, J. R. 2003. "Bioavailability of iron, zinc, and other trace minerals from vegetarian
diets." The American Journal of Clinical Nutrition 78 (3 Suppl):633S-639S.
doi:org.nwulib.nwu.ac.za/10.1093/ajcn/78.3.633S.
Jackson, M. D., B. S. Motswagole, L. D. Kwape, R. Kobue-Lekalake, T. B. Rakgantswana, T.
Mongwaketse, M. Mokotedi, and J. Jackson-Malete. 2013. "Validation and reproducibility of
an FFQ for use among adults in Botswana." Public Health Nutrition 16 (11):1995-2004.
doi:10.1017/S1368980012004636.
Johns, T., B. Powell, P. Maundu, and P. B. Eyzaguirre. 2013. "Agricultural biodiversity as a
link between traditional food systems and contemporary development, social integrity and
ecological health." Journal of the Science of Food and Agriculture 93 (14):3433-3442. doi:
10.1002/jsfa.6351.
Johnson-Down, L., and G. M. Egeland. 2010. "Adequate nutrient intakes are associated with
traditional food consumption in Nunavut Inuit children aged 3–5 years." The Journal of
Nutrition 140 (7):1311-1316. doi:10.3945/jn.109.117887.
Kamga, R. T, C. Kouamé, A. R. Atangana, T. Chagomoka, and R. Ndango. 2013. "Nutritional
Evaluation of Five African Indigenous Vegetables." Journal of Horticultural Research 21
(1):99-106. doi: 10.2478/johr-2013-0014.
Kasimba, S. N., B. S. Motswagole, N. M. Covic, and N. Claasen, N. 2017. "Household
access to traditional and indigenous foods positively associated with food security and

102
dietary diversity in Botswana." Public Health Nutrition 1-9.
doi:10.1017/S136898001700369X.
Kuhnlein, H. V., and O. Receveur. 2007. "Local cultural animal food contributes high levels of
nutrients for Arctic Canadian Indigenous adults and children." The Journal of Nutrition 137
(4):1110-1114.
Kuhnlein, H.V., B. Erasmus, and D. Spigelski 2009. Indigenous peoples' food systems: the
many dimensions of culture, diversity and environment for nutrition and health: Food and
Agriculture Organization of the United Nations, Rome, Italy.
La Frano, M. R., F. F. de Moura, E. Boy. B. Lönnerdal, and B. J. Burri. 2014. "Bioavailability
of iron, zinc, and provitamin A carotenoids in biofortified staple crops." Nutrition Reviews 72
(5):289-307. doi:10.1111/nure.12108.
Legwaila, G. M., W. Mojeremane, M. E. Madisa, R. M. Mmolotsi, and M. Rampart. 2011.
"Potential of traditional food plants in rural household food security in Botswana." Journal of
Horticulture and Forestry 3 (6):171-177. doi: 10.3945/ajcn.2009.27230G
Legwegoh, A. F., and L. Riley. 2014. "Food, place, and culture in urban Africa: comparative
consumption in Gaborone and Blantyre." Journal of Hunger and Environmental Nutrition 9
(2):256-279. doi: 10.1080/19320248.2013.845868.
Lowe, N. M., K. Fekete, and T. Decsi. 2009. "Methods of assessment of zinc status in
humans: a systematic review." The American Journal of Clinical Nutrition 89 (6):2040S-
2051S. doi: 10.3945/ajcn.2009.27230G.
Low, J. W., M. Arimond, N. Osman, B. Cunguara, F. Zano, and Tschirley D. 2007. "A food-
based approach introducing orange-fleshed sweet potatoes increased vitamin A intake and
serum retinol concentrations in young children in rural Mozambique." The Journal of
nutrition137, no. 5 : 1320-1327.doi.org/10.1093/jn/137.5.1320.
Maruapula, S., and K. Chapman- Novakofski. 2007. "Health and dietary patterns of the
elderly in Botswana." Journal of Nutrition Education and Behavior 39 (6):311-319. doi:
10.1016/j.jneb.2007.07.007.
103
Maruapula, S. D., and C. K. Novakofski. 2010. "Nutrient intake and adequacy of Batswana
elderly." African Journal of Food, Agriculture, Nutrition and Development 10 (7).
Maruapula, S. D., J. C. Jackson, J. Holsten, S. Shaibu, L. Malete, B. Wrotniak, S. J. Ratcliffe,
G. G. Mokone, N. Stettler, and C. Compher. 2011. "Socio-economic status and
urbanization are linked to snacks and obesity in adolescents in Botswana." Public Health
Nutrition 14 (12):2260-2267. doi:10.1017/S1368980011001339.
Mavengahama, S., M. McLachlan, and W. De Clercq. 2013. "The role of wild vegetable
species in household food security in maize based subsistence cropping systems." Food
Security 5 (2):227-233. doi: 10.1007/s12571-013-0243-2.
Meng, F., Y. Wei, and X. Yang. 2005. "Iron content and bioavailability in rice." Journal of
Trace Elements in Medicine and Biology 18 (4):333-338. doi:10.1016/j.jtemb.2005.02.008.
Mibei, K. Elias K, N.K., Ojijo, S. M., Karanja, and J. K., Kinyua. 2012. "Phytochemical and
antioxidant analysis of methanolic extracts of four African indigenous leafy vegetables."
Annals Food Science and Technology 13:37-42.
Misra, S., R. K. Maikhuri, C. P. Kala, K. S. Rao, and K. G. Saxena. 2008. "Wild leafy
vegetables: A study of their subsistence dietetic support to the inhabitants of Nanda Devi
Biosphere Reserve, India." Journal of Ethnobiology and Ethnomedicine 4 (1):1.
doi:10.1186/1746-4269-4-15.
Mwakikagile G. 2010. Botswana: Profile of a Nation: Continental Press Dar es Salaam
Tanzanaia;
Palafox‐Carlos, H., J. F. Ayala‐Zavala, and G. A. González‐Aguilar. 2011. "The role of
dietary fiber in the bioaccessibility and bioavailability of fruit and vegetable antioxidants."
Journal of Food Science 76 (1):6-15. doi: 10.1111/j.1750-3841.2010.01957.
Popkin, B. M., L. S. Adair, and S.W. Ng. 2012. "Global nutrition transition and the pandemic
of obesity in developing countries." Nutrition Reviews 70 (1):3-21. doi:10.1111/j.1753-
4887.2011.00456.x.

104
Roche, M. L., H. M. Creed-Kanashiro, I. Tuesta, and H. V. Kuhnlein. 2008. "Traditional food
diversity predicts dietary quality for the Awajun in the Peruvian Amazon." Public Health
Nutrition 11 (05):457-465. doi: 10.1017/S1368980007000560.
Reardon, T., and Gulati, A. 2008. The rise of supermarkets and their development
implications. International experience relevant for India. International Food Policy Research
Institute Washington, DC USA.
Ruel, M. T., N. Minot, and L. Smith 2005. Patterns and determinants of fruit and vegetable
consumption in sub-Saharan Africa: a multicountry comparison: WHO Geneva.
http://cdrwww.who.int/dietphysicalactivity/publications/f&v_africa_economics.pdf (accessed
Otober 22, 2016.
Ruel, M. T., J. L. Garrett, C. Hawkes, and M. J. Cohen. 2010. "The food, fuel, and financial
crises affect the urban and rural poor disproportionately: a review of the evidence." The
Journal of Nutrition 140 (1):170S-176S. doi:10.3945/jn.109.110791.
Stadlmayr, B., E. Nilsson, B. Mouille, E. Medhammar, B. Burlingame, and U. R.
Charrondiere. 2011. "Nutrition indicator for biodiversity on food composition-A report on the
progress of data availability." Journal of Food Composition and Analysis 24 (4-5):692-698.
doi:10.1016/j.jfca.2010.09.009.
Trichopoulou A., E. Vasilopoulou, K. Georga, S. Soukara, V. Dilis. Traditional foods: Why
and how to sustain them. Trends in Food Science & Technology. 2006 Sep 1;17(9):498-
504. doi:10.1016/j.tifs.2006.03.005.
UNICEF (United Nations International Children's Emergency Fund). 2009. "State of the
World’s Children Health. Maternal and new-born health.
http://www.unicef.org/sowc09/docs/SOWC09-FullReport-EN.pdf (accessed October 22,
2016).
Weinberger, K., and I. Swai. 2006. "Consumption of traditional vegetables in Central and
Northeastern Tanzania." Ecology of Food and Nutrition 45 (2):87-103. doi:
10.1080/03670240500530626.

105
WHO (World Health Organization). 2008. "Worldwide Prevalence of Anemia1993–2005:
WHO Global Database on Anaemia.
http://www.who.int/nutrition/publications/micronutrients/anaemia_iron_deficiency/97892415
96657/en/(accessed October 23, 2017).
Wolmarans, P. 2010. Medical Research Council Food Composition Tables. FoodFinder.
http://safoods.mrc.ac.za/foodcomp.htm (accessed May 18, 2017).
Yang, R., and G. B. Keding. 2009. "Nutritional contributions of important African indigenous
vegetables."African indigenous vegetables in urban agriculture. Earthscan, London:105-
144.

106
CHAPTER 5
Street vending of traditional and indigenous food and the potential contribution to
household income, food security and dietary diversity: The case of Gaborone,
Botswana
Salome Kasimba 1, Namukolo Covic 2, Boitumelo Motswagole 3, Marike Cockran 4 and Nicole
Claasen 5
1 Centre of Excellence for Nutrition (CEN), North-West University, Potchefstroom Campus,
Private Bag X6001, Potchefstroom 2520, South Africa
2 Poverty, Health and Nutrition Division, International Food and Policy Research Institute,
Addis Ababa; Ethiopia
3 National Food Technology Research Centre (NFTRC), Kanye, Botswana
4South Africa Statistical Consultation Services, North-West University, Potchefstroom, Africa
5Unit for Transdisciplinary Health Research (AUTHeR), North-West University,
Potchefstroom, South Africa
Please address all inquiries to the corresponding author: Salome Kasimba, Centre of
Excellence for Nutrition, North-West University, South Africa; Potchefstroom Campus;
Private Bag X6001; Potchefstroom; 2520. Tel:+27 (0)18299 4011; Fax +27 (0)18299 2464;
E-mail: [email protected]
This journal is formatted according to the guidelines of Journal of Hunger and Environmental
Nutrition

107
Abstract
Street vending of traditional and indigenous foods (TIF) remains largely unexplored on its
potential contribution to household income, household food security (access) and household
dietary diversity (HDD) within urban vendor households. Little is known about the related
food supply chains. This study explored the relationship between vending TIF and household
income, household food security (access) and HDD for TIF vendors in Gaborone and the
related TIF supply chain. A positive correlation was found between monthly income from sale
of TIF and overall household income (r = 0.594, P = 0.004) and between number of TIF
varieties for sale and HDD (r = 558, P = 0.002). A supply chain of TIF crossing boarders
emerged. Efforts are needed to promote more optimal linkages with TIF supply chains to
leverage the potential benefits of TIF towards improved household income, and more
nutritious diets.
Key words: Traditional foods, indigenous foods, income, food security, food access, dietary
diversity, street food vendors.

108
Introduction
Botswana is characterised by a semi-arid climate, with an erratic and unreliable rainfall
pattern.1 Drought is endemic in the country and this has led to low agricultural food
production for many years.1-3 Food security remains a major concern at national and
household level in Botswana.4 According to the Botswana core welfare indicators survey
2009/2010, 28.8% of urban households and 50.6% of rural households reported worries
about not having enough food during the past four weeks preceding the survey.3 The urban
poor population in Gaborone seems to be the most affected, with household food insecurity
rates of 88% as reported by the African Food Security Urban Network (AFSUN) in 2008.5
There is little or no urban agriculture in Gaborone and its contribution as a source of food to
the urban poor was reported to be insignificant.5, 6 In addition, rural-urban food transfers in
Gaborone has been noted to be inconsequential.7 Hence, households in Gaborone, including
the low-income residents, predominantly depend on economic access to foods8 with
supermarkets being the major food sources.9
Meanwhile, Botswana is seen as one of the best economic performing countries in Sub-
Saharan Africa.10 However, the high rates of economic growth, have been attributed
predominantly to one sector – diamond mining. Current statistics show that mining alone
contributed 24.0% of the GDP in 2014.11 Employment opportunities are limited and
unemployment stood at 18.0% in 2012.10 In 2010, 19.3% of the population lived below the
population datum line.3 Informal sector activities that provide income for poor households
have increased significantly in the country by an astounding 72.3% from 1999 – 2007.12
Street food vending, including the vending of traditional foods, is one of the informal sector
activities that can generate self-employment and income in response to the unemployment
and poverty.13 In the recent years the importance of traditional and indigenous foods for
nutritious, better quality and more sustainable diets has received global attention.14
Sustainable diets are defined as those diets with low environmental impact which contribute
to food security and to healthy lives for present and future generations.15 The resilience of
traditional or indigenous food plants and animals to adverse local environments and
resistance to plant and animal diseases make them an important part of food security,
particularly during dry spells.16-19
Supermarkets are widely increasing globally 20, consequently, some of the foods that are
acknowledged by locals to be traditional may be purchased from supermarkets and may also
be imported from the surrounding regions and countries. 21 In our research therefore,
traditional and indigenous foods (TIF) were defined as foods that are native or were

109
introduced into Botswana a long time ago, including plant and animal sources, whether
locally produced (either domesticated, cultivated) or accessed from the wild. Considering the
globalisation of food systems, these foods may also be purchased from retail outlets,
irrespective of their origin but recognised as part of country’s traditional food culture. The
definition of TIF was arrived at in a consultative process by a panel of nutrition experts, local
field assistants and the research team prior to the study. Some of the traditional Tswana
foods or dishes include, sorghum porridge, maize meal, samp (dehulled corn), dehulled corn
with beans, seswaa (pounded cooked beef), phane (mopane moth caterpillars), pumpkin
leaves and fruits such as mowana (Adansonia digitata),morula (Sclerocarya birrea), and
moretlwa (Grewia Flava). 22-25
In light of Botswana’s undiversified economy, high unemployment, rainfall variability and food
insecurity, especially among the urban poor, the potential of vending TIF deserves more
attention as an alternative way of making a living. However, little is known about street
vending of TIF and its contribution to household income, household food security (access),
household dietary diversity and the related TIF supply chains. Therefore, the present study
was designed to develop a greater understanding of the relationship between street vending
of TIF and the vendor’s overall household’s income, household food security (access),
household dietary diversity and the related TIF supply chains in Gaborone, Botswana.
Materials and methods
Study area
The study was conducted in Gaborone City along the streets of three malls, the Botswana
Building Society Mall, the Main Mall and the Rail Park Mall at the bus rank. Gaborone was
purposively selected because it is Botswana’s largest city and the nation’s capital that
accommodates the largest number of rural- urban migrants.26 It is also highly urbanising and
faced with the challenge of urban food insecurity.27 It is common to find TIF being sold along
the streets and alleys around some shopping malls. The capital city has a population of
227,333 people out of a national population of 2, 021, 000 i.e. 11.2% of the national
population.28
Study design and sampling
A mixed methods research approach was followed, applying a sequential explanatory study
design29 which involved quantitative data collection in the form of structured interviews with
purposively selected TIF street vendors. Qualitative data collection followed in the form of
focus group discussions (FGDs). Data collection was done between August and November

110
2015. The quantitative data collection came first and it involved structured interviews with 27
purposively selected vendors who sold raw or cooked TIF. Qualitative data collection was
conducted two months later with a sub sample of 18 participants who were recruited during
quantitative data collection. The criteria for the selection of the FGD participants were that
participants (either male or female) had to be at least 18 years or older; should have been
involved in the vending of TIF for at least three months prior to the study and be familiar with
TIF. In total, three FGDs were conducted, comprising of six participants each.
Quantitative data collection and analysis
Interviews were conducted with street TIF vendors at their stalls using a researcher-
administered structured questionnaire. Before the start of the interviews, trained field workers
sought written informed consent from the participants after giving adequate information
about the research, including the purpose of the research. The explanation was in the local
language (Setswana) and the participants were also given written information sheet written
in Setswana which they could refer to if needed. Every participant that expressed a
willingness to participate had to sign the written consent form before the interview started.
The questionnaire consisted of five sections: (i) demographic and socio-economic
characteristics which consisted of questions on household size, monthly household income
and education level, (ii) types of TIF varieties the participant sold, (iii) monthly income earned
from selling TIF, (iv) questions on household food insecurity (access) and (v) household
dietary diversity. The latter two sections were based on Food and Nutrition Technical
Assistance (FANTA) guidelines on household food insecurity access scale (HFIAS)30 and the
Food and Agricultural Organization of the United Nations (FAO) household dietary diversity
questionnaire31 respectively and the respondent answered on behalf of the other household
members. The HFIAS included nine occurrence questions and these were asked within a
recall period of 30 days preceding the study. The respondents were first asked an
occurrence question, that is - whether the condition in question happened at all in the past
30 days and this required a yes or no answer. If the respondent answered yes to an
occurrence question, the frequency of occurrence question was asked to determine whether
the condition happened rarely (once or twice), sometimes (three to ten times) or often (more
than ten times) in the past 30 days.30 The HFIA score for each household was then
calculated by adding the codes for each frequency of occurrence question. The maximum
score for a household was 27 and the minimum score was 0. The higher the score, the more
food insecure a household is and the lower the score the less food insecure a household is30.
Finally, the households were categorised into 4 levels of food insecurity; secure, mildly,
moderately and severely food insecure.30

111
The HDD questionnaire31 was administered to measure household dietary diversity as an
indication of household access to different types of food. The HDD was based a non-
quantitative 24-hour recall to capture foods (meals and snacks) that were prepared in the
home and consumed in the home or outside the home or purchased outside the home and
consumed in the home by any of the household members during the previous day and
night.31 HDD scores were calculated by adding the number of food groups consumed by all
members of the household, out of twelve groups: 1) Cereals, 2) white tubers and roots, 3)
fruits, 4) vegetables, 5) legumes, nut and seeds; 6) fish and other seafood’s; 7) meat, 8)
eggs, 9) oils and fats, 10) sweets, 11) milk and milk products, and 12) spices, condiments
and beverages.31 The households were then categorised into three dietary diversity score
categories defined by the research team: low (0-4 food groups), medium (5-8 food groups)
and high (9-12 food groups) for the purpose of determining the distribution of the scores.
Median HDD score was also calculated.
The Shapiro-Wilk test and Q-Q plots were used to check for normality of data. Data not
normally distributed were reported as the median and interquartile range (IQR). Descriptive
statistics were used to summarise demographic and socio-economic characteristics, HFIA
categories, HDD categories, median HDD score, type of TIF varieties displayed for sale and
the amount of money earned in a month from the sale of TIF. Spearman correlations were
used to determine the association between monthly income from the sale of TIF and overall
monthly household income, HFIA scores and HDD scores. Spearman correlations were also
used to determine the association between the number of TIF varieties displayed for sale
and overall household income, HFIA scores and HDD scores. For all the analysis, statistical
significance was set at P < 0.05.
Qualitative data collection and analysis
Three FGDs were conducted and these consisted of a sub-sampling of the vendors from
each of the study sites to get in-depth insight on the contribution of selling TIF on the
vendor’s household income, availability and access to TIF, as well the challenges vendors
faced in selling TIF on streets. Written consent for the FGD participation that included audio
recordings was sought by trained field workers. The FGDs were then conducted in
Setswana, which is the national language in Botswana, led by a moderator and two assistant
facilitators who were taking notes. The following guiding questions were applied:
(i) What are the foods considered as TIF in this area?

112
(ii) What is your view on the contribution of selling these foods to the income of your
household?
(iii) How does the income you get from selling TIF compare to the income you get from
other income generating activities that you may be involved in?
(iv) Where do the TIF that you sell come from?
(v) Have you seen any changes in the demand of TIF and if so, to which reasons can
that be attributed?
The voice recordings from FGDs were transcribed verbatim, comparing them with the notes
taken to ensure that the meaning of the data was preserved.29 The transcripts were then
translated from Setswana to English for analysis, with focus on preserving the meaning
rather than language accuracy. The data was coded and co-coded by an independent
researcher and collated to potential themes following thematic analysis.32, 33 ATLAS.ti version
7 was used.
Ethical considerations
Ethical clearance for this study was obtained from the Faculty of Health Sciences, Health
Research Ethics Committee, Potchefstroom Campus, North–West University, South Africa;
(NWU -00206-14-S1) and the Botswana Health Research and Development Division of the
Ministry of Health. Signed informed consent was obtained from participants after being given
adequate explanations in their local language. Participants had a choice to withdraw from the
study at any point.
Results
Table 1 shows the vendors’ characteristics, household food insecurity (access) and dietary
diversity. The highest level of education attained by most of the vendors (63%) was junior
secondary school education (grade 10) and a very small number went past high school level
(tertiary education) (7.4%). The largest share of the vendors’ households (37%) earned less
than P 3000.00 (BWP) per month. Median monthly income amount from the sale of TIF was
P2400.00 (BWP). About three quarters of the vendor households (74%) were food insecure
with 18.5%, 33.3% and 22.2% being mildly, moderately and severely food insecure,
respectively. Household dietary diversity results indicated that the majority of the households
(51.9%) fell into the lowest group of HDD score (0-4 food groups) while median HDD score
was 4 (3, 6).

113
Table 2 presents the various types of the TIF varieties that were sold. These included both
raw and cooked foods and dishes. More types of raw foods were mainly sold (n=23)
compared to cooked foods and dishes (n=13). Examples of those commonly sold raw were;
peanuts (manoko), Jugo beans (ditloo) and dried bean leaves (morogo wa dinawa).
Commonly sold cooked foods and dishes were beans with dried fresh maize (dikgobe tsa
lechotlho), dehulled corn and beans (dikgobe), sorghum meal (bogobe jwa mabele),
sorghum and melon (bogobe jwa lerotse).
Table 3 shows the spearman correlation of monthly income from sale of TIF and overall
monthly household income; HFIA scores and HDD scores; number of TIF varieties for sale
and overall household income; HFIA scores and HDD scores. A positive correlation was
found between monthly income from the sale of TIF and overall household income (r = 0.594
P = 0.004) and between number of TIF varieties for sale and HDD (r = 558, P = 0.002). No
correlation was found between monthly income from the sale of TIF and HFIA scores (r =
0.140, P = 0.535) and the number of TIF varieties for sale and HFIA scores (r = 0.136, P =
0.498).
The three main themes that emerged during qualitative analysis were (i) TIF as a source of
household income, (ii) availability and access to TIF, (iii) challenges faced in street vending
of TIF.
TIF as a source of income: During FGDs, participants confirmed that TIF contribute largely
to their household income and are a valuable livelihood strategy. This income enables them
to meet most of their families’ daily needs as well as supporting other family members who
are often dependent on the same income. The following quotes represent these perceptions:
‘Yes, we get profit from selling these foods (TIF), this enables us to buy everything we
want.’ (Group 2, BBS mall, 20.11.2015)
‘We are here and trying to make a living, so we are making money.’ (Group 3, Bus
rank, 20.11.2015)
‘My sister is not working, so I am a sole bread winner at home and my children are
solely dependent on this money.’ (Group 3, Bus rank, 20.11.2015)

114
‘I am a single mom and I make a living from selling on the streets, so I can say I have
really survived from the selling of these foods. Yes, I have managed to pay school fees
for my children with the money that I make from selling TIF and I have been selling TIF
for a very long time. All my children have finished school and they now work for
themselves.’ (Group 2, BBS mall, 20.11.2015)
‘I can’t remember when I started selling but I worked as a domestic worker before
coming to sell on the streets but I can tell you that I make profit. My children have not
been getting paid from their work, so I have to make ends meet at the end of the day.’
(Group 2, BBS mall, 20.11.2015)
Availability and access of TIF: It was discussed that availability was related to seasons,
with different TIF being available in different seasons of the year, either summer (rain
season) or winter (dry season). Access to TIF was either gained through sourcing from the
wild (including plants and animals), planting in fields or yards, or purchased from local shops
and supermarkets.
‘Yes, we know our traditional foods, some are from the wild such as, mogorogorwane
(wild orange), moretlwa (wild raisins), mowana (baobab fruit), moretologa (monkey
orange), mmupudu (Moepel) and thepe (amaranth).’ (Group 2, BBS mall, 20.11.2015)
‘The ones from the wild are thepe (Amaranth), mmupudu (Moepel) mogorogorwane
(wild orange), and lerotshe (melon).’(Group 3, Bus rank, 20.11.2015); ‘We get phane
(Mopane moth caterpillars) from the field.’ (Group 2, BBS mall, 20.11.2015)
‘I plant my own Makgomane (cooking melon).’ (Group 3, Bus rank, 20.11.2015); ‘When
there is a lot of rain, we sell fruits and vegetables. In winter, we sell less but we sell a
lot of fruits from the wild during summer and that is when a large number of people
participate in the selling.’ (Group 1, Main mall, 20.11.2015)
‘The dried amaranth is sold all year round.’ (Group 3, Bus rank, 20.11.2015)
The TIF that were reported to be commonly purchased were meat, maize, sweet potatoes
and manoko (peanuts).
‘I buy meat from the butcher, cook and sell it.’ (Group 2, BBS mall, 20.11.2015)

115
‘We buy maize from the shops that comes from South Africa.’ (Group 3, Bus rank,
20.11.2015)
‘I do get sweet potatoes from Zambia.’ (Group 2, BBS mall, 20.11.2015)
‘Some people get peanuts (manoko) from Zambia and they buy in bulk and sell to us
when we are run out of stock.’ (Group 2, BBS mall, 20.11.2015)
‘We buy them, but when it rains, all we grow is beans, maize, and when our
neighbouring countries have good rain we also buy from them.’ (Group 1, Main mall,
20.11.2015)
Challenges faced in vending of TIF: The major challenge in selling of TIF reported by the
participants was high competition among vendors, especially during rainy season, due to
plenty of produce.
‘Selling TIF is helping a lot but now we are so many people who sell on the streets.’
(Group 1, Main mall, 20.11.2015)
‘We are so many here, the competition is high. As a result we are not making enough
profit.’ (Group 1, Main mall, 20.11.2015)
‘We make money, yes, but we have a challenge when it rains we don’t sell a lot.’
(Group 2, BBS mall, 20.11.2015)
The participants also mentioned there is poor market infrastructure of traditional or
indigenous foods which limits the marketing of their foods.
‘Are you going to help us get new places to sell these foods (TIF) because we are
struggling when it rains. May be you can help us sell our foods into other countries just
like we buy foods from other countries.’ (Group 3, Bus rank, 20.11.2015)
The participants further reported that having inadequate food to cook at home causes them
to take some of the TIF stock to prepare at home as food for their families, which effectively
reduces their profits.

116
‘I would say because sometimes at home we don’t have any food to cook we are
forced to take the beans that we sell and cook at home for food - this then reduces the
stock and hence the profit that we make.’ (Group 2, BBS mall, 20.11.2015)
Discussion
This study explored the relationship between vending TIF and overall vendors’ household
income, household food security (access), household dietary diversity for purposively
selected TIF vendors and the related TIF supply chain. Quantitative results showed that
income from TIF contributed substantially to household income while qualitative data from
FGDs confirmed that selling TIF contributed largely to vendors’ livelihoods, with some
participants reporting that it acted as the main source of household income. Our research
findings suggest that selling TIF can play an important role in providing livelihood among
those participating in this trade. Median income per month from selling TIF (BWP 2400.00)
was higher when compared to the monthly minimum wage of BWP 1200.00 in several
industries in Botswana34, however, it is lower when compared to the 2009/2010 national
average household income of BWP 3936.12.3 This suggests that although vending TIF may
present a potential livelihood means, the income levels are relatively low. The low income
levels in our study are in line with the high levels of food insecurity (access) as was shown by
many of our study sample (74.0%). Previous research confirmed that most urban dwellers,
including those in Gaborone, Botswana, rely predominantly on economic access to food.5, 35,
36 The findings from this research corroborates with these researchers. Income may therefore
be an important aspect in attaining food security in urban Botswana, especially with the arid
nature of the country that limits own food production. This perspective is confirmed by
Raboloko37 in a recent study on determinants of urban household food insecurity in urban
Gaborone which reported that as wages increased, household food security improved.
AFSUN in 2008 investigated the extent and nature of food insecurity in Gaborone’s three
poorer areas: Old Naledi, White Bontleng and Broadhurst and reported that in these three
areas, 88 % of the households were food insecure.5 This research’s results and AFSUN’s
findings may be an indication that almost a decade later, food insecurity among the urban
poor households in Gaborone seems to persist and may therefore be of concern.
Our findings further showed a low HDD of between 0-4 food groups among more than half
(59.1%) of the vendors’ households with a median HDD score of 4 (3, 6) out of a possible
total of 12. AFSUN 5 reported a HDD score of 5 or lower among 32 % of the urban poor
households in Gaborone. The relatively low HDD in our study could also have been due to

117
economic constraints among the households. According to Ruel35, economic access
determines the capability of a household to purchase a variety of foods. The selling of TIF
contributed a large proportion to household income, however, we found no correlation
between monthly income from sale of TIF and HFIA scores, indicating there are other factors
at play. This may be because there are other sources of income that may fill the gap, an
aspect that this study did not determine. We found a strong positive correlation between the
number of TIF varieties the vendors sold and HDD scores. This highlights that the selling of
TIF may not just be a livelihood strategy in terms of income, but also a coping strategy with
food insecurity as was confirmed by our qualitative findings which showed that in times of
food shortages at home, participants took some of their selling stock and cooked for their
families.
Supporting and promoting better market opportunities for TIF could play a significant role in
improving food security and dietary diversity by providing an alternative food-purchasing
environment as opposed to supermarkets. However, although highly visible, the informal
food sector in Botswana has received little or no attention, with supermarkets acting as the
major food source for the majority of the population, including the poor households in
Gaborone.5 The fact that FGDs alluded to vendors sourcing some of the traditional foods
they sell from supermarkets is testament to this phenomena. Supermarkets sell a variety of
foods which also include traditional foods such as maize meal at significantly lower prices
than most of the other food outlets within Gaborone.38 However, the foods in the
supermarkets may not be affordable for the poorer urban households because of the bigger
size packages and their related prices involved. Indeed, research has shown that the urban
poor do not benefit from bulk buying due to low income, so they buy food in small quantities,
facilitated by the informal sector39, 40 a finding confirmed in the poor urban environments of
South Africa.36 An interesting aspect that came to light from the FGDs is that the supply chain
for the vendors crosses boarders. The vendors discussed that some of the TIF they sell
came from as far away as Zambia. The implication is that there is perhaps a poorly
recognised food supply chain associated with TIF vending that should be explored. It is only
by understanding the nature of the associated supply chains that means of promoting
developments to positively impact the related livelihoods could be leveraged. An area that
may lack recognition is that informal TIF vending in Gaborone may have the potential to
improve food security and dietary diversity by promoting consumption of neglected perceived
nutritious, traditional and indigenous foods by making them available and accessible in the
food supply chain. According to International Plant Generic Resource Institute (IPGRI), some
of the traditional foods such as vegetables and fruits are categorised as neglected, yet they

118
are important in improving the health and nutrition of urban and rural poor households.41
Many of the foods that fall into this category of neglected foods are included in the list of TIF
that are subject to vending. Examples are bean leaves (morogowa dinawa), okra, pumpkin,
lentils and fruits such as baobab. As alluded to previously, vendors will need more support in
terms of formalising markets for TIF. In many African countries, including Botswana, street
vending is perceived as a menace that causes disorganisation and overcrowding in the
cities.13, 42, 43 According to Joseph,44 no formalised well organised market places that have
been identified in Gaborone, specifically for street food vending. Additionally, council laws in
Gaborone do not recognise street food vending, therefore, vendors are denied registration
and viewed as illegal operators.13As a result, most vendors position themselves anywhere
conducive to run their businesses.13 Under such circumstances, the businesses are likely to
remain unstable and may not thrive well. A study that compared the implication of rising
supermarkets to informal food sources in India reported that informal traditional food sellers
are believed to sell foods of low quality, limited variety and at unpleasant shopping
environments, which gives them a disadvantage when competing with supermarkets.45 In
contrast, a recent study by Kasimba et al46 that investigated the association of household
access to TIF with household food security and dietary diversity in urban and rural low socio-
economic households in Botswana found that TIF were perceived as healthy and superior
when compared to non-TIF. Therefore, TIF vending in Gaborone warrants support in setting
up formal TIF markets in clean environments that will influence household food security and
dietary diversity by promoting availability and accessibility of TIF. Other benefits of
supporting and promoting TIF vending could be the promotion of cultural and food heritage,
as well as drought resistant food crops that could be used for food during the dry seasons.
This may be suitable for a country like Botswana where rainfall is erratic.1 Traditional foods
are nutritious, unique, affordable, adapted to local growing conditions and preserve cultural
traditions14. Therefore, traditional foods are crucial, not just for food security but also for more
in providing more sustainable diets, especially for poor families in rural, peri-urban and urban
areas.14 Promoting increased TIF consumption with related agricultural interventions may
further support small-scale farmers by introducing these products and developing markets for
their produce. IPGRI highlighted that local agriculture among small-scale farmers is
stimulated by promoting the use of traditional foods, which helps improve their livelihoods.41
The main limitation of this study is the small sample size which was solely depended on
identifying individuals involved in the vending of TIF. Similarly, it would also have been useful
to collect information from other parts of the country, including rural areas, in an effort to
establish possible regional differences. This may also have given a clearer indication of the

119
supply chain associated with TIF vending. It also needs highlighted that the present did not
collect data on other sources of income among the TIF vendors. It would be important for
future studies to investigate this to get a deeper understanding of the economic potential in
vending TIF in relation to overall household income, food security and dietary diversity.
Conclusion and recommendation
Vending TIF may have the potential to contribute to household income, household food
security and household dietary diversity among the households involved in this trading
activity. The study, however, calls for attention to factors related to the TIF supply and how
these could be developed to the benefit of the vendors. The research team further
recommends more research towards the promotion of nutrition-sensitive value chains of
underutilised traditional and indigenous foods that can promote smallholder farmers and
micro-entrepreneurs in income-generation, while at the same time, contributing to availability
and access to TIF believed to have the capability of providing better quality diets for the
urban population in the long term.
Acknowledgements
Acknowledgements: The authors wish to thank all the field workers who participated in the
study. Financial support: This was a collaborative study between North-West University
Potchefstroom Campus, South Africa and National Food Technology Centre (NFTRC)
Botswana. The two institutions are gratefully acknowledged for providing financial support for
the study. Conflict of interest: The authors declare that they have no competing interest.
Ethics of human subject participation: This study was conducted according to the guidelines
laid down in the Declaration of Helsinki and all procedures involving human subjects were
approved by the Faculty of Health Sciences, Health Research Ethics Committee,
Potchefstroom Campus, North–West University, South Africa - Ethics number (NWU -00206-
14-S1). Written informed consent was obtained from all subjects.

120
Table 1: Characteristics of street vendors of TIF in Gaborone
Characteristics of Vendors n=27 n (%)
Education level of respondents
None 1 (3.7)
Primary school (7 years of schooling) 4 (14.8)
Junior school (3 years of schooling) 17 (63)
Senior secondary (2 years of schooling) 3 (11.1)
Tertiary education (1 year and above) 2 (7.4)
Median household size (IQR a) 3 (2,5)
Monthly household income in BWP b
0-3000 10 (37)
3001-9000 9 (33.3)
>9000 5 (18.5)
Unknown 3 (11.1)
Median income per month from sale of TIF in BWP (IQR a) 2400 (950, 5000)
Minimum income per month from sale of TIF 500
Maximum income per month from sale of TIF 14700
Household food insecurity access scale (HFIAS)
categories c
Food secure 7 (25.9)
Mildly food insecure 5 (18.5)
Moderately food insecure 9 (33.3)
Severely food insecure 6 (22.2)
Household dietary diversity (HDD) score food group d
categories
Low (0-4 food groups) 14 (51.9)
Medium (5-8 food groups) 12 (44.4)
High (9-12 food groups) 1 (3.7)
Median HDD score (IQRa) 4 (3,6)

121
TIF varieties displayed for sale (n%)
Median number of TIF varieties displayed for sale e (IQRa) 7 (4,9)
Minimum number of TIF varieties displayed for sale e 1
Maximum number of TIF varieties displayed for sale e 14
a. IQR – inter quartile range.
b. Income is given in Botswana Pula; 1BWP = 0.10 US dollar.
c. HFIAS categories are based on Food and Nutrition Technical Assistance (FANTA) guidelines, see30.
d. Food groups are based on FAO guidelines for measuring HDD see FAO31.
e. Number of TIF varieties displayed for sale are considered during time of conducting interview.

122
Table 2: Types of TIF varieties for sale by TIF vendors in Gaborone (n=27)
Setswana name of food
English/ Scientific name Food group Number of vendors (%)
Raw foods
Manoko Peanuts Legume 13 (48.1)
Ditloo Jugo beans Legume 13 (48.1)
Morogo wa dinawa Bean leaves Vegetable 10 (37.0)
Thepe Amaranth leaves Vegetable 9 (33.3)
Dipotata Sweet potatoes Root tuber 8 (29.6)
Dinawa tsa Setswana Setswana beans Legumes 5 (18.5)
Delele Okra Vegetable 4 (14.8)
Black eyed beans Black eyed beans Legume 4 (14.8)
Rothwe Spider plant leaves Vegetable 4 (14.8)
Mae a koko Free range chicken eggs Egg 3 (11.1)
Mosutlhwane Dehulled sorghum grains Cereal 2 (7.4)
Tshwaramasiela beans Beans species Legume 2 (7.4)
Ntshe Sweet reed Sweets 2 (7.4)
Letlhodi Lentils Legume 2 (7.4)
Nakedi beans Beans species Legume 2 (7.4)
Porongwane beans Beans species Legume 1 (3.7)
Maeatshilwana beans Beans species Legume 1 (3.7)
Moreokgotsheng Beans species Legume 1 (3.7)
Lekwesha Pumpkin vegetable 1 (3.7)
Motsentsela (Berchemia discolor (Klotzsch)
Fruit 1 (3.7)
Mowana Baobab fruit Fruit 1 (3.7)
Moritela tshwene Beans species Legume 1 (3.7)
Dicheru Morula nut Nut 1 (3.7)
Cooked foods and dishes
Dikgobe tsa lechotlho Beans with dried fresh maize
Legume/cereal 13 (48.1)
Dikgobe Beans and dehulled corn Legume/cereal 7 (25.9)
Bogobe jwa mabele Sorghum meal Cereal 7 (25.9)
Bogobe jwa lerotse Sorghum and melon Cereal/fruit 5 (18.5)
Seswaa Pounded beef Meat 5 (18.5)
Serobe Tripe Meat 3 (11.1)
Kabu Dried boiled maize Cereal 3 (11.1)
Mmidi Maize on the cob Cereal 3 (11.1)
Phaphatha Roasted bread Cereal 2 (7.4)
Koko ya Setswana Chicken meat (free range) Meat 2 (7.4)
Samp Dehulled corn Cereal 2 (7.4)
Dobi Sorghum porridge with milk
Cereal/ milk 1 (3.7)
Nama ya podi Goat meat Meat 1 (3.7)
Types of TIF varieties for sale by TIF vendors in Gaborone are considered during time of conducting interview.

123
Table 3: Spearman correlation of monthly income from sale of TIF and overall monthly
household income; HFIA scores and HDD scores; number of TIF varieties for sale and
overall household income; HFIA scores and HDD scores
Overall household income per month
HFIA scores
HDD scores
Income from TIF correlation coefficient
0.594** 0.140 -0.065
P-value 0.004 0.535 0.773
Number of TIF varieties for sale correlation coefficient
-0.318 0.136 0.558**
P-value 0.106 0.498 0.002
**Correlation is significant at the 1% level.

124
References
1. Batisani N, Yarnal B. Rainfall variability and trends in semi-arid Botswana: implications for
climate change adaptation policy. Appl Geogr 2010; 30(4): 483- 489.
doi.org/10.1016/j.apgeog.2009.10.007.
2. Brinkhurst, Marena FE. "Fruit of sand: complexities of Botswana’s veld plant resources."
SURG. 2010; 3(2): 10-22.
3. Statistics Botswana. Botswana core welfare indicators survey:2009/10. Statistics
Botswana
http://www.statsbots.org.bw/sites/default/files/BCWIS%202009%2010%20MAIN%20REPOR
T.pdf. Published 2013. Accessed November 7, 2017.
4. Acquah B, Kapunda S. The State of Food Insecurity in Gaborone, Botswana: Southern
African Migration Programme; 2016.
5. Acquah B, Kapunda S, Legwegoh A. The dimensions of urban food insecurity in
Gaborone, Botswana. Urban Forum. 2014; 25: 217-226. doi 10.1007/s12132-014-9222-8.
6. Mosha AC. Urban agriculture in Botswana. Commonwealth Journal of Local Governance.
2016; 18: 48-67. doi.org/10.5130/cjlg.v0i18.4842.
7. Frayne B, Pendleton W, Crush J, Acquah B, Battersby-Lennard J, Bras E, et al. The state
of urban food insecurity in southern Africa: Urban food security series. 2010;2.
8. Legwegoh AF, Hovorka AJ. Assessing food insecurity in Botswana: the case of Gaborone.
Development in Practice. 2013;23(3):346-358. doi.org/10.1080/09614524.2013.781128.
9. Crush J, Hovorka A, Tevera D. Food security in Southern African cities The place of urban
agriculture. Progress in Development Studies. 2011;11(4):285-305.
doi.org/10.1177/146499341101100402.
10. International Monitory Fund. Botswana. Country report no. 12/235, International
Monetary Fund. 2012. https://www.imf.org/external/pubs/ft/scr/2012/cr12235.pdf. Published
August, 2012. Accessed November 5, 2017.

125
11. Botswana Ministry of Agriculture (2016) National Agricultural Policy: 1991. Gaborone:
Botswana Ministry of Agriculture.
12. Kapunda SM, Moffat BD. Employment trends and poverty reduction: The case of the
informal sector in Botswana. Journal of Social and Economic Policy. 2014;11(1):1-12.
13. Nakisani Carol C-M, Ongori H. An assessment of challenges faced by microenterprises
in Botswana: A case of street food vendors in Gaborone. International Journal of Learning
and Development. 2013;3(5):56-73.
14. Food and Agricultural Organization of the United Nations. Traditional foods: better
livelihoods, dietary diversity and health. TECA. 2012.
http://teca.fao.org/technology/traditional-foods-better-livelihoods-dietary-diversity-and-health.
Published November, 2012. Accessed November 4, 2017.
15. Burlingame BA, Dernini S. Sustainable diets and biodiversity. Proceedigs of the
International Scientific Symposium Biodiversity and Sustainable Diets United against
Hunger; November, 3–5, 2010; Rome, Italy.
16. Keding G, Weinberger K, Swai I, Mndiga H. Diversity, traits and use of traditional
vegetables in Tanzania. AVRDC-WorldVegetableCenter; 2007.
17. Food and Agricultural Organization. Expert Consultation on Nutrition Indicators for
Biodiversity. Food Composition, Book 1. Rome. 2008.
18. Kunyanga CN, Imungi JK, Vellingiri V. Nutritional evaluation of indigenous foods with
potential food-based solution to alleviate hunger and malnutrition in Kenya. J. Appl. Biosci.
2013;67:5277-5288.
19. Yang R-Y, Keding GB. African indigenous vegetables in urban agriculture . Charlie M.
Shackleton, Margaret W. Pasquini, Axel W. Drescher eds. Nutritional contributions of
important African indigenous vegetables. London, UK: Earthscan; 2009:105-143.
20. Reardon T & Gulati A. The rise of supermarkets and their development implications.
International experience relevant for India. Vol. 752. Washington, DC USA: IFPRI. 2008. 1-
61.

126
21. Kuhnlein HV, Erasmus B, Spigelski D. Indigenous peoples' food systems: the many
dimensions of culture, diversity and environment for nutrition and health. Rome: Food and
Agriculture Organization of the United Nations; 2009.
22. Legwaila GM, Mojeremane W, Madisa ME, Mmolotsi RM, Rampart M. Potential of
traditional food plants in rural household food security in Botswana. J. Hortic. For.
2011;3(6):171-177.
23. Neudeck L, Avelino L, Bareetseng P, Ngwenya BN, Teketay D, Motsholapheko M. The
contribution of edible wild plants to food security, dietary diversity and income of households
in Shorobe Village, northern Botswana. Ethnobotany Research & Applications. 2012;10:449-
462.
24. Clausen T, Charlton KE, Gobotswang KS, Holmboe-Ottesen G. Predictors of food variety
and dietary diversity among older persons in Botswana. Nutrition. 2005;21(1):86-95.
doi.org/10.1016/j.nut.2004.09.012.
25. Maruapula S, Chapman-Novakofski K. Health and dietary patterns of the elderly in
Botswana. J Nutr Educ Behav. 2007;39(6):311-319. doi.org/10.1016/j.jneb.2007.07.007.
26. Mwakikagile G. Botswana: Profile of a Nation: Continental Press Dar es Salaam
Tanzanaia; 2010.
27. Crush J, Frayne B. The invisible crisis: urban food security in Southern Africa: AFSUN
Cape Town; 2010.
28. Botswana Census Report. Botswana population and housing census.
http://www.statsbots.org.bw/sites/default/files/publications/Population%20and%20Housing%
20Census%202011.pdf. Published 2011. Accessed November 18, 2017.
29. Creswell JW. Qualitative, Quantitative, and Mixed Methods Approaches. Thousand
Oaks, CA: SAGE Publications,Inc. 2008.
30. Coates J, Swindale A, Bilinsky P. Household Food Insecurity Access Scale (HFIAS) for
measurement of food access: indicator guide. Washington, DC: Food and Nutrition Technical

127
Assistance Project, Academy for Educational Development.
http://www.fao.org/fileadmin/user_upload/eufao-fsi4dm/doc-training/hfias.pdf. Published
August 2007. Accessed November 8, 2017.
31. Food and Agricultural Organization (2010) Guidelines for measuring household and
individual dietary diversity. Rome, Italy.
http://www.fao.org/fileadmin/user_upload/wa_workshop/docs/FAO-guidelines-dietary-
diversity2011.pdf. Published 2011. Accessed November 9, 2017.
32. Vaismoradi M, Turunen H, Bondas T. Content analysis and thematic analysis:
Implications for conducting a qualitative descriptive study. Nurs Health Sci. 2013;15(3):398-
405. 10.1111/nhs.12048.
33. Braun V, Clarke V. Using thematic analysis in psychology. Qual Res Psycho. 2006;
3(2):77-101. doi.org/10.1191/1478088706qp063oa.
34. Minimum wages in Botswana. 2017.
https://mywage.com/main/salaries/minimum-wages/minimum-wages-in-botswana/minimum-
wages. WageIndicator 2017. Accessed November 13, 2017.
35. Ruel MT, Garrett JL, Hawkes C, Cohen MJ. The food, fuel, and financial crises affect the
urban and rural poor disproportionately: a review of the evidence. J Nutr. 2010;140(1):170S-
6S. doi:10.3945/jn.109.110791.
36. Battersby J. Urban food insecurity in Cape Town, South Africa: An alternative approach
to food access. Dev South Afr 2011;28(4):545-561.
doi.org/10.1080/0376835X.2011.605572.
37. Raboloko M. Determinants of urban household food security in Botswana. 2016; J
Biomed Clin Sci 1, 17–21.
38. Lane K, Hovorka A, Legwegoh A. Urban food dynamics in Botswana: insights from
Gaborone's Central Business District. African Geographical Review. 2012;31(2):111-125.
doi: 10.1080/19376812.2012.715975.

128
39. Food and Agricultural Organization of the United Nations. The informal food sector.
Briefing guide for mayors, city executives and urban planners, in developing countries and
countries in transition. http://www.fao.org/3/a-y4312e.pdf. Published 2003. Accessed
November 13, 2017.
40. Timalsina KP. An urban informal economy: Livelihood opportunity to poor or challenges
for urban governance. Global Journal of Human-Social Science Research. 2011;11(2).
41. Moore C, Raymond RD. Back by popular demand: the benefits of traditional vegetables:
one community's story: Bioversity International; 2006.
42. Njaya T. Operations of street food vendors and their impact on sustainable urban life in
high density suburbs of Harare, in Zimbabwe. Asian Journal of Economic Modelling. 2014; 2
(1): 18-31.
43. Muyanja C, Nayiga L, Brenda N, Nasinyama G. Practices, knowledge and risk factors of
street food vendors in Uganda. Food Control. 2011;22 (10):1551- 1558.
doi:10.1016/j.foodcont.2011.01.016.
44. Joseph MC. Beyond modernist planning: understanding urban street vending in
Botswana. Paper presented at the International RC21 conference 2011. Session: 5
Governance and diversity in cities ; July, 7-9, 2011; Amsterdam, Netherlands.
45. Reardon T, Gulati A. The rise of supermarkets and their development implications.
International experience relevant for India. New Delhi: International Food Policy Research
Institute; 2008. IFPRI Discussion Paper 00752.
46. Kasimba SN, Motswagole BS, Covic NM, Claasen N. "Household access to traditional
and indigenous foods positively associated with food security and dietary diversity in
Botswana." Public Health Nutr (2017): 1-9. doi:10.1017/S136898001700369X.

129
CHAPTER 6: CONCLUSION AND RECOMMENDATIONS
6.1 Introduction
This chapter presents a summary of the main findings of this study. Summary of main
findings of the first article are presented first, followed by the second article then thereafter
the third article. Lastly, general conclusions and recommendations based on the main
findings of the study are presented.
6.2.1 Household access to traditional and indigenous foods positively associated with
food security and dietary diversity in urban and rural areas in Botswana.
Our study found a high prevalence of food insecurity (access) (80.1%) among low socio-
economic households with 14.0%, 28.8% and 37.3% being mildly, moderately or severely
food insecure respectively. Severe food insecurity (access) was significantly higher in rural
areas compared to urban areas (P < 0. 001). Our findings further revealed that median
household HDD score was 6(5, 7) out of a total of 12 while the majority of households
(81.0%) fell into a medium HDD score (5-8 food groups) with no significant differences
between urban and rural areas (P = 0.153).
Results from HDD data showed that the largest share of households (56.3%) accessed
between three to five TIF in the previous day, an indication that TIF consumption forms
integral part of the Batswana diet. The research team expected participating rural
households to have access to higher variety of TIF but contrary to this expectation,
households in urban areas had access to a significantly higher variety of TIF. Access to a
higher variety of TIF among urban households could have been due to availability of some of
the foods we categorised as TIF (based on our definitions) in supermarkets such as beef,
fish, beans and maize meal among others. Focus Group Discussions (FGDs) listed about
130 known TIF, a reflection of vast knowledge among participants. Some examples were
compiled (see Chapter 3 Table 2). The importance of traditional and indigenous foods in
addressing food insecurity has been internationally recognised (FAO, 2012). Similarly, this
study showed that access to TIF was positively associated with household food security
(access) and dietary diversity, hence, the findings highlight the potential role TIF may play in
improving household food security (access) and household dietary diversity. We found no
correlation between the number of accessed TIF and women BMI. However, our study did
not determine dietary energy intake that is in part influenced by food preparation methods
along with physical activity, an important determinant of BMI which was not a focus in this
study.

130
With regards to participants’ perceptions of TIF use, three main themes emerged and these
were (i) health perceptions, (ii) availability and access, and (iii) declining consumption of TIF
and attributed factors. TIF were perceived as healthy when compared to non- TIF
supermarket foods such as cakes, rice and sugar-sweetened beverages. In terms of
availability and access, availability to TIF was discussed mainly in terms of seasonality.
FGDs revealed that TIF are mainly found during three seasons (summer, autumn and winter)
while in terms of access, participants explained that TIF are accessed from different sources
which included hunting (especially the animal sources) from the wild, cultivated at home, or
sold by street vendors or in shops. Despite this, the participants added that consumption of
TIF was on the decline. Although the study found associations between greater access to
TIF and better household food security (access) and higher household dietary diversity,
there is a need to explore the potential benefits of optimal use of TIF in contributing to food
security and nutrition.
6.2.2 Consumption of traditional and indigenous foods and their contribution to
nutrient intake among children 2-5 years and women 18-49 years old in Botswana
Our study showed that amidst times of declining use of traditional foods and increasing use
of westernised diets (Popkin et al., 2012; Johns et al., 2013), our study participants
consumed both TIF and non- TIF. TIF accounted for relatively high percentages of energy
intake (41 %, 36%) in children and women, respectively. Our results showed that the intake
of vitamin A in children was higher from TIF (mean 234 (184 - 299) compared to non-TIF
(mean 176 (138 - 224) P = 0.0851. In women, our findings showed that the intake of vitamin
A and zinc were significantly higher from TIF compared to non-TIF (zinc from TIF mean 4.9
(4.6 - 5.3), non- TIF mean 4.2 (3.9 - 4.5) P = 0.0033, vitamin A from TIF mean 409 (332 -
503), non-TIF mean 295 (240 - 362) P = 0.0286. Furthermore, our results showed that
across quartiles of increasing TIF energy intake, children in the third quartile consumed
significantly higher intakes of energy compared to children in the first quartile P < 0.05. In
addition, the results also showed that children in the second quartile consumed a
significantly higher intake of zinc compared to children in the first quartile P < 0.05. These
findings present the useful potential TIF may have in contributing to nutrients intake such as
energy, vitamin A and zinc. However, this study calls for further research in exploring the full
potential in TIF towards improved nutrients intake. Longitudinal studies that take into account
seasonality and wider categories of age and other geographical regions are recommended.

131
6.2.3 Street vending of traditional and indigenous food and the potential contribution
to household income, food security and dietary diversity: The case of Gaborone,
Botswana
In this study, quantitative results showed that income from TIF contributed substantially to
household income which was also confirmed from FGDs. However, the median income per
month is lower when compared to 2009/2010 national average household income of BWP
3936.12 (Statistics Botswana, 2010). This suggests that although vending TIF may present a
potential livelihood means, the income levels are relatively low. Our findings further showed
that almost three quarters of vendors households’ (74%) were food insecure. Median HDD
score was 4(3, 6) out of a total of 12 while the majority of the households (51.9%) fell into the
lowest group of HDD score (0-4) food groups. The low income levels in this study are in line
with the high levels of food insecurity and low household dietary diversity observed among
vendors’ households. Research shows that most urban dwellers, including those in
Gaborone, rely particularly on income to access food (Ruel et al., 2010; Battersby, 2011;
Acquah et al., 2014). This study found a positive correlation between monthly income from
sale of TIF and overall household income (r = 0.594, P = 0.004) and between the number of
TIF varieties for sale and HDD (r = 558, P = 0.002). This highlights that the selling of TIF may
not just be a livelihood strategy in terms of income, but also a coping strategy with food
insecurity. In this study, although the selling of TIF contributed a large proportion of
household income, we found no correlation between monthly income from sale of TIF and
HFIA scores, indicating there are other factors at play. This may be because there are other
sources of income that may fill the gap, an aspect that the study did not determine. From the
FGDs, it was mentioned that supply chains for TIF crossed boarders. The vendors discussed
that some of the TIF they sell came from as far away as Zambia. The implication is that there
is perhaps a poorly recognised food supply chain associated with TIF vending that should be
explored. Both raw and cooked TIF were sold (see Chapter 5 Table 2). Vending TIF may
have the potential to contribute to household income, food security and dietary diversity
among the households involved, however, this study calls for attention to factors related to
the supply chains of TIF and how these could be developed for the benefit of the vendors.
6.3 Study limitations
1. One limitation of this study was that there was no unified definition of traditional and
indigenous foods. While a group of local experts decided on selection criteria for TIF,
it was difficult to make a clear distinction between TIF and non-TIF in instances

132
where an introduced food has been part of cultural dishes for long periods of time and
may be purchased from retail outlets, hence, the research team had to define a new
concept.
2. Access to TIF was determined by means of a dietary diversity questionnaire - this
was only captured once during one particular season; hence, neglecting seasonal
availability of TIF. Therefore, seasonality may have contributed to fewer varieties of
TIF being accessible to the households compared to other seasons.
3. The QFFQ adapted and used showed that the relative validity of iron and vitamin A
(retinol), fruits and dark green leafy vegetables was poor (Jackson et al. 2013).
Therefore, results for these micronutrients and foods should be interpreted with
caution.
4. We used a 30 day QFFQ that required participants to report all the foods they
consumed in a month, therefore, due to recall bias, this would have influenced the
dietary intake to either over or underestimations.
5. Due to food composition tables not being available for Botswana, South African food
composition tables were used for nutrient analyses. Botswana relies heavily on food
imports from South Africa, therefore, the South African food composition food table
were appropriate for use. We do however acknowledge that there were some foods
that were traditional or indigenous to Botswana that were missing from the South
African food composition food table that had to be substituted with others of the same
type. This was in order due to the absence of nutrient composition of traditional or
indigenous foods globally as highlighted by (Charrondière et al., 2013).
6. This study did not investigate the dietary intake of TIF among individual women but
looked at the association between the number of TIF accessed at household level
and the women BMI. Individual TIF consumption and association with BMI may
require more research.
7. The study did not establish other sources of income among the TIF vendors. The
study recommends future studies to establish this for comparison purposes and get a
deeper understanding of the economic potential in vending TIF in relation to overall
household income, food security and dietary diversity.

133
8. Our study results cannot be generalised to the whole of Botswana due to the smaller
sample sizes involved. However, the sample sizes given for the quantitative data and
the qualitative component of the study were considered adequate to achieve the
study objectives (statistical consultation from Dr Suria Ellis, statistical section, North-
West University.
6.4 Conclusion
This study showed that food insecurity in terms of access and low diversified diets were
found to be highly prevalent in both urban and rural areas of Botswana and among the
vendors’ households. Large proportions of the households in the two rural and the two urban
areas were found to have access to TIF. This study highlights that TIF may present a useful
potential in contributing to household food security (access), household dietary diversity and
nutrients intake, especially energy, vitamin A and zinc. In addition, the study highlights that
vending TIF may contribute significantly to vendors’ household income and vendors’
household dietary diversity. However, there is a need to explore the potential benefits of
optimal use of TIF in contributing to household food security (access), household dietary
diversity, improved nutrients intake and vendors’ household income. This should also include
attention to related energy consumption and physical activity as these may influence nutrition
status outcomes. In addition, attention and research is required in understanding the factors
that relate to the supply chains of TIF and how these could be developed for the benefit of
the vendors.
6.5 Recommendations
1. Our findings showed that TIF formed integral part of the Batswana diets. The
research found associations of greater access to TIF with better household food
security (access) and higher household dietary diversity. Our findings further
demonstrated the vital role TIF may play in contributing to selected nutrients,
particularly energy, vitamin A and zinc. However, the study calls for further research
to explore the full potential of TIF towards improved household food security,
improved household dietary diversity and nutrients intake. Longitudinal studies that
take into account seasonality and wider categories of age and other geographical
regions are recommended. Additionally, the research recommends more qualitative
research to gain an in-depth understanding of TIF contribution to health as well as a

134
solid appreciation of the reasons attributed to their declining use in order to leverage
their benefits and reintroduce them back to communities.
2. The results also showed that households in urban areas had access to significantly
bigger variety of TIF compared to rural households. The research recommends future
studies to explore the extent to which TIF are channelled from rural to urban areas
through both formal and informal markets.
3. The research also showed that the supply chain of TIF crossed borders. The
recommendation is for further research that pays attention to factors relating to the
supply chains of TIF and how these could be developed for the benefit of vendors.
4. Further research attention is also needed to determine the nutrient content of TIF
towards developing food composition tables that include TIF.
5. Literature showed that previous research on TIF has focused mainly on TIF fruits and
vegetables. The research team therefore recommends supporting research on a
wider variety of TIF which will provide a more holistic understanding of TIF in various
aspects.

135
6.4 References
Acquah B, Kapunda S, Legwegoh A, (2014) The Dimensions of Urban Food Insecurity in
Gaborone, Botswana. Urban Forum; Springer 25, 217–226.
Battersby, J. 2011. Urban food insecurity in cape town, South Africa: an alternative approach
to food access. Development Southern Africa, 28(4):545-561.
Charrondière, U.R., Stadlmayr, B., Rittenschober, D., Mouille, B., Nilsson, E., Medhammar,
E., Olango, T., Eisenwagen, S., Persijn, D. & Ebanks, K. 2013. FAO/INFOODS food
composition database for biodiversity. Food Chemistry, 140(3):408-412.
Food and Agriculture Organization of the United Nations (2012) Traditional Foods: Better
Livelihoods, Dietary Diversity and Health. Rome: FAO; available at Italy:
http://teca.fao.org/technology/traditional-foods-better-livelihoods-dietary-diversity-and-health.
Jackson, M. D., B. S. Motswagole, L. D. Kwape, R. Kobue-Lekalake, T. B. Rakgantswana, T.
Mongwaketse, M. Mokotedi, and J. Jackson-Malete. 2013. "Validation and reproducibility of
an FFQ for use among adults in Botswana." Public Health Nutrition 16 (11):1995-2004.
Johnson-Down, Louise, and Grace M Egeland. 2010. "Adequate nutrient intakes are
associated with traditional food consumption in Nunavut Inuit children aged 3–5 years." The
Journal of Nutrition 140 (7):1311-1316.
Popkin BM, Adair LS, Ng SW (2012) Global nutrition transition and the pandemic of obesity
in developing countries. Nutrition Review 70, 3-21.
Ruel, M.T., garrett, J.L., Hawkes, C. & Cohen, M.J. 2010. The food, fuel, and financial crises
affect the urban and rural poor disproportionately: a review of the evidence. The Journal of
Nutrition, 140(1):170s-176s.
Statistics Botswana. Botswana core welfare indicators survey 2009/10. Statistics Botswana.
Gaborone. www.cso.gov.bw. 2013;1. Accessed July 20, 2017.

136
6.5 List of Addenda
Addendum 1: Instructions for authors Journal of Public Health nutrition
Public Health Nutrition (PHN) provides an international, peer-reviewed forum for the
publication and dissemination of research with a specific focus on nutrition-related public
health. The Journal publishes original and commissioned articles, high quality meta-analyses
and reviews, commentaries and discussion papers for debate, as well as special issues. It
also seeks to identify and publish special supplements on major topics of interest to readers.
SCOPE
The scope of Public Health Nutrition includes multi-level determinants of dietary intake and
patterns, anthropometry, food systems, and their effects on health-related outcomes. We
welcome papers that:
Address monitoring and surveillance of nutritional status and nutritional environments in
communities or populations at risk
Identify and analyse behavioral, sociocultural, economic, political, and environmental
determinants of nutrition-related public health
Develop methodology needed for assessment and monitoring
Inform efforts to improve communication of nutrition-related information
Build workforce capacity for effective public health nutrition action
Evaluate or discuss the effectiveness of food and nutrition policies
Describe the development, implementation, and evaluation of innovative interventions and
programs to address nutrition-related problems
Relate diet and nutrition to sustainability of the environment and food systems
Papers that do not fall within the scope as described above may be directed to more
appropriate journals. We prefer papers that are innovative (do not repeat research already
undertaken elsewhere) and relevant to an international readership.
ARTICLE TYPES
PHN publishes Research Articles, Short Communications, Review Articles, Letters to the
Editors, Commentaries and Editorials. Research Articles, Short Communications and Review
Articles should be submitted to http://mc.manuscriptcentral.com/phnutr. Please contact the
Editorial Office on [email protected] regarding any other types of submission.
A typical paper should be no more than 5000 words long, not including the abstract,
references, tables, figures and acknowledgements. Papers submitted as Short
Communications should consist of no more than 2000 words, plus a maximum of 3 tables
OR figures.
For systematic reviews and meta-analyses, the journal endorses the Preferred Reporting
Items for Systematic Reviews and Meta-Analyses (PRISMA) Statement (see British Medical
Journal (2009) 339, b2535). Such submissions should follow the PRISMA guidelines and
authors should include the PRISMA checklist with their submission (see instructions below).

137
Letters or commentaries are welcome that discuss, criticise or develop themes put forward in
papers published in PHN or that deal with matters relevant to it. They should not be used as
a means of publishing new work. Acceptance will be at the discretion of the Editorial Board,
and editorial changes may be required. Wherever possible, letters from responding authors
will be included in the same issue.
SUBMISSION AND REVIEW PROCESS
PHN uses ScholarOne Manuscripts for online submission and peer review. As part of the
online submission process, authors are asked to affirm that the submission represents
original work that has not been published previously; that it is not currently being considered
by another journal; and that each author has seen and approved the contents of the
submitted manuscript.
At submission, authors must nominate at least four potential referees who may be asked by
the Editorial Board to help review the work. PHN uses a double-blind review process, and
manuscripts are normally reviewed by two external peer reviewers and a member of the
Editorial Board.
Revisions must be resubmitted within 2 months or they will be deemed a new paper. When
substantial revisions are required after review, authors are normally given the opportunity to
do this once only; the need for any further changes should reflect only minor issues.
PUBLISHING ETHICS
PHN adheres to the Committee on Publication Ethics (COPE) guidelines on research and
publications ethics. The Journal considers all manuscripts on the strict condition that:
The manuscript is your own original work, and does not duplicate any previously published
work;
The manuscript has been submitted only to the journal - it is not under consideration or peer
review or accepted for publication or in press or published elsewhere;
All listed authors know of and agree to the manuscript being submitted to the journal; and
The manuscript contains nothing abusive, defamatory, fraudulent, illegal, libellous, or
obscene.
Text taken directly or closely paraphrased from earlier published work that has not been
acknowledged or referenced will be considered plagiarism. Submitted manuscripts in which
such text is identified will be withdrawn from the editorial process. Any concerns raised about
possible plagiarism or other violations of ethical guidelines in an article submitted to or
published in PHN will be investigated fully and dealt with in accordance with the COPE
guidelines.
DETAILED MANUSCRIPT PREPARATION INSTRUCTIONS
Language
Papers submitted for publication must be written in English and should be as concise as
possible. We recommend that authors have their manuscript checked by an English
language native speaker before submission, to ensure that submissions are judged at peer
review exclusively on academic merit.

138
We list a number of third-party services specialising in language editing and / or translation,
and suggest that authors contact as appropriate. Use of any of these services is voluntary,
and at the author's own expense.
Spelling should generally be that of the Concise Oxford Dictionary (1995), 9th ed. Oxford:
Clarendon Press. Authors are advised to consult a current issue in order to make themselves
familiar with PHN as to typographical and other conventions, layout of tables etc.
Authorship
The Journal conforms to the International Committee of Medical Journal Editors (ICMJE)
definition of authorship. Authorship credit should be based on:
Substantial contributions to conception and design, data acquisition, analysis and/or
interpretation;
Drafting the article or revising it critically for important intellectual content; and
Final approval of the version to be published.
The contribution of individuals who were involved in the study but do not meet these criteria
should be described in the Acknowledgments section.
Ethical standards
All submissions must abide by the guidelines in the World Medical Association (2000)
Declaration of Helsinki: Ethical Principles for Medical Research Involving Human Subjects,
with notes of clarification of 2002 and 2004
(http://www.wma.net/en/30publications/10policies/b3/ ), the Guidelines on the Practice of
Ethics Committees Involved in Medical Research Involving Human Subjects (3rd ed., 1996;
London: The Royal College of Physicians) and the Guidelines for the Ethical Conduct of
Medical Research Involving Children, revised in 2000 by the Royal College of Paediatrics
and Child Health: Ethics Advisory Committee (Arch Dis Child (2000) 82, 177–182).
PRISMA Checklist
For systematic reviews and meta-analyses, PHN requires completion of the Preferred
Reporting Items for Systematic Reviews and Meta-Analyses (PRISMA) checklist
(www.prisma-statement.org/). This policy includes all systematic reviews, including those for
observational studies. A completed copy of the checklist should be submitted along with the
manuscript, with page numbers noted as required. When a given item has not been
addressed, authors must provide an explanation.
Editors and reviewers will not evaluate manuscripts based on the number of items checked
off in the checklist. The purpose of the PRISMA guidelines is to recommend a critical set of
items that should typically be reported in a manuscript. The guidelines are meant to improve
transparency by helping authors improve the quality of their reporting. More clarity in
reporting will facilitate review of your manuscript and increase its value to readers.
Cover Letter
Authors are invited to submit a cover letter including a short explanation of how the article
advances the field of public health nutrition in terms of research, practice, or policy, and of its
relevance to an international readership. The text for the cover letter should be entered in the
appropriate box as part of the online submission process.

139
Title Page
Authors must submit a title page online as a separate file to their manuscript, to enable
double-blind reviewing. For the same reason, the information on the title page should not be
included in the manuscript itself. The title page should include:
The title of the article;
Authors’ names, given without titles or degrees;
Name and address of department(s) and institution(s) to which the work should be attributed
for each author, with each author’s institution(s) identified by a superscript number (e.g. A.B.
Smith1);
Name, mailing address, email address, telephone and fax numbers of the author responsible
for correspondence about the manuscript;
A shortened version of the title, not exceeding 45 characters (including letters and spaces) in
length;
Disclosure statements, as outlined below. These must be included on the title page and not
in the manuscript file, to enable double-blind reviewing; if the paper is accepted, they will
be inserted into the manuscript during production.
Acknowledgments
Here you may acknowledge individuals or organizations that provided advice and/or support
(non-financial). Formal financial support and funding should be listed in the following section.
Financial Support
Please provide details of the sources of financial support for all authors, including grant
numbers. For example, “This work was supported by the Medical research Council (grant
number XXXXXXX)”. Multiple grant numbers should be separated by a comma and space,
and where research was funded by more than one agency the different agencies should be
separated by a semi-colon, with “and” before the final funder. Grants held by different
authors should be identified as belonging to individual authors by the authors’ initials. For
example, “This work was supported by the Wellcome Trust (A.B., grant numbers XXXX,
YYYY), (C.D., grant number ZZZZ); the Natural Environment Research Council (E.F., grant
number FFFF); and the National Institutes of Health (A.B., grant number GGGG), (E.F., grant
number HHHH)”.
This disclosure is particularly important in the case of research supported by industry,
including not only direct financial support for the study but also support in kind such as
provision of medications, equipment, kits or reagents without charge or at reduced cost and
provision of services such as statistical analysis. All such support, financial and in kind,
should be disclosed here.
Where no specific funding has been provided for research, please provide the following
statement: “This research received no specific grant from any funding agency, commercial or
not-for-profit sectors.”
In addition to the source of financial support, please state whether the funder contributed to
the study design, conduct of the study, analysis of samples or data, interpretation of findings
or the preparation of the manuscript. If the funder made no such contribution, please provide

140
the following statement: "[Funder's name] had no role in the design, analysis or writing of this
article.”
Conflict of Interest
The Journal adheres to the definition of conflicts of interest given by the ICMJE guidelines. A
conflict of interest exists when an author has interests that might inappropriately influence his
or her judgement, even if that judgement is not influenced. Financial relationships such as
employment, consultancies, or honoraria, are the most easily identifiable conflicts of interest.
However, non-financial conflicts can also exist as a result of personal relationships,
academic competition, and personal or intellectual beliefs.
Having a conflict of interest is not in itself wrong, and not all relationships may lead to an
actual conflict of interest. However, PHN requires full disclosure about any relevant
relationships, even if the author or reviewer does not believe it affects their judgment. These
disclosures can then be used as a basis for editorial decisions. One question that provides
some guidance in deciding which relationships merit declaration as potential conflicts of
interest is this: if a relationship is not disclosed, would a reasonable reader feel misled?
When in doubt, full transparency is the best course of action. Perceived conflicts of
interest are as important as actual conflicts of interest, and undeclared conflicts (perceived
as well as actual) can undermine the credibility of both the journal and the authors.
So that others can make judgements about potential conflicts, please provide details of all
known financial and non-financial (professional and personal) relationships with the
potential to bias the work. Where no known conflicts of interest exist, please include the
following statement: “None.”
Authorship
Please provide a very brief description of the contribution of each author to the research.
Their roles in formulating the research question(s), designing the study, carrying it out,
analysing the data and writing the article should be made plain.
Ethical Standards Disclosure
Manuscripts describing experiments involving human subjects must include the following
statement: “This study was conducted according to the guidelines laid down in the
Declaration of Helsinki and all procedures involving human subjects/patients were approved
by the [name of the ethics committee]. Written [or Verbal] informed consent was obtained
from all subjects/patients.” Where verbal consent was obtained, this must be followed by a
statement such as: “Verbal consent was witnessed and formally recorded.”
Manuscript Format
The requirements of PHN are in accordance with the Uniform Requirements for Manuscripts
Submitted to Biomedical Journals produced by the ICMJE, and authors are encouraged to
consult the latest guidelines, which contain useful, general information about preparing
scientific papers. Authors should also consult the CONSORT guidelines for reporting results
of randomised trials.
For detailed instructions regarding mathematical modelling, statistical analysis and
nomenclature requirements, please refer to the Appendix to these instructions.

141
Typescripts should be prepared with 1.5 line spacing and wide margins (2 cm), the preferred
font being Times New Roman size 12. At the ends of lines, words should not be hyphenated
unless hyphens are to be printed. Line numbering and page numbering are required.
Manuscripts should be organised as follows:
Abstract
Each paper must open with a structured abstract of not more than 250 words. The abstract
should consist of the following headings: Objective, Design, Setting, Subjects, Results,
Conclusions. All the headings should be used, and there should be a separate paragraph for
each one. The abstract should be intelligible without reference to text or figures.
Keywords
Authors should list at least four keywords or phrases (each containing up to three words).
Introduction
It is not necessary to introduce a paper with a full account of the relevant literature, but the
introduction should indicate briefly the nature of the question asked and the reasons for
asking it.
Methods
For manuscripts describing experiments involving human subjects, the required ethical
standards disclosure statement must be included on the title page only as described
above. It will then be inserted into this section of the manuscript during production.
Results
These should be given as concisely as possible, using figures or tables as appropriate. Data
should not be duplicated in tables and figures.
Discussion
While it is generally desirable that the presentation of the results and the discussion of their
significance should be presented separately, there may be occasions when combining these
sections may be beneficial. Authors may also find that additional or alternative sections such
as ‘conclusions’ may be useful.
References
References should be numbered consecutively in the order in which they first appear in the
text using superscript Arabic numerals in parentheses, e.g. ‘The conceptual difficulty of this
approach has recently been highlighted(1,2)’. If a reference is cited more than once, the same
number should be used each time. References cited only in tables and figure legends should
be numbered in sequence from the last number used in the text and in the order of mention
of the individual tables and figures in the text.
Names and initials of authors of unpublished work should be given in the text as
‘unpublished results’ and not included in the References. References that have been
published online only but not yet in an issue should include the online publication date and
the Digital Object Identifier (doi) reference, as per the example below.
At the end of the paper, on a page(s) separate from the text, references should be listed in
numerical order using the Vancouver system. When an article has more than three authors

142
only the names of the first three authors should be given followed by ‘et al.’ The issue
number should be omitted if there is continuous pagination throughout a volume. Titles of
journals should appear in their abbreviated form using the NCBI LinkOut page. References
to books and monographs should include the town of publication and the number of the
edition to which reference is made. References to material available on websites should
follow a similar style, with the full URL included at the end of the reference, as well as the
date of the version cited and the date of access.
Examples of correct forms of references are given below.
Journal articles
Rebello SA, Koh H, Chen C et al.(2014) Amount, type, and sources of carbohydrates in
relation to ischemic heart disease mortality in a Chinese population: a prospective cohort
study. Am J Clin Nutr100, 53-64.
Villar J, Ismail LC, Victora CG et al. (2014) International standards for newborn weight,
length, and head circumference by gestational age and sex: the Newborn Cross-Sectional
Study of the INTERGROWTH-21st Project. Lancet384, 857-868.
Alonso VR & Guarner F (2013) Linking the gut microbiota to human health. Br J Nutr109,
Suppl. 2, S21–S26.
Bauserman M, Lokangaka A, Gado J et al. A cluster-randomized trial determining the
efficacy of caterpillar cereal as a locally available and sustainable complementary food to
prevent stunting and anaemia. Public Health Nutr. Published online: 29 January 2015. doi:
10.1017/S1368980014003334.
Books and monographs
Bradbury J (2002) Dietary intervention in edentulous patients. PhD Thesis, University of
Newcastle.
Ailhaud G & Hauner H (2004) Development of white adipose tissue. In Handbook of Obesity.
Etiology and Pathophysiology, 2nd ed., pp. 481–514 [GA Bray and C Bouchard, editors].
New York: Marcel Dekker.
Bruinsma J (editor) (2003) World Agriculture towards 2015/2030: An FAO Perspective.
London: Earthscan Publications.
World Health Organization (2003) Diet, Nutrition and the Prevention of Chronic Diseases.
Joint WHO/FAO Expert Consultation. WHO Technical Report Series no. 916. Geneva: WHO.
Keiding L (1997) Astma, Allergi og Anden Overfølsomhed i Danmark – Og Udviklingen
1987–199I (Asthma, Allergy and Other Hypersensitivities in Denmark, 1987–1991).
Copenhagen, Denmark: Dansk Institut for Klinisk Epidemiologi.
Sources from the internet
Nationmaster (2005) HIV AIDS – Adult prevalence rate. http://www.nationmaster.com/graph-
T/hea_hiv_aid_adu_pre_rat (accessed June 2013).
Tables
Tables should be placed in the main manuscript file at the end of the document, not within
the main text. Be sure that each table is cited in the text. Tables should carry headings

143
describing their content and should be comprehensible without reference to the text. Tables
should not be subdivided by ruled lines.
The dimensions of the values, e.g. mg/kg, should be given at the top of each column.
Separate columns should be used for measures of variance (SD, SE etc.), the ± sign should
not be used. The number of decimal places used should be standardised; for whole numbers
1.0, 2.0 etc. should be used. Shortened forms of the words weight (wt) and height (ht) may
be used to save space in tables.
Footnotes are given in the following order: (1) abbreviations, (2) superscript letters, (3)
symbols. Abbreviations are given in the format: RS, resistant starch. Abbreviations in tables
must be defined in footnotes in the order that they appear in the table (reading from left to
right across the table, then down each column). Symbols for footnotes should be used in the
sequence: *†‡§||¶, then ** etc. (omit * or †, or both, from the sequence if they are used to
indicate levels of significance).
For indicating statistical significance, superscript letters or symbols may be used. Superscript
letters are useful where comparisons are within a row or column and the level of significance
is uniform, e.g. ‘a,b,cMean values within a column with unlike superscript letters were
significantly different (P<0•05)’. Symbols are useful for indicating significant differences
between rows or columns, especially where different levels of significance are found, e.g.
‘Mean values were significantly different from those of the control group: *P<0•05, **P<0•01,
***P<0•001’. The symbols used for P values in the tables must be consistent.
Figures
Figures should be supplied as separate electronic files. Figure legends should be grouped in
a section at the end of the manuscript text. Each figure should be clearly marked with its
number and separate panels within figures should be clearly marked (a), (b), (c) etc. so that
they are easily identifiable when the article and figure files are merged for review. Each
figure, with its legend, should be comprehensible without reference to the text and should
include definitions of abbreviations.
We recommend that only TIFF, EPS or PDF formats are used for electronic artwork. Other
formats (e.g., JPG, PPT and GIF files and images created in Microsoft Word) are usable but
generally NOT suitable for conversion to print reproduction. For further information about
how to prepare your figures, including sizing and resolution requirements, please see our
artwork guide.
In curves presenting experimental results the determined points should be clearly shown, the
symbols used being, in order of preference, ○, ●, ∆, ▲, □, ■, ×, +. Curves and symbols
should not extend beyond the experimental points. Scale-marks on the axes should be on
the inner side of each axis and should extend beyond the last experimental point. Ensure
that lines and symbols used in graphs and shading used in histograms are large enough to
be easily identified when the figure size is reduced to fit the printed page.
Colour figures will be published online free of charge, and there is a fee of £250 per figure for
colour figures in the printed version. If you request colour figures in the printed version, you
will be contacted by CCC-Rightslink who are acting on our behalf to collect colour charges.
Please follow their instructions in order to avoid any delay in the publication of your article.
Supplementary material

144
Additional data (e.g. data sets, large tables) relevant to the paper can be submitted for
publication online only, where they are made available via a link from the paper. The paper
should stand alone without these data. Supplementary Material must be cited in a relevant
place in the text of the paper.
Although Supplementary Material is peer reviewed, it is not checked, copyedited or typeset
after acceptance and it is loaded onto the journal’s website exactly as supplied. You should
check your Supplementary Material carefully to ensure that it adheres to journal styles.
Corrections cannot be made to the Supplementary Material after acceptance of the
manuscript. Please bear this in mind when deciding what content to include as
Supplementary Material.
License to Publish form
Authors or their institutions retain copyright of papers published in PHN. The corresponding
author is asked to complete a License to Publish form on behalf of all authors, and upload
this with the manuscript files at the time of submission. The form includes confirmation that
permission for all appropriate uses has been obtained from the copyright holder for any
figures or other material not in the authors’ copyright, and that the appropriate
acknowledgement has been made to the original source. If the manuscript is not accepted,
the form will be destroyed.
Open Access
Authors in PHN have the option to publish their paper under a fully Open Access agreement,
upon payment of a one-off Article Processing Charge. In this case, the final published
Version of Record will be made freely available to all in perpetuity under a creative commons
license, enabling its re-use and re-distribution. This Open Access option is only offered to
authors upon acceptance of an article for publication.
Authors choosing the Open Access option are required to complete the Open Access
License to Publish form. More information about Open Access in PHN, including the current
Article Processing Charge, can be found on our website.
Accepted Manuscripts
PDF proofs are sent to authors in order to make sure that the paper has been correctly set
up in type. Only changes to errors induced by typesetting/copy-editing or typographical
errors will be accepted. Corrected proofs should be returned within 2 days by email to Gill
Watling at [email protected]. If corrected proofs are not received from authors
within 7 days the paper may be published as it stands.
Offprints
A PDF file of the paper will be supplied free of charge to the corresponding author of each
paper, and offprints may be ordered on the order form sent with the proofs.
CONTACT
Prospective authors may contact the Editorial Office directly on +44 (0) 1223 327954
(telephone) or [email protected].
Additionally, more information about the journal, including recent issues, can be found at
http://journals.cambridge.org/phn.
APPENDIX: MATHEMATICAL MODELLING, STATISTICS AND NOMENCLATURE

145
Addendum 2: Instructions for authors Journal of Ecology of Food and Nutrition
Thank you for choosing to submit your paper to us. These instructions will ensure we have
everything required so your paper can move through peer review, production and publication
smoothly. Please take the time to read and follow them as closely as possible, as doing so
will ensure your paper matches the journal’s requirements. For general guidance on the
publication process at Taylor & Francis please visit our Author Services website.
Please note that Ecology of Food and Nutrition uses CrossCheck™ software to screen
papers for unoriginal material. By submitting your paper to Ecology of Food and Nutrition you
are agreeing to any necessary originality checks your paper may have to undergo during the
peer review and production processes.
Submission of Manuscripts
Ecology of Food and Nutrition receives all manuscript submissions electronically via its
ScholarOne Manuscripts site located at: http://mc.manuscriptcentral.com/gefn. ScholarOne
Manuscripts allows for rapid submission of original and revised manuscripts, as well as
facilitating the review process and internal communication between authors, editors and
reviewers via a web-based platform. ScholarOne Manuscripts technical support can be
accessed via http://scholarone.com/services/support. If you have any other requests, please
contact Sunil Khanna, the journal’s Editor, at [email protected].
Preparation of Manuscripts
All parts of the manuscript should be typewritten, double-spaced, with margins of at least
one inch on all sides. Number manuscript pages consecutively throughout the paper.
Although manuscript length may vary according to the type of paper or subject matter,
Ecology of Food and Nutrition publishes manuscripts that are generally in the range of
6,000–7,000 words (including all supplementary materials). Authors should also supply a
shortened version of the title suitable for the running head, not exceeding 50 character
spaces. Each article should be summarised in an abstract of not more that 100 words. Avoid
abbreviations, diagrams, and reference to the text. Authors are reminded that publications
reporting results from research involving human subjects are required to include a statement
in the Methods section of their manuscript that the study protocol has been approved by an
Institutional Review Board (IRB) in the Institution where the study was conducted.
Furthermore, such a statement should include documentation that informed consent was
obtained from the study subjects or their parents when children are involved.
Authors are responsible for obtaining permission to reproduce copyrighted material from
other sources and are required to sign an agreement for the transfer of copyright to the
publisher. As an author, you are required to secure permission if you want to reproduce any
figure, table, or extract from the text of another source. This applies to direct reproduction as
well as "derivative reproduction" (where you have created a new figure or table which derives
substantially from a copyrighted source). All accepted manuscripts, artwork, and
photographs become the property of the publisher.
Illustrations

146
Illustrations submitted (line drawings, halftones, photos, photomicrographs, etc.) should be
clean originals or digital files. Digital files are recommended for highest quality reproduction
and should follow these guidelines:
300 dpi or higher
sized to fit on journal page
EPS, TIFF, or PSD format only
submitted as separate files, not embedded in text files
Color Reproduction
Color art will be reproduced in color in the online publication at no additional cost to the
author. Color illustrations will also be considered for print publication; however, the author
will be required to bear the full cost involved in color art reproduction. Please note that color
reprints can only be ordered if print reproduction costs are paid. Print Rates: $900 for the first
page of color; $450 per page for the next three pages of color. A custom quote will be
provided for articles with more than four pages of color. Art not supplied at a minimum of 300
dpi will not be considered for print.
Tables and Figures
Tables and figures should not be embedded in the text, but should be included as separate
files. A short descriptive title should appear above each table with a clear legend and any
footnotes suitably identified below. All units must be included. Figures should be completely
labeled, taking into account necessary size reduction. Captions should be typed, double-
spaced, on a separate sheet.
References
Ecology of Food and Nutrition uses The Chicago Manual of Style, 15th ed. The full list of
references should be collected at the end of the paper in alphabetical order. In the text,
references should be cited by author’s last name and date of publication in parentheses
(Smith 1979). List 1–2 authors on every mention; list 3 authors on the first mention and only
the first author and “et al.” on subsequent mentions; and list 4 or more authors by the first
author and “et al.” on all mentions. In the references, list all author names for up to 10
authors; list only the first 7 and “et al.” for references with 11 or more authors. First initials
precede last names for all author names except the first author. Use “and” not “&” in all text
citations and the references.
Journal: Annegers, J. F. 1974. Protein quality of West African foods. Ecology of Food and
Nutrition 3:125–130.
Book: Hill, A. B. 1989. Statistical methods in clinical and preventative medicine. New York:
Oxford University Press.
Chapter in a Book: Ruffner, J. D., and W. W. Steiner. 1973. Evaluation of plants for use in
critical sites. In Ecology and reclamation of devastated land, ed. R. J. Hutnick and G. Jones,
3–12. New York: Gordon and Breach.

147
Proofs and Complimentary Policy
The corresponding author will receive proofs, which should be proofread and returned within
48 hours of receipt. Corrections are limited to printer’s errors—no substantial author’s
changes will be made. Authors for whom we receive a valid email address will be provided
an opportunity to purchase reprints of individual articles, or copies of the complete print
issue. These authors will also be given complimentary access to their final article on Taylor &
Francis Online.

148
Addendum 3: Content and style guidelines for the Journal of Hunger and Environmental
Nutrition
Instructions for authors
Thank you for choosing to submit your paper to us. These instructions will ensure we have
everything required so your paper can move through peer review, production and publication
smoothly. Please take the time to read and follow them as closely as possible, as doing so will ensure
your paper matches the journal's requirements. For general guidance on the publication process at
Taylor & Francis please visit our Author Services website.
This journal uses ScholarOne Manuscripts (previously Manuscript Central) to peer review manuscript
submissions. Please read the guide for ScholarOne authors before making a submission. Complete
guidelines for preparing and +
q-+
your manuscript to this journal are provided below. -+-+
Aims and Scope
Journal of Hunger & Environmental Nutrition is the premier peer-reviewed journal among
professionals interested in nutrition, food and water security, health, agriculture and the
environment.
Journal of Hunger & Environmental Nutrition:
provides a distinguished venue for the publication of original articles prepared by scholars
and practitioners in the field and reviewed by qualified peers
publishes manuscripts that advance knowledge across the range of research and practice
issues in nutrition, food and water security, health, agriculture and the environment
supports the professional growth of researchers and practitioners in these areas.
Journal of Hunger & Environmental Nutrition studies the growing connection and interdependence
between the environment, food, nutrition, and health. It comprehensively examines local, national
and international hunger and environmental nutrition issues—specifically food access, food security,
food production, agriculture, and the interconnectedness on nutrition and health. The journal is
designed to provide current research and application information on public policy, legislation, and
regulation related to sustainable ecosystems and the link with maintaining optimal nutrition and
well-being for all people.

149
Please note that Journal of Hunger & Environmental Nutrition uses CrossCheck™ software to screen
papers for unoriginal material. By submitting your paper to Journal of Hunger & Environmental
Nutrition you are agreeing to any necessary originality checks your paper may have to undergo
during the peer review and production processes.
Submission of Manuscripts:
Journal of Hunger & Environmental Nutrition receives manuscript submissions electronically via its
ScholarOne Manuscripts site located at http://mc.manuscriptcentral.com/when. ScholarOne
Manuscripts allows for rapid submission of original and revised manuscripts and facilitates the
review process and internal communication between authors, editors, and reviewers via a web-
based platform. ScholarOne technical support can be accessed at
http://scholarone.com/services/support/. If you have any other requests, please contact the
journal’s Editor, Dr. Marie Boyle Struble, at [email protected].+-
The manuscripts should be double-spaced (including endnotes and references). Leave one-inch
margins on all four sides. Set all notes as endnotes. Submit a cover page with the manuscript,
indicating only the article title and an ABSTRACT of about 100 words (below the abstract provide 3-
10 key words for indexing purposes); (this is used for anonymous refereeing). Include a second "title
page" with the manuscript. The second "title page" should include the title; full authorship; an
ABSTRACT of about 100 words (below the abstract provide 3-10 key words for indexing purposes); a
header or footer on each page with abbreviated title and page number of total (e.g., pg 2 of 7); and
an introductory note with authors' academic degrees, professional titles, affiliations, mailing and e-
mail addresses, and any desired acknowledgment of research support or other credit.
Reports of original research (“Research Articles”) should be approximately 25 typed pages (including
references and abstract). Reports of results from a small or non-representative sample or report on
secondary results from a larger study (“Research Briefs”) should be approximately 14 typed pages.
Program and/or project “snapshots” that give a program or project’s mission, objectives,
implementation process, outcomes, and evaluation (“Field Notes”) should be no longer than 250-500
words. Timely expressions of sensible criticism or reaction to published material (“Letters to the
Editor”) should be no longer than 200 words. Lengthier manuscripts may be considered, but only at
the discretion of the Editor. Sometimes lengthier manuscripts may be considered if they can be
divided up into papers for publication in successive journal issues.
INCONSISTENCIES MUST BE AVOIDED. Be sure you are consistent in your use of abbreviations,
terminology, and in citing references, from one part of your paper to another. Words should be
underlined only when it is intended that they be typeset in italics.
If your paper is accepted by the editor contingent upon changes that are mandated by anonymous
specialist referees and/or members of the editorial board and if the editor returns your manuscript
for revisions, you are responsible for retyping any sections of the paper to incorporate these
revisions (if applicable, revisions should also be put on disk).
Each manuscript must be accompanied by a statement that it has not been published elsewhere and
that it has not been submitted simultaneously for publication elsewhere. Authors are responsible for
obtaining permission to reproduce copyrighted material from other sources and are required to sign
an agreement for the transfer of copyright to the publisher. All accepted manuscripts, artwork, and
photographs become the property of the publisher.

150
Prior to publication, all accepted papers are edited for style and grammar by Taylor & Francis’s
copyeditors.
References
References should be presented in a separate section at the end of the document, in accordance
with AMA Manual of Style (10th ed.) guidelines. The references should be listed and numbered
based on the order of their first citation. Every reference should be assigned its own unique number.
References should not be repeated in the list, with each mention given a different reference number,
nor should multiple references be combined under a single reference number. Superscripted digits
should be used for in-text citations Superscripted citations should only follow terminal punctuation
(e.g., periods, commas, closed quotation marks, question marks, exclamation points). Reference
numbers should not be subscripted.
Author listings in references should be formatted as indicated below.
1 author Smith A.
2 to 6 authors Smith A, Jones B, Smythe C, Jonesy D, Smitty E, Jonesi F.
7 or more authors Smith A, Jones B, Smythe C, et al.
Models from US National Library of Medicine (NLM) resources (e.g., MEDLINE, Index Medicus)should
be employed for abbreviating journal titles in the reference section. Examples of common reference
types appear below.
Journal article
12. Taylor J, Ogilvie BC. A conceptual model of adaptation to retirement among
athletes: a meta-analysis. J Appl Sport Psychol. 1994;6(1):1–20.
doi:10.1080/10413209408406462.
Book
2. Duke JA. Handbook of Phytochemical Constituents of GRAS Herbs and Other
Economic Plants. Boca Raton, FL: CRC Press; 2001.
Book with titled volume
and edition
18. Bowlby J. Loss: Sadness and Depression.Vol. 3 of Attachment and Loss. 3rd ed.
New York, NY: Basic Books; 1982.
Edited book chapter
34. Gordon S, Lavallee D. Career transitions in competitive sport. In: Morris T,
Summers J, eds. Sport Psychology: Theory, Applications and Issues. 2nd ed.
Brisbane, Australia: Wiley; 2004:584–610.
Edited book chapter
with volume and edition
26. Remael A. Audiovisual translation. In: Gambier Y, van Dooslaer L, eds.
Handbook of Translation Studies. Vol. 1. 2nd ed. Amsterdam, Netherlands: John
Benjamins; 2012:12–17.
Online/Website
8. United States Census Bureau. American housing survey: 2013 detailed tables .
United States Census Bureau Web site. http://www.census.gov/newsroom/press-
releases/2014/cb14-tps78.html. Published October 16, 2014. Accessed October
21, 2014.
Dissertation/Thesis
26. Allison N. Bacterial Degradation of Halogenated Aliphatic Acids [dissertation].
Nottingham, UK: Trent Polytechnic; 1981.

151
Conference
presentation
4. Alfermann D, Gross A. Coping with career termination: it all depends on
freedom of choice. Paper presented at: 9th
Annual World Congress on Sport Psychology; January 23, 1997; Netanya, Israel.
Paper/Report
55. Grigg W, Moran R, Kuang M. National Indian Education Study. Washington DC:
National Center for Education Statistics; 2010. NCES publication 2010-462.
Newspaper
22. Protzman, F. Clamor in the East: East Berliners explore land long forbidden.
New York Times. November 10, 1989:A1, A14.
Patent
67. Pfeifer A, Muhs A, Pihlgren M, Adolfsson O, Van Leuven F, inventors; AC
Immune S.A, Katholieke Universiteit Leuven, assignees. Humanized tau antibody.
US patent 9,657,091. May 23, 2017.
Computer software
with developer
10. Noguera J, Cumby C. SigmaXL [computer software]. Version 8.0. Kitchener,
Canada: SigmaXL, Inc; 2017.
Computer software
without developer 76. SPSS Amos [computer software]. Version 22.0. Armonk, NY: IBM; 2013.
Illustrations
Illustrations submitted (line drawings, halftones, photos, photomicrographs, etc.) should be clean
originals or digital files. Digital files are recommended for highest quality reproduction and should
follow these guidelines:
300 dpi or higher
sized to fit on journal page
EPS, TIFF, or PSD format only
submitted as separate files, not embedded in text files.
Color Reproduction
Color art will be reproduced in color in the online publication at no additional cost to the author.
Color illustrations will also be considered for print publication; however, the author will be required
to bear the full cost involved in color art reproduction. Please note that color reprints can only be
ordered if print reproduction costs are paid. Print Rates: $900 for the first page of color; $450 per
page for the next three pages of color. A custom quote will be provided for articles with more than
four pages of color. Art not supplied at a minimum of 300 dpi will not be considered for print. Please
ensure that color figures and images submitted for publication will render clearly in black & white
conversion for print.
Tables and Figures
Tables and figures should not be embedded in the text, but should be included as separate files. A

152
short descriptive title should appear above each table with a clear legend and any footnotes suitably
identified below. All units must be included. Figures should be completely labeled, taking into
account necessary size reduction. Captions should be typed, double-spaced, in a separate file. In the
text file, skip extra lines and indicate where these figures are placed. For final hardcopy submission,
tables and figures should be on disk or CD-ROM accompanying your manuscript.
Proofs
Page proofs are sent to the designated author using Taylor & Francis’ Central Article Tracking System
(CATS). They must be carefully checked and returned within 48 hours of receipt.
Reprints and Issues
Authors for whom we receive a valid email address will be provided an opportunity to purchase
reprints of individual articles, or copies of the complete print issue. These authors will also be given
complimentary access to their final article on Taylor & Francis Online.
Open Access
Taylor & Francis Open Select provides authors or their research sponsors and funders with the
option of paying a publishing fee and thereby making an article permanently available for free online
access – open access – immediately on publication to anyone, anywhere, at any time. This option is
made available once an article has been accepted in peer review. Full details of our Open Access
program
Taylor & Francis Statement on Ethics
We expect all authors submitting to a Taylor & Francis journal to adhere to the following ethical
guidelines:
• All authors must warrant that their article is their own original work, which does not infringe the
intellectual property rights of any other person or entity, and cannot be construed as plagiarizing any
other published work, including their own previously published work.
• All authors named on the paper are equally held accountable for the content of a submitted
manuscript or published paper.
• The corresponding author must ensure all named co-authors consent to publication and to being
named as a co-author. All persons who have made significant scientific or literary contributions to
the work reported should be named as co-authors.
• Authors must not submit a manuscript to more than one journal simultaneously.
• Authors should not submit previously published work, nor work which is based in substance on
previously published work, either in part or whole.
• Authors must appropriately cite all relevant publications. Information obtained privately, as in
conversation, correspondence, or discussion with third parties, should not be used or reported in the
author’s work unless fully cited, and with the permission of that third party.

153
• Authors must make available all necessary formal and documented ethical approval from an
appropriate research ethics committee, including evidence of anonymization and informed consent
from the client(s) or patient(s) studied, if appropriate.
• Authors must follow national and international procedures that govern the ethics of
experimentation on humans and animals. Research reported in the paper must be conducted in an
ethical and responsible manner, in full compliance with all relevant codes of experimentation and
legislation. All papers which report in vivo experiments or clinical trials on humans or animals must
include a written statement in the Methods section that such work was conducted with the formal
approval of the local human subject or animal care committees, and that clinical trials have been
registered as legislation requires.
• Authors must include all appropriate warnings concerning any specific and particular hazards that
may be involved in carrying out experiments or procedures described in the article or involved in
instructions, materials, or formulae in the article; include explicitly relevant safety precautions, and
cite, if an accepted standard or code of practice is relevant, a reference to the relevant standard or
code.
• If required, authors must facilitate access to data sets described in the article.
• Authors must avoid making defamatory statements in submitted articles which could be
construed as impugning any person’s reputation.
• Authors must declare any potential conflict of interest – be it professional or financial – which
could be held to arise with respect to the article.
• Authors must disclose all sources of funding for the research reported in the paper.
• If asked to provide a list of suggested reviewers, authors must provide the correct details for
suitable reviewers with the appropriate experience to review, ensuring that the suggested reviewers
do not have a conflict of interest.

154
Browse journals by subject
Back to top
Area Studies
Arts
Behavioral Sciences
Bioscience
Built Environment
Communication Studies
Computer Science
Development Studies
Earth Sciences
Economics, Finance, Business & Industry
Education
Engineering & Technology
Environment & Agriculture
Environment and Sustainability
Food Science & Technology
Geography
Health and Social Care
Humanities
Information Science
Language & Literature
Law
Mathematics & Statistics

155
Medicine, Dentistry, Nursing & Allied Health
Museum and Heritage Studies
Physical Sciences
Politics & International Relations
Social Sciences
Sports and Leisure
Tourism, Hospitality and Events
Urban Studies
Information for
Authors
Editors
Librarians
Societies
Open access
Overview
Open journals
Open Select
Cogent OA
Help and info
Help
FAQs
Press releases
Contact us
Commercial services
Connect with Taylor & Francis
Copyright © 2017 Informa UK Limited Privacy policy & cookies Terms & conditions Accessibility
Registered in England & Wales No. 3099067
5 Howick Place | London | SW1P 1WG

156
Addendum 4: Ethics PhD study
Ethics PhD study Ministry of Health Botswana

157

158

159
Addendum 5: Editors certificate
33 Little Gables Duzi Street Little Falls Roodepoort 1726 05 August 2017
To whom it may concern RE: Utilisation of traditional and indigenous foods and their potential contribution to consumers’ nutrition and vendors’ income in Botswana This serves to confirm that I undertook the editing of the main body of the above-mentioned thesis on behalf of SN Kasimba. This excluded checking references and List of Addenda. I gave her firm changes, which she applied as well as recommendations to improve readability. Should you have any queries, please contact me on 083 442 7715 Kind regards Elizabeth Sibanda 083 442 7715

160
Addendum 6: TIF foods substituted with other foods from the MRC FoodFinder
TIF foods substituted with other foods in the MRC FoodFinder
TIF Food item
Name in Setswana Name in English Food substituted with
Mogorogorwane Wild orange Oranges
Morogo wa dinawa Beans leaves Pumpkin leaves
Seswaa Pounded beef Minced meat
Morogo wa ditonki Wild amaranth Amaranth leaves
Nama ya tonki Donkey meat Beef meat
Tswii Wild potato Potatoes
Mowana Baobab fruit Oranges
Rothwe Spider plant leaves Pumpkin leaves
Lerotse Wild melon Water melon
Moretlwa Wild raisins Raisins
Impala meat Goat meat
Kukama Goat meat

161
Addendum 7: list of traditional and indigenous foods (TIF) and non-TIF
Indigenous foods and dishes
Setswana name English or Scientific name
Bogobe jwa mabele Sorghum meal stiff porridge
Mosulthwane Dehulled sorghum grains
Bogobe jwa lerotse Sorghum and melon meal
Thepe Amaranth leaves
Rothwe Spider plant leaves
Lerotse Wild water melon
Seswaa Pounded beef
Mae a ntshe Ostrich eggs
Mae a kgaka Guinea fowl eggs
Morogo wa dinawa Bean leaves
Tswii Sweet potato from water lily plant
Mahupu Truffles
Leruswa Wild potatoes
Morogo wa ditonki Wild amaranthus
Delele Okra
Morogo wa lepushe Pumpkin leaves
Dithotse tsa lephutshe Pumpkin seeds
Ntšhê Sweet reed
Mowana Baobab fruit
Mowana yoghurt Baobab yogurt
Lekwesha Wild pumpkin
Morula Sclerocarya birrea
Motoroko Prickly pears
Morojwa African chewing gum
Mmilo Wild meddler
Moretologa Monkey orange
Moretlwa Wild raisin berry
Motsotsojane Grewia flavescens Juss
Mogorogorwane Strychnos cocculoides
Mokongwa, Ricinodendron rautanenji
Motsiara Terminalia prurioides,
Motsotsojane Grewia flavescenes
Mokoyo Ficus abutilifolia
Mogwagwa Strychnos madagarscariensis
Moretologa Ximenia Americana
Mowana Adansonia digitata
Mochaba Ficus sycomorus
Motlopi coffee Shepherds tree coffee
Motsiara tea Terminalia prunioides
Morupaphiri Rhus tenuinervis
Mmilo juice Wild medlar juice
Moretlwa Grewia flava
Mokgomphata Grewia flavescens
Mokgalo Ziziphus mucronata
Mmupudu Vangueriopsis lanciflora (Hiern.)
Dicheru Morula nut
Mohanana (unidentified)

162
Monaba (unidentified)
Motatane (unidentified)
Maphoko (unidentified)
Lerophela (unidentified)
kganyane, (unidentified)
Tuane (unidentified)
Mokgotlthane (unidentified)
Morara (unidentified)
Manthofi (unidentified)
Morara (unidentified)
Mokabi (unidentified)
Wild birds
Game meat
Traditional foods and dishes
Paleche Maize meal stiff porridge
Magunya Deep fried flour dough,
Mmidi Maize on the cob
Samp Dehulled corn
Dikgobe Dehulled corn with beans
Dikgobe tsa lechotlho Beans with dried fresh maize
Phaphata Roasted bread
Lebelebele Millet porridge
Dipotata Sweet potatoes
Red peas Red peas
Kabu Dried boiled maize
Black eye beans Black eye beans
Serobe Tripe
Ditloo White Bambara groundnuts
Manoko Peanuts
Dinawa tsa Setswana Setswana beans
Letlhodi Lentils
Dobi Sorghum porridge with milk
Dikgobe tsa lechotlho Beans with dried fresh maize
Dithotse tsa lerotse Pumpkin seeds
Mashi Whole milk
Madila Fermented milk
Masi ya pudi Goat milk
Masi ya tonki Donkey milk
Koko Traditional chicken meat
Mae a koko Traditional chicken eggs
Nama ya Kgomo Beef meat
Nama ya podi Goat meat
Paraga Fish species
Lerotse Water melon
Makatane Wild melon
Ogondivi Fat from the neck of cow
Lebebe Cow’s milk cream fat
Dikgadika Fat from sheep
Lemepe Honey from bees
Bojalwa jwa mabele Traditional beer
Legalalatshwene Herbal tea

163
Bojalwa jwa morula Morula beer
Gemmere Ginger drink
Tomatoes
Mutton meat
Bream fish
Non- TIF
Malutu Fortified a fortified pre-cooked sorghum soya meal
Tsabana fortified extruded sorghum-soy meal
Coarsely crushed corn kernels Meal rice
White bread
Brown bread
Pasta
Breakfast cereals
Potatoes
Baked beans
Tuna fish
Texturized vegetable protein e.g. soy chunks
Sugar beans
Evaporated milk
Skimmed milk
Powdered milk
Condensed milk
Soy milk
Cheese
Ice cream
Yorghurt
Cream cheese
Minced meat
Corned beef
Processed meats such as sausage, vienna, polony etc.
Canned fish
Salted fish
Carrots
Spinach
Rape
Chomolia
Broccoli
Cauli flower
Lettuce
Cucumber
Pepper
Cabbage
Beet root
Orange grape fruit
Pawpaw
Mango
Banana
Apple
Peach
Pear

164
Lemon
Kiwi fruit
Strawberry
Pineapple
Guava
Butter
Salad dressing mayonnaise
Cheese snacks
Margarine
Sweets
Sugar
Soda or sweetened beverages
Fruit juices
Cookies
Biscuits
Cakes
Sugarcane
Beer
Whisky
Wine
Coffee
Tea
Chocolate

165
Addendum 8: Study questionnaires
Demographic Socioeconomic Questionnaire
Household code----------------------------Setting-------------------Location-------------
Household plot number ---------------Name of interviewer ------------ Date of interview-------------
Respondent Name----------------Respondent Tel number...............
1. Marital status of respondent (Tick one):
1 2 3 4 5 6 7
Single Married Divorced Separated Widowed Cohabitation Other
Please
Specify
2. Education level of respondent
1 2 3 4 5 6
None Primary
School
Junior
school
Senior
secondary
Tertiary Education Don’t
know
3. Gender of Head of Household M F
4. Occupation of household head.....................
5. Number of people you are staying with in the same household..................
6. Household income
per month (including
wages, rent, sales of
vegs, etc. State
grants)
(Tick one only)
1 2 3 4 5 6 7 8
None < P600 P600 –
1500
P1501-
3000
P3001-
6000
P6001-
9000
>P900
0
Don’t
know
7. How much money
is spent on food
weekly? (Tick one
only)
1 2 3 4 5 6 7 8 9 10
P0-
P50
P50-
P100
P100
-
P150
P150
-
P200
P200
-
P250
P250
-
P300
P300
-
P350
P350
-
P400
Over
P400
Don’t
know
8. Where do you get drinking 1 2 3 4 5

166
water most of the time? (Tick
one)
Own Tap
Commun
al
Tap
River,
Dam
Borehole,
Well
Other:
Specify
9. What type of toilet does this
household have? (Tick one)
1 2 3 4 5
Flush
Pit
Bucket,
Pot
Ventilated
Improved
Pit latrine
(VIP)
Other
(Specify)
10. What fuel is used for
cooking most of the time? (You
can tick more than one)
1 2 3 4 5 6
Electric
Gas
Paraffin
Wood/
Coal
Sun
Open Fire
Tick one
block only
for every
question
Self Spouse Father Mother Sibling Aunt Uncle Cousin Friend Other
1 2 3 4 5 6 7 8 9 10
11. Who is
mainly
responsible
for food
preparation
in the
house
12. Who
decides on
what types
of food are
bought for
the
household?
13. Who
decides
how much
is spent on
food?

167
Household and Dietary Diversity Questionnaire
Respondent (Person responsible for food preparation)
Please describe the foods (meals and snacks) that were prepared at home and eaten or
drank from home or carried and eaten away from home yesterday by any household
member during the day and night. Include also foods that were purchased and eaten at
home by any house hold member. Start with the first food or drink in the morning
Time Dish Ingredient
Source for
obtaining
food
1=Purchase
2=Domestica
te
3=Cultivate
4=Wild
5=Borrowed
6=Other
specify
Source
1=Plant
21)anima
l insect
22)anima
l non
insect
Type
I=Indigenous
2=Traditional
3=Non-TIF
Breakfast
1 2 3 4 5 6 1 21 22 1 2 3
1 2 3 4 5 6 1 21 22 1 2 3
1 2 3 4 5 6 1 21 22 1 2 3
1 2 3 4 5 6 1 21 22 1 2 3
1 2 3 4 5 6 1 21 22 1 2 3
1 2 3 4 5 6 1 21 22 1 2 3
Snack 1 2 3 4 5 6 1 21 22 1 2 3
1 2 3 4 5 6 1 21 22 1 2 3
1 2 3 4 5 6 1 21 22 1 2 3
1 2 3 4 5 6 1 21 22 1 2 3
Lunch
1 2 3 4 5 6 1 21 22 1 2 3
1 2 3 4 5 6 1 21 22 1 2 3
1 2 3 4 5 6 1 21 22 1 2 3

168
1 2 3 4 5 6 1 21 22 1 2 3
1 2 3 4 5 6 1 21 22 1 2 3
Snack 1 2 3 4 5 6 1 21 22 1 2 3
1 2 3 4 5 6 1 21 22 1 2 3
1 2 3 4 5 6 1 21 22 1 2 3
Dinner 1 2 3 4 5 6 1 21 22 1 2 3
1 2 3 4 5 6 1 21 22 1 2 3
1 2 3 4 5 6 1 21 22 1 2 3
1 2 3 4 5 6 1 21 22 1 2 3
Snack 1 2 3 4 5 6 1 21 22 1 2 3
1 2 3 4 5 6 1 21 22 1 2 3
1 2 3 4 5 6 1 21 22 1 2 3
1 2 3 4 5 6 1 21 22 1 2 3
% of indigenous
food
exposure(indi+tra
FAO adapted Household and Dietary Diversity Questionnaire.
Question
number
Food group Examples Yes
(1)
No
(2)
1 Cereals Corn/maize, rice, wheat, sorghum,
millet or any other grains or foods
made from these (e.g. bread,
noodles, porridge or other grain
products) e.g. other locally available
grains.............................
2 White tubers
and roots
White potatoes, white yams, white
cassava, or other foods made from
roots including local
foods.......................
3 Vegetables Vitamin A rich vegetables and tubers(
pumpkin, carrots, squash, or sweet
potatoes that are orange inside +
other locally available vitamin A rich
vegetables (e.g. red sweet pepper )
including wild ones + locally available
vitamin A rich leaves such as
amaranth, cassava leaves, kale,

169
spinach etc. other vegetables (e.g.
tomato, onion, eggplant), including
wild vegetables
4 Fruits Vitamin A rich fruits dark yellow or
orange (ripe mangoes, cantaloupe,
apricots (fresh or dried), ripe papaya,
dried peaches, passion fruits + other
locally available vitamin A rich, other
fruits, bananas, avocado, baobab
pulp apple, black berry black currant,
lemon etc including wild fruits
5 Meat liver, kidney, heart or other organ
meats or blood-based foods. Also
beef, pork, lamb, goat, rabbit, wild
game, chicken, duck, or other birds
6 Eggs chicken, duck, guinea fowl or any
other egg
7 Fish and other
seafood
fresh or dried fish or shellfish
8 Legumes, nuts
and seeds
Beans, peas, lentils, nuts, seeds or
foods made from these
9 Milk and milk
products
Milk, cheese, yogurt or other milk
products
10 Oils and fats Oil, fats or butter added to food or
used for cooking
11 Sweets Sugar, honey, sweetened, soda,
sweetened juice or sugary foods such
as chocolates, candies, cookies and
cakes
12 Spices,
condiments and
beverages
Spices (black pepper, salt)
condiments (soy sauce, hot sauce),
coffee, tea, alcoholic beverages or
local examples

170
Household Food Insecurity Access Scale (HFIAS) Questionnaire
Respondent (Person responsible for food preparation)
We would like to ask you questions to describe the behaviours and altitudes regarding food
insecurity in your household for the past 30 days. Please can you provide us with the
following information?
No Question Response options Code
1. In the past four weeks, did
you worry that your
household would not have
enough food
0 = No (skip to Q2)
1=Yes
….|___|
1.a How often did this happen? 1 = Rarely (once or twice in
the past four
weeks)
2 = Sometimes (three to ten
times in the past
four weeks)
3 = Often (more than ten
times in the past four
weeks)
….|___|
2. In the past four weeks,
were you or any household
member not able to eat the
kinds of foods you
preferred because of lack
of resources?
0 = No (skip to Q3)
1=Yes
….|___|
2.a How often did this happen 1 = Rarely (once or twice in
the past four
weeks)
2 = Sometimes (three to ten
times in the past
four weeks)
3 = Often (more than ten
….|___|

171
times in the past four
weeks)
3. In the past four weeks, did
you or any household
member have to eat a
limited variety of foods
due to a lack of resources?
0 = No (skip to Q4)
1 = Yes
….|___|
3.a How often did this happen? 1 = Rarely (once or twice in
the past four
weeks)
2 = Sometimes (three to ten
times in the past
four weeks)
3 = Often (more than ten
times in the past four
weeks)
….|___|
4. In the past four weeks, did
you or any household
member have to eat some
foods that you really did
not want to eat because of
a lack of resources to obtain other
types of food?
0 = No (skip to Q5)
1 = Yes
….|___|
4.a How often did this happen? 1 = Rarely (once or twice in
the past four
weeks)
2 = Sometimes (three to ten
times in the past
four weeks)
3 = Often (more than ten
times in the past four
weeks)
….|___|
5. In the past four weeks, did
you or any household
0 = No (skip to Q6)
1 = Yes
….|___|

172
member have to eat a
smaller meal than you felt
you needed because there
was not enough food?
5.a How often did this happen? 1 = Rarely (once or twice in
the past four
weeks)
2 = Sometimes (three to ten
times in the past
four weeks)
3 = Often (more than ten
times in the past four
weeks)
….|___|
6. In the past four weeks, did
you or any other household
member have to eat fewer
meals in a day because
there was not enough food?
0 = No (skip to Q7)
1 = Yes
….|___|
6.a How often did this happen? 1 = Rarely (once or twice in
the past four
weeks)
2 = Sometimes (three to ten
times in the past
four weeks)
3 = Often (more than ten
times in the past four
weeks)
….|___|
7. In the past four weeks, was
there ever no food to eat of
any kind in your household
because of lack of
resources to get food?
0 = No (skip to Q8)
1 = Yes
….|___|
7.a How often did this happen? 1 = Rarely (once or twice in
the past four
….|___|

173
weeks)
2 = Sometimes (three to ten
times in the past
four weeks)
3 = Often (more than ten
times in the past four
weeks)
8. In the past four weeks, did
you or any household
member go to sleep at
night hungry because there
was not enough food?
0 = No (skip to Q9)
1 = Yes
….|___|
8.a How often did this happen? 1 = Rarely (once or twice in
the past four
weeks)
2 = Sometimes (three to ten
times in the past
four weeks)
3 = Often (more than ten
times in the past four
weeks)
….|___|
9. In the past four weeks, did
you or any household
member go a whole day
and night without eating
anything because there was
not enough food?
0 = No (questionnaire is
finished)
1 = Yes
….|___|
9.a How often did this happen? 1 = Rarely (once or twice in
the past four
weeks)
2 = Sometimes (three to ten
times in the past
four weeks)
3 = Often (more than ten
….|___|

174
times in the past four
weeks)
The HFIAS score for each household will be calculated by summing the codes for each
frequency-of-occurrence question. The maximum score for a household will be 27 (That is if
the household response to all nine frequency-of-occurrence questions was often coded with
response code of 3) and the minimum score will be 0 (That is if the household responded no
to all occurrence questions). The HFIAS Score (0-27) will be the sum frequency-of-
occurrence question response code (Q1a + Q2a + Q3a + Q4a + Q5a + Q6a + Q7a + Q8a
+Q9a).

175
A 30 day quantitative food frequency questionnaire
I will now ask you questions about all the foods that you ate in the past 30 days. Please tell me if you consumed them, their amounts and
frequency of the consumption. Let us start with cereals. One adult woman of reproductive age 18-49 years and all children 2-5 years in the
household
Food Frequency Questionnaire
Think about your recent eating habits and how often you eat each of the following foods
Cereals
Almost
never Once/mth
2-
3/mth Once/wk
2-
4/wk
5-
6/wk
Once
/day
2+/da
y
Portio
n size
in a
day
Source
1-Indigenous
2-traditional
3-Non-TIF
Preparation
method
White bread (loaf) 3
Brown bread 3
Phaphatha 2
Fat cakes 2
Madombi 3
Rice (Refgrain)
(white/brown
3
Pasta- white or brown
3

176
Sorghum meal 1
Mabele/ lesasaoka 2
Mosutlhwane 1
Malutu
3
Tsabana 3
Mmidi (maize on the
cob) 2
Samp 2
Mealie rice 3
Lechotlho 2
Mageu 2
Mealie meal 2
Dikgobe/Lehata 2
Breakfast cereals
(cornflakes, oat meal,
wheat porridge etc) 3
Lebelebele
2
Bogobe jwa lerotse
1
White tubers and Almost Once/mth
2-Once/wk
2- 5- Once 2+/da Portiosource

177
roots never 3/mth 4/wk 6/wk /day y n size
Baked, boiled, fried or
mashed potato 3
Sweet potato 2
Lerophela 1
Leruswa 1
Modi wa motopi 1
Others
legumes nuts and
seeds
Almost
never Once/mth
2-
3/mth Once/wk
2-
4/wk
5-
6/wk
Once
/day
2+/da
y
Portio
n size source
Red peas 2
Baked beans 3
Black eye beans 2
Tswana beans 2
Bambara nuts ditloo 2
Peanuts (manoko 2
Green beans 3
Texturized vegetable
protein (soy
mince/chunks) 3
Green peas 3

178
Letlhodi 2
Sugar beans 3
Dithotse tsa lerotse 2
Milk and Milk products
Almost
never Once/mth
2-
3/mth Once/wk
2-
4/wk
5-
6/wk
Once
/day
2+/da
y
Portio
n size source
Whole milk 2
Evaporated milk 3
Skimmed milk 3
Powdered milk 3
Condensed milk 3
Soya milk 3
Madila/ Mayere 2
Cheese 3
Ice cream 3
Yoghurt 3
Cream cheese 3
Masi a
ngomo/pudi/nku 2
Mowana
1
Meat (organ meat and
flesh meat)
Almost
never Once/mth
2-
3/mth Once/wk
2-
4/wk
5-
6/wk
Once
/day
2+/da
y
Portio
n size source

179
Chicken without skin 2
Chicken with skin
2
Beef 2
Mutton(lamb) 2
Nama ya podi (goat) 2
Pork 2
Mince meat 3
Serobe 1
Seswaa 1
Liver(ox, chicken,
goat) 2
Kidney 2
Gizzards 2
Corned beef 3
Processed meats e.g.
sausage, corned beef,
poony, vienna
3
Others (birds, game
meat, lizards, insects
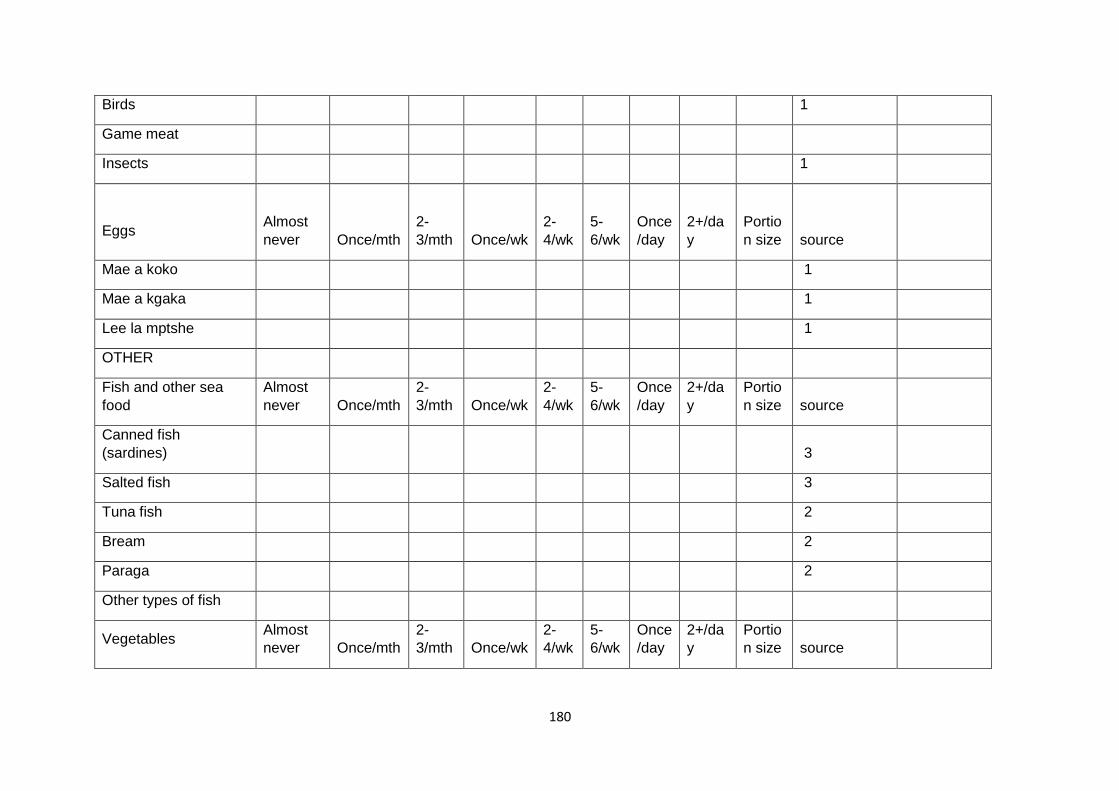
180
Birds 1
Game meat
Insects 1
Eggs
Almost
never
Once/mth
2-
3/mth
Once/wk
2-
4/wk
5-
6/wk
Once
/day
2+/da
y
Portio
n size
source
Mae a koko 1
Mae a kgaka 1
Lee la mptshe 1
OTHER
Fish and other sea
food
Almost
never Once/mth
2-
3/mth Once/wk
2-
4/wk
5-
6/wk
Once
/day
2+/da
y
Portio
n size source
Canned fish
(sardines) 3
Salted fish 3
Tuna fish 2
Bream 2
Paraga 2
Other types of fish
Vegetables Almost
never Once/mth
2-
3/mth Once/wk
2-
4/wk
5-
6/wk
Once
/day
2+/da
y
Portio
n size source

181
Tomato 2
Carrot 3
Pumpkin/ butternut 2
Maraka/makgomane 2
Lerotse 2
Spinach 3
Rape 3
Chomolia 3
Morogo wa dinawa 1
Broccoli 3
Cauliflower 3
Lettuce 3
Cucumber 3
Avocado 3
Pepper(Green/red/yell
ow 3
Mushroom 3
Cabbage 3
Tswii 1
Thepe 1

182
Rothwe 1
Morogowaditonki 1
Setlepetlepe 1
Morogowalephushe 2
Ledelele 1
Nxuma 1
OTHER
VEGETABLES
Onion 2
Beetroot 3
Fruits
Almost
never Once/mth
2-
3/mth Once/wk
2-
4/wk
5-
6/wk
Once
/day
2+/da
y
Portio
n size source
Orange 3
Grapefruit 3
Pawpaw 3
Mango 3
Banana 3
Apple 3
Peach 3
Pears 3
Watermelon 2

183
Grapes 3
Morula 1
Lemon 3
Motoroko 1
Kiwi 3
Strawberry 3
Mabele adinonyane 1
Guava
3
Pineapple
3
Morojwa 1
Mmilo 1
Moretlwa 1
Mogwana 1
Mogwagwa 1
Mokgomphatha 1
Mowana 1
Mogorogorwane 1
Monkgatau 1
Ntshatsha 1
Mokongwa 1

184
Mokgalo 1
Motlopi 1
Motsiara 1
Motsotsoojane 1
Mopipi 1
Motsentsela 1
Sekhura 1
Monapa 1
Magwolwane 1
Mmilo 1
Ditsheru 1
Mokoyo 1
Kganyane 1
Tuane 1
Mokgotlhwane 1
Manthofi 1
Morara 1
Motlhakola 1
Mokabi 1
Legalalatswene 1

185
Mmopudu 1
Moruda 1
Motatane 1
Maphoko 1
Monaba 1
Mongongo 1
Tsaudi 1
Mohanana 1
Mochaba 1
Other Fruits
Oils and fats
Almost
never Once/mth
2-
3/mth Once/wk
2-
4/wk
5-
6/wk
Once
/day
2+/da
y
Portio
n size source
Butter 3
Salad dressing 3
Mayonnaise 3
Cheese snacks 3

186
Margarine 3
Ogondivi 2
Lobebe 2
Kgomo/pudi/nku 2
Others
Sweets
Almost
never Once/mth
2-
3/mth Once/wk
2-
4/wk
5-
6/wk
Once
/day
2+/da
y
Portio
n size Source
Sweets/candy 3
Sugar (e.g. added to
tea) 3
Soda or sweetened
beverages 3
Diet sodas 3
Fruit juices 3
Fruit drinks 3
Cookies/biscuits 3
Cakes 3
Lemepe 2
Mooka
1
Ntshe
2
Sugarcane
3

187
Boreku
1
Others
spices, condiments
and Beverage
Almost
never Once/mth
2-
3/mth Once/wk
2-
4/wk
5-
6/wk
Once
/day
2+/da
y
Portio
n size source
Beer 3
Rum/Whiskey/Gin 3
Wine 3
Coffee 3
Tea(five roses) 3
Herbal Tea (Rooibos) 3
Chocolate drink 3
Bojalwa jwa mabele 2
Bojalwa jwa morula 2
Lekewesha (finger
millet bojalwa) 2
Bojalwa jwa madila 2
Motlopi juice 1
Motlopi coffee 1
Motsiara tea 1

188
Khadi
1
Mmilo juice
1
Mosakajwane
1
Others
Gemmere
2

189
Women anthropometric assessment Form
One Non pregnant women (18-49)
Nam
e
Cod
e
Date of
birth
Weight in Kilograms Height in centimetres
First
reading
Second
reading
Third
reading
Averag
e
First
reading
Second
reading
Third
reading
Averag
e
Vendors’ structured questionnaire
Demographic socioeconomic questionnaire
Household code----------------------------Setting-------------------Location-------------
Household plot number ---------------Name of interviewer ------------ Date of interview-------------
Respondent Name----------------Respondent Tel number...............
1. Marital status of respondent (Tick one):
1 2 3 4 5 6
Single Married Divorced Separated Widowed Other
Please
Specify
2. Education level of respondent
1 2 3 4 5 6
None Primary
School
Junior
school
Senior
secondary
Tertiary Education Don’t
know
3. Gender of Head of Household M F
4. Occupation of household head.....................
5. Number of people you are staying with in the same household..................

190
6. What types of TIF are you involved in selling? To be filled in the table below
Specific foods Where do you
get them from?
1=Purchase
2=Domesticate
3=Cultivate
4=Wild
5=Borrowed
6=Other specify
plant or
animal
source
1 = Animal
2= Plant
Primary source
1=Domesticate
2=Cultivate
3=Wild
Which food
sells most
Why do you
think it sells
most?
1 2 3 4 5 6 1 2 1 2 3
1 2 3 4 5 6 1 2 1 2 3
1 2 3 4 5 6 1 2 1 2 3
1 2 3 4 5 6 1 2 1 2 3
1 2 3 4 5 6 1 2 1 2 3
1 2 3 4 5 6 1 2 1 2 3
1 2 3 4 5 6 1 2 1 2 3
1 2 3 4 5 6 1 2 1 2 3
1 2 3 4 5 6 1 2 1 2 3
7. How much money do you earn in a month from selling these indigenous and traditional
foods?
8. Household
income per month
(including wages,
rent, sales of vegs,
etc. State
grants)(Tick one
only)
1 2 3 4 5 6 7 8
None <
P600
P600 –
1500
P1501-
3000
P3001-
6000
P6001-
9000
>P9000 Don’t
know
9. What is the
value (in terms of
money) for TIF
foods that you do
use in the
household
weekly? (Tick one
only)
1 2 3 4 5 6 7 8 9 10
P0-
P50
P50-
P100
P100-
P150
P150-
P200
P200-
P250
P250-
P300
P300-
P350
P350-
P400
Over
P400
Don’t
know

191
10. Type of dwelling:
(You can tick more than one
block if necessary)
1 2 3 4 5
Brick,
Concrete
Traditiona
l mud
Tin Plank,
Wood
Other,
specify
11. Number of rooms in house
(excluding bathroom, toilet and
kitchen, if separate):
12 Number of people per
living/sleeping room (Tick one)
1 2 3
0-2
persons
3-4
persons
More than
4
13. Where do you get drinking
water most of the time? (Tick
one)
1 2 3 4 5
Own Tap
Commun
al
Tap
River,
Dam
Borehole,
Well
Other:
Specify
14. What type of toilet does
your household have? (Tick
one)
1 2 3 4 5
Flush
Pit
Bucket,
Pot
Ventilated
Improved
Pit latrine
(VIP)
Other
(Specify)
15. What fuel is used for
cooking most of the time? (You
can tick more than one)
1 2 3 4 5 6
Electric
Gas
Paraffin
Wood/
Coal
Sun
Open
Fire

192
FGD guides for household survey and vendors cross sectional study
A (SURVEY)
Interviewer name …………. Date of interview ………….. Setting
……………………
Location ……….. Focus group code ………. length of
interview……………..
I am____________ from National Food Technology Research Centre (NFTRC) Botswana a
researcher working together with the North-West University to collect information on
utilisation of traditional and indigenous foods and potential contribution to consumers’
nutrition and vendors’ income in Botswana. The aim of the project is to contribute valuable
knowledge on the extent of use of TIF at household level in Botswana and the related
contribution to household income and livelihoods both in urban and rural settings. We would
like to hear your views about the TIF that are available in this area. We welcome all your
views as there are no wrong or right answers. During the discussion session we will do audio
recording to ensure that all views are captured correctly.
Anyone with a comment or question?
QUESTIONS
Let us talk about what you consider to be TIF in this area
What are the different types of TIF that are there?
Are the TIF used to the same extent throughout the year or month?
Can we discuss the different uses of these foods?
Let us talk about where you find these foods in the area.
What influences the use of these TIF in the area?
Thank you very much for your participation!
B (VENDORS)
Interviewer name ……….. Date of interview……………………
Focus group code …………… length of interview ………………………..
I am_____________from National Food Technology Research Centre (NFTRC) Botswana a
researcher working together with the North-West University to collect information on
utilisation of traditional and indigenous foods and potential contribution to consumers’
nutrition and vendors’ income in Botswana. The aim of the project is to contribute valuable
knowledge on the extent of use of TIF at household level in Botswana and the related
contribution to household income and livelihoods both in urban and rural settings. We would
like to hear your views about the TIF that are available in this area and your experiences of
selling TIF. We welcome all your views as there are no wrong or right answers. During the
discussion session we will do audio recording to ensure that all views are captured correctly.

193
Anyone with a comment or question?
QUESTIONS
Let us talk about what you consider to be TIF in this area
What are the different types of TIF that are there?
Now let us talk about them in relation to income generation
Have you seen any changes in demand of these TIF?
Which TIF sell most and why do you think so?
Can we discuss where the foods that you sell come from and where you get them from?
What is your view on the contribution of the foods to the income of your household?
How does the income you get from selling TIF compare to the income you get from other
income generating activities you may be involved in?
Thank you very much for your participation!
194
Addendum 9: Consent forms
Consent forms for household survey and vendors’ cross-sectional study
HREC Stamp
Participant information leaflet and consent form: for household survey and vendors cross-
sectional questionnaires (HDDQ, HFIAS, vendors’ structured questionnaire, and
demographic socioeconomic questionnaire)
TITLE OF PROJECT:Utilisation of traditional and indigenous foods and potential contribution
to consumers’ nutrition and vendors’ income in Botswana.
REFERENCE NUMBERS: NWU-00206-14-S1
PRINCIPAL INVESTIGATOR: Dr Namukolo Covic
ADDRESS:
North-West University
Faculty of Health Sciences
Private Bag X6001
Potchefstroom
2522
CONTACT NUMBER: Co- Principal Investigator- Dr Motswagole (72101198)
You are being invited to take part in a research project to gather information on use of
indigenous foods in Botswana. Some of the information gathered will be used to train Post
graduate students at North-West University. Please take some time to read the information
presented here, which will explain the details of this project. Please ask the researcher any

195
questions about any part of this project that you do not fully understand. It is very important
that you are fully satisfied that you clearly understand what this research entails and how
you could be involved. Also, your participation is entirely voluntary and you are free to
decline to participate. If you say no, this will not affect you negatively in any way whatsoever.
You are also free to withdraw from the study at any point, even if you do agree to take part.
This study has been approved by the Health Research Ethics Committee of the Faculty of
Health Sciences of the North-West University (NWU-00206-14-S1) and will be conducted
according to the ethical guidelines and principles of the international Declaration of Helsinki
and the ethical guidelines of the National Health Research Ethics Council. It might be
necessary for the research ethics committee members or relevant authorities to inspect the
research records.
What is this research study all about?
This study will be conducted in Gaborone, Francistown Maun and Kgalagadi and will involve
a cross-sectional household survey by experienced health researchers trained in conducting
community surveys. They will interview household participants who will be included in this
study.
The objectives of this research are:
Determine extent of TIF utilisation at household level in the given survey areas.
Determine possible associations between use of TIF at household level and selected
nutrition and food security indicators for both rural and urban survey sites.
Determine the contribution of selected sold TIF to vendors household income as a
livelihoods means of households involved in such activities
Determine the contribution of reportedly consumed selected TIF to nutrient intake of energy,
protein, Vitamin A, iron and zinc based on quantitative food frequency questionnaire data.
Why have you been invited to participate?
You have been invited to participate because you have been residing in a surveyed
household in this research area therefore you would be able to give us useful information
about different TIF which are available and are consumed in the area.
You have also complied with the following inclusion criteria in that:
You are18 years and above, and of good mental capacity.
You may be involved in selling of TIF.
You will be excluded if: you have not been residing here for more than 3 months or not in
good mental capacity.
What will your responsibilities be?

196
You will be expected;
To provide information on your experience on availability of foods for your household in the
last 30 days
To provide us with information on foods consumed by your household members in last 24
hours.
To answer questions about the member composition of your household their occupation,
education etc.
To provide information on your selling and buying of TIF and their contribution to your
household income and livelihood.
The interview may take one to two hours of your time to complete the consent forms and the
interview.
We may also consider you to form part of focus group discussions later. These will help us
get more information about the use of TIF by individuals and households in the area. For this
we would ask for your participation separately. We will seek separate consent for the focus
group discussions.
Will you benefit from taking part in this research?
There is no direct benefit to you as a participant.
The indirect benefit will be that the information you provide us will help National Food
Technology Research Centre (NFTRC) on how best to promote the use of TIF in Botswana
and to make recommendations on needs for conservation of the foods in the country.
Are there risks involved in your taking part in this research?
This study was approved by the North-West University Health Research Ethics Committee
(HREC)(NWU00206-14-S1). However you are welcomed to ask any questions or seek
further clarification from Dr Motswagole Co principal investigator at 72101 198 at NFTRC in
Botswana.
What will happen in the unlikely event of some form of discomfort occurring as a direct result
of your taking part in this research study?
Should you have unanticipated discomfort as a result of participating in this research you
may inform or seek clarification from DrMotswagole Co-principal investigator for this project
at NFTRC. The telephone number is 72101 198
You may feel uncomfortable when asked questions about your household income and
questions on how you experience food security in your home. Should you not wish to
respond to any of the questions you are free not to do so.
Who will have access to the data?

197
Anonymity will be maintained on all information collected as no names of individuals will be
used.
Confidentiality will be ensured on all information we collect from you in this survey. Reporting
of findings will be anonymous and even in case of all publications no names will be used and
the information that will be used to compile the dissertation by the students or the other
researcher no names of individuals will be reported at any point. Data will be kept safe and
secure by locking hard copies in locked cupboards in the researcher’s office and for
electronic data it will be password protected. Data will be stored for seven and half years.
NFTRC will be given a copy of the data sets.
Payment
No payment will be provided for participation and it will solely be on a voluntary basis.
If there anything else that you should want to know or do
You can contact DrMotswagole –Co principal investigator at 72101198
If you have any further queries or encounter any problems.
You can contact the Health Research Ethics Committee via Mrs Carolien van Zyl at +27
(0)18 299 2094; [email protected] if you have any concerns or complaints that
have not been adequately addressed by the researcher.
You will receive a copy of this information and consent form for your own records.
How will you know about the findings?
The results of the study will be shared to the research participants when completed. NWU in
collaboration with NFTRC will disseminate the study findings to the communities where the
research was done. This will be done though the village elders or the municipal councillors.
Declaration by participant
By signing below, I …………………………………..…………. agree to take part in a research
study entitled: Utilisation of traditional and indigenous foods and potential contribution to
consumers’ nutrition and vendors’ income in Botswana.
I declare that:
I have read this information and consent form and it is written in a language with which I am
fluent and comfortable.
I have had a chance to ask questions to both the person obtaining consent, as well as the
researcher and all my questions have been adequately answered.

198
I understand that taking part in this study is voluntary and I have not been pressurised to
take part.
I may choose to leave the study at any time and will not be penalised or prejudiced in any
way.
I may be asked to leave the study before it has finished, if the researcher feels it is in my
best interests, or if I do not follow the study plan, as agreed to.
Signed at (place) ......................…........…………….. on (date) …………....……….. 20....
Signature of participant Signature of witness
Declaration by person obtaining consent
I (name) ……………………………………………..……… declare that:
I explained the information in this document to …………………………………..
I encouraged him/her to ask questions and took adequate time to answer them.
I am satisfied that he/she adequately understands all aspects of the research, as discussed
above
I did/did not use an interpreter.
Signed at (place) ......................…........…………….. on (date) …………....……….. 20....
Signature of person obtaining consent Signature of witness
Declaration by researcher
I (name) ……………………………………………..……… declare that:
I explained the information in this document to …………………………………..
I encouraged him/her to ask questions and took adequate time to answer them.
I am satisfied that he/she adequately understands all aspects of the research, as discussed
above
I did/did not use an interpreter.

199
Signed at (place) ......................…........…………….. on (date) …………....……….. 20....
Signature of researcher Signature of witness
Consent forms for household and vendors FGDs
HREC Stamp
Participant information leaflet and consent form: for (household and vendors focus group
discussions)
TITLE OF PROJECT: Utilisation of traditional and indigenous foods and potential
contribution to consumers’ nutrition and vendors’ income in Botswana.
REFERENCE NUMBERS: NWU-00206-14-S1
PRINCIPAL INVESTIGATOR: Dr Namukolo Covic
ADDRESS:

200
North-West University
Faculty of Health Sciences
Private Bag X6001
Potchefstroom
2522
CONTACT NUMBER: Co- Principal Investigator- Dr Motswagole (72101198)
You are being invited to take part in a research project to gather information on use of TIF in
Botswana. Some of the information gathered will be used to train Post graduate students at
North-West University. Please take some time to read the information presented here, which
will explain the details of this project. Please ask the researcher any questions about any
part of this project that you do not fully understand. It is very important that you are fully
satisfied that you clearly understand what this research entails and how you could be
involved. Also, your participation is entirely voluntary and you are free to decline to
participate. If you say no, this will not affect you negatively in any way whatsoever. You are
also free to withdraw from the study at any point, even if you do agree to take part.
This study has been approved by the Health Research Ethics Committee of the Faculty of
Health Sciences of the North-West University (NWU-00206-14-S1) and will be conducted
according to the ethical guidelines and principles of the international Declaration of Helsinki
and the ethical guidelines of the National Health Research Ethics Council. It might be
necessary for the research ethics committee members or relevant authorities to inspect the
research records.
What is this research study all about?
This study will be conducted in Gaborone, Francis town, Maun and Kgalagadi and will
involve Focus Group Discussions with experienced health researchers trained in conducting
Focus Group Discussions with participants who will be included in this study.
The objectives of this research are:
Determine extent of TIF utilisation at household level in the given survey areas.
Determine possible associations between use of TIF at household level and selected
nutrition and food security indicators for both rural and urban survey sites.
Determine the contribution of selected sold TIF to vendors household income as a
livelihoods means of households involved in such activities
Determine the contribution of reportedly consumed selected TIF to nutrient intake of energy,
protein, Vitamin A, iron and zinc based on quantitative food frequency questionnaire data.
Why have you been invited to participate?

201
You have been invited to participate because you have been residing in the research area
therefore you will give us information on the different TIF which are available in your area
You have also complied with the following inclusion criteria: you are18 years above, you
make use of these foods frequently and you are of good mental capacity.
You may be involved in selling of TIF
You will be excluded if: you have not been residing here for more than 3 months or not in
good mental capacity
What will your responsibilities be?
You will be expected
Give us information on your experience on availability of different TIF and their uses in this
area.
Give us forty five minutes to one hour to participate in focus group discussions about your
past experience with TIF use in your area and also at your household.
If you are involved in selling TIF, you will give us information on buying and selling of TIF
and their contribution to your household income and livelihood.
If you are involved in selling TIF, you will also give us information on the sources of the TIF
you sell.
Will you benefit from taking part in this research?
There is no direct benefit to you as a participant.
The indirect benefit will be: the information you provide us with will help National Food
Technology Research Centre (NFTRC) on how best to promote the use of TIF in Botswana.
Are there risks involved in your taking part in this research?
This study was approved by the North-West University Health Research Ethics Committee
(HREC)(NWU. -00206-14-S1). However you are welcomed to ask any questions or seek
further clarification from Dr Motswagole –Co principal investigator at 72101198
What will happen in the unlikely event of some form of discomfort occurring as a direct result
of your taking part in this research study?
Should you have unanticipated discomfort as a result of participating in this research you
may inform or seek clarification from Dr Motswagole Co-principal investigator for this project
at NFTRC. The telephone number is 72101198
You may feel uncomfortable when asked questions about your income and household
income and questions on how you experience food security in your home. Should you not
wish to respond to any of the questions you are free not to do so

202
There will also be audio recording during the focus group discussion for us to have an
accurate record of the discussions. Therefore you will also let us know if you are comfortable
for the audio recording to take place.
Who will have access to the data?
Anonymity will be maintained on all information collected as no names of individuals will be
used.
Only partial confidentiality can be ensured on all information we collect from you in this
discussion because other participants will be involved in the discussion. Reporting of
findings will be anonymous and even in case of all publications no names will be used in the
information used to compile the thesis by the students or the other researchers. No names of
individuals will be reported at any point. Data will be kept safe and secure by locking hard
copies in locked cupboards in the researcher’s office and for electronic data it will be
password protected. Data will be stored for seven and half years. NFTRC will be given a
copy of the data sets.
Payment
Pula 50 will be given as taxi fare reimbursement to all Focus Group Discussion participants
and no other kind of payment will be done as participation is solely on a voluntary basis
If there is anything else that you need to know
You can contact Dr Motswagole –Co principal investigator at 72101198 at NFTRC.
If you have any further queries or encounter any problems.
You can contact the Health Research Ethics Committee via Mrs Carolien van Zyl at +27
(0)18 299 2094; [email protected] if you have any concerns or complaints that
have not been adequately addressed by the researcher.
You will receive a copy of this information and consent form for your own records.
How will you know about the findings?
The results of the study will be shared to the research participants when completed.NWU in
collaboration with NFTRC will disseminate the study findings to the communities where the
research was done. This will be done though the village elders or the municipal councillors.

203
Declaration by participant
By signing below, I …………………………………..…………. agree to take part in a research
study entitled: Utilisation of traditional and indigenous foods and potential contribution to
consumers’ nutrition and vendors’ income in Botswana.
I declare that:
I have read this information and consent form and it is written in a language with which I am
fluent and comfortable.
I have had a chance to ask questions to both the person obtaining consent, as well as the
researcher and all my questions have been adequately answered.
I understand that taking part in this study is voluntary and I have not been pressurised to
take part.
I may choose to leave the study at any time and will not be penalised or prejudiced in any
way.
I may be asked to leave the study before it has finished, if the researcher feels it is in my
best interests, or if I do not follow the study plan, as agreed to.
Signed at (place) ......................…........…………….. on (date) …………....……….. 20....
Signature of participant Signature of witness

204
Declaration by person obtaining consent
I (name) ……………………………………………..……… declare that:
I explained the information in this document to …………………………………..
I encouraged him/her to ask questions and took adequate time to answer them.
I am satisfied that he/she adequately understands all aspects of the research, as discussed
above
I did/did not use an interpreter.
Signed at (place) ......................…........…………….. on (date) …………....……….. 20....
Signature of person obtaining consent Signature of witness

205
Declaration by researcher
I (name) ……………………………………………..……… declare that:
I explained the information in this document to …………………………………..
I encouraged him/her to ask questions and took adequate time to answer them.
I am satisfied that he/she adequately understands all aspects of the research, as discussed
above
I did/did not use an interpreter.
Signed at (place) ......................…........…………….. on (date) …………....……….. 20....
Signature of researcher Signature of witness

206
Consent form: for anthropometry component and QFFQ for women 18-49 years
HREC Stamp
Participant information leaflet and consent form: for anthropometry component and QFFQ for
adult women 18-49 years
TITLE OF PROJECT: Utilisation of traditional and indigenous foods and potential
contribution to consumers’ nutrition and vendors’ income in Botswana.
REFERENCE NUMBERS: NWU-00206-14-S1
PRINCIPAL INVESTIGATOR: Dr Namukolo Covic
ADDRESS:
North-West University
Faculty of Health Sciences
Private Bag X6001

207
Potchefstroom
2522
CONTACT NUMBER: Co- Principal Investigator-Dr Motswagole (72101198)
You are being invited to take part in a research project to gather information on use of TIF in
Botswana. Some of the information gathered will be used to train Post graduate students at
North-West University. Please take some time to read the information presented here, which
will explain the details of this project. Please ask the researcher any questions about any
part of this project that you do not fully understand. It is very important that you are fully
satisfied that you clearly understand what this research entails and how you could be
involved. Also, your participation is entirely voluntary and you are free to decline to
participate. If you say no, this will not affect you negatively in any way whatsoever. You are
also free to withdraw from the study at any point, even if you do agree to take part.
This study has been approved by the Health Research Ethics Committee of the Faculty of
Health Sciences of the North-West University (NWU-00206-14-S1) and will be conducted
according to the ethical guidelines and principles of the international Declaration of Helsinki
and the ethical guidelines of the National Health Research Ethics Council. It might be
necessary for the research ethics committee members or relevant authorities to inspect the
research records
This study has been approved by the Health Research Ethics Committee of the Faculty of
Health Sciences of the North-West University (NWU -00206-14-S1) and will be conducted
according to the ethical guidelines and principles of the international Declaration of Helsinki
ad the ethical guidelines of the National Health Research Ethics Council. It might be
necessary for the research ethics committee members or relevant authorities to inspect the
research records.
What is this research study all about?
This study will be conducted in Gaborone, Francis town Maun and Kgalagadi and will involve
cross-sectional household survey with experienced health researchers trained in conducting
community surveys with household participants who will be included in this study.
The objectives of this research are:
Determine extent of TIF utilisation at household level in the given survey areas.
Determine possible associations between use of TIF at household level and selected
nutrition and food security indicators for both rural and urban survey sites.
Determine TIF contribution to household income and livelihoods of households involved in
such activities
Determine the contribution of reportedly consumed selected TIF to nutrient intake of energy,
protein, Vitamin A, iron and zinc based on quantitative food frequency questionnaire data
Why have you been invited to participate?

208
You have been invited to participate because you have been residing in this research area in
a surveyed household therefore you will be required to give us information about your eating
of TIF which are available in your area.
You have also complied with the following inclusion criteria: you are18 years and above, and
of good mental capacity.
You are an adult woman of reproductive age 18-49 years
You will be excluded if: you have not been residing here for more than 3 months or not in
good mental capacity
If you are pregnant.
What will your responsibilities be?
You will be expected
You will allow us take your weight and height (this will be done by trained field assistants,
National Food Technology Research Centre (NFTRC) researchers and the PhD student.
You will give us information on the various kinds of foods you ate for the last 30 days and
help us quantify the amount eaten.
You will give us one to two hours of your time to complete the consent forms and also to
interview you.
Will you benefit from taking part in this research?
The only direct benefit will be that your weight and height will be measured and this
information will be provided to you.
The indirect benefit will be: the information you provide us with will help NFTR on how best
to promote the use of indigenous foods in Botswana.
Are there risks involved in your taking part in this research?
This study was approved by the North-West University Health Research Ethics Committee
(HREC)(NWU. -00206-14-S1). However you are welcomed to ask any questions or seek
further clarification from DrMotswagole –Co principal investigator at NFTRC, Kanye,
72101198
What will happen in the unlikely event of some form of discomfort occurring as a direct result
of your taking part in this research study?
Should you have unanticipated discomfort as a result of participating in this research you
may inform or seek clarification from DrMotswagole Co-principal Investigator for this project
at NFTRC. The telephone number is 72101198

209
When your weight and height will be taken you will be asked to be in light clothing and to
remove your shoes and you may experience discomfort with this but you are free to indicate
if the assessment should continue or not.
As you will be asked questions about what you ate in the last 30 days you might feel
uncomfortable to remember and you can choose not to respond if you experience
discomfort.
Who will have access to the data?
Anonymity will be maintained on all information collected as no names of individuals will be
used.
Confidentiality will be ensured on all information we collect from you. Reporting of findings
will be anonymous and in case of publications no names will be used and the information
that will be used to compile reports and by the PhD student to compile her thesis no names
of individuals will be reported. Data will be kept safe and secure by locking hard copies in
locked cupboards in the researcher’s office and for electronic data it will be password
protected. Data will be stored for seven and half years. NFTRC will be given a copy of the
data sets
Payment
You will receive no payment for participation it is a voluntary exercise
If there is anything else that you should know or do
You can contact Dr Motswagole –Co principal investigator at 72101198
If you have any further queries or encounter any problems.
You can contact the Health Research Ethics Committee via Mrs Carolien van Zyl at +27
(0)18 299 2094; [email protected] if you have any concerns or complaints that
have not been adequately addressed by the researcher.
You will receive a copy of this information and consent form for your own records.
How will you know about the findings?
The results of the study will be shared with the research participants when completed.NWU
in collaboration with NFTRC will disseminate the study findings to the communities where
the research was done. This will be done though the village elders or the municipal
councillors.

210
Declaration by participant
By signing below, I …………………………………..…………. agree to take part in a research
study entitled: Utilisation of traditional and indigenous foods and potential contribution to
consumers’ nutrition and vendors’ income in Botswana.
I declare that:
I have read this information and consent form and it is written in a language with which I am
fluent and comfortable.
I have had a chance to ask questions to both the person obtaining consent, as well as the
researcher and all my questions have been adequately answered.
I understand that taking part in this study is voluntary and I have not been pressurised to
take part.
I may choose to leave the study at any time and will not be penalised or prejudiced in any
way.
I may be asked to leave the study before it has finished, if the researcher feels it is in my
best interests, or if I do not follow the study plan, as agreed to.
Signed at (place) ......................…........…………….. on (date) …………....……….. 20....
Signature of participant Signature of witness

211
Declaration by person obtaining consent
I (name) ……………………………………………..……… declare that:
I explained the information in this document to …………………………………..
I encouraged him/her to ask questions and took adequate time to answer them.
I am satisfied that he/she adequately understands all aspects of the research, as discussed
above
I did/did not use an interpreter.
Signed at (place) ......................…........…………….. on (date) …………....……….. 20....
Signature of person obtaining consent Signature of witness

212
Declaration by researcher
I (name) ……………………………………………..……… declare that:
I explained the information in this document to …………………………………..
I encouraged him/her to ask questions and took adequate time to answer them.
I am satisfied that he/she adequately understands all aspects of the research, as discussed
above
I did/did not use an interpreter.
Signed at (place) ......................…........…………….. on (date) …………....……….. 20....
Signature of researcher Signature of witness