Capacity utilisation in liner shipping
110
DEPARTMENT OF TECHNOLOGY MANAGEMENT AND ECONOMICS DIVISON OF SERVICE MANAGEMENT AND LOGISTICS CHALMERS UNIVERSITY OF TECHNOLOGY Gothenburg, Sweden 2020 www.chalmers.se Report No. E2020:036 Capacity utilisation in liner shipping Master’s thesis in Supply Chain Management Erik Frändberg Raj Luhar
-
Upload
khangminh22 -
Category
Documents
-
view
0 -
download
0
Transcript of Capacity utilisation in liner shipping

DEPARTMENT OF TECHNOLOGY MANAGEMENT AND ECONOMICS DIVISON OF SERVICE MANAGEMENT AND LOGISTICS
CHALMERS UNIVERSITY OF TECHNOLOGY Gothenburg, Sweden 2020
www.chalmers.se Report No. E2020:036
Capacity utilisation in liner shipping Master’s thesis in Supply Chain Management
Erik Frändberg Raj Luhar


REPORT NO. E2020:036
Capacity utilisation in liner shipping
Erik Frändberg Raj Luhar
Department of Technology Management and Economics Division of Service Management and Logistics CHALMERS UNIVERSITY OF TECHNOLOGY
Gothenburg, Sweden 2020

Capacity utilisation in liner shipping Erik Frändberg Raj Luhar © Erik Frändberg, 2020. © Raj Luhar, 2020. Supervisor: Vendela Santén, Ph.D. Senior Researcher and Project Manager, SSPA Examiner: Violeta Roso, Associate Professor Department of Technology Management and Economics Report no. E2020:036 Department of Technology Management and Economics Chalmers University of Technology SE-412 96 Gothenburg Sweden Telephone + 46 (0)31-772 1000 Gothenburg, Sweden 2020

Capacity utilisation in liner shipping Erik Frändberg Raj Luhar Department of Technology Management and Economics Chalmers University of Technology SUMMARY The purpose of the study has been to create a better understanding of capacity utilisation in the shipping industry and explore improvement opportunities for ship operators. This was done by investigating the negative and positive implication of different levels of capacity utilization as well as by mapping out and analysing factors that affect utilisation negatively and strategies to increase utilisation. The study was performed by investigating current practices amongst ship operators within several liner segments, categorising information from the conducted interviews and analysing it with help of previous literature within the topic under investigation. The outcome of the study presents that the planned level of capacity utilization differed between liner segments as their customer preferences and cost structure differ, where RoRo and RoPax ship operators aim for a lower level utilization compared to container and feeder operators. Twelve factors were identified to inhibit ship operators’ ability to achieve the desired level of utilisation. The most prevalent factors are a result of industry characteristics such as variations of demand, trade imbalances and schedule characteristics. Identified differences between the liner segments was that the container and feeder companies are more affected by late arrivals, no-shows and cancellations. The RoRo and RoPax segment are mostly affected by the schedule characteristics. The study also identified 14 strategies that companies can employ to increase their capacity utilization. These may be of a strategic nature such as increasing commitment between customers and ship operators or operational such as adjusting routes or frequency of departure to changing demand conditions. The strategy of two-way commitment is the only identified strategy which eliminates the negative impact from the factor late arrivals, no-shows and cancellations. The study indicates that the strategy of cooperative arrangement has highest impact on the utilisation as it counters several factors. The study also mapped out how the factors could be handled by compiling the relationships between the factors under investigation and the analysed strategies. This could be used as a roadmap by ship operators to increase the utilization when experiencing difficulties with any of the factors. Keywords: capacity utilisation, liner shipping, short sea shipping, deep sea shipping, factors,
strategies.

Acknowledgments This thesis was conducted during the spring of 2020 at the division of Service
management and Logistics at Chalmers University of Technology in
Gothenburg. The thesis was performed within the master program Supply
Chain Management. The master thesis was supervised by Violeta Roso,
associate professor at the division of Service Management and Logistics. Your
knowledge and encouragement have been of high importance. We would like
to thank you for your support and helpfulness.
The thesis project was offered by SSPA and we are thankful for getting the
opportunity to perform this thesis. The thesis was performed in cooperation with
eight case companies. We are grateful for every ship operating company who
took their time to meet us and share valuable knowledge to us. Without you this
thesis would have not been possible to perform.
Finally, we would like to thank our supervisor at the research department at
SSPA, Vendela Santén. For your immense support during the whole process,
in terms of feedback, suggestions and guidance. Your knowledge and
encouragement have been of high importance for the outcome of this study.
We are grateful for all the things we have learned and hope you find our thesis
useful.
Erik Frändberg and Raj Luhar
Gothenburg, May 2020


Table of Contents
1. Introduction.......................................................................................................................1
1.1 Background .............................................................................................................................. 1
1.2 Purpose and research questions ...................................................................................... 2
1.3 Scope and limitations ........................................................................................................... 3
2. Methodology ......................................................................................................................4
2.1 Research strategy .................................................................................................................. 4
2.2 Research process ................................................................................................................... 4
2.3 Research method ................................................................................................................... 5
2.4 Data analysis ............................................................................................................................ 8
2.5 Research quality ..................................................................................................................... 9
2.6 Ethics .......................................................................................................................................... 9
3. Frame of reference ....................................................................................................... 10
3.1 Description of shipping terms ....................................................................................... 10
3.2 Capacity utilisation in the maritime industry .......................................................... 11
3.3 Factors affecting capacity utilisation .......................................................................... 13
3.4 Capacity planning ............................................................................................................... 21
3.5 Strategies to increase capacity utilisation ................................................................ 23
4 Empirical findings ......................................................................................................... 28
4.1 RoRo1 ...................................................................................................................................... 28
4.2 RoRo2 ...................................................................................................................................... 32
4.3 RoRo3 ...................................................................................................................................... 36
4.4 RoPax1 .................................................................................................................................... 42
4.5 Feeder1 ................................................................................................................................... 46
4.6 Container1 ............................................................................................................................. 49
4.7 Container2 ............................................................................................................................. 53
4.8 Container3 ............................................................................................................................. 57
5 Analysis ............................................................................................................................. 61
5.1 Capacity planning ............................................................................................................... 61
5.2 Factors affecting capacity utilisation .......................................................................... 64
5.3 Strategies ............................................................................................................................... 71
6. Discussion........................................................................................................................ 82
6.1 Relationship between research questions ................................................................ 82
6.2 Facilitators ............................................................................................................................ 83
6.3 Implementation ................................................................................................................... 84
6.4 Future research ................................................................................................................... 86

7. Conclusions ..................................................................................................................... 87
References............................................................................................................................ 88
Appendices...............................................................................................................................I
Appendix A ....................................................................................................................................... I
Appendix B ......................................................................................................................................V

1
1. Introduction
This section gives an introduction to the study which is done by presenting the problem
under investigation and motivating the theoretical and practical relevance of the study.
The purpose and the research questions are thereafter presented, which are followed by
the limitations of the study.
1.1 Background
Globalisation has increased tremendously during the last decades and has been an
important factor impacting the logistic service and transportation sector by changing its
requirements and conditions (Kherbash & Mocan, 2015). The increased globalisation
has also led to an increased share of the total transport being performed by sea (Sthyre,
2010); since 1990 global container transport has grown by 10% annually (Fruth &
Teuteberg, 2017). This is supported by Kherbash and Mocan (2015), who state that sea
shipping accounts for 90% of the global trade. In order to accommodate the increased
demand, the ship operators have had to increase their available capacity and have
achieved higher levels of containerisation. The available capacity has however
increased at an increased rate compared to the demand of freight transport (Wu, 2012).
This is illustrated by Statista (2020), who presents that the quantity of loaded freight
increased by 84% from 2000-2018 while the available capacity of container ships
increased by over 290% in the same time period. The trend is a result of industry
characteristics such as economies of scale and high fixed costs which promotes
companies to invest in larger vessels (Sthyre, 2009). Customer requirements for
available capacity on demand and fluctuations in demand also create incentives for
shipping companies to increase their available capacity which further increases the
available capacity in relation to the required capacity (Sthyre, 2009). Fusillo (2003)
also states that companies in the liner shipping industry have been struggling to handle
excess capacity which could be the underlying reason for operational inefficiencies.
The ratio between available and required capacity is called capacity utilisation and a
high value is often strived for in order to have a more efficient transport, since having
a high capacity utilisation leads to lower transport costs while at the same time reducing
the carbon footprint (Santèn et al., 2018). Further, Styhre (2009) also presents that by
having a high capacity utilisation it makes it possible to transfer goods towards sea
transportation from less environmentally friendly alternatives such as road transport
which creates possibilities for companies as well as the society. As an example, society
would benefit in terms of reduced road congestion in densely populated areas, this way,
the infrastructure could be used to a larger extent by passenger transportation instead
of freight transport (Styhre, 2009). The energy efficiency of transportation increases as
the capacity utilisation increases which creates further incentives for stakeholders to
improve the load factor (Santèn et al., 2018). Different stakeholders have expressed the

2
need to improve the overall energy efficiency. The Swedish government has set a goal
to have 50% more efficient energy use by 2030 (Regeringen, 2016). The shipping
industry plays an important role in the reduction of energy use, where new methods and
techniques are needed in order to have more efficient operations (Styhre et al., 2014).
This indicates that there is interest in improving capacity utilisation for the shipping
industry as it results in a more efficient energy use.
There is ample of literature concerning load factor and capacity utilisation within road
transport, however, the literature concerning capacity utilisation within sea
transportation is more limited. The few studies that have been done within utilisation
exemplify the low degrees of load factor that are present in the current sea transport
systems (Santén et al., 2018). Styhre (2009) illustrated this in a study conducted on 19
Scandinavian ferry services where the average utilisation was 42%. For vessels to
achieve a break-even, a capacity utilisation around 80% is needed in terms of loaded
TEU in relation to the max capacity on the vessel (Santèn et al., 2018).
1.2 Purpose and research questions
Considering the low levels of utilisation in sea shipping and the limited knowledge
within the area there is a need for research that investigates issues addressed above. The
purpose of this report is therefore to create a better understanding of capacity utilisation
in the shipping industry and explore improvement opportunities by investigating
current practices amongst ship operators within several liner segments. The report also
aims to create a framework for ship operators which can be used to improve their
capacity utilisation. The purpose of the report is achieved by answering the three
research questions listed below.
In order to create a holistic view of utilisation, negative and positive implications of
different levels of utilisation are investigated for different liner segments. Therefore,
the first research question has been formulated as:
RQ1 What is the desired level of capacity utilisation for ship operators?
Thereafter, different factors are identified and studied in order to understand how they
inhibit ship operators’ ability to achieve a high capacity utilisation. Therefore, the
second research has been formulated as:
RQ2 What factors affect capacity utilisation?
Improvement opportunities and strategies to increase capacity utilisation are also
studied to understand how they improve capacity utilisation and impact the factors
affecting utilisation. The strategies applicability amongst different liner segments is
also investigated. Therefore, the third research question has been formulated as:

3
RQ3 How can ship operators achieve a high capacity utilisation?
1.3 Scope and limitations
The limitations are presented in order to clarify the scope of the study. The study is
limited to only focus on the ship operators within the supply chain. Even though these
are the actors with the most knowledge and improvement possibilities within the area,
there are actions that may be taken by other actors that are not taken into account. An
example is the way that the goods are packaged by the beneficiary cargo owners
(BCOs) or forwarders which affects utilisation on the packaging level and affects the
overall capacity utilisation on the fleet level. This limits the investigation of capacity
utilisation to the vessel and fleet level.
The study investigates RoRo (roll on roll of), RoPax (roll on roll of a passenger),
container and feeder ship operators. The interviewed ship operators provide liner
services within the deep sea- and short sea-shipping industry with offices located in
Sweden, Norway and Denmark. The results of the study and their implications are
therefore limited to the liner industry.
Given the nature of the study, where all the information from the interviews are
qualitative, the analysis is limited to the way that the factors affect utilisation and the
ways in which the strategies can be used and in which situations they are applicable.
Quantifying the degree to which factors and improvement possibilities impact
utilisation has therefore not been possible.

4
2. Methodology
In this the methodology for the study is presented. The research strategy, process and
method are firstly presented. This is followed by the data analysis and lastly the
research quality and ethics parts are presented.
2.1 Research strategy
The research strategy can either be qualitative or quantitative (Bryman & Bell, 2011;
Patel & Davidsson, 2011). Quantitative projects are more focused around quantitative
measurements to find information such as frequency, correlation between variables
with the help of statistical methods. In a qualitative study, the research contains the
researchers’ interpretation of the observations and interviews (Bryman & Bell, 2011;
Patel & Davidsson, 2011). This study has a qualitative approach since it makes it
possible to investigate and get an understanding of the desired level of capacity
utilisation, what factors affect capacity utilisation and what strategies the firms are
using to enhance their utilisation. A quantitative approach would not have been able to
provide the underlying explanation of the collected data. The qualitative study is
performed with the help of case studies with eight different companies. According to
Blomkvist and Hallin (2015) when a study aims towards investigating, explaining and
describing a case study is a suitable choice. This study has an explanatory nature, since
interviews are conducted to understand how different actors are operating with their
current operations and strategies which makes a qualitative study appropriate.
2.2 Research process
According to Dubois and Gadde (2002) the scope of the research can be changed, and
therefore the process may not be linear. The research process has been iterative as
different parts of the study have been continuously updated. In Figure 2.1 below the
research process is illustrated. At first, theoretical research was performed to gain
knowledge within the research area and establish research questions and an interview
template. Thereafter interviews were performed. These stages were performed in an
iterative process as can be seen in Figure 2.1, since during the interviews new concepts
and strategies were mentioned. This required the frame of reference, research questions
and interview questions to be updated. The collected data was later processed by
transcribing and organising it. The data from the interviews was used to compile the
results in the empirical findings. The findings were later used to analyse the data with
the help of the acquired literature. A discussion of the findings was made where future
research and implications of the study were presented.

5
Figure 2.1 The research process for the study.
2.3 Research method
This section presents how the qualitative study has been performed with help of semi-
structured interviews. The methodology for the literature study is also presented.
2.3.1 Qualitative study The study consists of both primary and secondary data. Primary data was collected by
performing face-to-face interviews, phone calls, and video interviews with eight
interviewees employed at eight different shipping companies, whose offices are located
in Gothenburg, Oslo and Copenhagen. Secondary data was provided by the
interviewees in the form of internal documents. According to Patel and Davidsson
(2011) it is important that information is acquired from various sources. This was
performed by combining primary data and secondary data. Table 2.1 presents
information about the interviewed actors. Several ship operators within the container
segment had feeder operations. In order to get a better understanding of a specific
segment and not mix the results for the segments the interviewees were asked to answer
from a container point of view.

6
Table 2.1 Information about the interviewed ship operators.
According to Ritchie, Lewis, Nicholls and Ormston (2013) interviews are used as a
main data collection method for case studies as they allow the researchers to ask
detailed questions and follow up questions to get a deeper understanding of the
situation. Interviews were an effective method for this study to gain knowledge about
the interviewees’ personal experience regarding general information about their
operations, questions about capacity planning, factors affecting capacity utilisation and
strategies to increase capacity utilisation. Hague (1998) states that semi-structured
interviews give the researchers more flexibility in their interviews. Denscombe (2018)
states that in semi-structured interviews the researchers have a list of topics to be
addressed and questions that need to be answered. It is important to let the interviewee
develop ideas and speak widely about raised issues (Denscombe, 2018). Semi-
structured interviews were performed as they gave the researchers more in-depth
answers and allowed them to develop their statements further.
The interviews were semi-structured with a low degree of standardisation. According
to Patel and Davidsson (2011), having a low degree of standardisation allows the
interviewer to change the order of the questions, have follow-up questions and add
additional questions during the interview. This was useful as it allowed the researchers
to get a deeper understanding of the topics under investigation. The order of the
questions could change depending on if the interviewee answered the questions already
or if it was appropriate to ask the question on a later stage. The structure of the questions

7
refer to whether or not the questions has a specific answer (Patel & Davidsson, 2011).
During the interviews the questions did not have specific answers that were expected
from the interviewees. The first questions within the discussed topics were open in
order to give the interviewees to give answers based on their own ideas and experiences.
Example of the more open questions were: what factors affect your ability to achieve
high capacity utilisation? or how do you work to increase capacity utilisation? More
specific answers were asked thereafter in order to cover all the topics under
investigation. This resulted in a mixed level of structure.
The interview questions can be seen in Appendix A, the interview was divided into the
following four topics: general information about the company, general information
about capacity utilisation, factors affecting capacity utilisation and strategies to increase
capacity utilisation. After four interviews were performed it was discovered that there
was a need to add questions to the interview form, since these questions were brought
up during the interviews even though they were not in the interview form. As an
example, following questions were added: How does bad weather affect you? Is there
any legislation that hinders you from loading the vessels maximally? The other added
questions are presented in the appendices. The changes in the interview template can
be seen in Appendix A. The changes affected the quality of the data and some
information might have been missed for the first four interviewed ship operators.
2.3.2 Literature study The theoretical research was divided in two parts. The first part aimed towards getting
a general understanding of the maritime industry and capacity utilisation. Information
was acquired by searching for keywords such as: liner shipping, tramp shipping, RoRo
vessels, LoLo vessels, capacity utilisation, load factor, maritime + terminology.
Chalmers library database and Google Scholar was used. When basic knowledge had
been obtained about the maritime industry and capacity utilisation, searches were
performed to find information about: factors affecting capacity utilisation, current
levels of capacity utilisation and about different strategies to achieve higher levels of
utilisation. Chalmers library database and Google Scholar were used to find articles
with the following keywords: capacity utilisation + maritime, capacity utilisation,
vessel fleet management, vessel fleet utilisation, optimal fleet capacity, excess capacity
+ maritime, factors affecting capacity +maritime, increase utilisation + maritime. After
performing the interviews new concepts and ideas were brought up. Therefore, an
additional theoretical research was performed with the following keywords:
overbooking + maritime, overbooking + overselling, slow steaming + maritime,
marketing strategies, marketing strategies + sales, marketing + increase demand. These
searches were performed on Google Scholar, Chalmers library database and
ScienceDirect. In addition to the literature gained through the various databases, articles
were obtained from the supervisors as well.

8
2.4 Data analysis
All interviews were recorded and transcribed by the researchers with the approval from
the interviewees. Denscombe (2018) recommends researchers to transcribe interviews,
since it allows for detailed searches in the collected data and simplifies the process of
comparing the data. Transcription is beneficial to perform as it allows the researchers
to go through the acquired data on several occasions and allows the researchers to get
more acquainted with it (Denscombe, 2018). A transcription was therefore performed
which also allowed the researchers to recall information from the interview on later
occasions. If there were any uncertainties regarding the answer, the information could
be confirmed with the transcribed document.
The information gathered in the interviews was sorted in categories which provided a
basis upon which the analysis could be performed. The analysis was performed in an
iterative process during the course of the project. This way, the information from the
interviews was easier to recall when used in the analysis. According to Patel and
Davidsson (2011), performing the analysis concurrently is appropriate in qualitative
studies as it give ideas on how to proceed with the study. In order to categorise and sort
the information, a table was created in Microsoft Excel where each specific ship
operator was listed on one column and the questions from the interview template were
listed on one row. After this, the answers from the transcribed documents were inserted
next to the most appropriate question. This was done as an answer to one question could
be answered several times on different occasions during the interviews. For example,
while asking about how different factors affect their ability to achieve a high capacity
utilisation, the interviewee could state a solution to the problems directly. Not only
answering about the factors when a question regarding this was asked. All the answers
to one question could be consolidated with quotes from the interviews in one cell in
Microsoft Excel. Creating a table was beneficial, as it made it easier to compare
information from the different companies. With help of the table it was also easier to
categorise which factors the firms were affected by and what strategies they were using.
When performing the analysis, the collected data was used to explain the underlying
reasons for why and how firms are affected by different factors and also to understand
when certain strategies were used to counter the factors to increase capacity utilisation.
The empirical data was also compared with and contrasted to the frame of reference, to
see if explanation to the ship operators’ choices could be described or to see if
contradictions were found between the literature and the empirical findings. Different
situations in which the strategies are appropriate to use were compiled in the end by
presenting the different factors that can be handled by specific strategies in order to
reach the desired utilisation.

9
2.5 Research quality
To achieve a high degree of research quality it is important that decisions and
interpretations are well motivated (Bryman & Bell, 2011). A high transparency was
aimed for in the report. This was achieved by being objective and presenting the
information with several quotes so that the reader could create their own understanding
of the situation. According to Denscombe (2018) it is important that the researchers
demonstrate accuracy and appropriateness of the data collected in order to achieve a
high credibility. The author states that there is not a predefined method to ensure the
project has a high credibility. Instead, several different measures can be taken to ensure
the reader that the data is to a high extent appropriate for this work. To ensure that the
data is accurate and appropriate for this work, the data was validated with the
respondent during the interview, where the answers were clarified with the respondents
to see if the answers were interpreted right.
Denscombe (2018) states that it is important that the researcher demonstrates and
motivates their procedures and their decision making in the report to increase the
reliability. This makes it easier for the reader to understand and provide them the
opportunity to follow the researchers’ decision making throughout the report
(Denscombe, 2018). To ensure high degree of reliability in this report each section has
been explained thoroughly where the reader can follow the researchers’ thoughts and
decision making. This increased the reliability in the study.
2.6 Ethics
Research should be conducted in a transparent way and research participants should be
informed of the risks and what their participation entails (Ritchie et al., 2013). In order
to achieve this, information regarding the project and its purpose as well as the intended
outcome was transmitted to the interview objects by email before the interviews and in
situ on the day of the interview. The confidentiality of the information provided by
participants should also be preserved and the research participants should be kept
anonymous (Ritchie et al., 2014). In the report, only information from the participants
that was seen as relevant to the study is disclosed, such as the field of work in order to
strengthen the validity of their statements. The name of the participants or the
companies at which they work is however not disclosed in order to keep their
anonymity. The participants were also asked before the interview not to disclose any
sensitive information. Information gathered from the interviews such as transcriptions
and audio files that could link the interviewee to the information were stored in
locations to which only the researchers had access to.

10
3. Frame of reference
The following section covers concepts and theories that have been developed by
researchers in the field of shipping and capacity utilisation. The different concepts are
defined and presented in order to build a basis upon which the research questions can
be analysed and discussed. The first subsection presents general information about the
shipping industry. This is followed up by a section defining capacity utilisation for sea
shipping. The following section covers factors that inhibit or facilitate ship operators’
ability to achieve a high capacity utilisation. Thereafter, how ship operators can plan
their desired level of capacity utilisation is presented. Lastly, strategies that can be used
to increase capacity utilisation are presented.
3.1 Description of shipping terms
In this section, terms used within the maritime industry are described. The following
terms are defined: deep sea and short sea shipping, liner and tramp shipping, RoRo (roll
on roll of) and LoLo (lift on lift off).
3.1.1 Deep sea and short sea shipping In the shipping industry there are two definitions used to describe what type of distance
the ship is transporting goods: deep sea shipping and short sea shipping (Europa, n.d.-
a). Deep sea shipping is defined as shipping goods on intercontinental routes (Europa,
n.d.-b). Deep sea shipping therefore covers long distances and normally uses larger
vessels, and it is most often transporting commodities (Eurosender, 2016). Short sea
shipping is referred to as moving cargo and passengers by sea on short distances
(ESCA, 2016). Short sea shipping includes transportation which is performed both
domestically and internationally, but also along coast and to/from island with the help
of feeder services (ESCA, 2016). As many large containerships can only dock at
specific high-volume ports, feeder services are required to transport the cargo to the
final destination (Ridolfi, 1999). This is done using feeder services which carry cargo
from the larger hub-ports to the local spoke ports (MSC, n.d.).
3.1.2 Liner and tramp shipping The maritime sector has mainly two types of transportation services: tramp shipping
and liner shipping. Tramp shipping is described as offering a service with unscheduled
transportation as it operates with cargo which has an irregular and unpredictable
demand (Bermig & Ritter, 2008). Liner shipping is defined as a service where a vessel
or a fleet of vessels operates regularly between predefined ports. In a liner service,
timetables and prices have been announced in advance and the vessels sail whether they
have been filled or not (Haralambides, 2007; Haralambides, 2004; Tran & Haasis,
2015). The norm is that the service is available to everyone (Haralambides, 2007;
Haralambides, 2004; Tran & Haasis, 2015).

11
According to Zheng, Gao, Yang and Sun (2015) liner shippers may choose to sign a
long-term shipment contract or a short-term shipment contract with the customers. The
long-term contracts result in a fixed demand for a specific time period as the contract
states the estimated volumes that the shippers expect to ship for that period of time
(Zheng et al., 2015). Shippers with short-term contracts may however switch ship
operators if the service is not satisfactory. The long-term contracts are therefore seen
as fixed demand whereas the short-term contracts are seen as variable (Zheng et al.,
2015).
3.1.3 RoRo and LoLo Liner shipping can be divided into two different segments: RoRo (roll on roll off) and
LoLo (lift on lift off). The division is based on how the goods are loaded and unloaded.
According to Styhre (2010) RoRo vessels transport only cargo that can roll on to the
deck such as train wagons, trailers, cars. The RoPax vessel is a type of RoRo vessel
which can handle passenger accommodation as well. RoRo vessels do not need cranes
for handling the cargo. They also have a shorter turnaround time at the port compared
to LoLo ships and are mainly used for short sea shipping (Styhre, 2010). As a result,
the RoRo segment is mainly competing against road and rail modes. Benefits such as
reducing road congestion and environmental impact have made it a more popular option
(Styhre, 2010). LoLo ships include vessels such as deep-sea container- and feeder
vessels. The benefit of using LoLo ships is that the unit cost for carrying the transport
is low (Styhre, 2010).
3.2 Capacity utilisation in the maritime industry
Capacity utilisation is a measurement that describes transportation efficiency by
indicating the degree to which a vehicle or vessel is loaded with goods (Santèn et al.,
2018). Capacity utilisation of a vehicle or a fleet of vehicles can be measured using the
load factor model developed by Santén (2016). Load factor is defined as “the ratio of
the load carried (required capacity) to the maximum load that could have been carried
(available capacity)” (Santén, 2016, p. 3). The load factor can be measured at several
levels such as the packaging level, shipping level, vehicle level and fleet level (Santén,
2016). The capacity utilisation is therefore a result of the load factor at these levels as
can be seen in Figure 3.1. The overall load factor can be calculated by comparing the
required capacity at the lowest packaging level with the available capacity at the fleet
level. A high capacity utilisation is therefore achieved by having a close balance
between available capacity and required capacity at every level. Santén (2016)
exemplifies this by stating that all the floor space can be covered with pallets even
though these may be empty, resulting in a low overall load factor. As the goods have
several characteristics that may limit the carrying capacity of a vehicle or ship such as
weight, volume or floor space, there are several ways to measure the load factor
(Santén, 2016). Measuring one dimension may therefore not provide a realistic picture
12
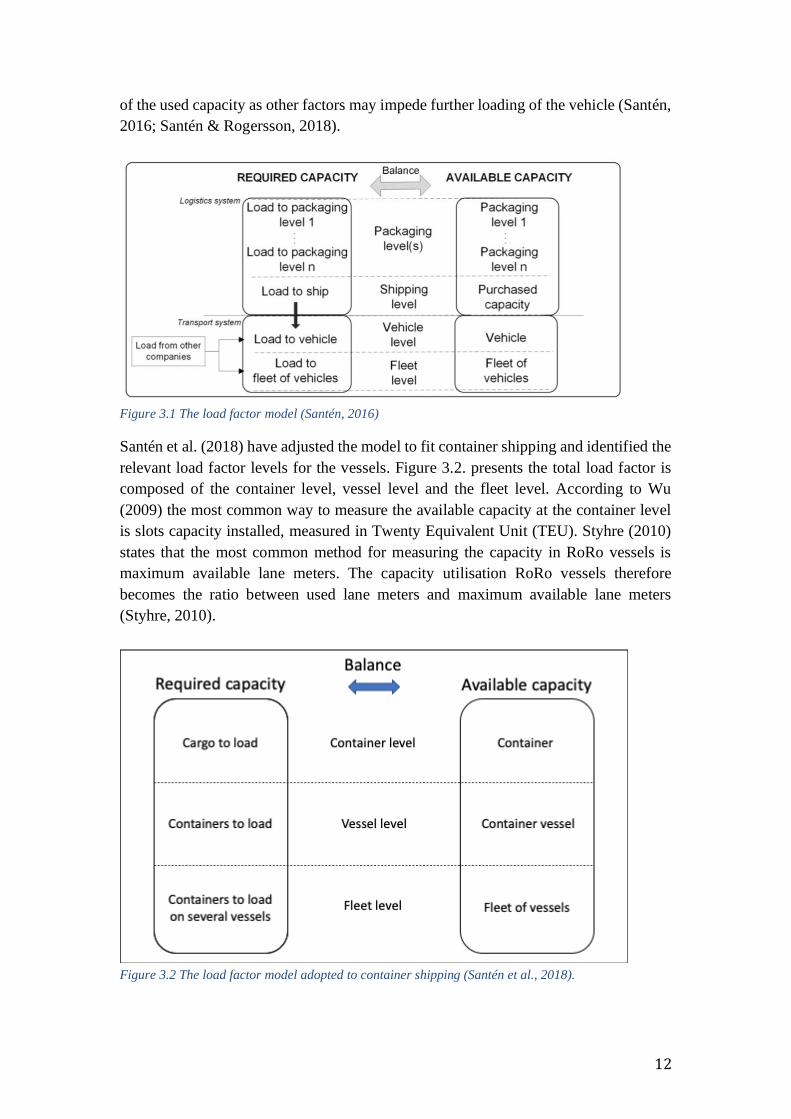
of the used capacity as other factors may impede further loading of the vehicle (Santén,
2016; Santén & Rogersson, 2018).
Figure 3.1 The load factor model (Santén, 2016)
Santén et al. (2018) have adjusted the model to fit container shipping and identified the
relevant load factor levels for the vessels. Figure 3.2. presents the total load factor is
composed of the container level, vessel level and the fleet level. According to Wu
(2009) the most common way to measure the available capacity at the container level
is slots capacity installed, measured in Twenty Equivalent Unit (TEU). Styhre (2010)
states that the most common method for measuring the capacity in RoRo vessels is
maximum available lane meters. The capacity utilisation RoRo vessels therefore
becomes the ratio between used lane meters and maximum available lane meters
(Styhre, 2010).
Figure 3.2 The load factor model adopted to container shipping (Santén et al., 2018).

13
3.3 Factors affecting capacity utilisation
This section presents factors which hinder or facilitate companies’ ability to achieve a
high level of capacity utilisation. These factors have in turn been categorised into the
following areas: market conditions, market structure, market requirements and internal
company factors, which is illustrated in Figure 3.3 below.
Figure 3.3 Illustration of the categorisation of factors which affect capacity utilisation.
3.3.1 Market conditions The shipping industry is characterised by having a fixed supply while demand is
variable which creates a challenge for ship operators when coping with changes in
demand (Fusillo, 2004). When demand varies ship operators are not able to match their
capacity with customers' demand at all times. This creates the effect of having excess
capacity on the vessels (Fusillo, 2003). This gives rise to core emptiness, which is
defined as a mismatch between supply and demand (Fusillo, 2003). The liner shipping
segment is especially vulnerable when demand decreases as their schedules are fixed
(Fusillo, 2003; Haralambides, 2004). Ship operators cannot delay their departures to
wait for more goods to utilise the vessel better or cancel scheduled departures (Fusillo,
2003). This forces them to depart with a low capacity utilisation as they are not able to
vary their supply on a short-term perspective (Fusillo, 2003). The market conditions
such as the available cargo to transport, trade imbalances and seasonal variations in
demand affect the capacity utilisation. (Styhre, 2010; Wu, 2012).
Fusillo (2004) mentions during periods of having low demand it can be more
economical to operate the vessels with low utilisation rather than having the departures
cancelled, which can be one of the reasons why carriers tend to operate with a lower
capacity utilisation than normal. This is also supported by Styhre and Lumsden (2007)
who mention that from an economical point of view it can be better to operate with
extremely low capacity utilisation rather than withdrawing capacity. In the
manufacturing industry when demand is lowered it is common to sell equipment to
reduce the fixed cost (Davies, 1983). However, in the shipping industry this is not as
viable. The reason for this is that if the vessel is sold, the shipping company cannot
longer offer a service with a high frequency (Davies, 1983).

14
3.3.1.1 Seasonal variation
Seasonal variation is a factor that affects capacity utilisation (Fusillo, 2003). Fusillo
(2003) observed that in the Eastbound Trans-pacific area between 1993 and 2003 the
inability to meet the variation gave rise to excess capacity (Fusillo, 2004). Styhre and
Lumsden (2007) state that in order to cover peaks in demand during the summer, ship
operators need to set a capacity that is able to cover the demand. As a result, when
demand is lower, excess capacity arises which results in a lower capacity utilisation
(Styhre & Lumsden, 2007). The shipping industry is highly affected by customers in
the trading and manufacturing sector (Styhre, 2010). Customers affect ship operators’
ability to utilise the capacity at a high level, since vacations, production breakdowns
and other incidents create fluctuation and instability in demand. Other sectors have as
a result a great impact on ship operators and their capacity utilisation (Styhre, 2010).
3.3.1.2 Trade imbalances
Styhre and Lumsden (2007) state that trade imbalances are a factor that negatively
affects capacity utilisation for ship operators. Differences between export and import
numbers are difficult to handle since they are influenced by internal trade patterns
which affects the capacity utilisation (Styhre and Lumsden, 2007). Ting and Tzeng
(2004) mention that there are large imbalances in the container shipping industry,
especially in Asia, Europe and in the transpacific trades. The trade imbalances also
create an uneven flow of containers in different directions which creates a need for liner
ship operators to transport empty containers in some directions, as containers need to
be available where transportation is needed (Ting & Tzeng, 2004). Haralambides
(2007) points out that the empty positioning of containers is one of the main cost drivers
for liner carriers. According to Ting and Tzeng (2004) the empty positioning reduces
the capacity utilisation of the ships as they need to be filled with empty containers that
need to be repositioned.
3.3.2 Market structure According to Porter (1981) there is a relationship between the structural characteristics
of a market and the way that companies behave in the market. Porter (1981) states that
the way that companies behave given the structural characteristics in turn affects the
performance of the companies in the market. The company structure refers to the
context in which companies in the industry compete (Porter, 1981). Examples in the
shipping industry are entry barriers, industry concentration and economies of scale
(Yip, Lun & Lau, 2012). The market structure affects the company’s conduct, which
refers to the company’s strategic choices regarding key decisions such as price and
capacity and how they interact with other companies in the market (Yip et al., 2012).
Figure 3.4 presents the relationship between the structure, conduct and performance.

15
Figure 3.4 The relationship between industry structure, conduct and performance (Porter, 1981).
3.3.2.1 Cost structure
The liner shipping industry is to some extent similar to a public transport service as it
provides a service to its customers to ship goods on a regular basis between specific
ports according to predefined timetables (Haralambides, 2004). Providing this service
requires companies to perform large investments in infrastructure such as a fleet of
vessels, equipment and cargo handling facilities (Davies, 1983; Haralambides, 2004).
Davies (1983) states that when the schedule is determined, costs which would otherwise
have been seen as variable in other industries are seen as fixed. Examples of this are
crew wages, maintenance and repair since they cannot be changed in the short run and
do not vary with volume carried. Haralambides (2004) states that the only variable costs
are terminal handling charges for loading and unloading operations.
The cost structure results in a majority of the costs being fixed, even though the
relationship between fixed and variable costs depends on the capacity utilisation
(Davies, 1983). A higher capacity utilisation results in a larger portion of the total costs
being variable costs as the terminal handling charges increase but the fixed costs are
the same (Davies, 1983). As a result, the average fixed costs decrease as the capacity
increases. The average variable costs are on the other hand constant until the capacity
utilisation reaches around 90%, where diseconomies of scale result in higher variable
costs per unit (Davies, 1983). According to Styre (2010) the diseconomies of scale are
a result of increased turnaround time in the port and administrative expenses. The
variable and fixed costs result in the figure 3.5 below, illustrating the average total cost
and short run marginal costs (Styhre, 2010). The marginal costs are defined as the
additional cost of carrying another trailer or container and is equal to the short run
average cost (Styhre, 2010). Figure 3.5 indicates that the cost structure in the shipping
industry results in a low marginal cost if the ship does not have a high capacity
utilisation, meaning that there are large economic incentives to increase the capacity
utilisation. If the transported amount of goods increases above a certain limit, the short
run marginal cost increases significantly which reduces the shipping operator’s
willingness to increase the capacity utilisation even further.

16
Figure 3.5 The short-run marginal cost and the average total cost in the shipping industry (Styhre, 2010).
The cost structure of shipping has implications for ship operators to incentives to adjust
their freight rates, as well as the interaction with other ship operators (Fusillo, 2004).
Haralambides (2007) argues that if a customer wants to make a shipment, the ship
operator is willing to transport it at a price just above the short run marginal cost, since
the expenses for carrying it are covered on a short-term perspective. This drives freight
rates to the short run marginal cost under perfect competition. If companies aimed for
this pricing strategy, the market would go towards destructive competition.
Haralambides (2007) states that ship operators would not be able to cover their long
run-average cost since capital costs such as repair of vessels and equipment costs would
not be covered. This would make the market unsustainable in the long run
(Haralambides, 2007).
3.3.2.2 Lumpy capital
As demand grows over time, liner companies need to increase their available capacity
(Fussilo, 2003). The capacity investments are lumpy as they involve large capital
investments. As a result, companies tend to increase their capacity in discrete units at
specific intervals. When choosing the adequate capacity to invest in, firms often adjust
the capacity increment to the market requirements without taking into consideration
other actors on the market (Fussilo, 2003). As several firms disregard each other, the
industry will face a situation with excess capacity resulting in a lower capacity
utilisation. As the cost of increasing capacity is lower the higher capacity increment,
companies may opt to increase their capacity in bigger steps at less frequent intervals
which further increases the excess capacity (Fussilo, 2003).
3.3.2.3 Economies of scale
Tran and Haasis (2015) state that there is a trend among ship operators to acquire larger
vessels in order to achieve economies of scale. Styhre (2010) points out this trend has
not only been seen for ocean shipping but also for short- and medium-distances.
According to Cullinane and Khanna (2000) the unit cost decreases as the size of the
ship increases, meaning that economies of scale can be achieved by employing larger
vessels. Cullinane and Khanna (2000) describe the main reasons for this being that the
larger vessels allow ship operators to carry larger volumes of goods on the ships. The

17
marginal savings achieved by acquiring larger vessels diminishes as the ships become
larger due to diseconomies of scale in port operations (Cullinane & Khanna, 2000).
Midoro, Musso and Parola (2005) found that an 8 000 TEU super post-Panamax vessel
spent 24 % of its overall time in ports compared to a 4 000 TEU Panamax vessel which
only spent 17% of its time in ports. This is a result of the increased call size, meaning
the number of containers that need to be handled in the port (Midoro et al., 2005).
Cullinane and Khanna (2000) also state that the economic benefits are higher if the
routes are longer, since the ships spend more time at sea reaping economies of scale
and less time at port where there are diseconomies of scale. Besides providing a lower
unit cost, larger vessels can operate at a faster speed which allows the ship operators to
provide their customers with a better service. The economic benefits provided by larger
ships provide a short-term competitive advantage which creates incentives for ship
operators to invest in larger vessels if the benefits exceed the negative implications
(Cullinane & Khanna, 2000). According to Styhre (2010) companies are only able to
reap the economic benefits of large ships if they are loaded to a high degree. A service
with smaller ships is able to have more frequent departures (Styhre, 2010). As a result,
there is a trade-off between economies of scale and frequency.
The economic benefits of the increased ship sizes have resulted in the employment of
large ships in the major trade routes by ship operators (Wu, 2009). This has resulted in
that the available capacity has increased at a greater pace than the required capacity,
which therefore has increased the risk of having excess capacity on the vessels. Wu
(2009) states that the competition amongst the ship operators to deliver low freight rates
and larger ships has therefore resulted in a deterioration of the load factor and therefore
a lower capacity utilisation.
3.3.2.4 Cooperative arrangements
In order to avoid destructive competition ship operators have been part of collusive
arrangements called conferences (Fussilo, 2004). Within the conferences fixed prices
are set on a specific route that are above the long-run average cost and therefore also
sustainable from a long-term perspective (Fussilo, 2004). Discussions agreements have
been found as a substitute to conferences in several trade routes (Fussilo, 2004). The
discussion agreements benchmark prices for different routes but does not oblige a ship
operator to have a predetermined rate for their services, as opposed to conferences.
Until 2008, the liner shipping industry was exempted from complying with European
Union regulations that inhibited actors in a market to fix prices and exchange
information that would reduce the competition on the market (Bermig & Ritter, 2008).
New laws were established in 2008 by the European commission which removed the
exemption, making it illegal for ship operators to fix prices (Bermig & Ritter, 2008).
This has resulted in conferences being illegal for all the routes that include a port stop
in the European Union (Europa, 2008).

18
Wu (2012) states that the capacity utilisation amongst shipping lines has increased since
1998. The author states that this is partly a result of the OSRA (Ocean Shipping Reform
Act), which was implemented in 1998 and has encouraged ship operators to take part
of and create shipping alliances. Shipping alliances are described as “formal
agreements among carriers operating on global routes to share equipment including
vessels and portside infrastructure” (Fussilo 2004, p. 223). Taking part in alliances
allows companies to offer their customers an increased service frequency (Panayides
and Cullinane, 2002). It also alleviates the issue of fixed capacity for the alliance
members as they are able to allocate capacity without investing in new vessels or
chartering vessels (Fusillo 2004; Cariou 2008). Panayides and Cullinane (2002) state
that this can be done by having slot sharing agreements. Fussilo (2004) states that
carriers may also coordinate their sailing schedules. By having more flexible capacity
and coordinated sailing schedules amongst members of the alliance, carriers are able
respond to changes in demand more effectively and therefore increase their capacity
utilisation (Wu, 2012).
Being part of an alliance also reduces the financial risk for the alliance members when
investments in new vessels are made together (Fussilo, 2004). Investing in newer and
larger vessels with members of the alliance therefore allows carriers to share the
investment cost and achieve a lower cost per slot by reaping economies of scale
(Midoro et al., 2005). This allows them to deploy larger and more efficient vessels on
the major trade-routes. Styhre (2010) states that the creation of formal alliances with
formal agreements amongst the members of the alliance also reduces destructive
competition as the prices are not pushed towards marginal costs. A drawback may
however be that it can be difficult to coordinate the different partners in the alliance
(Cariou, 2008). Panayides and Cullinane (2002) state that taking part of an alliance may
also give rise to difficulties as the organisations may have individual objectives that
may affect the cooperation among the partners.
3.3.2.5 Market concentration and vertical integration
Fussilo (2003) states that the shipping industry has several characteristics that are
representative of industries that go towards a monopoly. Examples are economies of
scale and having an increased number of firms producing a certain output reduces the
cost effectiveness (Fussilo, 2003). This can be seen in the shipping industry as the
number of ship operators in the industry has been decreasing the last decade (Santèn et
al. 2018). Midoro et al. (2005) state that there is a trend of firms integrating horizontally
in the shipping industry over the past decades as companies acquire each other through
mergers and acquisitions. According to Yip et al. (2012) this has been performed in
order to achieve a larger market share and establish a more competitive position against
other actors in the market. As a result, the concentration ratio of the shipping industry
has increased considerably (Midoro et al., 2005). According to Luo and Kou (2015)
total carrying capacity is used to calculate the market share of companies in the shipping

19
industry. Between 1996 and 2006, the market share of the 20 biggest carriers increased
from 39 % to 62 % in terms of slot carrying capacity (Midoro et al., 2005).
According to Midoro et al. (2005) fewer ports are able to cope with the increased
requirements of the larger vessels. This has increased the contractual strength of
stevedores which in turn has increased the stevedoring costs for ship operators (Midoro
et al., 2005). The increased vessel sizes have also resulted in increased time at port and
increased transhipment costs. In order to achieve a higher control over the stevedoring
costs and increase the schedule reliability, ship operators have started to integrate
vertically and control terminals (Midoro et al., 2005). Panayides and Cullinane (2002)
state that container liner companies are also diversifying their activities by offering
inland transportation and providing their customers with a door to door service.
According to Panayides and Cullinane (2002) this is a result of lower freight rates,
competition for market share and customer requirements. Due to increased vessel sizes,
the sea leg represents a low part of the total cost of transportation, which motivates
container shipping lines to offer a wider variety of logistical services (Panayides &
Cullinane, 2002). Integrating vertically allows companies to achieve larger market
shares, increased coordination and increased routing flexibility (Panayides &
Cullinane, 2002).
3.3.2.6 Entry deterrence
Ship operators may leave excess capacity on their vessels on purpose as a strategic
motive (Fusillo, 2003). The reason for this is that when a competitor is entering the
same segment or making a market expansion, the company can then reduce their prices
with help of the excess capacity to deter them from entering the market and keep their
market share (Fusillo, 2003; Wu 2009). Therefore, it is important to have a buffer of
excess capacity for these situations (Fusillo, 2003; Styhre & Lumsden 2007). Having
larger ships allows ship operators to not reject customer, which can give them an
advantage over their rivals. This may involve higher costs, however it does not imply
that it is an unprofitable option. The excess capacity is only beneficial until the
incremental costs of operating with excess capacity exceeds the incremental benefits
(Styhre & Lumsden, 2007). Cullinane and Khanna (2000) state that economies of scale
allow ship operators to achieve excess capacity at a low unit cost, which provides an
advantage to larger ship operators.
3.3.3 Market requirements This section presents how market requirements such as: service levels and frequency
affect ship operators utilisation level on their vessels.
3.3.3.1 Service level
According to Styhre (2009) service level is an important factor which plays a significant
role for the capacity utilisation. From a short run perspective, it is beneficial to have a
high capacity utilisation, since it increases the revenues (Styhre, 2010). However,

20
operating with levels close to 100% capacity utilisation might in the long run not be
beneficial for the shipping companies, as it provides competitors opportunities to take
market shares on the trade. When operating with a lower capacity utilisation, companies
are able to provide a high service level for existing customers but are also able to find
new customers (Styhre, 2010). Styhre (2009) mentions that having a strategy with a
utilisation above 90% can lead to dissatisfied customers since they might have to reject
customers when there are peaks in demand. Davies (1983) also points out that operating
at capacity utilisation levels close to 100% is not practical, since this can have a
negative impact on the customer relationships. This is partly a result of the loading
operations, as all goods may not be loaded before departure if utilisation is too high. If
this happens several times it may have a negative impact on their relationship and give
their competitors the possibility to increase their market share (Davies, 1983).
Therefore, it is important to have excess capacity on the vessels (Davies, 1983). The
excess capacity can be seen as an intangible asset, as it allows the ship operators to
serve their customers better (Davies, 1983).
3.3.3.2 Frequency
According to Styhre (2010) liner services which had a higher departure frequency had
a lower capacity utilisation compared to services which had lower frequency. Five
routes were identified with a high frequency of more than 100 departures per week
which on average had a capacity utilisation of 34% on the vessels. The low utilisation
was a result of the high frequency. Increasing the frequency however increases the total
amount of goods that are shipped during a year (Styhre, 2010). By providing a service
with a high frequency and at the same time a low utilisation rate, customers are not
obliged to plan their transportation on forefront and book slots in advance on the
vessels. This has led to the customer having different requirements on these routes since
they are expecting the high frequency with almost available space for every departure
(Styhre, 2010).
3.3.4 Internal barriers According to Styhre (2010) there are internal factors within the company’s
management that affect the extent to which a high capacity utilisation can be achieved
on the vessels. Within the company it is important that different functions and
departments are communicating with each other, and at the same time use the internal
resources by combining knowledge from the management side and from the employees
on the vessel (Styhre, 2010). This makes it easier for the company to create a holistic
view and work to achieve a higher capacity utilisation (Styhre, 2010). Christiansen and
Fagerholt (2004) present three different levels of planning for the liner shipping
segment. In the strategic planning optimal routes and schedules are established. In the
tactical planning the vessels are assigned to their schedules. Lastly, in the operational
planning, decisions regarding if cargo being accepted from customers is performed.
Working cross functionally and communicating between these different levels can have
a better impact on the capacity utilisation on the vessels (Styhre, 2010).

21
3.4 Capacity planning
The desired level of capacity and capacity utilisation varies between different ship
operators. From a short-term economic point of view there are benefits of trying to
achieve a capacity utilisation of close to 100% due to economies of scale and low
marginal costs. However, there are several factors that affect companies’ willingness
and ability to constantly have 100% utilisation which was presented in the previous
sections. One example is service level, which is reduced as capacity utilisation is
maximised (Styhre, 2010). This incentivises competitors to enter the market or to
increase their market shares (Davies, 1983). Styhre (2010) states that having extra
capacity available allows ship operators to ship the goods without delays, which is
important for companies working on a just-in-time basis. Styhre (2010) states that
market share and competitive situation also affect the companies’ willingness to operate
at full capacity. High levels of competition create incentives for companies to operate
at full capacity whereas companies operating in markets with low competition often
have lower levels of capacity utilisation (Styhre, 2010).
Styhre (2010) has identified two strategies that companies can adopt when deciding
upon appropriate levels of capacity utilisation. Figure 3.6 illustrates the first strategy,
the cut peaks strategy which cuts the peaks in the demand variations to achieve a high
capacity utilisation. This strategy utilises current vessel capacity to a high degree but
results in missed opportunities for the company when the demand increases above the
maximum carrying capacity. This may result in loss of market share if the market is
growing. The strategy can be achieved by having a low maximum capacity or by
increasing the market share. This strategy is suitable when there is a high variation in
demand and high trade imbalances, when a market is highly competitive and has low
levels of growth, and when customers can choose other options and there are low freight
rates.
Figure 3.6 The cut peaks strategy, where Z is the maximum capacity and z is the average utilised
capacity. The maximum capacity Z and the average utilised capacity z coincides when the capacity
utilisation on the vessel is 100%.
Figure 3.7 presents the second strategy, the never say no strategy, in which companies
establish a maximum capacity that is able to cope with the maximum peaks in demand

22
(Styhre, 2010). The strategy results in a low average vessel capacity utilisation as there
is always available space on the vessel for more cargo. The strategy provides a high
level of flexibility, service and reliability as there is always space available on the
vessel. This capacity utilisation strategy is suitable in situations where there is time
sensitive cargo, customers with long-time relationships, growing markets and situations
in which there are assignments on the spot-market with high freight rates (Styhre,
2010).
Figure 3.7 The never say no strategy. Y is defined as the maximum capacity and y is defined as the
average utilised capacity (Styhre, 2010)
Fussilo (2003) states that companies choose to have excess capacity if the cost of
missing transport assignments is higher than the cost of carrying excess capacity.
According to Styhre (2010) the cut peaks strategy and the never say no strategy should
be seen as extremes and a balance between both should be opted for based on the
company's specific circumstances. The strategy results in the ship operator not being
able to cope with the highest peaks of demand while having excess capacity when
demand is low. Figure 3.8 below illustrates the mixed strategy.
Figure 3.8 A combination of the cut peaks strategy and the never say no strategy, which allows some
peaks to be cut but keeps unutilised capacity for the rest of the time. X is defined as the maximum capacity
and x is defined as the average utilised capacity (Styhre, 2010).

23
3.5 Strategies to increase capacity utilisation
This section presents different strategies that aim towards increasing the capacity
utilisation.
3.5.1 Pricing strategy According to Styhre (2010) using price differentiation allows ship operators to increase
capacity utilisation. The author states that some customers are more prone to change
supplier if prices increase. By adjusting the rates to the specific customers, ship
operators are able to keep their customers and increase utilisation. Price differentiation
may therefore be used in situations where ship operators can charge their customers
with different prices. Having knowledge of the prices that ship operators can charge
their customers and their price elasticity allows ship operators to use price
differentiation. Price elasticity is defined as the change in demand caused by a change
in price. A high price elasticity results in a big change in demand if prices are changed
(Pass, Lowes & Davies, 2000; Styhre, 2010).
Figure 3.9 illustrates the price per unit for different customers and services (Styhre,
2010). Most of the customers are found in group B and C. These customer groups have
a low elasticity of demand and provide stable volumes to ship operators. The low-price
elasticity means that the customers are not price sensitive and volumes do not decrease
if prices change (Pass et al., 2000; Styhre, 2010). The freight rates are therefore stable
for these customer groups. Group B are highly important customers as they have freight
rates over the long run average cost (LRAC). When there is space which is not utilised
on the ships, customers in group D should be targeted. However, this should be limited
as the freight rates are just above the marginal costs which is not sustainable from a
long-term perspective. Customers who are in Group A have a low-price elasticity of
demand and are important, as higher freight rates can be charged to these customers
(Hummels, Lugovskyy & Skiba, 2009). These are normally customers with high value
cargo such as project cargo (Styhre, 2010; Hummels et al., 2009)
According to Styhre (2010) an increased number of competitors reduces the freight
rates and the applicability of price discrimination. Alternative transportation modes
such as rail or air-based transportation increases the elasticity of demand as customers
are prone to use other alternatives if prices increase (Styhre, 2010). Lam, Yap and
Cullinane (2007) state that a company's market power determines the degree to which
it can use different pricing policies such as price discrimination. Market power is
defined as “a company's ability to set prices above the marginal costs” (Lam et al.,
2007, p. 361). Lam et al., (2007) state that market power can be exercised by having
barriers to entry.

24
Figure 3.9 Price differentiation which can be used to increase capacity utilisation when operating in an
established service (Styhre, 2010).
Styhre (2010) states that imbalances in the physical volume that is transported in both
directions can also be handled with the pricing mechanism. This is done by setting
lower rates on the direction that has a lower demand. This does however require
companies to increase the freight rates on the high demand leg as profits would
deteriorate otherwise (Styhre, 2010).
3.5.2 Marketing Increasing demand for ship operators own service is a way to increase capacity
utilisation (Styhre, 2010). Marketing products and services is an effective way to
increase the demand for a company's products (Czinkota & Ronkainen, 2006). When
using marketing to market a company's services it is important that the communication
is effective and efficient. Having efficient communication allows companies to inform
customers about what service is available and convince them to not opt for competitors
offering (Czinkota & Ronkainen, 2006). It is also important to work with awareness,
since this is the first step when finding new customers. However, the awareness is also
important to remind potential customers about the existence of the offered service
(Feltenstein, 2010). An example of a way that marketing can be used to increase
demand on a service is to use sales promotions, which can be short-term incentives with
premiums and discounts to stimulate customers' purchases (Zeithaml, Bitner &
Gremler, 2009).
3.5.3 Rescheduling standby cargo To improve capacity utilisation, shipped cargo can be evened out through several
departures in order to be able to handle variations in demand (Rogerson and Santén,
2017; Jonsson 2008; Styhre, 2010). This allows ship operators to provide more space
on the attractive departures for new customers or new cargo, since other cargo is being
shifted to other departures (Styhre, 2010). As an example, if a Monday departure has a
high utilisation while the Wednesday departure has low utilisation, some of the cargo
from the Monday departure can be moved to the Wednesday departure (Jonsson 2008;

25
Styhre, 2010; Rogerson and Santén, 2017). This increases the overall utilisation of the
vessels, which can be seen in Figure 3.10 below (Styhre, 2010). According to Styhre
(2010) this is easier to perform with base cargo which has lower rates for transportation.
Base cargo is mainly cargo from loyal customers who can accept movement of goods
and get compensation for this, i.e. lower prices. However, this may not be suitable with
cargo that is time sensitive.
Figure 3.10 Illustration of how cargo can be rescheduled to another departure in order to increase
capacity utilisation (Styhre, 2010)
3.5.4 Adjusting capacity Capacity utilisation can be increased by increasing capacity in more frequent and
smaller steps as illustrated by Figure 3.11 down below (Styhre, 2010). Three strategies
can be used to adjust the capacity, the first one is to change the capacity within the
existing fleet, the second one is to increase the vessel capacity by smaller steps, the
third option is to invest in new vessels (Styhre, 2010).
Figure 3.11 Increasing capacity in smaller and more frequent steps in order to increase capacity
utilisation (Styhre, 2010).
An example of how a ship operator may change capacity within the existing fleet is to
shift vessels between the different routes when there is a change in the demand, but also
to work with the network of the routes instead of focusing on one individual route

26
(Styhre, 2010). Having flexibility in the capacity management is therefore important
since utilisation may be increased without high investment costs (Styhre, 2010). If the
current fleet cannot fulfil the need of the capacity, the ship operator can increase
capacity in smaller steps before a new large vessel is acquired. This can be achieved by
chartering vessels for a shorter time period (Cariou, 2008). Cariou (2008) mentions that
this is standard practice as it allows ship operators to have more flexibility where they
can increase or decrease capacity fast, without having the need of making larger
investments. If the ship operators see a trend of increased cargo in the market, they
invest in new vessels to expand their capacity from a long-term perspective (Styhre &
Lumsden, 2007). This increases the level of unutilised capacity and excess capacity for
a shorter time, however, if a recession comes, the levels will stay low for a longer time
(Styhre, 2010). Another characteristic in the shipping industry to increase their
available capacity in the network is by mergers and acquisition, however this is a more
costly option (Cariou, 2008).
3.5.5 Strategic alliances According to Cruijssen, Dullaert and Fleuren (2007) horizontal cooperation can be
performed with competing companies where win-win situations can be identified to
increase the performance in their supply chain. As explained by Wu (2012) strategic
shipping alliances may help ship operators to increase their capacity utilisation on their
vessels. An alliance makes it easier for ship operators to allocate their capacity on
vessels without having additional vessels through chartering or purchasing (Fusillo
2004; Cariou 2008). According to Wu (2012), ship operators can coordinate their
services within the alliance and achieve increased flexibility in their capacity. This
increases the flexibility for the actors involved as they can react to changes in demand
more efficiently. This can in turn help ship operators to increase their capacity
utilisation on the vessels (Wu, 2012). When operating on the same routes with similar
schedules of departure, two or more actors can create a strategic alliance by having slot
sharing agreements (Panavides & Wiedmer, 2011). This means that the competitors
have a fixed percentage of capacity on each other’s vessels. Being part of an alliance
does however not include having joint sales of the service and not interfering in each
other pricing and marketing strategies (Panavides & Wiedmer, 2011).
3.5.6 Speed Slow steaming is defined as operating a vessel at a lower speed than it is designed for
(Finnsgård, Kalantari, Roso & Woxenius, 2020). Slow steaming results in a lower
frequency of departure if the same number of vessels are used as the route takes longer
time to complete (Finnsgård, Kalantari & Raza, 2018). As the frequency is reduced, the
total capacity in the string is reduced. Slow steaming can therefore be used as a tool to
reduce capacity if demand decreases in order to increase capacity utilisation (Finnsgård
et al., 2018; Maloni, Paul & Gligor, 2013; Dere & Deniz, 2019; Faber, Freund, Köpke,
Nelissen 2010).

27
Raza, Woxenius and Finnsgård (2019) point out that slow steaming is mainly used for
deep-sea shipping and is not suitable for short sea shipping when having RoRo or
RoPax vessels. Customers within the RoRo and RoPax segments are more sensible to
changes in frequency. If slow steaming is to be used, the ship operators would need to
deploy more vessels which is not always a viable option (Raza et al., 2019). Slow
steaming can have a negative impact on the service level, since it results in increased
lead times and affects the customers inventory levels (Finnsgård et al., 2019; Finnsgård
et al, 2018).
3.5.7 Overbooking Overbooking is defined as intentionally selling more capacity than what is available
(Smith, Leimkuhler & Darrow, 1992). Overbooking is used in the shipping industry to
offset the effects of abandonments and cancellations (Qvartz, 2017). It is stated that
shippers can abandon bookings without any cancellation fee which creates incentives
for them to use these strategies (Qvartz, 2017). This strategy is therefore used as
customers often fail to claim their booked capacity (Biyalogorsky, Carmon, Fruchter &
Gerstner, 1999). By overbooking the departures, the negative effects of no-shows and
cancellations are countered, and capacity utilisation can be increased (Smith et al.,
1992). Biyalogorsky et al. (1999) state that overbooking is beneficial to use when there
are differences in customers willingness to pay a higher price, when high-paying
customers are expected to enter the market at a later stage and when there is an
uncertainty in number of customers in the market. In these cases, the capacity has a low
flexibility and cannot be adjusted easily.

28
4 Empirical findings
This section presents the empirical findings from the eight interviewed ship operators.
Firstly, general information about the ship operators is presented, thereafter how they
perform their capacity planning is presented. The identified factors are presented to
understand how they impact capacity utilisation and lastly the strategies are explained
in order to understand how they can increase their utilisation.
4.1 RoRo1
RoRo1 is operating within the RoRo and RoPax segment, transporting goods and
accommodating passengers on their vessels. They have targeted the segment short sea
shipping. In total the company transports 4-5 million lane meters per year, the
interviewed department is responsible for 1.5million lane meters transported per year.
The company operates over the whole Europe area. In Northern Europe their fleet
consists of a pool of 250 vessels, which consists of several different sizes. In general,
the company charters 10% of their vessels from external parts and 90% of the vessels
are owned by themselves. The department that was interviewed was responsible for
their trades between Sweden and England as well as between Sweden and Belgium. To
operate on these specific routes, the company has deployed nine vessels which have
departures twice a week.
RoRo1 mainly targets two types of customers: forwarders and BCOs (beneficial cargo
owners). 60-70% of the total volume that is shipped are goods from forwarders and the
other share is from BCOs. For their customers it is important that the service is reliable
and that the goods are delivered within the promised time frame. They have both loyal
customers but also customers who switch between several ship operators. Their largest
customers book space through a yearly contract where they define the amount of
volumes they are going to send and where the price is decided for the service. The
customers also share their forecasts with the shipping company. RoRo1 also allows last
minute bookings up to 30 minutes before departure, however, this is uncommon. With
their schedules with two departures per week, they have one prime departure which has
a higher price, and the second departure is less attractive with a lower transport rate.
RoRo1 mentions capacity utilisation is the most important key performance indicator
(KPI) for them, however, rate per lane meter is important for them to calculate the
revenues. Working with capacity utilisation is important both from an economic and
environmental perspective. RoRo1 measures capacity utilisation by taking used lane
meters divided by total available lane meters, which is followed up on every voyage on
a daily basis.

29
4.1.1 Capacity Planning When RoRo1 plans their schedules, a budget is created where the expected amount of
cargo which is going to be transported is taken into consideration. The interviewee
mentions planning is performed 6-12 months ahead, allowing them to see what volumes
they are expecting. Also, to see if any new flows are adding up in their network or
disappearing. By doing this they can increase or decrease the available capacity on the
market. In their long-term planning seasonal variation is accounted for as demand will
be lower or higher for certain periods. In order to handle the peaks, the company plans
for overcapacity to some extent. As an example, before summer vacation in Sweden
there will be a demand peak in demand. RoRo1 does not necessarily handle this by
having an extra vessel or a larger vessel, the capacity utilisation will instead increase
slightly for a certain period of time from for example 80% to 85%.
If RoRo1 could operate with 100% capacity utilisation they would, however, the
interviewee mentions that high levels of utilisation make the system vulnerable and not
sustainable from a long-term perspective. The interviewee mentions there is a need to
operate around 80% capacity utilisation to handle variations throughout the week. For
example, their flexibility will be too low if they are operating at 100% and face harsh
weather, resulting in diseconomies of scale.
The headquarters of RoRo1 has in total 250 vessels which can be redirected between
different routes if there are any changes in demand. If they are experiencing a short fall
of cargo on a specific route, the larger vessel can be exchanged for a smaller one. This
is performed to achieve a better capacity utilisation on the new vessel and the larger
ship will be moved to a route which has a need for more capacity. However, in certain
situations when a ship gives overcapacity, the company may decide to maintain that
overcapacity on the specific route until the demand will increase again, since there
might not be any option to exchange the vessel to a smaller one. The company also
charter vessels to other ship operators if they are not using the vessels themselves.
4.1.2 Factors affecting CU Variation in demand
In the interview it was stated that RoRo1 is affected by the industries in the Gothenburg
region, where there is a peak in demand before the summer vacation. After this there is
a regression for a shorter period.
Trade Imbalances
For the routes Sweden-UK and Sweden-Belgium, RoRo1 does not see trade imbalances
as a hindrance for them to achieve a high utilisation on their ships. This is stated by the
interviewee: “We do not have that much imbalance right now”. Customers are shipping
goods both ways, by doing this they have reduced the number of empty trailers in the
system.

30
Weather conditions
Bad weather conditions have a negative impact on their capacity utilisation, since it
leads to longer lead-times between ports which in turn will create delays at the terminal.
The reason for this is that they will not have the needed amount of resources at the
terminal and loading and unloading speed is therefore reduced. This will lead to a
lowered capacity utilisation on the ships.
Ports
The ports are a limiting factor as mentioned before when they are facing harsh weather
conditions, as the weather may cause delays in the loading and unloading operations.
Service level
If RoRo1 would have 100% capacity utilisation on their vessels, their system would
become vulnerable. Having this level of utilisation would negatively affect their service
level as they would not be able to provide their customers with a service that has a high
availability. This could lead to customers changing suppliers.
Schedule characteristics
The interviewee mentions they have several departures during the week. They need to
maintain the given frequency in order to provide their customers with a good service.
However, during weekends they have a lower demand which results in a lower capacity
utilisation for the departure and lower weekly figures.
Internal barriers
The interviewee mentions that they have no internal barriers within the company which
hinders them from achieving a high capacity utilisation on the vessels. They have a
close dialog with the ships and the stevedores which makes their operations more
efficient.
4.1.3 Strategies Increase demand
RoRo1 mentions pricing is not used as a tool to attract more goods when there is a
situation with low levels of capacity utilisation on their vessels. RoRo1 tries to maintain
the same price policy, since it is believed their service with the given frequency shall
have the given price. The interviewee also states that: “We would not go out and just
lower the price just to get more trailers, because we do not think there are many more
trailers in the market”. Instead, building strong relationships with their customers is
believed to be more important rather than just lowering prices. Lower prices may
however be offered to customers which have goods that are not time sensitive as it gives
them a higher flexibility. The reason for this is that they may be used as standby cargo
which allows them to move goods between departures.

31
In their service they have some prime departures that have a higher price and other
departures which have lower prices. By doing this they can even out the demand and
move cargo from prime departures to the less attractive ones.
Standby cargo
The ship operator has standby cargo to increase the utilisation on their vessels. RoRo1
experiences that there is a percentage of the trailers that do not make it on time to the
vessel. Therefore, they have a waiting list, so that they can optimise their
transportations. An example is industrial cargo, which does not have a fixed date for
when the cargo is scheduled. Instead, the cargo will be loaded on departures which are
less attractive in their service or loaded onto vessels when the capacity utilisation is
low. This makes it possible for them to achieve a higher capacity utilisation on their
vessels.
Cooperative arrangements
RoRo1 cooperates with one of their competitors on a route where they have a vessel
sharing agreement. This means that a fixed percentage of lane meters are booked on
each other's vessels. This reduces the necessity for RoRo1 to deploy more vessels on
this route, since they can have more departures now. This partnership will give benefits
of economies of scale but also a better capacity utilisation on each other's ships. The
interviewee mentions it is important to remember the following: “The only thing we are
sharing is space on our ships. That is all we are sharing”.
Vessel allocation
If RoRo1 is experiencing a lower demand on a route, the vessel can be exchanged to a
smaller vessel within their network. This allows them to increase their capacity
utilisation by matching supply better with demand.
Frequency
Throughout the year the frequency of the departures is varied. During eastern time the
company has less cargo to transport. In order to adjust to the reduced demand, the
frequency of departure is reduced. If demand is too low, blank sailings are performed.
This means that a vessel that should have departed on a specific route does not leave
on that route. Towards summer in June and July there is an increased demand in the
region before the summer vacation. Therefore, the frequency will be increased before
the vacation. When the vacation comes, demand is lowered and therefore the frequency
of their service will be reduced.
Routing
The company does not visit any additional ports during their route to pick up more
goods to increase the capacity utilisation. This is explained by the following statement
“The schedule we have does not leave time to make other calls, so it is a fixed schedule”.
Their customers also have expectations on the company to have the same departure on
a specific time without any changes.

32
Speed
When their demand is reduced, slow steaming will not be implemented to withdraw
excess capacity from their fleet. It will lead to lower bunker cost, however it will have
a negative impact on their customers. The reason for this is the lead-time for the
transportation can be increased with 50%. Increased lead-times will lead to the
following:
We will have a trailer that will be sitting on a vessel 50% longer, and that means
that in that system they would need more trailers to cover their business,
because it is occupied for a longer time on the ships.
The interviewee also mentions slow steaming is more beneficial for longer hauls and
not for short sea shipping. Reducing speed in their operations would entail there will
be a need for one additional vessel in the system to maintain the same capacity. This
strategy would lead to lower bunker cost. However, the cost for an extra vessel will
increase while the revenue streams are the same. Therefore, this option is not seen as
viable.
Ports
In the port of Gothenburg, the interviewed department owns 65% of the terminal
whereas the other 35% is owned by another ship operator. Overall the company owns
a large number of terminals. The reason for this is they believe that they can achieve a
better efficiency in their operations by having more control.
4.2 RoRo2
RoRo2 is operating with the RoRo segment and performs short sea shipping. RoRo2
was founded by a merger between two ship operators, where each partner owns 50% of
the firm. They operate in the Nordic Baltic sea and in the North Sea. The shipping
company transports 1.5 million ton of goods per year. The interviewee mentions RoRo2
is the only operator in the region who offers a liner service available for everyone. Their
fleet consists of three vessels which are owned by themselves. Two more vessels have
been ordered and will arrive in 2022.
RoRo2 works mainly with BCOs, however, all types of customers are allowed to use
their service. For their customers it is important that the service has a good frequency,
security and flexibility that is based on a market price. Their customers are loyal due to
the long contracts. Prioritising of customers on departures are performed after what has
been negotiated on their contracts. The interviewee mentions that the large BCOs are
competitors to each other, so it is important to be objective and allocate space fairly
among them and to smaller customers as well. It is also mentioned that cargo from
BCOs with e.g. paper pulp is less time-sensitive and can be prioritised for later
departures. Cargo from third-party logistics may be more time sensitive and is

33
prioritised on their departures. Their customers book space on their vessels through
long-term agreements, which stands for 65-70% of their cargo. There are also
customers who book space on the vessels on a spot basis when project cargo is going
to be shipped. RoRo2 can take bookings 5-6h before departure.
For RoRo2 important KPIs are capacity utilisation and revenues. A high capacity
utilisation allows the company to achieve its financial goals and the environmental
impact can be reduced. Capacity utilisation is to a large extent measured in lane meters.
However, when project cargo is being transported, the utilisation is also measured in
tons. As a result of this, the capacity utilisation is calculated with a formula that uses a
mix of both tons and lane meters. Next year project-cargo will not be transported,
instead RoRo2 will target trailers. This will result in the capacity utilisation being
measured in TEU then. The capacity utilisation is followed up on each departure as
well as on a weekly basis. When calculating capacity utilisation empty containers are
included, and with their new ordered boats operating, around 30% of their utilisation is
expected to consist of empty containers. The interviewee mentions that on average
RoRo vessels never have a capacity utilisation above 80-85%, where the reason can be
imbalances in the system and less attractive departures during the week. The
interviewee also mentions that an optimal level for them would be to fill their ships to
maximum to achieve 100% capacity utilisation.
4.2.1 Capacity Planning RoRo2 is expecting delivery of new vessels in 2022, for these ships an excess
capacity of 20-25% is planned. The reason for having excess capacity is based on the
fact that RoRo2 is expecting their customers having growth in their volumes in the
future. Therefore, the excess capacity will have to cover the increase of the goods that
are being shipped. However, the interviewee mentions that ships are supposed to last
for 30 years, and it is impossible to plan on a longer horizon. It may be that the excess
capacity has already been covered by increased volumes when the new vessels are
deployed. RoRo2 performs short-term planning on a horizon of 6 months. If there is a
capacity shortage the next step will be to purchase an additional vessel. RoRo2
continuously works with investigating the market for available vessels, if there would
be a need for an additional vessel. In the future RoRo2 may charter vessels, since
benefits are that you can always hand back the vessel at the end of the contract and
reduce the capacity.
4.2.2 Factors affecting CU Variation in demand
Fluctuations in demand affects RoRo2’s ability to fill their vessels. BCOs have large
fluctuations in their production: “From our large BCO customers and industrial cargo
owners, their production chart looks like an EKG from a man having a heart disease”.
RoRo2 experiences that more goods are being shipped in the first quarter without

34
knowing why. Further, there is also a peak in demand before the summer vacation in
Sweden.
Trade Imbalances
Trade imbalances have a negative impact on RoRo2’s capacity utilisation. The
interviewee gave the following statement “In general it is clear and obvious there is
more cargo going southbound than northbound”. By this the trade imbalance is
identified and RoRo2 has to handle 30% of empty containers in their system. A constant
challenge is to find cargo going northbound is mentioned by the interviewee: “We are
filling the vessel very good going southbound, but the challenge is to find cargo going
northbound”
Lumpy capital
RoRo2 plans for having 20-25% excess capacity when purchasing additional vessels to
be able to cover for increased demand in the future.
Ports
RoRo2 sees the ports as an important factor which limits their ability to fill their vessels.
The interviewee mentions “It is one of our biggest problems when developing sea trade,
especially domestic sea trade, where the flexibility in the ports are lousy”. The reason
for this is that the terminal cannot ensure to have terminal operators available in the
evening or nights, this has resulted in ports having low flexibility and reliability. This
in turn affects their ability to fill the vessels. As an example, if a vessel arrives late to
the port it might have to wait till the next shift when the terminal staff will return to
work. This will create delays for the ship operator and may lead to having to skip a stop
on their route to cover for the delay in the system. This will affect the amount of loaded
cargo on the vessels.
Service level
Operating at 100% utilisation will affect their service level as it has a negative impact
on the flexibility. The interviewee also mentions that operating at full capacity will
result in some cargo being rejected for transportation. However, this is seen as
beneficial and not only negative, since then the rates on their service can be increased
when the utilisation is high. Therefore, it will be possible to increase their power in
negotiations.
Schedule characteristics
The interviewee mentions their service has several departures throughout the week,
where some of their departures have a high capacity utilisation. However, their Sunday
departure has a low demand. This results in low capacity utilisation for this departure
and a lower average capacity utilisation.

35
4.2.3 Strategies to increase CU Increase demand
In general, RoRo2 does not use pricing to attract more cargo, since it is believed a lower
price will not create more available goods to be shipped. The interviewee exemplifies
that with the following statement “On a Sunday departure [...] there is no demand for
cargo being shipped. So, it does not matter if you offer a price with 20% lower rate.
There will be no more cargo just for that”. The interviewee mentioned that if their liner
service is competing against sea or land-based transportation then pricing can be used
as a tool to attract more goods.
Standby cargo
The interviewee states standby cargo is important for them with the following
statement:
Such cargo is insanely grateful to have what we call standby cargo, that does
not have to be shipped on a special departure but can wait for the next one. That
is the key to being able to really optimise the vessels in a good way.
Rescheduling of cargo can be performed with industrial cargo from BCOs. E.g. for one
route they had 40% of volume from their BCO and the other 60% volume booked by
forwarders. The forwarders had certain departures which suited them better, and these
vessels were loaded with their cargo. As the cargo from the BCOs was not time
sensitive, they could be put on hold for 2-3 days and loaded on the Sunday departure
where the demand from the forwarders was low. By doing this they could achieve a
capacity utilisation of 98% on their vessels. With some customers they have a system
which allows them to see the time with which specific goods can be delayed. With other
companies they need to have a close dialogue where they continuously ask if the cargo
can be rescheduled for the next departure.
Frequency
If they have noticed an increase in demand, the company may add another vessel to
increase available capacity which results in a higher frequency on the route. However,
if demand is lowered the vessel may be removed from the route to reduce capacity
which reduces the frequency.
Routing
RoRo2 added an additional port to their route, since they signed a contract with a new
customer. Current volumes on this port are low, however adding this port was a
strategic move. The reason for this is that they believe growth in volumes with their
current customer but also to find new customers which in turn will lead to a higher
capacity utilisation. Adding ports on a permanent basis is performed on the long-term
planning. Ad-hoc modification can be performed, for example once they visit an
additional port to load on two trailers. This was due to it being dangerous cargo, which
is charged with a high rate.

36
Ports
The company does not own any terminals and only purchase the stevedoring services
from other actors. The reason for this is that it would require large capital investments.
Cargo
RoRo2 constantly tries to search for different types of cargo which can be shipped on
the low-volume sea leg to reduce the trade imbalance in their system.
Overbooking
Overbooking is used by the company. By identifying different patterns in their
departures, they can calculate the percentage of overbooking they shall use. E.g. on
Tuesdays, 15% cargo will not make it on time to the port, then they can use 15% of
overbooking.
4.3 RoRo3
RoRo3 is a short-sea operator and operating all over Europe. The routes often have
several departures a week and the vessels go on a seven- or fourteen-day rotation. It is
jointly owned by two larger deep sea RoRo3 operators. 90% of all the goods that RoRo3
carries are cars. The company ships around 1,4 million cars per year and operates 16
ships, ranging from a capacity of 1000 to 4700 car-equivalent units. The vessels are
either designed or adapted for short sea trade and can carry rolling goods as well as
high and heavy cargo. Nine of these vessels have been built to ice class specifications
meaning that they can operate under harsh conditions in the northern waters. Some of
the vessels are PCTC vessels (Pure Car/Truck Carrier) which are specifically designed
to carry cars or trucks on its decks. Some of the vessels are as a result specialised
whereas they also have ships that are able to carry high and heavy cargo.
The ship operator’s customers are mainly BCOs, but they also have forwarders. RoRo3
states that their customers main aim is purchase a service for a low price. As there has
been an overcapacity in the market the last years, the customers have gotten the
frequency they wanted. The overcapacity has put the BCOs and the forwarders in an
advantageous position where they can ask for lower prices as there are several options
available for them. RoRo3 states that the customers are prone to change suppliers if
there are large price discrepancies between the current provider and an alternative. If
the current relationship is working, the customer may stay with the current provider
even though the prices are slightly higher. The customers have long term contracts
with RoRo3, whereas for the high and heavy there are some exceptions where they look
for goods on the spot market. The customers can book a spot on the vessel right before
departure. The customers provide RoRo3 with forecasts up to six months before with
expected volumes. The customers may however arrive with a different amount than
previously stated.

37
The most important KPI for the company is volume. RoRo3 is trying to keep its position
in the market by signing contracts for specific volumes in order to be able to provide a
good frequency to their customers. If they lose a contract for a specific volume, they
would not be able to operate with the same number of vessels as this would result into
a low capacity utilisation. This would in turn reduce the frequency of the departures
which would incentivise the remaining customers to change supplier, further reducing
the capacity utilisation. The interviewee states that in order to stay competitive, they
have to make the best use of the tools that they have and utilising the vessels to a high
degree is usually the way of achieving that.
The company measures capacity in stowed square meters, meaning the actual square
meters that are used. This is however changing slightly towards weight as more electric
vehicles are transported than before. The electric vehicles weigh more than vehicles
with combustion engine and the weight is now becoming the main restriction to load
more cars onto the vessel. Capacity utilisation could also be measured in volume, as
loading vehicles which are below 1,6 meters in height does not utilise the space on a
deck that is 2,6 meters to its full potential. RoRo3 measures capacity utilisation at
specific ports for every single trip.
4.3.1 Capacity planning RoRo3 wants to fully utilise the ship on every departure but does not dimension the
system to be at 100% when they plan for available capacity, as this would be to cost
full and result in a poor service for the customer. The interviewee states that:
If you have 50 trucks going to pick up cargo and you know there is more cargo
coming next week, it is easier for a trucking company to send 60 trucks next
week. For a shipping company it is very difficult if you have 104 % utilisation,
and you can only have one vessel or you can have two vessels, or you can have
six vessels or you can have seven vessels so, the next step of capacity is
extremely high. Obviously if you have 104 % utilisation and you need to send
the vessel to pick up 4%, you will just be burning money. So, long-term, it is
very difficult to be sustainable if you have 104% because then at some point
every single customer will complain, and at some point, you would just lose
contracts.
In areas where there are several competitors with excess capacity RoRo3 is able to plan
for a higher capacity utilisation, as they are able to load goods on the competitors’
vessels. In routes with a high network density, RoRo3 might be able to pick up goods
that did not fit in the vessel with other ships passing close to the port. The planned
capacity therefore needs to be adapted to the specific route. The company dimensions
their available capacity so that the vessels on average are 85-98% utilised. The company
charters around 50% of the vessels. This gives them a higher flexibility in their
available capacity as they can reduce it without scrapping vessels which is more costly.
Many of the charters are one-year contracts or shorter which gives RoRo3 the ability to

38
reduce their available capacity quickly if needed. Some of the vessels that are operated
are owned by the companies to which RoRo3 belongs to.
One of the company’s greatest advantages against competitors is that they have vessels
ranging from 1000 – around 5000 car-equivalent units. This makes it possible for them
to exchange vessels within their own network to adapt to changes in demand. If RoRo3
sees a need to increase or decrease capacity, they are able to exchange vessels within
their own network. The size of the vessels also affects the company’s cost and
flexibility. RoRo3 states that having larger ships allows them to drive down costs but
restricts their ability to lower their capacity. If they opt to have smaller ships, then it is
possible to remove one ship out of the system if volumes fall, which would not be
possible if the company operated with only one ship on the route. Smaller ships also
make it easier to increase capacity if necessary, without incurring high costs. Having
the right vessel for the route is also seen as important. Having excessive amounts of
capacity allocated to a specific route makes it difficult for the company to get enough
volume to fill the ship. RoRo3 also exchange vessels with other actors in the market to
increase or decrease capacity. Some vessels may however be adapted to specific
terminals with specific ramps and may not be able to load and unload on specific ports.
Ports located in canals may also not be able to cope with big vessels that have too much
draft or vessels that are too high. This restricts the company’s ability to swap vessels
between routes. In routes where there are several vessels operating on the same string,
if utilisation drops, they may also drop capacity by removing one vessel from the string.
Capacity may also be increased by chartering vessels. The charters can be made for
time periods of only one week if necessary. Adding vessels to a route by ordering new
ones is also done to increase capacity which also increases the frequency of departures.
Swapping vessels or exchanging them for bigger ones is done gradually as production
in a certain region increases over a long period of time, whereas adding new vessels is
often done in situations where demand increases due to new contracts or more sudden
increases in demand.
4.3.2 Factors affecting CU Variation in demand
RoRo3 has tender documentation which gives them information on the expected
demand that the customers are going to ship. The actual demand for their services is
however unknown as the customers may produce more or less cars than expected. This
makes it difficult for the company to match available capacity with the demand as the
latter is unknown, reducing the capacity utilisation. This is seen as the biggest challenge
for the company when trying to achieve a high capacity utilisation, as the actual
volumes at times have been 50% less than what was stated in the tender documentation.
The customers state that they receive the numbers from their own sales department,
which is the reason for the faulty numbers. The company also experiences variations in
demand due to seasonality in periods like summer and Christmas.
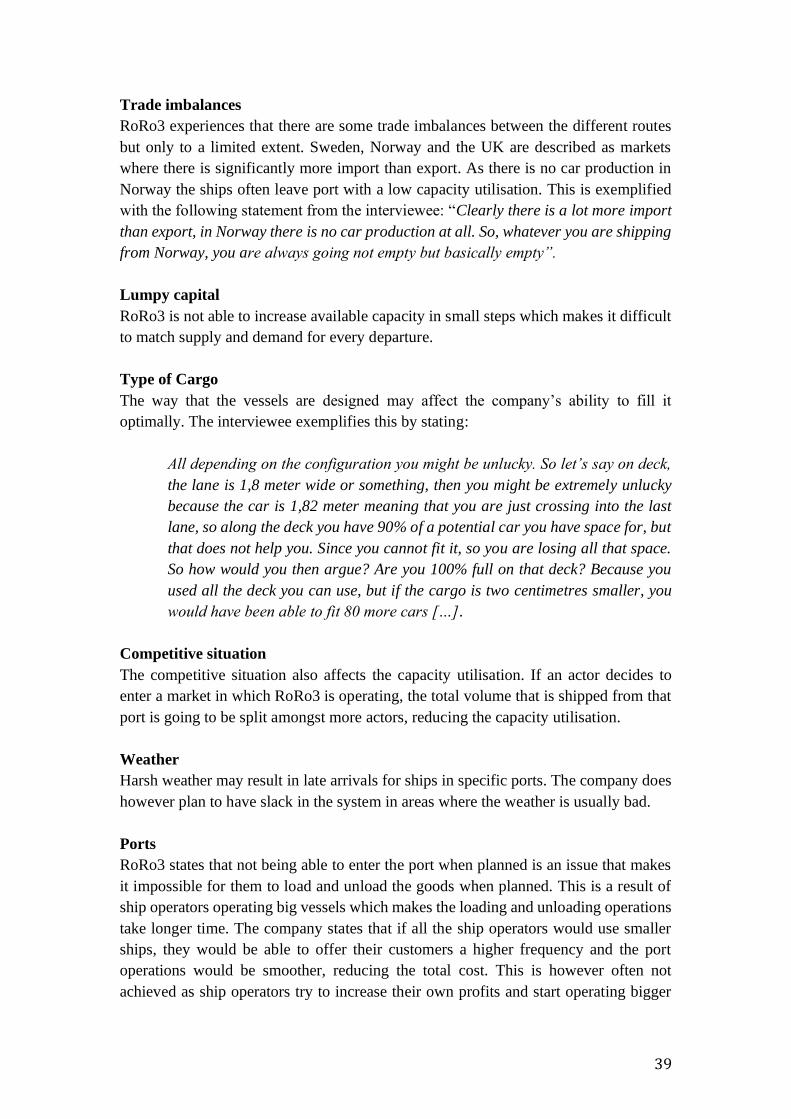
39
Trade imbalances
RoRo3 experiences that there are some trade imbalances between the different routes
but only to a limited extent. Sweden, Norway and the UK are described as markets
where there is significantly more import than export. As there is no car production in
Norway the ships often leave port with a low capacity utilisation. This is exemplified
with the following statement from the interviewee: “Clearly there is a lot more import
than export, in Norway there is no car production at all. So, whatever you are shipping
from Norway, you are always going not empty but basically empty”.
Lumpy capital
RoRo3 is not able to increase available capacity in small steps which makes it difficult
to match supply and demand for every departure.
Type of Cargo
The way that the vessels are designed may affect the company’s ability to fill it
optimally. The interviewee exemplifies this by stating:
All depending on the configuration you might be unlucky. So let’s say on deck,
the lane is 1,8 meter wide or something, then you might be extremely unlucky
because the car is 1,82 meter meaning that you are just crossing into the last
lane, so along the deck you have 90% of a potential car you have space for, but
that does not help you. Since you cannot fit it, so you are losing all that space.
So how would you then argue? Are you 100% full on that deck? Because you
used all the deck you can use, but if the cargo is two centimetres smaller, you
would have been able to fit 80 more cars […].
Competitive situation
The competitive situation also affects the capacity utilisation. If an actor decides to
enter a market in which RoRo3 is operating, the total volume that is shipped from that
port is going to be split amongst more actors, reducing the capacity utilisation.
Weather
Harsh weather may result in late arrivals for ships in specific ports. The company does
however plan to have slack in the system in areas where the weather is usually bad.
Ports
RoRo3 states that not being able to enter the port when planned is an issue that makes
it impossible for them to load and unload the goods when planned. This is a result of
ship operators operating big vessels which makes the loading and unloading operations
take longer time. The company states that if all the ship operators would use smaller
ships, they would be able to offer their customers a higher frequency and the port
operations would be smoother, reducing the total cost. This is however often not
achieved as ship operators try to increase their own profits and start operating bigger

40
ships, which incentivises other operators to do the same. Some ports do not have night
shifts which hinders RoRo3’s ability to load and unload goods during specific times.
Internal barriers
The company experiences that miscommunication over dimensions or bad coordination
is an issue that may affect capacity utilisation negatively, especially for high-and heavy
goods.
Legislation
When the company transports military cargo, there are restrictions regarding what
goods can be loaded on the vessels.
4.3.3 Strategies Increase demand
The company does not see marketing as a viable option as it would to increase the
demand for their service. They state that they could increase the demand for the
products they ship by marketing cars, but that would not be financially viable.
Standby cargo
The company sometimes leaves goods behind for the next departure as the vessels are
full but does not plan for it in advance.
Cooperative arrangements
In situations where the company reaches its maximum capacity and cannot load all the
goods, they may cooperate and load the remaining goods on the vessels of other actors
that have the same port of destination.
Vessel allocation
If utilisation for a vessel is low on a specific route the company may swap the vessel
for a smaller one within the RoRo3 network. This does however mean that there is a
need for a bigger vessel somewhere else in the network. If utilisation is high and a larger
vessel is needed the company may also swap vessels, but then the demand needs to be
lower on the other trade, otherwise the company would only cannibalise its own profits.
The company may also negotiate to exchange the vessel with a smaller one with another
company. Swapping vessels may be hindered by constraints in the port such as draft
requirements or port infrastructure such as ramps which may not fit the vessel that is to
be exchanged.
Having a dense network where several ships sail between the same ports allows RoRo3
to remove a ship if utilisation falls below a certain point, as the remaining goods can be
shipped with other vessels. The interviewee states that they can achieve a higher
capacity utilisation on the main legs where more ships are deployed.

41
Frequency
The frequency of departure is used as a tool to cope with increased or decreased
demand. If demand increases the company may add a new vessel to increase the
capacity.
Routing
Trade imbalances can be handled by combining ports that have mostly imports with
ports that have higher exports on the same routes. Designing the network so that the
vessel first picks up cargo in a port which almost only has export. After this a port
which has mainly imports will be visited, this allows RoRo3 to increase capacity
utilisation on the trade.
As only some of the ports operate during the night, RoRo3 plans its routes so that the
vessels arrive at the port during night-time. Arriving at more flexible ports during
nighttime allows RoRo3 to operate their vessels around the clock.
In situations where there is available capacity on a ship going through another port with
cargo available, RoRo3 is able to do an extra stop to pick up the cargo with the vessel.
Speed
RoRo3 does not alter the speed of the vessels to increase capacity if the demand
increases. The reason for this is that the vessel performs the route more often than other
vessels on the same route which may not be able to cover the whole route faster. This
has a negative impact on the sailing schedule. A customer that is promised three sailings
per week may only receive two, as the faster vessel may coincide on the same date as
another vessel. The interviewee states that increasing the speed hinders them from
operating like a bus, where the vessel visits specific ports at predefined times.
RoRo3 states that they have some time-slack in the system between certain ports in
order to be able to increase speed and follow the schedule reliably. This is the case if
the vessel needs to be able to unload the goods on a port with inflexible times or a
convoy entering Russia which only leaves at specific times. As the ports of are often
located close to each other, it is not always possible to increase the speed in order to
follow the schedule.
Cargo
As the trade imbalances make it difficult for RoRo3 to find cars going out from certain
markets, the company tries to find other commodities to fill the vessels on the leg with
lower volumes. This allows them to increase their capacity utilisation on routes with
large trade imbalances.
If the company reaches the max weight limit on a vessel there may be space left on the
vessel which could have been used. In order to be able to fit more goods on the vessels,
RoRo3 is trying to increase its cargo mix. By doing this, the risk of the company

42
reaching maximum capacity for any of the restrictions such as weight or square meters
is reduced.
Customer selection
Variation in demand is handled by trying to win contracts with several customers.
According to the interviewee, this makes it less likely that the volume will drop
simultaneously for all the customers at the same time which reduces the variation of
demand. As stated by the interviewee: “We try to avoid having only one factory at least,
not necessarily one port, that is usually not in itself not a problem. It does not
necessarily increase your utilisation, but it lowers the variability of how much you are
loading. I mean, in an ideal situation you have ten factories delivering to one vessel,
unless you get Corona, not all ten factories will drop at the same time”.
4.4 RoPax1
RoPax1 is a short sea shipper that provides liner services in the RoRo and RoPax
segments. The Ropax vessels are designed to transport a combination of passenger
traffic and freight goods and have an upper deck and often no internal ramp as opposed
to the RoRo vessels. This requires a specific infrastructure on the port side in order to
“load” the passengers on the boat. The company is active in Northern Europe and is
one of the biggest actors in the region. Last year, RoPax1 transported 1,7 million cars,
2,1 million freight units and 7,6 million passengers used their services. RoPax1 has 19
ferry services in Scandinavia, Great Britain and the Baltic and operates around 36 ships.
The ferry services have departures several times a day. The company is part of a bigger
concern from which the company acquires its vessels. The concern owns 80% percent
of its vessels and charters 20%.
The company’s customers are mainly forwarders, but they are also in contact with
BCOs. When it comes to the freight segment, the customers value service reliability
over other factors such as cost. This includes departing from the port according to
schedule and not cancelling departures. A low price is also seen as an important as well
as frequent departures and security. The requirements depend on location and goods
that are shipped. The customers loyalty varies depending on the corridor and number
of alternatives. In some corridors the company is the only actor providing a service,
resulting in a high loyalty from their customers. If several alternatives exist, such as
another ship operator or an alternative transport mode, the customers are prone to
change supplier if the service reliability is bad or the price is too high.
Most of the big actors with whom the company does business with signs a contract with
RoPax1 once a year for a specific volume. The contract is often renewed every year.
Some smaller actors buy the company’s services on a spot basis, meaning that they
compare different service providers for every shipment. Bookings from the spot-market
are often placed between two weeks in advance up until the last hour.

43
RoPax1 is mainly focusing on increasing profits and revenue. Security is also seen as
an important KPI that the company works with to improve. Capacity utilisation is also
a priority but is mainly seen as a way to achieve increased revenue. The company
measures available capacity using lane meters. The company measures their capacity
utilisation for every departure and calculates weekly averages for the vessels.
4.4.1 Capacity planning When deciding upon the available capacity, the company performs a market research
for their routes and set the available capacity to match the demand. RoPax1 always
wants to be able to take customer requests and barely has capacity shortages. The
company states that they do not plan for overcapacity but there is some slack built into
the system as the vehicles may often be arranged closer to the theoretical maximum
capacity by reducing the space between the vessels.
When facing capacity shortages for a specific route, the company may exchange to
larger vessels within their network in order to better match demand. Changing vessels
may on the other hand prove to be costly as the port infrastructure is adapted to the
current vessels. One example is the gate that used on the port to load passengers onto
the Ro-pax vessels. These are adapted to the number of decks that the vessel has, which
may vary between different vessels. As vessels are costly, they are often under
operation which makes it hard for a company to find an available vessel that fit the
company’s requirements. Changing the vessel set-up for a specific route is therefore
often done as a long-term measurement as when the company observes long-term
changes in demand. The company may also acquire a new vessel if it believes that the
demand is going to increase on a long-term horizon. As the vessels may be used for up
to 40 years and the vessel takes 2-3 years to build, the company only purchases new
vessels as a long-term strategy to increase the available capacity. The company charters
20% percent in order to have a little bit of flexibility and be able to reduce available
capacity if demand drops. The company also charters in order to benchmark costs and
compare the cost of operating its own vessels versus having another company operating
them.
4.4.2 Factors affecting capacity utilisation Variation in demand
The company experiences a daily variation of demand on some of the routes as there
are peak times that are more attractive for the customers and non-peak times which
often have a lower capacity utilisation. The company also experiences seasonal
variations in demand, especially for the travel side where the demand is higher during
the summer. Market trends and the global economy are factors that affect their
travelling customers willingness to use their ferry services and therefore also affect the
company’s capacity utilisation.

44
Trade imbalances
The company also experiences an imbalance in the amount of goods that are sent in
different directions in the services. This affects the load factor as more goods are sent
in one direction. RoPax1 does not experience this as a big problem however, as most
of the trailers that transport goods in one direction often take the same vessel back to
its original destination.
Vessel design
The vessels often have two decks, an upper and a lower main deck. Some of the vessels
are equipped with a hanging deck in the main deck which can be used to increase the
available lane meters. Using the hanging deck will on the other hand restrict the loading
of trailers on the main deck. This results in a dynamic capacity utilisation and a dynamic
capacity which the company works with to optimise the loading. As the vehicles cannot
be loaded without any space between them there will be a discrepancy between the
theoretical lane meters and practical lane meters that are available. The way that the
vehicles are loaded will therefore affect how close the company can come to achieve a
100% theoretical capacity utilisation
Competitive situation
How competitors operate on the same routes and price their services are also factors
that highly affect the company’s capacity utilisation, as it may reduce the demand for
their services. Other transport modes or intermodal solutions may also affect the
demand for RoPaxs’ services which also reduces the company's capacity utilisation.
Ports
As mentioned above, the way that the loading operations are performed and the space
between cars will also affect the company’s ability to reach a high capacity utilisation.
4.4.3 Strategies Increase demand
The most effective way to increase demand is to use pricing. During the day, the
company experiences that there are peak times and non-peak times. In order to even
out demand and increase the attractiveness of the non-peak times, the company
increases the price for the peak times while reducing the price for the less attractive
departures. RoPax1 states that the pricing tool has to be used with caution, as it may
affect the customers view of the market or instigate a price war with competitors.
Marketing is also used to increase the demand for their service.
Standby cargo
The company also works with customers which have goods that are not time sensitive
and do not need to be transported as soon as they arrive at the terminal. This allows
RoPax1 to transport the goods on departures that are not as attractive and have a lower
load factor which increases the utilisation of the vessel. In return, the customers get

45
lower prices for the flexibility that they provide to RoPax1. RoPax1 seldom moves
goods to other departures if it has not been stated in the contract with the customer.
Performing this will have a negative impact on their service for their customers. This
might give the risk of losing the contract when it is going to be renewed.
Cooperative arrangements
RoPax1 cooperates with other actors in specific routes. If the respective companies
have departures at different times, they can purchase capacity from each other in order
to provide their customers a better service and more frequent departures.
Vessel allocation
If the company has two routes that go back and forth close to each other, the company
may have a vessel that can be exchanged between the routes to provide flexibility in
the available capacity for both routes. However, this only viable if the routes are located
close to each other geographically. If utilisation is low on a route the vessel can be
exchanged for a smaller one within the network.
Frequency
The timetable can be adjusted to counter seasonal variability of demand. During the
summer the demand for RoPax vessels is increased. The company then implements a
summer timetable which has more departures during the day to increase the frequency.
This is done by increasing the speed of the vessels. The timetable may be adjusted a
couple of times every year but cannot be changed often as the customers expect the
vessels to leave the port at specific times.
Routing
RoPax1 does not change the routes or stop to make an extra port-call if the vessel has
a low utilisation. The main reason is that the timetable which needs to be followed and
stopping at another port to pick up extra goods is not feasible from a time perspective.
The routes may be changed in the long run but are not adjusted on a short-term basis.
Ports
RoPax1 has contracts with many ports to rent a terminal for a longer time. They also
own a couple of ports. In some of the ports they have their own stevedoring operations,
and in some cases, they use a third party. RoPax1 prefers to have their own stevedoring
operations as it allows them to create standardised work procedures on all their routes.
Overbooking
RoPax1 uses overbooking on rare occasions. The company uses it on occasions where
customers repeatedly do not arrive at the port with the promised goods to be shipped.

46
4.5 Feeder1
Feeder1 is a short sea ship operator that works as a feeder operator in northern Europe.
As a feeder operator, the company tranships the cargo to and from the larger hubs such
as Rotterdam and Hamburg following a predefined schedule. Feeder1 visits 46 ports
throughout its network and has around 150 port-calls a week. The company has the
largest feeder network in Europe. Feeder1 works with containerised cargo and to
provide their customers with a door to door service. This is done by transporting the
goods by sea on the long leg and then truck or rail on the final leg. Feeder1 has 32
vessels, most of them are chartered in order to have flexibility in capacity.
As Feeder1 is a feeder operator, their customers are container shipping lines. As the
larger shipping lines try to achieve cost reductions, a low price is seen as important for
them. Being able to connect the cargo with the ocean vessel that takes the cargo to the
final destination is also seen as important. As there are only around ten big carriers in
the world, losing a customer has a considerable negative impact on the business. The
company therefore tries to achieve close relationships with its customers. The
customers are however not loyal, as they change supplier if they can find lower prices
elsewhere. Feeder1 has contract with their customers which are between six months
and three years. As their customers are able to in-source a charter vessel themselves,
they are always measured against that alternative.
Capacity utilisation is seen as the most important KPI as it has a strong effect on the
bottom line. The company measures its capacity utilisation in terms of TEU on every
port call as well as the number of tons that have been unloaded and loaded.
4.5.1 Capacity planning Not having excess capacity is of high importance to the company. The interviewee
states that:
I don’t want to have excess capacity. We are like a fish trade, when you are
selling fish, and when you close your shop, what do you do with the fish you
have not sold? You throw it away! When I leave a port with excess capacity and
I am still able to load cargo on board, that is waste. I have paid the bunker, I
have paid the port call, I have paid the truck loader, I have paid the charter for
the vessel. If I do not use all the slots on board, that is waste. I cannot sell it
later.
Feeder1 prefers to be a little short on capacity than too high or else they will lose their
revenues. The company charters most of its fleet so that they reduce capacity if volumes
are dropping. The time period for charters can be between one week to one year.

47
4.5.2 Factors affecting capacity utilisation Variation of demand
Uncertainty of demand is an issue which makes it difficult for the company to plan
available capacity. There is a lacking commitment on the volume their customers want
them to carry. The interviewee states this is because the ocean-going ship operators do
not know the demand from their customers. The uncertainty makes it difficult for
Feeder1 to plan available capacity and allocate the right vessels for the specific routes.
The interviewee states that:
We have a lot of short charter because the commitment we get from our
customers, there is a commitment that they want to use on this route, but we do
not normally get a lot of commitment of how much volume there will be in that
route. And our customers do not know if IKEA is going to buy how many
containers from Shanghai next month because they do not know how much the
people are pulling out of the warehouses or the shops. The same goes for deep-
sea and for almost everyone, that the long-term planning of the volume, it might
be there, but it is not trailing down to the feeder operator.
Trade imbalances
Feeder1 states that there are large differences between different ports in terms of the
balance between import and export. Copenhagen and Stockholm are examples of cities
with more import than export. This creates a challenge for Feeder1 when trying to
design its routes so that the vessels can be utilised to a large degree.
Weather
Harsh weather conditions may result in late port calls and making the company miss
the scheduled time window. It may also inhibit the dock workers to load the goods onto
the ship.
Ports
Feeder1 has an agreed time window with the terminals for when the loading operations
can be done where the terminal guarantees a certain amount of container lifts. If the
window or parts of it are missed, the loading operations may need to be stopped before
all of the loading has been completed, reducing capacity utilisation.
Late arrivals, no-shows and cancellations
The company experiences that customers do not deliver the amount of cargo that they
have promised which creates difficulties when trying to plan its operations and may
result in overcapacity. The company also experiences that the goods coming from the
oceangoing vessels are not always on time and ready for loading in the transit terminal
which impedes loading cargo onto the vessels.

48
4.5.3 Strategies Increase demand
The company uses the pricing mechanism as a way to attract more customers and get
more contracts. It is however used with precaution as it may reduce the profitability.
Standby cargo
The company rolls some goods to later departures. Their ability to do this depends on
the kind of goods that are shipped and the customers willingness to roll the goods. For
example, medical cargo is of high value which makes it difficult to roll.
Cooperative arrangements
The company has vessel sharing agreements with other actors. This is done in order to
consolidate volumes together and be able to provide their customers with the frequency
they want, or to consolidate volumes and use bigger ships which reduces the slot cost.
Vessel allocation
If the utilisation is low on any of the routes, the company may look into the possibility
of changing the vessel in the route with a smaller one within their own network. Daily
decisions regarding vessel allocations are performed in order to be able to cater for the
customers’ requirements. Flexibility in vessel allocation can be achieved by having an
extensive network.
Routing
In order to handle the export and import differences of cities and trade imbalances the
ship operator tries to combine a port call of a larger city like Stockholm or Copenhagen
with more imports with several smaller port-calls where the export is in general larger
than the import. The company also works for having routing flexibility. They may also
visit more ports in their route if their schedule and time permits it to increase the
capacity utilisation. If volumes are falling, Feeder1 may also increase its capacity
utilisation by terminating a vessel out of their system. This is done by removing a route
from the system and including its port-calls into other routes. This makes it possible for
the company to remove a vessel and redeliver it to the ship-owner.
The interviewee states their routing flexibility is a result of their wide network. This
makes it possible for them to cater for differences in volumes or timings, as opposed to
a big shipping line which only has 3-5 services. By having 45 vessels in their network
Feeder1 are able to do changes without causing any disruptions.
Overbooking
Feeder1 uses overbooking to a large extent as no-shows are a problem for them. The
interviewee states that “I really prefer to be a little short than too high. Too high, then
we do not earn money”.

49
4.6 Container1
Container1 is a global company operating in 129 countries. The company has targeted
liner shipping within container transportation and is a leading actor in the market. In
total Container1 has 121 liner services and connections between 600 ports globally. For
trades in Transatlantic, Middle East, Latin America and Intra-America the company is
the leading ship operator. Container1 transports 12 million TEU yearly and has a pool
of 239 vessels. Container1 has the most modern fleet for reefer containers. 50-60% of
their fleet is owned by themselves and the other share is chartered. Container1 is in an
alliance with three other ship operators.
Container1 works with forwarders and BCOs. Container1 does not collaborate with
smaller private customers, instead they have to ship through forwarders. BCOs stands
for 30% of their volumes and forwarders for 70%. According to the interviewee it is
important for their customers to find a service for a low price. Their customers are loyal,
and the shipping company is seen as a company offering a service with high quality.
However, they also have customers who switch suppliers. Customers are prioritised on
the vessels based on a nomination they have gained from the contract. Based on this
they receive an allocation on the vessels. Their customers have contracts which are
renewed yearly or every second year with a yearly volume defined which is distributed
over 52 weeks. They also have customers who book space on a spot basis. Container1
can take bookings up to 24-48h before departure.
The most important KPI for company C is capacity utilisation and revenues per slot on
the vessels, both from a short-term and long-term perspective. Capacity utilisation is
measured in loaded tones divided by total allowed tones and loaded TEU divided by
total TEU capacity. In their calculations empty containers are included and capacity
utilisation is measured on every voyage.
4.6.1 Capacity planning Each country performs a budget yearly, where they make an estimation on the amount
of cargo that is going to be imported respectively exported. In their planning they also
take into account if any new flows of cargo are being added, since they might have to
add their own vessel to that specific route or have a third-party vessel. According to the
interviewee Container1 does not plan for having excess capacity on their vessels. They
always aim for 100% utilisation.
In total the company has around 239 vessels where they own 50-60% by themselves
and the other share is chartered. When they purchase their own vessels, it involves long-
term planning. To handle peaks on short-term horizons they either charter vessels or
see over opportunities with their partners in the alliance. This is exemplified from the
following statement: “With chartering it is the short-term peaks[...]” and “To cover
for peaks vessels can be chartered or discussions are made with alliance partners [...]”.

50
Container1 also mentions that they are flexible with switching vessels between different
routes within their network.
4.6.2 Factors affecting capacity utilisation Variation in demand
In their transportation Container1 experience seasonal variation, for example during
one period fish from Norway is being shipped. Increased shipping from Latin-America
is also seen during some periods. However, the goods that are being exported from
Sweden are in general even during the year.
Trade Imbalances
Container1 sees there is a great imbalance between Fareast and Europe but also between
Europe and Latin-America. When goods are being shipped from Latin-America to
Europe reefer containers are used. However, the export from Europe does not have high
demand on reefer containers which creates an imbalance in their system. This is
described by the interviewee:
There is a huge imbalance between Fareast and Europe and also Latin America
when it comes to it. There is bit of difference, for example, in Latin America and
Europe, the are the reefers needed in Latin America so they can be shipped to
Sweden. Meanwhile in Sweden the export volumes of refers to Latin America
are much lower.
Type of cargo
Container1 transports different types of cargo. On their ships it is often the maximum
weight that is the limiting factor for carrying goods and not the number of containers.
It is common that they transport project cargo such as windmills and turbines. This
affects their ability to fill their ships. This project cargo will affect them so that they
cannot load and sort containers as they would have done in the normal case. This will
lead to fewer containers loaded on the vessel.
Cooperative arrangements
Being in an alliance affects Container1’s ability to make ad-hoc changes. The reason
for this is that all of the 4 partners in the alliance have to agree when making decisions.
With more actors involved this process will become slower, which is exemplified from
the following: “That is the problem when you are in an alliance, the more members the
longer it takes”.
Weather condition
Poor weather conditions affect their ability to fill their vessels, since it may cause delays
for the vessels during the loading operations. This may result in the vessel having to
depart before the vessels are fully loaded.

51
Ports
In their planning they select ports which can handle ultra large vessels and have the
equipment. This is adapted depending on which vessel they are operating with.
Service level
According to the interviewee they do not have buffers on their vessels in case important
customers would like to ship goods. Instead every customer has been awarded an
allocation on their yearly contract. This allows Container1 to only make promises
which they can perform, otherwise it would have created delays and disturbances in the
system.
Internal barriers
Within the company the trade management department wants to have the highest paying
cargo, meanwhile the sales personnel want to have all their sold cargo on the vessels.
Therefore, it may incentivise departments within the company to work against different
targets which can have a negative impact on the utilisation.
Legislation
The interviewee mentioned dangerous goods are also being shipped on their vessels.
Only a certain amount of these containers can be loaded on their vessels and they must
have a certain distance between them. Therefore, this type of cargo affects their ability
to load the vessels.
4.6.3 Strategies Increase demand
If Container1 is experiencing low utilisation on their vessels, then they use pricing as a
tool in their first attempt to find more cargo to their service. The interviewee mentioned
the following: “The first thing that is performed is to lower the freight price to see if it
will attract more cargo”. However, it also mentioned that they use the pricing tool to
some extent, after a certain point it will not be viable to lower their rates.
Standby cargo
Container1 aims to have standby cargo at the last port they visit in Europe before they
are departing for a longer voyage. The reason for this is that they can then fill up their
vessels with goods before departure. This is done with cargo that is not time-sensitive
e.g. waste material or timber, which is supported by the following statement:
Before the long sail will be performed, we will always try to have cargo
available where the customers accept that it does not have to be shipped this
week. Instead it can be shipped next week or the week after. This cargo can
always be used to load the vessel till last. This is rather coveted cargo which
means that they do not have too much at all, but they still pay for the place on
the boat simply and it can be such waste paper or something else that is not of

52
high value or time-sensitive” has not reached the high value and is transit-
sensitive simply then.
With this kind of cargo, they can have a time frame with two to three weeks where they
can have the cargo in standby. However, the interviewee mentions that this is not
something they are performing in Sweden, since most of their cargo is time-sensitive
and has to be shipped on the first available departure. The cost of having the containers
at standby at the ports is a high cost, therefore it is important to ship the standby cargo
as soon as possible. Otherwise the cost will be higher than the revenues.
In a crisis situation they can move cargo between different days and have to prioritise
which cargo is going to be sent. However, this kind of situation is something they try
to avoid “This is a situation you are trying to avoid”.
Cooperative arrangements
Container1 is in a strategic alliance with four other actors. One reason is that by doing
this they are able to operate large vessels as the vessel capacity is shared among the
alliance members. The other reason is that it allows them to expand their network
globally and cover many routes. This is described by the interviewee in the following
way: “It makes us globally and can cover all routes. The resources will also be shared,
with vessels all over the world”. The interviewee also mentions that they have
collaboration across different alliances as well. For example, they are purchasing slots
from other alliances in order to provide a direct service to a port for customers.
Vessel allocation
According to the interviewee vessels can be exchanged between different routes within
their network.
Frequency
Most of Container1’s services have weekly departures. If they experience a situation
where they have a peak in demand, they will not increase the frequency. The reason for
this is that these lines are based on long-term planning. However, they can perform
blank sailings when the demand is low to lower their frequency. When a sailing is
blanked, the goods that would have been shipped on that vessel are loaded on other
services that have the same port of destination.
Routing
Container1 makes larger changes in their routes in April where they have meetings with
their alliance partners. The interviewee mentions that Container1 does not perform any
ad-hoc changes where they add an additional port in their route to be able to fill more
cargo. The reason for this is: “It is not like that a new location will be added from
nowhere. It does not happen. There is no cargo available to be shipped from there or
to be unloaded”. By having their own liner traffic, they have control over their
departures and arrivals, so therefore ad-hoc changes are not performed.

53
Speed
Slow steaming is not implemented on some specific vessels since it will affect their
operations negatively. The reason for this is that if one vessel is using slow steaming
and other vessels within the company are not, there is a risk that the slow steamed
vessels will interfere with the schedule of the other vessels. This will result in a domino
effect. Slow steaming is not used to withdraw excess capacity.
Ports
The terminals are not owned by Container1, instead they have close collaboration with
the terminals. Container1s main idea is that they should be excellent in their core
service to transport goods from A to B and not focus on terminal operations.
Overbooking
The interviewee mentions overbooking is used to a limited extent. Container1 does not
have a target to reach for their overbookings. Instead they look up which customers
they can perform overbooking on, the trade-off will be that the customer will receive a
lower rate.
4.7 Container2
Container2 is one of the biggest actors in the container shipping industry. They operate
in 120 countries and serves over 300 ports throughout its network. Container2 operates
750 container vessels globally, ranging from 3 500 TEU to 20 000 TEU. The size of
the vessels depends on the demand for that specific trade. 70% of the vessels are owned
and 30% are chartered. The majority of the large vessels are owned. Container2 is part
of an alliance with another ship operator. The purpose of the collaboration is mainly to
increase its network reach and reduce costs. Container2 has recently acquired another
company and is now responsible for two brands, where the new one mainly covers
transports to and from Africa and the middle east. The company has intra-continental
short sea as well as inter-continental deep-sea operations. Container1 describes its
services as a bus-route, where the vessels pick up and drop goods at several ports
throughout its route. The company states that the ocean margins have been reduced
significantly since 2008. In order to plug in to more revenue streams, Container2 is
extending its supply chain operations and is now offering fourth-party logistics
solutions such as customs haul brokerage, inventory warehousing and transportation to
inland destinations. Container2 states that this also allows them to provide a more
complete solution to their customers and provide a better service. Container2 is mainly
focusing on revenues and market shares. Capacity utilisation is seen as very important
as it highly affects the company’s ability to make a profit. A capacity utilisation below
95% is seen as low and may have a negative effect on the company’s profitability.
Container2 measures available capacity in TEU and slots utilised is used to measure
capacity utilisation. Their capacity utilisation under normal circumstances is around
97% globally.

54
The company’s customers are both BCOs and forwarders. In Scandinavia the share is
50% for both parts where the bigger actors often are in direct contact with Container2.
The share also depends on the trade lane. The loyalty varies between customer groups.
BCOs are loyal as they sign a contract for a certain volume once a year and often sign
new contracts every year. The forwarders have a more transactional behaviour where
they look for the cheapest prices on a daily basis. Container2 has a priority list for cargo,
where government cargo is highest priority, followed by refrigerated cargo, key account
clients and then a bucket system where the highest paying client gets a slot on the ship.
Container2 can accept bookings until 3-5 days before departure but customers often
place their bookings one-two weeks in advance. Container2 tries to have 60-70% of the
space on the vessels allocated, meaning that there is a contract to ship a certain amount
each week for a certain price. The rest is ad-hoc space for short-term cargo which gives
the company a little bit of flexibility when charging its customers. If the oil prices
increase, they are able to charge their ad-hoc customers a higher rate as an example.
4.7.1 Capacity planning Container2 plans their available capacity so that they are not fully able to cope with all
the peaks or dips in demand. This results in them having overcapacity when demand is
low and under-capacity when demand is high. They do however increase or decrease
capacity slightly when demand shifts. The company may for example change the vessel
setup, i.e. ordering a bigger vessel in order to better match supply with demand. This is
however not done if there is not a significant change in the market. Container2 states
that deploying bigger vessels on routes to increase capacity may result in price
deterioration and such decisions have to be taken with caution. Chartering vessels for
longer periods of time is also used as a way to cope with long-term increases of demand.
The company currently charters 30% of its fleet.
When demand is low on a short-term horizon the company may use a blank sailing. The
vessel can either be left idle, used as a feeder vessel or be deployed on another service.
When a sailing is blanked, the goods that would have been shipped on that vessel are
loaded on other services that have the same port of destination. Short term increases in
demand may also be handled by performing short-term charters.
4.7.2 Factors affecting CU Variations in demand
The variations of demand are partly a result of the customers inability to estimate their
production output properly which gives false information to the company. Another
reason is seasonality, which affects the company mainly during the Christmas holidays
and during the summer.

55
Trade imbalances
Container2 mentions there is an imbalance in Scandinavia with more exports than
imports. There is also an imbalance in the United Kingdom, where the import is four
times higher than the export in terms of containers being shipped. The market in
Germany is balanced due to the automotive industry. However, the overall volumes in
Europe indicated there is an imbalance which is described by the interviewee: “So I
think overall in Europe there is an imbalance probably with, I would say one and a half
to two containers in for every one container out”. This imbalance forces Container2 to
ship empty containers to Asia in order to have the containers available in Asia.
Weather
Weather is described as an issue which often also relates to the ports. If it is too windy,
the port in Rotterdam closes down. Fog is a common problem in China as the ships
cannot sail into the port under too foggy conditions. Not being able to enter the port
disrupts the operations as goods cannot be loaded or unloaded.
Ports
Container2 experiences that the ports may constitute a problem under certain situations.
Sometimes the ports are congested, making it difficult for them to carry out the loading
and unloading operations. Time at port is often also a limiting factor as the company
may have to do a cut and run, where they cut the operation and sail before all the loading
has been done. The equipment at the ports is not seen as a limiting factor as the company
only calls ports that have adequate equipment and the capacity to handle the big ships.
Some ports in areas which hinders Container2s ability to fill the vessel completely. One
example is the port in Hamburg where the vessels need to sail in a river in order to
reach the port. As the river is not that deep, the vessels can only have a certain draft.
This makes it impossible to utilise the 18 000 TEU-ships to a high degree as it otherwise
would get stuck in the mud. In some situations, there are bridges that force the ships to
have a certain draft.
Late arrivals, no-shows, cancellations
The company experiences that many of the customers book space on the vessels and
cancel before the departure. Customers may also book more space than they actually
require and show up with less cargo on the day of departure. As Container2 does not
charge its customers for a cancelled booking or showing up with less goods, there are
no repercussions for the customers which instigates this behaviour. The shippers are
however not obliged to take the goods on the ship if they are already full, which further
increases this behaviour from the customers. This is seen as the biggest challenge to
increase the capacity utilisation.

56
4.7.3 Strategies Increase demand
The company uses pricing to attract more goods but only to a limited degree. The
pricing mechanism is used for goods that are on the spot market. The interviewee states
that:
If I reduce my prices for containers shipping from Asia to Europe, I cannot
increase demand. Because the production is what it is. They will not produce
more in the factory just because my prices are cheap. I can get cargo from other
shipping lines, but they will most likely retaliate by reducing their prices.
Standby cargo
Container2 has agreements with customers whose goods are not time sensitive to ship
the goods on later departures.
Cooperative arrangements
Container2 is part of a strategic alliance with one other ship operator. The alliance
allows Container2 to operate and fill bigger vessels which would otherwise not have
been possible. It also allows them to offer more frequent departures to their customers.
Their way of working with capacity utilisation has however not changed since they
joined the alliance.
Vessel allocation
Container2 can allocate and swap vessels between the routes if the demand situation
changes within the network.
Frequency
The frequency is rarely changed as a way to increase capacity utilisation. Sometimes
sailings are blanked and ad-hoc vessels can be put into use but the frequency is never
changed. Having blank sailings allows Container2 to better match supply with demand
when the demand drops and utilise the vessels that are under operation to a higher
degree. This is often used to cope with seasonal demand variations. Blanked vessels
may be used on other services that may have an increase in demand
Routing
The overall network and routes for the services are revised once a year in April.
Changes to the services, i.e. which ports they should call to is seldom performed besides
in April. However, in situations where a sailing has been blanked and a specific port
needs to be served, another service may need to add that port to its route. This is
however often not done for capacity utilisation purposes. This can be done on a week’s
notice.

57
In situations where one string is overbooked the company may move some of the goods
to other strings that visit some of the same ports but are not utilised to the same degree.
This is called an inducement call. In situations where demand is reduced for a specific
route, the company may choose to move cargo too another string that visits the same
port. Container2 states that this is an example of string optimisation, where cargo is
moved between string to increase capacity utilisation. This may however create
confusion for the customers.
Ports
Container2 owns many of the container terminals that it uses. In situations where they
do not own them, they have a contract with a terminal operator to serve the ships.
Overbooking
In order to achieve a high capacity utilisation, the company sees the need to overbook
their vessels. This is used as a tool to counter the cancellations and no-shows. The
interviewee mentions that “If we drive for 100% utilisation, we usually have to push
for 120%”.
Two-way commitment
In order to reduce the number of no-shows and cancellations, the company states that
there needs to be a two-way commitment where the shipping operators commit to
taking the cargo on the ship if a booking is placed, and the customers arrive at the port
with the promised cargo. A solution is mentioned where bookings are placed and paid
for beforehand and the ship operator commits to send the goods. If the customer or the
supplier do not deliver, they have to pay.
4.8 Container3
Container3 is a global ship operator who is operating in 155 countries. The company is
a leading actor within container shipping and also offers services such as passenger
ferries. The interviewed department was responsible for container shipping, where they
have liner and feeder services. Container3 targets both local and international
customers. On an annual basis they transport 21 million TEUs and have 500 port calls
worldwide through 200 trade routes. Their fleet consists of 520 vessels. Container3 is
in an alliance with one other leading actor in the market and has a market share of 22%
in Sweden.
Container3 collaborates with forwarders and BCOs, where 70% of their cargo comes
from BCOs and 30% of the cargo originates from forwarders. For their customers it is
important that Container3 offers a service which is connected to the local area.
Therefore, there will always be customer service available locally. Another important
aspect for their customers is to have a ship operator that is flexible, this is achieved by
Container3 by having local systems. According to the interviewee, their customers are

58
in general loyal. Customers contracts can have the length between 1-24 months.
Customers are prioritised for their departures, depending on their value in their
portfolio. In the port of Gothenburg Container3 accepts late bookings up to 24h before
departure.
The most important KPI for Container3 is volume, with the help of volume they
measure the amount of TEU that is being shipped or their market share. Capacity
utilisation is measured in different ways: by number of loaded TEU or the weight. This
is followed up on a weekly basis and their current levels are 85% for their capacity
utilisation.
4.8.1 Capacity planning In Container3s capacity planning, all local offices give their expectations on expected
volumes and continuously update their forecast to be able to optimize their network.
For their longer routes’ changes are planned on a yearly basis and implemented in April,
ad-hoc changes cannot be performed to the bigger routes. If changes in capacity are
needed, Container3 first tries to shift vessels between different routes within their
network at first. Chartering vessels is used as a second alternative. In their operations
Container3 does not plan to have overcapacity. An optimal level for them would be
101%.
4.8.2 Factors affecting CU Variation in demand
The interviewee stated that they are affected by seasonal variation, for example the
Chinese New Year.
Trade Imbalances
Container3 experiences trade imbalance in their system which affects their ability to
achieve a high capacity utilisation.
Type of Cargo
Loading heavy cargo may result in the vessel reaching its maximum carrying capacity
before the ship has been fully loaded with containers.
Weather condition
Changed weather conditions can affect their ability to achieve a high capacity utilisation
on their vessels.
Ports
On specific ports, there are problems that affect the company's capacity utilisation. This
is a result of the small buffers between arrivals and departures that the ports have, which
limit their flexibility.

59
Service level
Container3 does not leave any additional space left on their vessels in the purpose of
serving important customers that would come with cargo close to departure.
Internal barriers within the company
The interviewee mentions there are internal barriers within their company which puts
hindrance on their efficiency. It is mentioned that there is a challenge in prioritising
customers since it becomes a subjective judgment “The prioritisation can be
problematic and that can limit us [...]”. Further, lead-times on information that is
mediated within the company affects their ability.
Late arrivals, no-shows, cancellations and late arrivals
The interviewee mentions a problem which affects their ability to fill their vessels are
cancellations on some of their bookings. Customers inform that they want to ship 20
containers but only arrive with 15 containers to the port. This late downfall affects their
ability to fill the ships maximally. Combined with this they also experience customers
who do not make the scheduled appearance which also has a negative impact on their
operations.
Legislation
The interviewee stated that legislation affects their ability to fill ships with last minute-
cargo going to China. Custom papers have to be handed in 48h before departure,
therefore they cannot take cargo in the last minute to fill the ships.
4.8.3 Strategies Increase demand
The following was mentioned from the interviewee: “The price strategy can be revised
in the middle east to increase the volumes”. Container3 uses the pricing tool to attract
more cargo if there is a shortage of volumes. It is also mentioned that if Container3 has
started a new liner service they can lower the price in the beginning to attract customers
from competitors.
Standby cargo
In order to handle situations where customers do not arrive at the port with promised
goods, the company has cargo that can be rescheduled from previous departures. If they
do not have cargo available, empty containers can be used instead. As stated by the
interviewee: “It is good to have cargo which can be loaded. It is often empty
containers”.
Cooperative arrangements
Their strategic alliance with another actor has been seen beneficial for their capacity
utilisation. Being in a partnership has also made it possible for them to lower their unit
cost.

60
Vessel allocation
Vessels within their network can be exchanged between different routes in order to
match supply better with demand.
Frequency
If there is increased demand during a certain season, Container3 will not increase the
frequency of their service. If there is a lowered demand, they will have blank sailings
instead to reduce the available capacity: “Then departures are cancelled [...]”
Routing
In their long-term planning they look if changes can be made in their routing to increase
the capacity utilisation on their ships. If they see a trend or an increased flow on a
certain area, Container3 can add ports to their liner services. This is however only done
in their long-term planning.
Speed
Container3 is already using slow steaming on their vessels. However, it is mentioned
that slow steaming is not used to increase the utilisation on their ships, but rather to
save bunker cost.
Ports
It is seen beneficial to own the terminals and the stevedores, since it will give ship
operators better control of the operations. This will also make it easier to make
prioritising in the ports.
Overbooking
In order to handle No-shows, Container3 uses overbooking in their planning to a limited
extent.

61
5 Analysis
The structure of the analysis follows the order of the research questions where 5.1
addresses the desired level of capacity utilisation among ship operators. 5.2 covers the
factors that affect companies’ ability to achieve the desired capacity utilisation and 5.3
analyses what strategies can be used in order for ship operators to increase their capacity
utilisation. In Appendix B a summary of 5.1, 5.2 and 5.3 has been presented.
5.1 Capacity planning
This section answers research question number one by analysing how ship operators
plan their available capacity. First, different capacity utilisation strategies are explored
and their applicability to different liner segments is studied. Thereafter, how capacity
can be adjusted is investigated.
5.1.1 Planning of available capacity Most of the studied companies perform long-term planning for their available capacity
once or twice a year. During their planning, they look at the flows and see how they
change and whether new ones are appearing. They also revise the expected total
demand for their services on their routes and try to adjust their capacity to the changing
needs. Table 5.1 below present the planned capacity utilisation and capacity utilisation
strategy employed by the interviewed ship operators. A planned capacity utilisation of
over 95% was defined as a cut peaks strategy, utilisation of below 85% was defined as
never say no and 85-95% was defined as mixed. Table 5.2 presents the most important
KPI for the customers of the interviewed ship operators.
Table 5.1 Planned capacity utilisation and capacity utilisation strategy employed by the interviewed
companies.
Table 5.2 The most important KPIs for the customers
The planned level of capacity utilisation differs between companies as well as
segments. Ship operators in the RoRo and RoPax segment are more prone to employ
excess capacity than companies in the container or feeder segments. This is described
by Styhre (2010) as a never say no strategy. The strategy employed is likely a result of
their customer requirements, as the ship operators need to adapt to them and provide

62
the customers with the right service to stay competitive. As can be seen in table 5.2, the
most important customer requirements within the segment are service reliability and
flexibility. According to Styhre (2010), having excess capacity increases service
reliability as goods can be shipped without delays which incentivise companies within
the RoRo segment to use the never say no strategy. Customers within the RoRo segment
also value flexibility to a large degree. According to Styhre (2010) this is more easily
provided by ship operators while having excess capacity. Frequency is also highly
valued amongst their customers. Having to provide their customers with frequent
departures forces the RoRo and RoPax ship operators to sail at a lower capacity
utilisation. This is supported by Styhre (2010), who states that having more frequent
departures every week makes it difficult for ship operators to achieve a high capacity
utilisation which forces them to utilise the ship less effectively. Companies in the RoRo
segment also expressed the need to have close customer relationships in order not to
lose contracts as this could be detrimental for their survival on a specific route since
capacity utilisation could drop drastically. According to Davies (1983) operating at
close to 100% capacity utilisation negatively affects customer relationships which
further incentivises RoRo companies to use the never say no strategy. As the sunk costs
of entering a new market are lower for companies in the RoRo segment than the deep-
sea container segment. The risk of new entrants is higher in the RoRo segment than the
container segment as the capital investments required are lower due to the smaller
vessel sizes. This increases the necessity for RoRo ship operators to operate with excess
capacity. As stated by Fusillo (2003), excess capacity may be used as a strategic motive
to guard against the uncertainty of new actors entering the market. This further
incentivises the RoRo companies to opt for a never say no strategy.
Container1 and Container2 are more focused on driving down prices for their customers
compared to other liner segments, as this is seen as highly important for them. This is
done by utilising the ship to a large degree which reduces the cost per unit transported.
This is supported by Davies (1983) who states that increasing capacity utilisation is
beneficial as the average total cost is reduced. As a result, container shipping lines use
the cut peaks strategy which results in a high capacity utilisation. Styhre (2010) states
that the strategy is suited for markets with low freight rates which incentivise container
shipping lines to use this strategy. Styhre (2010) states that this strategy is achieved by
increasing market share. This can be observed in the container shipping industry as
there are fewer actors in the market with more market share each.
Feeder1 mentioned their customers are large deep-sea container ship operators who aim
to drive down prices for their customers. Their services are also measured from a cost
point of view against the alternative of insourcing the feeder services. As a result, price
becomes the most important KPI for the feeder lines. The feeder line tries to drive down
prices by using the cut peaks strategy and fully utilise the vessels. This is supported by
Styhre (2010) which states that the cut peaks strategy is used in markets with low freight
rates.

63
The excess capacity on the vessel does however not only depend on the segment but
also differs between routes. RoRo3 states that the capacity needs to be adjusted to the
specific route as there are factors that make it easier or harder for companies to cope
with shortage of capacity. If the company has a high network density with several routes
passing through or close to the same ports, goods can be loaded on other departures
without causing delays. These factors make it easier for ship operators to handle
shortage in capacity which allows them to plan for a higher capacity utilisation.
According to Styhre (2010) RoRo vessels have a shorter turnaround time at port which
facilitates the use of some of these measures such as picking up goods on vessels
passing close to the port. Having competitors with excess capacity in the area may also
prove advantageous under certain circumstances as they may carry goods that did not
fit on their own vessels. Despite the ship operators long term planning for available
capacity, every company tries to achieve high an utilisation as possible on every
departure.
5.1.2 Increase and decrease capacity The companies are able to adjust to changes in demand by adjusting available capacity.
If demand is expected to increase on a long-term horizon, companies may opt to
purchase a new vessel (Styhre & Lumsden, 2007). As stated by RoPax1, this is a long-
term measurement as it takes 2-3 years to build a new vessel. Fussilo (2003) states that
there are economic incentives to invest in larger vessels which makes it difficult to
increase capacity in smaller steps when buying new vessels. Ordering oversized vessels
result in excessive amount of capacity and result in price deterioration, as ship operators
try to increase the capacity utilisation on the vessels by reducing their prices. If demand
is expected to be reduced on a long-term horizon, companies may choose to terminate
a vessel to reduce capacity. Table 5.3 below presents the share of owned vessels for the
interviewed ship operators.
Table 5.3 Share of owned vessels in the fleet.
Ship operators can choose to charter parts of the fleet or the whole fleet which makes
it easier to increase or decrease available capacity. The reason is that chartered vessels
are easier to remove from the fleet than owned vessels and do not require large
investments, as opposed to acquiring a new vessel (Cariou, 2008). Therefore, chartering
provides an increased flexibility of available capacity compared to a strategy where the
companies own the vessels themselves. Chartering is also used by ship operators in
order to increase capacity on a short-term perspective. It may be used in order to counter
short peaks in demand due to seasonal variations as an example. Some vessels are
highly specialised to carry specific cargo such as the PCTC vessels. These are difficult
to find in the market which forces companies to own the vessels themselves.

64
In situations where demand is falling on one route in the network and another route sees
an increase in demand, the company may swap vessels between the routes to adjust to
the changing demand situation. As stated by RoRo1, having a large fleet of vessels
makes it easier to redirect them between routes and adjust to changes in demand. RoRo3
states that having vessels of varying sizes also facilitates finding the right vessel for a
route. Routes located close to each other increases the feasibility of swapping as the
vessels do not have to sail far distances to be exchanged. However, swapping vessels
is not always feasible as the vessel are not compatible with the port infrastructure.
Vessels can have ramps adapted to specific ports which makes them unable to load
goods on other ports. This affects the RoRo segment the most as their cargo varies in
shape and size as opposed to containers which has affected the design of the vessels to
vary widely as well. Ports may also be located in geographical areas that do not allow
for a certain draft on the vessels which may restrict companies from swapping vessels.
RoRo3 states the size of the vessels has an effect on the companies’ ability to increase
or decrease available capacity. Operating smaller vessels increases costs due to a lack
of economies of scale but increases capacity utilisation. RoRo3 states that if volumes
fall, the company is able to reduce capacity with more ease as the capacity is more
divisible. Smaller ships also allow companies to adjust the available capacity to the
demand with more ease. This is supported by Styhre (2010) who states increasing
capacity in smaller and frequent steps will lead to a higher capacity utilisation.
5.2 Factors affecting capacity utilisation
In this section, research question two will be answered. By addressing which factors
are affecting companies and analysing how they inhibit them from achieving a high
level of capacity utilisation. Table 5.4 presents a compilation of the factors that the ship
operators are affected by.
Table 5.4 Compilation of factors affecting the interviewed ship operators.

65
5.2.1 Variation in demand Several operators stated variation in demand affected their ability to achieve a higher
capacity utilisation on their vessels. The ship operators are dependent on the
manufacturing industry, as fluctuations in their production affects ship operators' ability
to fill their vessels (Styhre, 2010; Styhre & Lumsden, 2007). Container2 states that
before summer vacation there is a peak in demand. The scenario is the same before
Chinese New Year and Christmas holidays. After these holidays the firms experience
a regression in demand during a time period. Several ship operators also state that some
products have seasonal variations in demand which increases the volumes that need to
be transported for a certain period. Fluctuations in demand affect ship operators
negatively since the supply is fixed from a short-term perspective (Fusillo, 2004).
Therefore, this will create a challenge to cope with changes in demand and a mismatch
between supply and demand will arise (Fusillo, 2004). As explained by Fusillo (2004)
this mismatch reduces the utilisation on the vessels. Ship operators' ability to estimate
their customers' production output therefore has a great impact on the utilisation levels
on the vessels, as they are able to plan their available capacity accordingly. Besides
having fixed capacity on a short-term perspective, ship operators also have a fixed
schedule which they need to adhere to (Fussilo, 2004). This also creates difficulties
when trying to cope with variations in demand as ship operators are not able to wait for
more cargo for a specific departure to fill up the vessels when demand is low. This
results in a lower capacity utilisation since the departures are fixed.
5.2.2 Trade imbalances Every company except RoRo1 identified trade imbalances as one factor affecting their
ability to achieve a high capacity utilisation on their vessels. RoRo1 is not affected by
trade imbalances in the Gothenburg region, since they have achieved a good balance in
their system. This may however be an issue for the ship operator on other routes.
RoRo2 mentioned within Sweden there is an imbalance with more goods going
southbound compared to northbound within the country. The underlying reason for this
is that the production and raw materials are placed in the northern parts of Sweden
whereas the consumption is in southern Sweden which also has a larger population.
This creates an imbalance in their system and repositioning of empty containers is
required. This in turn leads to a lower capacity utilisation for their transports going
northbound.
Several ship operators mention the import volumes are higher for Europe compared to
the export volumes. According to Styhre (2010) and Ting and Tzen (2004) this is a
result of the international trade patterns. This will in turn lead to a lower utilisation on
the vessels going out from Europe as the vessels are dimensioned for the heavy leg of
the route. These imbalances have also created issues for the ship operators to handle
the empty positioning of containers in their system. For example, Container1 mentioned
that they need to transport more reefer-containers to Latin America due to the low

66
export volumes from Europe. This affects their capacity utilisation since they are forced
to transport empty containers instead of containers loaded with cargo. This is supported
by Ting and Tzen (2004) who state that transporting empty containers affects the
capacity utilisation negatively, since empty containers have to be repositioned and
therefore reduce the capacity utilisation on the vessels. As stated by Styhre (2010), the
maximum capacity may be reached in different ways such as volume or weight. Empty
container repositioning only restricts further loading on the vessel with more cargo if
volume is the limiting factor.
5.2.3 Lumpy Capital Capital lumpiness is an issue that is experienced by RoRo2 and RoRo3 and affects their
utilisation. As stated by RoRo2, newly built vessels should last for at least 30 years and
are built on a few occasions. As a result, they dimension their available capacity with
20-25% excess capacity to be able to cope with increased demand in the future. Fussilo
(2003) states that increasing the available capacity at few occasions is a result of the
costs that incur when acquiring new vessels. As the cost per capacity increment
decreases with increased capacity, companies are prone to increase capacity in larger
and less frequent steps. According to Davies (1983) the cost structure of the industry
where high fixed costs and low variable costs incentivise companies to invest in larger
ships to gain economies of scale (Davies, 1983). This is however not optimal from an
utilisation point of view, as the larger vessels create an excessive amount of capacity
which has a negative impact on the utilisation. Having larger and fewer vessels are also
creating problems for companies trying to match demand with their available capacity.
5.2.4 Vessel design The vessel design in conjunction with how the goods are loaded is an issue that affects
the capacity utilisation for the RoPax1. As opposed to containers which are stacked on
top of each other, the cars are loaded on to the decks with varying degrees of success.
RoPax vessels often have a hanging deck on the main deck which increases the
available lane meters but reduces the max height of the goods on the main deck.
Loading trailers on the main deck inhibits the use of the hanging deck which reduces
the available capacity on the ship. The way that the goods are loaded and the extent to
which the main deck can be used therefore affects the amount of lane meters that can
be transported on the vessel, which in turn affects capacity utilisation.
5.2.5 Type of cargo Container1 and Container3 state that transporting heavy project cargo, i.e. windmills
limit their ability to load more containers on their vessels. The heavy cargo causes the
ship to reach its maximum capacity faster in terms of weight. As a result, more
containers cannot be loaded even if there is space left on the vessel. The heavy cargo
often also has varying dimensions which makes it harder to utilise the space on the ship

67
optimally. This can reduce capacity utilisation on the ships. The incentive for
transporting cargo which cause a lower utilisation is that it is generating more revenues.
RoRo3 states that the dimensions of the cargo being transported affect the utilisation
on their vessels. The RoRo segment is affected by transporting different cargo with
different dimensions as it is not standardised and homogeneous which makes it difficult
for the ship operators to find a balance between available capacity and demand on the
vessel level. A vehicle may have a varying width and height, compared to a container
which is standardised to have the same dimensions. As the units that are being carried
on the ships are not as standardised, there are often discrepancies on the decks between
available capacity and the unit loads. This was exemplified by RoRo3, who stated that
a car could be 1,82 meters wide whereas the lane only was 1,8 meters wide. This
resulted in the last lane being unutilised to a large extent as the cars crossed over the
lanes throughout the deck. As described by Santén et al. (2018), not utilising every deck
to its maximum potential results in a low load factor on the ship level, which reduces
the overall capacity utilisation.
5.2.6 Cooperative arrangements All the ship operators except RoRo2 cooperate with other actors in order to achieve a
higher utilisation. However, Container1 experienced that cooperative arrangements
could also affect utilisation negatively. According to Container1, the drawback of being
in an alliance with several ship operators is that all actors in the alliance have to approve
changes. Examples mentioned are changes to the routes and schedules. The ship
operator states that an increased number of actors in the alliance makes the decision
making slower compared to only having an alliance with one actor. This is a result of
negotiations which become more complex and everyone may have different agendas.
This is supported by Cariou (2008), who states that the drawback of an alliance is that
the coordination of different actors can be complex. As an example, a change that would
increase utilisation for most of the parties involved could be stopped by an operator that
does not benefit from that change. This would reduce utilisation for the remaining
actors. This is supported by Panayides and Cullinane (2002) who state that different
actors may drive their own individual objectives in the partnership. The fact that
Container1 is the only ship operator with more than two alliance members may explain
the reason why they are the only company experiencing the negative consequences of
being part of a shipping alliance.
5.2.7 Competitive situation RoPax1 and RoRo3 mentioned the competitive situation as a factor that has a negative
impact on the capacity utilisation. The competitive situation in terms of the number of
actors that are operating on a specific string is a factor that affects the utilisation of the
vessels. This is a result of the demand situation to a large extent. The total demand for
the services provided by liner companies is mostly unaffected by actions taken by the
ship operators to promote their services and more affected by market conditions (Wu,

68
2012). As stated by RoRo3, more cars are not going to be manufactured and sold as a
result of reduced prices on their transportation service. The RoPax segment is an
exception to this rule as they are able to use marketing and pricing to increase the total
demand for their services. As a result of this, the total volume that needs to be
transported between specific ports is shared between the actors that operate on that
string. Increased competition is therefore detrimental for a ship operator’s capacity
utilisation. In a situation where two actors are operating on a string and a third one
enters; the capacity utilisation can be reduced by 33% assuming they achieve the same
market share. In order to guard against the uncertainty and threat of new entrants,
companies may decide to operate at a lower capacity utilisation in case a new actor
decides to enter the market (Fussilo, 2003). In a situation where a competitor decides
to enter the market, the ship operators are able to reduce their prices and allocate more
volume to their existing fleet which deters new entrants from entering the market
(Fusillo, 2003; Wu 2009).
Threat from substitutes also negatively affects the demand for the ship operator’s
services. This is the case for the RoPax segment as there are several alternatives to
taking the ferry. RoPax1 exemplifies this by stating that the customer may take land
borne solutions as opposed to the ferry. As stated by Feeder1, their customers are
container ship operators and are therefore able to perform the services that they provide
themselves. The way that competitors’ price their services also affects capacity
utilisation. Reduced prices from other actors reduces the demand for the ship operator’s
services as they get a smaller share of the total demand, which may also affect capacity
utilisation.
5.2.8 Weather Majority of the companies mention they are affected by harsh weather conditions as it
may cause delays in their sailings schedule. Not arriving on the scheduled berth-time
may result in a shorter time for loading and unloading operations. This may have a
negative effect on utilisation as all the cargo may not be loaded before the berth time is
over. As stated by Container2, having windy or foggy weather conditions may inhibit
them from calling the port, which would entail cargo not being loaded on the vessels.
This reduces utilisation on the vessel.
5.2.9 Ports All studied companies mentioned ports hinder their ability to achieve a high capacity
utilisation. Several ship operators experience the ports have a low flexibility. If the ship
operators arrive with a delay to the port, their time window at the port will be reduced.
The berth-time cannot be increased. This results in less time for loading cargo on the
vessels, which reduces capacity utilisation. RoRo3 states that some of the ports are not
opened during the night which inhibits ship operators to load and unload goods at
specific times during the day. If the ship operators arrive at night, some ports cannot
guarantee to have stevedoring employees available which makes it impossible for the

69
ship operator to load the goods at certain times. Container2 and RoRo3 mention that
congested ports cause slower unloading and loading operations. RoRo3 states that not
being able to enter the port when planned inhibits them from loading goods on to the
vessels, reducing utilisation. This is a result of ship operators capitalising on economies
of scale and operating large ships which take longer time to process for the ports. This
is supported by Midoro et al. (2005) who state that increased vessel sizes have increased
the time at port. The location in which the port is situated may also affect utilisation.
As stated by Container2, certain ports cannot handle a high draft, which means that
large vessels cannot be loaded to a high utilisation.
5.2.10 Service level Only one of the ship operator’s experiences that the service level has a negative impact
on their capacity utilisation. RoRo1 mentions operating at 100% capacity utilisation
would not be sustainable for them. They state operating at high levels would increase
the risk of rejecting cargo from customers, which in turn will have a negative impact
on their service level. If cargo is rejected several times from the customers, some
customers may opt to switch supplier, reducing the ship operator’s market share. For
this reason, ship operators want to leave unutilised capacity on their ships to serve
important customers. This is aligned with Styhre (2009) who states that ship operators
may not want to operate at 100% utilisation for this reason. Davies (1983) also states
that operating on high levels can lead to ship operators having to reject cargo from some
customers. If this happens several times, it will have a negative impact on their
relationship and may lead to the customers changing to another supplier.
Container1 and Container3 do not leave capacity unutilised for important customers,
instead their aim is to fill the vessels to 100%. This is contractionary to the explanation
presented by Styhre (2009) and Davies (1983). The reason for this can be that these
ship operators believe it is more sustainable for them to utilise their ships fully, without
leaving capacity idle on their vessels on purpose as this generates more revenues. As
Container1 and Container3 have a large market share, they may use their available
capacity to a larger extent and reject cargo from customers since the customers are more
dependent on them.
5.2.11 Schedule characteristics RoRo1 and RoRo2 have several departures throughout the week. The weekend
departures have a lower demand compared to the other departures. These departures on
the weekend lowers their weekly figures for capacity utilisation as there is a lower
demand for their services during the weekend. The ship operators need to have these
departures in their schedule however as they need to offer the service to their customers
several days throughout the week. Without having the high frequency customers may
opt to transport cargo with other suppliers instead. Not providing a high frequency can
cause loss of sales, since there will be no service available for the customers during the
weekend. Styhre (2010) states that having a higher frequency may lead to a lower

70
utilisation per voyage. However, the total amount of goods that are shipped during a
year are increased. By transporting more goods annually, the revenues can be increased.
However, increasing the frequency increases the total cost for the service (Styhre,
2010). Container2 states that most of their services have weekly departures. Deep-sea
container ship operators transport goods that are less time sensitive than short-sea
operators. As a result, their customers do not require them to provide departures with
as high a frequency. This reduces the negative implication of schedule characteristics
mentioned above.
5.2.12 Internal barriers RoRo3, Container1 and Container3 mentioned internal barriers within their company
may have a negative impact on their operations to achieve a high capacity utilisation.
Miscommunication between different functions may as an example impact the loading
operations on the vessels when handling high-and heavy cargo. If the right dimension
of the cargo has not been forwarded onto another function the reserved space may be
larger than required. This may result in unutilised space on the vessels. Container1 and
Containter2 mention that different functions within the company have different goals
and want to prioritise different cargo on the vessels. This will affect their levels of
capacity utilisation, since one customer might have 10 containers and it is an important
customer for salesman 1. Another salesman may have a customer with 50 containers
ready for transportation but may not be able to load the goods as salesman 1 has already
allocated the 10 containers to the vessel. The way that the prioritisation is done will
therefore affect the levels of capacity utilisation. Styhre (2010) emphasised the need for
different departments within the company to communicate with each other. Further, it
is also important to achieve a holistic view over the company's situation (Styhre, 2010).
Having miscommunication between different functions and having different agendas
will therefore affect capacity utilisation negatively.
5.2.13 Late arrivals, no-shows and cancellations Customers delivery behaviour is an issue that is seen as one of the biggest challenges
that liner companies need to cope with. Late arrivals to the terminals inhibit companies
from loading goods on the booked departure. The feeder services provide a connecting
service for container shipping lines and are therefore highly impacted by no-shows and
late arrivals. Service reliability is seen as an important KPI for them which makes it
difficult to have countermeasures such as overbooking. No-shows and cancellations are
also common, especially in the container industry. Customers book space on the vessels
and do not arrive with the amount stated in the booking or cancel bookings right before
departure. Container2 states that the customers are able to do this as they are not obliged
to pay a fee and do not have any other repercussions for this kind of behaviour. None
of the interviewed actors charged their customers for not arriving at the terminal with
the predetermined amount of goods. The lack of commitment makes it difficult to plan
available capacity to match the demand as it creates an uncertainty of demand, reducing

71
the capacity utilisation. If the company doesn’t have any standby cargo which they are
able to fill the vessels with, the utilisation is reduced.
5.2.14 Legislation Legislation regarding customer declaration for cargo being transported from Sweden to
China has a negative impact on Container3’s operations. Custom papers have to be
handed in 48h before departure. This rule does not allow Container3 to fill up their
vessels with cargo coming 48h before departure even if there is space left idle on the
vessels. Instead, the cargo has to be scheduled for another departure, which results in a
lower capacity utilisation. The time limit does not allow Container3 to take orders close
to departure which may inhibit them from reaching higher levels of utilisation. Short
sea RoRo and feeder companies are however able to accept bookings up to 30 minutes
before departure. This legislation is therefore not applicable to them and does not affect
them.
RoRo3 and Container1 mentioned certain cargo has to follow special rules, which limits
their ability to load the cargo on the vessels efficiently. For example, transporting
military cargo puts restrictions on what other cargo can be loaded on the vessels or
larger space is reserved for this cargo. This hinders the ship operator’s ability to allocate
cargo efficiently. Dangerous goods need to have a certain distance between them and
only a limited number of containers can be loaded. Keeping a safety distance between
the containers results in space being left idle where other containers could have been
loaded. This reduces utilisation, since fewer containers will be loaded on the vessel.
However, this may not always be seen as a negative aspect. The dangerous cargo may
be charged with a higher price. So, there can be a trade-off between revenues and
capacity utilisation.
5.3 Strategies
This section answers research question number three by presenting strategies and tools
that can be used by ship operators to increase capacity utilisation. The applicability of
the strategies is evaluated by combining information acquired by the interviewed
companies as well as the literature study. Identified differences in applicability between
liner segments are presented. Table 5.5 is a compilation of the strategies that were
mentioned to be used by the interviewed ship operators.
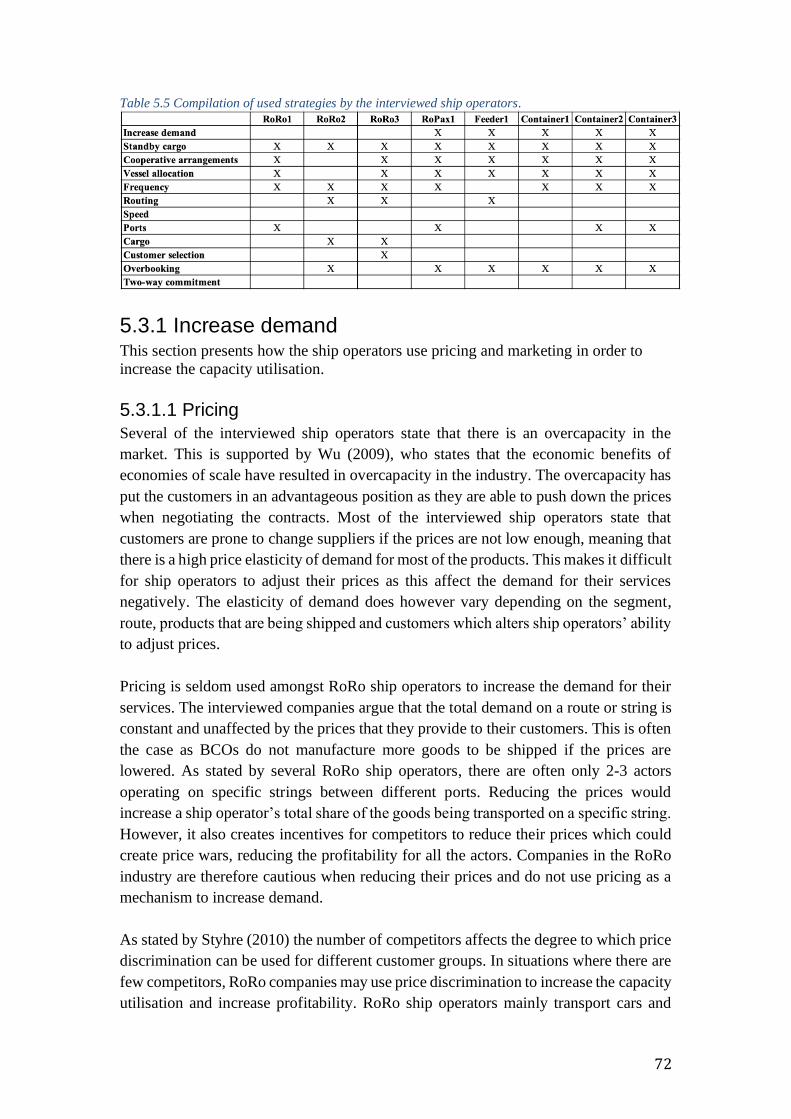
72
Table 5.5 Compilation of used strategies by the interviewed ship operators.
5.3.1 Increase demand This section presents how the ship operators use pricing and marketing in order to
increase the capacity utilisation.
5.3.1.1 Pricing
Several of the interviewed ship operators state that there is an overcapacity in the
market. This is supported by Wu (2009), who states that the economic benefits of
economies of scale have resulted in overcapacity in the industry. The overcapacity has
put the customers in an advantageous position as they are able to push down the prices
when negotiating the contracts. Most of the interviewed ship operators state that
customers are prone to change suppliers if the prices are not low enough, meaning that
there is a high price elasticity of demand for most of the products. This makes it difficult
for ship operators to adjust their prices as this affect the demand for their services
negatively. The elasticity of demand does however vary depending on the segment,
route, products that are being shipped and customers which alters ship operators’ ability
to adjust prices.
Pricing is seldom used amongst RoRo ship operators to increase the demand for their
services. The interviewed companies argue that the total demand on a route or string is
constant and unaffected by the prices that they provide to their customers. This is often
the case as BCOs do not manufacture more goods to be shipped if the prices are
lowered. As stated by several RoRo ship operators, there are often only 2-3 actors
operating on specific strings between different ports. Reducing the prices would
increase a ship operator’s total share of the goods being transported on a specific string.
However, it also creates incentives for competitors to reduce their prices which could
create price wars, reducing the profitability for all the actors. Companies in the RoRo
industry are therefore cautious when reducing their prices and do not use pricing as a
mechanism to increase demand.
As stated by Styhre (2010) the number of competitors affects the degree to which price
discrimination can be used for different customer groups. In situations where there are
few competitors, RoRo companies may use price discrimination to increase the capacity
utilisation and increase profitability. RoRo ship operators mainly transport cars and

73
trailers, but also project cargo and containers. Project cargo are often goods which
cannot be transported on other transportation modes due to their heavy weight or
dimensions (Styhre, 2010). This reduces the elasticity of demand for these goods as
there are no other transportation alternatives. However, containers and cars can be
transported on containerships which increases the elasticity of demand and reduces the
RoRo operator’s ability to adjust the prices without negatively affecting the demand on
their service. RoRo ship operators should charge prices above the long-run average
costs for the project cargo, as this is not expected to reduce the demand to a large degree.
This gives the companies more freedom to charge lower prices if necessary, for cargo
with higher elasticity of demand such as containers which should increase the load
factor.
The customers of the RoRo ship operators are mainly BCOs but they are also handling
cargo on behalf of forwarders. The forwarders have a more transactional behaviour
where they chose the cheapest option for every departure. This makes it difficult for
ship operators to use price discrimination with forwarders. However, BCOs value
flexibility, reliability and frequency to a larger extent which increases the flexibility of
the ship operators when pricing their services.
The RoPax segment differs with regards to the total demand situation for the passenger
segment as they can increase the total demand for their services by reducing their prices.
As an example, if the price for the ferry ticket is reduced, more customers are prone to
use their services. Pricing is therefore used to a larger extent than for the RoRo and
container segment. It can be used as a way to handle seasonal demand variations, as
lowering prices during the off-season.
The interviewed container shipping lines are part of alliances which reduces the
competitiveness on the market and the negative effects of price reductions. As stated
by Styhre (2010), strategic alliances reduce destructive competition and prices are not
pushed to marginal costs to the same extent. This allows container shipping lines to use
the pricing mechanism with greater freedom. This could be observed as the interviewed
container shipping lines used the pricing mechanism to a larger extent than ship
operators in the RoRo sector. As the service provided is homogeneous, the most
important differentiator amongst the container shipping lines is price. The container
shipping lines are therefore more prone to reduce prices as a way to increase their
capacity utilisation and their revenues. The interviewed container ship operators are
however also cautious with the pricing mechanism and do not want to deflate the prices
excessively. The feeder segment has container shipping lines as customers which value
low prices to a high degree. Pricing is therefore used as a way to attract more customers
by the feeder operators. As the cargo transported by container and feeder ship operators
is mainly containers it limits their ability to differentiate the prices between customer
segments and use price differentiation to increase utilisation.

74
Pricing can be used to handle trade imbalances. This can be done by using price
differentiation by reducing the prices for the low-volume sea leg while increasing the
prices for the high-volume leg which increases the balance in the route. The negative
effects of the schedule characteristics, where demand is lower for certain departures
can also be handled by using price differentiation. The attractiveness of the departures
with low demand can be increased by lowering their prices.
5.3.1.2 Marketing
Marketing is only used as a tool to increase demand by RoPax1. The reason for this lies
in the type of services that are provided by the company. RoPax1 is the only interviewed
actor that transports passengers on the vessels. Customers using the service have many
alternatives to taking the vessel, such as taking the car over a bridge going to the same
destination or taking the plane to for a summer vacation in another country. The total
demand for their services is therefore affected by the knowledge that the customers
have of their service. This is supported by Felstein (2010) who states it is important to
work with awareness to remind customers about their offering. This is not the case for
ship operators transporting containers or cars as there are often not many alternatives
to transport the goods. As stated by RoRo3, there are often only two to three actors
providing a service between specific ports. Customers working in the logistics sector
often have knowledge about the alternatives that are available as they negotiate with
them for the lowest prices and best services. Zeithhaml et al. (2009) states that demand
can be increased by using marketing tools such as promotions during low seasons to
even out the demand and counter seasonality of demand.
5.3.2 Standby cargo All interviewed companies stated that standby cargo is used to increase the capacity
utilisation on the ships. In general, standby cargo is cargo that is not time sensitive and
can therefore be rescheduled for another departure which has a low capacity utilisation
(Styhre, 2010). This allows companies to even out the demand for their services. If the
Monday departure has a high utilisation whereas the Wednesday has a lower utilisation,
standby cargo which has a departure for Monday may be allocated to the departure on
Wednesday. Standby cargo is used by several ship operators to cope with the downfall
caused by late arrivals, no-shows and cancellations. Changing departures for standby
cargo makes it possible to handle variation in demand and simultaneously be able to
increase the capacity utilisation on the vessels (Rogerson & Santén, 2017; Jonsson,
2008; Styhre, 2010). Standby cargo can be rescheduled to be shipped either for earlier
or later departure to fill the vessels when the utilisation is low. Styhre (2010) states
standby cargo have lower rates and are often not time sensitive. The customers have
reduced rates for standby cargo since the arrival date is not fixed which gives ship
operators a higher flexibility when planning the allocation of cargo. Besides using
standby cargo to counter the downfall of cargo caused by late arrivals, no-shows’
cancellations, it could also be used to counter negative effects of schedule
characteristics. The characteristics of the schedules, where demand is lower for some

75
departures can be countered by having standby cargo available which evens out the
demand throughout the week. It is therefore important for ship operators to ensure to
have standby-cargo available, as it allows them to reduce the empty space on their
vessels.
5.3.3 Cooperative arrangements All firms except RoRo2 are part of an alliance or a collaboration with other actors on
the market. Being part of an alliance allows companies to adjust their available capacity
more easily as it reduces the need of purchasing additional vessels to change the
available capacity (Fusillo 2004; Cariou 2008). As stated by Fusilli (2003) investments
in additional vessels can be done with alliance members which reduces the negative
effects of capital lumpiness and allows companies to increase capacity in smaller steps.
The firms mentioned that by being a part of a strategic alliance or collaboration they
are able to allocate capacity on each other’s vessel. This allows ship operators to
consolidate goods and transport cargo on fewer vessels. This is done by having slot
sharing agreements as described by (Panayides & Cullinane, 2002). Ship operators in
an alliance are able to load more goods on the vessels without negatively affecting the
service towards the customers as they are able to load goods on the vessels of the
alliance members if necessary. The interviewed ship operators state that being part of a
strategic alliance allows them to transport goods on one vessel instead of having two
vessels operating back to back with a low utilisation. If two alliance members are
operating on the same route, they can use one vessel instead of two to transport the
same amount of goods. This allows ship operators to handle negative effects of schedule
characteristics, where demand is lower for certain departures as capacity can be more
easily adjusted throughout the week. As a result, capacity utilisation is increased on the
vessels. The increased flexibility in capacity allows ship operators in an alliance to
match capacity better with demand. This allows them to cope with variations of demand
more easily. Cooperating with other actors in the industry increases the market
concentration and reduces the number of competitors in the market. This reduces the
competitiveness on the market and its negative effects on capacity utilisation.
5.3.4 Vessel allocation RoRo1 has a fleet of vessels with various sizes, which allows them to shift vessels
between different routes within their network. If there is a lower demand on one route
resulting in a low capacity utilisation, the vessel can be exchanged for a smaller one
under the presumption that a larger vessel is needed somewhere else within the network.
Having vessels of varying sizes therefore allows ship operators to increase their
capacity utilisation on one route and increase their ability to cope with increased
demand on another route. Ship operators can as a result react to changing market
conditions and variations in demand by swapping vessels. Styhre (2010) states that the
increased flexibility that companies achieve by swapping vessels increases capacity
utilisation. Having an extensive network of vessels is beneficial, since it gives ship
operators a better flexibility to adjust their capacity on different routes. Being part of

76
an alliance facilitates the use of this strategy, since it gives the ship operators access to
a larger fleet of vessels. In situations of increased demand, swapping vessels allows
companies to increase their available capacity without investing in new vessels which
reduces the capital lumpiness. RoRo3 states if there are several vessels operating on the
same route and the demand is lowered, one of the vessels can be terminated. This allows
them to transport the same amount of goods on fewer vessels, which can increase the
capacity utilisation.
5.3.5 Frequency The ship operators within the RoRo and RoPax segment adjust their schedule to the
demand situation to some extent. If there is an increase of demand before summer, they
increase their frequency in order to match supply better with demand and be able to
increase their sales and handle variations in demand. However, after seasonal peaks or
if demand is lowered, their frequency is reduced by having a new schedule in order to
increase their capacity utilisation. Having less departures allows ship operators to
consolidate cargo to a larger extent, which results in a higher utilisation on their vessels.
Maintaining the same schedule with the same vessel setup and frequency of departures
throughout the year would result in a lower average utilisation as the total capacity is
not adjusted to the demand situation. Reducing the frequency may however affect the
service towards their customers negatively. Operating with a higher frequency and
smaller vessels reduces the congestion in the ports as stated by RoRo3. This reduces
the necessity to do cut and runs as the loading operations are done in time at the port.
However, reducing the vessel sizes decreases the benefits achieved by economies of
scale.
The interviewed container shipping lines have a fixed schedule that does not change in
frequency throughout the year. If the companies experience lower demand, blank
sailings will be used instead, reducing the number of departures. This allows ship
operators to consolidate more goods and reduces their need to sail with vessels that
have a low utilisation. Blank sailings are not changes that will be implemented
permanently, instead blank sailings are used as a tool to increase their utilisation on a
short-term basis.
5.3.6 Routing When doing the long-term planning for their routes, the interviewed actors take trade
patterns into account. If the companies experience an increase in demand in a specific
port, it can be added to their route. This will help the ship operators to increase capacity
utilisation from a long-term perspective. RoRo3 takes weather into account when
designing their routes. By having slack in the schedule between ports where delays
usually occur due to harsh weather conditions the company is able to avoid missing
their berth-time at port. As some ports do not have a night shift, companies should plan
their routes so that this does not affect their operations.
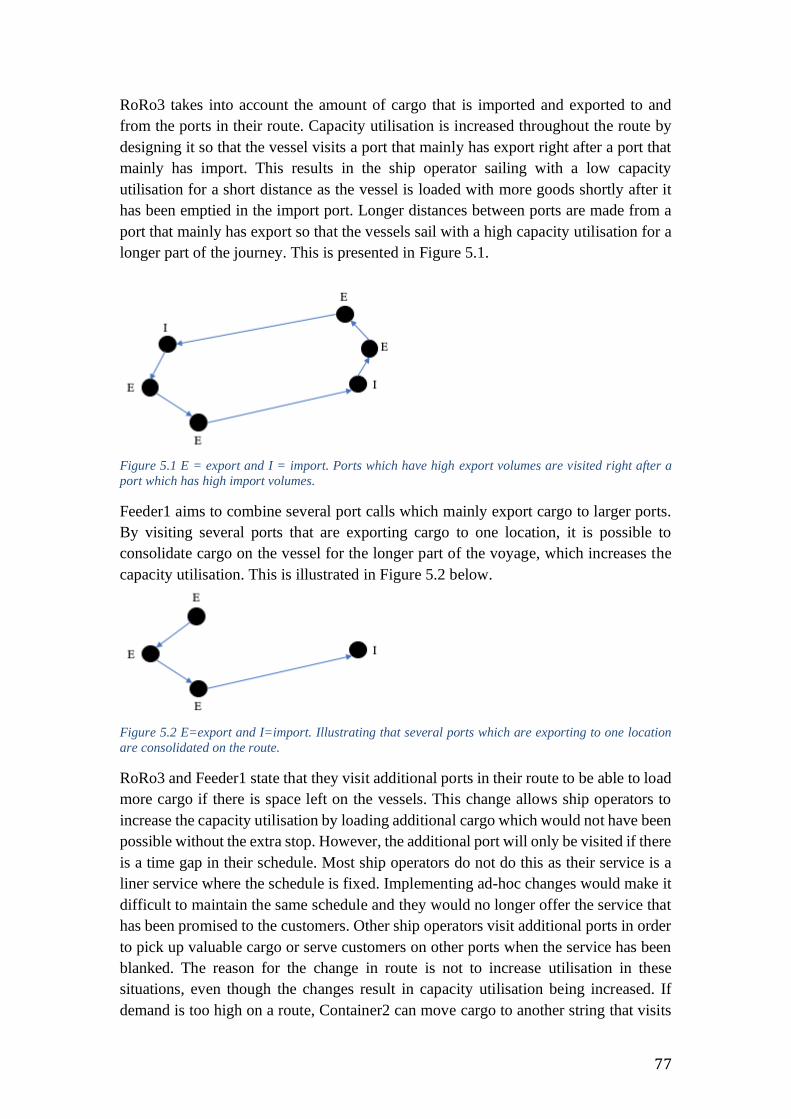
77
RoRo3 takes into account the amount of cargo that is imported and exported to and
from the ports in their route. Capacity utilisation is increased throughout the route by
designing it so that the vessel visits a port that mainly has export right after a port that
mainly has import. This results in the ship operator sailing with a low capacity
utilisation for a short distance as the vessel is loaded with more goods shortly after it
has been emptied in the import port. Longer distances between ports are made from a
port that mainly has export so that the vessels sail with a high capacity utilisation for a
longer part of the journey. This is presented in Figure 5.1.
Figure 5.1 E = export and I = import. Ports which have high export volumes are visited right after a
port which has high import volumes.
Feeder1 aims to combine several port calls which mainly export cargo to larger ports.
By visiting several ports that are exporting cargo to one location, it is possible to
consolidate cargo on the vessel for the longer part of the voyage, which increases the
capacity utilisation. This is illustrated in Figure 5.2 below.
Figure 5.2 E=export and I=import. Illustrating that several ports which are exporting to one location
are consolidated on the route.
RoRo3 and Feeder1 state that they visit additional ports in their route to be able to load
more cargo if there is space left on the vessels. This change allows ship operators to
increase the capacity utilisation by loading additional cargo which would not have been
possible without the extra stop. However, the additional port will only be visited if there
is a time gap in their schedule. Most ship operators do not do this as their service is a
liner service where the schedule is fixed. Implementing ad-hoc changes would make it
difficult to maintain the same schedule and they would no longer offer the service that
has been promised to the customers. Other ship operators visit additional ports in order
to pick up valuable cargo or serve customers on other ports when the service has been
blanked. The reason for the change in route is not to increase utilisation in these
situations, even though the changes result in capacity utilisation being increased. If
demand is too high on a route, Container2 can move cargo to another string that visits

78
the same port. This increases the utilisation on one string and reduces the load on the
other route. If demand drops on a route, Container2 may choose to blank a vessel and
move cargo to another route to increase utilisation.
5.3.7 Speed Implementing slow steaming allows ship operators to absorb excess capacity from the
market (Finnsgård et al., 2018; Malono et al., 2013; Dere & Deniz, 2019). However,
none of the interviewed companies use this as a strategy to withdraw capacity from the
market when they are experiencing low capacity utilisation on their vessels. This is
supported by Raza et al. (2019), who state that slow steaming is not used within the
RoRo segment. Instead, the interviewees mentioned slow steaming is used for the
purpose to save bunker cost for deep sea shipping. Finnsgård et al. (2018) state that
implementing slow steaming with the same number of vessels on a specific route forces
ship operator to reduce the frequency of departure. This would affect the customers
negatively which reduces the viability of reducing the speed to decrease capacity.
However, slow steaming may be more favourable in a situation where there is large
regression in demand and exceptional cost saving measures are required. RoRo3 states
that altering the speed for a vessel on a specific route is not feasible as a short-term
measurement to increase or decrease capacity on that string to affect utilisation.
Changing the speed would change the frequency for that vessel whereas other vessels
would have the same frequency. This would result in the vessels coinciding on the same
port at the same date which would reduce the sailing frequency for the customers.
5.3.8 Ports Several ship operators own the terminals and perform the stevedoring operations by
themselves. This may be beneficial as it allows them to have a better control of the
operations. As stated by RoRo3, having own terminals and stevedores allows
companies to work in the same ways across ports, increasing the standardisation.
Having better control of their operations and increased standardisation can increase
efficiency in their loading and unloading operations, which in turn could increase their
capacity utilisation. Midoro et al. (2006) support this as they state that owning the
stevedores the schedule reliability can be increased. This is a result of the companies
being responsible for the planning and can make the prioritisation at the terminal by
themselves. Container3 states that being able to prioritise cargo and berth-time at docks
allows companies to make adjustments and cope with situations when the vessels arrive
late due to harsh weather conditions. RoPax1 states that owning terminal and
stevedoring operations allows them to have a coherent view on which KPIs are
important for the firm. This way the different units within the firm can work to achieve
a better capacity utilisation by working towards the same target. However, if the
terminal and stevedores are owned by another company, the goals might not be aligned
between stevedores and the ship operators and lead to efficient operations.

79
5.3.9 Cargo As stated by Santén (2016), vessels are able to reach maximum capacity on different
dimensions such as weight or volume on the ship level. Loading heavy cargo with low
volume results in reaching maximum capacity from a weight standpoint while the space
on the vessel is still highly unutilised. RoRo ship operators are therefore able to increase
their capacity utilisation by increasing their cargo mix, as this reduces the probability
of reaching the maximum capacity of one restriction such as weight or volume long
before the other. RoRo3 states transporting cargo that fits better with the dimensions of
the vessels also increases utilisation. An example is carrying cars which have
approximately the same height as the deck on the vessel as volume is better utilised.
RoRo2 and RoRo3 state that finding cargo going on the low-volume sea leg is also a
strategy adopted by them. This reduces the trade imbalances and allows ship operators
to increase their overall capacity utilisation.
5.3.10 Customer selection Container1 and Container2 state that it is beneficial to have a large part of the space on
the vessel being allocated as it reduces uncertainty of demand. This is done by having
long-term contracts where there is a fixed price for a certain amount to be shipped every
week. Even though the weekly volume may deviate to some extent, the ship operators
are able to plan their available capacity more easily. The loyalty amongst customer
groups varies. Ship operators experience that BCOs are more loyal than forwarders and
are more prone to sign long term contracts. Having a larger part of the volume allocated
to BCOs with whom the companies have long term contracts reduces the uncertainty of
demand and variation of demand. However, a smaller part of the volume can be
allocated to forwarders as this allows the company to absorb peaks in demand. Table
5.6 presents the share of the volume that is transported for BCOs. The remaining
volumes are allocated to forward except for Feeder1, which only ships goods for ship
operators within the container segment.
Table 5.6 Share of volumes transported for BCOs.
RoRo3 aims to have a customer portfolio that consists of several customers within
different segments. This will reduce the risk that the different customers will have
fluctuations with their peaks and troughs coinciding simultaneously. This allows the
ship operators to cope with variation in demand better which results in an increased
capacity utilisation. Customers have different preferences with regards to the departures
that they prefer throughout the week. Having a large customer portfolio therefore
increase the probability of being able to allocate cargo to different departures
throughout the week.

80
5.3.11 Overbooking As presented in section 5.2.13 several ship operators face the problem of late arrivals,
no-shows and cancellations. RoRo1 and Container2 state that customers are currently
not penalised for this, which creates incentives for them to continue with this behaviour
which reduces capacity utilisation. Container2 and RoRo2 states if customers
behaviours are characterised by late arrivals, no-shows or cancellations they overbook
the vessels. This is supported by Biyalogorsky et al. (1999) who state that this strategy
is used when a customer does not make use of their booked capacity. As an example,
for a departure that is fully booked the ship operator may expect 20% of the cargo not
to arrive on time. In this situation, the ship operator may overbook the vessel by 20%
to achieve the desired utilisation. Performing overbooking is a viable tool to handle the
effects of no-shows and cancellation which will increase the utilisation (Qvartz, 2017;
Smith et al., 1992). Qvartz (2017) points out that no-shows and cancellation are
common problems in the sea trade. Therefore, it may be beneficial to use overbooking
on most of the departures. In general ship operators are not punished for rolling cargo
to other departures and can choose what cargo to load on the vessels. As a result, the
highest paying cargo can be selected if there would be a situation when more than 100%
cargo is available at the port. This way the capacity utilisation increases as well as the
revenues. Overbooking can also be used as a tool to absorb short-term variations in
demand. However, this will have a negative impact on the service and should therefore
be used with caution. Overbooking is therefore used more by ship operators opting for
a cut peaks strategy and less by ship operators opting for a never say no strategy as the
customer relationships and service is negatively affected.
5.3.12 Two-way commitment Container2 stated that increasing the commitment between the customers and ship
operators would make it easier for ship operators to increase their capacity utilisation.
At the current stage, the customers do not have to pay for a cancellation fee or any
punishment fees for late arrivals, no-shows or cancellations. At the same time the ship
operators do not guarantee to transport their cargo for a specific departure. As the ship
operators know their customers cancel departures, they are more prone to overbook.
The customers know the ship operators uses overbooking, therefore they are more
likely to book more space on the vessels than needed and then cancel departures or not
arrive with the stated quantity. Figure 5.3 presents the current situation whereas Figure
5.4 illustrates the improvement opportunity.

81
Figure 5.3 Illustration of incentives to overbook capacity and space on the vessels by ship operators and
customers.
Container2 states that in order to overcome this situation, customers and ship operators
should create a system where they commit to their promises. Container2 states that
customers could perform the payment for the shipment before the transportation has
been made. Containter2 states if the ship operators’ does not transport the cargo, they
would be obliged to pay a punishment fee which would create an incentive for them to
follow up on their promise. This would create a situation in which both actors have an
economic incentive to deliver on their promise. Container2 states that implementing
this would therefore make it easier for ship operators to forecast the amount of cargo
that arrives at the port as there would not be the same amount of downfall due to late
arrivals, no-shows and cancellations. This would in turn result in an increased capacity
utilisation as the number of late arrivals, no-shows and cancellation would be reduced.
The strategy of increasing commitment between actors may not be used simultaneously
with overbooking, since overbooking reduces the commitment from the ship operators
to the customers and incentivise them to use no-shows and cancellations.
Figure 5.4 Solution in which a payment before departure is performed by the customer and in return the
ship operator guarantees space on the vessels.

82
6. Discussion
This section presents the discussion, where the relationship between the three research
questions is presented. Facilitators for the different strategies are discussed and
presented. Challenges with implementation of different strategies is also discussed. The
sections end with suggestion for future research.
6.1 Relationship between research questions
As could be seen in the analysis there are different ways in which the strategies can be
used to increase capacity utilisation. In some situations the strategies can directly
increase utilisation. Ad-hoc changes to the routes such as extra stops to pick up more
goods is an example as this directly increases utilisation without positively affecting
any of the factors under study. In other situations, the strategies increase utilisation by
countering or reducing the negative impacts of the factors that negatively affect
utilisation. Table 6.1 presents a compilation of the relationship between the analysed
strategies and the factors, which can be used as a guideline by ship operators to increase
utilisation. None of the previous studies made within the area of capacity utilisation has
investigated the direct relationship between strategies to increase utilisation and factors
that inhibit ship operators from achieving their desired capacity (Wu, 2009; Cullinane
& Khanna, 2000; Ting & Tzeng, 2004). As can be seen in Table 6.1, cooperative
arrangements’ impacts more factors than any of the other analysed strategies.
Table 6.1 Ways in which the factors can be countered by the different strategies.

83
Some of the factors are not improved by the discussed strategies but are important to
have knowledge about as they affect utilisation negatively. They may be handled with
other countermeasures outside of the scope of the project or measures which are not
specifically defined as strategies in the project. An example is the competitive situation,
which can be handled by having excess capacity to deter against new entrants from
entering the market. Excess capacity is not defined as a strategy, as it reduces capacity
utilisation, but it reduces the negative implications of the competitive situation which
is a factor in this study. The factors may also impact the analysed strategies. An example
is legislation, which affects the applicability of pricing policies. As stated by
Container2, there are strict laws regarding the information that may be exchanged
between actors in the industry and prices can not be discussed. This increases the
probability of prices being reduced towards marginal pricing which reduces the
applicability of differential pricing, which could be used to increase utilisation. The
discussion above which explains the relationship between strategies, factors and the
desired level of capacity utilisation is summarized in Figure 6.1 below.
Figure 6.1 Illustration of the relationship between the research questions.
There is previous literature within the area of capacity utilization where factors and
strategies to increase utilisation have been analysed to observe its effects on
utilisation (Wu, 2009; Davies, 1983; Fussilo, 2003; Haralambides, 2004). However,
there is no study that has a holistic perspective on utilisation and identifies the ways in
which utilisation can be affected or improved by actions taken by ship operators to
achieve a desired level of utilisation for several liner segments within deep sea and
short sea.
6.2 Facilitators
The strategies that have been identified to increase utilisation can be achieved with
varying degrees of success, as there are measures that can be taken by the ship operators
to facilitate the adoption of these strategies. Three measures have been identified to
improve the feasibility of the strategies or increase their positive effects. Horizontal

84
integration is an example discussed by Cruijssen (2007). Acquiring another ship
operator through mergers and acquisitions provides companies an increased vessel fleet
and a more extensive network, which is supported by Panayides and Cullinane (2002).
The studies do however not state how this may impact capacity utilisation. In this study
it was found that this facilitates the use of the strategy vessel allocation as there are
more vessels that may be exchanged between different routes to match supply better
with demand. Merging with another actor also provides the ship operator with more
customers and an increased cargo mix. The cargo can as a result be allocated to the
adequate vessel to increase capacity utilization. Acquiring another ship operator
provides the company more contacts with other ship operators and therefore increases
their ability to cooperate with other actors in the industry to increase utilization.
Acquisition of other ship operators also reduces the competition on the market which
makes it easier to use pricing policies that can be beneficial from an utilisation point of
view.
Ship operators should also try to achieve a high network density. Having shorter
distances between the routes reduces the distance that ships have to travel when they
are swapped between different routes which reduces empty running and increases the
applicability of the strategy vessel allocation. Having a higher network density
increases the number of routes passing through the same ports, which is supported by
Panayides and Cullinane (2002). This makes it easier for ship operators to reduce
capacity by introducing blank sailings as the gods may be loaded on other departures.
A high network density could be achieved by integrating horizontally or through
strategic alliances with other actors in the industry. Focusing on a specific geographical
area instead of expanding to other locations is also preferable from an utilisation point
of view.
This study has also found that close customer relationships should also be strived for
as they provide ship operators with a better insight into their customers operations and
allows for better communication. Better information from the customer regarding the
necessity for specific cargo to be shipped on a specific date can be achieved which
makes it easier to use standby cargo. Ship operators could as an example gain insight
into the customers ERP (enterprise resource planning) systems to make better decisions
regarding the goods that should be left behind. Closer relationships can also be useful
when trying to increase the commitment from the customers and reduce the number of
late arrivals, no-shows and cancellations.
6.3 Implementation
Qvartz (2017) identified that there is a lack of commitment between the ship operators
and customers, which creates the problem of no-shows and cancellations. The same
issue has been found in this study. To counter this the strategy of two-way commitment
is proposed as a solution. However, the strategy of two-way commitment has not yet
been implemented in the industry by any of the actors as it requires ship operators to

85
charge their customers before departure, which results in a service that is seen as worse
by the customers. If a ship operator with a small market share would start implementing
the strategy, it is likely that their customers would change supplier when there are
several other ship operators who do not require a payment before departure and do not
have a punishment fee. This may result in losing their customers and increase the risk
of being outperformed by other ship operators. Smaller ship operators are likely not
going to affect larger actors in the industry and would not be able to bring a change to
the shipping industry. To make this strategy viable it is necessary that a larger ship
operator such as Container2 and Container3 starts with implementing the two-way
commitment strategy. This would be more viable, as smaller actors would be more
prone to follow them. As the larger ship operators have a larger market share and more
power in the market it is likely that their customers are more dependent on them
compared to smaller ship operators. As an example, between Sweden and China,
Container2 and Containter3 are the only ship operators providing a direct liner service,
in this case it may be beneficial to implement the two-way commitment as the
customers are more dependent on the ship operators as they cannot change to another
supplier for the same service. As Container2 and Container3 are large actors they are
likely able to cope with the eventual customer loss at the beginning of the transitions
towards a larger commitment between both parties.
There are several strategies proposed to counter the different factors affecting capacity
utilization. However, some of the strategies are more difficult to implement as they
also affect other ship operators within their alliance. Several studies have found that
there are difficulties that arise as a result of being a part of a collaboration with other
actors in the industry (Cariou, 2008; Panayides & Cullinane, 2002). This study
identifies how collaborations affect the strategies which has not been found in previous
studies. As an example, most ship operators mentioned that they revise their routes once
a year, and in their long-term planning for routes ports can be added or removed. Being
in an alliance makes this change harder, since all ship operators in the alliance have to
approve the changes. One ship operator may not be able to implement a change
according to their proposals to the alliance, instead they need to compromise with their
alliance members. The same situation could arise when changing the frequency of their
departure, which cannot be changed without the approval of the other alliance members
if they are sharing a vessel on a route. Therefore, the decision making of these strategies
can be more complex and time-consuming when more decision makers are involved.
Vessel allocation is one of the proposed strategies to increase capacity utilization by
swapping vessels between different routes in order to match supply better with demand.
Being part of an alliance can be beneficial as ship operators can achieve an extensive
and dense network of vessels. However, this may cause rigidity in the system as
swapping vessels between different routes becomes more complex, as the swapping
involves other ship operators. Not being part of an alliance would allow the ship
operators to perform these on their own with more ease.

86
6.4 Future research
This study was based upon eight different case studies in order to identify improvement
opportunities for ship operators. However, the impact of the proposed strategies on
capacity utilisation has not been quantified. Therefore, further research within the
proposed areas is needed to see the impact of each strategy. Further research within two
way-commitment is also needed, since this strategy has not been implemented by ship
operators before.

87
7. Conclusions
The desired level of capacity utilisation is affected by several factors such as customer
requirements and such as service reliability and frequency of departure. Having excess
capacity allows ship operators to provide a better service as cargo can be delivered with
a higher level of reliability. A high frequency also often results in a lower capacity
utilisation as goods are spread out amongst more departures. Market factors such as
risk of new entrants also affects the desired level of utilisation as there is a need to
employ excess capacity to deter new entrants from entering the market. Cost
effectiveness is positively affected by an increased utilisation which incentivises
companies to strive for a high level of utilisation. As cost effectiveness is the most
important order winner and competitive factor amongst container and feeder ship
operators, a cut peaks strategy is seen as beneficial. Close customer relationships are of
high importance for RoRo and RoPax ship operators which they achieve by providing
their customers with a high service reliability, high frequency of departure and high
flexibility. This makes a never say no strategy more suitable.
The capacity utilisation is a result of a variety of factors that impact the performance of
ship operators. The performance of the company from an utilisation point of view is
partly a result of actions taken by the ship operators, since most of the inhibiting factors
are external contingencies and situations that impact the ship operators negatively. The
most prevalent ones are external factors such as: variations in demand, trade
imbalances, ports and weather conditions. The studied liner segments are affected by
the factors to varying degrees as their customers and the characteristics of their
respective industries vary. The most prevalent differences are late arrivals, no-shows
and cancellation, which mostly affect container and feeder ship operators, as well as
schedule characteristics which RoRo and RoPax ship operators are mostly affected by.
The study has identified 12 different strategies to increase utilisation. These can be of
a strategic, tactical or operational nature as they require different time horizons for
implementation and take longer or shorter time to have an impact on the utilisation.
Some of the strategies work better if they are used concurrently such as vessel allocation
and cooperative arrangements. However, others cannot be used simultaneously such as
two-way commitment and overbooking. The applicability and usefulness of the
strategies also vary between liner segments as the contexts in which the segments
operate differ. The strategies can increase capacity utilisation by countering the factors
that have an impact on utilisation or directly increasing utilisation. The strategies that
have been studied reduce the negative implications of the factors, whereas two way
commitment is the only strategy that eliminates the negative implication of a factor (late
arrivals, no-shows and cancellations). This study indicates that cooperative
arrangements is the most important strategy for increasing capacity utilisation, as it
provides a solution to several of the factors under investigation.

88
References
Alvehus, J. (2013). Skriva uppsats med kvalitativ metod : en handbok. (1. uppl.). Retrieved from http://search.ebscohost.com/login.aspx?direct=true&AuthType=sso&db=cat07470a&AN=clc.765fdf39a03e464bb2d87c79b8e1002a&site=eds-live&scope=site&custid=s3911979&authtype=sso&group=main&profile=eds
Bermig, C., & Ritter, C. (2008). The new Guidelines on the application of Article 81 of the EC Treaty to the maritime sector. Retrieved from https://ec.europa.eu/competition/publications/cpn/2008_3_25.pdf
Biyalogorsky, E., Carmon, Z., Fruchter, G. E., & Gerstner, E. (1999). Research note: Overselling with opportunistic cancellations. Marketing Science, 18(4), 605–610. https://doi.org/10.1287/mksc.18.4.605
Blomkvist, P., & Hallin, A. (2014). Metod för teknologer : examensarbete enligt 4-fasmodellen. (1. uppl.). Retrieved from http://search.ebscohost.com/login.aspx?direct=true&AuthType=sso&db=cat07470a&AN=clc.b78a0d183e0b45358e994748f4b39e21&site=eds-live&scope=site&custid=s3911979&authtype=sso&group=main&profile=eds
Bryman, A., & Bell, E. (2011). Business research methods. (3. ed.). Retrieved from http://search.ebscohost.com/login.aspx?direct=true&AuthType=sso&db=cat07470a&AN=clc.d5fa7fc0265b4e3da8cd2ce1c127e92c&site=eds-live&scope=site&custid=s3911979&authtype=sso&group=main&profile=eds
Bryman, A., & Bell, E. (2015). Business research methods. (4. ed.). Retrieved from http://search.ebscohost.com/login.aspx?direct=true&AuthType=sso&db=cat07470a&AN=clc.54e5d31272494d2894ae7e7c86005939&site=eds-live&scope=site&custid=s3911979&authtype=sso&group=main&profile=eds
Cariou, P. (2008). Liner Shipping Strategies. International. Journal of Ocean Systems Management, 1(1), 2–13.
Christiansen, M., Fagerholt, K., & Ronen, D. (2004). Ship Routing and Scheduling: Status and Perspectives. Transportation Science, 38(1), 1–18. https://doi.org/10.1287/trsc.1030.0036
Cruijssen, F., Dullaert, W., & Fleuren, H. (2007). Horizontal cooperation in transport and logistics: A literature review. Transportation Journal, 46(3), 22–39. https://doi.org/10.2307/20713677
Cullinane, K., & Khanna, M. (2000). Economies of scale in large containerships: Optimal size and geographical implications. Journal of Transport Geography, 8(3), 181–195. https://doi.org/10.1016/S0966-6923(00)00010-7
Czinkota, M., & Ronkainen, I. (2006). International Marketing. Cengage Learning. Davies, J. E. (1983). An Analysis of Cost and Supply Conditions in the Liner Shipping
Industry. The Journal of Industrial Economics, 31(4), 417. https://doi.org/10.2307/2098339
Denscombe, M. (2018). Forskningshandboken : för småskaliga forskningsprojekt inom samhällsvetenskaperna. (Fjärde upp). Retrieved from http://search.ebscohost.com/login.aspx?direct=true&AuthType=sso&db=cat07470a&AN=clc.e4f0013abbcb4e449d3c4f76299f01a6&site=eds-live&scope=site&custid=s3911979&authtype=sso&group=main&profile=eds
Dere, C., & Deniz, C. (2019). Load optimization of central cooling system pumps of a

89
container ship for the slow steaming conditions to enhance the energy efficiency. Journal of Cleaner Production, 222, 206–217. https://doi.org/https://doi.org/10.1016/j.jclepro.2019.03.030
Dubois, A., & Gadde, L. E. (2002). Systematic combining: An abductive approach to case research. Journal of Business Research, 55(7), 553–560. https://doi.org/10.1016/S0148-2963(00)00195-8
ESCA. (2016). Short Sea Shipping - The full potential yet to be unleashed. Retrieved from https://www.ecsa.eu/sites/default/files/publications/ECSA_SSS_Download 1_0.pdf
Europa. (n.d.-a). Glossary: Deep sea shipping. Retrieved March 22, 2020, from https://www.google.com/url?q=https://ec.europa.eu/eurostat/statistics-explained/index.php?title%3DGlossary:Deep_sea_shipping&sa=D&ust=1589959023535000&usg=AFQjCNF-R_s396hP9G3xv2X3ychbDZrNaA
Europa. (n.d.-b). Glossary: Short sea shipping (SSS). Retrieved March 22, 2020, from https://ec.europa.eu/eurostat/statistics-explained/index.php/Glossary:Short_sea_shipping_(SSS)
Europa. (2008). Guidelines on the application of Article 81 of the EC Treaty to maritime transport services. Retrieved April 23, 2020, from Official Journal of the European Union website: https://eur-lex.europa.eu/legal-content/EN/TXT/PDF/?uri=CELEX:52008XC0926(01)&from=EN
Eurosender. (n.d.). Understanding sea freight. Retrieved April 2, 2020, from https://www.eurosender.com/en/sea-freight
Faber, J., Freund, M., Köpke, M., Nelissen, D., & . (2010). Going Slow to Reduce Emissions: can the current surplus of maritime transport capacity be turned into an opportunity to reduce GHG emissions? (January), 29. Retrieved from http://www.cleanshipping.org/download/Speed Study January 2010 final - SAR version.pdf
Feltenstein, T. (2010). 501 Killer Marketing Tactics to Increase Sales, Maximize Profits, and Stomp Your Competition: Revised and Expanded Second Edition. https://doi.org/doi:10.1036/9780071744096
Finnsgård, C., Kalantari, J., Raza, Z., Roso, V., & Woxenius, J. (2018). Swedish shippers’ strategies for coping with slow-steaming in deep sea container shipping. Journal of Shipping and Trade, 3(1). https://doi.org/10.1186/s41072-018-0033-2
Finnsgård, C., Kalantari, J., Roso, V., & Woxenius, J. (2020). The Shipper’s perspective on slow steaming - Study of Six Swedish companies. Transport Policy, 86(June 2017), 44–49. https://doi.org/10.1016/j.tranpol.2019.10.005
Fruth, M., & Teuteberg, F. (2017). Digitization in maritime logistics—What is there and what is missing? Cogent Business and Management, 4(1), 1–41. https://doi.org/10.1080/23311975.2017.1411066
Fusillo, M. (2003). Excess capacity and entry deterrence: The case of ocean liner shipping markets. Maritime Economics and Logistics, Vol. 5, pp. 100–115. https://doi.org/10.1057/palgrave.mel.9100074
Fusillo, M. (2004). Is liner shipping supply fixed? Maritime Economics and Logistics, 6(3), 220–235. https://doi.org/10.1057/palgrave.mel.9100110
Hague, P. (316AD). A practical Guide to Market Research.

90
Haralambides, H. E. (2000). A second scenario on the future of the hub-and-spoke system in liner shipping. Latin Ports & Shipping 2000 Conference & Exhibition, Miami FL., USA, (January 2000), 1–9.
Haralambides, H.E. (2007). Structure and Operations in the Liner Shipping Industry. (June), 761–775. https://doi.org/10.1108/9780857245670-040
Haralambides, Hercules E. (2016). Determinants of Price and Price Stability in Liner Shipping PROFESSOR HERCULES E . HARALAMBIDES Workshop on The Industrial Organization of Shipping and Ports National University of Singapore 5-6 March 2004 , Singapore. (March 2004).
Hummels, D., Lugovskyy, V., & Skiba, A. (2009). The trade reducing effects of market power in international shipping. Journal of Development Economics, 89(1), 84–97. https://doi.org/10.1016/j.jdeveco.2008.05.001
Jonsson, P. (2008). Logistics and supply chain management. Retrieved from http://search.ebscohost.com/login.aspx?direct=true&AuthType=sso&db=cat07470a&AN=clc.ea15793cd5be42cca2b415322bee7e1f&site=eds-live&scope=site&custid=s3911979&authtype=sso&group=main&profile=eds
Kherbash, O., & Mocan, M. L. (2015). A Review of Logistics and Transport Sector as a Factor of Globalization. Procedia Economics and Finance, 27(15), 42–47. https://doi.org/10.1016/s2212-5671(15)00969-7
Kou, Y., & Luo, M. (2016). Strategic capacity competition and overcapacity in shipping. Maritime Policy and Management, Vol. 43, pp. 389–406. https://doi.org/10.1080/03088839.2015.1105395
Lam, J. S. L., Yap, W. Y., & Cullinane, K. (2007). Structure, conduct and performance on the major liner shipping routes [1]. Maritime Policy and Management, Vol. 34, pp. 359–381. https://doi.org/10.1080/03088830701539149
Luo, M., & Kou, Y. (2015). Modelling the relationship between ship price and freight rate with structural changes. Journal of Transport Economics and Policy, 49, 276–294.
Maloni, M., Paul, J. A., & Gligor, D. M. (2013). Slow steaming impacts on ocean carriers and shippers. Maritime Economics and Logistics, 15(2), 151–171. https://doi.org/10.1057/mel.2013.2
Midoro, R., Musso, E., & Parola, F. (2005). Maritime liner shipping and the stevedoring industry: Market structure and competition strategies. Maritime Policy and Management, 32(2), 89–106. https://doi.org/10.1080/03088830500083521
MSC. (n.d.). Interactive shipping glossary. Retrieved May 1, 2020, from https://www.msc.com/fin/help-centre/interactive-shipping-glossary
Panayides, P. M., & Cullinane, K. (2002). Competitive Advantage in Liner Shipping: A Review and Research Agenda. International Journal of Maritime Economics, 4(3), 189–209. https://doi.org/10.1057/palgrave.ijme.9100045
Pass, C., Lowes, B., & Davies, L. (2000). Economics (3d edition). Glasgow: HarperCollins Publishers.
Patel, R., & Davidson, B. (2011). Forskningsmetodikens grunder : att planera, genomföra och rapportera en undersökning. (4., [uppda). Retrieved from http://search.ebscohost.com/login.aspx?direct=true&AuthType=sso&db=cat07470a&AN=clc.f4842ca64f9b4e38af16bfb850c56318&site=eds-live&scope=site&custid=s3911979&authtype=sso&group=main&profile=eds

91
Porter, M. E. (1981). The Contributions of Industrial Organization To Strategic Management , . Academy of Management Review, 6(4), 609–620. https://doi.org/10.5465/amr.1981.4285706
Qvartz. (n.d.). Endgames in liner - What are the consequential next steps for carriers? Retrieved May 1, 2020, from 2017 website: https://qvartz.com/media/1537/endgames-in-liner-shipping.pdf
Raza, Z., Woxenius, J., & Finnsgård, C. (2019). Slow steaming as part of SECA compliance strategies among RoRo and RoPax shipping companies. Sustainability (Switzerland), 11(5), 1–19. https://doi.org/10.3390/su11051435
Regeringen. (2016). Överenskommelse om Sveriges mål för energieffektivisering. Retrieved January 28, 2020, from https://www.regeringen.se/pressmeddelanden/2016/11/overenskommelse-om-sveriges-mal-for-energieffektivisering/
Ridolfi, G. (1999). Containerisation in the Mediterranean: Between global ocean routeways and feeder services. GeoJournal, 48(1), 29–34. https://doi.org/10.1023/A:1007036702694
Ritchie, J., Lewis, J., Lewis, P. S. P. J., Nicholls, C. M. N., & Ormston, R. (2013). Qualitative Research Practice: A Guide for Social Science Students and Researchers. SAGE Publications.
Rogerson, S., & Santén, V. (2017). Shippers’ opportunities to increase load factor: managing imbalances between required and available capacity. International Journal of Logistics Research and Applications, 20(6), 581–603. https://doi.org/10.1080/13675567.2017.1306612
Santén, V. (2016). Towards environmentally sustainable freight transport Shippers’ logistics actions to improve load factor performance. In Telephone + (Vol. 46). Retrieved from http://publications.lib.chalmers.se/records/fulltext/243257/243257.pdf
Santén, V., Alexandersson, M., Hörteborn, A., Rogerson, S., Svanberg, M., & Olsson, F. (2018). Energieffektivisering genom ökad fyllnadgrad i sjötransporter.
Santén, V., & Rogersson, S. (2018). Shippers’ transport efficiency: An approach for measuring load factor. 11(1). https://doi.org/10.23773/2018_3
Smith, B. C., Leimkuhler, J. F., & Darrow, R. M. (1992). Yield Management at American Airlines. Interfaces, 22(1), 8–31. https://doi.org/10.1287/inte.22.1.8
Statista. (2020). Quantity of loaded freight in international maritime trade from 1970 to 2018. Retrieved January 26, 2020, from https://www.statista.com/statistics/234698/loaded-freight-in-international-maritime-trade-since-1970/
Styhre, L., & Lumsden, K. (2007). Vessel capacity utilisation in ferry services and the bridge substitute dilemma. Journal of Maritime Research: JMR, 4(3), 55–66.
Styhre, Linda. (2009). Strategies for capacity utilisation in short sea shipping. Maritime Economics and Logistics, 11(4), 418–437. https://doi.org/10.1057/mel.2009.11
Styhre, Linda. (2010). Capacity utilisation in short sea shipping. In Technology Management. Retrieved from http://publications.lib.chalmers.se/records/fulltext/124588.pdf
Styhre, Linda, Winnes, H., Bännstrand, M., Karlsson, R., Lützhöft, M., & Falk och Daniel Åström, M. (2014). Energieffektiv svensk sjöfart. (Ivl).
92
Ting, S. C., & Tzeng, G. H. (2004). An optimal containership slot allocation for liner shipping revenue management. Maritime Policy and Management, 31(3), 199–211. https://doi.org/10.1080/0308883032000209553
Tran, N. K., & Haasis, H. D. (2015). Literature survey of network optimization in container liner shipping. Flexible Services and Manufacturing Journal, 27(2–3), 139–179. https://doi.org/10.1007/s10696-013-9179-2
Wu, W. M. (2009). An approach for measuring the optimal fleet capacity: Evidence from the container shipping lines in Taiwan. International Journal of Production Economics, 122(1), 118–126. https://doi.org/10.1016/j.ijpe.2008.12.020
Wu, W. M. (2012). Capacity utilization and its determinants for a container shipping line: Theory and evidence. Applied Economics, 44(27), 3491–3502. https://doi.org/10.1080/00036846.2011.577020
Yip, T. L., Lun, Y. H. V., & Lau, Y. Y. (2012). Scale diseconomies and efficiencies of liner shipping. Maritime Policy and Management, Vol. 39, pp. 673–683. https://doi.org/10.1080/03088839.2012.738315
Zeithaml, V. A., Bitner, M. J., & Gremler, D. D. (2009). Services Marketing: Integrating Customer Focus Across the Firm. McGraw-Hill Irwin.
Zheng, J., Gao, Z., Yang, D., & Sun, Z. (2015). Network design and capacity exchange for liner alliances with fixed and variable container demands. Transportation Science, 49(4), 886–899. https://doi.org/10.1287/trsc.2014.0572

I
Appendices
Appendix A
Bold questions are added questions after the fourth interview.
General questions ● Can you give us a short presentation about yourself and your role in the
company?
● What type of customers do you have?
○ Forwarding agents?
○ Shippers?
○ What is the share of the different customers?
● What do your customers think is most important for you to provide?
○ Price?
○ service?
○ Reliability?
● Where are your customers located?
● What is the share of loyal customers vs customers that may change supplier or
use several suppliers?
○ Do you prioritise any of your customers shipments? In that case, how?
● Are your customers prone to change supplier if your increase the prices?
■ Are there any differences between customer groups?
● What routes do you traffic?
○ Do you ship goods oversea or shortsea?
○ How often do you change the routes?
■ What has been the reason for these changes?
○ How fast can you change routes if necessary?
● How much goods do you transport per year?
○ Do you see that there is an imbalance in the amount of goods that is sent
in different directions?
● How much does the demand from your customers vary?
○ Weekly?
○ Monthly?
○ Yearly?
● How do your customers book space on your vessels?
○ How does your customers behaviour look like when booking capacity?
■ How late do your customers usually book capacity?
■ How close to departure do you accept new bookings?
■ Are there customers that book fixed capacity for every
departure?
● How common is this?

II
● How is your fleet structured?
○ How many ships do you have?
○ What type of ships are they?
○ How many of them do you own and how many are leased?
Capacity utilisation general information
● What KPIs are important for you?
○ Profits? Market share?
● How is capacity utilisation prioritised compared to other targets?
● Is working with CU important for you?
○ Why? (Economic or sustainability reasons?)
● How do you measure capacity utilisation? Do you have a standard?
○ Number of loaded TEU / maximum capacity? Draught utilisation? Lane
meters?
○ Do you take into consideration empty containers when calculating
capacity utilisation?
■ If you do, how do you take them into account?
● Do you follow up on your levels of capacity utilisation in a structured way?
○ If you do, how do you do it?
● What are your current levels of capacity utilisation?
● What is an optimal level of capacity utilisation for you?
○ Why this level?
● Are there any differences between short sea shipping and oversea shipping
when it comes to your way of working with capacity utilisation and your current
levels?
■ Different segments (RoRo vs LoLo)
What affects capacity utilisation?
● What are the reasons for why you cannot fill your ships maximally?
○ From an economic point of view, do you experience that it is good to fill
the vessel to its maximum capacity?
○ Is your ability to provide a good service to your customers hindered by
a high capacity utilisation?
○ How does bad weather affect your operations?
○ Are the ports a limiting factor when trying to load the ships to their
maximum capacity?
■ Ex due to not having enough cranes or trucks
■ Is the time at port a limiting factor when trying to fill the vessels
to their maximum capacity?
○ Do you own the terminal and stevedores?
■ What is the share that you own vs lease?
■ What do you prefer?
○ Does the way that you work in the company affect CU? In what way?

III
○ Do you experience that there are differences in the amount of goods that
are sent in different directions?
■ Does this affect your ability to fill your vessels optimally?
○ Is there any legislation that hinders you from loading the vessels
maximally?
Strategies to increase capacity utilisation
● How do you work to increase your capacity utilisation?
○ How does it differ in terms of a ship or a fleet of vessels?
○ How do you plan your available capacity on a long-term horizon?
■ Do you plan for overcapacity in the system?
● What is the reason for that?
○ Ex, to be able to handle seasonal variations?
○ How do you increase capacity?
■ Do you exchange smaller vessels for bigger ones or buy new
ones? when and why? alliance members? High fixed costs!
○ How do you work to increase demand when the vessels are at low
capacity utilisation?
■ Do you use pricing as a mechanism to attract more goods?
○ How flexible are you with changing your fleet of vessels?
■ How do you do go about when you do it?
■ Can you lease vessels when demand increases, and capacity isn’t
enough?
■ Can you terminate a contract if the demand decreases?
■ Can you shift vessels between different routes?
○ Do you ever change the routes to increase CU?
■ How? Can you give examples?
■ Do you increase the number of ports you visit when demand is
decreased?
○ What reasons do you have for changing the frequency of departures?
■ Why would you increase the frequency?
● Do you increase the frequency to increase the capacity if
the demand increases?
■ Why would you decrease it?
● To increase capacity utilisation.
○ Do you increase the speed of the vessels to increase the amount of goods
that are shipped or to increase the number of departures?
○ Do you use slow steaming when the demand is decreased?
○ Do you use overbooking or standby cargo in case there are no-shows?
○ Can you move the goods between different departures to increase the
capacity utilisation?
■ Is the customer willing to change days of dispatch?
○ Do you always want to be able to accept requests from your customers
when they want to ship goods?
■ If no, can you provide us with some examples?

IV
● Are you a part of a partnership or collaboration with another actor in the market?
What is the purpose of that collaboration?
○ How do you work together?
○ Has your way of working with capacity utilisation or handle problems
related to capacity utilisation changed since you entered the partnership?
Finishing question ● What is the biggest/hardest challenge that you experience when trying to
increase your capacity utilisation?

V
Appendix B
• RQ1 What is the desired level of capacity utilisation for ship operators?
The desired level of capacity is affected by factors such as customer requirements and
such as service reliability and frequency of departure. Having excess capacity allows
ship operators to provide a better service as cargo can be delivered with a higher level
of reliability. A high frequency also often results in a lower capacity utilisation as goods
are spread out amongst more departures. Market factors such as risk of new entrants
also affects the desired level of utilisation as there is a need to employ excess capacity
to deter new entrants from entering the market. Cost effectiveness is positively affected
by an increased utilisation which incentivises companies to strive for a high level of
capacity utilisation.
Based on previous literature, three different strategies have been used to categorize the
studied liner segments depending on their adequate levels of utilisation. These are the
cut peaks strategy, the never say no strategy and the mixed strategy. In the never say
no strategy ship operators plan their available capacity so that they sail with 100%
utilisation whereas the cut peaks strategy plans for excess capacity. The mixed strategy
is a balance between both. Table B.1 presents the employed strategy for the analysed
segments.
Table B.1 presenting the capacity utilisation for each segment.
• RQ2 What factors affect capacity utilisation?
Several factors have been identified to affect capacity utilisation negatively. The list
below presents the factors and how they affect utilisation:
• Variation in demand: Fixed supply on a short-term horizon and varying
demand creates imbalance between available and required capacity.
• Trade imbalances: Planning available capacity for the high volume sea leg
reduces utilisation on the low volume sea leg. Repositioning of containers
reduces utilisation.
• Lumpy capital: Cost structure creates incentives for ship operators to increase
capacity at excessively large steps, reducing utilisation for a limited time.
• Vessel design: Bad compatibility between vessel design and cargo results in
unutilised space in the vessel. The way that cargo is loaded may affect the use
of space on the vessel.

VI
• Type of cargo: Cargo with unstandardised dimensions and/or heavy weight
makes it harder to utilise space on the vessel. Discrepancies between dimensions
of unit loads and deck space reduces utilisation on the ship level.
• Cooperative arrangements: Rigidity in approval of changes reduces the
ability of ship operators to perform short-term measurements to increase
utilization. Different interests may result in changes that do not benefit the ship
operator from an utilization point of view.
• Competitive situation: Increased competition reduces the demand for each
ship operator’s service. Guarding against the uncertainty of new entrants creates
incentives for ship operators to operate with excess capacity, reducing
utilisation.
• Weather: Harsh weather conditions may cause delays in the schedule reducing
the berth time or not being able to make a port call.
• Ports: The ports have a low flexibility as the berth-time cannot be increased
when delays occur and some ports are unmanned during the night shifts which
inhibits ship operators to load cargo at specific times. Congested ports may
cause slower loading and unloading operations.
• Service level: Having unutilised capacity on the vessels in order to serve
important customers reduces utilisation.
• Schedule characteristics: Providing a service with several departures
throughout the week results in having less attractive departures with lower
utilisation. This reduces the weekly average capacity utilisation.
• Internal barriers: Miscommunication between different departments
regarding the dimension of project cargo may result in unutilised space on the
vessel. Conflicts between employees on priorisationing customers' cargo can
lead to less cargo being loaded on the vessel.
• Late arrivals, no-shows and cancellations: Customers book space on the
vessels and do not arrive with the amount of cargo stated in the booking, or
cancel bookings right before departure.
• Legislation: On deep sea departures, ship operators cannot accept bookings
from customers close to departure due restrictions. Regulations regarding space
between certain goods reduces the utilisation on the decks.
• RQ3 How can ship operators achieve a high capacity utilisation?
The study has identified 12 strategies that companies can employ to increase their
capacity utilisation. These can be of a strategic, tactical or operational nature and their
applicability varies between liner segments.
• Increase demand: Ship operators can use the pricing mechanism as a way to
increase demand for their services, this can however create price wars which
reduces the applicability of the strategy. Pricing can be used to counter trade
imbalances by reducing the freight rates for the low volume sea leg. Price
differentiation may also be used amongst customer groups in order to increase

VII
utilisation. This strategy may be used if cargo being transported have different
price elasticities of demand. The price elasticity may be high or low depending
on the segment, route, cargo or transportation alternatives. Marketing may also
be used by RoPax ship operators as the total demand for their services may be
increased by marketing their products.
• Standby cargo: Cargo that is not time sensitive can be rescheduled to other
departures, evening out the demand and countering schedule characteristics. It
may also be used to handle the downfall from late arrivals and no-shows.
• Cooperative arrangements: Being in a strategic alliance increases the
flexibility in available capacity as cargo may be loaded on the alliance members
vessels and reduces the negative impact of lumpy capital as investments are
made with alliance members. A high service may also be provided to customers
without having excessive capacity available. Schedule characteristics may also
be countered by transporting cargo on the alliance members vessels. The
increased flexibility in capacity that comes as a result of slot sharing agreements
allows alliance members to handle variations of demand.
• Vessel allocation: Variations in demand may be handled by swapping vessels
between routes. It also reduces the capital lumpiness as the increased flexibility
in capacity reduces the need to invest in new capacity.
• Frequency: The schedule may be changed to accomodate for seasonal
variations in demand. blank sailings may also be introduced if there is short-
term reduction of demand by consolidating cargo on the remaining departures.
• Routing: Trade imbalances may be handled by adjusting the routes to the ports
trade patterns. Extra stops could also be made to increase utilisation for specific
departures. If one route has to high demand, cargo can be shifted to another
string which visits the same ports to increase the overall utilisation in the
network. Capacity utilisation may also be optimized amongst the routes by
blanking a vessel with low utilization and transporting cargo on another string.
• Speed: Sailing at a lower speed may be used by ship operators to remove
capacity from a specific trade. However, this is not done as it directly affects
the frequency of departure negatively.
• Ports: Owning terminals and stevedores is beneficial since the ship operators
have more control and can standardise the loading and unloading operations
which increases the utilisation. This also allows the ship operators and
stevedores to align their goals to achieve a higher utilisation on the vessels.
Further, by owning the terminals the ship operators are responsible of the
planning and prioritisation at the port and can therefore more easily cope with
delays due to harsh weather conditions
• Cargo: A mix of cargo allows ship operators to have a balance between the
weight and volume restriction on the vessels and not reach maximum capacity
early for one of the parameters. Having cargo which is better adapted to the
vessel requirements also increases the utilisation. Trade imbalances can be
handled by finding various kinds of cargo which can be transported on the low-
volume sea leg.

VIII
• Customer selection: Ship operators experience that BCOs are more loyal
customers compared to forwarders. It is therefore beneficial to allocate larger
parts of volumes to BCOs as the demand becomes more predictable. A smaller
part of the volumes can be allocated to forwarders in order to handle peaks in
demand. This allows ship operators to handle variation in demand. Having a
customer portfolio consisting of customers in different segments reduces the
risk that they will have fluctuations coinciding at the same time, which reduces
variations of demand.
• Overbooking: The maritime industry is characterized with no-shows and
cancellation. Using overbooking ship operators can counter the downfall of
cargo.
• Two-way commitment: This strategy allows ship operators to counter the
problem of no-shows and cancellations. The customers have to perform a
payment for the service before departure and in return the ship operators have
to transport their cargo on a specific departure and not roll on the cargo to
another departure. If the ship operators do not follow their commitment they
have to pay a punishment fee. This allows ship operators to better predict the
demand for their services and adjust their available capacity accordingly.

DEPARTMENT OF TECHNOLOGY MANAGEMENT AND ECONOMICS
DIVISION OF SERVICE MANAGEMENT AND LOGISTICS CHALMERS UNIVERSITY OF TECHNOLOGY
Gothenburg, Sweden
www.chalmers.se