resource availability, allocation, utilisation and the
127
RESOURCE AVAILABILITY, ALLOCATION, UTILISATION AND THE PERFORMANCE OF SMALL AND MEDIUM SCALE ENTERPRISES (SMEs): A CASE STUDY OF KAMPALA-NAKAWA DIVISION, UGANDA BY PATRICIA OKIPI 0772629674 / 0757629674 Reg. No. 10/MMSPPM/22/054 A DISSERTATION SUBMITTED TO THE HIGHER DEGREES DEPARTMENT IN FULFILLMENT OF THE REQUIREMENTS FOR THE AWARD OF MASTERS DEGREE IN MANAGEMENT STUDIES (PROJECT PLANNING MANAGEMENT) OF UGANDA MANAGEMENT INSTITUTE FEBRUARY 2014
-
Upload
khangminh22 -
Category
Documents
-
view
0 -
download
0
Transcript of resource availability, allocation, utilisation and the
RESOURCE AVAILABILITY, ALLOCATION, UTILISATION AND THE
PERFORMANCE OF SMALL AND MEDIUM SCALE ENTERPRISES (SMEs): A
CASE STUDY OF KAMPALA-NAKAWA DIVISION,
UGANDA
BY
PATRICIA OKIPI
0772629674 / 0757629674
Reg. No. 10/MMSPPM/22/054
A DISSERTATION SUBMITTED TO THE HIGHER DEGREES DEPARTMENT IN
FULFILLMENT OF THE REQUIREMENTS FOR THE AWARD OF MASTERS
DEGREE IN MANAGEMENT STUDIES (PROJECT PLANNING MANAGEMENT)
OF UGANDA MANAGEMENT INSTITUTE
FEBRUARY 2014
i
DECLARATION
I Patricia Okipi, hereby declare that this dissertation: “Resource Availability, Allocation,
Utilization and Performance of Small and Medium Scale Enterprises (SMEs): A Case Study of
Kampala Nakawa division” and its content is a result of my individual efforts and to the best
of my knowledge, it has never been presented to any other institution of learning for academic
award, whatsoever.
………………………………… ………………………..
Patricia Okipi Date
Reg.No.10/MMSPPM/22/054

ii
APPROVAL

iii
DEDICATION
This work is dedicated to the Almighty God, and my family who have greatly inspired me all
my life to stretch beyond limits in this undertaking.
iv
ACKNOWLEDGEMENT
I would like to extend my sincere gratitude and appreciation to the following people for their
support, patience and guidance, without whom, this study would not have been successfully
completed. First, to my family members; Mr. Festo Mawanga, Mrs. Jennifer Oonyu, Mrs.
Grace Ousi, Mr. and Mrs. Obatre, Tata Amoding Tereza, Uncle Lambert, Anderson Onyait,
my colleagues of the MMS 22nd intake and the lecturers who encouraged me through
knowledge sharing and consultations. The friends who constantly encouraged me to press on;
Jessica Tushabe, Lyza, Irene among others, I have not mentioned, May God bless you all
abundantly.
Secondly, to my supervisors, Dr. David Onen and Professor (Dr) Benon Basheka whose
wisdom, knowledge, commitment and guidance inspired, motivated and guided me through
this research. Thirdly, I also wish to thank the staff of Uganda Management Institute who were
helpful in many ways; Enterprise Uganda, staff of Kampala Capital City Authority, Edgar
Kirya, who availed me with information during data collection process. To you all, I say thank
you.
v
TABLE OF CONTENTS
APPROVAL ............................................................................................................................. ii
DEDICATION........................................................................................................................ iii
ACKNOWLEDGEMENT ...................................................................................................... iv
TABLE OF CONTENTS ........................................................................................................ v
LIST OF TABLES ................................................................................................................... x
LIST OF FIGURES ................................................................................................................ xi
ABSTRACT .......................................................................................................................... xiii
CHAPTER ONE: INTRODUCTION .................................................................................... 1
1.1 Introduction ............................................................................................................... 1
1.2 Background to the study ........................................................................................... 1
1.2.1 Historical Background ......................................................................................... 2
1.2.1.1 Theoretical background ................................................................................ 3
1.2.1.2 Conceptual background ................................................................................ 5
1.2.1.3 Contextual background................................................................................. 8
1.3 Problem Statement .................................................................................................... 9
1.4 Purpose of the study ................................................................................................ 11
1.5 Specific Objectives................................................................................................... 11
1.6 Research Questions ................................................................................................. 11
1.7 Research Hypothesis ............................................................................................... 11
1.8 Scope of the study .................................................................................................... 12
1.9 Significance of the study ......................................................................................... 12
1.10 Justification of the study ..................................................................................... 13
1.11 Conceptual framework........................................................................................ 14
1.12 Definition of Key Terms and Operations .......................................................... 15
vi
CHAPTER 2: LITERATURE REVIEW ............................................................................ 17
2.1 Introduction ............................................................................................................. 17
2.2 Theoretical review ................................................................................................... 17
2.3 Resources availability, allocation, Utilization and Performance of SMEs ........ 18
2.3.1 Effect of resources availability on performance of SMEs ................................. 18
2.3.2 Effect of resource Allocation on performance of SMEs .................................... 22
2.3.3 Effect of Resource Utilization and Performance of SMEs ................................ 25
2.3.4 Performance of SMEs ........................................................................................ 30
CHAPTER 3: METHODOLOGY ....................................................................................... 35
3.1 Introduction ............................................................................................................. 35
3.2 Research Design....................................................................................................... 35
3.3 Study Population ..................................................................................................... 36
3.4 Sample Size and Sampling Techniques ................................................................. 36
3.5 Data Collection Methods ........................................................................................ 38
3.5.1 Questionnaire Survey Method ........................................................................... 38
3.5.2 Interview Methods ............................................................................................. 38
3.6 Instruments of data collection ................................................................................ 39
3.6.1 Structured Questionnaire ................................................................................... 39
3.6.2 Interview guide/checklist ................................................................................... 39
3.7 Data Quality Control .............................................................................................. 40
3.7.1 Validity .............................................................................................................. 40
3.7.2 Reliability ........................................................................................................... 40
3.8 Data collection Procedure ....................................................................................... 41
3.9 Data Analysis ........................................................................................................... 42
3.9.1 Quantitative Data Analysis ................................................................................ 42
vii
3.9.2 Qualitative Data Analysis .................................................................................. 42
3.10 Measurement of Variables .................................................................................. 43
CHAPTER 4: DATA PRESENTATAION, ANALYSIS AND INTERPRETATION .... 44
4.1 Introduction ............................................................................................................. 44
4.2 Response Rate .......................................................................................................... 44
4.3 Background Information of Respondents ............................................................. 45
4.3.1 Gender of respondents ....................................................................................... 45
4.3.2 Age distribution of respondents ......................................................................... 46
4.3.3 Distribution of respondents by level of Education ............................................ 47
4.3.4 Duration of Business .......................................................................................... 48
4.4 Empirical Findings .................................................................................................. 49
4.4.1 Availability of resources on the performance of SMEs ..................................... 49
4.4.1.1 Bivariate Correlations and linear regression results ................................. 54
4.4.2 Performance of SMEs ........................................................................................ 55
4.4.3 Allocation of resources and the performance of SMEs ..................................... 57
4.4.4 Bivariate Correlation and linear regression results for allocation of resources and
performance of SMEs ...................................................................................................... 61
4.4.5 Utilization of resources on the performance of SMEs ....................................... 62
4.4.5.1 Bivariate Correlation and linear regression results for Utilization of
resources and Performance of SMEs ........................................................................... 69
CHAPTER 5: SUMMARY, DISCUSSION, CONCLUSION AND
RECOMMENDATION ......................................................................................................... 71
5.1 Introduction ............................................................................................................. 71
5.2 Summary of Findings .............................................................................................. 71
5.2.1 The effect of availability of resources on the performance of SMEs ................ 71
viii
5.2.2 Objective Two: To investigate the effect of allocation of resources on the
performance of SMEs. ..................................................................................................... 72
5.2.3 Objective Three: To examine the effect of utilization of resources on the
performance of SMEs. ..................................................................................................... 72
5.3 Discussion of Findings ............................................................................................. 73
5.3.1 The effect of availability of resources on the Performance of SMEs ................ 73
5.3.2 Objective Two: To investigate the effect of allocation of resources on the
performance of SMEs ...................................................................................................... 76
5.3.3 Objective Three: To examine the effect of utilization of resources on the
performance of SMEs ...................................................................................................... 80
5.3.4 Objective Four: Performance of SMEs ............................................................. 83
5.4 Conclusion of the Study .......................................................................................... 85
5.4.1 Objective one: The effect of availability of resources on the performance of
SMEs 85
5.4.2 Objective Two: To investigate the effect of allocation of resources on the
performance of SMEs ...................................................................................................... 85
5.4.3 Objective Three: To examine the effect of Utilisation of resources on the
performance of SMEs ...................................................................................................... 86
5.5 Recommendations for the Study ............................................................................ 86
5.5.1 Objective One: To determine the effect of availability of resources on the
performance of SMEs ...................................................................................................... 87
5.5.2 Objective Two: investigate the effect of allocation of resources on the
performance of SMEs ...................................................................................................... 87
5.5.3 Objective Three: To examine the effect of Utilisation of resources on the
performance of SMEs ...................................................................................................... 87

ix
5.6 Limitations of the Study ......................................................................................... 88
5.7 Contributions of the Study ..................................................................................... 88
5.8 Areas for Further Study ......................................................................................... 89
REFERENCES ....................................................................................................................... 89
APPENDICES ...................................................................................................................... 103
x
LIST OF TABLES
Table 3.1: Accessible Population, Sample size and Techniques ...........................................37
Table 3.2: Reliability Results .................................................................................................41
Table 4.1: Response Rate .......................................................................................................44
Table 4.2: Level of Education ................................................................................................47
Table 4.3: Descriptive Statistics on Availability of Resources..............................................50
Table 4.4: Correlation and Regression Results on Availability of Resources .......................54
Table 4.5: Descriptive statistics on Performance of SMEs....................................................55
Table 4.6: Descriptive Statistics on Allocation of Resources ................................................58
Table 4.7: Correlation and Regression Results on Allocation of Resources .........................62
Table 4.8: Descriptive statistics on Utilization of Resources ................................................64
Table 4.9: Correlation and Regression Results on Utilization of Resources .........................70
xi
LIST OF FIGURES
Figure 1.1: Economy and society sub-
systems .........................................................................................................................................
.5
Figure 1.2: Conceptual
Framework ...................................................................................................................................
14
Figure 4.1: Distribution of Respondents by
Gender ..........................................................................................................................................
45
Figure 4.2: Age of
Respondents .................................................................................................................................
46
Figure 4.3: Time spent operating
Business .......................................................................................................................................
48
xii
LIST OF ABBREVIATIONS AND ACRONYMS
BOU - Bank of Uganda
CVI - Content Validity Index
EUg - Enterprise Uganda
GDP - Gross Domestic Product
GOU - Government of Uganda
IAS - International Accounting Standards
GEM - Global Entrepreneurship Monitor
KCCA - Kampala Capital City Authority
MFPED - Ministry of Finance Planning and Economic Development
MSMEs - Micro, Small and Medium Scale Enterprises
NDP - National Development Plan
SIGMA - Sustainability Integrated Guidelines for Management
SMEs - Small and Medium Scale Enterprises
UIA - Uganda Investment Authority
xiii
UK - United Kingdom
UN - United Nations
UNDP - United Nations Development Program
WBCSD - World Business Council for Sustainable Development
ABSTRACT
The purpose of this study was to examine the effect of Resource Availability, Allocation,
Utilization and Performance of SMEs in Kampala-Nakawa division. The study was prompted
by the high rate of business collapse in Kampala especially in Nakawa division. The study used
descriptive correlation cross-sectional survey design with both qualitative and quantitative
methods of data collection employed. The accessible population of 526 respondents was
identified from which a sample size of 227 respondents was obtained using Yamane (1967:886)
formula. A response rate obtained was 79.3%. Key findings indicated that resource availability
and SMEs performance were positively related (.334**), a positive relationship (.418**) was
obtained between allocation of resources and Performance of SMEs and utilization of resources
was found to have a positive relationship (.692**) with performance of SMEs. In conclusion,
the researcher observed that for SMEs to perform and thrive in business, resource availability,
allocation, and utilization were significant predictors of performance of SMEs. The study
recommended that other than the factors studied in the model, further studies be done on

xiv
different factors that may influence performance of SMEs in Nakawa, other divisions of
Kampala and the country at large.
CHAPTER ONE: INTRODUCTION
1.1 Introduction
Small and Medium enterprises (SMEs) represent one of the most viable means of promoting
sustainable grass-root economic growth (MFPED, 2008). The private sector in Uganda is
predominately consisted of micro, small and medium enterprises. In many economies of the
world, majority of jobs are provided by SMEs. Therefore, the contribution of SMEs to the
economic development of all countries, regardless of their level of development, is no longer
disputable. SMEs serve as incubators for entrepreneurship, job creation and innovation
(Kassami, 2001). SMEs continue to be an opportunity for accelerating the country’s sustainable
growth (Bank of Uganda Sector Report, 2009). The government of Uganda has put in a lot of
initiative to promote the SME Sector through collaboration with Private Sector Foundation,
Enterprise Uganda, Uganda Investment Authority and Ministry of Tourism, Trade and Industry
as entities through which SMEs can access information and services. Recent studies show that
SME development is closely linked with growth. For example, Beck et al. (2005a) find a robust,
positive relationship between the relative size of the SME sector and economic growth, even
when controlling for other growth determinants. Despite governments’ initiative to promote
the private sector, the performance of SMEs remains a challenge in many developing countries
Uganda inclusive. This study was undertaken to examine the effect of resource availability,
allocation, utilization on the performance of (SMEs) in Kampala-Nakawa division. This
chapter presents the background to the study, statement of the problem; purpose of the study,
objectives of the study, research questions, hypotheses, significance of the study, justification
of the study, scope of the study and operational definitions of terms and concepts.
1.2 Background to the study
2
1.2.1 Historical Background
The evolution of business began in ancient times and continues to this very day. The phases of
evolution of business include; feudalism, mercantilism, capitalism, commerce, property rights,
and industrial revolution (Smith, 1776). SMEs as business systems are drawing attention
worldwide both in developing countries, transitional countries as well as in advanced
developed countries. Success stories of SMEs are talked about in many countries and play a
key role in the revitalization and development of national economy in many countries and that
their role has become essential, (Kasekende & Opondo, 2003).
In Uganda, SMEs face many challenges that hinder their growth or even further cause their
permanent shutdown. The findings from Global Entrepreneurship Monitor Report (2004) have
shown that most SMEs particularly in Uganda die within their first five years of existence. The
report ranked Uganda as the second highest in terms of business start-ups and the highest in
terms of business failure. While only about five to ten percent of young companies survive,
thrive and grow to maturity (Balunywa, 2007, Ocici, 2010). For instance, Storey (1994) has
compiled results of previous studies focused on the birth, growth and death of small business
firms, on the basis of which he presents the normative ‘Dos’ and ‘Don’ts’, lessons for small
firms. Many factors have been identified as likely contributing factors to the premature death
of these SMEs. Key among these include insufficient capital, lack of focus, inadequate market
research, over-concentration on one or two markets for finished products, lack of succession
plan, inexperience, lack of proper book keeping, irregular power supply, infrastructural
inadequacies, lack of proper records or lack of any records at all, inability to separate business
and family or personal finances, lack of business strategy, inability to distinguish between
revenue and profit, inability to procure the right plant and machinery, inability to engage or
employ the right caliber staff, cut-throat competition (Basil 2005). Therefore, it is critical and
3
extremely important to identify and examine these factors that lead small businesses to survive,
succeed or be sustainable. A tremendous challenge in studying these factors is inconsistent and
variable nature and the absence of a well-defined standard set of factors across the globe (Ocici,
2010). In other words, these factors which are human, financial, and material resources could
significantly vary from nation to nation and from one business environment to the other due to
economical, geographical, and cultural disparities and variations.
1.2.1.1 Theoretical background
The study was guided by the systems theory of organizations which emerged as part of an
intellectual ferment following the World War 2. Its founder, Ludwig Von Bertalanffy in the
early 1950s was concerned about the growing compartmentalization of knowledge and argued
that certain general ideas could have relevance across broad spectrum of discipline, that despite
obvious differences among the many kinds of organizations, they still share very general
characteristics and it is important to discover what they are (Hong et al., 2004). He states that
a system is an organised or complex whole or combination of units that form a complex whole.
It is important to recognise the integrated nature of systems, including the fact that each system
has specific inputs and outputs and can be viewed as a self-contained unit. The systems theory
cuts across every organization that produces input and output in a system of some sort (Katz &
Kahn, 1966). An organization, including any business entity, are in constant exchange with the
larger society in terms of its stakeholders for example the relationship between the business
and employees, customers, suppliers, bankers, community, government are in constant forward
and backward linkage. Regardless of its size, purpose and management perspective, business
systems are basically concerned with relationships, structures and interdependence rather than
just constant attributes (Katz & Kahn, 1966). When a firm or business is in constant favorable
interaction with both internal and external business environment, it ensures performance and
4
sustainability in the long run. Systems theory adequately explains how small businesses are
sub-systems of larger systems like big industries, companies and society (John, Kast &
Rosenweig, 1964).
SMEs or business organizations are man-made systems which have a dynamic interplay with
its environment. A business organization is system of interrelated parts working together in
order to accomplish a number of goals, both of the organization and of individual participants.
A common analogy is the comparison of a business organization to the human body, circulatory
system as the staff function, nervous system as the communication function, and brain as the
top level management and the organization as the self-maintaining structure (John, Kast &
Rosenweig, 1964). The system set up of these businesses; creates a conducive environment
for decision making and performance of SMEs. The system theory thus emphasises the
consideration of relationships between the organization and its environment, as well as what
goes on in the organization (Hall, 1977). In other words, SMEs are systems that receive inputs,
transform them and release them to the environment as outputs. Therefore the researcher looks
at the factors studied as inputs. It is also recognised that a firmly established and properly
managed business sector constitutes a catalyst for a country’s’ economic development process.
A country’s economic development is dependent on a conducive business environment and
existence of a business system (Whitley, 1992). As adapted in this study, system theory holds
that resource availability, allocation and utilization as a whole affects the performance of SMEs
in relation to sales, profits and the number of years in business operation. However, in adopting
this systems theory for the study, the researcher is not ignorant of its shortcomings. The inter-
relationship among parts of the system has to be understood by all people involved. It requires
a cohesive effort from all sub-systems of a business to work as a complete whole which task is
not easy to achieve (Oso & Onen, 2008), diagram below shows the relationship.
Figure 1.1: Economy and Society are sub-systems of Environment
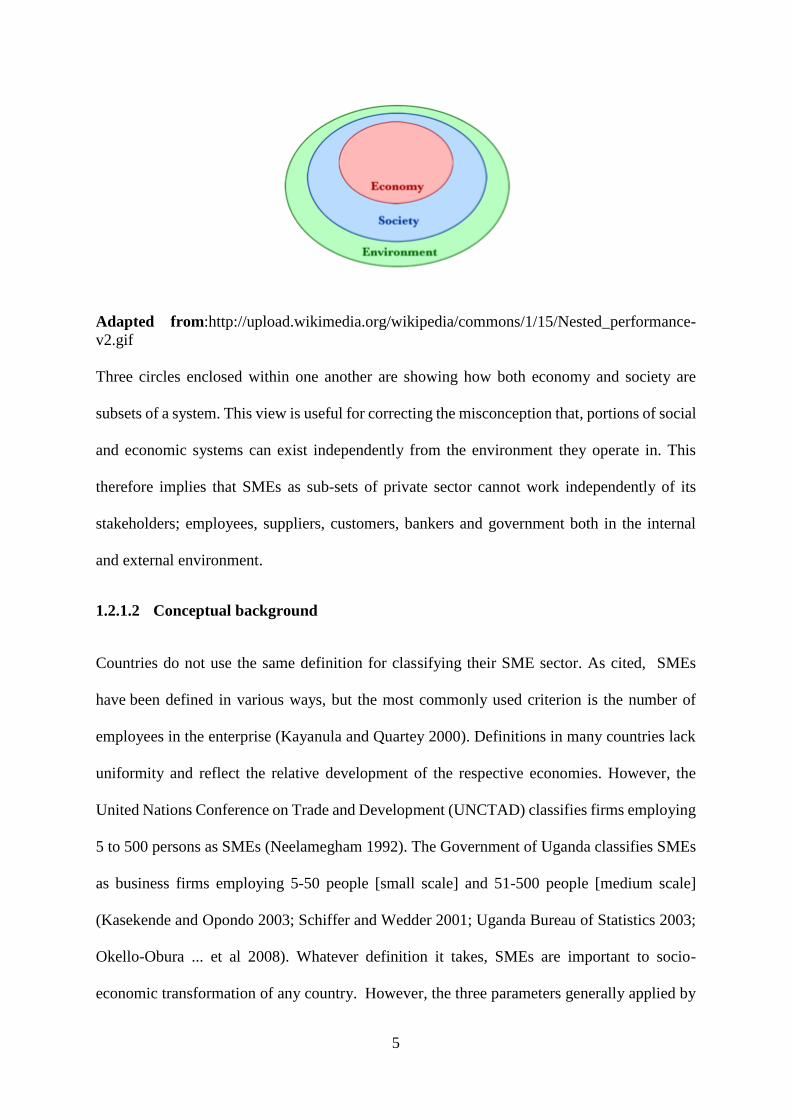
5
Adapted from:http://upload.wikimedia.org/wikipedia/commons/1/15/Nested_performance-
v2.gif
Three circles enclosed within one another are showing how both economy and society are
subsets of a system. This view is useful for correcting the misconception that, portions of social
and economic systems can exist independently from the environment they operate in. This
therefore implies that SMEs as sub-sets of private sector cannot work independently of its
stakeholders; employees, suppliers, customers, bankers and government both in the internal
and external environment.
1.2.1.2 Conceptual background
Countries do not use the same definition for classifying their SME sector. As cited, SMEs
have been defined in various ways, but the most commonly used criterion is the number of
employees in the enterprise (Kayanula and Quartey 2000). Definitions in many countries lack
uniformity and reflect the relative development of the respective economies. However, the
United Nations Conference on Trade and Development (UNCTAD) classifies firms employing
5 to 500 persons as SMEs (Neelamegham 1992). The Government of Uganda classifies SMEs
as business firms employing 5-50 people [small scale] and 51-500 people [medium scale]
(Kasekende and Opondo 2003; Schiffer and Wedder 2001; Uganda Bureau of Statistics 2003;
Okello-Obura ... et al 2008). Whatever definition it takes, SMEs are important to socio-
economic transformation of any country. However, the three parameters generally applied by
6
most countries, singly or in combination are; capital investment on plant and machinery;
number of workers employed; and volume of production or turnover of business (Drucker,
1954). This definition where an SME is defined by size of capital investment, number of
employees, turnover, management style, location and market share (Kasekende & Opondo,
2003). There is no official definition of SMEs; it is defined in terms of total revenue, number
of employees as an indicator by World Business Council for Sustainable Development
(WBCSD, 2007). In Uganda, SMEs are predominately owner managed or sole proprietorship.
The following definitions have been adapted in the Ugandan context and recommended by the
Commonwealth Secretariat, (2007). For a business to be regarded as an SME they consider:
number of employees, Sales turnover, capital investment, profitability, business coverage,
managerial processes, and number of years of business operation. Micro enterprise is an
enterprise employing a maximum of 4 people, with annual sales turnover of Ush.12million and
total asset of maximum Ush.12 million. Small enterprise is an enterprise employing a
maximum of 50 people, with annual sales turnover of Ush.360 million and total asset of
maximum Ush.360 million. Medium enterprise is an enterprise employing more than 50
people, with annual sales turnover of more than Ush.360 million and total asset more than
Ush.360 million.
In the context of this study, availability of resources is defined as how many resources are
available at any one time to do a job. Availability of human, financial and material resources
is an important aspect of the performance of SMEs if they are to grow and survive. In Uganda,
the economy has great potential and it is endowed with natural resources in terms raw materials,
abundant labor force, although there is limited access to finance (www.bidnetwork.org).
According to Kasekende & Opondo (2003), there is a direct relationship between availability
of resources and performance of SMEs, but the challenges is not only accessing finance and
7
working capital, but also in human resource development, market access, access to raw
materials, modern technology and information.
According to this study, Resource allocation in terms of human, financial, and material is the
process of assigning the available resources in an economic way. It involves scheduling of
activities and resources while taking into consideration resource availability and time.
According to the standard economic theory, efficient allocation of resources should have the
effect of maximizing utility from consumption. Drucker (1954), states that there is a direct
relationship between allocation of resources and performance of SMEs. When human resources
are well allocated, there is optimal use of labor and flexibility of a business firm to effectively
deploy its manpower, cost efficiency in producing goods/services and increase in yield per
employee in the assignment of resources. When SMEs fail to allocate resources well, they can
become outdated due to technological advancement, lose its customers if it fails to meet their
expectations, be unable to access raw materials and services if it ignores suppliers expectations,
be subject to penalties if it does not respond to changes in the regulatory environment and incur
losses if it does not continually build a competitive advantage in the face of increasing
competition. It is upon this basis that the researcher investigated the effect of resource
allocation on the performance of SMEs in Kampala, Nakawa division.
Resource utilization is how best company assets are used. Betancourt (1986) refers resource
utilization as the duration of operations of productive processes. Bosworth & Dawkins (1984),
state it as the timing of input flows and in particular to shift work and overtime. Resource
utilization also refers to optimum use of resources in terms of manpower, machinery and
financial assets. According to Betancourt (1986), there is a direct relationship between resource
utilization and performance of SMEs
8
Performance of SMEs is a multi-dimensional concept, it can be financial or non-financial, since
majority of these business are unable or unwilling to provide information (Griffiths, 2002), and
only perceived firm/business performance is measured. Perceived firm performance can be
measured by sales growth, development of new markets and products (Taglianvini et al, 2002).
In this study, performance of SMEs will be measured in terms of sales, number of years of
operation, succession planning.
Different authors have defined resources differently. A resource is defined as a commodity,
service, or other asset used to produce goods and services that meet human needs and wants,
and they are human, financial and material (Mankiw, 2008).According to the study a resource
is defined as financial, human and material which are factors of production. Availability of
resources is how many resources are available at any one time to do a job, Allocation of
resources, as a process used to assign the available resources in an economic way, Utilization
of resources as how best to use company assets like machinery, land manpower and financial
resources in the most economical way to achieve business objective of increase in sales, profits,
number of years of operation and business continuity or succession.
1.2.1.3 Contextual background
Many economies in the world over the past few decades reveal that countries that have achieved
growth did so through diverse policies and institutional arrangements which include removal
of binding constraints to economic growth. In Uganda, SMEs are increasingly taking the role
of primary vehicles for creation of employment, income generation through self-employment
and have been tools for promoting efficient allocation of scarce resources, poverty alleviation
and equitable and sustained growth and development of the country (MFPED, 2010). SMEs in
Uganda suffer from constraints that lower their resilience to risk prevent them from growing,
surviving and attaining economies of scale. The challenges are not only in the areas of financing
9
investments and working capital, but also in human resource development, market access,
access to raw materials, modern technology and information (Kasekende & Opondo, 2003).
Currently, Uganda has only one city Kampala with a population of about 1,659,600 million
people which accounts for 40% of the urban population (UBOS, 2011). The primacy of
Kampala city has affected the growth of other towns as it has attracted most of the investment
opportunities due to availability of basic services. Kampala is an urban area with large markets
where economies of scale can be exploited to enhance economic production. It is a centre of
technological advancement, innovation, civilization and social-cultural change. It absorbs labor
supplies as a result of economic growth to produce goods and services (outputs) that are
consumed in the city and country side. On the other hand rural areas supply agricultural produce
including food (inputs) to the city. Kampala provides economic opportunities to urban dwellers
that improve their economic status but has also fueled rural urban migration which has led to
increased number of urban poor with high level of unemployment and underemployment thus
being forced into the informal private sector (SMEs) that accounts for 50% of the unskilled
workforce who start up SMEs as means of survival (UBOS, 2011). These high rates of
unskilled workforce, unexploited investment opportunities, failure to reap from the benefit of
concentration of population in the urban area, explains the high rate of business startups and
also high rates of business collapse which undermines Kampala as a business district (U.I.A,
2011) and Nakawa division in particular as a potential place and engine for economic growth.
1.3 Problem Statement
Small and medium enterprises (SMEs) contribute greatly to the economies of all countries,
regardless of their level of development and their contribution is no longer disputable. Over
10
90% of all businesses in the world are family businesses or started as SMEs (Matama, 2008).
SMEs employ approximately 1.5million people equivalent to 90% of total non-farm private
workers. SMEs represent the most viable vehicle for grass root growth and they serve as
incubators for entrepreneurship and innovation (Kassami, 2008). In the development of a
nation and the business sector, SMEs should be considered as an appropriate means to promote
growth, increase employment and incomes, improve quality of life of people. Successful
performance of SMEs in this study should be reflected by increase in sales turnover, profits,
and strategic leadership that is able to maximally utilize the available resources to the benefit
of the business. While a considerable amount is known about the factors that affect the success
of SMEs, this knowledge continues to be imperfect and a large number of questions remain
unanswered about why SMEs in developing countries collapse at a high rate (Cook, 2001).
There has been persistent poor performance of many SMEs in Uganda. The investment climate
currently has been adversely affected by corruption, bureaucracy, inefficiencies in public
institutions, raising the cost of doing business on account of high fuel prices, high transport
costs, depreciating shilling, unstable supply of electricity, poor quality of infrastructure, weak
institutional policies, inaccessibility to finance, high cost of production, and inaccessibility to
markets. Resources have been unevenly distributed, with income inequalities being persistent
and sometimes increasing over time. The numbers of the extremely poor and malnourished
remain high while affluence and resources are concentrated among the few (Kassami, 2008).
). If the above conditions are not addressed by government, and this trend continues it will
impact negatively on performance and survival of SMEs and as result undermine performance,
achievement of economic growth and development. Researchers, report that only 30% of
businesses survive the transition from the founders (first generation) to the second generation
of owner management. Moreover of those who do that, 15% tend to survive the transition from
2nd to 3rd generation of ownership Balunywa, (2007). This is in agreement with the GEM Report
11
(2004) that states that most businesses in Uganda do not live to see their first birthday, almost
35% of these businesses that close, 37% start new businesses again. It is upon this background
that the researcher set out to find out the discrepancy between high rates of collapse in
Kampala, Nakawa division.
1.4 Purpose of the study
The purpose of the study was to examine the effect of resource availability, allocation and
utilization on the performance of SMEs by taking a case study of Kampala, Nakawa division.
1.5 Specific Objectives
The specific objectives of the study were to:
a) Determine the effect of availability of resources on the performance of SMEs
b) Investigate the effect of allocation of resources on the performance of SMEs
c) Examine the effect of utilization of resources on the performance of SMEs
1.6 Research Questions
The research questions of the study were:
a) What is the effect of availability of resources on the performance of SMEs?
b) What is the effect of allocation of resources on performance of SMEs?
c) To what extent does utilization of resources affect performance of SMEs?
1.7 Research Hypothesis
The research hypotheses of the study are:
a) Availability of resources has an effect on the performance of SMEs
12
b) Allocation of resources has an effect on the performance of SMEs
c) Utilization of resources has an effect on performance of SMEs
1.8 Scope of the study
The research study aimed at covering business resources but the study was limited to
availability, allocation and utilization of resources and how they affected performance of
SMEs. This was due to the fact that business resources as a topic was too broad thus needed to
break it down to the main resources of a business which were: financial, human, and material
that run a business and whose exemption any business will not survive. The study was also
limited to the geographical scope of businesses in Nakawa division because of the
concentration of businesses in this areas and easy accessibility for the researcher. The study
was focussed on a time scope of SMEs from 2000-2012, because these businesses had shown
a level resilience in terms of increased sales and profits, the number of years of operation of
more than five years and displayed level of succession in business.
1.9 Significance of the study
This study is important because it adds to the pool of knowledge of SMEs in Kampala central
and Uganda at large especially at such a time as this when there is much interest in SMEs as
vehicles for potential economic growth and development. Unless much attention is paid to
creating conducive environment for SME performance, SMEs can fail to deliver the intended
goal of producing goods and services to the public, create employment, increase incomes,
improve standard of living and promote economic development. The gaps in study can be used
as a basis for further research by academicians in the same area of SME Sector. The findings
of this research is hoped to be helpful and useful to individual entrepreneurs as well as
academicians, business sector, policy makers, development planners and government to come
13
up with favourable policies that will influence the performance of SMEs in the economy and
most especially Kampala City, Nakawa division.
1.10 Justification of the study
At this project inception, although much has been done on SMEs generally, not much study
has been done on their high rate of collapse in business operations in less than five years of
business activity. New developments have come up in this sector of but scanty information is
available on resource availability, allocation, utilization and performance of SMEs in Kampala
city. The research was undertaken to find out if resource availability, allocation, and utilization
contributed to increased performance and high growth rate of SMEs and bridge the gap that
caused their high rate of collapse and permanent shutdown. The study enabled the researcher
to find out the critical underlying factors that bring about sustainable performance and growth
of these SMEs.
14
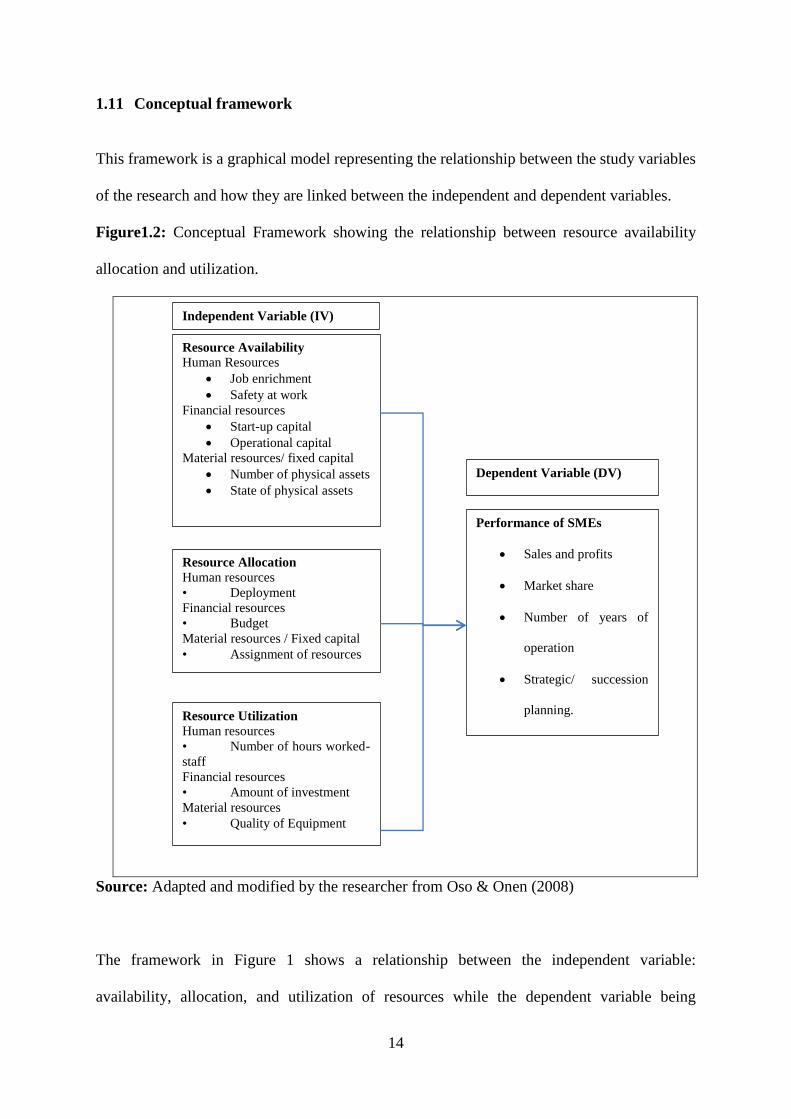
1.11 Conceptual framework
This framework is a graphical model representing the relationship between the study variables
of the research and how they are linked between the independent and dependent variables.
Figure1.2: Conceptual Framework showing the relationship between resource availability
allocation and utilization.
Source: Adapted and modified by the researcher from Oso & Onen (2008)
The framework in Figure 1 shows a relationship between the independent variable:
availability, allocation, and utilization of resources while the dependent variable being
Resource Availability
Human Resources
Job enrichment
Safety at work
Financial resources
Start-up capital
Operational capital
Material resources/ fixed capital
Number of physical assets
State of physical assets
Resource Allocation
Human resources
• Deployment
Financial resources
• Budget
Material resources / Fixed capital
• Assignment of resources
Resource Utilization
Human resources
• Number of hours worked-
staff
Financial resources
• Amount of investment
Material resources
• Quality of Equipment
Performance of SMEs
Sales and profits
Market share
Number of years of
operation
Strategic/ succession
planning.
Dependent Variable (DV)
Independent Variable (IV)
15
performance of SMEs in terms of sales turnover, level of profits, distribution of business and
number of years of operation. The framework envisaged that balanced availability, allocation
and utilization of human, financial, and materials resources determined performance of SMEs.
1.12 Definition of Key Terms and Operations
Entrepreneur: A person who undertakes or operates a new business venture or enterprise,
while taking the risks and the responsibility for setting up a new operation. This involves
planning, organizing, coordinating, managing and also taking risks of a business or enterprise.
Enterprise: The execution of various combinations and new skills in business.
SMEs: Micro, small and medium enterprises. This will consider: number of employees, Sales
turnover, capital investment, profitability, business coverage, managerial processes, and
number of years of business operation.
Micro enterprise: Micro enterprise is an enterprise employing a maximum of 4 people, with
annual sales turnover of Ush.12million and total asset of maximum Ush.12 million.
Small enterprise: Small enterprise is an enterprise employing a maximum of 50 people, with
annual sales turnover of Ush.360 million and total asset of maximum Ush.360 million.
Medium enterprises: Medium enterprise is an enterprise employing more than 50 people, with
annual sales turnover of more than Ush.360 million and total asset more than Ush.360 million.
Resources: Financial, human, material resources and entrepreneurship are the four factors of
production.
Availability of resources: Resource Availability specifies how many resources are available
at any one time to do a job.
Allocation of resources: A process used to assign the available resources in an economic way.
It involves scheduling of activities and the resources required by those activities while taking
into consideration both the resource availability and time.
16
Utilization of resources: How best company assets are used. This includes machinery, land
manpower and financial resources.
Performance: Defined in output terms as the achievement of quantified objectives. What
people achieve and how they achieve them
Labor productivity: Defined as value added per worker, is the most common measure of
productivity. It reflects the effectiveness and efficiency of labor in the production and sale of
the output.
Financial/Capital productivity: measures the effectiveness and efficiency of capital in the
generation of output.
Value added: A measure of output. It represents the wealth created through the organization’s
production process or provision of services.
Sales: measures the monetary value of the output generated by the organization.
17
CHAPTER 2: LITERATURE REVIEW
2.1 Introduction
This chapter represents a review literature on Resource availability, allocation, utilization and
performance of SMEs. It particularly focuses on literature related to Resource availability and
performance of SMEs, Resource allocation and performance of SMEs, Resource Utilization
and performance of SMEs. The review is conceptualized under the study objectives and focuses
mainly on human, financial and material resources.
2.2 Theoretical review
The knowledge of resources reveals that their strategic importance is a reasonable issue to be
considered. In other words the acceptance of the role of resources in the performance of SMEs
implies that their strategic importance cannot be ignored. A resource is defined as a commodity,
service, or other asset used to produce goods and services that meet human needs and wants,
and they are human, financial and material (Mankiw, 2008). This is in agreement with the
classical economist who defined a resource as land, labor, and capital (Smith, 1776). Firms’
resources include all assets, capabilities, organizational processes, firms’ attributes,
information, knowledge etc controlled by a firm that enables it to conceive and implement
strategies that improve its efficiency and effectiveness (Daft, 1983). This definition is in
agreement with (Learned, Christensen, Andrews & Guth, 1969; Porter, 1981) who define
firm’s resources as strengths that a firm can use to conceive and implement their strategies. A
variety of authors have generated a firms attributes that enable it to conceive and implement
value adding strategies classified into three main categories as physical capital resources
(Williamson, 1975), human capital resources( Becker, 1964), and organizational capital
resources (Tomer, 1987). Physical capital resources include physical technology used in a firm,
18
plant and equipment, geographical location and access to raw material. Human capital
resources include training, experience, intelligence, judgment, relationships and insights of
individual managers and workers of a firm. Organizational capital resources include firm’s
formal reporting structures, its formal and informal planning, controlling and coordinating
systems, as well as informal relationships among groups within a firm and between a firm and
those of its environment. Other researchers believe that knowledge as a resource matters more
than the conventionally tended resources (material, labor, capital), and must be managed
explicitly, not left to fend for itself (Stewart, 1998). However, not all aspect of firm’s physical
capital resource, human capital resource and organizational capital resource are strategically
relevant resources. Some of these firms attributes may prevent a firm from conceiving and
implementing firm’s strategies (Barney, 1986). Other firm’s attributes may reduce a firm’s
efficiency and effectiveness others may not even have an impact on the performance of a firm
(Wernerfelt, 1984).
2.3 Resources availability, allocation, Utilization and Performance of SMEs
2.3.1 Effect of resources availability on performance of SMEs
Several theories have been advanced to describe the relationship between resource availability
and performance of SMEs. As noted, resource-based theory centers on the firm’s diverse
collection of internal resources. Wernerfelt (1984) traces the concept of organizations as sets
of resources to the seminal work of Penrose in 1959. Penrose, who envisioned the firm as “a
collection of productive resources,” argued that resources support a business’s competitive
position in direct proportion to how these resources are leveraged and made available to the
benefit of the firm Newbert, (2007). Although, Alvarez and Busenitz (2001) observe that
scholarly work in resource- based theory recognizes that entrepreneurship is integral to the
resource-based framework. Systems theory was adopted by the researcher because it best
19
describes the relationship between the variables under study. Systems theory looks at business
organization or SMEs as systems of interrelated parts working together in order to accomplish
a number of goals, both of the organization and of individual participants. Business systems
have a dynamic interplay with its environment; customers, competitors, suppliers, human
resource, organization and government, which have a backward and forward linkage.
Availability of resources is needed to achieve performance of SMEs. Resource availability
specifies how many resources are available at any one time to do a job (Seidman,
2008).According to Drucker (1954), availability of resources (human, financial and material)
is very important because of its role in the attainment of organizational or business objectives.
Human resources (labor) is a unique input necessary for the overall development of skills.
Labor refers to all categories of employees in the business. Labor is measured in terms of
number of employees and number of hours worked. This measure reflects the actual amount of
input used in the work done and its impact in the performance of a business. Financial and
(capital), refers to the amount of investment in monetary terms in physical assets such as
machinery and equipment, land and buildings, and inventories that are used by the business in
the production of goods or provision of services. Material resources/ Capital are physical assets
such as machinery and equipment, land and buildings, and inventories that can be measured in
physical quantity e.g. number of machine hours, number of physical assets, land in hectares
(Drucker, 1954).
Availability of human resources relates to the human capital that people bring into the
firm/business system. We conceptualize human capital as consisting of education, experience
and skills at a given point in time ( Boxall & Steeneveld, 1999) that helps in the tasks of getting
work done. Traditional human capital theory research focused on employees’ human capital
and its effects on earnings (Becker, 1980). Later the theory was applied to small scale
20
businesses as well, where human capital was conceptualized as a characteristic of the business
owner (Bruederl, Preisendoefer & Ziegler, 1992). There is a positive effect of human resources
on the performance and success of small business is empirically well established (Rauch &
Frese, 2000). In a similar dimension, the relationship between human resources and
performance in SMEs and the adoption of explicit strategic planning by the business owner has
been documented (Perren, Berry & Partridge, 1999 and Georgellis, Joyce & Woods, 2000, each
cited in Chan & Foster, 2001). This relationship between the variable understudy should lead
to improved performance and continued survival of SMEs.
Financial capital is a necessary component in business performance, Startup capital is capital
used for initial setting up of the business. The entrepreneur or business owner is responsible
for acquiring and maintaining these resources for business startup. The sources of this startup
capital can be owners’ savings, loan, grant, or credit depending on the business owner but it is
advisable to use equity for small business startups because debt/loan usually erodes business
capital if not managed well, Ocici (2007), of Enterprise Uganda. Operational capital is capital
for the day to day running of the business. This will include raw materials, salaries, rent,
electricity, water, transport, meals etc. The business owner must be accountable for his or her
financial resources. He or she needs to have some means for knowing what is happening with
respect to financial resources if one is to make informed management decisions and this means
keeping track of how money is spent and received from the business (Balunywa, 2011).
Regardless of how small the business is, some form of book keeping or records must be
maintained, and should be accurate so it can act as a basis for informed decision making.
Resources can be wasted if decisions are poor or are not made in a timely fashion. They are
wasted if they are not used to best advantage of the business for example if more is bought than
is needed or if the purchase price was not competitive. SMEs therefore, need to establish
policies and procedures that determine how resources or purchases are to be made including
21
when, by whom, and how sales and profits, if any, are to be handled
(www.luckyfamilybiz.com). Fixed capital also known as a non-current asset or as property,
plant, and equipment is a term used in accounting for assets and property which cannot easily
be converted into cash. Fixed assets normally include items such as land and buildings, motor
vehicles, furniture, office equipment, computers, fixtures and fittings, and plant and machinery,
according to International Accounting Standard (IAS) 16. When financial resources are not
available to businesses or projects that can use it productively, economic activity slows as new
firms are not started due to inadequate start-up capital, and existing firms postpone investments
due to insufficient operating capital causing these enterprises to contract or fail, Seidman,
(2008). In other words, financing becomes a constraint to business formation and growth when
other factors of production are in place but appropriate financial capital is not available.
Sustained availability of capital will not only boost business activity, it will affect the quality
and supply of other inputs into economic development process like the development of
infrastructure like roads, schools, hospitals and sanitation. Therefore, sound financial
management is fundamental for business success. Poor financial management, on the other
hand, often accompanies and contributes to business failure, Seidman, (2008).On the contrary,
even when financial capital is available, and often its cost is unaffordable to most SMEs.
Securing of capital and other resources that are necessary to keep abreast with business and the
development are main obstacles facing small business enterprises. Shortage of resources
severely restricts business capacity. Limited financial resources make it difficult to promote
and market products and hence constraining SMEs to expand their business operations (Ocici,
2010).
22
2.3.2 Effect of resource Allocation on performance of SMEs
Resource allocation is a process used to assign the available resources in an economic way
(Smith, 1776). It involves scheduling of activities and the resources required by those activities
while taking into consideration both the resource availability and time. The allocation of scarce
organizational resources such as human, financial, and material resources is essential for SMEs.
From entrepreneurship theory, it is determined that the small business leader is the person who
allocates resources for various uses. Decision-making theory provides intellectual space for
decisions to be made within the framework of the small business leader’s knowledge and
experience, rather than in accordance with a rational structure only. From the economic point
of view of the neoclassical economic theory, markets are presumed to be the best resource
allocators and occasional correction of the market imperfection being the role of government
(Toman, 1992).
Human resource planning and deployment, is the ability to secure sufficient numbers and
categories of suitable employees to undertake the task of producing goods and services to the
standard expected by the end user or client. To yield high levels of business performance
requires having the right people with the right skills in the right places at the right time they
are needed. When human resources are well allocated, there is optimal use of labor and
flexibility of a business firm to effectively deploy its manpower, cost efficiency of producing
goods/services and increase in yield per employee in the assignment of resources (Drucker,
1954). SMEs as business systems also focus on allocation of resources to achieve their
maximum advantage of performance and growth in terms of increase in sales turn-over, profits,
strategic planning and a number of years of operation which frequently leaves them to respond
to external influences as they occur rather than taking a proactive approach (McAdam, 2002).
On the contrary, by their nature, SMEs have limited human, material and financial resources
23
(McAdam 2002; Vossen 1998 as cited in Huang, Soutar & Brown, 2002). It concurs with
(Honsby & Kuratko, 2003) that SMEs have limited resources and rely on fewer people in the
firm or business to perform vitally all important functions that have a major impact on the
current and future prospects of the firm. Hence, people while important to the business
organization are important to the functioning, performance of the SME. It is also noted that
progressive human resource management practices of selectivity in staffing, training,
deployment and incentive compensation were found to be positively related to measures of
organizational performance (Delaney & Huselid, 1996) and in relation to the systems theory,
the study of how resources (inputs) are critical for successful performance (output) of small
business, employee-relations factors, including training, involvement in decision making and
a reward/discipline system were positively co-related to success of a firm (Gadenne 1998).On
the contrary, due to resource constraints, business owners or managers tend to prioritize their
business needs to what needs attention in the moment (Jawahar and McLaughlin, 2001).
Therefore, until human resource issues reach potentially acute levels in SMEs, business owners
tend not to devote sufficient time to them. In spite all, Human capital of employees (qualified
personnel) should lead to more efficient work and this should in turn; affect business
performance and its success and ability for the business to survive for generations.
SMEs as business systems are constrained by financial capital as they operate in a crowded and
competitive environment.As a result, SMEs need to budget their resources in order to maximize
profits. A budget is a tool of allocating financial resources, usually expressed in financial terms
of the desired performance of a business or organization in the pursuit of its objectives in the
short term usually one year. Budgetary control makes the targets of the desired performance as
its standards, then systematically gathers information relating to actual performance and
identifies the variance between target and actual performance of a business (Cole 2004). A
deeper analysis of the situation indicates that SMEs tend to be cash flow trapped in terms of
24
start-up and operational capital because of cash locked up inventory in the supply chain as
result of retailers taking advantage of their small size (Hong, 2006). It is noted that economic
burden of inventory in the supply chain is the most severe hardship for an SME and the
infrastructure required to trade with suppliers and customers is often a critical handicap.
Therefore, challenge of budgeting, forecasting demand, achieving perfect orders, and timely
and accurate delivery of products cannot be overstated. SMEs without a plan only have the
option of reaction. To do nothing would in most cases be an inappropriate response because
depending on the strength of the force, an SME can become outdated due to a technological
advance, lose its customers if it fails to meet their expectations, be unable to access raw
materials and services if it ignores suppliers expectations, be subject to penalties if it does not
respond to changes in the regulatory environment and incur losses if it does not continually
build a competitive advantage in the face of increasing competition (Hodges & Kent,2007).
Therefore, resource allocation in actual practice is not an easy job; there are constraints in
resource allocation. Many ‘budget battles’ could be avoided if targets, resource sharing,
prioritization and midway revisions etc., in a business system are decided in an atmosphere of
close cooperation and participation, especially at departmental, divisional or unit levels in order
to enhance performance of financial resources. Allocating resources to specific divisions and
departments alone does not mean successful strategy implementation; the deciding authorities
should look for a suitable business plan for implementing the allocations.
Allocation of material resources involves translating customer’s requirements or work orders
into production instructions, supply of raw materials, availability of work tools or machines,
allocation of people or work teams, setting of production and quality targets and then market
final goods or service Cole (2004). For the final product to be produced the amounts and
corresponding delivery dates should be given by the customer orders and all must be delivered
on time. The production of the net requirement for each main product of a customer’s order is
25
regarded as an activity, which is the set up and processing time for a product and components
of the product, Sohner (1995). Therefore, SME as a business system needs the large enterprise
sector as a source of material resources (inputs), a market for its output and also as source of
individual entrepreneurial leadership. This points to the need to create a synergistic relationship
between the SME and the large enterprise sectors, rather than thinking of a zero-sum
environment in which the performance and success of the small can only be secured by
destroying or disassembling the large. Positive and mutually reinforcing interactions can be
expected to emerge if ways can be found to encourage the formation of purpose-built alliances
and sub-contracting relationships in allocation of resources. In a business system relationship,
SMEs also allow residents and indigenous/ the local community to participate in the economic
development and, consequently, to obtain the economic benefits generated by the community
(Howard & Hine, 1995). In many different historical and contemporary economic systems
large firms and small firms interact in complex relationships which confer reciprocal
advantages (Piore & Sabel, 1984).The operations and practises of resource-constrained SMEs
can be counterproductive for those aspiring to achieve global growth (Macpherson, 2005).
However, SMEs may take practical steps to implement desirable growth paths through
management practices that utilize inter and intra organisational capabilities (Jin, 2007) in terms
of human, financial and material resources if they are to improve on their performance and
sustainability in the long run.
2.3.3 Effect of Resource Utilization and Performance of SMEs
Resource utilization can be defined in several ways; it is how best company’s assets are used.
Betancourt (1986) refers resource utilization as the duration of operations of productive
processes. Bosworth & Dawkins (1983) refer to resource utilization as the timing of input flows
and in particular to shift work and overtime. In this case, resource utilization refers to optimal
26
use of the available resources. It is the relationship between the quantity of output and the
quantity of input used to generate that output. It is basically a measure of the effectiveness and
efficiency of your organization in generating output with the resources available (Drucker,
1954). Resource utilization is measured by productivity of a particular resource. Labour can be
measured in three ways, number of hours worked, it excludes hours paid but not worked,
number of workers engaged, labour costs include salaries, bonuses, allowances and benefits
paid to employees, this measure reflects the actual amount of input used. Material resources
refer to physical assets such as machinery and equipment, land and buildings, and inventories
that are used by the organization in the production of goods or provision of services. It can be
measured in physical quantity as number of machine hours worked, hectares of land used,
financial resources as the amount of investment capital used to produce goods and services and
it is measured in monetary terms (Drucker, 1954). This definition of resource utilization is
considered appropriate because it is in line with the variables under study.
Literature review concurs that human resources measure individuals’ knowledge and
experiences (Rauch &Frese, 2000). Human resources can determine the quality of an
entrepreneur (Dollinger, 1999) and make individual more efficient in organizing processes and
in attracting customers and investors Rauch & Frese, (2000). In this study, the interest is how
utilization of human resources affects performance of SMEs.
African governments and Uganda in particular, need to develop the internal capacity to help
potential entrepreneurs/ business owners gain the necessary entrepreneurial skills to recognize
opportunities to start and operate successful business enterprises. A study by Ladzani & Van
Vuuren (2002) on content and training methods of SME service providers in South Africa
found that business skills were emphasized to emerging entrepreneurs rather than
entrepreneurial skills. This suggests, indirectly or otherwise, that governments need to
27
recognize the importance of education and training in entrepreneurial leadership for successful
and sustainable establishment of business enterprises; strategies must be put into place to
facilitate the competitiveness of their budding entrepreneurs. In the quest to identify
entrepreneurial leadership, some form of training and mentoring may be necessary. This is
premised on the notion that entrepreneurship is not natural, which means people learn to be
entrepreneurs. In other words, there is no such thing as ‘born’ entrepreneurs. As Barringer and
Ireland put it: “One of the myths about entrepreneurship is that entrepreneurs are born, not
made. This is based on the mistaken belief that some people are genetically predisposed to be
entrepreneurs. No one is born an entrepreneur. Everyone has the potential to become one.”
(Barringer & Ireland, 2006)
Therefore, training for small business owners/managers as well as their subordinates allow
them acquire the necessary skills to ensure the survival and success of their business, Holt
(1993), Becker & Gerhart (1996). Training has been considered in many studies as a key
success factor for small businesses such as Duchesneau & Gartner (1990), Storey (1994), Kent
(1994), Gatewood et al (1995), Brown & Huang (1999), Blackwood & Mowl (2000).
Businesses systems that are sustainable attract and retain customers, workers and experience
less financial and reputation risk. They use performance budgets as a tool in monitoring
financial resources. Here the basic purpose of a performance budget is to focus attention on the
work to be carried out, services to be rendered rather than things to be spent for or acquired. It
concentrates attention on physical aspects of achievement. Here, there is not only a work plan
but a work plan in terms of work done. It takes a systems view of activities to try and associate
the inputs of the expenditure with the output of accomplishment in terms of services, benefits
etc (Cole, 2004). On the other hand, SMEs commonly regard sales turnover and profits as a
key measure of their success. A sale is an act of completion of a commercial activity which
28
involves selling products or services in return for money or compensation. Sales growth is a
measure of performance. Assumption is made that if sales increase, cash-flow and profits will
eventually follow to cover costs incurred in generation of revenue (Thomas & Mason, 2007).
Therefore sale growth is a key determinant of a firm’s success and survival. Using profits as a
measure may seem to imply that the organization will benefit more if costs such as salaries and
depreciation for capital reinvestment are reduced. However, lowering salaries to increase
profits tends to lead to conflicts in the relationship between employees and management in a
business system environment. Minimizing capital investment often has a negative impact on
the efficiency of operations, and eventually affects profits (Drucker, 1954). Therefore,
increasing profits by reducing such expenses is only a short-term measure. The only viable way
to increasing profits in a sustainable manner is to increase the value added through higher
productivity. This can be done with better cooperation from employees, higher investment in
capital, and optimal use of capital. In return for your employees’ efforts, your organization
should share the additional wealth generated in the form of higher wages and improved
benefits. This will reinforce and encourage them to further improve their performance which
is key to sustaining profits in the long run (Drucker, 1954). On the contrary, Resource-based
perspective or theory argues that traditional resources such as financial capital, materials and
technology are less important because they are easier to imitate than human resources (Neal &
Hesketh, 2002). In view of the issues raised there is a significant relationship between financial
resources and performance of SMEs.
A number of factors must be taken into account when considering the best use of material
resources. If you have expensive machinery then, on the surface, that machinery is not being
used optimally when it is not in use. The utilization of machinery/facility over a given time
29
period can be varied along two dimensions, duration and intensity (speed) (Betancourt, 1986).
Other areas of consideration involve employees as well as the hours, working conditions and
productivity of those employees. Ultimately, capital utilization involves all of the assets which
a company may have at its disposal and how those resources are put to work to achieve
maximum productivity and return on investment.
Business organizations, whatever their products are, face the same daily practical problems,
that customers want products to be available in a shorter time than it takes to make them. This
means that some level of planning is required. Companies or SMEs need to control the types
and quantities of materials they purchase, plan which products are to be produced and in what
quantities and ensure that they are able to meet current and future customer demand, all at the
lowest possible cost. Making a bad decision in any of these areas will make the company lose
money (Cole, 2004). For example, if a company purchases insufficient quantity of an item used
in manufacturing or the wrong item it may be unable to meet contract obligations to supply
products on time. To ensure this is achieved, materials must be available for production and
products are available for delivery to customers, Maintain the lowest possible material and
product levels in store and plan production or manufacturing activities, delivery schedules and
purchasing activities. If a company purchases excessive quantities of an item, money is wasted
- the excess quantity ties up cash while it remains as stock and may never even be used at all
and beginning production of an order at the wrong time can cause customer deadlines to be
missed. Therefore there should be a balance between availability of materials, allocation and
their utilization.
30
2.3.4 Performance of SMEs
Performance is simply defined in output terms as the achievement of quantified objectives.
What people achieve and how they achieve them (Armstrong, 2006). The advances of theorists
like Deming, Juran and Crosby have formed the basis for total quality management (TQM)
movement (quest for continuous improvement and elevated customer satisfaction) that
Mawson (1993) noted has tremendous relevance to the SMEs. Cameron (1994) concurred that
effective organizations are responsive to and expedient in identifying and meeting the needs of
their target market. Cameron (1994) defines organizational effectiveness as a process of
evaluating an organization actual performance relative to predetermined standards or series of
objectives. Ostroff and Schmitt (1993) noted that organizational researchers have offered a
variety of models for examining organizational performance, yet there is little consensus as to
what constitutes a valid set of performance criteria. Cameron (1978) stated that multiple
measures of performance (effectiveness) are important to gaining a valid assessment. There are
several approaches to measuring organizational effectiveness. The ‘goal approach’ has been
the most widely used method Cameron (1978) and grounded on organizational leaders
determining a set of well-defined goals for the enterprise and measuring performance relative
to listed objectives on a time bound schedule (Chelladurai, 1985). The key to this approach
rests in the preciseness of stating the goals in advance coupled with the need for framing the
goal with deadlines for attainment. The goals can be stated like; increase in level of sales by
18%, increase in profits by 25%. At the end of the year, staff sit down to evaluate their
performance relative to stated goals. The limitation with approach is that some organizations
have goals that operate in opposition (Cameron, 1986) for example increase in profits while
decreasing salaries of employees. Systems resource approach is another popular organizational
effectiveness paradigm that measures an organizational ability to acquire scarce and valuable
resources (Chellandurai, 1985). Organizations perceived to acquire more resources are viewed
31
more successful in this age of limited resources. Similar to problems associated with goal
approach model, Cameron and Whetten (1993) suggest that the organization may have little
influence on acquiring resources (unattainable regardless of the efforts to attain them). The
process approach calls for effective assessment being made on basis of an organization
functioning and integration. Activities that need to be carried out to make the organization
successful are identified and how effectively and efficiently people in the organization carry
out their assigned duties. The problem with this approach is that there is no guarantee that
effectively carrying out of these duties leads to heighted organizational effectiveness. There
are different parameters to measure performance of SMEs, this therefore will depend on the
business owner which approach to use. Colvin & Slevin (1991), state that performance of
SMEs is fundamental for their survival and sustainability. Progressive performance of SMEs
has been found to spur business expansion, technological progress and wealth creation in both
start up and existing businesses. Whereas SMEs found to be poor performers experienced
stagnant or reducing sales and profits, market share, no strategic plan, low returns on
investment, low value for money which makes them less competitive on both local and
international market (SEDA Uganda, 2009). Despite government efforts to provide support to
SMEs in order to attain performance and sustainability of these businesses through different
programs, there has been marginal improvement in the performance of SMEs (BOU Report,
2009).
However, literature has also shown a contradictory finding on whether or not SMEs perform
and survive past their fifth birthday. The lack of universally accepted standard measures or
indicators makes the door open to business organizations to decide and choose their own
measure that might not truly reflect their sustainable performance. Such measures include but
not limited to: market share, sales volume, company reputation, number of years of operation
and profitability. While some might argue that most of these measures are appropriate for large
32
corporations, they are not always perfectly applicable to small businesses. In all cases,
regardless of what measure should be used to determine performance of small business, the
literature has strongly endorsed using multiple indicators (Corchran & Wood, 1984; Hall, 1982;
Ibrahim & Rue, 1998). One measure that is widely used among small businesses, as a subjective
indicator of the overall business performance is the degree of owner/manager satisfaction with
the business. Few researchers have consulted owner/managers about their views on success of
their small business ventures (Simpson, Tuck &Bellamy, 2004). Luk (1996) identified the
success of small businesses as actual performance equal to or exceeding the business
owner/manager’s expectations. For example, a small business with declining profits or market
share could be seen as failing when in fact its owners/managers are satisfied with the overall
business performance. Adequate income, job satisfaction, a happy workforce, and a stable
market position are all factors that lead to small business owners’/managers’ satisfaction.
Another valid measure is sales turnover. Turnover growth is an objective measure that is
relatively easy to get due to data availability and common use and is also a good indicator of
firm size and a proxy for overall business growth. In this respect, Barkham (1996) concluded
that an analysis of a company’s growth should, at least in part, be based on changes in turnover.
In all cases, regardless of what measure should be used, the literature has strongly endorsed
using multiple performance measures. To promote performance and sustainability of SMEs,
the literature review also states that, an employer has a common law duty to provide a safe
place of work for his employees, and is liable for accidents caused by his employees in the
course of their employment. The principle statutory duties of employers arise from the
following; Health and safety at Work Act (1974), Factory Act (1961). These laws are in place
to encourage safe working conditions for employees. Government should also encourage small
firms by providing access to most investment incentives in order to subsidise on high rent-
seeking costs that cause most of them to shut down. Secondly, financial sector interventions
33
should stop discriminating against SMEs. Thirdly, the problems of dealing with government
regulations and tax authorities weighs more heavily on smaller firms in the shape of higher
compliance costs, i.e. the fixed costs of complying with import/export and tax regulations,
labour market regulations, and licensing and price control. Fourth, the countries
underdeveloped physical and social infrastructures create a binding constraint to SMEs growth.
Therefore, these SMEs are left to rely heavily on inefficiently provided state infrastructures
such as electricity and water and cannot afford the cost of developing any
alternatives.(www.enterprisedevelop.com/.../edg%20sustainable%20enterprise%).When these
binding constraint are eliminated, then shall SMEs achieve sustainable businesses growth and
economic development. It can be inferred from the literature so far that human, financial and
material resources have positive, significant relationship with the performance of SMEs.
Strategic planning is also needed for successful performance of SMEs. It refers to the setting
of long-term business goals, and the developing and implementing of formal plans to achieve
these goals (O'Regan & Ghobadian, 2004; Stonehouse & Pemberton, 2002). Comprehensive
reviews of the small business literature suggest that, ceteris paribus, strategic planning is
generally more common in better performing enterprises (Hormozi, Sutton, McMinn, & Lucio,
2002; Lurie, 1987; Miller & Cardinal, 1994; Schwenk & Shrader, 1993). For example, small
businesses that strategically plan (compared to those that do not) are more likely to be those
that achieve higher sales growth, higher returns on assets, higher profit margins and higher
employee growth (Berman, Gordon, & Sussman, 1997; Bracker, Keats, & Pearson, 1988;
Carland & Carland, 2003; Gibson & Casser, 2005). Hodges and Kent (2007) are clear in their
direction to small business owners, “If you want to be more successful and survive, then obtain
more knowledge of the strategic planning process”. Where a strategic plan is in place of
allocation of resources, leadership/business owner has been able to undertake proactively an
appropriate response to the forces for change. Small businesses that strategically plan are also
34
more likely to be those that are innovative, those that achieve international growth and also
leave for generations (Beaver & Prince, 2002; Gibbons & O'Connor, 2005; Stewart, 2002;
Upton, Teal, & Felan, 2001) and those less likely to fail (Gaskill, van Auken & Manning 1993;
Perry 2001, Balunywa, 2012). What should be noted is that “Strategic planning is not just a
one day activity, the process must begin long before the real act takes place if it is to be
successful, and if it is a sustainable wealth creating succession (Matama 2012)”. AdatiaSalim
(2011) of KamuKamu Plaza, who asserts that for successful business management, you will
need to have a goal or vision, write it and keep reminding yourself and other family members
about it, have a concentrated focus and don’t lose any minute in business. Overall, the
relationship between strategic planning and business Performance is best summarized by the
following statement: “Of all the contrasts between the successful and the unsuccessful business,
between the leader and follower, the single most important differentiating factor is strategy”
(J. Thomas Canon cited in Olson & Currie, 1992).`Research into why small businesses
generally do not engage in strategic planning has suggested that operators may be hindered or
discouraged by ‘planning barriers’ such as a lack of time, a lack of specialized expertise,
inadequate knowledge of the planning processes, or a reluctance to share strategic plans with
employees and external consultants (Robinson and Pearce 1984). The reason is that many are
in business primarily to pursue personal, non-financial goals (e.g. lifestyle change, the need to
be independent, etc.) and consequently do not perceive a need to engage extensively in business
planning activities.
35
CHAPTER 3: METHODOLOGY
3.1 Introduction
This chapter presents a detailed description of research methodology. Methodology is the
detailed procedure used to answer research questions and it includes a description of the
research design, study population, sample size and selection, sampling techniques, data
collection instruments and data analysis.
3.2 Research Design
The research design used in this study was a descriptive cross-sectional survey. A descriptive
study was undertaken because the researcher wanted to describe the study variables to
determine the effect between the two variables under study (Amin, 2005). The cross-sectional
survey was used because data was collected at one point in time which was time saving. The
survey was used because the study was done on a big population, (Kampala district, Nakawa
division) whose findings could be generalized to include other firms. The researcher further
used the quantitative and qualitative approaches to support the collection of data from the field.
Combining the qualitative and quantitative approaches enabled the researcher to gather in depth
explanation in the case of qualitative approach, in addition to the statistics in terms of
percentages, mean, standard deviation that was explained by the quantitative approach. The
reason why a descriptive cross-sectional survey was chosen for this study is due to its intensive
and descriptive analysis of the entity and it also helped to describe and explain variables more
clearly rather than predicting.
36
3.3 Study Population
The population of the study included SME owners and in cases where the owners were not
available, the in-charge (Manager) was used and workers. According to the Uganda Small
Scale Industries Association (USSIA) annual report of 2010, there are over 1200 SME carrying
out business in Nakawa division. In this annual report, 526 SMEs were registered. The
researcher therefore took the accessible population of 526 SMEs which were studied in order
to get accurate and unbiased results.
3.4 Sample Size and Sampling Techniques
The sample size of 227 respondents was obtained based on Yamane (1967:886) formula and
Table, from a population of 526 respondents. The assumptions were that the sample was
representative of the accessible population, the error was small, the sample was viable in the
context of funds available for the research study, systematic bias was controlled in a better way
and results obtained from the sample study were generalizable.
Yamane (1967:886) provides a simplified formula to calculate sample sizes. A 95%
confidence level and P = .5 are assumed for the Equation.
Where n is the sample size, N is the population size, and e =+/-5% (0.05) is the level of
precision. When this formula is applied to the above sample, we get Equation below.
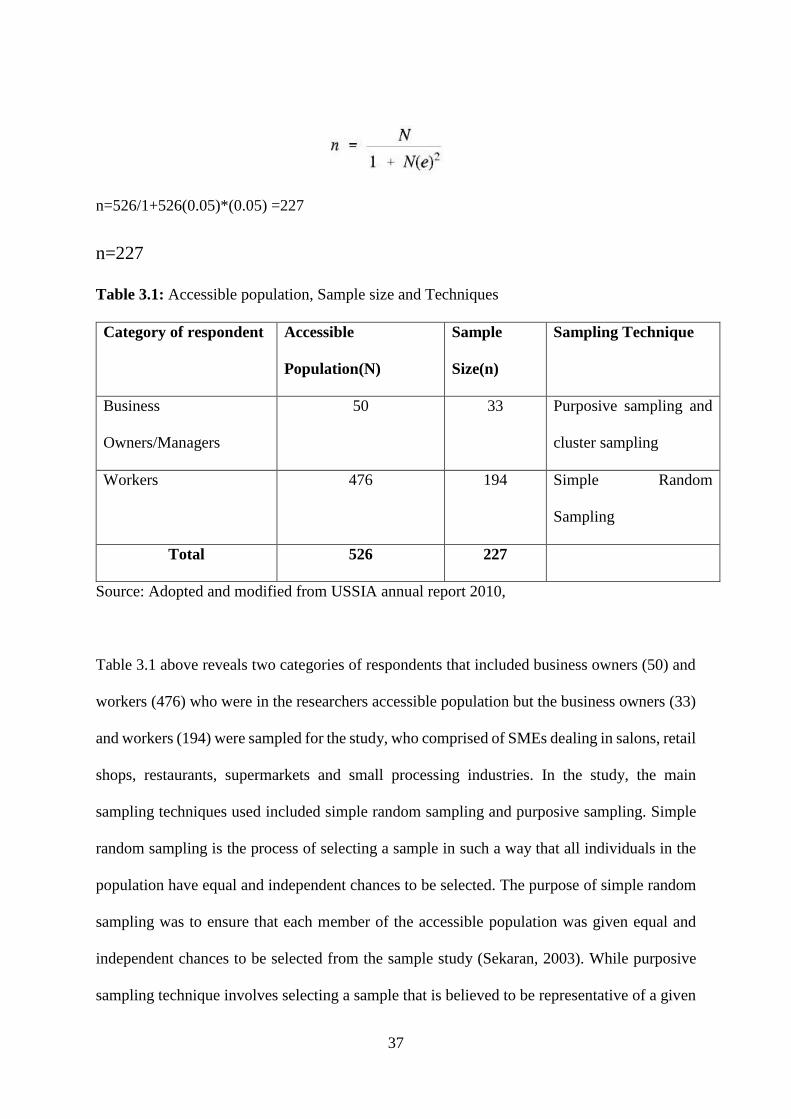
37
n=526/1+526(0.05)*(0.05) =227
n=227
Table 3.1: Accessible population, Sample size and Techniques
Category of respondent Accessible
Population(N)
Sample
Size(n)
Sampling Technique
Business
Owners/Managers
50 33 Purposive sampling and
cluster sampling
Workers 476 194 Simple Random
Sampling
Total 526 227
Source: Adopted and modified from USSIA annual report 2010,
Table 3.1 above reveals two categories of respondents that included business owners (50) and
workers (476) who were in the researchers accessible population but the business owners (33)
and workers (194) were sampled for the study, who comprised of SMEs dealing in salons, retail
shops, restaurants, supermarkets and small processing industries. In the study, the main
sampling techniques used included simple random sampling and purposive sampling. Simple
random sampling is the process of selecting a sample in such a way that all individuals in the
population have equal and independent chances to be selected. The purpose of simple random
sampling was to ensure that each member of the accessible population was given equal and
independent chances to be selected from the sample study (Sekaran, 2003). While purposive
sampling technique involves selecting a sample that is believed to be representative of a given
38
population based on expert judgment. Purpose sampling was used, where the researcher
decided who was to be included in the sample based on their expertise in the area of SMEs.
The purpose was to collect focused information in the sector, because this enabled the
researcher to gather useful data only and the technique was time and money saving.
3.5 Data Collection Methods
The study was conducted using data collection methods such as questionnaire surveys and
interviews.
3.5.1 Questionnaire Survey Method
Questionnaire survey method was used because it collects a large number of data at one given
point in time and it also saves time and costs. The Questionnaire had 39 close-ended statements
tagged on a 5 point likert scale seeking respondents’ feedback. It had four sections, the
independent variable as availability of resources, allocation of resources, and utilization of
resources while the dependent variable as performance of SMEs.
3.5.2 Interview Methods
Key informant interviews were administered through face to face interviews conducted by
researcher who interviewed business owners/managers of sampled enterprises. This was a
person to person verbal communication where the interviewer asked the interviewee questions
intended to elicit information or opinions. The purpose was to collect in-depth information
from the business owners and experts in the SMEs sector that could not be directly observed
and further capture the meaning beyond words that a questionnaire would not be able to
capture. Interviews were the best method to capture such information because it helped clarify
difficult or unclear questions.
39
3.6 Instruments of data collection
The selection of these instruments was guided by the nature of the data to be collected, time
available as well as the objectives of the study. The data collection instrument used in this study
included; Structured administered questionnaire and interview guide/ check list. The researcher
was mainly concerned about the perceptions, feelings, and attitudes of people owning these
SMEs and such data was best collected using questionnaires and interviews (Bell, 1993;
Touliatos & Compton, 1988).
3.6.1 Structured Questionnaire
A self-administered questionnaire comprising of close ended questions were delivered to
respondents in each of the selected sampled categories. The likert rating scale with the five
category response continuum was used. 1: Strongly disagree, 2: Disagree, 3: Undecided, 4:
Agree, 5: Strongly agree. These response categories weighted 1-5 and averaged for all its items
as recommended by Amin (2005). The questionnaire was used because the population under
study could read and write and it enabled the researcher to administer it to large number of
respondents at a given point in time. It was useful for generating data for quantitative approach.
(Appendix I)
3.6.2 Interview guide/checklist
A semi- structured interview guide was used in the study. According to Coombes (2001), while
having the advantage of written questions to guide the researcher, semi-structured interview
guide can allow for additional comments to be noted. According to William (2005), a semi-
structured interview enables defined answers to be achieved for defined questions, while
leaving time for further development of those answers and including more open ended
questions. This instrument allowed the researcher the flexibility to structure questions that fit
the interview while being guided by the interview guide. (Appendix II)
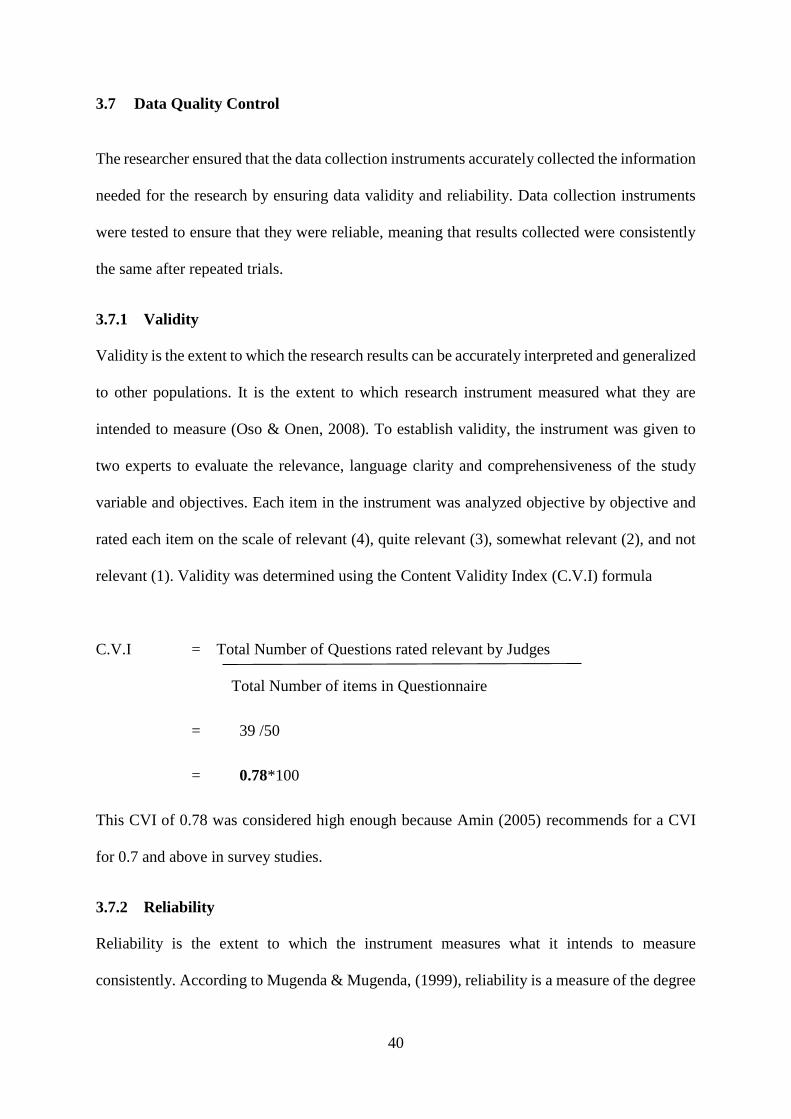
40
3.7 Data Quality Control
The researcher ensured that the data collection instruments accurately collected the information
needed for the research by ensuring data validity and reliability. Data collection instruments
were tested to ensure that they were reliable, meaning that results collected were consistently
the same after repeated trials.
3.7.1 Validity
Validity is the extent to which the research results can be accurately interpreted and generalized
to other populations. It is the extent to which research instrument measured what they are
intended to measure (Oso & Onen, 2008). To establish validity, the instrument was given to
two experts to evaluate the relevance, language clarity and comprehensiveness of the study
variable and objectives. Each item in the instrument was analyzed objective by objective and
rated each item on the scale of relevant (4), quite relevant (3), somewhat relevant (2), and not
relevant (1). Validity was determined using the Content Validity Index (C.V.I) formula
C.V.I = Total Number of Questions rated relevant by Judges
Total Number of items in Questionnaire
= 39 /50
= 0.78*100
This CVI of 0.78 was considered high enough because Amin (2005) recommends for a CVI
for 0.7 and above in survey studies.
3.7.2 Reliability
Reliability is the extent to which the instrument measures what it intends to measure
consistently. According to Mugenda & Mugenda, (1999), reliability is a measure of the degree
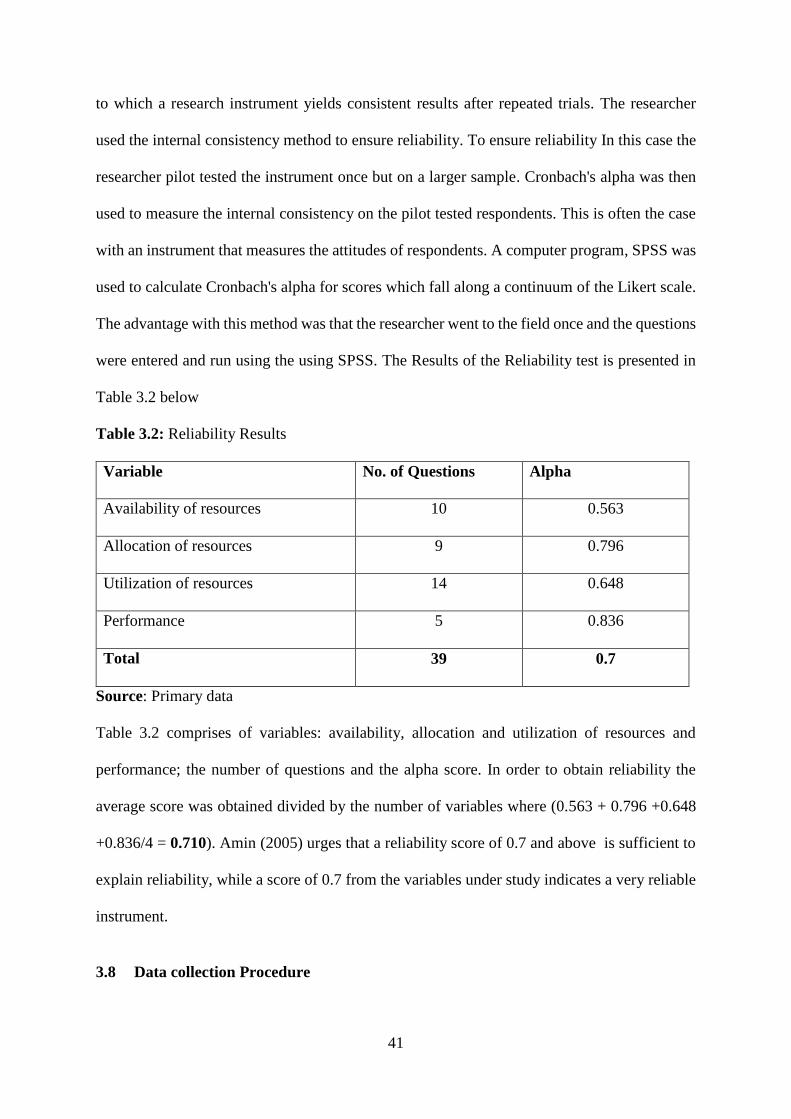
41
to which a research instrument yields consistent results after repeated trials. The researcher
used the internal consistency method to ensure reliability. To ensure reliability In this case the
researcher pilot tested the instrument once but on a larger sample. Cronbach's alpha was then
used to measure the internal consistency on the pilot tested respondents. This is often the case
with an instrument that measures the attitudes of respondents. A computer program, SPSS was
used to calculate Cronbach's alpha for scores which fall along a continuum of the Likert scale.
The advantage with this method was that the researcher went to the field once and the questions
were entered and run using the using SPSS. The Results of the Reliability test is presented in
Table 3.2 below
Table 3.2: Reliability Results
Variable No. of Questions Alpha
Availability of resources 10 0.563
Allocation of resources 9 0.796
Utilization of resources 14 0.648
Performance 5 0.836
Total 39 0.7
Source: Primary data
Table 3.2 comprises of variables: availability, allocation and utilization of resources and
performance; the number of questions and the alpha score. In order to obtain reliability the
average score was obtained divided by the number of variables where (0.563 + 0.796 +0.648
+0.836/4 = 0.710). Amin (2005) urges that a reliability score of 0.7 and above is sufficient to
explain reliability, while a score of 0.7 from the variables under study indicates a very reliable
instrument.
3.8 Data collection Procedure
42
After proposal defense, the researcher went ahead and completed panel corrections, proceeded
to Uganda Management Institute, School of Management; submitted the final copies and based
on this, a letter of authorization was obtained and always presented to the key respondents and
used as a basis to collect the data. With help of three research assistants, the questionnaires
were administered while the researcher was in charge of all interviews the entire exercise took
three months. Quantitative data was coded, presented, analyzed and interpreted while
qualitative data transcribed to make meaning for analysis and interpretation.
3.9 Data Analysis
Data was analyzed both quantitatively and qualitatively.
3.9.1 Quantitative Data Analysis
Once the questionnaires were administered, the mass raw data was organized in a manner that
facilitated analysis. Data collected was coded, sorted, entered and thereafter interpreted using
statistical packages for Social Science Research (SPSS) to bring out the meaning of the
variables under study. This was descriptively presented in tabular form and reflected
graphically using frequencies, percentages, means and standard deviation while inferential
statistics in Pearson product correlation moment specifically bivariate correlation was used to
determine whether a relationship existed between variables while linear regression was used to
determine the variations between variables.
3.9.2 Qualitative Data Analysis
Face to face sessions were conducted between the researcher and key informants. These
sessions were fully written down and later analyzed. Qualitative data was analyzed with
support of content analysis. Narrative statements were obtained and used to supplement
quantitative data in chapter four.

43
3.10 Measurement of Variables
The likert scale as proposed by Amin (2005) was used to draw opinions and attitudes from
respondents who we rated on a five point scale. (1: Strongly Disagree, 2: Disagree, 3:
Undecided, 4: Agree, 5: Strongly Agree). This scale was used to measure both the independent
and dependent variables such as pertaining to availability, allocation and utilization of
resources and performance of SMEs.
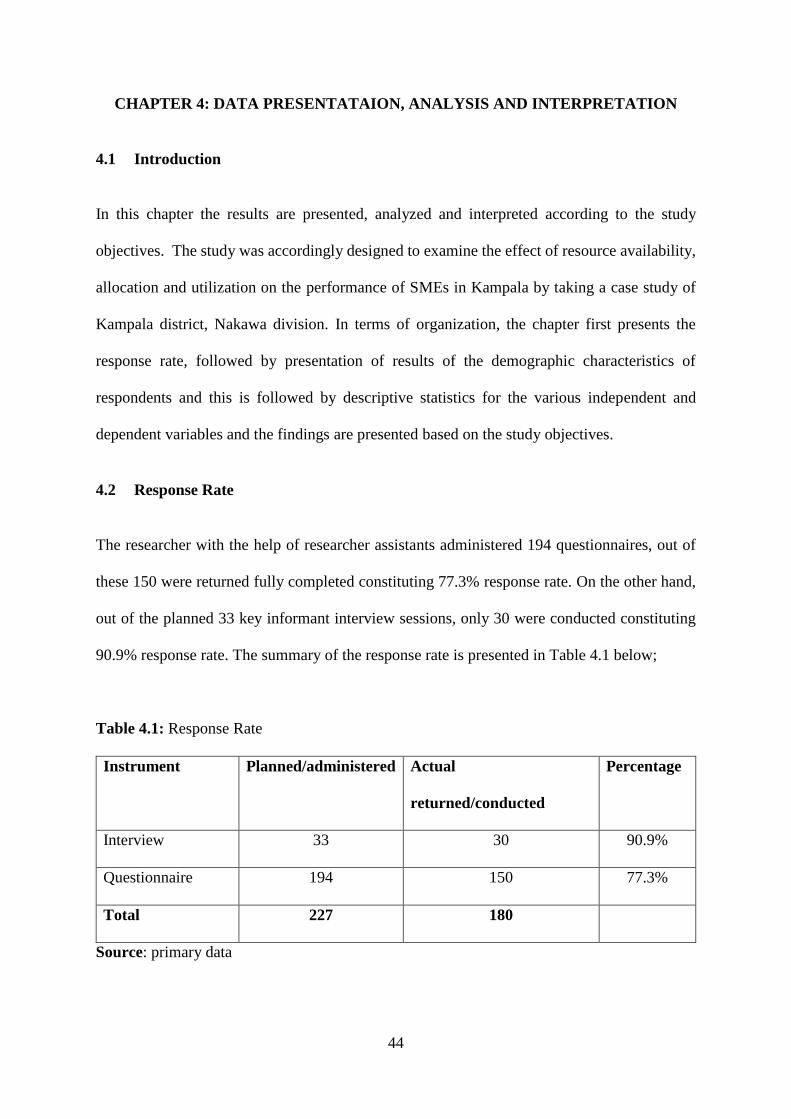
44
CHAPTER 4: DATA PRESENTATAION, ANALYSIS AND INTERPRETATION
4.1 Introduction
In this chapter the results are presented, analyzed and interpreted according to the study
objectives. The study was accordingly designed to examine the effect of resource availability,
allocation and utilization on the performance of SMEs in Kampala by taking a case study of
Kampala district, Nakawa division. In terms of organization, the chapter first presents the
response rate, followed by presentation of results of the demographic characteristics of
respondents and this is followed by descriptive statistics for the various independent and
dependent variables and the findings are presented based on the study objectives.
4.2 Response Rate
The researcher with the help of researcher assistants administered 194 questionnaires, out of
these 150 were returned fully completed constituting 77.3% response rate. On the other hand,
out of the planned 33 key informant interview sessions, only 30 were conducted constituting
90.9% response rate. The summary of the response rate is presented in Table 4.1 below;
Table 4.1: Response Rate
Instrument Planned/administered Actual
returned/conducted
Percentage
Interview 33 30 90.9%
Questionnaire 194 150 77.3%
Total 227 180
Source: primary data
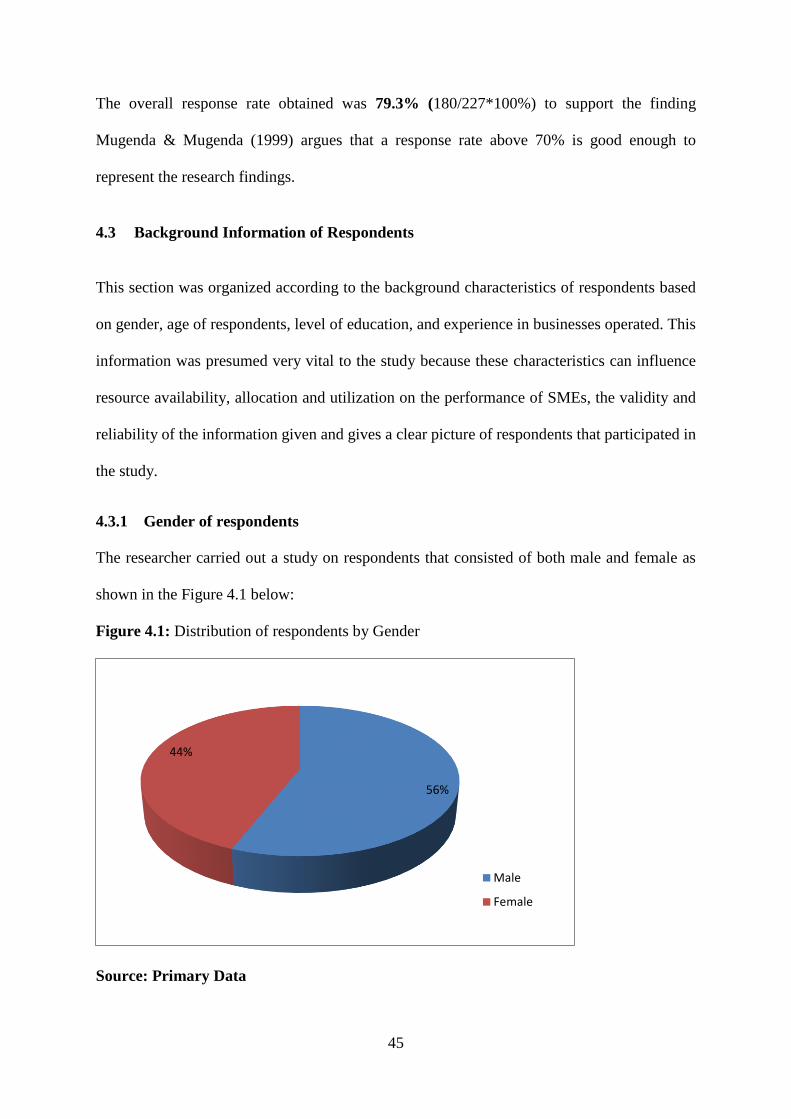
45
The overall response rate obtained was 79.3% (180/227*100%) to support the finding
Mugenda & Mugenda (1999) argues that a response rate above 70% is good enough to
represent the research findings.
4.3 Background Information of Respondents
This section was organized according to the background characteristics of respondents based
on gender, age of respondents, level of education, and experience in businesses operated. This
information was presumed very vital to the study because these characteristics can influence
resource availability, allocation and utilization on the performance of SMEs, the validity and
reliability of the information given and gives a clear picture of respondents that participated in
the study.
4.3.1 Gender of respondents
The researcher carried out a study on respondents that consisted of both male and female as
shown in the Figure 4.1 below:
Figure 4.1: Distribution of respondents by Gender
Source: Primary Data
56%
44%
Male
Female
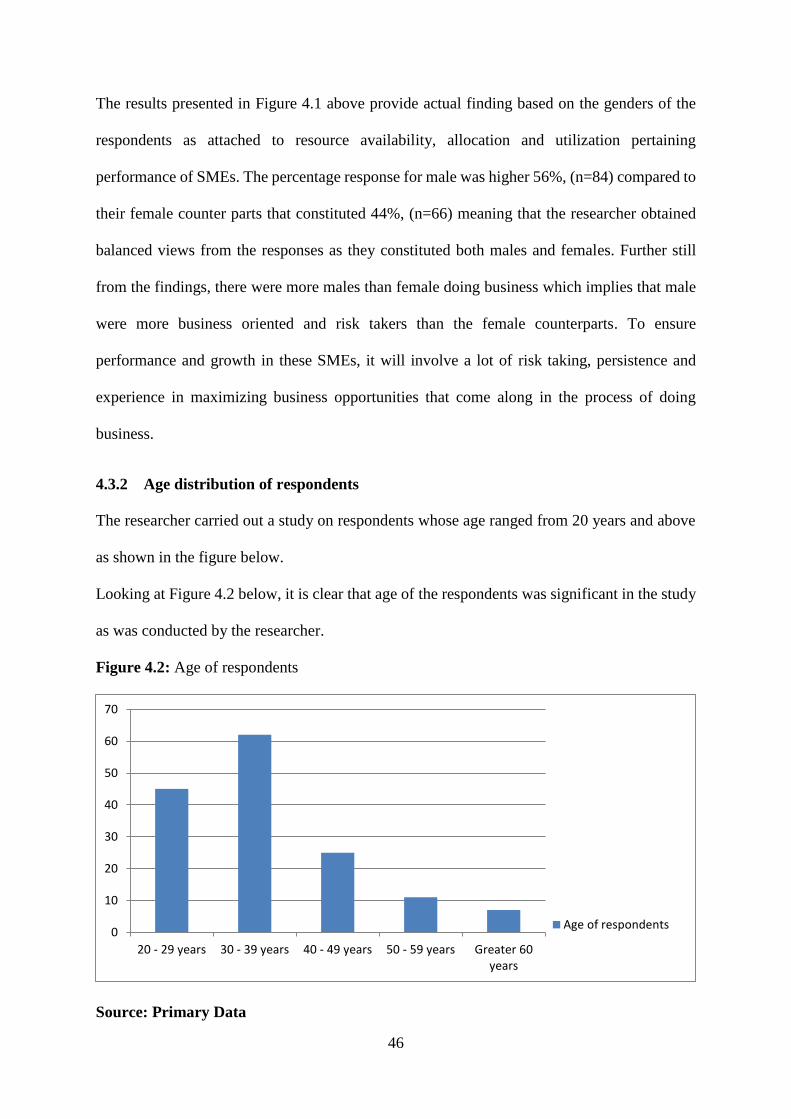
46
The results presented in Figure 4.1 above provide actual finding based on the genders of the
respondents as attached to resource availability, allocation and utilization pertaining
performance of SMEs. The percentage response for male was higher 56%, (n=84) compared to
their female counter parts that constituted 44%, (n=66) meaning that the researcher obtained
balanced views from the responses as they constituted both males and females. Further still
from the findings, there were more males than female doing business which implies that male
were more business oriented and risk takers than the female counterparts. To ensure
performance and growth in these SMEs, it will involve a lot of risk taking, persistence and
experience in maximizing business opportunities that come along in the process of doing
business.
4.3.2 Age distribution of respondents
The researcher carried out a study on respondents whose age ranged from 20 years and above
as shown in the figure below.
Looking at Figure 4.2 below, it is clear that age of the respondents was significant in the study
as was conducted by the researcher.
Figure 4.2: Age of respondents
Source: Primary Data
0
10
20
30
40
50
60
70
20 - 29 years 30 - 39 years 40 - 49 years 50 - 59 years Greater 60years
Age of respondents
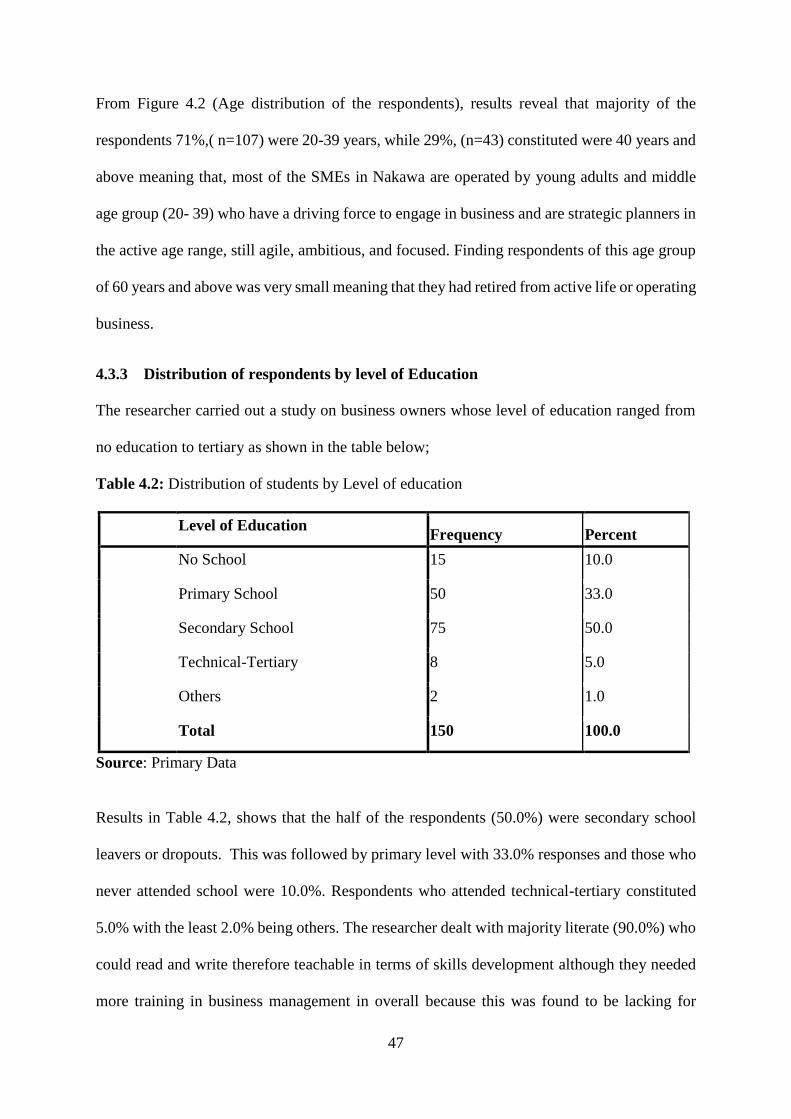
47
From Figure 4.2 (Age distribution of the respondents), results reveal that majority of the
respondents 71%,( n=107) were 20-39 years, while 29%, (n=43) constituted were 40 years and
above meaning that, most of the SMEs in Nakawa are operated by young adults and middle
age group (20- 39) who have a driving force to engage in business and are strategic planners in
the active age range, still agile, ambitious, and focused. Finding respondents of this age group
of 60 years and above was very small meaning that they had retired from active life or operating
business.
4.3.3 Distribution of respondents by level of Education
The researcher carried out a study on business owners whose level of education ranged from
no education to tertiary as shown in the table below;
Table 4.2: Distribution of students by Level of education
Level of Education Frequency Percent
No School 15 10.0
Primary School 50 33.0
Secondary School 75 50.0
Technical-Tertiary 8 5.0
Others 2 1.0
Total 150 100.0
Source: Primary Data
Results in Table 4.2, shows that the half of the respondents (50.0%) were secondary school
leavers or dropouts. This was followed by primary level with 33.0% responses and those who
never attended school were 10.0%. Respondents who attended technical-tertiary constituted
5.0% with the least 2.0% being others. The researcher dealt with majority literate (90.0%) who
could read and write therefore teachable in terms of skills development although they needed
more training in business management in overall because this was found to be lacking for
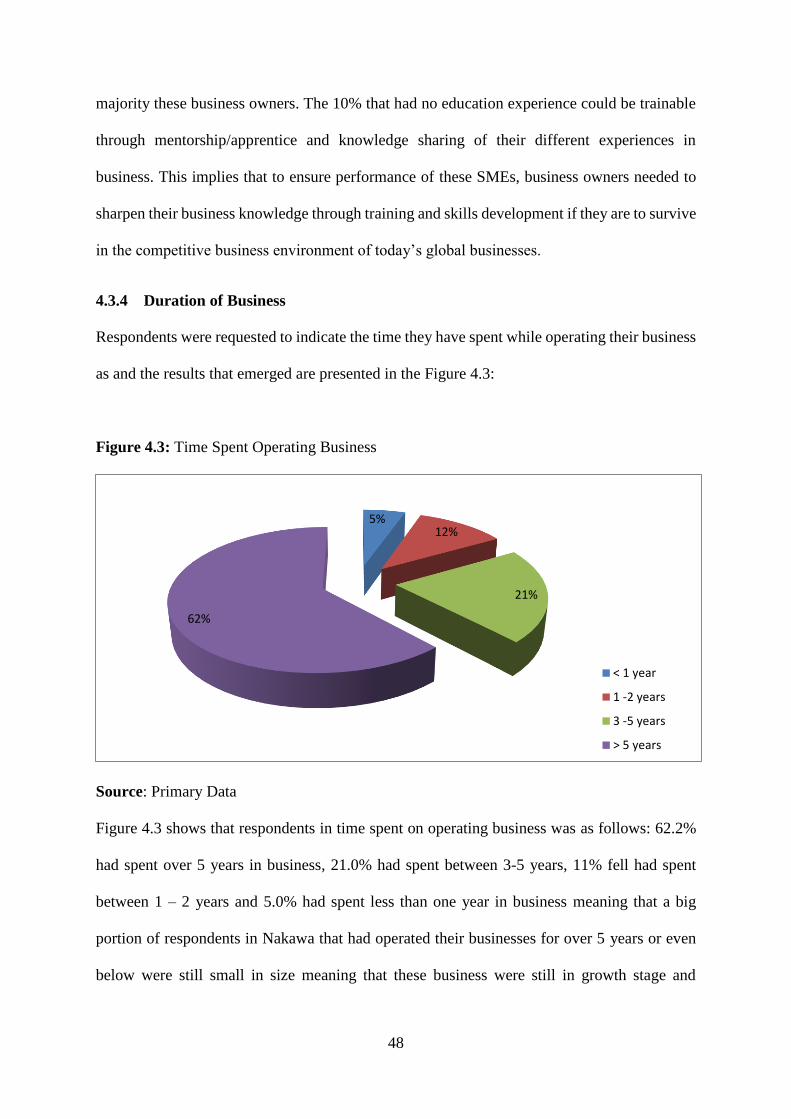
48
majority these business owners. The 10% that had no education experience could be trainable
through mentorship/apprentice and knowledge sharing of their different experiences in
business. This implies that to ensure performance of these SMEs, business owners needed to
sharpen their business knowledge through training and skills development if they are to survive
in the competitive business environment of today’s global businesses.
4.3.4 Duration of Business
Respondents were requested to indicate the time they have spent while operating their business
as and the results that emerged are presented in the Figure 4.3:
Figure 4.3: Time Spent Operating Business
Source: Primary Data
Figure 4.3 shows that respondents in time spent on operating business was as follows: 62.2%
had spent over 5 years in business, 21.0% had spent between 3-5 years, 11% fell had spent
between 1 – 2 years and 5.0% had spent less than one year in business meaning that a big
portion of respondents in Nakawa that had operated their businesses for over 5 years or even
below were still small in size meaning that these business were still in growth stage and
5%12%
21%
62%
< 1 year
1 -2 years
3 -5 years
> 5 years
49
struggling to grow and survive. This implies that for these SMEs to perform, grow and become
sustainable there should be access to resources and their efficient allocation and utilization.
4.4 Empirical Findings
The researcher’s main objective of the study was to examine the effect of resource availability,
allocation and utilization on the performance of SMEs in Kampala by taking a Case study of
Nakawa division. The analysis of the findings which follow were presented according to the
objectives of the study as Descriptive statistics, Correlations, regressions and the qualitative
results as were obtained from the questionnaire administered and the interviews conducted with
key informants.
4.4.1 Availability of resources on the performance of SMEs
The first objective of the study was to determine the effect of availability of resources on the
performance of SMEs. Availability of resources was conceptualized basing on nine items
which were measured on a five point Likert Scale ranging from (5) to (1) see key below. The
results that emerged are shown in the Table 4.3 below.
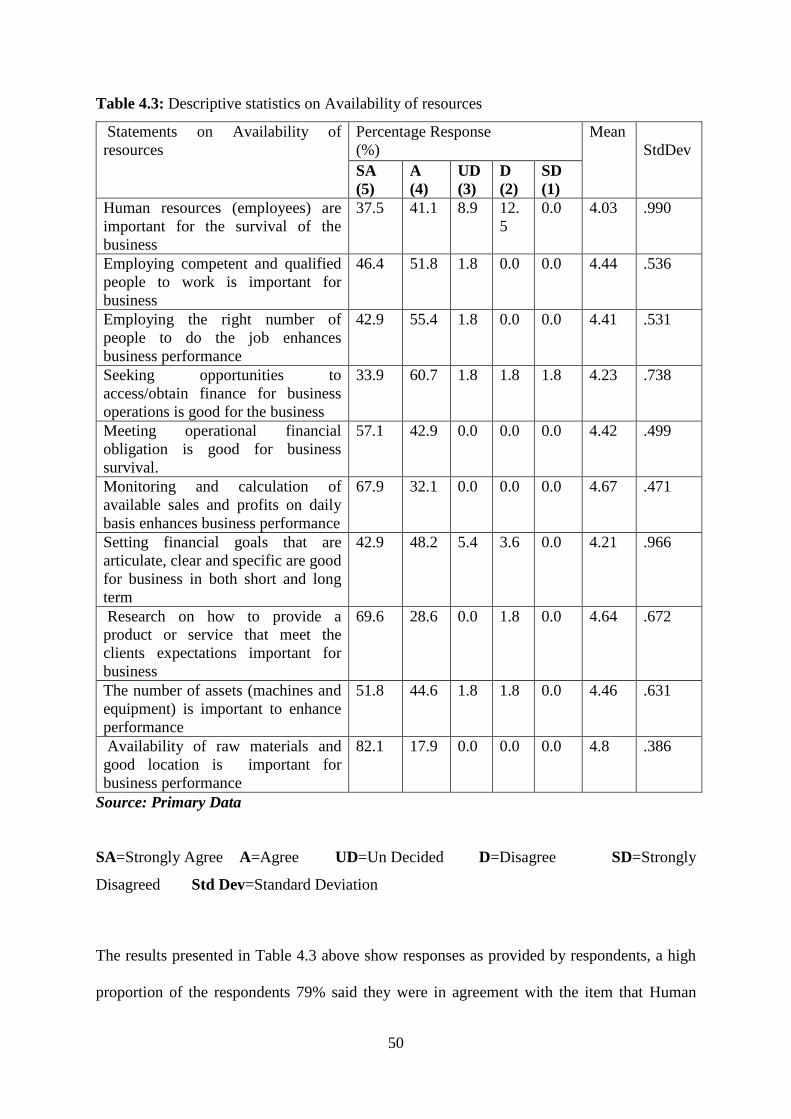
50
Table 4.3: Descriptive statistics on Availability of resources
Statements on Availability of
resources
Percentage Response
(%)
Mean
StdDev
SA
(5)
A
(4)
UD
(3)
D
(2)
SD
(1)
Human resources (employees) are
important for the survival of the
business
37.5 41.1 8.9 12.
5
0.0 4.03 .990
Employing competent and qualified
people to work is important for
business
46.4 51.8 1.8 0.0 0.0 4.44 .536
Employing the right number of
people to do the job enhances
business performance
42.9 55.4 1.8 0.0 0.0 4.41 .531
Seeking opportunities to
access/obtain finance for business
operations is good for the business
33.9 60.7 1.8 1.8 1.8 4.23 .738
Meeting operational financial
obligation is good for business
survival.
57.1 42.9 0.0 0.0 0.0 4.42 .499
Monitoring and calculation of
available sales and profits on daily
basis enhances business performance
67.9 32.1 0.0 0.0 0.0 4.67 .471
Setting financial goals that are
articulate, clear and specific are good
for business in both short and long
term
42.9 48.2 5.4 3.6 0.0 4.21 .966
Research on how to provide a
product or service that meet the
clients expectations important for
business
69.6 28.6 0.0 1.8 0.0 4.64 .672
The number of assets (machines and
equipment) is important to enhance
performance
51.8 44.6 1.8 1.8 0.0 4.46 .631
Availability of raw materials and
good location is important for
business performance
82.1 17.9 0.0 0.0 0.0 4.8 .386
Source: Primary Data
SA=Strongly Agree A=Agree UD=Un Decided D=Disagree SD=Strongly
Disagreed Std Dev=Standard Deviation
The results presented in Table 4.3 above show responses as provided by respondents, a high
proportion of the respondents 79% said they were in agreement with the item that Human
51
resources (employees) are important for the survival of the business, 9% was lowest that they
were undecided and 13% disagreed respectively. This means that majority of the respondents
knew the value of human resources (employees) in the survival of the business. Those that were
undecided or disagreed were not sure of their worth in the future of the businesses.
During an interview was conducted and a respondent had this to say “The contribution
employees make to ensure survival of this business cannot be taken for granted, the boss cannot
just fire us like he wishes. The implication here is that unless business owners start appreciating
the contribution that employees make towards the existence and performance of their
businesses, their businesses will not be able to survive because the human resource is the heart
beat of every organization.
A high proportion of respondents 98% said employing competent and qualified people to work
is important for business, only 2% were undecided, this means that for a business to succeed
the right people should be recruited and placed in the right places/jobs in order to do a good
job, those that were undecided either preferred to use cheap unskilled labor or relatives. This
implies that unless business owners start to appreciate the value of skilled workers in the work
processes, the cheap unskilled workers will compromise the performance of their SMEs.
Table 4.3, many respondents 98% agreed that they seek for the right number of people to do
the job, 2% did not, meaning that majority knew the importance of having the right number of
people doing a task. The other 2% that opposed did not understand the importance of placing
the right number of people to do the job. This implies that for a business owner to get work
done on time in order to meet deadlines, the right numbers of people have to do the job in order
to maximize business opportunity, profits and hence improved performance leading to business
continuity of this SME.
52
It is surprising that as high as 94% respondents, gave positive views about the statement that
seeking opportunities to access/obtain finance for business operations is good for the business,
correspondingly, 4% disagreed and 2% were neutral. Majority respondents, who
acknowledged, knew the value that access to finance had on their businesses, although they
admitted facing many huddles to get this finance. The 4% that disagreed claimed their operating
capital was sufficient and did not want to go through the huddles of getting loans with high
interest rates by money lenders or banks. Therefore, their operating capital was enough to
sustain their business operations. During an interview conducted with one of the business
owners had this to say “I went to a financial institution to seek for finance for my business, I
was subjected to many questions, a lengthy appraisal system and also asked if I had collateral
for my business, which I did not have. Although I had the desire to seek for finance, the whole
process was very discouraging”. This implies that as much as business owners value the role
finance has towards the performance of their businesses, access to this finance is a “nightmare”.
Over the issue of meeting operational financial capital or obligation is good for business
survival all respondents 100% respondents agreed meaning that, business owners knew that
liquidity or cash at hand facilitated their business operations. This implies that unless a business
has cash at hand to meet day to day operations of the business, it may not meet the day to day
demands of its customers which will hinder the performance and sustainability of these
businesses.
Views were collected about statement that setting financial goals that are articulate, clear and
specific are good for business in both short and long term, answers included; 91% agreed, 5%
that disagreed and 4% that were neutral. This means that the 91% of the respondents operating
business that agreed knew the importance of setting clear financial goals in the performance
53
their businesses, as opposed to the 5% that disagreed due to lack of knowledge/skills of how to
set these financial goals or priorities.
During an interview one of the business owners had this to say “What is important to me is
that I am selling and making profits to earn a living for me and my family, this business of
setting financial goals is timing wasting because what I get out of business is from hand to
mouth”. This implies that, unless business owners know the value of setting financial goals,
and having a clear vision in mind of where they want their businesses to go, it hinders
performance and achieving long term survival of these businesses.
Over the issue of availability of raw materials and good location are important for business
performance, 98% agreed and 2% that disagreed. This means that, 98% of the respondents that
agreed considered availability of raw material and good location as key in the performance of
their businesses, the 2% that disagreed considered other factors other than availability of raw
material and location to be paramount in their business performance and success. This implies
to a greater extent that for businesses to succeed in their operations, access to raw material for
production of goods and services and a good location is very important.
Interestingly 96% respondents said that the number of assets (machines and equipment) is
important to enhance business performance, 2% disagreed and were neutral. This means that
majority respondents that agreed knew the importance availability of machines and equipment
had on their performance, the 2% did not bother whether they were had the right tools for work.
The implication is that unless business owners acquire the right number of tools to enhance
performance of workers, maximizing production of goods or services becomes a huddle thus
hindering the overall performance of the business.
Lastly, views were collected about the item that they researched on how to provide a product
or service that meets the clients expectations, all 100% respondents agreed, this means that for
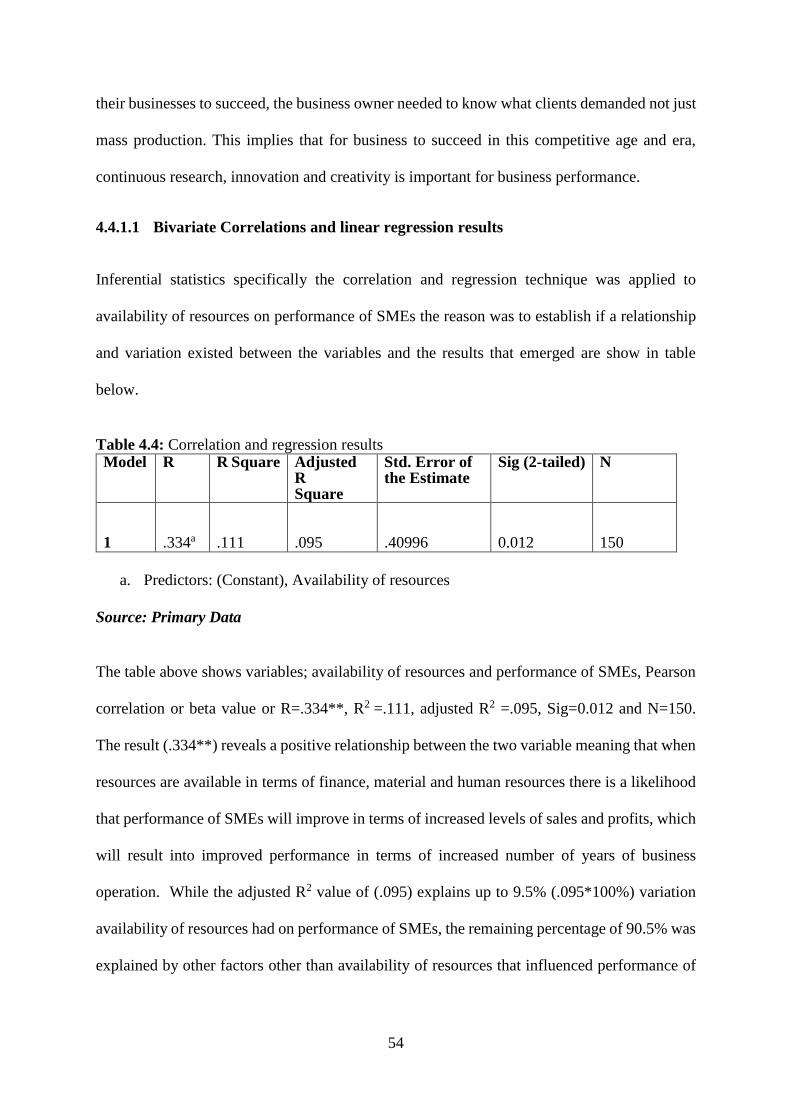
54
their businesses to succeed, the business owner needed to know what clients demanded not just
mass production. This implies that for business to succeed in this competitive age and era,
continuous research, innovation and creativity is important for business performance.
4.4.1.1 Bivariate Correlations and linear regression results
Inferential statistics specifically the correlation and regression technique was applied to
availability of resources on performance of SMEs the reason was to establish if a relationship
and variation existed between the variables and the results that emerged are show in table
below.
Table 4.4: Correlation and regression results Model R R Square Adjusted
R Square
Std. Error of the Estimate
Sig (2-tailed) N
1
.334a
.111
.095
.40996
0.012
150
a. Predictors: (Constant), Availability of resources
Source: Primary Data
The table above shows variables; availability of resources and performance of SMEs, Pearson
correlation or beta value or R=.334**, R2 =.111, adjusted R2 =.095, Sig=0.012 and N=150.
The result (.334**) reveals a positive relationship between the two variable meaning that when
resources are available in terms of finance, material and human resources there is a likelihood
that performance of SMEs will improve in terms of increased levels of sales and profits, which
will result into improved performance in terms of increased number of years of business
operation. While the adjusted R2 value of (.095) explains up to 9.5% (.095*100%) variation
availability of resources had on performance of SMEs, the remaining percentage of 90.5% was
explained by other factors other than availability of resources that influenced performance of
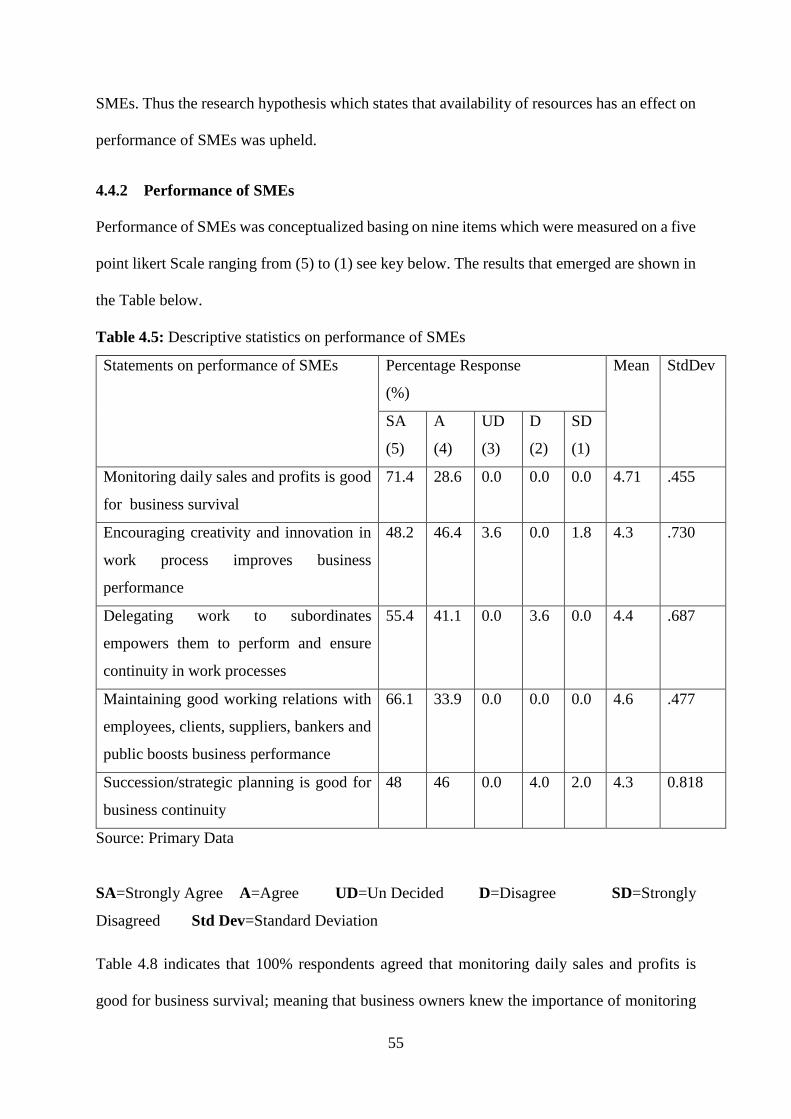
55
SMEs. Thus the research hypothesis which states that availability of resources has an effect on
performance of SMEs was upheld.
4.4.2 Performance of SMEs
Performance of SMEs was conceptualized basing on nine items which were measured on a five
point likert Scale ranging from (5) to (1) see key below. The results that emerged are shown in
the Table below.
Table 4.5: Descriptive statistics on performance of SMEs
Statements on performance of SMEs Percentage Response
(%)
Mean StdDev
SA
(5)
A
(4)
UD
(3)
D
(2)
SD
(1)
Monitoring daily sales and profits is good
for business survival
71.4
28.6 0.0 0.0 0.0 4.71 .455
Encouraging creativity and innovation in
work process improves business
performance
48.2 46.4 3.6 0.0 1.8 4.3 .730
Delegating work to subordinates
empowers them to perform and ensure
continuity in work processes
55.4 41.1 0.0 3.6 0.0 4.4 .687
Maintaining good working relations with
employees, clients, suppliers, bankers and
public boosts business performance
66.1 33.9 0.0 0.0 0.0 4.6 .477
Succession/strategic planning is good for
business continuity
48 46 0.0 4.0 2.0 4.3 0.818
Source: Primary Data
SA=Strongly Agree A=Agree UD=Un Decided D=Disagree SD=Strongly
Disagreed Std Dev=Standard Deviation
Table 4.8 indicates that 100% respondents agreed that monitoring daily sales and profits is
good for business survival; meaning that business owners knew the importance of monitoring

56
their businesses sales and profits in their operations, therefore in order to ensure improvement
in performance, business owners should put in place control measures (checks and balances)
that enable them to monitor sales and profits in their businesses.
When asked to provide answers to the question posed that encouraging creativity and
innovation in work process improve business performance, a big portion of respondents, 94.6%
agreed and were very positive to the statement, 3.6% of the respondents were undecided and
only 1.8% disagreed, this means that as much they as majority respondents agreed that they
encouraged creativity and innovation in their business operations, not all had innovative
business. Therefore, there is need by government to support research and development of
indigenous (local) products in terms of value addition, if SMEs are to break the barrier of
producing sub-standard goods and services.
Further still, on the issue of the statement that delegating work to subordinates empowers them
to perform and ensure continuity in work processes, a great majority of respondents 96.5%
agreed; however 3.6% were negative about the statement. This means that the majority of the
respondents knew the value of delegation if their businesses are to succeed, the other 3.6% that
were negative wanted to retain full control of their business as they felt too much delegation
would make the business collapse, as worker would exploit any opportunity to steal from the
business owner. In overall, to ensure continuity in business operations, putting in place work
ethics trust, responsibility, good mentorship or empowerment of workers is very important to
ensure continuity of business which in the long run results into improved performance of these
SMEs.
With regards to the statement that maintaining good working relations with employees, clients,
suppliers, bankers and public boosts business performance all respondents’ 100% agreed,
meaning that business owners understood the importance of maintaining good relation with
57
clients, suppliers, employees and the public in general if they were to sustain their businesses
in the long run. Therefore, in order to build good working relation with the different
stakeholders, there is need to keep close contacts and working relations with them in order to
have a synergetic benefits for the business in the long run.
Lastly, answers were got from the statement that Succession/strategic planning is good for
business continuity, 94.6% agreed and 5.4% (n=3) that disagreed. This means that majority of
the respondent knew the importance of succession planning. One business man had this to say
“My motto is to succeed in passing on the business to the next generation, there is need for
objectivity, preparedness and not forgetting the fact that the most capable candidate (Director)
is chosen in order to ensure performance of the business”. This implies that, strategic planning
is important in order to ensure business continuity, if no measures are put in place for
succession; the business is bound to collapse.
4.4.3 Allocation of resources and the performance of SMEs
Objective two of the study was to investigate the effect of allocation of resources on the
performance of SMEs. Allocation of resources was conceptualized basing on the nine items
which were measured on a five point likert scale ranging from (5) to (1) see key below. The
results that emerged are shown in the Table below.
Table 4.6: Descriptive Statistics on allocation of resources
Statements on allocation of resources Percentage Response
(%)
Mean StdDev
SA
(5)
A
(4)
UD
(3)
D
(2)
SD
(1)
Deploying the right number of employees
to do work enhances performance
38.0 41.0 9.0 12.0 0.0 4.03 .990
Motivating employees improves
production of timely goods and services
46.0 52.0 0.0 2.0 0.0 4.44 .536
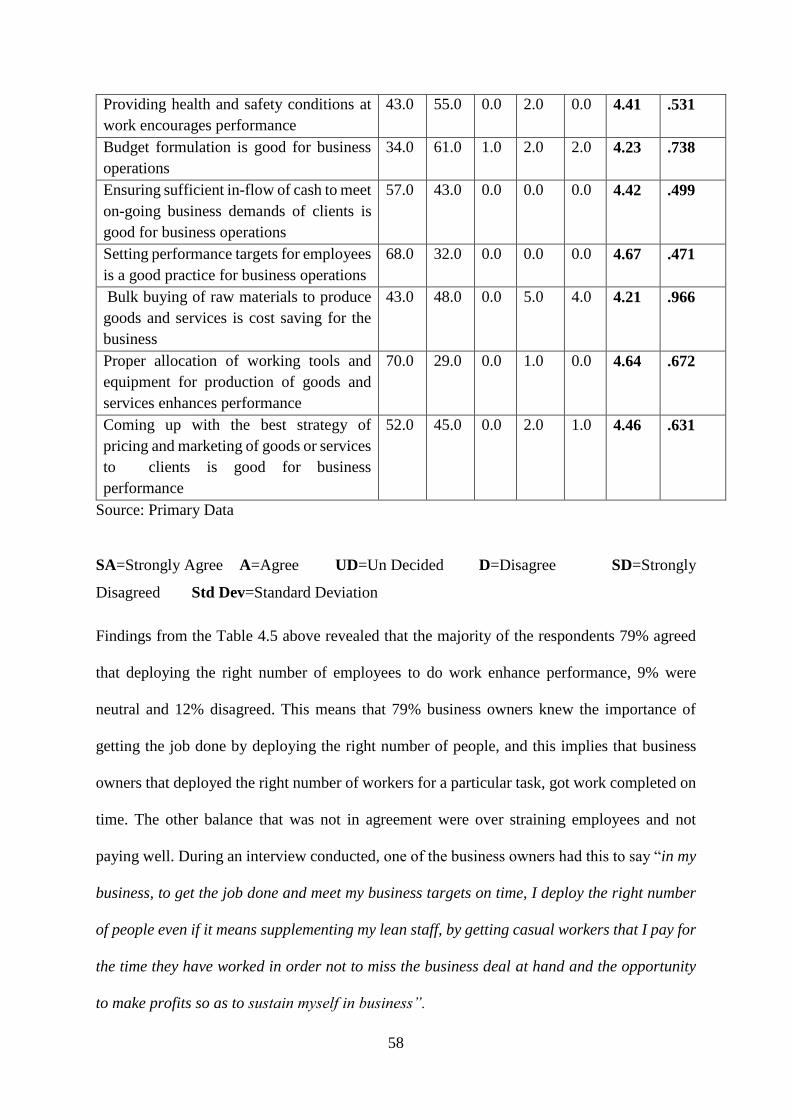
58
Providing health and safety conditions at
work encourages performance
43.0 55.0 0.0 2.0 0.0 4.41 .531
Budget formulation is good for business
operations
34.0 61.0 1.0 2.0 2.0 4.23 .738
Ensuring sufficient in-flow of cash to meet
on-going business demands of clients is
good for business operations
57.0 43.0 0.0 0.0 0.0 4.42 .499
Setting performance targets for employees
is a good practice for business operations
68.0 32.0 0.0 0.0 0.0 4.67 .471
Bulk buying of raw materials to produce
goods and services is cost saving for the
business
43.0 48.0 0.0 5.0 4.0 4.21 .966
Proper allocation of working tools and
equipment for production of goods and
services enhances performance
70.0 29.0 0.0 1.0 0.0 4.64 .672
Coming up with the best strategy of
pricing and marketing of goods or services
to clients is good for business
performance
52.0 45.0 0.0 2.0 1.0 4.46 .631
Source: Primary Data
SA=Strongly Agree A=Agree UD=Un Decided D=Disagree SD=Strongly
Disagreed Std Dev=Standard Deviation
Findings from the Table 4.5 above revealed that the majority of the respondents 79% agreed
that deploying the right number of employees to do work enhance performance, 9% were
neutral and 12% disagreed. This means that 79% business owners knew the importance of
getting the job done by deploying the right number of people, and this implies that business
owners that deployed the right number of workers for a particular task, got work completed on
time. The other balance that was not in agreement were over straining employees and not
paying well. During an interview conducted, one of the business owners had this to say “in my
business, to get the job done and meet my business targets on time, I deploy the right number
of people even if it means supplementing my lean staff, by getting casual workers that I pay for
the time they have worked in order not to miss the business deal at hand and the opportunity
to make profits so as to sustain myself in business”.
59
A good number of respondents 98% agreed to the statement that motivating employees
improves production of timely goods and services, and 2% this means that the 98% majority
of the business owners knew the importance of motivating their employees in order to perform,
while the 2% who were not able to motivate their workers were rigid with their money or were
still struggling financially. In an interview, one of the business owners asserted that “I have
been able to achieve a lot in my business by simple acts of gratitude, appreciation towards my
employees and giving them small incentives like bonus, when we have met and surpassed our
targets”. This implies that businesses that motivate their workers realize increases level of
performance in terms of increased production, sales and profits, business continuity as
compared to those that do not motivate their staff.
On the issue of providing health and safety conditions at work encourage performance, many
of the respondents 98% agreed and 2% disagreed. This means that majority of these business
owners new either by practice or theory that health and safety of workers is of paramount
importance, the remaining 2% that disagreed did not take health or safety to be so important in
the performance of workers, thus never bothered to cause awareness among employees. If
businesses owners realized the importance of health and safety at the work place, performance
would tremendously improve and positively affect production of goods and services, sales and
profit and business continuity of these SMEs.
A portion of respondents 95% agreed that ensuring sufficient in-flow of cash to meet on-going
business demands of clients is good for business operations, 1% was undecided and 4%
disagreed, this means that 95% of these businesses owners knew the importance of cash at hand
in the running of their business operations. The 5% of these business owners who disagreed
were crisis managers, who handled their businesses depending on the business demands of the
day as they set in. This implies that to efficiently run a business, the business owner should
60
know the balance between the demand for liquidity (cash at hand) to maintain day to day
operations and the need for profitability of the business in the long run.
Views were collected about the statement that setting performance targets for employees is a
good practice for business operations, 100% respondents that agreed meaning that both
business owners and employees knew the impotence of setting performance targets in order to
get work done. The implication is that where performance targets are not set, it becomes
difficult to attain and maximize the allocation of resources to achieve improved performance
in the business.
With regard to, the statement that bulk buying of raw materials to produce goods and services
are cost saving for the business, 91% agreed, while 9% disagreed. The majority that were in
agreement, as business owners considered bulk buying of raw materials important and also
knew the value of forecasting demand or supply of raw materials in order to remain relevant in
business. The 9% that disagreed, some were producing their own raw materials and others did
not have ready cash to buy raw materials in bulk. A business owner when interviewed had this
to say “My business requires bulk buying of raw materials and I exploit peak seasons of harvest
to make purchases which I stock for my business, direct from farmers not middle men who add
costs so as to sell”.
This implies that unless business owners take advantage of bulk purchase of raw materials
which reduces the cost production, high cost of production erodes profits and ultimately hinders
performance of these SMEs.
Majority of the respondents 99% indicated positively that proper allocation of working tools
and equipment for production of goods and services enhances performance, compared to 1%
that disagreed meaning that majority of these business owners knew the importance of working
tools if a timely and a good quality commodity are to be produced. During an interview “one
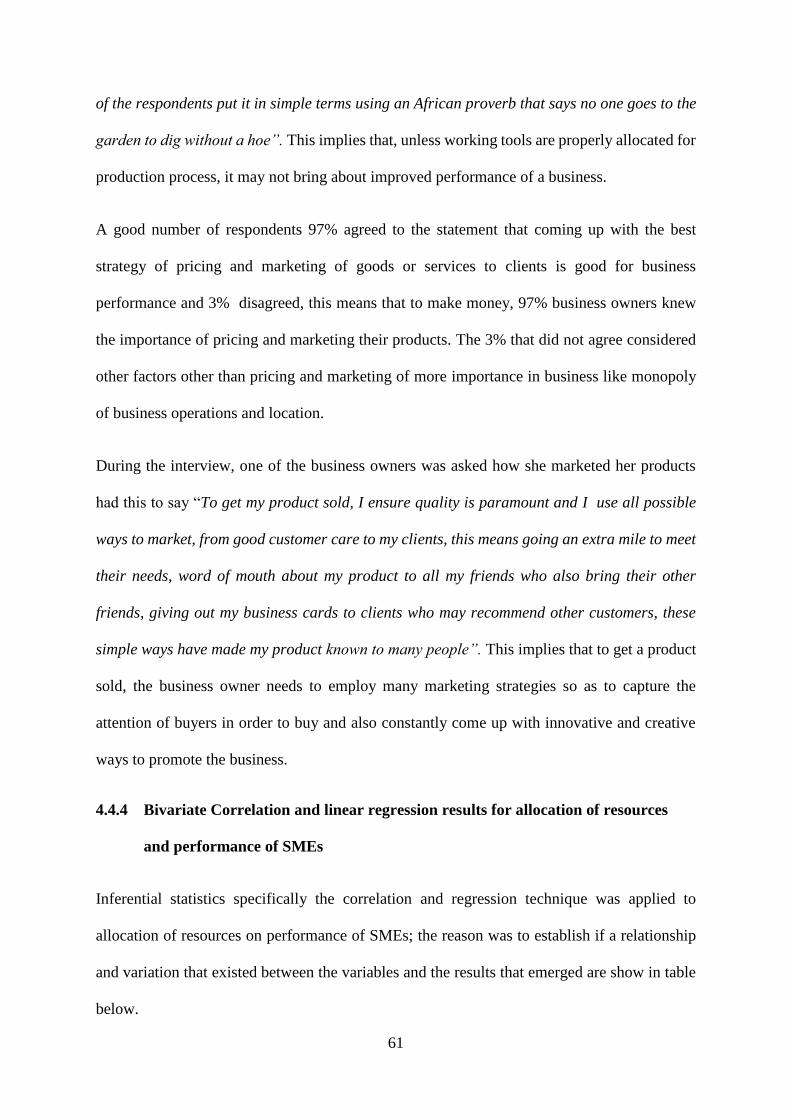
61
of the respondents put it in simple terms using an African proverb that says no one goes to the
garden to dig without a hoe”. This implies that, unless working tools are properly allocated for
production process, it may not bring about improved performance of a business.
A good number of respondents 97% agreed to the statement that coming up with the best
strategy of pricing and marketing of goods or services to clients is good for business
performance and 3% disagreed, this means that to make money, 97% business owners knew
the importance of pricing and marketing their products. The 3% that did not agree considered
other factors other than pricing and marketing of more importance in business like monopoly
of business operations and location.
During the interview, one of the business owners was asked how she marketed her products
had this to say “To get my product sold, I ensure quality is paramount and I use all possible
ways to market, from good customer care to my clients, this means going an extra mile to meet
their needs, word of mouth about my product to all my friends who also bring their other
friends, giving out my business cards to clients who may recommend other customers, these
simple ways have made my product known to many people”. This implies that to get a product
sold, the business owner needs to employ many marketing strategies so as to capture the
attention of buyers in order to buy and also constantly come up with innovative and creative
ways to promote the business.
4.4.4 Bivariate Correlation and linear regression results for allocation of resources
and performance of SMEs
Inferential statistics specifically the correlation and regression technique was applied to
allocation of resources on performance of SMEs; the reason was to establish if a relationship
and variation that existed between the variables and the results that emerged are show in table
below.
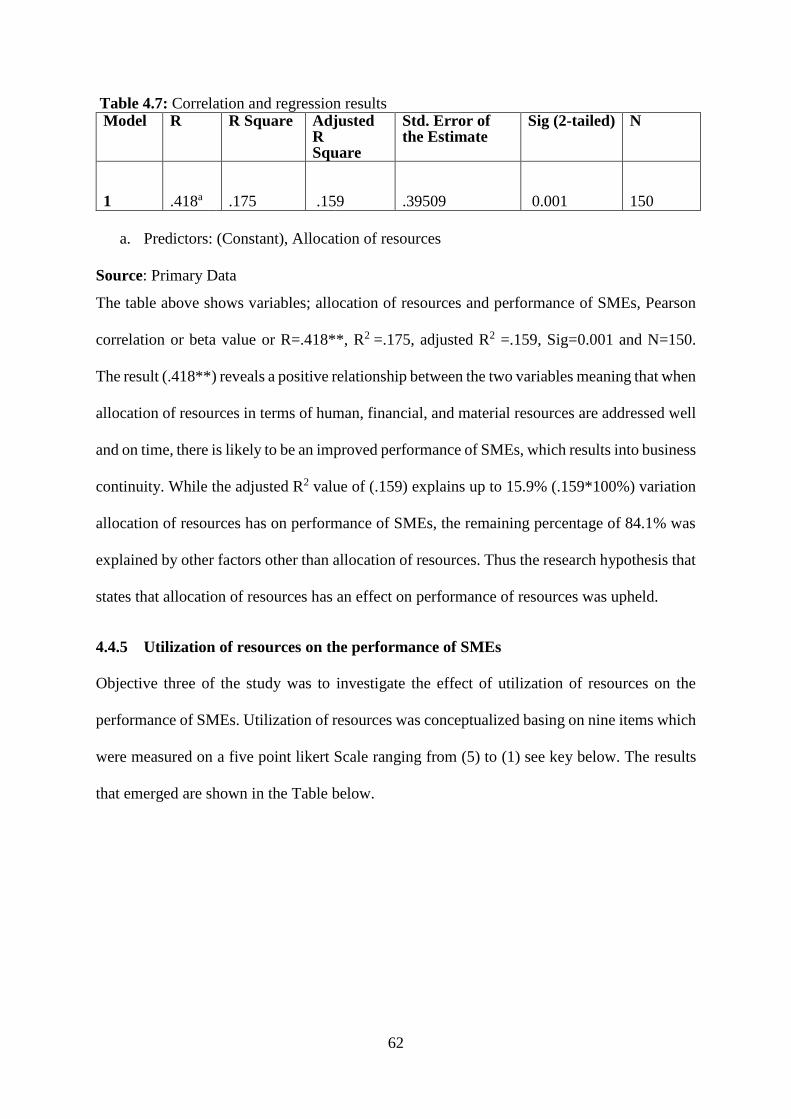
62
Table 4.7: Correlation and regression results Model R R Square Adjusted
R Square
Std. Error of the Estimate
Sig (2-tailed) N
1
.418a
.175
.159
.39509
0.001
150
a. Predictors: (Constant), Allocation of resources
Source: Primary Data
The table above shows variables; allocation of resources and performance of SMEs, Pearson
correlation or beta value or R=.418**, R2 =.175, adjusted R2 =.159, Sig=0.001 and N=150.
The result (.418**) reveals a positive relationship between the two variables meaning that when
allocation of resources in terms of human, financial, and material resources are addressed well
and on time, there is likely to be an improved performance of SMEs, which results into business
continuity. While the adjusted R2 value of (.159) explains up to 15.9% (.159*100%) variation
allocation of resources has on performance of SMEs, the remaining percentage of 84.1% was
explained by other factors other than allocation of resources. Thus the research hypothesis that
states that allocation of resources has an effect on performance of resources was upheld.
4.4.5 Utilization of resources on the performance of SMEs
Objective three of the study was to investigate the effect of utilization of resources on the
performance of SMEs. Utilization of resources was conceptualized basing on nine items which
were measured on a five point likert Scale ranging from (5) to (1) see key below. The results
that emerged are shown in the Table below.
63
Table 4.8: Descriptive statistics on Utilization of resources
Statements on Utilization of resources
Percentage Response (%)
Mean StdDev
SA (5)
A (4)
UD (3)
D (2)
SD (1)
Setting goals and mission for the business improves performance
50.0 37.5 8.9 3.6 0.0 4.33 .792
Breaking down large tasks into sub-tasks improves performance
64.3 30.4 1.8 3.6 0.0 4.55 .711
Having the right skills at work enhances performance
58.9 39.3 0.0 0.0 1.8 4.55 .600
Maximum utilization of employees at work ensure business performance
53.6 42.9 0.0 1.8 1.8 4.46 .760
Keeping financial records is useful for making business decisions
46.4 50.0 0.0 1.8 1.8 4.3 .752
Time management is important for employee performance
58.9 30.4 3.6 7.1 0.0 4.41 .869
Tracking the amount of business investment is good for the performance of the business
50.0 48.2 1.8 0.0 0.0 4.41 .539
Utilizing opportunities to expand business into new products, services and areas is good for business performance
30.4 53.6 10.7
3.6 1.8 4.07 .849
Social responsibility to the community boosts business image and ensures its survival
19.6 39.3 17.9
16.1
7.1 3.4 1.19
Efficiency and effectiveness in production of goods and service delivery is important for business performance
67.9 32.1 0.0 0.0 0.0 4.67 .471
Reinvesting profits for the purpose of expansion encourages performance and growth of the business
50.0 44.6 3.6 1.8 0.0 4.42 .656
Ensuring quality standards of excellence during production process improves business performance
44.6 53.6 1.8 0.0 0.0 4.42 .534
Employee welfare improves the corporate image of the business
41.1 57.1 0.0 1.8 0.0 4.37 .589
Preventing environmental degradation during production process is good for business image
32.1 57.1 0.0 8.9 1.8 4.19 .672
Source: Primary Data
SA=Strongly Agree A=Agree UD=Un Decided D=Disagree SD=Strongly
Disagreed Std Dev=Standard Deviation
The results of the data presented in Table 4.7 provide answers to the study questions on
utilization of resources. Views were collected about how setting goals and mission for the
business improves performance, majority were in agreement 89%, and 9% were neutral, 3%
64
disagreed, this meant that majority of the respondents knew the importance of goal setting in
business and were kin to explain them to workers so that they can rally behind the goals to
attain business performance. The 9% and 3% that never articulated their mission and goals to
their workers meaning businesses were run with no clear direction. During an interview, one
business owner had this say “When I recruit my staff, the first thing I do is take them through
what we do as a business, where we are at the moment and where we want to go in the next
five years and beyond”. This implies that if business owners want improved performance of
their businesses, missions and goal setting is important as a road map or direction of what the
business wants to achieve and where it wants to go at a set time.
Majority of the respondents 94%, indicated positively that breaking down large tasks into sub-
tasks improves performance, 2% were neutral and 4% disagreed, this means that for majority
of the respondents valued work systems and processes, the 2% and 4% that do not value work
processes, found problems in their operations. In an interview, this is what one of the team
managers had to say “In this restaurant, our job is service based and time bound, so each staff
is assigned tasks that contribute to the production of the whole product if our customers or
clients are to be serviced on time.” The implication is that unless job tasks or roles are properly
assigned to workers with clear expectations, confusion and poor performance is bound to arise.
On the issue of having the right skills at work enhances performance, a big margin of
respondents 98% agreed to the statement, 2% disagreed. This meant that the majority of
respondents the researcher approached appreciated the impotence of a trained workforce in
their work place. An interview conducted, one business owner had this to say “If we
concentrated in line with our businesses, if we concentrated with what we already find, if we
maximize whatever knowledge and skill we obtain from our parents and colleagues, most of
our businesses would be surviving. Unfortunately we do not care about how these businesses
65
are managed” implying that there is need for skilled manpower if business owners want to
achieve improved performance of their business.
Ninety six percent (96%) respondents believed that maximum utilization of employees at work
ensures business performance, 4% disagreed. This meant that effective utilization of workers
ensures business performance but unless business owners learn the importance of maximum
utilization of employees, they are bound to incur high operational costs in terms of salaries,
transport and feeding costs that will ultimately impact on performance of their business. The
4% that disagreed had not figured out the magnitude that redundant workforce affects
performance in their businesses.
Over the statement that, Time management is important for employee performance, 96% that
agreed and 4% that disagreed, meaning that majority of the respondents knew how time
management in business is very paramount for their businesses performance. Those that
disagreed had problems with time management and meeting of deadlines in their business
operations.
One of the business owners interviewed had this to say “One thing I notice about Ugandans
is that they waste a lot of time, unlike Indians, Chinese, Japanese who works 24 hours, if we
had the work ethics of Japanese and Chinese and Entrepreneurs like Karim-Hirji who wake
up at 4am and by 6:30pm he has already appraised several of his firms/businesses across
Entebbe and Kampala, this calls for discipline and respect for time,”. The implication is that
for SMEs in Nakawa and the country at large to achieve high level performance, there must be
change in the mind set or paradigm shift of workers in terms of time management in our
businesses.
66
Over the issues of keeping financial records is useful for making business decisions, a good
number of respondents 89% agreed, 3% were undecided and 7% disagreed, this meant that
many value the importance of keeping financial records enables them make informed decisions
and keep track of their business operations. The 3% and 7% that did not keep records had
limited knowledge of financial management, thus unable to keep financial records. This calls
for training in financial management in these businesses, if they are to improve in their
performance.
Table 4.7 shows that, Ninety eight percent (98%) constitute majority of the respondents who
believed that tracking the amount of business investment is good for the performance of the
business; two percent (2%) were undecided. The results meant that 98% considered tracking
the amount of business investment important for their businesses, the 2% that were undecided
said they had no significant businesses to track the amount of their investment was very small.
The implication is that unless SMEs learn the value of keeping track of their business
investments irrespective of the size (small or big), there is bound to be a problem with realizing
improved performance.
When asked whether they reinvest profits for the purpose of expansion, performance and
growth of the business, a great number of respondents 84% answered positively; 11% were not
sure as 5% disagreed; this meant that as much as the 84% of respondents valued the importance
of re-investing of profits back in the business for the purpose of expansion, but the constraint
was the capacity to expand in terms of capital, manpower, equipment and location. The 11%
that were not sure and 5% that disagreed preferred to remain small businesses so that the owners
have direct control of their business as compared to expansion where the owner loses touch or
control of the business, implying that for most of these businesses as much as they desired to
re-invest their profits, the profits were eroded by high operational costs, limiting the capacity
67
to expand. The need for financial discipline and saving culture is needed if business
performance of SMEs is to be achieved.
Further still, 59% agreed that Social responsibility to the community boosts business image
and ensures its survival, (corporate responsibility), 18% were undecided as 23% disagreed.
This meant that 59% of businesses owners knew they were not operating in a vacuum but in an
open environment that interacted with the outside world, so their social responsibility ranged
from community service involving garbage collection, payment of security services for the
community or taking care of need orphans, as a way of promoting their business names to
improve their performance and visibility in the community. Unlike the 18% and 23% that
declined to participating in community service for lack of money or being misers. Therefore,
unless businesses come to understand the importance of forward and backward linkage they
have with the community in terms of sources for raw materials, labor, business clients, goods
and services, then there is bound to a problem with performance and survival in the long run.
Overall findings show that majority of the respondents, 100% agreed that efficiency and
effectiveness in production of goods and service delivery is important for business
performance, this meant that as much as 100% of the respondents demanded for efficiency and
quality in their business operations, not all achieved it. This calls for a change of mind set that
demands excellence in all aspects of business. During an interview an entrepreneur had this to
say “in my business even if it means repeating a task to ensure efficiency, I encourage work to
be thoroughly done but poor management is a major problem leading to sub-standard goods
and services in East Africa’’.
Results affirm that 99% agreed that efficiency and effectiveness in production of goods and
service delivery is important for business performance, they found ways to do things faster,
68
better, and cheaper, with only 1% disagreeing to the statement. This meant that as much 99%
respondents found cheaper ways of doing things faster and better, although these innovative
technologies were unaffordable to a common businessman so they were appealing to
government to subsidize on such technologies and also reduce taxes levied on their
commodities to enable them sustain their SMEs. The 1% was comfortable doing business in
their traditional ways. Therefore, for SMEs to succeed in this completive age, they must
constantly re-innovate themselves to keep at pace with global standards.
Further still, results above clearly shows that majority ninety eight percent (98%) agreed that
ensuring quality standards of excellence during production process improves business
performance, however only 2% disagreed. This meant that majority of these businesses that
agreed, took repeated actions to overcome obstacles in the production process, which is a true
spirit of business minded people, the others who didn’t agree settled for low quality goods and
services as they gave an excuse of high costs involved in pursuit for quality products. Therefore
unless businesses start to value quality products, fake products will continue to flood the market
which will affect business reputation and ultimately failure to achieve increased performance
and survival in the long run.
Lastly, statistics as presented in the Table 4.1 above in line with the last item posed that
preventing environmental degradation during production process is good for business image, a
good number of respondents answered; 89% agreed and 9% were neutral well as 2% disagreed.
This meant that with the current sensitization by KCCA, the majority of these respondents
operating businesses in Nakawa were aware of the problems and penalties that came along with
environmental degradation, therefore took kin interest to ensure that their businesses complied
with demands for environmental protection. The rest that that were neutral or disagreed didn’t
understand the impact that environmental degradation had on the environment. To ensure
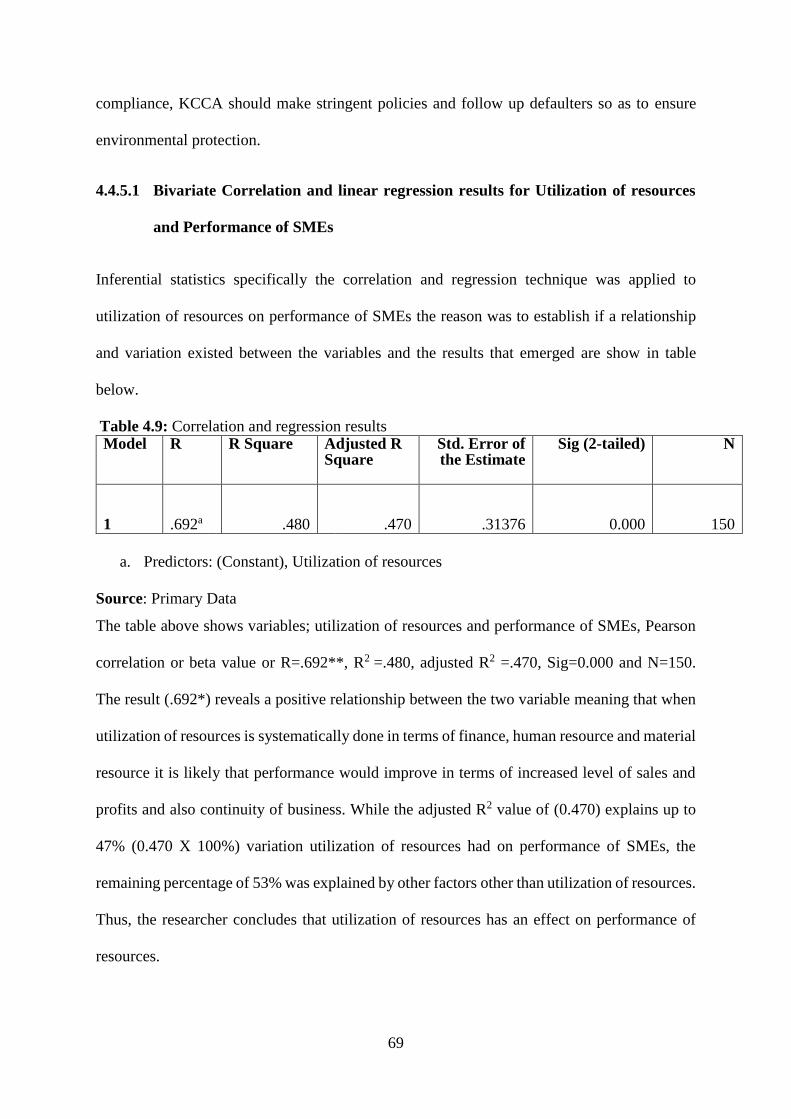
69
compliance, KCCA should make stringent policies and follow up defaulters so as to ensure
environmental protection.
4.4.5.1 Bivariate Correlation and linear regression results for Utilization of resources
and Performance of SMEs
Inferential statistics specifically the correlation and regression technique was applied to
utilization of resources on performance of SMEs the reason was to establish if a relationship
and variation existed between the variables and the results that emerged are show in table
below.
Table 4.9: Correlation and regression results Model R R Square Adjusted R
Square Std. Error of the Estimate
Sig (2-tailed) N
1
.692a
.480
.470
.31376
0.000
150
a. Predictors: (Constant), Utilization of resources
Source: Primary Data
The table above shows variables; utilization of resources and performance of SMEs, Pearson
correlation or beta value or R=.692**, R2 =.480, adjusted R2 =.470, Sig=0.000 and N=150.
The result (.692*) reveals a positive relationship between the two variable meaning that when
utilization of resources is systematically done in terms of finance, human resource and material
resource it is likely that performance would improve in terms of increased level of sales and
profits and also continuity of business. While the adjusted R2 value of (0.470) explains up to
47% (0.470 X 100%) variation utilization of resources had on performance of SMEs, the
remaining percentage of 53% was explained by other factors other than utilization of resources.
Thus, the researcher concludes that utilization of resources has an effect on performance of
resources.

70
71
CHAPTER 5: SUMMARY, DISCUSSION, CONCLUSION AND
RECOMMENDATION
5.1 Introduction
This chapter comprises of summary of the study, discussion of the findings, conclusions and
recommendations. It also presents the contributions of the study and areas for further research.
The discussion of the findings, conclusions and recommendations are presented according to
the study objectives and discussed in relation to existing literature. This is presented under the
specific headings; determine the effect of availability of resources on the performance of SMEs
and investigate the effect of utilization of resources on the performance of SMEs. The findings
are based on the general objective of examine the effect of resource availability, allocation and
utilization on the performance of SMEs in Kampala by taking a case study of Nakawa division.
5.2 Summary of Findings
5.2.1 The effect of availability of resources on the performance of SMEs
The results revealed a positive relationship between availability of resources and performance
of SMEs. Further still, there was a variation 9.5% that availability of resources had on the
performance of SMEs. The following can be noted; human resource increased chances of
business survival, right number of qualified workers enhanced performance, access to finance
boosted business operations, setting financial goals promoted performance, research and
innovation improved work processes, and access to raw material and location boosted business
performance.
72
5.2.2 Objective Two: To investigate the effect of allocation of resources on the
performance of SMEs.
Finding obtained in chapter four revealed that allocation of resources and performance of SMEs
were positively related with a variation 15.9% on the performance of SMEs. The following can
be summarized notably; well deployed staff increased business performance, motivated
employees increased production, health and safety at work encouraged improved the working
environment, budget formulation promoted business operation, setting performance targets
increased business performance, bulk purchasing of raw materials saved costs of production,
proper allocation of work tools and equipment enhanced performance, well planned pricing
and marketing strategies increased level of sales and profits.
5.2.3 Objective Three: To examine the effect of utilization of resources on the
performance of SMEs.
The results showed a positive relationship between utilisation of resources and performance of
SMEs. Further still, there was a percentage effect of 47% or variation of utilization of resources
on the Performance of SMEs. The following were found out; well set business goals and
mission improved performance, maximum utilization of employees increased performance,
well-kept financial records enhanced decision making, time management improved
performance, well tracked investments increased chances of business survival, quality working
standards improved work processes, corporate social responsibility of a business boosted its
public image.
73
5.3 Discussion of Findings
The discussion of findings for the study was done according to the study objectives. Here the
researcher sought support of the already existing literature on the study variable conducted
other researchers to enhance the discussion of the variables under study.
5.3.1 The effect of availability of resources on the Performance of SMEs
Findings obtained in chapter four reveal that availability of human resources was positively
related to performance of SMEs. This is supported by the positive responses that were given
by the respondents for instance; it is surprising that respondents constituting the majority
indicated positive views about the statement that availability of human resource is important
for survival of the business. A big margin of respondents agreed to the statement that they had
the skills and made personal sacrifices or efforts to accomplish tasks at hand or assigned to
them. This is supported by many authors who state that there is a positive effect of human
resources on the performance and success of small business is empirically well established
(Rauch & Frese, 2000) and where human capital was conceptualized as a characteristic of the
business owner (Bruederl, Preisendoefer & Ziegler, 1992). We conceptualize human capital as
consisting of education, experience and skills at a given point in time (Boxall & Steeneveld,
1999) that helps in the tasks of getting work done. Therefore, training for small business
owners/managers as well as their subordinates allow them acquire the necessary skills to ensure
the survival and success of their business, Holt (1993), Becker & Gerhart (1996). Training has
been considered in many studies as a key success factor for small businesses such as
Duchesneau & Gartner (1990), Storey (1994), Kent (1994), Gatewood et al (1995), Brown &
Huang (1999), Blackwood & Mowl (2000). What should be noted from the research finding
was that those disagreed that qualifications did not matter after all they could still do the job
did not have the right skills for the jobs they were performing but were either recruited by their
74
relatives or had minimal skills due to low levels of education. In my view as much as skills are
important in business survival, on job training, mentorship/apprentice in business is also very
important to ensure performance of these SMEs.
Seeking opportunities to obtain finance for their businesses but actually as much as majority
respondents sought opportunities to obtain finance a small margin respondents seeking for
finance got it, this is line with Rugasira (2011) who states that Banks are skeptical to lend
money to SMEs due to their high mortality rate and lack of collateral. He asserts that access to
affordable patient capital is the biggest hurdle to businesses yet it is the heart beat of every
business, and also the need for collateral or security before accessing finance was a
requirement. Ocici (2007), of Enterprise Uganda advises that startup businesses should not rush
for bank credit because high bank interest rates cripple businesses but should exploit other
sources of finance/capital like owners’ savings, grants, or credit depending on the business
owner but it is advisable to use equity for small business startups because debt/loan usually
erodes business capital if not managed well. On the contrary, even when financial capital is
available, and often its cost is unaffordable to most SMEs. Securing of capital and other
resources that are necessary to keep abreast with business and the development are main
obstacles facing small business enterprises. Shortage of resources severely restricts business
capacity. Limited financial resources make it difficult to promote and market products and
hence constraining SMEs to expand their business operations (Ocici, 2010). When financial
resources are not available to businesses or projects that can use it productively, economic
activity slows as new firms are not started due to inadequate start-up capital, and existing firms
postpone investments due to insufficient operating capital causing these enterprises to contract
or fail, (Seidman 2008). In other words, financing becomes a constraint to business formation
and growth when other factors of production are in place but appropriate financial capital is
not available. What should be noted is that, sustained availability of financial capital will not
75
only boost business activity, it will affect the quality and supply of other inputs into economic
development process. Ocici (2007) asserts that, Government interventions to promote SMEs
through providing affordable loans will go a long way to enhance their performance. However,
the fewer respondents that did not agree to the statement as this reflects a loophole in the way
finances were accessed or disbursed, loan requirements of collateral/ security, long loan
appraisal systems, inflexible repayment deadlines, and high interest rates all compounded,
hindered access and availability of finance to improve business performance.
Researching on how to provide a product or service that meets the clients expectations;
majority of respondents agreed, this means that for businesses to succeed, clients demanded
for quality products and services, this put pressure on the business owners to meet the quality
standards, this concurs with Kyambadde (2011) who asserts that without quality, our products
will not get market both regionally and internationally; quality and standards are the business
languages recognized internationally if we are ensure performance of SMEs. Cameron (1994)
concurred that effective organizations are responsive to and expedient in identifying and
meeting the needs of their target market. For the final product to be produced, the amounts and
corresponding delivery dates should be given by the customer orders and all must be delivered
on time. The production of the net requirement for each main product of a customer’s order is
regarded as an activity, which is the set up and processing time for a product and components
of the product, Sohner (1995). What should be noted is that quality and timely products will
ensure that repeat customers keep bringing in continuous business thus ensuring performance
of SMEs.
76
5.3.2 Objective Two: To investigate the effect of allocation of resources on the
performance of SMEs
Findings reveal that the majority of the respondents as a business owners, say they sought and
deployed the right number of employees. This means that majority business owners knew the
importance of getting the job done by deploying the right number of people. In line with
literature review, human resource planning and deployment, is vital effective performance of
SMEs, it is the ability to secure sufficient numbers and categories of suitable employees to
undertake the task of producing goods and services to the standard expected by the end user or
client. To yield high levels of business performance requires having the right people with the
right skills in the right places at the right time they are needed. Labor is a vital part in the
production process, it means detailing the number and type of employees required before
production commences and after production to ensure timely delivery of these goods or
services to the clients, Drucker (1954). What should be noted is that when human resources are
well allocated, there is optimal use of labor and flexibility of a business firm to effectively
deploy its manpower, cost efficiency of producing goods/services and increase in yield per
employee in the assignment of resources (Drucker, 1954). SMEs as business systems also focus
on allocation of resources to achieve their maximum advantage of performance and growth in
terms of increase in sales turn-over, profits, strategic planning and a number of years of
operation which frequently leaves them to respond to external influences as they occur rather
than taking a proactive approach (McAdam, 2002). On the contrary, by their nature, SMEs
have limited human, material and financial resources (McAdam 2002; Vossen 1998 as cited in
Huang, Soutar & Brown, 2002). It concurs with (Honsby & Kuratko, 2003) that SMEs have
limited resources and rely on fewer people in the firm or business to perform vitally all
important functions that have a major impact on the current and future prospects of the firm.
77
Hence, people while important to the business organization are important to the functioning,
performance of the SME.
Findings indicated that majority of the respondents agreed that setting performance targets for
employees will improve business performance. The study found out that, majority who set
business targets realized increase in sales, profits, expansion, and business continuity and these
targets are not made in isolation of the operational environment. This concurs with literature
review where the assumption is made that if sales increase, cash-flow and profits will
eventually follow to cover costs incurred in generation of revenue (Thomas & Mason, 2007).
Therefore sale growth is a key determinant of a firm’s success and survival. Using profits as a
measure may seem to imply that the organization will benefit more if costs such as salaries and
depreciation for capital reinvestment are reduced. However, lowering salaries to increase
profits tends to lead to conflicts in the relationship between employees and management in a
business system environment. Minimizing capital investment often has a negative impact on
the efficiency of operations, and eventually affects profits (Drucker, 1954). Therefore,
increasing profits by reducing such expenses is only a short-term measure. The only viable way
to increasing profits in a sustainable manner is to increase the value added through higher
productivity. This can be done with better cooperation from employees, higher investment in
capital, and optimal use of capital. In return for your employees’ efforts, your organization
should share the additional wealth generated in the form of higher wages and improved
benefits. This will reinforce and encourage them to further improve their performance which
is key to sustaining profits in the long run (Drucker, 1954).
A good number of respondents agreed to the statement that motivating employees to produce
timely goods and services improves business performance, this means that the majority of these
business owners knew the importance of motivating employees in whatever way to get the job
78
done, if they are to produce timely goods and services so as to remain in business in order to
bring about performance of SMEs. It is also noted that progressive human resource
management practices of selectivity in staffing, training, deployment and incentive
compensation were found to be positively related to measures of organizational performance
(Delaney & Huselid, 1996) .and in relation to the systems theory, the study of how resources
(inputs) are critical for successful performance (output) of small business, employee-relations
factors, including training, involvement in decision making and a reward/discipline system
were positively co-related to success of a firm (Gadenne 1998). On the contrary, due to resource
constraints, business owners or managers tend to prioritize their business needs to what needed
attention in the moment (Jawahar and McLaughlin, 2001) at the expense of motivating their
employees.
Research findings show that sufficient cash to meet ongoing business demands of clients is
good for business performance, which majority was in agreement with. The need for
operational capital is for the day to day running of the business. This includes raw materials,
salaries, rent, electricity, water, transport, meals etc. What should be noted is that business
owner must be accountable for their financial resources. Literature review affirms that, there is
need to have some means for knowing what is happening with respect to financial resources if
one is to make informed management decisions and this means keeping track of how money is
spent and received from the business (Balunywa, 2011). Regardless of how small the business
is, some form of book keeping or records must be maintained, and should be accurate so it can
act as a basis for informed decision making. The limitation is that financial resources can be
wasted if decisions are poor or are not made in a timely fashion. Those who were neutral or
disagreed claimed that high taxes and high bank interest rates had an effect on their businesses.
This concurs with the literature reviewed that financial sector interventions should stop
discriminating against SMEs and the problem that erodes their cash inflow is dealing with
79
government regulations and tax authorities who weigh more heavily on smaller firms in the
shape of higher compliance costs, i.e. the fixed costs of complying with import/export and tax
regulations, labour market regulations, and licensing and price control
(www.enterprisedevelop.com) . When these constraining factors are compounded, it erodes
cash inflow and causes businesses to collapse.
Many of the respondents agreed to the statement that providing health and safety conditions at
work encouraged business performance, and the few that didn’t, means that majority of these
business owners knew either by practice or theory that health and safety of workers is of
paramount importance if continuous production of goods and services to be realized. Research
findings show that for those businesses that practiced health and safety at work realized
improved performance. This is in agreement with the literature reviewed that, an employer has
a common law duty to provide a safe place of work for his employees, and is liable for accidents
caused by his employees in the course of their employment. The principle statutory duties of
employers arise from the following; Health and safety at Work Act (1974), Factory Act (1961).
The researcher noted that as much as majority business owners knew about health and safety,
a few business owners implemented and caused awareness about the issues at the place of work.
Many acknowledged that Social responsibility promoted business image which confirms that,
SME as a business system operate in an open environment which interacts with the external
environment like large enterprise sector as a source of material resources (inputs), a market for
its output and other economies of scale. This points to the need to create a synergistic
relationship between the SME and the large enterprise sectors, rather than thinking of a zero-
sum environment in which the performance and success of the small can only be secured by
destroying or disassembling the large. Positive and mutually reinforcing interactions can be
expected to emerge if ways can be found to encourage the formation of purpose-built alliances
80
and sub-contracting relationships in allocation of resources. In a business system relationship,
SMEs also allow residents and indigenous/ the local community to participate in the economic
development and, consequently, to obtain the economic benefits generated by the community
(Howard & Hine, 1995). In many different historical and contemporary economic systems
large firms and small firms interact in complex relationships which confer reciprocal
advantages (Piore & Sabel, 1984). On the contrary findings show that business that did not
engage in whatever form of social responsibility with the community tended to lose out on
business because the community they operated in de-campaigned their businesses and
discouraged customers from buying their products.
5.3.3 Objective Three: To examine the effect of utilization of resources on the
performance of SMEs
The statement that, I ensure that Goals and mission of the business are well articulated for all
employees, majority were in agreement, this is in line with Adatia (2011) of KamuKamu Plaza,
who asserts that for successful business management, you will need to have a goal or vision,
write it and keep reminding yourself, employees and other family members about it, have a
concentrated focus and don’t lose any minute in business, which the researcher concurs with if
you are to ensure performance of these SMEs. System theory supplement by the ‘goal
approach’ by Cameron (1978), grounded on organizational leaders determining a set of well-
defined goals for the enterprise and measuring performance relative to listed objectives on a
time bound schedule (Chelladurai, 1985). The key to this approach rests in the preciseness of
stating the goals in advance coupled with the need for framing the goal with deadlines for
attainment. For example, goals can be stated like; increase in level of sales by 18%, increase in
profits by 25% by end of year. At the end of the year, staff sit down to evaluate their
performance relative to stated goals. The limitation with approach is that some organizations
81
have goals that operate in opposition (Cameron, 1986) for example increasing and retaining
profits while decreasing salaries at the expense of employees.
A high proportion of the respondents said they were in agreement with the item that as business
owners, they sought unusual opportunities to expand into new business products, services and
areas/location. This means that majority of the respondents desired to expand their businesses
when presented with the right opportunities namely; finances, time, location and manpower,
although this proved to be a big huddle for many SMEs. While, Literature review states that
Systems resource approach is the organizational ability to acquire scarce and valuable
resources (Chellandurai, 1985) which is in line with many respondents. Majority of the
businesses expanding are perceived to acquire more resources and viewed more successful in
this age of limited resources. Therefore, Process approach calls for effective assessment of the
right opportunity being made on basis of an organization functioning and integration. Activities
that need to be carried out to make the organization successful are identified and how
effectively and efficiently people in the organization carry out their assigned duties. The
problem with this approach is that there is no guarantee that effectively carrying out of these
duties leads to heighted organizational effectiveness and ultimate expansion. As a result,
Cameron and Whetten (1993) suggest that the organization may have little influence on
acquiring resources (unattainable regardless of the efforts to attain them). Findings show that
although most businesses were constrained by scarce resources, there is also a significant
amount of ambiguity and anxiety in one’s intention to engage in a business venture, regardless
of the size. The fear of failure usually operationalized by an individual’s risk aversion is a
particularly critical issue for a business owner or an entrepreneur, due to the small separation
between business and personal risk in a business venture, (Watson & Robinson, 2003). In this
case, engaging in business can be characterized as requiring a fair degree of tolerance to
ambiguity, a locus of control that is more internal than external, as well as a willingness to take
82
risks that are relatively well calculated (Shabbir & Di Gregorio 1996; Pitt & Kannemeyer 2000;
Fielden & Dawe 2004). This indicates that willingness to take on risks by venturing into new
areas in business is an important variable in determining success or performance of SMEs.
Majority of the respondents were in agreement that efficiency and effectiveness in production
of goods and services improves performance of business and also ensuring that quality standard
of work were met, this is in agreement with the literature review, Cameron (1994) defines
organizational effectiveness as a process of evaluating an organization actual performance
relative to predetermined standards or series of objectives. Drucker (1954) measure of
productivity of a particular resource, like Labor can be measured in three ways, number of
hours worked, it excludes hours paid but not worked, number of workers engaged, labor costs
include salaries, bonuses, allowances and benefits paid to employees, this measure reflects the
actual amount of input used. Cole (2004) assets that “Companies need to control the types and
quantities of materials they purchase, plan which products are to be produced and in what
quantities and ensure that they are able to meet current and future customer demand, all at the
lowest possible cost. Making a bad decision in any of these areas will make the company lose
money”. This is only possible when employees have the right mind set as stated by Balunywa
(2011) who had this to say “as long as we are not in position to transform our culture of work,
we shall not progress and succeed; the culture of business today is quality through timeliness,
low cost and high productivity but not the opposite like what is seen in most developing
economies such as Uganda”. This was actually noted from the respondents who were
employees, who were neutral or in disagreement meaning they were not bothered about how
the business was run as they claimed it was their boss’ business not theirs.
83
5.3.4 Objective Four: Performance of SMEs
The result revealed a positive relationship between monitoring of business operations through
utilization of resources and performance of SMEs. This means that, when monitoring and
utilization of resources is done systematically in terms of finance, material and human
resources there is a likelihood that performance of SMEs will improve, in terms of increased
levels of sales and profits (www.luckyfamilybiz.com). Colvin & Slevin (1991) also concur that
performance of SMEs is fundamental for their survival and sustainability. Progressive
performance of SMEs has been found to spur business expansion, technological progress and
wealth creation in both start up and existing businesses. Whereas SMEs found to be poor
performers experienced stagnant or reducing sales and profits, market share, no strategic plan,
low returns on investment, low value for money which makes them less competitive on both
local and international market (SEDA Uganda, 2009). SMEs, need to establish policies and
procedures that determine how resources and business operations are to be made including
when, by whom, and how sales and profits, if any, are to be handled. The limitation is that,
despite government efforts to provide support to SMEs in order to attain performance and
sustainability of these businesses through different programs, there has been marginal
improvement in the performance of SMEs (BOU Report, 2009).
When asked to provide answers to the statement that creativity and innovation in work
processes improves business performance, a big portion of respondents, agreed and were very
positive to the statement, this means that although majority were in agreement, but actually few
businesses in Nakawa had innovative ideas, the rest were in ‘copy and paste businesses’. The
mentality observed in the research findings is that once a business owner is found to be
successful in for example in a restaurant business, then many join in without taking a feasibility
study on the business to be started, which usually leads to high rates of business collapse.
84
Researchers believe that knowledge as a resource matters more than the conventionally tended
resources (material, labor, capital), and must be managed explicitly, not left to fend for itself
(Stewart, 1998). It is also noted that Small businesses that strategically plan, carry out research
and development are also more likely to be those that are innovative, those that achieve
international growth and also leave for generations (Beaver & Prince, 2002; Gibbons &
O'Connor, 2005; Stewart, 2002; Upton, Teal, & Felan, 2001) and those less likely to fail
(Gaskill, van Auken & Manning 1993; Perry 2001, Balunywa, 2012), this because they have
to be able to differentiate themselves from the rest of the similar businesses in operation.
Government has to come in with innovative and creative ways to boost such businesses and
not being left to fend for themselves to ensure their performance and economic growth. “Be
seriously focused on leadership and innovation, the issues of innovation have been
underestimated. Africans need to wake up and style up seriously, work hard, working hard and
smart is key in success, Shaukat (2011)” which the researcher concurs with. Innovation requires
room for entrepreneurship mindset, an open and creative environment that can be acquired
through personal effort and training, a study by Ladzani & Van Vuuren (2002) on content and
training methods of SME service providers in South Africa found that business skills were
emphasized to emerging entrepreneurs rather than entrepreneurial skills. This suggests,
indirectly or otherwise, that governments need to recognize the importance of entrepreneurial
leadership for successful and sustainable establishment of business enterprises.
Lastly, answers were got for the item that, strategic planning is good for business continuity
and responses included majority that agreed and a few that disagreed. This means that majority
of the respondent knew the importance of strategic planning. It is in agreement with
comprehensive reviews of the small business literature that suggest that, ceteris paribus,
strategic planning is generally more common in better performing enterprises (Hormozi,
Sutton, McMinn, & Lucio, 2002; Lurie, 1987; Miller & Cardinal, 1994; Schwenk & Shrader,
85
1993). For example, small businesses that strategically plan (compared to those that do not) are
more likely to be those that achieve higher sales growth, higher returns on assets, higher profit
margins and higher employee growth (Berman, Gordon, & Sussman, 1997; Bracker, Keats, &
Pearson, 1988; Carland & Carland, 2003; Gibson & Casser, 2005). What should be noted is
that “Strategic planning is not just a one day activity, the process must begin long before the
real act takes place if it is to be successful, and if it is a sustainable wealth creating succession
(Matama 2012)”. On the contrary, from the research findings those that were neutral or
disagreed said they had no knowledge about strategic planning, and this is in agreement with
research into why small businesses generally do not engage in strategic planning, it is suggested
that operators may be hindered or discouraged by ‘planning barriers’ such as a lack of time, a
lack of specialized expertise, inadequate knowledge of the planning processes, or a reluctance
to share strategic plans with employees and external consultants (Robinson and Pearce 1984).
5.4 Conclusion of the Study
5.4.1 Objective one: The effect of availability of resources on the performance of SMEs
During the course of the study; key discussions were made and based on these findings, the
following can be concluded; it can be noted that human resources was key if the business was
to survive in the long run, few business owners calculated financial risk before running their
business, for SMEs to grow and expand availability of raw materials and location was
paramount.
5.4.2 Objective Two: To investigate the effect of allocation of resources on the
performance of SMEs
From the key findings, SMEs need mentorship and tailor made skills training programs offered
by Government agencies. There is need to improve allocation of human, financial and material
86
resources, if SMEs are to survive in the business age and era. Regarding financial resources of
SMEs that are constrained, these businesses should be granted tax incentives (tax breaks) to
help them re-invest their profits to encourage growth and performance of their businesses. For
Material resources, there should be improved access to information sharing, through
development of interactive mechanisms that can be used by SMEs to market their products.
Encourage formation of grass root associations which have direct contact with business, and
use them to communicate and provide SMEs with market information. Encourage SME
associations to enable their ability to supply markets requiring huge quantities.
5.4.3 Objective Three: To examine the effect of Utilisation of resources on the
performance of SMEs
As much as there is production of goods and services, access to markets by SMEs is
fundamental for them to continue generating employment and income for majority of the
population. SMEs face severe challenges in accessing both local and foreign markets and
keeping pace with global competitors. In fact, they are unable to reduce the costs and risks
involved in penetrating new markets. In both local and international market, SMEs are unable
exploit existing lucrative market opportunities that require large volumes of production,
finance and a broad product range due to low productivity and irregular supply.
The poor transport system in the country does not favour on-time delivery of products and is
unfavourable to rural SMEs in terms of accessing Kampala city and Nakawa in particular which
is one of the main local markets for a number of products, easily and timely.
5.5 Recommendations for the Study
87
5.5.1 Objective One: To determine the effect of availability of resources on the
performance of SMEs
To improve performance of unskilled employees, tailor made training should be designed by
the employer in collaboration with trainers like Enterprise Uganda, to be conducted in order to
develop skills of unskilled workers. This enhances capacity of the workers to perform beyond
their previous level. There is need to provide mentorship/apprentice or incubation centers by
the government for start-up businesses if SMEs are to realize increased performance and
growth.
5.5.2 Objective Two: investigate the effect of allocation of resources on the
performance of SMEs
Government should encourage SMEs to form associations for better bargaining power and to
be able them to provide the quantity and quality products needed in the global market and also
promote standardization through patenting their innovations through UNBS (Uganda National
Beaurue of Standards). Encourage SMEs to form associations that strengthen their bargaining
power in marketing their goods and services locally and internationally, through Uganda
Exports Promotion Board.
Government should encourage businesses to improve efficiency and productivity to meet
international standards in order to increase revenues and capital for further investment, through
participating in trainings conducted by Enterprise Uganda, UMA, and Private sector
Foundation.
5.5.3 Objective Three: To examine the effect of Utilisation of resources on the
performance of SMEs
Government should upgrade and provide incentives to SMEs so as to promote their growth or
facilitate and provide resources to vocational and technical training colleges that train SMEs
especially those that are willing to establish themselves in rural areas.
88
Government should encourage innovation among SMEs, government should develop industrial
clusters or business incubation centres that mentor small struggling businesses and encourage
industries/institutions to provide industrial attachments to start-up business in order to enhance
technology transfer.
5.6 Limitations of the Study
The study was limited to Nakawa Division therefore the findings could not be generalized to
other divisions. Results generated were not representative of the entire population as findings
specific to Nakawa were limited that geographical scope.
Findings on resource availability, allocation, and utilization are not the only factors that
determine SME performance but a range of other factors not studied in this research. The
measurement scales used in this study were adopted from other studies carried out in different
setting that may have not applied for the Nakawa setting.
In terms of finance, there was limited funding for the research which had an impact on the
overall completion of the research project. Inability to afford research assistants caused the
researcher to carry out the entire research process personally. In accessibility to afford
secretarial services also caused a delay in the completion of the dissertation.
5.7 Contributions of the Study
The research has added to the pool of knowledge in terms of access to information on resource
availability, allocation and utilization in relation to performance of SMEs. This knowledge can
be used by academicians, policy makers and other researchers.
89
5.8 Areas for Further Study
The research was limited to the study of resource availability, allocation and utilization and its
effect on performance of SMEs of businesses in Kampala, Nakawa division but other areas of
study can be. The study model could only explain up to 72.4% variance resource availability,
allocation and utilization had on performance of SMEs, the researcher recommends studies to
be carried out on other factors that would affect SME performance other than availability,
allocation and utilization of resources.
Effects of policy formulation and the performance of SMEs in Uganda. Uganda has no clear
national policies for small and medium enterprises (SMEs), and industrial development.
However, government has put in place a Poverty Eradication and Action Plan (PEAP) out of
which a number of strategies have been formulated. Therefore, further research should be
carried out in this area.
Effects of Legal framework and the performance of SMEs in Uganda. There is need to carry
out research on analytical work to review existing legislation and practices, identify SME
bottlenecks, generate strategic options for a SME support programme, and develop the training
materials and other supporting documents on the operations of SMEs in Uganda.
REFERENCES
AdatiaSalim (2011). www.luckyfamily.biz
Adam Smith (1776), The Wealth of Nations, Smith: Wealth of Nations | Library of Economics and
Liberty B.I, Ch.6, Of the Component Parts of the Price of Commodities in paragraph I.6.9.
90
Adler, P.S. and Kwon, S.-W. (2002) Social Capital: Prospects for A New Concept. Academy of
Management Review 27, 17-40
Ahern, J. (2011). From fail-safe to safe-fail: Sustainability and resilience in the new urban world.
Landscape and Urban Planning, 100, 341-343.
Alvarez, S. A. & Busenitz, L. W. (2001).The Entrepreneurship of Resource-based Theory. Journal of
Management, 27(6), 755-775.
Audretsch, D.B. & Thurik, R. (2002), ‘Linking entrepreneurship to growth’, OECD Science,
Technology and Industry Working Paper 2001/2, OECD Publishing
Amin, M. (2005). ‘Social science Research, conception Methodology & Analysis’, Makerere
University, Uganda
Aremu, M. A. (2004). Small Scale Enterprises: ‘Panacea to Poverty Problem in Nigeria’. Journal of
Enterprises Development, International Research and Development Institute, Uyo, AkwaIbom,
Nigeria, I(1): 1 – 8.
Aremu, M. A. (2010). ‘Small and Medium Scale Enterprises as A Means of Employment Generation
and Capacity Building in Nigeria’. A Paper Presented at the International Conference on
Management and Enterprise Development on “Intellectuals and New Strategies for
Sustainability Development of the Third World” Held at Conference Center, University of
Ibadan, Ibadan, Nigeria, October 5th - 8th.
Arinaitwe, S. (2006). "Factors Constraining the Growth and Survival of Small Scale Businesses: A
Developing Countries Analysis." Journal of American Academy of Business, Cambridge 8(2).
Baker, Ted & Nelson, Reed E. (2005) ‘Creating something from nothing: resource construction
through entrepreneurial bricolage’. Administrative Science Quarterly, 50(2005) 329-366.
Balunywa, (2007). www.luckyfamily.biz
Balunywa, 2012. www.luckyfamily.biz
91
Basil, A. N. O. (2005). Small and Medium Enterprises (SMES) in Nigeria: Problems and Prospects,
Ph.D. Thesis, St. Clements University.
Barringer, B. R. & Ireland, R. D. (2006). Entrepreneurship: successfully launching new Venture. New
Jersey: Pearson-Prentice Hall
Barkham R. Gudgin G. Hart M. & Hanvey E. (1996) The Determinants of Small Firm
Growth: An Inter-Regional Study in the United Kingdom 1986-1990 University of Cambridge, UK.
Beaver, G., & Jennings, P. (2000). Small business, entrepreneurship and Enterprise development.
Strategic Change, 9(7), 397-403.
Becker & Gerhart(1996). www.asiaentrepreneurshipjournal.com/AJESIII2All.pdf
Bell, 1993; Touliatos and Compton, (1988)…………..
Berman, JA, Gordon, DD & Sussman, G 1997, ‘A Study to Determine the Benefits Small Business
Firms Derive from Sophisticated Planning Versus Less Sophisticated Types of Planning’, The
Journal of Business and Economic Studies, 3 (3), 1-11.
Bernice K. and Meredith G. (1997), Relationships among owner/manager personal values, Business
strategies and enterprise Performance. Journal of Small business Management, 35:2,37-64.
Betancourt, R.R. 1986. “A Generalization of Modern Production Theory,” Applied Economics, Vol.
18, No. 8, pp. 915-928
Birch (1991).www.dlsu.edu.ph/research/journals/apssr/pdf/200706/2_roxas.pdf
Blackwood T. and Mowl G. (2000). Expatriate-owned small businesses: Measuring and accounting
for success. International Small Business Journal, 18:3 60-73.
Bosma, Niels, & Rebecca Harding. 2006. Global Entrepreneurship Monitor 2006. London: London
Business School
Bosma, N., M. van Prag., R. Thurik, & G. de Wit (2004). The Value of Human and Social Capital
Investments for the Business Performance of Startups. Small Business Economics 23(3), 227-
236
92
Bossell, Hartmut (1999). Indicators for sustainable development: Theory, method, Application. A
Report to the Balaton Group, pg2
Bosworth & Dawkins (1983). Food and Agriculture Organization of the United Nations. 1997a. The
State of World Fisheries and Aquaculture, 1996. Rome: FAO Fisheries Technical Paper.
Bridges (2002). Supporting entrepreneurship in developing countries: survey of the field and Inventory
of initiates.
Bracker, JS, Keats, BW & Pearson, JN 1988, ‘Planning and Financial Performance Among Small
Firms in a Growth Industry’, Strategic Management Journal, 9 (6),591-603.
Briton, J. E (1999). Sustainability reporting guidelines for organizations Brockhaus, R. H. (1980):
“Risk Taking Propensity of Entrepreneurs”. Academy of Management Journal, 23 (3) 509-520.
Brockhaus, R.H. & PS. Horwitz (1986) The Psychology of the Entrepreneur. The Art andScience of
Entrepreneurship, 25-48.
Brockhaus, R. H. (1980): “Risk Taking Propensity of Entrepreneurs”. Academy of Management
Journal, 23 (3) 509-520.
Carland, JC & Carland, JW 2003, ‘A Model of Entrepreneurial Planning and its Effect on
Performance’, paper presented at the ASBE Annual Conference - Building Bridges to the
Future, Houston, Texas.
Chagnati, R. (1987). Small Business Strategies in different Industry Growth Environments. Journal of
Small Business Management, 25, 61 -68.
Charmes, J. (1999) ‘Micro-enterprises in West Africa’, in King, K. and McGrath, S. (Eds)
Chandle, G.N & McEvoy, G.M (2000). Human Resource Management, Total Quality Management
and firm Performance in Small and Medium Sized Enterprises. Entrepreneurship theory and
practice, 25(3): 43-57.
Cochran, R. L. & Wood R. A. (1984) Corporate Social Responsibility and Financial Performance.
Academy of Management Journal, 736-742.
93
Coleman,J.S., (1988), Social capital in the creation of Human capital, The American Journal of
Sociology, Vol.94, 95-120
Cook.P.( 2001). Finance and small and medium-sized enterprise in developing countries. Journal of
Developmental Entrepreneurship, Norfolk, 6:1, 17-40.
Coombes (2001). Environmental Needs of a Micro-Company
sector.books.google.co.ug/books?isbn=1874719802
Churchill, N.C & Lewis, V.L. (1984).Lessons for small businesses from the recession. Journal of small
business management. 22,2: 5-17.
Cole, G.A & Phil, K. (2004).“Management Theory and Practice 7th Edition.” Functional Management;
Marketing, Production, Personnel and Finance. Pg 354-567.
Cunningham, J. B., & Lischeron, J. (1991). Defining entrepreneurship. Journal of Small Business
Management, 29, 45-61.
Cunningham, D. & Hornby, W. (1993). Pricing decision in small firms: Theory and Practice.
Management Decision. 31, 7: 46-55.
Daly, H. (1996). The Economics of Sustainable Development. www.thesocialcontract.com, social
contract Journal issues, Spring2003. Enterprise in Africa: Between Poverty and Growth,
London: Intermediate Technology Publications, pp. 71-82.
Daily, C. M., & Dollinger, M. J. (1992). An empirical examination of ownership structure in family
and professionally managed firms, Family Business Review, 5(2), 117–136.
Davidsson, Per and Honig, Benson (2003).‘The role of social and human capital among nascent
entrepreneurs’.Journal of Business Venturing18(3):pp. 301-331.
Dollinger, M. J. (1995). Entrepreneurship: Strategies andresources. Burr Ridge, IL: Irwin.
Diego, M. and Juan, M. G. (1998).PERFORMANCE as a Major Source of Competitive Advantage for
Small and Medium Sized Enterprises, 7th International Conference of the Greening of Industry
Network, November 15-18, Rome, Italy.
94
Dozia (2005). www.asiaentrepreneurshipjournal.com/AJESIII1Adegbite.pdf
Duchesneau, D. A., and W. Gartner, (1990). A Profile of New Venture Success and Failure in an
Emerging Industry, Journal of Business Venturing 5, 297-312.
Drucker, P. F. (1985). Innovation and entrepreneurship. New York: Harper.
Drucker, P. (1970). Entrepreneurship in Business Enterprise, Journal of Business Policy, 1, 3 – 12
Esnard, A.M. (2003). Beyond semantics and the immediate postdisaster period: Community quality of
life as an overarching theme for sustaining collective action. Natural Hazards
Review, 4(3), 159-165.
Enterprise Uganda (2007).Business Entrepreneurship Start-up Tool Programme.
Filey, A. andPricer, R. (1991).Growing Companies: Tools for Small Business Success.
Madison, USA: Magna Publications Inc.
Finnerty J and AT Krzystofik,.(1985). “Barriers to Small Business Formation”.Journal of Small
Business Management, Vol 23 No 3, pp 50–58 .
Freese, M. (2000).‘Success and Failure of Micro Business Owners in Africa’: A
PsychologicalApproach, Westport, CT: Quorum.
Fielden, S.L and Dawe, A. (2004). Entrepreneurship and Social Inclusion. Women in Management
Review 19(3), 139-142.
Fiet, J.O. (2000a), “The theoretical side of teaching entrepreneurship” Journal of Business Venturing,
Vol.16. 1,pp.1-24.
Fiksel.J. (2006).“A Framework for sustainable material management”.Journal of materials
management.
Gartner, W.B., 1989, High Growth Entrepreneurial Ventures: A Content Analysis to Identify
Common Strategic Factors, presented at the Babson Entrepreneurship Research Conference,
Wellesley, Mass.: Babson College.
95
Gaskill, LR, van Auken, HE and Manning, RA (1993). ‘A Factor Analytic Study of the Perceived
Causes of Small Business Failure’, Journal of Small Business Management,31 (4), 18-31.
Gatewood, E., Shaver, K. and Gartner, W., (1995).‘A Longitudinal Study of Cognitive Factors
Influencing Start-up Behaviors and Success at Venture Creation’.Journal of Business Venturing, 10,
371-391.
Geis, D., andKutzmark, T. (1995). Developing sustainable communities: “The future is now”.
Public Management, 77(8), 4–13.
Gibson, B andCasser, G 2005, ‘Longitudinal Analysis of Relationships between Planning and
Performance in Small Firms’, Small Business Economics, 25 (3), 207-222.
Gibbons, PT and O'Connor, T 2005, ‘Influences on Strategic Planning ProcessesAmong Irish SMEs’.
Journal of Small Business Management, 43(2), 170-186.
Gifford, S. (1998). .Limited Entrepreneurial Attention and Economic Development Small Business
Economics 10(1): 17-30.
Gnyawali, D., andFogel, D. (1994). Environments for entrepreneurship development: Key dimensions
and research implications. Entrepreneurship Theory and Practice, 18(4).
Hall, R. H., 1982, Organizations: Structure and Process. Englewood Cliffs, N. J.: Prentice-Hall.
Herroelen, W.S and Leus, R.(2004). Robust and Reactive project scheduling: A review and
classification of production Research 42:1599-1620
Herron, L. A. (1990) ‘The effects of characteristics of the entrepreneur on new venture Performance’,
Doctoral Dissertation, University of South Carolina.
Hisrich, R.D, Peters, M.P and Sheperd, D.A. (2008).Entrepreneurship. 7th ed. Boston: McGraw-Hill.
Holt (1993).www.asiaentrepreneurshipjournal.com/AJESIII2All.pdf
Hormozi, AM, Sutton, GS, McMinn, RD andLucio, W 2002, ‘Business Plans For Newor Small
Businesses: Paving the Path to Success’, Management Decision, 40 (8), 755-763.
96
Hornsby, J.S and Kuratko, D.F, (2003). Human Resource Management in U.S. Small Business: A
replication and extension. Journal of development Entrepreneurship, 8(1): 73-89.
Hornsby. J. S., andKuratko, D. F. (1990). Human resource management in small business: Critical
issues for the 1990's. Journal of Small Business Management, 28(3), 9-18.
Howard, D. and Hine, D. (1995). The Population of Organisations Life Cycle (POLC): Implications
for small business assistance programs.
Huang X and Brown A, 1999, An analysis and classification of problems in small business.
Internaitonal Small Business Journal, 18:1 73-85
Ibrahim N and Rue L, 1998, The relationship between planning sophistication and Performance in
small businesses. Journal of Small Business Management, 36:4 24-32.
Jawahar, I.M and McLaughlin, G (2001). Towards a descriptive stakeholder theory: An organizational
lifecycle approach. Academy of management review, 26(3): 397-415.
Jennings, P. D. and Beaver, G. (1995). The Performance and competitive advantage of small firms: A
Management Perspective. International Small Business Journal.15 (2): 63 - 75.
Kahan, J.H., Allen, A.C., and George, J.K. (2009). An operational framework for resilience.
Journal of Homeland Security and Emergency Manageemnt, 6(1), article 83.
Kathuri, L.R and Pals, A.D. (1993).Introduction to Educational Research.Egerton University
Education Book Series.
Kassami (2001), (2008) “The National Development plan 2010/2011-2014/15, Ministry of Finance
Planning and Economic development, www.npa.ug
Kent P., 1994, Management advisory services and the financial Performance of clients.
International Small Business Journal, 12:4, 45.
Kirby, D. A. (2003). Entrepreneurship education: Can business schools meet the challenge? In E.
Genesca, D. Urbano, J. Capellera, C. Guallarte& J. Vergés, Creación de empresas:
97
Entrepreneurship: Homenaje al profesor José MaríaVecianaVergés(pp. 359-375). Bellatera:
Universidad Autónoma de Barcelona.
Koop, S., De Reu, T., andFrese, M. (2000).Sociodemographics factors,entrepreneurial orientation,
personal initiative and environmental problemsin Uganda. Success and failure of
microbusiness owners in Africa: Apsychological approach. Westport, Ct. Quorum. 55-76.
Krejce,R.V and Morgan, D.W. (1970). Determining sample size for research activities: Educational
and Psychological measurement, 30, pp.607-610. State: Kampala.
Kuratko, D.F. and Hodgetts, R.M (2007).Entrepreneurship. 7th ed. Ohio: Thomson
Sothwestern.
Kyambadde.A (2011). ). www.luckyfamily.biz
Franck, B. and K. Neumann, C. Schwindt (1997).A capacity-oriented hierarchical approach to single-
item and small-batch production planning using project-scheduling methods, 77-85.
Kasekende, L & Opondo, H. (2003). Financing small and medium-scale enterprises (SMEs): Uganda’s
experience. BOU working paper. Available:www.bou.or.ug/FINANCESMEs.pdf [accessed 15
December 2004].
Kayanula, D & Quartey P. (2000). The Policy environment for promoting small and medium-sized
enterprises in Ghana and Malawi. Working series paper, 15. Manchester: Institute for
Development Policy and Management, University of Manchester. Available:
www.devinit.org/findev/Fd-wp15.doc [accessed 5th January 2006].
Kiggundu, M. N. (2002) ‘Entrepreneurs and entrepreneurship in Africa: what is known and what needs
to be done’, Journal of Development Entrepreneurship, Vol.7, No. 3, pp. 239-259.
Lado, A.A and Wilson, M.C(1994). Human resource systems and sustained competitive Advantage:
A competency- based perspective. Academy of management review, 19(4): 699-727.
98
Ladzani and Van (2002).www.ajol.info/index.php/saje/article/download/25136/4335
Lambert, M.R and H.Vanderveken (1979).Production Scheduling for Multi-stage production systems,
103-114.
Leaptrott, John. 2005. An institutional theory view of the family business. Family BusinessReview,
18(3): 215-228.
Lowrey, Y. (2003). The entrepreneur and entrepreneurship: A neoclassical approach. Paper presented
at the ASSA Annual Meeting, Washington, D.C: Office of Advocacy, Small Business
Administration, January 5.
Lundström, A., and Stevenson, L. A. (2005).Entrepreneurship policy: Theory and practice. New York:
Springer Science + Business Media, Inc.
Luk T. K., 1996, Success in Hong Kong: Factors self-reported by successful small businessowners.
Journal of Small Busines Management 34:3 68.
Lurie, SM 1987, ‘Strategic Business Planning for the Small- to Medium-SizedCompany’, The CPA
Journal, 57 (6), 90-92.
McDade, B. and Spring, A. (2005) ‘The new generation of African entrepreneurs’: networking to
change the climate for business and private sector-led development’, Entrepreneurship and
Regional development, Vol. 17, pp. 17-42.
Mankiw, N.G. (2008).Principles of Economics, (5th ed), South-Western College Publishing, Boston,
MA. ISBN 1111399115.
Mariotti, S. (2007). Entrepreneurship: Starting and Operating a Small Business. New Jersey: Pearson
Prentice Hall.
Matama.R. (2012).www.luckyfamily.biz
Matambalya (2000). The profile of Small and Medium scale enterprises in the SADC Economies.
www.wipo.int/about-ip/en/studies/pdf/study_f_matambalya.pdf
99
Matthews, C. H. and Moser, S. B. 1995. Family background and gender: Implications for interest in
small firm ownership. Entrepreneurship and Regional Development, 7: 365–377.
McEvoy, G.M. (1983). Personnel practice in small business firms: a survey and recommendations.
American Journal of Small Business. 8, 2: 32-40.
Mileti, D. (1999). Disasters by Design: A reassessment of natural hazards in the United States.
Washington, DC: Joseph Henry Press.
Miller, CC and Cardinal, LB 1994, ‘Strategic Planning and Firm Performance: ASynthesis of More
Than Two Decades of Research’, Academy of ManagementJournal, 37 (6), 1649-1665.
MoFPED, (2001/2002). Poverty Eradication Plan (PEAP)
MoFPED, (2008).Enhancing competitiveness of Micro, Small and Medium Enterprises, Discussion
Paper 15
MoFPED, (2008).Third National Competitive Forum, Kampala. www.cics.go.ug
MoFPED, (2009).National Budget Framework Paper (FY 2009/10-FY2013/14)
Monk, R., (2000). ‘Why Small Business Fail?’. CMA Management 74(6), 12-13.
Neumann, K. and C. Schwindt (1998). A capacitated hierarchical approach to make-to-order
production. European Journal of Automation 32, 397-413
Neelameghan, A. (1992). Information for small enterprises. Bangalore: Sarada Ranganathan
Endowment for Library Science.
Okello-Obura, C., Minishi-Majanja, M.K, Cloete, L.M. & Ikoja-Odongo, J.R. (2008). Business
activities and information needs of SMEs in northern Uganda: prerequisites for an information
system. Library Management, Vol.4, No.5.
Okello-Obura, C., Minishi-Majanja, MK, Cloete, LM. & Ikoja-Odongo, J.R. (2008). Improving
information use by SMEs in northern Uganda through ICTs, MOUSAION, Vol. 26, No.1, pp:
126-149
100
Olson, S.F. and H.M. Currie (1992). Female entrepreneurs: personal value systems and business
strategies in a male-dominated industry. Journal of Small Business Management, January, 49-
57. arrow.monash.edu.au/vital/access/%20/services/Download/.../DOC
O'Regan, N andGhobadian, A(2004).‘Re-visiting the Strategy-Performance Question:An Empirical
Analysis’, International Journal of Management and Decision Making,5 (2/3), 144-170.
Oso and Onen (2008).General guidelines to Writing Research proposal and Report. The Jomo Kenyatta
Foundation, Nairobi Kenya
Penrose, E.T. (1959). The Theory of the Growth of the Firm, New York: Wiley.
Perry, SC (2001).‘The Relationship between Written Business Plans and the Failure ofSmall
Businesses in the US’, Journal of Small Business Management, 39 (3), 201-208.
Plaschka, G., (1990) Person-Related and Microsocial Characteristics of Successfuland Unsuccessful
Entrepreneurs.In: Donckels, R. and Miettinen, A., eds. NewFindings and Perspectives in
Entrepreneurship.Aldershot: Avebury. 187-202.
Rauch, A. andFrese, M. (2000). Psychological approaches to entrepreneurial success: A generalmodel
and an overview of findings. In C.L.Cooper& I.T. Robertson (Eds), InternationalReview of
Industrail and Organizational Psychology, Vol. 15, 100-135
Robinson, R.B. and J.A. Pearce (1983).The impact of formalizedfor·mal·ize strategic planning on
financial Performance in small organizations. Strategic Management Journal, 4, 197-207.
Robinson, RB and Pearce, JA 1984, ‘Research Thrusts in Small Firm Strategic Planning’, Academy of
Management, 9 (1), 128-137.
Rugasira, A. (2011). www.luckyfamily.biz
Seidman, (2008).www.resolv.org/site-assessment/files/2012/06/Appendices-Only.pdf

101
Sekaran, U. (2003). Research Methods for Business: A skill Building approach. New York: John Wiley
and sons.Inc.
Schiffer, M & Weder, B. (2001). Firm size and the business environment: worldwide survey results:
discussion paper 43. Washington: World Bank.
Schumpeter, J. (1934): The Theory of Economic Development. (Cambridge, Mass: Harvard
University Press).
Scott, M. G. andTwomey, D. F. 1988. The long-term supply of entrepreneurs: Students career
aspirations inrelation to entrepreneurship. Journal of Small Business Management, 26(4): 5–
13.
Shabbir,A and Di Gregorio,S. (1996). An Examination of the Relationship between Women’s personal
goals and structural factors influencing their decisions to start businesses: Case of Shaukat.
A.(2011).www.luckyfamily.biz
Sen, A (1999). Development as Freedom.www.amazon.com/Development-as-Freedom-Amartya-
Sen/.../03754061
Simpson M., Nicki T., and Bellamy S.(2004).Small Business Success Factors: the Role of
Education and Training ;Education + Training, 46: 8-9 p481-491.
Solow, R.M (1992). Sustainable Development: Concepts, Rationalities, and strategies; Dordrecht,
Kluwer Academic Publishers, Economy and Environment series 1998.pp299-317
Stewart, KS 2002, ‘Formal Business Planning and Small Business Success: A Surveyof Small
Businesses With An International Focus’, Journal of American Academy of
102
Business, 2 (1), 42-46.
Storey, D.J.,(1994). Understanding the small business sector, London: Thomson Learning.
Sriram, V., Mersha, T. & Herron, L. (2007).Drivers of urban entrepreneurship: an intergrative model
International Journal of Entrepreneurial Behaviour and Research (4) Emerald Stonehouse, G
& Pemberton, J 2002, ‘Strategic Planning in SMEs - Some Empirical Findings’,Management
Decision, 40 (9), 853-861.
Tendler, J. and Amorim, A. M. (1996). Small Firms and their helpers: Lessons on Demand. World
Development.24 (3): 407-426.
Tocher, N. and Rutherford, M.W.(2009). Perceived acute human resource management in Small and
Medium Firms: An Emphirical Examination. Entrepreneurship Theory and Practice, 33(2):
455-790.
Toman, M. A (1992).The Difficulty in defining PERFORMANCE.Washington, D.C; Island press.
Tumwine. E. ( 2009). www.luckyfamily.biz
U.I.A, (2011).Uganda Investment Authority.Investor Survey 2012 Report
Upton, N, Teal, EJ &Felan, JT (2001). ‘Strategic and Business Planning Practices ofFast Growth
Family Firms’, Journal of Small Business Management, 39 (1), 60-72.
Van.A.H and Fry, F.L. (2006). Role Model Influences on Entrepreneurial Intentions: A Comparison
Between USA and Mexico. International Entrepreneurship and Management Journal, Volume
2 Issue 3: September 2006
Watson and Robinson (2003). Ecological Economics 48, 369-384
WCED (1987). Report of the World Commission on Environment and Development: Our Common
Future (Brundtland Report).
Wernerfelt, B. (1984).The Resource-Based View of the Firm. Strategic Management Journal; 5, (2),
pp. 171–180.
103
Wijewardena H and Tibbits G E, (1999). Factors contributing to the growth of smallmanufacturing
firms: Data from Australia, Journal of Small Business Management, 37:2 88-95.
WijewardenaH., and Cooray S. (1995). Determinant of Growth in Small JapaneseManufacturing
Firms: Survey Evidence from Kobe. Journal of Small Business Management33:4, 87-92.
Wiklund J., and Shepherd D., 2005, Entrepreneurial orientation and small business Performance: a
configurational approach. Journal of Business Venturing, 20:1, p71-91
(www.enterprisedevelop.com/.../edg%20sustainable%20enterprise%...)
www.cengage.co.uk/colekelly7 .
Adam Smith (1776), The Wealth of Nations, Smith: Wealth of Nations | Library of Economics and Liberty B.I, Ch.6,
Of the Component Parts of the Price of Commodities in paragraph I.6.9.
APPENDICES
Appendix 1: Budget
No. Item Description Unit cost Estimated
Amount
1 Field Assistant 1 field assistant for 10 days 20,000/- 200,000/-
2 Travel Transport fare per day for 10
days 5,000/- 50,000/-
3 Stationary 1 realm of photocopying
paper 10,000/- 10,000/-

104
4 Consultancy 1 consultant for data analysis 250,000/- 250,000/-
5
Miscellaneous
Total
1% of total cost
285,000/-
5,100/-
510,000/-
105
Appendix 2: Time Framework
Phase/ Activity Time
(Months) Dates Dependency
A Development of
Proposal 3
March
-May
2011
A
B
Development &
piloting of
instruments
1 June
2011 B
C Data collection 1 July
2011 C
D
Data organization,
analysis, and
interpretation
3
Augus
t-
Octob
er
2011
D
E
Typing/Editing/Re
port writing/
submission
4
Octob
er-
Januar
y
2011
D,E
106
Questionnaire for a study on Resource availability, allocation and utilization on
performance of SMEs
Dear Respondent,
This research is for study purposes at Uganda Management Institute.
This questionnaire is designed to seek your views on resource availability and utilization on
performance of SMEs. Your views will be treated with the highest view of confidentiality and
will be used for the purpose of this study only.
Part A: (Personal Information)
Please respond to the following questions by placing a tick in the brackets indicating your
appropriate response.
1) Gender: Male [ ] Female [ ]
2) Age of respondent: 20-29 [ ] 30-39 [ ] 40-49 [ ] 50-59 [ ] 60-69 [ ]
70 and above [ ]
3) Level of education:
No school [ ] Primary school [ ] Secondary school [ ] Technical/University
[ ] Other (Specify): …
4) Please indicate time period you have operated business
Less than 1 year [ ] 1-2 years [ ] 3-5 years [ ]
More than 5 years [ ]
Part B: (Business information)
For each of the statements below, please indicate the extent of your agreement or disagreement
by placing a tick in the appropriate box.
The response scale is as follows:
SCALE 1=Strongly
Disagree
2=Disagree 3=Undecided 4=Agree 5=Strongly
Agree
107
Part B (i) Availability of Resources
Human resources 1 2 3 4 5
As a business owner, I seek unusual opportunity to
start a new business
As a business owner, I plan for competent and
qualified people to work for me
I plan for the right number of people to do the job
Part B (ii)
Financial resources 1 2 3 4 5
As a business owner, I seek opportunities to obtain
finance for business
As a business owner, I deliberately calculate
financial risks and evaluate alternatives in business
decision
I seek information and strategies on how best to
price my products or services
As a business owner, I set financial goals that
articulate, clear and specific for both short and long
term
Part B (iii)
Material resources 1 2 3 4 5
As a business owner, I seek opportunity to obtain
information about raw materials, equipment and
good location for business
I personally seek information about competitors,
clients and suppliers
As a business owner, I research on how to provide a
product or service that meet the clients expectations
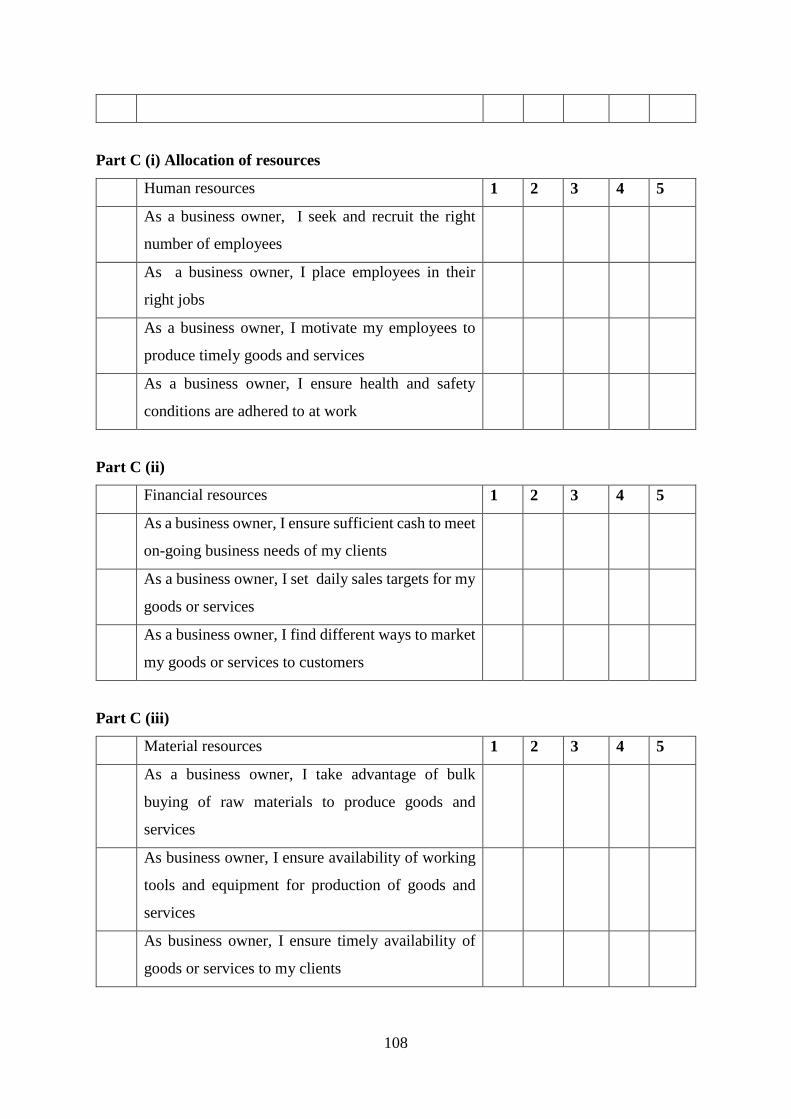
108
Part C (i) Allocation of resources
Human resources 1 2 3 4 5
As a business owner, I seek and recruit the right
number of employees
As a business owner, I place employees in their
right jobs
As a business owner, I motivate my employees to
produce timely goods and services
As a business owner, I ensure health and safety
conditions are adhered to at work
Part C (ii)
Financial resources 1 2 3 4 5
As a business owner, I ensure sufficient cash to meet
on-going business needs of my clients
As a business owner, I set daily sales targets for my
goods or services
As a business owner, I find different ways to market
my goods or services to customers
Part C (iii)
Material resources 1 2 3 4 5
As a business owner, I take advantage of bulk
buying of raw materials to produce goods and
services
As business owner, I ensure availability of working
tools and equipment for production of goods and
services
As business owner, I ensure timely availability of
goods or services to my clients
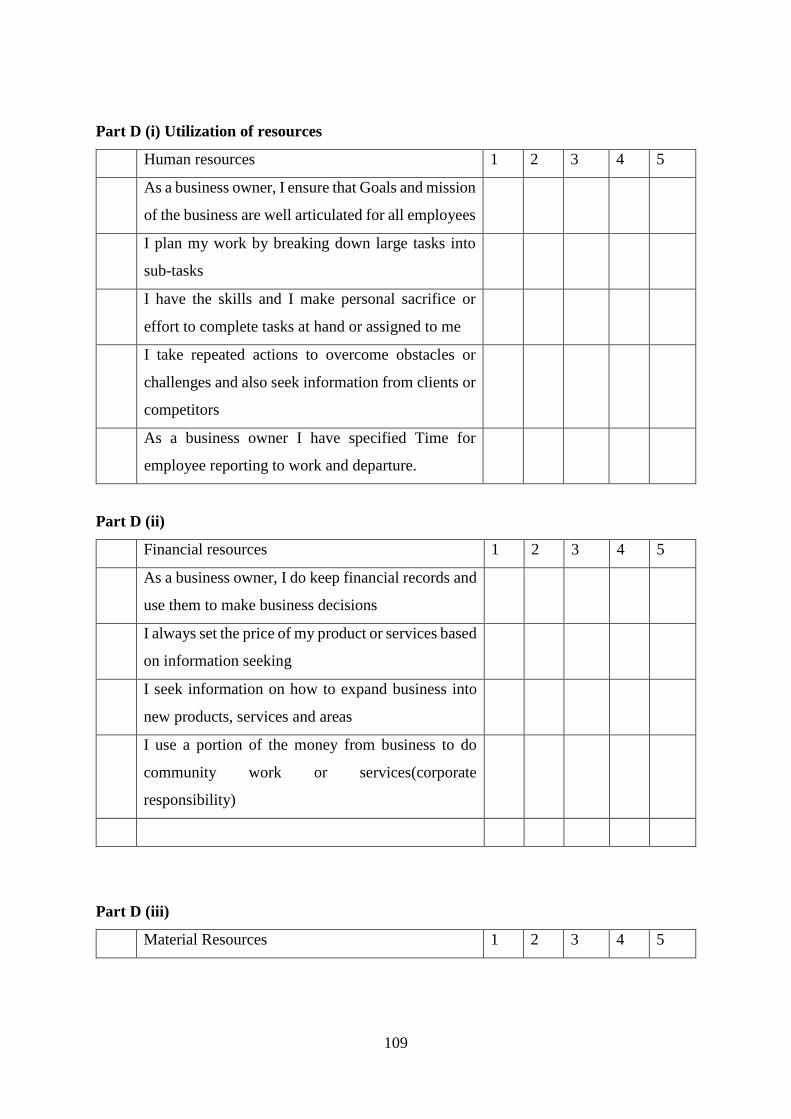
109
Part D (i) Utilization of resources
Human resources 1 2 3 4 5
As a business owner, I ensure that Goals and mission
of the business are well articulated for all employees
I plan my work by breaking down large tasks into
sub-tasks
I have the skills and I make personal sacrifice or
effort to complete tasks at hand or assigned to me
I take repeated actions to overcome obstacles or
challenges and also seek information from clients or
competitors
As a business owner I have specified Time for
employee reporting to work and departure.
Part D (ii)
Financial resources 1 2 3 4 5
As a business owner, I do keep financial records and
use them to make business decisions
I always set the price of my product or services based
on information seeking
I seek information on how to expand business into
new products, services and areas
I use a portion of the money from business to do
community work or services(corporate
responsibility)
Part D (iii)
Material Resources 1 2 3 4 5
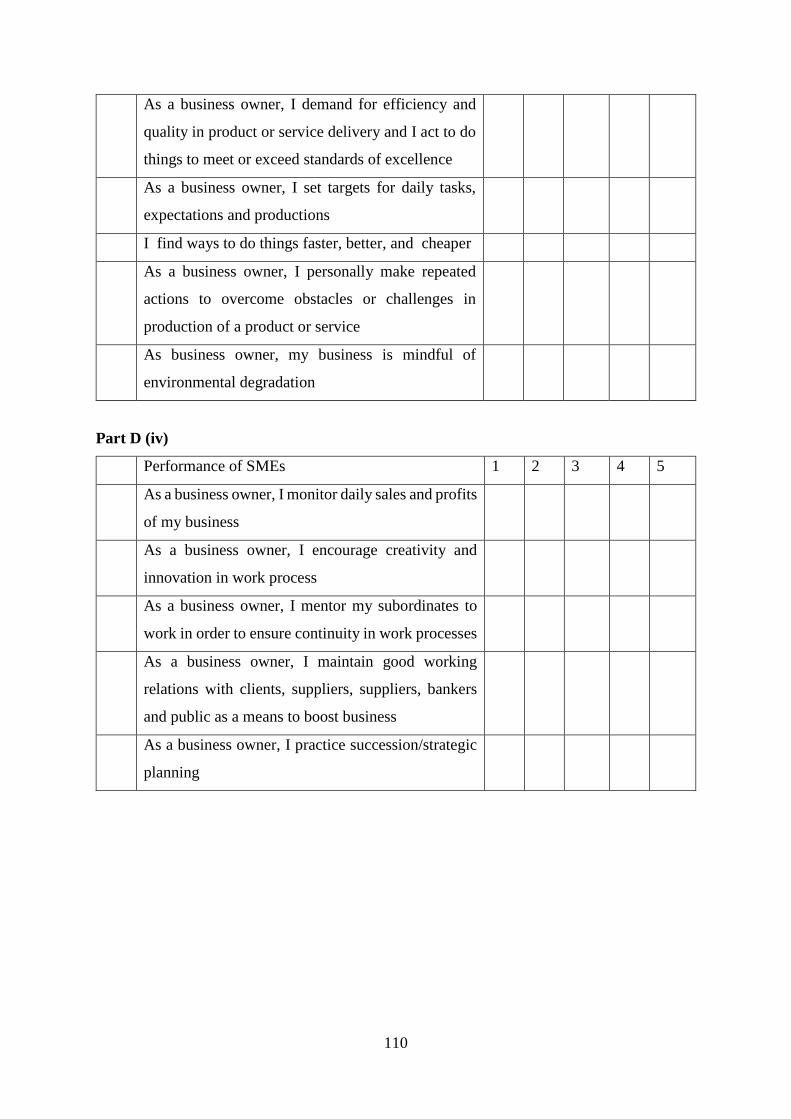
110
As a business owner, I demand for efficiency and
quality in product or service delivery and I act to do
things to meet or exceed standards of excellence
As a business owner, I set targets for daily tasks,
expectations and productions
I find ways to do things faster, better, and cheaper
As a business owner, I personally make repeated
actions to overcome obstacles or challenges in
production of a product or service
As business owner, my business is mindful of
environmental degradation
Part D (iv)
Performance of SMEs 1 2 3 4 5
As a business owner, I monitor daily sales and profits
of my business
As a business owner, I encourage creativity and
innovation in work process
As a business owner, I mentor my subordinates to
work in order to ensure continuity in work processes
As a business owner, I maintain good working
relations with clients, suppliers, suppliers, bankers
and public as a means to boost business
As a business owner, I practice succession/strategic
planning
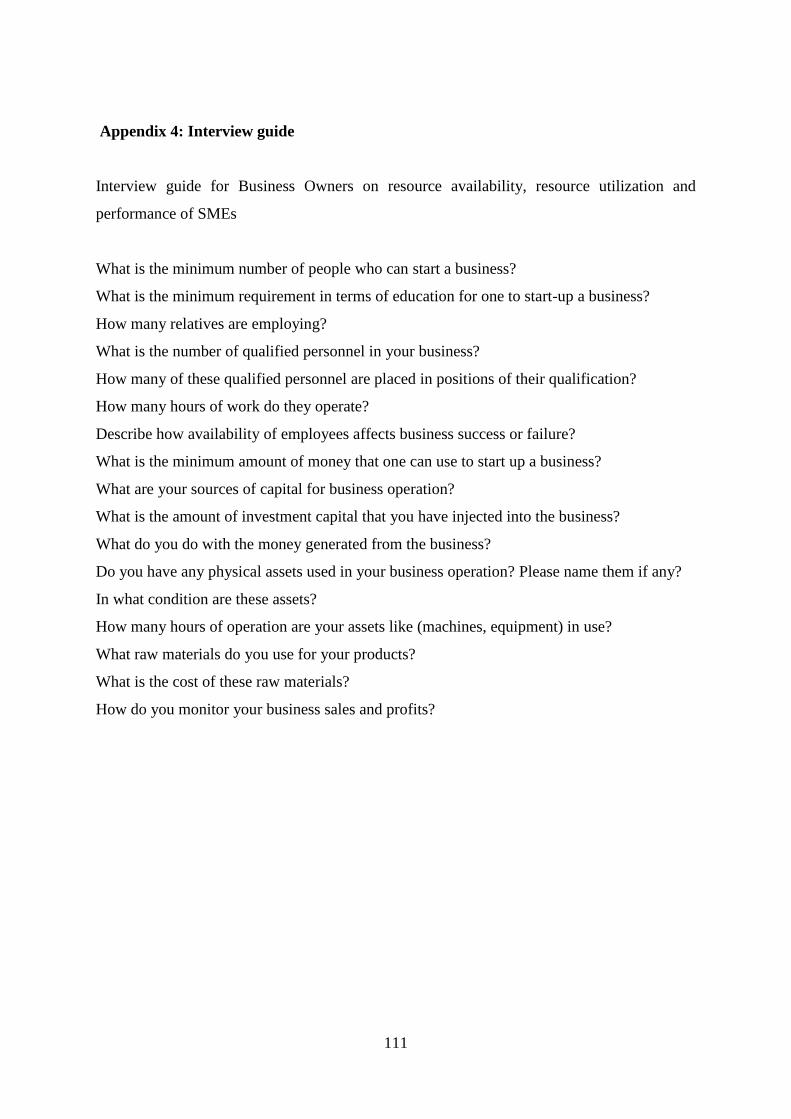
111
Appendix 4: Interview guide
Interview guide for Business Owners on resource availability, resource utilization and
performance of SMEs
What is the minimum number of people who can start a business?
What is the minimum requirement in terms of education for one to start-up a business?
How many relatives are employing?
What is the number of qualified personnel in your business?
How many of these qualified personnel are placed in positions of their qualification?
How many hours of work do they operate?
Describe how availability of employees affects business success or failure?
What is the minimum amount of money that one can use to start up a business?
What are your sources of capital for business operation?
What is the amount of investment capital that you have injected into the business?
What do you do with the money generated from the business?
Do you have any physical assets used in your business operation? Please name them if any?
In what condition are these assets?
How many hours of operation are your assets like (machines, equipment) in use?
What raw materials do you use for your products?
What is the cost of these raw materials?
How do you monitor your business sales and profits?

112