
Using visualization tools to guide consensus in group decision making
9
Using Visualization Tools to Guide Consensus in Group Decision Making Sergio Alonso 1 , Enrique Herrera-Viedma 2 , Francisco Javier Cabrerizo 2 , Carlos Porcel 3 , and A.G. L´ opez-Herrera 4 1 Software Engineering Dept., University of Granada (Spain) 2 Computer Science and Artificial Intelligence Dept., University of Granada (Spain) 3 Computer Science and Numerical Analysis Dept., University of C´ordoba (Spain) 4 Computer Science Dept., University of Ja´ en (Spain) {salonso,viedma}@decsai.ugr.es,[email protected], [email protected],[email protected] Abstract. In the resolution of group decision making problems where the consensus process can not be held face to face by the experts it is usually difficult for them to be able to identify the closeness of the opin- ions of the rest of the experts, and thus, it is difficult to have a clear view of the current state of the consensus process. In this paper we present a tool that creates consensus diagrams that can help experts to easily comprehend the current consensus state and to easily identify the ex- perts that have similar or very different opinions. Those diagrams are based on several new similarity and consistency measures. Keywords: Consensus, Visualization, Consistency, Group Decision Making. 1 Introduction Usually, to solve Group Decision Making problems, that is, problems where a set of experts E = {e 1 ,...,e m } have to choose the best alternative or alternatives from a feasible set of alternatives X = {x 1 ,...,x n }, two different processes have to be carried out: the consensus process and the selection process. The former consists on obtaining the highest consensus level among experts, that is, to obtain a state were the opinions of the different experts are as close as possible one to another. The latter process consists on obtaining the final solution to the problem from the opinions expressed by the experts in the last round of the consensus process. While the selection process can be almost fully automatized using different Soft Computing techniques [4,5,9,10,12,17], the consensus process [2,3,11,14,16,22] in- volves the communication and discussion among experts and between the experts and the moderator, which is usually encharged to guide the consensus process in order to obtain the final solution for the problem with a high level of consensus. Thus, to fully automatize the consensus process is a more difficult task. However, several new different approaches and tools to adapt classical consensus processes F. Masulli, S. Mitra, and G. Pasi (Eds.): WILF 2007, LNAI 4578, pp. 77–85, 2007. c Springer-Verlag Berlin Heidelberg 2007
Transcript of Using visualization tools to guide consensus in group decision making

Using Visualization Tools to Guide Consensus inGroup Decision Making
Sergio Alonso1, Enrique Herrera-Viedma2, Francisco Javier Cabrerizo2,Carlos Porcel3, and A.G. Lopez-Herrera4
1 Software Engineering Dept., University of Granada (Spain)2 Computer Science and Artificial Intelligence Dept., University of Granada (Spain)3 Computer Science and Numerical Analysis Dept., University of Cordoba (Spain)
4 Computer Science Dept., University of Jaen (Spain){salonso,viedma}@decsai.ugr.es,[email protected],
[email protected],[email protected]
Abstract. In the resolution of group decision making problems wherethe consensus process can not be held face to face by the experts it isusually difficult for them to be able to identify the closeness of the opin-ions of the rest of the experts, and thus, it is difficult to have a clear viewof the current state of the consensus process. In this paper we presenta tool that creates consensus diagrams that can help experts to easilycomprehend the current consensus state and to easily identify the ex-perts that have similar or very different opinions. Those diagrams arebased on several new similarity and consistency measures.
Keywords: Consensus, Visualization, Consistency, Group DecisionMaking.
1 Introduction
Usually, to solve Group Decision Making problems, that is, problems where a setof experts E = {e1, . . . , em} have to choose the best alternative or alternativesfrom a feasible set of alternatives X = {x1, . . . , xn}, two different processeshave to be carried out: the consensus process and the selection process. Theformer consists on obtaining the highest consensus level among experts, that is,to obtain a state were the opinions of the different experts are as close as possibleone to another. The latter process consists on obtaining the final solution to theproblem from the opinions expressed by the experts in the last round of theconsensus process.
While the selection process can be almost fully automatized using different SoftComputing techniques [4,5,9,10,12,17], the consensus process [2,3,11,14,16,22] in-volves the communication and discussion among experts and between the expertsand the moderator, which is usually encharged to guide the consensus process inorder to obtain the final solution for the problem with a high level of consensus.Thus, to fully automatize the consensus process is a more difficult task. However,several new different approaches and tools to adapt classical consensus processes
F. Masulli, S. Mitra, and G. Pasi (Eds.): WILF 2007, LNAI 4578, pp. 77–85, 2007.c© Springer-Verlag Berlin Heidelberg 2007

78 S. Alonso et al.
and models to new environments and making use of new technologies (mainlyweb-based technologies) can be found in the literature [1,18,19,21].
The application of these new technologies allow to carry out consensusprocesses in situations which previously could not be correctly addressed. Forexample, nowadays it is possible to carry out consensus processes among sev-eral experts which are located in different countries around the world. Though,it is important to remark that even with the adoption of new communicationtechnologies (video-conference, chat rooms, instant messaging, e-mail and so on)there is still an important need of new collaboration and information tools forthe experts being able to solve decision making problems where they cannotmeet together with the other experts.
In this work we center our attention in a particular problem that arises inmany consensus processes for group decision making when experts do not havethe possibility of gathering together: experts may not have a clear idea about thecurrent consensus status among all the experts involved in the decision process.In usual decision making models, where experts gather together to discuss theiropinions about the different alternatives, it is relatively easy to determine whichexperts have similar opinions, and thus, experts may join or form different groupsto better discuss and to reason out about the pros and cons of every alternative.Additionally, when experts are able to determine the consensus state of thedecision making process it is more easy for them to influence the other experts[8]. However, in the cases where direct communication is not possible, expertswill probably need some assistance to stablish connections among them and toobtain a clear view of the consensus process progress.
To ease the perception of the consensus state to the experts, we propose touse a novel visualization tool which generates simple consensus diagrams of thecurrent consensus state in the decision making problem that is being solved bydrawing a graph in which the experts are nodes which are separated from eachother depending on the affinity of their preferences about the alternatives inthe problem. Visual elements do have a great protential to influence experts indecision processes [20] and thus, these consensus diagrams, when presented tothe experts, will allow them to have a more profound and clear view about theconsensus process and about which experts have similar or different opinionsabout the alternatives. To develop the visualization tool we take into accountseveral factors as the consistency of the information expressed by each expertand the similarity of the opinions of the experts at three different levels. Thisvisualization tool can be easily integrated into existing consensus models.
The structure of this contribution is as follows: In section 2 we present fuzzypreference relations as the representation model that the experts will use to pro-vide their preferences about the alternatives and some consistency propertiesand measures about them. In section 3 we present some similarity masures thatcan be computed from the preferences expressed by the experts. Section 4 de-scribes the visualization tool that using the previous similarity and consistencymeasures generates some consensus diagrams that can be used by the experts

Using Visualization Tools to Guide Consensus in GDM 79
to obtain a clear picture of the current consensus state in the problem. Finally,some conclusions and future works are outlined in section 5.
2 Preliminaries
In this section we present fuzzy preference relations as the representation modelthat the experts will use to express their preferences about the alternatives in theproblem. Additionally, some consistency measures for the preference relations atthree different levels (pair of alternatives, alternatives and preference relationlevels) are presented.
There exists many different representation formats that can be used by expertsto provide their preferences about the alternatives in a group decision makingproblem. One of the most used formats is fuzzy preference relations due to theireffectiveness as a tool for modelling decision processes and their utility andeasiness of use when we want to aggregate experts’ preferences into group ones[13,15,23]:
Definition 1. A fuzzy preference relation P h given by expert eh on a set ofalternatives X is a fuzzy set on the product set X × X, i.e., it is characterizedby a membership function μP h : X × X −→ [0, 1].
When cardinality of X is small, the preference relation may be convenientlyrepresented by the n × n matrix P h = (ph
ik), being phik = μP h(xi, xk) (∀i, k ∈
{1, . . . , n}) interpreted as the preference degree or intensity of the alternative xi
over xk: phik = 1/2 indicates indifference between xi and xk (xi ∼ xk), ph
ik = 1indicates that xi is absolutely preferred to xk, and ph
ik > 1/2 indicates that xi
is preferred to xk (xi � xk). Based on this interpretation we have that phii =
1/2 ∀i ∈ {1, . . . , n} (xi ∼ xi).Consistency [13], that is, lack of contradiction, is usually a very desirable prop-
erty for preference relations (information without contradiction is usually morevaluable than contradictory information). In [12] we developed some consistencymeasures for fuzzy preference relations which are based on the additive consis-tency property, whose mathematical definition was provided by Tanino in [23]:
(phij − 0.5) + (ph
jk − 0.5) = (phik − 0.5) ∀i, j, k ∈ {1, . . . , n} (1)
that can be rewritten as:
phik = ph
ij + phjk − 0.5 ∀i, j, k ∈ {1, . . . , n} (2)
We consider a fuzzy preference relation P h to be additive consistent when forevery three alternatives in the problem xi, xj , xk ∈ X their associated preferencedegrees ph
ij , phjk, ph
ik fulfil (2).Additionally, expression (2) can be used to calculate an estimated value of a
preference degree using other preference degrees in a fuzzy preference relation.Indeed, the preference value ph
ik (i �= k) can be estimated using an intermediatealternative xj in three different ways:

80 S. Alonso et al.
1. From phik = ph
ij + phjk − 0.5 we obtain the estimate
(cphik)j1 = ph
ij + phjk − 0.5 (3)
2. From phjk = ph
ji + phik − 0.5 we obtain the estimate
(cphik)j2 = ph
jk − phji + 0.5 (4)
3. From phij = ph
ik + phkj − 0.5 we obtain the estimate
(cphik)j3 = ph
ij − phkj + 0.5 (5)
The overall estimated value cphik of ph
ik is obtained as the average of all possible(cph
ik)j1, (cphik)j2 and (cph
ik)j3 values:
cphik =
∑nj=1;i�=k �=j(cp
hik)j1 + (cph
ik)j2 + (cphik)j3
3(n − 2)(6)
When the information provided is completely consistent then (cphik)jl=ph
ik∀j, l.However, because experts are not always fully consistent, the information givenby an expert may not verify (2) and some of the estimated preference de-gree values (cph
ik)jl may not belong to the unit interval [0, 1]. We note, fromexpressions (3–5), that the maximum value of any of the preference degrees(cph
ik)jl (l ∈ {1, 2, 3}) is 1.5 while the minimum one is -0.5. Taking this intoaccount, we define the error between a preference value and its estimated one asfollows:
Definition 2. The error between a preference value and its estimated one in[0, 1] is computed as:
εphik =
23
· |cphik − ph
ik| (7)
Thus, it can be used to define the consistency level between the preference degreeph
ik and the rest of the preference values of the fuzzy preference relation.
Definition 3. The consistency level associated to a preference value phik is de-
fined as
clhik = 1 − εphik (8)
When clhik = 1 then εphik = 0 and there is no inconsistency at all. The lower the
value of clhik, the higher the value of εphik and the more inconsistent is ph
ik withrespect to the rest of information.
Easily, we can define the consistency measures for particular alternatives andfor the whole fuzzy preference relation:

Using Visualization Tools to Guide Consensus in GDM 81
Definition 4. The consistency level associated to a particular alternative xi ofa fuzzy preference relation P h is defined as
clhi =
n∑
k=1i�=k
(clhik + clhki)
2(n − 1)(9)
with clhi ∈ [0, 1].
Definition 5. The consistency level of a fuzzy preference relation P h is definedas follows:
clh =
n∑
i=1
clhi
n(10)
with clh ∈ [0, 1].
3 Computing Similarity Measures
In this section we present some new similarity measures among experts that canbe computed from the fuzzy preference relations expressed by experts. Thesenew measures, as the consistency measures presented in section 2, are computedin three different levels (pair of alternatives, alternatives and preference relationslevels) for every pair of experts in the problem.
To do so, for each pair of experts (eh, el) (h < l) we define a similarity matrixSMhl =
(smhl
ik
)where
smhlik = 1 − |ph
ik − plik| (11)
Definition 6. The measure of similarity of the preference experts eh and el
about the alternative xi over xk is smhlik.
The closer smhlik is to 1, the more similar is the opinion of the experts about
alternative xi over xk.We can now compute similarity measures at the alternatives and preference
relation levels:
Definition 7. A similarity measure for experts eh and el for a particular alter-native xi is computed as:
smhli =
n∑
k=1i�=k
(smhlik + smhl
ki)
2(n − 1)(12)

82 S. Alonso et al.
Definition 8. A global similarity measure for experts eh and el (taking intoaccount the whole preference relations) is computed as:
smhl =
n∑
i=1
smhli
n(13)
4 A Tool to Visualize the Consensus State for GroupDecision Making Problems
In this section we present a novel visualization tool that generates consensusdiagrams in which the experts on the problem are drawn in different locationsdepending on the similarity of their opinions, that is, experts with similar opin-ions will be drawn near to each other, while the experts whose opinions differgreatly will be drawn far away from each other.
To draw the consensus diagramswe use a spring model graph drawing algorithm[7] in which the experts correspond to the nodes of the graph and a similarity mea-sure between each pair of experts act as the length of the spring associated to eachedge of the graph. These kind of algorithms simulate a system of springs definedon the graph and output a locally minimum energy configuration.
As we have defined several different similarity measures the tool can use differ-ent similarity measures depending on the information that we want to visualize.For example, if we need a general overview of the consensus state for the prob-lem, we can choose to use the global similarity measures smhl, but if we wantto visualize the consensus state about a particular alternative xi we can chooseto use the similarity measures smhl
i .As consistency of the information is also an important issue to take into ac-
count (inconsistent experts are usually far away from the opinions of the otherexperts) we have introduced in the visualization tool the possibility of incorpo-rating the consistency measures presented in section 2 to improve the consensusdiagrams. This improvements are reflected in two different ways:
- The most consistent experts are drawn bigger. Thus, it is easy to recognizethe most consistent experts and those who provide contradictory information.
- The similarity measures are altered according to the consistency of the ex-perts involved:
smhlik =
smhlik
(clhik + cllik)/2; smhl
i =smhl
i
(clhi + clli)/2; smhl =
smhl
(clh + cll)/2
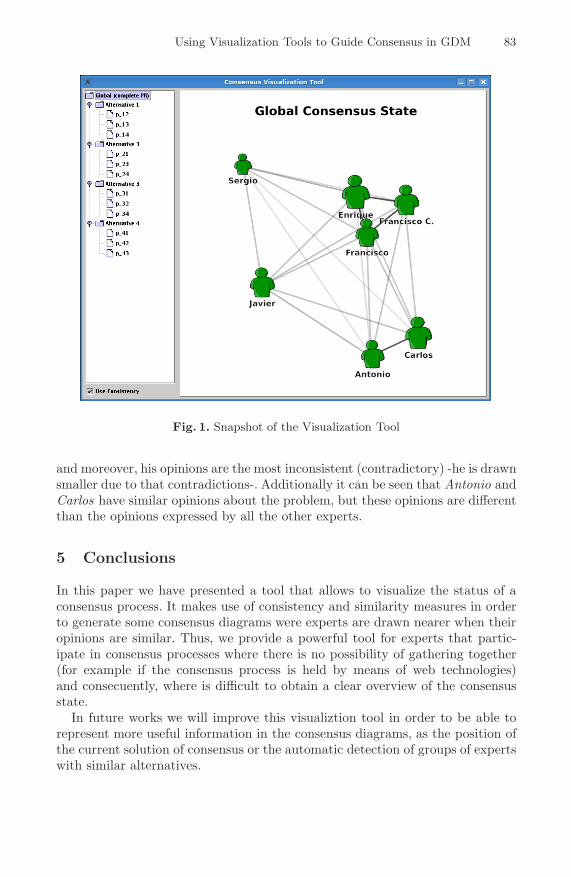
In figure 1 we have a snapshot of the tool where the global consensus state isdepicted for a group decision making problem with 4 different alternatives and7 different experts involved. As it can be seen, there are three experts (Enrique,Francisco and Francisco C.) with similar opinions -they are close to each other-.On the other hand, Sergio’s opinions seem to be far from all the other experts,
Using Visualization Tools to Guide Consensus in GDM 83
Fig. 1. Snapshot of the Visualization Tool
and moreover, his opinions are the most inconsistent (contradictory) -he is drawnsmaller due to that contradictions-. Additionally it can be seen that Antonio andCarlos have similar opinions about the problem, but these opinions are differentthan the opinions expressed by all the other experts.
5 Conclusions
In this paper we have presented a tool that allows to visualize the status of aconsensus process. It makes use of consistency and similarity measures in orderto generate some consensus diagrams were experts are drawn nearer when theiropinions are similar. Thus, we provide a powerful tool for experts that partic-ipate in consensus processes where there is no possibility of gathering together(for example if the consensus process is held by means of web technologies)and consecuently, where is difficult to obtain a clear overview of the consensusstate.
In future works we will improve this visualiztion tool in order to be able torepresent more useful information in the consensus diagrams, as the position ofthe current solution of consensus or the automatic detection of groups of expertswith similar alternatives.
84 S. Alonso et al.
References
1. Alonso, S., Herrera-Viedma, E., Herrera, F., Cabrerizo, F.J., Chiclana, F.: AnInteractive Support System to Aid Experts to Express Consistent Preferences.In: Proceddings of the 7th International FLINS Conference on Applied ArtificialIntelligence (FLINS, Genova (Italy) pp.425–432 (2006)
2. Bordogna, G., Fedrizzi, M., Pasi, G.: A linguistic modeling of consensus in groupdecision making based on OWA operators. IEEE Transactions on Systems, Manand Cybernetics, Part A 27, 126–133 (1997)
3. Bryson, N.: Group decision-making and the analytic hierarchy process: explor-ing the consensus-relevant information content. Computers and Operational Re-search 23, 27–35 (1996)
4. Chiclana, F., Herrera, F., Herrera-Viedma, E.: Integrating Three RepresentationModels in Fuzzy Multipurpose Decision Making Based on Fuzzy Preference Rela-tions. Fuzzy Sets and Systems 97, 33–48 (1998)
5. Chiclana, F., Herrera, F., Herrera-Viedma, E.: Integrating multiplicative prefer-ence relations in a multipurpose decision-making model based on fuzzy preferencerelations. Fuzzy Sets and Systems 122(2), 277–291 (2001)
6. Choudhury, A.K., Shankar, R., Tiwari, M.K.: Consensus-based intelligent groupdecision-making model for the selection of advanced technology. Decision SupportSystems 42(3), 1776–1799 (2006)
7. Eades, P.: A heuristic for graph drawing. Congress Numerant. 42, 149–160 (1984)8. Erb, H.P., Bohner, G.: Mere Consensus Effects in Minority and Majority Influ-
ence. In: De Dreu, C.K.W., De Vries, N.K. (eds.) Group Consensus and MinorityInfluence, Implications for Innovation, Blackwell Publishers, Oxford (UK) (2001)
9. Evangelos, T.: Multi-Criteria Decision Making Methods: A Comparative Study.Kluwer Academic Publishers, Dordrecht (2000)
10. Herrera, F., Herrera-Viedma, E., Verdegay, J.L.: A sequential selection process ingroup decision making with linguistic assessments. Information Sciences 85, 223–239 (1998)
11. Herrera-Viedma, E., Alonso, S., Herrera, F., Chiclana, F., Consensus, A.: Modelfor Group Decision Making with Incomplete Fuzzy Preference Relations. IEEETransactions on Fuzzy Systems (2006) (in press)
12. Herrera-Viedma, E., Chiclana, F., Herrera, F., Alonso, S.: A Group Decision Mak-ing Model with Incomplete Fuzzy Preference Relations Based on Additive Con-sistency. IEEE Transactions on Systems, Man and Cybernetics B37(1), 176–189(2007)
13. Herrera-Viedma, E., Herrera, F., Chiclana, F., Luque, M.: Some issues on consis-tency of fuzzy preference relations. Europ. J. of Operational Research 154, 98–109(2004)
14. Herrera-Viedma, E., Martınez, L., Mata, F., Chiclana, F.: A consensus supportsystem model for group decision-making problems with multi-granular linguisticpreference relations. IEEE Transactions on Fuzzy Systems 13(5), 644–658 (2005)
15. Kacprzyk, J.: Group decision making with a fuzzy linguistic majority. Fuzzy Setsand Systems 18, 105–118 (1986)
16. Kacprzyk, J., Fedrizzi, M., Nurmi, H.: Group decision making and consensus underfuzzy preferences and fuzzy majority. Fuzzy Sets and Systems 49, 21–31 (1992)
17. Kahraman, C., Ruan, D., Dogan, I.: Fuzzy group decision-making for facility loca-tion selection. Infomation Sciences 157, 135–153 (2003)

Using Visualization Tools to Guide Consensus in GDM 85
18. Kersten, G., Noronha, S.: Negotiation via the World Wide Web: A Cross-culturalStudy of Decision Making. Group Decision and Negotiation 8(3), 251–279 (1999)
19. Kersten, G.: e-democracy and participatory decision processes: lessons from e-negotiation experiments. Journal of Multi-Criteria Decision Analysis 12, 127–143(2004)
20. Messaris, P.: Visual Persuasion. The Role of Images in Advertising. SAGE Publi-cations, London (UK) (1997)
21. O’Keefe, R.M., McEachern, T.: Web-based customer decision support systems.Communications of the ACM 41(3), 71–78 (1998)
22. Szmidt, E., Kacprzyk, J.: A consensus reaching process under intuitionistic fuzzypreference relations. Int. Journal of Intelligent Systems 18(7), 837–852 (2003)
23. Tanino, T.: Fuzzy preference orderings in group decision making. Fuzzy Sets andSystems 12, 117–131 (1984)