Using Software to Analyse Qualitative Data
24
University of Wollongong Research Online Faculty of Commerce - Papers Faculty of Commerce 2007 Using Software to Analyse Qualitative Data M. L. Jones University of Wollongong, [email protected] Research Online is the open access institutional repository for the University of Wollongong. For further information contact Manager Repository Services: [email protected]. Recommended Citation Jones, M. L.: Using Software to Analyse Qualitative Data 2007. http://ro.uow.edu.au/commpapers/429
-
Upload
khangminh22 -
Category
Documents
-
view
1 -
download
0
Transcript of Using Software to Analyse Qualitative Data
University of WollongongResearch Online
Faculty of Commerce - Papers Faculty of Commerce
2007
Using Software to Analyse Qualitative DataM. L. JonesUniversity of Wollongong, [email protected]
Research Online is the open access institutional repository for theUniversity of Wollongong. For further information contact ManagerRepository Services: [email protected].
Recommended CitationJones, M. L.: Using Software to Analyse Qualitative Data 2007.http://ro.uow.edu.au/commpapers/429
Using Software to Analyse Qualitative Data
AbstractWhile quantitative analysis software eg. SPSS (Statistical Package for the Social Sciences) have been in vogueamongst researchers for some time, qualitative analysis software has taken a lot longer to acquire an audience.However, the use of software for the purpose of qualitative analysis can provide tangible benefits. Appropriatesoftware can shorten analysis timeframes, can provide more thorough and rigorous coding and interpretation,and provide researchers with enhanced data management. This chapter examines qualitative data analysis;illuminating some of the difficulties and moves to a discussion on the often contentious use of analyticalsoftware. Evidence within the chapter points to the clear advantages that qualitative data analysis software canprovide users. One such product – QSR NVivo – is discussed with an expansion on the benefits that thisproduct offers qualitative researchers. The reader is also taken by the hand for a brief practical overview of theprogram. The chapter concludes with a quick look at what the future has on offer for researcherscontemplating the use of this software.
Publication DetailsThis article was originally published as Jones, ML, Using Software to Analyse Qualitative Data, MalaysianJournal of Qualitative Research, 1(1), 2007, 64-76.
This journal article is available at Research Online: http://ro.uow.edu.au/commpapers/429
Using Software to Analyse Qualitative Data
Michael Jones
School of Management and Marketing
Faculty of Commerce
University of Wollongong
Abstract
While quantitative analysis software eg. SPSS (Statistical Package for the Social
Sciences) have been in vogue amongst researchers for some time, qualitative analysis
software has taken a lot longer to acquire an audience. However, the use of software
for the purpose of qualitative analysis can provide tangible benefits. Appropriate
software can shorten analysis timeframes, can provide more thorough and rigorous
coding and interpretation, and provide researchers with enhanced data management.
This chapter examines qualitative data analysis; illuminating some of the difficulties
and moves to a discussion on the often contentious use of analytical software.
Evidence within the chapter points to the clear advantages that qualitative data
analysis software can provide users. One such product – QSR NVivo – is discussed
with an expansion on the benefits that this product offers qualitative researchers.
The reader is also taken by the hand for a brief practical overview of the program.
The chapter concludes with a quick look at what the future has on offer for
researchers contemplating the use of this software.
Introduction
Analysing qualitative data is often seen as a demanding, repetitive and arduous task
(Basit, 2003, 143). Although predominately a mechanical exercise, it requires an
ability of the researcher to be dynamic, intuitive and creative, to be able to think,
reason and theorise (Basit, 2003, 143). The goal of qualitative analysis is to
deconstruct blocks of data through fragmentation and then have them coalesce into
collections of categories which relate conceptually and theoretically, and which make
assumptions about the phenomenon being studied. Richards calls this process
“decontextualizing and recontextualizing” (2002, p.200) and regards this as the
fundamental process of qualitative data analysis. Typically, qualitative research is a
one researcher domain. Data are acquired through first hand experience as a result
of subjective interpretation. Understandings of phenomena are tempered through
experience, bias and knowledge (Ely, Anzul, Friedman, Garner, & Steinmetz, 1991).
In 1979, Miles argued that qualitative analysis was among the most
demanding and least examined areas of social research. Basit (2003) finds that this
observation remains cogent today. This may be due to the relatively higher levels of
time and effort that this research requires. Qualitative research does not allow short
cuts (Delamont, 1992) and is a continuous process which is dominant throughout the
research activity, from data collection through until conceptualisation (Ely et al.,
1991). (Miles, 1979)
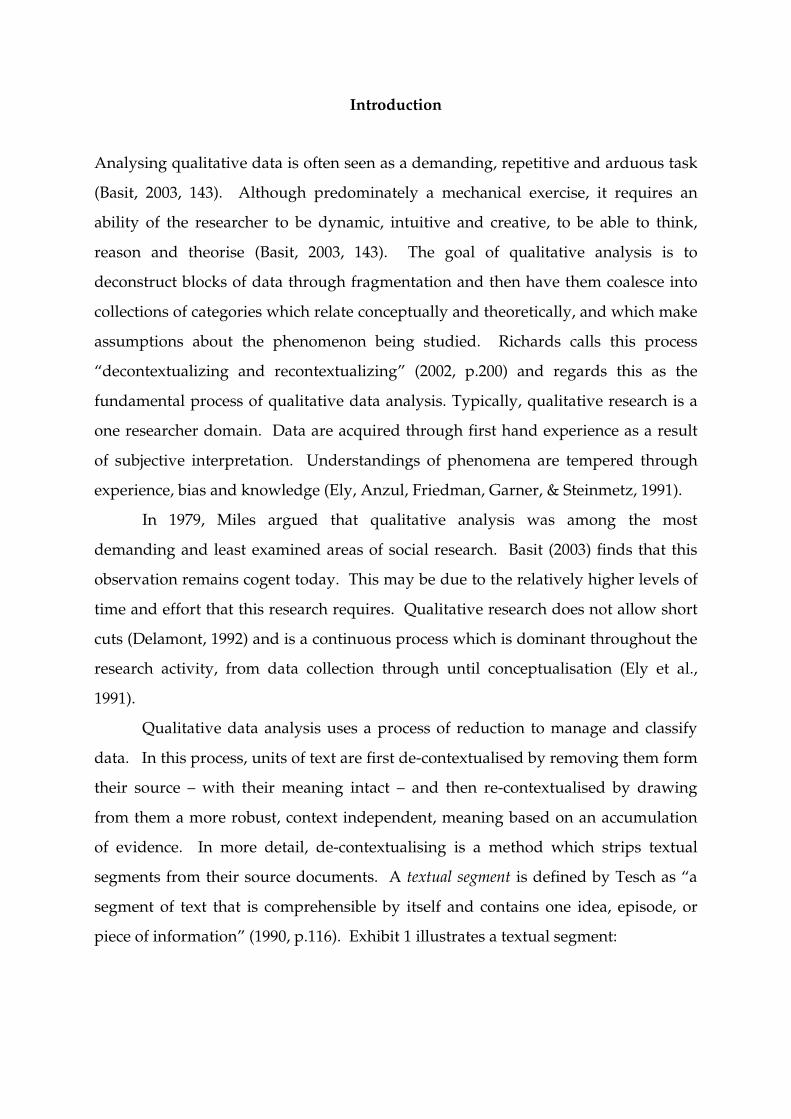
Qualitative data analysis uses a process of reduction to manage and classify
data. In this process, units of text are first de-contextualised by removing them form
their source – with their meaning intact – and then re-contextualised by drawing
from them a more robust, context independent, meaning based on an accumulation
of evidence. In more detail, de-contextualising is a method which strips textual
segments from their source documents. A textual segment is defined by Tesch as “a
segment of text that is comprehensible by itself and contains one idea, episode, or
piece of information” (1990, p.116). Exhibit 1 illustrates a textual segment:
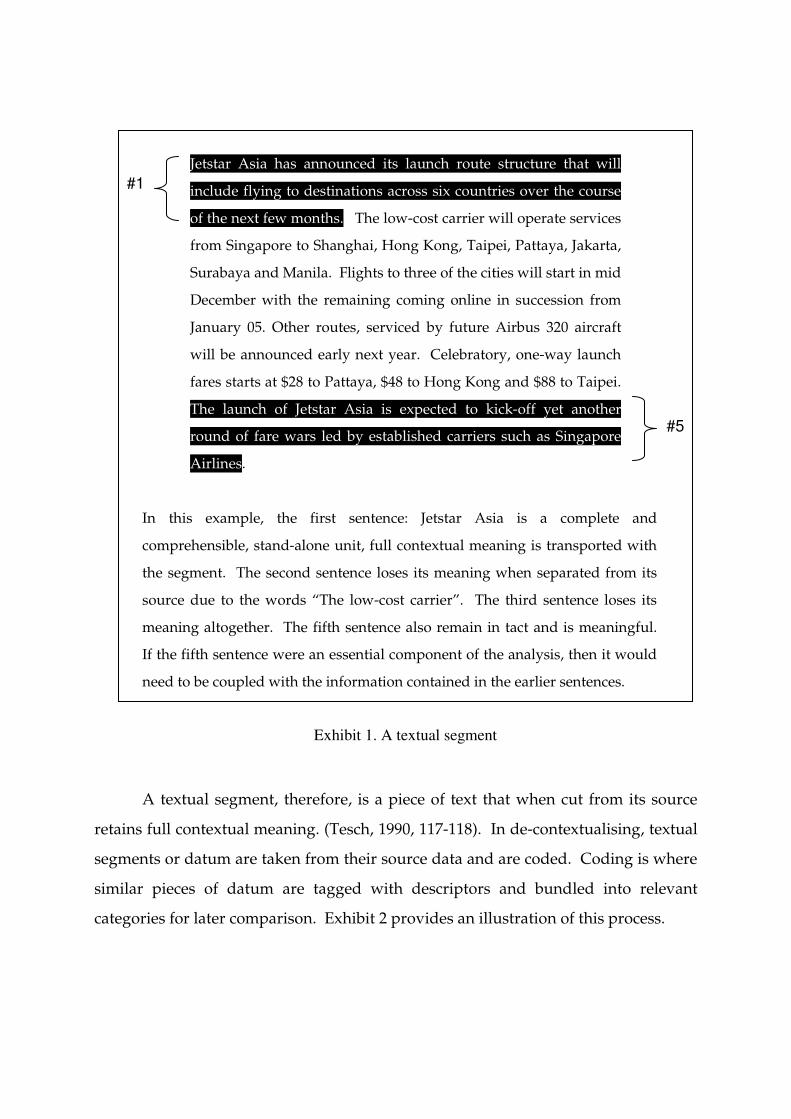
Jetstar Asia has announced its launch route structure that will
include flying to destinations across six countries over the course
of the next few months. The low-cost carrier will operate services
from Singapore to Shanghai, Hong Kong, Taipei, Pattaya, Jakarta,
Surabaya and Manila. Flights to three of the cities will start in mid
December with the remaining coming online in succession from
January 05. Other routes, serviced by future Airbus 320 aircraft
will be announced early next year. Celebratory, one-way launch
fares starts at $28 to Pattaya, $48 to Hong Kong and $88 to Taipei.
The launch of Jetstar Asia is expected to kick-off yet another
round of fare wars led by established carriers such as Singapore
Airlines.
In this example, the first sentence: Jetstar Asia is a complete and
comprehensible, stand-alone unit, full contextual meaning is transported with
the segment. The second sentence loses its meaning when separated from its
source due to the words “The low-cost carrier”. The third sentence loses its
meaning altogether. The fifth sentence also remain in tact and is meaningful.
If the fifth sentence were an essential component of the analysis, then it would
need to be coupled with the information contained in the earlier sentences.
A textual segment, therefore, is a piece of text that when cut from its source
retains full contextual meaning. (Tesch, 1990, 117-118). In de-contextualising, textual
segments or datum are taken from their source data and are coded. Coding is where
similar pieces of datum are tagged with descriptors and bundled into relevant
categories for later comparison. Exhibit 2 provides an illustration of this process.
#1
#5
Exhibit 1. A textual segment
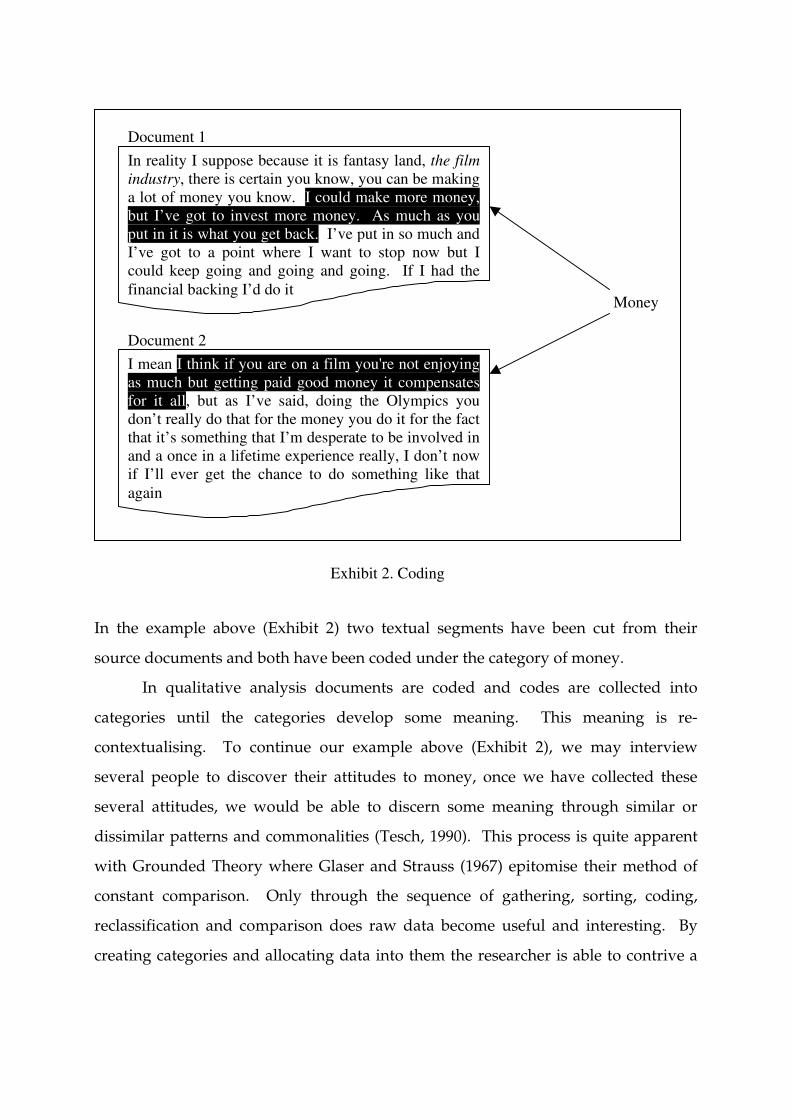
In the example above (Exhibit 2) two textual segments have been cut from their
source documents and both have been coded under the category of money.
In qualitative analysis documents are coded and codes are collected into
categories until the categories develop some meaning. This meaning is re-
contextualising. To continue our example above (Exhibit 2), we may interview
several people to discover their attitudes to money, once we have collected these
several attitudes, we would be able to discern some meaning through similar or
dissimilar patterns and commonalities (Tesch, 1990). This process is quite apparent
with Grounded Theory where Glaser and Strauss (1967) epitomise their method of
constant comparison. Only through the sequence of gathering, sorting, coding,
reclassification and comparison does raw data become useful and interesting. By
creating categories and allocating data into them the researcher is able to contrive a
In reality I suppose because it is fantasy land, the film industry, there is certain you know, you can be making a lot of money you know. I could make more money, but I’ve got to invest more money. As much as you put in it is what you get back. I’ve put in so much and I’ve got to a point where I want to stop now but I could keep going and going and going. If I had the financial backing I’d do it
I mean I think if you are on a film you're not enjoying as much but getting paid good money it compensates for it all, but as I’ve said, doing the Olympics you don’t really do that for the money you do it for the fact that it’s something that I’m desperate to be involved in and a once in a lifetime experience really, I don’t now if I’ll ever get the chance to do something like that again
Document 1
Document 2
Money
Exhibit 2. Coding
conceptual schema which allows the researcher to ask questions of the data and
inquire about the situation under investigation (Basit, 2003, p.144).
The ability of the researcher to code is an important part of analysis (Basit,
2003, p.144; DeNardo & Levers, 2002, p.4). It involves the researcher in two ways,
firstly the data must be divided into meaningful textual segments which are logical
and which add value to the research, and secondly a tag or label must be attached to
the data which is descriptive and sufficiently abstract to encompass other similar, yet
unique, datum (Glaser, 1978). Miles and Huberman (1994) discuss two methods of
code creation. The first is a method preferred by inductive researchers, this involves
coding the data without a priori knowledge and labelling the data, at least initially,
using the data itself as the descriptor (Glaser & Strauss, 1967). This is often called in
vivo coding. The other method utilises a preconceived list – a start list – of categories
into which the researcher endeavours to fit emerging data. This list may expand or
change over time but the start list allows a faster, but less emergent beginning. This
method is often used when there is more than one researcher, or where quite a lot is
already known about the research.
Qualitative Data Analysis Software
During the final two decades of the last century and more relevantly during these
most recent years of the twenty first century researchers have endeavoured to
employ tools which would ease the labour intensive burden of qualitative data
analysis (L. Richards & Richards, 1986). Computer assisted analysis began with
simple text searching tools in the form of word processors which allowed categories
to be searched and text to be marked or edited (T. Richards, 2002, 199-200).
However, it was not until computer analysis packages were able to decontextualise
and recontextualise that they were of any real value to qualitative researchers.
One of the first computer programs to provide real assistance to qualitative
researchers was NUD*IST™ 1.01 (Richards 2002). NUD*IST was touted to do what
the acronym suggested it would do: Non-Numerical Unstructured Data by Indexing,
1 QSR International Pty Ltd
Searching, and Theorising (L. Richards, 1999, 413). The fundamental purpose of
NUD*IST was to provide functions which would assist researchers in the retrieval of
text from data, allow users to code that data, and to develop a system of relating
codes to each other using a tree structure.
Software, in one form or another, has been viable since the advent of the
Microsoft Windows platform in the early 1990’s which provided the power and
flexibility these programs needed. However, the uptake of these products has not
been without controversy. The research community is sharply divided as to the
benefits and effects of digital intervention in what is fundamentally a human
enterprise (Basit, 2003, p.143; Crowley, Harré , & Tagg, 2002, p.193). Opponents cite
the methodological impurities that may result as data are transferred into a digital
environment and the resulting abstraction as a result of software manipulation. This
can certainly be the case with plain text programs, where expression and emphasis
can be lost, but rich text programs tend to mitigate this deficiency (Bourdon, 2002, 1;
Crowley et al., 2002, 193). Computers are excellent tools for counting and producing
numbers and users can fall into the trap of turning qualitative accounts into semi-
quantitative arrays of analysis by enumerating the facts rather than interpreting
them. While qualitative analysis software will often provide these facilities, it is not
their strength and it detracts from their purpose (Crowley et al., 2002, 193; Welsh,
2002, 1). Software can also work to distance the researcher from their research by
providing a buffer between the person and their data (Bourdon, 2002, 1; Welsh, 2002,
1).
Proponents see qualitative analysis software as the genesis of the new age in
qualitative research. The software assists these researchers by providing better
management of their data, saving time and offering greater flexibility. They see this
electronic data analysis as providing greater accuracy and greater transparency
(Welsh, 2002, 3). The software can provide faster and more comprehensive methods
of inquiring into the data, and much more versatile and efficient systems of
collecting, storing and reporting (Basit, 2003, 145; DeNardo & Levers, 2002, 5). As is
often misconstrued by the opponents of computer analysis, the programs do not do
the analysis for the researcher. The researcher must still collect the data, decide what
to code and how to name the categories. The software does, however, render more
easy the repetitive and mechanical tasks of data analysis; those traditional tasks of
making concept cards, creating categories, segmenting, coding and duplicating
(Bourdon, 2002, 3). Where ‘paper and pen’ activities once thwarted the qualitative
researcher’s work, software removes many of these less pleasant areas of research.
Computer assistance is merely a tool which facilitates more effective and efficient
analysis (Coffey & Atkinson, 1996). “Researchers who use the packages are often
amazed that this kind of work, with its thousands of pages of data, could ever have
been conducted by hand” (Basit, 2003, 145). Welsh provides a good analogy of how
computer software can enhance the task of qualitative analysis:
It is useful to think of the qualitative research project as a rich tapestry. The
software is the loom that facilitates the knitting together of the tapestry, but
the loom cannot determine the final picture on the tapestry. It can though,
through its advanced technology, speed up the process of producing the
tapestry and it may also limit the weaver’s errors, but for the weaver to
succeed in making the tapestry she or he needs to have an overview of what
she or he is trying to produce. It is very possible, and quite legitimate, that
different researchers would weave different tapestries from the same
available material depending on the questions asked of the data. However,
they would have to agree on the material they have to begin with. Software
programs can be used to explore systematically this basic material creating
broad agreement amongst researchers about what is being dealt with. Hence,
the quality, rigour and trustworthiness of the research is enhanced. ( 2002, p.
5).
Despite these debates, computers are being increasingly employed in the use
of qualitative data analysis (Basit, 2003, 145; DeNardo & Levers, 2002, 5). A number
of notable qualitative theorists have encouraged the use qualitative data analysis
software within their research: (Berg, 2001; Denzin & Lincoln, 1998; Krueger, 1998;
Merriam, 2001; Miles & Huberman, 1994; Morse & Richards, 2002; Patton, 2002;
Silverman, 2000, 2001; Taylor & Bodgan, 1998; Tesch, 1990). Tom Richards, the
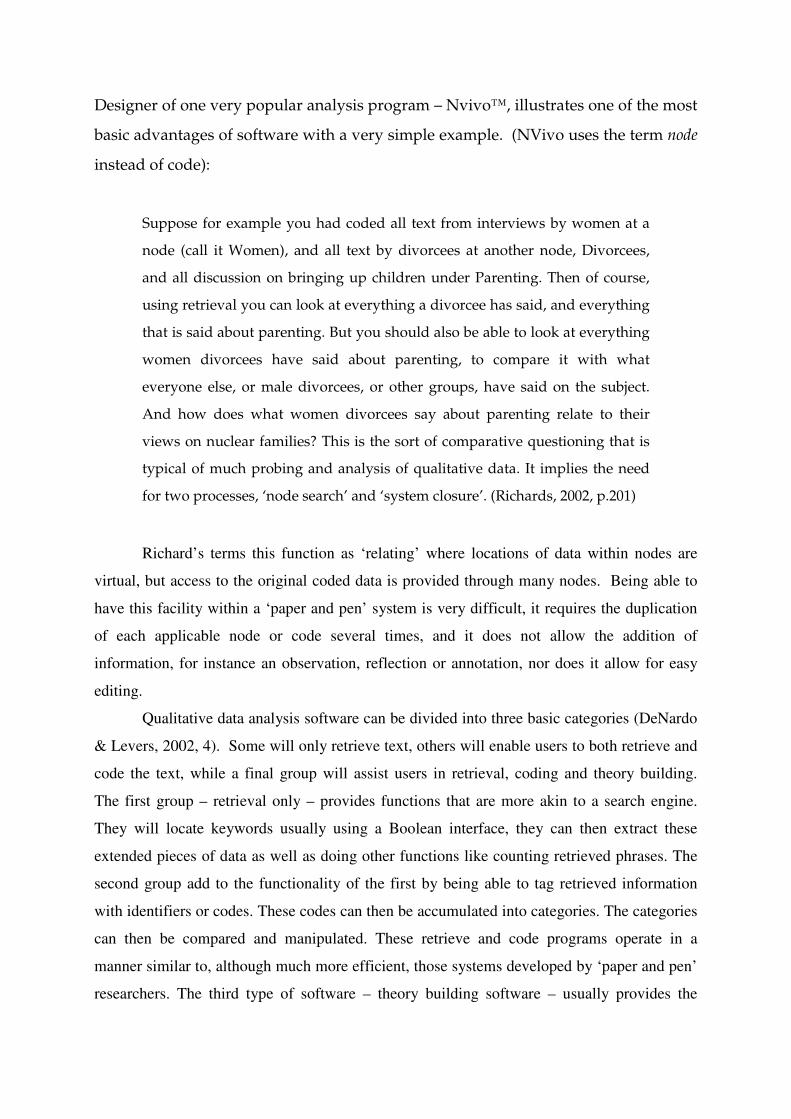
Designer of one very popular analysis program – Nvivo™, illustrates one of the most
basic advantages of software with a very simple example. (NVivo uses the term node
instead of code):
Suppose for example you had coded all text from interviews by women at a
node (call it Women), and all text by divorcees at another node, Divorcees,
and all discussion on bringing up children under Parenting. Then of course,
using retrieval you can look at everything a divorcee has said, and everything
that is said about parenting. But you should also be able to look at everything
women divorcees have said about parenting, to compare it with what
everyone else, or male divorcees, or other groups, have said on the subject.
And how does what women divorcees say about parenting relate to their
views on nuclear families? This is the sort of comparative questioning that is
typical of much probing and analysis of qualitative data. It implies the need
for two processes, ‘node search’ and ‘system closure’. (Richards, 2002, p.201)
Richard’s terms this function as ‘relating’ where locations of data within nodes are
virtual, but access to the original coded data is provided through many nodes. Being able to
have this facility within a ‘paper and pen’ system is very difficult, it requires the duplication
of each applicable node or code several times, and it does not allow the addition of
information, for instance an observation, reflection or annotation, nor does it allow for easy
editing.
Qualitative data analysis software can be divided into three basic categories (DeNardo
& Levers, 2002, 4). Some will only retrieve text, others will enable users to both retrieve and
code the text, while a final group will assist users in retrieval, coding and theory building.
The first group – retrieval only – provides functions that are more akin to a search engine.
They will locate keywords usually using a Boolean interface, they can then extract these
extended pieces of data as well as doing other functions like counting retrieved phrases. The
second group add to the functionality of the first by being able to tag retrieved information
with identifiers or codes. These codes can then be accumulated into categories. The categories
can then be compared and manipulated. These retrieve and code programs operate in a
manner similar to, although much more efficient, those systems developed by ‘paper and pen’
researchers. The third type of software – theory building software – usually provides the
features of the first two, but adds to the inventory of features by being able to establish
relationships between categories and codes, assemble higher order categories with developed
abstraction, and develop and test hypotheses (DeNardo & Levers, 2002, 4).
In the experience of this researcher with qualitative data analysis software –
predominantly NVivo™ 2.0 (QSR International Pty Ltd, 2002) – the software
approach has been an invaluable tool. Large amounts of data, in excess of 20 hours
of transcripts, were managed relatively easily. Data were coded more generously
than would be achieved with ‘paper and pen’ methods, and while this most probably
led to over-coding (this is a problem reported by Blismas and Dainty (2003, 460), it
allowed ideas and issues to emerge more freely without the compulsion to force data
into already established categories. When it came to reporting the findings, the
natural emergent system of logical categories and nodes, and the reflection that is
part of the process assisted greatly with the structure and content. Another great
feature of the software approach is that categories and nodes can be changed or re-
shuffled at will, therefore as new data re-focussed the study the old data could be
easily reshaped to fit into the emerging framework. A final observation on the value
of software is the ability to duplicate and distribute the findings; it is important to
keep all stakeholders up-to-date with all developments. Software allows easy
copying and distribution by either compact disk or through email. This facility
would be extremely difficult to achieve with a traditional ‘paper and pen’ system.
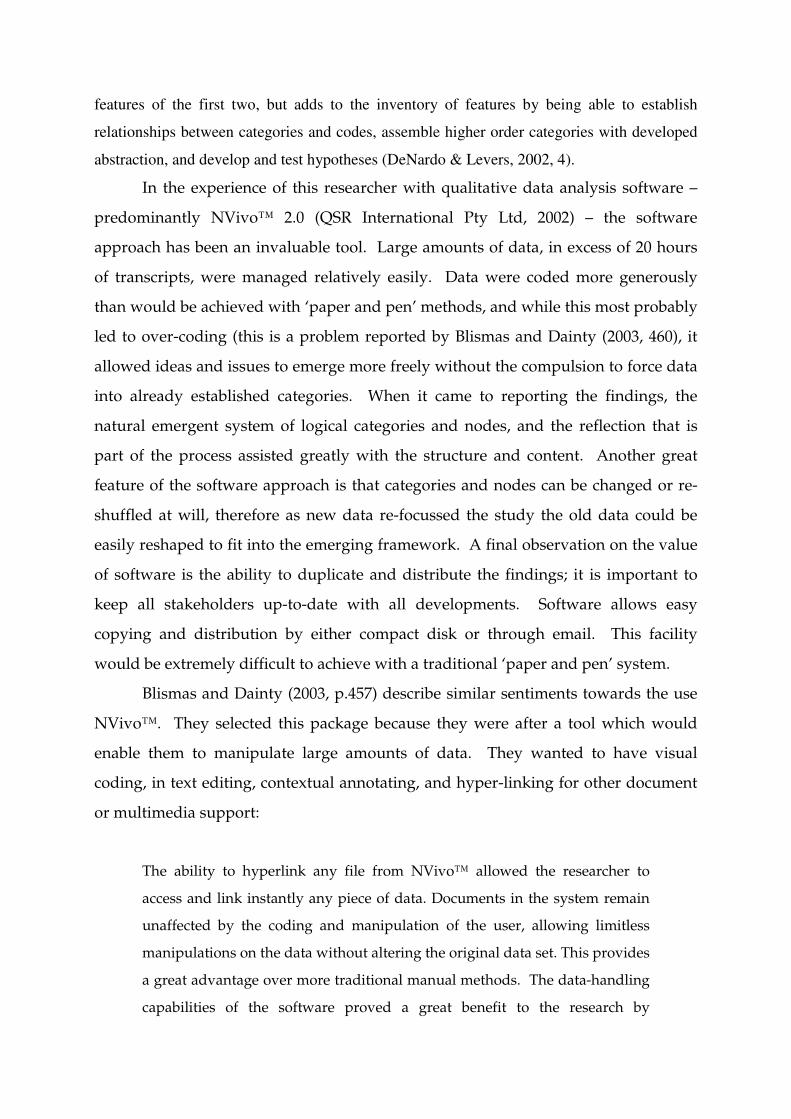
Blismas and Dainty (2003, p.457) describe similar sentiments towards the use
NVivo™. They selected this package because they were after a tool which would
enable them to manipulate large amounts of data. They wanted to have visual
coding, in text editing, contextual annotating, and hyper-linking for other document
or multimedia support:
The ability to hyperlink any file from NVivo™ allowed the researcher to
access and link instantly any piece of data. Documents in the system remain
unaffected by the coding and manipulation of the user, allowing limitless
manipulations on the data without altering the original data set. This provides
a great advantage over more traditional manual methods. The data-handling
capabilities of the software proved a great benefit to the research by
significantly increasing the rate at which data could be accessed, retrieved and
viewed. Whereas without computer assistance a trade-off is required between
the number of cases that the researcher investigates and the number of
attributes studied within those cases (assuming that the research is time
limited), NVivo™ provides the potential for a virtually unlimited sample size
and unlimited searches of the data. Additional features such as colour coding
of documents were useful in managing the coding and analysis status of
documents. It is difficult to foresee an occasion where analysis of textual data
or interview transcripts would not benefit from such data-handling
capabilities.
These views are also supported by Bourdon (2002, 8), where he found that
qualitative analysis software made a collaborative enterprise possible, which may not
have been as easily coordinated and executed without the software. A final
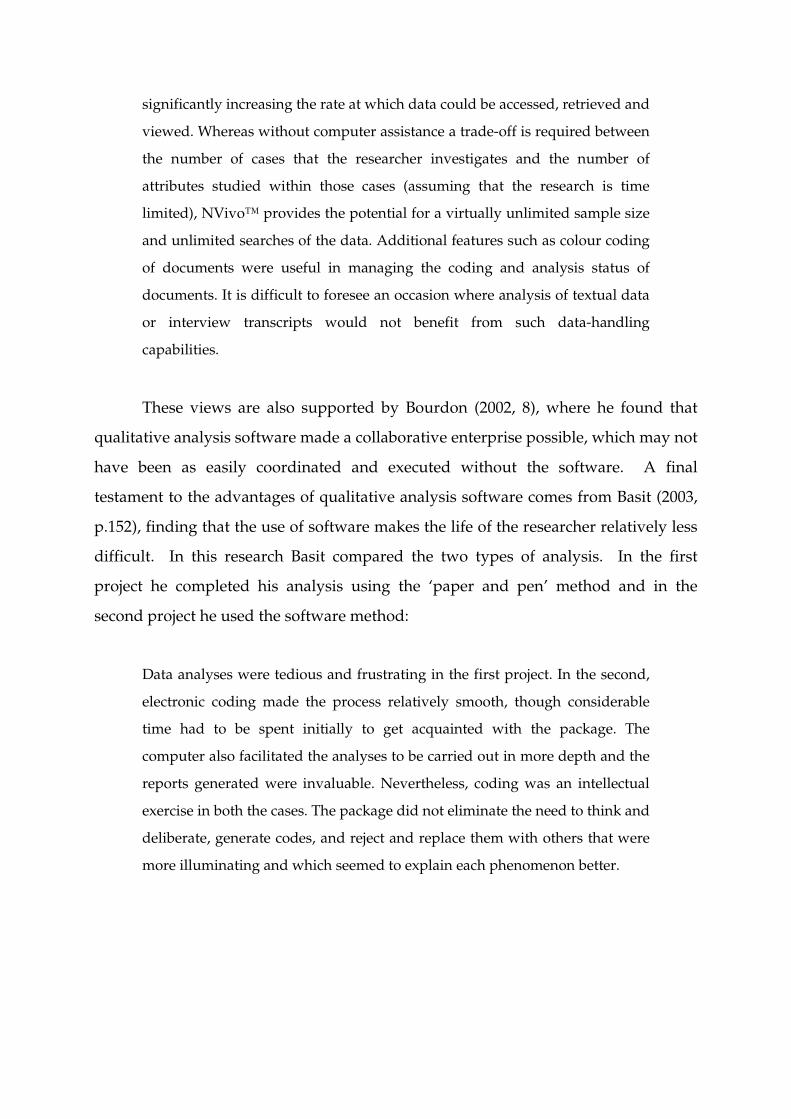
testament to the advantages of qualitative analysis software comes from Basit (2003,
p.152), finding that the use of software makes the life of the researcher relatively less
difficult. In this research Basit compared the two types of analysis. In the first
project he completed his analysis using the ‘paper and pen’ method and in the
second project he used the software method:
Data analyses were tedious and frustrating in the first project. In the second,
electronic coding made the process relatively smooth, though considerable
time had to be spent initially to get acquainted with the package. The
computer also facilitated the analyses to be carried out in more depth and the
reports generated were invaluable. Nevertheless, coding was an intellectual
exercise in both the cases. The package did not eliminate the need to think and
deliberate, generate codes, and reject and replace them with others that were
more illuminating and which seemed to explain each phenomenon better.
What Does NVivo™ Offer
NVivo™ is a retrieve, code and theory building tool. It allows users to replicate all of
the abilities of the ‘paper and pen’ system into the software, and much more. The
software utilises rich text which allows integrated emphasis through colour, font and
character style (DeNardo and Levers 2002, 8). Once imported, text can continue to be
emphasised through the internal rich text editor for the manipulation of colour, font
and character style (Blismas and Dainty 2003, 460). Selected data can be coded both
in vivo and through an accumulated tree structure. Editing is dynamic, in that text
can be edited while it is coded, and memos and comments can be added throughout.
This allows for easy and progressive reflection and conceptualisation (Richards 2002,
211). In addition, documents and nodes can have attributes attached. The use of
attributes allows the integration of quantitative and demographic data which can
augment the results of analysis. As Tom Richards States: “A project need no longer
be separated into the bits you do on the computer (e.g. coding the interviews) and
the rest (your notes, results, reports, and conclusions). A qualitative project becomes
seamless again” (2002, p. 211).
Other, more advanced functions allow the hyper-linking of external
documents and other data, the construction of conceptual models, and the testing of
hypotheses through advanced search facilities which not only offer standard Boolean
operators but also offer more sophisticated options like scoping, attributions, and
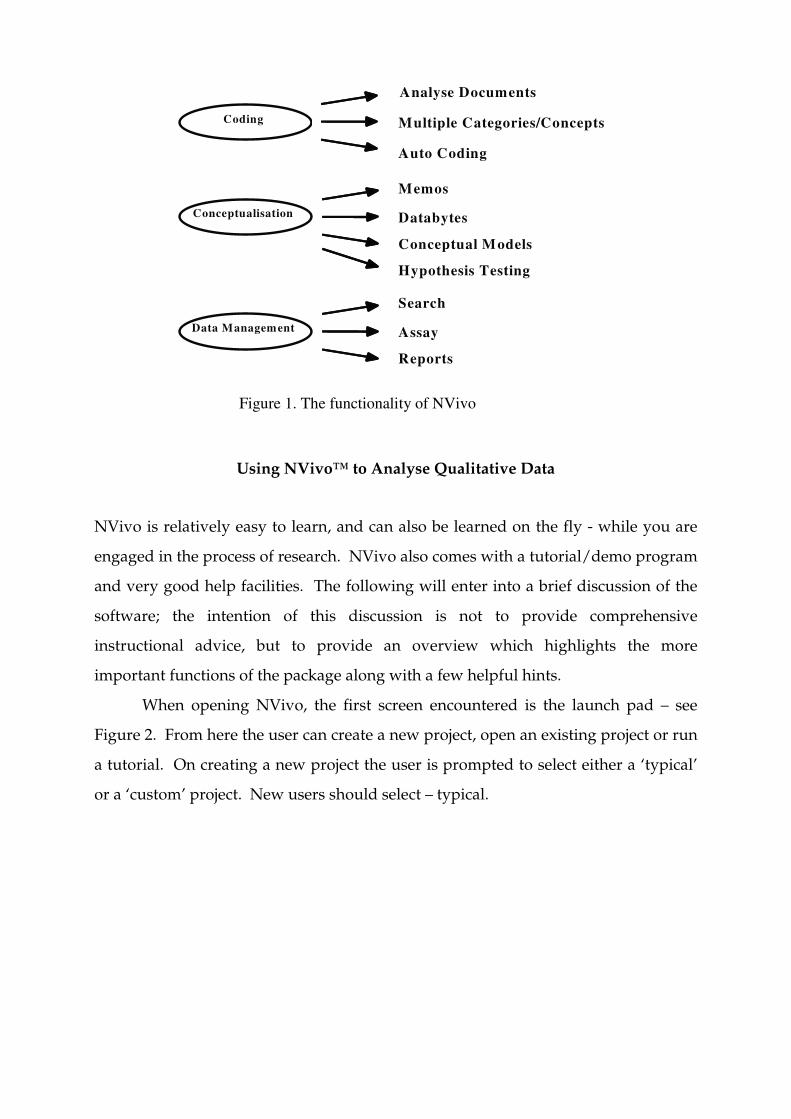
proximity, as well as matrix searching (Richards 2002, 214). Figure 1 provides a
breakdown of NVivo’s functional elements.
Using NVivo™ to Analyse Qualitative Data
NVivo is relatively easy to learn, and can also be learned on the fly - while you are
engaged in the process of research. NVivo also comes with a tutorial/demo program
and very good help facilities. The following will enter into a brief discussion of the
software; the intention of this discussion is not to provide comprehensive
instructional advice, but to provide an overview which highlights the more
important functions of the package along with a few helpful hints.
When opening NVivo, the first screen encountered is the launch pad – see
Figure 2. From here the user can create a new project, open an existing project or run
a tutorial. On creating a new project the user is prompted to select either a ‘typical’
or a ‘custom’ project. New users should select – typical.
Coding
Analyse Documents
Multiple Categories/Concepts
Auto Coding
Conceptualisation
Memos
Databytes
Conceptual Models
Data Management
Search
Assay
Reports
Hypothesis Testing
Figure 1. The functionality of NVivo
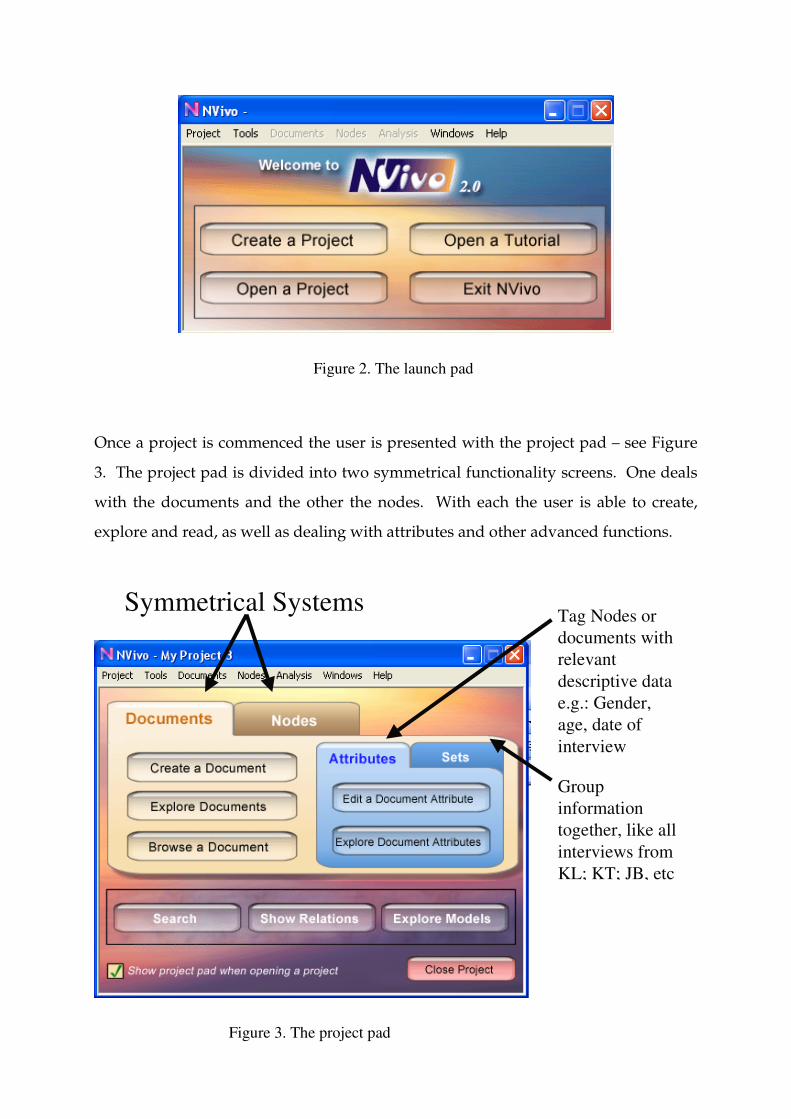
Once a project is commenced the user is presented with the project pad – see Figure
3. The project pad is divided into two symmetrical functionality screens. One deals
with the documents and the other the nodes. With each the user is able to create,
explore and read, as well as dealing with attributes and other advanced functions.
Figure 2. The launch pad
Figure 3. The project pad
Symmetrical SystemsTag Nodes or documents with relevant descriptive data e.g.: Gender, age, date of interview
Group information together, like all interviews from KL; KT; JB, etc
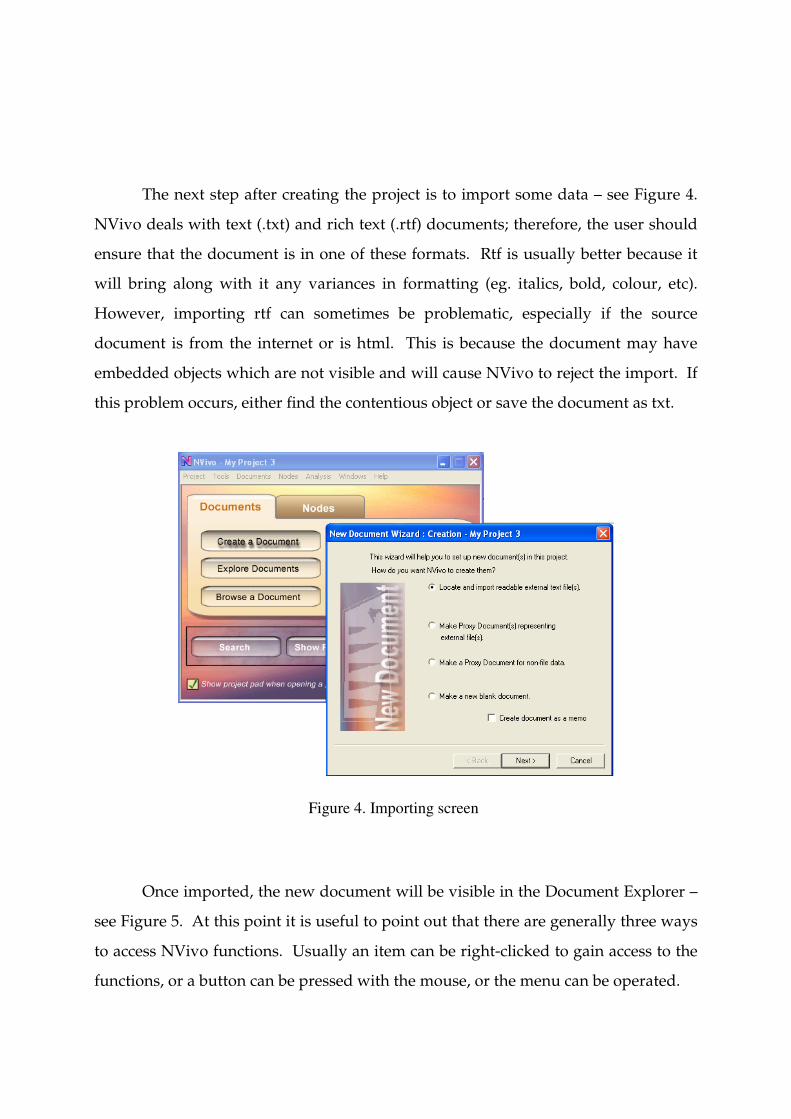
The next step after creating the project is to import some data – see Figure 4.
NVivo deals with text (.txt) and rich text (.rtf) documents; therefore, the user should
ensure that the document is in one of these formats. Rtf is usually better because it
will bring along with it any variances in formatting (eg. italics, bold, colour, etc).
However, importing rtf can sometimes be problematic, especially if the source
document is from the internet or is html. This is because the document may have
embedded objects which are not visible and will cause NVivo to reject the import. If
this problem occurs, either find the contentious object or save the document as txt.
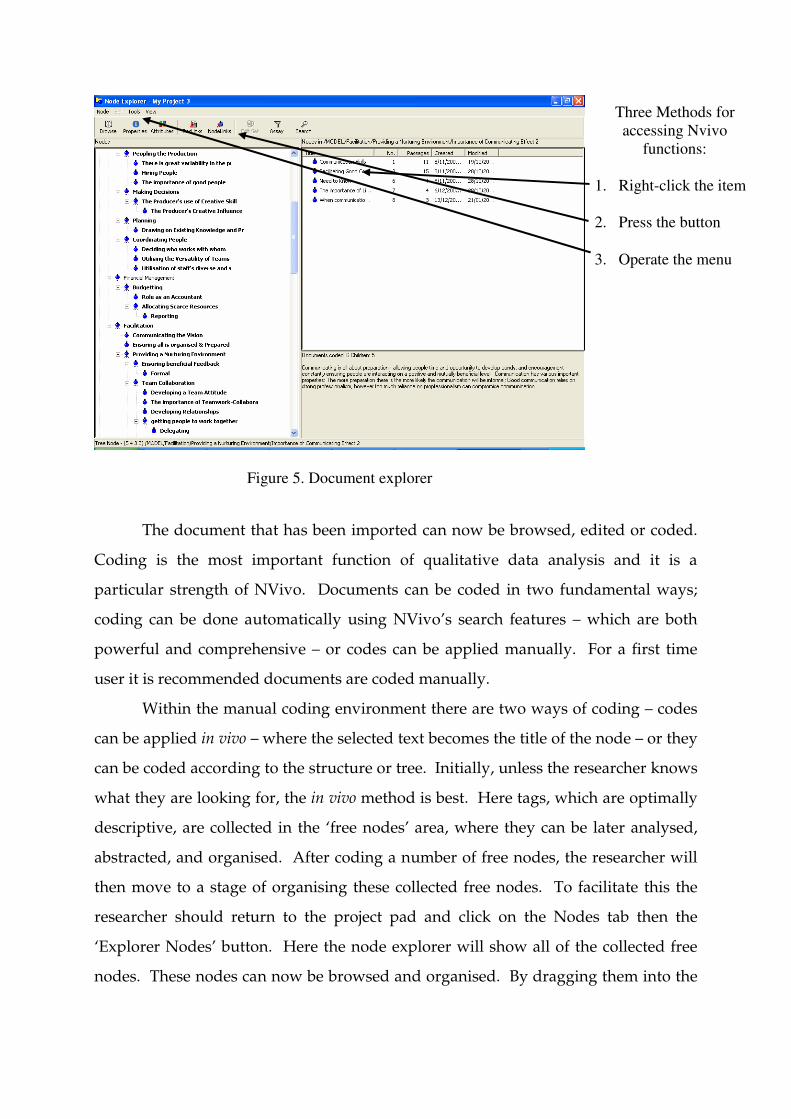
Once imported, the new document will be visible in the Document Explorer –
see Figure 5. At this point it is useful to point out that there are generally three ways
to access NVivo functions. Usually an item can be right-clicked to gain access to the
functions, or a button can be pressed with the mouse, or the menu can be operated.
Figure 4. Importing screen
The document that has been imported can now be browsed, edited or coded.
Coding is the most important function of qualitative data analysis and it is a
particular strength of NVivo. Documents can be coded in two fundamental ways;
coding can be done automatically using NVivo’s search features – which are both
powerful and comprehensive – or codes can be applied manually. For a first time
user it is recommended documents are coded manually.
Within the manual coding environment there are two ways of coding – codes
can be applied in vivo – where the selected text becomes the title of the node – or they
can be coded according to the structure or tree. Initially, unless the researcher knows
what they are looking for, the in vivo method is best. Here tags, which are optimally
descriptive, are collected in the ‘free nodes’ area, where they can be later analysed,
abstracted, and organised. After coding a number of free nodes, the researcher will
then move to a stage of organising these collected free nodes. To facilitate this the
researcher should return to the project pad and click on the Nodes tab then the
‘Explorer Nodes’ button. Here the node explorer will show all of the collected free
nodes. These nodes can now be browsed and organised. By dragging them into the
Figure 5. Document explorer
Three Methods for accessing Nvivo
functions: 1. Right-click the item 2. Press the button 3. Operate the menu
‘trees’ section, an embryonic structure can be crafted. This is the first stage of
analysis.
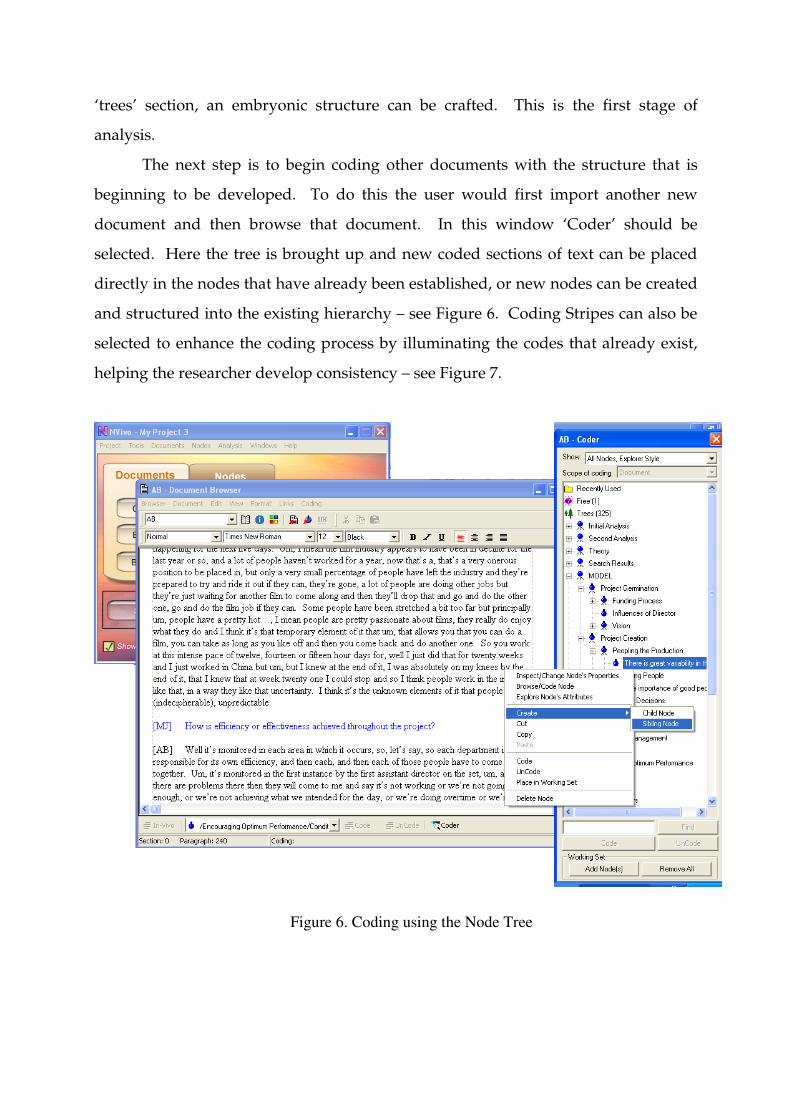
The next step is to begin coding other documents with the structure that is
beginning to be developed. To do this the user would first import another new
document and then browse that document. In this window ‘Coder’ should be
selected. Here the tree is brought up and new coded sections of text can be placed
directly in the nodes that have already been established, or new nodes can be created
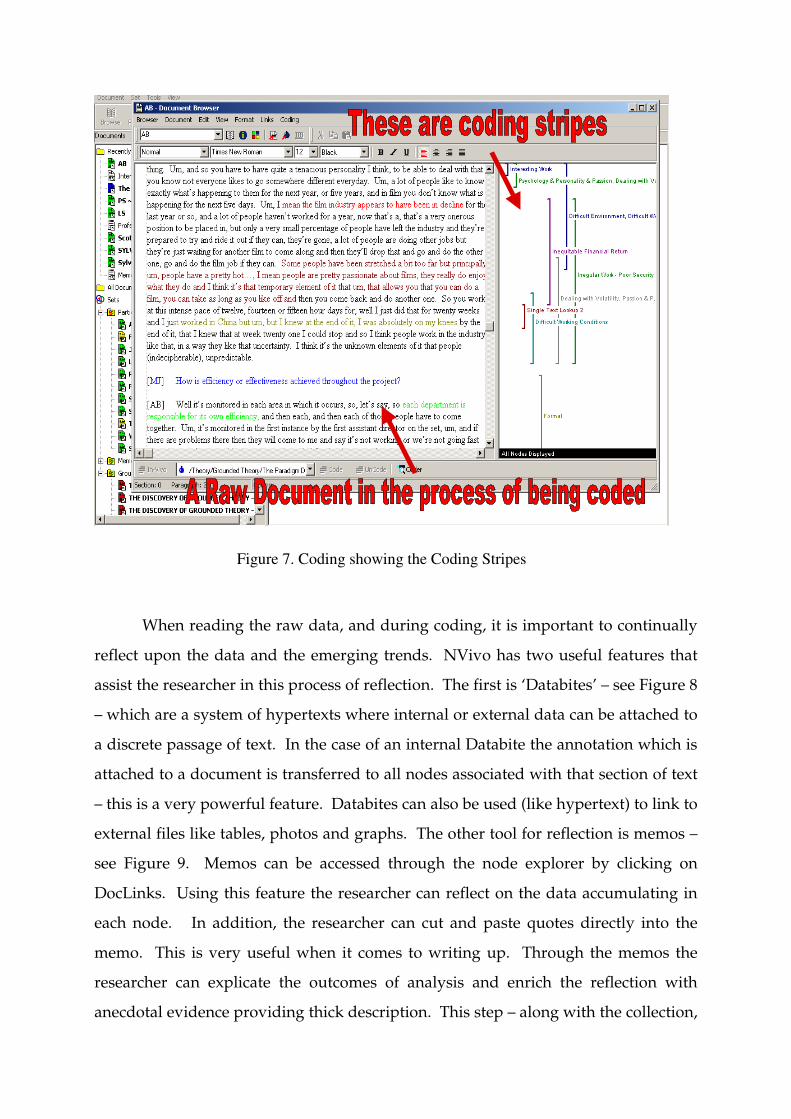
and structured into the existing hierarchy – see Figure 6. Coding Stripes can also be
selected to enhance the coding process by illuminating the codes that already exist,
helping the researcher develop consistency – see Figure 7.
Figure 6. Coding using the Node Tree
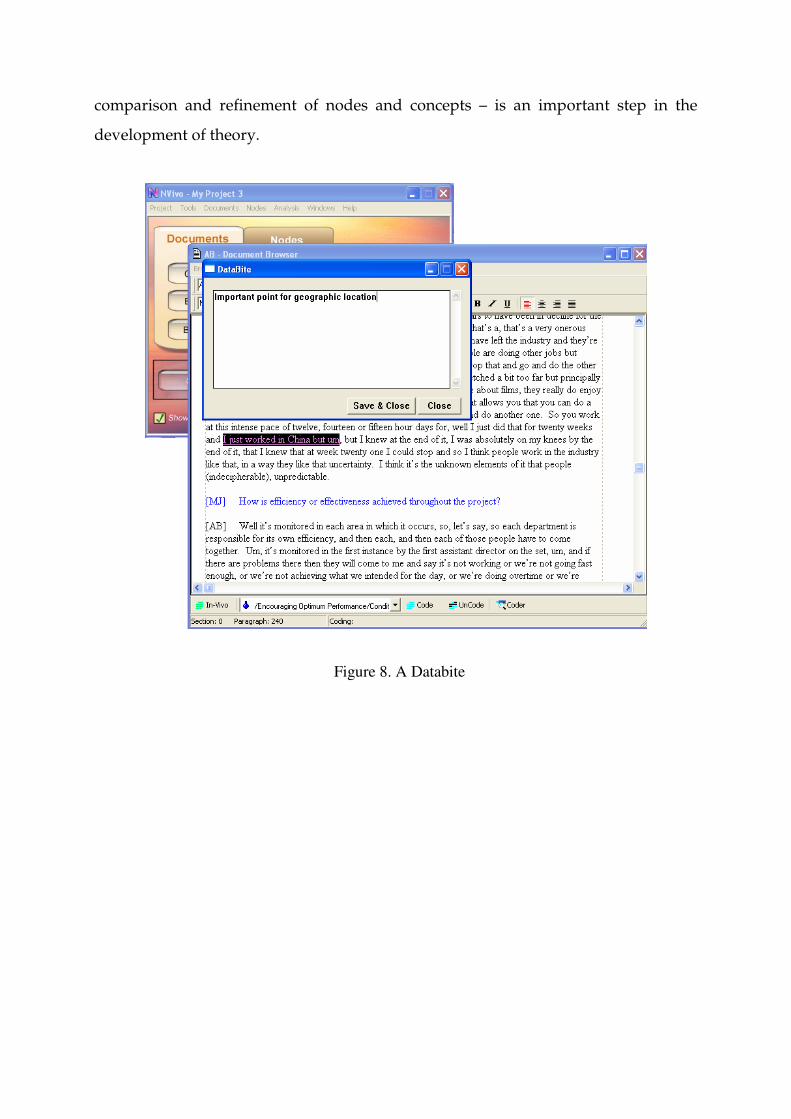
When reading the raw data, and during coding, it is important to continually
reflect upon the data and the emerging trends. NVivo has two useful features that
assist the researcher in this process of reflection. The first is ‘Databites’ – see Figure 8
– which are a system of hypertexts where internal or external data can be attached to
a discrete passage of text. In the case of an internal Databite the annotation which is
attached to a document is transferred to all nodes associated with that section of text
– this is a very powerful feature. Databites can also be used (like hypertext) to link to
external files like tables, photos and graphs. The other tool for reflection is memos –
see Figure 9. Memos can be accessed through the node explorer by clicking on
DocLinks. Using this feature the researcher can reflect on the data accumulating in
each node. In addition, the researcher can cut and paste quotes directly into the
memo. This is very useful when it comes to writing up. Through the memos the
researcher can explicate the outcomes of analysis and enrich the reflection with
anecdotal evidence providing thick description. This step – along with the collection,
Figure 7. Coding showing the Coding Stripes
comparison and refinement of nodes and concepts – is an important step in the
development of theory.
Figure 8. A Databite

This brief overview of NVivo has discussed how to get started in the program,
how to code and analyse the data, how to conceive concepts, and through reflection,
how to develop theory. While there are many more advanced functions of NVivo
that have not been discussed here, this overview should be sufficient to enable most
researchers to get up and running with the program.
What’s Next?
The latest product for qualitative data analysis will become available in 2006. This
product NVivo 7 combines the power of NUD*IST 6 with the flexibility and
advanced features of NVivo 2 offering users more power and greater flexibility (QSR
International Pty Ltd, 2005a). In addition, the new program allows analysis of data
in languages other than English, including Chinese and Tamil. The import and data
handling features have moved beyond rich text to be able to manage full MS Word™
Figure 9. A Memo
documents including tables and graphics. The new search engine retains the
advanced capabilities of the old search tools, but now has the power and speed of a
google™ type engine, with a query based language, and the ability to rank findings
in order of relevance. NVivo 7 will also provide undo facilities, the ability to
experiment with the data and improved security and portability (QSR International
Pty Ltd, 2005a, 2005b).
Conclusion
Qualitative data analysis software is fighting for, and winning dominance in the
world of qualitative researchers. More and more researchers are adopting electronic
tools, even if they are not using them to their complete advantage. While there is
definitely an argument for and against their use, there are tangible benefits for those
who make the investment. Qualitative data analysis software makes many of the
more repetitive and mechanical aspects of qualitative research easier and more
efficient. In addition, the software offers researchers an abundance of tools and
accessories which, when used appropriately, will enhance the research project and
remove much of the stress and tedium.
NVivo™ is one such analysis product that is quite widely used in the
qualitative research community. It is a type three product that allows researchers to
retrieve and code data, and develop theory building and modelling. This product is
well regarded by researchers and has been used to great success by this author.
The future for qualitative researchers is set to improve with even more
powerful and flexible data analysis tools such as NVivo 7, which offers features that
will make analysis faster and collaboration easier.
References
Basit, T. N. (2003). Manual or electronic? The role of coding in qualitative data analysis. Educational Research, 45(2), 143-154.
Berg, B. L. (2001). Qualitative research methods for the social sciences (4th ed.). Boston: Allyn and Bacon.
Blismas, N. G., & Dainty, A. R. J. (2003). Computer-aided qualitative data analysis: Panacea or paradox? Building research & information, 31(6), 455-463.
Bourdon, S. (2002). The integration of qualitative data analysis software in research strategies: Resistances and possibilities. Forum: Qualitative Social Research, 3(2), 1-10.
Coffey, A., & Atkinson, P. (1996). Making sense of qualitative data. London: Sage. Crowley, C., Harré , R., & Tagg, C. (2002). Qualitative research and computing:
Methodological issues and practices in using NVivo and NUD*IST. International Journal of Social Research Methodology, 5(3), 193-197.
Delamont, S. (1992). Fieldwork in educational settings: Methods, pitfalls and perspectives. London: Falmer Press.
DeNardo, A. M., & Levers, L. L. (2002, 19th November, 2002). Using NVivo to analyze qualitative data. Retrieved 15th August, 2005, 2005, from http://www.education.duq.edu/institutes/PDF/papers2002/DeNardo&Levers.pdf
Denzin, N. K., & Lincoln, Y. S. (1998). Strategies of qualitative inquiry. Thousand Oaks, CA: Sage.
Ely, M., Anzul, M., Friedman, T., Garner, D., & Steinmetz, A. (1991). Doing qualitative research: circles within circles. London: Falmer Press.
Glaser, B. G. (1978). Theoretical sensitivity: Advances in the methodology of grounded theory. Mill Valley, CA: Sociology Press.
Glaser, B. G., & Strauss, A. (1967). The discovery of grounded theory: Strategies for qualitative research. New York: Aldine.
Krueger, R. A. (1998). Analyzing and reporting focus group results. Thousand Oaks, CA: Sage.
Merriam, S. B. (2001). Qualitative research and case study applications in education (2nd ed.). San Francisco: Jossey-Bass.
Miles, M. B. (1979). Qualitative data as an attractive nuisance: The problem of analysis. Administrative Science Quarterly, 24, 590–601.
Miles, M. B., & Huberman, A. M. (1994). Qualitative data analysis: An expanded source book (2nd. ed.). Thousand Oaks: Sage.
Morse, J. M., & Richards, L. (2002). Readme first. Thousand Oaks, CA: Sage. Patton, M. Q. (2002). Qualitative research and evaluation methods (3rd ed.). Thousand
Oaks, CA: Sage. QSR International Pty Ltd. (2002). QSR NVivo (Version 2.0.161). QSR International Pty Ltd. (2005a). NVivo 7: Raising the bar for innovative research.
QSR NSight, 27, 6-7.
QSR International Pty Ltd. (2005b, 1st August, 2005). Viva NVivo 7! Retrieved 16th August, 2005, from http://www.qsrinternational.com/products/productoverview/NVivo_7.htm
Richards, L. (1999). Data Alive! The Thinking Behind NVivo. Qualitative Health Research, 9(3), 412-428.
Richards, L., & Richards, T. (1986). Qualitative data analysis : confronting the constraints. Melbourne: La Trobe University.
Richards, T. (2002). An intellectual history of NUD*IST and NVivo. International Journal of Social Research Methodology, 5(3), 199-214.
Silverman, D. (2000). Doing Qualitative Research: A practical handbook. Thousand Oaks, CA: Sage.
Silverman, D. (2001). Interpreting Qualitative Data: Methods for analysing talk, text and interaction. Thousand Oaks, CA: Sage.
Taylor, S. J., & Bodgan, R. (1998). Introduction to Qualitative Research Methods (Third Edition ed.). New York: John Wiley & Sons.
Tesch, R. (1990). Qualitative Research: Analysis types and software tools. New York: Falmer Press.
Welsh, E. (2002). Dealing with Data: Using NVivo in the Qualitative Data Analysis Process. Forum: Qualitative Social Research, 3(2), 1-7.