Training spiking neural models using cuckoo search algorithm
Upload
johnshopkinsCategory
view
1download
0
Using Point Process Models to Compare Neural SpikingActivity in the Subthalamic Nucleus of ParkinsonsPatients and a Healthy Primate
Citation Sarma, S.V. et al. “Using Point Process Models to CompareNeural Spiking Activity in the Subthalamic Nucleus of Parkinson'sPatients and a Healthy Primate.” Biomedical Engineering, IEEETransactions on 57.6 (2010): 1297-1305. © Copyright 2010 IEEE
As Published http://dx.doi.org/10.1109/tbme.2009.2039213
Publisher Institute of Electrical and Electronics Engineers
Version Final published version
Accessed Sat May 21 02:13:02 EDT 2011
Citable Link http://hdl.handle.net/1721.1/62018
Terms of Use Article is made available in accordance with the publisher's policyand may be subject to US copyright law. Please refer to thepublisher's site for terms of use.
Detailed Terms
IEEE TRANSACTIONS ON BIOMEDICAL ENGINEERING, VOL. 57, NO. 6, JUNE 2010 1297
Using Point Process Models to Compare NeuralSpiking Activity in the Subthalamic Nucleus of
Parkinson’s Patients and a Healthy PrimateSridevi V. Sarma∗, Member, IEEE, Uri T. Eden, Ming L. Cheng, Ziv M. Williams, Rollin Hu,
Emad Eskandar, and Emery N. Brown, Fellow, IEEE
Abstract—Placement of deep brain stimulating electrodes in thesubthalamic nucleus (STN) to treat Parkinson’s disease (PD) alsoallows the recording of single neuron spiking activity. Analyses ofthese unique data offer an important opportunity to better under-stand the pathophysiology of PD. Despite the point process natureof PD neural spiking activity, point process methods are rarely usedto analyze these recordings. We develop a point process representa-tion of PD neural spiking activity using a generalized linear modelto describe long- and short-term temporal dependencies in the spik-ing activity of 28 STN neurons from seven PD patients and 35 neu-rons from one healthy primate (surrogate control) recorded, whilethe subjects executed a directed-hand movement task. We usedthe point process model to characterize each neuron’s bursting,oscillatory, and directional tuning properties during key periodsin the task trial. Relative to the control neurons, the PD neuronsshowed increased bursting, increased 10–30 Hz oscillations, andincreased fluctuations in directional tuning. These features, whichtraditional methods failed to capture accurately, were efficientlysummarized in a single model in the point process analysis of eachneuron. The point process framework suggests a useful approachfor developing quantitative neural correlates that may be relateddirectly to the movement and behavioral disorders characteristicof PD.
Index Terms—Deep brain stimulation (DBS), Parkinson’sdisease (PD), point processes, spike trains.
I. INTRODUCTION
THE USE of chronic deep brain stimulation (DBS) is now awell-established therapy for Parkinson’s disease (PD) [5],
[23]. Prior to the placement of the stimulating electrodes in the
Manuscript received March 2, 2009; revised September 20, 2009; acceptedNovember 17, 2009. Date of publication February 17, 2010; date of currentversion May 14, 2010. The work of S. V. Sarma was supported by Burrough’sWellcome Fund and a L’Oreal FWIS Fellowship. The work of E. Eskandar wassupported in part by NIH—National Eye Institute under Grant 1R01EY017658,in part by NIH—National Institute Drug Addiction under Grant 1R01NS063249,in part by National Science Foundation under Grant IOB 0645886, and in partby HHMI and Klingenstein Foundation. The work of E. N. Brown was sup-ported under Grants R01 DA015644 and DP1 OD003646. Asterisk indicatescorresponding author.
∗S. V. Sarma was with the Brain and Cognitive Sciences, MassachusettsInstitute of Technology, Cambridge, MA 02139 USA. She is now with theDepartment of Biomedical Engineering, Institute for Computational Medicine,Johns Hopkins University, Baltimore, MD 21218 USA (e-mail: [email protected]).
U. T. Eden is with the Mathematics and Statistics Department, Boston Uni-versity, Boston, MA 02115 USA.
M. L. Cheng is with the Clinical Neuroscience Department, Brown University,Providence, RI 02912 USA.
Z. M. Williams, R. Hu, and E. Eskandar are with Neurosurgery,Massachusetts General Hospital, Boston, MA 02114 USA.
E. N. Brown is with the Brain and Cognitive Sciences, Massachusetts Insti-tute of Technology, Cambridge, MA 02139 USA.
Digital Object Identifier 10.1109/TBME.2009.2039213
commonly targeted subthalamic nucleus (STN), microelectroderecordings are routinely performed to help to locate the STNand to insure proper placement of the electrode. The need torecord neural spiking activity to insure proper electrode place-ment gives neurophysiologists a unique opportunity to learndirectly about the pathological properties of STN neurons inhuman patients with PD [1], [4], [5], [10], [26], [29].
To date, the analyses of these unique data typically use sev-eral different statistical techniques to characterize the spikingproperties of the STN neurons [14]. Short-term history depen-dence within a spike train is analyzed with interspike inter-val histograms [37]. Long-term history dependence related toneural oscillations is often studied in the frequency domainusing power spectra by transforming the spike train into acontinuous-valued signal before computing its Fourier trans-form [22], [28]. Movement-related properties are determinedfrom a tuning curve computed as the average spike rates acrossmultiple trials in each movement direction [20], [21], [33].
More recently, point process methods have been used to an-alyze the spike train activity for a broad range of neural sys-tems [6], [25], [30], [35], [42], [43]. Despite the point processnature of STN spiking activity, point process methods are notroutinely used to analyze these recordings. Some studies haveapplied Poisson models to neuronal spiking data of PD patients,but these models fail to capture any temporal dependencies thatexist in the spiking activity, such as refractoriness, bursting,and oscillations [26], [29]. Zelnikera et al. [40] analyzed thestochastic structure of the short- and long-term dependencies astwo Poisson processes with different rate constants. Althoughinformative, this approach restricted the summary of the tem-poral dependencies in the data to the differences between thetwo rate constants. Eden et al. recently demonstrated that asingle point process model could be used to characterize thespiking activity in STN neurons recorded from PD patients ex-ecuting a directed-hand movement task [18]. The model useda generalized linear model (GLM) [27] to represent the pointprocess conditional intensity function (CIF) in terms of bothshort- and long-term history dependence [35]. The single modelcaptured oscillations, bursting, directional tuning, and thus, ob-viated the need for multiple different analyses. In addition, themodel identified a previously undescribed period of decreasedspiking propensity 20–30 ms following a spike immediatelyprior to movement [18].
To use this recent work to understand more clearly the extentto which the features of the neural spiking activity observed in
0018-9294/$26.00 © 2010 IEEE
1298 IEEE TRANSACTIONS ON BIOMEDICAL ENGINEERING, VOL. 57, NO. 6, JUNE 2010
the PD patient’s are signatures of this pathological condition, itwould be ideal to compare these features with similar featuresderived from spiking activity recorded in healthy human subjectsexecuting the same movement task. Because this is not possiblefor obvious ethical reasons, we decided to compare the STNneural spiking activity of seven PD patients with STN activityrecorded from a healthy nonhuman primate, rhesus monkey,executing the movement task. The nonhuman primate serves asa surrogate control. We use GLMs to formulate point processmodels [15], [34] to characterize the relative contribution ofintrinsic factors (e.g., short- and long-term history effects) andextrinsic factors (e.g., the impact of movement direction) onthe probability that the neuron will spike at any given time[35]. Once adequate goodness-of-fit is established, we use themodel parameters to analyze the relative importance of bursting,oscillations, directional tuning in characterizing differences inspiking propensity of neurons in the two groups.
II. METHODS
A. Human Subjects
Seven patients undergoing deep brain stimulator placementfor the treatment of PD were included in the study. All pa-tients had idiopathic PD with a Hoehn–Yahr score [41] of threeor higher and had a documented response to L-dopa replace-ment therapy. All patients received a thorough preoperative neu-rological exam. Exclusion criteria for surgery included thosepatients with Parkinson “plus” syndromes, cognitive impair-ment, active psychiatric disorders, or anatomic abnormalities onMRI [4], [5]. None of the patients had undergone prior surgeryfor the treatment of PD. Informed consent for the study wasobtained in strict accordance with a protocol approved by theInstitutional Review Board and the multidisciplinary movementdisorders assessment committee at the Massachusetts GeneralHospital. The decision to offer surgery was based on clinicalindications alone, and bear no relation to the patients’ participa-tion in this study. To ensure that the patients were comfortablewith performing the behavioral joystick task, they practiced itprior to surgery. Subjects were able to remove their hand fromthe joystick or stop the task at any time. At all time pointsbefore and during surgery, the patients had the clear under-standing that their participation was not related to the surgicaloutcome, and that they could withdraw from the study at anytime.
B. Electrophysiology
Anti-Parkinsonian medications were withheld the night be-fore surgery. No sedatives were given prior to or during perfor-mance of recordings. A local anesthetic was used prior to the in-cision and burr hole placement. The stereotactic localization us-ing preoperative MRI and computerized tomography, as well asgeneral techniques of intraoperative microelectrode recordingshave been described previously [1], [4], [5]. Single-unit record-ings were made from the dorsal-lateral motor subterritory of theSTN based on stereotactic localization and reconstructions ofthe electrode trajectories [1]. The STN has characteristic high-
firing rates in comparison to the surrounding structures [2] andhas clear dorsal and ventral borders that are evident when re-constructing neuronal activity along the electrode trajectories.Once within the STN, no attempt was made to explicitly se-lect cells based on presence or absence of movement-relatedactivity, or on whether the cells responded to passive and/orvolitional movement. This was done specifically to limit the po-tential for a sampling bias. We used an array of three tungstenmicroelectrodes, separated by 2 mm and placed in a parasagit-tal orientation. The electrodes were advanced simultaneously in50 µm increments using a motorized microdrive (Alpha Omega,Nazareth, Israel). The behavioral paradigm was controlled bya Macintosh G4 computer using custom-made software. Neu-ronal activity was bandpass filtered (300 Hz–6 kHz) and sam-pled at 20 kHz. Spikes were sorted offline using a standardizedtemplate-matching algorithm (Cambridge Electronics Design,Cambridge, England).
C. Primate Subject
One adult male rhesus monkey (macaca mulatta), a.k.a.“Bohr,” was included in this study. A titanium head post, plasticrecording chamber, and scleral search coil were surgically im-planted in accordance with guidelines set by the animal reviewcommittee at Massachusetts General Hospital. Neuronal activ-ity was amplified, bandpass filtered between 200 Hz–5 kHz, andsampled at 20 kHz. Spikes were stored and sorted offline using atemplate-matching algorithm (Spike 2, Cambridge ElectronicsDesign). Eye position and joystick position were each sampledand recorded at 1 kHz. Bohr performed 868 trials of a directedmovement task described below and recordings were taken from96 neurons.
D. Behavioral Task
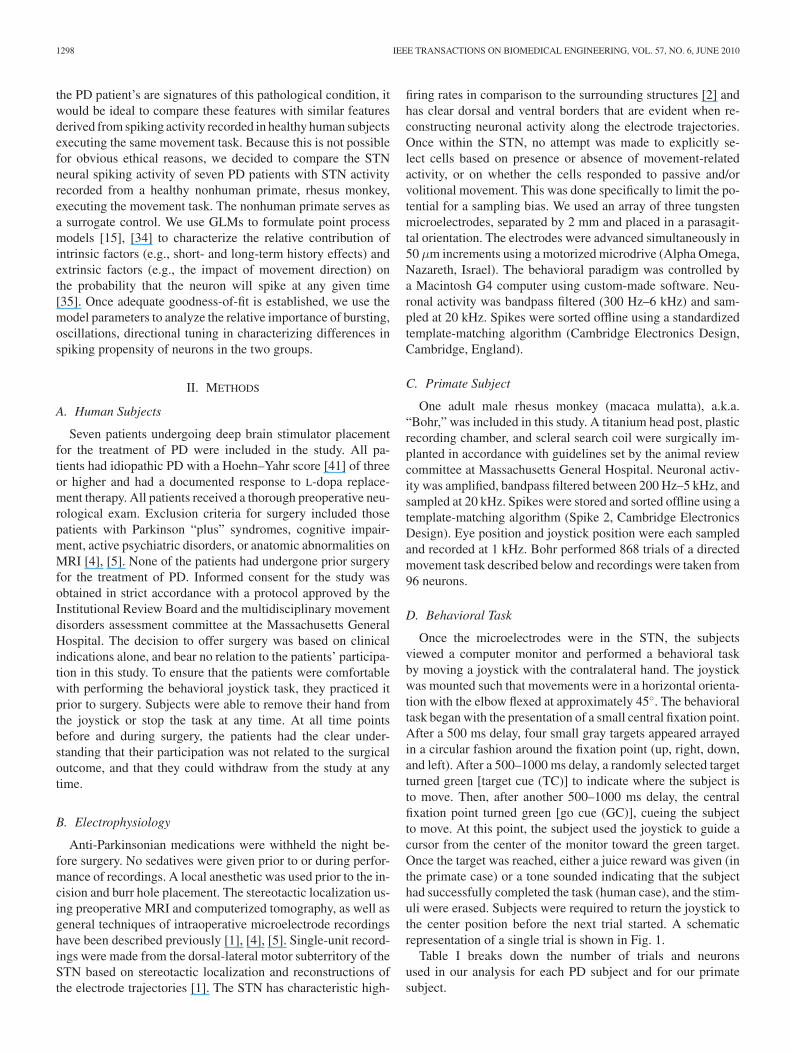
Once the microelectrodes were in the STN, the subjectsviewed a computer monitor and performed a behavioral taskby moving a joystick with the contralateral hand. The joystickwas mounted such that movements were in a horizontal orienta-tion with the elbow flexed at approximately 45◦. The behavioraltask began with the presentation of a small central fixation point.After a 500 ms delay, four small gray targets appeared arrayedin a circular fashion around the fixation point (up, right, down,and left). After a 500–1000 ms delay, a randomly selected targetturned green [target cue (TC)] to indicate where the subject isto move. Then, after another 500–1000 ms delay, the centralfixation point turned green [go cue (GC)], cueing the subjectto move. At this point, the subject used the joystick to guide acursor from the center of the monitor toward the green target.Once the target was reached, either a juice reward was given (inthe primate case) or a tone sounded indicating that the subjecthad successfully completed the task (human case), and the stim-uli were erased. Subjects were required to return the joystick tothe center position before the next trial started. A schematicrepresentation of a single trial is shown in Fig. 1.
Table I breaks down the number of trials and neuronsused in our analysis for each PD subject and for our primatesubject.
SARMA et al.: USING POINT PROCESS MODELS TO COMPARE NEURAL SPIKING ACTIVITY 1299
Fig. 1. Schematic of behavioral task trial.
TABLE IDISTRIBUTION OF TRIALS AND RECORDED NEURONS PER PATIENT
AND PRIMATE
E. Point Process Model of STN Dynamics
We formulate a point process model to relate the spikingpropensity of each STN neuron to factors associated with move-ment direction and features of the neuron’s spiking history. Weuse the model parameters to analyze oscillations, bursting, anddirectional tuning modulations across the entire trial and makecomparisons between two subject groups.
A point process is a series of 0–1 random events that occurin continuous time. For a neural spike train, the 1-s are indi-vidual spike times and the 0-s are the times at which no spikesoccur. To define a point process model of neural spiking activ-ity, in this analysis, we consider an observation interval (0, T ],and let N(t) be the number of spikes counted in interval (0, t]for t ∈ (0, T ]. A point process model of a neural spike traincan be completely characterized by its CIF, λ(t|Ht) defined asfollows:
λ(t|Ht) = lim∆→0
P (N(t + ∆) − N(t) = 1|Ht)∆
(1)
where Ht denotes the history of spikes up to time t. It followsfrom (1) that the probability of a single spike in a small interval(t, t + ∆] is approximately
Pr(spike in (t, t + ∆]|Ht) ∼= λ(t|Ht)∆. (2)
Details can be found in [15] and [34]. When ∆ is small, (2)is approximately the spiking propensity at time t.
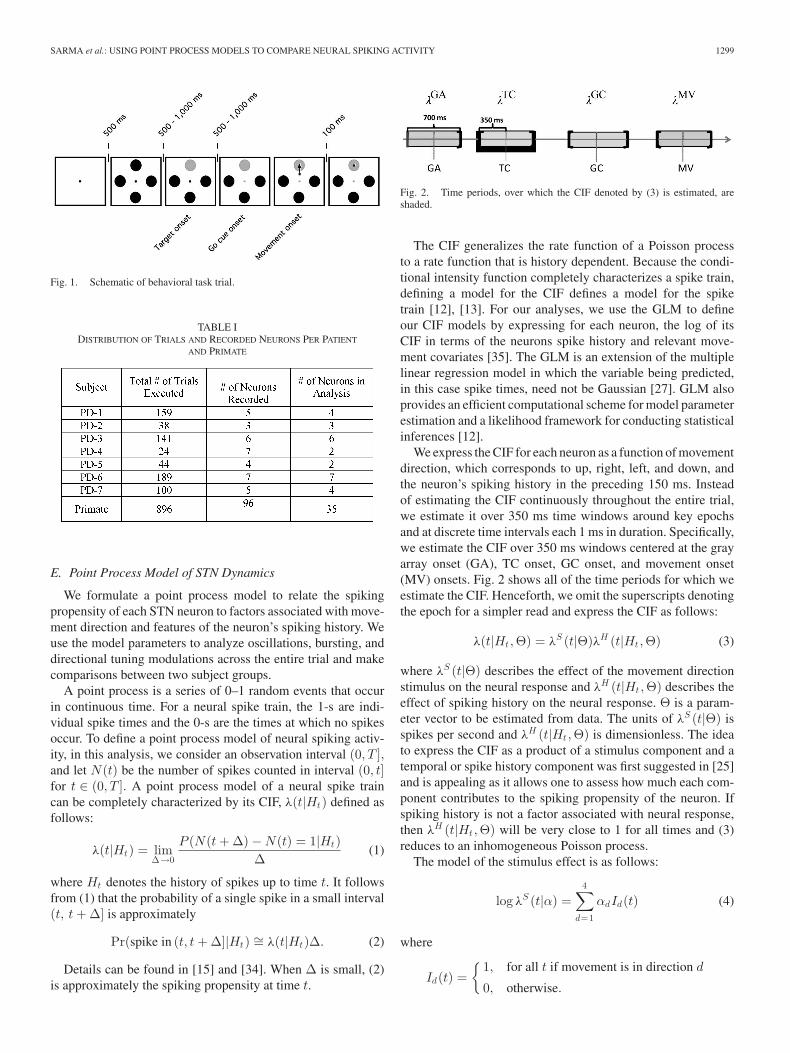
Fig. 2. Time periods, over which the CIF denoted by (3) is estimated, areshaded.
The CIF generalizes the rate function of a Poisson processto a rate function that is history dependent. Because the condi-tional intensity function completely characterizes a spike train,defining a model for the CIF defines a model for the spiketrain [12], [13]. For our analyses, we use the GLM to defineour CIF models by expressing for each neuron, the log of itsCIF in terms of the neurons spike history and relevant move-ment covariates [35]. The GLM is an extension of the multiplelinear regression model in which the variable being predicted,in this case spike times, need not be Gaussian [27]. GLM alsoprovides an efficient computational scheme for model parameterestimation and a likelihood framework for conducting statisticalinferences [12].
We express the CIF for each neuron as a function of movementdirection, which corresponds to up, right, left, and down, andthe neuron’s spiking history in the preceding 150 ms. Insteadof estimating the CIF continuously throughout the entire trial,we estimate it over 350 ms time windows around key epochsand at discrete time intervals each 1 ms in duration. Specifically,we estimate the CIF over 350 ms windows centered at the grayarray onset (GA), TC onset, GC onset, and movement onset(MV) onsets. Fig. 2 shows all of the time periods for which weestimate the CIF. Henceforth, we omit the superscripts denotingthe epoch for a simpler read and express the CIF as follows:
λ(t|Ht,Θ) = λS (t|Θ)λH (t|Ht,Θ) (3)
where λS (t|Θ) describes the effect of the movement directionstimulus on the neural response and λH (t|Ht,Θ) describes theeffect of spiking history on the neural response. Θ is a param-eter vector to be estimated from data. The units of λS (t|Θ) isspikes per second and λH (t|Ht,Θ) is dimensionless. The ideato express the CIF as a product of a stimulus component and atemporal or spike history component was first suggested in [25]and is appealing as it allows one to assess how much each com-ponent contributes to the spiking propensity of the neuron. Ifspiking history is not a factor associated with neural response,then λH (t|Ht,Θ) will be very close to 1 for all times and (3)reduces to an inhomogeneous Poisson process.
The model of the stimulus effect is as follows:
log λS (t|α) =4∑
d=1
αdId(t) (4)
where
Id(t) ={
1, for all t if movement is in direction d
0, otherwise.
1300 IEEE TRANSACTIONS ON BIOMEDICAL ENGINEERING, VOL. 57, NO. 6, JUNE 2010
The {αd}4d=1 parameters measure the effects of movement
direction on the spiking propensity. For example, if α1 issignificantly larger than α2 , α3 , and α4 during movement, thenthe probability that a neuron will spike is greater when the pa-tient moves in the up direction, suggesting that the neuron maybe tuned in the up direction.
Our model of spike history effect is as follows:
log λH (t|Ht, β, γ) =10∑
j=1
βjn(t − j : t − (j + 1))
+14∑
k=1
γkn(t − (10k + 9) : t − 10k) (5)
where n(a : b) is the number of spikes observed in the time in-terval [a, b) during the epoch. The {βj}10
j=1 parameters measurethe effects of spiking history in the previous 10 ms, and there-fore, can capture refractoriness and/or bursting on the spikingprobability in the given epoch. For example, if eβ1 is close tozero for any given epoch, then for any given time t, if the neuronhad a spike in the previous millisecond then the probability thatit will spike again is also close to zero (due to refractory period).Or if eβ5 is significantly larger than 1, then for any time t, if theneuron had a spike five prior to t, then the probability that it willspike again is modulated up, suggesting bursting.
The {γk}14k=1 parameters measure the effects of the spiking
history in the previous 10–150 ms on the spiking probability,which may be associated with not only the neuron’s individualspiking activity, but also that of its local neural network. Forexample, if eγ4 is significantly larger than 1, then for any timet if the neuron had one or more spikes between 40–50 prior tot, then the probability that it will spike again is modulated up,suggesting 20–25 Hz oscillations.
By combining (4) and (5), we see that the CIF may be writtenas follows:
λ(t|Ht,Θ) = exp
{4∑
d=1
αdId(t)
}exp
10∑j=1
βjn(t − (j)) : t
− (j + 1)) +14∑
k=1
γkn(t − (10k + 9) : t10K)
}.
(6)
The model parameter vector Θ = {αb, βj , γk} contains 28unknown parameters (for each epoch and time window mod-eled). We compute maximum-likelihood (ML) estimates forΘ and 95% confidence intervals of Θ for each neuron usingglmfit.m in MATLAB.
Finally, to choose the model defined by (6), we varied thehistory bins [a and b in n(a:b)] and also varied the basis functionsId(t) multiplying the parameters {αd} and analyzed the tradeoffbetween the number of parameters in the model and the ML costof the fitted model. That is, we computed the Aikaike’s criterion(AIC) [3], which is 2∗(number of parameters – log likelihoodof model), for each possible model. The model given by (6)
was selected as optimal because it rendered the minimum AICamongst model classes explored.
F. Model Fitting
Establishing the degree of agreement between a point processmodel and observations of the spike train and associated exper-imental variables is a prerequisite for using the point processanalysis to make scientific inferences. We used Kolmogorov–Smirov (KS) plots based on the time-rescaling theorem to as-sess model goodness-of-fit. The time-rescaling theorem is a wellknown result in probability theory, which states that any pointprocess with an integrable conditional intensity function maybe transformed into a Poisson process with unit rate [24]. A KSplot, which plots the empirical cumulative distribution functionof the transformed spike times versus the cumulative distribu-tion function of a unit rate exponential, is used to visualize thegoodness-of-fit for each model. The model is better if its cor-responding KS plot lies near the 45◦ line. We computed 95%confidence bounds for the degree of agreement using the distri-bution of the KS statistic [24]. If a model’s KS plot was withinthe 95% confidence bounds, we included it in our analyses.
III. RESULTS
As mentioned earlier, we built point process models for STNneurons in seven Parkinson’s patients and one healthy primate,which captured dynamics across four different epochs within adirected hand-movement task. We summarize results for eachspecies later. For the PD data, 28 STN neuron models passedthe KS test and for the primate data, 35 models passed the KStest.
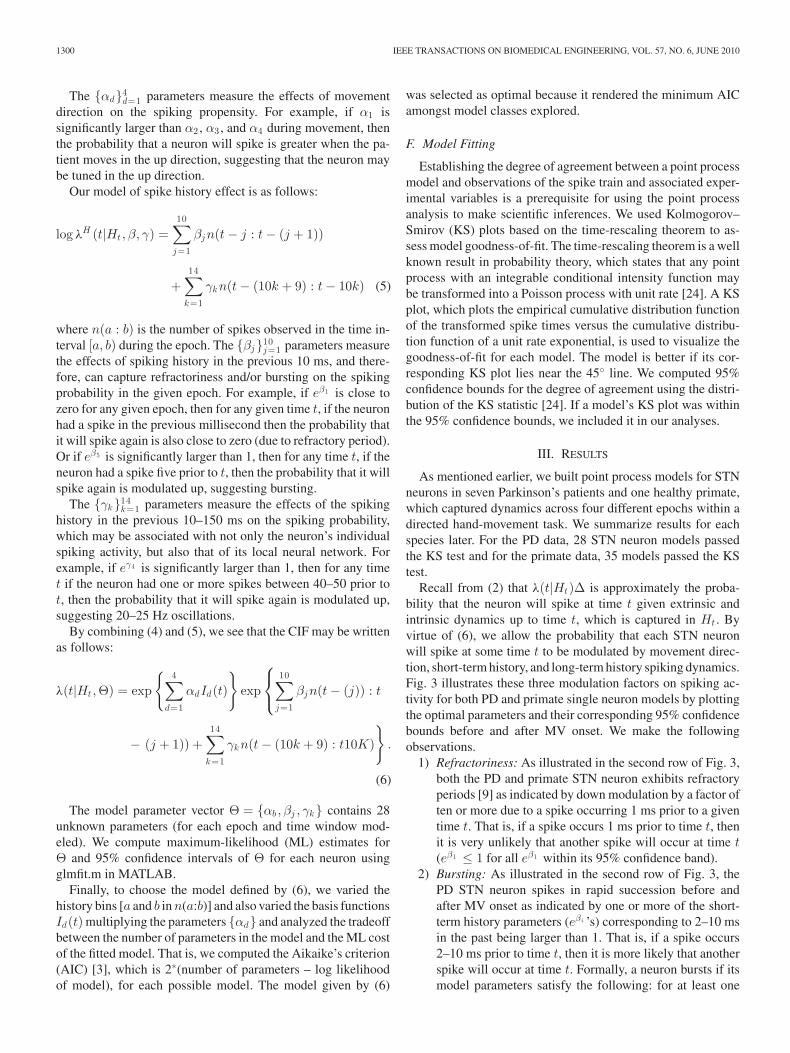
Recall from (2) that λ(t|Ht)∆ is approximately the proba-bility that the neuron will spike at time t given extrinsic andintrinsic dynamics up to time t, which is captured in Ht . Byvirtue of (6), we allow the probability that each STN neuronwill spike at some time t to be modulated by movement direc-tion, short-term history, and long-term history spiking dynamics.Fig. 3 illustrates these three modulation factors on spiking ac-tivity for both PD and primate single neuron models by plottingthe optimal parameters and their corresponding 95% confidencebounds before and after MV onset. We make the followingobservations.
1) Refractoriness: As illustrated in the second row of Fig. 3,both the PD and primate STN neuron exhibits refractoryperiods [9] as indicated by down modulation by a factor often or more due to a spike occurring 1 ms prior to a giventime t. That is, if a spike occurs 1 ms prior to time t, thenit is very unlikely that another spike will occur at time t(eβ1 ≤ 1 for all eβ1 within its 95% confidence band).
2) Bursting: As illustrated in the second row of Fig. 3, thePD STN neuron spikes in rapid succession before andafter MV onset as indicated by one or more of the short-term history parameters (eβi ’s) corresponding to 2–10 msin the past being larger than 1. That is, if a spike occurs2–10 ms prior to time t, then it is more likely that anotherspike will occur at time t. Formally, a neuron bursts if itsmodel parameters satisfy the following: for at least one
SARMA et al.: USING POINT PROCESS MODELS TO COMPARE NEURAL SPIKING ACTIVITY 1301
Fig. 3. Optimal model parameters for an STN neuron during MV– andMV+ periods of a (left) PD patient and (right) healthy primate. [Top row(movement direction modulation)] Optimal extrinsic factors eα d for d =1, 2, 3, 4(U, R, D, L) are plotted in black lines from left to right and corre-sponding 95% confidence intervals are shaded around each black line in a gray.[Middle row (short-term history modulation)] Optimal short-term history factorseβ i for i = 1, 2, . . . , 10 are plotted in black from right to left and the corre-sponding 95% confidence intervals are shaded in gray. [Bottom row (long-termhistory modulation)] Optimal long-term history factors eγ i for j = 1, 2, . . . , 14are plotted in black from right to left and corresponding 95% confidence inter-vals are shaded in gray.
i = 2, 3, . . . , 10,LBi ≥ 1 and UBi ≥ 1.5, where LBi ≤eβi ≤ UBi . LB and UB are the 95% lower and upperconfidence bounds, respectively.
3) 10–30 Hz oscillations: As illustrated in the third row ofFig. 3, the PD STN neuron exhibits 10–30 Hz oscillatoryfiring before movement. That is, the probability that thePD STN neuron will spike at a given time t is modulated upif a spike occurs 30–100 ms prior to t. Formally, a neuronhas 10–30 Hz oscillations if its model parameters satisfythe following: for at least one i = 2, 3, . . . , 5,LBi ≥ 1 andUBi ≥ 1.5, where LBi ≤ eγi ≤ UBi .
4) Directional tuning: As illustrated in the first row of Fig. 3,the PD STN neuron appears to exhibit more directionaltuning after MV onset. That is, the PD neuron seems morelikely to spike in one direction more than at least one otherdirection. To quantify directional tuning, we performed thefollowing test for each neuron, each time relative to onset,and each epoch:a) For each direction d∗ = {U,R,D,L}, compute
pd∗d = Pr(eαd ∗ > eαd ) = Pr(αd∗ > αd) for d �= d∗.Define pd∗d∗ = 0. Use the Gaussian approximation forαd , which is one of the asymptotic properties of MLestimates to compute pd∗d .
b) If maxd∗=1,2,3,4 pd∗d ≥ 0.975 then neuron exhibits di-rectional tuning.
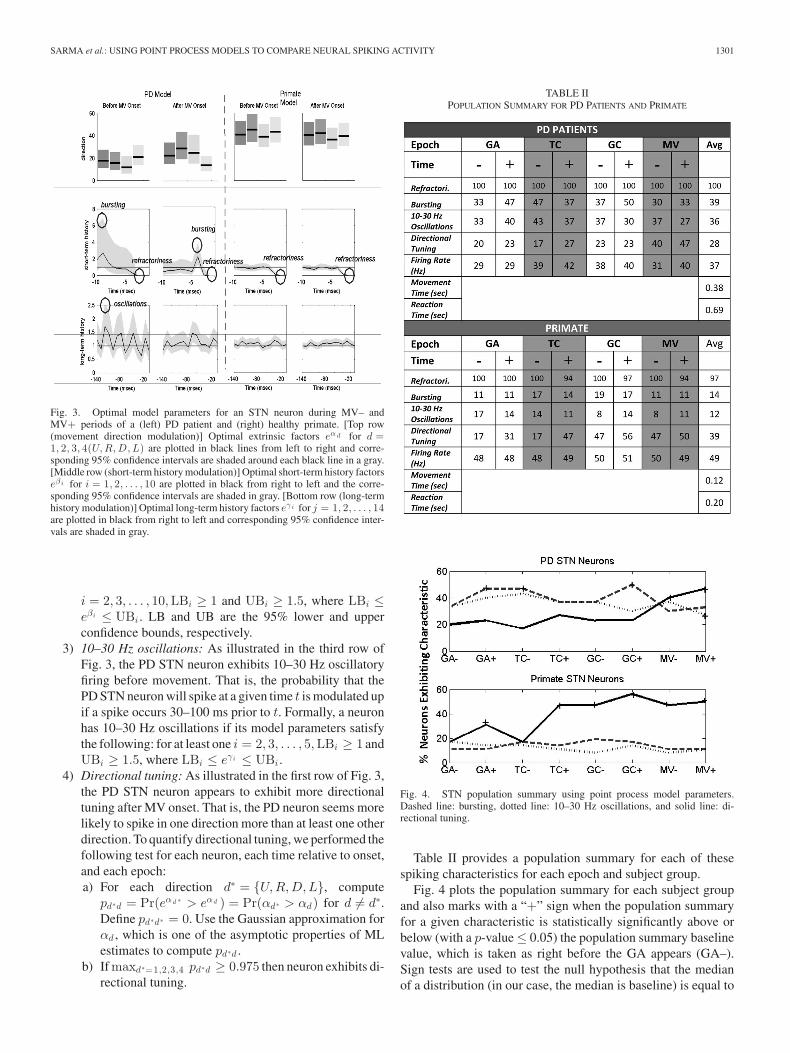
TABLE IIPOPULATION SUMMARY FOR PD PATIENTS AND PRIMATE
Fig. 4. STN population summary using point process model parameters.Dashed line: bursting, dotted line: 10–30 Hz oscillations, and solid line: di-rectional tuning.
Table II provides a population summary for each of thesespiking characteristics for each epoch and subject group.
Fig. 4 plots the population summary for each subject groupand also marks with a “+” sign when the population summaryfor a given characteristic is statistically significantly above orbelow (with a p-value ≤ 0.05) the population summary baselinevalue, which is taken as right before the GA appears (GA–).Sign tests are used to test the null hypothesis that the medianof a distribution (in our case, the median is baseline) is equal to
1302 IEEE TRANSACTIONS ON BIOMEDICAL ENGINEERING, VOL. 57, NO. 6, JUNE 2010
some value [39]. Under the null hypothesis, we expect half ofthe observations to be above the median and half to be below,therefore, the number of observations at any given time windowduring a trial (e.g., MV– is a 350 ms window right before MVonset) that are above the median, which follow a binomial dis-tribution with p = 1/2 and n equals the total number of observa-tions above the mean and below the mean. We considered eachpatient separately and computed the number of observations(across all neurons in patient) that collectively were above orbelow the patient’s baseline for each STN characteristic (bursts,high-frequency oscillations (HFOs), and directional tuning) andfor each epoch. We then computed either 1, if the probability ofobserving something greater if the number of observations weregreater than the baseline under the null hypothesis, or 2, if theprobability of observing something less if the number of obser-vations were less than the baseline under the null hypothesis.These probabilities are the p-values.
We make the following observations from Fig. 4 and Table II.Most neurons in both species exhibit refractoriness. Burstingis prevalent across all epochs in neural activity of PD patients(on average 39% of PD STN neurons burst). In contrast, neuralactivity in the healthy primate exhibits little bursting (14% onaverage) across all epochs. Ten to thirty hertz oscillations areprevalent in neural activity of PD patients during across allepochs (on average 36%) and significantly decrease relative tothis baseline post movement as denoted by “+” symbols in thesolid curve at the top of Fig. 4. Beta oscillations have beenobserved experimentally in both Parkinsonian primates and PDpatients [7], [8], [10], [17], [29], [32], and attenuation of theseoscillation post movement have also been observed [4], [36].In contrast, an average of 12% of the primate neurons exhibit10–30 Hz oscillations, which does not significantly modulateacross the entire trial. Directional tuning is more prevalent inthe healthy primate across the trial. In particular, directionaltuning increases significantly above baseline right after the GAis shown in the primate case (see “+” in solid curve at thebottom of Fig. 4 at GA+). This makes sense as the primateknows and moves to one of the four possible directions shown.Tuning increased further in the primate neurons after the TCappears, as now the subject knows which direction to move whencued to move. In contrast, directional tuning fails to increasesignificantly above baseline until right before MV onset (see“+” in solid curve at the top plot of Fig. 4 at MV–) in PD STNneurons. The lack of significant increase in directional tuning inPD STN neurons early on in the trial may reflect the lack of adynamic range in the STN neurons of PD patients, which maycause their slow and impaired movements.
For comparison, we also computed spiking characteristics us-ing traditional methods. Next, we describe these computations.
A. Beta Oscillations
To analyze beta oscillations, we computed spectrograms foreach epoch window (e.g., 350 ms window right before the GAappears), each neuron and each trial. Then, for each spectro-gram, we computed the oscillation density of the spectrogramin the 10–30 Hz range as the integral of the spectrogram in the
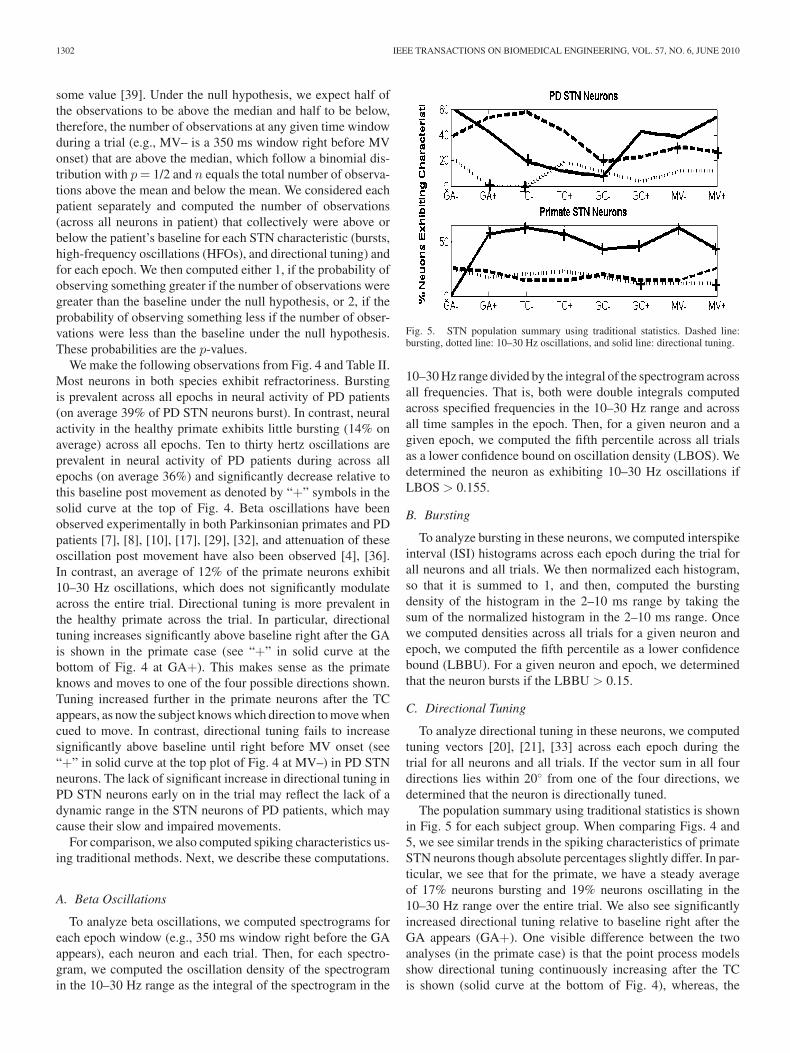
Fig. 5. STN population summary using traditional statistics. Dashed line:bursting, dotted line: 10–30 Hz oscillations, and solid line: directional tuning.
10–30 Hz range divided by the integral of the spectrogram acrossall frequencies. That is, both were double integrals computedacross specified frequencies in the 10–30 Hz range and acrossall time samples in the epoch. Then, for a given neuron and agiven epoch, we computed the fifth percentile across all trialsas a lower confidence bound on oscillation density (LBOS). Wedetermined the neuron as exhibiting 10–30 Hz oscillations ifLBOS > 0.155.
B. Bursting
To analyze bursting in these neurons, we computed interspikeinterval (ISI) histograms across each epoch during the trial forall neurons and all trials. We then normalized each histogram,so that it is summed to 1, and then, computed the burstingdensity of the histogram in the 2–10 ms range by taking thesum of the normalized histogram in the 2–10 ms range. Oncewe computed densities across all trials for a given neuron andepoch, we computed the fifth percentile as a lower confidencebound (LBBU). For a given neuron and epoch, we determinedthat the neuron bursts if the LBBU > 0.15.
C. Directional Tuning
To analyze directional tuning in these neurons, we computedtuning vectors [20], [21], [33] across each epoch during thetrial for all neurons and all trials. If the vector sum in all fourdirections lies within 20◦ from one of the four directions, wedetermined that the neuron is directionally tuned.
The population summary using traditional statistics is shownin Fig. 5 for each subject group. When comparing Figs. 4 and5, we see similar trends in the spiking characteristics of primateSTN neurons though absolute percentages slightly differ. In par-ticular, we see that for the primate, we have a steady averageof 17% neurons bursting and 19% neurons oscillating in the10–30 Hz range over the entire trial. We also see significantlyincreased directional tuning relative to baseline right after theGA appears (GA+). One visible difference between the twoanalyses (in the primate case) is that the point process modelsshow directional tuning continuously increasing after the TCis shown (solid curve at the bottom of Fig. 4), whereas, the
SARMA et al.: USING POINT PROCESS MODELS TO COMPARE NEURAL SPIKING ACTIVITY 1303
tuning vector analysis shows a decrease in directional tuningaround the GC epoch (solid curve at the bottom of Fig. 5). Thereason for this discrepancy is due to the fact that tuning vectorsare only capturing first-order statistics of the point process. Thepoint process model parameters take into account the stimu-lus parameters (α′s) probability distributions (not just the meanvalues), and directional tuning is determined from these distri-butions as described earlier. Therefore, making inferences fromaverage tuning vectors can be misleading.
In the human case, we see significant differences betweenthe two analyses. The point process models show significantbursting and oscillations throughout the trial (an average of39% and 36%, respectively), while traditional methods leadus to believe that there is much less bursting than 10–30 Hzoscillations (an average of 10% and 37%, respectively). Thereason the ISI histogram does not show as much bursting in theneurons is precisely because there are also 10–30 Hz oscillationsin the spiking activity. Therefore, there are secondary peaks inthe ISI histograms between 30–100 ms range. These secondarypeaks result in less bursting density, leading us to believe thatbursting may not be prevalent. The fact is, PD STN neuronsoften burst and oscillate in the beta frequency range and thisis captured by the point process model parameters as describedearlier, since our GLM separates the contributions of short-termintrinsic factors and long-term intrinsic factors on the propensityof the neuron to spike (5).
Another drawback of using traditional statistics is that theyare significantly different from one another, and therefore, usingthem to define whether a neuron bursts, oscillates, or exhibitsdirectional tuning over a certain epoch is not straightforward. Infact, the population summary shown in Fig. 5 varies significantlyas we change thresholds. In contrast, for point process models,we can use the same threshold to determine whether a neuronoscillates and bursts as the threshold is on how model parametersmodulate the overall probability that the neuron spikes at anygiven time.
IV. CONCLUSION
We have applied the point process framework to the analy-sis of STN microelectrode recordings from PD patients and ahealthy nonhuman primate, to understand the relative impor-tance of movement and spiking history on neural responses.We used GLM representations of the point process CIF to de-velop an efficient likelihood-based approach to model fitting,goodness-of-fit assessment, and inference. The point processmodel parameters allowed us to identify pathological charac-teristics of the STN neurons in PD patients, including bursting,10–30 Hz oscillations, and decreased directional tuning prior tomovement. These characteristics, which differed from the char-acteristics of the non-PD STN neurons, had been previouslydescribed using traditional methods. However, such techniquescan lead to erroneous inferences when spiking data containssignificant temporal dependencies as is the case of PD STNspiking activity. The point process framework is, therefore, auseful paradigm for providing a succinct, quantitative charac-terization of the pathological behavior of STN spiking activityin PD patients.
REFERENCES
[1] A. Abosch, W. D. Hutchison, J. A. Saint-Cyr, J. O. Dostrovsky, andA. M. Lozano, “Movement-related neurons of the subthalamic nucleus inpatients with Parkinson disease,” J. Neurosurg., vol. 97, pp. 1167–1172,2002.
[2] R. L. Albin, A. B. Young, and J. B. Penney, “The functional anatomy ofbasal ganglia disorders,” Trends Neurosci., vol. 12, pp. 366–375, 1989.
[3] H. Akaike, “A new look at the statistical model identification,” IEEETrans. Autom. Control, vol. AC-19, no. 6, pp. 716–723, Dec. 1974.
[4] R. Arminovin, Z. M. Williams, G. R. Cosgrove, and E. N. Eskandar,“Visually guided movements suppress subthalamic oscillations in Parkin-son’s disease patients,” J. Neurosci., vol. 24, no. 50, pp. 11302–11306,2004.
[5] R. Arminovin, Z. M. Williams, G. R. Cosgrove, and E. N. Eskandar,“Experience with microelectrode guided subthalamic nucleus deep brainstimulation,” Neurosurgery, vol. 58, no. 1, Feb. 2006.
[6] R. Barbieri, M. C. Quirk, L. M. Frank, M. A. Wilson, and E. N. Brown,“Construction and analysis of non-poisson stimulus response models ofneural spike train activity,” J. Neurosci. Methods, vol. 105, pp. 25–37,2001.
[7] H. Bergman, T. Wichman, B. Karmon, and M. R. DeLong, “The pri-mate subthalamic nucleus. II. Neuronal activity in the MPTP model ofparkinsonism,” J. Neurophysiol., vol. 72, pp. 507–520, 1994.
[8] M. D. Bevan, P. J. Magill, D. Terman, J. P. Bolam, and C. J. Wilson,“Move to the rhythm: Oscillations in the subthalamic nucleus-externalglobus pallidus network,” Trends Neurosci., vol. 25, pp. 525–531, 2002.
[9] P. Brodal, The Central Nervous System: Structure and Function. NewYork: Oxford Univ. Press, 1998.
[10] P. Brown, “Oscillatory nature of human basal ganglia activity: Relation-ship to the pathophysiology of Parkinson’s disease,” Mov. Disord, vol. 18,pp. 357–363, 2003.
[11] E. N. Brown, R. Barbieri, V. Ventura, R. E. Kass, and L. M. Frank,“The time-rescaling theorem and its application to neural spike train dataanalysis,” Neural Comput., vol. 14, pp. 325–346, 2002.
[12] E. N. Brown, R. Barbieri, U. T. Eden, and L. M. Frank, “Likelihoodmethods for neural data analysis,” in Computational Neuroscience: AComprehensive Approach, J Feng, Ed. London: CRC, 2003, pp. 253–286, ch. 9.
[13] E. N. Brown, “Theory of point processes for neural systems,” in Meth-ods and Models in Neurophysics, C. C. Chow, B. Gutkin, D. Hansel,C. Meunier, and J. Dalibard, Eds. Paris: Elsevier, 2005, ch. 14, pp. 691–726.
[14] E. N. Brown, R. E. Kass, and P. Mitra, “Multiple neural spike train dataanalysis: State-of-the-art and future challenges,” Nature Neurosci., vol. 7,pp. 456–461, 2004.
[15] D. R. Cox and V. Isham, Point Processes. Boca Raton, FL: CRC, 2000.[16] M. D. Crutcher and M. R. DeLong, “Single cell studies of the pri-
mate putamen. II. Relations to direction of movement and pattern ofmuscular activity,” Exp. Brain Res., vol. 53, no. 2, pp. 244–258,1984.
[17] J. Dostrovsky and H. Bergman, “Oscillatory activity in the basal ganglia—Relationship to normal physiology and pathophysiology,” Brain, vol. 127,pp. 721–722, 2004.
[18] U. T. Eden, R. Amirnovin, E. N. Brown, and E. N. Eskandar, “Constructingmodels of the spiking activ of neurons in the subthalamic nucleus ofParkinson’s patients,” Proc. Joint Stat. Meet. (JSM), Salt Lake City, UT,2007.
[19] M. J. Gdowski, L. E. Miller, T. Parrish, E. K. Nenonene, and J. C. Houk,“Context dependency in the globus pallidus internal segment during tar-geted arm movements,” J. Neurophysiol., vol. 85, no. 2, pp. 998–1004,Feb. 2001.
[20] A. P. Georgopoulos, M. R. DeLong, and M. D. Crutcher, “Relations be-tween parameters of step-tracking movements and single cell discharge inthe gobus pallidus and subthalamic nucleus of the behaving monkey,” J.Neurosci., vol. 3, pp. 1586–1598, 1983.
[21] A. P. Georgopoulos, J. F. Kalaska, R. Caminiti, and J. T. Massey, “On therelations between the direction of two-dimensional arm movements andcell discharge in primate motor cortex,” J. Neurosci., vol. 2, pp. 1527–1537, 1982.
[22] D. Hudsen and M. E. Cohen, Chapter in Neural Engineering: NeuralSignal Processing. New York: Springer-Verlag, 2005, pp. 193–219.
[23] W. D. Hutchison, R. J. Allan, H. Opitz, R. Levy, J. O. Dostrovsky,A. E. Lang, and A. M. Lozano, “Neurophysiological identification of thesubthalamic nucleus in surgery for Parkinson’s disease,” Ann. Neurol.,vol. 44, no. 4, pp. 622–628, 1998.
1304 IEEE TRANSACTIONS ON BIOMEDICAL ENGINEERING, VOL. 57, NO. 6, JUNE 2010
[24] N. L. Johnson and S. Kotz, “Distributions in statistics,” in ContinuousUnivariate Distributions–2. New York: Wiley, 1970.
[25] R. E. Kass and V. Ventura, “A spike train probability model,” NeuralComput., vol. 13, pp. 1713–1720, 2001.
[26] R. Levy et al., “Dependence of subthalamic nucleus oscillations on move-ment and dopamine in Parkinson’s disease,” Brain, vol. 125, pp. 1196–1209, 2002.
[27] P. McCullagh and J. A. Nelder, Generalized Linear Models, 2nd ed. BocaRaton, FL: Chapman and Hall/CRC, 1989.
[28] P. P. Mitra and M. R. Jarvis, “Sampling properties of the spectrum andcoherency of sequences of action potentials,” Neural Comput., vol. 13,no. 4, pp. 717–749, Apr. 2001. DOI: arXiv:physics/0002053v1.
[29] E. Montgomery Jr., “Subthalamic nucleus neuronal activity in Parkinson’sdisease and epilepsy subjects,” Parkinsonism Relat. Disord., vol. 14, no. 2,pp. 120–125, 2008.
[30] L. Paninski, “Maximum likelihood estimation of cascade point-processneural encoding models,” Netw.: Comput. Neural Syst., vol. 15, no. 4,pp. 243–262, 2004.
[31] G. Paradiso, J. A. Saint-Cyr, A. M. Lozano, A. E. Lang, and R. Chen, “In-volvement of the human subthalamic nucleus in movement preparation,”Neurology, vol. 61, no. 11, pp. 1538–1545, 2003.
[32] A. Raz, E. Vaadia, and H. Bergman, “Firing patterns and correlations ofspontaneous discharge of pallidal neurons in the normal and the tremulous1-methyl-4-phenyl-1,2,3,6-tetrahydropyridine vervet model of parkinson-ism,” J. Neurosci., vol. 20, pp. 8559–8571, 2000.
[33] A. B. Schwartz, “Direct cortical representation of drawing,” Science,vol. 265, pp. 540–542, 1994.
[34] D. L. Snyder and M. I. Miller, Random Point Processes in Time and Space.New York, NY: Springer-Verlag, 1991.
[35] W. Truccollo, U. T. Eden, M. R. Fellow, J. P. Donoghue, and E. N. Brown,“A point process framework for relating neural spiking activity for spikinghistory, neural ensemble and extrinsic covariate effects,” J. Neurophys.,vol. 93, pp. 1074–1089, 2005.
[36] Z. M. Williams, J. S. Neimat, G. R. Cosgrove, and E. N. Eskandar, “Timingand direction selectivity of subthalamic and pallidal neurons in patientswith Parkinson disease,” Exp. Brain Res., vol. 162, no. 4, pp. 407–416,May 2005.
[37] C. D. Brody, “Correlations without synchrony,” Neural Comput., vol. 11,pp. 1537–1551, 1999.
[38] J. Keat, P. Reinagel, R. C. Reid, and M. Meister, “Predicting every spike:A model for the responses of visual neurons,” Neuron, vol. 30, no. 3,pp. 803–817, 2001.
[39] J. H. Zar, Biostatistical Analysis, 4th ed. Upper Saddle River, NJ:Prentice-Hall, 1999.
[40] E. Zelnikera, A. P. Bradley, J. E. Castnerc, H. J. Cheneryc, D. A. Copland,and P. A. Silburnd, “Estimation of neuronal firing rates with the three-statebiological point process model,” J. Neurosci. Methods, vol. 174, no. 2,pp. 281–291, Sep. 30, 2008.
[41] M. Hoehn and M. Yahr, “Parkinsonism: Onset, progression and mortality,”Neurology, vol. 17, no. 5, pp. 427–442, 1967.
[42] C. Czanner, U. T. Eden, S. Wirth, M. Yanike, W. Suzuki, and E. N. Brown,“Analysis of between-trial and within-trial neural spiking dynamics,” J.Neurophysiol., vol. 99, pp. 2672–2693, 2008.
[43] W. Truccolo, L. R. Hochberg, and J. P. Donoghue, “Collective dynamics inhuman and monkey sensorimotor cortex: Predicting single neuron spikes.”Nat. Neurosci. (2009, Dec. 6). [Online]. Doi: 10.1038/nn.2455. (News onResearch Highlights), Nat. Rev. Neurosci., vol. 11, no. 2, 2010.
Sridevi V. Sarma (M’04) received the B.S. degreein electrical engineering from Cornell University,Ithaca, NY, in 1994, and the M.S. and Ph.D. degreesin electrical engineering and computer science fromMassachusetts Institute of Technology, CambridgeMA, in 1997 and 2006, respectively.
From 2006 to 2009, she was a Postdoctoral Fel-low in the Brain and Cognitive Sciences Department,Massachusetts Institute of Technology. She is cur-rently an Assistant Professor in the Department ofBiomedical Engineering, Institute for Computational
Medicine, Johns Hopkins University, Baltimore MD. Her research interests in-clude modeling, and estimation and control of neural systems.
Dr. Sarma is the recipient of the General Electric Faculty for the future schol-arship, a National Science Foundation Graduate Research Fellow, a L’Oreal ForWomen in Science Fellow, and the Burroughs Wellcome Fund Careers at theScientific Interface Award.
Uri T. Eden received the B.S. degree in mathemat-ics, and engineering and applied sciences from theCalifornia Institute of Technology, Pasadena, CA, in1999, the S.M. degree in engineering sciences, andthe Ph.D. degree in engineering sciences from Har-vard University, Cambridge, MA, in 2002 and 2005,respectively.
From 2005 to 2006, he was a Postdoctoral Fel-low in the Brain and Cognitive Sciences Department,Massachusetts Institute of Technology, Cambridge.In 2006, he joined the Department of Mathematics
and Statistics, Boston University, Boston, MA. His current research interestsinclude developing mathematical and statistical methods to analyze neural spik-ing activity, integrating methodologies related to model identification, statisticalinference, signal processing, and stochastic estimation and control.
Ming L. Cheng received the B.S. degree in chem-istry, molecular and cellular biology, and nutritionfrom the University of California, Berkley, CA, in1994, and the M.D. degree from Stanford MedicalSchool, Palo Alto, CA, in 1998.
From 1999 to 2001, he was a Resident in Neu-rosurgery, Barrow Neurological Institute, Phoenix,AZ. From 2002 to 2005, he was in Neurosurgery,University of North Carolina at Chapel Hill, ChapelHill, NC. From 2006 to 2008, he was a Clinical andResearch Fellow in Functional and Epilepsy Neuro-
surgery, Harvard Medical School, Massachusetts General Hospital, Boston, MA.He is currently an Assistant Professor in the Department of Neurosurgery, AlpertMedical School, Brown University, Providence, RI, and a Chief of Functionaland Epilepsy Surgery, Rhode Island Hospital/The Neurosurgery Foundation,Providence. His research interests include deep brain stimulation and epilepsy.
Ziv M. Williams received the B.S. degree in bio-chemistry and cell biology from the University ofCalifornia, San Diego, CA, in 1994, and the M.D. de-gree from Stanford Medical School, Palo Alto, CA,in 1999.
From 1998 to 1999, he was a Doctoral ResearchFellow in the Department of Neurosurgery, StanfordSchool of Medicine. From 1999 to 2000, he was aGeneral Surgery Intern at Harvard Medical School,Massachusetts General Hospital, Boston, MA, wherehe is currently a Postdoctoral Research Fellow in the
Department of Neurobiology. From 2000 to 2006, he was a Resident in Neu-rosurgery and from 2003 to 2004, a Fellow in Stereotactic and FunctionalNeurosurgery at Massachusetts General Hospital.
Dr. Williams is a member of the Society for Neuroscience, the AmericanAssociation of Neurological Surgeons, and the American Society of Stereotacticand Functional Neurosurgery.
Rollin Hu received the B.S. and A.B. degrees in bi-ological sciences and public policy from StanfordUniversity, Stanford, CA, in 2000, and the M.D. de-gree from Harvard Medical School, Boston, MA, in2004.
In 2005, he was a General Surgery Intern,where he is currently a Resident in Neurosurgery,Massachusetts General Hospital (MGH), Boston. Hehas been a Postdoctoral Research Fellow at the De-partment of Neurosurgery, MGH-Harvard MedicalSchool Center for Nervous System Repair.
Dr. Hu is a member of the American Association of Neurological Surgeonsand the Congress of Neurological Surgeons.
SARMA et al.: USING POINT PROCESS MODELS TO COMPARE NEURAL SPIKING ACTIVITY 1305
Emad Eskandar received the B.A. degree in chem-istry from the University of Nebraska, Lincoln, NE,in 1987, and the M.D. degree from the University ofSouthern California, Los Angeles, CA, in 1993.
From 1989 to 1991, he was a Fellow in Neuro-physiology, National Institutes of Health, Bethesda,MD. From 1993 to 1999, he was a Resident in Neu-rosurgery, Massachusetts General Hospital, Boston,MA. From 1996 to 1998, he was a Postdoctoral Fel-low in Neurophysiology, Harvard Medical School,Cambridge, MA. He is currently a Neurosurgeon at
the Massachusetts General Hospital and an Associate Professor of Surgery atHarvard Medical School. He has been involved in multidisciplinary programand also in psychiatry, neurology, and anesthesia. He is also engaged in cutting-edge surgical treatments for movement disorders, epilepsy, pain, and severepsychiatric disorders. He has been involved in basic research laboratory, wherehe is engaged in theories of learning, motivation, depression and drug addiction.
Emery N. Brown (M’01–SM’06–F’08) received theB.A. degree from Harvard College, Cambridge, MA,the M.D. degree from Harvard Medical School,Boston, MA, and the A.M. and Ph.D. degrees in statis-tics from Harvard University, Cambridge, MA.
He is currently a Professor of computational neu-roscience and health sciences and technology in theDepartment of Brain and Cognitive Sciences andthe Division of Health Sciences and Technology,Harvard-Massachusetts Institute of Technology, theWarren M. Zapol Professor of Anesthesia at Harvard
Medical School, and an Anesthesiologist in the Department of Anesthesia, Crit-ical Care and Pain Medicine, Massachusetts General Hospital. His researchinterests include signal processing algorithms for the study of neural systems,functional neuroimaging, and electrophysiological methods to study generalanesthesia in human subjects.
Dr. Brown is a member of the Association of University of Anesthesiolo-gists. He is also a Fellow of the American Statistical Association, a Fellow ofthe American Association for the Advancement of Science, and a member ofthe Institute of Medicine. He was a recipient of the 2007 National Institutes ofHealth Director’s Pioneer Award.
Copyright © 2022 FDOKUMEN