Tsc1 represses parvalbumin expression and fast-spiking properties ...
16
ARTICLE Tsc1 represses parvalbumin expression and fast- spiking properties in somatostatin lineage cortical interneurons Ruchi Malik 1,2,3 , Emily Ling-Lin Pai 1,4,5 , Anna N Rubin 1,5 , April M Stafford 6 , Kartik Angara 6 , Petros Minasi 1 , John L. Rubenstein 1,4,5 , Vikaas S Sohal 1,2,3 * & Daniel Vogt 6,7 * Medial ganglionic eminence (MGE)-derived somatostatin (SST)+ and parvalbumin (PV)+ cortical interneurons (CINs), have characteristic molecular, anatomical and physiological properties. However, mechanisms regulating their diversity remain poorly understood. Here, we show that conditional loss of the Tuberous Sclerosis Complex (TSC) gene, Tsc1, which inhibits the mammalian target of rapamycin (MTOR), causes a subset of SST+ CINs, to express PV and adopt fast-spiking (FS) properties, characteristic of PV+ CINs. Milder intermediate phenotypes also occur when only one allele of Tsc1 is deleted. Notably, treat- ment of adult mice with rapamycin, which inhibits MTOR, reverses the phenotypes. These data reveal novel functions of MTOR signaling in regulating PV expression and FS properties, which may contribute to TSC neuropsychiatric symptoms. Moreover, they suggest that CINs can exhibit properties intermediate between those classically associated with PV+ or SST+ CINs, which may be dynamically regulated by the MTOR signaling. https://doi.org/10.1038/s41467-019-12962-4 OPEN 1 Department of Psychiatry and UCSF Weill Institute for Neurosciences, 675 Nelson Rising Ln, San Francisco, CA 94158, USA. 2 Center for Integrative Neuroscience, University of California San Francisco, 1550 4th St., San Francisco, CA 94158, USA. 3 Sloan-Swartz Center for Theoretical Neurobiology, University of California San Francisco, 1550 4th St., San Francisco, CA 94158, USA. 4 Neuroscience Program, UCSF, University of California San Francisco, 1550 4th St., San Francisco, CA 94158, USA. 5 Nina Ireland Laboratory of Developmental Neurobiology, University of California San Francisco, 1550 4th St., San Francisco, CA 94158, USA. 6 Department of Pediatrics and Human Development, 400 Monroe Ave. NW, Grand Rapids, MI 49503, USA. 7 Neuroscience Program, Michigan State University, East Lansing, MI, USA. *email: [email protected]; [email protected] NATURE COMMUNICATIONS | (2019)10:4994 | https://doi.org/10.1038/s41467-019-12962-4 | www.nature.com/naturecommunications 1 1234567890():,;
-
Upload
khangminh22 -
Category
Documents
-
view
0 -
download
0
Transcript of Tsc1 represses parvalbumin expression and fast-spiking properties ...

ARTICLE
Tsc1 represses parvalbumin expression and fast-spiking properties in somatostatin lineage corticalinterneuronsRuchi Malik 1,2,3, Emily Ling-Lin Pai1,4,5, Anna N Rubin 1,5, April M Stafford6, Kartik Angara6, Petros Minasi1,
John L. Rubenstein1,4,5, Vikaas S Sohal1,2,3* & Daniel Vogt 6,7*
Medial ganglionic eminence (MGE)-derived somatostatin (SST)+ and parvalbumin (PV)+cortical interneurons (CINs), have characteristic molecular, anatomical and physiological
properties. However, mechanisms regulating their diversity remain poorly understood. Here,
we show that conditional loss of the Tuberous Sclerosis Complex (TSC) gene, Tsc1, which
inhibits the mammalian target of rapamycin (MTOR), causes a subset of SST+ CINs, to
express PV and adopt fast-spiking (FS) properties, characteristic of PV+ CINs. Milder
intermediate phenotypes also occur when only one allele of Tsc1 is deleted. Notably, treat-
ment of adult mice with rapamycin, which inhibits MTOR, reverses the phenotypes. These
data reveal novel functions of MTOR signaling in regulating PV expression and FS properties,
which may contribute to TSC neuropsychiatric symptoms. Moreover, they suggest that CINs
can exhibit properties intermediate between those classically associated with PV+ or SST+CINs, which may be dynamically regulated by the MTOR signaling.
https://doi.org/10.1038/s41467-019-12962-4 OPEN
1 Department of Psychiatry and UCSF Weill Institute for Neurosciences, 675 Nelson Rising Ln, San Francisco, CA 94158, USA. 2 Center for IntegrativeNeuroscience, University of California San Francisco, 1550 4th St., San Francisco, CA 94158, USA. 3 Sloan-Swartz Center for Theoretical Neurobiology,University of California San Francisco, 1550 4th St., San Francisco, CA 94158, USA. 4Neuroscience Program, UCSF, University of California San Francisco,1550 4th St., San Francisco, CA 94158, USA. 5Nina Ireland Laboratory of Developmental Neurobiology, University of California San Francisco, 1550 4th St.,San Francisco, CA 94158, USA. 6 Department of Pediatrics and Human Development, 400 Monroe Ave. NW, Grand Rapids, MI 49503, USA. 7NeuroscienceProgram, Michigan State University, East Lansing, MI, USA. *email: [email protected]; [email protected]
NATURE COMMUNICATIONS | (2019) 10:4994 | https://doi.org/10.1038/s41467-019-12962-4 | www.nature.com/naturecommunications 1
1234
5678
90():,;

Tuberous sclerosis complex (TSC) is a disorder that affectsmultiple organ systems. Roughly half of those diagnosedwith TSC have autism spectrum disorder (ASD) or intel-
lectual disability (ID), and ~90% exhibit seizures1–4. TSC iscaused by mutations in the TSC1 and TSC2 genes, which encodethe HAMARTIN and TUBERIN proteins, respectively5,6.HAMARTIN and TUBERIN proteins dimerize to form a proteincomplex that inhibits the activity of the mammalian target ofrapamycin (MTOR), a protein complex that is a rheostat forenergy homeostasis and is also an important regulator of proteintranslation7. Multiple proteins in the TSC/MTOR signalingpathway are either high confidence ASD-causative genes orunderlie disorders with high ASD coincidence8,9. This has rele-vance to the high rate of ASD in TSC and potentially other TSC-Associated Neuropsychiatric Disorders (TANDs), which arecommon in the syndrome10. Uncovering how this pathway reg-ulates neuronal development and function is, therefore, funda-mental to understanding the molecular and cellularunderpinnings of ASD and complex neuropsychiatric symptomsin TSC.
Accumulating evidence suggests that neuropsychiatric dis-orders, such as ASD, and associated comorbidities like epilepsy,may be partially caused by changes in cortical GABAergicinterneuron (CIN) function and connectivity, which leads toexcitation/inhibition (E/I) imbalance in cortical circuits11. Whilethe role of MTOR signaling and Tsc genes on excitatory neuronshas been studied for some time, relatively little is known abouttheir roles in CIN development and function12–14. CINs are themajor source of cortical inhibition and are largely derivedfrom the medial and caudal ganglionic eminences (MGE andCGE)15,16. Parvalbumin (PV)+ and somatostatin (SST)+ CINsare derived from MGE and constitute ~70% of all CINs. Thesecells have substantially different morphological and physiologicalproperties17,18. PV+ CINs exhibit fast-spiking (FS) firing prop-erties and synapse onto soma/axons of excitatory neurons. Bycontrast, SST+ CINs have regular-spiking (RS) firing propertiesand target the distal dendrites of excitatory neurons18,19. Thedifference in firing properties between SST+ and PV+ CINs isdependent on the differential expression of voltage-gated ionchannels. Specifically, expression of delayed rectifying potassiumchannels (Kv3) is critical for FS physiology of PV+ CINs20.
From their birth through maturity, CINs acquire a combina-tion of molecular, cellular and physiological characteristics (hencereferred to as cell programming). Most studies investigatingMGE-derived CIN programming have largely focused on the roleof transcription factors (TFs)21–24, yet little is known about howcellular signaling influences CIN development. Recent work fromus and others highlighted the importance of Pten, another inhi-bitor of MTOR signaling that acts upstream of Tsc1, on estab-lishing proper numbers of MGE-derived CINs in the cortex25,26.Therefore, we speculate that aberrant MTOR signaling in TSCmight lead to abnormalities in the development and function ofMGE-derived CINs.
To investigate this, we conditionally deleted Tsc1 in MGE-derived SST-lineage CINs, which allowed us to assess the impactof Tsc1 loss/MTOR activity starting during early post-mitoticstages. We then investigated the role of Tsc1/MTOR signaling inCIN cell programming. Surprisingly, homozygous loss of Tsc1caused SST-lineage CINs to aberrantly exhibit properties ofPV+/FS CINs. In addition, this phenotype can be rescued byinhibiting MTOR during adult stages, suggesting that drugscurrently being studied to treat TSC, including rapamycin deri-vatives, may be effective in treating TSC symptoms caused byCIN dysfunction. Overall, our findings demonstrate novel rolesfor Tsc1 in the development and function of CINs. We proposethat the choice between SST+ and PV+ cell programming is
mediated in part by non-transcriptional processes, includingcellular signaling events, suggesting a new avenue towardsunderstanding these important cell types.
ResultsLoss of Tsc1 causes ectopic PV expression in SST lineages. Totest whether loss of Tsc1 in SST-expressing post-mitotic CINsalters their development, we crossed Tsc1floxed mice27 and SST-IRES-Cre mice28 (SST-Cre hereafter). The Cre-dependent tdTo-mato reporter, Ai1429, was included to track the Tsc1 WT, con-ditional heterozygous (cHet) and knockout (cKO) cells. Tsc1transcript was absent from SST-Cre; Tsc1 cKO CINs in theneocortex at postnatal day (P) 35 (Supplementary Fig. 1a–d). Atthe same age, SST-Cre-lineage cHet and cKO cells in the neo-cortex had elevated levels of ribosomal subunit S6 phosphorylatedat Serines 240 and 244 (Supplementary Fig. 1e-g), indicatingincreased MTOR activity. Tsc1 cKOs had normal numbers ofSST-Cre-lineage CINs (tdTomato+) in the neocortex but the cellshad increased soma size (Fig. 1a–h). The laminar distribution oftdTomato+ CINs was not altered by Tsc1 deletion (Supplemen-tary Fig. 2).
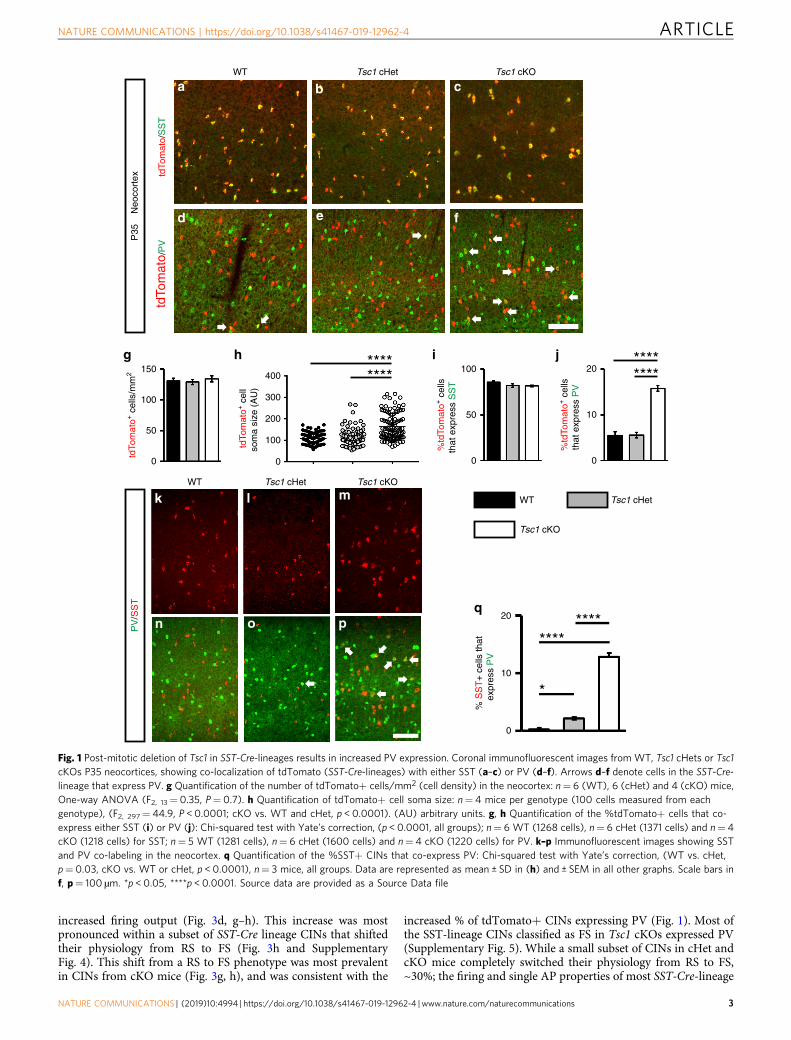
SST-lineage CINs are derived from MGE progenitors that alsogive rise to PV+ CINs. Thus, we investigated the expression ofSST and PV at P35 in the neocortex. While the % of tdTomato+CINs that expressed SST was unchanged, there was ~3-foldincrease in the % of SST-Cre-lineage CINs that expressed PV incKO mice (Fig. 1a–f, i, j). These data suggest that SST and PVproteins could be co-expressed in a subset of SST-Cre-lineageCINs in cKO mice. To test this, we quantified WT, Tsc1 cHet andcKO neocortices for SST and PV co-labeled CINs at P35 in theneocortex. While there were almost no co-labeled CINs in WTs,~2 and 13% co-labeled CINs were observed in cHets and cKOs,respectively (Fig. 1k–q). A similar phenotype of ectopic PVexpression in SST+ CINs after Tsc1 deletion was observed inNkx2.1-Cre; Tsc1 cKOs (Supplementary Fig. 3), which begins toexpress in MGE progenitors30. Together, these data suggest thatTsc1 deletion causes PV expression in a subset of SST-lineageCINs, and its deletion causes these SST+ CINs to develop a dualmolecular identity.
Since PV expression was elevated in a subset of SST+ CINsafter Tsc1 deletion, we wanted to assess whether MTOR activitymay be different in WT SST+ and WT PV+ CINs in theneocortex. To this end, we assessed the expression of phosphory-lated S6, a marker of MTOR activity, in SST+ or PV+ CINs inthe P35 WT neocortex. While only ~20% of SST+ CINs co-expressed this marker, ~70% of PV+ CINs were co-labeled(Fig. 2a–g). Thus, PV+ CINs normally exhibit greater MTORactivity than SST+ CINs in the neocortex.
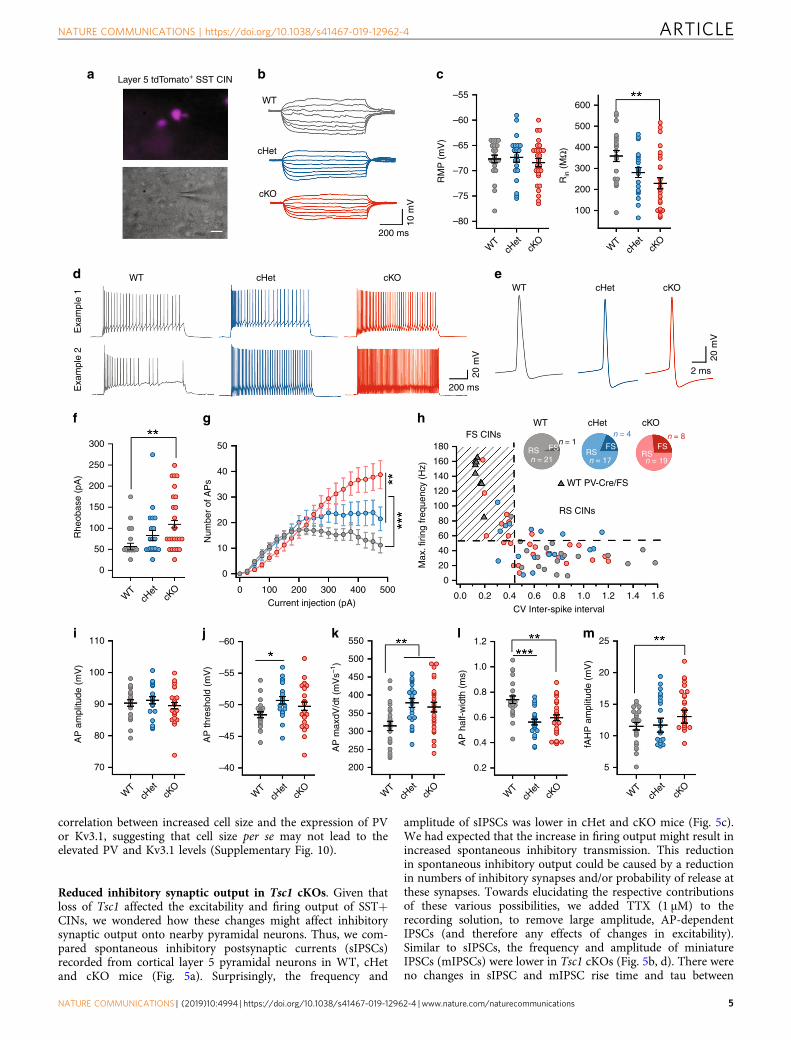
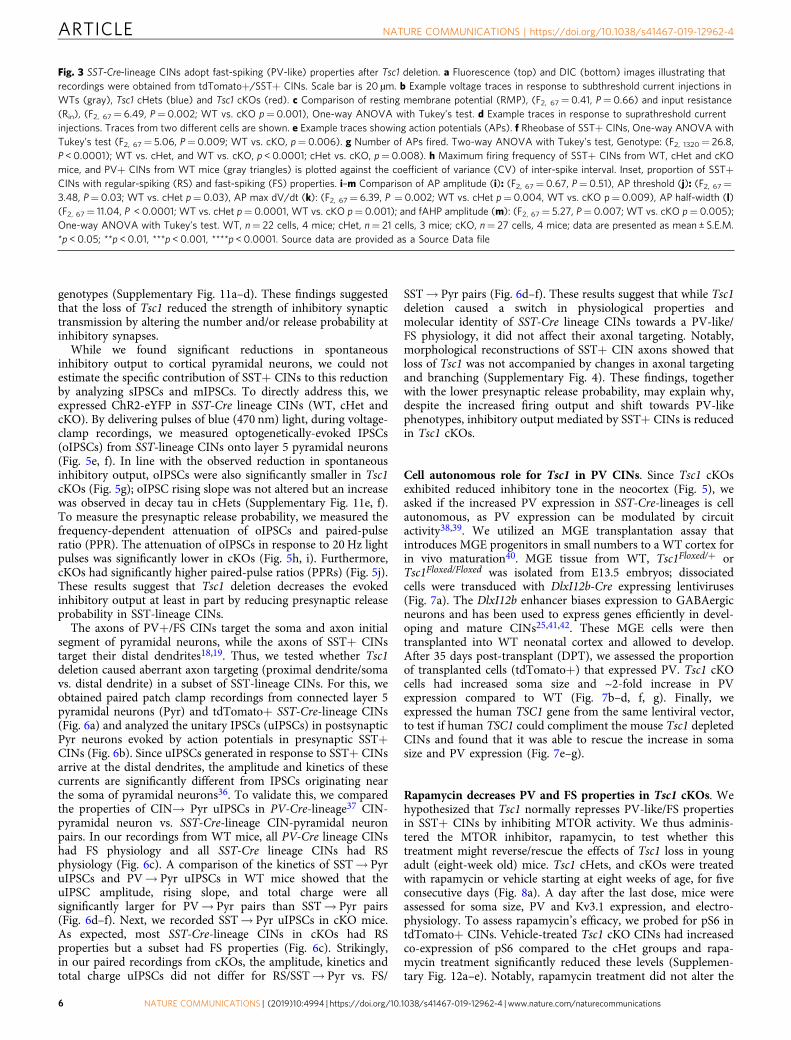
SST CINs in Tsc1 cKOs exhibit fast-spiking properties. Next,we assessed the physiological properties of SST-lineage CINs inthe Tsc1 cKOs. We obtained ex vivo patch clamp recordings fromlayer 5 SST-Cre-lineage CINs (tdTomato+) in WT, cHet andcKO mice (example cells, Fig. 3a, and current induced voltageresponses, Fig. 3b). WT CINs had RS physiological properties,including strong spike frequency accommodation (SFA), widerspikes, relatively slow action potential (AP) rate of rise (max dV/dt) and relatively small fast afterhyperpolarization (fAHP)amplitudes (Fig. 3), as expected17,18,31. Consistent with theincreased complexity of neuron processes promoted by increasedMTOR signaling31,32, loss of Tsc1 decreased the input resistance(Rin) and produced a corresponding increase in the rheobase(current threshold) of cKO CINs (Fig. 3c, f). A reduction in Rin
and an increase in rheobase predicts that Tsc1 loss would lowerthe excitability of SST+ CINs. However, Tsc1 cKO CINs had
ARTICLE NATURE COMMUNICATIONS | https://doi.org/10.1038/s41467-019-12962-4
2 NATURE COMMUNICATIONS | (2019) 10:4994 | https://doi.org/10.1038/s41467-019-12962-4 | www.nature.com/naturecommunications
increased firing output (Fig. 3d, g–h). This increase was mostpronounced within a subset of SST-Cre lineage CINs that shiftedtheir physiology from RS to FS (Fig. 3h and SupplementaryFig. 4). This shift from a RS to FS phenotype was most prevalentin CINs from cKO mice (Fig. 3g, h), and was consistent with the
increased % of tdTomato+ CINs expressing PV (Fig. 1). Most ofthe SST-lineage CINs classified as FS in Tsc1 cKOs expressed PV(Supplementary Fig. 5). While a small subset of CINs in cHet andcKO mice completely switched their physiology from RS to FS,~30%; the firing and single AP properties of most SST-Cre-lineage
P35
N
eoco
rtex
PV
/SS
Ttd
Tom
ato+
cel
ls/m
m2
%td
Tom
ato+
cel
lsth
at e
xpre
ss S
ST
%td
Tom
ato+
cel
lsth
at e
xpre
ss P
V
********
g h i j
WT Tsc1 cHet
Tsc1 cKO
tdTo
mat
o/P
Vtd
Tom
ato/
SS
T
f
c
e
b
d
aWT Tsc1 cHet Tsc1 cKO
WT Tsc1 cHet Tsc1 cKO
********
tdTo
mat
o+ c
ell
som
a si
ze (
AU
)
k l
n
m
o p
150400
100
0
50
20
0
10
q****
****
*
% S
ST
+ c
ells
that
expr
ess
PV
20
0
10
300
200
100
0
100
50
0
Fig. 1 Post-mitotic deletion of Tsc1 in SST-Cre-lineages results in increased PV expression. Coronal immunofluorescent images from WT, Tsc1 cHets or Tsc1cKOs P35 neocortices, showing co-localization of tdTomato (SST-Cre-lineages) with either SST (a–c) or PV (d–f). Arrows d–f denote cells in the SST-Cre-lineage that express PV. g Quantification of the number of tdTomato+ cells/mm2 (cell density) in the neocortex: n= 6 (WT), 6 (cHet) and 4 (cKO) mice,One-way ANOVA (F2, 13= 0.35, P= 0.7). h Quantification of tdTomato+ cell soma size: n= 4 mice per genotype (100 cells measured from eachgenotype), (F2, 297= 44.9, P < 0.0001; cKO vs. WT and cHet, p < 0.0001). (AU) arbitrary units. g, h Quantification of the %tdTomato+ cells that co-express either SST (i) or PV (j): Chi-squared test with Yate’s correction, (p < 0.0001, all groups); n= 6 WT (1268 cells), n= 6 cHet (1371 cells) and n= 4cKO (1218 cells) for SST; n= 5 WT (1281 cells), n= 6 cHet (1600 cells) and n= 4 cKO (1220 cells) for PV. k–p Immunofluorescent images showing SSTand PV co-labeling in the neocortex. q Quantification of the %SST+ CINs that co-express PV: Chi-squared test with Yate’s correction, (WT vs. cHet,p= 0.03, cKO vs. WT or cHet, p < 0.0001), n= 3 mice, all groups. Data are represented as mean ± SD in (h) and ± SEM in all other graphs. Scale bars inf, p= 100 µm. *p < 0.05, ****p < 0.0001. Source data are provided as a Source Data file
NATURE COMMUNICATIONS | https://doi.org/10.1038/s41467-019-12962-4 ARTICLE
NATURE COMMUNICATIONS | (2019) 10:4994 | https://doi.org/10.1038/s41467-019-12962-4 | www.nature.com/naturecommunications 3

CINs in cHet and cKO mice shifted towards a FS-like physiology.Further, the firing output and AP properties of SST+ CINs withFS physiology were comparable to properties of FS PV+ CINs(Supplementary Fig. 6). Significant shifts were observed in APthreshold, AP rate of rise (max. dV/dt), AP duration and fAHPamplitudes (Fig. 3i–m).
Apart from differences in firing properties, SST+ and PV+ CINsare known to differ in their expression of Hyperpolarization-activated cyclic nucleotide-gated (HCN) channels33. Compared toWT SST+ CINs, WT PV+ CINs have lower HCN channelmediated sag and rebound. However, the Tsc1 deletion mediatedswitch in physiology of SST+ CINs was not accompanied by achange in sag and rebound (Supplementary Fig. 7). Together,these analyses showed that while loss of Tsc1 reduced theexcitability of SST+ CINs, their overall firing output was higherdue to the increased proportion of SST+ CINs with PV-like/FSproperties.
Increased Kv3.1 expression in Tsc1 cKO SST CINs. Since Tsc1deletion resulted in a shift towards FS physiology within SST-Cre-lineages, we asked whether Tsc1 cHets and cKOs had increasedlevels of the fast-inactivating Kv3.1 potassium channel. Kv3.1expression is primarily restricted to PV+ CINs and is the primary
contributor to their fast-spiking properties (like short AP half-width and large fAHP)20,34 (Supplementary Fig. 8). Indeed, wefound that a similar proportion of SST-Cre-lineage CINs co-expressed Kv3.1 in cHets and cKOs (Fig. 4a, b).
To understand the effects of increased Kv3.1 channelexpression on the physiological properties of SST+ CINs, weused biophysical simulations in four different models ofneocortical layer 5 SST+ CINs35. Specifically, we asked if anincrease in somatic Kv3.1 conductance density was sufficient toproduce a transition from RS to FS properties (similar to theswitch observed in Tsc1 cKOs). In all four models, increasingKv3.1 conductance density increased the firing output (~28%),reduced spike frequency accommodation (~40%), reduced APhalf-width (~32%), and increased fAHP amplitude, (~80%)(Fig. 4c–i and Supplementary Fig. 9). These results suggest thatthe FS properties observed in Tsc1 cKOs are due to elevatedKv3.1channels in SST-lineage CINs.
Tsc1 deletion caused an increase in pS6, PV and Kv3.1expression in a cohort of SST-Cre-lineage CINs, and alsoincreased their cell body (soma) size. Since SST-Cre-lineageCIN cKOs exhibited a range of soma sizes, it allowed us to assesswhether cell size was correlated with the increased expression ofmolecular markers, i.e. pS6, PV and Kv3.1. We found a positivecorrelation between cell size and pS6 expression but no
WT
P35
Neo
cort
ex
SST MergepS6Ser240/244
pS6Ser240/244PV Merge
a b c
ed f
g
%M
arke
r+ C
INs
that
are
pS6S
er24
0/24
4 +
SST PV
****80
40
0
Fig. 2 The MTOR activity marker, pS6, is preferentially enriched in PV+ CINs. a–c P35 immunofluorescent images of WT neocortices co-labeled for SSTand pS6. d–f Immunofluorescent co-labeling of PV and pS6 from P35 WT neocortices. Arrows denote co-labeled CINs. g Quantification of the % of eitherSST+ or PV+ CINs that are pS6+: Chi-squared test with Yate’s correction, ****p < 0.0001. Data are expressed as the ± SEM, n= 3 mice/marker (145SST cells and 208 PV cells counted). Scale bar in f= 100 µm. Source data are provided as a Source Data file
ARTICLE NATURE COMMUNICATIONS | https://doi.org/10.1038/s41467-019-12962-4
4 NATURE COMMUNICATIONS | (2019) 10:4994 | https://doi.org/10.1038/s41467-019-12962-4 | www.nature.com/naturecommunications
correlation between increased cell size and the expression of PVor Kv3.1, suggesting that cell size per se may not lead to theelevated PV and Kv3.1 levels (Supplementary Fig. 10).
Reduced inhibitory synaptic output in Tsc1 cKOs. Given thatloss of Tsc1 affected the excitability and firing output of SST+CINs, we wondered how these changes might affect inhibitorysynaptic output onto nearby pyramidal neurons. Thus, we com-pared spontaneous inhibitory postsynaptic currents (sIPSCs)recorded from cortical layer 5 pyramidal neurons in WT, cHetand cKO mice (Fig. 5a). Surprisingly, the frequency and
amplitude of sIPSCs was lower in cHet and cKO mice (Fig. 5c).We had expected that the increase in firing output might result inincreased spontaneous inhibitory transmission. This reductionin spontaneous inhibitory output could be caused by a reductionin numbers of inhibitory synapses and/or probability of release atthese synapses. Towards elucidating the respective contributionsof these various possibilities, we added TTX (1 µM) to therecording solution, to remove large amplitude, AP-dependentIPSCs (and therefore any effects of changes in excitability).Similar to sIPSCs, the frequency and amplitude of miniatureIPSCs (mIPSCs) were lower in Tsc1 cKOs (Fig. 5b, d). There wereno changes in sIPSC and mIPSC rise time and tau between
Layer 5 tdTomato+ SST CIN
WT
cHet
cHet
cKO
cKO
10 m
V
200 ms
20 m
V
200 ms
20 m
V
2 ms
–60
–55600
500
400
300
200
100
–65
–70
RM
P (
mV
)
Rin (
MΩ
)
WT
cHet
cKO
WT
WTcHet cKOWT
cHet
cKO
WT
cHet
cKO
WT
cHet
cKO
WT
cHet
cKO
WT
cHet
cKO
WT
cHet
cKO
WT
cHet
cKO
–75
–80
Exa
mpl
e 2
Exa
mpl
e 1
300 50 180
RS CINs
WT PV-Cre/FS
160
140
120
100
80
60
40
20
0.0 0.2 0.4 0.6 0.8 1.0 1.2 1.4 1.6
0
40
30
20
10
0
0 100 200 300 400 500
250
200
150
100
50
0
Rhe
obas
e (p
A)
Num
ber
of A
Ps
Max
. firi
ng fr
eque
ncy
(Hz)
CV Inter-spike intervalCurrent injection (pA)
WTFS CINs
cHet cKO
RSn = 21
n = 1n = 4 n = 8
FS RSn = 17
FSRSn = 19
FS
110 –60 550 1.2 25
20
15
10
5
1.0
0.8
0.6
0.4
0.2
500
450
400
350
300
250
200
–55
–50
–45
–40
100
80
70
90
AP
am
plitu
de (
mV
)
AP
thre
shol
d (m
V)
AP
max
dV/d
t (m
Vs–1
)
AP
hal
f-w
idth
(m
s)
fAH
P a
mpl
itude
(m
V)
a b c
ed
f g h
i j k l m
NATURE COMMUNICATIONS | https://doi.org/10.1038/s41467-019-12962-4 ARTICLE
NATURE COMMUNICATIONS | (2019) 10:4994 | https://doi.org/10.1038/s41467-019-12962-4 | www.nature.com/naturecommunications 5
genotypes (Supplementary Fig. 11a–d). These findings suggestedthat the loss of Tsc1 reduced the strength of inhibitory synaptictransmission by altering the number and/or release probability atinhibitory synapses.
While we found significant reductions in spontaneousinhibitory output to cortical pyramidal neurons, we could notestimate the specific contribution of SST+ CINs to this reductionby analyzing sIPSCs and mIPSCs. To directly address this, weexpressed ChR2-eYFP in SST-Cre lineage CINs (WT, cHet andcKO). By delivering pulses of blue (470 nm) light, during voltage-clamp recordings, we measured optogenetically-evoked IPSCs(oIPSCs) from SST-lineage CINs onto layer 5 pyramidal neurons(Fig. 5e, f). In line with the observed reduction in spontaneousinhibitory output, oIPSCs were also significantly smaller in Tsc1cKOs (Fig. 5g); oIPSC rising slope was not altered but an increasewas observed in decay tau in cHets (Supplementary Fig. 11e, f).To measure the presynaptic release probability, we measured thefrequency-dependent attenuation of oIPSCs and paired-pulseratio (PPR). The attenuation of oIPSCs in response to 20 Hz lightpulses was significantly lower in cKOs (Fig. 5h, i). Furthermore,cKOs had significantly higher paired-pulse ratios (PPRs) (Fig. 5j).These results suggest that Tsc1 deletion decreases the evokedinhibitory output at least in part by reducing presynaptic releaseprobability in SST-lineage CINs.
The axons of PV+/FS CINs target the soma and axon initialsegment of pyramidal neurons, while the axons of SST+ CINstarget their distal dendrites18,19. Thus, we tested whether Tsc1deletion caused aberrant axon targeting (proximal dendrite/somavs. distal dendrite) in a subset of SST-lineage CINs. For this, weobtained paired patch clamp recordings from connected layer 5pyramidal neurons (Pyr) and tdTomato+ SST-Cre-lineage CINs(Fig. 6a) and analyzed the unitary IPSCs (uIPSCs) in postsynapticPyr neurons evoked by action potentials in presynaptic SST+CINs (Fig. 6b). Since uIPSCs generated in response to SST+ CINsarrive at the distal dendrites, the amplitude and kinetics of thesecurrents are significantly different from IPSCs originating nearthe soma of pyramidal neurons36. To validate this, we comparedthe properties of CIN→ Pyr uIPSCs in PV-Cre-lineage37 CIN-pyramidal neuron vs. SST-Cre-lineage CIN-pyramidal neuronpairs. In our recordings from WT mice, all PV-Cre lineage CINshad FS physiology and all SST-Cre lineage CINs had RSphysiology (Fig. 6c). A comparison of the kinetics of SST→ PyruIPSCs and PV→ Pyr uIPSCs in WT mice showed that theuIPSC amplitude, rising slope, and total charge were allsignificantly larger for PV→ Pyr pairs than SST→ Pyr pairs(Fig. 6d–f). Next, we recorded SST→ Pyr uIPSCs in cKO mice.As expected, most SST-Cre-lineage CINs in cKOs had RSproperties but a subset had FS properties (Fig. 6c). Strikingly,in our paired recordings from cKOs, the amplitude, kinetics andtotal charge uIPSCs did not differ for RS/SST→ Pyr vs. FS/
SST→ Pyr pairs (Fig. 6d–f). These results suggest that while Tsc1deletion caused a switch in physiological properties andmolecular identity of SST-Cre lineage CINs towards a PV-like/FS physiology, it did not affect their axonal targeting. Notably,morphological reconstructions of SST+ CIN axons showed thatloss of Tsc1 was not accompanied by changes in axonal targetingand branching (Supplementary Fig. 4). These findings, togetherwith the lower presynaptic release probability, may explain why,despite the increased firing output and shift towards PV-likephenotypes, inhibitory output mediated by SST+ CINs is reducedin Tsc1 cKOs.
Cell autonomous role for Tsc1 in PV CINs. Since Tsc1 cKOsexhibited reduced inhibitory tone in the neocortex (Fig. 5), weasked if the increased PV expression in SST-Cre-lineages is cellautonomous, as PV expression can be modulated by circuitactivity38,39. We utilized an MGE transplantation assay thatintroduces MGE progenitors in small numbers to a WT cortex forin vivo maturation40. MGE tissue from WT, Tsc1Floxed/+ orTsc1Floxed/Floxed was isolated from E13.5 embryos; dissociatedcells were transduced with DlxI12b-Cre expressing lentiviruses(Fig. 7a). The DlxI12b enhancer biases expression to GABAergicneurons and has been used to express genes efficiently in devel-oping and mature CINs25,41,42. These MGE cells were thentransplanted into WT neonatal cortex and allowed to develop.After 35 days post-transplant (DPT), we assessed the proportionof transplanted cells (tdTomato+) that expressed PV. Tsc1 cKOcells had increased soma size and ~2-fold increase in PVexpression compared to WT (Fig. 7b–d, f, g). Finally, weexpressed the human TSC1 gene from the same lentiviral vector,to test if human TSC1 could compliment the mouse Tsc1 depletedCINs and found that it was able to rescue the increase in somasize and PV expression (Fig. 7e–g).
Rapamycin decreases PV and FS properties in Tsc1 cKOs. Wehypothesized that Tsc1 normally represses PV-like/FS propertiesin SST+ CINs by inhibiting MTOR activity. We thus adminis-tered the MTOR inhibitor, rapamycin, to test whether thistreatment might reverse/rescue the effects of Tsc1 loss in youngadult (eight-week old) mice. Tsc1 cHets, and cKOs were treatedwith rapamycin or vehicle starting at eight weeks of age, for fiveconsecutive days (Fig. 8a). A day after the last dose, mice wereassessed for soma size, PV and Kv3.1 expression, and electro-physiology. To assess rapamycin’s efficacy, we probed for pS6 intdTomato+ CINs. Vehicle-treated Tsc1 cKO CINs had increasedco-expression of pS6 compared to the cHet groups and rapa-mycin treatment significantly reduced these levels (Supplemen-tary Fig. 12a–e). Notably, rapamycin treatment did not alter the
Fig. 3 SST-Cre-lineage CINs adopt fast-spiking (PV-like) properties after Tsc1 deletion. a Fluorescence (top) and DIC (bottom) images illustrating thatrecordings were obtained from tdTomato+/SST+ CINs. Scale bar is 20 µm. b Example voltage traces in response to subthreshold current injections inWTs (gray), Tsc1 cHets (blue) and Tsc1 cKOs (red). c Comparison of resting membrane potential (RMP), (F2, 67= 0.41, P= 0.66) and input resistance(Rin), (F2, 67= 6.49, P= 0.002; WT vs. cKO p= 0.001), One-way ANOVA with Tukey’s test. d Example traces in response to suprathreshold currentinjections. Traces from two different cells are shown. e Example traces showing action potentials (APs). f Rheobase of SST+ CINs, One-way ANOVA withTukey’s test (F2, 67= 5.06, P= 0.009; WT vs. cKO, p= 0.006). g Number of APs fired. Two-way ANOVA with Tukey’s test, Genotype: (F2, 1320= 26.8,P < 0.0001); WT vs. cHet, and WT vs. cKO, p < 0.0001; cHet vs. cKO, p= 0.008). h Maximum firing frequency of SST+ CINs from WT, cHet and cKOmice, and PV+ CINs from WT mice (gray triangles) is plotted against the coefficient of variance (CV) of inter-spike interval. Inset, proportion of SST+CINs with regular-spiking (RS) and fast-spiking (FS) properties. i–m Comparison of AP amplitude (i): (F2, 67= 0.67, P= 0.51), AP threshold (j): (F2, 67=3.48, P= 0.03; WT vs. cHet p= 0.03), AP max dV/dt (k): (F2, 67= 6.39, P = 0.002; WT vs. cHet p= 0.004, WT vs. cKO p= 0.009), AP half-width (l)(F2, 67= 11.04, P < 0.0001; WT vs. cHet p= 0.0001, WT vs. cKO p= 0.001); and fAHP amplitude (m): (F2, 67= 5.27, P= 0.007; WT vs. cKO p= 0.005);One-way ANOVA with Tukey’s test. WT, n= 22 cells, 4 mice; cHet, n= 21 cells, 3 mice; cKO, n= 27 cells, 4 mice; data are presented as mean ± S.E.M.*p < 0.05; **p < 0.01, ***p < 0.001, ****p < 0.0001. Source data are provided as a Source Data file
ARTICLE NATURE COMMUNICATIONS | https://doi.org/10.1038/s41467-019-12962-4
6 NATURE COMMUNICATIONS | (2019) 10:4994 | https://doi.org/10.1038/s41467-019-12962-4 | www.nature.com/naturecommunications

cell density of tdTomato+ CINs or those expressing SST (Sup-plementary Fig. 12f, g).
Vehicle treated cKO CINs exhibited increased soma size as wellas increased Kv3.1 and PV expression compared to the cHetgroups (Fig. 8b, c, f, g, j–l). Rapamycin treatment significantlyreduced the soma size of SST-lineage CINs in cKOs anddecreased Kv3.1 and PV expression, however, did not alter somasize or Kv3.1 and PV expression in SST-Cre-lineage cHets(Fig. 8d, e, h–l). In addition, we assessed whether these cellular
and molecular phenotypes changed after analyzing rapamycin-treated mice 5 days after discontinuing the drug. While there wasno gross change in soma size 5 days after discontinuingrapamycin there were increased numbers of Kv3.1+ and PV+CINs (Supplementary Fig. 13a–c), suggesting that Kv3.1 and PVexpression is dynamic with changes in MTOR activity. Usinga chemogenetic approach, we tested whether PV expression inSST+ CINs is linked to neuronal excitability. Adult WT SST-Cremice expressing either Gq-DREADD-mCherry or mcherry were
WT
Tsc1
cH
etTs
c1 c
KO
Kv3.1/tdTomato
i ii iii
******
iv v vi
vii viii ix
WT
Tsc1 cHet
Tsc1 cKO
120
80
40
0
Num
ber
of s
pike
s
30025020015010050 Current (pA)
160
120
80
40
403020100 Spike number
Inst
. firin
g fr
eq. (
Hz)
200 ms
20 m
V
c
d e
Low Kv3.1 High Kv3.1
f140
120
100
80
60
40
20 Max
. firin
g fr
eque
ncy
(Hz)
3.5
3.0
2.5
2.0
1.5
1.0
0.5
0.0
SFA
inde
x
Low Kv3.1
High Kv3.1
Low Kv3.1
High Kv3.1
g** *
1.0
0.8
0.6
0.4
0.2
0.0
AP
hal
f-w
idth
(m
s)
40
30
20
10
0
fAH
P a
mpl
itude
(m
V)
Low Kv3.1
High Kv3.1
Low Kv3.1
High Kv3.1
h i **
a
b
%td
Tom
ato
+ c
ells
that
expr
ess
Kv3
.1
*
20
10
0
**
*
Fig. 4 Increased Kv3.1 channel expression in SST-Cre-lineage CINs underlie FS properties. a P35 coronal sections showing immunofluorescent labeling ofKv3.1 and tdTomato+ cells from SST-Cre-lineages in the neocortices of WT (i–iii), Tsc1 cHets (iv–vi) and cKOs (vii–ix). Arrows denote co-labeled cells.Scale bar is 100 µm. b Quantification of the %tdTomato+ cells expressing Kv3.1: Chi-squared test with Yate’s correction, WT vs. cHet, p= 0.02 or cKO,p < 0.0001, and cHet vs. cKO, p= 0.008, n= 3, all groups (405 WT, 441 cHet and 446 cKO cells counted). c Example firing traces from a model of a layer5 SST+ CIN with low expression of Kv3.1 (grey) and high expression of Kv3.1 (purple). d, e Firing data from one representative model is shown. Increasingthe conductance of Kv3.1 channel increases the number of APs fired in response to depolarizing current injections (d) and decreases the change ininstantaneous firing frequency during a train of APs (e). Increasing the Kv3.1 conductance in four different models of SST+ CINs increases the maximumfiring frequency: paired two-tailed t-test (t3= 8.1, p= 0.003) (f) and decreases the spike frequency accommodation: SFA; paired two-tailed t-test (t3= 4.9,p= 0.016) (g). Increasing Kv3.1 conductance in models of SST+ CINs decreases the duration of APs: paired two-tailed t-test (t3= 4.7, p= 0.018) (h) andincreases the fAHP: paired two-tailed t-test (t3= 3.8, p= 0.03) (i). Data are presented as mean ± S.E.M. *p < 0.05, **p < 0.01, ****p < 0.0001. Source dataare provided as a Source Data file
NATURE COMMUNICATIONS | https://doi.org/10.1038/s41467-019-12962-4 ARTICLE
NATURE COMMUNICATIONS | (2019) 10:4994 | https://doi.org/10.1038/s41467-019-12962-4 | www.nature.com/naturecommunications 7

sIPSCs
sIP
SC
freq
uenc
y (H
z)
mIPSCs
WT
cHet
cKO1 s
50 pA
6
4
2
0
Optogenetic stimulation ofSST-lineage CINs
470 nm
VC + 10 mV
sIP
SC
am
plitu
de (
pA)
80
60
40
20
0
WT
cHet
cKO
WT cHet cKO
mIP
SC
freq
uenc
y (H
z)
6
4
2
0
WT
cHet
cKO
WT
cHet
cKO
WT
cHet
cKOW
TcH
etcK
O
oIP
SC
am
plitu
de (
nA)
3
2
1
0
1.1
1.0
0.8
Pai
red-
puls
e ra
tio
0.9
0.7
0.6
1.0
0.9
0.7
Pai
red-
puls
e ra
tio
Nor
mal
ized
oIP
SC
am
plitu
de
0.8
0.6109876
Pulse number5432
20 Hz light pulses
WT
cHET
cKO470 nm
100 ms
1 nA
50 ms
1 nA
0.5
0.6
0.7
0.8
0.8
1.0
5 10 25Light intensity (%)
50 ms100 ms
50 100
mIP
SC
am
plitu
de (
pA)
40
30
20
10
0
WT
cHet
cKO
a b
c d
e f g
h i j
Fig. 5 Reduced inhibitory output of SST+ CINs in Tsc1 cKOs. Example traces showing sIPSCs (a) and mIPSCs (b) recorded from pyramidal neurons in WTs(grey), cHets (blue) and cKOs (red). Comparison of the frequency and amplitude of sIPSCs (c) and mIPSCs (d) (WT, n= 14 cells, 3 mice; cHet, n= 9 cells,2 mice; cKO, n= 13 cells, 3 mice). One-way ANOVA with Tukey’s test, sIPSC Frequency: (F2, 33= 11.16, P= 0.0002; WT vs. cHet p= 0.02; WT vs. cKOp= 0.0002); sIPSC Amplitude: (F2, 33= 4.3, P= 0.02; WT vs. cKO p= 0.03). mIPSC Frequency: (F2, 33= 3.2, P= 0.04; WT vs. cKO p= 0.04); mIPSCAmplitude: (F2, 33= 5.1, P= 0.01; WT vs. cKO p= 0.01). e Voltage clamp recordings were obtained from pyramidal neurons while activating ChR2-expressing SST+ CINs. f Example optogenetically-activated IPSCs (oIPSCs) recorded in WTs (21 cells, 3 mice), cHets (24 cells, 3 mice) and cKOs (25 cells,3 mice) in response to blue light (470 nm) flashes of increasing light-intensity. g Average oIPSC amplitudes in response to light pulses of increasingintensity. Two-way ANOVA with Tukey’s test (F2, 335= 16.19, P < 0.0001; WT and cHet vs. cKO p < 0.0001). h Example oIPSCs in response to 20 Hz lightpulse trains. i Attenuation in oIPSC amplitude during repeated activation of SST+ CINs by 20 Hz light pulse trains. Two-way ANOVA with Tukey’s test(F2, 612 = 56.6, P < 0.0001; WT and cHet vs. cKO p < 0.0001). j Paired-pulse ratio of oIPSCs in response to pairs of light pulses. One-way ANOVA withTukey’s test, 100ms inter-pulse interval: (F2, 67= 12, p= 0.0002; WT vs. cKO p= 0.002; cHet vs. cKO p < 0.0001) and 50ms inter-pulse interval:(F2, 67= 7.4, P= 0.001; WT vs. cKO p= 0.002; cHet vs. cKO p= 0.008). Data are presented as mean ± S.E.M. *p < 0.05, **p < 0.01, ****p < 0.0001.Source data are provided as a Source Data file
ARTICLE NATURE COMMUNICATIONS | https://doi.org/10.1038/s41467-019-12962-4
8 NATURE COMMUNICATIONS | (2019) 10:4994 | https://doi.org/10.1038/s41467-019-12962-4 | www.nature.com/naturecommunications

given daily injections of clozapine-N-oxide (CNO, 3 mg/Kg dose)for 5 days. Interestingly, Gq-DREADD expressing SST+ CINshad significantly lower expression of PV in comparison to thecontrol group (Supplementary Fig. 14). In general, these resultssuggest that neuronal excitability and cellular signaling events candynamically modulate the molecular programming of CINs.
Next, we tested whether the rapamycin-mediated reduction inPV expression was accompanied by a reduction in FSphysiological properties within cKO SST-Cre-lineage CINs.Rapamycin treatment did not change the Rin, firing output orAP properties of cHet CINs (Fig. 9e, g, h, Supplementary Fig. 14).However, in the cKO group, rapamycin treatment increased Rin,reduced the rheobase and increased spike frequency accommoda-tion (SFA) (Supplementary Fig. 15). Furthermore, rapamycinreduced the firing output and decreased the fraction of SST-Cre-lineage CINs that were classified as FS in cKOs (Fig. 9f, i, j).Notably, even in rapamycin-treated cKO mice, the fraction of FSSST-Cre-lineage CINs was higher than the fraction of FS SST-Cre-lineage FS CINs in WT mice (Fig. 3h, inset). Rapamycin-treatment failed to reverse some effects of Tsc1 loss, includingaltered AP properties in cKOs (Supplementary Fig. 15). Overall,the 5-day rapamycin treatment in adult cKO mice decreased theaberrant PV expression and partially reversed shifts towards FSphenotypes in SST-Cre-lineage CINs.
DiscussionImbalances in neuronal excitation/inhibition (E/I) are implicatedin neuropsychiatric disorders11, and changes in neuronal num-bers, synaptic connectivity and intrinsic properties of GABAergicinterneurons are, sometimes as a result of compensatory
mechanisms, critical contributors to shifts in E/I balance25,43–46.TSC-associated neuropsychiatric disorders (TANDs) are com-mon manifestations of the disorder10 but the mechanismsunderlying TANDs are poorly understood. In this study, wefound that deletion of the TSC causative gene, Tsc1, inducedmolecular and physiological changes in CINs that may underliesome neuropsychiatric symptoms and seizures observed in TSC(model, supplementary Fig. 16). First, loss of Tsc1 in SST-lineageCINs altered the programming of PV and Kv3.1 expression andinduced FS properties. This reveals a novel mechanism involvedin regulating the programming of CINs. Second, loss of Tsc1 inSST-lineages resulted in a neocortex with less synaptic inhibitiononto deep layer pyramidal neurons, which may contribute to thehigher seizure susceptibility observed in TSC. Third, alteredprogramming could be partially reversed by rapamycin admin-istration in adulthood, suggesting that these phenotypes remainplastic in post-mitotic CINs and could provide insights intopotential therapeutic mechanisms to treat TSC.
Previous studies in a mouse model of TSC emphasized thatdysregulation of MTOR signaling primarily affects excitatorycircuits12, and alters E/I balance through effects on excitatorysynapses. While one report examined CINs with regards toTSC47, little was known about changes in inhibitory circuits. Inthis context, we assessed cellular and physiological properties ofCINs and inhibitory synapses in Tsc1 cHets and cKOs. We dis-covered that loss of Tsc1 in SST-lineages resulted in aberrantexpression of PV and the voltage-gated potassium channel, Kv3.1,in a subset of SST-lineage CINs. This, in turn, shifts their phy-siological properties from RS to a continuum encompassing bothRS and FS properties. Notably, not all SST-lineage CINs adoptedthese properties, showing that some are less susceptible. This is
Paired recordings
Layer 5tdTomat+ CIN and
tdtomat– Pyr neuronIN PN
VC + 10 mVCC
uIP
SC
AP
WT PV-CreFS IN
WT SST-CreRS IN
cKo SST-CreRS IN
cKo SST-CreFS IN
10 ms 100
pA40
mV
150
100
50
0 0
50
100
200
300
400
0
2
4
6
8
10
20
40
uIP
SC
am
plitu
de (
pA)
uIP
SC
ris
ing
slop
e (p
A/m
s)
uIP
SC
cha
rge
(pC
)
60
80
200
400
600
0FS RS
WT cKO
RS FS FS RS
WT cKO
RS FS FS RS
WT cKO
RS FS FS RS
WT cKO
RS FS
Max
. firi
ng fr
eque
ncy
(Hz)
a b
c d e f
CCVC
Fig. 6 FS/SST-Cre CINs in Tsc1 cKOs send their outputs to distal dendrites of pyramidal neurons. a Left, Experimental design: Simultaneous recordings wereobtained from connected layer 5 tdTomato+ CINs, (current clamp, CC) and pyramidal neurons, (voltage clamp, VC), +10 mV. Right, representative imageshowing patch pipettes targeting tdTomato+ CIN (arrowhead) and tdTomato− pyramidal neuron (arrow). Scale bar is 50 µm. b Example unitary inhibitorypost synaptic currents (uIPSCs) recorded in pyramidal neurons generated in response to action potentials (AP) in WT FS/PV-Cre CINs (black, 5 pairs), WTRS/SST-Cre CINs (grey, 8 pairs), cKO RS/SST-Cre CINs (salmon, 12 pairs) and cKO FS/SST-Cre CINs (red, 4 pairs). c Maximum firing frequency of fourgroups of CINs is compared: One-way ANOVA with Tukey’s test: (F3, 25= 20, P < 0.0001; FS vs. RS p < 0.0001). d–f uIPSC amplitude, rising slope and totalcharge is compared. One-way ANOVA with Tukey’s test, uIPSC amplitude (d): (F3, 25= 29, P < 0.0001; WT FS/PV-Cre vs. all groups p < 0.0001); risingslope (e): (F3, 25= 28.11, P < 0.0001; WT FS/PV-Cre vs. all groups p < 0.0001); and total charge (f): (F3, 25= 18, P < 0.0001; WT FS/PV-Cre vs. all groupsp < 0.0001). Data are presented as mean ± S.E.M. ****p < 0.0001. Source data are provided as a Source Data file
NATURE COMMUNICATIONS | https://doi.org/10.1038/s41467-019-12962-4 ARTICLE
NATURE COMMUNICATIONS | (2019) 10:4994 | https://doi.org/10.1038/s41467-019-12962-4 | www.nature.com/naturecommunications 9

particularly interesting as recent data has shed new light onsubpopulations of SST+ CINs, with distinct molecular identitiesand functions48–50.
In contrast to our findings, another group deleted Tsc1 usingthe same SST-Cre line and a PV-Cre line but found no physio-logical phenotypes51, concluding that most TSC phenotypes arisefrom excitatory pyramidal neurons. One possibility is that thesedisparities could have arisen from each of our groups using dif-ferent mouse background strains, C57BL/6 vs. CD-1, which couldsuggest that some genetic modifiers, i.e. protective and/orexacerbating, may exist that could be therapeutic targets for TSC.Moreover, studies into whether distinct cohorts of SST-lineageCINs are sensitive to MTOR signaling may help elucidate novel
molecular and/or functional properties. Notably, we discoveredthat ~20% of WT SST+ CINs have observable pS6 expression(Supplementary Fig. 1) which may be a distinct susceptible cohortwhen Tsc1 is lost. While the phenotypes were milder, Tsc1 cHetsexhibited some of the same changes observed in Tsc1 cKOs.Finally, TSC1/2 homozygous mutants have been identified inneural progenitors via a combination of germline and somaticmutations in a TSC patient52, potentially suggesting that somephenotypes we observed in Tsc1 cKO mice may also be relevantto some cases of TSC.
This study suggests new ideas about how some aspects of CINcell programming and function are regulated, particularly in post-mitotic/maturing CINs. Previous studies identified TFs that are
a
MGE Inject transduced MGE cellsinto P1 WT host neocortices
Assess cell fate oftdTomato +cells at 35 DPT
Transduce MGE cells withDlxI12b-Cre lentiviruses
Tsc1 +/+; Ai14 Floxed/+
Tsc1 Floxed/+; Ai14 Floxed/+
Tsc1 Floxed/Floxed; Ai14 Floxed/+
or
or
tdTo
mat
o/P
V
Som
a si
ze (
AU
)
% td
Tom
ato+
cel
lsth
at e
xpre
ss P
V
E13.5 MGE transplants
b c d e
gf****
****
200
0
400
600
WT
Tsc1
cHet
Tsc1
cKO
Tsc1
cKO +
hTSC1 W
T
Tsc1
cHet
Tsc1
cKO
Tsc1
cKO +
hTSC1
****
********
****
0
30
60
Fig. 7 Cell autonomous increase in PV expression in Tsc1 null MGE-derived CINs. a Schema depicting the transplantation procedure. E13.5 Ai14Floxed/+ MGEcells (tdTomato+) that were either Tsc1+/+, Tsc1Floxed/+ or Tsc1Floxed/Floxed were transduced with a DlxI12b-Cre lentivirus, transplanted into WT P1neocortices, then developed for 35 days post-transplant (DPT). Coronal immunofluorescent images of neocortices transplanted with Tsc1+/+ (WT),Tsc1Floxed/+ (cHet) or Tsc1Floxed/Floxed (cKO) MGE cells show co-expression of tdTomato and PV (b–d). In addition, human TSC1 was expressed in Tsc1Floxed/Floxed (cKO) MGE cells and assessed in the same manner (e). Arrows point to co-expressing cells. Quantification of soma size of the tdTomato+ cells (f):One-way ANOVA, (F3, 296= 24.1, P < 0.0001; cKO vs. all groups, p < 0.0001), n= 3 mice (25 cells counted from each). (AU) arbitrary units. Quantificationof the proportion of tdTomato+ cells that express PV (g): Chi-squared test with Yate’s correction, (cKO vs. all groups, p < 0.0001), n= 3, all groups (330WT, 821 cHet, 913 cKO and 317 cKO/hTSC1 cells counted). Data are represented as mean ± SD in (f) and ± SEM in (g). Scale bar in (e)= 100 µm. ****p <0.0001. Source data are provided as a Source Data file
ARTICLE NATURE COMMUNICATIONS | https://doi.org/10.1038/s41467-019-12962-4
10 NATURE COMMUNICATIONS | (2019) 10:4994 | https://doi.org/10.1038/s41467-019-12962-4 | www.nature.com/naturecommunications

expressed in SST+ CINs but not in PV+ CINs, as well as TFs thatcan alter the ratios of SST+ and PV+ CINs22–24,42,53–55. Of note,the majority of uniquely expressed TFs are found in SST+CINs56. One hypothesis is that PV+ CIN identity is a defaultstate of MGE-derived CINs, and is repressed by TFs restricted toSST-lineages56. Furthermore, perhaps during the maturation of
PV-lineage CINs, MTOR activity is induced to promote PVexpression and FS properties, i.e. when PV expression firstbecomes evident during adolescence. This may be achieved as aconsequence of activating certain growth factor receptors orpotentially via synaptic activity7,57 in prospective PV-lineages.However, given that Tsc1/2 and other components of the MTOR
tdTo
mat
o/K
v3.1
tdTo
mat
o/P
V
Tsc1 cKOTsc1 cKO
f
h
g
i
Veh
icle
5d R
apa
Veh
icle
5d R
apa
Vehicle
RapamycinVehicle
Rapamycin
cHet cKO
Vehicle
RapamycinVehicle
RapamycinVehicle
RapamycinVehicle
Rapamycin
cHet cKO cHet cKO
Som
a si
ze (
AU
)
tdTo
mat
o ce
lls th
at e
xpre
ss
Kv3
.1/m
m2
tdTo
mat
o ce
lls th
at e
xpre
ss
PV
/mm
2
j k
******
***
**** **************
****
l
Tsc1 cHet
b c
d e
a2 Weeks 8 Weeks 8 Weeks + 5 days
Inject vehicle orRapamycin daily for 5
days
Assess for rescue
*****
Tsc1 cHet
Timeline0
300
200
100
0 0
15
30
30
15
0
NATURE COMMUNICATIONS | https://doi.org/10.1038/s41467-019-12962-4 ARTICLE
NATURE COMMUNICATIONS | (2019) 10:4994 | https://doi.org/10.1038/s41467-019-12962-4 | www.nature.com/naturecommunications 11

pathway are expressed in most cell types, there would need to beunique factors coupling MTOR signaling in PV-lineages that aredifferent in SST-lineages. These ideas will be investigated infuture studies.
Most PV+ CINs have FS physiological properties. In contrast,most SST+ CINs exhibit a RS physiology, although a class ofquasi-fast-spiking SST+ neurons was recently described48.Moreover, these two neuronal groups are believed to play distinctand dissociable roles in circuit function58–62. Our data suggestnew possibilities about these classes. First, CINs exhibit inter-mediate properties after Tsc1 loss, which fall along a continuumbetween the classic SST+ and PV+ distinct groups of CINs.Second, the programming of these classes may be more dynamicthan previously thought. In particular, rapamycin was able to
reverse the expression of PV and FS properties in mature SST-lineage cKO CINs, suggesting that some aspects of CIN cellcharacteristics and programming are malleable by signaling-dependent plasticity mechanisms that remain to be elucidated.
The extent to which changes in molecular (expression of PV vs.SST) and physiological (FS vs.RS) properties correlate withchanges in cortical function remains a major question. Differ-ential expression of ion-channels, like Kv3 channels, underlie thefast-spiking properties of PV+ CINs20,63. Loss of Tsc1 leads to anincrease in the occurrence of dual identity CINs, which expressboth PV and SST. Furthermore, SST-lineage CINs lacking Tsc1have increased expression of Kv3.1 and the properties of theseCINs are shifted towards a FS physiology. Interestingly, deletionof FMRP, another monogenic ASD-risk gene, inhibits protein
Fig. 8 Rapamycin decreases PV and Kv3.1 expression in SST-Cre-lineage CINs of cKO mice. a Eight-week old mice that were either SST-Cre; Tsc1 cHetsor cKOs were injected with vehicle or rapamycin consecutively for 5 days and then assessed a day after for soma size, Kv3.1 and PV expression.b Quantification of tdTomato+ cell soma size: One-way ANOVA (F3, 296= 95.39, P < 0.0001; cKO vs. all groups, cKO veh vs. rapa, and cHet rapa vs. cKOrapa, p < 0.0001), n= 3 mice per group (25 cells measured from each). (AU) arbitrary units. Immunofluorescent images of the neocortex from vehicletreated (c, d) and rapamycin treated (e, f) cHet and cKO mice that were co-labeled for tdTomato and Kv3.1. Immunofluorescent images of vehicle treated(g, h) and rapamycin treated (i, j) cHet and cKO mice co-labeled for tdtomato and PV. Arrows point to co-labeled cells. k Quantification of the cell densityof tdTomato+ cells that co-express Kv3.1: One-way ANOVA (F3, 8= 17.56, P= 0.0007; cKO veh vs. cHet veh, p= 0.0027, cKO veh vs. cHet rapa, p=0.0007, and cKO veh vs. cKO rapa, p= 0.0035), n= 3 mice per group. l Quantification of the cell density of tdTomato+ cells that co-express PV: One-wayANOVA (F3, 8= 30.51, P= 0.0001; cKO veh vs. cHet veh and cHet rapa, p= 0.0002 and cKO veh vs. cKO, p= 0.0004), n= 3 mice per group. Data arepresented as mean ± SD in (c) and ± SEM in all other graphs. *p < 0.05, **p < 0.01, ****p < 0.0001. Scale bar j= 100 µm. Source data are provided as aSource Data file
cHet cKO
Vehicle Rapamycin
Rapam
ycin
Vehicle Rapamycin
Vehicle Rapamycin
200 ms
20 m
V
200 ms
20 m
V
FS22%
FS18%
RS78%
RS82%
Vehicle Rapamycin
FS37%
FS18%
RS63%
RS82%60
50
40
30
20
10
0
160
140
120
100
80
60
40
20
0
Vehic
le0 100 200
Current (pA)
Num
ber
of a
ctio
n po
tent
ials
Max
.firin
g fr
eque
ncy
(Hz)
300
60
50
40
30
20
10
0
0 100 200
Current (pA)
Num
ber
of a
ctio
n po
tent
ials
300
Rapam
ycin
160
140
120
100
80
60
40
20
0
Vehic
le
Max
.firin
g fr
eque
ncy
(Hz)
a b
c d e f
Fig. 9 Rapamycin treatment decreases fast-spiking phenotype in SST-Cre lineage CINs in cKO mice. a, b Example voltage traces in response tosuprathreshold current injections in SST+ CINs from vehicle and rapamycin treated cHet (a) and cKO (b) mice. c, d Comparison of firing output: Two-wayANOVA (F14, 475= 0.63, P= 0.83); and maximum firing frequency: Two-way unpaired t-test (t33= 1.4, p= 0.15) of tdTomato+ CINs in vehicle andrapamycin treated cHet mice (Vehicle, n= 18 from 2 mice; Rapamycin, n= 17 cells from 2 mice). Inset, pie charts showing the proportion of SST+ CINswith RS and FS physiological properties in each treatment group. e, f Same as (c, d) for vehicle and rapamycin treated cKO mice. Note the CINs fromrapamycin treated cKO mice have lower firing output: Two-way ANOVA with Bonferroni’s test (F14, 555= 2.86, P= 0.003; 325 pA, p= 0.004 and 350 pA,p= 0.001), and maximum firing frequency: Two-way unpaired t-test (t37= 2.1, p= 0.04); (Vehicle, n= 19 cells from 2 mice; Rapamycin, n= 20 from 2mice). Inset, pie charts showing the proportion of SST-lineage CINs with FS and RS physiological properties in each treatment group. Data are presented asmean ± SEM in all graphs. *p < 0.05, **p < 0.01, ****p < 0.0001. Source data are provided as a Source Data file
ARTICLE NATURE COMMUNICATIONS | https://doi.org/10.1038/s41467-019-12962-4
12 NATURE COMMUNICATIONS | (2019) 10:4994 | https://doi.org/10.1038/s41467-019-12962-4 | www.nature.com/naturecommunications

translation downstream of MTOR, of which the Kv3.1 channel isknown to be a target in auditory brain stem neurons64. Theseconverging findings suggest that modulators of the Kv3.1 channelcould be potential targets for treating cellular and circuitabnormalities in TSC. Future work will be necessary to under-stand whether Tsc1 deletion induced shifts in CIN cell pro-gramming underlie behavioral abnormalities in mutant mice andhumans diagnosed with TSC, which may lead to new therapeutictargets.
We previously found some overlapping phenotypes afterdeletion of Pten in MGE progenitors using Nkx2.1-Cre25. How-ever, due to a drastic loss in CIN numbers, we were not able todetermine if manipulation of MTOR activity, via Pten loss, spe-cifically altered CIN programming. Furthermore, Pten deletionusing SST-Cre resulted in no phenotypes, whereas Tsc1 deletionusing SST-Cre did exhibit molecular and physiological pheno-types without any loss of CINs. These phenotypes allowed us togain insights into how MTOR activity influences CIN program-ming. We do not currently understand why Tsc1 cKOs inimmature SST CINs, but not Pten cKOs, resulted in these phe-notypes. However, the Tsc genes lie downstream of Pten and at acrucial point in the signaling pathway inhibiting MTOR signaling.Moreover, they can be inhibited by other signaling events, i.e.MAPK signaling. Thus, both their proximity to MTOR in thesignaling cascade and their ability to be inhibited by other sig-naling moieties may have resulted in differences between the Tsc1and Pten cKOs.
In summary, we provided evidence that Tsc1-inhibition ofMTOR represses PV+/FS properties in a cohort of SST-Cre-lineage CINs. Notably, it suggests that regulation of some CINmolecular and physiological properties can be initiated by non-transcriptional events, i.e. MTOR signaling. However, whethertranscription is targeted downstream of MTOR signaling is notyet known. Moreover, we identified specific alterations inGABAergic CINs and underlying molecular mediators (e.g.,MTOR and Kv3.1) that could plausibly contribute to neurocog-nitive symptoms of TSC. Future studies should assess whethersimilar abnormalities occur in humans diagnosed with TSC and/or can be reversed by rapamycin analogs, to more directlyimplicate these findings about CINs in the pathogenesis and/ortreatment of TSC.
MethodsAnimals. All mouse strains have been published: Ai14 Cre-reporter29, Nkx2.1-Cre30, PV-Cre37, SST-IRES-Cre28, Tsc1floxed,27,. Tsc1floxed mice were initially on amixed C57BL6/J, CD-1 background, then backcrossed to CD-1 for at least fourgenerations before analysis. For timed pregnancies, noon on the day of the vaginalplug was counted as embryonic day 0.5. Both male and female mice were assessed.We did not observe any phenotypic differences between genders and combined alldata for each genotype. All animal care and procedures were performed andapproved according to the Michigan State University and University of CaliforniaSan Francisco Laboratory Animal Research Center guidelines. We have compliedwith all relevant ethical regulations for animal research.
Cell Counting. To determine cell density (cells/mm2), we counted the number ofcells in a given section and then divided by the area of that region. To calculate the% of tdTomato+ cells that co-labeled with specific markers, we divided the numberof co-labeled cells by the total number of tdTomato+ cells. For cell transplants, alltdTomato+ cells were counted in the neocortex from all sections in a rostral tocaudal series. For cell fate counts, only transplants where at least 50 tdTomato+
cells could be counted were used for analysis. For soma size quantification, theperimeter of each tdTomato+ cell’s soma was traced in Image J, and at least 25 cellswere measured and averaged for each mouse.
Acute cortical slice preparation. Adult mice of either sex (P45–P60 days) wereanesthetized with an intraperitonial injection of euthasol and transcardially per-fused with an ice-cold cutting solution containing (in mM) 210 sucrose, 2.5 KCl,1.25 NaH2PO4, 25 NaHCO3, 0.5 CaCl2, 7 MgCl2, 7 dextrose (bubbled with 95%O2–5% CO2, pH ~7.4). Mice were decapitated, the brains were removed and twoparallel cuts were made along the coronal plane at the rostral and caudal ends of
the brains. Brains were mounted on the flat surface created at the caudal end.Approximately, three coronal slices (250 µm thick) were obtained using Vibratingblade microtome (VT1200S, Leica Microsystems Inc.). Slices were allowed torecover at 34 °C for 30 min followed by 30 min recovery at room temperature in aholding solution containing (in mM) 125 NaCl, 2.5 KCl, 1.25 NaH2PO4, 25NaHCO3, 2 CaCl2, 2 MgCl2, 12.5 dextrose, 1.3 ascorbic acid, 3 sodium pyruvate.
Whole-cell patch clamp recordings. Somatic whole-cell current clamp and vol-tage clamp recordings were obtained from submerged slices perfused in heated(32–34 °C) artificial cerebrospinal fluid (aCSF) containing (in mM); 125 NaCl, 3KCl, 1.25 NaH2 PO4, 25 NaHCO3, 2 CaCl2, 1 MgCl2, 12.5 dextrose (bubbled with95% O2/5% CO2, pH ~7.4). Neurons were visualized using DIC optics fitted with a40x water-immersion objective (BX51WI, Olympus microscope). Pyramidal neu-rons and tdtomato expressing CINs located in layer 5 were targeted for patching.Patch electrodes (2–4MΩ) were pulled from borosilicate capillary glass of externaldiameter 1 mm (Sutter Instruments) using a Flaming/Brown micropipette puller(model P-2000, Sutter Instruments). For current clamp recordings, electrodes werefilled with an internal solution containing the following (in mM): 120 K-gluconate,20 KCl, 10 HEPES, 4 NaCl, 7 K2-phosphocreatine, 0.3 Na-GTP, and 4 Mg-ATP(pH ~7.3 adjusted with KOH). Biocytin (Vector Laboratories) was included(0.1–0.2%) for subsequent histological processing. For voltage clamp recordings,the internal solution contained the following (in mM): 130 Cs-methanesulfonate,10 CsCl, 10 HEPES, 4 NaCl, 7 phosphocreatine, 0.3 Na-GTP, 4 Mg-ATP, and 2QX314-Br (pH ∼7.3 adjusted with CsOH).
Electrophysiology data were recorded using Multiclamp 700B amplifier(Molecular Devices). Voltages have not been corrected for measured liquidjunction potential (~8 mV). Upon successful transition to the whole-cellconfiguration, the neuron was given at least 5 min to stabilize before data werecollected. Series resistance and pipette capacitance were appropriately compensatedbefore each recording. Series resistance was usually 10–20MΩ, and experimentswere terminated if series resistances exceeded 25MΩ.
Electrophysiology protocols and data analysis. All data analyses were performedusing custom routines written in IGOR Pro (Wavemetrics). Code is available uponrequest. Resting membrane potential (RMP) was measured as the membranevoltage measured in current clamp mode immediately after reaching the whole-cellconfiguration. Input resistance (Rin) was calculated as the slope of the linear fit ofthe voltage–current plot generated from a family of hyperpolarizing and depolar-izing current injections (−50 to +20 pA, steps of 10 pA). Firing output was cal-culated as the number of action potentials (APs) fired in response to 800 ms longdepolarizing current injections (25–500 pA). Firing frequency was calculating asthe number of APs fired per second. Rheobase was measured as the minimumcurrent injection that elicited spiking. Firing traces in response to 50 pA currentabove the rheobase were used for analysis of single AP properties– AP threshold,maximum dV/dt (rate of rise of AP), AP amplitude, AP half-width and fast afterhyperpolarization (fAHP) amplitude. Threshold was defined as the voltage atwhich the value of third derivative of voltage with time is maximum. Actionpotential amplitude was measured from threshold to peak, with the half-widthmeasured at half this distance. Fast after hyperpolarization was measured from thethreshold to the negative voltage peak after the AP. Index of spike-frequencyaccommodation (SFA) was calculated as the ratio of the last inter-spike interval tothe first inter-spike interval. Coefficient of variance (CV) for inter-spike interval(ISI), AP amplitude and AP half-width was calculated as the ratio of standarddeviation to the mean. Recorded CINs in all genotypes were classified as fast-spiking or regular-spiking based on electrophysiological properties. Specifically,CINs were classified as fast-spiking if the AP half-width was <0.5 ms, firing fre-quency >50 Hz, fAHP amplitude was >14 mV and SFA was <2. The correspon-dence between PV expression and fast-spiking electrophysiological properties wasconfirmed in a subset of CINs by quantification of PV staining in biocytin-filledneurons (16 of 21 biocytin-labeled CINs classified as fast-spiking were PV+).
Spontaneous inhibitory currents were recorded for 5 min with neurons voltageclamped at +10 mV. Miniature inhibitory currents were recorded in the presenceof TTX. Spontaneous and miniature inhibitory currents were analyzed off-lineusing Clampfit (pClamp, Molecular devices) event detection.
For Cre-dependent expression, 600 nl of AAV-DIO-ChR2-eFYP virus wasbilaterally injected into P30–40 SST-Cremice. We waited at least 4 weeks after virusinjection before preparing brain slices. To measure optogenetically evokedinhibitory currents (oIPSCs), we voltage-clamped layer 5 pyramidal neurons at+10 mV. We stimulated ChR2 using 5 ms long single or multiple light pulses(maximum light power, 4 mW/mm2) generated by a Lambda DG-4 high-speedoptical switch with a 300W Xenon lamp (Sutter Instruments) and an excitationfilter centered around 470 nm, delivered to the slice through a ×40 objective(Olympus). Frequency dependent attenuation (20 Hz) and paired-pulse ratios ofoIPSCs were measured at the maximum light power.
To measure unitary inhibitory currents (uIPSCs), dual whole-cell recordingswere obtained from connected layer 5 tdTomato expressing (SST-Cre lineage orPV-Cre lineage) CINs and adjacent layer 5 pyramidal neurons. We obtainedcurrent clamp recordings from tdTomato+ CINs and voltage clamp recordings(+10 mV) from pyramidal neurons. Short duration (1–2 ms) depolarizing currentsteps (1–1.5 nA) were injected into the CINs to elicit single action potentials and
NATURE COMMUNICATIONS | https://doi.org/10.1038/s41467-019-12962-4 ARTICLE
NATURE COMMUNICATIONS | (2019) 10:4994 | https://doi.org/10.1038/s41467-019-12962-4 | www.nature.com/naturecommunications 13
uIPSCs were recorded in postsynaptic pyramidal neurons. Average of 20–30uIPSCs were used to calculate the peak amplitude (from the baseline to the peak ofuIPSC), rising slope (slope of a fitting line from 10–90% after onset of uIPSC) andtotal charge of uIPSCs (integral of uIPSCs from the onset until the trace returnedcompletely to the baseline).
Computer simulations. Simulations were performed using the NEURON7.4 simulation environment (Carnevale and Hines, 2006) with Python interface.Four different morphologically detailed models of SST+ neocortical layer 5 CINswere used from Allen Brain Atlas; Allen Institute (2015) Documentation, http://help.brain-map.org/display/celltypes/Documentation. Model files for simulation inPython environment were downloaded from ModelDB (senselab.med.yale.edu).Maximum conductance densities (in S/cm2) of Kv3.1 channel (ḡ_kv3.1) were notedfor the four different models (0.25, 0.009, 0.29, 0.56). These values were used forthe low Kv3.1 conductance conditions. To simulate the effects of increase in Kv3.1expression, ḡ_kv3.1 was increased to 1.5 in all four models. Firing output in the lowand high Kv3.1 conditions were measured as the number of spikes fired in responseto 1 s long depolarizing current steps (50–350 pA). Spike times were measured bydetermining the time of AP peak. Instantaneous frequency (1/inter-spike interval)was computed from current injections that elicited >40 APs. Subthreshold mem-brane properties were calculated from the voltage traces in response to hyperpo-larizing and depolarizing current injections (−50 to +20 pA, steps of 10 pA).
Immunofluorescent tissue staining. Immunofluorescent labeling was performedon 25 µm cryo-sectioned tissue with the following antibodies: mouse anti-Kv3.1b1:400 (NeuroMab cat. # 75-041); rabbit anti-phosphoS6SER240/244 1:400 (Cell Sig-naling Technologies cat. # 5364); rabbit anti-PV 1:400 (Swant cat. # PV 27); ratanti-SST 1:200 (Millipore cat. # MAB354). The appropriate 488, 594 or 647 Alexa-conjugated secondary antibodies were from Thermo Fisher Scientific (1:300 dilu-tion). Sections were cover-slipped with Vectashield (Vector labs).
MGE cell transplantation. Lentiviral transduction of MGE cells followed byintracranial transplantation followed a reported protocol40. Briefly, HEK293T cellswere transfected using Lipofectamine2000 (Thermo Fischer Scientific) with fourplasmids to generate lentivirus particles. E13.5 MGEs from individual embryoswere dissected in ice-cold HBSS and then kept on ice in DMEM media (containing10% fetal bovine serum). MGEs were then mechanically dissociated with a p1000pipette tip and transduced with lentivirus. To perform transductions, dissociatedMGE cells were mixed with pre-warmed media that was at physiological pH andwas incubated with ~10–20 μls of concentrated lentivirus, with titers ranging from1 × 108–1 × 10¹⁰ infectious units/ml. They were next incubated at 37 °C for 30 min,with intervals of agitation. Since the MGE cells had a Cre-dependent reporter,Ai1429, only MGE cells transduced with Cre-expressing lentiviruses were visible inthe host neocortex after transplantation. This combinatorial method allows thetransduced/transplanted cells to express a strong reporter, i.e. tdTomato expressedfrom the beta-actin promoter, while maintaining cell type specificity. Cells werethen pelleted in a tabletop centrifuge at low speed (700 × g, ~4 min) and washed 3times with media followed by trituration to disperse cells between each wash toremove excess virus. The final pellet was left under a few μls of media, put on ice,and the remaining media was removed with a fine point kim wipe before theinjection needle was loaded. For injections, a glass micropipette with a 45° beveledtip, ~50 μm outer diameter, was preloaded with sterile mineral oil and cells werethen front-loaded into the tip of the needle using a plunger connected to ahydraulic drive (Narishige MO-10) that was mounted to a stereotaxic frame. Pupswere anesthetized on ice for 1–2 min before being placed on a mold for injections.Each pup received 3–6 injections of cells, at 70 nl per site, in their right hemisphere.These sites were about 1 mm apart from rostral to caudal and medial to lateral andwere then injected into layers V-VI of a P1 WT neocortex. After injections, pupswere allowed to recover and then put back with their mother. The transplantedmice were sacrificed at 35 days post-transplant and transcardially perfused withPBS followed by 4% PFA. Brains were then post-fixed in 4% PFA for a shortinterval, ~30 min, and then sunk in 30% sucrose before embedding in OCT.
DNA vector generation. The DlxI12b-BG-IRES-Cre lentiviral vector backbone isreported in65. To generate the DlxI12b-BG-hTSC1-IRES-Cre lentiviral vector, thehuman TSC1 gene was PCR amplified from a vector containing the hTSC1 cDNA(Addgene)66. The primers (Forward 5′-GAGAGCTAGCATGGCCCAACAAGCAAATG-3′ and Reverse 5′-GAGATGTACATTAGCTGTGTTCATGATG-3′), wereused to introduce NheI and BsrGI restriction enzyme sites, respectively (under-lined). Next the PCR product and the DlxI12b-BG-IRES-Cre vector were digestedwith the appropriate enzymes and ligated. The vector was verified by restrictiondigest and sequencing.
Rapamycin treatment. Rapamycin (LC Laboratories, Woburn, MA, USA) wasdissolved in ethanol at a concentration of 20 mg/ml and stored at −20 °C. On theday of the injections, drug was resuspended in saline (containing 0.25% PEG and0.25% Tween-80). Mice received rapamycin solution (10 mg kg−1) or an equalvolume of vehicle by intraperitoneal injection once daily for 5 consecutive days aspreviously described67.
Quantification and statistical analysis. For anatomical analyses, statistics wereperformed using Prism version 6, a p-value of <0.05 was considered significant. Formost parametric measurements, we used a One-Way ANOVA with Tukey’s posttest to determine significance (cell density and soma size measurements). For non-parametric data sets, we used a Chi-squared test with Yate’s correction to deter-mine significance (data normalized and expressed as a percentage). For electro-physiological analyses, statistical comparisons were done using custom-writtensoftware in MATLAB or Prism (Graphpad). Statistical significance was assessedusing a paired or unpaired two-tailed Student’s t-test. For repeated observations,two-way ANOVA followed by a post hoc Tukey’s or Bonferroni’s test was used.Statistical comparisons across three groups were done using one-way ANOVAfollowed by a post hoc Tukey test. Probability values for ANOVAs are denoted as Pand the probability values for post hoc comparisons are denoted as p. Error barsindicate ± SEM unless otherwise noted.
Reporting summary. Further information on research design is available inthe Nature Research Reporting Summary linked to this article.
Data availabilityThe data used in the analysis of this study are available from the corresponding authorsupon reasonable request. A reporting summary for this article is available as aSupplementary Information file. The source data for all relevant figures are provided as aSource Data file.
Received: 13 April 2019; Accepted: 4 October 2019;
References1. Chu-Shore, C. J., Major, P., Camposano, S., Muzykewicz, D. & Thiele, E. A.
The natural history of epilepsy in tuberous sclerosis complex. Epilepsia 51,1236–1241 (2010).
2. Numis, A. L. et al. Identification of risk factors for autism spectrum disordersin tuberous sclerosis complex. Neurology 76, 981–987 (2011).
3. Spurling Jeste, S. et al. Early developmental trajectories associated with ASD ininfants with tuberous sclerosis complex. Neurology 83, 160–168 (2014).
4. Winterkorn, E. B., Pulsifer, M. B. & Thiele, E. A. Cognitive prognosis ofpatients with tuberous sclerosis complex. Neurology 68, 62–64 (2007).
5. European Chromosome 16 Tuberous Sclerosis Consortium. Identification andcharacterization of the tuberous sclerosis gene on chromosome 16. Cell 75,1305–1315 (1993).
6. van Slegtenhorst, M. et al. Interaction between hamartin and tuberin, theTSC1 and TSC2 gene products. Hum. Mol. Genet 7, 1053–1057 (1998).
7. Laplante, M. & Sabatini, D. M. mTOR signaling in growth control and disease.Cell 149, 274–293 (2012).
8. O’Roak, B. J. et al. Multiplex targeted sequencing identifies recurrentlymutated genes in autism spectrum disorders. Science 338, 1619–1622(2012).
9. Richards, C., Jones, C., Groves, L., Moss, J. & Oliver, C. Prevalence of autismspectrum disorder phenomenology in genetic disorders: a systematic reviewand meta-analysis. Lancet Psychiatry 2, 909–916 (2015).
10. Curatolo, P., Moavero, R. & de Vries, P. J. Neurological and neuropsychiatricaspects of tuberous sclerosis complex. Lancet Neurol. 14, 733–745 (2015).
11. Sohal, V. S. & Rubenstein, J. L. R. Excitation-inhibition balance as aframework for investigating mechanisms in neuropsychiatric disorders. Mol.Psychiatry. https://doi.org/10.1038/s41380-019-0426-0. (2019).
12. Bateup, H. S., Takasaki, K. T., Saulnier, J. L., Denefrio, C. L. & Sabatini, B. L.Loss of Tsc1 in vivo impairs hippocampal mGluR-LTD and increasesexcitatory synaptic function. J. Neurosci. 31, 8862–8869 (2011).
13. Ehninger, D. et al. Reversal of learning deficits in a Tsc2+/- mouse model oftuberous sclerosis. Nat. Med 14, 843–848 (2008).
14. Tavazoie, S. F., Alvarez, V. A., Ridenour, D. A., Kwiatkowski, D. J. & Sabatini,B. L. Regulation of neuronal morphology and function by the tumorsuppressors Tsc1 and Tsc2. Nat. Neurosci. 8, 1727–1734 (2005).
15. Wonders, C. P. & Anderson, S. A. The origin and specification of corticalinterneurons. Nat. Rev. Neurosci. 7, 687–696 (2006).
16. Miyoshi, G. et al. Genetic fate mapping reveals that the caudal ganglioniceminence produces a large and diverse population of superficial corticalinterneurons. J. Neurosci. 30, 1582–1594 (2010).
17. Kepecs, A. & Fishell, G. Interneuron cell types are fit to function. Nature 505,318–326 (2014).
18. Huang, Z. J., Di Cristo, G. & Ango, F. Development of GABA innervation inthe cerebral and cerebellar cortices. Nat. Rev. Neurosci. 8, 673–686 (2007).
19. Chiu, C. Q. et al. Compartmentalization of GABAergic inhibition by dendriticspines. Science 340, 759–762 (2013).
ARTICLE NATURE COMMUNICATIONS | https://doi.org/10.1038/s41467-019-12962-4
14 NATURE COMMUNICATIONS | (2019) 10:4994 | https://doi.org/10.1038/s41467-019-12962-4 | www.nature.com/naturecommunications

20. Erisir, A., Lau, D., Rudy, B. & Leonard, C. S. Function of specific K(+)channels in sustained high-frequency firing of fast-spiking neocorticalinterneurons. J. Neurophysiol. 82, 2476–2489 (1999).
21. Butt, S. J. B. et al. The requirement of Nkx2-1 in the temporal specification ofcortical interneuron subtypes. Neuron 59, 722–732 (2008).
22. Liodis, P. et al. Lhx6 activity is required for the normal migration andspecification of cortical interneuron subtypes. J. Neurosci. 27, 3078–3089(2007).
23. Zhao, Y. et al. Distinct molecular pathways for development of telencephalicinterneuron subtypes revealed through analysis of Lhx6 mutants. J. Comp.Neurol. 510, 79–99 (2008).
24. Pai, E. L.-L. et al. Mafb and c-Maf Have Prenatal Compensatory and PostnatalAntagonistic Roles in Cortical Interneuron Fate and Function. Cell Rep. 26,1157–1173.e5 (2019).
25. Vogt, D., Cho, K. K. A., Lee, A. T., Sohal, V. S. & Rubenstein, J. L. R. Theparvalbumin/somatostatin ratio is increased in Pten mutant mice and byhuman PTEN ASD alleles. Cell Rep. 11, 944–956 (2015).
26. Wong, F. K. et al. Pyramidal cell regulation of interneuron survival sculptscortical networks. Nature 557, 668–673 (2018).
27. Kwiatkowski, D. J. et al. A mouse model of TSC1 reveals sex-dependentlethality from liver hemangiomas, and up-regulation of p70S6 kinase activityin Tsc1 null cells. Hum. Mol. Genet 11, 525–534 (2002).
28. Taniguchi, H. et al. A Resource of Cre driver lines for genetic targeting ofGABAergic neurons in cerebral cortex. Neuron 71, 995–1013 (2011).
29. Madisen, L. et al. A robust and high-throughput Cre reporting andcharacterization system for the whole mouse brain. Nat. Neurosci. 13, 133–40.(2010).
30. Xu, Q., Tam, M. & Anderson, S. A. Fate mapping Nkx2.1-lineage cells in themouse telencephalon. J. Comp. Neurol. 506, 16–29 (2008).
31. Halabisky, B., Shen, F., Huguenard, J. R. & Prince, D. A. Electrophysiologicalclassification of somatostatin-positive interneurons in mouse sensorimotorcortex. J. Neurophysiol. 96, 834–845 (2006).
32. Butt, S. J. B. et al. The temporal and spatial origins of cortical interneuronspredict their physiological subtype. Neuron 48, 591–604 (2005).
33. Ma, Y., Hu, H., Berrebi, A. S., Mathers, P. H. & Agmon, A. Distinct subtypesof somatostatin-containing neocortical interneurons revealed in transgenicmice. J. Neurosci. 26, 5069–5082 (2006).
34. Du, J., Zhang, L., Weiser, M., Rudy, B. & McBain, C. J. Developmentalexpression and functional characterization of the potassium-channel subunitKv3.1b in parvalbumin-containing interneurons of the rat hippocampus. J.Neurosci. 16, 506–518 (1996).
35. Gouwens, N. W. et al. Systematic generation of biophysically detailed modelsfor diverse cortical neuron types. Nat. Commun. 9, 710 (2018).
36. Safari, M.-S., Mirnajafi-Zadeh, J., Hioki, H. & Tsumoto, T. Parvalbumin-expressing interneurons can act solo while somatostatin-expressinginterneurons act in chorus in most cases on cortical pyramidal cells. Sci. Rep.7, 12764 (2017).
37. Hippenmeyer, S. et al. A developmental switch in the response ofDRG neurons to ETS transcription factor signaling. PLoS Biol. 3, e159(2005).
38. Cohen, S. M. et al. Excitation-transcription coupling in parvalbumin-positiveinterneurons employs a novel CaM kinase-dependent pathway distinct fromexcitatory neurons. Neuron 90, 292–307 (2016).
39. Parrish, R. R., Codadu, N. K., Racca, C. & Trevelyan, A. J. Pyramidal cellactivity levels affect the polarity of activity-induced gene transcription changesin interneurons. J. Neurophysiol. 120, 2358–2367 (2018).
40. Vogt, D. et al. Viral-mediated labeling and transplantation of medialganglionic eminence (MGE) cells for in vivo studies. J. Vis. Exp. 98, e52740(2015).
41. Arguello, A. et al. Dapper antagonist of catenin-1 cooperates with Dishevelled-1 during postsynaptic development in mouse forebrain GABAergicinterneurons. PloS One 8, e67679 (2013).
42. Vogt, D. et al. Lhx6 directly regulates Arx and CXCR7 to determine corticalinterneuron fate and laminar position. Neuron 82, 350–364 (2014).
43. Ajram, L. A. et al. Shifting brain inhibitory balance and connectivity of theprefrontal cortex of adults with autism spectrum disorder. Transl. Psychiatry7, e1137 (2017).
44. Han, S. et al. Autistic-like behaviour in Scn1a+/− mice and rescueby enhanced GABA-mediated neurotransmission. Nature 489, 385–390(2012).
45. Markram, K., Rinaldi, T., La Mendola, D., Sandi, C. & Markram, H. Abnormalfear conditioning and amygdala processing in an animal model of autism.Neuropsychopharmacol 33, 901–912 (2008).
46. Antoine, M. W., Langberg, T., Schnepel, P. & Feldman, D. E. Increasedexcitation-inhibition ratio stabilizes synapse and circuit excitability in fourautism mouse models. Neuron 101, 648–661.e4 (2019).
47. Fu, C. et al. GABAergic interneuron development and function is modulatedby the Tsc1 gene. Cereb. Cortex 22, 2111–2119 (2012).
48. Nigro, M. J., Hashikawa-Yamasaki, Y. & Rudy, B. Diversity and connectivityof layer 5 somatostatin-expressing interneurons in the mouse barrel cortex. J.Neurosci. 38, 1622–1633 (2018).
49. Paul, A. et al. Transcriptional architecture of synaptic communicationdelineates GABAergic neuron identity. Cell 171, 522–539.e20 (2017).
50. Tasic, B. et al. Adult mouse cortical cell taxonomy revealed by single celltranscriptomics. Nat. Neurosci. 19, 335–346 (2016).
51. Zhao, J.-P. & Yoshii, A. Hyperexcitability of the local cortical circuit in mousemodels of tuberous sclerosis complex. Mol. Brain 12, 6 (2019).
52. D’Gama, A. M. et al. Somatic mutations activating the mTOR pathway indorsal telencephalic progenitors cause a continuum of cortical dysplasias. CellRep. 21, 3754–3766 (2017).
53. Mayer, C. et al. Developmental diversification of cortical inhibitoryinterneurons. Nature 555, 457–462 (2018).
54. Stanco, A. et al. NPAS1 represses the generation of specific subtypes of corticalinterneurons. Neuron 84, 940–953 (2014).
55. Hu, J. S. et al. Coup-TF1 and Coup-TF2 control subtype and laminar identityof MGE-derived neocortical interneurons. Dev 144, 2837–2851 (2017).
56. Hu, J. S., Vogt, D., Sandberg, M. & Rubenstein, J. L. Cortical interneurondevelopment: a tale of time and space. Dev 144, 3867–3878 (2017).
57. Pirbhoy, P. S., Farris, S. & Steward, O. Synaptically driven phosphorylation ofribosomal protein S6 is differentially regulated at active synapses versusdendrites and cell bodies by MAPK and PI3K/mTOR signaling pathways.Learn Mem. 24, 341–357 (2017).
58. Abbas, A. I. et al. Somatostatin interneurons facilitate hippocampal-prefrontal synchrony and prefrontal spatial encoding. Neuron 100, 926–939(2018).
59. Lee, S.-H. et al. Activation of specific interneurons improves V1 featureselectivity and visual perception. Nature 488, 379–383 (2012).
60. Phillips E. A., Hasenstaub A. R. Asymmetric effects of activating andinactivating cortical interneurons. eLife 2016; 5. https://doi.org/10.7554/eLife.18383.
61. Phillips, E. A. K., Schreiner, C. E. & Hasenstaub, A. R. Cortical interneuronsdifferentially regulate the effects of acoustic context. Cell Rep. 20, 771–778(2017).
62. Pinto, L. & Dan, Y. Cell-type-specific activity in prefrontal cortex during goal-directed behavior. Neuron 87, 437–450 (2015).
63. Rudy, B. & McBain, C. J. Kv3 channels: voltage-gated K+ channels designedfor high-frequency repetitive firing. Trends Neurosci. 24, 517–526 (2001).
64. Strumbos, J. G., Brown, M. R., Kronengold, J., Polley, D. B. & Kaczmarek, L.K. Fragile X mental retardation protein is required for rapid experience-dependent regulation of the potassium channel Kv3.1b. J. Neurosci. 30,10263–10271 (2010).
65. Vogt, D. et al. Mouse Cntnap2 and human CNTNAP2 ASD alleles cellautonomously regulate PV+ cortical interneurons. Cereb. Cortex 28,3868–3879 (2018).
66. Tee, A. R. et al. Tuberous sclerosis complex-1 and -2 gene products functiontogether to inhibit mammalian target of rapamycin (mTOR)-mediateddownstream signaling. Proc. Natl. Acad. Sci. USA 99, 13571–13576 (2002).
67. Zhou, J. et al. Pharmacological inhibition of mTORC1 suppresses anatomical,cellular, and behavioral abnormalities in neural-specific Pten knock-out mice.J. Neurosci. 29, 1773–1783 (2009).
AcknowledgementsV.S.S. was funded by CDMRP (#TS150059) and NIMH R01 (#MH106507). J.L.R. byNina Ireland, NIMH R01 (#MH081880), NIMH R37 (#MH049428) and CDMRP(#TS150059). R.M. by NARSAD Young Investigator Award (Leichtung Family Investi-gator, BBRF). E.L.L.P. by UCSF Neuroscience Program and NIMH R01 (#MH081880).A.N.R. by NIMH R01 (#MH081880). A.M.S., K.A., and D.V. by the Spectrum Health-MSU Alliance Corporation.
Author contributionsR.M. conducted electrophysiology experiments, biophysical simulations, morphologicalanalysis, and virus injections. E.L.L.P. performed FISH, immunofluorescent labeling, andimaging. D.V. performed transplantation assays, immunofluorescence labeling, andimaging. A.M.S. and P.M. performed soma size measurements. A.N.R. performed bio-cytin immuno-labeling. K.A. performed pS6 staining. R.M., E.L.L.P., J.L.R., V.S.S.,and D.V. conceived experiments and wrote the paper, all authors read and editedthe PAPER.
Competing interestsJ.L.R. is cofounder, stockholder, and on the scientific board of Neurona, a companystudying the potential therapeutic use of CIN transplantation. V.S.S. receives researchfunding from Neurona. The remaining authors declare no competing interests.
NATURE COMMUNICATIONS | https://doi.org/10.1038/s41467-019-12962-4 ARTICLE
NATURE COMMUNICATIONS | (2019) 10:4994 | https://doi.org/10.1038/s41467-019-12962-4 | www.nature.com/naturecommunications 15
Additional informationSupplementary information is avaliable for this paper at https://doi.org/10.1038/s41467-019-12962-4.
Correspondence and requests for materials should be addressed to V.S.S. or D.V.
Peer review information Nature Communications thanks Stewart Anderson, TimothyPetros and Mustafa Sahin for their contribution to the peer review of this work. Peerreviewer reports are available.
Reprints and permission information is available at http://www.nature.com/reprints
Publisher’s note Springer Nature remains neutral with regard to jurisdictional claims inpublished maps and institutional affiliations.
Open Access This article is licensed under a Creative CommonsAttribution 4.0 International License, which permits use, sharing,
adaptation, distribution and reproduction in any medium or format, as long as you giveappropriate credit to the original author(s) and the source, provide a link to the CreativeCommons license, and indicate if changes were made. The images or other third partymaterial in this article are included in the article’s Creative Commons license, unlessindicated otherwise in a credit line to the material. If material is not included in thearticle’s Creative Commons license and your intended use is not permitted by statutoryregulation or exceeds the permitted use, you will need to obtain permission directly fromthe copyright holder. To view a copy of this license, visit http://creativecommons.org/licenses/by/4.0/.
© The Author(s) 2019
ARTICLE NATURE COMMUNICATIONS | https://doi.org/10.1038/s41467-019-12962-4
16 NATURE COMMUNICATIONS | (2019) 10:4994 | https://doi.org/10.1038/s41467-019-12962-4 | www.nature.com/naturecommunications