pre-project study of peringamkulam pond revival programme ...

South African Journal of Geomatics, Vol. 1, No. 1, January 2012
Using Multi-criteria Evaluation and GIS for Flood Risk Analysis in Informal Settlements of Cape Town: The Case of Graveyard Pond
Kevin Musungu¹, Siddique Motala², Julian Smit¹
¹Geomatics Division, University of Cape Town, Cape Town, South Africa, [email protected]
²Civil Engineering and Surveying, Cape Peninsula University of Technology, Cape Town, South Africa.
Abstract Rural-urban migrations have contributed to the steady increase in the population of Cape Town.
Many of the migrants have settled in informal settlements because they cannot afford to rent or buy
decent housing. Many of these settlements are however located on marginal and often poorly
drained land. Consequently, most of these settlements are prone to flooding after prolonged
rainfall. Current flood risk management techniques implemented by the authorities of the Cape
Town City Council (CTCC) are not designed to support informal settlements. In fact, owing to a
lack of information about the levels of flood risk within the individual settlements, either the CTCC
has often been uninvolved or it has implemented inappropriate remedies within such settlements.
This study sought to investigate a methodology that the CTCC could use to improve flood risk
assessment.
Using a case study of an informal settlement in Cape Town, this study proposed a methodology
of integration of community-based information into a Geographic Information System (GIS) that
can be used by the CTCC for risk assessment. In addition, this research demonstrated the use of a
participatory multi-criteria evaluation (MCE) for risk assessment. A questionnaire was used to
collect community-based information. The shack outlines of the informal settlement were digitized
using CTCC aerial imagery. The questionnaires were captured using spreadsheets and linked to the
corresponding shacks in the GIS. Risk weights were subsequently calculated using pairwise
comparisons for each household, based on their responses to the questionnaires. The risk weights
were then mapped in the GIS to show the spatial disparities in risk.
Keywords: Informal settlements. Flood risk management. Multi-criteria Evaluation. GIS.
Participation. Risk weights.
1. Introduction
1.1 Background
In the period between 1996 and 2005, floods have had devastating effects on the continents of
Africa, Asia, and the Americas (Satterthwaite et al., 2007). It is reported that, during that period,
there were 290 flood-disasters in Africa alone, which left 8,183 people dead and 23 million people
77
South African Journal of Geomatics, Vol. 1, No. 1, January 2012
affected, and which caused economic losses of $1.9 billion (ibid). Similarly, 472 flood-disasters in
Asia over the same period killed 42,570 people and affected 1.3 billion people, and were
responsible for economic losses estimated at $129 billion (ibid.). It is also worth mentioning that
floods were the most frequent natural disaster in Africa and the most common in Asia during that
time period (ibid.). Magrin et al (2007) recounted that the incidence of disasters related to weather
have increased 2.4 times between 1970 and 2005, and more increases are expected in the future.
Studies on the changing weather patterns in South Africa predict increased intensity of high rainfall
events (Mason et al, 1999). Incidentally, Satterthwaite et al (2007) reported that climate change has
the potential to increase flooding risks in cities because of rising sea levels and storm surges, as well
as heavier and prolonged rainfall and increased river flows.
Satterthwaite et al. (2007) postulated that inadequate solid-waste management and drain
maintenance can lead to clogged drains, which in turn leads to localized flooding even with light
rainfall. However, for most urban environments, properly maintained infrastructure such as road
drains and channels are adequate to prevent flooding. Unfortunately, owing to high rural-urban
migrations, there has been a growth of informal settlements in cities across the world. The migrants
are often too poor to afford proper housing in the serviced parts of the city and therefore settle on
risk prone land (Barry & Rüther, 2005; SDI, 2009).
In a local context, according to the 2007 Cape Town City Council (CTCC) census report, there
were approximately 109,000 families living in informal settlements in Cape Town (City of Cape
Town, 2008a). A number of reports point out the extensive effect of flooding in many of these
informal settlements. For instance, the CTCC conducted a study in three informal settlements,
namely Joe Slovo, Sweet Home and Nonqubela K-Section in Khayelitsha. The study reported that
83% of the residents had been affected by flooding (City of Cape Town, 2005). Bouchard et al
(2007) reported that, during the winter month of July 2007, heavy rainfall resulted in flooding that
affected 8,000 households, comprising 38,000 residents, in the informal settlements of Khayelitsha
and Philippi. All the aforementioned studies demonstrate the significant impact of flooding on
informal settlements across Cape Town and the consequent need for an efficient flood management
policy in such areas. Meyer et al. (2009) identified the two main components of flood risk
management as flood risk assessment and flood risk mitigation. This paper will present a novel way
of carrying out risk assessment in informal settlements.
1.2 Assessing Risk A widely accepted description of risk was offered by Crichton (1999) and cited by Kelman
(2003: 7) as follows:
“Risk is the probability of a loss, and this depends on three elements, hazard, vulnerability and
exposure”. Hence, the following equation was put forward:
Risk = Hazard × Exposure × Vulnerability [1]
78
South African Journal of Geomatics, Vol. 1, No. 1, January 2012
Based on this description, Crichton (1999) postulated that if any of these three elements in risk
increases or decreases, then risk increases or decreases respectively; an opinion shared by Cardona
(2004). Cardona (2004) also suggested that hazard and vulnerability cannot exist independently of
each other. Hence any changes in hazard and/or vulnerability will influence the extent of the risk.
Furthermore, Cardona (2004) pointed out that since hazards cannot be modified; efforts aimed at
reducing risk to a hazard can only be focussed on reducing vulnerability of the exposed
communities or environments to that hazard.
From Equation 1, it may appear that reducing exposure would also reduce risk. Nevertheless, a
different argument was offered by Wilde (1994), Etkin (1999) and Kelman (2001), as cited in
Kelman (2003). They subscribed to the theory of risk homeostasis, which basically states that
individuals, communities and societies maintain a constant level of risk, irrespective of external
influences (Kelman, 2003). For instance, reducing exposure to a hazard will cause behaviour that
inadvertently reduces preparedness in relation to the hazard and consequently increases
vulnerability. They subsequently contended that external measures do little to influence overall risk
in the long term. Instead, Kelman (2003) agreed with Lewis (1999) that, since vulnerability assesses
the processes at work between hazard and risk, and since it is applicable to any hazard, targeting
vulnerability will reduce overall risk to an acceptable level.
Drawing from the arguments of Wilde (1994), Etkin (1999), Kelman (2001), Cardona (2004),
Crichton (1999) and UN DHA (1992), vulnerability has a strong bearing on the magnitude of risk.
Consequently, studies into the level of vulnerability of an environment or community to a particular
hazard will invariably provide insight into the magnitude of risk of the environment or the
community to that hazard. This research therefore adopted vulnerability as an indicator of risk.
Kumpulainen (2006) stated that vulnerability could be viewed as a state of conditions and
processes resulting from physical, social, economic and environmental factors that increase the
liability of a community with regard to the impact of hazards. Consequently, Kumpulainen (2006)
adopted the following notation for vulnerability:
Regional Vulnerability = Damage potential + Coping capacity [2]
Turner et al (2003) stated that holistic studies on vulnerability which are meant to have an input
in decision making should include among others:
A study of all the hazards affecting the system (community or environment); How the system gets exposed to the hazard; and The coping capacity of the system.
This study was therefore focused on assessing these prescribed indicators in an informal
settlement in Cape Town. Variations in these indicators will invariably result in variations in
vulnerability. For instance, if a household in an informal settlement was exposed to more hazards
than another, it would have a higher level of vulnerability than the other. Similarly, variations in the
79
South African Journal of Geomatics, Vol. 1, No. 1, January 2012
forms of exposure of the households to the same hazard will cause variations in levels of
vulnerability. Hence, an assessment of relative vulnerability of a household of interest to another
household requires the consideration and comparison of the criteria prescribed by Turner et al
(2003) in those particular households.
1.3 Multi-criteria Evaluation
Multi Criteria Evaluation (MCE) is used to analyse a series of alternatives or objectives with a
view to ranking them from the most preferable to the least preferable using a structured approach.
The end result of MCE is often a set of weights linked to the various alternatives. The weights
indicate the preference of the alternatives relative to each other. They may also be seen as the
perceived advantage or disadvantage when changing from one alternative to another. The choice of
methodologies for the calculation of these weights varies from text to text. Several authors (Stewart
& Scott, 1995; Joubert et al 1997; Jankowski et al 2001; Ayalew & Yamagishi, 2005; Yahaya &
Abdalla, 2010; Kourgialas & Karatzas, 2011) have used the methods highlighted by Malczewski
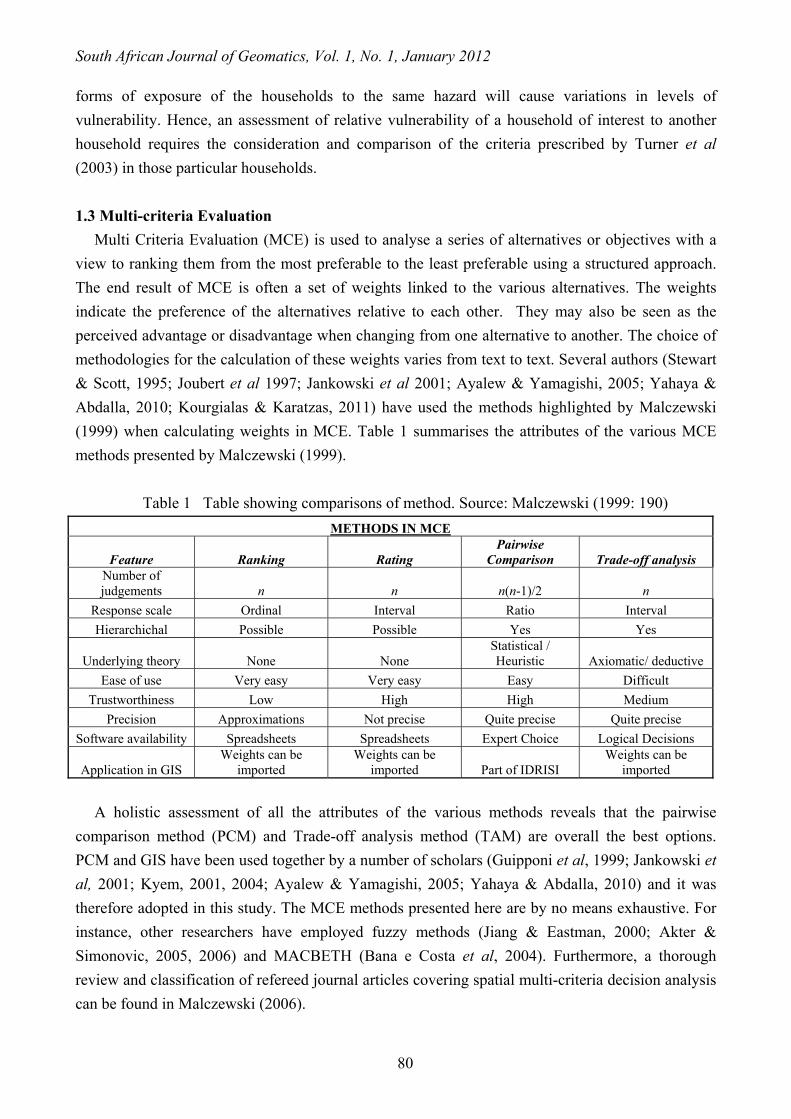
(1999) when calculating weights in MCE. Table 1 summarises the attributes of the various MCE
methods presented by Malczewski (1999).
Table 1 Table showing comparisons of method. Source: Malczewski (1999: 190)
METHODS IN MCE
Feature Ranking Rating Pairwise
Comparison Trade-off analysis Number of judgements n n n(n-1)/2 n
Response scale Ordinal Interval Ratio Interval
Hierarchichal Possible Possible Yes Yes
Underlying theory None None Statistical / Heuristic Axiomatic/ deductive
Ease of use Very easy Very easy Easy Difficult
Trustworthiness Low High High Medium
Precision Approximations Not precise Quite precise Quite precise
Software availability Spreadsheets Spreadsheets Expert Choice Logical Decisions
Application in GIS Weights can be
imported Weights can be
imported Part of IDRISI Weights can be
imported
A holistic assessment of all the attributes of the various methods reveals that the pairwise
comparison method (PCM) and Trade-off analysis method (TAM) are overall the best options.
PCM and GIS have been used together by a number of scholars (Guipponi et al, 1999; Jankowski et
al, 2001; Kyem, 2001, 2004; Ayalew & Yamagishi, 2005; Yahaya & Abdalla, 2010) and it was
therefore adopted in this study. The MCE methods presented here are by no means exhaustive. For
instance, other researchers have employed fuzzy methods (Jiang & Eastman, 2000; Akter &
Simonovic, 2005, 2006) and MACBETH (Bana e Costa et al, 2004). Furthermore, a thorough
review and classification of refereed journal articles covering spatial multi-criteria decision analysis
can be found in Malczewski (2006).
80
South African Journal of Geomatics, Vol. 1, No. 1, January 2012
A flood vulnerability study was conducted by Yalcin & Akyurek (2004) in Turkey. The study
involved the vulnerability assessment of an area located between the Filyos and Bartin river basins
in Northern Turkey. The research focussed on biophysical vulnerability and considered the
contribution of annual rainfall, the size of the watershed, the basin slope, the gradient of the primary
drainage channel, the drainage density, the land use and the soil types with regard to vulnerability in
the river basins. The corresponding weights derived from PCM were found to be 0.26, 0.21, 0.17,
0.16, 0.10, 0.06 and 0.04 respectively. The consistency ratio was found to be 0.042, which showed
an acceptable level of consistency in ranking the alternatives. Thereafter, vulnerability maps were
created, and the authors were able to locate the most vulnerable areas located between the two
rivers.
Yahaya & Abdalla (2010) conducted a similar study into flood vulnerability in the Hadejia-
Jama’are River Basin in Nigeria. Their research also focused on biophysical vulnerability, and the
researchers analysed the contribution of annual rainfall, the basin’s slope, drainage network, land
cover and the type of soil to vulnerability in Hadejia-Jama’are. A combination of PCM and ranking
methods were used to calculate the weights of these attributes. Each attribute was compared to the
others, and the PCM matrices were calculated using the MATLAB software package. After the
PCM calculations had been done, the normalized weights were found to be 0.339, 0.255, 0.197,
0.152, and 0.057, for annual rainfall, the drainage network in the river basin, the basin slope, the
soil type and land cover respectively. Consequently, the highest contributors to risk vulnerability in
the region were found to be annual rainfall, the drainage network in the river basin and the basin
slope. A check on the consistency yielded a consistency ratio of 0.0506. Since it was significantly
less than 0.1, the authors found the analysis to be reasonably consistent. Yahaya & Abdalla (2010)
replicated the methodology used by Yalcin & Akyurek (2004) to link the weights into the raster
based GIS data and create vulnerability maps.
The studies reported here show that PCM can be used in conjunction with GIS for risk
assessment and mapping. A critique of these studies though, is that the communities around the
river basins were never involved in the analysis; hence, the existing risk mitigation efforts were not
taken into context when assessing vulnerability. In contrast, this study therefore adopted a
participatory approach to MCE. The resulting weights were imported into a GIS environment and
mapped to identify disparities in vulnerability.
1.4 Study Area
Graveyard Pond is an informal settlement located in Philippi, a suburb of Cape Town. It lies
southwest of the intersection of Sheffield Road and New Eisleben Road. This settlement is
particularly prone to flooding because it is located in an area designated as a catchment pond by the
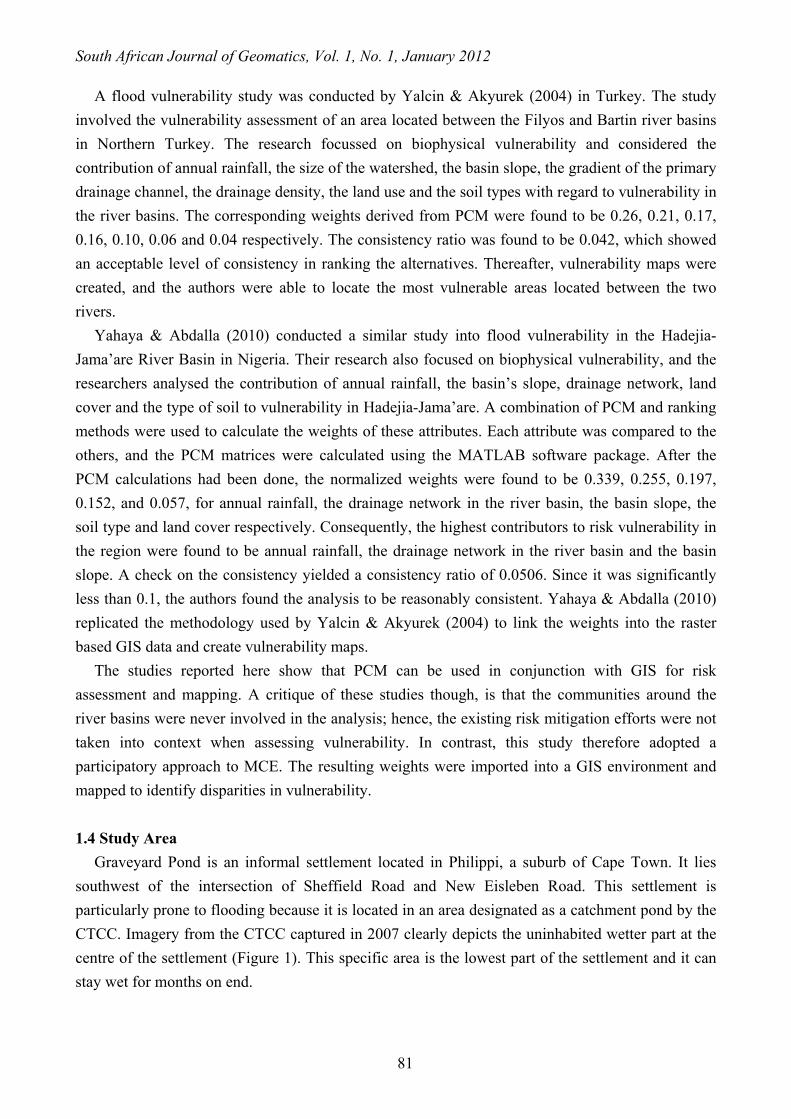
CTCC. Imagery from the CTCC captured in 2007 clearly depicts the uninhabited wetter part at the
centre of the settlement (Figure 1). This specific area is the lowest part of the settlement and it can
stay wet for months on end.
81
South African Journal of Geomatics, Vol. 1, No. 1, January 2012
Figure 1. Graveyard Pond, September 2007 (Source: City of Cape Town, 2008)
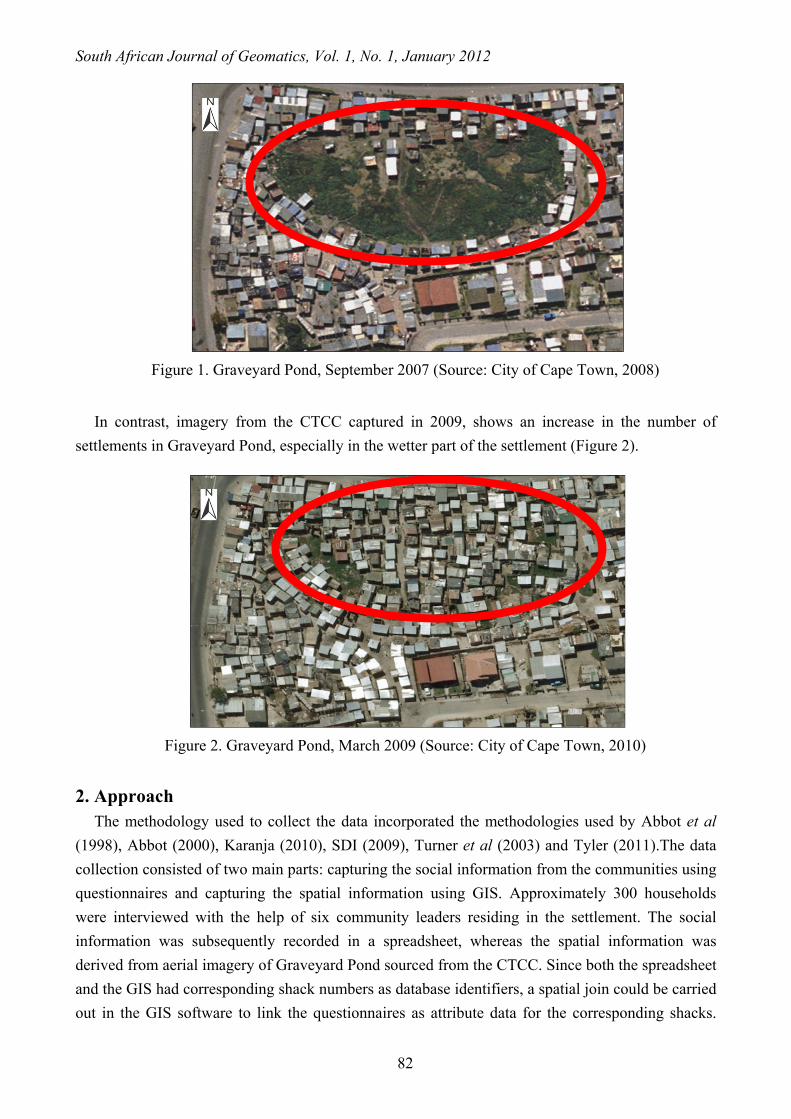
In contrast, imagery from the CTCC captured in 2009, shows an increase in the number of
settlements in Graveyard Pond, especially in the wetter part of the settlement (Figure 2).
Figure 2. Graveyard Pond, March 2009 (Source: City of Cape Town, 2010)
2. Approach The methodology used to collect the data incorporated the methodologies used by Abbot et al
(1998), Abbot (2000), Karanja (2010), SDI (2009), Turner et al (2003) and Tyler (2011).The data
collection consisted of two main parts: capturing the social information from the communities using
questionnaires and capturing the spatial information using GIS. Approximately 300 households
were interviewed with the help of six community leaders residing in the settlement. The social
information was subsequently recorded in a spreadsheet, whereas the spatial information was
derived from aerial imagery of Graveyard Pond sourced from the CTCC. Since both the spreadsheet
and the GIS had corresponding shack numbers as database identifiers, a spatial join could be carried
out in the GIS software to link the questionnaires as attribute data for the corresponding shacks.
82
South African Journal of Geomatics, Vol. 1, No. 1, January 2012
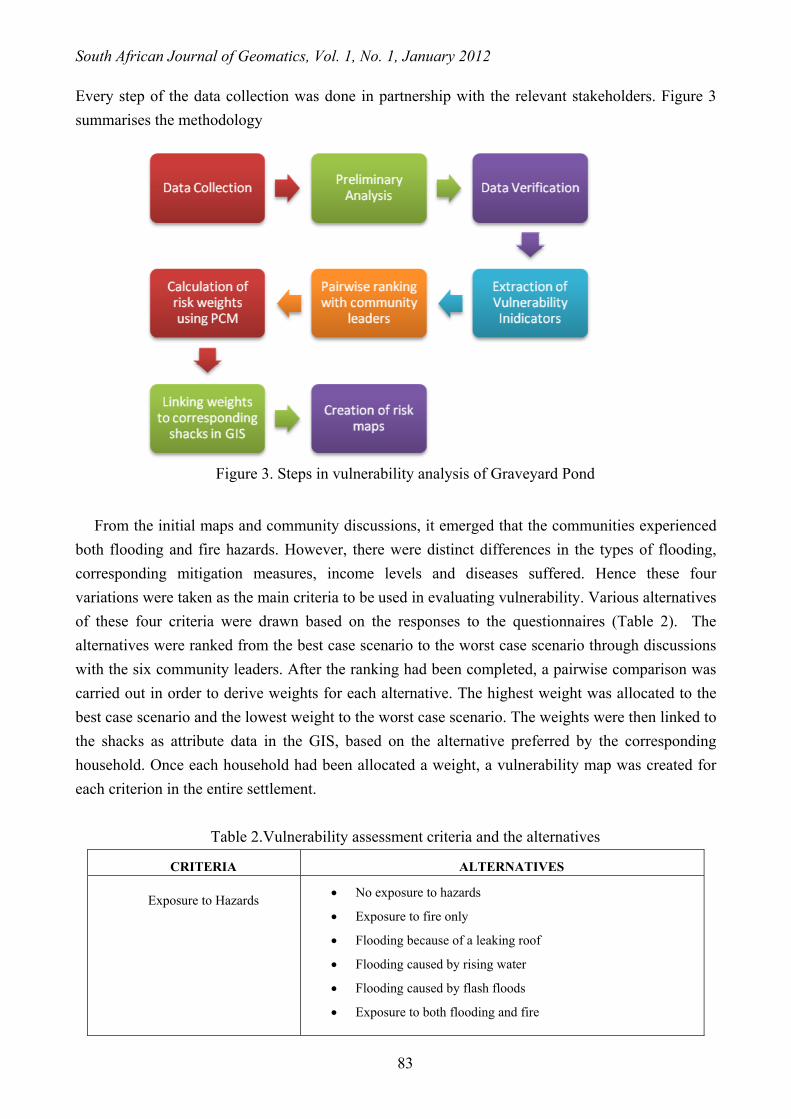
Every step of the data collection was done in partnership with the relevant stakeholders. Figure 3
summarises the methodology
Figure 3. Steps in vulnerability analysis of Graveyard Pond
From the initial maps and community discussions, it emerged that the communities experienced
both flooding and fire hazards. However, there were distinct differences in the types of flooding,
corresponding mitigation measures, income levels and diseases suffered. Hence these four
variations were taken as the main criteria to be used in evaluating vulnerability. Various alternatives
of these four criteria were drawn based on the responses to the questionnaires (Table 2). The
alternatives were ranked from the best case scenario to the worst case scenario through discussions
with the six community leaders. After the ranking had been completed, a pairwise comparison was
carried out in order to derive weights for each alternative. The highest weight was allocated to the
best case scenario and the lowest weight to the worst case scenario. The weights were then linked to
the shacks as attribute data in the GIS, based on the alternative preferred by the corresponding
household. Once each household had been allocated a weight, a vulnerability map was created for
each criterion in the entire settlement.
Table 2.Vulnerability assessment criteria and the alternatives
CRITERIA ALTERNATIVES
Exposure to Hazards No exposure to hazards
Exposure to fire only
Flooding because of a leaking roof
Flooding caused by rising water
Flooding caused by flash floods
Exposure to both flooding and fire
83
South African Journal of Geomatics, Vol. 1, No. 1, January 2012
Methods of Mitigation Digging of trenches
Raising of shacks
Use of sandbags
Relocation
Use of concrete floors
Sanitation and Disease No incidence of diseases
Running tummy
Respiratory diseases
Rashes
Running tummy and respiratory diseases
Rashes and respiratory diseases; and
All diseases (respiratory diseases, rashes and running tummy)
Income Full-time or self-employment
Full-time or self-employment and welfare grants
Part-time employment and welfare grants
Part-time employment
Only welfare grants
No income at all
3. Results
3.1 Exposure to Hazards
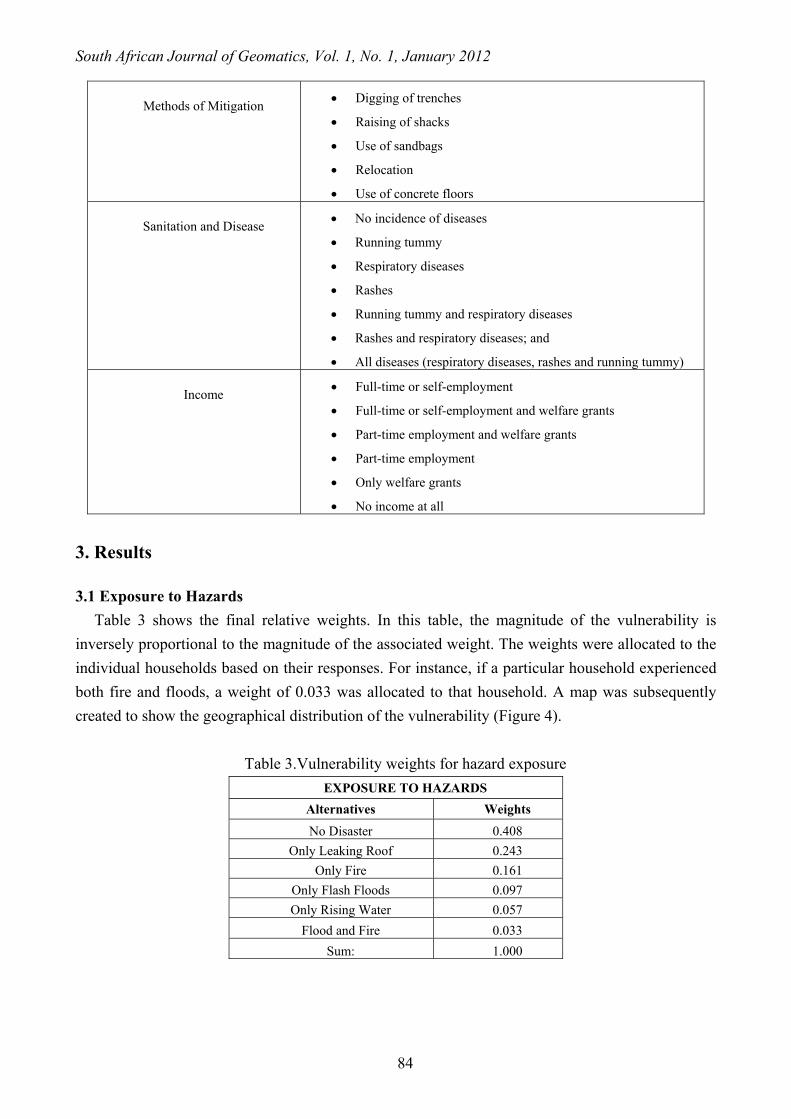
Table 3 shows the final relative weights. In this table, the magnitude of the vulnerability is
inversely proportional to the magnitude of the associated weight. The weights were allocated to the
individual households based on their responses. For instance, if a particular household experienced
both fire and floods, a weight of 0.033 was allocated to that household. A map was subsequently
created to show the geographical distribution of the vulnerability (Figure 4).
Table 3.Vulnerability weights for hazard exposure
EXPOSURE TO HAZARDS
Alternatives Weights
No Disaster 0.408
Only Leaking Roof 0.243
Only Fire 0.161
Only Flash Floods 0.097
Only Rising Water 0.057
Flood and Fire 0.033
Sum: 1.000
84
South African Journal of Geomatics, Vol. 1, No. 1, January 2012
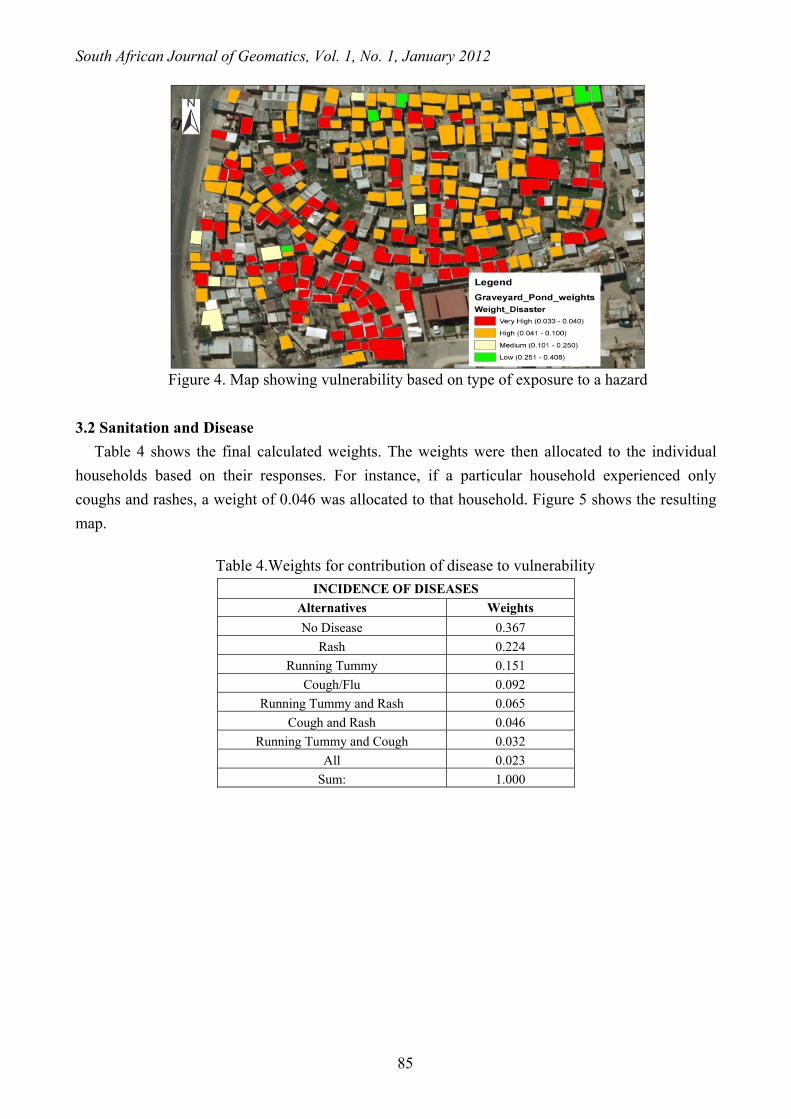
Figure 4. Map showing vulnerability based on type of exposure to a hazard
3.2 Sanitation and Disease
Table 4 shows the final calculated weights. The weights were then allocated to the individual
households based on their responses. For instance, if a particular household experienced only
coughs and rashes, a weight of 0.046 was allocated to that household. Figure 5 shows the resulting
map.
Table 4.Weights for contribution of disease to vulnerability
INCIDENCE OF DISEASES
Alternatives Weights
No Disease 0.367
Rash 0.224
Running Tummy 0.151
Cough/Flu 0.092
Running Tummy and Rash 0.065
Cough and Rash 0.046
Running Tummy and Cough 0.032
All 0.023
Sum: 1.000
85
South African Journal of Geomatics, Vol. 1, No. 1, January 2012
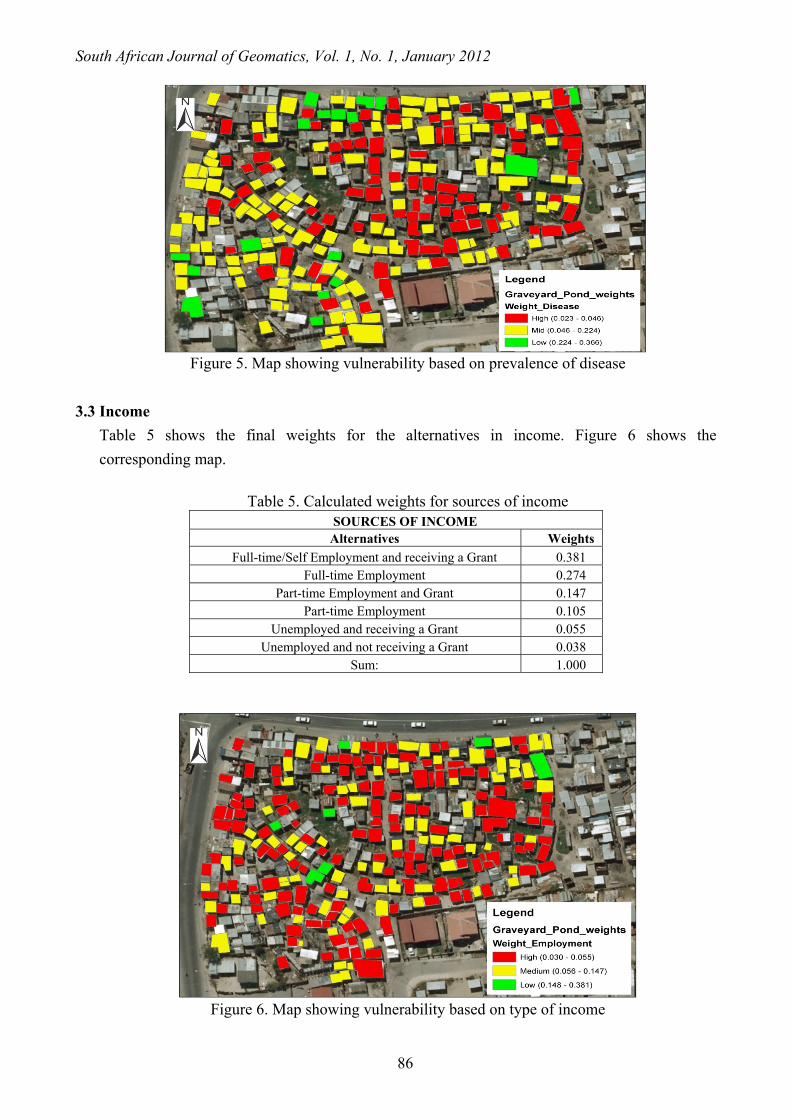
Figure 5. Map showing vulnerability based on prevalence of disease
3.3 Income
Table 5 shows the final weights for the alternatives in income. Figure 6 shows the
corresponding map.
Table 5. Calculated weights for sources of income
SOURCES OF INCOME Alternatives Weights
Full-time/Self Employment and receiving a Grant 0.381 Full-time Employment 0.274
Part-time Employment and Grant 0.147 Part-time Employment 0.105
Unemployed and receiving a Grant 0.055 Unemployed and not receiving a Grant 0.038
Sum: 1.000
Figure 6. Map showing vulnerability based on type of income
86

South African Journal of Geomatics, Vol. 1, No. 1, January 2012
3.4 Methods of Mitigation
Table 6 shows the results of the PCM analysis based on discussions with the community leaders.
The mitigation techniques were sequentially ranked based on their efficiency in mitigating the
various forms of exposure to flooding. Figure 7 shows the resulting map.
Table 6.Vulnerability weights for methods of mitigation METHODS OF MITIGATION
Alternatives Weights Flash Floods & Dig trenches 0.085
Flash Floods &Raise shacks 0.085
Flash Floods & Sand bags 0.064
Flash Floods &Relocation 0.056
Flash Floods &Concrete floors 0.050
Leaking Roof &Relocation 0.081
Leaking Roof & Sand bags 0.074
Leaking Roof & Raise shacks 0.060
Leaking Roof & Concrete floors 0.060
Leaking Roof & Dig trenches 0.051
Rising Water & Raise shacks 0.069
Rising Water & Concrete floors 0.069
Rising Water & Sand bags 0.060
Rising Water & Relocation 0.087
Rising Water & Dig trenches 0.050
Sum: 1.000
Figure 7. Map showing vulnerability based on methods of mitigation
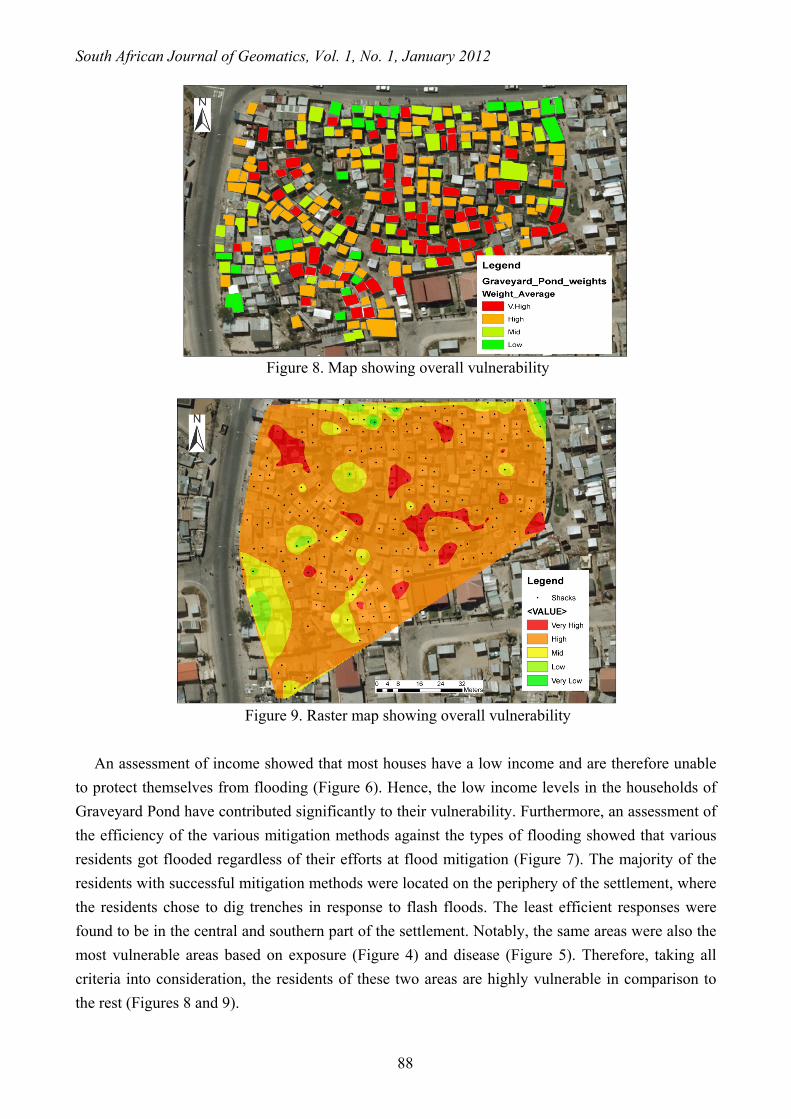
3.5 Overall Vulnerability
An average weight was calculated for each household to create a holistic value for vulnerability.
Figure 8 shows the resulting map. A raster map was also created by interpolating the weights
(Figure 9).
87
South African Journal of Geomatics, Vol. 1, No. 1, January 2012
Figure 8. Map showing overall vulnerability
Figure 9. Raster map showing overall vulnerability
An assessment of income showed that most houses have a low income and are therefore unable
to protect themselves from flooding (Figure 6). Hence, the low income levels in the households of
Graveyard Pond have contributed significantly to their vulnerability. Furthermore, an assessment of
the efficiency of the various mitigation methods against the types of flooding showed that various
residents got flooded regardless of their efforts at flood mitigation (Figure 7). The majority of the
residents with successful mitigation methods were located on the periphery of the settlement, where
the residents chose to dig trenches in response to flash floods. The least efficient responses were
found to be in the central and southern part of the settlement. Notably, the same areas were also the
most vulnerable areas based on exposure (Figure 4) and disease (Figure 5). Therefore, taking all
criteria into consideration, the residents of these two areas are highly vulnerable in comparison to
the rest (Figures 8 and 9).
88
South African Journal of Geomatics, Vol. 1, No. 1, January 2012
4. Conclusions Multi-criteria Evaluation (MCE) has been at the root of various statistical studies. The MCE
methods include, among others, ranking, rating, PCM and TAM (Malczewski, 1999); fuzzy
methods (Jiang & Eastman, 2000; Akter & Simonovic, 2005, 2006); and MACBETH (Bana e Costa
et al, 2004). This study employed PCM because of its simplicity. At any given stage of the MCE,
the community leader had to assess between only two alternatives. This made the ranking
significantly simpler than assessing all the alternatives at once. By assessing the relative importance
of all the alternatives in relation to a particular alternative, the various alternatives were implicitly
ranked against each other. Based on the results of this study, a participatory approach to risk
assessment in informal settlements is plausible. The participation of the community is essential in
estimating risk and identifying dynamics that may be amplifying risk. Pinpointing such dynamics
can help identify potential solutions.
The various maps showed that vulnerability and implicitly, risk was not homogeneous across
Graveyard Pond. It was found that the central and southern sections of the settlement were most
vulnerable based on exposure to both fires and flooding. Furthermore, the majority of the people in
the central and southern regions of the settlement were unemployed and dependent on welfare
grants. Lastly, waterborne and respiratory diseases were most prevalent in the central regions.
5. References Abbot, J, Chambers, R, Dunn, C, Harris, T, de Merode, E, Porter, G, Townsend, J, & Weiner, D 1998,
‘Participatory GIS: Opportunity or Oxymoron’, PLA Notes, Vol. 33, pp. 27–34.
Abbot, JR 2000, ‘An Integrated spatial information framework for informal settlement upgrading’,
International Archives of Photogrammetry and Remote Sensing, Vol. 33, Part B2, pp. 7–16.
Akter, T. & Simonovic, SP2005, ‘Aggregation of fuzzy views of a large number of stakeholders for multi-
objective flood management decision-making’, Journal of Environmental Management, Vol. 77, No. 2,
pp. 133–143.
Ayalew, L. & Yamagishi, H 2005, ‘The application of GIS-based logistic regression for landslide
susceptibility mapping in the Kakuda–Yahiko Mountains, Central Japan’, Geomorphology, Vol. 65, No.
2, pp. 15–31.
Bana e Costa, CA, Antão da Silva, P, &NunesCorreia, F 2004, ‘Multi-criteria evaluation of flood control
measures: The case of Ribeira do Livramento’, Water Resources Management, Vol. 18, No. 3, pp. 263–
283.
Barry, M. & Rüther, H 2005, ‘Data Collection Techniques for Informal Settlement Upgrades in Cape Town,
South Africa’, URISA Journal, Vol. 17, No. 1, pp. 43–52.
Bouchard, B, Goncalo, A, Susienka, M& Wilson, K 2007, ‘Improving flood risk management in informal
settlements of Cape Town’ E-project-121307-110919. Available at: http://www.wpi.edu/Pubs/E-
project/Available/E-project-121307110919/unrestricted/FinalReport.pdf. Accessed on 14 January 2011.
Cardona, OD 2004, ‘The Need for Rethinking the Concepts of Vulnerability and Risk from a Holistic
Perspective: A Necessary Review and Criticism for Effective Risk Management’, in G Bankoff, G Frerks
and DHilhorst (eds.), Mapping Vulnerability: Disasters, Development and People, Earthscan,London
89
South African Journal of Geomatics, Vol. 1, No. 1, January 2012
City of Cape Town 2005, Study on the social profile of residents of three informal settlements in Cape Town.
Cape Town: City of Cape Town. Viewed 14 January 2011,
http://www.capetown.gov.za/en/stats/CityReports/Documents/Informal%20Settlements/Informal_Settlement
s_Executive_Summary_272200611403_359.pdf.
City of Cape Town 2008,State of Cape Town (CCSCT) – Development Issues in Cape Town. Cape Town:
City of Cape Town. Viewed on 14 January 2011.
http://www.capetown.gov.za/en/stats/CityReports/Pages/IDP.aspx.
Crichton, D 1999, ‘The Risk Triangle’, in JIngleton (ed.), Natural Disaster Management, Tudor Rose,
London.
Etkin, D 1999, ‘Risk Transference and related trends: Driving forces towards more mega-disasters’,
Environmental hazards, Vol.1, pp. 69-75.
Giupponi, C, Eiselt, B and Ghetti, PF 1999, ‘A multi-criteria approach for mapping risks of agricultural
pollution for water resources: The Venice Lagoon watershed case study’, Journal of Environmental
Management, Vol. 56, No. 4, pp. 259–269.
Jankowski, P, Andrienko, N &Andrienko, G 2001, ‘Map-centred exploratory approach to multiple criteria
spatial decision making’, International Journal of Geographical Information Science, Vol. 15, pp. 101–
127.
Jiang, H & Eastman, JR 2000, ‘Application of fuzzy measures in multi-criteria evaluation in GIS’,
International Journal of Geographical Information Systems, Vol. 14, No. 2, pp. 173– 184.
Joubert, AR, Leiman, A, de Klerk, HM, Katu, S, Aggenbach, JC 1997, ‘Fynbos (fine bush) vegetation and
the supply of water: a comparison of multi-criteria decision analysis’, Ecological Economics , Vol. 22,
No. 2, pp. 123–140.
Karanja, I 2010, ‘An enumeration and mapping of informal settlements in Kisumu, Kenya, implemented by
their inhabitants’, Environment and Urbanization, Vol. 22, No. 1, pp. 217–239.
Kelman, I. 2001, ‘The autumn 2000 floods in England and flood management’, Weather, Vol. 56, No. 10, pp
353-360.
Kelman, I 2003,‘Defining Risk’, Flood Risk Newsletter, Issue 2, Winter 2003.
Kourgialas, NN & Karatzas, GP 2011, ‘Flood management and a GIS modelling method to assess flood-
hazard areas: A case study’, Hydrological Sciences Journal, Vol. 56, No. 2, pp. 212–225.
Kumpulainen, S 2006, ‘Vulnerability concepts in hazard and risk assessment. Natural and technological
hazards and risks affecting the spatial development of European regions’, Geological Survey of Finland,
Special Paper 42, pp. 65–74.
Kyem, PAK 2001. ‘An application of a choice heuristic algorithm for managing land resource allocation
problems involving multiple parties and conflicting interests.’, Transactions in GIS, Vol. 5, No. 2, pp.
111–129.
Kyem, PAK 2004, ‘Of intractable conflicts and participatory GIS applications: The search for consensus
amidst competing claims and institutional demands’, Annals of the Association of American Geographers,
Vol. 94, No. 1, pp. 37–57.
Lewis, J 1999, Development in Disaster-prone Places: Studies of Vulnerability, Intermediate Technology
Publications, London.
90
South African Journal of Geomatics, Vol. 1, No. 1, January 2012
91
Malczewski, J 1999, GIS and Multi-criteria Decision Analysis, John Wiley and Sons, New York
Mason, SJ, Waylen, PR, Mimmack, GM, Rajaratnam, B & Harrison, JM 1999, ‘Changes in extreme rainfall
events in South Africa’, Climate Change, Vol. 41, No. 2, pp. 249–257.
Meyer, V, Scheuer, S & Haase, D 2009, ‘A multi-criteria approach for flood risk mapping exemplified at the
Mulde river, Germany’, Natural Hazards, Vol. 48, No.1, pp. 17–39.
Saaty, TL 1980, The analytic hierarchy process, Mcgraw-Hill, New York.
Satterthwaite, D, Huq, S, Pelling, M, Reid, H & Lankao, P 2007, ‘Adapting to Climate Change in Urban
Areas’, International Institute for Environment and Development, London.Viewed on 12 December 2010.
Available at: http://pubs.iied.org/pdfs/10549IIED.pdf.
Slum Dwellers International (SDI) 2009, Joe Slovo Household enumeration report, Langa, Cape Town,
Viewed on 20 December 2010.http://www.sdinet.org/static/upload/documents/JSEnumeration.pdf.
Stewart, TJ & Scott, L 1995, ‘A Scenario-Based Framework for Multicriteria Decision Analysis in Water
Resources Planning’, Water Resources Research, Vol.31, No. 11, pp.2835–2843.
Turner II, BL, Kasperson, RE, Matson, PE, McCarthy, JJ, Corell, RW, Christensen, L, Eckley, N,
Kasperson, JX, Luerse,A, Martellog, ML, Polsky, C, Pulsipher, A, and Schiller, A 2003, ‘A framework
for vulnerability analysis in sustainability science’, Proceedings of the National Academy of Sciences of
the United States of America, Vol. 100, pp. 8074–8079.
Tyler, R 2011, Incorporating Local participation and GIS in Assessing Flood Vulnerability in Informal
Settlement: Masiphumulele Case Study, Unpublished MPhil dissertation, University of Cape Town, Cape
Town.
UN DHA 1992, Internationally Agreed Glossary of Basic Terms Related to Disaster Management, UN DHA
(United Nations Department of Humanitarian Affairs), Geneva, December 1992.
Yahaya, S, Ahmad, N. & Abdalla, RF 2010, ‘Multi-criteria analysis for flood vulnerable areas in Hadejia-
Jama’are River basin, Nigeria’, European Journal of Scientific Research,Vol.42, No. 1, pp. 71–83.
Yalcin, G & Akyurek, Z 2004, ‘Analysing Flood Vulnerable Areas with Multi-criteria Evaluation’,
20th ISPRS Congress, Istanbul, Turkey, 12–23 July.
Wilde, GJS 1994, Target Risk, PDE Publications, Toronto
Copyright © 2022 FDOKUMEN