Percid Pond Production Techniques
12
. I I ·" ..Ii& Percid Pond Production Techniques: Timing, Enrichment, and Stocking Manipulation David A. Culver Sharook P. Madon Jianguang Qin ABSTRACT. Tremendous variation in survival and growth of per- cid fry stocked in ponds was addressed through manipulation of amounts and kinds of fertilizers added and stocking densities of fish. Ponds were filled with water from nearby eutrophic lakes less than one week prior to stocking. Survival in these ponds averaged 64%, whereas ponds filled one month before stocking averaged only 14%. Optimal inorganic Jertilization was identified as_ 3 weekly restoration to 600 μg NIL (NH4 + NO"j) and 30 μg P/L as P04. Organic fertiliza- tion gave variable results and water qualities. In one experiment, low organic fertilization alone (28 kg alfalfa meal/ha/week) pro- vided survival and growth comparable to optimal fertilization with inorganic nutrients. Although similar in results, inorganic fertiliza- tion was more cost effective than the alfalfa meal. Low fish predation from low stocking or survival allowed Daphnia to overgraze algae. This resulted in a crash in both algae and zooplankton in the ponds. Doubling the initial stocking density increased harvests from 150,000 to 300,000 fish/ha and increased yield from 45 to 100 kg/ha. David A. Culver, Sharook P. Madon, and Jianguang Qin, Department of Zool- ogy and Ohio Cooperative Fisheries and Wildlife Research Unit, The Ohio State University, 1735 Neil Avenue, Columbus, OH 43210, USA. [Haworth co-indexing entry note]: "Percid Pond Production Techniques: Timing, Enrichment, and Stocking Density Manipulation." Culver, David A., Sharook P. Madon, and Jianguang Qin. Co-pub- lished simultaneously in the Journal of Applied Aquaculture, (The Haworth Press, Inc.) Vol. 2, No. 3/4, 1993, pp. 9-31; and: Strategies and Tactics for Management of Fertilized Hatchery Ponds (ed: Richard 0. Anderson, and Douglas Tave) The Haworth Press, Inc., 1993, pp. 9-31. Multiple copies of this article/chapter may be purchased from The Haworth Document Delivery Center [1-800-3-HAWORTH; 9:00 a.rtJ. - 5:00 p.m. (EST)]. © 1993 by The Haworth Press, Inc. All rights reserved. 9
Transcript of Percid Pond Production Techniques
. I
I ·"
..Ii&
Percid Pond Production Techniques: Timing, Enrichment,
and Stocking Dens~ty Manipulation
David A. Culver Sharook P. Madon
Jianguang Qin
ABSTRACT. Tremendous variation in survival and growth of percid fry stocked in ponds was addressed through manipulation of amounts and kinds of fertilizers added and stocking densities of fish. Ponds were filled with water from nearby eutrophic lakes less than one week prior to stocking. Survival in these ponds averaged 64%, whereas ponds filled one month before stocking averaged only 14%. Optimal inorganic Jertilization was identified as_3weekly restoration to 600 µg NIL (NH4 + NO"j) and 30 µg P/L as P04. Organic fertilization gave variable results and water qualities. In one experiment, low organic fertilization alone (28 kg alfalfa meal/ha/week) provided survival and growth comparable to optimal fertilization with inorganic nutrients. Although similar in results, inorganic fertilization was more cost effective than the alfalfa meal. Low fish predation from low stocking or survival allowed Daphnia to overgraze algae. This resulted in a crash in both algae and zooplankton in the ponds. Doubling the initial stocking density increased harvests from 150,000 to 300,000 fish/ha and increased yield from 45 to 100 kg/ha.
David A. Culver, Sharook P. Madon, and Jianguang Qin, Department of Zoology and Ohio Cooperative Fisheries and Wildlife Research Unit, The Ohio State University, 1735 Neil Avenue, Columbus, OH 43210, USA.
[Haworth co-indexing entry note]: "Percid Pond Production Techniques: Timing, Enrichment, and Stocking Density Manipulation." Culver, David A., Sharook P. Madon, and Jianguang Qin. Co-published simultaneously in the Journal of Applied Aquaculture, (The Haworth Press, Inc.) Vol. 2, No. 3/4, 1993, pp. 9-31; and: Strategies and Tactics for Management of Fertilized Hatchery Ponds (ed: Richard 0. Anderson, and Douglas Tave) The Haworth Press, Inc., 1993, pp. 9-31. Multiple copies of this article/chapter may be purchased from The Haworth Document Delivery Center [1-800-3-HAWORTH; 9:00 a.rtJ. - 5:00 p.m. (EST)].
© 1993 by The Haworth Press, Inc. All rights reserved. 9
JO Strategies a11d Tactics for Ma11ageme11t of Fertilized Hatchery Po11ds
No cannibalism was observed at any density. Overall, implementation of this plan from 1987 to 1991 increased percid yield (nwnber/ ha) four-fold, while increasing average survival by as much as tenfold, to 60%. Late pond filling and optimization of inorganic fertility levels and stocking densities greatly improved reliability and the economic and ecological efficiency of fish production.
INTRODUCTION
Due to inadequate natural reproduction of fish in suboptimal habitats, many important fisheries are maintained in inland waters through active stocking programs involving the release of millions of fry or fingerlings (Bardach 1976; Lasker 1987). Because the release of larger fish improves survival, culturing fry to the fingerling stage in ponds is a common practice (Bardach 1978; Laarman 1978). Larval fish require live zooplankton of appropriate abundance and size ranges in a habitat with high water quality in order to survive and grow to stockable size (Rosenthal and Hempel 1970; Wong and Ward 1972; Hunter 1981; Raisanen and Applegate 1983; Dabrowski and Bardega 1984; Mills et al. 1989). Maintaining adequate zooplankton abundance while providing high water quality has proved difficult Success in culturing walleye, Stizostedion vitreum, saugeye, walleye ~ X S. canadense o, and hybrid striped bass, Morone chrysops ~ X M. saxatilis o, for stocking in lakes and reservoirs has been shown to be strongly affected by variation in survival in the ponds and in the growth and condition achieved during the culture period (Lynch et al. 1982; Geiger 1983; Geiger et al. 1985; Fox 1989, Fox et al. 1989; Fox and Flowers 1990; Malison ct al. 1990; Siegworth and Summerfelt 1990).
Variability in yields makes it difficult to predict how many fingcrlings will be available for stocking from year to year. This makes it difficult to comply with management plans and programs. Acreage of ponds, numbers of personnel, fry production facilities, and expenses for fertilizers and other supplies required are all increased by this uncertainty. .
Zooplankton availability and water quality are closely related to: the interactions among nutrient concentrations, phytoplankton abundance and species composition, and zooplankton grazing, repro-
Culver et al. II
duction, and survival. A pond management regimen that maintains adequate zooplankton for one fish species, therefore, has a high likelihood of working well for others, provided variations in hatchery location and water supply can be taken into account. Review of common hatchery practices showed that most hatcheries added far more fertilizer, particularly phosphate (Culver 1991), than would be suggested from studies of lake eutrophication (Barica et al. 1980). Experiments at Hebron Hatchery showed that algal composition could be manipulated by altering the inorganic N:P ratios in the ponds (Helal 1990) just as had been previously found for lakes (Tilman et al. 1986). Low N:P ratios and infrequent additions of large amounts of fertilizer rather than frequent additions of small amounts favor blue-green algae and filamentous green algae that create inefficiency in food chains and interfere with fish survival, growth, and harvest from ponds. The extent to which variation in fish survival in ponds is influenced by toxic blue-green algae needs further work, but Oscillatoria has been shown to have a negative effect on Daphnia (Infante and Abella 1985). Recent progress in research on toxic algae such as Oscillatoria agardhii (Lindholm et al. 1989; Meriluoto 1989) and Microcystis aernginosa (Eriksson et al. 1988) has identified peptide toxins whose effects on fish are still unknown. High phosphate levels favor large colonial and filamentous algae because of their phosphorus-storage ability (Darley 1982). Hydrodictyon, Rhizoclonium, and Spirogyra can be particularly troublesome to hatchery managers.
A fertilization and stocking regimen was developed based on: (1) filling ponds immediately before stocking; (2) spraying dilute solutions of liquid inorganic fertilizer; (3) adding no organic fertilizers; ( 4) fertilizing weekly based on weekly inorganic nitrogen and phosphorus analyses in each pond so that its phosphate concentration was raised to 30 µg P04-P/L and Ammonia-N + Nitrate-N concentrations were raised to 600 µg NIL; and (5) stocking sufficient fry to harvest 300,000 fish/ha. For these conditions and species, this meant stocking 450,000 fry/ha.
If a fingerling production strategy such as this is to be useful, it must be equally effective under a variety of types of water supply, pond size and shape and for more than one species of fish. In this research project, therefore, production results for walleye and saug-

12 Strategies a11d Tactics for Ma11ageme11t of Fertilized Hatchery Po11ds
eye were compared and contrasted for three fish hatcheries differing with respect to water supply and pond size and depth, using the new management regimen as compared to previous management regimens used at the same locations.
MATERIALS AND METHODS
Approach
Percid production records for 80 ponds from three hatcheries over 5 years (1986-1990) were made available by the Ohio Department of Natural Resources and were used to determine variation in survival and production (kg/ha) and to compare growth (individual weight at harvest) of walleye vs. saugeye under similar production methods (1991). The number of ponds used for raising walleye and saugeye varied among hatcheries and years, due to changing needs for a given taxon. Fertilization and stocking densities were not sufficiently constant to test yearly differences for significance. The shift to the recommended fertilization regimen was gradual. All hatcheries did use the recommended regimen in 1991, however, so comparison of its efficacy with that of the previous methods as a group was done.
Study Sites
Three different hatcheries in eastern, central, and western Ohio (Figure 1) were used in this study. Each draws water from existing mesotrophic (Senecaville) or eutrophic (Hebron and St. Mary's) reservoirs. Senecaville draws water via a 30-cm diameter pipe from well above the reservoir bottom, and St. Mary's has two similarsized inputs from near the bottom of the shallow (1.5 m) Grand Lake-St. Mary's Reservoir. Unlike the other two hatcheries, not all St. Mary's ponds can be filled individually, so initial filling and "topping up" often involved flow-through from another pond. Hebron draws water from Buckeye Lake via a 2-km section of the old Ohio canal system accessed through a large inlet pipe. All hatcheries filter the water entering the ponds through 0.5-mm screens to pre-
Culver et al. 13
FIGURE 1. Location of hatcheries used in the study. The distance between Senecaville and St. Mary's is approximately 320 km.
Hatchery locations in Ohio
• St. Mary's
• • Hebron Senecaville
vent introduction of undesired larval fish. Zooplankton and phytoplankton pass easily through the screens. Ponds were 0.1 to 2.85 ha and contained 1,000 to 59,000 m3 of water. Most averaged 1 min depth.
Pond Filling and Fertilization Schedules
Previous work (Geiger et al. 1985; Culver 1988) shows that ponds have a profound decline in phyto- and zooplankton abundance in 4 or 5 weeks after filling, with or without fish. This suggests that prompt stocking after filling would be advantageous. Pond records were examined to determine pond filling schedules relative to stocking dates and fertilization patterns. Fertilization costs for 1990 for the liquid, granular, and organic fertilizers were also determined, relative to the number of fish raised. In that year, Senecaville Hatchery personnel added 9.5 kg/ha N as dry ammonium nitrate, 560 kg/ha alfalfa hay at the time of stocking, 56 kg/ha alfalfa meal on each of two occasions, and 4.7 L/ha 10:34:0 (N:P20s:K20) and 30.0 L/ha 28:0:0 liquid fertilizer. Hebron aver-

14 Strategies a11d Tactics/or Ma11ageme11t of Fertilized Hatchery Po11ds
aged 8.3 l.Jha 10:34:0 and 78.2 L/ha 28:0:0 liquid fertilizer divided into 5 weekly additions. Nitrogen in the 28:0:0 fertilizer was approximately 50% from urea and 50% from ammonium nitrate, while the 10:34:0 fertilizer was ammonium phosphate. Nominal percentages of N and P in fertilizer were not reliable, and required analysis for ammonia, nitrate, urea, and phosphate of appropriately diluted samples from each lot. Urea analyses were performed by local hospital analytical labs on diluted samples using autoanalyzer techniques for blood urea nitrogen. The volume of fertilizer diluted and sprayed into each pond at Hebron (and all hatcheries in 1991) depended upon the nitrate + ammonia and phosphate-P content of each pond (analyses according to methods in APHA et al. [1980]) on the previous day and raised the inorganic N to 600 µg/L as N and raised the reactive phosphate to 30 µg/L as P each week. At St. Mary's, ponds in the 1990 comparison either received alfalfa meal at 28 kg/ha/week, or 28:0:0 and 10:34:0 in the same manner as at Hebron. Nitrogen and phosphorus content of alfalfa meal is approximately 2.9% and 0.24%, respectively (NRC 1982).
Ponds that were stocked less than 7 days after filling were selected randomly for the fertilizer comparisons, but water was allowed to set for 1 month prior to stocking or fertilization in one set of nine ponds at St. Mary's. In 1991, the three hatcheries all used the same filling schedules and fertilization regimens in a total of 80 ponds-15 for walleye and 65 for saugeye. Fish were usually harvested by draining the water 30 to 40 days after stocking, but some ponds in 1987 were kept in production for as long as 76 days. Fish survival, average individual weight at harvest, and total numerical and weight yields were recorded for all ponds for all years, but growth and yield analyses were restricted to fish harvested 30-50 days after stocking.
Stocking Density Effects
Although counterintuitive, previous experiments had shown that increased stocking densities increased yields both in weight and numbers, because large zooplankton (especially Daphnia spp.) overgrazed the available algae in low or no-fish ponds (Culver et al. 1984; Munch et al. 1984; Qin and Culver 1992). Because survival percentage varies greatly among ponds and also because stocking
Culver et al. 15
numbers are less precise than harvest numbers, final individual weight and yield as a function of final harvest numbers/ha were used as measures of the effectiveness of the new pond management regimen for producing fish. Most ponds (50/80) were stocked at 400,000 or more fry/ha in 1991, but Hebron Hatchery had a low stocking density (100,000/ha) in 1991 for three walleye ponds and three saugeye ponds as part of additional density-dependence experiments discussed elsewhere (Culver et al. 1992). Because high-density stocking might lead to cannibalism, stomach contents of both walleye and saugeye in a series of ponds stocked at different densi-ties were examined.
Statistical Analyses
Comparison among years, hatcheries, and species for survival was performed with one-way analysis of variance (ANOVA), while yield and individual weight were regressed on harvest density (number/m2) and were compared using analysis of covariance (ANCOVA) after testing for homogeneity of slopes. A significance level of a. = 0.05 was set.
RESULTS AND DISCUSSION
Unpredictability of Fish Production
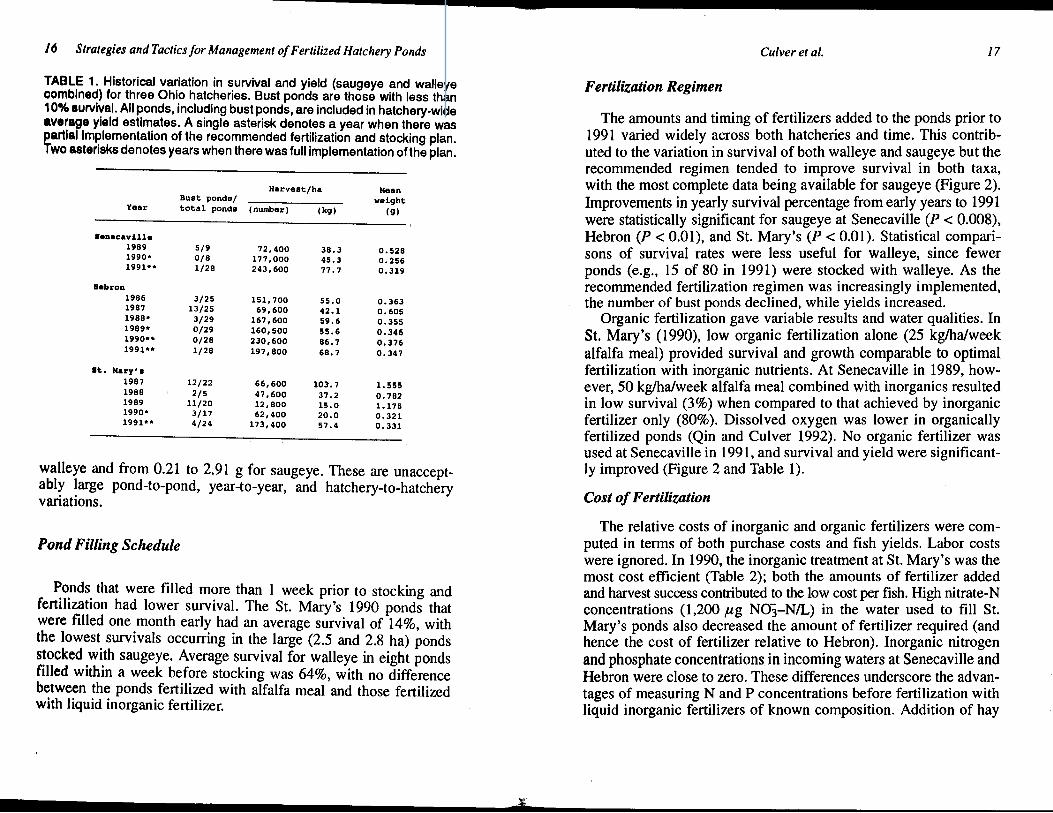
Comparison of survival and growth of both walleye and saugeye from 1986 to 1990 illustrates the wide variation in culturing success and the unpredictability of yields (Table l). The number of ponds with survival below 10% ("bust ponds") gradually decreased as fertilization levels were reduced to match those found effective at the Hebron hatchery in 1988 (Helal 1990; Helal and Culver 1991). Three of the bust ponds that year at Hebron were experimental ponds with large amounts of fertilizer. The variability in yield shown in Table 1 reflects differences in time between filling and stocking, fertilization treatments, and stocking density; it also indicates the unpredictability of yields. Fish size at harvest was variable from pond to pond also, ranging from 0.17 to 11.07 g wet weight for
16 Strategies and Tactics for Management of Fertilized Hatchery Ponds
TABLE 1. Historical variation in survival and yield (saugeye and walleye combined) for three Ohio hatcheries. Bust ponds are those with less than 10% survival. All ponds, including bust ponds, are included in hatchery-wide average yield estimates. A single asterisk denotes a year when there was partial Implementation of the recommended fertilization and stocking plan. Two asterisks denotes years when there was full implementation of the plan.
Harvest/ha Mean Bust ponds/ weight
Year total ponds (number) (k9) (9)
lanacavilla 1989 5/9 72,400 38.3 0.528 1990• 0/8 177,000 45.3 0.256 1991** 1/28 243,600 77. 7 0.319
B•bron 1986 3/25 151,700 55.0 0.363 1987 13/25 69,600 42.1 0.605 1988• 3/29 167,600 59.6 0.355 1989• 0/29 160,500 55.6 0.346 1990•• 0/28 230,600 86.7 0.376 1991•• 1/28 197,800 68.7 0.347
St. Mary'• 1987 12/22 66,600 103.7 1.555 1988 2/5 47,600 37.2 0.782 1989 11/20 12,800 15.0 1.175 1990• 3/17 62,400 20.0 0,321 1991•• 4/24 173,400 57.4 0.331
walleye and from 0.21 to 2.91 g for saugeye. These are unacceptably large pond-to-pond, year-to-year, and hatchery-to-hatchery variations.
Pond Filling Schedule
Ponds that were filled more than 1 week prior to stocking and fertilization had lower survival. The St. Mary's 1990 ponds that were filled one month early had an average survival of 14%, with the lowest survivals occurring in the large (2.5 and 2.8 ha) ponds stocked with saugeye. Average survival for walleye in eight ponds filled within a week before stocking was 64%, with no difference between the ponds fertilized with alfalfa meal and those fertilized with liquid inorganic fertilizer.
1ll
Culver et al. 17
Fertilization Regimen
The amounts and timing of fertilizers added to the ponds prior to 1991 varied widely across both hatcheries and time. This contributed to the variation in survival of both walleye and saugeye but the recommended regimen tended to improve survival in both taxa, with the most complete data being available for saugeye (Figure 2). Improvements in yearly survival percentage from early years to 1991 were statistically significant for saugeye at Senecaville (P < 0.008), Hebron (P < 0.01), and St. Mary's (P < 0.01). Statistical comparisons of survival rates were less useful for walleye, since fewer ponds (e.g., 15 of 80 in 1991) were stocked with walleye. As the recommended fertilization regimen was increasingly implemented, the number of bust ponds declined, while yields increased.
Organic fertilization gave variable results and water qualities. In St. Mary's (1990), low organic fertilization alone (25 kg/ha/week alfalfa meal) provided survival and growth comparable to optimal fertilization with inorganic nutrients. At Senecaville in 1989, however, 50 kg/ha/week alfalfa meal combined with inorganics resulted in low survival (3%) when compared to that achieved by inorganic fertilizer only (80% ). Dissolved oxygen was lower in organically fertilized ponds (Qin and Culver 1992). No organic fertilizer was used at Senecaville in 1991, and survival and yield were significantly improved (Figure 2 and Table 1).
Cost of Fertilization
The relative costs of inorganic and organic fertilizers were computed in terms of both purchase costs and fish yields. Labor costs were ignored. In 1990, the inorganic treatment at St. Mary's was the most cost efficient (Table 2); both the amounts of fertilizer added and harvest success contributed to the low cost per fish. High nitrate-N concentrations (1,200 µg N03-NIL) in the water used to fill St. Mary's ponds also decreased the amount of fertilizer required (and hence the cost of fertilizer relative to Hebron). Inorganic nitrogen and phosphate concentrations in incoming waters at Senecaville and Hebron were close to zero. These differences underscore the advantages of measuring N and P concentrations before fertilization with liquid inorganic fertilizers of known composition. Addition of hay

! Q)
~ rn 1>..
a:s J-4 () a:1
! Q) ::!! ~
Q ..J Q)
o. rt.l rt.l
~~ -68, 1ii Q)
~~ ~. ·- O> "C :J
Q) 2 g>= \ ~ (/) (/) Q) cu 'C:
i~ • • 1=: \ I ,g 'iii ~1ii ~~
~x· gi·e :.5i! ..... 8g 1ii I!? §~
~/~ J:: ~ Q) Q) >.-:g, 'iii :J s:: as . (/) ..... om i~ • O>
:J :J ~
~= I I I I I I I I C\I co
0 0 0 0 0 0 0 0 w~ CD l.'- co in ~ t"J N .-I a:,... :::> E ~,g (%) 1VAIAtrns
18
N 0)
T~
+~
+~ 0) CX'.) 0)
.-I ea
CD ~ CD 0) .-I
t~
+~ I~
0.-t
Culver et al. 19
TABLE 2. Fish yield and relative cost for various fertilization regimens during the 1990 production season at three Ohio Hatcheries. St. Mary's ponds marked with an asterisk were filled one month before stocking and fertilization; all others were filled within one week of stocking.
Fertilizer costs No. Harvest Inorganic Organic Total
Ponds (No./ha) ($/ha) ($/ha) ($/101 fish)
Senecaville 8 177,000 24.50 123.75 0.84
Hebron 28 230,600 19.41 0.08
St. Mary's Liquid inorganic 4 263,600 10.20 organic (alfalfa) 4 232,800 Liquid inorganic 9* 43,300 17.76
0.04 21.60 0.09
0.41
and alfalfa meal at Senecaville decreased yield through lower survival, while adding tremendously to cost of materials. Three of the nine St. Mary's ponds filled one month early were deeper than the others listed, so they required more fertilizer to achieve the same nutrient concentrations. The low survival due to early filling greatly increased the cost per fish.
Stocking Density Impacts on Yield
The increased average survival, coupled with the decreased numbers of bust ponds associated with appropriate inorganic fertilization, enabled analysis of the optimal stocking densities for saugeye and walleye. Comparison of yield can provide useful information on the ecological efficiency of management regimens, and yields have increased across all three hatcheries (Table l). The effect of this management plan on yield cannot be seen directly, however, because yields vary with survival and stocking densities. If yields are regressed on harvest density, however, one can test whether the lines were similar for 1986-1990 (various fertilization regimens and stocking densities) and 1991 (identical fertilization regimens and similar stocking density ranges). Because none of the pairs of regressions was homogeneous with respect to slope (P < 0.05), the before-1991 ecological efficiency could not be compared statistically

20 Strategies a11d Tactics for Ma11ageme11t of Fertilized Hatchery Ponds
with that of 1991. Yield vs. harvest density relationships among hatcheries for 1991 could, however, be compared, and the slopes were all identical except for walleye yields compared between St. Mary's and Senecaville (P = 0.012), so the homogeneous data for all hatcheries were lumped for each species (Figures 3 and 4 ). Regressions for both saugeye (Figure 3) and walleye (Figure 4) show that increasing the number of fish in the pond increases the yield, up to at least 300,000 fish/ha at harvest.
Given these results, it appears that with these ponds and this mmtagement regimen, a harvest density of 300,000/ha represents good success. ff 65% survival is a reasonable expectation under favorable conditions, then an appropriate stocking density of larvae should be about 450,000/ha. Not all ponds were in fact stocked at this density in 1991-<lensity experiments at Hebron called for 100,000 fry/ha in six ponds and 500,000 fry/ha in six others. These ponds had been used for hybrid striped bass predation experiments the previous summer and had carry-over growth of Potamogeton that interfered with harvest and caused mortality by stranding fish during harvest. These effects are reflected in lower yield and survival at Hebron in 1991. Other ponds had lower stocking densities due to availability of fry.
Nevertheless, the overall improvement in survival and production at the three hatcheries implies that the fertilization and stocking treatments chosen override differences between hatchery characteristics and between walleye and saugeye and that abundance and production of zooplankton are not constant but vary with fish abundance. At low fish densities, the abundance and production of zooplankton, and hence fish yield, are influenced by competitive relationships among zooplankton and overgrazing of algae (Culver et al. 1984, Culver et al. 1992). At higher fish densities, zooplankton abundance and production are controlled more by the reproductive capacity of the zooplankton under high mortality due to fish (Culver et al. 1992). The traditional sense of a carrying capacity does not apply because phytoplankton, zooplankton, and fish biomass all vary profoundly with time. This is not an equilibrium system, because numerical responses by phytoplankton and zooplankton to changing resources and mortality rates are, in tum, influenced by the exponential increase in fish consumption associated with fish growth (Culver et al. 1992).
I!? Q)
..0 E ::I c: -0 c: 0 n c: ~ t1S
la ~
O> O> ~
c: ·-II) (I)
·;:: Q)
13 cu .c Q) • Q) "C .... c: £0
- c. t1S (]) -..::-"E> .c c: O>"-·-II) Q) t1S ~II) --Q) c: 3l: Q) -:g
"C .... - c. -~~ -Q) c: >-·-Q) 0 C>c. ::I .c t1S ~ cnw C') •
"C w Q)
a: iii ::::> Q)
~~ u.. .c
i:I 0 J-4
,.c Cl> ~
<I
I 0 0 N
<I
D
<I
• D •
•• Cl> <I rn -...... '">. ·> J-4 Cd Cd 0
:::!! Cl> ~
+i Cl> UJ UJ
• D
I I 0 0 LO 0 ..-1 ..-1
('9q/B:>I) mau.
0 en T~ r-r-.--t
+ ~ 0 ~ 0 -r- co ~ «S N l'- ..c:l c:i c:i .........
rn "O II II ~
"O J.t «S - 0 rn Cl) :::1 •.-4 0 >i in 0
..c:l +J
D -~ 1-4 UJ
0 z 0 r:i::I N Q
E-4 UJ
~ 0 0 - ..-!
I 'W'=fO 0 0 LO
21

22 Strategies and Tactics for Management of Fertilized Hatchery Ponds
FIGURE 4. Walleye yield (wet weight) at three hatcheries in 1991, as a function of numbers harvested/ha. Each point represents a single pond: SM • Saint Mary's; HB = Hebron; SC = Senecaville.
150
0 Yield = 23.I + 0.0003 HD: r' = 0.912
] .100 SM£/o 0 ........
bO ~ -Q ~ J:J.:i -~ 50
L:.. 0 ~") : ~ ~eld = 19.9 + 0.0002 HD: r' = 0.977
~HB \..:'Yield = 17.2 + 0.000001 HD: r' = 0.197
L:..
0 '---~~....___~~_._~~--'-~~~ 0 100 200 300 400
HAR VEST DENSITY (thousands/ha)
Stocking Density Impacts on Fish Size at Harvest
Increased survival and yield do not benefit the hatchery manager unless the fish are of sufficient quality to survive once stocked in a reservoir. Survival in reservoirs was outside the scope of this study, but individual weights of fish for both species grown at the three hatcheries were examined. Non-homogeneity of slopes precluded statistical comparison of regressions of individual weight vs. harvest density for early years with those from 1991, but this was not a problem for comparison of regressions for saugeye between Hebron and St Mary's hatcheries for 1991 (Figure 5). These regressions did not differ signifi-
~ Cl)
.J:l E ::J c: -0 c: 0
~ c: ::J -ro gj i:l
..... 0 en M en ..0 ..... Q) .5 ::r:: Cl) >. Q)
<I C> ::J ro I/) ,_
.$?. t; Cl)
~ -g ..c: 0 - a. ~~ ..c: C> C> c:
'ii) 'iii :;:: ro
- I/)
~c: - Cl) ro I/) ::J Cl)
"O ,_ ·- a. .~Cl) "O ,_ c:-·- c: Q) ·a lfil a. ,_ ..c: Q) 0
~~ i.ri -0 N w <D a: t; ...--! ::::> Q)
CJ~ - ro LL ..c:
0 N Tg lO 0
+ Cl ::c: 0
Q) co 0 ........ ......... 1'/l ........ 0 ""'4 td >. '!)! 0 ,.Q
~ td ~ ""'4 " 0 0 ""'4 <J 1'/l
::!I Q) I "d i:l 0 s:l +> Q) II II td
UJ UJ 0 1'/l +> :::1 ~
J...t 0
• D t"J 0 ,.Q
~ +> D -
~ • -UJ
0 z 0 ~ •• N i::::i
E-t
D UJ
~ ~ 0 <I 0
• ~
<J • 9JD e <I
• 0
0 CD co "<:fl N 0
...--! 0 0 0 0 0
(~) J.HDl:!I.M. :!iDVH:!IAV
23

24 Strategies and Tactics for Management of Fertilized Hatchery Ponds
cantly (ANCOVA, P = 0.699). Senecaville•s regression was not homogeneous with Hebron•s, so ANCOVA could not be performed. Nevertheless, a regression line is shown (Figure 5) for all the data combined to demonstrate the important point that there was little difference in individual weight over a range of harvest densities from 200,000 to 400,000 fish/ha, so hatchery managers could increase stocking density within this range without decreasing the size of fish at harvest. Although average weight at harvest was regressed against harvest density, weight actually appeared to decline 50% from a harvest density of essentially no fish up to a harvest density of 100,000/ha and then had a slope of zero up to the highest densities observed (Figure 5). Densities lower than 100,000 fish/ha at harvest produced slightly larger fish at the expense of much lower numbers of fish produced (Figure 5). The research suggests that this is because zooplankton are prevented from overgrazing algae at higher fish densities, so both algae and zooplankton are produced for a longer period before the increased daily ration sizes of fish suppress the zooplankton and the fish switch to eating chironomids (Culver et al. 1992).
Comparative Success for Saugeye and Walleye
Pooling homogeneous data sets for 1991 permits testing whether saugeye and walleye responded differently to these culture methods. Despite the restrictions caused by the small number of ponds used to culture walleye in 1991 (Figure 6), four of the possible six pair-wise comparisons for three hatcheries and two fish species showed no difference between hatcheries, again suggesting that growth relationships are comparable even though water supplies, soil types, and pond shapes and sizes all differed among hatcheries.
Regressions of 1991 yield on harvest density lumped from all hatcheries (Figure 7) showed no significant difference between saugeye and walleye (ANCOVA, P > 0.328). The regression of size at harvest as a function of harvest density did not differ significantly (ANCOVA, P > 0.80) between the two species (Figure 8). Taken together, these results suggest that the same techniques may be used at all three hatcheries for both species with equivalent results.
Culver et al. 25
FIGURE 6. Average individual wet weight at harvest for walleye in 1991 as a function of numbers harvested: SM =St. Mary's; HB = Hebron; SC= Senecaville.
10 r t::..
- t::.. b.O 0.8 -
E-4 I t::..
::I: d ~'Wt - 0.195 - 0.000003 HDo <' • O.Q7 - 0.6 B Ill ~ Av Wt= 0.511 - 0.0000005 HD: r' = 0.681
Ill t::..~ d 0.4 < t::.. 0 ~ Ill t::.. \ ~ 0.2 SC
Av Wt = 0.37 - 0.0000004 HD: r' = 0.992
0.0 0 100 200 300 400
HAR VEST DENSITY (thousands/ha)
Cannibalism and Fish Stocking Densities
Because cannibalism has been suggested to be responsible for low survival in pond culture, some managers have stocked fewer fish to decrease the encounter rate. During dietary analysis in this study, over one thousand fish stomachs from the three hatcheries were examined. Fish density at harvest ranged from 100,000 to 460,000 fish/ha. Prey found included copepods, cladocerans, and chironomid larvae (Qin and Culver 1992). No cannibalism was observed at any harvest density, so there is no evidence that stocking densities in these ranges caused significant mortality from this source.

2tS Strategies and Tactics for Management of Fertilized Hatchery Ponds
FIGURE 7. Saugeye and walleye yields (wet weight) vs. harvest density for all 1991 ponds: circles = saugeye; triangles = walleye.
1 5 0 r SaugeyeO-- 0 0 0
Walleye.A.------ 0 0
0 ~o Yield = 12.6 + 0.0003 HD: r' = ~678 A.0 /o
-.\ ,,ef ~ c.s 100 ..cl
' bO .w O / 19 A.0 A. - 0 0 0 / /0 c9 0 ~ ~ 0 0 r.LI lo-I so .o 0
> 0
~3'
~®· ere
Yield = 24.2 + 0.0002 HD: r' = 0.73
0 0 c!9
0 100 200 300 400
HAR VEST DENSITY (thousands/ha)
SUMMARY
This research improved the total yield of percid fingerlings for the three hatcheries four-fold from 1987 to 1991, while increasing survival by as much as ten-fold. The system depended primarily upon photosynthesis by phytoplankton, which in turn supported the zooplankton (Culver et al. 1992). The lack of any organic fertilizer improved water quality by decreasing oxygen consumption (Qin and Culver 1992). Furthermore, use of organic fertilizers such as alfalfa meal would have made it difficult to adjust the relative amounts of nitrogen and phosphorus added to the ponds. Addition of small amounts of inorganic fertilizer each week avoided the
Culver et al. 27
FIGURE 8. Saugeye and walleye average individual wet weights vs. harvest density for all 1991 ponds: circles = saugeye; triangles = walleye.
l .O r Av irt = 0.665 - 0.000001 HD: r' = 0.21
SaugeyeO---
::§ 0.81. ~o 0 Walleye A--- - ---
E--< 0 ... = 0 0 C!) til o.6 r -~ 0 ()0 ....... ~
~ r ·t~ C!) 0.4 ~ ....... < 0 0 0 ~ 0 cP 0 o~ ij:)eo ~ ... 0 8 0 ~ 0.2 0
0 Av Wt = 0.548 - 0.000001 HD: r' = 0.17 0.0 .__ __ ..__ __ _..__ __ _._ __ __.
0 100 200 300 400
HAR VEST DENSITY (thousands/ha)
production of large filamentous algae which had been problems during harvest at all three hatcheries. Weekly analyses of inorganic nitrogen and phosphate concentrations assured that appropriate amounts of fertilizer were added. This was particularly important when first filling the ponds, when variation in the nutrient content of water sources could result in initial nutrient concentrations being as much as three times target values. At Senecaville, where high initial nitrate concentrations resulted from agricultural runoff, addition of only phosphate fertilizer encouraged algal growth, and brought the nitrate concentration below the target level within one week. Nutrient determinations were also important at week four or five, when declining algal abundance allowed nitrogen to accumulate. If hatchery managers note the clearing water and add ammonium nitrate and phosphate, ammonia toxicity to fish could result, whereas weekly chemical analysis of pond water will allow addition as needed without over-fertilization. All ponds showed this algal decline at week 4 or 5, so it is important to fill the ponds as soon before adding fry as is
2H Strategies a11d Tactics for Ma11agement of Fertilized Hatchery Ponds
practicable. No flushing is required. In fact, flowing water through ponds makes control of nutrient inputs difficult.
Stocking 450,000 fry/ha in ponds appears appropriate for obtaining both the greatest total weight and numbers of fish from the ponds. High stocking densities do not seem to greatly diminish the size of fish. Potentially, even higher yields might be obtained with higher stocking densities.
This study has not considered all the factors that could potentially influence its adoption at other sites. All the hatchery water sources had total alkalinities of 80-lll mg/L as CaC03 which provided adequate inorganic carbon to support photosynthesis at the fertilizer rates used. pH was not monitored routinely, but values in a few ponds reached 9.7, so pH could be a source of fish mortality on its own and through its influence on free ammonia. The experiments were limited to mid-April through early June, and water temperatures seldom exceeded 23 °C. Other fish taxa spawning later in the year would potentially involve a different set of nutrient/phytoplankton/zooplankton interactions. All results were for ponds stocked from productive reservoirs. Hatcheries filling ponds with well water may experience a different set of dynamics for the initiation of the phytoplankton and zooplankton blooms.
ACKNOWLEDGMENTS
We wish to thank D. Uetrecht, M. Giere, L. DePinto, M. Grove, and D. Stoeckel for their very helpful assistance in field and laboratory and also J. Stafford and staff at the Hebron Fish Hatchery, P. Keyes and staff at the Senecaville Fish Hatchery, and R. Chittum and staff at St. Mary's Fish Hatchery for providing all kinds of help and access to experimental ponds. This research was supported by the Ohio Department of Natural Resources Division of Wildlife and the US Fish and Wildlife Service, project F-57-R; the Ohio Cooperative Fish and Wildlife Research Unit; and The Ohio State University.
REFERENCES
APHA et al. (American Public Health Association, American Water Works Association, and Water Pollution Control Federation). 1980. Standard Methods for the Examination of Water and Wastewater, 15th ed American Public Health Association, Washington, D.C.
I
Culver et al. 29
Bardach, J. E. 1976. Aquaculture revisited. Journal of the Fisheries Research Board of Canada 33:880-887.
Bardach, J. E. 1978. The growing science of aquaculture. Pages 424-446 in S. D. Gerking, ed. Ecology of Freshwater Fish Production. Blackwell Scientific Publications, Oxford.
Barica, J., H. Kling, and J. Gibson. 1980. Experimental manipulation of algal bloom composition by nitrogen addition. Canadian Journal of Fisheries and Aquatic Sciences 37:1175-1183.
Culver, D. A. 1988. Plankton ecology in fish hatchery ponds in Narrandera, NSW, Australia. Verhandlungen Internationale Vereinigung filr Theoretische und Angewandte Limnologie 23: 1085-1089.
Culver, D. A. 1991. Effects of the N :P ratio in fertilizer for fish hatchery ponds. Verhandlungen Internationale Vereinigung fiir Theoretische und Angewandte Limnologie 24:1503-1507.
Culver, D. A., R. M. Vaga, and C. S. Munch. 1984. Evidence of size-selective fish predation on the reproductive output of Cladocera in hatchery ponds. Verhandlungen Internationale Vereinigung filr Theoretische und Angewandte Limnologie 22:1636-1639.
Culver, D. A., J. Qin, S. P. Madon, and H. A. Helal. 1992. Daphnia Production Techniques for Rearing Fingerling Walleye and Saugeye. Completion Report, Federal Aid in Fish Restoration Project F-57-R, for the Ohio Department of Natural Resources and U.S. Fish and Wildlife Service, Columbus, Ohio.
Dabrowski, K., and R. Bardega. 1984. Mouth size and predicted food size preferences of larvae of three cyprinid fish species. Aquaculture 40:41-46.
Darley, W. M. 1982. Algal Biology: A Physiological Approach. Basic Microbiology, Vol. 9, J.F. Wilkins, series ed. Blackwell Scientific Publishers. Oxford
Eriksson, J.E., J. A. 0. Meriluoto, H.P. Kujari, and 0. M. Skulberg. 1988. A comparison of toxins isolated from the cyanobacteria Oscillatoria agardhii and Microcystis aeruginosa. Comparative Biochemistry and Physiology 89C: 207-210.
Fox, M. G. 1989. Effect of prey density and prey size on growth and survival of juvenile walleye (Stizostedion vitreum vitreum). Canadian Journal of Fisheries and Aquatic Sciences 46: 1323-1328.
Fox, M. G., and D. D. Flowers. 1990. Effect of fish density on growth, survival, and food consumption by juvenile walleye in rearing ponds. Transactions of the American Fisheries Society 119:112-121.
Fox, M. G., J. A. Keast, and R. J. Swainson. 1989. The effect of fertilization regime on juvenile walleye growth and prey utilization in rearing ponds. Environmental Biology of Fishes 26:129-142.
Geiger, J. G. 1983. A review of pond zooplankton production and fertilization for the culture of larval and fingerling striped bass. Aquaculture 35:353-369.
Geiger, J. G., C. J. Turner, K. Fitzmayer, and W. C. Nicols. 1985. Feeding habits of larval and fingerling striped bass and zooplankton dynamics in fertilized rearing ponds. Progressive Fish-Culturist 47:213-223.
JO Strategies a11d Tactics for Management of Fertilized Hatchery Ponds
Holal, H. A. 1990. Nitrogen:Phosphorus Ratio and Trophic Dynamics in Fishhatchery Ponds. Doctoral dissertation, The Ohio State University, Ohio.
Holal, H. A., and D. A. Culver. 1991. N:P ratio and plankton production in fish ponds. Verhandlungen Internationale Vereinigung fiir Theoretische und Angewandte Limnologie 24: 1508-1511.
Hunter, J. R. 1981. Feeding ecology of marine fish larvae. Pages 33-77 in R. Luker, ed. Marine Fish Larvae. Washington Sea Grant Program. University of Washington, Seattle, Washington.
lnfutte, A., and S. E. B. Abella. 1985. Inhibition of Daphnia by Oscillatoria in Lake Washington. Limnology and Oceanography 30:1046-1052.
Laannan, P. N. 1978. Case histories of stocking walleyes in inland lakes, impoundments and the Great Lakes-100 years of walleye. Pages 254-260 in R. L. Kendall, ed. Selected Coolwater Fishes of North America. Special Publication No. 11, American Fisheries Society, Washington, D. C.
Lasker, R. 1987. Use of fish eggs and larvae in probing some major problems in fisheries and aquaculture. Transactions of the American Fisheries Society Symposium 2:1-16.
LI, S., and J. A. Mathias. 1982. Causes of high mortality among cultured larval walleyes. Transactions of the American Fisheries Society 111:710-721.
Lindholm, T., J. E. Eriksson, and J. A. 0. Meriluoto. 1989. Toxic cyanobacteria and water quality problems-Examples from a eutrophic lake on Aland, South West Finland Water Research 23(4): 481-486.
Lynch, W. E., B. L. Johnson, and S. A. Schell. 1982. Survival, growth and food habits of walleye X sauger hybrids (saugeye) in ponds. North American Journal of Fisheries Management 4:381-387.
Matison, J. A., T. B. Kayes, J. A. Held, and C.H. Amundson. 1990. Comparative survival, growth, and reproductive development of juvenile walleye and sauger and their hybrids reared under intensive culture conditions. Progressive Fish-Culturist 52:73-82.
Mcriluoto, J. A. 0., A. Sandstrom, J. E. Eriksson, G. Remaud, A. Grey Craig, and J, Chattopadhyaya. 1989. Structure and toxicity of a peptide hepatotoxin from the cyanobacterium Oscillatoria agardhii. Toxicon 27: 1021-1034.
Mills, E. L., M. V. Pol, R. E. Sherman, and T. 8. Culver. 1989. Interrelationships between prey body size and growth of age-0 yellow perch. Transactions of the American Fisheries Society 118: 1-10.
Munch, C. S., R. M. Vaga, and D. A. Culver. 1984. Evidence for size-selective grazing of phytoplankton species by zooplankton in fish hatchery ponds. Verhandlungen Internationale Vereinigung fiir Theoretische und Angewandte Limnologie 22:1640-1644.
NRC (National Research Council [U.S.], Subcommittee on Feed Composition.) 1982. United States-Canadian Tables of Feed Composition: Nutritional Data for United States and Canadian feeds, 3rd revision. National Academy Press, Washington, D.C.
Qin, J., and D. A. Culver. 1992. The survival and growth of larval walleye,
Culver et al. 31
Stizostedion vitreum, and trophic dynamics in fertilized ponds. Aquaculture 108:257-276.
Raisanen, G. A., and R. L. Applegate. 1983. Prey selection of walleye fry in an experimental system. Progressive Fish-Culturist 45:209-214.
Rosenthal, H., and G. Hempel. 1970. Experimental studies in feeding and food requirements of herring larvae (Clupea harengus L.). Pages 344-364 in J. H. Steele, ed. Marine Food Chains. Oliver and Boyd, Edinburgh.
Siegworth, G. L., and R. C. Surnmerfelt. 1990. Growth comparison between fingerling walleyes and walleye X sauger hybrids reared in intensive culture. Progressive Fish-Culturist 52:100-104.
Tilman, D., R. Kiesling, R. Sterner, S.S. Kilham. and F. A. Johnson. 1986. Green, blue-green and diatom algae: Taxonomic differences in competitive ability for phosphorus, silicon and nitrogen. Archiv fiir Hydrobiologie 106:473-485.
Wong, B., and F. J. Ward 1972. Size selection of Daphnia pulicaria by yellow perch (Perea flavescens) fry in West Blue Lake, Manitoba. Journal of the Fisheries Research Board of Canada 29: 1761-1764.