
Using Modelling and Simulation to Improve Elderly Care in ...
16
Technological University Dublin Technological University Dublin ARROW@TU Dublin ARROW@TU Dublin Articles School of Marketing 2013 Using Modelling and Simulation to Improve Elderly Care in Ireland: Using Modelling and Simulation to Improve Elderly Care in Ireland: A Case Study A Case Study Amr Arisha Technological University Dublin, [email protected] Mohamed Ragab Technological University Dublin, [email protected] Wael Rashwan Technological University Dublin, [email protected] See next page for additional authors Follow this and additional works at: https://arrow.tudublin.ie/buschmarart Part of the Industrial Engineering Commons, Operational Research Commons, Operations and Supply Chain Management Commons, and the Other Operations Research, Systems Engineering and Industrial Engineering Commons Recommended Citation Recommended Citation Arisha, A., Ragab, M., Rashwan, W. and Abo-Hamad, W. International Journal on Advances in Life Sciences, Vol. 5, No. 2, 2013, pages: 89 – 102 http://www.iariajournals.org This Article is brought to you for free and open access by the School of Marketing at ARROW@TU Dublin. It has been accepted for inclusion in Articles by an authorized administrator of ARROW@TU Dublin. For more information, please contact [email protected], [email protected]. This work is licensed under a Creative Commons Attribution-Noncommercial-Share Alike 4.0 License
-
Upload
khangminh22 -
Category
Documents
-
view
1 -
download
0
Transcript of Using Modelling and Simulation to Improve Elderly Care in ...
Technological University Dublin Technological University Dublin
ARROW@TU Dublin ARROW@TU Dublin
Articles School of Marketing
2013
Using Modelling and Simulation to Improve Elderly Care in Ireland: Using Modelling and Simulation to Improve Elderly Care in Ireland:
A Case Study A Case Study
Amr Arisha Technological University Dublin, [email protected]
Mohamed Ragab Technological University Dublin, [email protected]
Wael Rashwan Technological University Dublin, [email protected]
See next page for additional authors
Follow this and additional works at: https://arrow.tudublin.ie/buschmarart
Part of the Industrial Engineering Commons, Operational Research Commons, Operations and Supply
Chain Management Commons, and the Other Operations Research, Systems Engineering and Industrial
Engineering Commons
Recommended Citation Recommended Citation Arisha, A., Ragab, M., Rashwan, W. and Abo-Hamad, W. International Journal on Advances in Life Sciences, Vol. 5, No. 2, 2013, pages: 89 – 102 http://www.iariajournals.org
This Article is brought to you for free and open access by the School of Marketing at ARROW@TU Dublin. It has been accepted for inclusion in Articles by an authorized administrator of ARROW@TU Dublin. For more information, please contact [email protected], [email protected].
This work is licensed under a Creative Commons Attribution-Noncommercial-Share Alike 4.0 License

Authors Authors Amr Arisha, Mohamed Ragab, Wael Rashwan, and Waleed Abo-Hamad
This article is available at ARROW@TU Dublin: https://arrow.tudublin.ie/buschmarart/122
Using Modelling and Simulation to Improve ElderlyCare in Ireland: A Case Study
Mohamed A.F. Ragab,Wael Rashwan,Walled Abo-Hamad, and Amr Arisha3S Group, College of BusinessDublin Institute of Technology
Dublin 2, IrelandEmail: [email protected], [email protected], [email protected], [email protected]
Abstract—Health care services both globally and domestically- are encountering critical issues due to the increasing demand forservices at the time of economic recession. Hospital performanceis subject to many constraints, and planning is made moredifficult by the complexity and uncertainty of demand. Populationageing is creating immense pressures on healthcare facilitiesacross the world, leaving them struggling to cope with the growingdemand for elderly healthcare services. Current demand-supplygaps result in prolonged waiting times for patients and substantialcost burdens for healthcare systems due to delayed discharges.This paper reports on a project that uses modelling and simu-lation to address elderly care pathways in the Irish healthcaresector. The faster management of frail patients admitted to acutehospitals and the introduction of new intermediate care beds arealternative interventions that healthcare executives are interestedin simulating to examine their impact on the performance ofthe elderly care system. The simulation model developed, alongwith the statistical analysis, enabled hospital services managersto assess the critical performance and financial issues of thecurrent system, and highlighted the decision variables that couldsignificantly improve the flow of elderly patients.
Keywords—Population Ageing, Elderly Care, Discrete EventSimulation, Discharge Planning.
I. INTRODUCTION
THIS study builds on and extends our previous researchpresented to the SIMUL 2012 Conference, in Lisbon,
Portugal [1]: this extended version includes more detail in allsections.
Advances in pharmaceutical and medical technology duringthe last century caused a major shift in global demograph-ics, increasing life expectancy to unprecedented figures. Sothere are now more aged people than ever before - in bothdeveloping and developed countries which can be seen as anindicator of advances in global health [2]. Worldwide, there arearound 600 million people aged 60 years and over: as Fig. 1-ashows, this total is expected to double by 2025 and to reachvirtually two billion by 2050 (World Health Organization -WHO) [3]. In Europe, there are currently 108 million elderlypeople who constitute 15% of the continent’s population, a
M. Shell is with the Department of Electrical and Computer Engineering,Georgia Institute of Technology, Atlanta, GA, 30332 USA e-mail: (seehttp://www.michaelshell.org/contact.html).
J. Doe and J. Doe are with Anonymous University.Manuscript received April 19, 2005; revised January 11, 2007.
figure which is forecast to increase to 26% by 2050 [4], atrend which is reflected in Ireland where the elderly populationis projected to grow from 500, 000 to 1.3 million over thenext 30 years [5]. As Fig. 1-b shows, projections by the IrishNational Council on Ageing and Older People (2002) showfemale and male ‘seniors’ (65 years and over) accounting,respectively, for 16.4% and 14.1% of the Irish populationby 2021[6]. Older people are the major users of health andsocial care services while elderly patients currently represent11% of the Irish population, they are estimated to accountfor up to 50% of hospital bed usage [5]. At the same timeas increasing the demand for health and social care servicesgenerally, population ageing is affecting the supply of healthand social care professionals as the health workforce will haveto grow to cope with the demands of the ageing population.These projections constitute a major challenge that is critical toprosperity and quality of life of society as a whole, and promiseto put great demand on national healthcare organizations.
Consequently, pressures are now rising on Irish hospitals,not only due to the increased demand for acute hospitalbeds, but also because elderly patients use hospital resourcesdisproportionately: these demographic changes mean that Irishhospitals are struggling to fill the existing gap between supplyand demand while maintaining their service quality[5]. Theglobal economic crisis has inflicted severe cuts on availablehealthcare funds and led to a ‘limited resource’ policy in hos-pitals and other healthcare services: Thus Irish hospitals andelderly healthcare facilities both face equally grave capacityplanning challenges if they are to respond effectively to currentand projected demand increases [7].
The shortage of beds resulting from this demand increasehas had numerous facets that have adversely impacted theoverall performance of the Irish healthcare system. Firstly, bedshortages have significantly increased overcrowding in Emer-gency Departments (EDs), with high percentages of patientsleaving without having been seen, and increased mortalityrates for elderly patients [5]. Several national reports havehighlighted the growing demand for emergency care and thesimultaneous decrease in the number of EDs operating to meetthis demand; mainly due to economic constraints. Over 1.1million individuals attended the 33 Irish EDs during 2010, 30%of whom were admitted to hospitals as emergency admissions[8]. Secondly, shortage of community care beds leads todelayed discharges from acute hospitals, which not only delays
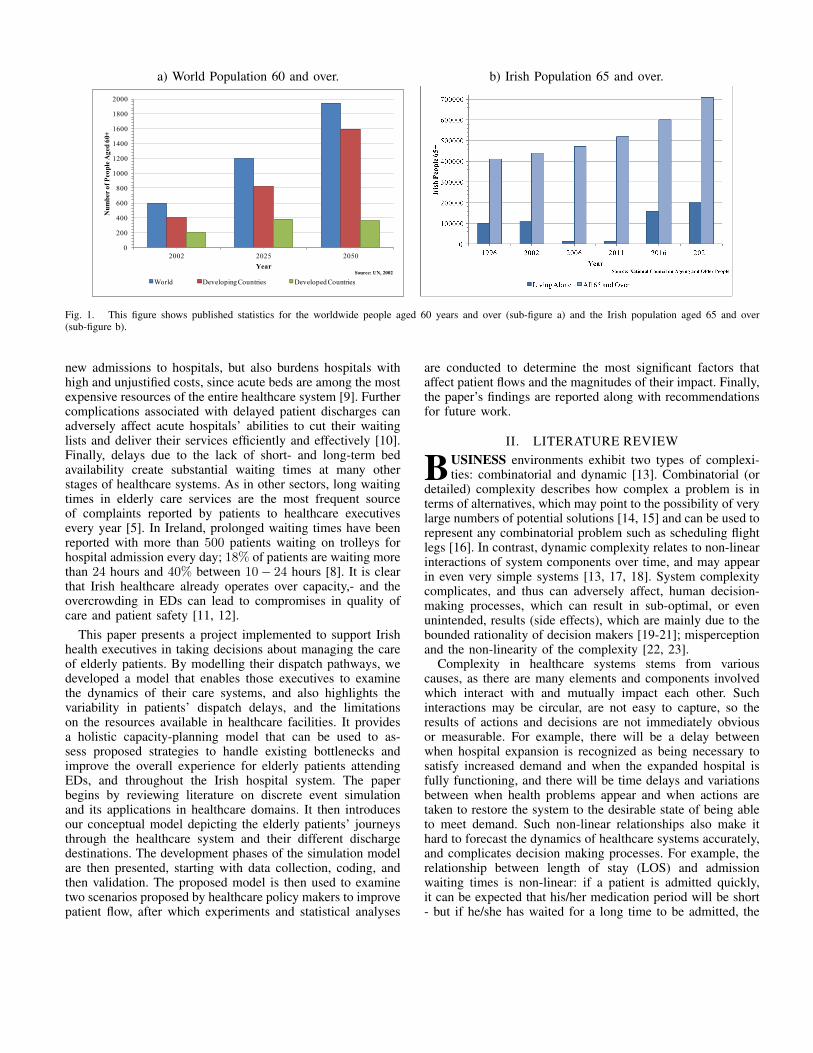
a) World Population 60 and over. b) Irish Population 65 and over.
0
200
400
600
800
1000
1200
1400
1600
1800
2000
2002 2025 2050
Nu
mb
er o
f P
eop
le A
ged
60+
Year
World Developing Countries Developed Countries
Source: UN, 2002 Source: UN, 2002
Fig. 1. This figure shows published statistics for the worldwide people aged 60 years and over (sub-figure a) and the Irish population aged 65 and over(sub-figure b).
new admissions to hospitals, but also burdens hospitals withhigh and unjustified costs, since acute beds are among the mostexpensive resources of the entire healthcare system [9]. Furthercomplications associated with delayed patient discharges canadversely affect acute hospitals’ abilities to cut their waitinglists and deliver their services efficiently and effectively [10].Finally, delays due to the lack of short- and long-term bedavailability create substantial waiting times at many otherstages of healthcare systems. As in other sectors, long waitingtimes in elderly care services are the most frequent sourceof complaints reported by patients to healthcare executivesevery year [5]. In Ireland, prolonged waiting times have beenreported with more than 500 patients waiting on trolleys forhospital admission every day; 18% of patients are waiting morethan 24 hours and 40% between 10− 24 hours [8]. It is clearthat Irish healthcare already operates over capacity,- and theovercrowding in EDs can lead to compromises in quality ofcare and patient safety [11, 12].
This paper presents a project implemented to support Irishhealth executives in taking decisions about managing the careof elderly patients. By modelling their dispatch pathways, wedeveloped a model that enables those executives to examinethe dynamics of their care systems, and also highlights thevariability in patients’ dispatch delays, and the limitationson the resources available in healthcare facilities. It providesa holistic capacity-planning model that can be used to as-sess proposed strategies to handle existing bottlenecks andimprove the overall experience for elderly patients attendingEDs, and throughout the Irish hospital system. The paperbegins by reviewing literature on discrete event simulationand its applications in healthcare domains. It then introducesour conceptual model depicting the elderly patients’ journeysthrough the healthcare system and their different dischargedestinations. The development phases of the simulation modelare then presented, starting with data collection, coding, andthen validation. The proposed model is then used to examinetwo scenarios proposed by healthcare policy makers to improvepatient flow, after which experiments and statistical analyses
are conducted to determine the most significant factors thataffect patient flows and the magnitudes of their impact. Finally,the paper’s findings are reported along with recommendationsfor future work.
II. LITERATURE REVIEW
BUSINESS environments exhibit two types of complexi-ties: combinatorial and dynamic [13]. Combinatorial (or
detailed) complexity describes how complex a problem is interms of alternatives, which may point to the possibility of verylarge numbers of potential solutions [14, 15] and can be used torepresent any combinatorial problem such as scheduling flightlegs [16]. In contrast, dynamic complexity relates to non-linearinteractions of system components over time, and may appearin even very simple systems [13, 17, 18]. System complexitycomplicates, and thus can adversely affect, human decision-making processes, which can result in sub-optimal, or evenunintended, results (side effects), which are mainly due to thebounded rationality of decision makers [19-21]; misperceptionand the non-linearity of the complexity [22, 23].
Complexity in healthcare systems stems from variouscauses, as there are many elements and components involvedwhich interact with and mutually impact each other. Suchinteractions may be circular, are not easy to capture, so theresults of actions and decisions are not immediately obviousor measurable. For example, there will be a delay betweenwhen hospital expansion is recognized as being necessary tosatisfy increased demand and when the expanded hospital isfully functioning, and there will be time delays and variationsbetween when health problems appear and when actions aretaken to restore the system to the desirable state of being ableto meet demand. Such non-linear relationships also make ithard to forecast the dynamics of healthcare systems accurately,and complicates decision making processes. For example, therelationship between length of stay (LOS) and admissionwaiting times is non-linear: if a patient is admitted quickly,it can be expected that his/her medication period will be short- but if he/she has waited for a long time to be admitted, the
medication time is likely to be significantly longer indeedthe patient’s situation may have worsened considerably whilewaiting for medication, especially if they are elderly. Thesemake the results of policies intended to improve system’sperformance may be disappointing, as they may be subjectto resistance from staff, in particular consultants, and counter-intuitive behaviour on the part of the policy makers. Simulationand modelling can be an effective and flexible tool to tacklewith several of these concerns and so contribute towardsimproved health system performance and thus better healthcare provision [25].
In most recent studies of simulation an modelling, discreteevent simulation (DES) has been the most widely used inpractice. The system’s functions are modelled as a finite-statemachine in which transitions occur based on events [26, 27].DES system modelling can be viewed as a queuing network:individual entities (here, patients) go through a process (aconsecutive series of activities), each of which may have aqueue of other entities waiting to be processed. Individualentities have attributes that reflect their particular character-istics and which determine what happens to them duringtheir journey through the system. The selection of probabilitydistributions is subject to the modeller’s decisions, historicaldata, literatures and the nature of the particular problem beingmodelled. Traditionally, DES models have been applied to dealwith details, process, decision rules, queues and schedulingactivities at both operational and tactical levels. Such modelsrequire large amounts of quantitative numerical data, and theirintrinsic stochastic nature means they need extensive statisticalanalysis and design experiments. The main target of thesemodels is performance prediction, comparison of scenariosand optimizing performance measurement with accompanyingoptimization algorithms [28, 29].
Healthcare administrators can benefit from DES to assesscurrent settings and in predicting changes in performance afterproposed operational changes. DES models can be very effec-tive tools to deal with hospital problem areas, like operatingtheatres and emergency departments, where healthcare demandwill be variable but resources are likely to be limited [30,31], and to identify possible areas of improvement that couldbe achieved via reorganization and re-allocation of existingresources [32, 33]. Many studies have discussed the suitabilityof DES for modelling healthcare processes in detail [27, 34-37], and they have been used to examine outpatient clinics[38, 39], planning for healthcare services [40, 41]; ambulancescheduling [42]; and improving capacity utilization in intensivecare units [43]. A previous study has used a stochastic sim-ulation model for bed occupancy[44], and other applicationshave included settings - such as emergency departments [25,45-47], operating theatres [48]; and pre-operative process[49] - in which resources are scarce and patients arrive atirregular times, where modelling can facilitate the effectiveevaluation and testing of the outcomes of various alternativesand interventions [39]. The dynamic capabilities of simulationcan allow a more accurate interpretation of the utilization ofhospital resources to be envisaged [50], supporting hospitalmanagers’ decisions on bed usage and patient flow through thehospital [51] by modelling problems of patient flows [52], and
then using scenarios to illustrate the consequences of possiblesolutions suggested by hospital management[53].
III. PROBLEM CONTEXTUALIZATIONA. Background
Elderly patients are usually defined as those who are aged65 and older and this study adheres to that convention [54].The most challenging elderly patients are those referred to asfrail - as suffering from an array of medical conditions thatindividually may be curable, but collectively create complexand potentially overwhelming burdens of disease [2]. Frailpatients constitute 18 − 20% of the Irish elderly populationand usually require longer treatment in the healthcare facilities,followed by rehabilitation and/or community care. In termsof length of stay (LOS), frail patients are characterized inthis study as those needing treatment in acute systems (i.e.,hospitals) for more than 15 days: The remaining 80 − 82%of elderly patients (who receive shorter treatment periods) arereferred to as non-frail. While this study focused initially juston frail patients, since all 65+ patients use the same healthcaresystem resources, it was found necessary to widen the project’sscope to encompass all elderly patients, both frail and non-frail.Although elderly patients utilize a wide range of resources, theinitial phase of the proposed model gives special attention tobed capacity in healthcare facilities based on a request fromhealthcare executives: thus elderly care services that do notinvolve admissions - such as outpatient clinics - are excludedfrom the model as they do not affect hospital bed utilization.
B. ConceptualizationElderly patients’ journeys through hospital systems usually
begin with their arrival at ED by ambulance, walk-in orfollowing a referral by a General Practitioner (GP). Afteradmission, elderly patients receive treatment in acute beds untilthey are assigned care pathways according to their diagnosisand frailty level. The duration of treatment ranges from fewdays to two weeks for non-frail patients, but usually exceeds45 days for frail patients. After their stay in acute beds, elderlypatients are discharged to one of the following destinations:• Another Hospital: Certain medical procedures may re-
quire equipment that is unavailable in the acute hospitalwhere an elderly patient has been admitted, and theyneed to be transferred to another hospital where thetechnology required for the procedure they need isavailable. Discharge figures to another hospital (6% ofall elderly patients) include patients who are moved toundergo certain procedures, and those who are returnedto their original hospital after such procedures
• Rehabilitation: Patients whose are deemed ‘frail’, butwho are judged as having the potential to improvetowards functional independence are discharged to anon- or off-site facility where they receive rehabilitation.Such facilities can be seen as intermediate destinationssuitable to the situation where they are no longer cat-egorized as acutely ill, but still need close medicalobservation in the hope that they will recover [55].
After rehabilitation, the majority of patients (80%) aredischarged home, and the remaining 20%, who have notrecovered, to long term care.
• Convalescence: Around 10% of non-frail patients aredischarged to a convalescent care facility for a shortstay to recover from a medical procedure. Convales-cence offers less intensive care than rehabilitation, as itessentially prepares patients to go home, and may takeplace within dedicated short stay beds in nursing homefacilities.
• Long Term Care (LTC): More than a quarter of frailelderly patients will be unable to live alone at theirhomes as they are unable to care for themselves, andmay require ongoing medical supervision. Such patientsare discharged to a public or private nursing home toreceive LTC, where they usually stay for years until theydie. This prolonged stay in nursing homes hampers thesupply of LTC beds in the healthcare system, and canresult in waiting times that amount to several months.In addition to hospital demand, there is also a demandfrom frail patients in the community who need LTC, andmust wait in their homes for a nursing home place.
• Home: The vast majority of non-frail elderly patients -88.9% in all - are eventually discharged to their homes,whether directly or after a short stay in convalescence.24% of frail patients are discharged directly to theirhomes, and another 28.8% go home after a period ofrehabilitation. More than half of them will continueto require medical care in their own homes, and aregiven Home Care Packages (HCP), which comprise a setof state-provided services that may include home help,nursing, physiotherapy, occupational therapy and otherservices [5].
• Other Destinations: In addition to these destinations, 6%of elderly patients are likely to die during their acutestay, with the probability of mortality increasing pro-portionally with the frailty level, while another minimalnumber of patients (slightly more than 1%) with specialconditions are discharged to ‘other’ destinations (e.g.,prisons, psychiatric facilities, etc).
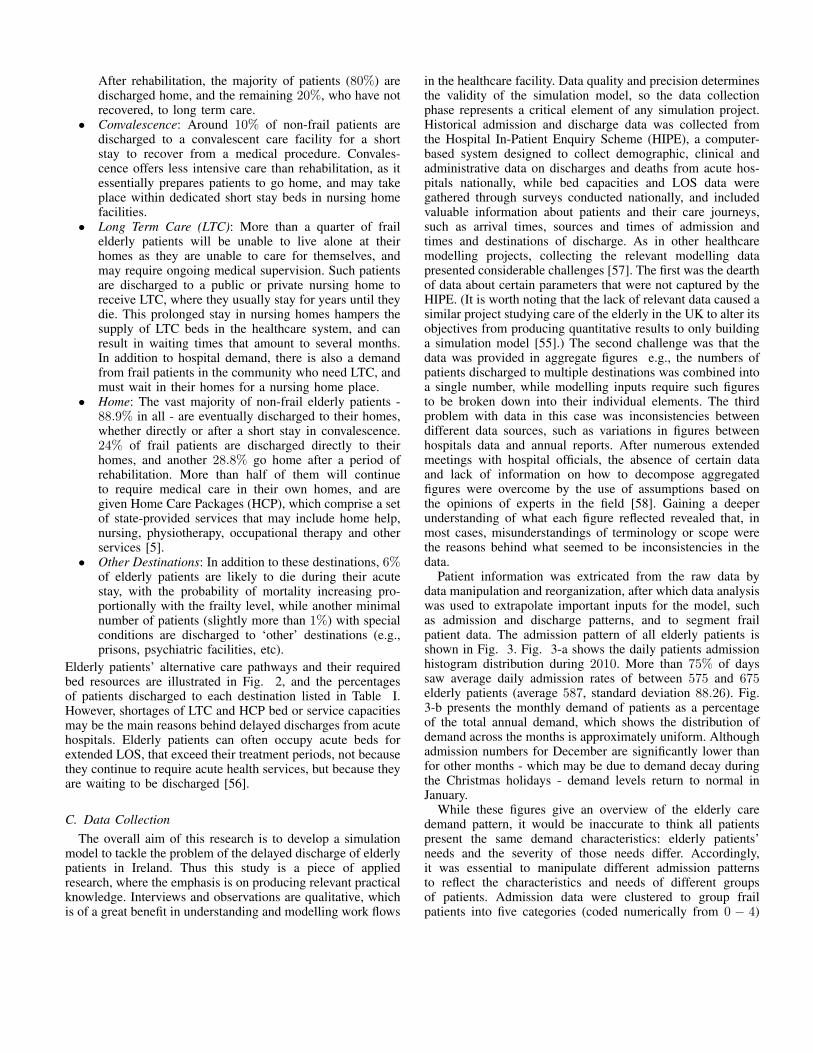
Elderly patients’ alternative care pathways and their requiredbed resources are illustrated in Fig. 2, and the percentagesof patients discharged to each destination listed in Table I.However, shortages of LTC and HCP bed or service capacitiesmay be the main reasons behind delayed discharges from acutehospitals. Elderly patients can often occupy acute beds forextended LOS, that exceed their treatment periods, not becausethey continue to require acute health services, but because theyare waiting to be discharged [56].
C. Data CollectionThe overall aim of this research is to develop a simulation
model to tackle the problem of the delayed discharge of elderlypatients in Ireland. Thus this study is a piece of appliedresearch, where the emphasis is on producing relevant practicalknowledge. Interviews and observations are qualitative, whichis of a great benefit in understanding and modelling work flows
in the healthcare facility. Data quality and precision determinesthe validity of the simulation model, so the data collectionphase represents a critical element of any simulation project.Historical admission and discharge data was collected fromthe Hospital In-Patient Enquiry Scheme (HIPE), a computer-based system designed to collect demographic, clinical andadministrative data on discharges and deaths from acute hos-pitals nationally, while bed capacities and LOS data weregathered through surveys conducted nationally, and includedvaluable information about patients and their care journeys,such as arrival times, sources and times of admission andtimes and destinations of discharge. As in other healthcaremodelling projects, collecting the relevant modelling datapresented considerable challenges [57]. The first was the dearthof data about certain parameters that were not captured by theHIPE. (It is worth noting that the lack of relevant data caused asimilar project studying care of the elderly in the UK to alter itsobjectives from producing quantitative results to only buildinga simulation model [55].) The second challenge was that thedata was provided in aggregate figures e.g., the numbers ofpatients discharged to multiple destinations was combined intoa single number, while modelling inputs require such figuresto be broken down into their individual elements. The thirdproblem with data in this case was inconsistencies betweendifferent data sources, such as variations in figures betweenhospitals data and annual reports. After numerous extendedmeetings with hospital officials, the absence of certain dataand lack of information on how to decompose aggregatedfigures were overcome by the use of assumptions based onthe opinions of experts in the field [58]. Gaining a deeperunderstanding of what each figure reflected revealed that, inmost cases, misunderstandings of terminology or scope werethe reasons behind what seemed to be inconsistencies in thedata.
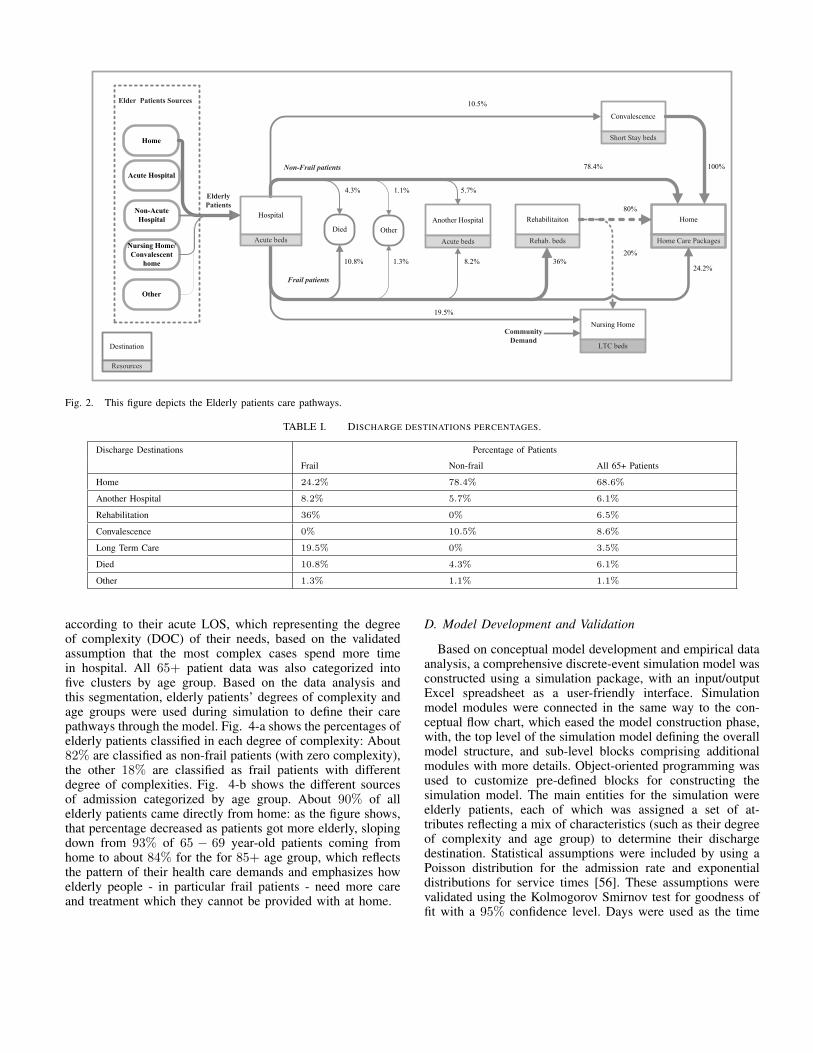
Patient information was extricated from the raw data bydata manipulation and reorganization, after which data analysiswas used to extrapolate important inputs for the model, suchas admission and discharge patterns, and to segment frailpatient data. The admission pattern of all elderly patients isshown in Fig. 3. Fig. 3-a shows the daily patients admissionhistogram distribution during 2010. More than 75% of dayssaw average daily admission rates of between 575 and 675elderly patients (average 587, standard deviation 88.26). Fig.3-b presents the monthly demand of patients as a percentageof the total annual demand, which shows the distribution ofdemand across the months is approximately uniform. Althoughadmission numbers for December are significantly lower thanfor other months - which may be due to demand decay duringthe Christmas holidays - demand levels return to normal inJanuary.
While these figures give an overview of the elderly caredemand pattern, it would be inaccurate to think all patientspresent the same demand characteristics: elderly patients’needs and the severity of those needs differ. Accordingly,it was essential to manipulate different admission patternsto reflect the characteristics and needs of different groupsof patients. Admission data were clustered to group frailpatients into five categories (coded numerically from 0 − 4)
Non-Frail patients
Community
Demand
Rehabilitaiton
Rehab. beds
Another Hospital
Acute beds
Home
Home Care Packages
Nursing Home
LTC beds
Convalescence
Short Stay beds
Destination
Resources
Frail patients
Hospital
Acute beds
Died Other
10.5%
4.3% 1.1% 5.7%
80%
20%
10.8% 1.3% 8.2% 36%24.2%
100%
19.5%
Acute Hospital
Home
Other
Nursing Home/
Convalescent
home
Non-Acute
Hospital
Elderly
Patients
Elder Patients Sources
78.4%
Fig. 2. This figure depicts the Elderly patients care pathways.
TABLE I. DISCHARGE DESTINATIONS PERCENTAGES.
Discharge Destinations Percentage of Patients
Frail Non-frail All 65+ Patients
Home 24.2% 78.4% 68.6%
Another Hospital 8.2% 5.7% 6.1%
Rehabilitation 36% 0% 6.5%
Convalescence 0% 10.5% 8.6%
Long Term Care 19.5% 0% 3.5%
Died 10.8% 4.3% 6.1%
Other 1.3% 1.1% 1.1%
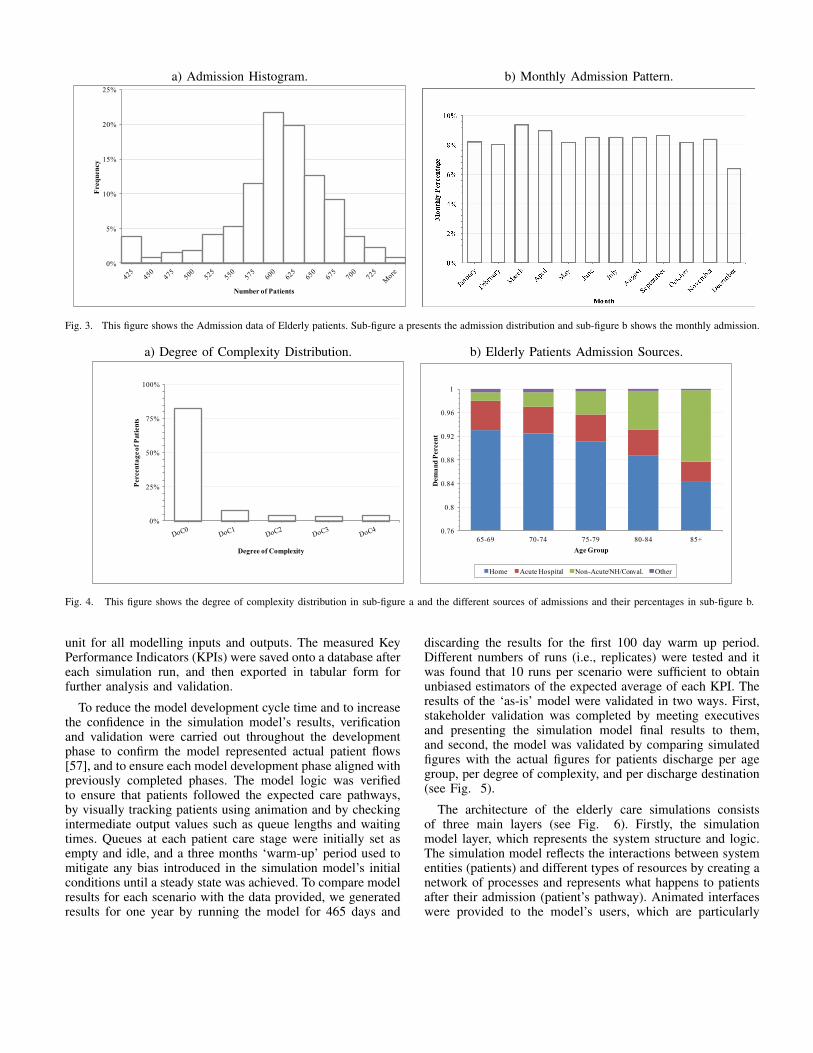
according to their acute LOS, which representing the degreeof complexity (DOC) of their needs, based on the validatedassumption that the most complex cases spend more timein hospital. All 65+ patient data was also categorized intofive clusters by age group. Based on the data analysis andthis segmentation, elderly patients’ degrees of complexity andage groups were used during simulation to define their carepathways through the model. Fig. 4-a shows the percentages ofelderly patients classified in each degree of complexity: About82% are classified as non-frail patients (with zero complexity),the other 18% are classified as frail patients with differentdegree of complexities. Fig. 4-b shows the different sourcesof admission categorized by age group. About 90% of allelderly patients came directly from home: as the figure shows,that percentage decreased as patients got more elderly, slopingdown from 93% of 65 − 69 year-old patients coming fromhome to about 84% for the for 85+ age group, which reflectsthe pattern of their health care demands and emphasizes howelderly people - in particular frail patients - need more careand treatment which they cannot be provided with at home.
D. Model Development and Validation
Based on conceptual model development and empirical dataanalysis, a comprehensive discrete-event simulation model wasconstructed using a simulation package, with an input/outputExcel spreadsheet as a user-friendly interface. Simulationmodel modules were connected in the same way to the con-ceptual flow chart, which eased the model construction phase,with, the top level of the simulation model defining the overallmodel structure, and sub-level blocks comprising additionalmodules with more details. Object-oriented programming wasused to customize pre-defined blocks for constructing thesimulation model. The main entities for the simulation wereelderly patients, each of which was assigned a set of at-tributes reflecting a mix of characteristics (such as their degreeof complexity and age group) to determine their dischargedestination. Statistical assumptions were included by using aPoisson distribution for the admission rate and exponentialdistributions for service times [56]. These assumptions werevalidated using the Kolmogorov Smirnov test for goodness offit with a 95% confidence level. Days were used as the time
a) Admission Histogram. b) Monthly Admission Pattern.
0%
5%
10%
15%
20%
25%F
req
uen
cy
Number of Patients
Fig. 3. This figure shows the Admission data of Elderly patients. Sub-figure a presents the admission distribution and sub-figure b shows the monthly admission.
a) Degree of Complexity Distribution. b) Elderly Patients Admission Sources.
0%
25%
50%
75%
100%
Percen
tag
e o
f P
ati
en
ts
Degree of Complexity
0.76
0.8
0.84
0.88
0.92
0.96
1
65-69 70-74 75-79 80-84 85+
Dem
an
d P
ercen
t
Age Group
Home Acute Hospital Non-Acute/NH/Conval. Other
Fig. 4. This figure shows the degree of complexity distribution in sub-figure a and the different sources of admissions and their percentages in sub-figure b.
unit for all modelling inputs and outputs. The measured KeyPerformance Indicators (KPIs) were saved onto a database aftereach simulation run, and then exported in tabular form forfurther analysis and validation.
To reduce the model development cycle time and to increasethe confidence in the simulation model’s results, verificationand validation were carried out throughout the developmentphase to confirm the model represented actual patient flows[57], and to ensure each model development phase aligned withpreviously completed phases. The model logic was verifiedto ensure that patients followed the expected care pathways,by visually tracking patients using animation and by checkingintermediate output values such as queue lengths and waitingtimes. Queues at each patient care stage were initially set asempty and idle, and a three months ‘warm-up’ period used tomitigate any bias introduced in the simulation model’s initialconditions until a steady state was achieved. To compare modelresults for each scenario with the data provided, we generatedresults for one year by running the model for 465 days and
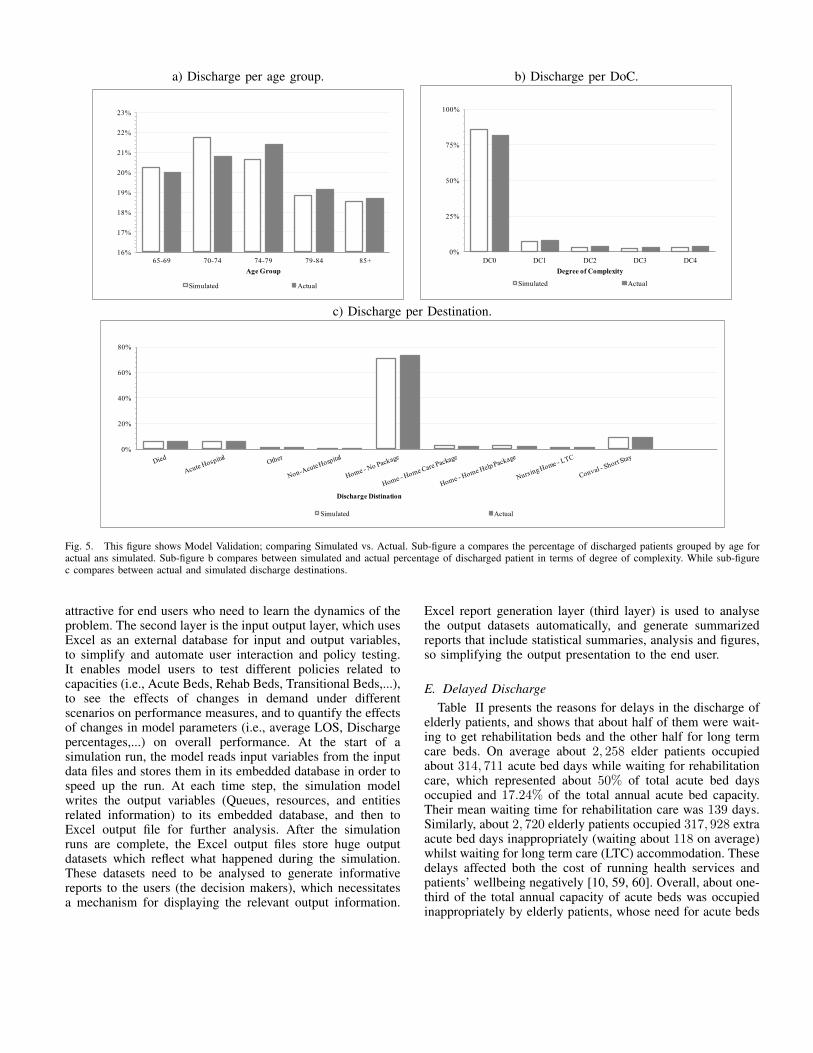
discarding the results for the first 100 day warm up period.Different numbers of runs (i.e., replicates) were tested and itwas found that 10 runs per scenario were sufficient to obtainunbiased estimators of the expected average of each KPI. Theresults of the ‘as-is’ model were validated in two ways. First,stakeholder validation was completed by meeting executivesand presenting the simulation model final results to them,and second, the model was validated by comparing simulatedfigures with the actual figures for patients discharge per agegroup, per degree of complexity, and per discharge destination(see Fig. 5).
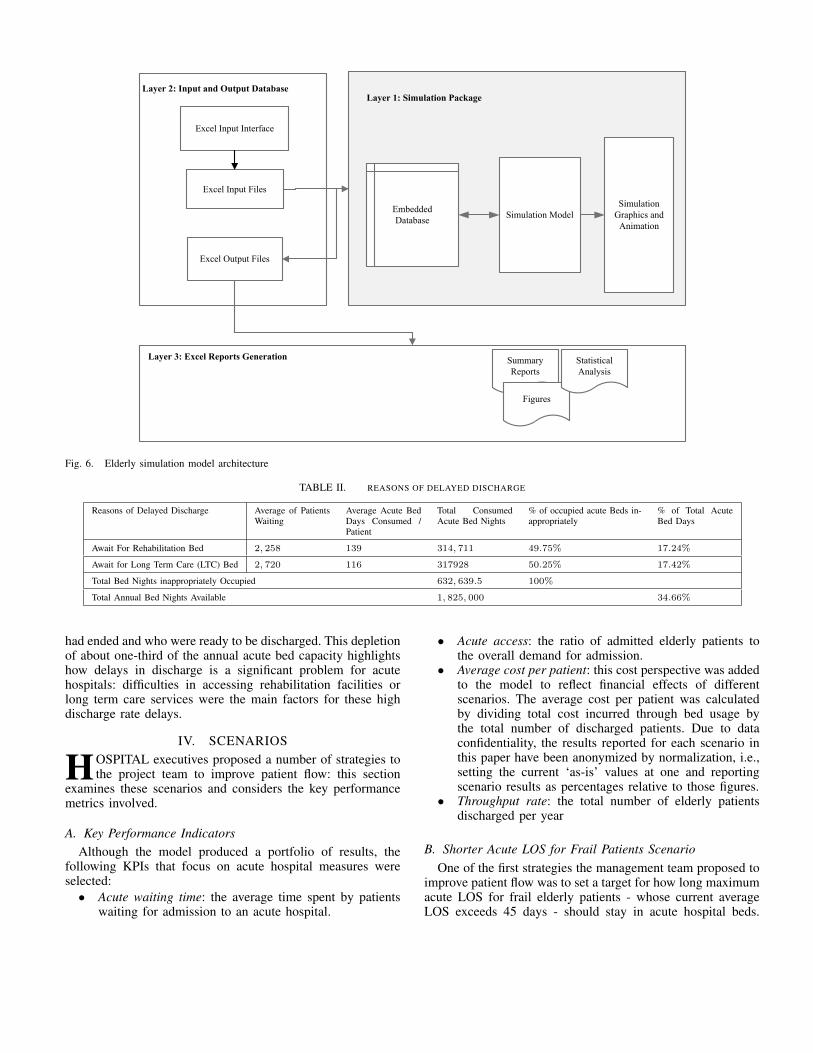
The architecture of the elderly care simulations consistsof three main layers (see Fig. 6). Firstly, the simulationmodel layer, which represents the system structure and logic.The simulation model reflects the interactions between systementities (patients) and different types of resources by creating anetwork of processes and represents what happens to patientsafter their admission (patient’s pathway). Animated interfaceswere provided to the model’s users, which are particularly
a) Discharge per age group. b) Discharge per DoC.
16%
17%
18%
19%
20%
21%
22%
23%
65-69 70-74 74-79 79-84 85+
Age Group
Simulated Actual
0%
25%
50%
75%
100%
DC0 DC1 DC2 DC3 DC4
Degree of Complexity
Simulated Actual
c) Discharge per Destination.
0%
20%
40%
60%
80%
Discharge Distination
Simulated Actual
Fig. 5. This figure shows Model Validation; comparing Simulated vs. Actual. Sub-figure a compares the percentage of discharged patients grouped by age foractual ans simulated. Sub-figure b compares between simulated and actual percentage of discharged patient in terms of degree of complexity. While sub-figurec compares between actual and simulated discharge destinations.
attractive for end users who need to learn the dynamics of theproblem. The second layer is the input output layer, which usesExcel as an external database for input and output variables,to simplify and automate user interaction and policy testing.It enables model users to test different policies related tocapacities (i.e., Acute Beds, Rehab Beds, Transitional Beds,...),to see the effects of changes in demand under differentscenarios on performance measures, and to quantify the effectsof changes in model parameters (i.e., average LOS, Dischargepercentages,...) on overall performance. At the start of asimulation run, the model reads input variables from the inputdata files and stores them in its embedded database in order tospeed up the run. At each time step, the simulation modelwrites the output variables (Queues, resources, and entitiesrelated information) to its embedded database, and then toExcel output file for further analysis. After the simulationruns are complete, the Excel output files store huge outputdatasets which reflect what happened during the simulation.These datasets need to be analysed to generate informativereports to the users (the decision makers), which necessitatesa mechanism for displaying the relevant output information.
Excel report generation layer (third layer) is used to analysethe output datasets automatically, and generate summarizedreports that include statistical summaries, analysis and figures,so simplifying the output presentation to the end user.
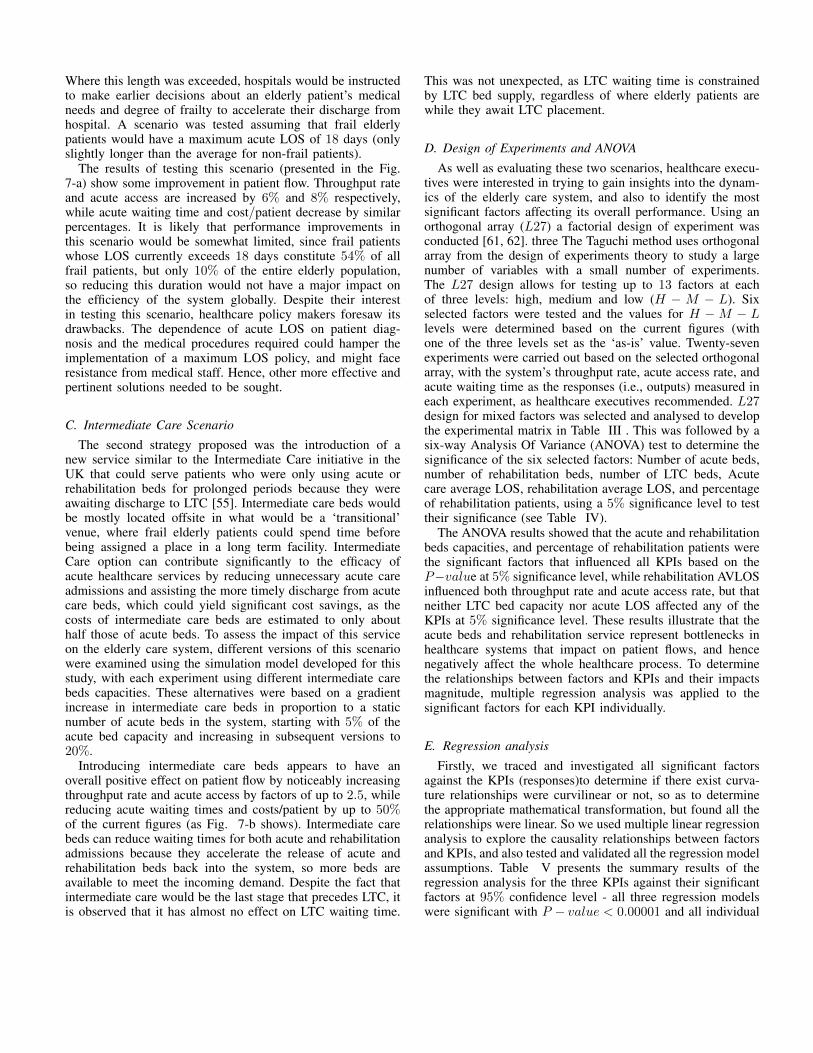
E. Delayed DischargeTable II presents the reasons for delays in the discharge of
elderly patients, and shows that about half of them were wait-ing to get rehabilitation beds and the other half for long termcare beds. On average about 2, 258 elder patients occupiedabout 314, 711 acute bed days while waiting for rehabilitationcare, which represented about 50% of total acute bed daysoccupied and 17.24% of the total annual acute bed capacity.Their mean waiting time for rehabilitation care was 139 days.Similarly, about 2, 720 elderly patients occupied 317, 928 extraacute bed days inappropriately (waiting about 118 on average)whilst waiting for long term care (LTC) accommodation. Thesedelays affected both the cost of running health services andpatients’ wellbeing negatively [10, 59, 60]. Overall, about one-third of the total annual capacity of acute beds was occupiedinappropriately by elderly patients, whose need for acute beds
Simulation ModelEmbedded
Database
Excel Input Files
Excel Output Files
Layer 1: Simulation Package
Summary
Reports
Simulation
Graphics and
Animation
Layer 3: Excel Reports Generation
Figures
Statistical
Analysis
Layer 2: Input and Output Database
Excel Input Interface
Fig. 6. Elderly simulation model architecture
TABLE II. REASONS OF DELAYED DISCHARGE
Reasons of Delayed Discharge Average of PatientsWaiting
Average Acute BedDays Consumed /Patient
Total ConsumedAcute Bed Nights
% of occupied acute Beds in-appropriately
% of Total AcuteBed Days
Await For Rehabilitation Bed 2, 258 139 314, 711 49.75% 17.24%
Await for Long Term Care (LTC) Bed 2, 720 116 317928 50.25% 17.42%
Total Bed Nights inappropriately Occupied 632, 639.5 100%
Total Annual Bed Nights Available 1, 825, 000 34.66%
had ended and who were ready to be discharged. This depletionof about one-third of the annual acute bed capacity highlightshow delays in discharge is a significant problem for acutehospitals: difficulties in accessing rehabilitation facilities orlong term care services were the main factors for these highdischarge rate delays.
IV. SCENARIOS
HOSPITAL executives proposed a number of strategies tothe project team to improve patient flow: this section
examines these scenarios and considers the key performancemetrics involved.
A. Key Performance IndicatorsAlthough the model produced a portfolio of results, the
following KPIs that focus on acute hospital measures wereselected:
• Acute waiting time: the average time spent by patientswaiting for admission to an acute hospital.
• Acute access: the ratio of admitted elderly patients tothe overall demand for admission.
• Average cost per patient: this cost perspective was addedto the model to reflect financial effects of differentscenarios. The average cost per patient was calculatedby dividing total cost incurred through bed usage bythe total number of discharged patients. Due to dataconfidentiality, the results reported for each scenario inthis paper have been anonymized by normalization, i.e.,setting the current ‘as-is’ values at one and reportingscenario results as percentages relative to those figures.
• Throughput rate: the total number of elderly patientsdischarged per year
B. Shorter Acute LOS for Frail Patients ScenarioOne of the first strategies the management team proposed to
improve patient flow was to set a target for how long maximumacute LOS for frail elderly patients - whose current averageLOS exceeds 45 days - should stay in acute hospital beds.
Where this length was exceeded, hospitals would be instructedto make earlier decisions about an elderly patient’s medicalneeds and degree of frailty to accelerate their discharge fromhospital. A scenario was tested assuming that frail elderlypatients would have a maximum acute LOS of 18 days (onlyslightly longer than the average for non-frail patients).
The results of testing this scenario (presented in the Fig.7-a) show some improvement in patient flow. Throughput rateand acute access are increased by 6% and 8% respectively,while acute waiting time and cost/patient decrease by similarpercentages. It is likely that performance improvements inthis scenario would be somewhat limited, since frail patientswhose LOS currently exceeds 18 days constitute 54% of allfrail patients, but only 10% of the entire elderly population,so reducing this duration would not have a major impact onthe efficiency of the system globally. Despite their interestin testing this scenario, healthcare policy makers foresaw itsdrawbacks. The dependence of acute LOS on patient diag-nosis and the medical procedures required could hamper theimplementation of a maximum LOS policy, and might faceresistance from medical staff. Hence, other more effective andpertinent solutions needed to be sought.
C. Intermediate Care ScenarioThe second strategy proposed was the introduction of a
new service similar to the Intermediate Care initiative in theUK that could serve patients who were only using acute orrehabilitation beds for prolonged periods because they wereawaiting discharge to LTC [55]. Intermediate care beds wouldbe mostly located offsite in what would be a ‘transitional’venue, where frail elderly patients could spend time beforebeing assigned a place in a long term facility. IntermediateCare option can contribute significantly to the efficacy ofacute healthcare services by reducing unnecessary acute careadmissions and assisting the more timely discharge from acutecare beds, which could yield significant cost savings, as thecosts of intermediate care beds are estimated to only abouthalf those of acute beds. To assess the impact of this serviceon the elderly care system, different versions of this scenariowere examined using the simulation model developed for thisstudy, with each experiment using different intermediate carebeds capacities. These alternatives were based on a gradientincrease in intermediate care beds in proportion to a staticnumber of acute beds in the system, starting with 5% of theacute bed capacity and increasing in subsequent versions to20%.
Introducing intermediate care beds appears to have anoverall positive effect on patient flow by noticeably increasingthroughput rate and acute access by factors of up to 2.5, whilereducing acute waiting times and costs/patient by up to 50%of the current figures (as Fig. 7-b shows). Intermediate carebeds can reduce waiting times for both acute and rehabilitationadmissions because they accelerate the release of acute andrehabilitation beds back into the system, so more beds areavailable to meet the incoming demand. Despite the fact thatintermediate care would be the last stage that precedes LTC, itis observed that it has almost no effect on LTC waiting time.
This was not unexpected, as LTC waiting time is constrainedby LTC bed supply, regardless of where elderly patients arewhile they await LTC placement.
D. Design of Experiments and ANOVA
As well as evaluating these two scenarios, healthcare execu-tives were interested in trying to gain insights into the dynam-ics of the elderly care system, and also to identify the mostsignificant factors affecting its overall performance. Using anorthogonal array (L27) a factorial design of experiment wasconducted [61, 62]. three The Taguchi method uses orthogonalarray from the design of experiments theory to study a largenumber of variables with a small number of experiments.The L27 design allows for testing up to 13 factors at eachof three levels: high, medium and low (H − M − L). Sixselected factors were tested and the values for H − M − Llevels were determined based on the current figures (withone of the three levels set as the ‘as-is’ value. Twenty-sevenexperiments were carried out based on the selected orthogonalarray, with the system’s throughput rate, acute access rate, andacute waiting time as the responses (i.e., outputs) measured ineach experiment, as healthcare executives recommended. L27design for mixed factors was selected and analysed to developthe experimental matrix in Table III . This was followed by asix-way Analysis Of Variance (ANOVA) test to determine thesignificance of the six selected factors: Number of acute beds,number of rehabilitation beds, number of LTC beds, Acutecare average LOS, rehabilitation average LOS, and percentageof rehabilitation patients, using a 5% significance level to testtheir significance (see Table IV).
The ANOVA results showed that the acute and rehabilitationbeds capacities, and percentage of rehabilitation patients werethe significant factors that influenced all KPIs based on theP−value at 5% significance level, while rehabilitation AVLOSinfluenced both throughput rate and acute access rate, but thatneither LTC bed capacity nor acute LOS affected any of theKPIs at 5% significance level. These results illustrate that theacute beds and rehabilitation service represent bottlenecks inhealthcare systems that impact on patient flows, and hencenegatively affect the whole healthcare process. To determinethe relationships between factors and KPIs and their impactsmagnitude, multiple regression analysis was applied to thesignificant factors for each KPI individually.
E. Regression analysis
Firstly, we traced and investigated all significant factorsagainst the KPIs (responses)to determine if there exist curva-ture relationships were curvilinear or not, so as to determinethe appropriate mathematical transformation, but found all therelationships were linear. So we used multiple linear regressionanalysis to explore the causality relationships between factorsand KPIs, and also tested and validated all the regression modelassumptions. Table V presents the summary results of theregression analysis for the three KPIs against their significantfactors at 95% confidence level - all three regression modelswere significant with P − value < 0.00001 and all individual
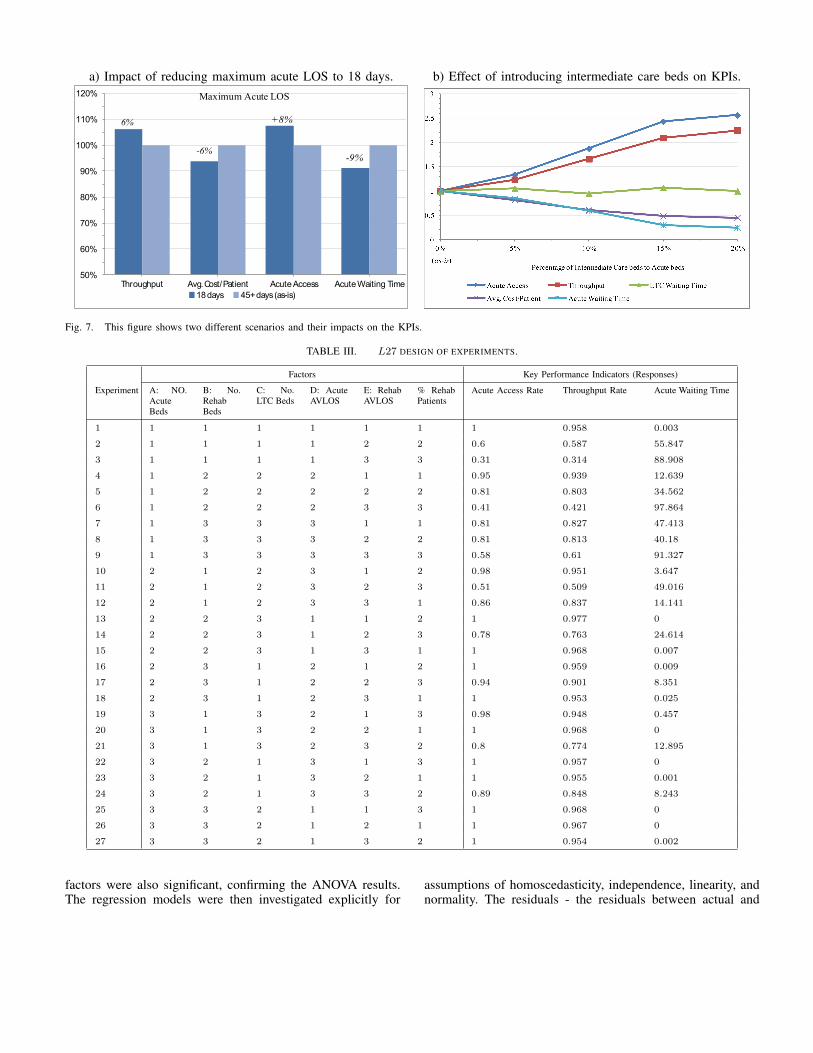
a) Impact of reducing maximum acute LOS to 18 days. b) Effect of introducing intermediate care beds on KPIs.
50%
60%
70%
80%
90%
100%
110%
120%
Throughput Avg. Cost/Patient Acute Access Acute Waiting Time
18 days 45+ days (as-is)
+8%
-9%
Maximum Acute LOS
-6%
6%
Fig. 7. This figure shows two different scenarios and their impacts on the KPIs.
TABLE III. L27 DESIGN OF EXPERIMENTS.
Factors Key Performance Indicators (Responses)
Experiment A: NO.AcuteBeds
B: No.RehabBeds
C: No.LTC Beds
D: AcuteAVLOS
E: RehabAVLOS
% RehabPatients
Acute Access Rate Throughput Rate Acute Waiting Time
1 1 1 1 1 1 1 1 0.958 0.003
2 1 1 1 1 2 2 0.6 0.587 55.847
3 1 1 1 1 3 3 0.31 0.314 88.908
4 1 2 2 2 1 1 0.95 0.939 12.639
5 1 2 2 2 2 2 0.81 0.803 34.562
6 1 2 2 2 3 3 0.41 0.421 97.864
7 1 3 3 3 1 1 0.81 0.827 47.413
8 1 3 3 3 2 2 0.81 0.813 40.18
9 1 3 3 3 3 3 0.58 0.61 91.327
10 2 1 2 3 1 2 0.98 0.951 3.647
11 2 1 2 3 2 3 0.51 0.509 49.016
12 2 1 2 3 3 1 0.86 0.837 14.141
13 2 2 3 1 1 2 1 0.977 0
14 2 2 3 1 2 3 0.78 0.763 24.614
15 2 2 3 1 3 1 1 0.968 0.007
16 2 3 1 2 1 2 1 0.959 0.009
17 2 3 1 2 2 3 0.94 0.901 8.351
18 2 3 1 2 3 1 1 0.953 0.025
19 3 1 3 2 1 3 0.98 0.948 0.457
20 3 1 3 2 2 1 1 0.968 0
21 3 1 3 2 3 2 0.8 0.774 12.895
22 3 2 1 3 1 3 1 0.957 0
23 3 2 1 3 2 1 1 0.955 0.001
24 3 2 1 3 3 2 0.89 0.848 8.243
25 3 3 2 1 1 3 1 0.968 0
26 3 3 2 1 2 1 1 0.967 0
27 3 3 2 1 3 2 1 0.954 0.002
factors were also significant, confirming the ANOVA results.The regression models were then investigated explicitly for
assumptions of homoscedasticity, independence, linearity, andnormality. The residuals - the residuals between actual and
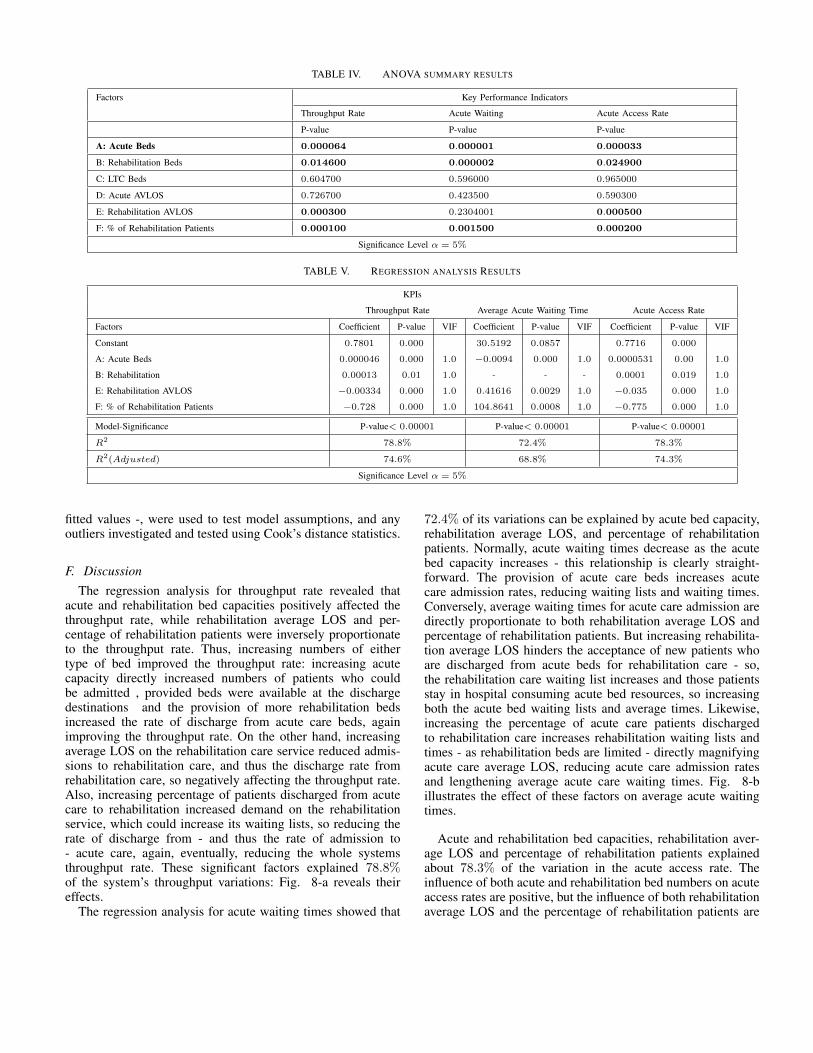
TABLE IV. ANOVA SUMMARY RESULTS
Factors Key Performance Indicators
Throughput Rate Acute Waiting Acute Access Rate
P-value P-value P-value
A: Acute Beds 0.000064 0.000001 0.000033
B: Rehabilitation Beds 0.014600 0.000002 0.024900
C: LTC Beds 0.604700 0.596000 0.965000
D: Acute AVLOS 0.726700 0.423500 0.590300
E: Rehabilitation AVLOS 0.000300 0.2304001 0.000500
F: % of Rehabilitation Patients 0.000100 0.001500 0.000200
Significance Level α = 5%
TABLE V. REGRESSION ANALYSIS RESULTS
KPIs
Throughput Rate Average Acute Waiting Time Acute Access Rate
Factors Coefficient P-value VIF Coefficient P-value VIF Coefficient P-value VIF
Constant 0.7801 0.000 30.5192 0.0857 0.7716 0.000
A: Acute Beds 0.000046 0.000 1.0 −0.0094 0.000 1.0 0.0000531 0.00 1.0
B: Rehabilitation 0.00013 0.01 1.0 - - - 0.0001 0.019 1.0
E: Rehabilitation AVLOS −0.00334 0.000 1.0 0.41616 0.0029 1.0 −0.035 0.000 1.0
F: % of Rehabilitation Patients −0.728 0.000 1.0 104.8641 0.0008 1.0 −0.775 0.000 1.0
Model-Significance P-value< 0.00001 P-value< 0.00001 P-value< 0.00001
R2 78.8% 72.4% 78.3%
R2(Adjusted) 74.6% 68.8% 74.3%
Significance Level α = 5%
fitted values -, were used to test model assumptions, and anyoutliers investigated and tested using Cook’s distance statistics.
F. DiscussionThe regression analysis for throughput rate revealed that
acute and rehabilitation bed capacities positively affected thethroughput rate, while rehabilitation average LOS and per-centage of rehabilitation patients were inversely proportionateto the throughput rate. Thus, increasing numbers of eithertype of bed improved the throughput rate: increasing acutecapacity directly increased numbers of patients who couldbe admitted , provided beds were available at the dischargedestinations and the provision of more rehabilitation bedsincreased the rate of discharge from acute care beds, againimproving the throughput rate. On the other hand, increasingaverage LOS on the rehabilitation care service reduced admis-sions to rehabilitation care, and thus the discharge rate fromrehabilitation care, so negatively affecting the throughput rate.Also, increasing percentage of patients discharged from acutecare to rehabilitation increased demand on the rehabilitationservice, which could increase its waiting lists, so reducing therate of discharge from - and thus the rate of admission to- acute care, again, eventually, reducing the whole systemsthroughput rate. These significant factors explained 78.8%of the system’s throughput variations: Fig. 8-a reveals theireffects.
The regression analysis for acute waiting times showed that
72.4% of its variations can be explained by acute bed capacity,rehabilitation average LOS, and percentage of rehabilitationpatients. Normally, acute waiting times decrease as the acutebed capacity increases - this relationship is clearly straight-forward. The provision of acute care beds increases acutecare admission rates, reducing waiting lists and waiting times.Conversely, average waiting times for acute care admission aredirectly proportionate to both rehabilitation average LOS andpercentage of rehabilitation patients. But increasing rehabilita-tion average LOS hinders the acceptance of new patients whoare discharged from acute beds for rehabilitation care - so,the rehabilitation care waiting list increases and those patientsstay in hospital consuming acute bed resources, so increasingboth the acute bed waiting lists and average times. Likewise,increasing the percentage of acute care patients dischargedto rehabilitation care increases rehabilitation waiting lists andtimes - as rehabilitation beds are limited - directly magnifyingacute care average LOS, reducing acute care admission ratesand lengthening average acute care waiting times. Fig. 8-billustrates the effect of these factors on average acute waitingtimes.
Acute and rehabilitation bed capacities, rehabilitation aver-age LOS and percentage of rehabilitation patients explainedabout 78.3% of the variation in the acute access rate. Theinfluence of both acute and rehabilitation bed numbers on acuteaccess rates are positive, but the influence of both rehabilitationaverage LOS and the percentage of rehabilitation patients are
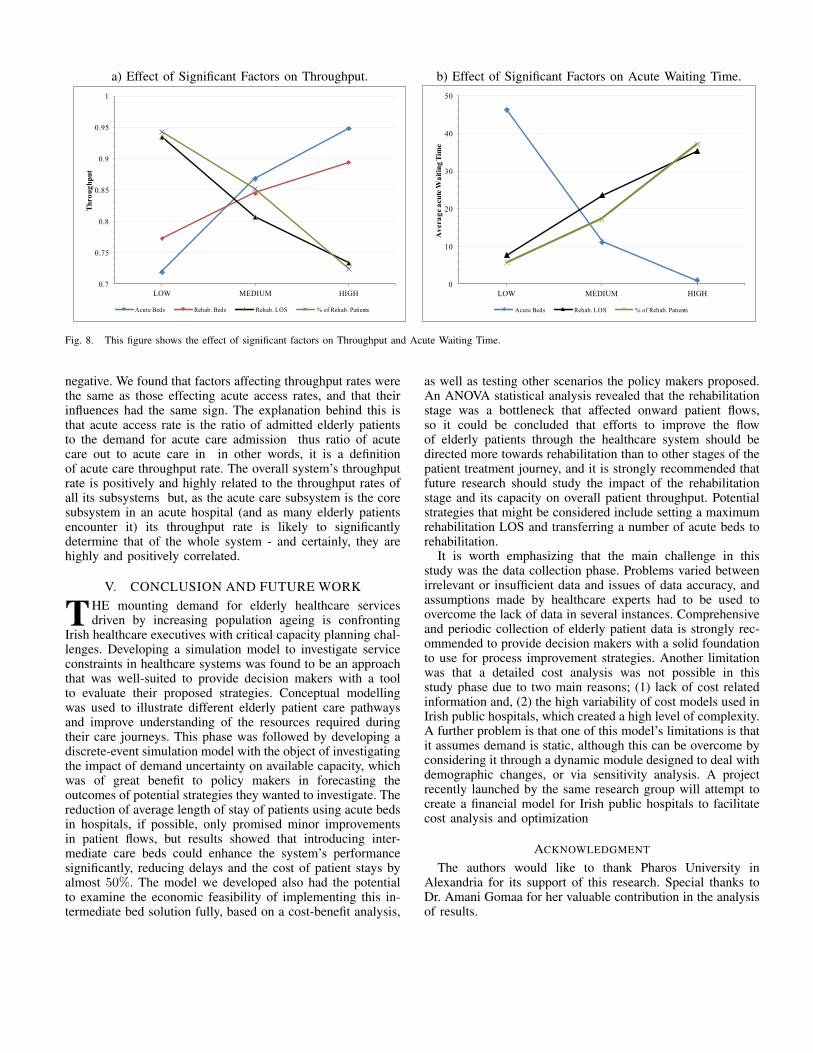
a) Effect of Significant Factors on Throughput. b) Effect of Significant Factors on Acute Waiting Time.
0.7
0.75
0.8
0.85
0.9
0.95
1
LOW MEDIUM HIGH
Throughput
Acute Beds Rehab. Beds Rehab. LOS % of Rehab. Patients
0
10
20
30
40
50
LOW MEDIUM HIGH
Av
era
ge a
cu
te W
ait
ing T
ime
Acute Beds Rehab. LOS % of Rehab. Patients
Fig. 8. This figure shows the effect of significant factors on Throughput and Acute Waiting Time.
negative. We found that factors affecting throughput rates werethe same as those effecting acute access rates, and that theirinfluences had the same sign. The explanation behind this isthat acute access rate is the ratio of admitted elderly patientsto the demand for acute care admission thus ratio of acutecare out to acute care in in other words, it is a definitionof acute care throughput rate. The overall system’s throughputrate is positively and highly related to the throughput rates ofall its subsystems but, as the acute care subsystem is the coresubsystem in an acute hospital (and as many elderly patientsencounter it) its throughput rate is likely to significantlydetermine that of the whole system - and certainly, they arehighly and positively correlated.
V. CONCLUSION AND FUTURE WORK
THE mounting demand for elderly healthcare servicesdriven by increasing population ageing is confronting
Irish healthcare executives with critical capacity planning chal-lenges. Developing a simulation model to investigate serviceconstraints in healthcare systems was found to be an approachthat was well-suited to provide decision makers with a toolto evaluate their proposed strategies. Conceptual modellingwas used to illustrate different elderly patient care pathwaysand improve understanding of the resources required duringtheir care journeys. This phase was followed by developing adiscrete-event simulation model with the object of investigatingthe impact of demand uncertainty on available capacity, whichwas of great benefit to policy makers in forecasting theoutcomes of potential strategies they wanted to investigate. Thereduction of average length of stay of patients using acute bedsin hospitals, if possible, only promised minor improvementsin patient flows, but results showed that introducing inter-mediate care beds could enhance the system’s performancesignificantly, reducing delays and the cost of patient stays byalmost 50%. The model we developed also had the potentialto examine the economic feasibility of implementing this in-termediate bed solution fully, based on a cost-benefit analysis,
as well as testing other scenarios the policy makers proposed.An ANOVA statistical analysis revealed that the rehabilitationstage was a bottleneck that affected onward patient flows,so it could be concluded that efforts to improve the flowof elderly patients through the healthcare system should bedirected more towards rehabilitation than to other stages of thepatient treatment journey, and it is strongly recommended thatfuture research should study the impact of the rehabilitationstage and its capacity on overall patient throughput. Potentialstrategies that might be considered include setting a maximumrehabilitation LOS and transferring a number of acute beds torehabilitation.
It is worth emphasizing that the main challenge in thisstudy was the data collection phase. Problems varied betweenirrelevant or insufficient data and issues of data accuracy, andassumptions made by healthcare experts had to be used toovercome the lack of data in several instances. Comprehensiveand periodic collection of elderly patient data is strongly rec-ommended to provide decision makers with a solid foundationto use for process improvement strategies. Another limitationwas that a detailed cost analysis was not possible in thisstudy phase due to two main reasons; (1) lack of cost relatedinformation and, (2) the high variability of cost models used inIrish public hospitals, which created a high level of complexity.A further problem is that one of this model’s limitations is thatit assumes demand is static, although this can be overcome byconsidering it through a dynamic module designed to deal withdemographic changes, or via sensitivity analysis. A projectrecently launched by the same research group will attempt tocreate a financial model for Irish public hospitals to facilitatecost analysis and optimization
ACKNOWLEDGMENT
The authors would like to thank Pharos University inAlexandria for its support of this research. Special thanks toDr. Amani Gomaa for her valuable contribution in the analysisof results.
REFERENCES
[1] M. Ragab, W. Abo-Hamad, and A. Arisha, "Capacity Planning for Elderly Care in Ireland Using Simluation Modeling," in SIMUL, Lisbon, Portugal, 2012.
[2] R. C. McDermid and S. M. Bagshaw, "ICU and critical care outreach for the elderly," Best practice & research. Clinical anaesthesiology, vol. 25, pp. 439-49, Sep 2011.
[3] WHO, "10 facts on ageing and the life course." vol. 2012, 2011.
[4] R. D. Piers, I. J. van Eechoud, S. Van Camp, M. Grypdonck, M. Deveugele, N. C. Verbeke, and N. J. Van Den Noortgate, "Advance Care Planning in terminally ill and frail older persons," Patient education and counseling, Aug 1 2011.
[5] HSE, "Annual Report and Financial Statements." vol. 2012, 2010.
[6] P. Connell and L. Pringle, "Population Ageing in Ireland," Dublin: National Council on Ageing and Older People, 2004.
[7] S. Thomas, C. Keegan, S. Barry, R. Layte, M. Jowett, C. Portela, and C. Normand, "Resilience of the Irish Health System: Surviving and utilising the economic contraction Year 1 Report of the Resilience Project," Centre for Health Policy and Management, Trinity College Dublin., Dublin 2012.
[8] HSE, "Performance Report. http://www.hse.ie/eng/services/Publications/corporate/performancereports/November_2010_Performance_Report.pdf," November, 2010.
[9] G. Liotta, S. Mancinelli, P. Scarcella, and L. Emberti Gialloreti, "Determinants of acute hospital care use by elderly patients in Italy from 1996 to 2006," Archives of gerontology and geriatrics, Sep 5 2011.
[10] M. Majeed, D. Williams, R. Pollock, F. Amir, M. Liam, K. Foong, and C. Whitaker, "Delay in discharge and its impact on unnecessary hospital bed occupancy," BMC Health Services Research, vol. 12, p. 410, 2012.
[11] V. F. Nieva and J. Sorra, "Safety culture assessment: a tool for improving patient safety in healthcare organizations," Quality and Safety in Health Care, vol. 12, p. ii17, 2003.
[12] D. M. Fatovich, Y. Nagree, and P. Sprivulis, "Access block causes emergency department overcrowding and ambulance diversion in Perth, Western Australia," Emergency Medicine Journal, vol. 22, p. 351, 2005.
[13] J. Sterman, Business Dynamics: System Thinking and Modeling for a Complex World.: Boston:Irwin/McGraw Hill., 2004.
[14] M. C. Cai, X. G. Yang, and J. Z. Zhang, "The complexity analysis of the inverse center location problem," Journal of Global Optimization, vol. 15, pp. 213-218, 1999.
[15] C. H. Papadimitriou and K. Steiglitz, Combinatorial optimization: algorithms and complexity: Dover Pubns, 1998.
[16] E. Baker and M. Fisher, "Computational results for very large air crew scheduling problems," Omega, vol. 9, pp. 613-618, 1981.
[17] P. M. Senge, "The Fifth Discipline: The Art and Practice of the Learning Organization: Book review," 1993.
[18] J. D. Sterman, "System Dynamics Modeling," California management review, vol. 43, p. 8, 2001.
[19] J. D. Sterman, "Learning in and about complex systems," System Dynamics Review, vol. 10, pp. 291-330, 1994.
[20] H. A. Simon, "Bounded rationality and organizational learning," Organization science, vol. 2, pp. 125-134, 1991.
[21] J. Conlisk, "Why bounded rationality?," Journal of economic literature, vol. 34, pp. 669-700, 1996.
[22] J. D. Sterman, "Misperceptions of feedback in dynamic decision making," Organizational behavior and human decision processes, vol. 43, pp. 301-335, 1989a.
[23] J. D. Sterman, "Modeling managerial behavior: Misperceptions of feedback in a dynamic decision making experiment," Management science, pp. 321-339, 1989b.
[24] R. Davies and H. T. O. Davies, "Modelling patient flows and resource provision in health systems," Omega, vol. 22, pp. 123-131, 1994.
[25] K. Ismail, W. Abo-Hamad, and A. Arisha, "Integrating balanced scorecard and simulation modeling to improve Emergency Department performance in Irish hospitals," 2010, pp. 2340-2351.
[26] A. M. Law and W. D. Kelton, Simulation modeling and analysis, 3 ed. vol. 2: McGraw Hill Boston, MA, 2000.
[27] J. Banks, J. S. Carson, B. L. Nelson, and D. M. Nicol, Discrete event system simulation, 3rd ed: Prentice Hall, Upper Saddle River, NJ., 2001.
[28] M. A. Ahmed and T. M. Alkhamis, "Simulation optimization for an emergency department healthcare unit in Kuwait," European Journal of Operational Research, vol. 198, pp. 936-942, 2009.
[29] N. Xiao, R. Sharman, H. R. Rao, and S. Dutta, "A simulation based study for managing hospital emergency department's capacity in extreme events," International Journal of Business Excellence, vol. 5, pp. 140-154, 2012.
[30] J. Jun, S. Jacobson, and J. Swisher, "Application of discrete-event simulation in health care clinics: A survey," Journal of the Operational Research Society, vol. 50, pp. 109-123, 1999.
[31] A. P. Wierzbicki, "Modelling as a way of organising knowledge," European journal of operational research, vol. 176, pp. 610-635, 2007.
[32] P. R. Harper, A. K. Shahani, J. E. Gallagher, and C. Bowie, "Planning health services with explicit geographical considerations: a stochastic location-allocation approach," Omega, vol. 33, pp. 141-152, 2005.
[33] J. E. Stahl, D. Rattner, R. Wiklund, J. Lester, M. Beinfeld, and G. S. Gazelle, "Reorganizing the system of care surrounding laparoscopic surgery: a cost-effectiveness analysis using discrete-event simulation," Medical decision making, vol. 24, p. 461, 2004.
[34] T. Eldabi, R. J. Paul, and T. Young, "Simulation modelling in healthcare: reviewing legacies and investigating futures," Journal of the Operational Research Society, vol. 58, pp. 262-270, 2006.
[35] J. B. Jun, S. H. Jacobson, and J. R. Swisher, "Application of discrete-event simulation in health care clinics: A survey," Journal of the Operational Research Society, vol. 50, pp. 109-123, 1999.
[36] R. Davies, S. Brailsford, P. Roderick, C. Canning, and D. Crabbe, "Using simulation modelling for evaluating screening services for diabetic retinopathy," Journal of the Operational Research Society, pp. 476-484, 2000.
[37] D. Fone, S. Hollinghurst, M. Temple, A. Round, N. Lester, A. Weightman, K. Roberts, E. Coyle, G. Bevan, and S. Palmer, "Systematic review of the use and value of computer simulation modelling in population health and health care delivery," Journal of Public Health, vol. 25, p. 325, 2003.
[38] P. R. Harper and H. M. Gamlin, "Reduced outpatient waiting times with improved appointment scheduling: a simulation modelling approach," Or Spectrum, vol. 25, pp. 207-222, 2003.
[39] J. R. Swisher and S. H. Jacobson, "Evaluating the design of a family practice healthcare clinic using discrete-event simulation," Health Care Management Science, vol. 5, pp. 75-88, 2002.
[40] J. C. Ridge, S. K. Jones, M. S. Nielsen, and A. K. Shahani, "Capacity planning for intensive care units," European Journal of Operational Research, vol. 105, pp. 346-355, 1998.
[41] J. Oddoye, D. Jones, M. Tamiz, and P. Schmidt, "Combining simulation and goal programming for healthcare planning in a medical assessment unit," European Journal of Operational Research, vol. 193, pp. 250-261, 2009.
[42] A. Ingolfsson, E. Erkut, and S. Budge, "Simulation of single start station for Edmonton EMS," Journal of the Operational Research Society, pp. 736-746, 2003.
[43] C. T. R. CooRdinaToRs, "LIVINDHOME Living independantly at home Reforms in home care in 9 European countries," SFI – The Danish National Centre for Social Research, Copenhagen 2011.
[44] G. W. Harrison, A. Shafer, and M. Mackay, "Modelling variability in hospital bed occupancy," Health Care Management Science, vol. 8, pp. 325-334, 2005.
[45] A. Bagust and J. W. Posnett, "Dynamics of bed use in accommodating emergency admissions: stochastic simulation model," BMJ, vol. 319, pp. 155-158, 1999.
[46] D. M. Ferrin, M. J. Miller, and D. L. McBroom, "Maximizing hospital finanacial impact and emergency department throughput with simulation," in Proceedings of the 39th conference on Winter simulation: 40 years! The best is yet to come, 2007, pp. 1566-1573.
[47] W. Abo-Hamad and A. Arisha, "Simulation-based Framework to Improve Patient Experience in an Emergency Department," European Journal of Operational Research, 2013.
[48] J. P. M. Arnaout and S. Kulbashian, "Maximizing the utilization of operating rooms with stochastic times using simulation," in Winter Simulation Conference, 2008, pp. 1617-1623.
[49] J. E. Stahl, D. Rattner, R. Wiklund, J. Lester, M. Beinfeld, and G. S. Gazelle, "Reorganizing the system of care surrounding laparoscopic surgery: a cost-effectiveness analysis using discrete-event simulation," Medical decision making, vol. 24, pp. 461-471, 2004.
[50] M. Thorwarth, A. Arisha, and P. Harper, "Simulation model to investigate flexible workload management for healthcare and servicescape environment," 2009, pp. 1946-1956.
[51] P. R. Harper, "A framework for operational modelling of hospital resources," Health Care Management Science, vol. 5, pp. 165-173, Aug 2002.
[52] D. Retzlaff-Roberts and S. Ezelle, "A simulation case study of patient flow at the University of South Alabama Medical Center," in Winter Simulation Conference, 2007, pp. 2391-2391.
[53] M. M. Gunal and M. Pidd, "Interconnected DES models of emergency, outpatient, and inpatient departments of a hospital," in Winter Simulation Conference, 2007, pp. 1461-1466.
[54] J. A. Paul and G. Hariharan, "Hospital capacity planning for efficient disaster mitigation during a bioterrorist attack," 2007, pp. 1139-1147.
[55] K. Katsaliaki, S. Brailsford, D. Browning, and P. Knight, "Mapping care pathways for the elderly," Journal of Health Organisation and Management, vol. 19, pp. 57-72, 2005.
[56] Y. Zhang, M. L. Puterman, M. Nelson, and D. Atkins, "A Simulation Optimization Approach for Long-Term Care
Capacity Planning," Working Paper, University of British Columbia 2010.
[57] S. D. Roberts, "TUTORIAL ON THE SIMULATION OF HEALTHCARE SYSTEMS," in Proceedings of the 2011 Winter Simulation Conference, 2011, pp. 1403-1414.
[58] C. R. Standridge, "A tutorial on simulation in health care: applications issues," in The 31st conference on Winter simulation, 1999, pp. 49-55.
[59] A. P. Costa, J. W. Poss, T. Peirce, and J. P. Hirdes, "Acute care inpatients with long-term delayed-discharge: evidence from a Canadian health region," BMC Health Services Research, vol. 12, p. 172, 2012.
[60] P. Gallagher, N. O’Callaghan, and C. Henry, "Do relatives of elderly patients block the discharge process?," Instructions for Authors, vol. 105, 2012.
[61] G. Taguchi and S. Konishi, Orthogonal arrays and linear graphs: tools for quality engineering: American Supplier Institute Allen Park, MI, 1987.
[62] F. F. Baesler, H. E. Jahnsen, and M. DaCosta, "The use of simulation and design of experiments for estimating maximum capacity in an emergency room," 2003, pp. 1903-1906.