Using Halpha Morphology and Surface Brightness Fluctuations to Age-date Star Clusters in M83
33
arXiv:1103.4026v1 [astro-ph.GA] 21 Mar 2011 Using Hα Morphology and Surface Brightness Fluctuations to Age-Date Star Clusters in M83 Bradley C. Whitmore, 1 Rupali Chandar, 2 Hwihyun Kim, 3 Catherine Kaleida, 3 Max Mutchler, 1 Daniela Calzetti, 4 Abhijit Saha, 5 Robert O’Connell, 6 Bruce Balick, 7 Howard E. Bond, 1 Marcella Carollo, 8 Michael J. Disney, 9 Michael A. Dopita, 10 Jay A. Frogel, 11 Donald N. B. Hall, 12 Jon A. Holtzman, 13 Randy A. Kimble, 14 Patrick J. McCarthy, 15 Francesco Paresce, 16 Joseph I. Silk, 17 John T. Trauger, 18 Alistair R. Walker, 19 Rogier A. Windhorst, 3 and Erick T. Young 20 [email protected] 1 Space Telescope Science Institute, Baltimore, MD, USA 2 Department of Physics & Astronomy, The University of Toledo, Toledo, OH 43606 3 School of Earth and Space Exploration, Arizona State University, Tempe, AZ 85287-1404, USA 4 Department of Astronomy, University of Massachusetts, Amherst, MA 01003, USA 5 NOAO, Tucson, AZ 85726-6732, USA 6 Department of Astronomy, University of Virginia, Charlottesville, VA 22904-4325, USA 7 Department of Astronomy, University of Washington, Seattle, WA 98195-1580, USA 8 Institute of Astronomy, ETH-Zurich, Zurich, 8093 Switzerland 9 Department of Physics and Astronomy, Cardiff University, Cardiff CF24 3AA, UK 10 Research School of Astronomy & Astrophysics, The Australian National University, Cotter Road, Weston Creek, ACT 2611, Australia 11 AURA, Washington, DC 20005, USA 12 Institute for Astronomy, Honolulu, HI 96822, USA 13 New Mexico State University, Las Cruces, NM 88003, USA 14 Goddard Space Flight Center, Greenbelt, MD 20771, USA 15 Carnegie Institute of Washington, Pasadena, CA 91101-1292, USA 16 Istituto di Astrofisica Spaziale e Fisica Cosmica, INAF, Via Gobetti 101, 40129, Bologna, Italy 17 Department of Physics, University of Oxford, Oxford OX1 3PU, UK 18 NASA JPL, Pasadena, CA 91109, USA 19 Cerro Tololo Inter-American Observatory, La Serena, Chile 20 NASA–Ames Research Center, Moffett Field, CA 94035, USA
Transcript of Using Halpha Morphology and Surface Brightness Fluctuations to Age-date Star Clusters in M83
arX
iv:1
103.
4026
v1 [
astr
o-ph
.GA
] 2
1 M
ar 2
011
Using Hα Morphology and Surface Brightness Fluctuations to
Age-Date Star Clusters in M83
Bradley C. Whitmore,1 Rupali Chandar,2 Hwihyun Kim,3 Catherine Kaleida,3
Max Mutchler,1 Daniela Calzetti,4 Abhijit Saha,5 Robert O’Connell,6 Bruce Balick,7
Howard E. Bond,1 Marcella Carollo,8 Michael J. Disney,9 Michael A. Dopita,10
Jay A. Frogel,11 Donald N. B. Hall,12 Jon A. Holtzman,13 Randy A. Kimble,14
Patrick J. McCarthy,15 Francesco Paresce,16 Joseph I. Silk,17 John T. Trauger,18
Alistair R. Walker,19 Rogier A. Windhorst,3 and Erick T. Young20
1Space Telescope Science Institute, Baltimore, MD, USA
2Department of Physics & Astronomy, The University of Toledo, Toledo, OH 43606
3School of Earth and Space Exploration, Arizona State University, Tempe, AZ 85287-1404, USA
4Department of Astronomy, University of Massachusetts, Amherst, MA 01003, USA
5NOAO, Tucson, AZ 85726-6732, USA
6Department of Astronomy, University of Virginia, Charlottesville, VA 22904-4325, USA
7Department of Astronomy, University of Washington, Seattle, WA 98195-1580, USA
8Institute of Astronomy, ETH-Zurich, Zurich, 8093 Switzerland
9Department of Physics and Astronomy, Cardiff University, Cardiff CF24 3AA, UK
10Research School of Astronomy & Astrophysics, The Australian National University, Cotter Road, Weston
Creek, ACT 2611, Australia
11AURA, Washington, DC 20005, USA
12Institute for Astronomy, Honolulu, HI 96822, USA
13New Mexico State University, Las Cruces, NM 88003, USA
14Goddard Space Flight Center, Greenbelt, MD 20771, USA
15Carnegie Institute of Washington, Pasadena, CA 91101-1292, USA
16Istituto di Astrofisica Spaziale e Fisica Cosmica, INAF, Via Gobetti 101, 40129, Bologna, Italy
17Department of Physics, University of Oxford, Oxford OX1 3PU, UK
18NASA JPL, Pasadena, CA 91109, USA
19Cerro Tololo Inter-American Observatory, La Serena, Chile
20NASA–Ames Research Center, Moffett Field, CA 94035, USA
– 2 –
ABSTRACT
We use new WFC3 observations of the nearby grand design spiral galaxy M83
to develop two independent methods for estimating the ages of young star clus-
ters. The first method uses the physical extent and morphology of Hα emission to
estimate the ages of clusters younger than τ ≈ 10 Myr. It is based on the simple
premise that the gas in very young (τ < few Myr) clusters is largely coincident
with the cluster stars, is in a small, ring-like structure surrounding the stars in
slightly older clusters since massive star winds and supernovae have had time to
push out the natal gas (e.g., τ ≈ 5 Myr), and is in a larger ring-like bubble for still
older clusters (i.e., ≈ 5–10 Myr). If no Hα is associated with a cluster it is older
than ≈ 10 Myr. The second method is based on an observed relation between
pixel-to-pixel flux variations within clusters and their ages. This method relies
on the fact that the brightest individual stars in a cluster are most prominent
at ages around 10 Myr, and fall below the detection limit (i.e., MV < −3.5) for
ages older than about 100 Myr. Older clusters therefore have a smoother ap-
pearance and smaller pixel-to-pixel variations. The youngest clusters also have
lower flux variations, hence the relationship is double valued. This degeneracy
in age can be broken using other age indicators such as Hα morphology. These
two methods are the basis for a new morphological classification system which
can be used to estimate the ages of star clusters based on their appearance.
We compare previous age estimates of clusters in M83 determined from fitting
UBVIHα measurements using predictions from stellar evolutionary models with
our new morphological categories and find good agreement at the ≈ 95% level.
The scatter within categories is ≈ 0.1 dex in log τ for young clusters (<10 Myr)
and ≈ 0.5 dex for older (>10 Myr) clusters. A by-product of this study is the
identification of 22 “single-star” HII regions in M83, with central stars having
ages ≈ 4 Myr.
Subject headings: galaxies: individual (M83) — galaxies: star clusters: general
— HII regions — ISM: bubbles — stars: formation
1. Introduction
Age estimates are required for studying the evolutionary history of star clusters. Based
on such age estimates, a general framework has been developed starting from formation
within the dense cores of giant molecular clouds (GMCs); a stage where the young stars are
– 3 –
completely obscured by their dusty gas cocoons; an emerging stage where the clusters become
visible in the infrared (IR) and then visible in the optical as stellar winds and supernovae
blow away the gas and dust; a stage where an expanding bubble of ionized gas is blown; and
later stages with no evidence of ionized gas (e.g., see the Lada & Lada 2003 review article).
In the past, two general methods for estimating the ages of unresolved extragalactic star
clusters have been used. The first requires obtaining high quality spectroscopic observations
covering wavelength regions of lines which change as a function of time. Examples of this
approach include Bica & Alloin (1986), Schweizer & Seitzer (1993), Whitmore et al. (1999),
Bastian et al. (2009) and Wofford et al. (2010). While these spectroscopic observations
typically provide high quality age determinations, they are limited to age-dating relatively
small numbers of bright clusters due to constraints on the brightness of clusters that can be
observed spectroscopically in a reasonable amount of time. The standard method for age-
dating large numbers of extra-galactic clusters compares photometry in several broadband
filters (e.g., UBVI ) with predictions from population synthesis models (e.g., Chandar et al.
2010).
Comparisons of age estimates using spectroscopic and photometric observations of the
same clusters show good agreement in most cases. An early example of this is the famous
Searle et al. (1980) paper where they compare integrated four-filter ugvr photometry of
61 star clusters in the Magellanic Clouds with the strength of different spectral features
(e.g., Balmer lines, G band, etc.) A recent example is Wofford et al. (2010) who compared
ages estimated from spectral energy distribution (SED) fitting with those derived from UV
spectroscopy for 14 young (τ <∼ 30 Myr) clusters in the nuclear starburst region of M83
and found that the photometric ages are within a factor of 1.4 of the spectroscopic ones.
Whitmore et al. (2010) find similar agreement between their photometric age estimates
and the spectroscopic estimates from Bastian et al. (2009) for clusters in the Antennae
galaxies. While generally satisfactory, both the spectroscopic and photometric techniques
have limitations. It is therefore important to develop independent methods for estimating
the ages of clusters, especially for cases where spectroscopic or multi-band photometric
observations are not available and it is necessary to estimate ages based on morphological
appearance alone.
Here, we develop two new methods for estimating the ages of young star clusters in
nearby galaxies based on high-resolution images at optical wavelengths. The first method
uses the morphology of the ionized gas and its position relative to the cluster stars, as
measured from narrowband Hα emission, to estimate ages (τ) for clusters younger than
τ <∼ 10 Myr. This method relies on the general premise that the distribution of Hα will be
largely coincident with the distribution of optical light in the youngest clusters (i.e., < few
– 4 –
Myr), will be in a small ring-like structure around the optical stellar emission in slightly
older clusters where massive star winds and supernovae have had time to blow a bubble (i.e.,
5 ≈ Myr), and will be in a larger ring-like bubble for still older clusters (i.e., 5–10 Myr).
Many past observational and theoretical studies of HII regions and “supershells” in the
Milky Way and nearby galaxies have laid the groundwork for this method. For example,
Walborn (2002; see also Walborn & Parker 1992 and especially Walborn 2010 for related
discussions) outlined an evolutionary cluster sequence based on observed properties of several
well known clusters and OB associations in the Milky Way with ages ranging from ≈ 1 Myr
to ≈ 10 Myr. This sequence was then used to illustrate observed changes with age in the
visually brightest stars, in the ionized gas and dust content, and in the existence of red
supergiants. Much of this sequence was based on spectroscopy of individual stars. While we
are unable to make similarly detailed observations at the distance of M83, many of the same
basic correlations and underlying physical processes are relevant for the age sequence outlined
in this paper. Theoretically, several works have made predictions for the size evolution of
an expanding HII region over time. Oey & Clark (1997, 1998) model the size evolution due
to mass loss and supernova-injected energy from cluster stars, and assume that expanding
bubbles “stall” when their internal pressure equals the ambient pressure in the ISM. These
simulations predict a strong dependence of bubble size on both the age and mass of the
central cluster. (e.g., Weaver et al. 1977, Oey & Massey 1995, Oey & Garcia-Segura 2004,
Dopita et al. 2006a, 2006b). Our observations of clusters in M83 reveal a strong dependence
of bubble size on cluster age, and possibly a weak dependence on cluster mass, as discussed
in Section 6.
The second method developed in this paper uses the surface brightness fluctuations of
cluster stars to estimate their ages. Young clusters have strong pixel-to-pixel flux variations,
due to the presence of massive, luminous stars. As a cluster ages, the bright, short-lived
massive stars disappear, and these fluctuations fade in strength. This technique is especially
useful in the range τ ≈ 10–100 Myr, ages that can be somewhat difficult to deal with using
the SED method, because the predicted integrated colors loop back on themselves.
Our primary target for this study is the spiral galaxy M83. At a distance of 4.5 Mpc
(corresponding to a distance modulus of m − M = 28.28; Thim et al. 2003, and a pixel
scale of 0.876 pc pixel−1), M83, nicknamed the “Southern Pinwheel,” is the nearest massive
grand-design spiral galaxy. It is a slightly barred galaxy, with a Hubble type SAB(s)c (3RC).
In this work, we make use of observations taken with the Wide-Field Camera 3 (WFC3),
which were described in detail in Dopita et al. (2010) and Chandar et al. (2010). Briefly,
the observations are part of the Early Release Science project 1 (ERS1) program 11360 (PI:
O’Connell) and were taken in August, 2009. Observations were taken in several broadband
– 5 –
(“UV” - F225W, “U” - F336W, “B” - F438W, “V” - F555W, “I” - F814W, “J” - F110W,
and “H” - F160W), and narrowband filters ([OIII] - F373N, Hβ - F487N, [OII] F502N, Hα
- F657N, [SII] - F673N, Paschenβ - F128N, and [FeII] - F164N). In the Appendix we briefly
investigate clusters in M51 and find that the age versus morphological category relationship
derived for M83 is appropriate for this galaxy as well.
This paper is organized as follows: In Section 2 we outline our working scheme for
an evolutionary cluster classification system based on observables at optical wavelengths. In
Section 3 we investigate the correlation between Hαmorphology and SED age estimates while
Section 4 examines the correlation between the strength of surface brightness fluctuations
within clusters and their ages. A catalog of smaller HII regions, apparently ionized by “single
stars,” is presented in Section 5. We examine the effect of cluster mass on Hα bubble size
in Section 6, and summarize our primary results in Section 7.
2. An Evolutionary Classification Scheme Based on Observables at Optical
Wavelengths
The early formative stages of star cluster evolution are best studied in the IR or mi-
crowave part of the spectrum, since the stars remain embedded in their placental dust cocoons
for the first million years or so (Lada & Lada 2003). For example, in nearby groups and
clusters in the Milky Way, individual young stellar objects (YSOs) can be age-dated using
a classification scheme ranging from category 0 to III, as developed by Wilking et al. (1989)
and Andre et al. (1993), based on near-IR observations.
In this paper we outline a working classification scheme for cluster evolution in external
galaxies. We focus on the later stages based on the optical portion of the spectrum. Our
primary goals are to test how well we can use Hα morphology and surface brightness fluc-
tuations to age date star clusters. The basic categories are defined below. In all cases we
assume that the clusters have radial profiles that are broader than the point-spread function
(PSF), hence confusion with individual stars is not a major issue (see Chandar et al. 2010).
Examples of clusters in categories 3 through 6 are shown in Figure 1. M83 clusters in cat-
egories 1 and 2 will be discussed in a later paper which presents our WFC3 observations in
the J and H bands.
Category 1: opaque dust cloud - core of a GMC - dark region on optical image with no
associated IR/UVIS source - often studied using millimeter observations of the HCN line
(e.g., Gao & Solomon 2004)
– 6 –
Category 2a: - embedded cluster - weak IR source with no optical (I band) counterpart
(i.e., Av > 10) - no ionized Hα gas visible
Category 2b: - obscured cluster - strong IR and weak optical source (3 < Av < 10)
Category 3: - emerging cluster - ionized gas spatially coincident with cluster stars - cluster
has a reddish color due to dust - surface brightness fluctuations from individual stars are
relatively small since the brightest, evolved stars have not yet appeared
Category 4a: - very young cluster - ionized gas in a small bubble surrounding the cluster
- cluster has a bluish color since most of the dust has been expelled - surface brightness
fluctuations from individual stars are strong
Category 4b: - young cluster - similar to category 4a but the ionized gas is now in a
large bubble surrounding the cluster (i.e., radii larger than approximately 20 pc) - surface
brightness fluctuations from individual stars reach maximum
Category 5a: - young/intermediate-age cluster - no ionized gas is observed - surface
brightness fluctuations are still present, but weaker
Category 5b: - intermediate-age cluster - ionized gas and surface brightness fluctuations
among cluster stars are not observed - cluster has a slightly redder color due to aging of stars
Category 6: - old cluster - no ionized gas or surface brightness fluctuations among cluster
stars are observed, - cluster appears yellow/red with no evidence of dust in vicinity
3. Hα Morphology as an Age Indicator for τ <∼
10 Myr Clusters
3.1. General Trends
In principle, it should be possible to approximately estimate the ages of young (τ <∼10 Myr) star clusters from the size of the ionized gas (Hα) bubble that surrounds them, as
outlined in Sections 1 and 2. In this section we test this idea by selecting a representative
catalog of young clusters primarily based on their apprearance in the narrowband Hα image
(i.e., the red color in Figure 2), and then visually classify each source based on the scheme
outlined in Section 2. Each region is then matched with the apparent central source of
ionization from the Chandar et al. (2010) catalog, and compared with the ages from that
paper based on SED fitting of the UBVIHα bands. We do not, at this point, separate the
– 7 –
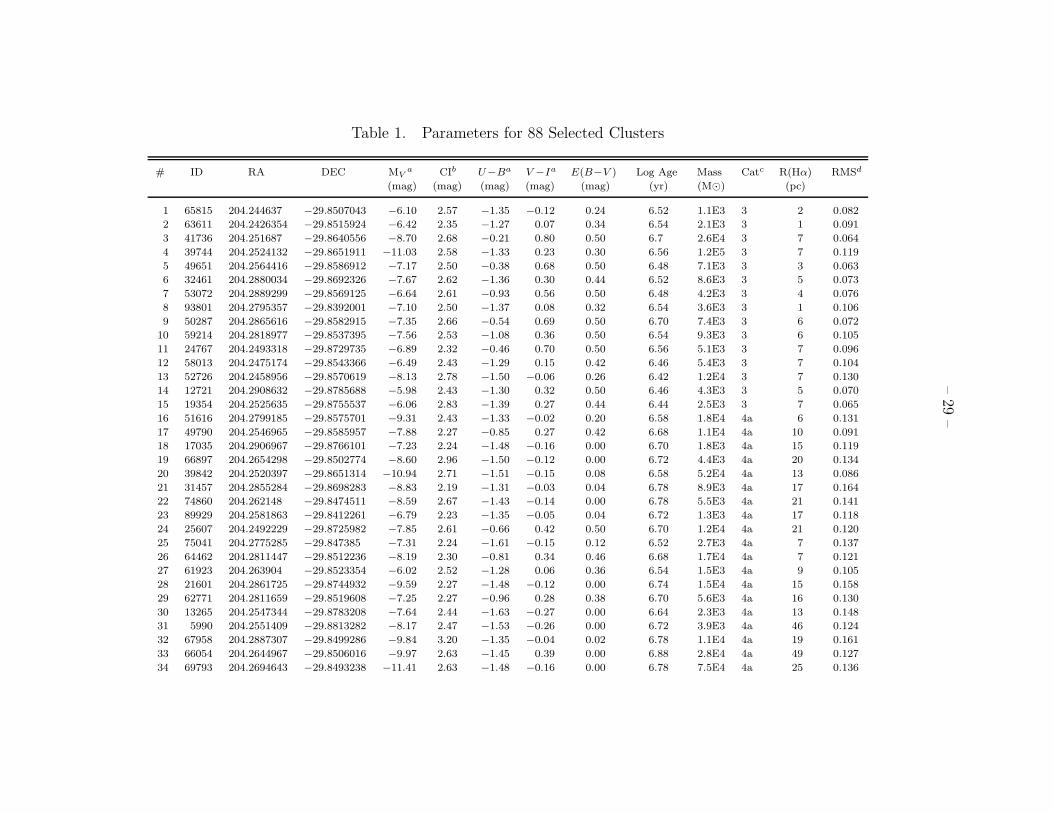
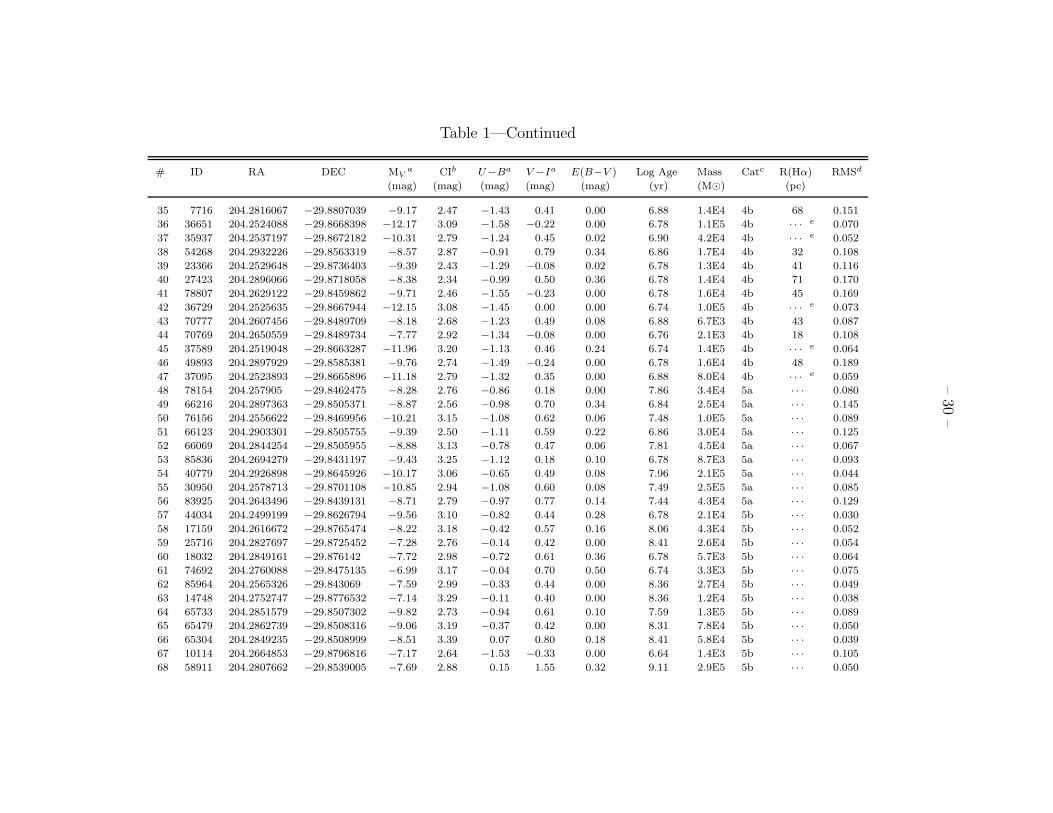
clusters by mass (the effect of cluster mass on bubble size is discussed in Section 6). Basic
properties of the selected clusters are presented in Table 1, including position (RA and decl.)
and photometric measurements (MV , V −I, and U−B) for the central cluster.
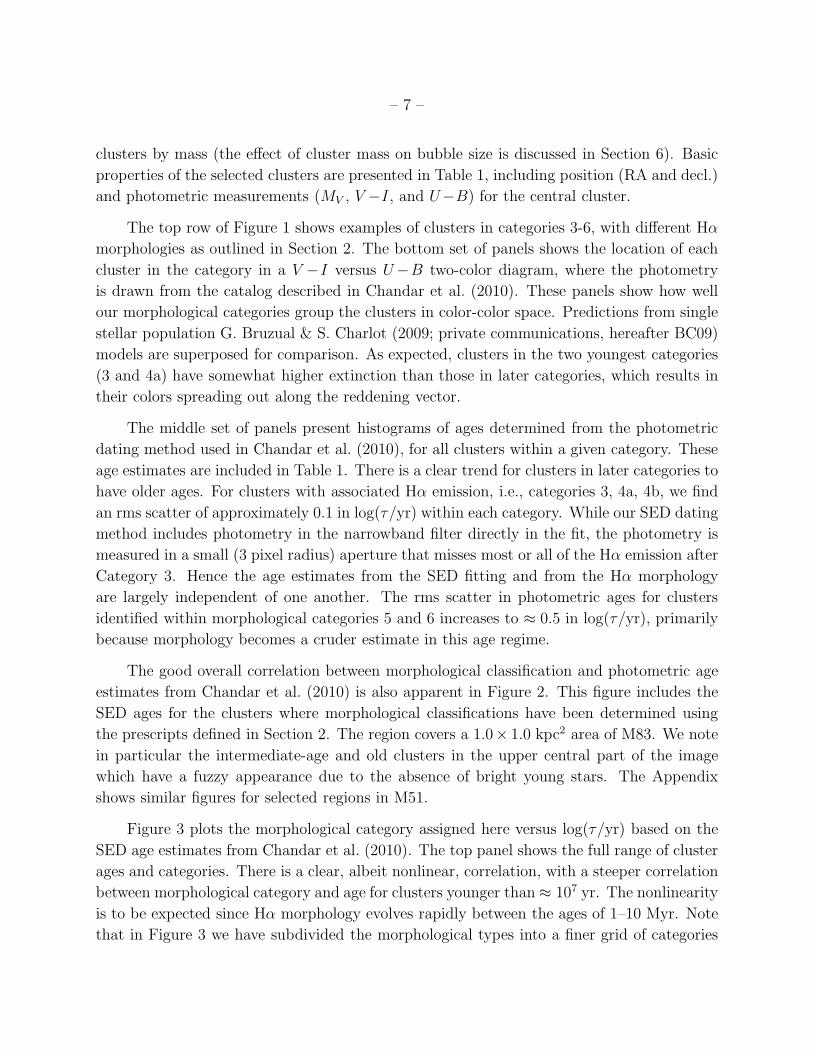
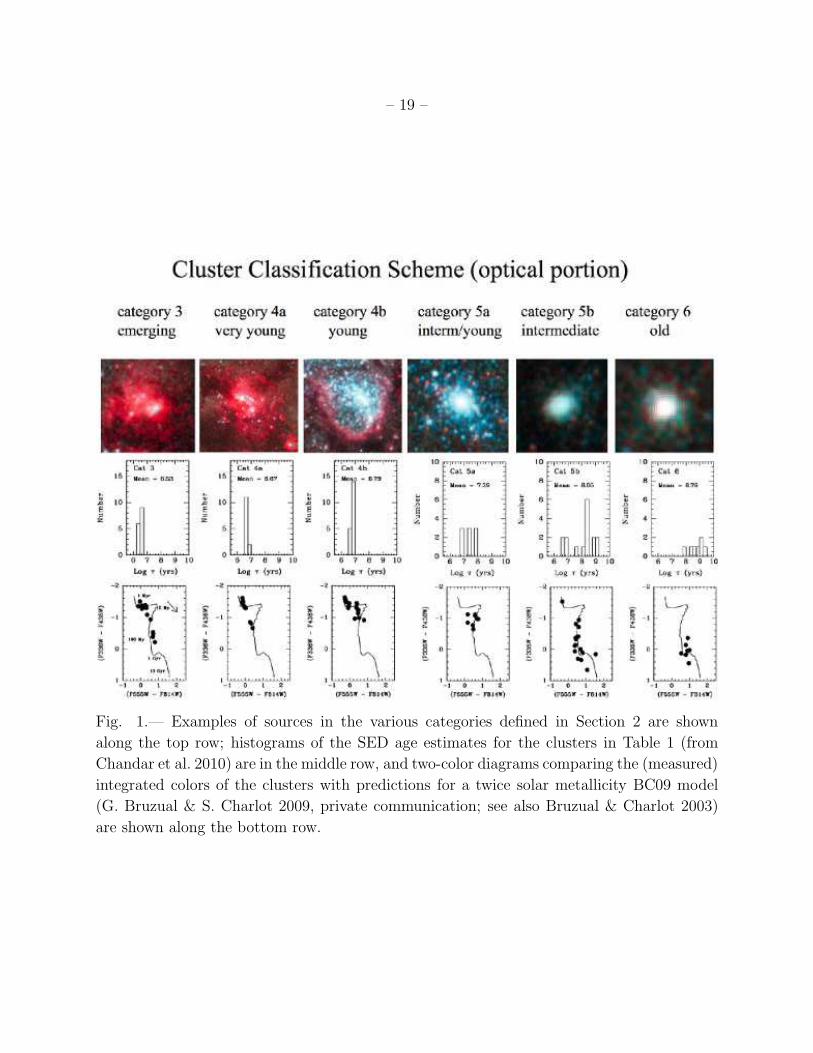
The top row of Figure 1 shows examples of clusters in categories 3-6, with different Hα
morphologies as outlined in Section 2. The bottom set of panels shows the location of each
cluster in the category in a V −I versus U−B two-color diagram, where the photometry
is drawn from the catalog described in Chandar et al. (2010). These panels show how well
our morphological categories group the clusters in color-color space. Predictions from single
stellar population G. Bruzual & S. Charlot (2009; private communications, hereafter BC09)
models are superposed for comparison. As expected, clusters in the two youngest categories
(3 and 4a) have somewhat higher extinction than those in later categories, which results in
their colors spreading out along the reddening vector.
The middle set of panels present histograms of ages determined from the photometric
dating method used in Chandar et al. (2010), for all clusters within a given category. These
age estimates are included in Table 1. There is a clear trend for clusters in later categories to
have older ages. For clusters with associated Hα emission, i.e., categories 3, 4a, 4b, we find
an rms scatter of approximately 0.1 in log(τ/yr) within each category. While our SED dating
method includes photometry in the narrowband filter directly in the fit, the photometry is
measured in a small (3 pixel radius) aperture that misses most or all of the Hα emission after
Category 3. Hence the age estimates from the SED fitting and from the Hα morphology
are largely independent of one another. The rms scatter in photometric ages for clusters
identified within morphological categories 5 and 6 increases to ≈ 0.5 in log(τ/yr), primarily
because morphology becomes a cruder estimate in this age regime.
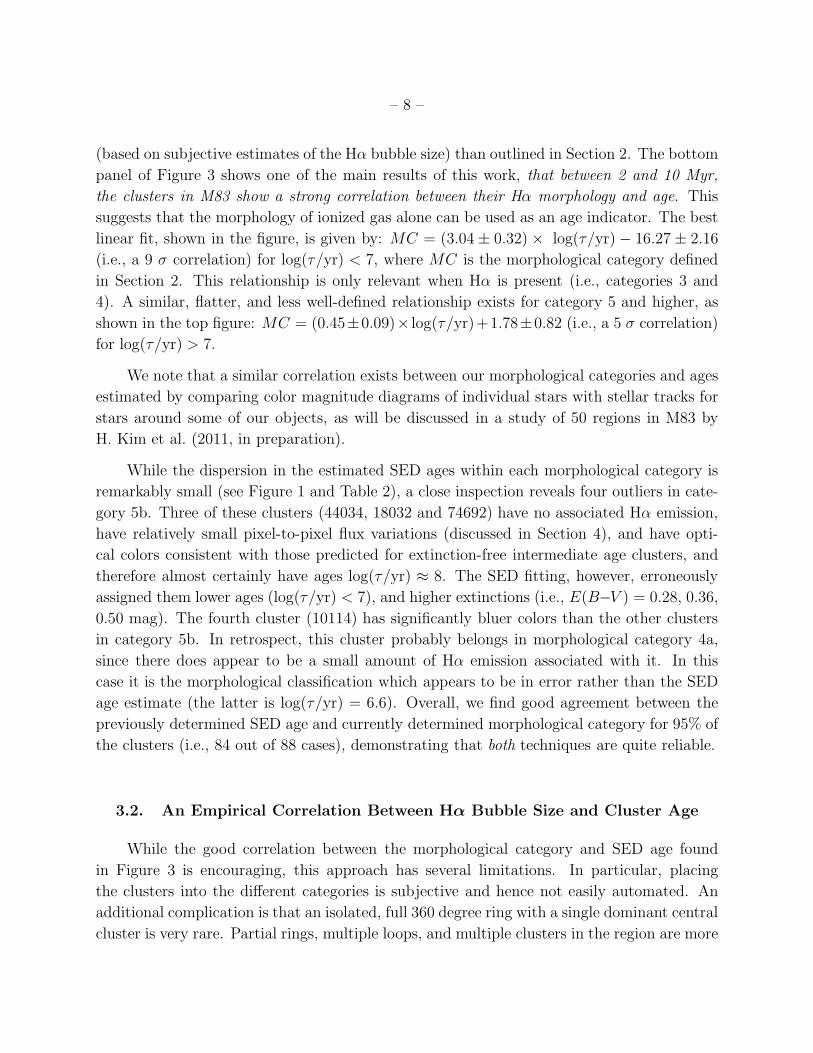
The good overall correlation between morphological classification and photometric age
estimates from Chandar et al. (2010) is also apparent in Figure 2. This figure includes the
SED ages for the clusters where morphological classifications have been determined using
the prescripts defined in Section 2. The region covers a 1.0× 1.0 kpc2 area of M83. We note
in particular the intermediate-age and old clusters in the upper central part of the image
which have a fuzzy appearance due to the absence of bright young stars. The Appendix
shows similar figures for selected regions in M51.
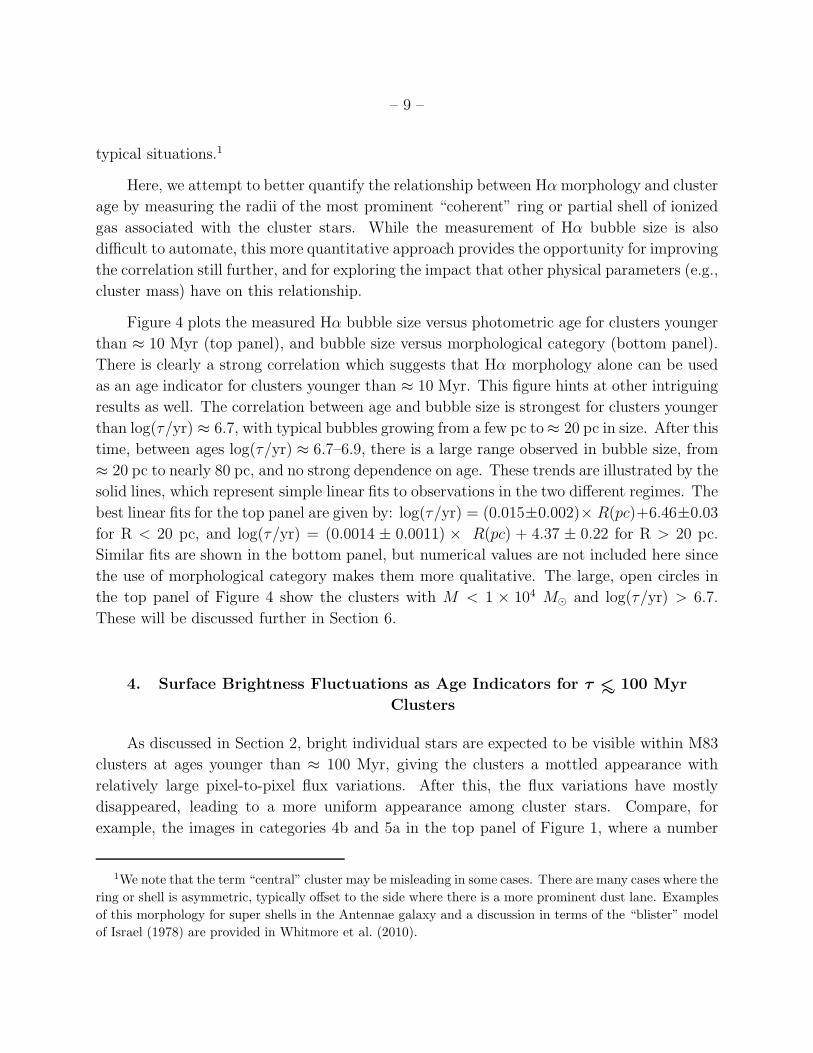
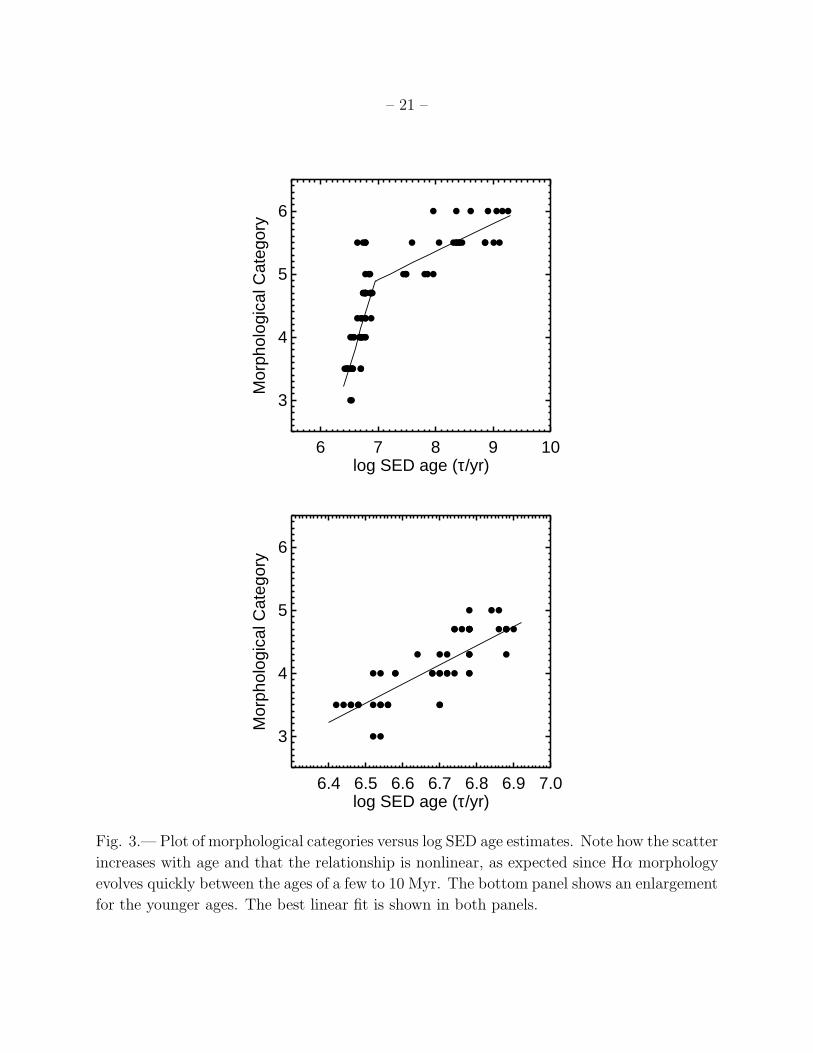
Figure 3 plots the morphological category assigned here versus log(τ/yr) based on the
SED age estimates from Chandar et al. (2010). The top panel shows the full range of cluster
ages and categories. There is a clear, albeit nonlinear, correlation, with a steeper correlation
between morphological category and age for clusters younger than≈ 107 yr. The nonlinearity
is to be expected since Hα morphology evolves rapidly between the ages of 1–10 Myr. Note
that in Figure 3 we have subdivided the morphological types into a finer grid of categories
– 8 –
(based on subjective estimates of the Hα bubble size) than outlined in Section 2. The bottom
panel of Figure 3 shows one of the main results of this work, that between 2 and 10 Myr,
the clusters in M83 show a strong correlation between their Hα morphology and age. This
suggests that the morphology of ionized gas alone can be used as an age indicator. The best
linear fit, shown in the figure, is given by: MC = (3.04± 0.32)× log(τ/yr)− 16.27 ± 2.16
(i.e., a 9 σ correlation) for log(τ/yr) < 7, where MC is the morphological category defined
in Section 2. This relationship is only relevant when Hα is present (i.e., categories 3 and
4). A similar, flatter, and less well-defined relationship exists for category 5 and higher, as
shown in the top figure: MC = (0.45±0.09)× log(τ/yr)+1.78±0.82 (i.e., a 5 σ correlation)
for log(τ/yr) > 7.
We note that a similar correlation exists between our morphological categories and ages
estimated by comparing color magnitude diagrams of individual stars with stellar tracks for
stars around some of our objects, as will be discussed in a study of 50 regions in M83 by
H. Kim et al. (2011, in preparation).
While the dispersion in the estimated SED ages within each morphological category is
remarkably small (see Figure 1 and Table 2), a close inspection reveals four outliers in cate-
gory 5b. Three of these clusters (44034, 18032 and 74692) have no associated Hα emission,
have relatively small pixel-to-pixel flux variations (discussed in Section 4), and have opti-
cal colors consistent with those predicted for extinction-free intermediate age clusters, and
therefore almost certainly have ages log(τ/yr) ≈ 8. The SED fitting, however, erroneously
assigned them lower ages (log(τ/yr) < 7), and higher extinctions (i.e., E(B−V ) = 0.28, 0.36,
0.50 mag). The fourth cluster (10114) has significantly bluer colors than the other clusters
in category 5b. In retrospect, this cluster probably belongs in morphological category 4a,
since there does appear to be a small amount of Hα emission associated with it. In this
case it is the morphological classification which appears to be in error rather than the SED
age estimate (the latter is log(τ/yr) = 6.6). Overall, we find good agreement between the
previously determined SED age and currently determined morphological category for 95% of
the clusters (i.e., 84 out of 88 cases), demonstrating that both techniques are quite reliable.
3.2. An Empirical Correlation Between Hα Bubble Size and Cluster Age
While the good correlation between the morphological category and SED age found
in Figure 3 is encouraging, this approach has several limitations. In particular, placing
the clusters into the different categories is subjective and hence not easily automated. An
additional complication is that an isolated, full 360 degree ring with a single dominant central
cluster is very rare. Partial rings, multiple loops, and multiple clusters in the region are more
– 9 –
typical situations.1
Here, we attempt to better quantify the relationship between Hαmorphology and cluster
age by measuring the radii of the most prominent “coherent” ring or partial shell of ionized
gas associated with the cluster stars. While the measurement of Hα bubble size is also
difficult to automate, this more quantitative approach provides the opportunity for improving
the correlation still further, and for exploring the impact that other physical parameters (e.g.,
cluster mass) have on this relationship.
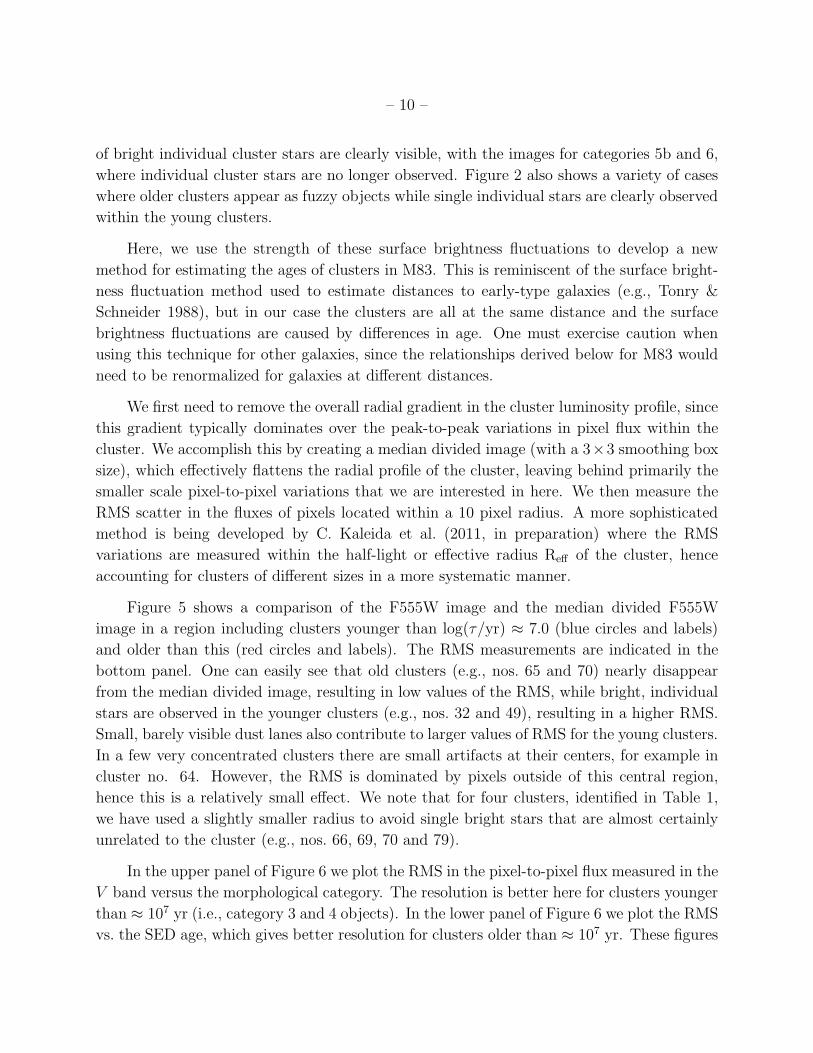
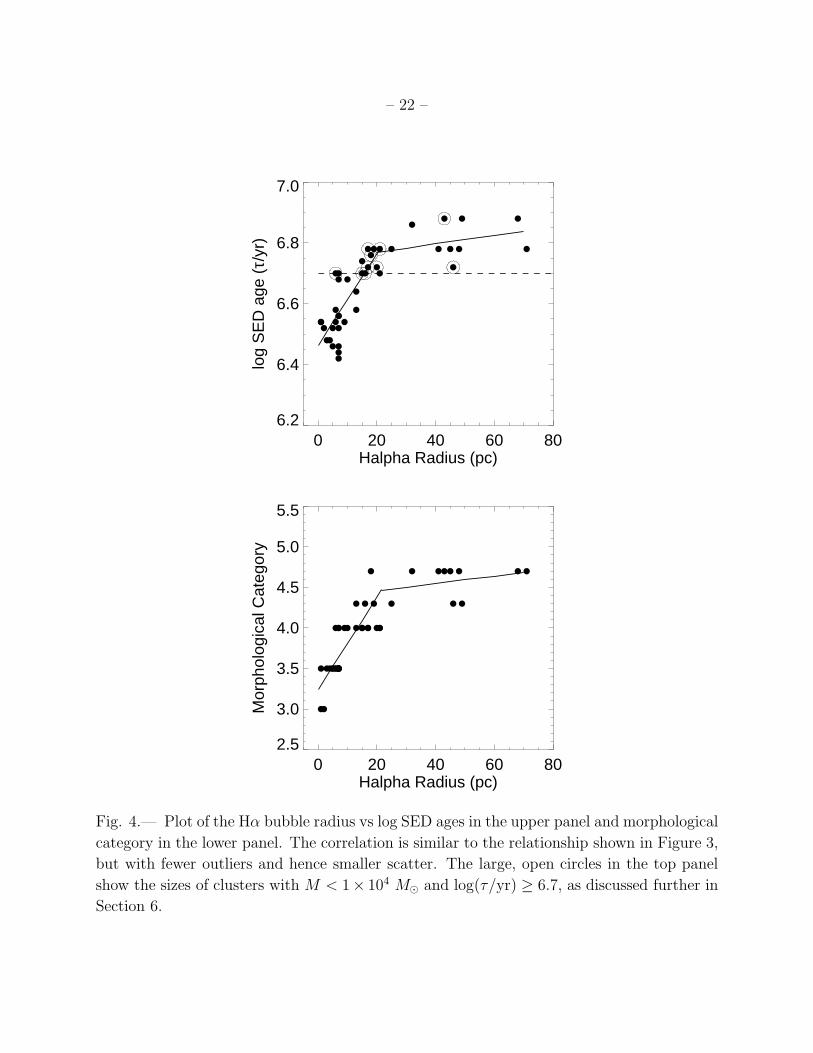
Figure 4 plots the measured Hα bubble size versus photometric age for clusters younger
than ≈ 10 Myr (top panel), and bubble size versus morphological category (bottom panel).
There is clearly a strong correlation which suggests that Hα morphology alone can be used
as an age indicator for clusters younger than ≈ 10 Myr. This figure hints at other intriguing
results as well. The correlation between age and bubble size is strongest for clusters younger
than log(τ/yr) ≈ 6.7, with typical bubbles growing from a few pc to≈ 20 pc in size. After this
time, between ages log(τ/yr) ≈ 6.7–6.9, there is a large range observed in bubble size, from
≈ 20 pc to nearly 80 pc, and no strong dependence on age. These trends are illustrated by the
solid lines, which represent simple linear fits to observations in the two different regimes. The
best linear fits for the top panel are given by: log(τ/yr) = (0.015±0.002)× R(pc)+6.46±0.03
for R < 20 pc, and log(τ/yr) = (0.0014 ± 0.0011) × R(pc) + 4.37 ± 0.22 for R > 20 pc.
Similar fits are shown in the bottom panel, but numerical values are not included here since
the use of morphological category makes them more qualitative. The large, open circles in
the top panel of Figure 4 show the clusters with M < 1 × 10⁴ M⊙ and log(τ/yr) > 6.7.
These will be discussed further in Section 6.
4. Surface Brightness Fluctuations as Age Indicators for τ <∼
100 Myr
Clusters
As discussed in Section 2, bright individual stars are expected to be visible within M83
clusters at ages younger than ≈ 100 Myr, giving the clusters a mottled appearance with
relatively large pixel-to-pixel flux variations. After this, the flux variations have mostly
disappeared, leading to a more uniform appearance among cluster stars. Compare, for
example, the images in categories 4b and 5a in the top panel of Figure 1, where a number
1We note that the term “central” cluster may be misleading in some cases. There are many cases where the
ring or shell is asymmetric, typically offset to the side where there is a more prominent dust lane. Examples
of this morphology for super shells in the Antennae galaxy and a discussion in terms of the “blister” model
of Israel (1978) are provided in Whitmore et al. (2010).
– 10 –
of bright individual cluster stars are clearly visible, with the images for categories 5b and 6,
where individual cluster stars are no longer observed. Figure 2 also shows a variety of cases
where older clusters appear as fuzzy objects while single individual stars are clearly observed
within the young clusters.
Here, we use the strength of these surface brightness fluctuations to develop a new
method for estimating the ages of clusters in M83. This is reminiscent of the surface bright-
ness fluctuation method used to estimate distances to early-type galaxies (e.g., Tonry &
Schneider 1988), but in our case the clusters are all at the same distance and the surface
brightness fluctuations are caused by differences in age. One must exercise caution when
using this technique for other galaxies, since the relationships derived below for M83 would
need to be renormalized for galaxies at different distances.
We first need to remove the overall radial gradient in the cluster luminosity profile, since
this gradient typically dominates over the peak-to-peak variations in pixel flux within the
cluster. We accomplish this by creating a median divided image (with a 3×3 smoothing box
size), which effectively flattens the radial profile of the cluster, leaving behind primarily the
smaller scale pixel-to-pixel variations that we are interested in here. We then measure the
RMS scatter in the fluxes of pixels located within a 10 pixel radius. A more sophisticated
method is being developed by C. Kaleida et al. (2011, in preparation) where the RMS
variations are measured within the half-light or effective radius Reff of the cluster, hence
accounting for clusters of different sizes in a more systematic manner.
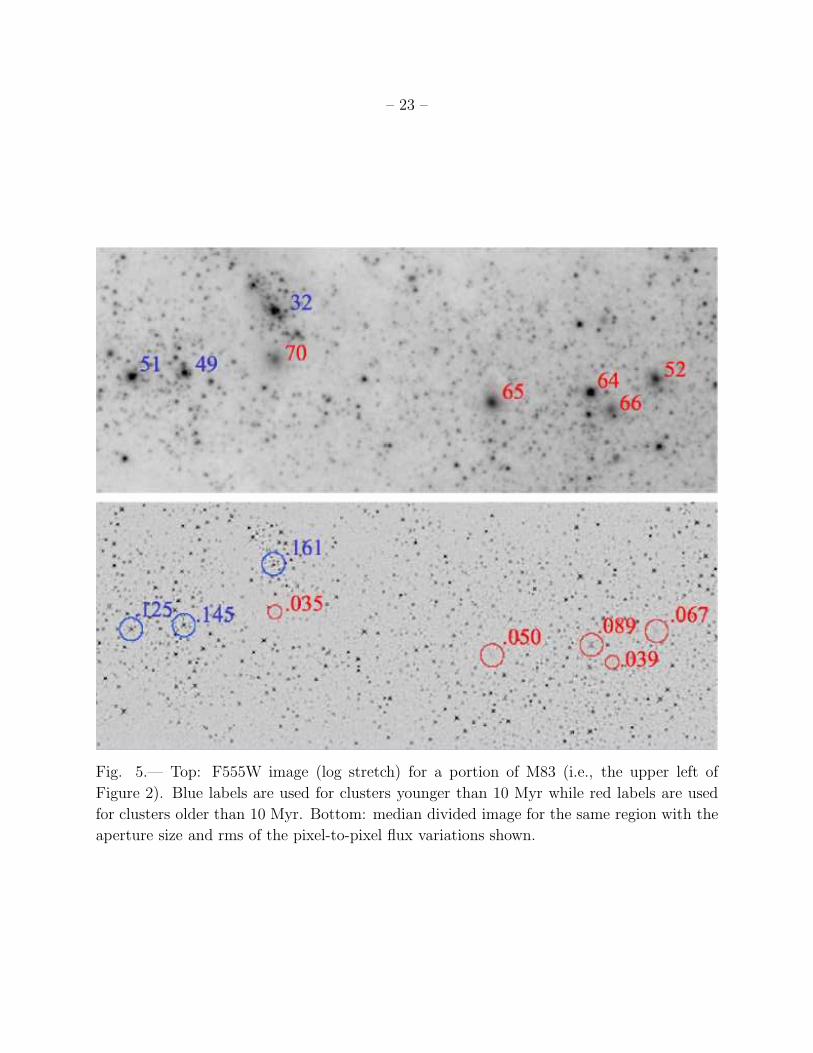
Figure 5 shows a comparison of the F555W image and the median divided F555W
image in a region including clusters younger than log(τ/yr) ≈ 7.0 (blue circles and labels)
and older than this (red circles and labels). The RMS measurements are indicated in the
bottom panel. One can easily see that old clusters (e.g., nos. 65 and 70) nearly disappear
from the median divided image, resulting in low values of the RMS, while bright, individual
stars are observed in the younger clusters (e.g., nos. 32 and 49), resulting in a higher RMS.
Small, barely visible dust lanes also contribute to larger values of RMS for the young clusters.
In a few very concentrated clusters there are small artifacts at their centers, for example in
cluster no. 64. However, the RMS is dominated by pixels outside of this central region,
hence this is a relatively small effect. We note that for four clusters, identified in Table 1,
we have used a slightly smaller radius to avoid single bright stars that are almost certainly
unrelated to the cluster (e.g., nos. 66, 69, 70 and 79).
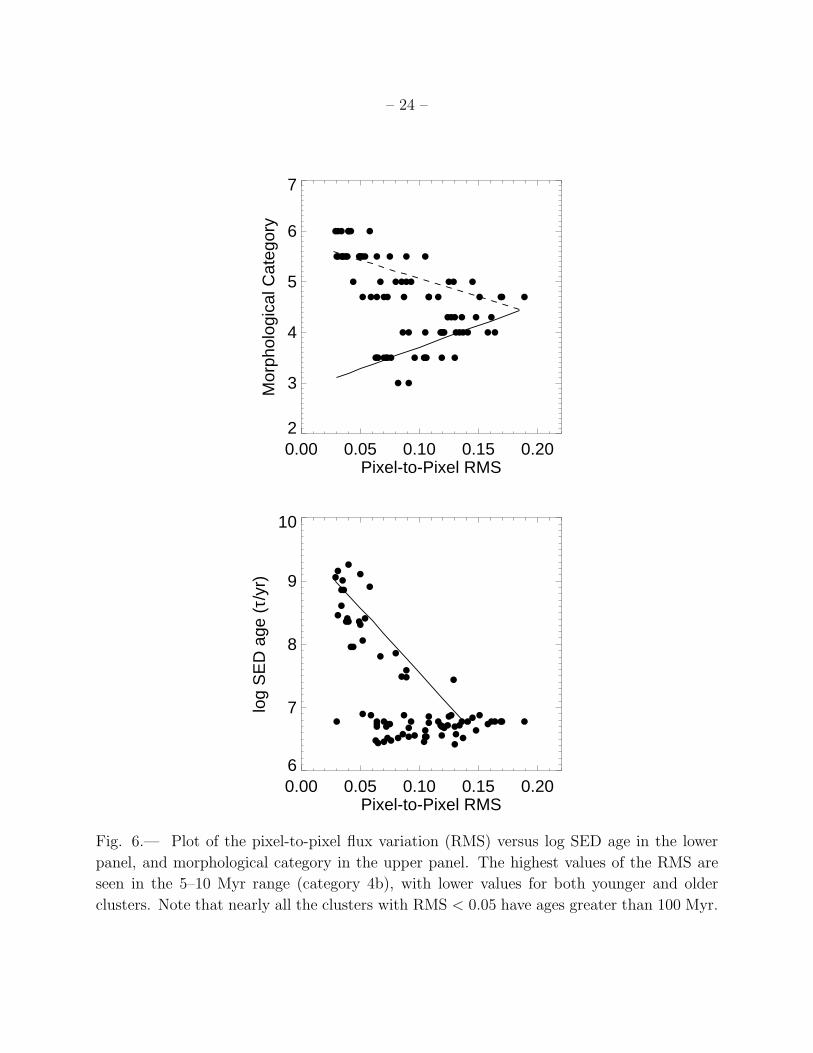
In the upper panel of Figure 6 we plot the RMS in the pixel-to-pixel flux measured in the
V band versus the morphological category. The resolution is better here for clusters younger
than ≈ 107 yr (i.e., category 3 and 4 objects). In the lower panel of Figure 6 we plot the RMS
vs. the SED age, which gives better resolution for clusters older than ≈ 107 yr. These figures
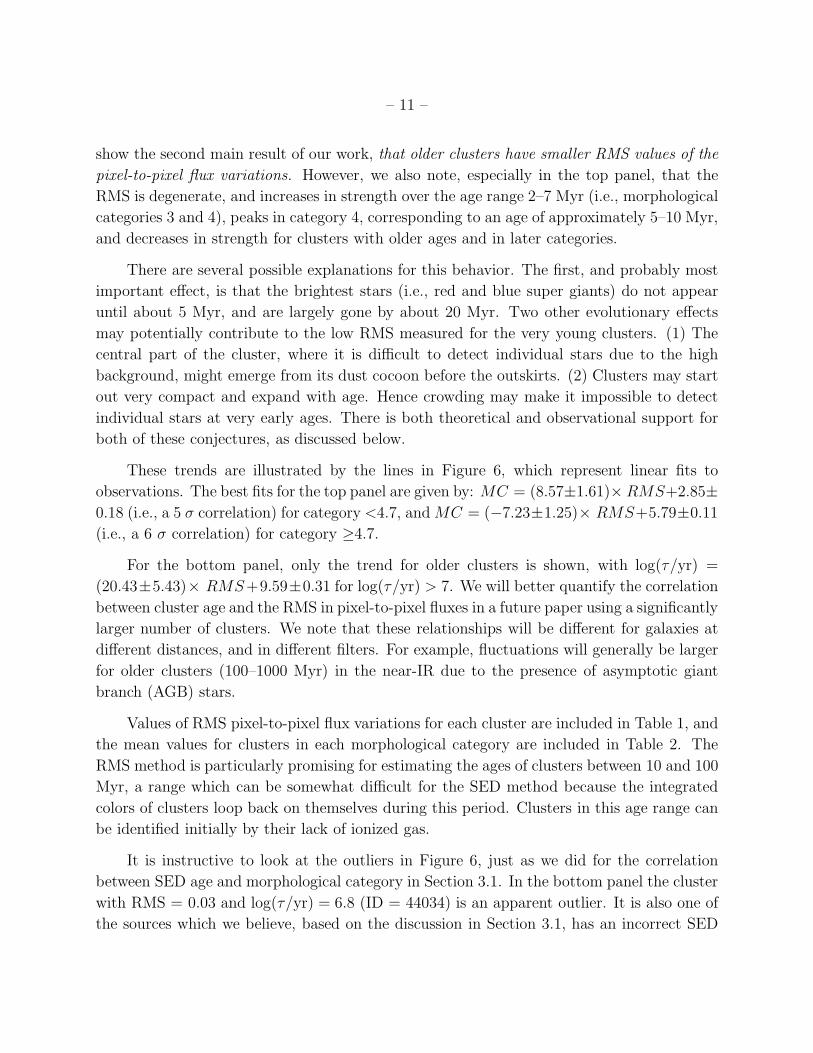
– 11 –
show the second main result of our work, that older clusters have smaller RMS values of the
pixel-to-pixel flux variations. However, we also note, especially in the top panel, that the
RMS is degenerate, and increases in strength over the age range 2–7 Myr (i.e., morphological
categories 3 and 4), peaks in category 4, corresponding to an age of approximately 5–10 Myr,
and decreases in strength for clusters with older ages and in later categories.
There are several possible explanations for this behavior. The first, and probably most
important effect, is that the brightest stars (i.e., red and blue super giants) do not appear
until about 5 Myr, and are largely gone by about 20 Myr. Two other evolutionary effects
may potentially contribute to the low RMS measured for the very young clusters. (1) The
central part of the cluster, where it is difficult to detect individual stars due to the high
background, might emerge from its dust cocoon before the outskirts. (2) Clusters may start
out very compact and expand with age. Hence crowding may make it impossible to detect
individual stars at very early ages. There is both theoretical and observational support for
both of these conjectures, as discussed below.
These trends are illustrated by the lines in Figure 6, which represent linear fits to
observations. The best fits for the top panel are given by: MC = (8.57±1.61)× RMS+2.85±
0.18 (i.e., a 5 σ correlation) for category <4.7, andMC = (−7.23±1.25)× RMS+5.79±0.11
(i.e., a 6 σ correlation) for category ≥4.7.
For the bottom panel, only the trend for older clusters is shown, with log(τ/yr) =
(20.43±5.43)× RMS+9.59±0.31 for log(τ/yr) > 7. We will better quantify the correlation
between cluster age and the RMS in pixel-to-pixel fluxes in a future paper using a significantly
larger number of clusters. We note that these relationships will be different for galaxies at
different distances, and in different filters. For example, fluctuations will generally be larger
for older clusters (100–1000 Myr) in the near-IR due to the presence of asymptotic giant
branch (AGB) stars.
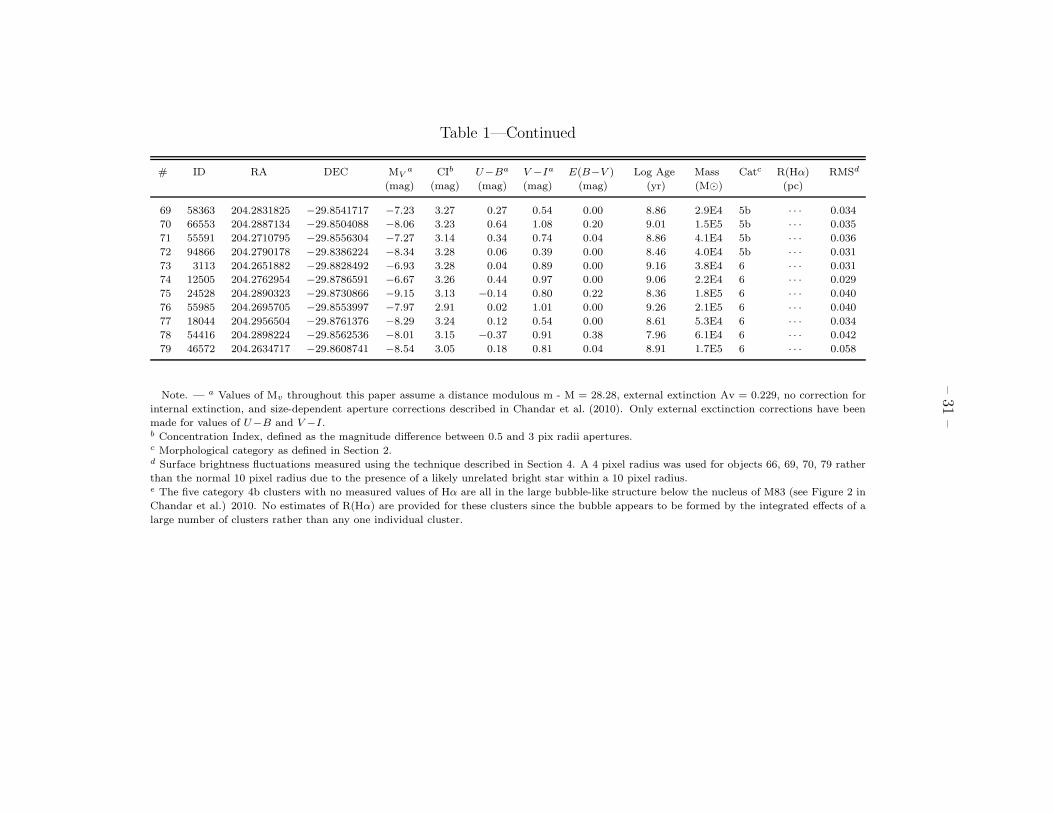
Values of RMS pixel-to-pixel flux variations for each cluster are included in Table 1, and
the mean values for clusters in each morphological category are included in Table 2. The
RMS method is particularly promising for estimating the ages of clusters between 10 and 100
Myr, a range which can be somewhat difficult for the SED method because the integrated
colors of clusters loop back on themselves during this period. Clusters in this age range can
be identified initially by their lack of ionized gas.
It is instructive to look at the outliers in Figure 6, just as we did for the correlation
between SED age and morphological category in Section 3.1. In the bottom panel the cluster
with RMS = 0.03 and log(τ/yr) = 6.8 (ID = 44034) is an apparent outlier. It is also one of
the sources which we believe, based on the discussion in Section 3.1, has an incorrect SED
– 12 –
age estimate. Based on its measured colors and assuming E(B−V ) = 0.0 instead of 0.28,
this cluster has a likely age of log(τ/yr) ≈ 7.8, more appropriate for it’s low RMS value.
Similarly, many of the data points just to the right of this one are the same category 5b
outliers discussed in Section 3.1 that have suspect ages. Other data points in the same region
of the log(τ/yr) versus RMS plot are located in the large bubble just below the nucleus of
M83, where it is difficult to measure the RMS accurately due to the very high background.
We note that the four clusters with RMS < 0.07 and log(τ/yr) < 6.5 are all in morphological
category 3, and are largely responsible for the decline in the measured RMS for the youngest
clusters.
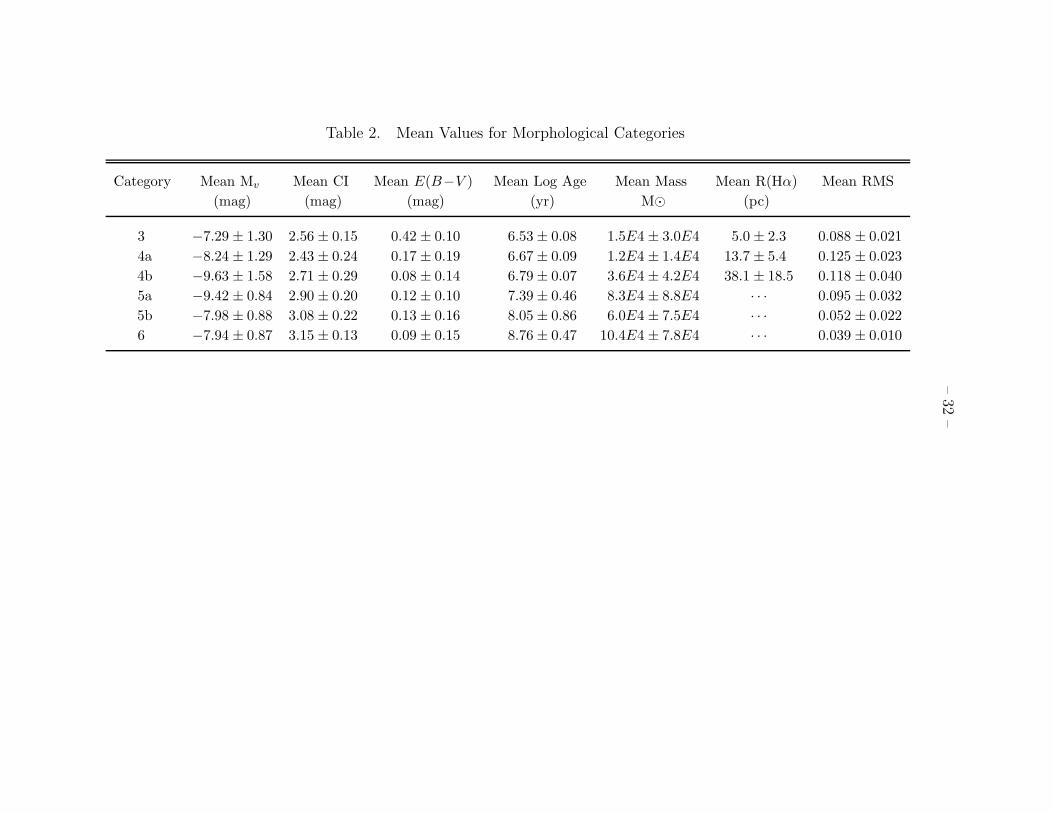
Many of the trends discussed above are seen in Table 2, which lists the mean values
of several parameters as a function of morphological category. In particular, the trends in
E(B−V ), log(τ/yr), and Hα shell radius (when present) are clearly evident. In addition,
the double-valued nature of pixel-to-pixel RMS values is evident, with a peak at category
4a. One correlation that was mentioned briefly is the trend of increasing cluster size with
age, quantified by the increase in the concentration index (CI) from values around 2.5 for
Categories 3 and 4a to > 3.0 for Categories 5b and 6. We find the same trend in our M51
data, which is briefly discussed in the Appendix. This effect appears to be real, and is
likely related to the rapid expansion of the clusters (see, for example, Mackey & Gilmore
2003; Bastian et al. 2009; Pfalzner 2009). Several different physical mechanisms may be
responsible for this expansion, including the expulsion of leftover ISM due to feedback from
massive stars (e.g., Goodwin & Bastian 2006; Baumgardt & Kroupa 2007), and heating by
binary stars and stellar mass black holes (e.g., Mackey et al. 2008; see Portegies Zwart et al.
2010 for a review of this subject). The early expansion of star clusters will be discussed in
more detail in a future paper (R. Chandar et al. 2011, in preparation).
5. “Single Star” HII Regions
While the dominant sources of ionizing flux responsible for the Hα emission in M83
are massive, young star clusters, which were studied in the previous sections, there is also a
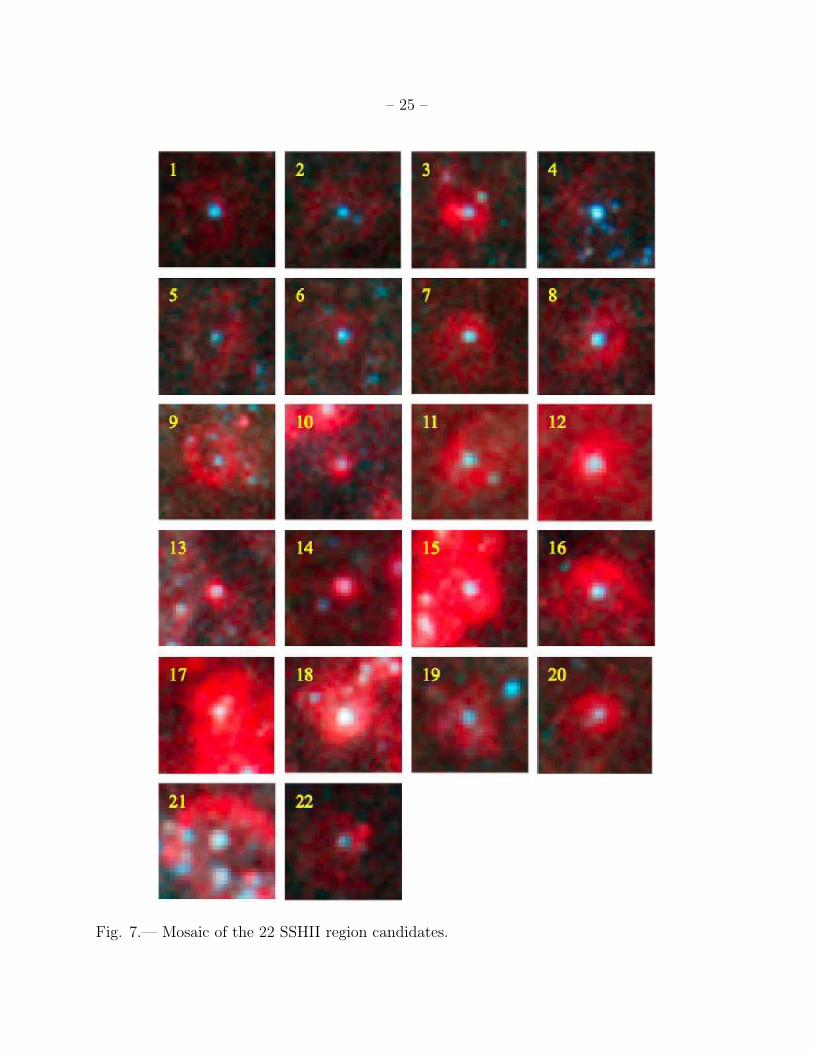
population of compact HII regions which are ionized by what appear to be single stars. In
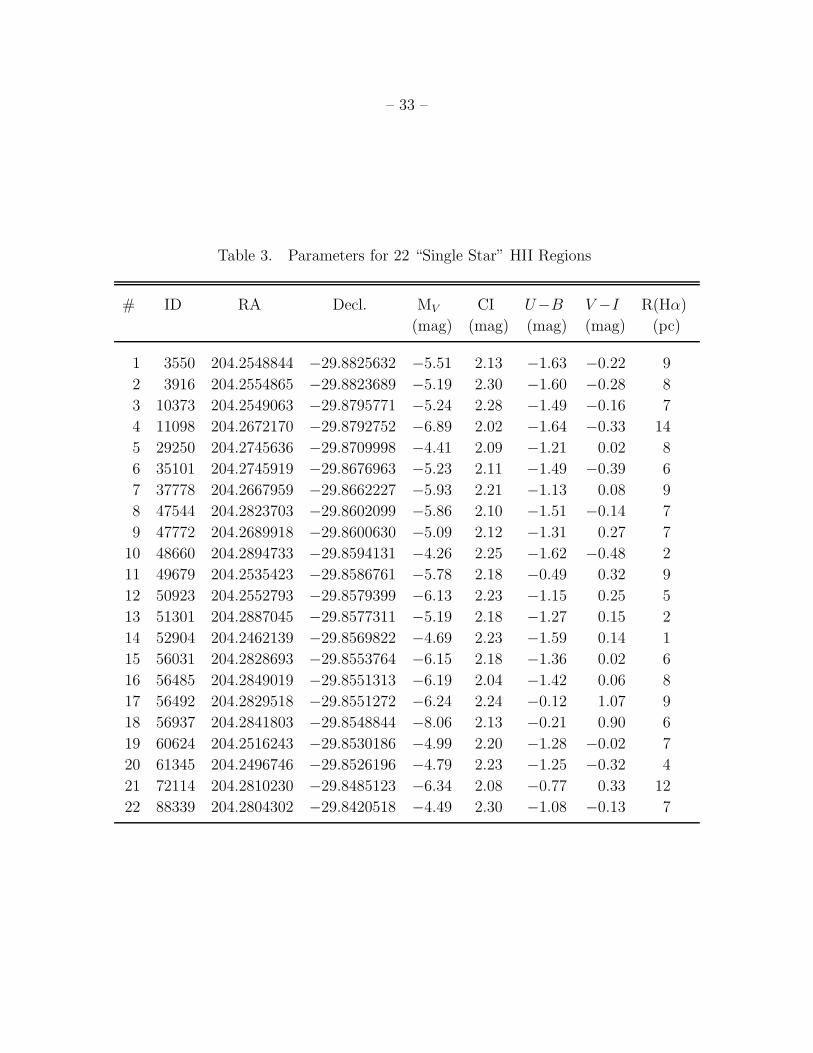
this section we identify and study a sample of 22 HII regions with very small Hα radii and an
unresolved central point source (based on their CI, i.e., the magnitude difference between 0.5
and 3 pixel radii; see Chandar et al. 2010). Color images of the selected sources are shown
in Figure 7. Only the brighter candidates have been retained for this first exploratory study;
the sample could be increased by a factor of two or more if fainter, less distinct objects were
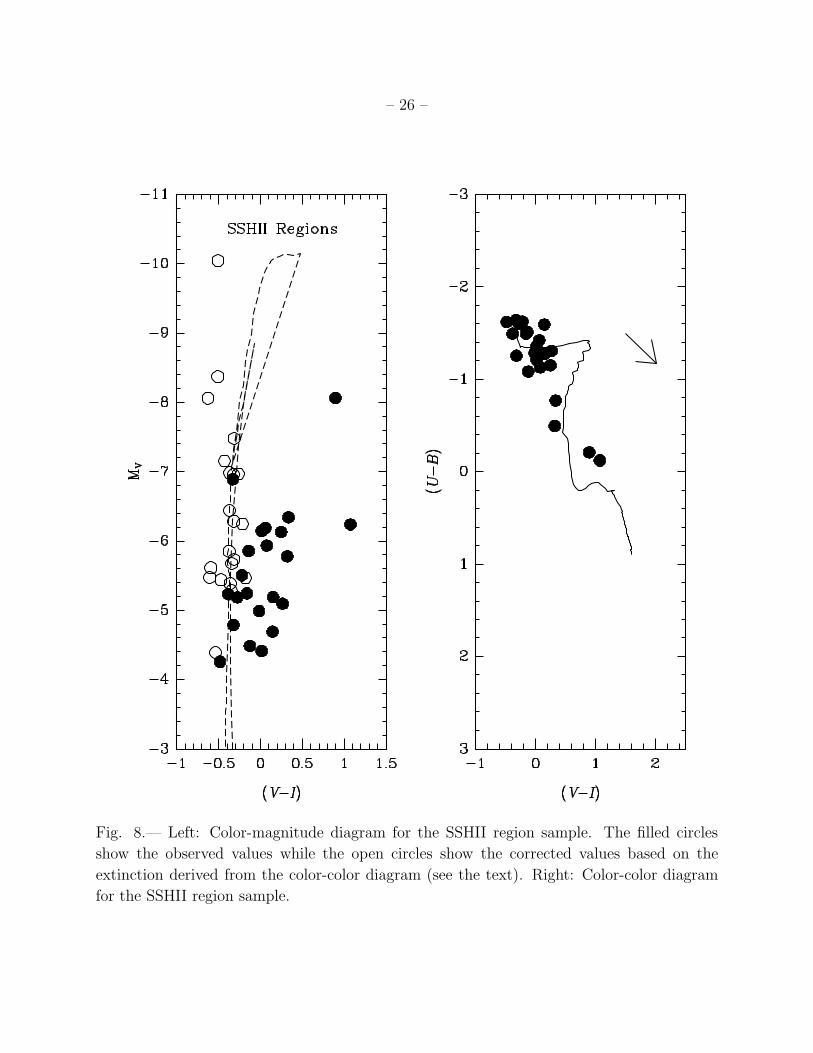
included. The measured colors of these sources, shown in Figure 8, either coincide with the
– 13 –
colors predicted for the bluest (youngest) stars in the upper left portion of the diagram, or are
found downstream along the reddening vector. Basic properties of these sources, including
positions, MV , CI, colors and measured radii of the Hα bubble, are compiled in Table 3.
We note that it is unlikely that all of these objects are actually individual massive
stars, hence the use of quotes around “Single Star.” Some, or even most of these may be
a dominant star among a close grouping of stars which are either too close to the primary
source, or too faint, to be detected. What we can say is that a single (or very close binary)
star dominates the light profile, resulting in a CI that is indistinguishable from a single star.
If we assume that all of these objects have a similar age, and that the distribution in the
two-color diagram is primarily due to reddening, we can correct for the effects of reddening
and extinction. We show the corrected photometry in a color magnitude diagram in the left
panel of Figure 8. Here, we have assumed an intrinsic color of U−I = −2.2, the color of
the bluest object, and solve for the V −I color excess of each HII region. We find that this
procedure moves most of the objects to a very young isochrone (4 Myr is shown), although
three sources scatter to the left of the models. These may be especially young stars, or the
offset may result from observational uncertainties, since these are the three most reddened
sources, and hence have the largest corrections.
While many of these single-star HII (i.e., SSHII) regions are found near large regions of
recent star formation, several of them are quite isolated (see Figure 3 from Whitmore 2010),
raising the possibility that these massive stars formed in the field rather than in clusters or
associations. For example, five of the 22 SSHII regions are ≈1 kpc away from any region
of active star formation. If these are stars that have been dynamically ejected from their
birthsites, i.e., runaways, they must have velocities ≈200 km/s. However, they do not appear
to have the prominent bow-front morphologies typical of many runaway stars in the Galaxy
and Magellanic Clouds (e.g., Gvaramadze et al. 2011). Velocity measurements are needed to
establish if these massive stars formed in the field or are runaways from larger star-forming
regions.
6. Discussion
As summarized in the Introduction, the spatial relationship between young τ <∼ 107 yr
star clusters and their HII regions has been previously studied both observationally and
theoretically. To our knowledge however, no study has yet systematically measured the sizes
of Hα bubbles in a nearby galaxy and correlated these sizes with the properties of their
ionizing star clusters, as we have done here. We have demonstrated that in M83 there is a
– 14 –
good correlation between bubble size and age for clusters younger than log(τ/yr) ≈ 6.7, and
that clusters with ages log(τ/yr) ≈ 6.7–6.9 have a larger range in bubble size. This suggests
that some of the expanding bubbles at these older ages may have effectively “stalled.”
Theoretical work suggests that bubble size should depend not only on the ambient
pressure in the ISM and the age of the cluster, but also on cluster mass. To look for
evidence of a mass-dependence on bubble size, we compare the sizes measured for Hα bubbles
associated with log(τ/yr) = 6.7–6.9 clusters that are more and less massive than 104 M⊙. At
these ages the bubbles are presumably approaching their stall radius, and the effect of cluster
mass should be more apparent. The large, open circles in the top panel of Figure 4 show
the sizes of clusters with M < 1 × 10⁴ M⊙ and log(τ/yr) > 6.7. While clusters at high and
low masses have an overlapping range in cluster size, there is a tendency for more massive
clusters to have larger bubbles, with median sizes of 18 pc and 41 pc for M < 104 M⊙ and
M ≥ 104 M⊙, respectively. A formal fit of Hα radius versus log(M/M⊙) for these clusters
gives a slope of 0.006 ± 0.005, suggesting that there may be a weak correlation between
bubble size and mass. Future studies that include a larger number of sources, selected in a
more systematic way, are needed to confirm this result.
However, other effects may also be important. For example, stochasticity in the number
of massive stars formed in lower mass clusters can strongly affect their integrtated colors
and hence their estimated ages. In this case, a lower mass cluster can have an intrinsically
redder color than a higher mass cluster of the same age (e.g., Fouesneau & Lancon 2010),
and hence an older estimate for the age of the cluster.
In addition to the correlation between Hα bubble size and cluster age (and possibly
mass), we also found that the RMS variations in pixel-to-pixel brightness correlates with
cluster age. This result has applications beyond star clusters, and can be used to constrain
the ages of stellar populations in general. For example, portions of M83 itself that contain
young stars and star clusters, such as along the spiral arms, have larger pixel-to-pixel flux
variations than portions of M83 dominated by older stars, such as between the arms (see
H. Kim et al. 2011, in preparation for a discussion). This is also true in large portions of M82
and in portions of the tidal tails of galaxy mergers, where regions dominated by intermediate
age star clusters (≈100 Myr) have small fluctuations in the surface brightness of the field
stars.
– 15 –
7. Summary and Conclusions
We have used observations taken with the newly installed WFC3 camera on-board
the Hubble Space Telescope to develop two independent methods for age-dating young star
clusters in the nearby spiral galaxy M83. Our primary results are summarized below.
1. A working classification system, largely based on Hα morphology and pixel-to-pixel
flux variations, was developed to map an observed age sequence onto a proposed sequence of
cluster evolution. The underlying evolutionary picture includes the formation of dense cores
in giant molecular clouds (GMCs); a stage where the young stars are completely obscured by
their dust cocoon; an emerging stage where the clusters become visible in the IR, and then in
the optical as stellar winds and supernovae blow away the dust; a stage where an expanding
Hα bubble is blown and the existence of very bright young stars leads to large pixel-to-pixel
flux variations; and later stages with no evidence of Hα and diminishing pixel-to-pixel flux
variations.
2. We found that Hα morphology, i.e., the size of the ionized gas bubble, provides a
viable method for age-dating clusters in the range 1–10 Myr. This method is based on the
simple premise that the gas in very young (τ < few Myr) clusters is largely coincident with
the cluster stars, is in a small, ring-like structure surrounding the stars in slightly older
clusters since the winds from massive stars have had time to push out the natal gas (e.g.,
τ ≈ 5 Myr), and is in a larger ring-like bubble for still older clusters (i.e., ≈5–10 Myr). If
no Hα is associated with a cluster it is generally older than ≈10 Myr.
We first made qualitative estimates based on the classification scheme outlined above,
and find that the ages of the clusters, as determined from the SED method described in
Chandar et al. (2010), correlate well with the morphological categories, with a scatter of
≈0.1 in log(τ/yr) within each category for the clusters with Hα emission, and a scatter of
≈0.5 in log(τ/yr) for the older clusters. We then quantified this technique by correlating
the measured radii of the most conspicuous Hα-emitting ring or shell which appears to be
physically related to the cluster with the SED ages determined in Chandar et al. (2010). We
found tentative evidence for a weak correlation between bubble size and cluster mass, but a
larger, more objectively selected sample will be required to confirm this.
3. We then used pixel-to-pixel flux variations to age-date clusters. This technique is
based on the fact that individual stars are bright enough to be visible within clusters when
they are young (e.g., MV < −3.5, the approximate detection level, for the brightest stars with
ages <100 Myr), leading to relatively large pixel-to-pixel variations in flux. The strength
of the fluctuations peaks in clusters with ages of ≈5–10 Myr, presumably because this is
when the brightest stars (e.g., red and blue super giants) appear. The number of luminous,
– 16 –
evolved stars falls off for both younger and older clusters. This degeneracy in age can be
broken using other age indicators such as the Hα morphology. The technique is especially
useful for identifying clusters older than 100 Myr.
4. A by-product of this study was the identification of 22 “single-star” HII regions in
M83. By assuming that all of these objects have a similar age, and that the distribution in
the two-color diagram is primarily due to reddening, we corrected for the effects of reddening
and extinction. We found that this procedure moves most of the objects to a very young
isochrone with an age approximately 4 Myr. Some of these massive stars are located far from
any star-forming region, indicating that they either formed in the field or were dynamically
ejected from their birthsites at very high velocities. These SSHII regioins will be studied in
more detail in H. Kim et al. (2011, in preparation).
In the future, we will extend the classification system into the near-IR (i.e., categories 1
and 2) using our J and H observations. We will also calculate the energy budget of cluster
stars and compare with physical properties of the clusters and the ISM. Finally, we will
extend this analysis to other galaxies in the ERS1 sample (including “low pressure” systems
such as the dwarf starburst galaxy NGC 4214) in order to determine whether the relationships
are universal or are strongly dependent on environment.
We thank Zolt Levay for making the color images used in Figures 1 and 2. This paper
is based on observations taken with the NASA/ESA Hubble Space Telescope obtained at
the Space Telescope Science Institute, which is operated by AURA, Inc., under NASA con-
tract NAS5-26555. The paper makes use of Early Release Science observations made by the
WFC3 Science Oversight Committee. We are grateful to the Director of STScI for awarding
Director’s Discretionary time for this program. R. C. is grateful for support from the NSF
through CAREER award 0847467. This research has made use of the NASA/IPAC Extra-
galactic Database (NED), which is operated by the Jet Propulsion Laboratory, California
Institute of Technology, under contract with NASA.
Facilities: HST.
Appendix
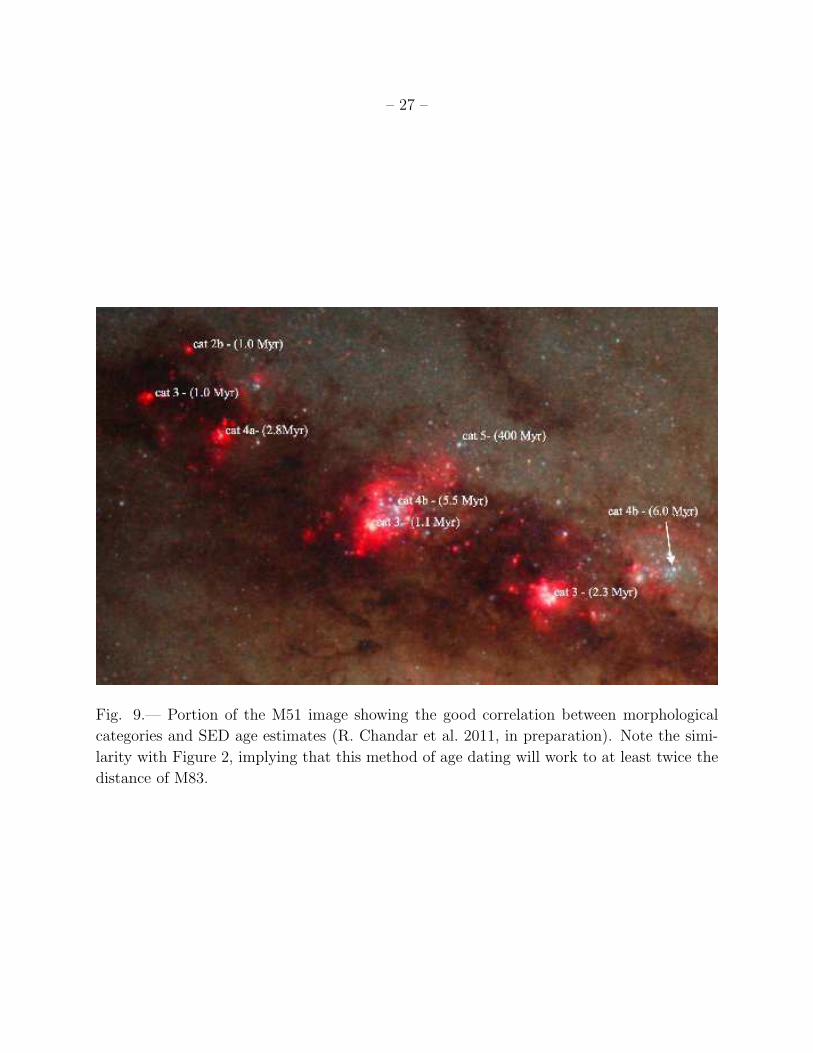
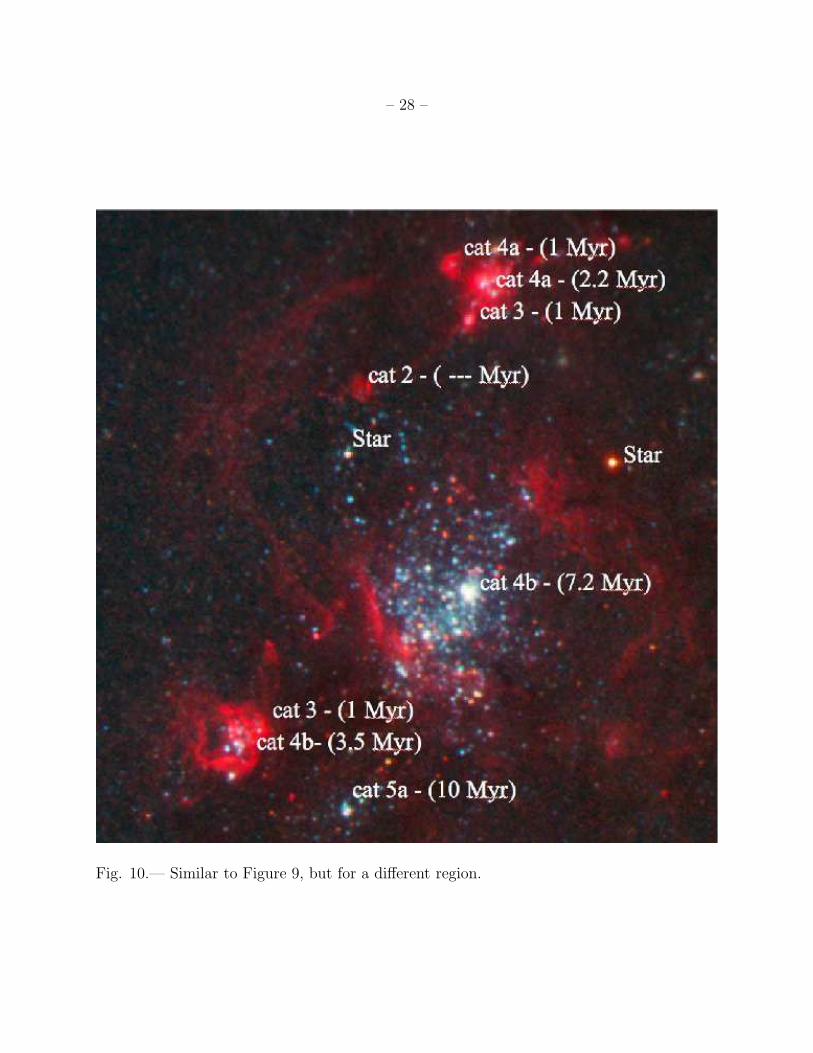
The spiral galaxy M51 was originally used to perform a pilot study to test how well Hα
morphology can be used to estimate cluster ages. Examples of the results are included in
Figures 9 and 10. These are similar to Figure 2 for M83 and show that even at twice the
distance of M83 the quality of the images are comparable, and the morphological categories
match SED age estimates at a similar level. A more complete analysis will be included in a
future paper (R. Chandar et al. 2011; in preparation).
– 17 –
REFERENCES
Andre, P., Ward-Thompson, D., & Barsony, M. 1993, ApJ, 406, 122
Bastian, N., Trancho, G., Konstantopoulos, I. S., & Miller, B. W. 2009, ApJ, 701, 607
Baumgardt, H., & Kroupa, P. 2007, MNRAS, 380, 1589
Bica, E., & Alloin, D. 1986, A&AS, 666, 171
Bruzual, G., & Charlot, S. 2003, MNRAS, 344, 1000
Chandar, R., Whitmore, B. C., & Fall, S. M. 2010, ApJ, 719, 966
Dopita, M. A., et al. 2006a, ApJ, 647, 244
Dopita, M. A., et al. 2006b, ApJS, 167, 177
Dopita, M., et al. 2010, ApJ, 710, 964
Fouesneau, M., & Lancon, A. 2010, A&A, 521, 22
Gao, Y., & Solomon, P. 2004, ApJ, 606, 271
Goodwin, S. P., & Bastian, N. 2006, MNRAS, 373, 752
Gvaramadze, V. V., Kroupa, P., Pflamm-Altenburg, J. 2011, A&A, 525, A17
Israel, F. P. 1978, A&A, 70, 769
Lada, C. J., & Lada, E. A. 2003, ARA&A, 41, 57
Mackey, A. D., & Gilmore, G. F. 2003, MNRAS, 338, 85
Mackey, A. D., Wilkison, M. I., Davies, M. B., & Gilmore, G. F. 2008, MNRAS, 386, 65
Oey, M. S., & Clarke, C. J. 1997, MNRAS, 289, 570
Oey, M. S., & Clarke, C. J. 1998, AJ, 115, 1543
Oey, M. S., & Garcia-Segura, G. 2004, ApJ, 613, 302
Oey, M. S., & Massey, P. 1995, ApJ, 452, 210
Pfalzner, S. 2009, A&A, 498, L37
Portegies Zwart, S. F., McMillan, S. L. W., & Gieles, M. 2010, ARA&A, 48, 431
– 18 –
Schweizer, F., & Seitzer, P. 1993, ApJ, 417, L29
Searle, L., Wilkinson, A., & Bagnuolo, W. G. 1980, ApJ, 239, 803
Thim, F., Tammann, G. A., Saha, A., Dolphin, A., Sandage, A., Tolstoy, E., & Labhardt,
L. 2003, ApJ, 590, 256
Tonry, J., & Schneider, D. P. 1988, AJ, 96, 807
Walborn, N. R. 2002, in ASP Conf. Ser. 267, Hot Star Workshop III: The Earliest Phases of
Massive Star Birth, ed. P. A. Crowther (San Francisco, CA: ASP), 111
Walborn, N. R. 2010, in ASP Conf. Ser. 425, Hot And Cool: Bridging Gaps in Massive Star
Evolution, ed. C. Leitherer, Ph.D. Bennett, P.W. Morris, & J.Th. van Loon (San
Francisco, CA: ASP), 45
Walborn, N. R., & J. Wm. Parker, ApJL, 399, L87, 1992
Weaver, R., McCray, R., Castor, J., Shapiro, P., & Moore, R. 1977, ApJ, 218, 377
Whitmore, B. C. 2010 in ASP Conf. Ser., UP: Have Observations Revealed a Variable Upper
End of the Initial Mass Function, ed. M. Treyer et al. (San Francisco, CA: ASP), 141,
in press
Whitmore, B. C., Zhang, Q., Leitherer, C., Fall, S. M., Schweizer, F., & Miller, B. W. 1999,
AJ, 118, 1551
Whitmore, B. C., et al. 2010, AJ, 140, 75
Wilking, B. A., Lada, C. J., & Young, E. T. 1989, ApJ, 340, 823
Wofford, A., Leitherer, C., & Chandar, R. 2010, ApJ, 727, 100
This preprint was prepared with the AAS LATEX macros v5.2.
– 19 –
Fig. 1.— Examples of sources in the various categories defined in Section 2 are shown
along the top row; histograms of the SED age estimates for the clusters in Table 1 (from
Chandar et al. 2010) are in the middle row, and two-color diagrams comparing the (measured)
integrated colors of the clusters with predictions for a twice solar metallicity BC09 model
(G. Bruzual & S. Charlot 2009, private communication; see also Bruzual & Charlot 2003)
are shown along the bottom row.
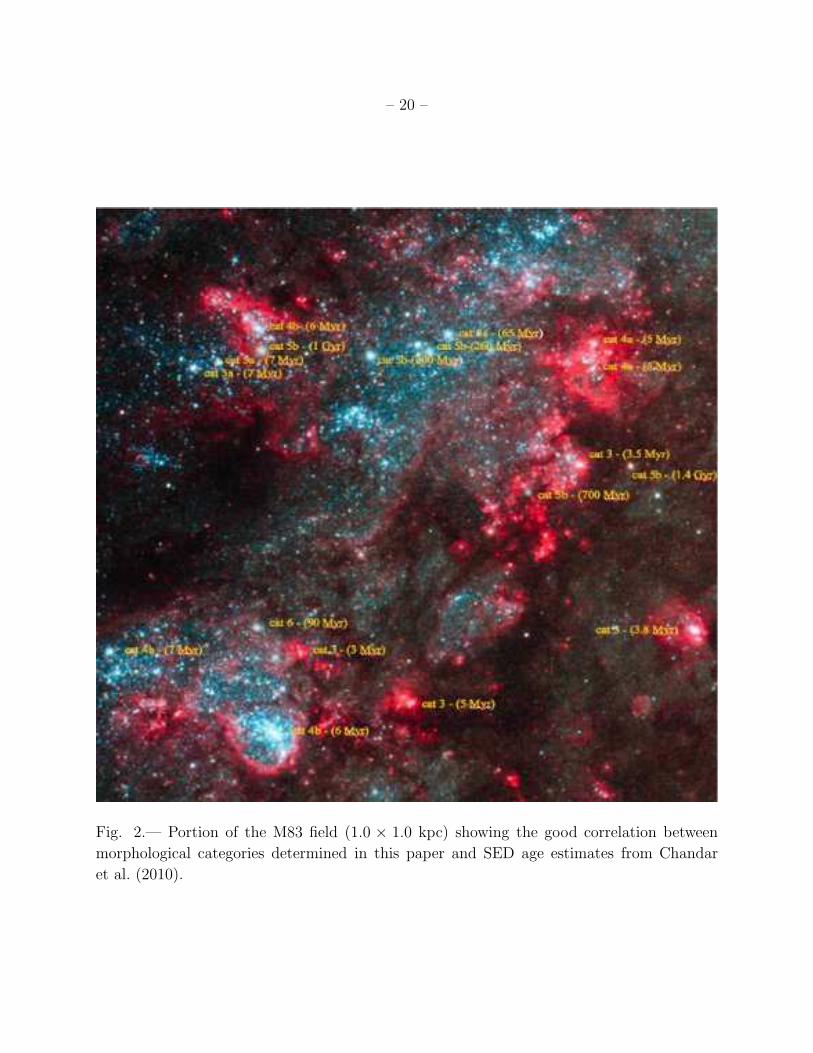
– 20 –
Fig. 2.— Portion of the M83 field (1.0 × 1.0 kpc) showing the good correlation between
morphological categories determined in this paper and SED age estimates from Chandar
et al. (2010).
– 21 –
6 7 8 9 10log SED age (τ/yr)
3
4
5
6
Mor
phol
ogic
al C
ateg
ory
6.4 6.5 6.6 6.7 6.8 6.9 7.0log SED age (τ/yr)
3
4
5
6
Mor
phol
ogic
al C
ateg
ory
Fig. 3.— Plot of morphological categories versus log SED age estimates. Note how the scatter
increases with age and that the relationship is nonlinear, as expected since Hα morphology
evolves quickly between the ages of a few to 10 Myr. The bottom panel shows an enlargement
for the younger ages. The best linear fit is shown in both panels.
– 22 –
0 20 40 60 80Halpha Radius (pc)
6.2
6.4
6.6
6.8
7.0
log
SE
D a
ge (
τ/yr
)
0 20 40 60 80Halpha Radius (pc)
2.5
3.0
3.5
4.0
4.5
5.0
5.5
Mor
phol
ogic
al C
ateg
ory
Fig. 4.— Plot of the Hα bubble radius vs log SED ages in the upper panel and morphological
category in the lower panel. The correlation is similar to the relationship shown in Figure 3,
but with fewer outliers and hence smaller scatter. The large, open circles in the top panel
show the sizes of clusters with M < 1× 10⁴ M⊙ and log(τ/yr) ≥ 6.7, as discussed further in
Section 6.
– 23 –
Fig. 5.— Top: F555W image (log stretch) for a portion of M83 (i.e., the upper left of
Figure 2). Blue labels are used for clusters younger than 10 Myr while red labels are used
for clusters older than 10 Myr. Bottom: median divided image for the same region with the
aperture size and rms of the pixel-to-pixel flux variations shown.
– 24 –
0.00 0.05 0.10 0.15 0.20Pixel-to-Pixel RMS
2
3
4
5
6
7
Mor
phol
ogic
al C
ateg
ory
0.00 0.05 0.10 0.15 0.20Pixel-to-Pixel RMS
6
7
8
9
10
log
SE
D a
ge (
τ/yr
)
Fig. 6.— Plot of the pixel-to-pixel flux variation (RMS) versus log SED age in the lower
panel, and morphological category in the upper panel. The highest values of the RMS are
seen in the 5–10 Myr range (category 4b), with lower values for both younger and older
clusters. Note that nearly all the clusters with RMS < 0.05 have ages greater than 100 Myr.
– 25 –
Fig. 7.— Mosaic of the 22 SSHII region candidates.
– 26 –
Fig. 8.— Left: Color-magnitude diagram for the SSHII region sample. The filled circles
show the observed values while the open circles show the corrected values based on the
extinction derived from the color-color diagram (see the text). Right: Color-color diagram
for the SSHII region sample.
– 27 –
Fig. 9.— Portion of the M51 image showing the good correlation between morphological
categories and SED age estimates (R. Chandar et al. 2011, in preparation). Note the simi-
larity with Figure 2, implying that this method of age dating will work to at least twice the
distance of M83.
– 28 –
Fig. 10.— Similar to Figure 9, but for a different region.
–29
–
Table 1. Parameters for 88 Selected Clusters
# ID RA DEC MVa CIb U−B
aV −I
aE(B−V ) Log Age Mass Catc R(Hα) RMSd
(mag) (mag) (mag) (mag) (mag) (yr) (M⊙) (pc)
1 65815 204.244637 −29.8507043 −6.10 2.57 −1.35 −0.12 0.24 6.52 1.1E3 3 2 0.082
2 63611 204.2426354 −29.8515924 −6.42 2.35 −1.27 0.07 0.34 6.54 2.1E3 3 1 0.091
3 41736 204.251687 −29.8640556 −8.70 2.68 −0.21 0.80 0.50 6.7 2.6E4 3 7 0.064
4 39744 204.2524132 −29.8651911 −11.03 2.58 −1.33 0.23 0.30 6.56 1.2E5 3 7 0.119
5 49651 204.2564416 −29.8586912 −7.17 2.50 −0.38 0.68 0.50 6.48 7.1E3 3 3 0.063
6 32461 204.2880034 −29.8692326 −7.67 2.62 −1.36 0.30 0.44 6.52 8.6E3 3 5 0.073
7 53072 204.2889299 −29.8569125 −6.64 2.61 −0.93 0.56 0.50 6.48 4.2E3 3 4 0.076
8 93801 204.2795357 −29.8392001 −7.10 2.50 −1.37 0.08 0.32 6.54 3.6E3 3 1 0.106
9 50287 204.2865616 −29.8582915 −7.35 2.66 −0.54 0.69 0.50 6.70 7.4E3 3 6 0.072
10 59214 204.2818977 −29.8537395 −7.56 2.53 −1.08 0.36 0.50 6.54 9.3E3 3 6 0.105
11 24767 204.2493318 −29.8729735 −6.89 2.32 −0.46 0.70 0.50 6.56 5.1E3 3 7 0.096
12 58013 204.2475174 −29.8543366 −6.49 2.43 −1.29 0.15 0.42 6.46 5.4E3 3 7 0.104
13 52726 204.2458956 −29.8570619 −8.13 2.78 −1.50 −0.06 0.26 6.42 1.2E4 3 7 0.130
14 12721 204.2908632 −29.8785688 −5.98 2.43 −1.30 0.32 0.50 6.46 4.3E3 3 5 0.070
15 19354 204.2525635 −29.8755537 −6.06 2.83 −1.39 0.27 0.44 6.44 2.5E3 3 7 0.065
16 51616 204.2799185 −29.8575701 −9.31 2.43 −1.33 −0.02 0.20 6.58 1.8E4 4a 6 0.131
17 49790 204.2546965 −29.8585957 −7.88 2.27 −0.85 0.27 0.42 6.68 1.1E4 4a 10 0.091
18 17035 204.2906967 −29.8766101 −7.23 2.24 −1.48 −0.16 0.00 6.70 1.8E3 4a 15 0.119
19 66897 204.2654298 −29.8502774 −8.60 2.96 −1.50 −0.12 0.00 6.72 4.4E3 4a 20 0.134
20 39842 204.2520397 −29.8651314 −10.94 2.71 −1.51 −0.15 0.08 6.58 5.2E4 4a 13 0.086
21 31457 204.2855284 −29.8698283 −8.83 2.19 −1.31 −0.03 0.04 6.78 8.9E3 4a 17 0.164
22 74860 204.262148 −29.8474511 −8.59 2.67 −1.43 −0.14 0.00 6.78 5.5E3 4a 21 0.141
23 89929 204.2581863 −29.8412261 −6.79 2.23 −1.35 −0.05 0.04 6.72 1.3E3 4a 17 0.118
24 25607 204.2492229 −29.8725982 −7.85 2.61 −0.66 0.42 0.50 6.70 1.2E4 4a 21 0.120
25 75041 204.2775285 −29.847385 −7.31 2.24 −1.61 −0.15 0.12 6.52 2.7E3 4a 7 0.137
26 64462 204.2811447 −29.8512236 −8.19 2.30 −0.81 0.34 0.46 6.68 1.7E4 4a 7 0.121
27 61923 204.263904 −29.8523354 −6.02 2.52 −1.28 0.06 0.36 6.54 1.5E3 4a 9 0.105
28 21601 204.2861725 −29.8744932 −9.59 2.27 −1.48 −0.12 0.00 6.74 1.5E4 4a 15 0.158
29 62771 204.2811659 −29.8519608 −7.25 2.27 −0.96 0.28 0.38 6.70 5.6E3 4a 16 0.130
30 13265 204.2547344 −29.8783208 −7.64 2.44 −1.63 −0.27 0.00 6.64 2.3E3 4a 13 0.148
31 5990 204.2551409 −29.8813282 −8.17 2.47 −1.53 −0.26 0.00 6.72 3.9E3 4a 46 0.124
32 67958 204.2887307 −29.8499286 −9.84 3.20 −1.35 −0.04 0.02 6.78 1.1E4 4a 19 0.161
33 66054 204.2644967 −29.8506016 −9.97 2.63 −1.45 0.39 0.00 6.88 2.8E4 4a 49 0.127
34 69793 204.2694643 −29.8493238 −11.41 2.63 −1.48 −0.16 0.00 6.78 7.5E4 4a 25 0.136
–30
–
Table 1—Continued
# ID RA DEC MVa CIb U−B
aV −I
aE(B−V ) Log Age Mass Catc R(Hα) RMSd
(mag) (mag) (mag) (mag) (mag) (yr) (M⊙) (pc)
35 7716 204.2816067 −29.8807039 −9.17 2.47 −1.43 0.41 0.00 6.88 1.4E4 4b 68 0.151
36 36651 204.2524088 −29.8668398 −12.17 3.09 −1.58 −0.22 0.00 6.78 1.1E5 4b · · · e 0.070
37 35937 204.2537197 −29.8672182 −10.31 2.79 −1.24 0.45 0.02 6.90 4.2E4 4b · · · e 0.052
38 54268 204.2932226 −29.8563319 −8.57 2.87 −0.91 0.79 0.34 6.86 1.7E4 4b 32 0.108
39 23366 204.2529648 −29.8736403 −9.39 2.43 −1.29 −0.08 0.02 6.78 1.3E4 4b 41 0.116
40 27423 204.2896066 −29.8718058 −8.38 2.34 −0.99 0.50 0.36 6.78 1.4E4 4b 71 0.170
41 78807 204.2629122 −29.8459862 −9.71 2.46 −1.55 −0.23 0.00 6.78 1.6E4 4b 45 0.169
42 36729 204.2525635 −29.8667944 −12.15 3.08 −1.45 0.00 0.00 6.74 1.0E5 4b · · ·e 0.073
43 70777 204.2607456 −29.8489709 −8.18 2.68 −1.23 0.49 0.08 6.88 6.7E3 4b 43 0.087
44 70769 204.2650559 −29.8489734 −7.77 2.92 −1.34 −0.08 0.00 6.76 2.1E3 4b 18 0.108
45 37589 204.2519048 −29.8663287 −11.96 3.20 −1.13 0.46 0.24 6.74 1.4E5 4b · · · e 0.064
46 49893 204.2897929 −29.8585381 −9.76 2.74 −1.49 −0.24 0.00 6.78 1.6E4 4b 48 0.189
47 37095 204.2523893 −29.8665896 −11.18 2.79 −1.32 0.35 0.00 6.88 8.0E4 4b · · ·e 0.059
48 78154 204.257905 −29.8462475 −8.28 2.76 −0.86 0.18 0.00 7.86 3.4E4 5a · · · 0.080
49 66216 204.2897363 −29.8505371 −8.87 2.56 −0.98 0.70 0.34 6.84 2.5E4 5a · · · 0.145
50 76156 204.2556622 −29.8469956 −10.21 3.15 −1.08 0.62 0.06 7.48 1.0E5 5a · · · 0.089
51 66123 204.2903301 −29.8505755 −9.39 2.50 −1.11 0.59 0.22 6.86 3.0E4 5a · · · 0.125
52 66069 204.2844254 −29.8505955 −8.88 3.13 −0.78 0.47 0.06 7.81 4.5E4 5a · · · 0.067
53 85836 204.2694279 −29.8431197 −9.43 3.25 −1.12 0.18 0.10 6.78 8.7E3 5a · · · 0.093
54 40779 204.2926898 −29.8645926 −10.17 3.06 −0.65 0.49 0.08 7.96 2.1E5 5a · · · 0.044
55 30950 204.2578713 −29.8701108 −10.85 2.94 −1.08 0.60 0.08 7.49 2.5E5 5a · · · 0.085
56 83925 204.2643496 −29.8439131 −8.71 2.79 −0.97 0.77 0.14 7.44 4.3E4 5a · · · 0.129
57 44034 204.2499199 −29.8626794 −9.56 3.10 −0.82 0.44 0.28 6.78 2.1E4 5b · · · 0.030
58 17159 204.2616672 −29.8765474 −8.22 3.18 −0.42 0.57 0.16 8.06 4.3E4 5b · · · 0.052
59 25716 204.2827697 −29.8725452 −7.28 2.76 −0.14 0.42 0.00 8.41 2.6E4 5b · · · 0.054
60 18032 204.2849161 −29.876142 −7.72 2.98 −0.72 0.61 0.36 6.78 5.7E3 5b · · · 0.064
61 74692 204.2760088 −29.8475135 −6.99 3.17 −0.04 0.70 0.50 6.74 3.3E3 5b · · · 0.075
62 85964 204.2565326 −29.843069 −7.59 2.99 −0.33 0.44 0.00 8.36 2.7E4 5b · · · 0.049
63 14748 204.2752747 −29.8776532 −7.14 3.29 −0.11 0.40 0.00 8.36 1.2E4 5b · · · 0.038
64 65733 204.2851579 −29.8507302 −9.82 2.73 −0.94 0.61 0.10 7.59 1.3E5 5b · · · 0.089
65 65479 204.2862739 −29.8508316 −9.06 3.19 −0.37 0.42 0.00 8.31 7.8E4 5b · · · 0.050
66 65304 204.2849235 −29.8508999 −8.51 3.39 0.07 0.80 0.18 8.41 5.8E4 5b · · · 0.039
67 10114 204.2664853 −29.8796816 −7.17 2.64 −1.53 −0.33 0.00 6.64 1.4E3 5b · · · 0.105
68 58911 204.2807662 −29.8539005 −7.69 2.88 0.15 1.55 0.32 9.11 2.9E5 5b · · · 0.050
–31
–
Table 1—Continued
# ID RA DEC MVa CIb U−B
aV −I
aE(B−V ) Log Age Mass Catc R(Hα) RMSd
(mag) (mag) (mag) (mag) (mag) (yr) (M⊙) (pc)
69 58363 204.2831825 −29.8541717 −7.23 3.27 0.27 0.54 0.00 8.86 2.9E4 5b · · · 0.034
70 66553 204.2887134 −29.8504088 −8.06 3.23 0.64 1.08 0.20 9.01 1.5E5 5b · · · 0.035
71 55591 204.2710795 −29.8556304 −7.27 3.14 0.34 0.74 0.04 8.86 4.1E4 5b · · · 0.036
72 94866 204.2790178 −29.8386224 −8.34 3.28 0.06 0.39 0.00 8.46 4.0E4 5b · · · 0.031
73 3113 204.2651882 −29.8828492 −6.93 3.28 0.04 0.89 0.00 9.16 3.8E4 6 · · · 0.031
74 12505 204.2762954 −29.8786591 −6.67 3.26 0.44 0.97 0.00 9.06 2.2E4 6 · · · 0.029
75 24528 204.2890323 −29.8730866 −9.15 3.13 −0.14 0.80 0.22 8.36 1.8E5 6 · · · 0.040
76 55985 204.2695705 −29.8553997 −7.97 2.91 0.02 1.01 0.00 9.26 2.1E5 6 · · · 0.040
77 18044 204.2956504 −29.8761376 −8.29 3.24 0.12 0.54 0.00 8.61 5.3E4 6 · · · 0.034
78 54416 204.2898224 −29.8562536 −8.01 3.15 −0.37 0.91 0.38 7.96 6.1E4 6 · · · 0.042
79 46572 204.2634717 −29.8608741 −8.54 3.05 0.18 0.81 0.04 8.91 1.7E5 6 · · · 0.058
Note. — a Values of Mv throughout this paper assume a distance modulous m - M = 28.28, external extinction Av = 0.229, no correction for
internal extinction, and size-dependent aperture corrections described in Chandar et al. (2010). Only external exctinction corrections have been
made for values of U−B and V −I.b Concentration Index, defined as the magnitude difference between 0.5 and 3 pix radii apertures.c Morphological category as defined in Section 2.d Surface brightness fluctuations measured using the technique described in Section 4. A 4 pixel radius was used for objects 66, 69, 70, 79 rather
than the normal 10 pixel radius due to the presence of a likely unrelated bright star within a 10 pixel radius.e The five category 4b clusters with no measured values of Hα are all in the large bubble-like structure below the nucleus of M83 (see Figure 2 in
Chandar et al.) 2010. No estimates of R(Hα) are provided for these clusters since the bubble appears to be formed by the integrated effects of a
large number of clusters rather than any one individual cluster.
–32
–
Table 2. Mean Values for Morphological Categories
Category Mean Mv Mean CI Mean E(B−V ) Mean Log Age Mean Mass Mean R(Hα) Mean RMS
(mag) (mag) (mag) (yr) M⊙ (pc)
3 −7.29 ± 1.30 2.56 ± 0.15 0.42 ± 0.10 6.53± 0.08 1.5E4 ± 3.0E4 5.0± 2.3 0.088 ± 0.021
4a −8.24 ± 1.29 2.43 ± 0.24 0.17 ± 0.19 6.67± 0.09 1.2E4 ± 1.4E4 13.7 ± 5.4 0.125 ± 0.023
4b −9.63 ± 1.58 2.71 ± 0.29 0.08 ± 0.14 6.79± 0.07 3.6E4 ± 4.2E4 38.1 ± 18.5 0.118 ± 0.040
5a −9.42 ± 0.84 2.90 ± 0.20 0.12 ± 0.10 7.39± 0.46 8.3E4 ± 8.8E4 · · · 0.095 ± 0.032
5b −7.98 ± 0.88 3.08 ± 0.22 0.13 ± 0.16 8.05± 0.86 6.0E4 ± 7.5E4 · · · 0.052 ± 0.022
6 −7.94 ± 0.87 3.15 ± 0.13 0.09 ± 0.15 8.76± 0.47 10.4E4 ± 7.8E4 · · · 0.039 ± 0.010
– 33 –
Table 3. Parameters for 22 “Single Star” HII Regions
# ID RA Decl. MV CI U−B V −I R(Hα)
(mag) (mag) (mag) (mag) (pc)
1 3550 204.2548844 −29.8825632 −5.51 2.13 −1.63 −0.22 9
2 3916 204.2554865 −29.8823689 −5.19 2.30 −1.60 −0.28 8
3 10373 204.2549063 −29.8795771 −5.24 2.28 −1.49 −0.16 7
4 11098 204.2672170 −29.8792752 −6.89 2.02 −1.64 −0.33 14
5 29250 204.2745636 −29.8709998 −4.41 2.09 −1.21 0.02 8
6 35101 204.2745919 −29.8676963 −5.23 2.11 −1.49 −0.39 6
7 37778 204.2667959 −29.8662227 −5.93 2.21 −1.13 0.08 9
8 47544 204.2823703 −29.8602099 −5.86 2.10 −1.51 −0.14 7
9 47772 204.2689918 −29.8600630 −5.09 2.12 −1.31 0.27 7
10 48660 204.2894733 −29.8594131 −4.26 2.25 −1.62 −0.48 2
11 49679 204.2535423 −29.8586761 −5.78 2.18 −0.49 0.32 9
12 50923 204.2552793 −29.8579399 −6.13 2.23 −1.15 0.25 5
13 51301 204.2887045 −29.8577311 −5.19 2.18 −1.27 0.15 2
14 52904 204.2462139 −29.8569822 −4.69 2.23 −1.59 0.14 1
15 56031 204.2828693 −29.8553764 −6.15 2.18 −1.36 0.02 6
16 56485 204.2849019 −29.8551313 −6.19 2.04 −1.42 0.06 8
17 56492 204.2829518 −29.8551272 −6.24 2.24 −0.12 1.07 9
18 56937 204.2841803 −29.8548844 −8.06 2.13 −0.21 0.90 6
19 60624 204.2516243 −29.8530186 −4.99 2.20 −1.28 −0.02 7
20 61345 204.2496746 −29.8526196 −4.79 2.23 −1.25 −0.32 4
21 72114 204.2810230 −29.8485123 −6.34 2.08 −0.77 0.33 12
22 88339 204.2804302 −29.8420518 −4.49 2.30 −1.08 −0.13 7