Using friction measurements to characterize chemical mechanical polishing lubrication regime
25
-
Upload
independent -
Category
Documents
-
view
1 -
download
0
Transcript of Using friction measurements to characterize chemical mechanical polishing lubrication regime

Using Friction Measurements to Characterize Chemical Mechanical
Polishing Lubrication Regime
Coppeta, J., Rogers, C., Racz, L., Philipossian, A., Kaufman, F. B.
1 Abstract
A small scaled (1:2) polishing platform was used to examine slurry behavior during polishing. In particu-
lar, wafer friction data is used to begin to characterize the lubrication regime during CMP processes. Friction
measurements are made non-intrusively during normal polishing operations. Friction data is investigated as
a function of conditioning, down force, platen speed, and ow rate. The friction data suggests that all four
variables interact to determine the overall lubrictation regime. In situ conditioning interacted with platen
speed to cause the wafer to oscillate between asperity contact and hydroplaning modes of contact. Platen
speed and down force also interacted to determine the onset conditions for hydroplaning. Flow rate had a
non-linear e�ect on the magnitude of the coe�cient of friction. Down force always increased the wafer drag
except in the hydroplaning contact mode. Both asperity contact and hydroplaning modes of contact were
attained under normal CMP conditions.
1
2 Introduction
One of the most important factors governing polishing performance is the interaction between the pad
and wafer. The nature of this interaction determines the polishing mechanism and can be described in terms
of the three di�erent lubrication regimes. The three di�erent lubrication regimes include direct contact,
partial asperity contact, and full separation (hydrodynamic lubrication). It is unclear whether the pad and
wafer are in intimate contact, fully separted by a hydrodynamic layer, or some combination of the two.
Research groups have supported hydrodynamic polishing [1, 2, 3, 4, 5, 6], and varying degrees of asperity
contact [7, 8, 9, 10].
The goal of this research is to correlate an easily measurable quantity on an industrial polisher to the
lubrication regime beneath a wafer during polishing. One such measurement that has been historically used
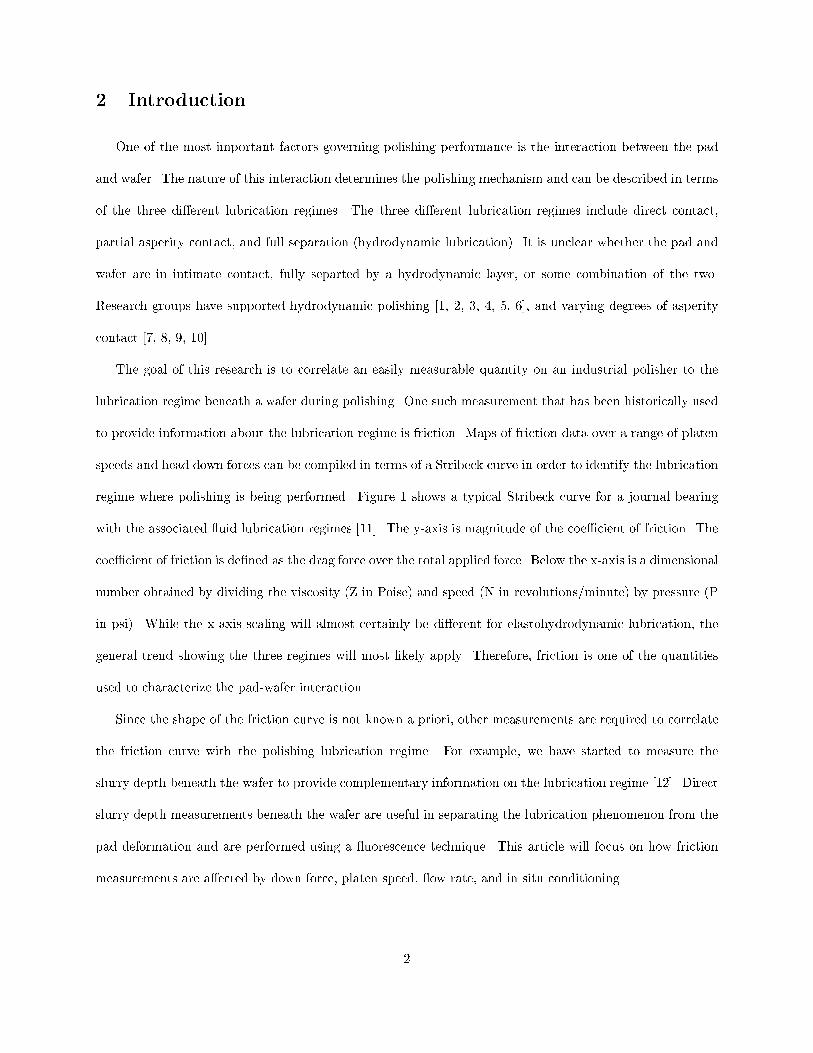
to provide information about the lubrication regime is friction. Maps of friction data over a range of platen
speeds and head down forces can be compiled in terms of a Stribeck curve in order to identify the lubrication
regime where polishing is being performed. Figure 1 shows a typical Stribeck curve for a journal bearing
with the associated uid lubrication regimes [11]. The y-axis is magnitude of the coe�cient of friction. The
coe�cient of friction is de�ned as the drag force over the total applied force. Below the x-axis is a dimensional
number obtained by dividing the viscosity (Z in Poise) and speed (N in revolutions/minute) by pressure (P
in psi). While the x-axis scaling will almost certainly be di�erent for elastohydrodynamic lubrication, the
general trend showing the three regimes will most likely apply. Therefore, friction is one of the quantities
used to characterize the pad-wafer interaction.
Since the shape of the friction curve is not known a priori, other measurements are required to correlate
the friction curve with the polishing lubrication regime. For example, we have started to measure the
slurry depth beneath the wafer to provide complementary information on the lubrication regime [12]. Direct
slurry depth measurements beneath the wafer are useful in separating the lubrication phenomenon from the
pad deformation and are performed using a uorescence technique. This article will focus on how friction
measurements are a�ected by down force, platen speed, ow rate, and in situ conditioning.
2

[Figure 1 about here.]
3 Experimental Apparatus
We have created a functional small scale (1:2) version of an industrial silicon dioxide (oxide) chemical
mechanical polishing platform in order to measure the behavior of slurry ow. This set up is described in
detail in our previous work [12] [13] [14] and therefore only a brief description will be included here. Figure 2
shows our modi�ed CMP setup used to study the slurry ow beneath a wafer. A tabletop Struers RotoPol-31
polisher is used to rotate a 30.5 cm (12") polishing pad. In situ or ex situ pad conditioning can be performed
using the device shown in Figure 3. A 75 mm (3") diamond grit wafer co-rotating with the platen conditions
the pad by periodically sweeping across the pad radius. The tabletop polisher is mounted on a slider table
to allow friction measurements as shown in Figure 4. The slider table's position is �xed using a strain gauge
so that one can measure the force (wafer drag) required to keep the table from sliding. The force is typically
sampled at 100 Hz for 10 seconds. We calibrated the strain gauge by applying known forces on the slider
table and found that the measurements were repeatable to within 3.5% of the applied load. The RotoPol
head has been replaced with a 20" industrial rated drill press that both rotates and applies down force to
a 75 mm (3") wafer. Typical removal rates were between 1000 to 3000 Angstroms/min. The wafer used in
this study had a bowed surface because of edge fast polishing. The height di�erence between the wafer's
center to edge was approximately 12 microns. Since we perform measurements of uid parameters using
an optical technique known as dual emission laser induced uorescence or DELIF [15], the wafer must be
transparent and a pure silicon wafer cannot be used. Instead, a glass wafer that is transparent to visible
light is used. Many of the polishing parameters including platen speed, down force, slurry delivery, and
conditioning speeds are computer controlled and monitored.
[Figure 2 about here.]
[Figure 3 about here.]
[Figure 4 about here.]
3

4 Methodology
Before any data was acquired a microporous urethane pad (no sub-pad) was placed on the platen where it
was conditioned for 10 minutes using a diamond grit (163 micron) wafer that both rotates about its own axis
and oscillates across the pad. The physical properties of the Freudenberg FX-9 polishing pad are shown in
Table 1. A 1:1.5 dilution of Cabo-Sperse SC1 slurry was continuously fed onto the pad during conditioning at
approximately 35 cc/min. Head and platen rotation rates were set at 60 rpm during conditioning. The head
speed remained at 60 rpm for all tests. Once conditioning was completed, measurements were conducted on
the pad. Friction measurements were made on two polyurethane pads (Freudenberg FX-9) on two di�erent
days. The pad was continuously conditioned during all friction measurements. A range of CMP parameters
were investigated; platen speeds from 30-180 rpm, wafer pressures from 14-42 kPa (2-6 psi), and ow rates
from 20-50 cc/min.
[Table 1 about here.]
5 Results
There were two dominant features in the friction curve regardless of the pad manufacturer, platen speed
or down force. Figure 5 shows a typical friction measurement taken on a Freudenberg FX-9 pad rotating at
30 rpm with 14 kPa (2 psi) down force. Note that there is a dominant frequency at 0.5 Hz or 30 rpm. This
feature is present in all friction curves and the dominant frequency always matches the platen rotational
frequency. The sinusoidal pattern did not appear when the polisher was running but the wafer was not in
contact with the pad, therefore the pattern was attributed to a mechanical e�ect. Measurements on the
platen showed that the platen height varied by as much as 0.38 mm (0.015 inch) in one rotation. E�orts to
reduce this irregularity using shim stock reduced the amplitude of the sinusoid but did not eliminate it. A
precise method of leveling the table will be required to eliminate the problem.
[Figure 5 about here.]
4

More importantly, in situ conditioning caused large uctuations in the friction values at high platen
speeds. The conditioner's motion periodically feeds and starves the wafer of slurry, as shown in Figure 6.
The friction is the lowest when the conditioner is located closest to the center of the pad and directing slurry
toward the front of the wafer and highest when the conditioner is directing slurry away from the wafer.
When slurry is directed toward the wafer the uid appears to provide a uid bearing. Figure 7 shows the
conditioner's e�ects on the friction curve at platen rotation rates of 90 and 150 rpm. Note that the platen's
mechanical e�ects are still present but the overall friction signal is modulated at the conditioner's oscillation
frequency of 0.125 Hertz. The lower drag values result from the conditioner directing slurry to the wafer
while the higher friction values result from the conditioner directing slurry away from the wafer.
[Figure 6 about here.]
[Figure 7 about here.]
Figure 8 shows a typical map of the coe�cient of friction as a function of platen speed and wafer down
force when the conditioner is not starving the wafer. The slurry ow rate was 20 cc/min.
[Figure 8 about here.]
There are several trends that are apparent in Figure 8. The coe�cient of friction increases with an
increase in down force except at high platen speeds. The increase in the coe�cient of friction with down
force suggests that the pad-wafer interaction changes with a change in down force. The change in the
interaction may be the result of pad deformation, a change in the orientation between the pad and wafer,
or a change in the uid �lm thickness. As mentioned previously, friction data alone cannot characterize the
pad-wafer interaction and therefore more data is required to understand the trends.
All of the curves in Figure 8 tend to decrease to a very low value above platen speeds of 100 rpm or 0.9
m/s. This trend suggests that the wafer is starting to hydroplane at high platen speeds. A higher down force
causes the friction curves to plateau at higher platen speeds because the uid �lm thickness decreases with
an increasing applied load. It is somewhat surprising that once the coe�cient of friction reaches its minimum
5

value it becomes nearly independent of platen speed. A higher platen speed should produce greater shear
stress in the uid between the pad and wafer. However, a simple calculation of the wall shear stress indicates
that the drag on the wafer due to the uid shear is negligibly small assuming a linear velocity gradient
between the pad and wafer and a 30 micron gap width. One can estimate the shear force (Fshear) as;
Fshear =
Z Z�dV
dyjy=0 dxdz � �
dV
dy�A � 1� 10�3
kg
m � s(
0:5ms
30� 10�6m)�(0:038m)2 = 0:076N; (1)
where � is the absolute viscosity, V is the relative velocity between the pad and wafer, y is the coordinate
perpendicular to the pad surface, A is the wafer's area, and x and z are coordinates in the plane of the
pad surface. The calculation shows that the drag force due to uid shear is 0.076 Newtons or 0.017 lb,
which translates into a coe�cient of friction that is smaller than 0.001. Thus, increasing the platen speed
by a factor of two would also produce a change in the drag that would fall within the uncertainty of the
measurement system. Therefore, something other than uid shear must be the source of the frictional forces.
First, the above calculation is oversimpli�ed. If the wafer were completely separated from the pad, it stands
to reason that the actual gap between the pad and the wafer would be much smaller than the measured uid
depth because of the pad asperities. Also the uid gradient may be more complicated than a simple linear
function and the added friction of polishing is not included in the calculation.
Finally, at higher pressures and low platen speeds, a local maximum occurs in the coe�cient of friction;
possibly due to changes in pad deformation. The pad is a viscoelastic material and as such it has the
characteristics of a viscous uid at low deformation rates and the characteristics of an elastic solid at high
deformation rates. Therefore, a greater force would be required to move the wafer at a faster rate through
the (viscoelastic uid) pad at low deformation rates. This trend continues until the local maximum in the
coe�cient of friction, after which either the wafer begins to separate from the pad or the pad begins to move
too fast to deform beneath the wafer. The pad's resistance to deformation at high platen speeds may explain
at region of the graphs when the wafer is slurry starved (not hydroplaning). To determine if this hypothesis
6

is plausible, one would need to measure the time scales and magnitude of pad de ection and viscoelastic
constants.
Friction maps of down force and platen speed were created for the two di�erent Freudenberg pads at
three di�erent ow rates (20 cc/min, 35 cc/min, and 50 cc/min). Figure 9shows the friction data with the
conditioner located towards the center of the pad and each data set appears to follow the same trend. Figure
10 shows the friction data with the conditioner located towards the edge of the pad (slurry starved case)
and the data sets appear to have more scatter than those in Figure 9. Note the large di�erence between the
shape and magnitude of the friction curves when the wafer is slurry starved versus slurry fed. Clearly, uid
mechanics is playing a large role in the pad-wafer interaction over the entire range of parameters examined.
That is, 50 cc/min caused the highest friction, followed by 20 cc/min, and �nally 35 cc/min. As expected,
neither curve resembles the Stribeck curve for a journal bearing. Additional types of data, such as the uid
�lm thickness and wafer orientation relative to the pad are required to fully understand the friction data. We
recently have demonstrated the ability to measure the uid �lm thickness and the wafer's orientation relative
to the pad [12] and intend on using this technique to correlate the friction data to the polishing lubrication
regime. This will be accomplished by simultaneously measuring the uid �lm thickness and friction data,
the results of which will be included in future publications.
[Figure 9 about here.]
[Figure 10 about here.]
6 Discussion
The friction trends suggest that the lubrication regime could either be described as hydrodynamic or
asperity contact depending upon the platen speed, wafer down force, slurry ow rate and conditioning. All
of these variables interact with each other to produce the overall lubrication regime. The conditioner has one
of the largest e�ects on the overall uid ow and thus the lubrication regime. Depending on the conditioner's
position, uid is either directed toward or away from the wafer, which can cause the contact mode to oscillate
7

between asperity contact and hydroplaning lubrication regimes. When uid is directed toward the wafer the
friction decreases, and when the conditioner directs uid away from the wafer the friction increases. The
friction is also strongly in uenced by the slurry ow rate and the platen speed. Faster platen speeds tend
to decrease the friction, indicating the onset of a hydroplaning mode. Down force always increased the drag
on the wafer except at high platen speeds where the wafer is believed to be hydroplaning.
The main goal of this research is to correlate the polishing performance to the uid behavior. While we
are currently working on this aspect of the research, the data we have now suggests that the slurry behavior
has a large impact on how the wafer interacts with the pad. Therefore, slurry behavior will most likely have
a large impact on the polishing performance. We have several hypotheses, based on physical arguements, on
how the slurry behavior may in uence the polishing performance . One hypothesis is that the wafer's angle of
attack relative to the pad will have a large impact on the polishing uniformity. Increasing the wafer's angle of
attack is expected to reduce the wafer's uniformity because of the resulting non-linear pressure distribution
across the wafer's surface. This non-linear pressure distribution when the wafer is not parallel to the pad is
expected regardless of whether the wafer is hydroplaning or not. Removal rates and wafer topography maps
indicate that our wafer is bowed which may provide direct evidence to support the uniformity's dependency
on the wafer's angle of attack. The question remains whether the wafer's bow caused the angle of attack or
whether the angle of attack caused the wafer's bow.
Increasing the amount of pad asperity contact is expected to increase the polishing removal rate. This is
because the pad asperities locally increase the pressure between the slurry particles and the wafer. Friction
data supports the notion that the wafer hydroplanes above certain platen speeds. At platen speeds above
90 rpm, in situ conditioning may cause the wafer to oscillate between asperity contact and hydroplaning
interactions with the pad. Platen speed's e�ect on the removal rate would be expected to be linear within a
lubrication regime but non-linear during transitions. That is, within either asperity contact or hydrodynamic
regimes, increasing the platen speed should increase the removal rate due to an increase in mechanical energy
or uid shear. Conditions that cause a transition between apserity contact to hydroplaning regimes should
cause a decrease in the removal rate.
8

Finally, increasing wafer drag is expected to increase the removal rate because more mechanical energy is
being delivered to the wafer surface. This concept may not be true if the wafer is slurry starved. Therefore,
platen speed and ow rate are expected to have a more complex e�ect on the wafer drag because these
factors in uence whether the wafer is in partial contact with the pad but lubricated, in partial contact with
the pad but slurry starved, or completely separted from the pad. Also, the shape and trends in the friction
curves were too complicated to ascertain the dependencies from the limited data. The only trend that is
clearly evident is that down force increases the wafer drag, although not necessarily the coe�cient of friction.
This is because the coe�cient of friction is a normalized value (wafer drag normalized by the wafer down
force) that is expected to change only when the friction mechanism changes.
7 Conclusion
We have shown friction data that suggests that the lubrication regime in chemical mechanical polishing
is dependent upon in situ conditioning, ow rate, down force, and platen speed. The combination of these
variables can cause the polisher to operate in an asperity contact mode or a hydroplaning mode. Because
of the conditioner's e�ect on the bulk slurry ow, in situ conditioning can have the strongest e�ect by
causing the polisher to oscillate between the two contact modes even if the other variables are kept constant.
Therefore, in situ conditioning is likely to have a large impact on the polishing performance. In general, slurry
behavior may have a large a�ect on polishing performance by in uencing the wafer's angle of attack relative
to the pad, the lubrication regime or amount of asperity contact between the pad and wafer, and the amount
of friction between the wafer and pad. Future work will involve simultaneously measuring friction and uid
�lm depth over a larger number of pads and correlating the slurry behavior to the polishing performance.
8 Acknowledgements
The authors would like to thank Intel and Cabot corporations for funding this research. We would also
like to thank VEECO corporation for donation of a Dektak 200 Si diamond tip pro�lometer, which enabled us
9

to measure removal rates. We would also like to thank Freudenberg Nonwovens for donating FX-9 polishing
pads.
10
References
[1] Y Mori, K Yamaguchi, and K Endo. Elastic Emission Machining. Precision Engineering, 9(3):123{128,
July 1987.
[2] L Cook. Chemical Processes in Glass Polishing. Journal of Non-Crystalline Solids, 120:152{171, 1990.
[3] S Runnels and L Eyman. Tribology analysis of chemical mechanical polishing. Journal of Electrochemical
Society, 141(6):1698{1701, June 1994.
[4] S Runnels. Feature-scale uid-based erosion modeling for chemical mechanical polishing. Journal of
Electrochemical Society, 141(7):1900{1904, June 1994.
[5] S Soares, D Baselt, J Black, K Jungling, and W Stowell. Float-polishing process and analysis of oat-
polished quartz. Applied Optics, 33(1):89{95, jan 1994.
[6] W Tseng and Y Wang. Re-examination of Pressure and Speed Dependences of Removal Rates during
Chemical Mechanical Polishing Processes. Journal of Electrochemical Society, 144(2):L15{L17, February
1995.
[7] C Liu, B Dai, W Tseng, and C Yeh. Modeling of the Wear Mechanism during Chemical Mechanical
Polishing. Journal of Electrochemical Society, 143(2):721{716, February 1996.
[8] T Yu, C Yu, and M Orlowski. A statistical polishing pad model for chemical-mechanical polish pla-
narization. IEDM Tech. Dig, pages 865{868, 1993.
[9] L Cook, J Wang, D James, and A Sethuraman. Theoretical and Practical Aspects of Dielectric and
Metal CMP. Semiconductor International, pages 141{144, November 1995.
[10] R Bhushan, R Rouse, and J Lukens. Chemical Mechanical Polishing in Semidirect Contact Mode.
Journal of Electrochemical Society, pages 3845{3851, November 1995.
[11] Eugene Avallone and Theodore Baumeister, editors. Mark's Standard Handbook for Mechanical Engi-
neers. McGraw-Hill Book Company, ninth edition, 1987.
11

[12] J Coppeta. Investigating uid behavior beneath a wafer during chemical mechanical polishing processes.
PhD thesis, Tufts University, 1999.
[13] J Coppeta, C Rogers, Livia Racz, A Philipossian, and F Kaufman. Investigating Slurry Transport
beneath a Wafer during Chemical Mechanical Polishing Processes. To be published, 1999.
[14] J Coppeta, C Rogers, L Racz, A Philipossian, and F Kaufman. Pad e�ects on slurry transport beneath a
wafer during polishing. In Third International Chemical-Mechanical Polish (C.M.P.) for ULSI Multilevel
Interconnection Conference (CMP-MIC), pages 36{43, 1998.
[15] J Coppeta and C Rogers. Dual Emission Laser Induced Fluorescence For Direct Planar Scalar Behavior
Measurements. Experiments in Fluids, 25:141{144, 1997.
12

List of Figures
1 Stribeck Curve . . . . . . . . . . . . . . . . . . . . . . . . . . . . . . . . . . . . . . . . . . . . 14
2 Experimental Apparatus . . . . . . . . . . . . . . . . . . . . . . . . . . . . . . . . . . . . . . . 15
3 In situ conditioner . . . . . . . . . . . . . . . . . . . . . . . . . . . . . . . . . . . . . . . . . . 16
4 Experimental Apparatus: Friction Setup . . . . . . . . . . . . . . . . . . . . . . . . . . . . . . 17
5 Sinusoidal oscillations in friction . . . . . . . . . . . . . . . . . . . . . . . . . . . . . . . . . . 18
6 E�ects of in situ conditioning . . . . . . . . . . . . . . . . . . . . . . . . . . . . . . . . . . . . 19
7 E�ects of in situ conditioning . . . . . . . . . . . . . . . . . . . . . . . . . . . . . . . . . . . . 20
8 Friction as a function of platen speed and down force (20 cc/min, Conditioner in) . . . . . . . 21
9 Friction data plotted as a Stribeck curve . . . . . . . . . . . . . . . . . . . . . . . . . . . . . 22
10 Friction data plotted as a Stribeck curve . . . . . . . . . . . . . . . . . . . . . . . . . . . . . 23
13

Figure 1: Stribeck Curve
14

Figure 2: Experimental Apparatus
15

Figure 3: In situ conditioner
16

Figure 4: Experimental Apparatus: Friction Setup
17

0.5 HertzData
Time (sec)
Drag(lbs)
109876543210
5
4.5
4
3.5
3
2.5
2
1.5
1
0.5
0
Figure 5: Sinusoidal oscillations in friction
18

Figure 6: E�ects of in situ conditioning
19

150 rpm90 rpm
Time (sec)
Drag(lbs)
1086420
6
5
4
3
2
1
0
Figure 7: E�ects of in situ conditioning
20

6 psi5 psi4 psi3 psi2 psi
Platen Speed (rpm)
Coe�.ofFriction
18016014012010080604020
0.5
0.45
0.4
0.35
0.3
0.25
0.2
0.15
0.1
0.05
0
Figure 8: Friction as a function of platen speed and down force (20 cc/min, Conditioner in)
21

50 cc/min35 cc/min20 cc/min
ZN
P
Coe�.ofFriction
6000500040003000200010000
0.4
0.35
0.3
0.25
0.2
0.15
0.1
0.05
0
Figure 9: Friction data plotted as a Stribeck curve
22

50 cc/min35 cc/min20 cc/min
ZN
P
Coe�.ofFriction
6000500040003000200010000
0.4
0.35
0.3
0.25
0.2
0.15
0.1
0.05
0
Figure 10: Friction data plotted as a Stribeck curve
23

List of Tables
1 Physical properties of Freudenberg FX-9 polishing pads . . . . . . . . . . . . . . . . . . . . . 25
24

Physical Property Unit Minimum Maximum
Thickness mils 53.0 57.0
Speci�c Gravity g/cc 0.65 0.75
Hardness Shore D 48.0 55.0
Compressibility % 0.5 1.8
Table 1: Physical properties of Freudenberg FX-9 polishing pads
25