Using Density Functional Theory to Model Realistic TiO2 ...
24
catalysts Article Using Density Functional Theory to Model Realistic TiO 2 Nanoparticles, Their Photoactivation and Interaction with Water Daniele Selli, Gianluca Fazio and Cristiana Di Valentin * Dipartimento di Scienza dei Materiali, Università di Milano-Bicocca, via R. Cozzi 55, 20125 Milano, Italy; [email protected] (D.S.); [email protected] (G.F.) * Correspondence: [email protected] Received: 16 October 2017; Accepted: 20 November 2017; Published: 24 November 2017 Abstract: Computational modeling of titanium dioxide nanoparticles of realistic size is extremely relevant for the direct comparison with experiments but it is also a rather demanding task. We have recently worked on a multistep/scale procedure to obtain global optimized minimum structures for chemically stable spherical titania nanoparticles of increasing size, with diameter from 1.5 nm (~300 atoms) to 4.4 nm (~4000 atoms). We use first self-consistent-charge density functional tight-binding (SCC-DFTB) methodology to perform thermal annealing simulations to obtain globally optimized structures and then hybrid density functional theory (DFT) to refine them and to achieve high accuracy in the description of structural and electronic properties. This allows also to assess SCC-DFTB performance in comparison with DFT(B3LYP) results. As a further step, we investigate photoexcitation and photoemission processes involving electron/hole pair formation, separation, trapping and recombination in the nanosphere of medium size by hybrid DFT. Finally, we show how a recently defined new set of parameters for SCC-DFTB allows for a proper description of titania/water multilayers interface, which paves the way for modeling large realistic nanoparticles in aqueous environment. Keywords: nanospheres; simulated Extended X-ray Adsorption Fine-Structure (EXAFS); excitons; trapping; titania/water interface; SCC-DFTB; B3LYP 1. Introduction TiO 2 nanoparticles are fundamental building blocks in photocatalysis [1–4]. Their theoretical description is indeed relevant and requires the size of the model to be as realistic as possible, for direct comparison with experimental samples. TiO 2 nanoparticles are most typically obtained from sol-gel synthesis. Several studies have proven that shape and size can be successfully tailored by controlling the conditions of preparation and by using ad-hoc surface chemistry [5–7]. The minimum energy shape was predicted by Barnard et al. [8] by Wulff construction, for dimensions below 10 nm, to be a decahedron in the anatase phase, exposing mainly (101) and small (001) facets. However, growth determining factors are pH and particle density. An excessive dilution may cause a partial dissolution of titania nanocrystals leading to the formation of spherical nanoparticles [9]. Those, analogously to nanotubes and nanorods, are characterized by a high curvature profile and, thus, expected to be more reactive towards molecular adsorption. The majority of the computational first-principles studies are devoted to bulk or surface slabs of anatase TiO 2 [10]. Few works have dealt with the decahedral faceted nanoparticles [11–16] but none with spherical ones. Modelling nanoparticles of realistic size (few nanometers) by first-principles calculations is very demanding and a global optimization is hardly feasible [17]. Ours is a multistep/scale approach [18] where we propose first to apply a less expensive but still rather Catalysts 2017, 7, 357; doi:10.3390/catal7120357 www.mdpi.com/journal/catalysts
-
Upload
khangminh22 -
Category
Documents
-
view
0 -
download
0
Transcript of Using Density Functional Theory to Model Realistic TiO2 ...
catalysts
Article
Using Density Functional Theory to Model RealisticTiO2 Nanoparticles, Their Photoactivation andInteraction with Water
Daniele Selli, Gianluca Fazio and Cristiana Di Valentin *
Dipartimento di Scienza dei Materiali, Università di Milano-Bicocca, via R. Cozzi 55, 20125 Milano, Italy;[email protected] (D.S.); [email protected] (G.F.)* Correspondence: [email protected]
Received: 16 October 2017; Accepted: 20 November 2017; Published: 24 November 2017
Abstract: Computational modeling of titanium dioxide nanoparticles of realistic size is extremelyrelevant for the direct comparison with experiments but it is also a rather demanding task.We have recently worked on a multistep/scale procedure to obtain global optimized minimumstructures for chemically stable spherical titania nanoparticles of increasing size, with diameter from1.5 nm (~300 atoms) to 4.4 nm (~4000 atoms). We use first self-consistent-charge density functionaltight-binding (SCC-DFTB) methodology to perform thermal annealing simulations to obtain globallyoptimized structures and then hybrid density functional theory (DFT) to refine them and to achievehigh accuracy in the description of structural and electronic properties. This allows also to assessSCC-DFTB performance in comparison with DFT(B3LYP) results. As a further step, we investigatephotoexcitation and photoemission processes involving electron/hole pair formation, separation,trapping and recombination in the nanosphere of medium size by hybrid DFT. Finally, we showhow a recently defined new set of parameters for SCC-DFTB allows for a proper description oftitania/water multilayers interface, which paves the way for modeling large realistic nanoparticles inaqueous environment.
Keywords: nanospheres; simulated Extended X-ray Adsorption Fine-Structure (EXAFS); excitons;trapping; titania/water interface; SCC-DFTB; B3LYP
1. Introduction
TiO2 nanoparticles are fundamental building blocks in photocatalysis [1–4]. Their theoreticaldescription is indeed relevant and requires the size of the model to be as realistic as possible, for directcomparison with experimental samples.
TiO2 nanoparticles are most typically obtained from sol-gel synthesis. Several studies have proventhat shape and size can be successfully tailored by controlling the conditions of preparation and byusing ad-hoc surface chemistry [5–7]. The minimum energy shape was predicted by Barnard et al. [8]by Wulff construction, for dimensions below 10 nm, to be a decahedron in the anatase phase, exposingmainly (101) and small (001) facets. However, growth determining factors are pH and particle density.An excessive dilution may cause a partial dissolution of titania nanocrystals leading to the formationof spherical nanoparticles [9]. Those, analogously to nanotubes and nanorods, are characterized by ahigh curvature profile and, thus, expected to be more reactive towards molecular adsorption.
The majority of the computational first-principles studies are devoted to bulk or surface slabsof anatase TiO2 [10]. Few works have dealt with the decahedral faceted nanoparticles [11–16]but none with spherical ones. Modelling nanoparticles of realistic size (few nanometers) byfirst-principles calculations is very demanding and a global optimization is hardly feasible [17]. Ours isa multistep/scale approach [18] where we propose first to apply a less expensive but still rather
Catalysts 2017, 7, 357; doi:10.3390/catal7120357 www.mdpi.com/journal/catalysts
Catalysts 2017, 7, 357 2 of 24
accurate method based on density functional theory (DFT), which is the self-consistent-charge densityfunctional tight-binding (SCC-DFTB) [19], to perform a global structure optimization search of thenanoparticles; then to run a further DFT relaxation to determine structural and electronic propertieswith first-principles level accuracy. For the latter, we use hybrid functionals since they are known tobetter describe electronic structure details of TiO2 materials [20–22]. SCC-DFTB has been demonstratedto be a powerful tool for the quantum mechanics study of many system involving TiO2 [23–26].The method retains most of the physics of standard DFT at an extremely reduced computational cost.
Furthermore, we would like to describe the interaction of such nanoparticles with light and theirphotoactivation producing energy carriers (excitons) and charge carriers (electrons and holes). The aimis to improve the general understanding of the processes at the basis of light energy conversion intochemical species with intrinsic redox potential that are those triggering the redox reaction at the oxidesurface [14,27–30].
It is generally accepted that water, as the surrounding environment where titania nanoparticlework in photocatalytic processes, plays an active role [31–39]. It is, therefore, fundamental to describeaccurately the dynamical water layers arrangement on the surface and how water molecules may enterthe photoactivated reaction chain [40].
In the following, we will present a critical review of our work, relative to the topics highlighted anddiscussed above: in Section 2, we present the Computational methodology; in Section 3, we describehow to obtain realistic spherical nanoparticles models; in Section 4, we discuss the description of thephotoexcitation processes; and, in Section 5, we analyze how the water environment can be modeledwith sufficient accuracy.
2. Computational Details
To tackle the surface complexity of the TiO2 spherical nanoparticles and maintain a high degreeof accuracy, different levels of theory are necessary. Nowadays, density functional theory (DFT) is themost used method to properly describe equilibrium geometries and electronic structures. However,many interesting features of the system are accessible only at certain size and time scale. For example,to explore the potential energy surface related to the different configurations of the TiO2 sphericalnanoparticles through molecular dynamics and simulated annealing processes, an approximatedmethod has to be used. The self-consistent-charge density functional tight-binding (SCC-DFTB)approach is a DFT-based quantum mechanical method, which retains a quantum description of thesystem at a considerably reduced computational cost. Thus, in addition to geometry optimizationsand electronic structure calculations, SCC-DFTB also enables molecular dynamic simulations for largesystems with a reasonable time length.
2.1. Electronic Structure Calculations
The choice of a specific density functional is based on the aim of the study. Standardgeneralized-gradient approximation (GGA) functionals may be sufficient to describe equilibriumgeometries or adsorption energies, however a correct description of the electronic structure ofsemiconducting oxides requires the inclusion of a certain portion of exact exchange. The use ofsuch hybrid functionals in a plane-wave code is extremely cumbersome, thus localized basis functioncodes are preferred. The CRYSTAL14 code [41] has been used for most of the density functional theory(DFT) calculations, employing all-electron Gaussian basis sets [O 8-411(d1) Ti 86-411 (d41) and H511(p1)] and the B3LYP [42,43] and the HSE06 [44] hybrid functionals. For periodic systems, referenceDFT calculations were carried out with the Quantum ESPRESSO [45] simulation package, using thePBE functional [46], ultrasoft Vanderbilt pseudopotentials and a plane-wave basis set with a cut off of30 Ry (300 Ry for the charge density).
The optimized lattice parameters for bulk TiO2 anatase are 3.789 Å and 3.766 Å for a and9.777 Å and 9.663 Å for c, respectively, for B3LYP and HSE06, which are in good agreement with theexperimental values [47].
Catalysts 2017, 7, 357 3 of 24
A 6√
2 × 6√
2 × 1 TiO2 anatase bulk supercell with 864 atoms was employed to model theexciton and the related distortions in the bulk. The (101) anatase surface has been taken as a referencefor: (i) surface energies; and (ii) interaction with water. (i) We employed the CRYSTAL14 codeand a minimal cell slab of ten triatomic layers with 60 atoms, where the periodicity was set alongthe [101] and [010] directions and not in the direction perpendicular to the surface. (ii) A 1 × 2supercell three-triatomic-layer slab (72 atoms) has been used within the Quantum ESPRESSO code,where the replicas in the direction perpendicular to the surface were separated by 20 Å in orderto avoid any interaction between images. For the k-point sampling, a 1 × 1 × 6, a 8 × 8 × 1 anda 2 × 2 × 1 Monkhorst–Pack grid was used for the bulk, the minimal slab cell and the 1 × 2 slabsupercell, respectively.
Anatase TiO2 nanospheres have been carved from a bulk supercell following the procedurealready described in a previous work by some of us [17]. Nanoparticles have been considered asmolecules in the vacuum with no periodic boundary conditions. Therefore, when an excess electronor hole is introduced in the system, no background of charge is necessary. In the case of open-shellsystems, spin polarization is taken into account.
Trapping energies (∆Etrap) for excitons, extra electrons and holes are calculated as the total energydifference between the trap optimized geometry and the delocalized solution in the neutral groundstate geometry.
The total densities of states (DOS) of the nanoparticles have been simulated with the convolutionof Gaussian functions (σ = 0.005 eV) peaked at the value of the Kohn-Sham energies of each orbital.Projected densities of states (PDOS) are built using the following procedure, based on the molecularorbitals coefficients in the linear combination of atomic orbitals (LCAO): summing the squares ofthe coefficients of all the atomic orbitals centered on a certain atom type results, after normalization,in the relative contribution of each atom type to a specific eigenstate. Then, the various projections areobtained from the convolution of Gaussian peaks with heights that are proportional to the relativecontribution. The zero energy for all the DOS is set to the vacuum level, i.e., the energy of an electronat an infinite distance from the surface of the system.
2.2. SCC-DFTB Approach
The self-consistent-charge density functional tight-binding method (SCC-DFTB) is based on theapproximation of the Kohn-Sham (KS) DFT formalism. Assuming a second-order expansion of theKS-DFT total energy with respect to the electron density fluctuations, the SCC-DFTB total energy isdefined as:
ESCC−DFTBtot = ∑
iniεi +
12 ∑
αβ
vαβrep
(Rαβ
)+
12 ∑
αβ
γαβ∆qα∆qβ (1)
where the first term contains the one-electron energies εi from the diagonalization of an approximatedHamiltonian matrix and represents the attractive part of the energy, whereas the second termapproximates the short-range repulsive energy, given by the sum of the pairwise distance-dependentpotential vαβ
rep(
Rαβ
)between the pair of atoms α and β, and ∆qα and ∆qβ are the charges induced on
the atoms α and β, which interact through a Coulombic-like potential γαβ. For more information onthe details of the SCC-DFTB method, see Refs. [19,48,49].
For all the SCC-DFTB calculations, we employed the DFTB+ simulation package [50]. We initiallymade used of the “matsci-0-3” Slater–Koster parameters, which have been shown to be well-suitedfor the study of anatase TiO2 in Ref. [24]. Subsequently, to better describe the titania/water/waterinterface, we combined the “matsci-0-3” parameters for Ti-O and Ti-Ti interactions with the parametersin the “mio-1-1” set [19] for O-O, O-H and H-H interactions in what we have named as “MATORG” set.Furthermore, we modified the γαβ function to improve the description of H-bonding, using a hydrogenbonding damping function (HBD), in which a ζ = 4 parameter has been used [51]. In this work, werefer to this HBD modified Slater–Koster parameters set as “MATORG+HBD” [40]. From now on,DFTB will be used as a shorthand for SCC-DFTB.
Catalysts 2017, 7, 357 4 of 24
To perform the simulated annealing procedure, we carried out Born–Oppenheimer DFTBmolecular dynamics (MD) within the canonical ensemble (NVT). The integration of the Newton’sequations of motion has been done with the Velocity Verlet algorithm, using a relative small timestep of 0.5 fs to ensure reversibility. A Nosé–Hoover chain thermostat with a time constant of0.03 ps was applied to reach the desired temperature during the temperature-annealing simulations.The simulation time length of the annealing processes was made commensurate to the size of thenanosphere. Thus, we used a simulation time up to 45 ps for the 1.5 nm, 24 ps for the 2.2 nm, 14 ps forthe 3.0 nm and 11 ps for the 4.4 nm nanosphere. In the case of the titania/water interface, each MDsimulation has been performed for 25 ps.
For the molecular dynamics of the titania/water interface, a 1 × 3 supercell anatase (101) slab(108 atoms) with a monolayer (ML), a bilayer (BL) and a trilayer (TL) of water, composed of 6, 12 and18 water molecules, respectively, was used. The desired temperature of the thermostat was set to aconstant low value (160 K) to avoid the desorption of surface water molecules.
2.3. Structural Analysis
The extended X-ray adsorption fine structure (EXAFS) simulated spectra has been simulated via aGaussian convolution of peaks (σ = 0.0005 Å) centered at the length of the distance between each Tiatom and other atoms (O or Ti) in the first, second, and third coordination shells. Projections have beencomputed considering only the distances centered on specific Ti atoms with a certain coordinationsphere. In the text, we also report the surface-to-bulk ratio, defined as the ratio between the number ofTi and O atoms at the surface of the nanosphere and the number of Ti and O atoms in the bulk.
3. Modelling Realistic TiO2 Nanoparticles
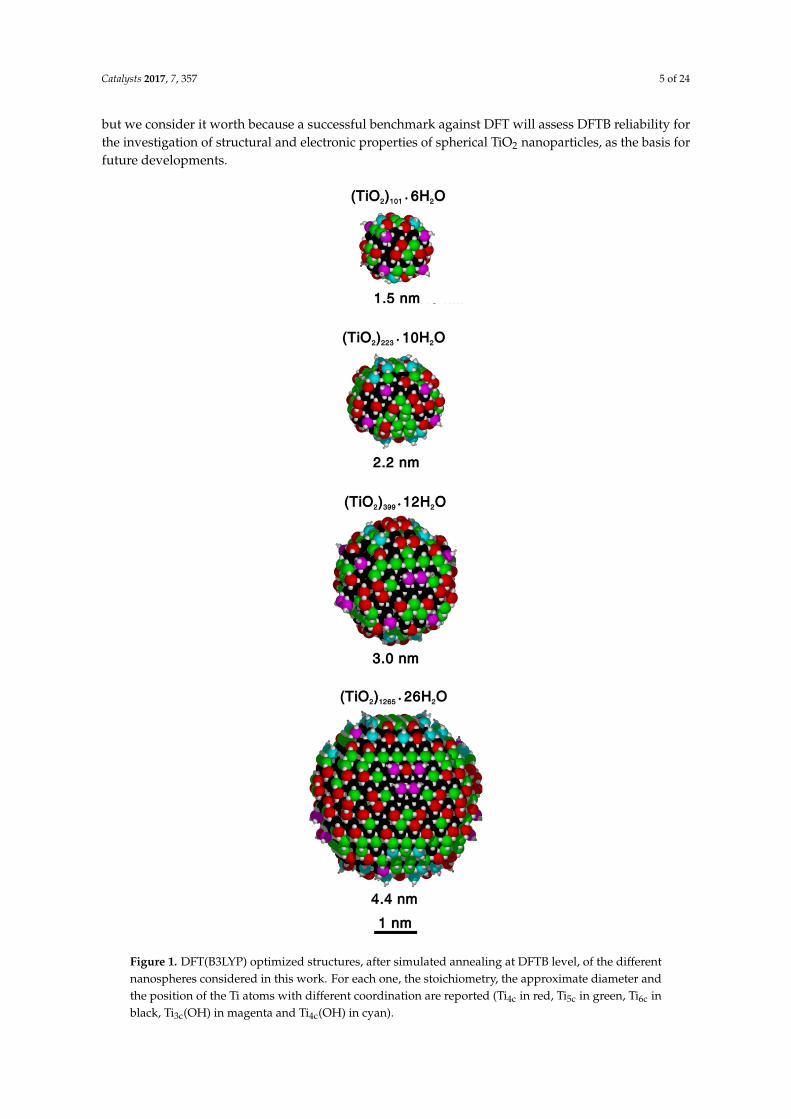
We carved TiO2 spherical nanoparticles from large bulk anatase supercells. The radius of thesphere is set to a desired value and only atoms within that sphere are considered, whereas those outsidethe sphere are removed. Some very low coordinated Ti sites are found to be left at the surface of themodel that must be removed or saturated with OH groups; analogously monocoordinated O must beremoved or saturated with H atoms. Therefore, we use a number of water molecules to achieve thechemical stability of the nanoparticle. We try to keep the number of water molecules as low as possible.Since we aim at modelling nanoparticles of realistic size, we range from spheres with diameter of1.5 nm up to 4.4 nm. These contain from 300 up to almost 4000 atoms. The exact stoichiometry of theprepared nanoparticles [(TiO2)101·6H2O, (TiO2)223·10H2O, (TiO2)399·12H2O, and (TiO2)1265·26H2O] isreported in Figure 1.
Structural relaxation by geometry optimization from the “as-carved” and chemically stabilizedmodels is not an efficient approach because we found that it leads to local minimum structures,which are far from the global minimum one. For this reason, we have drastically changed our approachand decided to use a less computationally expensive, but still rather accurate, DFT-based method(DFTB) and to run some molecular dynamics simulations starting from the “as-carved” structuresat increasing temperature (up to 700 K in some cases). This approach allows moving from the localminimum structure basin, close to the “as-carved” structure, and to further sample the configurationspace. The thermally equilibrated structures obtained with this approach, and then fully relaxed,are much more stable to any surface modification (i.e., addition of a molecular adsorbate) becausethose are true global minima on the potential energy surface of the TiO2 nanospheres. This multi-stepprocedure can be rather easily and reasonably applied to nanospheres of increasing size, and certainlyup to the one with a 4.4 nm diameter (~4000 atoms). Once the fully relaxed nanospheres are prepared,we can investigate structural and electronic properties at the DFTB level of theory. However, to assessthe accuracy of DFTB in this specific context, we must perform a benchmark study against hybrid DFTmodel calculations. Those were obtained by full atomic relaxation starting from the DFTB thermallyannealed and optimized spheres. Note that we performed this further DFT(B3LYP) optimization forall four nanospheres. For the very large one (~4000 atoms) it was an extremely expensive procedure,
Catalysts 2017, 7, 357 5 of 24
but we consider it worth because a successful benchmark against DFT will assess DFTB reliability forthe investigation of structural and electronic properties of spherical TiO2 nanoparticles, as the basis forfuture developments.
Catalysts 2017, 7, 357 5 of 24
successful benchmark against DFT will assess DFTB reliability for the investigation of structural and
electronic properties of spherical TiO2 nanoparticles, as the basis for future developments.
Figure 1. DFT(B3LYP) optimized structures, after simulated annealing at DFTB level, of the different
nanospheres considered in this work. For each one, the stoichiometry, the approximate diameter and
the position of the Ti atoms with different coordination are reported (Ti4c in red, Ti5c in green, Ti6c in
black, Ti3c(OH) in magenta and Ti4c(OH) in cyan).
Figure 1. DFT(B3LYP) optimized structures, after simulated annealing at DFTB level, of the differentnanospheres considered in this work. For each one, the stoichiometry, the approximate diameter andthe position of the Ti atoms with different coordination are reported (Ti4c in red, Ti5c in green, Ti6c inblack, Ti3c(OH) in magenta and Ti4c(OH) in cyan).

Catalysts 2017, 7, 357 6 of 24
3.1. Structural Properties
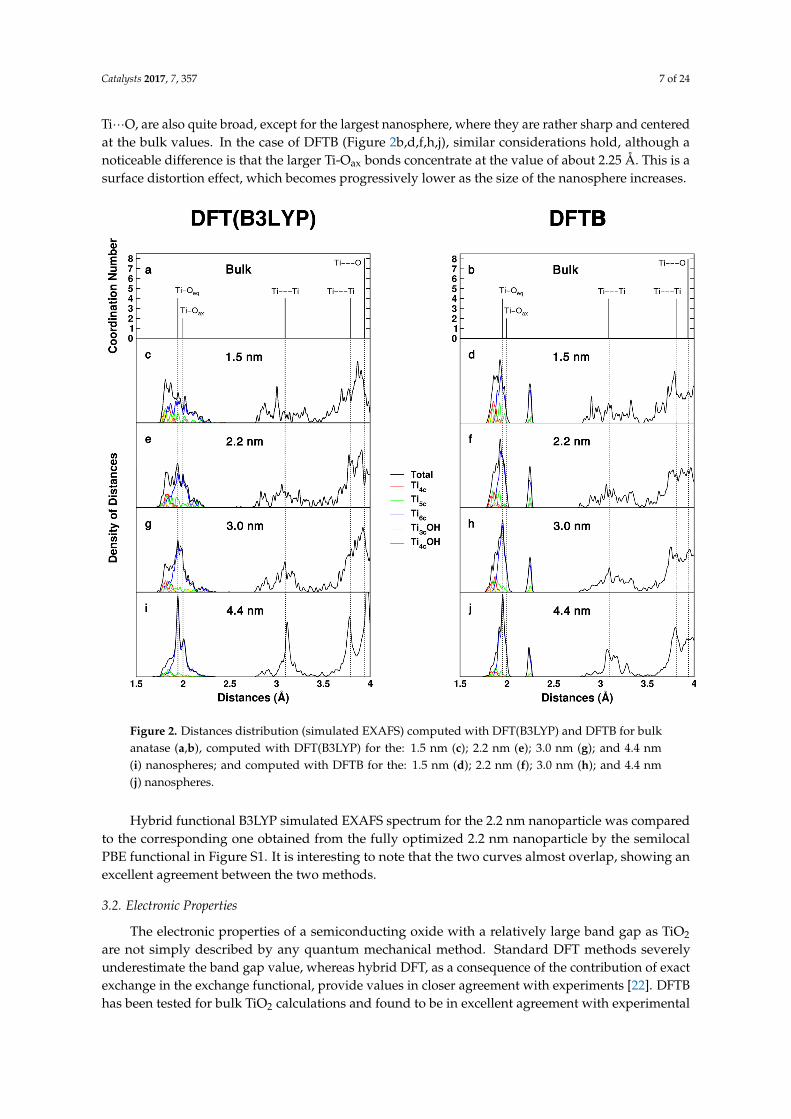
Our study is not only meant to validate the DFTB methodology with respect to an accurate hybridDFT method, but also to highlight how the enhanced curvature present in small TiO2 nanospheres, inanalogy to that in nanotubes and nanorods, affects both the coordination of the surface atoms and theirgeometrical environment. The different coordination types are illustrated in Figure 1 and their relativepercentage is reported in Table 1. Flat anatase surfaces and faceted nanoparticles are dominated byTi6c and Ti5c, whereas it is evident that on spherical nanoparticles different types of coordinationexist that are expected to play a key role in the processes of chemical adsorption. The structuraldistortions induced by the nanosize and by the high curvature are investigated through the analysisof the simulated direct space X-ray absorption fine structure spectra (EXAFS) for bulk and for thenanospheres models of different size, as obtained with both DFT(B3LYP) and DFTB calculations(Figure 2). Those provide the distribution of the distances for each Ti atom with the neighboring O ornext neighboring Ti atoms. Figure 2a,b show the EXAFS spectra for the bulk case. Here, no distributionis observed since crystalline bulk is characterized by two Ti-O distances (two lines on the left side),which are attributed to equatorial and axial O atoms resulting from a D2d point symmetry at eachTi center [DFT(B3LYP): Ti-Oeq = 1.946 Å and Ti-Oax = 2.000 Å; DFTB: Ti-Oeq = 1.955 Å and Ti-Oax =1.995 Å], and single Ti···Ti distances at regular lattice positions [DFT(B3LYP): first shell 3.092 Å, secondshell 3.789 Å; DFTB: first shell 3.090 Å, second shell 3.809 Å].
Table 1. Amount of Ti atoms with different coordination for the variously sized nanospheres, asoptimized at DFTB level, in terms of their number and percentage with respect to the total number ofTi atoms, is reported. Corresponding values for the optimized nanosphere at the DFT(B3LYP) level arein parenthesis, only when different from DFTB.
DFTB [DFT(B3LYP)] Number % Number % Number % Number %
Ti Site 1.5 nm 2.2 nm 3.0 nm 4.4 nm
Ti4c20 19.8
36 16.1 53 13.3 106 8.4(19) (18.8)
Ti5c20 19.8 43 19.2 69 17.3
159 12.6(21) (20.8) (49) (22.0) (65) (16.3)
Ti6c_sup 20 19.828 12.6 72 18
157 12.4(24) (10.8) (75) (18.8)
Ti6c 29 28.796 43.1 181 43.4
791 62.5(94] (42.1) (182) (45.6)
Ti3c(OH) 8 7.9 8 3.6 16 4 20 1.6
Ti4c(OH) 4 4 12 5.4 8 2 32 2.5
Figure 2c–j reports the EXAFS simulated spectra for the nanospheres of increasing size.With respect to bulk, we register a variety of distances due to the lattice distortion and diversityof coordination sites. For this reason and to improve the level of information provided, we presenta convolution of peaks and project it on each type of coordination site. In the case of DFT(B3LYP)(left colomn), the first broad peak on the left, related to first neighbor Ti-O distances, is predominantlymade up of Ti6c-O bond lenghts. Low coordinated sites contribute to the shorter Ti-O distances thanin the bulk (red, yellow, brown lines), whereas Ti5c and Ti6c species contribute to the range of bulkvalues and to the longer Ti-O distances up to 2.2–2.3 Å (blue, green lines). It is evident that, as the sizeincreases, the relative portion of Ti6c sites increases (blue line) with a distribution of Ti-O distancesthat becomes increasingly more peaked at the bulk values (see Figure 2i). It is clear that the EXAFSspectrum of the nanosphere with a diameter of 4.4 nm already quite largely resembles that of bulkanatase, since the surface-to-bulk ratio (0.43) is rather reduced with respect to the other nanospheres(1.70 > 0.94 > 0.83). The other peaks, for the second and third coordination spheres of Ti···Ti and of
Catalysts 2017, 7, 357 7 of 24
Ti···O, are also quite broad, except for the largest nanosphere, where they are rather sharp and centeredat the bulk values. In the case of DFTB (Figure 2b,d,f,h,j), similar considerations hold, although anoticeable difference is that the larger Ti-Oax bonds concentrate at the value of about 2.25 Å. This is asurface distortion effect, which becomes progressively lower as the size of the nanosphere increases.
Catalysts 2017, 7, 357 7 of 24
Ti3c(OH) 8 7.9 8 3.6 16 4 20 1.6
Ti4c(OH) 4 4 12 5.4 8 2 32 2.5
Figure 2. Distances distribution (simulated EXAFS) computed with DFT(B3LYP) and DFTB for bulk
anatase (a,b), computed with DFT(B3LYP) for the: 1.5 nm (c); 2.2 nm (e); 3.0 nm (g); and 4.4 nm (i)
nanospheres; and computed with DFTB for the: 1.5 nm (d); 2.2 nm (f); 3.0 nm (h); and 4.4 nm (j)
nanospheres.
Hybrid functional B3LYP simulated EXAFS spectrum for the 2.2 nm nanoparticle was
compared to the corresponding one obtained from the fully optimized 2.2 nm nanoparticle by the
semilocal PBE functional in Figure S1. It is interesting to note that the two curves almost overlap,
showing an excellent agreement between the two methods.
3.2. Electronic Properties
The electronic properties of a semiconducting oxide with a relatively large band gap as TiO2 are
not simply described by any quantum mechanical method. Standard DFT methods severely
underestimate the band gap value, whereas hybrid DFT, as a consequence of the contribution of
exact exchange in the exchange functional, provide values in closer agreement with experiments
[22]. DFTB has been tested for bulk TiO2 calculations and found to be in excellent agreement with
experimental data and DFT Hubbard corrected values [23]. Therefore, DFTB is expected to perform
well when investigating TiO2 nanoparticles.
In the following, we present a comparison of the density of states (DOS) for the nanospheres of
different size, as shown in Figure 3, that have been obtained with DFT(B3LYP) and DFTB on the
corresponding fully relaxed structures. Considering that nanoparticles are finite systems, one could
Figure 2. Distances distribution (simulated EXAFS) computed with DFT(B3LYP) and DFTB for bulkanatase (a,b), computed with DFT(B3LYP) for the: 1.5 nm (c); 2.2 nm (e); 3.0 nm (g); and 4.4 nm(i) nanospheres; and computed with DFTB for the: 1.5 nm (d); 2.2 nm (f); 3.0 nm (h); and 4.4 nm(j) nanospheres.
Hybrid functional B3LYP simulated EXAFS spectrum for the 2.2 nm nanoparticle was comparedto the corresponding one obtained from the fully optimized 2.2 nm nanoparticle by the semilocalPBE functional in Figure S1. It is interesting to note that the two curves almost overlap, showing anexcellent agreement between the two methods.
3.2. Electronic Properties
The electronic properties of a semiconducting oxide with a relatively large band gap as TiO2
are not simply described by any quantum mechanical method. Standard DFT methods severelyunderestimate the band gap value, whereas hybrid DFT, as a consequence of the contribution of exactexchange in the exchange functional, provide values in closer agreement with experiments [22]. DFTBhas been tested for bulk TiO2 calculations and found to be in excellent agreement with experimental
Catalysts 2017, 7, 357 8 of 24
data and DFT Hubbard corrected values [23]. Therefore, DFTB is expected to perform well wheninvestigating TiO2 nanoparticles.
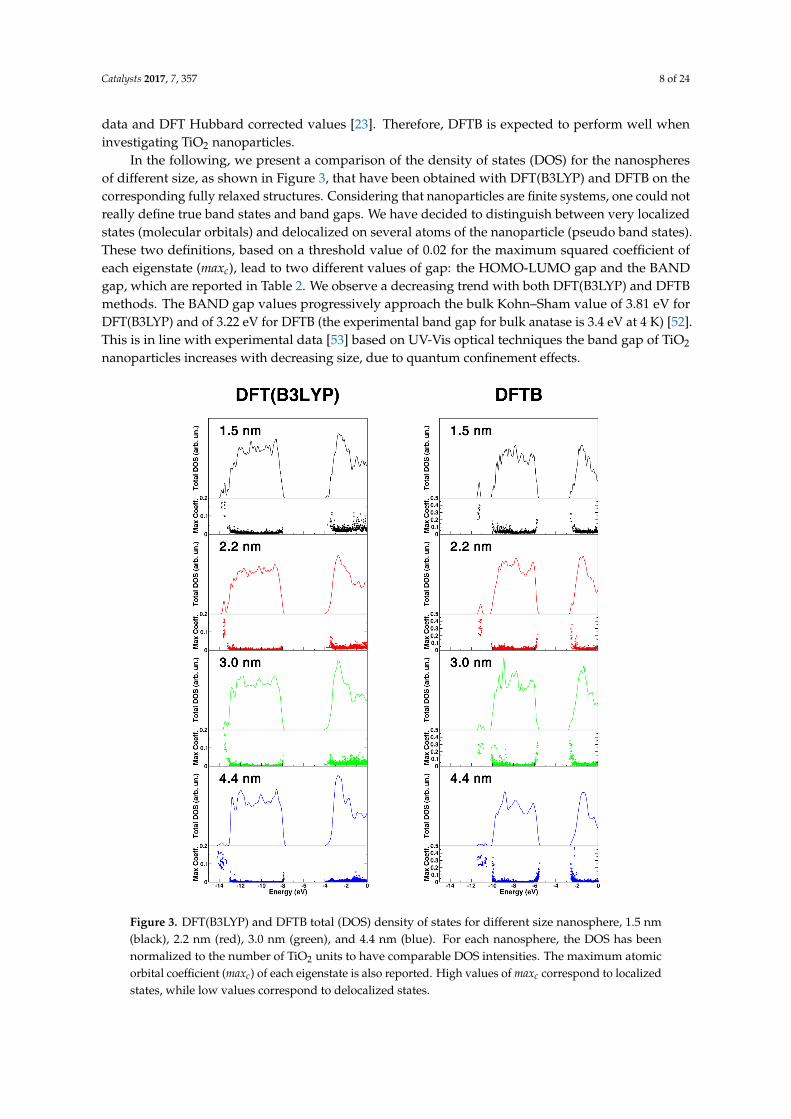
In the following, we present a comparison of the density of states (DOS) for the nanospheresof different size, as shown in Figure 3, that have been obtained with DFT(B3LYP) and DFTB on thecorresponding fully relaxed structures. Considering that nanoparticles are finite systems, one could notreally define true band states and band gaps. We have decided to distinguish between very localizedstates (molecular orbitals) and delocalized on several atoms of the nanoparticle (pseudo band states).These two definitions, based on a threshold value of 0.02 for the maximum squared coefficient ofeach eigenstate (maxc), lead to two different values of gap: the HOMO-LUMO gap and the BANDgap, which are reported in Table 2. We observe a decreasing trend with both DFT(B3LYP) and DFTBmethods. The BAND gap values progressively approach the bulk Kohn–Sham value of 3.81 eV forDFT(B3LYP) and of 3.22 eV for DFTB (the experimental band gap for bulk anatase is 3.4 eV at 4 K) [52].This is in line with experimental data [53] based on UV-Vis optical techniques the band gap of TiO2
nanoparticles increases with decreasing size, due to quantum confinement effects.
Catalysts 2017, 7, 357 8 of 24
not really define true band states and band gaps. We have decided to distinguish between very
localized states (molecular orbitals) and delocalized on several atoms of the nanoparticle (pseudo
band states). These two definitions, based on a threshold value of 0.02 for the maximum squared
coefficient of each eigenstate (maxc), lead to two different values of gap: the HOMO‐LUMO gap and
the BAND gap, which are reported in Table 2. We observe a decreasing trend with both DFT(B3LYP)
and DFTB methods. The BAND gap values progressively approach the bulk Kohn–Sham value of
3.81 eV for DFT(B3LYP) and of 3.22 eV for DFTB (the experimental band gap for bulk anatase is 3.4
eV at 4 K) [52]. This is in line with experimental data [53] based on UV‐Vis optical techniques the
band gap of TiO2 nanoparticles increases with decreasing size, due to quantum confinement effects.
Table 2. HOMO‐LUMO electronic gap (∆ ) and electronic BAND gap ∆ (expressed in eV)
calculated for nanospheres of different size and for bulk anatase with both DFT(B3LYP) and DFTB
methods.
MODEL ∆ ∆Nanospheres DFT(B3LYP) DFTB DFT(B3LYP) DFTB
1.5 nm 4.23 3.12 4.81 3.62
2.2 nm 4.13 3.11 4.31 3.55
3.0 nm 4.00 2.95 4.13 3.42
4.4 nm 3.92 2.95 3.96 3.33
BULK ‐ ‐ 3.81 3.22
Figure 3. DFT(B3LYP) and DFTB total (DOS) density of states for different size nanosphere, 1.5 nm(black), 2.2 nm (red), 3.0 nm (green), and 4.4 nm (blue). For each nanosphere, the DOS has beennormalized to the number of TiO2 units to have comparable DOS intensities. The maximum atomicorbital coefficient (maxc) of each eigenstate is also reported. High values of maxc correspond to localizedstates, while low values correspond to delocalized states.
Catalysts 2017, 7, 357 9 of 24
Table 2. HOMO-LUMO electronic gap (∆EH−L) and electronic BAND gap ∆EBAND (expressed ineV) calculated for nanospheres of different size and for bulk anatase with both DFT(B3LYP) andDFTB methods.
MODEL ∆EH−L ∆EBAND
Nanospheres DFT(B3LYP) DFTB DFT(B3LYP) DFTB
1.5 nm 4.23 3.12 4.81 3.622.2 nm 4.13 3.11 4.31 3.553.0 nm 4.00 2.95 4.13 3.424.4 nm 3.92 2.95 3.96 3.33BULK - - 3.81 3.22
The DOS curves shown in Figure 3 for the different nanospheres further confirm a band gapopening going from the largest one (bottom panel) to the smallest one (upper panel). Additionally,we present the value of maxc for each eigenstate because we wish to highlight the degree oflocalization/delocalization of the states making up the DOS. The higher the value of maxc, the higherthe localization. DFT(B3LYP) results show some localization at the band edges (top of the valence bandand bottom of the conduction band) and in the range of OH groups in the low energy range (at about−14 eV). DFTB results are qualitatively similar, although some excess localization can be observed.In Figure S2 of the Supplementary Materials we have also reported and compared the total DOS forthe anatase bulk TiO2 calculated at DFT(B3LYP) and DFTB level of theory.
We may conclude this section devoted to the preparation and description of models for TiO2
spherical nanoparticles with the following summarizing remarks: spherical models carved from bulksupercells must be made chemically stable by the introduction of some hydroxyl groups that saturatehighly undercoordinated sites; such rough models must then undergo a simulated thermal annealing(with DFTB method) that allows to achieve global minimum stable structures; those must be thenfurther optimized either with DFTB or, to reach even higher accuracy, with a hybrid DFT method(here B3LYP). Although some fine details are different, the general picture we obtain with DFTB israther similar to that from DFT(B3LYP), which assesses DFTB as a reliable method to investigatenanoparticles of large realistic size (up to 4000 atoms, corresponding to a diameter of 4.4 nm). This willallow for further future development and for the study of nanoparticles’ surface functionalization.
4. Modelling Photoactivation of TiO2 Nanoparticles
Titanium dioxide is still considered the reference system in the research fields of photocatalysis andphotovoltaics for its ability to convert light photons into chemical energy. In the very beginning of thephotocatalytic process in a semiconductor, when the material is irradiated with light, an electron/holepair or “exciton”, is initially formed [54,55]. Then, if the coupling with lattice vibrations is strongenough, the exciton may become self-trapped (self-trapped exciton, STE) on few atoms of the crystal,reducing significantly its mobility. Finally, the photoexcited charge carriers may: (i) migrate towardsthe surface of the semiconductor as trapped electrons or holes and express their intrinsic redox activity;or (ii) recombinate radiatively and emit a photoluminescence photon.
In this regard, the quantum confinement of an exciton in a nanoparticle with a dimension of fewnanometers may significantly influence its size and localization [56]. Furthermore, in a TiO2 sphericalnanoparticle, the close presence of highly undercoordinated surface sites may be a driving force for theprocess of excitons separation into electrons and holes or, on the contrary, may accelerate the radiativerecombination via exciton self-trapping processes.
The study of photoexcited charge carriers in nanoparticles, although very demanding, must beperformed by using a hybrid functional method (here B3LYP), since any other local or semilocalfunctional, and therefore also DFTB, would not properly describe the degree of electron/holelocalization as a consequence of the self-interaction problem inherent in those methods [57]. DFT+U
Catalysts 2017, 7, 357 10 of 24
approach could be an alternative viable route; however, hole trapping was found to required very highand unphysical U values [58].
4.1. Free/Trapped Excitons and Radiative Recombination
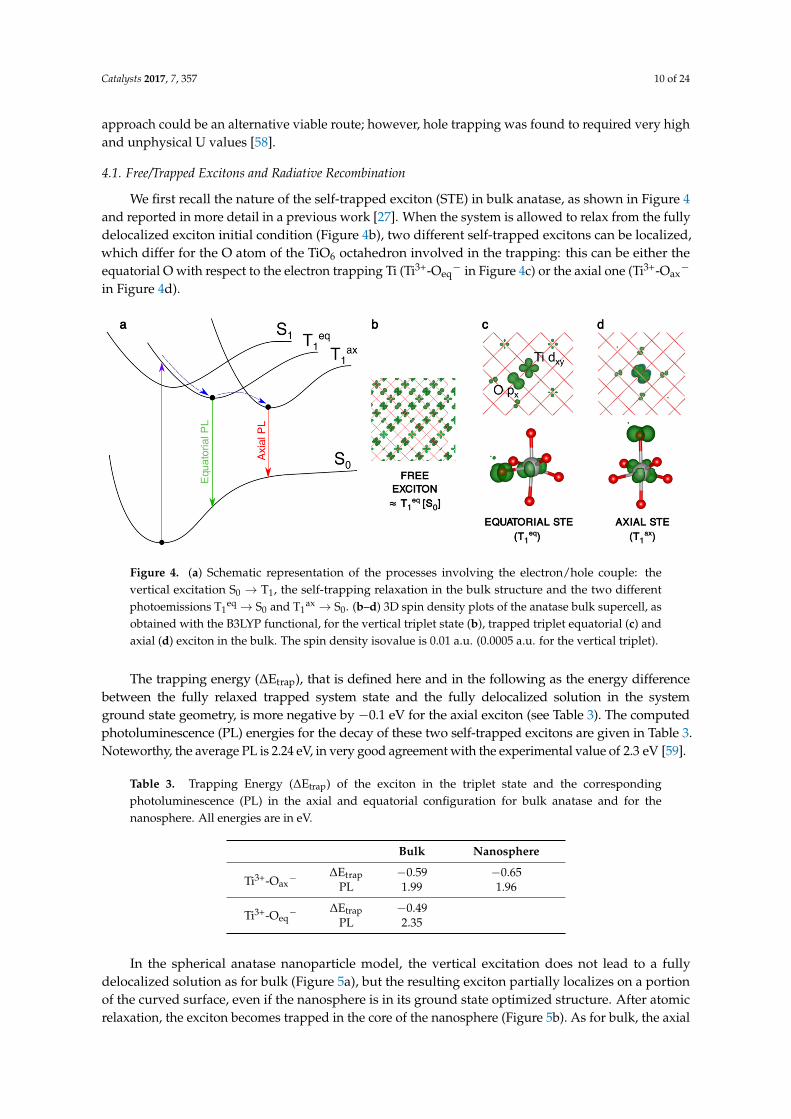
We first recall the nature of the self-trapped exciton (STE) in bulk anatase, as shown in Figure 4and reported in more detail in a previous work [27]. When the system is allowed to relax from the fullydelocalized exciton initial condition (Figure 4b), two different self-trapped excitons can be localized,which differ for the O atom of the TiO6 octahedron involved in the trapping: this can be either theequatorial O with respect to the electron trapping Ti (Ti3+-Oeq
− in Figure 4c) or the axial one (Ti3+-Oax−
in Figure 4d).
Catalysts 2017, 7, 357 10 of 24
localized, which differ for the O atom of the TiO6 octahedron involved in the trapping: this can be
either the equatorial O with respect to the electron trapping Ti (Ti3+‐Oeq− in Figure 4c) or the axial one
(Ti3+‐Oax− in Figure 4d).
Figure 4. (a) Schematic representation of the processes involving the electron/hole couple: the
vertical excitation S0 → T1, the self‐trapping relaxation in the bulk structure and the two different
photoemissions T1eq → S0 and T1ax → S0. (b–d) 3D spin density plots of the anatase bulk supercell, as
obtained with the B3LYP functional, for the vertical triplet state (b), trapped triplet equatorial (c) and
axial (d) exciton in the bulk. The spin density isovalue is 0.01 a.u. (0.0005 a.u. for the vertical triplet).
The trapping energy (ΔEtrap), that is defined here and in the following as the energy difference
between the fully relaxed trapped system state and the fully delocalized solution in the system
ground state geometry, is more negative by −0.1 eV for the axial exciton (see Table 3). The computed
photoluminescence (PL) energies for the decay of these two self‐trapped excitons are given in Table
3. Noteworthy, the average PL is 2.24 eV, in very good agreement with the experimental value of 2.3
eV [59].
Table 3. Trapping Energy (ΔEtrap) of the exciton in the triplet state and the corresponding
photoluminescence (PL) in the axial and equatorial configuration for bulk anatase and for the
nanosphere. All energies are in eV.
Bulk Nanosphere
Ti3+‐Oax− ΔEtrap −0.59 −0.65
PL 1.99 1.96
Ti3+‐Oeq− ΔEtrap −0.49
PL 2.35
In the spherical anatase nanoparticle model, the vertical excitation does not lead to a fully
delocalized solution as for bulk (Figure 5a), but the resulting exciton partially localizes on a portion
of the curved surface, even if the nanosphere is in its ground state optimized structure. After atomic
relaxation, the exciton becomes trapped in the core of the nanosphere (Figure 5b). As for bulk, the
axial solution is favored, with trapping and photoluminescence energies similar to the bulk values
(Table 3). Thus, to summarize, a confinement effect in the nanosized systems is observed for the
“Franck–Condon” exciton, but not for the self‐trapped exciton in the core.
Figure 4. (a) Schematic representation of the processes involving the electron/hole couple: thevertical excitation S0 → T1, the self-trapping relaxation in the bulk structure and the two differentphotoemissions T1
eq → S0 and T1ax → S0. (b–d) 3D spin density plots of the anatase bulk supercell, as
obtained with the B3LYP functional, for the vertical triplet state (b), trapped triplet equatorial (c) andaxial (d) exciton in the bulk. The spin density isovalue is 0.01 a.u. (0.0005 a.u. for the vertical triplet).
The trapping energy (∆Etrap), that is defined here and in the following as the energy differencebetween the fully relaxed trapped system state and the fully delocalized solution in the systemground state geometry, is more negative by −0.1 eV for the axial exciton (see Table 3). The computedphotoluminescence (PL) energies for the decay of these two self-trapped excitons are given in Table 3.Noteworthy, the average PL is 2.24 eV, in very good agreement with the experimental value of 2.3 eV [59].
Table 3. Trapping Energy (∆Etrap) of the exciton in the triplet state and the correspondingphotoluminescence (PL) in the axial and equatorial configuration for bulk anatase and for thenanosphere. All energies are in eV.
Bulk Nanosphere
Ti3+-Oax− ∆Etrap −0.59 −0.65
PL 1.99 1.96
Ti3+-Oeq− ∆Etrap −0.49
PL 2.35
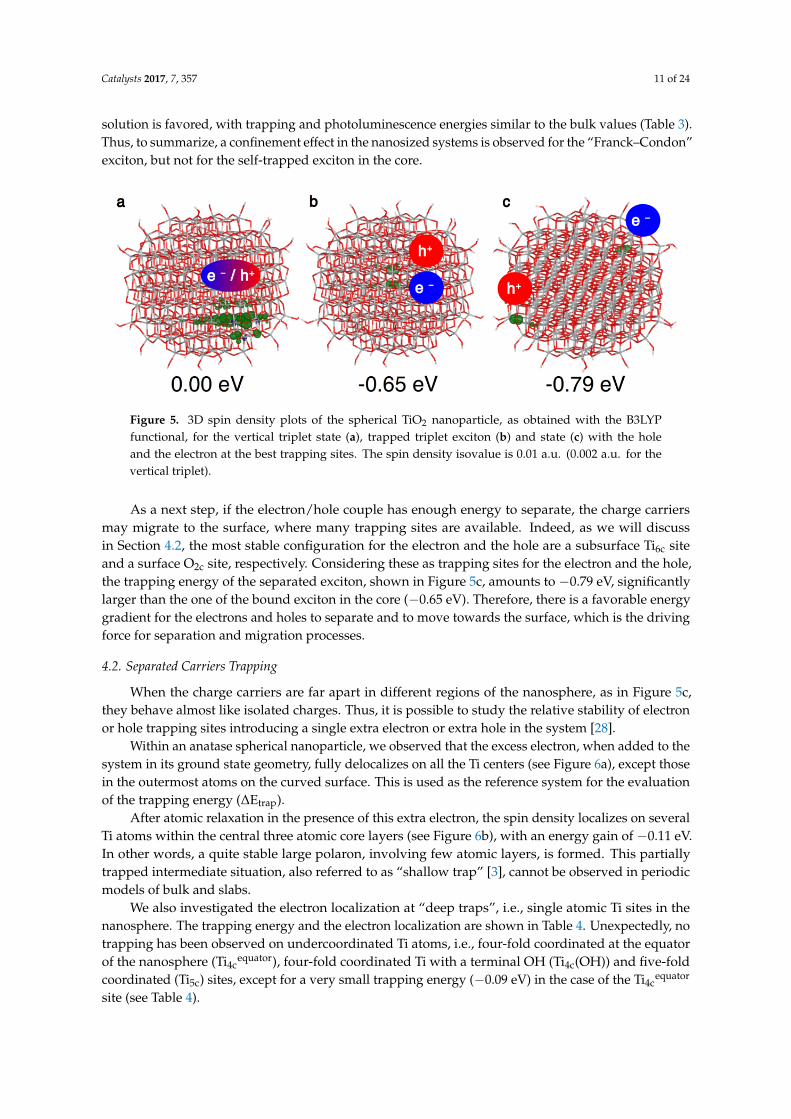
In the spherical anatase nanoparticle model, the vertical excitation does not lead to a fullydelocalized solution as for bulk (Figure 5a), but the resulting exciton partially localizes on a portionof the curved surface, even if the nanosphere is in its ground state optimized structure. After atomicrelaxation, the exciton becomes trapped in the core of the nanosphere (Figure 5b). As for bulk, the axial
Catalysts 2017, 7, 357 11 of 24
solution is favored, with trapping and photoluminescence energies similar to the bulk values (Table 3).Thus, to summarize, a confinement effect in the nanosized systems is observed for the “Franck–Condon”exciton, but not for the self-trapped exciton in the core.Catalysts 2017, 7, 357 11 of 24
Figure 5. 3D spin density plots of the spherical TiO2 nanoparticle, as obtained with the B3LYP
functional, for the vertical triplet state (a), trapped triplet exciton (b) and state (c) with the hole and
the electron at the best trapping sites. The spin density isovalue is 0.01 a.u. (0.002 a.u. for the vertical
triplet).
As a next step, if the electron/hole couple has enough energy to separate, the charge carriers
may migrate to the surface, where many trapping sites are available. Indeed, as we will discuss in
Section 4.2, the most stable configuration for the electron and the hole are a subsurface Ti6c site and a
surface O2c site, respectively. Considering these as trapping sites for the electron and the hole, the
trapping energy of the separated exciton, shown in Figure 5c, amounts to −0.79 eV, significantly
larger than the one of the bound exciton in the core (−0.65 eV). Therefore, there is a favorable energy
gradient for the electrons and holes to separate and to move towards the surface, which is the
driving force for separation and migration processes.
4.2. Separated Carriers Trapping
When the charge carriers are far apart in different regions of the nanosphere, as in Figure 5c,
they behave almost like isolated charges. Thus, it is possible to study the relative stability of electron
or hole trapping sites introducing a single extra electron or extra hole in the system [28].
Within an anatase spherical nanoparticle, we observed that the excess electron, when added to
the system in its ground state geometry, fully delocalizes on all the Ti centers (see Figure 6a), except
those in the outermost atoms on the curved surface. This is used as the reference system for the
evaluation of the trapping energy (ΔEtrap).
After atomic relaxation in the presence of this extra electron, the spin density localizes on
several Ti atoms within the central three atomic core layers (see Figure 6b), with an energy gain of
−0.11 eV. In other words, a quite stable large polaron, involving few atomic layers, is formed. This
partially trapped intermediate situation, also referred to as “shallow trap” [3], cannot be observed in periodic models of bulk and slabs.
We also investigated the electron localization at “deep traps”, i.e., single atomic Ti sites in the
nanosphere. The trapping energy and the electron localization are shown in Table 4. Unexpectedly,
no trapping has been observed on undercoordinated Ti atoms, i.e., four‐fold coordinated at the
equator of the nanosphere (Ti4cequator), four‐fold coordinated Ti with a terminal OH (Ti4c(OH)) and
five‐fold coordinated (Ti5c) sites, except for a very small trapping energy (−0.09 eV) in the case of the
Ti4cequator site (see Table 4).
On the contrary, the best electron trap is the fully coordinated Ti6c site on the subsurface
(Ti6csubsurf in Table 4 and Figure 6c) with a ∆Etrap of −0.40 eV. Noteworthy, the electron delocalization
in the core of the nanoparticle (Coredeloc in Table 4 and Figure 6b) has been found to be less favored
than complete or full localization on a single subsurface Ti site (−0.11 vs. −0.40 eV), indicating an
energy gradient, and thus a driving force, for the migration and localization of photoexcited
electrons towards atoms near the surface.
Figure 5. 3D spin density plots of the spherical TiO2 nanoparticle, as obtained with the B3LYPfunctional, for the vertical triplet state (a), trapped triplet exciton (b) and state (c) with the holeand the electron at the best trapping sites. The spin density isovalue is 0.01 a.u. (0.002 a.u. for thevertical triplet).
As a next step, if the electron/hole couple has enough energy to separate, the charge carriersmay migrate to the surface, where many trapping sites are available. Indeed, as we will discussin Section 4.2, the most stable configuration for the electron and the hole are a subsurface Ti6c siteand a surface O2c site, respectively. Considering these as trapping sites for the electron and the hole,the trapping energy of the separated exciton, shown in Figure 5c, amounts to −0.79 eV, significantlylarger than the one of the bound exciton in the core (−0.65 eV). Therefore, there is a favorable energygradient for the electrons and holes to separate and to move towards the surface, which is the drivingforce for separation and migration processes.
4.2. Separated Carriers Trapping
When the charge carriers are far apart in different regions of the nanosphere, as in Figure 5c,they behave almost like isolated charges. Thus, it is possible to study the relative stability of electronor hole trapping sites introducing a single extra electron or extra hole in the system [28].
Within an anatase spherical nanoparticle, we observed that the excess electron, when added to thesystem in its ground state geometry, fully delocalizes on all the Ti centers (see Figure 6a), except thosein the outermost atoms on the curved surface. This is used as the reference system for the evaluationof the trapping energy (∆Etrap).
After atomic relaxation in the presence of this extra electron, the spin density localizes on severalTi atoms within the central three atomic core layers (see Figure 6b), with an energy gain of −0.11 eV.In other words, a quite stable large polaron, involving few atomic layers, is formed. This partiallytrapped intermediate situation, also referred to as “shallow trap” [3], cannot be observed in periodicmodels of bulk and slabs.
We also investigated the electron localization at “deep traps”, i.e., single atomic Ti sites in thenanosphere. The trapping energy and the electron localization are shown in Table 4. Unexpectedly, notrapping has been observed on undercoordinated Ti atoms, i.e., four-fold coordinated at the equatorof the nanosphere (Ti4c
equator), four-fold coordinated Ti with a terminal OH (Ti4c(OH)) and five-foldcoordinated (Ti5c) sites, except for a very small trapping energy (−0.09 eV) in the case of the Ti4c
equator
site (see Table 4).
Catalysts 2017, 7, 357 12 of 24Catalysts 2017, 7, 357 12 of 24
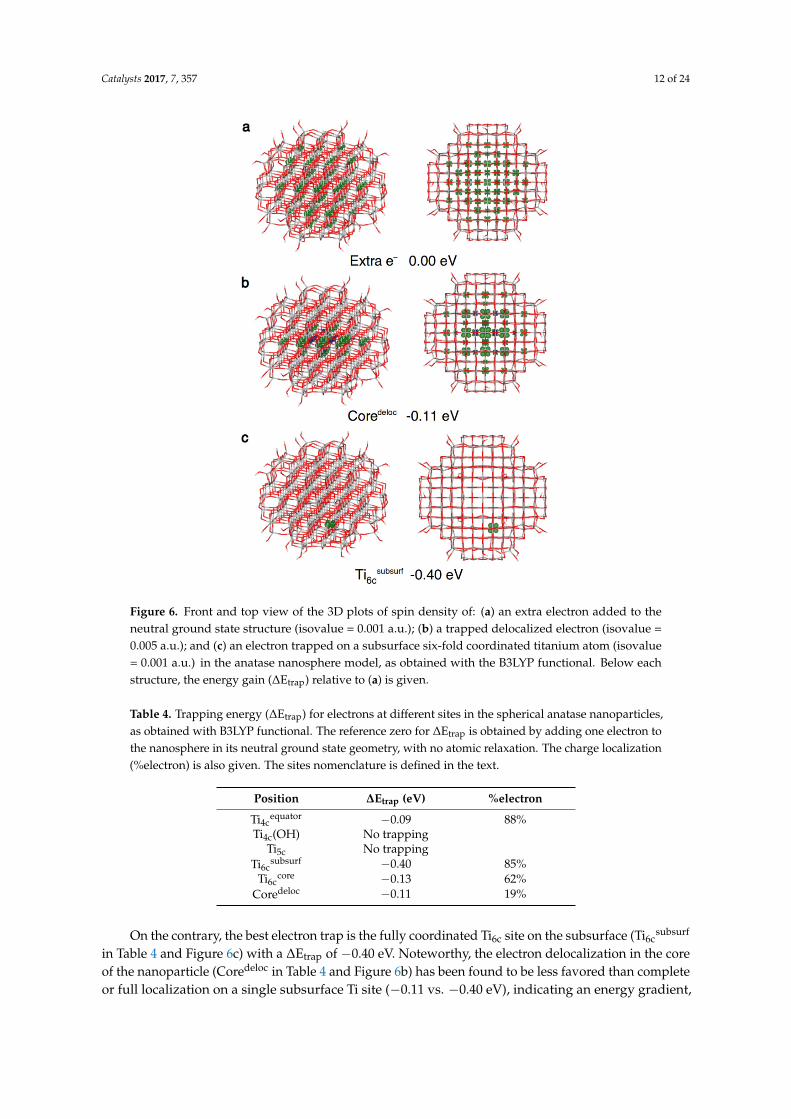
Figure 6. Front and top view of the 3D plots of spin density of: (a) an extra electron added to the
neutral ground state structure (isovalue = 0.001 a.u.); (b) a trapped delocalized electron (isovalue =
0.005 a.u.); and (c) an electron trapped on a subsurface six‐fold coordinated titanium atom (isovalue =
0.001 a.u.) in the anatase nanosphere model, as obtained with the B3LYP functional. Below each
structure, the energy gain (ΔEtrap) relative to (a) is given.
Table 4. Trapping energy (ΔEtrap) for electrons at different sites in the spherical anatase nanoparticles,
as obtained with B3LYP functional. The reference zero for ΔEtrap is obtained by adding one electron to
the nanosphere in its neutral ground state geometry, with no atomic relaxation. The charge
localization (%electron) is also given. The sites nomenclature is defined in the text.
Position ΔEtrap (eV) %electron
Ti4cequator −0.09 88%
Ti4c(OH) No trapping
Ti5c No trapping
Ti6csubsurf −0.40 85%
Ti6ccore −0.13 62%
Coredeloc −0.11 19%
Concerning the hole trapping on spherical TiO2 nanoparticles, if one electron is removed
without any atomic relaxation (vertical ionization), only some regions of the nanoparticles are
involved, as shown in Figure 7a. Since this solution cannot be seen as a delocalized band‐like state of
a free (or untrapped) hole, its total energy cannot be used as the reference to compute trapping
energies (ΔEtrap). Thus, in the following we will use adiabatic ionization potentials (IPs) for
comparisons, since they correlate with trapping energies: the smaller the adiabatic IP, the larger the
trapping energy of the considered site. In the core of the nanosphere, the hole almost completely
Figure 6. Front and top view of the 3D plots of spin density of: (a) an extra electron added to theneutral ground state structure (isovalue = 0.001 a.u.); (b) a trapped delocalized electron (isovalue =0.005 a.u.); and (c) an electron trapped on a subsurface six-fold coordinated titanium atom (isovalue= 0.001 a.u.) in the anatase nanosphere model, as obtained with the B3LYP functional. Below eachstructure, the energy gain (∆Etrap) relative to (a) is given.
Table 4. Trapping energy (∆Etrap) for electrons at different sites in the spherical anatase nanoparticles,as obtained with B3LYP functional. The reference zero for ∆Etrap is obtained by adding one electron tothe nanosphere in its neutral ground state geometry, with no atomic relaxation. The charge localization(%electron) is also given. The sites nomenclature is defined in the text.
Position ∆Etrap (eV) %electron
Ti4cequator −0.09 88%
Ti4c(OH) No trappingTi5c No trapping
Ti6csubsurf −0.40 85%
Ti6ccore −0.13 62%
Coredeloc −0.11 19%
On the contrary, the best electron trap is the fully coordinated Ti6c site on the subsurface (Ti6csubsurf
in Table 4 and Figure 6c) with a ∆Etrap of −0.40 eV. Noteworthy, the electron delocalization in the coreof the nanoparticle (Coredeloc in Table 4 and Figure 6b) has been found to be less favored than completeor full localization on a single subsurface Ti site (−0.11 vs. −0.40 eV), indicating an energy gradient,
Catalysts 2017, 7, 357 13 of 24
and thus a driving force, for the migration and localization of photoexcited electrons towards atomsnear the surface.
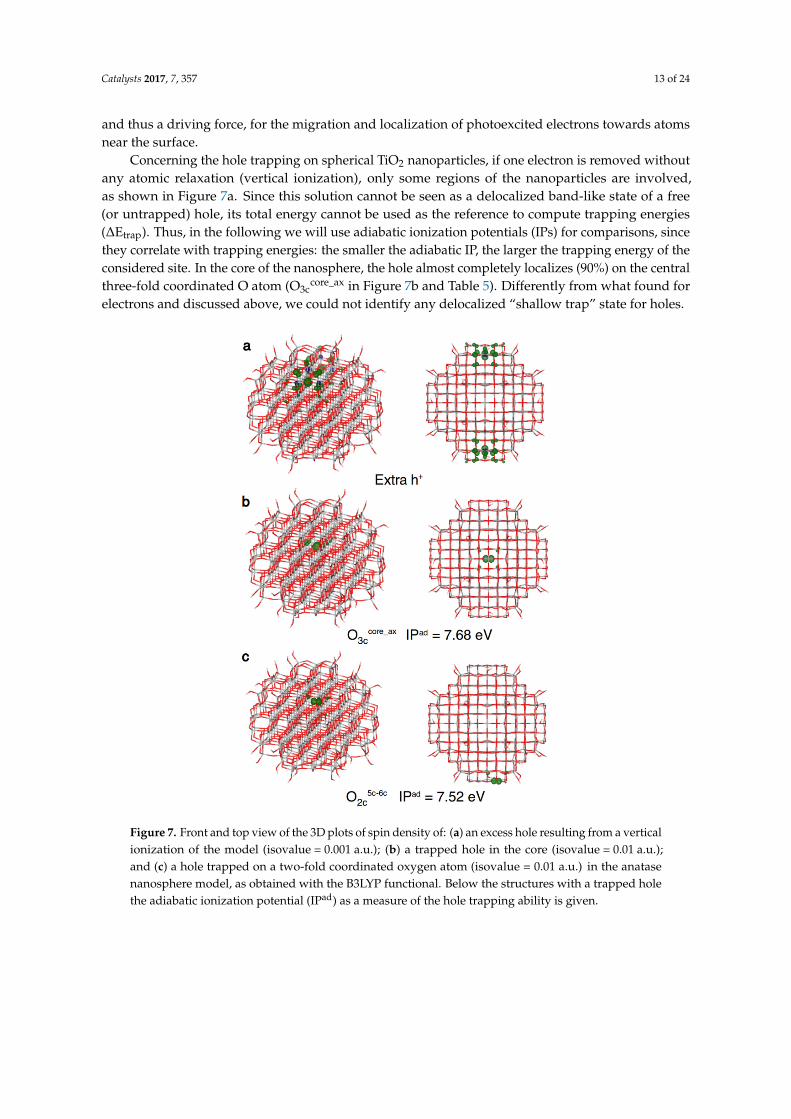
Concerning the hole trapping on spherical TiO2 nanoparticles, if one electron is removed withoutany atomic relaxation (vertical ionization), only some regions of the nanoparticles are involved,as shown in Figure 7a. Since this solution cannot be seen as a delocalized band-like state of a free(or untrapped) hole, its total energy cannot be used as the reference to compute trapping energies(∆Etrap). Thus, in the following we will use adiabatic ionization potentials (IPs) for comparisons, sincethey correlate with trapping energies: the smaller the adiabatic IP, the larger the trapping energy of theconsidered site. In the core of the nanosphere, the hole almost completely localizes (90%) on the centralthree-fold coordinated O atom (O3c
core_ax in Figure 7b and Table 5). Differently from what found forelectrons and discussed above, we could not identify any delocalized “shallow trap” state for holes.Catalysts 2017, 7, 357 14 of 24
Figure 7. Front and top view of the 3D plots of spin density of: (a) an excess hole resulting from a
vertical ionization of the model (isovalue = 0.001 a.u.); (b) a trapped hole in the core (isovalue = 0.01
a.u.); and (c) a hole trapped on a two‐fold coordinated oxygen atom (isovalue = 0.01 a.u.) in the
anatase nanosphere model, as obtained with the B3LYP functional. Below the structures with a
trapped hole the adiabatic ionization potential (IPad) as a measure of the hole trapping ability is
given.
4.3. Comparison with Experiments
Experimental data on trapped charges in anatase TiO2 are available in literature and they can be
compared with calculations performed with the spherical nanoparticle models shown above. First,
the calculated values of the trapping energy relative to a free electron in the conduction band are in
good agreement with the experimental observations for both shallow (delocalized) [60–63] and deep
(localized) [64–66] electron trapping states.
Moreover, the degree of electron localization can be probed through the hyperfine coupling
constant (aiso) with the next‐neighboring 17O in the electron paramagnetic resonance (EPR) spectrum.
High values of aiso are expected for localized electrons, low values for delocalized ones. Indeed, the
computed aiso is 6.7 MHz for an electron localized on the innermost Ti atom of the NP (see Ti6ccore
Table 4), whereas it is 3.9 MHz for an electron delocalized in the NP core (Coredeloc in Table 4), in
good agreement with experimental observations of a significant decrease of aiso going from a fully
localized electron on a single Ti ion (as in the Ti3+(H2O)6 complex) [67] to shallow electron traps in
anatase nanoparticles [68]. For the most stable hole trap on the surface, the computed EPR
parameters (g = [2.004, 2.015, 2.019] G and A = [31, 30, −97] G) are in excellent quantitative agreement
with the g‐ and A‐tensor data available in the experimental literature [69,70]. Hence, we may
conclude that a correct localization of both charge carriers is provided by the computational models
and methods.
Figure 7. Front and top view of the 3D plots of spin density of: (a) an excess hole resulting from a verticalionization of the model (isovalue = 0.001 a.u.); (b) a trapped hole in the core (isovalue = 0.01 a.u.);and (c) a hole trapped on a two-fold coordinated oxygen atom (isovalue = 0.01 a.u.) in the anatasenanosphere model, as obtained with the B3LYP functional. Below the structures with a trapped holethe adiabatic ionization potential (IPad) as a measure of the hole trapping ability is given.
Catalysts 2017, 7, 357 14 of 24
Table 5. Adiabatic ionization potential (IPad) for holes at different sites of the spherical anatasenanoparticle, as obtained with B3LYP functional. The charge localization (%hole) is also reported. Thesites nomenclature is defined in the text.
Position IPad (eV) %hole
O2c4c–6c 7.74 89%/11%
O2c5c–6c 7.52 92%/8%
O3ccore_ax 7.68 90%
Ti3c(OH) No trappingTi4c(OH) No trappingTi5c(OH) 7.81 85%/15%
If we allow the hole to reach the curved surface of the nanosphere, several types of O sites areavailable for trapping. Among them, the most stable one is a two-fold O atom bridging a Ti5c anda Ti6c atom (O2c
5c–6c Table 5 and Figure 7c). A second type of two-fold O on the surface, between aTi4c and a Ti6c atom (see O2c
4c–6c in Table 5), can also trap the hole but less efficiently than a O2c5c–6c
site. It is worth underlining that the migration of holes from the nanosphere core to the surface isenergetically favourable by −0.12 eV.
Finally, one should note that on the surface of a spherical nanoparticle there are several hydroxylgroups that may be stable hole trapping sites. However, as reported in Table 5, we were not able tolocalize the hole on the hydroxyl group of a Ti3c(OH) and Ti4c(OH) sites on the nanosphere surface.On the contrary, we could trap the hole on a Ti5c(OH) site, formed upon dissociation of a watermolecule on a Ti5c, probably because a OH bound to a fully coordinated Ti site is more electron richthan one bound to an undercoordinated Ti atom. Nonetheless, the OH trapping site is less effectiveby 0.29 eV than the most stable O2c hole trapping site. Therefore, in vacuum, the OH groups are notgood trapping sites, but the scenario may change in an aqueous medium, where water moleculesmay enhance the trapping properties of the hydroxyl groups, through binding as a ligand to TiOH orH-bonding to the hydrogen of the OH.
4.3. Comparison with Experiments
Experimental data on trapped charges in anatase TiO2 are available in literature and they can becompared with calculations performed with the spherical nanoparticle models shown above. First,the calculated values of the trapping energy relative to a free electron in the conduction band are ingood agreement with the experimental observations for both shallow (delocalized) [60–63] and deep(localized) [64–66] electron trapping states.
Moreover, the degree of electron localization can be probed through the hyperfine couplingconstant (aiso) with the next-neighboring 17O in the electron paramagnetic resonance (EPR) spectrum.High values of aiso are expected for localized electrons, low values for delocalized ones. Indeed,the computed aiso is 6.7 MHz for an electron localized on the innermost Ti atom of the NP (see Ti6c
core
Table 4), whereas it is 3.9 MHz for an electron delocalized in the NP core (Coredeloc in Table 4),in good agreement with experimental observations of a significant decrease of aiso going from a fullylocalized electron on a single Ti ion (as in the Ti3+(H2O)6 complex) [67] to shallow electron traps inanatase nanoparticles [68]. For the most stable hole trap on the surface, the computed EPR parameters(g = [2.004, 2.015, 2.019] G and A = [31, 30, −97] G) are in excellent quantitative agreement with theg- and A-tensor data available in the experimental literature [69,70]. Hence, we may conclude that acorrect localization of both charge carriers is provided by the computational models and methods.
Finally, we employed the transition level approach [27,71] to estimate the electronic transitionenergies of the charged traps, since this methodology produces accurate results for excitations ofdefects in solids. In the case of electrons, the calculated transition from the trap level of the bestelectron trap (Ti6c
subsurf in Table 4) to the conduction band minimum (CBM) is 1.25 eV, in accordancewith the experimental value of 1.37 eV, measured with transient absorption (TA) spectroscopy [72].
Catalysts 2017, 7, 357 15 of 24
In the case of holes, we computed a transition from the valence band maximum to the trap level forthe best hole trapping site (O2c
5c–6c in Table 5) of 2.59 eV, to be compared with a reported experimentalvalue of 1.9 eV in the experimental TA spectrum [72]. This inconsistency between the computed andexperimental results may arise because these experiments have been performed in an aqueous solutionand, as mentioned in Section 4.2, the presence of water layers on the nanoparticle may influence thehole trapping ability of the system, as reported in a recent experimental work [35].
To conclude this section devoted to the study of the life path of energy carriers (excitons) andcharge carriers (electron and holes) in spherical TiO2 nanoparticles by hybrid DFT(B3LYP), we cansummarize as follows: the photoexcited exciton self-trapping is a favorable process but electron andhole can then separate to migrate towards the surface where they can be highly stabilized. In particular,for electrons, we observed that deep trapping at subsurface fully coordinated Ti sites is favored withrespect to shallow trapping in the core. In the case of holes, only deep traps were observed with asurface O2c (Ti5c-O-Ti6c) being the preferential hole trapping site. Computed electron paramagneticresonance (EPR) parameters and optical transitions for those electron/hole traps are in good agreementwith experimental data.
5. Modelling Surface Interaction with Water
Understanding the interaction of water with TiO2 anatase surface [73] is essential sinceTiO2-based technologies, including photocatalysis, normally operate in an aqueous environment. Manycomputational studies based on DFT methods have tackled the interaction between the most exposedanatase TiO2 (101) surface and water layers [74–76] revealing how the surface complexity influencesthe water-titania interface.
However, the study of the dynamical behavior of real size TiO2 nanoparticles (i.e., with diameterin the range 2–8 nm) [53,69,77–80] in a realistic aqueous environment and with sufficiently longsimulation times, is currently not feasible with DFT methods.
As regards DFTB, from a technical point of view, its performance in the description of a certainsystem critically depends on the parameterization of the element-pairs interaction of the atomsinvolved. In the case of Ti-containing compounds, two different sets of parameters are available:“mio-1-1/tiorg-0-1” [23] and “matsci-0-3” [24]. The first set has been developed to handle the interactionof low index surfaces of both anatase and rutile with water and small organic molecule, but noassessment has been done for the anatase TiO2 (101) surface. The second set has been thought todescribe bulk TiO2 structures and chemical reactivity of (101) anatase and (110) rutile surfaces withisolated molecule and monolayers of water. However, this set has been never tested for the descriptionof bulk water, which is essential for a correct characterization of titania/water-multilayers interfaces.
Recently, we have shown [40] that if these two sets are properly combined in a new one, referredto as “MATORG”, with some further improvement coming from the inclusion of an empiricalcorrection [51] for a finer description of the hydrogen bonding (“MATORG+HBD”), it is possibleto achieve a DFT-like description of the interaction between water-multilayers and anatase TiO2 (101)surface. In the following, we will shortly present the performance of this new set of parametersfor the static and dynamic description of TiO2/water interface by comparison with previous DFTresults. The positive assessment of DFTB methods for studying this type of solid/liquid interface isextremely important because it gives a solid basis for its application on large realistic nanoparticles inan aqueous environment.
5.1. Bulk Water and Anatase TiO2 Description
The correct description of the titania/water-multilayers interface is tightly related to the methodability of properly describing the two components separately. Bulk TiO2 lattice parameters havebeen calculated with DFTB and compared, in Table 6, with DFT and experimental values reported inliterature [17,47,81,82]. The agreement is extremely good. The MATORG+HBD set gives an extremelyaccurate a value and only slightly overestimates the c lattice parameter and consequently the c/a ratio.
Catalysts 2017, 7, 357 16 of 24
Table 6. Lattice parameters a and c and their c/a ratio for bulk TiO2 anatase. Values computed with theDFTB and DFT methods are reported and compared with the experimental values. In parenthesis, theabsolute errors referred to the experimental data are shown.
Method Reference a (Å) c (Å) c/a (Å)
DFTB-MATORG+HBD This work 3.796 (+0.014) 9.790 (+0.288) 2.579 (+0.067)DFT(PBE) This work 3.789 (+0.007) 9.612 (+0.110) 2.537 (+0.025)DFT(PBE) Ref. [81] 3.786 (+0.004) 9.737 (+0.235) 2.572 (+0.060)
DFT(B3LYP) Ref. [82] 3.783 (+0.001) 9.805 (+0.303) 2.592 (+0.080)DFT(B3LYP) Ref. [17] 3.789 (+0.007) 9.777 (+0.275) 2.580 (+0.068)DFT(HSE06) Ref. [17] 3.766 (−0.016) 9.663 (+0.161) 2.566 (+0.054)
Exp. Ref. [47] 3.782 9.502 2.512
To assess the reliability of DFTB method and MATORG+HBD parameters for the descriptionof bulk water, two different features are evaluated: the H-bond strength and the radial distributionfunction (RDF). We estimate the H-bond strength (∆EH−bond) by the water dimer binding energyand report it in Table 7, together with the equilibrium O-O distances (RO-O) of the water dimer.DFTB results are compared with those obtained with standard and hybrid DFT [83], CCSD [84] andexperiments [85,86]. The description of the H-bond with the MATORG+HBD set is extremely good,very close to the first-principles and experimental references.
Table 7. Water dimer binding energy (∆EH−bond) and oxygen–oxygen distance (RO-O). Values obtainedwith DFTB (MATORG+HBD), higher-level methods (CCSD, PBE and B3LYP) and experiments arereported. In parenthesis, the absolute errors referred to the experimental data are shown.
Method Reference ∆EH−bond (eV) RO-O (Å)
DFTB-MATORG+HBD This work 0.199 (–0.037) 2.815 (−0.157)DFT(PBE) Ref. [83] 0.222 2.889
DFT(B3LYP) Ref. [83] 0.198 2.926CCSD Ref. [84] 0.218 2.912Exp. Refs. [85,86] 0.236 2.972
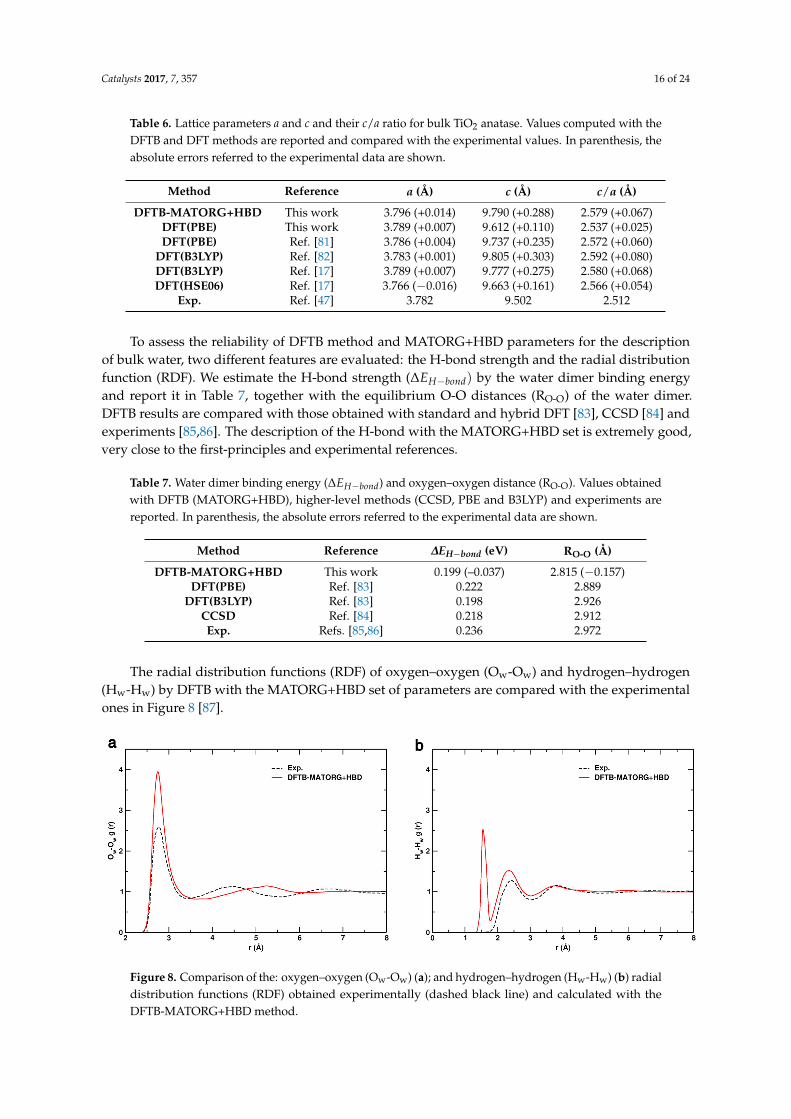
The radial distribution functions (RDF) of oxygen–oxygen (Ow-Ow) and hydrogen–hydrogen(Hw-Hw) by DFTB with the MATORG+HBD set of parameters are compared with the experimentalones in Figure 8 [87].Catalysts 2017, 7, 357 17 of 24
Figure 8. Comparison of the: oxygen–oxygen (Ow‐Ow) (a); and hydrogen–hydrogen (Hw‐Hw) (b)
radial distribution functions (RDF) obtained experimentally (dashed black line) and calculated with
the DFTB‐MATORG+HBD method.
In the experiment, the first intermolecular peaks for r(Ow‐Ow) and r(Hw‐Hw) are found to be
located at 2.77 and 2.31 Å, respectively. In excellent agreement, with the MATORG+HBD set, the
first peak position of the Ow‐Ow RDF is at 2.75 Å (Figure 8a). The experimental/theoretical curves
partially overlap for distances lower than 3.30 Å: the water density depletion zones are very similar
and the second intermolecular peak is at 5.25 Å, not too far from the experimental data (4.55 Å).
Regarding the Hw‐Hw radial distribution function (Figure 8b), the experimental curve is well
reproduced by MATORG+HBD, with the first intermolecular peak located at 2.34 Å.
5.2. Static Description of TiO2/Water Interface
The molecular (undissociated, H2O) and dissociated (OH, H) adsorption of water on the anatase
TiO2 (101) surface has been investigated at different water coverages (low, θ = 0.25 and full, θ = 1).
The adsorption energy per molecule ( ∆ ) has been calculated with MATORG and
MATORG+HBD and compared with DFT(PBE) results and experimental measurements in Table 8.
Table 8. Values calculated with DFT and DFTB methods of the adsorption energies per molecule
(∆ ) of water on the TiO2 (101) anatase slab in the molecular (H2O) and dissociated (OH, H) state.
Different coverages are considered (low, θ = 0.25 and full, θ = 1). The experimental adsorption energy
of the water monolayer on the (101) surface is also reported. The absolute errors (in parenthesis)
reported for DFTB are calculated with respect to the PBE values from this work.
Method Reference Coverage, θ ∆ , H2O (eV) ∆ , OH, H
(eV)
DFTB‐MATORG This work 0.25 –1.08 (+0.41) –0.54 (+0.22)
1 –0.96 (+0.34) –0.58 (+0.15)
DFTB‐MATORG+HBD This work 0.25 –0.80 (+0.13) –0.31 (–0.01)
1 –0.71 (+0.09) –0.40 (–0.03)
DFT(PBE) This work 0.25 –0.67 –0.32
1 –0.62 –0.43
DFT(PBE) Ref. [88] 0.25 –0.74 –0.23
1 –0.72 –0.44
Exp. Refs. [89.90] 1 –0.5/–0.7
The DFTB method predicts the molecular adsorption mode of a single water molecule to be
favored with respect to the dissociated one. This is in line with several experimental observations
[73,89–91] and previous DFT data [10,88]. In the full coverage regime (θ = 1), the MATORG set also
correctly reproduces the binding energy decrease for the molecular adsorption mode and the
increase for the dissociated one. However, the MATORG set tends to overestimate adsorption
Figure 8. Comparison of the: oxygen–oxygen (Ow-Ow) (a); and hydrogen–hydrogen (Hw-Hw) (b) radialdistribution functions (RDF) obtained experimentally (dashed black line) and calculated with theDFTB-MATORG+HBD method.
Catalysts 2017, 7, 357 17 of 24
In the experiment, the first intermolecular peaks for r(Ow-Ow) and r(Hw-Hw) are found to belocated at 2.77 and 2.31 Å, respectively. In excellent agreement, with the MATORG+HBD set, the firstpeak position of the Ow-Ow RDF is at 2.75 Å (Figure 8a). The experimental/theoretical curves partiallyoverlap for distances lower than 3.30 Å: the water density depletion zones are very similar and thesecond intermolecular peak is at 5.25 Å, not too far from the experimental data (4.55 Å). Regardingthe Hw-Hw radial distribution function (Figure 8b), the experimental curve is well reproduced byMATORG+HBD, with the first intermolecular peak located at 2.34 Å.
5.2. Static Description of TiO2/Water Interface
The molecular (undissociated, H2O) and dissociated (OH, H) adsorption of water on the anataseTiO2 (101) surface has been investigated at different water coverages (low, θ = 0.25 and full, θ = 1).The adsorption energy per molecule (∆Emol
ads ) has been calculated with MATORG and MATORG+HBDand compared with DFT(PBE) results and experimental measurements in Table 8.
Table 8. Values calculated with DFT and DFTB methods of the adsorption energies per molecule(∆Emol
ads ) of water on the TiO2 (101) anatase slab in the molecular (H2O) and dissociated (OH, H) state.Different coverages are considered (low, θ = 0.25 and full, θ = 1). The experimental adsorption energy ofthe water monolayer on the (101) surface is also reported. The absolute errors (in parenthesis) reportedfor DFTB are calculated with respect to the PBE values from this work.
Method Reference Coverage, θ ∆Emolads , H2O (eV) ∆Emol
ads , OH, H (eV)
DFTB-MATORG This work0.25 –1.08 (+0.41) –0.54 (+0.22)
1 –0.96 (+0.34) –0.58 (+0.15)
DFTB-MATORG+HBD This work0.25 –0.80 (+0.13) –0.31 (–0.01)
1 –0.71 (+0.09) –0.40 (–0.03)
DFT(PBE) This work0.25 –0.67 –0.32
1 –0.62 –0.43
DFT(PBE) Ref. [88]0.25 –0.74 –0.23
1 –0.72 –0.44
Exp. Refs. [89,90] 1 –0.5/–0.7
The DFTB method predicts the molecular adsorption mode of a single water moleculeto be favored with respect to the dissociated one. This is in line with several experimentalobservations [73,89–91] and previous DFT data [10,88]. In the full coverage regime (θ = 1),the MATORG set also correctly reproduces the binding energy decrease for the molecular adsorptionmode and the increase for the dissociated one. However, the MATORG set tends to overestimateadsorption energies with errors up to 0.41 eV. This discrepancy is almost solved with the inclusion ofthe HBD correction, which reduces the error values to less than 0.13 eV.
5.3. Dynamic Description of TiO2/Water Interface
The study of complex and realistic TiO2 (nano)systems in aqueous environment is strongly relatedto the ability of the method used to describe the titania/water-multilayers dynamic behavior. To assessthe performance of the MATORG+HBD set of parameters, first-principles simulations must be used asreference. We will use Car–Parrinello molecular dynamics (CPMD) DFT(PBE) simulations [75] andother DFT(PBE) structural investigations [92] of water layers on the TiO2 (101) anatase surface, whichalready exist in the literature.
In Figure 9, we show the 0 K optimized geometries starting from the last snapshot of eachmolecular dynamics trajectory performed with the MATORG+HBD set, in the case of the fullyundissociated water monolayer (ML), bilayer (BL) and trilayer (TL) of water on the (101) TiO2 anatasesurface, respectively.
Catalysts 2017, 7, 357 18 of 24
Catalysts 2017, 7, 357 18 of 24
energies with errors up to 0.41 eV. This discrepancy is almost solved with the inclusion of the HBD
correction, which reduces the error values to less than 0.13 eV.
5.3. Dynamic Description of TiO2/Water Interface
The study of complex and realistic TiO2 (nano)systems in aqueous environment is strongly
related to the ability of the method used to describe the titania/water‐multilayers dynamic behavior.
To assess the performance of the MATORG+HBD set of parameters, first‐principles simulations
must be used as reference. We will use Car–Parrinello molecular dynamics (CPMD) DFT(PBE)
simulations [75] and other DFT(PBE) structural investigations [92] of water layers on the TiO2 (101)
anatase surface, which already exist in the literature.
In Figure 9, we show the 0 K optimized geometries starting from the last snapshot of each
molecular dynamics trajectory performed with the MATORG+HBD set, in the case of the fully
undissociated water monolayer (ML), bilayer (BL) and trilayer (TL) of water on the (101) TiO2
anatase surface, respectively.
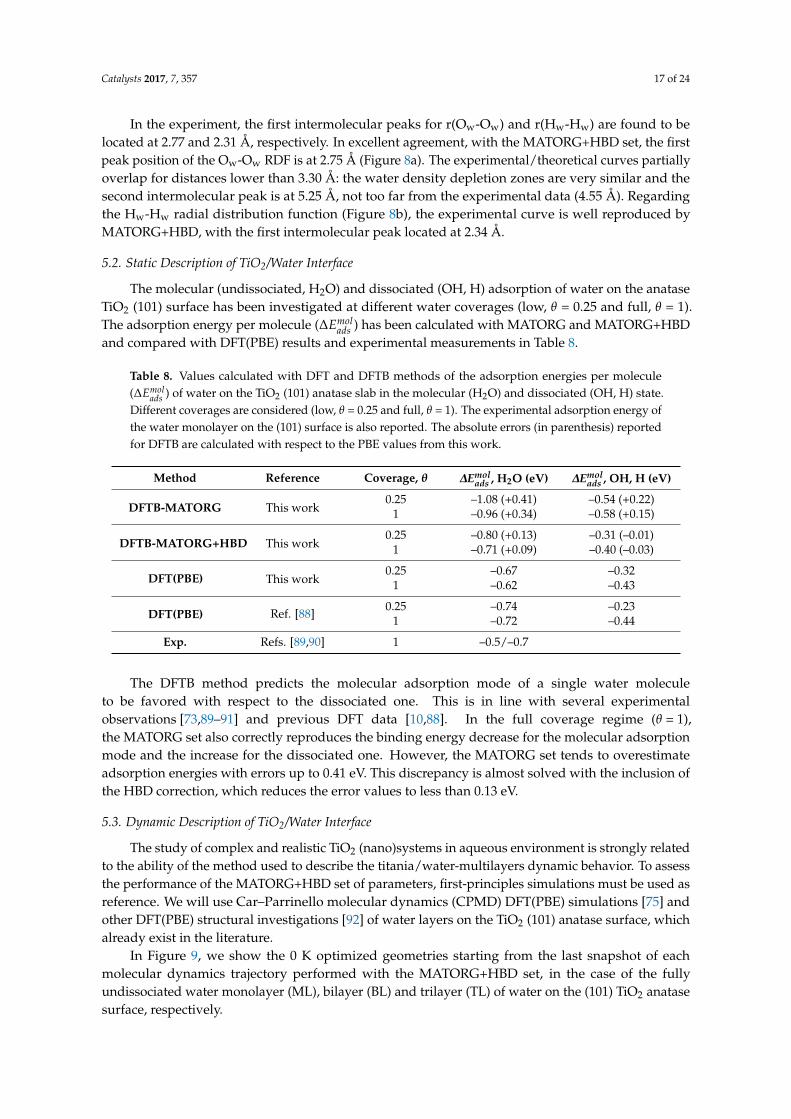
Figure 9. DFTB‐MATORG+HBD structures of a monolayer (ML), a bilayer (BL) and a trilayer (TL) of
water on the (101) TiO2 anatase surface. Dashed lines correspond to H‐bonds.
For the ML, each water molecule (in yellow in Figure 9, left panel) binds a Ti5c of the surface and
establishes two H‐bonds with the O2c with an adsorption energy per molecule (∆ in Table 9),
calculated with the MATORG+HBD method, of −0.70 eV, in very good quantitative agreement with
the DFT(PBE) references [74].
In the BL configuration, the water molecules of the first layer are bound to Ti5c atoms of the
surface and form two H‐bonds with two molecules of the second layer. The water molecules of the
second layer (in blue in Figure 9, middle panel) have only one H‐bond with an O2c of the titania
surface, with the other H atom pointing towards the vacuum. For the BL, the MATORG+HBD
adsorption energy is −0.73 eV, in agreement with DFT(PBE) results (see Table 9).
The TL case is more complicated, since the third water layer (in green in Figure 9, right panel) is
too mobile to allow for a unique structure definition. We added a third water layer on the BL
equilibrium structure with a MATORG+HBD adsorption energy of −0.53 eV (see Table 9), again in
very good agreement with the DFT(PBE) previous study.
Figure 9. DFTB-MATORG+HBD structures of a monolayer (ML), a bilayer (BL) and a trilayer (TL) ofwater on the (101) TiO2 anatase surface. Dashed lines correspond to H-bonds.
For the ML, each water molecule (in yellow in Figure 9, left panel) binds a Ti5c of the surfaceand establishes two H-bonds with the O2c with an adsorption energy per molecule (∆Emol
ads in Table 9),calculated with the MATORG+HBD method, of −0.70 eV, in very good quantitative agreement withthe DFT(PBE) references [74].
Table 9. Values calculated with DFT and DFTB methods of the binding energy per molecule (∆Emolads
in eV) of the water monolayer (ML), bilayer (BL) and trilayer (TL) on the (101) TiO2 anatase surfaceafter an optimization run from the last snapshot of the MD simulation. The binding energy (∆Emol
ads ) isdefined as the difference between the total energy of the titania/water interface equilibrium structureand the sum of the total energy of six isolated water molecules plus the total energy of the optimizedslab with one water layer less.
Water Configuration∆Emol
ads (eV)
DFTB-MATORG+HBD DFT(PBE) a DFT(PBE) b
ML –0.70 –0.62 –0.69BL –0.73 –0.67 –0.65TL –0.53 –0.53 –0.56
a This work; b from Ref. [74].
In the BL configuration, the water molecules of the first layer are bound to Ti5c atoms of thesurface and form two H-bonds with two molecules of the second layer. The water molecules of thesecond layer (in blue in Figure 9, middle panel) have only one H-bond with an O2c of the titania surface,with the other H atom pointing towards the vacuum. For the BL, the MATORG+HBD adsorptionenergy is −0.73 eV, in agreement with DFT(PBE) results (see Table 9).
The TL case is more complicated, since the third water layer (in green in Figure 9, right panel)is too mobile to allow for a unique structure definition. We added a third water layer on the BLequilibrium structure with a MATORG+HBD adsorption energy of −0.53 eV (see Table 9), again invery good agreement with the DFT(PBE) previous study.
Finally, to analyze the behavior of the titania/water-multilayers interfaces during the MDsimulations, the distribution p(z) of the vertical distances between the O atoms of the H2O moleculesand the Ti5c plane of the surface, together with their time evolution (z(t)), were extracted from the MDtrajectory, as shown in Figure 10, and compared to DFT(PBE) CPMD results [75].
Catalysts 2017, 7, 357 19 of 24
Catalysts 2017, 7, 357 19 of 24
Table 9. Values calculated with DFT and DFTB methods of the binding energy per molecule (∆
in eV) of the water monolayer (ML), bilayer (BL) and trilayer (TL) on the (101) TiO2 anatase surface
after an optimization run from the last snapshot of the MD simulation. The binding energy (∆
is defined as the difference between the total energy of the titania/water interface equilibrium
structure and the sum of the total energy of six isolated water molecules plus the total energy of the
optimized slab with one water layer less.
Water Configuration ∆ (eV)
DFTB‐MATORG+HBD DFT(PBE) a DFT(PBE) b
ML –0.70 –0.62 –0.69
BL –0.73 –0.67 –0.65
TL –0.53 –0.53 –0.56 a This work; b from Ref. [74].
Finally, to analyze the behavior of the titania/water‐multilayers interfaces during the MD
simulations, the distribution p(z) of the vertical distances between the O atoms of the H2O molecules
and the Ti5c plane of the surface, together with their time evolution (z(t)), were extracted from the
MD trajectory, as shown in Figure 10, and compared to DFT(PBE) CPMD results [75].
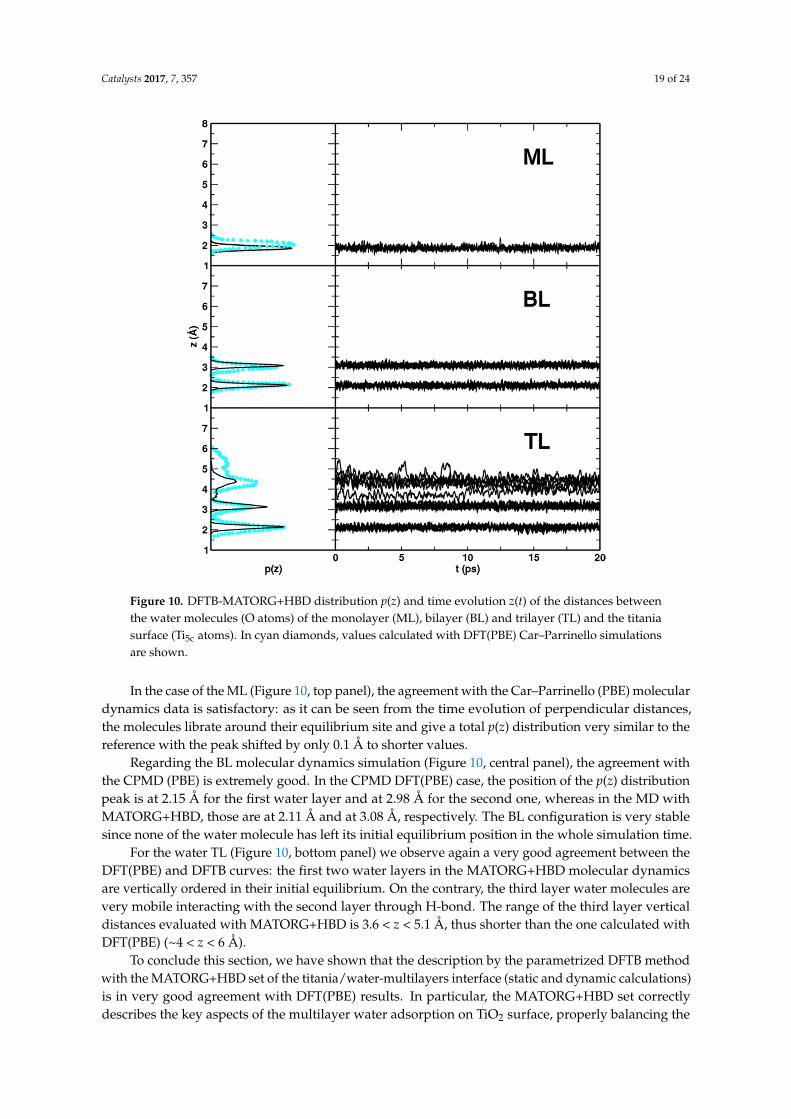
Figure 10. DFTB‐MATORG+HBD distribution p(z) and time evolution z(t) of the distances between
the water molecules (O atoms) of the monolayer (ML), bilayer (BL) and trilayer (TL) and the titania
surface (Ti5c atoms). In cyan diamonds, values calculated with DFT(PBE) Car–Parrinello simulations
are shown.
In the case of the ML (Figure 10, top panel), the agreement with the Car–Parrinello (PBE)
molecular dynamics data is satisfactory: as it can be seen from the time evolution of perpendicular
distances, the molecules librate around their equilibrium site and give a total p(z) distribution very
similar to the reference with the peak shifted by only 0.1 Å to shorter values.
Figure 10. DFTB-MATORG+HBD distribution p(z) and time evolution z(t) of the distances betweenthe water molecules (O atoms) of the monolayer (ML), bilayer (BL) and trilayer (TL) and the titaniasurface (Ti5c atoms). In cyan diamonds, values calculated with DFT(PBE) Car–Parrinello simulationsare shown.
In the case of the ML (Figure 10, top panel), the agreement with the Car–Parrinello (PBE) moleculardynamics data is satisfactory: as it can be seen from the time evolution of perpendicular distances,the molecules librate around their equilibrium site and give a total p(z) distribution very similar to thereference with the peak shifted by only 0.1 Å to shorter values.
Regarding the BL molecular dynamics simulation (Figure 10, central panel), the agreement withthe CPMD (PBE) is extremely good. In the CPMD DFT(PBE) case, the position of the p(z) distributionpeak is at 2.15 Å for the first water layer and at 2.98 Å for the second one, whereas in the MD withMATORG+HBD, those are at 2.11 Å and at 3.08 Å, respectively. The BL configuration is very stablesince none of the water molecule has left its initial equilibrium position in the whole simulation time.
For the water TL (Figure 10, bottom panel) we observe again a very good agreement between theDFT(PBE) and DFTB curves: the first two water layers in the MATORG+HBD molecular dynamicsare vertically ordered in their initial equilibrium. On the contrary, the third layer water molecules arevery mobile interacting with the second layer through H-bond. The range of the third layer verticaldistances evaluated with MATORG+HBD is 3.6 < z < 5.1 Å, thus shorter than the one calculated withDFT(PBE) (~4 < z < 6 Å).
To conclude this section, we have shown that the description by the parametrized DFTB methodwith the MATORG+HBD set of the titania/water-multilayers interface (static and dynamic calculations)is in very good agreement with DFT(PBE) results. In particular, the MATORG+HBD set correctlydescribes the key aspects of the multilayer water adsorption on TiO2 surface, properly balancing the
Catalysts 2017, 7, 357 20 of 24
surface/water and water/water interactions. Based on this assessment and on the computationalefficiency of DFTB, we conclude that this method enables the study of large and realistic TiO2
nanostructured systems into an aqueous environment.
6. Concluding Remarks
In the sections above, we have presented an overview of current possibilities, as explored byour group with state-of-the-art DFT and DFT-based (DFTB) methodologies, for the description ofrealistic nanoparticles in water solution for photoapplications. It is evident that, when the size ofthe nanoparticle becomes relatively large (about 4000 atoms), to achieve a diameter size close to thesmallest TiO2 nanoparticles used in practical applications (4.4 nm), the feasible limit for hybrid DFTcalculations is almost reached. We showed that DFTB method can be used to obtain global minimumstructures and to provide a reasonable description of both structural and electronic properties ofthese complex systems. Additionally, DFTB method is found to also yield a satisfactory accuracyfor the description of the water layers on top of TiO2 surfaces, which allows introducing the waterenvironment explicitly into the calculations. However, we have shown that the DFT level of theory isstill mandatory when one wants to describe photoexcitation processes taking place in the nanoparticlesor on its surface, such as exciton formation, charge carrier trapping or electron transfer to adsorbates.
Supplementary Materials: The following are available online at www.mdpi.com/2073-4344/7/12/357/s1,Figure S1: Comparison of the distances distribution (simulated EXAFS) computed with DFT(PBE), in blackand DFT(B3LYP) in red, for the 2.2 nm NS produced at 300 K, Figure S2: DFT(B3LYP) and DFTB total (DOS)density of states for anatase bulk TiO2. The maximum atomic orbital coefficient (maxc) of each eigenstate isalso reported.
Acknowledgments: The authors are grateful to Gotthard Seifert for very fruitful discussions and to LorenzoFerraro for his technical help. The project has received funding from the European Research Council (ERC) underthe European Union’s HORIZON2020 research and innovation programme (ERC Grant Agreement No [647020])and from CINECA supercomputing center through the computing LI05p_GRV4CUPT grant.
Author Contributions: G.F., D.S. and C.D.V. conceived the models and designed the calculations; D.S. and G.F.performed the calculations; D.S., G.F. and C.D.V. performed the data analysis; C.D.V. wrote the manuscript withthe help of D.S. and G.F.
Conflicts of Interest: The authors declare no conflict of interest.
References
1. Sang, L.; Zhao, Y.; Burda, C. TiO2 Nanoparticles as Functional Building Blocks. Chem. Rev. 2014, 114,9283–9318. [CrossRef] [PubMed]
2. Ma, Y.; Wang, X.L.; Jia, Y.S.; Chen, X.B.; Han, H.X.; Li, C. Titanium Dioxide-Based Nanomaterials forPhotocatalytic Fuel Generations. Chem. Rev. 2014, 114, 9987–10043. [CrossRef] [PubMed]
3. Schneider, J.; Matsuoka, M.; Takeuchi, M.; Zhang, J.; Horiuchi, Y.; Anpo, M.; Bahnemann, D.W.Understanding TiO2 Photocatalysis: Mechanisms and Materials. Chem. Rev. 2014, 114, 9919–9986. [CrossRef][PubMed]
4. Tong, H.; Ouyang, S.; Bi, Y.; Umezawa, N.; Oshikiri, M.; Ye, J. Nano-photocatalytic Materials: Possibilitiesand Challenges. Adv. Mater. 2012, 24, 229–251. [CrossRef] [PubMed]
5. Cargnello, M.; Gordon, T.R.; Murray, C.B. Solution-Phase Synthesis of Titanium Dioxide Nanoparticles andNanocrystals. Chem. Rev. 2014, 114, 9319–9345. [CrossRef] [PubMed]
6. Tang, J.; Redl, F.; Zhu, Y.; Siegrist, T.; Brus, L.E.; Steigerwald, M.L. An Organometallic Synthesis of TiO2
Nanoparticles. Nano Lett. 2005, 3, 543–548. [CrossRef] [PubMed]7. Chen, C.; Hu, R.; Mai, K.; Ren, Z.; Wang, H.; Qian, G.; Wang, Z. Shape Evolution of Highly Crystalline
Anatase TiO2 Nanobipyramids. Cryst. Growth Des. 2011, 11, 5221–5226. [CrossRef]8. Barnard, A.S.; Zapol, P. Effects of Particle Morphology and Surface Hydrogenation on the Phase Stability of
TiO2. Phys. Rev. B 2004, 70, 235403. [CrossRef]9. Rajh, T.; Dimitrijevic, N.M.; Bissonnette, M.; Koritarov, T.; Konda, V. Titanium Dioxide in the Service of the
Biomedical Revolution. Chem. Rev. 2014, 114, 10177–10216. [CrossRef] [PubMed]
Catalysts 2017, 7, 357 21 of 24
10. De Angelis, F.; Di Valentin, C.; Fantacci, S.; Vittadini, A.; Selloni, A. Theoretical Studies on Anatase and LessCommon TiO2 Phases: Bulk, Surfaces, and Nanomaterials. Chem. Rev. 2014, 114, 9708–9753. [CrossRef][PubMed]
11. Hummer, D.R.; Kubicki, J.D.; Kent, P.R.C.; Post, J.E.; Heaney, P.J. Origin of Nanoscale Phase StabilityReversals in Titanium Oxide Polymorphs. J. Phys. Chem. C 2009, 113, 4240–4245. [CrossRef]
12. Nunzi, F.; Mosconi, E.; Storchi, L.; Ronca, E.; Selloni, A.; Gratzel, M.; De Angelis, F. Inherent ElectronicTrap States in TiO2 Nanocrystals: Effect of saturation and sintering. Energy Environ. Sci. 2013, 6, 1221–1229.[CrossRef]
13. Li, Y.-F.; Liu, Z.-P. Particle Size, Shape and Activity for Photocatalysis on Titania Anatase Nanoparticles inAqueous Surroundings. J. Am. Chem. Soc. 2011, 133, 15743–15752. [CrossRef] [PubMed]
14. Mattioli, G.; Bonapasta, A.A.; Bovi, D.; Giannozzi, P. Photocatalytic and Photovoltaic Properties of TiO2
Nanoparticles Investigated by Ab Initio Simulations. J. Phys. Chem. C 2014, 118, 29928–29942. [CrossRef]15. Nunzi, F.; Storchi, L.; Manca, M.; Giannuzzi, R.; Gigli, G.; De Angelis, F. Shape and Morphology Effects on
the Electronic Structure of TiO2 Nanostructures: From Nanocrystals to Nanorods. Appl. Mater. Interfaces2014, 6, 2471–2478. [CrossRef] [PubMed]
16. Lamiel-Garcia, O.; Ko, K.C.; Lee, J.Y.; Bromley, S.T.; Illas, F. When Anatase Nanoparticles Become Bulklike:Properties of Realistic TiO2 Nanoparticles in the 1–6 nm Size Range from All Electron Relativistic DensityFunctional Theory Based Calculations. J. Chem. Theory Comput. 2017, 13, 1785–1793. [CrossRef] [PubMed]
17. Fazio, G.; Ferrighi, L.; Di Valentin, C. Spherical versus Faceted Anatase TiO2 Nanoparticles: A Model Studyof Structural and Electronic Properties. J. Phys. Chem. C 2015, 119, 20735–20746. [CrossRef]
18. Selli, D.; Fazio, G.; Di Valentin, C. Modelling Realistic TiO2 Nanospheres: A Benchmark Study of SCC-DFTBagainst Hybrid DFT. J. Chem. Phys. 2017, 147, 164701. [CrossRef] [PubMed]
19. Elstner, M.; Porezag, D.; Jungnickel, G.; Elsner, J.; Haugk, M.; Frauenheim, T.; Suhai, S.; Seifert, G.Self-Consistent-Charge Density-Functional Tight-Binding Method for Simulations of Complex MaterialsProperties. Phys. Rev. B 1998, 58, 7260. [CrossRef]
20. Corà, F.; Alfredsson, M.; Mallia, G.; Middlemiss, D.S.; Mackrodt, W.C.; Dovesi, R.; Orlando, R.The Performance of Hybrid Density Functionals in Solid State Chemistry. In Principles and Applicationsof Density Functional Theory in Inorganic Chemistry II. Structure and Bonding; Springer: Berlin/Heidelberg,Germany, 2004; Volume 113.
21. Muscat, J.; Wander, A.; Harrison, N.M. On the Prediction of Band Gaps from Hybrid Functional Theory.Chem. Phys. Lett. 2001, 3, 397–401. [CrossRef]
22. Labat, F.; Baranek, P.; Adamo, C. Structural and Electronic Properties of Selected Rutile and Anatase TiO2
Surfaces: An ab Initio Investigation. J. Chem. Theory. Comput. 2008, 4, 341–352. [CrossRef] [PubMed]23. Dolgonos, G.; Aradi, B.; Moreira, N.H.; Frauenheim, T. An Improved Self-Consistent-Charge
Density-Functional Tight-Binding (SCC-DFTB) Set of Parameters for Simulation of Bulk and MolecularSystems Involving Titanium. J. Chem. Theory Comput. 2010, 6, 266–278. [CrossRef] [PubMed]
24. Luschtinetz, R.; Frenzel, J.; Milek, T.; Seifert, G. Adsorption of Phosphonic Acid at the TiO2 Anatase (101)and Rutile (110) Surfaces. J. Phys. Chem. C 2009, 113, 5730–5740. [CrossRef]
25. Fox, H.; Newman, K.E.; Schneider, W.F.; Corcelli, S.A. Bulk and Surface Properties of Rutile TiO2 fromSelf-Consistent-Charge Density Functional Tight Binding. J. Chem. Theory Comput. 2010, 6, 499–507.[CrossRef] [PubMed]
26. Fuertes, V.C.; Negre, C.F.A.; Oviedo, M.B.; Bonafé, F.P.; Oliva, F.Y.; Sánchez, C.G. A Theoretical Study of theOptical Properties of Nanostructured TiO2. J. Phys. Condens. Matter 2013, 25, 115304. [CrossRef] [PubMed]
27. Di Valentin, C.; Selloni, A. Bulk and Surface Polarons in Photoexcited Anatase TiO2. J. Phys. Chem. Lett. 2011,2, 2223–2228. [CrossRef]
28. Fazio, G.; Ferrighi, L.; Di Valentin, C. Photoexcited Carriers Recombination and Trapping in Spherical vs.Faceted TiO2 Nanoparticles. Nano Energy 2016, 27, 673–689. [CrossRef]
29. Nunzi, F.; Agrawal, S.; Selloni, A.; De Angelis, F. Structural and Electronic Properties of Photoexcited TiO2
Nanoparticles from First Principles. J. Chem. Theory Comput. 2015, 11, 635–645. [CrossRef] [PubMed]30. Nunzi, F.; De Angelis, F.; Selloni, A. Ab Initio Simulation of the Absorption Spectra of Photoexcited Carriers
in TiO2 Nanoparticles. J. Phys. Chem. Lett. 2016, 7, 3597–3602. [CrossRef] [PubMed]31. Diebold, U. The Surface Science of Titanium Dioxide. Surf. Sci. Rep. 2003, 48, 53–229. [CrossRef]
Catalysts 2017, 7, 357 22 of 24
32. Sclafani, A.; Herrmann, J.M. Comparison of the Photoelectronic and Photocatalytic Activities of VariousAnatase and Rutile Forms of Titania in Pure Liquid Organic Phases and in Aqueous Solutions. J. Phys. Chem.1996, 100, 13655–13661. [CrossRef]
33. Dimitrijevic, N.M.; Vijayan, B.K.; Poluektov, O.G.; Rajh, T.; Gray, K.A.; He, H.; Zapol, P. Role of Waterand Carbonates in Photocatalytic Transformation of CO2 to CH4 on Titania. J. Am. Chem. Soc. 2011, 133,3964–3971. [CrossRef] [PubMed]
34. Mino, L.; Zecchina, A.; Martra, G.; Rossi, A.M.; Spoto, G. A Surface Science Approach to TiO2 P25Photocatalysis: An In Situ FTIR Study of Phenol Photodegradation at Controlled Water Coverages fromSub-Monolayer to Multilayer. Appl. Catal. B Environ. 2016, 196, 135–141. [CrossRef]
35. Shirai, K.; Sugimoto, T.; Watanabe, K.; Haruta, M.; Kurata, H.; Matsumoto, Y. Effect of Water Adsorption onCarrier Trapping Dynamics at the Surface of Anatase TiO2 Nanoparticles. Nano Lett. 2016, 16, 1323–1327.[CrossRef] [PubMed]
36. Panarelli, E.G.; Livraghi, S.; Maurelli, S.; Polliotto, V.; Chiesa, M.; Giamello, E. Role of Surface WaterMolecules in Stabilizing Trapped Hole Centres in Titanium Dioxide (Anatase) as Monitored by ElectronParamagnetic Resonance. J. Photochem. Photobiol. A 2016, 322, 27–34. [CrossRef]
37. Addamo, M.; Augugliaro, V.; Coluccia, S.; Di Paola, A.; García-López, E.; Loddo, V.; Marcì, G.; Martra, G.;Palmisano, L. The Role of Water in the Photocatalytic Degradation of Acetonitrile and Toluene in Gas-Solidand Liquid-Solid Regimes. Int. J. Photoenergy 2006, 2006, 39182. [CrossRef]
38. Miller, K.L.; Lee, C.W.; Falconer, J.L.; Medlin, J.W. Effect of Water on Formic Acid PhotocatalyticDecomposition on TiO2 and Pt/TiO2. J. Catal. 2010, 275, 294–299. [CrossRef]
39. Salvador, P. On the Nature of Photogenerated Radical Species Active in the Oxidative Degradation ofDissolved Pollutants with TiO2 Aqueous Suspensions: A Revision in the Light of the Electronic Structure ofAdsorbed Water. J. Phys. Chem. C 2007, 111, 17038–17043. [CrossRef]
40. Selli, D.; Fazio, G.; Seifert, G.; Di Valentin, C. Water Multilayers on TiO2 (101) Anatase Surface: Assessmentof a DFTB-Based Method. J. Chem. Theory Comput. 2017, 13, 3862–3873. [CrossRef] [PubMed]
41. Dovesi, R.; Saunders, V.R.; Roetti, C.; Orlando, R.; Zicovich-Wilson, C.M.; Pascale, F.; Civalleri, B.; Doll, K.;Harrison, N.M.; Bush, I.J.; et al. CRYSTAL14 User’s Manual; University of Torino: Torino, Italy, 2014.
42. Becke, A.D. Density-Functional Thermochemistry. III. The Role of Exact Exchange. J. Chem. Phys. 1993, 98,5648. [CrossRef]
43. Lee, C.; Yang, W.; Parr, R.G. Development of the Colle-Salvetti Correlation-Energy Formula into a Functionalof the Electron Density. Phys. Rev. B 1988, 37, 785–789. [CrossRef]
44. Krukau, A.V.; Vydrov, O.A.; Izmaylov, A.F.; Scuseria, G.E. Influence of the Exchange Screening Parameter onthe Performance of Screened Hybrid Functionals. J. Chem. Phys. 2006, 125, 224106. [CrossRef] [PubMed]
45. Giannozzi, P.; Baroni, S.; Bonini, N.; Calandra, M.; Car, R.; Cavazzoni, C.; Ceresoli, D.; Chiarotti, G.L.;Cococcioni, M.; Dabo, I.; et al. QUANTUM ESPRESSO: A Modular and Open-Source Software Project forQuantum Simulations of Materials. J. Phys. Condens. Matter 2009, 21, 395502. [CrossRef] [PubMed]
46. Perdew, J.P.; Burke, K.; Ernzerhof, M. Generalized Gradient Approximation Made Simple. Phys. Rev. Lett.1996, 77, 3865–3868. [CrossRef] [PubMed]
47. Burdett, J.K.; Hughbanks, T.; Miller, G.J.; Richardson, J.W., Jr.; Smith, J.V. Structural-Electronic Relationshipsin Inorganic Solids: Powder Neutron Diffraction Studies of the Rutile and Anatase Polymorphs of TitaniumDioxide at 15 K and 295 K. J. Am. Chem. Soc. 1987, 109, 3639–3646. [CrossRef]
48. Elstner, M.; Seifert, G. Density Functional Tight Binding. Philos. Trans. R. Soc. A 2014, 372, 20120483.[CrossRef] [PubMed]
49. Seifert, G.; Joswig, J.-O. Density-Functional Tight Binding—An Approximate Density-Functional TheoryMethod. WIREs Comput. Mol. Sci. 2012, 2, 456–465. [CrossRef]
50. Aradi, B.; Hourahine, B.; Frauenheim, T. DFTB+, a Sparse Matrix-Based Implementation of the DFTB Method.J. Phys. Chem. A 2007, 111, 5678–5684. [CrossRef] [PubMed]
51. Hu, H.; Lu, Z.; Elstner, M.; Hermans, J.; Yang, W. Simulating Water with the Self-Consistent-Charge DensityFunctional Tight Binding Method: From Molecular Clusters to the Liquid State. J. Phys. Chem. A 2007, 111,5685. [CrossRef] [PubMed]
52. Tang, H.; Levy, F.; Berger, H.; Schmid, P.E. Urbach tail of anatase TiO2. Phys. Rev. B 1995, 52, 7771. [CrossRef]53. Liu, Y.; Claus, R.O. Blue Light Emitting Nanosized TiO2 Colloids. J. Am. Chem. Soc. 1997, 119, 5273–5274.
[CrossRef]

Catalysts 2017, 7, 357 23 of 24
54. Koch, S.W.; Kira, M.; Khitrova, G.; Gibbs, H.M. Semiconductor Excitons in New Light. Nat. Mater. 2006, 5,523–531. [CrossRef] [PubMed]
55. Tang, H.; Berger, H.; Schmid, P.E.; Lévy, F. Photoluminescence in TiO2 Anatase Single Crystals. Solid StateCommun. 1993, 87, 847–850. [CrossRef]
56. El-Sayed, M.A. Small Is Different: Shape-, Size-, and Composition-Dependent Properties of Some ColloidalSemiconductor Nanocrystals. Acc. Chem. Res. 2004, 37, 326–333. [CrossRef] [PubMed]
57. Mori-Sánchez, P.; Cohen, A.J.; Yang, W. Localization and Delocalization Errors in Density Functional Theoryand Implications for Band-Gap Prediction. Phys. Rev. Lett. 2008, 100, 146401. [CrossRef] [PubMed]
58. Deskins, N.A.; Dupuis, M. Intrinsic Hole Migration Rates in TiO2 from Density Functional Theory. J. Phys.Chem. C 2009, 113, 346–358. [CrossRef]
59. Najafov, H.; Tokita, S.; Ohshio, S.; Kato, A.; Saitoh, H. Green and Ultraviolet Emissions from Anatase TiO2
Films Fabricated by Chemical Vapor Deposition. Jpn. J. Appl. Phys. 2005, 44, 245–253. [CrossRef]60. Panayotov, D.A.; Yates, J.T., Jr. n-Type Doping of TiO2 with Atomic Hydrogen—Observation of the
Production of Conduction Band Electrons by Infrared Spectroscopy. Chem. Phys. Lett. 2007, 436, 204.[CrossRef]
61. Yamakata, A.; Ishibashi, T.; Onishi, H. Time-Resolved Infrared Absorption Spectroscopy of PhotogeneratedElectrons in Platinized TiO2 Particles. Chem. Phys. Lett. 2001, 333, 271–277. [CrossRef]
62. Durrant, J.R. Modulating Interfacial Electron Transfer Dynamics in Dye Sensitised Nanocrystalline MetalOxide Films. J. Photochem. Photobiol. A 2002, 148, 5–10. [CrossRef]
63. Martin, S.T.; Hermann, H.; Hoffmann, M.R. Time-Resolved Microwave Conductivity. Part 1.—TiO2
Photoreactivity and Size Quantization. J. Chem. Soc. Faraday Trans. 1994, 90, 3323–3330. [CrossRef]64. Beermann, N.; Boschloo, G.; Hagfeldt, A. Trapping of electrons in nanostructured TiO2 studied by
photocurrent transients. J. Photochem. Photobiol. A 2002, 152, 213. [CrossRef]65. Boschloo, G.; Fitzmaurice, D. Spectroelectrochemical Investigation of Surface States in Nanostructured TiO2
Electrodes. J. Phys. Chem. B 1999, 103, 2228–2231. [CrossRef]66. Szezepankiewicz, S.H.; Moss, J.A.; Hoffmann, M.R. Slow Surface Charge Trapping Kinetics on Irradiated
TiO2. J. Phys. Chem. B 2002, 106, 2922–2927. [CrossRef]67. Maurelli, S.; Livraghi, S.; Chiesa, M.; Giamello, E.; Van Doorslaer, S.; Di Valentin, C.; Pacchioni, G. Hydration
Structure of the Ti(III) Cation as Revealed by Pulse EPR and DFT Studies: New Insights into a Textbook Case.Inorg. Chem. 2011, 50, 2385–2394. [CrossRef] [PubMed]
68. Chiesa, M.; Paganini, M.C.; Livraghi, S.; Giamello, E. Charge Trapping in TiO2 Polymorphs as Seen byElectron Paramagnetic Resonance Spectroscopy. Phys. Chem. Chem. Phys. 2013, 15, 9435–9447. [CrossRef][PubMed]
69. Micic, O.I.; Zhang, Y.; Cromack, K.R.; Trifunac, A.D.; Thurnauer, M.C. Trapped Holes on Titania ColloidsStudied by Electron Paramagnetic Resonance. J. Phys. Chem. 1993, 97, 7227–7283. [CrossRef]
70. Brezová, V.; Barbieriková, Z.; Zukalová, M.; Dvoranová, D.; Kavan, L. EPR Study of 17O-Enriched TitaniaNanopowders under UV Irradiation. Catal. Today 2014, 230, 112–118. [CrossRef]
71. Gallino, F.; Pacchioni, G.; Di Valentin, C. Transition Levels of Defect Centers in ZnO by Hybrid Functionalsand Localized Basis Set Approach. J. Chem. Phys. 2010, 133, 144512. [CrossRef] [PubMed]
72. Shkrob, I.A.; Sauer, M.C., Jr. Hole Scavenging and Photo-Stimulated Recombination of Electron−Hole Pairsin Aqueous TiO2 Nanoparticles. J. Phys. Chem. B 2004, 108, 12497–12511. [CrossRef]
73. He, Y.; Tilocca, A.; Dulub, O.; Selloni, A.; Diebold, U. Local Ordering and Electronic Signatures ofSubmonolayer Water on Anatase TiO2(101). Nat. Mater. 2009, 8, 585–589. [CrossRef] [PubMed]
74. Tilocca, A.; Selloni, A. Vertical and Lateral Order in Adsorbed Water Layers on Anatase TiO2(101). Langmuir2004, 20, 8379–8384. [CrossRef] [PubMed]
75. Tilocca, A.; Selloni, A. DFT-GGA and DFT+U Simulations of Thin Water Layers on Reduced TiO2 Anatase.J. Phys. Chem. C 2012, 116, 9114–9121. [CrossRef]
76. Aschauer, U.J.; Tilocca, A.; Selloni, A. Ab Initio Simulations of the Structure of Thin Water Layers on DefectiveAnatase TiO2 (101) Surfaces. Int. J. Quant. Chem. 2015, 115, 1250–1257. [CrossRef]
77. Zhu, Y.; Ding, C.; Ma, G.; Du, Z. Electronic State Characterization of TiO2 Ultrafine Particles by LuminescenceSpectroscopy. J. Solid State Chem. 1998, 139, 124–127. [CrossRef]
Catalysts 2017, 7, 357 24 of 24
78. Dimitrijevic, N.M.; Saponjic, Z.V.; Rabatic, B.M.; Poluektov, O.G.; Rajh, T. Effect of Size and Shape ofNanocrystalline TiO2 on Photogenerated Charges. An EPR Study. J. Phys. Chem. C 2007, 111, 14597–14601.[CrossRef]
79. Luca, V. Comparison of Size-Dependent Structural and Electronic Properties of Anatase and RutileNanoparticles. J. Phys. Chem. C 2009, 113, 6367–6380. [CrossRef]
80. Colombo, D.P., Jr.; Roussel, K.A.; Saeh, J.; Skinner, D.E.; Cavaleri, J.J.; Bowman, R.M. Femtosecond Studyof the Intensity Dependence of Electron-Hole Dynamics in TiO2 Nanoclusters. Chem. Phys. Lett. 1995, 232,207–214. [CrossRef]
81. Lazzeri, M.; Vittadini, A.; Selloni, A. Structure and Energetics of Stoichiometric TiO2 Anatase Surfaces.Phys. Rev. B 2001, 63, 155409. [CrossRef]
82. Labat, F.; Baranek, P.; Domain, C.; Minot, C.; Adamo, C. Density Functional Theory Analysis of theStructural and Electronic Properties of TiO2 Rutile and Anatase Polytypes: Performances of DifferentExchange-Correlation Functionals. J. Chem. Phys. 2007, 126, 154703. [CrossRef] [PubMed]
83. Xu, X.; Goddard, W.A. Bonding Properties of the Water Dimer: A Comparative Study of Density FunctionalTheories. J. Phys. Chem. A 2004, 108, 2305–2313. [CrossRef]
84. Tschumper, G.S.; Leininger, M.L.; Hoffman, B.C.; Waleev, E.F.; Schaefer, H.F., III; Quack, M. Anchoring theWater Dimer Potential Energy Surface with Explicitly Correlated Computations and Focal Point Analyses.J. Chem. Phys. 2002, 116, 690–701. [CrossRef]
85. Curtiss, L.A.; Frurip, D.J.; Blander, M. Studies of Molecular Association in H2O and D2O Vapors byMeasurement of Thermal Conductivity. J. Chem. Phys. 1979, 71, 2703–2711. [CrossRef]
86. Odutola, J.A.; Dyke, T.R. Partially Deuterated Water Dimers: Microwave Spectra and Structure. J. Chem.Phys. 1980, 72, 5062–5070. [CrossRef]
87. Soper, A.K.; Benmore, C.J. Quantum Differences between Heavy and Light Water. Phys. Rev. Lett. 2008, 101,065502. [CrossRef] [PubMed]
88. Vittadini, A.; Selloni, A.; Rotzinger, F.P.; Grätzel, M. Structure and Energetics of Water Adsorbed at TiO2
Anatase (101) and (001) Surfaces. Phys. Rev. Lett. 1998, 81, 2954–2957. [CrossRef]89. Egashira, M.; Kawasumi, S.; Kagawa, S.; Seiyama, T. Temperature Programmed Desorption Study of Water
Adsorbed on Metal Oxides. I. Anatase and Rutile. Bull. Chem. Soc. Jpn. 1978, 51, 3144–3149. [CrossRef]90. Beck, D.D.; White, J.M.; Ratcliffe, C.T. Catalytic Reduction of CO with Hydrogen Sulfide. 2. Adsorption of
H2O and H2S on Anatase and Rutile. J. Phys. Chem. 1986, 90, 3123–3131. [CrossRef]91. Herman, G.S.; Dohnàlek, Z.; Ruzycki, N.; Diebold, U. Experimental Investigation of the Interaction of Water
and Methanol with Anatase-TiO2(101). J. Phys. Chem. B 2003, 107, 2788–2795. [CrossRef]92. Zhao, Z.; Li, Z.; Zou, Z. Structure and Properties of Water on the Anatase TiO2(101) Surface: From
Single-Molecule Adsorption to Interface Formation. J. Phys. Chem. C 2012, 116, 11054–11061. [CrossRef]
© 2017 by the authors. Licensee MDPI, Basel, Switzerland. This article is an open accessarticle distributed under the terms and conditions of the Creative Commons Attribution(CC BY) license (http://creativecommons.org/licenses/by/4.0/).