Ventilation, passive cooling, ventilation strategies, wind tower, venturi effect, stack effect
Upload
independentCategory
view
0download
0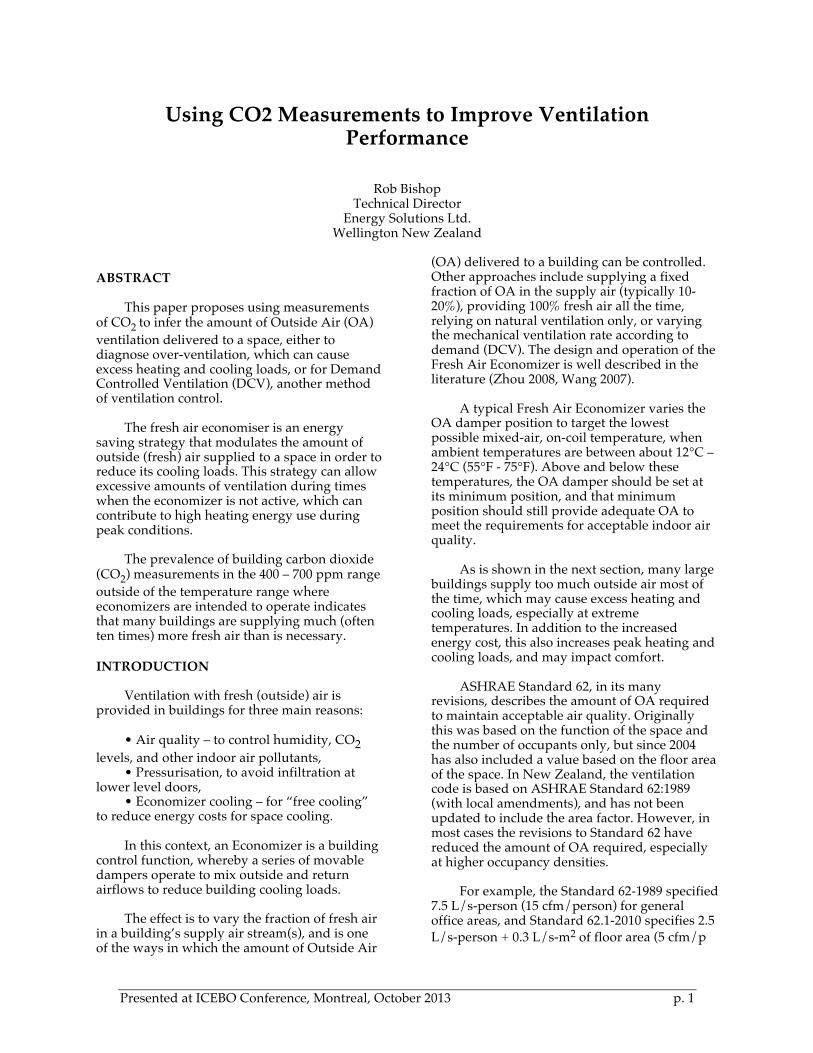
Presented at ICEBO Conference, Montreal, October 2013 p. 1
Using CO2 Measurements to Improve Ventilation Performance
Rob Bishop
Technical Director Energy Solutions Ltd.
Wellington New Zealand
ABSTRACT This paper proposes using measurements
of CO2 to infer the amount of Outside Air (OA) ventilation delivered to a space, either to diagnose over-ventilation, which can cause excess heating and cooling loads, or for Demand Controlled Ventilation (DCV), another method of ventilation control.
The fresh air economiser is an energy
saving strategy that modulates the amount of outside (fresh) air supplied to a space in order to reduce its cooling loads. This strategy can allow excessive amounts of ventilation during times when the economizer is not active, which can contribute to high heating energy use during peak conditions.
The prevalence of building carbon dioxide
(CO2) measurements in the 400 – 700 ppm range outside of the temperature range where economizers are intended to operate indicates that many buildings are supplying much (often ten times) more fresh air than is necessary.
INTRODUCTION Ventilation with fresh (outside) air is
provided in buildings for three main reasons: • Air quality – to control humidity, CO2
levels, and other indoor air pollutants, • Pressurisation, to avoid infiltration at
lower level doors, • Economizer cooling – for “free cooling”
to reduce energy costs for space cooling. In this context, an Economizer is a building
control function, whereby a series of movable dampers operate to mix outside and return airflows to reduce building cooling loads.
The effect is to vary the fraction of fresh air
in a building’s supply air stream(s), and is one of the ways in which the amount of Outside Air
(OA) delivered to a building can be controlled. Other approaches include supplying a fixed fraction of OA in the supply air (typically 10-20%), providing 100% fresh air all the time, relying on natural ventilation only, or varying the mechanical ventilation rate according to demand (DCV). The design and operation of the Fresh Air Economizer is well described in the literature (Zhou 2008, Wang 2007).
A typical Fresh Air Economizer varies the
OA damper position to target the lowest possible mixed-air, on-coil temperature, when ambient temperatures are between about 12°C – 24°C (55°F - 75°F). Above and below these temperatures, the OA damper should be set at its minimum position, and that minimum position should still provide adequate OA to meet the requirements for acceptable indoor air quality.
As is shown in the next section, many large
buildings supply too much outside air most of the time, which may cause excess heating and cooling loads, especially at extreme temperatures. In addition to the increased energy cost, this also increases peak heating and cooling loads, and may impact comfort.
ASHRAE Standard 62, in its many
revisions, describes the amount of OA required to maintain acceptable air quality. Originally this was based on the function of the space and the number of occupants only, but since 2004 has also included a value based on the floor area of the space. In New Zealand, the ventilation code is based on ASHRAE Standard 62:1989 (with local amendments), and has not been updated to include the area factor. However, in most cases the revisions to Standard 62 have reduced the amount of OA required, especially at higher occupancy densities.
For example, the Standard 62-1989 specified
7.5 L/s-person (15 cfm/person) for general office areas, and Standard 62.1-2010 specifies 2.5 L/s-person + 0.3 L/s-m2 of floor area (5 cfm/p
Presented at ICEBO Conference, Montreal, October 2013 p. 2
plus 0.06 cfm/ft2). For occupant densities of 5 people/100 m2 (5 people/1,000 ft2), this gives a total of 0.43 L/s.m2 (85 cfm/1000 ft2), or effectively 8.5 L/s-p (17 cfm/p). This would result in a steady-state rise of 590 ppm above ambient, or 1040 ppm at 450 ppm ambient.
However, at higher densities, say 20
people/100 m2 (20 people/1,000 ft2), the required ventilation totals only 0.80 L/s.m2 (160 cfm/1000 ft2), or effectively 4 L/s-person (8 cfm/person), resulting in a space CO2 concentration of about 1700 ppm.
This type of measurement of space CO2
allow the amount of OA delivered to a space to be inferred, which can be used for diagnosing problems, or for controlling Demand Controlled Ventilation.
Note that this paper does not recommend
reductions in OA down to the minimum required by Code, as there are clearly concerns with the practicality of this (Bohanon 2011, Warden 2004, Douga 2004, Schell 1998). Instead it recommends reductions from the routine over-ventilation - >50 L/s.person (>100 cfm/person) - often observed in practice, especially during cold ambient temperatures.
EVIDENCE OF EXCESS OA A study of energy use in commercial
buildings in New Zealand included the logging of CO2 concentrations in about one hundred buildings selected at random (Bishop et al 2011). An example of the results is shown in Figure 1. This is a 24-hour profile of measured CO2 concentrations in an occupied office space.
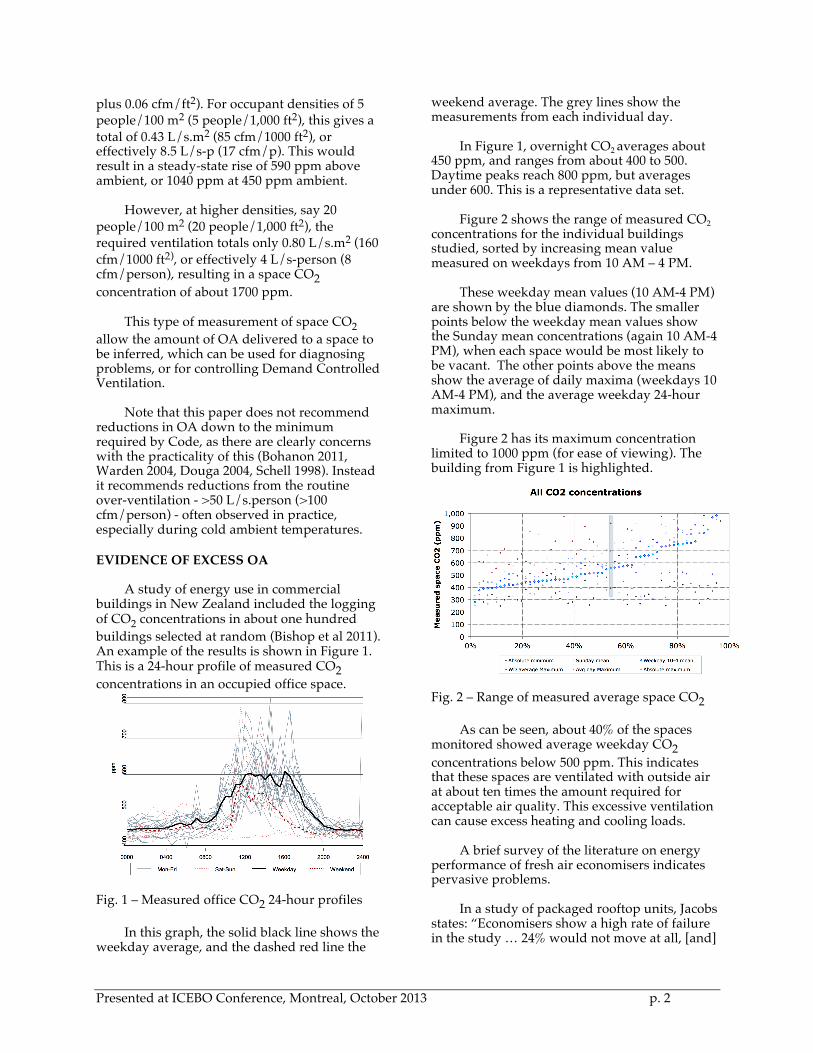
Fig. 1 – Measured office CO2 24-hour profiles
In this graph, the solid black line shows the weekday average, and the dashed red line the
weekend average. The grey lines show the measurements from each individual day.
In Figure 1, overnight CO2 averages about
450 ppm, and ranges from about 400 to 500. Daytime peaks reach 800 ppm, but averages under 600. This is a representative data set.
Figure 2 shows the range of measured CO2
concentrations for the individual buildings studied, sorted by increasing mean value measured on weekdays from 10 AM – 4 PM.
These weekday mean values (10 AM-4 PM)
are shown by the blue diamonds. The smaller points below the weekday mean values show the Sunday mean concentrations (again 10 AM-4 PM), when each space would be most likely to be vacant. The other points above the means show the average of daily maxima (weekdays 10 AM-4 PM), and the average weekday 24-hour maximum.
Figure 2 has its maximum concentration
limited to 1000 ppm (for ease of viewing). The building from Figure 1 is highlighted.
Fig. 2 – Range of measured average space CO2 As can be seen, about 40% of the spaces
monitored showed average weekday CO2
concentrations below 500 ppm. This indicates that these spaces are ventilated with outside air at about ten times the amount required for acceptable air quality. This excessive ventilation can cause excess heating and cooling loads.
A brief survey of the literature on energy performance of fresh air economisers indicates pervasive problems.
In a study of packaged rooftop units, Jacobs states: “Economisers show a high rate of failure in the study … 24% would not move at all, [and]

Presented at ICEBO Conference, Montreal, October 2013 p. 3
40% either did not respond to the cold spray test or did not modulate during the short-term monitoring period.” (Jacobs, 2003)
The PECI Functional Testing Guide states: “This design outside air flow is often well above the actual flow required, since design flow is routinely based on an overestimation of the number of occupants. With excess ventilation air, the air handling system serves an unnecessary heating load during cold outside conditions and an unnecessary cooling load during hot and humid conditions.” (PECI FTG section 3.4.3 “Excess Minimum Outside Air”) An E-Source study noted that: “Estimates indicate that only about one in four economizers works properly, with the remaining three providing sub-par performance or, worse yet, wasting prodigious amounts of energy. Failures are a result of maintenance deficiencies, improper control, or systemic problems.” (Liescheidt 2000)
That paper showed that, according to simulations, a malfunctioning economizer (which was delivering 100% OA) would cause HVAC energy consumption to increase by up to 50% (muggy climate) to 150% (cold climate). The extra energy use came during peak conditions, when energy prices would be highest.
Anecdotal comments about low CO2 levels
measured in large buildings include: “we rarely see interior air CO2 levels exceed 600 or 800 ppm, well below the 1,100 ppm recommended by ASHRAE Standard 62.1-2007” and ”the CO2 level seldom varied much above the outdoor level of roughly 450 ppm.” (Copeland 2012)
The presence of economisers, and the
ability of HVAC systems to supply full fresh air, may allow this condition to occur unnecessarily, causing the over-ventilation that appears to be so pervasive.
CO2 AND BUILDING VENTILATION The actual ventilation rate in buildings is
easy to infer through a measurement of space CO2 concentration. This is conveniently done in the return air (RA) duct. Figure 3 shows the amount of outside air delivered per person in the building, calculated from a simple mass balance and assuming steady state conditions.
This is calculated from the formula and data provided in Appendix C of ASHRAE Standard 62.1-2010, and the equivalent Appendix D of NZS 4303:1990.
Figure 3 – OA/person vs CO2 concentration
This shows the inferred outside air ventilation rate as a function of indoor CO2 concentration, with three lines representing three outdoor air concentrations of CO2. In urban areas, the value of 450 ppm is recommended, with 400 and 500 ppm being the approximate range experienced in practice, depending on wind speed and proximity to emission sources.
As can be seen from this chart, if the space CO2 concentration is measured as 800 ppm (with 450 ppm outside – the green line on Figure 3), then 15 L/s-person (30 cfm/p) of outside air is being supplied, or about double the ventilation (+ infiltration) rate than is required by the Standard for good air quality.
If the space CO2 concentration is measured as 600 ppm (again with 450 ppm outside), then about 35 L/s-person (70 cfm/p) of outside air is being supplied, about four times as much as required by the Standard. At 500 ppm, about 100 L/s-person (200 cfm/p) of outside air is being supplied, over ten times as much as is required.
While these effects are not limited to variable-outside-air economizer systems, the prevalence of economizer systems, and their known failures make them suspect.
In general, with space CO2 concentrations less than about 600 ppm, it is difficult to accurately calculate the actual air exchange rate due to its sensitivity to typical meter accuracy (nominally ±50 ppm) and assumptions about the outside air CO2 concentrations and occupant emissions, except to note that the ventilation rate is much higher than necessary to maintain good air quality.

Presented at ICEBO Conference, Montreal, October 2013 p. 4
THERMAL LOADS AND VENTILATION Ventilation with outside air can often be the
largest source of heating load in large commercial buildings. Several published papers show significant potential heating and cooling energy savings resulting from Demand Controlled Ventilation – up to 90+% heating and 10-20% cooling energy savings (Nassif 2012, Brandemuehl 1999, Rock 1998).
The following two graphs show the net
zone cooling and heating loads experienced in a large building with typical loads (40 W/m2 or 4 W/ ft2 internal gains), occupancy (10 people /100 m2 or per 1,000 ft2), and setpoints (20°C/68°F for heating and 24°C/75°F for cooling), as a function of outside air temperature. This is shown for two representative zones: a perimeter zone (within five metres of the windows) and an interior zone.
Figure 4 shows the net loads with the
minimum amount of outside air (10 L/s person or 20 cfm/person).
Figure 4 – Net cooling loads @ 10 L/s.p OA
This building requires cooling almost all the time. In perimeter zones the heat gains exceed the heat losses, requiring cooling down to an ambient temperature of about 11°C (52°F). Heating is only required in the perimeter when ambient temperatures are below about 7°C (44°F). Interior zones, with similar heat gains but no heat losses to ambient except their outside air ventilation stream, require cooling to below 0°C.
Figure 5 shows the net loads for the same
building, but with 50 L/s.p (100 cfm/person) outside air supplied. The effective ventilation
heat losses to ambient are much higher, so this building requires more heating. Both the perimeter and interior zones require heating when ambient temperatures are below about 15°C (59°F). This type of heating requirement is observed in many large buildings.
Figure 5 – Net cooling loads @ 50 L/s.p OA
As can be seen, with this amount of OA,
cooling is only required down to about 19°C (66°F), at which time the space heat gains balance the losses from the ventilation air. Below about 15°C (59°F), heating is required in both zones.
Figure 6 illustrates the effects of optimising the amount of outside air delivered, to minimise the heating and cooling loads at the perimeter.
Fig. 6 – Comparative perimeter cooling loads
In Figure 6, the dashed lines show the
cooling (blue) and heating (red) requirement, in W/m2 at an OA ventilation rate of 50 L/s.p (100 cfm/person). The solid lines show the same loads, but with only 10 L/s.p (20 cfm/person). The green line shows the minimum heating and cooling loads at each ambient temperature.
The operation of the economizer function is
seen as the reduction in the cooling load
Presented at ICEBO Conference, Montreal, October 2013 p. 5
between ambient temperatures of about 20 and 24°C, as the maximum OA is supplied, where the green line tracks the dashed blue line. This shows no net load between about 12° and 20°C.
For this situation, there is no net heating or
cooling load between the ambient temperatures of 7°C and 19°C. For some climates, this makes up the bulk of the heating and cooling season.
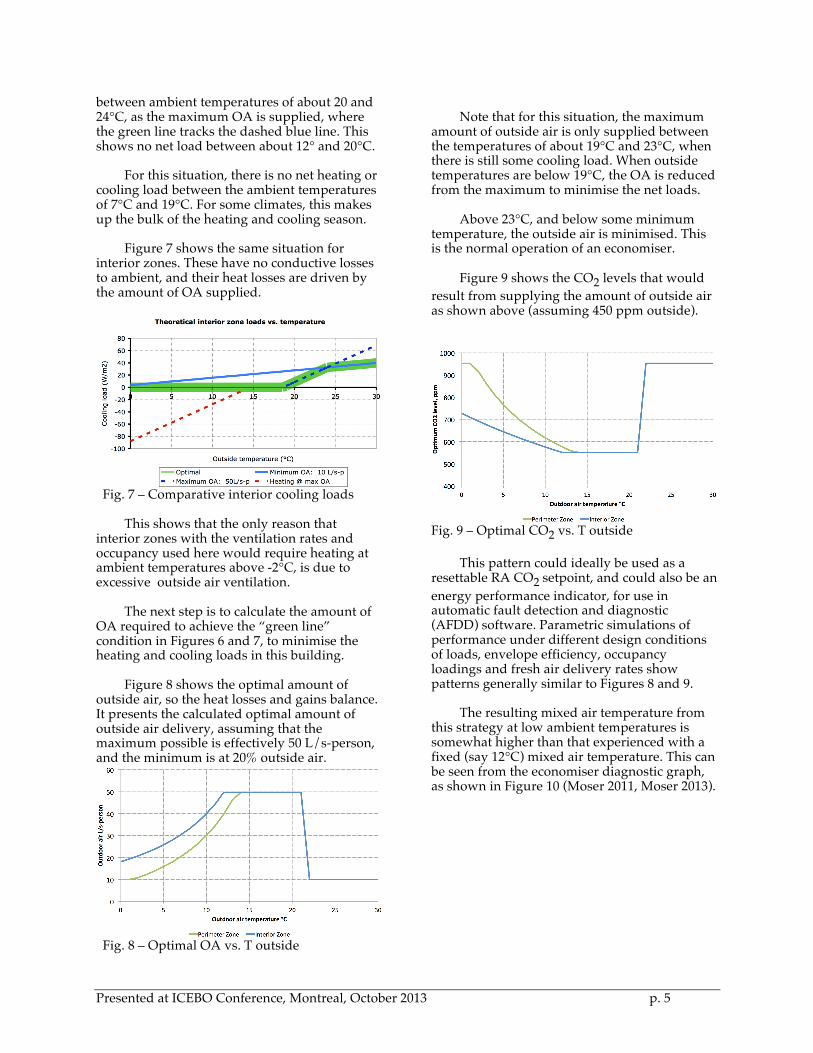
Figure 7 shows the same situation for
interior zones. These have no conductive losses to ambient, and their heat losses are driven by the amount of OA supplied.
Fig. 7 – Comparative interior cooling loads
This shows that the only reason that
interior zones with the ventilation rates and occupancy used here would require heating at ambient temperatures above -2°C, is due to excessive outside air ventilation.
The next step is to calculate the amount of
OA required to achieve the “green line” condition in Figures 6 and 7, to minimise the heating and cooling loads in this building.
Figure 8 shows the optimal amount of
outside air, so the heat losses and gains balance. It presents the calculated optimal amount of outside air delivery, assuming that the maximum possible is effectively 50 L/s-person, and the minimum is at 20% outside air.
Fig. 8 – Optimal OA vs. T outside
Note that for this situation, the maximum
amount of outside air is only supplied between the temperatures of about 19°C and 23°C, when there is still some cooling load. When outside temperatures are below 19°C, the OA is reduced from the maximum to minimise the net loads.
Above 23°C, and below some minimum
temperature, the outside air is minimised. This is the normal operation of an economiser.
Figure 9 shows the CO2 levels that would result from supplying the amount of outside air as shown above (assuming 450 ppm outside).
Fig. 9 – Optimal CO2 vs. T outside
This pattern could ideally be used as a
resettable RA CO2 setpoint, and could also be an energy performance indicator, for use in automatic fault detection and diagnostic (AFDD) software. Parametric simulations of performance under different design conditions of loads, envelope efficiency, occupancy loadings and fresh air delivery rates show patterns generally similar to Figures 8 and 9.
The resulting mixed air temperature from
this strategy at low ambient temperatures is somewhat higher than that experienced with a fixed (say 12°C) mixed air temperature. This can be seen from the economiser diagnostic graph, as shown in Figure 10 (Moser 2011, Moser 2013).

Presented at ICEBO Conference, Montreal, October 2013 p. 6
Fig. 10 – Economizer diagnostic plot
This single graph shows the fraction of OA
in the supply airstream, with three independent variables (the temperatures of return air, outside air, and mixed air), and is used to determine actual economiser performance from simple temperature measurements.
On this graph, correct (ideal) economizer
performance is shown by the dashed line, while the actual performance for this example is shown as the set of pink data points. This example shows an economizer which is actually delivering a constant fraction of outside air.
When using the OA control described in
this paper, the resulting economiser performance graph is shown in Figure 11.
Fig. 11 – Ideal economizer performance
This shows that the condition lines at low ambient temperatures reach a minimum, then rise slightly as temperature drops, instead of a horizontal line as in the standard graph.
RESULTS AND CONCLUSIONS The central thesis of this paper is that most
large mechanically ventilated buildings supply much more OA than is necessary to meet
ventilation codes, and that this causes most of the space heating load at moderate and low temperatures. It is the author’s belief that this is more prevalent in buildings where the fraction of OA in the supply air stream can be varied, i.e. buildings using the fresh air economizer control function.
In buildings where the fraction of OA in the
supply air stream can be varied, monitoring the CO2 concentration in the space (or return air) results in an indicator of the amount of OA supplied (Fig. 9), so allowing it to be controlled.
Even with a well-functioning Building
Management System, the amount of OA delivered to the spaces and its effect on heating and cooling loads is difficult to observe.
Measurements of space CO2 are a good
indicator of the amount of OA ventilation. Understanding the ideal amount of OA at any ambient temperature, to both maintain adequate indoor air quality and to minimise the heating and cooling loads, may only be possible by measuring and analysing CO2, and ideally using this to control the amount of OA delivered, especially when the space is operating outside of economizer (free cooling) mode.
Calculations indicate that the modulation of
outdoor air quantities between design minima and maxima could result in no net heating or cooling loads for a wide range of outside temperature conditions.
Buildings that have their OA fractions
controlled like this will show very low space heating loads, especially in their interior zones, down to ambient temperatures well below 10°C (50°F), as shown in Figures 6 and 7.
Conversely, buildings which show space
heating requirements at temperatures above 10°C (outside of morning warm-ups) probably are supplying excess outside air, which may be caused by an economizer problem.
Achieving the reductions in heating load
doesn’t require reductions in OA down to the minimum required by Code, but rather reductions from the 50 L/s.person (100 cfm/person) often observed in practice, to “reasonable” values, especially during times with hot or cold ambient temperatures.

Presented at ICEBO Conference, Montreal, October 2013 p. 7
REFERENCES ASHRAE, ANSI/ASHRAE Standard 62.1-
2010, Ventilation for Acceptable Indoor Air Quality, American Society of Heating Refrigerating and Air-Conditioning Engineers, Atlanta.
Bishop, R., Camilleri, M. & Isaacs, N. “Achieved Conditions – BEES Interim Report” Study Report SR 260/4 (2011), Building Research Association of New Zealand, 2011.
Bohanon, H., “Demand Control Ventilation
Methods to Meet ASHRAE Standard”, ASHRAE Transactions 2011 p. 262.
Brandemuehl, M., and Braun, J., “The
Impact of Demand-Controlled and Economizer Ventilation Strategies on Energy Use in Buildings” 1999 ASHRAE Transactions 105.2 p. 39
Copeland, C.C., “Improving Energy
Performance of NYC’s Existing Office Buildings”, ASHRAE Journal, August 2012, p. 28.
Dougan D., and Damiano, L., “CO2-Based
Demand Control Ventilation: Do Risks Outweigh Potential Rewards?” ASHRAE Journal 46.10, October 2004 p. 47.
Jacobs, P., “Small HVAC Problems and
Potential Savings Reports”, California Energy Commission Technical Report P500-03-082-A-25 October 2003.
Liescheidt, S., “Economizers in Air
Handling Systems”, CED Engineering Course M01-014, Stony Point New York, 2000.
Moser, D., “Free Cooling: Don’t Let Savings
Slip Away”, Portland Energy Conservation Inc., published in Building Operating Management, September 2011.
Moser, D., “Commissioning Existing Airside Economizer Systems”, ASHRAE Journal, March 2013, p. 34.
Nassif, N., “Supply Air CO2-Based Demand-Controlled Ventilation for Multi-Zone HVAC Systems”, ASHRAE Transactions 2012, p 300.
New Zealand, Standard NZS 4303:1990,
Ventilation for Acceptable Indoor Air Quality,
Standards Association of New Zealand, Wellington.
Portland Energy Conservation Inc., from
Functional Testing Guide on website: (http://www.peci.org/ftguide/ftct/ahu-econmixed.htm) referenced July 2013.
Rock, B., “Performance of Fixed, Air-Side
Economizer, and Neural Network Demand-Controlled Ventilation in CAV Systems”, ASHRAET 1998 104, p. 234.
Schell, M., Turner, S., Shim, R., “Application of CO2-Based Demand-Controlled Ventilation Using ASHRAE Standard 62(1989): Optimizing Energy Use and Ventilation”, ASHRAE Transactions 1998, Vol. 104, p. 1213.
Wang, G., Wang, Z., Xu, K., and Liu, M.,
ESL-IC-07-11-06, “Air Handling Unit Supply Temperature Optimization during Economizer Cycles”, Proceedings of ICEBO 2007.
Warden, D., “Supply air CO2 control of
minimum outdoor air for multiple space systems”, ASHRAE Journal 46.10, October 2004 p. 26.
Zhou, J., Wei, G., Turner, W.D., and
Claridge D., “Airside Economizer – Comparing Different Control Strategies and Common Misconceptions”, ESL-IC-08-10-54, Proceedings of ICEBO 2008, Berlin.
Copyright © 2022 FDOKUMEN