Using ArcMap™ - NCDOT
538
Using ArcMap ™ Michael Minami GIS by ESRI ™
-
Upload
khangminh22 -
Category
Documents
-
view
3 -
download
0
Transcript of Using ArcMap™ - NCDOT
Using ArcMap™
Michael MinamiGIS by ESRI ™
Copyright © 2000 Environmental Systems Research Institute, Inc.All rights reserved.Printed in the United States of America.
The information contained in this document is the exclusive property of Environmental Systems Research Institute, Inc. This work is protected under UnitedStates copyright law and other international copyright treaties and conventions. No part of this work may be reproduced or transmitted in any form or by anymeans, electronic or mechanical, including photocopying and recording, or by any information storage or retrieval system, except as expressly permitted inwriting by Environmental Systems Research Institute, Inc. All requests should be sent to Attention: Contracts Manager, Environmental Systems ResearchInstitute, Inc., 380 New York Street, Redlands, CA 92373-8100, USA.
The information contained in this document is subject to change without notice.
DATA CREDITSQuick-Start Tutorial Data: Wilson, North Carolina.Population Density�Conterminous United States Map: U.S. Department of Census.The African Landscape Map: Major Habitat Types�Conservation Science Program, WWF-US; Rainfall�ArcAtlas�, ESRI, Redlands, California;Population data from EROS Data Center USGS/UNEP.Amazonia Map: Conservation International.Forest Buffer Zone�100 Meters Map: U.S. Forest Service (Tongass Region).Horn of Africa Map: Basemap data from ArcWorld� (1:3M), ESRI, Redlands, California; DEM and Hillshade from EROS Data Center USGS/UNEP.Mexico Population Density Map: ESRI Data & Maps CDs, ESRI, Redlands, California.Health Care in the United States Map: Population data from U.S. Department of Census; Health Service Areas from the trustees of Dartmouth College;Service Providers data from Healthcare Financing Administration.Clark County Land Use Map: Clark County Office, Washington State.Southeast Asia Population Distribution Map: ArcWorld (1:3M), ESRI, Redlands, California.Global 200�World�s Biologically Outstanding Ecoregions Map: Ecoregions data from Conservation Science Program, WWF-US; Country boundariesfrom ArcWorld (1:3M), ESRI, Redlands, California.Australia Map: Major Habitat Types data from Conservation Science Program, WWF-US; Basemap from ArcWorld (1:3M), ESRI, Redlands, California.New Hampshire Telecom Map: Geographic Data Technology, Inc.Redlands Image: Courtesy of Emerge, a division of TASC.
CONTRIBUTING WRITERSAlan Hatakeyama, Andy Mitchell, Bob Booth, Bruce Payne, Cory Eicher, Eleanor Blades, Ian Sims, Jonathan Bailey, Pat Brennan, and Sandy Stephens.
U.S. GOVERNMENT RESTRICTED/LIMITED RIGHTSAny software, documentation, and/or data delivered hereunder is subject to the terms of the License Agreement. In no event shall the U.S. Government acquiregreater than RESTRICTED/LIMITED RIGHTS. At a minimum, use, duplication, or disclosure by the U.S. Government is subject to restrictions as set forthin FAR §52.227-14 Alternates I, II, and III (JUN 1987); FAR §52.227-19 (JUN 1987) and/or FAR §12.211/12.212 (Commercial Technical Data/ComputerSoftware); and DFARS §252.227-7015 (NOV 1995) (Technical Data) and/or DFARS §227.7202 (Computer Software), as applicable. Contractor/Manufactureris Environmental Systems Research Institute, Inc., 380 New York Street, Redlands, CA 92373-8100, USA.
ESRI, ArcView, and the ESRI globe logo are trademarks of Environmental Systems Research Institute, Inc., registered in the United States and certain othercountries; registration is pending in the European Community. ArcInfo, ArcCatalog, ArcMap, ArcToolbox, ArcGIS, ArcPress, ArcIMS, ArcSDE, ArcObjects, theESRI Press logo, and GIS by ESRI are trademarks and ArcWeb, www.esri.com, Geography Network, the Geography Network logo, and www.geographynetwork.comare service marks of Environmental Systems Research Institute, Inc. The Microsoft Internet Explorer logo is a trademark of Microsoft Corporation.
Other companies and products mentioned herein are trademarks or registered trademarks of their respective trademark owners.
Attribution.p65 12/01/2000, 9:45 AM1
iii
Contents Getting started
1 Welcome to ArcMap 3Visualizing information 4Working geographically 5Showing relationships 6Solving problems 7Creating and updating data 8Presenting results 9Developing mapping applications 10Tips on learning ArcMap 11
2 Quick-start tutorial 13Exercise 1: Exploring your data 14Exercise 2: Working with geographic features 28Exercise 3: Working with tables 42Exercise 4: Editing features 51Exercise 5: Working with map elements 59
3 ArcMap basics 65Layers, data frames, and the table of contents 66Starting ArcMap 68The ArcMap window 70Opening a map 71Using the table of contents 73Looking at a map in data view and layout view 75Moving around the map 76Setting bookmarks 79Opening magnifier and overview windows 82Exploring data on a map 83Getting help 86Saving a map and exiting ArcMap 89
Contents.p65 12/01/2000, 10:14 AM3
iv USING ARCMAP
12Displaying data
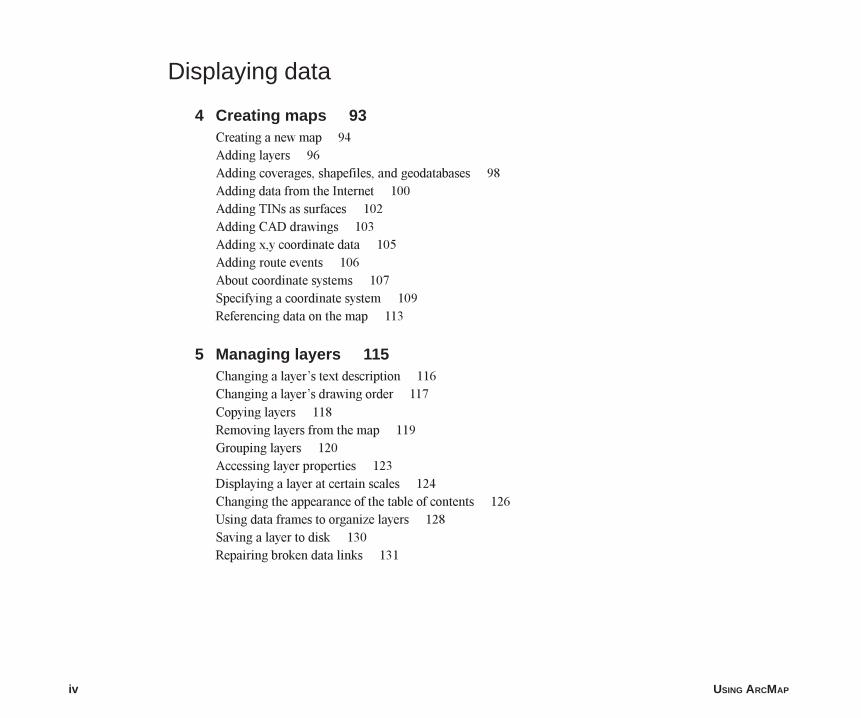
4 Creating maps 93Creating a new map 94Adding layers 96Adding coverages, shapefiles, and geodatabases 98Adding data from the Internet 100Adding TINs as surfaces 102Adding CAD drawings 103Adding x,y coordinate data 105Adding route events 106About coordinate systems 107Specifying a coordinate system 109Referencing data on the map 113
5 Managing layers 115Changing a layer�s text description 116Changing a layer�s drawing order 117Copying layers 118Removing layers from the map 119Grouping layers 120Accessing layer properties 123Displaying a layer at certain scales 124Changing the appearance of the table of contents 126Using data frames to organize layers 128Saving a layer to disk 130Repairing broken data links 131
Contents.p65 12/01/2000, 10:14 AM4
CONTENTS v
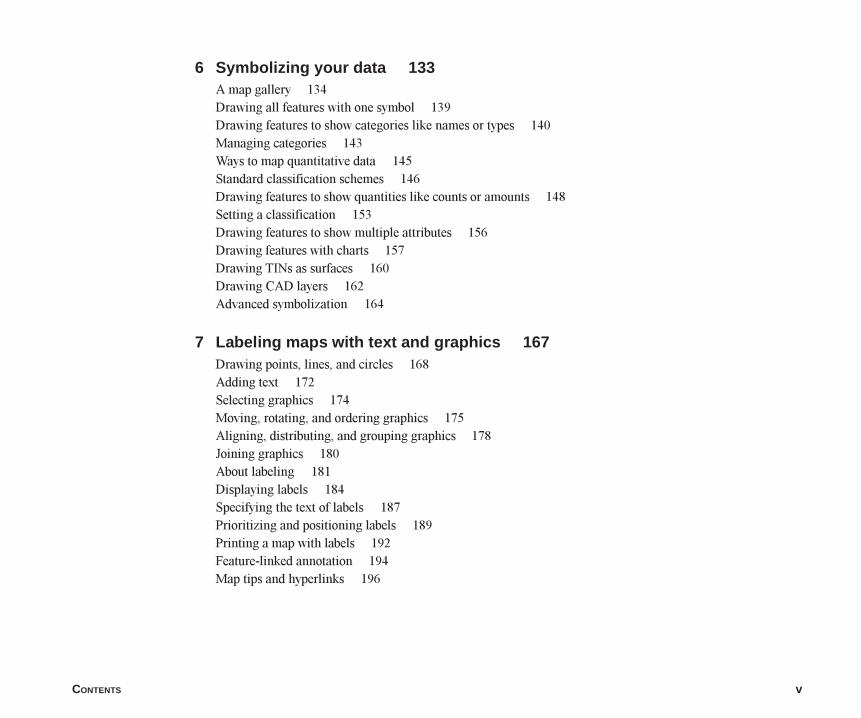
6 Symbolizing your data 133A map gallery 134Drawing all features with one symbol 139Drawing features to show categories like names or types 140Managing categories 143Ways to map quantitative data 145Standard classification schemes 146Drawing features to show quantities like counts or amounts 148Setting a classification 153Drawing features to show multiple attributes 156Drawing features with charts 157Drawing TINs as surfaces 160Drawing CAD layers 162Advanced symbolization 164
7 Labeling maps with text and graphics 167Drawing points, lines, and circles 168Adding text 172Selecting graphics 174Moving, rotating, and ordering graphics 175Aligning, distributing, and grouping graphics 178Joining graphics 180About labeling 181Displaying labels 184Specifying the text of labels 187Prioritizing and positioning labels 189Printing a map with labels 192Feature-linked annotation 194Map tips and hyperlinks 196
Contents.p65 12/01/2000, 10:14 AM5
vi USING ARCMAP
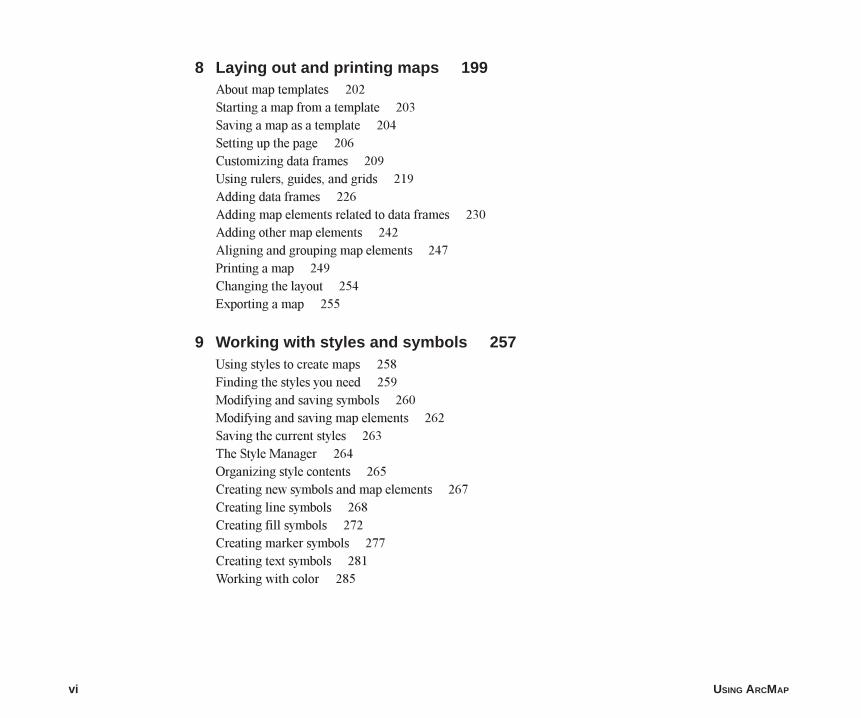
8 Laying out and printing maps 199About map templates 202Starting a map from a template 203Saving a map as a template 204Setting up the page 206Customizing data frames 209Using rulers, guides, and grids 219Adding data frames 226Adding map elements related to data frames 230Adding other map elements 242Aligning and grouping map elements 247Printing a map 249Changing the layout 254Exporting a map 255
9 Working with styles and symbols 257Using styles to create maps 258Finding the styles you need 259Modifying and saving symbols 260Modifying and saving map elements 262Saving the current styles 263The Style Manager 264Organizing style contents 265Creating new symbols and map elements 267Creating line symbols 268Creating fill symbols 272Creating marker symbols 277Creating text symbols 281Working with color 285
Contents.p65 12/01/2000, 10:14 AM6
CONTENTS vii
Querying data
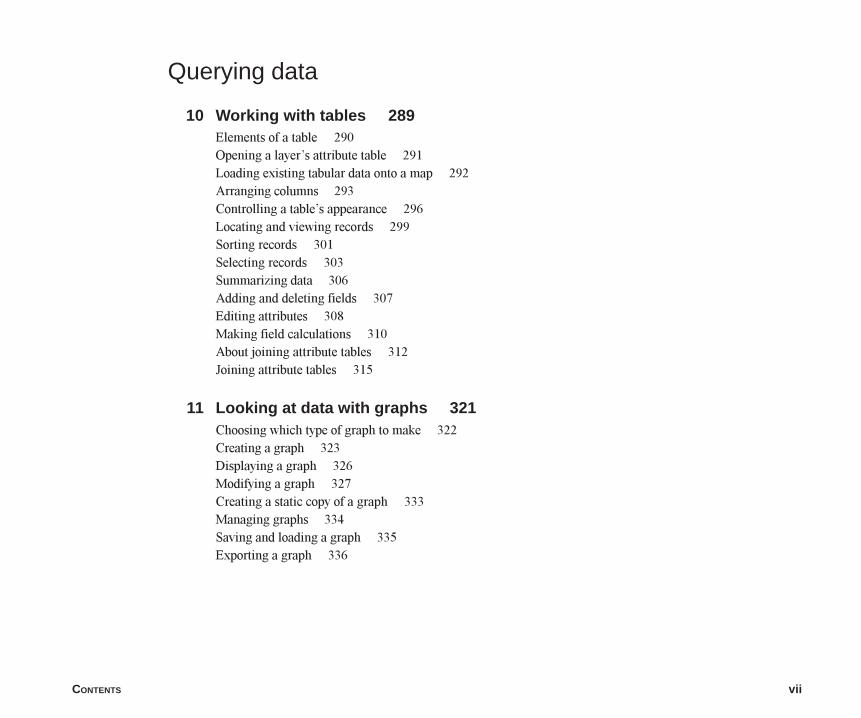
10 Working with tables 289Elements of a table 290Opening a layer�s attribute table 291Loading existing tabular data onto a map 292Arranging columns 293Controlling a table�s appearance 296Locating and viewing records 299Sorting records 301Selecting records 303Summarizing data 306Adding and deleting fields 307Editing attributes 308Making field calculations 310About joining attribute tables 312Joining attribute tables 315
11 Looking at data with graphs 321Choosing which type of graph to make 322Creating a graph 323Displaying a graph 326Modifying a graph 327Creating a static copy of a graph 333Managing graphs 334Saving and loading a graph 335Exporting a graph 336
Contents.p65 12/01/2000, 10:14 AM7
viii USING ARCMAP
12 Creating reports 337About reports 338Creating a simple report 342Setting the report type and size 344Working with fields 346Organizing report data 350Adding report elements 352Controlling the presentation 357Saving and loading a report 360Using Crystal Reports 362
13 Querying maps 365Identifying features 366Displaying a Web page or document about a feature 367Selecting features interactively 369Selecting features by searching with an SQL expression 372Building an SQL expression 373Ways to find features by their location 375Selecting features by their location 377Specifying how selected features highlight 378Displaying information about selected features 379Exporting selected features 381Creating buffers around features 383Aggregating data with the GeoProcessing Wizard 385Joining the attributes of features by their location 390
Contents.p65 12/01/2000, 10:14 AM8
CONTENTS ix
14 Working with rasters 393Adding a raster to your map 394Displaying rasters 396Ways to improve raster display 400Faster drawing with pyramids 403About georeferencing 404The Georeferencing toolbar 406Georeferencing a raster 407
15 Geocoding addresses 411Managing geocoding services in ArcMap 412Controlling the geocoding process 414Finding an address 419Geocoding a table of addresses 422Rematching a geocoded feature class 426
16 Analyzing utility networks 431Geometric networks 432Opening a geometric network 433Symbolizing network features 435Adding network features 437Connecting and disconnecting network features 439Enabling and disabling features 440Adding the Utility Network Analyst toolbar 441Exploring the Utility Network Analyst toolbar 442Flow direction 445Displaying flow direction 447Setting flow direction 449Tracing on networks 451Tracing operations 454
Contents.p65 12/01/2000, 10:14 AM9
x USING ARCMAP
Customization
17 Customizing ArcMap 471Basic user interface elements 472Hiding and showing toolbars 475Creating custom toolbars 476Changing a toolbar�s contents 478Modifying context menus 480Changing a command�s appearance 483Creating shortcut keys 485Saving customizations in a template 488Changing where customization changes are saved by default 490Setting toolbar options 491Creating, editing, and running macros 492Creating custom commands with VBA 495Working with UIControls 497Adding custom commands 498Updating the ArcID module 499Locking customization, documents, and templates 500Changing VBA security 502
Glossary 503
Index 515
Contents.p65 12/01/2000, 10:14 AM10
Section 1
Getting started
section1.p65 12/01/2000, 10:21 AM1

section1.p65 12/01/2000, 10:21 AM2
IN THIS CHAPTER
3
Welcome to ArcMap 1• Visualizing information
• Working geographically
• Showing relationships
• Solving problems
• Creating and updating data
• Presenting results
• Developing mapping applications
• Tips on learning ArcMap
Welcome to ArcMap�, the premier ESRI® software for desktop geographicinformation systems (GIS) and mapping. ArcMap gives you the power to:
� Visualize. In no time you�ll be working with your data geographically:seeing patterns you couldn�t see before, revealing hidden trends anddistributions, and gaining new insights.
� Create. It�s easy to create maps to convey your message. ArcMapprovides all the tools you need to put your data on a map and display itin an effective manner.
� Solve. Working geographically lets you answer questions such as �Whereis...?�, �How much...?�, and �What if...?�. Understanding theserelationships will help you make better decisions.
� Present. Showing the results of your work is easy. You can make great-looking publication-quality maps and create interactive displays that linkcharts, tables, drawings, photographs, and other elements to your data.You�ll find that communicating geographically is a powerful way toinform and motivate others.
� Develop. The ArcMap customization environment lets you tailor theinterface to suit your needs or the needs of your organization, build newtools to automate your work, and develop standalone applications basedon ArcMap mapping components.
The next few pages show you some of the things you can do with ArcMap.As you start making your own maps, you�ll discover even more.
ch1.p65 12/01/2000, 10:28 AM3
4 USING ARCMAP
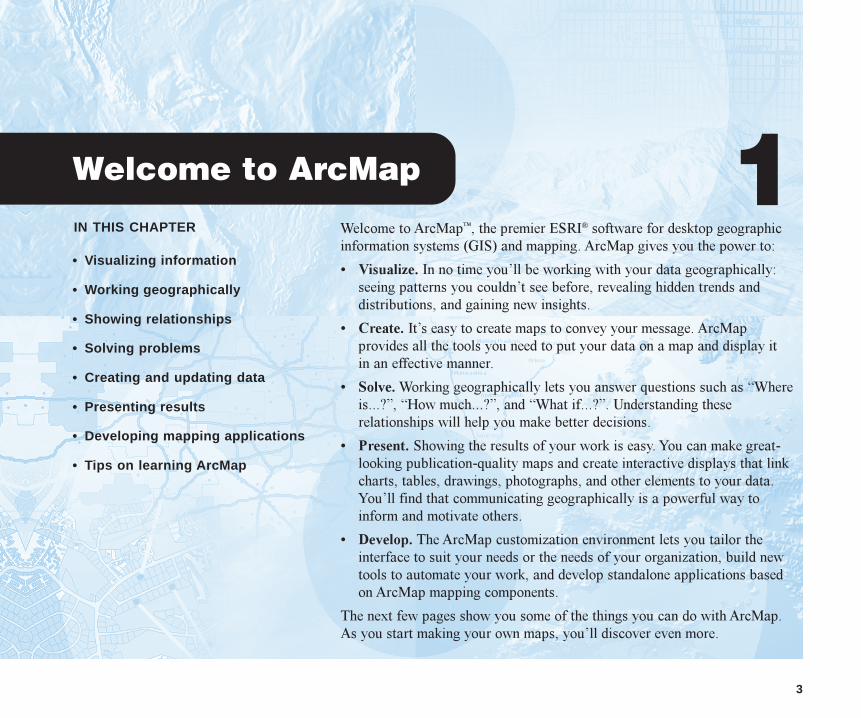
Visualizing informationSometimes just looking at a map will tell you what you want to know. Maps not only tell you where things are, but also what�s specialabout them. This population map shows you where people live in the United States. From it, you can easily see where the majormetropolitan areas are located.
Do you live in a populated area? Areas drawn with dark blue have a lower population density than areas drawn withyellow and brown.
ch1.p65 12/01/2000, 10:28 AM4
WELCOME TO ARCMAP 5
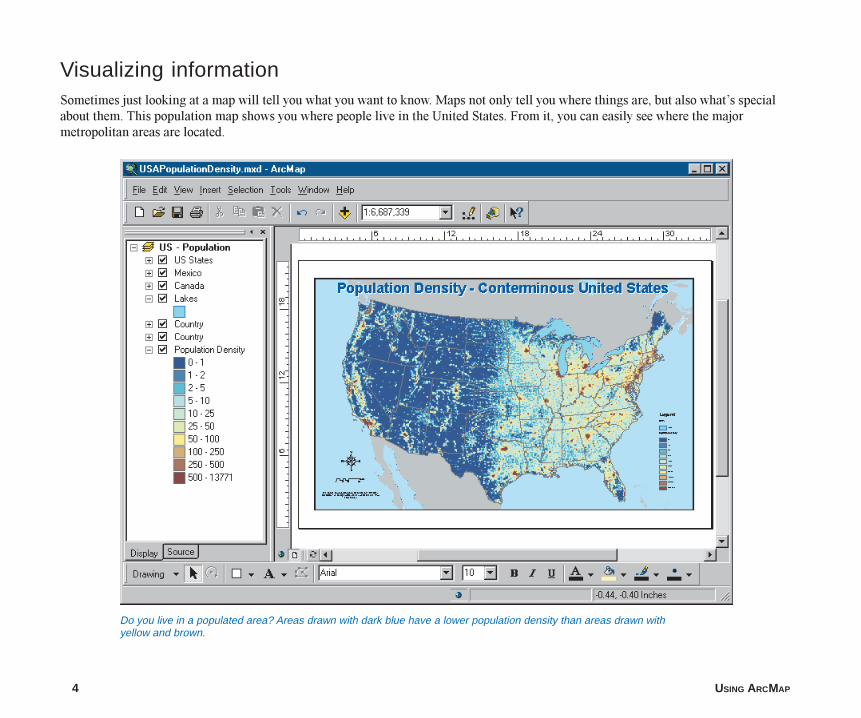
Working geographicallyMaps are not static displays; they�re interactive. You can browse a map�taking a closer look at a particular area�and point at featuresto find out more about them.
Get a regional perspective by zooming in. Want to know more about aparticular area? Just point at it.
ch1.p65 12/01/2000, 10:29 AM5
6 USING ARCMAP
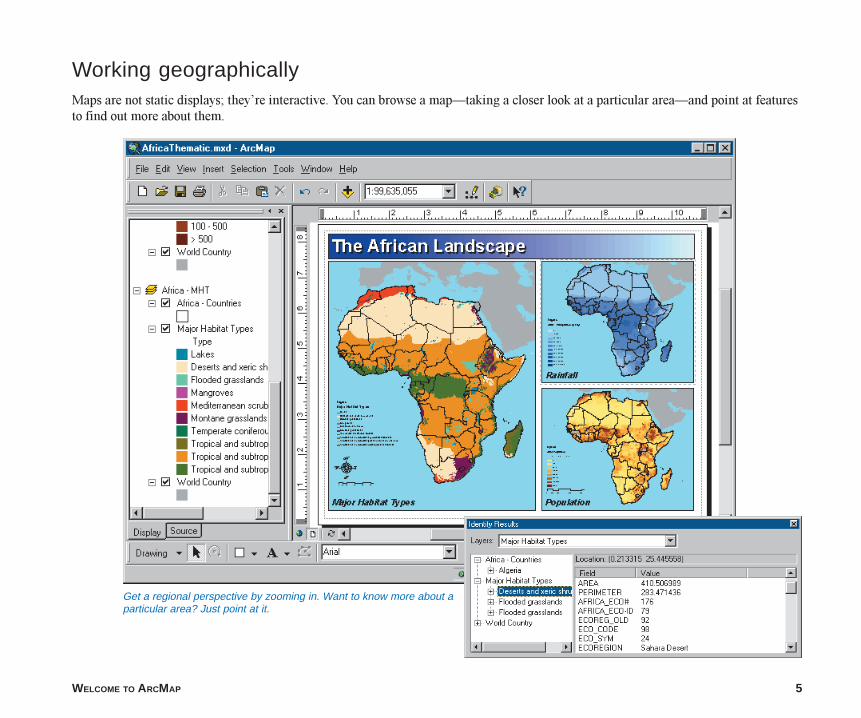
Showing relationshipsYou can show relationships between features by opening tables and creating charts, then adding these elements to the map.
Charts and tables complement the map because they quickly summarize information that would otherwise take moretime to understand.
ch1.p65 12/01/2000, 10:29 AM6
WELCOME TO ARCMAP 7
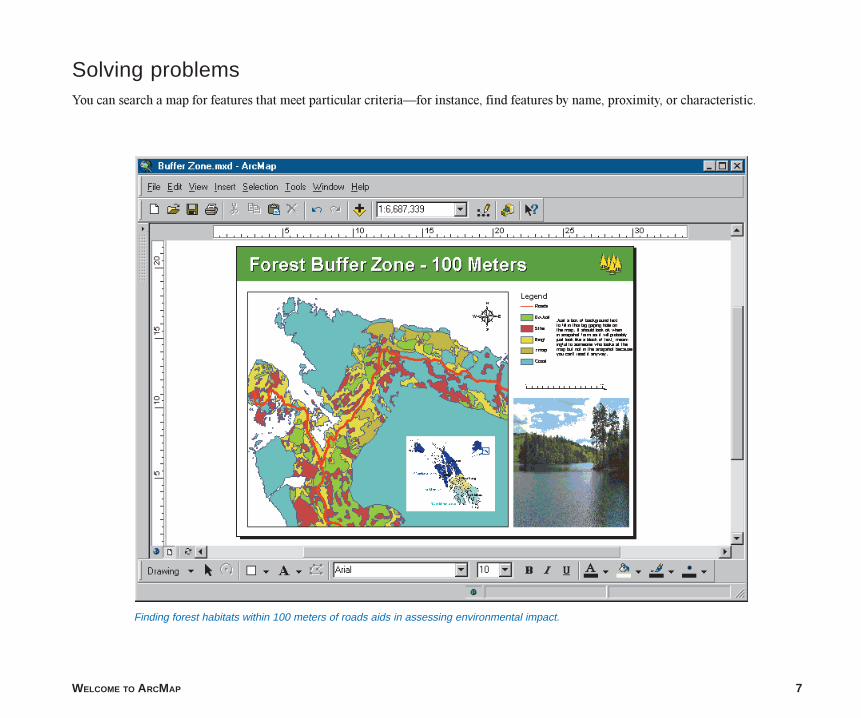
Solving problemsYou can search a map for features that meet particular criteria�for instance, find features by name, proximity, or characteristic.
Finding forest habitats within 100 meters of roads aids in assessing environmental impact.
ch1.p65 12/01/2000, 10:29 AM7
8 USING ARCMAP
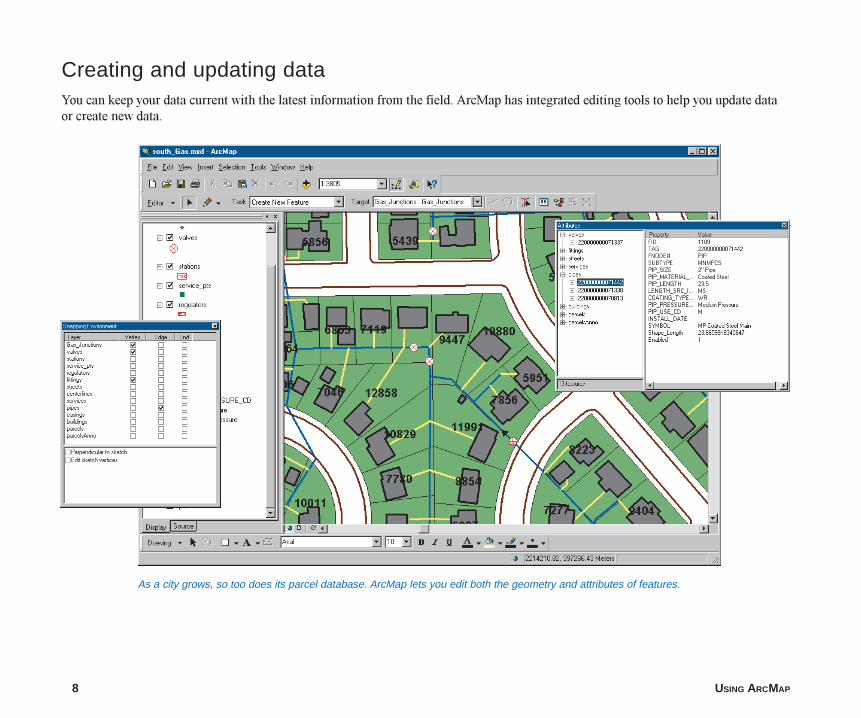
Creating and updating dataYou can keep your data current with the latest information from the field. ArcMap has integrated editing tools to help you update dataor create new data.
As a city grows, so too does its parcel database. ArcMap lets you edit both the geometry and attributes of features.
ch1.p65 12/01/2000, 10:30 AM8
WELCOME TO ARCMAP 9
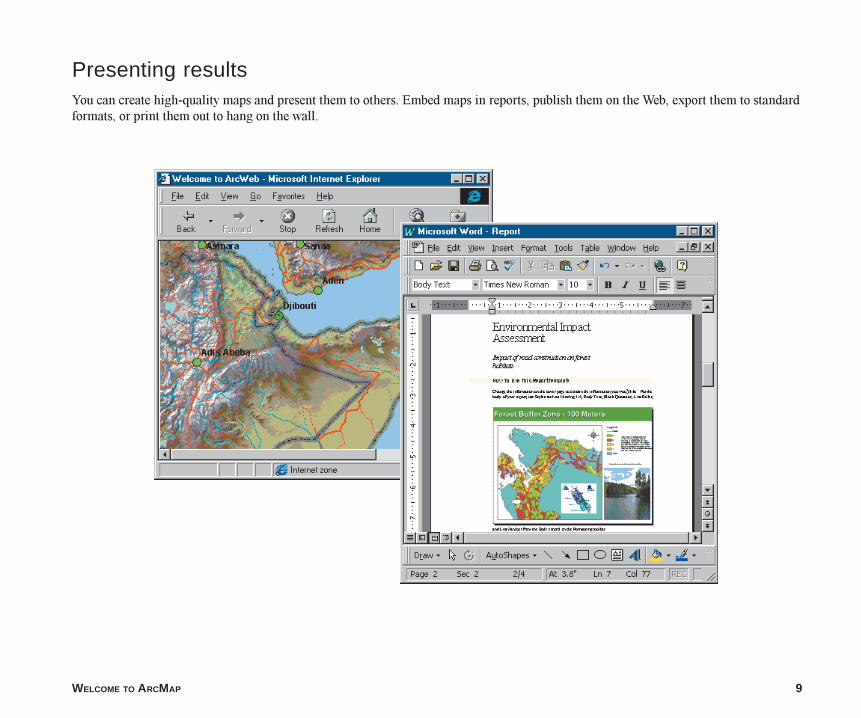
Presenting resultsYou can create high-quality maps and present them to others. Embed maps in reports, publish them on the Web, export them to standardformats, or print them out to hang on the wall.
ch1.p65 12/01/2000, 10:30 AM9
10 USING ARCMAP
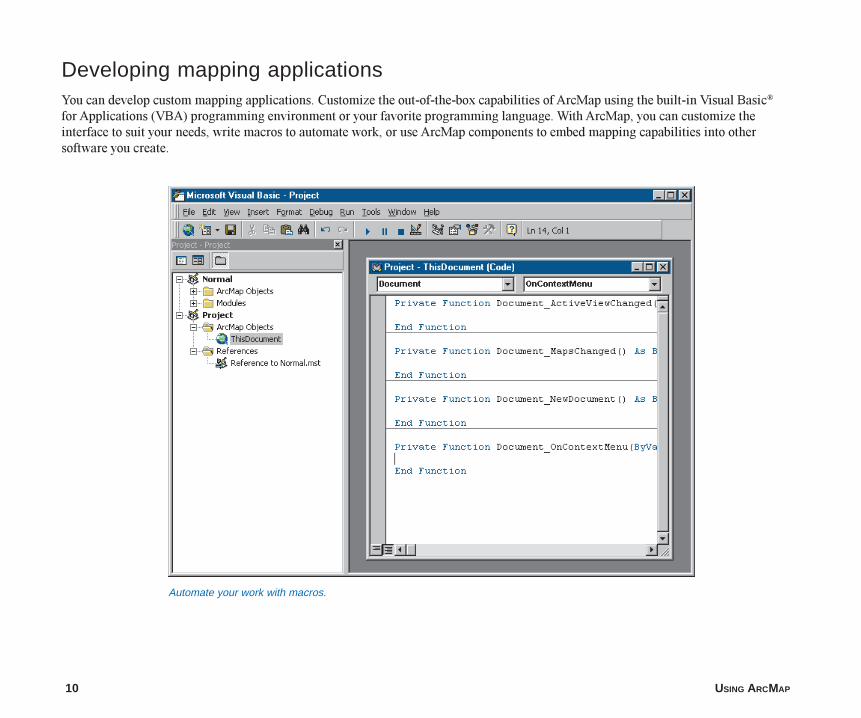
Developing mapping applicationsYou can develop custom mapping applications. Customize the out-of-the-box capabilities of ArcMap using the built-in Visual Basic®
for Applications (VBA) programming environment or your favorite programming language. With ArcMap, you can customize theinterface to suit your needs, write macros to automate work, or use ArcMap components to embed mapping capabilities into othersoftware you create.
Automate your work with macros.
ch1.p65 12/01/2000, 10:30 AM10

WELCOME TO ARCMAP 11
Tips on learning ArcMapIf you�re new to GIS and mapping, remember that you don�t haveto learn everything about ArcMap to get immediate results. Beginlearning ArcMap by reading Chapter 2, �Quick-start tutorial�.This chapter shows you how quickly and easily you can make amap and gain insights into the steps you�ll use to create yourown. ArcMap comes with the data used in the tutorial, so you canfollow along step by step at your computer. You can also read thetutorial without using your computer.
If you prefer to jump right in and experiment on your own, take alook at some of the maps distributed with ArcMap. Try browsinga map, changing symbols, and adding your own data.
When you�re ready to build your own maps, you�ll find thatArcMap comes with useful data you can use directly or asbasemap data for your own data. If you don�t find what you need,more data is available from ESRI, from other organizations, andfrom the Internet. ArcMap also comes with lots of predefinedsymbols, North arrows, and scale bars to make building mapseasier.
Finding answers to questions
Like most people, your goal is to complete your tasks whileinvesting a minimum amount of time and effort on learning howto use software. You want intuitive, easy-to-use software thatgives you immediate results without having to read pages ofdocumentation. However, when you do have a question, you wantthe answer quickly so you can complete your task. That�s whatthis book is all about�getting you the answers you need whenyou need them.
This book describes the mapping tasks�from basic toadvanced�that you�ll perform with ArcMap. Although you canread this book from start to finish, you�ll likely use it more as areference. When you want to know how to do a particular task,such as saving a map, just look it up in the table of contents or
index. What you�ll find is a concise, step-by-step description ofhow to complete the task. Some chapters also include detailedinformation that you can read if you want to learn more about theconcepts behind the tasks. You may also refer to the glossary inthis book if you come across any unfamiliar GIS terms or need torefresh your memory.
Getting help on your computer
In addition to this book, the ArcMap online Help system is avaluable resource for learning how to use the software. To learnhow to use Help, see �Getting help� in Chapter 3 of this book.
Learning about ArcMap extensions
ArcMap extensions are add-on programs that provide specializedGIS functionality. Extensions that come with ArcMap are coveredin this book.
Contacting ESRI
If you need to contact ESRI for technical support, see the productregistration and support card you received with ArcMap or referto �Getting technical support� in the online Help system�s�Getting more help� section.
You can also visit ESRI on the Web at www.esri.com for moreinformation on ArcMap and ArcInfo�.
ESRI education solutions
ESRI provides educational opportunities related to geographicinformation science, GIS applications, and technology. You canchoose among instructor-led courses, Web-based courses, andself-study workbooks to find education solutions that fit yourlearning style and pocketbook. For more information, visitwww.esri.com/education on the Web.
ch1.p65 12/01/2000, 10:30 AM11

ch1.p65 12/01/2000, 10:30 AM12
IN THIS CHAPTER
13
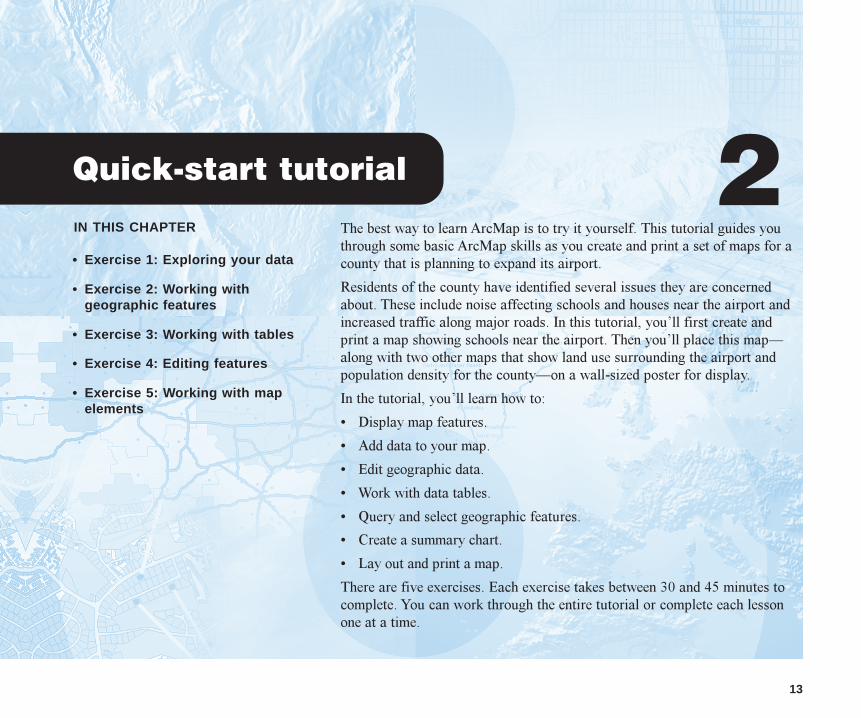
Quick-start tutorial 2• Exercise 1: Exploring your data
• Exercise 2: Working withgeographic features
• Exercise 3: Working with tables
• Exercise 4: Editing features
• Exercise 5: Working with mapelements
The best way to learn ArcMap is to try it yourself. This tutorial guides youthrough some basic ArcMap skills as you create and print a set of maps for acounty that is planning to expand its airport.
Residents of the county have identified several issues they are concernedabout. These include noise affecting schools and houses near the airport andincreased traffic along major roads. In this tutorial, you�ll first create andprint a map showing schools near the airport. Then you�ll place this map�along with two other maps that show land use surrounding the airport andpopulation density for the county�on a wall-sized poster for display.
In the tutorial, you�ll learn how to:
� Display map features.
� Add data to your map.
� Edit geographic data.
� Work with data tables.
� Query and select geographic features.
� Create a summary chart.
� Lay out and print a map.
There are five exercises. Each exercise takes between 30 and 45 minutes tocomplete. You can work through the entire tutorial or complete each lessonone at a time.
ch2.p65 12/01/2000, 2:21 PM13
14 USING ARCMAP
Exercise 1: Exploring your data
In this exercise, you�ll create a map showing locations ofschools near the airport along with a noise contour to seewhich schools may be affected by noise from the airport.The noise contour is based on the 65 Community NoiseEquivalency Level (CNEL), which indicates areasexperiencing more than 65 decibels of noise, averaged overa 24-hour period. In many cases, buildings within the65 CNEL will need soundproofing or other mitigationmeasures.
The exercises in this chapter use the tutorial datadistributed with ArcMap. The default install location of thedata is C:\ArcGIS\ArcTutor\Map. The exercises requirethat you have write access to this data. If you don�t, you�llneed to copy the data to a location that you do have writeaccess to.
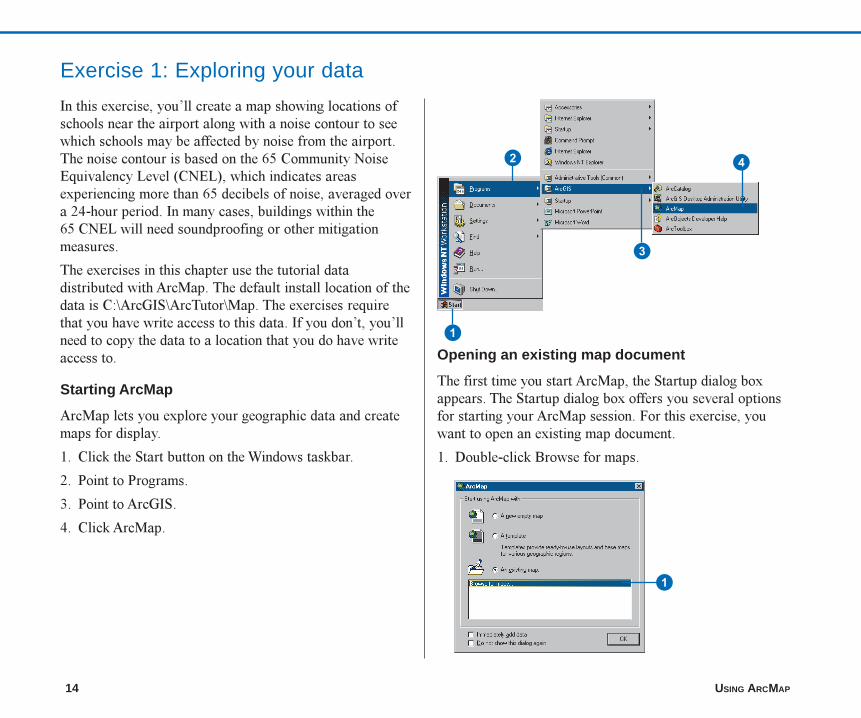
Starting ArcMap
ArcMap lets you explore your geographic data and createmaps for display.
1. Click the Start button on the Windows taskbar.
2. Point to Programs.
3. Point to ArcGIS.
4. Click ArcMap.
Opening an existing map document
The first time you start ArcMap, the Startup dialog boxappears. The Startup dialog box offers you several optionsfor starting your ArcMap session. For this exercise, youwant to open an existing map document.
1. Double-click Browse for maps.
1
2
3
4
1
ch2.p65 12/01/2000, 2:21 PM14
QUICK-START TUTORIAL 15
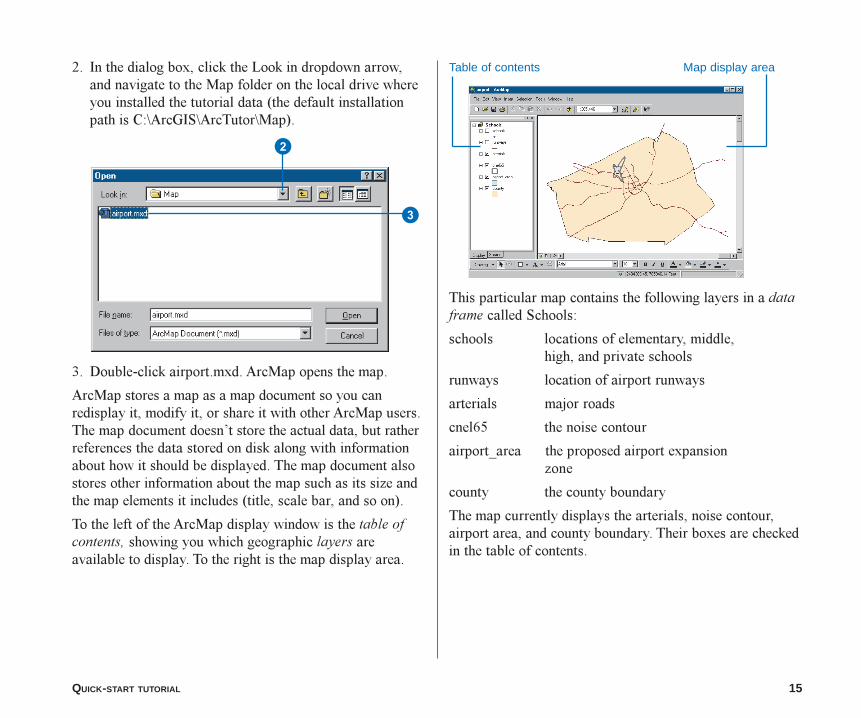
2. In the dialog box, click the Look in dropdown arrow,and navigate to the Map folder on the local drive whereyou installed the tutorial data (the default installationpath is C:\ArcGIS\ArcTutor\Map).
3. Double-click airport.mxd. ArcMap opens the map.
ArcMap stores a map as a map document so you canredisplay it, modify it, or share it with other ArcMap users.The map document doesn�t store the actual data, but ratherreferences the data stored on disk along with informationabout how it should be displayed. The map document alsostores other information about the map such as its size andthe map elements it includes (title, scale bar, and so on).
To the left of the ArcMap display window is the table ofcontents, showing you which geographic layers areavailable to display. To the right is the map display area.
This particular map contains the following layers in a dataframe called Schools:
schools locations of elementary, middle,high, and private schools
runways location of airport runways
arterials major roads
cnel65 the noise contour
airport_area the proposed airport expansionzone
county the county boundary
The map currently displays the arterials, noise contour,airport area, and county boundary. Their boxes are checkedin the table of contents.
Table of contents Map display area
2
3
ch2.p65 12/01/2000, 2:21 PM15
16 USING ARCMAP
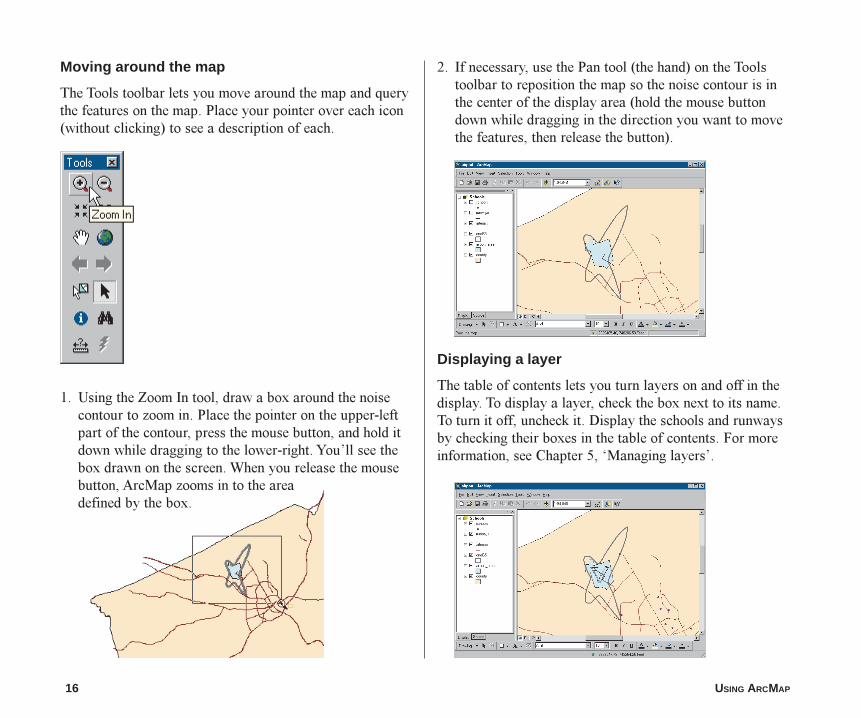
Moving around the map
The Tools toolbar lets you move around the map and querythe features on the map. Place your pointer over each icon(without clicking) to see a description of each.
1. Using the Zoom In tool, draw a box around the noisecontour to zoom in. Place the pointer on the upper-leftpart of the contour, press the mouse button, and hold itdown while dragging to the lower-right. You�ll see thebox drawn on the screen. When you release the mousebutton, ArcMap zooms in to the areadefined by the box.
2. If necessary, use the Pan tool (the hand) on the Toolstoolbar to reposition the map so the noise contour is inthe center of the display area (hold the mouse buttondown while dragging in the direction you want to movethe features, then release the button).
Displaying a layer
The table of contents lets you turn layers on and off in thedisplay. To display a layer, check the box next to its name.To turn it off, uncheck it. Display the schools and runwaysby checking their boxes in the table of contents. For moreinformation, see Chapter 5, �Managing layers�.
ch2.p65 12/01/2000, 2:22 PM16
QUICK-START TUTORIAL 17
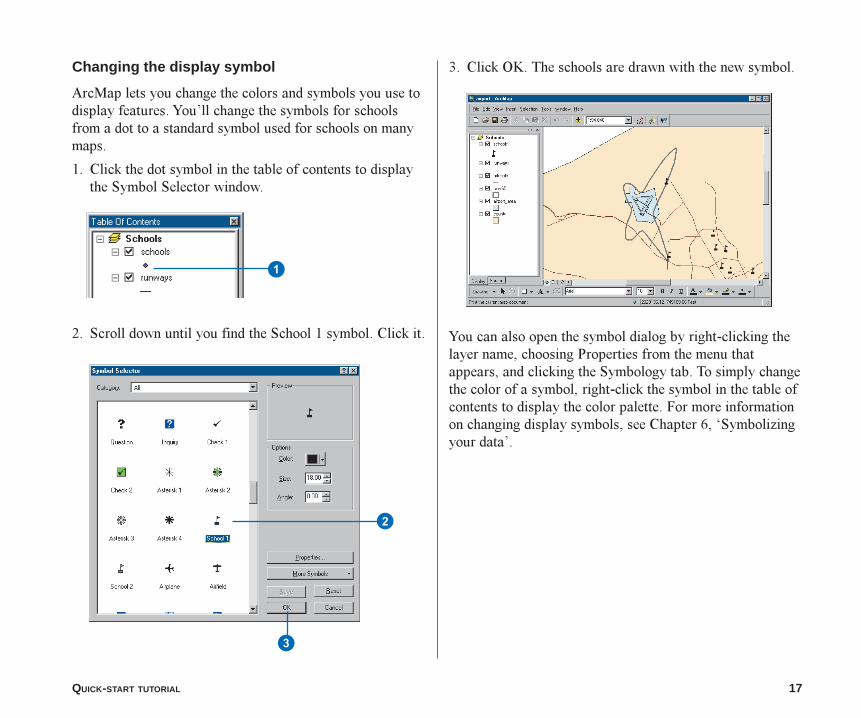
Changing the display symbol
ArcMap lets you change the colors and symbols you use todisplay features. You�ll change the symbols for schoolsfrom a dot to a standard symbol used for schools on manymaps.
1. Click the dot symbol in the table of contents to displaythe Symbol Selector window.
2. Scroll down until you find the School 1 symbol. Click it.
3. Click OK. The schools are drawn with the new symbol.
You can also open the symbol dialog by right-clicking thelayer name, choosing Properties from the menu thatappears, and clicking the Symbology tab. To simply changethe color of a symbol, right-click the symbol in the table ofcontents to display the color palette. For more informationon changing display symbols, see Chapter 6, �Symbolizingyour data�.
1
2
3
ch2.p65 12/01/2000, 2:22 PM17
18 USING ARCMAP
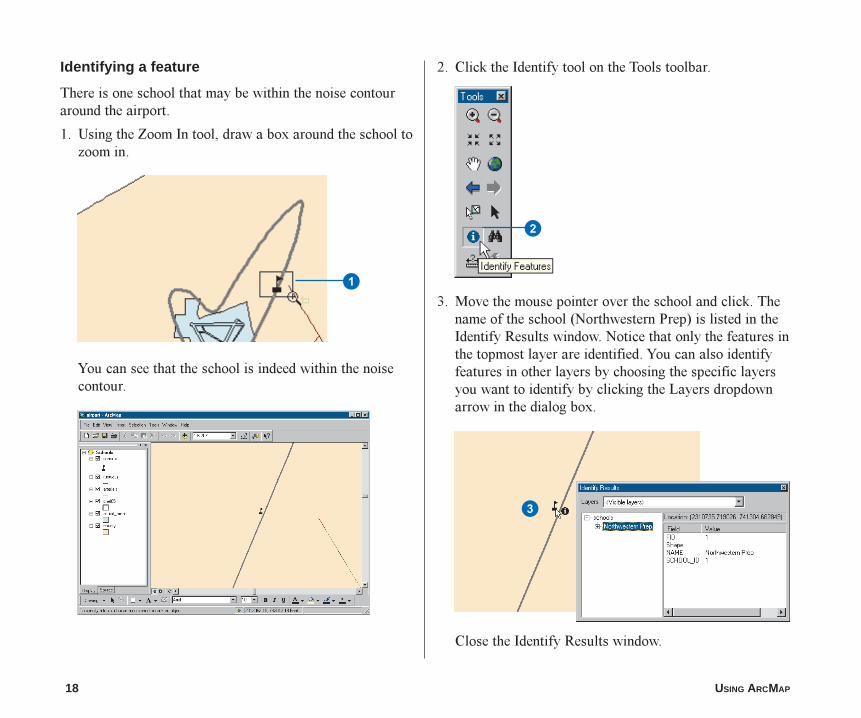
Identifying a feature
There is one school that may be within the noise contouraround the airport.
1. Using the Zoom In tool, draw a box around the school tozoom in.
You can see that the school is indeed within the noisecontour.
2. Click the Identify tool on the Tools toolbar.
3. Move the mouse pointer over the school and click. Thename of the school (Northwestern Prep) is listed in theIdentify Results window. Notice that only the features inthe topmost layer are identified. You can also identifyfeatures in other layers by choosing the specific layersyou want to identify by clicking the Layers dropdownarrow in the dialog box.
Close the Identify Results window.
3
1
2
ch2.p65 12/01/2000, 2:23 PM18
QUICK-START TUTORIAL 19
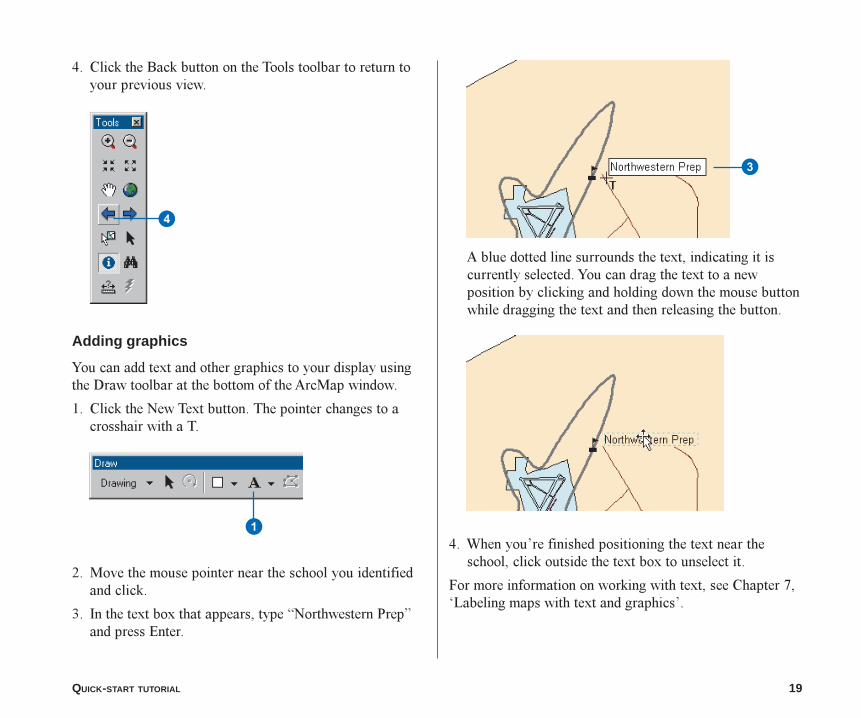
4. Click the Back button on the Tools toolbar to return toyour previous view.
Adding graphics
You can add text and other graphics to your display usingthe Draw toolbar at the bottom of the ArcMap window.
1. Click the New Text button. The pointer changes to acrosshair with a T.
2. Move the mouse pointer near the school you identifiedand click.
3. In the text box that appears, type �Northwestern Prep�and press Enter.
A blue dotted line surrounds the text, indicating it iscurrently selected. You can drag the text to a newposition by clicking and holding down the mouse buttonwhile dragging the text and then releasing the button.
4. When you�re finished positioning the text near theschool, click outside the text box to unselect it.
For more information on working with text, see Chapter 7,�Labeling maps with text and graphics�.
4
1
3
ch2.p65 12/01/2000, 2:23 PM19
20 USING ARCMAP
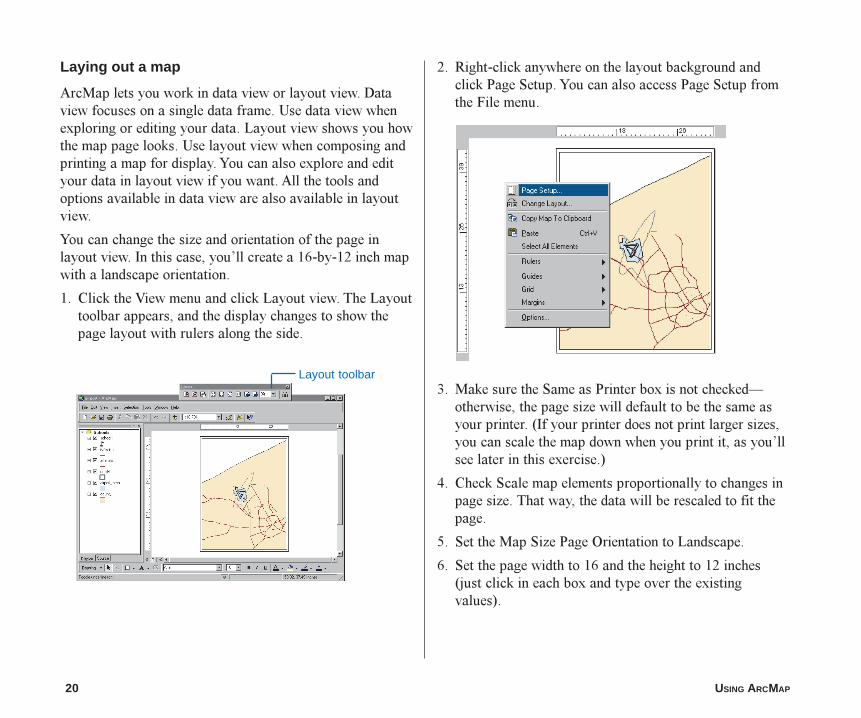
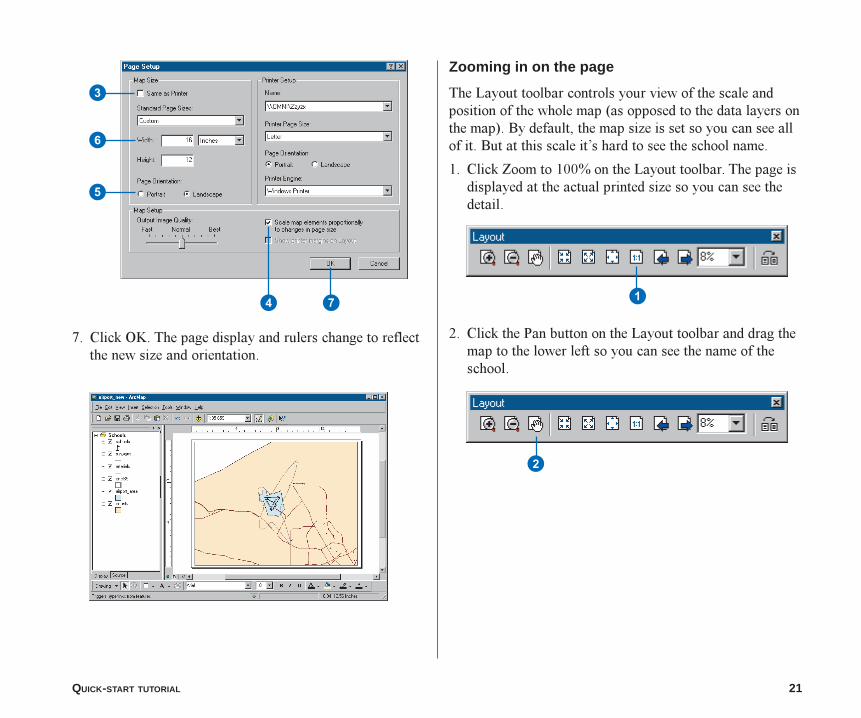
Laying out a map
ArcMap lets you work in data view or layout view. Dataview focuses on a single data frame. Use data view whenexploring or editing your data. Layout view shows you howthe map page looks. Use layout view when composing andprinting a map for display. You can also explore and edityour data in layout view if you want. All the tools andoptions available in data view are also available in layoutview.
You can change the size and orientation of the page inlayout view. In this case, you�ll create a 16-by-12 inch mapwith a landscape orientation.
1. Click the View menu and click Layout view. The Layouttoolbar appears, and the display changes to show thepage layout with rulers along the side.
2. Right-click anywhere on the layout background andclick Page Setup. You can also access Page Setup fromthe File menu.
3. Make sure the Same as Printer box is not checked�otherwise, the page size will default to be the same asyour printer. (If your printer does not print larger sizes,you can scale the map down when you print it, as you�llsee later in this exercise.)
4. Check Scale map elements proportionally to changes inpage size. That way, the data will be rescaled to fit thepage.
5. Set the Map Size Page Orientation to Landscape.
6. Set the page width to 16 and the height to 12 inches(just click in each box and type over the existingvalues).
Layout toolbar
ch2.p65 12/01/2000, 2:24 PM20
QUICK-START TUTORIAL 21
Zooming in on the page
The Layout toolbar controls your view of the scale andposition of the whole map (as opposed to the data layers onthe map). By default, the map size is set so you can see allof it. But at this scale it�s hard to see the school name.
1. Click Zoom to 100% on the Layout toolbar. The page isdisplayed at the actual printed size so you can see thedetail.
2. Click the Pan button on the Layout toolbar and drag themap to the lower left so you can see the name of theschool.
7. Click OK. The page display and rulers change to reflectthe new size and orientation.
3
6
5
74 1
2
ch2.p65 12/01/2000, 2:24 PM21
22 USING ARCMAP
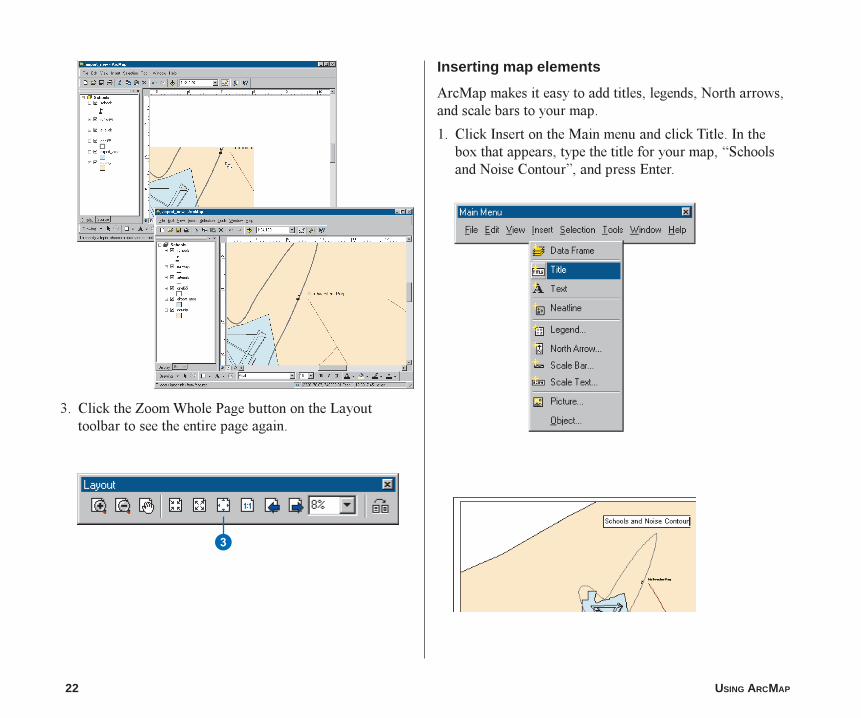
3. Click the Zoom Whole Page button on the Layouttoolbar to see the entire page again.
Inserting map elements
ArcMap makes it easy to add titles, legends, North arrows,and scale bars to your map.
1. Click Insert on the Main menu and click Title. In thebox that appears, type the title for your map, �Schoolsand Noise Contour�, and press Enter.
3
ch2.p65 12/01/2000, 2:25 PM22
QUICK-START TUTORIAL 23
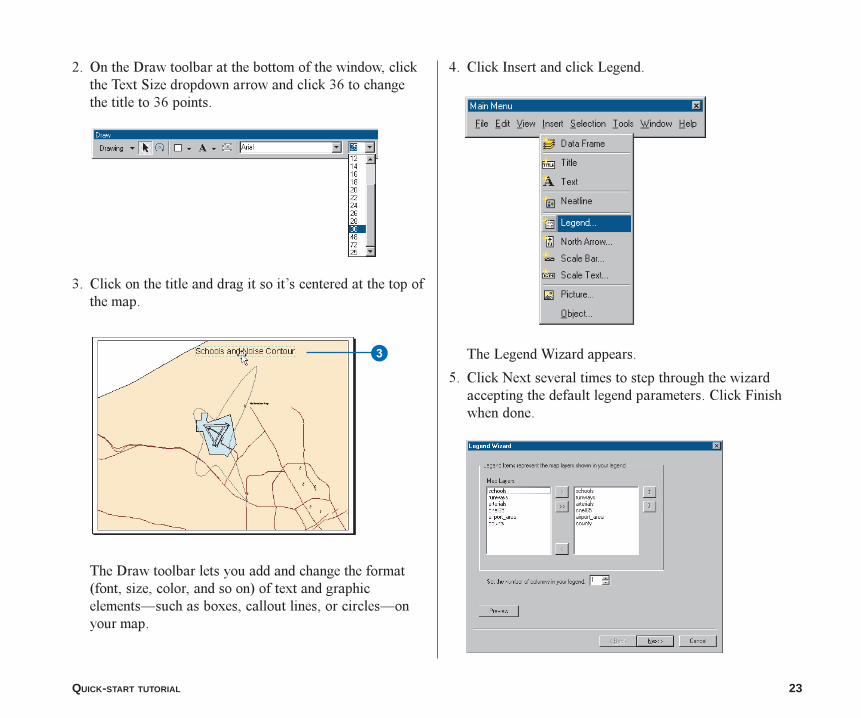
2. On the Draw toolbar at the bottom of the window, clickthe Text Size dropdown arrow and click 36 to changethe title to 36 points.
3. Click on the title and drag it so it�s centered at the top ofthe map.
The Draw toolbar lets you add and change the format(font, size, color, and so on) of text and graphicelements�such as boxes, callout lines, or circles�onyour map.
4. Click Insert and click Legend.
The Legend Wizard appears.
5. Click Next several times to step through the wizardaccepting the default legend parameters. Click Finishwhen done.
3
ch2.p65 12/01/2000, 2:26 PM23
24 USING ARCMAP
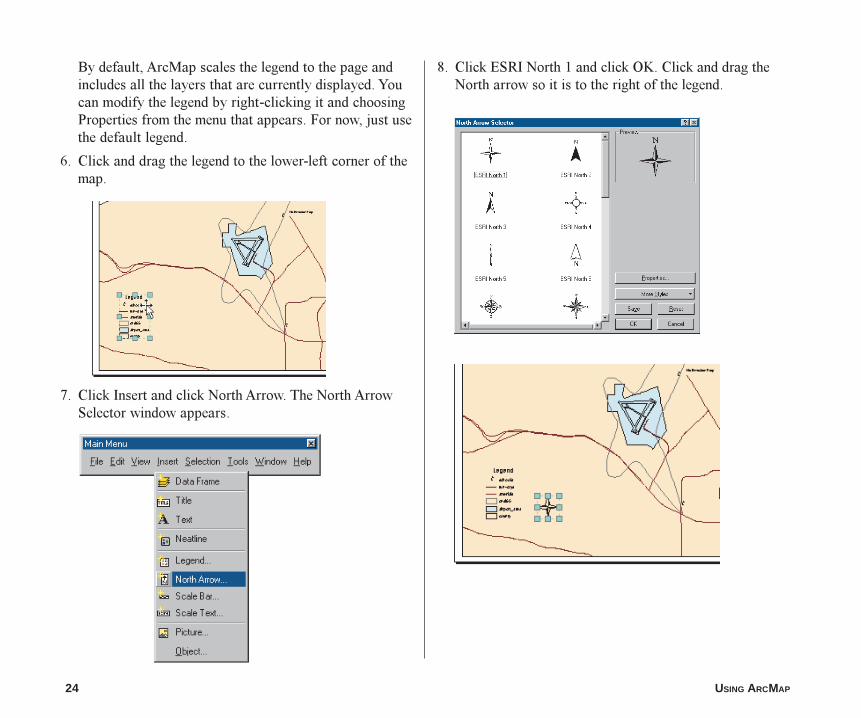
By default, ArcMap scales the legend to the page andincludes all the layers that are currently displayed. Youcan modify the legend by right-clicking it and choosingProperties from the menu that appears. For now, just usethe default legend.
6. Click and drag the legend to the lower-left corner of themap.
7. Click Insert and click North Arrow. The North ArrowSelector window appears.
8. Click ESRI North 1 and click OK. Click and drag theNorth arrow so it is to the right of the legend.
ch2.p65 12/01/2000, 2:27 PM24
QUICK-START TUTORIAL 25
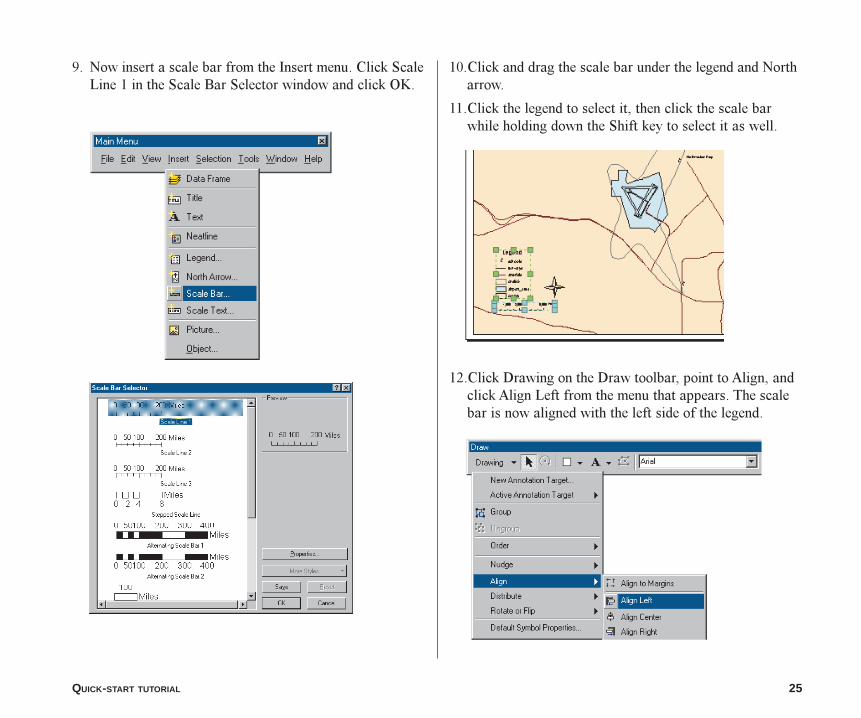
9. Now insert a scale bar from the Insert menu. Click ScaleLine 1 in the Scale Bar Selector window and click OK.
10.Click and drag the scale bar under the legend and Northarrow.
11.Click the legend to select it, then click the scale barwhile holding down the Shift key to select it as well.
12.Click Drawing on the Draw toolbar, point to Align, andclick Align Left from the menu that appears. The scalebar is now aligned with the left side of the legend.
ch2.p65 12/01/2000, 2:27 PM25
26 USING ARCMAP
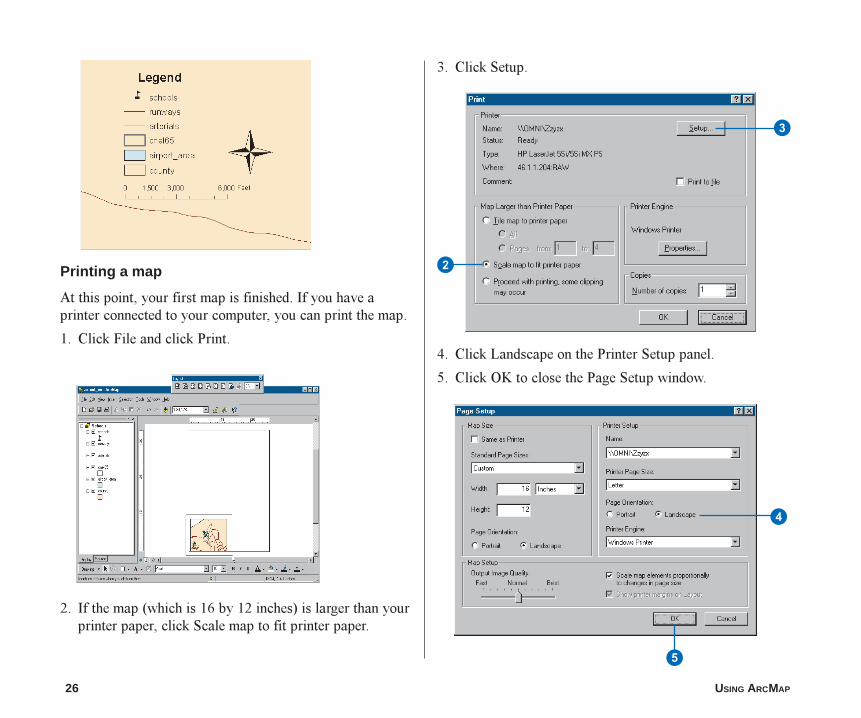
Printing a map
At this point, your first map is finished. If you have aprinter connected to your computer, you can print the map.
1. Click File and click Print.
2. If the map (which is 16 by 12 inches) is larger than yourprinter paper, click Scale map to fit printer paper.
3. Click Setup.
4. Click Landscape on the Printer Setup panel.
5. Click OK to close the Page Setup window.
3
2
5
4
ch2.p65 12/01/2000, 2:28 PM26
QUICK-START TUTORIAL 27
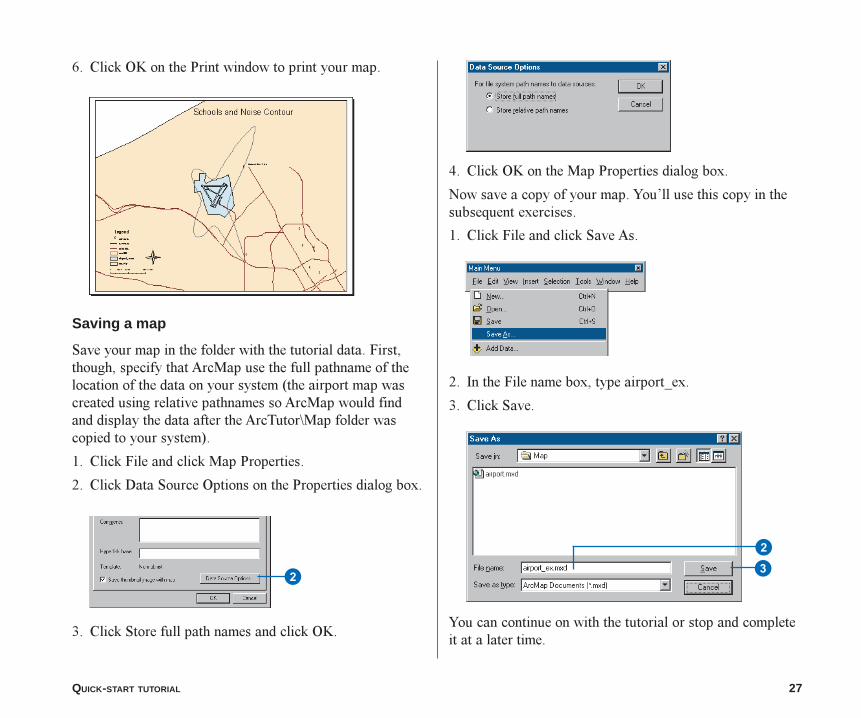
6. Click OK on the Print window to print your map.
Saving a map
Save your map in the folder with the tutorial data. First,though, specify that ArcMap use the full pathname of thelocation of the data on your system (the airport map wascreated using relative pathnames so ArcMap would findand display the data after the ArcTutor\Map folder wascopied to your system).
1. Click File and click Map Properties.
2. Click Data Source Options on the Properties dialog box.
3. Click Store full path names and click OK.
4. Click OK on the Map Properties dialog box.
Now save a copy of your map. You�ll use this copy in thesubsequent exercises.
1. Click File and click Save As.
2. In the File name box, type airport_ex.
3. Click Save.
You can continue on with the tutorial or stop and completeit at a later time.
2
23
ch2.p65 12/01/2000, 2:29 PM27
28 USING ARCMAP
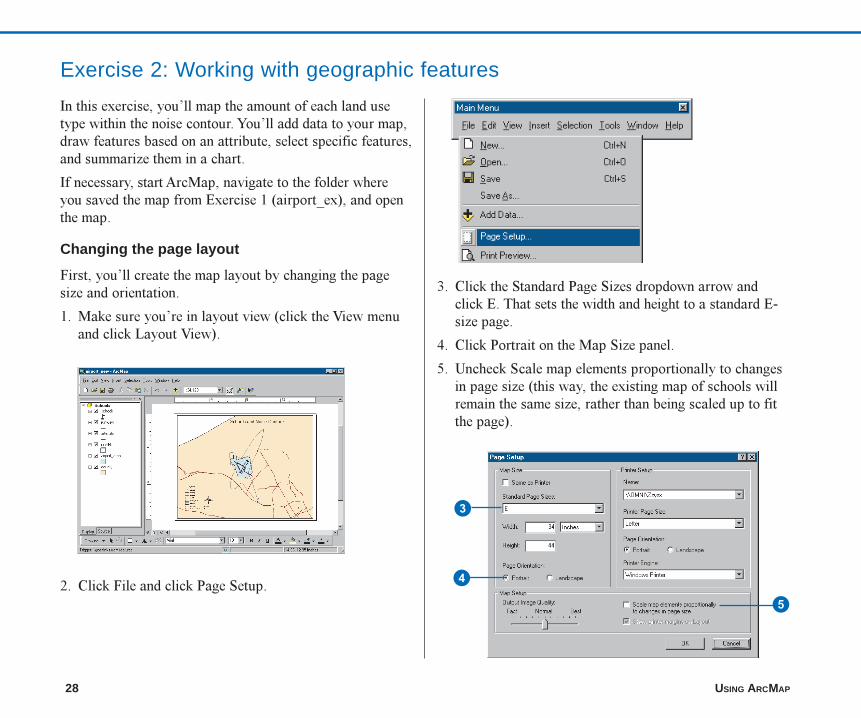
Exercise 2: Working with geographic features
In this exercise, you�ll map the amount of each land usetype within the noise contour. You�ll add data to your map,draw features based on an attribute, select specific features,and summarize them in a chart.
If necessary, start ArcMap, navigate to the folder whereyou saved the map from Exercise 1 (airport_ex), and openthe map.
Changing the page layout
First, you�ll create the map layout by changing the pagesize and orientation.
1. Make sure you�re in layout view (click the View menuand click Layout View).
2. Click File and click Page Setup.
3. Click the Standard Page Sizes dropdown arrow andclick E. That sets the width and height to a standard E-size page.
4. Click Portrait on the Map Size panel.
5. Uncheck Scale map elements proportionally to changesin page size (this way, the existing map of schools willremain the same size, rather than being scaled up to fitthe page).
3
4
5
ch2.p65 12/01/2000, 2:30 PM28
QUICK-START TUTORIAL 29
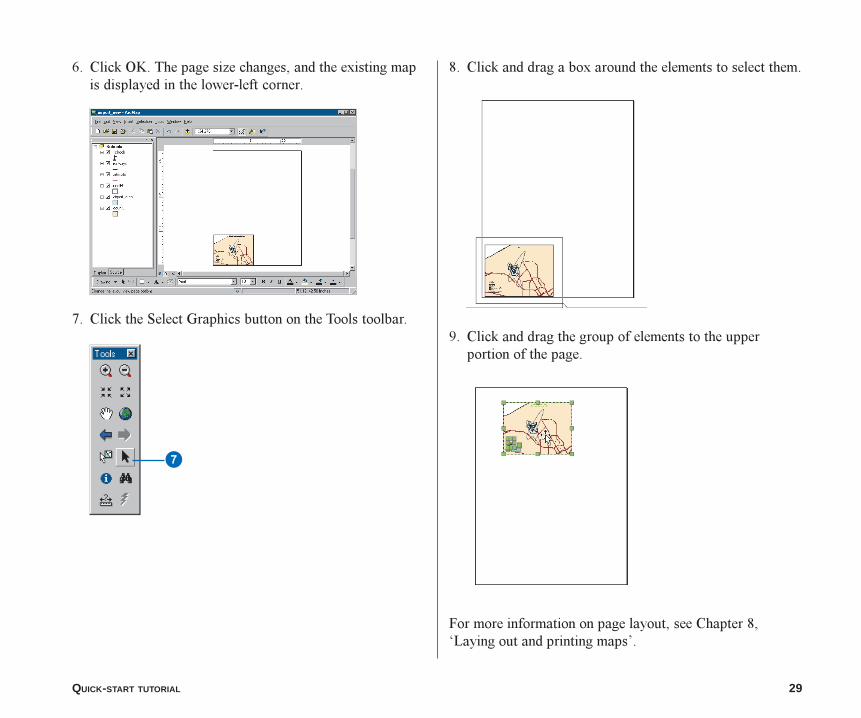
6. Click OK. The page size changes, and the existing mapis displayed in the lower-left corner.
7. Click the Select Graphics button on the Tools toolbar.
8. Click and drag a box around the elements to select them.
9. Click and drag the group of elements to the upperportion of the page.
For more information on page layout, see Chapter 8,�Laying out and printing maps�.
7
ch2.p65 12/01/2000, 2:30 PM29
30 USING ARCMAP
Creating a new data frame
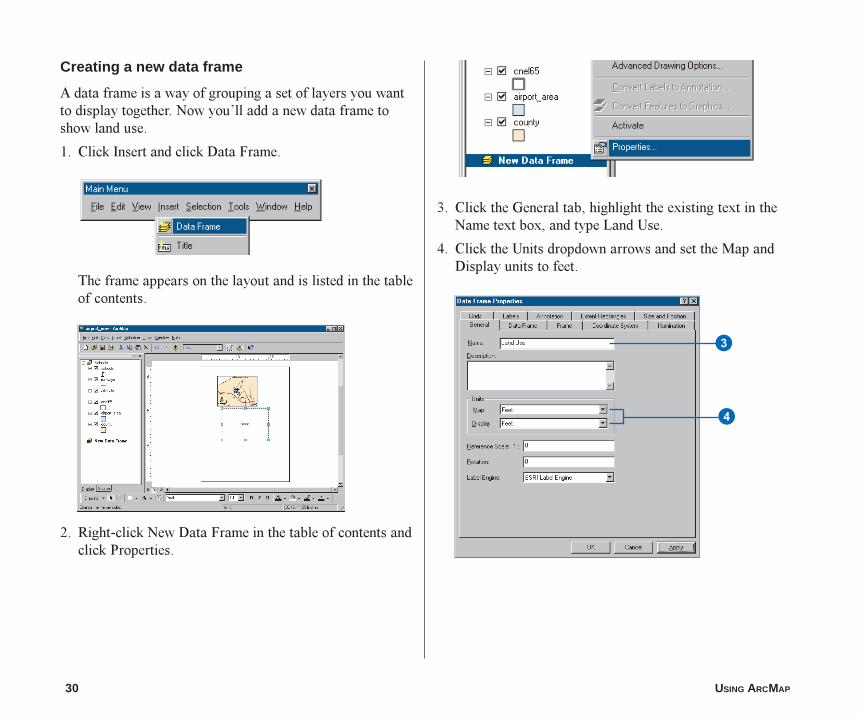
A data frame is a way of grouping a set of layers you wantto display together. Now you�ll add a new data frame toshow land use.
1. Click Insert and click Data Frame.
The frame appears on the layout and is listed in the tableof contents.
2. Right-click New Data Frame in the table of contents andclick Properties.
3. Click the General tab, highlight the existing text in theName text box, and type Land Use.
4. Click the Units dropdown arrows and set the Map andDisplay units to feet.
3
4
ch2.p65 12/01/2000, 2:31 PM30
QUICK-START TUTORIAL 31
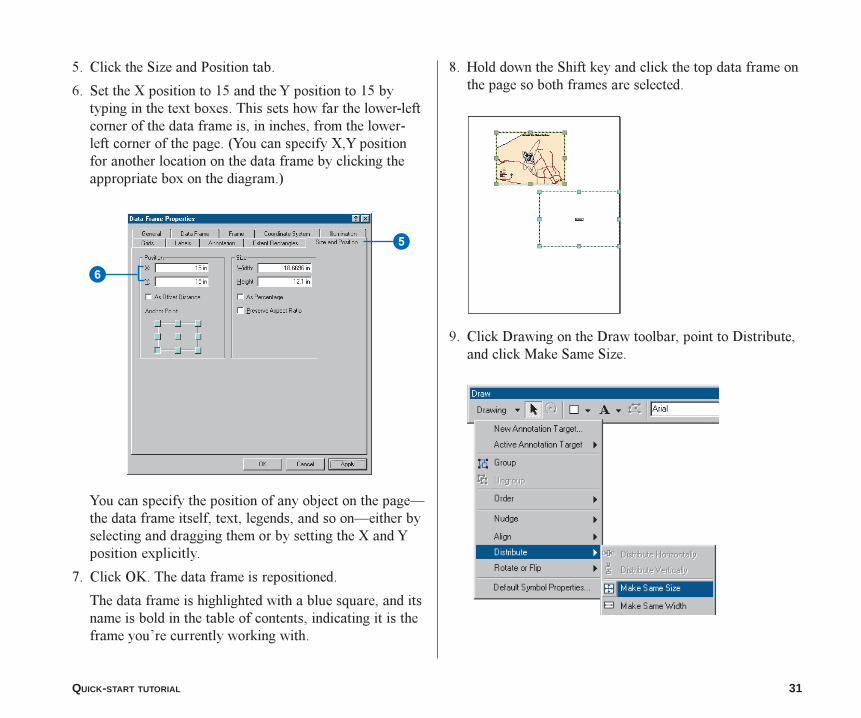
5. Click the Size and Position tab.
6. Set the X position to 15 and the Y position to 15 bytyping in the text boxes. This sets how far the lower-leftcorner of the data frame is, in inches, from the lower-left corner of the page. (You can specify X,Y positionfor another location on the data frame by clicking theappropriate box on the diagram.)
You can specify the position of any object on the page�the data frame itself, text, legends, and so on�either byselecting and dragging them or by setting the X and Yposition explicitly.
7. Click OK. The data frame is repositioned.
The data frame is highlighted with a blue square, and itsname is bold in the table of contents, indicating it is theframe you�re currently working with.
8. Hold down the Shift key and click the top data frame onthe page so both frames are selected.
9. Click Drawing on the Draw toolbar, point to Distribute,and click Make Same Size.
5
6
ch2.p65 12/01/2000, 2:32 PM31
32 USING ARCMAP
Both data frames are now the same size.
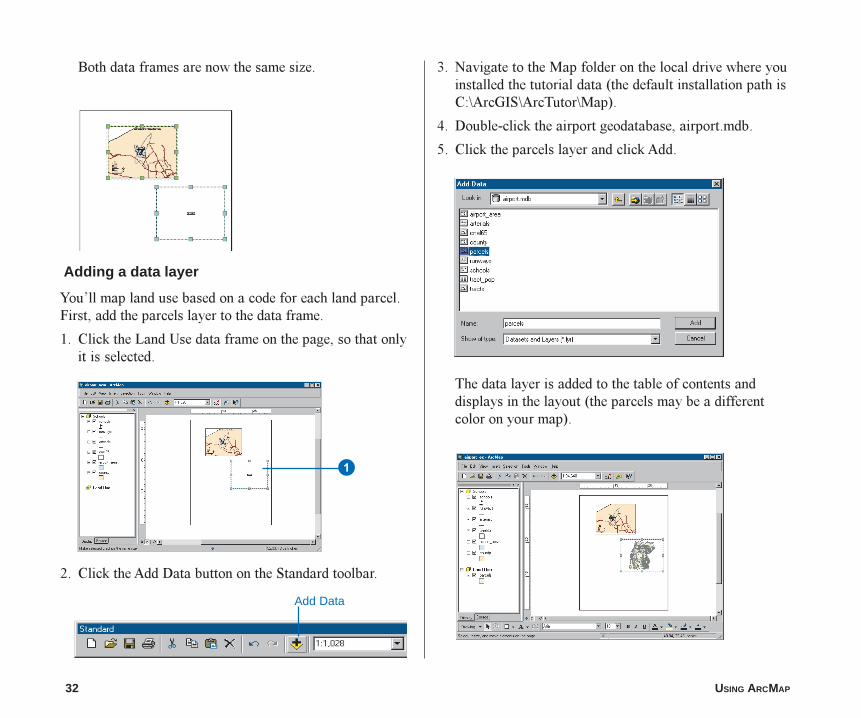
Adding a data layer
You�ll map land use based on a code for each land parcel.First, add the parcels layer to the data frame.
1. Click the Land Use data frame on the page, so that onlyit is selected.
2. Click the Add Data button on the Standard toolbar.
3. Navigate to the Map folder on the local drive where youinstalled the tutorial data (the default installation path isC:\ArcGIS\ArcTutor\Map).
4. Double-click the airport geodatabase, airport.mdb.
5. Click the parcels layer and click Add.
The data layer is added to the table of contents anddisplays in the layout (the parcels may be a differentcolor on your map).
1
Add Data
ch2.p65 12/01/2000, 2:33 PM32
QUICK-START TUTORIAL 33
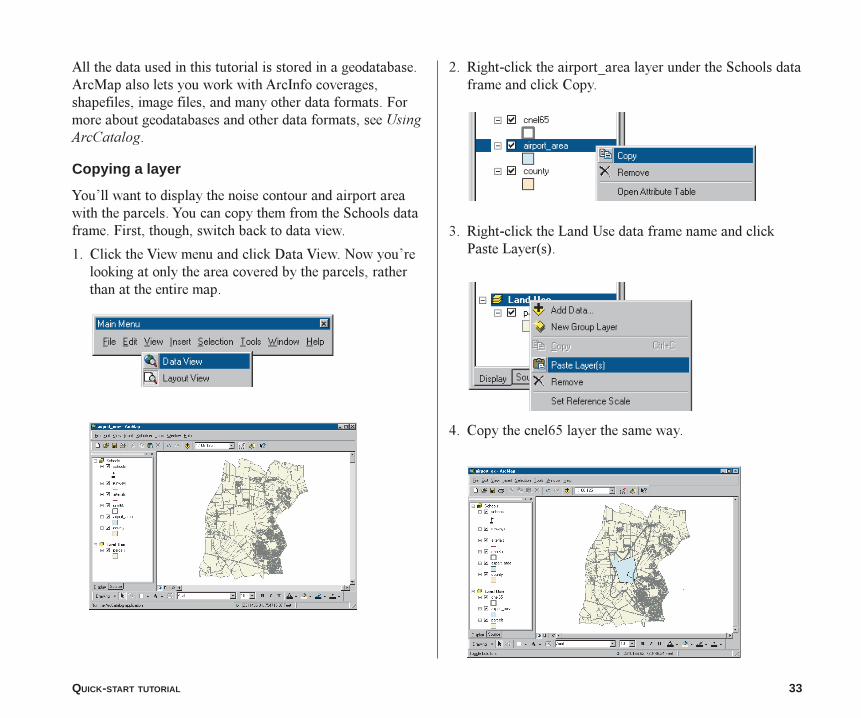
All the data used in this tutorial is stored in a geodatabase.ArcMap also lets you work with ArcInfo coverages,shapefiles, image files, and many other data formats. Formore about geodatabases and other data formats, see UsingArcCatalog.
Copying a layer
You�ll want to display the noise contour and airport areawith the parcels. You can copy them from the Schools dataframe. First, though, switch back to data view.
1. Click the View menu and click Data View. Now you�relooking at only the area covered by the parcels, ratherthan at the entire map.
2. Right-click the airport_area layer under the Schools dataframe and click Copy.
3. Right-click the Land Use data frame name and clickPaste Layer(s).
4. Copy the cnel65 layer the same way.
ch2.p65 12/01/2000, 2:33 PM33
34 USING ARCMAP
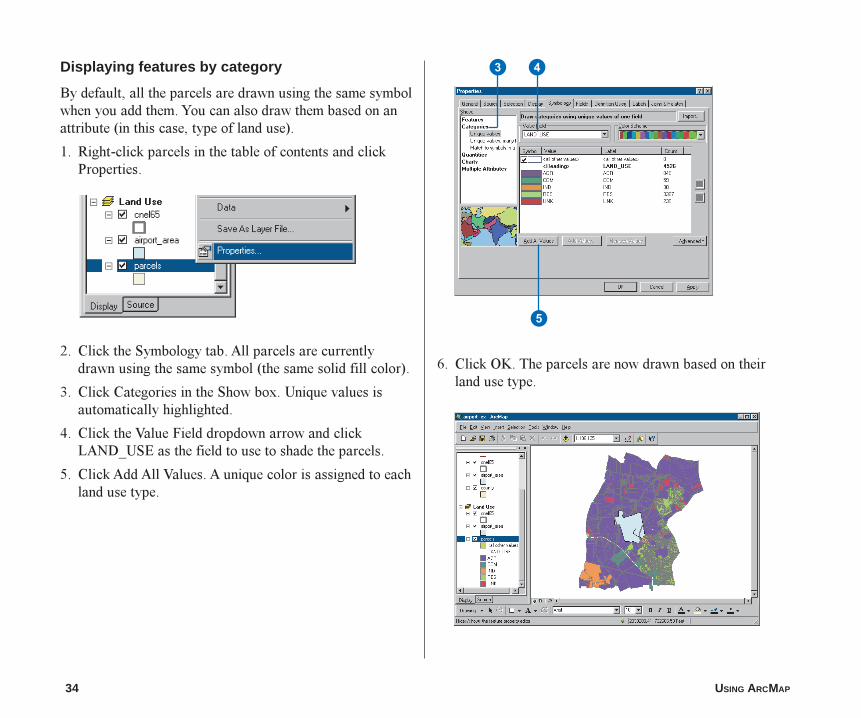
Displaying features by category
By default, all the parcels are drawn using the same symbolwhen you add them. You can also draw them based on anattribute (in this case, type of land use).
1. Right-click parcels in the table of contents and clickProperties.
2. Click the Symbology tab. All parcels are currentlydrawn using the same symbol (the same solid fill color).
3. Click Categories in the Show box. Unique values isautomatically highlighted.
4. Click the Value Field dropdown arrow and clickLAND_USE as the field to use to shade the parcels.
5. Click Add All Values. A unique color is assigned to eachland use type.
6. Click OK. The parcels are now drawn based on theirland use type.
3 4
5
ch2.p65 12/01/2000, 2:34 PM34
QUICK-START TUTORIAL 35
Using a style
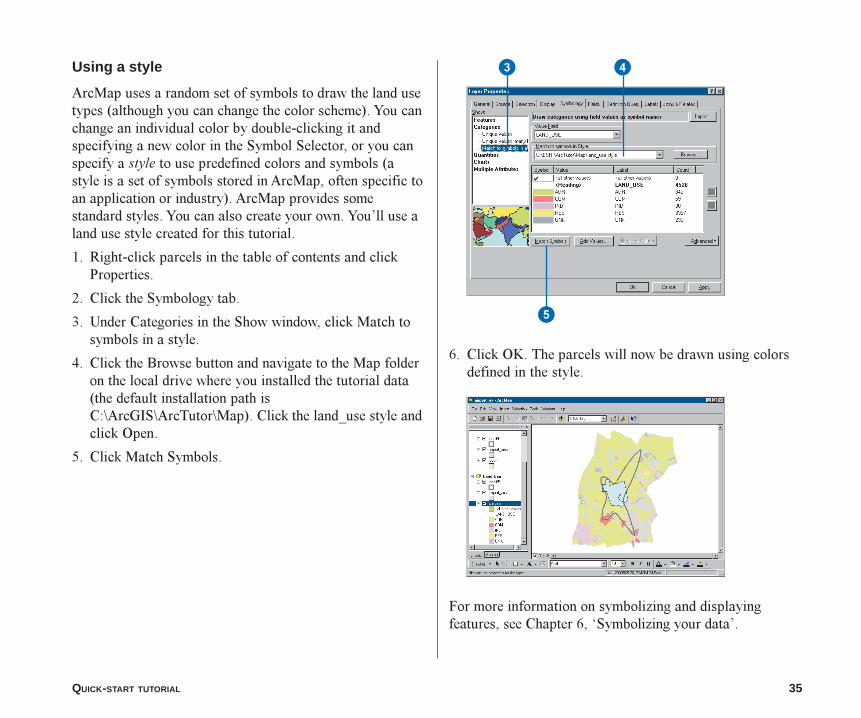
ArcMap uses a random set of symbols to draw the land usetypes (although you can change the color scheme). You canchange an individual color by double-clicking it andspecifying a new color in the Symbol Selector, or you canspecify a style to use predefined colors and symbols (astyle is a set of symbols stored in ArcMap, often specific toan application or industry). ArcMap provides somestandard styles. You can also create your own. You�ll use aland use style created for this tutorial.
1. Right-click parcels in the table of contents and clickProperties.
2. Click the Symbology tab.
3. Under Categories in the Show window, click Match tosymbols in a style.
4. Click the Browse button and navigate to the Map folderon the local drive where you installed the tutorial data(the default installation path isC:\ArcGIS\ArcTutor\Map). Click the land_use style andclick Open.
5. Click Match Symbols.
6. Click OK. The parcels will now be drawn using colorsdefined in the style.
For more information on symbolizing and displayingfeatures, see Chapter 6, �Symbolizing your data�.
3 4
5
ch2.p65 12/01/2000, 2:34 PM35
36 USING ARCMAP
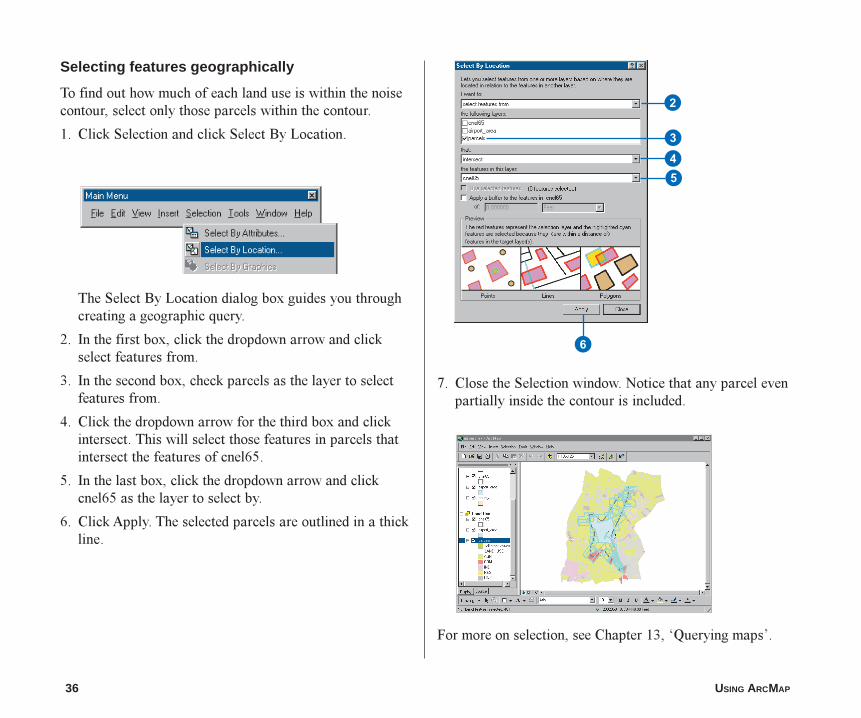
Selecting features geographically
To find out how much of each land use is within the noisecontour, select only those parcels within the contour.
1. Click Selection and click Select By Location.
The Select By Location dialog box guides you throughcreating a geographic query.
2. In the first box, click the dropdown arrow and clickselect features from.
3. In the second box, check parcels as the layer to selectfeatures from.
4. Click the dropdown arrow for the third box and clickintersect. This will select those features in parcels thatintersect the features of cnel65.
5. In the last box, click the dropdown arrow and clickcnel65 as the layer to select by.
6. Click Apply. The selected parcels are outlined in a thickline.
7. Close the Selection window. Notice that any parcel evenpartially inside the contour is included.
For more on selection, see Chapter 13, �Querying maps�.
6
43
2
5
ch2.p65 12/01/2000, 2:34 PM36
QUICK-START TUTORIAL 37
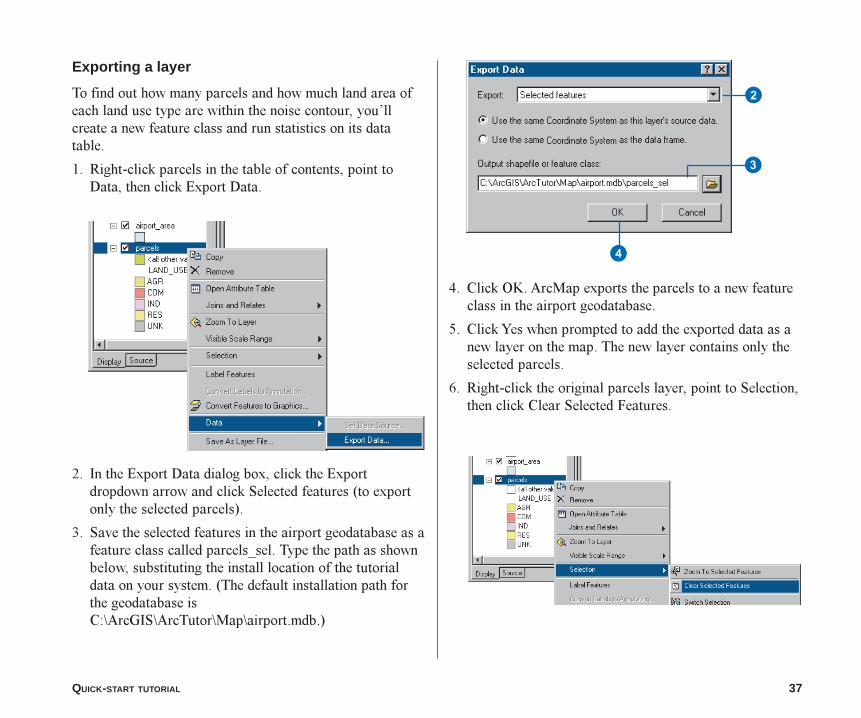
Exporting a layer
To find out how many parcels and how much land area ofeach land use type are within the noise contour, you�llcreate a new feature class and run statistics on its datatable.
1. Right-click parcels in the table of contents, point toData, then click Export Data.
2. In the Export Data dialog box, click the Exportdropdown arrow and click Selected features (to exportonly the selected parcels).
3. Save the selected features in the airport geodatabase as afeature class called parcels_sel. Type the path as shownbelow, substituting the install location of the tutorialdata on your system. (The default installation path forthe geodatabase isC:\ArcGIS\ArcTutor\Map\airport.mdb.)
4. Click OK. ArcMap exports the parcels to a new featureclass in the airport geodatabase.
5. Click Yes when prompted to add the exported data as anew layer on the map. The new layer contains only theselected parcels.
6. Right-click the original parcels layer, point to Selection,then click Clear Selected Features.
2
3
4
ch2.p65 12/01/2000, 2:35 PM37
38 USING ARCMAP
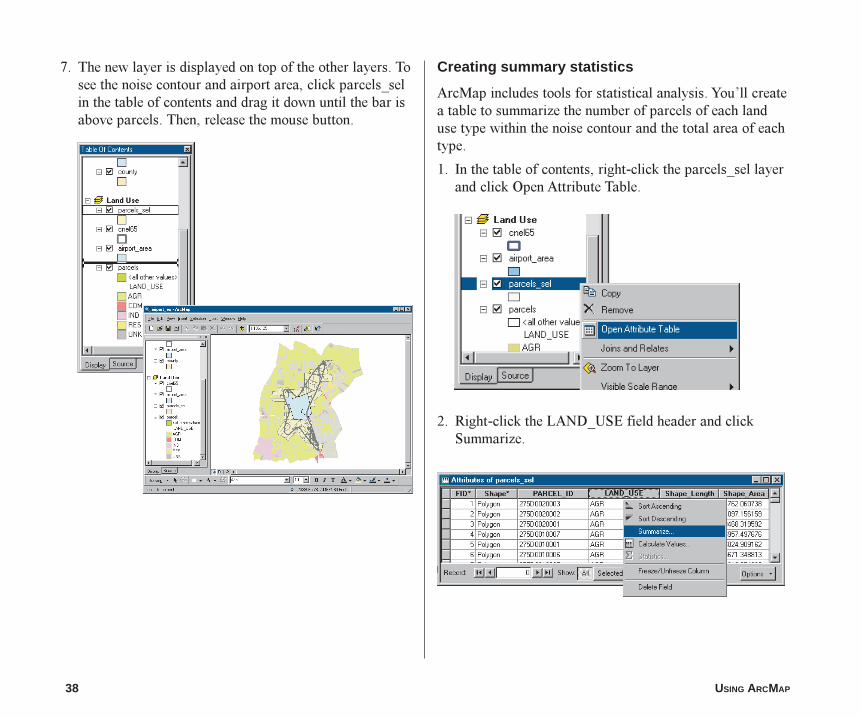
7. The new layer is displayed on top of the other layers. Tosee the noise contour and airport area, click parcels_selin the table of contents and drag it down until the bar isabove parcels. Then, release the mouse button.
Creating summary statistics
ArcMap includes tools for statistical analysis. You�ll createa table to summarize the number of parcels of each landuse type within the noise contour and the total area of eachtype.
1. In the table of contents, right-click the parcels_sel layerand click Open Attribute Table.
2. Right-click the LAND_USE field header and clickSummarize.
ch2.p65 12/01/2000, 2:35 PM38

QUICK-START TUTORIAL 39
3. Make sure the field to summarize is LAND_USE.
4. Click the plus sign next to Shape_Area to expand it.Check Sum to summarize the area by land use type.
5. Create the output table in the airport geodatabase andname it lu_frequency.
6. Click OK. ArcMap creates a new table with a record foreach land use type showing the number of parcels ofthat type and the total land area (in square feet).
7. Click Yes when prompted to add the resulting table tothe map.
Opening a table
You may have noticed that when the table is added to themap, the table of contents switches from the Display tab tothe Source tab (at the bottom of the table of contents). TheSource tab shows the location of all data in the table ofcontents; this is useful when editing data in ArcMapbecause it shows you which layers are in the sameworkspace. (When you edit in ArcMap, you edit an entireworkspace; that is, all the layers in the workspace areavailable for editing.) The Source tab also lists all tables.Tables don�t show up when the Display tab is selected sincea table is not a geographic feature that gets displayed on themap.
1. Right-click lu_frequency in the table of contents andclick Open. You can see the number of parcels and thetotal area (in square feet) of each land use type.
2. Close the table window.
3
4
5
6
ch2.p65 12/01/2000, 2:36 PM39
40 USING ARCMAP
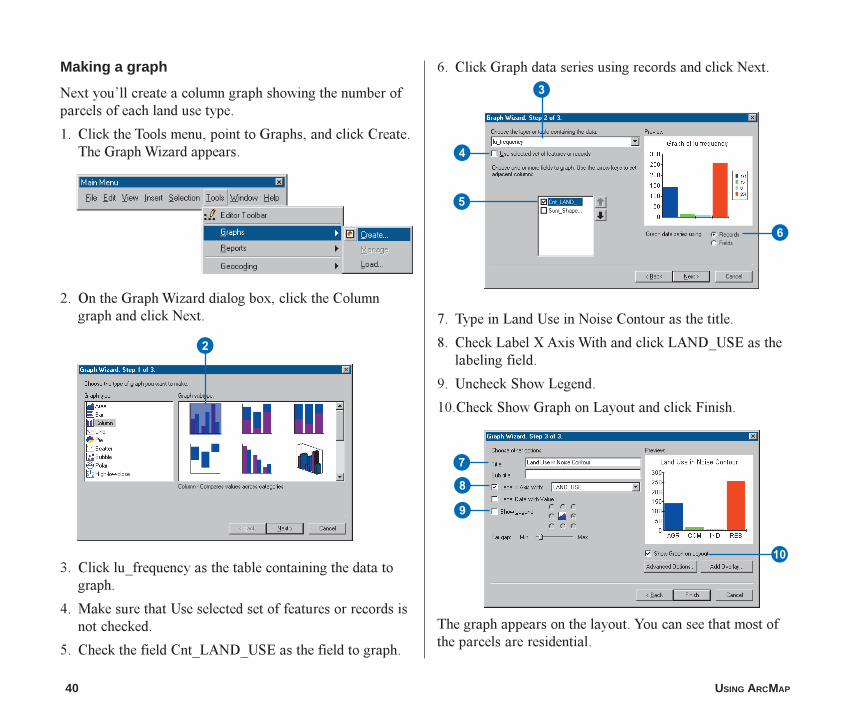
Making a graph
Next you�ll create a column graph showing the number ofparcels of each land use type.
1. Click the Tools menu, point to Graphs, and click Create.The Graph Wizard appears.
2. On the Graph Wizard dialog box, click the Columngraph and click Next.
3. Click lu_frequency as the table containing the data tograph.
4. Make sure that Use selected set of features or records isnot checked.
5. Check the field Cnt_LAND_USE as the field to graph.
6. Click Graph data series using records and click Next.
7. Type in Land Use in Noise Contour as the title.
8. Check Label X Axis With and click LAND_USE as thelabeling field.
9. Uncheck Show Legend.
10.Check Show Graph on Layout and click Finish.
The graph appears on the layout. You can see that most ofthe parcels are residential.
2
7
8
9
Q
3
4
5
6
ch2.p65 12/01/2000, 2:36 PM40
QUICK-START TUTORIAL 41
W
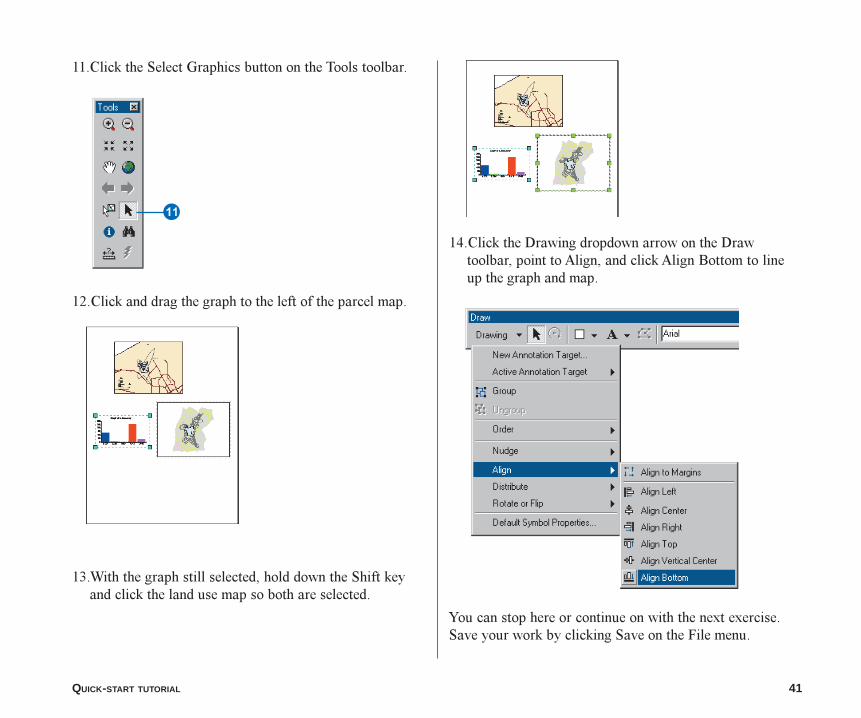
11.Click the Select Graphics button on the Tools toolbar.
12.Click and drag the graph to the left of the parcel map.
13.With the graph still selected, hold down the Shift keyand click the land use map so both are selected.
14.Click the Drawing dropdown arrow on the Drawtoolbar, point to Align, and click Align Bottom to lineup the graph and map.
You can stop here or continue on with the next exercise.Save your work by clicking Save on the File menu.
ch2.p65 12/02/2000, 2:57 PM41
42 USING ARCMAP
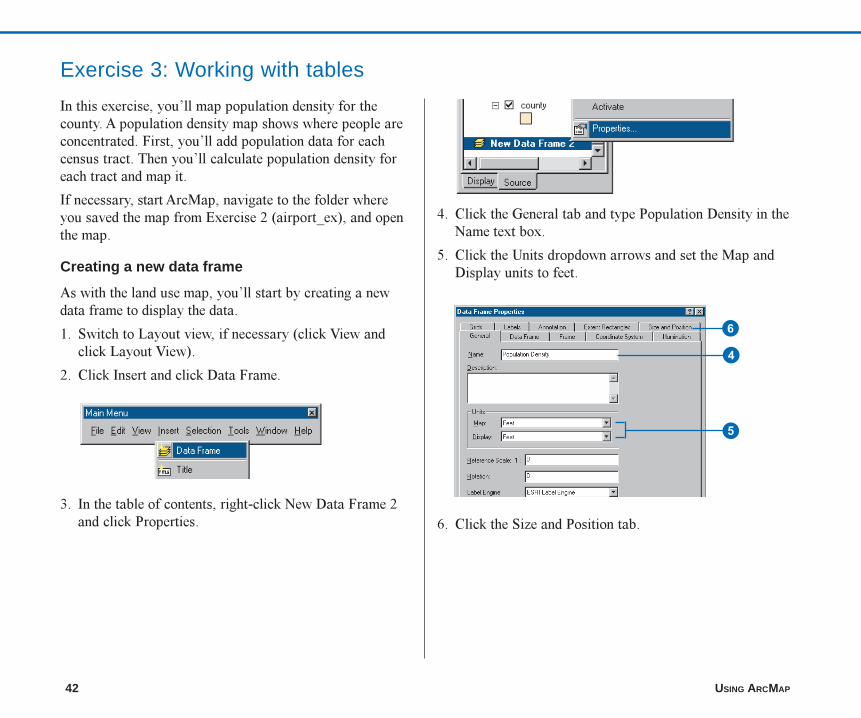
Exercise 3: Working with tables
In this exercise, you�ll map population density for thecounty. A population density map shows where people areconcentrated. First, you�ll add population data for eachcensus tract. Then you�ll calculate population density foreach tract and map it.
If necessary, start ArcMap, navigate to the folder whereyou saved the map from Exercise 2 (airport_ex), and openthe map.
Creating a new data frame
As with the land use map, you�ll start by creating a newdata frame to display the data.
1. Switch to Layout view, if necessary (click View andclick Layout View).
2. Click Insert and click Data Frame.
3. In the table of contents, right-click New Data Frame 2and click Properties.
4. Click the General tab and type Population Density in theName text box.
5. Click the Units dropdown arrows and set the Map andDisplay units to feet.
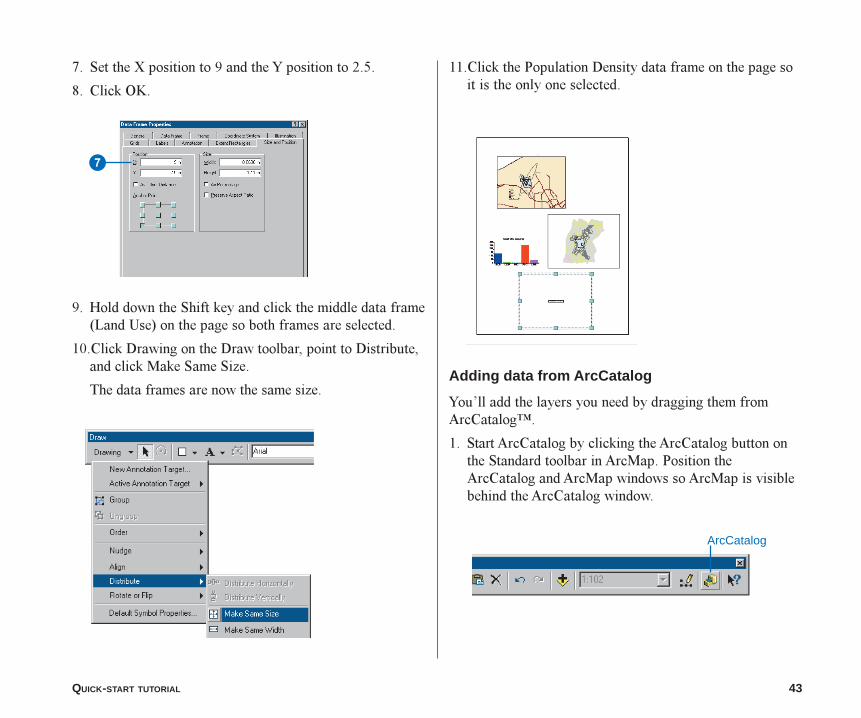
6. Click the Size and Position tab.
4
5
6
ch2.p65 12/02/2000, 2:58 PM42
QUICK-START TUTORIAL 43
7. Set the X position to 9 and the Y position to 2.5.
8. Click OK.
9. Hold down the Shift key and click the middle data frame(Land Use) on the page so both frames are selected.
10.Click Drawing on the Draw toolbar, point to Distribute,and click Make Same Size.
The data frames are now the same size.
11.Click the Population Density data frame on the page soit is the only one selected.
Adding data from ArcCatalog
You�ll add the layers you need by dragging them fromArcCatalog�.
1. Start ArcCatalog by clicking the ArcCatalog button onthe Standard toolbar in ArcMap. Position theArcCatalog and ArcMap windows so ArcMap is visiblebehind the ArcCatalog window.
ArcCatalog
7
ch2.p65 12/02/2000, 2:58 PM43
44 USING ARCMAP
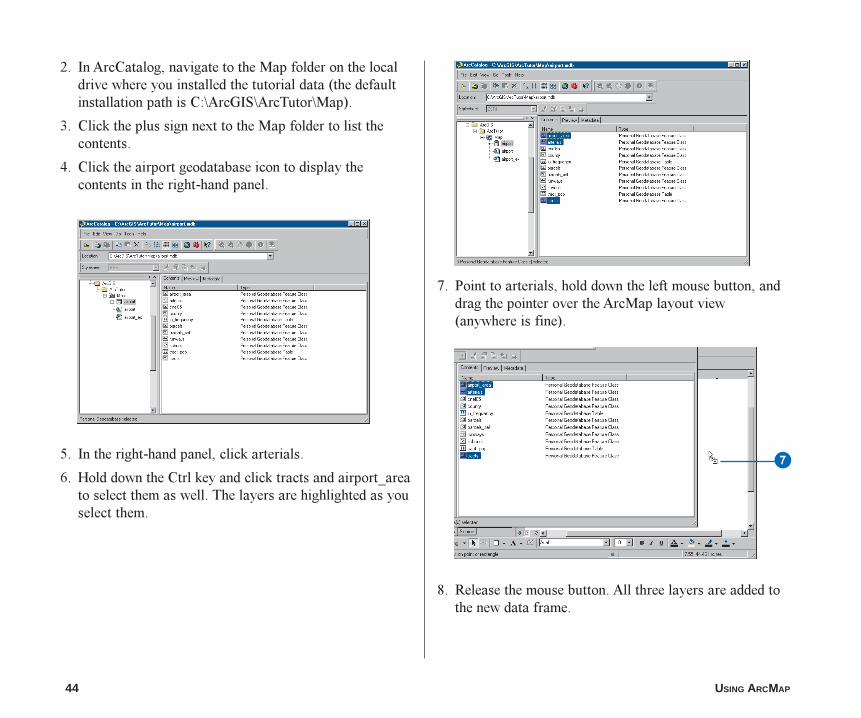
2. In ArcCatalog, navigate to the Map folder on the localdrive where you installed the tutorial data (the defaultinstallation path is C:\ArcGIS\ArcTutor\Map).
3. Click the plus sign next to the Map folder to list thecontents.
4. Click the airport geodatabase icon to display thecontents in the right-hand panel.
5. In the right-hand panel, click arterials.
6. Hold down the Ctrl key and click tracts and airport_areato select them as well. The layers are highlighted as youselect them.
7. Point to arterials, hold down the left mouse button, anddrag the pointer over the ArcMap layout view(anywhere is fine).
8. Release the mouse button. All three layers are added tothe new data frame.
7
ch2.p65 12/02/2000, 2:59 PM44
QUICK-START TUTORIAL 45
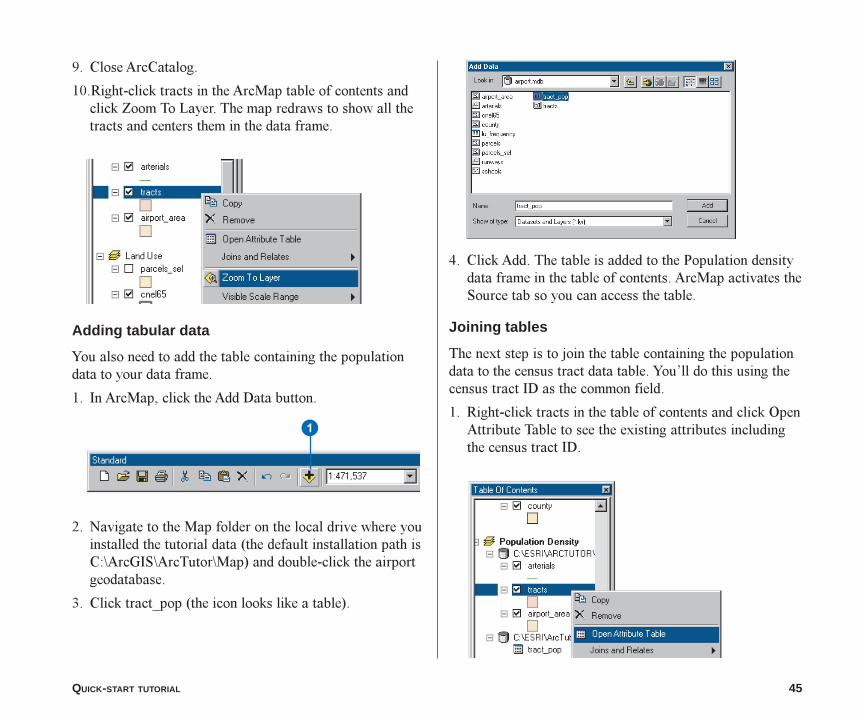
9. Close ArcCatalog.
10.Right-click tracts in the ArcMap table of contents andclick Zoom To Layer. The map redraws to show all thetracts and centers them in the data frame.
Adding tabular data
You also need to add the table containing the populationdata to your data frame.
1. In ArcMap, click the Add Data button.
2. Navigate to the Map folder on the local drive where youinstalled the tutorial data (the default installation path isC:\ArcGIS\ArcTutor\Map) and double-click the airportgeodatabase.
3. Click tract_pop (the icon looks like a table).
4. Click Add. The table is added to the Population densitydata frame in the table of contents. ArcMap activates theSource tab so you can access the table.
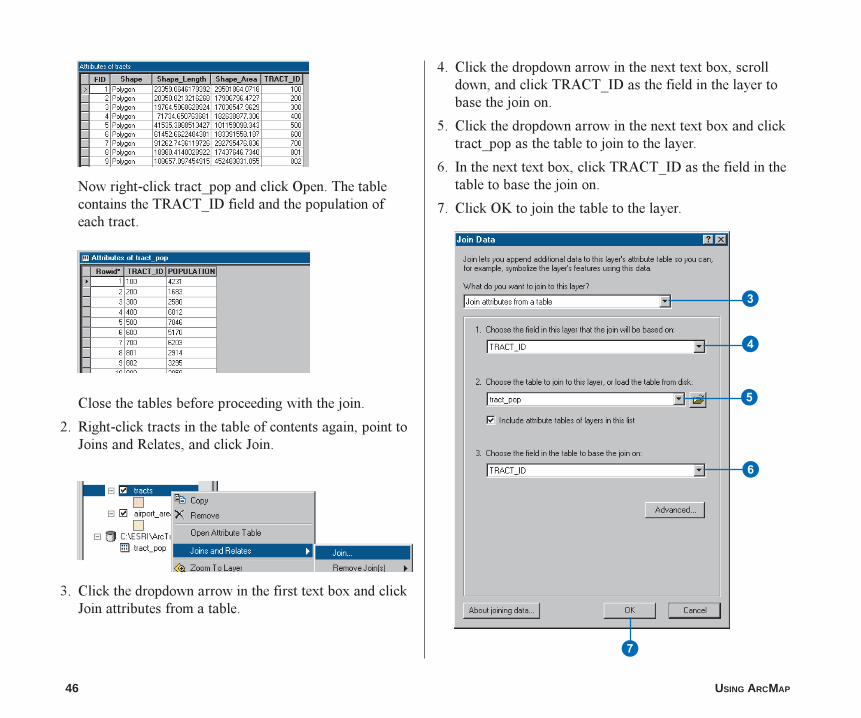
Joining tables
The next step is to join the table containing the populationdata to the census tract data table. You�ll do this using thecensus tract ID as the common field.
1. Right-click tracts in the table of contents and click OpenAttribute Table to see the existing attributes includingthe census tract ID.
1
ch2.p65 12/02/2000, 2:59 PM45
46 USING ARCMAP
Now right-click tract_pop and click Open. The tablecontains the TRACT_ID field and the population ofeach tract.
Close the tables before proceeding with the join.
2. Right-click tracts in the table of contents again, point toJoins and Relates, and click Join.
3. Click the dropdown arrow in the first text box and clickJoin attributes from a table.
3
4
5
6
7
4. Click the dropdown arrow in the next text box, scrolldown, and click TRACT_ID as the field in the layer tobase the join on.
5. Click the dropdown arrow in the next text box and clicktract_pop as the table to join to the layer.
6. In the next text box, click TRACT_ID as the field in thetable to base the join on.
7. Click OK to join the table to the layer.
ch2.p65 12/02/2000, 3:00 PM46
QUICK-START TUTORIAL 47
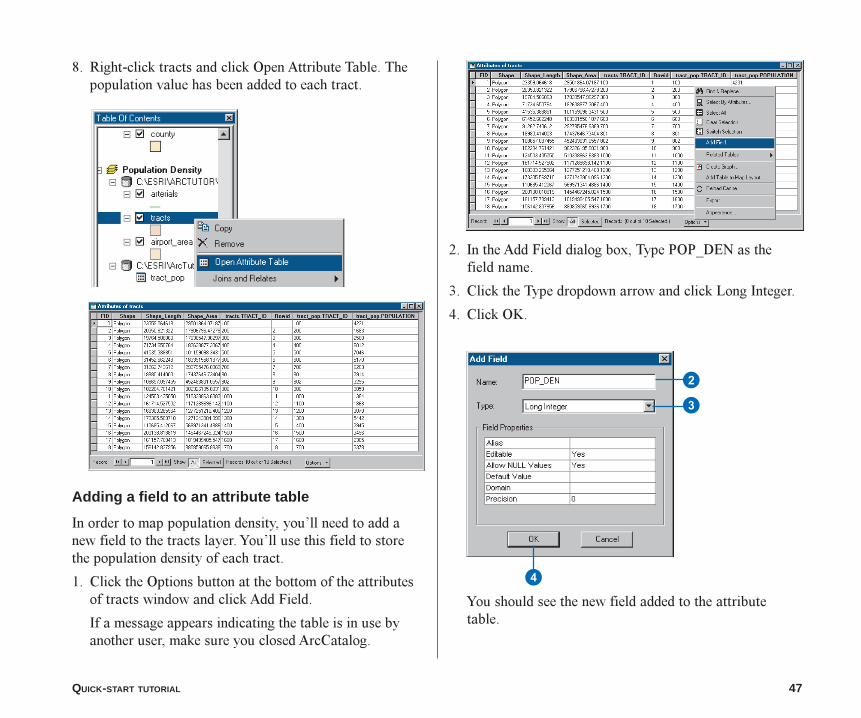
8. Right-click tracts and click Open Attribute Table. Thepopulation value has been added to each tract.
Adding a field to an attribute table
In order to map population density, you�ll need to add anew field to the tracts layer. You�ll use this field to storethe population density of each tract.
1. Click the Options button at the bottom of the attributesof tracts window and click Add Field.
If a message appears indicating the table is in use byanother user, make sure you closed ArcCatalog.
2. In the Add Field dialog box, Type POP_DEN as thefield name.
3. Click the Type dropdown arrow and click Long Integer.
4. Click OK.
You should see the new field added to the attributetable.
2
3
4
ch2.p65 12/02/2000, 3:01 PM47
48 USING ARCMAP
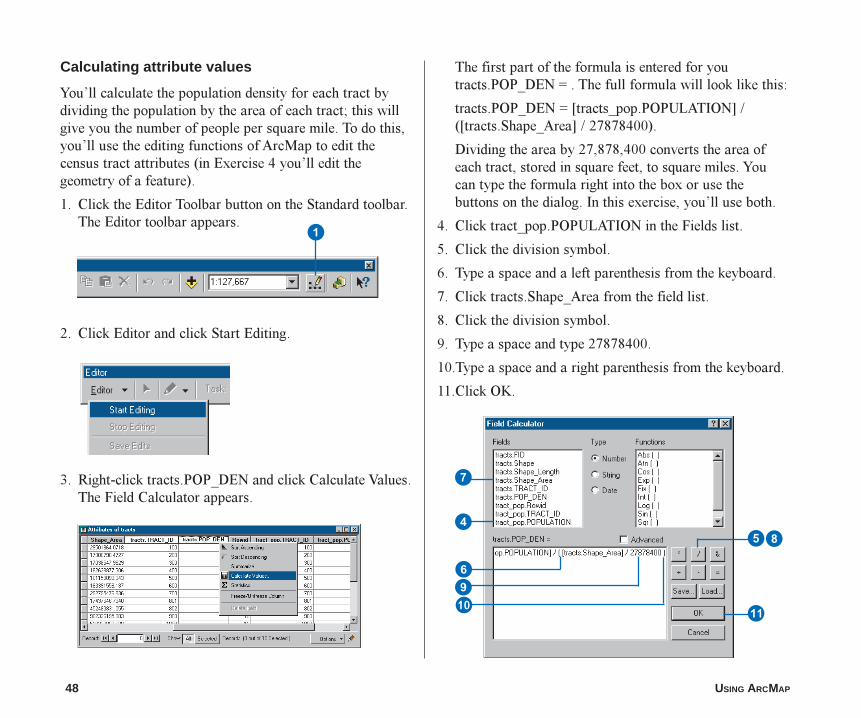
The first part of the formula is entered for youtracts.POP_DEN = . The full formula will look like this:
tracts.POP_DEN = [tracts_pop.POPULATION] /([tracts.Shape_Area] / 27878400).
Dividing the area by 27,878,400 converts the area ofeach tract, stored in square feet, to square miles. Youcan type the formula right into the box or use thebuttons on the dialog. In this exercise, you�ll use both.
4. Click tract_pop.POPULATION in the Fields list.
5. Click the division symbol.
6. Type a space and a left parenthesis from the keyboard.
7. Click tracts.Shape_Area from the field list.
8. Click the division symbol.
9. Type a space and type 27878400.
10.Type a space and a right parenthesis from the keyboard.
11.Click OK.
Calculating attribute values
You�ll calculate the population density for each tract bydividing the population by the area of each tract; this willgive you the number of people per square mile. To do this,you�ll use the editing functions of ArcMap to edit thecensus tract attributes (in Exercise 4 you�ll edit thegeometry of a feature).
1. Click the Editor Toolbar button on the Standard toolbar.The Editor toolbar appears.
2. Click Editor and click Start Editing.
3. Right-click tracts.POP_DEN and click Calculate Values.The Field Calculator appears.
1
W
7
4
69Q
58
ch2.p65 12/02/2000, 3:01 PM48
QUICK-START TUTORIAL 49
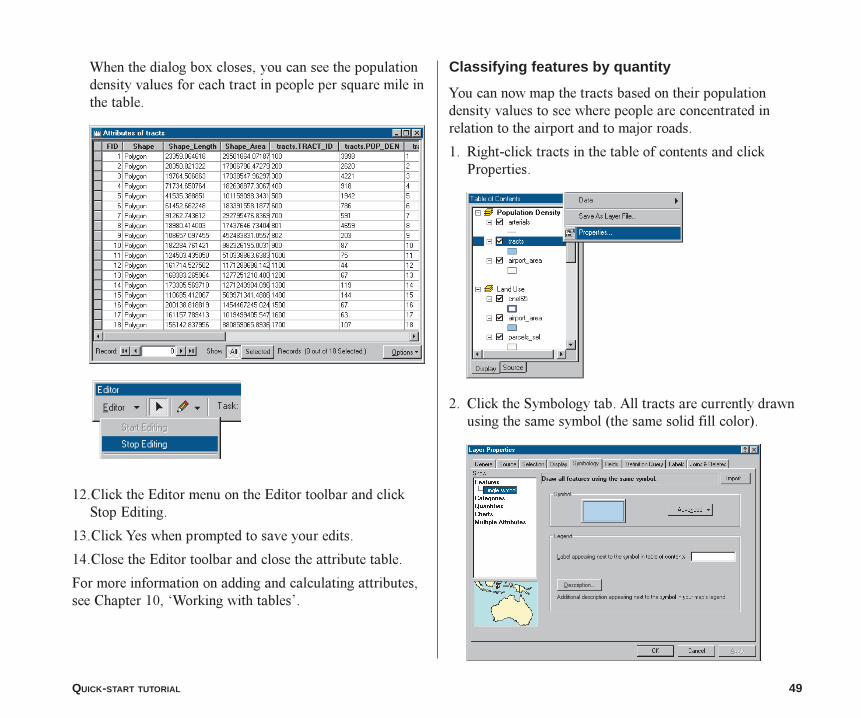
When the dialog box closes, you can see the populationdensity values for each tract in people per square mile inthe table.
12.Click the Editor menu on the Editor toolbar and clickStop Editing.
13.Click Yes when prompted to save your edits.
14.Close the Editor toolbar and close the attribute table.
For more information on adding and calculating attributes,see Chapter 10, �Working with tables�.
Classifying features by quantity
You can now map the tracts based on their populationdensity values to see where people are concentrated inrelation to the airport and to major roads.
1. Right-click tracts in the table of contents and clickProperties.
2. Click the Symbology tab. All tracts are currently drawnusing the same symbol (the same solid fill color).
ch2.p65 12/02/2000, 3:01 PM49
50 USING ARCMAP
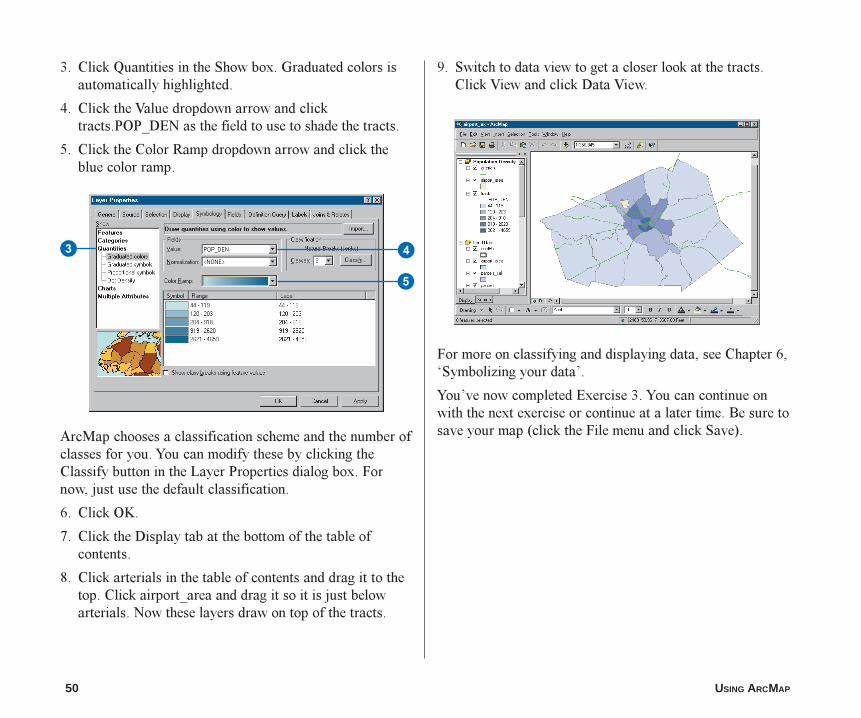
3. Click Quantities in the Show box. Graduated colors isautomatically highlighted.
4. Click the Value dropdown arrow and clicktracts.POP_DEN as the field to use to shade the tracts.
5. Click the Color Ramp dropdown arrow and click theblue color ramp.
ArcMap chooses a classification scheme and the number ofclasses for you. You can modify these by clicking theClassify button in the Layer Properties dialog box. Fornow, just use the default classification.
6. Click OK.
7. Click the Display tab at the bottom of the table ofcontents.
8. Click arterials in the table of contents and drag it to thetop. Click airport_area and drag it so it is just belowarterials. Now these layers draw on top of the tracts.
43
5
9. Switch to data view to get a closer look at the tracts.Click View and click Data View.
For more on classifying and displaying data, see Chapter 6,�Symbolizing your data�.
You�ve now completed Exercise 3. You can continue onwith the next exercise or continue at a later time. Be sure tosave your map (click the File menu and click Save).
ch2.p65 12/02/2000, 3:02 PM50
QUICK-START TUTORIAL 51
Exercise 4: Editing features
You can use ArcMap to edit your data as well as createmaps. In this exercise you�ll extend the airport road tocreate a new loop road joining up with an existing arterialroad. This exercise is a very brief introduction to editing,which is covered in much more detail in Editing inArcMap.
If necessary, start ArcMap, navigate to the folder whereyou saved the map from Exercise 3 (airport_ex), and openthe map.
Exporting data
You�ll be working with the schools data frame. First, makea copy of the arterials data. That way, in case you need to,you can start over again with the original data.
1. Switch to Data view (click the View menu and clickData view).
2. Right-click the Schools data frame in the table ofcontents and click Activate.
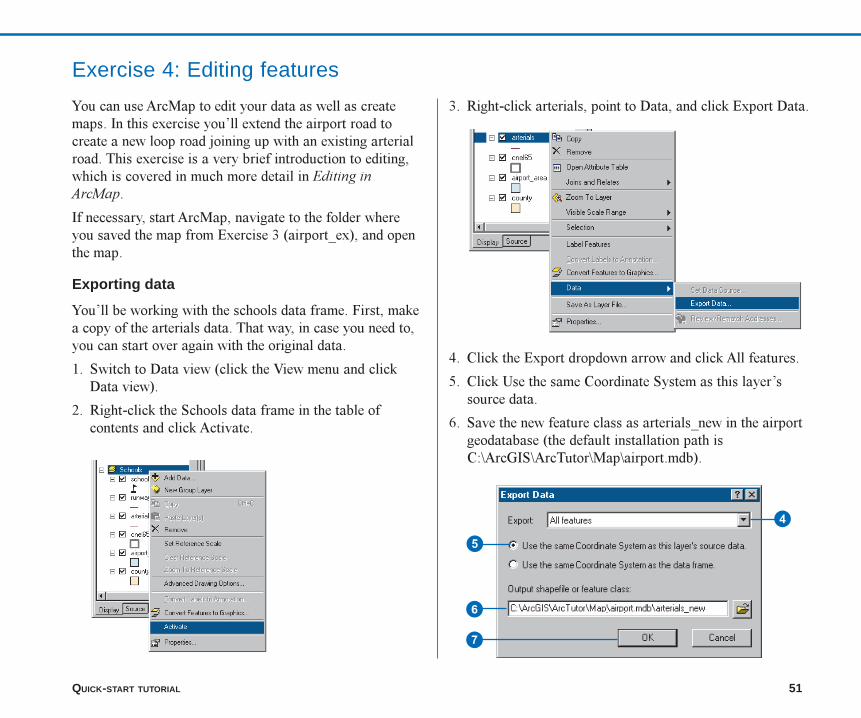
3. Right-click arterials, point to Data, and click Export Data.
4. Click the Export dropdown arrow and click All features.
5. Click Use the same Coordinate System as this layer�ssource data.
6. Save the new feature class as arterials_new in the airportgeodatabase (the default installation path isC:\ArcGIS\ArcTutor\Map\airport.mdb).
4
5
7
6
ch2.p65 12/02/2000, 3:02 PM51
52 USING ARCMAP
7. Click OK to export the data.
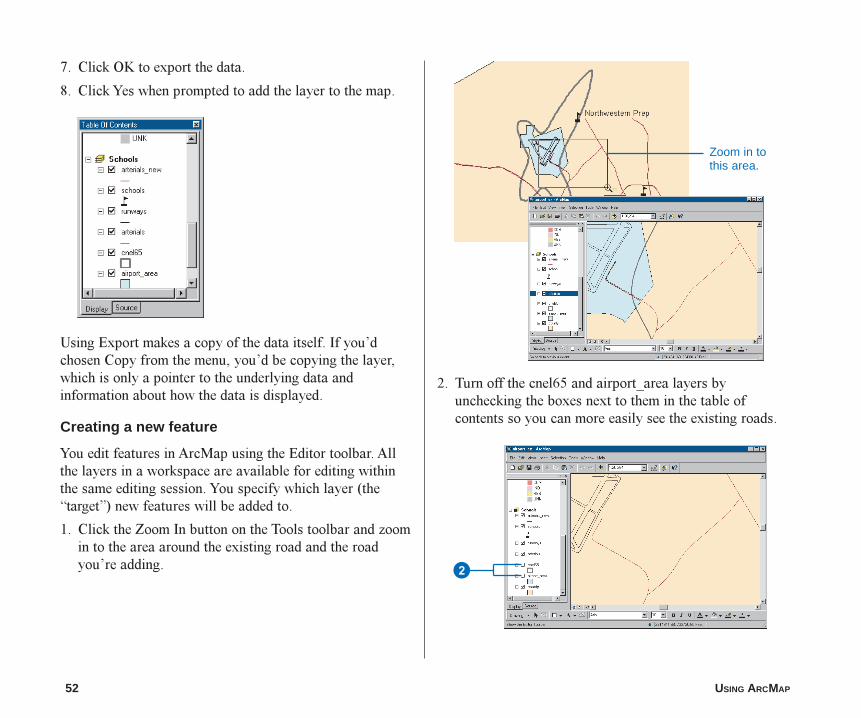
8. Click Yes when prompted to add the layer to the map.
Using Export makes a copy of the data itself. If you�dchosen Copy from the menu, you�d be copying the layer,which is only a pointer to the underlying data andinformation about how the data is displayed.
Creating a new feature
You edit features in ArcMap using the Editor toolbar. Allthe layers in a workspace are available for editing withinthe same editing session. You specify which layer (the�target�) new features will be added to.
1. Click the Zoom In button on the Tools toolbar and zoomin to the area around the existing road and the roadyou�re adding.
2. Turn off the cnel65 and airport_area layers byunchecking the boxes next to them in the table ofcontents so you can more easily see the existing roads.
2
Zoom in tothis area.
ch2.p65 12/02/2000, 3:03 PM52
QUICK-START TUTORIAL 53
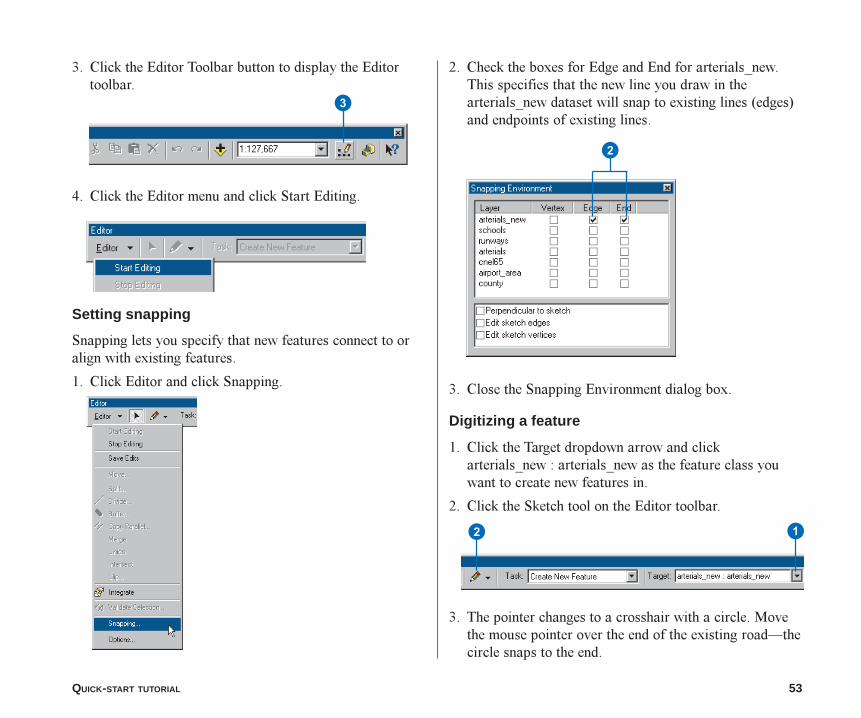
2. Check the boxes for Edge and End for arterials_new.This specifies that the new line you draw in thearterials_new dataset will snap to existing lines (edges)and endpoints of existing lines.
3. Close the Snapping Environment dialog box.
Digitizing a feature
1. Click the Target dropdown arrow and clickarterials_new : arterials_new as the feature class youwant to create new features in.
2. Click the Sketch tool on the Editor toolbar.
3. The pointer changes to a crosshair with a circle. Movethe mouse pointer over the end of the existing road�thecircle snaps to the end.
3. Click the Editor Toolbar button to display the Editortoolbar.
4. Click the Editor menu and click Start Editing.
Setting snapping
Snapping lets you specify that new features connect to oralign with existing features.
1. Click Editor and click Snapping.
3
2
12
ch2.p65 12/02/2000, 3:03 PM53
54 USING ARCMAP
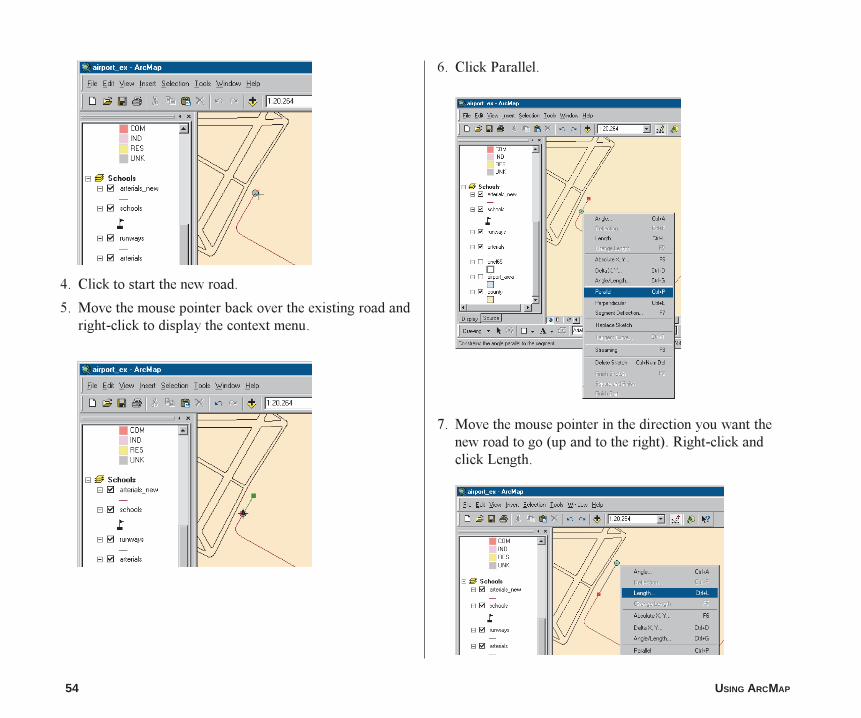
4. Click to start the new road.
5. Move the mouse pointer back over the existing road andright-click to display the context menu.
6. Click Parallel.
7. Move the mouse pointer in the direction you want thenew road to go (up and to the right). Right-click andclick Length.
ch2.p65 12/02/2000, 3:04 PM54
QUICK-START TUTORIAL 55
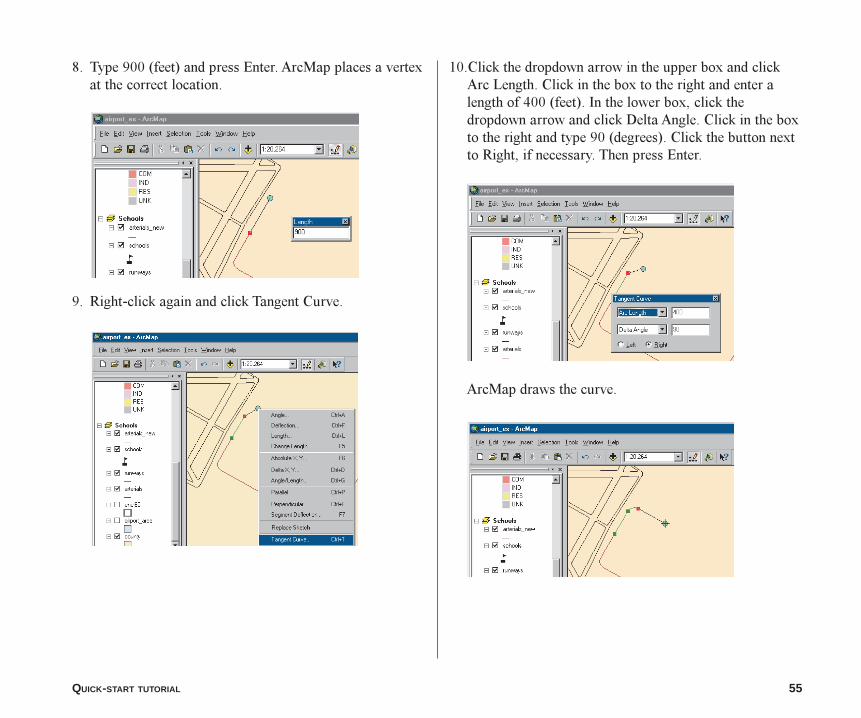
8. Type 900 (feet) and press Enter. ArcMap places a vertexat the correct location.
9. Right-click again and click Tangent Curve.
10.Click the dropdown arrow in the upper box and clickArc Length. Click in the box to the right and enter alength of 400 (feet). In the lower box, click thedropdown arrow and click Delta Angle. Click in the boxto the right and type 90 (degrees). Click the button nextto Right, if necessary. Then press Enter.
ArcMap draws the curve.
ch2.p65 12/02/2000, 3:05 PM55
56 USING ARCMAP
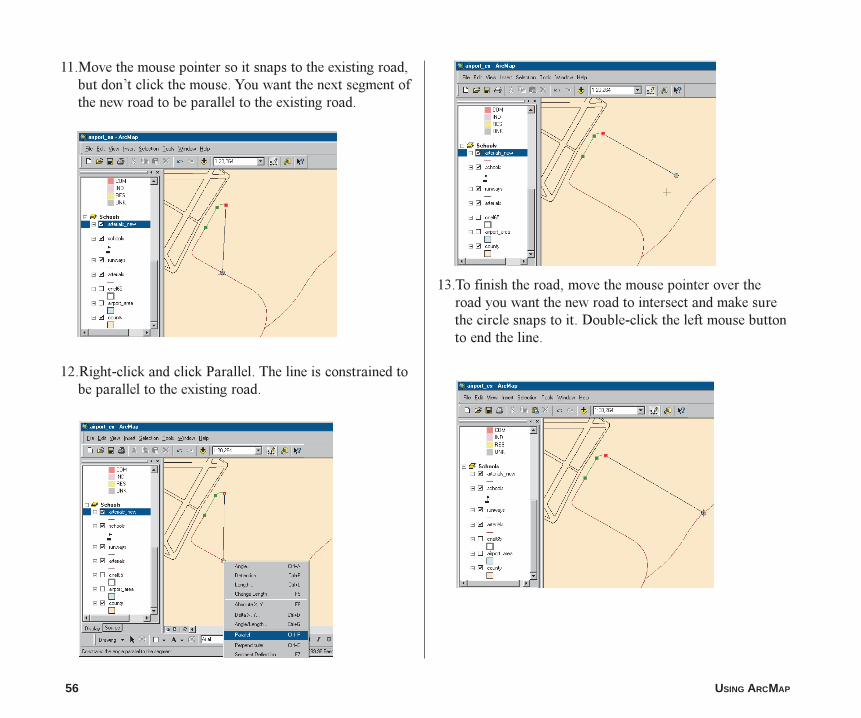
11.Move the mouse pointer so it snaps to the existing road,but don�t click the mouse. You want the next segment ofthe new road to be parallel to the existing road.
12.Right-click and click Parallel. The line is constrained tobe parallel to the existing road.
13.To finish the road, move the mouse pointer over theroad you want the new road to intersect and make surethe circle snaps to it. Double-click the left mouse buttonto end the line.
ch2.p65 12/02/2000, 3:06 PM56
QUICK-START TUTORIAL 57
2
1
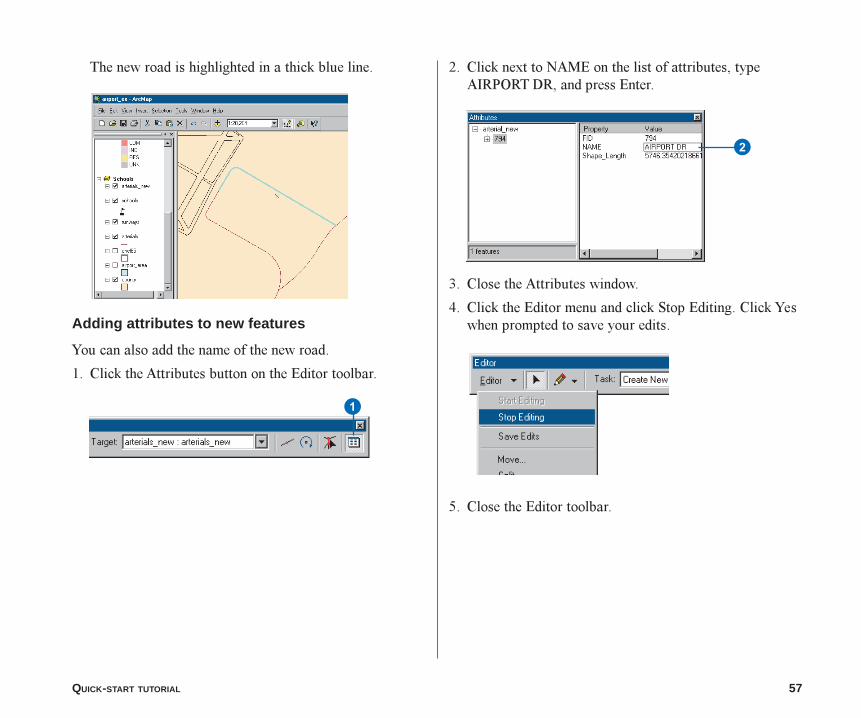
The new road is highlighted in a thick blue line.
Adding attributes to new features
You can also add the name of the new road.
1. Click the Attributes button on the Editor toolbar.
2. Click next to NAME on the list of attributes, typeAIRPORT DR, and press Enter.
3. Close the Attributes window.
4. Click the Editor menu and click Stop Editing. Click Yeswhen prompted to save your edits.
5. Close the Editor toolbar.
ch2.p65 12/02/2000, 3:06 PM57
58 USING ARCMAP
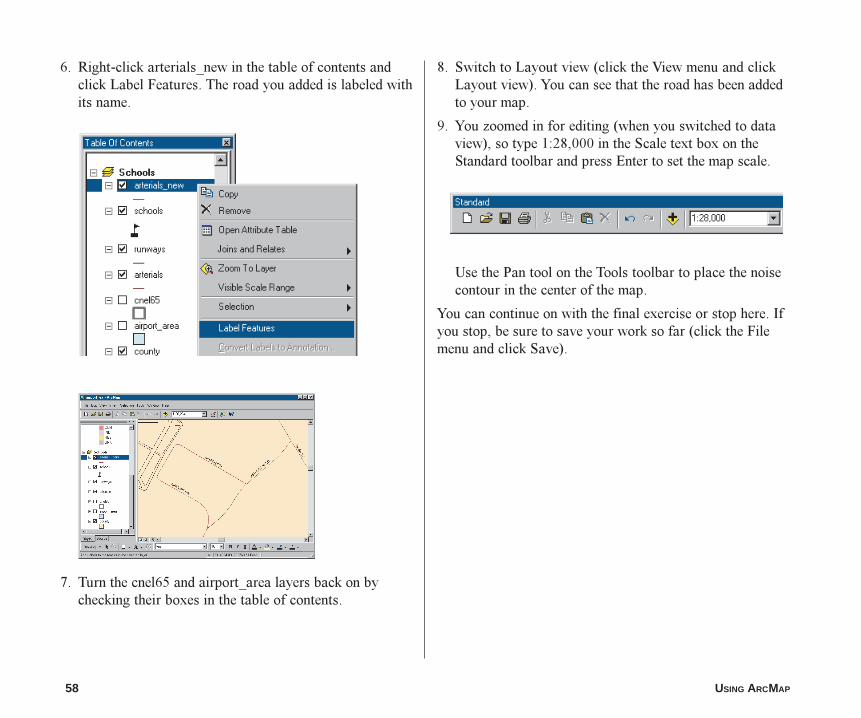
6. Right-click arterials_new in the table of contents andclick Label Features. The road you added is labeled withits name.
7. Turn the cnel65 and airport_area layers back on bychecking their boxes in the table of contents.
8. Switch to Layout view (click the View menu and clickLayout view). You can see that the road has been addedto your map.
9. You zoomed in for editing (when you switched to dataview), so type 1:28,000 in the Scale text box on theStandard toolbar and press Enter to set the map scale.
Use the Pan tool on the Tools toolbar to place the noisecontour in the center of the map.
You can continue on with the final exercise or stop here. Ifyou stop, be sure to save your work so far (click the Filemenu and click Save).
ch2.p65 12/02/2000, 3:07 PM58
QUICK-START TUTORIAL 59
Exercise 5: Working with map elements
In this exercise, you�ll add additional map elements tocomplete your poster and print it.
If necessary, start ArcMap, navigate to the folder whereyou saved the map from Exercise 4 (airport_ex), and openthe map.
Adding a background, titles, legends, and scalebars
1. Switch to Layout view, if necessary (click View andclick Layout view).
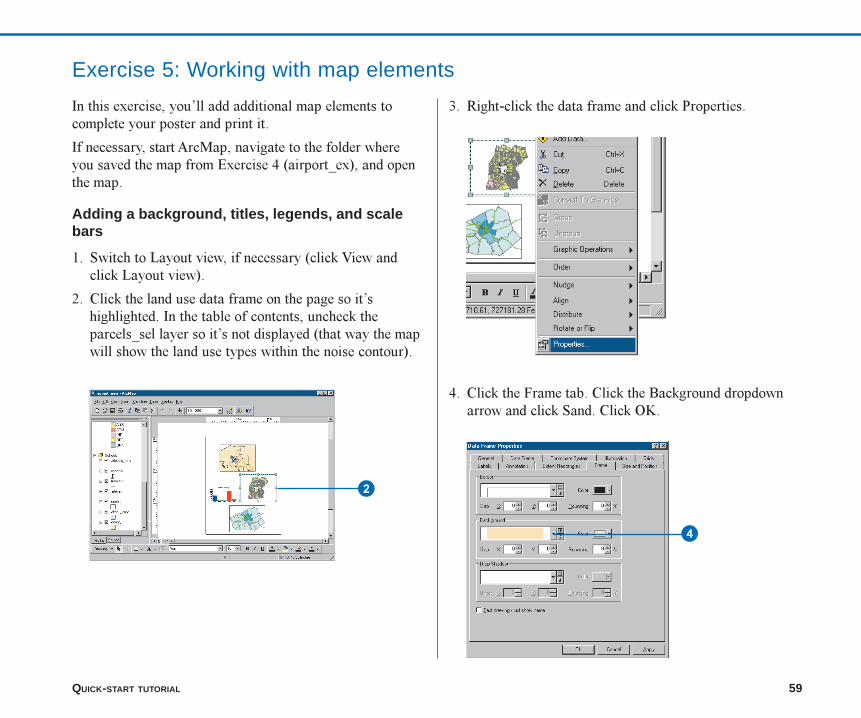
2. Click the land use data frame on the page so it�shighlighted. In the table of contents, uncheck theparcels_sel layer so it�s not displayed (that way the mapwill show the land use types within the noise contour).
4. Click the Frame tab. Click the Background dropdownarrow and click Sand. Click OK.
3. Right-click the data frame and click Properties.
2
4
ch2.p65 12/02/2000, 3:08 PM59
60 USING ARCMAP
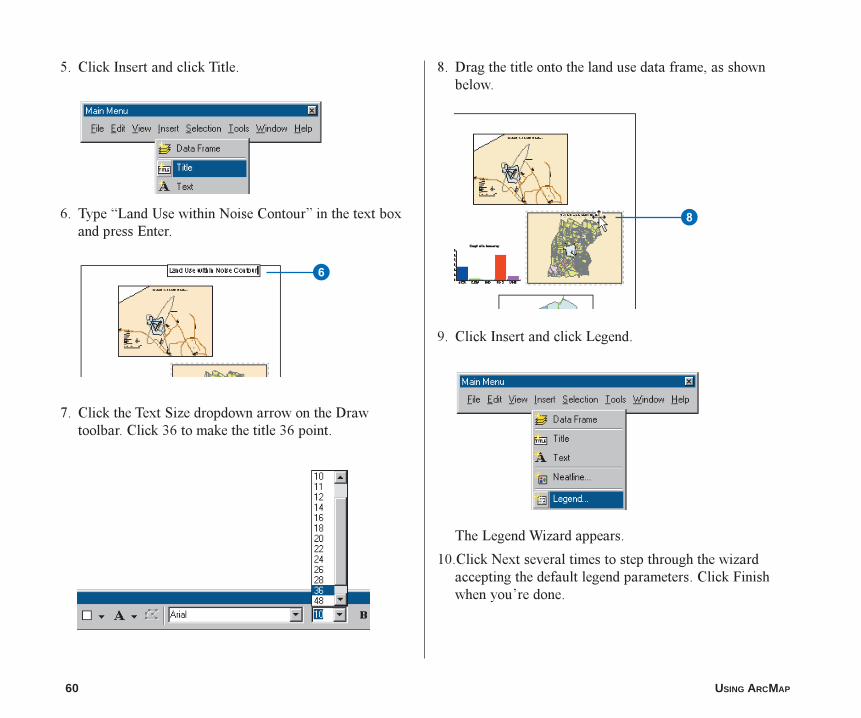
8. Drag the title onto the land use data frame, as shownbelow.
9. Click Insert and click Legend.
The Legend Wizard appears.
10.Click Next several times to step through the wizardaccepting the default legend parameters. Click Finishwhen you�re done.
5. Click Insert and click Title.
6. Type �Land Use within Noise Contour� in the text boxand press Enter.
7. Click the Text Size dropdown arrow on the Drawtoolbar. Click 36 to make the title 36 point.
6
8
ch2.p65 12/02/2000, 3:08 PM60
QUICK-START TUTORIAL 61
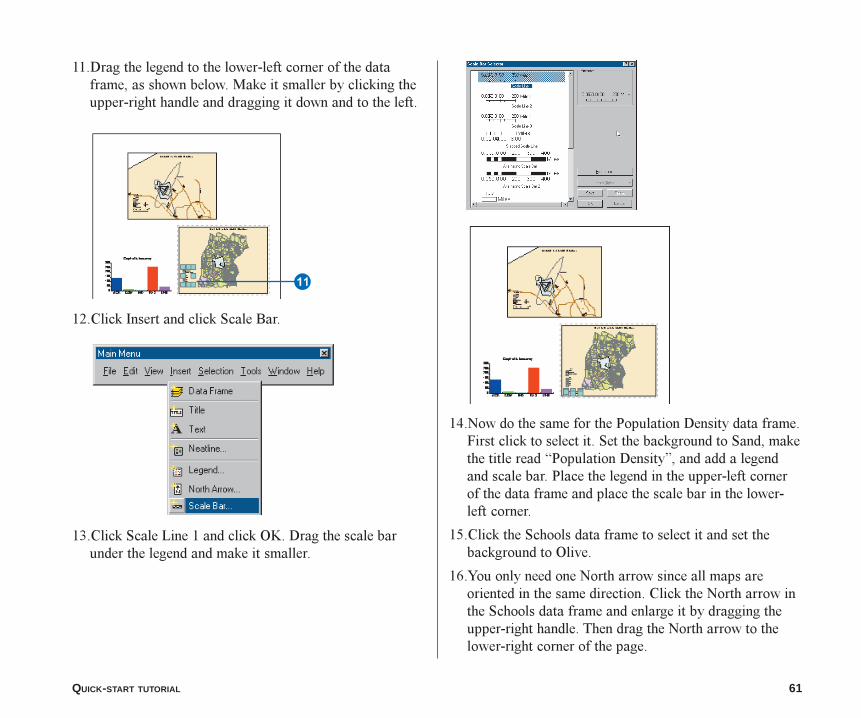
11.Drag the legend to the lower-left corner of the dataframe, as shown below. Make it smaller by clicking theupper-right handle and dragging it down and to the left.
12.Click Insert and click Scale Bar.
13.Click Scale Line 1 and click OK. Drag the scale barunder the legend and make it smaller.
14.Now do the same for the Population Density data frame.First click to select it. Set the background to Sand, makethe title read �Population Density�, and add a legendand scale bar. Place the legend in the upper-left cornerof the data frame and place the scale bar in the lower-left corner.
15.Click the Schools data frame to select it and set thebackground to Olive.
16.You only need one North arrow since all maps areoriented in the same direction. Click the North arrow inthe Schools data frame and enlarge it by dragging theupper-right handle. Then drag the North arrow to thelower-right corner of the page.
W
ch2.p65 12/02/2000, 3:09 PM61
62 USING ARCMAP
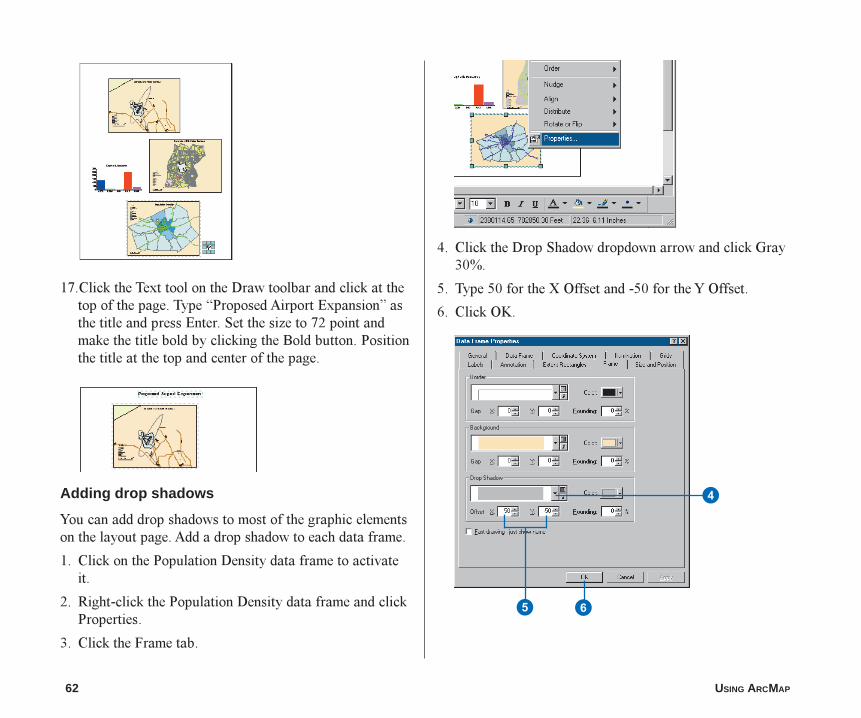
17.Click the Text tool on the Draw toolbar and click at thetop of the page. Type �Proposed Airport Expansion� asthe title and press Enter. Set the size to 72 point andmake the title bold by clicking the Bold button. Positionthe title at the top and center of the page.
Adding drop shadows
You can add drop shadows to most of the graphic elementson the layout page. Add a drop shadow to each data frame.
1. Click on the Population Density data frame to activateit.
2. Right-click the Population Density data frame and clickProperties.
3. Click the Frame tab.
4. Click the Drop Shadow dropdown arrow and click Gray30%.
5. Type 50 for the X Offset and -50 for the Y Offset.
6. Click OK.
4
5 6
ch2.p65 12/02/2000, 3:10 PM62
QUICK-START TUTORIAL 63
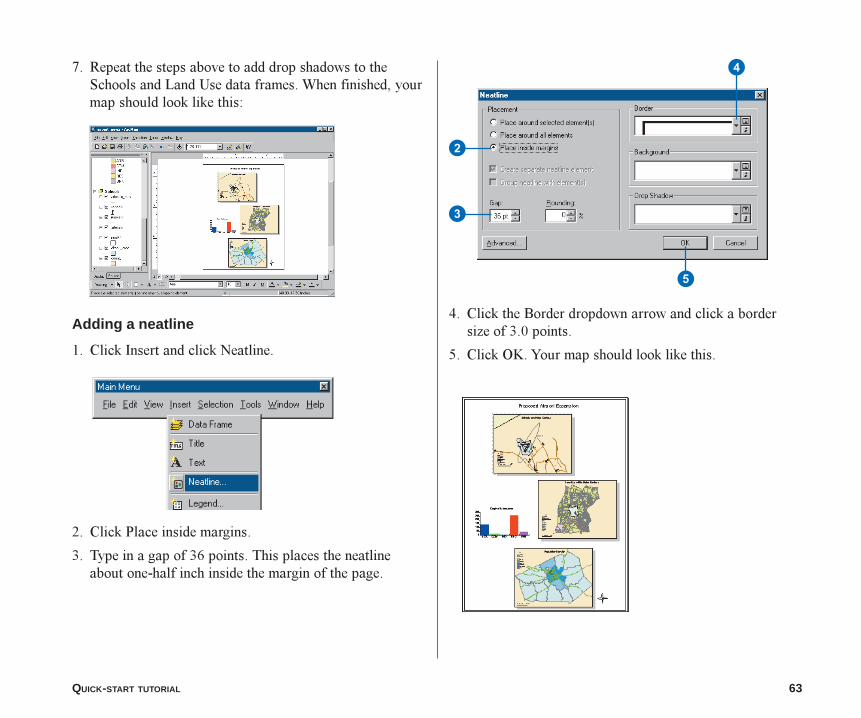
7. Repeat the steps above to add drop shadows to theSchools and Land Use data frames. When finished, yourmap should look like this:
Adding a neatline
1. Click Insert and click Neatline.
2. Click Place inside margins.
3. Type in a gap of 36 points. This places the neatlineabout one-half inch inside the margin of the page.
4. Click the Border dropdown arrow and click a bordersize of 3.0 points.
5. Click OK. Your map should look like this.
4
2
3
5
ch2.p65 12/02/2000, 3:10 PM63
64 USING ARCMAP
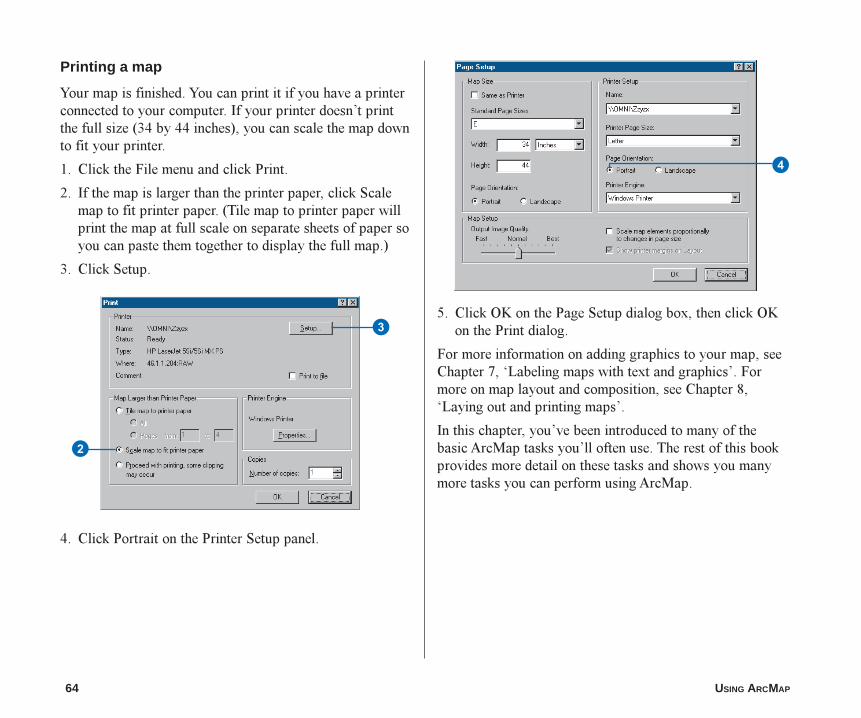
Printing a map
Your map is finished. You can print it if you have a printerconnected to your computer. If your printer doesn�t printthe full size (34 by 44 inches), you can scale the map downto fit your printer.
1. Click the File menu and click Print.
2. If the map is larger than the printer paper, click Scalemap to fit printer paper. (Tile map to printer paper willprint the map at full scale on separate sheets of paper soyou can paste them together to display the full map.)
3. Click Setup.
4. Click Portrait on the Printer Setup panel.
4
2
35. Click OK on the Page Setup dialog box, then click OK
on the Print dialog.
For more information on adding graphics to your map, seeChapter 7, �Labeling maps with text and graphics�. Formore on map layout and composition, see Chapter 8,�Laying out and printing maps�.
In this chapter, you�ve been introduced to many of thebasic ArcMap tasks you�ll often use. The rest of this bookprovides more detail on these tasks and shows you manymore tasks you can perform using ArcMap.
ch2.p65 12/02/2000, 3:11 PM64
IN THIS CHAPTER
65
ArcMap basics 3• Layers, data frames, and the table
of contents
• Starting ArcMap
• The ArcMap window
• Opening a map
• Using the table of contents
• Looking at a map in data view andlayout view
• Moving around the map
• Setting bookmarks
• Opening magnifier and overviewwindows
• Exploring data on a map
• Getting help
• Saving a map and exitingArcMap
A map is the fundamental component you work with in ArcMap. Maps helpyou visualize geographic data by showing you where things are, telling youwhat they are, and helping you understand why they are that way.
Maps serve a variety of purposes. Some maps are interactive and meant to bebrowsed online, while others are formatted for printing or embedding inanother application such as a word processor. Every map can have a uniquelook�including both its graphic layout and interface�tailored to those whowill ultimately use the map.
Maps are documents stored on disk and managed with ArcCatalog. ThroughArcCatalog, you can find the map you want to work with and open it inArcMap. Once your map is open, you might browse its contents, edit thegeographic data it contains, or prepare it for printing by arranging mapelements, such as titles, North arrows, legends, and scale bars, around thedata in a visually pleasing manner. When you�re through working with themap, you can save the document.
Whether you�re building a map or just looking at one, you can make it showexactly what you want. For instance, you can choose what geographic datayou want to see, focus on a particular geographic area and display it at aspecific scale, and query features to find out about them and explore theirrelationship to other features. When you�re finished, you can give the map tosomeone else to look at.
ch3.p65 12/02/2000, 2:43 PM65
66 USING ARCMAP
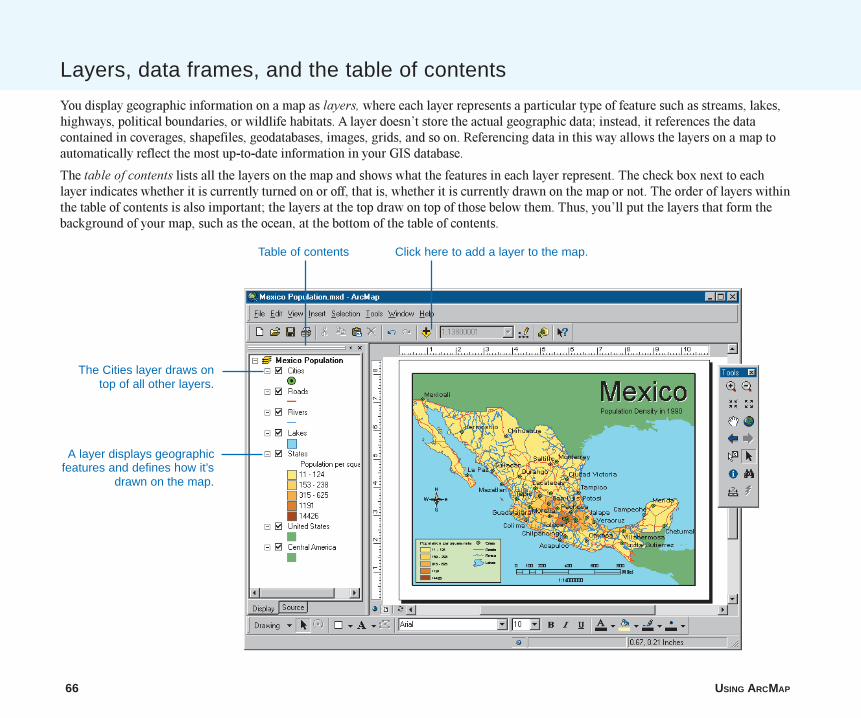
You display geographic information on a map as layers, where each layer represents a particular type of feature such as streams, lakes,highways, political boundaries, or wildlife habitats. A layer doesn�t store the actual geographic data; instead, it references the datacontained in coverages, shapefiles, geodatabases, images, grids, and so on. Referencing data in this way allows the layers on a map toautomatically reflect the most up-to-date information in your GIS database.
The table of contents lists all the layers on the map and shows what the features in each layer represent. The check box next to eachlayer indicates whether it is currently turned on or off, that is, whether it is currently drawn on the map or not. The order of layers withinthe table of contents is also important; the layers at the top draw on top of those below them. Thus, you�ll put the layers that form thebackground of your map, such as the ocean, at the bottom of the table of contents.
Layers, data frames, and the table of contents
Table of contents
A layer displays geographicfeatures and defines how it’s
drawn on the map.
Click here to add a layer to the map.
The Cities layer draws ontop of all other layers.
ch3.p65 12/02/2000, 2:44 PM66
ARCMAP BASICS 67
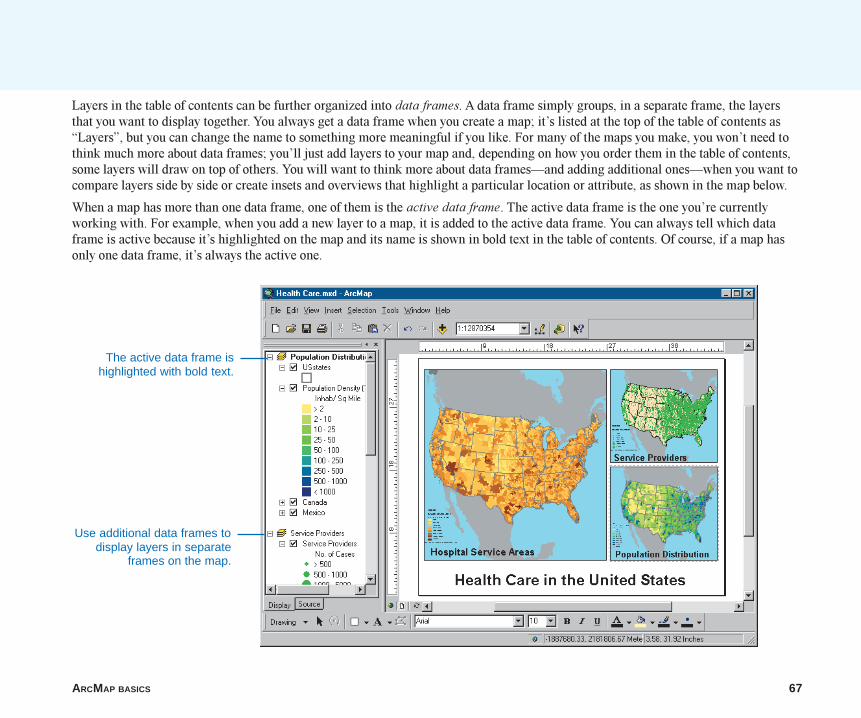
Layers in the table of contents can be further organized into data frames. A data frame simply groups, in a separate frame, the layersthat you want to display together. You always get a data frame when you create a map; it�s listed at the top of the table of contents as�Layers�, but you can change the name to something more meaningful if you like. For many of the maps you make, you won�t need tothink much more about data frames; you�ll just add layers to your map and, depending on how you order them in the table of contents,some layers will draw on top of others. You will want to think more about data frames�and adding additional ones�when you want tocompare layers side by side or create insets and overviews that highlight a particular location or attribute, as shown in the map below.
When a map has more than one data frame, one of them is the active data frame. The active data frame is the one you�re currentlyworking with. For example, when you add a new layer to a map, it is added to the active data frame. You can always tell which dataframe is active because it�s highlighted on the map and its name is shown in bold text in the table of contents. Of course, if a map hasonly one data frame, it�s always the active one.
The active data frame ishighlighted with bold text.
Use additional data frames todisplay layers in separate
frames on the map.
ch3.p65 12/02/2000, 2:44 PM67
68 USING ARCMAP
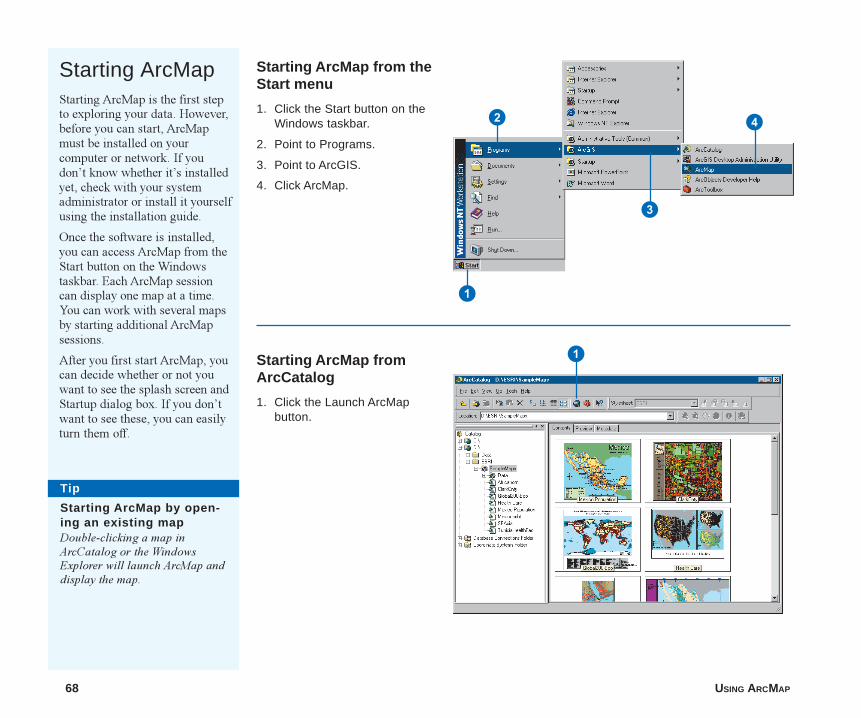
Starting ArcMapStarting ArcMap is the first stepto exploring your data. However,before you can start, ArcMapmust be installed on yourcomputer or network. If youdon�t know whether it�s installedyet, check with your systemadministrator or install it yourselfusing the installation guide.
Once the software is installed,you can access ArcMap from theStart button on the Windowstaskbar. Each ArcMap sessioncan display one map at a time.You can work with several mapsby starting additional ArcMapsessions.
After you first start ArcMap, youcan decide whether or not youwant to see the splash screen andStartup dialog box. If you don�twant to see these, you can easilyturn them off.
Tip
Starting ArcMap by open-ing an existing mapDouble-clicking a map inArcCatalog or the WindowsExplorer will launch ArcMap anddisplay the map.
Starting ArcMap from theStart menu
1. Click the Start button on theWindows taskbar.
2. Point to Programs.
3. Point to ArcGIS.
4. Click ArcMap.
Starting ArcMap fromArcCatalog
1. Click the Launch ArcMapbutton.
1
2
3
4
1
ch3.p65 12/02/2000, 2:44 PM68
ARCMAP BASICS 69
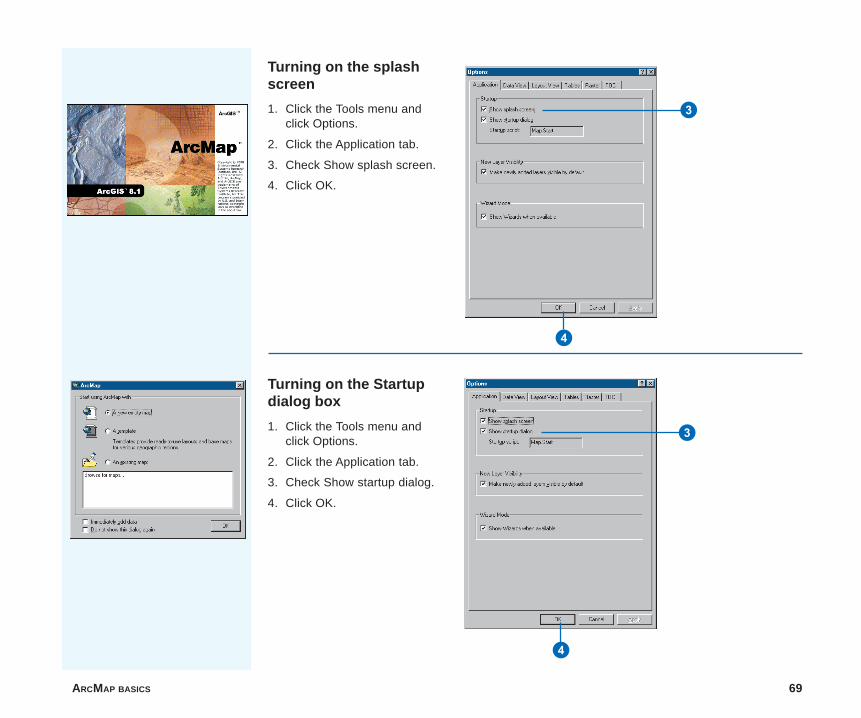
Turning on the splashscreen
1. Click the Tools menu andclick Options.
2. Click the Application tab.
3. Check Show splash screen.
4. Click OK.
Turning on the Startupdialog box
1. Click the Tools menu andclick Options.
2. Click the Application tab.
3. Check Show startup dialog.
4. Click OK.
3
3
4
4
ch3.p65 12/02/2000, 2:45 PM69
70 USING ARCMAP
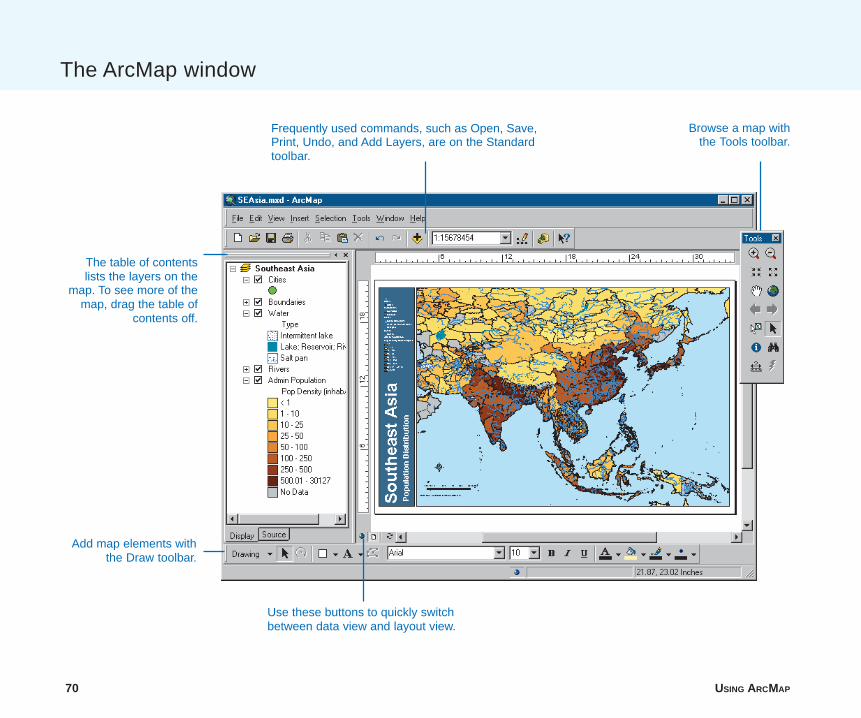
The ArcMap window
Browse a map withthe Tools toolbar.
Frequently used commands, such as Open, Save,Print, Undo, and Add Layers, are on the Standardtoolbar.
Use these buttons to quickly switchbetween data view and layout view.
The table of contentslists the layers on the
map. To see more of themap, drag the table of
contents off.
Add map elements withthe Draw toolbar.
ch3.p65 12/02/2000, 2:45 PM70
ARCMAP BASICS 71
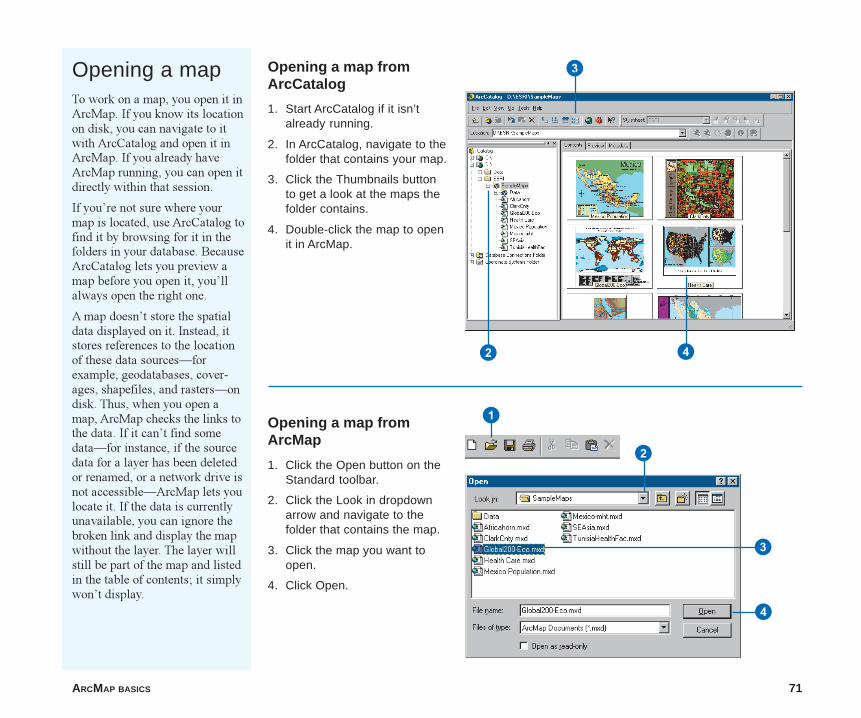
Opening a mapTo work on a map, you open it inArcMap. If you know its locationon disk, you can navigate to itwith ArcCatalog and open it inArcMap. If you already haveArcMap running, you can open itdirectly within that session.
If you�re not sure where yourmap is located, use ArcCatalog tofind it by browsing for it in thefolders in your database. BecauseArcCatalog lets you preview amap before you open it, you�llalways open the right one.
A map doesn�t store the spatialdata displayed on it. Instead, itstores references to the locationof these data sources�forexample, geodatabases, cover-ages, shapefiles, and rasters�ondisk. Thus, when you open amap, ArcMap checks the links tothe data. If it can�t find somedata�for instance, if the sourcedata for a layer has been deletedor renamed, or a network drive isnot accessible�ArcMap lets youlocate it. If the data is currentlyunavailable, you can ignore thebroken link and display the mapwithout the layer. The layer willstill be part of the map and listedin the table of contents; it simplywon�t display.
Opening a map fromArcCatalog
1. Start ArcCatalog if it isn’talready running.
2. In ArcCatalog, navigate to thefolder that contains your map.
3. Click the Thumbnails buttonto get a look at the maps thefolder contains.
4. Double-click the map to openit in ArcMap.
4
Opening a map fromArcMap
1. Click the Open button on theStandard toolbar.
2. Click the Look in dropdownarrow and navigate to thefolder that contains the map.
3. Click the map you want toopen.
4. Click Open.
2
3
3
4
1
2
ch3.p65 12/02/2000, 2:46 PM71
72 USING ARCMAP
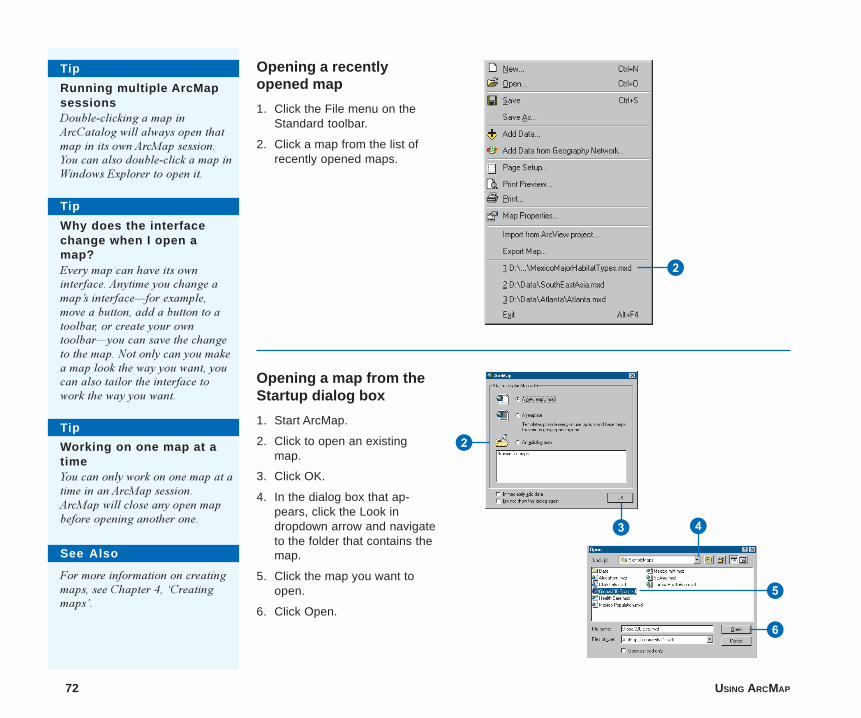
Opening a recentlyopened map
1. Click the File menu on theStandard toolbar.
2. Click a map from the list ofrecently opened maps.
Tip
Working on one map at atimeYou can only work on one map at atime in an ArcMap session.ArcMap will close any open mapbefore opening another one.
Tip
Why does the interfacechange when I open amap?Every map can have its owninterface. Anytime you change amap�s interface�for example,move a button, add a button to atoolbar, or create your owntoolbar�you can save the changeto the map. Not only can you makea map look the way you want, youcan also tailor the interface towork the way you want.
Tip
Running multiple ArcMapsessionsDouble-clicking a map inArcCatalog will always open thatmap in its own ArcMap session.You can also double-click a map inWindows Explorer to open it.
Opening a map from theStartup dialog box
1. Start ArcMap.
2. Click to open an existingmap.
3. Click OK.
4. In the dialog box that ap-pears, click the Look indropdown arrow and navigateto the folder that contains themap.
5. Click the map you want toopen.
6. Click Open.
See Also
For more information on creatingmaps, see Chapter 4, �Creatingmaps�.
3
2
5
6
2
4
ch3.p65 12/02/2000, 2:46 PM72
ARCMAP BASICS 73
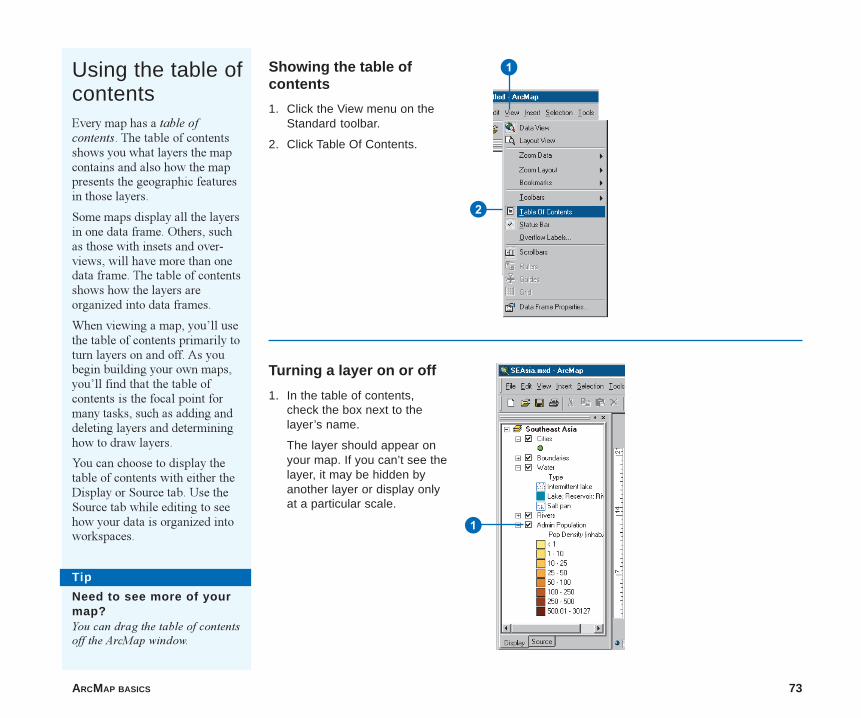
Using the table ofcontentsEvery map has a table ofcontents. The table of contentsshows you what layers the mapcontains and also how the mappresents the geographic featuresin those layers.
Some maps display all the layersin one data frame. Others, suchas those with insets and over-views, will have more than onedata frame. The table of contentsshows how the layers areorganized into data frames.
When viewing a map, you�ll usethe table of contents primarily toturn layers on and off. As youbegin building your own maps,you�ll find that the table ofcontents is the focal point formany tasks, such as adding anddeleting layers and determininghow to draw layers.
You can choose to display thetable of contents with either theDisplay or Source tab. Use theSource tab while editing to seehow your data is organized intoworkspaces.
Showing the table ofcontents
1. Click the View menu on theStandard toolbar.
2. Click Table Of Contents.
Turning a layer on or off
1. In the table of contents,check the box next to thelayer’s name.
The layer should appear onyour map. If you can’t see thelayer, it may be hidden byanother layer or display onlyat a particular scale.
Tip
Need to see more of yourmap?You can drag the table of contentsoff the ArcMap window.
1
2
1
ch3.p65 12/02/2000, 2:46 PM73
74 USING ARCMAP
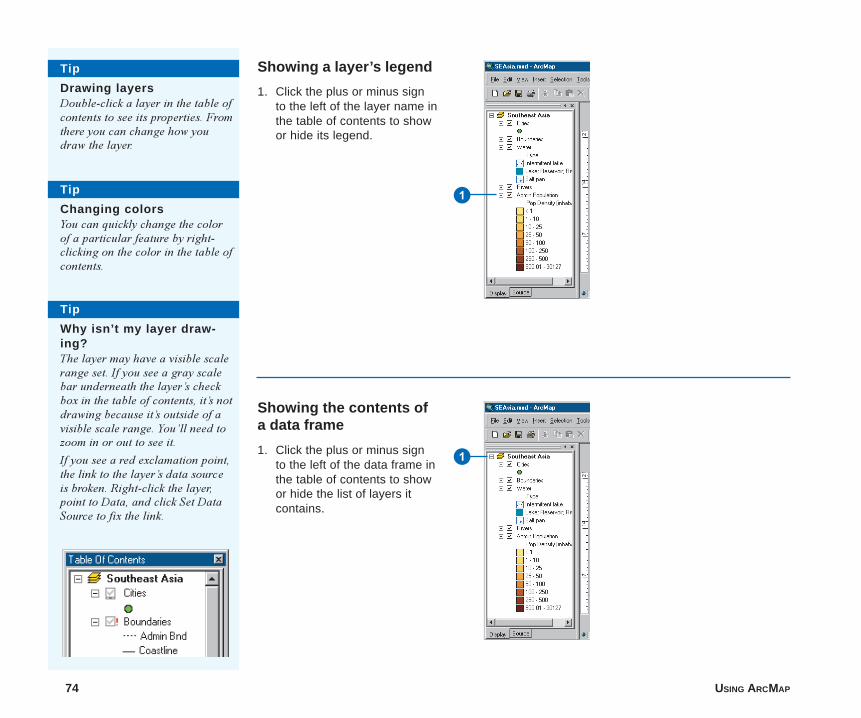
Showing a layer’s legend
1. Click the plus or minus signto the left of the layer name inthe table of contents to showor hide its legend.
Showing the contents ofa data frame
1. Click the plus or minus signto the left of the data frame inthe table of contents to showor hide the list of layers itcontains.
Tip
Drawing layersDouble-click a layer in the table ofcontents to see its properties. Fromthere you can change how youdraw the layer.
Tip
Changing colorsYou can quickly change the colorof a particular feature by right-clicking on the color in the table ofcontents.
1
1
Tip
Why isn’t my layer draw-ing?The layer may have a visible scalerange set. If you see a gray scalebar underneath the layer�s checkbox in the table of contents, it�s notdrawing because it�s outside of avisible scale range. You�ll need tozoom in or out to see it.
If you see a red exclamation point,the link to the layer�s data sourceis broken. Right-click the layer,point to Data, and click Set DataSource to fix the link.
ch3.p65 12/02/2000, 2:47 PM74
ARCMAP BASICS 75
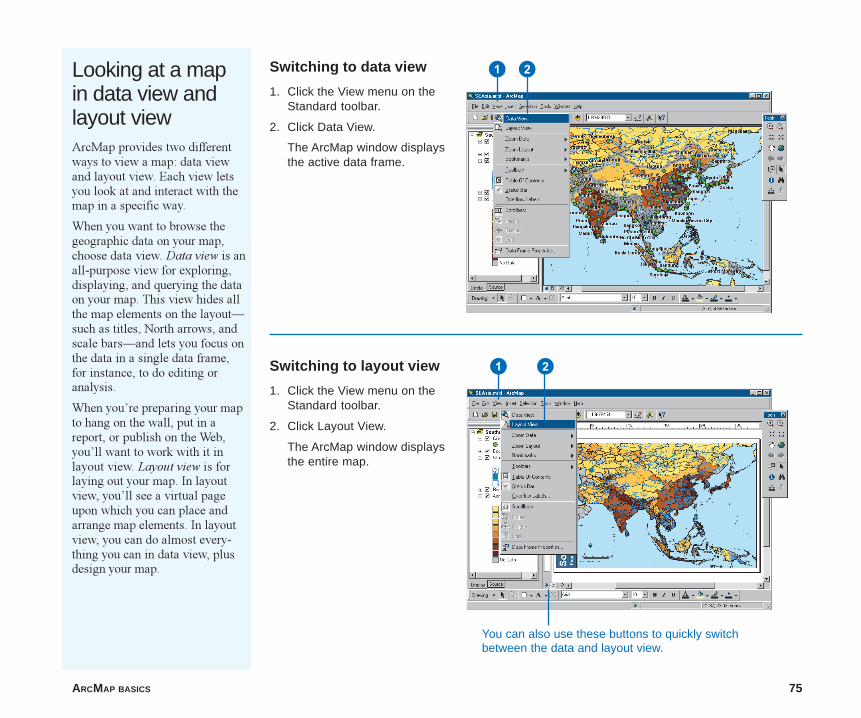
Looking at a mapin data view andlayout viewArcMap provides two differentways to view a map: data viewand layout view. Each view letsyou look at and interact with themap in a specific way.
When you want to browse thegeographic data on your map,choose data view. Data view is anall-purpose view for exploring,displaying, and querying the dataon your map. This view hides allthe map elements on the layout�such as titles, North arrows, andscale bars�and lets you focus onthe data in a single data frame,for instance, to do editing oranalysis.
When you�re preparing your mapto hang on the wall, put in areport, or publish on the Web,you�ll want to work with it inlayout view. Layout view is forlaying out your map. In layoutview, you�ll see a virtual pageupon which you can place andarrange map elements. In layoutview, you can do almost every-thing you can in data view, plusdesign your map.
Switching to layout view
1. Click the View menu on theStandard toolbar.
2. Click Layout View.
The ArcMap window displaysthe entire map.
Switching to data view
1. Click the View menu on theStandard toolbar.
2. Click Data View.
The ArcMap window displaysthe active data frame.
21
21
You can also use these buttons to quickly switchbetween the data and layout view.
ch3.p65 12/02/2000, 2:47 PM75
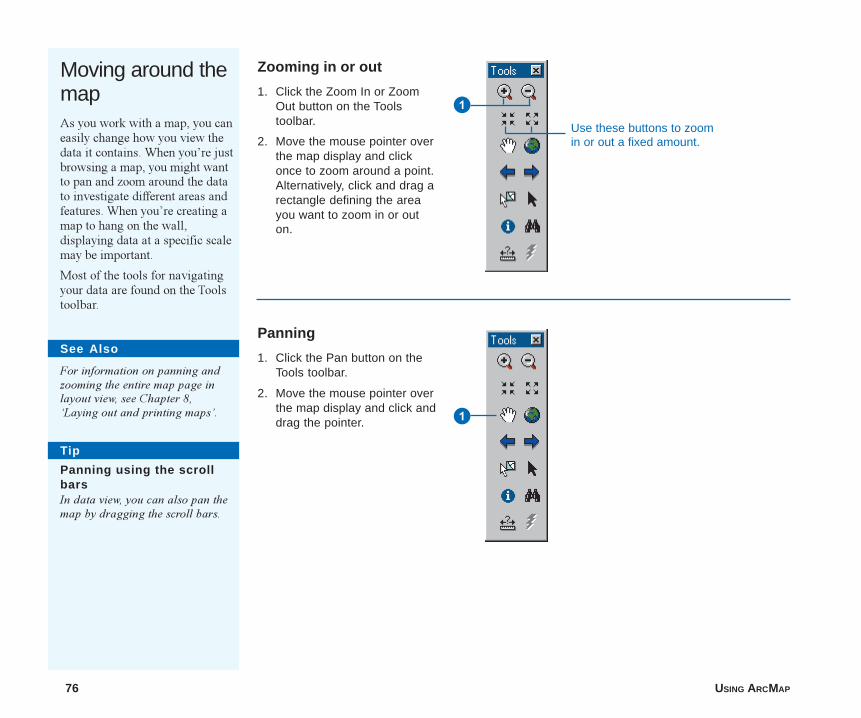
76 USING ARCMAP
Moving around themapAs you work with a map, you caneasily change how you view thedata it contains. When you�re justbrowsing a map, you might wantto pan and zoom around the datato investigate different areas andfeatures. When you�re creating amap to hang on the wall,displaying data at a specific scalemay be important.
Most of the tools for navigatingyour data are found on the Toolstoolbar.
Zooming in or out
1. Click the Zoom In or ZoomOut button on the Toolstoolbar.
2. Move the mouse pointer overthe map display and clickonce to zoom around a point.Alternatively, click and drag arectangle defining the areayou want to zoom in or outon.
See Also
For information on panning andzooming the entire map page inlayout view, see Chapter 8,�Laying out and printing maps�.
Panning
1. Click the Pan button on theTools toolbar.
2. Move the mouse pointer overthe map display and click anddrag the pointer.
Tip
Panning using the scrollbarsIn data view, you can also pan themap by dragging the scroll bars.
1Use these buttons to zoomin or out a fixed amount.
1
ch3.p65 12/02/2000, 2:47 PM76
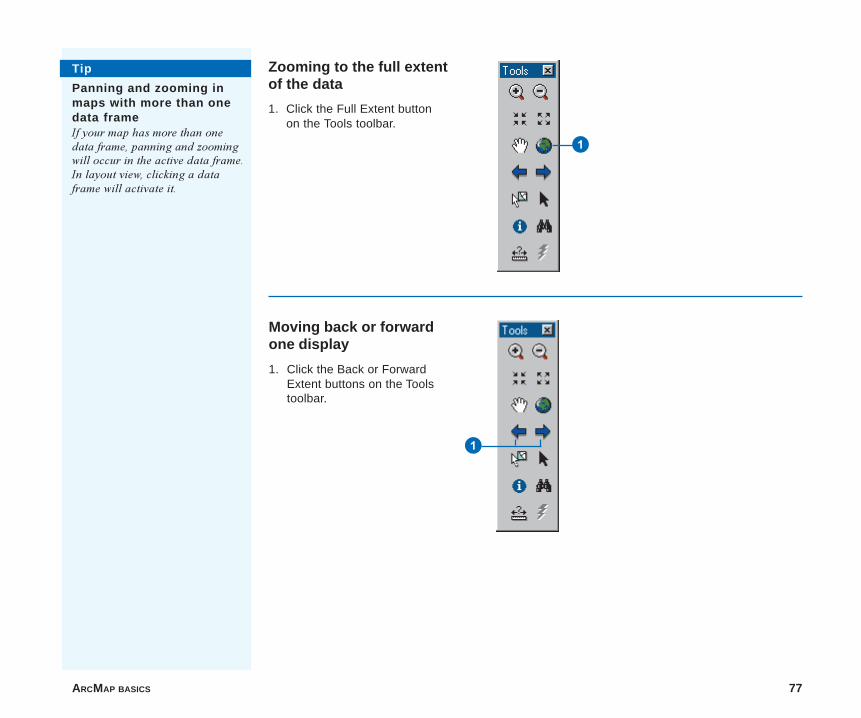
ARCMAP BASICS 77
Zooming to the full extentof the data
1. Click the Full Extent buttonon the Tools toolbar.
Moving back or forwardone display
1. Click the Back or ForwardExtent buttons on the Toolstoolbar.
Tip
Panning and zooming inmaps with more than onedata frameIf your map has more than onedata frame, panning and zoomingwill occur in the active data frame.In layout view, clicking a dataframe will activate it.
1
1
ch3.p65 12/02/2000, 2:47 PM77
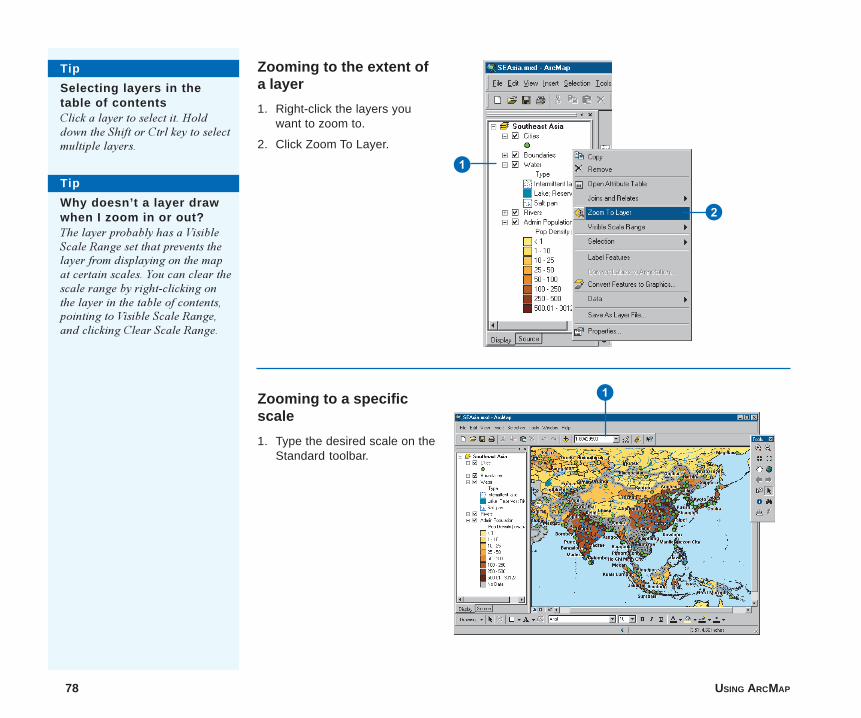
78 USING ARCMAP
Zooming to a specificscale
1. Type the desired scale on theStandard toolbar.
Zooming to the extent ofa layer
1. Right-click the layers youwant to zoom to.
2. Click Zoom To Layer.
1
2
1
Tip
Why doesn’t a layer drawwhen I zoom in or out?The layer probably has a VisibleScale Range set that prevents thelayer from displaying on the mapat certain scales. You can clear thescale range by right-clicking onthe layer in the table of contents,pointing to Visible Scale Range,and clicking Clear Scale Range.
Tip
Selecting layers in thetable of contentsClick a layer to select it. Holddown the Shift or Ctrl key to selectmultiple layers.
ch3.p65 12/02/2000, 2:48 PM78
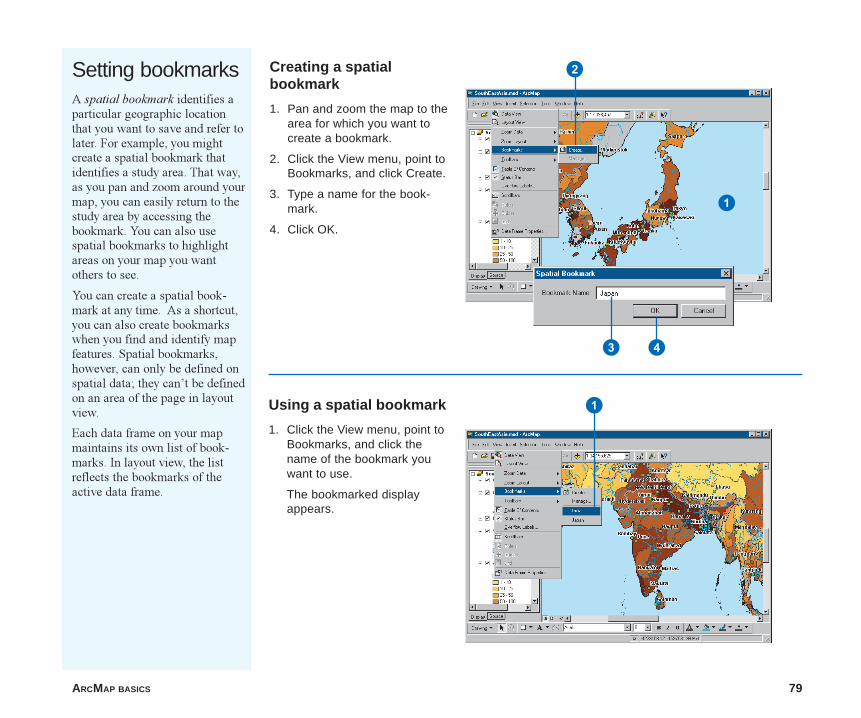
ARCMAP BASICS 79
Setting bookmarksA spatial bookmark identifies aparticular geographic locationthat you want to save and refer tolater. For example, you mightcreate a spatial bookmark thatidentifies a study area. That way,as you pan and zoom around yourmap, you can easily return to thestudy area by accessing thebookmark. You can also usespatial bookmarks to highlightareas on your map you wantothers to see.
You can create a spatial book-mark at any time. As a shortcut,you can also create bookmarkswhen you find and identify mapfeatures. Spatial bookmarks,however, can only be defined onspatial data; they can�t be definedon an area of the page in layoutview.
Each data frame on your mapmaintains its own list of book-marks. In layout view, the listreflects the bookmarks of theactive data frame.
Creating a spatialbookmark
1. Pan and zoom the map to thearea for which you want tocreate a bookmark.
2. Click the View menu, point toBookmarks, and click Create.
3. Type a name for the book-mark.
4. Click OK.
Using a spatial bookmark
1. Click the View menu, point toBookmarks, and click thename of the bookmark youwant to use.
The bookmarked displayappears.
3
1
2
4
1
ch3.p65 12/02/2000, 2:49 PM79
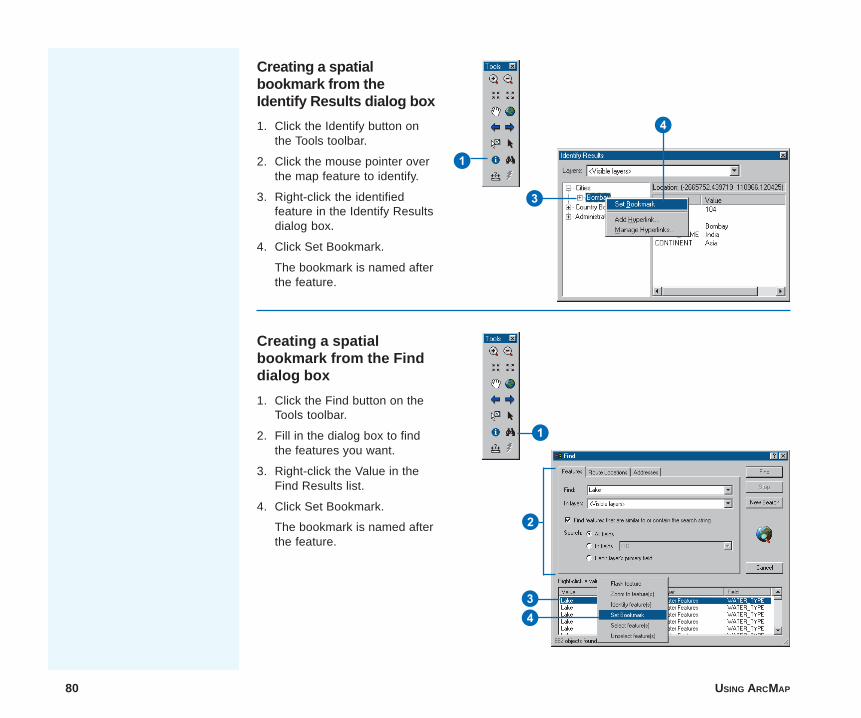
80 USING ARCMAP
Creating a spatialbookmark from theIdentify Results dialog box
1. Click the Identify button onthe Tools toolbar.
2. Click the mouse pointer overthe map feature to identify.
3. Right-click the identifiedfeature in the Identify Resultsdialog box.
4. Click Set Bookmark.
The bookmark is named afterthe feature.
Creating a spatialbookmark from the Finddialog box
1. Click the Find button on theTools toolbar.
2. Fill in the dialog box to findthe features you want.
3. Right-click the Value in theFind Results list.
4. Click Set Bookmark.
The bookmark is named afterthe feature.
3
1
4
1
34
2
ch3.p65 12/02/2000, 2:49 PM80
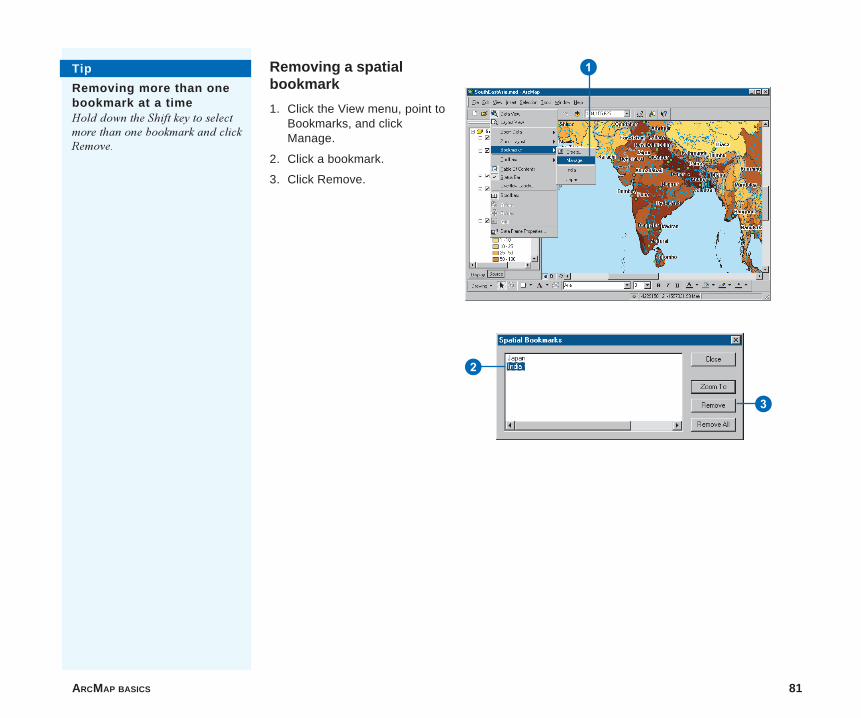
ARCMAP BASICS 81
Removing a spatialbookmark
1. Click the View menu, point toBookmarks, and clickManage.
2. Click a bookmark.
3. Click Remove.
Tip
Removing more than onebookmark at a timeHold down the Shift key to selectmore than one bookmark and clickRemove.
2
3
1
ch3.p65 12/02/2000, 2:49 PM81
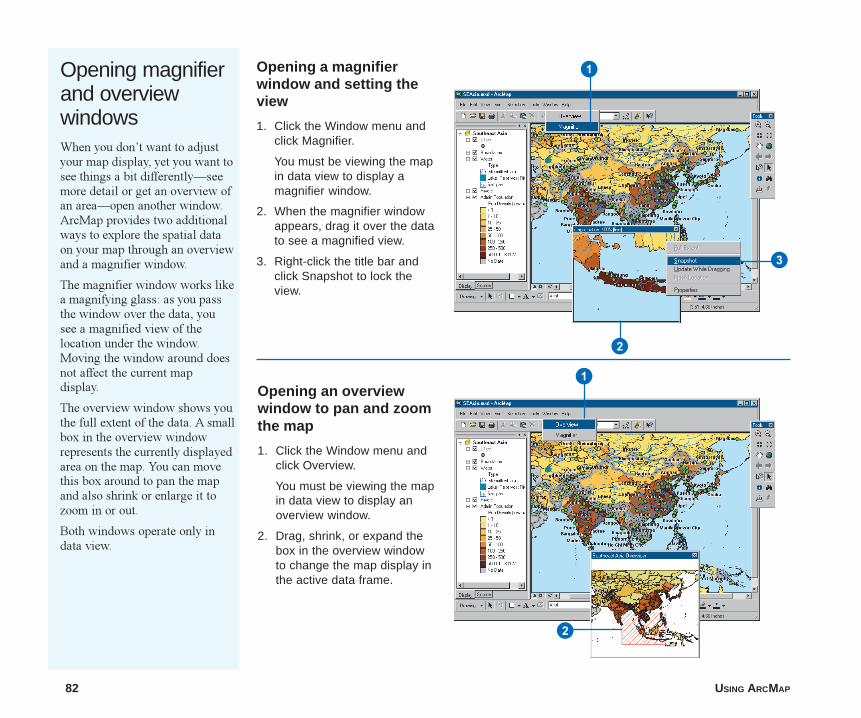
82 USING ARCMAP
Opening magnifierand overviewwindowsWhen you don�t want to adjustyour map display, yet you want tosee things a bit differently�seemore detail or get an overview ofan area�open another window.ArcMap provides two additionalways to explore the spatial dataon your map through an overviewand a magnifier window.
The magnifier window works likea magnifying glass: as you passthe window over the data, yousee a magnified view of thelocation under the window.Moving the window around doesnot affect the current mapdisplay.
The overview window shows youthe full extent of the data. A smallbox in the overview windowrepresents the currently displayedarea on the map. You can movethis box around to pan the mapand also shrink or enlarge it tozoom in or out.
Both windows operate only indata view.
Opening an overviewwindow to pan and zoomthe map
1. Click the Window menu andclick Overview.
You must be viewing the mapin data view to display anoverview window.
2. Drag, shrink, or expand thebox in the overview windowto change the map display inthe active data frame.
Opening a magnifierwindow and setting theview
1. Click the Window menu andclick Magnifier.
You must be viewing the mapin data view to display amagnifier window.
2. When the magnifier windowappears, drag it over the datato see a magnified view.
3. Right-click the title bar andclick Snapshot to lock theview.
1
2
3
1
2
ch3.p65 12/02/2000, 2:50 PM82
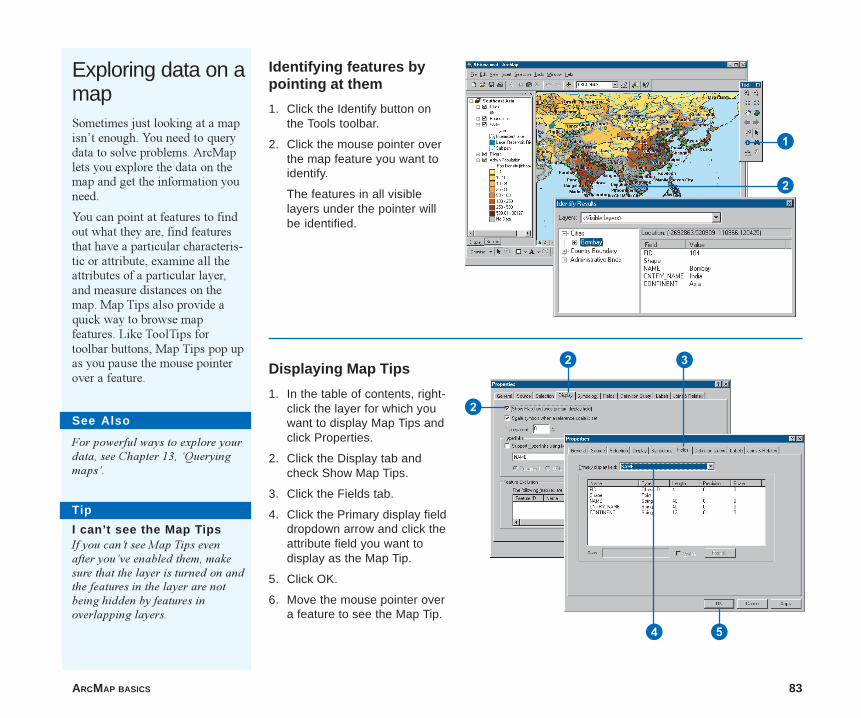
ARCMAP BASICS 83
Exploring data on amapSometimes just looking at a mapisn�t enough. You need to querydata to solve problems. ArcMaplets you explore the data on themap and get the information youneed.
You can point at features to findout what they are, find featuresthat have a particular characteris-tic or attribute, examine all theattributes of a particular layer,and measure distances on themap. Map Tips also provide aquick way to browse mapfeatures. Like ToolTips fortoolbar buttons, Map Tips pop upas you pause the mouse pointerover a feature.
See Also
For powerful ways to explore yourdata, see Chapter 13, �Queryingmaps�.
Identifying features bypointing at them
1. Click the Identify button onthe Tools toolbar.
2. Click the mouse pointer overthe map feature you want toidentify.
The features in all visiblelayers under the pointer willbe identified.
Displaying Map Tips
1. In the table of contents, right-click the layer for which youwant to display Map Tips andclick Properties.
2. Click the Display tab andcheck Show Map Tips.
3. Click the Fields tab.
4. Click the Primary display fielddropdown arrow and click theattribute field you want todisplay as the Map Tip.
5. Click OK.
6. Move the mouse pointer overa feature to see the Map Tip.
Tip
I can’t see the Map TipsIf you can�t see Map Tips evenafter you�ve enabled them, makesure that the layer is turned on andthe features in the layer are notbeing hidden by features inoverlapping layers.
1
2
2
2
3
4 5
ch3.p65 12/02/2000, 2:51 PM83
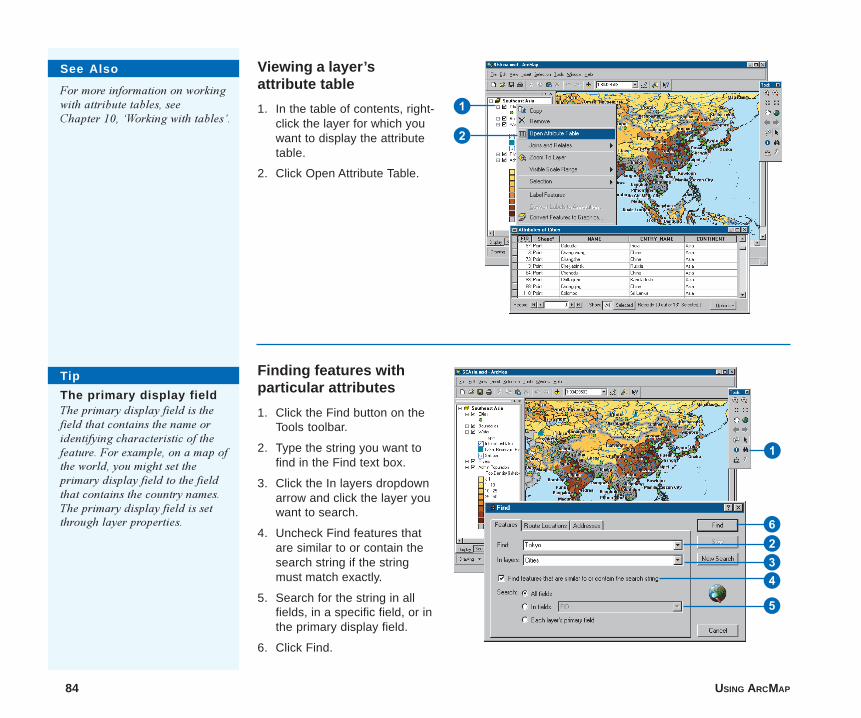
84 USING ARCMAP
Viewing a layer’sattribute table
1. In the table of contents, right-click the layer for which youwant to display the attributetable.
2. Click Open Attribute Table.
Finding features withparticular attributes
1. Click the Find button on theTools toolbar.
2. Type the string you want tofind in the Find text box.
3. Click the In layers dropdownarrow and click the layer youwant to search.
4. Uncheck Find features thatare similar to or contain thesearch string if the stringmust match exactly.
5. Search for the string in allfields, in a specific field, or inthe primary display field.
6. Click Find.
6
Tip
The primary display fieldThe primary display field is thefield that contains the name oridentifying characteristic of thefeature. For example, on a map ofthe world, you might set theprimary display field to the fieldthat contains the country names.The primary display field is setthrough layer properties.
See Also
For more information on workingwith attribute tables, seeChapter 10, �Working with tables�.
1
2
1
234
5
ch3.p65 12/02/2000, 2:52 PM84
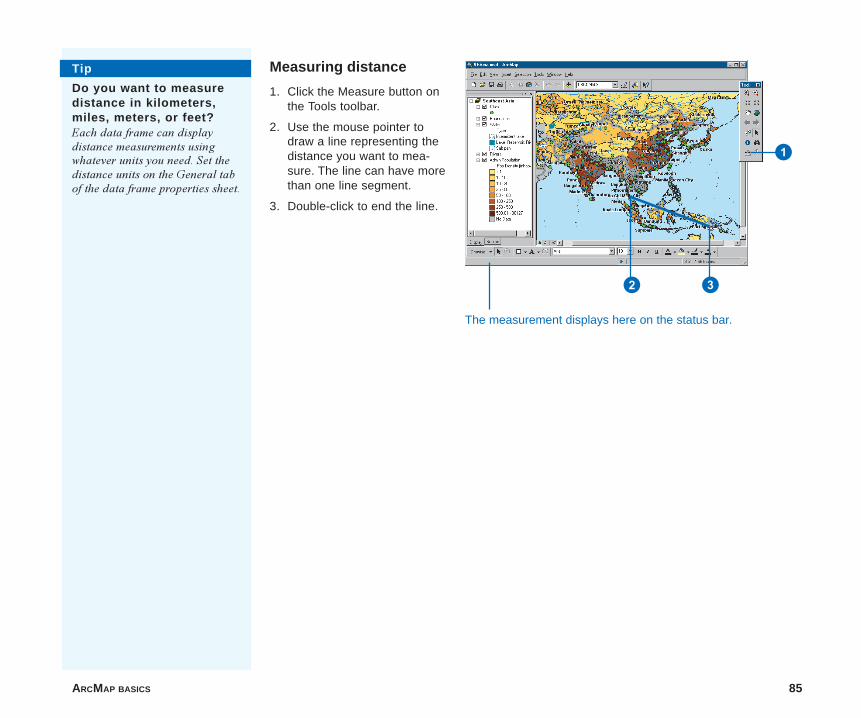
ARCMAP BASICS 85
Measuring distance
1. Click the Measure button onthe Tools toolbar.
2. Use the mouse pointer todraw a line representing thedistance you want to mea-sure. The line can have morethan one line segment.
3. Double-click to end the line.
Tip
Do you want to measuredistance in kilometers,miles, meters, or feet?Each data frame can displaydistance measurements usingwhatever units you need. Set thedistance units on the General tabof the data frame properties sheet.
1
2 3
The measurement displays here on the status bar.
ch3.p65 12/02/2000, 2:52 PM85

86 USING ARCMAP
2
1
Getting helpA quick way to learn whatArcMap can do is to get helpabout the buttons and menucommands you see on theinterface. After clicking theWhat�s This? button, you canclick an item in the window todisplay a popup description of it.
You can also get help in somedialog boxes. When you click theWhat�s This? button in the upper-right corner and click an item inthe dialog box, a description ofthe item pops up.
Much of the information in thisbook is available in the onlineHelp system. The Help topics areorganized around the main tasksyou want to complete as well asthe concepts behind the tasks.
You can look up general Helptopics in the Help Contents. Youcan search the Index for specifictasks and issues. You can alsouse the Find tab to look up Helptopics that have specific words orphrases.
Getting help in theArcMap window
1. Click the What’s This? button.
2. With the Help pointer, clickthe item in the ArcMapwindow about which you wantmore information.
3. Click anywhere on the screento close the Help descriptionbox.
Getting help in a dialogbox
1. Click the What’s This? button.
2. With the Help pointer, clickthe item in the dialog boxabout which you want moreinformation.
3. Click anywhere on the screento close the Help descriptionbox.
Tip
Another way to get help ina dialog boxSometimes a dialog box will alsohave a Help button on the bottom;clicking it opens a Help topic withdetailed information about the taskyou�re trying to accomplish.
12
ch3.p65 12/02/2000, 2:52 PM86
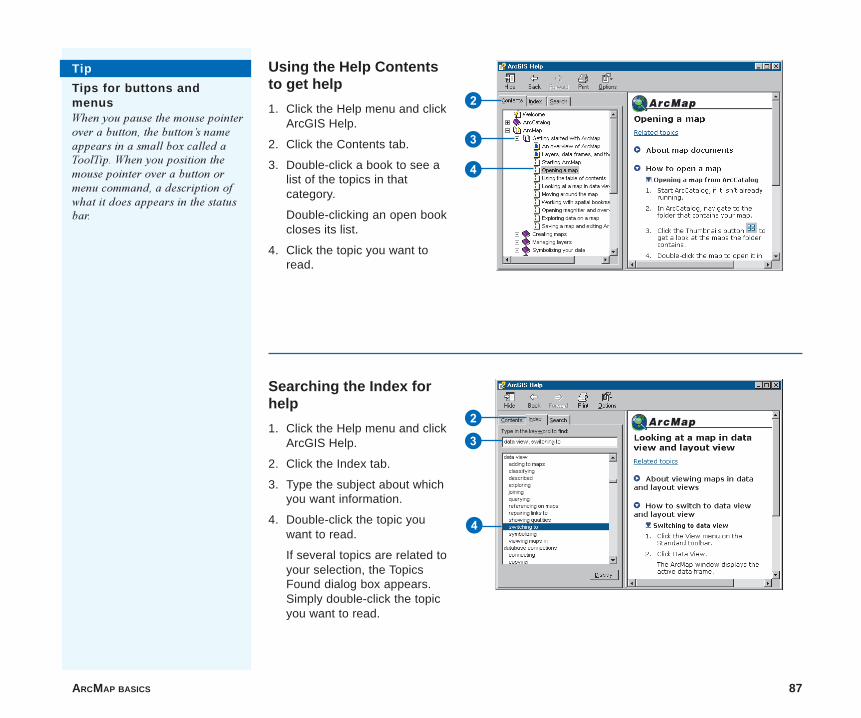
ARCMAP BASICS 87
Using the Help Contentsto get help
1. Click the Help menu and clickArcGIS Help.
2. Click the Contents tab.
3. Double-click a book to see alist of the topics in thatcategory.
Double-clicking an open bookcloses its list.
4. Click the topic you want toread.
Searching the Index forhelp
1. Click the Help menu and clickArcGIS Help.
2. Click the Index tab.
3. Type the subject about whichyou want information.
4. Double-click the topic youwant to read.
If several topics are related toyour selection, the TopicsFound dialog box appears.Simply double-click the topicyou want to read.
Tip
Tips for buttons andmenusWhen you pause the mouse pointerover a button, the button�s nameappears in a small box called aToolTip. When you position themouse pointer over a button ormenu command, a description ofwhat it does appears in the statusbar.
2
3
4
2
3
4
ch3.p65 12/02/2000, 2:52 PM87
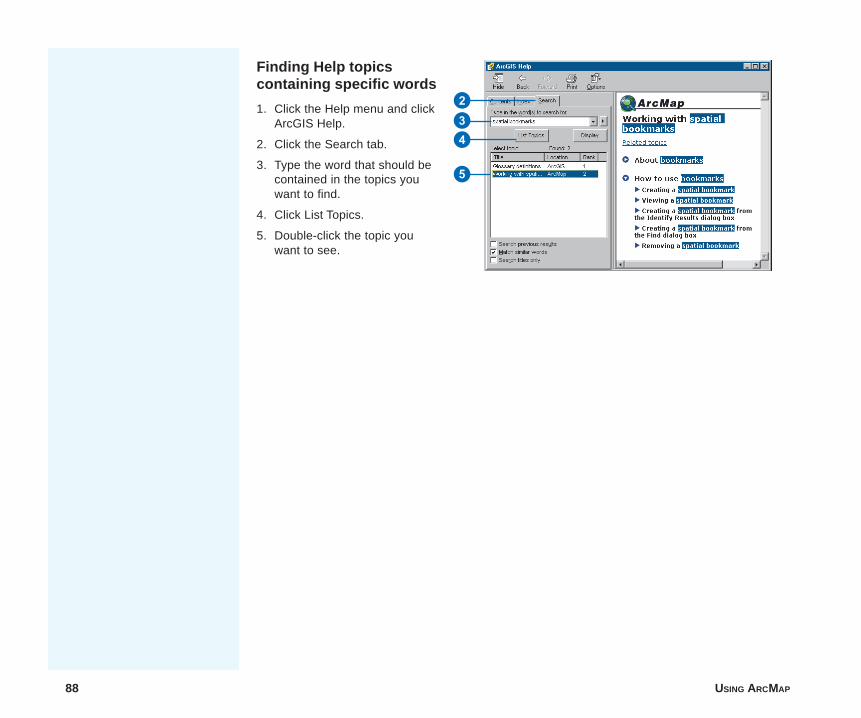
88 USING ARCMAP
Finding Help topicscontaining specific words
1. Click the Help menu and clickArcGIS Help.
2. Click the Search tab.
3. Type the word that should becontained in the topics youwant to find.
4. Click List Topics.
5. Double-click the topic youwant to see.
234
5
ch3.p65 12/02/2000, 2:53 PM88
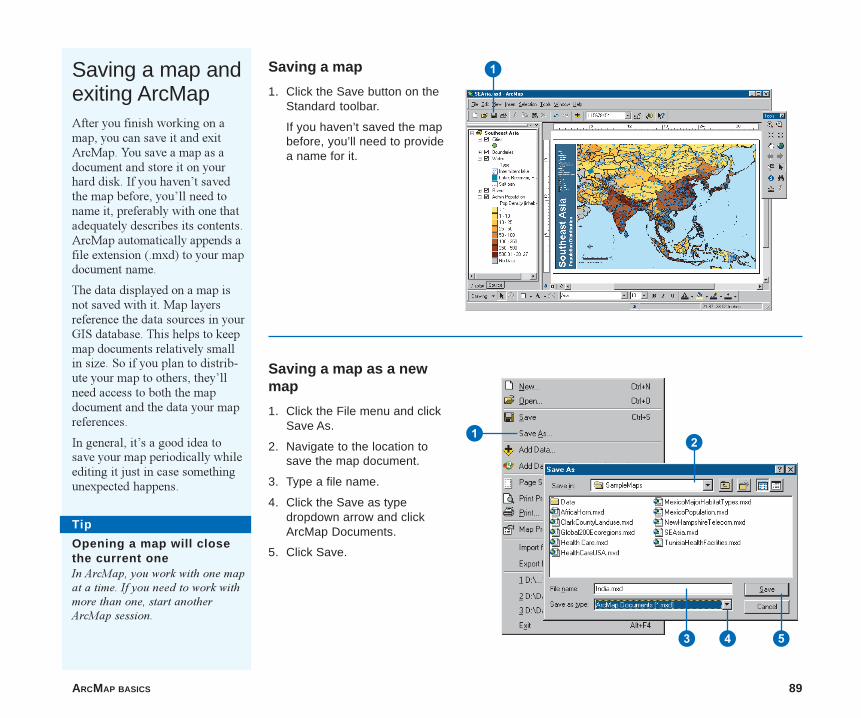
ARCMAP BASICS 89
Saving a map
1. Click the Save button on theStandard toolbar.
If you haven’t saved the mapbefore, you’ll need to providea name for it.
Tip
Opening a map will closethe current oneIn ArcMap, you work with one mapat a time. If you need to work withmore than one, start anotherArcMap session.
Saving a map andexiting ArcMapAfter you finish working on amap, you can save it and exitArcMap. You save a map as adocument and store it on yourhard disk. If you haven�t savedthe map before, you�ll need toname it, preferably with one thatadequately describes its contents.ArcMap automatically appends afile extension (.mxd) to your mapdocument name.
The data displayed on a map isnot saved with it. Map layersreference the data sources in yourGIS database. This helps to keepmap documents relatively smallin size. So if you plan to distrib-ute your map to others, they�llneed access to both the mapdocument and the data your mapreferences.
In general, it�s a good idea tosave your map periodically whileediting it just in case somethingunexpected happens.
1
Saving a map as a newmap
1. Click the File menu and clickSave As.
2. Navigate to the location tosave the map document.
3. Type a file name.
4. Click the Save as typedropdown arrow and clickArcMap Documents.
5. Click Save.
12
543
ch3.p65 12/02/2000, 2:53 PM89
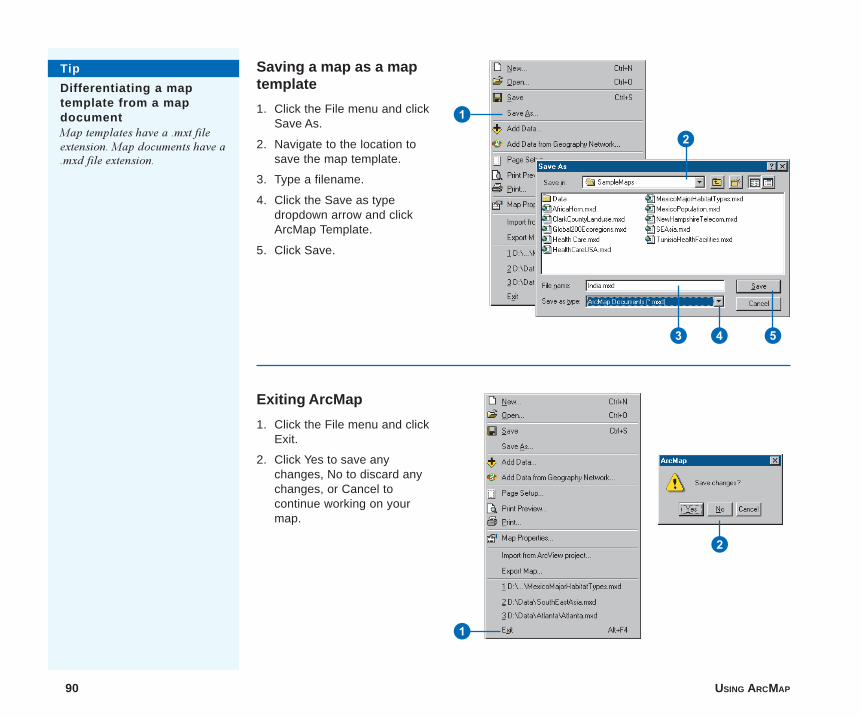
90 USING ARCMAP
Exiting ArcMap
1. Click the File menu and clickExit.
2. Click Yes to save anychanges, No to discard anychanges, or Cancel tocontinue working on yourmap.
Saving a map as a maptemplate
1. Click the File menu and clickSave As.
2. Navigate to the location tosave the map template.
3. Type a filename.
4. Click the Save as typedropdown arrow and clickArcMap Template.
5. Click Save.
Tip
Differentiating a maptemplate from a mapdocumentMap templates have a .mxt fileextension. Map documents have a.mxd file extension.
1
2
543
1
2
ch3.p65 12/02/2000, 2:53 PM90
Section 2
Displaying data
section2.p65 12/02/2000, 3:25 PM91

section2.p65 12/02/2000, 3:25 PM92

IN THIS CHAPTER
93
Creating maps 4• Creating a new map
• Adding layers
• Adding coverages, shapefiles, andgeodatabases
• Adding data from the Internet
• Adding TINs as surfaces
• Adding CAD drawings
• Adding x,y coordinate data
• Adding route events
• About coordinate systems
• Specifying a coordinate system
• Referencing data on the map
Before you sit down to create a map, you need to think about its purpose.What do you want your map to show? Does the map need to stand on itsown, or will it be part of a larger presentation? Who is the audience for themap? Answering these and other similar questions will help you determinehow to organize and present the information on your map�for instance,what level of detail you need to show; what colors and symbols you shoulduse to draw features; and whether you need to create an interactive mappeople use at the computer, or one you simply print out and display on awall, or both.
The first step to creating a map is to locate the data you want to put on it.Finding data may be as simple as using ArcCatalog to browse yourorganization�s GIS database or the spatial data distributed with ArcMap. TheInternet is also an excellent resource for finding data�you can add datadirectly from the Internet using the Geography NetworkSM Web site atwww.geographynetwork.com. Many government agencies distribute data tothe public at minimal or no cost. Commercial data vendors also packagedata for a wide variety of applications, from business to natural resources. Ifyou have special data requirements, you might create your own data (seeEditing in ArcMap) or contact one of the many service bureaus or GISconsulting companies that can produce data for you. Even if you don�t thinkyou have any spatial data, you just might.
ch4.p65 12/04/2000, 10:08 AM93
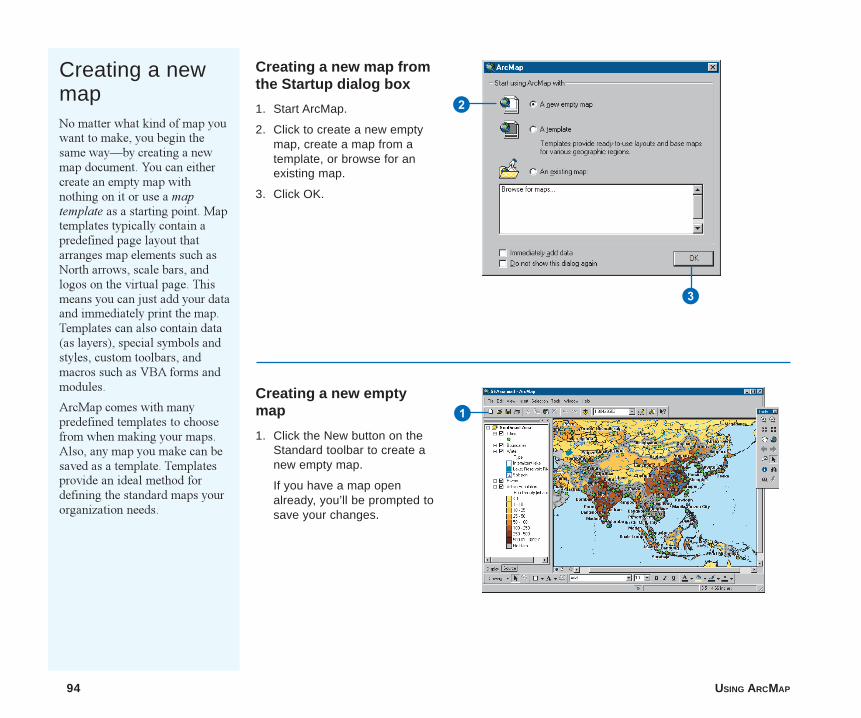
94 USING ARCMAP
Creating a newmapNo matter what kind of map youwant to make, you begin thesame way�by creating a newmap document. You can eithercreate an empty map withnothing on it or use a maptemplate as a starting point. Maptemplates typically contain apredefined page layout thatarranges map elements such asNorth arrows, scale bars, andlogos on the virtual page. Thismeans you can just add your dataand immediately print the map.Templates can also contain data(as layers), special symbols andstyles, custom toolbars, andmacros such as VBA forms andmodules.
ArcMap comes with manypredefined templates to choosefrom when making your maps.Also, any map you make can besaved as a template. Templatesprovide an ideal method fordefining the standard maps yourorganization needs.
Creating a new map fromthe Startup dialog box
1. Start ArcMap.
2. Click to create a new emptymap, create a map from atemplate, or browse for anexisting map.
3. Click OK.
Creating a new emptymap
1. Click the New button on theStandard toolbar to create anew empty map.
If you have a map openalready, you’ll be prompted tosave your changes.
3
2
1
ch4.p65 12/04/2000, 10:09 AM94
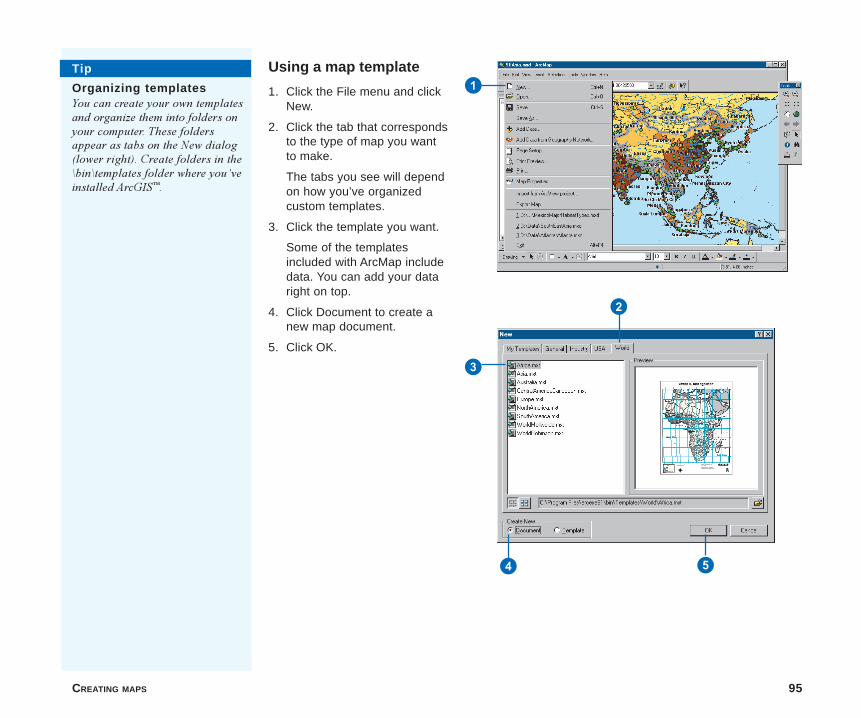
CREATING MAPS 95
Using a map template
1. Click the File menu and clickNew.
2. Click the tab that correspondsto the type of map you wantto make.
The tabs you see will dependon how you’ve organizedcustom templates.
3. Click the template you want.
Some of the templatesincluded with ArcMap includedata. You can add your dataright on top.
4. Click Document to create anew map document.
5. Click OK.
2
3
4 5
Tip
Organizing templatesYou can create your own templatesand organize them into folders onyour computer. These foldersappear as tabs on the New dialog(lower right). Create folders in the\bin\templates folder where you�veinstalled ArcGIS�.
1
ch4.p65 12/04/2000, 10:09 AM95
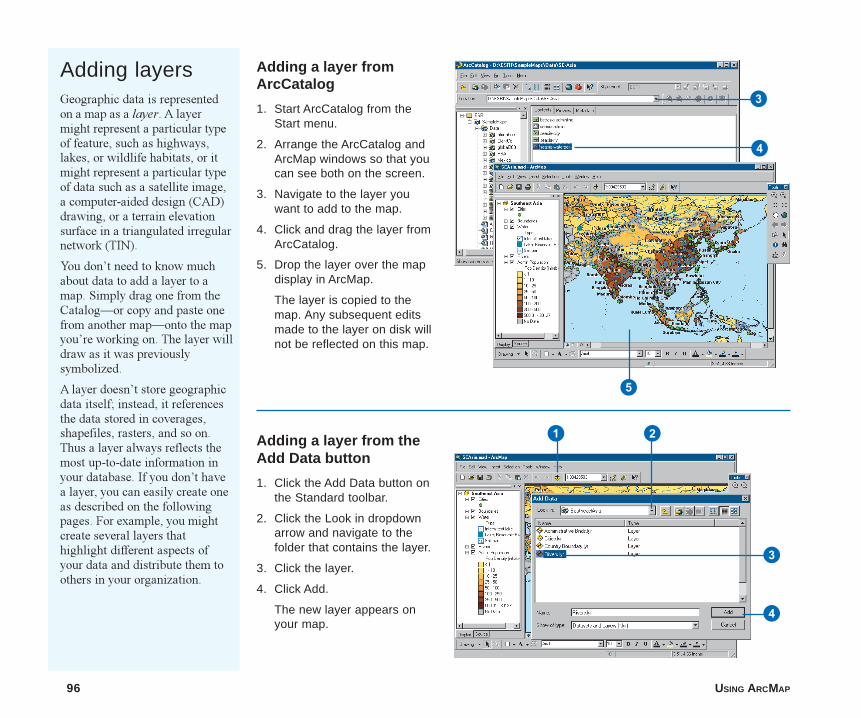
96 USING ARCMAP
Adding layersGeographic data is representedon a map as a layer. A layermight represent a particular typeof feature, such as highways,lakes, or wildlife habitats, or itmight represent a particular typeof data such as a satellite image,a computer-aided design (CAD)drawing, or a terrain elevationsurface in a triangulated irregularnetwork (TIN).
You don�t need to know muchabout data to add a layer to amap. Simply drag one from theCatalog�or copy and paste onefrom another map�onto the mapyou�re working on. The layer willdraw as it was previouslysymbolized.
A layer doesn�t store geographicdata itself; instead, it referencesthe data stored in coverages,shapefiles, rasters, and so on.Thus a layer always reflects themost up-to-date information inyour database. If you don�t havea layer, you can easily create oneas described on the followingpages. For example, you mightcreate several layers thathighlight different aspects ofyour data and distribute them toothers in your organization.
Adding a layer fromArcCatalog
1. Start ArcCatalog from theStart menu.
2. Arrange the ArcCatalog andArcMap windows so that youcan see both on the screen.
3. Navigate to the layer youwant to add to the map.
4. Click and drag the layer fromArcCatalog.
5. Drop the layer over the mapdisplay in ArcMap.
The layer is copied to themap. Any subsequent editsmade to the layer on disk willnot be reflected on this map.
3
4
Adding a layer from theAdd Data button
1. Click the Add Data button onthe Standard toolbar.
2. Click the Look in dropdownarrow and navigate to thefolder that contains the layer.
3. Click the layer.
4. Click Add.
The new layer appears onyour map.
1
5
2
3
4
ch4.p65 12/04/2000, 10:10 AM96

CREATING MAPS 97
Tip
To see a layer on a map,you must have access toits data sourceEven though you have access to alayer on disk, it won�t draw onyour map unless you also haveaccess to the data source the layeris based on.
Tip
Adding a layer from theCatalogWhen you add a predefined layerto your map from the Catalog, acopy is placed on the current map.Your current map will not changeif the original layer is modified.
Adding a layer fromanother map
1. Open the map that containsthe layer you want to copy.
2. In the table of contents, right-click the layer and click SaveAs Layer File.
3. Click the Look in dropdownarrow and navigate to thefolder where you want tosave the layer.
4. Type a name for the layer.
5. Click Save.
6. Click the Open button on theStandard toolbar to open themap you want to add thelayer to.
7. Click the Add Data button.
8. Click the Look in dropdownarrow and navigate to thefolder that contains the layer.
9. Click the layer.
10.Click Add.
2
5
4
6
3
7
9
Q
8
ch4.p65 12/04/2000, 10:11 AM97
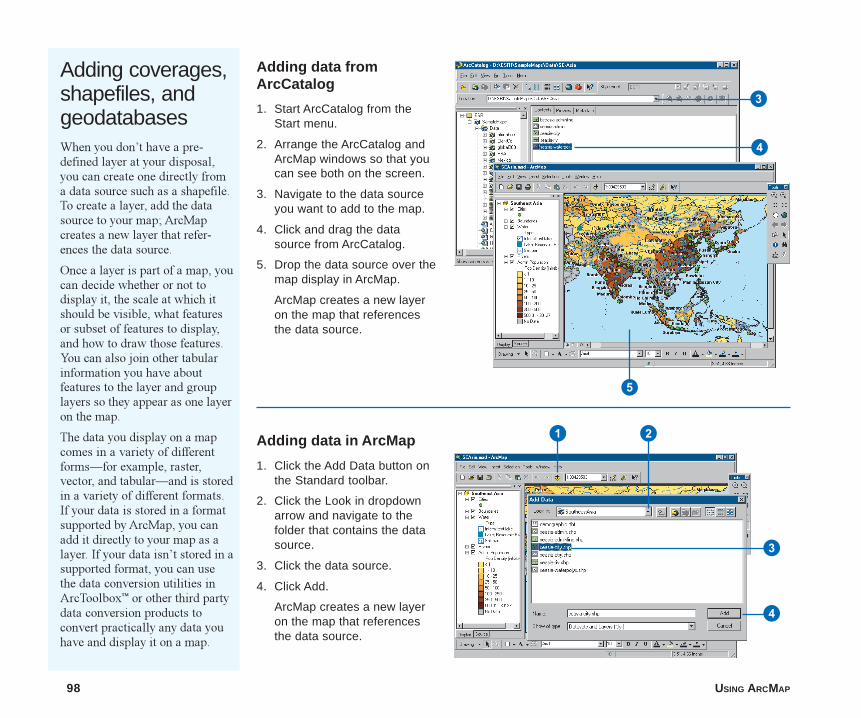
98 USING ARCMAP
Adding coverages,shapefiles, andgeodatabasesWhen you don�t have a pre-defined layer at your disposal,you can create one directly froma data source such as a shapefile.To create a layer, add the datasource to your map; ArcMapcreates a new layer that refer-ences the data source.
Once a layer is part of a map, youcan decide whether or not todisplay it, the scale at which itshould be visible, what featuresor subset of features to display,and how to draw those features.You can also join other tabularinformation you have aboutfeatures to the layer and grouplayers so they appear as one layeron the map.
The data you display on a mapcomes in a variety of differentforms�for example, raster,vector, and tabular�and is storedin a variety of different formats.If your data is stored in a formatsupported by ArcMap, you canadd it directly to your map as alayer. If your data isn�t stored in asupported format, you can usethe data conversion utilities inArcToolbox� or other third partydata conversion products toconvert practically any data youhave and display it on a map.
Adding data in ArcMap
1. Click the Add Data button onthe Standard toolbar.
2. Click the Look in dropdownarrow and navigate to thefolder that contains the datasource.
3. Click the data source.
4. Click Add.
ArcMap creates a new layeron the map that referencesthe data source.
Adding data fromArcCatalog
1. Start ArcCatalog from theStart menu.
2. Arrange the ArcCatalog andArcMap windows so that youcan see both on the screen.
3. Navigate to the data sourceyou want to add to the map.
4. Click and drag the datasource from ArcCatalog.
5. Drop the data source over themap display in ArcMap.
ArcMap creates a new layeron the map that referencesthe data source.
3
4
5
1 2
3
4
ch4.p65 12/04/2000, 10:11 AM98
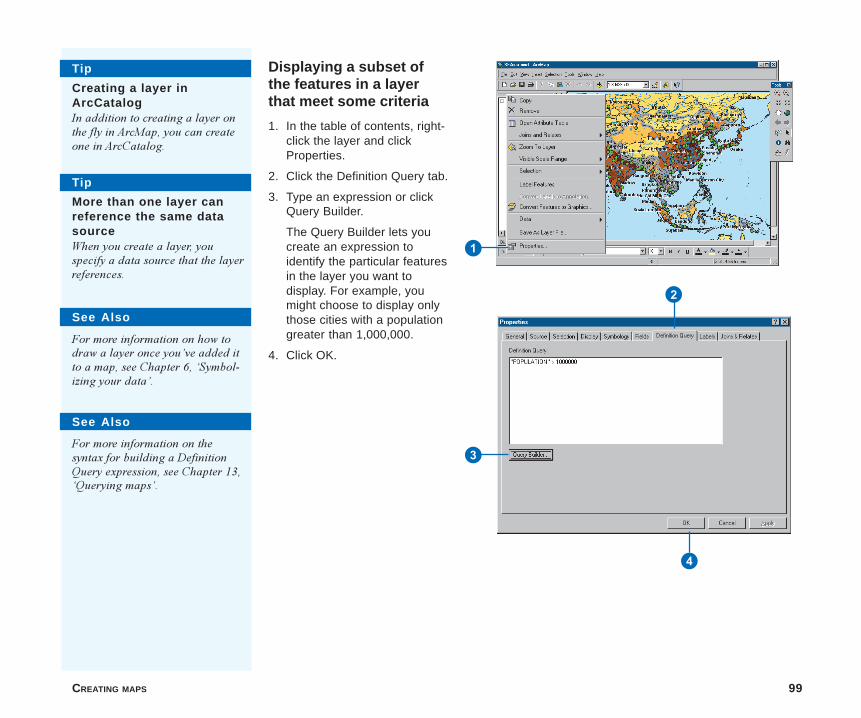
CREATING MAPS 99
Displaying a subset ofthe features in a layerthat meet some criteria
1. In the table of contents, right-click the layer and clickProperties.
2. Click the Definition Query tab.
3. Type an expression or clickQuery Builder.
The Query Builder lets youcreate an expression toidentify the particular featuresin the layer you want todisplay. For example, youmight choose to display onlythose cities with a populationgreater than 1,000,000.
4. Click OK.
See Also
For more information on how todraw a layer once you�ve added itto a map, see Chapter 6, �Symbol-izing your data�.
Tip
Creating a layer inArcCatalogIn addition to creating a layer onthe fly in ArcMap, you can createone in ArcCatalog.
Tip
More than one layer canreference the same datasourceWhen you create a layer, youspecify a data source that the layerreferences.
1
2
4
3
See Also
For more information on thesyntax for building a DefinitionQuery expression, see Chapter 13,�Querying maps�.
ch4.p65 12/04/2000, 10:12 AM99
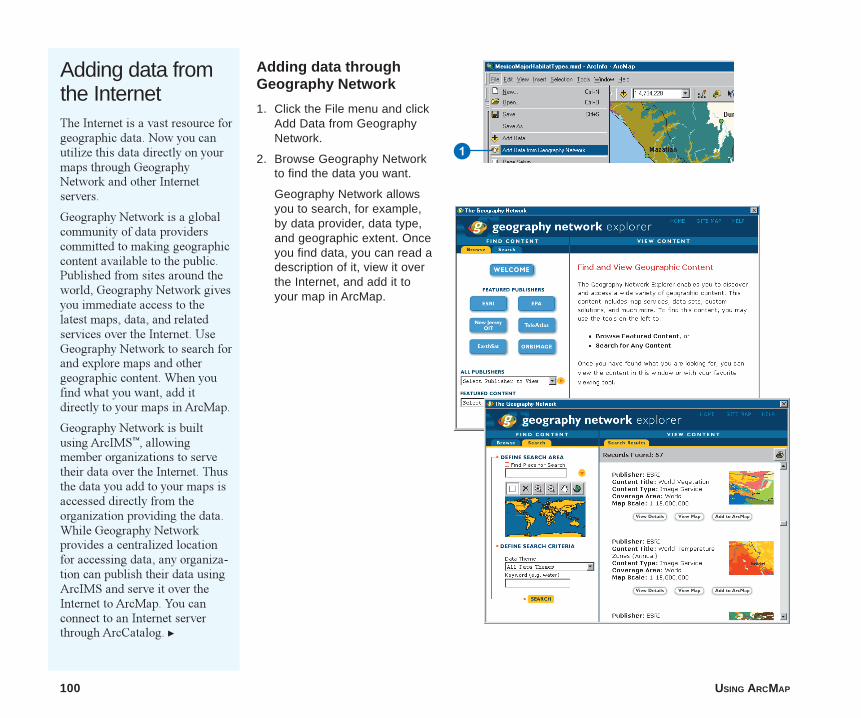
100 USING ARCMAP
Adding data fromthe InternetThe Internet is a vast resource forgeographic data. Now you canutilize this data directly on yourmaps through GeographyNetwork and other Internetservers.
Geography Network is a globalcommunity of data providerscommitted to making geographiccontent available to the public.Published from sites around theworld, Geography Network givesyou immediate access to thelatest maps, data, and relatedservices over the Internet. UseGeography Network to search forand explore maps and othergeographic content. When youfind what you want, add itdirectly to your maps in ArcMap.
Geography Network is builtusing ArcIMS�, allowingmember organizations to servetheir data over the Internet. Thusthe data you add to your maps isaccessed directly from theorganization providing the data.While Geography Networkprovides a centralized locationfor accessing data, any organiza-tion can publish their data usingArcIMS and serve it over theInternet to ArcMap. You canconnect to an Internet serverthrough ArcCatalog. u
Adding data throughGeography Network
1. Click the File menu and clickAdd Data from GeographyNetwork.
2. Browse Geography Networkto find the data you want.
Geography Network allowsyou to search, for example,by data provider, data type,and geographic extent. Onceyou find data, you can read adescription of it, view it overthe Internet, and add it toyour map in ArcMap.
1
ch4.p65 12/04/2000, 10:12 AM100
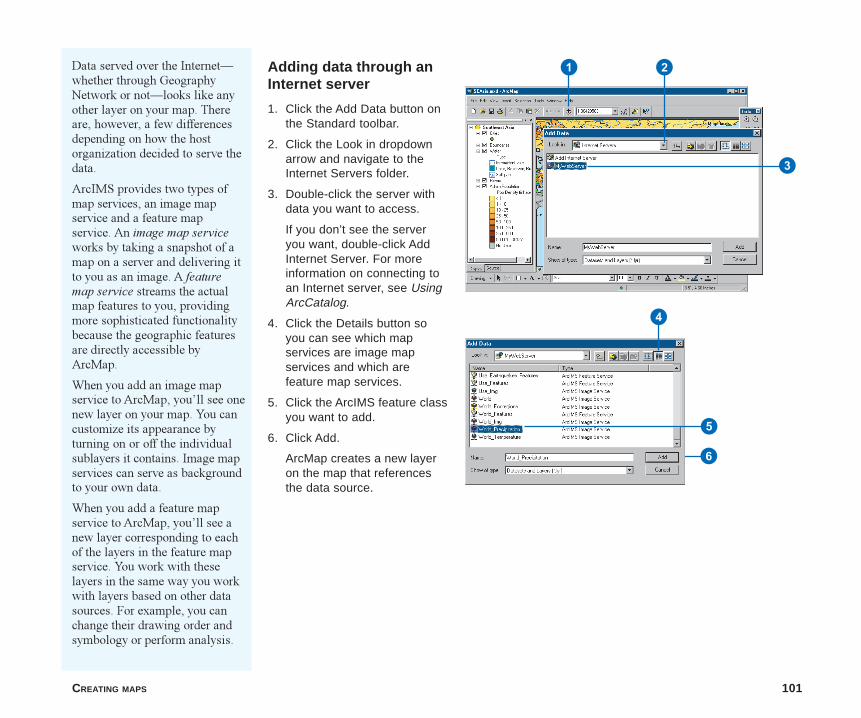
CREATING MAPS 101
Data served over the Internet�whether through GeographyNetwork or not�looks like anyother layer on your map. Thereare, however, a few differencesdepending on how the hostorganization decided to serve thedata.
ArcIMS provides two types ofmap services, an image mapservice and a feature mapservice. An image map serviceworks by taking a snapshot of amap on a server and delivering itto you as an image. A featuremap service streams the actualmap features to you, providingmore sophisticated functionalitybecause the geographic featuresare directly accessible byArcMap.
When you add an image mapservice to ArcMap, you�ll see onenew layer on your map. You cancustomize its appearance byturning on or off the individualsublayers it contains. Image mapservices can serve as backgroundto your own data.
When you add a feature mapservice to ArcMap, you�ll see anew layer corresponding to eachof the layers in the feature mapservice. You work with theselayers in the same way you workwith layers based on other datasources. For example, you canchange their drawing order andsymbology or perform analysis.
Adding data through anInternet server
1. Click the Add Data button onthe Standard toolbar.
2. Click the Look in dropdownarrow and navigate to theInternet Servers folder.
3. Double-click the server withdata you want to access.
If you don’t see the serveryou want, double-click AddInternet Server. For moreinformation on connecting toan Internet server, see UsingArcCatalog.
4. Click the Details button soyou can see which mapservices are image mapservices and which arefeature map services.
5. Click the ArcIMS feature classyou want to add.
6. Click Add.
ArcMap creates a new layeron the map that referencesthe data source.
1 2
3
6
5
4
ch4.p65 12/04/2000, 10:12 AM101
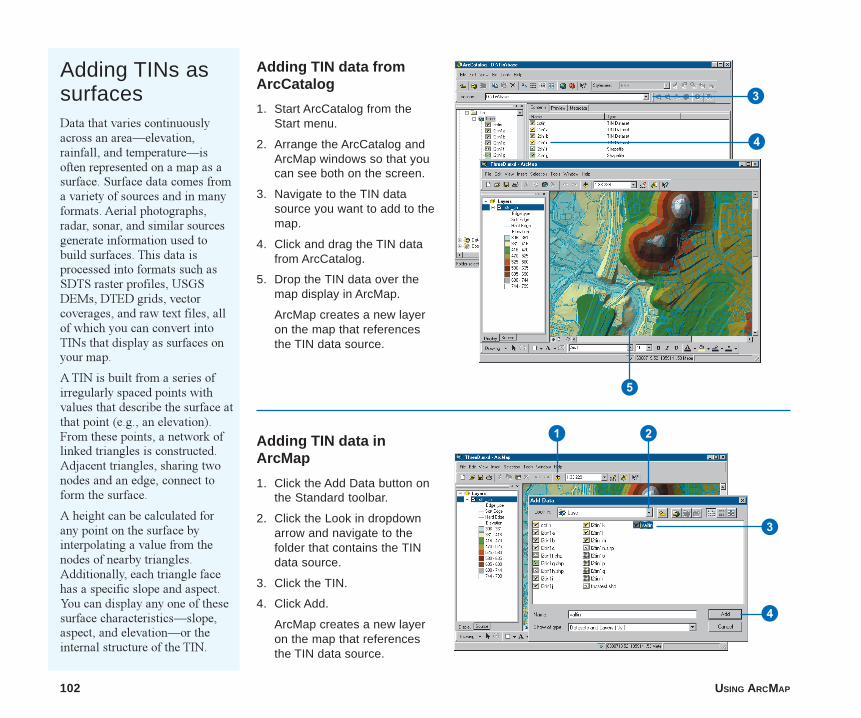
102 USING ARCMAP
Adding TINs assurfacesData that varies continuouslyacross an area�elevation,rainfall, and temperature�isoften represented on a map as asurface. Surface data comes froma variety of sources and in manyformats. Aerial photographs,radar, sonar, and similar sourcesgenerate information used tobuild surfaces. This data isprocessed into formats such asSDTS raster profiles, USGSDEMs, DTED grids, vectorcoverages, and raw text files, allof which you can convert intoTINs that display as surfaces onyour map.
A TIN is built from a series ofirregularly spaced points withvalues that describe the surface atthat point (e.g., an elevation).From these points, a network oflinked triangles is constructed.Adjacent triangles, sharing twonodes and an edge, connect toform the surface.
A height can be calculated forany point on the surface byinterpolating a value from thenodes of nearby triangles.Additionally, each triangle facehas a specific slope and aspect.You can display any one of thesesurface characteristics�slope,aspect, and elevation�or theinternal structure of the TIN.
Adding TIN data inArcMap
1. Click the Add Data button onthe Standard toolbar.
2. Click the Look in dropdownarrow and navigate to thefolder that contains the TINdata source.
3. Click the TIN.
4. Click Add.
ArcMap creates a new layeron the map that referencesthe TIN data source.
Adding TIN data fromArcCatalog
1. Start ArcCatalog from theStart menu.
2. Arrange the ArcCatalog andArcMap windows so that youcan see both on the screen.
3. Navigate to the TIN datasource you want to add to themap.
4. Click and drag the TIN datafrom ArcCatalog.
5. Drop the TIN data over themap display in ArcMap.
ArcMap creates a new layeron the map that referencesthe TIN data source.
3
4
1 2
3
4
5
ch4.p65 12/04/2000, 10:13 AM102
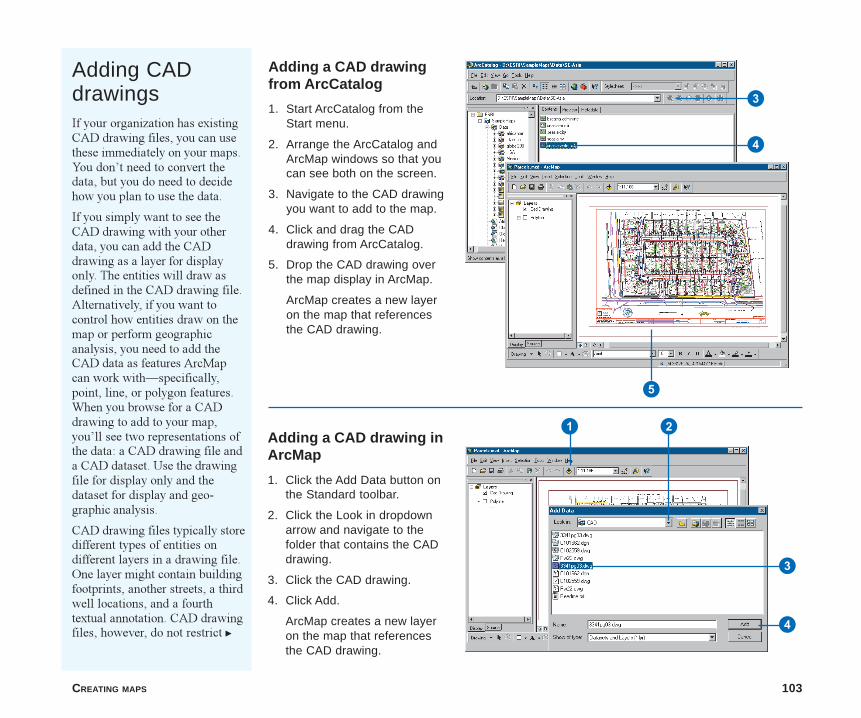
CREATING MAPS 103
Adding CADdrawingsIf your organization has existingCAD drawing files, you can usethese immediately on your maps.You don�t need to convert thedata, but you do need to decidehow you plan to use the data.
If you simply want to see theCAD drawing with your otherdata, you can add the CADdrawing as a layer for displayonly. The entities will draw asdefined in the CAD drawing file.Alternatively, if you want tocontrol how entities draw on themap or perform geographicanalysis, you need to add theCAD data as features ArcMapcan work with�specifically,point, line, or polygon features.When you browse for a CADdrawing to add to your map,you�ll see two representations ofthe data: a CAD drawing file anda CAD dataset. Use the drawingfile for display only and thedataset for display and geo-graphic analysis.
CAD drawing files typically storedifferent types of entities ondifferent layers in a drawing file.One layer might contain buildingfootprints, another streets, a thirdwell locations, and a fourthtextual annotation. CAD drawingfiles, however, do not restrict u
Adding a CAD drawingfrom ArcCatalog
1. Start ArcCatalog from theStart menu.
2. Arrange the ArcCatalog andArcMap windows so that youcan see both on the screen.
3. Navigate to the CAD drawingyou want to add to the map.
4. Click and drag the CADdrawing from ArcCatalog.
5. Drop the CAD drawing overthe map display in ArcMap.
ArcMap creates a new layeron the map that referencesthe CAD drawing.
3
4
5
Adding a CAD drawing inArcMap
1. Click the Add Data button onthe Standard toolbar.
2. Click the Look in dropdownarrow and navigate to thefolder that contains the CADdrawing.
3. Click the CAD drawing.
4. Click Add.
ArcMap creates a new layeron the map that referencesthe CAD drawing.
1 2
3
4
ch4.p65 12/04/2000, 10:13 AM103
104 USING ARCMAP
the type of entities you can haveon a drawing layer. Thus buildingfootprints might be on the samedrawing layer as streets. Whenworking with a CAD drawing asfeatures, you�ll likely add severalArcMap layers from the sameCAD drawing file and adjustwhat features display in thoselayers.
Adding a CAD dataset fordisplay and analysis
1. Click the Add Data button onthe Standard toolbar.
2. Click the Look in dropdownarrow and navigate to thefolder that contains the CADdataset.
3. Double-click the CAD datasetand click the CAD feature youwant to add.
4. Click Add.
Only the subset of features inthe layer will display.
1
2
4
3
ch4.p65 12/04/2000, 10:14 AM104
CREATING MAPS 105
Adding x,ycoordinate dataYou don�t always have to have adata source, such as a shapefile,to add data to your map. If youhave some tabular data thatcontains geographic locations inthe form of x,y coordinates, youcan add this to a map as well.
X,y coordinates describe discretelocations on the earth�s surfacesuch as the location of firehydrants in a city or the pointswhere soil samples were col-lected. You can easily collect x,ycoordinate data using a globalpositioning system (GPS) device.
In order to add a table of x,ycoordinates to your map, thetable must contain two fields,one for the x-coordinate and onefor the y-coordinate. The valuesin the fields may represent anycoordinate system and units suchas latitude and longitude ormeters.
Once you have added the data toyour map, the layer behaves justlike any other feature layer. Forinstance, you can decide whetheror not you want to display it,symbolize it, set the visible scale,or display a subset of featuresthat meet some criteria.
1
Adding a table with x,ycoordinates
1. Click the Tools menu on theStandard toolbar and clickAdd XY Data.
2. Click the table dropdownarrow and click a table thatcontains x,y coordinate data.If the table is not on the map,click the browse button toaccess it from disk.
3. Click the X Field dropdownarrow and click the fieldcontaining x-coordinatevalues.
4. Click the Y Field dropdownarrow and click the fieldcontaining y-coordinatevalues.
5. Click Edit to define thecoordinate system and unitsrepresented in the x and yfields.
The x,y coordinates will beautomatically transformed tomatch the coordinate systemof the data frame.
6. Click OK.
2
3 4
6
5
ch4.p65 12/04/2000, 10:14 AM105
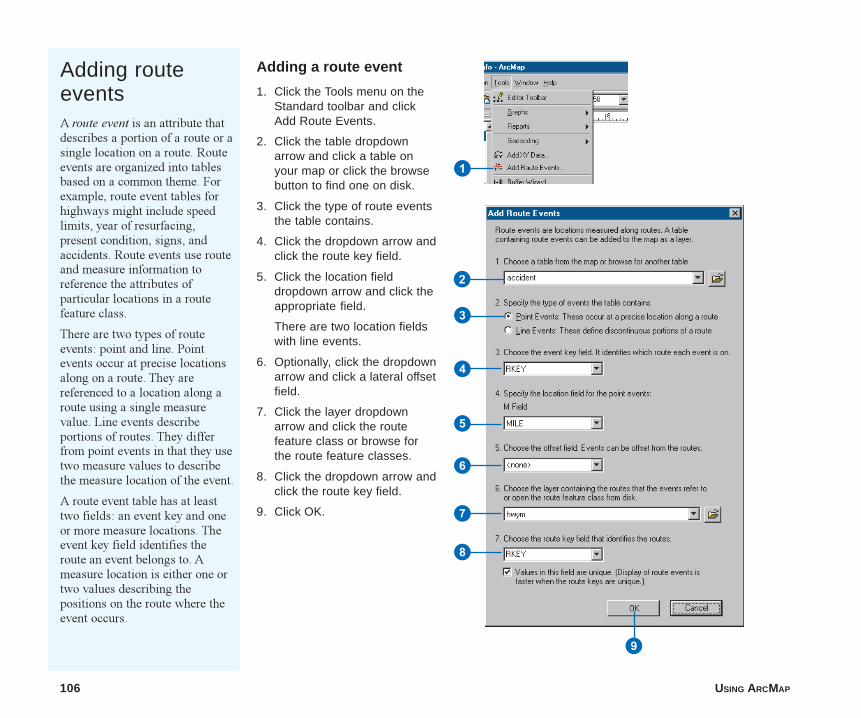
106 USING ARCMAP
Adding a route event
1. Click the Tools menu on theStandard toolbar and clickAdd Route Events.
2. Click the table dropdownarrow and click a table onyour map or click the browsebutton to find one on disk.
3. Click the type of route eventsthe table contains.
4. Click the dropdown arrow andclick the route key field.
5. Click the location fielddropdown arrow and click theappropriate field.
There are two location fieldswith line events.
6. Optionally, click the dropdownarrow and click a lateral offsetfield.
7. Click the layer dropdownarrow and click the routefeature class or browse forthe route feature classes.
8. Click the dropdown arrow andclick the route key field.
9. Click OK.
Adding routeeventsA route event is an attribute thatdescribes a portion of a route or asingle location on a route. Routeevents are organized into tablesbased on a common theme. Forexample, route event tables forhighways might include speedlimits, year of resurfacing,present condition, signs, andaccidents. Route events use routeand measure information toreference the attributes ofparticular locations in a routefeature class.
There are two types of routeevents: point and line. Pointevents occur at precise locationsalong on a route. They arereferenced to a location along aroute using a single measurevalue. Line events describeportions of routes. They differfrom point events in that they usetwo measure values to describethe measure location of the event.
A route event table has at leasttwo fields: an event key and oneor more measure locations. Theevent key field identifies theroute an event belongs to. Ameasure location is either one ortwo values describing thepositions on the route where theevent occurs.
1
2
3
4
5
6
7
8
9
ch4.p65 12/04/2000, 10:15 AM106

CREATING MAPS 107
About coordinate systems
The features on a map reference the actual locations of theobjects they represent in the real world. The positions of objectson the earth�s spherical surface are measured in degrees oflatitude and longitude, also known as geographic coordinates.While latitude and longitude can locate exact positions on thesurface of the earth, they are not uniform units of measure; onlyalong the equator does the distance represented by one degree oflongitude approximate the distance represented by one degree oflatitude. To overcome measurement difficulties, data is oftentransformed from the three-dimensional geographic coordinatesystem to the two-dimensional planar surface in a projectedcoordinate system. Projected coordinate systems describe thedistance from an origin (0,0) along two separate axes, ahorizontal x-axis representing east�west, and a vertical y-axisrepresenting north�south.
Because the earth is round and maps are flat, getting informationfrom the curved surface to a flat one involves a mathematicalformula called a map projection. A map projection transformslatitude and longitude to x,y coordinates in a projected coordinatesystem.
This process of flattening the earth will cause distortions in oneor more of the following spatial properties: distance, area, shape,and direction. No projection can preserve all these propertiesand, as a result, all flat maps are distorted to some degree.Fortunately, you can choose from many different mapprojections. Each is distinguished by its suitability forrepresenting a particular portion and amount of the earth�ssurface and by its ability to preserve distance, area, shape, ordirection. Some map projections minimize distortion in oneproperty at the expense of another, while others strive to balancethe overall distortion. As a mapmaker, you can decide whichproperties are most important and choose a projection that suitsyour needs.
Locations are expressed as latitude and longitude on a globe and as x,ycoordinates on a map.
Do you need to display your data with a projectedcoordinate system?
If your spatial data references locations with latitude andlongitude�for example, decimal degrees�you can still display iton your map. ArcMap draws the data by simply treating thelatitude/longitude coordinates as planar x,y coordinates. If yourmap doesn�t require a high level of locational accuracy�if youwon�t be performing queries based on location and distance or ifyou just want to make a quick map�you might decide not totransform your data to a projected coordinate system. If,however, you need to make precise measurements on your map,you should choose a projected coordinate system.
Displaying the world using the sinusoidal projection (left) and the Robinsonprojection (right).
ch4.p65 12/04/2000, 10:15 AM107
108 USING ARCMAP
Reasons for using a projected coordinate system
� You want to make accurate measurements from your map andbe sure that spatial analysis options you use in ArcMapcalculate distance correctly. Latitude/Longitude is a goodsystem for storing spatial data, but not very good for viewing,querying, or analyzing maps. Degrees of latitude andlongitude are not consistent units of measure for area, shape,distance, and direction.
� You are making a map in which you want to preserve one ormore of these properties: area, shape, distance, and direction.
� You are making a small-scale map such as a national or worldmap. With a small-scale map, your choice of map projectiondetermines the overall appearance of the map. For example,with some projections, lines of latitude and longitude willappear curved; with others they will appear straight.
� Your organization mandates using a particular projectedcoordinate system for all maps.
What type of map projection should you choose?
Here are a few things to consider when choosing a projection:
� Which spatial properties do you want to preserve?
� Where is the area you�re mapping? Is your data in a polarregion? An equatorial region?
� What shape is the area you�re mapping? Is it square? Is itwider in the east�west direction?
� How big is the area you�re mapping? On large-scale maps,such as street maps, distortion may be negligible because yourmap covers only a small part of the earth�s surface. On small-scale maps, where a small distance on the map represents aconsiderable distance on the earth, distortion may have abigger impact, especially if you use your map to compare ormeasure shape, area, or distance.
Answering these questions will determine what map projectionand thus what projected coordinate system you�ll want to use todisplay your data.
Map projections can be generally classified according to whatspatial attribute they preserve.
� Equal Area projections preserve area. Many thematic mapsuse an equal area projection. Maps of the United Statescommonly use the Albers Equal Area Conic projection.
� Conformal projections preserve shape and are useful fornavigational charts and weather maps. Shape is preserved forsmall areas, but the shape of a large area such as a continentwill be significantly distorted. The Lambert Conformal Conicand Mercator projections are common conformal projections.
� Equidistant projections preserve distances, but no projectioncan preserve distances from all points to all other points.Instead, distance can be held true from one point (or a fewpoints) to all other points or along all meridians or parallels. Ifyou will be using your map to find features that are within acertain distance of other features, you should use anequidistant map projection.
� Azimuthal projections preserve direction from one point to allother points. This quality can be combined with equal area,conformal, and equidistant projections, as in the Lambertequal area azimuthal and the azimuthal equidistantprojections.
� Other projections minimize overall distortion but don�tpreserve any of the four spatial properties of area, shape,distance, and direction. The Robinson projection, forexample, is neither equal area nor conformal but isaesthetically pleasing and useful for general mapping.
For more information on coordinate systems, see UnderstandingMap Projections.
ch4.p65 12/04/2000, 10:15 AM108
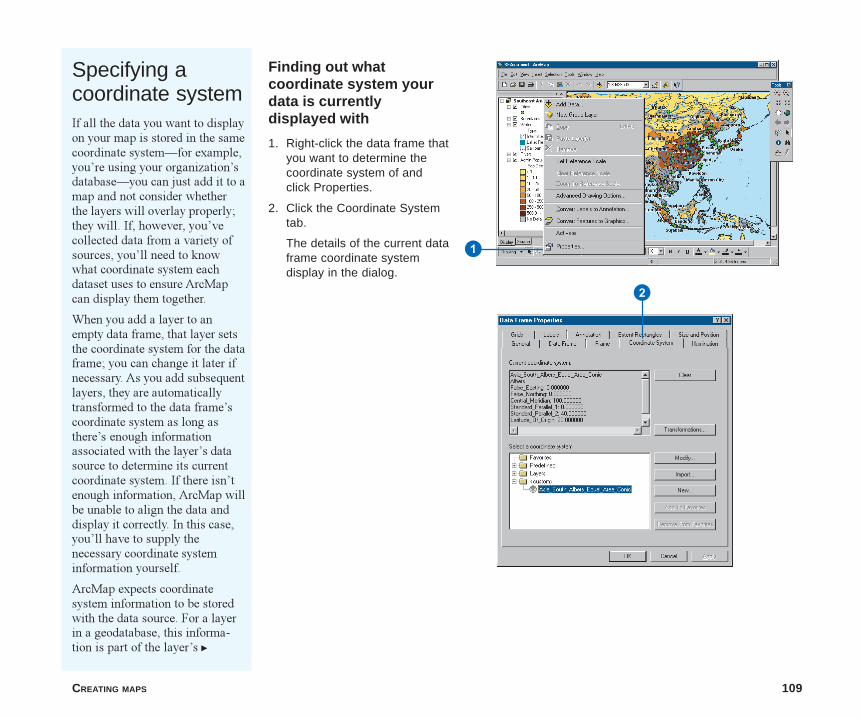
CREATING MAPS 109
Specifying acoordinate systemIf all the data you want to displayon your map is stored in the samecoordinate system�for example,you�re using your organization�sdatabase�you can just add it to amap and not consider whetherthe layers will overlay properly;they will. If, however, you�vecollected data from a variety ofsources, you�ll need to knowwhat coordinate system eachdataset uses to ensure ArcMapcan display them together.
When you add a layer to anempty data frame, that layer setsthe coordinate system for the dataframe; you can change it later ifnecessary. As you add subsequentlayers, they are automaticallytransformed to the data frame�scoordinate system as long asthere�s enough informationassociated with the layer�s datasource to determine its currentcoordinate system. If there isn�tenough information, ArcMap willbe unable to align the data anddisplay it correctly. In this case,you�ll have to supply thenecessary coordinate systeminformation yourself.
ArcMap expects coordinatesystem information to be storedwith the data source. For a layerin a geodatabase, this informa-tion is part of the layer�s u
Finding out whatcoordinate system yourdata is currentlydisplayed with
1. Right-click the data frame thatyou want to determine thecoordinate system of andclick Properties.
2. Click the Coordinate Systemtab.
The details of the current dataframe coordinate systemdisplay in the dialog.
1
2
ch4.p65 12/04/2000, 10:16 AM109
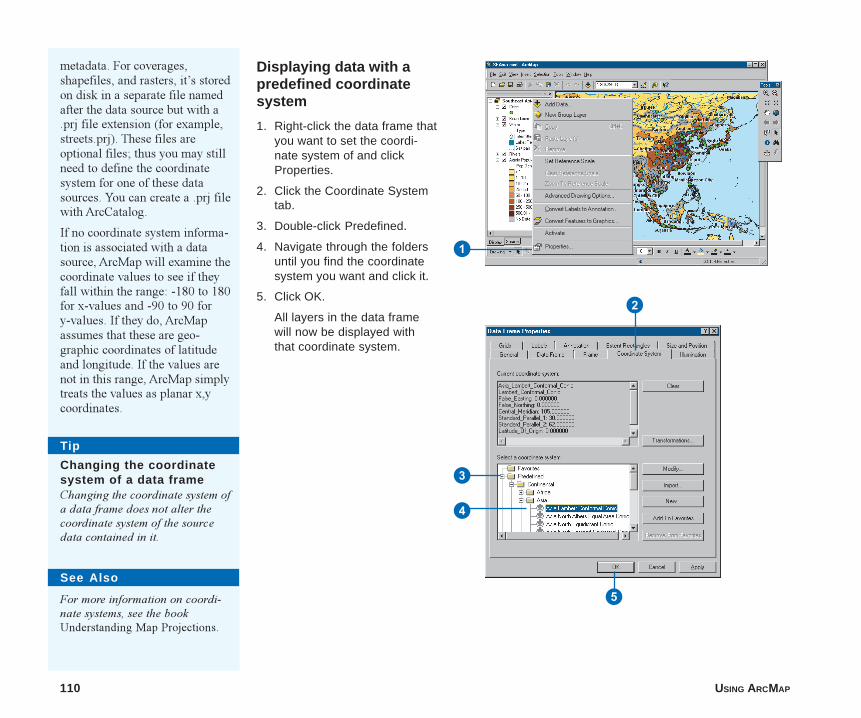
110 USING ARCMAP
Tip
Changing the coordinatesystem of a data frameChanging the coordinate system ofa data frame does not alter thecoordinate system of the sourcedata contained in it.
See Also
For more information on coordi-nate systems, see the bookUnderstanding Map Projections.
metadata. For coverages,shapefiles, and rasters, it�s storedon disk in a separate file namedafter the data source but with a.prj file extension (for example,streets.prj). These files areoptional files; thus you may stillneed to define the coordinatesystem for one of these datasources. You can create a .prj filewith ArcCatalog.
If no coordinate system informa-tion is associated with a datasource, ArcMap will examine thecoordinate values to see if theyfall within the range: -180 to 180for x-values and -90 to 90 fory-values. If they do, ArcMapassumes that these are geo-graphic coordinates of latitudeand longitude. If the values arenot in this range, ArcMap simplytreats the values as planar x,ycoordinates.
Displaying data with apredefined coordinatesystem
1. Right-click the data frame thatyou want to set the coordi-nate system of and clickProperties.
2. Click the Coordinate Systemtab.
3. Double-click Predefined.
4. Navigate through the foldersuntil you find the coordinatesystem you want and click it.
5. Click OK.
All layers in the data framewill now be displayed withthat coordinate system.
1
2
3
4
5
ch4.p65 12/04/2000, 10:16 AM110
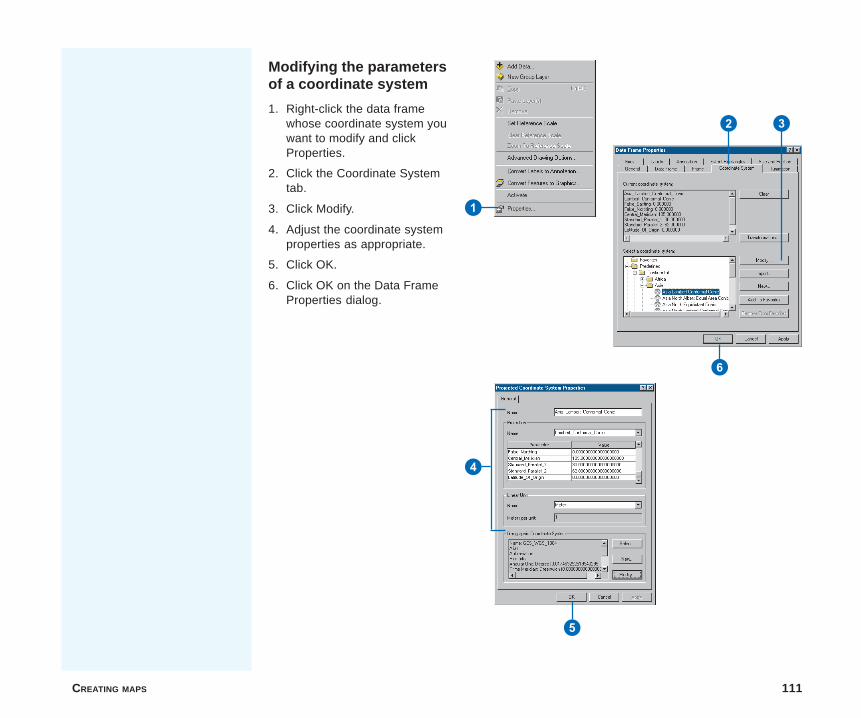
CREATING MAPS 111
Modifying the parametersof a coordinate system
1. Right-click the data framewhose coordinate system youwant to modify and clickProperties.
2. Click the Coordinate Systemtab.
3. Click Modify.
4. Adjust the coordinate systemproperties as appropriate.
5. Click OK.
6. Click OK on the Data FrameProperties dialog.
1
2
6
4
5
3
ch4.p65 12/04/2000, 10:17 AM111
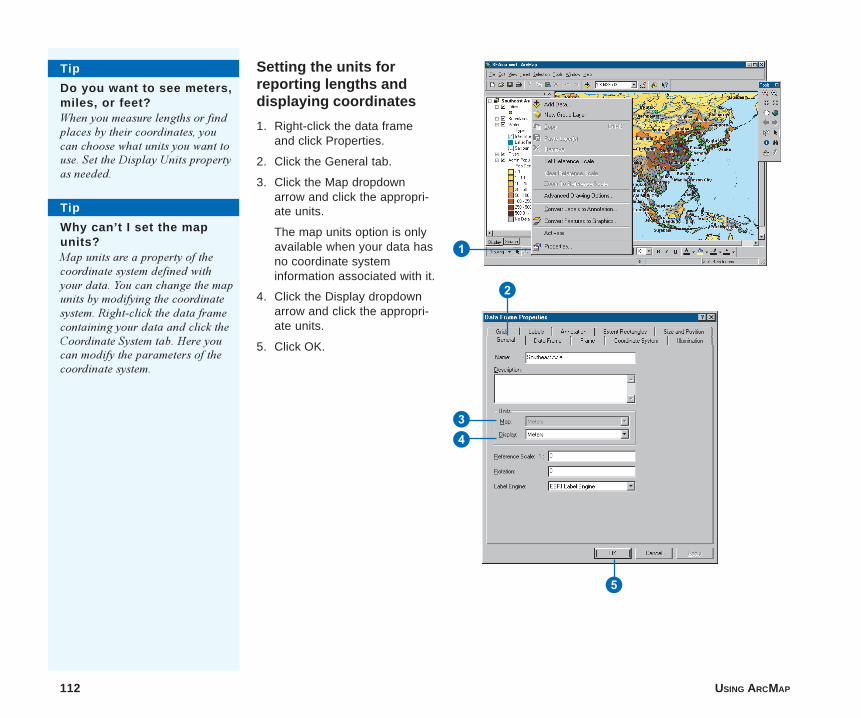
112 USING ARCMAP
Setting the units forreporting lengths anddisplaying coordinates
1. Right-click the data frameand click Properties.
2. Click the General tab.
3. Click the Map dropdownarrow and click the appropri-ate units.
The map units option is onlyavailable when your data hasno coordinate systeminformation associated with it.
4. Click the Display dropdownarrow and click the appropri-ate units.
5. Click OK.
Tip
Do you want to see meters,miles, or feet?When you measure lengths or findplaces by their coordinates, youcan choose what units you want touse. Set the Display Units propertyas needed.
1
2
34
5
Tip
Why can’t I set the mapunits?Map units are a property of thecoordinate system defined withyour data. You can change the mapunits by modifying the coordinatesystem. Right-click the data framecontaining your data and click theCoordinate System tab. Here youcan modify the parameters of thecoordinate system.
ch4.p65 12/04/2000, 10:17 AM112
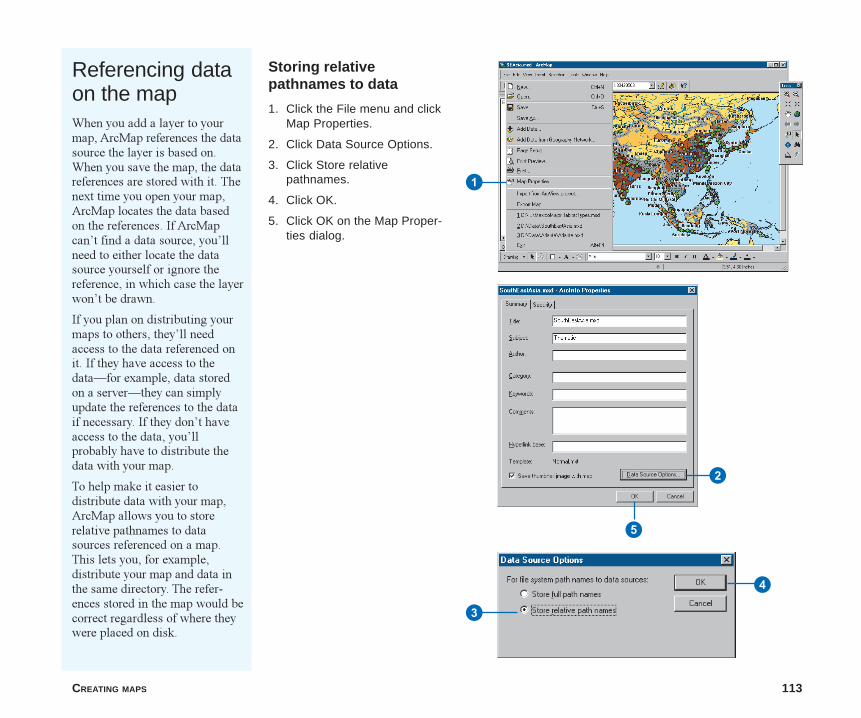
CREATING MAPS 113
Referencing dataon the mapWhen you add a layer to yourmap, ArcMap references the datasource the layer is based on.When you save the map, the datareferences are stored with it. Thenext time you open your map,ArcMap locates the data basedon the references. If ArcMapcan�t find a data source, you�llneed to either locate the datasource yourself or ignore thereference, in which case the layerwon�t be drawn.
If you plan on distributing yourmaps to others, they�ll needaccess to the data referenced onit. If they have access to thedata�for example, data storedon a server�they can simplyupdate the references to the dataif necessary. If they don�t haveaccess to the data, you�llprobably have to distribute thedata with your map.
To help make it easier todistribute data with your map,ArcMap allows you to storerelative pathnames to datasources referenced on a map.This lets you, for example,distribute your map and data inthe same directory. The refer-ences stored in the map would becorrect regardless of where theywere placed on disk.
Storing relativepathnames to data
1. Click the File menu and clickMap Properties.
2. Click Data Source Options.
3. Click Store relativepathnames.
4. Click OK.
5. Click OK on the Map Proper-ties dialog.
3
4
1
2
5
ch4.p65 12/04/2000, 10:18 AM113
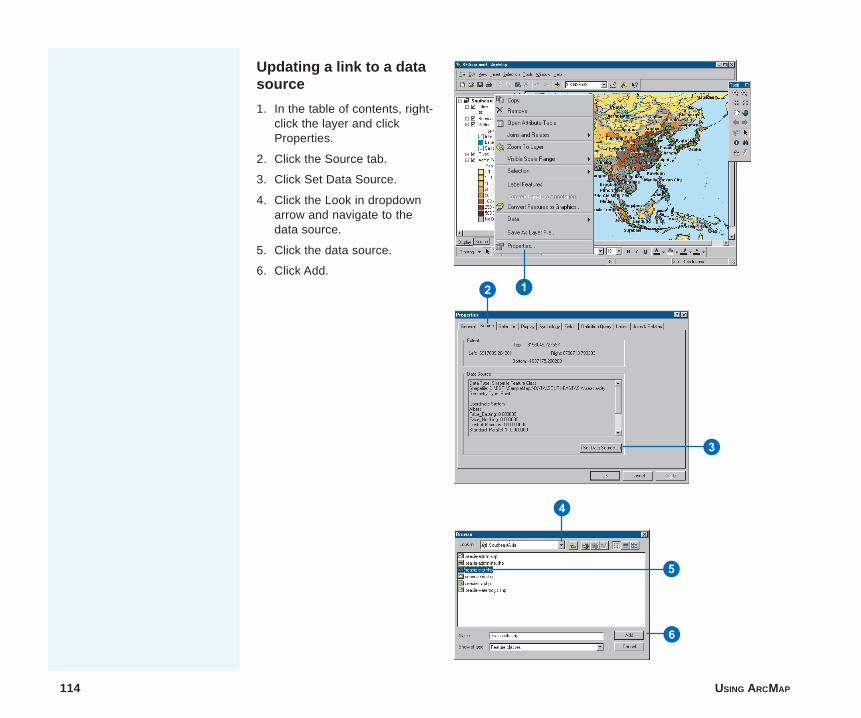
114 USING ARCMAP
Updating a link to a datasource
1. In the table of contents, right-click the layer and clickProperties.
2. Click the Source tab.
3. Click Set Data Source.
4. Click the Look in dropdownarrow and navigate to thedata source.
5. Click the data source.
6. Click Add.
2
3
4
5
6
1
ch4.p65 12/04/2000, 10:19 AM114
IN THIS CHAPTER
115
Managing layers 5• Changing a layer’s text
description
• Changing a layer’s drawing order
• Copying layers
• Removing layers from the map
• Grouping layers
• Accessing layer properties
• Displaying a layer at certainscales
• Changing the appearance of thetable of contents
• Using data frames to organizelayers
• Saving a layer to disk
• Repairing broken data links
You can think of a layer as a convenient way to access geographic data. Alayer defines how to display the geographic data it references and where thatdata is located in your database. If you don�t know much about thegeographic data in your organization, you�ll likely just add prebuilt layers toyour maps. If you help maintain the geographic data, you�ll probably createlayers that effectively communicate information about the data for others touse on their maps.
As you saw in the previous chapter, it�s easy to add layers to a map�yousimply drag them from ArcCatalog to your map. Once they are on your map,you�ll typically organize them to make your map look the way you want it to.You organize and manage layers through the table of contents. The table ofcontents lets you control when the layer draws, how it draws, and in whatdata frame on the map it appears. You can also remove layers, group them,and save them to disk.
A layer at the top of the table of contents draws on top of those below it.Thus, you�ll place layers that form the background of your map, such as anocean layer, at the bottom of the table of contents.
ch5.p65 12/04/2000, 11:05 AM115
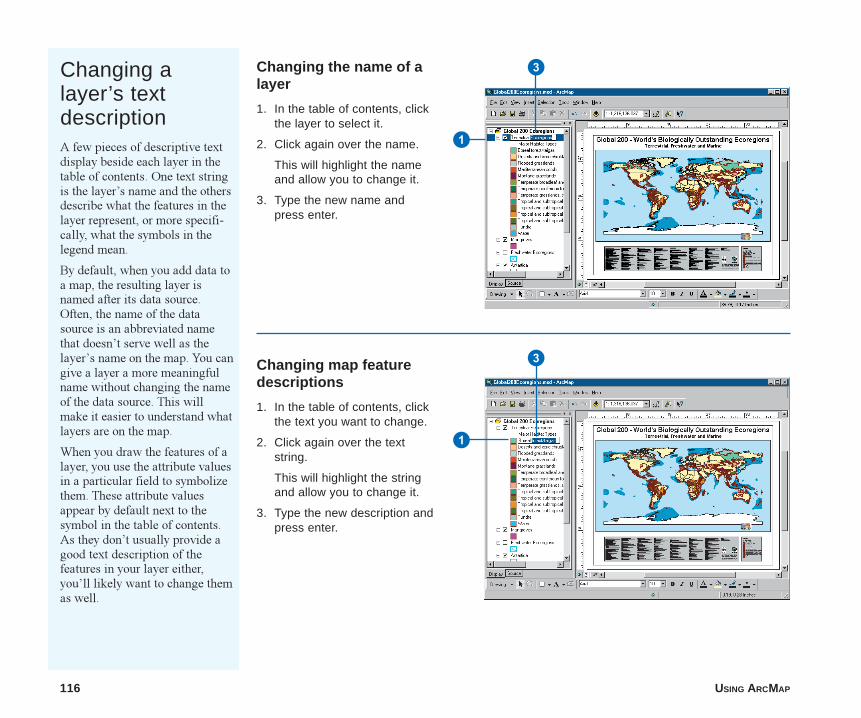
116 USING ARCMAP
Changing alayer’s textdescriptionA few pieces of descriptive textdisplay beside each layer in thetable of contents. One text stringis the layer�s name and the othersdescribe what the features in thelayer represent, or more specifi-cally, what the symbols in thelegend mean.
By default, when you add data toa map, the resulting layer isnamed after its data source.Often, the name of the datasource is an abbreviated namethat doesn�t serve well as thelayer�s name on the map. You cangive a layer a more meaningfulname without changing the nameof the data source. This willmake it easier to understand whatlayers are on the map.
When you draw the features of alayer, you use the attribute valuesin a particular field to symbolizethem. These attribute valuesappear by default next to thesymbol in the table of contents.As they don�t usually provide agood text description of thefeatures in your layer either,you�ll likely want to change themas well.
Changing the name of alayer
1. In the table of contents, clickthe layer to select it.
2. Click again over the name.
This will highlight the nameand allow you to change it.
3. Type the new name andpress enter.
Changing map featuredescriptions
1. In the table of contents, clickthe text you want to change.
2. Click again over the textstring.
This will highlight the stringand allow you to change it.
3. Type the new description andpress enter.
1
3
1
3
ch5.p65 12/04/2000, 11:06 AM116
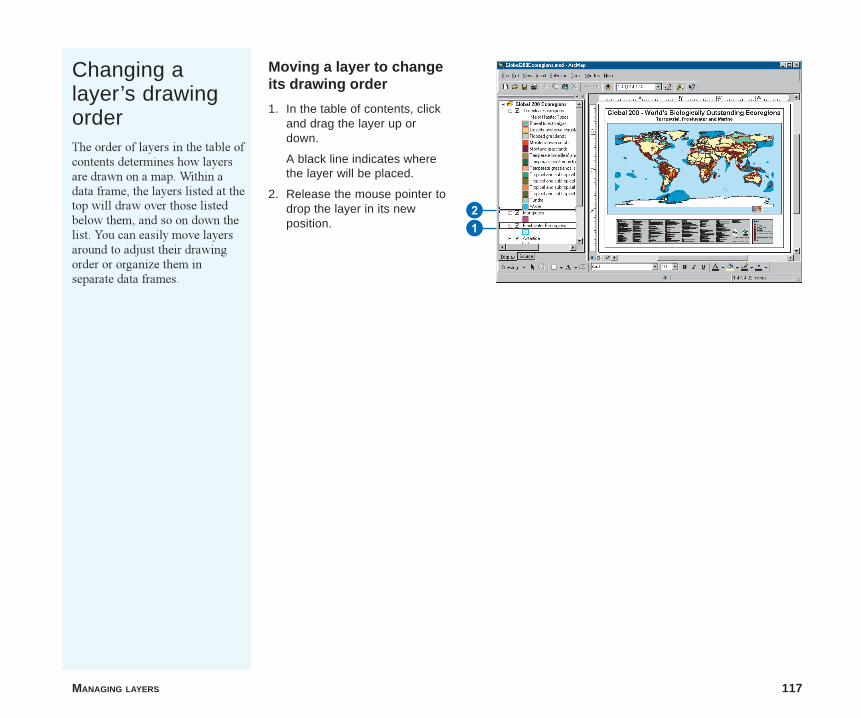
MANAGING LAYERS 117
Changing alayer’s drawingorderThe order of layers in the table ofcontents determines how layersare drawn on a map. Within adata frame, the layers listed at thetop will draw over those listedbelow them, and so on down thelist. You can easily move layersaround to adjust their drawingorder or organize them inseparate data frames.
Moving a layer to changeits drawing order
1. In the table of contents, clickand drag the layer up ordown.
A black line indicates wherethe layer will be placed.
2. Release the mouse pointer todrop the layer in its newposition.
21
ch5.p65 12/04/2000, 11:06 AM117
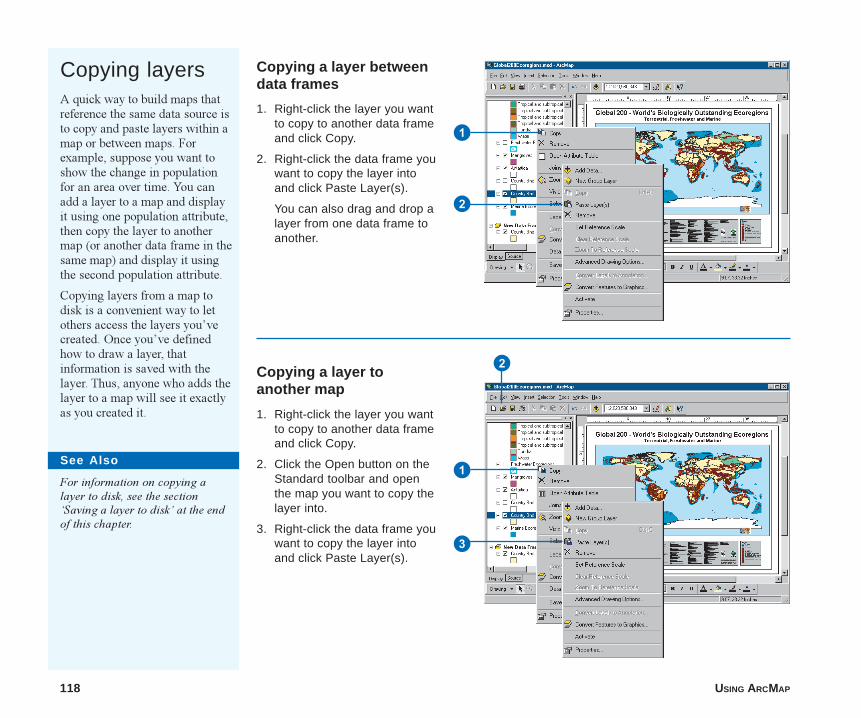
118 USING ARCMAP
Copying a layer toanother map
1. Right-click the layer you wantto copy to another data frameand click Copy.
2. Click the Open button on theStandard toolbar and openthe map you want to copy thelayer into.
3. Right-click the data frame youwant to copy the layer intoand click Paste Layer(s).
Copying layersA quick way to build maps thatreference the same data source isto copy and paste layers within amap or between maps. Forexample, suppose you want toshow the change in populationfor an area over time. You canadd a layer to a map and displayit using one population attribute,then copy the layer to anothermap (or another data frame in thesame map) and display it usingthe second population attribute.
Copying layers from a map todisk is a convenient way to letothers access the layers you�vecreated. Once you�ve definedhow to draw a layer, thatinformation is saved with thelayer. Thus, anyone who adds thelayer to a map will see it exactlyas you created it.
Copying a layer betweendata frames
1. Right-click the layer you wantto copy to another data frameand click Copy.
2. Right-click the data frame youwant to copy the layer intoand click Paste Layer(s).
You can also drag and drop alayer from one data frame toanother.
1
1
3
2
2
See Also
For information on copying alayer to disk, see the section�Saving a layer to disk� at the endof this chapter.
ch5.p65 12/04/2000, 11:07 AM118
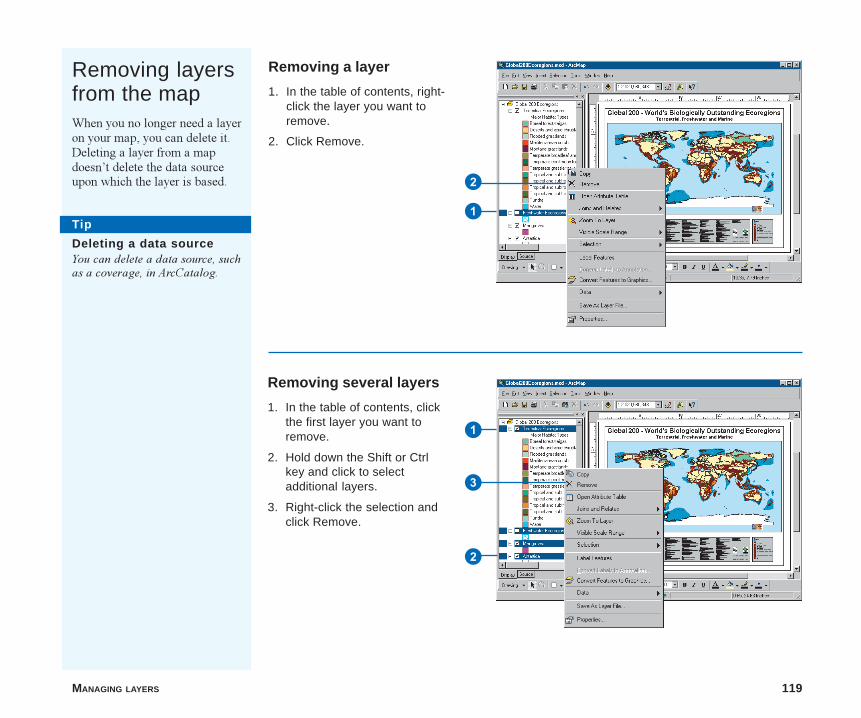
MANAGING LAYERS 119
Removing a layer
1. In the table of contents, right-click the layer you want toremove.
2. Click Remove.
Removing several layers
1. In the table of contents, clickthe first layer you want toremove.
2. Hold down the Shift or Ctrlkey and click to selectadditional layers.
3. Right-click the selection andclick Remove.
Removing layersfrom the mapWhen you no longer need a layeron your map, you can delete it.Deleting a layer from a mapdoesn�t delete the data sourceupon which the layer is based.
Tip
Deleting a data sourceYou can delete a data source, suchas a coverage, in ArcCatalog.
2
1
2
1
3
ch5.p65 12/04/2000, 11:08 AM119
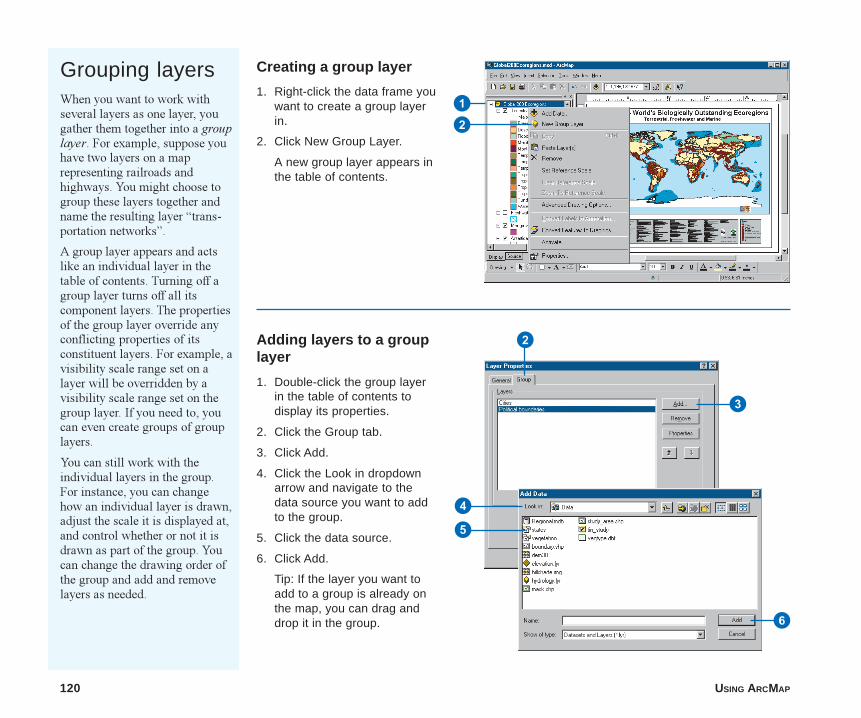
120 USING ARCMAP
Grouping layersWhen you want to work withseveral layers as one layer, yougather them together into a grouplayer. For example, suppose youhave two layers on a maprepresenting railroads andhighways. You might choose togroup these layers together andname the resulting layer �trans-portation networks�.
A group layer appears and actslike an individual layer in thetable of contents. Turning off agroup layer turns off all itscomponent layers. The propertiesof the group layer override anyconflicting properties of itsconstituent layers. For example, avisibility scale range set on alayer will be overridden by avisibility scale range set on thegroup layer. If you need to, youcan even create groups of grouplayers.
You can still work with theindividual layers in the group.For instance, you can changehow an individual layer is drawn,adjust the scale it is displayed at,and control whether or not it isdrawn as part of the group. Youcan change the drawing order ofthe group and add and removelayers as needed.
Creating a group layer
1. Right-click the data frame youwant to create a group layerin.
2. Click New Group Layer.
A new group layer appears inthe table of contents.
Adding layers to a grouplayer
1. Double-click the group layerin the table of contents todisplay its properties.
2. Click the Group tab.
3. Click Add.
4. Click the Look in dropdownarrow and navigate to thedata source you want to addto the group.
5. Click the data source.
6. Click Add.
Tip: If the layer you want toadd to a group is already onthe map, you can drag anddrop it in the group.
21
3
5
4
6
2
ch5.p65 12/04/2000, 11:08 AM120
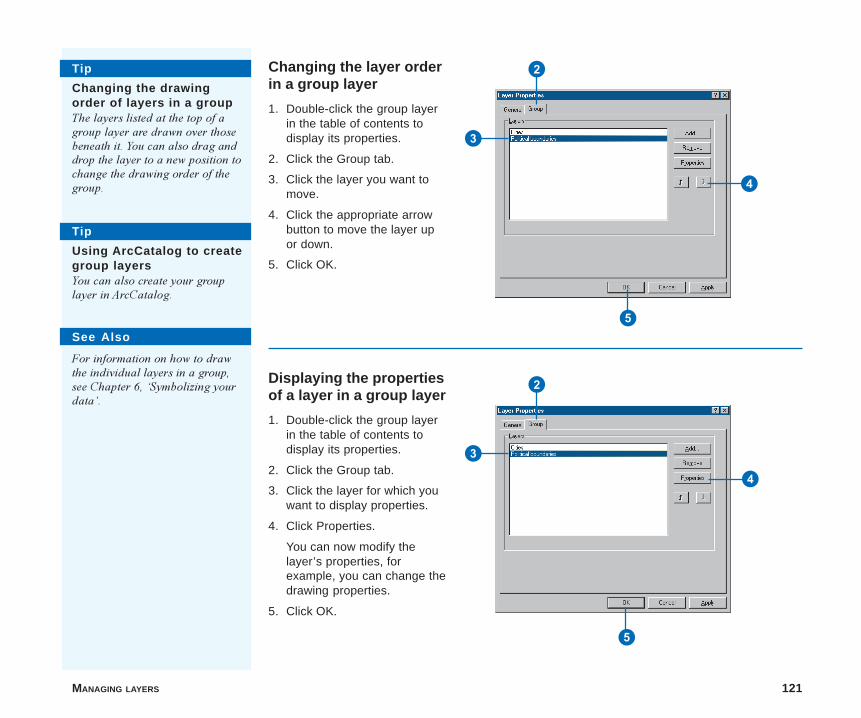
MANAGING LAYERS 121
Tip
Changing the drawingorder of layers in a groupThe layers listed at the top of agroup layer are drawn over thosebeneath it. You can also drag anddrop the layer to a new position tochange the drawing order of thegroup.
See Also
For information on how to drawthe individual layers in a group,see Chapter 6, �Symbolizing yourdata�.
Tip
Using ArcCatalog to creategroup layersYou can also create your grouplayer in ArcCatalog.
Changing the layer orderin a group layer
1. Double-click the group layerin the table of contents todisplay its properties.
2. Click the Group tab.
3. Click the layer you want tomove.
4. Click the appropriate arrowbutton to move the layer upor down.
5. Click OK.
Displaying the propertiesof a layer in a group layer
1. Double-click the group layerin the table of contents todisplay its properties.
2. Click the Group tab.
3. Click the layer for which youwant to display properties.
4. Click Properties.
You can now modify thelayer’s properties, forexample, you can change thedrawing properties.
5. Click OK.
4
3
2
5
4
3
2
5
ch5.p65 12/04/2000, 11:09 AM121

122 USING ARCMAP
Removing a layer from agroup layer
1. Double-click the group layerin the table of contents todisplay its properties.
2. Click the Group tab.
3. Click the layer that you wantto remove.
4. Click Remove.
5. Click OK.
Tip
Removing several layersfrom a group layerHold down the Shift or Ctrl key toselect more than one layer in thegroup. 4
3
2
5
ch5.p65 12/04/2000, 11:10 AM122
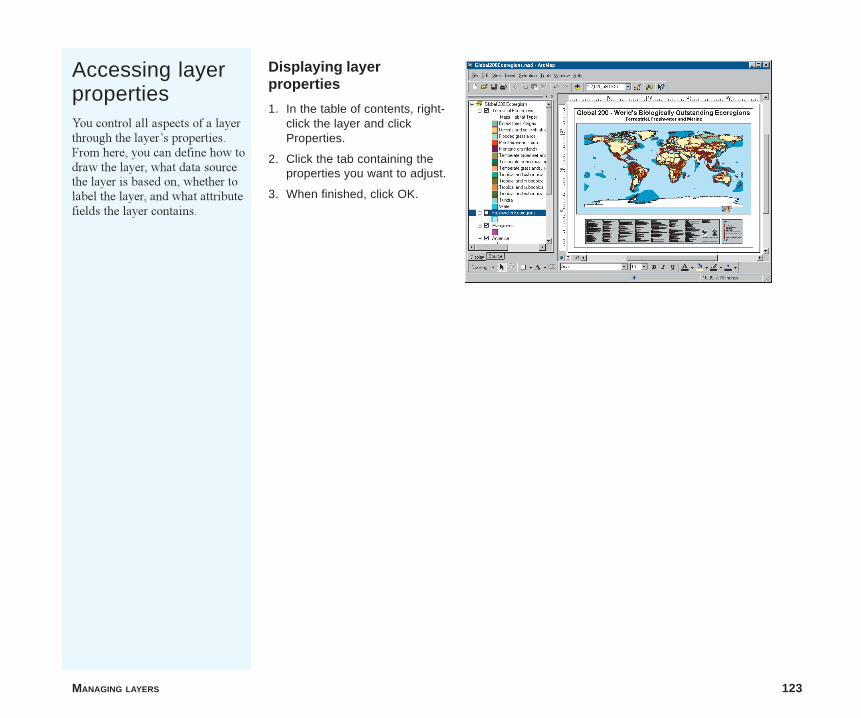
MANAGING LAYERS 123
Accessing layerpropertiesYou control all aspects of a layerthrough the layer�s properties.From here, you can define how todraw the layer, what data sourcethe layer is based on, whether tolabel the layer, and what attributefields the layer contains.
Displaying layerproperties
1. In the table of contents, right-click the layer and clickProperties.
2. Click the tab containing theproperties you want to adjust.
3. When finished, click OK.
ch5.p65 12/04/2000, 11:10 AM123

124 USING ARCMAP
Displaying a layerat certain scalesAs long as a layer is turned on inthe table of contents, ArcMapdraws it, regardless of the mapscale. As you zoom out, it maybecome harder to distinguishfeatures in layers that containmore detailed information. Whileyou can turn a layer off, this maybe inconvenient, especially ifyour map contains several layersand you change scale frequentlyas you work.
To help you automatically displaylayers at the appropriate scale,you can set a layer�s visible scalerange and define the range ofscales at which ArcMap drawsthe layer. Whenever the scale ofthe data frame is outside thelayer�s visible scale range, thelayer won�t draw. In this way,you can control how the maplooks at various scales. Forexample, you can hide a detailedlayer that might otherwise clutterup your map when you zoom out.Or, you can progressively displaymore detailed layers as you zoomin on an area, that is, as the scaleof the data frame gets larger.Setting a visible scale range isespecially useful if you arecreating a map for others to usebecause it makes browsing themap easier.
Setting the minimumvisible scale for a layer
1. Right-click the layer in thetable of contents and clickProperties.
2. Click the General tab.
3. Click Don’t show layer whenzoomed.
4. Type a minimum scale for thelayer.
If you zoom out beyond thisscale, the layer will not bevisible.
5. Click OK.
Setting the maximumvisible scale for a layer
1. Right-click the layer in thetable of contents and clickProperties.
2. Click the General tab.
3. Click Don’t show layer whenzoomed.
4. Type a maximum scale for thelayer.
If you zoom in beyond thisscale, the layer will not bevisible.
5. Click OK.
2
34
5
2
3
4
5
ch5.p65 12/04/2000, 11:10 AM124
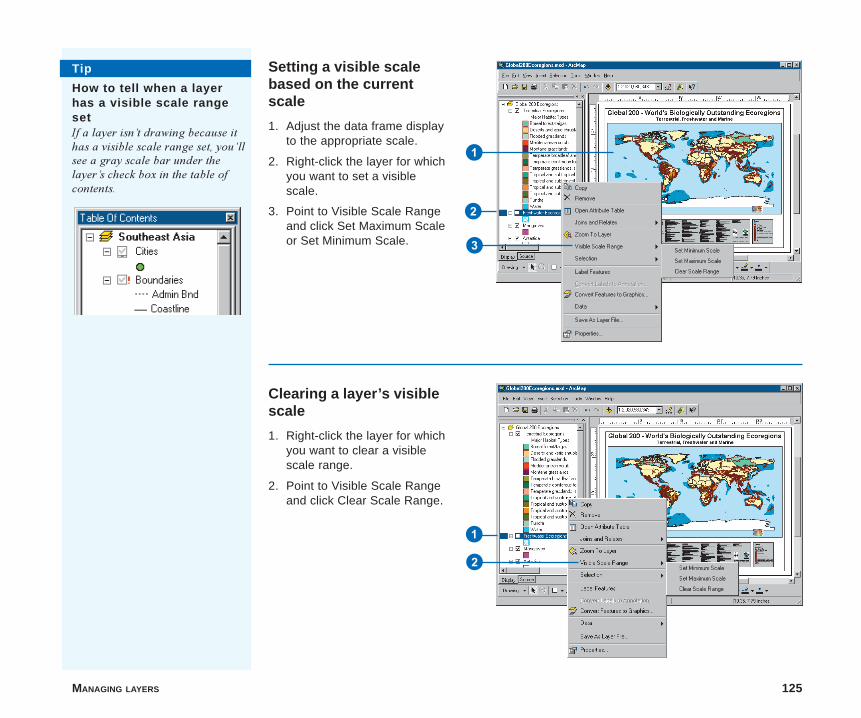
MANAGING LAYERS 125
Clearing a layer’s visiblescale
1. Right-click the layer for whichyou want to clear a visiblescale range.
2. Point to Visible Scale Rangeand click Clear Scale Range.
Setting a visible scalebased on the currentscale
1. Adjust the data frame displayto the appropriate scale.
2. Right-click the layer for whichyou want to set a visiblescale.
3. Point to Visible Scale Rangeand click Set Maximum Scaleor Set Minimum Scale.
3
2
2
1
1
Tip
How to tell when a layerhas a visible scale rangesetIf a layer isn�t drawing because ithas a visible scale range set, you�llsee a gray scale bar under thelayer�s check box in the table ofcontents.
ch5.p65 12/04/2000, 11:11 AM125
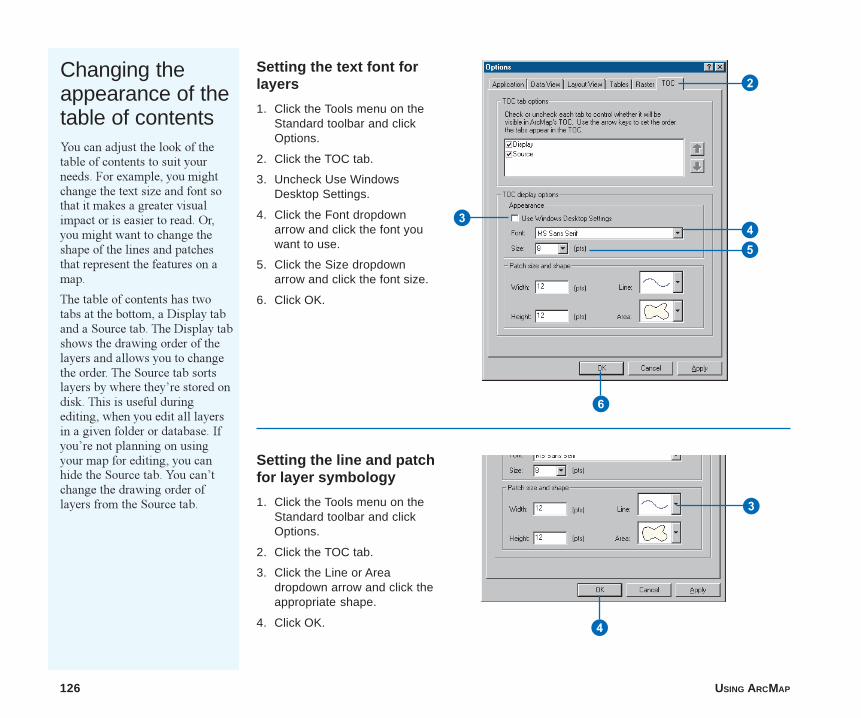
126 USING ARCMAP
Setting the text font forlayers
1. Click the Tools menu on theStandard toolbar and clickOptions.
2. Click the TOC tab.
3. Uncheck Use WindowsDesktop Settings.
4. Click the Font dropdownarrow and click the font youwant to use.
5. Click the Size dropdownarrow and click the font size.
6. Click OK.
Changing theappearance of thetable of contentsYou can adjust the look of thetable of contents to suit yourneeds. For example, you mightchange the text size and font sothat it makes a greater visualimpact or is easier to read. Or,you might want to change theshape of the lines and patchesthat represent the features on amap.
The table of contents has twotabs at the bottom, a Display taband a Source tab. The Display tabshows the drawing order of thelayers and allows you to changethe order. The Source tab sortslayers by where they�re stored ondisk. This is useful duringediting, when you edit all layersin a given folder or database. Ifyou�re not planning on usingyour map for editing, you canhide the Source tab. You can�tchange the drawing order oflayers from the Source tab.
Setting the line and patchfor layer symbology
1. Click the Tools menu on theStandard toolbar and clickOptions.
2. Click the TOC tab.
3. Click the Line or Areadropdown arrow and click theappropriate shape.
4. Click OK.
3
2
45
6
3
4
ch5.p65 12/04/2000, 11:11 AM126
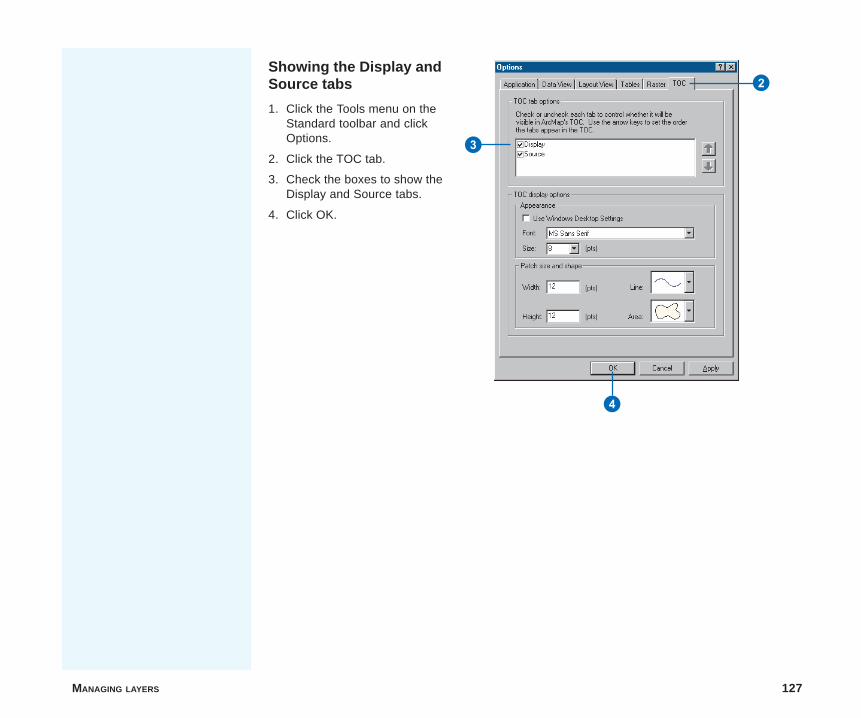
MANAGING LAYERS 127
Showing the Display andSource tabs
1. Click the Tools menu on theStandard toolbar and clickOptions.
2. Click the TOC tab.
3. Check the boxes to show theDisplay and Source tabs.
4. Click OK.
3
2
4
ch5.p65 12/04/2000, 11:11 AM127
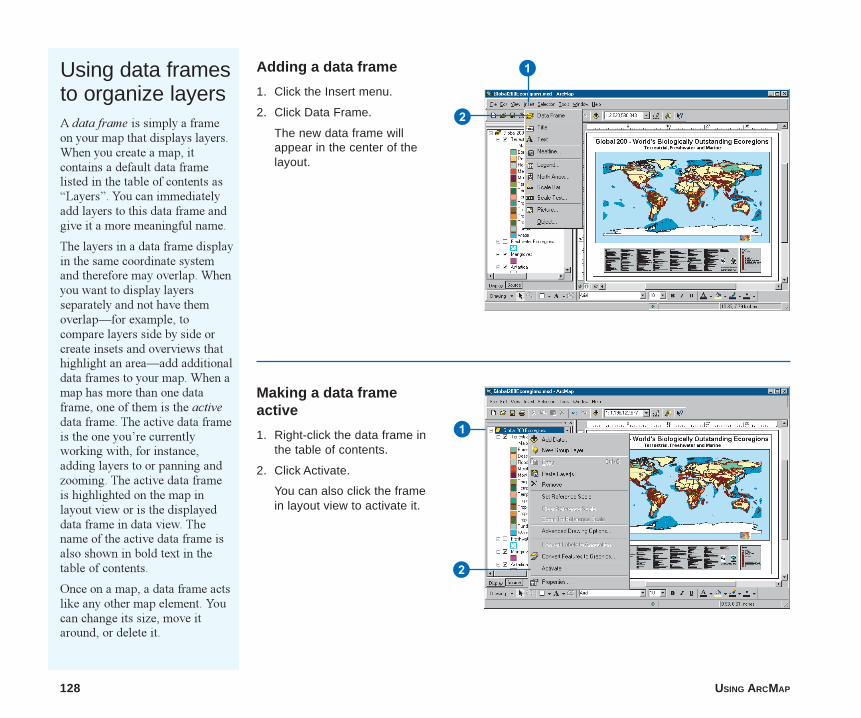
128 USING ARCMAP
Using data framesto organize layersA data frame is simply a frameon your map that displays layers.When you create a map, itcontains a default data framelisted in the table of contents as�Layers�. You can immediatelyadd layers to this data frame andgive it a more meaningful name.
The layers in a data frame displayin the same coordinate systemand therefore may overlap. Whenyou want to display layersseparately and not have themoverlap�for example, tocompare layers side by side orcreate insets and overviews thathighlight an area�add additionaldata frames to your map. When amap has more than one dataframe, one of them is the activedata frame. The active data frameis the one you�re currentlyworking with, for instance,adding layers to or panning andzooming. The active data frameis highlighted on the map inlayout view or is the displayeddata frame in data view. Thename of the active data frame isalso shown in bold text in thetable of contents.
Once on a map, a data frame actslike any other map element. Youcan change its size, move itaround, or delete it.
Adding a data frame
1. Click the Insert menu.
2. Click Data Frame.
The new data frame willappear in the center of thelayout.
Making a data frameactive
1. Right-click the data frame inthe table of contents.
2. Click Activate.
You can also click the framein layout view to activate it.
1
2
2
1
ch5.p65 12/04/2000, 11:12 AM128
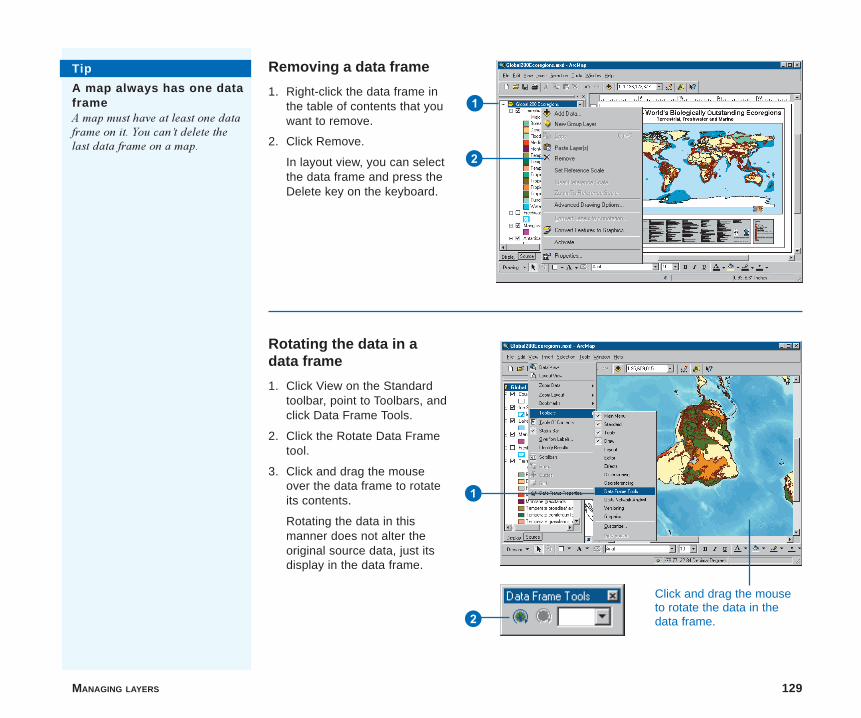
MANAGING LAYERS 129
Removing a data frame
1. Right-click the data frame inthe table of contents that youwant to remove.
2. Click Remove.
In layout view, you can selectthe data frame and press theDelete key on the keyboard.
2
1
Tip
A map always has one dataframeA map must have at least one dataframe on it. You can�t delete thelast data frame on a map.
Rotating the data in adata frame
1. Click View on the Standardtoolbar, point to Toolbars, andclick Data Frame Tools.
2. Click the Rotate Data Frametool.
3. Click and drag the mouseover the data frame to rotateits contents.
Rotating the data in thismanner does not alter theoriginal source data, just itsdisplay in the data frame.
1
2
Click and drag the mouseto rotate the data in thedata frame.
ch5.p65 12/04/2000, 11:12 AM129

130 USING ARCMAP
Saving a layer to disk
1. In the table of contents, right-click the layer and click SaveAs Layer File.
2. Click the Look in dropdownarrow and navigate to thelocation where you want tosave the layer.
3. Optionally, change the layername.
4. Click Save.
Saving a layer todiskOne of the main features of alayer is that it can exist as a filein your GIS database. This makesit easy for others to access thelayers you�ve built.
When you save a layer to disk,you save everything about thelayer. When you add the layer toanother map, it will draw exactlyas it was saved. This is veryconvenient when others at yourorganization need to make mapsbut don�t know how to representor access the data in yourdatabase. All they need to do isadd the layer.
2
1
4
3
Tip
Layer filenamesThe filename you provide whenyou save a layer to disk does nothave to be the same as its name onthe current map. The layer nameon the map, not the layer filename,will be displayed whenever thelayer is added to another map.
ch5.p65 12/04/2000, 11:13 AM130
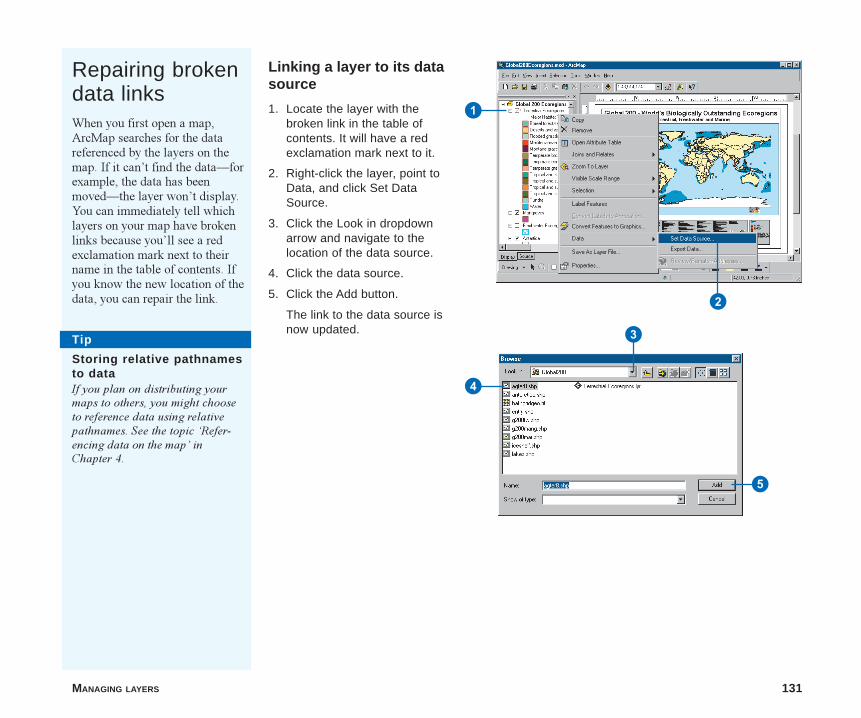
MANAGING LAYERS 131
Repairing brokendata linksWhen you first open a map,ArcMap searches for the datareferenced by the layers on themap. If it can�t find the data�forexample, the data has beenmoved�the layer won�t display.You can immediately tell whichlayers on your map have brokenlinks because you�ll see a redexclamation mark next to theirname in the table of contents. Ifyou know the new location of thedata, you can repair the link.
Tip
Storing relative pathnamesto dataIf you plan on distributing yourmaps to others, you might chooseto reference data using relativepathnames. See the topic �Refer-encing data on the map� inChapter 4.
Linking a layer to its datasource
1. Locate the layer with thebroken link in the table ofcontents. It will have a redexclamation mark next to it.
2. Right-click the layer, point toData, and click Set DataSource.
3. Click the Look in dropdownarrow and navigate to thelocation of the data source.
4. Click the data source.
5. Click the Add button.
The link to the data source isnow updated.
3
1
5
2
4
ch5.p65 12/04/2000, 11:14 AM131

ch5.p65 12/04/2000, 11:14 AM132
IN THIS CHAPTER
133
Symbolizing your data 6• A map gallery
• Drawing all features with one symbol
• Drawing features to showcategories like names or types
• Managing categories
• Ways to map quantitative data
• Standard classification schemes
• Drawing features to showquantities like counts or amounts
• Setting a classification
• Drawing features to showmultiple attributes
• Drawing features with charts
• Drawing TINs as surfaces
• Drawing CAD layers
• Advanced symbolization
Choosing how to represent your data on a map may be the most importantmapmaking decision you make. How you represent your data determineswhat your map communicates.
On some maps, you might simply want to show where things are. The easiestway to do this is to draw all the features in a layer with the same symbol. Onother maps, you might draw features based on an attribute value orcharacteristic that identifies them. For example, you could map roads by typeto get a better sense of traffic patterns or map the wildlife habitat suitabilityof a particular bird species, ranked from least to most suitable.
In general, you can draw map features as follows:
� With a single symbol
� To show a category such as a name (unique values maps)
� To represent a quantity such as population (graduated color, graduatedsymbol, and dot density maps)
� To show multiple attributes that are related (multivariate and chart maps)
You can also draw these other data types:
� Images and rasters (see Chapter 14, �Working with rasters�)
� TINs representing a three-dimensional surface
� CAD drawing files
Browse the map gallery on the next few pages to see the various ways youcan symbolize your data.
ch6.p65 12/04/2000, 12:09 PM133
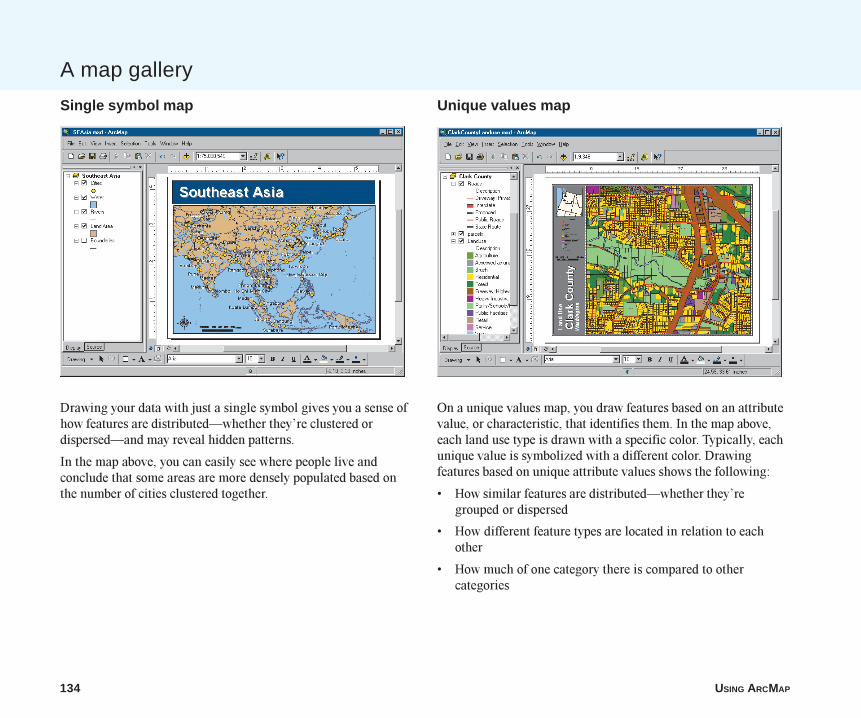
134 USING ARCMAP
A map gallery
Single symbol map Unique values map
Drawing your data with just a single symbol gives you a sense ofhow features are distributed�whether they�re clustered ordispersed�and may reveal hidden patterns.
In the map above, you can easily see where people live andconclude that some areas are more densely populated based onthe number of cities clustered together.
On a unique values map, you draw features based on an attributevalue, or characteristic, that identifies them. In the map above,each land use type is drawn with a specific color. Typically, eachunique value is symbolized with a different color. Drawingfeatures based on unique attribute values shows the following:
� How similar features are distributed�whether they�regrouped or dispersed
� How different feature types are located in relation to eachother
� How much of one category there is compared to othercategories
ch6.p65 12/04/2000, 12:09 PM134
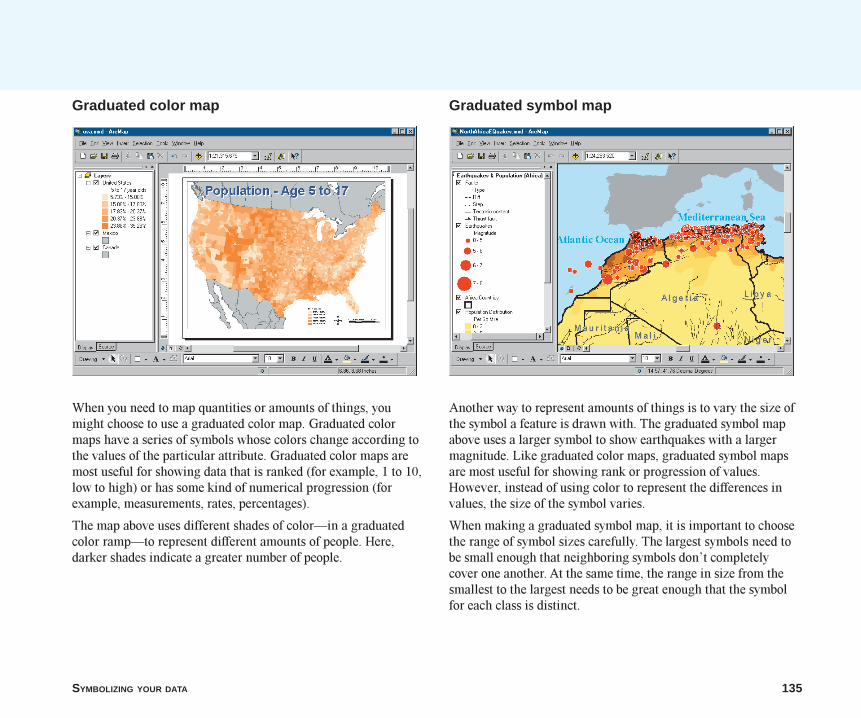
SYMBOLIZING YOUR DATA 135
Graduated color map Graduated symbol map
When you need to map quantities or amounts of things, youmight choose to use a graduated color map. Graduated colormaps have a series of symbols whose colors change according tothe values of the particular attribute. Graduated color maps aremost useful for showing data that is ranked (for example, 1 to 10,low to high) or has some kind of numerical progression (forexample, measurements, rates, percentages).
The map above uses different shades of color�in a graduatedcolor ramp�to represent different amounts of people. Here,darker shades indicate a greater number of people.
Another way to represent amounts of things is to vary the size ofthe symbol a feature is drawn with. The graduated symbol mapabove uses a larger symbol to show earthquakes with a largermagnitude. Like graduated color maps, graduated symbol mapsare most useful for showing rank or progression of values.However, instead of using color to represent the differences invalues, the size of the symbol varies.
When making a graduated symbol map, it is important to choosethe range of symbol sizes carefully. The largest symbols need tobe small enough that neighboring symbols don�t completelycover one another. At the same time, the range in size from thesmallest to the largest needs to be great enough that the symbolfor each class is distinct.
ch6.p65 12/04/2000, 12:10 PM135
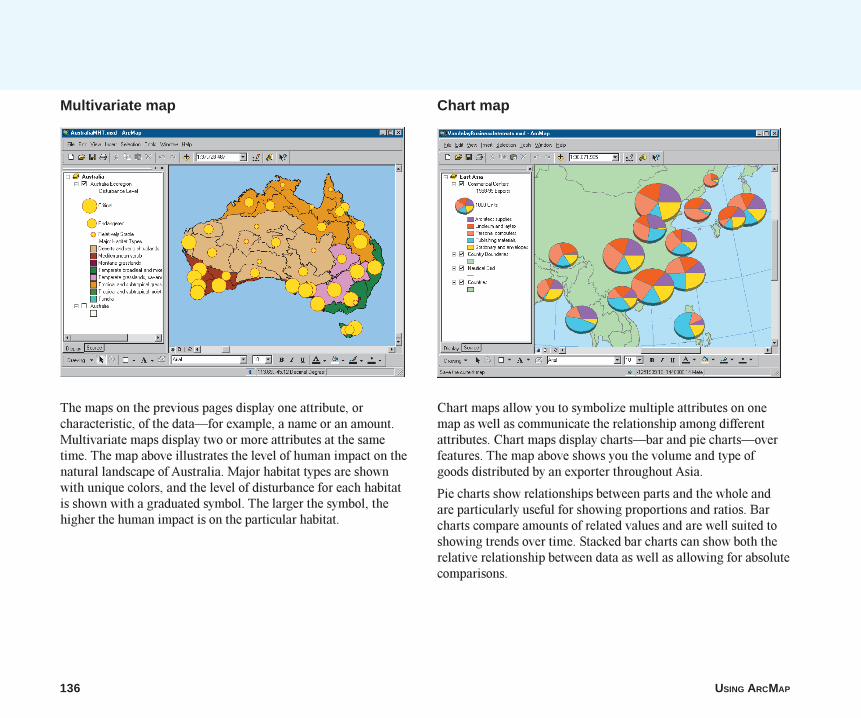
136 USING ARCMAP
Multivariate map
The maps on the previous pages display one attribute, orcharacteristic, of the data�for example, a name or an amount.Multivariate maps display two or more attributes at the sametime. The map above illustrates the level of human impact on thenatural landscape of Australia. Major habitat types are shownwith unique colors, and the level of disturbance for each habitatis shown with a graduated symbol. The larger the symbol, thehigher the human impact is on the particular habitat.
Chart map
Chart maps allow you to symbolize multiple attributes on onemap as well as communicate the relationship among differentattributes. Chart maps display charts�bar and pie charts�overfeatures. The map above shows you the volume and type ofgoods distributed by an exporter throughout Asia.
Pie charts show relationships between parts and the whole andare particularly useful for showing proportions and ratios. Barcharts compare amounts of related values and are well suited toshowing trends over time. Stacked bar charts can show both therelative relationship between data as well as allowing for absolutecomparisons.
ch6.p65 12/04/2000, 12:10 PM136
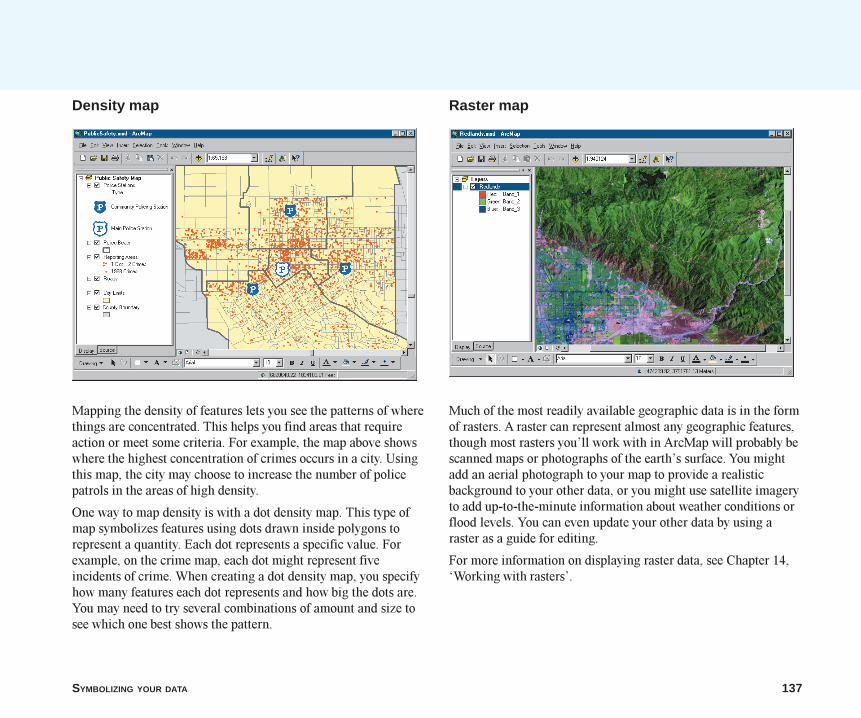
SYMBOLIZING YOUR DATA 137
Raster map
Much of the most readily available geographic data is in the formof rasters. A raster can represent almost any geographic features,though most rasters you�ll work with in ArcMap will probably bescanned maps or photographs of the earth�s surface. You mightadd an aerial photograph to your map to provide a realisticbackground to your other data, or you might use satellite imageryto add up-to-the-minute information about weather conditions orflood levels. You can even update your other data by using araster as a guide for editing.
For more information on displaying raster data, see Chapter 14,�Working with rasters�.
Density map
Mapping the density of features lets you see the patterns of wherethings are concentrated. This helps you find areas that requireaction or meet some criteria. For example, the map above showswhere the highest concentration of crimes occurs in a city. Usingthis map, the city may choose to increase the number of policepatrols in the areas of high density.
One way to map density is with a dot density map. This type ofmap symbolizes features using dots drawn inside polygons torepresent a quantity. Each dot represents a specific value. Forexample, on the crime map, each dot might represent fiveincidents of crime. When creating a dot density map, you specifyhow many features each dot represents and how big the dots are.You may need to try several combinations of amount and size tosee which one best shows the pattern.
ch6.p65 12/04/2000, 12:11 PM137
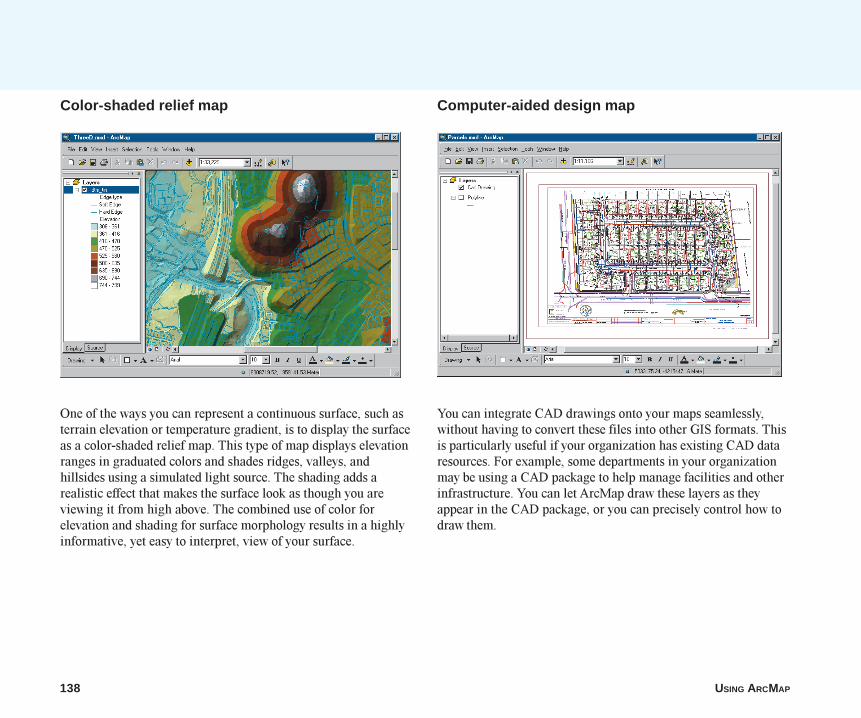
138 USING ARCMAP
Color-shaded relief map
One of the ways you can represent a continuous surface, such asterrain elevation or temperature gradient, is to display the surfaceas a color-shaded relief map. This type of map displays elevationranges in graduated colors and shades ridges, valleys, andhillsides using a simulated light source. The shading adds arealistic effect that makes the surface look as though you areviewing it from high above. The combined use of color forelevation and shading for surface morphology results in a highlyinformative, yet easy to interpret, view of your surface.
Computer-aided design map
You can integrate CAD drawings onto your maps seamlessly,without having to convert these files into other GIS formats. Thisis particularly useful if your organization has existing CAD dataresources. For example, some departments in your organizationmay be using a CAD package to help manage facilities and otherinfrastructure. You can let ArcMap draw these layers as theyappear in the CAD package, or you can precisely control how todraw them.
ch6.p65 12/04/2000, 12:11 PM138
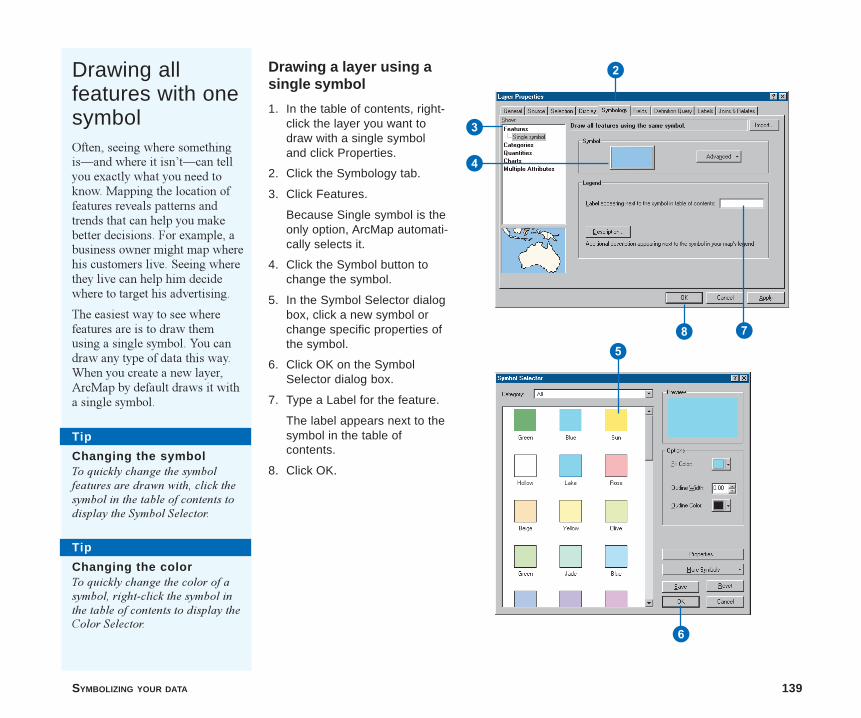
SYMBOLIZING YOUR DATA 139
Drawing allfeatures with onesymbolOften, seeing where somethingis�and where it isn�t�can tellyou exactly what you need toknow. Mapping the location offeatures reveals patterns andtrends that can help you makebetter decisions. For example, abusiness owner might map wherehis customers live. Seeing wherethey live can help him decidewhere to target his advertising.
The easiest way to see wherefeatures are is to draw themusing a single symbol. You candraw any type of data this way.When you create a new layer,ArcMap by default draws it witha single symbol.
Drawing a layer using asingle symbol
1. In the table of contents, right-click the layer you want todraw with a single symboland click Properties.
2. Click the Symbology tab.
3. Click Features.
Because Single symbol is theonly option, ArcMap automati-cally selects it.
4. Click the Symbol button tochange the symbol.
5. In the Symbol Selector dialogbox, click a new symbol orchange specific properties ofthe symbol.
6. Click OK on the SymbolSelector dialog box.
7. Type a Label for the feature.
The label appears next to thesymbol in the table ofcontents.
8. Click OK.
Tip
Changing the symbolTo quickly change the symbolfeatures are drawn with, click thesymbol in the table of contents todisplay the Symbol Selector.
Tip
Changing the colorTo quickly change the color of asymbol, right-click the symbol inthe table of contents to display theColor Selector.
2
3
4
5
6
78
ch6.p65 12/04/2000, 12:11 PM139
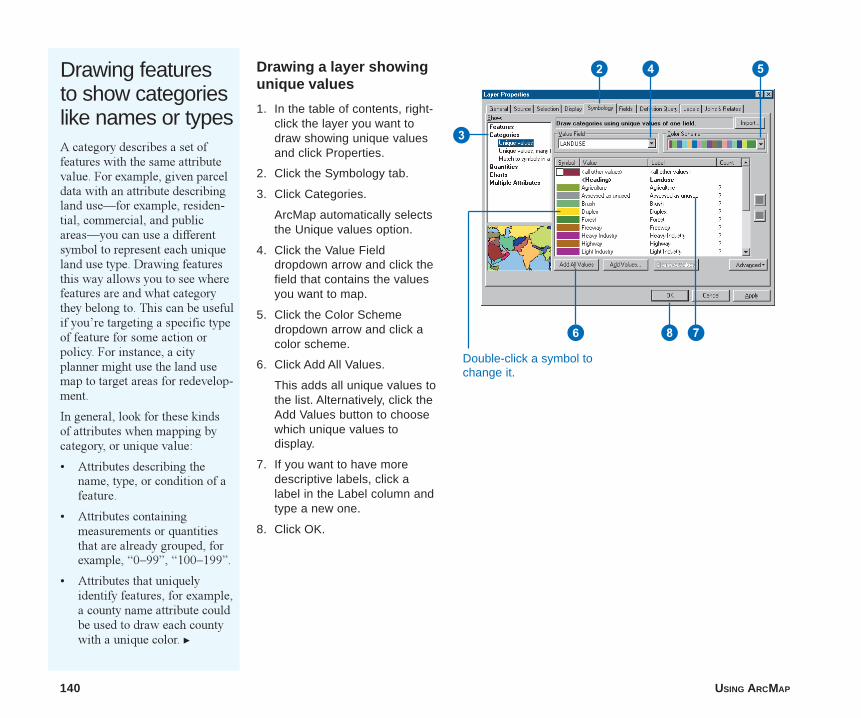
140 USING ARCMAP
Drawing featuresto show categorieslike names or typesA category describes a set offeatures with the same attributevalue. For example, given parceldata with an attribute describingland use�for example, residen-tial, commercial, and publicareas�you can use a differentsymbol to represent each uniqueland use type. Drawing featuresthis way allows you to see wherefeatures are and what categorythey belong to. This can be usefulif you�re targeting a specific typeof feature for some action orpolicy. For instance, a cityplanner might use the land usemap to target areas for redevelop-ment.
In general, look for these kindsof attributes when mapping bycategory, or unique value:
� Attributes describing thename, type, or condition of afeature.
� Attributes containingmeasurements or quantitiesthat are already grouped, forexample, �0�99�, �100�199�.
� Attributes that uniquelyidentify features, for example,a county name attribute couldbe used to draw each countywith a unique color. u
Drawing a layer showingunique values
1. In the table of contents, right-click the layer you want todraw showing unique valuesand click Properties.
2. Click the Symbology tab.
3. Click Categories.
ArcMap automatically selectsthe Unique values option.
4. Click the Value Fielddropdown arrow and click thefield that contains the valuesyou want to map.
5. Click the Color Schemedropdown arrow and click acolor scheme.
6. Click Add All Values.
This adds all unique values tothe list. Alternatively, click theAdd Values button to choosewhich unique values todisplay.
7. If you want to have moredescriptive labels, click alabel in the Label column andtype a new one.
8. Click OK.
2
3
4 5
6 8 7Double-click a symbol tochange it.
ch6.p65 12/04/2000, 12:11 PM140
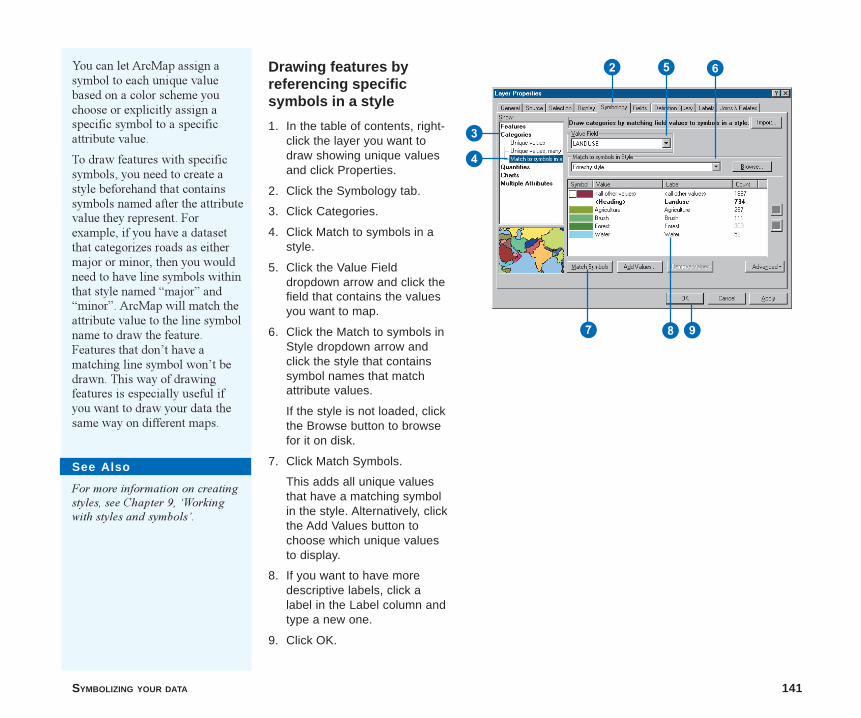
SYMBOLIZING YOUR DATA 141
Drawing features byreferencing specificsymbols in a style
1. In the table of contents, right-click the layer you want todraw showing unique valuesand click Properties.
2. Click the Symbology tab.
3. Click Categories.
4. Click Match to symbols in astyle.
5. Click the Value Fielddropdown arrow and click thefield that contains the valuesyou want to map.
6. Click the Match to symbols inStyle dropdown arrow andclick the style that containssymbol names that matchattribute values.
If the style is not loaded, clickthe Browse button to browsefor it on disk.
7. Click Match Symbols.
This adds all unique valuesthat have a matching symbolin the style. Alternatively, clickthe Add Values button tochoose which unique valuesto display.
8. If you want to have moredescriptive labels, click alabel in the Label column andtype a new one.
9. Click OK.
You can let ArcMap assign asymbol to each unique valuebased on a color scheme youchoose or explicitly assign aspecific symbol to a specificattribute value.
To draw features with specificsymbols, you need to create astyle beforehand that containssymbols named after the attributevalue they represent. Forexample, if you have a datasetthat categorizes roads as eithermajor or minor, then you wouldneed to have line symbols withinthat style named �major� and�minor�. ArcMap will match theattribute value to the line symbolname to draw the feature.Features that don�t have amatching line symbol won�t bedrawn. This way of drawingfeatures is especially useful ifyou want to draw your data thesame way on different maps.
See Also
For more information on creatingstyles, see Chapter 9, �Workingwith styles and symbols�.
2
3
5 6
7 98
4
ch6.p65 12/04/2000, 12:11 PM141
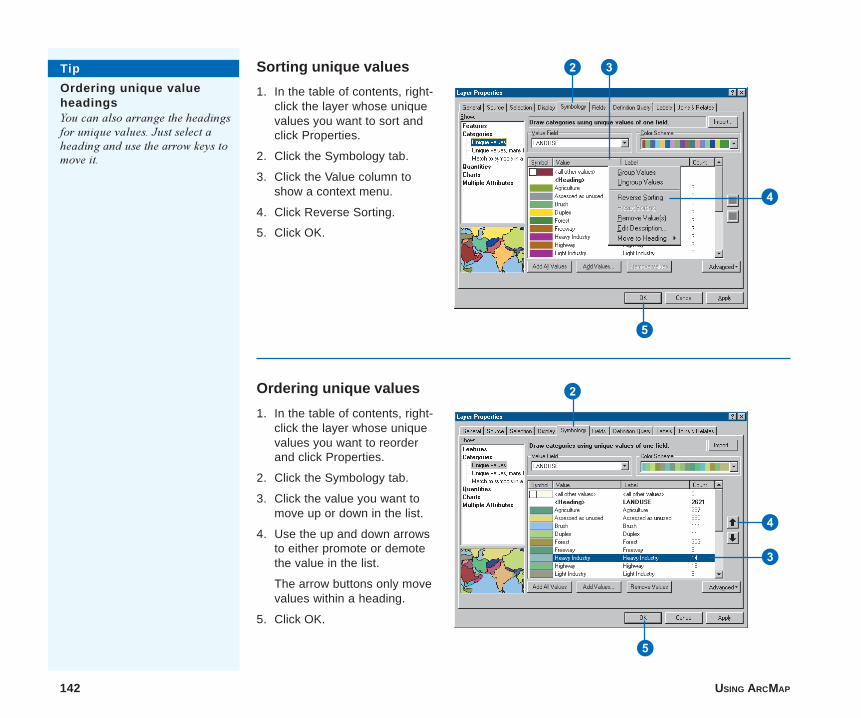
142 USING ARCMAP
Sorting unique values
1. In the table of contents, right-click the layer whose uniquevalues you want to sort andclick Properties.
2. Click the Symbology tab.
3. Click the Value column toshow a context menu.
4. Click Reverse Sorting.
5. Click OK.
2 3
5
4
Ordering unique values
1. In the table of contents, right-click the layer whose uniquevalues you want to reorderand click Properties.
2. Click the Symbology tab.
3. Click the value you want tomove up or down in the list.
4. Use the up and down arrowsto either promote or demotethe value in the list.
The arrow buttons only movevalues within a heading.
5. Click OK.
5
2
3
4
Tip
Ordering unique valueheadingsYou can also arrange the headingsfor unique values. Just select aheading and use the arrow keys tomove it.
ch6.p65 12/07/2000, 8:29 AM142
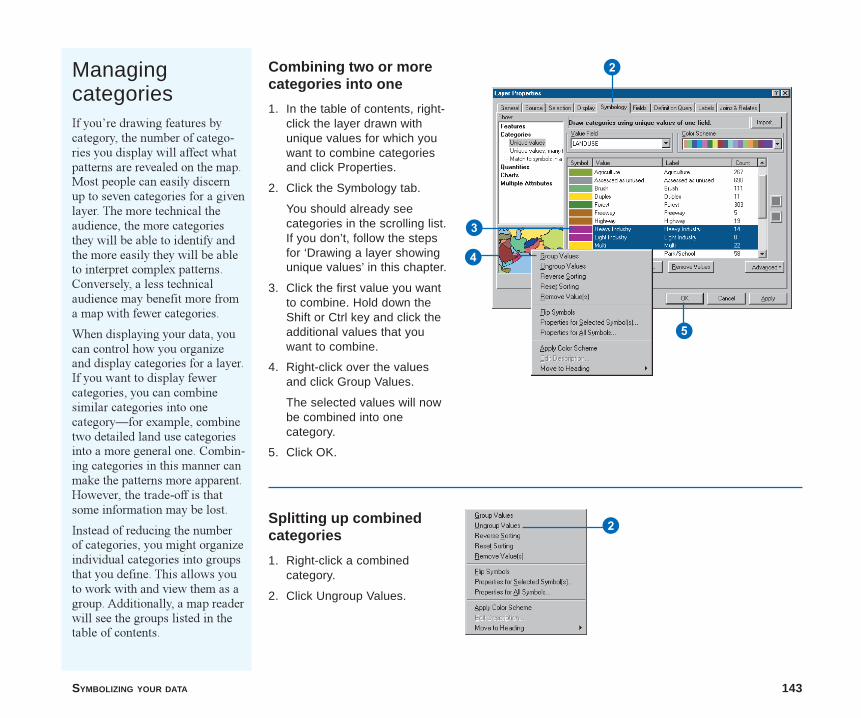
SYMBOLIZING YOUR DATA 143
ManagingcategoriesIf you�re drawing features bycategory, the number of catego-ries you display will affect whatpatterns are revealed on the map.Most people can easily discernup to seven categories for a givenlayer. The more technical theaudience, the more categoriesthey will be able to identify andthe more easily they will be ableto interpret complex patterns.Conversely, a less technicalaudience may benefit more froma map with fewer categories.
When displaying your data, youcan control how you organizeand display categories for a layer.If you want to display fewercategories, you can combinesimilar categories into onecategory�for example, combinetwo detailed land use categoriesinto a more general one. Combin-ing categories in this manner canmake the patterns more apparent.However, the trade-off is thatsome information may be lost.
Instead of reducing the numberof categories, you might organizeindividual categories into groupsthat you define. This allows youto work with and view them as agroup. Additionally, a map readerwill see the groups listed in thetable of contents.
Combining two or morecategories into one
1. In the table of contents, right-click the layer drawn withunique values for which youwant to combine categoriesand click Properties.
2. Click the Symbology tab.
You should already seecategories in the scrolling list.If you don’t, follow the stepsfor ‘Drawing a layer showingunique values’ in this chapter.
3. Click the first value you wantto combine. Hold down theShift or Ctrl key and click theadditional values that youwant to combine.
4. Right-click over the valuesand click Group Values.
The selected values will nowbe combined into onecategory.
5. Click OK.
Splitting up combinedcategories
1. Right-click a combinedcategory.
2. Click Ungroup Values.
2
3
5
4
2
ch6.p65 12/04/2000, 12:12 PM143
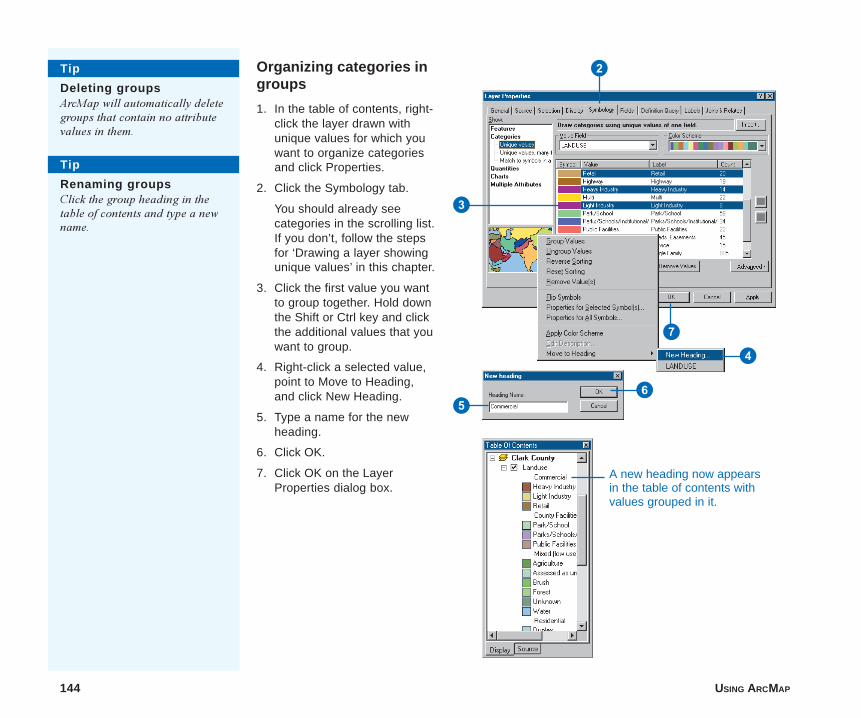
144 USING ARCMAP
Organizing categories ingroups
1. In the table of contents, right-click the layer drawn withunique values for which youwant to organize categoriesand click Properties.
2. Click the Symbology tab.
You should already seecategories in the scrolling list.If you don’t, follow the stepsfor ‘Drawing a layer showingunique values’ in this chapter.
3. Click the first value you wantto group together. Hold downthe Shift or Ctrl key and clickthe additional values that youwant to group.
4. Right-click a selected value,point to Move to Heading,and click New Heading.
5. Type a name for the newheading.
6. Click OK.
7. Click OK on the LayerProperties dialog box.
Tip
Deleting groupsArcMap will automatically deletegroups that contain no attributevalues in them.
Tip
Renaming groupsClick the group heading in thetable of contents and type a newname.
2
7
3
4
56
A new heading now appearsin the table of contents withvalues grouped in it.
ch6.p65 12/04/2000, 12:12 PM144
SYMBOLIZING YOUR DATA 145
Ways to map quantitative data
Quantitative data is data that describes features in terms of aquantitative value measuring some magnitude of the feature.Unlike categorical data, where features are described by a uniqueattribute value such as a name, quantitative data generallydescribes counts or amounts, ratios, or ranked values. Forexample, data representing precipitation, population, and habitatsuitability can all be mapped quantitatively.
Which quantitative value should you map?
Knowing what type of data you have and what you want to showwill help you determine what quantitative value to map. Ingeneral, you can follow these guidelines:
� Map counts or amounts if you want to see actual measuredvalues as well as relative magnitude. Use care when mappingcounts as the values may be influenced by other factors andcould yield a misleading map. For example, when making amap showing the total sales figures of a product by state, thetotal sales figure is likely to reflect the differences inpopulation among the states.
� Map ratios if you want to minimize differences based on thesize of areas or numbers of features in each area. Ratios arecreated by dividing two data values and are also referred to asnormalizing the data. For example, dividing the 18- to 30-year-old population by the total population yields thepercentage of people aged 18�30. Similarly, dividing a valueby the area of the feature yields a value per unit area, ordensity.
� Map ranks if you�re interested in relative measures and actualvalues are not important. For example, you may know afeature with a rank of �3� is higher than one ranked �2� andlower than a �4�, but you can�t tell how much higher or lower.
Should you map individual values or group themin classes?
When you map quantitative data, you can either assign each valueits own symbol or group values into classes using a differentsymbol for each class.
If you�re only mapping a few values (less than 10), you canassign a unique symbol to each value. This may present a moreaccurate picture of the data, since you�re not predeterminingwhich features are grouped together. More likely, your datavalues will be too numerous to map individually and you�ll wantto group them in classes, or classify the data. A good example ofclassified data is a temperature map you might find in anewspaper. Instead of displaying individual temperatures, thesemaps show temperature bands, where each band represents agiven range in temperature.
Ways to classify your data
How you define the class ranges and breaks�the high and lowvalues that bracket each class�will determine which features fallinto each class and thus what the map will look like. By changingthe classes you can create very different-looking maps. Generally,the goal is to make sure features with similar values are in thesame class.
Two key factors for classifying your data are the classificationscheme you use and the number of classes you create. If youknow your data well, you can manually define your own classes.Alternatively, you can let ArcMap classify your data usingstandard classification schemes. The four most common schemesare natural breaks, quantile, equal interval, and standarddeviation. These are described on the following pages.
ch6.p65 12/04/2000, 12:12 PM145

146 USING ARCMAP
Standard classification schemes
Natural breaks (Jenks)
Classes are based on natural groupings of data values. ArcMap identifies break points by looking for groupings and patterns inherent inthe data. The features are divided into classes whose boundaries are set where there are relatively big jumps in the data values.
Quantile
Each class contains an equal number of features. A quantile classification is well suited to linearly distributed data. Because features aregrouped by the number in each class, the resulting map can be misleading. Similar features can be placed in adjacent classes, or featureswith widely different values can be put in the same class. You can minimize this distortion by increasing the number of classes.
Value
Num
ber
of fe
atur
es
Value
Num
ber
of fe
atur
es
ch6.p65 12/04/2000, 12:12 PM146
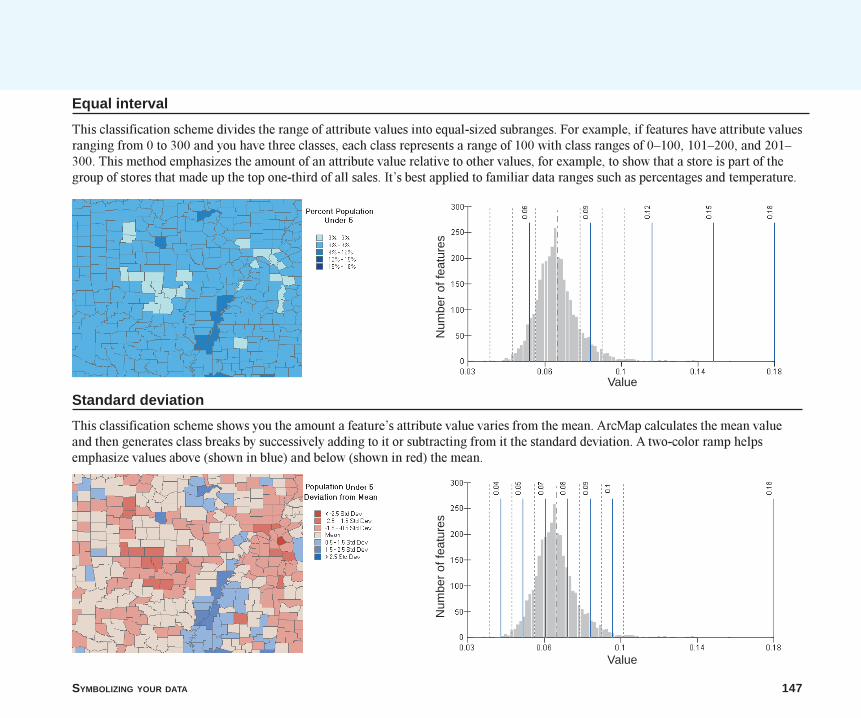
SYMBOLIZING YOUR DATA 147
Equal interval
This classification scheme divides the range of attribute values into equal-sized subranges. For example, if features have attribute valuesranging from 0 to 300 and you have three classes, each class represents a range of 100 with class ranges of 0�100, 101�200, and 201�300. This method emphasizes the amount of an attribute value relative to other values, for example, to show that a store is part of thegroup of stores that made up the top one-third of all sales. It�s best applied to familiar data ranges such as percentages and temperature.
Standard deviation
This classification scheme shows you the amount a feature�s attribute value varies from the mean. ArcMap calculates the mean valueand then generates class breaks by successively adding to it or subtracting from it the standard deviation. A two-color ramp helpsemphasize values above (shown in blue) and below (shown in red) the mean.
Value
Num
ber
of fe
atur
es
Value
Num
ber
of fe
atur
es
ch6.p65 12/04/2000, 12:13 PM147
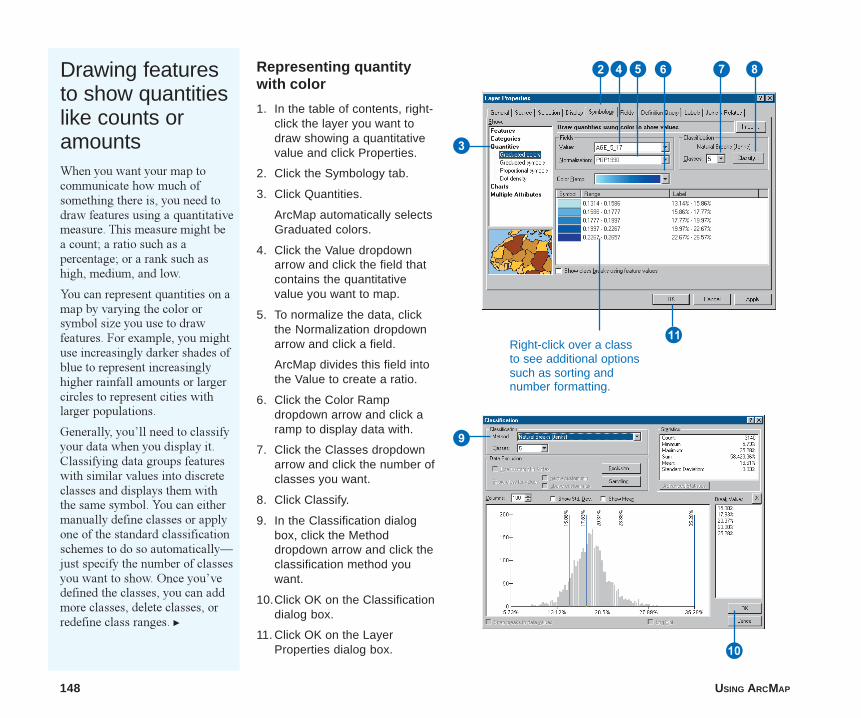
148 USING ARCMAP
Drawing featuresto show quantitieslike counts oramountsWhen you want your map tocommunicate how much ofsomething there is, you need todraw features using a quantitativemeasure. This measure might bea count; a ratio such as apercentage; or a rank such ashigh, medium, and low.
You can represent quantities on amap by varying the color orsymbol size you use to drawfeatures. For example, you mightuse increasingly darker shades ofblue to represent increasinglyhigher rainfall amounts or largercircles to represent cities withlarger populations.
Generally, you�ll need to classifyyour data when you display it.Classifying data groups featureswith similar values into discreteclasses and displays them withthe same symbol. You can eithermanually define classes or applyone of the standard classificationschemes to do so automatically�just specify the number of classesyou want to show. Once you�vedefined the classes, you can addmore classes, delete classes, orredefine class ranges. u
Representing quantitywith color
1. In the table of contents, right-click the layer you want todraw showing a quantitativevalue and click Properties.
2. Click the Symbology tab.
3. Click Quantities.
ArcMap automatically selectsGraduated colors.
4. Click the Value dropdownarrow and click the field thatcontains the quantitativevalue you want to map.
5. To normalize the data, clickthe Normalization dropdownarrow and click a field.
ArcMap divides this field intothe Value to create a ratio.
6. Click the Color Rampdropdown arrow and click aramp to display data with.
7. Click the Classes dropdownarrow and click the number ofclasses you want.
8. Click Classify.
9. In the Classification dialogbox, click the Methoddropdown arrow and click theclassification method youwant.
10.Click OK on the Classificationdialog box.
11. Click OK on the LayerProperties dialog box.
Right-click over a classto see additional optionssuch as sorting andnumber formatting.
245 6 8
3
7
9
Q
W
ch6.p65 12/04/2000, 12:13 PM148
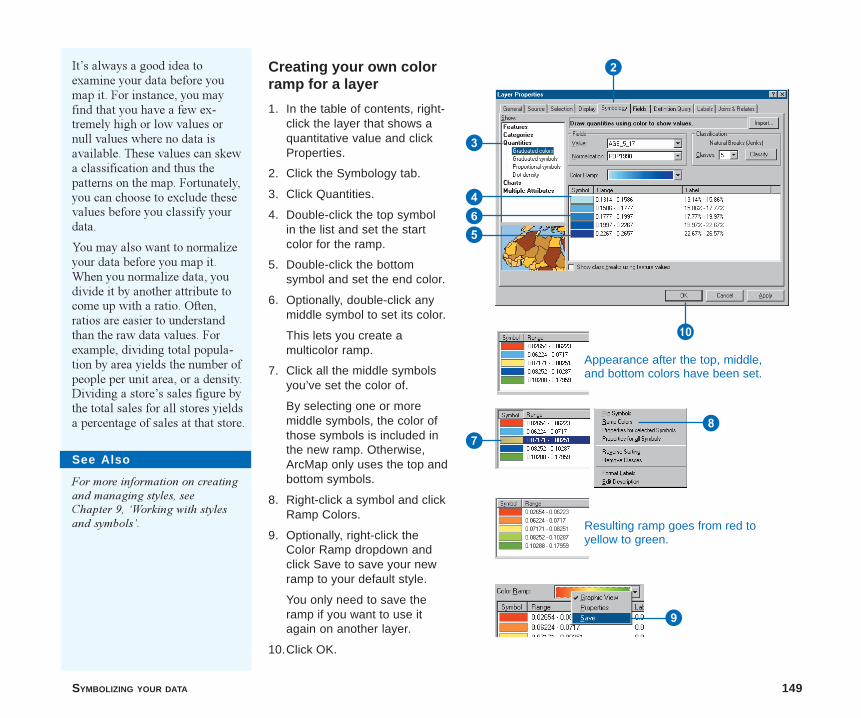
SYMBOLIZING YOUR DATA 149
It�s always a good idea toexamine your data before youmap it. For instance, you mayfind that you have a few ex-tremely high or low values ornull values where no data isavailable. These values can skewa classification and thus thepatterns on the map. Fortunately,you can choose to exclude thesevalues before you classify yourdata.
You may also want to normalizeyour data before you map it.When you normalize data, youdivide it by another attribute tocome up with a ratio. Often,ratios are easier to understandthan the raw data values. Forexample, dividing total popula-tion by area yields the number ofpeople per unit area, or a density.Dividing a store�s sales figure bythe total sales for all stores yieldsa percentage of sales at that store.
Creating your own colorramp for a layer
1. In the table of contents, right-click the layer that shows aquantitative value and clickProperties.
2. Click the Symbology tab.
3. Click Quantities.
4. Double-click the top symbolin the list and set the startcolor for the ramp.
5. Double-click the bottomsymbol and set the end color.
6. Optionally, double-click anymiddle symbol to set its color.
This lets you create amulticolor ramp.
7. Click all the middle symbolsyou’ve set the color of.
By selecting one or moremiddle symbols, the color ofthose symbols is included inthe new ramp. Otherwise,ArcMap only uses the top andbottom symbols.
8. Right-click a symbol and clickRamp Colors.
9. Optionally, right-click theColor Ramp dropdown andclick Save to save your newramp to your default style.
You only need to save theramp if you want to use itagain on another layer.
10.Click OK.
9
See Also
For more information on creatingand managing styles, seeChapter 9, �Working with stylesand symbols�.
2
3
Q
465
Appearance after the top, middle,and bottom colors have been set.
78
Resulting ramp goes from red toyellow to green.
ch6.p65 12/04/2000, 12:13 PM149
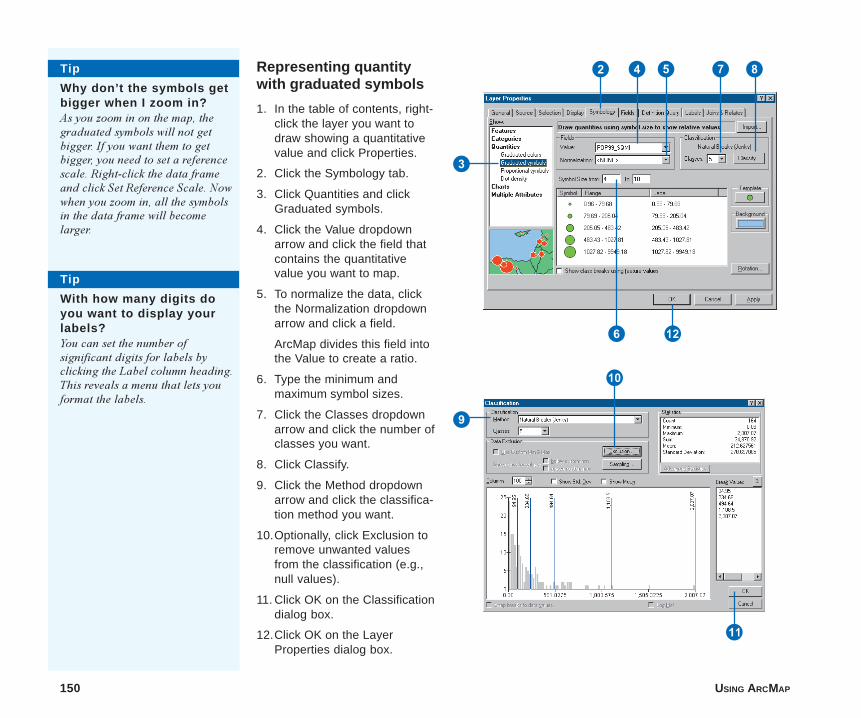
150 USING ARCMAP
Representing quantitywith graduated symbols
1. In the table of contents, right-click the layer you want todraw showing a quantitativevalue and click Properties.
2. Click the Symbology tab.
3. Click Quantities and clickGraduated symbols.
4. Click the Value dropdownarrow and click the field thatcontains the quantitativevalue you want to map.
5. To normalize the data, clickthe Normalization dropdownarrow and click a field.
ArcMap divides this field intothe Value to create a ratio.
6. Type the minimum andmaximum symbol sizes.
7. Click the Classes dropdownarrow and click the number ofclasses you want.
8. Click Classify.
9. Click the Method dropdownarrow and click the classifica-tion method you want.
10.Optionally, click Exclusion toremove unwanted valuesfrom the classification (e.g.,null values).
11. Click OK on the Classificationdialog box.
12.Click OK on the LayerProperties dialog box.
Tip
Why don’t the symbols getbigger when I zoom in?As you zoom in on the map, thegraduated symbols will not getbigger. If you want them to getbigger, you need to set a referencescale. Right-click the data frameand click Set Reference Scale. Nowwhen you zoom in, all the symbolsin the data frame will becomelarger.
Tip
With how many digits doyou want to display yourlabels?You can set the number ofsignificant digits for labels byclicking the Label column heading.This reveals a menu that lets youformat the labels.
2 4 5 8
3
E
7
9
W
6
Q
ch6.p65 12/04/2000, 12:13 PM150
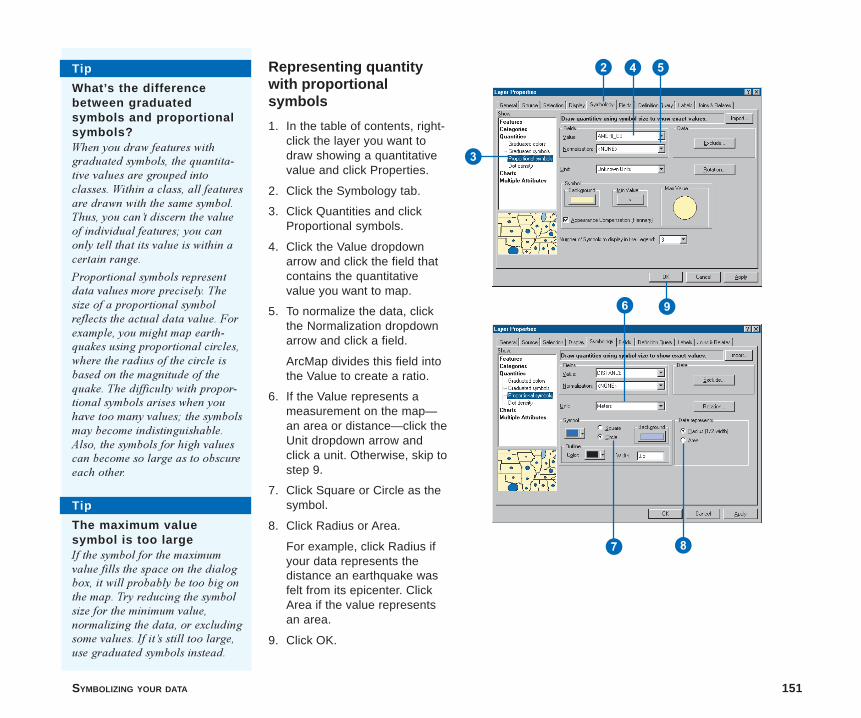
SYMBOLIZING YOUR DATA 151
Representing quantitywith proportionalsymbols
1. In the table of contents, right-click the layer you want todraw showing a quantitativevalue and click Properties.
2. Click the Symbology tab.
3. Click Quantities and clickProportional symbols.
4. Click the Value dropdownarrow and click the field thatcontains the quantitativevalue you want to map.
5. To normalize the data, clickthe Normalization dropdownarrow and click a field.
ArcMap divides this field intothe Value to create a ratio.
6. If the Value represents ameasurement on the map—an area or distance—click theUnit dropdown arrow andclick a unit. Otherwise, skip tostep 9.
7. Click Square or Circle as thesymbol.
8. Click Radius or Area.
For example, click Radius ifyour data represents thedistance an earthquake wasfelt from its epicenter. ClickArea if the value representsan area.
9. Click OK.
Tip
What’s the differencebetween graduatedsymbols and proportionalsymbols?When you draw features withgraduated symbols, the quantita-tive values are grouped intoclasses. Within a class, all featuresare drawn with the same symbol.Thus, you can�t discern the valueof individual features; you canonly tell that its value is within acertain range.
Proportional symbols representdata values more precisely. Thesize of a proportional symbolreflects the actual data value. Forexample, you might map earth-quakes using proportional circles,where the radius of the circle isbased on the magnitude of thequake. The difficulty with propor-tional symbols arises when youhave too many values; the symbolsmay become indistinguishable.Also, the symbols for high valuescan become so large as to obscureeach other.
Tip
The maximum valuesymbol is too largeIf the symbol for the maximumvalue fills the space on the dialogbox, it will probably be too big onthe map. Try reducing the symbolsize for the minimum value,normalizing the data, or excludingsome values. If it�s still too large,use graduated symbols instead.
2
3
4 5
6 9
7 8
ch6.p65 12/04/2000, 12:13 PM151
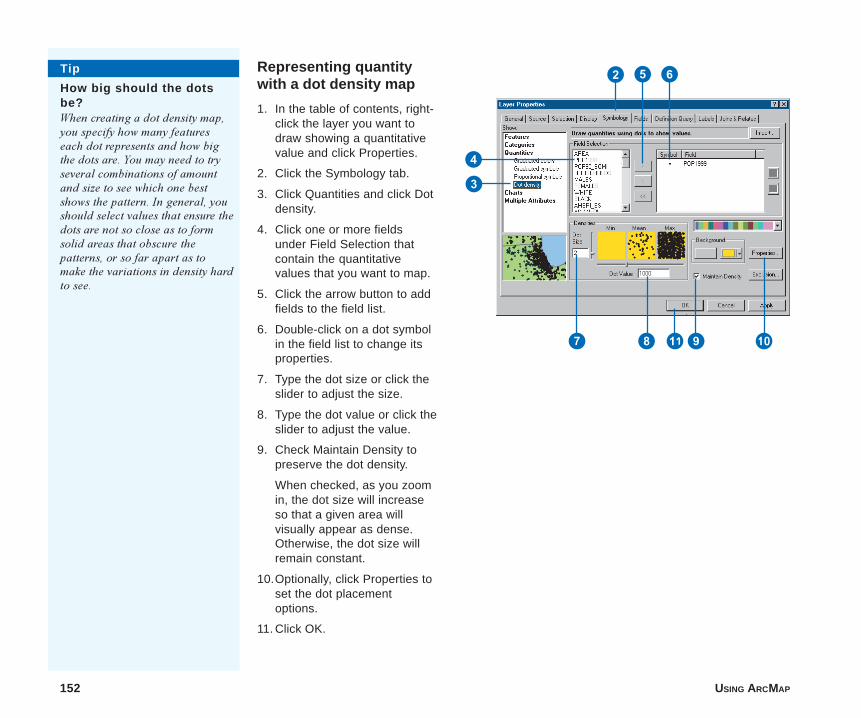
152 USING ARCMAP
Representing quantitywith a dot density map
1. In the table of contents, right-click the layer you want todraw showing a quantitativevalue and click Properties.
2. Click the Symbology tab.
3. Click Quantities and click Dotdensity.
4. Click one or more fieldsunder Field Selection thatcontain the quantitativevalues that you want to map.
5. Click the arrow button to addfields to the field list.
6. Double-click on a dot symbolin the field list to change itsproperties.
7. Type the dot size or click theslider to adjust the size.
8. Type the dot value or click theslider to adjust the value.
9. Check Maintain Density topreserve the dot density.
When checked, as you zoomin, the dot size will increaseso that a given area willvisually appear as dense.Otherwise, the dot size willremain constant.
10.Optionally, click Properties toset the dot placementoptions.
11. Click OK.
Tip
How big should the dotsbe?When creating a dot density map,you specify how many featureseach dot represents and how bigthe dots are. You may need to tryseveral combinations of amountand size to see which one bestshows the pattern. In general, youshould select values that ensure thedots are not so close as to formsolid areas that obscure thepatterns, or so far apart as tomake the variations in density hardto see.
2 5 6
4
3
7 8 W9 Q
ch6.p65 12/04/2000, 12:14 PM152

SYMBOLIZING YOUR DATA 153
Setting aclassificationWhen you classify your data, youcan either use one of the standardclassification schemes ArcMapprovides or create custom classesbased on class ranges youspecify. If you choose to letArcMap classify the data, simplychoose the classification schemeyou want and set the number ofclasses. If you want to defineyour own classes, you canmanually add class breaks and setclass ranges that are appropriatefor your data. Alternatively, youcan start with one of the standardclassifications and make adjust-ments as needed.
Why set class ranges manually?There may already be certainstandards or guidelines formapping your data. For example,temperature maps are oftendisplayed with 10 degreetemperature bands. Or you mightwant to emphasize features withparticular values, for example,those above or below a thresholdvalue that determines whethersome action will occur. Whateveryour reason, make sure youclearly specify what the classesmean on the map.
Setting a standardclassification method
1. In the table of contents, right-click the layer that shows aquantitative value for whichyou want to change theclassification.
2. Click the Symbology tab.
3. Click Quantities.
You should see the currentclassification.
4. Click Classify.
5. Click the Method dropdownarrow and click the classifica-tion method you want.
6. Click the Classes dropdownarrow and click the number ofclasses you want to display.
7. Click OK on the Classificationdialog box.
8. Click OK on the LayerProperties dialog box.
2 4
3
8
5
7
6
ch6.p65 12/04/2000, 12:14 PM153
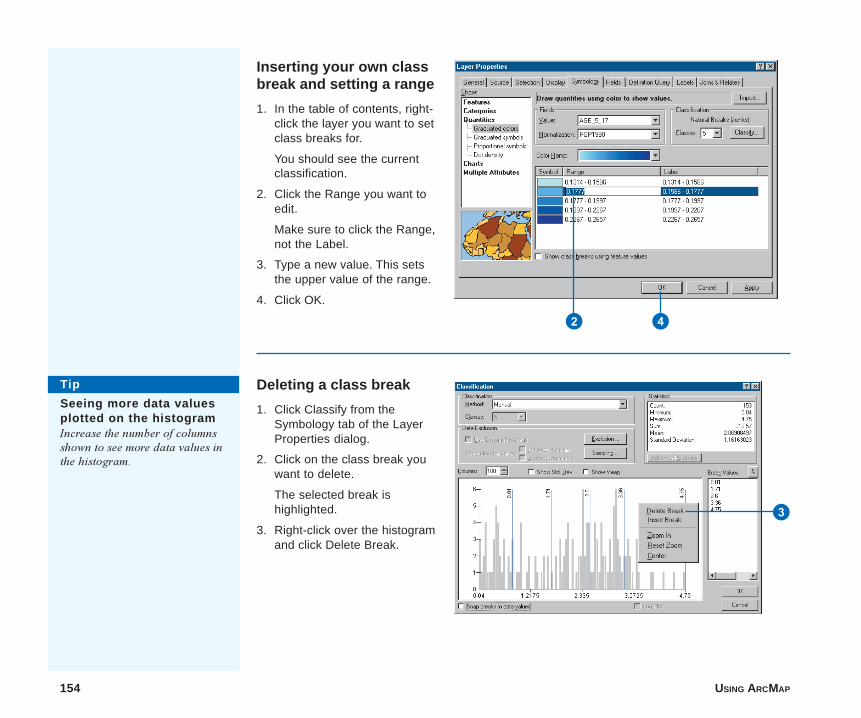
154 USING ARCMAP
Deleting a class break
1. Click Classify from theSymbology tab of the LayerProperties dialog.
2. Click on the class break youwant to delete.
The selected break ishighlighted.
3. Right-click over the histogramand click Delete Break.
Tip
Seeing more data valuesplotted on the histogramIncrease the number of columnsshown to see more data values inthe histogram.
Inserting your own classbreak and setting a range
1. In the table of contents, right-click the layer you want to setclass breaks for.
You should see the currentclassification.
2. Click the Range you want toedit.
Make sure to click the Range,not the Label.
3. Type a new value. This setsthe upper value of the range.
4. Click OK.
2
3
4
ch6.p65 12/07/2000, 8:30 AM154
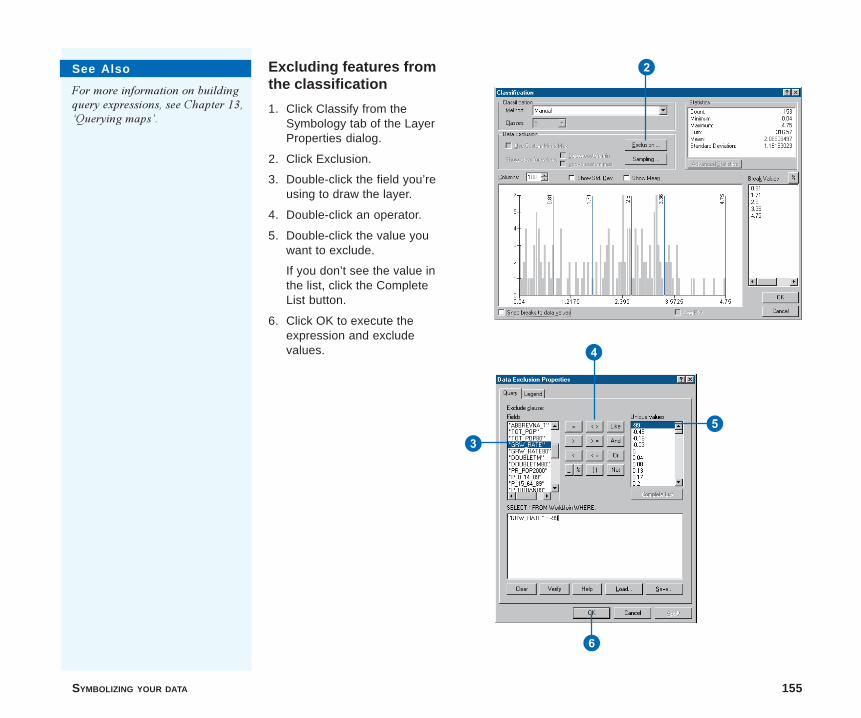
SYMBOLIZING YOUR DATA 155
Excluding features fromthe classification
1. Click Classify from theSymbology tab of the LayerProperties dialog.
2. Click Exclusion.
3. Double-click the field you’reusing to draw the layer.
4. Double-click an operator.
5. Double-click the value youwant to exclude.
If you don’t see the value inthe list, click the CompleteList button.
6. Click OK to execute theexpression and excludevalues.
2
3
4
5
6
See Also
For more information on buildingquery expressions, see Chapter 13,�Querying maps�.
ch6.p65 12/04/2000, 12:14 PM155
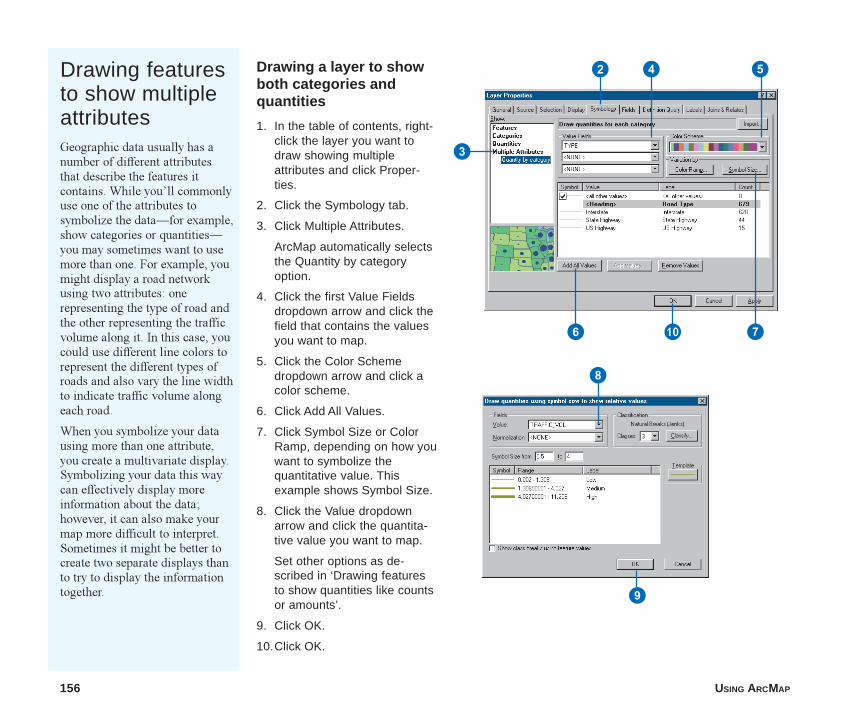
156 USING ARCMAP
Drawing featuresto show multipleattributesGeographic data usually has anumber of different attributesthat describe the features itcontains. While you�ll commonlyuse one of the attributes tosymbolize the data�for example,show categories or quantities�you may sometimes want to usemore than one. For example, youmight display a road networkusing two attributes: onerepresenting the type of road andthe other representing the trafficvolume along it. In this case, youcould use different line colors torepresent the different types ofroads and also vary the line widthto indicate traffic volume alongeach road.
When you symbolize your datausing more than one attribute,you create a multivariate display.Symbolizing your data this waycan effectively display moreinformation about the data;however, it can also make yourmap more difficult to interpret.Sometimes it might be better tocreate two separate displays thanto try to display the informationtogether.
Drawing a layer to showboth categories andquantities
1. In the table of contents, right-click the layer you want todraw showing multipleattributes and click Proper-ties.
2. Click the Symbology tab.
3. Click Multiple Attributes.
ArcMap automatically selectsthe Quantity by categoryoption.
4. Click the first Value Fieldsdropdown arrow and click thefield that contains the valuesyou want to map.
5. Click the Color Schemedropdown arrow and click acolor scheme.
6. Click Add All Values.
7. Click Symbol Size or ColorRamp, depending on how youwant to symbolize thequantitative value. Thisexample shows Symbol Size.
8. Click the Value dropdownarrow and click the quantita-tive value you want to map.
Set other options as de-scribed in ‘Drawing featuresto show quantities like countsor amounts’.
9. Click OK.
10.Click OK.
2
3
4 5
6 Q
8
9
7
ch6.p65 12/04/2000, 12:15 PM156
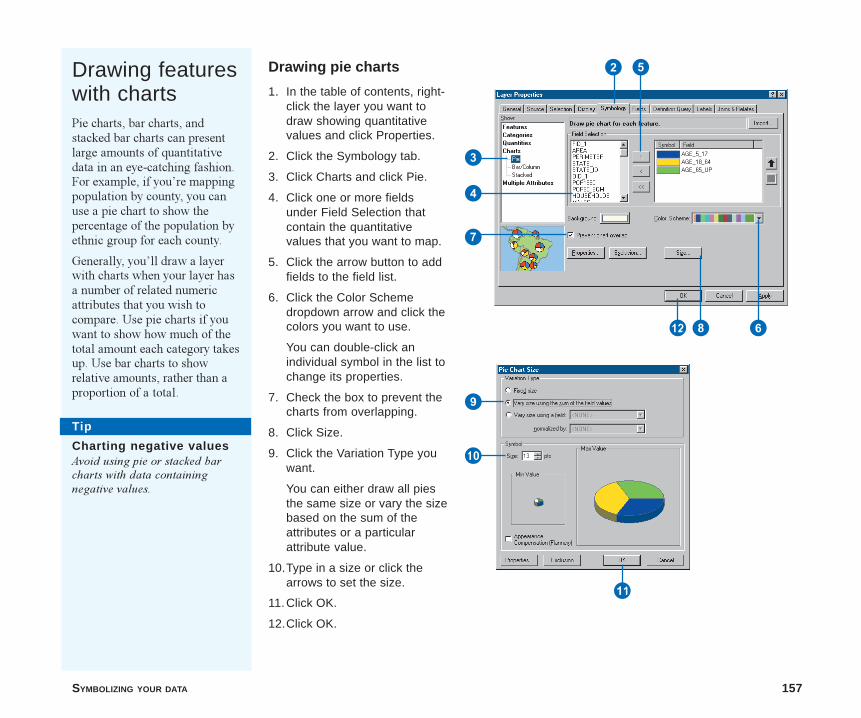
SYMBOLIZING YOUR DATA 157
Drawing featureswith chartsPie charts, bar charts, andstacked bar charts can presentlarge amounts of quantitativedata in an eye-catching fashion.For example, if you�re mappingpopulation by county, you canuse a pie chart to show thepercentage of the population byethnic group for each county.
Generally, you�ll draw a layerwith charts when your layer hasa number of related numericattributes that you wish tocompare. Use pie charts if youwant to show how much of thetotal amount each category takesup. Use bar charts to showrelative amounts, rather than aproportion of a total.
Drawing pie charts
1. In the table of contents, right-click the layer you want todraw showing quantitativevalues and click Properties.
2. Click the Symbology tab.
3. Click Charts and click Pie.
4. Click one or more fieldsunder Field Selection thatcontain the quantitativevalues that you want to map.
5. Click the arrow button to addfields to the field list.
6. Click the Color Schemedropdown arrow and click thecolors you want to use.
You can double-click anindividual symbol in the list tochange its properties.
7. Check the box to prevent thecharts from overlapping.
8. Click Size.
9. Click the Variation Type youwant.
You can either draw all piesthe same size or vary the sizebased on the sum of theattributes or a particularattribute value.
10.Type in a size or click thearrows to set the size.
11.Click OK.
12.Click OK.
Tip
Charting negative valuesAvoid using pie or stacked barcharts with data containingnegative values.
2 5
3
4
E 8 6
9
Q
W
7
ch6.p65 12/04/2000, 12:15 PM157
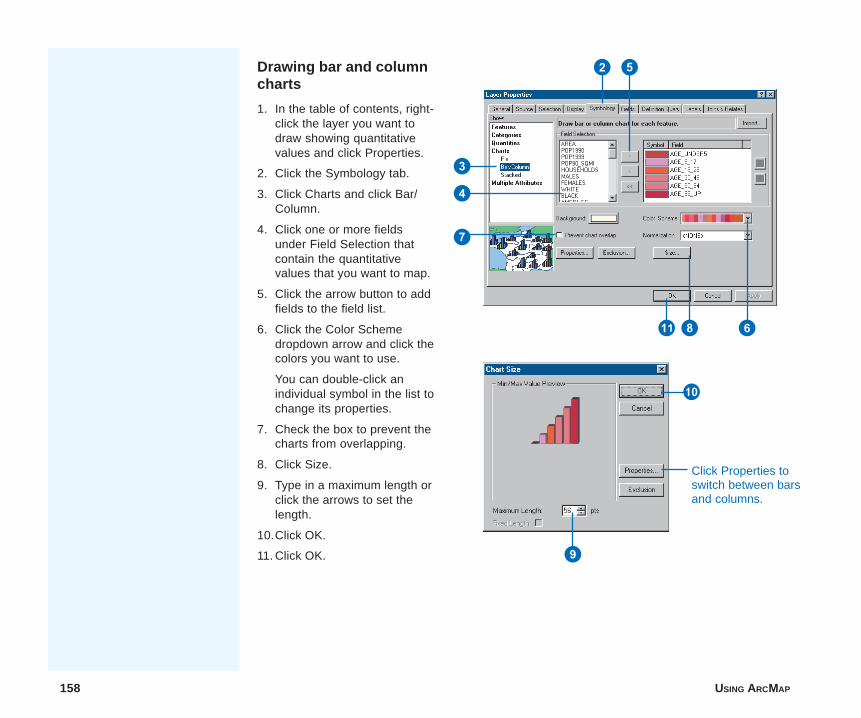
158 USING ARCMAP
Drawing bar and columncharts
1. In the table of contents, right-click the layer you want todraw showing quantitativevalues and click Properties.
2. Click the Symbology tab.
3. Click Charts and click Bar/Column.
4. Click one or more fieldsunder Field Selection thatcontain the quantitativevalues that you want to map.
5. Click the arrow button to addfields to the field list.
6. Click the Color Schemedropdown arrow and click thecolors you want to use.
You can double-click anindividual symbol in the list tochange its properties.
7. Check the box to prevent thecharts from overlapping.
8. Click Size.
9. Type in a maximum length orclick the arrows to set thelength.
10.Click OK.
11. Click OK.
2 5
3
4
W 8 6
7
Q
9
Click Properties toswitch between barsand columns.
ch6.p65 12/04/2000, 12:15 PM158
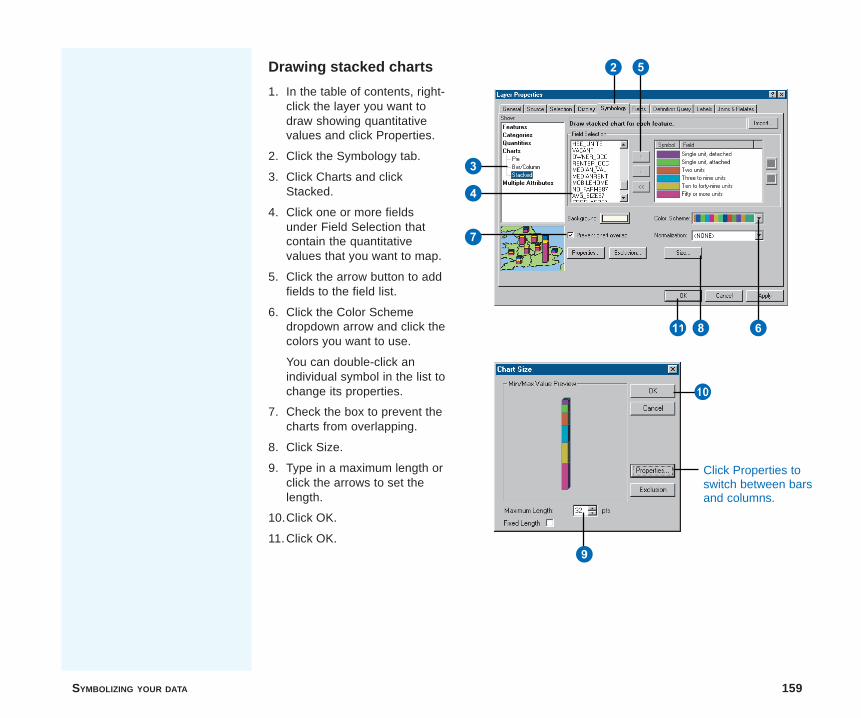
SYMBOLIZING YOUR DATA 159
Drawing stacked charts
1. In the table of contents, right-click the layer you want todraw showing quantitativevalues and click Properties.
2. Click the Symbology tab.
3. Click Charts and clickStacked.
4. Click one or more fieldsunder Field Selection thatcontain the quantitativevalues that you want to map.
5. Click the arrow button to addfields to the field list.
6. Click the Color Schemedropdown arrow and click thecolors you want to use.
You can double-click anindividual symbol in the list tochange its properties.
7. Check the box to prevent thecharts from overlapping.
8. Click Size.
9. Type in a maximum length orclick the arrows to set thelength.
10.Click OK.
11.Click OK.
2 5
3
4
W 8 6
7
Q
9
Click Properties toswitch between barsand columns.
ch6.p65 12/04/2000, 12:15 PM159
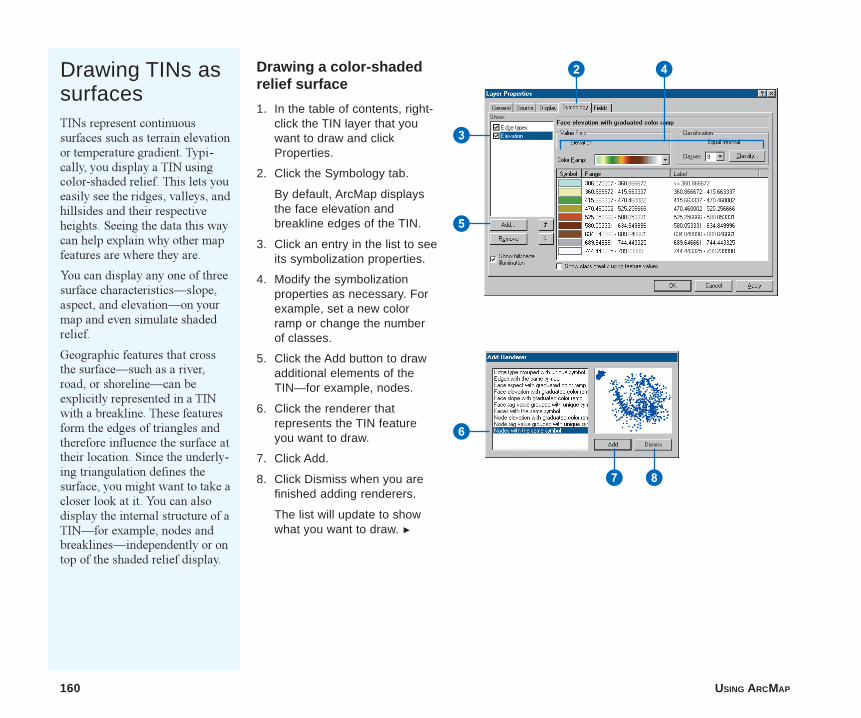
160 USING ARCMAP
Drawing TINs assurfacesTINs represent continuoussurfaces such as terrain elevationor temperature gradient. Typi-cally, you display a TIN usingcolor-shaded relief. This lets youeasily see the ridges, valleys, andhillsides and their respectiveheights. Seeing the data this waycan help explain why other mapfeatures are where they are.
You can display any one of threesurface characteristics�slope,aspect, and elevation�on yourmap and even simulate shadedrelief.
Geographic features that crossthe surface�such as a river,road, or shoreline�can beexplicitly represented in a TINwith a breakline. These featuresform the edges of triangles andtherefore influence the surface attheir location. Since the underly-ing triangulation defines thesurface, you might want to take acloser look at it. You can alsodisplay the internal structure of aTIN�for example, nodes andbreaklines�independently or ontop of the shaded relief display.
Drawing a color-shadedrelief surface
1. In the table of contents, right-click the TIN layer that youwant to draw and clickProperties.
2. Click the Symbology tab.
By default, ArcMap displaysthe face elevation andbreakline edges of the TIN.
3. Click an entry in the list to seeits symbolization properties.
4. Modify the symbolizationproperties as necessary. Forexample, set a new colorramp or change the numberof classes.
5. Click the Add button to drawadditional elements of theTIN—for example, nodes.
6. Click the renderer thatrepresents the TIN featureyou want to draw.
7. Click Add.
8. Click Dismiss when you arefinished adding renderers.
The list will update to showwhat you want to draw. u
2
3
4
5
6
7 8
ch6.p65 12/04/2000, 12:16 PM160
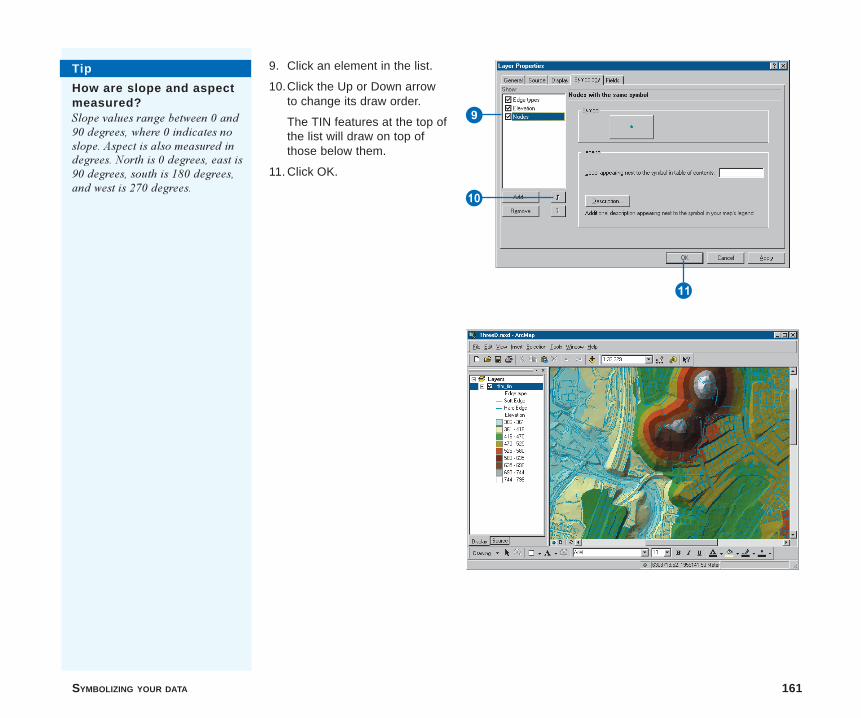
SYMBOLIZING YOUR DATA 161
9. Click an element in the list.
10.Click the Up or Down arrowto change its draw order.
The TIN features at the top ofthe list will draw on top ofthose below them.
11. Click OK.
9
Q
W
Tip
How are slope and aspectmeasured?Slope values range between 0 and90 degrees, where 0 indicates noslope. Aspect is also measured indegrees. North is 0 degrees, east is90 degrees, south is 180 degrees,and west is 270 degrees.
ch6.p65 12/04/2000, 12:16 PM161
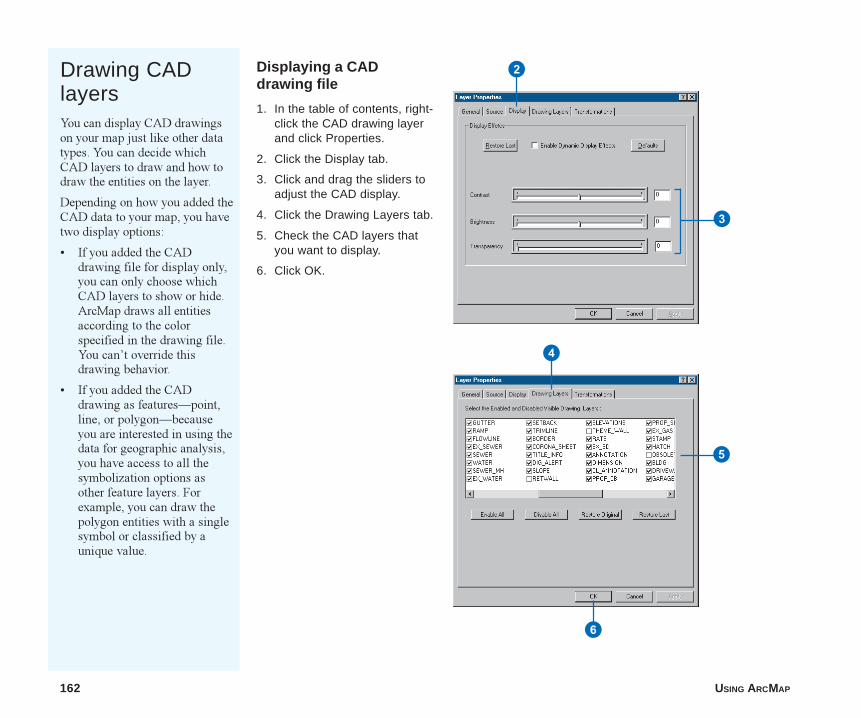
162 USING ARCMAP
Drawing CADlayersYou can display CAD drawingson your map just like other datatypes. You can decide whichCAD layers to draw and how todraw the entities on the layer.
Depending on how you added theCAD data to your map, you havetwo display options:
� If you added the CADdrawing file for display only,you can only choose whichCAD layers to show or hide.ArcMap draws all entitiesaccording to the colorspecified in the drawing file.You can�t override thisdrawing behavior.
� If you added the CADdrawing as features�point,line, or polygon�becauseyou are interested in using thedata for geographic analysis,you have access to all thesymbolization options asother feature layers. Forexample, you can draw thepolygon entities with a singlesymbol or classified by aunique value.
Displaying a CADdrawing file
1. In the table of contents, right-click the CAD drawing layerand click Properties.
2. Click the Display tab.
3. Click and drag the sliders toadjust the CAD display.
4. Click the Drawing Layers tab.
5. Check the CAD layers thatyou want to display.
6. Click OK.
2
3
4
5
6
ch6.p65 12/04/2000, 12:17 PM162
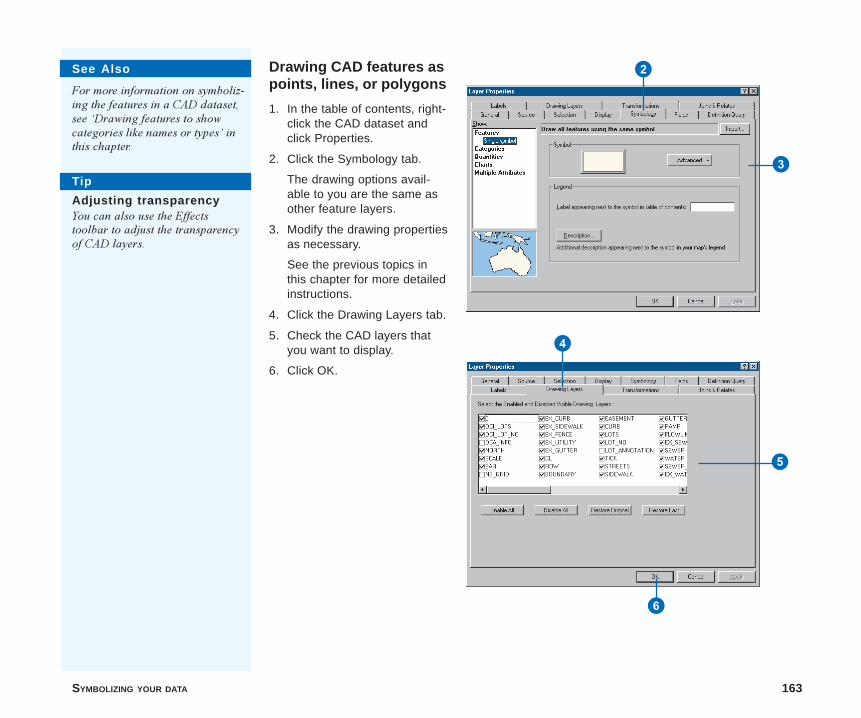
SYMBOLIZING YOUR DATA 163
Drawing CAD features aspoints, lines, or polygons
1. In the table of contents, right-click the CAD dataset andclick Properties.
2. Click the Symbology tab.
The drawing options avail-able to you are the same asother feature layers.
3. Modify the drawing propertiesas necessary.
See the previous topics inthis chapter for more detailedinstructions.
4. Click the Drawing Layers tab.
5. Check the CAD layers thatyou want to display.
6. Click OK.
See Also
For more information on symboliz-ing the features in a CAD dataset,see �Drawing features to showcategories like names or types� inthis chapter.
2
3
4
5
6
Tip
Adjusting transparencyYou can also use the Effectstoolbar to adjust the transparencyof CAD layers.
ch6.p65 12/04/2000, 12:17 PM163
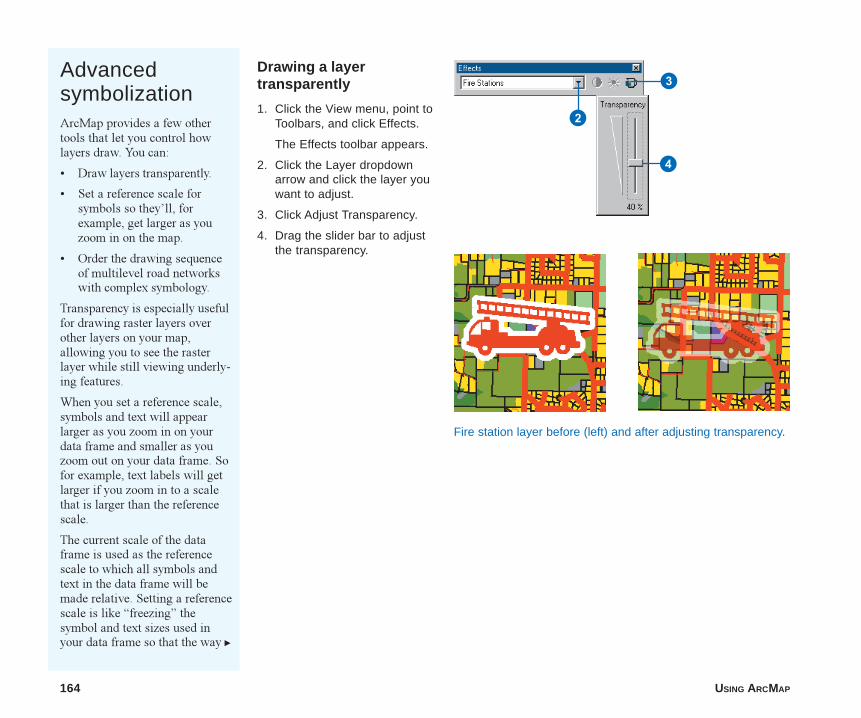
164 USING ARCMAP
AdvancedsymbolizationArcMap provides a few othertools that let you control howlayers draw. You can:
� Draw layers transparently.
� Set a reference scale forsymbols so they�ll, forexample, get larger as youzoom in on the map.
� Order the drawing sequenceof multilevel road networkswith complex symbology.
Transparency is especially usefulfor drawing raster layers overother layers on your map,allowing you to see the rasterlayer while still viewing underly-ing features.
When you set a reference scale,symbols and text will appearlarger as you zoom in on yourdata frame and smaller as youzoom out on your data frame. Sofor example, text labels will getlarger if you zoom in to a scalethat is larger than the referencescale.
The current scale of the dataframe is used as the referencescale to which all symbols andtext in the data frame will bemade relative. Setting a referencescale is like �freezing� thesymbol and text sizes used inyour data frame so that the way u
Drawing a layertransparently
1. Click the View menu, point toToolbars, and click Effects.
The Effects toolbar appears.
2. Click the Layer dropdownarrow and click the layer youwant to adjust.
3. Click Adjust Transparency.
4. Drag the slider bar to adjustthe transparency.
2
3
4
Fire station layer before (left) and after adjusting transparency.
ch6.p65 12/04/2000, 12:17 PM164
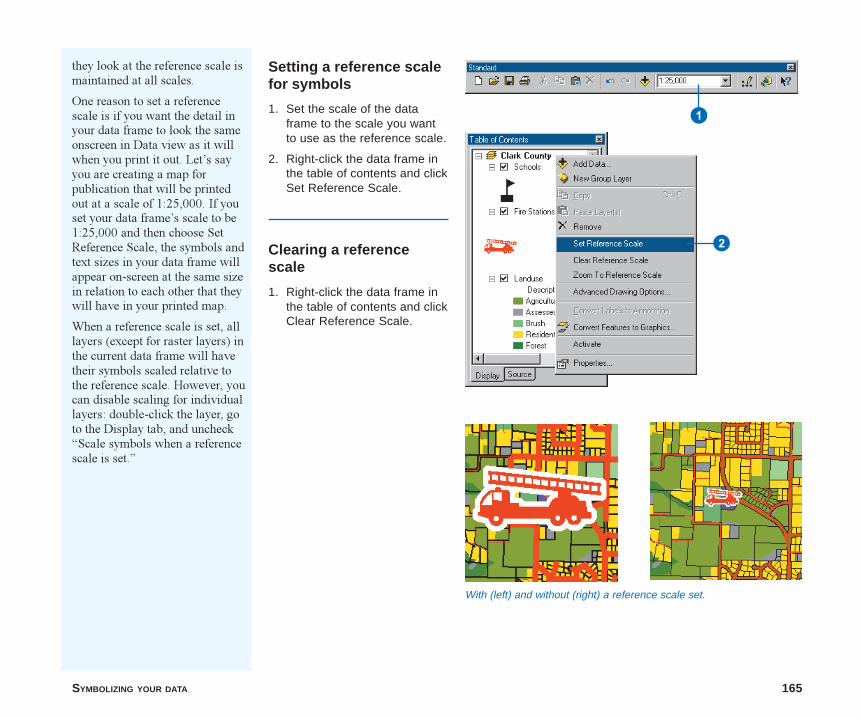
SYMBOLIZING YOUR DATA 165
they look at the reference scale ismaintained at all scales.
One reason to set a referencescale is if you want the detail inyour data frame to look the sameonscreen in Data view as it willwhen you print it out. Let�s sayyou are creating a map forpublication that will be printedout at a scale of 1:25,000. If youset your data frame�s scale to be1:25,000 and then choose SetReference Scale, the symbols andtext sizes in your data frame willappear on-screen at the same sizein relation to each other that theywill have in your printed map.
When a reference scale is set, alllayers (except for raster layers) inthe current data frame will havetheir symbols scaled relative tothe reference scale. However, youcan disable scaling for individuallayers: double-click the layer, goto the Display tab, and uncheck�Scale symbols when a referencescale is set.�
Setting a reference scalefor symbols
1. Set the scale of the dataframe to the scale you wantto use as the reference scale.
2. Right-click the data frame inthe table of contents and clickSet Reference Scale.
With (left) and without (right) a reference scale set.
1
2Clearing a referencescale
1. Right-click the data frame inthe table of contents and clickClear Reference Scale.
ch6.p65 12/04/2000, 12:17 PM165
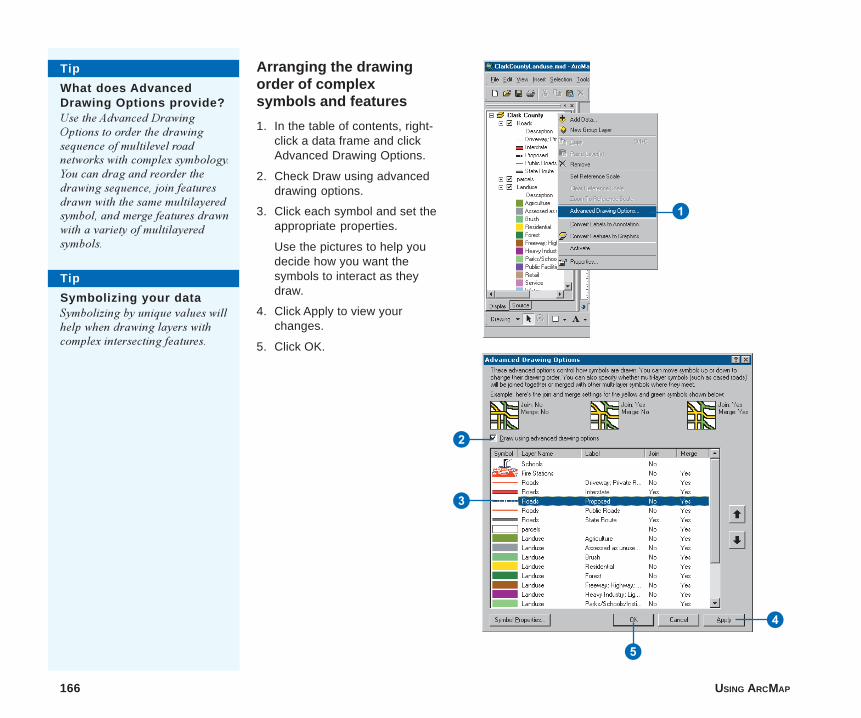
166 USING ARCMAP
Arranging the drawingorder of complexsymbols and features
1. In the table of contents, right-click a data frame and clickAdvanced Drawing Options.
2. Check Draw using advanceddrawing options.
3. Click each symbol and set theappropriate properties.
Use the pictures to help youdecide how you want thesymbols to interact as theydraw.
4. Click Apply to view yourchanges.
5. Click OK.
3
4
2
1
5
Tip
Symbolizing your dataSymbolizing by unique values willhelp when drawing layers withcomplex intersecting features.
Tip
What does AdvancedDrawing Options provide?Use the Advanced DrawingOptions to order the drawingsequence of multilevel roadnetworks with complex symbology.You can drag and reorder thedrawing sequence, join featuresdrawn with the same multilayeredsymbol, and merge features drawnwith a variety of multilayeredsymbols.
ch6.p65 12/04/2000, 12:18 PM166
IN THIS CHAPTER
167
Labeling maps with text and graphics 7• Drawing points, lines, and circles
• Adding text
• Selecting graphics
• Moving, rotating, and orderinggraphics
• Aligning, distributing, and groupinggraphics
• Joining graphics
• About labeling
• Displaying labels
• Specifying the text of labels
• Prioritizing and positioning labels
• Printing a map with labels
• Feature-linked annotation
• Map tips and hyperlinks
Maps convey information about geographic features. Yet displaying onlyfeatures on a map�even those with symbols that describe exactly what theyare�isn�t always enough to make your point. Sometimes you�ll want to addtext and other graphics, such as polygons, circles, and lines, on top of yourdata to draw attention to particular features or highlight important areas. Forexample, you might want to outline a study area with a polygon, point outpotential locations for new stores, or label city streets with their names. Othertimes, you�ll use text and graphics to enhance your map presentation. Forexample, you can add titles to your map or draw neatlines around its border.These sorts of graphics are not associated with any particular map features,although they are added to the map the same way.
Text that�s associated with a map feature is called a label. You can type in alabel by hand if you know what the feature is, but more likely you�ll letArcMap label features automatically based on an attribute of the feature�forexample, a soil type, street name, or land use category. If you�re working witha geodatabase, you can dynamically link the label to the feature. That way, ifyou move the feature, the label will move with it; if you delete the feature, thelabel will also be deleted; and if you change the attribute value referenced bythe label, the label will update with the new value.
Another more subtle way to label map features is with map tips andhyperlinks. Use map tips to display an attribute when you pause the mousepointer over a feature. Use hyperlinks to display images, photographs,documents, drawings, video clips, Web pages, or any other information storedas a file on your system or on the Internet.
ch7.p65 12/04/2000, 12:57 PM 167
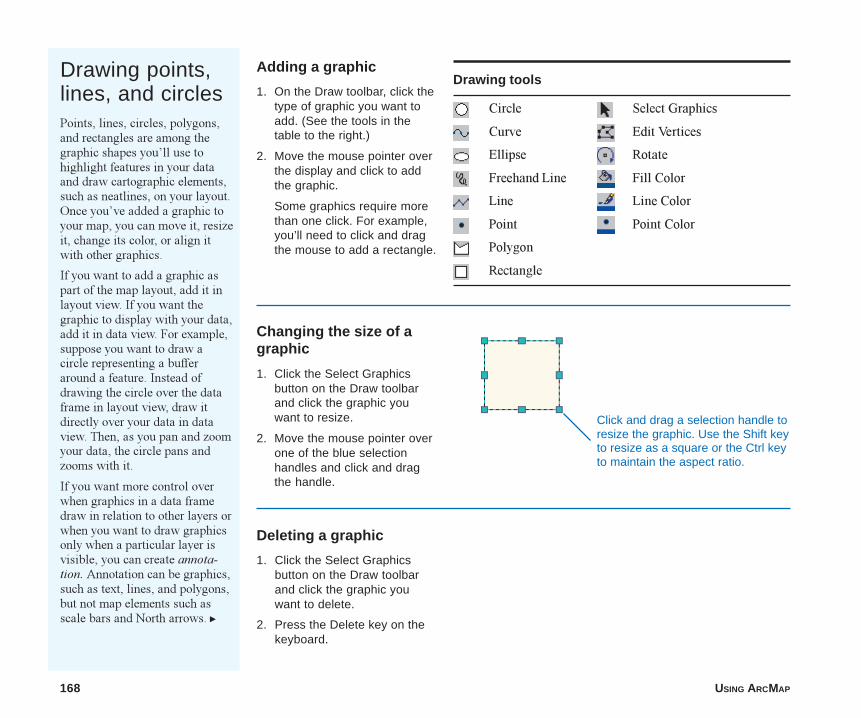
168 USING ARCMAP
Drawing points,lines, and circlesPoints, lines, circles, polygons,and rectangles are among thegraphic shapes you�ll use tohighlight features in your dataand draw cartographic elements,such as neatlines, on your layout.Once you�ve added a graphic toyour map, you can move it, resizeit, change its color, or align itwith other graphics.
If you want to add a graphic aspart of the map layout, add it inlayout view. If you want thegraphic to display with your data,add it in data view. For example,suppose you want to draw acircle representing a bufferaround a feature. Instead ofdrawing the circle over the dataframe in layout view, draw itdirectly over your data in dataview. Then, as you pan and zoomyour data, the circle pans andzooms with it.
If you want more control overwhen graphics in a data framedraw in relation to other layers orwhen you want to draw graphicsonly when a particular layer isvisible, you can create annota-tion. Annotation can be graphics,such as text, lines, and polygons,but not map elements such asscale bars and North arrows. u
Adding a graphic
1. On the Draw toolbar, click thetype of graphic you want toadd. (See the tools in thetable to the right.)
2. Move the mouse pointer overthe display and click to addthe graphic.
Some graphics require morethan one click. For example,you’ll need to click and dragthe mouse to add a rectangle.
Changing the size of agraphic
1. Click the Select Graphicsbutton on the Draw toolbarand click the graphic youwant to resize.
2. Move the mouse pointer overone of the blue selectionhandles and click and dragthe handle.
Drawing tools
Circle Select Graphics
Curve Edit Vertices
Ellipse Rotate
Freehand Line Fill Color
Line Line Color
Point Point Color
Polygon
Rectangle
Click and drag a selection handle toresize the graphic. Use the Shift keyto resize as a square or the Ctrl keyto maintain the aspect ratio.
Deleting a graphic
1. Click the Select Graphicsbutton on the Draw toolbarand click the graphic youwant to delete.
2. Press the Delete key on thekeyboard.
ch7.p65 12/04/2000, 12:57 PM168
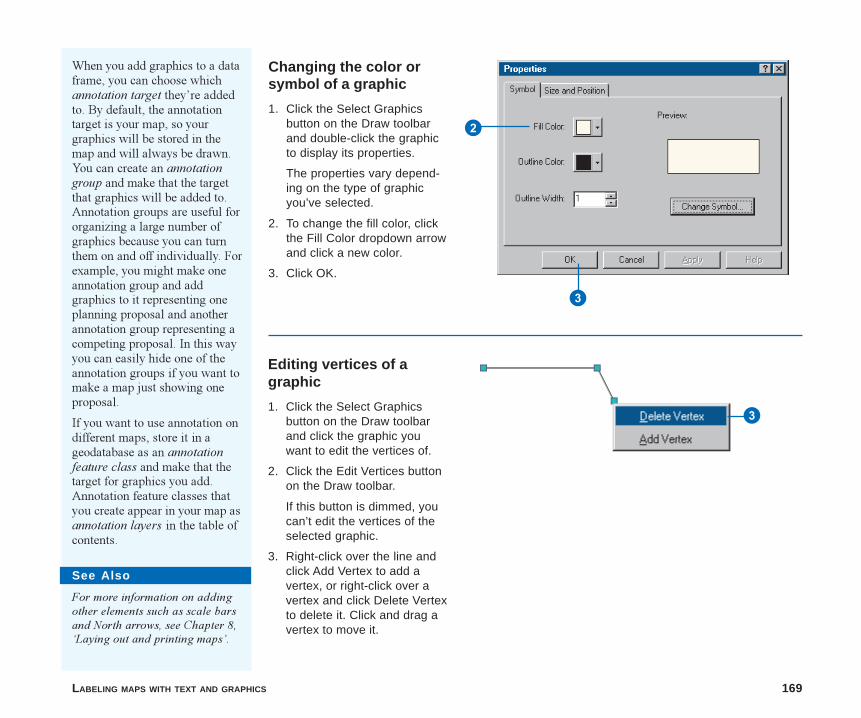
LABELING MAPS WITH TEXT AND GRAPHICS 169
See Also
For more information on addingother elements such as scale barsand North arrows, see Chapter 8,�Laying out and printing maps�.
Editing vertices of agraphic
1. Click the Select Graphicsbutton on the Draw toolbarand click the graphic youwant to edit the vertices of.
2. Click the Edit Vertices buttonon the Draw toolbar.
If this button is dimmed, youcan’t edit the vertices of theselected graphic.
3. Right-click over the line andclick Add Vertex to add avertex, or right-click over avertex and click Delete Vertexto delete it. Click and drag avertex to move it.
Changing the color orsymbol of a graphic
1. Click the Select Graphicsbutton on the Draw toolbarand double-click the graphicto display its properties.
The properties vary depend-ing on the type of graphicyou’ve selected.
2. To change the fill color, clickthe Fill Color dropdown arrowand click a new color.
3. Click OK.
2
3
3
When you add graphics to a dataframe, you can choose whichannotation target they�re addedto. By default, the annotationtarget is your map, so yourgraphics will be stored in themap and will always be drawn.You can create an annotationgroup and make that the targetthat graphics will be added to.Annotation groups are useful fororganizing a large number ofgraphics because you can turnthem on and off individually. Forexample, you might make oneannotation group and addgraphics to it representing oneplanning proposal and anotherannotation group representing acompeting proposal. In this wayyou can easily hide one of theannotation groups if you want tomake a map just showing oneproposal.
If you want to use annotation ondifferent maps, store it in ageodatabase as an annotationfeature class and make that thetarget for graphics you add.Annotation feature classes thatyou create appear in your map asannotation layers in the table ofcontents.
ch7.p65 12/04/2000, 12:57 PM169
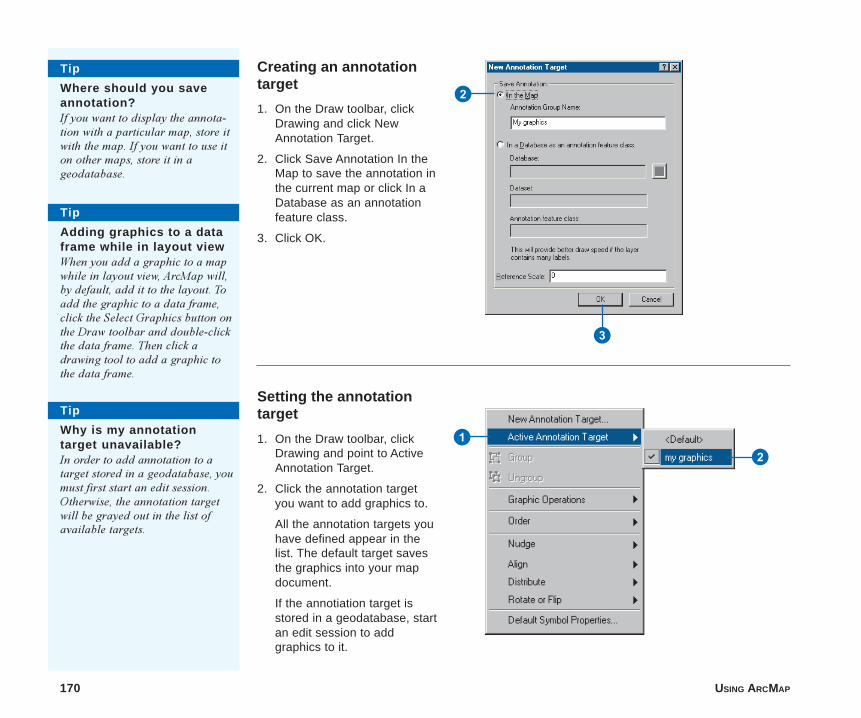
170 USING ARCMAP
Setting the annotationtarget
1. On the Draw toolbar, clickDrawing and point to ActiveAnnotation Target.
2. Click the annotation targetyou want to add graphics to.
All the annotation targets youhave defined appear in thelist. The default target savesthe graphics into your mapdocument.
If the annotiation target isstored in a geodatabase, startan edit session to addgraphics to it.
Creating an annotationtarget
1. On the Draw toolbar, clickDrawing and click NewAnnotation Target.
2. Click Save Annotation In theMap to save the annotation inthe current map or click In aDatabase as an annotationfeature class.
3. Click OK.
Tip
Where should you saveannotation?If you want to display the annota-tion with a particular map, store itwith the map. If you want to use iton other maps, store it in ageodatabase.
Tip
Adding graphics to a dataframe while in layout viewWhen you add a graphic to a mapwhile in layout view, ArcMap will,by default, add it to the layout. Toadd the graphic to a data frame,click the Select Graphics button onthe Draw toolbar and double-clickthe data frame. Then click adrawing tool to add a graphic tothe data frame.
2
3
21
Tip
Why is my annotationtarget unavailable?In order to add annotation to atarget stored in a geodatabase, youmust first start an edit session.Otherwise, the annotation targetwill be grayed out in the list ofavailable targets.
ch7.p65 12/04/2000, 12:57 PM170
LABELING MAPS WITH TEXT AND GRAPHICS 171
Converting features intographics
1. Right-click the layer in thetable of contents that youwant to convert to graphicsand click Convert Features toGraphics.
2. Click all to convert allfeatures or selected toconvert the selected features.
3. Click the Target dropdownarrow and click the annota-tion target you want to addthe graphics to.
4. Click OK.
2
3
4
Tip
Why convert features tographics?You can convert the features in alayer to graphics that can bemoved, resized, and edited on themap. This option is useful if youwant to change the location offeatures relative to each other forcartographic purposes, such asgeneralization, but you don�t wantto edit the source data that yourlayer represents.
Setting the defaultsymbol properties
1. On the Draw toolbar, clickDefault Symbol Properties.
2. Click the appropriate buttonto set the symbol propertiesfor that type of graphicelement.
3. Click OK.
1
3
2
ch7.p65 12/04/2000, 12:58 PM171
172 USING ARCMAP
Adding textText serves a variety of purposeson a map. You can use text toannotate map features, to presentinformation about the data on themap such as its coordinatesystem, or to provide a title thatdescribes the purpose of the map.
You can interactively place texton a map in several ways. Youcan place text along a horizon-tal line, along a curved line, orwith a callout box behind it thatmasks what�s underneath thetext. You can also control thefont, color, style, and size oftext as needed.
Text associated with mapfeatures should be added to thedata frame containing thefeatures. Text representing anelement on the map layout�such as a title�should beadded to the layout in layoutview.
Adding text along ahorizontal line
1. Click the Text button on theDraw toolbar.
2. Click the mouse pointer overthe map display and type thetext string.
Adding text along acurved line
1. Click the Splined Text buttonon the Draw toolbar.
2. Click the mouse pointer overthe map to add vertices alongwhich the text should besplined.
3. Double-click to end the line.
4. Type the text string.
Adding text with a calloutbox
1. Click the Callout Text buttonon the Draw toolbar.
2. Click and drag the mousepointer over the map displayto draw the callout line.
3. Type the text string.
Text tools
Text Select Graphics
Splined Text Edit Vertices
Label Tool Rotate
Callout Text
See Also
To dynamically label featuresbased on an attribute value, seethe section �About labeling� in thischapter.
2 3
4
3
2
Click the Edit Vertices button on the Draw toolbar to edit thevertices of the splined text.
You can click and drag the endpoint of the callout to position itcorrectly.
ch7.p65 12/07/2000, 8:39 AM172
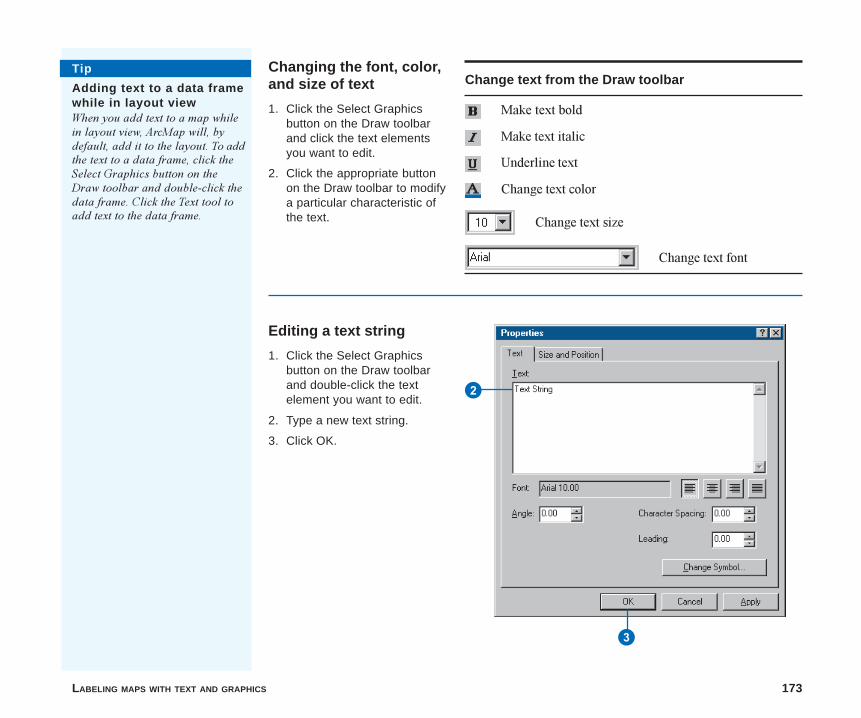
LABELING MAPS WITH TEXT AND GRAPHICS 173
Tip
Adding text to a data framewhile in layout viewWhen you add text to a map whilein layout view, ArcMap will, bydefault, add it to the layout. To addthe text to a data frame, click theSelect Graphics button on theDraw toolbar and double-click thedata frame. Click the Text tool toadd text to the data frame.
Editing a text string
1. Click the Select Graphicsbutton on the Draw toolbarand double-click the textelement you want to edit.
2. Type a new text string.
3. Click OK.
Changing the font, color,and size of text
1. Click the Select Graphicsbutton on the Draw toolbarand click the text elementsyou want to edit.
2. Click the appropriate buttonon the Draw toolbar to modifya particular characteristic ofthe text.
Change text from the Draw toolbar
Make text bold
Make text italic
Underline text
Change text color
Change text size
Change text font
2
3
ch7.p65 12/07/2000, 8:40 AM173
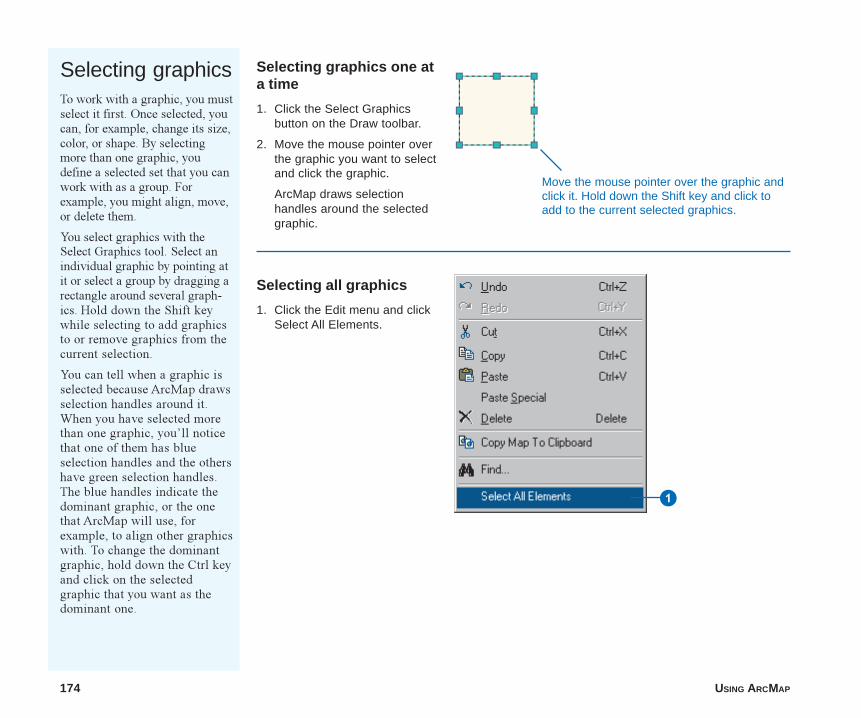
174 USING ARCMAP
Selecting graphicsTo work with a graphic, you mustselect it first. Once selected, youcan, for example, change its size,color, or shape. By selectingmore than one graphic, youdefine a selected set that you canwork with as a group. Forexample, you might align, move,or delete them.
You select graphics with theSelect Graphics tool. Select anindividual graphic by pointing atit or select a group by dragging arectangle around several graph-ics. Hold down the Shift keywhile selecting to add graphicsto or remove graphics from thecurrent selection.
You can tell when a graphic isselected because ArcMap drawsselection handles around it.When you have selected morethan one graphic, you�ll noticethat one of them has blueselection handles and the othershave green selection handles.The blue handles indicate thedominant graphic, or the onethat ArcMap will use, forexample, to align other graphicswith. To change the dominantgraphic, hold down the Ctrl keyand click on the selectedgraphic that you want as thedominant one.
Selecting graphics one ata time
1. Click the Select Graphicsbutton on the Draw toolbar.
2. Move the mouse pointer overthe graphic you want to selectand click the graphic.
ArcMap draws selectionhandles around the selectedgraphic.
Selecting all graphics
1. Click the Edit menu and clickSelect All Elements.
Move the mouse pointer over the graphic andclick it. Hold down the Shift key and click toadd to the current selected graphics.
1
ch7.p65 12/04/2000, 12:58 PM174
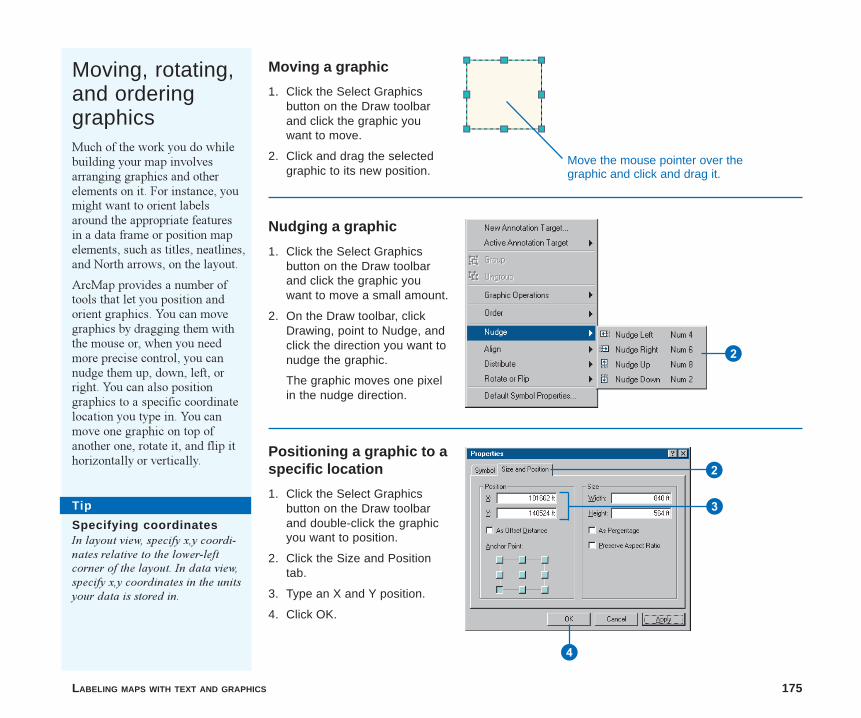
LABELING MAPS WITH TEXT AND GRAPHICS 175
Moving, rotating,and orderinggraphicsMuch of the work you do whilebuilding your map involvesarranging graphics and otherelements on it. For instance, youmight want to orient labelsaround the appropriate featuresin a data frame or position mapelements, such as titles, neatlines,and North arrows, on the layout.
ArcMap provides a number oftools that let you position andorient graphics. You can movegraphics by dragging them withthe mouse or, when you needmore precise control, you cannudge them up, down, left, orright. You can also positiongraphics to a specific coordinatelocation you type in. You canmove one graphic on top ofanother one, rotate it, and flip ithorizontally or vertically.
Nudging a graphic
1. Click the Select Graphicsbutton on the Draw toolbarand click the graphic youwant to move a small amount.
2. On the Draw toolbar, clickDrawing, point to Nudge, andclick the direction you want tonudge the graphic.
The graphic moves one pixelin the nudge direction.
Moving a graphic
1. Click the Select Graphicsbutton on the Draw toolbarand click the graphic youwant to move.
2. Click and drag the selectedgraphic to its new position.
Positioning a graphic to aspecific location
1. Click the Select Graphicsbutton on the Draw toolbarand double-click the graphicyou want to position.
2. Click the Size and Positiontab.
3. Type an X and Y position.
4. Click OK.
Tip
Specifying coordinatesIn layout view, specify x,y coordi-nates relative to the lower-leftcorner of the layout. In data view,specify x,y coordinates in the unitsyour data is stored in.
2
2
3
4
Move the mouse pointer over thegraphic and click and drag it.
ch7.p65 12/04/2000, 12:58 PM175
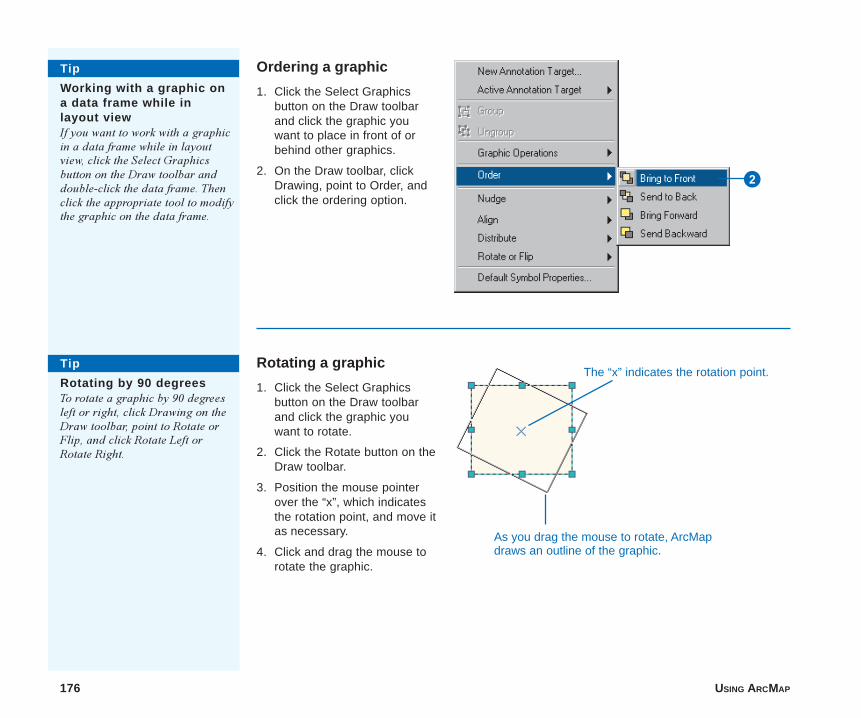
176 USING ARCMAP
Rotating a graphic
1. Click the Select Graphicsbutton on the Draw toolbarand click the graphic youwant to rotate.
2. Click the Rotate button on theDraw toolbar.
3. Position the mouse pointerover the “x”, which indicatesthe rotation point, and move itas necessary.
4. Click and drag the mouse torotate the graphic.
Ordering a graphic
1. Click the Select Graphicsbutton on the Draw toolbarand click the graphic youwant to place in front of orbehind other graphics.
2. On the Draw toolbar, clickDrawing, point to Order, andclick the ordering option.
Tip
Rotating by 90 degreesTo rotate a graphic by 90 degreesleft or right, click Drawing on theDraw toolbar, point to Rotate orFlip, and click Rotate Left orRotate Right.
2
The “x” indicates the rotation point.
As you drag the mouse to rotate, ArcMapdraws an outline of the graphic.
Tip
Working with a graphic ona data frame while inlayout viewIf you want to work with a graphicin a data frame while in layoutview, click the Select Graphicsbutton on the Draw toolbar anddouble-click the data frame. Thenclick the appropriate tool to modifythe graphic on the data frame.
ch7.p65 12/04/2000, 12:59 PM176
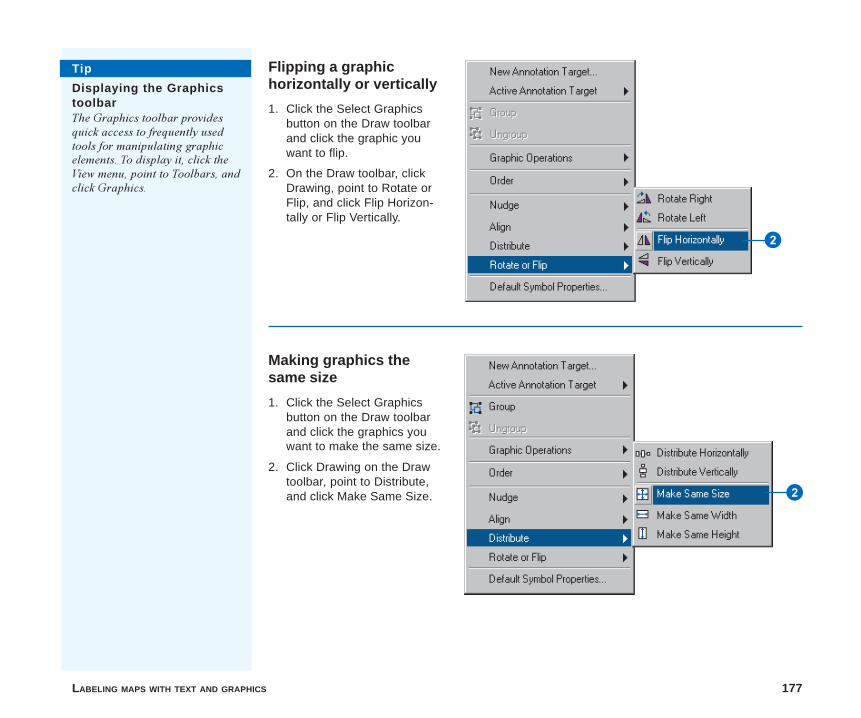
LABELING MAPS WITH TEXT AND GRAPHICS 177
Flipping a graphichorizontally or vertically
1. Click the Select Graphicsbutton on the Draw toolbarand click the graphic youwant to flip.
2. On the Draw toolbar, clickDrawing, point to Rotate orFlip, and click Flip Horizon-tally or Flip Vertically.
2
Making graphics thesame size
1. Click the Select Graphicsbutton on the Draw toolbarand click the graphics youwant to make the same size.
2. Click Drawing on the Drawtoolbar, point to Distribute,and click Make Same Size. 2
Tip
Displaying the GraphicstoolbarThe Graphics toolbar providesquick access to frequently usedtools for manipulating graphicelements. To display it, click theView menu, point to Toolbars, andclick Graphics.
ch7.p65 12/04/2000, 12:59 PM177
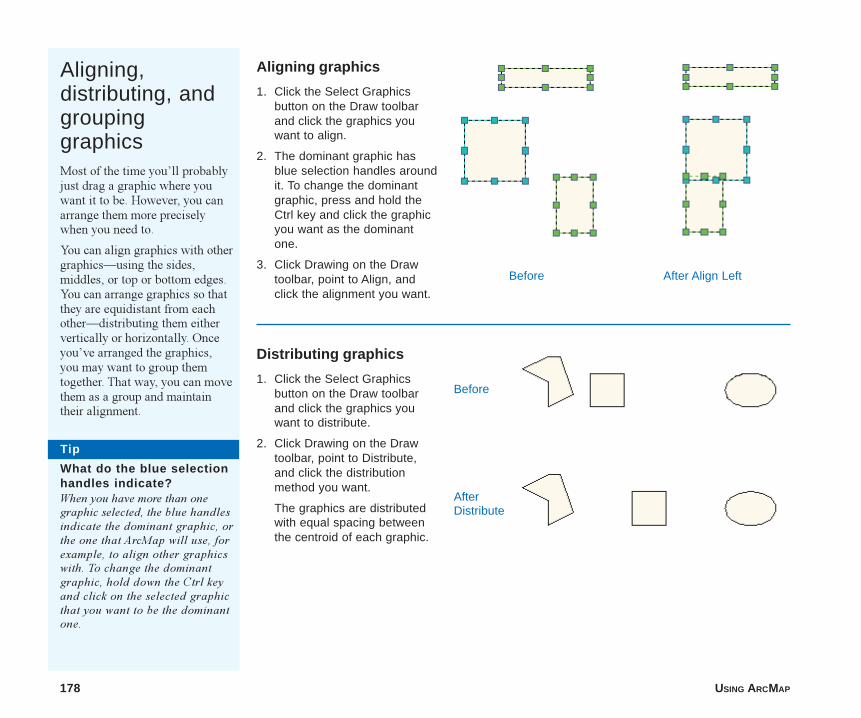
178 USING ARCMAP
Aligning,distributing, andgroupinggraphicsMost of the time you�ll probablyjust drag a graphic where youwant it to be. However, you canarrange them more preciselywhen you need to.
You can align graphics with othergraphics�using the sides,middles, or top or bottom edges.You can arrange graphics so thatthey are equidistant from eachother�distributing them eithervertically or horizontally. Onceyou�ve arranged the graphics,you may want to group themtogether. That way, you can movethem as a group and maintaintheir alignment.
Aligning graphics
1. Click the Select Graphicsbutton on the Draw toolbarand click the graphics youwant to align.
2. The dominant graphic hasblue selection handles aroundit. To change the dominantgraphic, press and hold theCtrl key and click the graphicyou want as the dominantone.
3. Click Drawing on the Drawtoolbar, point to Align, andclick the alignment you want.
Distributing graphics
1. Click the Select Graphicsbutton on the Draw toolbarand click the graphics youwant to distribute.
2. Click Drawing on the Drawtoolbar, point to Distribute,and click the distributionmethod you want.
The graphics are distributedwith equal spacing betweenthe centroid of each graphic.
Tip
What do the blue selectionhandles indicate?When you have more than onegraphic selected, the blue handlesindicate the dominant graphic, orthe one that ArcMap will use, forexample, to align other graphicswith. To change the dominantgraphic, hold down the Ctrl keyand click on the selected graphicthat you want to be the dominantone.
Before After Align Left
Before
AfterDistribute
ch7.p65 12/04/2000, 12:59 PM178
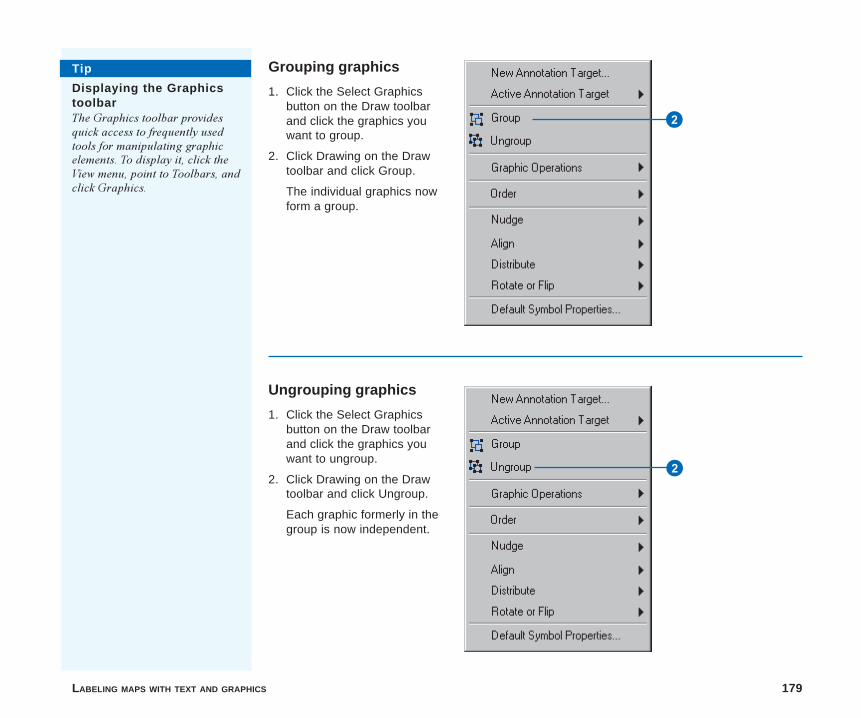
LABELING MAPS WITH TEXT AND GRAPHICS 179
Ungrouping graphics
1. Click the Select Graphicsbutton on the Draw toolbarand click the graphics youwant to ungroup.
2. Click Drawing on the Drawtoolbar and click Ungroup.
Each graphic formerly in thegroup is now independent.
Grouping graphics
1. Click the Select Graphicsbutton on the Draw toolbarand click the graphics youwant to group.
2. Click Drawing on the Drawtoolbar and click Group.
The individual graphics nowform a group.
2
2
Tip
Displaying the GraphicstoolbarThe Graphics toolbar providesquick access to frequently usedtools for manipulating graphicelements. To display it, click theView menu, point to Toolbars, andclick Graphics.
ch7.p65 12/04/2000, 12:59 PM179
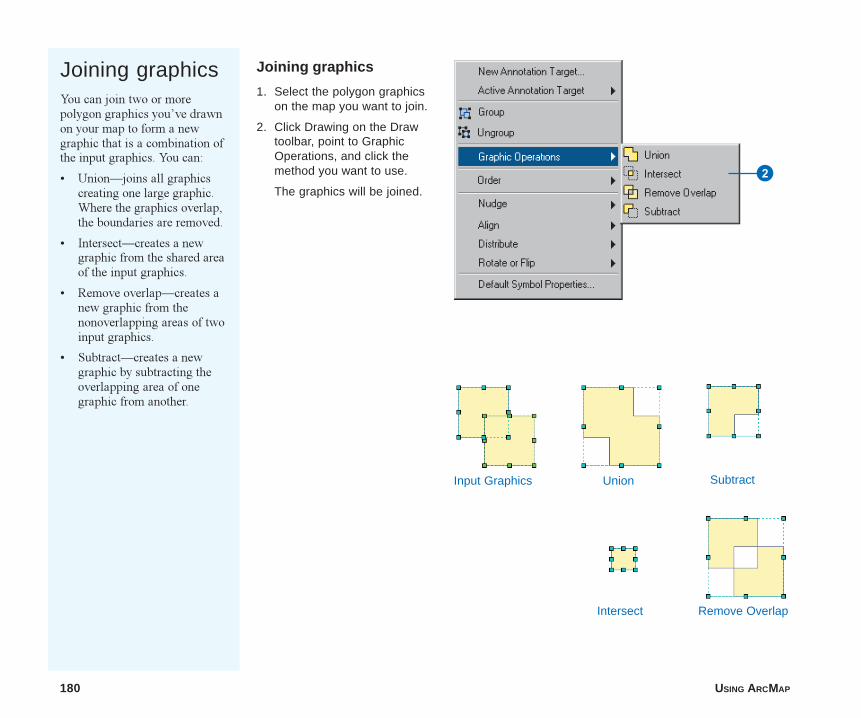
180 USING ARCMAP
Joining graphicsYou can join two or morepolygon graphics you�ve drawnon your map to form a newgraphic that is a combination ofthe input graphics. You can:
� Union�joins all graphicscreating one large graphic.Where the graphics overlap,the boundaries are removed.
� Intersect�creates a newgraphic from the shared areaof the input graphics.
� Remove overlap�creates anew graphic from thenonoverlapping areas of twoinput graphics.
� Subtract�creates a newgraphic by subtracting theoverlapping area of onegraphic from another.
Joining graphics
1. Select the polygon graphicson the map you want to join.
2. Click Drawing on the Drawtoolbar, point to GraphicOperations, and click themethod you want to use.
The graphics will be joined.2
Input Graphics Union Subtract
Intersect Remove Overlap
ch7.p65 12/04/2000, 1:00 PM180
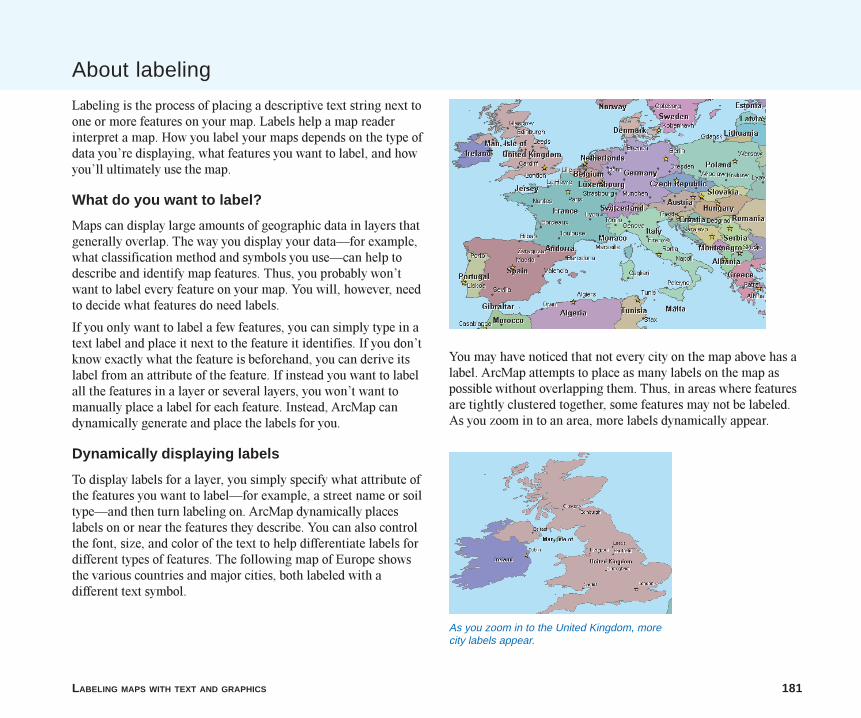
LABELING MAPS WITH TEXT AND GRAPHICS 181
About labeling
Labeling is the process of placing a descriptive text string next toone or more features on your map. Labels help a map readerinterpret a map. How you label your maps depends on the type ofdata you�re displaying, what features you want to label, and howyou�ll ultimately use the map.
What do you want to label?
Maps can display large amounts of geographic data in layers thatgenerally overlap. The way you display your data�for example,what classification method and symbols you use�can help todescribe and identify map features. Thus, you probably won�twant to label every feature on your map. You will, however, needto decide what features do need labels.
If you only want to label a few features, you can simply type in atext label and place it next to the feature it identifies. If you don�tknow exactly what the feature is beforehand, you can derive itslabel from an attribute of the feature. If instead you want to labelall the features in a layer or several layers, you won�t want tomanually place a label for each feature. Instead, ArcMap candynamically generate and place the labels for you.
Dynamically displaying labels
To display labels for a layer, you simply specify what attribute ofthe features you want to label�for example, a street name or soiltype�and then turn labeling on. ArcMap dynamically placeslabels on or near the features they describe. You can also controlthe font, size, and color of the text to help differentiate labels fordifferent types of features. The following map of Europe showsthe various countries and major cities, both labeled with adifferent text symbol.
You may have noticed that not every city on the map above has alabel. ArcMap attempts to place as many labels on the map aspossible without overlapping them. Thus, in areas where featuresare tightly clustered together, some features may not be labeled.As you zoom in to an area, more labels dynamically appear.
As you zoom in to the United Kingdom, morecity labels appear.
ch7.p65 12/04/2000, 1:00 PM181

182 USING ARCMAP
Controlling what features are labeled
As you pan and zoom around your map, ArcMap dynamicallyadjusts the labels to fit the available space. At smaller scales, yousee fewer labels because ArcMap has less space to place them.Because fewer features can be labeled, you might want toprioritize the labeling of some features. For instance, on the mapof Europe, you might want to label a country with its nameinstead of labeling a city if ArcMap can�t fit both labels.
For each layer you want to label, you can set its labeling priority.This means that a feature in a layer with a higher priority will belabeled over a feature in another layer with a lower priority.Similarly, within a single layer you can set labeling priorities onspecific groups of features�for example, you might set a highlabeling priority on cities with larger populations and a lowpriority on cities with smaller populations.
Still, there�s no guarantee that you�ll get exactly the labels youwant positioned exactly where you want them. Thus, dynamiclabeling is best suited to maps where you don�t need precisecontrol over what is labeled and where the label is placed. Whenyou do want precise control over labels, you must manage thelabeling process more closely.
Getting the labels you want, where you want them
When you need more precise control over label placement, youcan convert the dynamic labels to annotation. Converting labelsto annotation allows you to manually control the labeling offeatures. The conversion process creates text graphics from thedynamic labels and displays them on your map. Then you canwork with each label, or text graphic, independently�move it,change its size or font, and change the text. For example, youmight want to move a few labels to make room for one thatArcMap was unable to place due to space constraints. ArcMap
also provides you with a list of all the labels that weren�t placedand lets you interactively place them on your map as needed.
While annotation is typically text, it can also be any graphicelement that annotates your map�such as lines, circles, andpolygons.
Deciding where to store annotation
Suppose you�ve decided to convert your labels to annotationbecause you want direct control over what features are labeledand where. When you convert the labels to annotation, you canstore them with the map as an annotation group, or you can storethem separately in a geodatabase as an annotation feature classand reference it like other data on your map.
Storing annotation in a geodatabase is similar to storinggeographic features�line, point, and polygon�in a geodatabase.You can add annotation stored in a geodatabase to any map. Itappears as an annotation layer in the table of contents.
Where should you store your converted labels? The answer tothis question depends on how you plan to use the labels. Here aresome guidelines:
� If you�re creating a map specifically for printing and thelabels you�ve created apply only to this map, store the labelsas an annotation group in the map document. Then, if youdelete the map, the annotation is also deleted because it�sstored with the map.
� If you want to use the labels you�ve just placed on othermaps�because you�ve invested the time and effort to positionthem�store them as an annotation feature class in ageodatabase. You can add the annotation as a layer to othermaps.
ch7.p65 12/04/2000, 1:00 PM182
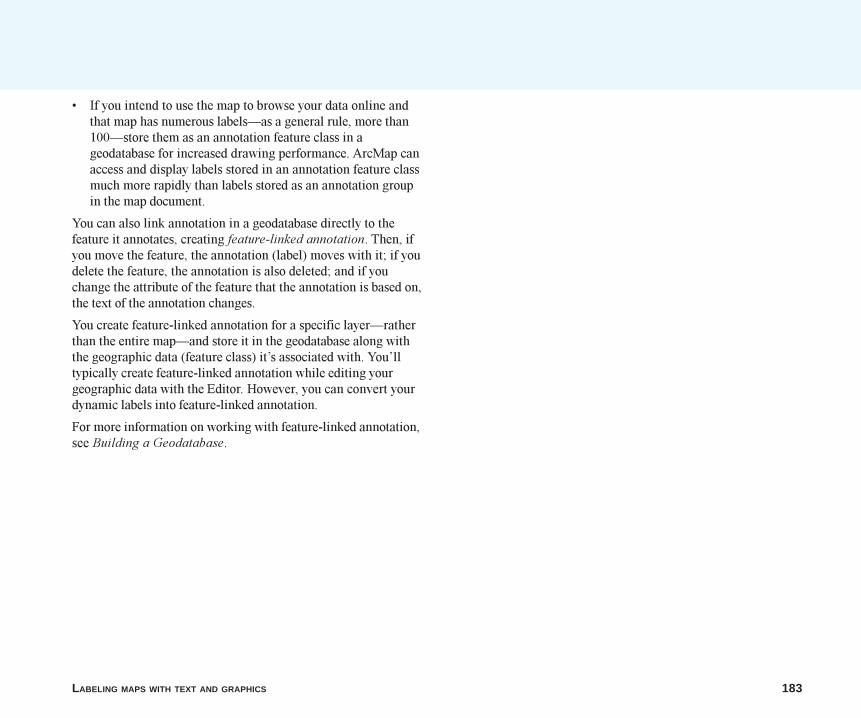
LABELING MAPS WITH TEXT AND GRAPHICS 183
� If you intend to use the map to browse your data online andthat map has numerous labels�as a general rule, more than100�store them as an annotation feature class in ageodatabase for increased drawing performance. ArcMap canaccess and display labels stored in an annotation feature classmuch more rapidly than labels stored as an annotation groupin the map document.
You can also link annotation in a geodatabase directly to thefeature it annotates, creating feature-linked annotation. Then, ifyou move the feature, the annotation (label) moves with it; if youdelete the feature, the annotation is also deleted; and if youchange the attribute of the feature that the annotation is based on,the text of the annotation changes.
You create feature-linked annotation for a specific layer�ratherthan the entire map�and store it in the geodatabase along withthe geographic data (feature class) it�s associated with. You�lltypically create feature-linked annotation while editing yourgeographic data with the Editor. However, you can convert yourdynamic labels into feature-linked annotation.
For more information on working with feature-linked annotation,see Building a Geodatabase.
ch7.p65 12/04/2000, 1:00 PM183
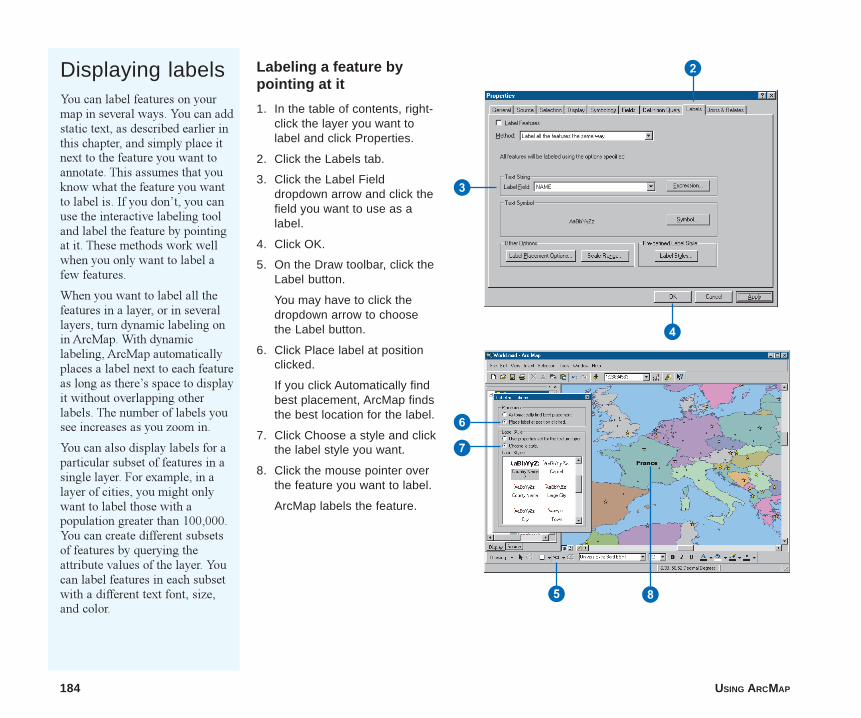
184 USING ARCMAP
Displaying labelsYou can label features on yourmap in several ways. You can addstatic text, as described earlier inthis chapter, and simply place itnext to the feature you want toannotate. This assumes that youknow what the feature you wantto label is. If you don�t, you canuse the interactive labeling tooland label the feature by pointingat it. These methods work wellwhen you only want to label afew features.
When you want to label all thefeatures in a layer, or in severallayers, turn dynamic labeling onin ArcMap. With dynamiclabeling, ArcMap automaticallyplaces a label next to each featureas long as there�s space to displayit without overlapping otherlabels. The number of labels yousee increases as you zoom in.
You can also display labels for aparticular subset of features in asingle layer. For example, in alayer of cities, you might onlywant to label those with apopulation greater than 100,000.You can create different subsetsof features by querying theattribute values of the layer. Youcan label features in each subsetwith a different text font, size,and color.
Labeling a feature bypointing at it
1. In the table of contents, right-click the layer you want tolabel and click Properties.
2. Click the Labels tab.
3. Click the Label Fielddropdown arrow and click thefield you want to use as alabel.
4. Click OK.
5. On the Draw toolbar, click theLabel button.
You may have to click thedropdown arrow to choosethe Label button.
6. Click Place label at positionclicked.
If you click Automatically findbest placement, ArcMap findsthe best location for the label.
7. Click Choose a style and clickthe label style you want.
8. Click the mouse pointer overthe feature you want to label.
ArcMap labels the feature.
2
3
4
5
6
7
8
ch7.p65 12/04/2000, 1:00 PM184
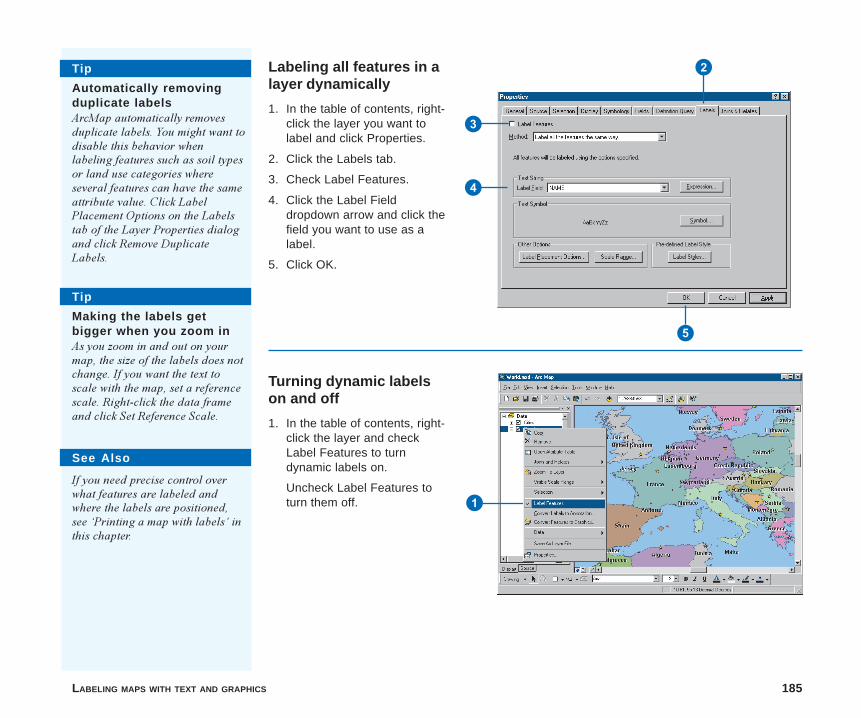
LABELING MAPS WITH TEXT AND GRAPHICS 185
Labeling all features in alayer dynamically
1. In the table of contents, right-click the layer you want tolabel and click Properties.
2. Click the Labels tab.
3. Check Label Features.
4. Click the Label Fielddropdown arrow and click thefield you want to use as alabel.
5. Click OK.
3
5
1
Tip
Making the labels getbigger when you zoom inAs you zoom in and out on yourmap, the size of the labels does notchange. If you want the text toscale with the map, set a referencescale. Right-click the data frameand click Set Reference Scale.
4
Turning dynamic labelson and off
1. In the table of contents, right-click the layer and checkLabel Features to turndynamic labels on.
Uncheck Label Features toturn them off.
See Also
If you need precise control overwhat features are labeled andwhere the labels are positioned,see �Printing a map with labels� inthis chapter.
Tip
Automatically removingduplicate labelsArcMap automatically removesduplicate labels. You might want todisable this behavior whenlabeling features such as soil typesor land use categories whereseveral features can have the sameattribute value. Click LabelPlacement Options on the Labelstab of the Layer Properties dialogand click Remove DuplicateLabels.
2
ch7.p65 12/04/2000, 1:01 PM185
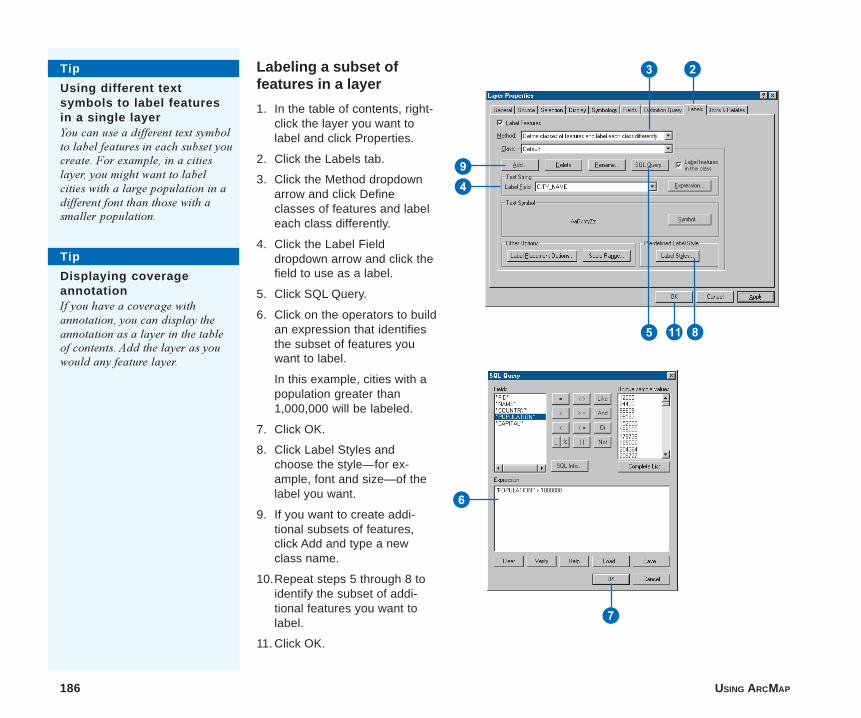
186 USING ARCMAP
W
Labeling a subset offeatures in a layer
1. In the table of contents, right-click the layer you want tolabel and click Properties.
2. Click the Labels tab.
3. Click the Method dropdownarrow and click Defineclasses of features and labeleach class differently.
4. Click the Label Fielddropdown arrow and click thefield to use as a label.
5. Click SQL Query.
6. Click on the operators to buildan expression that identifiesthe subset of features youwant to label.
In this example, cities with apopulation greater than1,000,000 will be labeled.
7. Click OK.
8. Click Label Styles andchoose the style—for ex-ample, font and size—of thelabel you want.
9. If you want to create addi-tional subsets of features,click Add and type a newclass name.
10.Repeat steps 5 through 8 toidentify the subset of addi-tional features you want tolabel.
11. Click OK.
Tip
Displaying coverageannotationIf you have a coverage withannotation, you can display theannotation as a layer in the tableof contents. Add the layer as youwould any feature layer.
23
4
5
6
Tip
Using different textsymbols to label featuresin a single layerYou can use a different text symbolto label features in each subset youcreate. For example, in a citieslayer, you might want to labelcities with a large population in adifferent font than those with asmaller population.
7
9
8
ch7.p65 12/04/2000, 1:01 PM186
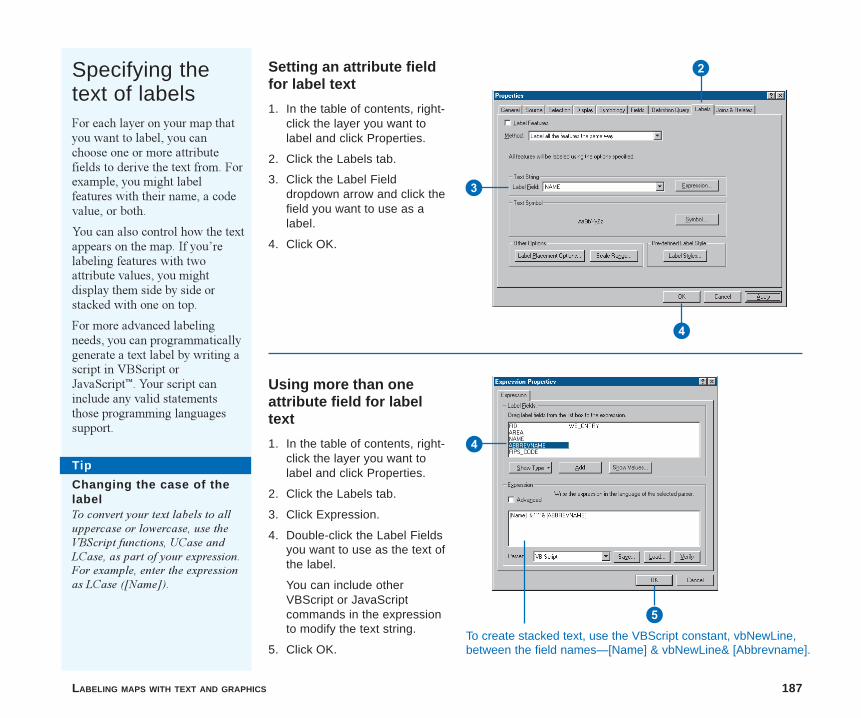
LABELING MAPS WITH TEXT AND GRAPHICS 187
Specifying thetext of labelsFor each layer on your map thatyou want to label, you canchoose one or more attributefields to derive the text from. Forexample, you might labelfeatures with their name, a codevalue, or both.
You can also control how the textappears on the map. If you�relabeling features with twoattribute values, you mightdisplay them side by side orstacked with one on top.
For more advanced labelingneeds, you can programmaticallygenerate a text label by writing ascript in VBScript orJavaScript�. Your script caninclude any valid statementsthose programming languagessupport.
Setting an attribute fieldfor label text
1. In the table of contents, right-click the layer you want tolabel and click Properties.
2. Click the Labels tab.
3. Click the Label Fielddropdown arrow and click thefield you want to use as alabel.
4. Click OK.
2
3
4
Using more than oneattribute field for labeltext
1. In the table of contents, right-click the layer you want tolabel and click Properties.
2. Click the Labels tab.
3. Click Expression.
4. Double-click the Label Fieldsyou want to use as the text ofthe label.
You can include otherVBScript or JavaScriptcommands in the expressionto modify the text string.
5. Click OK.
5To create stacked text, use the VBScript constant, vbNewLine,between the field names—[Name] & vbNewLine& [Abbrevname].
Tip
Changing the case of thelabelTo convert your text labels to alluppercase or lowercase, use theVBScript functions, UCase andLCase, as part of your expression.For example, enter the expressionas LCase ([Name]).
4
ch7.p65 12/04/2000, 1:02 PM187
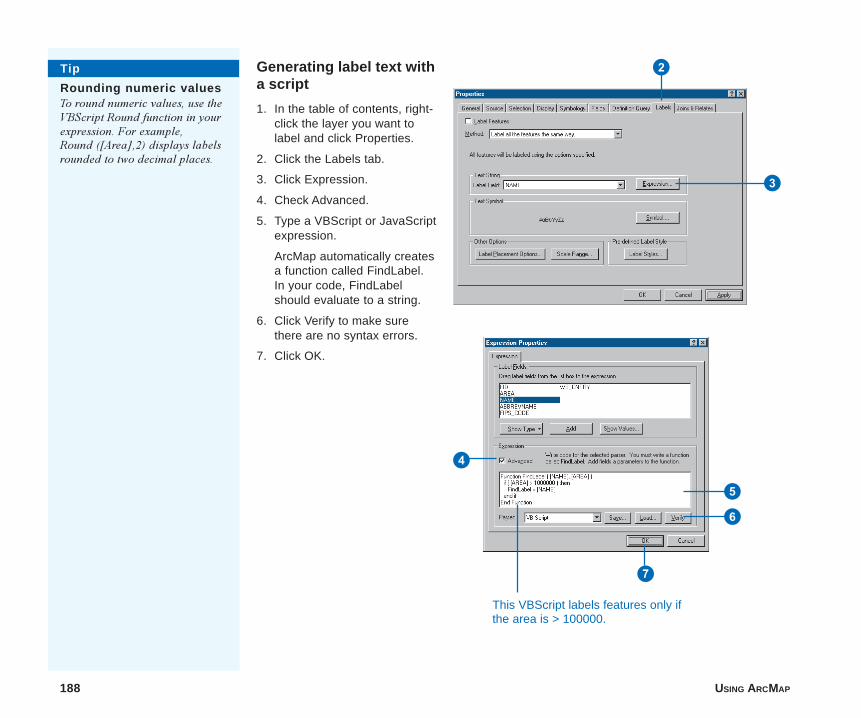
188 USING ARCMAP
Tip
Rounding numeric valuesTo round numeric values, use theVBScript Round function in yourexpression. For example,Round ([Area],2) displays labelsrounded to two decimal places.
Generating label text witha script
1. In the table of contents, right-click the layer you want tolabel and click Properties.
2. Click the Labels tab.
3. Click Expression.
4. Check Advanced.
5. Type a VBScript or JavaScriptexpression.
ArcMap automatically createsa function called FindLabel.In your code, FindLabelshould evaluate to a string.
6. Click Verify to make surethere are no syntax errors.
7. Click OK.
2
3
This VBScript labels features only ifthe area is > 100000.
4
5
6
7
ch7.p65 12/04/2000, 1:02 PM188
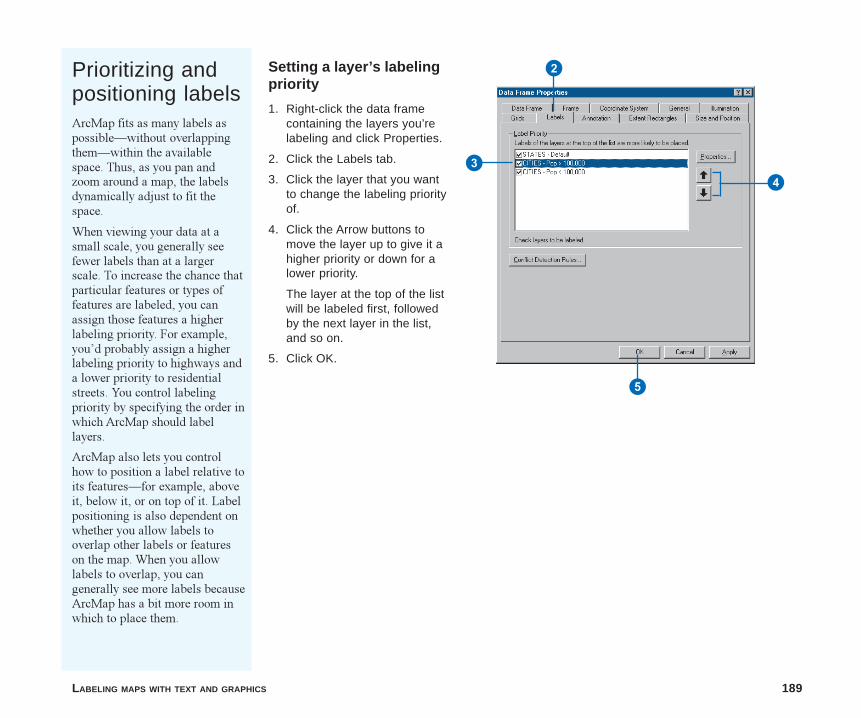
LABELING MAPS WITH TEXT AND GRAPHICS 189
Prioritizing andpositioning labelsArcMap fits as many labels aspossible�without overlappingthem�within the availablespace. Thus, as you pan andzoom around a map, the labelsdynamically adjust to fit thespace.
When viewing your data at asmall scale, you generally seefewer labels than at a largerscale. To increase the chance thatparticular features or types offeatures are labeled, you canassign those features a higherlabeling priority. For example,you�d probably assign a higherlabeling priority to highways anda lower priority to residentialstreets. You control labelingpriority by specifying the order inwhich ArcMap should labellayers.
ArcMap also lets you controlhow to position a label relative toits features�for example, aboveit, below it, or on top of it. Labelpositioning is also dependent onwhether you allow labels tooverlap other labels or featureson the map. When you allowlabels to overlap, you cangenerally see more labels becauseArcMap has a bit more room inwhich to place them.
Setting a layer’s labelingpriority
1. Right-click the data framecontaining the layers you’relabeling and click Properties.
2. Click the Labels tab.
3. Click the layer that you wantto change the labeling priorityof.
4. Click the Arrow buttons tomove the layer up to give it ahigher priority or down for alower priority.
The layer at the top of the listwill be labeled first, followedby the next layer in the list,and so on.
5. Click OK.
2
34
5
ch7.p65 12/04/2000, 1:02 PM189
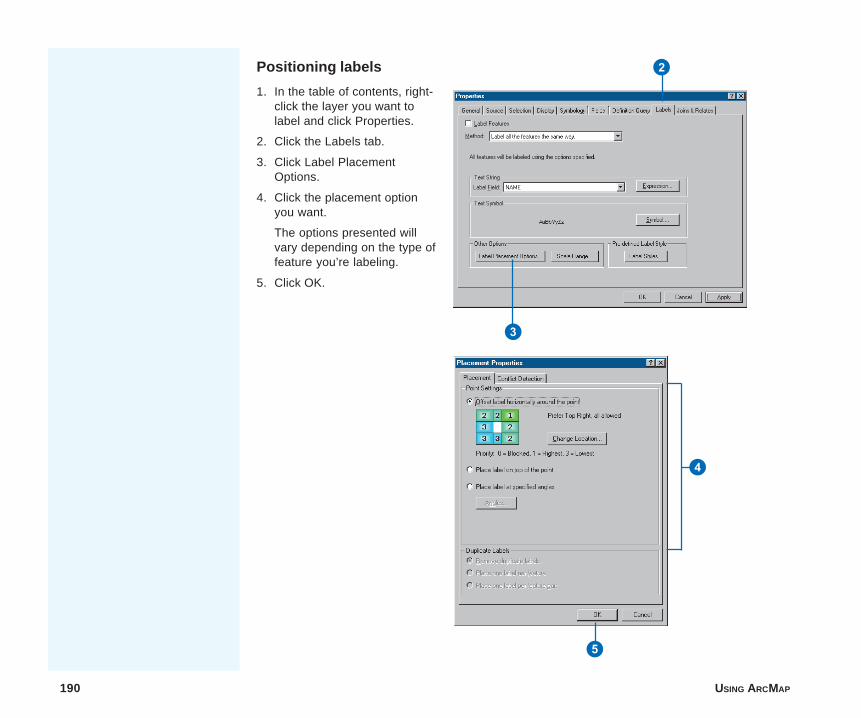
190 USING ARCMAP
Positioning labels
1. In the table of contents, right-click the layer you want tolabel and click Properties.
2. Click the Labels tab.
3. Click Label PlacementOptions.
4. Click the placement optionyou want.
The options presented willvary depending on the type offeature you’re labeling.
5. Click OK.
2
3
4
5
ch7.p65 12/04/2000, 1:03 PM190
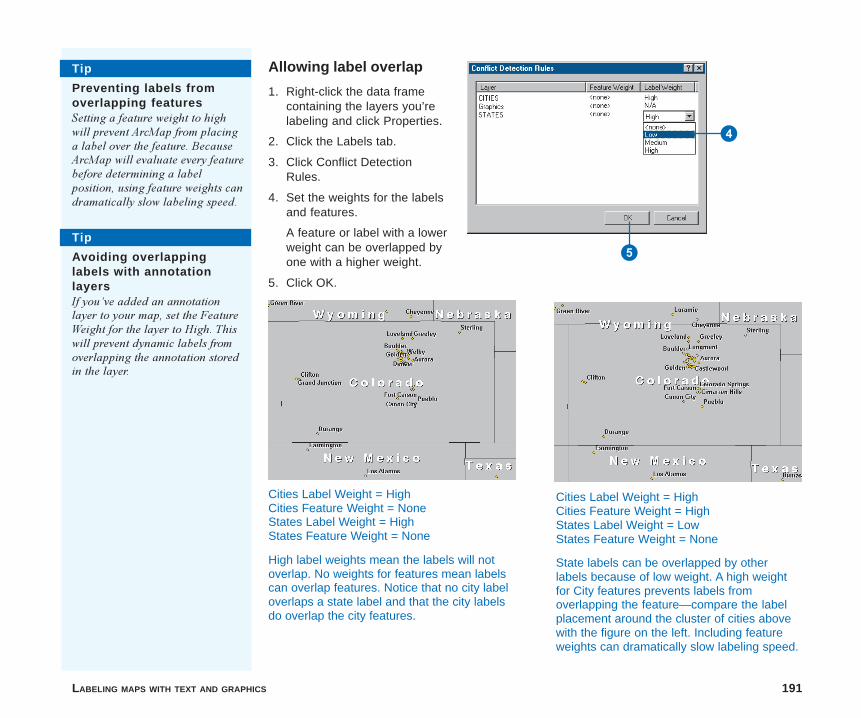
LABELING MAPS WITH TEXT AND GRAPHICS 191
Allowing label overlap
1. Right-click the data framecontaining the layers you’relabeling and click Properties.
2. Click the Labels tab.
3. Click Conflict DetectionRules.
4. Set the weights for the labelsand features.
A feature or label with a lowerweight can be overlapped byone with a higher weight.
5. Click OK.
Cities Label Weight = HighCities Feature Weight = NoneStates Label Weight = HighStates Feature Weight = None
High label weights mean the labels will notoverlap. No weights for features mean labelscan overlap features. Notice that no city labeloverlaps a state label and that the city labelsdo overlap the city features.
Cities Label Weight = HighCities Feature Weight = HighStates Label Weight = LowStates Feature Weight = None
State labels can be overlapped by otherlabels because of low weight. A high weightfor City features prevents labels fromoverlapping the feature—compare the labelplacement around the cluster of cities abovewith the figure on the left. Including featureweights can dramatically slow labeling speed.
Tip
Preventing labels fromoverlapping featuresSetting a feature weight to highwill prevent ArcMap from placinga label over the feature. BecauseArcMap will evaluate every featurebefore determining a labelposition, using feature weights candramatically slow labeling speed.
Tip
Avoiding overlappinglabels with annotationlayersIf you�ve added an annotationlayer to your map, set the FeatureWeight for the layer to High. Thiswill prevent dynamic labels fromoverlapping the annotation storedin the layer.
4
5
ch7.p65 12/04/2000, 1:03 PM191
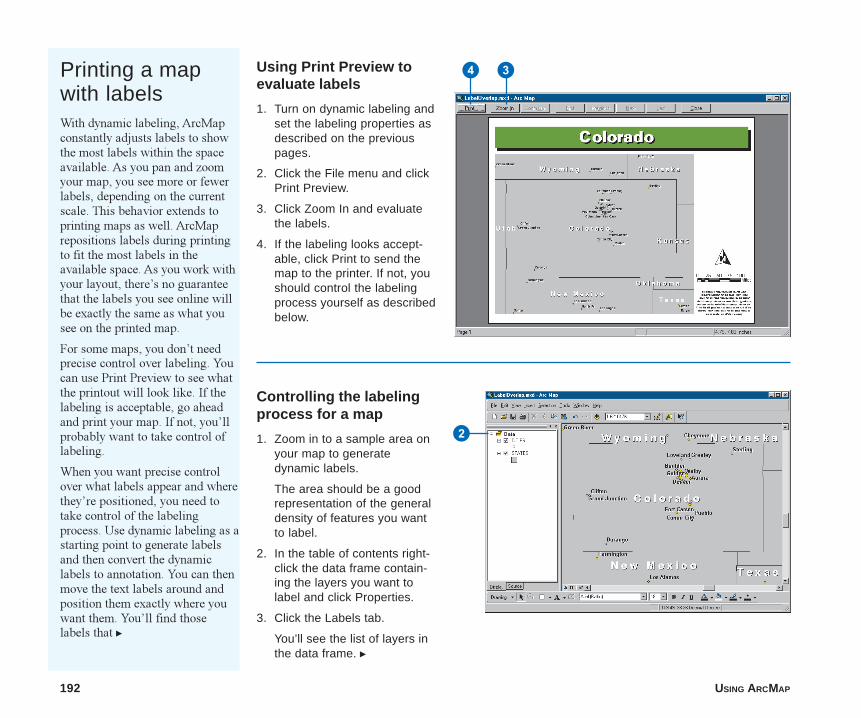
192 USING ARCMAP
Printing a mapwith labelsWith dynamic labeling, ArcMapconstantly adjusts labels to showthe most labels within the spaceavailable. As you pan and zoomyour map, you see more or fewerlabels, depending on the currentscale. This behavior extends toprinting maps as well. ArcMaprepositions labels during printingto fit the most labels in theavailable space. As you work withyour layout, there�s no guaranteethat the labels you see online willbe exactly the same as what yousee on the printed map.
For some maps, you don�t needprecise control over labeling. Youcan use Print Preview to see whatthe printout will look like. If thelabeling is acceptable, go aheadand print your map. If not, you�llprobably want to take control oflabeling.
When you want precise controlover what labels appear and wherethey�re positioned, you need totake control of the labelingprocess. Use dynamic labeling as astarting point to generate labelsand then convert the dynamiclabels to annotation. You can thenmove the text labels around andposition them exactly where youwant them. You�ll find thoselabels that u
Using Print Preview toevaluate labels
1. Turn on dynamic labeling andset the labeling properties asdescribed on the previouspages.
2. Click the File menu and clickPrint Preview.
3. Click Zoom In and evaluatethe labels.
4. If the labeling looks accept-able, click Print to send themap to the printer. If not, youshould control the labelingprocess yourself as describedbelow.
34
Controlling the labelingprocess for a map
1. Zoom in to a sample area onyour map to generatedynamic labels.
The area should be a goodrepresentation of the generaldensity of features you wantto label.
2. In the table of contents right-click the data frame contain-ing the layers you want tolabel and click Properties.
3. Click the Labels tab.
You’ll see the list of layers inthe data frame. u
2
ch7.p65 12/04/2000, 1:04 PM192
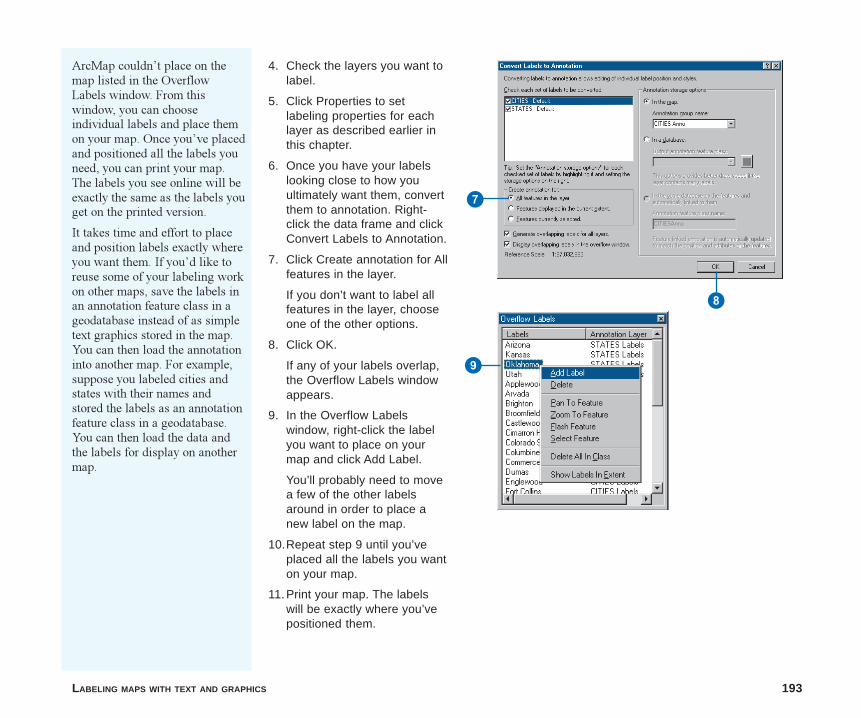
LABELING MAPS WITH TEXT AND GRAPHICS 193
ArcMap couldn�t place on themap listed in the OverflowLabels window. From thiswindow, you can chooseindividual labels and place themon your map. Once you�ve placedand positioned all the labels youneed, you can print your map.The labels you see online will beexactly the same as the labels youget on the printed version.
It takes time and effort to placeand position labels exactly whereyou want them. If you�d like toreuse some of your labeling workon other maps, save the labels inan annotation feature class in ageodatabase instead of as simpletext graphics stored in the map.You can then load the annotationinto another map. For example,suppose you labeled cities andstates with their names andstored the labels as an annotationfeature class in a geodatabase.You can then load the data andthe labels for display on anothermap.
4. Check the layers you want tolabel.
5. Click Properties to setlabeling properties for eachlayer as described earlier inthis chapter.
6. Once you have your labelslooking close to how youultimately want them, convertthem to annotation. Right-click the data frame and clickConvert Labels to Annotation.
7. Click Create annotation for Allfeatures in the layer.
If you don’t want to label allfeatures in the layer, chooseone of the other options.
8. Click OK.
If any of your labels overlap,the Overflow Labels windowappears.
9. In the Overflow Labelswindow, right-click the labelyou want to place on yourmap and click Add Label.
You’ll probably need to movea few of the other labelsaround in order to place anew label on the map.
10.Repeat step 9 until you’veplaced all the labels you wanton your map.
11.Print your map. The labelswill be exactly where you’vepositioned them.
7
9
8
ch7.p65 12/04/2000, 1:04 PM193
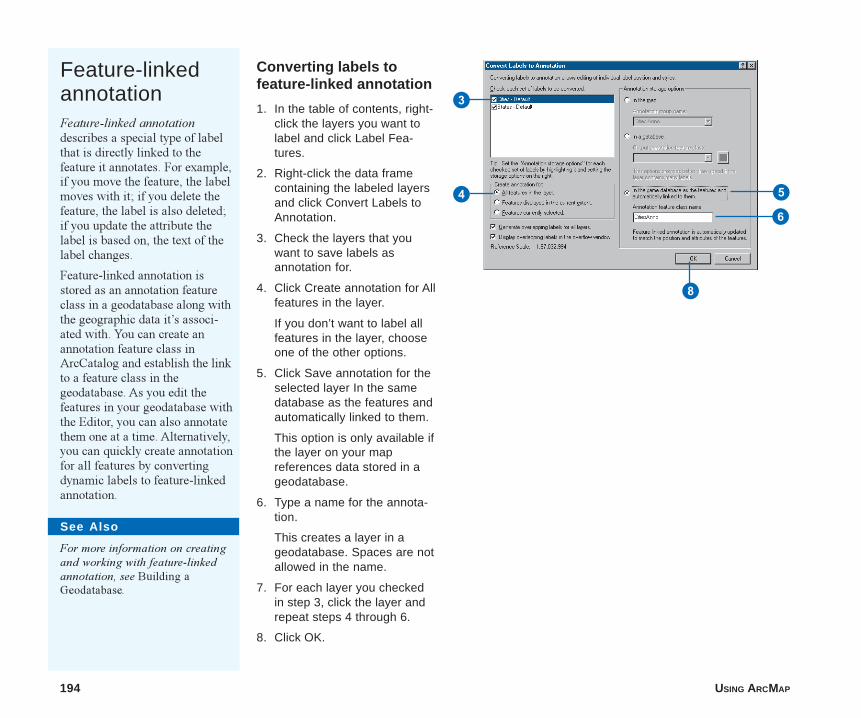
194 USING ARCMAP
Feature-linkedannotationFeature-linked annotationdescribes a special type of labelthat is directly linked to thefeature it annotates. For example,if you move the feature, the labelmoves with it; if you delete thefeature, the label is also deleted;if you update the attribute thelabel is based on, the text of thelabel changes.
Feature-linked annotation isstored as an annotation featureclass in a geodatabase along withthe geographic data it�s associ-ated with. You can create anannotation feature class inArcCatalog and establish the linkto a feature class in thegeodatabase. As you edit thefeatures in your geodatabase withthe Editor, you can also annotatethem one at a time. Alternatively,you can quickly create annotationfor all features by convertingdynamic labels to feature-linkedannotation.
Converting labels tofeature-linked annotation
1. In the table of contents, right-click the layers you want tolabel and click Label Fea-tures.
2. Right-click the data framecontaining the labeled layersand click Convert Labels toAnnotation.
3. Check the layers that youwant to save labels asannotation for.
4. Click Create annotation for Allfeatures in the layer.
If you don’t want to label allfeatures in the layer, chooseone of the other options.
5. Click Save annotation for theselected layer In the samedatabase as the features andautomatically linked to them.
This option is only available ifthe layer on your mapreferences data stored in ageodatabase.
6. Type a name for the annota-tion.
This creates a layer in ageodatabase. Spaces are notallowed in the name.
7. For each layer you checkedin step 3, click the layer andrepeat steps 4 through 6.
8. Click OK.
See Also
For more information on creatingand working with feature-linkedannotation, see Building aGeodatabase.
3
4 5
6
8
ch7.p65 12/04/2000, 1:04 PM194

LABELING MAPS WITH TEXT AND GRAPHICS 195
Annotating selectedfeatures
1. Select the features in thelayer you want to createfeature-linked annotation for.
2. Right-click the layer, point toSelection, and click Annotateselected features.
You must already havefeature-linked annotation forthe layer; otherwise, theoption will be unavailable.
3. If you have more than oneannotation feature classdisplayed for the layer, checkthe ones you want to addannotation to.
4. Click OK.
3
4
Annotating an individualfeature
1. If you haven’t done soalready, add an annotationfeature class to your mapthat’s linked to the layer youwant to create feature-linkedannotation for.
2. On the Draw toolbar, clickDrawing, point to ActiveAnnotation Target, and clickthe name of the annotationfeature class.
3. Click the Label button.
4. Point to the feature you wantto label.
2 3
Tip
Creating an annotationfeature classYou can create an annotationfeature class in ArcCatalog or byconverting labels to feature-linkedannotation as described on theprevious page.
Tip
Why is my annotationtarget unavailable?In order to add annotation to atarget stored in a geodatabase, youmust first start an edit session.Otherwise, the annotation targetwill be grayed out in the list ofavailable targets.
ch7.p65 12/04/2000, 1:04 PM195
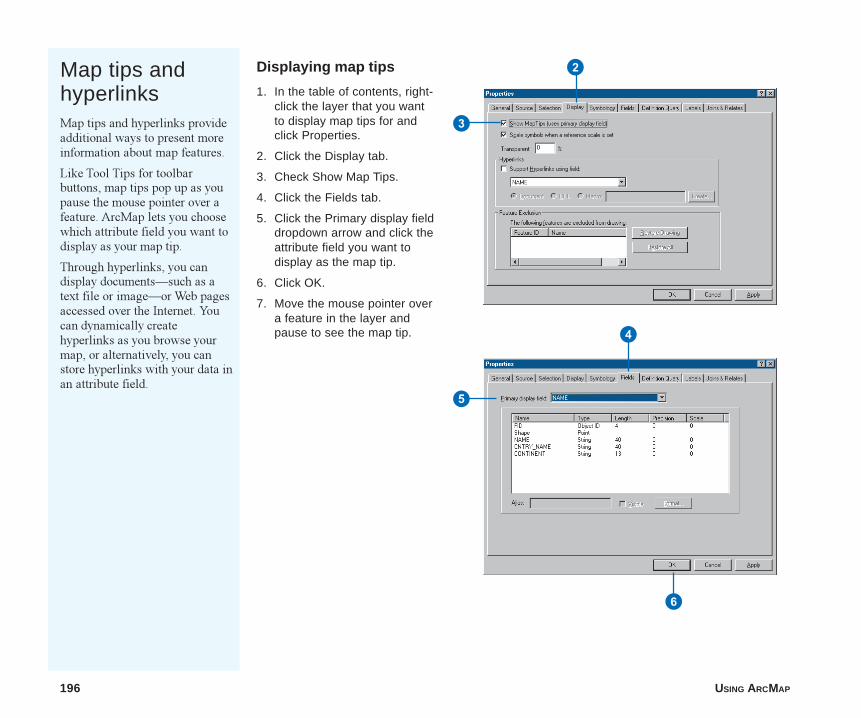
196 USING ARCMAP
Map tips andhyperlinksMap tips and hyperlinks provideadditional ways to present moreinformation about map features.
Like Tool Tips for toolbarbuttons, map tips pop up as youpause the mouse pointer over afeature. ArcMap lets you choosewhich attribute field you want todisplay as your map tip.
Through hyperlinks, you candisplay documents�such as atext file or image�or Web pagesaccessed over the Internet. Youcan dynamically createhyperlinks as you browse yourmap, or alternatively, you canstore hyperlinks with your data inan attribute field.
Displaying map tips
1. In the table of contents, right-click the layer that you wantto display map tips for andclick Properties.
2. Click the Display tab.
3. Check Show Map Tips.
4. Click the Fields tab.
5. Click the Primary display fielddropdown arrow and click theattribute field you want todisplay as the map tip.
6. Click OK.
7. Move the mouse pointer overa feature in the layer andpause to see the map tip.
2
3
4
5
6
ch7.p65 12/04/2000, 1:05 PM196
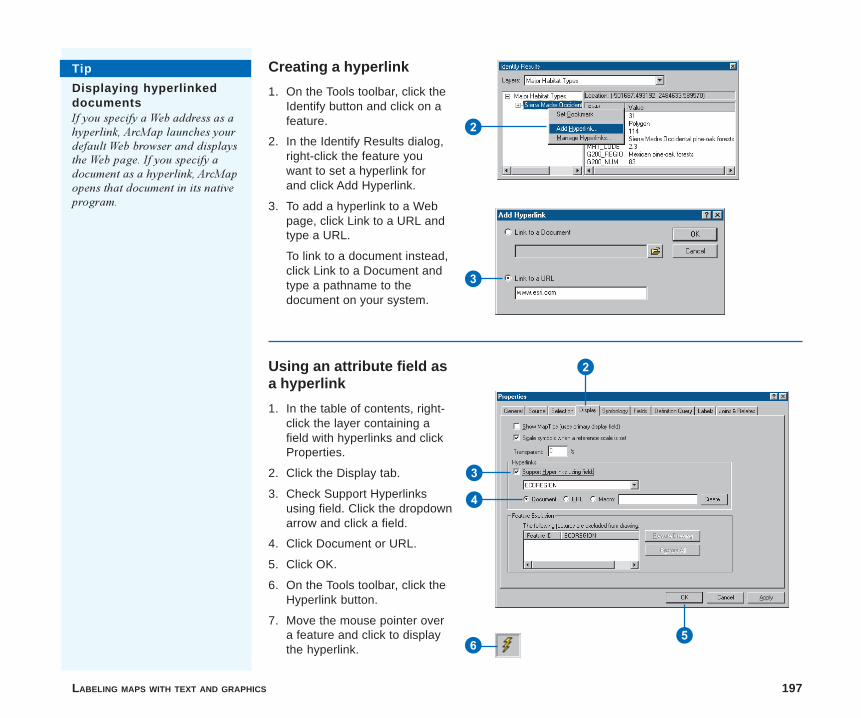
LABELING MAPS WITH TEXT AND GRAPHICS 197
Creating a hyperlink
1. On the Tools toolbar, click theIdentify button and click on afeature.
2. In the Identify Results dialog,right-click the feature youwant to set a hyperlink forand click Add Hyperlink.
3. To add a hyperlink to a Webpage, click Link to a URL andtype a URL.
To link to a document instead,click Link to a Document andtype a pathname to thedocument on your system.
Using an attribute field asa hyperlink
1. In the table of contents, right-click the layer containing afield with hyperlinks and clickProperties.
2. Click the Display tab.
3. Check Support Hyperlinksusing field. Click the dropdownarrow and click a field.
4. Click Document or URL.
5. Click OK.
6. On the Tools toolbar, click theHyperlink button.
7. Move the mouse pointer overa feature and click to displaythe hyperlink.
2
3
Tip
Displaying hyperlinkeddocumentsIf you specify a Web address as ahyperlink, ArcMap launches yourdefault Web browser and displaysthe Web page. If you specify adocument as a hyperlink, ArcMapopens that document in its nativeprogram.
3
56
2
4
ch7.p65 12/04/2000, 1:05 PM197

ch7.p65 12/04/2000, 1:05 PM198
IN THIS CHAPTER
199
Laying out and printing maps 8• About map templates
• Starting a map from a template
• Saving a map as a template
• Setting up the page
• Customizing data frames
• Using rulers, guides, and grids
• Adding data frames
• Adding map elements related todata frames
• Adding other map elements
• Aligning and grouping map ele-ments
• Printing a map
• Changing the layout
• Exporting a map
Before you begin to symbolize data for a map, you�ll need to think abouthow you want the map to look when it�s printed or published.
You should consider questions such as:
� Will the map stand alone, or will it be part of a series of maps that share asimilar design?
� What size will the printed version of the map be?
� How will the page be oriented?
� How many data frames will the map have?
� Will the map have other map elements such as a title, a North arrow, anda legend?
� Will the map contain graphs or reports to complement the geographicview of the data?
� How will scale be indicated on the map?
� How will the map elements be organized on the page?
If the map is part of a series, you may have a template to work from, or youmay create a new template for the series. Map templates make it easy toproduce maps that conform to a standard, and they save time by letting youdo the layout work for all of the maps in the series at once.
You can also use the map templates that come with ArcMap to quickly makea variety of styles of maps. You can use these templates to get ideas for yourown maps, and you can modify them to suit your needs.
ch8.p65 12/04/2000, 2:36 PM199
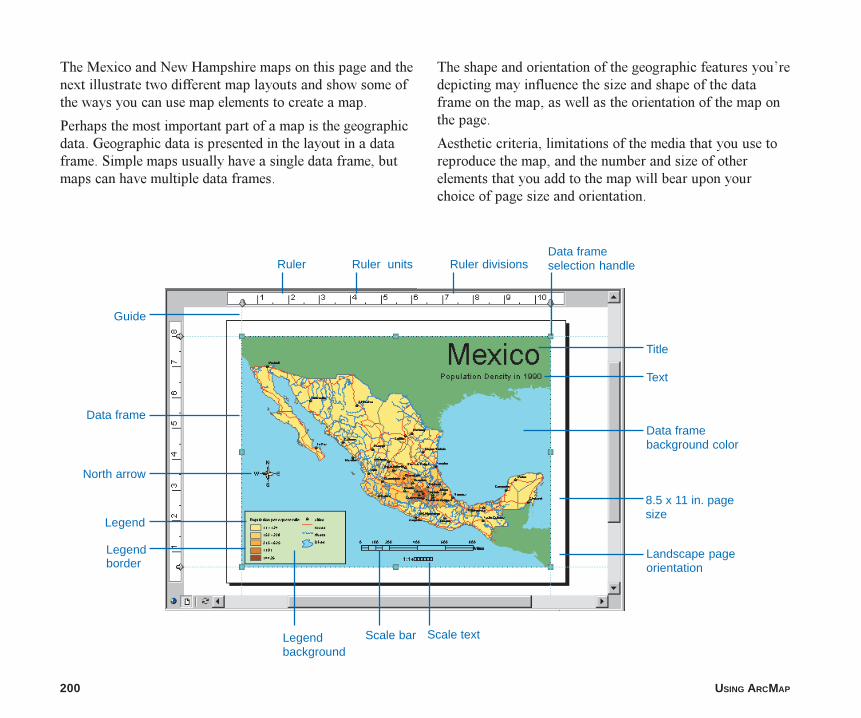
200 USING ARCMAP
The Mexico and New Hampshire maps on this page and thenext illustrate two different map layouts and show some ofthe ways you can use map elements to create a map.
Perhaps the most important part of a map is the geographicdata. Geographic data is presented in the layout in a dataframe. Simple maps usually have a single data frame, butmaps can have multiple data frames.
The shape and orientation of the geographic features you�redepicting may influence the size and shape of the dataframe on the map, as well as the orientation of the map onthe page.
Aesthetic criteria, limitations of the media that you use toreproduce the map, and the number and size of otherelements that you add to the map will bear upon yourchoice of page size and orientation.
Title
Text
Ruler
Guide
Data frame
North arrow
Legend
Legendborder
Legendbackground
Scale bar Scale text
Data framebackground color
Data frameselection handleRuler units Ruler divisions
Landscape pageorientation
8.5 x 11 in. pagesize
ch8.p65 12/04/2000, 2:36 PM200
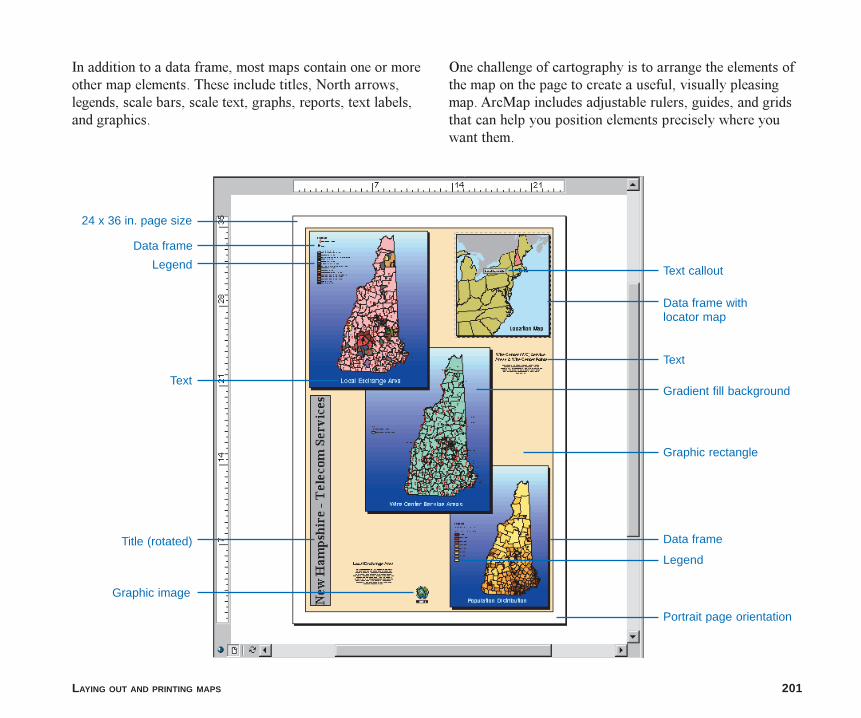
LAYING OUT AND PRINTING MAPS 201
Legend
Legend
Text callout
Title (rotated)
Data frame withlocator map
Data frame
Data frame
Text
Graphic rectangle
Gradient fill backgroundText
Graphic image
Portrait page orientation
24 x 36 in. page size
In addition to a data frame, most maps contain one or moreother map elements. These include titles, North arrows,legends, scale bars, scale text, graphs, reports, text labels,and graphics.
One challenge of cartography is to arrange the elements ofthe map on the page to create a useful, visually pleasingmap. ArcMap includes adjustable rulers, guides, and gridsthat can help you position elements precisely where youwant them.
ch8.p65 12/04/2000, 2:36 PM201
202 USING ARCMAP
About map templates
If you are creating a series of maps and it is important that theyhave the same look and feel, you can use a map template tostandardize the layout. If the series contains the same backgrounddata, you can include that data in the template. Using a templatecan save you time since you don�t have to manually reproducethe common parts of the maps.
You can also use the map templates that come with ArcMap toquickly make a map that looks good, with a minimal amount oflayout work on your part. Just choose a template that has the lookyou want, add your data, and make whatever changes you want,and your map is done.
Like maps and layers, templates can be shared within anorganization to increase productivity and standardize the mapsthat the organization produces. You can use a template to storelayout, data, and customization of the ArcMap interface that youwant to be able to use over and over again.
You can modify existing maps or templates and save them as newtemplates, or you can create new maps from scratch and savethem as templates.
Map templates are ArcMap documents that ArcMap recognizesas templates. When you start a new map using a template,ArcMap reproduces the template on a new map document andkeeps the original template document intact. Map templates havethe file extension .mxt to differentiate them from map documents(.mxd).
Using map templates
If you want to make a map using a template, start a new map,choose the template that you want to use, then start adding layersto the map. Later, if you want to change the layout, you can applya new template.
The Normal template
ArcMap uses a special template called the Normal template(Normal.mxt) to store information about the default userinterface, for example, the state�visible or hidden, docked orfree-floating�of each of the ArcMap toolbars. This informationis recorded automatically in the Normal template when youchange it, so when you start ArcMap (whether you saved the mapyou were working on or not), the toolbars look the same as theydid when you quit.
When you add custom toolbars or tools to ArcMap, you can savethe changes to the Normal template or to the current map. If yousave changes to the interface in the Normal template, they will bereflected in all the maps that you open. If you save changes toanother map or template, they will only appear when you openthat map or template.
ch8.p65 12/04/2000, 2:36 PM202
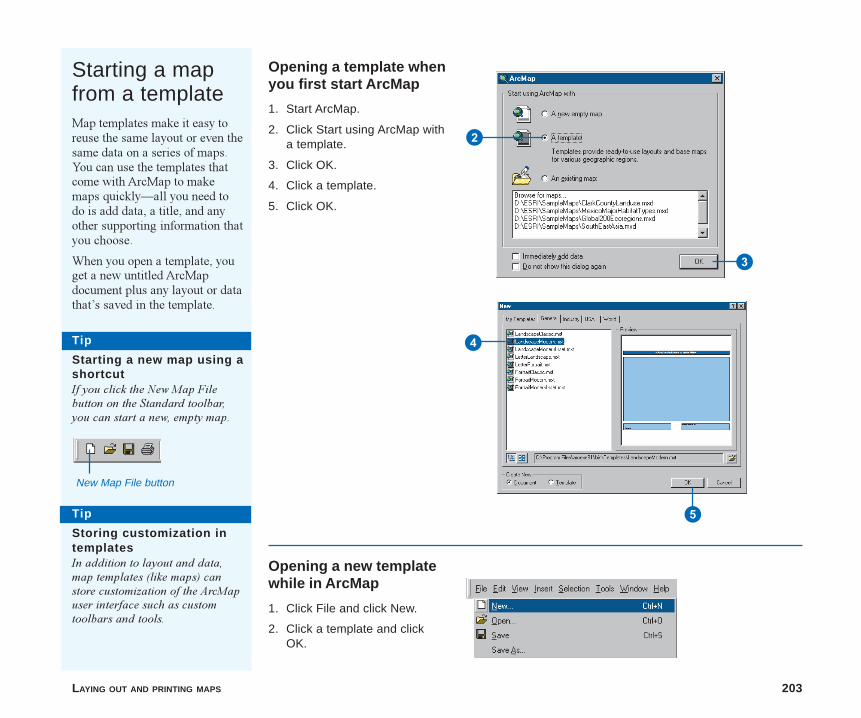
LAYING OUT AND PRINTING MAPS 203
Starting a mapfrom a templateMap templates make it easy toreuse the same layout or even thesame data on a series of maps.You can use the templates thatcome with ArcMap to makemaps quickly�all you need todo is add data, a title, and anyother supporting information thatyou choose.
When you open a template, youget a new untitled ArcMapdocument plus any layout or datathat�s saved in the template.
Opening a template whenyou first start ArcMap
1. Start ArcMap.
2. Click Start using ArcMap witha template.
3. Click OK.
4. Click a template.
5. Click OK.
New Map File button
Opening a new templatewhile in ArcMap
1. Click File and click New.
2. Click a template and clickOK.
4
3
2
5Tip
Storing customization intemplatesIn addition to layout and data,map templates (like maps) canstore customization of the ArcMapuser interface such as customtoolbars and tools.
Tip
Starting a new map using ashortcutIf you click the New Map Filebutton on the Standard toolbar,you can start a new, empty map.
ch8.p65 12/04/2000, 2:37 PM203
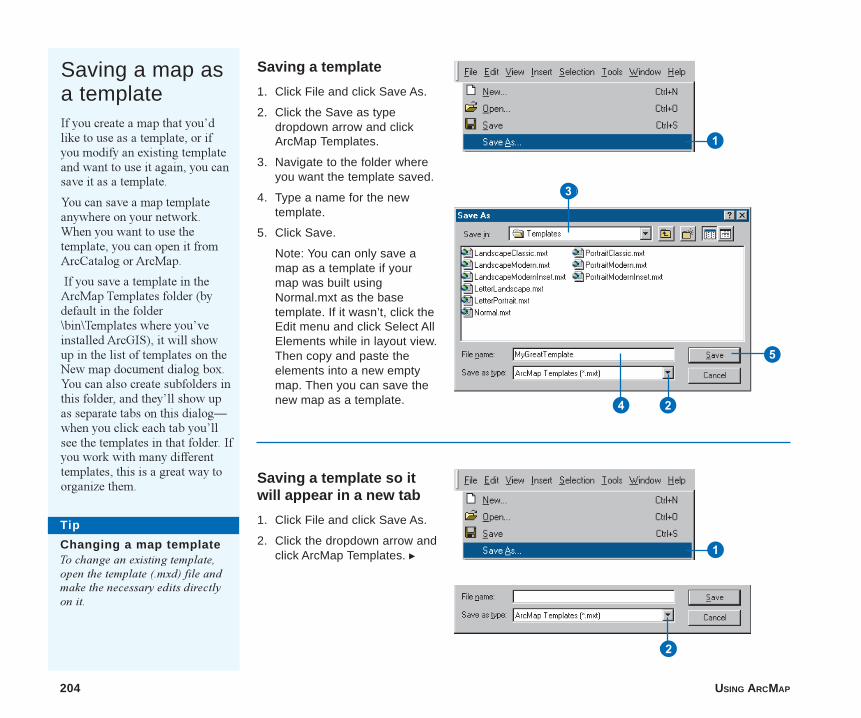
204 USING ARCMAP
Saving a map asa templateIf you create a map that you�dlike to use as a template, or ifyou modify an existing templateand want to use it again, you cansave it as a template.
You can save a map templateanywhere on your network.When you want to use thetemplate, you can open it fromArcCatalog or ArcMap.
If you save a template in theArcMap Templates folder (bydefault in the folder\bin\Templates where you�veinstalled ArcGIS), it will showup in the list of templates on theNew map document dialog box.You can also create subfolders inthis folder, and they�ll show upas separate tabs on this dialog�when you click each tab you�llsee the templates in that folder. Ifyou work with many differenttemplates, this is a great way toorganize them.
Saving a template
1. Click File and click Save As.
2. Click the Save as typedropdown arrow and clickArcMap Templates.
3. Navigate to the folder whereyou want the template saved.
4. Type a name for the newtemplate.
5. Click Save.
Note: You can only save amap as a template if yourmap was built usingNormal.mxt as the basetemplate. If it wasn’t, click theEdit menu and click Select AllElements while in layout view.Then copy and paste theelements into a new emptymap. Then you can save thenew map as a template.
Saving a template so itwill appear in a new tab
1. Click File and click Save As.
2. Click the dropdown arrow andclick ArcMap Templates. u
1
3
5
24
1
2
Tip
Changing a map templateTo change an existing template,open the template (.mxd) file andmake the necessary edits directlyon it.
ch8.p65 12/04/2000, 2:37 PM204
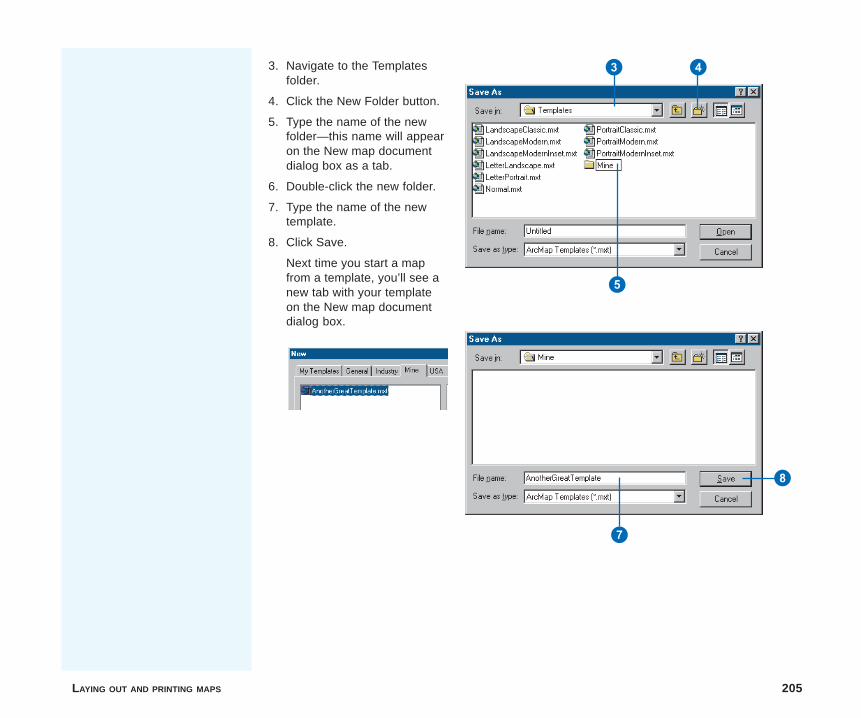
LAYING OUT AND PRINTING MAPS 205
3. Navigate to the Templatesfolder.
4. Click the New Folder button.
5. Type the name of the newfolder—this name will appearon the New map documentdialog box as a tab.
6. Double-click the new folder.
7. Type the name of the newtemplate.
8. Click Save.
Next time you start a mapfrom a template, you’ll see anew tab with your templateon the New map documentdialog box.
3 4
5
8
7
ch8.p65 12/04/2000, 2:37 PM205
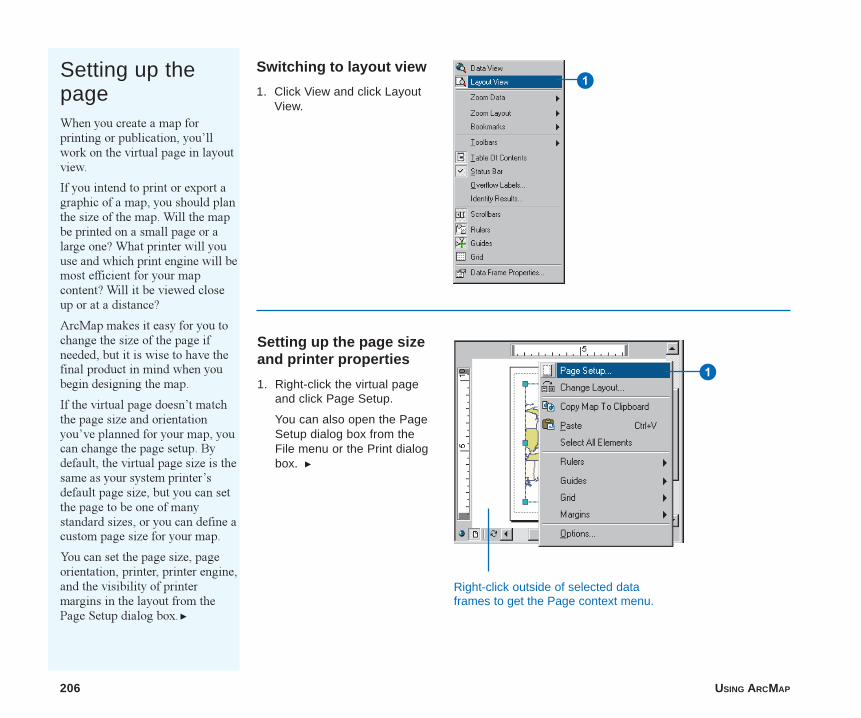
206 USING ARCMAP
Setting up thepageWhen you create a map forprinting or publication, you�llwork on the virtual page in layoutview.
If you intend to print or export agraphic of a map, you should planthe size of the map. Will the mapbe printed on a small page or alarge one? What printer will youuse and which print engine will bemost efficient for your mapcontent? Will it be viewed closeup or at a distance?
ArcMap makes it easy for you tochange the size of the page ifneeded, but it is wise to have thefinal product in mind when youbegin designing the map.
If the virtual page doesn�t matchthe page size and orientationyou�ve planned for your map, youcan change the page setup. Bydefault, the virtual page size is thesame as your system printer�sdefault page size, but you can setthe page to be one of manystandard sizes, or you can define acustom page size for your map.
You can set the page size, pageorientation, printer, printer engine,and the visibility of printermargins in the layout from thePage Setup dialog box. u
Switching to layout view
1. Click View and click LayoutView.
Setting up the page sizeand printer properties
1. Right-click the virtual pageand click Page Setup.
You can also open the PageSetup dialog box from theFile menu or the Print dialogbox. u
Right-click outside of selected dataframes to get the Page context menu.
1
1
ch8.p65 12/04/2000, 2:38 PM206
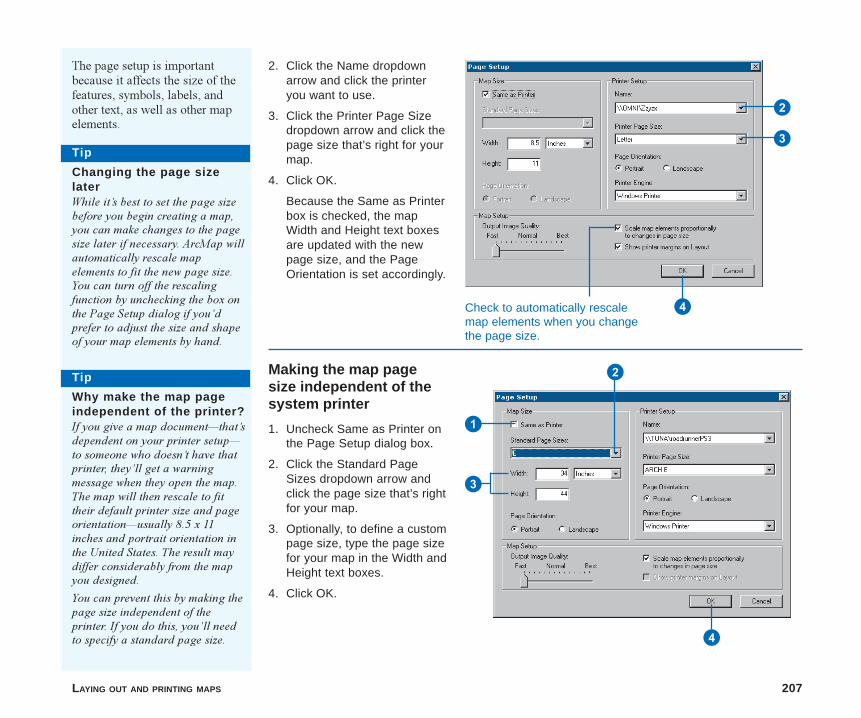
LAYING OUT AND PRINTING MAPS 207
2. Click the Name dropdownarrow and click the printeryou want to use.
3. Click the Printer Page Sizedropdown arrow and click thepage size that’s right for yourmap.
4. Click OK.
Because the Same as Printerbox is checked, the mapWidth and Height text boxesare updated with the newpage size, and the PageOrientation is set accordingly.
Making the map pagesize independent of thesystem printer
1. Uncheck Same as Printer onthe Page Setup dialog box.
2. Click the Standard PageSizes dropdown arrow andclick the page size that’s rightfor your map.
3. Optionally, to define a custompage size, type the page sizefor your map in the Width andHeight text boxes.
4. Click OK.
Check to automatically rescalemap elements when you changethe page size.
3
4
2
1
3
4
Tip
Changing the page sizelaterWhile it�s best to set the page sizebefore you begin creating a map,you can make changes to the pagesize later if necessary. ArcMap willautomatically rescale mapelements to fit the new page size.You can turn off the rescalingfunction by unchecking the box onthe Page Setup dialog if you�dprefer to adjust the size and shapeof your map elements by hand.
Tip
Why make the map pageindependent of the printer?If you give a map document�that�sdependent on your printer setup�to someone who doesn�t have thatprinter, they�ll get a warningmessage when they open the map.The map will then rescale to fittheir default printer size and pageorientation�usually 8.5 x 11inches and portrait orientation inthe United States. The result maydiffer considerably from the mapyou designed.
You can prevent this by making thepage size independent of theprinter. If you do this, you�ll needto specify a standard page size.
The page setup is importantbecause it affects the size of thefeatures, symbols, labels, andother text, as well as other mapelements.
2
ch8.p65 12/04/2000, 2:38 PM207
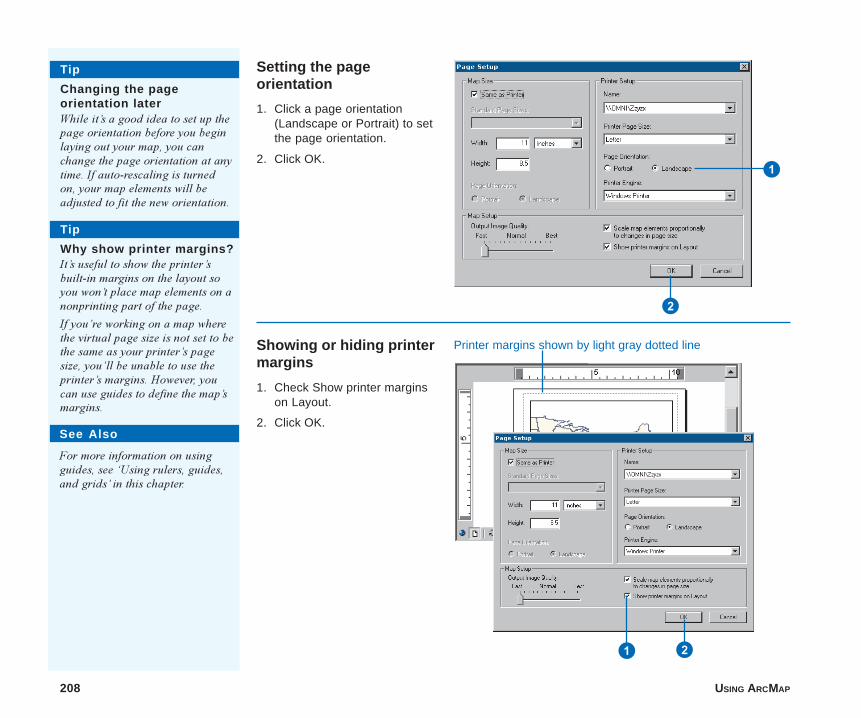
208 USING ARCMAP
Setting the pageorientation
1. Click a page orientation(Landscape or Portrait) to setthe page orientation.
2. Click OK.
Showing or hiding printermargins
1. Check Show printer marginson Layout.
2. Click OK.
Printer margins shown by light gray dotted line
1
1 2
2
Tip
Changing the pageorientation laterWhile it�s a good idea to set up thepage orientation before you beginlaying out your map, you canchange the page orientation at anytime. If auto-rescaling is turnedon, your map elements will beadjusted to fit the new orientation.
Tip
Why show printer margins?It�s useful to show the printer�sbuilt-in margins on the layout soyou won�t place map elements on anonprinting part of the page.
If you�re working on a map wherethe virtual page size is not set to bethe same as your printer�s pagesize, you�ll be unable to use theprinter�s margins. However, youcan use guides to define the map�smargins.
See Also
For more information on usingguides, see �Using rulers, guides,and grids� in this chapter.
ch8.p65 12/04/2000, 2:39 PM208
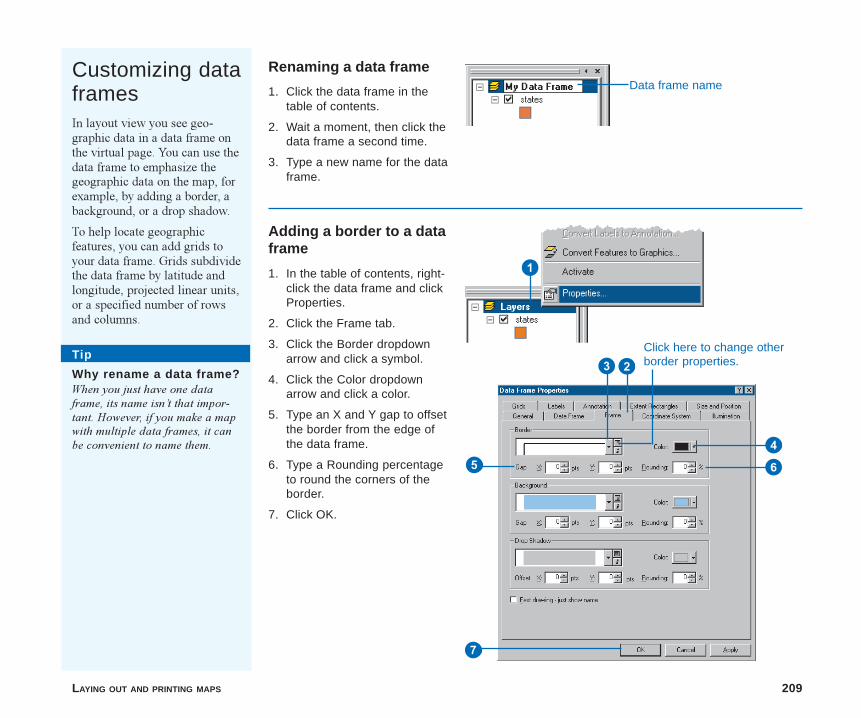
LAYING OUT AND PRINTING MAPS 209
Customizing dataframesIn layout view you see geo-graphic data in a data frame onthe virtual page. You can use thedata frame to emphasize thegeographic data on the map, forexample, by adding a border, abackground, or a drop shadow.
To help locate geographicfeatures, you can add grids toyour data frame. Grids subdividethe data frame by latitude andlongitude, projected linear units,or a specified number of rowsand columns.
Renaming a data frame
1. Click the data frame in thetable of contents.
2. Wait a moment, then click thedata frame a second time.
3. Type a new name for the dataframe.
Adding a border to a dataframe
1. In the table of contents, right-click the data frame and clickProperties.
2. Click the Frame tab.
3. Click the Border dropdownarrow and click a symbol.
4. Click the Color dropdownarrow and click a color.
5. Type an X and Y gap to offsetthe border from the edge ofthe data frame.
6. Type a Rounding percentageto round the corners of theborder.
7. Click OK.
Data frame name
6
2
1
Tip
Why rename a data frame?When you just have one dataframe, its name isn�t that impor-tant. However, if you make a mapwith multiple data frames, it canbe convenient to name them.
54
3
7
Click here to change otherborder properties.
ch8.p65 12/04/2000, 2:39 PM209
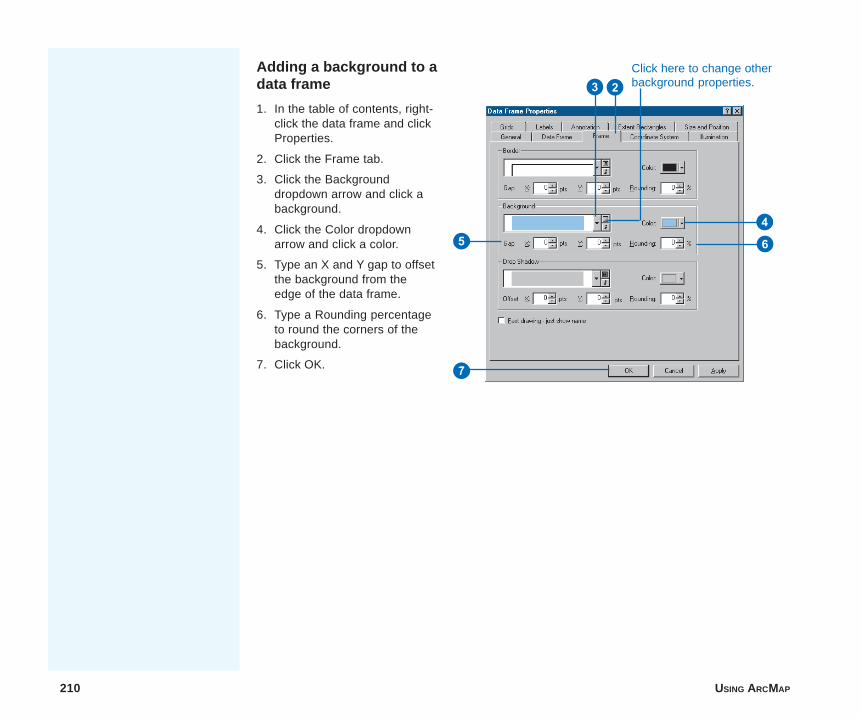
210 USING ARCMAP
Adding a background to adata frame
1. In the table of contents, right-click the data frame and clickProperties.
2. Click the Frame tab.
3. Click the Backgrounddropdown arrow and click abackground.
4. Click the Color dropdownarrow and click a color.
5. Type an X and Y gap to offsetthe background from theedge of the data frame.
6. Type a Rounding percentageto round the corners of thebackground.
7. Click OK.
6
2
54
3
7
Click here to change otherbackground properties.
ch8.p65 12/04/2000, 2:40 PM210
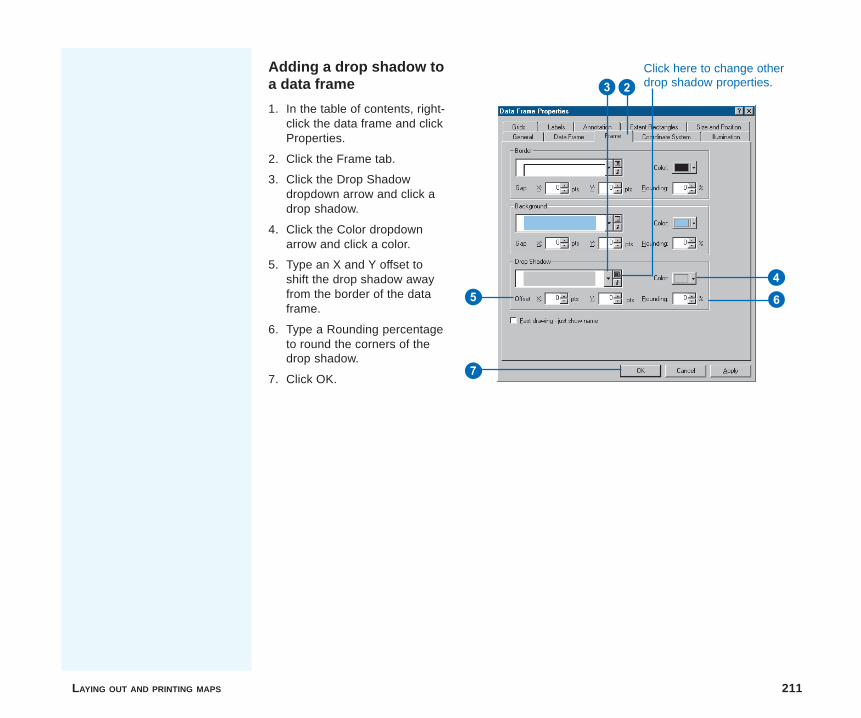
LAYING OUT AND PRINTING MAPS 211
Adding a drop shadow toa data frame
1. In the table of contents, right-click the data frame and clickProperties.
2. Click the Frame tab.
3. Click the Drop Shadowdropdown arrow and click adrop shadow.
4. Click the Color dropdownarrow and click a color.
5. Type an X and Y offset toshift the drop shadow awayfrom the border of the dataframe.
6. Type a Rounding percentageto round the corners of thedrop shadow.
7. Click OK.
6
2
54
3
7
Click here to change otherdrop shadow properties.
ch8.p65 12/04/2000, 2:40 PM211

212 USING ARCMAP
Rotating the data in adata frame
1. Click View, point to Toolbars,and click Data Frame Tools.
2. Click the Rotate Data Frametool.
3. Click and drag the mouseover the data frame to rotateits contents.
Rotating the data in thismanner does not alter theoriginal source data, just itsdisplay in the data frame.
1
2
Click and drag the mouseto rotate the data in thedata frame.
Tip
Rotating using a specificangleIf you want to rotate your dataframe by a specific angle, you cantype in the angle on the DataFrame Tools toolbar.
You can also typein an angle here.
ch8.p65 12/04/2000, 2:40 PM212
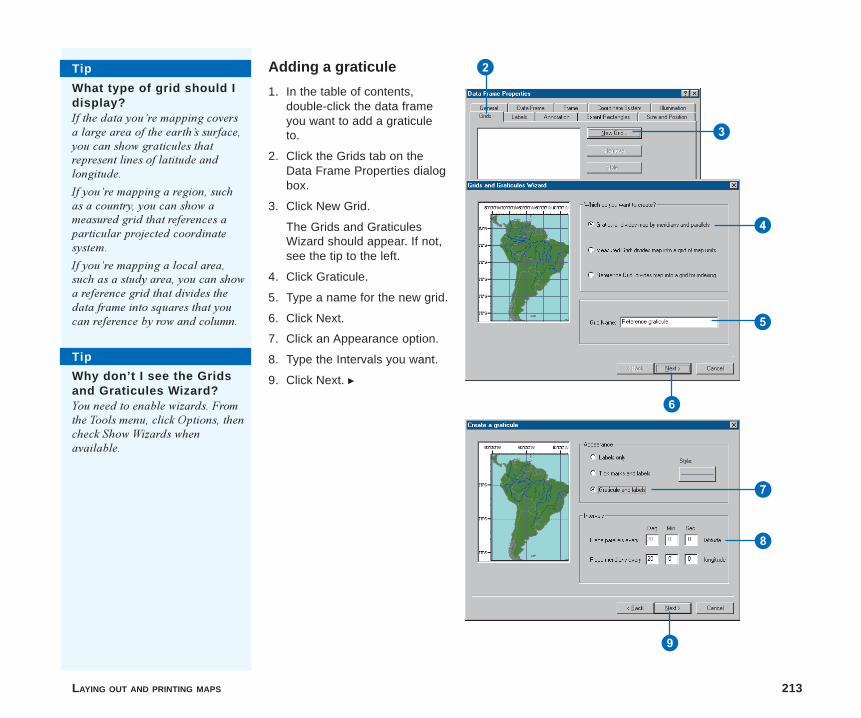
LAYING OUT AND PRINTING MAPS 213
Adding a graticule
1. In the table of contents,double-click the data frameyou want to add a graticuleto.
2. Click the Grids tab on theData Frame Properties dialogbox.
3. Click New Grid.
The Grids and GraticulesWizard should appear. If not,see the tip to the left.
4. Click Graticule.
5. Type a name for the new grid.
6. Click Next.
7. Click an Appearance option.
8. Type the Intervals you want.
9. Click Next. u
Tip
What type of grid should Idisplay?If the data you�re mapping coversa large area of the earth�s surface,you can show graticules thatrepresent lines of latitude andlongitude.
If you�re mapping a region, suchas a country, you can show ameasured grid that references aparticular projected coordinatesystem.
If you�re mapping a local area,such as a study area, you can showa reference grid that divides thedata frame into squares that youcan reference by row and column.
2
3
4
5
6
9
7
8
Tip
Why don’t I see the Gridsand Graticules Wizard?You need to enable wizards. Fromthe Tools menu, click Options, thencheck Show Wizards whenavailable.
ch8.p65 12/04/2000, 2:41 PM213
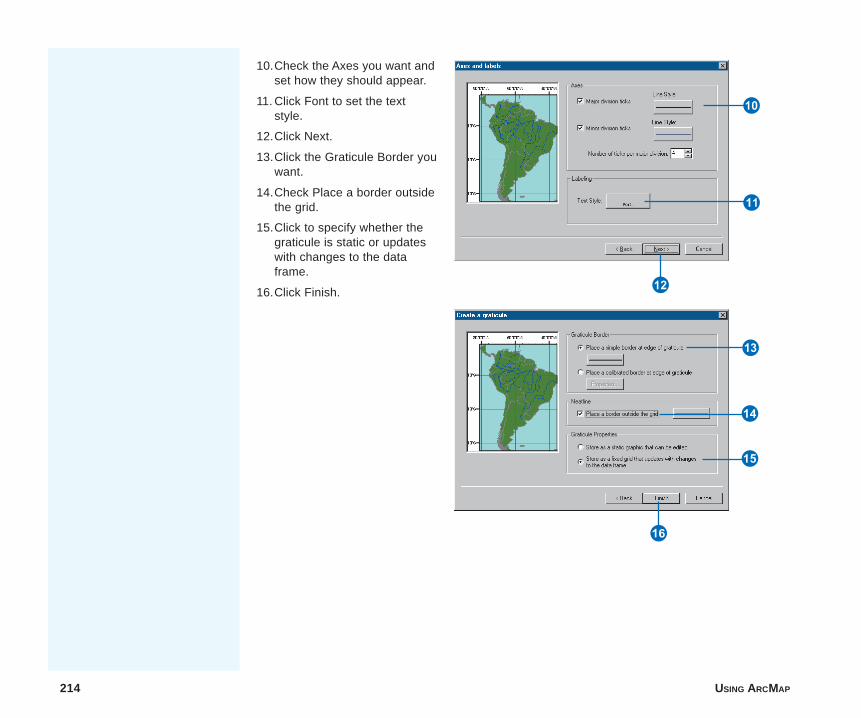
214 USING ARCMAP
Q
W
E
U
R
T
10.Check the Axes you want andset how they should appear.
11. Click Font to set the textstyle.
12.Click Next.
13.Click the Graticule Border youwant.
14.Check Place a border outsidethe grid.
15.Click to specify whether thegraticule is static or updateswith changes to the dataframe.
16.Click Finish.
Y
ch8.p65 12/04/2000, 2:42 PM214
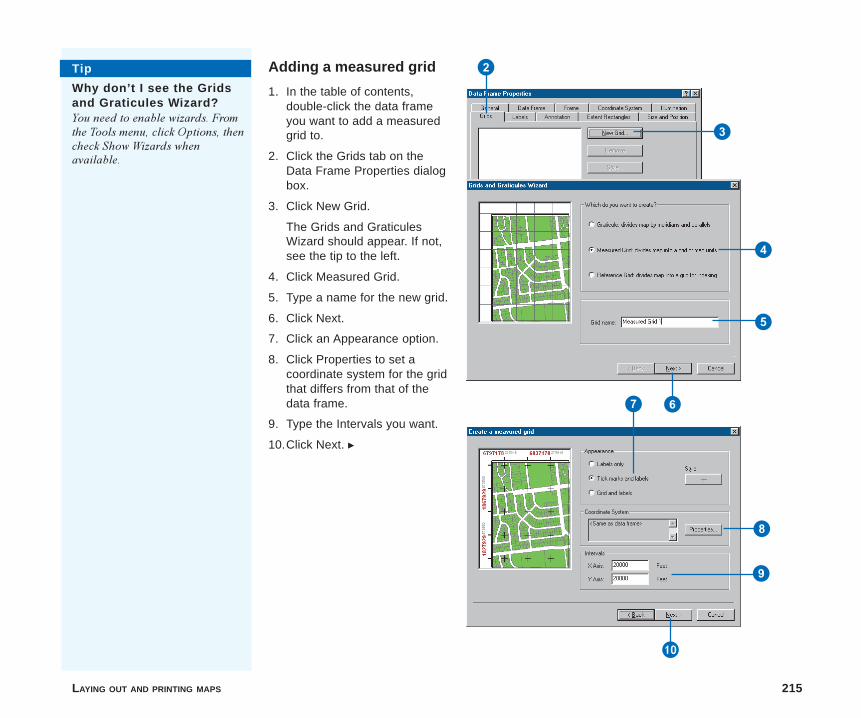
LAYING OUT AND PRINTING MAPS 215
Adding a measured grid
1. In the table of contents,double-click the data frameyou want to add a measuredgrid to.
2. Click the Grids tab on theData Frame Properties dialogbox.
3. Click New Grid.
The Grids and GraticulesWizard should appear. If not,see the tip to the left.
4. Click Measured Grid.
5. Type a name for the new grid.
6. Click Next.
7. Click an Appearance option.
8. Click Properties to set acoordinate system for the gridthat differs from that of thedata frame.
9. Type the Intervals you want.
10.Click Next. u
2
3
4
5
6
Q
7
8
9
Tip
Why don’t I see the Gridsand Graticules Wizard?You need to enable wizards. Fromthe Tools menu, click Options, thencheck Show Wizards whenavailable.
ch8.p65 12/04/2000, 2:43 PM215
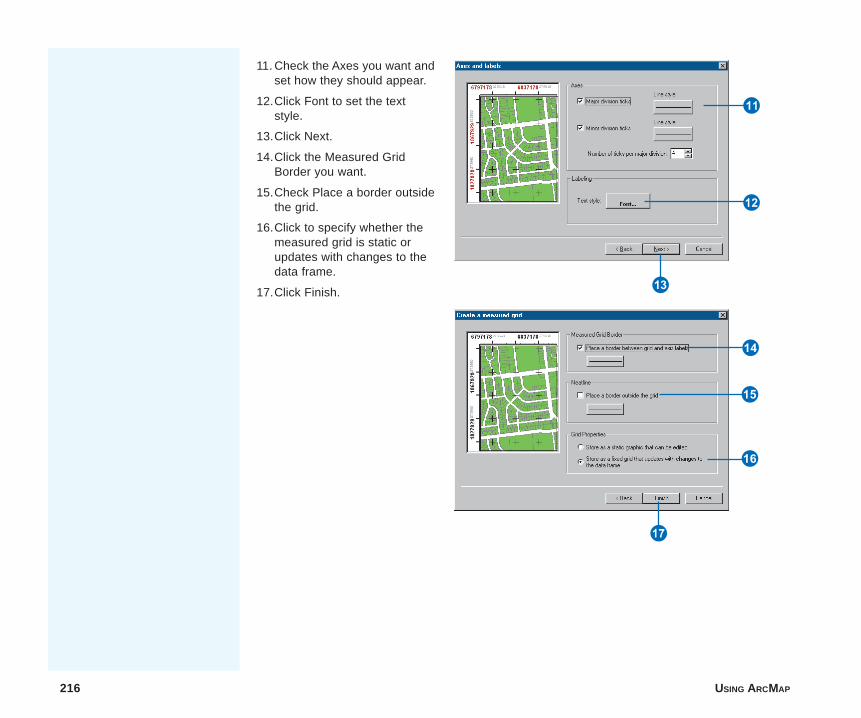
216 USING ARCMAP
W
E
R
I
T
Y
U
11. Check the Axes you want andset how they should appear.
12.Click Font to set the textstyle.
13.Click Next.
14.Click the Measured GridBorder you want.
15.Check Place a border outsidethe grid.
16.Click to specify whether themeasured grid is static orupdates with changes to thedata frame.
17.Click Finish.
ch8.p65 12/04/2000, 2:43 PM216
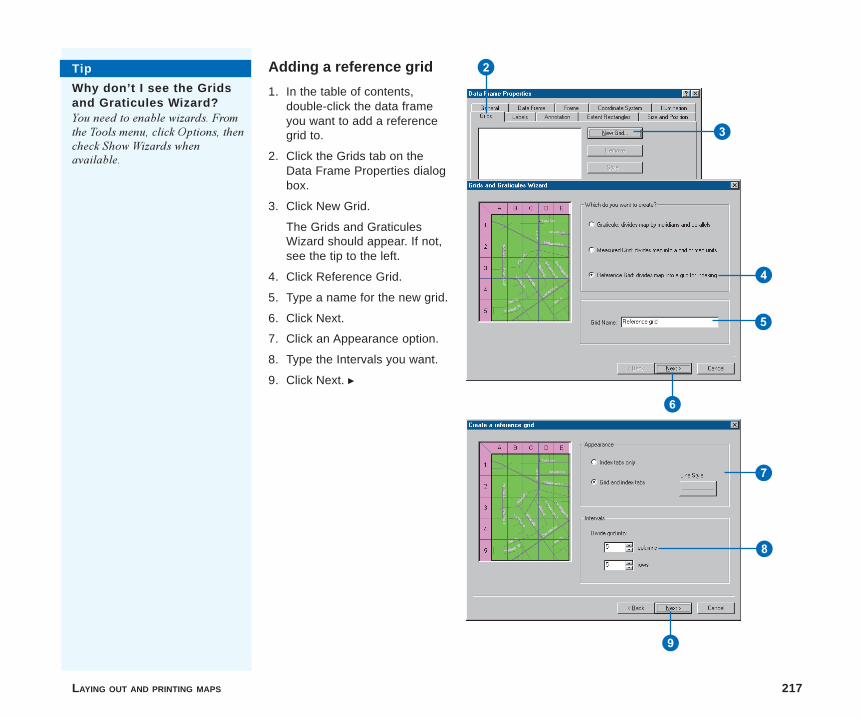
LAYING OUT AND PRINTING MAPS 217
Adding a reference grid
1. In the table of contents,double-click the data frameyou want to add a referencegrid to.
2. Click the Grids tab on theData Frame Properties dialogbox.
3. Click New Grid.
The Grids and GraticulesWizard should appear. If not,see the tip to the left.
4. Click Reference Grid.
5. Type a name for the new grid.
6. Click Next.
7. Click an Appearance option.
8. Type the Intervals you want.
9. Click Next. u
2
3
4
5
6
9
7
8
Tip
Why don’t I see the Gridsand Graticules Wizard?You need to enable wizards. Fromthe Tools menu, click Options, thencheck Show Wizards whenavailable.
ch8.p65 12/04/2000, 2:44 PM217
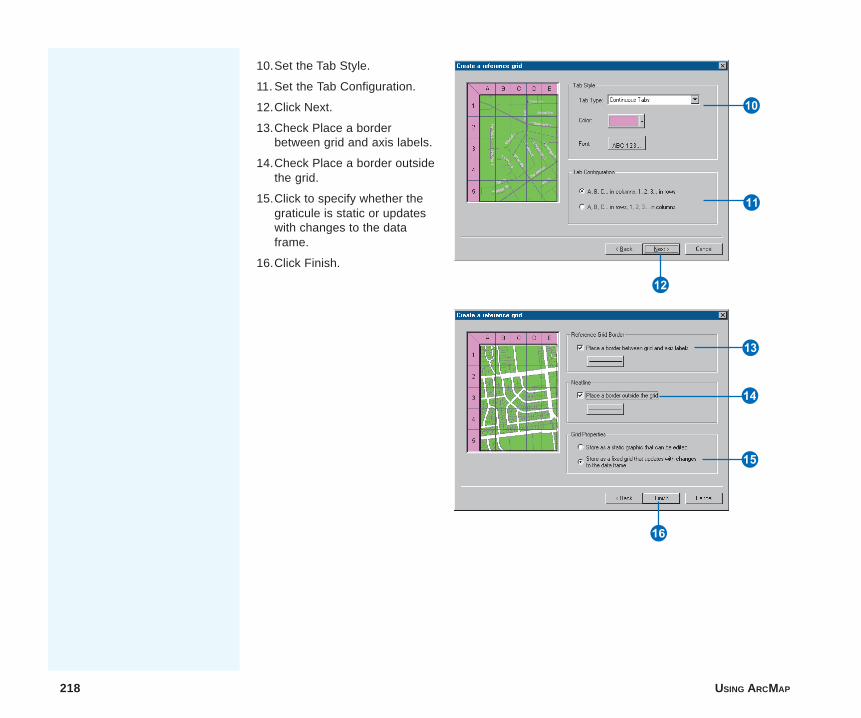
218 USING ARCMAP
Q
W
E
U
R
T
Y
10.Set the Tab Style.
11. Set the Tab Configuration.
12.Click Next.
13.Check Place a borderbetween grid and axis labels.
14.Check Place a border outsidethe grid.
15.Click to specify whether thegraticule is static or updateswith changes to the dataframe.
16.Click Finish.
ch8.p65 12/04/2000, 2:44 PM218
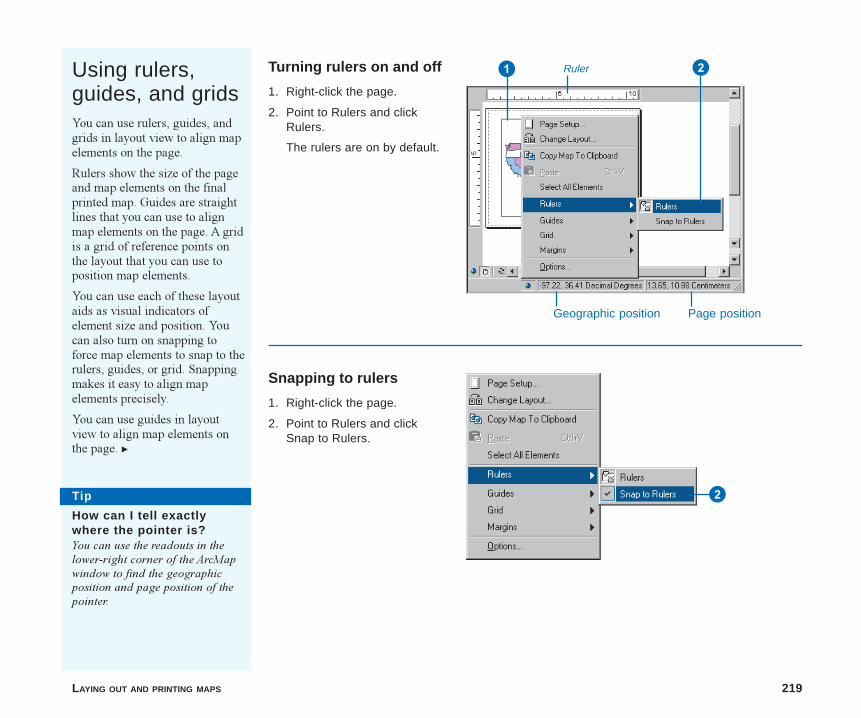
LAYING OUT AND PRINTING MAPS 219
Using rulers,guides, and gridsYou can use rulers, guides, andgrids in layout view to align mapelements on the page.
Rulers show the size of the pageand map elements on the finalprinted map. Guides are straightlines that you can use to alignmap elements on the page. A gridis a grid of reference points onthe layout that you can use toposition map elements.
You can use each of these layoutaids as visual indicators ofelement size and position. Youcan also turn on snapping toforce map elements to snap to therulers, guides, or grid. Snappingmakes it easy to align mapelements precisely.
You can use guides in layoutview to align map elements onthe page. u
Turning rulers on and off
1. Right-click the page.
2. Point to Rulers and clickRulers.
The rulers are on by default.
Ruler
Page positionGeographic position
Snapping to rulers
1. Right-click the page.
2. Point to Rulers and clickSnap to Rulers.
2
Tip
How can I tell exactlywhere the pointer is?You can use the readouts in thelower-right corner of the ArcMapwindow to find the geographicposition and page position of thepointer.
1
2
ch8.p65 12/04/2000, 2:45 PM219
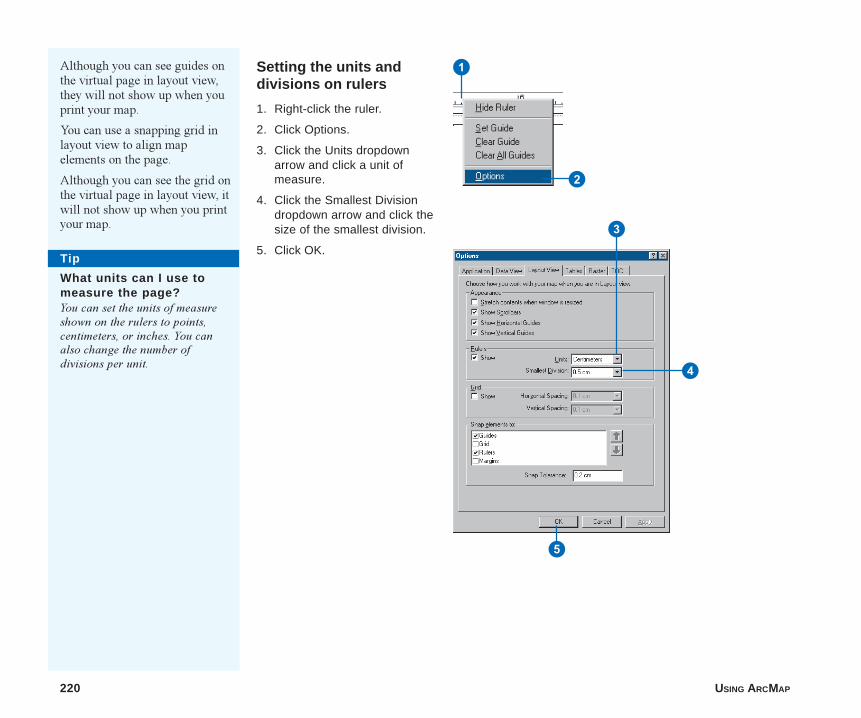
220 USING ARCMAP
Setting the units anddivisions on rulers
1. Right-click the ruler.
2. Click Options.
3. Click the Units dropdownarrow and click a unit ofmeasure.
4. Click the Smallest Divisiondropdown arrow and click thesize of the smallest division.
5. Click OK.
Although you can see guides onthe virtual page in layout view,they will not show up when youprint your map.
You can use a snapping grid inlayout view to align mapelements on the page.
Although you can see the grid onthe virtual page in layout view, itwill not show up when you printyour map.
2
1
4
3
5
Tip
What units can I use tomeasure the page?You can set the units of measureshown on the rulers to points,centimeters, or inches. You canalso change the number ofdivisions per unit.
ch8.p65 12/04/2000, 2:45 PM220
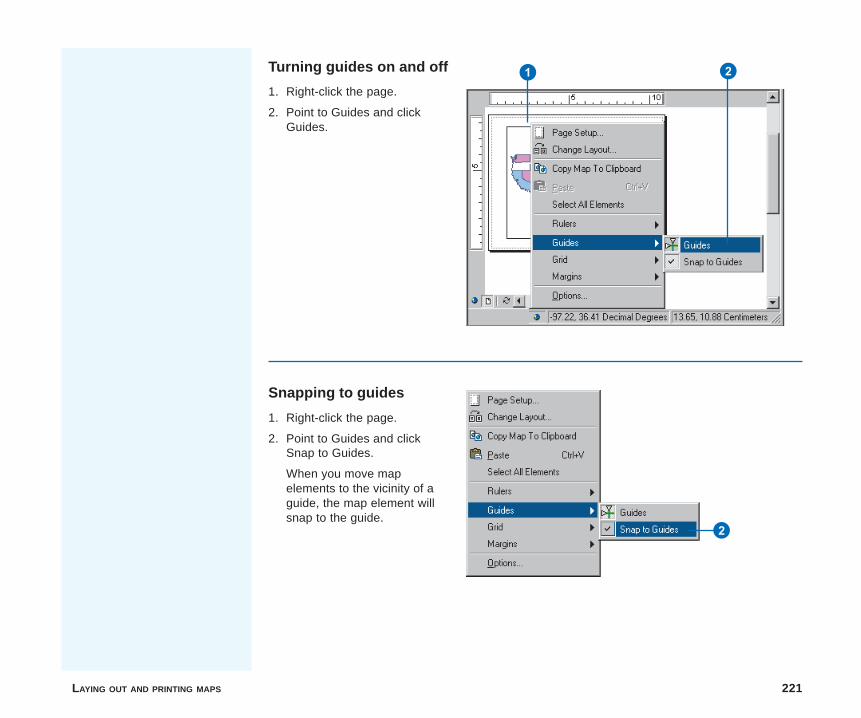
LAYING OUT AND PRINTING MAPS 221
Turning guides on and off
1. Right-click the page.
2. Point to Guides and clickGuides.
Snapping to guides
1. Right-click the page.
2. Point to Guides and clickSnap to Guides.
When you move mapelements to the vicinity of aguide, the map element willsnap to the guide.
1 2
2
ch8.p65 12/04/2000, 2:45 PM221
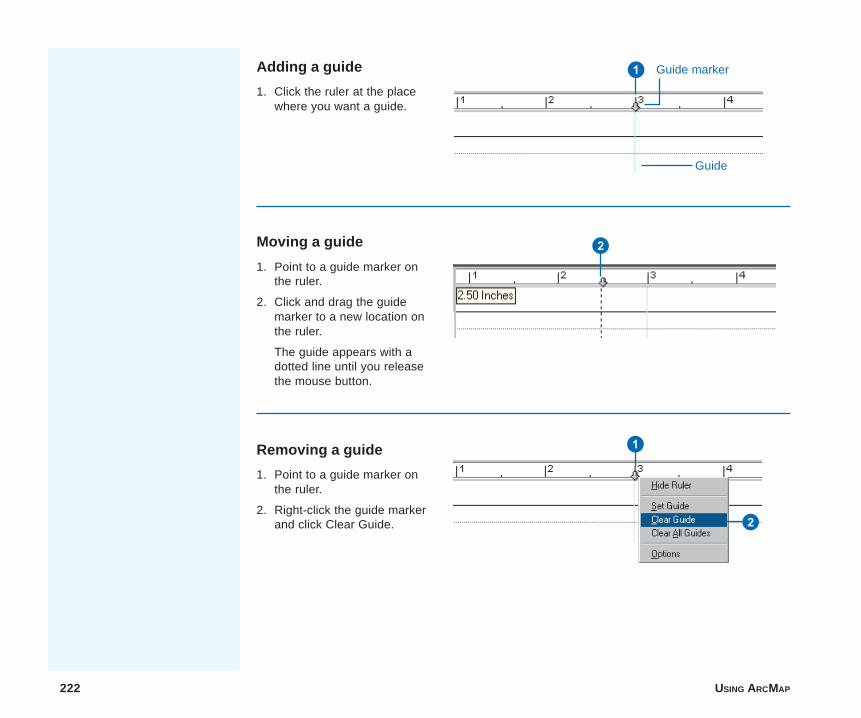
222 USING ARCMAP
Adding a guide
1. Click the ruler at the placewhere you want a guide.
Moving a guide
1. Point to a guide marker onthe ruler.
2. Click and drag the guidemarker to a new location onthe ruler.
The guide appears with adotted line until you releasethe mouse button.
Guide marker
Guide
Removing a guide
1. Point to a guide marker onthe ruler.
2. Right-click the guide markerand click Clear Guide.
1
2
2
1
ch8.p65 12/04/2000, 2:45 PM222
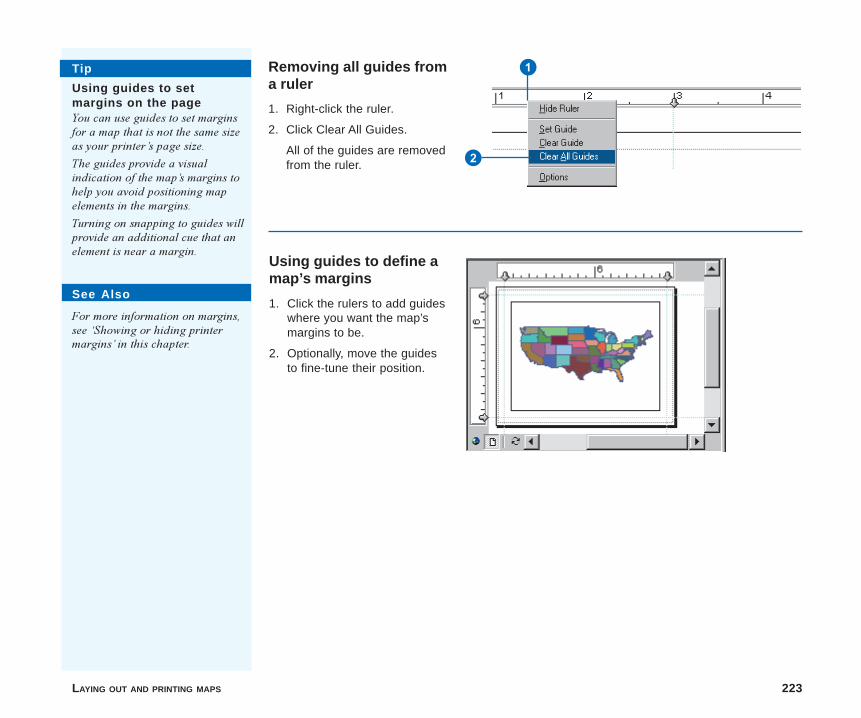
LAYING OUT AND PRINTING MAPS 223
Using guides to define amap’s margins
1. Click the rulers to add guideswhere you want the map’smargins to be.
2. Optionally, move the guidesto fine-tune their position.
Removing all guides froma ruler
1. Right-click the ruler.
2. Click Clear All Guides.
All of the guides are removedfrom the ruler.
1
2
See Also
For more information on margins,see �Showing or hiding printermargins� in this chapter.
Tip
Using guides to setmargins on the pageYou can use guides to set marginsfor a map that is not the same sizeas your printer�s page size.
The guides provide a visualindication of the map�s margins tohelp you avoid positioning mapelements in the margins.
Turning on snapping to guides willprovide an additional cue that anelement is near a margin.
ch8.p65 12/04/2000, 2:45 PM223
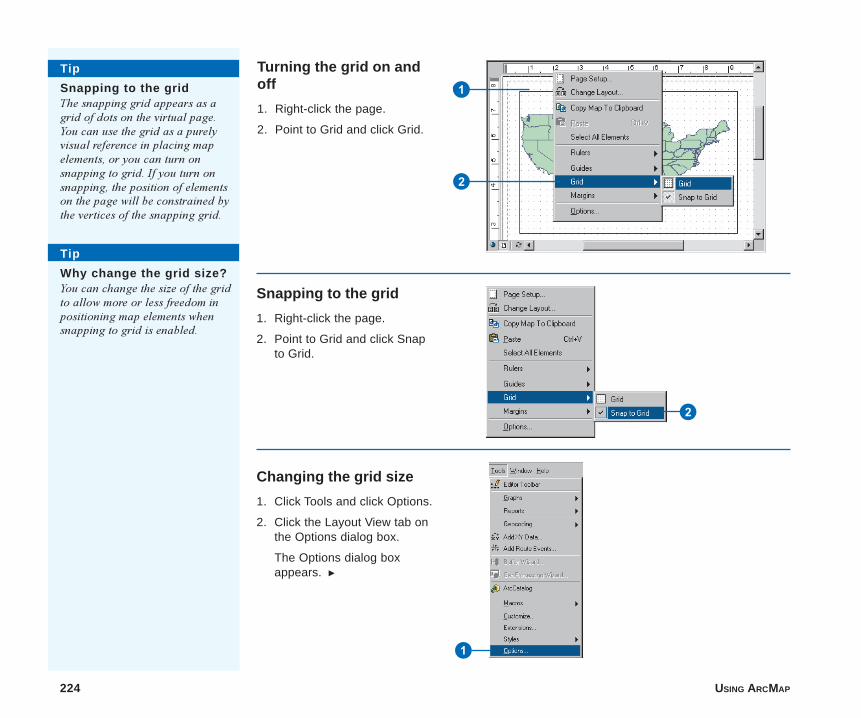
224 USING ARCMAP
Turning the grid on andoff
1. Right-click the page.
2. Point to Grid and click Grid.
Changing the grid size
1. Click Tools and click Options.
2. Click the Layout View tab onthe Options dialog box.
The Options dialog boxappears. u
Tip
Snapping to the gridThe snapping grid appears as agrid of dots on the virtual page.You can use the grid as a purelyvisual reference in placing mapelements, or you can turn onsnapping to grid. If you turn onsnapping, the position of elementson the page will be constrained bythe vertices of the snapping grid.
Snapping to the grid
1. Right-click the page.
2. Point to Grid and click Snapto Grid.
1
2
2
1
Tip
Why change the grid size?You can change the size of the gridto allow more or less freedom inpositioning map elements whensnapping to grid is enabled.
ch8.p65 12/04/2000, 2:46 PM224
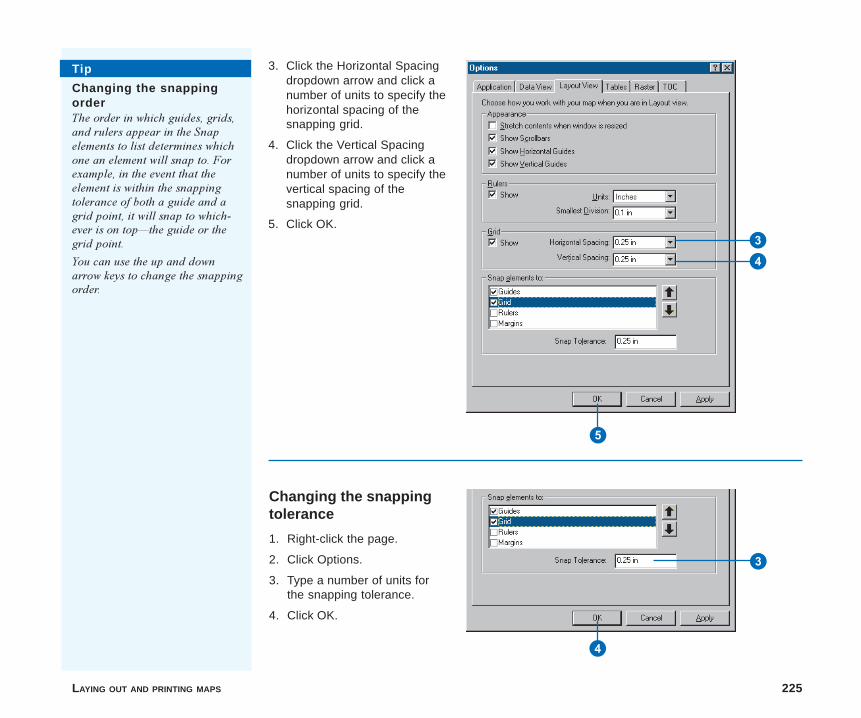
LAYING OUT AND PRINTING MAPS 225
3. Click the Horizontal Spacingdropdown arrow and click anumber of units to specify thehorizontal spacing of thesnapping grid.
4. Click the Vertical Spacingdropdown arrow and click anumber of units to specify thevertical spacing of thesnapping grid.
5. Click OK.
Changing the snappingtolerance
1. Right-click the page.
2. Click Options.
3. Type a number of units forthe snapping tolerance.
4. Click OK.
3
4
43
5
Tip
Changing the snappingorderThe order in which guides, grids,and rulers appear in the Snapelements to list determines whichone an element will snap to. Forexample, in the event that theelement is within the snappingtolerance of both a guide and agrid point, it will snap to which-ever is on top�the guide or thegrid point.
You can use the up and downarrow keys to change the snappingorder.
ch8.p65 12/04/2000, 2:46 PM225
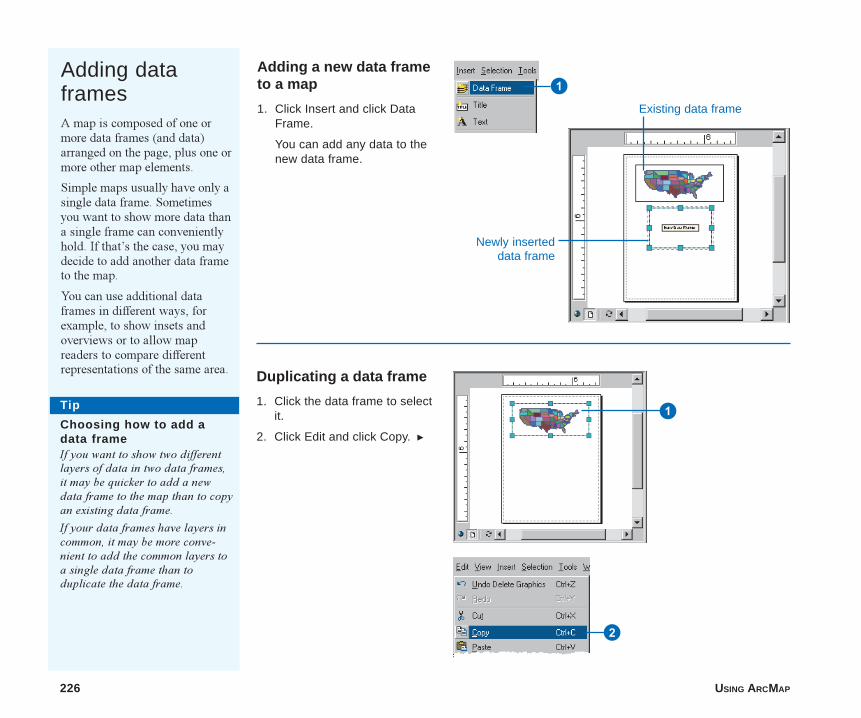
226 USING ARCMAP
Adding dataframesA map is composed of one ormore data frames (and data)arranged on the page, plus one ormore other map elements.
Simple maps usually have only asingle data frame. Sometimesyou want to show more data thana single frame can convenientlyhold. If that�s the case, you maydecide to add another data frameto the map.
You can use additional dataframes in different ways, forexample, to show insets andoverviews or to allow mapreaders to compare differentrepresentations of the same area.
Adding a new data frameto a map
1. Click Insert and click DataFrame.
You can add any data to thenew data frame.
Newly inserteddata frame
Existing data frame
Duplicating a data frame
1. Click the data frame to selectit.
2. Click Edit and click Copy. u
1
1
2
Tip
Choosing how to add adata frameIf you want to show two differentlayers of data in two data frames,it may be quicker to add a newdata frame to the map than to copyan existing data frame.
If your data frames have layers incommon, it may be more conve-nient to add the common layers toa single data frame than toduplicate the data frame.
ch8.p65 12/04/2000, 2:46 PM226
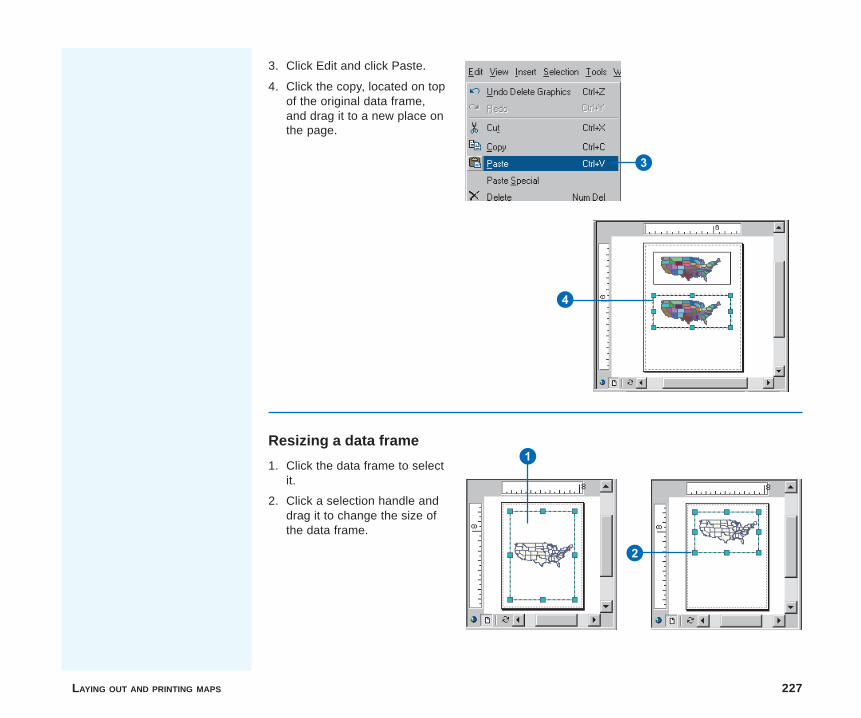
LAYING OUT AND PRINTING MAPS 227
3. Click Edit and click Paste.
4. Click the copy, located on topof the original data frame,and drag it to a new place onthe page.
Resizing a data frame
1. Click the data frame to selectit.
2. Click a selection handle anddrag it to change the size ofthe data frame.
3
4
1
2
ch8.p65 12/04/2000, 2:47 PM227
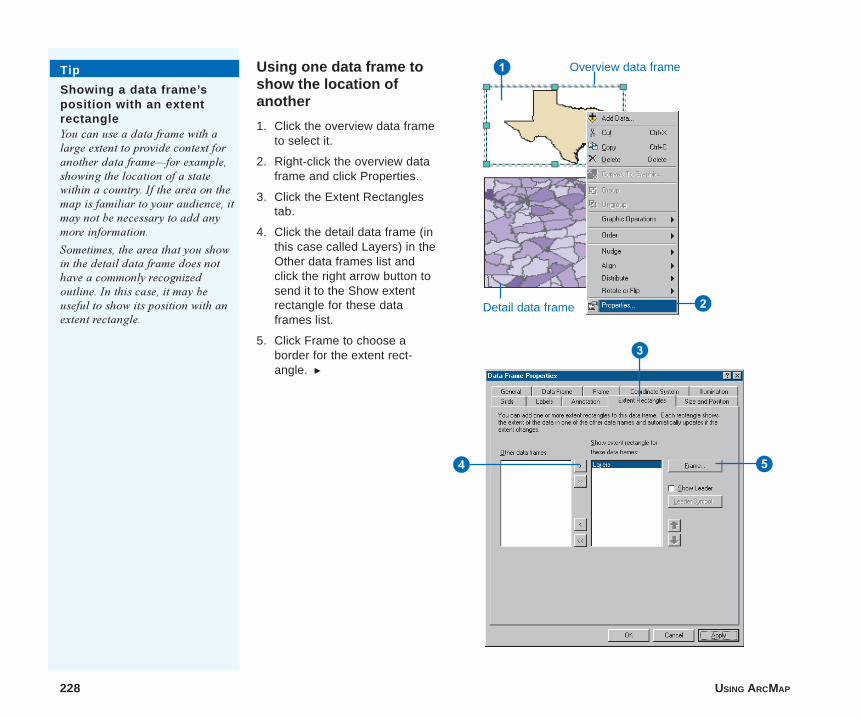
228 USING ARCMAP
Using one data frame toshow the location ofanother
1. Click the overview data frameto select it.
2. Right-click the overview dataframe and click Properties.
3. Click the Extent Rectanglestab.
4. Click the detail data frame (inthis case called Layers) in theOther data frames list andclick the right arrow button tosend it to the Show extentrectangle for these dataframes list.
5. Click Frame to choose aborder for the extent rect-angle. u
Overview data frame
Detail data frame
Tip
Showing a data frame’sposition with an extentrectangleYou can use a data frame with alarge extent to provide context foranother data frame�for example,showing the location of a statewithin a country. If the area on themap is familiar to your audience, itmay not be necessary to add anymore information.
Sometimes, the area that you showin the detail data frame does nothave a commonly recognizedoutline. In this case, it may beuseful to show its position with anextent rectangle.
2
1
54
3
ch8.p65 12/04/2000, 2:47 PM228
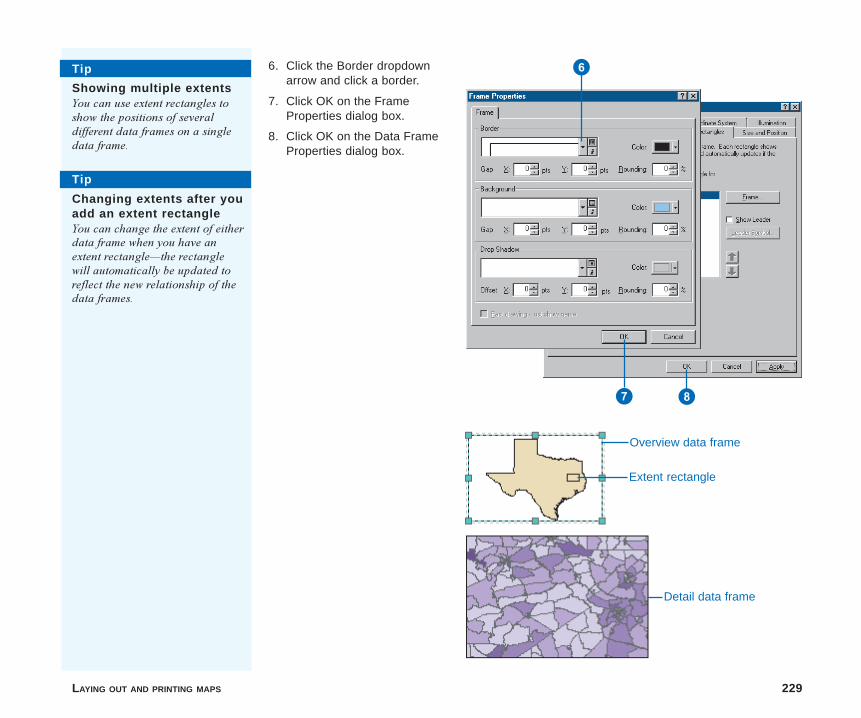
LAYING OUT AND PRINTING MAPS 229
6. Click the Border dropdownarrow and click a border.
7. Click OK on the FrameProperties dialog box.
8. Click OK on the Data FrameProperties dialog box.
Extent rectangle
Overview data frame
Detail data frame
87
6
Tip
Changing extents after youadd an extent rectangleYou can change the extent of eitherdata frame when you have anextent rectangle�the rectanglewill automatically be updated toreflect the new relationship of thedata frames.
Tip
Showing multiple extentsYou can use extent rectangles toshow the positions of severaldifferent data frames on a singledata frame.
ch8.p65 12/04/2000, 2:48 PM229
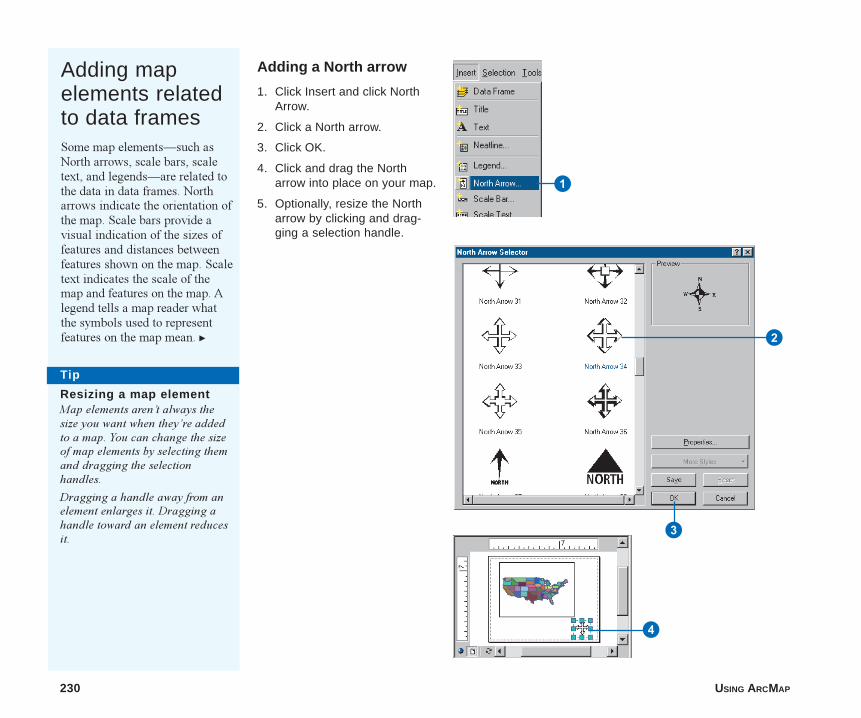
230 USING ARCMAP
Adding mapelements relatedto data framesSome map elements�such asNorth arrows, scale bars, scaletext, and legends�are related tothe data in data frames. Northarrows indicate the orientation ofthe map. Scale bars provide avisual indication of the sizes offeatures and distances betweenfeatures shown on the map. Scaletext indicates the scale of themap and features on the map. Alegend tells a map reader whatthe symbols used to representfeatures on the map mean. u
Adding a North arrow
1. Click Insert and click NorthArrow.
2. Click a North arrow.
3. Click OK.
4. Click and drag the Northarrow into place on your map.
5. Optionally, resize the Northarrow by clicking and drag-ging a selection handle.
1
2
4
3
Tip
Resizing a map elementMap elements aren�t always thesize you want when they�re addedto a map. You can change the sizeof map elements by selecting themand dragging the selectionhandles.
Dragging a handle away from anelement enlarges it. Dragging ahandle toward an element reducesit.
ch8.p65 12/04/2000, 2:48 PM230
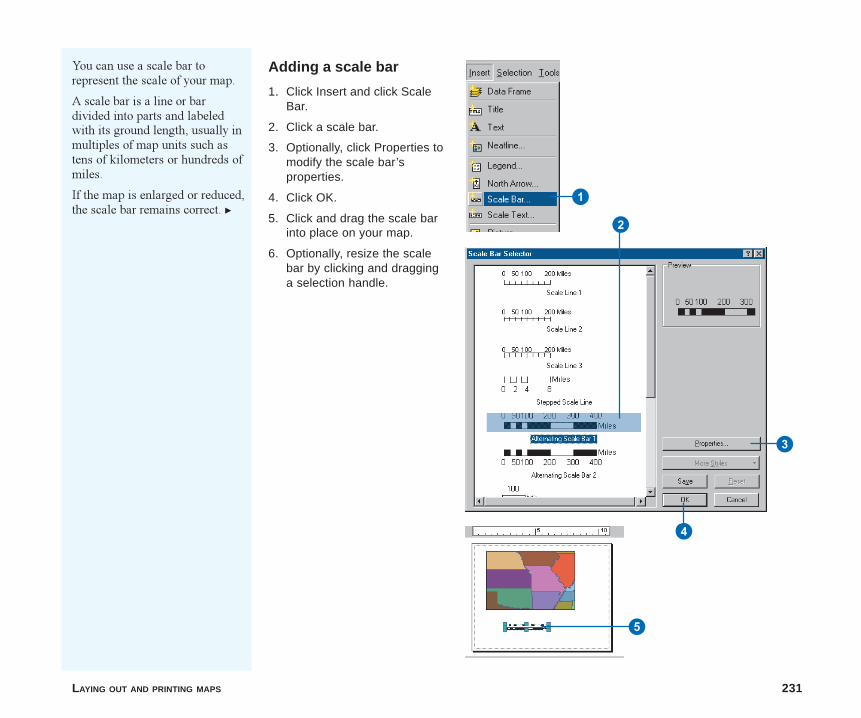
LAYING OUT AND PRINTING MAPS 231
Adding a scale bar
1. Click Insert and click ScaleBar.
2. Click a scale bar.
3. Optionally, click Properties tomodify the scale bar’sproperties.
4. Click OK.
5. Click and drag the scale barinto place on your map.
6. Optionally, resize the scalebar by clicking and dragginga selection handle.
You can use a scale bar torepresent the scale of your map.
A scale bar is a line or bardivided into parts and labeledwith its ground length, usually inmultiples of map units such astens of kilometers or hundreds ofmiles.
If the map is enlarged or reduced,the scale bar remains correct. u
1
2
3
4
5
ch8.p65 12/04/2000, 2:49 PM231
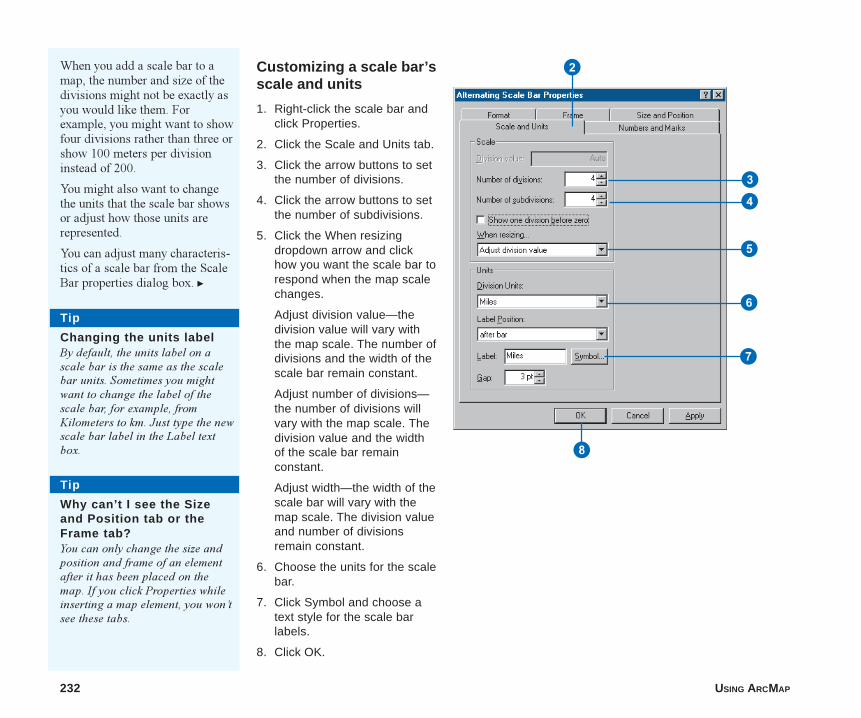
232 USING ARCMAP
Customizing a scale bar’sscale and units
1. Right-click the scale bar andclick Properties.
2. Click the Scale and Units tab.
3. Click the arrow buttons to setthe number of divisions.
4. Click the arrow buttons to setthe number of subdivisions.
5. Click the When resizingdropdown arrow and clickhow you want the scale bar torespond when the map scalechanges.
Adjust division value—thedivision value will vary withthe map scale. The number ofdivisions and the width of thescale bar remain constant.
Adjust number of divisions—the number of divisions willvary with the map scale. Thedivision value and the widthof the scale bar remainconstant.
Adjust width—the width of thescale bar will vary with themap scale. The division valueand number of divisionsremain constant.
6. Choose the units for the scalebar.
7. Click Symbol and choose atext style for the scale barlabels.
8. Click OK.
When you add a scale bar to amap, the number and size of thedivisions might not be exactly asyou would like them. Forexample, you might want to showfour divisions rather than three orshow 100 meters per divisioninstead of 200.
You might also want to changethe units that the scale bar showsor adjust how those units arerepresented.
You can adjust many characteris-tics of a scale bar from the ScaleBar properties dialog box. u
8
2
3
4
5
7
6
Tip
Why can’t I see the Sizeand Position tab or theFrame tab?You can only change the size andposition and frame of an elementafter it has been placed on themap. If you click Properties whileinserting a map element, you won�tsee these tabs.
Tip
Changing the units labelBy default, the units label on ascale bar is the same as the scalebar units. Sometimes you mightwant to change the label of thescale bar, for example, fromKilometers to km. Just type the newscale bar label in the Label textbox.
ch8.p65 12/04/2000, 2:49 PM232
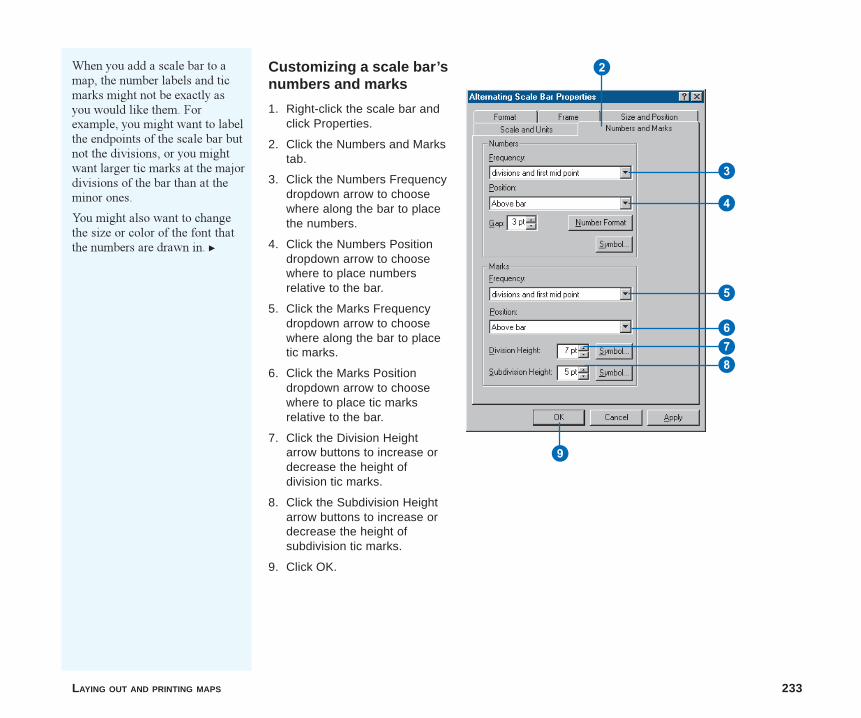
LAYING OUT AND PRINTING MAPS 233
Customizing a scale bar’snumbers and marks
1. Right-click the scale bar andclick Properties.
2. Click the Numbers and Markstab.
3. Click the Numbers Frequencydropdown arrow to choosewhere along the bar to placethe numbers.
4. Click the Numbers Positiondropdown arrow to choosewhere to place numbersrelative to the bar.
5. Click the Marks Frequencydropdown arrow to choosewhere along the bar to placetic marks.
6. Click the Marks Positiondropdown arrow to choosewhere to place tic marksrelative to the bar.
7. Click the Division Heightarrow buttons to increase ordecrease the height ofdivision tic marks.
8. Click the Subdivision Heightarrow buttons to increase ordecrease the height ofsubdivision tic marks.
9. Click OK.
When you add a scale bar to amap, the number labels and ticmarks might not be exactly asyou would like them. Forexample, you might want to labelthe endpoints of the scale bar butnot the divisions, or you mightwant larger tic marks at the majordivisions of the bar than at theminor ones.
You might also want to changethe size or color of the font thatthe numbers are drawn in. u
2
3
4
5
678
9
ch8.p65 12/04/2000, 2:49 PM233
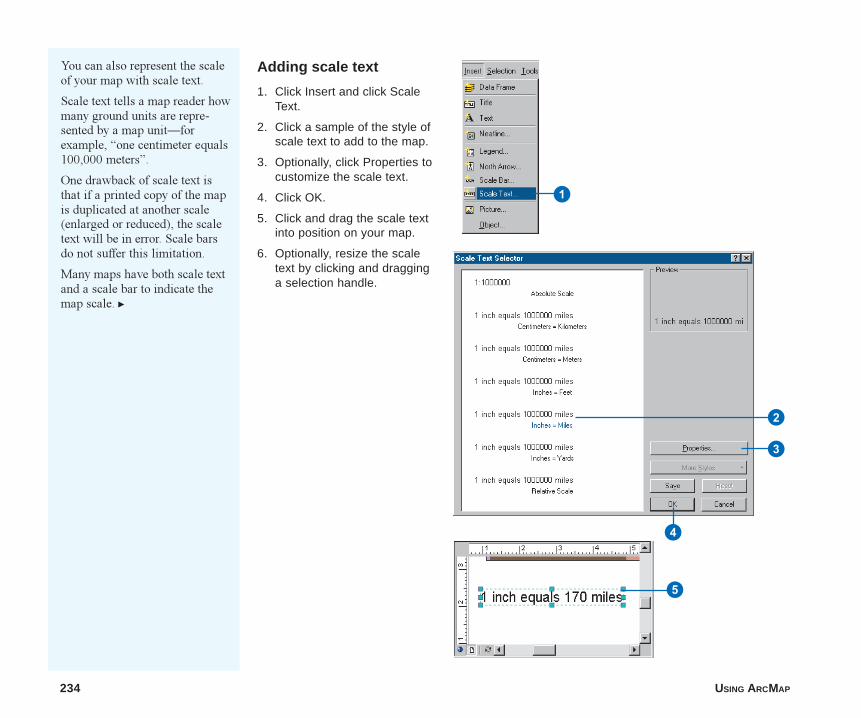
234 USING ARCMAP
You can also represent the scaleof your map with scale text.
Scale text tells a map reader howmany ground units are repre-sented by a map unit�forexample, �one centimeter equals100,000 meters�.
One drawback of scale text isthat if a printed copy of the mapis duplicated at another scale(enlarged or reduced), the scaletext will be in error. Scale barsdo not suffer this limitation.
Many maps have both scale textand a scale bar to indicate themap scale. u
Adding scale text
1. Click Insert and click ScaleText.
2. Click a sample of the style ofscale text to add to the map.
3. Optionally, click Properties tocustomize the scale text.
4. Click OK.
5. Click and drag the scale textinto position on your map.
6. Optionally, resize the scaletext by clicking and dragginga selection handle.
4
5
2
3
1
ch8.p65 12/04/2000, 2:50 PM234
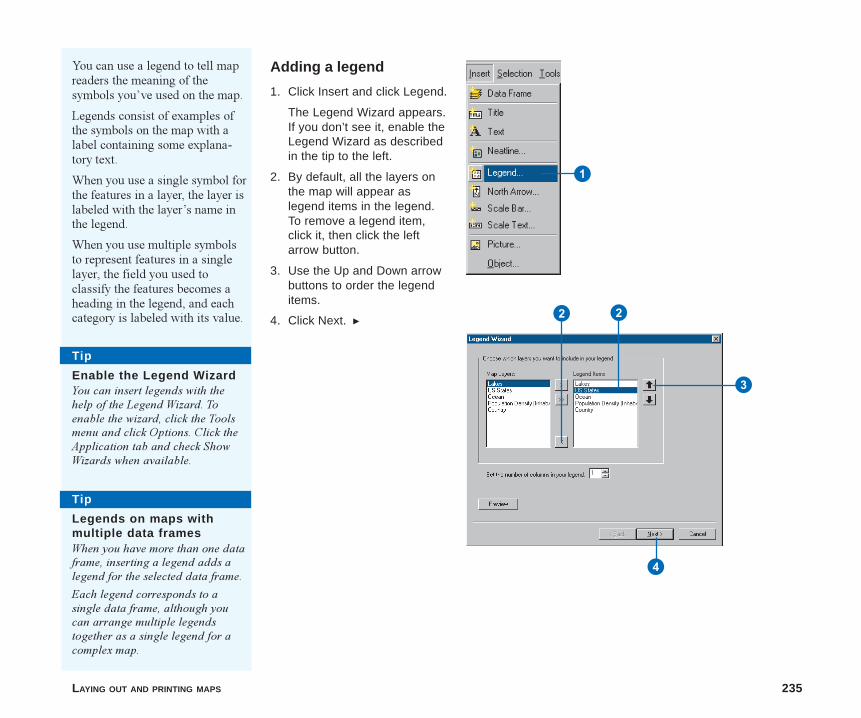
LAYING OUT AND PRINTING MAPS 235
You can use a legend to tell mapreaders the meaning of thesymbols you�ve used on the map.
Legends consist of examples ofthe symbols on the map with alabel containing some explana-tory text.
When you use a single symbol forthe features in a layer, the layer islabeled with the layer�s name inthe legend.
When you use multiple symbolsto represent features in a singlelayer, the field you used toclassify the features becomes aheading in the legend, and eachcategory is labeled with its value.
Adding a legend
1. Click Insert and click Legend.
The Legend Wizard appears.If you don’t see it, enable theLegend Wizard as describedin the tip to the left.
2. By default, all the layers onthe map will appear aslegend items in the legend.To remove a legend item,click it, then click the leftarrow button.
3. Use the Up and Down arrowbuttons to order the legenditems.
4. Click Next. u
1
Tip
Legends on maps withmultiple data framesWhen you have more than one dataframe, inserting a legend adds alegend for the selected data frame.
Each legend corresponds to asingle data frame, although youcan arrange multiple legendstogether as a single legend for acomplex map.
Tip
Enable the Legend WizardYou can insert legends with thehelp of the Legend Wizard. Toenable the wizard, click the Toolsmenu and click Options. Click theApplication tab and check ShowWizards when available.
2 2
3
4
ch8.p65 12/04/2000, 2:50 PM235
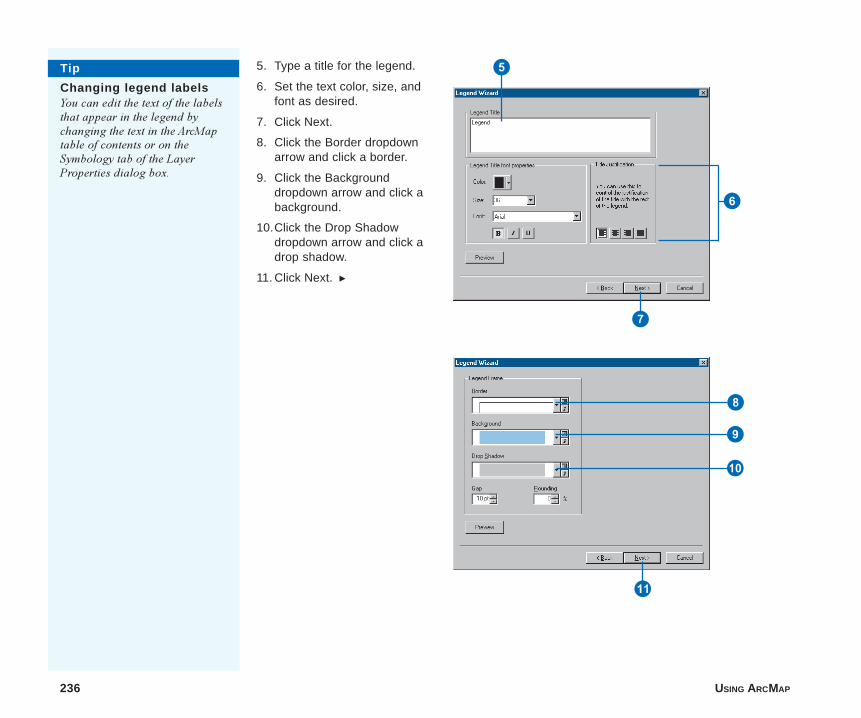
236 USING ARCMAP
5. Type a title for the legend.
6. Set the text color, size, andfont as desired.
7. Click Next.
8. Click the Border dropdownarrow and click a border.
9. Click the Backgrounddropdown arrow and click abackground.
10.Click the Drop Shadowdropdown arrow and click adrop shadow.
11. Click Next. u
Tip
Changing legend labelsYou can edit the text of the labelsthat appear in the legend bychanging the text in the ArcMaptable of contents or on theSymbology tab of the LayerProperties dialog box.
5
6
7
8
9
Q
W
ch8.p65 12/04/2000, 2:51 PM236
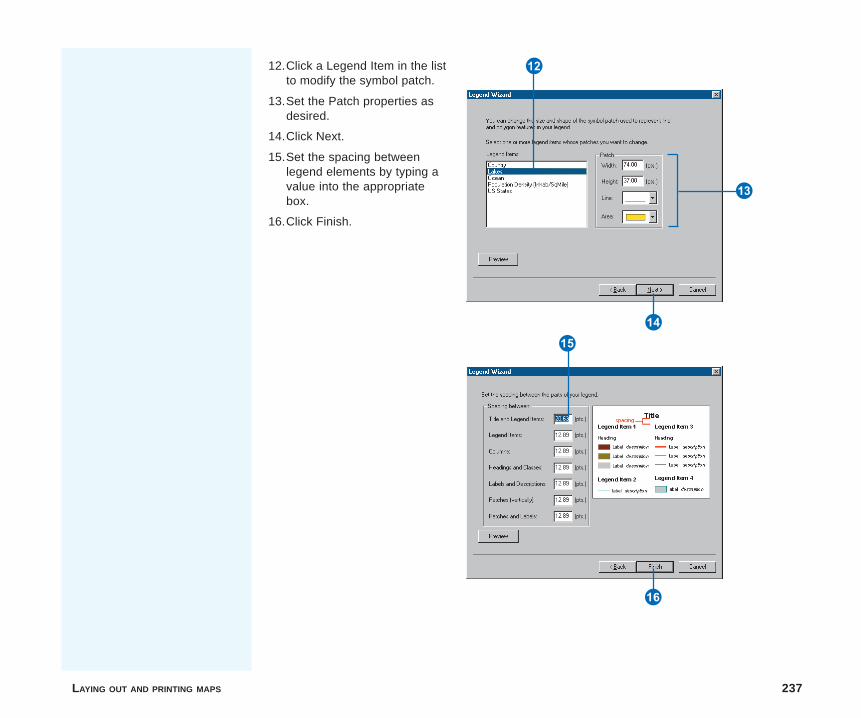
LAYING OUT AND PRINTING MAPS 237
12.Click a Legend Item in the listto modify the symbol patch.
13.Set the Patch properties asdesired.
14.Click Next.
15.Set the spacing betweenlegend elements by typing avalue into the appropriatebox.
16.Click Finish.
E
R
TY
U
ch8.p65 12/04/2000, 2:51 PM237
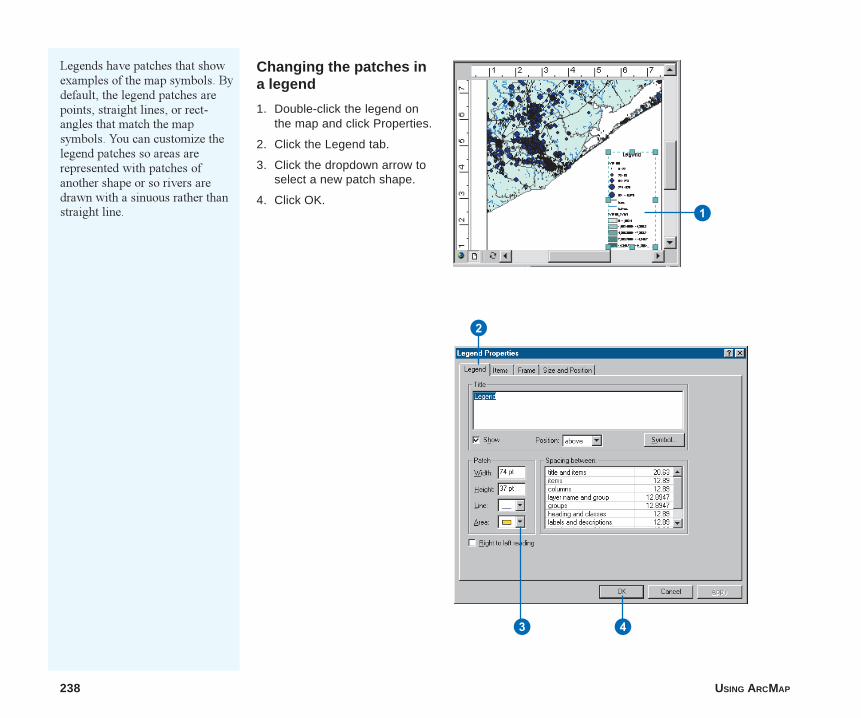
238 USING ARCMAP
Changing the patches ina legend
1. Double-click the legend onthe map and click Properties.
2. Click the Legend tab.
3. Click the dropdown arrow toselect a new patch shape.
4. Click OK.
Legends have patches that showexamples of the map symbols. Bydefault, the legend patches arepoints, straight lines, or rect-angles that match the mapsymbols. You can customize thelegend patches so areas arerepresented with patches ofanother shape or so rivers aredrawn with a sinuous rather thanstraight line. 1
2
3 4
ch8.p65 12/04/2000, 2:52 PM238
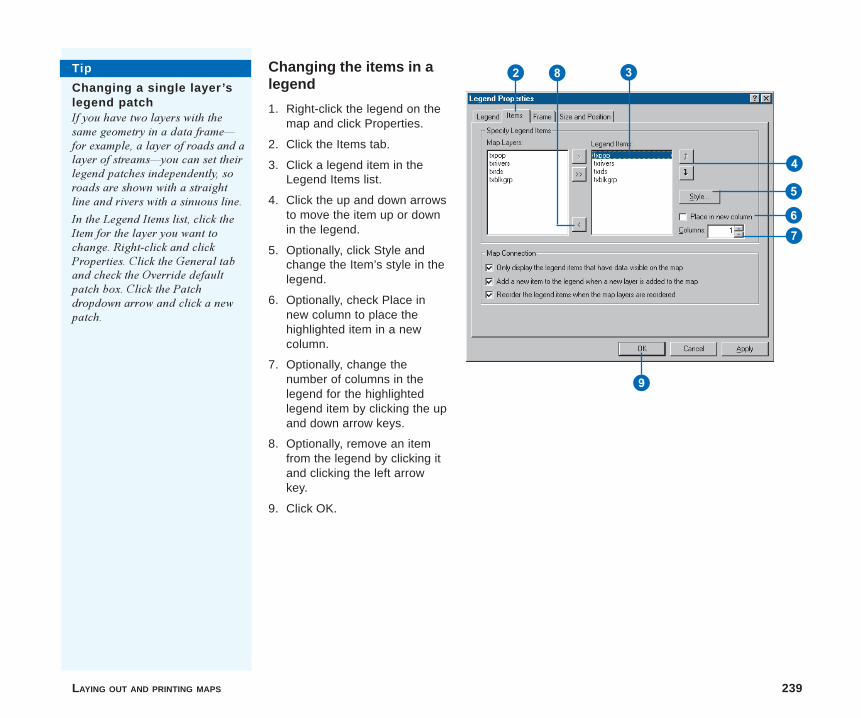
LAYING OUT AND PRINTING MAPS 239
Changing the items in alegend
1. Right-click the legend on themap and click Properties.
2. Click the Items tab.
3. Click a legend item in theLegend Items list.
4. Click the up and down arrowsto move the item up or downin the legend.
5. Optionally, click Style andchange the Item’s style in thelegend.
6. Optionally, check Place innew column to place thehighlighted item in a newcolumn.
7. Optionally, change thenumber of columns in thelegend for the highlightedlegend item by clicking the upand down arrow keys.
8. Optionally, remove an itemfrom the legend by clicking itand clicking the left arrowkey.
9. Click OK.
Tip
Changing a single layer ’slegend patchIf you have two layers with thesame geometry in a data frame�for example, a layer of roads and alayer of streams�you can set theirlegend patches independently, soroads are shown with a straightline and rivers with a sinuous line.
In the Legend Items list, click theItem for the layer you want tochange. Right-click and clickProperties. Click the General taband check the Override defaultpatch box. Click the Patchdropdown arrow and click a newpatch.
2 8 3
4
5
67
9
ch8.p65 12/04/2000, 2:52 PM239
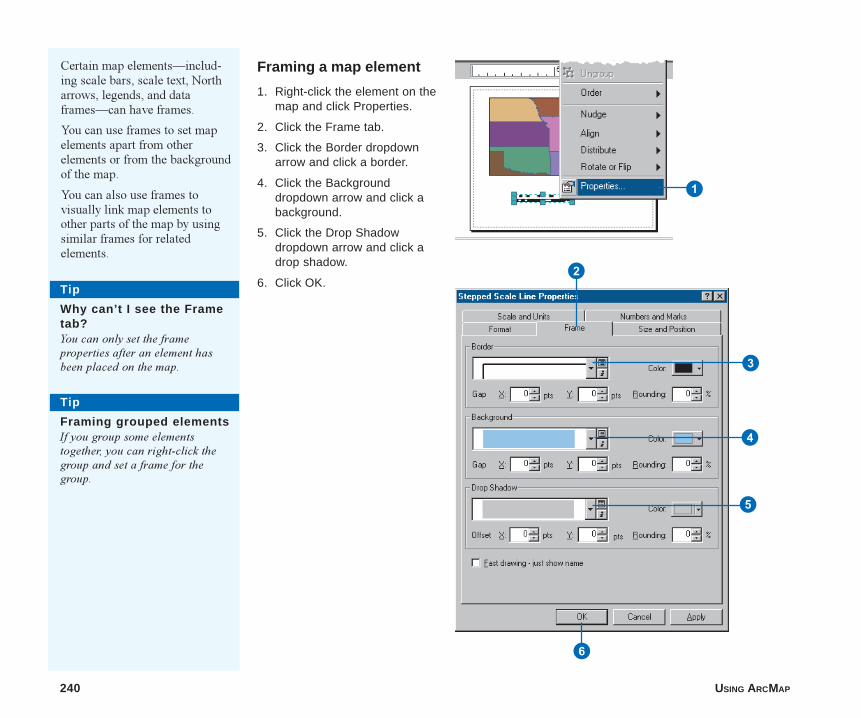
240 USING ARCMAP
Framing a map element
1. Right-click the element on themap and click Properties.
2. Click the Frame tab.
3. Click the Border dropdownarrow and click a border.
4. Click the Backgrounddropdown arrow and click abackground.
5. Click the Drop Shadowdropdown arrow and click adrop shadow.
6. Click OK.
Certain map elements�includ-ing scale bars, scale text, Northarrows, legends, and dataframes�can have frames.
You can use frames to set mapelements apart from otherelements or from the backgroundof the map.
You can also use frames tovisually link map elements toother parts of the map by usingsimilar frames for relatedelements.
1
2
6
Tip
Why can’t I see the Frametab?You can only set the frameproperties after an element hasbeen placed on the map.
Tip
Framing grouped elementsIf you group some elementstogether, you can right-click thegroup and set a frame for thegroup.
3
4
5
ch8.p65 12/04/2000, 2:52 PM240
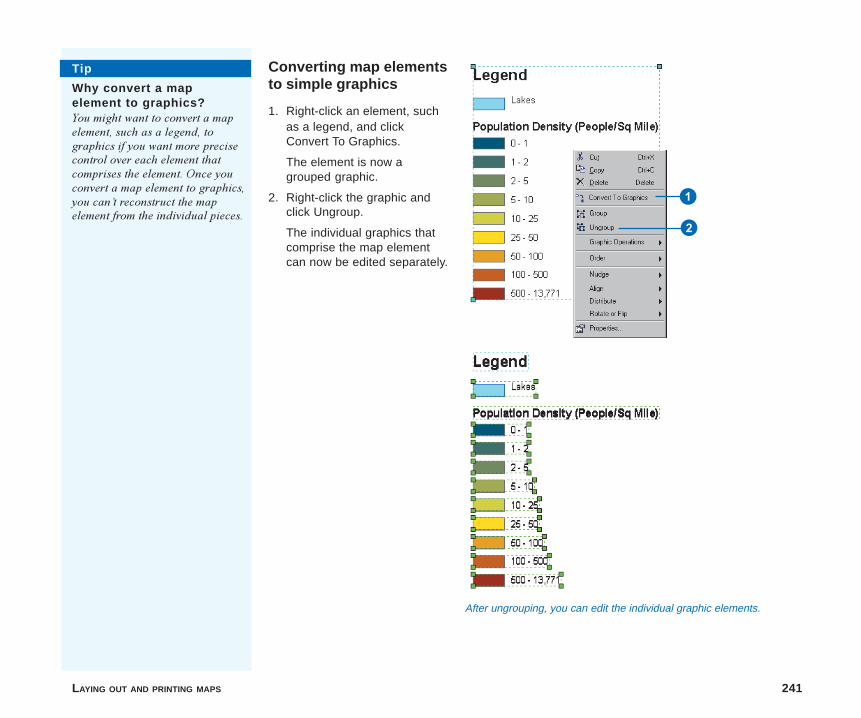
LAYING OUT AND PRINTING MAPS 241
Converting map elementsto simple graphics
1. Right-click an element, suchas a legend, and clickConvert To Graphics.
The element is now agrouped graphic.
2. Right-click the graphic andclick Ungroup.
The individual graphics thatcomprise the map elementcan now be edited separately.
1
2
After ungrouping, you can edit the individual graphic elements.
Tip
Why convert a mapelement to graphics?You might want to convert a mapelement, such as a legend, tographics if you want more precisecontrol over each element thatcomprises the element. Once youconvert a map element to graphics,you can�t reconstruct the mapelement from the individual pieces.
ch8.p65 12/04/2000, 2:53 PM241
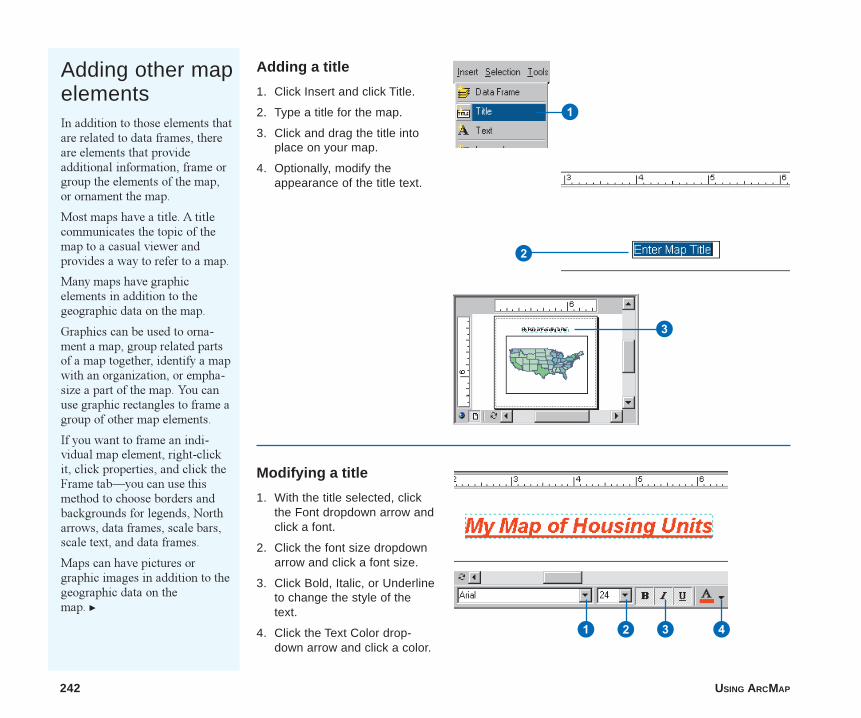
242 USING ARCMAP
Adding other mapelementsIn addition to those elements thatare related to data frames, thereare elements that provideadditional information, frame orgroup the elements of the map,or ornament the map.
Most maps have a title. A titlecommunicates the topic of themap to a casual viewer andprovides a way to refer to a map.
Many maps have graphicelements in addition to thegeographic data on the map.
Graphics can be used to orna-ment a map, group related partsof a map together, identify a mapwith an organization, or empha-size a part of the map. You canuse graphic rectangles to frame agroup of other map elements.
If you want to frame an indi-vidual map element, right-clickit, click properties, and click theFrame tab�you can use thismethod to choose borders andbackgrounds for legends, Northarrows, data frames, scale bars,scale text, and data frames.
Maps can have pictures orgraphic images in addition to thegeographic data on themap. u
Adding a title
1. Click Insert and click Title.
2. Type a title for the map.
3. Click and drag the title intoplace on your map.
4. Optionally, modify theappearance of the title text.
Modifying a title
1. With the title selected, clickthe Font dropdown arrow andclick a font.
2. Click the font size dropdownarrow and click a font size.
3. Click Bold, Italic, or Underlineto change the style of thetext.
4. Click the Text Color drop-down arrow and click a color.
1 2 3 4
1
2
3
ch8.p65 12/04/2000, 2:53 PM242
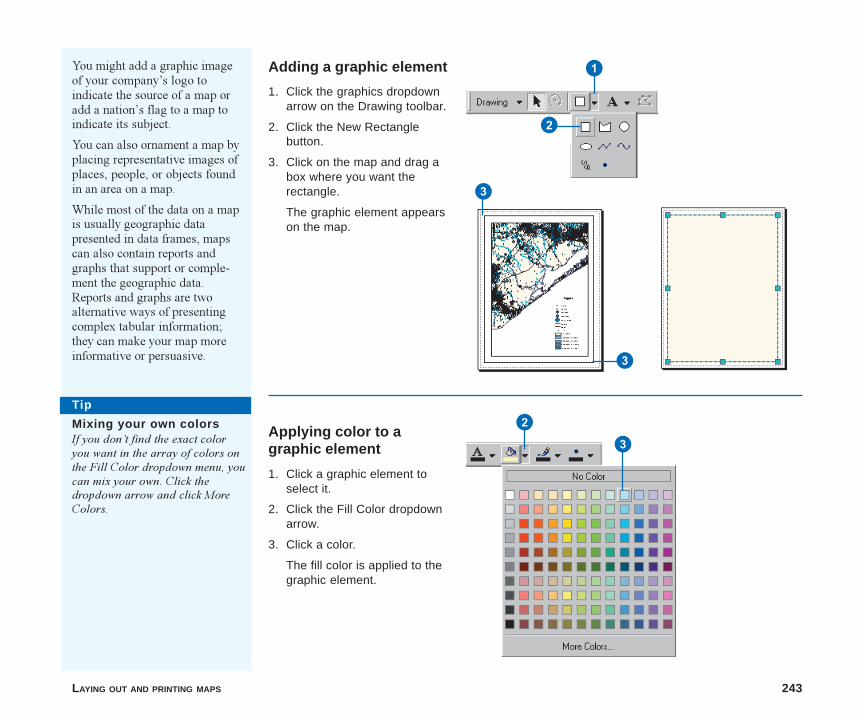
LAYING OUT AND PRINTING MAPS 243
Adding a graphic element
1. Click the graphics dropdownarrow on the Drawing toolbar.
2. Click the New Rectanglebutton.
3. Click on the map and drag abox where you want therectangle.
The graphic element appearson the map.
3
3
Applying color to agraphic element
1. Click a graphic element toselect it.
2. Click the Fill Color dropdownarrow.
3. Click a color.
The fill color is applied to thegraphic element.
3
You might add a graphic imageof your company�s logo toindicate the source of a map oradd a nation�s flag to a map toindicate its subject.
You can also ornament a map byplacing representative images ofplaces, people, or objects foundin an area on a map.
While most of the data on a mapis usually geographic datapresented in data frames, mapscan also contain reports andgraphs that support or comple-ment the geographic data.Reports and graphs are twoalternative ways of presentingcomplex tabular information;they can make your map moreinformative or persuasive.
1
2
2
Tip
Mixing your own colorsIf you don�t find the exact coloryou want in the array of colors onthe Fill Color dropdown menu, youcan mix your own. Click thedropdown arrow and click MoreColors.
ch8.p65 12/04/2000, 2:53 PM243

244 USING ARCMAP
Applying a line color to agraphic element
1. Click a graphic element toselect it.
2. Click the Line Color drop-down arrow.
3. Click a color.
The line color is applied tothe graphic element.
Placing a graphic elementbehind other elements
1. Click the graphic element toselect it.
2. Right-click on the graphicelement, point to Order, andclick Send to Back.
Graphic rectangle behindmap elements
2
3
2
ch8.p65 12/04/2000, 2:53 PM244
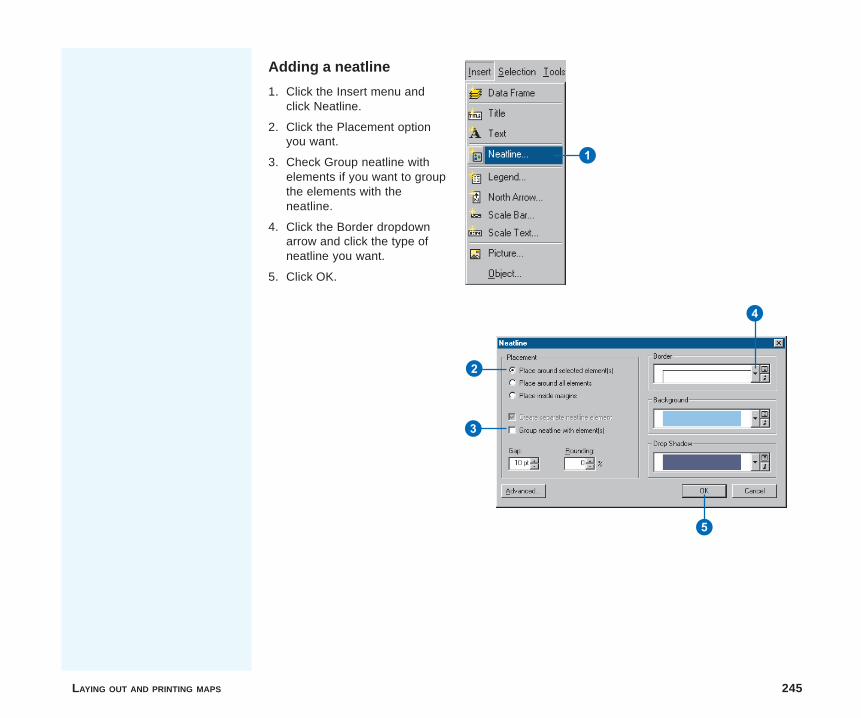
LAYING OUT AND PRINTING MAPS 245
Adding a neatline
1. Click the Insert menu andclick Neatline.
2. Click the Placement optionyou want.
3. Check Group neatline withelements if you want to groupthe elements with theneatline.
4. Click the Border dropdownarrow and click the type ofneatline you want.
5. Click OK.
2
3
4
5
1
ch8.p65 12/04/2000, 2:54 PM245
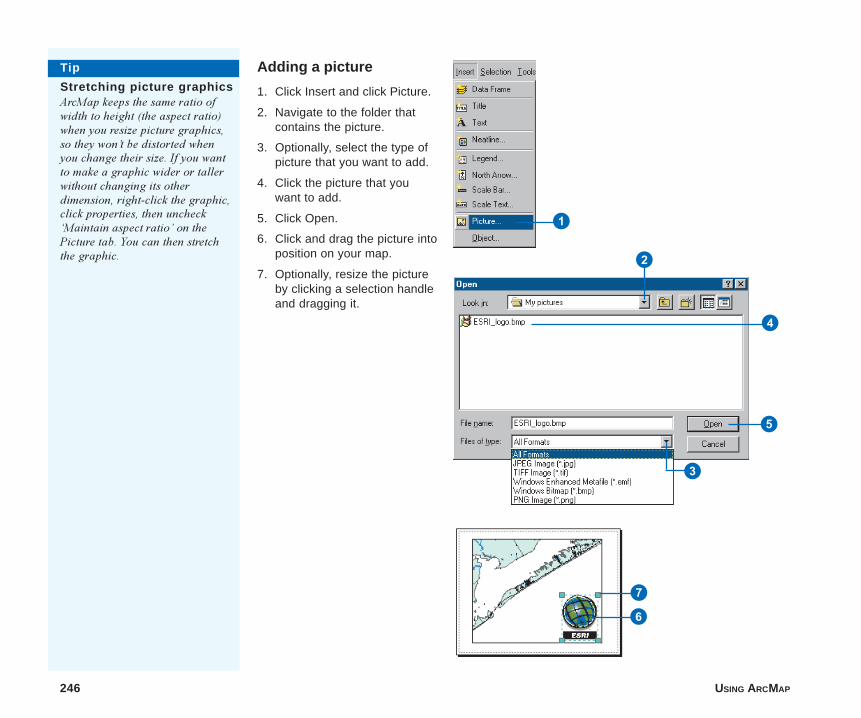
246 USING ARCMAP
Adding a picture
1. Click Insert and click Picture.
2. Navigate to the folder thatcontains the picture.
3. Optionally, select the type ofpicture that you want to add.
4. Click the picture that youwant to add.
5. Click Open.
6. Click and drag the picture intoposition on your map.
7. Optionally, resize the pictureby clicking a selection handleand dragging it.
Tip
Stretching picture graphicsArcMap keeps the same ratio ofwidth to height (the aspect ratio)when you resize picture graphics,so they won�t be distorted whenyou change their size. If you wantto make a graphic wider or tallerwithout changing its otherdimension, right-click the graphic,click properties, then uncheck�Maintain aspect ratio� on thePicture tab. You can then stretchthe graphic.
1
2
4
5
3
6
7
ch8.p65 12/04/2000, 2:54 PM246
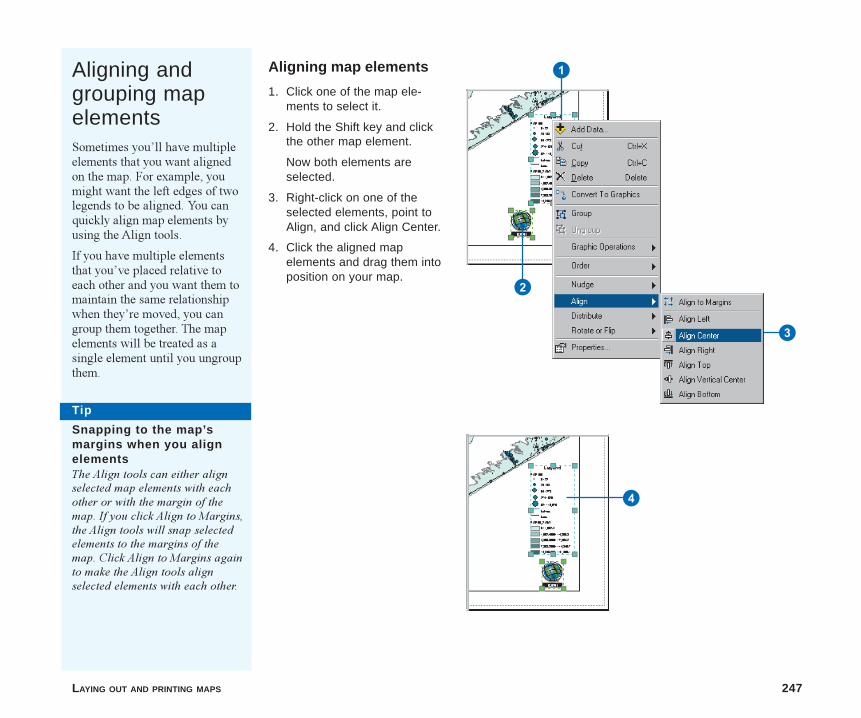
LAYING OUT AND PRINTING MAPS 247
Aligning map elements
1. Click one of the map ele-ments to select it.
2. Hold the Shift key and clickthe other map element.
Now both elements areselected.
3. Right-click on one of theselected elements, point toAlign, and click Align Center.
4. Click the aligned mapelements and drag them intoposition on your map.
Aligning andgrouping mapelementsSometimes you�ll have multipleelements that you want alignedon the map. For example, youmight want the left edges of twolegends to be aligned. You canquickly align map elements byusing the Align tools.
If you have multiple elementsthat you�ve placed relative toeach other and you want them tomaintain the same relationshipwhen they�re moved, you cangroup them together. The mapelements will be treated as asingle element until you ungroupthem.
4
2
1
3
Tip
Snapping to the map’smargins when you alignelementsThe Align tools can either alignselected map elements with eachother or with the margin of themap. If you click Align to Margins,the Align tools will snap selectedelements to the margins of themap. Click Align to Margins againto make the Align tools alignselected elements with each other.
ch8.p65 12/04/2000, 2:54 PM247
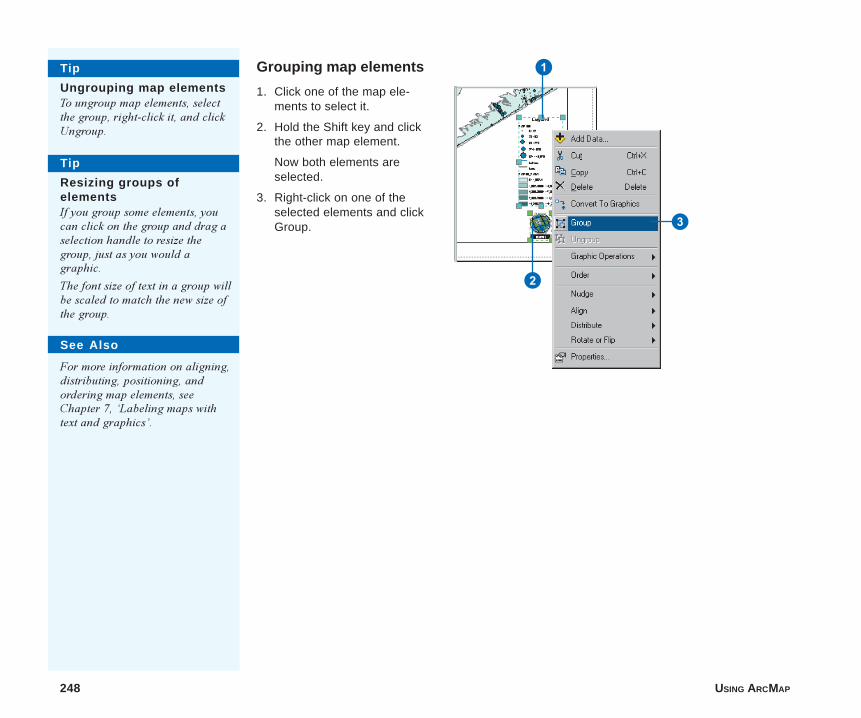
248 USING ARCMAP
Grouping map elements
1. Click one of the map ele-ments to select it.
2. Hold the Shift key and clickthe other map element.
Now both elements areselected.
3. Right-click on one of theselected elements and clickGroup.
1
3
2
Tip
Ungrouping map elementsTo ungroup map elements, selectthe group, right-click it, and clickUngroup.
Tip
Resizing groups ofelementsIf you group some elements, youcan click on the group and drag aselection handle to resize thegroup, just as you would agraphic.
The font size of text in a group willbe scaled to match the new size ofthe group.
See Also
For more information on aligning,distributing, positioning, andordering map elements, seeChapter 7, �Labeling maps withtext and graphics�.
ch8.p65 12/04/2000, 2:54 PM248
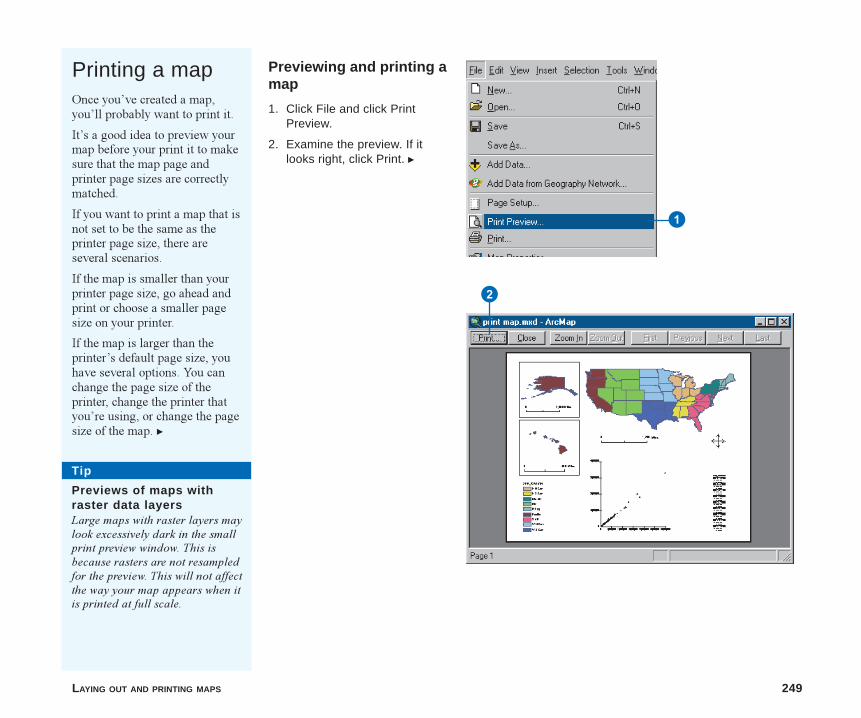
LAYING OUT AND PRINTING MAPS 249
Printing a mapOnce you�ve created a map,you�ll probably want to print it.
It�s a good idea to preview yourmap before your print it to makesure that the map page andprinter page sizes are correctlymatched.
If you want to print a map that isnot set to be the same as theprinter page size, there areseveral scenarios.
If the map is smaller than yourprinter page size, go ahead andprint or choose a smaller pagesize on your printer.
If the map is larger than theprinter�s default page size, youhave several options. You canchange the page size of theprinter, change the printer thatyou�re using, or change the pagesize of the map. u
Previewing and printing amap
1. Click File and click PrintPreview.
2. Examine the preview. If itlooks right, click Print. u
Tip
Previews of maps withraster data layersLarge maps with raster layers maylook excessively dark in the smallprint preview window. This isbecause rasters are not resampledfor the preview. This will not affectthe way your map appears when itis printed at full scale.
1
2
ch8.p65 12/04/2000, 2:55 PM249
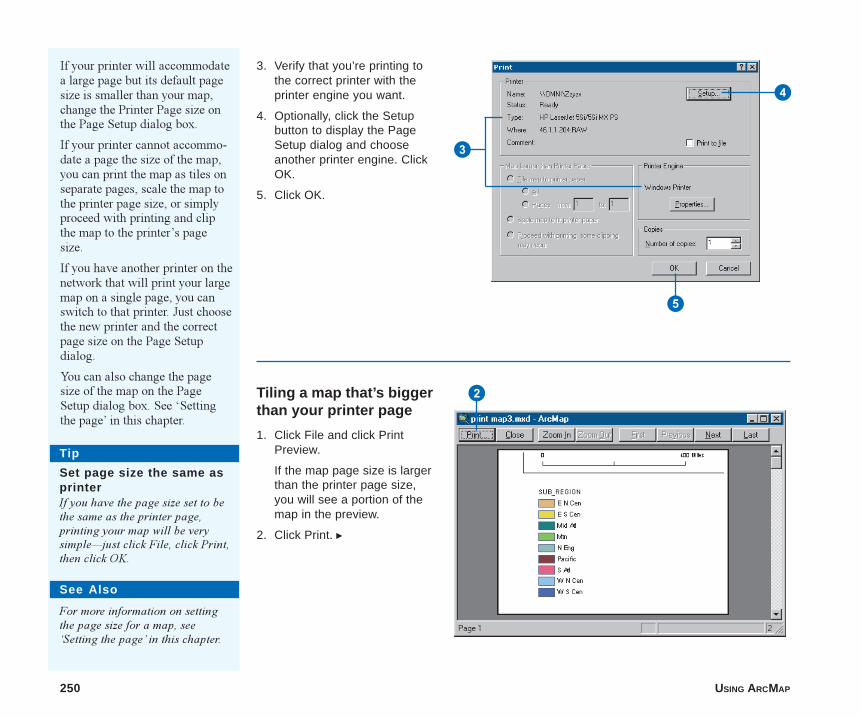
250 USING ARCMAP
3. Verify that you’re printing tothe correct printer with theprinter engine you want.
4. Optionally, click the Setupbutton to display the PageSetup dialog and chooseanother printer engine. ClickOK.
5. Click OK.
Tiling a map that’s biggerthan your printer page
1. Click File and click PrintPreview.
If the map page size is largerthan the printer page size,you will see a portion of themap in the preview.
2. Click Print. u
If your printer will accommodatea large page but its default pagesize is smaller than your map,change the Printer Page size onthe Page Setup dialog box.
If your printer cannot accommo-date a page the size of the map,you can print the map as tiles onseparate pages, scale the map tothe printer page size, or simplyproceed with printing and clipthe map to the printer�s pagesize.
If you have another printer on thenetwork that will print your largemap on a single page, you canswitch to that printer. Just choosethe new printer and the correctpage size on the Page Setupdialog.
You can also change the pagesize of the map on the PageSetup dialog box. See �Settingthe page� in this chapter.
5
2
Tip
Set page size the same asprinterIf you have the page size set to bethe same as the printer page,printing your map will be verysimple�just click File, click Print,then click OK.
3
4
See Also
For more information on settingthe page size for a map, see�Setting the page� in this chapter.
ch8.p65 12/04/2000, 2:55 PM250
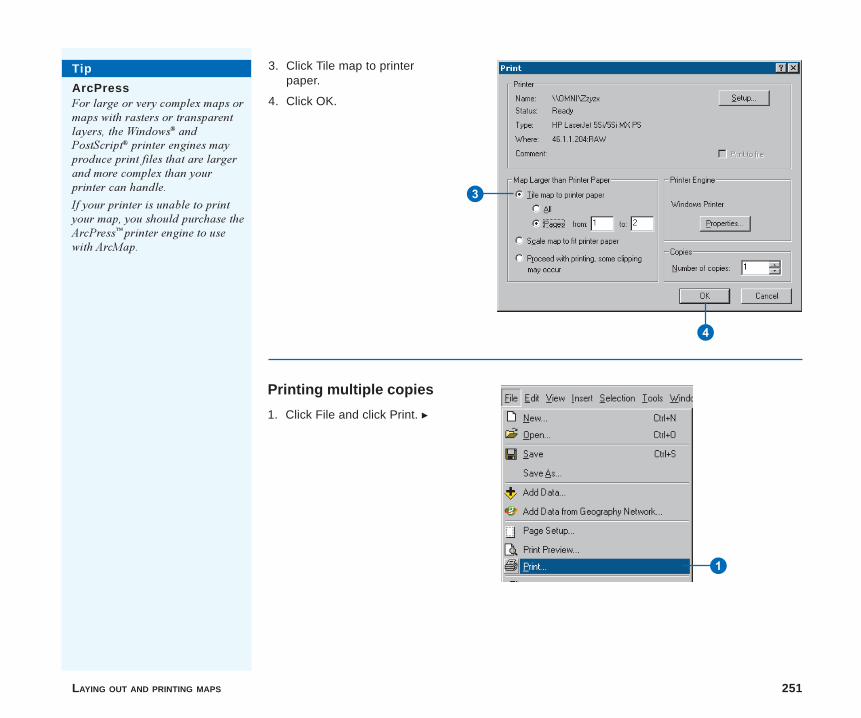
LAYING OUT AND PRINTING MAPS 251
3. Click Tile map to printerpaper.
4. Click OK.
Printing multiple copies
1. Click File and click Print. u
4
3
1
Tip
ArcPressFor large or very complex maps ormaps with rasters or transparentlayers, the Windows® andPostScript® printer engines mayproduce print files that are largerand more complex than yourprinter can handle.
If your printer is unable to printyour map, you should purchase theArcPress� printer engine to usewith ArcMap.
ch8.p65 12/04/2000, 2:55 PM251
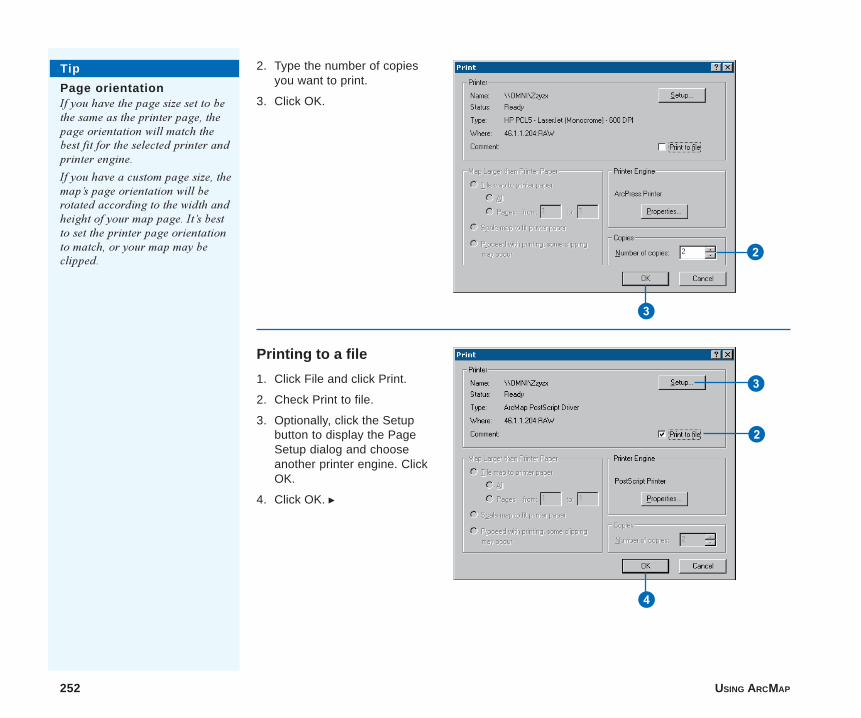
252 USING ARCMAP
2. Type the number of copiesyou want to print.
3. Click OK.
Printing to a file
1. Click File and click Print.
2. Check Print to file.
3. Optionally, click the Setupbutton to display the PageSetup dialog and chooseanother printer engine. ClickOK.
4. Click OK. u
3
2
2
3
4
Tip
Page orientationIf you have the page size set to bethe same as the printer page, thepage orientation will match thebest fit for the selected printer andprinter engine.
If you have a custom page size, themap�s page orientation will berotated according to the width andheight of your map page. It�s bestto set the printer page orientationto match, or your map may beclipped.
ch8.p65 12/04/2000, 2:56 PM252

LAYING OUT AND PRINTING MAPS 253
7
5
6
5. Navigate to where you wantto save the output printer file.
6. Type a name for your printfile.
7. Click Save.
Tip
Print filename extensionsIf you choose the Windows printerengine, you�ll create a Windowsprinter file, *.prn. If you choosethe PostScript printer engine,you�ll create a PostScript file, *.ps.If you choose the ArcPress printerengine, you�ll create a raster filewith the extension of the ArcPressdriver you�ve selected.
ch8.p65 12/04/2000, 2:56 PM253
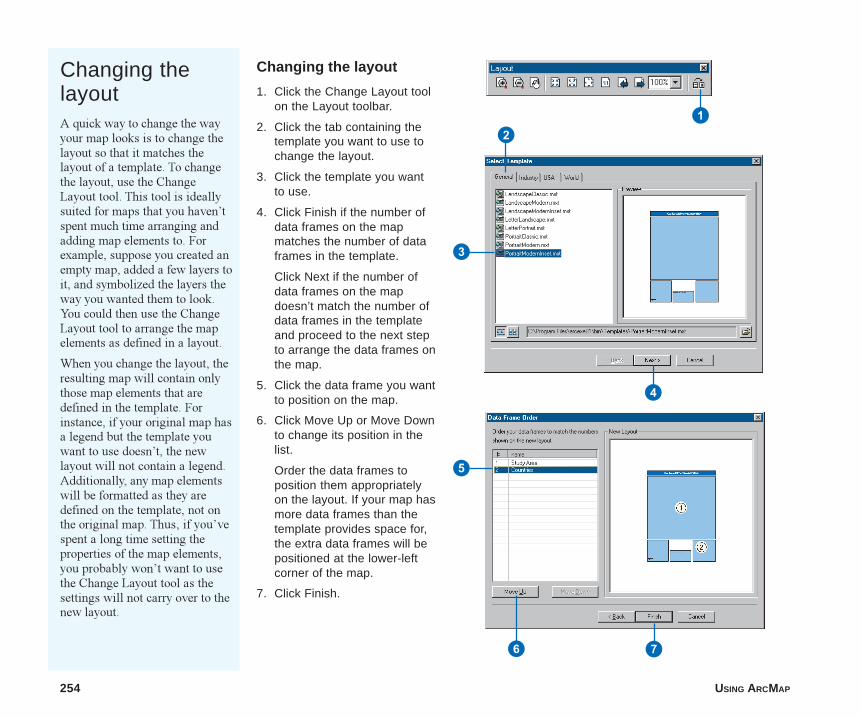
254 USING ARCMAP
Changing thelayoutA quick way to change the wayyour map looks is to change thelayout so that it matches thelayout of a template. To changethe layout, use the ChangeLayout tool. This tool is ideallysuited for maps that you haven�tspent much time arranging andadding map elements to. Forexample, suppose you created anempty map, added a few layers toit, and symbolized the layers theway you wanted them to look.You could then use the ChangeLayout tool to arrange the mapelements as defined in a layout.
When you change the layout, theresulting map will contain onlythose map elements that aredefined in the template. Forinstance, if your original map hasa legend but the template youwant to use doesn�t, the newlayout will not contain a legend.Additionally, any map elementswill be formatted as they aredefined on the template, not onthe original map. Thus, if you�vespent a long time setting theproperties of the map elements,you probably won�t want to usethe Change Layout tool as thesettings will not carry over to thenew layout.
Changing the layout
1. Click the Change Layout toolon the Layout toolbar.
2. Click the tab containing thetemplate you want to use tochange the layout.
3. Click the template you wantto use.
4. Click Finish if the number ofdata frames on the mapmatches the number of dataframes in the template.
Click Next if the number ofdata frames on the mapdoesn’t match the number ofdata frames in the templateand proceed to the next stepto arrange the data frames onthe map.
5. Click the data frame you wantto position on the map.
6. Click Move Up or Move Downto change its position in thelist.
Order the data frames toposition them appropriatelyon the layout. If your map hasmore data frames than thetemplate provides space for,the extra data frames will bepositioned at the lower-leftcorner of the map.
7. Click Finish.
12
3
4
5
6 7
ch8.p65 12/04/2000, 2:57 PM254
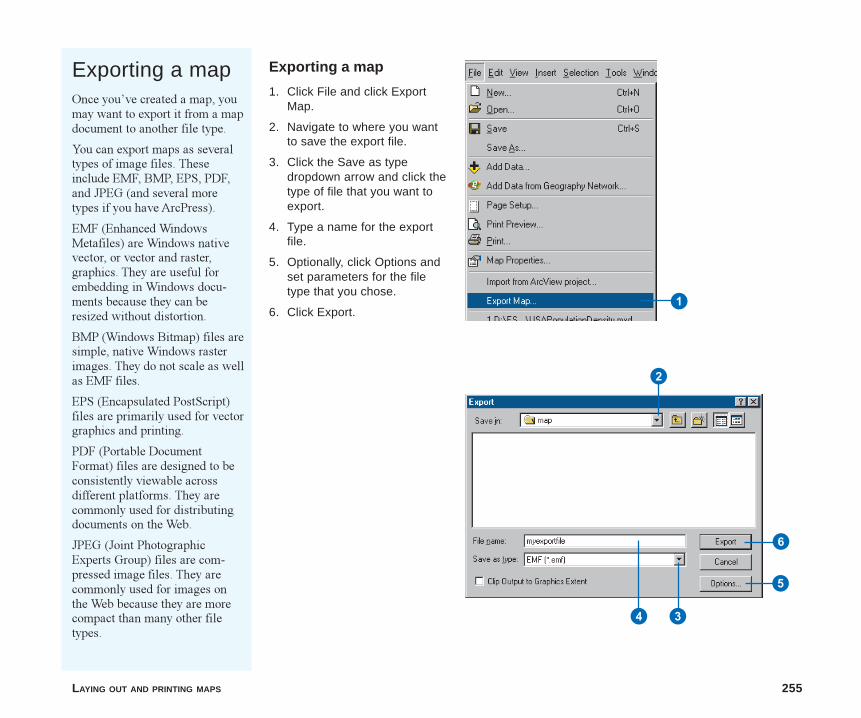
LAYING OUT AND PRINTING MAPS 255
Exporting a mapOnce you�ve created a map, youmay want to export it from a mapdocument to another file type.
You can export maps as severaltypes of image files. Theseinclude EMF, BMP, EPS, PDF,and JPEG (and several moretypes if you have ArcPress).
EMF (Enhanced WindowsMetafiles) are Windows nativevector, or vector and raster,graphics. They are useful forembedding in Windows docu-ments because they can beresized without distortion.
BMP (Windows Bitmap) files aresimple, native Windows rasterimages. They do not scale as wellas EMF files.
EPS (Encapsulated PostScript)files are primarily used for vectorgraphics and printing.
PDF (Portable DocumentFormat) files are designed to beconsistently viewable acrossdifferent platforms. They arecommonly used for distributingdocuments on the Web.
JPEG (Joint PhotographicExperts Group) files are com-pressed image files. They arecommonly used for images onthe Web because they are morecompact than many other filetypes.
Exporting a map
1. Click File and click ExportMap.
2. Navigate to where you wantto save the export file.
3. Click the Save as typedropdown arrow and click thetype of file that you want toexport.
4. Type a name for the exportfile.
5. Optionally, click Options andset parameters for the filetype that you chose.
6. Click Export.
2
34
6
1
5
ch8.p65 12/04/2000, 2:57 PM255

ch8.p65 12/04/2000, 2:57 PM256
IN THIS CHAPTER
257
Working with styles and symbols 9• Using styles to create maps
• Finding the styles you need
• Modifying and saving symbols
• Modifying and saving map ele-ments
• Saving the current styles
• The Style Manager
• Organizing style contents
• Creating new symbols and mapelements
• Creating line symbols
• Creating fill symbols
• Creating marker symbols
• Creating text symbols
• Working with color
Styles provide a complete set of tools to help you create a map. Each stylecontains a suite of symbols and map elements that provide information aboutsymbol properties, label specifications, color schemes, legend and scale barcharacteristics, coordinate reference systems, and much more.
Styles help to describe not only how data is drawn, but also the appearanceand placement of map elements, symbols, and other cartographic additions onyour map. Every time you select and apply a particular map element orsymbol, you are using the contents of a style.
Styles are designed to be used with map templates and feature layers. A styleor group of styles can be referenced with a map template to help you create amap for a specific purpose or a map series.
Styles can help you maintain standards for symbols, colors, patterns, andmethods of rendering distributions, relationships, and trends. Using familiarstyles lets your map communicate in the most effective way. Styles enablepeople to easily explore, understand, and analyze a map. ArcMap comes witha wide variety of styles to help you create maps that convey the right messagefor a specific application and audience.
In the previous chapters, you have learned how to symbolize data and how todraw map elements and graphics. You are probably already familiar with mostof the symbol and map element dialog boxes.
In this chapter, you will learn how to create the symbols you want and savethem in styles you can reuse to produce maps that meet the needs of yourorganization.
ch9.p65 12/05/2000, 11:35 AM257
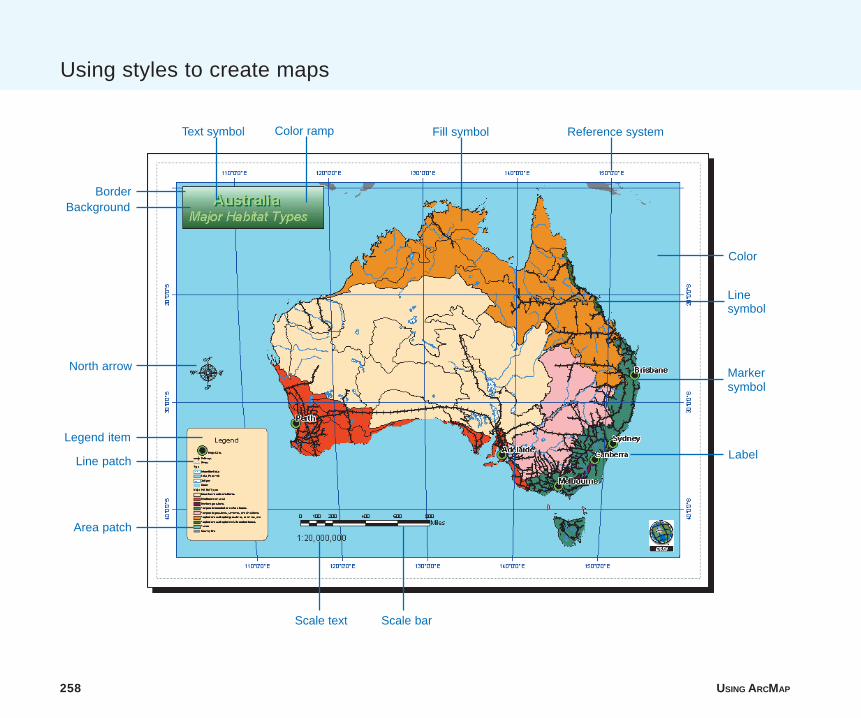
258 USING ARCMAP
Using styles to create maps
Markersymbol
Fill symbol Reference system
Color
Scale bar
Legend item
Area patch
Text symbol
Label
North arrow
Color ramp
Scale text
BorderBackground
Line patch
Linesymbol
ch9.p65 12/05/2000, 11:36 AM258
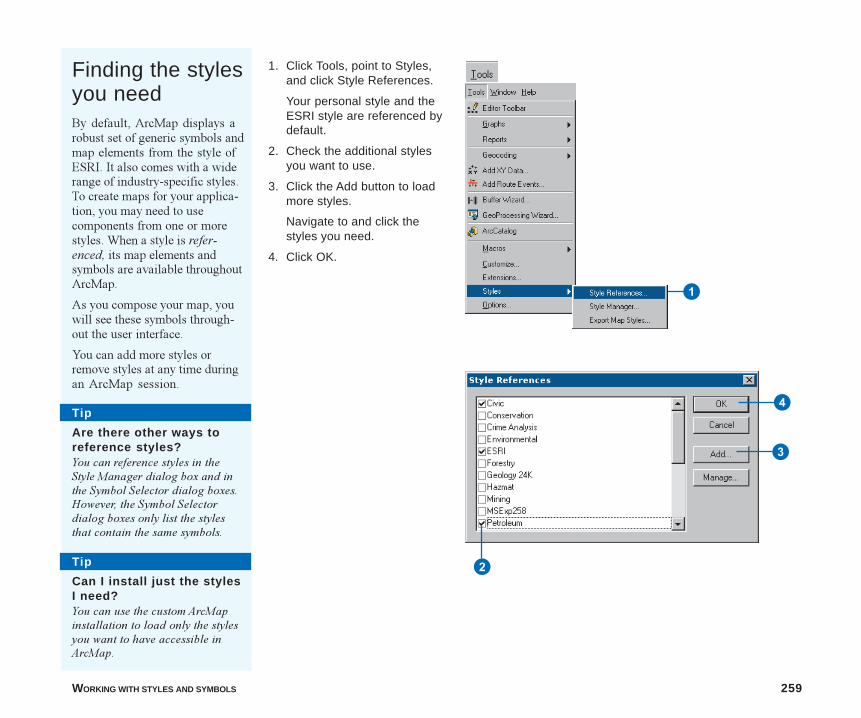
WORKING WITH STYLES AND SYMBOLS 259
Finding the stylesyou needBy default, ArcMap displays arobust set of generic symbols andmap elements from the style ofESRI. It also comes with a widerange of industry-specific styles.To create maps for your applica-tion, you may need to usecomponents from one or morestyles. When a style is refer-enced, its map elements andsymbols are available throughoutArcMap.
As you compose your map, youwill see these symbols through-out the user interface.
You can add more styles orremove styles at any time duringan ArcMap session.
1. Click Tools, point to Styles,and click Style References.
Your personal style and theESRI style are referenced bydefault.
2. Check the additional stylesyou want to use.
3. Click the Add button to loadmore styles.
Navigate to and click thestyles you need.
4. Click OK.
4
1
2
3
Tip
Are there other ways toreference styles?You can reference styles in theStyle Manager dialog box and inthe Symbol Selector dialog boxes.However, the Symbol Selectordialog boxes only list the stylesthat contain the same symbols.
Tip
Can I install just the stylesI need?You can use the custom ArcMapinstallation to load only the stylesyou want to have accessible inArcMap.
ch9.p65 12/05/2000, 11:36 AM259
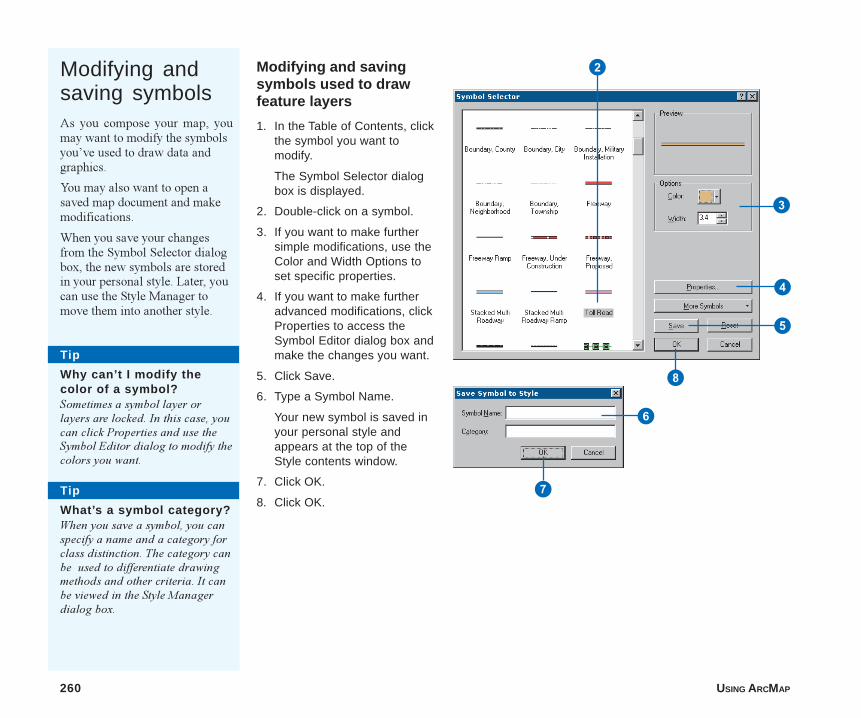
260 USING ARCMAP
Modifying and savingsymbols used to drawfeature layers
1. In the Table of Contents, clickthe symbol you want tomodify.
The Symbol Selector dialogbox is displayed.
2. Double-click on a symbol.
3. If you want to make furthersimple modifications, use theColor and Width Options toset specific properties.
4. If you want to make furtheradvanced modifications, clickProperties to access theSymbol Editor dialog box andmake the changes you want.
5. Click Save.
6. Type a Symbol Name.
Your new symbol is saved inyour personal style andappears at the top of theStyle contents window.
7. Click OK.
8. Click OK.
4
7
2
3
8
5
6
Modifying andsaving symbolsAs you compose your map, youmay want to modify the symbolsyou�ve used to draw data andgraphics.
You may also want to open asaved map document and makemodifications.
When you save your changesfrom the Symbol Selector dialogbox, the new symbols are storedin your personal style. Later, youcan use the Style Manager tomove them into another style.
Tip
Why can’t I modify thecolor of a symbol?Sometimes a symbol layer orlayers are locked. In this case, youcan click Properties and use theSymbol Editor dialog to modify thecolors you want.
Tip
What’s a symbol category?When you save a symbol, you canspecify a name and a category forclass distinction. The category canbe used to differentiate drawingmethods and other criteria. It canbe viewed in the Style Managerdialog box.
ch9.p65 12/05/2000, 11:36 AM260
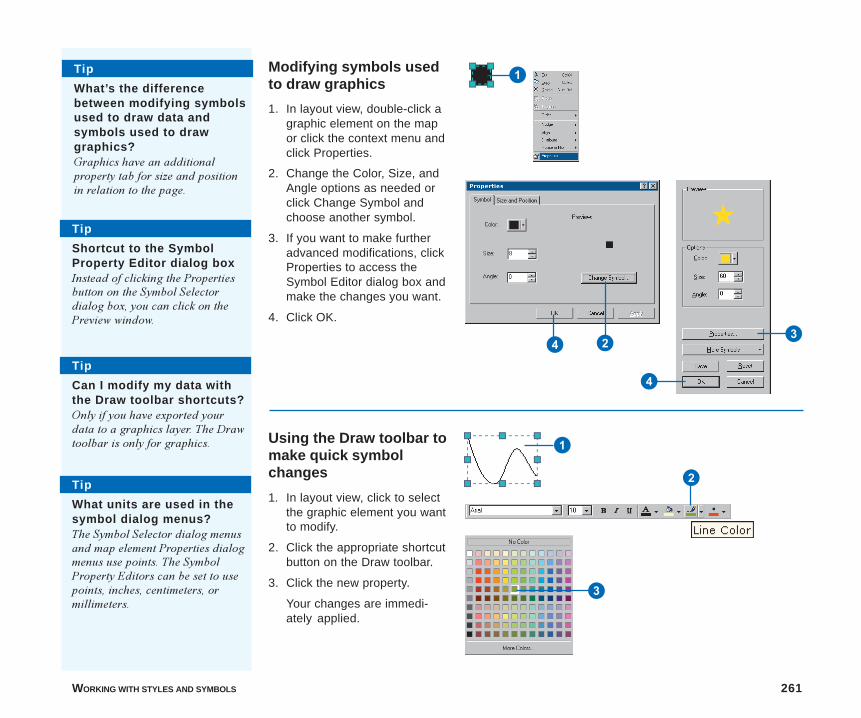
WORKING WITH STYLES AND SYMBOLS 261
Modifying symbols usedto draw graphics
1. In layout view, double-click agraphic element on the mapor click the context menu andclick Properties.
2. Change the Color, Size, andAngle options as needed orclick Change Symbol andchoose another symbol.
3. If you want to make furtheradvanced modifications, clickProperties to access theSymbol Editor dialog box andmake the changes you want.
4. Click OK.
2
3
4
Using the Draw toolbar tomake quick symbolchanges
1. In layout view, click to selectthe graphic element you wantto modify.
2. Click the appropriate shortcutbutton on the Draw toolbar.
3. Click the new property.
Your changes are immedi-ately applied.
1
1
324
Tip
Can I modify my data withthe Draw toolbar shortcuts?Only if you have exported yourdata to a graphics layer. The Drawtoolbar is only for graphics.
Tip
What’s the differencebetween modifying symbolsused to draw data andsymbols used to drawgraphics?Graphics have an additionalproperty tab for size and positionin relation to the page.
Tip
Shortcut to the SymbolProperty Editor dialog boxInstead of clicking the Propertiesbutton on the Symbol Selectordialog box, you can click on thePreview window.
Tip
What units are used in thesymbol dialog menus?The Symbol Selector dialog menusand map element Properties dialogmenus use points. The SymbolProperty Editors can be set to usepoints, inches, centimeters, ormillimeters.
ch9.p65 12/05/2000, 11:36 AM261
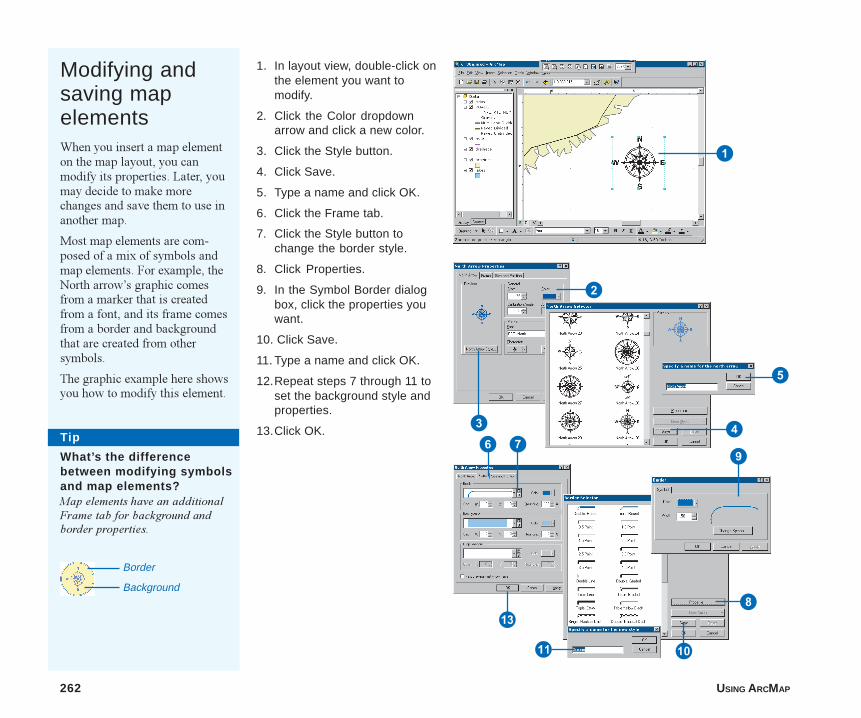
262 USING ARCMAP
Modifying andsaving mapelementsWhen you insert a map elementon the map layout, you canmodify its properties. Later, youmay decide to make morechanges and save them to use inanother map.
Most map elements are com-posed of a mix of symbols andmap elements. For example, theNorth arrow�s graphic comesfrom a marker that is createdfrom a font, and its frame comesfrom a border and backgroundthat are created from othersymbols.
The graphic example here showsyou how to modify this element.
1. In layout view, double-click onthe element you want tomodify.
2. Click the Color dropdownarrow and click a new color.
3. Click the Style button.
4. Click Save.
5. Type a name and click OK.
6. Click the Frame tab.
7. Click the Style button tochange the border style.
8. Click Properties.
9. In the Symbol Border dialogbox, click the properties youwant.
10. Click Save.
11. Type a name and click OK.
12.Repeat steps 7 through 11 toset the background style andproperties.
13.Click OK.Tip
What’s the differencebetween modifying symbolsand map elements?Map elements have an additionalFrame tab for background andborder properties.
Border
Background
1
2
5
6 7
8R
W
9
3 4
Q
ch9.p65 12/05/2000, 11:38 AM262
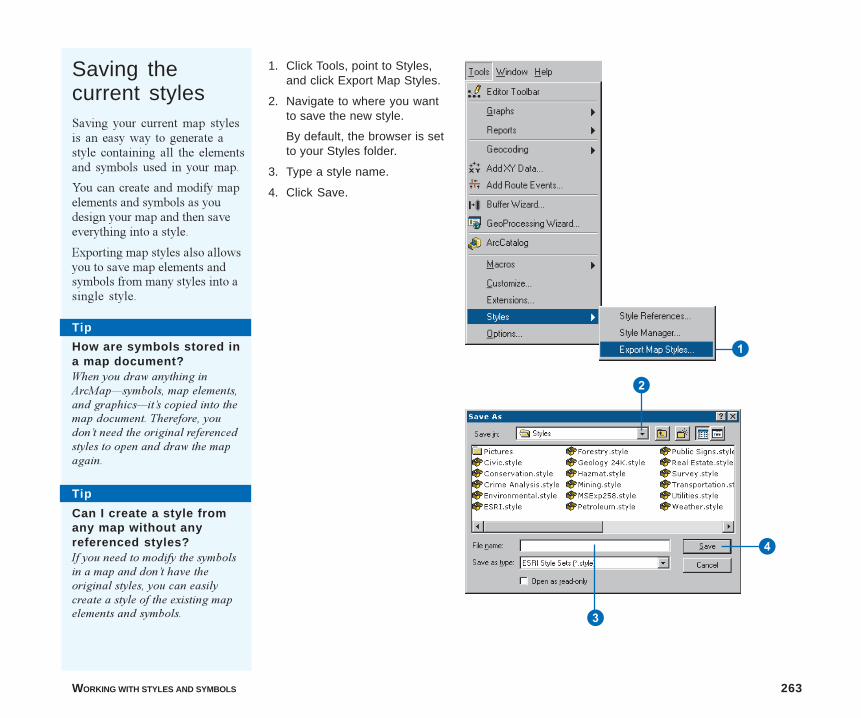
WORKING WITH STYLES AND SYMBOLS 263
Saving thecurrent stylesSaving your current map stylesis an easy way to generate astyle containing all the elementsand symbols used in your map.
You can create and modify mapelements and symbols as youdesign your map and then saveeverything into a style.
Exporting map styles also allowsyou to save map elements andsymbols from many styles into asingle style.
1. Click Tools, point to Styles,and click Export Map Styles.
2. Navigate to where you wantto save the new style.
By default, the browser is setto your Styles folder.
3. Type a style name.
4. Click Save.
2
3
1
4
Tip
Can I create a style fromany map without anyreferenced styles?If you need to modify the symbolsin a map and don�t have theoriginal styles, you can easilycreate a style of the existing mapelements and symbols.
Tip
How are symbols stored ina map document?When you draw anything inArcMap�symbols, map elements,and graphics�it�s copied into themap document. Therefore, youdon�t need the original referencedstyles to open and draw the mapagain.
ch9.p65 12/05/2000, 11:38 AM263
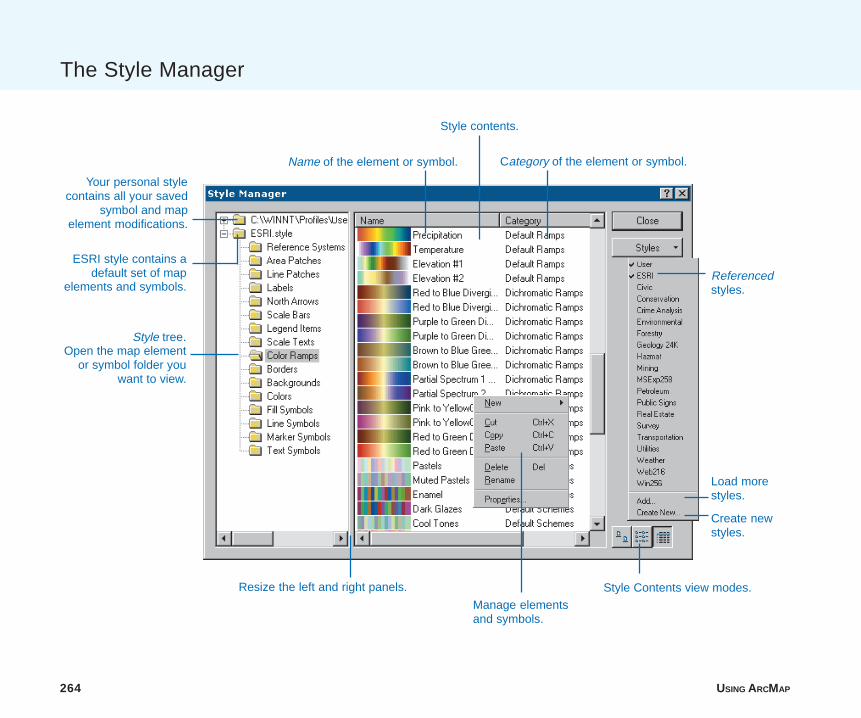
264 USING ARCMAP
The Style Manager
Style tree.Open the map element
or symbol folder youwant to view.
Name of the element or symbol. Category of the element or symbol.
Style Contents view modes.
Your personal stylecontains all your saved
symbol and mapelement modifications.
Referencedstyles.
ESRI style contains adefault set of map
elements and symbols.
Manage elementsand symbols.
Load morestyles.
Create newstyles.
Resize the left and right panels.
Style contents.
ch9.p65 12/05/2000, 11:39 AM264

WORKING WITH STYLES AND SYMBOLS 265
Organizing stylecontentsThe Style Manager dialog boxlets you organize styles and theircontents�symbols and mapelements. You can cut, copy,paste, rename, and modify anystyle contents. You can alsocreate new styles, symbols, andmap elements.
You can create a new style andcopy in your personal stylecontents as well as symbols andmap elements from other existingstyles.
You may want to customize someof the ArcMap-provided styles bydeleting the symbols and mapelements you don�t need.
You can easily distinguish whichstyle folders contain mapelements and symbols, which canbe modified, and which areempty.
Read/WriteRead onlyEmpty
Creating a new style
1. Click Tools, point to Styles,and click Style Manager.
2. Click Styles and click CreateNew.
3. Navigate to the Styles folder.
4. Type the name for the newstyle you’re creating.
5. Click Save.
23
4
5
1
ch9.p65 12/05/2000, 11:39 AM265
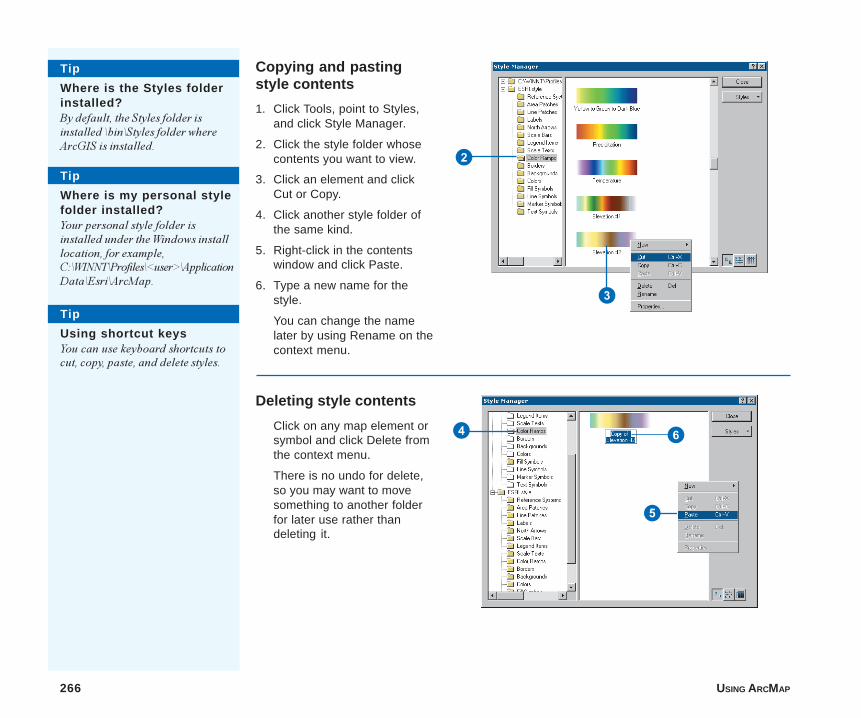
266 USING ARCMAP
Tip
Where is the Styles folderinstalled?By default, the Styles folder isinstalled \bin\Styles folder whereArcGIS is installed.
Tip
Where is my personal stylefolder installed?Your personal style folder isinstalled under the Windows installlocation, for example,C:\WINNT\Profiles\<user>\ApplicationData\Esri\ArcMap.
Copying and pastingstyle contents
1. Click Tools, point to Styles,and click Style Manager.
2. Click the style folder whosecontents you want to view.
3. Click an element and clickCut or Copy.
4. Click another style folder ofthe same kind.
5. Right-click in the contentswindow and click Paste.
6. Type a new name for thestyle.
You can change the namelater by using Rename on thecontext menu.
Deleting style contents
Click on any map element orsymbol and click Delete fromthe context menu.
There is no undo for delete,so you may want to movesomething to another folderfor later use rather thandeleting it.
Tip
Using shortcut keysYou can use keyboard shortcuts tocut, copy, paste, and delete styles.
4 6
3
5
2
ch9.p65 12/05/2000, 11:39 AM266
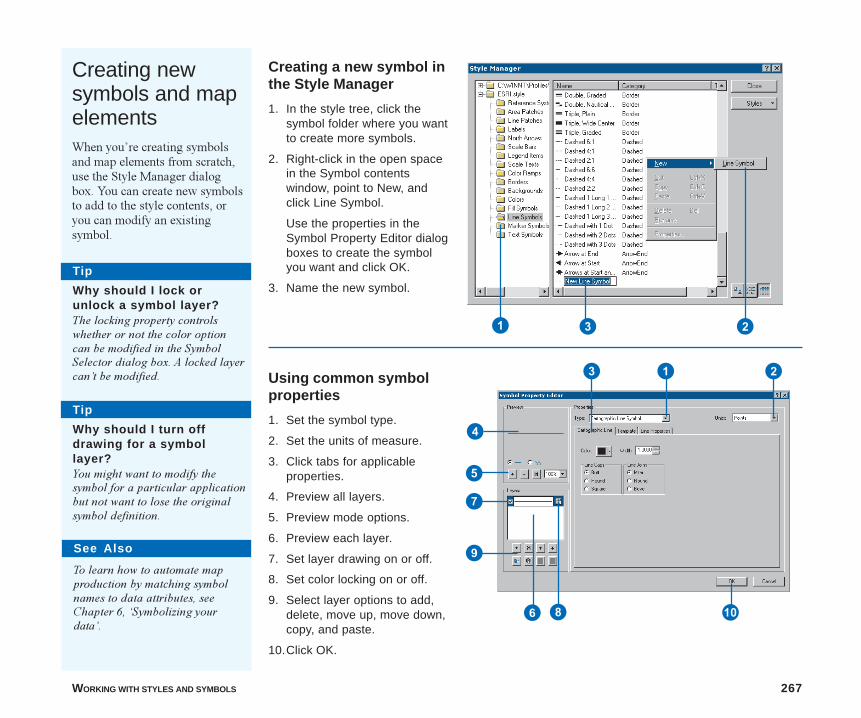
WORKING WITH STYLES AND SYMBOLS 267
Creating newsymbols and mapelementsWhen you�re creating symbolsand map elements from scratch,use the Style Manager dialogbox. You can create new symbolsto add to the style contents, oryou can modify an existingsymbol.
Creating a new symbol inthe Style Manager
1. In the style tree, click thesymbol folder where you wantto create more symbols.
2. Right-click in the open spacein the Symbol contentswindow, point to New, andclick Line Symbol.
Use the properties in theSymbol Property Editor dialogboxes to create the symbolyou want and click OK.
3. Name the new symbol.
3
4
5
7
8 Q
9
1 2
1 23
6
Tip
Why should I lock orunlock a symbol layer?The locking property controlswhether or not the color optioncan be modified in the SymbolSelector dialog box. A locked layercan�t be modified.
Tip
Why should I turn offdrawing for a symbollayer?You might want to modify thesymbol for a particular applicationbut not want to lose the originalsymbol definition.
Using common symbolproperties
1. Set the symbol type.
2. Set the units of measure.
3. Click tabs for applicableproperties.
4. Preview all layers.
5. Preview mode options.
6. Preview each layer.
7. Set layer drawing on or off.
8. Set color locking on or off.
9. Select layer options to add,delete, move up, move down,copy, and paste.
10.Click OK.
See Also
To learn how to automate mapproduction by matching symbolnames to data attributes, seeChapter 6, �Symbolizing yourdata�.
ch9.p65 12/05/2000, 11:39 AM267
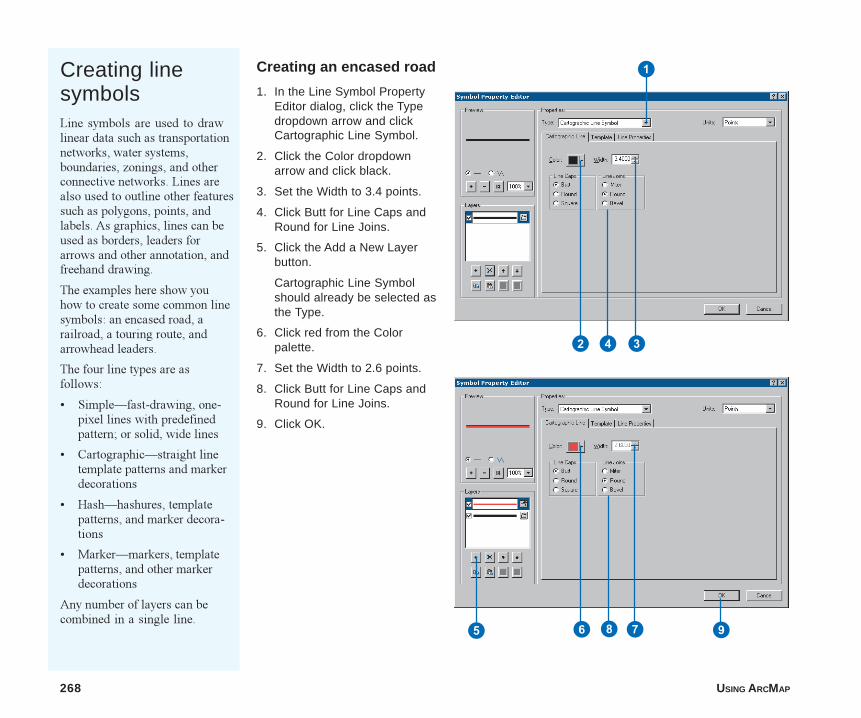
268 USING ARCMAP
Creating an encased road
1. In the Line Symbol PropertyEditor dialog, click the Typedropdown arrow and clickCartographic Line Symbol.
2. Click the Color dropdownarrow and click black.
3. Set the Width to 3.4 points.
4. Click Butt for Line Caps andRound for Line Joins.
5. Click the Add a New Layerbutton.
Cartographic Line Symbolshould already be selected asthe Type.
6. Click red from the Colorpalette.
7. Set the Width to 2.6 points.
8. Click Butt for Line Caps andRound for Line Joins.
9. Click OK.
1
4
5 9
Creating linesymbolsLine symbols are used to drawlinear data such as transportationnetworks, water systems,boundaries, zonings, and otherconnective networks. Lines arealso used to outline other featuressuch as polygons, points, andlabels. As graphics, lines can beused as borders, leaders forarrows and other annotation, andfreehand drawing.
The examples here show youhow to create some common linesymbols: an encased road, arailroad, a touring route, andarrowhead leaders.
The four line types are asfollows:
� Simple�fast-drawing, one-pixel lines with predefinedpattern; or solid, wide lines
� Cartographic�straight linetemplate patterns and markerdecorations
� Hash�hashures, templatepatterns, and marker decora-tions
� Marker�markers, templatepatterns, and other markerdecorations
Any number of layers can becombined in a single line.
2 3
86 7
ch9.p65 12/05/2000, 11:39 AM268
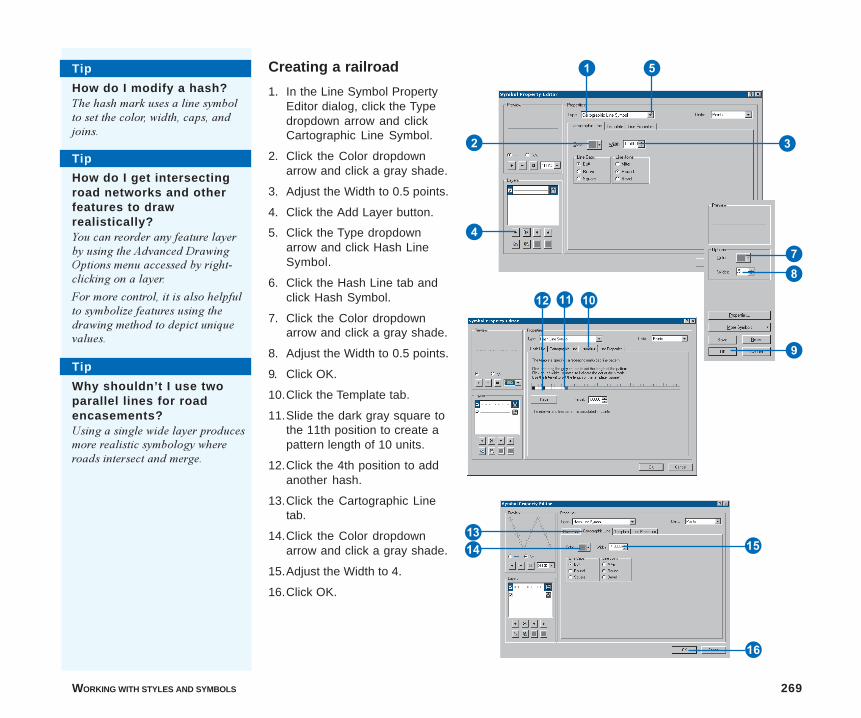
WORKING WITH STYLES AND SYMBOLS 269
1
2 3
4
5
78
E QW
9
Creating a railroad
1. In the Line Symbol PropertyEditor dialog, click the Typedropdown arrow and clickCartographic Line Symbol.
2. Click the Color dropdownarrow and click a gray shade.
3. Adjust the Width to 0.5 points.
4. Click the Add Layer button.
5. Click the Type dropdownarrow and click Hash LineSymbol.
6. Click the Hash Line tab andclick Hash Symbol.
7. Click the Color dropdownarrow and click a gray shade.
8. Adjust the Width to 0.5 points.
9. Click OK.
10.Click the Template tab.
11.Slide the dark gray square tothe 11th position to create apattern length of 10 units.
12.Click the 4th position to addanother hash.
13.Click the Cartographic Linetab.
14.Click the Color dropdownarrow and click a gray shade.
15.Adjust the Width to 4.
16.Click OK.
Tip
How do I get intersectingroad networks and otherfeatures to drawrealistically?You can reorder any feature layerby using the Advanced DrawingOptions menu accessed by right-clicking on a layer.
For more control, it is also helpfulto symbolize features using thedrawing method to depict uniquevalues.
Y
U
Tip
How do I modify a hash?The hash mark uses a line symbolto set the color, width, caps, andjoins.
Tip
Why shouldn’t I use twoparallel lines for roadencasements?Using a single wide layer producesmore realistic symbology whereroads intersect and merge.
RT
ch9.p65 12/05/2000, 11:40 AM269
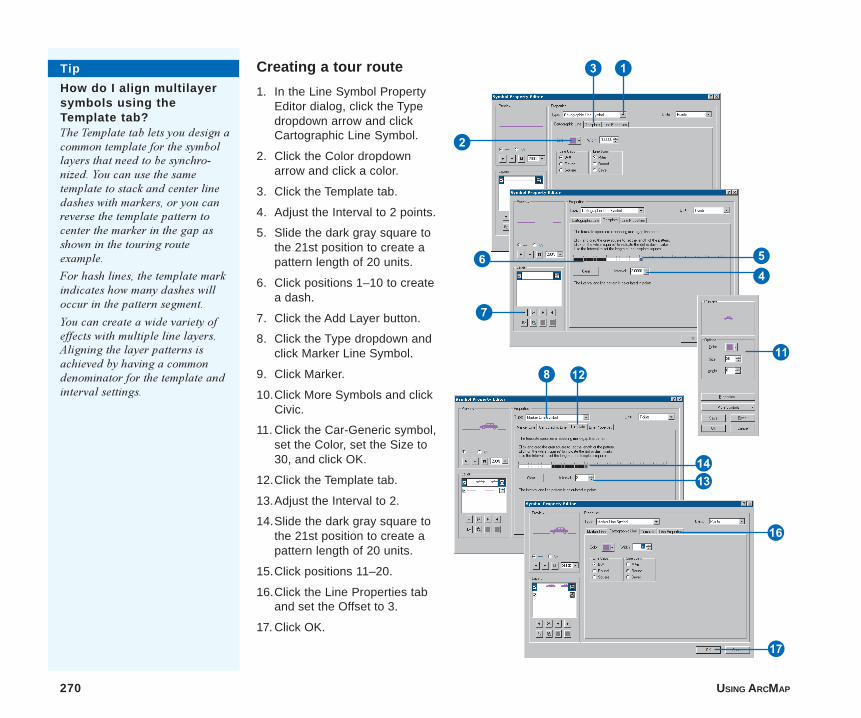
270 USING ARCMAP
Creating a tour route
1. In the Line Symbol PropertyEditor dialog, click the Typedropdown arrow and clickCartographic Line Symbol.
2. Click the Color dropdownarrow and click a color.
3. Click the Template tab.
4. Adjust the Interval to 2 points.
5. Slide the dark gray square tothe 21st position to create apattern length of 20 units.
6. Click positions 1–10 to createa dash.
7. Click the Add Layer button.
8. Click the Type dropdown andclick Marker Line Symbol.
9. Click Marker.
10.Click More Symbols and clickCivic.
11. Click the Car-Generic symbol,set the Color, set the Size to30, and click OK.
12.Click the Template tab.
13.Adjust the Interval to 2.
14.Slide the dark gray square tothe 21st position to create apattern length of 20 units.
15.Click positions 11–20.
16.Click the Line Properties taband set the Offset to 3.
17. Click OK.
1
2
3
54
7
W
Tip
How do I align multilayersymbols using theTemplate tab?The Template tab lets you design acommon template for the symbollayers that need to be synchro-nized. You can use the sametemplate to stack and center linedashes with markers, or you canreverse the template pattern tocenter the marker in the gap asshown in the touring routeexample.
For hash lines, the template markindicates how many dashes willoccur in the pattern segment.
You can create a wide variety ofeffects with multiple line layers.Aligning the layer patterns isachieved by having a commondenominator for the template andinterval settings.
6
E
RT
U
I
8
ch9.p65 12/05/2000, 11:40 AM270
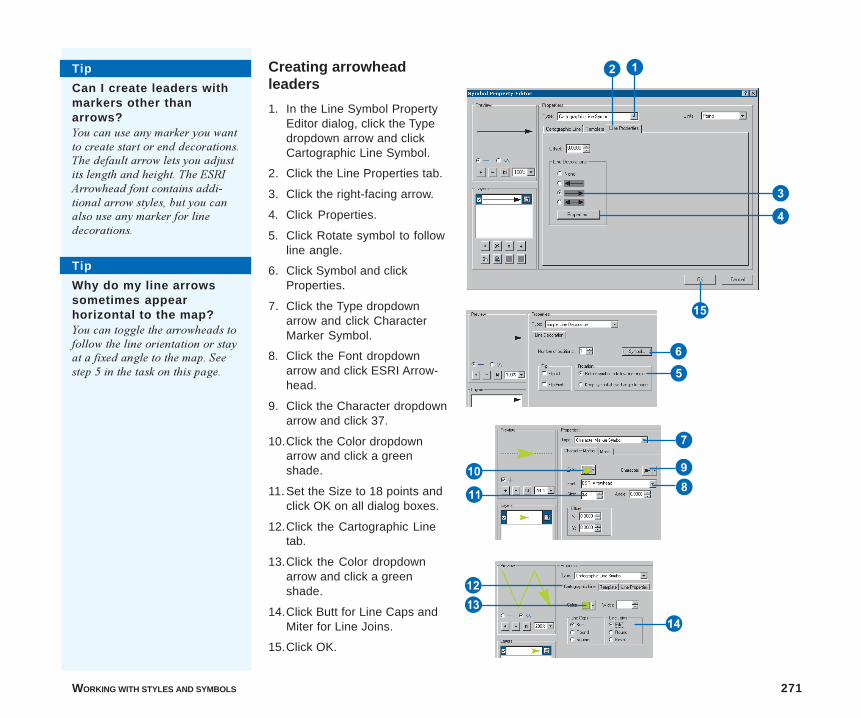
WORKING WITH STYLES AND SYMBOLS 271
4
T
E
Q
W
Creating arrowheadleaders
1. In the Line Symbol PropertyEditor dialog, click the Typedropdown arrow and clickCartographic Line Symbol.
2. Click the Line Properties tab.
3. Click the right-facing arrow.
4. Click Properties.
5. Click Rotate symbol to followline angle.
6. Click Symbol and clickProperties.
7. Click the Type dropdownarrow and click CharacterMarker Symbol.
8. Click the Font dropdownarrow and click ESRI Arrow-head.
9. Click the Character dropdownarrow and click 37.
10.Click the Color dropdownarrow and click a greenshade.
11.Set the Size to 18 points andclick OK on all dialog boxes.
12.Click the Cartographic Linetab.
13.Click the Color dropdownarrow and click a greenshade.
14.Click Butt for Line Caps andMiter for Line Joins.
15.Click OK.
1
3
5
6
7
98
Y
Tip
Can I create leaders withmarkers other thanarrows?You can use any marker you wantto create start or end decorations.The default arrow lets you adjustits length and height. The ESRIArrowhead font contains addi-tional arrow styles, but you canalso use any marker for linedecorations.
Tip
Why do my line arrowssometimes appearhorizontal to the map?You can toggle the arrowheads tofollow the line orientation or stayat a fixed angle to the map. Seestep 5 in the task on this page.
2
R
ch9.p65 12/05/2000, 11:40 AM271
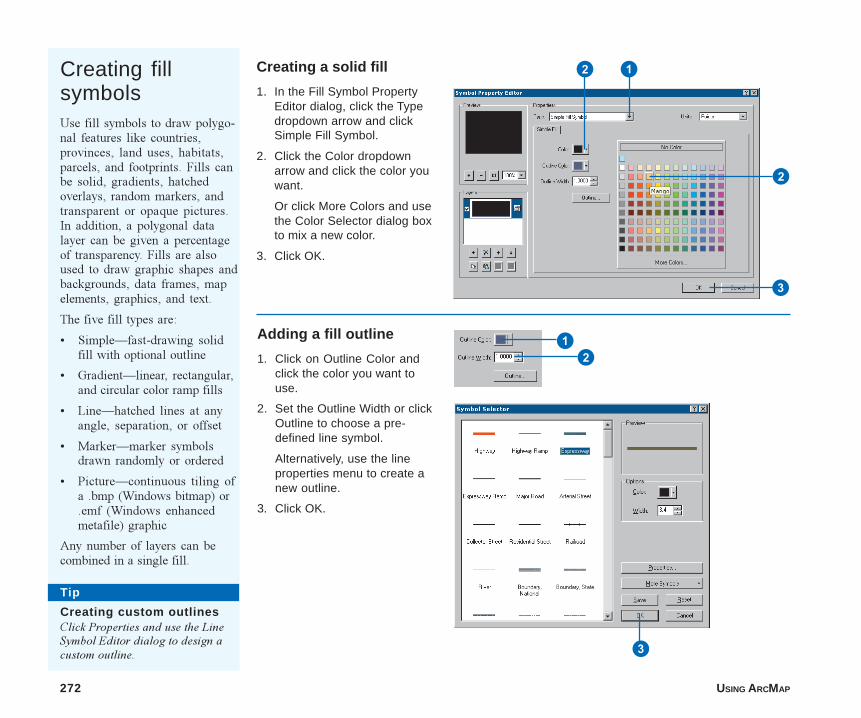
272 USING ARCMAP
Creating a solid fill
1. In the Fill Symbol PropertyEditor dialog, click the Typedropdown arrow and clickSimple Fill Symbol.
2. Click the Color dropdownarrow and click the color youwant.
Or click More Colors and usethe Color Selector dialog boxto mix a new color.
3. Click OK.
12
2
3
12
3
Creating fillsymbolsUse fill symbols to draw polygo-nal features like countries,provinces, land uses, habitats,parcels, and footprints. Fills canbe solid, gradients, hatchedoverlays, random markers, andtransparent or opaque pictures.In addition, a polygonal datalayer can be given a percentageof transparency. Fills are alsoused to draw graphic shapes andbackgrounds, data frames, mapelements, graphics, and text.
The five fill types are:
� Simple�fast-drawing solidfill with optional outline
� Gradient�linear, rectangular,and circular color ramp fills
� Line�hatched lines at anyangle, separation, or offset
� Marker�marker symbolsdrawn randomly or ordered
� Picture�continuous tiling ofa .bmp (Windows bitmap) or.emf (Windows enhancedmetafile) graphic
Any number of layers can becombined in a single fill.
Adding a fill outline
1. Click on Outline Color andclick the color you want touse.
2. Set the Outline Width or clickOutline to choose a pre-defined line symbol.
Alternatively, use the lineproperties menu to create anew outline.
3. Click OK.
Tip
Creating custom outlinesClick Properties and use the LineSymbol Editor dialog to design acustom outline.
ch9.p65 12/05/2000, 11:41 AM272
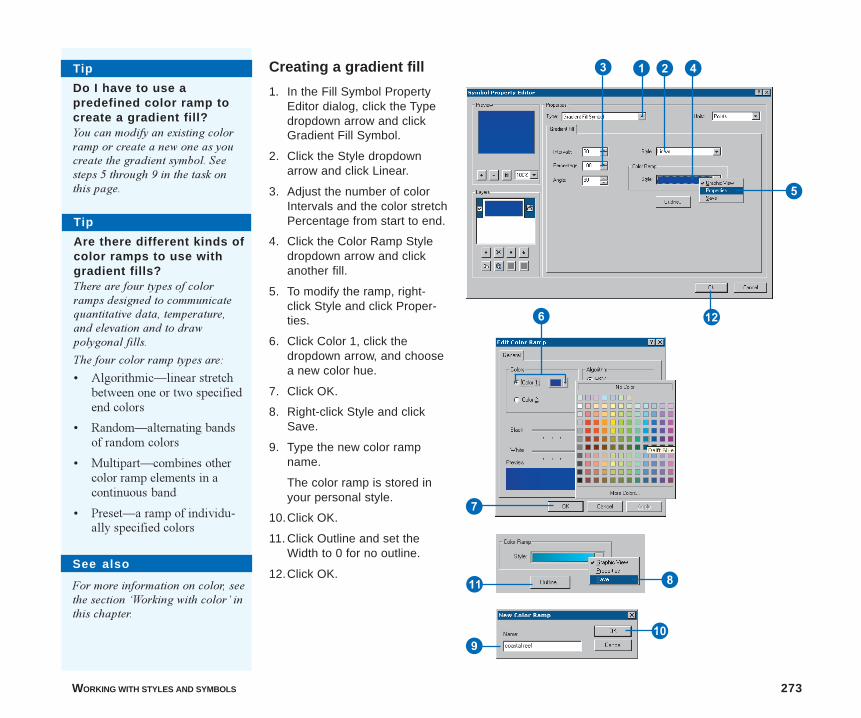
WORKING WITH STYLES AND SYMBOLS 273
E
W
Q
Creating a gradient fill
1. In the Fill Symbol PropertyEditor dialog, click the Typedropdown arrow and clickGradient Fill Symbol.
2. Click the Style dropdownarrow and click Linear.
3. Adjust the number of colorIntervals and the color stretchPercentage from start to end.
4. Click the Color Ramp Styledropdown arrow and clickanother fill.
5. To modify the ramp, right-click Style and click Proper-ties.
6. Click Color 1, click thedropdown arrow, and choosea new color hue.
7. Click OK.
8. Right-click Style and clickSave.
9. Type the new color rampname.
The color ramp is stored inyour personal style.
10.Click OK.
11. Click Outline and set theWidth to 0 for no outline.
12.Click OK.
13
5
4
7
9
2Tip
Do I have to use apredefined color ramp tocreate a gradient fill?You can modify an existing colorramp or create a new one as youcreate the gradient symbol. Seesteps 5 through 9 in the task onthis page.
Tip
Are there different kinds ofcolor ramps to use withgradient fills?There are four types of colorramps designed to communicatequantitative data, temperature,and elevation and to drawpolygonal fills.
The four color ramp types are:
� Algorithmic�linear stretchbetween one or two specifiedend colors
� Random�alternating bandsof random colors
� Multipart�combines othercolor ramp elements in acontinuous band
� Preset�a ramp of individu-ally specified colors
See also
For more information on color, seethe section �Working with color� inthis chapter.
6
8
ch9.p65 12/05/2000, 11:41 AM273
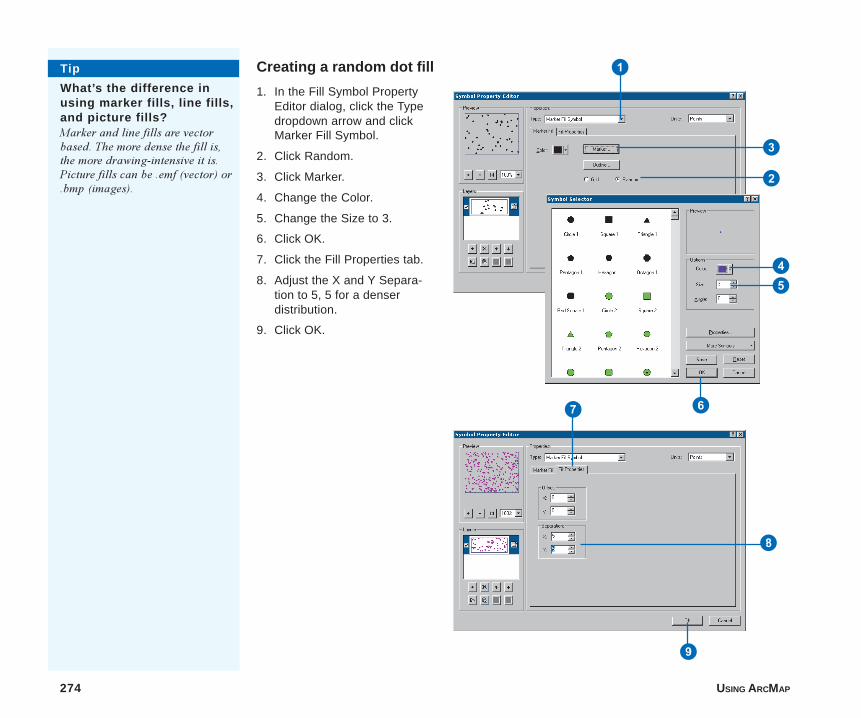
274 USING ARCMAP
Creating a random dot fill
1. In the Fill Symbol PropertyEditor dialog, click the Typedropdown arrow and clickMarker Fill Symbol.
2. Click Random.
3. Click Marker.
4. Change the Color.
5. Change the Size to 3.
6. Click OK.
7. Click the Fill Properties tab.
8. Adjust the X and Y Separa-tion to 5, 5 for a denserdistribution.
9. Click OK.
1
3
2
45
67
8
9
Tip
What’s the difference inusing marker fills, line fills,and picture fills?Marker and line fills are vectorbased. The more dense the fill is,the more drawing-intensive it is.Picture fills can be .emf (vector) or.bmp (images).
ch9.p65 12/05/2000, 11:42 AM274

WORKING WITH STYLES AND SYMBOLS 275
U
EQ
I
R
Y
W
Creating an overlay fill
1. In the Fill Symbol PropertyEditor dialog, click the Typedropdown arrow and clickLine Fill Symbol.
2. Click the Units dropdownarrow and click Inches.
3. Click Line and click Proper-ties.
4. Click the Units dropdownarrow and click Inches.
5. Click the Color dropdownarrow and click an orangeshade.
6. Set the Width to 0.05.
7. Click OK twice.
8. Adjust the Angle to 45.
9. Set the Separation to 0.1.
10.Click Outline and set it to 0.Click OK.
11.Click the Add Layer button.
12.Repeat steps 3 through 5.Set the Width to 0.01. ClickOK twice.
13.Adjust the Angle to 45.
14.Set the Offset to 0.12.
15.Set the Separation to 0.1.
16.Click Outline and set it to 0.Click OK.
17.Click OK.
1 2
4
5
6
7
8
9
Tip
Is there more than one wayto create a transparentoverlay fill?You can create a hatched line fillwith alternating opaque andtransparent hatches. You can alsoset the entire feature layer to apercentage of transparency.Combining these can achieve avariety of effects.
3
Tip
Can I mix symbols withdifferent units in the samestyle?You can use any units you prefer.
T
ch9.p65 12/05/2000, 11:42 AM275
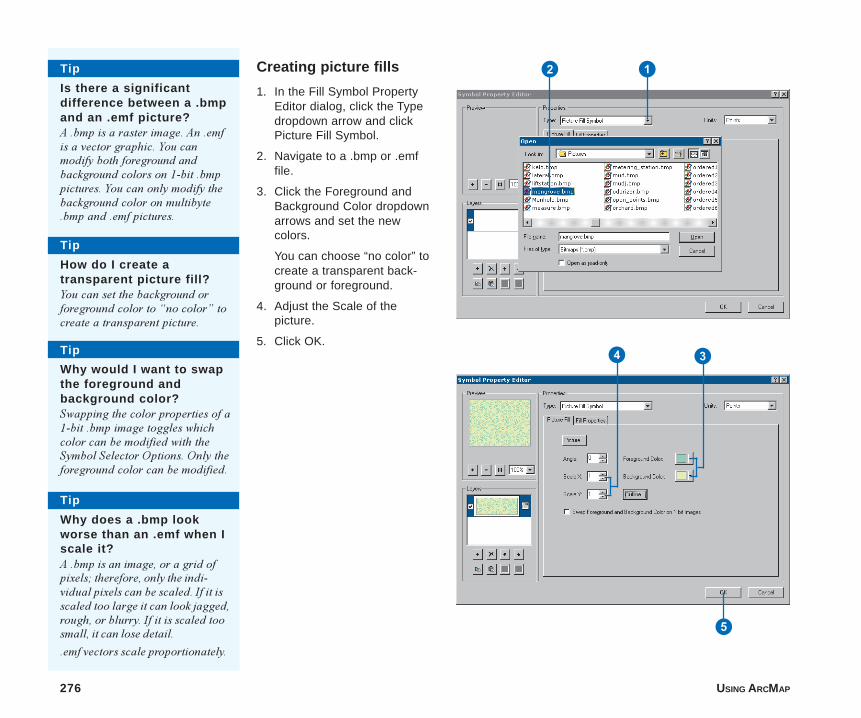
276 USING ARCMAP
2
3
5
Creating picture fills
1. In the Fill Symbol PropertyEditor dialog, click the Typedropdown arrow and clickPicture Fill Symbol.
2. Navigate to a .bmp or .emffile.
3. Click the Foreground andBackground Color dropdownarrows and set the newcolors.
You can choose “no color” tocreate a transparent back-ground or foreground.
4. Adjust the Scale of thepicture.
5. Click OK.
1
4
Tip
How do I create atransparent picture fill?You can set the background orforeground color to �no color� tocreate a transparent picture.
Tip
Why would I want to swapthe foreground andbackground color?Swapping the color properties of a1-bit .bmp image toggles whichcolor can be modified with theSymbol Selector Options. Only theforeground color can be modified.
Tip
Why does a .bmp lookworse than an .emf when Iscale it?A .bmp is an image, or a grid ofpixels; therefore, only the indi-vidual pixels can be scaled. If it isscaled too large it can look jagged,rough, or blurry. If it is scaled toosmall, it can lose detail.
.emf vectors scale proportionately.
Tip
Is there a significantdifference between a .bmpand an .emf picture?A .bmp is a raster image. An .emfis a vector graphic. You canmodify both foreground andbackground colors on 1-bit .bmppictures. You can only modify thebackground color on multibyte.bmp and .emf pictures.
ch9.p65 12/05/2000, 11:42 AM276
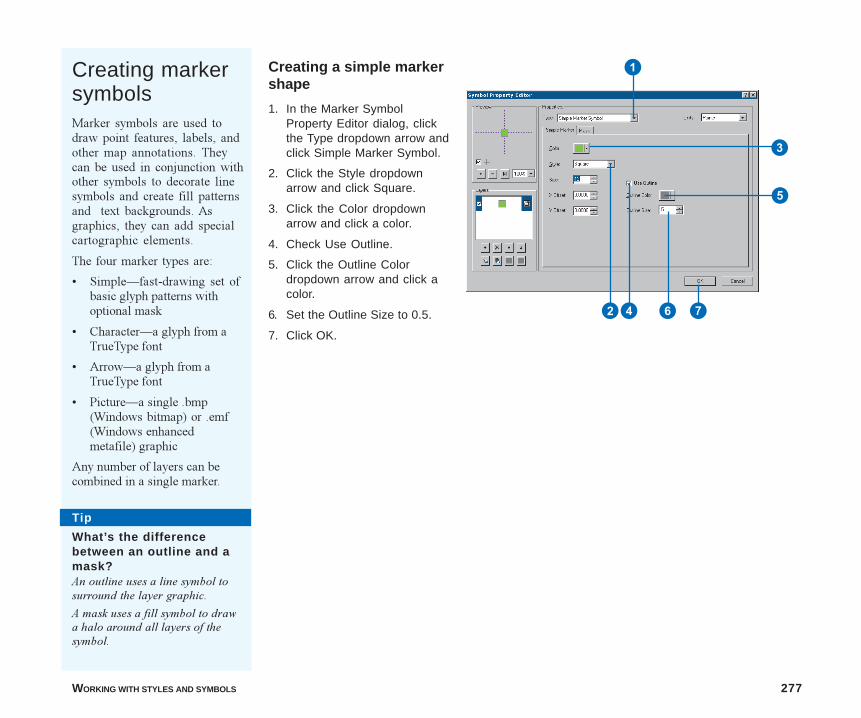
WORKING WITH STYLES AND SYMBOLS 277
Creating a simple markershape
1. In the Marker SymbolProperty Editor dialog, clickthe Type dropdown arrow andclick Simple Marker Symbol.
2. Click the Style dropdownarrow and click Square.
3. Click the Color dropdownarrow and click a color.
4. Check Use Outline.
5. Click the Outline Colordropdown arrow and click acolor.
6. Set the Outline Size to 0.5.
7. Click OK.
1
3
5
Creating markersymbolsMarker symbols are used todraw point features, labels, andother map annotations. Theycan be used in conjunction withother symbols to decorate linesymbols and create fill patternsand text backgrounds. Asgraphics, they can add specialcartographic elements.
The four marker types are:
� Simple�fast-drawing set ofbasic glyph patterns withoptional mask
� Character�a glyph from aTrueType font
� Arrow�a glyph from aTrueType font
� Picture�a single .bmp(Windows bitmap) or .emf(Windows enhancedmetafile) graphic
Any number of layers can becombined in a single marker.
74
Tip
What’s the differencebetween an outline and amask?An outline uses a line symbol tosurround the layer graphic.
A mask uses a fill symbol to drawa halo around all layers of thesymbol.
2 6
ch9.p65 12/05/2000, 11:42 AM277
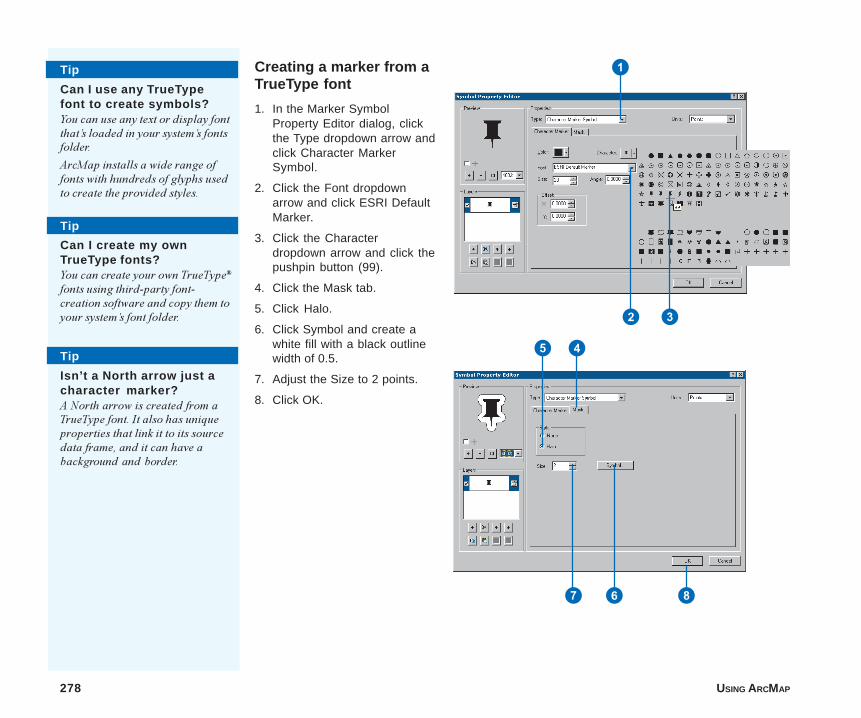
278 USING ARCMAP
1
2 3
45
67 8
Creating a marker from aTrueType font
1. In the Marker SymbolProperty Editor dialog, clickthe Type dropdown arrow andclick Character MarkerSymbol.
2. Click the Font dropdownarrow and click ESRI DefaultMarker.
3. Click the Characterdropdown arrow and click thepushpin button (99).
4. Click the Mask tab.
5. Click Halo.
6. Click Symbol and create awhite fill with a black outlinewidth of 0.5.
7. Adjust the Size to 2 points.
8. Click OK.
Tip
Can I use any TrueTypefont to create symbols?You can use any text or display fontthat�s loaded in your system�s fontsfolder.
ArcMap installs a wide range offonts with hundreds of glyphs usedto create the provided styles.
Tip
Can I create my ownTrueType fonts?You can create your own TrueType®
fonts using third-party font-creation software and copy them toyour system�s font folder.
Tip
Isn’t a North arrow just acharacter marker?A North arrow is created from aTrueType font. It also has uniqueproperties that link it to its sourcedata frame, and it can have abackground and border.
ch9.p65 12/05/2000, 11:42 AM278
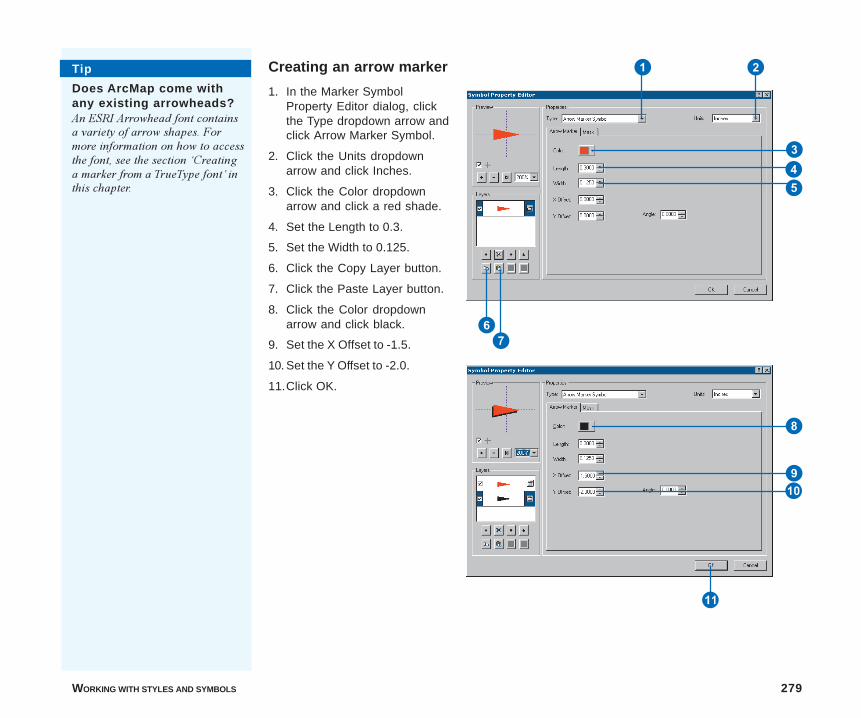
WORKING WITH STYLES AND SYMBOLS 279
W
8
Q
1 2
3
6
9
Creating an arrow marker
1. In the Marker SymbolProperty Editor dialog, clickthe Type dropdown arrow andclick Arrow Marker Symbol.
2. Click the Units dropdownarrow and click Inches.
3. Click the Color dropdownarrow and click a red shade.
4. Set the Length to 0.3.
5. Set the Width to 0.125.
6. Click the Copy Layer button.
7. Click the Paste Layer button.
8. Click the Color dropdownarrow and click black.
9. Set the X Offset to -1.5.
10. Set the Y Offset to -2.0.
11.Click OK.
45
7
Tip
Does ArcMap come withany existing arrowheads?An ESRI Arrowhead font containsa variety of arrow shapes. Formore information on how to accessthe font, see the section �Creatinga marker from a TrueType font� inthis chapter.
ch9.p65 12/05/2000, 11:42 AM279
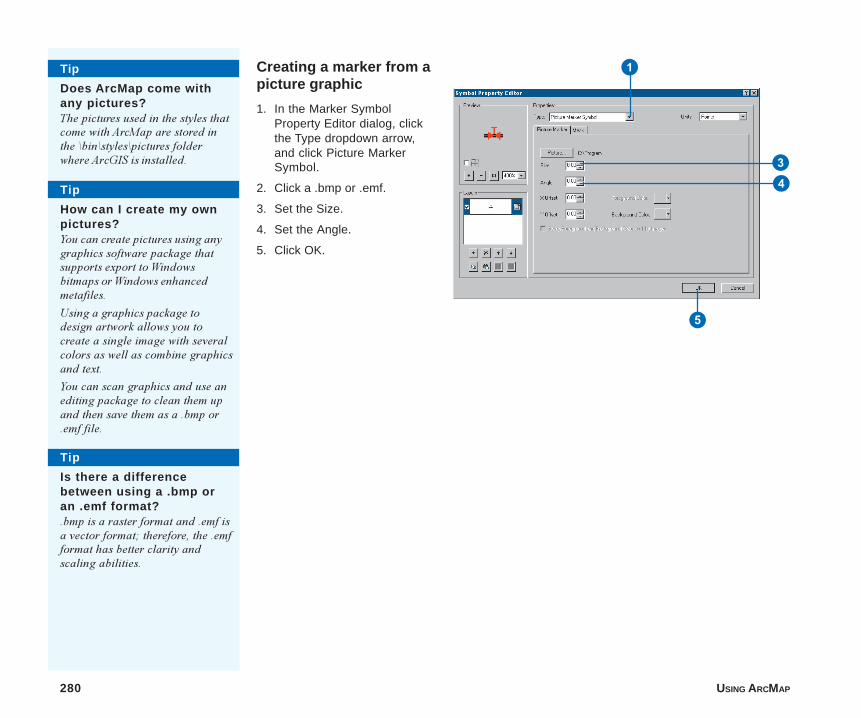
280 USING ARCMAP
1
3
5
4
Creating a marker from apicture graphic
1. In the Marker SymbolProperty Editor dialog, clickthe Type dropdown arrow,and click Picture MarkerSymbol.
2. Click a .bmp or .emf.
3. Set the Size.
4. Set the Angle.
5. Click OK.
Tip
Does ArcMap come withany pictures?The pictures used in the styles thatcome with ArcMap are stored inthe \bin\styles\pictures folderwhere ArcGIS is installed.
Tip
How can I create my ownpictures?You can create pictures using anygraphics software package thatsupports export to Windowsbitmaps or Windows enhancedmetafiles.
Using a graphics package todesign artwork allows you tocreate a single image with severalcolors as well as combine graphicsand text.
You can scan graphics and use anediting package to clean them upand then save them as a .bmp or.emf file.
Tip
Is there a differencebetween using a .bmp oran .emf format?.bmp is a raster format and .emf isa vector format; therefore, the .emfformat has better clarity andscaling abilities.
ch9.p65 12/05/2000, 11:42 AM280

WORKING WITH STYLES AND SYMBOLS 281
2
2
4
5
6
7
8
Creating textbackgrounds
1. In the Text Symbol PropertyEditor dialog, click theGeneral tab.
2. Click the Font dropdownarrow and choose a Font,Font style, and Size and clickOK.
3. Set the Vertical and Horizon-tal Alignment.
4. Click the Advanced Text tab.
5. Check Text Background andclick Properties.
6. Click the rounded styleballoon callout.
7. Set the Right and LeftMargins.
8. Click OK in all dialog boxes.
Creating textsymbolsText symbols are used to drawlabels and annotation thatidentify and add meaning to yourdata. Text is also used for titles,descriptions, callouts, legends,scale bars, graticule labels,tables, and other textual andtabular information conveyed onyour map.
You can create simple textsymbols or add advancedformatting, backgrounds, fills,shadows, and halos.
Text symbols consist of a singlelayer.
Tip
What’s the differencebetween text and labels?Text describes the font, style,formatting, and effects. Labels aredrawn with text symbols and haveadditional properties for place-ment and conflict detection.
3
ch9.p65 12/05/2000, 11:43 AM281
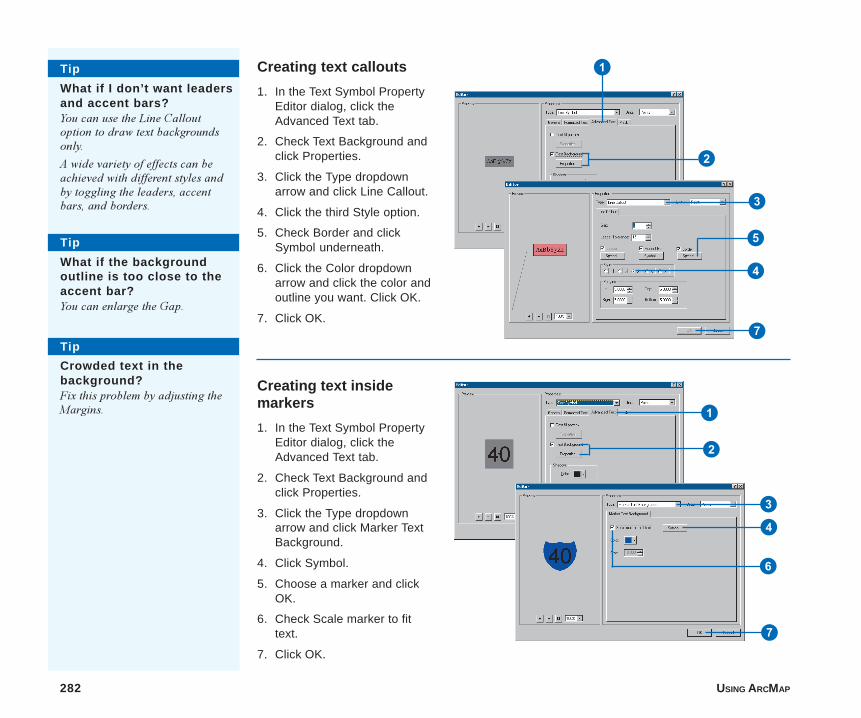
282 USING ARCMAP
Creating text callouts
1. In the Text Symbol PropertyEditor dialog, click theAdvanced Text tab.
2. Check Text Background andclick Properties.
3. Click the Type dropdownarrow and click Line Callout.
4. Click the third Style option.
5. Check Border and clickSymbol underneath.
6. Click the Color dropdownarrow and click the color andoutline you want. Click OK.
7. Click OK.
Creating text insidemarkers
1. In the Text Symbol PropertyEditor dialog, click theAdvanced Text tab.
2. Check Text Background andclick Properties.
3. Click the Type dropdownarrow and click Marker TextBackground.
4. Click Symbol.
5. Choose a marker and clickOK.
6. Check Scale marker to fittext.
7. Click OK.
1
2
3
5
7
3
4
1
2
4
6
7
Tip
What if I don’t want leadersand accent bars?You can use the Line Calloutoption to draw text backgroundsonly.
A wide variety of effects can beachieved with different styles andby toggling the leaders, accentbars, and borders.
Tip
What if the backgroundoutline is too close to theaccent bar?You can enlarge the Gap.
Tip
Crowded text in thebackground?Fix this problem by adjusting theMargins.
ch9.p65 12/05/2000, 11:43 AM282
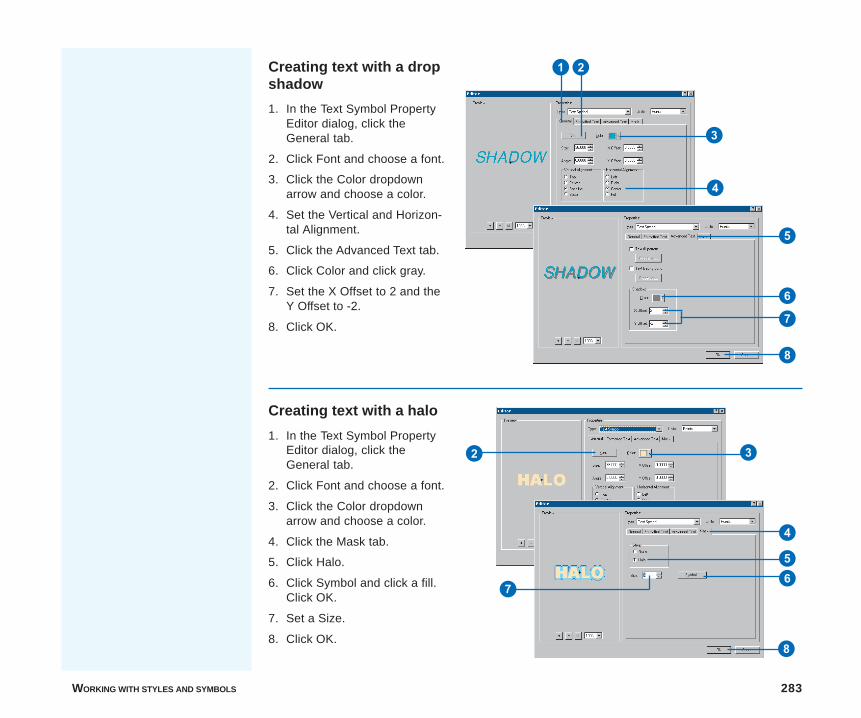
WORKING WITH STYLES AND SYMBOLS 283
Creating text with a dropshadow
1. In the Text Symbol PropertyEditor dialog, click theGeneral tab.
2. Click Font and choose a font.
3. Click the Color dropdownarrow and choose a color.
4. Set the Vertical and Horizon-tal Alignment.
5. Click the Advanced Text tab.
6. Click Color and click gray.
7. Set the X Offset to 2 and theY Offset to -2.
8. Click OK.
Creating text with a halo
1. In the Text Symbol PropertyEditor dialog, click theGeneral tab.
2. Click Font and choose a font.
3. Click the Color dropdownarrow and choose a color.
4. Click the Mask tab.
5. Click Halo.
6. Click Symbol and click a fill.Click OK.
7. Set a Size.
8. Click OK.8
6
1
4
3
8
5
6
7
5
2 3
4
7
2
ch9.p65 12/05/2000, 11:43 AM283

284 USING ARCMAP
Q
2
4
5
6
7
8
9
3
Creating filled text
1. In the Text Symbol PropertyEditor dialog, click theGeneral tab.
2. Click Font and choose a font.
3. Set the Vertical and Horizon-tal Alignment.
4. Click the Formatted Text tab.
5. Set the Character Spacing.
6. Click the Advanced Text tab.
7. Check Text fill pattern andclick Properties.
8. Select a fill.
9. Set the Outline Width andColor and click OK.
10.Click OK.
1
ch9.p65 12/05/2000, 11:44 AM284
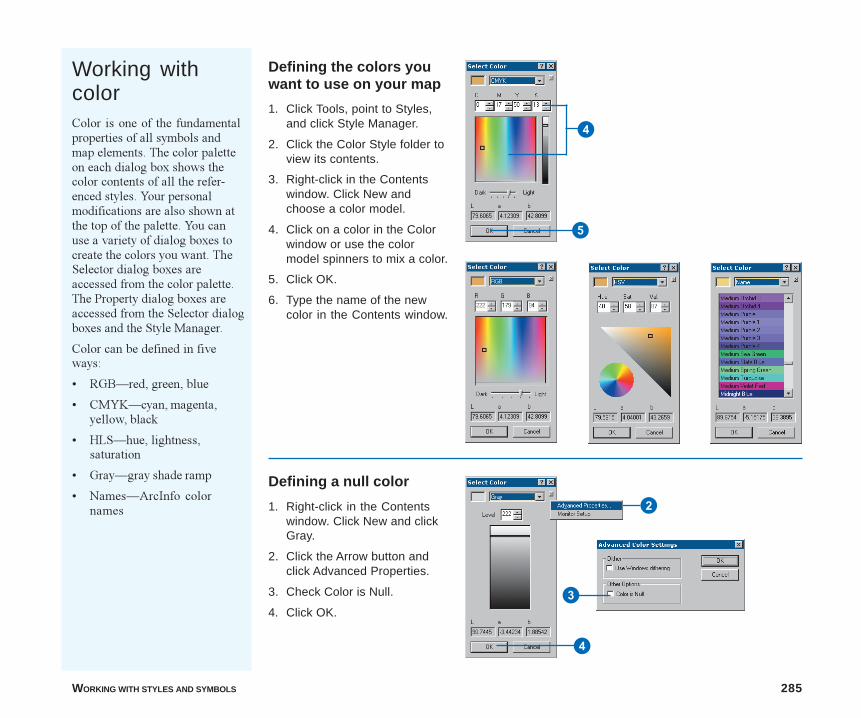
WORKING WITH STYLES AND SYMBOLS 285
5
Working withcolorColor is one of the fundamentalproperties of all symbols andmap elements. The color paletteon each dialog box shows thecolor contents of all the refer-enced styles. Your personalmodifications are also shown atthe top of the palette. You canuse a variety of dialog boxes tocreate the colors you want. TheSelector dialog boxes areaccessed from the color palette.The Property dialog boxes areaccessed from the Selector dialogboxes and the Style Manager.
Color can be defined in fiveways:
� RGB�red, green, blue
� CMYK�cyan, magenta,yellow, black
� HLS�hue, lightness,saturation
� Gray�gray shade ramp
� Names�ArcInfo colornames
Defining the colors youwant to use on your map
1. Click Tools, point to Styles,and click Style Manager.
2. Click the Color Style folder toview its contents.
3. Right-click in the Contentswindow. Click New andchoose a color model.
4. Click on a color in the Colorwindow or use the colormodel spinners to mix a color.
5. Click OK.
6. Type the name of the newcolor in the Contents window.
Defining a null color
1. Right-click in the Contentswindow. Click New and clickGray.
2. Click the Arrow button andclick Advanced Properties.
3. Check Color is Null.
4. Click OK.
2
4
4
3
ch9.p65 12/05/2000, 11:44 AM285
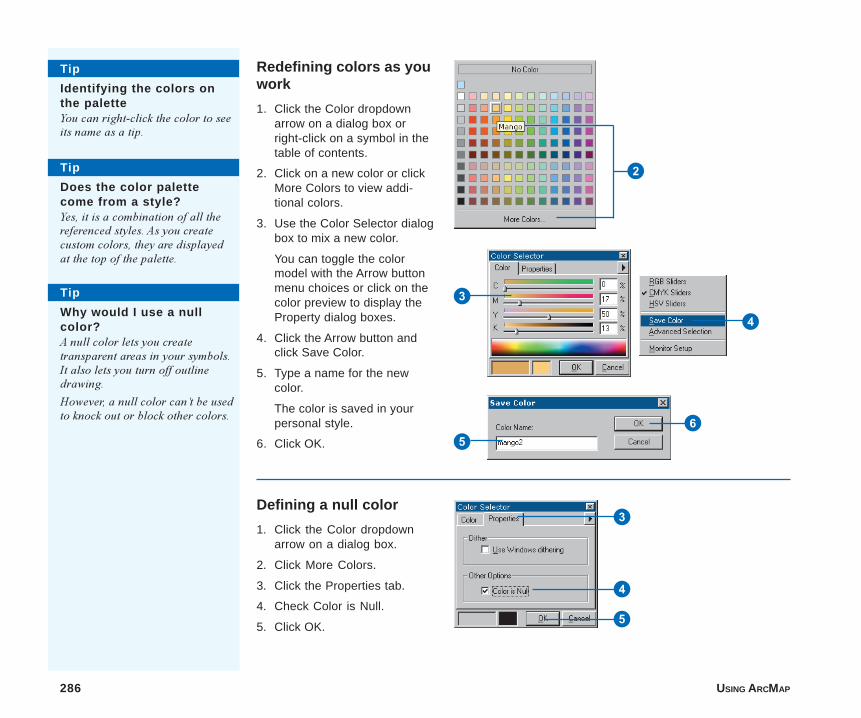
286 USING ARCMAP
Redefining colors as youwork
1. Click the Color dropdownarrow on a dialog box orright-click on a symbol in thetable of contents.
2. Click on a new color or clickMore Colors to view addi-tional colors.
3. Use the Color Selector dialogbox to mix a new color.
You can toggle the colormodel with the Arrow buttonmenu choices or click on thecolor preview to display theProperty dialog boxes.
4. Click the Arrow button andclick Save Color.
5. Type a name for the newcolor.
The color is saved in yourpersonal style.
6. Click OK.
Tip
Identifying the colors onthe paletteYou can right-click the color to seeits name as a tip.
Defining a null color
1. Click the Color dropdownarrow on a dialog box.
2. Click More Colors.
3. Click the Properties tab.
4. Check Color is Null.
5. Click OK.
Tip
Does the color palettecome from a style?Yes, it is a combination of all thereferenced styles. As you createcustom colors, they are displayedat the top of the palette.
3
2
6
4
5
3
4
5
Tip
Why would I use a nullcolor?A null color lets you createtransparent areas in your symbols.It also lets you turn off outlinedrawing.
However, a null color can�t be usedto knock out or block other colors.
ch9.p65 12/05/2000, 11:45 AM286
Section 3
Querying data
section3.p65 12/05/2000, 11:48 AM287

section3.p65 12/05/2000, 11:48 AM288
IN THIS CHAPTER
289
Working with tables 10• Elements of a table
• Opening a layer’s attribute table
• Loading existing tabular data ontoa map
• Arranging columns
• Controlling a table’s appearance
• Locating and viewing records
• Sorting records
• Selecting records
• Summarizing data
• Adding and deleting fields
• Editing attributes
• Making field calculations
• About joining attribute tables
• Joining attribute tables
A table is a database component that contains a series of rows and columns,where each row, or record, represents a geographic feature�such as aparcel, power pole, highway, or lake�and each column, or field, describes aparticular attribute of the feature�such as its length, depth, cost, and so on.Tables are stored in a database�for example, INFO�, Microsoft® Access,dBASE®, FoxPro®, Oracle®, and SQL Server�.
You�ll typically use tables in ArcMap to inspect the attributes of geographicfeatures. From a table, you can identify features with particular attributesand select them on the map. Over time, you might also update the attributesto reflect changes to geographic features�for example, a new subdivisionextends your parcel database, or the construction of a dam alters a rivernetwork.
Tables can also store information related to features such as warehouseinventories, monthly sales figures, and maintenance records. By joining thisinformation to your spatial data, you can uncover new patterns andrelationships that were not apparent before. For example, you might seewhich stores have the top monthly sales figures, what roads requiremaintenance in the near future, or where the largest number of endangeredspecies are located.
ch10.p65 12/05/2000, 12:34 PM289
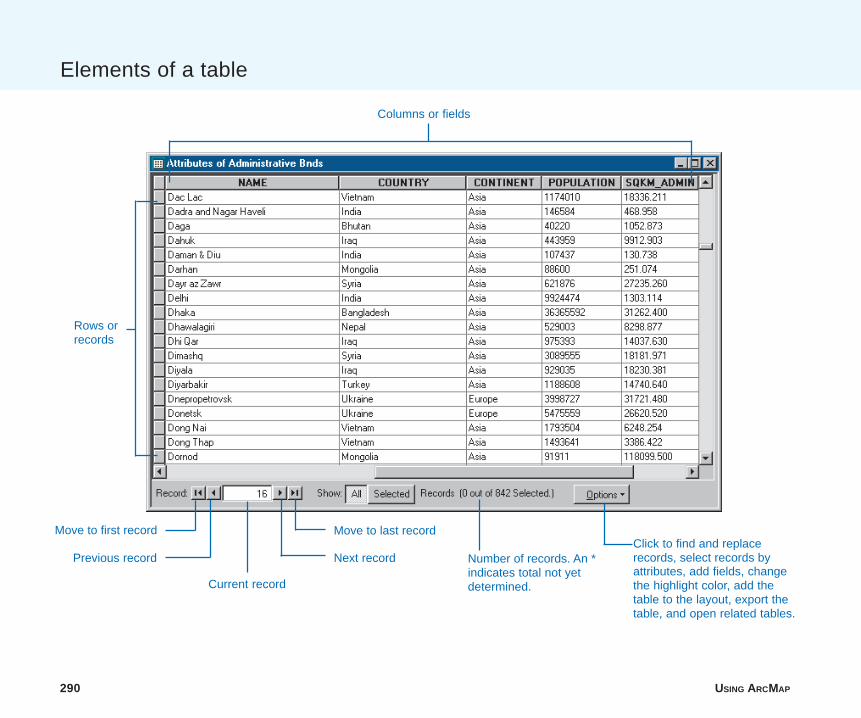
290 USING ARCMAP
Elements of a table
Move to first record
Rows orrecords
Number of records. An *indicates total not yetdetermined.
Previous record
Current record
Move to last record
Next recordClick to find and replacerecords, select records byattributes, add fields, changethe highlight color, add thetable to the layout, export thetable, and open related tables.
Columns or fields
ch10.p65 12/05/2000, 12:34 PM290
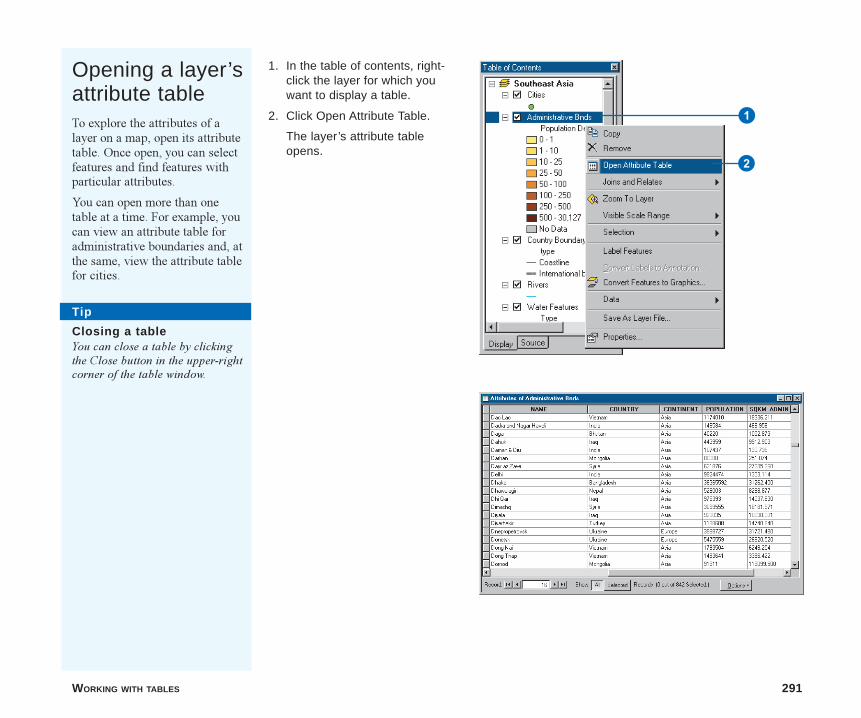
WORKING WITH TABLES 291
Opening a layer’sattribute tableTo explore the attributes of alayer on a map, open its attributetable. Once open, you can selectfeatures and find features withparticular attributes.
You can open more than onetable at a time. For example, youcan view an attribute table foradministrative boundaries and, atthe same, view the attribute tablefor cities.
1. In the table of contents, right-click the layer for which youwant to display a table.
2. Click Open Attribute Table.
The layer’s attribute tableopens.
Tip
Closing a tableYou can close a table by clickingthe Close button in the upper-rightcorner of the table window.
1
2
ch10.p65 12/05/2000, 12:34 PM291
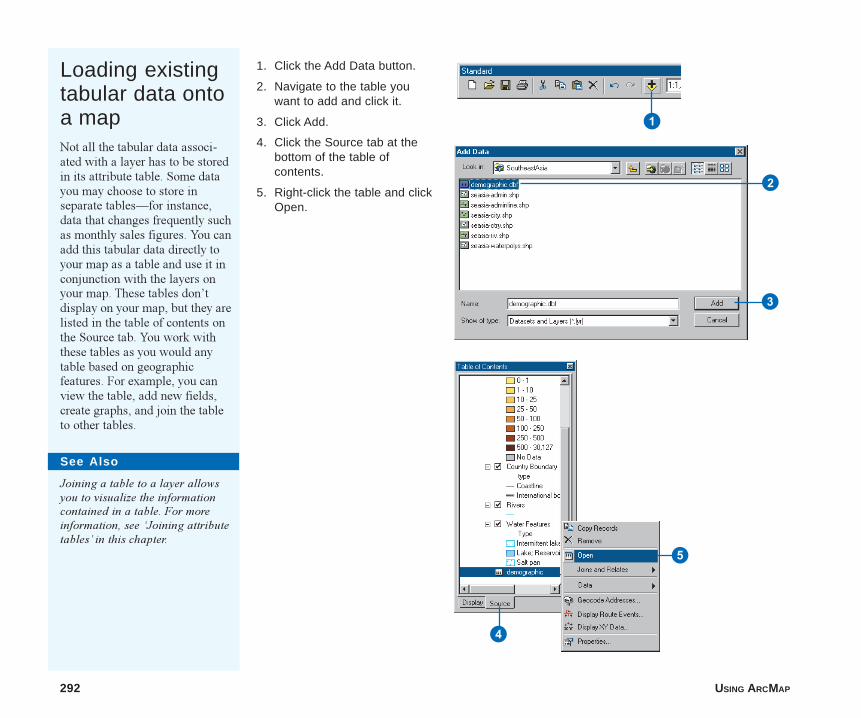
292 USING ARCMAP
Loading existingtabular data ontoa mapNot all the tabular data associ-ated with a layer has to be storedin its attribute table. Some datayou may choose to store inseparate tables�for instance,data that changes frequently suchas monthly sales figures. You canadd this tabular data directly toyour map as a table and use it inconjunction with the layers onyour map. These tables don�tdisplay on your map, but they arelisted in the table of contents onthe Source tab. You work withthese tables as you would anytable based on geographicfeatures. For example, you canview the table, add new fields,create graphs, and join the tableto other tables.
1. Click the Add Data button.
2. Navigate to the table youwant to add and click it.
3. Click Add.
4. Click the Source tab at thebottom of the table ofcontents.
5. Right-click the table and clickOpen.
See Also
Joining a table to a layer allowsyou to visualize the informationcontained in a table. For moreinformation, see �Joining attributetables� in this chapter.
1
2
3
4
5
ch10.p65 12/05/2000, 12:34 PM292
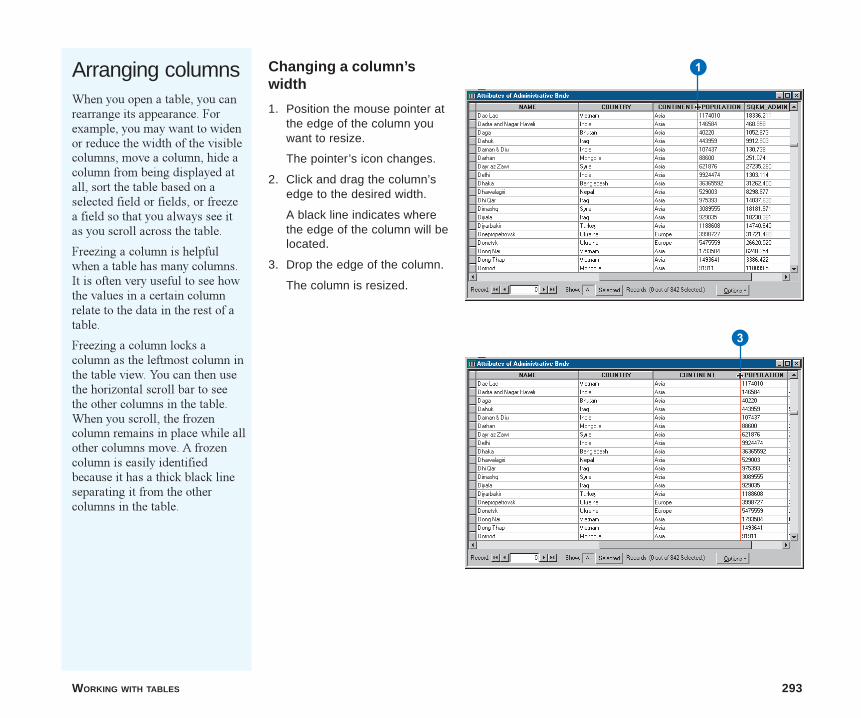
WORKING WITH TABLES 293
Changing a column’swidth
1. Position the mouse pointer atthe edge of the column youwant to resize.
The pointer’s icon changes.
2. Click and drag the column’sedge to the desired width.
A black line indicates wherethe edge of the column will belocated.
3. Drop the edge of the column.
The column is resized.
Arranging columnsWhen you open a table, you canrearrange its appearance. Forexample, you may want to widenor reduce the width of the visiblecolumns, move a column, hide acolumn from being displayed atall, sort the table based on aselected field or fields, or freezea field so that you always see itas you scroll across the table.
Freezing a column is helpfulwhen a table has many columns.It is often very useful to see howthe values in a certain columnrelate to the data in the rest of atable.
Freezing a column locks acolumn as the leftmost column inthe table view. You can then usethe horizontal scroll bar to seethe other columns in the table.When you scroll, the frozencolumn remains in place while allother columns move. A frozencolumn is easily identifiedbecause it has a thick black lineseparating it from the othercolumns in the table.
1
3
ch10.p65 12/05/2000, 12:34 PM293
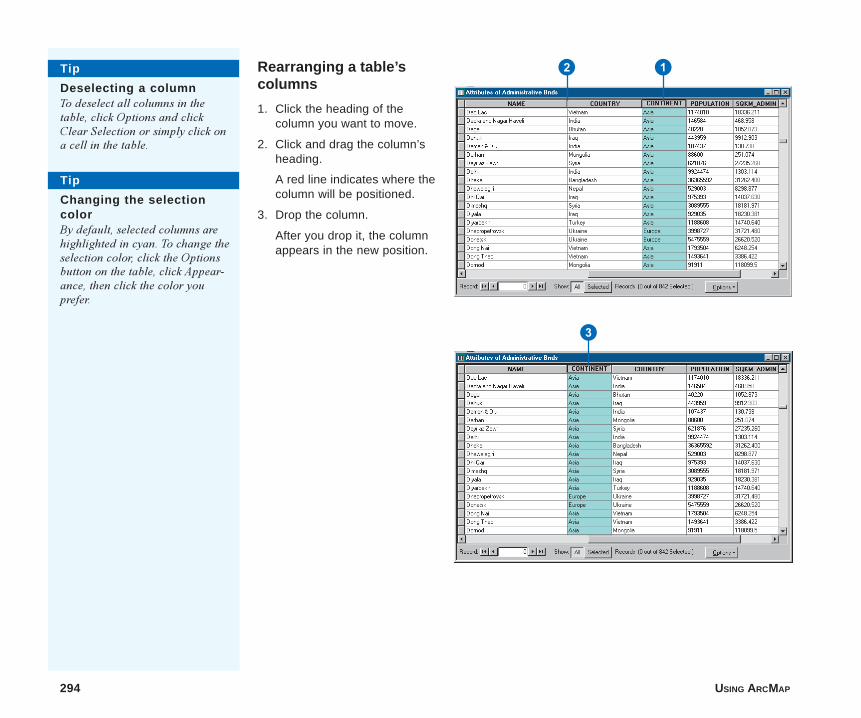
294 USING ARCMAP
Rearranging a table’scolumns
1. Click the heading of thecolumn you want to move.
2. Click and drag the column’sheading.
A red line indicates where thecolumn will be positioned.
3. Drop the column.
After you drop it, the columnappears in the new position.
Tip
Changing the selectioncolorBy default, selected columns arehighlighted in cyan. To change theselection color, click the Optionsbutton on the table, click Appear-ance, then click the color youprefer.
Tip
Deselecting a columnTo deselect all columns in thetable, click Options and clickClear Selection or simply click ona cell in the table.
2 1
3
ch10.p65 12/05/2000, 12:34 PM294
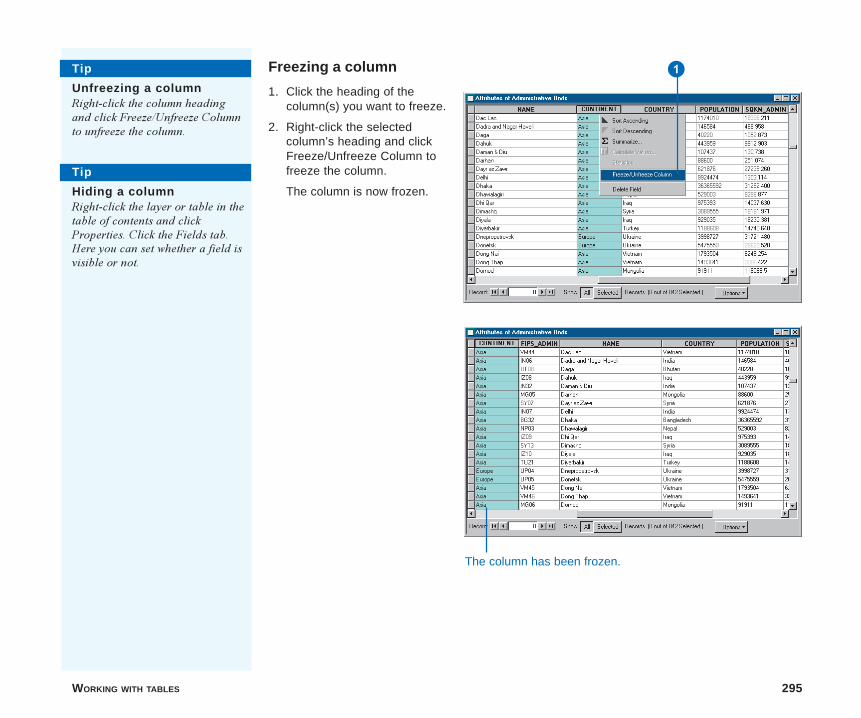
WORKING WITH TABLES 295
Freezing a column
1. Click the heading of thecolumn(s) you want to freeze.
2. Right-click the selectedcolumn’s heading and clickFreeze/Unfreeze Column tofreeze the column.
The column is now frozen.
Tip
Unfreezing a columnRight-click the column headingand click Freeze/Unfreeze Columnto unfreeze the column.
Tip
Hiding a columnRight-click the layer or table in thetable of contents and clickProperties. Click the Fields tab.Here you can set whether a field isvisible or not.
1
The column has been frozen.
ch10.p65 12/05/2000, 12:35 PM295
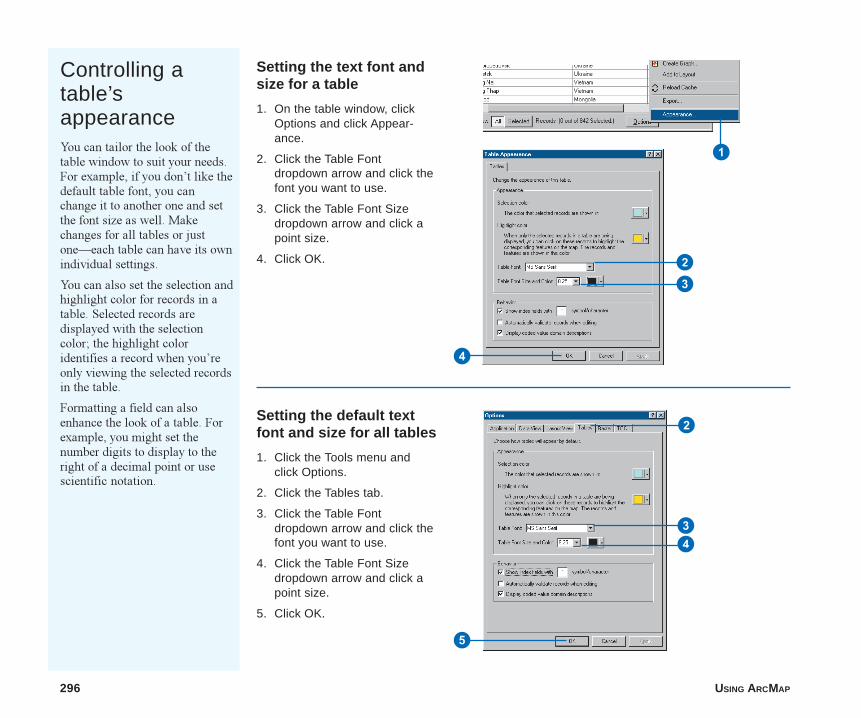
296 USING ARCMAP
Setting the text font andsize for a table
1. On the table window, clickOptions and click Appear-ance.
2. Click the Table Fontdropdown arrow and click thefont you want to use.
3. Click the Table Font Sizedropdown arrow and click apoint size.
4. Click OK.
Setting the default textfont and size for all tables
1. Click the Tools menu andclick Options.
2. Click the Tables tab.
3. Click the Table Fontdropdown arrow and click thefont you want to use.
4. Click the Table Font Sizedropdown arrow and click apoint size.
5. Click OK.
1
2
3
4
2
4
5
3
Controlling atable’sappearanceYou can tailor the look of thetable window to suit your needs.For example, if you don�t like thedefault table font, you canchange it to another one and setthe font size as well. Makechanges for all tables or justone�each table can have its ownindividual settings.
You can also set the selection andhighlight color for records in atable. Selected records aredisplayed with the selectioncolor; the highlight coloridentifies a record when you�reonly viewing the selected recordsin the table.
Formatting a field can alsoenhance the look of a table. Forexample, you might set thenumber digits to display to theright of a decimal point or usescientific notation.
ch10.p65 12/05/2000, 12:35 PM296
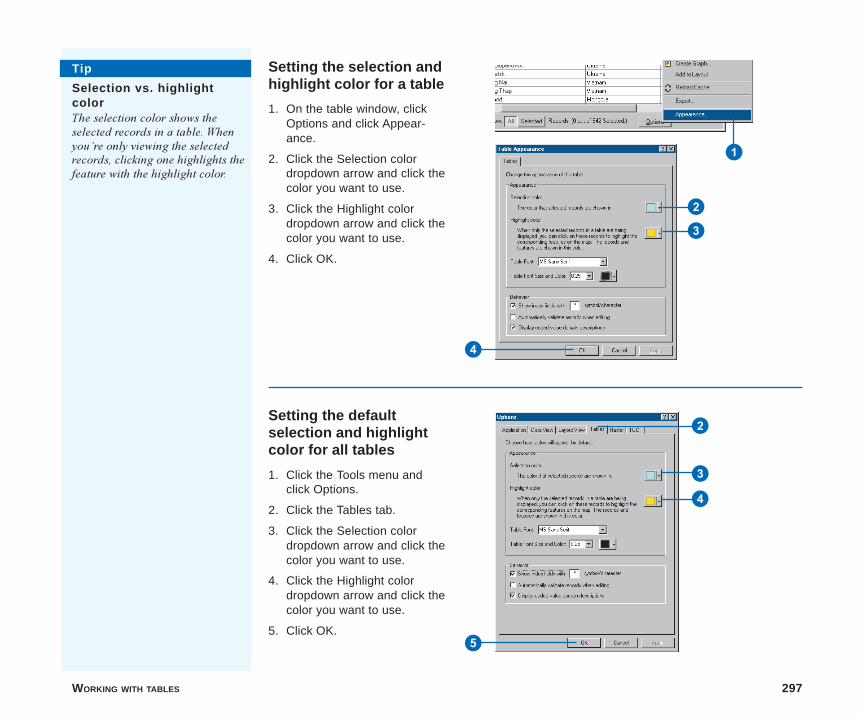
WORKING WITH TABLES 297
Setting the selection andhighlight color for a table
1. On the table window, clickOptions and click Appear-ance.
2. Click the Selection colordropdown arrow and click thecolor you want to use.
3. Click the Highlight colordropdown arrow and click thecolor you want to use.
4. Click OK.
Setting the defaultselection and highlightcolor for all tables
1. Click the Tools menu andclick Options.
2. Click the Tables tab.
3. Click the Selection colordropdown arrow and click thecolor you want to use.
4. Click the Highlight colordropdown arrow and click thecolor you want to use.
5. Click OK.
1
2
5
2
3
3
4
4
Tip
Selection vs. highlightcolorThe selection color shows theselected records in a table. Whenyou�re only viewing the selectedrecords, clicking one highlights thefeature with the highlight color.
ch10.p65 12/05/2000, 12:36 PM297
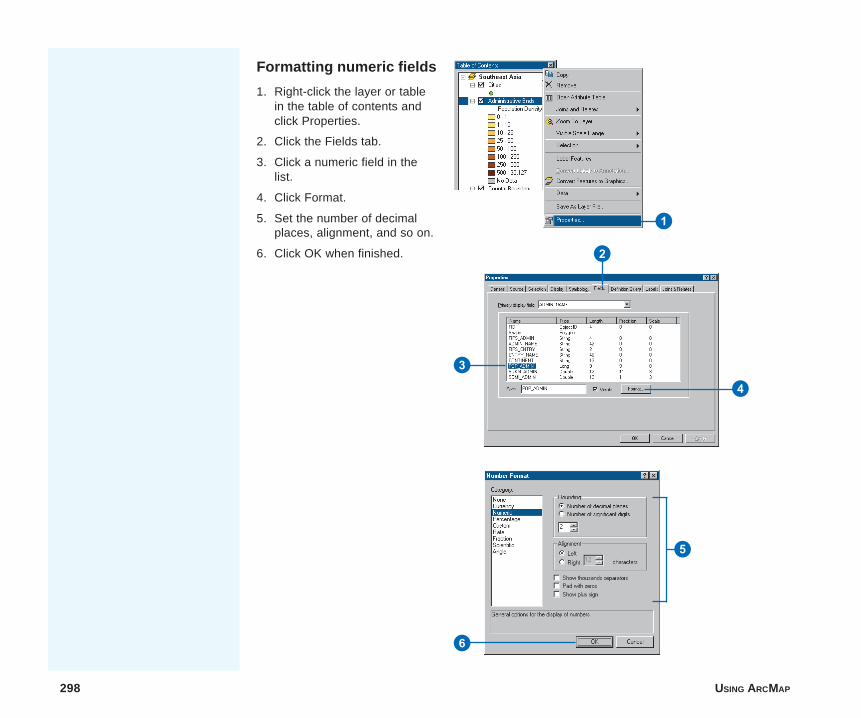
298 USING ARCMAP
Formatting numeric fields
1. Right-click the layer or tablein the table of contents andclick Properties.
2. Click the Fields tab.
3. Click a numeric field in thelist.
4. Click Format.
5. Set the number of decimalplaces, alignment, and so on.
6. Click OK when finished.
1
2
3
4
6
5
ch10.p65 12/05/2000, 12:36 PM298
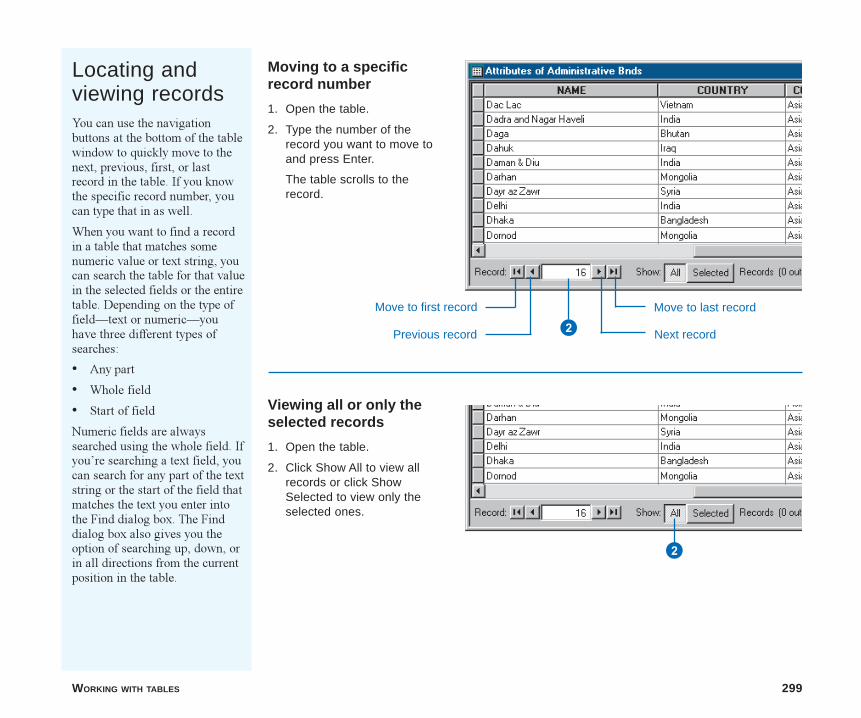
WORKING WITH TABLES 299
Locating andviewing recordsYou can use the navigationbuttons at the bottom of the tablewindow to quickly move to thenext, previous, first, or lastrecord in the table. If you knowthe specific record number, youcan type that in as well.
When you want to find a recordin a table that matches somenumeric value or text string, youcan search the table for that valuein the selected fields or the entiretable. Depending on the type offield�text or numeric�youhave three different types ofsearches:
� Any part
� Whole field
� Start of field
Numeric fields are alwayssearched using the whole field. Ifyou�re searching a text field, youcan search for any part of the textstring or the start of the field thatmatches the text you enter intothe Find dialog box. The Finddialog box also gives you theoption of searching up, down, orin all directions from the currentposition in the table.
Moving to a specificrecord number
1. Open the table.
2. Type the number of therecord you want to move toand press Enter.
The table scrolls to therecord.
Move to first record
Previous record
Move to last record
Next record2
Viewing all or only theselected records
1. Open the table.
2. Click Show All to view allrecords or click ShowSelected to view only theselected ones.
2
ch10.p65 12/05/2000, 12:36 PM299
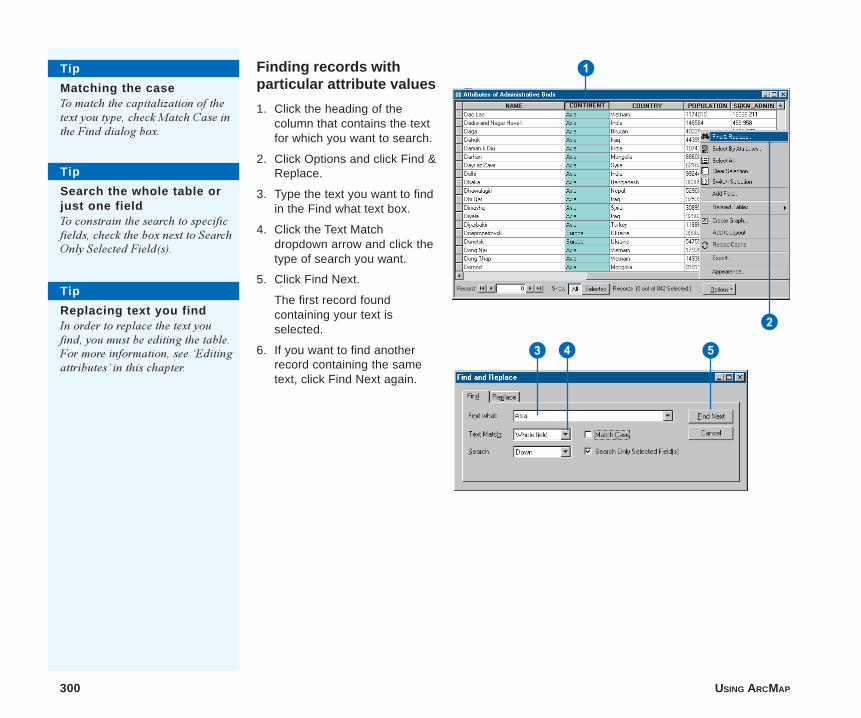
300 USING ARCMAP
Finding records withparticular attribute values
1. Click the heading of thecolumn that contains the textfor which you want to search.
2. Click Options and click Find &Replace.
3. Type the text you want to findin the Find what text box.
4. Click the Text Matchdropdown arrow and click thetype of search you want.
5. Click Find Next.
The first record foundcontaining your text isselected.
6. If you want to find anotherrecord containing the sametext, click Find Next again.
Tip
Matching the caseTo match the capitalization of thetext you type, check Match Case inthe Find dialog box.
1
2
543
Tip
Search the whole table orjust one fieldTo constrain the search to specificfields, check the box next to SearchOnly Selected Field(s).
Tip
Replacing text you findIn order to replace the text youfind, you must be editing the table.For more information, see �Editingattributes� in this chapter.
ch10.p65 12/05/2000, 12:37 PM300
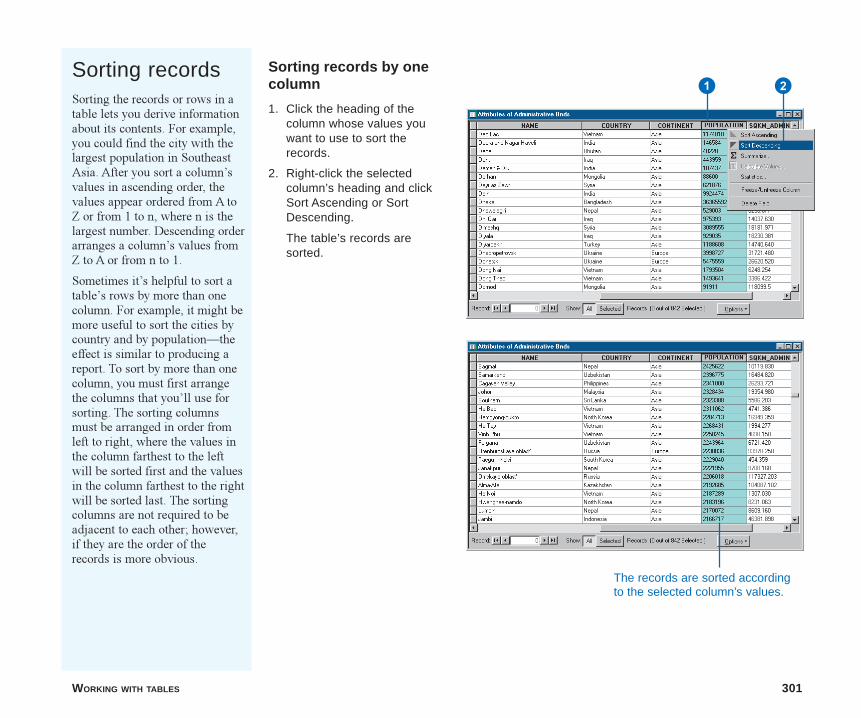
WORKING WITH TABLES 301
Sorting records by onecolumn
1. Click the heading of thecolumn whose values youwant to use to sort therecords.
2. Right-click the selectedcolumn’s heading and clickSort Ascending or SortDescending.
The table’s records aresorted.
Sorting recordsSorting the records or rows in atable lets you derive informationabout its contents. For example,you could find the city with thelargest population in SoutheastAsia. After you sort a column�svalues in ascending order, thevalues appear ordered from A toZ or from 1 to n, where n is thelargest number. Descending orderarranges a column�s values fromZ to A or from n to 1.
Sometimes it�s helpful to sort atable�s rows by more than onecolumn. For example, it might bemore useful to sort the cities bycountry and by population�theeffect is similar to producing areport. To sort by more than onecolumn, you must first arrangethe columns that you�ll use forsorting. The sorting columnsmust be arranged in order fromleft to right, where the values inthe column farthest to the leftwill be sorted first and the valuesin the column farthest to the rightwill be sorted last. The sortingcolumns are not required to beadjacent to each other; however,if they are the order of therecords is more obvious.
1 2
The records are sorted accordingto the selected column’s values.
ch10.p65 12/05/2000, 12:37 PM301
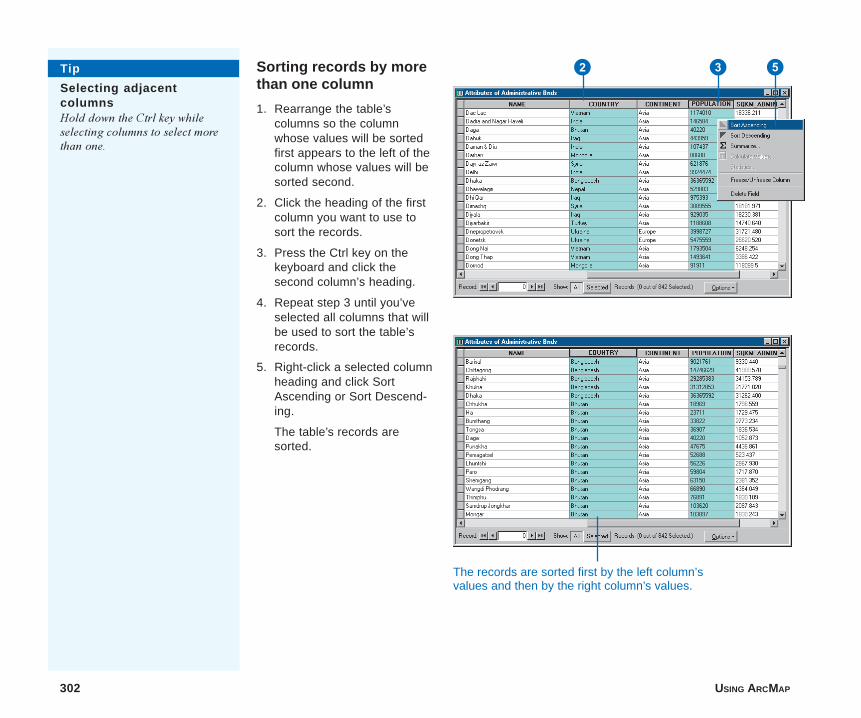
302 USING ARCMAP
Sorting records by morethan one column
1. Rearrange the table’scolumns so the columnwhose values will be sortedfirst appears to the left of thecolumn whose values will besorted second.
2. Click the heading of the firstcolumn you want to use tosort the records.
3. Press the Ctrl key on thekeyboard and click thesecond column’s heading.
4. Repeat step 3 until you’veselected all columns that willbe used to sort the table’srecords.
5. Right-click a selected columnheading and click SortAscending or Sort Descend-ing.
The table’s records aresorted.
The records are sorted first by the left column’svalues and then by the right column’s values.
Tip
Selecting adjacentcolumnsHold down the Ctrl key whileselecting columns to select morethan one.
2 3 5
ch10.p65 12/05/2000, 12:37 PM302
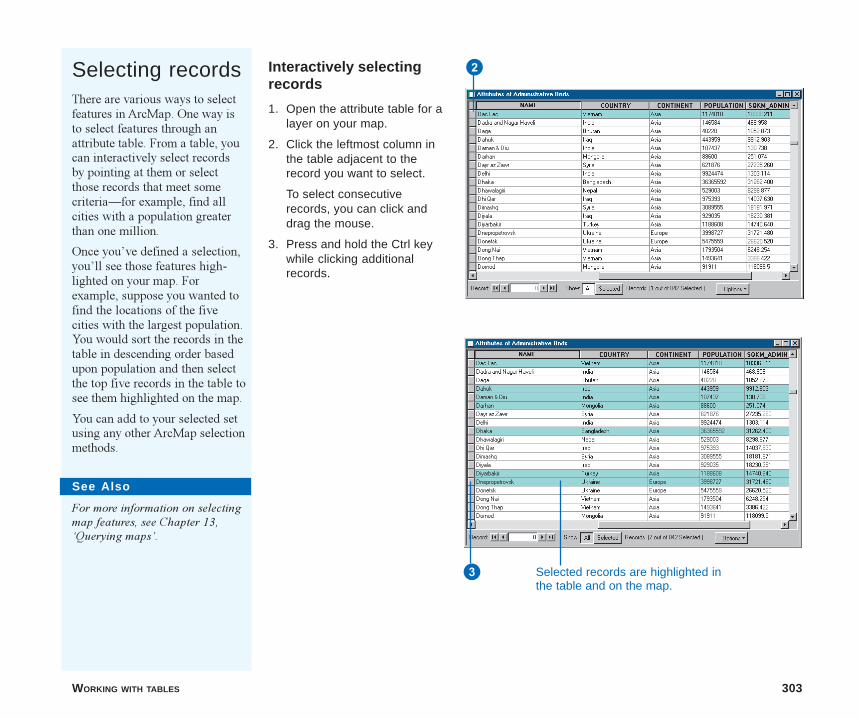
WORKING WITH TABLES 303
Selecting recordsThere are various ways to selectfeatures in ArcMap. One way isto select features through anattribute table. From a table, youcan interactively select recordsby pointing at them or selectthose records that meet somecriteria�for example, find allcities with a population greaterthan one million.
Once you�ve defined a selection,you�ll see those features high-lighted on your map. Forexample, suppose you wanted tofind the locations of the fivecities with the largest population.You would sort the records in thetable in descending order basedupon population and then selectthe top five records in the table tosee them highlighted on the map.
You can add to your selected setusing any other ArcMap selectionmethods.
Interactively selectingrecords
1. Open the attribute table for alayer on your map.
2. Click the leftmost column inthe table adjacent to therecord you want to select.
To select consecutiverecords, you can click anddrag the mouse.
3. Press and hold the Ctrl keywhile clicking additionalrecords.
Selected records are highlighted inthe table and on the map.
2
3
See Also
For more information on selectingmap features, see Chapter 13,�Querying maps�.
ch10.p65 12/05/2000, 12:37 PM303
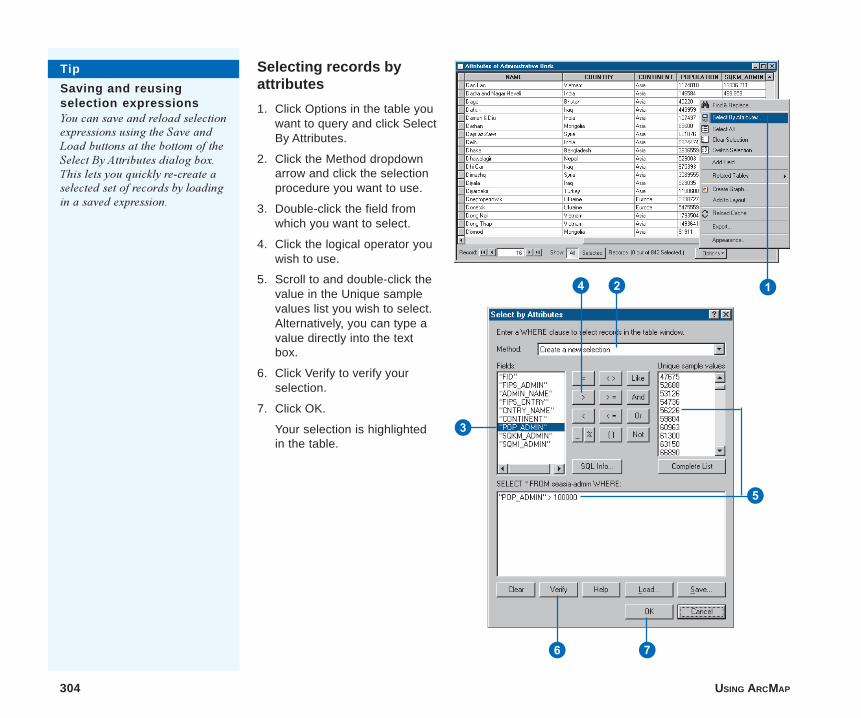
304 USING ARCMAP
Tip
Saving and reusingselection expressionsYou can save and reload selectionexpressions using the Save andLoad buttons at the bottom of theSelect By Attributes dialog box.This lets you quickly re-create aselected set of records by loadingin a saved expression.
Selecting records byattributes
1. Click Options in the table youwant to query and click SelectBy Attributes.
2. Click the Method dropdownarrow and click the selectionprocedure you want to use.
3. Double-click the field fromwhich you want to select.
4. Click the logical operator youwish to use.
5. Scroll to and double-click thevalue in the Unique samplevalues list you wish to select.Alternatively, you can type avalue directly into the textbox.
6. Click Verify to verify yourselection.
7. Click OK.
Your selection is highlightedin the table.
124
3
5
6 7
ch10.p65 12/05/2000, 12:37 PM304
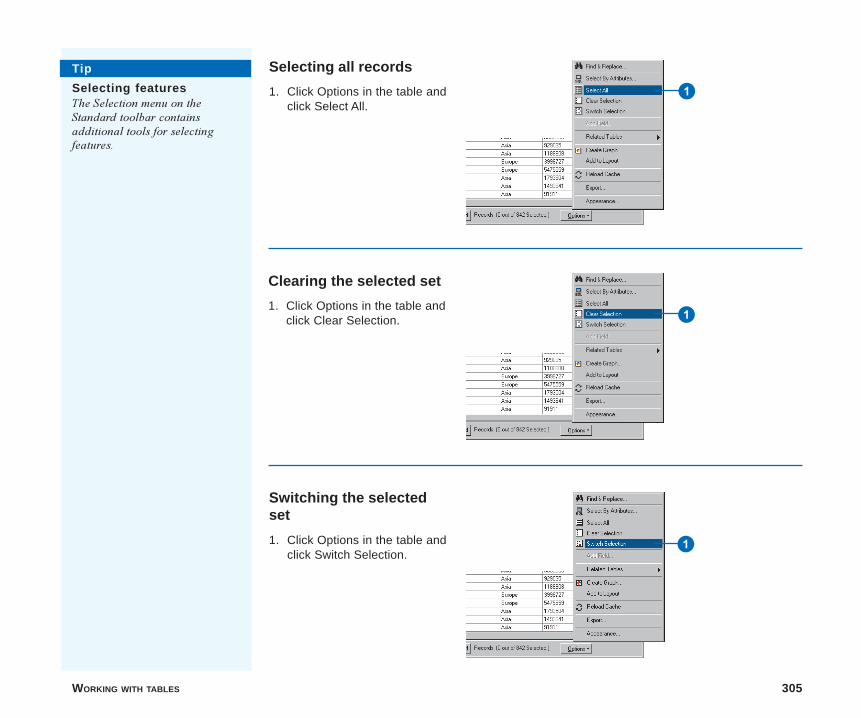
WORKING WITH TABLES 305
Selecting all records
1. Click Options in the table andclick Select All.
Clearing the selected set
1. Click Options in the table andclick Clear Selection.
Switching the selectedset
1. Click Options in the table andclick Switch Selection.
1
1
1
Tip
Selecting featuresThe Selection menu on theStandard toolbar containsadditional tools for selectingfeatures.
ch10.p65 12/05/2000, 12:38 PM305
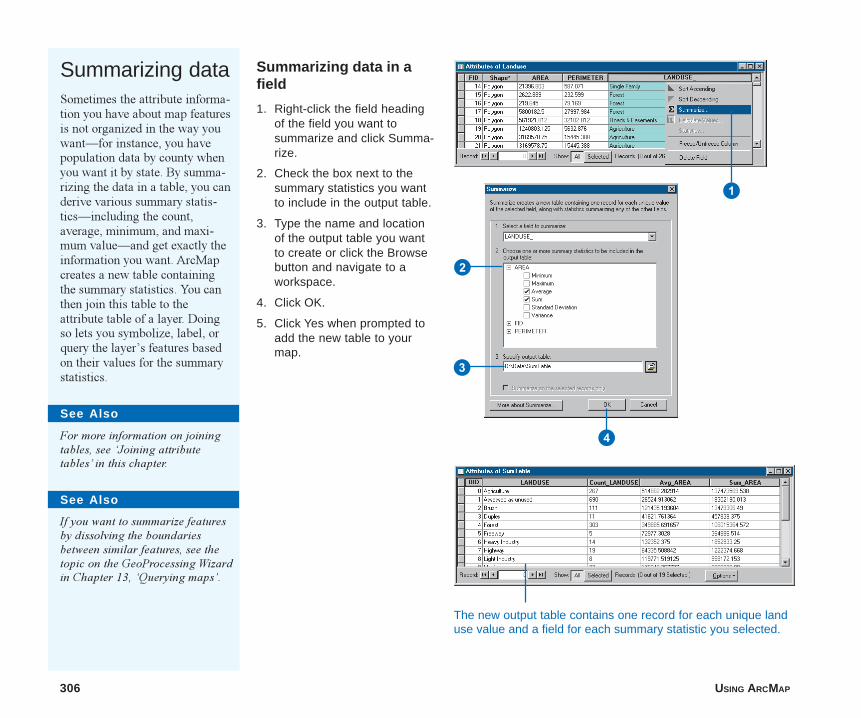
306 USING ARCMAP
Summarizing dataSometimes the attribute informa-tion you have about map featuresis not organized in the way youwant�for instance, you havepopulation data by county whenyou want it by state. By summa-rizing the data in a table, you canderive various summary statis-tics�including the count,average, minimum, and maxi-mum value�and get exactly theinformation you want. ArcMapcreates a new table containingthe summary statistics. You canthen join this table to theattribute table of a layer. Doingso lets you symbolize, label, orquery the layer�s features basedon their values for the summarystatistics.
See Also
For more information on joiningtables, see �Joining attributetables� in this chapter.
See Also
If you want to summarize featuresby dissolving the boundariesbetween similar features, see thetopic on the GeoProcessing Wizardin Chapter 13, �Querying maps�.
Summarizing data in afield
1. Right-click the field headingof the field you want tosummarize and click Summa-rize.
2. Check the box next to thesummary statistics you wantto include in the output table.
3. Type the name and locationof the output table you wantto create or click the Browsebutton and navigate to aworkspace.
4. Click OK.
5. Click Yes when prompted toadd the new table to yourmap.
1
2
3
4
The new output table contains one record for each unique landuse value and a field for each summary statistic you selected.
ch10.p65 12/05/2000, 12:38 PM306
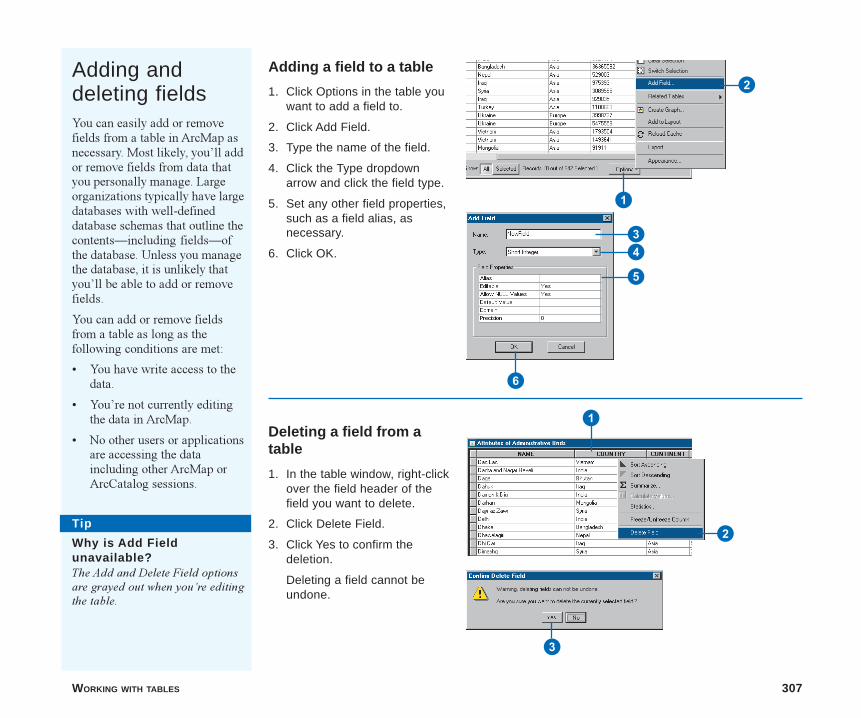
WORKING WITH TABLES 307
Adding anddeleting fieldsYou can easily add or removefields from a table in ArcMap asnecessary. Most likely, you�ll addor remove fields from data thatyou personally manage. Largeorganizations typically have largedatabases with well-defineddatabase schemas that outline thecontents�including fields�ofthe database. Unless you managethe database, it is unlikely thatyou�ll be able to add or removefields.
You can add or remove fieldsfrom a table as long as thefollowing conditions are met:
� You have write access to thedata.
� You�re not currently editingthe data in ArcMap.
� No other users or applicationsare accessing the dataincluding other ArcMap orArcCatalog sessions.
Adding a field to a table
1. Click Options in the table youwant to add a field to.
2. Click Add Field.
3. Type the name of the field.
4. Click the Type dropdownarrow and click the field type.
5. Set any other field properties,such as a field alias, asnecessary.
6. Click OK.
Tip
Why is Add Fieldunavailable?The Add and Delete Field optionsare grayed out when you�re editingthe table.
1
2
34
5
6
Deleting a field from atable
1. In the table window, right-clickover the field header of thefield you want to delete.
2. Click Delete Field.
3. Click Yes to confirm thedeletion.
Deleting a field cannot beundone.
1
2
3
ch10.p65 12/05/2000, 12:39 PM307
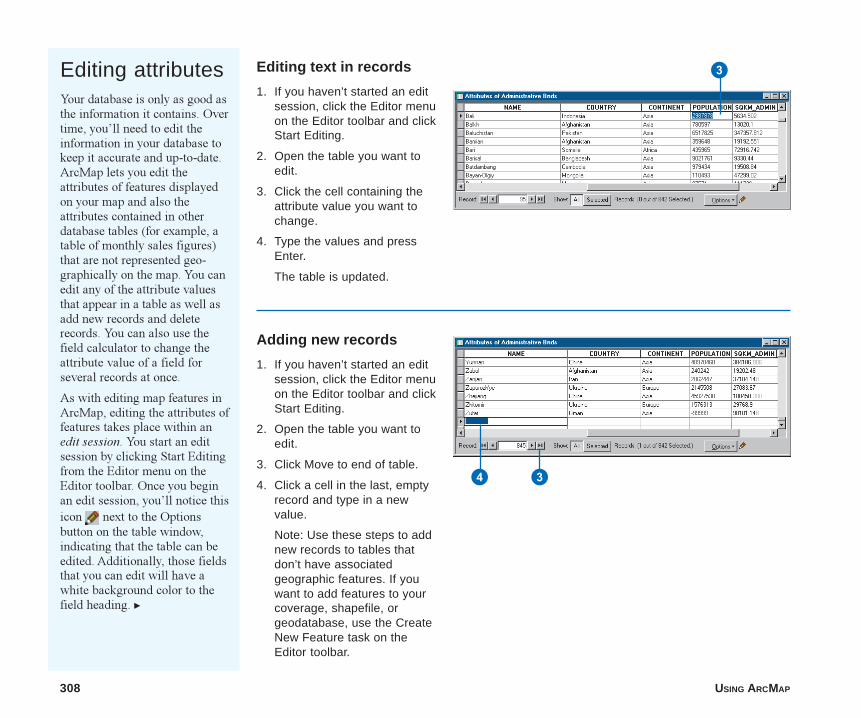
308 USING ARCMAP
Editing attributesYour database is only as good asthe information it contains. Overtime, you�ll need to edit theinformation in your database tokeep it accurate and up-to-date.ArcMap lets you edit theattributes of features displayedon your map and also theattributes contained in otherdatabase tables (for example, atable of monthly sales figures)that are not represented geo-graphically on the map. You canedit any of the attribute valuesthat appear in a table as well asadd new records and deleterecords. You can also use thefield calculator to change theattribute value of a field forseveral records at once.
As with editing map features inArcMap, editing the attributes offeatures takes place within anedit session. You start an editsession by clicking Start Editingfrom the Editor menu on theEditor toolbar. Once you beginan edit session, you�ll notice thisicon next to the Optionsbutton on the table window,indicating that the table can beedited. Additionally, those fieldsthat you can edit will have awhite background color to thefield heading. u
Editing text in records
1. If you haven’t started an editsession, click the Editor menuon the Editor toolbar and clickStart Editing.
2. Open the table you want toedit.
3. Click the cell containing theattribute value you want tochange.
4. Type the values and pressEnter.
The table is updated.
3
Adding new records
1. If you haven’t started an editsession, click the Editor menuon the Editor toolbar and clickStart Editing.
2. Open the table you want toedit.
3. Click Move to end of table.
4. Click a cell in the last, emptyrecord and type in a newvalue.
Note: Use these steps to addnew records to tables thatdon’t have associatedgeographic features. If youwant to add features to yourcoverage, shapefile, orgeodatabase, use the CreateNew Feature task on theEditor toolbar.
34
ch10.p65 12/05/2000, 12:39 PM308
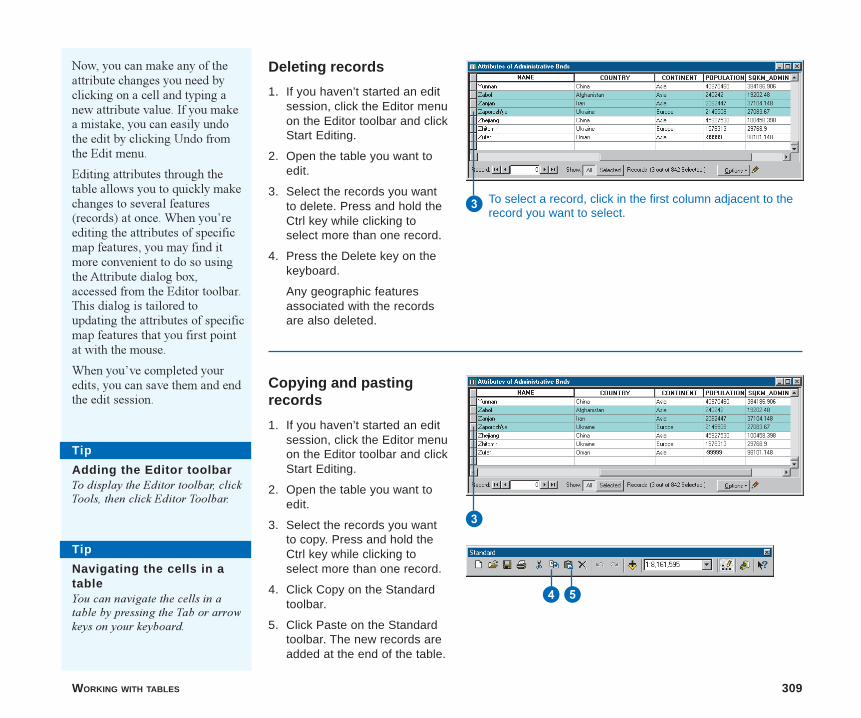
WORKING WITH TABLES 309
Tip
Navigating the cells in atableYou can navigate the cells in atable by pressing the Tab or arrowkeys on your keyboard.
Now, you can make any of theattribute changes you need byclicking on a cell and typing anew attribute value. If you makea mistake, you can easily undothe edit by clicking Undo fromthe Edit menu.
Editing attributes through thetable allows you to quickly makechanges to several features(records) at once. When you�reediting the attributes of specificmap features, you may find itmore convenient to do so usingthe Attribute dialog box,accessed from the Editor toolbar.This dialog is tailored toupdating the attributes of specificmap features that you first pointat with the mouse.
When you�ve completed youredits, you can save them and endthe edit session.
Tip
Adding the Editor toolbarTo display the Editor toolbar, clickTools, then click Editor Toolbar.
Deleting records
1. If you haven’t started an editsession, click the Editor menuon the Editor toolbar and clickStart Editing.
2. Open the table you want toedit.
3. Select the records you wantto delete. Press and hold theCtrl key while clicking toselect more than one record.
4. Press the Delete key on thekeyboard.
Any geographic featuresassociated with the recordsare also deleted.
3
Copying and pastingrecords
1. If you haven’t started an editsession, click the Editor menuon the Editor toolbar and clickStart Editing.
2. Open the table you want toedit.
3. Select the records you wantto copy. Press and hold theCtrl key while clicking toselect more than one record.
4. Click Copy on the Standardtoolbar.
5. Click Paste on the Standardtoolbar. The new records areadded at the end of the table.
3
4 5
To select a record, click in the first column adjacent to therecord you want to select.
ch10.p65 12/05/2000, 12:39 PM309
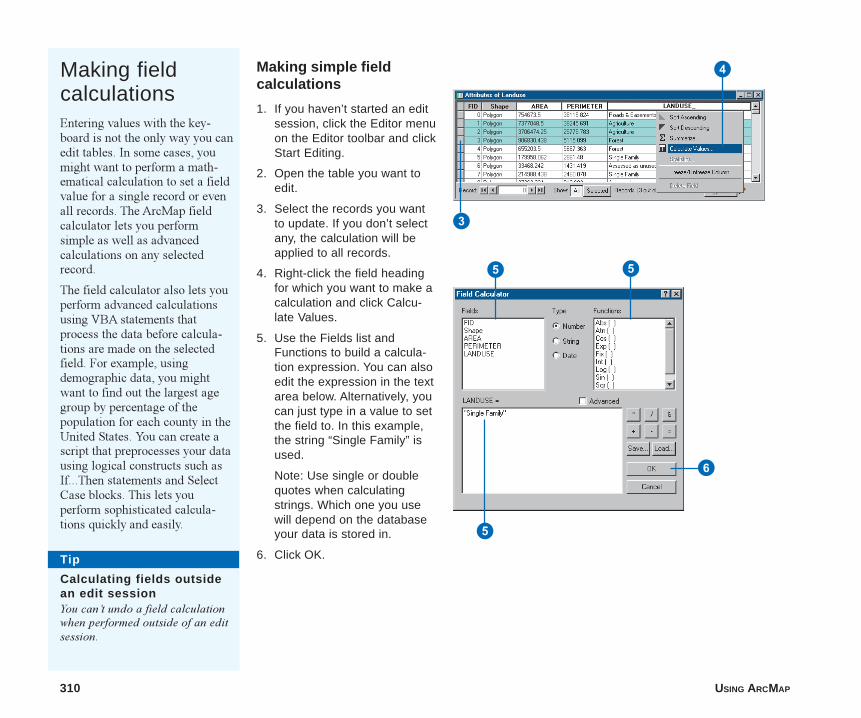
310 USING ARCMAP
Making simple fieldcalculations
1. If you haven’t started an editsession, click the Editor menuon the Editor toolbar and clickStart Editing.
2. Open the table you want toedit.
3. Select the records you wantto update. If you don’t selectany, the calculation will beapplied to all records.
4. Right-click the field headingfor which you want to make acalculation and click Calcu-late Values.
5. Use the Fields list andFunctions to build a calcula-tion expression. You can alsoedit the expression in the textarea below. Alternatively, youcan just type in a value to setthe field to. In this example,the string “Single Family” isused.
Note: Use single or doublequotes when calculatingstrings. Which one you usewill depend on the databaseyour data is stored in.
6. Click OK.
Making fieldcalculationsEntering values with the key-board is not the only way you canedit tables. In some cases, youmight want to perform a math-ematical calculation to set a fieldvalue for a single record or evenall records. The ArcMap fieldcalculator lets you performsimple as well as advancedcalculations on any selectedrecord.
The field calculator also lets youperform advanced calculationsusing VBA statements thatprocess the data before calcula-tions are made on the selectedfield. For example, usingdemographic data, you mightwant to find out the largest agegroup by percentage of thepopulation for each county in theUnited States. You can create ascript that preprocesses your datausing logical constructs such asIf...Then statements and SelectCase blocks. This lets youperform sophisticated calcula-tions quickly and easily.
3
4
5 5
5
6
Tip
Calculating fields outsidean edit sessionYou can�t undo a field calculationwhen performed outside of an editsession.
ch10.p65 12/05/2000, 12:39 PM310
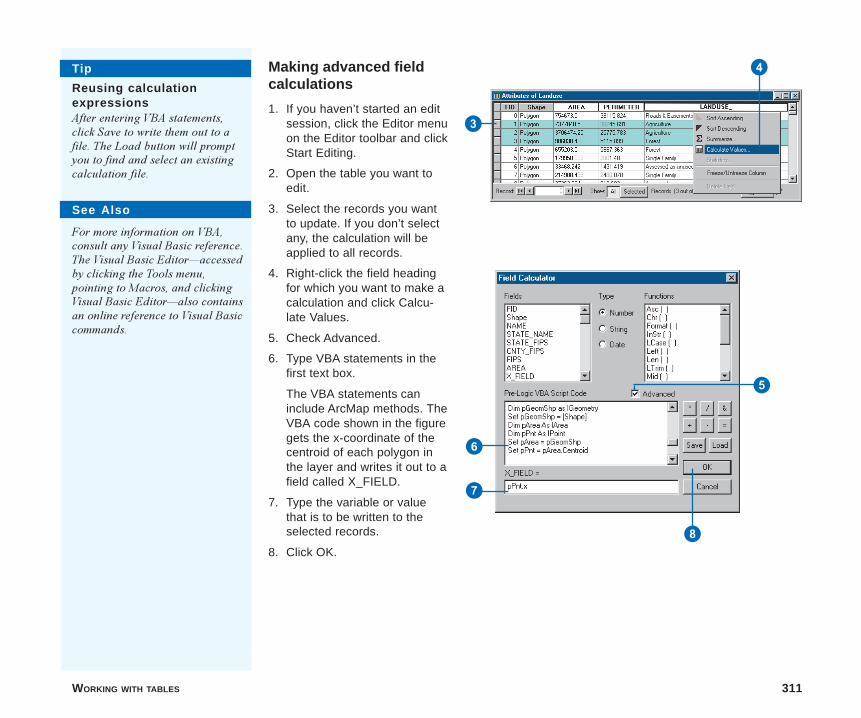
WORKING WITH TABLES 311
Making advanced fieldcalculations
1. If you haven’t started an editsession, click the Editor menuon the Editor toolbar and clickStart Editing.
2. Open the table you want toedit.
3. Select the records you wantto update. If you don’t selectany, the calculation will beapplied to all records.
4. Right-click the field headingfor which you want to make acalculation and click Calcu-late Values.
5. Check Advanced.
6. Type VBA statements in thefirst text box.
The VBA statements caninclude ArcMap methods. TheVBA code shown in the figuregets the x-coordinate of thecentroid of each polygon inthe layer and writes it out to afield called X_FIELD.
7. Type the variable or valuethat is to be written to theselected records.
8. Click OK.
6
8
Tip
Reusing calculationexpressionsAfter entering VBA statements,click Save to write them out to afile. The Load button will promptyou to find and select an existingcalculation file.
5
7
3
4
See Also
For more information on VBA,consult any Visual Basic reference.The Visual Basic Editor�accessedby clicking the Tools menu,pointing to Macros, and clickingVisual Basic Editor�also containsan online reference to Visual Basiccommands.
ch10.p65 12/05/2000, 12:39 PM311
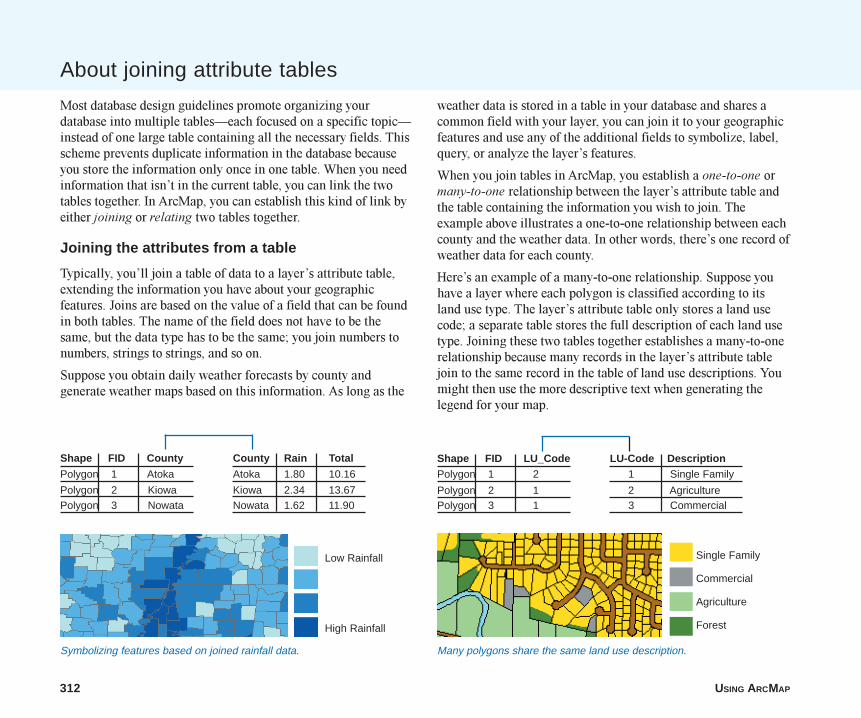
312 USING ARCMAP
About joining attribute tables
Most database design guidelines promote organizing yourdatabase into multiple tables�each focused on a specific topic�instead of one large table containing all the necessary fields. Thisscheme prevents duplicate information in the database becauseyou store the information only once in one table. When you needinformation that isn�t in the current table, you can link the twotables together. In ArcMap, you can establish this kind of link byeither joining or relating two tables together.
Joining the attributes from a table
Typically, you�ll join a table of data to a layer�s attribute table,extending the information you have about your geographicfeatures. Joins are based on the value of a field that can be foundin both tables. The name of the field does not have to be thesame, but the data type has to be the same; you join numbers tonumbers, strings to strings, and so on.
Suppose you obtain daily weather forecasts by county andgenerate weather maps based on this information. As long as the
Shape FID County
Polygon 1 Atoka
Polygon 2 KiowaPolygon 3 Nowata
County Rain Total
Atoka 1.80 10.16
Kiowa 2.34 13.67Nowata 1.62 11.90
Symbolizing features based on joined rainfall data.
weather data is stored in a table in your database and shares acommon field with your layer, you can join it to your geographicfeatures and use any of the additional fields to symbolize, label,query, or analyze the layer�s features.
When you join tables in ArcMap, you establish a one-to-one ormany-to-one relationship between the layer�s attribute table andthe table containing the information you wish to join. Theexample above illustrates a one-to-one relationship between eachcounty and the weather data. In other words, there�s one record ofweather data for each county.
Here�s an example of a many-to-one relationship. Suppose youhave a layer where each polygon is classified according to itsland use type. The layer�s attribute table only stores a land usecode; a separate table stores the full description of each land usetype. Joining these two tables together establishes a many-to-onerelationship because many records in the layer�s attribute tablejoin to the same record in the table of land use descriptions. Youmight then use the more descriptive text when generating thelegend for your map.
Shape FID LU_CodePolygon 1 2
Polygon 2 1Polygon 3 1
LU-Code Description 1 Single Family
2 Agriculture 3 Commercial
Many polygons share the same land use description.
Single Family
Commercial
Agriculture
Forest
Low Rainfall
High Rainfall
ch10.p65 12/05/2000, 12:40 PM312

WORKING WITH TABLES 313
Summarizing your data before joining it
Depending on how your data is organized, you may have to startby summarizing the data in your table before you join it to alayer. When you summarize a table, ArcMap creates a new tablecontaining summary statistics derived from your table. You cancreate various summary statistics including count, average, sum,minimum, and maximum.
For example, suppose you want to create weather maps by stateinstead of by county, but the weather information you have isorganized by county. You could summarize the county data bystate�for instance, finding the average rainfall for all countieswithin a state�and then join the newly created output table to astate layer to create a weather map of rainfall by state.
When to relate tables instead of joining them
You�ve seen how joining tables establishes a one-to-one or many-to-one relationship between a layer and a table. However, insome situations, you may want to establish a one-to-many or amany-to-many relationship between a layer and a table.
An example of a one-to-many relationship is building occupancy.One building, such as a shopping center, may be occupied bymany tenants. You may want to join a table of tenants to theattribute table of a layer representing buildings. However, if youperform a join, ArcMap will only find the first tenant belongingto each building, ignoring additional tenants. In this case, youshould relate the tables instead of joining them.
Unlike joining tables, relating tables simply defines a relationshipbetween two tables. The associated data isn�t appended to thelayer�s attribute table like it is with a join. Instead, you can accessthe related data when you work with the layer�s attributes. Forexample, if you select a building, you can find all the tenants thatoccupy that building. Similarly, if you select a tenant, you canfind what building they reside in (or several buildings, in the caseof a chain of stores in multiple shopping centers�a many-to-many relationship).
Relates defined in ArcMap are essentially the same as simplerelationship classes defined in a geodatabase, except that they aresaved with the map instead of in a geodatabase. For moreinformation on creating relationship classes, see Chapter 6,�Defining relationship classes�, in Building a Geodatabase.
Sometimes it may be necessary to summarize your tabular data so that itcan be joined to your geographic data.
State County Rain TotalOklahoma Atoka 1.80 10.16
Oklahoma Kiowa 2.34 13.67
Oklahoma Nowata 1.62 11.90
State Count Avg_Rain Max_Rain
Oklahoma 77 2.56 3.86Ohio 88 3.21 4.50
Oregon 36 5.66 7.92
ch10.p65 12/05/2000, 12:40 PM313

314 USING ARCMAP
Joining data spatially
When the layers on your map don�t share a common attributefield, you can instead join them using a spatial join. A spatial joinjoins the attributes of two layers based on the location of thefeatures in the layers. With a spatial join, you can:
� Find the closest feature to another feature.
� Find what�s inside a feature.
� Find what intersects a feature.
For example, you might want to tell a customer where they canfind the nearest retail store and how far away it is from them. Ora biologist might summarize information about endangeredspecies sightings based on what region in a national park theobservations were made.
For information on how to perform a spatial join, see Chapter 13,�Querying maps�.
How are joins and relates saved in your map?
When you save a map containing joins and relates, ArcMap savesthe definition of how the two attribute tables are linked ratherthan saving the linked data itself. The next time you open yourmap, ArcMap reestablishes the relationship (whether a join orrelate) between the tables by reading the tables from thedatabase. In this way, any changes to the source tables that havetaken place since they were last viewed on the map areautomatically included and reflected on the map.
If you want, you can make a permanent disk copy of a layer withjoined data; simply export the layer. To export the layer, right-click it in the table of contents, point to Data, and click ExportData. This creates a new feature class with all of the attributes,including the joined fields, written out.
ch10.p65 12/05/2000, 12:40 PM314
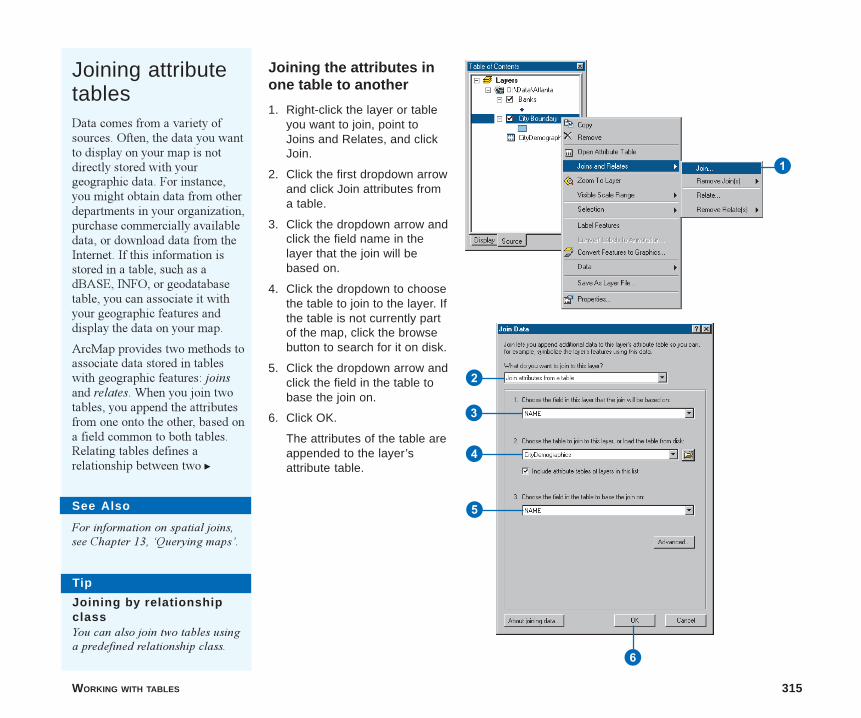
WORKING WITH TABLES 315
Joining attributetablesData comes from a variety ofsources. Often, the data you wantto display on your map is notdirectly stored with yourgeographic data. For instance,you might obtain data from otherdepartments in your organization,purchase commercially availabledata, or download data from theInternet. If this information isstored in a table, such as adBASE, INFO, or geodatabasetable, you can associate it withyour geographic features anddisplay the data on your map.
ArcMap provides two methods toassociate data stored in tableswith geographic features: joinsand relates. When you join twotables, you append the attributesfrom one onto the other, based ona field common to both tables.Relating tables defines arelationship between two u
Joining the attributes inone table to another
1. Right-click the layer or tableyou want to join, point toJoins and Relates, and clickJoin.
2. Click the first dropdown arrowand click Join attributes froma table.
3. Click the dropdown arrow andclick the field name in thelayer that the join will bebased on.
4. Click the dropdown to choosethe table to join to the layer. Ifthe table is not currently partof the map, click the browsebutton to search for it on disk.
5. Click the dropdown arrow andclick the field in the table tobase the join on.
6. Click OK.
The attributes of the table areappended to the layer’sattribute table.
See Also
For information on spatial joins,see Chapter 13, �Querying maps�.
1
2
3
4
5
6
Tip
Joining by relationshipclassYou can also join two tables usinga predefined relationship class.
ch10.p65 12/05/2000, 12:40 PM315
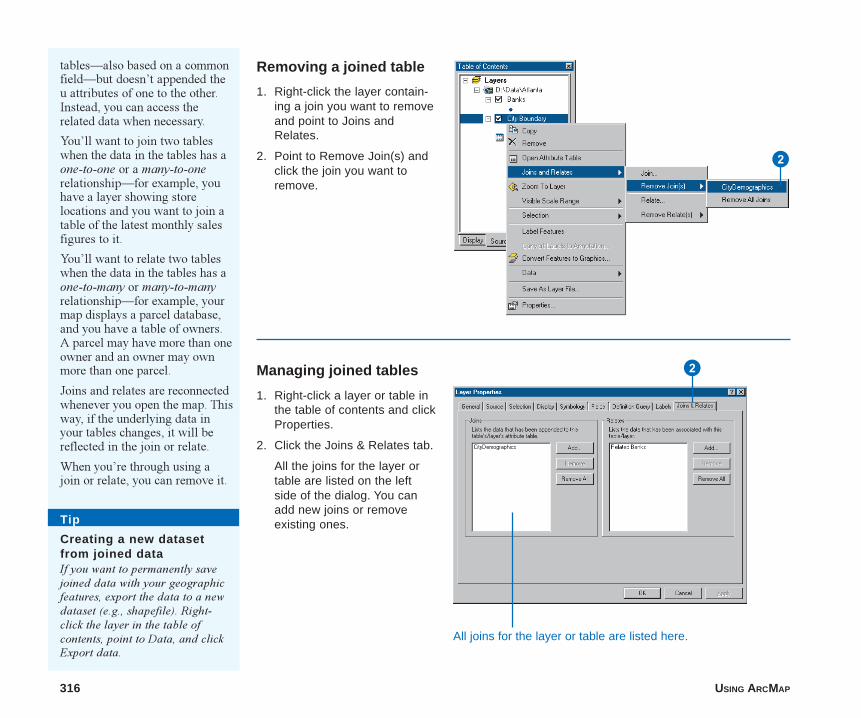
316 USING ARCMAP
tables�also based on a commonfield�but doesn�t appended theu attributes of one to the other.Instead, you can access therelated data when necessary.
You�ll want to join two tableswhen the data in the tables has aone-to-one or a many-to-onerelationship�for example, youhave a layer showing storelocations and you want to join atable of the latest monthly salesfigures to it.
You�ll want to relate two tableswhen the data in the tables has aone-to-many or many-to-manyrelationship�for example, yourmap displays a parcel database,and you have a table of owners.A parcel may have more than oneowner and an owner may ownmore than one parcel.
Joins and relates are reconnectedwhenever you open the map. Thisway, if the underlying data inyour tables changes, it will bereflected in the join or relate.
When you�re through using ajoin or relate, you can remove it.
Removing a joined table
1. Right-click the layer contain-ing a join you want to removeand point to Joins andRelates.
2. Point to Remove Join(s) andclick the join you want toremove.
2
Managing joined tables
1. Right-click a layer or table inthe table of contents and clickProperties.
2. Click the Joins & Relates tab.
All the joins for the layer ortable are listed on the leftside of the dialog. You canadd new joins or removeexisting ones.
2
All joins for the layer or table are listed here.
Tip
Creating a new datasetfrom joined dataIf you want to permanently savejoined data with your geographicfeatures, export the data to a newdataset (e.g., shapefile). Right-click the layer in the table ofcontents, point to Data, and clickExport data.
ch10.p65 12/05/2000, 12:40 PM316
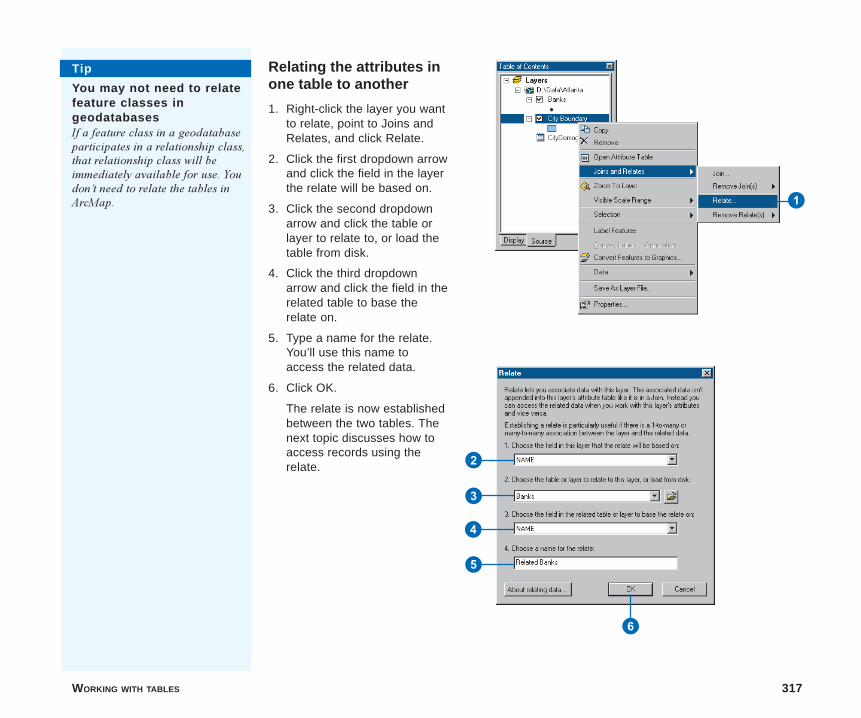
WORKING WITH TABLES 317
Relating the attributes inone table to another
1. Right-click the layer you wantto relate, point to Joins andRelates, and click Relate.
2. Click the first dropdown arrowand click the field in the layerthe relate will be based on.
3. Click the second dropdownarrow and click the table orlayer to relate to, or load thetable from disk.
4. Click the third dropdownarrow and click the field in therelated table to base therelate on.
5. Type a name for the relate.You’ll use this name toaccess the related data.
6. Click OK.
The relate is now establishedbetween the two tables. Thenext topic discusses how toaccess records using therelate.
1
2
3
4
5
6
Tip
You may not need to relatefeature classes ingeodatabasesIf a feature class in a geodatabaseparticipates in a relationship class,that relationship class will beimmediately available for use. Youdon�t need to relate the tables inArcMap.
ch10.p65 12/05/2000, 12:41 PM317
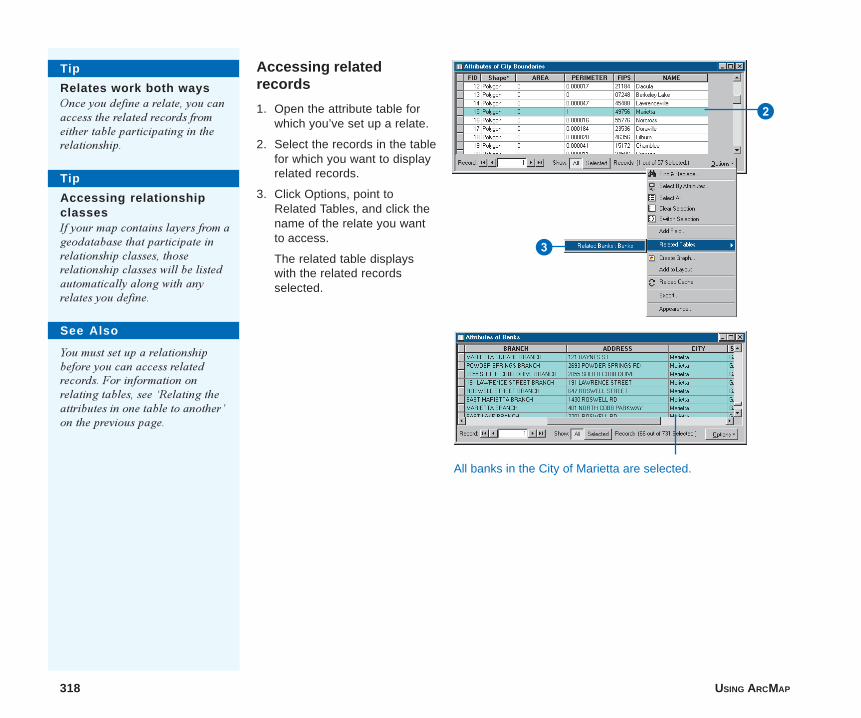
318 USING ARCMAP
Accessing relatedrecords
1. Open the attribute table forwhich you’ve set up a relate.
2. Select the records in the tablefor which you want to displayrelated records.
3. Click Options, point toRelated Tables, and click thename of the relate you wantto access.
The related table displayswith the related recordsselected.
See Also
You must set up a relationshipbefore you can access relatedrecords. For information onrelating tables, see �Relating theattributes in one table to another�on the previous page.
All banks in the City of Marietta are selected.
2
3
Tip
Accessing relationshipclassesIf your map contains layers from ageodatabase that participate inrelationship classes, thoserelationship classes will be listedautomatically along with anyrelates you define.
Tip
Relates work both waysOnce you define a relate, you canaccess the related records fromeither table participating in therelationship.
ch10.p65 12/05/2000, 12:41 PM318
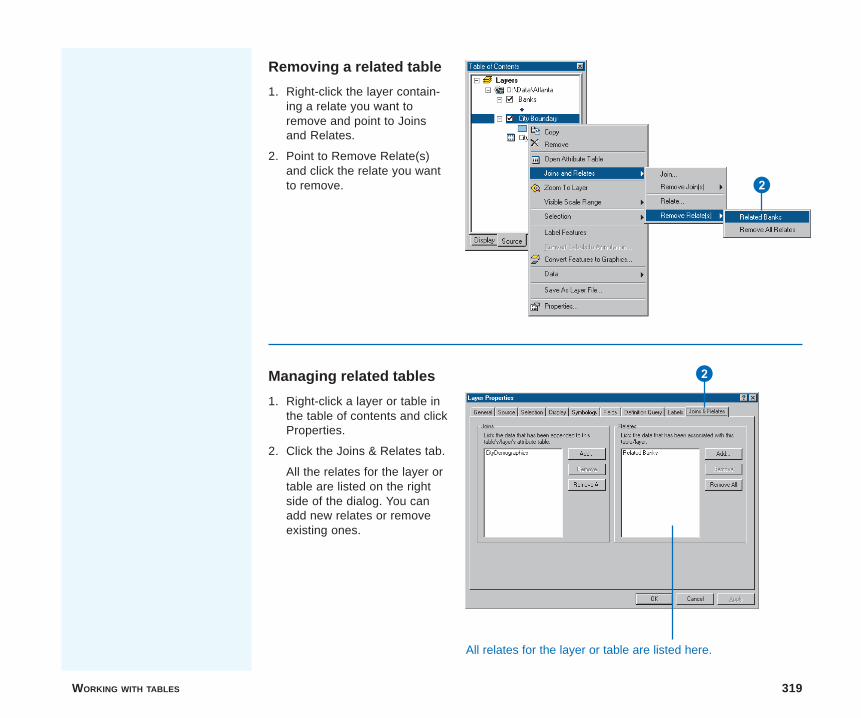
WORKING WITH TABLES 319
Removing a related table
1. Right-click the layer contain-ing a relate you want toremove and point to Joinsand Relates.
2. Point to Remove Relate(s)and click the relate you wantto remove. 2
Managing related tables
1. Right-click a layer or table inthe table of contents and clickProperties.
2. Click the Joins & Relates tab.
All the relates for the layer ortable are listed on the rightside of the dialog. You canadd new relates or removeexisting ones.
2
All relates for the layer or table are listed here.
ch10.p65 12/05/2000, 12:41 PM319

ch10.p65 12/05/2000, 12:41 PM320
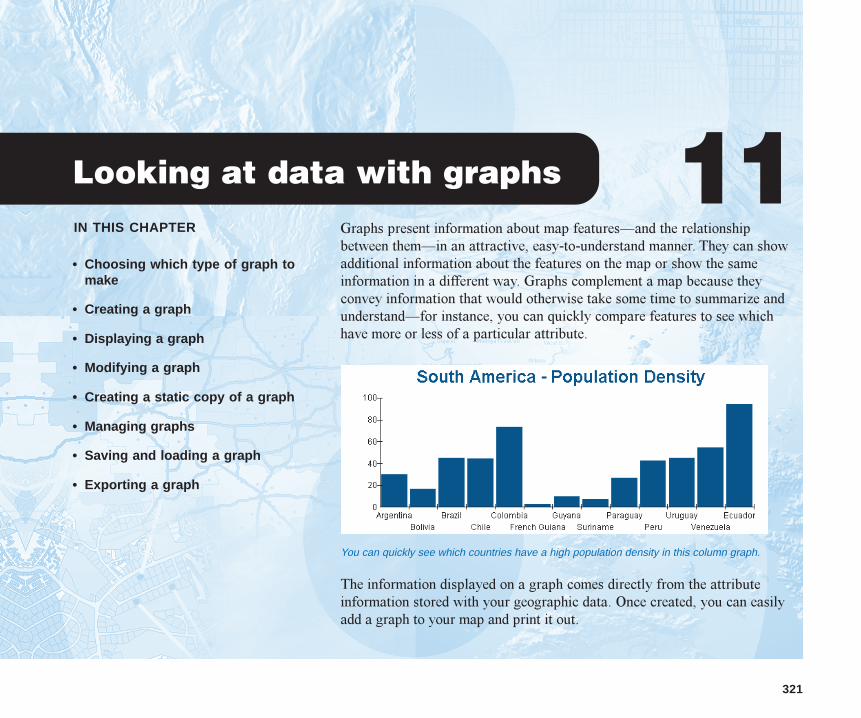
IN THIS CHAPTER
321
Looking at data with graphs 11• Choosing which type of graph to
make
• Creating a graph
• Displaying a graph
• Modifying a graph
• Creating a static copy of a graph
• Managing graphs
• Saving and loading a graph
• Exporting a graph
Graphs present information about map features�and the relationshipbetween them�in an attractive, easy-to-understand manner. They can showadditional information about the features on the map or show the sameinformation in a different way. Graphs complement a map because theyconvey information that would otherwise take some time to summarize andunderstand�for instance, you can quickly compare features to see whichhave more or less of a particular attribute.
You can quickly see which countries have a high population density in this column graph.
The information displayed on a graph comes directly from the attributeinformation stored with your geographic data. Once created, you can easilyadd a graph to your map and print it out.
ch11.p65 12/05/2000, 1:41 PM321
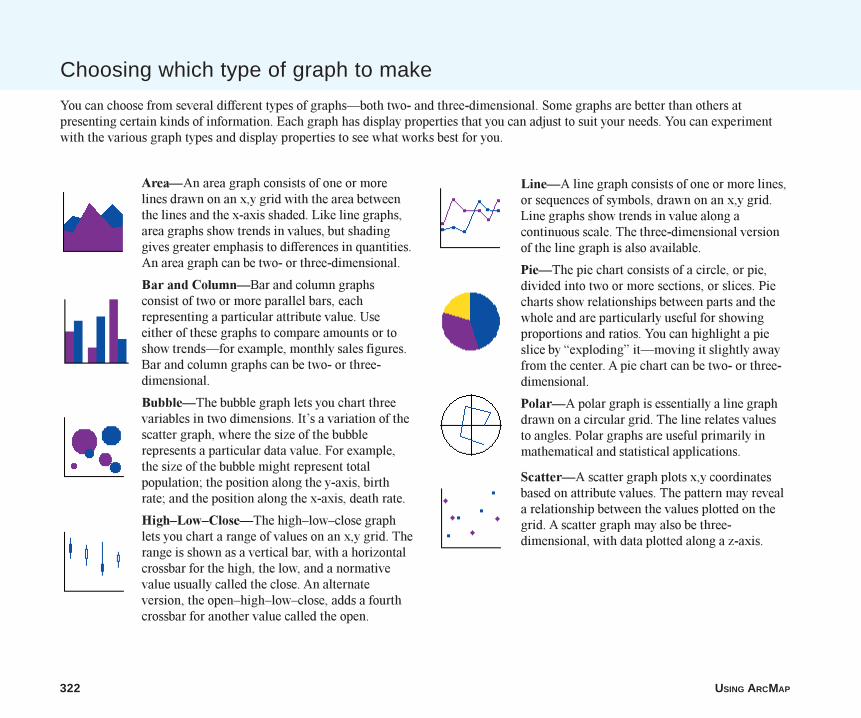
322 USING ARCMAP
Choosing which type of graph to make
You can choose from several different types of graphs�both two- and three-dimensional. Some graphs are better than others atpresenting certain kinds of information. Each graph has display properties that you can adjust to suit your needs. You can experimentwith the various graph types and display properties to see what works best for you.
Area�An area graph consists of one or morelines drawn on an x,y grid with the area betweenthe lines and the x-axis shaded. Like line graphs,area graphs show trends in values, but shadinggives greater emphasis to differences in quantities.An area graph can be two- or three-dimensional.
Bar and Column�Bar and column graphsconsist of two or more parallel bars, eachrepresenting a particular attribute value. Useeither of these graphs to compare amounts or toshow trends�for example, monthly sales figures.Bar and column graphs can be two- or three-dimensional.
Bubble�The bubble graph lets you chart threevariables in two dimensions. It�s a variation of thescatter graph, where the size of the bubblerepresents a particular data value. For example,the size of the bubble might represent totalpopulation; the position along the y-axis, birthrate; and the position along the x-axis, death rate.
High�Low�Close�The high�low�close graphlets you chart a range of values on an x,y grid. Therange is shown as a vertical bar, with a horizontalcrossbar for the high, the low, and a normativevalue usually called the close. An alternateversion, the open�high�low�close, adds a fourthcrossbar for another value called the open.
Line�A line graph consists of one or more lines,or sequences of symbols, drawn on an x,y grid.Line graphs show trends in value along acontinuous scale. The three-dimensional versionof the line graph is also available.
Pie�The pie chart consists of a circle, or pie,divided into two or more sections, or slices. Piecharts show relationships between parts and thewhole and are particularly useful for showingproportions and ratios. You can highlight a pieslice by �exploding� it�moving it slightly awayfrom the center. A pie chart can be two- or three-dimensional.
Polar�A polar graph is essentially a line graphdrawn on a circular grid. The line relates valuesto angles. Polar graphs are useful primarily inmathematical and statistical applications.
Scatter�A scatter graph plots x,y coordinatesbased on attribute values. The pattern may reveala relationship between the values plotted on thegrid. A scatter graph may also be three-dimensional, with data plotted along a z-axis.
ch11.p65 12/05/2000, 1:41 PM322
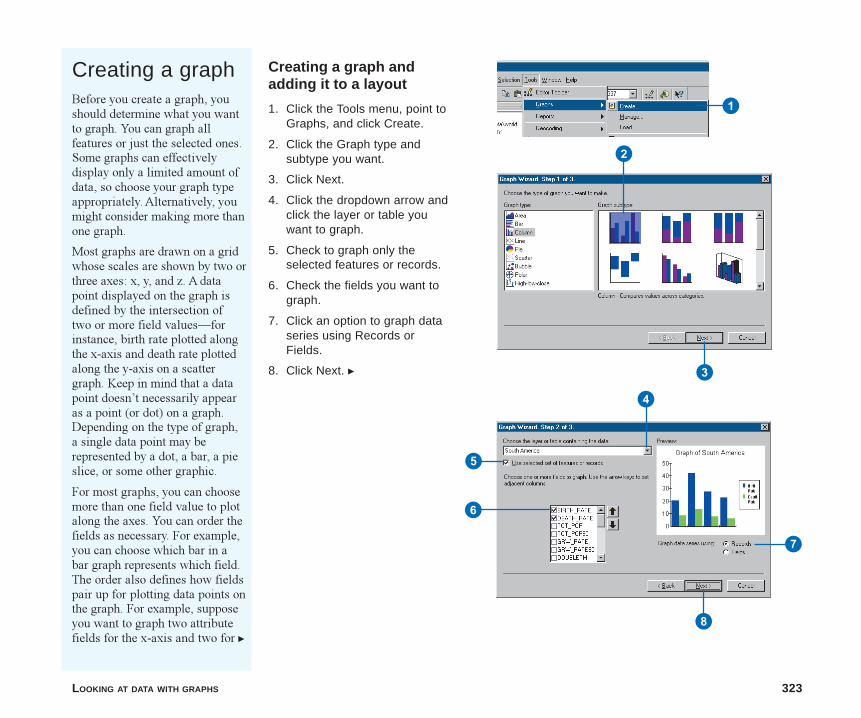
LOOKING AT DATA WITH GRAPHS 323
Creating a graphBefore you create a graph, youshould determine what you wantto graph. You can graph allfeatures or just the selected ones.Some graphs can effectivelydisplay only a limited amount ofdata, so choose your graph typeappropriately. Alternatively, youmight consider making more thanone graph.
Most graphs are drawn on a gridwhose scales are shown by two orthree axes: x, y, and z. A datapoint displayed on the graph isdefined by the intersection oftwo or more field values�forinstance, birth rate plotted alongthe x-axis and death rate plottedalong the y-axis on a scattergraph. Keep in mind that a datapoint doesn�t necessarily appearas a point (or dot) on a graph.Depending on the type of graph,a single data point may berepresented by a dot, a bar, a pieslice, or some other graphic.
For most graphs, you can choosemore than one field value to plotalong the axes. You can order thefields as necessary. For example,you can choose which bar in abar graph represents which field.The order also defines how fieldspair up for plotting data points onthe graph. For example, supposeyou want to graph two attributefields for the x-axis and two for u
Creating a graph andadding it to a layout
1. Click the Tools menu, point toGraphs, and click Create.
2. Click the Graph type andsubtype you want.
3. Click Next.
4. Click the dropdown arrow andclick the layer or table youwant to graph.
5. Check to graph only theselected features or records.
6. Check the fields you want tograph.
7. Click an option to graph dataseries using Records orFields.
8. Click Next. u
1
2
3
4
5
6
8
7
ch11.p65 12/05/2000, 1:41 PM323
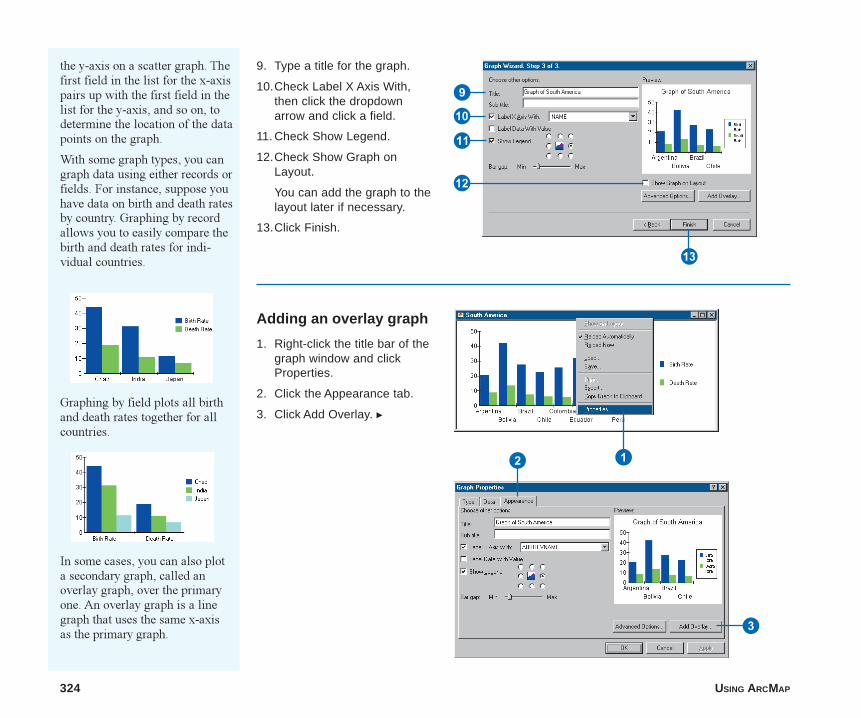
324 USING ARCMAP
the y-axis on a scatter graph. Thefirst field in the list for the x-axispairs up with the first field in thelist for the y-axis, and so on, todetermine the location of the datapoints on the graph.
With some graph types, you cangraph data using either records orfields. For instance, suppose youhave data on birth and death ratesby country. Graphing by recordallows you to easily compare thebirth and death rates for indi-vidual countries.
9. Type a title for the graph.
10.Check Label X Axis With,then click the dropdownarrow and click a field.
11. Check Show Legend.
12.Check Show Graph onLayout.
You can add the graph to thelayout later if necessary.
13.Click Finish.
Graphing by field plots all birthand death rates together for allcountries.
In some cases, you can also plota secondary graph, called anoverlay graph, over the primaryone. An overlay graph is a linegraph that uses the same x-axisas the primary graph.
Adding an overlay graph
1. Right-click the title bar of thegraph window and clickProperties.
2. Click the Appearance tab.
3. Click Add Overlay. u
E
Q
9
W
R
12
3
ch11.p65 12/05/2000, 1:42 PM324
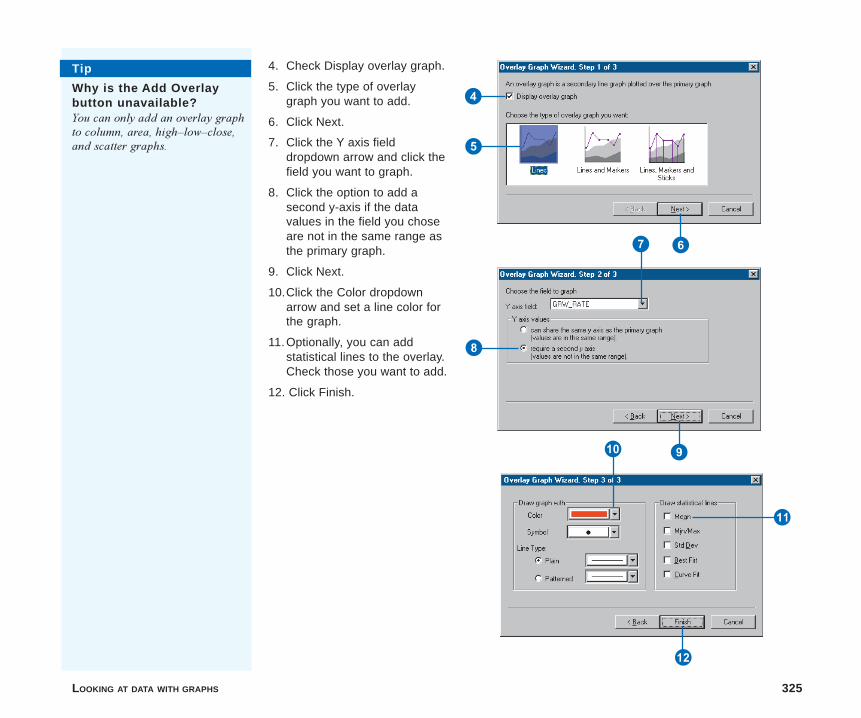
LOOKING AT DATA WITH GRAPHS 325
Tip
Why is the Add Overlaybutton unavailable?You can only add an overlay graphto column, area, high�low�close,and scatter graphs.
4. Check Display overlay graph.
5. Click the type of overlaygraph you want to add.
6. Click Next.
7. Click the Y axis fielddropdown arrow and click thefield you want to graph.
8. Click the option to add asecond y-axis if the datavalues in the field you choseare not in the same range asthe primary graph.
9. Click Next.
10.Click the Color dropdownarrow and set a line color forthe graph.
11.Optionally, you can addstatistical lines to the overlay.Check those you want to add.
12. Click Finish.
4
5
67
8
9Q
W
E
ch11.p65 12/05/2000, 1:43 PM325
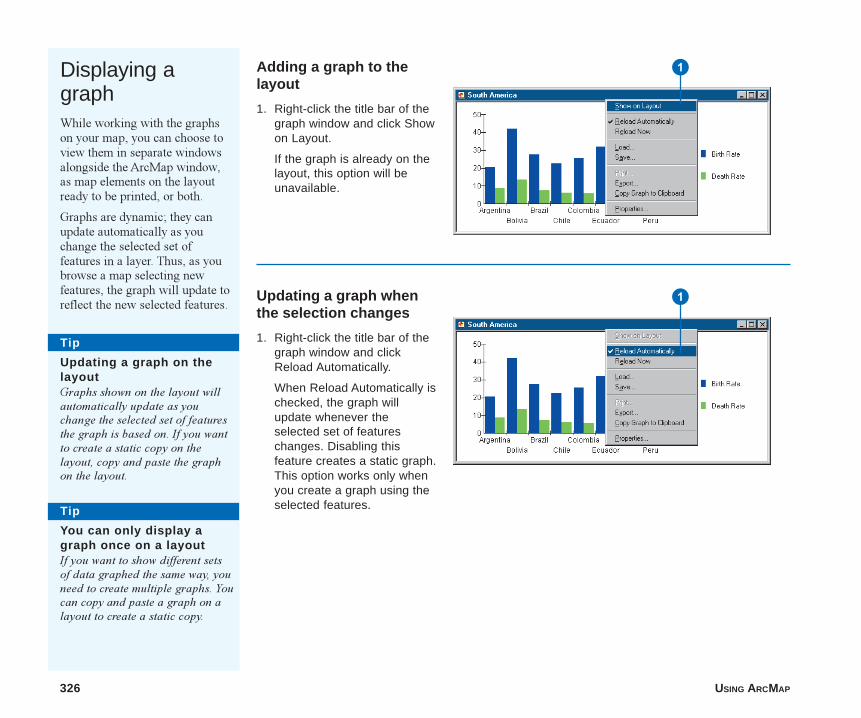
326 USING ARCMAP
Displaying agraphWhile working with the graphson your map, you can choose toview them in separate windowsalongside the ArcMap window,as map elements on the layoutready to be printed, or both.
Graphs are dynamic; they canupdate automatically as youchange the selected set offeatures in a layer. Thus, as youbrowse a map selecting newfeatures, the graph will update toreflect the new selected features.
Adding a graph to thelayout
1. Right-click the title bar of thegraph window and click Showon Layout.
If the graph is already on thelayout, this option will beunavailable.
Tip
Updating a graph on thelayoutGraphs shown on the layout willautomatically update as youchange the selected set of featuresthe graph is based on. If you wantto create a static copy on thelayout, copy and paste the graphon the layout.
1
Updating a graph whenthe selection changes
1. Right-click the title bar of thegraph window and clickReload Automatically.
When Reload Automatically ischecked, the graph willupdate whenever theselected set of featureschanges. Disabling thisfeature creates a static graph.This option works only whenyou create a graph using theselected features.Tip
You can only display agraph once on a layoutIf you want to show different setsof data graphed the same way, youneed to create multiple graphs. Youcan copy and paste a graph on alayout to create a static copy.
1
ch11.p65 12/05/2000, 1:43 PM326
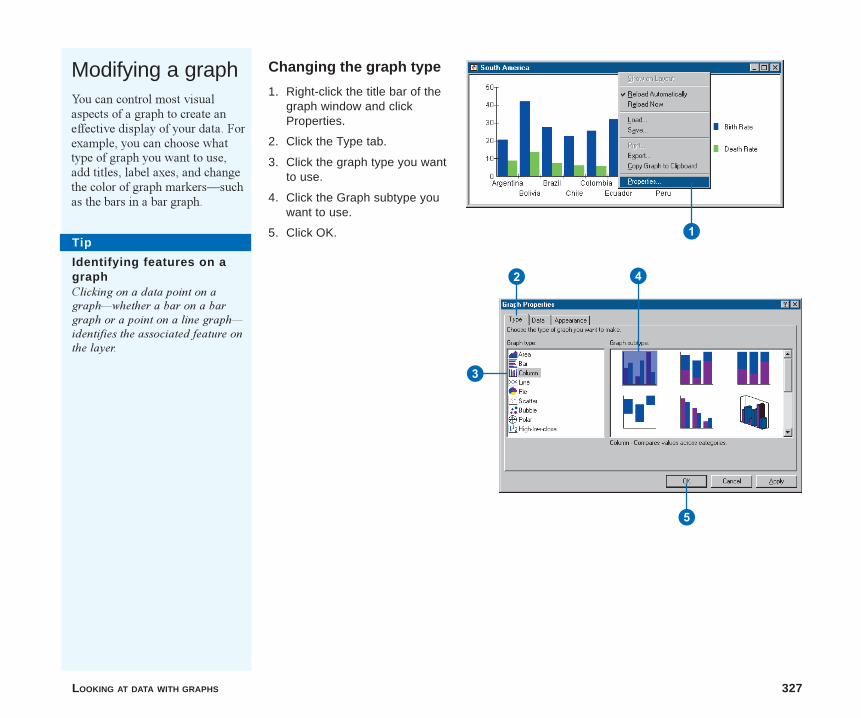
LOOKING AT DATA WITH GRAPHS 327
Modifying a graphYou can control most visualaspects of a graph to create aneffective display of your data. Forexample, you can choose whattype of graph you want to use,add titles, label axes, and changethe color of graph markers�suchas the bars in a bar graph.
Changing the graph type
1. Right-click the title bar of thegraph window and clickProperties.
2. Click the Type tab.
3. Click the graph type you wantto use.
4. Click the Graph subtype youwant to use.
5. Click OK. 1
3
2 4
5
Tip
Identifying features on agraphClicking on a data point on agraph�whether a bar on a bargraph or a point on a line graph�identifies the associated feature onthe layer.
ch11.p65 12/05/2000, 1:43 PM327
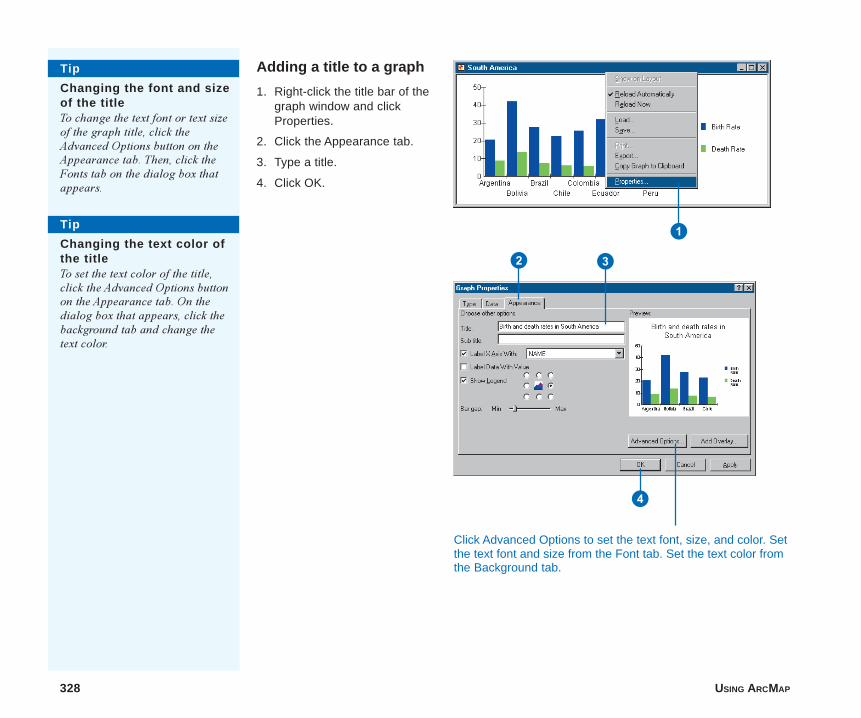
328 USING ARCMAP
Adding a title to a graph
1. Right-click the title bar of thegraph window and clickProperties.
2. Click the Appearance tab.
3. Type a title.
4. Click OK.
Tip
Changing the font and sizeof the titleTo change the text font or text sizeof the graph title, click theAdvanced Options button on theAppearance tab. Then, click theFonts tab on the dialog box thatappears.
Tip
Changing the text color ofthe titleTo set the text color of the title,click the Advanced Options buttonon the Appearance tab. On thedialog box that appears, click thebackground tab and change thetext color.
1
2 3
4
Click Advanced Options to set the text font, size, and color. Setthe text font and size from the Font tab. Set the text color fromthe Background tab.
ch11.p65 12/05/2000, 1:44 PM328
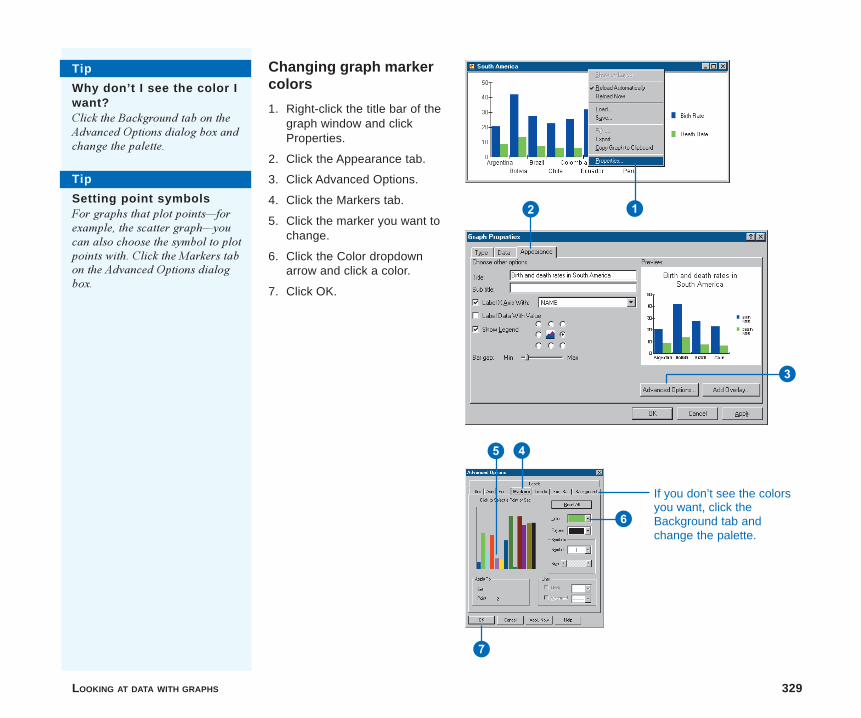
LOOKING AT DATA WITH GRAPHS 329
Changing graph markercolors
1. Right-click the title bar of thegraph window and clickProperties.
2. Click the Appearance tab.
3. Click Advanced Options.
4. Click the Markers tab.
5. Click the marker you want tochange.
6. Click the Color dropdownarrow and click a color.
7. Click OK.
7
5 4
6
Tip
Setting point symbolsFor graphs that plot points�forexample, the scatter graph�youcan also choose the symbol to plotpoints with. Click the Markers tabon the Advanced Options dialogbox.
Tip
Why don’t I see the color Iwant?Click the Background tab on theAdvanced Options dialog box andchange the palette.
2
3
1
If you don’t see the colorsyou want, click theBackground tab andchange the palette.
ch11.p65 12/05/2000, 1:44 PM329
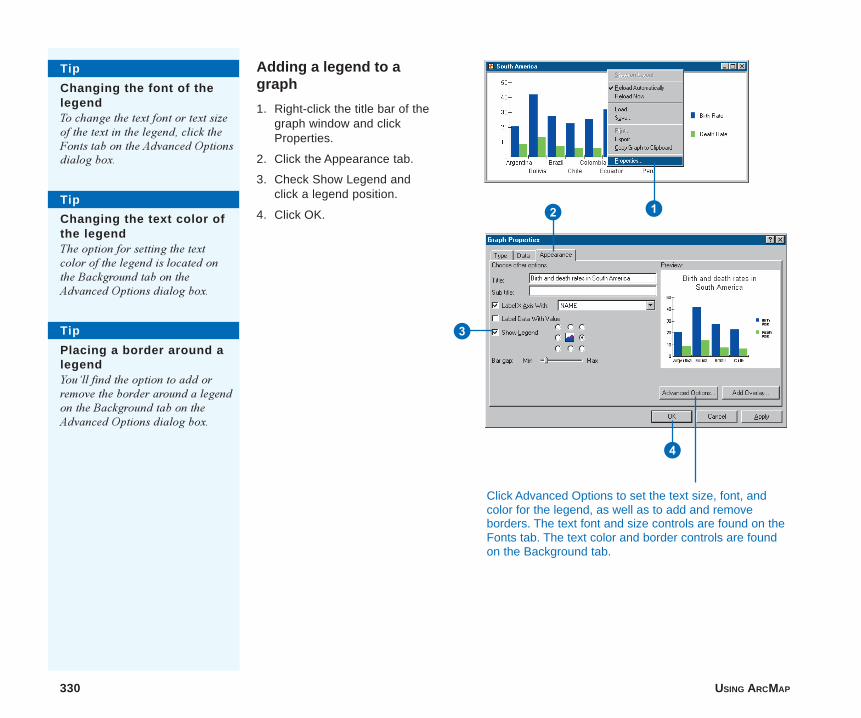
330 USING ARCMAP
Adding a legend to agraph
1. Right-click the title bar of thegraph window and clickProperties.
2. Click the Appearance tab.
3. Check Show Legend andclick a legend position.
4. Click OK.
4
Tip
Changing the font of thelegendTo change the text font or text sizeof the text in the legend, click theFonts tab on the Advanced Optionsdialog box.
Tip
Changing the text color ofthe legendThe option for setting the textcolor of the legend is located onthe Background tab on theAdvanced Options dialog box.
2
3
1
Tip
Placing a border around alegendYou�ll find the option to add orremove the border around a legendon the Background tab on theAdvanced Options dialog box.
Click Advanced Options to set the text size, font, andcolor for the legend, as well as to add and removeborders. The text font and size controls are found on theFonts tab. The text color and border controls are foundon the Background tab.
ch11.p65 12/05/2000, 1:45 PM330
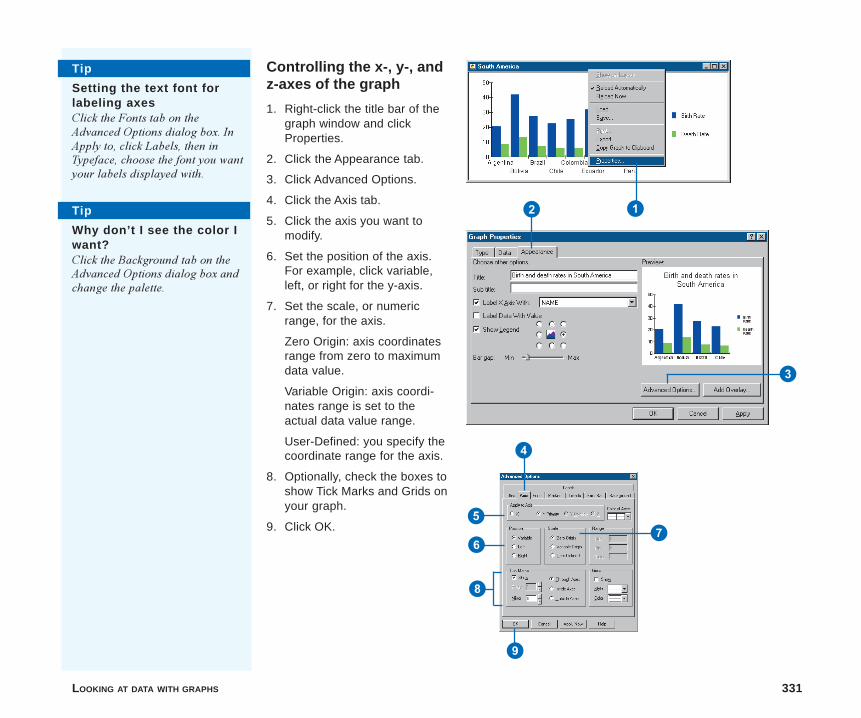
LOOKING AT DATA WITH GRAPHS 331
Controlling the x-, y-, andz-axes of the graph
1. Right-click the title bar of thegraph window and clickProperties.
2. Click the Appearance tab.
3. Click Advanced Options.
4. Click the Axis tab.
5. Click the axis you want tomodify.
6. Set the position of the axis.For example, click variable,left, or right for the y-axis.
7. Set the scale, or numericrange, for the axis.
Zero Origin: axis coordinatesrange from zero to maximumdata value.
Variable Origin: axis coordi-nates range is set to theactual data value range.
User-Defined: you specify thecoordinate range for the axis.
8. Optionally, check the boxes toshow Tick Marks and Grids onyour graph.
9. Click OK.
9
5
4
67
8
2
3
1
Tip
Setting the text font forlabeling axesClick the Fonts tab on theAdvanced Options dialog box. InApply to, click Labels, then inTypeface, choose the font you wantyour labels displayed with.
Tip
Why don’t I see the color Iwant?Click the Background tab on theAdvanced Options dialog box andchange the palette.
ch11.p65 12/05/2000, 1:45 PM331
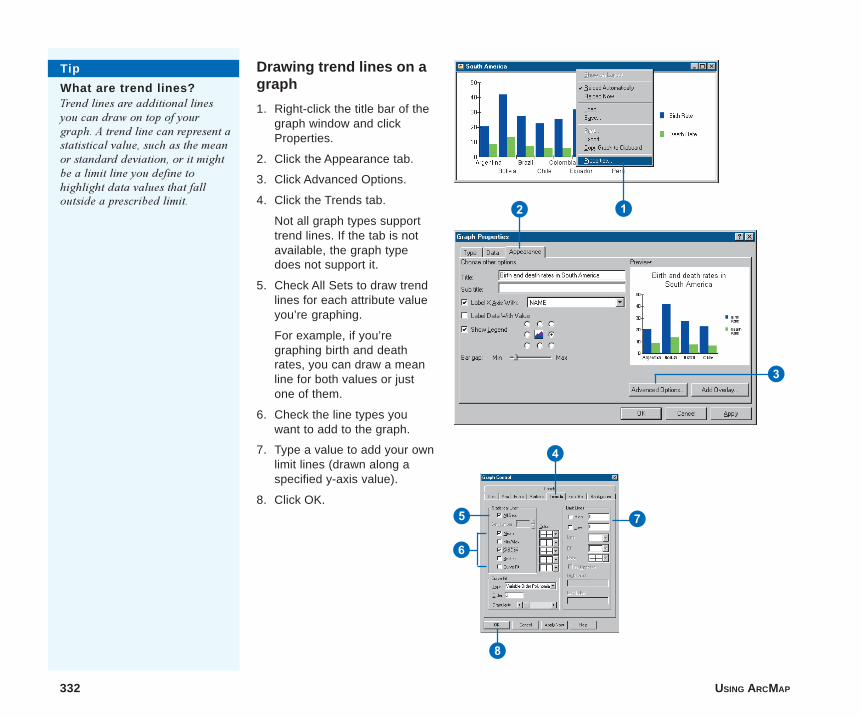
332 USING ARCMAP
Drawing trend lines on agraph
1. Right-click the title bar of thegraph window and clickProperties.
2. Click the Appearance tab.
3. Click Advanced Options.
4. Click the Trends tab.
Not all graph types supporttrend lines. If the tab is notavailable, the graph typedoes not support it.
5. Check All Sets to draw trendlines for each attribute valueyou’re graphing.
For example, if you’regraphing birth and deathrates, you can draw a meanline for both values or justone of them.
6. Check the line types youwant to add to the graph.
7. Type a value to add your ownlimit lines (drawn along aspecified y-axis value).
8. Click OK.
Tip
What are trend lines?Trend lines are additional linesyou can draw on top of yourgraph. A trend line can represent astatistical value, such as the meanor standard deviation, or it mightbe a limit line you define tohighlight data values that falloutside a prescribed limit.
8
5
4
7
6
2
3
1
ch11.p65 12/05/2000, 1:46 PM332
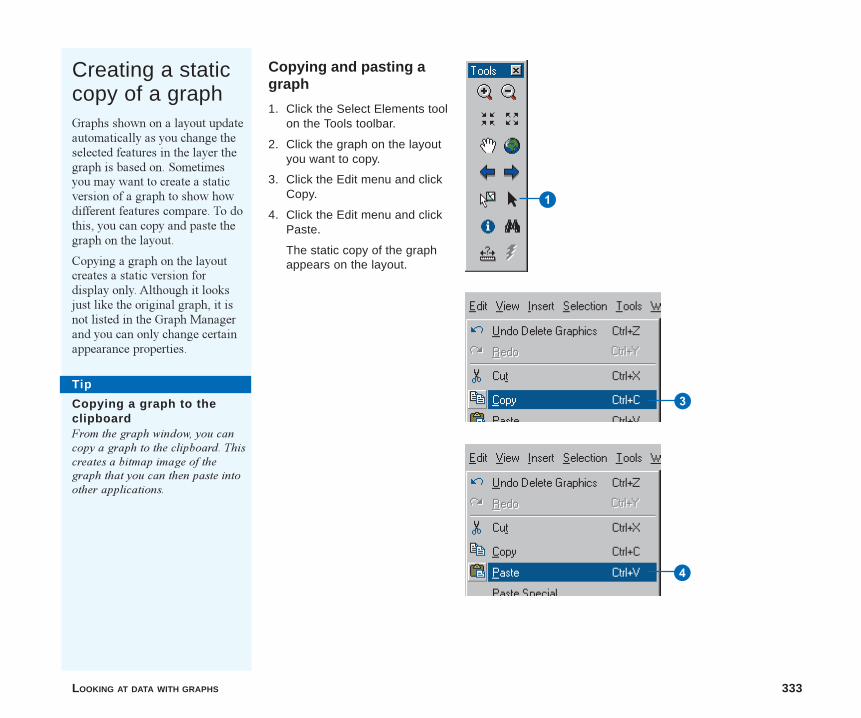
LOOKING AT DATA WITH GRAPHS 333
Creating a staticcopy of a graphGraphs shown on a layout updateautomatically as you change theselected features in the layer thegraph is based on. Sometimesyou may want to create a staticversion of a graph to show howdifferent features compare. To dothis, you can copy and paste thegraph on the layout.
Copying a graph on the layoutcreates a static version fordisplay only. Although it looksjust like the original graph, it isnot listed in the Graph Managerand you can only change certainappearance properties.
Tip
Copying a graph to theclipboardFrom the graph window, you cancopy a graph to the clipboard. Thiscreates a bitmap image of thegraph that you can then paste intoother applications.
Copying and pasting agraph
1. Click the Select Elements toolon the Tools toolbar.
2. Click the graph on the layoutyou want to copy.
3. Click the Edit menu and clickCopy.
4. Click the Edit menu and clickPaste.
The static copy of the graphappears on the layout.
1
3
4
ch11.p65 12/05/2000, 1:46 PM333
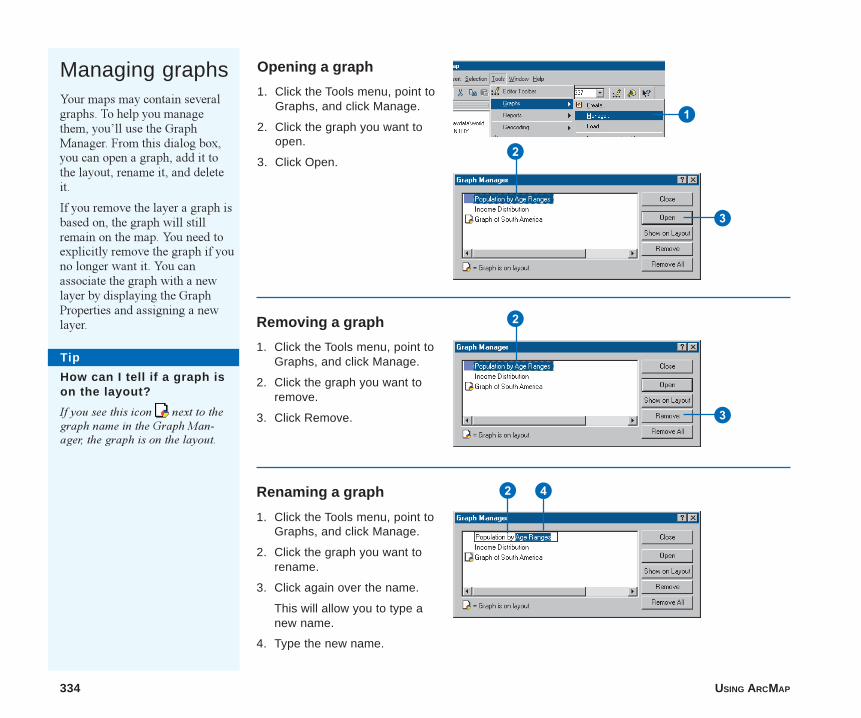
334 USING ARCMAP
Managing graphsYour maps may contain severalgraphs. To help you managethem, you�ll use the GraphManager. From this dialog box,you can open a graph, add it tothe layout, rename it, and deleteit.
If you remove the layer a graph isbased on, the graph will stillremain on the map. You need toexplicitly remove the graph if youno longer want it. You canassociate the graph with a newlayer by displaying the GraphProperties and assigning a newlayer.
Opening a graph
1. Click the Tools menu, point toGraphs, and click Manage.
2. Click the graph you want toopen.
3. Click Open.
Removing a graph
1. Click the Tools menu, point toGraphs, and click Manage.
2. Click the graph you want toremove.
3. Click Remove.
Renaming a graph
1. Click the Tools menu, point toGraphs, and click Manage.
2. Click the graph you want torename.
3. Click again over the name.
This will allow you to type anew name.
4. Type the new name.
1
Tip
How can I tell if a graph ison the layout?
If you see this icon next to thegraph name in the Graph Man-ager, the graph is on the layout.
2
3
2
3
2 4
ch11.p65 12/05/2000, 1:47 PM334
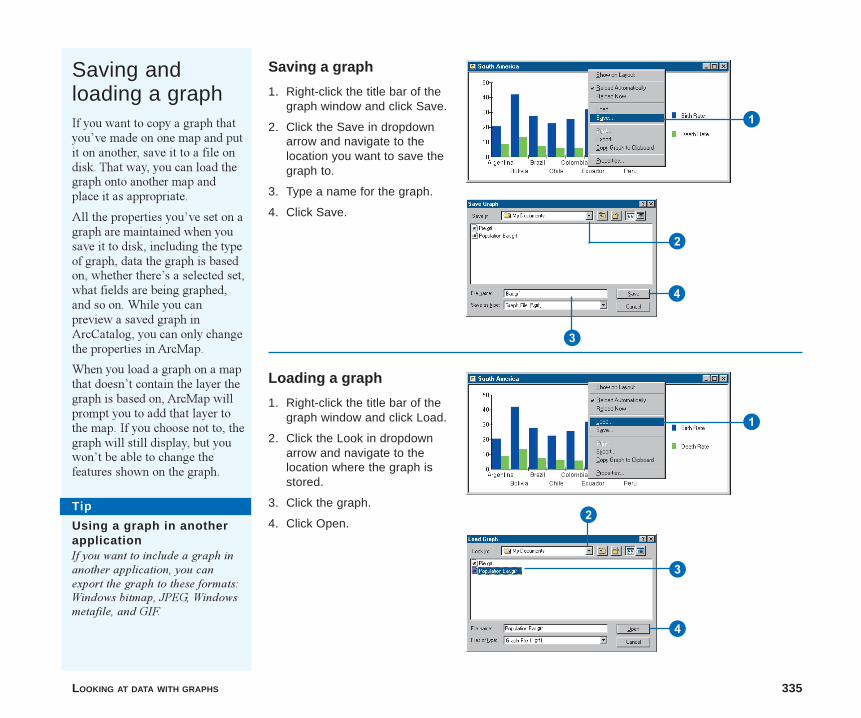
LOOKING AT DATA WITH GRAPHS 335
Saving andloading a graphIf you want to copy a graph thatyou�ve made on one map and putit on another, save it to a file ondisk. That way, you can load thegraph onto another map andplace it as appropriate.
All the properties you�ve set on agraph are maintained when yousave it to disk, including the typeof graph, data the graph is basedon, whether there�s a selected set,what fields are being graphed,and so on. While you canpreview a saved graph inArcCatalog, you can only changethe properties in ArcMap.
When you load a graph on a mapthat doesn�t contain the layer thegraph is based on, ArcMap willprompt you to add that layer tothe map. If you choose not to, thegraph will still display, but youwon�t be able to change thefeatures shown on the graph.
Saving a graph
1. Right-click the title bar of thegraph window and click Save.
2. Click the Save in dropdownarrow and navigate to thelocation you want to save thegraph to.
3. Type a name for the graph.
4. Click Save.
2
3
4
Loading a graph
1. Right-click the title bar of thegraph window and click Load.
2. Click the Look in dropdownarrow and navigate to thelocation where the graph isstored.
3. Click the graph.
4. Click Open.
3
4
2Tip
Using a graph in anotherapplicationIf you want to include a graph inanother application, you canexport the graph to these formats:Windows bitmap, JPEG, Windowsmetafile, and GIF.
1
1
ch11.p65 12/05/2000, 1:47 PM335
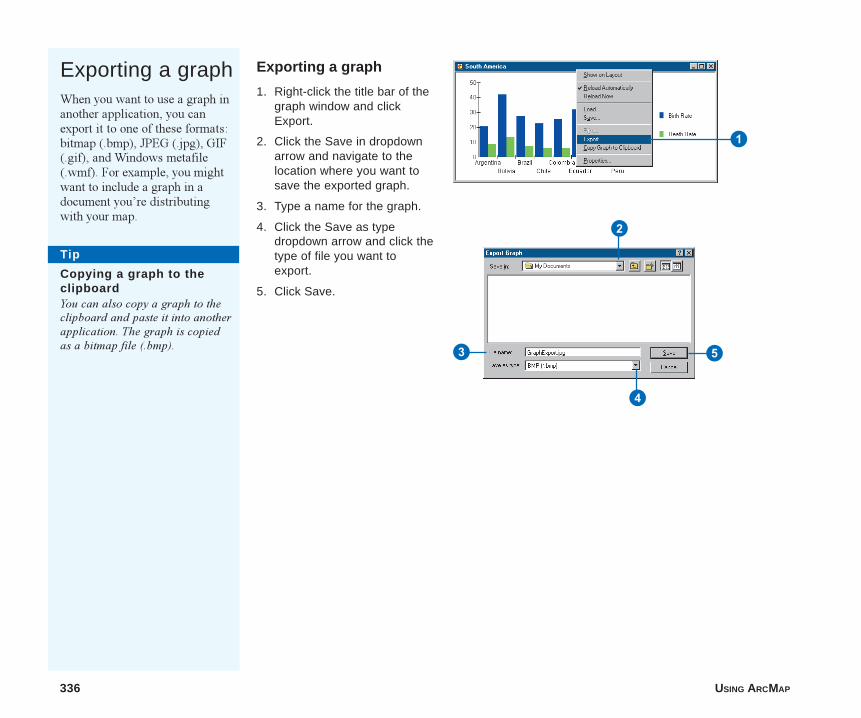
336 USING ARCMAP
Exporting a graph
1. Right-click the title bar of thegraph window and clickExport.
2. Click the Save in dropdownarrow and navigate to thelocation where you want tosave the exported graph.
3. Type a name for the graph.
4. Click the Save as typedropdown arrow and click thetype of file you want toexport.
5. Click Save.
2
3
4
5
Exporting a graphWhen you want to use a graph inanother application, you canexport it to one of these formats:bitmap (.bmp), JPEG (.jpg), GIF(.gif), and Windows metafile(.wmf). For example, you mightwant to include a graph in adocument you�re distributingwith your map.
1
Tip
Copying a graph to theclipboardYou can also copy a graph to theclipboard and paste it into anotherapplication. The graph is copiedas a bitmap file (.bmp).
ch11.p65 12/05/2000, 1:47 PM336
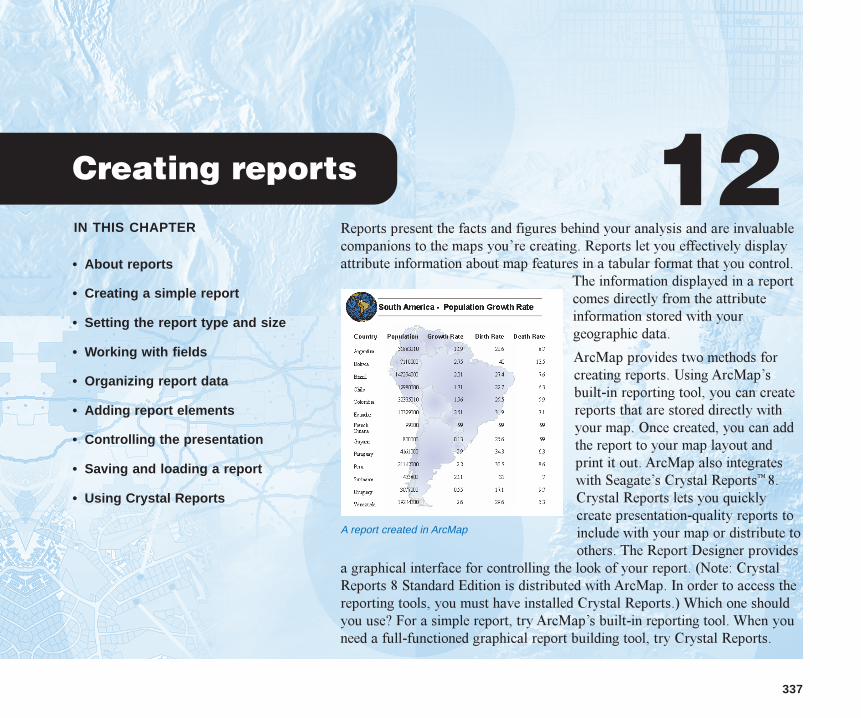
IN THIS CHAPTER
337
Creating reports 12• About reports
• Creating a simple report
• Setting the report type and size
• Working with fields
• Organizing report data
• Adding report elements
• Controlling the presentation
• Saving and loading a report
• Using Crystal Reports
Reports present the facts and figures behind your analysis and are invaluablecompanions to the maps you�re creating. Reports let you effectively displayattribute information about map features in a tabular format that you control.
The information displayed in a reportcomes directly from the attributeinformation stored with yourgeographic data.
ArcMap provides two methods forcreating reports. Using ArcMap�sbuilt-in reporting tool, you can createreports that are stored directly withyour map. Once created, you can addthe report to your map layout andprint it out. ArcMap also integrateswith Seagate�s Crystal Reports� 8.Crystal Reports lets you quicklycreate presentation-quality reports toinclude with your map or distribute toothers. The Report Designer provides
a graphical interface for controlling the look of your report. (Note: CrystalReports 8 Standard Edition is distributed with ArcMap. In order to access thereporting tools, you must have installed Crystal Reports.) Which one shouldyou use? For a simple report, try ArcMap�s built-in reporting tool. When youneed a full-functioned graphical report building tool, try Crystal Reports.
A report created in ArcMap
ch12.p65 12/06/2000, 9:21 AM337
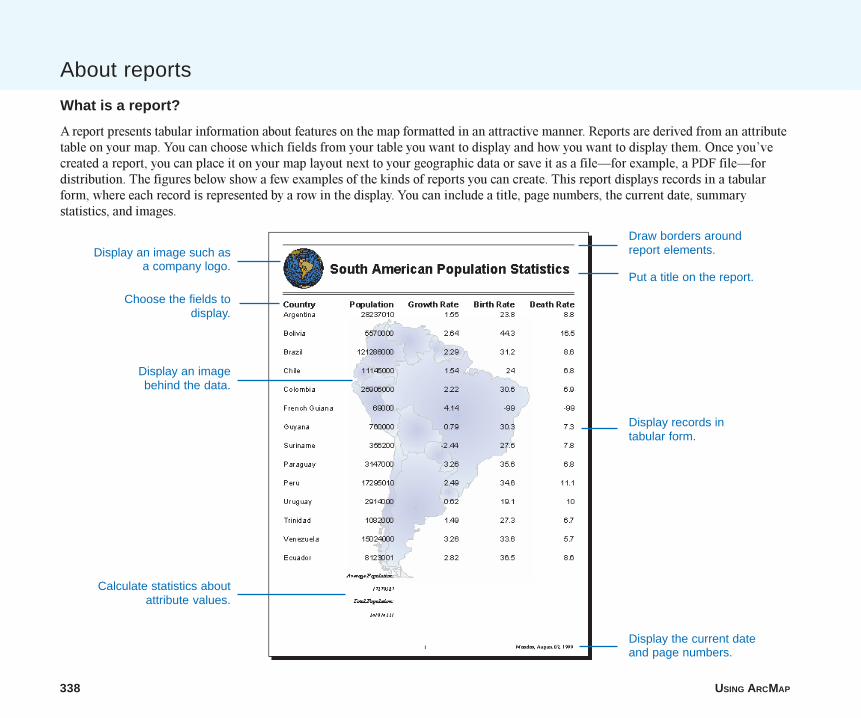
338 USING ARCMAP
About reports
What is a report?
A report presents tabular information about features on the map formatted in an attractive manner. Reports are derived from an attributetable on your map. You can choose which fields from your table you want to display and how you want to display them. Once you�vecreated a report, you can place it on your map layout next to your geographic data or save it as a file�for example, a PDF file�fordistribution. The figures below show a few examples of the kinds of reports you can create. This report displays records in a tabularform, where each record is represented by a row in the display. You can include a title, page numbers, the current date, summarystatistics, and images.
Display an imagebehind the data.
Display an image such asa company logo.
Display records intabular form.
Put a title on the report.
Display the current dateand page numbers.
Calculate statistics aboutattribute values.
Draw borders aroundreport elements.
Choose the fields todisplay.
ch12.p65 12/06/2000, 9:21 AM338
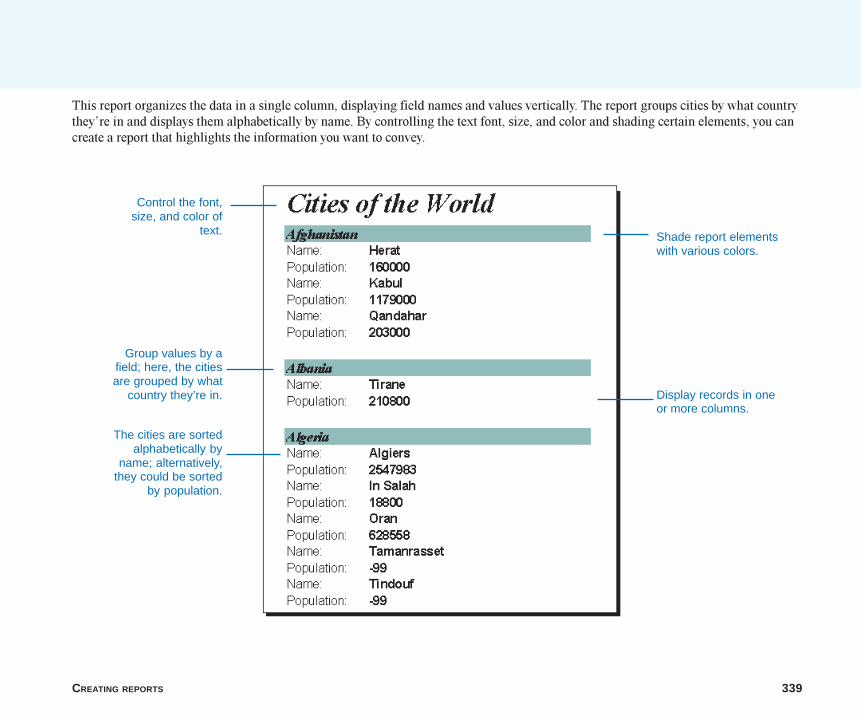
CREATING REPORTS 339
Control the font,size, and color of
text. Shade report elementswith various colors.
The cities are sortedalphabetically by
name; alternatively,they could be sorted
by population.
Group values by afield; here, the citiesare grouped by what
country they’re in. Display records in oneor more columns.
This report organizes the data in a single column, displaying field names and values vertically. The report groups cities by what countrythey�re in and displays them alphabetically by name. By controlling the text font, size, and color and shading certain elements, you cancreate a report that highlights the information you want to convey.
ch12.p65 12/06/2000, 9:21 AM339
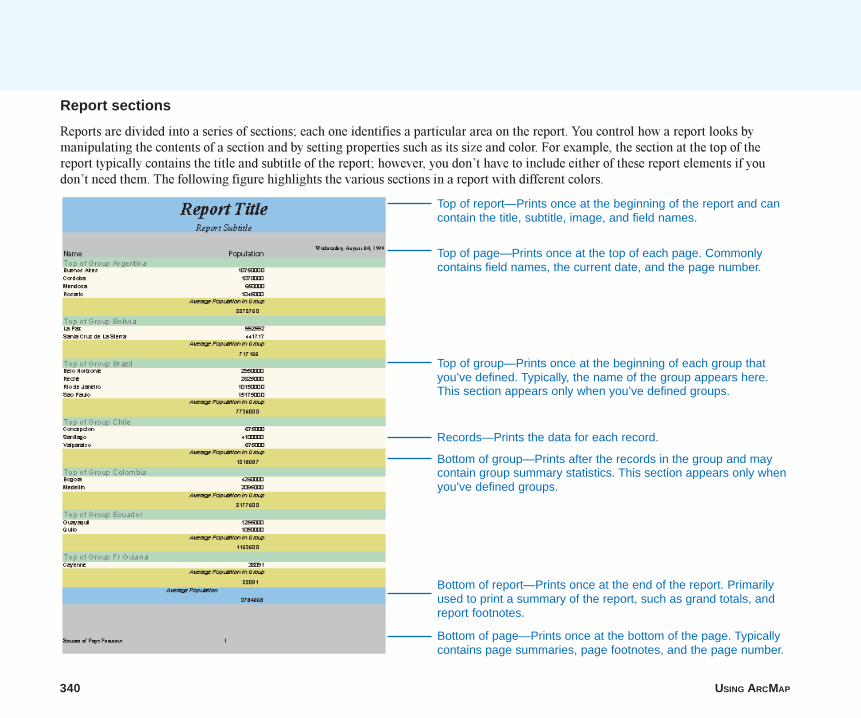
340 USING ARCMAP
Report sections
Reports are divided into a series of sections; each one identifies a particular area on the report. You control how a report looks bymanipulating the contents of a section and by setting properties such as its size and color. For example, the section at the top of thereport typically contains the title and subtitle of the report; however, you don�t have to include either of these report elements if youdon�t need them. The following figure highlights the various sections in a report with different colors.
Top of report—Prints once at the beginning of the report and cancontain the title, subtitle, image, and field names.
Top of page—Prints once at the top of each page. Commonlycontains field names, the current date, and the page number.
Top of group—Prints once at the beginning of each group thatyou’ve defined. Typically, the name of the group appears here.This section appears only when you’ve defined groups.
Records—Prints the data for each record.
Bottom of group—Prints after the records in the group and maycontain group summary statistics. This section appears only whenyou’ve defined groups.
Bottom of page—Prints once at the bottom of the page. Typicallycontains page summaries, page footnotes, and the page number.
Bottom of report—Prints once at the end of the report. Primarilyused to print a summary of the report, such as grand totals, andreport footnotes.
ch12.p65 12/06/2000, 9:21 AM340
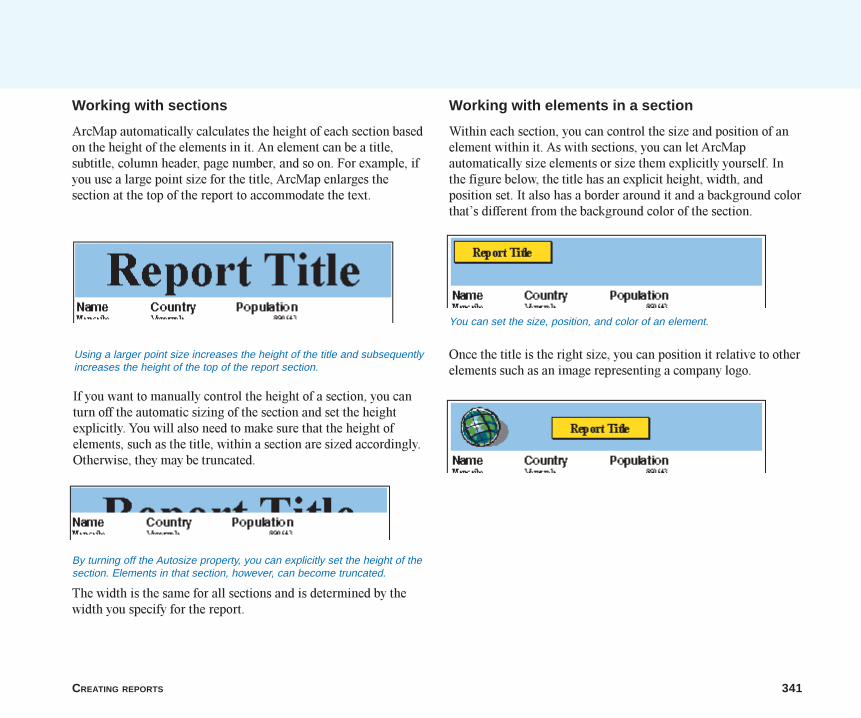
CREATING REPORTS 341
Working with sections
ArcMap automatically calculates the height of each section basedon the height of the elements in it. An element can be a title,subtitle, column header, page number, and so on. For example, ifyou use a large point size for the title, ArcMap enlarges thesection at the top of the report to accommodate the text.
If you want to manually control the height of a section, you canturn off the automatic sizing of the section and set the heightexplicitly. You will also need to make sure that the height ofelements, such as the title, within a section are sized accordingly.Otherwise, they may be truncated.
Using a larger point size increases the height of the title and subsequentlyincreases the height of the top of the report section.
By turning off the Autosize property, you can explicitly set the height of thesection. Elements in that section, however, can become truncated.
The width is the same for all sections and is determined by thewidth you specify for the report.
Working with elements in a section
Within each section, you can control the size and position of anelement within it. As with sections, you can let ArcMapautomatically size elements or size them explicitly yourself. Inthe figure below, the title has an explicit height, width, andposition set. It also has a border around it and a background colorthat�s different from the background color of the section.
You can set the size, position, and color of an element.
Once the title is the right size, you can position it relative to otherelements such as an image representing a company logo.
ch12.p65 12/06/2000, 9:22 AM341
342 USING ARCMAP
Creating a simplereportA report lets you organize anddisplay the tabular data that�sassociated with your geographicfeatures. Sometimes you�ll wantto print out a report to distributewith your map or, alternatively,you might put the report right onthe map.
When you create your report, youchoose what fields to display andwhether you want to generate areport listing all features in alayer or only the selected ones.Once you�ve created your report,you can put it on the layout nextto your map display or print itout.
A report has many properties thatyou set when you create it. Forexample, you can set a propertyto define what type of report youwant�tabular or columnar. Youcan also set a particular page sizeand use a particular text font andcolor for the text on your report.
The set of steps to the right showyou how to make a simple tabularreport. Subsequent sections inthis chapter focus on how to setreport properties to achieve aparticular result.
Creating a simple tabularreport
1. Click the Tools menu, point toReports, and click CreateReport.
2. On the Fields tab, click theLayer/Table dropdown arrowand click the layer or tableyou want to base the reporton.
3. In the Available Fields list,double-click the fields youwant to include in the report.
4. Check Use Selected Set ifyou want to create a reportwith only the selectedfeatures.
5. Click the arrow buttons toorder the report fields.
6. Click the Sorting tab.
7. Click a field to sort in the Sortcolumn.
8. Click the Display tab. u
2
3
4
5
786
ch12.p65 12/06/2000, 9:22 AM342
CREATING REPORTS 343
U
Y
Q
W
RT
E
9. Under Settings, click Ele-ments.
10.Check Title to add a title tothe report.
11. Locate the Text property andtype a title for the report.
12.Click the Font property andset the font and size of thetitle.
13.Click Show Settings topreview the report.
14.Click Generate Report.
15.At the top of the ReportViewer, click Add to add thereport to the map layout.
16.Click OK.
The report is added to thelayout as a graphic element.Each page of the report isadded as a separate graphicelement on the layout.
9
Tip
Adding a report to the maplayoutOnce you�ve created a report, youcan display it on your map layout.By creating a report with aparticular page size, you canensure that it fits exactly where youwant it on the layout.
Tip
Adding titles, subtitles,and page numbers to yourreportYou can add additional elements toyour report�such as a title, pagenumbers, an image, and foot-notes�to enhance the display. TheElements setting on the Displaytab lists all the additional thingsyou can add.
Tip
Shading recordsTo make the data in your reportseasier to read, you can shade everyother record with a color. On theReport Properties dialog, click theDisplay tab. Click Report and clickRecords. Then set the ShadeRecords and Shade Colorproperties.
ch12.p65 12/06/2000, 9:23 AM343
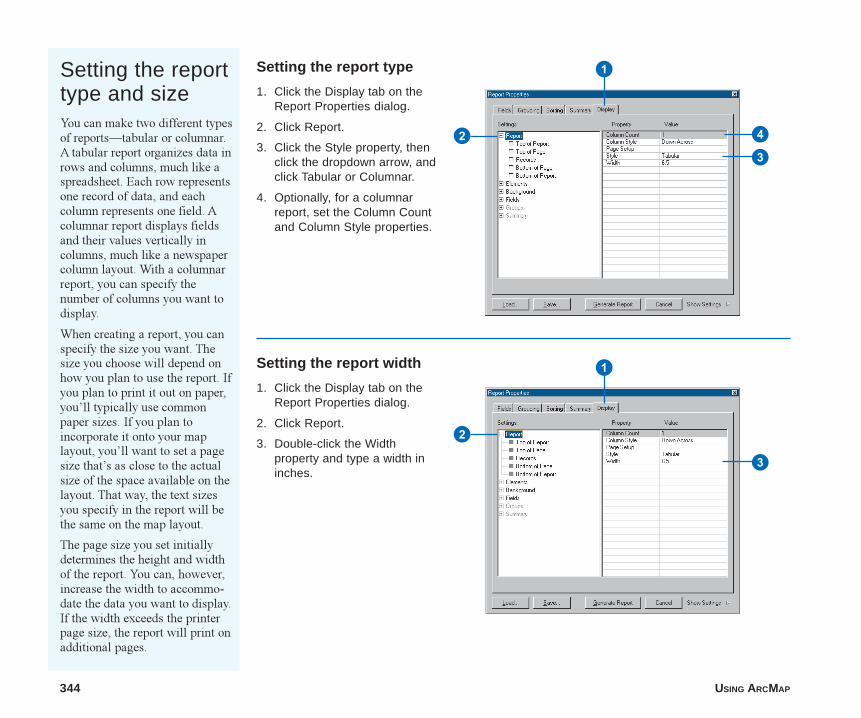
344 USING ARCMAP
Setting the reporttype and sizeYou can make two different typesof reports�tabular or columnar.A tabular report organizes data inrows and columns, much like aspreadsheet. Each row representsone record of data, and eachcolumn represents one field. Acolumnar report displays fieldsand their values vertically incolumns, much like a newspapercolumn layout. With a columnarreport, you can specify thenumber of columns you want todisplay.
When creating a report, you canspecify the size you want. Thesize you choose will depend onhow you plan to use the report. Ifyou plan to print it out on paper,you�ll typically use commonpaper sizes. If you plan toincorporate it onto your maplayout, you�ll want to set a pagesize that�s as close to the actualsize of the space available on thelayout. That way, the text sizesyou specify in the report will bethe same on the map layout.
The page size you set initiallydetermines the height and widthof the report. You can, however,increase the width to accommo-date the data you want to display.If the width exceeds the printerpage size, the report will print onadditional pages.
Setting the report type
1. Click the Display tab on theReport Properties dialog.
2. Click Report.
3. Click the Style property, thenclick the dropdown arrow, andclick Tabular or Columnar.
4. Optionally, for a columnarreport, set the Column Countand Column Style properties.
Setting the report width
1. Click the Display tab on theReport Properties dialog.
2. Click Report.
3. Double-click the Widthproperty and type a width ininches.
1
23
4
1
2
3
ch12.p65 12/06/2000, 9:24 AM344
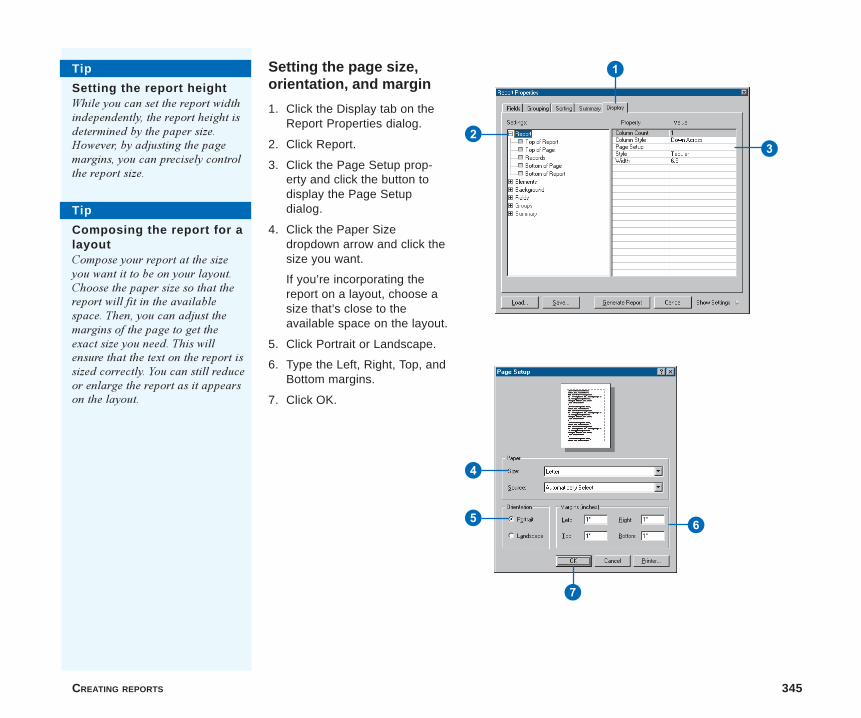
CREATING REPORTS 345
Setting the page size,orientation, and margin
1. Click the Display tab on theReport Properties dialog.
2. Click Report.
3. Click the Page Setup prop-erty and click the button todisplay the Page Setupdialog.
4. Click the Paper Sizedropdown arrow and click thesize you want.
If you’re incorporating thereport on a layout, choose asize that’s close to theavailable space on the layout.
5. Click Portrait or Landscape.
6. Type the Left, Right, Top, andBottom margins.
7. Click OK.
Tip
Setting the report heightWhile you can set the report widthindependently, the report height isdetermined by the paper size.However, by adjusting the pagemargins, you can precisely controlthe report size.
Tip
Composing the report for alayoutCompose your report at the sizeyou want it to be on your layout.Choose the paper size so that thereport will fit in the availablespace. Then, you can adjust themargins of the page to get theexact size you need. This willensure that the text on the report issized correctly. You can still reduceor enlarge the report as it appearson the layout.
1
23
4
5 6
7
ch12.p65 12/06/2000, 9:25 AM345
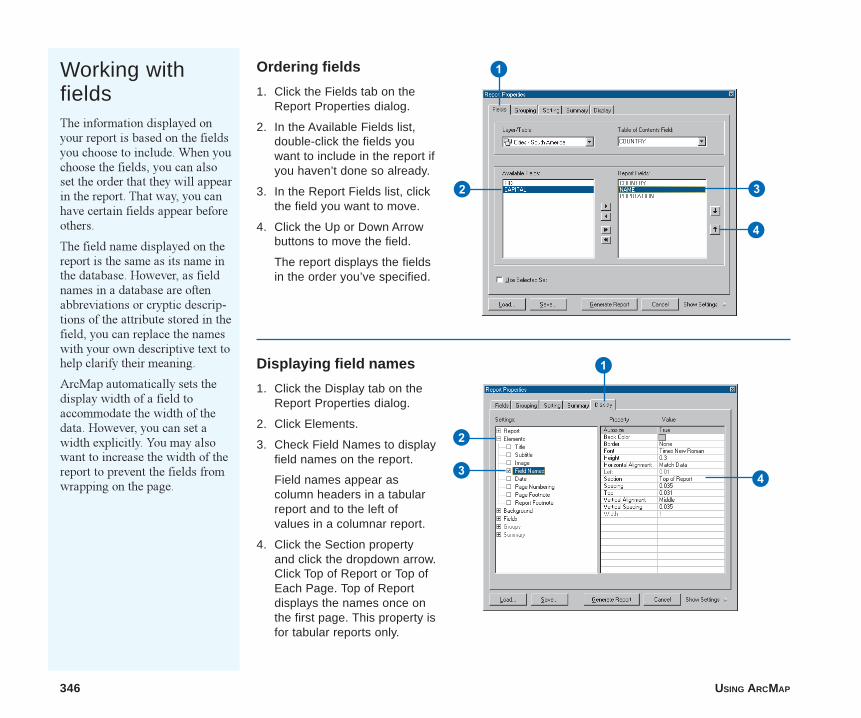
346 USING ARCMAP
Working withfieldsThe information displayed onyour report is based on the fieldsyou choose to include. When youchoose the fields, you can alsoset the order that they will appearin the report. That way, you canhave certain fields appear beforeothers.
The field name displayed on thereport is the same as its name inthe database. However, as fieldnames in a database are oftenabbreviations or cryptic descrip-tions of the attribute stored in thefield, you can replace the nameswith your own descriptive text tohelp clarify their meaning.
ArcMap automatically sets thedisplay width of a field toaccommodate the width of thedata. However, you can set awidth explicitly. You may alsowant to increase the width of thereport to prevent the fields fromwrapping on the page.
Ordering fields
1. Click the Fields tab on theReport Properties dialog.
2. In the Available Fields list,double-click the fields youwant to include in the report ifyou haven’t done so already.
3. In the Report Fields list, clickthe field you want to move.
4. Click the Up or Down Arrowbuttons to move the field.
The report displays the fieldsin the order you’ve specified.
Displaying field names
1. Click the Display tab on theReport Properties dialog.
2. Click Elements.
3. Check Field Names to displayfield names on the report.
Field names appear ascolumn headers in a tabularreport and to the left ofvalues in a columnar report.
4. Click the Section propertyand click the dropdown arrow.Click Top of Report or Top ofEach Page. Top of Reportdisplays the names once onthe first page. This property isfor tabular reports only.
4
1
2 3
1
2
3 4
ch12.p65 12/06/2000, 9:25 AM346
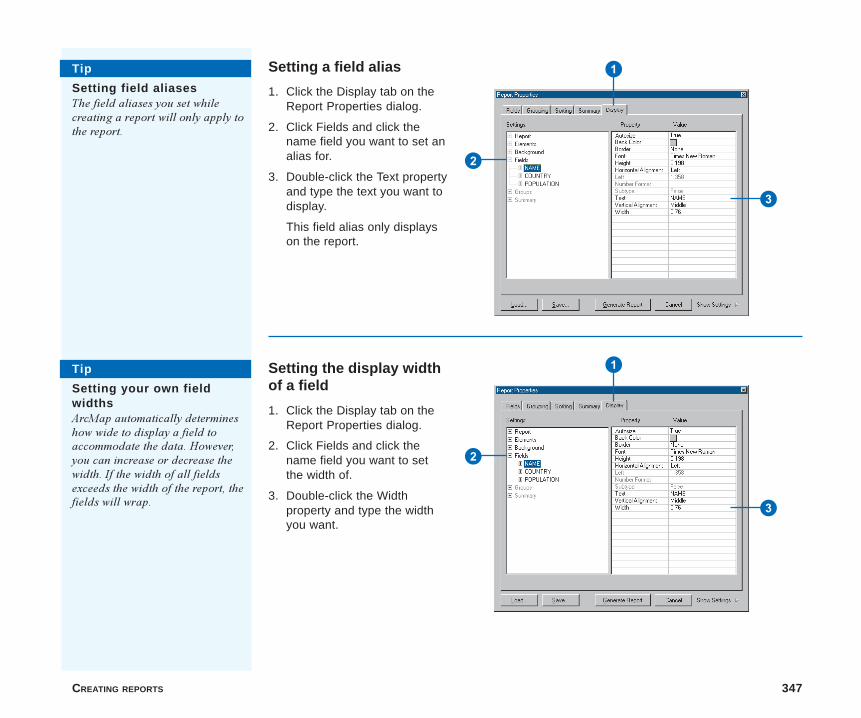
CREATING REPORTS 347
Setting a field alias
1. Click the Display tab on theReport Properties dialog.
2. Click Fields and click thename field you want to set analias for.
3. Double-click the Text propertyand type the text you want todisplay.
This field alias only displayson the report.
Setting the display widthof a field
1. Click the Display tab on theReport Properties dialog.
2. Click Fields and click thename field you want to setthe width of.
3. Double-click the Widthproperty and type the widthyou want.
1
2
3
1
2
3
Tip
Setting field aliasesThe field aliases you set whilecreating a report will only apply tothe report.
Tip
Setting your own fieldwidthsArcMap automatically determineshow wide to display a field toaccommodate the data. However,you can increase or decrease thewidth. If the width of all fieldsexceeds the width of the report, thefields will wrap.
ch12.p65 12/06/2000, 9:26 AM347
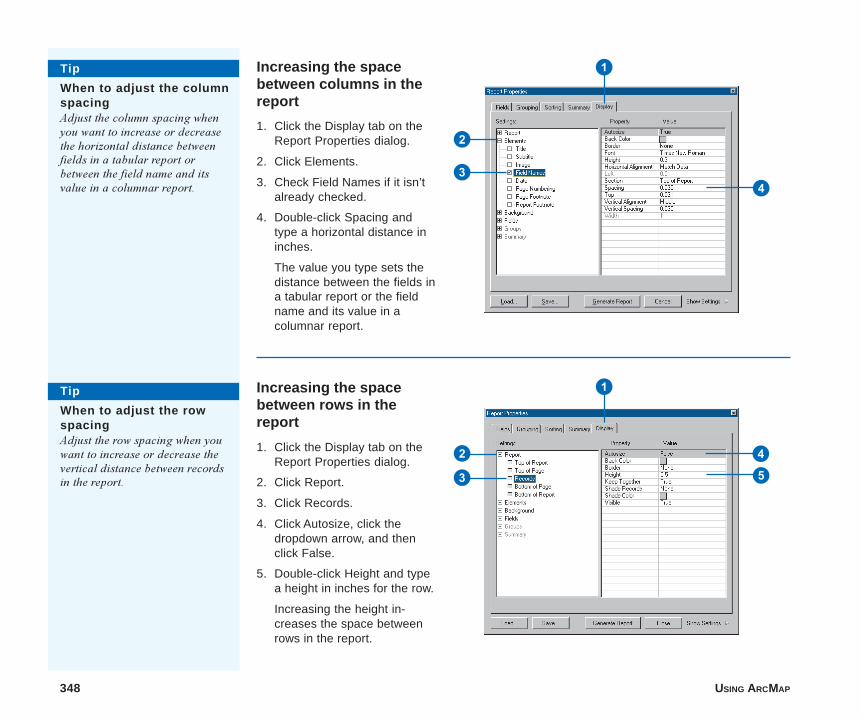
348 USING ARCMAP
Increasing the spacebetween columns in thereport
1. Click the Display tab on theReport Properties dialog.
2. Click Elements.
3. Check Field Names if it isn’talready checked.
4. Double-click Spacing andtype a horizontal distance ininches.
The value you type sets thedistance between the fields ina tabular report or the fieldname and its value in acolumnar report.
Increasing the spacebetween rows in thereport
1. Click the Display tab on theReport Properties dialog.
2. Click Report.
3. Click Records.
4. Click Autosize, click thedropdown arrow, and thenclick False.
5. Double-click Height and typea height in inches for the row.
Increasing the height in-creases the space betweenrows in the report.
Tip
When to adjust the columnspacingAdjust the column spacing whenyou want to increase or decreasethe horizontal distance betweenfields in a tabular report orbetween the field name and itsvalue in a columnar report.
Tip
When to adjust the rowspacingAdjust the row spacing when youwant to increase or decrease thevertical distance between recordsin the report.
1
2
34
1
2
3 5
4
ch12.p65 12/06/2000, 9:27 AM348
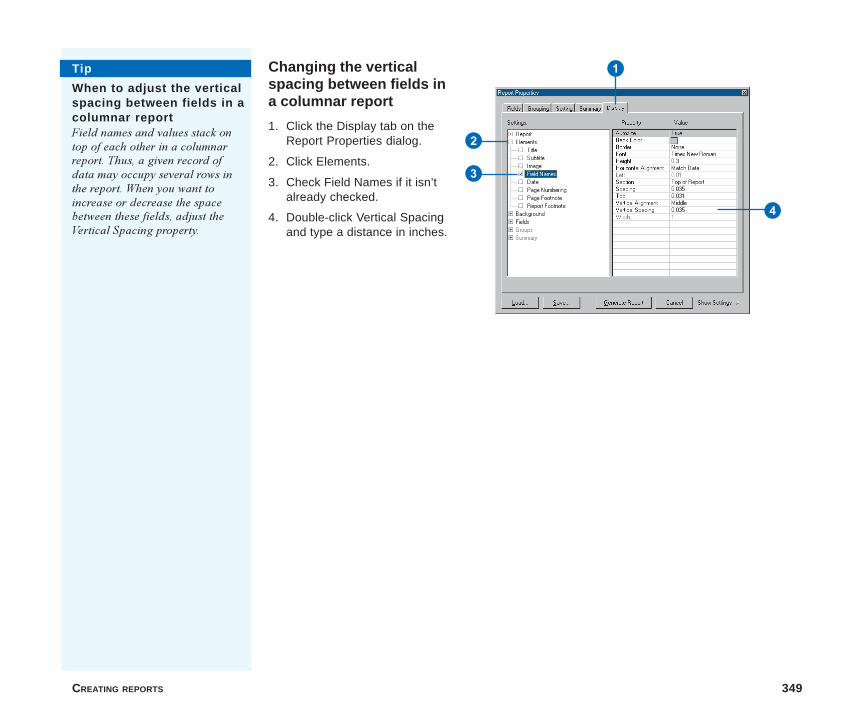
CREATING REPORTS 349
1Changing the verticalspacing between fields ina columnar report
1. Click the Display tab on theReport Properties dialog.
2. Click Elements.
3. Check Field Names if it isn’talready checked.
4. Double-click Vertical Spacingand type a distance in inches.
Tip
When to adjust the verticalspacing between fields in acolumnar reportField names and values stack ontop of each other in a columnarreport. Thus, a given record ofdata may occupy several rows inthe report. When you want toincrease or decrease the spacebetween these fields, adjust theVertical Spacing property.
2
3
4
ch12.p65 12/06/2000, 9:27 AM349
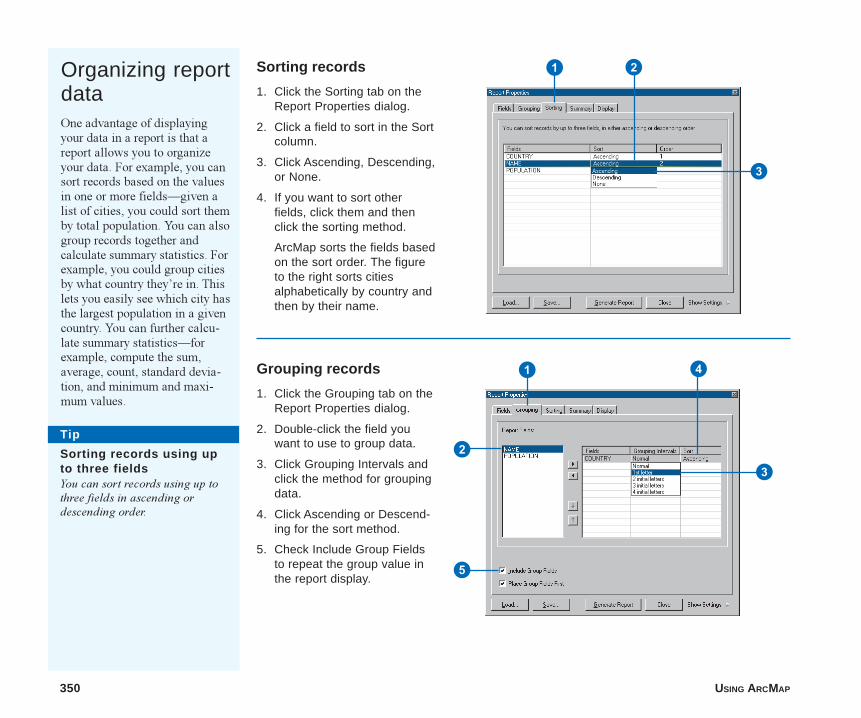
350 USING ARCMAP
Organizing reportdataOne advantage of displayingyour data in a report is that areport allows you to organizeyour data. For example, you cansort records based on the valuesin one or more fields�given alist of cities, you could sort themby total population. You can alsogroup records together andcalculate summary statistics. Forexample, you could group citiesby what country they�re in. Thislets you easily see which city hasthe largest population in a givencountry. You can further calcu-late summary statistics�forexample, compute the sum,average, count, standard devia-tion, and minimum and maxi-mum values.
Sorting records
1. Click the Sorting tab on theReport Properties dialog.
2. Click a field to sort in the Sortcolumn.
3. Click Ascending, Descending,or None.
4. If you want to sort otherfields, click them and thenclick the sorting method.
ArcMap sorts the fields basedon the sort order. The figureto the right sorts citiesalphabetically by country andthen by their name.
Grouping records
1. Click the Grouping tab on theReport Properties dialog.
2. Double-click the field youwant to use to group data.
3. Click Grouping Intervals andclick the method for groupingdata.
4. Click Ascending or Descend-ing for the sort method.
5. Check Include Group Fieldsto repeat the group value inthe report display.
Tip
Sorting records using upto three fieldsYou can sort records using up tothree fields in ascending ordescending order.
21
3
3
1
2
4
5
ch12.p65 12/06/2000, 9:28 AM350
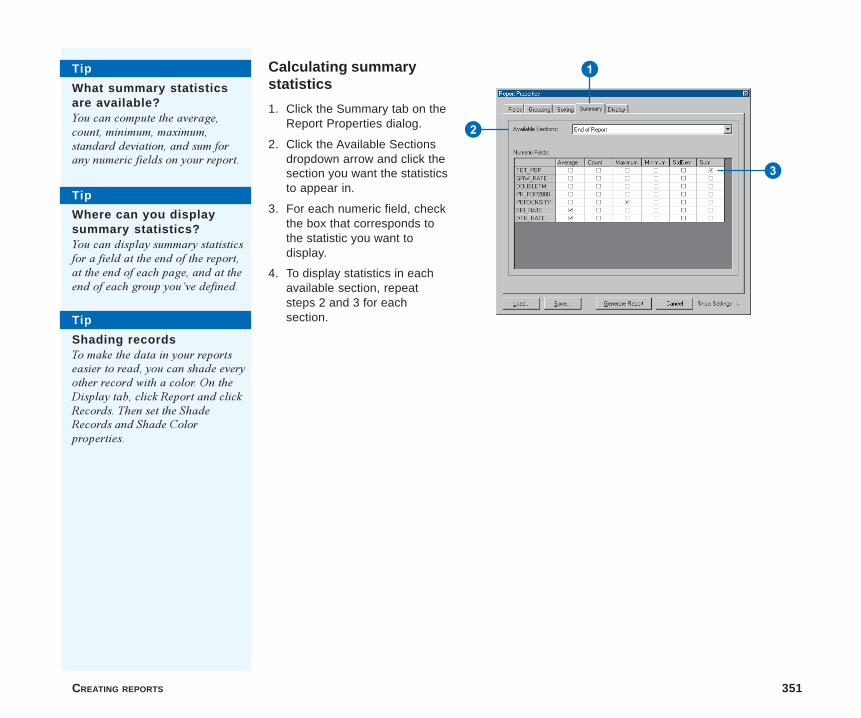
CREATING REPORTS 351
Calculating summarystatistics
1. Click the Summary tab on theReport Properties dialog.
2. Click the Available Sectionsdropdown arrow and click thesection you want the statisticsto appear in.
3. For each numeric field, checkthe box that corresponds tothe statistic you want todisplay.
4. To display statistics in eachavailable section, repeatsteps 2 and 3 for eachsection.
Tip
Where can you displaysummary statistics?You can display summary statisticsfor a field at the end of the report,at the end of each page, and at theend of each group you�ve defined.
1
2
3
Tip
What summary statisticsare available?You can compute the average,count, minimum, maximum,standard deviation, and sum forany numeric fields on your report.
Tip
Shading recordsTo make the data in your reportseasier to read, you can shade everyother record with a color. On theDisplay tab, click Report and clickRecords. Then set the ShadeRecords and Shade Colorproperties.
ch12.p65 12/06/2000, 9:29 AM351
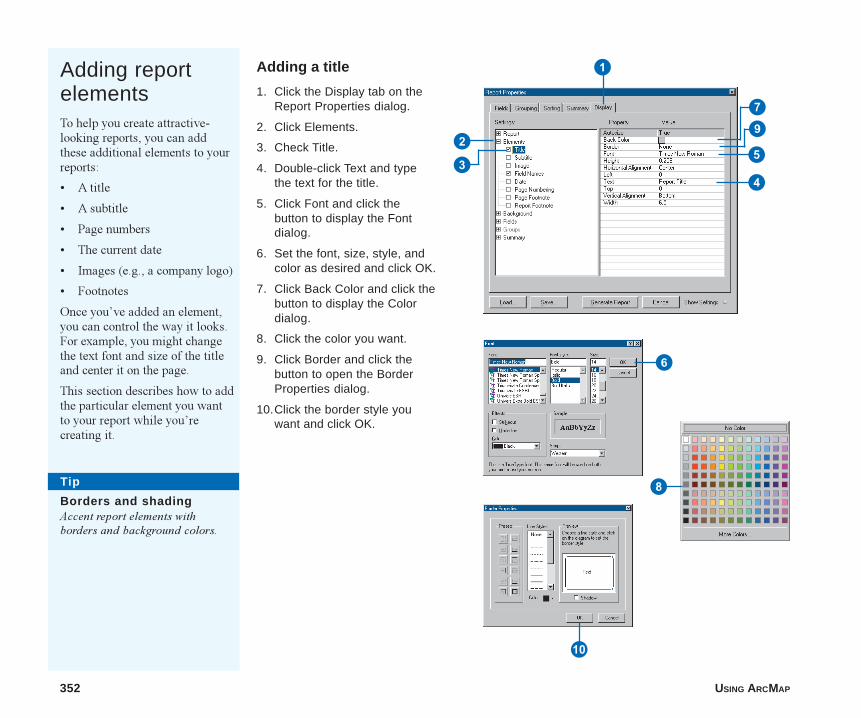
352 USING ARCMAP
Q
Adding reportelementsTo help you create attractive-looking reports, you can addthese additional elements to yourreports:
� A title
� A subtitle
� Page numbers
� The current date
� Images (e.g., a company logo)
� Footnotes
Once you�ve added an element,you can control the way it looks.For example, you might changethe text font and size of the titleand center it on the page.
This section describes how to addthe particular element you wantto your report while you�recreating it.
Adding a title
1. Click the Display tab on theReport Properties dialog.
2. Click Elements.
3. Check Title.
4. Double-click Text and typethe text for the title.
5. Click Font and click thebutton to display the Fontdialog.
6. Set the font, size, style, andcolor as desired and click OK.
7. Click Back Color and click thebutton to display the Colordialog.
8. Click the color you want.
9. Click Border and click thebutton to open the BorderProperties dialog.
10.Click the border style youwant and click OK.
2
1
34
5
6
8
7
9
Tip
Borders and shadingAccent report elements withborders and background colors.
ch12.p65 12/06/2000, 9:29 AM352
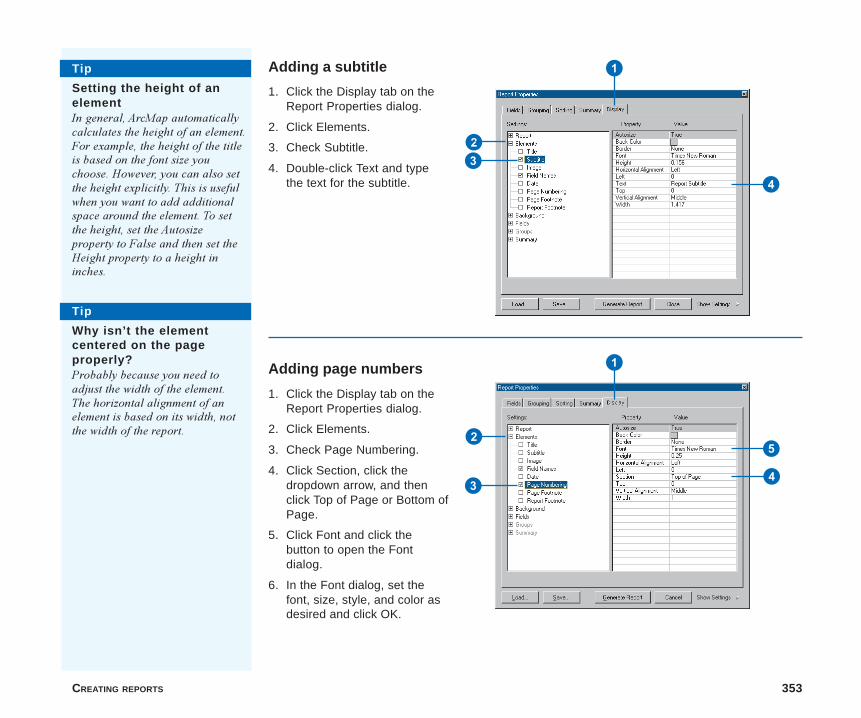
CREATING REPORTS 353
Tip
Setting the height of anelementIn general, ArcMap automaticallycalculates the height of an element.For example, the height of the titleis based on the font size youchoose. However, you can also setthe height explicitly. This is usefulwhen you want to add additionalspace around the element. To setthe height, set the Autosizeproperty to False and then set theHeight property to a height ininches.
Adding a subtitle
1. Click the Display tab on theReport Properties dialog.
2. Click Elements.
3. Check Subtitle.
4. Double-click Text and typethe text for the subtitle.
Adding page numbers
1. Click the Display tab on theReport Properties dialog.
2. Click Elements.
3. Check Page Numbering.
4. Click Section, click thedropdown arrow, and thenclick Top of Page or Bottom ofPage.
5. Click Font and click thebutton to open the Fontdialog.
6. In the Font dialog, set thefont, size, style, and color asdesired and click OK.
Tip
Why isn’t the elementcentered on the pageproperly?Probably because you need toadjust the width of the element.The horizontal alignment of anelement is based on its width, notthe width of the report.
2
1
3
4
2
1
34
5
ch12.p65 12/06/2000, 9:30 AM353
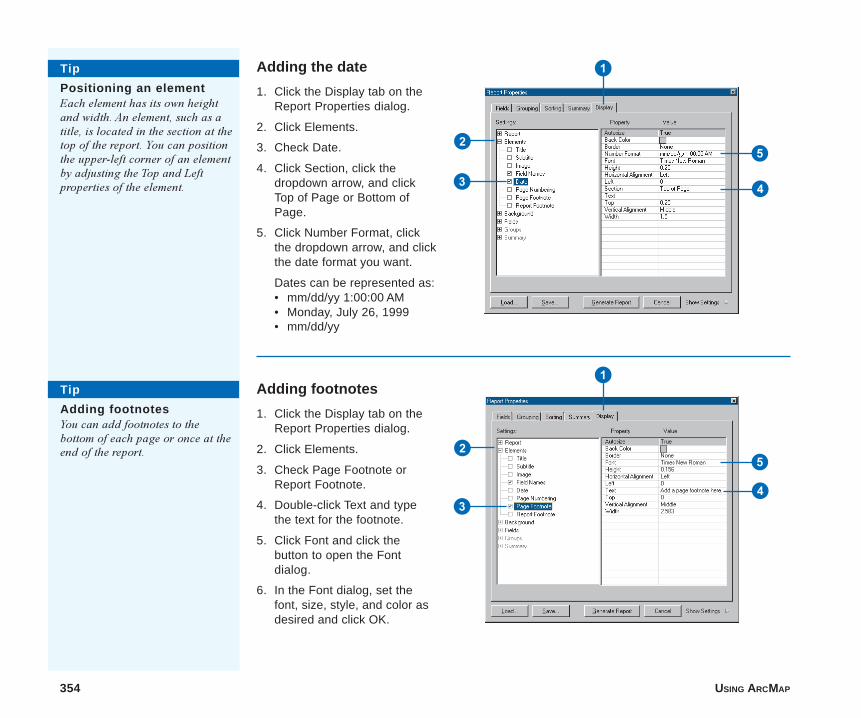
354 USING ARCMAP
Adding footnotes
1. Click the Display tab on theReport Properties dialog.
2. Click Elements.
3. Check Page Footnote orReport Footnote.
4. Double-click Text and typethe text for the footnote.
5. Click Font and click thebutton to open the Fontdialog.
6. In the Font dialog, set thefont, size, style, and color asdesired and click OK.
Tip
Positioning an elementEach element has its own heightand width. An element, such as atitle, is located in the section at thetop of the report. You can positionthe upper-left corner of an elementby adjusting the Top and Leftproperties of the element.
Adding the date
1. Click the Display tab on theReport Properties dialog.
2. Click Elements.
3. Check Date.
4. Click Section, click thedropdown arrow, and clickTop of Page or Bottom ofPage.
5. Click Number Format, clickthe dropdown arrow, and clickthe date format you want.
Dates can be represented as:• mm/dd/yy 1:00:00 AM• Monday, July 26, 1999• mm/dd/yy
2
1
3 4
5
2
1
34
5
Tip
Adding footnotesYou can add footnotes to thebottom of each page or once at theend of the report.
ch12.p65 12/06/2000, 9:31 AM354
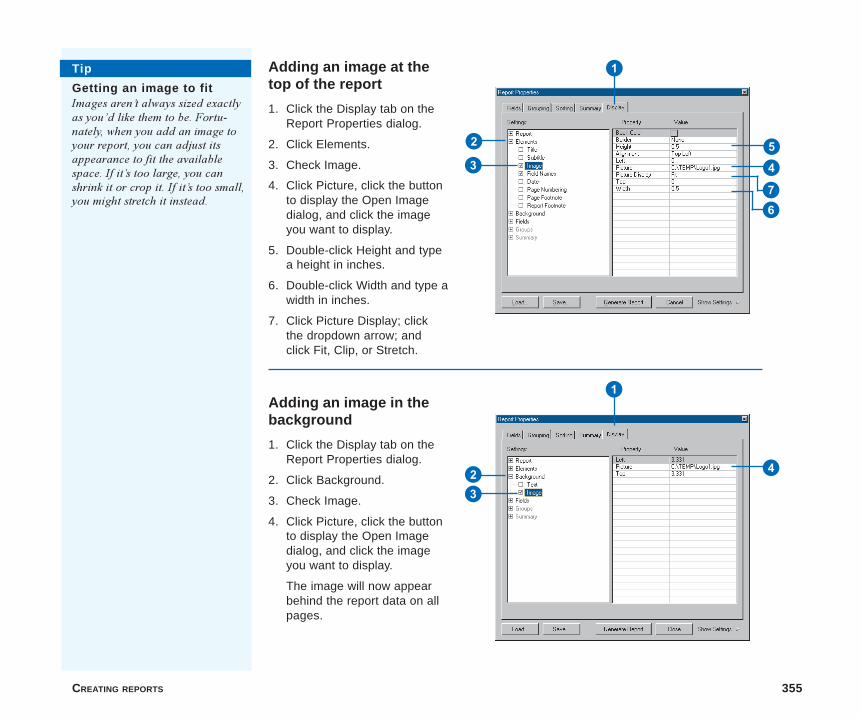
CREATING REPORTS 355
Adding an image at thetop of the report
1. Click the Display tab on theReport Properties dialog.
2. Click Elements.
3. Check Image.
4. Click Picture, click the buttonto display the Open Imagedialog, and click the imageyou want to display.
5. Double-click Height and typea height in inches.
6. Double-click Width and type awidth in inches.
7. Click Picture Display; clickthe dropdown arrow; andclick Fit, Clip, or Stretch.
Adding an image in thebackground
1. Click the Display tab on theReport Properties dialog.
2. Click Background.
3. Check Image.
4. Click Picture, click the buttonto display the Open Imagedialog, and click the imageyou want to display.
The image will now appearbehind the report data on allpages.
2
1
354
Tip
Getting an image to fitImages aren�t always sized exactlyas you�d like them to be. Fortu-nately, when you add an image toyour report, you can adjust itsappearance to fit the availablespace. If it�s too large, you canshrink it or crop it. If it�s too small,you might stretch it instead.
67
2
1
4
3
ch12.p65 12/06/2000, 9:32 AM355
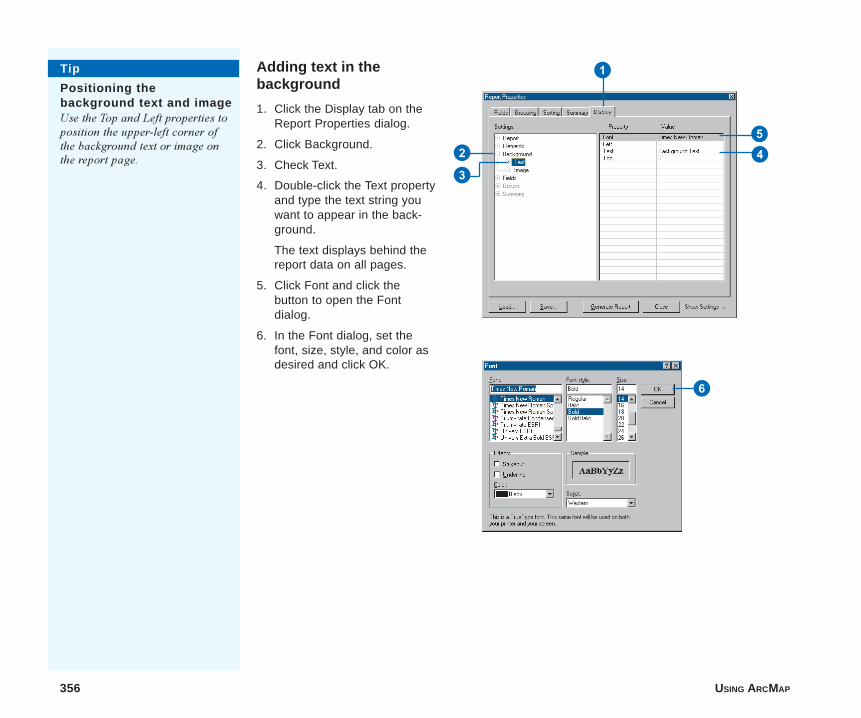
356 USING ARCMAP
Adding text in thebackground
1. Click the Display tab on theReport Properties dialog.
2. Click Background.
3. Check Text.
4. Double-click the Text propertyand type the text string youwant to appear in the back-ground.
The text displays behind thereport data on all pages.
5. Click Font and click thebutton to open the Fontdialog.
6. In the Font dialog, set thefont, size, style, and color asdesired and click OK.
2
1
43
6
5
Tip
Positioning thebackground text and imageUse the Top and Left properties toposition the upper-left corner ofthe background text or image onthe report page.
ch12.p65 12/06/2000, 9:33 AM356
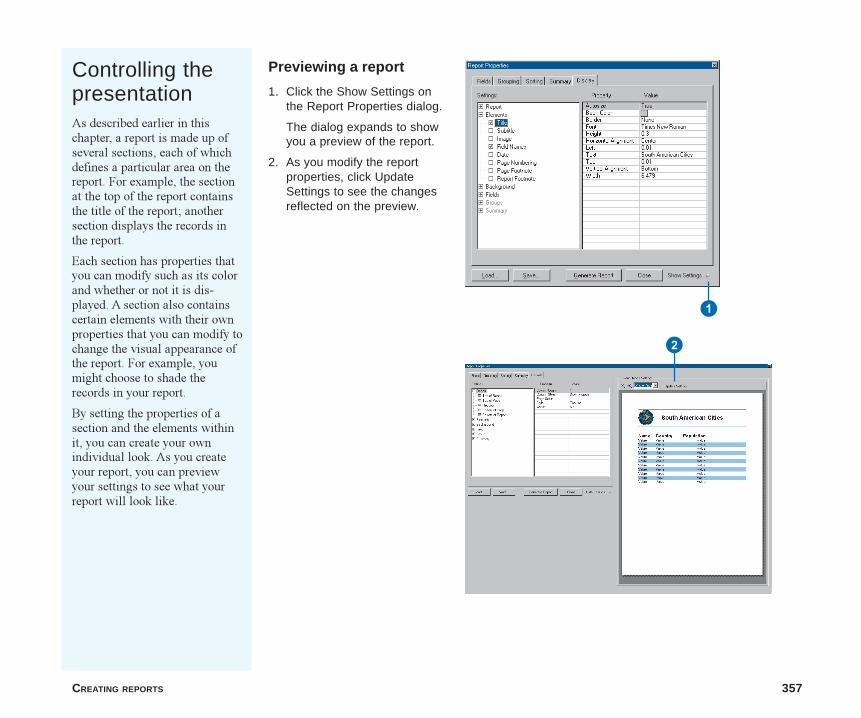
CREATING REPORTS 357
Controlling thepresentationAs described earlier in thischapter, a report is made up ofseveral sections, each of whichdefines a particular area on thereport. For example, the sectionat the top of the report containsthe title of the report; anothersection displays the records inthe report.
Each section has properties thatyou can modify such as its colorand whether or not it is dis-played. A section also containscertain elements with their ownproperties that you can modify tochange the visual appearance ofthe report. For example, youmight choose to shade therecords in your report.
By setting the properties of asection and the elements withinit, you can create your ownindividual look. As you createyour report, you can previewyour settings to see what yourreport will look like.
Previewing a report
1. Click the Show Settings onthe Report Properties dialog.
The dialog expands to showyou a preview of the report.
2. As you modify the reportproperties, click UpdateSettings to see the changesreflected on the preview.
1
2
ch12.p65 12/06/2000, 9:34 AM357
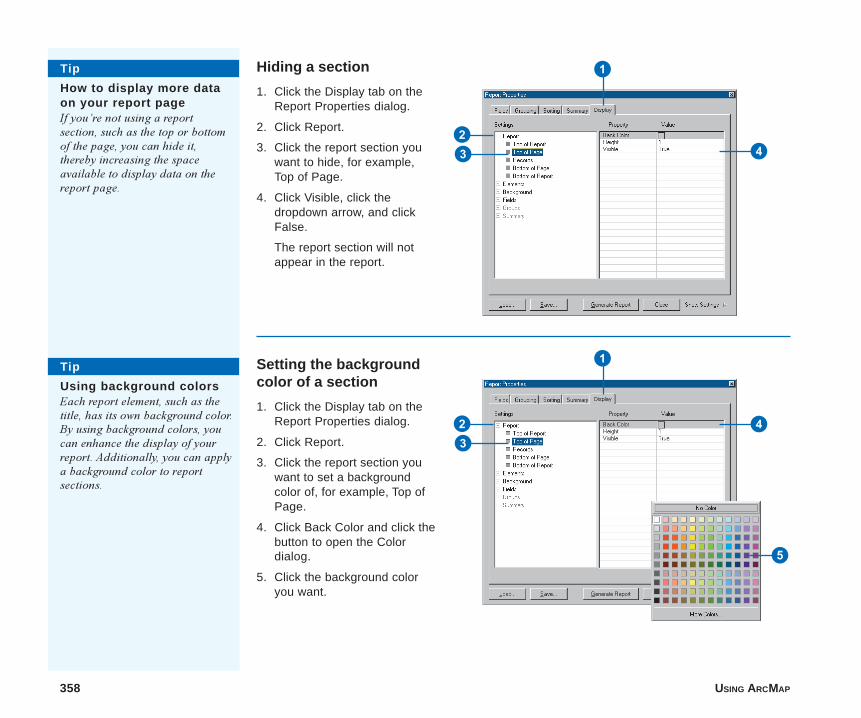
358 USING ARCMAP
Setting the backgroundcolor of a section
1. Click the Display tab on theReport Properties dialog.
2. Click Report.
3. Click the report section youwant to set a backgroundcolor of, for example, Top ofPage.
4. Click Back Color and click thebutton to open the Colordialog.
5. Click the background coloryou want.
Hiding a section
1. Click the Display tab on theReport Properties dialog.
2. Click Report.
3. Click the report section youwant to hide, for example,Top of Page.
4. Click Visible, click thedropdown arrow, and clickFalse.
The report section will notappear in the report.
Tip
How to display more dataon your report pageIf you�re not using a reportsection, such as the top or bottomof the page, you can hide it,thereby increasing the spaceavailable to display data on thereport page.
Tip
Using background colorsEach report element, such as thetitle, has its own background color.By using background colors, youcan enhance the display of yourreport. Additionally, you can applya background color to reportsections.
2
1
43
2
1
43
5
ch12.p65 12/06/2000, 9:35 AM358
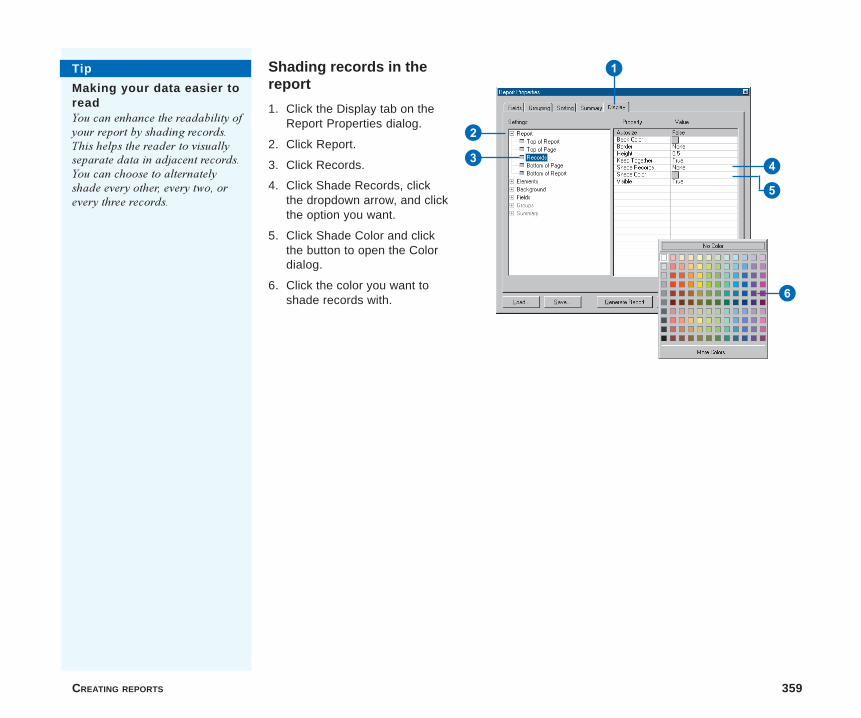
CREATING REPORTS 359
Shading records in thereport
1. Click the Display tab on theReport Properties dialog.
2. Click Report.
3. Click Records.
4. Click Shade Records, clickthe dropdown arrow, and clickthe option you want.
5. Click Shade Color and clickthe button to open the Colordialog.
6. Click the color you want toshade records with.
2
1
43
Tip
Making your data easier toreadYou can enhance the readability ofyour report by shading records.This helps the reader to visuallyseparate data in adjacent records.You can choose to alternatelyshade every other, every two, orevery three records.
6
5
ch12.p65 12/06/2000, 9:35 AM359
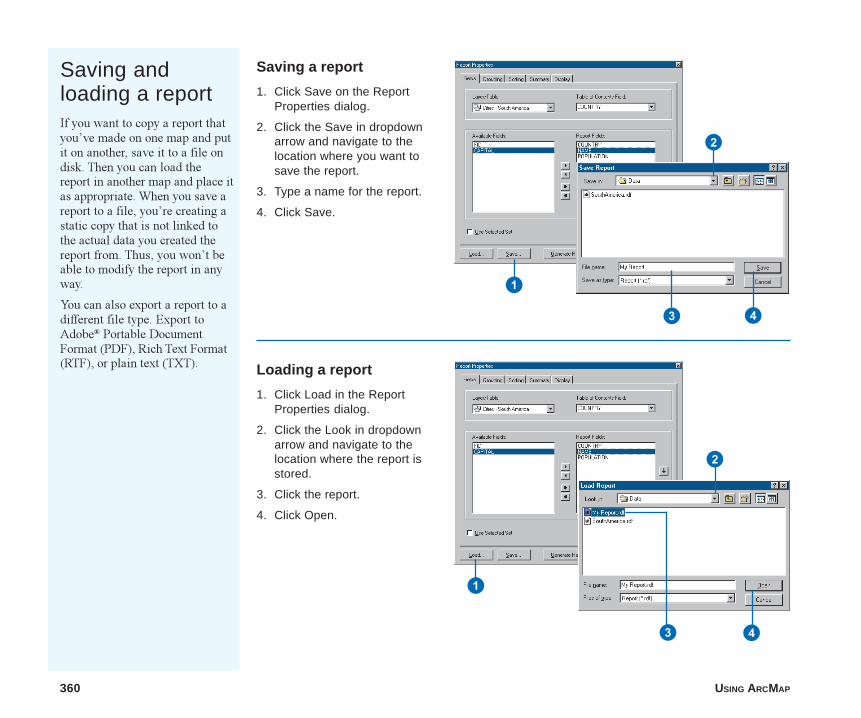
360 USING ARCMAP
Saving andloading a reportIf you want to copy a report thatyou�ve made on one map and putit on another, save it to a file ondisk. Then you can load thereport in another map and place itas appropriate. When you save areport to a file, you�re creating astatic copy that is not linked tothe actual data you created thereport from. Thus, you won�t beable to modify the report in anyway.
You can also export a report to adifferent file type. Export toAdobe® Portable DocumentFormat (PDF), Rich Text Format(RTF), or plain text (TXT).
Saving a report
1. Click Save on the ReportProperties dialog.
2. Click the Save in dropdownarrow and navigate to thelocation where you want tosave the report.
3. Type a name for the report.
4. Click Save.
Loading a report
1. Click Load in the ReportProperties dialog.
2. Click the Look in dropdownarrow and navigate to thelocation where the report isstored.
3. Click the report.
4. Click Open.
1
2
3 4
1
2
43
ch12.p65 12/06/2000, 9:36 AM360
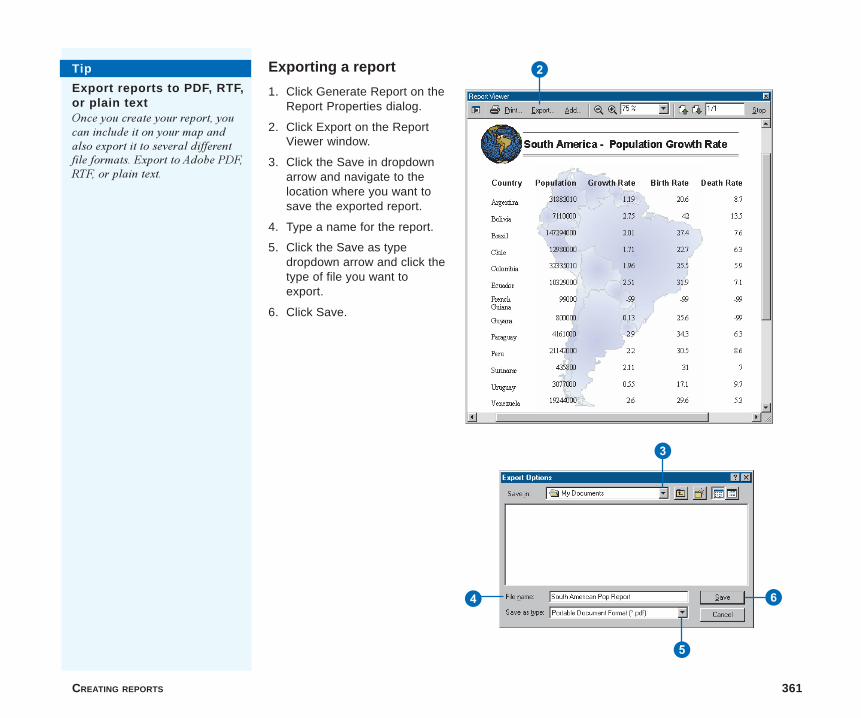
CREATING REPORTS 361
Exporting a report
1. Click Generate Report on theReport Properties dialog.
2. Click Export on the ReportViewer window.
3. Click the Save in dropdownarrow and navigate to thelocation where you want tosave the exported report.
4. Type a name for the report.
5. Click the Save as typedropdown arrow and click thetype of file you want toexport.
6. Click Save.
2
3
4
5
6
Tip
Export reports to PDF, RTF,or plain textOnce you create your report, youcan include it on your map andalso export it to several differentfile formats. Export to Adobe PDF,RTF, or plain text.
ch12.p65 12/06/2000, 9:37 AM361
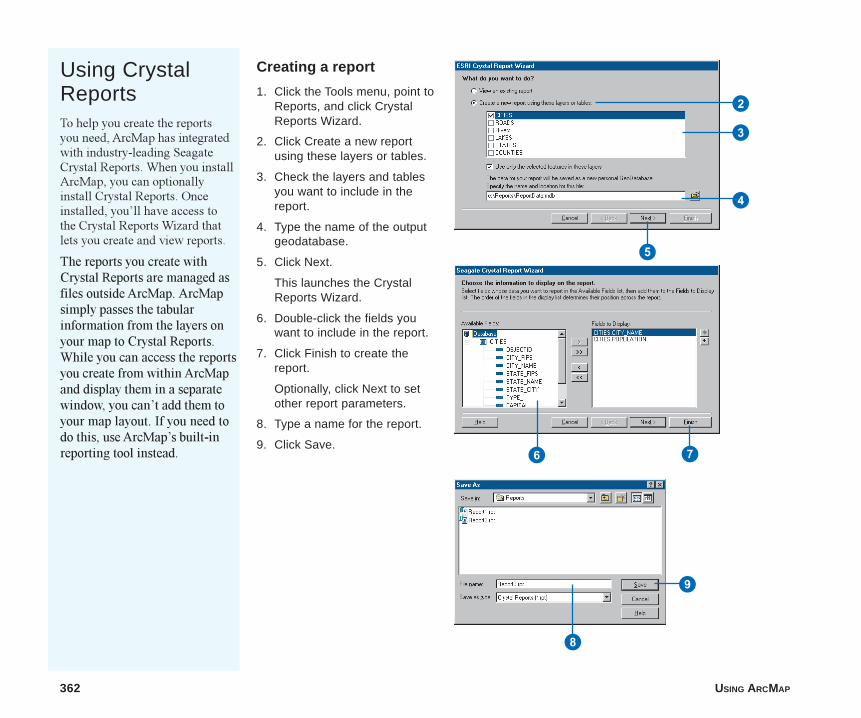
362 USING ARCMAP
Using CrystalReportsTo help you create the reportsyou need, ArcMap has integratedwith industry-leading SeagateCrystal Reports. When you installArcMap, you can optionallyinstall Crystal Reports. Onceinstalled, you�ll have access tothe Crystal Reports Wizard thatlets you create and view reports.
The reports you create withCrystal Reports are managed asfiles outside ArcMap. ArcMapsimply passes the tabularinformation from the layers onyour map to Crystal Reports.While you can access the reportsyou create from within ArcMapand display them in a separatewindow, you can�t add them toyour map layout. If you need todo this, use ArcMap�s built-inreporting tool instead.
Creating a report
1. Click the Tools menu, point toReports, and click CrystalReports Wizard.
2. Click Create a new reportusing these layers or tables.
3. Check the layers and tablesyou want to include in thereport.
4. Type the name of the outputgeodatabase.
5. Click Next.
This launches the CrystalReports Wizard.
6. Double-click the fields youwant to include in the report.
7. Click Finish to create thereport.
Optionally, click Next to setother report parameters.
8. Type a name for the report.
9. Click Save.
2
3
4
5
6 7
8
9
ch12.p65 12/06/2000, 9:37 AM362
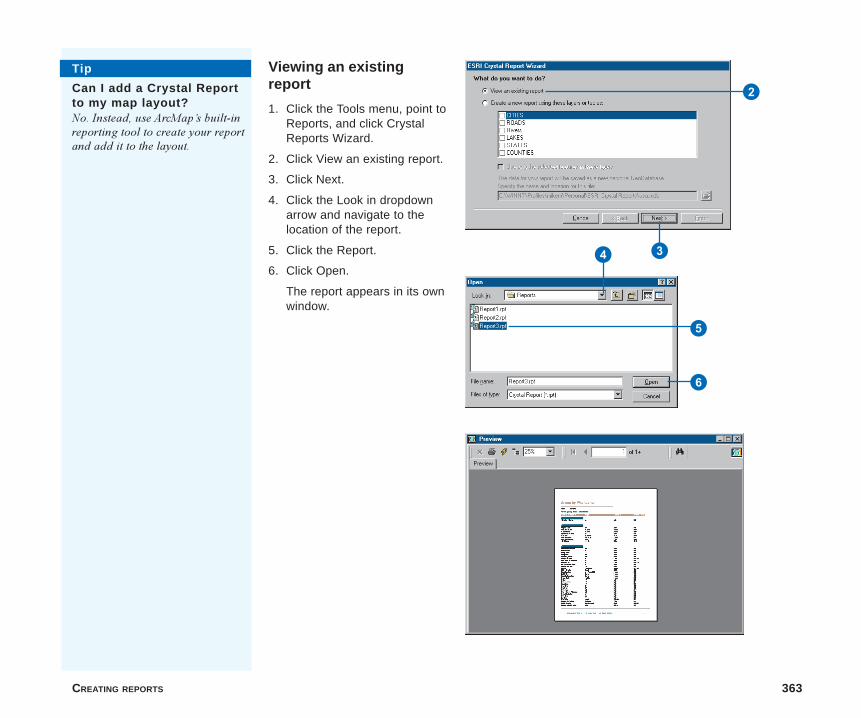
CREATING REPORTS 363
Viewing an existingreport
1. Click the Tools menu, point toReports, and click CrystalReports Wizard.
2. Click View an existing report.
3. Click Next.
4. Click the Look in dropdownarrow and navigate to thelocation of the report.
5. Click the Report.
6. Click Open.
The report appears in its ownwindow.
2
34
5
6
Tip
Can I add a Crystal Reportto my map layout?No. Instead, use ArcMap�s built-inreporting tool to create your reportand add it to the layout.
ch12.p65 12/06/2000, 9:38 AM363

ch12.p65 12/06/2000, 9:38 AM364
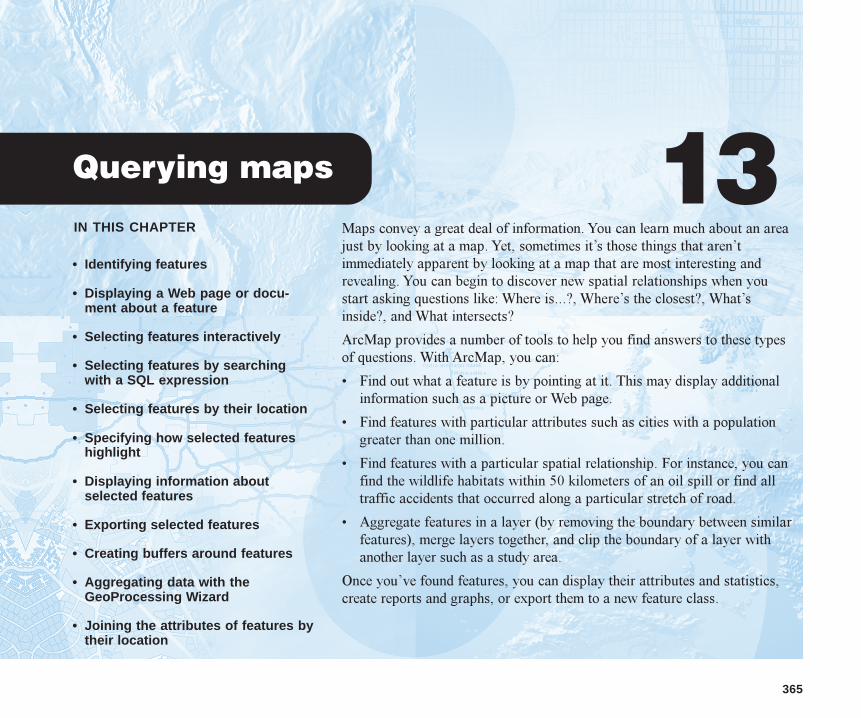
IN THIS CHAPTER
365
Querying maps 13• Identifying features
• Displaying a Web page or docu-ment about a feature
• Selecting features interactively
• Selecting features by searchingwith a SQL expression
• Selecting features by their location
• Specifying how selected featureshighlight
• Displaying information aboutselected features
• Exporting selected features
• Creating buffers around features
• Aggregating data with theGeoProcessing Wizard
• Joining the attributes of features bytheir location
Maps convey a great deal of information. You can learn much about an areajust by looking at a map. Yet, sometimes it�s those things that aren�timmediately apparent by looking at a map that are most interesting andrevealing. You can begin to discover new spatial relationships when youstart asking questions like: Where is...?, Where�s the closest?, What�sinside?, and What intersects?
ArcMap provides a number of tools to help you find answers to these typesof questions. With ArcMap, you can:
� Find out what a feature is by pointing at it. This may display additionalinformation such as a picture or Web page.
� Find features with particular attributes such as cities with a populationgreater than one million.
� Find features with a particular spatial relationship. For instance, you canfind the wildlife habitats within 50 kilometers of an oil spill or find alltraffic accidents that occurred along a particular stretch of road.
� Aggregate features in a layer (by removing the boundary between similarfeatures), merge layers together, and clip the boundary of a layer withanother layer such as a study area.
Once you�ve found features, you can display their attributes and statistics,create reports and graphs, or export them to a new feature class.
ch13.p65 12/06/2000, 11:42 AM365
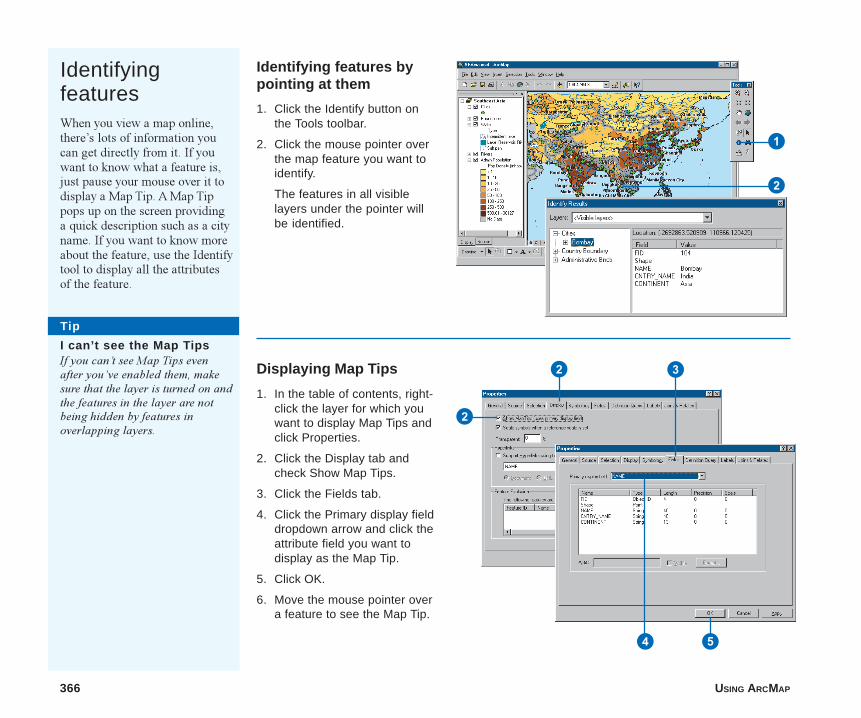
366 USING ARCMAP
IdentifyingfeaturesWhen you view a map online,there�s lots of information youcan get directly from it. If youwant to know what a feature is,just pause your mouse over it todisplay a Map Tip. A Map Tippops up on the screen providinga quick description such as a cityname. If you want to know moreabout the feature, use the Identifytool to display all the attributesof the feature.
Identifying features bypointing at them
1. Click the Identify button onthe Tools toolbar.
2. Click the mouse pointer overthe map feature you want toidentify.
The features in all visiblelayers under the pointer willbe identified.
Displaying Map Tips
1. In the table of contents, right-click the layer for which youwant to display Map Tips andclick Properties.
2. Click the Display tab andcheck Show Map Tips.
3. Click the Fields tab.
4. Click the Primary display fielddropdown arrow and click theattribute field you want todisplay as the Map Tip.
5. Click OK.
6. Move the mouse pointer overa feature to see the Map Tip.
Tip
I can’t see the Map TipsIf you can�t see Map Tips evenafter you�ve enabled them, makesure that the layer is turned on andthe features in the layer are notbeing hidden by features inoverlapping layers.
1
2
2
2
3
4 5
ch13.p65 12/06/2000, 11:43 AM366
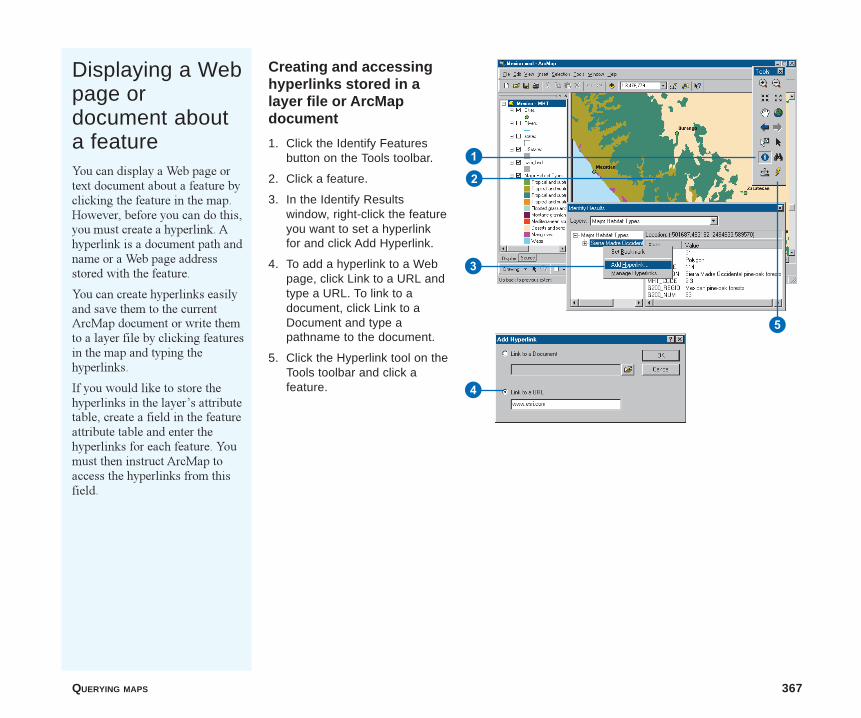
QUERYING MAPS 367
Creating and accessinghyperlinks stored in alayer file or ArcMapdocument
1. Click the Identify Featuresbutton on the Tools toolbar.
2. Click a feature.
3. In the Identify Resultswindow, right-click the featureyou want to set a hyperlinkfor and click Add Hyperlink.
4. To add a hyperlink to a Webpage, click Link to a URL andtype a URL. To link to adocument, click Link to aDocument and type apathname to the document.
5. Click the Hyperlink tool on theTools toolbar and click afeature.
Displaying a Webpage ordocument abouta featureYou can display a Web page ortext document about a feature byclicking the feature in the map.However, before you can do this,you must create a hyperlink. Ahyperlink is a document path andname or a Web page addressstored with the feature.
You can create hyperlinks easilyand save them to the currentArcMap document or write themto a layer file by clicking featuresin the map and typing thehyperlinks.
If you would like to store thehyperlinks in the layer�s attributetable, create a field in the featureattribute table and enter thehyperlinks for each feature. Youmust then instruct ArcMap toaccess the hyperlinks from thisfield.
4
2
1
5
3
ch13.p65 12/06/2000, 11:43 AM367
368 USING ARCMAP
Accessing hyperlinksstored in an attributetable
1. Double-click the layer in thetable of contents you want todisplay a Web page ordocument for.
2. Click the Display tab.
3. Check Support Hyperlinksusing field, click thedropdown arrow, and click afield.
4. Click OK.
5. Click the Hyperlink button andclick a feature. The documentor Web page displays.
2
3
5
ch13.p65 12/06/2000, 11:43 AM368
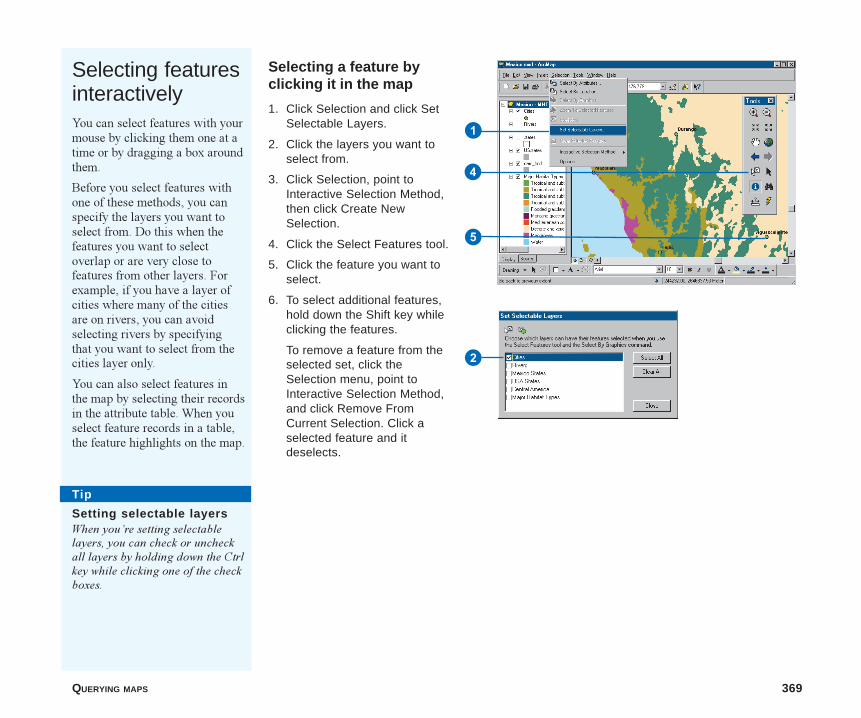
QUERYING MAPS 369
Selecting featuresinteractivelyYou can select features with yourmouse by clicking them one at atime or by dragging a box aroundthem.
Before you select features withone of these methods, you canspecify the layers you want toselect from. Do this when thefeatures you want to selectoverlap or are very close tofeatures from other layers. Forexample, if you have a layer ofcities where many of the citiesare on rivers, you can avoidselecting rivers by specifyingthat you want to select from thecities layer only.
You can also select features inthe map by selecting their recordsin the attribute table. When youselect feature records in a table,the feature highlights on the map.
Selecting a feature byclicking it in the map
1. Click Selection and click SetSelectable Layers.
2. Click the layers you want toselect from.
3. Click Selection, point toInteractive Selection Method,then click Create NewSelection.
4. Click the Select Features tool.
5. Click the feature you want toselect.
6. To select additional features,hold down the Shift key whileclicking the features.
To remove a feature from theselected set, click theSelection menu, point toInteractive Selection Method,and click Remove FromCurrent Selection. Click aselected feature and itdeselects.
4
5
2
1
Tip
Setting selectable layersWhen you�re setting selectablelayers, you can check or uncheckall layers by holding down the Ctrlkey while clicking one of the checkboxes.
ch13.p65 12/06/2000, 11:43 AM369

370 USING ARCMAP
Select features bydragging a box
1. Click Selection and click SetSelectable Layers.
2. Click the layers you want toselect from.
3. Click Selection, point toInteractive Selection Method,then click Create NewSelection.
4. Click Selection and clickOptions.
5. Specify how you’d like toselect features with the boxand click OK.
6. Click the Select Featuresbutton.
7. Click and drag a box aroundthe features you want toselect.
8. To select additional features,hold down the Shift key asyou drag the box.
To remove a feature from theselected set, click theSelection menu, point toInteractive Selection Method,and click Remove FromCurrent Selection. Drag a boxaround the features you wantto deselect.
Tip
Deselecting all featuresTo deselect all selected features atonce, click the map where thereare no features or click a feature ofa layer that is not selectable. Ifyou are unable to do this, click theSelection menu and click ClearSelected Features.
5
1
6
7
ch13.p65 12/06/2000, 11:44 AM370
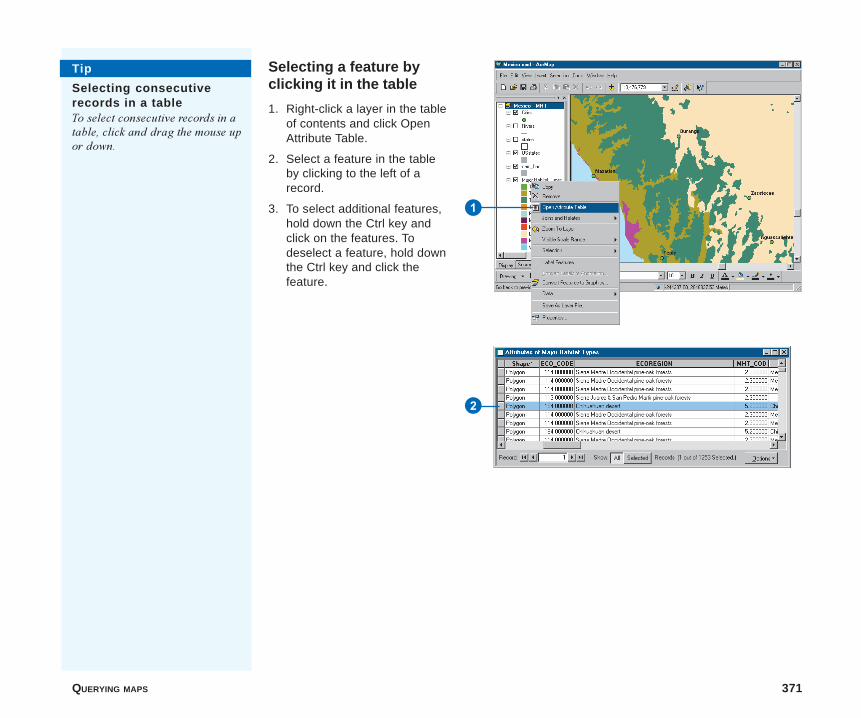
QUERYING MAPS 371
Selecting a feature byclicking it in the table
1. Right-click a layer in the tableof contents and click OpenAttribute Table.
2. Select a feature in the tableby clicking to the left of arecord.
3. To select additional features,hold down the Ctrl key andclick on the features. Todeselect a feature, hold downthe Ctrl key and click thefeature.
2
1
Tip
Selecting consecutiverecords in a tableTo select consecutive records in atable, click and drag the mouse upor down.
ch13.p65 12/06/2000, 11:44 AM371
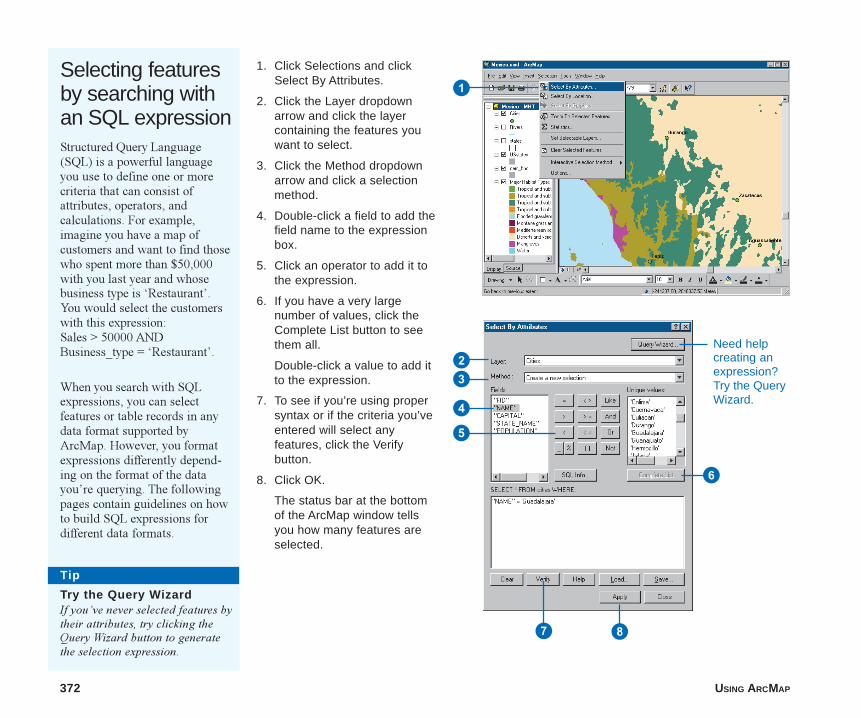
372 USING ARCMAP
Selecting featuresby searching withan SQL expressionStructured Query Language(SQL) is a powerful languageyou use to define one or morecriteria that can consist ofattributes, operators, andcalculations. For example,imagine you have a map ofcustomers and want to find thosewho spent more than $50,000with you last year and whosebusiness type is �Restaurant�.You would select the customerswith this expression:Sales > 50000 ANDBusiness_type = �Restaurant�.
When you search with SQLexpressions, you can selectfeatures or table records in anydata format supported byArcMap. However, you formatexpressions differently depend-ing on the format of the datayou�re querying. The followingpages contain guidelines on howto build SQL expressions fordifferent data formats.
1. Click Selections and clickSelect By Attributes.
2. Click the Layer dropdownarrow and click the layercontaining the features youwant to select.
3. Click the Method dropdownarrow and click a selectionmethod.
4. Double-click a field to add thefield name to the expressionbox.
5. Click an operator to add it tothe expression.
6. If you have a very largenumber of values, click theComplete List button to seethem all.
Double-click a value to add itto the expression.
7. To see if you’re using propersyntax or if the criteria you’veentered will select anyfeatures, click the Verifybutton.
8. Click OK.
The status bar at the bottomof the ArcMap window tellsyou how many features areselected.
8
23
4
5
6
7
1
Tip
Try the Query WizardIf you�ve never selected features bytheir attributes, try clicking theQuery Wizard button to generatethe selection expression.
Need helpcreating anexpression?Try the QueryWizard.
ch13.p65 12/06/2000, 11:44 AM372
QUERYING MAPS 373
When you create an expression in the Select By Attributes dialogbox, you create it in a version of SQL; the one you use dependson the format of the data you�re querying.
You use ANSI SQL with shared geodatabase data and Jet SQLwith personal geodatabase data. These two versions of SQL aresimilar; however, each supports features and functions the otherdoesn�t.
When you query coverages, shapefiles, INFO tables, and dBASEtables, you use a limited version of SQL that doesn�t supportfunctions or the many features of ANSI and Jet SQL.
The following shows you how to build simple expressions. Forinformation on how to build more complex expressions, pleaseconsult your SQL reference manual.
Specifying fields
� If you�re querying ArcInfo coverages, shapefiles, INFOtables, or dBASE tables, enclose fields in double quotes:
�AREA�
� If you�re querying personal geodatabase data, enclose fieldsin square brackets:
[AREA]
� If you�re querying shared geodatabase data, don�t enclosefields:
AREA
Searching for strings
Regardless of the data you�re querying, always enclose stringssuch as names in single quotes. For example, this query willselect California in a layer based on personal geodatabase data:
[STATE_NAME] = �California�
Strings are case-sensitive for coverages, shapefiles, INFO tables,dBASE tables, and shared geodatabases. If you are unsure ofcase, use the operator LIKE, not �=�. For example,�STATE_NAME� = �rhode island� will not find a feature with�Rhode Island� in its attribute record, but �STATE_NAME�LIKE �rhode island� will.
Strings are not case-sensitive for personal geodatabases. Forexample, [STATE_NAME] = �rhode island� will select a featurewith �Rhode Island� in its attribute record.
If you are uncertain of spelling or just want to use a shorter stringin your expression, use LIKE with wild cards. If you are queryinga coverage, shapefile, INFO table, dBASE table, or a sharedgeodatabase:
�_� represents any one character and �%� any group of characters.
If you are querying a personal geodatabase:
�?� represents any one character and �*� any group of characters.
For example, this query will select Mississippi in a sharedgeodatabase:
STATE_NAME LIKE �Miss%�
This query will find Catherine Smith and Katherine Smith in alayer based on personal geodatabase data:
[OWNER_NAME] LIKE �?atherine smith�
If you use a wild card character in a string with the = operator,the character is considered part of the string, not a wild card.
Searching for values
To search for a specific value, use the = operator. To comparevalues use the <, >, <=, >=, and <> operators. For example, thisquery will select all houses greater than or equal to 1,500 squarefeet in a coverage:
Building an SQL expression
ch13.p65 12/06/2000, 11:44 AM373
374 USING ARCMAP
�AREA� >= 1500
You can include calculations in expressions. Mathematicaloperators you can use include +-* and /. For example, to find thecounties with a population density of less than or equal to25 people per square kilometer, you could use the query:
�POP2000� / Area <= 25
Longer calculations first evaluate * and / operators from left toright and then the + and - operators. For example, this querywould multiply PRICE by AREA and then add TAX:
�NETVALUE� > �TAX� + �PRICE� * AREA
To control the order calculations evaluate, use parentheses.Calculations within parentheses evaluate first. For example, toadd TAX to PRICE and then multiply by AREA, use:
�NETVALUE� > (�TAX� + �PRICE�) * �AREA�
Building expressions with more than one criteria
To search for several strings or values in a field, use the INoperator. For example, this expression will search for fourdifferent state names in a shared geodatabase:
STATE_NAME IN (�Alabama�, �Alaska�, �California�, �Florida�)
To build an expression with more than one criteria when bothcriteria must be true, use the AND operator. For example, to findareas of pine forest larger than 100 square kilometers, use thisexpression:
VEGETATION = �Pine Forest� AND AREA > 100
When at least one of the criteria must be true, use the ORoperator. For example, this expression will select any feature withat least one of the following conditions:
SALES > 20000 OR ORDERS > 20000
To exclude, use the NOT operator. For example, to select all thePacific states except California, use:
SUB_REGION = �Pacific� AND NOT STATE_NAME =�California�
ch13.p65 12/06/2000, 11:44 AM374
QUERYING MAPS 375
With the Select By Location dialog box, you can select featuresbased on their location relative to other features. You can use avariety of methods to select the point, line, or polygon features inone layer that are near or overlap the features in the same oranother layer.
Are crossed by the outline of
This method selects the features that are overlapped by thefeatures of another layer. For example, selecting wilderness areascrossed by the outline of roads will select any wilderness areawith a road crossing its boundaries.
Intersect
This method is similar to the Are crossed by the outline ofmethod but also selects any features bordered by the referencefeatures. For example, selecting wilderness areas intersected byroads will select any wilderness area with a road running withinits boundaries or alongside it.
Are within a distance of
This method selects features near or adjacent to features in thesame layer or in a different layer. For example, if you have alayer of clean and polluted wells, you can find all the clean wellswithin 500 meters of the polluted ones. Or, you could find thereservoirs and farms in other layers that are within this distanceof the polluted wells. You can also use this option to find featuresadjacent to other features. For example, you may have alreadyselected land parcels that your company might purchase, and nowyou want to get information about adjacent parcels. In this caseyou would select the parcels within zero distance of the onesyou�ve already selected.
Have their center in
This method selects the features in one layer that have theircenter in the features of another layer.
Are completely within
This method selects features in one layer that fall completelyinside the polygons of another. For example, you can select lakescompletely within a forested area. To select features that are adistance from the edges of the polygon they fall inside, specify abuffer distance. For example, you can select lakes that are at least500 meters within a forested area.
Completely contain
You can select polygons in one layer that completely contain thefeatures in another layer. For example, select forested areas thathave lakes completely within them. To select polygons thatcompletely contain features a certain distance within them,specify a buffer distance. For example, you can select forestedareas with lakes at least 500 meters within them by buffering thelakes.
Share a line segment with
This method selects features that share line segments, vertices, ornodes with other features.
Are identical to
This method selects any feature having the same geometry as afeature of another layer. The feature types must be the same�forexample, you use polygons to select polygons, lines to selectlines, and points to select points.
Ways to find features by their location
ch13.p65 12/06/2000, 11:44 AM375
376 USING ARCMAP
Contain
This method selects features in one layer that contains thefeatures of another. This method differs from the Completelycontain method in that the boundaries of the features can touch.For example, with the Contain method, a forest will contain alake�and thus be selected�even if the border of the laketouches the border of the forest. The forest would not be selectedusing Completely contain because the borders touch.
Are contained by
This method selects features in one layer that are contained bythe features in another. For example, you can select those citiesthat are contained by a county. This method differs from Arecompletely within in that the edges of the features can touch.
ch13.p65 12/06/2000, 11:44 AM376
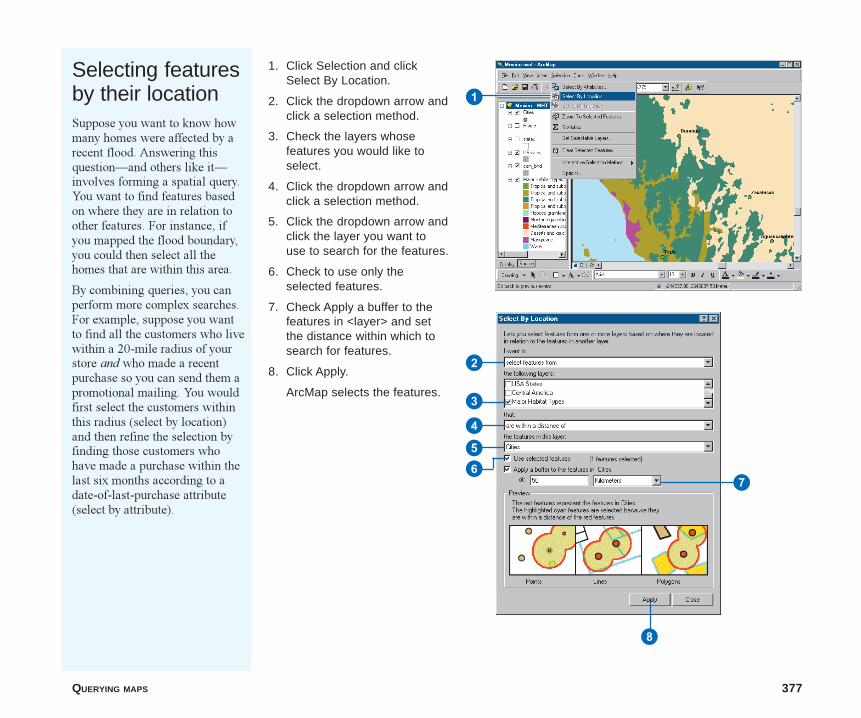
QUERYING MAPS 377
1. Click Selection and clickSelect By Location.
2. Click the dropdown arrow andclick a selection method.
3. Check the layers whosefeatures you would like toselect.
4. Click the dropdown arrow andclick a selection method.
5. Click the dropdown arrow andclick the layer you want touse to search for the features.
6. Check to use only theselected features.
7. Check Apply a buffer to thefeatures in <layer> and setthe distance within which tosearch for features.
8. Click Apply.
ArcMap selects the features.
Selecting featuresby their locationSuppose you want to know howmany homes were affected by arecent flood. Answering thisquestion�and others like it�involves forming a spatial query.You want to find features basedon where they are in relation toother features. For instance, ifyou mapped the flood boundary,you could then select all thehomes that are within this area.
By combining queries, you canperform more complex searches.For example, suppose you wantto find all the customers who livewithin a 20-mile radius of yourstore and who made a recentpurchase so you can send them apromotional mailing. You wouldfirst select the customers withinthis radius (select by location)and then refine the selection byfinding those customers whohave made a purchase within thelast six months according to adate-of-last-purchase attribute(select by attribute).
1
2
3
4
56
7
8
ch13.p65 12/06/2000, 11:44 AM377
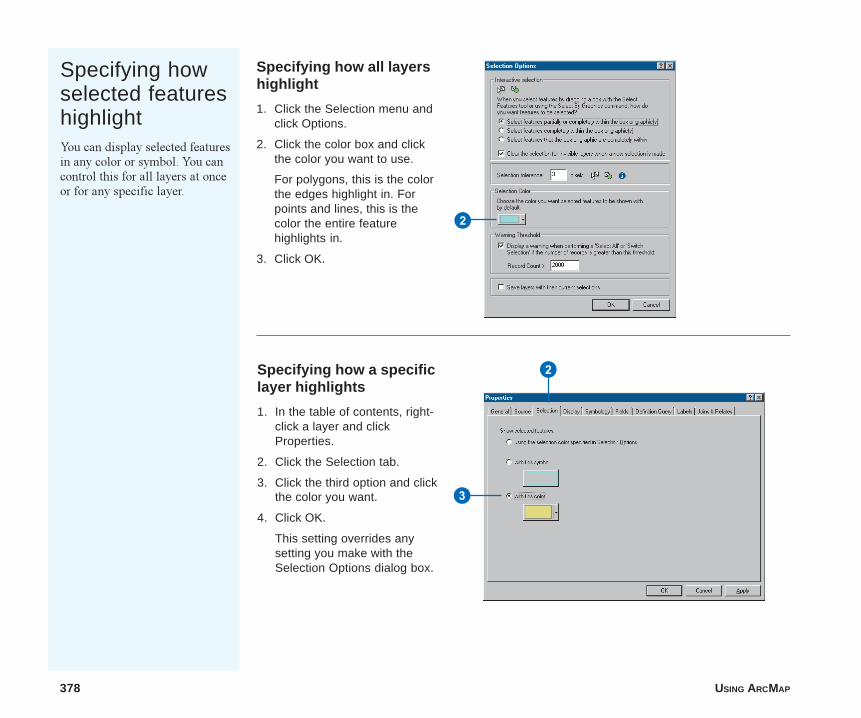
378 USING ARCMAP
Specifying howselected featureshighlightYou can display selected featuresin any color or symbol. You cancontrol this for all layers at onceor for any specific layer.
Specifying how all layershighlight
1. Click the Selection menu andclick Options.
2. Click the color box and clickthe color you want to use.
For polygons, this is the colorthe edges highlight in. Forpoints and lines, this is thecolor the entire featurehighlights in.
3. Click OK.
Specifying how a specificlayer highlights
1. In the table of contents, right-click a layer and clickProperties.
2. Click the Selection tab.
3. Click the third option and clickthe color you want.
4. Click OK.
This setting overrides anysetting you make with theSelection Options dialog box.
2
3
2
ch13.p65 12/06/2000, 11:45 AM378
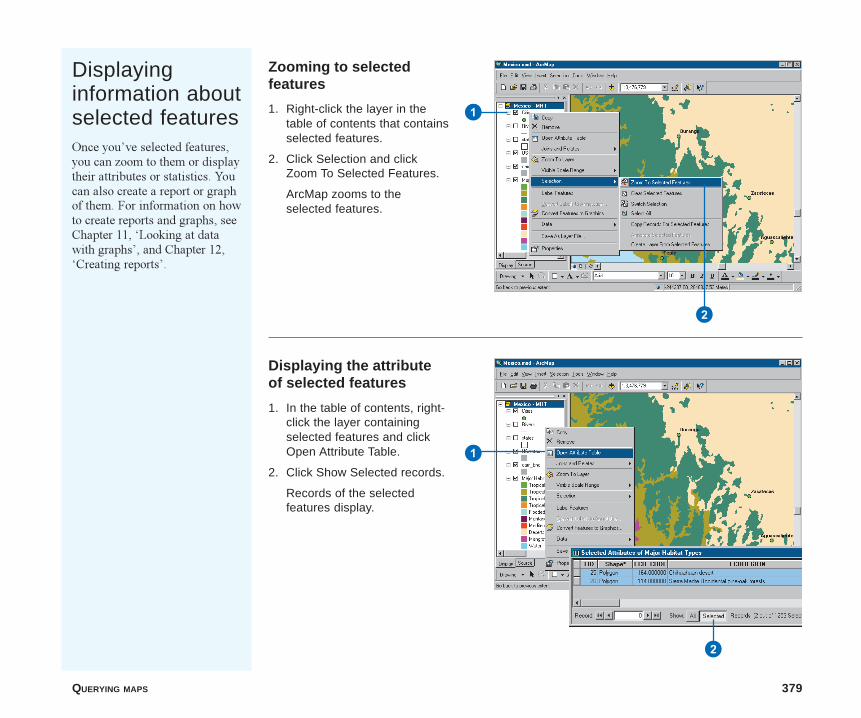
QUERYING MAPS 379
Zooming to selectedfeatures
1. Right-click the layer in thetable of contents that containsselected features.
2. Click Selection and clickZoom To Selected Features.
ArcMap zooms to theselected features.
Displayinginformation aboutselected featuresOnce you�ve selected features,you can zoom to them or displaytheir attributes or statistics. Youcan also create a report or graphof them. For information on howto create reports and graphs, seeChapter 11, �Looking at datawith graphs�, and Chapter 12,�Creating reports�.
Displaying the attributeof selected features
1. In the table of contents, right-click the layer containingselected features and clickOpen Attribute Table.
2. Click Show Selected records.
Records of the selectedfeatures display.
1
1
2
2
ch13.p65 12/06/2000, 11:45 AM379
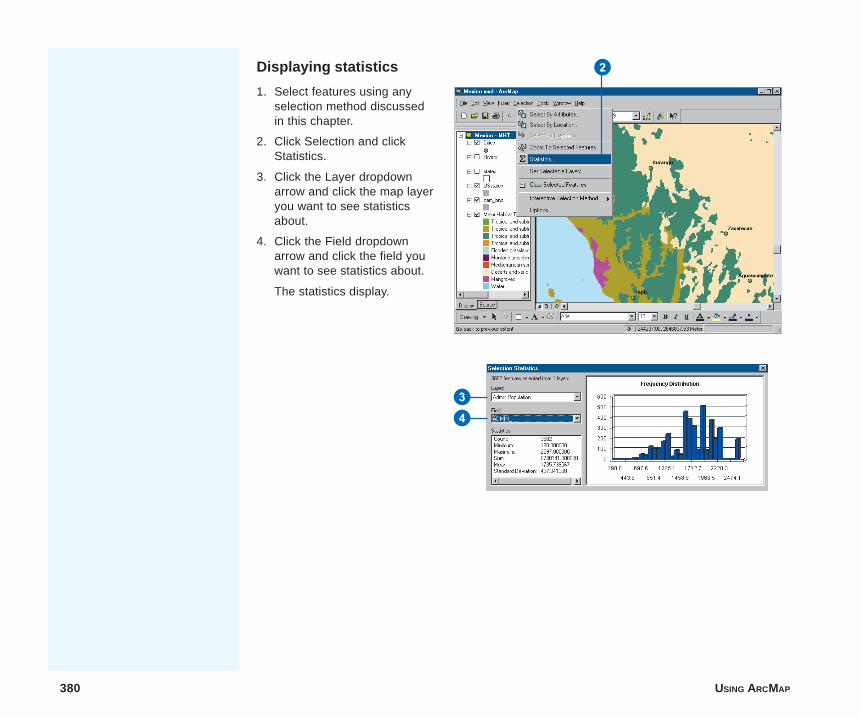
380 USING ARCMAP
Displaying statistics
1. Select features using anyselection method discussedin this chapter.
2. Click Selection and clickStatistics.
3. Click the Layer dropdownarrow and click the map layeryou want to see statisticsabout.
4. Click the Field dropdownarrow and click the field youwant to see statistics about.
The statistics display.
43
2
ch13.p65 12/06/2000, 11:45 AM380
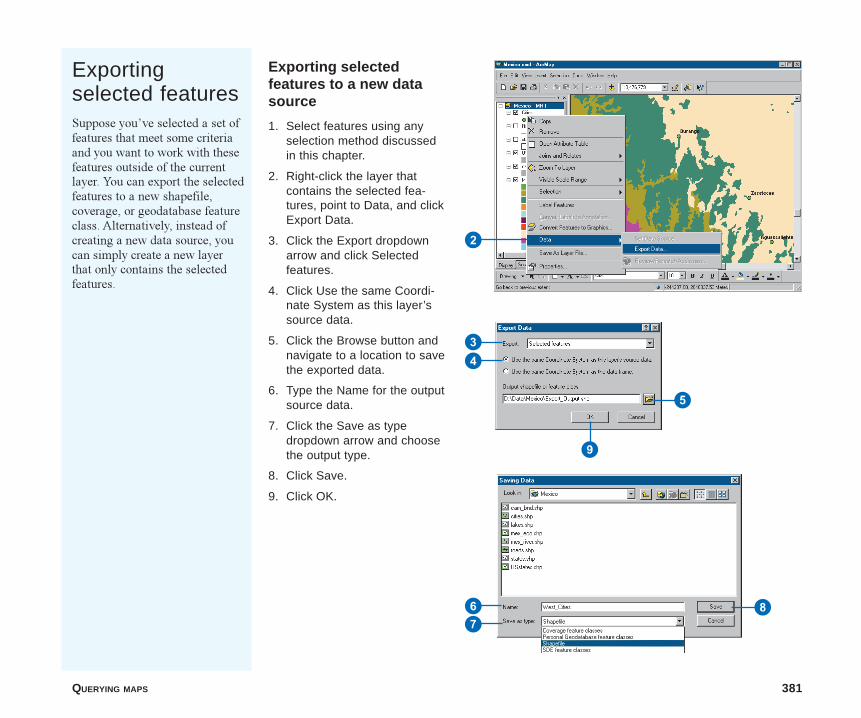
QUERYING MAPS 381
Exportingselected featuresSuppose you�ve selected a set offeatures that meet some criteriaand you want to work with thesefeatures outside of the currentlayer. You can export the selectedfeatures to a new shapefile,coverage, or geodatabase featureclass. Alternatively, instead ofcreating a new data source, youcan simply create a new layerthat only contains the selectedfeatures.
Exporting selectedfeatures to a new datasource
1. Select features using anyselection method discussedin this chapter.
2. Right-click the layer thatcontains the selected fea-tures, point to Data, and clickExport Data.
3. Click the Export dropdownarrow and click Selectedfeatures.
4. Click Use the same Coordi-nate System as this layer’ssource data.
5. Click the Browse button andnavigate to a location to savethe exported data.
6. Type the Name for the outputsource data.
7. Click the Save as typedropdown arrow and choosethe output type.
8. Click Save.
9. Click OK.
2
34
5
67
8
9
ch13.p65 12/06/2000, 11:46 AM381
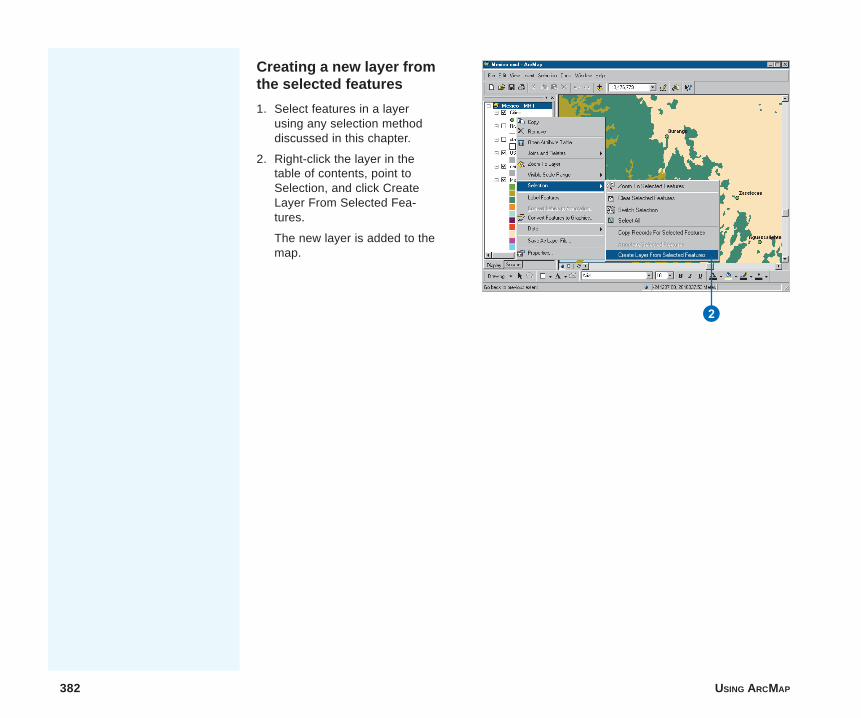
382 USING ARCMAP
Creating a new layer fromthe selected features
1. Select features in a layerusing any selection methoddiscussed in this chapter.
2. Right-click the layer in thetable of contents, point toSelection, and click CreateLayer From Selected Fea-tures.
The new layer is added to themap.
2
ch13.p65 12/06/2000, 11:46 AM382
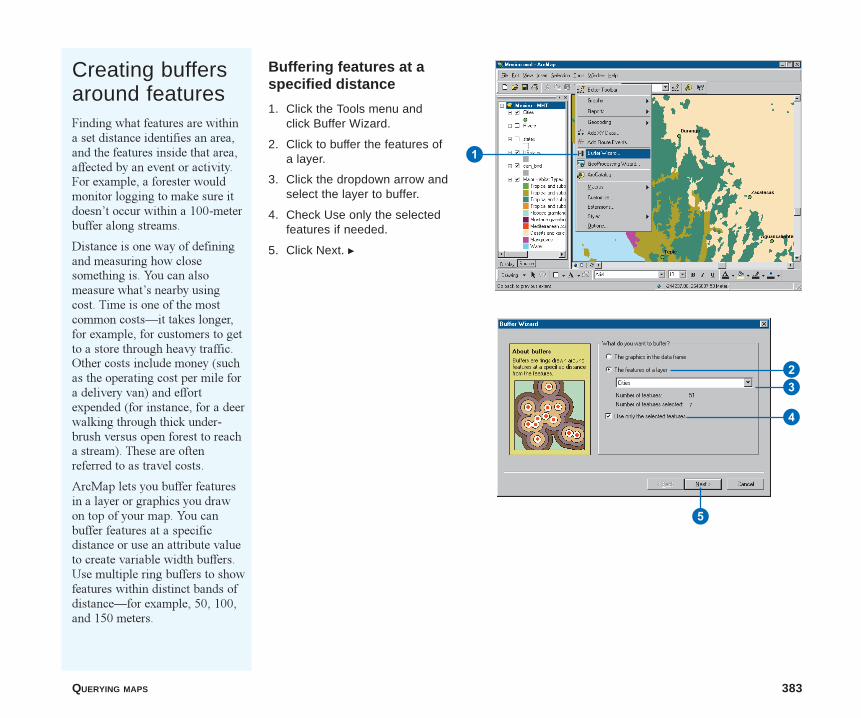
QUERYING MAPS 383
Creating buffersaround featuresFinding what features are withina set distance identifies an area,and the features inside that area,affected by an event or activity.For example, a forester wouldmonitor logging to make sure itdoesn�t occur within a 100-meterbuffer along streams.
Distance is one way of definingand measuring how closesomething is. You can alsomeasure what�s nearby usingcost. Time is one of the mostcommon costs�it takes longer,for example, for customers to getto a store through heavy traffic.Other costs include money (suchas the operating cost per mile fora delivery van) and effortexpended (for instance, for a deerwalking through thick under-brush versus open forest to reacha stream). These are oftenreferred to as travel costs.
ArcMap lets you buffer featuresin a layer or graphics you drawon top of your map. You canbuffer features at a specificdistance or use an attribute valueto create variable width buffers.Use multiple ring buffers to showfeatures within distinct bands ofdistance�for example, 50, 100,and 150 meters.
Buffering features at aspecified distance
1. Click the Tools menu andclick Buffer Wizard.
2. Click to buffer the features ofa layer.
3. Click the dropdown arrow andselect the layer to buffer.
4. Check Use only the selectedfeatures if needed.
5. Click Next. u
1
23
4
5
ch13.p65 12/06/2000, 11:46 AM383
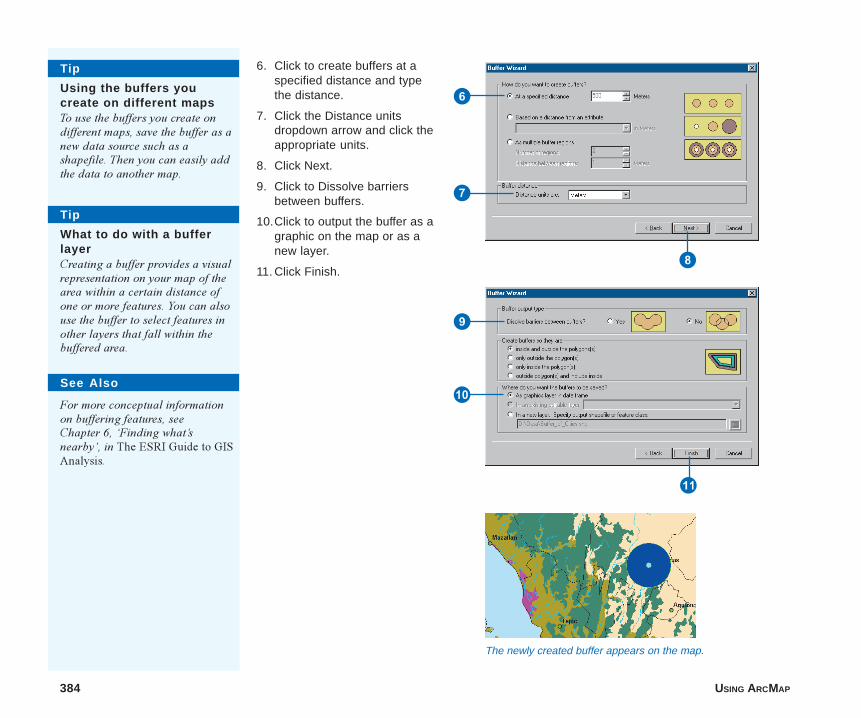
384 USING ARCMAP
6. Click to create buffers at aspecified distance and typethe distance.
7. Click the Distance unitsdropdown arrow and click theappropriate units.
8. Click Next.
9. Click to Dissolve barriersbetween buffers.
10.Click to output the buffer as agraphic on the map or as anew layer.
11. Click Finish.
See Also
For more conceptual informationon buffering features, seeChapter 6, �Finding what�snearby�, in The ESRI Guide to GISAnalysis.
6
7
8
Tip
Using the buffers youcreate on different mapsTo use the buffers you create ondifferent maps, save the buffer as anew data source such as ashapefile. Then you can easily addthe data to another map.
9
W
Q
The newly created buffer appears on the map.
Tip
What to do with a bufferlayerCreating a buffer provides a visualrepresentation on your map of thearea within a certain distance ofone or more features. You can alsouse the buffer to select features inother layers that fall within thebuffered area.
ch13.p65 12/06/2000, 11:47 AM384
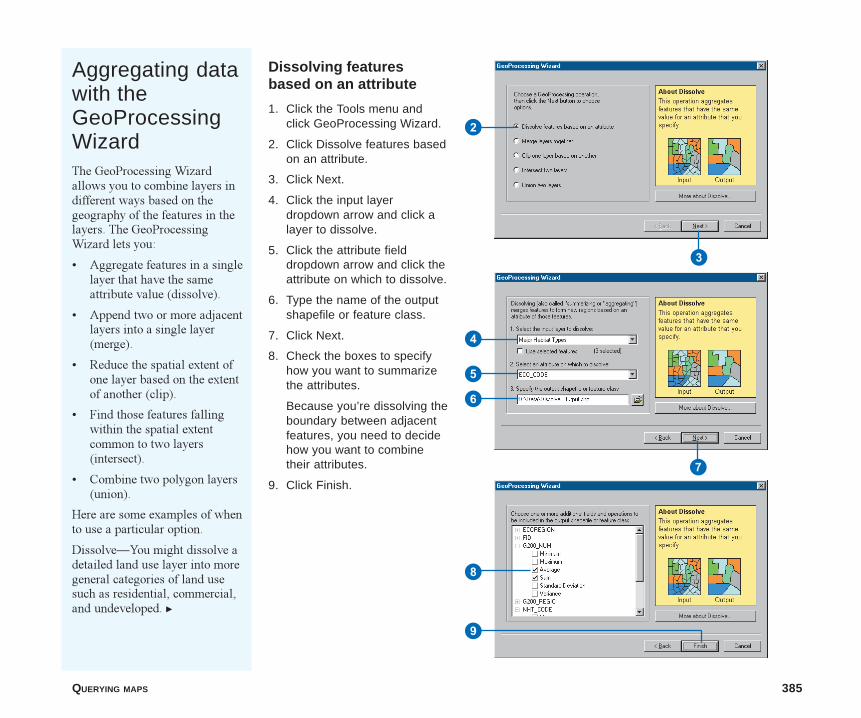
QUERYING MAPS 385
Aggregating datawith theGeoProcessingWizardThe GeoProcessing Wizardallows you to combine layers indifferent ways based on thegeography of the features in thelayers. The GeoProcessingWizard lets you:
� Aggregate features in a singlelayer that have the sameattribute value (dissolve).
� Append two or more adjacentlayers into a single layer(merge).
� Reduce the spatial extent ofone layer based on the extentof another (clip).
� Find those features fallingwithin the spatial extentcommon to two layers(intersect).
� Combine two polygon layers(union).
Here are some examples of whento use a particular option.
Dissolve�You might dissolve adetailed land use layer into moregeneral categories of land usesuch as residential, commercial,and undeveloped. u
Dissolving featuresbased on an attribute
1. Click the Tools menu andclick GeoProcessing Wizard.
2. Click Dissolve features basedon an attribute.
3. Click Next.
4. Click the input layerdropdown arrow and click alayer to dissolve.
5. Click the attribute fielddropdown arrow and click theattribute on which to dissolve.
6. Type the name of the outputshapefile or feature class.
7. Click Next.
8. Check the boxes to specifyhow you want to summarizethe attributes.
Because you’re dissolving theboundary between adjacentfeatures, you need to decidehow you want to combinetheir attributes.
9. Click Finish.
4
5
6
8
2
3
7
9
ch13.p65 12/06/2000, 11:48 AM385
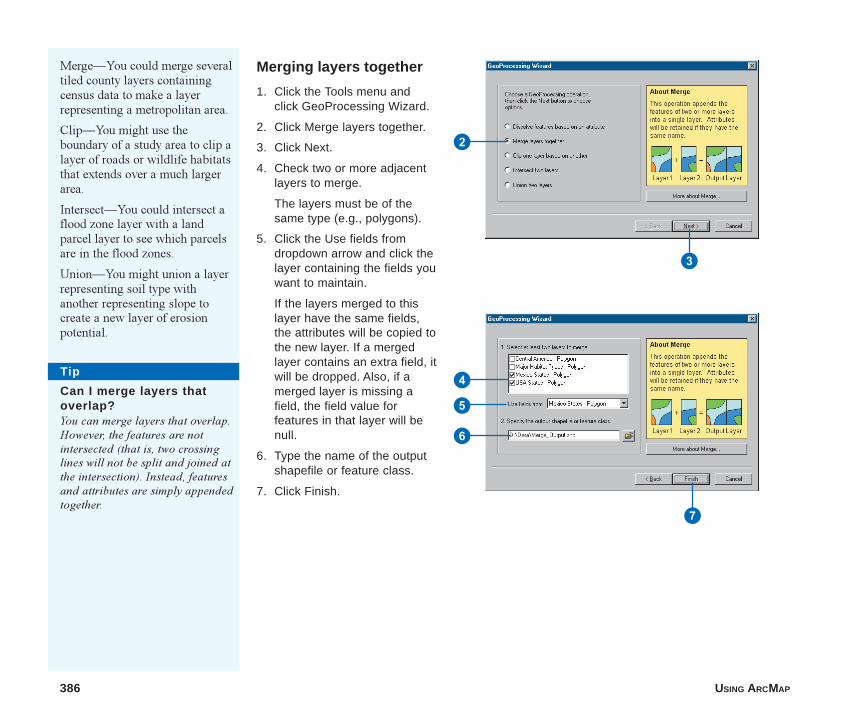
386 USING ARCMAP
Merge�You could merge severaltiled county layers containingcensus data to make a layerrepresenting a metropolitan area.
Clip�You might use theboundary of a study area to clip alayer of roads or wildlife habitatsthat extends over a much largerarea.
Intersect�You could intersect aflood zone layer with a landparcel layer to see which parcelsare in the flood zones.
Union�You might union a layerrepresenting soil type withanother representing slope tocreate a new layer of erosionpotential.
Merging layers together
1. Click the Tools menu andclick GeoProcessing Wizard.
2. Click Merge layers together.
3. Click Next.
4. Check two or more adjacentlayers to merge.
The layers must be of thesame type (e.g., polygons).
5. Click the Use fields fromdropdown arrow and click thelayer containing the fields youwant to maintain.
If the layers merged to thislayer have the same fields,the attributes will be copied tothe new layer. If a mergedlayer contains an extra field, itwill be dropped. Also, if amerged layer is missing afield, the field value forfeatures in that layer will benull.
6. Type the name of the outputshapefile or feature class.
7. Click Finish.
2
3
4
5
6
7
Tip
Can I merge layers thatoverlap?You can merge layers that overlap.However, the features are notintersected (that is, two crossinglines will not be split and joined atthe intersection). Instead, featuresand attributes are simply appendedtogether.
ch13.p65 12/06/2000, 11:48 AM386
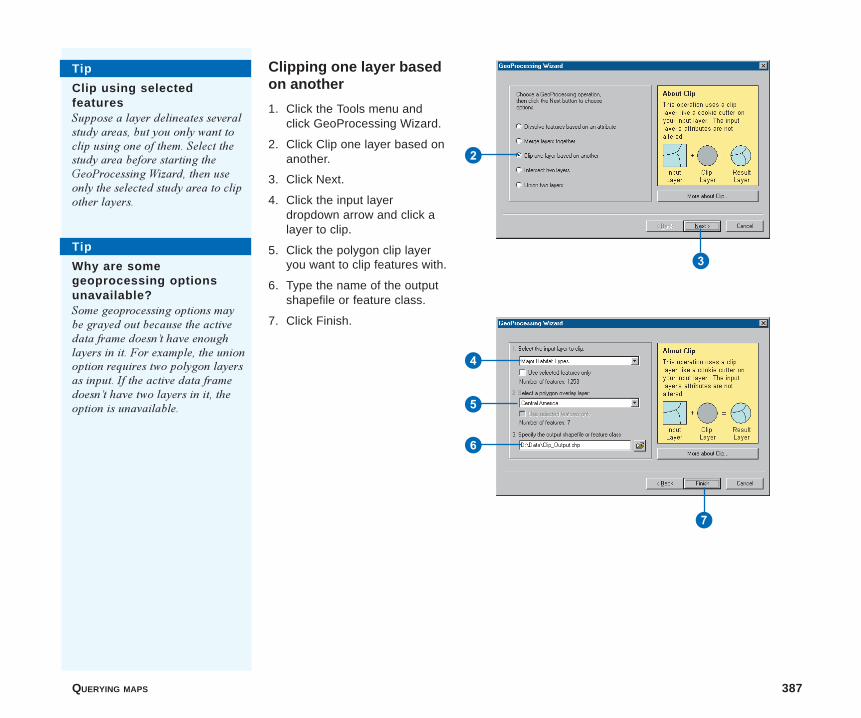
QUERYING MAPS 387
Clipping one layer basedon another
1. Click the Tools menu andclick GeoProcessing Wizard.
2. Click Clip one layer based onanother.
3. Click Next.
4. Click the input layerdropdown arrow and click alayer to clip.
5. Click the polygon clip layeryou want to clip features with.
6. Type the name of the outputshapefile or feature class.
7. Click Finish.
2
3
4
5
6
7
Tip
Clip using selectedfeaturesSuppose a layer delineates severalstudy areas, but you only want toclip using one of them. Select thestudy area before starting theGeoProcessing Wizard, then useonly the selected study area to clipother layers.
Tip
Why are somegeoprocessing optionsunavailable?Some geoprocessing options maybe grayed out because the activedata frame doesn�t have enoughlayers in it. For example, the unionoption requires two polygon layersas input. If the active data framedoesn�t have two layers in it, theoption is unavailable.
ch13.p65 12/06/2000, 11:48 AM387
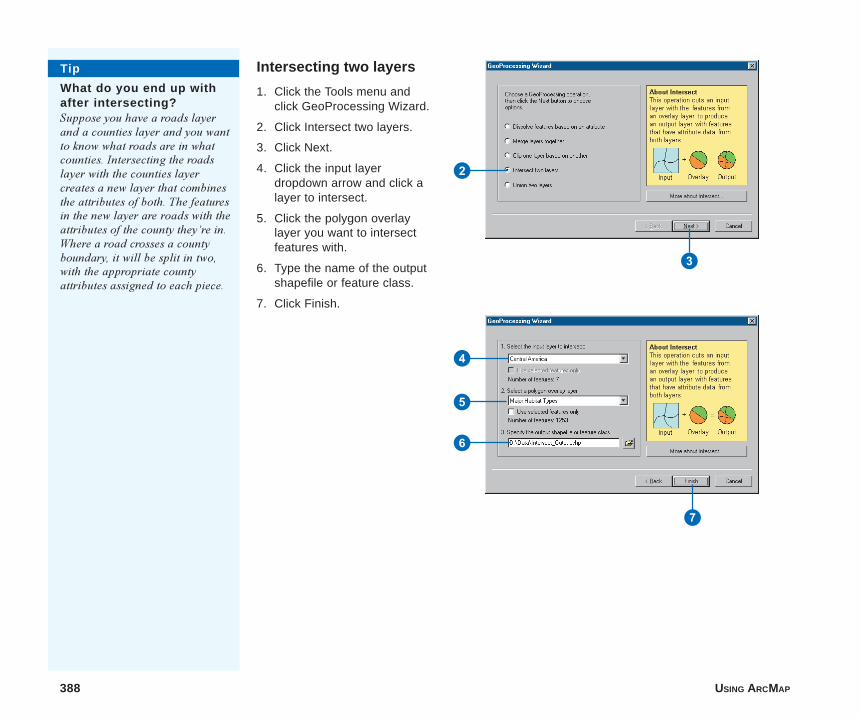
388 USING ARCMAP
Intersecting two layers
1. Click the Tools menu andclick GeoProcessing Wizard.
2. Click Intersect two layers.
3. Click Next.
4. Click the input layerdropdown arrow and click alayer to intersect.
5. Click the polygon overlaylayer you want to intersectfeatures with.
6. Type the name of the outputshapefile or feature class.
7. Click Finish.
2
3
4
5
6
7
Tip
What do you end up withafter intersecting?Suppose you have a roads layerand a counties layer and you wantto know what roads are in whatcounties. Intersecting the roadslayer with the counties layercreates a new layer that combinesthe attributes of both. The featuresin the new layer are roads with theattributes of the county they�re in.Where a road crosses a countyboundary, it will be split in two,with the appropriate countyattributes assigned to each piece.
ch13.p65 12/06/2000, 11:49 AM388
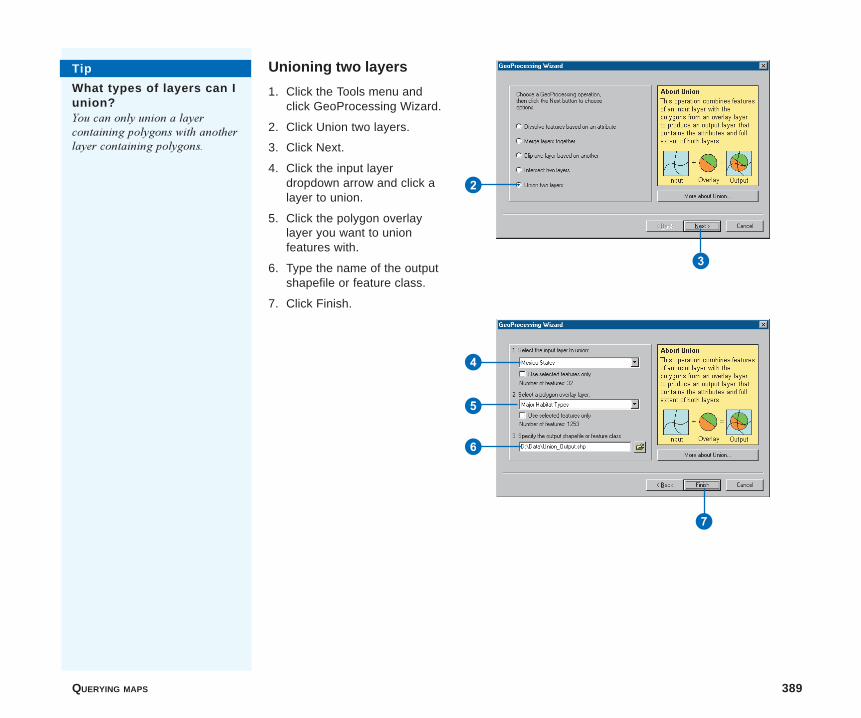
QUERYING MAPS 389
Unioning two layers
1. Click the Tools menu andclick GeoProcessing Wizard.
2. Click Union two layers.
3. Click Next.
4. Click the input layerdropdown arrow and click alayer to union.
5. Click the polygon overlaylayer you want to unionfeatures with.
6. Type the name of the outputshapefile or feature class.
7. Click Finish.
2
3
4
5
6
7
Tip
What types of layers can Iunion?You can only union a layercontaining polygons with anotherlayer containing polygons.
ch13.p65 12/06/2000, 11:49 AM389
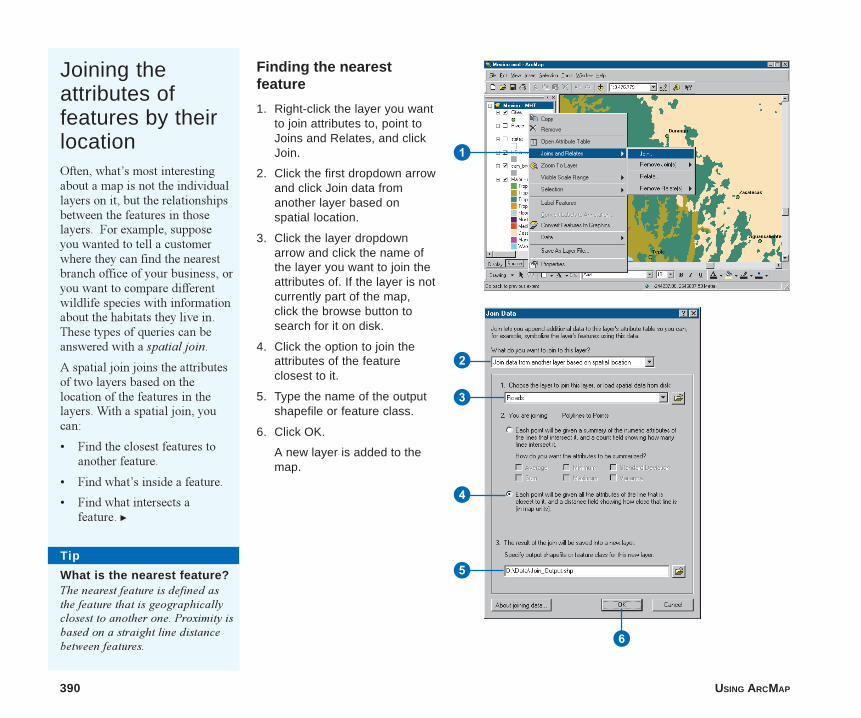
390 USING ARCMAP
Finding the nearestfeature
1. Right-click the layer you wantto join attributes to, point toJoins and Relates, and clickJoin.
2. Click the first dropdown arrowand click Join data fromanother layer based onspatial location.
3. Click the layer dropdownarrow and click the name ofthe layer you want to join theattributes of. If the layer is notcurrently part of the map,click the browse button tosearch for it on disk.
4. Click the option to join theattributes of the featureclosest to it.
5. Type the name of the outputshapefile or feature class.
6. Click OK.
A new layer is added to themap.
Joining theattributes offeatures by theirlocationOften, what�s most interestingabout a map is not the individuallayers on it, but the relationshipsbetween the features in thoselayers. For example, supposeyou wanted to tell a customerwhere they can find the nearestbranch office of your business, oryou want to compare differentwildlife species with informationabout the habitats they live in.These types of queries can beanswered with a spatial join.
A spatial join joins the attributesof two layers based on thelocation of the features in thelayers. With a spatial join, youcan:
� Find the closest features toanother feature.
� Find what�s inside a feature.
� Find what intersects afeature. u
1
2
3
4
5
6
Tip
What is the nearest feature?The nearest feature is defined asthe feature that is geographicallyclosest to another one. Proximity isbased on a straight line distancebetween features.
ch13.p65 12/06/2000, 11:50 AM390
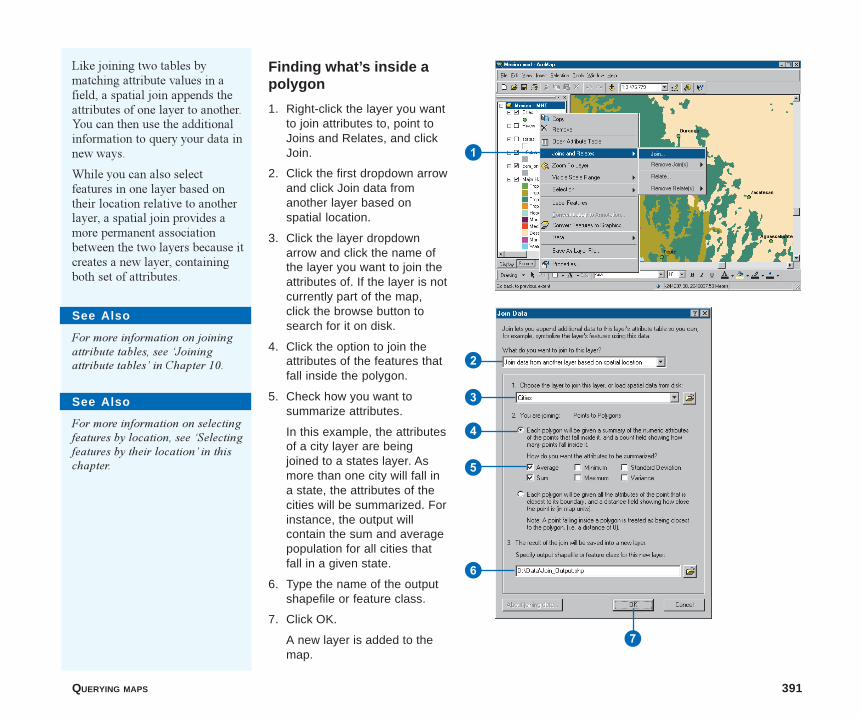
QUERYING MAPS 391
Finding what’s inside apolygon
1. Right-click the layer you wantto join attributes to, point toJoins and Relates, and clickJoin.
2. Click the first dropdown arrowand click Join data fromanother layer based onspatial location.
3. Click the layer dropdownarrow and click the name ofthe layer you want to join theattributes of. If the layer is notcurrently part of the map,click the browse button tosearch for it on disk.
4. Click the option to join theattributes of the features thatfall inside the polygon.
5. Check how you want tosummarize attributes.
In this example, the attributesof a city layer are beingjoined to a states layer. Asmore than one city will fall ina state, the attributes of thecities will be summarized. Forinstance, the output willcontain the sum and averagepopulation for all cities thatfall in a given state.
6. Type the name of the outputshapefile or feature class.
7. Click OK.
A new layer is added to themap.
Like joining two tables bymatching attribute values in afield, a spatial join appends theattributes of one layer to another.You can then use the additionalinformation to query your data innew ways.
While you can also selectfeatures in one layer based ontheir location relative to anotherlayer, a spatial join provides amore permanent associationbetween the two layers because itcreates a new layer, containingboth set of attributes.
See Also
For more information on joiningattribute tables, see �Joiningattribute tables� in Chapter 10.
See Also
For more information on selectingfeatures by location, see �Selectingfeatures by their location� in thischapter.
1
2
3
6
7
4
5
ch13.p65 12/06/2000, 11:50 AM391
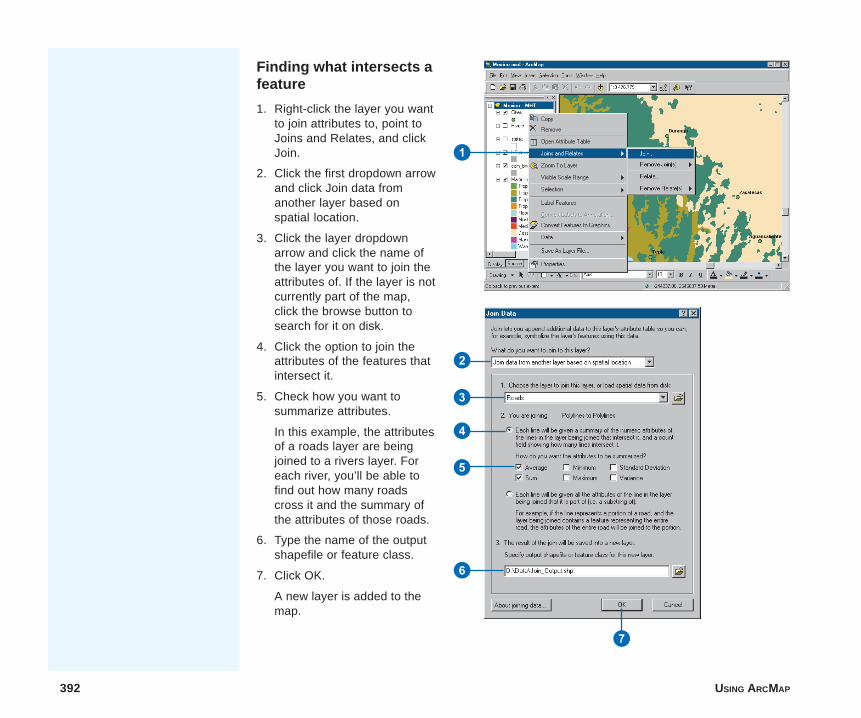
392 USING ARCMAP
Finding what intersects afeature
1. Right-click the layer you wantto join attributes to, point toJoins and Relates, and clickJoin.
2. Click the first dropdown arrowand click Join data fromanother layer based onspatial location.
3. Click the layer dropdownarrow and click the name ofthe layer you want to join theattributes of. If the layer is notcurrently part of the map,click the browse button tosearch for it on disk.
4. Click the option to join theattributes of the features thatintersect it.
5. Check how you want tosummarize attributes.
In this example, the attributesof a roads layer are beingjoined to a rivers layer. Foreach river, you’ll be able tofind out how many roadscross it and the summary ofthe attributes of those roads.
6. Type the name of the outputshapefile or feature class.
7. Click OK.
A new layer is added to themap.
1
2
3
6
7
4
5
ch13.p65 12/06/2000, 11:50 AM392
IN THIS CHAPTER
393
Working with rasters 14• Adding a raster to your map
• Displaying rasters
• Ways to improve raster display
• Faster drawing with pyramids
• About georeferencing
• The Georeferencing toolbar
• Georeferencing a raster
Vector data�such as coverages and shapefiles�represents geographicfeatures with lines, points, and polygons. Rasters�such as images andgrids�represent geographic features by dividing the world into discretesquares called cells. Cells are laid out in a grid, where each cell has alocation relative to an origin and a value describing the feature beingobserved�for instance, the cell values in an aerial photograph represent theamount of light reflecting off the earth�s surface.
A raster can represent thematic data, such as land use and elevation; spectraldata, such as satellite images and aerial photographs; and pictures, such asscanned maps and building photographs. You�ll generally display thematicand spectral rasters as a background to other geographic data on your map.Picture rasters, when displayed alongside geographic data, can conveyadditional information about map features.
Some rasters have a single band of data, while others have multiple bands; asatellite image commonly has multiple bands representing differentwavelengths of energy from the ultraviolet through the visible and infraredportions of the electromagnetic spectrum.
ch14.p65 12/06/2000, 12:15 PM393
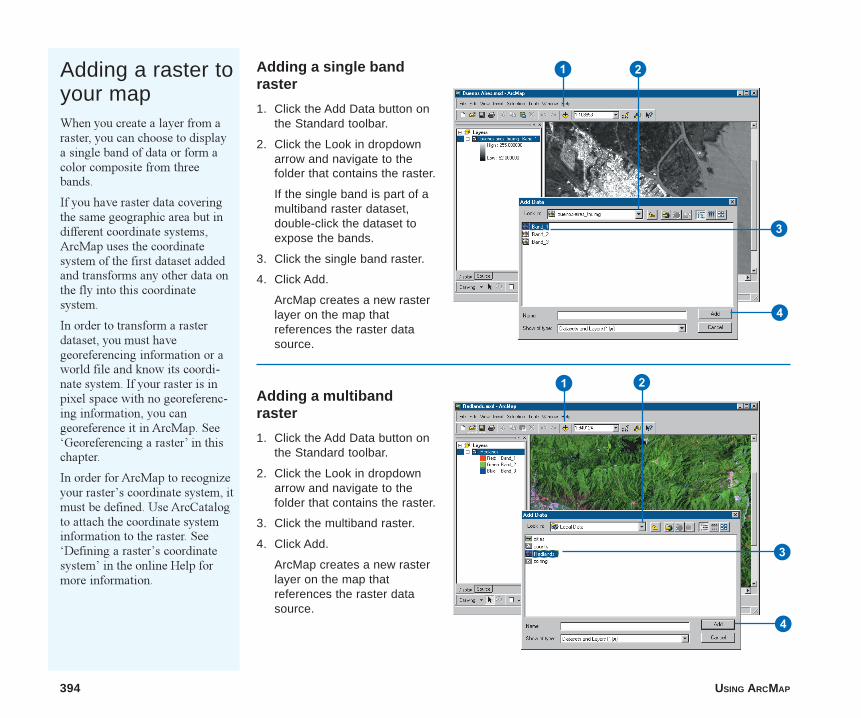
394 USING ARCMAP
Adding a raster toyour mapWhen you create a layer from araster, you can choose to displaya single band of data or form acolor composite from threebands.
If you have raster data coveringthe same geographic area but indifferent coordinate systems,ArcMap uses the coordinatesystem of the first dataset addedand transforms any other data onthe fly into this coordinatesystem.
In order to transform a rasterdataset, you must havegeoreferencing information or aworld file and know its coordi-nate system. If your raster is inpixel space with no georeferenc-ing information, you cangeoreference it in ArcMap. See�Georeferencing a raster� in thischapter.
In order for ArcMap to recognizeyour raster�s coordinate system, itmust be defined. Use ArcCatalogto attach the coordinate systeminformation to the raster. See�Defining a raster�s coordinatesystem� in the online Help formore information.
Adding a single bandraster
1. Click the Add Data button onthe Standard toolbar.
2. Click the Look in dropdownarrow and navigate to thefolder that contains the raster.
If the single band is part of amultiband raster dataset,double-click the dataset toexpose the bands.
3. Click the single band raster.
4. Click Add.
ArcMap creates a new rasterlayer on the map thatreferences the raster datasource.
Adding a multibandraster
1. Click the Add Data button onthe Standard toolbar.
2. Click the Look in dropdownarrow and navigate to thefolder that contains the raster.
3. Click the multiband raster.
4. Click Add.
ArcMap creates a new rasterlayer on the map thatreferences the raster datasource.
1 2
3
4
1 2
3
4
ch14.p65 12/06/2000, 12:16 PM394
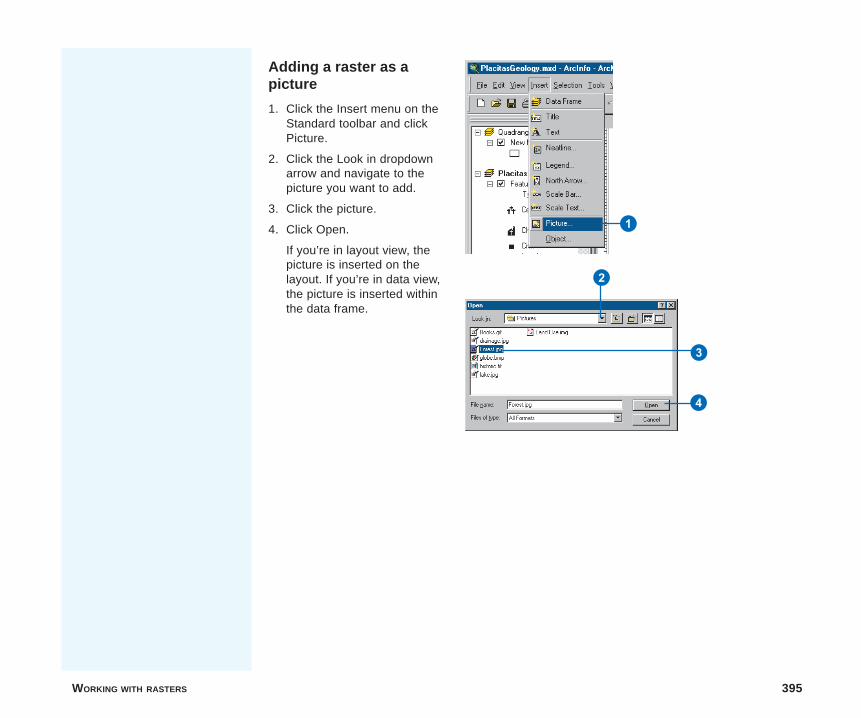
WORKING WITH RASTERS 395
Adding a raster as apicture
1. Click the Insert menu on theStandard toolbar and clickPicture.
2. Click the Look in dropdownarrow and navigate to thepicture you want to add.
3. Click the picture.
4. Click Open.
If you’re in layout view, thepicture is inserted on thelayout. If you’re in data view,the picture is inserted withinthe data frame.
1
2
4
3
ch14.p65 12/06/2000, 12:16 PM395
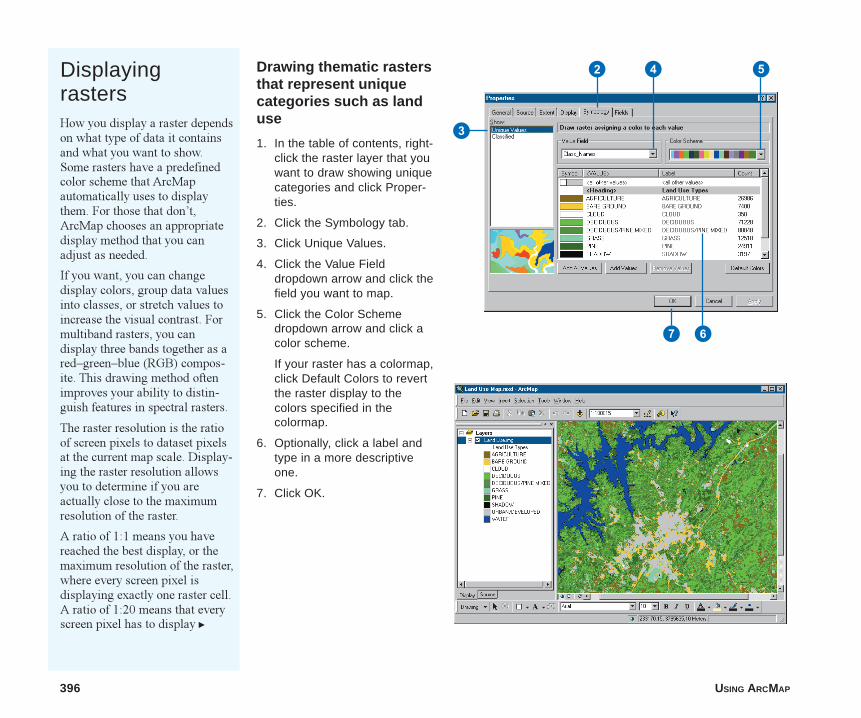
396 USING ARCMAP
DisplayingrastersHow you display a raster dependson what type of data it containsand what you want to show.Some rasters have a predefinedcolor scheme that ArcMapautomatically uses to displaythem. For those that don�t,ArcMap chooses an appropriatedisplay method that you canadjust as needed.
If you want, you can changedisplay colors, group data valuesinto classes, or stretch values toincrease the visual contrast. Formultiband rasters, you candisplay three bands together as ared�green�blue (RGB) compos-ite. This drawing method oftenimproves your ability to distin-guish features in spectral rasters.
The raster resolution is the ratioof screen pixels to dataset pixelsat the current map scale. Display-ing the raster resolution allowsyou to determine if you areactually close to the maximumresolution of the raster.
A ratio of 1:1 means you havereached the best display, or themaximum resolution of the raster,where every screen pixel isdisplaying exactly one raster cell.A ratio of 1:20 means that everyscreen pixel has to display u
Drawing thematic rastersthat represent uniquecategories such as landuse
1. In the table of contents, right-click the raster layer that youwant to draw showing uniquecategories and click Proper-ties.
2. Click the Symbology tab.
3. Click Unique Values.
4. Click the Value Fielddropdown arrow and click thefield you want to map.
5. Click the Color Schemedropdown arrow and click acolor scheme.
If your raster has a colormap,click Default Colors to revertthe raster display to thecolors specified in thecolormap.
6. Optionally, click a label andtype in a more descriptiveone.
7. Click OK.
2
3
5
7
4
6
ch14.p65 12/06/2000, 12:16 PM396
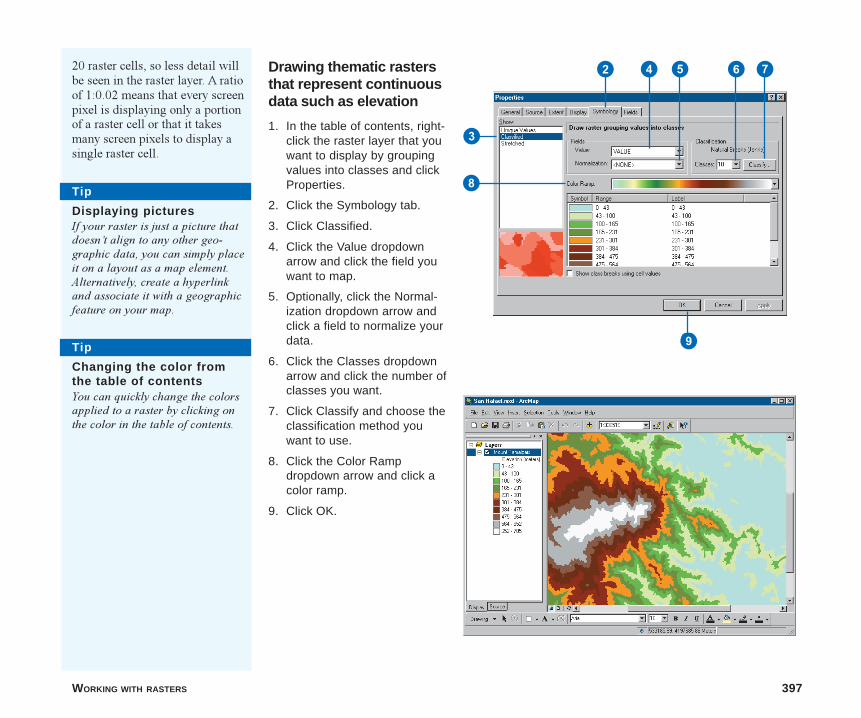
WORKING WITH RASTERS 397
Drawing thematic rastersthat represent continuousdata such as elevation
1. In the table of contents, right-click the raster layer that youwant to display by groupingvalues into classes and clickProperties.
2. Click the Symbology tab.
3. Click Classified.
4. Click the Value dropdownarrow and click the field youwant to map.
5. Optionally, click the Normal-ization dropdown arrow andclick a field to normalize yourdata.
6. Click the Classes dropdownarrow and click the number ofclasses you want.
7. Click Classify and choose theclassification method youwant to use.
8. Click the Color Rampdropdown arrow and click acolor ramp.
9. Click OK.
2
3
8
7
9
4 5 620 raster cells, so less detail willbe seen in the raster layer. A ratioof 1:0.02 means that every screenpixel is displaying only a portionof a raster cell or that it takesmany screen pixels to display asingle raster cell.
Tip
Displaying picturesIf your raster is just a picture thatdoesn�t align to any other geo-graphic data, you can simply placeit on a layout as a map element.Alternatively, create a hyperlinkand associate it with a geographicfeature on your map.
Tip
Changing the color fromthe table of contentsYou can quickly change the colorsapplied to a raster by clicking onthe color in the table of contents.
ch14.p65 12/06/2000, 12:17 PM397
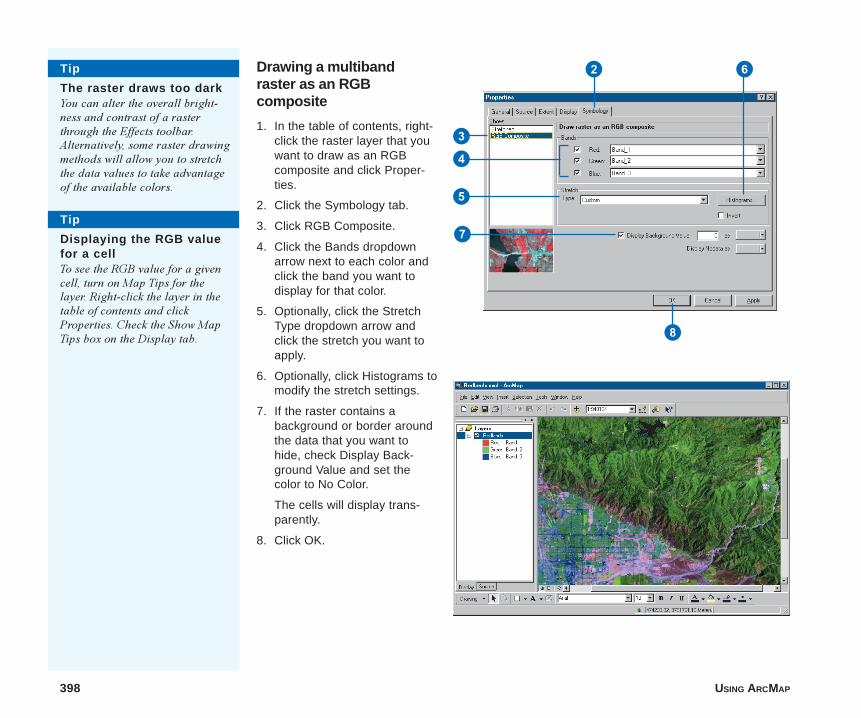
398 USING ARCMAP
Drawing a multibandraster as an RGBcomposite
1. In the table of contents, right-click the raster layer that youwant to draw as an RGBcomposite and click Proper-ties.
2. Click the Symbology tab.
3. Click RGB Composite.
4. Click the Bands dropdownarrow next to each color andclick the band you want todisplay for that color.
5. Optionally, click the StretchType dropdown arrow andclick the stretch you want toapply.
6. Optionally, click Histograms tomodify the stretch settings.
7. If the raster contains abackground or border aroundthe data that you want tohide, check Display Back-ground Value and set thecolor to No Color.
The cells will display trans-parently.
8. Click OK.
2
3
4
5
6
7
8
Tip
Displaying the RGB valuefor a cellTo see the RGB value for a givencell, turn on Map Tips for thelayer. Right-click the layer in thetable of contents and clickProperties. Check the Show MapTips box on the Display tab.
Tip
The raster draws too darkYou can alter the overall bright-ness and contrast of a rasterthrough the Effects toolbar.Alternatively, some raster drawingmethods will allow you to stretchthe data values to take advantageof the available colors.
ch14.p65 12/06/2000, 12:17 PM398
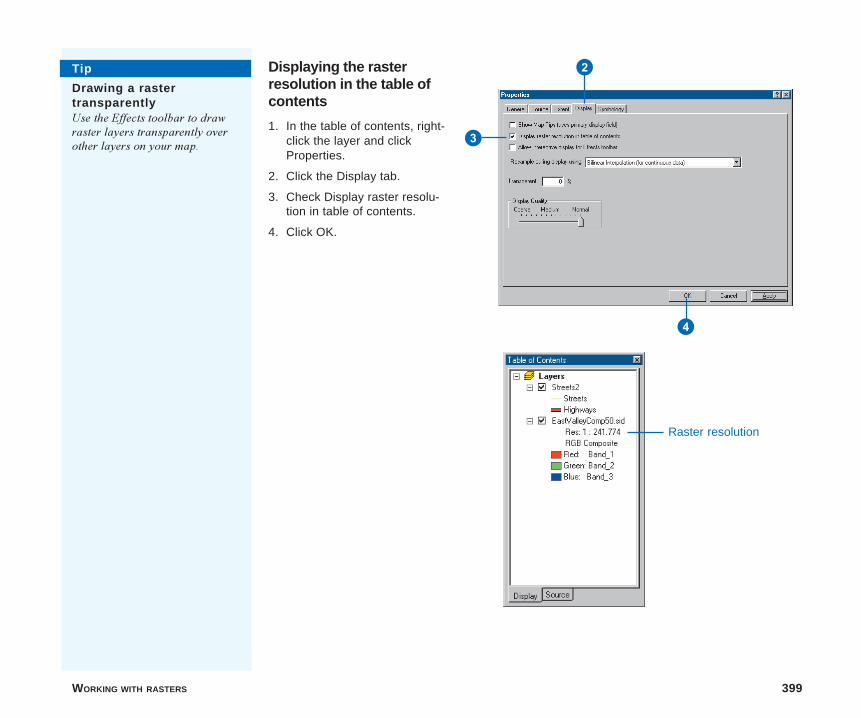
WORKING WITH RASTERS 399
Displaying the rasterresolution in the table ofcontents
1. In the table of contents, right-click the layer and clickProperties.
2. Click the Display tab.
3. Check Display raster resolu-tion in table of contents.
4. Click OK.
2
3
4
Tip
Drawing a rastertransparentlyUse the Effects toolbar to drawraster layers transparently overother layers on your map.
Raster resolution
ch14.p65 12/06/2000, 12:17 PM399
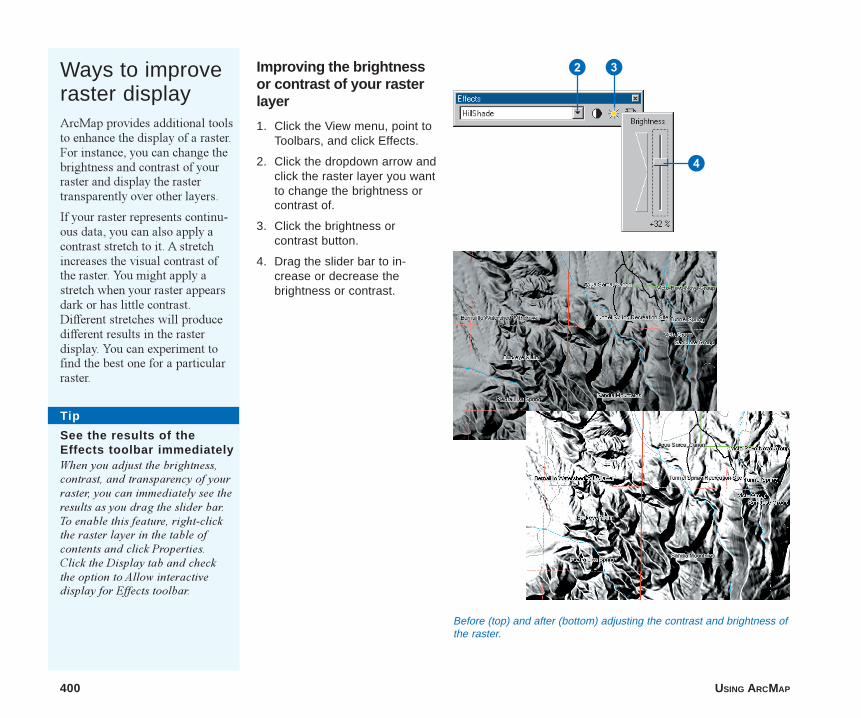
400 USING ARCMAP
Ways to improveraster displayArcMap provides additional toolsto enhance the display of a raster.For instance, you can change thebrightness and contrast of yourraster and display the rastertransparently over other layers.
If your raster represents continu-ous data, you can also apply acontrast stretch to it. A stretchincreases the visual contrast ofthe raster. You might apply astretch when your raster appearsdark or has little contrast.Different stretches will producedifferent results in the rasterdisplay. You can experiment tofind the best one for a particularraster.
Improving the brightnessor contrast of your rasterlayer
1. Click the View menu, point toToolbars, and click Effects.
2. Click the dropdown arrow andclick the raster layer you wantto change the brightness orcontrast of.
3. Click the brightness orcontrast button.
4. Drag the slider bar to in-crease or decrease thebrightness or contrast.
Tip
See the results of theEffects toolbar immediatelyWhen you adjust the brightness,contrast, and transparency of yourraster, you can immediately see theresults as you drag the slider bar.To enable this feature, right-clickthe raster layer in the table ofcontents and click Properties.Click the Display tab and checkthe option to Allow interactivedisplay for Effects toolbar.
2 3
4
Before (top) and after (bottom) adjusting the contrast and brightness ofthe raster.
ch14.p65 12/06/2000, 12:17 PM400
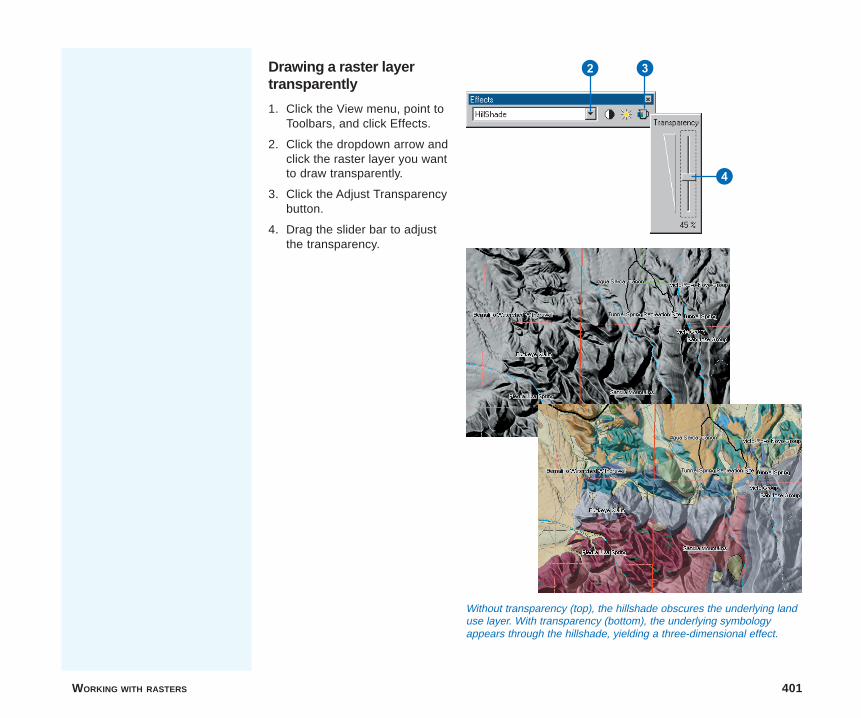
WORKING WITH RASTERS 401
Drawing a raster layertransparently
1. Click the View menu, point toToolbars, and click Effects.
2. Click the dropdown arrow andclick the raster layer you wantto draw transparently.
3. Click the Adjust Transparencybutton.
4. Drag the slider bar to adjustthe transparency.
2 3
4
Without transparency (top), the hillshade obscures the underlying landuse layer. With transparency (bottom), the underlying symbologyappears through the hillshade, yielding a three-dimensional effect.
ch14.p65 12/06/2000, 12:18 PM401
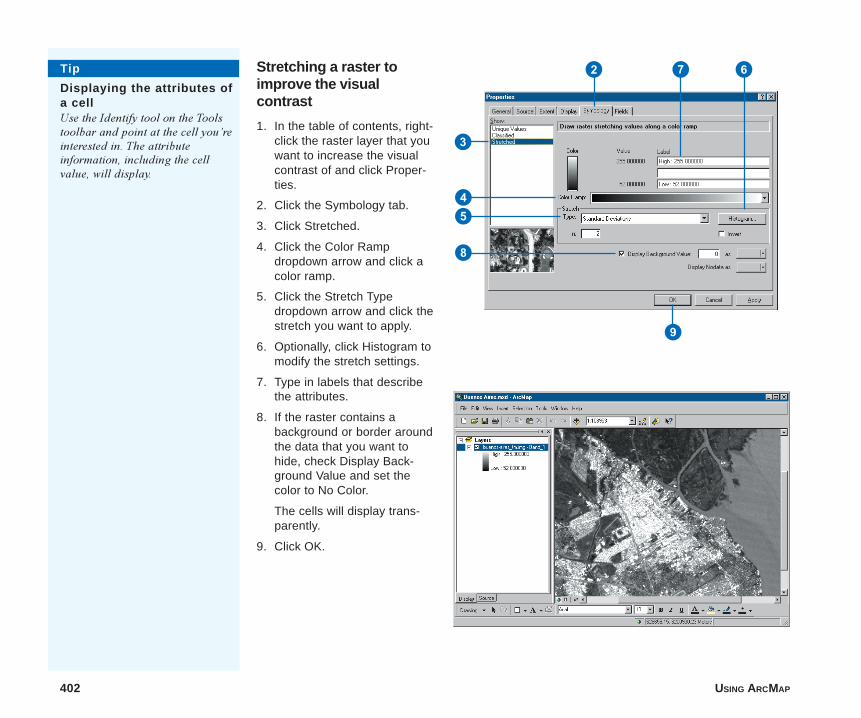
402 USING ARCMAP
Stretching a raster toimprove the visualcontrast
1. In the table of contents, right-click the raster layer that youwant to increase the visualcontrast of and click Proper-ties.
2. Click the Symbology tab.
3. Click Stretched.
4. Click the Color Rampdropdown arrow and click acolor ramp.
5. Click the Stretch Typedropdown arrow and click thestretch you want to apply.
6. Optionally, click Histogram tomodify the stretch settings.
7. Type in labels that describethe attributes.
8. If the raster contains abackground or border aroundthe data that you want tohide, check Display Back-ground Value and set thecolor to No Color.
The cells will display trans-parently.
9. Click OK.
Tip
Displaying the attributes ofa cellUse the Identify tool on the Toolstoolbar and point at the cell you�reinterested in. The attributeinformation, including the cellvalue, will display.
2
3
45
6
8
9
7
ch14.p65 12/06/2000, 12:18 PM402
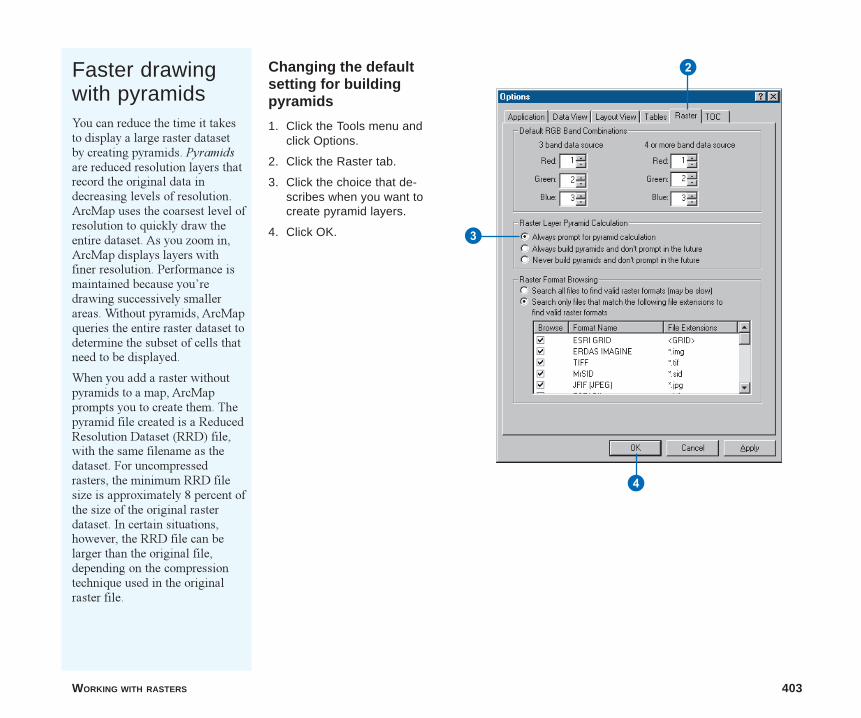
WORKING WITH RASTERS 403
Faster drawingwith pyramidsYou can reduce the time it takesto display a large raster datasetby creating pyramids. Pyramidsare reduced resolution layers thatrecord the original data indecreasing levels of resolution.ArcMap uses the coarsest level ofresolution to quickly draw theentire dataset. As you zoom in,ArcMap displays layers withfiner resolution. Performance ismaintained because you�redrawing successively smallerareas. Without pyramids, ArcMapqueries the entire raster dataset todetermine the subset of cells thatneed to be displayed.
When you add a raster withoutpyramids to a map, ArcMapprompts you to create them. Thepyramid file created is a ReducedResolution Dataset (RRD) file,with the same filename as thedataset. For uncompressedrasters, the minimum RRD filesize is approximately 8 percent ofthe size of the original rasterdataset. In certain situations,however, the RRD file can belarger than the original file,depending on the compressiontechnique used in the originalraster file.
Changing the defaultsetting for buildingpyramids
1. Click the Tools menu andclick Options.
2. Click the Raster tab.
3. Click the choice that de-scribes when you want tocreate pyramid layers.
4. Click OK.
2
3
4
ch14.p65 12/06/2000, 12:19 PM403
404 USING ARCMAP
About georeferencing
Raster data is commonly obtained by scanning maps or collectingaerial photographs and satellite images. Scanned maps don�tusually contain information as to where the area represented onthe map fits on the surface of the earth; the locational informationdelivered with aerial photos and satellite imagery is ofteninadequate to perform analysis or display in proper alignmentwith other data. Thus, in order to use these types of raster data inconjunction with your other spatial data, you often need toalign�or georeference�it to a map coordinate system.
When you georeference your raster, you define how the data issituated in map coordinates. This process includes assigning acoordinate system that associates the data with a specific locationon the earth. Georeferencing raster data allows it to be viewed,queried, and analyzed with other geographic data.
How to align the raster
Generally, you�ll align your raster to existing spatial data, such asa coverage, that resides in the desired map coordinate system.This assumes that there are features in your spatial data (targetdata) that are also visible in the raster�for example, streets,building footprints, and streams. The basic procedure forgeoreferencing is to move the raster into the same space as thetarget data by identifying a series of ground control points�ofknown x,y coordinates�that link locations on the raster withlocations in the target data in map coordinates. A combination ofone control point on the raster and the corresponding controlpoint on the target data is called a link.
The number of links you need to create depends on the methodyou plan to use to transform the raster to map coordinates.However, adding more links will not necessarily yield a betterregistration. If possible, you should spread the links out over theentire raster rather than concentrating them in one area. Typically,
having at least one link near each corner of the raster and a fewthroughout the interior produces the best results. In general, thegreater the overlap between the raster and target data, the betterthe alignment results because you�ll have more widely spacedpoints with which to georeference the raster. For example, if yourtarget data only occupies one quarter of the area of your raster,the points you could use to align the raster would be confined tothat area of overlap. You can only assume that areas outside theoverlap area are properly aligned.
Transforming the raster
When you�ve created enough links, you can transform�orwarp�the raster to map coordinates. Warping uses amathematical transformation to determine the correct mapcoordinate location for each cell in the raster.
Use a first order�or affine�transformation to shift, scale, androtate your raster. Straight lines on the raster are mapped ontostraight lines in the warped raster. Thus squares and rectangles onthe raster are commonly changed into parallelograms of arbitraryscaling and angle orientation.
A first-order transformation will probably handle most of yourgeoreferencing requirements. With the minimum of three links,the mathematical equation used with a first-order transformationcan exactly map each raster point to the target location. Any morethan three links introduces errors, or residuals, that are distributedthroughout all the links. In practice, add more than three links.Given only three, if one link is positionally wrong, it has a muchgreater impact on the transformation. Thus, even though themathematical transformation error may increase as you createmore links, the overall accuracy of the transformation willincrease as well.
ch14.p65 12/06/2000, 12:19 PM404
WORKING WITH RASTERS 405
The higher the transformation order, the more complex thedistortion that can be corrected. However, in practice,transformations higher than third order are rarely needed. Higher-order transformations require more links and thus will involveprogressively more processing time. In general, if your rasterneeds to be stretched, scaled, and rotated, use a first-ordertransformation. If, however, the raster must be bent or curved,use a second- or third-order transformation.
Interpreting the root mean square error
The degree to which the transformation can accurately map allcontrol points can be measured mathematically by comparing theactual location of the map coordinate to the transformed positionin the raster. The distance between these two points is known asthe residual error. The total error is computed by taking the rootmean square (RMS) sum of all the residuals to compute the RMSerror. This value describes how consistent the transformation isbetween the different control points. While the RMS error is agood assessment of the accuracy of the transformation, don�tconfuse a low RMS error with an accurate registration. Thetransformation may still contain significant errors, for example,due to a poorly entered control point.
What is resampling?
While you might think each cell in a raster is transformed to itsnew map coordinate location, in reality the process works inreverse. During georeferencing, a matrix of �empty� cells iscomputed in map coordinates. Then each cell is given a valuebased on a process called resampling.
The three most common resampling techniques are nearestneighbor assignment, bilinear interpolation, and cubicconvolution. These techniques assign a value to each empty cellby examining the cells in the untransformed raster. Nearest
neighbor assignment takes the value from the cell closest to thetransformed cell as the new value. It�s the fastest resamplingtechnique and is appropriate for categorical, or thematic, data.Bilinear interpolation and cubic convolution techniques combinea greater number of nearby cells (4 and 16, respectively) tocompute the value for the transformed cell. These two techniquesuse a weighted averaging method to compute the outputtransformed cell value and thus are only appropriate forcontinuous data such as elevation, slope, and other continuoussurfaces.
Should you rectify your raster?
You can permanently transform your raster after georeferencing itby using the Rectify command on the Georeferencing toolbar.Rectify creates a new raster that is georeferenced to mapcoordinates. You can save this in ESRI GRID, TIFF, or ERDAS®
IMAGINE® format.
ArcMap doesn�t require you to rectify your raster to display itwith other spatial data. You might choose to rectify your raster ifyou plan to perform analysis with it or want to use it with anothersoftware package that doesn�t recognize the externalgeoreferencing information created by ArcMap and requires theraster to be in map coordinates.
ch14.p65 12/06/2000, 12:19 PM405
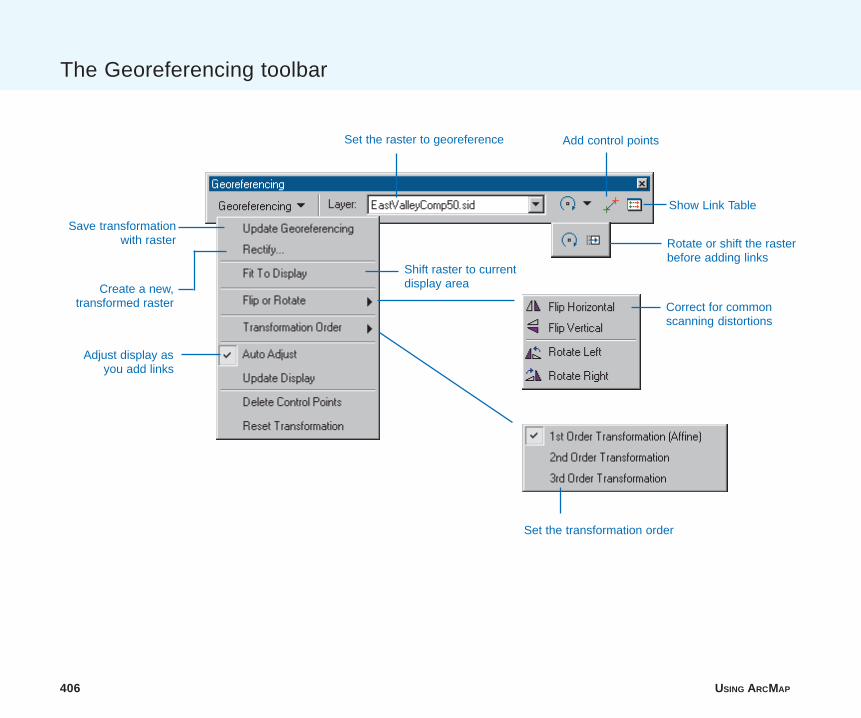
406 USING ARCMAP
The Georeferencing toolbar
Rotate or shift the rasterbefore adding links
Set the raster to georeference Add control points
Save transformationwith raster
Correct for commonscanning distortions
Set the transformation order
Create a new,transformed raster
Adjust display asyou add links
Show Link Table
Shift raster to currentdisplay area
ch14.p65 12/06/2000, 12:19 PM406

WORKING WITH RASTERS 407
Georeferencing arasterThe general steps forgeoreferencing a raster are:
1. Add to your map the rasterand the layers (target data)you want to align it to.
2. Add control points that linkknown raster positions toknown target data positions inmap coordinates.
3. When you�re satisfied withthe registration, save thegeoreferencing informationwith the raster.
For most rasters, the georeferenc-ing information is stored in aseparate file with the same nameas the raster but with an .aux fileextension. You can permanentlytransform the raster by using theRectify command on theGeoreferencing toolbar.
The coordinate system assignedto the raster is the same as thecoordinate system defined on thedata frame the raster is part of.
Georeferencing a raster
1. Add the layers residing inmap coordinates (target data)and the raster you want togeoreference.
2. In the table of contents, right-click a target layer and clickZoom to Layer.
3. From the Georeferencingtoolbar, click the Layerdropdown arrow and click theraster layer you want togeoreference.
4. Click Georeferencing andclick Fit To Display.
This will display the raster inthe same area as the targetlayers. You can also use theShift and Rotate tools tomove the raster as needed.
5. Click the Control Points toolto add control points.
6. To add a link, click the mousepointer over a known locationon the raster, then over aknown location on the targetdata.
You may find it useful to usea Magnification window toadd your links in.
7. Add enough links for thetransformation order. Youneed a minimum of threelinks for a first-order transfor-mation, six links for a secondorder, and 10 links for a thirdorder. u
Tip
Displaying theGeoreferencing toolbarRight-click the Tools menu, pointto Toolbars, and clickGeoreferencing.
3 54
6
To create a link, click a control point on the raster, then clickthe corresponding control point on the target data.
When enabled, the rasterautomatically shifts as youenter each link.
ch14.p65 12/06/2000, 12:19 PM407
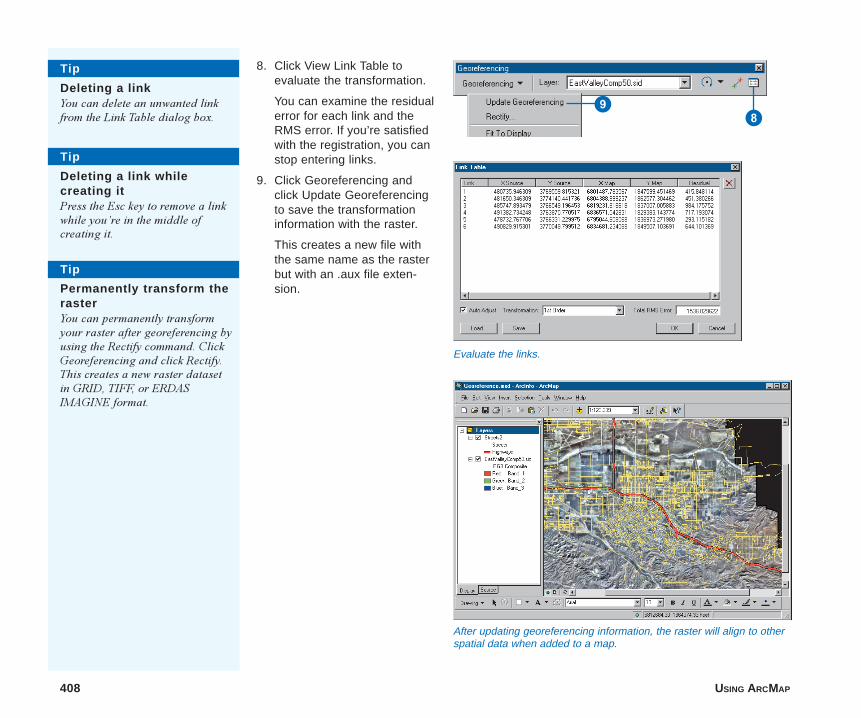
408 USING ARCMAP
Tip
Deleting a link whilecreating itPress the Esc key to remove a linkwhile you�re in the middle ofcreating it.
Tip
Deleting a linkYou can delete an unwanted linkfrom the Link Table dialog box.
8. Click View Link Table toevaluate the transformation.
You can examine the residualerror for each link and theRMS error. If you’re satisfiedwith the registration, you canstop entering links.
9. Click Georeferencing andclick Update Georeferencingto save the transformationinformation with the raster.
This creates a new file withthe same name as the rasterbut with an .aux file exten-sion.
89
Tip
Permanently transform therasterYou can permanently transformyour raster after georeferencing byusing the Rectify command. ClickGeoreferencing and click Rectify.This creates a new raster datasetin GRID, TIFF, or ERDASIMAGINE format.
After updating georeferencing information, the raster will align to otherspatial data when added to a map.
Evaluate the links.
ch14.p65 12/06/2000, 12:19 PM408
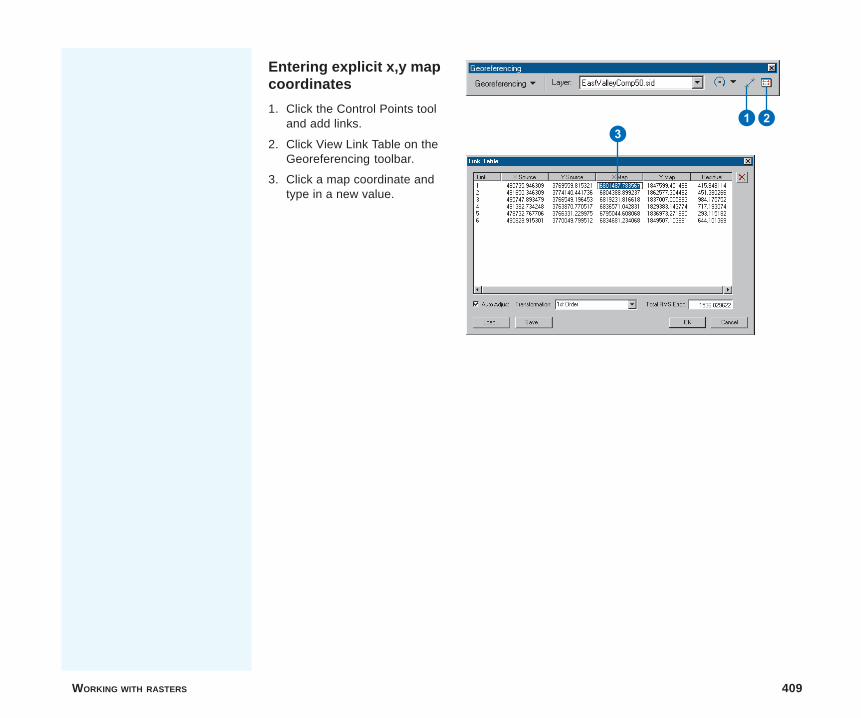
WORKING WITH RASTERS 409
Entering explicit x,y mapcoordinates
1. Click the Control Points tooland add links.
2. Click View Link Table on theGeoreferencing toolbar.
3. Click a map coordinate andtype in a new value.
213
ch14.p65 12/06/2000, 12:19 PM409

ch14.p65 12/06/2000, 12:19 PM410
IN THIS CHAPTER
411
Geocoding addresses 15� Managing geocoding services
in ArcMap
� Controlling the geocodingprocess
� Finding an address
� Geocoding a table of addresses
� Rematching a geocoded featureclass
A feature is an object that has geometry. In most cases, this geometry iscaptured by digitizing or scanning paper maps. In many cases, however,geographic data exists that indirectly captures geometry by describinglocations such as street addresses, city names, or even telephone numbers.While humans understand what these descriptions mean and how they relateto locations on the earth�s surface, computers do not. In order to displaythese locations on a map and perform analyses with them, a computer mustbe given geometric representations (such as point features) of these loca-tions.
Geocoding (also commonly known as address matching) is the process ofcreating geometric representations for descriptions of locations. A geocodingservice defines a process for converting alphanumeric descriptions oflocations into geometric shapes.
You can use geocoding services in ArcMap to find individual addresses andto geocode tables of addresses. You can also review and rematch the featureclasses and shapefiles that you create by geocoding tables of addresses.
In order to geocode in ArcMap, you must first define geocoding services.For information on creating geocoding services, see Using ArcCatalog.
Ch15.p65 12/06/2000, 1:30 PM 411
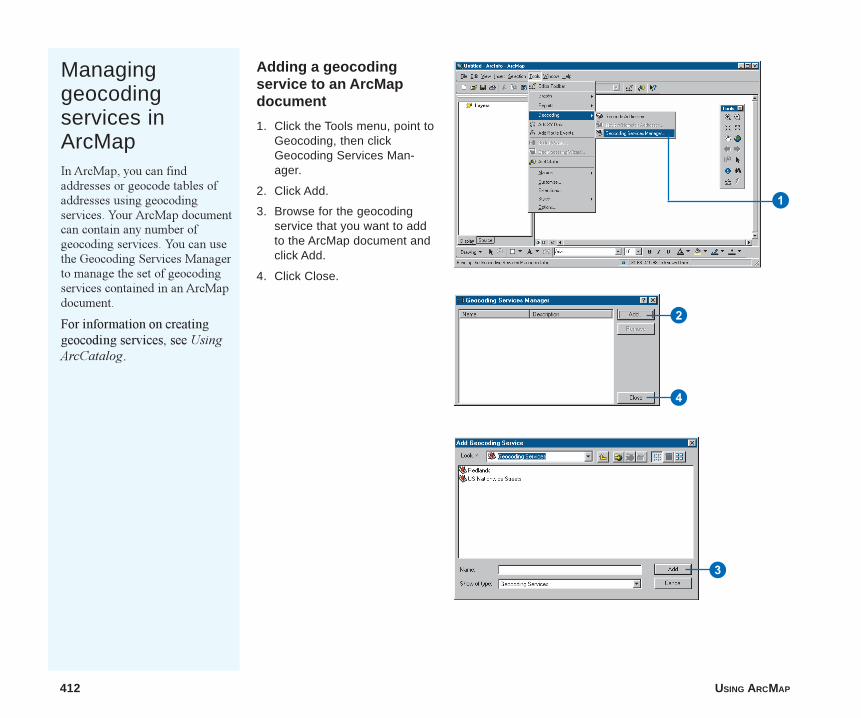
412 USING ARCMAP
Managinggeocodingservices inArcMapIn ArcMap, you can findaddresses or geocode tables ofaddresses using geocodingservices. Your ArcMap documentcan contain any number ofgeocoding services. You can usethe Geocoding Services Managerto manage the set of geocodingservices contained in an ArcMapdocument.
For information on creatinggeocoding services, see UsingArcCatalog.
Adding a geocodingservice to an ArcMapdocument
1. Click the Tools menu, point toGeocoding, then clickGeocoding Services Man-ager.
2. Click Add.
3. Browse for the geocodingservice that you want to addto the ArcMap document andclick Add.
4. Click Close.
1
2
4
3
Ch15.p65 12/06/2000, 1:30 PM412
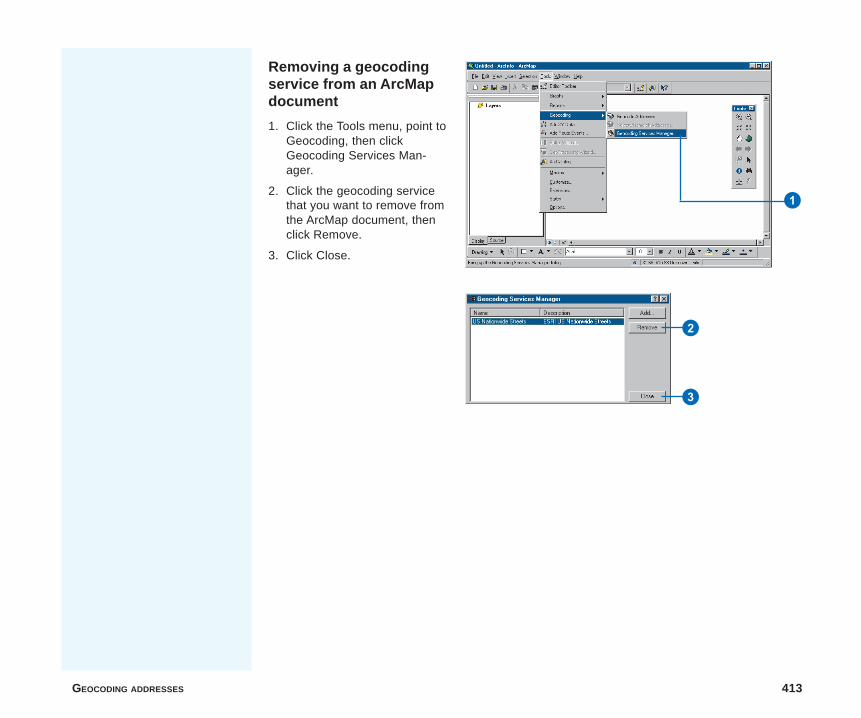
GEOCODING ADDRESSES 413
Removing a geocodingservice from an ArcMapdocument
1. Click the Tools menu, point toGeocoding, then clickGeocoding Services Man-ager.
2. Click the geocoding servicethat you want to remove fromthe ArcMap document, thenclick Remove.
3. Click Close.
1
2
3
Ch15.p65 12/06/2000, 1:31 PM413
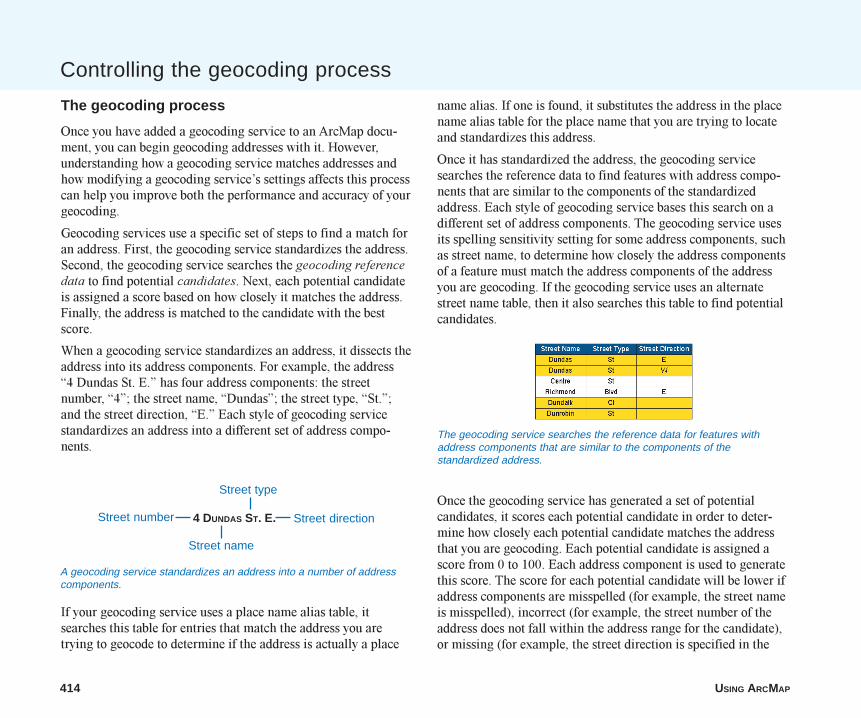
414 USING ARCMAP
Controlling the geocoding process
The geocoding process
Once you have added a geocoding service to an ArcMap docu-ment, you can begin geocoding addresses with it. However,understanding how a geocoding service matches addresses andhow modifying a geocoding service�s settings affects this processcan help you improve both the performance and accuracy of yourgeocoding.
Geocoding services use a specific set of steps to find a match foran address. First, the geocoding service standardizes the address.Second, the geocoding service searches the geocoding referencedata to find potential candidates. Next, each potential candidateis assigned a score based on how closely it matches the address.Finally, the address is matched to the candidate with the bestscore.
When a geocoding service standardizes an address, it dissects theaddress into its address components. For example, the address�4 Dundas St. E.� has four address components: the streetnumber, �4�; the street name, �Dundas�; the street type, �St.�;and the street direction, �E.� Each style of geocoding servicestandardizes an address into a different set of address compo-nents.
If your geocoding service uses a place name alias table, itsearches this table for entries that match the address you aretrying to geocode to determine if the address is actually a place
name alias. If one is found, it substitutes the address in the placename alias table for the place name that you are trying to locateand standardizes this address.
Once it has standardized the address, the geocoding servicesearches the reference data to find features with address compo-nents that are similar to the components of the standardizedaddress. Each style of geocoding service bases this search on adifferent set of address components. The geocoding service usesits spelling sensitivity setting for some address components, suchas street name, to determine how closely the address componentsof a feature must match the address components of the addressyou are geocoding. If the geocoding service uses an alternatestreet name table, then it also searches this table to find potentialcandidates.
Once the geocoding service has generated a set of potentialcandidates, it scores each potential candidate in order to deter-mine how closely each potential candidate matches the addressthat you are geocoding. Each potential candidate is assigned ascore from 0 to 100. Each address component is used to generatethis score. The score for each potential candidate will be lower ifaddress components are misspelled (for example, the street nameis misspelled), incorrect (for example, the street number of theaddress does not fall within the address range for the candidate),or missing (for example, the street direction is specified in the
A geocoding service standardizes an address into a number of addresscomponents.
4 DUNDAS ST. E.Street number
Street name
Street type
Street direction
The geocoding service searches the reference data for features withaddress components that are similar to the components of thestandardized address.
Ch15.p65 12/06/2000, 1:31 PM414
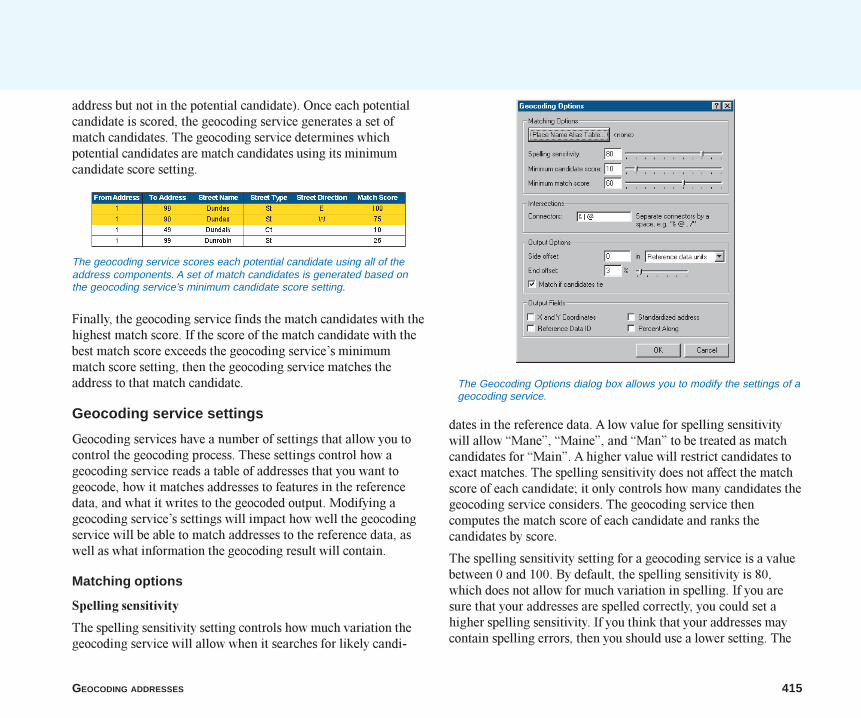
GEOCODING ADDRESSES 415
The geocoding service scores each potential candidate using all of theaddress components. A set of match candidates is generated based onthe geocoding service’s minimum candidate score setting.
The Geocoding Options dialog box allows you to modify the settings of ageocoding service.
address but not in the potential candidate). Once each potentialcandidate is scored, the geocoding service generates a set ofmatch candidates. The geocoding service determines whichpotential candidates are match candidates using its minimumcandidate score setting.
Finally, the geocoding service finds the match candidates with thehighest match score. If the score of the match candidate with thebest match score exceeds the geocoding service�s minimummatch score setting, then the geocoding service matches theaddress to that match candidate.
Geocoding service settings
Geocoding services have a number of settings that allow you tocontrol the geocoding process. These settings control how ageocoding service reads a table of addresses that you want togeocode, how it matches addresses to features in the referencedata, and what it writes to the geocoded output. Modifying ageocoding service�s settings will impact how well the geocodingservice will be able to match addresses to the reference data, aswell as what information the geocoding result will contain.
Matching options
Spelling sensitivity
The spelling sensitivity setting controls how much variation thegeocoding service will allow when it searches for likely candi-
dates in the reference data. A low value for spelling sensitivitywill allow �Mane�, �Maine�, and �Man� to be treated as matchcandidates for �Main�. A higher value will restrict candidates toexact matches. The spelling sensitivity does not affect the matchscore of each candidate; it only controls how many candidates thegeocoding service considers. The geocoding service thencomputes the match score of each candidate and ranks thecandidates by score.
The spelling sensitivity setting for a geocoding service is a valuebetween 0 and 100. By default, the spelling sensitivity is 80,which does not allow for much variation in spelling. If you aresure that your addresses are spelled correctly, you could set ahigher spelling sensitivity. If you think that your addresses maycontain spelling errors, then you should use a lower setting. The
Ch15.p65 12/06/2000, 1:31 PM415
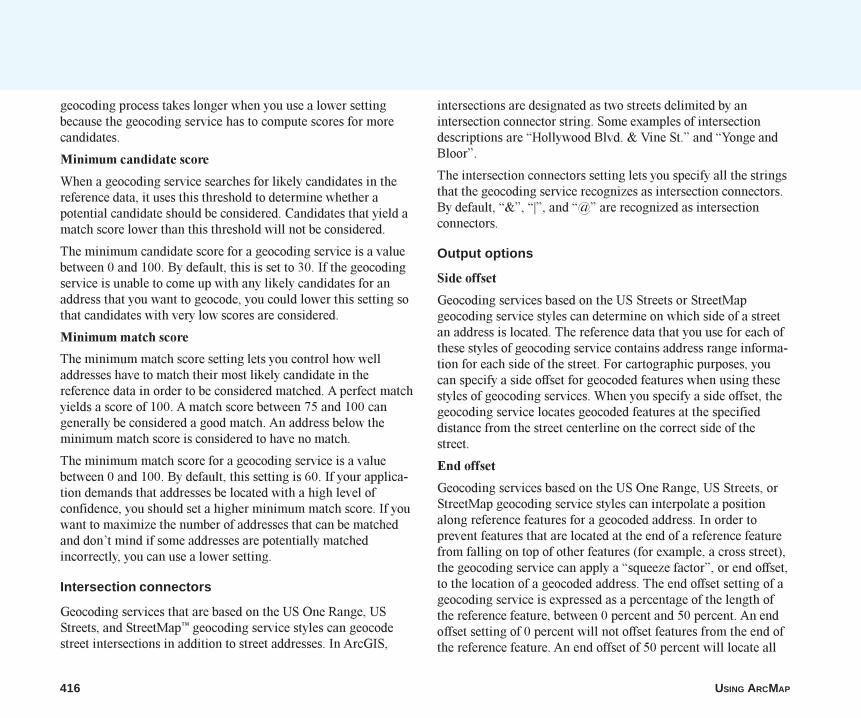
416 USING ARCMAP
geocoding process takes longer when you use a lower settingbecause the geocoding service has to compute scores for morecandidates.
Minimum candidate score
When a geocoding service searches for likely candidates in thereference data, it uses this threshold to determine whether apotential candidate should be considered. Candidates that yield amatch score lower than this threshold will not be considered.
The minimum candidate score for a geocoding service is a valuebetween 0 and 100. By default, this is set to 30. If the geocodingservice is unable to come up with any likely candidates for anaddress that you want to geocode, you could lower this setting sothat candidates with very low scores are considered.
Minimum match score
The minimum match score setting lets you control how welladdresses have to match their most likely candidate in thereference data in order to be considered matched. A perfect matchyields a score of 100. A match score between 75 and 100 cangenerally be considered a good match. An address below theminimum match score is considered to have no match.
The minimum match score for a geocoding service is a valuebetween 0 and 100. By default, this setting is 60. If your applica-tion demands that addresses be located with a high level ofconfidence, you should set a higher minimum match score. If youwant to maximize the number of addresses that can be matchedand don�t mind if some addresses are potentially matchedincorrectly, you can use a lower setting.
Intersection connectors
Geocoding services that are based on the US One Range, USStreets, and StreetMap� geocoding service styles can geocodestreet intersections in addition to street addresses. In ArcGIS,
intersections are designated as two streets delimited by anintersection connector string. Some examples of intersectiondescriptions are �Hollywood Blvd. & Vine St.� and �Yonge andBloor�.
The intersection connectors setting lets you specify all the stringsthat the geocoding service recognizes as intersection connectors.By default, �&�, �|�, and �@� are recognized as intersectionconnectors.
Output options
Side offset
Geocoding services based on the US Streets or StreetMapgeocoding service styles can determine on which side of a streetan address is located. The reference data that you use for each ofthese styles of geocoding service contains address range informa-tion for each side of the street. For cartographic purposes, youcan specify a side offset for geocoded features when using thesestyles of geocoding services. When you specify a side offset, thegeocoding service locates geocoded features at the specifieddistance from the street centerline on the correct side of thestreet.
End offset
Geocoding services based on the US One Range, US Streets, orStreetMap geocoding service styles can interpolate a positionalong reference features for a geocoded address. In order toprevent features that are located at the end of a reference featurefrom falling on top of other features (for example, a cross street),the geocoding service can apply a �squeeze factor�, or end offset,to the location of a geocoded address. The end offset setting of ageocoding service is expressed as a percentage of the length ofthe reference feature, between 0 percent and 50 percent. An endoffset setting of 0 percent will not offset features from the end ofthe reference feature. An end offset of 50 percent will locate all
Ch15.p65 12/06/2000, 1:31 PM416
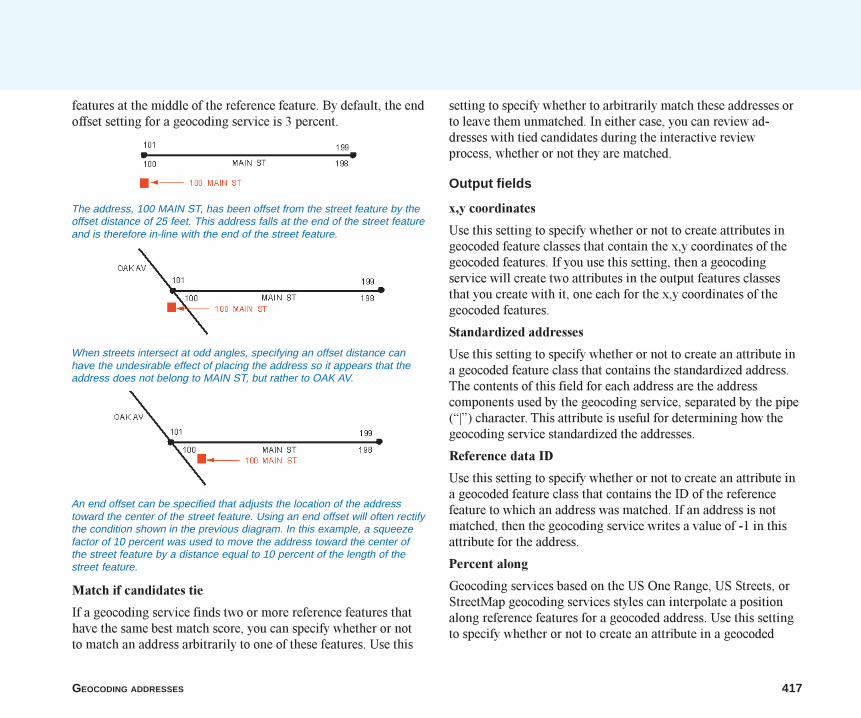
GEOCODING ADDRESSES 417
An end offset can be specified that adjusts the location of the addresstoward the center of the street feature. Using an end offset will often rectifythe condition shown in the previous diagram. In this example, a squeezefactor of 10 percent was used to move the address toward the center ofthe street feature by a distance equal to 10 percent of the length of thestreet feature.
The address, 100 MAIN ST, has been offset from the street feature by theoffset distance of 25 feet. This address falls at the end of the street featureand is therefore in-line with the end of the street feature.
When streets intersect at odd angles, specifying an offset distance canhave the undesirable effect of placing the address so it appears that theaddress does not belong to MAIN ST, but rather to OAK AV.
features at the middle of the reference feature. By default, the endoffset setting for a geocoding service is 3 percent.
Match if candidates tie
If a geocoding service finds two or more reference features thathave the same best match score, you can specify whether or notto match an address arbitrarily to one of these features. Use this
setting to specify whether to arbitrarily match these addresses orto leave them unmatched. In either case, you can review ad-dresses with tied candidates during the interactive reviewprocess, whether or not they are matched.
Output fields
x,y coordinates
Use this setting to specify whether or not to create attributes ingeocoded feature classes that contain the x,y coordinates of thegeocoded features. If you use this setting, then a geocodingservice will create two attributes in the output features classesthat you create with it, one each for the x,y coordinates of thegeocoded features.
Standardized addresses
Use this setting to specify whether or not to create an attribute ina geocoded feature class that contains the standardized address.The contents of this field for each address are the addresscomponents used by the geocoding service, separated by the pipe(�|�) character. This attribute is useful for determining how thegeocoding service standardized the addresses.
Reference data ID
Use this setting to specify whether or not to create an attribute ina geocoded feature class that contains the ID of the referencefeature to which an address was matched. If an address is notmatched, then the geocoding service writes a value of -1 in thisattribute for the address.
Percent along
Geocoding services based on the US One Range, US Streets, orStreetMap geocoding services styles can interpolate a positionalong reference features for a geocoded address. Use this settingto specify whether or not to create an attribute in a geocoded
Ch15.p65 12/06/2000, 1:31 PM417
418 USING ARCMAP
feature class that contains the position along the reference featureto which the address was matched. The value of this attribute is anumber between 0 and 100, with 0 indicating the starting node ofthe reference feature and 100 indicating the ending node of thereference feature. If an address is not matched, then thegeocoding service does not write a value in this attribute for theaddress.
Ch15.p65 12/06/2000, 1:31 PM418

GEOCODING ADDRESSES 419
Finding anaddressYou can use geocoding servicesto find addresses in ArcMap. Inorder to use a geocoding servicein ArcMap, it must be loaded intothe ArcMap document. You don�tneed to load the reference datafor a geocoding service into theArcMap document, but doing sowill help you choose an appropri-ate candidate for an address.
In ArcMap, you can modify thegeocoding settings that thegeocoding service uses to findaddresses. Modifying thegeocoding settings in ArcMapdoes not change the geocodingservice that you are using. Onlythe settings that are used to findaddresses in your ArcMapsession are modified.
1. In ArcMap, click the Find tool.
2. Click the Addresses tab.
3. Choose the geocodingservice that you want to useto find the address from thelist.
If the geocoding service thatyou want to use does notappear in the list, you need toadd it to the ArcMap docu-ment. Click the Browsebutton to browse forgeocoding services to add tothe document.
4. Type the address compo-nents in the text boxes.
5. Click Find.
6. Click Show all candidates tosee all of the candidates thatthe geocoding servicegenerated.
By default, only the candi-dates that meet or exceed theminimum match score areshown.
7. If you want to modify thegeocoding settings that thegeocoding service uses tofind the address, clickOptions.
Otherwise, skip to step 9. u
1
2 3
4
5
67
Ch15.p65 12/06/2000, 1:33 PM419
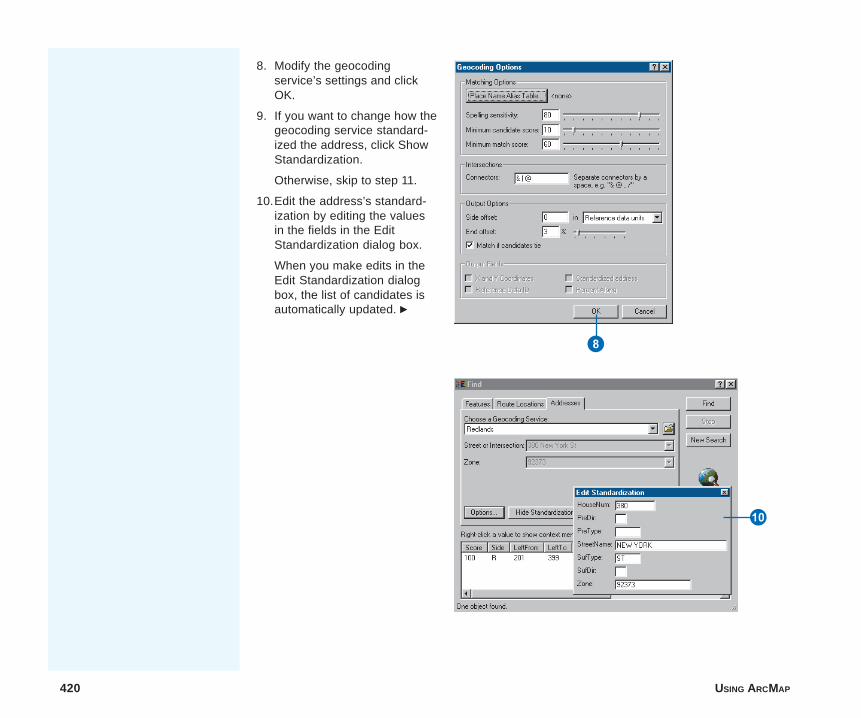
420 USING ARCMAP
8. Modify the geocodingservice’s settings and clickOK.
9. If you want to change how thegeocoding service standard-ized the address, click ShowStandardization.
Otherwise, skip to step 11.
10.Edit the address’s standard-ization by editing the valuesin the fields in the EditStandardization dialog box.
When you make edits in theEdit Standardization dialogbox, the list of candidates isautomatically updated. u
8
Q
Ch15.p65 12/06/2000, 1:33 PM420
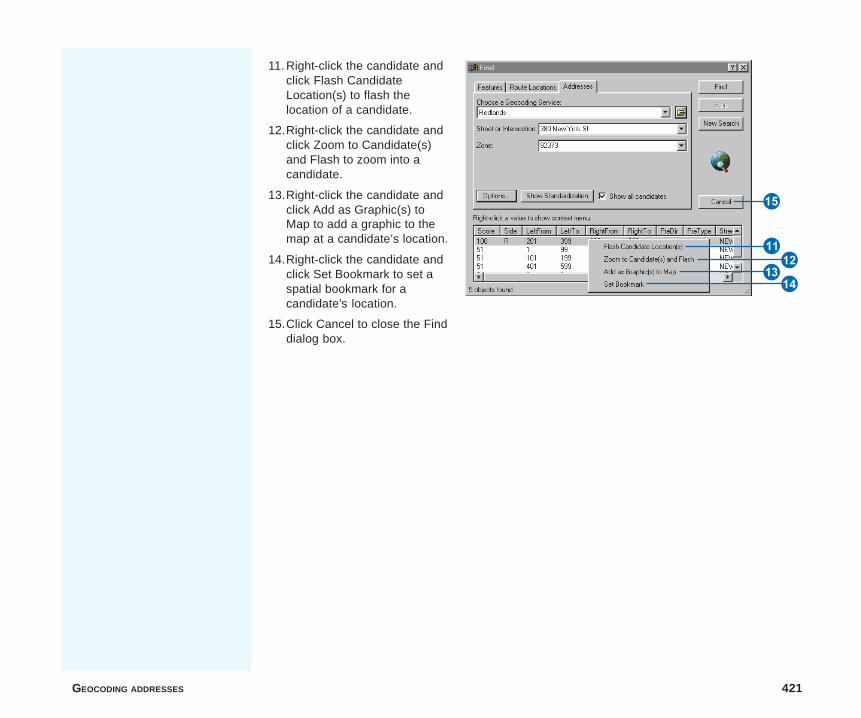
GEOCODING ADDRESSES 421
11.Right-click the candidate andclick Flash CandidateLocation(s) to flash thelocation of a candidate.
12.Right-click the candidate andclick Zoom to Candidate(s)and Flash to zoom into acandidate.
13.Right-click the candidate andclick Add as Graphic(s) toMap to add a graphic to themap at a candidate’s location.
14.Right-click the candidate andclick Set Bookmark to set aspatial bookmark for acandidate’s location.
15.Click Cancel to close the Finddialog box.
RE
Y
W
T
Ch15.p65 12/06/2000, 1:34 PM421
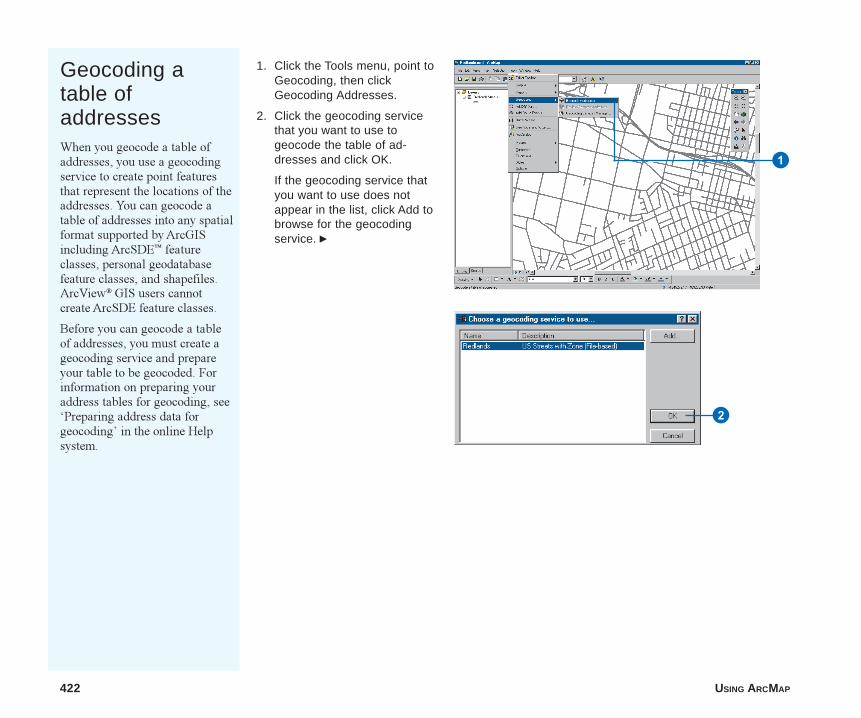
422 USING ARCMAP
Geocoding atable ofaddressesWhen you geocode a table ofaddresses, you use a geocodingservice to create point featuresthat represent the locations of theaddresses. You can geocode atable of addresses into any spatialformat supported by ArcGISincluding ArcSDE� featureclasses, personal geodatabasefeature classes, and shapefiles.ArcView® GIS users cannotcreate ArcSDE feature classes.
Before you can geocode a tableof addresses, you must create ageocoding service and prepareyour table to be geocoded. Forinformation on preparing youraddress tables for geocoding, see�Preparing address data forgeocoding� in the online Helpsystem.
1. Click the Tools menu, point toGeocoding, then clickGeocoding Addresses.
2. Click the geocoding servicethat you want to use togeocode the table of ad-dresses and click OK.
If the geocoding service thatyou want to use does notappear in the list, click Add tobrowse for the geocodingservice. u
1
2
Ch15.p65 12/06/2000, 1:35 PM422
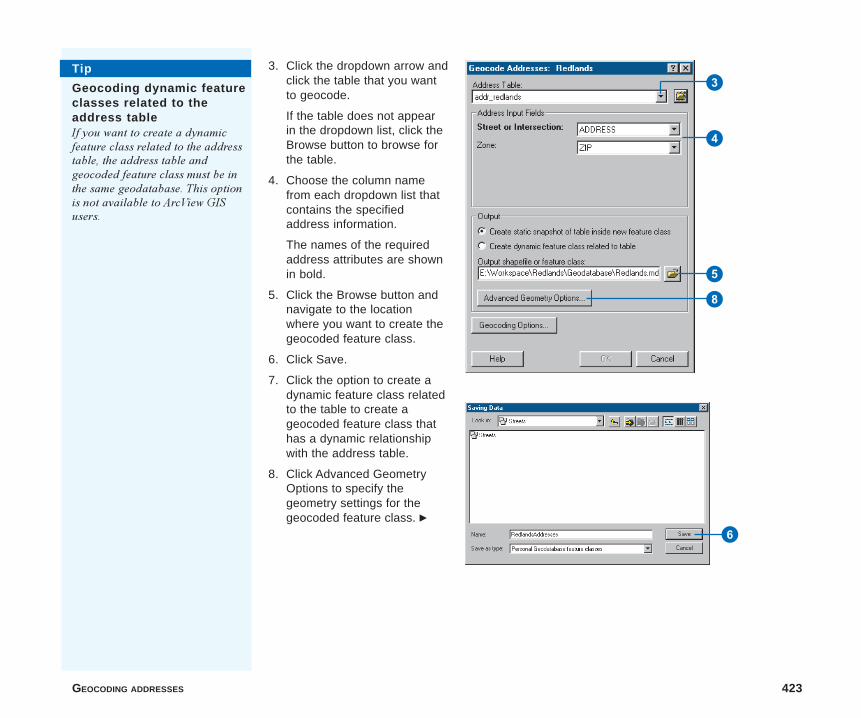
GEOCODING ADDRESSES 423
3. Click the dropdown arrow andclick the table that you wantto geocode.
If the table does not appearin the dropdown list, click theBrowse button to browse forthe table.
4. Choose the column namefrom each dropdown list thatcontains the specifiedaddress information.
The names of the requiredaddress attributes are shownin bold.
5. Click the Browse button andnavigate to the locationwhere you want to create thegeocoded feature class.
6. Click Save.
7. Click the option to create adynamic feature class relatedto the table to create ageocoded feature class thathas a dynamic relationshipwith the address table.
8. Click Advanced GeometryOptions to specify thegeometry settings for thegeocoded feature class. u
3
4
5
8
6
Tip
Geocoding dynamic featureclasses related to theaddress tableIf you want to create a dynamicfeature class related to the addresstable, the address table andgeocoded feature class must be inthe same geodatabase. This optionis not available to ArcView GISusers.
Ch15.p65 12/06/2000, 1:36 PM423
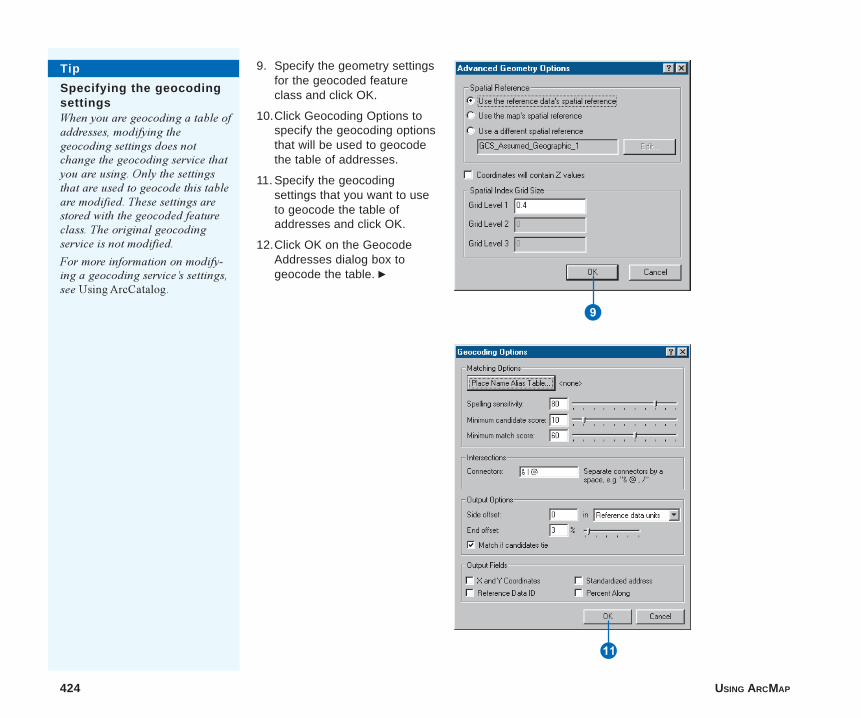
424 USING ARCMAP
9. Specify the geometry settingsfor the geocoded featureclass and click OK.
10.Click Geocoding Options tospecify the geocoding optionsthat will be used to geocodethe table of addresses.
11. Specify the geocodingsettings that you want to useto geocode the table ofaddresses and click OK.
12.Click OK on the GeocodeAddresses dialog box togeocode the table. u
W
Tip
Specifying the geocodingsettingsWhen you are geocoding a table ofaddresses, modifying thegeocoding settings does notchange the geocoding service thatyou are using. Only the settingsthat are used to geocode this tableare modified. These settings arestored with the geocoded featureclass. The original geocodingservice is not modified.
For more information on modify-ing a geocoding service�s settings,see Using ArcCatalog.
9
Ch15.p65 12/06/2000, 1:36 PM424
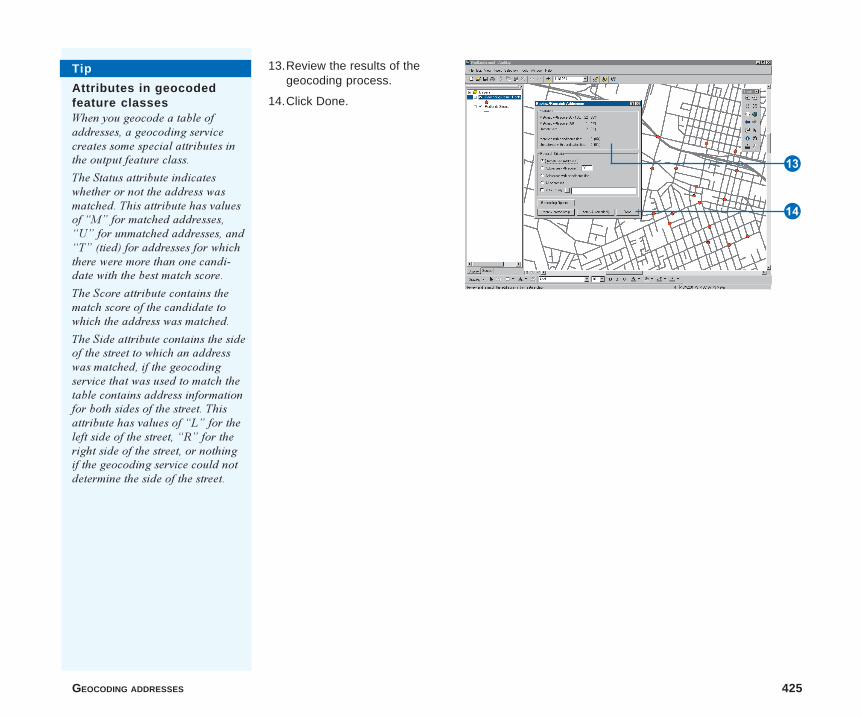
GEOCODING ADDRESSES 425
13.Review the results of thegeocoding process.
14.Click Done.
T
R
Tip
Attributes in geocodedfeature classesWhen you geocode a table ofaddresses, a geocoding servicecreates some special attributes inthe output feature class.
The Status attribute indicateswhether or not the address wasmatched. This attribute has valuesof �M� for matched addresses,�U� for unmatched addresses, and�T� (tied) for addresses for whichthere were more than one candi-date with the best match score.
The Score attribute contains thematch score of the candidate towhich the address was matched.
The Side attribute contains the sideof the street to which an addresswas matched, if the geocodingservice that was used to match thetable contains address informationfor both sides of the street. Thisattribute has values of �L� for theleft side of the street, �R� for theright side of the street, or nothingif the geocoding service could notdetermine the side of the street.
Ch15.p65 12/06/2000, 1:37 PM425
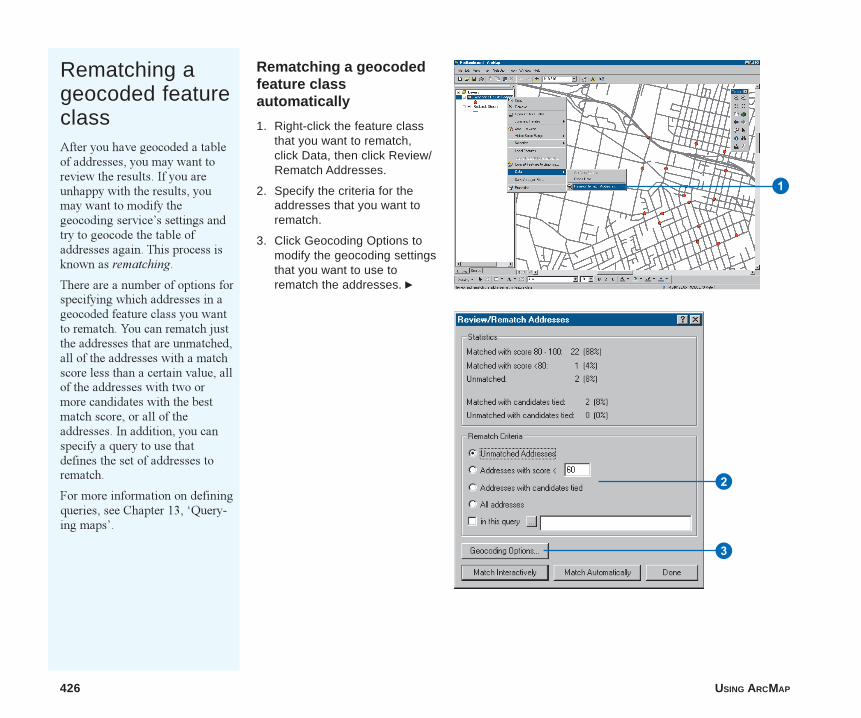
426 USING ARCMAP
Rematching ageocoded featureclassAfter you have geocoded a tableof addresses, you may want toreview the results. If you areunhappy with the results, youmay want to modify thegeocoding service�s settings andtry to geocode the table ofaddresses again. This process isknown as rematching.
There are a number of options forspecifying which addresses in ageocoded feature class you wantto rematch. You can rematch justthe addresses that are unmatched,all of the addresses with a matchscore less than a certain value, allof the addresses with two ormore candidates with the bestmatch score, or all of theaddresses. In addition, you canspecify a query to use thatdefines the set of addresses torematch.
For more information on definingqueries, see Chapter 13, �Query-ing maps�.
Rematching a geocodedfeature classautomatically
1. Right-click the feature classthat you want to rematch,click Data, then click Review/Rematch Addresses.
2. Specify the criteria for theaddresses that you want torematch.
3. Click Geocoding Options tomodify the geocoding settingsthat you want to use torematch the addresses. u
1
2
3
Ch15.p65 12/06/2000, 1:39 PM426
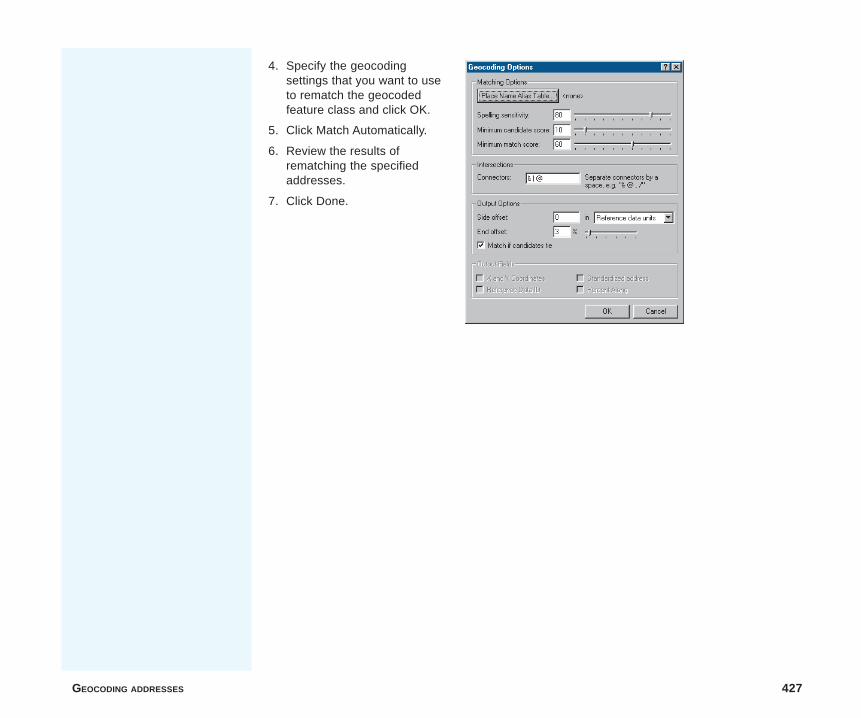
GEOCODING ADDRESSES 427
4. Specify the geocodingsettings that you want to useto rematch the geocodedfeature class and click OK.
5. Click Match Automatically.
6. Review the results ofrematching the specifiedaddresses.
7. Click Done.
Ch15.p65 12/06/2000, 1:39 PM427
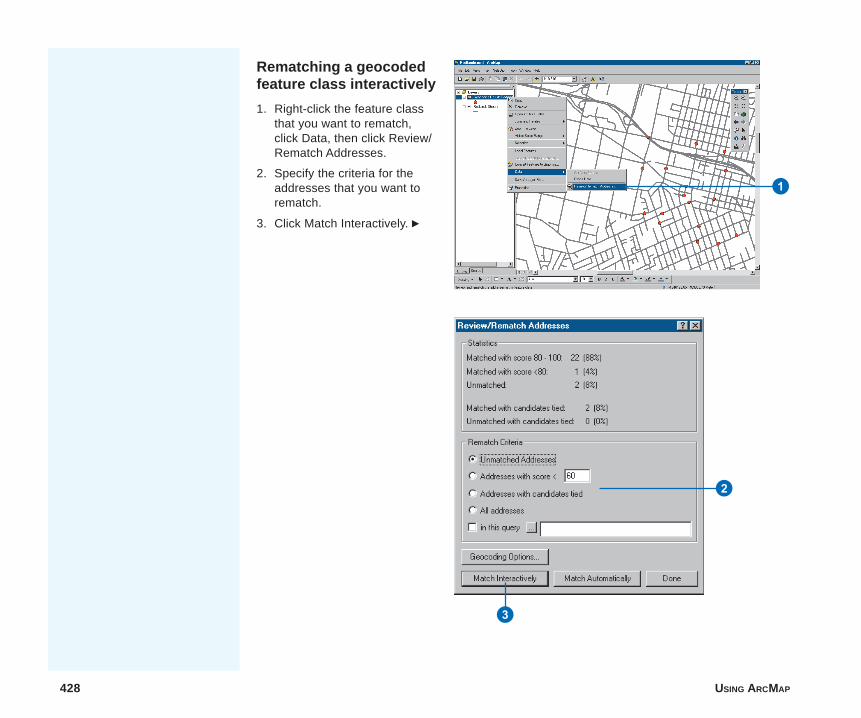
428 USING ARCMAP
Rematching a geocodedfeature class interactively
1. Right-click the feature classthat you want to rematch,click Data, then click Review/Rematch Addresses.
2. Specify the criteria for theaddresses that you want torematch.
3. Click Match Interactively. u
2
3
1
Ch15.p65 12/06/2000, 1:41 PM428
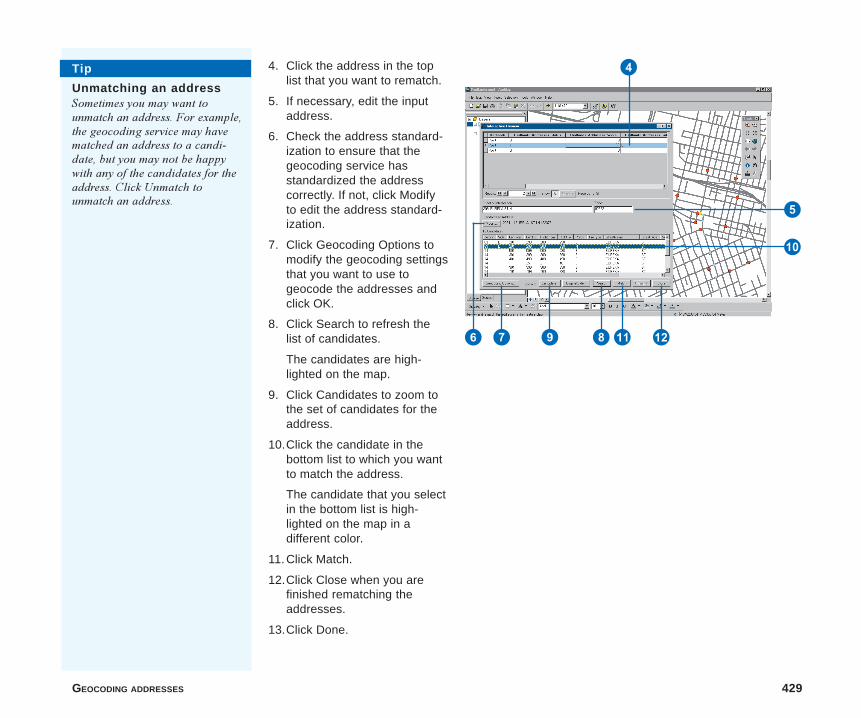
GEOCODING ADDRESSES 429
4. Click the address in the toplist that you want to rematch.
5. If necessary, edit the inputaddress.
6. Check the address standard-ization to ensure that thegeocoding service hasstandardized the addresscorrectly. If not, click Modifyto edit the address standard-ization.
7. Click Geocoding Options tomodify the geocoding settingsthat you want to use togeocode the addresses andclick OK.
8. Click Search to refresh thelist of candidates.
The candidates are high-lighted on the map.
9. Click Candidates to zoom tothe set of candidates for theaddress.
10.Click the candidate in thebottom list to which you wantto match the address.
The candidate that you selectin the bottom list is high-lighted on the map in adifferent color.
11.Click Match.
12.Click Close when you arefinished rematching theaddresses.
13.Click Done.
Tip
Unmatching an addressSometimes you may want tounmatch an address. For example,the geocoding service may havematched an address to a candi-date, but you may not be happywith any of the candidates for theaddress. Click Unmatch tounmatch an address.
4
5
Q
6 7 9 8W E
Ch15.p65 12/06/2000, 1:42 PM429

Ch15.p65 12/06/2000, 1:42 PM430
IN THIS CHAPTER
431
Analyzing utility networks 16• What is a geometric network?
• What can you do with networks inArcMap?
• Opening a geometric network
• Symbolizing network features
• Editing geometric networks
• Loading the Utility Network Ana-lyst toolbar
• Exploring the Utility NetworkAnalyst toolbar
• Flow direction
• Displaying flow direction
• Setting flow direction
• Tracing on networks
• Tracing operations
The economic foundation of the modern world is its infrastructure�thecollection of cables, pipelines, and wires that enables the movement ofenergy, commodities, and information. This infrastructure can be modeledas networks. ArcGIS provides a complete model for capturing, storing, andanalyzing networks.
What can you do with networks in ArcMap?
ArcMap provides a rich set of tools that perform many common networkanalysis tasks on geometric networks. Some of the common types ofanalyses that you can perform on your network using ArcMap are:
� Trouble call analysis: determines the likely cause of a problem based onthe location of customers with service problems.
� Isolation traces: determines which switches have to be opened in orderto cut power to a part of the network.
� Contaminant tracing: determines whether a particular site is a possiblecause of contamination.
Before you can work with geometric networks in ArcMap, you need tobuild a geometric network. To learn how to build a geometric networkusing ArcCatalog, see Building a Geodatabase.
ch16.p65 12/06/2000, 2:51 PM 431
432 USING ARCMAP
Networks consist of two fundamental components: edges andjunctions. The edges and junctions in a network are topologicallyconnected to each other. An edge is a type of network elementthat has a length and through which some commodity flows.Electrical transmission lines, pipes, and stream reaches areexamples of edges. A junction occurs at the intersection of two ormore edges and allows the transfer of flow between edges. Fuses,switches, service taps, and the confluence of stream reaches areexamples of junctions. Edges connect to each other at junctions;the flow from edges in the network is transferred to other edgesthrough junctions.
In ArcGIS, feature classes can participate together in a network.Feature classes representing transmission lines, switches, fuses,and transformers can all be part of the same network. Because thefeatures have geometry and can be mapped, the network offeatures is called a geometric network. A geometric networkcontains the connectivity information between edges andjunctions and defines rules of behavior such as which classes ofedges can connect to a particular class of junction or to whichclass of junction two classes of edges must connect.
To create a geometric network, you use a wizard to specify whichfeature classes will participate in the network, or you create anempty network and add feature classes to it later. Once thenetwork is created, it is maintained throughout the life cycle ofthe database. ArcGIS maintains the connectivity informationwhenever you edit the participating feature classes, based on theconnectivity rules and relationships that you define in thegeodatabase.
ArcGIS includes a variety of tools for analyzing networks and arich set of objects for building custom networks with complexbehavior. For more information on modeling networks in ArcGIS,see Modeling Our World. To learn how to create geometricnetworks and define connectivity rules, and for information ondefining relationships between feature classes, see Building aGeodatabase.
Geometric networks
ch16.p65 12/06/2000, 2:51 PM432
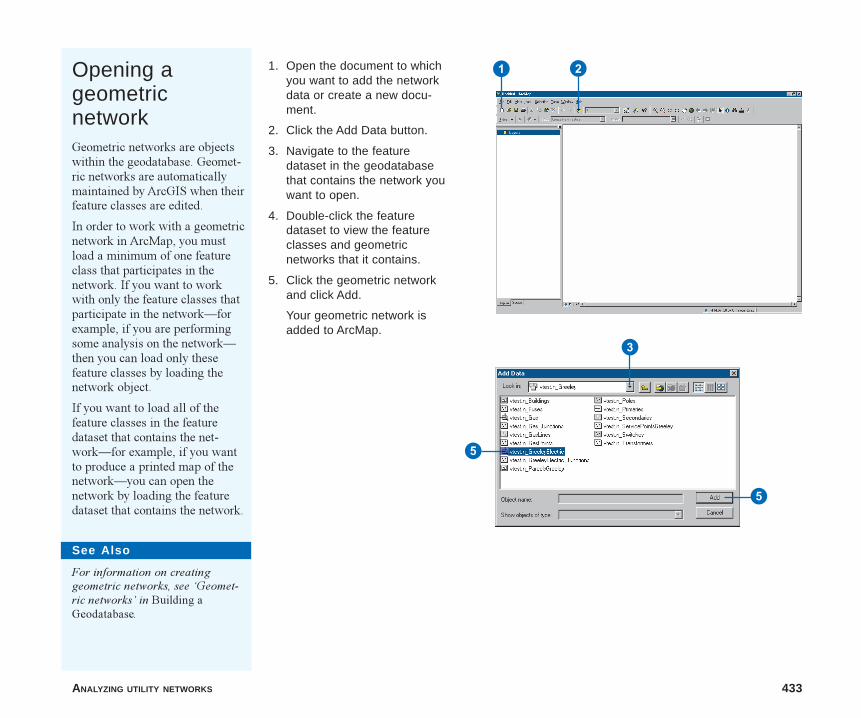
ANALYZING UTILITY NETWORKS 433
Opening ageometricnetworkGeometric networks are objectswithin the geodatabase. Geomet-ric networks are automaticallymaintained by ArcGIS when theirfeature classes are edited.
In order to work with a geometricnetwork in ArcMap, you mustload a minimum of one featureclass that participates in thenetwork. If you want to workwith only the feature classes thatparticipate in the network�forexample, if you are performingsome analysis on the network�then you can load only thesefeature classes by loading thenetwork object.
If you want to load all of thefeature classes in the featuredataset that contains the net-work�for example, if you wantto produce a printed map of thenetwork�you can open thenetwork by loading the featuredataset that contains the network.
1. Open the document to whichyou want to add the networkdata or create a new docu-ment.
2. Click the Add Data button.
3. Navigate to the featuredataset in the geodatabasethat contains the network youwant to open.
4. Double-click the featuredataset to view the featureclasses and geometricnetworks that it contains.
5. Click the geometric networkand click Add.
Your geometric network isadded to ArcMap.
See Also
For information on creatinggeometric networks, see �Geomet-ric networks� in Building aGeodatabase.
1 2
3
5
5
ch16.p65 12/06/2000, 2:52 PM433
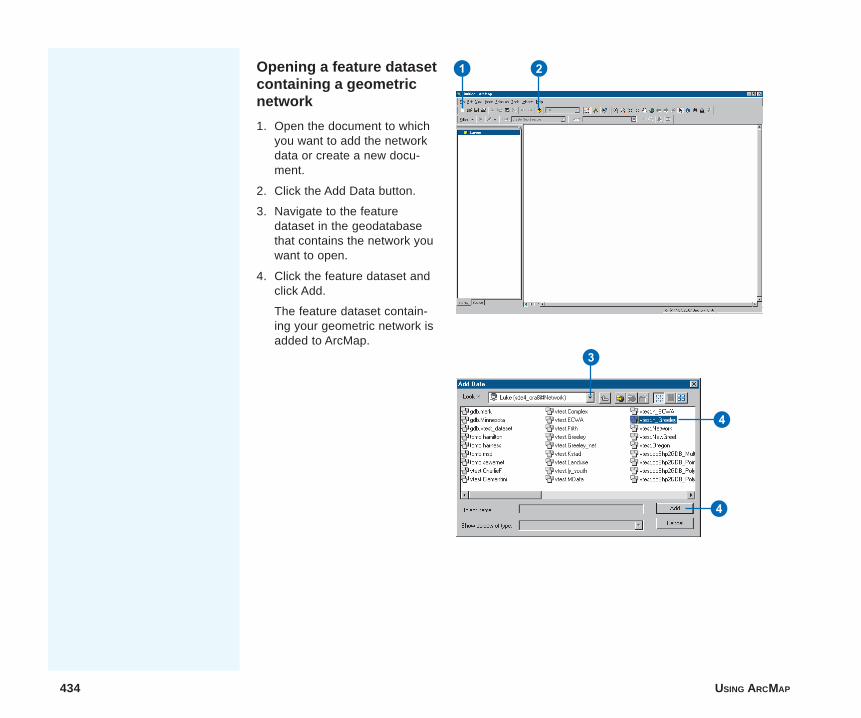
434 USING ARCMAP
Opening a feature datasetcontaining a geometricnetwork
1. Open the document to whichyou want to add the networkdata or create a new docu-ment.
2. Click the Add Data button.
3. Navigate to the featuredataset in the geodatabasethat contains the network youwant to open.
4. Click the feature dataset andclick Add.
The feature dataset contain-ing your geometric network isadded to ArcMap.
4
4
3
21
ch16.p65 12/06/2000, 2:54 PM434
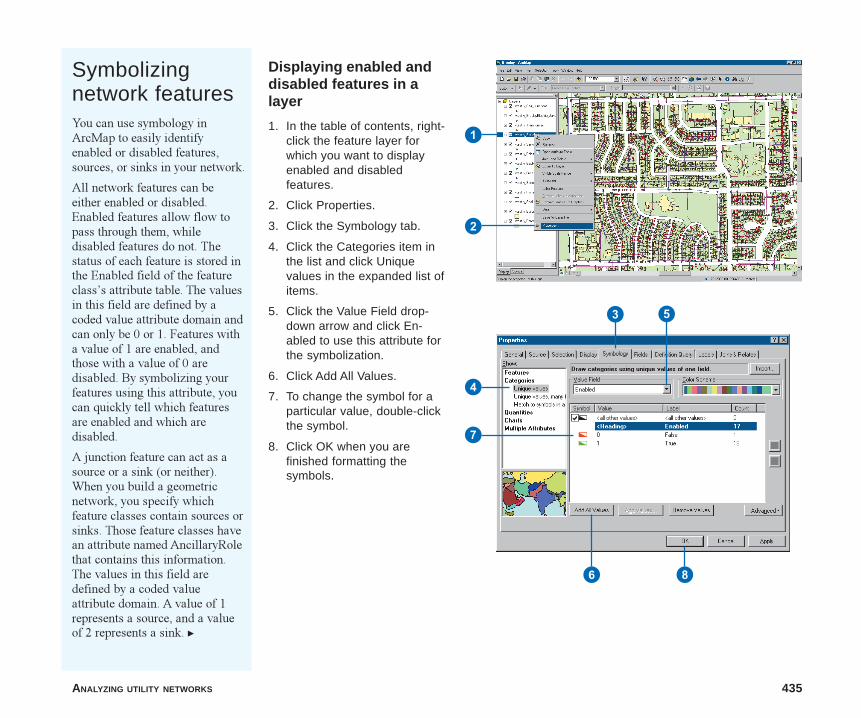
ANALYZING UTILITY NETWORKS 435
1
4
Symbolizingnetwork featuresYou can use symbology inArcMap to easily identifyenabled or disabled features,sources, or sinks in your network.
All network features can beeither enabled or disabled.Enabled features allow flow topass through them, whiledisabled features do not. Thestatus of each feature is stored inthe Enabled field of the featureclass�s attribute table. The valuesin this field are defined by acoded value attribute domain andcan only be 0 or 1. Features witha value of 1 are enabled, andthose with a value of 0 aredisabled. By symbolizing yourfeatures using this attribute, youcan quickly tell which featuresare enabled and which aredisabled.
A junction feature can act as asource or a sink (or neither).When you build a geometricnetwork, you specify whichfeature classes contain sources orsinks. Those feature classes havean attribute named AncillaryRolethat contains this information.The values in this field aredefined by a coded valueattribute domain. A value of 1represents a source, and a valueof 2 represents a sink. u
Displaying enabled anddisabled features in alayer
1. In the table of contents, right-click the feature layer forwhich you want to displayenabled and disabledfeatures.
2. Click Properties.
3. Click the Symbology tab.
4. Click the Categories item inthe list and click Uniquevalues in the expanded list ofitems.
5. Click the Value Field drop-down arrow and click En-abled to use this attribute forthe symbolization.
6. Click Add All Values.
7. To change the symbol for aparticular value, double-clickthe symbol.
8. Click OK when you arefinished formatting thesymbols.
2
3 5
7
6 8
ch16.p65 12/06/2000, 2:54 PM435
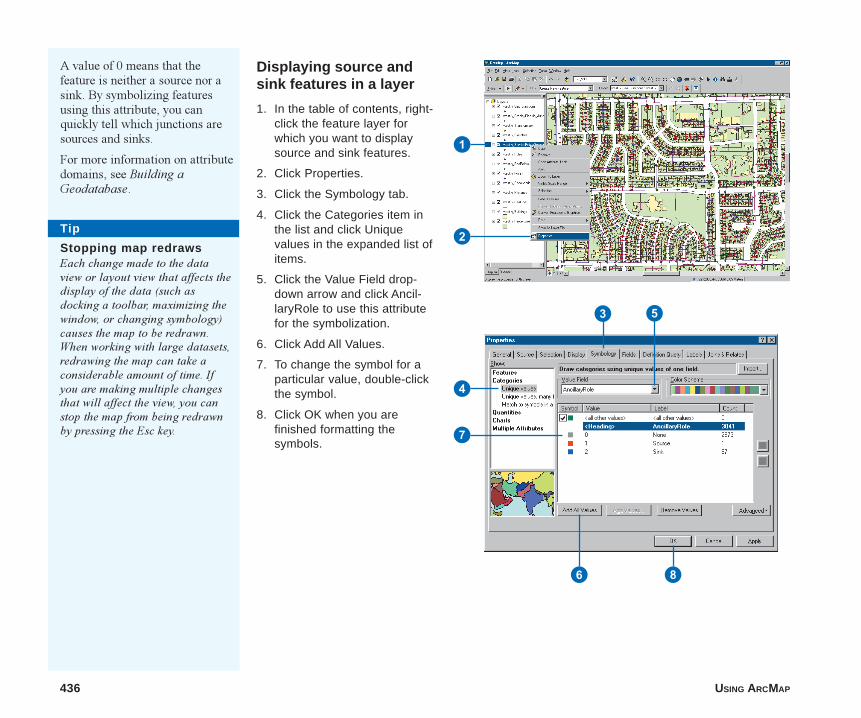
436 USING ARCMAP
4
Tip
Stopping map redrawsEach change made to the dataview or layout view that affects thedisplay of the data (such asdocking a toolbar, maximizing thewindow, or changing symbology)causes the map to be redrawn.When working with large datasets,redrawing the map can take aconsiderable amount of time. Ifyou are making multiple changesthat will affect the view, you canstop the map from being redrawnby pressing the Esc key.
Displaying source andsink features in a layer
1. In the table of contents, right-click the feature layer forwhich you want to displaysource and sink features.
2. Click Properties.
3. Click the Symbology tab.
4. Click the Categories item inthe list and click Uniquevalues in the expanded list ofitems.
5. Click the Value Field drop-down arrow and click Ancil-laryRole to use this attributefor the symbolization.
6. Click Add All Values.
7. To change the symbol for aparticular value, double-clickthe symbol.
8. Click OK when you arefinished formatting thesymbols.
A value of 0 means that thefeature is neither a source nor asink. By symbolizing featuresusing this attribute, you canquickly tell which junctions aresources and sinks.
For more information on attributedomains, see Building aGeodatabase.
1
2
3
7
6 8
5
ch16.p65 12/06/2000, 2:55 PM436
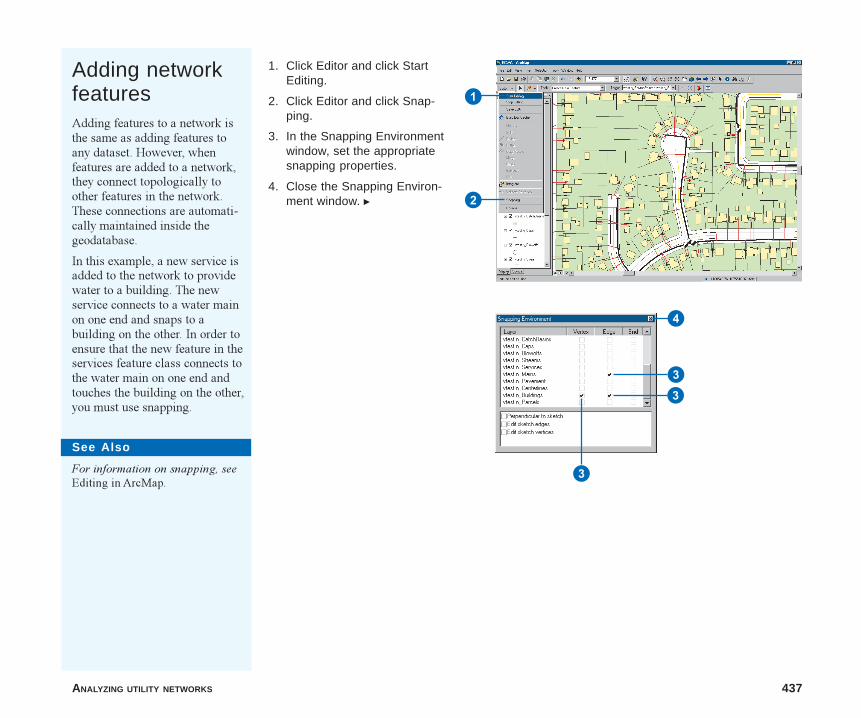
ANALYZING UTILITY NETWORKS 437
Adding networkfeaturesAdding features to a network isthe same as adding features toany dataset. However, whenfeatures are added to a network,they connect topologically toother features in the network.These connections are automati-cally maintained inside thegeodatabase.
In this example, a new service isadded to the network to providewater to a building. The newservice connects to a water mainon one end and snaps to abuilding on the other. In order toensure that the new feature in theservices feature class connects tothe water main on one end andtouches the building on the other,you must use snapping.
1. Click Editor and click StartEditing.
2. Click Editor and click Snap-ping.
3. In the Snapping Environmentwindow, set the appropriatesnapping properties.
4. Close the Snapping Environ-ment window. u
See Also
For information on snapping, seeEditing in ArcMap.
1
2
4
33
3
ch16.p65 12/06/2000, 2:56 PM437

438 USING ARCMAP
Q
5. Click the Task dropdownarrow and click Create NewFeature.
6. Click the Target dropdownarrow and click the layer towhich you want to add afeature.
7. Click the Sketch tool.
8. Point to a position on thefeature where the new featureis to connect. A targetappears to show that snap-ping is on. Click to create thefirst vertex of the new feature.
9. Create the remaining verticesof the sketch and double-clickto finish it.
10.Click Editor and click StopEditing.
11. Click Yes to save yourchanges.
7 5 6
98
ch16.p65 12/06/2000, 2:57 PM438
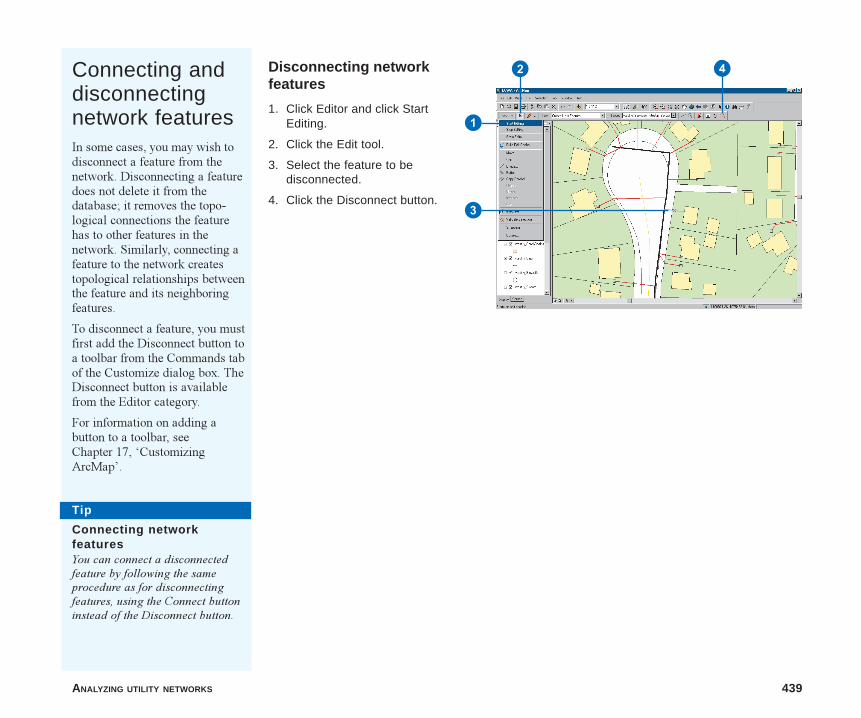
ANALYZING UTILITY NETWORKS 439
Connecting anddisconnectingnetwork featuresIn some cases, you may wish todisconnect a feature from thenetwork. Disconnecting a featuredoes not delete it from thedatabase; it removes the topo-logical connections the featurehas to other features in thenetwork. Similarly, connecting afeature to the network createstopological relationships betweenthe feature and its neighboringfeatures.
To disconnect a feature, you mustfirst add the Disconnect button toa toolbar from the Commands tabof the Customize dialog box. TheDisconnect button is availablefrom the Editor category.
For information on adding abutton to a toolbar, seeChapter 17, �CustomizingArcMap�.
Disconnecting networkfeatures
1. Click Editor and click StartEditing.
2. Click the Edit tool.
3. Select the feature to bedisconnected.
4. Click the Disconnect button.
Tip
Connecting networkfeaturesYou can connect a disconnectedfeature by following the sameprocedure as for disconnectingfeatures, using the Connect buttoninstead of the Disconnect button.
2 4
3
1
ch16.p65 12/06/2000, 2:58 PM439
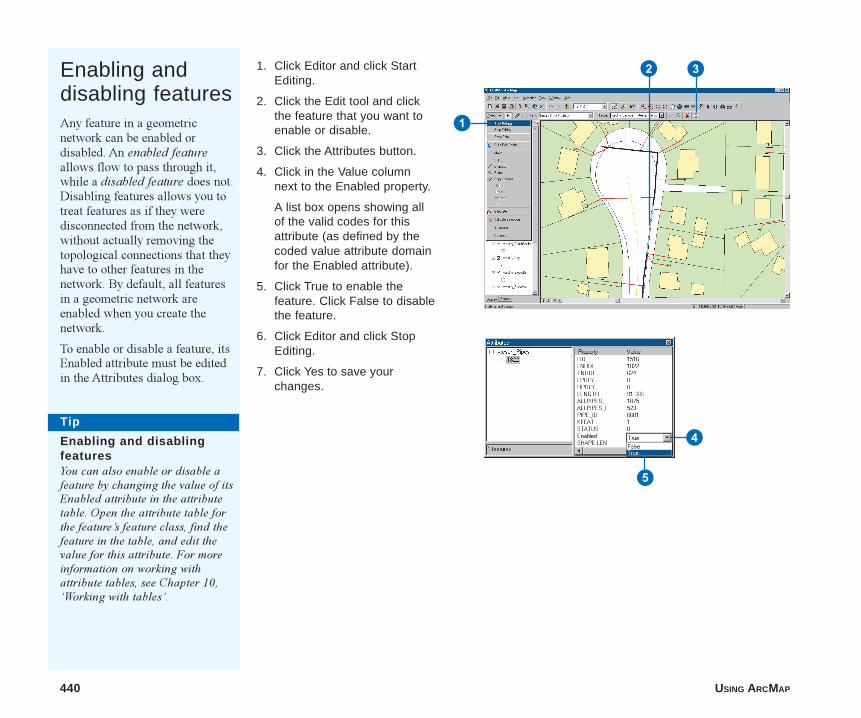
440 USING ARCMAP
Enabling anddisabling featuresAny feature in a geometricnetwork can be enabled ordisabled. An enabled featureallows flow to pass through it,while a disabled feature does not.Disabling features allows you totreat features as if they weredisconnected from the network,without actually removing thetopological connections that theyhave to other features in thenetwork. By default, all featuresin a geometric network areenabled when you create thenetwork.
To enable or disable a feature, itsEnabled attribute must be editedin the Attributes dialog box.
1. Click Editor and click StartEditing.
2. Click the Edit tool and clickthe feature that you want toenable or disable.
3. Click the Attributes button.
4. Click in the Value columnnext to the Enabled property.
A list box opens showing allof the valid codes for thisattribute (as defined by thecoded value attribute domainfor the Enabled attribute).
5. Click True to enable thefeature. Click False to disablethe feature.
6. Click Editor and click StopEditing.
7. Click Yes to save yourchanges.
Tip
Enabling and disablingfeaturesYou can also enable or disable afeature by changing the value of itsEnabled attribute in the attributetable. Open the attribute table forthe feature�s feature class, find thefeature in the table, and edit thevalue for this attribute. For moreinformation on working withattribute tables, see Chapter 10,�Working with tables�.
2 3
1
5
4
ch16.p65 12/28/2000, 11:03 AM440
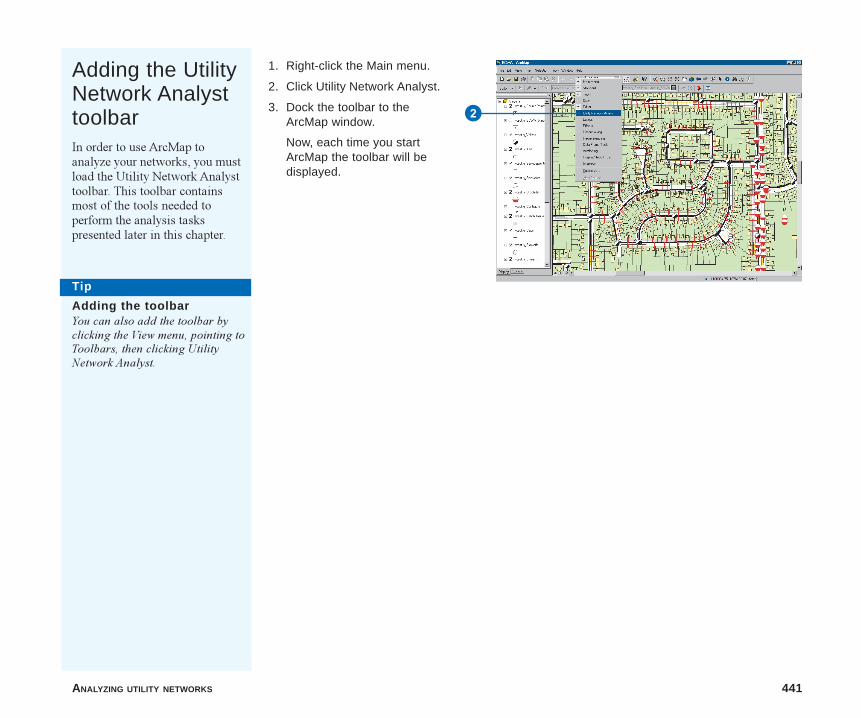
ANALYZING UTILITY NETWORKS 441
Adding the UtilityNetwork AnalysttoolbarIn order to use ArcMap toanalyze your networks, you mustload the Utility Network Analysttoolbar. This toolbar containsmost of the tools needed toperform the analysis taskspresented later in this chapter.
1. Right-click the Main menu.
2. Click Utility Network Analyst.
3. Dock the toolbar to theArcMap window.
Now, each time you startArcMap the toolbar will bedisplayed.
Tip
Adding the toolbarYou can also add the toolbar byclicking the View menu, pointing toToolbars, then clicking UtilityNetwork Analyst.
2
ch16.p65 12/06/2000, 3:00 PM441
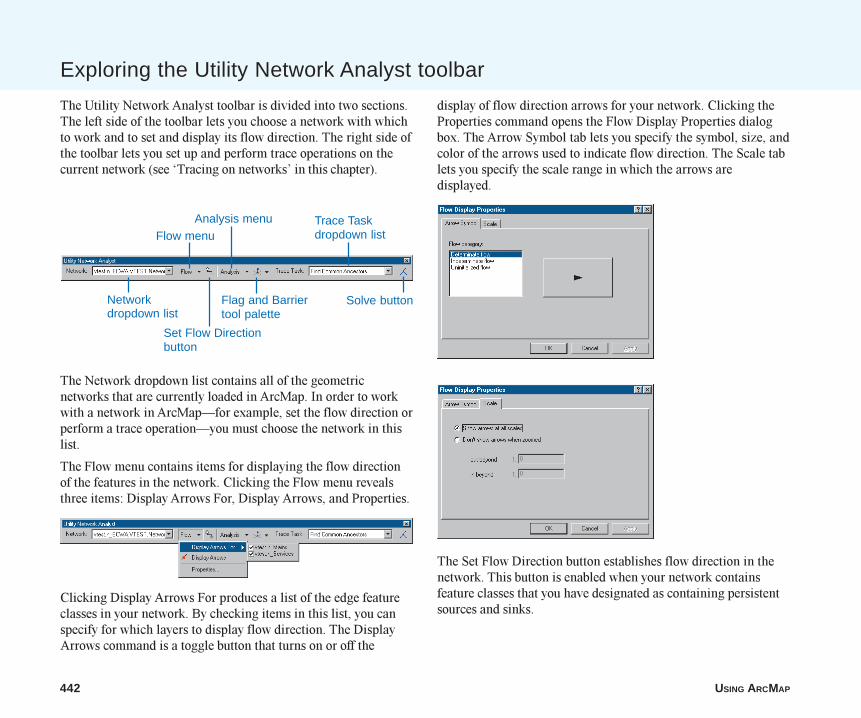
442 USING ARCMAP
Exploring the Utility Network Analyst toolbar
The Network dropdown list contains all of the geometricnetworks that are currently loaded in ArcMap. In order to workwith a network in ArcMap�for example, set the flow direction orperform a trace operation�you must choose the network in thislist.
The Flow menu contains items for displaying the flow directionof the features in the network. Clicking the Flow menu revealsthree items: Display Arrows For, Display Arrows, and Properties.
The Utility Network Analyst toolbar is divided into two sections.The left side of the toolbar lets you choose a network with whichto work and to set and display its flow direction. The right side ofthe toolbar lets you set up and perform trace operations on thecurrent network (see �Tracing on networks� in this chapter).
The Set Flow Direction button establishes flow direction in thenetwork. This button is enabled when your network containsfeature classes that you have designated as containing persistentsources and sinks.
Clicking Display Arrows For produces a list of the edge featureclasses in your network. By checking items in this list, you canspecify for which layers to display flow direction. The DisplayArrows command is a toggle button that turns on or off the
Networkdropdown list
Flow menu
Set Flow Directionbutton
Analysis menu
Flag and Barriertool palette
Trace Taskdropdown list
Solve button
display of flow direction arrows for your network. Clicking theProperties command opens the Flow Display Properties dialogbox. The Arrow Symbol tab lets you specify the symbol, size, andcolor of the arrows used to indicate flow direction. The Scale tablets you specify the scale range in which the arrows aredisplayed.
ch16.p65 12/06/2000, 3:00 PM442
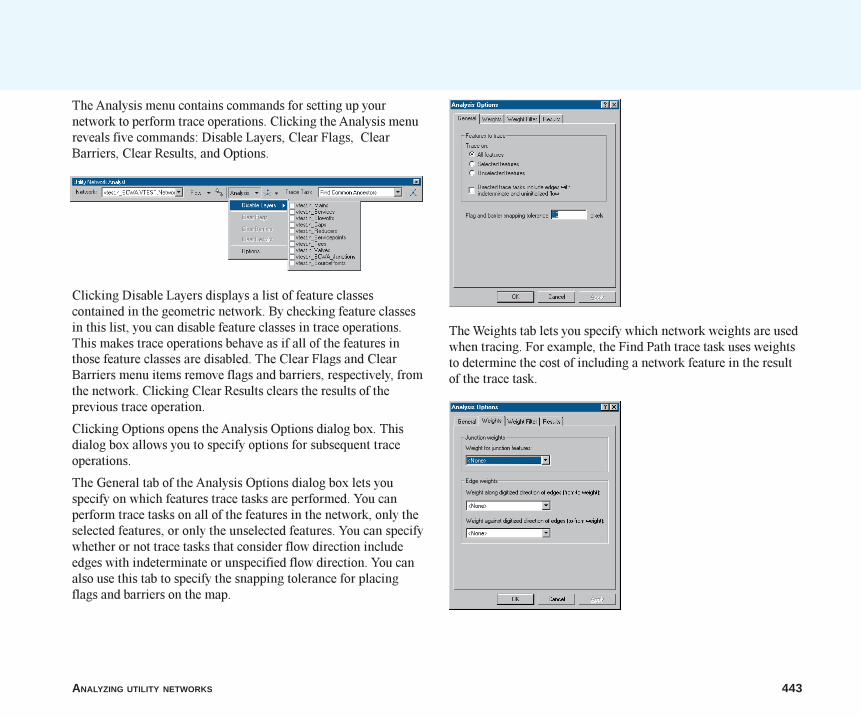
ANALYZING UTILITY NETWORKS 443
The Analysis menu contains commands for setting up yournetwork to perform trace operations. Clicking the Analysis menureveals five commands: Disable Layers, Clear Flags, ClearBarriers, Clear Results, and Options.
Clicking Disable Layers displays a list of feature classescontained in the geometric network. By checking feature classesin this list, you can disable feature classes in trace operations.This makes trace operations behave as if all of the features inthose feature classes are disabled. The Clear Flags and ClearBarriers menu items remove flags and barriers, respectively, fromthe network. Clicking Clear Results clears the results of theprevious trace operation.
Clicking Options opens the Analysis Options dialog box. Thisdialog box allows you to specify options for subsequent traceoperations.
The General tab of the Analysis Options dialog box lets youspecify on which features trace tasks are performed. You canperform trace tasks on all of the features in the network, only theselected features, or only the unselected features. You can specifywhether or not trace tasks that consider flow direction includeedges with indeterminate or unspecified flow direction. You canalso use this tab to specify the snapping tolerance for placingflags and barriers on the map.
The Weights tab lets you specify which network weights are usedwhen tracing. For example, the Find Path trace task uses weightsto determine the cost of including a network feature in the resultof the trace task.
ch16.p65 12/06/2000, 3:01 PM443
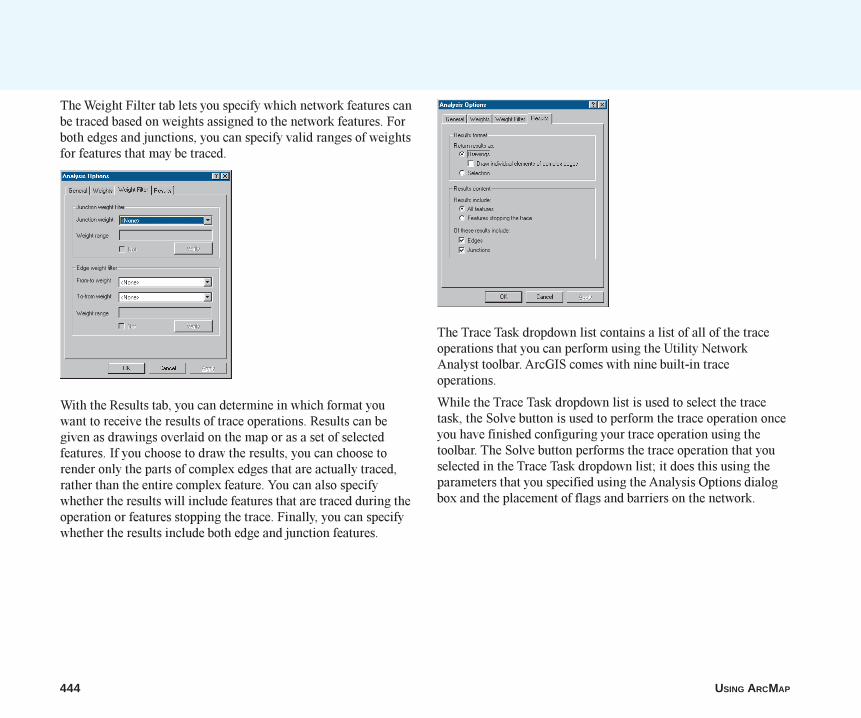
444 USING ARCMAP
The Trace Task dropdown list contains a list of all of the traceoperations that you can perform using the Utility NetworkAnalyst toolbar. ArcGIS comes with nine built-in traceoperations.
While the Trace Task dropdown list is used to select the tracetask, the Solve button is used to perform the trace operation onceyou have finished configuring your trace operation using thetoolbar. The Solve button performs the trace operation that youselected in the Trace Task dropdown list; it does this using theparameters that you specified using the Analysis Options dialogbox and the placement of flags and barriers on the network.
The Weight Filter tab lets you specify which network features canbe traced based on weights assigned to the network features. Forboth edges and junctions, you can specify valid ranges of weightsfor features that may be traced.
With the Results tab, you can determine in which format youwant to receive the results of trace operations. Results can begiven as drawings overlaid on the map or as a set of selectedfeatures. If you choose to draw the results, you can choose torender only the parts of complex edges that are actually traced,rather than the entire complex feature. You can also specifywhether the results will include features that are traced during theoperation or features stopping the trace. Finally, you can specifywhether the results include both edge and junction features.
ch16.p65 12/06/2000, 3:01 PM444
ANALYZING UTILITY NETWORKS 445
Flow direction
In utility network applications, knowing the flow direction alongnetwork edges is essential. Establishing the flow direction in ageometric network determines the direction in whichcommodities flow along each edge. The flow direction in anetwork is determined by the topology of the network, thelocations of sources and sinks in the network, and the enabled ordisabled state of features.
Sources and sinks drive flow through a utility network. Sourcesare junction features that push flow away from themselvesthrough the edges of the network. For example, in a waterdistribution network, pump stations can be modeled as sources,since they drive the water through the pipes away from the pumpstations. Sinks are junction features that pull flow towardthemselves from the edges in the network. For example, in a rivernetwork, the mouth of the river can be modeled as a sink, sincegravity drives all water towards it. Flow moves away fromsources or towards sinks. Because flow direction can beestablished with either sources or sinks, it usually suffices tospecify only sources or only sinks in a network.
It is important to remember that disabled features are accountedfor when setting flow direction. Disabling a feature makes it actas if flow cannot pass through it. Thus, disabling a feature meansthat the flow direction cannot be set for the disabled features, orfor those features that are connected to the sources or sinksexclusively through the disabled feature.
After you set the flow direction for your network, an edge hasone of three categories of flow direction: determinate,indeterminate, or uninitialized.
Determinate flow direction
If the flow direction of an edge can be uniquely determined fromthe topology of the network, the locations of sources and sinks,and the enabled or disabled states of features, the feature is said
to have determinate flow. Determinate flow for an edge isspecified as either with or against the direction in which thefeature was digitized.
Indeterminate flow direction
Indeterminate flow direction in a network occurs when the flowdirection cannot be uniquely determined from the topology of thenetwork, the locations of sources and sinks, and the enabled ordisabled states of the features. Indeterminate flow commonlyoccurs for edges that form part of a loop, or closed circuit. It canalso occur for an edge whose flow is determined by multiplesources and sinks, where one source or sink is driving the flow inone direction through the edge, but another source or sink isdriving it in the opposite direction. For example, an edge that hasa source at both of its ends will have indeterminate flow.
Uninitialized flow direction
Uninitialized flow direction in a network occurs in edges that areisolated from the sources and sinks in the network. This canhappen if the edge is not topologically connected through thenetwork to the sources and sinks or if the edge is only connectedto sources and sinks through disabled features.
Specifying flow direction
All utility networks that have flow have sources and sinks. Insome cases, you may not know the locations of the sources andsinks, but you may know the flow direction. If this is the case,you must choose the junctions in your network to act as sourcesand sinks that produce the correct flow direction.
After setting the flow direction for your network, indeterminateflow may occur, even when you know the direction of flow. Thisis because the flow direction is determined by properties of the
ch16.p65 12/06/2000, 3:01 PM445
446 USING ARCMAP
network or the features making up the network in addition to thetopology or locations of sources and sinks. For example, in awater network, the flow direction in a pipe is determined by thedifference in water pressure between the ends of the pipe. Thepressure at each end of the pipe is affected by such things as thematerial out of which the pipe is made, the pipe diameter, theflow rate through the pipe, the physical configuration of the pipe(including any bottlenecks, valves, or sharp bends), thetemperature of the water, the elevation of the ends of the pipe,and the topology of the network. Since ArcGIS deals with generalutility networks (and not with domain-specific types ofnetworks), this information is not used to set the flow direction.Thus, the flow direction may be set to indeterminate for someedges in these networks.
A set of similar variables exists in every domain. Developers canwrite custom flow-direction solvers that use these variables tofind determinate flow direction in domain-specific networks.
ch16.p65 12/06/2000, 3:01 PM446
ANALYZING UTILITY NETWORKS 447
Displaying flowdirectionNetwork flow direction specifiesthe direction in which commod-ity flows through the network.ArcGIS stores this informationfor edge features in a network.
You can display the flowdirection for edges using theUtility Network Analyst toolbar.You can display which edgeshave determinate flow direction,indeterminate flow direction, oruninitialized flow.
1. Click the Flow menu on theUtility Network Analysttoolbar.
2. Point to Display Arrows For.
3. Check the layers for whichyou want to display flowdirection.
4. Click Properties.
5. Click the Arrow Symbol tab.Click a flow category in thelist and click the button tospecify the size and color ofthe flow direction arrows. u
See Also
For more information on flowdirection, see �Flow direction� inthis chapter.
4
12 3
5
ch16.p65 12/06/2000, 3:02 PM447
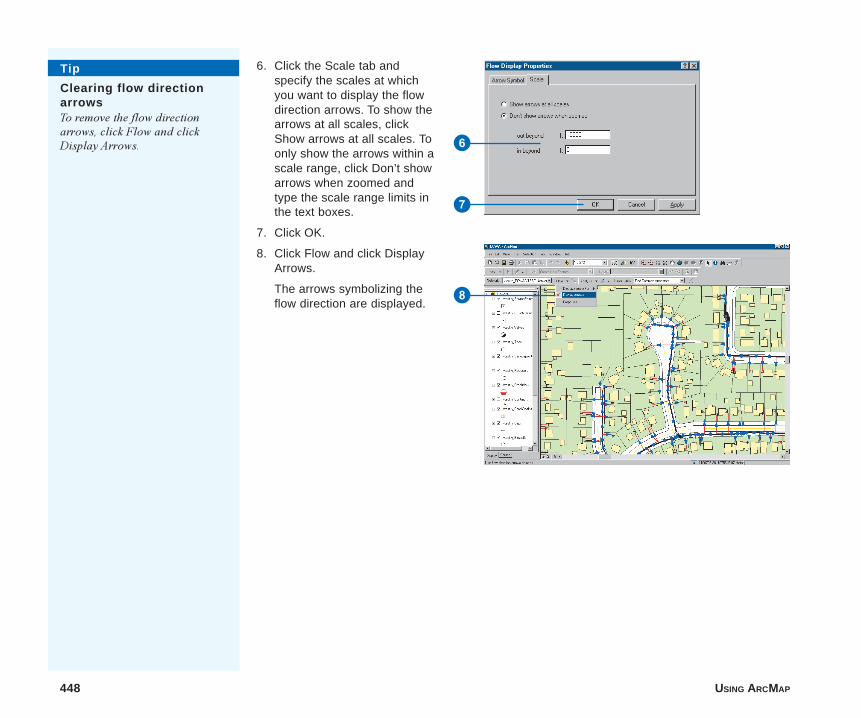
448 USING ARCMAP
6. Click the Scale tab andspecify the scales at whichyou want to display the flowdirection arrows. To show thearrows at all scales, clickShow arrows at all scales. Toonly show the arrows within ascale range, click Don’t showarrows when zoomed andtype the scale range limits inthe text boxes.
7. Click OK.
8. Click Flow and click DisplayArrows.
The arrows symbolizing theflow direction are displayed.
Tip
Clearing flow directionarrowsTo remove the flow directionarrows, click Flow and clickDisplay Arrows. 6
7
8
ch16.p65 12/06/2000, 3:04 PM448
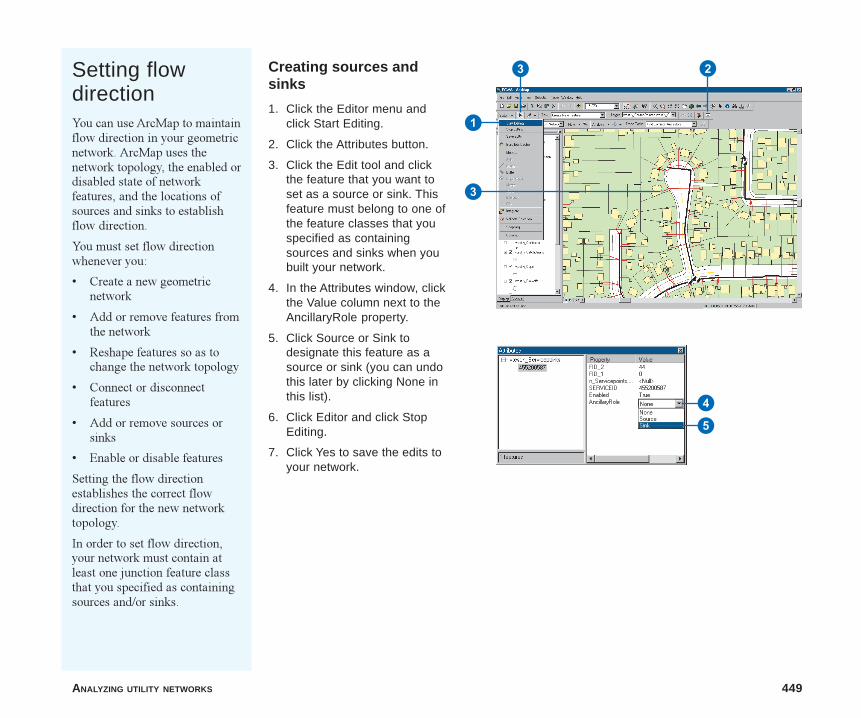
ANALYZING UTILITY NETWORKS 449
Setting flowdirectionYou can use ArcMap to maintainflow direction in your geometricnetwork. ArcMap uses thenetwork topology, the enabled ordisabled state of networkfeatures, and the locations ofsources and sinks to establishflow direction.
You must set flow directionwhenever you:
� Create a new geometricnetwork
� Add or remove features fromthe network
� Reshape features so as tochange the network topology
� Connect or disconnectfeatures
� Add or remove sources orsinks
� Enable or disable features
Setting the flow directionestablishes the correct flowdirection for the new networktopology.
In order to set flow direction,your network must contain atleast one junction feature classthat you specified as containingsources and/or sinks.
Creating sources andsinks
1. Click the Editor menu andclick Start Editing.
2. Click the Attributes button.
3. Click the Edit tool and clickthe feature that you want toset as a source or sink. Thisfeature must belong to one ofthe feature classes that youspecified as containingsources and sinks when youbuilt your network.
4. In the Attributes window, clickthe Value column next to theAncillaryRole property.
5. Click Source or Sink todesignate this feature as asource or sink (you can undothis later by clicking None inthis list).
6. Click Editor and click StopEditing.
7. Click Yes to save the edits toyour network.
3 2
1
3
4
5
ch16.p65 12/07/2000, 7:28 AM449
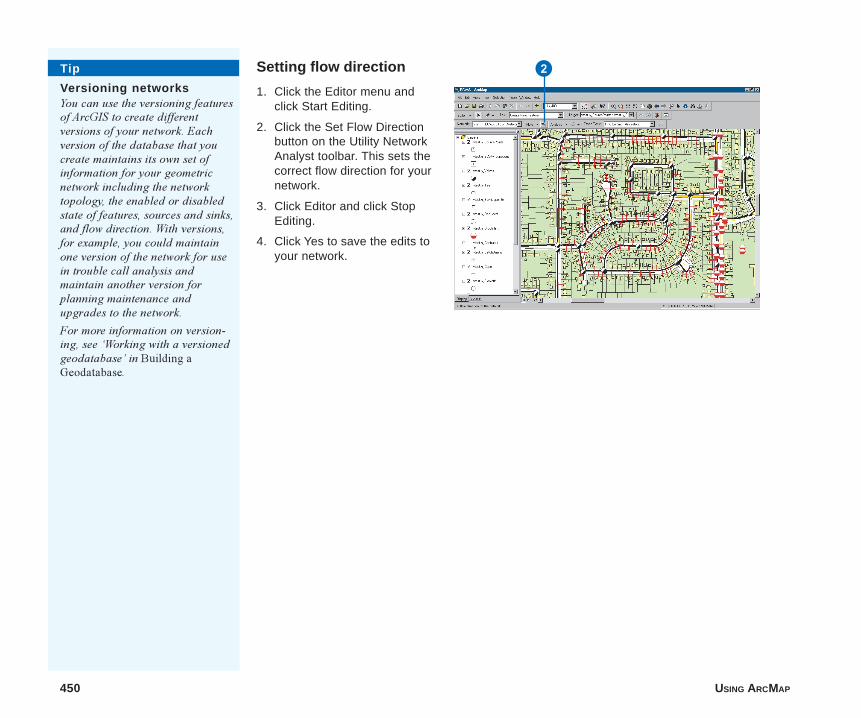
450 USING ARCMAP
Setting flow direction
1. Click the Editor menu andclick Start Editing.
2. Click the Set Flow Directionbutton on the Utility NetworkAnalyst toolbar. This sets thecorrect flow direction for yournetwork.
3. Click Editor and click StopEditing.
4. Click Yes to save the edits toyour network.
Tip
Versioning networksYou can use the versioning featuresof ArcGIS to create differentversions of your network. Eachversion of the database that youcreate maintains its own set ofinformation for your geometricnetwork including the networktopology, the enabled or disabledstate of features, sources and sinks,and flow direction. With versions,for example, you could maintainone version of the network for usein trouble call analysis andmaintain another version forplanning maintenance andupgrades to the network.
For more information on version-ing, see �Working with a versionedgeodatabase� in Building aGeodatabase.
2
ch16.p65 12/07/2000, 7:29 AM450
ANALYZING UTILITY NETWORKS 451
Tracing on networks
Network analysis involves tracing. The term tracing is used hereto describe building a set of network elements according to someprocedure. You can think of tracing as placing a transparency ontop of a map of your network and tracing all of the networkelements that you want to include in your result onto thetransparency.
When working with networks, tracing involves connectivity. Anetwork element can only be included in a trace result if it is insome way connected to other elements in the trace result. Thetrace result is the set of network features that is found by thetrace operation.
For example, suppose you want to find all of the featuresupstream of a particular point in a river network. Using atransparency placed over the map of the river network, you couldtrace over all of the branches of the river that were upstream ofthat point. What is drawn on the transparency after this would beyour desired result.
Similarly, when you perform a trace operation in ArcMap, yourresult is a set of the network elements included in the trace. InArcMap, your trace results can either be drawings on top of yourmap or a selection.
Flags and barriers
In ArcMap, flags define the starting points for traces. Forexample, if you are performing an upstream trace, you use a flagto specify where the upstream trace will begin. Flags can beplaced anywhere along edges or on junctions. When performingthe trace operation, ArcMap uses the underlying edge or junctionfeature as the starting point of the trace operation. Networkelements connected to these edges or junctions are considered forinclusion in the trace result.
Barriers define places in the network past which traces cannotcontinue. If you are only interested in tracing on a particular part
of your network, you can use barriers to isolate that part of thenetwork. Like flags, barriers can be placed anywhere along edgesor on junctions. When performing trace operations, ArcMaptreats the underlying network features as if they are disabled, thuspreventing the trace from continuing beyond these features.
Disabling features
Disabling features is a more permanent method of creating abarrier at a particular location. In a municipal water network, forexample, if a water main has been opened and capped due to aroad construction project, water cannot flow through that sectionof the water main. Disabling the network feature representing thiswater main would stop a trace at this feature.
Disabling feature layers
In some cases, disabling entire layers may be necessary. Forexample, by disabling the switches layer in an electricaldistribution network and tracing from some point in the network,you can find the switches that need to be thrown to isolate thispoint from the network; these will be the features at which thetrace operation is stopped.
Weights
Edges and junctions can have any number of weights associatedwith them. A weight is a property of a network feature typicallyused to represent a cost for traversing across an edge or through ajunction. An example of an edge weight is the length of the edge.In a shortest path analysis, you would choose this weight if youwanted the resulting path to be of the shortest length. Anotherexample is the resistance to traversing an edge in an electricalnetwork. Using a resistance weight, the shortest path would bethe path of least resistance.
ch16.p65 12/07/2000, 7:29 AM451

452 USING ARCMAP
When you build a network, you specify which attributes of edgeand junction feature classes will become weights. You can usethese weights to specify the cost of including a feature in theresults of a trace operation. Of the trace tasks included withArcGIS, only the Find Path, Find Path Upstream, and FindUpstream Accumulation trace tasks use weights to calculate thecost of the trace.
In order to find the cost using these trace tasks, you must specifywhich weights to use. For junction features, a single weight isused. For edge features, two weights can be used: one along thedigitized direction of the edge feature (the From-to weight) andone against the digitized direction of the edge feature (the To-from weight). The digitized direction of an edge feature refers tothe order in which the shape nodes of the feature are stored in thegeodatabase. You can specify a different weight for eachdirection of an edge for cases where tracing an edge in onedirection has a different cost than tracing it in the other direction.
Weight filters
You can use a weight filter to limit the set of network featuresthat may be traced. A weight filter specifies which networkfeatures can be traced based on their weight values. A weightfilter serves the same purpose as creating a selection of networkelements based on a simple SQL query, except that theperformance of the weight filter is much faster.
Using a weight filter, you specify valid or invalid ranges ofweight values for network features that may be traced. As withusing weights to represent the cost of including a feature in traceresults, a single weight is used for junction features, and twoweights may be used for edge features.
Traced features and features stopping the trace
When tracing using the Find Connected, Trace Downstream, orTrace Upstream trace tasks, you can return either the features thatare traced or the features that stop the trace. Features that aretraced are those that are actually traced over by the operation.Features that stop the trace are those features past which the tracecannot continue. Features that stop the trace include thefollowing:
� Disabled features
� Features upon which barriers are placed
� Traced features that are only connected to one other feature(deadends)
� Features that have been filtered out with a weight filter
Using selections to modify trace tasks
When tracing, ArcMap lets you use selections to modify tracetasks in three main ways.
First, the Analysis Options dialog box lets you specify whetherthe trace operation is performed on all features in the network, onthe selected features only, or on the unselected features only.Tracing on just the selected features means that unselectedfeatures act as barriers, while tracing on just the unselectedfeatures means that selected features act as barriers. By usingselections in this manner, you could, for example, perform a traceoperation to produce a set of barriers for a subsequent operation,or you could build a selection query to produce a set of networkfeatures upon which to perform a trace operation.
ch16.p65 12/07/2000, 7:29 AM452
ANALYZING UTILITY NETWORKS 453
ArcMap also lets you specify which layers are selected whenperforming a trace operation. From the Selection menu inArcMap, you can specify which layers can and cannot beselected. When ArcMap returns the results of a trace operation asa selection set, the settings you specify in the Selection menu areused to determine which features should be included in theselection set returned by the trace.
Finally, you can also use the interactive selection method�setthrough the Selection menu�to specify the behavior of theresulting selection set. You can create a new selection, add theresults of your trace operation to the current selection, select theresults of your trace operation from the current selection, orremove the results of your trace operation from the currentselection.
By using the power of selections in ArcMap, you can use thesimple trace tasks included with ArcMap to perform compoundand complex trace operations.
Putting it all together
This section introduced some concepts you can use whenconstructing traces to perform on your network. You can returnthe trace results as a selection set, disable individual features orentire feature layers, place barriers on edges or junctions, includethe traced features or the features stopping the trace, trace onlyon selected or unselected features, specify which layers toinclude in the results, and use different selection methods. All ofthese concepts can be used simultaneously when creating a traceresult. Combining these concepts in trace operations allows youto execute very powerful traces on your network.
ch16.p65 12/07/2000, 7:29 AM453
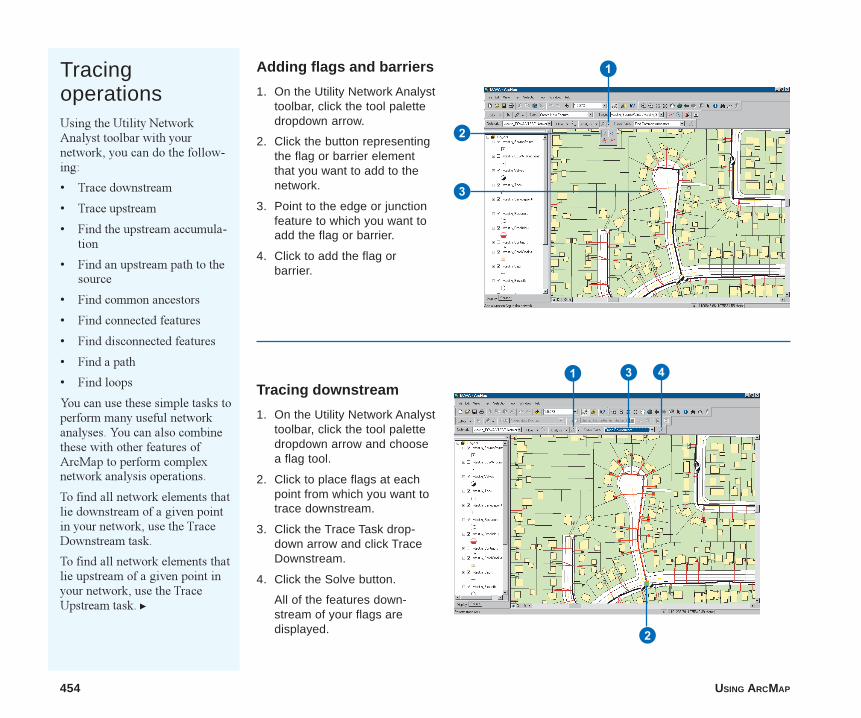
454 USING ARCMAP
TracingoperationsUsing the Utility NetworkAnalyst toolbar with yournetwork, you can do the follow-ing:
� Trace downstream
� Trace upstream
� Find the upstream accumula-tion
� Find an upstream path to thesource
� Find common ancestors
� Find connected features
� Find disconnected features
� Find a path
� Find loops
You can use these simple tasks toperform many useful networkanalyses. You can also combinethese with other features ofArcMap to perform complexnetwork analysis operations.
To find all network elements thatlie downstream of a given pointin your network, use the TraceDownstream task.
To find all network elements thatlie upstream of a given point inyour network, use the TraceUpstream task. u
Adding flags and barriers
1. On the Utility Network Analysttoolbar, click the tool palettedropdown arrow.
2. Click the button representingthe flag or barrier elementthat you want to add to thenetwork.
3. Point to the edge or junctionfeature to which you want toadd the flag or barrier.
4. Click to add the flag orbarrier.
1
2
3
1 3 4Tracing downstream
1. On the Utility Network Analysttoolbar, click the tool palettedropdown arrow and choosea flag tool.
2. Click to place flags at eachpoint from which you want totrace downstream.
3. Click the Trace Task drop-down arrow and click TraceDownstream.
4. Click the Solve button.
All of the features down-stream of your flags aredisplayed.
2
ch16.p65 12/07/2000, 7:30 AM454

ANALYZING UTILITY NETWORKS 455
To find the total cost of allnetwork elements that lieupstream of a given point in yournetwork, use the Find UpstreamAccumulation task.
To find an upstream path from apoint in the network to thesource, use the Find PathUpstream task.
To find the common features thatare upstream of a set of points inyour network, use the FindCommon Ancestors task.
To find all of the features that areconnected to a given pointthrough your network, use theFind Connected task.
To find all of the features that arenot connected to a given pointthrough your network, use theFind Disconnected task.
To find a path between twopoints in the network, use theFind Path task. The path foundcan be just one of a number ofpaths between these two points�depending on whether or notyour network contains loops.
To find loops in your network,use the Find Loops task. Loopscan result in multiple pathsbetween points in a network.
Tracing upstream
1. On the Utility Network Analysttoolbar, click the tool palettedropdown arrow and choosea flag tool.
2. Click to place flags at eachpoint from which you want totrace upstream.
3. Click the Trace Task drop-down arrow and click TraceUpstream.
4. Click the Solve button.
All of the features upstreamof your flags are displayed.
Finding the upstreamaccumulation
1. On the Utility Network Analysttoolbar, click the tool palettedropdown arrow and choosea flag tool.
2. Click to place flags at eachpoint from which you want tofind the upstream accumula-tion.
3. Click Analysis and clickOptions. u
1 3 4
13
2
2
2
2
ch16.p65 12/07/2000, 7:32 AM455
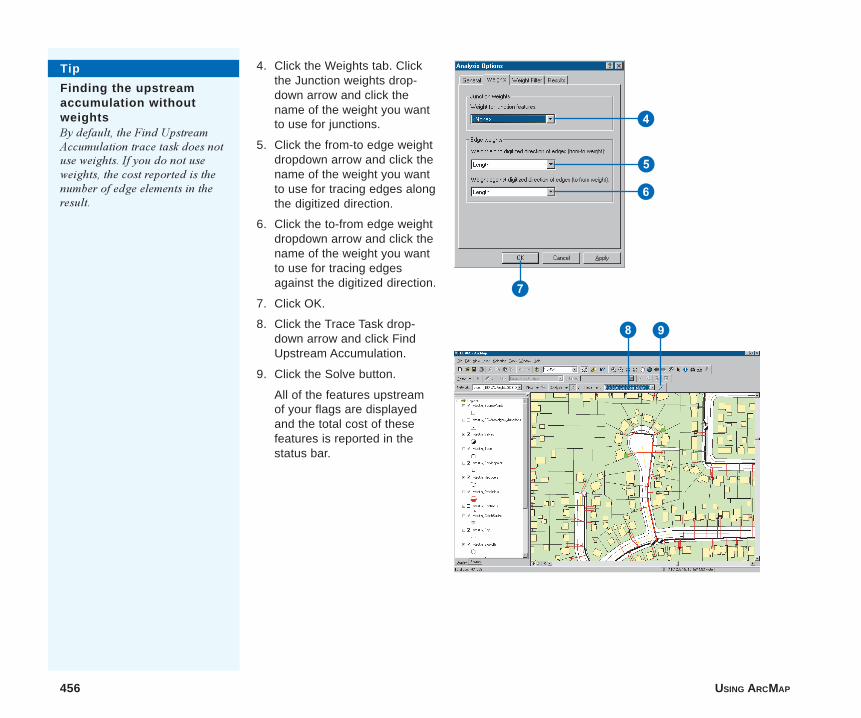
456 USING ARCMAP
4. Click the Weights tab. Clickthe Junction weights drop-down arrow and click thename of the weight you wantto use for junctions.
5. Click the from-to edge weightdropdown arrow and click thename of the weight you wantto use for tracing edges alongthe digitized direction.
6. Click the to-from edge weightdropdown arrow and click thename of the weight you wantto use for tracing edgesagainst the digitized direction.
7. Click OK.
8. Click the Trace Task drop-down arrow and click FindUpstream Accumulation.
9. Click the Solve button.
All of the features upstreamof your flags are displayedand the total cost of thesefeatures is reported in thestatus bar.
4
5
6
7
8
Tip
Finding the upstreamaccumulation withoutweightsBy default, the Find UpstreamAccumulation trace task does notuse weights. If you do not useweights, the cost reported is thenumber of edge elements in theresult.
9
ch16.p65 12/07/2000, 7:33 AM456
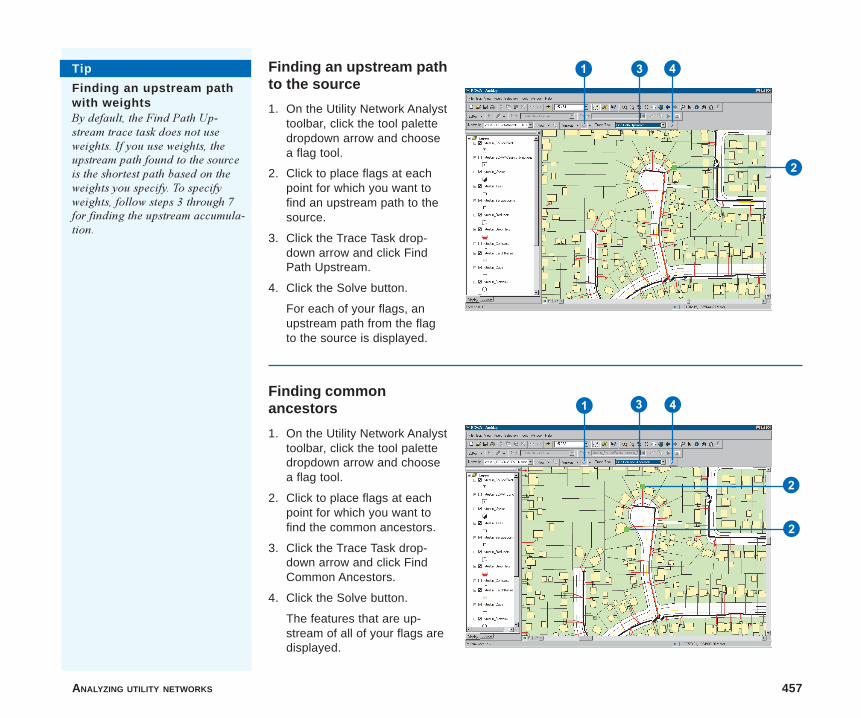
ANALYZING UTILITY NETWORKS 457
Finding commonancestors
1. On the Utility Network Analysttoolbar, click the tool palettedropdown arrow and choosea flag tool.
2. Click to place flags at eachpoint for which you want tofind the common ancestors.
3. Click the Trace Task drop-down arrow and click FindCommon Ancestors.
4. Click the Solve button.
The features that are up-stream of all of your flags aredisplayed.
1 3 4
2
2
Finding an upstream pathto the source
1. On the Utility Network Analysttoolbar, click the tool palettedropdown arrow and choosea flag tool.
2. Click to place flags at eachpoint for which you want tofind an upstream path to thesource.
3. Click the Trace Task drop-down arrow and click FindPath Upstream.
4. Click the Solve button.
For each of your flags, anupstream path from the flagto the source is displayed.
1 3 4
2
Tip
Finding an upstream pathwith weightsBy default, the Find Path Up-stream trace task does not useweights. If you use weights, theupstream path found to the sourceis the shortest path based on theweights you specify. To specifyweights, follow steps 3 through 7for finding the upstream accumula-tion.
ch16.p65 12/07/2000, 7:35 AM457
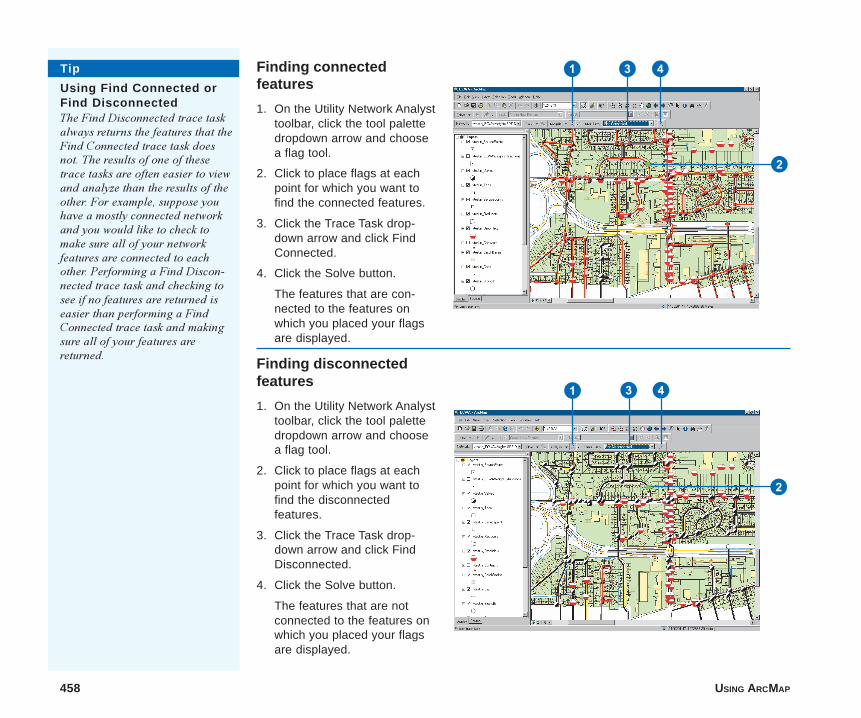
458 USING ARCMAP
Finding connectedfeatures
1. On the Utility Network Analysttoolbar, click the tool palettedropdown arrow and choosea flag tool.
2. Click to place flags at eachpoint for which you want tofind the connected features.
3. Click the Trace Task drop-down arrow and click FindConnected.
4. Click the Solve button.
The features that are con-nected to the features onwhich you placed your flagsare displayed.
1 3 4
2
Tip
Using Find Connected orFind DisconnectedThe Find Disconnected trace taskalways returns the features that theFind Connected trace task doesnot. The results of one of thesetrace tasks are often easier to viewand analyze than the results of theother. For example, suppose youhave a mostly connected networkand you would like to check tomake sure all of your networkfeatures are connected to eachother. Performing a Find Discon-nected trace task and checking tosee if no features are returned iseasier than performing a FindConnected trace task and makingsure all of your features arereturned.
Finding disconnectedfeatures
1. On the Utility Network Analysttoolbar, click the tool palettedropdown arrow and choosea flag tool.
2. Click to place flags at eachpoint for which you want tofind the disconnectedfeatures.
3. Click the Trace Task drop-down arrow and click FindDisconnected.
4. Click the Solve button.
The features that are notconnected to the features onwhich you placed your flagsare displayed.
1 3 4
2
ch16.p65 12/07/2000, 7:36 AM458
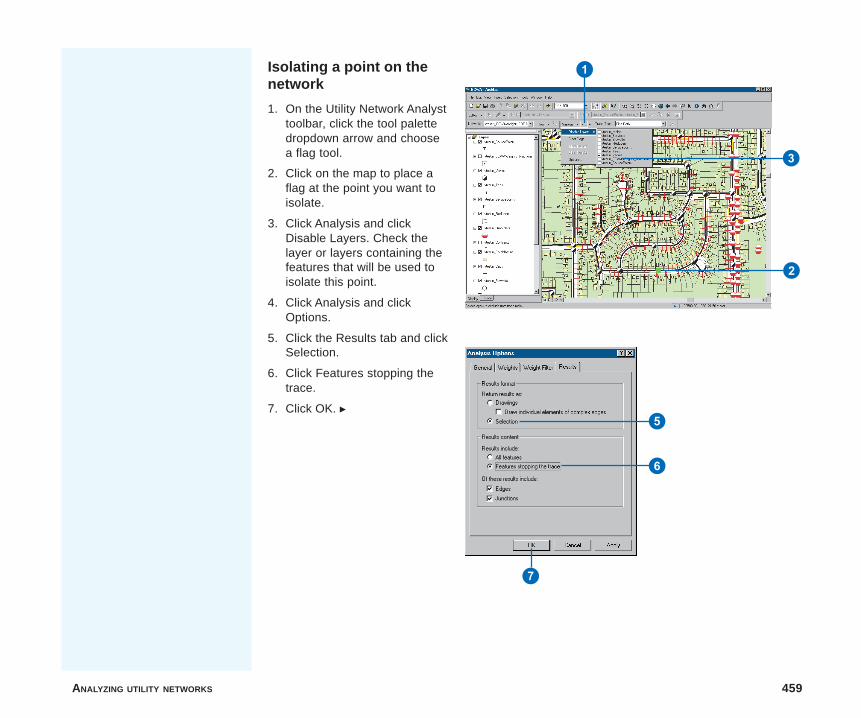
ANALYZING UTILITY NETWORKS 459
Isolating a point on thenetwork
1. On the Utility Network Analysttoolbar, click the tool palettedropdown arrow and choosea flag tool.
2. Click on the map to place aflag at the point you want toisolate.
3. Click Analysis and clickDisable Layers. Check thelayer or layers containing thefeatures that will be used toisolate this point.
4. Click Analysis and clickOptions.
5. Click the Results tab and clickSelection.
6. Click Features stopping thetrace.
7. Click OK. u
2
3
1
5
6
7
ch16.p65 12/07/2000, 7:37 AM459
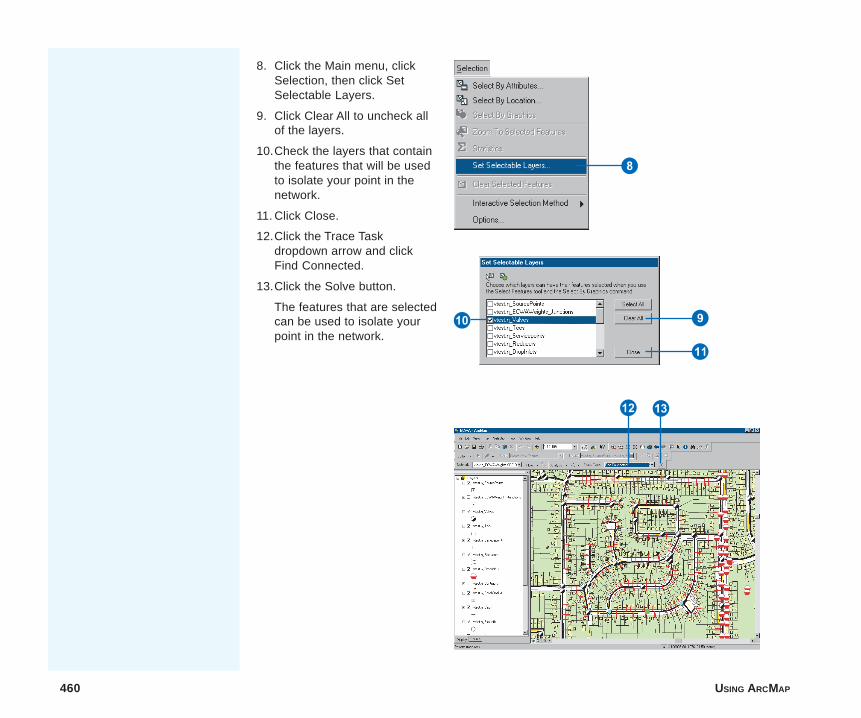
460 USING ARCMAP
R
8. Click the Main menu, clickSelection, then click SetSelectable Layers.
9. Click Clear All to uncheck allof the layers.
10.Check the layers that containthe features that will be usedto isolate your point in thenetwork.
11. Click Close.
12.Click the Trace Taskdropdown arrow and clickFind Connected.
13.Click the Solve button.
The features that are selectedcan be used to isolate yourpoint in the network.
E
8
9
W
Q
ch16.p65 12/07/2000, 7:37 AM460
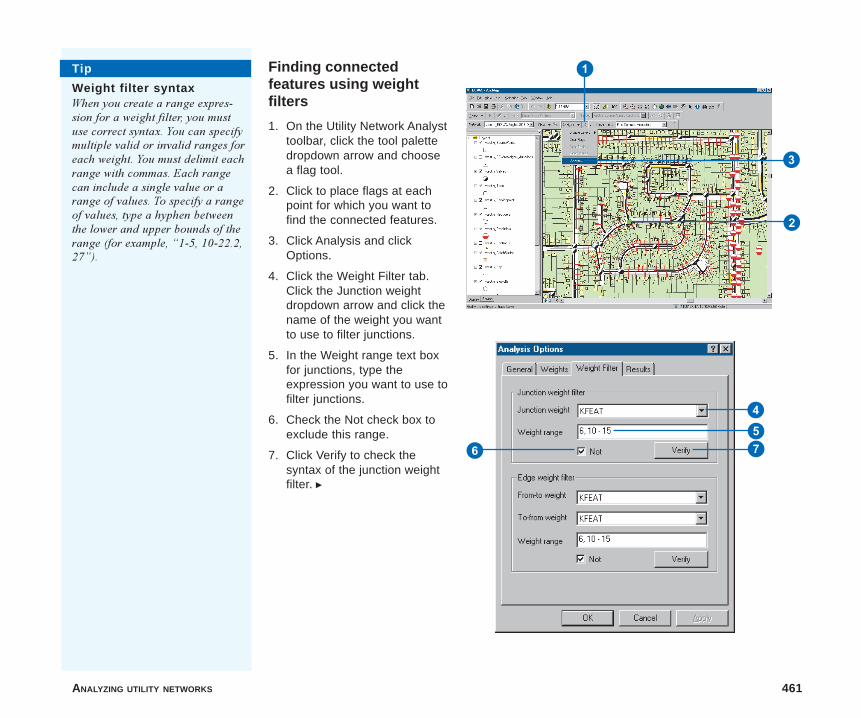
ANALYZING UTILITY NETWORKS 461
Finding connectedfeatures using weightfilters
1. On the Utility Network Analysttoolbar, click the tool palettedropdown arrow and choosea flag tool.
2. Click to place flags at eachpoint for which you want tofind the connected features.
3. Click Analysis and clickOptions.
4. Click the Weight Filter tab.Click the Junction weightdropdown arrow and click thename of the weight you wantto use to filter junctions.
5. In the Weight range text boxfor junctions, type theexpression you want to use tofilter junctions.
6. Check the Not check box toexclude this range.
7. Click Verify to check thesyntax of the junction weightfilter. u
Tip
Weight filter syntaxWhen you create a range expres-sion for a weight filter, you mustuse correct syntax. You can specifymultiple valid or invalid ranges foreach weight. You must delimit eachrange with commas. Each rangecan include a single value or arange of values. To specify a rangeof values, type a hyphen betweenthe lower and upper bounds of therange (for example, �1-5, 10-22.2,27�).
1
3
2
6 754
ch16.p65 12/07/2000, 7:39 AM461
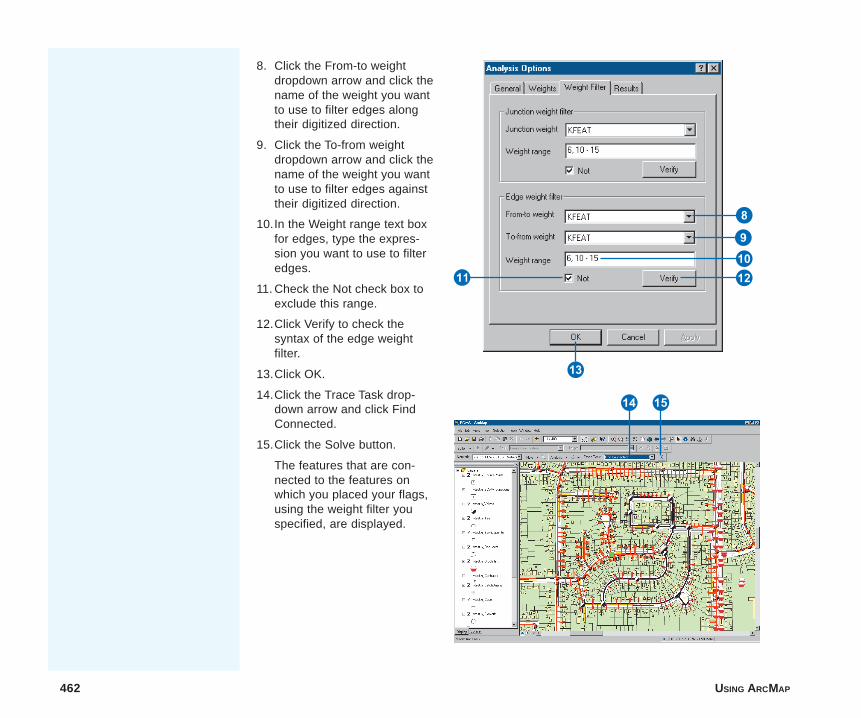
462 USING ARCMAP
T Y
8. Click the From-to weightdropdown arrow and click thename of the weight you wantto use to filter edges alongtheir digitized direction.
9. Click the To-from weightdropdown arrow and click thename of the weight you wantto use to filter edges againsttheir digitized direction.
10.In the Weight range text boxfor edges, type the expres-sion you want to use to filteredges.
11. Check the Not check box toexclude this range.
12.Click Verify to check thesyntax of the edge weightfilter.
13.Click OK.
14.Click the Trace Task drop-down arrow and click FindConnected.
15.Click the Solve button.
The features that are con-nected to the features onwhich you placed your flags,using the weight filter youspecified, are displayed.
W
R
EQ9
8
ch16.p65 12/07/2000, 7:40 AM462
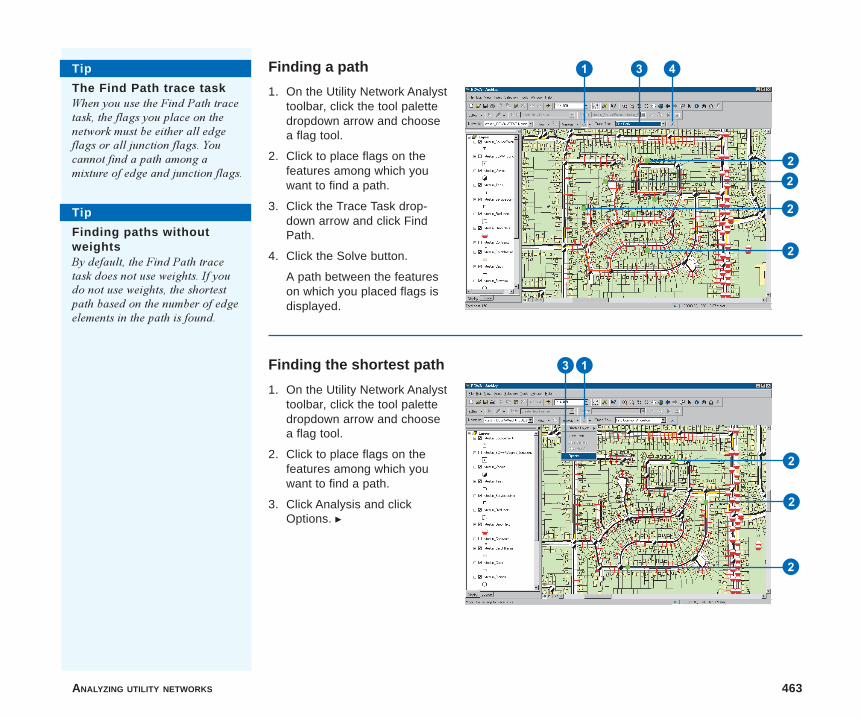
ANALYZING UTILITY NETWORKS 463
Finding a path
1. On the Utility Network Analysttoolbar, click the tool palettedropdown arrow and choosea flag tool.
2. Click to place flags on thefeatures among which youwant to find a path.
3. Click the Trace Task drop-down arrow and click FindPath.
4. Click the Solve button.
A path between the featureson which you placed flags isdisplayed.
Tip
The Find Path trace taskWhen you use the Find Path tracetask, the flags you place on thenetwork must be either all edgeflags or all junction flags. Youcannot find a path among amixture of edge and junction flags.
Finding the shortest path
1. On the Utility Network Analysttoolbar, click the tool palettedropdown arrow and choosea flag tool.
2. Click to place flags on thefeatures among which youwant to find a path.
3. Click Analysis and clickOptions. u
Tip
Finding paths withoutweightsBy default, the Find Path tracetask does not use weights. If youdo not use weights, the shortestpath based on the number of edgeelements in the path is found.
1 3 4
22
2
2
2
2
2
31
ch16.p65 12/07/2000, 7:43 AM463

464 USING ARCMAP
4. Click the Weights tab. Clickthe Junction weights drop-down arrow and click thename of the weight you wantto use for junctions.
5. Click the from-to edge weightdropdown arrow and click thename of the weight you wantto use for tracing edges alongthe digitized direction.
6. Click the to-from edge weightdropdown arrow and click thename of the weight you wantto use for tracing edgesagainst the digitized direction.
7. Click OK.
8. Click the Trace Task drop-down arrow and click FindPath.
9. Click the Solve button.
The shortest path based onthe weights you chose isdisplayed. The total cost ofthis path is reported in thestatus bar.
4
5
6
7
8 9
ch16.p65 12/07/2000, 7:45 AM464
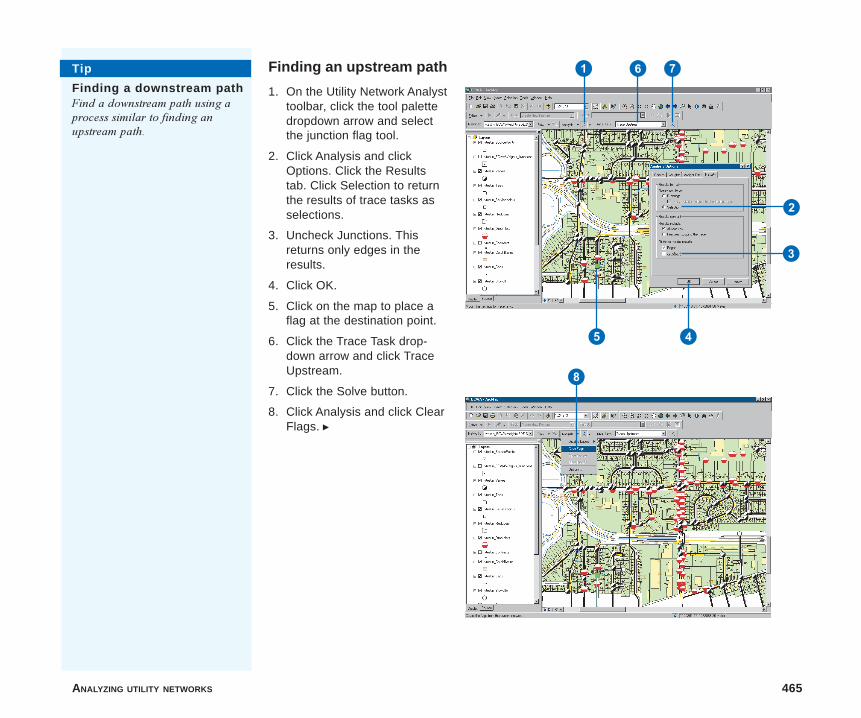
ANALYZING UTILITY NETWORKS 465
Finding an upstream path
1. On the Utility Network Analysttoolbar, click the tool palettedropdown arrow and selectthe junction flag tool.
2. Click Analysis and clickOptions. Click the Resultstab. Click Selection to returnthe results of trace tasks asselections.
3. Uncheck Junctions. Thisreturns only edges in theresults.
4. Click OK.
5. Click on the map to place aflag at the destination point.
6. Click the Trace Task drop-down arrow and click TraceUpstream.
7. Click the Solve button.
8. Click Analysis and click ClearFlags. u
Tip
Finding a downstream pathFind a downstream path using aprocess similar to finding anupstream path.
1
5
6
2
3
4
7
8
ch16.p65 12/07/2000, 7:47 AM465

466 USING ARCMAP
T
R
Q
W9. Click the Main menu and clickSelection. Point to InteractiveSelection Method and clickAdd to Current Selection.
10.Click on the map to place aflag at the origin point.
11. Click the Trace Task drop-down arrow and click TraceDownstream.
12.Click the Solve button.
13.Click Analysis and clickOptions. Click the Generaltab and click Unselectedfeatures to treat the currentselection as barriers.
14.Click OK. u
9
E
ch16.p65 12/07/2000, 7:48 AM466
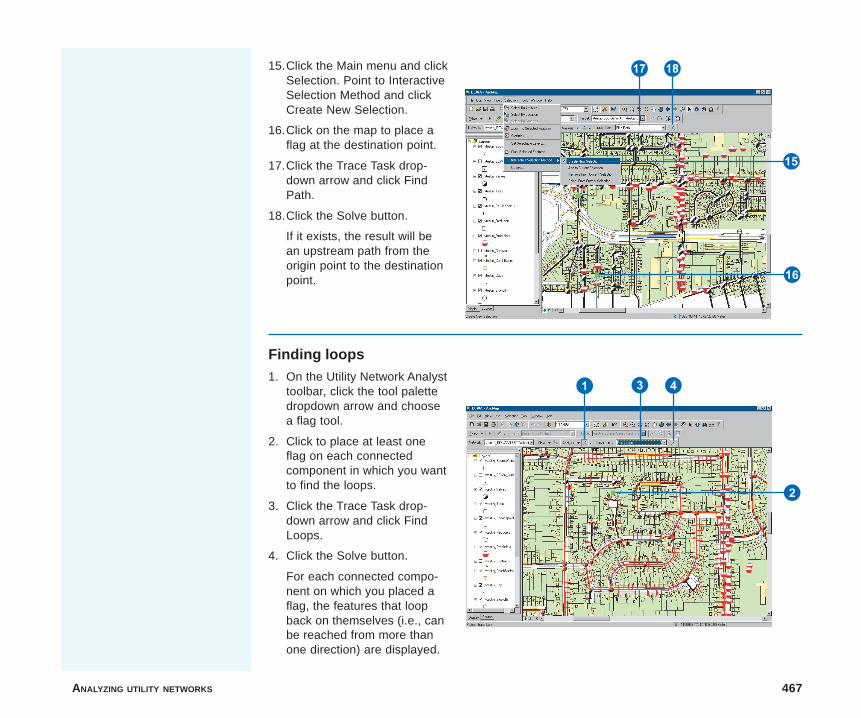
ANALYZING UTILITY NETWORKS 467
I15.Click the Main menu and clickSelection. Point to InteractiveSelection Method and clickCreate New Selection.
16.Click on the map to place aflag at the destination point.
17.Click the Trace Task drop-down arrow and click FindPath.
18.Click the Solve button.
If it exists, the result will bean upstream path from theorigin point to the destinationpoint.
O
Y
U
Finding loops1. On the Utility Network Analyst
toolbar, click the tool palettedropdown arrow and choosea flag tool.
2. Click to place at least oneflag on each connectedcomponent in which you wantto find the loops.
3. Click the Trace Task drop-down arrow and click FindLoops.
4. Click the Solve button.
For each connected compo-nent on which you placed aflag, the features that loopback on themselves (i.e., canbe reached from more thanone direction) are displayed.
1 3 4
2
ch16.p65 12/07/2000, 7:49 AM467

ch16.p65 12/07/2000, 7:49 AM468
Section 4
Customization
section4.p65 12/06/2000, 2:49 PM469

section4.p65 12/06/2000, 2:49 PM470
IN THIS CHAPTER
471
Customizing ArcMap 17• Basic user interface elements
• Hiding and showing toolbars
• Creating custom toolbars
• Changing a toolbar’s contents
• Changing a command’sappearance
• Creating shortcut keys
• Saving customizations in atemplate
• Setting toolbar options
• Creating, editing, and runningmacros
• Creating custom commands withVBA
• Working with UIControls
• Locking documents and templates
• And more
Although ESRI end user applications are designed to be flexible and easy touse, you may want the ArcMap interface to reflect your own preferences andthe way you work. If you work in a larger organization, others may want youto develop a customized work environment for them. As a developer, you�llbe glad to learn that many of the customization tasks you may be asked toperform can be handled without writing a single line of code; in fact, youmay be able to instruct others on how to use the customization environmentthemselves to create the look and feel they want on their own. You canchange or create toolbars, menus, keystrokes, and so on, to help you getyour work done in the most efficient way. Not only can you change the waythe existing work environment is organized, but you�ll also be able toprovide additional functionality by linking code you or others have writtento menu commands or tools. This chapter shows that the customizationenvironment for ArcMap is rich with possibilities.
ch17.p65 12/08/2000, 10:52 AM471
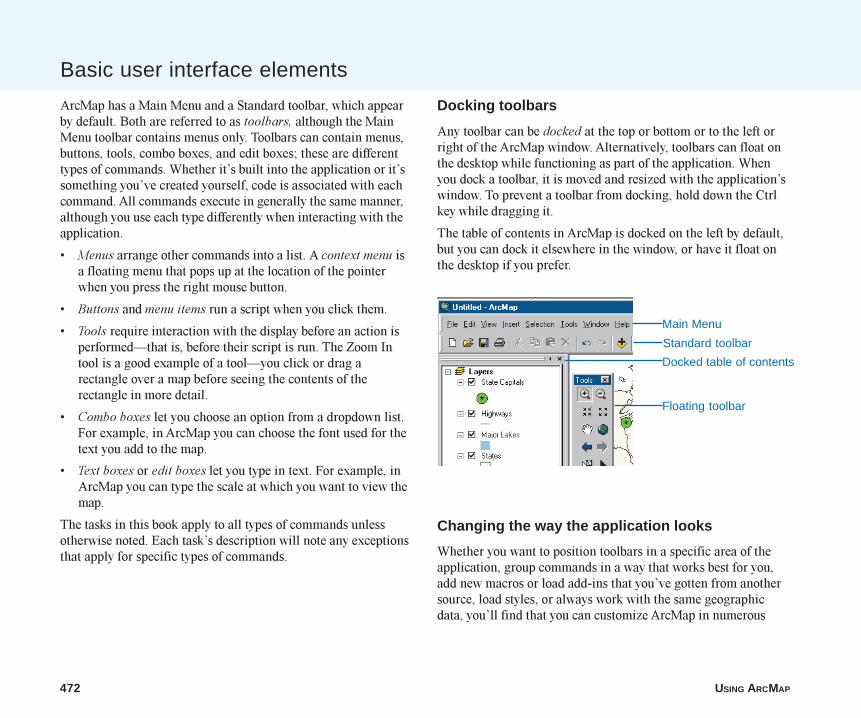
472 USING ARCMAP
Basic user interface elements
Docking toolbars
Any toolbar can be docked at the top or bottom or to the left orright of the ArcMap window. Alternatively, toolbars can float onthe desktop while functioning as part of the application. Whenyou dock a toolbar, it is moved and resized with the application�swindow. To prevent a toolbar from docking, hold down the Ctrlkey while dragging it.
The table of contents in ArcMap is docked on the left by default,but you can dock it elsewhere in the window, or have it float onthe desktop if you prefer.
Changing the way the application looks
Whether you want to position toolbars in a specific area of theapplication, group commands in a way that works best for you,add new macros or load add-ins that you�ve gotten from anothersource, load styles, or always work with the same geographicdata, you�ll find that you can customize ArcMap in numerous
Main Menu
Standard toolbar
Floating toolbar
Docked table of contents
ArcMap has a Main Menu and a Standard toolbar, which appearby default. Both are referred to as toolbars, although the MainMenu toolbar contains menus only. Toolbars can contain menus,buttons, tools, combo boxes, and edit boxes; these are differenttypes of commands. Whether it�s built into the application or it�ssomething you�ve created yourself, code is associated with eachcommand. All commands execute in generally the same manner,although you use each type differently when interacting with theapplication.
� Menus arrange other commands into a list. A context menu isa floating menu that pops up at the location of the pointerwhen you press the right mouse button.
� Buttons and menu items run a script when you click them.
� Tools require interaction with the display before an action isperformed�that is, before their script is run. The Zoom Intool is a good example of a tool�you click or drag arectangle over a map before seeing the contents of therectangle in more detail.
� Combo boxes let you choose an option from a dropdown list.For example, in ArcMap you can choose the font used for thetext you add to the map.
� Text boxes or edit boxes let you type in text. For example, inArcMap you can type the scale at which you want to view themap.
The tasks in this book apply to all types of commands unlessotherwise noted. Each task�s description will note any exceptionsthat apply for specific types of commands.
ch17.p65 12/07/2000, 1:45 PM472
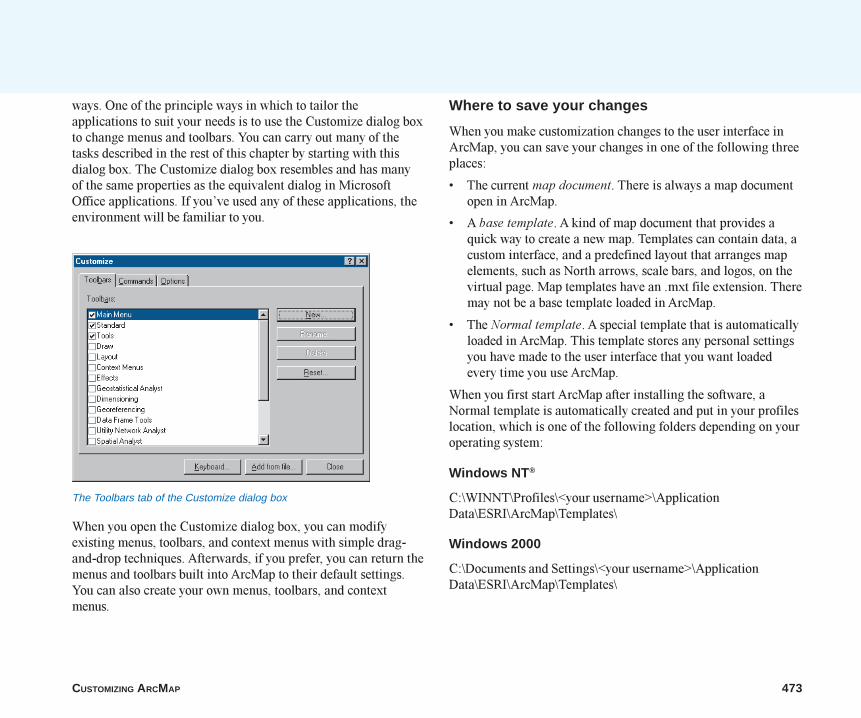
CUSTOMIZING ARCMAP 473
ways. One of the principle ways in which to tailor theapplications to suit your needs is to use the Customize dialog boxto change menus and toolbars. You can carry out many of thetasks described in the rest of this chapter by starting with thisdialog box. The Customize dialog box resembles and has manyof the same properties as the equivalent dialog in MicrosoftOffice applications. If you�ve used any of these applications, theenvironment will be familiar to you.
When you open the Customize dialog box, you can modifyexisting menus, toolbars, and context menus with simple drag-and-drop techniques. Afterwards, if you prefer, you can return themenus and toolbars built into ArcMap to their default settings.You can also create your own menus, toolbars, and contextmenus.
The Toolbars tab of the Customize dialog box
Where to save your changes
When you make customization changes to the user interface inArcMap, you can save your changes in one of the following threeplaces:
� The current map document. There is always a map documentopen in ArcMap.
� A base template. A kind of map document that provides aquick way to create a new map. Templates can contain data, acustom interface, and a predefined layout that arranges mapelements, such as North arrows, scale bars, and logos, on thevirtual page. Map templates have an .mxt file extension. Theremay not be a base template loaded in ArcMap.
� The Normal template. A special template that is automaticallyloaded in ArcMap. This template stores any personal settingsyou have made to the user interface that you want loadedevery time you use ArcMap.
When you first start ArcMap after installing the software, aNormal template is automatically created and put in your profileslocation, which is one of the following folders depending on youroperating system:
Windows NT ®
C:\WINNT\Profiles\<your username>\ApplicationData\ESRI\ArcMap\Templates\
Windows 2000
C:\Documents and Settings\<your username>\ApplicationData\ESRI\ArcMap\Templates\
ch17.p65 12/07/2000, 1:45 PM473
474 USING ARCMAP
This is the default out-of-the-box Normal template that containsall the standard toolbars and commands and places the toolbarsand the table of contents in their default positions. Anycustomizations that you save in your Normal template get savedin this file. If you want to make changes that appear every timeyou open ArcMap, save them in the Normal template.
You might want to make changes that only appear when workingwith a particular map. For example, you might want your customquery and analysis toolbar to appear only in specific maps. In thiscase you would choose to save your customization in the currentdocument. By default, all of your changes are saved in theNormal template. After you save a change in the currentdocument, however, all subsequent changes will be saved in thecurrent document by default.
Suppose you�ve created more than just a custom toolbar�you�vecreated an entire environment with custom tools and macros thatare used only when you edit a dataset�s features. You can savethis environment as a customized template. When you create anew map document, you can choose to base it on the Normaltemplate or your custom template. For more information onsaving customized templates, see �Saving customizations in atemplate� later in this chapter.
Suppose your administrator has custom toolbars or tools that shewould like to make accessible to everyone in your organization.Your administrator could create a customized Normal templateand allow everyone in your organization to use that Normaltemplate instead of the default Normal template. To accomplishthis, your administrator would customize her Normal templateand then copy that Normal.mxt file to the \arcexe81\bin\templatesfolder. Everyone would then start with this Normal templateinstead of the default Normal template. The following is anexplanation of how this works.
If there is no Normal.mxt file in your profiles location when youstart ArcMap, the application will look in the\arcexe81\bin\Templates folder where ArcMap is installed. If aNormal.mxt file exists in the \arcexe81\bin\Templates folder, thatfile will be copied to your profiles location and is subsequentlytreated as your personal Normal template. Therefore, you start offwith a copy of your organization�s customized Normal template,but from that point on you are able to save your owncustomizations to it.
If a Normal.mxt file is not found in your profiles location or inthe \arcexe81\bin\Templates folder, then a new defaultNormal.mxt file is created and placed in your profiles location.
ch17.p65 12/07/2000, 1:45 PM474
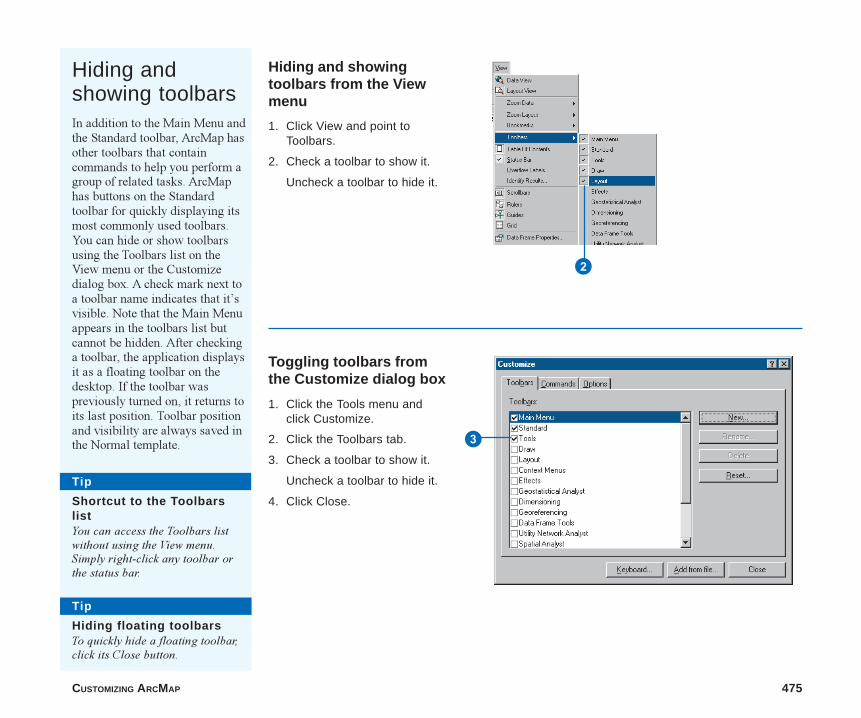
CUSTOMIZING ARCMAP 475
Hiding andshowing toolbarsIn addition to the Main Menu andthe Standard toolbar, ArcMap hasother toolbars that containcommands to help you perform agroup of related tasks. ArcMaphas buttons on the Standardtoolbar for quickly displaying itsmost commonly used toolbars.You can hide or show toolbarsusing the Toolbars list on theView menu or the Customizedialog box. A check mark next toa toolbar name indicates that it�svisible. Note that the Main Menuappears in the toolbars list butcannot be hidden. After checkinga toolbar, the application displaysit as a floating toolbar on thedesktop. If the toolbar waspreviously turned on, it returns toits last position. Toolbar positionand visibility are always saved inthe Normal template.
Hiding and showingtoolbars from the Viewmenu
1. Click View and point toToolbars.
2. Check a toolbar to show it.
Uncheck a toolbar to hide it.
Toggling toolbars fromthe Customize dialog box
1. Click the Tools menu andclick Customize.
2. Click the Toolbars tab.
3. Check a toolbar to show it.
Uncheck a toolbar to hide it.
4. Click Close.
2
3
Tip
Shortcut to the ToolbarslistYou can access the Toolbars listwithout using the View menu.Simply right-click any toolbar orthe status bar.
Tip
Hiding floating toolbarsTo quickly hide a floating toolbar,click its Close button.
ch17.p65 12/07/2000, 1:45 PM475
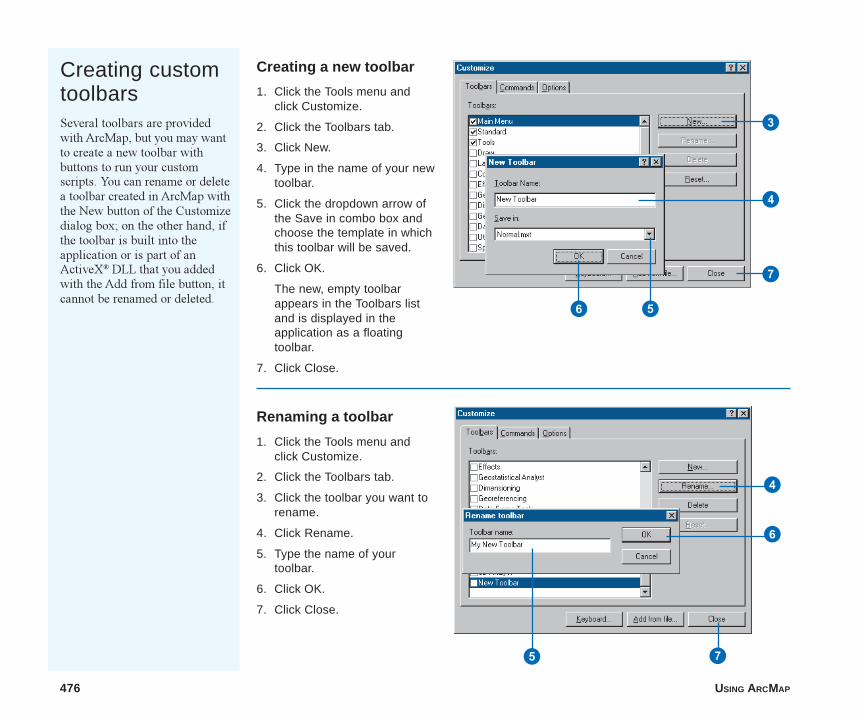
476 USING ARCMAP
7
4
4
7
Creating customtoolbarsSeveral toolbars are providedwith ArcMap, but you may wantto create a new toolbar withbuttons to run your customscripts. You can rename or deletea toolbar created in ArcMap withthe New button of the Customizedialog box; on the other hand, ifthe toolbar is built into theapplication or is part of anActiveX® DLL that you addedwith the Add from file button, itcannot be renamed or deleted.
Creating a new toolbar
1. Click the Tools menu andclick Customize.
2. Click the Toolbars tab.
3. Click New.
4. Type in the name of your newtoolbar.
5. Click the dropdown arrow ofthe Save in combo box andchoose the template in whichthis toolbar will be saved.
6. Click OK.
The new, empty toolbarappears in the Toolbars listand is displayed in theapplication as a floatingtoolbar.
7. Click Close.
Renaming a toolbar
1. Click the Tools menu andclick Customize.
2. Click the Toolbars tab.
3. Click the toolbar you want torename.
4. Click Rename.
5. Type the name of yourtoolbar.
6. Click OK.
7. Click Close.
3
56
5
6
ch17.p65 12/07/2000, 1:46 PM476
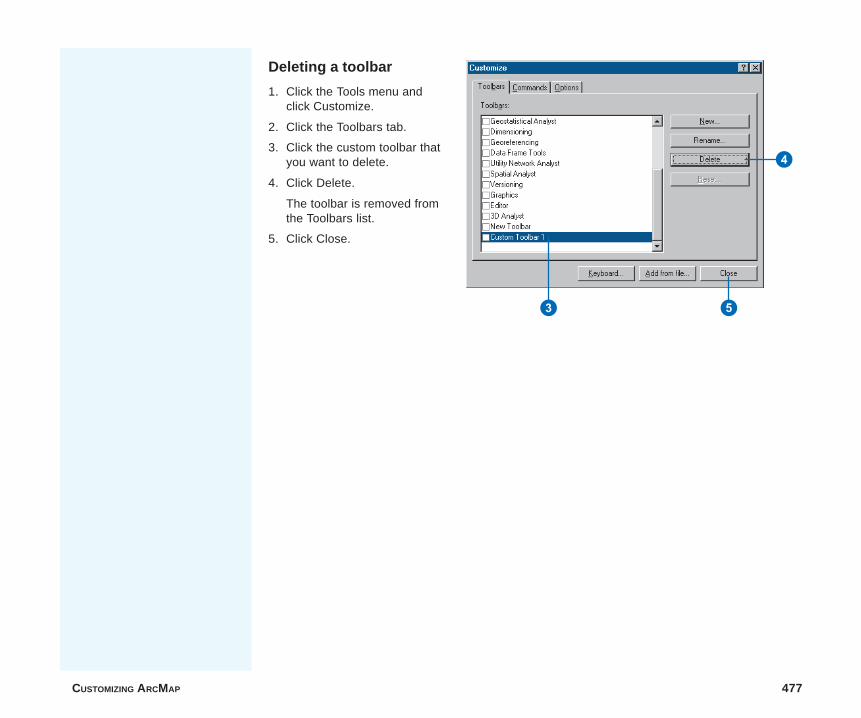
CUSTOMIZING ARCMAP 477
Deleting a toolbar
1. Click the Tools menu andclick Customize.
2. Click the Toolbars tab.
3. Click the custom toolbar thatyou want to delete.
4. Click Delete.
The toolbar is removed fromthe Toolbars list.
5. Click Close.
4
3 5
ch17.p65 12/07/2000, 1:46 PM477

478 USING ARCMAP
Q
Changing atoolbar’s contentsYou can modify the contents ofany toolbar by adding, moving,and removing commands.Grouping commands together ona toolbar can help to visuallyseparate commands used fordifferent tasks such as browsingand querying. After modifying abuilt-in toolbar, you can return itto its original contents; youmight want to do this if youaccidentally remove a commandfrom the toolbar.
Adding a command to atoolbar or menu
1. Click the Tools menu andclick Customize.
2. Click the Toolbars tab.
3. Make sure the toolbar youwant to change is checked.
4. Click the Commands tab.
5. In the Save in combo box,click the dropdown arrow andchoose the template in whichthe changes to the toolbarwill be saved.
6. Click the category thatcontains the command youwant to add.
7. Click the command you wantto add.
8. Drag the command you wantto add to any location on thetarget toolbar.
9. Repeat steps 6 through 8until all the commands youwant are added.
10.Click Close.
4 6
7
3
5
8
Tip
About the Save in comboboxThe Save in combo box appears onthe Commands tab, in the Newtoolbar dialog, in the Reset toolbardialog, and in the CustomizeKeyboard dialog. Use this settingto specify whether the change youare about to make will be saved inthe Normal template, anothertemplate, or the current document.
ch17.p65 12/07/2000, 1:47 PM478
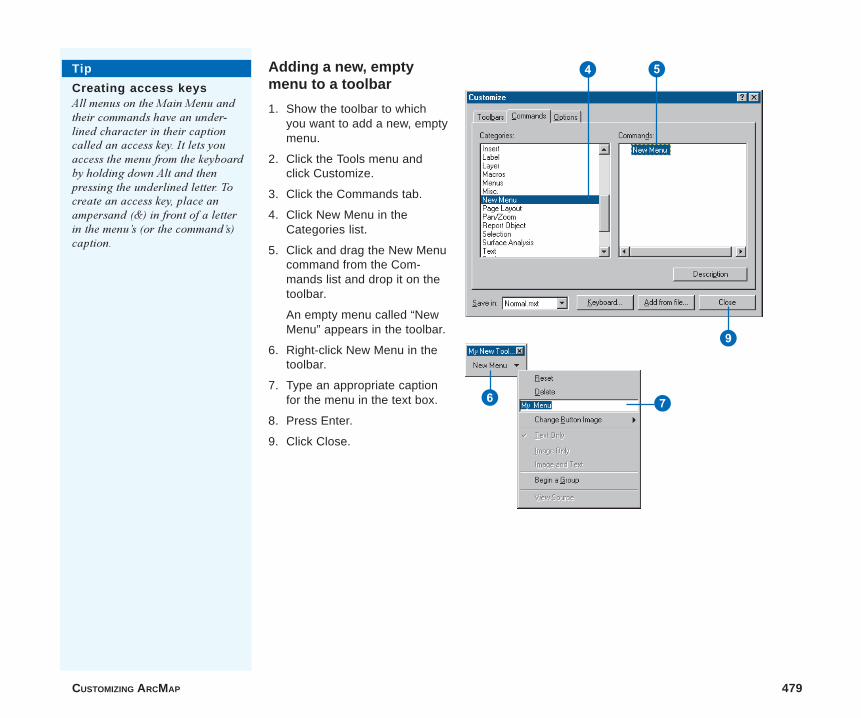
CUSTOMIZING ARCMAP 479
76
9
Adding a new, emptymenu to a toolbar
1. Show the toolbar to whichyou want to add a new, emptymenu.
2. Click the Tools menu andclick Customize.
3. Click the Commands tab.
4. Click New Menu in theCategories list.
5. Click and drag the New Menucommand from the Com-mands list and drop it on thetoolbar.
An empty menu called “NewMenu” appears in the toolbar.
6. Right-click New Menu in thetoolbar.
7. Type an appropriate captionfor the menu in the text box.
8. Press Enter.
9. Click Close.
54Tip
Creating access keysAll menus on the Main Menu andtheir commands have an under-lined character in their captioncalled an access key. It lets youaccess the menu from the keyboardby holding down Alt and thenpressing the underlined letter. Tocreate an access key, place anampersand (&) in front of a letterin the menu�s (or the command�s)caption.
ch17.p65 12/07/2000, 1:47 PM479
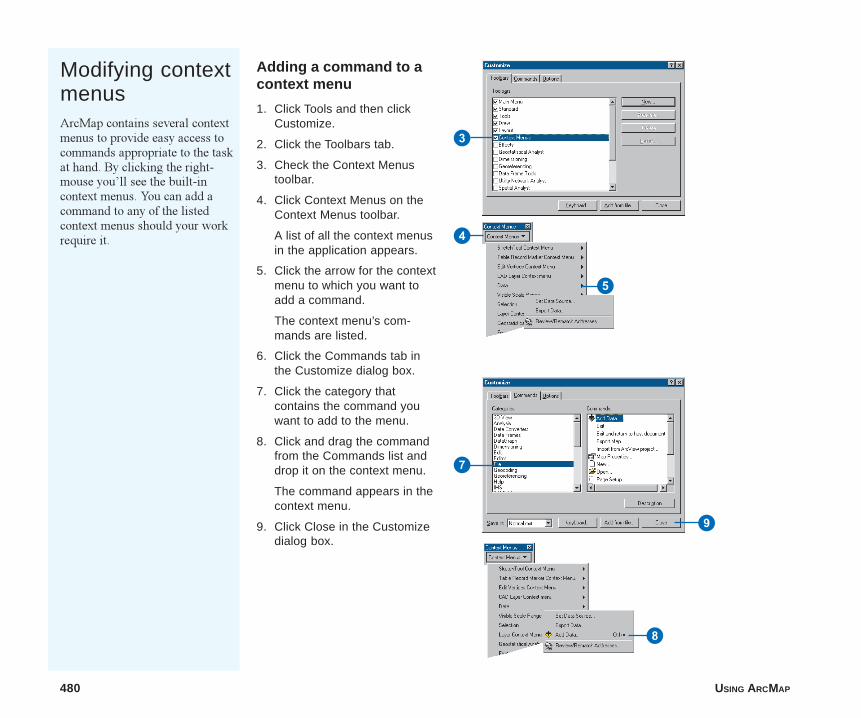
480 USING ARCMAP
Adding a command to acontext menu
1. Click Tools and then clickCustomize.
2. Click the Toolbars tab.
3. Check the Context Menustoolbar.
4. Click Context Menus on theContext Menus toolbar.
A list of all the context menusin the application appears.
5. Click the arrow for the contextmenu to which you want toadd a command.
The context menu’s com-mands are listed.
6. Click the Commands tab inthe Customize dialog box.
7. Click the category thatcontains the command youwant to add to the menu.
8. Click and drag the commandfrom the Commands list anddrop it on the context menu.
The command appears in thecontext menu.
9. Click Close in the Customizedialog box.
5
4
Modifying contextmenusArcMap contains several contextmenus to provide easy access tocommands appropriate to the taskat hand. By clicking the right-mouse you�ll see the built-incontext menus. You can add acommand to any of the listedcontext menus should your workrequire it.
3
7
8
9
ch17.p65 12/07/2000, 1:48 PM480
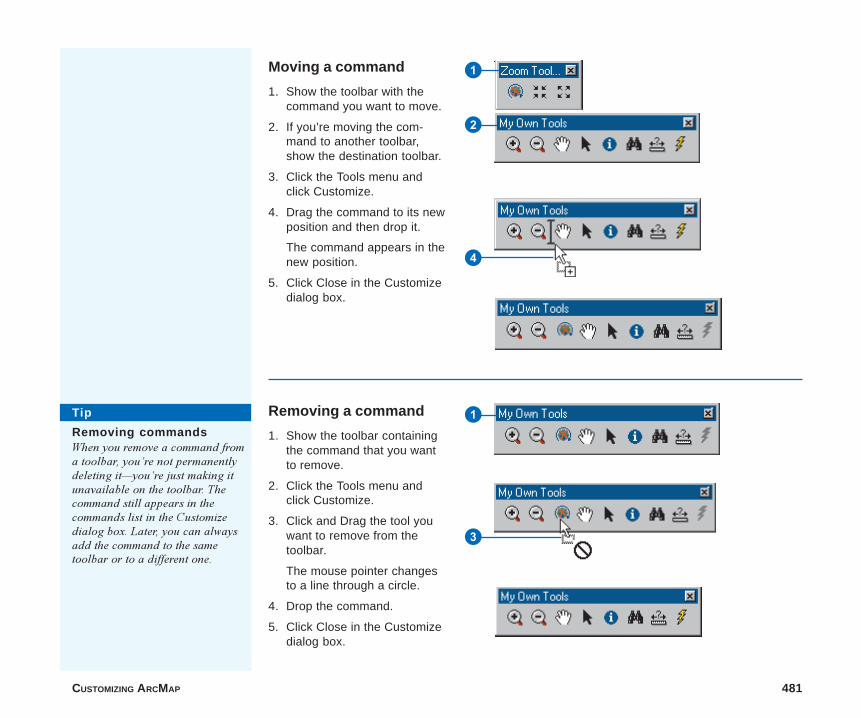
CUSTOMIZING ARCMAP 481
Moving a command
1. Show the toolbar with thecommand you want to move.
2. If you’re moving the com-mand to another toolbar,show the destination toolbar.
3. Click the Tools menu andclick Customize.
4. Drag the command to its newposition and then drop it.
The command appears in thenew position.
5. Click Close in the Customizedialog box.
Removing a command
1. Show the toolbar containingthe command that you wantto remove.
2. Click the Tools menu andclick Customize.
3. Click and Drag the tool youwant to remove from thetoolbar.
The mouse pointer changesto a line through a circle.
4. Drop the command.
5. Click Close in the Customizedialog box.
1
2
4
1
3
Tip
Removing commandsWhen you remove a command froma toolbar, you�re not permanentlydeleting it�you�re just making itunavailable on the toolbar. Thecommand still appears in thecommands list in the Customizedialog box. Later, you can alwaysadd the command to the sametoolbar or to a different one.
ch17.p65 12/07/2000, 1:48 PM481
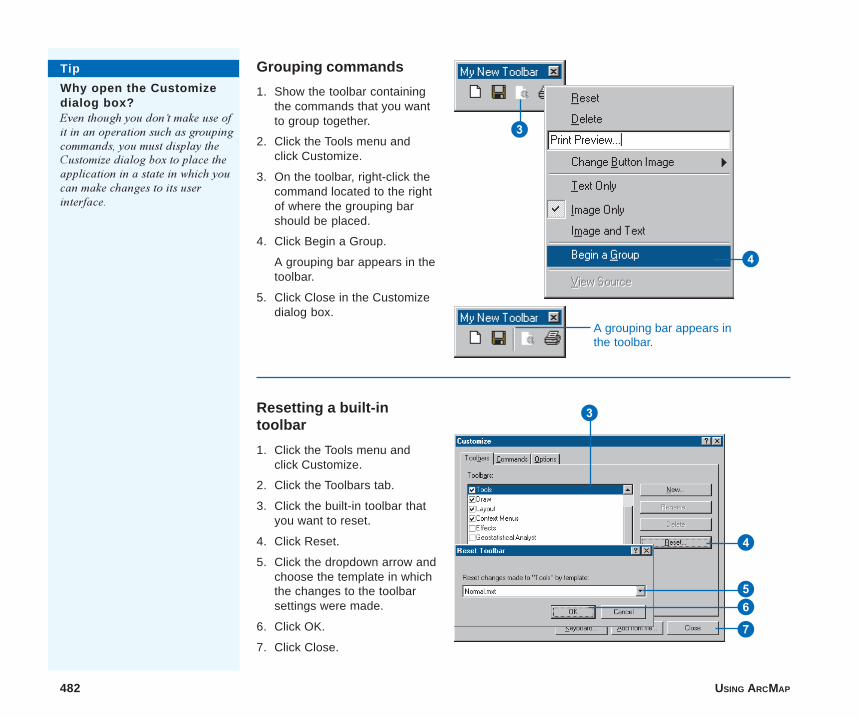
482 USING ARCMAP
Grouping commands
1. Show the toolbar containingthe commands that you wantto group together.
2. Click the Tools menu andclick Customize.
3. On the toolbar, right-click thecommand located to the rightof where the grouping barshould be placed.
4. Click Begin a Group.
A grouping bar appears in thetoolbar.
5. Click Close in the Customizedialog box.
Resetting a built-intoolbar
1. Click the Tools menu andclick Customize.
2. Click the Toolbars tab.
3. Click the built-in toolbar thatyou want to reset.
4. Click Reset.
5. Click the dropdown arrow andchoose the template in whichthe changes to the toolbarsettings were made.
6. Click OK.
7. Click Close.
A grouping bar appears inthe toolbar.
4
4
5
3
6
7
3
Tip
Why open the Customizedialog box?Even though you don�t make use ofit in an operation such as groupingcommands, you must display theCustomize dialog box to place theapplication in a state in which youcan make changes to its userinterface.
ch17.p65 12/07/2000, 1:49 PM482
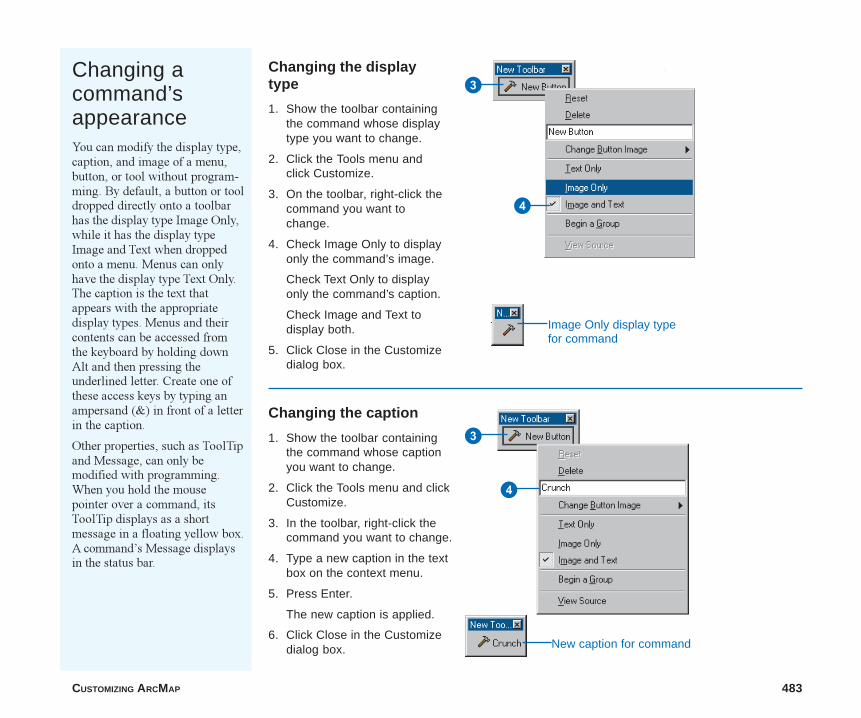
CUSTOMIZING ARCMAP 483
Changing acommand’sappearanceYou can modify the display type,caption, and image of a menu,button, or tool without program-ming. By default, a button or tooldropped directly onto a toolbarhas the display type Image Only,while it has the display typeImage and Text when droppedonto a menu. Menus can onlyhave the display type Text Only.The caption is the text thatappears with the appropriatedisplay types. Menus and theircontents can be accessed fromthe keyboard by holding downAlt and then pressing theunderlined letter. Create one ofthese access keys by typing anampersand (&) in front of a letterin the caption.
Other properties, such as ToolTipand Message, can only bemodified with programming.When you hold the mousepointer over a command, itsToolTip displays as a shortmessage in a floating yellow box.A command�s Message displaysin the status bar.
Changing the displaytype
1. Show the toolbar containingthe command whose displaytype you want to change.
2. Click the Tools menu andclick Customize.
3. On the toolbar, right-click thecommand you want tochange.
4. Check Image Only to displayonly the command’s image.
Check Text Only to displayonly the command’s caption.
Check Image and Text todisplay both.
5. Click Close in the Customizedialog box.
Changing the caption
1. Show the toolbar containingthe command whose captionyou want to change.
2. Click the Tools menu and clickCustomize.
3. In the toolbar, right-click thecommand you want to change.
4. Type a new caption in the textbox on the context menu.
5. Press Enter.
The new caption is applied.
6. Click Close in the Customizedialog box.
4
3
3
4
Image Only display typefor command
New caption for command
ch17.p65 12/07/2000, 1:49 PM483
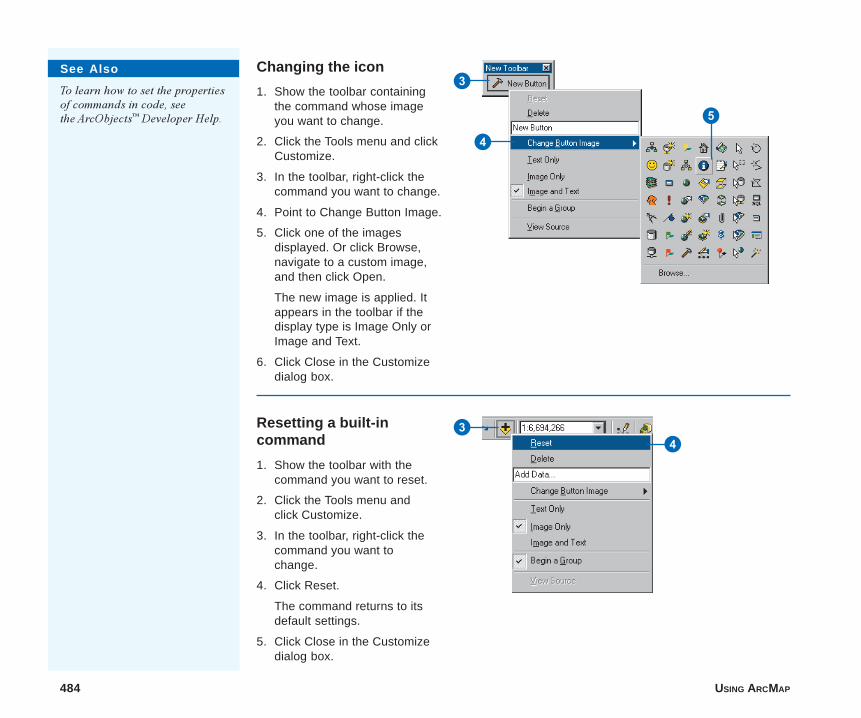
484 USING ARCMAP
Changing the icon
1. Show the toolbar containingthe command whose imageyou want to change.
2. Click the Tools menu and clickCustomize.
3. In the toolbar, right-click thecommand you want to change.
4. Point to Change Button Image.
5. Click one of the imagesdisplayed. Or click Browse,navigate to a custom image,and then click Open.
The new image is applied. Itappears in the toolbar if thedisplay type is Image Only orImage and Text.
6. Click Close in the Customizedialog box.
Resetting a built-incommand
1. Show the toolbar with thecommand you want to reset.
2. Click the Tools menu andclick Customize.
3. In the toolbar, right-click thecommand you want tochange.
4. Click Reset.
The command returns to itsdefault settings.
5. Click Close in the Customizedialog box.
3
34
4
5
See Also
To learn how to set the propertiesof commands in code, seethe ArcObjects� Developer Help.
ch17.p65 12/07/2000, 1:49 PM484
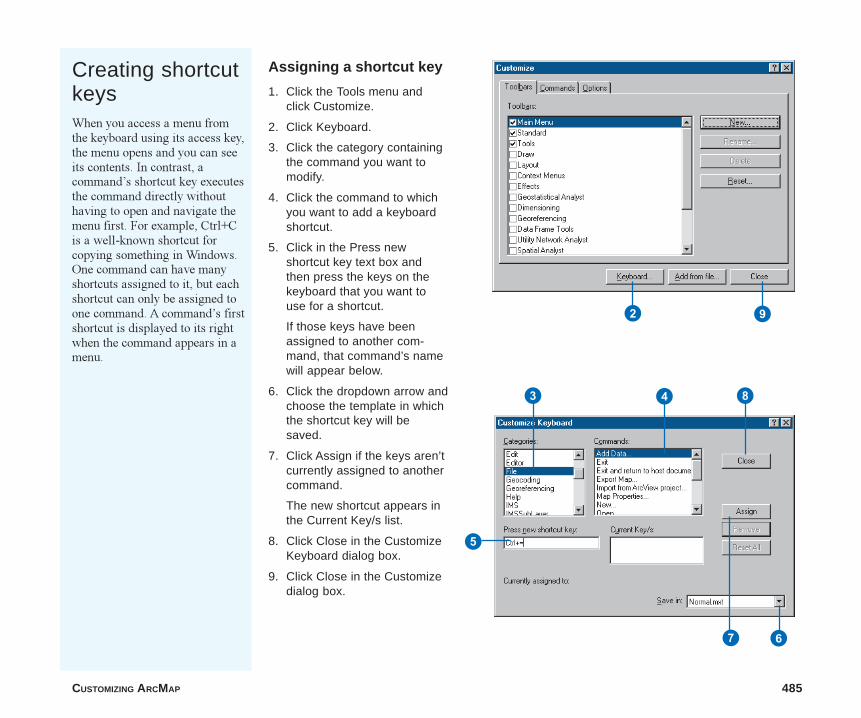
CUSTOMIZING ARCMAP 485
Creating shortcutkeysWhen you access a menu fromthe keyboard using its access key,the menu opens and you can seeits contents. In contrast, acommand�s shortcut key executesthe command directly withouthaving to open and navigate themenu first. For example, Ctrl+Cis a well-known shortcut forcopying something in Windows.One command can have manyshortcuts assigned to it, but eachshortcut can only be assigned toone command. A command�s firstshortcut is displayed to its rightwhen the command appears in amenu.
Assigning a shortcut key
1. Click the Tools menu andclick Customize.
2. Click Keyboard.
3. Click the category containingthe command you want tomodify.
4. Click the command to whichyou want to add a keyboardshortcut.
5. Click in the Press newshortcut key text box andthen press the keys on thekeyboard that you want touse for a shortcut.
If those keys have beenassigned to another com-mand, that command’s namewill appear below.
6. Click the dropdown arrow andchoose the template in whichthe shortcut key will besaved.
7. Click Assign if the keys aren’tcurrently assigned to anothercommand.
The new shortcut appears inthe Current Key/s list.
8. Click Close in the CustomizeKeyboard dialog box.
9. Click Close in the Customizedialog box.
3 4 8
5
67
92
ch17.p65 12/07/2000, 1:50 PM485
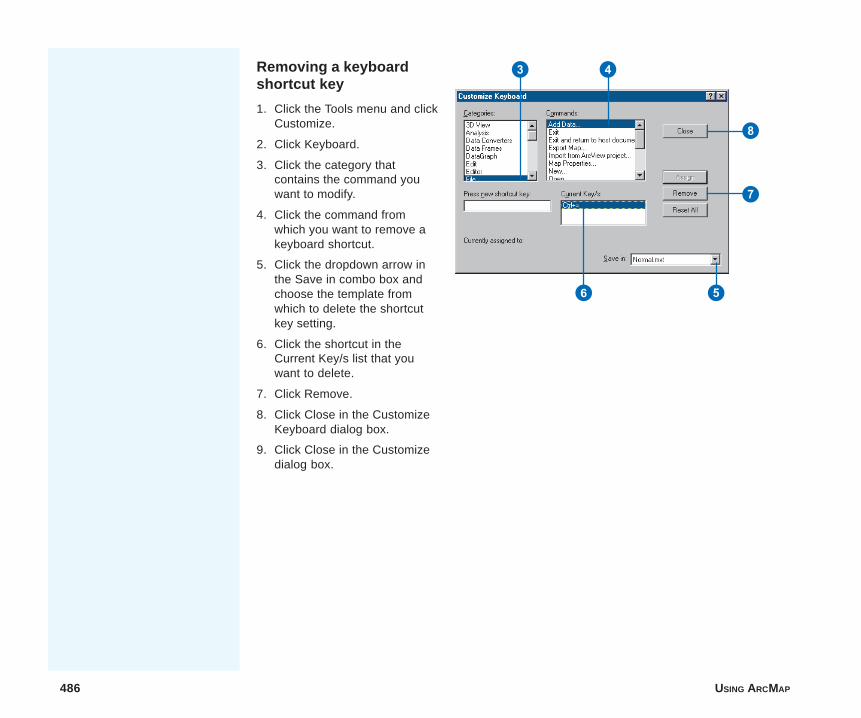
486 USING ARCMAP
Removing a keyboardshortcut key
1. Click the Tools menu and clickCustomize.
2. Click Keyboard.
3. Click the category thatcontains the command youwant to modify.
4. Click the command fromwhich you want to remove akeyboard shortcut.
5. Click the dropdown arrow inthe Save in combo box andchoose the template fromwhich to delete the shortcutkey setting.
6. Click the shortcut in theCurrent Key/s list that youwant to delete.
7. Click Remove.
8. Click Close in the CustomizeKeyboard dialog box.
9. Click Close in the Customizedialog box.
3 4
6 5
7
8
ch17.p65 12/07/2000, 1:50 PM486
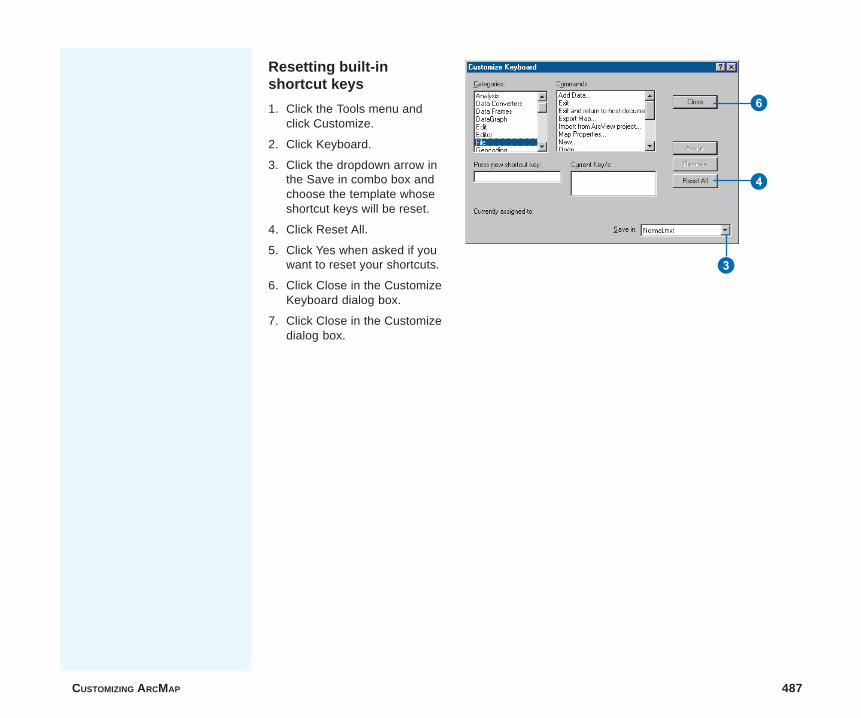
CUSTOMIZING ARCMAP 487
Resetting built-in shortcut keys
1. Click the Tools menu andclick Customize.
2. Click Keyboard.
3. Click the dropdown arrow inthe Save in combo box andchoose the template whoseshortcut keys will be reset.
4. Click Reset All.
5. Click Yes when asked if youwant to reset your shortcuts.
6. Click Close in the CustomizeKeyboard dialog box.
7. Click Close in the Customizedialog box.
3
6
4
ch17.p65 12/07/2000, 1:50 PM487
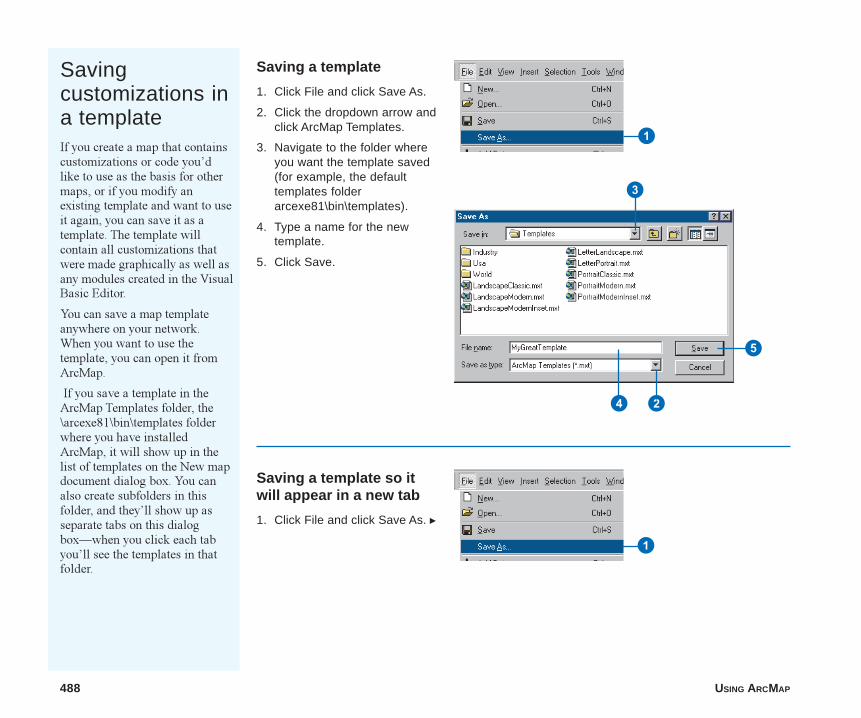
488 USING ARCMAP
Savingcustomizations ina templateIf you create a map that containscustomizations or code you�dlike to use as the basis for othermaps, or if you modify anexisting template and want to useit again, you can save it as atemplate. The template willcontain all customizations thatwere made graphically as well asany modules created in the VisualBasic Editor.
You can save a map templateanywhere on your network.When you want to use thetemplate, you can open it fromArcMap.
If you save a template in theArcMap Templates folder, the\arcexe81\bin\templates folderwhere you have installedArcMap, it will show up in thelist of templates on the New mapdocument dialog box. You canalso create subfolders in thisfolder, and they�ll show up asseparate tabs on this dialogbox�when you click each tabyou�ll see the templates in thatfolder.
Saving a template
1. Click File and click Save As.
2. Click the dropdown arrow andclick ArcMap Templates.
3. Navigate to the folder whereyou want the template saved(for example, the defaulttemplates folderarcexe81\bin\templates).
4. Type a name for the newtemplate.
5. Click Save.
Saving a template so itwill appear in a new tab
1. Click File and click Save As. u
24
3
5
1
1
ch17.p65 12/07/2000, 1:50 PM488
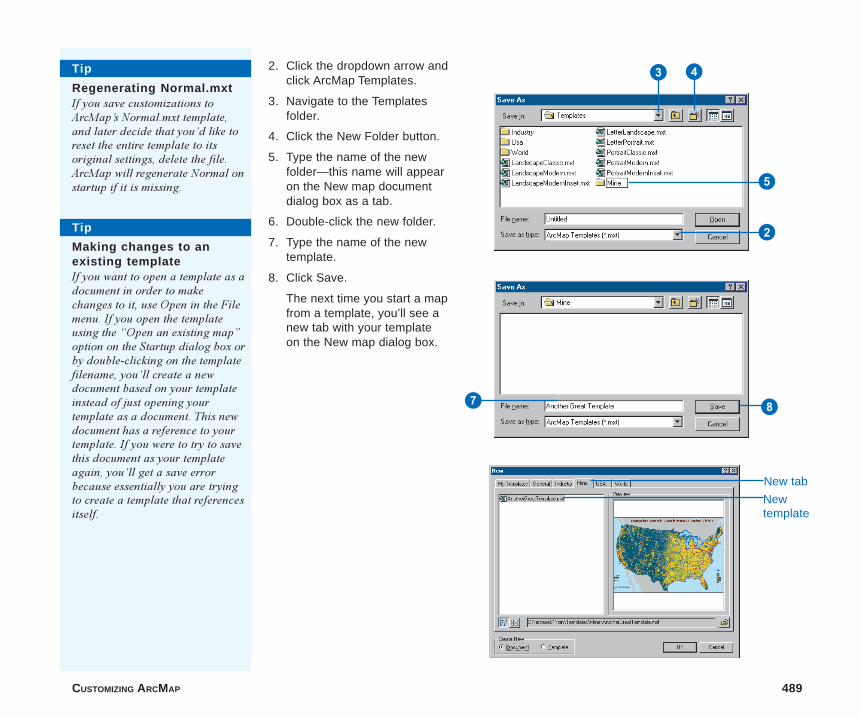
CUSTOMIZING ARCMAP 489
Tip
Regenerating Normal.mxtIf you save customizations toArcMap�s Normal.mxt template,and later decide that you�d like toreset the entire template to itsoriginal settings, delete the file.ArcMap will regenerate Normal onstartup if it is missing.
Tip
Making changes to anexisting templateIf you want to open a template as adocument in order to makechanges to it, use Open in the Filemenu. If you open the templateusing the �Open an existing map�option on the Startup dialog box orby double-clicking on the templatefilename, you�ll create a newdocument based on your templateinstead of just opening yourtemplate as a document. This newdocument has a reference to yourtemplate. If you were to try to savethis document as your templateagain, you�ll get a save errorbecause essentially you are tryingto create a template that referencesitself.
4
5
7 8
3
New tab
Newtemplate
2
2. Click the dropdown arrow andclick ArcMap Templates.
3. Navigate to the Templatesfolder.
4. Click the New Folder button.
5. Type the name of the newfolder—this name will appearon the New map documentdialog box as a tab.
6. Double-click the new folder.
7. Type the name of the newtemplate.
8. Click Save.
The next time you start a mapfrom a template, you’ll see anew tab with your templateon the New map dialog box.
ch17.p65 12/07/2000, 1:51 PM489
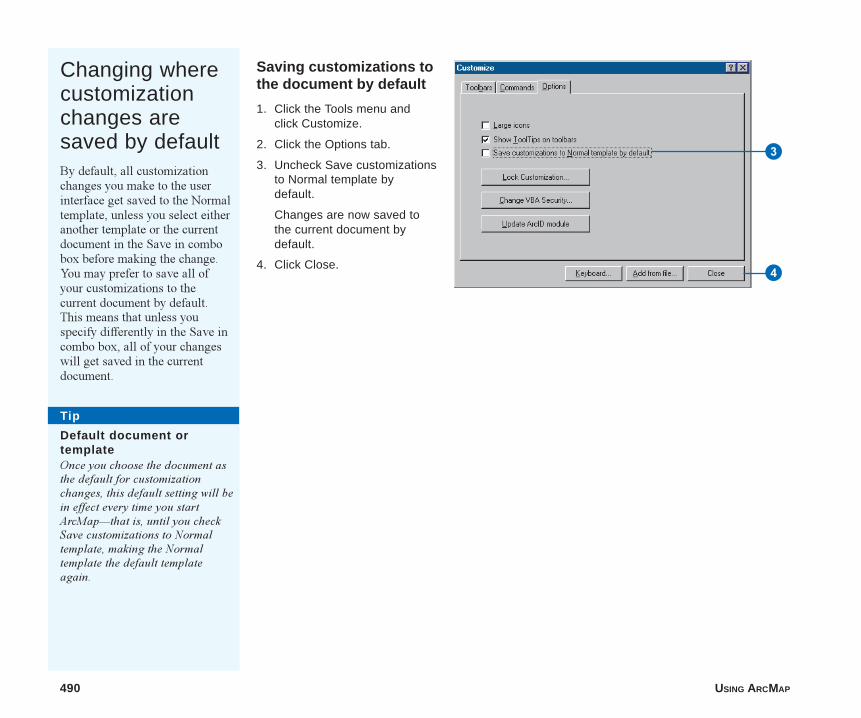
490 USING ARCMAP
Changing wherecustomizationchanges aresaved by defaultBy default, all customizationchanges you make to the userinterface get saved to the Normaltemplate, unless you select eitheranother template or the currentdocument in the Save in combobox before making the change.You may prefer to save all ofyour customizations to thecurrent document by default.This means that unless youspecify differently in the Save incombo box, all of your changeswill get saved in the currentdocument.
Saving customizations tothe document by default
1. Click the Tools menu andclick Customize.
2. Click the Options tab.
3. Uncheck Save customizationsto Normal template bydefault.
Changes are now saved tothe current document bydefault.
4. Click Close.4
3
Tip
Default document ortemplateOnce you choose the document asthe default for customizationchanges, this default setting will bein effect every time you startArcMap�that is, until you checkSave customizations to Normaltemplate, making the Normaltemplate the default templateagain.
ch17.p65 12/07/2000, 1:51 PM490
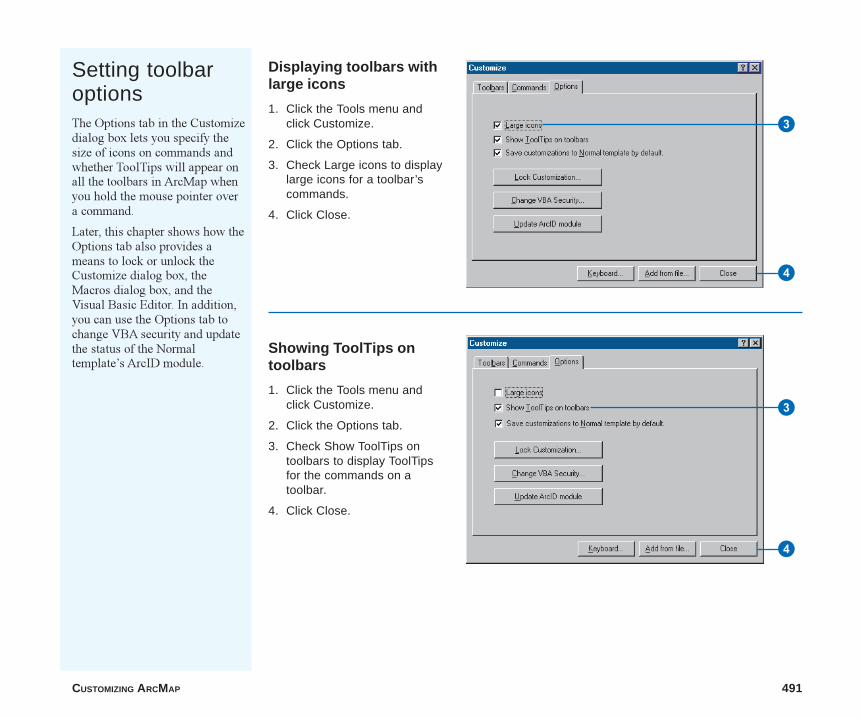
CUSTOMIZING ARCMAP 491
Setting toolbaroptionsThe Options tab in the Customizedialog box lets you specify thesize of icons on commands andwhether ToolTips will appear onall the toolbars in ArcMap whenyou hold the mouse pointer overa command.
Later, this chapter shows how theOptions tab also provides ameans to lock or unlock theCustomize dialog box, theMacros dialog box, and theVisual Basic Editor. In addition,you can use the Options tab tochange VBA security and updatethe status of the Normaltemplate�s ArcID module.
Displaying toolbars withlarge icons
1. Click the Tools menu andclick Customize.
2. Click the Options tab.
3. Check Large icons to displaylarge icons for a toolbar’scommands.
4. Click Close.
Showing ToolTips ontoolbars
1. Click the Tools menu andclick Customize.
2. Click the Options tab.
3. Check Show ToolTips ontoolbars to display ToolTipsfor the commands on atoolbar.
4. Click Close.
4
4
3
3
ch17.p65 12/07/2000, 1:52 PM491
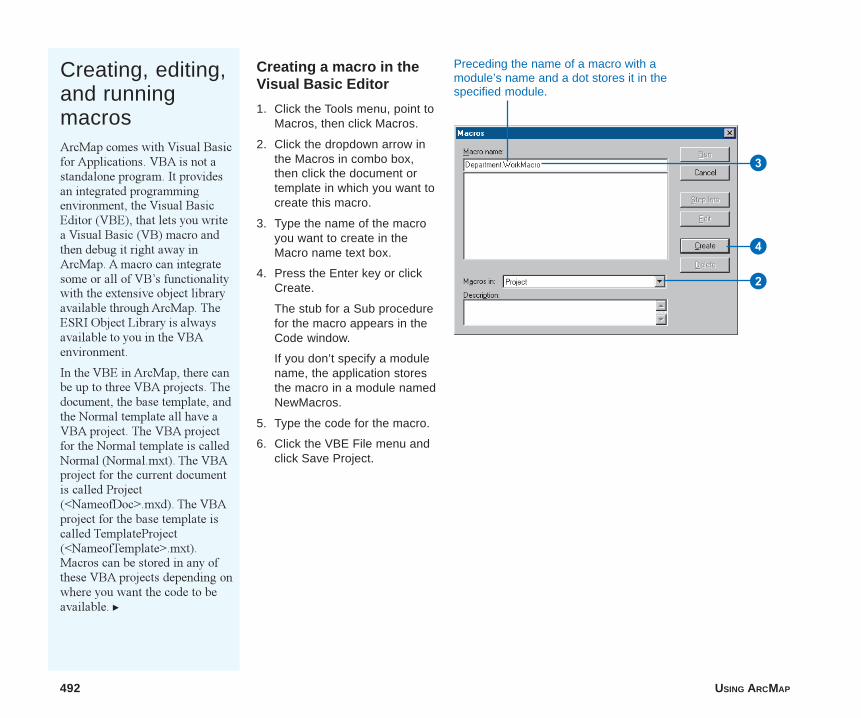
492 USING ARCMAP
Creating, editing,and runningmacrosArcMap comes with Visual Basicfor Applications. VBA is not astandalone program. It providesan integrated programmingenvironment, the Visual BasicEditor (VBE), that lets you writea Visual Basic (VB) macro andthen debug it right away inArcMap. A macro can integratesome or all of VB�s functionalitywith the extensive object libraryavailable through ArcMap. TheESRI Object Library is alwaysavailable to you in the VBAenvironment.
In the VBE in ArcMap, there canbe up to three VBA projects. Thedocument, the base template, andthe Normal template all have aVBA project. The VBA projectfor the Normal template is calledNormal (Normal.mxt). The VBAproject for the current documentis called Project(<NameofDoc>.mxd). The VBAproject for the base template iscalled TemplateProject(<NameofTemplate>.mxt).Macros can be stored in any ofthese VBA projects depending onwhere you want the code to beavailable. u
Creating a macro in theVisual Basic Editor
1. Click the Tools menu, point toMacros, then click Macros.
2. Click the dropdown arrow inthe Macros in combo box,then click the document ortemplate in which you want tocreate this macro.
3. Type the name of the macroyou want to create in theMacro name text box.
4. Press the Enter key or clickCreate.
The stub for a Sub procedurefor the macro appears in theCode window.
If you don’t specify a modulename, the application storesthe macro in a module namedNewMacros.
5. Type the code for the macro.
6. Click the VBE File menu andclick Save Project.
Preceding the name of a macro with amodule’s name and a dot stores it in thespecified module.
3
4
2
ch17.p65 12/07/2000, 1:52 PM492
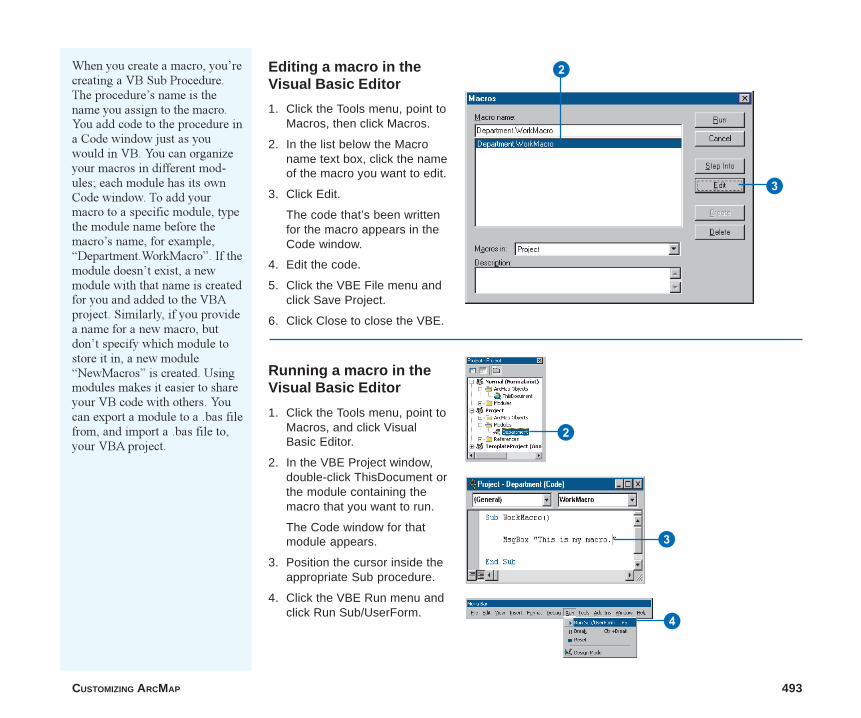
CUSTOMIZING ARCMAP 493
Running a macro in theVisual Basic Editor
1. Click the Tools menu, point toMacros, and click VisualBasic Editor.
2. In the VBE Project window,double-click ThisDocument orthe module containing themacro that you want to run.
The Code window for thatmodule appears.
3. Position the cursor inside theappropriate Sub procedure.
4. Click the VBE Run menu andclick Run Sub/UserForm.
When you create a macro, you�recreating a VB Sub Procedure.The procedure�s name is thename you assign to the macro.You add code to the procedure ina Code window just as youwould in VB. You can organizeyour macros in different mod-ules; each module has its ownCode window. To add yourmacro to a specific module, typethe module name before themacro�s name, for example,�Department.WorkMacro�. If themodule doesn�t exist, a newmodule with that name is createdfor you and added to the VBAproject. Similarly, if you providea name for a new macro, butdon�t specify which module tostore it in, a new module�NewMacros� is created. Usingmodules makes it easier to shareyour VB code with others. Youcan export a module to a .bas filefrom, and import a .bas file to,your VBA project.
Editing a macro in theVisual Basic Editor
1. Click the Tools menu, point toMacros, then click Macros.
2. In the list below the Macroname text box, click the nameof the macro you want to edit.
3. Click Edit.
The code that’s been writtenfor the macro appears in theCode window.
4. Edit the code.
5. Click the VBE File menu andclick Save Project.
6. Click Close to close the VBE.
2
3
2
4
3
ch17.p65 12/07/2000, 1:52 PM493
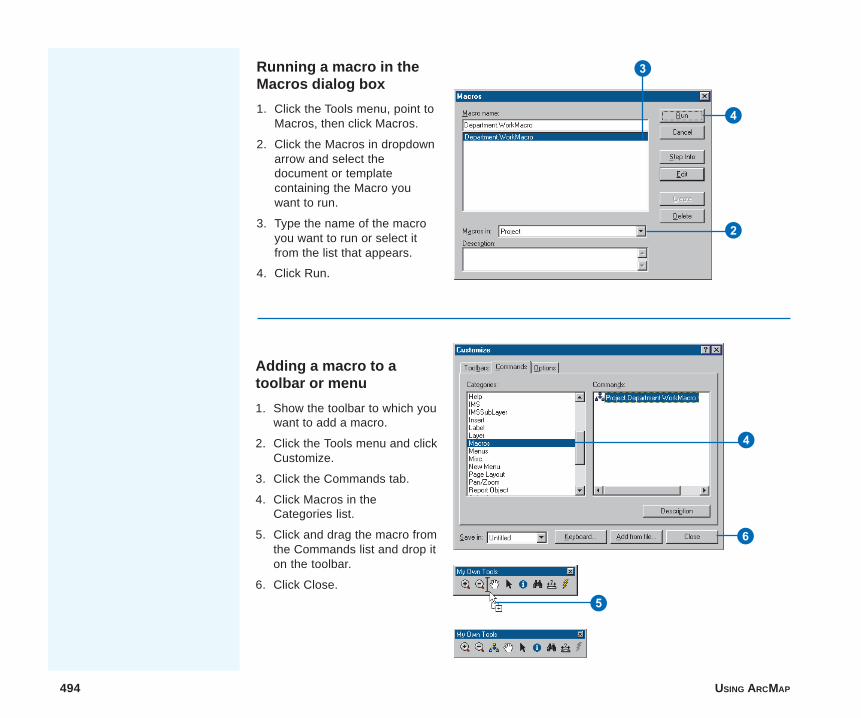
494 USING ARCMAP
Adding a macro to atoolbar or menu
1. Show the toolbar to which youwant to add a macro.
2. Click the Tools menu and clickCustomize.
3. Click the Commands tab.
4. Click Macros in theCategories list.
5. Click and drag the macro fromthe Commands list and drop iton the toolbar.
6. Click Close.
5
Running a macro in theMacros dialog box
1. Click the Tools menu, point toMacros, then click Macros.
2. Click the Macros in dropdownarrow and select thedocument or templatecontaining the Macro youwant to run.
3. Type the name of the macroyou want to run or select itfrom the list that appears.
4. Click Run.
4
2
6
4
3
ch17.p65 12/07/2000, 1:53 PM494
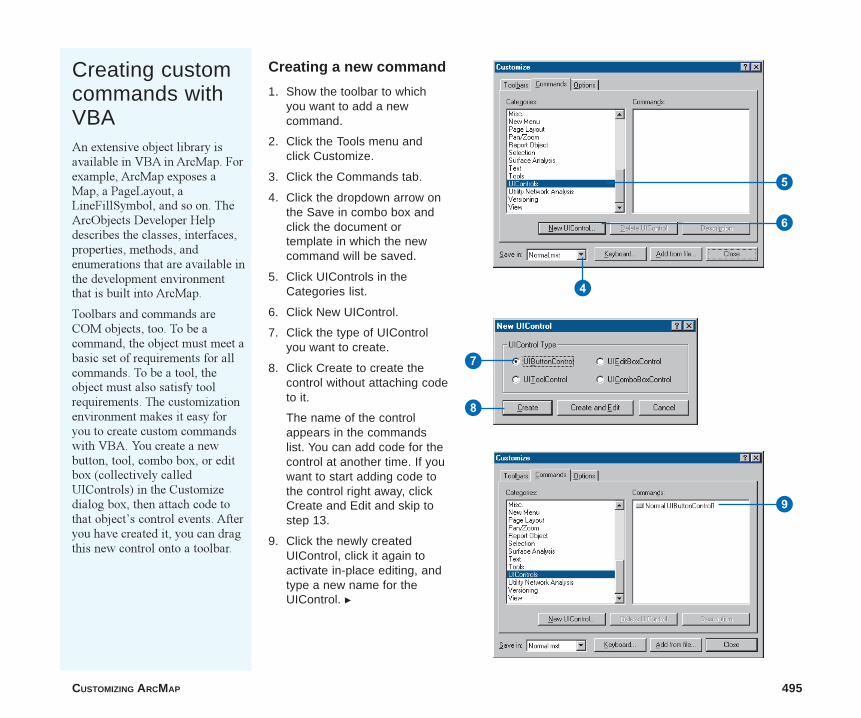
CUSTOMIZING ARCMAP 495
Creating customcommands withVBAAn extensive object library isavailable in VBA in ArcMap. Forexample, ArcMap exposes aMap, a PageLayout, aLineFillSymbol, and so on. TheArcObjects Developer Helpdescribes the classes, interfaces,properties, methods, andenumerations that are available inthe development environmentthat is built into ArcMap.
Toolbars and commands areCOM objects, too. To be acommand, the object must meet abasic set of requirements for allcommands. To be a tool, theobject must also satisfy toolrequirements. The customizationenvironment makes it easy foryou to create custom commandswith VBA. You create a newbutton, tool, combo box, or editbox (collectively calledUIControls) in the Customizedialog box, then attach code tothat object�s control events. Afteryou have created it, you can dragthis new control onto a toolbar.
Creating a new command
1. Show the toolbar to whichyou want to add a newcommand.
2. Click the Tools menu andclick Customize.
3. Click the Commands tab.
4. Click the dropdown arrow onthe Save in combo box andclick the document ortemplate in which the newcommand will be saved.
5. Click UIControls in theCategories list.
6. Click New UIControl.
7. Click the type of UIControlyou want to create.
8. Click Create to create thecontrol without attaching codeto it.
The name of the controlappears in the commandslist. You can add code for thecontrol at another time. If youwant to start adding code tothe control right away, clickCreate and Edit and skip tostep 13.
9. Click the newly createdUIControl, click it again toactivate in-place editing, andtype a new name for theUIControl. u
8
7
4
6
5
9
ch17.p65 12/07/2000, 1:53 PM495
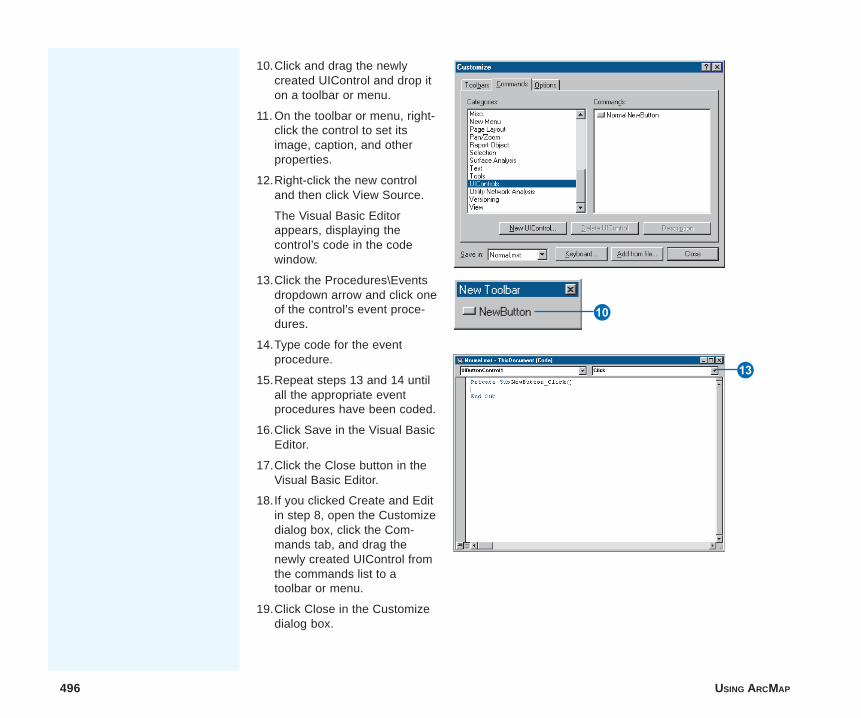
496 USING ARCMAP
10.Click and drag the newlycreated UIControl and drop iton a toolbar or menu.
11. On the toolbar or menu, right-click the control to set itsimage, caption, and otherproperties.
12.Right-click the new controland then click View Source.
The Visual Basic Editorappears, displaying thecontrol’s code in the codewindow.
13.Click the Procedures\Eventsdropdown arrow and click oneof the control’s event proce-dures.
14.Type code for the eventprocedure.
15.Repeat steps 13 and 14 untilall the appropriate eventprocedures have been coded.
16.Click Save in the Visual BasicEditor.
17.Click the Close button in theVisual Basic Editor.
18.If you clicked Create and Editin step 8, open the Customizedialog box, click the Com-mands tab, and drag thenewly created UIControl fromthe commands list to atoolbar or menu.
19.Click Close in the Customizedialog box.
Q
R
ch17.p65 12/07/2000, 1:54 PM496
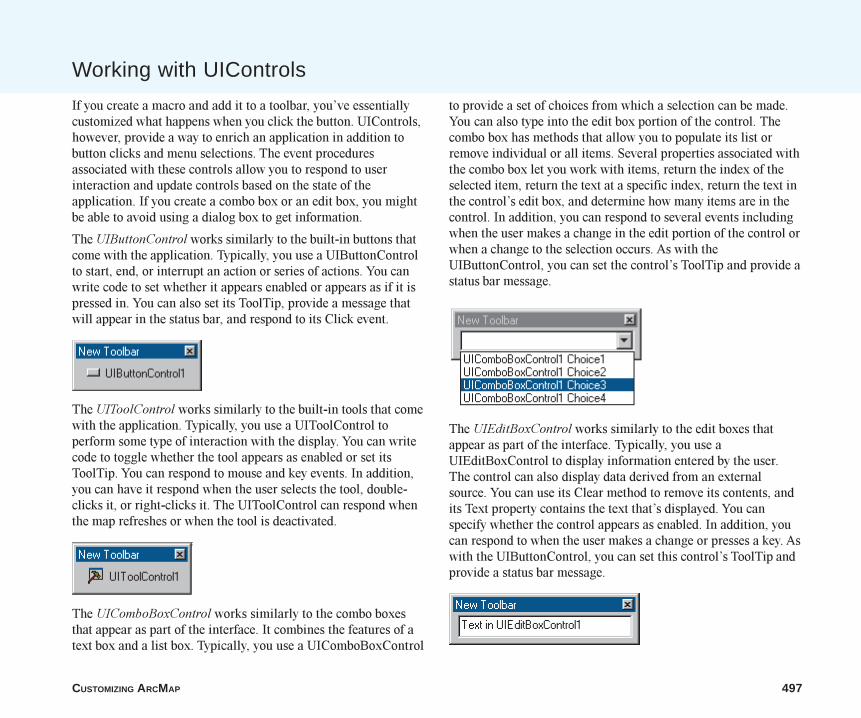
CUSTOMIZING ARCMAP 497
Working with UIControls
If you create a macro and add it to a toolbar, you�ve essentiallycustomized what happens when you click the button. UIControls,however, provide a way to enrich an application in addition tobutton clicks and menu selections. The event proceduresassociated with these controls allow you to respond to userinteraction and update controls based on the state of theapplication. If you create a combo box or an edit box, you mightbe able to avoid using a dialog box to get information.
The UIButtonControl works similarly to the built-in buttons thatcome with the application. Typically, you use a UIButtonControlto start, end, or interrupt an action or series of actions. You canwrite code to set whether it appears enabled or appears as if it ispressed in. You can also set its ToolTip, provide a message thatwill appear in the status bar, and respond to its Click event.
The UIToolControl works similarly to the built-in tools that comewith the application. Typically, you use a UIToolControl toperform some type of interaction with the display. You can writecode to toggle whether the tool appears as enabled or set itsToolTip. You can respond to mouse and key events. In addition,you can have it respond when the user selects the tool, double-clicks it, or right-clicks it. The UIToolControl can respond whenthe map refreshes or when the tool is deactivated.
The UIComboBoxControl works similarly to the combo boxesthat appear as part of the interface. It combines the features of atext box and a list box. Typically, you use a UIComboBoxControl
to provide a set of choices from which a selection can be made.You can also type into the edit box portion of the control. Thecombo box has methods that allow you to populate its list orremove individual or all items. Several properties associated withthe combo box let you work with items, return the index of theselected item, return the text at a specific index, return the text inthe control�s edit box, and determine how many items are in thecontrol. In addition, you can respond to several events includingwhen the user makes a change in the edit portion of the control orwhen a change to the selection occurs. As with theUIButtonControl, you can set the control�s ToolTip and provide astatus bar message.
The UIEditBoxControl works similarly to the edit boxes thatappear as part of the interface. Typically, you use aUIEditBoxControl to display information entered by the user.The control can also display data derived from an externalsource. You can use its Clear method to remove its contents, andits Text property contains the text that�s displayed. You canspecify whether the control appears as enabled. In addition, youcan respond to when the user makes a change or presses a key. Aswith the UIButtonControl, you can set this control�s ToolTip andprovide a status bar message.
ch17.p65 12/07/2000, 1:54 PM497
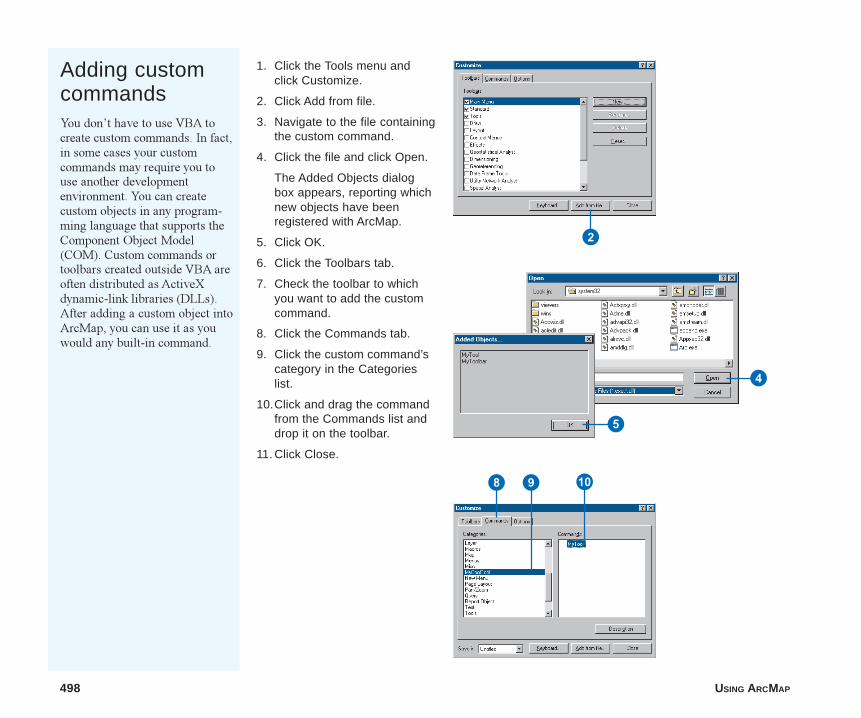
498 USING ARCMAP
Adding customcommandsYou don�t have to use VBA tocreate custom commands. In fact,in some cases your customcommands may require you touse another developmentenvironment. You can createcustom objects in any program-ming language that supports theComponent Object Model(COM). Custom commands ortoolbars created outside VBA areoften distributed as ActiveXdynamic-link libraries (DLLs).After adding a custom object intoArcMap, you can use it as youwould any built-in command.
1. Click the Tools menu andclick Customize.
2. Click Add from file.
3. Navigate to the file containingthe custom command.
4. Click the file and click Open.
The Added Objects dialogbox appears, reporting whichnew objects have beenregistered with ArcMap.
5. Click OK.
6. Click the Toolbars tab.
7. Check the toolbar to whichyou want to add the customcommand.
8. Click the Commands tab.
9. Click the custom command’scategory in the Categorieslist.
10.Click and drag the commandfrom the Commands list anddrop it on the toolbar.
11. Click Close.
2
5
4
9 Q8
ch17.p65 12/07/2000, 1:55 PM498
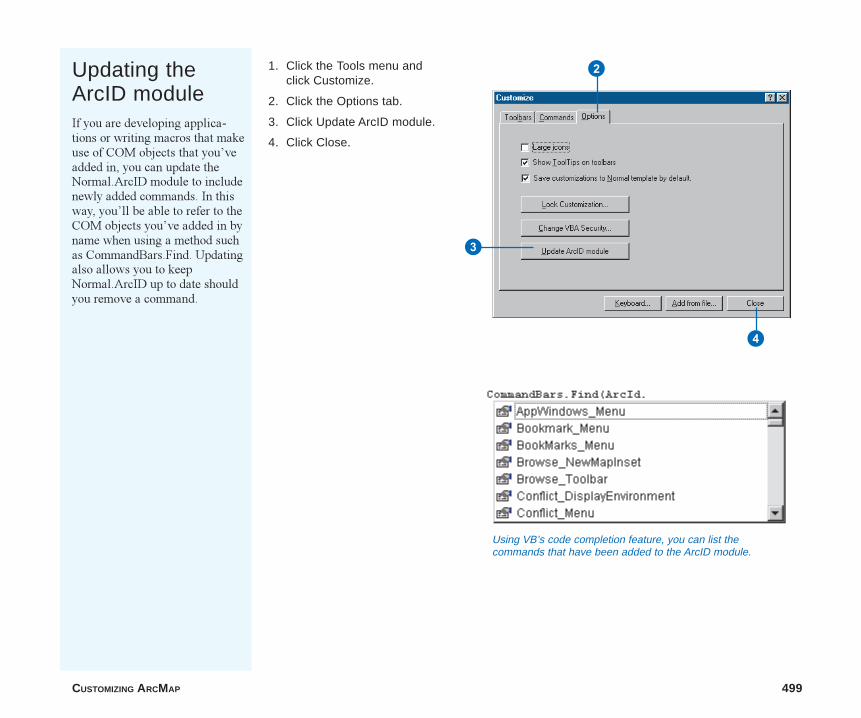
CUSTOMIZING ARCMAP 499
Updating theArcID moduleIf you are developing applica-tions or writing macros that makeuse of COM objects that you�veadded in, you can update theNormal.ArcID module to includenewly added commands. In thisway, you�ll be able to refer to theCOM objects you�ve added in byname when using a method suchas CommandBars.Find. Updatingalso allows you to keepNormal.ArcID up to date shouldyou remove a command.
1. Click the Tools menu andclick Customize.
2. Click the Options tab.
3. Click Update ArcID module.
4. Click Close.
3
4
Using VB’s code completion feature, you can list thecommands that have been added to the ArcID module.
2
ch17.p65 12/07/2000, 1:55 PM499
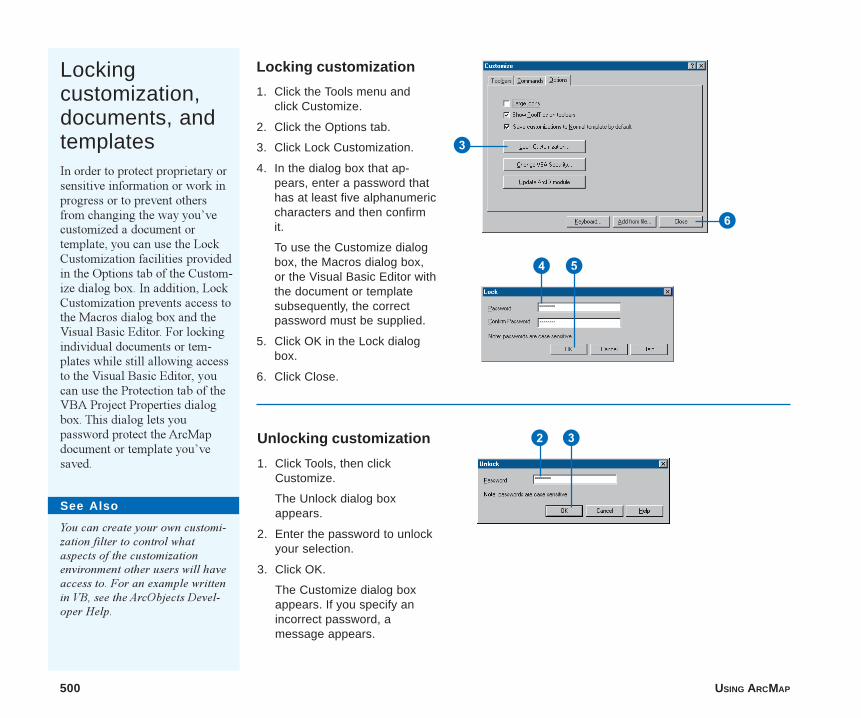
500 USING ARCMAP
Lockingcustomization,documents, andtemplatesIn order to protect proprietary orsensitive information or work inprogress or to prevent othersfrom changing the way you�vecustomized a document ortemplate, you can use the LockCustomization facilities providedin the Options tab of the Custom-ize dialog box. In addition, LockCustomization prevents access tothe Macros dialog box and theVisual Basic Editor. For lockingindividual documents or tem-plates while still allowing accessto the Visual Basic Editor, youcan use the Protection tab of theVBA Project Properties dialogbox. This dialog lets youpassword protect the ArcMapdocument or template you�vesaved.
Locking customization
1. Click the Tools menu andclick Customize.
2. Click the Options tab.
3. Click Lock Customization.
4. In the dialog box that ap-pears, enter a password thathas at least five alphanumericcharacters and then confirmit.
To use the Customize dialogbox, the Macros dialog box,or the Visual Basic Editor withthe document or templatesubsequently, the correctpassword must be supplied.
5. Click OK in the Lock dialogbox.
6. Click Close.
Unlocking customization
1. Click Tools, then clickCustomize.
The Unlock dialog boxappears.
2. Enter the password to unlockyour selection.
3. Click OK.
The Customize dialog boxappears. If you specify anincorrect password, amessage appears.
3
See Also
You can create your own customi-zation filter to control whataspects of the customizationenvironment other users will haveaccess to. For an example writtenin VB, see the ArcObjects Devel-oper Help.
54
6
32
ch17.p65 12/07/2000, 1:55 PM500
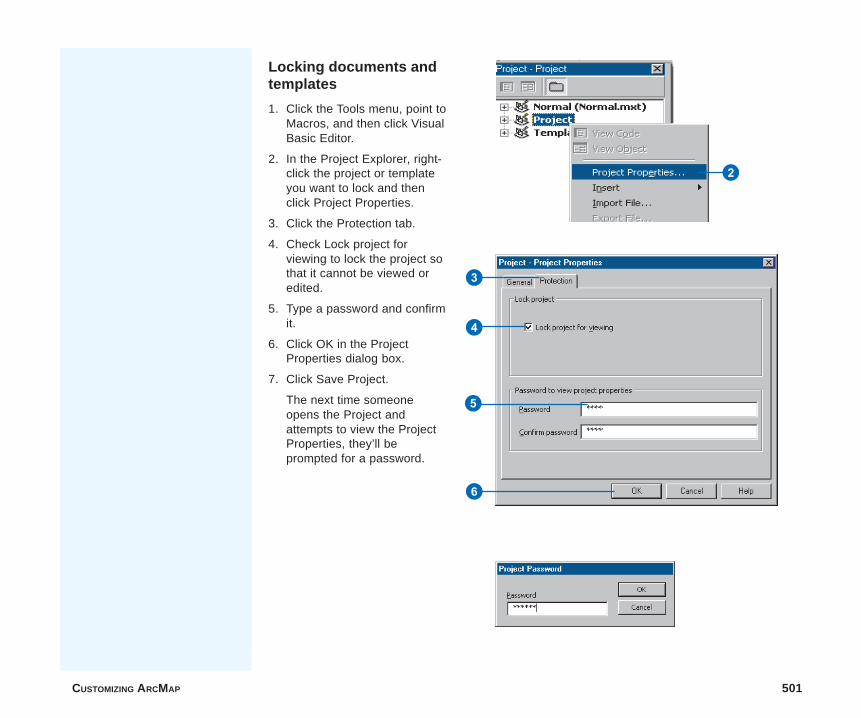
CUSTOMIZING ARCMAP 501
Locking documents andtemplates
1. Click the Tools menu, point toMacros, and then click VisualBasic Editor.
2. In the Project Explorer, right-click the project or templateyou want to lock and thenclick Project Properties.
3. Click the Protection tab.
4. Check Lock project forviewing to lock the project sothat it cannot be viewed oredited.
5. Type a password and confirmit.
6. Click OK in the ProjectProperties dialog box.
7. Click Save Project.
The next time someoneopens the Project andattempts to view the ProjectProperties, they’ll beprompted for a password.
5
6
4
3
2
ch17.p65 12/07/2000, 1:56 PM501
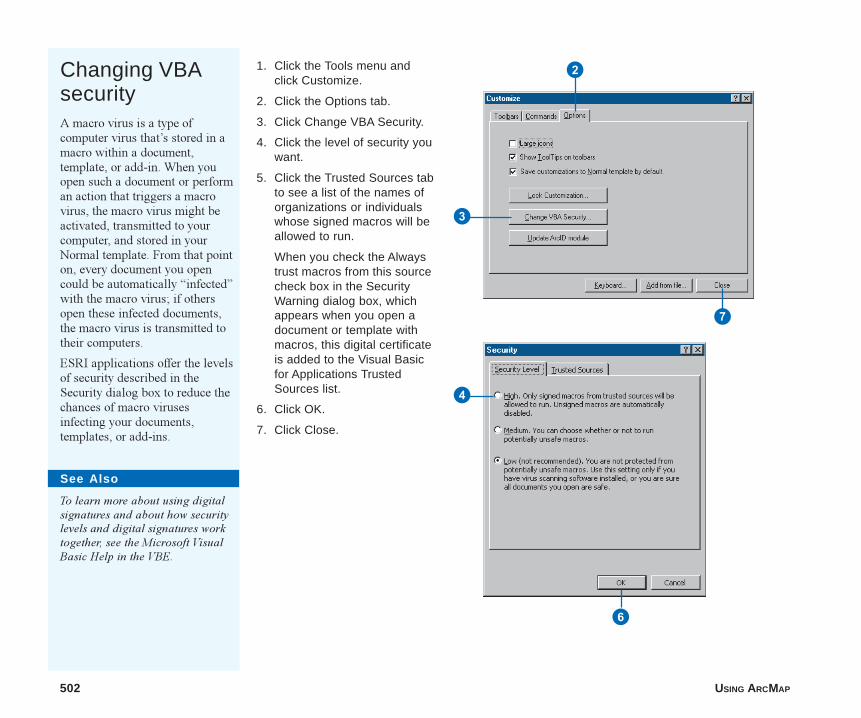
502 USING ARCMAP
1. Click the Tools menu andclick Customize.
2. Click the Options tab.
3. Click Change VBA Security.
4. Click the level of security youwant.
5. Click the Trusted Sources tabto see a list of the names oforganizations or individualswhose signed macros will beallowed to run.
When you check the Alwaystrust macros from this sourcecheck box in the SecurityWarning dialog box, whichappears when you open adocument or template withmacros, this digital certificateis added to the Visual Basicfor Applications TrustedSources list.
6. Click OK.
7. Click Close.
4
Changing VBAsecurityA macro virus is a type ofcomputer virus that�s stored in amacro within a document,template, or add-in. When youopen such a document or performan action that triggers a macrovirus, the macro virus might beactivated, transmitted to yourcomputer, and stored in yourNormal template. From that pointon, every document you opencould be automatically �infected�with the macro virus; if othersopen these infected documents,the macro virus is transmitted totheir computers.
ESRI applications offer the levelsof security described in theSecurity dialog box to reduce thechances of macro virusesinfecting your documents,templates, or add-ins.
See Also
To learn more about using digitalsignatures and about how securitylevels and digital signatures worktogether, see the Microsoft VisualBasic Help in the VBE.
3
6
7
2
ch17.p65 12/07/2000, 1:56 PM502
503
12Glossary active data frameThe data frame you�re currently working with, for example, adding layers to. The active data frameis shown in bold text in the table of contents.
address matchingThe process of assigning x,y coordinates to addresses so they can be displayed as points on a map.
aliasAnother name for a field in a table.
ArcInfo workspaceSee coverage.
attributeA characteristic of a map feature. Attributes of a river might include its name, length, averagedepth, and so on.
attribute tableInformation about features on a map, stored in rows and columns. Each row relates to a singlefeature; each column contains the values for a single characteristic.
Attributes dialog boxA dialog box that lets you view and edit attributes of features you�ve selected.
bandA measure of some characteristic or quality of the features being observed in a raster. Some rastershave a single band; others have more than one. For example, satellite imagery commonly hasmultiple bands representing different wavelengths of energy from along the electromagneticspectrum.
barrierAn object that is placed on a map to specify a place in a network past which a trace cannotcontinue.
ArcMap&Editor_Glossary.p65 12/07/2000, 2:02 PM503
504 USING ARCMAP
CADComputer-aided design. An automated system for the design,drafting, and display of graphically oriented information.
candidatesA record from a geocoding reference data source that is apotential match for an address.
cellA discretely uniform unit�such as a square meter or squaremile�that represents a portion of the earth in a raster. A cell hasa value that corresponds to the feature or characteristic at that sitesuch as a soil type, census tract, or elevation.
chartA graphic representation of tabular data. Also referred to as agraph.
classA group or category of attribute values.
classifyingThe process of sorting or arranging attribute values into groupsor categories; all members of a group are represented on the mapby the same symbol.
cluster toleranceThe distance range in which all vertices and boundaries in ashapefile or feature dataset are considered identical, orcoincident, when you run the Integrate command from the Editormenu.
For example, if the cluster tolerance is set to 10 map units, afterrunning Integrate there will be no more than one vertex within10 map units of another.
coincidentSee cluster tolerance.
color rampA range of colors used in a map to show ranking or order offeature attributes.
control pointsPoints you establish on a paper map to represent known groundpoints or specific locations. Control points are used to register apaper map before you begin digitizing features on it with adigitizer.
coordinate systemA method for specifying the location of real-world features on thesurface of the earth.
coverageA vector data storage format for storing the location, shape, andattributes of geographic features. One of the primary vector datastorage formats for ArcInfo. Coverages are stored in an ArcInfoworkspace.
current taskThe setting of the Current Task dropdown list that determineswith which task the sketch construction tools (Sketch, Arc,Distance�Distance, and Intersection) will work.
The current task is set by clicking a task in the Current Taskdropdown list. All tasks in the Current Task dropdown list workwith a sketch that you create. For example, the Create NewFeature task uses a sketch you create to make a new feature. TheExtend/Trim Feature task uses a sketch you create to determinewhere the selected feature will be extended or trimmed. The CutPolygon Feature task uses a sketch you create to determine wherethe polygon will be cut.
ArcMap&Editor_Glossary.p65 12/07/2000, 2:02 PM504
GLOSSARY 505
dataA collection of related facts usually arranged in a particularformat and gathered for a particular purpose.
data frameA frame on the map that displays layers occupying the samegeographic area. You may have one or more data frames on yourmap depending on how you want to organize your data. Forinstance, one data frame might highlight a study area, and anothermight provide an overview of where the study area is.
data sourceAny geographic data such as a coverage, shapefile, raster, orgeodatabase.
data viewAn all-purpose view for exploring, displaying, and queryinggeographic data. This view hides all map elements such as titles,North arrows, and scale bars. See also layout view.
databaseA collection of related files organized for efficient retrieval ofinformation.
datasetSame as data source.
decimal degreesDegrees of latitude and longitude expressed as a decimal ratherthan in degrees, minutes, and seconds.
determinate flow directionFor an edge feature, occurs when the flow direction can bedetermined from the topology of the network, the locations ofsources and sinks, and the enabled or disabled states of features.
digitizerSee digitizing.
digitizer puckSee digitizing.
digitizingThe process of converting the features on a paper map into digitalformat. When you digitize a map, you use a digitizing tablet, ordigitizer, connected to your computer and trace over features witha digitizer puck, which is similar to a mouse. The x,y coordinatesof these features are automatically recorded and stored as spatialdata.
digitizing modeAlso called absolute mode, digitizing mode is one of the ways inwhich a digitizing tablet operates. In digitizing mode, the locationof the tablet is mapped to a specific location on the screen.Moving the digitizer puck on the tablet surface causes the screenpointer to move to precisely the same position. See also mousemode.
digitizing tabletSee digitizing.
disabled featureA network feature that does not allow flow to pass through it.
display unitsThe units�for example, feet, miles, meters, or kilometers�ArcMap uses to report measurements, dimensions of shapes, anddistance tolerances and offsets.
ArcMap&Editor_Glossary.p65 12/07/2000, 2:02 PM505
506 USING ARCMAP
edgeA network feature that has a length and through whichcommodity flows.
edit cacheA command in ArcMap Editor that causes the features visible inthe current map extent to be held in memory on your localmachine. Designed to be used when working with large amountsof data, an edit cache results in faster editing because the Editordoesn�t have to retrieve the data from the server.
edit sessionAll editing takes place within an edit session. An edit sessionbegins when you choose Start Editing from the Editor menu andends when you choose Stop Editing.
Editor toolbarA toolbar that lets you create and modify features and theirattributes in ArcMap.
enabled featureA network feature that allows flow to pass through it.
featureA representation of a real-world object in a layer on a map.
feature class1. A classification describing the format of geographic featuresand supporting data in a coverage. Coverage feature classes forrepresenting geographic features include point, arc, node, route-system, route, section, polygon, and region. One or morecoverage features are used to model geographic features; forexample, arcs and nodes can be used to model linear featuressuch as street centerlines. The tic, annotation, link, and boundaryfeature classes provide supporting data for coverage datamanagement and viewing.
2. The conceptual representation of a geographic feature. Whenreferring to geographic features, feature classes include point,line, area, and surface. In a geodatabase, an object class thatstores features and has a field of type geometry in a geodatabase.
feature datasetA collection of feature classes in a geodatabase that share thesame spatial reference. Because the feature classes share thesame spatial reference, they can participate in topologicalrelationships with each other such as in a geometric network.Object classes and relationship classes can also be stored in afeature dataset.
fieldA column in a table. Each field contains the values for a singleattribute.
flagAn object that is placed on a map to specify the starting point fora trace task.
flow directionThe direction in which commodities flow through edge elementsin a network.
geocodingThe process of creating geometric representations for locations(such as point features) from descriptions of locations (such asaddresses).
geocoding reference dataData that a geocoding service uses to determine the geometricrepresentations for locations.
ArcMap&Editor_Glossary.p65 12/07/2000, 2:02 PM506
GLOSSARY 507
geocoding serviceAn object that defines a process for creating geometricrepresentations for locations (such as point features) fromdescriptions of locations (such as addresses).
geodatabaseA geographic database that provides services for managinggeographic data. A geodatabase is hosted inside a relationaldatabase management system. A geodatabase contains featuredatasets.
geographic coordinatesA measurement of a location on the earth�s surface expressed indegrees of latitude and longitude. See projected coordinates.
geometric networkA set of feature classes that participate together in a network.
georeferenceThe process of defining how raster data is situated in mapcoordinates. Georeferencing raster data allows it to be viewed,queried, and analyzed with other geographic data.
graticuleA graphic representation on a map of the network of parallels andmeridians (latitude and longitude) that subdivide the earth�ssurface.
gridA geographic representation of the world as an array of equallysized square cells arranged in rows and columns. Each grid cell isreferenced by its geographic x,y location. See raster.
ground control pointA location of known x,y coordinates used to georeference araster. A ground control point links a location on a raster to alocation in map coordinates.
group layerSeveral layers that appear and act like an individual layer in thetable of contents in ArcMap.
hyperlinkDisplays data, such as an image or Web page, when you click it.
imageRepresents geographic features by dividing the world intodiscrete squares called cells. Examples include satellite and aerialphotographs, scanned documents, and building photographs. Seealso raster.
indeterminate flow directionFor an edge feature, this occurs when the flow direction cannotbe determined from the topology of the network, the locations ofsources and sinks, and the enabled or disabled states of features.
joinThe process of attaching tabular data to a layer. The fields in thetable are appended to the layer using a common field. Joinestablishes a one-to-one, one-to-many, or a many-to-manyrelationship between map features and table attributes.
junctionA network feature that occurs at the intersection of two or moreedges or at the endpoint of an edge that allows the transfer offlow between edges.
ArcMap&Editor_Glossary.p65 12/07/2000, 2:02 PM507

508 USING ARCMAP
layerA collection of similar geographic features�such as rivers, lakes,counties, or cities�of a particular area or place for display on amap. A layer references geographic data stored in a data source,such as a coverage, and defines how to display it. You can createand manage layers as you would any other type of data in yourdatabase.
layoutThe design or arrangement of elements�such as geographicdata, North arrows, and scale bars�in a digital map display orprinted map.
layout viewThe view for laying out your map. Layout view shows the virtualpage upon which you place and arrange geographic data and mapelements�such as titles, legends, and scale bars�for printing.See also data view.
legendA list of symbols appearing on the map; includes a sample ofeach symbol and text describing what feature each symbolrepresents.
mapA graphical presentation of geographic information. It containsgeographic data and other elements such as a title, North arrow,legend, and scale bar. You can interactively display and query thegeographic data on the map and also prepare a printable map byarranging the map elements around the data in a visually pleasingmanner.
map displayA graphic representation of the map on the computer screen.
map documentThe disk-based representation of a map. Map documents can beprinted or embedded into other documents. Map documents havean .mxd file extension.
map elementA graphic component, such as a scale bar, North arrow, and title,that helps describe the geographic data on the map.
map featureSee feature.
map projectionSee projection.
map scaleSee scale.
map surroundSee map element.
map templateA kind of map document that provides a quick way to create anew map. Templates can contain data, a custom interface, and apredefined layout that arranges map elements, such as Northarrows, scale bars, and logos, on the virtual page. Map templateshave an .mxt file extension.
map tipsDisplays onscreen descriptions of map features when you pausethe mouse pointer over the feature.
map unitsThe units�for example, feet, miles, meters, or kilometers�inwhich the coordinates of spatial data are stored.
ArcMap&Editor_Glossary.p65 12/07/2000, 2:02 PM508
GLOSSARY 509
mouse modeAlso known as relative mode, mouse mode is one of the ways inwhich a digitizing tablet operates. In mouse mode, the digitizerpuck behaves just like a mouse; there is no correlation betweenthe position of the screen pointer and the surface of the digitizingtablet, but you can choose interface elements with the pointer.See also digitizing mode.
multipart featureA feature that is composed of more than one physical part butonly references one set of attributes in the database.
For example, in a layer of states, the State of Hawaii could beconsidered a multipart feature. Although composed of manyislands, it would be recorded in the database as one feature.
multipoint featureA feature that consists of more than one point but only referencesone set of attributes in the database. For example, a system of oilwells might be considered a multipoint feature, as there is asingle set of attributes for the main well and multiple well holes.
neatlineA border commonly drawn around geographic features, often toseparate them from other map elements.
networkA set of edges and junctions that are topologically connected toeach other.
network featureA feature that participates in a geometric network.
nodataSame as null value but specific to rasters.
normalizeCreating a ratio by dividing two data values. Normalizing dataminimizes differences in values based on the size of areas ornumbers of features in each area. For example, dividing a valueby the area of a feature yields a value per unit area, or density.
North arrowA map element that shows how the map is oriented.
null valueThe absence of a value. A geographic feature for which there isno associated attribute information.
parametric curveA curved segment that has only two vertices as endpoints, insteadof being made of numerous vertices. You can create a parametriccurve using the Arc tool or the Tangent Curve command in theArcMap Editor. Also known as a true curve.
point mode digitizingOne of two methods of digitizing features digitally using ArcMapEditor�s Sketch tool or from a paper map using a digitizer. Withpoint mode digitizing, you can create or edit features bydigitizing a series of precise points, or vertices. Point modedigitizing is effective when precise digitizing is required�forexample, when digitizing a perfectly straight line. See also streammode digitizing.
projected coordinatesA measurement of locations on the earth�s surface expressed in atwo-dimensional system that locates features based on theirdistance from an origin (0,0) along two axes, a horizontal x-axisrepresenting east�west and a vertical y-axis representing north�south. A map projection transforms latitude and longitude to x,ycoordinates in a projected coordinate system. See alsogeographic coordinates.
ArcMap&Editor_Glossary.p65 12/07/2000, 2:02 PM509
510 USING ARCMAP
projectionA mathematical formula that transforms feature locations fromthe earth�s curved surface to a map�s flat surface. A projectedcoordinate system employs a projection to transform locationsexpressed as latitude and longitude values to x,y coordinates.Projections cause distortions in one or more of these spatialproperties: distance, area, shape, and direction.
pyramidsReduced resolution raster layers that record the original rasterdata in decreasing levels of resolution. Pyramids help to reducethe time it takes to display raster data.
queryA question or request used for selecting features. A query oftenappears in the form of a statement or logical expression. InArcMap, a query contains a field, an operator, and a value.
rasterRepresents any data source that uses a grid structure to storegeographic information. See grid and image.
rematchingThe process of re-geocoding a subset of features in a geocodedfeature class.
resamplingThe process of assigning a value to a cell when transforming araster. The three most common resampling techniques are nearestneighbor assignment, bilinear interpolation, and cubicconvolution.
resolution1. The accuracy at which a given map scale can depict thelocation and shape of geographic features. The larger the mapscale, the higher the possible resolution. As map scale decreases,resolution diminishes and feature boundaries must be smoothed,simplified, or not shown at all. For example, small areas mayhave to be represented as points.
2. The size of the smallest feature that can be represented in asurface.
3. The number of points in x and y in a raster.
scaleThe relationship between the dimensions of features on a mapand the geographic objects they represent on the earth, commonlyexpressed as a fraction or a ratio. A map scale of 1/100,000 or1:100,000 means that one unit of measure on the map equals100,000 of the same unit on the earth.
scale barA map element that graphically shows a map�s scale.
segmentA line that connects vertices in a sketch. For example, in a sketchof a building, a segment would represent one wall.
selectTo choose from a number or group of features or records; tocreate a separate set, or subset.
selected setA subset of the features in a layer or records in a table. ArcMapprovides several ways to select features and records graphicallyor according to their attribute values.
ArcMap&Editor_Glossary.p65 12/07/2000, 2:02 PM510
GLOSSARY 511
selection anchorA small �x� located in the center of selected features. Theselection anchor is used when you move features using snapping.It is the point on the feature or group of features that will besnapped to the snapping location. This is also the point aroundwhich your selection will rotate when you use the Rotate tool andaround which your feature will scale when you use the Scale tool.
shapefileA vector data storage format for storing the location, shape, andattributes of geographic features. A shapefile is stored in a folderand contains one feature class.
shared boundaryA segment or boundary common to two features. For example, ina parcel database, adjacent parcels will share a boundary. Anotherexample might be a parcel that shares a boundary on one sidewith a river. The segment of the river that coincides with theparcel boundary would share the same coordinates as the parcelboundary.
shared vertexA vertex common to multiple features. For example, in a parceldatabase, adjacent parcels will share a vertex at the commoncorner.
sinkA junction feature at which flow terminates.
sketchA shape that represents a feature�s geometry. Every existingfeature on a map has an alternate form, a sketch. A sketch lets yousee exactly how a feature is composed with all vertices andsegments of the feature visible. To modify a feature�s geometry,you must modify its sketch. To create a feature, you must firstcreate a sketch. You can only create line and polygon sketches, aspoints have neither vertices nor segments.
Sketches help complete the current task. For example, the CreateNew Feature task uses a sketch you create to make a new feature.The Extend/Trim Feature task uses a sketch you create todetermine where the selected feature will be extended ortrimmed. The Cut Polygon Feature task uses a sketch you createto determine where the polygon will be cut into two features.
sketch constraintsThe angle or length limitations you can place on segments you�recreating.
These commands are available on the Sketch tool context menu.For example, you can set a length constraint that specifies that thelength of the segment you�re creating will be 50 map units. Atwhatever angle you create that segment, its length will beconstrained to 50 map units.
Angle constraints work in the same way. For example, you canset an angle constraint that specifies that the angle of the segmentyou�re creating will be 45 degrees measured from another featurethat already exists. At whatever length you create that segment,its angle will be constrained to 45 degrees.
sketch operationsEditing operations that are performed on an existing sketch.
Examples are Insert Vertex, Delete Vertex, Flip, Trim, DeleteSketch, Finish Sketch, and Finish Part. All of these operations areavailable from the Sketch context menu, which is available whenyou right-click on any part of a sketch using any editing tools.
ArcMap&Editor_Glossary.p65 12/07/2000, 2:02 PM511
512 USING ARCMAP
snapping environmentSettings in the ArcMap Editor�s Snapping Environment windowand Editing Options dialog box that help you establish exactlocations in relation to other features. You determine thesnapping environment by setting a snapping tolerance, snappingproperties, and a snapping priority.
snapping priorityThe order in which snapping will occur by layer. You can set thesnapping priority by dragging the layer names in the SnappingEnvironment window to new locations.
snapping propertiesA combination of a shape to snap to and a method for what partof the shape you will snap to. You can set your snappingproperties to have a feature snap to a vertex, edge, or endpoint offeatures in a specific layer.
For example, a layer snapping property might let you snap to thevertices of buildings. A more generic, sketch-specific snappingproperty might let you snap to the vertices of a sketch you�recreating.
snapping toleranceThe distance within which the pointer or a feature will snap toanother location.
If the location being snapped to (vertex, boundary, midpoint, orconnection) is within the distance you set, the pointer willautomatically snap. For example, if you want to snap a power lineto a utility pole and the snapping tolerance is set to 25 pixels,whenever the power line comes within a 25-pixel range of thepole, it will automatically snap to it. Snapping tolerance can bemeasured using either map units or pixels.
sourceA junction feature at which flow originates.
spatial analysisThe study of the locations and shapes of geographic features andthe relationships between them.
spatial bookmarkIdentifies a particular geographic location that you want to saveand refer to later�for example, a study area.
spatial dataThe locations and shapes of geographic features with descriptionsof each.
spatial joinA type of spatial analysis in which the attributes of features intwo different layers are joined together based on the relativelocations of the features.
spatial overlayThe process of superimposing layers of geographic data thatoccupy the same space in order to study the relationship betweenthem.
stream mode digitizingOne of the two methods of digitizing features from a paper map.Also known as streaming, stream mode digitizing provides aneasy way to capture features when you don�t require muchprecision�for example, to digitize rivers, streams, and contourlines. With stream mode, you create the first vertex of the featureand trace over the rest of the feature with the digitizer puck. Youcan also use digitize in stream mode with the Editor�s Sketch toolwhen editing �freehand�. See also point mode digitizing.
ArcMap&Editor_Glossary.p65 12/07/2000, 2:02 PM512
GLOSSARY 513
stream toleranceThe interval at which vertices are added along the feature you�redigitizing in stream mode. When streaming, vertices areautomatically created at a defined interval as you move themouse. For example, if the stream tolerance is set to 10 mapunits, you must move the pointer at least 10 map units before thenext vertex will be created. If you move the pointer more than10 map units, there may be more space between vertices, butthere will always be a minimum interval of 10 map units. Streamtolerance is measured in map units. See also stream modedigitizing.
stretchApplied to a raster to increase the visual contrast between itscells.
styleAn organized collection of elements that you use to make yourmaps or put on your maps. Styles include elements such assymbols, scale bars, North arrows, and colors. You might createdifferent styles that contain the specific elements for the specifictypes of maps you make.
Style ManagerThe tool that you use to create new styles and edit existing ones.
surfaceA geographic phenomenon represented as a set of continuousdata such as elevation or air temperature over an area. A clear orsharp break in values of the phenomenon (breaklines) indicates asignificant change in the structure of the phenomenon (forexample, a cliff), not a change in geographic feature.
symbolA graphic representation of an individual feature or class offeatures that helps identify it and distinguish it from otherfeatures.
symbologyThe criteria used to determine symbols for the features in a layer.A characteristic of a feature may influence the size, color, andshape of the symbol used.
tableInformation formatted in rows and columns. See attribute table.
table of contentsLists all the layers on the map and shows what the features ineach layer represent.
tabular dataDescriptive information that is stored in rows and columns andcan be linked to map features.
target layerThe setting of the Target Layer dropdown list that determines towhich layer new features will be added. The target layer is set byclicking a layer in the Target Layer dropdown list. For instance, ifyou set the target layer to Buildings, any features you create willbe part of the Buildings layer. You must set the target layerwhenever you�re creating new features�whether you�re creatingthem with the Sketch tool, by copying and pasting, or bybuffering another feature.
templateSee map template.
ArcMap&Editor_Glossary.p65 12/07/2000, 2:02 PM513
514 USING ARCMAP
text labelText added to a map to help identify features.
TINTriangulated irregular network. A data structure that represents acontinuous surface through a series of irregularly spaced pointswith values that describe the surface at that point (for example,an elevation). From these points, a network of linked trianglesforms the surface.
topological associationThe spatial relationship between features that share geometrysuch as boundaries and vertices. When you edit a boundary orvertex shared by two or more features using the topology tools inArcMap Editor, the shape of each of those features is updated.
tracingThe process of building a set of network features based on someprocedure.
uninitialized flow directionFor an edge feature, this occurs when the edge feature is nottopologically connected through the network to sources and sinksor if the edge feature is only connected to sources and sinksthrough disabled features.
vertexA point that joins two segments of a feature. For instance, asquare building would have four vertices, one at each corner.
warpTransforming a raster to map coordinates.
weightA property of a network feature typically used to represent a costfor traversing across an edge or through a junction.
weight filterA specification of which network features can be traced based ontheir weight values.
ArcMap&Editor_Glossary.p65 12/07/2000, 2:02 PM514
515
12Index A
Accent barsusing with text 282
Access keyscontrasted with shortcut keys 485creating 479, 483
Active data frame 67defined 503
ActiveX DLLsdistributing custom commands as 498
Address matchingdefined 503
Addresses. See also Geocodingcandidates 414�415, 417, 419, 421, 429components 414finding 419�421geocoding tables of 422�425standardizing 414, 417, 420, 429
Aerial photographs 393Alias
defined 503Align
graphics 178map elements 247to margins 247
Alternate street name table 414AncillaryRole attribute 435, 436, 449. See also
Sinks; SourcesAnnotation. See also Labels
converting labels to 182described 168feature-linked 183
Annotation feature classes 169, 182Annotation groups 169, 182Annotation layers 169, 182Annotation target
creating 170described 169setting 170
ArcCatalogopening a map from 71starting ArcMap from 68
ArcID module 499ArcPress
printer engine 251printing complex maps 251
Area graph 322Area patches
example 258Arrowheads
creating 279Aspect ratio
stretching graphics 246Attribute tables
defined 503hyperlinks 367
AttributesAttributes dialog box 503defined 503viewing
selected features 379Azimuthal projection 108
B
Backgroundsadding 210color of 200emphasizing a data frame with 209example 201, 258modifying 262using with text 282
Bandsin rasters 393
defined 503Bar graph 322
index.p65 12/07/2000, 2:12 PM515
516 USING ARCMAP
Barriers. See also Network tracingadding 454defined 503described 451selected features 452
BMP (Windows Bitmap)exporting to 255using with fill symbols 276using with marker symbols 280
Bookmarks. See Spatial bookmarksBorders
adding 209emphasizing a data frame with 209example 200, 258modifying 262using with text 282
Bubble graph 322Buffers
creating 383Buttons
changing icon 484creating 495�496described 472
C
CAD drawings (Computer-aided design)adding as layer 103as a dataset 103described 103drawing 162
CAD map 138Candidates
for geocodingdefined 504
Captionschanging 483
Categoriessymbol 260
example 262
Cellsin rasters 393
defined 504Chart map 136
bar 158column 158pie 157stacked 159
Charts. See GraphsClassification schemes
defining your own 154equal interval 147excluding features from 154natural breaks 146quantile 146setting 153standard deviation 147
Classifyingdefined 504
Clipmap to printer page 250one layer with another 385
Cluster tolerance. See also Cleaning datadefined 504
Color rampscreating 149, 273defined 504described 273example 258modifying 273using with fill symbols 273
Color shaded relief map 138Colors
changing fill color 243changing line color 244described 285example 258locking a symbol layer 260, 267mixing your own 243, 285models 285
Colors (continued)modifying 286naming 286saving 286type
CMYK 285Gray 285HLS 285Names 285RGB 285
Column graph 322Columns
in a legend 239in tables. See Tables
Combo boxescreating 495�496described 472
Commands 472adding to toolbar or menu 478changing appearance 483changing captions 483creating 495�496display types 483grouping on toolbars 482moving 481removing 481resetting 484shortcut keys 485
Complex mapsprinting with ArcPress 251
Computer-aided design files. See CADdrawings
Conformal projection 108Context menus
adding commands to 480described 472modifying 480
Contrast stretchapplying to rasters 402defined 513
index.p65 12/07/2000, 2:12 PM516
INDEX 517
Control pointsdefined 504
Coordinate systemsdefined 504described 107modifying parameters of 111predefined 110specifying 109
Copyingdata frames 226map elements 266symbols 266
Coveragesadding as layer 98defined 504drawing 133
Crystal Reports 337, 362Current task 504Custom commands
adding from file 498Customization
saving in a template 202saving in Normal template 202
Customizationschanging default save location 490locking 500saving in templates 488unlocking 500where to save 473
Customize dialog box 473, 482
D
Data framesactivating 128active 67, 128adding 128, 226coordinate system 109defined 505described 67drop shadow 211
Data frames (continued)duplicating 226example 200, 201graticules 213maps with several data frames 199measured grids 215name of 209organizing layers in 67, 128reference grids 217removing 129resizing 227rotating the data in 129showing position of other data 228showing the contents of 74uses of in layouts 200, 226
Data sourcesdefined 505
Data viewdefined 505described 75switching to 70, 75
Databasesdefined 505
Datasetsdefined 505
Decimal degreesdefined 505
Deletingmap elements 266symbols 266
Density map 137Determinate flow direction 445
defined 505Digitizing
defined 505in digitizing (absolute) mode 505in mouse (relative) mode 509in point mode 509in stream mode 512�513
Displayunits
defined 505
Display tabshowing in table of contents 127
Display units 112Dissolve
boundaries between like features 385Distance
measuring 85units 85
Distributing graphics 178Documents
locking 501Dot density
described 137drawing layer as 152
Downstream trace. See Network tracingDrawing layers 133Drop shadows
emphasizing a data frame with 211for map elements 240properties 211
Dynamic segmentation 106Dynamic labels 181
E
Edge barriers. See BarriersEdge flags. See FlagsEdges. See also Network features
defined 432, 506Edit boxes. See Text boxesEdit cache
defined 506Edit session
defined 506Editing
tables 308Editor toolbar
defined 506Elements
adding 242aligning 247
index.p65 12/07/2000, 2:12 PM517
518 USING ARCMAP
Elements (continued)grouping 247related to data frames 230
EMF (Enhanced Windows Metafile)exporting to 255using with fill symbols 276using with marker symbols 280
Enabled attribute 435, 440. See also Networkfeatures
Encapsulated Postscript (EPS)exporting to 255
End offset 416�417Enhanced Windows Metafile (EMF)
exporting to 255using with fill symbols 276using with marker symbols 280
EPS (Encapsulated PostScript)exporting to 255
Equal area projection 108Equal interval classification 147Equidistant projection 108ESRI style
example 262Event key 106Events 106Export
features 381options 255styles
in your current map 263Extent rectangles
changing extent 229showing multiple extents 229showing position of data 228
F
Feature classdefined 506
Feature datasetdefined 506
Feature map service 100Feature-linked annotation 183, 194Features
converting to graphics 171defined 506displaying documents about 367displaying Web pages about 367exporting to geodatabase or shapefile 381finding on a map 84highlighting selected 378hyperlinks 367identifying 83, 366searching with an expression 372selecting by clicking them 369selecting by dragging a box 370selecting by location 377selecting by using an expression 372selecting in tables 371
Fieldsadding 307alias
defined 503arranging in tables 294calculating values in 310defined 506deleting 307formatting 298freezing 295primary display field 84selecting 302setting width of 293summarizing values in 306
File extensionsof coordinate systems 110of map documents 202of map templates 202
Fill colorschanging 243
Fill symbolscreating 272described 272
Fill symbols (continued)example 258
outline 272overlay 275picture 276random dot 274solid 272
typegradient 273line 275marker 274picture 276simple 272
using with text symbols 281, 282, 284Find tool 84Finding features on a map
by searching with an expression 372Flags. See also Network tracing
adding 454defined 506described 451
Flow direction 445. See also Sinks; Sourcesdefined 447, 506described 445displaying 447establishing 445, 449with disabled features 445
Frame tabvisibility of 232, 240
Framesfor map elements 240groups of elements 240uses of 240
G
Geocoding 411. See also Addressesattributes of geocoded features 425candidates
defined 504defined 506
index.p65 12/07/2000, 2:12 PM518
INDEX 519
Geocoding (continued)described 411overview 414�415reference data 414, 417
defined 506rematching
defined 510rematching a geocoded feature class 426�
427, 428�429services
defined 507tables of addresses 422�425
Geocoding services 411, 419adding to a document 412defined 507removing from a document 413settings 415�418, 419, 424, 427
intersection connectors 416matching options 415�416output fields 417�418output options 416�417
styles 416Geocoding Services Manager 412, 413Geodatabase
adding as layer 98defined 507
Geographic coordinatesdefined 507described 107
Geographic positionfinding 219
Geography Network 100Geometric networks. See also Network
features; Network weightsdefined 432, 507described 432opening 433, 434versioning 450
GeoProcessing Wizard 385Georeference
defined 507
Georeferencing rasters 404Gradient fills
example 201using with fill symbols 273using with text symbols 284
Graduated color map 135Graduated symbol map 135Graphics
adding 168, 243aligning 178as annotation 168changing color of 169, 243changing line color 244changing size of 168convert from map element 241converting features to 171default symbol 171deleting 168distributing 178editing vertices of 169grouping 178intersecting 180joining 180modifying 261moving 175ordering 175rotating 175selecting 174sizing 177subtracting 180ungrouping 179unioning 180
Graphsadding to layout 323, 326axes 331changing type 327color, changing 329creating 323deleting 334described 321exporting 336
Graphs (continued)legend, adding 330loading from file 335opening 334overlays 324refreshing 326removing 334renaming 334saving to file 335titles, adding 328trend lines 332types of 322
Graticules 213. See also Measured gridsdefined 507
Grid (snapping)changing size of 224showing 224snapping to 224
Grids. See RastersGround control point
defined 404Group layers
adding layers to 120creating 120defined 507described 120ordering layers in 121properties of 121removing layers from 122
Groupsof graphic elements 178of map elements 247resizing groups of elements 248
Guidesadding 222example 200moving 222removing 222removing all 223showing 221snapping to 221
index.p65 12/07/2000, 2:12 PM519
520 USING ARCMAP
H
Halosusing with marker symbols 278using with text symbols 283
Help 86contents 87finding specific words in 88in dialog boxes 86index 87pointer 86
High-low-close graph 322Highlighting selected features 378Hyperlinks 196, 367
defined 507
I
Iconschanging on buttons 484
Identify tool 83, 366Identifying features 83, 366Image map service 100Images
adding as layer 394bands in 393
defined 503cells
defined 504defined 507described 393drawing 396stretching 402
Indeterminate flow direction 445defined 507
Installingstyles 259
Internetadding data from
Geography Network 100internet servers 100
Intersectgraphics 180one layer with another 385
Intersection connectors 416Isolation tracing. See Network tracing
J
Joining tables 315by spatial location 390defined 507described 312managing 316spatially 314
Joint Photographic Experts Group (JPEG)exporting to 255
JPEG (Joint Photographic Experts Group)exporting to 255
Junction barriers. See BarriersJunction flags. See FlagsJunctions. See also Network features
defined 432, 507
K
Keyboard shortcutsassigning 485removing 486resetting 487
L
Labels. See also Annotationconverting to annotation 182described 181�182displaying 184, 185dynamic 181example 258overlap, allowing 191positioning 189printing a map with 192
Labels (continued)prioritizing 182, 189specifying text of 187
Landscape page orientationexample 200
Latitude and longitudedescribed 107
Layersadding 66, 96copying
to data frames 118to maps 118
creating 98defined 508definition query 99described 66, 115displaying labels 167, 184drawing 133
by matching to style 141density with dots 152showing categories 140showing multiple attributes 156showing quantities 148with chart symbols 157with graduated colors 148with graduated symbols 150with proportional symbols 151with single symbol 139
drawing order 66changing 117
groupadding layers to 120creating 120described 120ordering layers in 121properties of 121removing layers from 122
identifying features in 83, 366joining attributes 390organizing in data frames 67properties 123
index.p65 12/07/2000, 2:12 PM520
INDEX 521
Layers (continued)referencing data 113, 131removing 119renaming 116saving to disk 130showing the legend of 74storing relative pathnames to 113updating data source of 114, 131viewing attribute table of 84visible scale range 74
clearing 125described 124setting 124
Laying out and printing maps 199Layout
applying a template 254tools for positioning elements 201
Layout aidsgrids 219guides 219rulers 219snapping to 219
Layout viewdefined 508described 75switching to 70, 75virtual page 206
Leaderscreating 271using with text symbols 282
Legend itemschanging defaults 239example 258
Legendsadding 235changing items 239changing labels 236changing patches 238defined 508example 200, 201number of columns 239
Legends (continued)patch for a single layer 239with multiple data frames 235
Line colorschanging 244
Line graph 322Line patches
example 258Line symbols
creating 268described 268example 258
arrowhead leaders 271encased road 268railroad 269tour route 270
layersaligning 270
templates 269, 270type
cartographic 268, 269, 270, 271hash 269marker 271simple 268
using with fill symbols 275using with text symbols 284
Linksfor georeferencing rasters 404to data 71
repairing 131updating data 114
Loadingstyles 259
Locationshowing with a data frame 228showing with Extent rectangle 228
Lockingcustomizations 500documents 501symbol layer color 260, 267templates 501
Longitude and latitudedescribed 107
M
Macro viruses 502Macros 492
adding to toolbars 494creating 492editing 493running
from Macros dialog box 494from module 493
Magnifier window 82Main Menu 472, 475Many-to-many relationship 313Many-to-one relationship 312Map display
defined 508Map documents 65
defined 508Map elements
converting to simple graphics 241copying 266defined 508deleting 266examples 199, 201, 258modifying 262
backgrounds 262borders 262
naming, renaming 266pasting 266saving 262
Map projectionsdefined 508described 107
Map scaledefined 508
Map templatesapplying to layout 254creating maps from 95
index.p65 12/07/2000, 2:12 PM521
522 USING ARCMAP
Map templates (continued)defined 508discussion of 202making a map series 199organizing 95quickly making a map 199reusing data 203reusing layout 203saving maps as 90standardizing maps 199
Map tips 83, 196, 366defined 508
Map units 112defined 508
Mapsas documents 65containing graphs 199containing reports 199creating 94defined 508described 65opening 71querying 365saving 89
as new map 89as template 90
series 199size 199storing relative pathnames 113
Marginsusing guides to define 223
Marker symbolscreating 277described 277example 258
arrowhead 279mask, halo 277outline 277picture graphic 280simple shapes 277TrueType font 278
Marker symbols (continued)type
arrow 277, 279character 277, 278picture 277, 280simple 277
using with fill symbols 274using with line symbols 270, 271using with text 282
Maskingusing with marker symbols 278using with text symbols 283
Matching options 415�416Measure locations 106Measured grids 215. See also GraticulesMeasurements
setting ruler units 220Menu items
described 472Menus
adding commands to 478adding to toolbars 479creating 479described 472
Mergeone layer with another 385
Mexicosample map 200
Minimum candidate score 415, 416�418Minimum match score 415, 416Modifying
color ramps 273colors 286map elements 262symbols
used to draw feature layers 260used to draw graphics 261using the drawing toolbar 261
Mouse mode 509Multipart features
defined 509
Multipoint featuresdefined 509
Multivariate map 136
N
Natural breaks classification 146Neatlines
adding 245defined 509
Network features. See also Edges; Geometricnetworks; Junctions
adding 437connecting 439defined 509disabled 435, 445disabling 440, 445, 451disconnecting 439enabled 435enabling 440symbolizing 435
Network tracing 451. See also Barriers; Flagsdescribed 451features stopping traces 452finding a path 455, 463finding common ancestors 455, 457finding connected features 455, 458finding disconnected features 455, 458finding downstream path 465finding loops 455, 467finding shortest path 463finding the upstream accumulation 455finding upstream path 465finding upstream path to source 455, 457isolating a point 459trace results 451tracing downstream 454tracing upstream 454, 455using selections 452
index.p65 12/07/2000, 2:12 PM522
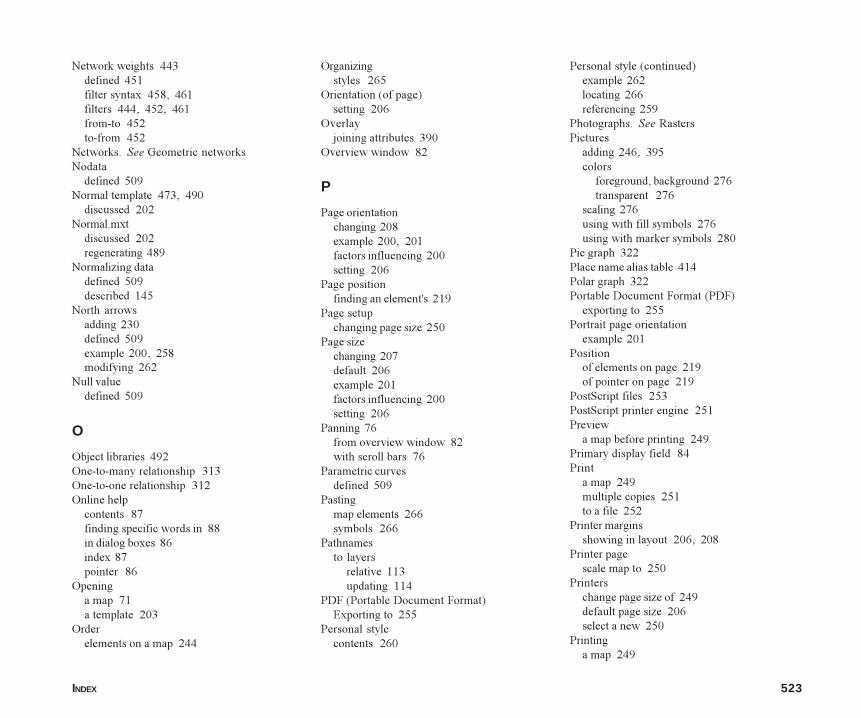
INDEX 523
Network weights 443defined 451filter syntax 458, 461filters 444, 452, 461from-to 452to-from 452
Networks. See Geometric networksNodata
defined 509Normal template 473, 490
discussed 202Normal.mxt
discussed 202regenerating 489
Normalizing datadefined 509described 145
North arrowsadding 230defined 509example 200, 258modifying 262
Null valuedefined 509
O
Object libraries 492One-to-many relationship 313One-to-one relationship 312Online help
contents 87finding specific words in 88in dialog boxes 86index 87pointer 86
Openinga map 71a template 203
Orderelements on a map 244
Organizingstyles 265
Orientation (of page)setting 206
Overlayjoining attributes 390
Overview window 82
P
Page orientationchanging 208example 200, 201factors influencing 200setting 206
Page positionfinding an element's 219
Page setupchanging page size 250
Page sizechanging 207default 206example 201factors influencing 200setting 206
Panning 76from overview window 82with scroll bars 76
Parametric curvesdefined 509
Pastingmap elements 266symbols 266
Pathnamesto layers
relative 113updating 114
PDF (Portable Document Format)Exporting to 255
Personal stylecontents 260
Personal style (continued)example 262locating 266referencing 259
Photographs. See RastersPictures
adding 246, 395colors
foreground, background 276transparent 276
scaling 276using with fill symbols 276using with marker symbols 280
Pie graph 322Place name alias table 414Polar graph 322Portable Document Format (PDF)
exporting to 255Portrait page orientation
example 201Position
of elements on page 219of pointer on page 219
PostScript files 253PostScript printer engine 251Preview
a map before printing 249Primary display field 84Print
a map 249multiple copies 251to a file 252
Printer marginsshowing in layout 206, 208
Printer pagescale map to 250
Printerschange page size of 249default page size 206select a new 250
Printinga map 249
index.p65 12/07/2000, 2:12 PM523
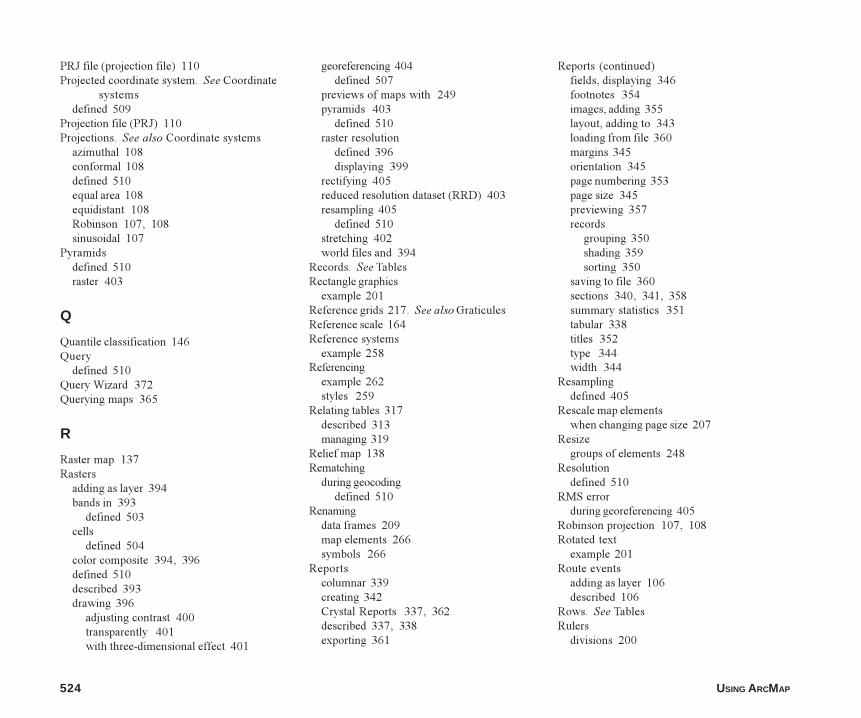
524 USING ARCMAP
PRJ file (projection file) 110Projected coordinate system. See Coordinate
systemsdefined 509
Projection file (PRJ) 110Projections. See also Coordinate systems
azimuthal 108conformal 108defined 510equal area 108equidistant 108Robinson 107, 108sinusoidal 107
Pyramidsdefined 510raster 403
Q
Quantile classification 146Query
defined 510Query Wizard 372Querying maps 365
R
Raster map 137Rasters
adding as layer 394bands in 393
defined 503cells
defined 504color composite 394, 396defined 510described 393drawing 396
adjusting contrast 400transparently 401with three-dimensional effect 401
georeferencing 404defined 507
previews of maps with 249pyramids 403
defined 510raster resolution
defined 396displaying 399
rectifying 405reduced resolution dataset (RRD) 403resampling 405
defined 510stretching 402world files and 394
Records. See TablesRectangle graphics
example 201Reference grids 217. See also GraticulesReference scale 164Reference systems
example 258Referencing
example 262styles 259
Relating tables 317described 313managing 319
Relief map 138Rematching
during geocodingdefined 510
Renamingdata frames 209map elements 266symbols 266
Reportscolumnar 339creating 342Crystal Reports 337, 362described 337, 338exporting 361
Reports (continued)fields, displaying 346footnotes 354images, adding 355layout, adding to 343loading from file 360margins 345orientation 345page numbering 353page size 345previewing 357records
grouping 350shading 359sorting 350
saving to file 360sections 340, 341, 358summary statistics 351tabular 338titles 352type 344width 344
Resamplingdefined 405
Rescale map elementswhen changing page size 207
Resizegroups of elements 248
Resolutiondefined 510
RMS errorduring georeferencing 405
Robinson projection 107, 108Rotated text
example 201Route events
adding as layer 106described 106
Rows. See TablesRulers
divisions 200
index.p65 12/07/2000, 2:12 PM524
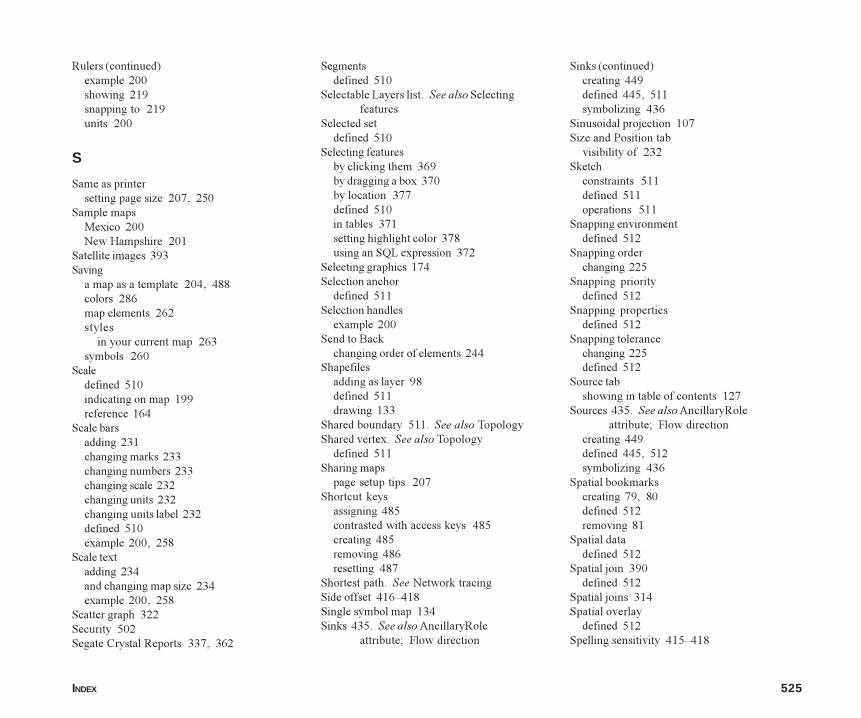
INDEX 525
Rulers (continued)example 200showing 219snapping to 219units 200
S
Same as printersetting page size 207, 250
Sample mapsMexico 200New Hampshire 201
Satellite images 393Saving
a map as a template 204, 488colors 286map elements 262styles
in your current map 263symbols 260
Scaledefined 510indicating on map 199reference 164
Scale barsadding 231changing marks 233changing numbers 233changing scale 232changing units 232changing units label 232defined 510example 200, 258
Scale textadding 234and changing map size 234example 200, 258
Scatter graph 322Security 502Segate Crystal Reports 337, 362
Segmentsdefined 510
Selectable Layers list. See also Selectingfeatures
Selected setdefined 510
Selecting featuresby clicking them 369by dragging a box 370by location 377defined 510in tables 371setting highlight color 378using an SQL expression 372
Selecting graphics 174Selection anchor
defined 511Selection handles
example 200Send to Back
changing order of elements 244Shapefiles
adding as layer 98defined 511drawing 133
Shared boundary 511. See also TopologyShared vertex. See also Topology
defined 511Sharing maps
page setup tips 207Shortcut keys
assigning 485contrasted with access keys 485creating 485removing 486resetting 487
Shortest path. See Network tracingSide offset 416�418Single symbol map 134Sinks 435. See also AncillaryRole
attribute; Flow direction
Sinks (continued)creating 449defined 445, 511symbolizing 436
Sinusoidal projection 107Size and Position tab
visibility of 232Sketch
constraints 511defined 511operations 511
Snapping environmentdefined 512
Snapping orderchanging 225
Snapping prioritydefined 512
Snapping propertiesdefined 512
Snapping tolerancechanging 225defined 512
Source tabshowing in table of contents 127
Sources 435. See also AncillaryRoleattribute; Flow direction
creating 449defined 445, 512symbolizing 436
Spatial bookmarkscreating 79, 80defined 512removing 81
Spatial datadefined 512
Spatial join 390defined 512
Spatial joins 314Spatial overlay
defined 512Spelling sensitivity 415�418
index.p65 12/07/2000, 2:12 PM525
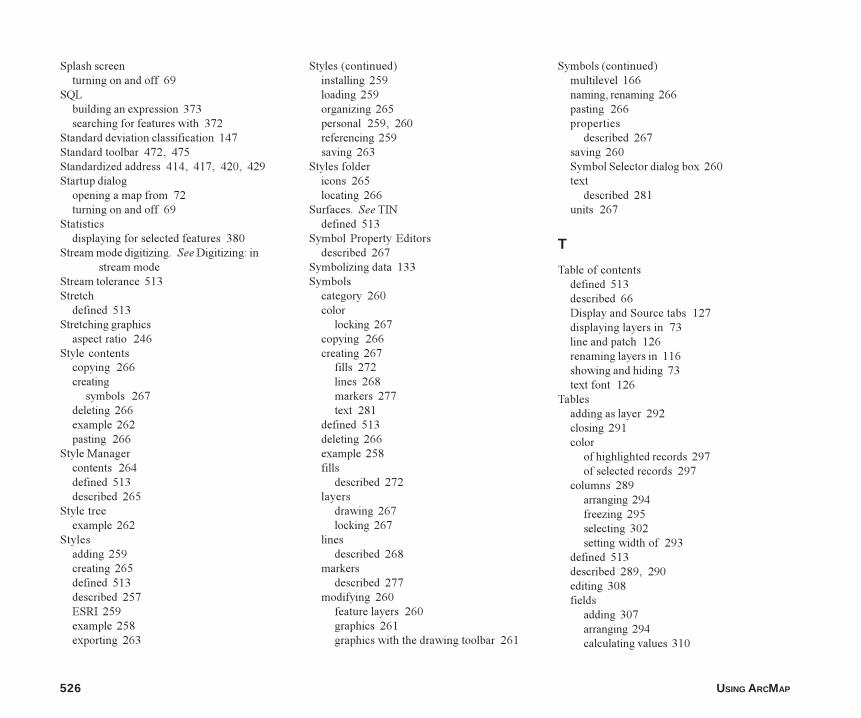
526 USING ARCMAP
Splash screenturning on and off 69
SQLbuilding an expression 373searching for features with 372
Standard deviation classification 147Standard toolbar 472, 475Standardized address 414, 417, 420, 429Startup dialog
opening a map from 72turning on and off 69
Statisticsdisplaying for selected features 380
Stream mode digitizing. See Digitizing: instream mode
Stream tolerance 513Stretch
defined 513Stretching graphics
aspect ratio 246Style contents
copying 266creating
symbols 267deleting 266example 262pasting 266
Style Managercontents 264defined 513described 265
Style treeexample 262
Stylesadding 259creating 265defined 513described 257ESRI 259example 258exporting 263
Styles (continued)installing 259loading 259organizing 265personal 259, 260referencing 259saving 263
Styles foldericons 265locating 266
Surfaces. See TINdefined 513
Symbol Property Editorsdescribed 267
Symbolizing data 133Symbols
category 260color
locking 267copying 266creating 267
fills 272lines 268markers 277text 281
defined 513deleting 266example 258fills
described 272layers
drawing 267locking 267
linesdescribed 268
markersdescribed 277
modifying 260feature layers 260graphics 261graphics with the drawing toolbar 261
Symbols (continued)multilevel 166naming, renaming 266pasting 266properties
described 267saving 260Symbol Selector dialog box 260text
described 281units 267
T
Table of contentsdefined 513described 66Display and Source tabs 127displaying layers in 73line and patch 126renaming layers in 116showing and hiding 73text font 126
Tablesadding as layer 292closing 291color
of highlighted records 297of selected records 297
columns 289arranging 294freezing 295selecting 302setting width of 293
defined 513described 289, 290editing 308fields
adding 307arranging 294calculating values 310
index.p65 12/07/2000, 2:12 PM526
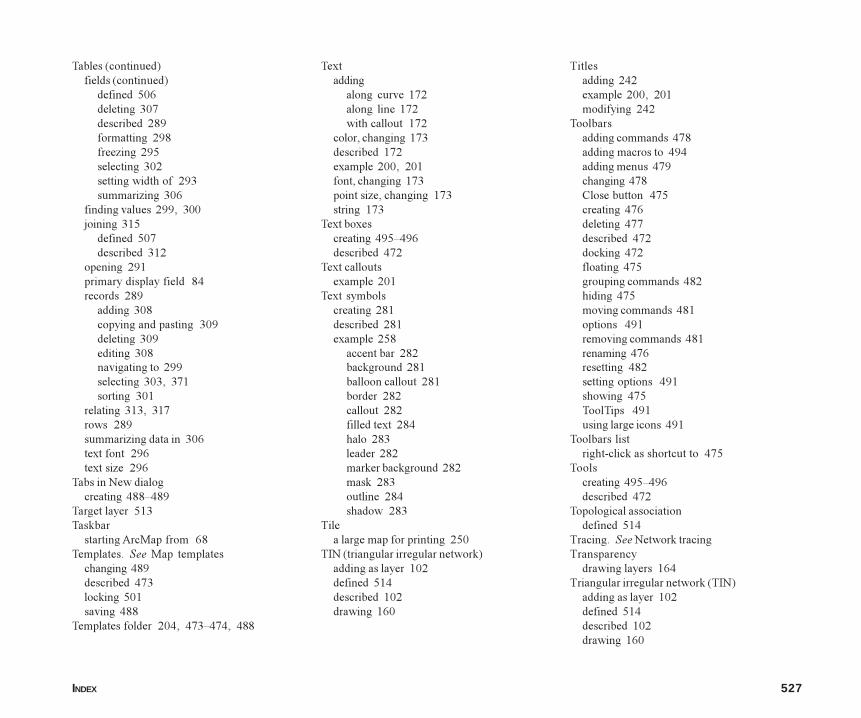
INDEX 527
Tables (continued)fields (continued)
defined 506deleting 307described 289formatting 298freezing 295selecting 302setting width of 293summarizing 306
finding values 299, 300joining 315
defined 507described 312
opening 291primary display field 84records 289
adding 308copying and pasting 309deleting 309editing 308navigating to 299selecting 303, 371sorting 301
relating 313, 317rows 289summarizing data in 306text font 296text size 296
Tabs in New dialogcreating 488�489
Target layer 513Taskbar
starting ArcMap from 68Templates. See Map templates
changing 489described 473locking 501saving 488
Templates folder 204, 473�474, 488
Textadding
along curve 172along line 172with callout 172
color, changing 173described 172example 200, 201font, changing 173point size, changing 173string 173
Text boxescreating 495�496described 472
Text calloutsexample 201
Text symbolscreating 281described 281example 258
accent bar 282background 281balloon callout 281border 282callout 282filled text 284halo 283leader 282marker background 282mask 283outline 284shadow 283
Tilea large map for printing 250
TIN (triangular irregular network)adding as layer 102defined 514described 102drawing 160
Titlesadding 242example 200, 201modifying 242
Toolbarsadding commands 478adding macros to 494adding menus 479changing 478Close button 475creating 476deleting 477described 472docking 472floating 475grouping commands 482hiding 475moving commands 481options 491removing commands 481renaming 476resetting 482setting options 491showing 475ToolTips 491using large icons 491
Toolbars listright-click as shortcut to 475
Toolscreating 495�496described 472
Topological associationdefined 514
Tracing. See Network tracingTransparency
drawing layers 164Triangular irregular network (TIN)
adding as layer 102defined 514described 102drawing 160
index.p65 12/07/2000, 2:12 PM527
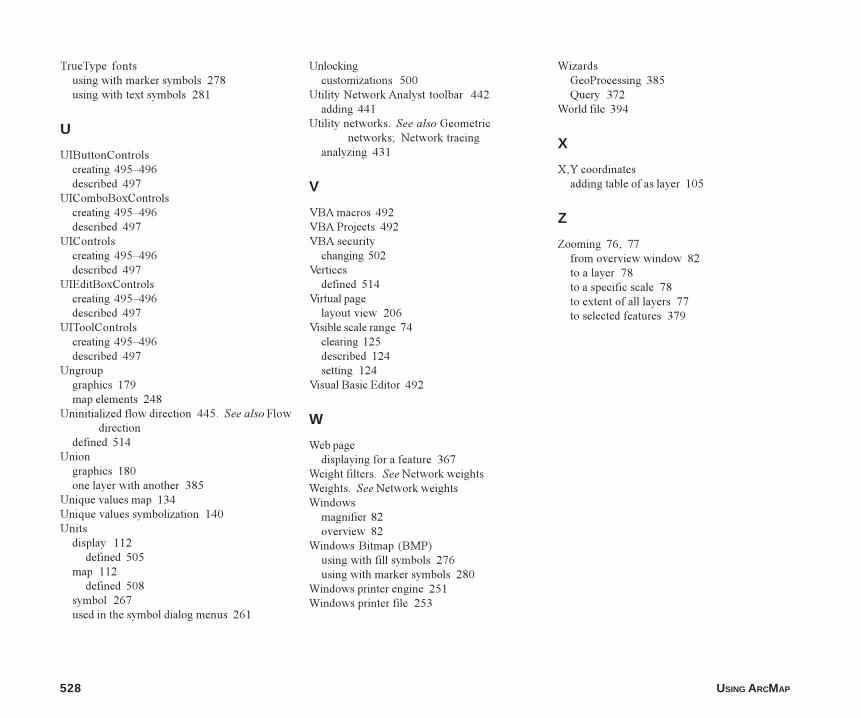
528 USING ARCMAP
TrueType fontsusing with marker symbols 278using with text symbols 281
U
UIButtonControlscreating 495�496described 497
UIComboBoxControlscreating 495�496described 497
UIControlscreating 495�496described 497
UIEditBoxControlscreating 495�496described 497
UIToolControlscreating 495�496described 497
Ungroupgraphics 179map elements 248
Uninitialized flow direction 445. See also Flowdirection
defined 514Union
graphics 180one layer with another 385
Unique values map 134Unique values symbolization 140Units
display 112defined 505
map 112defined 508
symbol 267used in the symbol dialog menus 261
Unlockingcustomizations 500
Utility Network Analyst toolbar 442adding 441
Utility networks. See also Geometricnetworks; Network tracing
analyzing 431
V
VBA macros 492VBA Projects 492VBA security
changing 502Vertices
defined 514Virtual page
layout view 206Visible scale range 74
clearing 125described 124setting 124
Visual Basic Editor 492
W
Web pagedisplaying for a feature 367
Weight filters. See Network weightsWeights. See Network weightsWindows
magnifier 82overview 82
Windows Bitmap (BMP)using with fill symbols 276using with marker symbols 280
Windows printer engine 251Windows printer file 253
WizardsGeoProcessing 385Query 372
World file 394
X
X,Y coordinatesadding table of as layer 105
Z
Zooming 76, 77from overview window 82to a layer 78to a specific scale 78to extent of all layers 77to selected features 379
index.p65 12/07/2000, 2:12 PM528