monroe-november-2020-traffic-revenue-update.pdf - NCDOT
43
77 Hartland Street, Suite 201 East Hartford, CT 06108 tel. : 860-529-7615 November 2020 Mr. David Roy Chief Financial Officer North Carolina Turnpike Authority 1 South Wilmington Street 1578 Mail Service Center Raleigh, NC 27601 Subject: Monroe Expressway Planning Level T&R Forecast Update Dear Mr. Roy: This letter summarizes the work efforts and updated inputs and assumptions used to develop planning-level traffic and toll revenue estimates for the Monroe Expressway. To produce this updated forecast, CDM Smith relied primarily on actual traffic and revenue data on the facility, and updated the models originally developed for the North Carolina Monroe Expressway Traffic and Toll Revenue Study, dated November 2016 (2016 T&R Study). The following key inputs and assumptions were updated: ▪ Calibration and validation of the traffic and revenue model to a base year of 2019, reflecting: • Observed transactions and revenue data on the Monroe Expressway, which opened in November 2018 • Observed travel times and speeds on US 74 parallel to the Monroe Expressway • Observed 2019 traffic counts on many parallel roads within the study area ▪ Updates to current and projected socioeconomic data in Union and Mecklenburg Counties, provided by Dr. Stephen Appold, independent economist ▪ Updates to future travel demand model networks based on the NCDOT STIP as of June 2020 ▪ Updates to inflation forecasts and other variables affecting travelers’ values of time and vehicle operating costs ▪ Short term impacts to traffic and revenue from the COVID-19 pandemic The intent of this letter report is to review and revise, as warranted, the forecasts developed for the 2016 T&R Study. Updated fiscal year forecasts are provided for the base case as well as a hypothetical no-COVID case for comparison purposes.
-
Upload
khangminh22 -
Category
Documents
-
view
3 -
download
0
Transcript of monroe-november-2020-traffic-revenue-update.pdf - NCDOT

77 Hartland Street, Suite 201
East Hartford, CT 06108
tel. : 860-529-7615
November 2020
Mr. David Roy
Chief Financial Officer
North Carolina Turnpike Authority
1 South Wilmington Street
1578 Mail Service Center
Raleigh, NC 27601
Subject: Monroe Expressway Planning Level T&R Forecast Update Dear Mr. Roy:
This letter summarizes the work efforts and updated inputs and assumptions used to develop
planning-level traffic and toll revenue estimates for the Monroe Expressway. To produce this
updated forecast, CDM Smith relied primarily on actual traffic and revenue data on the facility, and
updated the models originally developed for the North Carolina Monroe Expressway Traffic and
Toll Revenue Study, dated November 2016 (2016 T&R Study). The following key inputs and
assumptions were updated:
▪ Calibration and validation of the traffic and revenue model to a base year of 2019, reflecting:
• Observed transactions and revenue data on the Monroe Expressway, which opened in
November 2018
• Observed travel times and speeds on US 74 parallel to the Monroe Expressway
• Observed 2019 traffic counts on many parallel roads within the study area
▪ Updates to current and projected socioeconomic data in Union and Mecklenburg Counties,
provided by Dr. Stephen Appold, independent economist
▪ Updates to future travel demand model networks based on the NCDOT STIP as of June 2020
▪ Updates to inflation forecasts and other variables affecting travelers’ values of time and
vehicle operating costs
▪ Short term impacts to traffic and revenue from the COVID-19 pandemic
The intent of this letter report is to review and revise, as warranted, the forecasts developed for the
2016 T&R Study. Updated fiscal year forecasts are provided for the base case as well as a
hypothetical no-COVID case for comparison purposes.

Monroe Expressway Planning Level T&R Forecast Update
November 2020
Page 2
1. Project Overview 1.1 Project Description
The Monroe Expressway, shown in Figure 1, is a controlled-access toll road, extending from US 74
near I-485 in Mecklenburg County to US 74 between the towns of Wingate and Marshville in Union
County, a distance of approximately 19.7 miles. The Monroe Expressway is generally parallel with
US 74 and provides a high-speed alternative to US 74 for area motorists. The road opened to toll-
paying traffic on November 27, 2018.
Figure 1 shows the general alignment of the Monroe Expressway and the toll concept. Six full
intermediate interchanges are located at Indian Trail Fairview Road (SR 1520), Unionville Indian
Trail Road (SR 1367), North Rocky River Road (SR 1514), US 601, NC 200 (Morgan Mill Road), and
Austin Chaney Road (SR 1758). Partial interchanges are located between US 74 and the Monroe
Expressway at the east and west termini of the tolled portion of the project. Tolls are collected
electronically via overhead mainline gantries using both electronic toll collection (ETC) and video
toll collection (Bill by Mail or BBM). If a motorist does not have a transponder, high-speed cameras
mounted on gantries record a license plate image and an invoice is mailed to the registered owner
of the vehicle through the BBM program. ETC transactions receive a 35 percent discount from the
BBM toll. Toll gantries are located within a toll zone that are placed on each mainline section
between interchanges. Toll rates are based on the distance covered on each mainline section. The
toll zones are numbered 1 through 7 and are depicted in Figure 1 along with the distance covered
for each toll zone.
Figure 2 shows 2020 toll rates on Monroe Expressway for each toll location by class and method of
payment. These toll rates are in effect throughout the day. Class 2 rates are double Class 1 rates,
and Class 3 rates are four times Class 1 rates. ETC toll rates reflect a 35 percent discount from BBM
toll rates.

Monroe Expressway Planning Level T&R Forecast Update
November 2020
Page 3
Fi
gure
1 -
Pro
ject
Lo
cati
on
Map

Monroe Expressway Planning Level T&R Forecast Update
November 2020
Page 4
Figu
re 2
- 2
020
To
ll R
ates
by
Cla
ss a
nd
Met
ho
d o
f P
aym
ent
No
t To
Sca
le
74
Ind
ian
Tra
ilFa
irvi
ew R
d.
Un
ion
ville
Ind
ian
Tra
il R
d.
Au
stin
Ch
aney
Rd
.
No
rth
Ro
cky
Riv
er R
d.
Co
nco
rdH
wy.
74
601
$0
.27
($
0.4
1)
$0
.54
($
0.8
2)
$1
.08
($
1.6
4)
$0
.33
($
0.4
9)
$0
.64
($
0.9
8)
$1
.28
($
1.9
6)
$0
.19
($
0.3
0)
$0
.38
($
0.6
0)
$0
.76
($
1.2
0)
$0
.56
($
0.8
7)
$1
.12
($
1.7
4)
$2
.24
($
3.4
8)
$0
.26
($
0.4
0)
$0
.52
($
0.8
0)
$1
.04
($
1.6
0)
$0
.57
($
0.8
8)
$1
.14
($
1.7
6)
$2
.28
($
3.5
2)
$0
.43
($
0.6
6)
$0
.86
($
1.3
2)
$1
.72
($
2.6
4)
$2
.60
$5
.20
$1
0.4
0
$0
.14
$0
.29
$0
.57
($0
.22
)($
0.4
4)
($0
.88
)
($4
.01
)($
8.0
2)
($1
6.0
4)
Cla
ss 1
Cla
ss 2
Cla
ss 3
Toll
Per
Mile
Toll
Toll
Per
Mile
Toll
Veh
icle
Cla
ss
ETC
BB
M
Thro
ugh
Tri
p N
C Q
uic
k P
ass
Toll
Rat
es
74
200
Mo
rgan
Mill
Rd
.
Toll
Gan
try
Mo
nro
eEx
pre
ssw
ay
Ram
p
LEG
END
$0
.00
($
0.0
0)
$0
.00
($
0.0
0)
$0
.00
($
0.0
0)
Cla
ss 1
Cla
ss 2
Cla
ss 3
BB
MET
C
Toll
Zo
ne
01
/02
Toll
Zo
ne
03
/04
Toll
Zo
ne
05
/06
Toll
Zo
ne
07
/08
Toll
Zo
ne
09
/10
Toll
Zo
ne
11
/12
Toll
Zo
ne
13
/14

Monroe Expressway Planning Level T&R Forecast Update
November 2020
Page 5
2. Monroe Expressway Transaction and Toll Revenue This section presents an overview of historical transactions and revenue on the Monroe
Expressway from its opening in November 2018 to Fall 2020. A particular emphasis is given to
evaluating the impact of the COVID-19 pandemic on the performance of the facility.
2.1 Historical Transaction and Toll Revenue Growth
Monthly transactions and collected toll revenue from opening day through October 2020, are
shown in Table 1. The table also shows the truck share of transactions, and the average per-
transaction toll rate.
Strong growth occurred from opening through Fall 2019 for both passenger cars (Class 1) and
trucks (Classes 2 and 3 combined). Historical transaction trends reflect ramp-up effects on this new
facility, as well as seasonal variations with passenger car transactions peaking in August 2019 when
recreational traffic is high. The impacts of the COVID-19 pandemic started in March 2020 and were
most severe in April 2020 when Class 1 transactions were down 44 percent compared to April
2019. Traffic recovered fairly quickly after April on the Monroe Expressway; in fact, Class 1
transactions as well as total transactions in June 2020 were higher than in June 2019. Truck traffic
was less impacted by COVID, with a decline of approximately 10 percent in April 2020 followed by a
rebound to pre-COVID levels in June 2020. Truck transactions continued to grow, peaking in
October 2020.
Table 1 shows similar monthly trends for collected revenue. Revenue peaked in October 2019, both
for Class 1 and overall revenue. In June 2020, the total revenue was higher than in June 2019.
indicating that the Monroe Expressway was more resilient to the pandemic impacts than many
other tolled facilities.
Transaction breakout by class generally shows a gradual increase in truck share, from about 10
percent in December 2019 to 13.6 percent in October 2020. However, there was a spike in April
2020 due to COVID, when passenger car traffic dropped significantly due to travel restrictions while
truck traffic was less severely impacted.
Pre-COVID, the average per-transaction toll rate increased gradually primarily due to the truck
share increase, and the annual toll rate increase on January 1, 2020. In April 2020, the average toll
rate peaked with the very high truck share of traffic resulting from the COVID impacts. Between
May 2020 and October 2020, average toll rates returned to similar levels and mirrored seasonal
trends observed in the same months in 2019.
Monroe Expressway Planning Level T&R Forecast Update
November 2020
Page 6
Table 1 - Monthly T&R by Class
1) Facility opened to toll-paying traffic on November 27, 2018 2) Programmed toll increases occurred every year on January 1st 3) COVID-19 related transaction and toll revenue impacts began in March 2020
Source: NCTA
Table 2 shows the ETC market share of Monroe Expressway transactions by vehicle class through
September 2020. The data in Table 2 represents ETC market share after image-based tolls are
processed and those that can be associated with a valid pre-paid transponder account (either in-
state or out-of-state) are identified and charged the appropriate ETC toll rate. The ETC market
share of transactions shown in Table 2 was used to benchmark transaction forecasts in this study.
Among passenger cars, ETC transaction market share grew from about 34 percent in December
2018 to about 44 percent in calendar year (CY) 2020 (through September). Truck ETC market share
grew from about 57 percent in December 2018 to about 65 percent in CY 2020.
Classes 2 & 3 Average
Classes Classes Percent of Weighted
Class 1 2 & 3 Total Class 1 2 & 3 Total Transactions Toll
2018 November (1) 76 12 88 $10 $3 $13 13.1% $0.15
December 1,048 118 1,166 78 73 151 10.1% 0.13
2019 January (2) 1,658 179 1,838 267 116 383 9.8% 0.21
February 1,481 193 1,674 599 49 648 11.5% 0.39
March 2,299 286 2,585 656 311 967 11.1% 0.37
April 2,256 281 2,537 973 206 1,179 11.1% 0.46
May 2,495 335 2,830 1,137 175 1,312 11.8% 0.46
June 2,437 311 2,748 883 339 1,222 11.3% 0.44
July 3,042 356 3,397 1,385 288 1,673 10.5% 0.49
August 3,284 406 3,691 1,409 263 1,671 11.0% 0.45
September 2,997 368 3,365 1,468 314 1,781 10.9% 0.53
October 3,086 400 3,486 1,648 271 1,918 11.5% 0.55
November 2,769 360 3,129 1,412 281 1,693 11.5% 0.54
December 2,732 339 3,071 1,402 253 1,655 11.0% 0.54
2020 January (2) 2,460 357 2,817 1,539 240 1,778 12.7% 0.63
February 2,378 330 2,708 1,380 236 1,615 12.2% 0.60
March (3) 2,098 381 2,479 1,245 272 1,517 15.4% 0.61
April 1,265 344 1,609 1,065 251 1,316 21.4% 0.82
May 2,112 358 2,470 901 269 1,169 14.5% 0.47
June 2,630 388 3,018 1,044 285 1,329 12.9% 0.44
July 2,803 420 3,223 1,212 323 1,535 13.0% 0.48
August 2,710 402 3,113 1,224 407 1,631 12.9% 0.52
September 2,766 407 3,173 1,281 309 1,589 12.8% 0.50
October 2,748 431 3,179 1,267 342 1,609 13.6% 0.51
Total CY18 (Nov-Dec) 1,124 129 1,254 89 75 164 10.3% 0.13
Total CY19 (Jan-Dec) 30,537 3,815 34,352 13,237 2,864 16,102 11.1% 0.47
Total CY20 (Jan-Oct) 23,969 3,820 27,789 12,156 2,932 15,088 13.7% 0.54
Toll Transactions (000s) Collected Toll Revenue (000s)
CY Month

Monroe Expressway Planning Level T&R Forecast Update
November 2020
Page 7
Table 2 - ETC Market Share by Toll Class
1) Facility opened to toll-paying traffic on November 27, 2018 Source: NCTA
ETC market share tends to be lower in the summer due to higher recreational traffic. In the first
part of 2020 (pre-COVID), overall ETC market share was about five percent higher than in early
2019. Following the pandemic, the ETC market share decreased by about five percent.
2.2 Timeline of COVID-19 Events Impacting Monroe Expressway
The COVID-19 pandemic is impacting nearly all aspects of society and the economy, including
travel. Beginning in March of 2020, the pandemic caused significant reductions in transactions and
revenue on toll facilities around the U.S., including on the Monroe Expressway. Table 3 provides
the timeline of events, mandates, and other announcements related to COVID-19 affecting travel in
the Monroe Expressway region.
ClassesCY Month Class 1 2 & 3 Total
2018 November (1) 40.5% 55.5% 42.2%December 33.5% 57.1% 35.8%
2019 January 40.0% 59.8% 42.4%February 43.5% 60.9% 45.6%March 41.8% 61.0% 44.0%April 41.4% 61.8% 43.9%May 41.5% 62.3% 44.1%June 39.5% 62.7% 42.3%July 37.8% 61.8% 40.6%August 39.3% 61.8% 41.9%September 42.5% 61.8% 44.9%October 44.7% 63.7% 47.2%November 45.2% 65.7% 47.7%December 45.0% 67.3% 47.7%
2020 January 49.4% 68.6% 52.0%February 49.0% 67.9% 51.4%March 47.5% 66.4% 50.6%April 46.8% 65.9% 51.0%May 41.2% 63.3% 44.6%June 40.6% 63.5% 43.8%July 40.2% 62.9% 43.4%August 41.8% 62.0% 44.7%September 42.1% 61.9% 44.9%
Total CY18 (Nov-Dec) 34.1% 56.9% 36.4%
Total CY19 (Jan-Dec) 41.9% 62.8% 44.3%
Total CY20 (Jan-Sep) 44.0% 64.5% 47.0%
ETC Market Share
Monroe Expressway Planning Level T&R Forecast Update
November 2020
Page 8
Table 3 - National, North Carolina, Local and NCTA Mandates Related to COVID-19
Regionwide travel announcements that resulted in reduced travel on the Monroe Expressway
include: the closure of schools beginning on March 16, 2020; the gradual limitation of gatherings in
public and closure of specific businesses initiated between March 16 and March 25; and the closure
of non-essential businesses on March 30. On March 30, NCTA announced suspension of third-party
Date Location Description
March 3 NC - First case of COVID-19 in NC identified in Wake County.
March 10 NC - Gov. Roy Cooper declares state of emergency due to COVID-19 cases.
March 12Mecklenburg/
Cabarrus County
- Mecklenburg County reports its first two confirmed cases of COVID-19 and Cabarrus County reports
one.
March 13 USA - National Emergency declared
March 16 NC - Executive Order 117: No mass gatherings. K-12 public schools closed
March 17 NC - Executive Order 118: Close sit-down service at restaurants
March 18 NC- NC Quick Pass Customer Service Centers have been closed since March 18 to customers.
Call center staff operating at reduced levels to maintain social distancing.
March 18-20 USA - U.S./Canada and U.S./Mexico borders closed for non-essential travel
March 25 NC- Executive Order 120: Limit gatherings to less than 50 people. Close gyms, movie theaters,
parlors, and other similar facilities by 3/25.
March 30 NC/ NCTA
- Executive Order 121: Stay At Home order until April 29, 2020. Only essential business to
remain open. Bans gatherings of more than 10 people and directs everyone to physically
stay at least 6 feet apart from others.
- NCTA Relief Effort: NCTA suspends third-party collection efforts for past due accounts and
placement of new DMV vehicle registration hold for past due accounts.
April 3 NCTA- NCTA Relief Effort: NCTA suspends all processing fees and civil penalties on Bill-by-Mail
Invoices.
April 9 NC
- Executive Order 131: Retail stores still operating to implement new social distancing
policies. Earlier COVID-19 guidelines mandatory for nursing facilities, and recommends
other long-term care facilities to do the same. Issues changes to unemployment benefits
that will speed up certain benefit payments to those who are out of work.
April 23 NC - Executive Order 135: Extends North Carolina’s Stay At Home order until May 8.
May 9 NC
- Executive Order 138: Transition to Phase 1 recovery. Stay at home order remains in place.
Nonessential businesses allowed to open at 50 percent capacity. Parks, outdoor worship
services, and childcare facilities allowed to reopen.
May 23 NC- Phase 2 Announcement: Transition to Phase 2 recovery. Social gatherings allowed for less
than 10 people indoors and less than 25 people outdoors. Indoor sit-down dining reopens.
June 24 NC
- Executive Order 147: North Carolina will remain in Safe at Home Phase 2 for three more
weeks (July 17). Face coverings must be worn when people are in public places as
officials seek to stabilize concerning trends of increasing viral spread.
July 16 NC- Executive Order 151: North Carolina extends Safe at Home Phase 2 measures until at least
August 7, 2020.
July 28 NC- Executive Order 153: Restaurants, breweries, wineries, distilleries, shall cease the sale
and service of alcoholic beverages for onsite consumption between 11:00 pm and 7:00 am.
August 12 NC - NCTA reopens Monroe and Charlotte Customer Service Centers.
August 17Charlotte-
Mecklenburg- Charlotte-Mecklenburg students will follow a full-remote learning plan
October 12Charlotte-
Mecklenburg
- Charlotte-Mecklenburg students will move to in-person instruction in a phased plan that would
begin Oct. 12. Under the plan, all pre-K students will return first on Oct. 12. Next, groups of K-5
students will return to classrooms on a rotational basis, starting on Nov. 2. Groups of middle school
students will return to classrooms on a rotational basis starting on Nov. 23. Groups of high school
students will return to classrooms for testing the weeks of Dec. 14 and Dec. 21, and then return to
classrooms on a rotational basis for instruction on Jan. 5.
October 26 NCTA - NCTA resumes processing fees and civil penalties on Bill-by-Mail invoices

Monroe Expressway Planning Level T&R Forecast Update
November 2020
Page 9
collection efforts and all processing fees and penalties; this suspension has since been rescinded as
of October 26, 2020.
2.3 Estimated Impacts of COVID-19 Pandemic on Monroe Expressway
CDM Smith conducted an analysis on total system transactions from the existing Monroe
Expressway to estimate the impacts due to the COVID-19 pandemic on passenger cars and
commercial vehicles traffic and to develop a trend analysis toward a gradual recovery. The analysis
methodology used is described below:
1. Daily transaction data for each Monroe Expressway toll zone was obtained for the period
from January 2019 through August 2020.
2. Since the facility was still in early stages of ramp-up through most of 2019, actual weekday
transaction totals for cars and trucks were adjusted to estimate conditions without ramp-
up.
3. Baseline (without COVID impact) growth rates from 2019 to 2020 were estimated based on
the 2016 Traffic and Revenue Study as well as comparison of growth for January and
February 2020 against the same period in 2019 (by passenger cars versus commercial
vehicles).
4. Baseline growth rates were applied to 2019 average weekday daily transactions from Step 2
to estimate baseline 2020 transactions without COVID impacts and without ramp-up.
5. Actual traffic from March through August was compared to the baseline 2020 (no COVID
impact) estimates developed in Step 3 to identify impacts on a weekly basis for passenger
cars and commercial vehicles. Ultimately, a seven-day rolling average was used for
passenger cars and a 21-day rolling average for commercial vehicles to illustrate the
impacts due to COVID-19 and the related stay-at-home orders on passenger cars and
commercial vehicles.
The impact of the COVID-19 pandemic on passenger car and commercial vehicle transactions on the
Monroe Expressway are shown in Figure 3 by ETC and BBM.
The largest drop in passenger car traffic versus expected no-COVID 2020 traffic occurred the week
immediately following the closure of K-12 schools, from – 5.1 percent week ending March 15 to -
30.5 percent week ending March 22. After non-essential businesses were closed on March 30,
transactions dropped by an additional 20 percent (–31 to –51 percent in the week ending April 5).
Total system passenger car impacts are estimated to have bottomed out in mid-April at about –55
percent, meaning that about 45 percent of normal passenger car traffic was retained on the system.
The state transitioned through Phase 1 in early May and entered into Phase 2 recovery on May 23,
resulting in traffic recovering to about 80 percent of expected levels (-20 percent), where it has
hovered through the end of August. Traffic in July and August appear to be slightly lower, but that is

Monroe Expressway Planning Level T&R Forecast Update
November 2020
Page 10
based on estimated “normal” traffic conditions that were influenced by both strong seasonal
summer traffic and traffic ramp-up during first year of operation in 2019.
Figure 3 - Monroe Expressway Estimated COVID-19 Transaction Impacts by Vehicle Class and Payment Method
The impact of COVID-19 on commercial vehicle traffic on the Monroe Expressway, shown on a 21-
day rolling average, is also shown in Figure 3. As observed on other toll facilities around the U.S.,
the impact of COVID-19 has been lower on commercial vehicle traffic overall, resulting in a
maximum impact of -11 percent in the week ending April 4, which would be the first 21-day period
using data entirely after the beginning of closures in March. Following the Phase 2 reopening of the
region on May 23, commercial vehicle traffic recovered to expected levels by the last week in May.
While the graphs for commercial vehicles appear to have dipped in June, July, and August, the
expected 2020 levels against which these are compared were estimated using one year of operating
experience, which could be slightly overestimated. Revenue impacts of COVID-19 on the Monroe
Expressway have generally followed the traffic patterns.
-80.0%
-60.0%
-40.0%
-20.0%
0.0%
20.0%
40.0%
60.0%
Mar
01
Mar
08
Mar
15
Mar
22
Mar
29
Ap
r 0
5
Ap
r 1
2
Ap
r 1
9
Ap
r 2
6
May
03
May
10
May
17
May
24
May
31
Jun
07
Jun
14
Jun
21
Jun
28
Jul 0
5
Jul 1
2
Jul 1
9
Jul 2
6
Au
g 0
2
Au
g 0
9
Au
g 1
6
Au
g 2
3
Au
g 3
0
Passenger Car ETC Passenger Car BBM Commercial Vehicle ETC Commercial Vehicle BBM

Monroe Expressway Planning Level T&R Forecast Update
November 2020
Page 11
3. Model Update and Calibration For this update, CDM Smith focused on collecting data and updating model inputs which were most
likely to significantly influence the traffic and revenue estimates on the Monroe Expressway. CDM
Smith used the Metrolina Regional Model 15 version 1.1 (MRM) for the 2016 T&R Study and again
as the basis for this update. Various elements of the model were updated or adjusted for the 2016
T&R Study based on information available to the project team at the time the work was performed.
The following key inputs and assumptions were further updated for this study:
▪ Socioeconomic forecasts including population and employment
▪ Corridor traffic counts and travel time data (2019)
▪ Current adopted long-range highway improvement program
▪ Inflation forecasts and vehicle operating cost estimates
▪ Model calibration to reflect actual experience over the first 16 months of operation (pre-
pandemic conditions)
Traffic counts around the Monroe Expressway were collected for NCTA in April and May of 2019 as
part of the Monroe Expressway Impacts on the U.S. 74 Corridor Study, dated September 2019.
This, along with average travel speed data gathered from HERE, provided operating conditions for
purposes of model calibration and validation, and to update conditions for future years in which
model runs were conducted: 2025, 2030 and 2040.
3.1 Socioeconomic Forecasts
CDM Smith engaged an independent economist, Dr. Stephen J. Appold, to provide a review and
update of the land use and socioeconomic growth forecasts used in the 2016 T&R Study. Dr.
Appold’s review focused on overall population and employment in Union and Mecklenburg
Counties. Dr. Appold had developed the socioeconomic forecasts used in the 2016 T&R Study.
Similar, but more rudimentary, methods were used in generating the updated baseline estimates
and projections for Mecklenburg and Union Counties in this planning-level T&R forecast update.
While the earlier study used 2015 as the baseline year, this update uses 2019-based population and
employment estimates generated from Census 2019 population estimates and the latest NC Office
of State Budget and Management’s (OSBM’s) population projections.
There are some slight differences in methodology with the original study. Most notably, Census
county-level estimates were used as population control totals because 2019 NC OSBM estimates
were not yet available. Both organizations have access to the same data and use essentially the
same methodology. However, the OSBM and Census population estimates have drifted apart over
the course of the decade. It is not uncommon for inter-Census population estimates to be corrected
in the light of information from a complete count. Clarification will not likely be available for a year

Monroe Expressway Planning Level T&R Forecast Update
November 2020
Page 12
or more. A newer vintage of the Census American Community Survey has been used in creating
aspects of this version of the socioeconomic data, which could result in minor changes.
The same sources of small area (sub-county) information on employment were used in both
versions of the data. Regional planners have not mounted a comprehensive update to their
estimates of employment location since the previous study. The main impact of the baseline update
is likely to be related to recent developments that may or may not have been accurately foreseen at
the time of the earlier survey.
Due to the timing of this update report, the impacts of the COVID-19 pandemic were not taken into
account in generating either the (pre-pandemic) 2019 baseline nor in the growth projections
presented in this section. These impacts are applied in subsequent steps of the traffic and revenue
analysis as described later in this report.
3.1.1 Adjustments to Population Forecast
Table 4 presents the updated population forecasts for Mecklenburg and Union Counties. The
regional model spans 12 counties but the project corridor is located entirely within Union County
and ends near the Mecklenburg County border to the north. Actual total regional growth from 2015
to 2019 for these two counties has generally fallen in line with the growth rate originally
forecasted, with a total change of 9.0 percent. Total population in the updated forecast for the two
counties is higher than that used in the previous study by 3.9 percent in 2025, increasing to a
difference of 7.3 percent by 2040.
Table 4 - Total Population Forecasts for Mecklenburg and Union Counties (population in thousands)
The socioeconomic data was aggregated into 19 superzones adjacent to the Monroe Expressway
and US 74 to summarize data within the immediate study area (see Figure 4 and Table 5). The
total forecast for population within the 19 superzones has increased by 3.7 percent over the
previous study for 2025 and 10.1 percent for 2045. In the near term (2025), the revised forecasts
show higher growth at two superzones at the south/east end of the project area (superzones 19
and 7) and near the north/west end (superzone 15).
County 2015 2019 Growth%
Growth
2016
Study
Update
StudyDiff.
%
Diff.
2016
Study
Update
StudyDiff.
%
Diff.
2016
Study
Update
StudyDiff.
%
Diff.
Mecklenburg 1,018.5 1,112.1 93.5 9.2% 1,204.0 1,249.1 45.0 3.7% 1,291.6 1,353.1 61.4 4.8% 1,473.1 1,565.8 92.7 6.3%
Union 220.2 238.6 18.4 8.4% 260.9 273.0 12.1 4.6% 281.8 302.4 20.6 7.3% 323.5 361.9 38.4 11.9%
Total 1,238.7 1,350.7 112.0 9.0% 1,464.9 1,522.0 57.1 3.9% 1,573.5 1,655.5 82.0 5.2% 1,796.6 1,927.7 131.1 7.3%
Actual 2025 2030 2040

Monroe Expressway Planning Level T&R Forecast Update
November 2020
Page 13
Figure 4 - Superzone Boundaries
Table 5 - Study Area Total Population Forecasts by Superzone (population in thousands)
Super
zone2015 2019 Growth
%
Growth
2016
Study
Update
StudyDiff.
%
Diff.
2016
Study
Update
StudyDiff.
%
Diff.
2016
Study
Update
StudyDiff.
%
Diff.
1 11,243 13,001 1,758 15.6% 13,198 13,734 536 4.1% 14,207 14,800 593 4.2% 16,158 16,888 730 4.5%
2 7,061 8,129 1,068 15.1% 11,393 9,502 -1,891 -16.6% 12,238 11,027 -1,211 -9.9% 13,966 13,947 -19 -0.1%
3 2,468 2,819 351 14.2% 3,343 3,409 66 2.0% 3,664 3,879 215 5.9% 4,289 4,903 614 14.3%
4 2,276 2,350 74 3.3% 2,585 2,669 84 3.2% 2,761 2,920 159 5.8% 3,105 3,393 288 9.3%
5 2,840 3,136 296 10.4% 3,333 3,662 329 9.9% 3,619 4,048 429 11.9% 4,172 4,786 614 14.7%
6 2,381 2,449 68 2.9% 2,701 2,889 188 7.0% 2,854 3,207 353 12.4% 3,148 3,816 668 21.2%
7 634 653 19 3.0% 753 856 103 13.7% 804 994 190 23.6% 900 1,259 359 39.9%
8 13,394 14,182 788 5.9% 14,890 15,674 784 5.3% 15,838 16,839 1,001 6.3% 17,756 19,402 1,646 9.3%
9 5,141 5,401 260 5.1% 5,969 6,281 312 5.2% 6,444 6,979 535 8.3% 7,366 8,337 971 13.2%
10 4,460 4,579 119 2.7% 4,924 5,068 144 2.9% 5,192 5,455 263 5.1% 5,713 6,197 484 8.5%
11 4,593 5,018 425 9.3% 5,126 5,569 443 8.6% 5,472 5,980 508 9.3% 6,160 6,832 672 10.9%
12 15,582 16,505 923 5.9% 16,976 17,794 818 4.8% 17,765 18,633 868 4.9% 19,159 20,486 1,327 6.9%
13 23,098 23,987 889 3.8% 26,161 27,494 1,333 5.1% 28,220 30,182 1,962 7.0% 31,742 35,305 3,563 11.2%
14 11,723 12,246 523 4.5% 14,296 14,682 386 2.7% 15,432 16,438 1,006 6.5% 17,703 19,920 2,217 12.5%
15 11,987 12,938 951 7.9% 13,126 14,570 1,444 11.0% 14,291 15,871 1,580 11.1% 16,650 18,535 1,885 11.3%
16 15,868 16,415 547 3.4% 17,717 18,300 583 3.3% 18,725 19,700 975 5.2% 20,660 22,434 1,774 8.6%
17 9,519 9,651 132 1.4% 10,940 11,248 308 2.8% 11,519 12,314 795 6.9% 12,634 14,359 1,725 13.7%
18 2,546 2,709 163 6.4% 3,012 3,261 249 8.3% 3,272 3,711 439 13.4% 3,781 4,569 788 20.8%
19 1,441 1,458 17 1.2% 1,679 1,874 195 11.6% 1,787 2,143 356 19.9% 1,990 2,663 673 33.8%
Total 148,255 157,626 9,371 6.3% 172,122 178,536 6,414 3.7% 184,104 195,120 11,016 6.0% 207,052 228,031 20,979 10.1%
Actual 2025 2030 2040

Monroe Expressway Planning Level T&R Forecast Update
November 2020
Page 14
3.1.2 Employment Forecasts
Dr. Appold determined that the current (2019) levels of employment were consistent with the
projections assumed in the 2016 T&R Study, and that there was no reason to adjust them or to
change the forecasts for future years (see Table 6).
Table 6 - Total Employment Forecasts for Mecklenburg and Union Counties (jobs in thousands)
3.1.3 Forecasting in the Age of a Pandemic
The ongoing COVID-19 pandemic has upset traffic forecasting in two fundamental ways. First, the
pandemic has brought on significant employment loss and a serious economic contraction of
unknown duration, partly because many businesses were either forced to close due to
governmental restrictions, while others reduced operations in response to diminished demand.
Second, many of those who are still employed are working from home. Both factors have impacted
the number of journeys to work.
Any projection of the course of either indicator, the number of people employed and the proportion
of the employed working remotely, must be seen as speculative at this point. Those speculations,
however, are not without basis. The following paragraphs address the first concern, employment
trends.
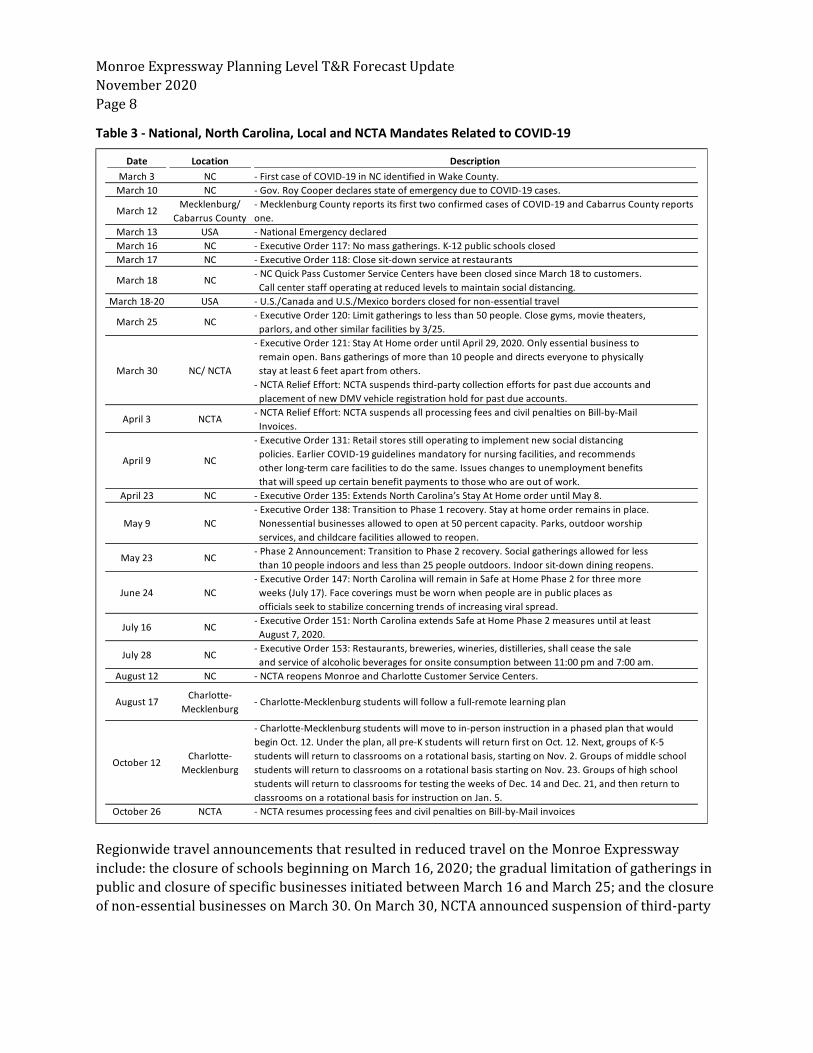
Figure 5 shows the past and projected growth of real Gross Domestic Product (GDP) for the U.S.
economy according to the latest available Congressional Budget Office (CBO) analysis which is
based on data available as of June 26, 2020.1 The sharp contraction in economic activity can be
seen. In these revisions of its estimates generated in May 2020, CBO has revised downward its
estimate of growth in the second half of 2020. Nevertheless, the CBO expects real GDP to recover to
its pre-pandemic level by the middle of 2022. Unemployment will likely remain above pre-
pandemic levels for several years.
1 As of October 28, 2020, no update had been issued.
County 2015 2019 Growth%
Growth
2016
Study
Update
StudyDiff.
%
Diff.
2016
Study
Update
StudyDiff.
%
Diff.
2016
Study
Update
StudyDiff.
%
Diff.
Mecklenburg 768.3 828.3 60.0 7.8% 899.1 899.1 0.0 0.0% 951.4 951.4 0.0 0.0% 1,080.2 1,080.2 0.0 0.0%
Union 86.0 91.0 5.0 5.8% 97.8 97.8 0.0 0.0% 103.3 103.3 0.0 0.0% 116.6 116.7 0.0 0.0%
Total 854.3 919.3 65.0 7.6% 996.9 996.9 0.0 0.0% 1,054.6 1,054.7 0.0 0.0% 1,196.9 1,196.9 0.0 0.0%
Actual 2025 2030 2040
Monroe Expressway Planning Level T&R Forecast Update
November 2020
Page 15
Figure 5 - Growth of Real GDP and Real Potential GDP, CBO July 2020
Source: CBO, An Update to the Economic Outlook: 2020 to 2030, https://www.cbo.gov/publication/56465
The Federal Reserve Bank has been compiling a weekly index of U.S. economic activity based on 10
series of consumer behavior and industrial production data sources. These are national data but are
fairly representative of the North Carolina economy as well. The advantage of these data is that they
provide a more up-to-date profile of the state of the U.S. economy than the CBO publication. As
shown in Figure 6, annualized economic growth rates are charted so that a reading of, say, 2.00
would imply that the economy was growing at rate which would be equivalent to two percent
annually, even though that rate was measured for just one week.
-6%
-4%
-2%
0%
2%
4%
6%
2000 2005 2010 2015 2020 2025 2030
Real GDP Growth Real Potential GDP Growth
Projected

Monroe Expressway Planning Level T&R Forecast Update
November 2020
Page 16
Figure 6 - Annualized Weekly Economic Index for U.S.
Source: Lewis, Daniel J., Mertens, Karel, and Stock, James H., Weekly Economic Index,
https://www.newyorkfed.org/research/policy/weekly-economic-index
The trends in Figure 6 over time are complex. The graphic includes the contractions of the Great
Recession, the subsequent rapid initial recovery, the return to an underlying long-term economic
growth rate followed by a slowing of growth in 2015 and a subsequent recovery in 2016. There is
evidence of a general slowdown in 2019 even before the pandemic impacts begin in March and
April 2020. The initial period after the COVID-19 nadir suggested a rapid V-shaped recovery. Other
evidence, including the CBO projections, suggests that despite the sharp partial rebound, full
recovery will likely take years to be manifested.
The Federal Reserve also maintains an on-going daily Mobility and Engagement Index (MEI) using
cell phone location data from Safegraph.2 The MEI is based on a weighted combination of:
1. Fraction of devices leaving home in a day.
2. Fraction of devices away from home for three to six hours at a fixed location.
3. Fraction of devices away from home longer than six hours at a fixed location.
2 https://www.dallasfed.org/research/~/media/documents/research/papers/2020/wp2014.pdf
-14.0
-12.0
-10.0
-8.0
-6.0
-4.0
-2.0
0.0
2.0
4.0
6.0
Jan-08 Jan-09 Jan-10 Jan-11 Jan-12 Jan-13 Jan-14 Jan-15 Jan-16 Jan-17 Jan-18 Jan-19 Jan-20
An
nu
aliz
ed W
eekl
y Ec
on
om
ic G
row
th In
des

Monroe Expressway Planning Level T&R Forecast Update
November 2020
Page 17
4. An adjusted average of daytime hours spent at home.
5. Fraction of devices taking trips longer than 16 kilometers (10 miles).
6. Fraction of devices taking trips less than 2 kilometers (1.2 miles).
7. Average time spent at locations far from home.
The data are scaled so that the daily average measurements for January and February of this year
average zero.3 Data for the Charlotte MSA and all MSAs nation-wide are shown in Figure 7.
The two data series are roughly consistent. Four time periods can be seen: the period of normal
mobility in January and February, the rapid drop off during March and the first half of April, the
fairly rapid partial resumption of movement in late April and May, and a plateauing of movement
beginning in early June and lasting through the present. Those same patterns are repeated, with
some variation, for each of the North Carolina metropolitan areas.
Figure 7 - Average Mobility and Engagement Index for Charlotte MSA and All MSA, January to October 2020
Source: Federal Reserve Bank, Dallas
3 https://www.dallasfed.org/research/mei
-120
-100
-80
-60
-40
-20
0
20
1/4
1/11
1/18
1/25 2/
1
2/8
2/15
2/22
2/29 3/
7
3/14
3/21
3/28 4/
4
4/11
4/18
4/25 5/
2
5/9
5/16
5/23
5/30 6/
6
6/13
6/20
6/27 7/
4
7/11
7/18
7/25 8/
1
8/8
8/15
8/22
8/29 9/
5
9/12
9/19
9/26
10/3
10/1
0
10/1
7
Mo
bili
ty a
nd
En
gage
me
nt
Ind
ex
All MSAs Charlotte MSA

Monroe Expressway Planning Level T&R Forecast Update
November 2020
Page 18
The employment trends for North Carolina, the Charlotte-Concord-Gastonia metropolitan area, and
the two most relevant counties of the Metrolina region (Mecklenburg and Union Counties) (see
Figure 8) provides provisional corroborative support for the CBO and Federal Reserve analysis.
Statewide employment, illustrated by the dashed line using the right scale, grew throughout the last
decade, as did employment in the metropolitan area and each of the two selected counties. U.S.
employment grew by 16.3 percent between January 2010 and October 2019 (not shown) and North
Carolina employment grew by 23.2 percent over that same period while employment in the
Charlotte metropolitan area, Mecklenburg, and Union Counties increased by 36.9 percent, 40.7
percent, and 38.1 percent, respectively. Employment then dropped marginally, 0.6 percent for the
U.S. and 0.1 percent in North Carolina, to the pre-pandemic level measured in February. The
Charlotte metropolitan area then lost 226,027 jobs (130,271 in Mecklenburg and Union Counties) –
approximately 17 percent – then bottoming out at 1,114,258 (605,035 for Mecklenburg and Union
Counties) in April.
Figure 8 - Monthly Employment, January 2010 to September 2020
Source: North Carolina Department of Commerce
0
1,000,000
2,000,000
3,000,000
4,000,000
5,000,000
6,000,000
0
200,000
400,000
600,000
800,000
1,000,000
1,200,000
1,400,000
1,600,000
1,800,000
2,000,000
2010 2011 2012 2013 2014 2015 2016 2017 2018 2019 2020
No
rth
Car
olin
a Em
plo
yme
nt
Ch
arlo
tte
Are
a Em
plo
yme
nt
Charlotte-Concord-Gastonia MSA Mecklenburg County Union County North Carolina

Monroe Expressway Planning Level T&R Forecast Update
November 2020
Page 19
Employment rebounded decisively in May 2020, then decisively in June, but only modestly in July.
By July, the Charlotte metropolitan area and the two selected counties had recovered 53 percent of
their February pre-pandemic peak and had risen modestly to approximately 55 percent by
September. Regional employment growth varies from the national pattern, alternatively falling
behind and then surging ahead of national growth rates. Using the average weekly employment
growth in May through September as a rough and arbitrary recovery guide, the Charlotte
metropolitan area, including Mecklenburg and Union Counties, is projected to recover its pre-
pandemic employment peak by July or August of 2021. The state of North Carolina is projected to
reach that milestone at the same time and the U.S., as a whole, a month before that. These
calculations suggest a more rapid recovery than that projected by the CBO, but they are less rapid
than expected earlier. These are, of course, simple extrapolations from a short trend and the coming
months will provide critical information in refining these calculations.
Figure 9, which charts unemployment rates in the U.S., North Carolina, the Charlotte metropolitan
area, and the two selected counties, suggests that the pandemic-induced downturn may not have
been as severe in Union County as elsewhere. The drop in unemployment rates in the Charlotte
region generally corroborates the analysis above.
Figure 9 - Monthly Unemployment Rate January 2017 to September 2020
Source: North Carolina Department of Commerce
0.0
2.0
4.0
6.0
8.0
10.0
12.0
14.0
16.0
2017 2018 2019 2020
Pe
rce
nt
Un
em
plo
yed
United States North Carolina Charlotte-Concord-Gastonia MSA Mecklenburg County Union County

Monroe Expressway Planning Level T&R Forecast Update
November 2020
Page 20
3.1.4 Results from a Recent Small-Business Survey
This section presents a selection of results from the Census Bureau’s Small Business “Pulse” Survey
series for the Charlotte-Concord-Gastonia, NC Metropolitan Statistical Area (MSA) for the week of
October 2 to October 10, 2020. The respondents are small businesses, and therefore do not directly
reflect the situation of large businesses and government. However, since most small businesses are
directly or indirectly dependent upon large businesses, the responses are likely good indications of
regional conditions.
Figure 10 shows the responses to a question about the pandemic’s impact on business operations.
Not surprisingly, three-fourths of the respondents claim negative impacts. This is almost exactly as
many a had claimed a negative impact at the end of August. A large negative impact was reported
by 30 percent of respondents.
Figure 10 - Overall how has this business been affected by the Coronavirus pandemic?
Source: Census Bureau Small Business Pulse Survey, October 2020
0.0%
5.0%
10.0%
15.0%
20.0%
25.0%
30.0%
35.0%
40.0%
45.0%
50.0%
Large negative effect Moderate negative effect Little or no effect Moderate positive effect Large positive effect

Monroe Expressway Planning Level T&R Forecast Update
November 2020
Page 21
Figure 11 shows the responses to a question about future strategic business actions (respondents
could select multiple choices so the bars may not sum to 100 percent). The good news is that
comparatively few businesses foresaw closing. However, nearly 20 percent saw the need for a cash
infusion. Compared to August, fewer businesses expected to need to hire new employees. Many
businesses were actively strategizing for the future, suggesting acknowledgement of difficult times
for the coming months, but with optimistic anticipation.
Figure 11 - In the next six months, do you think this business will need to do any of the following?
Source: Census Bureau Small Business Pulse Survey, October 2020
0.0%
5.0%
10.0%
15.0%
20.0%
25.0%
30.0%
35.0%
40.0%
Obtain financialassistance or
additional capital
Identify newsupply chain
options
Develop onlinesales or websites
Increase marketingor sales
Learn how tobetter provide for
the safety ofcustomers and
employees
Identify and hirenew employees
Permanently closethis business
None of the above

Monroe Expressway Planning Level T&R Forecast Update
November 2020
Page 22
Figure 12 most directly shows the range of anticipated business trajectories from the survey
respondents. Nearly half the respondents predicted recovery times of six months or more. By now,
it is possible to compare responses over time, and the pattern of responses has been fairly constant
over time. Taken together, these responses show significant impacts of the pandemic on business
operations but also suggest strong optimism about the future – even if significant challenges are
anticipated.
Figure 12 - In your opinion, how much time do you think will pass before this business returns to its normal level of operations relative to one year ago?
Source: Census Bureau Small Business Pulse Survey, October 2020
These are survey responses. The respondents can claim no special insight into the economy but can
report on what they observe in their businesses’ day to day. The series is relatively new, and
subsequent waves of the survey will allow for more careful tracing of the path towards economic
recovery.
0%
10%
20%
30%
40%
50%
60%
1 month or less 2-3 months 4-6 months More than 6months
I do not believethis business will
return to itsnormal level of
operations.
This business haspermanently
closed.
There has beenlittle or no effecton this business's
normal level ofoperations.
This business hasreturned to itsnormal level of
operations.

Monroe Expressway Planning Level T&R Forecast Update
November 2020
Page 23
3.1.5 Adjustments to Future Year Trip Tables
The updated socioeconomic forecasts were used to inform adjustments to the trip tables developed
from the regional travel demand model, Metrolina Regional Model (MRM), used in the 2016 T&R
Study. For the purposes of this study, the full MRM model was not rerun; the trip tables from the
previous study were adjusted considering the changes in population and employment in each zone.
First, CDM Smith used the total trip ends in a zone from the MRM trip tables used in the 2016 T&R
Study and the population and employment in each zone to estimate a regression model. Then, the
changes in population and employment from this update study were applied using the relationships
from that regression model to estimate adjustments to total daily vehicle trips for each zone. The
output of this process is a series of baseline trip tables that do not reflect the impacts of the COVID-
19 pandemic.
As noted earlier, the updated socioeconomic forecasts developed by Dr. Appold did not take into
account any impacts of the ongoing COVID-19 pandemic since there was very limited actual data
available on changes at the small area level at the time of this analysis and the situation continues
to evolve.
In light of this, COVID-19 impacts have been applied to the traffic and revenue forecast in this study
in two ways. First, actual experience from March through August 2020 was used to estimate an
assumed recovery pattern in the region for the next several years. Second, it is assumed that the
pandemic will have resulted in a slowdown in growth over the short-term. To reflect this impact in
these forecasts, the total growth previously assumed to take place between 2019 and 2025 has
been assumed to be delayed three years to 2028. Assuming that the 2025 trip tables reflecting Dr.
Appold’s changes will occur by 2028, an adjusted 2025 trip table was developed by interpolation
from 2019. The net difference between the 2025 and 2028 trip tables was also subtracted from the
baseline 2030 and 2040 trip tables to recognize this delayed growth.
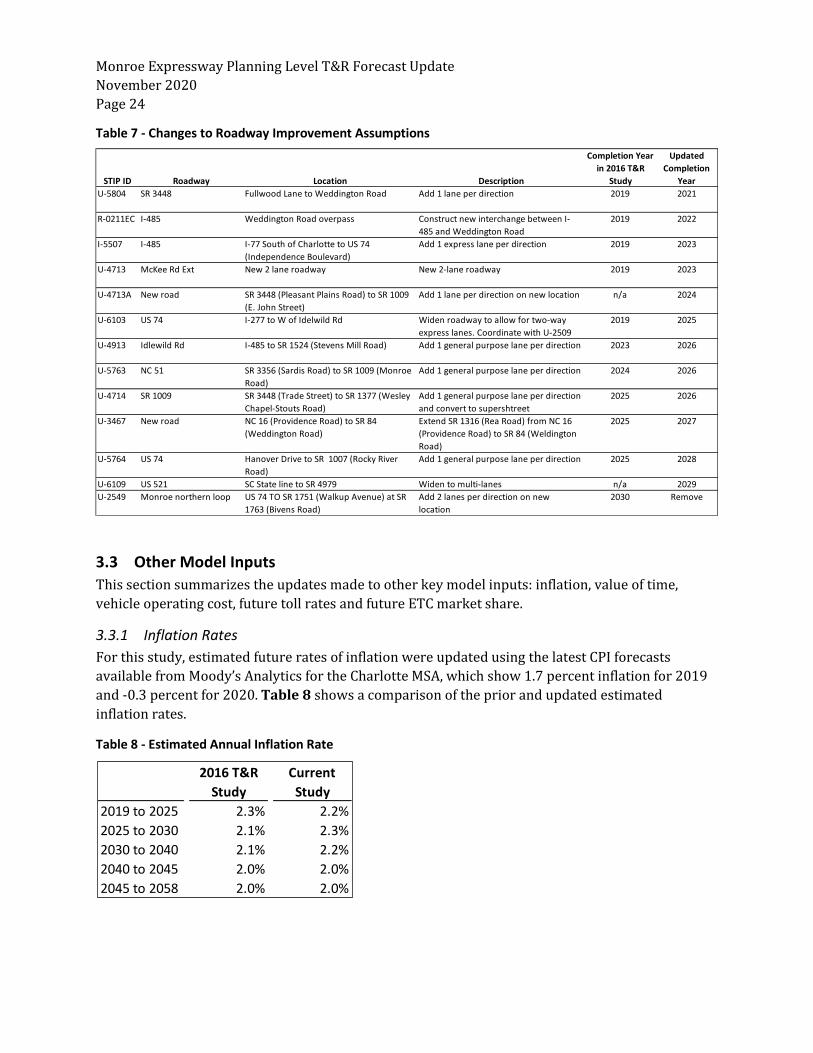
3.2 Changes to Roadway Improvements Assumptions
The 2016 T&R Study used the roadway improvement program contained in the NCDOT 2015 State
Transportation Improvement Program (STIP) as the basis for the networks used in the model. The
STIP has since been updated. CDM Smith reviewed the current NCDOT 2020-2029 STIP (as of July
2020) and consulted with NCDOT/NCTA staff to determine if any revisions were needed to the
2019, 2025, 2030 and 2040 roadway networks used in the model. Table 7 presents a list of
roadway improvement projects with the greatest potential to influence travel on the Monroe
expressway corridor that have been added, removed, or for which completion years have shifted in
the current STIP. The table indicates the original year of completion used in the 2016 T&R Study,
and the updated year of completion used in this study.
Monroe Expressway Planning Level T&R Forecast Update
November 2020
Page 24
Table 7 - Changes to Roadway Improvement Assumptions
3.3 Other Model Inputs
This section summarizes the updates made to other key model inputs: inflation, value of time,
vehicle operating cost, future toll rates and future ETC market share.
3.3.1 Inflation Rates
For this study, estimated future rates of inflation were updated using the latest CPI forecasts
available from Moody’s Analytics for the Charlotte MSA, which show 1.7 percent inflation for 2019
and -0.3 percent for 2020. Table 8 shows a comparison of the prior and updated estimated
inflation rates.
Table 8 - Estimated Annual Inflation Rate
STIP ID Roadway Location Description
Completion Year
in 2016 T&R
Study
Updated
Completion
Year
U-5804 SR 3448 Fullwood Lane to Weddington Road Add 1 lane per direction 2019 2021
R-0211EC I-485 Weddington Road overpass Construct new interchange between I-
485 and Weddington Road
2019 2022
I-5507 I-485 I-77 South of Charlotte to US 74
(Independence Boulevard)
Add 1 express lane per direction 2019 2023
U-4713 McKee Rd Ext New 2 lane roadway New 2-lane roadway 2019 2023
U-4713A New road SR 3448 (Pleasant Plains Road) to SR 1009
(E. John Street)
Add 1 lane per direction on new location n/a 2024
U-6103 US 74 I-277 to W of Idelwild Rd Widen roadway to allow for two-way
express lanes. Coordinate with U-2509
2019 2025
U-4913 Idlewild Rd I-485 to SR 1524 (Stevens Mill Road) Add 1 general purpose lane per direction 2023 2026
U-5763 NC 51 SR 3356 (Sardis Road) to SR 1009 (Monroe
Road)
Add 1 general purpose lane per direction 2024 2026
U-4714 SR 1009 SR 3448 (Trade Street) to SR 1377 (Wesley
Chapel-Stouts Road)
Add 1 general purpose lane per direction
and convert to supershtreet
2025 2026
U-3467 New road NC 16 (Providence Road) to SR 84
(Weddington Road)
Extend SR 1316 (Rea Road) from NC 16
(Providence Road) to SR 84 (Weldington
Road)
2025 2027
U-5764 US 74 Hanover Drive to SR 1007 (Rocky River
Road)
Add 1 general purpose lane per direction 2025 2028
U-6109 US 521 SC State line to SR 4979 Widen to multi-lanes n/a 2029
U-2549 Monroe northern loop US 74 TO SR 1751 (Walkup Avenue) at SR
1763 (Bivens Road)
Add 2 lanes per direction on new
location
2030 Remove
2016 T&R
Study
Current
Study
2019 to 2025 2.3% 2.2%
2025 to 2030 2.1% 2.3%
2030 to 2040 2.1% 2.2%
2040 to 2045 2.0% 2.0%
2045 to 2058 2.0% 2.0%

Monroe Expressway Planning Level T&R Forecast Update
November 2020
Page 25
3.3.2 Value of Time
The values of time used for the 2016 T&R Study were calculated based on median household
income data by traffic analysis zone in the MRM model. For this update study, the values of time
were adjusted using changes in income in the region and updated inflation forecasts. The resulting
values of time are lower than the previous study by 0.2 percent in 2025 on a net basis, and higher
by 1.3 percent in 2040. Table 9 shows the aggregate values of time for each model year in the 2016
T&R Study and the current study.
Table 9 - Estimated Values of Time
3.3.3 Vehicle Operating Costs
The vehicle operating costs were updated to reflect changes in forecasted inflation rates, updated
forecasts of fuel prices, changes in fuel efficiency standards adopted by the Environmental
Protection Agency (EPA) in April 2019, and the 2019 information on average vehicle maintenance
costs from the Automobile Association of America. Table 10 shows the vehicle operating costs used
for each model year in the 2016 T&R Study and the current study.
Table 10 - Estimated Vehicle Operating Costs
Average Value of Time ($ per minute)
2019 2025 2030 2040
2016 T&R Study
Passenger Cars 0.178$ 0.204$ 0.227$ 0.279$
Commercial Vehicles 0.309$ 0.355$ 0.395$ 0.540$
Current Study
Passenger Cars 0.177$ 0.202$ 0.226$ 0.282$
Commercial Vehicles 0.305$ 0.348$ 0.391$ 0.542$
Vehicle Operating Cost ($ per mile)
2019 2025 2030 2040
2016 T&R Study
Passenger Cars $0.180 $0.190 $0.209 $0.276
Commercial Vehicles $0.616 $0.730 $0.846 $1.188
Current Study
Passenger Cars $0.198 $0.212 $0.239 $0.306
Commercial Vehicles $0.643 $0.727 $0.844 $1.110

Monroe Expressway Planning Level T&R Forecast Update
November 2020
Page 26
3.3.4 ETC Market Share
Table 11 shows the assumed percent of travelers who have ETC transponders, by vehicle type and
by model year in the 2016 T&R Study and the current study. The 2019 and 2025 percentages are
lower than assumed in the 2016 T&R Study, reflecting actual transaction experience on the Monroe
Expressway after it opened. As in the 2016 T&R Study, it is assumed that over time, more travelers
would acquire ETC transponders in order to pay lower toll rates. The 2030 and 2040 ETC
percentages are similar to those assumed in the 2016 T&R Study.
Table 11 - Average Weekday ETC Market Share Model Input Splits
Note that these percentages of travelers do not necessarily translate to exact percentages of
transactions on the Monroe Expressway itself; rather they correspond to the percent of travelers
for whom the assumed toll charge on the Expressway would be the ETC charge, were they to choose
a travel route that includes the expressway. Since the tolls for ETC traffic is lower than BBM, the
ETC shares from model outputs tend to be about five percent higher than the values in Table 11 for
passenger cars, better matching observations on Monroe Expressway.
3.4 Model Inputs Calibration and Validation
The 2016 T&R Study included an extensive model calibration effort to 2015 conditions. The
calibration year for this study was 2019.
The Monroe Expressway was open for all of 2019, so a major component of the model calibration
was to accurately represent average daily transactions on the Monroe Expressway for that year.
Other key elements of calibration and validation involved comparisons between modeled and
observed traffic volumes across screenlines and speeds on US 74.
2019 2025 2030 2040
2016 T&R Study
Passenger Cars 55% 57% 60% 65%
Commercial Vehicles 68% 70% 72% 74%
Current Study
Passenger Cars 42% 55% 60% 65%
Commercial Vehicles 62% 70% 75% 78%

Monroe Expressway Planning Level T&R Forecast Update
November 2020
Page 27
3.4.1 Daily Transactions
Table 12 shows the comparison of average daily transactions for calendar year 2019 between
actual observations and modeled transactions after calibration.
Table 12 - Comparison of Observed and Modeled Daily Transactions
In addition to improving the consistency between the model and observed daily transactions, the
model calibration increased the truck share on the Monroe Expressway from four to 12 percent,
more closely matching the observed truck share of 15 percent. The model calibration also
decreased the ETC market share on the Monroe Expressway from 54 to 49 percent, matching the
observed market share in 2019.
As part of forecasting the transaction and revenue streams presented later in this memo, future
year model outputs (2025, 2030 and 2040) were adjusted to account for the remaining differences
between 2019 modeled and observed transactions by time of day, direction, ETC share, and truck
shares.
Gantry Location Direction Observed Model % Diff
M01 WB 8,639 9,473 10%
M02 EB 8,512 9,249 9%
M03 WB 8,448 8,630 2%
M04 EB 8,436 8,663 3%
M05 WB 8,012 7,647 -5%
M06 EB 7,665 7,800 2%
M07 WB 7,706 7,138 -7%
M08 EB 7,583 6,953 -8%
M09 WB 6,639 6,025 -9%
M10 EB 6,812 5,824 -14%
M11 WB 5,317 4,852 -9%
M12 EB 5,507 4,442 -19%
M13 WB 4,310 3,643 -15%
M14 EB 4,493 3,394 -24%
Austin Chaney Rd -
US 74
Indian Trail Fairview -
Unionville Indian Trail
Unionville Indian Trail -
Rocky River Rd
Rocky River Rd -
US 601
US 601 -
Morgan Mill Rd
Morgan Mill Rd -
Austin Chaney Rd
US 74 -
Indian Trail Fairview
Monroe Expressway Planning Level T&R Forecast Update
November 2020
Page 28
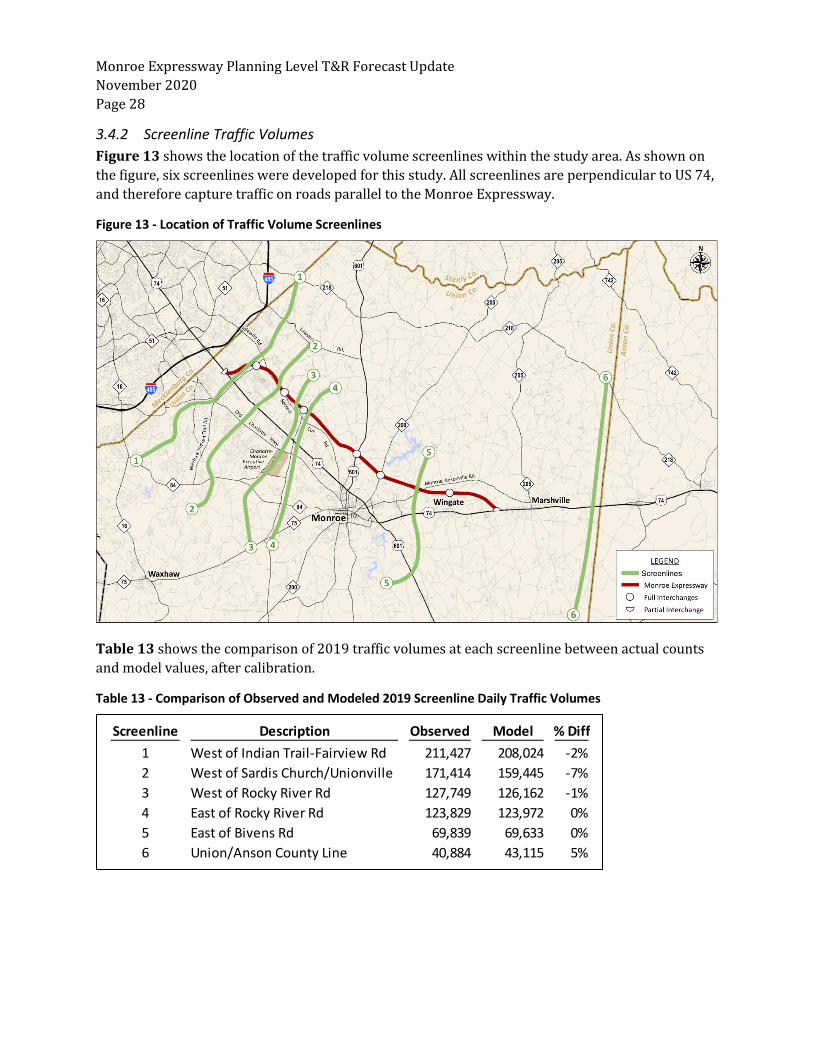
3.4.2 Screenline Traffic Volumes
Figure 13 shows the location of the traffic volume screenlines within the study area. As shown on
the figure, six screenlines were developed for this study. All screenlines are perpendicular to US 74,
and therefore capture traffic on roads parallel to the Monroe Expressway.
Figure 13 - Location of Traffic Volume Screenlines
Table 13 shows the comparison of 2019 traffic volumes at each screenline between actual counts
and model values, after calibration.
Table 13 - Comparison of Observed and Modeled 2019 Screenline Daily Traffic Volumes
Screenline Description Observed Model % Diff
1 West of Indian Trail-Fairview Rd 211,427 208,024 -2%
2 West of Sardis Church/Unionville 171,414 159,445 -7%
3 West of Rocky River Rd 127,749 126,162 -1%
4 East of Rocky River Rd 123,829 123,972 0%
5 East of Bivens Rd 69,839 69,633 0%
6 Union/Anson County Line 40,884 43,115 5%
Monroe Expressway Planning Level T&R Forecast Update
November 2020
Page 29
3.4.3 Travel Speeds along US 74
Table 14 shows the comparison of actual vs calibrated model speeds along US 74. This 22-mile
section of US 74 between I-485 and NC-205 in Marshville is the main toll-free alternative route to
the Monroe Expressway. The observed speeds by segment were obtained from HERE4 and
represent average conditions by for each model period on non-holiday weekdays in CY 2019.
The calibration effort resulted in model speeds closer to observations, particularly at both ends of
the corridor, to the point where none of the travel segments had differences exceeding 10 mph.
Speed differences of five mph or higher are highlighted on the table.
4. Traffic and Revenue Forecasts Estimated annual traffic and revenue forecasts are presented in this section. First, some of key
assumptions not already covered in the prior section are summarized. Also included in this section
is a comparison with the 2016 T&R study forecast and with a hypothetical no-COVID case, as well as
T&R estimates at the monthly level for the period July 2020 through December 2021.
4.1 T&R Forecast Assumptions
In general, the forecasting approach used for this study is the same as the 2016 T&R Study with the
incorporation of several adjustments in the model and post-processing techniques. The model
adjustments were described in Section 3. Post processing adjustments included incorporation of
the COVID-19 pandemic impacts, and revised factors for ramp-up, annualization, and leakage.
4.1.1 Basic Modeling Assumptions
Basic modeling assumptions and adjustments applied in this study are listed below.
▪ The model was calibrated against 2019 conditions based on actual transactions on the
Monroe Expressway, traffic counts and travel speeds in the corridor of influence, and revised
2019 population estimates from the independent economist
▪ Economic growth in the study area will generally occur as forecasted by the independent
economist
▪ Planned roadway improvements within the study area will be implemented within the time
frames assumed in the June 2020 version of NCDOT’s STIP (State Transportation
Improvement Program).
▪ Model inputs related to value of time, vehicle operating cost, and inflation were reviewed and
revised as needed.
▪ ETC market share assumptions by vehicle type and by model year were reviewed and
updated.
4 HERE speed data is built on a database derived from vast amounts of GPS probes.

Monroe Expressway Planning Level T&R Forecast Update
November 2020
Page 30
Fro
mTo
AM
MD
PM
NT
AM
MD
PM
NT
AM
MD
PM
NT
I-48
5/JA
MES
G M
AR
TIN
FW
YST
ALL
ING
S R
D0.
8958
5757
5653
5352
54-4
-4-4
-2
STA
LLIN
GS
RD
IND
IAN
TR
AIL
-FA
IRV
IEW
RD
1.23
4442
3246
4041
3943
-3-2
8-3
IND
IAN
TR
AIL
-FA
IRV
IEW
RD
WES
LEY
CH
AP
EL S
TOU
TS R
D2.
1243
4138
4336
3734
39-8
-4-4
-4
WES
LEY
CH
AP
EL S
TOU
TS R
DR
OC
KY
RIV
ER R
D2.
5445
3441
4943
4441
46-2
100
-3
RO
CK
Y R
IVER
RD
RO
LAN
D D
R2.
2443
4036
4440
4140
43-3
14
-1
RO
LAN
D D
RD
ICK
ERSO
N B
LVD
0.92
3432
2834
3535
3338
13
54
DIC
KER
SON
BLV
DU
S-60
1/N
C-2
00/C
ON
CO
RD
HW
Y0.
7237
3333
3736
3634
380
31
2
US-
601/
NC
-200
/CO
NC
OR
D H
WY
US-
601/
NC
-200
/CO
NC
OR
D H
WY
0.28
3733
3337
3737
3739
14
43
US-
601/
NC
-200
/CO
NC
OR
D H
WY
NC
-200
/MO
RG
AN
MIL
L R
D1.
1535
3534
3838
3837
392
33
1
NC
-200
/MO
RG
AN
MIL
L R
DE
FRA
NK
LIN
ST
1.22
2926
2636
3232
3234
37
6-3
E FR
AN
KLI
N S
TU
S-60
1/P
AG
ELA
ND
HW
Y0.
1434
2828
3730
3029
32-4
21
-5
US-
601/
PA
GEL
AN
D H
WY
NC
-205
/ELM
ST
8.56
4645
4546
4342
4243
-3-4
-3-4
TOTA
L Ea
stb
ou
nd
22.0
142
3938
4440
4039
42-2
11
-2
Fro
mTo
AM
MD
PM
NT
AM
MD
PM
NT
AM
MD
PM
NT
NC
-205
/ELM
ST
US-
601/
PA
GEL
AN
D H
WY
8.58
4645
4546
4141
4141
-5-4
-4-5
US-
601/
PA
GEL
AN
D H
WY
E FR
AN
KLI
N S
T0.
1419
2218
2926
2625
287
48
-1
E FR
AN
KLI
N S
TN
C-2
00/M
OR
GA
N M
ILL
RD
1.22
2628
2732
2828
2829
20
1-2
NC
-200
/MO
RG
AN
MIL
L R
DU
S-60
1/U
S-74
/NC
-200
1.15
3733
3437
3838
3839
15
42
US-
601/
US-
74/N
C-2
00U
S-60
1/N
C-2
000.
2839
3537
3938
3838
39-1
31
0
US-
601/
NC
-200
DIC
KER
SON
BLV
D0.
7236
3032
3735
3636
38-1
74
1
DIC
KER
SON
BLV
DR
OLA
ND
DR
0.92
3332
3136
3435
3438
14
32
RO
LAN
D D
RR
OC
KY
RIV
ER R
D2.
2439
3438
4441
4140
431
71
-1
RO
CK
Y R
IVER
RD
WES
LEY
CH
AP
EL S
TOU
TS R
D2.
5342
4141
4841
4342
46-1
21
-2
WES
LEY
CH
AP
EL S
TOU
TS R
DIN
DIA
N T
RA
IL-F
AIR
VIE
W R
D2.
3036
3836
4134
3735
40-2
-1-1
-1
IND
IAN
TR
AIL
-FA
IRV
IEW
RD
STA
LLIN
GS
RD
1.06
4748
4747
4649
4650
-11
-13
STA
LLIN
GS
RD
I-48
5/JA
MES
G M
AR
TIN
FW
Y0.
8643
5254
5453
5454
559
20
1
TOTA
L W
est
bo
un
d22
.00
4039
3943
3940
3941
-11
0-2
Dif
fere
nce
East
bo
un
d
We
stb
ou
nd
HER
E O
bse
rve
d S
pe
ed
sM
od
el S
pe
ed
sD
iffe
ren
ce
Dis
tan
ce
(mi)
Dis
tan
ce
(mi)
HER
E O
bse
rve
d S
pe
ed
sM
od
el S
pe
ed
s
Tab
le 1
4 -
Co
mp
aris
on
of
Ob
serv
ed
an
d M
od
eled
Sp
eed
s o
n U
S 74
Monroe Expressway Planning Level T&R Forecast Update
November 2020
Page 31
4.1.2 Toll Schedule
Table 15 shows Class 1 ETC and BBM rates, by tolling zone, for all years from 2019 through 2040.
In all years, Class 2 rates are double Class 1 rates, and Class 3 rates are four times Class 1 rates. ETC
toll rates receive a 35 percent discount from BBM toll rates. Annual rate adjustments are assumed
to take place each year on January 1.
4.1.3 COVID-19 Impacts
COVID-19 impacts on traffic and revenue were described in Section 2 and accounted for in the
updated forecast in two ways. First, as described in Section 3.1.5, it is assumed that the pandemic
will have resulted in a slowdown in growth over the short-term. To reflect this impact, the growth
previously assumed to occur between 2019 and 2025 is assumed to be delayed by three years to
2028. Assuming that the 2025 trip tables reflecting Dr. Appold’s changes will occur by 2028, an
adjusted 2025 trip table was developed by interpolation from 2019. The net difference between
2025 and 2028 was also subtracted from the baseline 2030 and 2040 trip tables to recognize this
delayed growth effect.
Second, near-term impacts due to the COVID-19 pandemic were incorporated into the forecast
using a series of negative monthly impact factors by vehicle class and payment method. Transaction
and revenue impacts for the second half of CY 2020 were estimated to be –19.5 percent and –16.2
percent, respectively. This reflects the observed pace of recovery on the Monroe Expressway and
the potential for continued cautiousness from policy makers regarding school and business re-
opening. Transaction and revenue impacts for the first half of CY 2021 were estimated to be –18.1
percent and –14.8 percent, respectively, reflecting a gradual recovery accelerating into the summer
months. Continued recovery was assumed resulting in an estimated impact to Fiscal Year (FY) 2022
transactions and revenue of –10.0 percent and –7.9 percent, respectively. Estimated FY 2023 and
FY 2024 transactions were developed by interpolation using the compound annual growth rate
between FY 2022 and FY 2025. A return to long-term modeled growth rates was assumed
beginning in January 2025.
4.1.4 Updated Ramp-Up Factors
The Monroe Expressway opened to traffic in November 2018; ramp up effects are expected to last
for three years. Based on observed traffic volumes on Monroe Expressway, updated ramp-up
factors, reflecting a lag between project opening and full utilization, were estimated to be 0.75 in
calendar year 2019, 0.85 in 2020, and 0.95 in 2021. These factors were derived from prior
experience on other similar facilities, and actual data on the Monroe Expressway through July 2020
reflective of typical ramp-up combined with COVID-19 impacts. The initial year ramp-up factor was
also incorporated into the estimated impacts of the pandemic on 2020 traffic and revenue.

Monroe Expressway Planning Level T&R Forecast Update
November 2020
Page 32
Tab
le 1
5 -
Mo
nro
e Ex
pre
ssw
ay A
nn
ual
To
ll R
ates
by
Tolli
ng
Zon
e –
Cla
ss 1
ETC
an
d B
BM

Monroe Expressway Planning Level T&R Forecast Update
November 2020
Page 33
4.1.5 Annualization Factors
Annualization factors are used to derive annual transactions and revenue based on average
Monday-Thursday transactions (excluding holidays) estimated from the model. The 2016 T&R
Study used an annualization factor of 327 for all vehicle classes and for all years; this reflected the
assumptions that Fridays would have similar volumes to other weekdays, and that weekends and
holidays would have 68 percent as many transactions as average weekdays. However, the use of the
Monroe Expressway on Fridays and weekends during the first year of operation has been higher
than predicted, particularly during summer months.
Actual traffic and revenue collected from the Monroe Expressway was used to estimate actual
annualization factors in 2019. In 2019, Fridays had 26 percent higher passenger car volumes than
other weekdays, while weekends had 2 percent higher passenger car volumes. Conversely, truck
volumes were similar on Fridays to other weekdays, but were only 39 percent as high on weekends.
This translates to annualization factors of 380 for passenger cars and 295 for trucks in 2019; these
values are significantly higher than those assumed in the 2016 T&R Study.
These factors are expected to decrease significantly in the future. Based on the socioeconomic
growth anticipated in the area, the share of commuter traffic on Monroe Expressway is expected to
grow more rapidly than recreational traffic. In addition, it appears that the weekend usage of the
facility has ramped up more quickly than weekday traffic. These two factors are anticipated to
result in an increasing proportion of overall transactions occurring on weekdays over time. Table
16 shows the revised annualization factors for 2019 and for the forecast years. For passenger cars
(Class 1), the assumed annualization factor decreases gradually from 2019 to 2040. The decrease
between 2019 and 2025 is based on projected differences in the rate of growth, including ramp up,
in weekday versus weekend-day traffic. This trend is expected to continue beyond 2025, albeit at a
slower rate, resulting in a decrease from a factor of 350 in 2025 to 333 in 2040. The progression
between 2025 and 2040 was developed via straight-line interpolation. This trend is expected to
stabilize for Class 2 and Class 3 vehicles by 2025 resulting in a factor of 284 and stays at that level
for the remaining forecast horizon. The resulting overall annualization factor of 327 in 2040 is
equal to the value used in the 2016 T&R Study which was derived from observed traffic counts in
the US 74 corridor prior to the opening of the Monroe Expressway.
Table 16 - Annualization Factors (Ratio of annual to average weekday transactions)
Annualization Factor
Year(s) Class 1 Classes 2 & 3 Overall
2019 380 295 369
2025 350 284 343
2030 346 284 339
2040 333 284 327

Monroe Expressway Planning Level T&R Forecast Update
November 2020
Page 34
4.1.6 Collected Revenue
Collected revenue reflects leakage due to unbillable and uncollectible BBM transactions and also
includes processing fee revenue from late BBM payments. The following assumptions were used in
the process of converting gross revenue into collected revenue.
Leakage estimates in this study assumed 8.2 percent of BBM transactions (and revenue) to be
unbillable, due to reasons such as missing, blocked or damaged license plates, or insufficient vehicle
owner address information. Of the remaining 91.8 percent of transactions and revenue that is
invoiced, 12.1 percent was assumed to remain unpaid after all invoicing and collections steps. This
results in a combined leakage rate of approximately 22 percent which was applied to BBM toll
revenue estimates in all forecast years. For comparison, the 2016 T&R Study assumed a leakage
rate of approximately 21 percent in all forecast years.
Processing fee revenue projections in this study were estimated based on the relationship between
observed BBM transactions on the Monroe Expressway and collected processing fee revenue. This
relationship results in a factor of 0.117 which was applied to projected BBM transactions to
estimate processing fee revenue in each forecast year. This process was used due to the limited
period of operating history on Monroe Expressway for metrics such as invoice payment rates and
transactions per invoice to stabilize prior to the onset of COVID-related impacts. For comparison,
processing fee revenue estimates in the 2016 T&R study were based on the assumption that 56.9
percent of BBM invoices would be paid on the first invoice, 15.3 percent on the second invoice with
a $6 late fee, and 15.6 percent on the third or later invoice with an additional $6 late fee. These
assumptions were based on actual invoice payment rates on the Triangle Expressway in 2014 and
2015. An average of 16 transactions were assumed per invoice. These assumptions resulted in a
factor of 0.193. The factor of 0.117 used in this study represents a reduction of 39 percent from the
factor used in the 2016 T&R Study.
4.2 Updated T&R Forecast
4.2.1 Annual Transactions
Estimated annual toll transactions by class and by payment type are presented in Table 17. Annual
transactions are expected to increase from 36.8 million in FY 2021, to 53.9 million in FY 2025, 59.2
million in FY 2030, and 67.0 million in FY 2040. Traffic estimates for FY 2021 and FY 2022 were
adjusted downward to reflect the assumed three-year ramp-up period following project opening.
Over the entire forecast period between FY 2021 and FY 2058, annual transactions are expected to
increase by 2.1 percent on average. The growth rate is higher in the earlier years, with transactions
increasing by 10 percent per year on average between FY 2021 and FY 2025. This strong
transaction growth through FY 2025 is due to the combination of recovery from COVID-19 impacts,
the end of the ramp up effects, and strong economic growth anticipated in the study area.
After FY 2025, the transaction growth is primarily reflective of projected socioeconomic trends. The
annual growth rate is expected to gradually taper down from 1.9 percent on average between 2025
and 2030, to 1.2 percent between 2030 and 2040, and 0.9 percent between 2040 and 2058.

Monroe Expressway Planning Level T&R Forecast Update
November 2020
Page 35
Table 17 - Estimated Annual Transactions FY 2021 – FY 2058 (in thousands)
1) Ramp up was applied to the first 36-month period after opening.
Fiscal Class 1 Classes 2 and 3 All Vehicles
Year BBM ETC Total BBM ETC Total BBM ETC Total
2021 (1) 17,232 14,781 32,013 1,808 3,008 4,816 19,040 17,790 36,830
2022 (1) 19,687 18,288 37,974 1,951 3,329 5,280 21,638 21,616 43,255
2023 20,774 21,415 42,188 1,975 3,772 5,746 22,748 25,187 47,935
2024 20,965 24,035 45,000 1,887 4,048 5,935 22,852 28,083 50,935
2025 21,000 26,765 47,765 1,791 4,311 6,102 22,791 31,076 53,867
2026 20,671 28,733 49,404 1,721 4,482 6,203 22,392 33,215 55,607
2027 20,140 29,975 50,115 1,690 4,581 6,271 21,830 34,555 56,385
2028 19,629 31,272 50,900 1,660 4,682 6,342 21,288 35,954 57,242
2029 19,135 32,628 51,763 1,630 4,787 6,416 20,765 37,414 58,180
2030 18,660 34,045 52,705 1,601 4,893 6,494 20,261 38,939 59,199
2031 18,406 35,089 53,495 1,591 4,993 6,584 19,997 40,082 60,079
2032 18,366 35,734 54,100 1,599 5,085 6,684 19,965 40,819 60,784
2033 18,325 36,391 54,716 1,607 5,179 6,787 19,933 41,570 61,503
2034 18,285 37,060 55,346 1,616 5,275 6,891 19,901 42,335 62,236
2035 18,245 37,742 55,987 1,624 5,373 6,997 19,870 43,115 62,984
2036 18,206 38,437 56,642 1,633 5,472 7,105 19,838 43,909 63,747
2037 18,166 39,144 57,310 1,641 5,574 7,215 19,808 44,718 64,525
2038 18,127 39,865 57,992 1,650 5,677 7,327 19,777 45,542 65,319
2039 18,088 40,599 58,687 1,659 5,782 7,441 19,747 46,382 66,128
2040 18,049 41,347 59,396 1,668 5,890 7,557 19,716 47,237 66,953
2041 18,049 42,032 60,081 1,673 5,984 7,658 19,722 48,017 67,738
2042 18,087 42,652 60,739 1,676 6,066 7,742 19,763 48,718 68,480
2043 18,125 43,280 61,406 1,678 6,148 7,827 19,804 49,429 69,232
2044 18,164 43,918 62,082 1,681 6,232 7,913 19,845 50,150 69,995
2045 18,203 44,565 62,768 1,683 6,317 8,000 19,886 50,882 70,769
2046 18,211 45,153 63,364 1,683 6,393 8,076 19,894 51,546 71,440
2047 18,188 45,680 63,868 1,680 6,460 8,140 19,868 52,140 72,008
2048 18,165 46,212 64,378 1,677 6,529 8,205 19,842 52,741 72,583
2049 18,143 46,751 64,894 1,674 6,597 8,271 19,816 53,348 73,165
2050 18,120 47,296 65,416 1,671 6,667 8,338 19,791 53,963 73,754
2051 18,091 47,847 65,937 1,667 6,738 8,404 19,758 54,584 74,342
2052 18,056 48,402 66,458 1,661 6,809 8,471 19,717 55,211 74,928
2053 18,021 48,964 66,985 1,656 6,882 8,538 19,677 55,846 75,523
2054 17,986 49,532 67,518 1,651 6,955 8,606 19,637 56,487 76,124
2055 17,951 50,107 68,058 1,645 7,029 8,675 19,597 57,137 76,733
2056 17,916 50,689 68,605 1,640 7,104 8,744 19,557 57,793 77,350
2057 17,882 51,277 69,159 1,635 7,180 8,815 19,517 58,457 77,974
2058 17,847 51,873 69,720 1,630 7,256 8,886 19,477 59,129 78,606
Monroe Expressway Planning Level T&R Forecast Update
November 2020
Page 36
The share of ETC transactions is anticipated to increase from 48.3 percent in FY 2021 to 65.8
percent by FY 2030; after 2030, the ETC penetration rate continues to increase gradually to reach
75.2 percent by 2058.
The share of truck transactions (Classes 2 and 3) is anticipated to decline from 13.1 percent in FY
2021 to 11.0 percent by FY 2030; after 2030, the truck share remains stable between 11 and 11.5
percent. This reflects the observation that truck traffic has ramped up faster than passenger car
traffic on the Monroe Expressway.
4.2.2 Gross Toll Revenue
In this section, gross toll revenue represents expected revenue prior to accounting for BBM leakage
and processing fee revenue. Estimated annual gross toll revenue by class (Classes 2-3 combined)
and by payment type are presented in Table 18. Annual gross toll revenue is expected to increase
from $22.9 million in FY 2021 to $85.5 million in FY 2058.
Over the entire forecast period from FY 2021 to FY 2058, annual gross revenue is expected to grow
at an average rate of 3.6 percent. This is higher than the average annual transaction growth rate
(2.1 percent) because adopted future toll rates are scheduled to increase annually. In the short term
(through FY 2025), the average revenue per transaction stays fairly flat due to the increasing ETC
market share and Class 1 vehicles are expected to grow more rapidly than Classes 2 and 3 as they
recover from greater negative impacts due to COVID-19.
Consistent with transaction trends, the share of gross revenue generated by ETC transactions
increases from 40.3 percent in FY 2021 to 67.3 percent in FY 2058.
The share of gross revenue generated by trucks declines from 35 percent in FY 2021 to 29.5
percent in FY 2058. This is also consistent with the increasing share of Class 1 transactions over
time.
4.2.3 Collected Revenue
Estimates of collected revenue include adjustments for leakage associated with BBM and
anticipated processing fee revenue. Estimated annual collected toll revenue by class and by
payment type are presented in Table 19. Annual collected toll revenue is expected to increase from
$20.9 million in FY 2021 to $81.5 million in FY 2058. Collected revenue ranges from 3.0 percent to
4.6 percent lower than gross toll revenue throughout the forecast, as leakage is expected to exceed
processing fee revenues in all years. Collected revenue growth trends are consistent with the trends
previously described for gross revenue projections.

Monroe Expressway Planning Level T&R Forecast Update
November 2020
Page 37
Table 18 - Estimated Annual Gross Toll Revenue FY 2021 – FY 2058 (1) (in thousands of $)
1) Gross toll revenue is the expected revenue prior to accounting for BBM leakage and processing fee revenue. 2) Ramp up was applied to the first 36-month period after opening.
Fiscal Class 1 Classes 2 and 3 All Vehicles
Year BBM ETC Total BBM ETC Total BBM ETC Total
2021 (2) $9,690 $5,191 $14,881 $3,990 $4,027 $8,016 $13,680 $9,217 $22,898
2022 (2) 11,280 6,547 17,827 4,354 4,515 8,869 15,634 11,063 26,697
2023 12,175 7,849 20,024 4,326 5,074 9,400 16,501 12,923 29,424
2024 12,571 9,021 21,593 4,065 5,410 9,476 16,637 14,432 31,068
2025 12,883 10,287 23,170 3,793 5,725 9,518 16,676 16,012 32,688
2026 12,957 11,236 24,193 3,655 5,971 9,626 16,612 17,207 33,819
2027 12,893 11,969 24,862 3,678 6,229 9,907 16,571 18,198 34,769
2028 12,820 12,809 25,628 3,698 6,520 10,217 16,517 19,328 35,846
2029 12,728 13,665 26,393 3,712 6,816 10,528 16,440 20,482 36,921
2030 12,643 14,539 27,182 3,726 7,110 10,836 16,368 21,649 38,017
2031 12,710 15,284 27,993 3,780 7,400 11,180 16,490 22,684 39,174
2032 12,942 15,882 28,824 3,879 7,691 11,570 16,821 23,573 40,394
2033 13,171 16,509 29,680 3,978 7,997 11,974 17,149 24,505 41,654
2034 13,394 17,190 30,584 4,078 8,327 12,405 17,472 25,517 42,989
2035 13,646 17,896 31,542 4,185 8,663 12,847 17,831 26,559 44,389
2036 13,913 18,572 32,485 4,297 8,991 13,288 18,210 27,563 45,773
2037 14,178 19,285 33,463 4,412 9,338 13,749 18,590 28,623 47,213
2038 14,451 20,121 34,572 4,530 9,740 14,270 18,981 29,861 48,842
2039 14,705 20,859 35,563 4,644 10,100 14,744 19,348 30,959 50,308
2040 14,962 21,674 36,635 4,763 10,496 15,259 19,725 32,170 51,894
2041 15,283 22,604 37,888 4,877 10,918 15,795 20,160 33,523 53,683
2042 15,619 23,414 39,033 4,979 11,287 16,266 20,598 34,701 55,299
2043 15,968 24,195 40,164 5,092 11,678 16,770 21,060 35,873 56,933
2044 16,326 24,966 41,292 5,206 12,067 17,273 21,532 37,033 58,565
2045 16,698 25,818 42,516 5,319 12,469 17,787 22,017 38,287 60,304
2046 17,054 26,733 43,787 5,426 12,874 18,300 22,481 39,607 62,088
2047 17,358 27,588 44,946 5,527 13,276 18,802 22,885 40,863 63,748
2048 17,690 28,459 46,149 5,629 13,690 19,319 23,319 42,149 65,468
2049 18,033 29,433 47,466 5,732 14,106 19,838 23,765 43,539 67,304
2050 18,362 30,425 48,787 5,837 14,539 20,376 24,199 44,964 69,162
2051 18,691 31,319 50,011 5,943 14,988 20,930 24,634 46,307 70,941
2052 19,033 32,269 51,302 6,047 15,451 21,498 25,079 47,721 72,800
2053 19,384 33,291 52,675 6,149 15,927 22,076 25,532 49,219 74,751
2054 19,728 34,358 54,086 6,255 16,416 22,671 25,982 50,774 76,757
2055 20,107 35,453 55,560 6,365 16,925 23,290 26,472 52,379 78,850
2056 20,493 36,576 57,069 6,475 17,456 23,931 26,968 54,031 80,999
2057 20,847 37,759 58,607 6,586 17,990 24,576 27,433 55,749 83,183
2058 21,226 39,028 60,254 6,699 18,534 25,233 27,925 57,562 85,487

Monroe Expressway Planning Level T&R Forecast Update
November 2020
Page 38
Table 19 - Estimated Annual Collected Toll Revenue FY 2021 – FY 2058 (1) (in thousands of $)
1) Collected revenue is the expected revenue after accounting for BBM leakage and processing fee revenue. 2) Ramp up was applied to the first 36-month period after opening.
Collected Toll Revenue Processing Total
Fiscal Class 1 Classes 2 and 3 All Vehicles Fee Collected
Year BBM ETC Total BBM ETC Total BBM ETC Total Revenue Revenue
2021 (2) $7,969 $5,191 $13,160 $2,531 $4,027 $6,558 $10,501 $9,217 $19,718 $1,222 $20,940
2022 (2) 9,277 6,547 15,824 2,762 4,515 7,278 12,039 11,063 23,102 2,532 25,633
2023 10,012 7,849 17,861 2,744 5,074 7,819 12,757 12,923 25,680 2,662 28,342
2024 10,339 9,021 19,360 2,579 5,410 7,989 12,918 14,432 27,350 2,674 30,023
2025 10,595 10,287 20,882 2,406 5,725 8,131 13,002 16,012 29,013 2,667 31,680
2026 10,656 11,236 21,891 2,319 5,971 8,290 12,974 17,207 30,182 2,620 32,802
2027 10,603 11,969 22,572 2,333 6,229 8,562 12,936 18,198 31,134 2,554 33,689
2028 10,543 12,809 23,352 2,346 6,520 8,866 12,889 19,328 32,217 2,491 34,708
2029 10,468 13,665 24,133 2,355 6,816 9,171 12,822 20,482 33,304 2,430 35,733
2030 10,397 14,539 24,936 2,364 7,110 9,474 12,761 21,649 34,410 2,371 36,780
2031 10,452 15,284 25,736 2,398 7,400 9,798 12,851 22,684 35,535 2,340 37,874
2032 10,644 15,882 26,526 2,461 7,691 10,152 13,104 23,573 36,678 2,336 39,014
2033 10,832 16,509 27,341 2,524 7,997 10,520 13,356 24,505 37,861 2,332 40,193
2034 11,015 17,190 28,205 2,587 8,327 10,914 13,602 25,517 39,120 2,328 41,448
2035 11,222 17,896 29,118 2,655 8,663 11,317 13,877 26,559 40,436 2,325 42,760
2036 11,442 18,572 30,014 2,726 8,991 11,717 14,168 27,563 41,731 2,321 44,052
2037 11,660 19,285 30,945 2,799 9,338 12,137 14,459 28,623 43,082 2,317 45,399
2038 11,884 20,121 32,005 2,874 9,740 12,614 14,758 29,861 44,619 2,314 46,933
2039 12,093 20,859 32,952 2,946 10,100 13,047 15,039 30,959 45,998 2,310 48,309
2040 12,304 21,674 33,978 3,022 10,496 13,518 15,326 32,170 47,496 2,307 49,803
2041 12,569 22,604 35,173 3,094 10,918 14,012 15,663 33,523 49,185 2,307 51,493
2042 12,845 23,414 36,259 3,159 11,287 14,446 16,004 34,701 50,704 2,312 53,017
2043 13,132 24,195 37,328 3,231 11,678 14,908 16,363 35,873 52,236 2,317 54,553
2044 13,426 24,966 38,393 3,303 12,067 15,370 16,729 37,033 53,762 2,322 56,084
2045 13,732 25,818 39,550 3,374 12,469 15,843 17,107 38,287 55,394 2,327 57,720
2046 14,026 26,733 40,759 3,443 12,874 16,317 17,468 39,607 57,075 2,328 59,403
2047 14,275 27,588 41,863 3,506 13,276 16,782 17,781 40,863 58,645 2,325 60,969
2048 14,548 28,459 43,008 3,571 13,690 17,261 18,119 42,149 60,268 2,322 62,590
2049 14,830 29,433 44,263 3,636 14,106 17,742 18,467 43,539 62,006 2,319 64,324
2050 15,101 30,425 45,526 3,703 14,539 18,242 18,804 44,964 63,767 2,316 66,083
2051 15,372 31,319 46,691 3,770 14,988 18,758 19,142 46,307 65,449 2,312 67,760
2052 15,652 32,269 47,922 3,836 15,451 19,288 19,489 47,721 67,209 2,307 69,516
2053 15,941 33,291 49,232 3,901 15,927 19,828 19,842 49,219 69,060 2,302 71,363
2054 16,224 34,358 50,582 3,968 16,416 20,385 20,192 50,774 70,966 2,297 73,264
2055 16,536 35,453 51,989 4,038 16,925 20,963 20,574 52,379 72,953 2,293 75,245
2056 16,854 36,576 53,429 4,108 17,456 21,564 20,961 54,031 74,993 2,288 77,281
2057 17,145 37,759 54,904 4,178 17,990 22,168 21,323 55,749 77,072 2,283 79,356
2058 17,456 39,028 56,484 4,250 18,534 22,784 21,707 57,562 79,268 2,279 81,547

Monroe Expressway Planning Level T&R Forecast Update
November 2020
Page 39
4.3 T&R Forecast Comparison
Table 20 shows a forecast comparison between the 2016 T&R Study, a hypothetical no-COVID
scenario and the base case.
Prior to making any COVID-related adjustments, the updated forecast has higher transaction and
revenue estimates than the 2016 T&R Study, particularly in FY 2025 and beyond. Starting in FY
2025, the no-COVID scenario shows transactions higher by 3.5 to 4.4 percent. This is due to a
combination of re-benchmarking to recent actual traffic and revenue, revised truck market share
estimates, increased annualization factors, and increased population growth forecasts. Following
the transaction trend, after 2025, collected revenue in the no-COVID scenario exceeds the 2016
T&R Study forecast by 3.3 percent to 6.6 percent.
Comparing the base case forecast to the no-COVID scenario, the collected revenue is estimated to be
20.2 percent lower in FY 2021 and 12.6 percent lower in FY 2022. By FY 2025, collected revenue for
the base case is expected to recover to 7.9 percent lower than the no-Covid case. This difference
gradually decreases to 5.4 percent by FY 2041 and remains unchanged thereafter.
Comparing the base case forecast to the 2016 T&R Study forecast, collected revenue is lower in the
short term, by 11.5 percent in FY 2021, 7.3 percent in FY 2022, and 4.8 percent in FY 2023. This
difference decreases over time as the increased population estimates gradually overcome the
COVID-related negative adjustments to the trip tables. Eventually, by FY 2050, collected revenue
estimates for the base case exceed the forecasts from the 2016 T&R Study but the difference is
never greater than 1 percent. This comparison is illustrated in Figure 14.

Monroe Expressway Planning Level T&R Forecast Update
November 2020
Page 40
Tota
l Tra
nsa
ctio
ns
Gro
ss T
oll
Re
ven
ue
Tota
l Co
llect
ed
Re
ven
ue
20
20
T&
R U
pd
ate
Stud
y2
02
0 T
&R
Up
dat
e St
udy
20
20
T&
R U
pd
ate
Stud
y
Fisc
al2
01
6 T
&R
No
P
erce
nt
Bas
eP
erce
nt
Per
cen
t2
01
6 T
&R
No
P
erce
nt
Bas
eP
erce
nt
Per
cen
t2
01
6 T
&R
No
P
erce
nt
Bas
eP
erce
nt
Per
cen
t
Ye
arSt
udy
CO
VID
Dif
f. (
1)
Cas
eD
iff.
(2
)D
iff.
(3
)St
udy
CO
VID
Dif
f. (
1)
Cas
eD
iff.
(2
)D
iff.
(3
)St
udy
CO
VID
Dif
f. (
1)
Cas
eD
iff.
(2
)D
iff.
(3
)
20
21
44
,03
4
4
5,3
58
3.0
3
6,8
30
(18
.8)
(16
.4)
$2
2,5
68
$2
7,0
95
20
.1
$
22
,89
8(1
5.5
)
1
.5
$2
3,6
59
$2
6,2
42
10
.9
$
20
,94
0(2
0.2
)
(1
1.5
)
20
22
50
,71
7
5
0,5
23
(0.4
)
4
3,2
55
(14
.4)
(14
.7)
26
,44
93
0,2
74
14
.5
2
6,6
97
(11
.8)
0.9
2
7,6
44
29
,32
8
6
.1
25
,63
3
(1
2.6
)
(7
.3)
20
23
53
,80
4
5
4,4
40
1.2
4
7,9
35
(11
.9)
(10
.9)
28
,57
23
2,5
94
14
.1
2
9,4
24
(9.7
)
3
.0
29
,76
73
1,5
97
6.1
2
8,3
42
(10
.3)
(4.8
)
20
24
55
,68
2
5
7,2
15
2.8
5
0,9
35
(11
.0)
(8.5
)
3
0,1
26
34
,21
0
1
3.6
31
,06
8
(9
.2)
3.1
3
1,2
92
33
,19
7
6
.1
30
,02
3
(9
.6)
(4.1
)
20
25
57
,25
1
5
9,2
33
3.5
5
3,8
67
(9.1
)
(5
.9)
31
,62
53
5,4
12
12
.0
3
2,6
88
(7.7
)
3
.4
32
,75
03
4,4
05
5.1
3
1,6
80
(7.9
)
(3
.3)
20
26
58
,26
1
6
0,4
64
3.8
5
5,6
07
(8.0
)
(4
.6)
32
,79
63
6,3
23
10
.8
3
3,8
19
(6.9
)
3
.1
33
,85
63
5,2
87
4.2
3
2,8
02
(7.0
)
(3
.1)
20
27
59
,06
5
6
1,2
53
3.7
5
6,3
85
(7.9
)
(4
.5)
33
,90
33
7,3
25
10
.1
3
4,7
69
(6.8
)
2
.6
34
,89
03
6,2
22
3.8
3
3,6
89
(7.0
)
(3
.4)
20
28
59
,88
9
6
2,1
20
3.7
5
7,2
42
(7.9
)
(4
.4)
35
,10
73
8,4
62
9.6
3
5,8
46
(6.8
)
2
.1
36
,02
03
7,2
96
3.5
3
4,7
08
(6.9
)
(3
.6)
20
29
60
,73
2
6
3,0
66
3.8
5
8,1
80
(7.7
)
(4
.2)
36
,29
63
9,5
92
9.1
3
6,9
21
(6.7
)
1
.7
37
,13
73
8,3
72
3.3
3
5,7
33
(6.9
)
(3
.8)
20
30
61
,50
7
6
4,0
95
4.2
5
9,1
99
(7.6
)
(3
.8)
37
,23
64
0,7
39
9.4
3
8,0
17
(6.7
)
2
.1
38
,02
03
9,4
66
3.8
3
6,7
80
(6.8
)
(3
.3)
20
31
62
,19
3
6
4,9
59
4.4
6
0,0
79
(7.5
)
(3
.4)
38
,17
34
1,9
33
9.8
3
9,1
74
(6.6
)
2
.6
38
,89
84
0,5
93
4.4
3
7,8
74
(6.7
)
(2
.6)
20
32
62
,87
8
6
5,6
25
4.4
6
0,7
84
(7.4
)
(3
.3)
39
,36
84
3,1
77
9.7
4
0,3
94
(6.4
)
2
.6
40
,01
34
1,7
53
4.3
3
9,0
14
(6.6
)
(2
.5)
20
33
63
,57
4
6
6,3
03
4.3
6
1,5
03
(7.2
)
(3
.3)
40
,59
14
4,4
60
9.5
4
1,6
54
(6.3
)
2
.6
41
,15
74
2,9
52
4.4
4
0,1
93
(6.4
)
(2
.3)
20
34
64
,28
3
6
6,9
95
4.2
6
2,2
36
(7.1
)
(3
.2)
41
,87
74
5,8
19
9.4
4
2,9
89
(6.2
)
2
.7
42
,36
54
4,2
29
4.4
4
1,4
48
(6.3
)
(2
.2)
20
35
65
,00
3
6
7,7
00
4.1
6
2,9
84
(7.0
)
(3
.1)
43
,24
24
7,2
44
9.3
4
4,3
89
(6.0
)
2
.7
43
,64
54
5,5
63
4.4
4
2,7
60
(6.2
)
(2
.0)
20
36
65
,73
7
6
8,4
19
4.1
6
3,7
47
(6.8
)
(3
.0)
44
,59
94
8,6
47
9.1
4
5,7
73
(5.9
)
2
.6
44
,91
04
6,8
71
4.4
4
4,0
52
(6.0
)
(1
.9)
20
37
66
,48
3
6
9,1
51
4.0
6
4,5
25
(6.7
)
(2
.9)
46
,00
95
0,1
05
8.9
4
7,2
13
(5.8
)
2
.6
46
,22
84
8,2
33
4.3
4
5,3
99
(5.9
)
(1
.8)
20
38
67
,24
2
6
9,8
98
4.0
6
5,3
19
(6.6
)
(2
.9)
47
,58
05
1,7
60
8.8
4
8,8
42
(5.6
)
2
.7
47
,70
64
9,7
90
4.4
4
6,9
33
(5.7
)
(1
.6)
20
39
68
,01
4
7
0,6
59
3.9
6
6,1
28
(6.4
)
(2
.8)
49
,01
75
3,2
36
8.6
5
0,3
08
(5.5
)
2
.6
49
,05
45
1,1
73
4.3
4
8,3
09
(5.6
)
(1
.5)
20
40
68
,79
9
7
1,4
35
3.8
6
6,9
53
(6.3
)
(2
.7)
50
,55
65
4,8
35
8.5
5
1,8
94
(5.4
)
2
.6
50
,50
15
2,6
78
4.3
4
9,8
03
(5.5
)
(1
.4)
20
41
69
,57
0
7
2,2
19
3.8
6
7,7
38
(6.2
)
(2
.6)
52
,15
95
6,6
86
8.7
5
3,6
83
(5.3
)
2
.9
52
,00
95
4,4
27
4.6
5
1,4
93
(5.4
)
(1
.0)
20
42
70
,32
7
7
3,0
10
3.8
6
8,4
80
(6.2
)
(2
.6)
53
,61
15
8,3
93
8.9
5
5,2
99
(5.3
)
3
.1
53
,37
35
6,0
37
5.0
5
3,0
17
(5.4
)
(0
.7)
20
43
71
,09
8
7
3,8
12
3.8
6
9,2
32
(6.2
)
(2
.6)
55
,17
76
0,1
18
9.0
5
6,9
33
(5.3
)
3
.2
54
,84
95
7,6
59
5.1
5
4,5
53
(5.4
)
(0
.5)
20
44
71
,88
3
7
4,6
25
3.8
6
9,9
95
(6.2
)
(2
.6)
56
,82
96
1,8
40
8.8
5
8,5
65
(5.3
)
3
.1
56
,40
55
9,2
76
5.1
5
6,0
84
(5.4
)
(0
.6)
20
45
72
,68
3
7
5,4
49
3.8
7
0,7
69
(6.2
)
(2
.6)
58
,54
96
3,6
75
8.8
6
0,3
04
(5.3
)
3
.0
58
,02
96
1,0
03
5.1
5
7,7
20
(5.4
)
(0
.5)
20
46
73
,37
5
7
6,1
66
3.8
7
1,4
40
(6.2
)
(2
.6)
60
,24
16
5,5
60
8.8
6
2,0
88
(5.3
)
3
.1
59
,62
06
2,7
81
5.3
5
9,4
03
(5.4
)
(0
.4)
20
47
73
,95
7
7
6,7
71
3.8
7
2,0
08
(6.2
)
(2
.6)
61
,85
76
7,3
12
8.8
6
3,7
48
(5.3
)
3
.1
61
,14
06
4,4
35
5.4
6
0,9
69
(5.4
)
(0
.3)
20
48
74
,54
8
7
7,3
84
3.8
7
2,5
83
(6.2
)
(2
.6)
63
,52
16
9,1
28
8.8
6
5,4
68
(5.3
)
3
.1
62
,71
46
6,1
46
5.5
6
2,5
90
(5.4
)
(0
.2)
20
49
75
,14
6
7
8,0
04
3.8
7
3,1
65
(6.2
)
(2
.6)
65
,26
57
1,0
68
8.9
6
7,3
04
(5.3
)
3
.1
64
,35
86
7,9
80
5.6
6
4,3
24
(5.4
)
(0
.1)
20
50
75
,75
1
7
8,6
32
3.8
7
3,7
54
(6.2
)
(2
.6)
66
,97
37
3,0
31
9.0
6
9,1
62
(5.3
)
3
.3
65
,96
76
9,8
38
5.9
6
6,0
83
(5.4
)
0
.2
20
51
76
,35
5
7
9,2
59
3.8
7
4,3
42
(6.2
)
(2
.6)
68
,69
77
4,9
07
9.0
7
0,9
41
(5.3
)
3
.3
67
,59
57
1,6
08
5.9
6
7,7
60
(5.4
)
0
.2
20
52
76
,95
6
7
9,8
85
3.8
7
4,9
28
(6.2
)
(2
.6)
70
,57
47
6,8
69
8.9
7
2,8
00
(5.3
)
3
.2
69
,36
87
3,4
61
5.9
6
9,5
16
(5.4
)
0
.2
20
53
77
,56
4
8
0,5
18
3.8
7
5,5
23
(6.2
)
(2
.6)
72
,46
47
8,9
29
8.9
7
4,7
51
(5.3
)
3
.2
71
,15
07
5,4
11
6.0
7
1,3
63
(5.4
)
0
.3
20
54
78
,18
2
8
1,1
59
3.8
7
6,1
24
(6.2
)
(2
.6)
74
,42
08
1,0
47
8.9
7
6,7
57
(5.3
)
3
.1
72
,99
57
7,4
19
6.1
7
3,2
64
(5.4
)
0
.4
20
55
78
,80
7
8
1,8
09
3.8
7
6,7
33
(6.2
)
(2
.6)
76
,40
28
3,2
58
9.0
7
8,8
50
(5.3
)
3
.2
74
,87
27
9,5
13
6.2
7
5,2
45
(5.4
)
0
.5
20
56
79
,44
1
8
2,4
66
3.8
7
7,3
50
(6.2
)
(2
.6)
78
,41
58
5,5
26
9.1
8
0,9
99
(5.3
)
3
.3
76
,78
08
1,6
61
6.4
7
7,2
81
(5.4
)
0
.7
20
57
80
,08
4
8
3,1
32
3.8
7
7,9
74
(6.2
)
(2
.6)
80
,59
08
7,8
31
9.0
8
3,1
83
(5.3
)
3
.2
78
,84
08
3,8
53
6.4
7
9,3
56
(5.4
)
0
.7
20
58
80
,73
5
8
3,8
06
3.8
7
8,6
06
(6.2
)
(2
.6)
82
,67
69
0,2
66
9.2
8
5,4
87
(5.3
)
3
.4
80
,81
88
6,1
69
6.6
8
1,5
47
(5.4
)
0
.9
Tab
le 2
0 -
Tran
sact
ion
an
d R
even
ue
Fore
cast
Co
mp
aris
on
(FY
20
21 –
FY
205
8)
(in
th
ou
san
ds)
1)
Per
cen
t d
iffe
ren
ce b
etw
ee
n t
he
No
-CO
VID
Cas
e an
d t
he
20
16
T&
R S
tud
y.
2)
Per
cen
t d
iffe
ren
ce b
etw
een
th
e B
ase
Cas
e an
d N
o-C
OV
ID C
ase.
3)
Per
cen
t d
iffe
ren
ce b
etw
een
th
e 2
02
0 B
ase
Cas
e an
d t
he
20
16
T&
R S
tud
y.

Monroe Expressway Planning Level T&R Forecast Update
November 2020
Page 41
$0
$1
0,0
00
$2
0,0
00
$3
0,0
00
$4
0,0
00
$5
0,0
00
$6
0,0
00
$7
0,0
00
$8
0,0
00
$9
0,0
00
$1
00
,00
0
2021
2022
2023
2024
2025
2026
2027
2028
2029
2030
2031
2032
2033
2034
2035
2036
2037
2038
2039
2040
2041
2042
2043
2044
2045
2046
2047
2048
2049
2050
2051
2052
2053
2054
2055
2056
2057
2058
FY Total Collected Revenue ($000s)
Fisc
al Y
ear
20
16
T&
R S
tud
yN
o-C
OV
ID S
cen
ario
Bas
e C
ase
Figu
re 1
4 –
Tota
l Co
llect
ed
Rev
enu
e Fo
reca
st C
om
par
iso
n

Monroe Expressway Planning Level T&R Forecast Update
November 2020
Page 42
Disclaimer CDM Smith used currently-accepted professional practices and procedures in the development of
the traffic and revenue estimates in this report. However, as with any forecast, it should be
understood that differences between forecasted and actual results may occur, as caused by events
and circumstances beyond the control of the forecasters. In formulating the estimates, CDM Smith
reasonably relied upon the accuracy and completeness of information provided (both written and
oral) by NCTA. CDM Smith also relied upon the reasonable assurances of independent parties and is
not aware of any material facts that would make such information misleading.
CDM Smith made qualitative judgments related to several key variables in the development and
analysis of the traffic and revenue estimates that must be considered as a whole; therefore,
selecting portions of any individual result without consideration of the intent of the whole may
create a misleading or incomplete view of the results and the underlying methodologies used to
obtain the results. CDM Smith gives no opinion as to the value or merit of partial information
extracted from this report
All estimates and projections reported herein are based on CDM Smith’s experience and judgment
and on a review of information obtained from multiple agencies, including NCTA. These estimates
and projections may not be indicative of actual or future values and are therefore subject to
substantial uncertainty. Certain variables such as future developments, economic cycles, global
pandemics and impacts related to advances in automotive technology etc. cannot be predicted with
certainty and may affect the estimates or projections expressed in this report, such that CDM Smith
does not specifically guarantee or warrant any estimate or projection contained within this report.
While CDM Smith believes that the projections and other forward-looking statements contained
within the report are based on reasonable assumptions as of the date of the report, such forward
looking statements involve risks and uncertainties that may cause actual results to differ materially
from the results predicted. Therefore, following the date of this report, CDM Smith will take no
responsibility or assume any obligation to advise of changes that may affect its assumptions
contained within the report, as they pertain to socioeconomic and demographic forecasts, proposed
residential or commercial land use development projects and/or potential improvements to the
regional transportation network.
The report and its contents are intended solely for use by the NCTA and designated parties
approved by NCTA and CDM Smith. Any use by third-parties, other than as noted above, is expressly
prohibited. In addition, any publication of the report without the express written consent of CDM
Smith is prohibited.
Monroe Expressway Planning Level T&R Forecast Update
November 2020
Page 43
CDM Smith is not, and has not been, a municipal advisor as defined in Federal law (the Dodd Frank
Bill) to NCTA and does not owe a fiduciary duty pursuant to Section 15B of the Exchange Act to
NCTA with respect to the information and material contained in this report. CDM Smith is not
recommending and has not recommended any action to NCTA. NCTA should discuss the
information and material contained in this report with any and all internal and external advisors
that it deems appropriate before acting on this information.
Sincerely,
Adam Aceto
Planner
CDM Smith Inc.
cc: Scott Allaire