Using a decision support model to identify export opportunities
189
Final report Using a decision support model to identify export opportunities Martin Cameron Wilma Viviers October 2017 When citing this paper, please use the title and the following reference number: F-38410-RWA-1
-
Upload
khangminh22 -
Category
Documents
-
view
0 -
download
0
Transcript of Using a decision support model to identify export opportunities

Final report
Using a decision
support
model to
identify export
opportunities
Martin Cameron
Wilma Viviers
October 2017 When citing this paper, please use the title and the followingreference number:F-38410-RWA-1

i Rwanda TRADE-DSM analysis – Technical study report final draft 31 August 2017
Project title:
Using a Decision Support Model to
identify export opportunities:
Rwanda
Project code: 1- VCT-VRWA-VXXX-38410
Abstract
The main objective of this study is to identify new opportunities for exporting Rwandan goods and
services using an alternative approach (also endorsed by the World Trade Organisation (WTO)) and
tool called the ‘Decision Support Model’ (DSM) approach. This approach aims to map out relatively
easy(ier)-to-access markets with low(er) barriers to entry that exhibit demonstrated import demand
and is not too concentrated from an import supply perspective. For this purpose the TRADE-DSMTM1
approach provides a scientific approach to also take into consideration more specific aspects of the
target market and product(s) in question. The DSM was initially specifically designed to assist with
the selection of the most promising markets for a given exporting country in order to assist export
promotion organisations in planning and assessing their export promotion activities.
The Decision Support Model (DSM) is an analytical tool, incorporating a thorough screening process
that facilitates systematic export market selection through the identification of realistic export
opportunities for firms wanting to expand their sales reach into foreign markets. It also offers
alternatives to exporters where they are facing saturation and/or declining growth in their
traditional markets. The DSM methodology takes into consideration all possible worldwide product-
country combinations and, using four filters, progressively eliminates less promising markets until
those with the greatest prospects of success are revealed.
A purpose-built DSM for Rwanda was developed for the purpose of informing this study. Detail
regarding key assumptions and the approach are discussed supported with contextual and relevant
research. In this version of the DSM methodology applied for the Rwanda case, focus was placed on
constructing logistics routing and costing assumptions reflecting a land-locked economy such as
Rwanda’s as well as a transit time cost component informed from empirical research by Hummels
(2001, 2006, 2007, and 2012) and coined the “Hummels constant” for the purposes of this approach.
It must be noted that this analysis is based on a modelled outcome, as opposed to observations from
relationships in the data. However, assumptions for the modelling are informed from various studies
and fields over a period of the last twenty years, the majority which is documented in Cuyvers et al.
1 TRADE-DSM is a registered trade mark of TRADE research focus area at the North-West University,
Potchefstroom Campus, South Africa.

ii Rwanda TRADE-DSM analysis – Technical study report final draft 31 August 2017
2012. As with any model the outcomes are subject to defined structure and parameter assumptions.
For this study the latest information on all relevant elements were incorporated where possible.
Outcomes from the analysis based on the DSM model for Rwanda indicates that more than 80
percent of the identified potential in terms of value of market-product line combinations are
contained in 6 geographic regions (in descending order of potential value) of Western Europe,
Eastern Asia, Northern America, Southern Europe, South-Eastern Asia and Northern Europe – not
within the direct geographic vicinity of Rwanda. In terms of the number of opportunities, in addition
to the first 6 regions, Western Asia, Eastern Europe and Western Africa contributes to reaching the
80 percent mark.
Close (to Rwanda) regional sub-Saharan markets in Middle Africa, Eastern Africa and Southern Africa
overall do not pose large (relatively speaking) opportunities in either value or number of product
lines in the short to medium term, with the combined markets in these regions accounting for only
1.4 percent of the potential and 7.7 percent of the number of opportunities.
By combining the outcomes obtained from the more detailed analysis on a country level for the
focus countries with that of the rest of the world outcomes, a “portfolio” of focus products and
markets was created in terms of guiding the focus of analysis and for the purposes of deriving policy
implications. This research opens up alternative questions on research around diversification in
terms of both markets and products for Rwanda, with three possible further focus sectors
(aeronautic maintenance and repairs and related services, mining and drilling maintenance and
repairs and related services and manufacture of plastics and related industries) highlighted by the
outcomes of this approach.
The purpose of this paper is not to be exhaustive nor authoritive, but rather illustrative of how the
outcomes from the DSM approach can be applied for decision making with specific relevance to
Rwanda’s policy makers in their journey of planning and building the country’s economy. While an
advantage is that the outcomes are provided at the HS6-digit product line detail, it can also pose a
challenge since data quality and frequency of reporting at this level can be problematic for lesser
developed countries as well as lesser traded products.
As an immediate priority it would be useful to cross-check key assumptions and possibly deepen the
analysis of current findings to ensure robustness. Thereafter, to sensibly and responsibly inform
strategic decisions, more detailed investigation and evaluation of each of the opportunities
identified for Rwanda by the DSM approach is required.

iii Rwanda TRADE-DSM analysis – Technical study report final draft 31 August 2017
Authors:
Martin Cameron TRADE (Trade and Development) research focus area PhD student North-West University, Potchefstroom Campus, South Africa
Prof. Wilma Viviers Director: TRADE (Trade and Development) research focus area and WTO Chair North-West University, Potchefstroom Campus, South Africa
Reviewers
Victor Steenbergen Country economist International Growth Centre, Kigali, Rwanda
Richard Newfarmer Country Director, Rwanda and Uganda, International Growth Centre, Washington DC

iv Rwanda TRADE-DSM analysis – Technical study report final draft 31 August 2017
© North-West University, Potchefstroom Campus, South Africa. All rights reserved.
This document contains confidential information that shall not be transmitted to any third party without written consent of North-
West University. The same applies to file copying (including but not limited to electronic copies), wholly or partially.
It is prohibited to change any and all versions of this document in any manner whatsoever, including but not limited to dividing it into
parts. In case of a conflict between an electronic version (e.g. PDF file) and the original paper version provided by North-West
University, the latter will prevail.
North-West University and/or its associated member/companies disclaim liability for any direct, indirect, consequential or incidental
damages that may result from the use of the information or data, or from the inability to use the information or data contained in this
document.

i Rwanda TRADE-DSM analysis – Technical study report final draft 31 August 2017
Contents
1. Introduction .................................................................................................................................. 12
1.1. Objective of this study .......................................................................................................... 14
1.2. Outcome reporting dimensions ............................................................................................ 15
2. Methodology applied .................................................................................................................... 15
2.1. Brief overview of the TRADE-DSM approach ........................................................................ 15
2.2. The international trade data used ........................................................................................ 18
2.3. Considering intensive and extensive margins ....................................................................... 18
2.4. Rwanda specific adjustments for the TRADE-DSM analysis ................................................. 21
3. Skill and technology intensity ....................................................................................................... 38
4. Contextual analysis – overview of Rwanda’s import and export trends ...................................... 39
5. Overview of outcomes obtained................................................................................................... 41
5.1. DSM filtering approach applied - outcomes per step ........................................................... 42
5.2. Outcomes by HS 6-digit product level (excluding petroleum and gold) including export
development and investment “immature” or “near mature” products .......................................... 43
5.3. Summary overview from both a product and market perspective ...................................... 49
5.4. Specific focus on neighbouring markets ............................................................................... 60
5.5. Outcomes by economic sector (excluding petroleum and gold) based on skill and
technology intensity and export maturity (RCA>=1) ...................................................................... 126
5.6. Summary ............................................................................................................................. 129
6. Observations and policy recommendations ............................................................................... 135
7. Conclusion ................................................................................................................................... 136
8. References .................................................................................................................................. 137
9. Appendices .................................................................................................................................. 142
9.1. More detailed overview of the DSM methodology ............................................................ 142
9.2. Treatment of underlying trade data applied in the modelling ........................................... 158
9.3. Selected additional tables ................................................................................................... 162
9.4. Technical observations related to Rwanda import and export statistics ........................... 163
9.5. Detailed assumptions for international logistics as applied for the Rwanda case ............. 164
9.6. Summary of selected outcomes tables ............................................................................... 174

ii Rwanda TRADE-DSM analysis – Technical study report final draft 31 August 2017
Glossary of selected key concepts
Ad valorem equivalent tariff: An ad valorem equivalent tariff is used to express tariffs not defined in
percentage form (so e.g. a tariff expressed in dollars per ton) through an estimated percentage of
the price. This estimated percentage is then referred to as the ad valorem equivalent tariff.
African Growth and Opportunity Act (AGOA): The act has the objective of expanding United States
of America’s trade and investment with sub-Sahara Africa. AGOA provides duty-free market access
to the United States for qualifying Sub-Saharan African beneficiary countries by extending duty-free
preferences previously available under the US Generalised System of Preferences. Rwanda was
declared AGOA eligible on 2 October 2000 and wearing apparel provisions were also included on 4
March 2003.
Backhaul: To haul a shipment back over part of a route which it has already travelled; a marine
transportation carrier’s return movement of cargo, usually opposite from the direction of its primary
cargo distribution.
Bulk cargo: Loose cargo (dry or liquid) that is loaded (shovelled, scooped, forked, mechanically
conveyed or pumped) in volume directly into a ship’s hold; e.g., grain, coal and oil.
Cost, insurance, freight (CIF): Refers to the valuation of imported goods, i.e., including international
transport and insurance costs.
Common Market for Eastern and Southern Africa (COMESA): A free trade area with twenty
member states: Burundi, Comoros, Côte d'Ivoire, Democratic Republic of the Congo, Djibouti, Egypt,
Eritrea, Ethiopia, Kenya, Libyan Arab Jamahiriya, Madagascar, Malawi, Mauritius, Rwanda,
Seychelles, Sudan, Swaziland, Uganda, Zambia , Zimbabwe.
Containerization: The technique of using a container to store, protect and handle cargo while it is in
transit. This shipping method has both greatly expedited the speed at which cargo is moved from
origin to destination and lowered shipping costs.
Digits or digit-level (for tariffs): A reference to the codes used to identify products. Categories of
products are subdivided by adding digits. See Harmonized System below.
East African Community (EAC): A regional intergovernmental organisation of 6 Partner States: the
Republics of Burundi, Kenya, Rwanda, South Sudan, the United Republic of Tanzania, and the
Republic of Uganda, with its headquarters in Arusha, Tanzania.
Free on board (FOB): Refers to the valuation of exported goods, i.e. excluding international
transport and insurance costs.
Free Trade Agreement (FTA): Free trade agreements involve cooperation between at least two
countries to reduce bilateral trade barriers – import quotas and tariffs – for the purpose to increase
trade of goods and services with each other.
General Agreement on Tariffs and Trade (GATT): A legal agreement between many countries,
whose overall purpose was to promote international trade by reducing or eliminating trade barriers

iii Rwanda TRADE-DSM analysis – Technical study report final draft 31 August 2017
such as tariffs or quotas. For more information see https://www.wto.org/english/docs_e/legal_e/06-
gatt_e.htm.
Generalized System of Preferences (GSPs): A preferential tariff system which provides for a formal
system of exemption from the more general rules of the World Trade Organization (WTO).
Harmonized Commodity Description and Coding System (HS): An internationally standardized
system of names and numbers to classify traded products that came into effect for the first time in
1988. It has since been developed and maintained by the World Customs Organization (WCO)
(formerly the Customs Co-operation Council), an independent intergovernmental organization based
in Brussels, Belgium, with over 200 member countries. The lowest level of internationally consistent
codes applied according to the system is at the HS 6-digit product level, however individual countries
may extend the coding system as required. Some countries such as the United States of America
applies a 10-digit classification for products.
Most-favoured-nation (MFN) tariff: Normal non-discriminatory tariff charged on imports (excludes
preferential tariffs under free trade agreements and other schemes or tariffs charged inside quotas)
Preferential trade agreement (PTA): A preferential trade agreement typically applies to a trading
bloc that gives preferential access to certain products from the participating countries. This is done
by reducing tariffs but not by abolishing them completely.
Revealed comparative advantage (RCA): The RCA index is often used as an indicator of relative
export advantage or proxy for export competitiveness of a country for a specific product relative to
the world as a comparator. The literature suggests that an RCA of at least 1 indicates that a country
is specialised in producing and exporting a particular product. One can therefore consider it a proxy
for export production capability and capacity of the exporting country if considered in combination
with the RTA (see below).
Realistic export opportunities (REOs): A realistic export opportunity based on the TRADE-DSM
methodology is defined as an opportunity (a HS2 6-digit product line-country combination) for
which demonstrated historical import demand exists in a given importing country (irrespective of
the supplying country(ies) for such imports); and which also meet the requirement of not being too
concentrated from a supplying trade partner perspective; while also being relatively (to other
possible choices) accessibly from the home market into the target market based on aspects such as
international transportation, border import costs and import tariffs applied on such products by the
target market or country; and for which the home market (exporting country) exhibits a revealed
comparative trade advantage (RCA – see above) of greater than 1 as well as an RTA (see below) of
greater than zero.
Revealed trade advantage (RTA): While the RCA index (see above) is often used as an indicator of
relative export advantage or competitiveness, it only accounts for exports without consideration of
imports. The RTA index however accounts for exports and imports simultaneously and is used as an
indicator of product-level competitiveness and productive capacity. An RTA>0 reveals positive
2 See glossary item on Harmonized Commodity Description and Coding System (HS).

iv Rwanda TRADE-DSM analysis – Technical study report final draft 31 August 2017
comparative trade advantage or trade competitiveness. It can be assumed that an RTA>0 implies
that the majority of the product exported is locally produced as it corrects for re-exports.
Standard International Trade Classification Revision 4 (SITC4): A classification of goods used to
classify the exports and imports of a country to enable comparing different countries and years
managed and maintained by the United Nations. The current classification that was promulgated in
2006 is at revision 4.
Tariff line: A product, as defined by a system of code numbers for tariffs.

v Rwanda TRADE-DSM analysis – Technical study report final draft 31 August 2017
List of tables
Table 1: Examples of tariffs applied by Fiji............................................................................................ 37
Table 2: Major existing export markets for HS 2615.90 supplied from Rwanda in Q1 ........................ 45
Table 3: Major potential new export markets for HS 2615.90 to be supplied from Rwanda in Q2 ..... 45
Table 4: Major existing export markets for HS 0902.30 supplied from Rwanda in Q1 ........................ 46
Table 5: Major potential new export markets for HS 0902.30 to be supplied from Rwanda in Q2 ..... 46
Table 6: Major potential new export markets for HS 3301.90 to be supplied from Rwanda in Q2 ..... 47
Table 7: REO Map outcomes for global opportunities for Rwanda ...................................................... 49
Table 8: REO Map outcomes for Africa opportunities for Rwanda ...................................................... 51
Table 9: REO Map outcomes for African (excl. South Africa) opportunities for Rwanda ..................... 52
Table 10: REO Map outcomes for Central and South American opportunities for Rwanda ................ 53
Table 11: REO Map outcomes for Northern American opportunities for Rwanda .............................. 54
Table 12: REO Map outcomes for Oceania opportunities for Rwanda ................................................. 55
Table 13: REO Map outcomes for Central, East and South-East Asian opportunities for Rwanda ...... 56
Table 14: REO Map outcomes for Western Asia (Middle East) opportunities for Rwanda .................. 57
Table 15: REO Map outcomes for Northern and Western European opportunities for Rwanda ........ 58
Table 16: REO Map outcomes for Southern and Eastern European opportunities for Rwanda .......... 59
Table 17: REO Map outcomes for Congo opportunities for Rwanda ................................................... 62
Table 18: Identified REOs (14) for Rwanda into the Congo (ranked descending by potential) ............ 63
Table 19: REO Map outcomes for DRC opportunities for Rwanda ....................................................... 70
Table 20: Identified REOs (27) for Rwanda into the Congo (ranked descending by potential) ............ 71
Table 21: REO Map outcomes for Burundi opportunities for Rwanda ................................................. 79
Table 22: Identified REOs (13) for Rwanda into Burundi (ranked descending by potential) ................ 80
Table 23: REO Map outcomes for Tanzania opportunities for Rwanda ............................................... 87
Table 24: Identified REOs (31) for Rwanda into Tanzania (ranked descending by potential) .............. 88
Table 25: REO Map outcomes for Uganda opportunities for Rwanda ................................................. 96
Table 26: Identified REOs (38) for Rwanda into Uganda (ranked descending by potential) ................ 97
Table 27: REO Map outcomes for Kenya opportunities for Rwanda .................................................. 106
Table 28: Identified REOs (35) for Rwanda into Kenya (ranked descending by potential) ................. 107
Table 29: REO Map outcomes for South Sudan opportunities for Rwanda ....................................... 116
Table 30: Identified REOs (1*) for Rwanda into South Sudan (ranked descending by potential) ...... 117
Table 31: REO Map outcomes for Somalia opportunities for Rwanda ............................................... 120
Table 32: Identified REOs (35) for Rwanda into Somalia (ranked descending by potential) .............. 121
Table 33: Summarised outcomes across focus countries and global opportunities .......................... 131
Table 34: Illustration of cut-off points for short- and long-term growth ........................................... 146
Table 35: Illustration of cut-off points for import market size ........................................................... 147
Table 36: Categorisation of product-country combinations in filter 2 ............................................... 147
Table 37: Final categorisation of realistic export opportunities ......................................................... 151
Table 38: Countries completely eliminated due to concentration and accessibility constraints ....... 162
Table 39: Rwanda exit point and route assumptions based on ASYCUDA data ................................. 171
Table 40: Details of main assumptions for neighbouring and focus markets .................................... 173
Table 41: Detail on selected outcomes for quadrant 1 – “Brown fields”, intensive margins (both
product and market) ........................................................................................................................... 174

vi Rwanda TRADE-DSM analysis – Technical study report final draft 31 August 2017
Table 42: Detail on selected outcomes for quadrant 2 – “Green pastures”, intensive margins
(product) and extensive margins (market) ......................................................................................... 176
Table 43: Detail on selected outcomes for quadrant 3 – “Blue sky”, extensive margins (product) and
extensive margins (market) ................................................................................................................ 182
Table 44: Detail on selected outcomes for quadrant 4 – “Grey fields”, extensive margins (product)
and intensive margins (market) .......................................................................................................... 183

vii Rwanda TRADE-DSM analysis – Technical study report final draft 31 August 2017
List of figures
Figure 1: Distilling data into intelligence in a nutshell .......................................................................... 16
Figure 2: REO MapTM ............................................................................................................................. 17
Figure 3: REO export maturity, market share, and growth and diversification conceptual model ...... 19
Figure 4: Comparison of total goods exports from different sources .................................................. 21
Figure 5: Rwanda exports major border exit points ............................................................................. 30
Figure 6: Rwanda exports major border exit points ............................................................................. 31
Figure 7: Example of landlocked country routing ................................................................................. 32
Figure 8: Actual example of costing elements applied ......................................................................... 32
Figure 9: Logistics routing chain for costing example ........................................................................... 32
Figure 10: Most probable maritime routing from Dar es Salaam to Western and Northern Europe .. 33
Figure 11: Tariff equivalent outcomes by region .................................................................................. 34
Figure 12: Average overall cost outcomes by region ............................................................................ 35
Figure 13: Average distance, time and cost per hour relationship ....................................................... 35
Figure 14: Overall logistics average time productivity by region.......................................................... 35
Figure 15: Overall ad valorem impact of the relative market access index .......................................... 36
Figure 16: Market Access Index outcomes distribution and pareto cut-off value applied .................. 36
Figure 17: Rwanda total trade and trade balance (2010-2015)............................................................ 39
Figure 18: Rwanda change in export shares by SITC4 main section (2010 versus 2015) ..................... 39
Figure 19: Rwanda change in export shares by SITC4 main section (2010 versus 2015) ..................... 40
Figure 20: Composition of Rwanda’s trade balance (2015) .................................................................. 40
Figure 21: Rwanda exports by skills and technology intensity ............................................................. 41
Figure 22: DSM filtering approach applied - outcomes per step .......................................................... 42
Figure 23: Overall DSM export maturity, market share, and growth and diversification matrix for
Rwanda ................................................................................................................................................. 44
Figure 24: Global outcomes by region .................................................................................................. 49
Figure 25: Overview of global distribution of potential associated with REOs for Rwanda ................. 49
Figure 26: Global REOs by major SITC group ........................................................................................ 50
Figure 27: African REOs by major SITC group ....................................................................................... 51
Figure 28: Overview of Africa distribution of potential associated with REOs for Rwanda ................. 51
Figure 29: Africa (excl. South Africa) REOs by major SITC group .......................................................... 52
Figure 30: Overview of Africa (excl. South Africa) distribution of potential associated with REOs for
Rwanda ................................................................................................................................................. 52
Figure 31: Caribbean, Central and South American REOs by major SITC group ................................... 53
Figure 32: Overview of Caribbean, Central and South America distribution of potential associated
with REOs for Rwanda........................................................................................................................... 53
Figure 33: Northern American REOs by major SITC group ................................................................... 54
Figure 34: Overview of Northern America distribution of potential associated with REOs for Rwanda
.............................................................................................................................................................. 54
Figure 35: Oceania REOs by major SITC group ...................................................................................... 55
Figure 36: Overview of Oceania distribution of potential associated with REOs for Rwanda ............. 55
Figure 37: Central, East and South-East Asian REOs by major SITC group ........................................... 56
Figure 38: Overview of Central, East and South-East Asia distribution of potential associated with
REOs for Rwanda ................................................................................................................................... 56

viii Rwanda TRADE-DSM analysis – Technical study report final draft 31 August 2017
Figure 39: Western Asia (Middle East) REOs by major SITC group ....................................................... 57
Figure 40: Overview of Western Asia (Middle East) distribution of potential associated with REOs for
Rwanda ................................................................................................................................................. 57
Figure 41: Northern and Western European REOs by major SITC group ............................................. 58
Figure 42: Overview of Northern and Western Europe distribution of potential associated with REOs
for Rwanda ............................................................................................................................................ 58
Figure 43: Southern and Eastern European REOs by major SITC group ............................................... 59
Figure 44: Overview of Southern and Eastern Europe distribution of potential associated with REOs
for Rwanda ............................................................................................................................................ 59
Figure 45: Map of the Congo ................................................................................................................ 61
Figure 46: Congo overall merchandise trade ........................................................................................ 61
Figure 47: Congo top overall importing partners ................................................................................. 61
Figure 48: Rwanda REO opportunities for Congo Brazzaville (excluding petroleum and gold)............ 62
Figure 49: Congo REO for HS843143..................................................................................................... 64
Figure 50: Congo REO HS843143 import origins versus Rwanda export destinations ......................... 64
Figure 51: Congo REO for HS220300..................................................................................................... 65
Figure 52: Congo REO HS220300 import origins versus Rwanda export destinations ......................... 65
Figure 53: Congo REO for HS200290..................................................................................................... 66
Figure 54: Congo REO HS200290 import origins versus Rwanda export destinations ......................... 66
Figure 55: Congo REO for HS040700..................................................................................................... 67
Figure 56: Congo REO HS040700 import origins versus Rwanda export destinations ......................... 67
Figure 57: Congo REO for HS711790..................................................................................................... 68
Figure 58: Congo REO HS711790 import origins versus Rwanda export destinations ......................... 68
Figure 59: Map of the DRC .................................................................................................................... 69
Figure 60: DRC overall merchandise trade ........................................................................................... 69
Figure 61: DRC top overall importing partners ..................................................................................... 69
Figure 62: Rwanda REO opportunities for DRC (excluding petroleum and gold) ................................. 70
Figure 63: DRC REO for HS220300 ........................................................................................................ 73
Figure 64: DRC REO HS220300 import origins versus Rwanda export destinations............................. 73
Figure 65: DRC REO for HS100640 ........................................................................................................ 74
Figure 66: DRC REO HS100640 import origins versus Rwanda export destinations............................. 74
Figure 67: DRC REO for HS860900 ........................................................................................................ 75
Figure 68: DRC REO HS860900 import origins versus Rwanda export destinations............................. 75
Figure 69: DRC REO for HS210320 ........................................................................................................ 76
Figure 70: DRC REO HS210320 import origins versus Rwanda export destinations............................. 76
Figure 71: DRC REO for HS110220 ........................................................................................................ 77
Figure 72: DRC REO HS110220 import origins versus Rwanda export destinations............................. 77
Figure 73: Map of Burundi .................................................................................................................... 78
Figure 74: Burundi overall merchandise trade ..................................................................................... 78
Figure 75: Burundi top overall importing partners ............................................................................... 78
Figure 76: Rwanda REO opportunities for Burundi (excluding petroleum and gold) ........................... 79
Figure 77: Burundi REO for HS220300 .................................................................................................. 81
Figure 78: Burundi REO HS220300 import origins versus Rwanda export destinations ...................... 81
Figure 79: Burundi REO for HS190531 .................................................................................................. 82
Figure 80: Burundi REO HS190531 import origins versus Rwanda export destinations ...................... 82

ix Rwanda TRADE-DSM analysis – Technical study report final draft 31 August 2017
Figure 81: Burundi REO for HS071331 .................................................................................................. 83
Figure 82: Burundi REO HS071331 import origins versus Rwanda export destinations ...................... 83
Figure 83: Burundi REO for HS940550 .................................................................................................. 84
Figure 84: Burundi REO HS940550 import origins versus Rwanda export destinations ...................... 84
Figure 85: Burundi REO for HS940429 .................................................................................................. 85
Figure 86: Burundi REO HS940429 import origins versus Rwanda export destinations ...................... 85
Figure 87: Map of Tanzania ................................................................................................................... 86
Figure 88: Tanzania overall merchandise trade .................................................................................... 86
Figure 89: Tanzania top overall importing partners ............................................................................. 86
Figure 90: Rwanda REO opportunities for Tanzania (excluding petroleum and gold) ......................... 87
Figure 91: Tanzania REO for HS220290 ................................................................................................ 90
Figure 92: Tanzania REO HS220290 import origins versus Rwanda export destinations ..................... 90
Figure 93: Tanzania REO for HS190531 ................................................................................................ 91
Figure 94: Tanzania REO HS190531 import origins versus Rwanda export destinations ..................... 91
Figure 95: Tanzania REO for HS220300 ................................................................................................ 92
Figure 96: Tanzania REO HS220300 import origins versus Rwanda export destinations ..................... 92
Figure 97: Tanzania REO for HS854370 ................................................................................................ 93
Figure 98: Tanzania REO HS854370 import origins versus Rwanda export destinations ..................... 93
Figure 99: Tanzania REO for HS151790 ................................................................................................ 94
Figure 100: Tanzania REO HS151790 import origins versus Rwanda export destinations ................... 94
Figure 101: Map of Uganda .................................................................................................................. 95
Figure 102: Uganda overall merchandise trade .................................................................................... 95
Figure 103: Uganda top overall importing partners ............................................................................. 95
Figure 104: Rwanda REO opportunities for Uganda (excluding petroleum and gold) ......................... 96
Figure 105: Uganda REO for HS220210 .............................................................................................. 100
Figure 106: Uganda REO HS220210 import origins versus Rwanda export destinations ................... 100
Figure 107: Uganda REO for HS551311 .............................................................................................. 101
Figure 108: Uganda REO HS551311 import origins versus Rwanda export destinations ................... 101
Figure 109: Uganda REO for HS392310 .............................................................................................. 102
Figure 110: Uganda REO HS392310 import origins versus Rwanda export destinations ................... 102
Figure 111: Uganda REO for HS840710 .............................................................................................. 103
Figure 112: Uganda REO HS840710 import origins versus Rwanda export destinations ................... 103
Figure 113: Uganda REO for HS210320 .............................................................................................. 104
Figure 114: Uganda REO HS210320 import origins versus Rwanda export destinations ................... 104
Figure 115: Map of Kenya ................................................................................................................... 105
Figure 116: Kenya overall merchandise trade .................................................................................... 105
Figure 117: Kenya top overall importing partners .............................................................................. 105
Figure 118: Rwanda REO opportunities for Kenya (excluding petroleum and gold) .......................... 106
Figure 119: Kenya REO for HS090240 ................................................................................................. 110
Figure 120: Kenya REO HS090240 import origins versus Rwanda export destinations ..................... 110
Figure 121: Kenya REO for HS090230 ................................................................................................. 111
Figure 122: Kenya REO HS090230 import origins versus Rwanda export destinations ..................... 111
Figure 123: Kenya REO for HS071310 ................................................................................................. 112
Figure 124: Uganda REO HS071310 import origins versus Rwanda export destinations ................... 112
Figure 125: Kenya REO for HS230400 ................................................................................................. 113

x Rwanda TRADE-DSM analysis – Technical study report final draft 31 August 2017
Figure 126: Kenya REO HS230400 import origins versus Rwanda export destinations ..................... 113
Figure 127: Kenya REO for HS840710 ................................................................................................. 114
Figure 128: Kenya REO HS840710 import origins versus Rwanda export destinations ..................... 114
Figure 129: Map of South Sudan......................................................................................................... 115
Figure 130: South Sudan overall merchandise trade .......................................................................... 115
Figure 131: South Sudan top overall importing partners ................................................................... 115
Figure 132: South Sudan REO for HS110220 ...................................................................................... 118
Figure 133: South Sudan REO HS110220 import origins versus Rwanda export destinations ........... 118
Figure 134: Map of Somalia ................................................................................................................ 119
Figure 135: Somalia overall merchandise trade ................................................................................. 119
Figure 136: Somalia top overall importing partners ........................................................................... 119
Figure 137: Rwanda REO opportunities for Somalia (excluding petroleum and gold) ....................... 120
Figure 138: Somalia REO for HS110100 .............................................................................................. 122
Figure 139: Somalia REO HS110100 import origins versus Rwanda export destinations .................. 122
Figure 140: Somalia REO for HS040700 .............................................................................................. 123
Figure 141: Somalia REO HS040700 import origins versus Rwanda export destinations .................. 123
Figure 142: Somalia REO for HS040700 .............................................................................................. 124
Figure 143: Somalia REO HS040700 import origins versus Rwanda export destinations .................. 124
Figure 144: Somalia REO for HS040700 .............................................................................................. 125
Figure 145: Somalia REO HS040700 import origins versus Rwanda export destinations .................. 125
Figure 146: REO overall outcomes by skill- and technology intensity ................................................ 126
Figure 147: REO overall outcomes – non-fuel primary commodities by economic sector ................ 127
Figure 148: REO overall outcomes – Low skill- and technology-intensive manufactures by economic
sector .................................................................................................................................................. 127
Figure 149: REO overall outcomes – medium skill- and technology intensity manufactures by
economic sector .................................................................................................................................. 128
Figure 150: REO overall outcomes – high skill and technology intensity manufactures by economic
sector .................................................................................................................................................. 128
Figure 151: Comparison of regional neighbours - potential and number of opportunities ............... 129
Figure 152: REO MapTM ....................................................................................................................... 152
Figure 153: Analysis of import partners .............................................................................................. 155
Figure 154: Example data set for share calculations .......................................................................... 160
Figure 155: Time-weighted vs. average share calculation outcomes ................................................. 160
Figure 156: Example data set for growth calculations ........................................................................ 160
Figure 157: Time-weighted versus unweighted growth calculation outcomes .................................. 160
Figure 158: Example data set for cyclical growth calculations ........................................................... 161
Figure 159: Time-weighted versus unweighted share calculation outcomes .................................... 161
Figure 160: Most probable maritime routing from Dar es Salaam to Southern Europe .................... 164
Figure 161: Most probable maritime routing from Dar es Salaam to Eastern Europe ....................... 164
Figure 162: Most probable maritime routing from Dar es Salaam to North America ........................ 165
Figure 163: Most probable maritime routing from Dar es Salaam to Central America and the
Caribbean ............................................................................................................................................ 165
Figure 164: Most probable maritime routing from Dar es Salaam to Caribbean ............................... 165
Figure 165: Most probable maritime routing from Dar es Salaam to South America (east coast) .... 166
Figure 166: Most probable maritime routing from Dar es Salaam to South America (west coast) ... 166

xi Rwanda TRADE-DSM analysis – Technical study report final draft 31 August 2017
Figure 167: Most probable maritime routing from Dar es Salaam to East Asia ................................. 167
Figure 168: Most probable maritime routing from Dar es Salaam to Australia and Oceania ............ 167
Figure 169: Most probable maritime routing from Dar es Salaam to Australia and Oceania ............ 168
Figure 170: Most probable maritime routing from Dar es Salaam to West and western Middle African
countries ............................................................................................................................................. 168
Figure 171: Most probable maritime routing from Dar es Salaam to West and western Middle African
countries ............................................................................................................................................. 169
Figure 172: Assumptions regarding Rwanda's direct neighbours ...................................................... 170
Figure 173: Assumptions Congo Brazzaville and Somalia ................................................................... 170
Figure 174: South Africa's imports from Rwanda by entry point ....................................................... 171
Figure 175: Map of routing assumptions for Southern African countries .......................................... 172
Figure 176: Ad valorem equivalent increase in costs ......................................................................... 172
Figure 177: Ad valorem equivalent increase in costs ......................................................................... 172

12 Rwanda TRADE-DSM analysis – Technical study report final draft 31 August 2017
1. Introduction
Industrial development is fundamentally about bringing about structural change in an informed way.
It therefore involves producing and exporting new goods with new technologies and transferring
resources from traditional activities to these new ones with the aim of uplifting and advancing the
overall economy (Dutt et al., 2008). Empirical research suggests that stimulating new exports is one
of the most efficient ways of improving firm capability. When faced with international competitive
pressures and with new demand for higher quality and larger markets, firms tend to grow, become
more productive, and invest in higher quality products (De Loecker, 2007; Bernard and Jensen, 1999;
Van Biesebroeck, 2005; Bustos, 2011; Pavcnik, 2002; Kugler and Verhoogen, 2012; Lileeva and
Trefler, 2010). Providing an evidence-based approach for governments to identify and stimulate
export opportunities will thus provide important feedback both for Rwanda’s policy makers as well
as for the International Growth Centre’s (IGC) Firm Capabilities research agenda.
Expanding exports has also become an urgent government priority in Rwanda in order to reduce a
growing trade imbalance, ensure non-farm job creation, and improve economic growth. This is also
reflected in Rwanda’s strategic plans, with the national export strategy for 2015-18 proposing a 20
percent annual rate of export growth (MINICOM, 2015, p.6).
In 2015, Hausmann et al. (2015) conducted an analysis based on the product space approach to
inform on possible export diversification paths for Rwanda in the presence of significant constraints.
For a detailed description of the product-space methodology see Hausmann et al. (2011).
While the product space approach is an innovative approach to inform on these questions, one of
the challenges is that the product space approach in isolation does not consider and inform on
potential markets for products from a specific “home market” since it is predominantly supply-side
focused (Kniahin, 2014).
Hausmann et al. (2015) however did recognise this shortcoming and subsequently conducted a
further analysis on the outcomes of the product space analysis by combining it with a transport cost
dimension to further inform not only on what Rwanda could potentially produce, but where
potential markets are for such identified products (see Hausmann et al. 2015, p.26 for details on
their approach).
Key observations from the analysis pointed to Rwanda’s high transportation costs and limited
productive knowledge that have held back greater export development and have resulted in
excessive rural density. Based on the analysis they found that three basic commodities – coffee, tea,
and tin – traditionally made up more than 80 percent of the country’s exports and still drive the bulk
of export growth today.
The purpose of their analysis was therefore to help identify new, scalable activities in urban areas
that Rwanda could pursue in its strategy drive to enhance economic development. The Hausmann et
al. (2015) study results identified more than 100 tradable products that lie at Rwanda’s knowledge
frontier while at the same time not being intensive in Rwanda’s scarce resources, and economise on
transportation costs.

13 Rwanda TRADE-DSM analysis – Technical study report final draft 31 August 2017
Outcomes from this analysis highlighted three main areas with greatest potential for Rwanda to
develop its global exports, namely:
1) Processed agricultural products, foods, beverages and agrochemicals
2) Specialised textiles and garments, and
3) Construction materials, metal and wood products.
From a regional perspective the analysis identified the following broad product groups to focus on
for supply to regional (Burundi, the Democratic Republic of the Congo, Kenya, Tanzania and Uganda)
import demand, namely:
1) Machinery and Electronics,
2) Construction Materials, Metal and Wood products, and
3) Chemical products.
The study concludes with some policy implications and suggestions focused around addressing
major supply-side challenges through for example the creation of Special Economic Zones (SEZs) and
investments in critical infrastructure outside of SEZs focusing on addressing the high cost of
transporting goods to and from regional and international ports. Furthermore, it is recommended
that attention be given to facilitating rural-to-urban migration and improving in agricultural
productivity.
While exporters need not necessarily serve the local market since local demand may not exist or be
sufficient, in activities economies of scale, producing for the domestic market may enable firms to
expand output to an extent that reduces marginal costs below the threshold to export to overseas
markets. Hence, policy variables that raise the fixed costs of entry into the local market and the
marginal costs of selling domestically will affect the number of firms and the potential number of
exporters. The observation around policy variables points to the importance of the overall incentive
regime governing investment, the business climate, labour regulations and the costs of key inputs.
The latter will be determined by the trade regime and the efficiency of ports and customs for those
firms dependent on imported inputs as well as the provision of backbone services such as
telecommunications, energy, water and finance.
It is worth noting that more recently, a consensus seems to be emerging that the deeper
determinants of economic development are not simply policies (such as trade and macroeconomic
policies) but rather the characteristics of the underlying institutions in a country. Dutt et al. (2008)
highlights the collective observation from various other studies that institutional indicators such as
the constraints on executive decision-making, the rule-of-law, and bureaucratic corruption have
been shown to have a much more significant impact on economic growth and level of development
than the aforementioned policies. The author further states that the prevailing consensus is that
institutional quality also trumps both the role of geography and economic integration with the rest
of the world in accounting for cross-country differences in income levels.
Rwanda can probably be classified as an example in the making of how changes in institutional focus
and efficiency and concentrating on economic enabling infrastructure and economic integration can
compensate for geography. This study for Rwanda forming the basis for this policy brief, however,
only considers the more direct aspects of demand, international trade and transport costs.

14 Rwanda TRADE-DSM analysis – Technical study report final draft 31 August 2017
1.1. Objective of this study
The Hausmann et al. (2015) analytical approach and study outcomes provide a robust platform to
inform economic development and more specifically export diversification for Rwanda. However,
since the approach is predominantly informed from the supply-side as the starting point, the need
was identified to compliment this work with more focus from a demand-side perspective.
The main objective of this study therefore is to identify new opportunities for exporting Rwandan
goods and services using an alternative approach (also endorsed by the World Trade Organisation
(WTO)) and tool called the ‘Decision Support Model’ (DSM) approach. This approach aims to map
out relatively easy(ier)-to-access markets with low(er) barriers to entry that exhibit demonstrated
import demand and are not too concentrated from an import supply perspective. For this purpose,
the TRADE-DSMTM3 approach provides a scientific approach to also take into consideration more
specific aspects of the target market and product(s) in question. The DSM was specifically designed
to assist with the selection of the most promising markets for a given exporting country in order to
assist export promotion organisations in planning and assessing their export promotion activities.
The Decision Support Model (DSM) is an analytical tool, incorporating a thorough screening process
that facilitates systematic export market selection through the identification of realistic export
opportunities for firms wanting to expand their sales reach into foreign markets. It also offers
alternatives to exporters where they are facing saturation and/or declining growth in their
traditional markets. The DSM methodology takes into consideration all possible worldwide product-
country combinations and, using four filters, progressively eliminates less promising markets until
those with the greatest prospects of success are revealed:
- Filter 1 of the DSM assesses countries from the point of view of their political and commercial risk,
and macroeconomic size and growth performance.
- Filter 2 assesses the market potential of the various product groups for the remaining countries, as
determined by the size and growth of import demand.
- Filter 3 examines the accessibility of the remaining countries in terms of their different barriers to
entry (including shipping time and cost, logistical efficiency, and tariffs and non-tariff barriers) and
degree of market concentration.
- Filter 4 categorises the final round of potential export markets according to the “home” market’s
(in this case Rwanda) current export performance in these markets compared to the performance of
the top six competitors in each market. An “unconstrained” potential export value is also assigned
to each identified product-market combination with a view to prioritising the shortlisted export
opportunities.
More details on the methodology follow later in this report.
3 TRADE-DSM is a registered trade mark of TRADE research focus area at the North-West University,
Potchefstroom Campus, South Africa.

15 Rwanda TRADE-DSM analysis – Technical study report final draft 31 August 2017
1.2. Outcome reporting dimensions
While the TRADE-DSM approach focuses on evaluating all potential markets in the world, the
requirement for purposes of this study is to focus on 3 specific dimensions, namely:
a) Identified potential products and how they compare with the product outcomes obtained in
the Hausmann et al. (2015) study;
b) Further away markets in the global economy, and
c) specific focus on geographically close markets in the region such as Congo Brazzaville,
Democratic Republic of the Congo, Burundi, Tanzania, Uganda, Kenya, South Sudan and
Somalia.
This report therefore is constituted as follows. Section 2 addresses methodological issues, section 3
considers the aspect of skill- and technology intensity of exports, while section 4 provides a brief
contextual overview of the latest developments in Rwanda’s import and export trends as reflected in
the underlying trade data used for the modelling; section 5 deals with the outcomes obtained from
the DSM approach while section 6 provides observations and policy recommendations. The report is
concluded in section 7 while references and appendices are duly provided in sections 8 and 9.
2. Methodology applied
This section provides an overview of the TRADE-DSM approach, as well as specific adjustments to
the approach for the purposes of modelling the Rwanda case.
2.1. Brief overview of the TRADE-DSM approach
This method was initially developed (Cuyvers, et al. 1995) in order to identify the product-country
combinations with the highest export potential for a single country. It was specifically designed to
provide export promotion agencies with a more scientific way of determining those products and
destination countries on which to focus their scarce export promotion resources.
Further refinements to the approach have been introduced over the past decade by TRADE research
focus area at the NWU and the outcomes of this analysis are based on this subsequent refined
approach.
In a nutshell, the method involves evaluating all worldwide country and product combinations, and
screening these using various intelligent ‘filters’ to eliminate export opportunities that are not
potentially viable.
The method uses four consecutive filters that sequentially eliminate less realistic/interesting
product-country combinations in an effort to categorise and prioritise realistic export opportunities
(REOs) in different positions on a grid (referred to as the REO MapTM 4), for the country/company for
which the analysis is applied.
4 REO-Map is a registered trade mark of TRADE research focus area at the North-West University, South Africa.

16 Rwanda TRADE-DSM analysis – Technical study report final draft 31 August 2017
These filters can be categorised in broad terms as:
a) Filter 1: Broad general market potential as reflected in economic size, growth, and political and commercial risk;
b) Filter 2: Product-country market potential characteristics;
c) Filter 3: Product-country market access conditions, including aspects such as market concentration (sub-filter 3.1) and accessibility (sub-filter 3.2); and lastly
d) Filter 4: Categorisation of outcomes based on the revealed comparative advantage (RCA), revealed trade advantage (RTA) and ‘home market’ and ‘target market’ product-level trade characteristics. Potential export markets are categorised according to the “home” market’s (in this case Rwanda) current export performance in these markets compared to the performance of the top six competitors in each market. An “unconstrained” potential export value is also assigned to each identified product-market combination with a view to prioritising the shortlisted export opportunities. This potential export value is considered as the average market value of the top six competitors in each market, excluding imports from the “home” market if the “home” market happens to be one of the top six sources of imports for the target market for a given product.
Figure 1: Distilling data into intelligence in a nutshell
Source: Cameron and Viviers (2015), adapted from Jeannet and
Hennessey (1988: 139)
This measure provides a relative indication of the potential “additional” size of different export opportunities relative to one another from the perspective of the “home” market relative to its existing exports to the target market. It is possible that the actual export value from the “home” market can be higher than this indicative potential export value, which means that the exporting country (“home” market) is one of the main exporters into a particular target market and its share in total imports into the target market exceeds the average market value for the same product supplied into this same target market by its top six competitors. This approach therefore provides a realistic indication (all else constant) of the potential market value that the “home” market could “target” to obtain, in addition to its existing exports to the target market. Under the “all else constant” assumption it would imply that the “home” market would need to win away market share5 from the group of other countries already supplying this product into the target market in question.
5 Note that this refers to market share at a country level and not on a company level and that this measure
does not consider existing supply or production capacity in the “home” market – hence referred to as “unconstrained”.

17 Rwanda TRADE-DSM analysis – Technical study report final draft 31 August 2017
For ease of understanding and reference, the outcomes are translated into a realistic export
opportunities map as depicted in Figure 2.
Figure 2: REO MapTM
Source: Authors
2.1.1. REOs’ ‘home market’ market share characteristics
Evident from the map is that the characteristics of the REOs (which are the result of the process
described at a high level above) can be used to inform appropriate, though still broadly defined,
export promotion or marketing strategies, as follows:
a) REO1,1 to REO2,5: The ‘home market’ (in this case, Rwanda) has a non-existent to low market
share for various reasons, and an offensive market exploration strategy is appropriate for
products where a comparative advantage exists or can be developed;
b) REO3,1 to REO3,5: The ‘home market’ has a relatively medium-large market share and REOs
are situated in large and/or growing market segments; therefore, an offensive market
expansion strategy can be advocated; and
c) REO4,1 to REO4,5: The ‘home market’ has already gained an important relative market share;
therefore, a defensive market sustain and maintain strategy seems most appropriate.
2.1.2. REOs’ ‘target market’ characteristics
The target (or importing) market’s characteristics in terms of both size and growth can also be used
to inform strategies.

18 Rwanda TRADE-DSM analysis – Technical study report final draft 31 August 2017
a) REO1,1; REO2,1; REO3,1: ‘Breaking into’ a large, ‘relatively’ new market, especially when the market share of the ‘home market’ is still relatively small (REO1,1 and REO2,1);
b) REO1,2; REO2,2; REO3,2: ‘Taking advantage of a growing market’, i.e. opportunities in target markets that are growing in both the short and long term;
c) REO1,3; REO2,3; REO3,3: ‘Growing and consolidating’, i.e. opportunities in target markets that experienced growth in the recent past/emerging opportunities;
d) REO1,4; REO2,4; REO3,4: ‘Leapfrogging’, i.e. opportunities in target markets that exhibit long-term growth;
e) REO1,5; REO2,5; REO3,5: ‘Jumping on the bandwagon’, i.e. opportunities in target markets that show large import volumes and growth in both the short and long term.
For a more detailed explanation of the methodology refer to appendix 9.1.
2.2. The international trade data used
The international trade data that informs the TRADE-DSM outcomes as applied in this study is based
on the CEPII BACI world trade database (2017 – HS2007 revision). According to CEPII the BACI
reported export values exclude re-exports, unlike the usual international trade data such as
COMTRADE.
The CEPII data applied in this report contains Southern African Customs Union (SACU) aggregate
data. In practice, South Africa accounts for the majority of transactions. However, we have made
adjustments to the data to reflect Botswana, Namibia, Lesotho and Swaziland separately.
Although later (2016) data is available from the Division’s UNCOMTRADE database and the ITC’s
TradeMap, the modelling requirement for reconciled data places a limit on the currency of the data.
The current DSM analysis and outputs as applied in this report therefore make use of data for the
period 2011-2015.
2.3. Considering intensive and extensive margins
Policy-makers need to be correctly informed to use the right tool for the right policy question, since
e.g. policies aimed at increasing diversity of exports in terms of products versus diversifying
destination markets are obviously very different (Carrere et al. 2011). To this effect Brenton and
Newfarmer (2007) defines expansion of existing products in existing markets as growth at the
intensive margin, while introduction of “new” products and new geographic markets as growth at
the extensive margins.
The authors find that the expansion of existing products in existing markets has greater weight in
terms of explaining export growth than the diversification of new products or new markets. They
also show that expanding trade into new geographic markets contributes more to export growth
than the development of new products. It is therefore important for government to facilitate the
identification and addressing of market failures prohibiting exporters to grow and even more so to
facilitate growth into existing markets.

19 Rwanda TRADE-DSM analysis – Technical study report final draft 31 August 2017
In this context, the concepts of intensive and extensive margins are an important policy dimension
to inform on and outcomes from the TRADE-DSM approach aligns with this policy information
requirement.
Figure 3: REO export maturity, market share, and growth and diversification conceptual model
Source: Adapted from Cameron and Viviers (2015)
The REO MapTM produces an outcome that makes it possible to evaluate realistic export
opportunities and, in turn, inform the nature of the export promotion strategy to be developed
based on the specific allocated REOxy category. The results from the methodology are arranged so as
to reflect (as opposed to eliminate) the REOs based on average market potential per opportunity,
while the relative (existing) specialisation (or not) of Rwandan exports represented by the RCA is
shown in a conceptual framework similar to that of the well-known Boston Consulting Group (BCG)
growth-share matrix (also applied by ITC Trade Map), as depicted in Figure 3.
The conceptual framework applied is underpinned by the following logic. The REOs have already
been ‘filtered’ through the DSM methodology, which considers many factors, including market share

20 Rwanda TRADE-DSM analysis – Technical study report final draft 31 August 2017
and growth (as per the BCG approach). Thus, the intention is to inform decision makers of the
additional attributes associated with each opportunity as it passes through the DSM filtering
process. The authors therefore present the products being evaluated/investigated and their
associated opportunities (based on the identified REOs), which are further categorised according to
five existing DSM attributes, namely (i) export potential (average per opportunity); (ii) maturity (as
indicated by the RCA); (iii) market diversification potential (as indicated by the number of different
markets for which the REO indicates an opportunity for a specific product); (iv) relative market share
(REOs in columns 1 and 2 indicating relatively low market share are associated with ‘new’ markets in
Q2 and Q3, while REOs in columns 3 and 4 are associated with ‘existing’ markets for which the
exporting country in question already has an intermediately-large to large market share); and (v)
market growth potential (as indicated by the DSM methodology classification of the market
characteristics of these potential markets).
The REOs are therefore plotted on the basis of the above dimensions, as follows (a) X-axis contains
the number of potential markets (diversification); (b) the Y-axis contains relative competitiveness
(more or less mature [RCA]); (c) the bubble size represents the market potential per product
(aggregated across markets); (d) Q2 and Q3 contains REOs in columns 1 and 2 indicating low market
share, termed ‘new’ markets; and (e) Q1 and Q4 contains columns 3 and 4 indicating intermediately-
large to large market share, termed ‘existing’ markets. The outcome is therefore that the various
REOs are positioned in one of the four quadrants, namely (i) quadrant 1 termed ‘Brown fields’
representing mature export products6 with growth potential in markets already well-serviced by the
exporting country (product-market combinations classified into columns 3 and 4 of the REO MAPTM,
depicted in Figure 3); (ii) quadrant 2 termed ‘Green (new) pastures’ representing mature products
with growth potential in new markets (product-market combinations classified into columns 1 and 2
of the REO MAPTM); (iii) quadrant 3 termed ‘Blue sky’ representing less mature export products7 with
growth potential in new markets; and lastly quadrant 4 termed ‘Grey fields’ representing less
mature products with growth potential in markets already well-serviced by the exporting country.
Figure 3 illustrate both the elegance and power of the TRADE-DSM methodology - elegance in that it
allows for a quick visual inspection and comparison of high-ranking REOs, and power in that it points
to where, with additional investment and/or support, promising export opportunities could become
true winners. To help policy makers from a diversification related to either the extensive or intensive
market perspective as articulated by Brenton and Newfarmer (2007) the different margins
combinations as pertains to the 4 quadrants are also indicated.
This framework was therefore applied to develop a view of all the potential product-country
combinations that policy makers in Rwanda may be interested in analysing for the purposes of
strategic decision making regarding industrial development and export promotion activities. The
approach can therefore inform on both a product-centric or market-centric approach, as well as a
combination of the two.
6 Mature export products are identified as those products with a Revealed Comparative Advantage (RCA) of
greater than 1, indicated on the vertical axis in Figure 3. 7 Less mature export products are identified as export products with a Revealed Comparative Advantage (RCA)
of less than 1, indicated on the vertical axis in Figure 3.

21 Rwanda TRADE-DSM analysis – Technical study report final draft 31 August 2017
2.4. Rwanda specific adjustments for the TRADE-DSM analysis
For context we provide a high level overview of the recent trends in Rwanda’s trade based on the
ASYCUDA8 data received. Part of the reason to do so is that most of the data underlying the
Hausmann et al. (2015) study was up to 2011 or 2010 and it provides more recent context.
Furthermore, we also use this section to compare the country-reported data with information as
processed and available from the International Trade Center (ITC) TradeMap (based on UN
Comtrade data) and the Base Analytique du Commerce International (BACI9) data set which is a
reconciled version of UN COMTRADE database provided by CEPII (Centre d’Études Prospectives et
d’Informations Internationales).
We then conduct the rest of the analysis based on the BACI data for the purposes of this analysis, as
this forms the basis of the TRADE-DSM methodology applied for this study.
2.4.1. Comparing Rwanda national reported export data with TradeMap and BACI
While the DSM modelling for Rwanda is conducted on the basis of the BACI adjusted international
trade data set Figure 4 provides a high level comparison of total merchandise exports according to
various sources for what is assumed to be the same information.
Figure 4: Comparison of total goods exports from different sources
Source: Authors representation from ITC, UN COMTRADE, National Institute of Statistics of Rwanda (NISR).
Evident from this analysis is that there is no 100 percent consistency between the different sources.
It would seem that the NISR data and that available via the ITC Trade Map is very similar. The
challenge is that when comparing what partner countries report they imported from Rwanda, the
values differ to the extent that partners only report around 60 percent of Rwanda’s reported export
values. Add to this the fact that the Rwanda exports is supposed to be reported in FOB terms, while
8 Automated SYstem for CUstoms DAta.
9 See Gaulier and Zignago, 2010. For further information also
http://www.cepii.fr/CEPII/en/bdd_modele/presentation.asp?id=1.

22 Rwanda TRADE-DSM analysis – Technical study report final draft 31 August 2017
the partners imports from Rwanda is reported in CIF terms – one would expect the difference to be
the other way around.
CEPII BACI data on the other side reports around 130 percent of the ITC TradeMap values – one
would expect that based on the CEPII approach the value should be between Rwanda exports and
partner reported imports. However, BACI is much better aligned with the latest UN COMTRADE
(which is the source for both the ITC and CEPII BACI data) in the last 2 years (2014 and 2015).
To understand the problem better, we then look into the information received on Rwanda. On
investigating in more detail the provide “raw” ASYCUDA data from Rwanda, the problem seems to
potential be with two aspects. One, the way FOB and CIF are reported, and two the fact that there
seems to be a lot of duplication in the value of exports in the way it is captured / reported.
We don’t investigate further into these discrepancies since the fundamental data set used for this
analysis is the CEPII BACI data set, with some assumptions based on ratios informed by the ASYCUDA
data.
2.4.2. Trade barriers with respect to Rwanda specific context
In Africa, the Middle East and Asia, trade by value with direct (border) neighbouring countries
account for only around 1 and 5 percent of these regions’ trade. For Latin America the share is
around 10 to 20 percent while for Europe and North America it is as high as 25–35 percent. In total
only around 23 percent of global trade in value terms occurs between countries that share a land
border. While this ratio varies widely across continents, it has been nearly constant over recent
decades (Hummels, 2007:132). While this state of trade relates to various aspects such as
development status and economies’ levels of sophistication and patterns of demand for imported
goods, barriers to trade also impacts on the ability of a country or company to trade (near and far)
and typically include aspects such as tariffs, non-tariff barriers, trade costs, trade time, distance,
infrastructure and logistics.
According to Cuyvers et al. (1995:180), it holds true that for a target market being selected on the
basis of size and growth does not necessarily mean that such markets can be easily penetrated.
Therefore, in filter 3 of the TRADE_DSM methodology, trade restrictions are considered to further
screen the remaining possible export opportunities. Two main categories of barriers are considered
in this filter, namely the degree of concentration (filter 3.1) and trade restrictions (filter 3.2) (Cuyvers
et al., 1995:180; Cuyvers, 1997:7; 2004:261).
In the original approach an index for ‘revealed absence of barriers to trade’ is used as a proxy in this
filter. The hypothesis is that if the neighbours of the exporting country for which the model is
applied could establish a relatively strong market position in a particular market, then it would not
be too difficult for the exporting country to overcome trade barriers in this market (Cuyvers et al.,
1995:181; Cuyvers, 1997:7; 2004:262).
However, a challenge occurs where neighbouring economies are not necessarily adequate similar
proxies for a specific home market (country). The first alternative treatment for filter 3.2 was in the
2007 application of the method for South Africa (see Viviers and Pearson, 2007 and Pearson et. al.
2010) followed by a more comprehensive approach incorporating distance, transport cost, the

23 Rwanda TRADE-DSM analysis – Technical study report final draft 31 August 2017
World Bank Logistics Performance Index, average applied tariffs per country and the frequency
coverage ratio of non-tariff barriers per country (see Steenkamp et al. 2009; Viviers et al. 2009).
In the 2010 application of the DSM for South Africa (see Cuyvers et al. 2012) further refinements to
this approach included the following elements:
a) International shipment time (Linescape, 2010) ;
b) International shipment cost – only ocean freight;
c) domestic time to import (Doing Business Report from the World Bank);
d) domestic cost to import (Doing Business Report from the World Bank);
e) logistics performance index (Doing Business Report from the World Bank);
f) ad valorem equivalent tariffs per product-country combination (Market Access Map, ITC
Comtrade database); and
g) ad valorum equivalent non-tariff barriers per product-country combination (Kee, Nicita &
Olarrega, 2008).
The World Economic Forum’s Enabling Trade Report (2014) states that “data on non-tariff barriers
are very outdated and the absence of a comprehensive, rigorous and global measure of non-tariff
measures (NTMs) leaves a gap in any research regarding market accessibility. The assessment of
NTMs should not stop at the border, but also focus on behind-the-border measures, such as product
standards, conformity assessment regulations and subsidies. The International Trade Centre (ITC) is
engaged in an effort to collect data for the elaboration of an indicator on the presence of NTMs
affecting international trade. Having to rely on surveys by experts in the field, the process is
inevitably slow and extremely costly. The ITC is not yet in the position of providing an updated data
set with a global coverage. To date, these data are available for only approximately 61 countries.”10
Coverage, datedness of the information and the challenge of translation of NTMs into ad valorem
equivalents led to the exclusion of the non-tariff barriers from the latest application of the DSM
approach.
According to the OECD (2011) the globally growing interdependence of countries has often been
largely attributed to lower trade barriers and to a decline in communications and transportation
costs combined with technological developments. Successive rounds of multilateral trade
negotiations have also contributed to lowering of tariff barriers. However, as the levels of tariffs
overall declined, other trade costs have taken on greater significance. In contrast to the level of
understanding as well as knowledge and stylized facts regarding lower levels of tariffs, the evolution
and impact of other types of trade costs are not well informed.
It is argued that total cost of shipment (including the cost associated with of international
transportation, all documentation, inland transport and handling, customs clearance and
inspections, port and terminal handling and official costs) together with the tariffs charged on the
product by the importing country, encapsulates the restrictive impact that time, distance,
infrastructure and logistics would have on trade.
10 A recent verification with the ITC shows coverage of 90 economies, for which most information was
collected for 2012 and further back, supporting the statement around datedness of information.

24 Rwanda TRADE-DSM analysis – Technical study report final draft 31 August 2017
Further refinement of the approach emerged from this study due to the fact that Rwanda is a
landlocked country. Due to this locational characteristic a more detailed land-based travel
component also needed to be developed. In addition, recent findings from various different sources
point to how the differential in transport costs and time impacts on determining trade flows and
comparative advantage of countries (e.g. Nordås et al. 2006; Hummels 2007, Blyde 2010, OECD 2011
and Hummels et al. 2012).
Blyde (2010) finds that domestic transport (within country) costs significantly affect the prospects of
exporting for a Colombian case study. The study finds that regions within the country with transport
costs in the 25th percentile export around 2.3 times more than regions with transport costs in the
75th percentile, once other factors are controlled for.
On the international side another quantitative case study demonstrates how relatively lower
transport cost and quicker delivery time coupled with a slightly lower unit value of the exported
product has contributed to make Australia’s iron ore more competitive in China than Brazil’s
(OECD,2011:20). Nordås et al. (2006) observes that “geography … matters less when time for exports
is controlled for, suggesting that geography matters partly because it is related to time. Countries
can therefore to some extent overcome geographical disadvantages by reducing the behind the
border time for exports.” Transit time is found to be more closely correlated with freight rates than
is direct maritime distance (Wilmsmeier et al., 2008).
Further back in earlier research Limão and Venables (2001) found that shipping an extra 1000
kilometres by sea raises transport costs by an estimated US$ 190 per container. When the additional
distance is overland they find a much larger increase in transport costs. Overall these authors found
that using distance alone as a proxy for transport costs only explained around 10 percent of its
variation.
While gravity models, the “workhorses” of trade flow models, generally use distance as a proxy for
transport and other trade costs, Clark (2007) and Martinez-Zarzoso and Nowak-Lehmann (2007) find
that distance is a poor proxy for transport costs and incite other analysts to refrain from using
distance as a proxy for such costs in gravity models. The OECD (2011) has found that distance is
imperfectly correlated with transport costs, especially distance measured between the capitals of
each of the two countries in a bilateral trading pair “as the crow flies”. The OECD (2011) study shows
that distance is in fact a highly inaccurate proxy for transport costs. In light of these suppositions,
some trade analysts have started to emphasize the importance of obtaining better data on transport
costs.
According to Hummels (2007) understanding modern changes in transportation costs is complex.
Types of products imported and exported, transportation service intensity of such products, and
mode of transport (road, rail, marine or air freight) all affect measured costs. However, two main
approaches are prevalent in the literature; that of direct quotes from the shipping industry or
transport and logistics operators and derived information. The derived information approach is
based on the national customs data in the form of the difference between import (CIF) export (FOB)
values. The import (CIF) value is divided by the export (FOB) value to obtain an indication of bilateral
transport costs between an origin and destination pair. The OECD (2011) study found that CIF/FOB
ratios are too imprecise to be used as a proxy for transport and insurance costs.

25 Rwanda TRADE-DSM analysis – Technical study report final draft 31 August 2017
While detailed data on the value of imports and exports by different modes of transport are sparse,
U.S. and Latin American data suggest that trade between country neighbours is mostly via modes
like truck, rail and pipeline. Perhaps 10 percent of such trade gets transported via air or maritime
transport Hummels (2007). In contrast the author finds that for nonadjacent trading partners, most
merchandise trade moves via maritime and air modes. Traditional bulk commodities such as
petroleum (including crude oil) products, coal, iron ore and grains are almost exclusively shipped via
maritime cargo.
Hummels (2001, 2006, 2007) estimates the tariff (ad valorem) equivalent in transit is 0.8 percent per
day. As an example this translates to a tariff equivalent of 16 percent on a 20 day voyage, whether
by ocean or land. As such it is clear that the cost of time represents potentially a more significant
barrier to trade than estimates for most trade policy variables. Hummels (2007) postulates that for
each maritime travel day a supplying country is further from the importing country, the probability
that the importing country will source manufactured goods from the exporting country decreases by
one percentage point.
In an independent study by Djankov et al. (2006) the authors find that each additional day in transit
reduces trade by one percent. An alternative way to interpret this is that for each additional day of
transit required it is equivalent to the country distancing itself from its trading partners by around 70
kilometres. In the case of traded products that are “time-sensitive” in nature, delays have an even
more direct effect. Therefore the authors find that a 10 percent increase in the relative time of
moving such products results in a five percent reduction in relative exports of such products.
Added to these observations the fact that mostly remote nations with very small markets face
relatively high transport costs (OECD, 2011) it becomes evident that maritime transport costs
represent insurmountable barriers to trade in some cases that they represent a significant drag on
most exports. Given these extremely high transport costs, these countries may need to consciously
strategize to develop exports of goods with very high value to weight ratios and for which transport
costs play a small role. Hausmann and Chauvin (2015) echoed this recommendation for the case of
Rwanda.
Transport and related trade costs are often viewed as technologically determined and therefore
resorts under non-policy barriers. Pomfret and Sourdin (2010) opinions that port infrastructure,
corrupt customs officials and other costs clearly are policy-related, while other variables may be
indirectly policy related. For example levels of competition among shippers may be due to low
volumes or due to non-implementation of anti-monopoly policy or a combination. For all countries
and companies trade risks always exist, but according to these authors country variations are more
related to institutions such as poor law enforcement. Even with ideal institutions, of course, some
trade costs will remain because there are real costs to moving goods over any distance.
Due to the importance of shipping costs (both domestic and international marine as well as land-
based transits, especially for landlocked countries) the DSM approach for this study therefore was
extended to compile detailed routing tables and mode switches (only marine versus road trucking)
to all major country destinations, including border crossings. This has the effect of creating a relative
cost index that not only considers the international (marine) shipping cost and domestic cost to
import (as reported by the Doing Business Report 2016 which only considers activities, time and cost
at the port of entry and does not include transport within or between countries between such port

26 Rwanda TRADE-DSM analysis – Technical study report final draft 31 August 2017
and transits to the destination). In terms of deviance from the original methodology, it is only
relevant to discuss changes to the trade restrictions (filter 3.2) in the case of Rwanda, as the rest
remains the same as described in Cuyvers et al. (2012).
The DSM approach therefore attempts to ensure that the rest of aspects such as tariffs, trade costs,
trade time, infrastructure and logistics (some differentiation between road truck and marine freight)
are still considered, not as explanatory variables but rather as part of the filtering process in order to
ensure most realistic opportunities are identified. Other research as demonstrated in this section
points to the explanatory power (or not with reference to distance and costs) of these elements.
As the unit of determining the costing for land and maritime transport a shipment of 15 metric ton
(or 20-foot container) of automotive parts11 (heavy) is used that is valued at US$ 50 000 (for
comparability, as the latest Doing Business Report 2016 uses US$ 50 000). The origin of routing
transactions assumed is Kigali, Rwanda. To arrive at an ad valorem equivalent international shipping
cost, the cost to import into each individual target market was divided by the $US 50 000 value of
the cargo. The purpose of this ad valorem conversion is to get a relative answer, as no values are
explicitly related to the nominal value assigned (it is purely a common denominator). While a
difference in this value will result in nominal differences in ad valorem percentages, it will not result
in overall relatively different outcomes from the DSM approach.
To this effect the latest iteration of improvements on the approach therefore not only considers
trade cost as a measure of trade barriers but includes (i) tariffs, (ii) international shipping cost and
both domestic and international transit times as well as transit country border cost approximations
and (iii) the domestic cost to import. These are each calculated as an ad valorem equivalent
(percent) on the value of the goods and added together to arrive at the total ad valorem equivalent
of trade cost per product-country combination.
2.4.2.1. Ad valorem equivalent tariffs per product
The International Trade Centre’s Market Access Map (MacMap) was used to gather tariff
information on HS 6-digit product level for all potential product-country combinations from
Rwanda’s perspective. Ad valorem equivalent tariffs were used due to the difficulty of comparing
specific duties (e.g. five Euros per kilogram of sugar) with ad valorem tariffs (e.g. 5 percent of the
total value of the imports) across countries.
According to the IMF (2005:14), the MacMap database is unique and extremely accurate12 to
measure the tariff levels faced by individual country exports due to the fact that it accounts for
bilateral, regional and preferential tariff systems. The MacMap database is also specifically suitable
for this study due to the fact that the data are available on a HS 6-digit level and also considers
different tariff regimes such as Most Favoured Nations (MFN) and specific agreements such as
between EAC members and COMESA members.
11 In order to be closely comparable with the World Bank Doing Business approach using a standardized
shipment of 15 metric tons of containerized auto parts (HS 8708). 12
The authors have however found that there are a number of HS-6 digit codes with data in the BACI data set that do not have entries in the ITC MacMap data. The treatment of these instances is covered under the tariff section.

27 Rwanda TRADE-DSM analysis – Technical study report final draft 31 August 2017
2.4.2.2. International shipping cost and domestic and international transit time
per country
In the general empirical trade literature trade costs are determined to be a main determinant of the
amount of trade between countries (see e.g. Limão and Venables, 2001). According to Bosker and
Garretsen (2007) trade costs are also a crucial element of new economic geography (NEG) models.
The authors state that the size of trade costs crucially determines the relevance of market access
and thereby of inter-regional spatial interdependencies. One of the challenges around international
shipping costs is that there is no single consistent and “authoritive” source of information to use for
research and related purposes. This is not only due to the fact that there are many players in the
market determining prices, but also a function of various variables impacting on pricing e.g. partner
country trade imbalances; infrastructure capabilities and availability; and risks such as piracy and
weather.
Directional imbalance in trade between trading partners implies that many carriers have to backhaul
empty containers on their return voyages. Pricing of shipping in one direction is therefore not the
same as that of the return trip.
Much literature exists on the importance of port infrastructure and its implications for maritime as
well as inland transport and time costs. Port infrastructure is a key building block of transport costs
and also influences aspects such as the size of ship that can enter any given port plus the time
needed to load / unload ships.
Piracy is a very real threat to ship owners and mariners in particular parts of the ocean. While the
numbers of ships actually attacked may seem minimal, their potential risk cause shipping rates to
increase as a result of increased insurance as well as additional costs due to security measures on
the ships themselves.
The OECD has a project on maritime transport costs13 to collection data that combines maritime
transport cost data from a variety of different sources. The challenge is that this data is only
available for a limited number of countries (Argentina, Australia, Brazil, Bolivia, Chile, Colombia,
Ecuador, New Zealand, Paraguay, Peru, United States and Uruguay) and that the data is also dated
(the data set is only available for the period 2003 to 2007).
For these reasons this study had to follow a somewhat “eclectic” approach and very manual process
to compile routing tables, distances, travel times and associated costs for Rwanda into all the
destinations in the world for which data international trade and economic was available.
Information sources for cost estimates, route options and scheduling used in this process includes
online sources such as World Freight Rates14, Searates.com15, Mediterranean Shipping Company
(MSC)16, Maersk, CMA CGM17, Pacific International Lines18, the Logistics Cluster19 and Google
Maps20.
13 See https://stats.oecd.org/Index.aspx?DataSetCode=MTC.
14 See http://www.worldfreightrates.com/en/freight
15 See https://www.searates.com/
16 See https://www.msc.com/routefinder

28 Rwanda TRADE-DSM analysis – Technical study report final draft 31 August 2017
Furthermore Rwanda’s own detailed international trade data21 was analysed and used to inform
initial routing form within the country, border exit points and neighbouring countries. South Africa’s
detailed import statistics including border entry points from the South African Revenue Services’
department of Customs and Excise were used to determine most probable flows from Rwanda into
Southern Africa.
More specific information regarding routing costs and times within the East Africa Northern and
Central Corridors were obtained from the latest reports published by Central Corridor Transit
Transport Facilitation Agency (CCTTFA, 2016) and the Northern Corridor Transit and Transport
Coordination Authority (NCTTCA, 2016).
While this process may not yield accurate actual commercial costs for actual shipment purposes, by
comparing various sources with each other the authors have confidence in the relative outcome
from routing, cost and time estimates from Rwanda to different parts of the world. This approach
needs to be contextualised relative to the purpose of the DSM - to have a mechanism for relative
discrimination between different options, not absolutely accurate commercial values in absolute real
world terms.
The drawback of this approach is however that most of the information is only relevant relative to
the specific home market at a specific point in time and is not created for all routes between all
trading partners for general international trade and transport studies.
Examples of actual routes and outcomes are discussed in the sections to follow.
2.4.2.3. Domestic cost to import per country
The World Bank’s cost to import estimates (Doing Business Report, 2016) information from the
Trading Across Borders section was used to obtain the domestic cost associated with transporting
and clearing goods for all the target countries under investigation.
These “cost to import” estimates include the cost associated with all documentation, inland
transport and handling, customs clearance and inspections, port and terminal handling and official
costs (no bribes) (The World Bank, 2014). In calculating the cost to import for each country, the fees
levied on a 20-foot container of general cargo valued at US$50 000 were used. The cost does not
include tariffs or costs related to ocean transport. Although Doing Business collects and publishes
data on the time and cost for domestic transport, it does not use this data in the calculations, hence
the need to construct routing tables and cost estimates for both domestic and international road
truck transport as well as maritime shipping routes and costs.
2.4.2.4. Creating a composite relative market access index
The total ad valorem equivalent percentage of the cost to transport goods from the harbour in the
exporting country to the final destination in the importing country is calculated by adding
17 See https://www.cma-cgm.com
18 See https://www.pilship.com/en-pil-pacific-international-lines/1.html
19 See http://www.logcluster.org/
20 See https://www.google.co.za/maps
21 Provided by Mr Victor Steenbergen, country economist for Rwanda, International Growth Centre.

29 Rwanda TRADE-DSM analysis – Technical study report final draft 31 August 2017
(unweighted) the ad valorem equivalent tariff per product-country combination to the ad valorem
equivalent international shipping cost, the ad valorem equivalent (based on what we term the
“Hummels ad valorem equivalent assumption” of 0.08 percent per 24 hrs) international shipping
time and domestic cost to import.
Therefore the composite relative market access index MAIij constructed from the home market i
(exporting country) for each potential target market j (importing country) and HS6-digit product (k)
in the world for which economic and international trade data exists and for which the relevant tariff
and shipping and time costs have been compiled can be expressed as:
MAI��� = ����� × AVET��� + ���� × AVES�� + ���ℎ × AVEH + ���� × AVED�� ≤ ∁ ���[��. 1]
The current assumption applied avet = aves = aveh = aved =1 and where:
AVETijk = ad valorem equivalent tariff for home market (exporter) i into target market (importer) j for product k;
avet = weighting coefficient for AVETijk overall for all combinations in population of possibilities; AVESijk = ad valorem equivalent international shipping cost for home market (exporter) i into
target market (importer) j; aves = weighting coefficient for AVESij overall for all combinations in population of possibilities; AVEH = Hummels ad valorem equivalent time cost constant assumption overall for all
combinations in population of possibilities; aveh = weighting coefficient for AVEH overall for all combinations in population of possibilities; AVEDj = ad valorem equivalent domestic cost to import for target market (importer) j; aved = weighting coefficient for AVEDj overall for all combinations in population of possibilities; ∁MAI = Pareto informed cut-off point for the relative market access index (MAI);
All product-country combinations that passed filter 3.2 therefore had to conform to a cut-off point
(∁) for transport costs informed by the classic eighty-twenty Pareto principle. Therefore such
product-country combinations must have an ad valorem equivalent percentage of transport cost of
less than or equal to the 80th percentile of the total ad valorem equivalent trade costs over the total
population of product-country combinations that passed filter 2.
2.4.3. Rwanda national reported export data informing export flow assumptions
Based on analysis of information obtained for Rwanda’s detailed imports and exports, it is evident
that more than 80 percent of Rwanda’s export in value terms flows through four border exit points
namely Rusumo (Tanzania border), Gatuna (Uganda border), Kigali-Aeroport (international) and
Goma (Border with the Democratic Republic of the Congo (DRC) border). In total value terms just
less than 10 percent of exports leave the country by air, while the rest is mainly on land and
maritime once through the ports of Mombassa (Kenya) and Dar es Salaam (Tanzania).

30 Rwanda TRADE-DSM analysis – Technical study report final draft 31 August 2017
Figure 5: Rwanda exports major border exit points
Source: Google Maps constructed from CCTTFA (2016) and NCTTA (2016) – not to scale. Shares calculated from Rwanda’s
ASYCUDA data received.
Based on the assumption that exports via Rusumo destined for countries other than Burundi, the
DRC, Tanzania or Kenya can either flow to Dar es Salaam port, or by road to neighbouring countries
to the South (Botswana, Malawi, Zambia, Zimbabwe) an estimate of the export in value terms that is
transported via the Dar es Salaam port can be derived.
Similarly, for exports leaving the country through Gatuna not bound for Uganda, the DRC, South
Sudan, Tanzania or Kenya it is assumed that these exports will travel via maritime transport from
Mombassa.
Based on these assumptions it is evident that while various other sources22 indicate oscillation of
overall trade of cargo in tonnage terms between Mombassa and Dar es Salaam, for Rwanda it seems
that in value terms Dar es Salaam over time has handled between 70 and 80 percent of Rwanda’s
exports on a consistent basis.
22 See e.g. “East Africa: Dar es Salaam and Mombasa Ports Fight for Rwanda Business”,
http://allafrica.com/stories/201309161873.html - 13 SEPTEMBER 2013 [accessed June 25 2017]; and “Mombasa port loses business as exporters opt for Dar es Salaam”, http://www.nation.co.ke/business/infrastructure/Mombasa-port-loses-business-as-exporters-opt-for-Dar-es-Salaam/1959776-1959816-90rwus/index.html - 29 August 2013 [accessed June 25 2017]; and “Tanzania traders ditch Dar port for Mombasa”, http://www.the-star.co.ke/news/2016/04/07/tanzania-traders-ditch-dar-port-for-mombasa_c1317331 – 7 April 2016 [accessed June 25 2017]; and “Drought, poll fears take toll on East African trade”, http://www.businessdailyafrica.com/economy/Drought--poll-fears-take-toll-on-East-African-trade/3946234-3991546-hg0mo0z/index.html - 29 June 2017 [accessed June 30 2017].

31 Rwanda TRADE-DSM analysis – Technical study report final draft 31 August 2017
Figure 6: Rwanda exports major border exit points
Source: Shares calculated from Rwanda’s ASYCUDA data received.
Based on this information of Rwanda’s international logistics and maritime shipping flows is
therefore assumed to be mainly through the port of Dar es Salaam for the purposes of this study.
With the model constructed it is possible to investigate the impact of alternative scenarios in this
regard, but the author is of the opinion that this will have an insignificant impact on the overall
results, while it may have more of an impact for the economies of Kenya and Tanzania.
2.4.4. Treatment of landlocked countries
While most of the countries in the world are serviced by maritime ports, currently 48 countries
(including four partially recognized states) are completely surrounded by at least one other country
(e.g. Lesotho in South Africa). In this context Rwanda is also totally landlocked. With the exception of
two countries in South America (Bolivia and Paraguay) the rest of these 46 countries are located in
Africa, Europe, and Asia. It is therefore key to account for this dimension of international transport
costs to specific target markets (importing countries).
Due to the importance of shipping costs (both domestic and international marine as well as land-
based transits, especially for landlocked countries) the DSM approach for this study therefore was
extended to compile detailed routing tables and mode switches (only maritime versus road trucking)
to all major country destinations, including border crossings.
The implication for such landlocked countries is that transport costs in general are higher and modal
changes in the transport of goods adds both time and costs to the overall transport costs into such
markets. An example from Dar es Salaam to Belarus is shown in Figure 7.

32 Rwanda TRADE-DSM analysis – Technical study report final draft 31 August 2017
Figure 7: Example of landlocked country routing
Source: Searates.com
Figure 8: Actual example of costing elements applied
Source: Google Maps, Searates.com, author annotations
Figure 8 and Figure 9 demonstrate the approach that was applied to construct detailed routing,
time, border crossing and mode switches with associated cost and time implications. These
adjustments have the effect of creating a relative cost index that not only considers the international
(maritime) shipping cost and domestic cost to import (as reported by the Doing Business Report
2016 which only considers activities, time and cost at the port of entry and does not include
transport within or between countries between such port and transits to the destination), but also
voyage and transit duration and cost implications.
Figure 9: Logistics routing chain for costing example
Source: Authors
Evident from Figure 8 the routing from Kigali in Rwanda to Bishkek in Kyrgyzstan transits 5 countries
through 7 border entries/exits, 3 transport mode switches (from road to maritime and back to
maritime). The assumption for import costs into Kyrgyzstan applied is from the Doing Business
Report (2016). However, transit costs through the various countries on the route are not generally
available. The approach applied was to make use of a weighted23 cost of import (from the Doing
Business Report) into each of the transit countries.
23 For an initial assumption a mechanistic weight of 0.5 is applied. More research around this element may be
required for future refinements. In the case where countries either were neighbours of Rwanda’s or part of the EAC or COMESA, this weight was set to 0.1 only to reflect the fact that administrative costs within the common

33 Rwanda TRADE-DSM analysis – Technical study report final draft 31 August 2017
While this may not be 100 percent accurate, it does provide for a realistic mechanism to
differentiate cost impacts between e.g. landlocked and non-landlocked target countries. The relative
difference between transits for landlocked countries within the European Union (much lower drag)
versus e.g. Middle Africa or Central Asia is also reflected well with this approach.
2.4.5. International logistics and shipping costs as applied for the Rwanda case
In terms of compiling the components of the composite relative market access index, assumptions
informed by most probable transport routes (maritime and road truck) needed to be formulated.
While the following illustrative routing maps provide a general indication of routes from Dar es
Salaam to all countries in the world, in the actual model a specific route for each and every possible
target market was applied. In total therefore 231 individual routes were constructed.
Figure 10 shows the typical maritime leg of the routing from Dar es Salaam to most Western and Northern European countries, namely:
Figure 10: Most probable maritime routing from Dar es Salaam to Western and Northern Europe
Source: Searates.com
- Austria - Belgium - Belgium-
Luxembourg - France - Germany - Netherlands - Denmark - Estonia
- Finland - Greenland - Iceland - Ireland - Latvia - Lithuania - Norway - Sweden - United Kingdom
The average route distance from Kigali in Rwanda for this group of countries is around 13 494
kilometres and 68 days total travel time.
While Switzerland is classified as geographically located in Western Europe, this country is assumed
to be accessed from Southern Europe via Italy (see Figure 160 in appendix section 9.5.1). The
average route distance for this group of countries from Kigali in Rwanda is around 9 924 kilometres
and 48 days total travel time.
A high level overview of the aspects considered in this context is provided in Appendix 9.5 for the
rest of the different regions, as well as more detail focused more specifically on Rwanda’s
neighbouring countries and Southern Africa.
economic areas should be providing a lower cost for member countries’ trade with each other versus trade from non-member countries.

34 Rwanda TRADE-DSM analysis – Technical study report final draft 31 August 2017
2.4.6. Global tariffs applicable to exports from Rwanda
Various studies confirm that market access matter and that, for example, GATT membership, access
through PTAs and GSPs, and geographic proximity to major markets all lead to an increase in export
diversification (Davis and Weinstein, 2003) and Melitz and Ottaviano (2008) highlights the potential
pro-competitive effects often associated with episodes of trade liberalization.
The last cost component in terms of the composite relative market index is therefore that of import
tariffs faced by exports from Rwanda into different target markets. While Rwanda is a member of
the EAC and COMESA, various other agreements also inform the levels of tariffs that some or all of
Rwanda’s export products will face. As discussed in a preceding section, information used for this
purpose is the International Trade Centre’s Market Access Map (MacMap) ad valorem equivalent
tariff rates. The purpose of this study is not to include detail on all the relevant applicable trade
agreements and rules of origin (for more information on this refer to the International Trade
Centre’s Market Access Map web site).
An analysis based on the information obtained from MacMap from Rwanda’s perspective from all
possible trading partners in the world for each HS 6-digit product level occurring in the BACI data set
used for the modelling finds that there a number of country-product lines for which the ITC MacMap
data has no entries. The approach to handle this was to revert to tariffs calculated based on average
(unweighted) higher level aggregates. So first a set of HS 4-digit unweighted average tariffs for all
country-product combinations were calculated, followed by a HS 2-digit (chapter) unweighted
average tariffs. For any HS 6-digit product level country-product entries in the BACI data that had no
corresponding entries in the ITC MacMap data therefore a high level hierarchy average tariff was
obtained from the calculated HS 4-digit unweighted average tariffs. In the event that no HS 4-digit
unweighted average tariffs existed, the HS 2-digit (chapter) unweighted average tariffs as applied.
The outcomes were aggregated by region for illustrate discussion purposes, as in total there are more than 1 million country-product HS 6-digit product level combinations. Figure 11 provides two summarised pieces of information relevant to this analysis. The first is the number of HS 6-digit product level on which a tariff exists (for any non-zero item irrespective of the value). Evident is that Middle Africa has the largest number of lines with an associated tariff at 89.5 percent of all tariff lines, followed by Western Africa at 87.6 lines. The second is the unweighted average tariffs for each region. In the case of Middle Africa, again countries in this region not only have on average the most tariff lines, but also the highest ad valorem equivalent tariff equivalent (unweighted) at 14.1 percent. Northern and Western Europe has the lowest both in terms of number and average percentage.
Figure 11: Tariff equivalent outcomes by region
Source: Authors’ calculations from ITC MacMap ad valorem
equivalent data.

35 Rwanda TRADE-DSM analysis – Technical study report final draft 31 August 2017
2.4.7. Composite relative market access index outcomes for Rwanda
The outcomes obtained based on the data, assumptions and calculations as discussed in the
preceding sections are then applied to calculate equation 1 - the composite relative market access
index MAIij constructed from the home market i (exporting country) for each potential target market
j (importing country) and HS6-digit product (k).
The outcomes averaged by region for the ad valorem equivalent international shipping cost for home market (exporter) i into target market (importer) j (AVESijk); the Hummels ad valorem equivalent time cost constant assumption (AVEH) and the ad
valorem equivalent domestic cost to import for target market (importer) j (AVEDj) are shown in Figure 12. Evident is that Eastern Africa on average in absolute terms exhibits the lowest overall cost component for the index. While the absolute average cost for a shipment from Kigali into the East African region is the lowest overall, Figure 13 clearly shows that in terms of distance covered versus time and cost spent, the East Africa region in relative terms (size of the bubble) are the most expensive to export to (around 19.67 US$ per hour). On the opposite end of the scale, while the Central American region, North America and the Caribbean are some of the furthest regions from Rwanda, the relatively lower rates of logistics services in these areas plus lower import costs and time yields the cheapest or most productive shipments in terms of relative costs (around 3.94 US$ per hour). The relative relationship in terms of cost per hour and distance is illustrated in Figure 14. The relative difference in magnitudes is better observable in this representation. However, as mentioned in section 2.4.5 with the example of Mongolia, it must be kept in mind that there can be significant variances of these outcomes within regions and these illustrations simply serve to provide some contextual understanding of the implications and outcomes of the modelled approach.
Figure 12: Average overall cost outcomes by re gion
Source: Authors’ calculations
Figure 13: Average distance, time and cost per hour relationship
Source: Authors’ calculations
Figure 14: Overall logistics average time productivity by region
Source: Authors’ calculations

36 Rwanda TRADE-DSM analysis – Technical study report final draft 31 August 2017
The final element to be added is therefore the ad valorem equivalent tariff for home market
(exporter) i into target market (importer) j for product k (AVETijk).
Evident is that overall the import tariff
informed component of the ad valorem
equivalent relative market access index is
relatively small compared to the
international administrative and shipping
logistics cost and time component.
In layman’s terms the index implies that for
a container with contents valued at 50 000
US$ shipped from Kigali, the effective cost
to transport such a container to Central
America will equate to around 105 427 US$,
while the same container will have an
effective ad valorem equivalent cost of
around 61 986 US$ on average in the East
African region.
So it will be nearly double the cost to take
the container to Central America relative to
somewhere in East Africa, considering all
the various cost direct and proxied cost
elements associated with all
documentation, inland transport and
handling, customs clearance and
inspections, port and terminal handling and
official costs, international road and
maritime shipping and the time value of the
consignments (Hummels constant).
Figure 15: Overall ad valorem impact of the r elative market access index
Source: Authors’ calculations
Figure 16: Market Access Index outcomes distribution and pareto cut -off value applied
Source: Authors’ calculations
However, it must be kept in mind that these are relative costs to differentiate potential destination
market-product combinations for modelling and strategy information purposes – not actual
commercial rates that will be applicable for a similar real world transaction.
The last element in the equation is then the Pareto informed cut-off value (∁ ���) which is calculated
(see Figure 16) across the population of all HS 6-digit product level country-product lines that could
be considered to be exported from Rwanda to the rest of the world (irrespective of Rwanda’s
current production and export capabilities). To this effect the DSM approach differs from the
product space approach in that all potential is evaluated based on demonstrated import demand for
all countries and all products. Specialisation in terms of RCA and other parameters are used as filters
to help define interpretation of outcomes – we do not exclude options with RCAs < 1 as in the case
of the product space approach. Based on the set of assumptions as explained and described in this
section, the Pareto informed cut-off value for Rwanda is therefore ∁ ��� = 0.9625.

37 Rwanda TRADE-DSM analysis – Technical study report final draft 31 August 2017
Therefore all HS 6-digit product level country-product lines that will pass the accessibility filter (sub-
filter 3.2 see section 2.1) have an accessibility tariff equivalent index of 96.25 percent or less. This
translates into around 700 000 HS 6-digit product level country-product lines that meet this
criterion. The median accessibility tariff equivalent index is around 74 percent, while the maximum is
in excess of 1000 percent. While in Figure 15 it was shown that on average the import tariff
informed component of the ad valorem equivalent relative market access index is relatively small
compared to the international administrative and shipping logistics cost and time component, in
exceptional cases the reverse holds. There are more than 140 000 HS 6-digit product level country-
product lines (16.4 percent of the total population of product-country lines) that have an
accessibility tariff equivalent index of 250 percent or more, which would mean in such instances that
the import tariff informed component far outweighs the international administrative and shipping
logistics cost and time component.
A practical example is that of e.g. Fiji in Oceania. While the international administrative and shipping
logistics cost and time component for Fiji is 89.5 percent, for selected HS 6-digit products Fiji has 1
329 HS 6-digit product lines with import tariffs in excess of 100 percent, and 15 in excess of 250
percent. Examples are provided Table 1.
Table 1: Examples of t ariffs applied by Fiji
Product: 22072010 - Undenatured ethyl alcohol of an alcoholic strength by volume of 80% vol or higher; ethyl alcohol and other spirits, denatured, of any strength : Ethyl alcohol and other spirits, denatured, of any strength : Of an alcoholic strength by volume of 57.12% vol or less Partner: Rwanda Data source: ITC (MAcMap) Year: 2013 Nomenclature: HS Rev.2012 AVE Methodology: AVE based on the World Tariff Profile (WTP)
Tariff regime
MFN duties (Applied) Applied tariff (as reported) $52.01/lt Applied tariff (converted) 28971.13 $/Ton Total ad valorem equivalent tariff 1,000.00%
Product: 24022000 - Cigars, cheroots, cigarillos and cigarettes, of tobacco or of tobacco substitutes : Cigarettes containing tobacco Partner: Rwanda Data source: ITC (MAcMap) Year: 2013 Nomenclature: HS Rev.2012 AVE Methodology: AVE based on the World Tariff Profile (WTP)
Tariff regime
MFN duties (Applied) Applied tariff (as reported) $169.14/Kg or 1000 cigarettes. whichever is the greater Applied tariff (converted) 94216.05 $/Ton but not less than 0.09 $/Ton Total ad valorem equivalent tariff 814.71%
Source: ITC Market Access Map

38 Rwanda TRADE-DSM analysis – Technical study report final draft 31 August 2017
3. Skill and technology intensity
A key insight for industrial policy making flowing from more recent research in the international
trade research environment is that policy makers have to be aware that it also does matter “what”
specifically the economy produces and “how” it produces. Trade can help stimulate growth but this
depends on what countries export rather than on how much they export (UNDESA, 2010). Various
studies have informed this question and one of the better known studies on this topic is that of
Hausmann et al. (2007).
While the benefits of international trade are often stressed, the more complex question of what
types of exports are most beneficial for human capital accumulation is empirically investigated by
Blanchard et al. (2017). The “how” the economy produces question also has some profound
implications. In a study published by UNCTAD (Basu and Das, 2011) focusing on export structure and
economic performance in 88 developing countries (during the period 1995–2007), the outcomes
supported the notion that, in general, higher levels of skill- and technology-intensive manufactures
(as opposed to lower) could help increase GDP per capita in developing countries (i.e. moving up the
value chain).
The research also supported the view that countries with higher quality export products together
with better institutional quality, human capital and financial markets are in a better position to
derive benefits from trade integration and economic policies than countries with low skill- and
technology-intensive products, weak institutional quality, low levels of human capital and a lack of
financial resources. Blanchard and Olney (2017) further demonstrate that growth in less skill-
intensive exports depresses average educational attainment while growth in skill-intensive exports
has the opposite effect.
To assist in understanding this dimension of opportunities identified with the DSM methodology, the
same approach in terms of mapping skill- and technology intensive export products based on the
initial work24 by Basu et al. (2011) is applied as an additional dimension. The classification considers
the mix of different skill, technology, capital and scale requirements at the final product stage. Based
on this approach the Harmonized System (HS) trade data25 in this case at the 6-digit level is mapped
in order to identify products in terms of six different levels: Non-fuel primary commodities (A),
Resource-intensive manufactures26 (B), Low skill- and technology-intensive manufactures (C),
Medium skill- and technology intensive manufactures (D), High skill- and technology intensive
manufactures (E) and Mineral fuels (F).
For manufacturing a relatively detailed classification can be achieved on this basis, however the
underlying UNCTAD classification used designates all industries in the Agricultural sector as "Non-
fuel primary commodities". We have not attempted to distinguish more detail for agriculture in this
regard; therefore agricultural industries are treated as homogenous and no separate more or less
skill-intensive agricultural exports are indicated. This is a potential area for future refinement.
24 Also available from the World Bank (see http://mec.worldbank.org).
25 Data obtained from the International Trade Centre Trade Map online data at http://www.trademap.org.
26 Resource intensive products according to the UNCTAD classification are products associated with e.g.
tobacco, textiles (wearing apparel), certain paper, furniture (including made from wood), non-fuel petroleum products, basic metals and non-metallic mineral products (other mining).

39 Rwanda TRADE-DSM analysis – Technical study report final draft 31 August 2017
4. Contextual analysis – overview of Rwanda’s import and export trends
This section provides a brief contextual overview of Rwanda’s more recent trade developments
based on the CEPII BACI data set used for the underlying modelling and analysis. For purposes of
determining whether any major structural shifts have developed since the Hausmann et al. (2015)
evaluation we compare the structural make-up of Rwanda’s trade in 2010 with that of 2015. This
provides for contextualisation of developments over the 5 year period since the Hausmann et al.
(2015) evaluation was conducted.
While the DSM approach provides
information at the HS 6-digit product level,
the overview provided is based on SITC4 for
comparative purposes.
Evident from Figure 17 is that Rwanda is a
net importer, with the trade balance having
worsened between 2010 and 2012, after
which it seem to have stabilised. Since 2013
the ratio of imports to exports is more than
240 percent.
The change in export shares by major SITC4 section is shown in Figure 18 in terms of 2010 versus 2015.
Figure 17: Rwanda total trade and trade balance (2010 -2015)
Source: Authors’ calculations based on BACI data
Notably Crude materials, inedible, except fuels (S2), Manufactured goods (S6) and Food and live animals (S0) as well as Beverages and tobacco (S1) have shown declines in contribution to overall exports. Crude materials, inedible, except fuels (S2) lost its place as largest export group with a decline of 15.8 percentage points, from 48.5 percent down to 32.8 percent. In terms of increased shares Mineral fuels, lubricants and related materials (S3), Miscellaneous manufactured articles (S8), Animal and vegetable oils, fats and waxes (S4) and Machinery and transport equipment (S7) how shown relative increases in the overall basket of exports for Rwanda between these two years.
Figure 18: Rwanda change in export shares by SITC4 main section (2010 versus 2015)
Source: Authors’ calculations based on BACI data
Mineral fuels, lubricants and related materials (S3) have shown the largest relative increase – from
0.5 percent up to 11.1 percent (a 10.6 percentage point increase).

40 Rwanda TRADE-DSM analysis – Technical study report final draft 31 August 2017
On the import side, Machinery and transport equipment (S7) is the largest group of imported products in value terms and also has shown the largest growth in share of imports over the period. Manufactured goods (S6) follows and while Chemicals and related products, n.e.s. (S5) is the third largest group, it has experienced the largest decrease in share of total imports of the period (from 22.6 down to 14.1 percent, a decrease of 8.5 percent). The composition of Rwanda’s 2015 trade balance is provided in Figure 20. Evident is that the largest contributor to the overall negative trade balance is Machinery and transport equipment (S7), followed by other Manufactured goods (S6) and Chemicals and related products, n.e.s. (S5).
Figure 19: Rwanda change in export shares by SITC4 main section (2010 versus 2015)
Source: Authors’ calculations based on BACI data
Crude materials, inedible, except fuels (S2), Mineral fuels, lubricants and related materials (S3), Food and live animals (S0) and Items n.e.s. (S9) are next foreign exchange earners for Rwanda. On closer inspection it would seem that petroleum related products dominate this item and is mainly imported and then re-exported in the region. The fuel storage capacity the government has jointly built with the private sector has made Rwanda attractive to oil marketers who store the fuel before exporting it to Eastern Democratic Republic of Congo and Burundi.27 However, as per the Hausmann et al. (2015) analysis it is evident that Rwanda specialises in “non-complex” and low-value added export products.
Figure 20: Composition of Rwanda’s trade balance (2015)
Source: Authors’ calculations based on BACI data
These observations are further confirmed when the merchandise exports from Rwanda is classified
according to skills and technology intensity as explained in section 3.
27 Rwanda’s fuel storage capacity has grown from 74 million liters in 2015 to 96 million liters in 2016 after
Societe Petroliere added a 22 million liters fuel storage facility in 2016 (“Rwanda’s exports to EA rise 31pc” in The East African, 22-03-2017, available at http://www.theeastafrican.co.ke/business/Rwanda-exports-EA-rise-/2560-3860116-lpxrkrz/index.html.)

41 Rwanda TRADE-DSM analysis – Technical study report final draft 31 August 2017
Evident from Figure 21 is that more than 80
percent of Rwanda’s exports are classified
as non-fuel primary commodities, which in
general are less complex and requires lower
skills and skills intensity.
The manufactured component of exports is
relatively small at around 10.7 percent only,
of which only 6.6 of the 10.7 percent refer
to medium and higher skills and technology
manufactures.
While this may be the case, as explained in
section 2.3 Brenton and Newfarmer (2007)
highlights that expansion of existing
products in existing markets contributing
more to export growth than the
diversification of new products or new
markets.
Figure 21: Rwanda exports by skills and technology intensity
Source: Authors’ calculations based on BACI data and Basu et al.
(2011) adjusted classifications
A country’s comparative advantage is not only dependent on factor endowments. Countries,
equipped with the correct information and strategies can also “leap” to different trees in the words
of Hausmann et al. (2015). However the choice of branches and trees to be pursued also needs to be
informed by what the market demands. In the search for new markets or new product opportunities
in existing markets to inform both trade policy and business decision making, a major challenge is to
optimise policy choices in terms of products and markets to pursue to achieve effective export
growth. This is where the DSM approach contributes to help with decision-making in this regard. The
next section provides outcomes as informed by the approach adjusted for the case of Rwanda as
discussed in the preceding sections.
5. Overview of outcomes obtained
Note that while the approach normally applies Filter 1 including the sub-filter on political and
commercial risk, the political and economic risk component was ignored for this analysis due to the
fact that in relative terms 21 African countries would be excluded based on this filter including
neighbours to Rwanda such as Burundi, the DRC, Malawi, Mozambique, Zimbabwe and South Sudan.
This filter sub-filter was therefore not applied in the filtering process described in section 5.1,
followed by an overview of outcomes from a product perspective is presented in section 5.2., then
grouped by international geographic regions in section 5.3 and some more detail for specific
neighbouring countries in section 5.4. Lastly, a high-level view of outcomes categorised by skill- and
technology intensity type and aggregated by economic sector is provided in section 5.5.
Some discussion for interpretative purposes is provided, but it is beyond the scope of this study to
analyse and document each of the individual product-market lines in detail. More detail is provided
in the tables contained in the appendices in section 9.6.

42 Rwanda TRADE-DSM analysis – Technical study report final draft 31 August 2017
5.1. DSM filtering approach applied - outcomes per step
The following diagram (Figure 22) provides the resulting outcomes for each of the filtering steps
applied. Based on possible on all HS 6-digit product level country-product lines for which data exists
the initial population of possibilities are 873 243 (consisting of 256 markets and 6 374 HS 6-digit
product lines). The theoretical possible population is 256 x 6 374 = 1 631 744 possible combinations.
However, not all areas import all products or record trade on all product lines in practice, hence the
lower than theoretical actual population of possible outcomes.
The application of Filter 1 sub-filter for economic size and growth only applied for all markets
therefore eliminates 55 markets in total.
Figure 22: DSM filtering approach applied - outcomes per step
Source: Authors’ calculations based on the DSM approach applied for each filter stage.
In filter 2 the requirement for relative size and growth is applied for each individual HS 6-digit
product level country-product line and as a result the combination of country-product lines that are
retained is 302 219 combinations.
In filter 3’s sub-filter 3.1 the import supply country concentration measure (an adjusted Herfindahl-
Hirshmann index calculation based on Hirshmann (1964) – see appendix 9.1.3.1 for a more detailed
discussion) is applied, resulting in 155 068 combinations of country-product lines remaining.
The application of sub-filter 3.2, the composite relative market access index (the construction of
which for Rwanda’s case is discussed in detail in section 2.4), results in 239 356 combinations of
country-product lines remaining.

43 Rwanda TRADE-DSM analysis – Technical study report final draft 31 August 2017
However, the methodology requires the intersection of the outcomes from these two sub-filters as
the overall result for this filter, which leaves 130 824 country-product lines (of the original starting
point of 836 994 possible combinations requiring consideration – around 15.6 percent of initial
possibilities).
In the last step (filter 4) the outcomes are categorised in various ways. Firstly, based on Rwanda’s
existing demonstrated export capabilities in term of focus for export promotion in the intensive (for
products – quadrants 1 and 2 in the export maturity, market share, and growth and diversification
conceptual model explained in section 2.3 and Figure 3) and extensive (for existing markets –
quadrant 1) context. This approach shares the same starting point than that of the product space in
terms of using the RCA. Where it deviates is that products that are “close” to having an RCA of
greater than 1 are also included in the final analysis from an extensive margins perspective for
products (quadrant 3 for extensive products and markets and quadrant 4 for intensive markets and
extensive products), as these may point to potential products that may need some assistance from
an export development and investment persepctive to become the next success stories.
Opportunities where Rwanda has an RCA of less than 1 (<1) and greater or equal to 0.8 (>=0.8) are
therefore also included in the outcomes analysis.
Another point of deviance from the product space analysis is that, in order to adjust for the fact as to
whether the product under consideration is probably locally produced or possibly only re-exported,
the Revealed Trade Advantage (RTA) index of Vollrath (1991) is employed. It can be assumed that an
RTA>0 implies that the majority of the product exported is locally produced as it corrects for re-
exports (refer to appendix section 9.1.7 for more detail).
In terms of the outcome “categorisation” step in filter 4 of the DSM methodology therefore there
are 9 662 country-product line opportunities that can be classified for which Rwanda has a revealed
comparative advantage. This set of outcomes is made up of 290 HS 6-digit product lines. When the
re-export test (RTA>0) is applied, this drops to 186 product lines at the HS 6-digit level with a final
tally of 5 525 country-product line combinations. This group of opportunities will be dissected at a
high level in the following sections with a focus on export promotion prioritisation by potential
target market (informed by relative potential of such opportunities, see appendix section 9.1.6 for
more detail on the potential calculation).
For export development and investment purposes a second set of outcomes based on the
“immature” or “near mature” products (as measured in terms of 0.8<=RCA>1) is also discussed. The
outcome of this “categorisation” step yields only 45 HS 6-digit product lines. When the RTA>0 test is
applied only 25 products remain, with a total of 699 country-product line opportunities.
5.2. Outcomes by HS 6-digit product level (excluding petroleum and gold)
including export development and investment “immature” or “near
mature” products
In order to assist with more granular decision-making information the DSM approach provides
outcomes at the HS 6-digit product level. The export maturity, market share, and growth and
diversification matrix representation as explained in section 2.3 in context of extensive and intensive
margins are employed in this discussion to demonstrate the application thereof for the Rwanda
case. Figure 23 provides a picture of what this matrix looks like when populated with the outcomes

44 Rwanda TRADE-DSM analysis – Technical study report final draft 31 August 2017
as obtained for the Rwanda case (including the additional 699 country-product line opportunities
that are classified as export development and investment candidates due to “immature” or “near
mature” products – those with RCAs less than 1 but equal or more than 0.8 discussed in section 5.1).
Figure 23: Overall DSM export maturity, market share, and growth and diversification matrix for Rwanda
Source: Authors, TRADE-DSM
Only some products have explicitly been indicated on the matrix, but for information clarity
purposes the rest are not labelled in this “static” representation (in electronic format it is easier to
investigate details of specific products).
Three examples28 are highlighted to facilitate interpretation. The first [Example 1 in Figure 23] is that
of HS261590: Niobium/tantalum/vanadium ores and concentrates, with an extremely high RCA
(12 708.17). For this reason the representation in Figure 23 applies a log-scale to the vertical (RCA)
axis.
28 Only some products have explicitly been indicated on the matrix, but for information clarity purposes the
rest are not labelled in this “static” representation (in electronic format it is easier to investigate details of specific products).

45 Rwanda TRADE-DSM analysis – Technical study report final draft 31 August 2017
This product is exported to existing markets such as China, the USA, Hong Kong etc. and therefore is
placed in Q1 – “brown fields”, which implies that the strategy around these markets for this product
should be informed around the intensive margin from both a product and market perspective. The
number of markets (10) is indicated on the horizontal (X) axis. The size of the bubble represents the
average potential (average of the US$ 23.2 million therefore US 2.3 million). More details regarding
the trade with these existing markets are provided in Table 2.
Table 2: Major existing export markets for HS 2615.90 supplied from Rwanda in Q1
Item Country
[A]
Realistic
Export
Potential to
Target
Market(s)
`000 US$
[B]
Total Exports
from Rwanda
to Target
Market(s)
`000 US$
[C] = [B] / [G]
Total Exports
from Rwanda
/ Target
Market(s)Total
Imports%
[E]
Target Market(s)
Imports from top 6
competitors
(Excl Rwanda)
`000 US$
[F]
Target Market(s)
Imports from Rest of
market
(Excl Rwanda & top 6
competitors)
`000 US$
[G]
Target
Market(s)
Total Imports
`000 US$
23 284.71 115 910.49 39.1% 139 657.26 40 960.35 296 528.09
1 China 11 339.68 32 480.21 23.9% 68 038.06 35 290.88 135 809.16
2 United States
of America
7 371.79 12 900.42 21.5% 44 230.71 2 948.83 60 079.96
3 Hong Kong
(SARC)
2 427.25 11 443.73 40.6% 14 563.47 2 207.54 28 214.74
4 Kazakhstan 1 617.72 11 330.67 52.7% 9 706.29 461.51 21 498.46
5 Japan 416.32 913.17 26.7% 2 497.93 5.88 3 416.98
6 Belgium-
Luxembourg
59.85 3 192.17 88.7% 359.13 45.71 3 597.00
7 Australia 38.08 49.04 20.5% 190.42 0.00 239.46
8 Czech Republic 11.24 44.59 44.2% 56.18 0.00 100.77
9 Switzerland 2.23 10 945.60 99.9% 13.39 0.00 10 958.99
10 Tanzania 0.55 32 610.89 100.0% 1.66 0.00 32 612.55
Source: Authors, TRADE-DSM
At the same time, the DSM approach (in line with the intensive margin for products, extensive
margin for markets) identifies that there are 3 potential “new” or “lesser served“ (from Rwanda’s
perspective) markets for the same product as indicated in Q2 [1B in Figure 23] – “green pastures”.
These are Thailand, Germany and Spain – details provided in Table 3. Spain is the only real “new”
potential market, while the share of Rwanda’s exports to Thailand and Germany is much lower than
that of the more mature markets indicated in Q1. In line with intensive margins thinking, these
markets could be developed more from Rwanda’s perspective.
Table 3: Major potential new export markets for HS 2615.90 to be supplied from Rwanda in Q2
Item Country
[A]
Realistic
Export
Potential
to Target
Market(s)
`000 US$
[B]
Total Exports
from Rwanda
to Target
Market(s)
`000 US$
[C] = [B] / [G]
Total Exports
from Rwanda
/ Target
Market(s)Total
Imports%
[E]
Target Market(s)
Imports from top 6
competitors
(Excl Rwanda)
`000 US$
[F]
Target Market(s)
Imports from Rest o
market
(Excl Rwanda & top 6
competitors)
`000 US$
[G]
Target
Market(s)
Total Imports
`000 US$
8 937.70 10 745.20 16.0% 53 626.18 2 919.31 67 290.69
1 Thailand 7 183.27 9 395.45 17.0% 43 099.65 2 771.21 55 266.31
2 Germany 1 437.29 1 349.75 13.3% 8 623.73 145.94 10 119.42
3 Spain 317.13 0.00 0.0% 1 902.80 2.16 1 904.96
Source: Authors, TRADE-DSM

46 Rwanda TRADE-DSM analysis – Technical study report final draft 31 August 2017
Another example [Example 2 in Figure 23] along similar lines is that of HS090230: Tea, black
(fermented) & partly fermented tea, whether or not flavoured, in immediate packings of a content
not >3kg. This product has an RCA of 233.98 and therefore is a relatively “mature” export product
from Rwanda’s perspective, hence appears in Q1 [2A in Figure 23] – but only for a single target
market, namely Kenya (see Table 4). It is possible that the formal statistics do not capture trade in
tea accurately as anecdotal evidence suggests that products are sold in border areas and
“informally” exported (small transactions) by a large number of small traders (Development
Alternatives Incorporated, 2016).
Table 4: Major existing export markets for H S 0902.30 supplied from Rwanda in Q1
Item Country
[A]
Realistic
Export
Potential to
Target
Market(s)
`000 US$
[B]
Total Exports
from Rwanda
to Target
Market(s)
`000 US$
[C] = [B] / [G]
Total Exports
from Rwanda
/ Target
Market(s)Total
Imports%
[E]
Target Market(s)
Imports from top 6
competitors
(Excl Rwanda)
`000 US$
[F]
Target Market(s)
Imports from Rest of
market
(Excl Rwanda & top 6
competitors)
`000 US$
[G]
Target
Market(s)
Total Imports
`000 US$
2 949.02 14 354.07 44.7% 17 694.13 64.98 32 113.18
1 Kenya 2 949.02 14 354.07 44.7% 17 694.13 64.98 32 113.18
Source: Authors, TRADE-DSM
According to the DSM approach however there are another 39 potential “new” or “lesser served“
markets from Rwanda’s perspective for the same product as indicated in Q2 [2B in Figure 23] –
“green pastures”.
Table 5: Major potential new export markets for HS 0902.30 to be supplied from Rwanda in Q2
Item Country
[A]
Realistic
Export
Potential to
Target
Market(s)
`000 US$
[B]
Total Exports
from Rwanda
to Target
Market(s)
`000 US$
[C] = [B] / [G]
Total Exports
from Rwanda
/ Target
Market(s)Total
Imports%
[E]
Target Market(s)
Imports from top 6
competitors
(Excl Rwanda)
`000 US$
[F]
Target Market(s)
Imports from Rest of
market
(Excl Rwanda & top 6
competitors)
`000 US$
[G]
Target
Market(s)
Total Imports
`000 US$
148 078.42 475.01 0.0% 888 470.50 125 442.44 1 014 387.94
1 Saudi Arabia 25 358.90 453.76 0.3% 152 153.39 11 067.37 163 674.52
2 United States of America
17 100.51 13.22 0.0% 102 603.08 20 103.62 122 719.92
3 Russian Federation
14 551.93 0.00 0.0% 87 311.55 8 657.61 95 969.16
4 Australia 13 008.06 0.00 0.0% 78 048.37 6 964.68 85 013.05
5 France 11 001.84 0.00 0.0% 66 011.06 14 824.05 80 835.11
6 Netherlands 7 311.32 0.00 0.0% 43 867.94 8 224.83 52 092.77
7 United Kingdom
7 118.69 0.00 0.0% 42 712.15 8 137.33 50 849.47
8 Ukraine 6 652.64 0.00 0.0% 39 915.83 1 144.74 41 060.57
9 Japan 6 219.66 1.01 0.0% 37 317.97 6 625.01 43 943.98
10 Belgium-Luxembourg
5 713.78 0.00 0.0% 34 282.68 3 712.24 37 994.92
11 Italy 5 651.03 7.02 0.0% 33 906.17 3 522.32 37 435.51
12 Germany 4 596.80 0.00 0.0% 27 580.81 12 531.22 40 112.03
13 Hong Kong (SARC)
4 362.14 0.00 0.0% 26 172.82 3 604.23 29 777.04
14 Jordan 4 093.49 0.00 0.0% 24 560.92 316.41 24 877.33
15 China 3 739.81 0.00 0.0% 22 438.87 2 441.84 24 880.72
Rest (24) 11 597.82 0.00 0.0% 69 586.90 13 564.95 83 151.84
Source: Authors, TRADE-DSM

47 Rwanda TRADE-DSM analysis – Technical study report final draft 31 August 2017
Major potential markets include Saudi Arabia, United States of America, Russian Federation,
Australia and France – details for the top 15 markets from a potential perspective is provided in
Table 5. As an example, while this product line is not eligible under the African Growth and
Opportunity Act (AGOA), it has free access under Generalized System of Preferences (GSPs) to the
United States and this fact should be capitalised upon by Rwanda to export directly to this market.
Saudi Arabia, the United States of America, Japan and Italy demonstrate some historical imports
from Rwanda, but in relative terms these markets are extremely small. Again, in line with intensive
margins thinking, these markets could be developed more for this product from Rwanda’s
perspective.
The last example [Example 3 in Table 22] in this discussion involves a product located in Q3 [3A in
Figure 23] – “blue sky”. The product is HS330190: Extracted oleoresins; concentrates of essential oils
in fats/fixed oils/waxes/the like, obtained by enfleurage/maceration, with an RCA of only 0.89. The
fact that this product has an RCA of less than 1 will cause the product space approach to ignore it,
while in the DSM approach products with RCAs of between 0.8 and 0.99 are also included for
analysis with a focus on future investment and export development in line with extensive margin
products. Furthermore, empirical data at the HS 6-digit level can be challenging and while a specific
products data calculation provides a result for an RCA, in cases where the result is close to 1 care
should be taken to simply discard such products.
Table 6: Major potential new export markets for HS 3301.90 to be supplied from Rwanda in Q2
Item Country
[A]
Realistic
Export
Potential to
Target
Market(s)
`000 US$
[B]
Total Exports
from Rwanda
to Target
Market(s)
`000 US$
[C] = [B] / [G]
Total Exports
from Rwanda
/ Target
Market(s)Total
Imports%
[E]
Target Market(s)
Imports from top 6
competitors
(Excl Rwanda)
`000 US$
[F]
Target Market(s)
Imports from Rest of
market
(Excl Rwanda & top 6
competitors)
`000 US$
[G]
Target
Market(s)
Total Imports
`000 US$
72 124.63 0.29 0.0% 432 747.78 104 684.26 537 432.33
1 United States of America
17 951.24 0.00 0.0% 107 707.47 18 569.41 126 276.88
2 India 6 113.62 0.00 0.0% 36 681.74 3 599.30 40 281.04
3 China 5 652.61 0.00 0.0% 33 915.63 6 614.61 40 530.24
4 United Kingdom
5 301.97 0.00 0.0% 31 811.81 9 846.18 41 658.00
5 Germany 5 117.20 0.00 0.0% 30 703.18 12 608.03 43 311.21
6 France 5 032.04 0.00 0.0% 30 192.22 13 883.08 44 075.30
7 Japan 3 363.96 0.00 0.0% 20 183.75 5 576.38 25 760.13
8 Spain 2 813.05 0.00 0.0% 16 878.30 3 955.61 20 833.92
9 Belgium-Luxembourg
2 758.71 0.00 0.0% 16 552.26 3 355.74 19 908.00
10 Netherlands 2 536.28 0.00 0.0% 15 217.67 6 821.56 22 039.23
11 Australia 1 779.82 0.00 0.0% 10 678.90 1 460.90 12 139.80
12 Hong Kong (SARC)
1 677.47 0.00 0.0% 10 064.83 2 374.54 12 439.37
13 Saudi Arabia 1 558.96 0.00 0.0% 9 353.75 2 913.28 12 267.03
14 Singapore 1 523.90 0.00 0.0% 9 143.42 3 319.61 12 463.03
15 Austria 1 489.90 0.00 0.0% 8 939.39 2 116.98 11 056.37
Rest 7 453.91 0.00 0.0% 44 723.46 7 669.04 52 392.80
Source: Authors, TRADE-DSM

48 Rwanda TRADE-DSM analysis – Technical study report final draft 31 August 2017
Evident is that while this specific product according to the trade data calculation does not exhibit an
RCA>1, there are 48 potential markets that would be accessible to Rwanda’s exports of this product,
which should be further investigated. The only markets where some of the product shows existing
but extremely small trade is Democratic Republic of the Congo and Kenya, but these do not feature
in the top markets from a potential perspective. Again only the top 15 results are provided in Table
6.
This discussion based on the DSM export maturity, market share, and growth and diversification
matrix representation for Rwanda clearly demonstrates that existing products from Rwanda
exhibiting RCAs > 1 have a number of potential untapped, or not yet sufficiently penetrated (in the
case where export trade with Rwanda already exists on specific product-country lines) opportunities.
From a market perspective it therefor stands to reason that while the intensive margins from a
market perspective should be pursued, in the case of Rwanda there is also a dire need to diversify
export markets (extensive margin) since there are a variety of products with a comparative
advantage but low number of current or existing markets.
While this may be the case, it would be advisable for policy makers in Rwanda to follow a two-
pronged strategy. For the short to medium term focusing export and investment promotion efforts
on the intensive margin (in terms of both products and markets) as well as extensive margin in terms
of development and marketing efforts on opportunities in the “green pastures” or Q2 quadrant
more aggressively.
At the same time the second focus should be on items in the “blue sky” quadrant (Q3) that could
potentially become comparatively competitive with focused assistance from government and other
support programmes.
Both these approaches should however also consider the move up the value chain in terms of skills-
and technology intensity and add this dimension to prioritisation drives from both a market as well
as a product perspective.
The next section will provide more specific details at a regional level and neighbouring markets.

49 Rwanda TRADE-DSM analysis – Technical study report final draft 31 August 2017
5.3. Summary overview from both a product and market perspective
The following high level overviews are provided to contextualise the outcomes obtained from the
filtering process as explained in the preceding section. More detail with a focus from a product
perspective and then from a market perspective follows, while this section is concluded with more
detail by regional focus and neigbouring countries.
5.3.1. Outcomes - global overview
Figure 24: Global outcomes by region
Source: Authors, TRADE-DSM Navigator
Figure 25: Overview of global distribution of potential associated with REOs for Rwanda
Source: Authors, TRADE-DSM Navigator
As mentioned and explained in the
preceding section around the step-wise
application of the DSM filtering approach,
in total only 159 markets (countries or
territories such as islands) remain from an
initial 256 possible options. Figure 25
provides a geographic view of these
markets, as well as the overall potential
associated with the 186 HS 6-digit level
country-product lines (with RCA>1) that
remain at filter 4. Eastern Asia and
Western Europe are the major potential
markets identified based on the DSM
approach (Figure 24).
Notably 98 to 99 percent (Table 7) of both
the number and associated potential of
these opportunities are in the first column
(1), meaning these are opportunities that
Rwanda does export and can supply to
such markets, but currently is not
exporting to such potential markets.
Table 7: REO Map outcomes for global opportunities for Rwanda
Source: Authors, TRADE-DSM Navigator

50 Rwanda TRADE-DSM analysis – Technical study report final draft 31 August 2017
Around 41 percent of the potential is associated with markets classified as REO1,5 meaning markets
that exhibit import demand for these product lines that are both relatively large and growing in the
short and long term (refer to section 2.1 for detailed explanation of the REO Map matrix).
For the overall set of outcomes
Figure 26 provides a view of both
potential value as well as number
of lines identified as possible
opportunities for Rwanda to
pursue grouped according to
major SITC group as opposed to
HS.
The items Animal and vegetable
oils, fats and waxes (S4***) and
Chemicals and related products,
n.e.s. (S5***) in relative terms
have small relative potential and
due to scale do not appear to have
any values on the chart.
Figure 26: Global REOs by major SITC group
Source: Authors, TRADE-DSM Navigator
Evident is that petroleum related products in the group Mineral fuels, lubricants and related
materials (S3*29) dominates in terms of potential, while relatively low in terms of number of
opportunity. This is due to most countries in the world having to import petroleum related products,
and that Rwanda in terms of its export statistics do have an RCA>1 for this group of products.
However, further analysis shows that the petroleum extraction sector in Rwanda is not a very well
developed sector and the only petroleum extraction related activity is the extraction of dissolved
methane from the waters of Lake Kivu (World Bank 2009). Recently (2016) Rwanda is reported to
have resumed its search for petroleum deposits in Lake Kivu to join regional countries that are
already looking forward to start commercial oil production30.
Similarly for Items n.e.s. (S9**) a more in depth analysis shows that this item is dominated by non-
monetary gold31 (excluding gold ores and concentrates).
While for consistency of comparisons in this section these items are kept in the results set for
sections 5.3.2 to 5.3.10, for section 5.4 on specific focus and neigbouring countries these product
groups and lines are excluded from the further analysis.
29 S33: Petroleum, petroleum products and related materials containing sub groups of S3330: Crude petroleum
and S33512: Paraffin wax, microcrystalline petroleum wax, slack wax, ozokerite, lignite wax, peat wax, other mineral waxes, & similar products obtained by synthesis/by other processes, whether/not coloured. 30
“Rwanda continues its exploration for oil” in Kenya Engineer, 27 MAY 2016 [accessed July 11 2017] available at http://www.kenyaengineer.co.ke/2016-05-27-10-44-22/powertrains/item/3504-rwanda-continues-its-exploration-for-oil. 31
S97: Gold, non-monetary (excluding gold ores and concentrates) and sub group S97101: Gold (including gold plated with platinum), non-monetary, unwrought/in semi-manufactured forms,/in powder form.

51 Rwanda TRADE-DSM analysis – Technical study report final draft 31 August 2017
5.3.2. Outcomes – summary for Africa
Figure 27: African REOs by major SITC group
Source: Authors, TRADE-DSM Navigator
Figure 28: Overview of Africa distribution of potential associated with REOs for Rwanda
Source: Authors, TRADE-DSM Navigator
In total only 42 markets in Africa remain
from an initial 62 possible options
(including islands). Figure 28 provides a
geographic view of these markets, as well
as the overall potential associated with the
167 HS 6-digit level country-product lines
(with RCA>1) that remain at filter 4. Total
potential associated with these product-
market lines are around US$ 12 billion.
The classification for these opportunities
are provided in Table 8. Notably 93 percent
of both the number of opportunities are in
the first column (1) and 99.8 percent of the
potential value. These are opportunities
that Rwanda does export and can supply to
such markets, but currently is not
exporting to such potential markets.
Around 52 percent of the potential is
associated with markets classified as REO1,2
meaning markets that exhibits import
demand for these product lines that are
not necessarily large, both are growing in
the short and long term.
South African potential in value terms
dominates the region, hence the results
excluding South Africa is provided in the
next section.
Table 8: REO Map outcomes for Africa opportunities for Rwanda
Source: Authors, TRADE-DSM Navigator

52 Rwanda TRADE-DSM analysis – Technical study report final draft 31 August 2017
5.3.3. Outcomes – summary for Africa excluding South Africa
Figure 29: Africa (excl. South Africa) REOs by major SITC group
Source: Authors, TRADE-DSM Navigator
Figure 30: Overview of Africa (excl. South Africa) distribution of potential associated with REOs for Rwanda
Source: Authors, TRADE-DSM Navigator
Evident is that when South Africa is
removed from the results set, more African
countries exhibit similar potential import
demand pools for 160 product lines (Figure
30). South Africa contributed to US$ 5.1
billion (leaving US$ 7 billion associated
with the rest of Africa) of the overall
potential for 54 products lines and should
not be discarded as a potential destination
for more exports from Rwanda. However,
as mentioned in the global overview
section, petroleum import demand also
dominates the relative picture for South
Africa and other African countries.
Evident from Figure 29 is that
opportunities classified as Food and live
animals (S0) and Machinery and transport
equipment (S7) dominates potential if
petroleum is ignored.
In terms of REO classifications, these
opportunities are concentrated (90.5
percent of potential) in markets classified
as REO1,2 meaning markets that exhibits
import demand for these product lines
that are not necessarily large, both are
growing in the short and long term.
Table 9: REO Map outcomes for African (excl. South Africa) opportunities for Rwanda
Source: Authors, TRADE-DSM Navigator
[Number and %
of Total Number]
Small: 1 Small: 2 Large: 3 Large: 40%<=s<5% 5%<=s<15% 15%<=s<25% 25%<=s Grand Total
Large: 1
5
(0.68%)
Mn US$
119.1
(1.69%)
(0.00%)
Mn US$
0.0
(0.00%)
(0.00%)
Mn US$
0.0
(0.00%)
1
(0.14%)
Mn US$
0.0
(0.00%)
6
(0.81%)
Mn US$
119.1
(1.69%)
Growing:
(short & long term):2
654
(88.62%)
Mn US$
6 369.6
(90.49%)
11
(1.49%)
Mn US$
8.2
(0.12%)
11
(1.49%)
Mn US$
2.4
(0.03%)
25
(3.39%)
Mn US$
4.3
(0.06%)
701
(94.99%)
Mn US$
6 384.5
(90.70%)
Large & Growing:
(only short term):3
2
(0.27%)
Mn US$
2.6
(0.04%)
(0.00%)
Mn US$
0.0
(0.00%)
(0.00%)
Mn US$
0.0
(0.00%)
(0.00%)
Mn US$
0.0
(0.00%)
2
(0.27%)
Mn US$
2.6
(0.04%)
Large & Growing:
(only long term):4
11
(1.49%)
Mn US$
370.0
(5.26%)
(0.00%)
Mn US$
0.0
(0.00%)
1
(0.14%)
Mn US$
14.2
(0.20%)
3
(0.41%)
Mn US$
0.0
(0.00%)
15
(2.03%)
Mn US$
384.1
(5.46%)
Large & Growing:
(both short & long
term):
5
12
(1.63%)
Mn US$
147.9
(2.10%)
1
(0.14%)
Mn US$
0.3
(0.00%)
(0.00%)
Mn US$
0.0
(0.00%)
1
(0.14%)
Mn US$
0.2
(0.00%)
14
(1.90%)
Mn US$
148.5
(2.11%)
Grand Total
684
(92.68%)
Mn US$
7 009.2
(99.58%)
12
(1.63%)
Mn US$
8.6
(0.12%)
12
(1.63%)
Mn US$
16.5
(0.24%)
30
(4.07%)
Mn US$
4.6
(0.06%)
738
(100.00%)
Mn US$
7 038.9
(100.00%)
Pro
du
ct-c
ou
ntr
y o
r ta
rge
t m
ark
et
(s)
imp
ort
de
ma
nd
size
an
d g
row
th c
ha
ract
eri
stic
s
Map of Realistic
Export Opportunities
(REO)
by type
Relative Market Share (s)
of home market (exporter country)
into target market(s)
[Potential Value (Mn US$)
and % of Total Value]
Intermediate

53 Rwanda TRADE-DSM analysis – Technical study report final draft 31 August 2017
5.3.4. Outcomes – summary for Caribbean, Central and South America
Figure 31: Caribbean, Central and South American REOs by major SITC group
Source: Authors, TRADE-DSM Navigator
Figure 32: Overview of Caribbean, Central and South America distribution of potential associated with REOs for Rwanda
Source: Authors, TRADE-DSM Navigator
Evident from Figure 32 it is evident that no
opportunities for the Central American
region pass the DSM filters. In total 104
product lines and 14 destination markets
remain in the result set with a potential of
US$ 387 million. In terms of product lines,
opportunities classified as Machinery and
transport equipment (S7), Food and live
animals (S0) dominates in potential value
terms, while Crude materials, inedible,
except fuels (S2) poses less demand, but
more diversity in terms of number of
opportunities (product lines and market
combinations). Again, in terms of REO
classifications, these opportunities are
concentrated (88.7 percent of potential) in
markets classified as REO1,2 meaning
markets that exhibits import demand for
these product lines that are not necessarily
large, both are growing in the short and
long term. Interestingly Paraguay’s
potential is slightly higher than that of
Brazil, followed by Chile and Argentina.
The focus of this study is not on detail on a
country level. However, the information
per target market was processed and can
be analysed in detail in future reports.
Table 10: REO Map outcomes for Central and South American opportunities for Rwanda
Source: Authors, TRADE-DSM Navigator

54 Rwanda TRADE-DSM analysis – Technical study report final draft 31 August 2017
5.3.5. Outcomes – summary for Northern America
Figure 33: Northern American REOs by major SITC group
Source: Authors, TRADE-DSM Navigator
Figure 34: Overview of Northern America distribution of potential associated with REOs for Rwanda
Source: Authors, TRADE-DSM Navigator
The United States as a single market
exhibits the largest overall potential. The
other areas included is Turks and Caicos
Islands (with only 2 opportunities namely
HS210320: Tomato ketchup & other
tomato sauces and HS220300: Beer made
from malt) and Canada (which exhibits no
potential opportunities that pass all the
filters). In terms of regional potential North
America (mainly the USA) is fourth in terms
of value at US$ 12.2 billion (see Figure 24
in the global overview section). However, it
must be kept in mind that this is a single
country that exhibits demand for 140
product lines, of which at the HS 6-digit
level 82 of these opportunities identified
conform to the AGOA agreement and
therefore qualifies for duty-free access into
the USA market. One of the major
products dominating the USA
opportunities is that of gold, which will be
excluded in the rest of the analysis. Since
the USA is a large market, most of these
opportunities are classified as REO1,5
meaning for these lines the demand is
relatively large and growing both in the
short and long term.
Table 11: REO Map outcomes for Northern American opportunities for Rwanda
Source: Authors, TRADE-DSM Navigator

55 Rwanda TRADE-DSM analysis – Technical study report final draft 31 August 2017
5.3.6. Outcomes – summary for Oceania
Figure 35: Oceania REOs by major SITC group
Source: Authors, TRADE-DSM Navigator
Figure 36: Overview of Oceania distribution of potential associated with REOs for Rwanda
Source: Authors, TRADE-DSM Navigator
In terms of Oceania the economies of
Australia and New Zealand dominate as
expected. The rest of the island economies
are relatively small and in transport
logistics terms expensive to reach. In total
there are 199 product lines with a
potential of US$ 3.1 billion – but the value
as in all cases in this section is heavily
skewed by petroleum and gold.
Opportunities in this region are mainly in
the SITC groups of Food and live animals
(S0), Machinery and transport equipment
(S7) and Miscellaneous manufactured
articles (S8). The fact that while the
relative value of opportunities are
relatively low, the number is higher due to
there are 7 other (over and above Australia
and New Zealand) major island economies
demanding a variety of products, albeit in
small value terms. Papua New Guinea and
a New Caledonia being the largest after
Australia and New Zealand in terms of
identified potential. The bulk of
opportunities are associated with REO1,2
meaning that these are small but growing
demand pockets.
Table 12: REO Map outcomes for Oceania opportunities for Rwanda
Source: Authors, TRADE-DSM Navigator
[Number and %
of Total Number]
Small: 1 Small: 2 Large: 3 Large: 40%<=s<5% 5%<=s<15% 15%<=s<25% 25%<=s Grand Total
Large: 1
6
(3.23%)
Mn US$
34.8
(1.10%)
(0.00%)
Mn US$
0.0
(0.00%)
(0.00%)
Mn US$
0.0
(0.00%)
(0.00%)
Mn US$
0.0
(0.00%)
6
(3.23%)
Mn US$
34.8
(1.10%)
Growing:
(short & long term):2
166
(89.25%)
Mn US$
2 991.0
(94.81%)
(0.00%)
Mn US$
0.0
(0.00%)
1
(0.54%)
Mn US$
0.0
(0.00%)
(0.00%)
Mn US$
0.0
(0.00%)
167
(89.78%)
Mn US$
2 991.0
(94.81%)
Large & Growing:
(only short term):3
(0.00%)
Mn US$
0.0
(0.00%)
(0.00%)
Mn US$
0.0
(0.00%)
(0.00%)
Mn US$
0.0
(0.00%)
(0.00%)
Mn US$
0.0
(0.00%)
(0.00%)
Mn US$
0.0
(0.00%)
Large & Growing:
(only long term):4
4
(2.15%)
Mn US$
23.6
(0.75%)
(0.00%)
Mn US$
0.0
(0.00%)
(0.00%)
Mn US$
0.0
(0.00%)
(0.00%)
Mn US$
0.0
(0.00%)
4
(2.15%)
Mn US$
23.6
(0.75%)
Large & Growing:
(both short & long
term):
5
9
(4.84%)
Mn US$
105.4
(3.34%)
(0.00%)
Mn US$
0.0
(0.00%)
(0.00%)
Mn US$
0.0
(0.00%)
(0.00%)
Mn US$
0.0
(0.00%)
9
(4.84%)
Mn US$
105.4
(3.34%)
Grand Total
185
(99.46%)
Mn US$
3 154.7
(100.00%)
(0.00%)
Mn US$
0.0
(0.00%)
1
(0.54%)
Mn US$
0.0
(0.00%)
(0.00%)
Mn US$
0.0
(0.00%)
186
(100.00%)
Mn US$
3 154.8
(100.00%)
Pro
du
ct-c
ou
ntr
y o
r ta
rge
t m
ark
et
(s)
imp
ort
de
ma
nd
size
an
d g
row
th c
ha
ract
eri
stic
s
Map of Realistic
Export Opportunities
(REO)
by type
Relative Market Share (s)
of home market (exporter country)
into target market(s)
[Potential Value (Mn US$)
and % of Total Value]
Intermediate

56 Rwanda TRADE-DSM analysis – Technical study report final draft 31 August 2017
5.3.7. Outcomes – summary for Central, East & Southern (South-east) Asia
Figure 37: Central, East and South -East Asian REOs by major SITC group
Source: Authors, TRADE-DSM Navigator
Figure 38: Overview of Central, East and South -East Asia distribution of potential associated with REOs for Rwanda
Source: Authors, TRADE-DSM Navigator
Overall the Central, East and Southern
Asian areas has the highest potential in
number of country-line combinations as
well as in value at US$ 46.6 billion (see
Figure 24 under global overview) with 30
potential markets and 181 product lines.
However, within the group the sub region
of Eastern Asia (including markets such as
Hong Kong, India, Japan, China, Korea etc.)
contains the most opportunities (744)
valued at US$ 29.8 billion. South East Asia
(Singapore, Indonesia, Malaysia, Vietnam,
Thailand etc.) follows East Asia in terms of
both number (488) and value at US$ 16.8
billion.
Opportunities in this region are mainly in
the SITC groups of Miscellaneous
manufactured articles (S8), Food and live
animals (S0), Crude materials, inedible,
except fuels (S2) and Machinery and
transport equipment (S7). The
opportunities are much more diversely
spread across REO classifications in the
first column (from REO1,1 with 27 percent
of potential value to REO1,5 with 25 percent
of value) than any of the other regions.
Table 13: REO Map outcomes for Central, East and South -East Asian opportunities for Rwanda
Source: Authors, TRADE-DSM Navigator

57 Rwanda TRADE-DSM analysis – Technical study report final draft 31 August 2017
5.3.8. Outcomes – summary for Western Asia (Middle East)
Figure 39: Western Asia (Middle East) REOs by major SITC group
Source: Authors, TRADE-DSM Navigator
Figure 40: Overview of Western Asia (Middle East) distribution of potential associated with REOs for Rwanda
Source: Authors, TRADE-DSM Navigator
Overall the geographic area of Western
Asia (comprising most “middle eastern”
countries) is ranked as the 5th highest
region in terms of potential value with
around US$ 687 million (see Figure 24
under global overview) with 18 markets
and 163 product lines.
Ignoring petroleum (S3) and gold (S9),
opportunities in this region are mainly in
the SITC groups of Food and live animals
(S0) and Machinery and transport
equipment (S7). Interestingly, while not
that large in potential value terms,
Beverages and tobacco (S1) shows the
most potential in terms of number of
product lines.
The opportunities are focused in mainly REO1,2 (growing import demand in both short and long term, but in relative terms not such large markets as some others such as the e.g. the USA and Northern and Western Europe) with around 63 percent in potential terms concentrated in this REO class.
Table 14: REO Map outcomes for Western Asia (Middle East) opportunities for Rwanda
Source: Authors, TRADE-DSM Navigator

58 Rwanda TRADE-DSM analysis – Technical study report final draft 31 August 2017
5.3.9. Outcomes – summary for Northern & Western Europe
Figure 41: Northern and Western European REOs by major SITC group
Source: Authors, TRADE-DSM Navigator
Figure 42: Overview of Northern and Western Europe distributi on of potential associated with REOs for Rwanda
Source: Authors, TRADE-DSM Navigator
The geographic areas of Northern and
Western Europe combined (comprising 17
countries) is second in terms of potential
value at US$ 37.4 billion after the
combined Central, East and Southern Asian
markets.
Again ignoring petroleum (S3) and gold
(S9), opportunities in this region are mainly
in the SITC groups of Food and live animals
(S0) and Crude materials, inedible, except
fuels (S2). Interestingly, while not that
large in potential value terms,
Manufactured goods (S6) shows the most
potential in terms of number of product
lines.
A reflection of the general size of markets
contained in these geographic areas, the
opportunities are focused in mainly REO1,5
(large import demand and growing in both
short and long term), with around 63
percent in potential terms concentrated in
this REO class. However, it must also be
kept in mind that intra-european trade
influences these outcomes and will be
competition for products coming into
these markets.
Table 15: REO Map outcomes for Northern and Western European opportunities for Rwanda
Source: Authors, TRADE-DSM Navigator

59 Rwanda TRADE-DSM analysis – Technical study report final draft 31 August 2017
5.3.10. Outcomes – summary for Southern & Eastern Europe
Figure 43: Southern and Eastern European REOs by major SITC group
Source: Authors, TRADE-DSM Navigator
Figure 44: Overview of Southern and Eastern Europe distribution of potential associated with REOs for Rwanda
Source: Authors, TRADE-DSM Navigator
Southern and Eastern Europe combined
comprises 23 countries associated with
potential value of US$ 6.2 billion. In terms
of markets within the regions Italy, Spain,
Poland, the Russian Federation and Czech
Republic represents the majority of
potential in value terms (around 84
percent of the value), but only 36 percent
of the number of product lines.
Excluding petroleum (S3) and gold (S9),
opportunities in this region are mainly in
the SITC groups of Food and live animals
(S0), Crude materials, inedible, except fuels
(S2) and Manufactured goods (S6).
Interestingly, while not that large in
potential value terms, Animal and
vegetable oils, fats and waxes (S4) shows
the most potential in terms of number of
product lines.
A reflection of the general size of markets contained in these geographic areas being on the smaller side the opportunities are focused in mainly REO1,2 (growing in both short and long term but with the exception of the above mentioned countries, not large markets), with around 57 percent in potential terms concentrated in this REO class.
Table 16: REO Map outcomes for Southern and Eastern Europe an opportunities for Rwanda
Source: Authors, TRADE-DSM Navigator

60 Rwanda TRADE-DSM analysis – Technical study report final draft 31 August 2017
5.4. Specific focus on neighbouring markets
The following countries are either bordering on Rwanda or are of specific regional interest due to
relatively close proximity to Rwanda. Direct neighbours are the Burundi, the DRC, Tanzania and
Uganda. The Congo (Brazzaville), Kenya, Somalia and South Sudan are not directly bordering
Rwanda but of regional interest.
For each of these countries brief context is provided as well as a view on total trade and major
trading partners over the period 2010 to 2015. The outcomes from the DSM methodology as applied
and obtained for these 8 countries are then provided in an overview and tabular format, followed by
a short illustrative overview of the 5 major opportunities at the HS6-digit product line detail for each
country.
The purpose of this section is not to be exhaustive nor authoritive, but rather illustrative of how the
outcomes from the DSM approach can be applied for decision making. While an advantage is that
the outcomes are provided at the HS6-digit product line detail, at the same time this can pose a
challenge since data quality and frequency of reporting at this level can be problematic for lesser
developed countries. Hence the emphasis on illustrative rather than authoritive outcomes in this
section, as to really sensibly and responsibly inform strategic decisions each of the detail
opportunities still would require more detailed investigation and evaluation (see e.g. the mining
equipment example for the Congo and rice for the DRC).
However, the advantage of this approach demonstrated in this section is that it does allow for
decision making and planning support at a detailed level but in a pragmatic fashion, while also
informing more macro-level decisions as illustrated in the preceding section.

61 Rwanda TRADE-DSM analysis – Technical study report final draft 31 August 2017
5.4.1. Congo (Brazzaville) (C178)
The Congo is removed by one country (the
Democratic Republic of the Congo) from
Rwanda. Overall the Congo covers an area of
342 000 square kilometres and size wise is
ranked as number 64 in the world.
The economy consists of mainly a mixture of
subsistence farming and hunting, an industrial
sector based largely on oil and support
services, and government spending. In terms
of GDP the economy is estimated at US$ 9
billion (2015) and the country’s estimated
population in 2015 was 4.6 million persons
(United Nations, 2016). The Congo’s economy
is relatively open in terms of imports to GDP at
64 percent (2015), but around 47 percent of
the population live below the national poverty
line (WFP, 2017b).
Figure 45: Map of the Congo
Source: The World Factbook (CIA)
Based on the data as compiled by CEPII the
Congo (Brazzaville) on average exported
around US$ 4 billion to US$ 10 billion over the
period 2010 to 2015, with 2014 being an
exceptional year.
In terms of imports it is evident from Figure 46
that merchandise imports have increased
steadily over the period 2010 to 2015, while
the trade balance have deteriorated. The top
10 trading partners (excluding Rwanda)
supplies in excess of 60 percent of the Congo’s
imports.
Figure 46: Congo overall merchandise trade
Source: Authors, BACI data
Over the period China is the leading source of
imports, followed by France, Italy, Belgium and
the United States of America. Evident from
Figure 47 is that Rwanda does not feature as a
major supplier of imports to the Congo, on
time-weighted basis over the period 2011 to
2015 only supplying US$ 130 000.00 worth of
imports to the Congo. However, there are
products that Rwanda is able to successfully
export which the Congo does import from
other suppliers.
Figure 47: Congo top overall importing partners
Source: Authors, BACI data

62 Rwanda TRADE-DSM analysis – Technical study report final draft 31 August 2017
All the opportunities (14) identified for
Rwanda into the Congo are classified as
REO1,2 (growing in both short and long
term, but overall not large
opportunities). The overall potential is
calculated at around US$ 12 million only.
The spread of these opportunities that
the Congo does import and that the
DSM methodology highlights as
potential realistic export opportunities
from Rwanda into the Congo are
depicted in Figure 48. More detail on
each of these is provided in Table 18.
The largest opportunities seem to be in
mining equipment, beer, processed
vegetables with a focus on tomatoes,
fresh eggs and artificial jewellery.
Table 17: REO Map outcomes for Congo opportunities for Rwanda
Source: Authors, TRADE-DSM Navigator
The nature of the Congo’s economy (due to petroleum production) in terms of difference from other regional neighbours reflects in the nature of demand and opportunities identified in Figure 48. Only 5 of the 14 opportunities relates to food products, the rest more towards manufactured products. However, while the country’s human development rating is high by regional standards, it masks unequal wealth distribution and high poverty rates (WFP, 2017b).
Figure 48: Rwanda REO opportunities for Congo Brazzaville (excluding petroleum and gold)
Source: Authors, TRADE-DSM
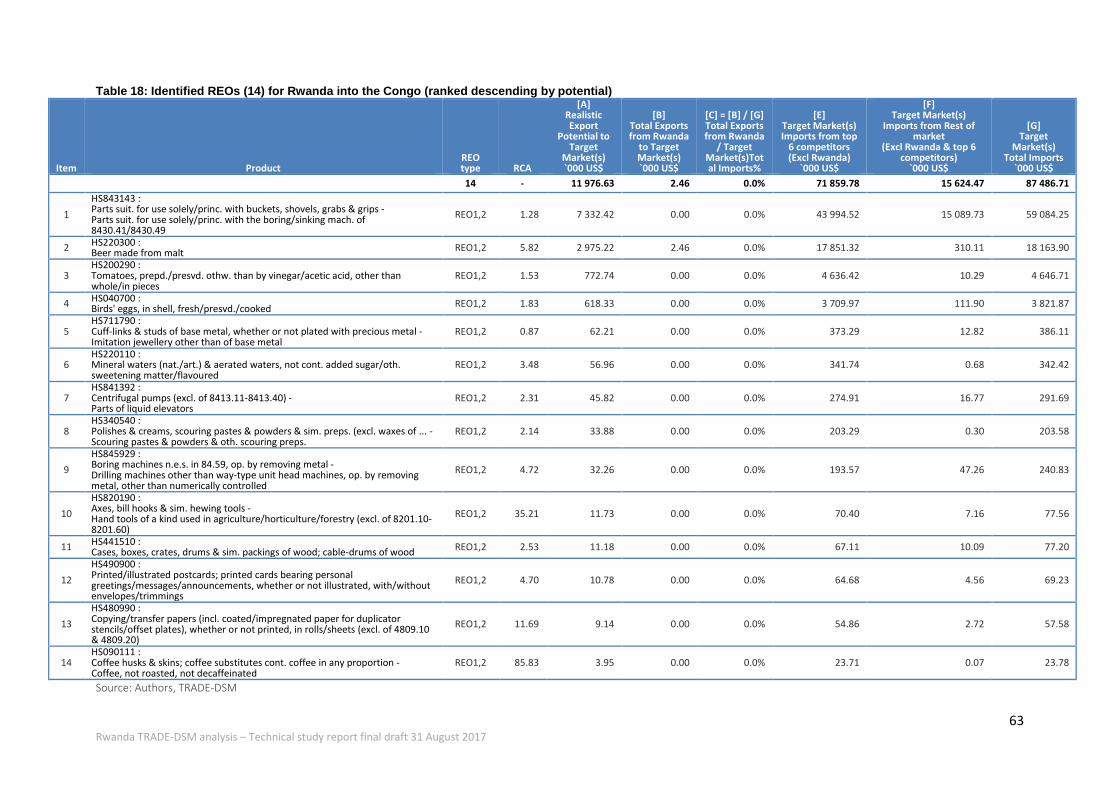
63 Rwanda TRADE-DSM analysis – Technical study report final draft 31 August 2017
Table 18: Identified REOs (14) for Rwanda into the Congo (ranked descending by potential)
Item Product REO type RCA
[A] Realistic Export
Potential to Target
Market(s) `000 US$
[B] Total Exports from Rwanda
to Target Market(s) `000 US$
[C] = [B] / [G] Total Exports from Rwanda
/ Target Market(s)Total Imports%
[E] Target Market(s) Imports from top
6 competitors (Excl Rwanda)
`000 US$
[F] Target Market(s)
Imports from Rest of market
(Excl Rwanda & top 6 competitors)
`000 US$
[G] Target
Market(s) Total Imports
`000 US$ 14 - 11 976.63 2.46 0.0% 71 859.78 15 624.47 87 486.71
1
HS843143 : Parts suit. for use solely/princ. with buckets, shovels, grabs & grips - Parts suit. for use solely/princ. with the boring/sinking mach. of 8430.41/8430.49
REO1,2 1.28 7 332.42 0.00 0.0% 43 994.52 15 089.73 59 084.25
2 HS220300 : Beer made from malt REO1,2 5.82 2 975.22 2.46 0.0% 17 851.32 310.11 18 163.90
3 HS200290 : Tomatoes, prepd./presvd. othw. than by vinegar/acetic acid, other than whole/in pieces
REO1,2 1.53 772.74 0.00 0.0% 4 636.42 10.29 4 646.71
4 HS040700 : Birds' eggs, in shell, fresh/presvd./cooked REO1,2 1.83 618.33 0.00 0.0% 3 709.97 111.90 3 821.87
5 HS711790 : Cuff-links & studs of base metal, whether or not plated with precious metal - Imitation jewellery other than of base metal
REO1,2 0.87 62.21 0.00 0.0% 373.29 12.82 386.11
6 HS220110 : Mineral waters (nat./art.) & aerated waters, not cont. added sugar/oth. sweetening matter/flavoured
REO1,2 3.48 56.96 0.00 0.0% 341.74 0.68 342.42
7 HS841392 : Centrifugal pumps (excl. of 8413.11-8413.40) - Parts of liquid elevators
REO1,2 2.31 45.82 0.00 0.0% 274.91 16.77 291.69
8 HS340540 : Polishes & creams, scouring pastes & powders & sim. preps. (excl. waxes of ... - Scouring pastes & powders & oth. scouring preps.
REO1,2 2.14 33.88 0.00 0.0% 203.29 0.30 203.58
9
HS845929 : Boring machines n.e.s. in 84.59, op. by removing metal - Drilling machines other than way-type unit head machines, op. by removing metal, other than numerically controlled
REO1,2 4.72 32.26 0.00 0.0% 193.57 47.26 240.83
10
HS820190 : Axes, bill hooks & sim. hewing tools - Hand tools of a kind used in agriculture/horticulture/forestry (excl. of 8201.10-8201.60)
REO1,2 35.21 11.73 0.00 0.0% 70.40 7.16 77.56
11 HS441510 : Cases, boxes, crates, drums & sim. packings of wood; cable-drums of wood REO1,2 2.53 11.18 0.00 0.0% 67.11 10.09 77.20
12
HS490900 : Printed/illustrated postcards; printed cards bearing personal greetings/messages/announcements, whether or not illustrated, with/without envelopes/trimmings
REO1,2 4.70 10.78 0.00 0.0% 64.68 4.56 69.23
13
HS480990 : Copying/transfer papers (incl. coated/impregnated paper for duplicator stencils/offset plates), whether or not printed, in rolls/sheets (excl. of 4809.10 & 4809.20)
REO1,2 11.69 9.14 0.00 0.0% 54.86 2.72 57.58
14 HS090111 : Coffee husks & skins; coffee substitutes cont. coffee in any proportion - Coffee, not roasted, not decaffeinated
REO1,2 85.83 3.95 0.00 0.0% 23.71 0.07 23.78
Source: Authors, TRADE-DSM

64 Rwanda TRADE-DSM analysis – Technical study report final draft 31 August 2017
While there are 14 HS6-digit product lines in total that the methodology identifies, the top 5 only are
discussed in more detail in this section of the report.
5.4.1.1. Parts of self-propelled drilling equipment (REO1,2)
The largest realistic export opportunity
identified for Rwanda into the Congo is that of
HS843143: Parts suitable for use solely/
principally with buckets, shovels, grabs &
grips - Parts suitable for use solely/ principally
with the boring/sinking machinery. of
8430.41/8430.49.
The product is produced in the Manufacture of
machinery for mining, quarrying and
construction sector (S3574) and of medium
skill- and technology intensity. Rwanda has an
RCA of 1.28 for this product and potential
estimated at US$ 7.3 million (based on the
calculation as explained in the appendix in
section 9.1.6). However, the characteristics of
this product indicate that this may be a re-
export and would require more detailed
research before any investment decisions are
taken.
Figure 49 provides the imports of the Congo of
this product over the period 2010 to 2015, as
well as the realistic potential estimate.
Figure 50 depicts the export of this product
from Rwanda to the top destinations – under
which the Congo does not feature. At the
same time top suppliers to the Congo are
depicted, again Rwanda not being one of
these.
The main export destination from Rwanda is
Uganda, while the main import origins for the
Congo are the United States of America, the
United Kingdom, Singapore, Belgium and
France.
Figure 49: Congo REO for HS8431 43
Source: Authors, TRADE-DSM
Figure 50: Congo REO HS843143 import origins versus Rwanda export destinations
Source: Authors, TRADE-DSM
Rwanda
Sells (Exports) to:
[1] Uganda (99.7%)
[2] Kenya (0.2%)
[3] Portugal (0.1%)
[4] United Kingdom (0.0%)
Congo
Buys (Imports) from:
[1] United States of America (33.8%)
[2] United Kingdom (13.4%)
[3] Singapore (7.7%)
[4] Belgium-Luxembourg (7.4%)
[5] France (6.1%)
?

65 Rwanda TRADE-DSM analysis – Technical study report final draft 31 August 2017
5.4.1.2. Beer (REO1,2)
The second largest realistic export opportunity
identified for Rwanda into the Congo is that of
HS220300: Beer made from malt.
The product is produced in Manufacture of
beer and other malt liquors and malt sector
(S3052) and classified as non-fuel primary
commodities (relatively low skill and
technology intensity). Rwanda has an RCA of
5.82 for this product and potential estimated
at US$ 2.9 million (based on the calculation as
explained in the appendix in section 9.1.6).
Figure 51 provides the imports of the Congo of
this product over the period 2010 to 2015, as
well as the realistic potential estimate. Evident
is that the imports of this product into the
Congo exhibits a steady growth over the
period.
Figure 52 depicts the export of this product
from Rwanda to the top destinations with the
Congo appearing at number 5 but an
insignificant 0.1 percent. At the same time top
suppliers to the Congo are depicted and
Rwanda is not included as one of these.
The main export destination from Rwanda is
the DRC, while the main import origins for the
Congo are the Netherlands, France, Denmark
and Belgium.
Figure 51: Congo REO for HS220300
Source: Authors, TRADE-DSM
Figure 52: Congo REO HS220300 import origins versus Rwanda export destinations
Source: Authors, TRADE-DSM
Rwanda
Sells (Exports) to:
[1] Democratic Republic of the Congo (85.9%)
[2] Burundi (12.5%)
[3] Uganda (1.2%)
[4] Tanzania (United Rep.) (0.2%)
[5] Congo (0.1%)
Congo
Buys (Imports) from:
[1] Netherlands (40.3%)
[2] France (22.3%)
[3] Denmark (18.5%)
[4] Belgium-Luxembourg (13.2%)
[5] Germany (2.6%)
?

66 Rwanda TRADE-DSM analysis – Technical study report final draft 31 August 2017
5.4.1.3. Processed tomatoes (REO1,2)
The third largest realistic export opportunity
identified for Rwanda into the Congo is that of
HS200290: Tomatoes, prepd./presvd. othw.
than by vinegar/acetic acid, other than
whole/in pieces.
The product is produced in Processing and
preserving of fruit and vegetables sector
(S3013) and classified as non-fuel primary
commodities (relatively low skill and
technology intensity). Rwanda has an RCA of
1.53 for this product and potential estimated
at US$ 773 000 (based on the calculation as
explained in the appendix in section 9.1.6).
Figure 53 provides the imports of the Congo of
this product over the period 2010 to 2015, as
well as the realistic potential estimate. Evident
is that the imports of this product into the
Congo exhibits a flat pattern over the period of
around US$ 4 million.
Figure 54 depicts the export of this product
from Rwanda to the top destinations with the
Congo not appearing. At the same time top
suppliers to the Congo are depicted and
Rwanda is not included as one of these.
The main export destination from Rwanda is
the DRC followed by Tanzania, while the main
import origins for the Congo are the China and
Italy.
Figure 53: Congo REO for HS200290
Source: Authors, TRADE-DSM
Figure 54: Congo REO HS200290 import origins versus Rwanda export destinations
Source: Authors, TRADE-DSM
Rwanda
Sells (Exports) to:
[1] Democratic Republic of the Congo (90.5%)
[2] Tanzania (United Rep.) (9.5%)
[3] Burundi (0.0%)
Congo
Buys (Imports) from:
[1] China (53.5%)
[2] Italy (45.5%)
[3] Malaysia (0.3%)
[4] Hong Kong (SARC) (0.2%)
[5] Portugal (0.2%)
?

67 Rwanda TRADE-DSM analysis – Technical study report final draft 31 August 2017
5.4.1.4. Eggs (REO1,2)
The third largest realistic export opportunity
identified for Rwanda into the Congo is that of
HS040700: Birds' eggs, in shell,
fresh/presvd./cooked.
The product is produced in the sector group of
Growing of crops; market gardening;
horticulture' farming of animals' growing of
crops combined with farming of animals
(S1110,1120,1130) and classified as non-fuel
primary commodities (relatively low skill and
technology intensity). Rwanda has an RCA of
1.83 for this product and potential estimated
at US$ 773 000 (based on the calculation as
explained in the appendix in section 9.1.6).
Figure 55 provides the imports of the Congo of
this product over the period 2010 to 2015, as
well as the realistic potential estimate. Evident
is that the imports of this product into the
Congo exhibits an increasing pattern over the
period of around US$ 3.5 million.
Figure 56 depicts the export of this product
from Rwanda to the top destinations with the
Congo not appear. At the same time top
suppliers to the Congo are depicted and
Rwanda is not included as one of these.
The main export destination from Rwanda is
the DRC (Burundi appears to have zero due to
rounding), while the main import origins for
the Congo are the Netherlands, Belgium and
the Ukraine.
Figure 55: Congo REO for HS040700
Source: Authors, TRADE-DSM
Figure 56: Congo REO HS040700 import origins versus Rwanda export destinations
Source: Authors, TRADE-DSM
Rwanda
Sells (Exports) to:
[1] Democratic Republic of the Congo (100.0%)
[2] Burundi (0.0%)
Congo
Buys (Imports) from:
[1] Netherlands (49.3%)
[2] Belgium-Luxembourg (16.2%)
[3] Ukraine (14.2%)
[4] Spain (11.0%)
[5] Portugal (3.6%)
?

68 Rwanda TRADE-DSM analysis – Technical study report final draft 31 August 2017
5.4.1.5. Artificial jewellery (REO1,2)
The third largest realistic export opportunity
identified for Rwanda into the Congo is that of
HS711790: Imitation jewellery other than of
base metal.
The product is produced in the sector
Manufacture of jewellery and related articles
(S3921) and classified as resource-intensive
manufactures. Rwanda has an RCA of 0.87 for
this product and potential estimated at US$ 62
000 (based on the calculation as explained in
the appendix in section 9.1.6).
Figure 57 provides the imports of the Congo of
this product over the period 2010 to 2015, as
well as the realistic potential estimate. Evident
is that the imports of this product into the
Congo exhibits a sharp increase in 2015.
Figure 58 depicts the export of this product
from Rwanda to the top destinations with the
Congo not appear. At the same time top
suppliers to the Congo are depicted and
Rwanda is not included as one of these.
The main export destination from Rwanda is
the United States of America, Japan, Hong
Kong and the United Kingdom, while the main
import origins for the Congo are the France,
Italy, China and India.
Figure 57: Congo REO for HS711790
Source: Authors, TRADE-DSM
Figure 58: Congo REO HS711790 import origins versus Rwanda export destinations
Source: Authors, TRADE-DSM
Rwanda
Sells (Exports) to:
[1] United States of America (46.3%)
[2] Japan (21.9%)
[3] Hong Kong (SARC) (18.8%)
[4] United Kingdom (8.3%)
[5] China (3.0%)
Congo
Buys (Imports) from:
[1] France (38.9%)
[2] Italy (23.5%)
[3] China (19.5%)
[4] India (8.2%)
[5] Hong Kong (SARC) (4.7%)
?

69 Rwanda TRADE-DSM analysis – Technical study report final draft 31 August 2017
5.4.2. Democratic Republic of the Congo (C180)
The Democratic Republic of the Congo (DRC)
borders Rwanda from the west and is
significantly larger than Rwanda. Overall the
DRC covers an area of 2 344 858 square
kilometres and size wise is ranked as number
11 in the world. Much economic activity still
occurs in the informal sector and is not
reflected in GDP data. The economy is mainly
dependent on mining and exports of
commodities. In terms of GDP the economy is
estimated at US$ 23 billion (2015) and the
country’s estimated population in 2015 was
77.3 million persons (United Nations, 2016).
The DRC’s economy is relatively open in terms
of imports to GDP at 35.8 percent (2015).
Around 64 percent of the population live
below the national poverty line (WFP, 2017c).
Figure 59: Map of the DRC
Source: The World Factbook (CIA)
Based on the data as compiled by CEPII the
DRC on average exported around US$ 4 billion
to US$ 8 billion over the period 2010 to 2015,
with 2015 showing a sharp decline. In terms of
imports it is evident from Figure 60 that
merchandise imports have increased steadily
over the period 2010 to 2013 then started to
decline. The top 10 trading partners (excluding
Rwanda) supplies in excess of 67.2 percent of
the DRC’s imports.
Figure 60: DRC overall merchandise trade
Source: Authors, BACI data
Over the period China is the leading source of
imports, followed by South Africa, Belgium,
France, India and Tanzania. Evident from
Figure 61 is that Rwanda supplies around 2.5
percent of imports to the DRC. On time-
weighted basis over the period 2011 to 2015
Rwanda supplied US$ 159.6 million worth of
imports to the DRC. There are 27 opportunities
identified for Rwanda into the DRC. Most (25
of 27) are classified as growing in both short
and long term, but overall not large
opportunities (REO2,n – so row 2).
Figure 61: DRC top overall importing partners
Source: Authors, BACI data

70 Rwanda TRADE-DSM analysis – Technical study report final draft 31 August 2017
Two where Rwanda already is a major
supplier (REO4,1 - HS811259: Thallium &
arts. thereof , n.e.s. in 81.12) and (REO4,5
- HS110220: Maize (corn) flour) are also
indicated. The overall potential is
calculated at around US$ 7.1 million
only.
There are 20 of these products that
Rwanda supplies to the DRC in Quadrant
1 (intensive margin) while 5 products are
located in Quadrant 2 (extensive margin
for markets, intensive margins for the
products) as depicted in Figure 62. Then
one in Q3 and one in Q4. More detail on
each of these is provided in Table 20.
The largest opportunities seem to be in
beer, rice, containers (for specialised
transport), processed vegetables with a
focus on tomato ketchup and maize
(corn) flour.
Table 19: REO Map outcomes for DRC opportunities for Rwanda
Source: Authors, TRADE-DSM Navigator
The nature of the DRC’s
economy in terms of food
insecurity and resource
challenges reflect in the
nature of demand and
opportunities identified in
Figure 62. The majority of
products relate to food or
basic housing items (such as
mattresses) but also to
mineral resource related
activities (waterproof
footwear, clasps and buckles,
containers and machinery
parts).
Figure 62: Rwanda REO opportunities for DRC (excluding petroleum and gold)
Source: Authors, TRADE-DSM

71 Rwanda TRADE-DSM analysis – Technical study report final draft 31 August 2017
Table 20: Identified REOs ( 27) for Rwanda into the Congo (ranked descending by potential)
Item Product REO type RCA
[A] Realistic Export
Potential to Target
Market(s) `000 US$
[B] Total Exports from Rwanda
to Target Market(s) `000 US$
[C] = [B] / [G] Total Exports from Rwanda
/ Target Market(s)Total Imports%
[E] Target Market(s) Imports from top
6 competitors (Excl Rwanda)
`000 US$
[F] Target Market(s)
Imports from Rest of market
(Excl Rwanda & top 6 competitors)
`000 US$
[G] Target
Market(s) Total Imports
`000 US$ 27 - 7 131.12 33 439.33 43.2% 42 697.42 1 319.49 77 456.24
1 HS220300 : Beer made from malt
REO2,2 5.82 3 060.58 2 897.39 13.3% 18 363.47 530.70 21 791.56
2 HS100640 : Broken rice REO3,2 56.29 1 843.20 5 079.77 31.4% 11 059.19 12.99 16 151.96
3 HS860900 : Containers (incl. conts. for the tpt. of fluids) specially designed & equipped for carriage by one/more modes of tpt.
REO1,2 1.55 575.13 0.00 0.0% 3 450.80 497.97 3 948.77
4 HS210320 : Mustard flour & meal & prepd. mustard - Tomato ketchup & oth. tomato sauces
REO4,2 20.86 408.53 1 368.09 35.6% 2 451.17 23.60 3 842.85
5 HS110220 : Cereal flour other than of wheat, meslin, rye, maize (corn), rice - Maize (corn) flour
REO4,5 465.02 206.47 8 067.36 86.7% 1 238.82 3.20 9 309.38
6 HS220110 : Mineral waters (nat./art.) & aerated waters, not cont. added sugar/oth. sweetening matter/flavoured
REO3,2 3.48 149.12 387.00 29.3% 894.73 38.63 1 320.37
7 HS220850 : Gin & Geneva REO3,2 6.10 106.59 266.62 28.0% 639.55 47.52 953.69
8 HS010290 : Live bovine animals other than pure-bred breeding animals REO4,2 19.61 102.88 6 692.57 91.5% 617.29 2.74 7 312.59
9 HS940410 : Mattress supports
REO4,2 181.94 101.76 5 710.24 90.0% 610.54 20.55 6 341.32
10 HS040210 : Milk & cream, concentrated (excl. in powder), sweetened - Milk in powder/granules/oth. solid form, fat content by wt. not >1.5%
REO4,2 2.03 93.70 663.97 51.8% 562.17 55.03 1 281.17
11 HS640199 : Waterproof footwear with outer soles & uppers of rubber/plastics (excl. of 6401.10)...(excl. of 6401.91 & 6401.92)
REO3,2 21.18 91.99 267.23 32.2% 551.94 12.01 831.18
12 HS151590 : Fixed vegetable fats & oils (excl. of 1515.11-1515.50), incl. jojoba oil & fractions thereof , whether or not ref. but not chemically modified
REO4,2 5.87 90.55 313.93 35.4% 543.30 28.71 885.93
13 HS401320 : Inner tubes, of rubber, of a kind used on bicycles REO2,2 4.55 78.60 68.33 12.7% 471.58 0.04 539.95
14 HS040130 : Milk & cream, not concentrated/sweetened, fat content by wt. >6% REO3,2 3.55 45.24 87.52 24.3% 271.46 0.49 359.47
15 HS846890 : Gas-operated mach. & app. for soldering/brazing/welding, other than hand-held ... - Parts of the mach. & app. of 84.68
REO1,2 6.78 41.17 0.00 0.0% 247.04 24.74 271.78
16 HS040291 : Milk & cream, concentrated (excl. in powder), unsweetened REO3,2 0.91 40.50 64.21 20.5% 243.02 6.60 313.83
17 HS110620 : Flour, meal & powder of sago/roots/tubers of 07.14
REO4,2 209.60 28.56 816.33 87.7% 114.26 0.00 930.59
18 HS960329 : REO3,2 1.05 15.24 37.04 28.6% 91.42 1.09 129.55

72 Rwanda TRADE-DSM analysis – Technical study report final draft 31 August 2017
Shaving brushes, hair brushes, nail brushes, eyelash brushes & oth. toilet brushes for use on the person, incl. such brushes constituting parts of appls.
19 HS640420 : Footwear with outer soles of leather/composition leather & uppers of textile mats.
REO4,2 1.80 10.96 51.03 43.7% 65.76 0.03 116.83
20 HS960500 : Travel sets for personal toilet/sewing/shoe/clothes cleaning REO3,2 68.70 8.78 15.05 19.0% 52.66 11.37 79.07
21 HS251612 : Granite, merely cut, by sawing/othw., into blocks/slabs of a rect. (incl. square) shape
REO4,2 2.83 7.80 43.94 58.5% 31.20 0.00 75.15
22
HS830890 : Clasps, frames with clasps, buckles, buckle-clasps, and the like, of base metal...(excl. of 8308.10), incl. parts; beads & spangles, of base metal... [see complete text #134]
REO1,2 1.14 6.44 0.00 0.0% 38.63 1.48 40.12
23
HS330190 : Essential oils of bergamot - Extracted oleoresins; concs. of essential oils in fats/fixed oils/waxes/the like, obt. by enfleurage/maceration
REO1,2 0.89 5.52 0.19 0.6% 33.10 0.00 33.29
24 HS210220 : Inactive yeasts; oth. single-cell micro-organisms, dead (excl. vaccines of 30.02) REO4,2 1.66 5.09 49.18 65.9% 25.44 0.00 74.62
25 HS190520 : Gingerbread and the like
REO4,2 1.57 4.76 20.36 51.7% 19.04 0.00 39.40
26
HS520849 : Plain weave cotton fabric,>/=85%, not more than 100 g/m2, unbleached - Woven fabrics of cotton (excl. of 5208.41-5208.43), cont. 85%/more by wt. of cotton, of yarns of diff. colours, weighing not >200g/m2
REO4,2 2.30 1.97 54.44 84.7% 9.86 0.00 64.29
27 HS811259 : Thallium & arts. thereof , n.e.s. in 81.12 REO4,1 1
577.64 0.00 417.54 100.0% 0.00 0.00 417.54
Source: Authors, TRADE-DSM

73 Rwanda TRADE-DSM analysis – Technical study report final draft 31 August 2017
While there are 27 HS6-digit product lines in total that the methodology identifies, the top 5 only are
discussed in more detail in this section of this report.
5.4.2.1. Beer (REO2,2)
The largest realistic export opportunity
identified for Rwanda into the DRC is that of
HS220300: Beer made from malt.
The product is produced in Manufacture of
beer and other malt liquors and malt sector
(S3052) and classified as non-fuel primary
commodities (relatively low skill and
technology intensity). Rwanda has an RCA of
5.82 for this product and potential estimated
at US$ 3.1 million (based on the calculation as
explained in the appendix in section 9.1.6).
Figure 63 provides the imports of the DRC of
this product over the period 2010 to 2015, as
well as the realistic potential estimate. Evident
is that the imports of this product into the DRC
had an exceptional year in 2013, with imports
flat in 2014 and 2015.
Figure 64 depicts the export of this product
from Rwanda to the top destinations with the
DRC appearing at the top. At the same time
top suppliers to the DRC are depicted and
Rwanda is not included as it supplies less than
15 percent of the DRC’s imports and is
therefore still classified is a “green pastures”
market for Rwanda.
The main export destination from Rwanda is
the DRC, while the main import origins for the
DRC are the Uganda, Burundi, Netherlands,
Rwanda and Denmark.
Figure 63: DRC REO for HS220300
Source: Authors, TRADE-DSM
Figure 64: DRC REO HS220300 import origins versus Rwanda export destinations
Source: Authors, TRADE-DSM
Rwanda
Sells (Exports) to:
[1] Democratic Republic of the Congo (85.9%)
[2] Burundi (12.5%)
[3] Uganda (1.2%)
[4] Tanzania (United Rep.) (0.2%)
[5] Congo (0.1%)
Democratic Republic of the Congo
Buys (Imports) from:
[1] Uganda (34.1%)
[2] Burundi (21.7%)
[3] Netherlands (15.8%)
[4] Rwanda (13.3%)
[5] Denmark (8.0%)
?

74 Rwanda TRADE-DSM analysis – Technical study report final draft 31 August 2017
5.4.2.2. Rice (REO3,2)
The second largest realistic export opportunity
identified for Rwanda into the DRC is that of
HS100640: Broken rice.
The product is produced in the Manufacture of
grain mill products sector (S3031) and
classified as non-fuel primary commodities
(relatively low skill and technology intensity).
Rwanda has an RCA of 56.29 for this product
and potential estimated at US$ 1.8 million
(based on the calculation as explained in the
appendix in section 9.1.6). Rwanda does have
local production capacity for this product (see
http://ricepedia.org/rwanda) and broken rice
as a by-product started to be exported since
around 2012.
Figure 65 provides the imports of the DRC of
this product over the period 2010 to 2015
(around US$ 15 million per annum), as well as
the realistic potential estimate.
Figure 66 depicts the export of this product
from Rwanda to the top destinations. The DRC
features as number 1 (expected for a product-
market line classified in Quadrant 1) followed
by Uganda and Kenya. At the same time top
suppliers to the DRC are depicted, with
Rwanda the number 2 supplier after Uganda.
The main import origins for the DRC are
Uganda, Rwanda, Tanzania and South Africa at
the margin.
Figure 65: DRC REO for HS100640
Source: Authors, TRADE-DSM
Figure 66: DRC REO HS100640 import origins versus Rwanda export destinations
Source: Authors, TRADE-DSM
Rwanda
Sells (Exports) to:
[1] Democratic Republic of the Congo (90.7%)
[2] Tanzania (United Rep.) (7.1%)
[3] Uganda (1.1%)
[4] Kenya (1.0%)
Democratic Republic of the Congo
Buys (Imports) from:
[1] Uganda (63.3%)
[2] Rwanda (31.4%)
[3] Tanzania (United Rep.) (3.8%)
[4] Zambia (0.9%)
[5] South Africa (0.2%)
?

75 Rwanda TRADE-DSM analysis – Technical study report final draft 31 August 2017
5.4.2.3. Containers (REO1,2)
The third largest realistic export opportunity
identified for Rwanda into the DRC is that of
HS860900: Containers (incl. conts. for the tpt.
of fluids) specially designed & equipped for
carriage by one/more modes of tpt.
The product is produced in Manufacture of
railway and tramway locomotives and rolling
stock sector (S3850) and classified as of low
skill- and technology intensity. Rwanda has an
RCA of 1.55 for this product and potential
estimated at US$ 575 000 (based on the
calculation as explained in the appendix in
section 9.1.6).
Figure 67 provides the imports of the DRC of
this product over the period 2010 to 2015, as
well as the realistic potential estimate. Evident
is that the imports of this product into the DRC
exhibits peaked in 2013, then stabilised
around US$ 2.5 million 2014 and 2015.
Figure 68 depicts the export of this product
from Rwanda to the top destinations with the
DRC not appearing. At the same time top
suppliers to the DRC are depicted and Rwanda
is not included as one of these.
The main export destination from Rwanda is
the Central African Republic followed by the
United Arab Emirates, while the main import
origins for the DRC are the South Africa,
Belgium and the Ivory Coast.
Figure 67: DRC REO for HS860900
Source: Authors, TRADE-DSM
Figure 68: DRC REO HS860900 import origins versus Rwanda export destinations
Source: Authors, TRADE-DSM
Rwanda
Sells (Exports) to:
[1] Central African Republic (50.6%)
[2] United Arab Emirates (32.3%)
[3] South Sudan (7.7%)
[4] Tanzania (United Rep.) (3.8%)
[5] Uganda (3.5%)
Democratic Republic of the Congo
Buys (Imports) from:
[1] South Africa (34.2%)
[2] Belgium-Luxembourg (22.4%)
[3] Cote d'Ivoire (18.5%)
[4] France (5.9%)
[5] Poland (3.5%)
?

76 Rwanda TRADE-DSM analysis – Technical study report final draft 31 August 2017
5.4.2.4. Tomato sauces (REO4,2)
The fourth largest realistic export opportunity
identified for Rwanda into the DRC is that of
HS210320: Tomato ketchup & other tomato
sauces.
The product is produced in the sector group of
Manufacture of other food products n.e.c
(S3049) and classified as non-fuel primary
commodities (relatively low skill and
technology intensity). Rwanda has an RCA of
20.86 for this product and potential estimated
at US$ 408 000 (based on the calculation as
explained in the appendix in section 9.1.6).
Figure 69 provides the imports of the DRC of
this product over the period 2010 to 2015, as
well as the realistic potential estimate. Evident
is that the imports of this product into the DRC
exhibits an increasing pattern over the period
of around US$ 3 to 5 million.
Figure 70 depicts the export of this product
from Rwanda to the top destinations with the
DRC at the top. At the same time top suppliers
to the DRC are depicted and Rwanda is second.
The main export destination from Rwanda
after the DRC is Tanzania and Burundi, while
the main import origins for the DRC are
Uganda, Rwanda, Belgium and South Africa.
Figure 69: DRC REO for HS210320
Source: Authors, TRADE-DSM
Figure 70: DRC REO HS210320 import origins versus Rwanda export destinations
Source: Authors, TRADE-DSM
Rwanda
Sells (Exports) to:
[1] Democratic Republic of the Congo (77.2%)
[2] Tanzania (United Rep.) (15.6%)
[3] Burundi (7.1%)
[4] Uganda (0.1%)
Democratic Republic of the Congo
Buys (Imports) from:
[1] Uganda (52.2%)
[2] Rwanda (35.6%)
[3] Belgium-Luxembourg (5.5%)
[4] South Africa (1.9%)
[5] Zambia (1.7%)
?

77 Rwanda TRADE-DSM analysis – Technical study report final draft 31 August 2017
5.4.2.5. Maize (corn) flour (REO4,5)
The fifth largest realistic export opportunity
identified for Rwanda into the Congo is that of
HS110220: Maize (corn) flour.
The product is produced in the Manufacture of
grain mill products sector (S3031) and
classified as non-fuel primary commodities
(relatively low skill and technology intensity).
Rwanda has an RCA of 465.0 for this product
and potential estimated at US$ 206 000 (based
on the calculation as explained in the appendix
in section 9.1.6).
Figure 71 provides the imports of the DRC of
this product over the period 2010 to 2015, as
well as the realistic potential estimate. Evident
is that the imports of this product into the DRC
exhibits a continued increase since 2011.
Figure 58 depicts the export of this product
from Rwanda to the top destinations with the
DRC at the top. At the same time top suppliers
to the DRC are depicted and Rwanda is first.
The main export destination from Rwanda
after the DRC is Burundi (but very small
values), while the main import origins for the
DRC are Rwanda and Uganda.
Figure 71: DRC REO for HS110220
Source: Authors, TRADE-DSM
Figure 72: DRC REO HS110220 import origins versus Rwanda export destinations
Source: Authors, TRADE-DSM
Rwanda
Sells (Exports) to:
[1] Democratic Republic of the Congo (99.4%)
[2] Burundi (0.5%)
[3] Belgium-Luxembourg (0.1%)
[4] Tanzania (United Rep.) (0.0%)
[5] Congo (0.0%)
Democratic Republic of the Congo
Buys (Imports) from:
[1] Rwanda (86.7%)
[2] Uganda (8.6%)
[3] Tanzania (United Rep.) (2.1%)
[4] South Africa (1.1%)
[5] Brazil (1.1%)
?

78 Rwanda TRADE-DSM analysis – Technical study report final draft 31 August 2017
5.4.3. Burundi (C108)
Burundi directly borders Rwanda from the
south and is slightly larger than Rwanda.
Overall Burundi covers an area of 27 830
square kilometres and size wise is ranked as
number 147 in the world. The economy is also
landlocked with agriculture accounting for
more than 40 percent of the economy and
employing around 90 percent of the
population. In terms of GDP the economy is
estimated at US$ 2 billion (2015) and the
country’s estimated population in 2015 was
11.2 million persons (United Nations, 2016).
Burundi’s economy is very open in terms of
imports to GDP at 74.9 percent (2015). Burundi
is resource-poor, low-income and has a food
deficit while being densely populated (WFP,
2017a). Foreign aid represented 48% of
Burundi's national income in 2015, one of the
highest percentages in Sub-Saharan Africa, but
decreased to 33.5% in 2016.
Based on the data as compiled by CEPII Burundi
on average exported around US$ 0.1 billion to
US$ 0.3 billion over the period 2010 to 2015,
with a sharp decline from 2014 to 2015. In
terms of imports it is evident from Figure 74
that merchandise imports have increased
steadily over the period 2010 to 2013 then
started to decline.
Figure 73: Map of Burundi
Source: The World Factbook (CIA)
Figure 74: Burundi overall merchandise trade
Source: Authors, BACI data
The top 10 trading partners (excluding Rwanda)
supplies in excess of 58.4 percent of Burundi’s
imports. Over the period China is the leading
source of imports, followed by India, Tanzania,
Saudi Arabia, Uganda, Kenya and the
Netherlands and France. Evident from Figure
75 is that Rwanda only supplies around 2.0
percent of imports to Burundi. On time-
weighted basis over the period 2011 to 2015
Rwanda only supplied US$ 13.3 million worth
of imports to Burundi.
Figure 75: Burundi top overall importing partners
Source: Authors, BACI data

79 Rwanda TRADE-DSM analysis – Technical study report final draft 31 August 2017
There are a total of 13 (if
Petroleum (HS271000) is
excluded) opportunities identified
for Rwanda into Burundi. All are
classified as growing in both short
and long term, but overall not
large opportunities (REOn,2 – so
row 2). The overall potential is
calculated at around US$ 0.7
million (including petroleum US$
16.8 million).
There are 8 of these products that
Rwanda supplies to Burundi in
Quadrant 1 (intensive margin)
while 4 products are located in
Quadrant 2 (extensive margin for
markets, intensive margins for the
products) and one in Q3 as
depicted in Figure 76. More detail
on each of these is provided in
Table 22.
Table 21: REO Map outcomes for Burundi opportunities for Rwanda
Source: Authors, TRADE-DSM Navigator
The largest opportunities
seem to be in beer, biscuits,
sweetened milk, beans and
non-electrical lamps. The
nature of Burundi’s economy
in terms of food insecurity
and resource challenges
reflect in the nature of
demand and opportunities
identified in Figure 76. The
majority of products relate to
food or basic housing items
(such as mattresses and non-
electrical lights).
Figure 76: Rwanda REO opportunities for Burundi (excluding petroleum and gold)
Source: Authors, TRADE-DSM

80 Rwanda TRADE-DSM analysis – Technical study report final draft 31 August 2017
Table 22: Identified REOs (13) for Rwanda into Burundi (ranked descending by potential)
Item Product REO type RCA
[A] Realistic Export
Potential to Target
Market(s) `000 US$
[B] Total Exports from Rwanda
to Target Market(s) `000 US$
[C] = [B] / [G] Total Exports from Rwanda
/ Target Market(s)Total Imports%
[E] Target Market(s) Imports from top
6 competitors (Excl Rwanda)
`000 US$
[F] Target Market(s)
Imports from Rest of market
(Excl Rwanda & top 6 competitors)
`000 US$
[G] Target
Market(s) Total Imports
`000 US$
13 - 652.95 1 373.88 27.0% 3 658.14 56.46 5 088.47
1 HS220300 : Beer made from malt
REO2,2 5.82 366.82 421.14 16.0% 2 200.89 9.99 2 632.03
2 HS190531 : Bread, pastry, cakes, biscuits & oth. bakers' wares n.e.s. in Ch.19, - Sweet biscuits
REO1,2 6.73 136.04 0.90 0.1% 816.23 11.51 828.64
3
HS071331 : Beans (Vigna spp., Phaseolus spp. (excl. of 0713.31-0713.33)), dried, shell ... - Beans of the species Vigna mungo (L.)/Hepper/Vigna radiata (L.) Wilczek, dried, shelled, whether or not skinned/split
REO4,2 5.77 37.33 156.53 80.7% 37.33 0.00 193.85
4 HS940550 : Chandeliers & oth. elec. ceiling/wall lighting fittings (excl. those of a k ... - Non-electrical lamps & lighting fittings
REO4,2 1.78 27.79 109.82 39.0% 166.75 4.80 281.37
5 HS940429 : Mattresses of oth. mats. (excl. cellular rubber/plastics) REO4,2 14.98 21.60 201.27 56.5% 129.63 25.46 356.36
6
HS845929 : Boring machines n.e.s. in 84.59, op. by removing metal - Drilling machines other than way-type unit head machines, op. by removing metal, other than numerically controlled
REO4,2 4.72 21.08 84.08 44.4% 105.40 0.00 189.48
7 HS040299 : Milk & cream, concentrated (excl. in powder), sweetened
REO2,2 6.73 14.57 21.64 19.7% 87.41 0.65 109.70
8
HS843143 : Parts suit. for use solely/princ. with buckets, shovels, grabs & grips - Parts suit. for use solely/princ. with the boring/sinking mach. of 8430.41/8430.49
REO1,2 1.28 10.88 0.00 0.0% 65.31 2.75 68.06
9 HS340540 : Polishes & creams, scouring pastes & powders & sim. preps. (excl. waxes of ... - scouring pastes & powders & oth. scouring preps.
REO4,2 2.14 8.26 37.36 69.4% 16.51 0.00 53.87
10 HS210320 : Tomato ketchup & oth. tomato sauces
REO4,2 20.86 3.84 126.68 83.9% 23.03 1.30 151.02
11
HS071333 : Beans (Vigna spp., Phaseolus spp. (excl. of 0713.31-0713.33)), dried, shell ... - Kidney beans, incl. white pea beans (Phaseolus vulgaris), dried, shelled, whether or not skinned/split
REO4,2 4.16 2.45 177.97 96.0% 7.35 0.00 185.32
12 HS230400 : Oil-cake & oth. solid residues, whether or not ground/in pellets, from extraction of soyabean oil
REO4,2 1.05 2.29 3.53 60.7% 2.29 0.00 5.83
13 HS070110 : Potatoes other than seed potatoes, fresh/chilled - Seed potatoes, fresh/chilled
REO4,2 0.93 0.00 32.94 100.0% 0.00 0.00 32.94
Source: Authors, TRADE-DSM

81 Rwanda TRADE-DSM analysis – Technical study report final draft 31 August 2017
While there are 13 HS6-digit product lines in total that the methodology identifies, the top 5 only are
discussed in more detail in this section of the report.
5.4.3.1. Beer (REO2,2)
The largest realistic export opportunity
identified for Rwanda into Burundi is that of
HS220300: Beer made from malt.
The product is produced in Manufacture of
beer and other malt liquors and malt sector
(S3052) and classified as non-fuel primary
commodities (relatively low skill and
technology intensity). Rwanda has an RCA of
5.82 for this product and potential estimated
at US$ 367 thousand (based on the calculation
as explained in the appendix in section 9.1.6).
Figure 77 provides the imports of Burundi of
this product over the period 2010 to 2015, as
well as the realistic potential estimate. Evident
is that the imports of this product into Burundi
showed steady growth in imports flat from
2011 and 2014, with a slight dip in 2015.
Figure 78 depicts the export of this product
from Rwanda to the top destinations with
Burundi appearing second from the top. At the
same time top suppliers to Burundi are
depicted and Rwanda is second as it supplies
just more than 16 percent of Burundi’s
imports. Burundi is still classified is a “green
pastures” market for Rwanda as there is a lot
of demand scope for intensified sales focused
on gaining market share relative to the
Netherlands.
The main export destination from Rwanda is
the DRC (at 86 percent), while the main import
origins for Burundi therefore are the
Netherlands, Rwanda, Kenya, Uganda and
Belgium.
Figure 77: Burundi REO for HS220300
Source: Authors, TRADE-DSM
Figure 78: Burundi REO HS220300 import origins versus Rwanda export destinations
Source: Authors, TRADE-DSM
Rwanda
Sells (Exports) to:
[1] Democratic Republic of the Congo (85.9%)
[2] Burundi (12.5%)
[3] Uganda (1.2%)
[4] Tanzania (United Rep.) (0.2%)
[5] Congo (0.1%)
Burundi
Buys (Imports) from:
[1] Netherlands (76.1%)
[2] Rwanda (16.0%)
[3] Kenya (2.5%)
[4] Uganda (2.3%)
[5] Belgium-Luxembourg (1.4%)
?
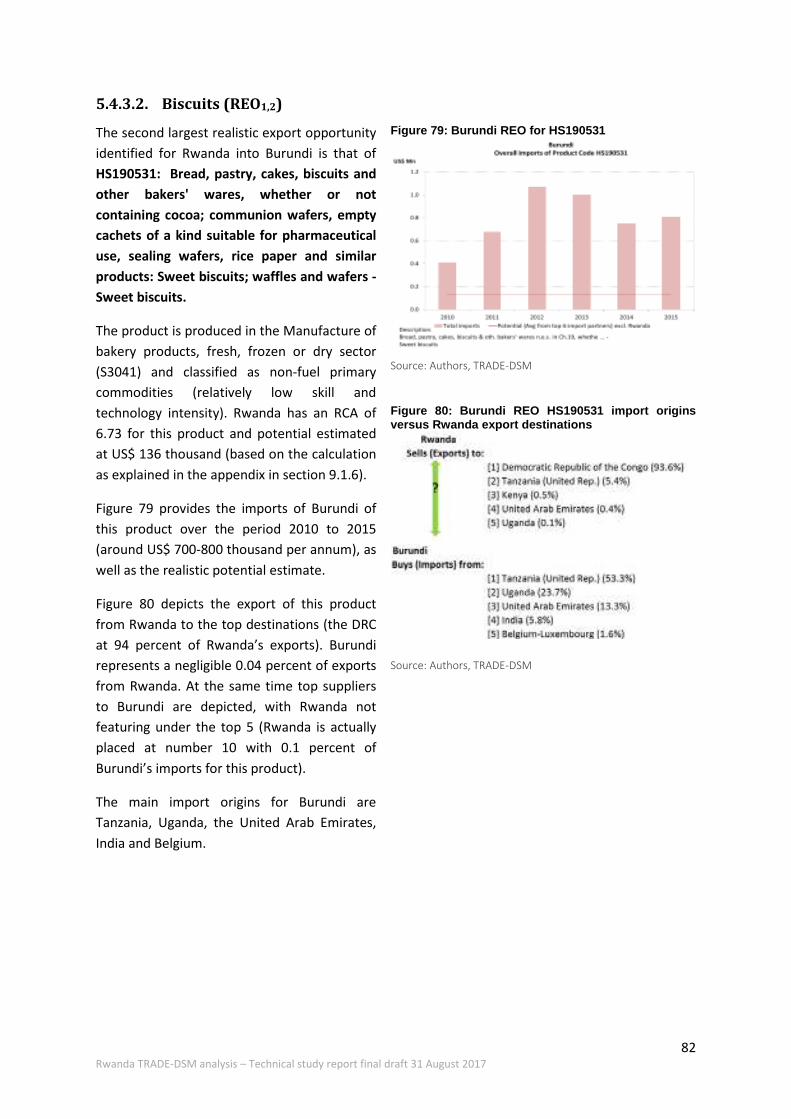
82 Rwanda TRADE-DSM analysis – Technical study report final draft 31 August 2017
5.4.3.2. Biscuits (REO1,2)
The second largest realistic export opportunity
identified for Rwanda into Burundi is that of
HS190531: Bread, pastry, cakes, biscuits and
other bakers' wares, whether or not
containing cocoa; communion wafers, empty
cachets of a kind suitable for pharmaceutical
use, sealing wafers, rice paper and similar
products: Sweet biscuits; waffles and wafers -
Sweet biscuits.
The product is produced in the Manufacture of
bakery products, fresh, frozen or dry sector
(S3041) and classified as non-fuel primary
commodities (relatively low skill and
technology intensity). Rwanda has an RCA of
6.73 for this product and potential estimated
at US$ 136 thousand (based on the calculation
as explained in the appendix in section 9.1.6).
Figure 79 provides the imports of Burundi of
this product over the period 2010 to 2015
(around US$ 700-800 thousand per annum), as
well as the realistic potential estimate.
Figure 80 depicts the export of this product
from Rwanda to the top destinations (the DRC
at 94 percent of Rwanda’s exports). Burundi
represents a negligible 0.04 percent of exports
from Rwanda. At the same time top suppliers
to Burundi are depicted, with Rwanda not
featuring under the top 5 (Rwanda is actually
placed at number 10 with 0.1 percent of
Burundi’s imports for this product).
The main import origins for Burundi are
Tanzania, Uganda, the United Arab Emirates,
India and Belgium.
Figure 79: Burundi REO for HS190531
Source: Authors, TRADE-DSM
Figure 80: Burundi REO HS190531 import origins versus Rwanda export destinations
Source: Authors, TRADE-DSM

83 Rwanda TRADE-DSM analysis – Technical study report final draft 31 August 2017
5.4.3.3. Beans (REO4,2)
The fourth largest realistic export opportunity
identified for Rwanda into Burundi is that of
HS071331: Dried leguminous vegetables,
shelled, whether or not skinned or split:
Beans of the species Vigna mungo (L.) Hepper
or Vigna radiata (L.) Wilczek.
The product is produced in the sector group of
Processing and preserving of fruit and
vegetables (S3013) and classified as non-fuel
primary commodities (relatively low skill and
technology intensity). Rwanda has an RCA of
5.78 for this product and potential estimated
at US$ 37 000 (based on the calculation as
explained in the appendix in section 9.1.6).
Figure 81 provides the imports for Burundi of
this product over the period 2010 to 2015, as
well as the realistic potential estimate. Evident
is that the imports of this product into Burundi
exhibited an increasing pattern over the period
2011 to 2013, then dropped to nearly zero,
recovering to around US$ 220 000 by 2015.
Figure 82 depicts the export of this product
from Rwanda to the top destinations with
Burundi at the top. At the same time top
suppliers to Burundi are depicted and Rwanda
is first at around 80 percent of Burundi’s
import demand with the rest coming from
Uganda.
Figure 81: Burundi REO for HS071331
Source: Authors, TRADE-DSM
Figure 82: Burundi REO HS071331 import origins versus Rwanda export destinations
Source: Authors, TRADE-DSM

84 Rwanda TRADE-DSM analysis – Technical study report final draft 31 August 2017
5.4.3.4. Non-electrical lamps (REO4,2)
The fifth largest realistic export opportunity identified for Rwanda into Burundi is that of HS940550: Lamps and lighting fittings
including searchlights and spotlights and
parts thereof, not elsewhere specified or
included; illuminated signs, illuminated
name-plates and the like, having a
permanently fixed light source, and parts
thereof not elsewhere specified or included:-
Non-electrical lamps & lighting fittings. The product is produced in the Manufacture of
electric lamps and lighting equipment sector
(S3650) and classified as relatively low skill and
technology intensive. Rwanda has an RCA of
1.78 for this product and potential estimated
at US$ 28 000 (based on the calculation as
explained in the appendix in section 9.1.6).
Figure 83 provides the imports of Burundi of
this product over the period 2010 to 2015, as
well as the realistic potential estimate. Evident
is that the imports of this product into Burundi
exhibits a continued increase since 2013 (in
2011 an abnormally high US$ 3.3 million was
recorded).
Figure 84 depicts the export of this product
from Rwanda to the top destinations with
Burundi at the top (99.4 percent). At the same
time top suppliers to Burundi are depicted and
Rwanda is the largest (at 39 percent), followed
by the United States.
Burundi further also sources from the United
Arab Emirates, France and China.
Figure 83: Burundi REO for HS940550
Source: Authors, TRADE-DSM
Figure 84: Burundi REO HS940550 import origins versus Rwanda export destinations
Source: Authors, TRADE-DSM
Rwanda
Sells (Exports) to:
[1] Burundi (99.4%)
[2] United States of America (0.5%)
[3] Nigeria (0.2%)
Burundi
Buys (Imports) from:
[1] Rwanda (39.0%)
[2] United States of America (37.7%)
[3] United Arab Emirates (9.5%)
[4] France (6.4%)
[5] China (3.0%)
?

85 Rwanda TRADE-DSM analysis – Technical study report final draft 31 August 2017
5.4.3.5. Sweetened milk (REO4,2)
The third largest realistic export opportunity
identified for Rwanda into Burundi is that of
HS940429: Mattresses of oth. mats. (excl.
cellular rubber/plastics).
The product is produced in Manufacture of
furniture sector (S3910) and classified as
resources (natural) intensive manufactures.
Rwanda has an RCA of 14.98 for this product
and potential estimated at US$ 21 600 (based
on the calculation as explained in the appendix
in section 9.1.6).
Figure 85 provides the imports into Burundi of
this product over the period 2010 to 2015, as
well as the realistic potential estimate. Evident
is that the imports of this product into Burundi
is small but has increased in recent years to
around US$ 423 thousand.
Figure 86 depicts the export of this product
from Rwanda to the top destinations with
Burundi the second largest market after the
DRC. At the same time top suppliers to
Burundi are depicted and Rwanda is the main
supplier to Burundi, followed by the United
Arab Emirates, Tanzania, Belgium and Uganda.
Figure 85: Burundi REO for HS940429
Source: Authors, TRADE-DSM
Figure 86: Burundi REO HS940429 import origins versus Rwanda export destinations
Source: Authors, TRADE-DSM

86 Rwanda TRADE-DSM analysis – Technical study report final draft 31 August 2017
5.4.4. Tanzania (C834)
Tanzania directly borders Rwanda from the
east and is significantly larger than Rwanda.
Overall Tanzania covers an area of 947 300
square kilometres and size wise is ranked as
number 31 in the world. In terms of GDP the
economy is estimated at US$ 34 billion (2015)
and the country’s estimated population in 2015
was 52.0 million persons (United Nations,
2016). Tanzania’s economy is slightly open in
terms of imports to GDP at 34.2 percent
(2015). Tanzania is one of the world's poorest
economies in terms of per capita income, but
has achieved high growth rates based on its
vast natural resource wealth and tourism. GDP
growth in 2009-16 averaged 6-7% per year.
The economy depends on agriculture, which
accounts for more than one-quarter of GDP,
provides 85% of exports, and employs about
65% of the work force. Tanzania has been
hosting refugees from the Congo and Burundi
since the 1970s (WFP, 2017d). The port in Dar
es Salaam is a key component of import and
export logistics in the region.
Based on the data as compiled by CEPII Burundi
on average exported around US$ 4.4 billion to
US$ 6.6 billion over the period 2010 to 2015,
with a marked decline from 2013 to 2015.
Figure 87: Map of Tanzania
Source: The World Factbook (CIA)
Figure 88: Tanzania overall merchandise trade
Source: Authors, BACI data
In terms of imports it is evident from Figure 88
that merchandise imports have increased
steadily over the period 2010 to 2015. The top
10 trading partners (excluding Rwanda)
supplies in excess of 62.4 percent of Tanzania’s
imports. Over the period Saudi Arabia is the
leading source of imports, followed by China,
the United Arab Emirates, South Africa
Switzerland and Japan. Evident from Figure 89
is that Rwanda only supplies around 0.6
percent of Tanzania’s imports. On time-
weighted basis over the period 2011 to 2015
Rwanda only supplied US$ 89.14 million worth
of imports to Tanzania.
Figure 89: Tanzania top overall importing partners
Source: Authors, BACI data

87 Rwanda TRADE-DSM analysis – Technical study report final draft 31 August 2017
There are a total of 31 (if
Petroleum (HS271000) is
excluded) opportunities identified
for Rwanda into Tanzania. Most
(27) are classified as growing in
both short and long term, but
overall not large opportunities
(REOn,2 – so row 2). The overall
potential is calculated at around
US$ 10.1 million (including
petroleum it is US$ 869.9 million).
There are 6 of these products that
Rwanda supplies to Tanzania in
Quadrant 1 (intensive margin)
while 24 products are located in
Quadrant 2 (extensive margin for
markets, intensive margins for the
products) and one in Q3 as
depicted in Figure 90. More detail
on each of these is provided in
Table 24.
Table 23: REO Map outcomes for Tanzania opportunities for Rwanda
Source: Authors, TRADE-DSM Navigator
The largest opportunities
seem to be in non-alcoholic
beverages, biscuits, beer,
electrical machines, apparatus
and parts and accessories and
margarine.
Figure 90: Rwanda REO opportunities for Tanzania (excluding petroleum and gold)
Source: Authors, TRADE-DSM

88 Rwanda TRADE-DSM analysis – Technical study report final draft 31 August 2017
Table 24: Identified REOs ( 31) for Rwanda into Tanzania (ranked descending by potential)
Item Product REO type RCA
[A] Realistic Export
Potential to Target
Market(s) `000 US$
[B] Total Exports from Rwanda
to Target Market(s) `000 US$
[C] = [B] / [G] Total Exports from Rwanda
/ Target Market(s)Total Imports%
[E] Target Market(s) Imports from top
6 competitors (Excl Rwanda)
`000 US$
[F] Target Market(s)
Imports from Rest of market
(Excl Rwanda & top 6 competitors)
`000 US$
[G] Target
Market(s) Total Imports
`000 US$ 32 - 869 927.76 76 525.86 1.3% 5 219 377.25 384 564.89 5 680 467.99
1 HS220290 : Non-alcoholic beverages other than waters of 2202.10 (not incl. fruit/veg. juices of 20.09)
REO1,2 3.70 1 724.73 61.62 0.5% 10 348.36 2 083.35 12 493.33
2 HS190531 : Bread, pastry, cakes, biscuits & oth. bakers' wares n.e.s. in Ch.19, - Sweet biscuits
REO1,2 6.73 1 330.29 125.96 1.5% 7 981.72 569.69 8 677.37
3 HS220300 : Beer made from malt
REO1,2 5.82 1 260.93 7.01 0.1% 7 565.57 188.40 7 760.97
4 HS854370 : Machines & app. for electroplating/electrolysis/electrophoresis - Other machines and apparatus
REO1,2 1.08 886.74 0.00 0.0% 5 320.45 910.27 6 230.71
5 HS151790 : Edible mixts./preps. of animal/veg. fats/oils/fractions of diff. fats/oils of Ch.15, other than edible fats/oils/fractions of 15.16/non-liquid margarine
REO1,2 4.98 775.59 1.54 0.0% 4 653.55 71.67 4 726.77
6 HS840710 : Spark-ignition recip./rotary int. comb. piston engines for aircraft REO1,2 14.96 559.64 0.00 0.0% 3 357.83 817.13 4 174.96
7 HS843049 : Boring/sinking mach. (excl. of 8430.10-8430.40), other than self-propelled
REO1,2 12.74 508.03 5.46 0.1% 3 048.18 1 028.28 4 081.92
8 HS230400 : Oil-cake & oth. solid residues, whether or not ground/in pellets, from extraction of soyabean oil
REO1,2 1.05 495.04 30.98 1.0% 2 970.23 2.08 3 003.28
9 HS870520 : Concrete-mixer lorries - Mobile drilling derricks
REO1,2 4.34 490.92 0.00 0.0% 2 945.52 400.60 3 346.13
10 HS071310 : Beans (Vigna spp., Phaseolus spp. (excl. of 0713.31-0713.33 - Peas (Pisum sativum), dried, shelled, whether or not skinned/split
REO1,2 3.63 440.51 0.00 0.0% 2 643.08 61.55 2 704.63
11 HS440420 : Hoopwood; split poles; piles, pickets & stakes of wood...non-coniferous
REO2,5 114.97 349.39 507.45 19.5% 2 096.31 0.88 2 604.64
12
HS121190 : Ginseng roots - Plants & parts of plants, incl. seeds & fruits, of a kind used primarily in perfumery/pharmacy/for insecticidal/ fungicidal/ sim. purps., n.e.s. in Ch.12, fresh/dried, whether or not cut/crushed/powdered
REO1,2 21.43 287.79 4.55 0.3% 1 726.77 41.23 1 772.55
13 HS842612 : Lifting mach. n.e.s. in 84.26 - Mobile lifting frames on tyres & straddle carriers REO1,2 1.20 198.78 0.00 0.0% 1 192.65 82.58 1 275.24
14 HS711790 : Cuff-links & studs of base metal, whether or not plated with precious metal ... - Imitation jewellery other than of base metal
REO1,2 0.87 157.02 0.00 0.0% 942.09 41.19 983.28
15
HS631090 : Used/new rags, scrap twine, cordage, rope & cables & worn out arts. of twin ... - Used/new rags, scrap twine, cordage, rope & cables & worn out arts. of twine/cordage/rope/cables, of textile mats. (excl. sorted)
REO1,2 1.09 151.81 0.00 0.0% 910.84 44.27 955.12
16 HS845310 : REO1,2 4.36 75.42 0.00 0.0% 452.53 37.25 489.78

89 Rwanda TRADE-DSM analysis – Technical study report final draft 31 August 2017
Machinery (excl. sewing machines) for making/repairing arts. of hides/skins ... - Machinery for preparing/tanning/working hides/skins/leather
17 HS940429 : Mattress supports - Mattresses of oth. mats. (excl. cellular rubber/plastics)
REO1,2 14.98 74.84 0.10 0.0% 449.02 134.23 583.35
18 HS841940 : Distilling/rectifying plant, whether or not electrically heated REO1,2 2.71 61.97 0.00 0.0% 371.84 36.30 408.14
19 HS392510 : Builders' ware of plastics, n.e.s. (excl. of 3925.10-3925.30) - Reservoirs, tanks, vats & sim. conts., of a cap. >300 l, of plastics
REO1,2 2.92 60.53 0.00 0.0% 363.19 252.84 616.04
20 HS110311 : Groats/meal of cereals other than wheat & maize (corn) - Groats/meal of wheat
REO4,2 21.19 53.52 374.42 70.0% 160.56 0.00 534.99
21 HS720429 : Waste & scrap of alloy steel other than stainless steel
REO1,2 3.17 44.08 4.63 1.5% 264.51 44.44 313.58
22 HS960500 : Travel sets for personal toilet/sewing/shoe/clothes cleaning REO3,2 68.70 37.87 109.42 26.8% 227.21 72.08 408.71
23 HS090190 : Coffee husks & skins; coffee substitutes cont. coffee in any proportion REO1,2 133.00 30.08 2.19 1.1% 180.45 24.30 206.94
24 HS040299 : Milk & cream, concentrated (excl. in powder), sweetened
REO1,2 6.73 21.00 0.00 0.0% 126.01 40.79 166.80
25 HS110290 : Cereal flour other than of wheat, meslin, rye, maize (corn), rice REO1,2 19.78 19.49 3.50 2.8% 116.93 2.33 122.75
26 HS481720 : Letter cards, plain postcards & correspondence cards, of paper/paperboard REO1,2 64.20 11.34 0.00 0.0% 68.02 3.43 71.45
27 HS261000 : Chromium ores & concs.
REO4,2 6.87 8.22 278.68 89.4% 32.89 0.00 311.57
28 HS711711 : Cuff-links & studs of base metal, whether or not plated with precious metal REO1,2 2.08 3.01 0.00 0.0% 18.04 0.70 18.74
29 HS261100 : Tungsten ores & concs. REO4,4
2 889.66 2.13 8 926.55 100.0% 2.13 0.00 8 928.68
30 HS261590 : Niobium/tantalum/vanadium ores & concs.
REO4,4 12 708.17
0.55 32 610.89 100.0% 1.66 0.00 32 612.55
31 HS260900 : Tin ores & concs. REO4,4 3
659.21 0.00 21 629.75 100.0% 0.00 0.00 21 629.75
Source: Authors, TRADE-DSM

90 Rwanda TRADE-DSM analysis – Technical study report final draft 31 August 2017
While there are 31 HS6-digit product lines in total that the methodology identifies, the top 5 only are
discussed in more detail in this section of the report.
5.4.4.1. Non-alcoholic beverages (REO1,2)
The largest realistic export opportunity
identified for Rwanda into Tanzania is that of
HS220290: Non-alcoholic beverages other
than waters of 2202.10 (not incl. fruit/veg.
juices of 20.09).
The product is produced in Manufacture of
soft drinks; production of mineral waters
sector (S3053) and classified as non-fuel
primary commodities (relatively low skill and
technology intensity). Rwanda has an RCA of
3.7 for this product and potential for Tanzania
estimated at US$ 1.7 million (based on the
calculation as explained in the appendix in
section 9.1.6).
Figure 91 provides the imports of Burundi of
this product over the period 2010 to 2015, as
well as the realistic potential estimate. Evident
is that while the imports of this product into
Tanzania declined somewhat in 2013 and 2014
it recovered in 2015 to around US$ 13 million.
Figure 92 depicts the export of this product
from Rwanda to the top destinations with
Tanzania appearing second from the top at 4.2
percent only. At the same time top suppliers to
Tanzania are depicted and Rwanda does not
appear on the list. Major suppliers to Tanzania
are Austria, Germany, Netherlands, South
Africa and Kenya.
Tanzania therefor is classified is a “green
pastures” market for Rwanda as there is a lot
of demand scope for intensified sales focused
on gaining market share relative to these
supplying countries.
Figure 91: Tanzania REO for HS 220290
Source: Authors, TRADE-DSM
Figure 92: Tanzania REO HS220290 import origins versus Rwanda export destinations
Source: Authors, TRADE-DSM

91 Rwanda TRADE-DSM analysis – Technical study report final draft 31 August 2017
5.4.4.2. Biscuits (REO1,2)
The second largest realistic export opportunity
identified for Rwanda into Tanzania is that of
HS190531: Bread, pastry, cakes, biscuits and
other bakers' wares, whether or not
containing cocoa; communion wafers, empty
cachets of a kind suitable for pharmaceutical
use, sealing wafers, rice paper and similar
products: Sweet biscuits; waffles and wafers -
Sweet biscuits.
The product is produced in the Manufacture of
bakery products, fresh, frozen or dry sector
(S3041) and classified as non-fuel primary
commodities (relatively low skill and
technology intensity). Rwanda has an RCA of
6.73 for this product and potential estimated
at US$ 1.3 million (based on the calculation as
explained in the appendix in section 9.1.6).
Figure 93 provides the imports of Tanzania of
this product over the period 2010 to 2015.
2012 exhibited an outlier in terms of US$ 38.5
million’s worth of imports, with more regular
levels around US$ 7 to 8 million by 2015.
Figure 94 depicts the export of this product
from Rwanda to the top destinations (Tanzania
is second at 5.4 percent of Rwanda’s exports).
At the same time top suppliers to Tanzania are
depicted, with Rwanda not featuring under the
top 5 (Rwanda is actually placed at number 8
with 1.5 percent of Tanzania’s imports for this
product).
The main import origins for Tanzania are India,
Zambia, the United Arab Emirates, South
Africa and Oman.
Figure 93: Tanzania REO for HS190531
Source: Authors, TRADE-DSM
Figure 94: Tanzania REO HS190531 import origins versus Rwanda export destinations
Source: Authors, TRADE-DSM

92 Rwanda TRADE-DSM analysis – Technical study report final draft 31 August 2017
5.4.4.3. Beer (REO1,2)
The third largest realistic export opportunity identified for Rwanda into Tanzania is that of HS220300: Beer made from malt. The product is produced in Manufacture of
beer and other malt liquors and malt sector
(S3052) and classified as non-fuel primary
commodities (relatively low skill and
technology intensity). Rwanda has an RCA of
5.82 for this product and Tanzania potential
estimated at US$ 1.2 million (based on the
calculation as explained in the appendix in
section 9.1.6).
Figure 95 provides the imports of Tanzania of
this product over the period 2010 to 2015, as
well as the realistic potential estimate. Evident
is that the imports of this product into
Tanzania exhibits a continued increase since
2013 to around US$ 9 million by 2015.
Figure 96 depicts the export of this product
from Rwanda to the top destinations with
Tanzania does not feature. At the same time
top suppliers to Tanzania are depicted and
Rwanda also do not feature as a major
supplier.
Tanzania mainly sources from The
Netherlands, South Africa and Namibia.
Figure 95: Tanzania REO for HS220300
Source: Authors, TRADE-DSM
Figure 96: Tanzania REO HS220300 import origins versus Rwanda export destinations
Source: Authors, TRADE-DSM

93 Rwanda TRADE-DSM analysis – Technical study report final draft 31 August 2017
5.4.4.4. Electrical machines, apparatus and parts and accessories (REO1,2)
The fourth largest realistic export opportunity
identified for Rwanda into Tanzania is that of
HS854370: Electrical machines and apparatus,
having individual functions, not specified or
included32.
The product is produced in Manufacture of
other electrical equipment not elsewhere
classified sector (S3660) and classified as
medium skill and technology intensity. Rwanda
has an RCA of 1.08 for this product and
potential estimated at US$ 886 000 (based on
the calculation as explained in the appendix in
section 9.1.6).
Figure 97 provides the imports into Tanzania
of this product over the period 2010 to 2015,
as well as the realistic potential estimate.
Imports drastically increased in 2015 up to
nearly US$ 10 million from around US$ 2
million before.
Figure 98 depicts the export of this product
from Rwanda to the top destinations with
Tanzania not appearing on the list. At the same
time top suppliers to Tanzania are depicted as
Korea, China, South Africa, United Kingdom
and the United States of America.
While this product group may be far removed
from the current capabilities of Rwanda it may
be possible to get involved in assembly of
electrical and electronic components with the
right drive and partners. In line with
Hausmann (2015) recommendations for higher
technology, higher value to weight ratio
products destined for air transport.
Figure 97: Tanzania REO for HS854370
Source: Authors, TRADE-DSM
Figure 98: Tanzania REO HS854370 import origins versus Rwanda export destinations
Source: Authors, TRADE-DSM
32 Including physical vapor deposition apparatus; electric synchros and transducers; flight data recorders;
defrosters and demisters with electric resistors for aircraft; articles designed for connection to telegraphic or telephonic apparatus or instruments or to telegraphic or telephonic networks; microwave amplifiers; for electrical nerve stimulation; electrical machines with translation or dictionary functions; flat panel displays other than for articles of heading 8528, except for subheadings 8528.52 or 8528.62; video game console controllers which use infrared transmissions to operate or access the various functions and capabilities of the console etc.).

94 Rwanda TRADE-DSM analysis – Technical study report final draft 31 August 2017
5.4.4.5. Margarine (based on artificial edible mixtures or preparations of animal
or vegetable fats or oils) (REO1,2)
The fifth largest realistic export opportunity
identified for Rwanda into Tanzania is that of
HS151790: Margarine; edible mixtures or
preparations of animal or vegetable fats or
oils or of fractions of different fats or oils of
this chapter, other than edible fats or oils or
their fractions of heading 151633.
The product is produced in the sector group of
Manufacture of vegetable and animal oils and
fats (S3014) and classified as non-fuel primary
commodities (relatively low skill and
technology intensity). Rwanda has an RCA of
4.98 for this product and potential estimated
at US$ 776 000 (based on the calculation as
explained in the appendix in section 9.1.6).
Figure 99 provides the imports for Tanzania of
this product over the period 2010 to 2015, as
well as the realistic potential estimate. Evident
is that the imports of this product into
Tanzania hovered around the US$ 1 million
mark over the period 2011 to 2014, then
increased significantly to around US$ 8 million
by 2015.
Figure 100 depicts the export of this product
from Rwanda to the top destinations with the
Tanzania second but negligible (0.2 percent).
At the same time top suppliers to Tanzania are
depicted with Malaysia, Singapore, Kenya,
Argentina and Indonesia being the main
suppliers.
Figure 99: Tanzania REO for HS151790
Source: Authors, TRADE-DSM
Figure 100: Tanzania REO HS151790 import origins versus Rwanda export destinations
Source: Authors, TRADE-DSM
Tanzania has a large Muslim population (35.2 percent according to the CIA World Factbook). The
major countries supplying these products into Tanzania are also associated with the Muslim religion
and as such these products may have Halaal processes associated with them which potentially need
to be considered (in Malaysia 61.3 percent, Singapore 14.3 percent and Indonesia 87.2 percent of
population are Muslims (CIA, 2017)).
33 HS 1516 = Animal or vegetable fats and oils and their fractions, partly or wholly hydrogenated, inter-
esterified, re-esterified or elaidinized, whether or not refined, but not further prepared – including animal fats and oils and their fractions; vegetable fats and oils and their fractions (rapeseed oil and other).

95 Rwanda TRADE-DSM analysis – Technical study report final draft 31 August 2017
5.4.5. Uganda (C800)
Uganda directly borders Rwanda from the
north and is significantly larger than Rwanda,
but also landlocked. Overall Uganda covers an
area of 241 038 square kilometres and size
wise is ranked as number 81 in the world. In
terms of GDP the economy is estimated at US$
21 billion (2015) and the country’s estimated
population in 2015 was 39.0 million persons
(United Nations, 2016). Uganda’s economy is
slightly less open in terms of imports to GDP at
29.1 percent (2015). Uganda has substantial
natural resources, including fertile soils, regular
rainfall, small deposits of copper, gold, and
other minerals, and recently discovered oil.
Agriculture is the most important sector of the
economy, employing more than one-third of
the work force. Uganda’s economy remains
predominantly agricultural with a small
industrial sector that is dependent on imported
inputs like oil and equipment. Instability in
South Sudan has led to a sharp increase in
Sudanese refugees and is disrupting Uganda's
main export market. Uganda hosts the largest
refugee caseloads in Africa with 1.27 million
refugees (WFP, 2017e).
Based on the data as compiled by CEPII Burundi
on average exported around US$ 1.8 billion to
US$ 2.3 billion over the period 2010 to 2015,
with a levelling from 2012 to 2015.
Figure 101: Map of Uganda
Source: The World Factbook (CIA)
Figure 102: Uganda overall merchandise trade
Source: Authors, BACI data
In terms of imports it is evident from Figure
102 that merchandise imports have increased
steadily over the period 2010 to 2014, then
started a slight decline. The top 10 trading
partners (excluding Rwanda) supplies in excess
of 61.8 percent of imports. Over the period
India is the leading source of imports, followed
by China, the United Arab Emirates, Japan,
South Africa and Indonesia. Evident from Figure
103 is that Rwanda only supplies around 0.6
percent of Uganda’s imports (on time-weighted
basis valued at US$ 34.55 million).
Figure 103: Uganda top overall importing pa rtners
Source: Authors, BACI data

96 Rwanda TRADE-DSM analysis – Technical study report final draft 31 August 2017
There are a total of 38 (if
Petroleum related (HS27nnnn)
products are excluded)
opportunities identified for
Rwanda into Uganda. All are
classified as growing in both short
and long term, but overall not
large opportunities (REOn,2 – so
row 2). The overall potential is
calculated at around US$ 4.2
million (if petroleum related
products are included US$ 155.9
million).
There are 8 of these products that
Rwanda supplies to Uganda in
Quadrant 1 (intensive margin)
while 25 products are located in
Quadrant 2 (extensive margin for
markets, intensive margins for the
products) and 4 in Q3 with 1 in Q4
as depicted in Figure 104.
Table 25: REO Map outcomes for Uganda opportunities for Rwanda
Source: Authors, TRADE-DSM Navigator
More detail on each of these
is provided in Table 26.
The largest opportunities
seem to be in bottled waters,
woven fabrics of polyester
staple fibres, plastic boxes
and crates, aircraft piston
engines and tomato sauces.
Figure 104: Rwanda REO opportunities for Uganda (excluding petroleum and gold)
Source: Authors, TRADE-DSM

97 Rwanda TRADE-DSM analysis – Technical study report final draft 31 August 2017
Table 26: Identified REOs (3 8) for Rwanda into Uganda (ranked descending by potential)
Item Product REO type RCA
[A] Realistic Export
Potential to Target
Market(s) `000 US$
[B] Total Exports from Rwanda
to Target Market(s) `000 US$
[C] = [B] / [G] Total Exports from Rwanda
/ Target Market(s)Total Imports%
[E] Target Market(s) Imports from top
6 competitors (Excl Rwanda)
`000 US$
[F] Target Market(s)
Imports from Rest of market
(Excl Rwanda & top 6 competitors)
`000 US$
[G] Target
Market(s) Total Imports
`000 US$ 38 - 155 937.29 5 721.85 0.5% 935 570.48 99 160.58 1 040 452.90
1 HS220210 : Waters, incl. min. waters & aerated waters, cont. added sugar/oth. sweetening matter/flavoured
REO1,2 0.88 880.21 1.17 0.0% 5 281.29 373.09 5 655.54
2
HS551311 : Woven fabrics of polyester staple fibres, cont. <85% by wt. of such fibres, mixed mainly or solely with cotton, of a wt. not >170g/m2, plain weave, unbleached/bleached
REO2,2 14.75 462.51 457.89 14.2% 2 775.04 0.12 3 233.05
3 HS392310 : Articles for the conveyance/packing of gds., of plastics (excl. of 3923.10- ... - Boxes, cases, crates & sim. arts., of plastics
REO1,2 2.65 439.54 9.99 0.4% 2 637.24 186.92 2 834.15
4 HS840710 : Spark-ignition recip./rotary int. comb. piston engines for aircraft REO1,2 14.96 390.31 0.00 0.0% 2 341.84 108.68 2 450.51
5 HS210320 : Tomato ketchup & oth. tomato sauces REO1,2 20.86 385.95 1.75 0.1% 2 315.67 138.73 2 456.15
6 HS720429 : Waste & scrap of alloy steel other than stainless steel
REO2,2 3.17 247.65 339.45 18.6% 1 485.92 2.65 1 828.02
7 HS410120 : Whole bovine (incl. buffalo)/equine hides & skins, wt. per skin not >8kg (simply dried)/10kg (dry-salted)/16kg (fresh/wet-salted/othw. presvd.)
REO4,2 205.51 210.63 3 051.10 70.7% 1 263.77 0.44 4 315.32
8 HS901420 : Direction finding compasses - Instruments & appls. for aeronautical/space navigation (excl. compasses)
REO1,2 1.14 182.93 0.00 0.0% 1 097.60 40.88 1 138.48
9 HS842612 : Mobile lifting frames on tyres & straddle carriers REO1,2 1.20 160.17 41.26 3.6% 961.00 158.55 1 160.81
10 HS845310 : Machinery for preparing/tanning/working hides/skins/leather
REO2,2 4.36 149.99 60.27 6.1% 899.92 34.51 994.70
11 HS040210 : Milk in powder/granules/oth. solid form, fat content by wt. not >1.5% REO1,2 2.03 104.04 0.44 0.1% 624.23 100.51 725.19
12 HS071310 : Peas (Pisum sativum), dried, shelled, whether or not skinned/split REO2,2 3.63 99.66 111.10 15.6% 597.96 0.93 709.99
13
HS845929 : Boring machines n.e.s. in 84.59, op. by removing metal - Drilling machines other than way-type unit head machines, op. by removing metal, other than numerically controlled
REO1,2 4.72 86.36 0.76 0.1% 518.17 127.09 646.03
14 HS720430 : Waste & scrap of tinned iron/steel
REO3,2 16.95 59.07 144.63 28.8% 354.43 3.09 502.15
15
HS480990 : Carbon/sim. copying papers, whether or not printed, in rolls >36cm. side/sh - Copying/transfer papers (incl. coated/impregnated paper for duplicator stencils/offset plates), whether or not printed, in rolls/sheets (excl. of 4809.10 & 4809.20)
REO1,2 11.69 40.74 0.51 0.2% 244.41 45.50 290.43
16 HS950890 : Roundabouts, swings, shooting galleries & oth. fairground amusements; trave ... - Roundabouts, swings, shooting galleries & oth. fairground amusements;
REO1,2 4.23 32.03 0.00 0.0% 192.16 4.27 196.43

98 Rwanda TRADE-DSM analysis – Technical study report final draft 31 August 2017
travelling theatres
17 HS040700 : Birds' eggs, in shell, fresh/presvd./cooked
REO1,2 1.83 30.40 0.00 0.0% 182.38 1.91 184.28
18 HS392510 : Builders' ware of plastics, n.e.s. (excl. of 3925.10-3925.30) - Reservoirs, tanks, vats & sim. conts., of a cap. >300 l, of plastics
REO1,2 2.92 27.02 0.76 0.3% 162.14 67.85 230.74
19 HS970300 : Original sculptures & statuary, in any mat.
REO1,2 1.31 22.54 0.41 0.3% 135.24 4.69 140.34
20 HS800120 : Tin alloys, unwrought REO4,2 17.86 18.43 397.35 84.4% 73.72 0.00 471.07
21 HS200551 : Beans (Vigna spp., Phaseolus spp.), shelled, prepd./presvd. othw. than by vinegar/acetic acid, not frozen, other than prods. of 20.06
REO2,2 1.60 18.34 19.24 14.6% 110.05 2.49 131.78
22 HS090240 : Tea, black (fermented) & partly fermented tea, whether or not flavoured, in immediate packings of a content >3kg
REO4,2 537.36 17.31 814.91 87.9% 103.88 8.66 927.45
23
HS640420 : Footwear (excl. waterproof) with outer soles of rubber/plastics & uppers of - Footwear with outer soles of leather/composition leather & uppers of textile mats.
REO1,2 1.80 16.63 0.00 0.0% 99.79 12.43 112.22
24 HS846890 : Gas-operated mach. & app. for soldering/brazing/welding, other than hand-he ... - Parts of the mach. & app. of 84.68
REO1,2 6.78 14.80 0.00 0.0% 88.79 9.27 98.06
25 HS391590 : Waste, parings & scrap, of plastics n.e.s. in 39.15 REO3,2 0.85 13.98 32.42 26.2% 83.87 7.51 123.80
26 HS841392 : Centrifugal pumps (excl. of 8413.11-8413.40) - Parts of liquid elevators
REO1,2 2.31 12.39 0.00 0.0% 74.35 10.53 84.87
27 HS090121 : Coffee, roasted, not decaffeinated REO1,2 0.80 10.77 0.08 0.1% 64.59 0.14 64.81
28
HS330190 : Essential oils of bergamot - Extracted oleoresins; concs. of essential oils in fats/fixed oils/waxes/the like, obt. by enfleurage/maceration [see complete text #34]
REO1,2 0.89 10.47 0.00 0.0% 62.79 5.94 68.73
29 HS220110 : Mineral waters (nat./art.) & aerated waters, not cont. added sugar/oth. sweetening matter/flavoured
REO1,2 3.48 10.33 0.63 1.0% 61.96 3.97 66.57
30 HS960500 : Travel sets for personal toilet/sewing/shoe/clothes cleaning REO4,2 68.70 9.65 64.25 49.7% 57.90 7.01 129.17
31 HS940410 : Mattress supports REO2,2 181.94 6.78 5.09 9.7% 40.66 7.00 52.75
32 HS110610 : Flour, meal & powder of the dried leguminous vegetables of 07.13
REO4,2 8.35 5.72 28.39 45.3% 34.33 0.00 62.72
33 HS850630 : Parts of the primary cells & primary batteries of 85.06 - Primary cells & primary batteries, mercuric oxide
REO1,2 1.23 4.63 0.00 0.0% 23.13 0.00 23.13
34
HS121190 : Ginseng roots - Plants & parts of plants, incl. seeds & fruits, of a kind used primarily in perfumery/pharmacy/for insecticidal/fungicidal/sim. purps., n.e.s. in Ch.12, fresh/dried, whether or not cut/crushed/powdered
REO1,2 21.43 4.37 0.00 0.0% 26.21 1.57 27.78
35
HS071331 : Beans (Vigna spp., Phaseolus spp. (excl. of 0713.31-0713.33)), dried, shell ... - Beans of the species Vigna mungo (L.)/Hepper/Vigna radiata (L.) Wilczek, dried, shelled, whether or not skinned/split
REO4,2 5.77 3.41 94.55 90.2% 10.23 0.00 104.78

99 Rwanda TRADE-DSM analysis – Technical study report final draft 31 August 2017
36 HS910390 : Clocks with watch movements (excl. of 91.04), other than electrically operated REO1,2 0.98 2.36 0.00 0.0% 14.15 0.37 14.52
37 HS711711 : Cuff-links & studs of base metal, whether or not plated with precious metal
REO1,2 2.08 0.86 0.00 0.0% 4.29 0.00 4.29
38 HS520299 : Cotton waste other than yarn waste (incl. thread waste) & garnetted stock REO4,2 2.20 0.35 31.12 95.7% 1.39 0.00 32.51
Source: Authors, TRADE-DSM

100 Rwanda TRADE-DSM analysis – Technical study report final draft 31 August 2017
While there are 38 HS6-digit product lines in total that the methodology identifies, the top 5 only are
discussed in more detail in this section of the report.
5.4.5.1. Bottled waters (REO1,2)
The largest realistic export opportunity
identified for Rwanda into Uganda is that of
HS220210: Waters, incl. min. waters &
aerated waters, cont. added sugar/oth.
sweetening matter/flavoured.
The product is produced in Manufacture of
soft drinks; production of mineral waters
sector (S3053) and classified as non-fuel
primary commodities (relatively low skill and
technology intensity). Rwanda has an RCA of
0.88 for this product and potential estimated
at US$ 880 thousand (based on the calculation
as explained in the appendix in section 9.1.6).
Figure 105 provides the imports of Uganda of
this product over the period 2010 to 2015, as
well as the realistic potential estimate. Evident
is that the imports of this product into Uganda
showed steady growth in imports over the
period ending at around US$ 6 million in 2015.
Figure 106 depicts the export of this product
from Rwanda to the top destinations with
Uganda not appearing in the list. At the same
time top suppliers to Uganda are depicted and
the main suppliers are Austria, Kenya,
Tanzania, Thailand and China.
While Rwanda currently does not have an RCA
of greater than 1 for this product, it is
classified as a “blue sky” product with
potential to become more mature since
existing local productive capacity does exist
and demonstrated export demand is available
to tap into.
Figure 105: Uganda REO for HS220210
Source: Authors, TRADE-DSM
Figure 106: Uganda REO HS220210 import origins versus Rwanda export destinations
Source: Authors, TRADE-DSM

101 Rwanda TRADE-DSM analysis – Technical study report final draft 31 August 2017
5.4.5.2. Woven fabrics of polyester staple fibres (REO2,2)
The second largest realistic export opportunity
identified for Rwanda into Uganda is that of
HS551311: Woven fabrics of polyester staple
fibres, cont. <85% by wt. of such fibres, mixed
mainly or solely with cotton, of a wt. not
>170g/m2, plain weave, unbleached/
bleached.
The product is produced in the Preparation
and spinning of textile fibres; weaving of
textiles sector (S3111) and classified as
resource-intensive manufactures. Rwanda has
an RCA of 14.75 for this product and potential
estimated for Uganda at US$ 462 thousand
(based on the calculation as explained in the
appendix in section 9.1.6).
Figure 107 provides the imports of Uganda of
this product over the period 2010 to 2015.
While declining around 2011 to 2013, strong
growth in import demand is observed from
2014 and 2015 ending at around US$ 4.5
million.
Figure 108 depicts the export of this product from Rwanda to the top destinations (Uganda taking up 100 percent of Rwanda’s exports), while Rwanda is the second largest supplier after China into Uganda. Uganda also imports from India, Kenya and the United Araba Emirates. While Rwanda already supplies to Uganda, the opportunity exists to gain market share against China and India for this product into this specific market.
Figure 107: Uganda REO for HS551311
Source: Authors, TRADE-DSM
Figure 108: Uganda REO HS551311 import origins versus Rwanda export destinations
Source: Authors, TRADE-DSM

102 Rwanda TRADE-DSM analysis – Technical study report final draft 31 August 2017
5.4.5.3. Boxes, cases, crates & sim. arts., of plastics (REO1,2)
The third largest realistic export opportunity identified for Rwanda into Uganda is that of HS392310: Boxes, cases, crates & sim. arts., of
plastics. The product is produced in the Manufacture of
plastic products sector (S3380) and classified
as medium skill and technology intensive.
Rwanda has an RCA of 2.65 for this product
and potential estimated at US$ 439 000 (based
on the calculation as explained in the appendix
in section 9.1.6).
Figure 109 provides the imports of Uganda of
this product over the period 2010 to 2015, as
well as the realistic potential estimate. Evident
is that the imports of this product into Uganda
declined from 2011, but started recovering
from 2013 onwards to around US$ 3 million.
Figure 110 depicts the export of this product
from Rwanda to the top destinations with
Uganda in fourth place (0.8 percent). The
major export destinations from Rwanda are
the DRC (56.4 percent) and Burundi. At the
same time top suppliers to Uganda are Kenya,
Tanzania, Egypt, China and India.
Figure 109: Uganda REO for HS392310
Source: Authors, TRADE-DSM
Figure 110: Uganda REO HS392310 import origins versus Rwanda export destinations
Source: Authors, TRADE-DSM

103 Rwanda TRADE-DSM analysis – Technical study report final draft 31 August 2017
5.4.5.4. Aircraft piston engines (REO1,2)
The fourth largest realistic export opportunity
identified for Rwanda into Uganda is that of
HS840710: Spark-ignition reciprocating or
rotary internal combustion piston engines for
aircraft.
The product is produced in the sector group of
Manufacture of aircraft and spacecraft (S3860)
and classified as medium skill- and technology
intensive manufactures. Rwanda has an RCA of
14.95 for this product and potential estimated
at US$ 390 000 (based on the calculation as
explained in the appendix in section 9.1.6).
Figure 111 provides the imports into Burundi
of this product over the period 2010 to 2015,
as well as the realistic potential estimate.
Evident is that the imports of this product into
Uganda oscillates around the US$ 2 million
mark per annum.
Figure 112 depicts the export of this product
from Rwanda – only to Germany (supporting
the observation that it may have to do with
refurbishment of existing planes). At the same
time top suppliers to Uganda are depicted and
main sources are Canada, the Ukraine, Russia,
South Africa and the United States of America.
Figure 111: Uganda REO for HS840710
Source: Authors, TRADE-DSM
Figure 112: Uganda REO HS840710 import origins versus Rwanda export destinations
Source: Authors, TRADE-DSM
While this may seem a tree too far for Rwanda (in product space terminology) due to the fact that
Rwanda may not currently specifically manufacture such engines, potential do exist to e.g. start with
services around maintenance, refurbishment and even assembly for the region. This may make
sense since East and Central African countries do make us of a lot of smaller planes due to
challenges of infrastructure and distances in the region. The recent announcements34 of e.g.
Volkswagen (Germany) opening an assembly plant in Kigali, is an example that with the right
investors and intent such a venture is totally plausible.
34 See http://www.engineeringnews.co.za/article/vwsa-md-takes-on-regional-responsibility-rwanda-to-open-vw-plant-2017-03-02 and
https://constructionreviewonline.com/2017/03/new-volkswagen-assembly-plant-to-be-constructed-in-rwanda/

104 Rwanda TRADE-DSM analysis – Technical study report final draft 31 August 2017
5.4.5.5. Tomato sauces (REO1,2)
The fifth largest realistic export opportunity
identified for Rwanda into Uganda is that of
HS210320: Tomato ketchup & other tomato
sauces.
The product is produced in the sector group of
Manufacture of other food products n.e.c
(S3049) and classified as non-fuel primary
commodities (relatively low skill and
technology intensity). Rwanda has an RCA of
20.86 for this product and potential for
Uganda estimated at US$ 386 000 (based on
the calculation as explained in the appendix in
section 9.1.6).
Figure 113 provides the imports for Burundi of
this product over the period 2010 to 2015, as
well as the realistic potential estimate. Evident
is that the imports of this product into Uganda
exhibited an increasing pattern over the period
2011 to 2013, then dropped to nearly zero,
recovering to around US$ 2.5 million by 2015.
Figure 114 depicts the export of this product
from Rwanda to the top destinations with the
Uganda at the bottom. At the same time top
suppliers to Uganda are depicted and Rwanda
does not appear on the list.
Uganda sources from the Hong Kong, China,
the United Arab Emirates, Egypt and Italy.
Figure 113: Uganda REO for HS210320
Source: Authors, TRADE-DSM
Figure 114: Uganda REO HS210320 import origins versus Rwanda export destinations
Source: Authors, TRADE-DSM

105 Rwanda TRADE-DSM analysis – Technical study report final draft 31 August 2017
5.4.6. Kenya (C404)
Kenya does not border directly with Rwanda
and is located to the east. The port at
Mombasa is a key logistics point for the region
and also for Rwanda. Overall Kenya covers an
area of 580 367 square kilometres and size
wise is ranked as number 49 in the world. In
terms of GDP the economy is estimated at US$
36 billion (2015) and the country’s estimated
population in 2015 was 46.1 million persons
(United Nations, 2016). Kenya’s economy is
relatively open in terms of imports to GDP at
39.8 percent (2015). Kenya is the economic,
financial, and transport hub of East Africa.
Kenya’s real GDP growth has averaged over 5%
for the last eight years. Agriculture remains the
backbone of the Kenyan economy, contributing
one-third of GDP. About 75% of Kenya’s
population work at least part-time in the
agricultural sector. The country’s highlands
comprise one of the most successful farming
areas in Africa, but 80 percent of Kenya is arid
or semi-arid. Kenya also has to deal with
refugees from South Sudan and Somalia (WFP,
2017f).
Based on the data as compiled by CEPII Burundi
on average exported around US$ 5 billion over
the period 2010 to 2015, with a levelling from
2013 to 2015.
Figure 115: Map of Kenya
Source: The World Factbook (CIA)
Figure 116: Kenya overall merchandise trade
Source: Authors, BACI data
In terms of imports it is evident from Figure
116 that merchandise imports have increased
steadily over the period 2010 to 2014, then
started a slight decline. The top 10 trading
partners (excluding Rwanda) supplies in excess
of 66 percent of imports. Over the period China
and India are the leading sources of imports,
followed by South Africa, Tanzania, the United
Kingdom, the United Arab Emirates, Germany
and the United States. Evident from Figure 117
is that Rwanda only supplies around 0.4
percent of Kenya’s imports (on time-weighted
basis valued at US$ 78.97 million).
Figure 117: Kenya top overall importing part ners
Source: Authors, BACI data

106 Rwanda TRADE-DSM analysis – Technical study report final draft 31 August 2017
There are a total of 35
opportunities identified for
Rwanda into Kenya. Most are
classified as growing in both short
and long term, but overall not
large opportunities (REOn,2 – so
row 2). The overall potential is
calculated at around US$ 37.8
million.
There are 7 of these products that
Rwanda supplies to Kenya in
Quadrant 1 (intensive margin)
while 26 products are located in
Quadrant 2 (extensive margin for
markets, intensive margins for the
products) and 2 in Q3 as depicted
in Figure 118. More detail on each
of these is provided in Table 28.
Table 27: REO Map outcomes for Kenya opportunities for Rwanda
Source: Authors, TRADE-DSM Navigator
The largest opportunities
seem to be in Other tea, black
tea, peas, soybean oil cake
and aircraft piston engines.
Figure 118: Rwanda REO opportunities for Kenya (excluding petroleum and gold)
Source: Authors, TRADE-DSM

107 Rwanda TRADE-DSM analysis – Technical study report final draft 31 August 2017
Table 28: Identified REOs (3 5) for Rwanda into Kenya (ranked descending by potential)
Item Product REO type RCA
[A] Realistic Export
Potential to Target
Market(s) `000 US$
[B] Total Exports from Rwanda
to Target Market(s) `000 US$
[C] = [B] / [G] Total Exports from Rwanda
/ Target Market(s)Total Imports%
[E] Target Market(s) Imports from top
6 competitors (Excl Rwanda)
`000 US$
[F] Target Market(s)
Imports from Rest of market
(Excl Rwanda & top 6 competitors)
`000 US$
[G] Target
Market(s) Total Imports
`000 US$ 35 - 37 834.50 59 098.05 20.8% 219 289.75 6 387.57 284 775.37
1 HS090240 : Other tea, black (fermented) & partly fermented tea, whether or not flavoured, in immediate packings of a content >3kg
REO3,4 537.36 14 154.13 39 359.81 31.4% 84 924.75 873.24 125 157.81
2 HS090230 : Tea, black (fermented) & partly fermented tea, whether or not flavoured, in immediate packings of a content not >3kg
REO4,2 233.98 2 949.02 14 354.07 44.7% 17 694.13 64.98 32 113.18
3 HS071310 : Beans (Vigna spp., Phaseolus spp. (excl. of 0713.31-0713.33)), dried, shell ... - Peas (Pisum sativum), dried, shelled, whether or not skinned/split
REO1,2 3.63 2 634.22 0.00 0.0% 15 805.33 928.56 16 733.89
4 HS230400 : Oil-cake & oth. solid residues, whether or not ground/in pellets, from extraction of soyabean oil
REO2,2 1.05 2 403.19 1 075.54 6.9% 14 419.14 8.87 15 503.55
5 HS840710 : Spark-ignition reciprocating or rotary internal combustion piston engines for aircraft.
REO1,2 14.96 2 400.70 0.00 0.0% 14 404.18 1 535.90 15 940.08
6 HS392310 : Articles for the conveyance/packing of gds., of plastics (excl. of 3923.10- ... - Boxes, cases, crates & sim. arts., of plastics
REO1,2 2.65 2 311.05 54.63 0.4% 13 866.30 583.80 14 504.72
7 HS230210 : Bran, sharps & oth. residues, whether or not in the form of pellets, derived from the sifting/milling/oth. working of maize (corn)
REO1,5 17.70 2 264.57 308.62 2.7% 11 322.87 0.00 11 631.49
8 HS040210 : Milk & cream, concentrated (excl. in powder), sweetened - Milk in powder/granules/oth. solid form, fat content by wt. not >1.5%
REO1,2 2.03 2 051.73 0.00 0.0% 12 310.39 800.06 13 110.45
9 HS230230 : Bran, sharps & oth. residues, whether or not in the form of pellets, derived from the sifting/milling/oth. working of wheat
REO2,2 54.43 1 665.60 573.60 10.3% 4 996.79 0.00 5 570.39
10 HS200290 : Tomatoes, prepd./presvd. othw. than by vinegar/acetic acid, other than whole/in pieces
REO1,2 1.53 1 258.20 0.00 0.0% 7 549.20 19.71 7 568.91
11 HS190531 : Bread, pastry, cakes, biscuits & oth. bakers' wares n.e.s. in Ch.19, whethe ... - Sweet biscuits
REO1,2 6.73 1 163.38 12.19 0.2% 6 980.31 828.55 7 821.06
12 HS631090 : Used/new rags, scrap twine, cordage, rope & cables & worn out arts. of twine/cordage/rope/cables, of textile mats. (excl. sorted)
REO1,2 1.09 412.62 18.36 0.7% 2 475.71 39.41 2 533.48
13 HS040700 : Birds' eggs, in shell, fresh/presvd./cooked
REO1,2 1.83 389.41 0.00 0.0% 2 336.47 19.64 2 356.11
14 HS901420 : Direction finding compasses - Instruments & appls. for aeronautical/space navigation (excl. compasses)
REO1,2 1.14 236.86 0.00 0.0% 1 421.18 102.48 1 523.67
15 HS151790 : Edible mixts./preps. of animal/veg. fats/oils/fractions of diff. fats/oils of Ch.15, other than edible fats/oils/fractions of 15.16/non-liquid margarine
REO1,2 4.98 202.64 0.00 0.0% 1 215.83 18.32 1 234.15

108 Rwanda TRADE-DSM analysis – Technical study report final draft 31 August 2017
16 HS410120 : Whole bovine (incl. buffalo)/equine hides & skins, wt. per skin not >8kg (simply dried)/10kg (dry-salted)/16kg (fresh/wet-salted/othw. presvd.)
REO4,2 205.51 148.07 1 161.47 72.3% 444.20 0.00 1 605.68
17
HS121190 : Ginseng roots - Plants & parts of plants, incl. seeds & fruits, of a kind used primarily in perfumery/pharmacy/for insecticidal/fungicidal/sim. purps., n.e.s. in Ch.12, fresh/dried, whether or not cut/crushed/powdered
REO1,2 21.43 144.46 0.00 0.0% 866.74 78.72 945.47
18 HS220850 : Gin & Geneva REO1,2 6.10 131.75 0.00 0.0% 790.50 83.74 874.24
19
HS830890 : Clasps, frames with clasps, buckles, buckle-clasps, and the like, of base metal...(excl. of 8308.10), incl. parts; beads & spangles, of base metal... [see complete text #134]
REO1,2 1.14 131.67 0.00 0.0% 790.02 41.23 831.25
20 HS130219 : Agar-agar - Vegetable saps & extracts (excl. of 1302.11-1302.14)
REO1,2 29.27 111.32 0.00 0.0% 667.93 47.43 715.36
21 HS842220 : Dish washing machines of the h-hold. type - Machinery for cleaning/drying bottles/oth. conts.
REO1,2 4.91 98.53 0.00 0.0% 591.16 35.91 627.07
22 HS392510 : Builders' ware of plastics, n.e.s. (excl. of 3925.10-3925.30) - Reservoirs, tanks, vats & sim. conts., of a cap. >300 l, of plastics
REO1,2 2.92 92.27 0.10 0.0% 553.64 125.13 678.86
23 HS900510 : Binoculars REO1,2 10.95 84.72 0.00 0.0% 508.33 26.62 534.94
24 HS540120 : Sewing thread of man-made filaments, whether or not put up for RS, of art. filaments
REO1,2 2.88 66.86 0.00 0.0% 401.13 4.70 405.84
25
HS410390 : Raw hides & skins of reptiles, n.e.s. in Ch.41 (fresh/salted/dried/limed/pickled/othw. presvd. but not tanned/parchment-dressed/furth. prepd.)
REO4,2 304.47 65.62 1 471.92 78.9% 393.70 0.00 1 865.62
26 HS846890 : Gas-operated mach. & app. for soldering/brazing/welding, other than hand-he ... - Parts of the mach. & app. of 84.68
REO1,2 6.78 59.52 0.00 0.0% 357.12 29.71 386.83
27 HS340590 : Polishes & creams, scouring pastes & powders & sim. preps. (excl. waxes of 34.04; excl. of 3405.10-3405.40)
REO1,2 0.83 46.76 0.00 0.0% 280.56 25.26 305.82
28 HS253090 : Kieserite, epsomite (nat. magnesium sulphates) - Mineral subs., n.e.s. in Ch.25
REO2,2 11.49 36.36 22.56 8.9% 218.14 13.69 254.40
29 HS330190 : Essential oils of bergamot - Extracted oleoresins; concs. of essential oils in fats/fixed oils/waxes/the like, obt. by enfleurage/maceration
REO1,2 0.89 32.16 0.10 0.0% 192.94 9.36 202.40
30 HS846120 : Broaching machines working by removing metal/cermets - Shaping/slotting machines working by removing metal/cermets
REO1,2 17.34 28.50 0.00 0.0% 171.00 3.44 174.44
31 HS441510 : Cases, boxes, crates, drums & sim. packings of wood; cable-drums of wood REO3,2 2.53 27.54 45.51 19.1% 165.23 27.48 238.21
32 HS110290 : Cereal flour other than of wheat, meslin, rye, maize (corn), rice
REO1,2 19.78 14.22 0.00 0.0% 85.31 2.30 87.61
33 HS420340 : Articles of apparel, of leather/composition leather - Clothing accessories (excl. of 4203.21-4203.30), of leather/composition leather
REO1,2 3.23 8.75 0.00 0.0% 52.49 8.17 60.66
34 HS711711 : REO3,2 2.08 5.20 12.88 28.5% 31.19 1.13 45.21

109 Rwanda TRADE-DSM analysis – Technical study report final draft 31 August 2017
Cuff-links & studs of base metal, whether or not plated with precious metal
35
HS410229 : Raw skins of sheep/lambs (excl. of 4102.10 & 4102.21), fresh/salted/dried.../othw. presvd. but not tanned/parchment-dressed...without wool on... [see complete text #57]
REO4,2 426.99 2.93 626.67 99.1% 5.85 0.00 632.53
Source: Authors, TRADE-DSM

110 Rwanda TRADE-DSM analysis – Technical study report final draft 31 August 2017
While there are 35 HS6-digit product lines in total that the methodology identifies, the top 5 only are
discussed in more detail in this section of the report.
5.4.6.1. Other tea (REO3,4)
The largest realistic export opportunity identified for Rwanda into Kenya is that of HS090240: Other tea, black (fermented) &
partly fermented tea, whether or not
flavoured, in immediate packings of a content
>3kg. Growing of crops; market gardening;
horticulture' farming of animals' growing of
crops combined with farming of animals
(S1110,1120,1130) and classified as non-fuel
primary commodities (relatively low skill and
technology intensity). Rwanda has an RCA of
537.36 for this product and potential
estimated at US$ 14.2 million (based on the
calculation as explained in the appendix in
section 9.1.6).
Figure 119 provides the imports of Kenya of
this product over the period 2010 to 2015, as
well as the realistic potential estimate. Evident
is that the imports of this product into Kenya
took a dip in 2013 but recovered to previous
levels of around US 130 million by 2015.
Figure 120 depicts the export of this product
from Rwanda to the top destinations with
Kenya appearing at the top. At the same time
top suppliers to Kenya are depicted and
Rwanda is second as it supplies just more than
31 percent of Kenya’s imports. Kenya is
classified is a “brown fields” market for
Rwanda as Rwanda is already supplying a large
share of the imported demand into Kenya –
therefore in the intensive margin both from a
product as well as market perspective.
After Kenya, the next export destination from
Rwanda is Pakistan (at 34.4 percent).
Figure 119: Kenya REO for HS090240
Source: Authors, TRADE-DSM
Figure 120: Kenya REO HS090240 import origins versus Rwanda export destinations
Source: Authors, TRADE-DSM

111 Rwanda TRADE-DSM analysis – Technical study report final draft 31 August 2017
5.4.6.2. Black tea (REO4,2)
The second largest realistic export opportunity identified for Rwanda into Kenya is that of HS090230: Tea, black (fermented) & partly
fermented tea, whether or not flavoured, in
immediate packings of a content not >3kg.
Growing of crops; market gardening;
horticulture' farming of animals' growing of
crops combined with farming of animals
(S1110,1120,1130) and classified as non-fuel
primary commodities (relatively low skill and
technology intensity). Rwanda has an RCA of
233.98 for this product and potential
estimated at US$ 2.9 million (based on the
calculation as explained in the appendix in
section 9.1.6).
Figure 121 provides the imports of Kenya of
this product over the period 2010 to 2015
(around US$ 25-30 million per annum), as well
as the realistic potential estimate.
Figure 122 depicts the export of this product
from Rwanda to the top destinations (Kenya at
71.7 percent of Rwanda’s exports). At the
same time top suppliers to Kenya are depicted,
with Rwanda featuring at number 2 after
Uganda.
Other smaller import origins for Kenya are
India, Mozambique and Sri Lanka.
Figure 121: Kenya REO for HS090230
Source: Authors, TRADE-DSM
Figure 122: Kenya REO HS090230 import origins versus Rwanda export destinations
Source: Authors, TRADE-DSM

112 Rwanda TRADE-DSM analysis – Technical study report final draft 31 August 2017
5.4.6.3. Peas (REO1,2)
The third largest realistic export opportunity identified for Rwanda into Kenya is that of HS071310: Peas (Pisum sativum), dried,
shelled, whether or not skinned/split. The product is produced in the Processing and
preserving of fruit and vegetables sector
(S3013) and classified as non-fuel primary
commodities (relatively low skill and
technology intensity). Rwanda has an RCA of
3.63 for this product and potential estimated
at US$ 2.6 million (based on the calculation as
explained in the appendix in section 9.1.6).
Figure 123 provides the imports of Burundi of
this product over the period 2010 to 2015, as
well as the realistic potential estimate. Evident
is that while the imports of this product into
Kenya declined from 2011 highs to around US$
13 million in 2014, in 2015 the direction
started turning and imports of this product
started to increase again.
Figure 124 depicts the export of this product
from Rwanda to the top destinations with
Kenya not appearing as a destination. At the
same time top suppliers to Kenya are depicted
and Rwanda is does not appear on the list.
Kenya mainly sources from the United States,
Turkey, the Ukraine, Russia and Canada.
Figure 123: Kenya REO for HS071310
Source: Authors, TRADE-DSM
Figure 124: Uganda REO HS071310 import origins versus Rwanda export destinations
Source: Authors, TRADE-DSM

113 Rwanda TRADE-DSM analysis – Technical study report final draft 31 August 2017
5.4.6.4. Soybean oil cake (REO2,2)
The fourth largest realistic export opportunity identified for Rwanda into Kenya is that of HS230400: Oil-cake & oth. solid residues,
whether or not ground/in pellets, from
extraction of soybean oil.
The product is produced in Manufacture of
vegetable and animal oils and fats sector
(S3014) and classified as non-fuel primary
commodities (relatively low skill and
technology intensity). Rwanda has an RCA of
1.05 for this product and potential estimated
at US$ 2.4 million (based on the calculation as
explained in the appendix in section 9.1.6).
Figure 125 provides the imports into Kenya of
this product over the period 2010 to 2015, as
well as the realistic potential estimate. Evident
is that while the imports of this product into
Kenya have oscillated up and down over the
period, strong growth was experienced
between 2014 and 2015 reaching US$ 20
million.
Figure 126 depicts the export of this product
from Rwanda to the top destinations with
Kenya the largest market. At the same time
top suppliers to Kenya are depicted and
Rwanda is only ranked at number 4 with 6.9
percent of Kenya’s import demand fulfilled by
Rwanda. The major supplier is India followed
by Malawi and Uganda.
Figure 125: Kenya REO for HS230400
Source: Authors, TRADE-DSM
Figure 126: Kenya REO HS230400 import origins versus Rwanda export destinations
Source: Authors, TRADE-DSM

114 Rwanda TRADE-DSM analysis – Technical study report final draft 31 August 2017
5.4.6.5. Aircraft piston engines (REO1,2)
The fifth largest realistic export opportunity
identified for Rwanda into Kenya is that of
HS840710: Spark-ignition reciprocating or
rotary internal combustion piston engines for
aircraft.
The product is produced in the sector group of
Manufacture of aircraft and spacecraft (S3860)
and classified as medium skill- and technology
intensive manufactures. Rwanda has an RCA of
14.95 for this product and potential estimated
at US$ 2.4 million (based on the calculation as
explained in the appendix in section 9.1.6).
Figure 127 provides the imports for Kenya of
this product over the period 2010 to 2015, as
well as the realistic potential estimate. Evident
is that the imports of this product into Kenya
exhibited exceptionally high values in 2010
(US$ 80 million) and 2013 (US$ 106 million).
This may have to do with refurbishment of
large aircraft.
Figure 128 depicts the export of this product
from Rwanda – only to Germany (supporting
the observation that it may have to do with
refurbishment of existing planes). At the same
time top suppliers to Kenya are depicted and
main sources are the United States, United
Kingdom, the Netherlands and Canada.
See previous observations on this product
under Uganda analysis in section 5.4.5.
Figure 127: Kenya REO for HS840710
Source: Authors, TRADE-DSM
Figure 128: Kenya REO HS840710 import origins versus Rwanda export destinations
Source: Authors, TRADE-DSM

115 Rwanda TRADE-DSM analysis – Technical study report final draft 31 August 2017
5.4.7. South Sudan (C728)
South Sudan does not border directly with
Rwanda and is located to the north with
Uganda in-between the two countries. Overall
the country covers an area of 644 329 square
kilometres and size wise is ranked as number
42 in the world. In terms of GDP the economy
is estimated at US$ 8 billion (2015) and the
country’s estimated population in 2015 was
12.3 million persons (United Nations, 2016).
South Sudan’s economy is relatively closed in
terms of imports to GDP at 25.7 percent
(2015). At independence in 2011, South Sudan
produced nearly 75 percent of former Sudan's
total oil output of nearly a half million barrels
per day. South Sudan’s economic conditions
have deteriorated since January 2012 when the
government decided to shut down oil
production following bilateral disagreements
with Sudan (the pipelines run through Sudan).
Since December 2013, conflict between
government and opposition forces led to a
humanitarian crisis with millions of South
Sudanese displaced and a major food crisis. In
July 2016 fighting again broke out plunging the
country back into conflict leading to the World
Food Programme having to assist more than 4
million people throughout South Sudan (WFP,
2017g).
Figure 129: Map of South Sudan
Source: The World Factbook (CIA)
Figure 130: South Sudan overall merchandise trade
Source: Authors, BACI data
The impact of these events is clearly visible in
Figure 130 with exports dropping away after
2014. In terms of imports it is evident from
Figure 130 that merchandise imports are small
and have decreased due to the instability in the
region, while mostly being related to
humanitarian aid. The top 10 trading partners
(excluding Rwanda) supplies in excess of 82
percent of imports. Uganda is the largest
source, followed by Pakistan and the United
States. Evident from Figure 117 is that Rwanda
only supplies around 0.7 percent of South
Sudan’s imports (on time-weighted basis
valued at US$ 2.79 million).
Figure 131: South Sudan top overall importing partners
Source: Authors, BACI data

116 Rwanda TRADE-DSM analysis – Technical study report final draft 31 August 2017
Based on the TRADE-DSM
methodology, no export
opportunities that meet all the
requirements are identified
through the filtering process for
Rwanda into South Sudan.
The opportunity that comes the closest is that of HS110220 :
Cereal flour other than of wheat,
meslin, rye, maize (corn), rice -
Maize (corn) flour.
While the product is indicated as a
realistic export opportunity in the
REO map in Table 29 as an REO1,3
(large and growing opportunity
with little or no sourcing from
Rwanda), it does not actually pass
the concentration filter, as all of
the imports recorded for maize
originates from Uganda according
to the BACI data.
Table 29: REO Map outcomes for South Sudan opportunities for Rwanda
Source: Authors, TRADE-DSM Navigator
This product therefore strictly is not an REO based on the TRADE-DSM methodology, but Rwanda
does have a very high RCA for this product and may be able to supply into South Sudan. For this
reason the overall DSM export maturity, market share, and growth and diversification matrix for
South Sudan is not shown.

117 Rwanda TRADE-DSM analysis – Technical study report final draft 31 August 2017
Table 30: Identified REOs (1 *) for Rwanda into South Sudan (ranked descending by potentia l)
Item Product REO type RCA
[A] Realistic Export
Potential to Target
Market(s) `000 US$
[B] Total Exports from Rwanda
to Target Market(s) `000 US$
[C] = [B] / [G] Total Exports from Rwanda
/ Target Market(s)Total Imports%
[E] Target Market(s) Imports from top
6 competitors (Excl Rwanda)
`000 US$
[F] Target Market(s)
Imports from Rest of market
(Excl Rwanda & top 6 competitors)
`000 US$
[G] Target
Market(s) Total Imports
`000 US$ 1 465.02 14 571.38 0.00 0.0% 14 571.38 0.00 14 571.38
1 HS110220 : Cereal flour other than of wheat, meslin, rye, maize (corn), rice - Maize (corn) flour
REO1,3 465.02 14 571.38 0.00 0.0% 14 571.38 0.00 14 571.38
Source: Authors, TRADE-DSM
* While the product is indicated as a realistic export opportunity, it does not actually pass the concentration filter, as all of the imports recorded for maize originate from Uganda according to
the BACI data. This product therefore strictly is not an REO based on the TRADE-DSM methodology, but Rwanda does have a very high RCA for this product and may be able to supply into South
Sudan.

118 Rwanda TRADE-DSM analysis – Technical study report final draft 31 August 2017
While there are actually no HS6-digit product lines in total that the methodology identifies, the as
indicated previously maize (corn) flour (HS110220) is included in the discussion for South Sudan in
this section of the report.
5.4.7.1. Maize (corn) flour (REO1,3)
The possible export opportunity identified for Rwanda into South Sudan is that of HS110220:
Cereal flour other than of wheat, meslin, rye,
maize (corn), rice - Maize (corn) flour. The product is produced in Manufacture of
grain mill products sector (S3031) and
classified as non-fuel primary commodities
(relatively low skill and technology intensity).
Rwanda has an RCA of 465.0 for this product
and potential estimated at US$ 14.5 million
(based on the calculation as explained in the
appendix in section 9.1.6).
Figure 132 provides the imports of South
Sudan of this product over the period 2010 to
2015, as well as the realistic potential
estimate. Evident is that the imports of this
product into showed a steep increase i from
2013 onwards, but is most probably related to
the humanitarian aid challenges in South
Sudan.
Figure 133 depicts the export of this product
from Rwanda to the top destinations with
South Sudan not appearing on the list. This is
due to the fact that 100 percent of the imports
into South Sudan are reported as being
sourced from Uganda. The main export
destination from Rwanda is the DRC (at 99.4
percent).
Figure 132: South Sudan REO for H S110220
Source: Authors, TRADE-DSM
Figure 133: South Sudan REO HS110220 import origins versus Rwanda export destinations
Source: Authors, TRADE-DSM

119 Rwanda TRADE-DSM analysis – Technical study report final draft 31 August 2017
5.4.8. Somalia (C706)
Somalia is two countries removed towards the
east of Rwanda. Overall Somalia covers an area
of 637 657 square kilometres and size wise is
ranked as number 44 in the world. In terms of
GDP the economy is estimated at US$ 3 billion
(2015) and the country’s estimated population
in 2015 was 10.8 million persons (United
Nations, 2016). Somalia’s economy is closed in
terms of imports to GDP at 1.7 percent (2015).
Agriculture is the most important sector, with
livestock normally accounting for about 40% of
GDP and more than 50% of export earnings.
Nomads and semi-pastoralists, who are
dependent upon livestock for their livelihood,
make up a large portion of the population.
Economic activity is estimated to have
increased by 3.7% in 2016 because of growth in
the agriculture, construction and
telecommunications sector. Somalia's small
industrial sector, based on the processing of
agricultural products, has largely been looted
and the machinery sold as scrap metal. Recent
drought have added another 761 000 people to
the already more than 3 million needing food
assistance (WFP, 2017h). Based on the data as
compiled by CEPII Burundi on average exported
around US$ 0.5 billion over the period 2010 to
2015, with a levelling from 2014 to 2015.
Figure 134: Map of Somalia
Source: The World Factbook (CIA)
Figure 135: Somalia overall merchandise trade
Source: Authors, BACI data
In terms of imports it is evident from Figure
135 that merchandise imports have increased
steadily over the period 2010 to 2014, then
started to decline. The top 10 trading partners
(excluding Rwanda) supplies in excess of 73.4
percent of imports. Ethiopia and India are the
leading sources of imports, followed by Oman,
the United Arab Emirates, Turkey, Yemen and
Egypt. Evident from Figure 136 is that Rwanda
supplies virtually no imports to Somalia (on
time-weighted basis).
Figure 136: Somalia top overall importing partners
Source: Authors, BACI data

120 Rwanda TRADE-DSM analysis – Technical study report final draft 31 August 2017
There are a total of only 4
opportunities identified for
Rwanda into Somalia. Three are
classified as growing in both short
and long term, but overall not
large opportunities (REO1,2), but
Rwanda do not currently supply
these products to Somalia. The
overall potential is calculated at
only around US$ 0.2 million.
There is one opportunity that is
classified as large and growing in
the longer term (REO1,4) to the
value of US$ 18.1 million in the
form of HS110100: Wheat/meslin
flour.
Table 31: REO Map outcomes for Somalia opportunities for Rwanda
Source: Authors, TRADE-DSM Navigator
The 4 products that Rwanda
could supply to Somalia are in
Quadrant 2 (extensive margin
for markets, intensive margins
for the products) as depicted
in Figure 137. More detail on
each of these is provided in
Table 32.
The largest opportunities
seem to be in wheat/meslin
flour, eggs, plastic large
volume water containers (>
300 litres).
Figure 137: Rwanda REO opportunities for Somalia (excluding petroleum and gold)
Source: Authors, TRADE-DSM

121 Rwanda TRADE-DSM analysis – Technical study report final draft 31 August 2017
Table 32: Identified REOs (35) for Rwanda into Somalia (ranked descending by potential)
Item Product REO type RCA
[A] Realistic Export
Potential to Target
Market(s) `000 US$
[B] Total Exports from Rwanda
to Target Market(s) `000 US$
[C] = [B] / [G] Total Exports from Rwanda
/ Target Market(s)Total Imports%
[E] Target Market(s) Imports from top
6 competitors (Excl Rwanda)
`000 US$
[F] Target Market(s)
Imports from Rest of market
(Excl Rwanda & top 6 competitors)
`000 US$
[G] Target
Market(s) Total Imports
`000 US$ 4 - 18 326.39 0.00 0.0% 109 958.35 540.23 110 498.58
1 HS110100 : Wheat/meslin flour
REO1,4 70.62 18 139.26 0.00 0.0% 108 835.57 470.08 109 305.66
2 HS040700 : Birds' eggs, in shell, fresh/presvd./cooked REO1,2 1.83 74.67 0.00 0.0% 448.01 14.84 462.85
3 HS392510 : Builders' ware of plastics, n.e.s. (excl. of 3925.10-3925.30) - Reservoirs, tanks, vats & sim. conts., of a cap. >300 l, of plastics
REO1,2 2.92 68.90 0.00 0.0% 413.42 9.33 422.75
4 HS392310 : Articles for the conveyance/packing of gds., of plastics (excl. of 3923.10- ... - Boxes, cases, crates & sim. arts., of plastics
REO1,2 2.65 43.56 0.00 0.0% 261.35 45.98 307.33
Source: Authors, TRADE-DSM

122 Rwanda TRADE-DSM analysis – Technical study report final draft 31 August 2017
The 4 HS6-digit product lines that the methodology identifies are discussed in more detail in this
section of the report.
5.4.8.1. Wheat/meslin flour (REO1,4)
The largest realistic export opportunity identified for Rwanda into Somalia is that of HS110100: Wheat/meslin flour.
The product is produced in the Manufacture of
grain mill products sector (S3031) and
classified as non-fuel primary commodities
(relatively low skill and technology intensity).
Rwanda has an RCA of 70.62 for this product
and potential estimated at US$ 18 million
(based on the calculation as explained in the
appendix in section 9.1.6).
Figure 138 provides the imports of Somalia of
this product over the period 2010 to 2015
(around US$ 100 million for 2014 and 2015), as
well as the realistic potential estimate.
Figure 141 depicts the export of this product
from Rwanda to the top destinations (the DRC
at 97.3 percent of Rwanda’s exports). Somalia
does not feature as an export destination from
Rwanda. At the same time top suppliers to
Somalia are depicted leading with Oman,
Egypt, India, Turkey and the United States.
Figure 138: Somalia REO for HS110100
Source: Authors, TRADE-DSM
Figure 139: Somalia REO HS110100 import origins versus Rwanda export destinations
Source: Authors, TRADE-DSM

123 Rwanda TRADE-DSM analysis – Technical study report final draft 31 August 2017
5.4.8.2. Eggs (REO1,2)
The second largest realistic export opportunity identified for Rwanda into Somalia is that of HS040700: Birds' eggs, in shell,
fresh/presvd./cooked.
Growing of crops; market gardening;
horticulture' farming of animals' growing of
crops combined with farming of animals
(S1110,1120,1130) and classified as non-fuel
primary commodities (relatively low skill and
technology intensity). Rwanda has an RCA of
6.73 for this product and potential estimated
at US$ 74.67 thousand (based on the
calculation as explained in the appendix in
section 9.1.6).
Figure 140 provides the imports of Somalia of
this product over the period 2010 to 2015
(around US$ 300-600 thousand per annum), as
well as the realistic potential estimate.
Figure 141 depicts the export of this product
from Rwanda to the top destinations of
Rwanda’s exports (the DRC at rounded 100
percent and Burundi negligible). Somalia does
not feature as a destination. At the same time
top suppliers to Somalia are depicted, with the
main import origins for Yemen, India, the
Turkey, the Netherlands and Belgium.
Figure 140: Somalia REO for HS040700
Source: Authors, TRADE-DSM
Figure 141: Somalia REO HS040700 import origins versus Rwanda export destinations
Source: Authors, TRADE-DSM

124 Rwanda TRADE-DSM analysis – Technical study report final draft 31 August 2017
5.4.8.3. Plastic large volume water containers (REO1,2)
The third largest realistic export opportunity identified for Rwanda into Somalia is that of HS392510: Builders' ware of plastics, n.e.s.
(excl. of 3925.10-3925.30) - Reservoirs, tanks,
vats & sim. conts., of a cap. >300 l, of plastics. The product is produced in the Manufacture of
plastic products sector (S3380) and classified
as relatively medium skill and technology
intensive. Rwanda has an RCA of 2.92 for this
product and potential estimated at US$ 68 900
(based on the calculation as explained in the
appendix in section 9.1.6).
Figure 142 provides the imports of Somalia of
this product over the period 2010 to 2015, as
well as the realistic potential estimate. Evident
is that the imports of this product into Somalia
is erratic but exhibits a continued increase
since 2014.
Figure 143 depicts the export of this product
from Rwanda to the top destinations with
Somalia not appearing as a destination. At the
same time top suppliers to Somalia are shown
and Kenya, China, Oman, France and the
United States feature as suppliers.
Figure 142: Somalia REO for HS040700
Source: Authors, TRADE-DSM
Figure 143: Somalia REO HS040700 import origins versus Rwanda export destinations
Source: Authors, TRADE-DSM

125 Rwanda TRADE-DSM analysis – Technical study report final draft 31 August 2017
5.4.8.4. Boxes, cases, crates & sim. arts., of plastics (REO1,2)
The final realistic export opportunity identified for Rwanda into Somalia is that of HS392310:
Boxes, cases, crates & sim. arts., of plastics.
The product is produced in the Manufacture of
plastic products sector (S3380) and classified
as relatively medium skill and technology
intensive. Rwanda has an RCA of 2.65 for this
product and potential estimated at US$ 43 560
(based on the calculation as explained in the
appendix in section 9.1.6).
Figure 144 provides the imports into Somalia
of this product over the period 2010 to 2015,
as well as the realistic potential estimate.
Evident is that while the imports of this
product into Somalia is small it has shown
steady growth in recent years to more than
US$ 350 000.
Figure 145 depicts the export of this product
from Rwanda to the top destinations. Again
Somalia does not appear as a destination. At
the same time top suppliers to Somalia are
Saudi Arabia, China, Oman, the United Arab
Emirates and Indonesia.
Figure 144: Somalia REO for HS040700
Source: Authors, TRADE-DSM
Figure 145: Somalia REO HS040700 import origins versus Rwanda export destinations
Source: Authors, TRADE-DSM

126 Rwanda TRADE-DSM analysis – Technical study report final draft 31 August 2017
5.5. Outcomes by economic sector (excluding petroleum and gold) based on
skill and technology intensity and export maturity (RCA>=1)
In line with the recommendations from the Hausmann et al. (2015) study regarding the types of
products to prioritise as informed by the product space approach, it is important for policy makers to
have a view on what the skills and technology intensity make-up of sectors and products that are
prioritised look like, since this aspect will determine how Rwanda will grow in the future. As
explained in section 3 this dimension of potential realistic export opportunities therefor has been
incorporated into the DSM for Rwanda for the purposes of this study.
Evident from Figure 146 is that the current outcomes of opportunities identified (excluding petroleum and gold) are focused around non-fuel primary commodities which are by (generalised35) nature lower skill and technology intensive. This is mainly due to the fact that both the product space and DSM approach incorporates the RCA as a key variable in the underlying methodology. It is therefore important to consider and keep track of the development of sectors and industries that will assist with capacity building of human capital in the longer term. While the share of low, medium and high skill and technology in the current make-up of exports is relatively small, the opportunities associated with the three categories are shown in more detail next.
Figure 146: REO overall outcomes by skill - and technology intensity
Source: Authors, TRADE-DSM Navigator
Non-fuel primary commodities are not discussed in more detail, as the understanding is that policy
makers would be interested in what the economy does not poses, as opposed to what it is well
endowed with.
35 There are specific exceptions as mentioned in the method section.

127 Rwanda TRADE-DSM analysis – Technical study report final draft 31 August 2017
In terms of opportunities by non-fuel primary
commodities two economic sectors stand out
(in terms of economic sectors according to the
Standard Industrial Classification sectors) –
that of Agriculture, forestry & fishing (11-13)
with potential of around US$ 4.6 billion (542
product-country lines) and manufacturing and
supply of Food (301-304) at US$ 8 billion (1401
product-country lines).
Basic non-ferrous metals (352), Beverages
(305), Basic iron & steel (351) and Other
mining (22, 24, 25, 29, and 39) also features.
While “low skill- and technology” seems to be
at the lower end of achievements a policy
maker may strive for, it is still a step-up from
non-fuel primary commodities in terms of skills
and value add in the economy.
Figure 147: REO overall outcomes – non -fuel primary commodities by economic sector
Source: Authors, TRADE-DSM Navigator
Evident is that in terms of the REOs identified
for Rwanda based on existing capability of the
domestic economy, with the low skill- and
technology intensity category, the largest
sector in terms of both potential (US$ 0.29
billion) and number (147) of product lines is
that of Metal products excluding machinery
(353-355) (see Figure 148).
Other sectors include Other industries (392),
Other transport equipment (384-387) and
Basic iron & steel (351).
Figure 148: REO overall outcomes – Low skill - and technology -intensive manufac tures by economic sector
Source: Authors, TRADE-DSM Navigator

128 Rwanda TRADE-DSM analysis – Technical study report final draft 31 August 2017
Medium skill- and technology related
opportunities are mainly concentrated in the
sectors of Electrical machinery (361-366),
Machinery & equipment (356-359) and Plastic
products (338) as is evident in Figure 149.
While Electrical machinery (361-366) has the
highest potential value (US$ 3 billion),
Machinery & equipment (356-359) has
relatively large potential in terms of both value
(US$ 2 billion) as well as number of product-
country lines (532).
Figure 149: REO overall outcomes – medium skill - and technology intensity manufactures by economic sector
Source: Authors, TRADE-DSM Navigator
For high skill- and technology intensity
opportunities these are mainly concentrated in
the Other transport equipment (384-387)
sector, with a potential value of around US$
0.55 billion and 62 product-country lines.
At much lower in terms of potential value, but
similar in terms of number of opportunities,
Organic and Inorganic chemicals (51, 52) as
well as Essential oils and resinoids and
perfume materials; toilet, polishing and
cleansing preparations (55) also feature but
with potential in the millions of US$, not
billions.
Figure 150: REO overall outcomes – high skill and technology intensity manufactures by economic sector
Source: Authors, TRADE-DSM Navigator

129 Rwanda TRADE-DSM analysis – Technical study report final draft 31 August 2017
5.6. Summary
In terms of broad geographic areas, more than 80 percent of the identified potential in terms of
value of market-product line combinations36 is contained in the 6 geographic regions (in descending
order of potential value) of Western Europe, Eastern Asia, Northern America, Southern Europe,
South-Eastern Asia and Northern Europe (all not within the direct geographic vicinity of Rwanda). In
terms of the number of opportunities, in addition to the first 6 regions, Western Asia, Eastern
Europe and Western Africa contributes to reaching the 80 percent mark.
The single market of the United States of America should be investigated in more depth, as this
market is indicated to have the most potential in value terms (more than US$ 5 billion excluding
petroleum and gold), while also presenting the second most opportunity based on number of
product lines, 82 of which qualify for duty free access to this market under the current AGOA
applicable to Rwanda.
In the short to medium term, close (to Rwanda) regional sub-Saharan markets in Middle Africa,
Eastern Africa and Southern Africa do not pose large (relatively speaking) opportunities in either
value or number of product lines, with the combined markets in these regions accounting for only
1.4 percent of the potential and 7.7 percent of the number of opportunities.
Direct neighbours to Rwanda are Burundi, the Democratic Republic of the Congo (DRC), Tanzania
and Uganda. The Congo (Brazzaville), Kenya, Somalia and South Sudan are not directly bordering
Rwanda but of regional interest.
Figure 151: Comparison of regional neighbours - potential and number of opportunities
Source: Authors’ calculations from TRADE-DSM
The outcomes in relative terms are shown in Figure 151. Evident is that while South Sudan and
Somalia have relatively large (size of bubble) opportunities, these are only few in number (vertical
36 For purposes of this analysis large dominating energy and minerals such as petroleum and gold are excluded.

130 Rwanda TRADE-DSM analysis – Technical study report final draft 31 August 2017
axis) and these are very much focused on humanitarian food aid type of products (wheat and corn
flour).
Kenya provides a large set (35) of higher value (average potential around US$ 1 million per
opportunity) and diverse opportunities compared to that of Uganda (38) and Tanzania (32) with
much lower per opportunity averages, while the DRC (27) and Congo (14) has fewer but also on
average larger potential than Uganda and Tanzania. Therefore, Kenya, the DRC and Congo provide
the best balance between diversity and value of opportunities out of the set of focus countries.
In terms of an economic sectoral perspective the following exhibits the majority of product-country
lines associated potential for Rwanda’s exports:
• Food,
• Agriculture, forestry & fishing,
• Electrical machinery,
• Basic non-ferrous metals,
• Beverages,
• Machinery & equipment,
• Basic iron & steel and
• Other transport equipment.
Further to the discussion on close (geographically) regional markets, as previously demonstrated,
the transport cost into this region is quantitatively shown to be extremely (relatively speaking)
unproductive and expensive relative to other destinations. However, this is an area of intervention
that the government of Rwanda seems to be keenly aware of and is giving attention to.
In order to create a focus set of product groups or “portfolio” of focus products and markets, the
outcomes obtained from the more detailed analysis on a country level for the focus countries was
combined with that of higher level aggregate rest of the world outcomes in each quadrant. By taking
the top 10 (based on average potential) for each HS 6-digit line (so 8 countries plus 4 quadrants
times 10 product lines) and rationalising the set of outcomes a set of 25 HS 6-digit lines are identified
that meets the focus countries as well as global opportunities requirement. The outcomes are
grouped by sectors (2 digit Standard International Trade Classification (SITC) chapter indicated) and
arranged in descending order based on the average size of potential across all markets within SITC
sectors and total potential between SITC sectors. The results are provided in a summarised format in
Table 33. For the individual countries the range of potential in monetary value terms are indicated
based on the ranges indicated in the key, while for the rest of the world the number of opportunities
(excluding the focus countries) are indicated, followed by the total average potential value across all
potential markets.

131 Rwanda TRADE-DSM analysis – Technical study report final draft 31 August 2017
Table 33: Summarised outcomes across focus countries and global opportunities
For focus countries value ranges of potential are indicated by colour of the cell: <= US$ 0.5 mn < US$ 0.5 mn <= US$ 1 mn > US$ 1 mn Regional focus countries
Rest of World
SITC Rev 4 Sector
Skill & Technology
intensity HS-6 digit Description Bu
run
di
Co
ng
o
DR
C
Ke
ny
a
So
ma
lia
So
uth
Su
da
n
Ta
nza
nia
Ug
an
da
Glo
ba
l Q
1
Glo
ba
l Q
2
Glo
ba
l Q
3
Glo
ba
l Q
4
To
tal
No
To
t A
ve
rag
e
Po
ten
tia
l
(Mn
US
$)
S11:Beverages Non-fuel primary commodities
HS220300 Beer made from malt 1 1 1 - - - 1 -
- 31 - - 35 38.47
HS220210 Waters, incl. min. waters & aerated waters, cont. added sugar/oth. sweetening matter/flavoured - - - - - - - 1 - - 42 - 43 16.42
HS220110 Mineral waters (nat./art.) & aerated waters, not cont. added sugar/oth. sweetening matter/flavoured
- 1 1 - - - - 1 - - - - 3 4.77
Sub-total (number, total potential value) 1 2 2 - - - 1 2
- 31 42 - 81 115.2 S02:Dairy products and birds’ eggs
Non-fuel primary commodities HS040700 Birds' eggs, in shell, fresh/presvd./cooked - 1 - 1 1 - - 1 - 39 - - 43 58.69
HS040210 Milk in powder/granules/oth. solid form, fat content by wt. not >1.5% - - 1 1 - - - 1 - - - - 3 31.29
HS040291 Milk & cream, concentrated (excl. in powder), unsweetened
- - 1 - - - - -
- - 30 - 31 25.25
Sub-total (number, total potential value) - 1 2 2 1 - - 2
39 30 - 77 59.7 S04:Cereals and cereal preparations
Non-fuel primary commodities HS190531 Sweet biscuits 1 - - 1 - - 1 - - 63 - - 66 14.74
HS100640 Broken rice - - 1 - - - - - - - - - 1 6.07
HS110220 Maize (corn) flour - - 1 - 1 - - - - - - - 2 10.11
Sub-total (number, total potential value) 1 - 2 1 - 1 1 -
63 - - 69 30.9 S05:Vegetables and fruit
Non-fuel primary commodities
HS200290 Tomatoes, prepd./presvd. othw. than by vinegar/acetic acid, other than whole/in pieces
- 1 - 1 - - - -
- 34 - - 36 13.22
HS071310 Peas (Pisum sativum), dried, shelled, whether or not skinned/split - - - 1 - - 1 1 - 28 - - 31 4.04
Sub-total (number, total potential value) - 1 - 2 - - 1 1
62 - - 67 17.3 S28:Metalliferous ores and metal scrap
Non-fuel primary commodities HS260900 Tin ores & concs. - - - - - - - - 5 - - - 5 6.16
Sub-total (number, total potential value)
11.4 S71:Power-generating machinery and equipment
Medium skill- and technology intensive manufactures HS840710
Spark-ignition recip./rotary int. comb. piston engines for aircraft
- - - 1 - - 1 1
- 27 - - 30 4.42
Sub-total (number, total potential value) 9.0 S89:Miscellaneous manufactured articles, n.e.s.
Medium skill- and technology intensive manufactures
HS392310 Boxes, cases, crates & sim. arts., of plastics - - - 1 1 - - 1 - 58 - - 61 8.98
Resource-intensive manufactures HS711790 Imitation jewellery other than of base metal - 1 - - - - 1 - - - 30 - 32 3.78
Sub-total (number, total potential value) - 1 - 1 1 - 1 1
- 58 30 - 93 8.2

132 Rwanda TRADE-DSM analysis – Technical study report final draft 31 August 2017
S00:Live animals other than animals of division 03
Non-fuel primary commodities HS010290 Live bovine animals other than pure-bred
breeding animals - - 1 - - - - - - - - - 1 6.14
Sub-total (number, total potential value)
7.7 S72:Machinery specialized for particular industries
Medium skill- and technology intensive manufactures
HS843143 Parts suit. for use solely/princ. with the boring/sinking mach. of 8430.41/8430.49 1 1 - - - - - - - 51 - - 53 0.73
Sub-total (number, total potential value) 6.8
S73:Metalworking machinery
Medium skill- and technology intensive manufactures
HS845929 Drilling machines other than way-type unit head machines, op. by removing metal, other than numerically controlled
1 1 - - - - - 1
- 67 - - 70 3.41
Sub-total (number, total potential value) 6.2 S08:Feeding stuff for animals (not including unmilled cereals)
Non-fuel primary commodities
HS230400 Oil-cake & oth. solid residues, whether or not ground/in pellets, from extraction of soyabean oil
1 - - 1 - - 1 -
- 23 - - 26 7.71
Sub-total (number, total potential value) 6.1
S21:Hides, skins and furskins, raw
Non-fuel primary commodities
HS410120 Whole bovine (incl. buffalo)/equine hides & skins, wt. per skin not >8kg (simply dried)/10kg (dry-salted)/16kg (fresh/wet-salted/othw. presvd.)
- - - 1 - - - 1
- - - - 2 0.48
Sub-total (number, total potential value) 6.1 S07:Coffee, tea, cocoa, spices, and manufactures thereof
Non-fuel primary commodities
HS090230 Tea, black (fermented) & partly fermented tea, whether or not flavoured, in immediate packings of a content not >3kg
- - - 1 - - - -
- - - - 1 11.38
HS090240 Other tea, black (fermented) & other partly fermented tea, whether or not flavoured, in immediate packings of a content >3kg
- - - 1 - - - 1 - - - - 2 3.04
Sub-total (number, total potential value) - - - 2 - - - 1
- - - - 3 4.1 S55:Essential oils and resinoids and perfume materials; toilet, polishing and cleansing preparations
High skill- and technology intensive manufactures
HS340540 Scouring pastes & powders & oth. scouring preps. 1 1 - - - - - - - 49 - - 51 6.76
Sub-total (number, total potential value) 3.0 S09:Miscellaneous edible products and preparations
Non-fuel primary commodities HS210320 Tomato ketchup & oth. tomato sauces 1 - 1 - - - - 1 - - - - 3 0.67
Sub-total (number, total potential value) 0.7
S57:Plastics in primary forms
High skill- and technology intensive manufactures
HS391590 Waste, parings & scrap, of plastics n.e.s. in 39.15 - - - - - - - 1 - - 28 - 29 6.07
Sub-total (number, total potential value) 0.5
Total 7 8 8 12 2 1 6 11
5 470 102 - 632 298
Source: Authors, TRADE-DSM

133 Rwanda TRADE-DSM analysis – Technical study report final draft 31 August 2017
Based on the more detailed analysis on a country level for the focus countries in the preceding
sections, combined with opportunities for the rest of the world the following SITC sectors (2 digit
SITC chapter indicated) exhibits the most opportunity are (arranged in descending order based on
the average size of potential across all markets):
• S11: Beverages (total of 81 potential markets valued at total potential of US$ 115.2 mn)
• S02: Dairy products and birds’ eggs (total of 77 potential markets valued at a total potential of US$ 59.7
mn)
• S04: Cereals and cereal preparations (total of 69 potential markets valued at a total potential of US$ 30.9
mn)
• S05: Vegetables and fruit (total of 67 potential markets valued at a total potential of US$ 17.3 mn)
• S28: Metalliferous ores and metal scrap (total of 5 potential markets valued at a total potential of US$ 11.4
mn)
• S71: Power-generating machinery and equipment (total of 30 potential markets valued at a total potential
of US$ 9.0 mn)
• S89: Miscellaneous manufactured articles, n.e.s. (total of 93 potential markets valued at a total potential of
US$ 8.2 mn)
• S00: Live animals other than animals of division 03 (total of 1 potential markets valued at a total potential
of US$ 7.7 mn)
• S72: Machinery specialized for particular industries (total of 53 potential markets valued at a total potential
of US$ 6.8 mn)
• S73: Metalworking machinery (total of 70 potential markets valued at a total potential of US$ 6.2 mn)
• S08: Feeding stuff for animals - not including unmilled cereals (total of 26 potential markets valued at a
total potential of US$ 6.1 mn)
• S21: Hides, skins and furskins, raw (total of 2 potential markets valued at a total potential of US$ 6.1 mn)
• S07: Coffee, tea, cocoa, spices, and manufactures thereof (total of 3 potential markets valued at a total
potential of US$ 4.1 mn)
• S55: Essential oils and resinoids and perfume materials; toilet, polishing and cleansing preparations
• S09: Miscellaneous edible products and preparations (total of 3 potential markets valued at a total
potential of US$ 0.7 mn)
• S57: Plastics in primary forms (total of 29 potential markets valued at a total potential of US$ 0.5 mn)
In comparison with the major outcomes from the Hausmann (2015) study, this analysis confirms the
main observation with regards to processed agricultural products, foods, beverages and
agrochemicals (in this instance SITC S00, S02, S04, S05, S07, S08, S09, S11, and S21 in the list above)
but with more specifics in terms of actual markets and size of potential. Note that these products all
are classified as non-fuel primary commodities from a skills- and technology intensity perspective.
In terms of the second observation from the Hausmann (2015) study regarding specialized textiles
and garments, the export opportunity analysis does not support these products on a portfolio level –
with the exception of the detailed analysis for Uganda (for HS551311: Woven fabrics of polyester
staple fibres, cont. <85% by wt. of such fibres, mixed mainly or solely with cotton, of a wt. not
>170g/m2, plain weave, unbleached/ bleached).
With regards to the last major grouping from the Hausmann (2015) study named construction
materials, metal and wood products; in the DSM analysis metal products are found in the portfolio
(S28) but not wood and other construction material per sé.

134 Rwanda TRADE-DSM analysis – Technical study report final draft 31 August 2017
While the product space approach mainly informs from a production perspective, the DSM approach
focuses more on demand and incorporates more trade and transportation elements. As a result the
approach indicates various additional potential products and SITC sectors over and above the
“traditional” products that would be informed from a historical production perspective. These
opportunities are associated with:
• S71: Power-generating machinery and equipment,
• S89: Miscellaneous manufactured articles, n.e.s. (plastic boxes, crates, cases etc. as well as imitation
jewellery not made of base metals),
• S57: Plastics in primary forms (mainly waste, parings and scrap of plastics),
• S55: Essential oils and resinoids and perfume materials; toilet, polishing and cleansing preparations,
• S72: Machinery specialized for particular industries, and
• S73: Metalworking machinery.
Given the relatively large travel distances and difficulty in terrain, combined with relatively weak
transport infrastructure, the region does seem to have some aerospace37 activity requiring
maintenance, refurbishment and support services. In addition, the region also has major mining and
exploration38 activities that require similar products and services. Although these types of products
are typically associated with medium- and higher skills- and technology intensity, Rwanda’s central
location combined with these types of demand expressed in the region as well as internationally,
could point to Rwanda focusing even more on becoming a transport (with a focus on aerospace and
aerospace engineering) and mining and drilling equipment and support logistics hub39.
The analysis also points to Germany as a current potential key partner for the region in the
aerospace related maintenance, refurbishment and support services. The fact that Volkswagen has
also in recent times committed to developing automotive assembly and distribution in Rwanda
signals the start of Rwanda potentially “skipping a few trees” and “jumping” further40 than what the
product space approach might indicate. By building further on these types of relationships, Rwanda
could “short-circuit” the traditional development process for focus sectors. Similar to the
automotive and aerospace sectors, based on the DSM analysis, the outcomes seem to indicate that
it may make sense to approach the global major mining equipment producers in a similar fashion to
explore potential options that could be beneficial to all parties.
37 Demonstrated by trade for HS840710 Spark-ignition recip./rotary int. comb. piston engines for aircraft.
38 Demonstrated by trade for HS843143 Parts suit. for use solely/princ. with the boring/sinking mach. of
8430.41/8430.49. 39
This observation is also previously and independently expressed in Steenbergen and Javorcik, 2016. 40
Hausmann and Klinger (2006) uses a metaphor of monkeys in a forest jumping to nearby trees to explain the process of structural transformation for firms in the product space concept.

135 Rwanda TRADE-DSM analysis – Technical study report final draft 31 August 2017
6. Observations and policy recommendations
In terms of the results and the background work that had to be conducted in order to inform on the
question for identification of realistic export opportunities based on the DSM approach for Rwanda
the following summary of observations may be relevant to policy making for Rwanda:
a) Rwanda should continue with the regional engagement and integration drive in order to
lower trade and logistics costs in all of its different dimensions. Based on various research
papers and also as shown in this report reducing trade and logistics costs are major
challenges, facing not only Rwanda but the whole region. Significant improvements in this
regard in the long run are likely to have the most impact on the economies of the region.
b) The requirement to develop human resources to become human capital in the production
and export value chain is also well documented and a concerted effort around this element
is key to future economic development. While Rwanda is relatively small and with
comparatively fewer resources than some of its neighbours, human capital development can
be a major differentiator. The drive to grow and diversify the economy of Rwanda should
heed the recommendations from the Hausman (2015) study in terms of requirements
around e.g. rural-to-urban migration as demand for more human capital in concentrated
urban areas increase, as well as the implications for schooling and education.
c) While regional economic integration and development is important, in the short to medium
term the potential demand from neighbouring markets (with the exception of Kenya, the
DRC and Congo) are extremely small. Therefore, a dual strategy should be followed in which
regional market development is pursued in combination with developing relationships and
enabling trade on the rest of the continent as well as further away international markets.
d) Different strategies will be required for different market and product combinations and
further detailed analysis around these dimensions need to form the basis for fact-based
export and investment promotion activities.
e) From an industry development perspective it would be prudent to further investigate some
of the identified “non-traditional” products and sectors such as aeronautic maintenance and
repairs and related services, mining and drilling maintenance and repairs and related
services.
f) Potentially, the manufacture of plastics and related industries (this could include the
recycling and repurposing of waste plastics into required plastic products such as water
tanks, cases and boxes) should be further investigated. While these are associated with
higher skill- and technology intensive production processes, the region does have a
demonstrated need and import demand for such products – also in terms of e.g. the primary
activities in agriculture and mining as well as basic municipal services and related activities.
This type of industry could have both a low skill, high employment requirement (on the
waste plastic collection side), as well as higher skilled, import substitution production
process with a focus to also supply to potential regional export markets, while being a
“green” as well as relatively less heavy (from a transport cost perspective) type products.
These activities could later link in with production of plastic related components also for the
automotive value chain that could develop around the initial assembly activities envisioned
for Rwanda by e.g. Volkswagen.

136 Rwanda TRADE-DSM analysis – Technical study report final draft 31 August 2017
7. Conclusion
From an export promotion and industrialisation perspective, it was discussed how important it is to
consider and keep track of the development of sectors and industries that will assist with capacity
building of human capital in the longer term. While the share of medium and high skill and
technology products (as opposed to lower skill and technology non-fuel primary commodities) in the
current make-up of exports is relatively small, these will only develop if a focused effort is placed on
ensuring a strategy that also considers this dimension explicitly. In this analysis, it was thus
demonstrated how the DSM approach can assist in this regard and how these opportunities
identified will contribute to this dimension of a strategy informed on this basis.
This research opens up alternative questions on research around diversification in terms of both
markets and products for Rwanda, with three possible further focus sectors (aeronautic
maintenance and repairs and related services, mining and drilling maintenance and repairs and
related services and manufacture of plastics and related industries) highlighted by the outcomes of
this approach.
In the final instance, it must be noted that this analysis is based on a modelled outcome, as opposed
to observations from relationships in the data. However, assumptions for the modelling are
informed from various international research studies and fields over a period of the last twenty
years, as explained in this report the majority of which is documented in Cuyvers et al. (2012). As
with any model, the outcomes are subject to defined structure and parameter assumptions. For this
study the latest information on all relevant elements were incorporated, where possible, as
discussed in the preceding sections if this report.
The purpose of this report is not to be exhaustive nor authoritative, but rather illustrative of how the
outcomes from the DSM approach can be applied for decision making with specific relevance to
Rwanda’s policy makers in their journey of planning and building the country’s economy. While an
advantage is that the outcomes are provided at the HS6-digit product line detail, it can also pose a
challenge since data quality and frequency of reporting at this level can be problematic for lesser
developed countries as well as lesser traded products.
In conclusion, Rwanda should continue to focus on interventions that help build systems, create
networks, develop institutions and align strategic priorities. As an immediate priority it would be
useful to cross-check key assumptions and possibly deepen the analysis of current findings to ensure
robustness. Thereafter, to sensibly and responsibly inform strategic decisions, more detailed
investigation and evaluation of each of the opportunities identified for Rwanda by the DSM
approach is required. However, the current outcomes help point the way in which policy makers
could focus.

137 Rwanda TRADE-DSM analysis – Technical study report final draft 31 August 2017
8. References
Behar, A. and Venables, A.J., 2011. Transport costs and international trade. Handbook of transport
economics, pp.97-115.
Bernard, A.B. and Jensen, J.B., 1999. Exporting and productivity (No. w7135). National bureau of
economic research.
Basu, S.R. and Das, M., 2011. Export Structure And Economic Performance In Developing Countries:
Evidence From Nonparametric Methodology (No. 48). United Nations Conference on Trade and
Development.
Basu, S.R., 2011. Retooling trade policy in developing countries: Does technology intensity of exports
matter for GDP per capita. Policy issues in International Trade and Commodities, 56.
Blanchard, E.J. and Olney, W.W., 2017. Globalization and human capital investment: Export
composition drives educational attainment. Journal of International Economics, 106, pp.165-183.
Blyde, J., 2010. Paving the road to export: the trade impacts of domestic transport costs and road
quality. Inter-American Development Bank. MPRA Paper No. 24625, posted 3. September 2010
14:12 UTC.
Bosker, E.M. and Garretsen, H., 2007. Trade costs, market access and economic geography: Why the
empirical specification of trade costs matters (August 2007). CESifo Working Paper No. 2071.
Available at SSRN: https://ssrn.com/abstract=1005576.
Brenton, P. and Newfarmer, R., 2007. Watching more than the discovery channel: export cycles and
diversification in development. Policy Research Working Paper 4302. International Trade
Department. August 2007.The World Bank.
Business, D., 2009. Doing Business, 2016. Doing Business 2017: Equal Opportunity for All. The World
Bank: Washington, DC. October 25, 2016. Available from:
http://www.doingbusiness.org/reports/global-reports/doing-business-2017.
Bustos, P., 2011. Trade liberalization, exports, and technology upgrading: Evidence on the impact of
MERCOSUR on Argentinian firms. The American economic review, 101(1), pp.304-340.
Cameron, M.J. and Viviers, W. 2015. Realistic Export Opportunity Analysis for Agricultural Products
in the Major Group: HS08 - Edible fruit and nuts; peel of citrus fruit or melons. Study report prepared
by TRADE (Trade and Development) research focus area, North-West University, Potchefstroom
Campus, for Department of Agriculture, Forestry and Fisheries, South Africa.
Carrère, C., Cadot, O. and Strauss-Kahn, V. 2011. Trade diversification: drivers and impacts. In:
Jansen, M. & Peters, R. & Salazar-Xirinachs, J.-M. Trade and Employment: from Myths to Facts.
Geneva : ILO-EC International Labour Office - European Commission, 2011. p. 253-307
CCTTFA. 2016. Central Corridor Transit Transport Facilitation Agency. Central Corridor Transport
observatory annual report. March 2016.

138 Rwanda TRADE-DSM analysis – Technical study report final draft 31 August 2017
CEPII. 2017. BACI.
http://www.cepii.fr/CEPII/en/bdd_modele/download.asp?id=1#sthash.jCRBRqXk.dpuf. Date of
access: 1 Feb. 2017.
Central Intelligence Agency. 2017. The World Factbook.
https://www.cia.gov/library/publications/the-world-factbook. Date of access: 24 Jul. 2017.
Clark, D.P., 2007. Distance, production and trade, Journal of International Trade and Economic
Development, vol. 16, no. 3, September 2007.
Cuyvers, L. 1997. Export opportunities of Thailand: a decision support model approach. (CAS
discussion paper, no. 9.) http://webhost.ua.ac.be/cas/PDF/CAS09.pdf Date of access: 17 Jan. 2008.
Cuyvers, L., De Pelsmacker, P., Rayp, G. & Roozen, I.T.M. 1995. A decision support model for the
planning and assessment of export promotion activities by government export promotion
institutions: the Belgian case. International journal of research in marketing, 12(2):173-186.
Cuyvers, L., Steenkamp, E.A. & Viviers, W. 2012. The methodology of the Decision Support Model
(DSM). In: Cuyvers, L. & Viviers, W. (Eds.) Export Promotion: A Decision Support Model Approach.
Stellenbosch: Sun Media Metro.
Davis, D.R. and Weinstein, D.E., 2003. Market access, economic geography and comparative
advantage: an empirical test. Journal of International Economics, 59(1), pp.1-23.
De la Cruz, J., Riker, D., 2012, Product Space analysis of the exports of Brazil, United States
International Trade Commission, working paper n° 2012-06A.
De Loecker, J., 2007. Product differentiation, multi-product firms and estimating the impact of trade
liberalization on productivity. NBER Working Paper No. 13155. June 2007, Revised November 2007.
JEL No. F13,L11.
Development Alternatives Incorporated (DAI). 2016. USAID East Africa Trade and Investment Hub –
Rwanda AGOA action plan. Report prepared for United States Agency for International Development
(Kenya and East Africa). Prepared by Development Alternatives Incorporated, DAI. 7600 Wisconsin
Avenue, Suite 200, Bethesda, MD 20814. April 2016.
Djankov, S., Freund, C. and Pham, C.S., 2010. Trading on time. The Review of Economics and
Statistics, 92(1), pp.166-173.
Dutt, P., Mihov, I., and Van Zandt, T., 2008, Trade diversification and economic development,
working paper, Insead.
Gaulier, G., and Zignago, S. 2010. BACI: International Trade Database at the Product Level. The 1994-
2007 Version. CEPII Working Paper, N°2010-23, October 2010.
Hausmann, R., and Chauvin, J. 2015. Moving to the Adjacent Possible: Discovering Paths for Export
Diversification in Rwanda. Center for International Development (CID) at Harvard University. CID
Working Paper No. 294. April 2015.

139 Rwanda TRADE-DSM analysis – Technical study report final draft 31 August 2017
Hausmann, R., and Hidalgo, C. a. (2011). The network structure of economic output. Journal of
Economic Growth, 16(4), 309–342. doi:10.1007/s10887-011-9071-4.
Hausmann, R. and Klinger, B., 2006. Structural transformation and patterns of comparative
advantage in the product space. Center for International Development (CID) at Harvard University.
CID Working Paper No. 128. August 2006.
Hummels, D., 2007. Transportation costs and international trade in the second era of globalization.
The Journal of Economic Perspectives, 21(3), pp.131-154.
Hummels, D. and Schaur, G., 2012. Time as a trade barrier (No. w17758). National Bureau of
Economic Research.
Jeannet, J.P. and H.D. Hennessey. 1998. International marketing management: strategies and cases.
Boston: Houghton Mifflin.
Kee, H.L., Nicita, A. and Olarrega, M. 2008. Estimating trade restrictiveness indices. [Online.]
Available from: http://siteresources.worldbank.org/INTRES/Resources/OTRIpaper.pdf. Accessed 4
November 2008.
Kniahin, D. 2014. Modeling International Trade Patterns with the Product Space Methodology.
Internship Thesis for degree of Master of Science in Economics. HEC Lausanne. August, 2014
Kugler, M. and Verhoogen, E., 2011. Prices, plant size, and product quality. The Review of Economic
Studies, 79(1), pp.307-339.
Lectard, P., Structural transformation, diversification and economic development: an overview of the
economic literature.
Lileeva, A. and Trefler, D., 2010. Improved access to foreign markets raises plant-level productivity…
for some plants. The Quarterly Journal of Economics, 125(3), pp.1051-1099.
Limão, N and Venables A.J., 2001. Infrastructure, Geographical Disadvantage, Transport Costs and
Trade, the World Bank Economic Review, vol. 15 no. 3, pp. 451-479, 2001.
Linescape. 2010. Independent search engine for ocean container schedules. [Online]. Available from:
http://www.linescape.com. Accessed 1-12 February 2010.
Martinez-Zarzoso, I. and Nowak-Lehmann, F.D., 2007. Is distance a good proxy for transport costs?
The case of competing transport modes. The Journal of International Trade & Economic
Development, 16(3), pp.411-434.
Matthee, M. 2007. Essays in domestic transport costs and export regions in South Africa.
Potchefstroom: North-West University, Potchefstroom Campus. (Thesis – Ph.D.).
Melitz, M.J., 2003. The impact of trade on intra-industry reallocations and aggregate industry
productivity. Econometrica, 71(6), pp.1695-1725.
Melitz, M.J. and Ottaviano, G.I., 2008. Market size, trade, and productivity. The review of economic
studies, 75(1), pp.295-316.

140 Rwanda TRADE-DSM analysis – Technical study report final draft 31 August 2017
MINICOM. 2015. National Export Strategy II. Ministry of Trade and Industry. Republic of Rwanda.
NCTTCA. 2016. Northern Corridor Transit and Transport Coordination Authority. Towards Efficient
Corridor Performance. Northern Corridor Transport Observatory Report. Issue No. 8 | May, 2016.
National Institute of Statistics of Rwanda (NISR). 2016. Formal external trade in goods. Fourth
Quarter 2016. March 2017.
Nordås, H.K., Pinali, E. and Grosso, M.G., 2006. Logistics and time as a trade barrier. OECD Trade
Policy Working Paper No. 35, OECD, Paris, 30 May 2006.
OECD. 2011. Clarifying Trade Costs in Maritime Transport, TAD/TD/WP(2008)10, 29-Mar-2011.
Pavcnik, N., 2002. Trade liberalization, exit, and productivity improvements: Evidence from Chilean
plants. The Review of Economic Studies, 69(1), pp.245-276.
Pearson, J. , Viviers, W., Cuyvers, L. and Naudé, W. 2010. “Identifying Export Opportunities for South
Africa in the Southern Engines: A DSM Approach”, International Business Review, Vol. 19, No.4,
August 2010, pp.345-359.
Pomfret, R. and Sourdin, P., 2010. Why do trade costs vary?. Review of World Economics, 146(4),
pp.709-730.
Steenbergen, V. and Javorick, B. 2016. Analysing the Impact of the Kigali Special Economic Zone on
Firm Behaviour. International Growth Centre Working Paper. FIRST DRAFT (June 2016).
Steenkamp, E., Rossouw, R., Viviers, W. and Cuyvers, L., 2009. Export market selection methods and
the identification of realistic export opportunities for South Africa using a Decision Support Model.
Trade and Industrial Policy Strategies Working Paper Series, 3.
United Nations. 2006. Standard International Trade Classification Revision 4. Statistical Papers Series
M No. 34/Rev. 4. ST/ESA/STAT/SER.M/34/REV.4. Department of Economic and Social Affairs
Statistics Division.
United Nations., 2010. World Economic and Social Survey 2010. Retooling Global Development.
Department of Economic and Social Affairs (UNDESA). United Nations Publications. New York.
E/2010/50/Rev.1 ST/ESA/330. ISBN 978-92-1-109161-8
United Nations, 2016. National accounts main aggregates database (Dec 2016). Source:
https://unstats.un.org
Van Biesebroeck, J., 2005. Firm size matters: Growth and productivity growth in African
manufacturing. Economic Development and Cultural Change, 53(3), pp.545-583.
Viviers, W. and Pearson, J.J.A.P., 2007. The Construction of a Decision Support Model for Evaluating
and Identifying Realistic Export Opportunities in South Africa. Unpublished report prepared for the
Department of Trade and Industry, South Africa, May, 92 p.

141 Rwanda TRADE-DSM analysis – Technical study report final draft 31 August 2017
Viviers, W., Rossouw, R. and Steenkamp, E.A. 2009. The sustainability of the DSM for identifying
realistic export opportunities for South Africa: 2007-2008. Unpublished report prepared for the
Department of Trade and Industry, South Africa, February, 105 p.
Vollrath, T. (1991). A theoretical evaluation of alternative trade intensity measures of revealed
comparative advantage. Weltwirtschaftliches Archiv, 127, 265-280.
Wilmsmeier, G. and Hoffmann. J. 2008. Liner shipping connectivity and port infrastructure as
determinants of freight rates in the Caribbean, Maritime Economics and Logistics, no. 10, 2008,
pp.130-51.
World Economic Forum. 2014. Enabling Trade. Available from
http://www3.weforum.org/docs/WEF_EnablingTradeReport_2014.pdf.
World Bank. 2009. Rwanda Petroleum Exploration Capacity Building Project. Washington, DC. ©
Available from World Bank. https://openknowledge.worldbank.org/handle/10986/12682 License: CC
BY 3.0 IGO.”
World Food Programme. 2017a. WFP Republic of Burundi Country Brief. June 2017. Available from
http://www.wfp.org/countries/burundi. Accessed 31 July 2017.
World Food Programme. 2017b. WFP Republic of Congo Country Brief. June 2017. Available from
http://www.wfp.org/countries/congo. Accessed 31 July 2017.
World Food Programme. 2017c. WFP Democratic Republic of the Congo Overview. Available from
http://www1.wfp.org/countries/democratic-republic-congo. Accessed 31 July 2017.
World Food Programme. 2017d. WFP Tanzania Country Brief. June 2017. Available from
http://www.wfp.org/countries/tanzania. Accessed 31 July 2017.
World Food Programme. 2017e. WFP Uganda Country Brief. June 2017. Available from
http://www.wfp.org/countries/uganda. Accessed 31 July 2017.
World Food Programme. 2017f. WFP Kenya Country Brief. June 2017. Available from
http://www.wfp.org/countries/kenya. Accessed 31 July 2017.
World Food Programme. 2017g. WFP South Sudan Country Brief. June 2017. Available from
http://www.wfp.org/countries/south-sudan. Accessed 31 July 2017.
World Food Programme. 2017h. WFP Somalia Country Brief. June 2017. Available from
http://www.wfp.org/countries/somalia. Accessed 31 July 2017.

142 Rwanda TRADE-DSM analysis – Technical study report final draft 31 August 2017
9. Appendices
9.1. More detailed overview of the DSM methodology
9.1.1. Filter 1: Identifying preliminary market opportunities
In filter 1 of the DSM, countries are eliminated that pose too high a political and/or commercial risk
to the exporting country (filter 1.1) and do not show adequate macro-economic size or growth (filter
1.2). The rationale for this is that, with all the countries of the world as a starting point, filter 1
enables the researchers to eliminate uninteresting countries in order to concentrate in detail on a
more limited set of product-country combinations in the consecutive filters. Small, high-risk
countries that lack general potential are therefore eliminated in this filter.
9.1.1.1. Filter 1.1: Political and commercial risk assessment
The first criteria that are considered in filter 1 are the political and commercial risks that exporters
would face in doing business with the foreign countries under investigation.
Many academic, private and government institutions around the world rate countries on the basis of
the political and commercial risks that an exporter would face in these countries41. In the DSM, the
country risk ratings of the Belgian public credit insurance agency, Office National du Ducroire
(ONDD), are used in this part of filter 1. The rating methodology of ONDD conforms to the OECD’s
Arrangement on Guidelines for Officially Supported Export Credits42 and are not conducted from the
point of view of a specific exporting country. These ratings can readily be consulted on the ONDD
website43. They can therefore be used by any exporter that wants to establish the degree of risk
involved in dealing with a specific country.
Commercial risk can be defined as the risk resulting from the deterioration of the importer’s
financial situation, leading to the impossibility of payment for a consignment (ONDD, 2014).
Indicators that are used to measure the overall commercial risk of a country include (i) economic and
financial indicators that affect all companies’ corporate results and balance sheets (e.g. devaluation
of the currency, real interest rates, GDP growth and inflation), (ii) indicators reflecting the country’s
payment experience (the ONDD and other credit providers’ past experience with the country) and
(iii) indicators characterising the institutional context in which local companies operate (e.g.
corruption index, transition economy) (ONDD, 2014).
41 See http://www.countryrisk.com
42 For more information, see Cutts and West, 1998:12-14; Moravcsik, 1989:173-205.
43 Previously www.delcredere.be, now https://www.credendo.com/country_risk as the ONDD rebranded to Credendo
Group in 2013.

143 Rwanda TRADE-DSM analysis – Technical study report final draft 31 August 2017
Political risk is defined as any event occurring in the importing country that would assume the nature
of force majeure for the importer, such as wars, revolutions, natural disasters, currency shortages
and government action (ONDD, 2014). Techniques that are used to measure the political risk of a
country include (i) an assessment of the economic and financial situation, (ii) an assessment of the
political situation and (iii) a payment experience analysis. The assessment of the financial situation is
based on external debt ratios and liquidity indicators, such as the level of foreign exchange reserves.
A country’s economic situation is evaluated by using three sets of indicators, namely indicators of
economic policy performance (e.g. fiscal policy, monetary policy, external balance, structural
reforms), indicators of the country’s growth potential (e.g. income level, savings, investments) and
indicators of external vulnerability (e.g. export diversification and aid dependency). The assessment
of the political situation in a country is based on a quantitative analysis of the political risks
associated with doing business in the country (not specified by the ONDD), while the payment
experience analysis is based on data drawn from the ONDD and other credit insurers’ past
encounters with the country (ONDD, 2014).
The ONDD rates countries on a scale of 1 to 7 for political risk, where 1 indicates a low political risk
and 7 indicates a high political risk. Political risk ratings are provided for the short, medium, and long
term. The commercial risk rating is presented as either an ‘A’, ‘B’, or ‘C’, where an ‘A’ indicates low
commercial risk and a ‘C’ indicates high commercial risk (ONDD, 2014).
The three political risk ratings for each country under investigation are transformed from a 1 to 7
scale to a 1 to 10 scale, whereas the commercial risk country rating is transformed in such a manner
that a score of 3.33 is assigned to an ‘A’ rating, a score of 6.67 is assigned to a ‘B’ rating, and a score
of 10 is assigned to a ‘C’ rating. This transformation is necessary to construct an overall country risk
score. Firstly, an average political risk score (simple average of the three political risk scores) is
calculated for each country under investigation. Secondly, the average political risk score and the
commercial risk score are weighted equally to calculate an overall country risk score for each
country under investigation. Countries with risk ratings of 6C, 7A, 7B or 7C are then eliminated.
9.1.1.2. Filter 1.2: Macro-economic size and growth
The second set of criteria that is used to screen the countries in filter 1 of the DSM is a county’s
macro-economic size and growth, measured by GDP and GDP per capita as well as GDP growth and
GDP per capita growth values. The data are gathered from the World Bank.
Cut-off points for the GDP and GDP per capita values in each year under consideration are
determined at the 20th percentile of the values for the countries for which all data necessary to run
the DSM are available. Countries are selected if the GDP or GDP per capita values for the country are

144 Rwanda TRADE-DSM analysis – Technical study report final draft 31 August 2017
higher than the cut-off values for at least two consecutive years of the most recent three-year
period for which data are available. This ensures that countries that do not meet the requirements
for only one year would not be eliminated for subsequent analysis (Cuyvers et al., 1995:178).
The cut-off values for the GDP growth and GDP per capita growth values are determined at the
world averages for each year. Countries should show above-average growth rates in both GDP and
GDP per capita in all three of the most recent three-year periods in order to be selected on the basis
of these criteria.
Countries can be selected in filter 1.2 either on the basis of macro-economic size (GDP or GDP per
capita) or growth (GDP growth and GDP per capita growth).
To enter filter 2, a country should qualify based on filter 1.1 and filter 1.2 (as depicted by the
coloured intersection of the circles in Figure 1).
9.1.2. Filter 2: Identifying possible opportunities
Filter 2 assesses the import demand for the various HS 6-digit product categories in the remaining
countries with a view to identifying product-country combinations (markets) with adequate import
size and growth.
Three criteria are used in this filter, namely short-term import growth, long-term import growth and
import market size. Import data were gathered from the CEPII BACI world trade database. This
database is constructed from the United Nations Statistics Division’s UN Comtrade database and
reconciles the data reported by almost 150 countries. The CIF import values and FOB export values
reported are reconciled to provide one trade figure for each bilateral trade flow, which excludes CIF
costs. Furthermore, the CEPII team assesses the reliability of country reporting and takes these
reporting quality weights into consideration when reconciling the bilateral trade flows. The BACI
database covers bilateral trade values at the HS 6-digit product disaggregation for more than 200
countries since 1995 and is updated every year (CEPII, 2017).
Short-term import growth is considered to be the most recently-available, simple annual growth rate
in imports. Long-term growth is calculated as the compounded annual percentage growth in imports
over a period of five years. Finally, the import market size is the total imports of country i for product
category j (Cuyvers et al., 1995:178; Cuyvers, 2004:259-260).
Subsequently, a cut-off value for each criterion in filter 2 needs to be calculated. Cuyvers et al.
(1995:179) argued that if the exporting country under consideration was already specialised in
exporting a particular product category, the cut-off points for these markets had to be less stringent.

145 Rwanda TRADE-DSM analysis – Technical study report final draft 31 August 2017
Therefore, the Revealed Comparative Advantage (RCA) index of Balassa (1964) is used to define cut-
off points for each of the above-mentioned sub-criteria.
����,� = ���,���,��÷ ���,�����,����
where:
Xn,j: exports of country n (which is the exporting country for which realistic export opportunities
are identified) of product j;
XW,j: worldwide exports of product j;
Xn,tot: total exports of country n; and
XW,tot: worldwide exports of all product categories.
An RCA index closer to 0 means that country n either does not export (RCA = 0) or exports very little
of the product category. An RCA index larger than or equal to 1 means that country n is relatively
specialised in exporting the product category under consideration (Cuyvers et al., 1995:179).
Cut-off values for the variables of filter 2 are defined as follows (Cuyvers, 1997:5; 2004:260):
For short- and long-term import growth, a scaling factor, sj, is firstly defined (Willeme & Van
Steerteghem, 1993, as quoted by Cuyvers, 1997:5; 2004:260) in order to take the exporting
country’s degree of specialisation in the exports of product category j into account when defining
cut-off values:
�� = 0.8 +1����� + 0.85���������−0.01�
The cut-off values were then defined as: ��,� ≥ ��;
with ��,� being the import growth rate of product category � by country �; and �� = ��,�. �� , �� ��,� ≥ 0; �� �� = ��,� ÷ �� , �� ��,� < 0
with ��,� being the total world imports of product category �. Table 34 illustrates these cut-off
points.

146 Rwanda TRADE-DSM analysis – Technical study report final draft 31 August 2017
Table 34: Illustration of cut -off points for short - and long -term growth
0 ≤ ����,� < 1
(The exporting country for which the model
is applied is not specialised in exporting
product �) ����,� ≥ 1
(The exporting country for which the model
is applied is specialised in exporting product �) ��,� > 0
(World short- or long-term growth rate
in product � is positive)
Country �’s short- or long-term import growth
rate of product j (gi,j) must be between one
and two times the world growth rate for
product j.
For example:
If RCAn,j = 0 and gw,j = 5%, then
sj = 1.988 and Gj (cut-off point) = 9.94%
If RCAn,j = 0.5 and gw,j = 5%, then
sj = 1.25 and Gj = 6.25%
Country i’s short- or long-term import
growth rate of product j (gi,j) is allowed to be
a bit lower than, or equal to, the world
growth rate for product j.
For example:
If RCAn,j = 1 and gw,j = 5%, then
sj = 1 and Gj = 5%
If RCAn,j = 1.5 and gw,j = 5%, then
sj = 0.895 and Gj = 4.475% ��,� < 0
(World short- or long term growth rate
in product � is negative)
Country �’s short- or long-term import growth
rate of product j (gi,j) must be higher than the
world growth rate for product �. For example:
If RCAn,j = 0 and gw,j = -5%, then
sj = 1.988 and Gj = -2.5%
If RCAn,j = 0.5 and gw,j = -5%, then
sj = 1.25 and Gj = -4%
Country �’s short- or long-term import
growth rate of product j (gi,j) is allowed to be
a bit lower than, or equal to, the world
growth rate for product �. For example:
If RCAn,j = 1 and gw,j = -5%, then
sj = 1 and Gj = -5%
If RCAn,j = 1.5 and gw,j = -5%, then
sj = 0.895 and Gj = -5.59%
Source: Authors’ own table based on Cuyvers (1997:5; 2004:260)
This procedure is carried out for both short-term and long-term growth rates (Cuyvers, 1997:6;
2004:260). If the above-mentioned criteria are met by a particular country for a specific product, a
‘1’ is assigned in the short-term and/or long-term import growth columns in Table 7. A ‘0’ is assigned
in cases where the criteria are not met.
Furthermore, the relative import market size of country i for product category j was considered
sufficiently large if (Cuyvers, 1997:6; 2004:260): ��,� ≥ ��
where ��,� is the total imports of country � for product category �; and �� = 0.02��,� , �� ����,� ≥ 1; �� �� = ��3− ����,��/100���,� , �� ����,� < 1
Table 35 illustrates the implication of the above-mentioned cut-off points.

147 Rwanda TRADE-DSM analysis – Technical study report final draft 31 August 2017
Table 35: Illustration of cut -off points for import market size
0 ≤ ����,� < 1
(The exporting country n for which the model is applied is not
specialised in exporting product �)
����,� ≥ 1
(The exporting country n for which the model is applied is
specialised in exporting product �)
Country i’s imports of product j (Zi,j) must be between 2% and 3%
of total world imports of product j.
For example:
If RCAn,j = 0, then
Sj (cut-off point) = 0.03 ZW,j (3% of total world imports of product
j)
If RCAn,j = 0.5, then
Sj = 0.025 ZW,j (2.5% of total world imports of product j)
Country i’s imports of product j (Zi,j) must be greater than or
equal to 2% of total world imports of product j.
Source: Authors’ own table based on Cuyvers (1997:6; 2004:260)
Again, each product-country combination is assigned a ‘0’ or a ‘1’ in the relative import market size
column, based on whether the above conditions, as illustrated in Table 35, are fulfilled or not.
The selection of markets in filter 2 is based on the categorisation illustrated in Table 36.
Table 36: Categorisation of product -country combinations in filt er 2
Category Short-term import market
growth
Long-term import market
growth Relative import market size
0 0 0 0
1 1 0 0
2 0 1 0
3 0 0 1
4 1 1 0
5 1 0 1
6 0 1 1
7 1 1 1
Source: Cuyvers (1997:7; 2004:261)
A product-country combination is selected to enter filter 3 if it falls in category 3, 4, 5, 6 or 7
(Cuyvers, 1997:6; 2004:261). A market should therefore at least be growing adequately in the short
or long term (see Table 34) and/or be of adequate size (see Table 35) to be considered for further
analysis. The remaining product-country combinations subsequently enter filter 3.
9.1.3. Filter 3: Identifying probable and realistic export opportunities
According to Cuyvers et al. (1995:180), it holds true that being selected on the basis of size and
growth does not necessarily mean that markets can be easily penetrated. In filter 3, trade
restrictions are considered to further screen the remaining possible export opportunities. Two
categories of barriers are considered in this filter, namely the degree of concentration (filter 3.1) and
trade restrictions (filter 3.2) (Cuyvers et al., 1995:180; Cuyvers, 1997:7; 2004:261).

148 Rwanda TRADE-DSM analysis – Technical study report final draft 31 August 2017
9.1.3.1. Filter 3.1: Degree of import market concentration
According to Cuyvers et al. (1995:180), a market that is very concentrated is difficult to enter. A
particular import market is considered to be concentrated if only a few exporting countries hold a
relatively large market share, and therefore have a lot of market knowledge and are well known by
local customers. To confirm their argument, Cuyvers et al. (1995:180) carried out a partial analysis
that revealed a negative correlation between export performance and market concentration.
Cuyvers et al. (1995:180) concluded that it would be inefficient for government export promotion
agencies with limited resources to focus on heavily concentrated markets for which the chances of
successful exporting are relatively small.
In the DSM the Herfindahl-Hirshmann Index (HHI) of Hirshmann (1964) is used to measure the
degree of concentration in a market. The index is calculated as follows:
����,� = �� ��,�,�����,�,��2
where: ��,�,�: the imports of country � from country �43F
44 for product category �; and ����,�,�: country �’s total imports of product category �. An HHI of 1 indicates that only one exporting country supplies the importing market and an HHI
closer to 0 indicates a lower market concentration (importing market supplied by many exporting
countries). It would therefore be more difficult for an exporting country to penetrate a particular
market if the HHI for that market is relatively high (closer to 1) (Cuyvers et al. 1995:180; Cuyvers,
1997:7; 2004:261).
A cut-off point for market concentration had to be derived. Cuyvers et al. (1995:180) stated that it
had to be kept in mind that concentration can be considered a bigger problem in a non-growing
market (where a market share will have to be won from often firmly established competitors) than
in a large, growing market. Therefore, the cut-off point for market concentration was designed to be
dependent on the category to which the various markets were assigned in filter 2 (see Table 36).
The cut-off points are defined as follows: ℎ� = ����,�
44 The import from the country for which the model is applied is excluded in the numerator of this equation.

149 Rwanda TRADE-DSM analysis – Technical study report final draft 31 August 2017
with: ℎ� = 0.4, ��� �������� 3 ℎ� = 0.5, ��� �������� 4, 5 & 6 ℎ� = 0.6, ��� �������� 7
Therefore, in relatively large markets, a concentration level of no more than 40% was allowed; in
relatively large and growing markets, a degree of concentration of no more than 50% was allowed;
and finally, in the most interesting markets that are relatively large and growing in the short and
long term, 60% concentration was allowed.
To explain the rationale for these cut-off values, the following examples apply. If there are only two
suppliers in a market, each holding an equal market share, the concentration in this market would
be 50% (HHI = 0.5). The market can be considered difficult to enter by a newcomer. On the other
hand, in a market with four suppliers of which three each hold a 10% market share and one holds a
70% market share, the concentration would be 52% (HHI = 0.52). Although concentrated by one
player, it might be easier to take up some of the market share of the smaller players if the market is
large and growing. Therefore, the cut-off values are set around 50% concentration.
9.1.3.2. Filter 3.2: Trade barriers
The second set of accessibility criteria used in filter 3 is trade barriers. An index for ‘revealed absence
of barriers to trade’ is used as a proxy in this filter. The hypothesis is that if the neighbours of the
exporting country for which the model is applied could establish a relatively strong market position
in a particular market, then it would not be too difficult for the exporting country to overcome trade
barriers in this market (Cuyvers et al., 1995:181; Cuyvers, 1997:7; 2004:262). The revealed absence
of barriers to trade (M_(i,j)) is calculated as follows:
��,� =
�����ℎ����1,�,������ℎ����1,� +�����ℎ����2,�,������ℎ����2,� +
�����ℎ����3,�,������ℎ����3,� + ⋯������,�,������,�
with: ��,�: the corrected market share of the neighbours of the country for which the model is
applied in country �’s imports of the HS 4-digit product category �; �����ℎ����1,�,�: the exports of each of the neighbouring countries of the country for which the
model is applied, of the HS 4-digit product category � to country �; �����ℎ����1,�: the total exports of each of the neighbouring countries to country �; ������,�,�: total world exports of the HS 4-digit product category � to country �.

150 Rwanda TRADE-DSM analysis – Technical study report final draft 31 August 2017
�����,�: total world exports to country �. The cut-off point is defined with the assumption that a higher relative share M_(i,j) reflects a relative
lack or a revealed absence of barriers to trade (Cuyvers et al., 1995:181). Therefore, the higher the
M_(i,j)-value, the easier it would be for the country for which the model is applied to access the
market in question (Cuyvers et al., 1995:181). Cuyvers (1997:8; 2004:263) applied the following rule
of thumb to define a cut-off point for this criterion: ��,� ≥ 0.95
This implies that, with a margin of error of 5%, if at least one of the neighbouring countries of the
exporting country for which the model is applied has a ‘Revealed Comparative Advantage’ in
exporting to a particular market, it is assumed that there are no “revealed barriers to trade” for the
exporting country for which the model is applied in that market (Cuyvers, 1997:8; 2004:263).
This analysis is carried out on an HS 6-digit level. It implies that if the neighbouring countries do have
a significant presence in a market on an HS 4-digit level, but not necessarily on an HS 6-digit level, all
the HS 6-digit level products within the HS 4-digit product category will still be selected in this filter.
This allows for more products to be selected than only those exported competitively by the
neighbouring countries.
However, for the Rwanda case the proxy approach was not applied – refer to section 2.4 in the main
report for changes to this filter as applied to the Rwanda case.
To enter filter 4, product-country combinations need to have sufficiently low-market concentration
and barriers to trade. In other words, both the conditions in filter 3 have to be met in order for a
market to enter filter 4.
9.1.4. Filter 4: Final analyses of opportunities
In the last stage of the analysis, the realistic export opportunities identified in filters 1 to 3 are
categorised and prioritised and no markets are eliminated.
For each of the markets that entered filter 4, the relative market share of the exporting country
(country n) of product category j in country i is calculated as follows:
��,�,� = � ��,�,�����,�,��
where: ��,�,�: country �’s exports of product category � to country �;

151 Rwanda TRADE-DSM analysis – Technical study report final draft 31 August 2017
����,�,�: top six countries’ total exports of product category � to country �. A comparison is therefore made between the relative market share of country � in each market that
entered filter 4 and the relative market share of the six largest competitors in these markets.
The following categories of market importance are identified (Cuyvers, 1997:14; 2004:267): ��,�,� < 0.05: Country �’s relative market share is relatively small.
0.05 ≤ ��,�,� < 0.25: Country �’s relative market share is intermediately small.
0.25 ≤ ��,�,� < 0.5: Country �’s relative market share is intermediately high. ��,�,� ≥ 0.5: Country �’s relative market share is relatively high.
The entire filtering process leads to the following matrix (Table 37) to categorise the realistic export
opportunities that were identified in filters 1 to 3 in terms of size and growth in demand and the
exporting country’s current market share in these markets.
Table 37: Final categorisation of realistic export opportunities
Size and growth of importing
market
Market share of country � (filter 4)
Relatively small Intermediately small Intermediately large Relatively large
Large product market Cell 1 Cell 6 Cell 11 Cell 16
Growing (short- and long-
term) product market Cell 2 Cell 7 Cell 12 Cell 17
Large product market with
short-term growth Cell 3 Cell 8 Cell 13 Cell 18
Large product market with
long-term growth Cell 4 Cell 9 Cell 14 Cell 19
Large product market with
short- and long-term growth Cell 5 Cell 10 Cell 15 Cell 20
Source: Cuyvers (2004:269)
The classification in the rows of Table 37 is obtained from filter 2 (see Table 36), which indicates the
size and growth of imports of the different markets, while the columns are based on the relative
market share of the exporting country calculated in filter 4.
A total of 20 different kinds of markets are distinguished, and the product-country combinations
that entered filter 4 are each assigned to one of these markets (Cuyvers et al., 1995:182; Cuyvers,
1997:15; 2004:269). The exporting country for which the model is applied will therefore know what
the potential (demand) in a particular market is (import size and growth) and to what degree it has
already utilised this opportunity (based on the relative market share). If a product-country
combination is classified in cell 5, for instance, it means that the demand in that market is large and
growing in the short and long term, but the exporting country for which the model is applied has a

152 Rwanda TRADE-DSM analysis – Technical study report final draft 31 August 2017
relatively small market share in that market. This is therefore a market opportunity that has not
been exploited to its full potential by the exporting country.
Export promotion agencies can also use these cells to formulate export promotion strategies for the
markets (product-country combinations) identified in the DSM as realistic export opportunities.
Cuyvers et al. (1995:183) suggest that an offensive market exploration export promotion strategy be
used for export opportunities in cells 1 to 10, based on the exporting country’s relatively small
market share in these markets. An offensive market expansion strategy is suggested for export
opportunities in cells 11 to 15. As the exporting country already has an intermediately large market
share in these markets and the demand is large and/or growing, market expansion is recommended.
For export opportunities in cells 16 to 20, a defensive export promotion strategy of market
maintenance is recommended by Cuyvers et al. (1995:183).
For ease of understanding and reference, the above matrix of cells is translated into a realistic
export opportunities map as depicted in Figure 152.
Figure 152: REO MapTM
Source: Authors

153 Rwanda TRADE-DSM analysis – Technical study report final draft 31 August 2017
9.1.4.1. REOs’ ‘home market’ market share characteristics
Evident from the map is that the characteristics of the REOs (which are the result of the process
described at a high level above) can be used to inform appropriate, though still broadly defined,
export promotion or marketing strategies, as follows:
d) REO1,1 to REO2,5: The ‘home market’ (in this case, Rwanda) has a non-existent to low market
share for various reasons, and an offensive market exploration strategy is appropriate for
products where a comparative advantage exists or can be developed;
e) REO3,1 to REO3,5: The ‘home market’ has a relatively medium-large market share and REOs
are situated in large and/or growing market segments; therefore, an offensive market
expansion strategy can be advocated; and
f) REO4,1 to REO4,5: The ‘home market’ has already gained an important relative market share;
therefore, a defensive market sustain and maintain strategy seems most appropriate.
9.1.4.2. REOs’ ‘target market’ characteristics
The target (or importing) market’s characteristics in terms of both size and growth can also be used
to inform strategies.
f) REO1,1; REO2,1; REO3,1: ‘Breaking into’ a large, ‘relatively’ new market, especially when the market share of the ‘home market’ is still relatively small (REO1,1 and REO2,1);
g) REO1,2; REO2,2; REO3,2: ‘Taking advantage of a growing market’, i.e. opportunities in target markets that are growing in both the short and long term;
h) REO1,3; REO2,3; REO3,3: ‘Growing and consolidating’, i.e. opportunities in target markets that experienced growth in the recent past/emerging opportunities;
i) REO1,4; REO2,4; REO3,4: ‘Leapfrogging’, i.e. opportunities in target markets that exhibit long-term growth;
j) REO1,5; REO2,5; REO3,5: ‘Jumping on the bandwagon’, i.e. opportunities in target markets that show large import volumes and growth in both the short and long term.
9.1.5. Taking the exporting country’s production capability into consideration
So far, the DSM approach mostly focuses on the demand potential (size, growth, concentration and
market access) for products in different countries and does not take into consideration the
production capacity of the exporting country. It may therefore be that the DSM so far identifies
export opportunities for a specific product in many countries, but the exporting country might not
have the capacity to produce this product.
The production capacity of the exporting country can therefore be taken into account by introducing
the following additional criterion after categorising the export opportunities in filter 4: ��� >= 1
with:

154 Rwanda TRADE-DSM analysis – Technical study report final draft 31 August 2017
����,� = � ��,�������,��÷ � ��,���������,���� 45
where ��,� is the exporting country �’s exports of product �, ��,��� is country �’s total exports of all
products, ������,� is the world’s exports of product � and ������,��� is the total world exports of all
products.
The literature suggests that an RCA of at least 1 indicates that a country is specialised in producing
and exporting a particular product (Balassa, 1964). By considering the exporting country’s Revealed
Comparative Advantage, it can be ensured that only products in which the exporting country has a
significant presence are selected as export opportunities.
9.1.6. The calculation of potential export values
Up until this point, only lists of realistic export opportunities can be provided, and it is difficult to
prioritise between export opportunities and between regions, countries, sectors and products, as no
value is attached to the product-country combinations. By way of an example from a previous
application of the DSM, small wares and toilet articles had export opportunities in 41 countries and
ranked second when compared with other products, while motor vehicles for the transportation of
goods or materials ranked 20th with opportunities in 35 countries. The size of the export
opportunities was not considered and a ranking based on the number of opportunities is not
accurate.
However, a statistical analysis of all the product codes on which trade is recorded over a five-year
period shows that for 94 percent of country-product import lines (more than 800,000 in the data
set), the top six supplying countries supply more than 80 percent of a country’s imports in value
terms (see Figure 153 panel [A]).
45 This formula is also used in filter 2 to calculate the cut-off values.

155 Rwanda TRADE-DSM analysis – Technical study report final draft 31 August 2017
Figure 153: Analysis of import partners
[A]
[B]
Source: Authors’ calculation from CEPII BACI data
Further analysis also shows that 46 percent of these country-product import lines have more than 10
supplying trading partners (exporters to the importing country), while 20 percent have two or less
partners.
Therefore, the calculation of a potential export value for each product-country combination that was
selected as a realistic export opportunity is introduced at this point:
���_����,� = ������������1,�,�,����2,�,�, … ,����6,�,�� where: ����1..6,�,� is country �’s imports of product � from each of the top six competitors (excluding the
exporting country for which the model is applied).
The potential export value is therefore considered the average market value of the top six
competitors in each market (excluding the exporting country for which the model is applied). It gives
a better indication of the size of the export opportunities relative to one another and is in line with
filter 4 in which the exporting country’s market share in each market is compared to that of the top
six competitors. The potential value will therefore be much higher than the exporting country’s
actual export value if the export opportunity is classified into cells 1 to 10, while it will be much
closer for export opportunities in cells 11 to 20. It is possible that the actual export value can be
higher than this potential export value, which means that the exporting country is one of the main
exporters in a particular market and exceeds the average market value of its top six competitors.

156 Rwanda TRADE-DSM analysis – Technical study report final draft 31 August 2017
9.1.7. Determining local production versus re-exports
Some countries, e.g. the Netherlands, Singapore and Hong Kong, are transit countries for many
goods going into Europe and other regions. Therefore, an indication need to be given in the results
as to whether the product under consideration is locally produced or probably only re-exported. This
is determined by using the Revealed Trade Advantage (RTA) index of Vollrath (1991).
The RCA index is often used as an indicator of relative export advantage or competitiveness, but it
only accounts for exports. Hence, the RTA index accounts for exports and imports simultaneously
and is used as an indicator of product-level competitiveness. An RTA>0 reveals positive comparative
trade advantage or trade competitiveness. It can be assumed that an RTA>0 implies that the
majority of the product exported is locally produced as it corrects for re-exports. ����� = ����� − �����
����� = ����� � ����,�≠�� � �� ����,�≠� � � ����,�≠��,�≠�� �� � where:
� represents imports, � is a country, � is a product, � is a year, and � represents all countries.

157 Rwanda TRADE-DSM analysis – Technical study report final draft 31 August 2017
9.1.8. Method references
Balassa, B. 1964. The purchasing power parity doctrine – A reappraisal. Journal of Political Economy,
72:584-596.
CEPII. 2017. BACI.
http://www.cepii.fr/CEPII/en/bdd_modele/download.asp?id=1#sthash.jCRBRqXk.dpuf. Date of
access: 1 Feb. 2017.
Cuyvers, L. 1997. Export opportunities of Thailand: a decision support model approach. (CAS
discussion paper, no. 9.) http://webhost.ua.ac.be/cas/PDF/CAS09.pdf Date of access: 17 Jan. 2008.
Cuyvers, L. 2004. Identifying export opportunities: the case of Thailand. International marketing
review, 21(3):255-278.
Cuyvers, L., De Pelsmacker, P., Rayp, G. & Roozen, I.T.M. 1995. A decision support model for the
planning and assessment of export promotion activities by government export promotion
institutions: the Belgian case. International journal of research in marketing, 12(2):173-186.
ONDD (Office National Du Ducroire). 2014. Rating explanation.
http://www.delcredereducroire.be/en/country-risks/rating/ Date of access: May 2014.
Vollrath, T. (1991). A theoretical evaluation of alternative trade intensity measures of revealed
comparative advantage. Weltwirtschaftliches Archiv, 127, 265-280.

158 Rwanda TRADE-DSM analysis – Technical study report final draft 31 August 2017
9.2. Treatment of underlying trade data applied in the modelling
As mentioned in section 2.2 the CEPII BACI world trade database (2017 – HS2007 revision) forms the
basis of the underlying trade data applied in the model. In past versions of the model the latest
year’s data was used to determine various variables such as:
a) The HS code and country combinations set applied;
b) The calculation of the exporting or “home” market actual exports and market share;
c) The calculation of the top 6 competing countries supplying into the “target” market, as
well as the exporting or “home” market relative (to these top 6 competitors) market share
(as applied in filter 4);
d) The RCA calculation as applied in filter 2 and filter 4;
e) The market concentration calculations of filter 3.1; and
f) The “revealed absence of barriers to trade” in filter 3.2.
Due to real world practicalities it could happen that this “single year” approach may yield a set of
outcomes that are only relevant for the specific year, as opposed to over a period. To improve on
this shortcoming the method was adjusted to include all HS code and country combinations that was
present in the data set over the period of investigation (5 years), irrespective of whether the specific
combination only appear in the last year of the period under investigation.
This change will allow for product-country combinations and subsequent realistic export
opportunities (if adhering to the rest of the filtering process requirements) to be identified and
included that may not exist in the final year due to e.g.
a) data capturing or reporting issues;
b) in agricultural product trade Sanitary and Phytosanitary Measures (SPS) that could be
implemented on a “temporary” basis; and
c) real world events e.g. factories that “temporarily” are out of action, and for that reason
trade is interrupted, but then continues again once production is restored.
Due to the fact that the model is based on “delayed” data (only up to 2015 currently) this approach
therefore minimises the type of error (of omission) that could be encountered with using only a
“snapshot” of the last year as basis for most of these calculations. In addition, it also introduces
some additional “robustness” in the approach that will make the outcomes less sensitive to the
specific end year selected.
9.2.1. Inclusion of Botswana and Namibia in the underlying data set
In the current formal version of the CEPII BACI world trade database (2017 version) the Southern
African Customs Union (area or country code 711) only is provided, while the trade for the member
states (South Africa [710], Botswana [072], Lesotho [426], Namibia [516] and Swaziland [748]) are
aggregated under this code [711] in the CEPII data set. However, the individual members of South
Africa, Botswana and Namibia has been reporting historically on HS 6 digit level, while Lesotho only

159 Rwanda TRADE-DSM analysis – Technical study report final draft 31 August 2017
reported data for 2001 to 2003, then again for 2007 to 2014, while Swaziland only reported 2001 to
2007, then again 2011 to 2015. For the 5 year period (2011 to 2015) as applied in the current
modelling South Africa, Botswana and Namibia therefore has sufficient information as reported by
the UN Comtrade via the ITC to create a data set for these countries on a consistent basis within the
CEPII BACI world trade database.
The data set as applied in the modelling therefore is an “adjusted” version of the CEPII BACI world
trade database (2017 version), where the SACU [711] region does not occur anymore, replaced by
the individual 5 countries’ individual information. The totals for the aggregate still corresponds to
that of the SACU [711] entry, while additional bilateral flows between the 5 member countries has
been added to the data set based on information obtained from their various statistical agencies
(with the exception of Lesotho and Swaziland).
9.2.2. Time-weighted approach applied to all key time-related variables
Owing to the potentially volatile nature of international export transactions on a detailed, product-
by-country level, the method applied to analyse share and ranking information is based on the
process of consistently applying a weighted 5-year share calculation.
The fundamental premise applied is that transactions occurring further back in history are less likely
to influence current decisions and information than more recent information. Therefore a “discount”
is applied to the contribution of each historical data point based on how far back the point is in
terms of time relative to the latest point. There are various weighting schemes that can be applied
for this purpose, depending on how fast one would want the historical influences to diminish. For
the current modelling initiative an arbitrary near exponential weighting scheme is applied where the
most recent value is allocated a weight of 1, the preceding historical points are each allocated a
weight of 0.5 the of the previous weight and normalised. For any set of data, the weighting would
therefore be provided by the following formula:
���−1 = �0.5 ���∑ ����1 �
and ��� = 1 ��� � = �
Where ��� = Time-weight allocated to period t � = number of time periods � = 1 to �
In this context, the example in Figure 154 and Figure 155 provides an illustration of the difference in
outcomes when weighted versus unweighted calculations is used for growth rates, shares, ratios or
composite indicators. In the illustration (Figure 154), Examples 2 and 3 will have exactly the same
percentage share (for Example 2 / Total (Example 1 + 2 + 3) and Example 3 / Total (Example 1 + 2 +

160 Rwanda TRADE-DSM analysis – Technical study report final draft 31 August 2017
3)) over the 5-year46 period for the normal arithmetic (or weight = 1 for each period) calculation of.
However, the trend pattern for Example 2 is declining, while that for Example 3 is increasing.
Therefore, in the outcome applied for the DSM approach, one would expect Example 3 to feature
more prominently in contributing towards a realistic export opportunity than Example 2 (except if
the decision centres on how to reverse or influence declining trends). The differences in actual ratios
calculated for this example is provided in and Figure 155.
Figure 154: Example data set for share calculations
Figure 155: Time-weighted v s. average share calculation outcomes
Source: Authors
Evident from the example is that where a ratio is applied, example 2 and 3 would have the same
outcome (in the case of the normal arithmetic average calculation) over the period, while in actual
fact example 3 should be positioned at a higher priority than example 2 (as in the case of the time-
weighted calculation). For the constant case (example 1) it is evident that the time-weighted and
normal arithmetic average calculations yields very close results.
Figure 156: Example data set for growth calculations
Figure 157: Time-weighted versus unweighted growth calculation outcomes
Source: Authors
46 The sample contains 6 years (t) for calculation of 5 year annual year-on-year growth rates. The ratio and
other calculations is only applied for t=1 to 5.

161 Rwanda TRADE-DSM analysis – Technical study report final draft 31 August 2017
In this second example, the weighted implications for growth rates are demonstrated. In the
numeric example displayed in Figure 158 in the furthest back period a major decline in the values
can be observed. However, the trend is reversed and the series ends at the same level than the
initial starting value. When evaluating the long-term growth outcome for this example, the resulting
growth is zero (Figure 159). If however, the dataset is shortened just a single year, the outcome
would have been positive. In the following year’s data update this may be the case. The question is
then from a practical advice perspective whether it would be sensible to indicate that the long-term
growth in this instance was zero or negative, while a year later the answer may be exactly the
opposite. The time-weighted result in this example therefore discounts the changes further back in
history and the result for the long-term outcome is positive.
Similarly, for a trend that is predominantly cyclical, the time-weighted long-term growth calculation
will emphasize the nearer term part of the cycle stronger than the normal arithmetic average
calculation (illustrated in Figure 158 and Figure 159).
Figure 158: Example data set for cyclical growth calculations
Figure 159: Time-weighted versus unweighted share calculation outcomes
Source: Authors
It is evident that in the context of looking for ‘emerging’ or increasing opportunities and shares, the
weighted calculation therefore yields a result that may be more insightful for current decision
making. However, this exposé also demonstrates the need for decision-makers to not only simply
look at the REO outcome, but in addition to also understand the trend context of such an REO.

162 Rwanda TRADE-DSM analysis – Technical study report final draft 31 August 2017
9.3. Selected additional tables
The following table provides a list of 29 countries that are completely eliminated through the
filtering process associated for tests related to concentration and accessibility. Note that while all
opportunities for South Sudan are eliminated by filter 3.1, South Sudan was included in the analysis
irrespective based on the request to also investigate this close regional destination. However, only a
single product line was identified for this country (see section 5.4.7).
Table 38: Countries completely eliminated due to concentration and accessibility constr aints
Item Country Region Sub-region
Concentration
(Filter 3.1)
Accessibility
(Filter 3.2)
1 Antigua and Barbuda Caribbean
X
2 Bahamas Caribbean X
3 Barbados Caribbean X
4 Belize Central America X
5 Bermuda North America Caribbean X
6 Bolivia South America X
7 Canada North America Northern America X
8 Cayman Islands Caribbean X
9 Colombia South America X
10 Costa Rica Central America X
11 Cuba Caribbean X
12 Democratic People's Republic of Korea (North)
Asia Eastern Asia X
13 Ecuador South America X
14 El Salvador Central America X
15 Guatemala Central America X
16 Haiti Caribbean X
17 Honduras Central America X
18 Jamaica Caribbean X
19 Kiribati Oceania X
20 Mexico Central America X
21 Nicaragua Central America X
22 Panama Central America X
23 Peru South America X
24 Samoa Oceania X
25 South Sudan Africa Northern Africa X
26 Tonga Oceania X
27 Trinidad and Tobago Caribbean X
28 Vanuatu Oceania X
29 Venezuela South America X
Source: Authors, TRADE-DSM

163 Rwanda TRADE-DSM analysis – Technical study report final draft 31 August 2017
9.4. Technical observations related to Rwanda import and export statistics
International trade ASYCUDA data as reported by Rwanda official systems seems to contain some
problematic in terms of content - possible erroneous entries - shared with Victor Steenbergen on 27
April 2017.
One would expect where the flow is imports, all the [destinationcountryname] values should be
Rwanda (unless it is transit cargo). However, there are numerous records that show
[seriesflowtypecode] of [imports] where [destinationcountryname] is NOT Rwanda - but also not
surrounding neighbours as could be the case for transit - amounting to between 11 percent to 15
percent of all imports over the years 2008 - 2016 spread across 3 - regimes (but no clear indication if
this is indeed transit cargo), namely:
B - Importation Simplied Declaration;
C - Consumption (Home) and Reimportation
S - Sensitive Items (Customs Warehousing Regime, Export Transit Procedures, Import Transit
Procedures, Temporary Importation, Warehouse after movement bond); but
in value terms of the 3 regimes S represents 99 percent of the value.
The following example for year 2010 demonstrates the issue:
Flow = Import
Export country = United Arab Emirates
Destination country = Japan
HS87033390
becproductdescription = Passenger motor cars
officeofentryexitname = Rusumo
The information implies that an entry for passenger motor cars have been captured originating in
the United Araba Emirates destined for Japan. The question is then why would the UAE send motor
cars or any other cargo to Japan via Rwanda - or the other way around? This seems to be a data
capturing issue.
A further challenge is that flows destined for southern African countries via road is not clear from
the export data - as only the point of exit and destination country is captured, but not transit
information. So when cargo exits at e.g. Rusumo, whether cargo is destined for sea transport via Dar
es Salaam or road down to e.g. South Africa or Mozambique etc. this information is not captured in
the supplied data. This complicates the logistics analysis, since without this information a high level
assumption has to be made on split between road and sea transport to such destinations. The
treatment applied for this issue is discussed in the appendices section 9.5.2.

164 Rwanda TRADE-DSM analysis – Technical study report final draft 31 August 2017
9.5. Detailed assumptions for international logistics as applied for the Rwanda
case
This appendix provides an overview of international logistics assumptions applied for various
geographic regions as well as more detail focused more specifically on Rwanda’s neighbouring
countries and Southern Africa.
9.5.1. High level international shipping routing assumptions for various
geographic regions
Figure 160 shows the typical maritime leg of the routing from Dar es Salaam to most Southern European countries, namely:
Figure 160: Most probable maritime routing from Dar es Salaam to Southern Europe
Source: Searates.com
- Albania - Andorra - Bosnia
Herzegovina - Croatia - Gibraltar - Greece - Italy - Macedonia, FYR
- Malta - Montenegro - Portugal - San Marino - Serbia - Slovenia - Spain
Figure 161 shows the typical maritime leg of the routing from Dar es Salaam to most Eastern European countries, namely: - Belarus - Bulgaria - Czech Republic - Hungary - Poland - Rep. of Moldova - Romania - Russia - Slovakia - Ukraine
Figure 161: Most probable maritime routing from Dar es Salaam to Eastern Europe
Source: Searates.com
The average route distance for this group of countries from Kigali in Rwanda is around 11 935 kilometres and 58 days total travel time. Some of the Eastern European countries are accessed from the south via the Black Sea, while others are accessed from the north (see previous Belarus example in Figure 7).

165 Rwanda TRADE-DSM analysis – Technical study report final draft 31 August 2017
Figure 162 shows the typical maritime leg of the routing from Dar es Salaam to most North America countries, namely: - Canada - Saint Pierre and Miquelon - Turks and Caicos Islands - United States The average route distance for this group of countries from Kigali in Rwanda is around 18 082 kilometres and 94 days total travel time.
Figure 162: Most probable maritime routing from Dar es Salaam to North America
Source: Searates.com
Figure 163 shows the major routes to Central America and the Caribbean around the Cape of Good Hope at the southern tip of Africa. The average route distance for this group of countries from Kigali in Rwanda is around 18 038 kilometres and 93 days total travel time. - Anguilla - Antigua and
Barbuda - Aruba - Bahamas - Barbados - Bermuda - Bonaire - Br. Virgin Isds - Cayman Isds - Cuba - Curaçao - Dominica - Dominican
Republic - Grenada - Haiti - Jamaica
- Montserrat - Neth. Antilles - Puerto Rico - Saint Maarten - St. Kitts and Nevis - St. Lucia - St. Vincent and the
Grenadines - Trinidad and
Tobago - Belize - Costa Rica - El Salvador - Guatemala - Honduras - Mexico - Nicaragua - Panama
Figure 163: Most probable maritime routing from Dar es Salaam to Central America and the Caribbean
Source: Searates.com
It should be noted that depending on the latitude of the location and volumes of traffic either north-bound (via the Suez canal) or south-bound (via the Cape of Good Hope) routes are used (as depicted in Figure 164 for the Bahamas and Figure 163 for Central America and the Caribbean islands).
Figure 164: Most probable maritime routing from Dar es Salaam to Caribbean
Source: Searates.com

166 Rwanda TRADE-DSM analysis – Technical study report final draft 31 August 2017
Figure 165 and Figure 166 show the major routes to the east and west coasts of South America respectively.
East coast of South America
- Argentina - Brazil - Colombia - Falkland Islands Malvinas - Guyana - Paraguay - Suriname - Uruguay - Venezuela The average route distance for this group of countries from Kigali in Rwanda is around 14 415 kilometres and 72 days total travel time.
Figure 165: Most probable maritime routing from Dar es Salaam to South America (east coast)
Source: Searates.com
West coast of South America
- Bolivia - Chile - Ecuador - Peru The average route distance for this group of countries from Kigali in Rwanda is around 17 562 kilometres and 89 days total travel time.
Figure 166: Most probable maritime routing from Dar es Salaam to South America (west coast)
Source: Searates.com

167 Rwanda TRADE-DSM analysis – Technical study report final draft 31 August 2017
Figure 167 shows the East Asian route. There are however multiple legs along the route to divert to e.g. the Gulf countries, ports in the Arabian sea and Bay of Bengal. Not all routes are shown. Some countries are landlocked as well. The average route distance for this group of countries from Kigali in Rwanda is around 9 744 kilometres and 47 days total travel time (however in this region individual countries’ distance and travel time e.g. Mongolia is as high as 15 698 kilometres and 73 days’ travel.)
Figure 167: Most probable maritime routing from Dar es Salaam to East Asia
Source: Searates.com
- Afghanistan - Bangladesh - Bhutan - British Indian
Ocean Territories - China - Dem. Peoples Rep.
of Korea (North) - Hong Kong, China - India
- Iran - Iraq - Japan - Korea (South) - Macau - Maldives - Mongolia - Nepal - Pakistan - Sri Lanka
The South-East Asia area lies more or less on the same latitude than Dar es Salaam as is evident from Figure 168. The average route distance for this group of countries from Kigali in Rwanda is around 9 627 kilometres and 48 days total travel time. - Brunei Darussalam - Cambodia - Christmas Islands - Cocos Islands - Indonesia - Lao PDR - Malaysia - Myanmar - Philippines - Singapore - Thailand - Timor-Leste - Vietnam
Figure 168: Most probable maritime routing from Dar es Salaam to Australia and Oceania
Source: Searates.com

168 Rwanda TRADE-DSM analysis – Technical study report final draft 31 August 2017
Figure 169 depicts the significant distance that the Oceanic islands are from Dar es Salaam. The
average route distance for this group of countries from Kigali in Rwanda is around 16 677 kilometres
and 81 days travelling.
- American Samoa - Australia - Cook Islands - Fiji - French Polynesia - Guam - Kiribati - Marshall Islands - Micronesia - N. Mariana Islands - Nauru - New Caledonia
- New Zealand - Niue - Norfolk Islands - Palau - Papua New Guinea - Pitcairn - Samoa - Solomon Islands - Tokelau - Tonga - Tuvalu - Vanuatu - Wallis and Futuna
Islands
Figure 169: Most probable maritime routing from Dar es Salaam to Australia and Oceania
Source: Searates.com
Figure 170 shows the routing for accessing West Africa as well as some of the more westerly located Middle African countries. For the purposes of this analysis Rwanda’s neighbouring countries in Middle Africa are assumed to be accessed directly via land routes – therefore the Democratic Republic of the Congo will not be serviced via Dar es Salaam. The average route distance for this group of countries from Kigali in Rwanda is around 10 450 kilometres and 52 days travelling. - Benin - Burkina Faso - Cape Verde - Côte d'Ivoire - Gambia - Ghana - Guinea - Guinea-Bissau - Liberia - Mali - Mauritania - Niger - Nigeria - Senegal - Sierra Leone - Togo
- Angola - Cameroon - Central African
Republic - Congo, Rep. - Equatorial Guinea - Gabon - Sao Tome and
Principe
Figure 170: Most probable maritime routing from Dar es Salaam to West and western Middle African countries
Source: Searates.com

169 Rwanda TRADE-DSM analysis – Technical study report final draft 31 August 2017
Figure 171 shows the routing for accessing Northern Africa via the Suez canal. Again, for the purposes of this analysis Rwanda’s neighbouring countries in Northern Africa are assumed to be accessed directly via land routes – therefore South Sudan and Somalia will not be serviced via Dar es Salaam. The average route distance for this group of countries from Kigali in Rwanda is around 7 013 kilometres and 33 days total travel time. - Algeria - Chad - Egypt - Libya - Morocco - Sudan - Tunisia
Figure 171: Most probable maritime routing from Dar es Salaam to West and western Middle African countries
Source: Searates.com

170 Rwanda TRADE-DSM analysis – Technical study report final draft 31 August 2017
9.5.2. Details of neighbouring and focus markets
For the neighbouring countries around Rwanda specific assumptions regarding land routes, time and
costs had to be made. These were informed from the ASYCUDA trade data and surveyed information
reported in CCTTFA (2016) and NCTTCA (2016).
Figure 172: Assumptions regarding Rwanda's direct neighbours
Source: Google Maps and author annotations
In the case for countries directly sharing borders as well as within the EAC the current assumption
applied is that 100 percent of trade from Rwanda to the DRC will be delivered via road to Kisangani,
to Bujumbura for Burundi, Kampala in Uganda, to Tanzania at Dar es Salaam, at Nairobi for Kenya
and Juba for South Sudan as depicted in Figure 172.
Figure 173: Assumptions Congo Brazzaville and Somalia
[A – Congo Brazzaville]
[B – Somalia]
Source: Google Maps
Assumptions regarding the exit points and routes for Congo Brazzaville, Somalia and other southern
African countries were informed from the ASYCUDA data as shown in Table 39. When cargo leaves
for any non-neighbouring country like South Africa or Botswana e.g. via Rusumo, no specific
information is available to inform on whether the cargo is shipped via road transport to South Africa,
or via maritime transport out of the port at Dar es Salaam.

171 Rwanda TRADE-DSM analysis – Technical study report final draft 31 August 2017
Table 39: Rwanda exit point and route assumptions based on ASYCUDA data
Destination
country Exit point 1
%
share Exit point 2
%
share Rest
Assumption
Applied
%
share Mode Exit Port
Entry
Port
Congo Mururu 56.2% Gisenyi-Corniche
28.6% 15.3% Mururu 100% Road -
Somalia Gatuna 100%
Gatuna 100% Road -
Angola* Kigali-
Aeroport 90.9% Rusumo 9.1% 0.0% Rusumo 100% Road+Ship
Dar es Salaam
Luanda
Malawi Rusumo 99.7% Kigali-
Aeroport 0.3% 0.0% Rusumo 100% Road -
Mozambique Rusumo 59.4% Gatuna 26.2% 14.4% Rusumo 100% Road+Ship Dar es Salaam
Maputo
Zambia Rusumo 73.3% Kigali-
Aeroport 23.6% 3.2% Rusumo 100% Road
Zimbabwe Rusumo 92.3% Kigali-
Aeroport 7.7% 0.0% Rusumo 100% Road
Botswana* Kigali-
Aeroport 88.4% Rusumo 11.6% 0.0% Rusumo 100% Road
Lesotho - 0% - 0% 0% Rusumo 100% Road+Ship Dar es Salaam
Durban
Namibia* Kigali-
Aeroport 100% - 0.0% 0.0% Rusumo 100% Road+Ship
Dar es Salaam
Walvisbay
South Africa Kigali-
Aeroport 87.5% Rusumo 11.3% 1.1% Rusumo 100% Road+Ship
Dar es Salaam
Durban
Swaziland** Gatuna 92.8% Rusumo 4.9% 2.2% Gatuna 100% Road+Ship Mombassa Durban
Source: Authors – derived from ASYCUDA data
* While the ASYCUDA data informs the fact that most / all exports by value recorded destined for Angola, Botswana and
Namibia flows by air transport, the current applied model does not provide for this mode of transport. Hence the
assumptions as made for these destinations as ilustrated in Figure 175 and Table 40.
** Exports in value terms from Rwanda to Swaziland are recorded to mainly flow via Gatuna (92.8%) which implies via
Mombassa to Durban, South Africa.
For South Africa an analysis of imports by entry point into South Africa for exports from Rwanda was conducted based on data available from the South African Revenue Services – Department of Customs and Excise. The analysis shows that around 70 percent in of imports from Rwanda in value terms arrives by sea and for the purposes of this analysis and modelling it can therefore safely be assumed that the bulk of trade with South Africa will flow via Dar es Salaam port. However, not all countries have information available to inform on this aspect and some broad assumptions had to formulated based on the available information.
Figure 174: South Africa's imports from Rwanda by entry point
Source: Calculated from South Africa’s trade data by port of
entry/exit, Department of Customs and Excise, South African
Revenue Services (SARS).

172 Rwanda TRADE-DSM analysis – Technical study report final draft 31 August 2017
Figure 175 provides a view of the assumed routes for Southern African destinations. While this section only shows information on assumptions for these few focus countries, similar detailed analysis informed the rest of the 231 destinations to inform exit and port flow assumptions.
Based on the assumptions applied Figure 176 demonstrates the additional cost relative to the value of a typical export container (assumed to be US$ 50 000.00) based on the approach and assumptions used to construct the routing and costing tables. Evident is that the Republic of the Congo (Brazzaville) and Angola (Luanda) has the highest ad valorem equivalent impacts at 66.5 percent and 67.0 percent respectively. However, the underlying reason for the cost increase is different for the two destinations. In the case of Congo (Brazzaville) the assumption is made that transport is via the DRC on road (Figure 173 panel A), at a distance of around 2 554 kilometres and a rate per kilometre of 6.4 US$ (NCTTCA, 2016, p.33, table 22). In the case of Luanda the distance is 8 939 kilometres. However the overall costs are relatively lower than that of overland to Congo (Brazzaville). E.g. the overland section from Kigali to Dar es Salaam is at a much lower rate of 2.48 US$ per kilometre (derived from Dar es Salaam to Kigali at a cost of 3 700 US$ per 20 or 40 foot container and 1 495 kilometre CCTTFA (2016, p.37, table 3)). Even with the additional costs, time delays at the port and maritime transport costs added, the route from Kigali to Congo (Brazzaville) amounts to 20.74 US$ per hour travel, while that of Angola (Luanda) only to 4.57 US$ per hour travel. Hence, although Luanda in Angola is in distance terms much further, in total transaction time versus cost productivity terms the Angola route operates at a much lower overall cost per hour rate.
Figure 175: Map of routing assumptions for Southern African countries
Source: Google Maps with author annotations
Figure 176: Ad valorem equivalent increase in costs
Source: Authors’ calculations
Figure 177: Ad valorem equivalent increase in costs
Source: Authors’ calculations

173 Rwanda TRADE-DSM analysis – Technical study report final draft 31 August 2017
Table 40: Details of main assumptions for neighbouring and focus markets
Destination
country
EAC
(1)
COMESA
(2)
BOTH
(3) Destination city Exit point
Mode
Road
(R)
Ship
(S)
Total
route
distance
(km)
Total time
(weeks @ 24
hrs x 7 days)
including
import
documentation
time, transport
time etc.
Transit
countries
Domestic
admin cost
to import
(US$)
Domestic
admin time
to import
(Days @ 24
hrs)
International
transport
cost (US$)
International
transport time
(Days @ 24 hrs)
Ad valorem transport
cost
+
time equivalent
(based on full container
load / 15 metric tons /
valued @ US$ 50 000)
Neighbours
Burundi 3 Bujumbura Rutete R 275 0.2 - 146.90 1.4 1 788.87 0.29 5.2%
Congo, Dem.
Rep. 2 Kisangani Mururu R 900 1.1 - 391.40 3.4 5 760.00 4.33 18.4%
Kenya 3 Nairobi Gatuna R 1 201 1.1 1 134.05 2.3 2 041.70 5.09 10.3%
South Sudan 3 Juba Gatuna R 1 138 1.2 1 152.35 3.5 5 803.80 4.93 18.6%
Tanzania 3 Dar es Salaam Rusumo R 1 495 0.9 - 172.50 2.7 3 707.60 3.82 13.0%
Uganda 3 Kampala Gatuna R 514 0.7 - 78.50 1.2 1 593.03 3.37 7.0%
Close regional
Congo, Rep. - Brazzaville Mururu R 2 554 5.3 1 2 086.70 28.6 16 345.60 8.47 66.5%
Somalia - Mogadishu Gatuna R 3 524 3.1 2 1 338.65 9.0 6 223.10 12.98 32.7%
Southern Africa
Angola - Luanda Rusumo R+S 8 939 9.4 1 1 481.25 21.7 5 728.63 44.06 67.0%
Malawi 2 Lilongwe Rusumo R 1 891 1.1 1 116.75 3.2 5 862.10 4.62 18.2%
Mozambique - Maputo Rusumo R+S 3 397 2.6 1 611.25 4.3 4 561.16 14.10 25.0%
Zambia 2 Lusaka Rusumo R 2 134 1.3 1 141.75 3.9 6 616.36 5.10 20.7%
Zimbabwe 2 Harare Rusumo R 2 624 1.6 2 185.20 5.2 8 133.10 6.08 25.7%
SACU
Botswana - Gaborone Rusumo R 3 595 1.9 2 279.00 4.2 8 915.60 9.27 29.2%
Lesotho - Maseru Rusumo R+S+R 5 033 4.4 2 761.25 10.5 5 438.93 20.26 37.0%
Namibia - Windhoek Rusumo R+S+R 7 670 5.5 1 294.25 3.1 6 456.63 35.28 44.2%
South Africa - Johannesburg Rusumo R+S+R 5 051 4.3 1 956.25 10.2 5 365.46 20.27 37.0%
Swaziland 2 Mbabane Rusumo R+S+R 5 451 3.9 2 107.25 2.4 6 741.41 24.85 35.5%
Source: Authors

174 Rwanda TRADE-DSM analysis – Technical study report final draft 31 August 2017
9.6. Summary of selected outcomes tables
The following tables provide the details for the entire set of product by market opportunities as depicted in Figure 23 in section 5.2 for the overall DSM
export maturity, market share, and growth and diversification matrix for Rwanda. The “No REOs” indicates how many markets are classified into which
quadrant for each product line listed that has passed all the DSM methodology’s filter requirements. The shaded (red) line indicates where the cumulative
average potential reaches 80% of the cumulative average potential.
Table 41: Detail on selected outcomes for quadrant 1 – “Brown fields”, intensive margins (both product and market )
Item Product No
REOs Potential RCA
Cumulative Potential
(US$) Cumulative
% Average Potential
(US$)
1 HS090240:Other tea, black (fermented) & partly fermented tea, whether or not flavoured, in immediate packings of a content >3kg
2 14 171 439.27 537.36 14 171 439.3 24.0% 7 085 720
2 HS090230:Tea, black (fermented) & partly fermented tea, whether or not flavoured, in immediate packings of a content not >3kg
1 2 949 021.23 233.98 17 120 460.5 29.1% 2 949 021
3 HS261590:Niobium/tantalum/vanadium ores & concs. 10 23 284 706.52 12 708.17 40 405 167.0 68.6% 2 328 471
4 HS100640:Broken rice 1 1 843 198.71 56.29 42 248 365.7 71.7% 1 843 199
5 HS260900:Tin ores & concs. 5 7 550 897.61 3 659.21 49 799 263.3 84.5% 1 510 180
6 HS261100:Tungsten ores & concs. 7 7 146 570.79 2 889.66 56 945 834.1 96.6% 1 020 939
7 HS210320:Tomato ketchup & oth. tomato sauces 1 408 528.03 20.86 57 354 362.2 97.3% 408 528
8 HS110220:Maize (corn) flour 1 206 469.40 465.02 57 560 831.6 97.7% 206 469
9 HS410120:Whole bovine (incl. buffalo)/equine hides & skins, wt. per skin not >8kg (simply dried)/10kg (dry-salted)/16kg (fresh/wet-salted/othw. presvd.)
2 358 697.02 205.51 57 919 528.6 98.3% 179 349
10 HS220110:Mineral waters (nat./art.) & aerated waters, not cont. added sugar/oth. sweetening matter/flavoured
1 149 121.50 3.48 58 068 650.1 98.5% 149 122
11 HS220850:Gin & Geneva 1 106 591.54 6.10 58 175 241.6 98.7% 106 592
12 HS010290:Live bovine animals other than pure-bred breeding animals 1 102 881.58 19.61 58 278 123.2 98.9% 102 882
13 HS040210:Milk in powder/granules/oth. solid form, fat content by wt. not >1.5% 1 93 695.08 2.03 58 371 818.3 99.1% 93 695
14 HS640199:Waterproof footwear with outer soles & uppers of rubber/plastics (excl. of 6401.10)...(excl. of 6401.91 & 6401.92) [see complete text #106]
1 91 989.64 21.18 58 463 807.9 99.2% 91 990
15 HS151590:Fixed vegatable fats & oils (excl. of 1515.11-1515.50), incl. jojoba oil & fractions thereof , whether or not ref. but not chemically modified
1 90 549.17 5.87 58 554 357.1 99.4% 90 549
16 HS410390:Raw hides & skins, n.e.s. in Ch.41 (fresh/salted/dried/limed/pickled/othw. presvd. but not tanned/parchment-dressed/furth. prepd.) [see complete text #43]
1 65 617.43 304.47 58 619 974.5 99.5% 65 617
17 HS720430:Waste & scrap of tinned iron/steel 1 59 070.91 16.95 58 679 045.4 99.6% 59 071
18 HS110311:Groats/meal of wheat 1 53 521.51 21.19 58 732 566.9 99.7% 53 522
19 HS040130:Milk & cream, not concentrated/sweetened, fat content by wt. >6% 1 45 243.40 3.55 58 777 810.3 99.7% 45 243

175 Rwanda TRADE-DSM analysis – Technical study report final draft 31 August 2017
20 HS110620:Flour, meal & powder of sago/roots/tubers of 07.14 1 28 564.73 209.60 58 806 375.1 99.8% 28 565
21 HS441510:Cases, boxes, crates, drums & sim. packings of wood; cable-drums of wood 1 27 537.70 2.53 58 833 912.8 99.8% 27 538
22 HS820190:Hand tools of a kind used in agriculture/horticulture/forestry (excl. of 8201.10-8201.60)
1 18 835.12 35.21 58 852 747.9 99.9% 18 835
23 HS800120:Tin alloys, unwrought 1 18 429.61 17.86 58 871 177.5 99.9% 18 430
24 HS640420:Footwear with outer soles of leather/composition leather & uppers of textile mats.
1 10 960.13 1.80 58 882 137.6 99.9% 10 960
25 HS261000:Chromium ores & concs. 1 8 221.84 6.87 58 890 359.5 99.9% 8 222
Source: Authors, TRADE-DSM

176 Rwanda TRADE-DSM analysis – Technical study report final draft 31 August 2017
Table 42: Detail on selected outcomes for quadrant 2 – “Green pastures”, intensive margins (product) and extensive margins (market)
Item Product No
REOs Potential RCA Cumulative
Potential (US$) Cumulative % Average Potential
(US$)
1 HS740400:Copper waste & scrap 28 2 120.17 1.12 2 120.17 7.7% 75.72
2 HS230400:Oil-cake & oth. solid residues, whether or not ground/in pellets, from extraction of soybean oil
26 1 525.98 1.05 3 646.15 13.2% 58.69
3 HS090111:Coffee, not roasted, not decaffeinated 43 2 081.92 85.83 5 728.07 20.8% 48.42
4 HS854370:Other machines and apparatus 64 3 065.31 1.08 8 793.38 31.9% 47.90
5 HS220300:Beer made from malt 34 1 307.81 5.82 10 101.19 36.7% 38.47
6 HS720421:Waste & scrap of stainless steel 26 708.04 7.52 10 809.23 39.2% 27.23
7 HS843143:Parts suit. for use solely/princ. with the boring/sinking mach. of 8430.41/8430.49 52 1 313.08 1.28 12 122.31 44.0% 25.25
8 HS100630:Semi-milled/wholly milled rice, whether or not polished/glazed 51 1 106.91 9.92 13 229.22 48.0% 21.70
9 HS220290:Non-alcoholic beverages other than waters of 2202.10 (not incl. fruit/veg. juices of 20.09)
31 615.48 3.70 13 844.70 50.3% 19.85
10 HS410411:Tanned/crust hides & skins of bovine (incl. buffalo)/equine animals, without hair on, in the wet state (incl. wet-blue), full grains, unsplit; grain splits but not furth. prepd.
16 298.21 2.07 14 142.91 51.3% 18.64
11 HS800110:Tin, not alloyed, unwrought 27 492.76 2.13 14 635.67 53.1% 18.25
12 HS040221:Milk in powder/granules/oth. solid form, unsweetened, fat content by wt. >1.5% 31 509.34 1.02 15 145.00 55.0% 16.43
13 HS261400:Titanium ores & concs. 16 246.31 22.72 15 391.32 55.9% 15.39
14 HS392310:Boxes, cases, crates & sim. arts., of plastics 61 899.28 2.65 16 290.60 59.1% 14.74
15 HS970300:Original sculptures & statuary, in any mat. 35 379.24 1.31 16 669.84 60.5% 10.84
16 HS880211:Helicopters of an unladen wt. not >2000kg 17 177.81 2.60 16 847.65 61.2% 10.46
17 HS040120:Milk & cream, not concentrated/sweetened, fat content by wt. >1% but not >6% 47 489.17 1.69 17 336.82 62.9% 10.41
18 HS901420:Instruments & appls. for aeronautical/space navigation (excl. compasses) 39 402.09 1.14 17 738.91 64.4% 10.31
19 HS190531:Sweet biscuits 65 656.83 6.73 18 395.74 66.8% 10.11
20 HS070190:Potatoes other than seed potatoes, fresh/chilled 35 295.78 6.44 18 691.52 67.9% 8.45
21 HS880390:Parts of gds. of 88.01/88.02, n.e.s. in 88.03 45 369.04 5.28 19 060.56 69.2% 8.20
22 HS410419:Tanned/crust hides & skins of bovine (incl. buffalo)/equine animals, without hair on, in the wet state (incl. wet-blue), whether or not split but not furth. prepd. (excl. of 4104.11)
20 153.05 1.45 19 213.61 69.8% 7.65
23 HS110100:Wheat/meslin flour 35 264.41 70.62 19 478.03 70.7% 7.55
24 HS720429:Waste & scrap of alloy steel other than stainless steel 32 228.00 3.17 19 706.02 71.5% 7.12
25 HS840710:Spark-ignition recip./rotary int. comb. piston engines for aircraft 30 202.89 14.96 19 908.91 72.3% 6.76
26 HS261510:Zirconium ores & concs. 23 152.38 18.87 20 061.29 72.8% 6.63
27 HS860900:Containers (incl. conts. for the tpt. of fluids) specially designed & equipped for carriage by one/more modes of tpt.
48 296.88 1.55 20 358.17 73.9% 6.18

177 Rwanda TRADE-DSM analysis – Technical study report final draft 31 August 2017
28 HS040700:Birds' eggs, in shell, fresh/presvd./cooked 43 265.00 1.83 20 623.17 74.9% 6.16
29 HS200290:Tomatoes, prepd./presvd. othw. than by vinegar/acetic acid, other than whole/in pieces
36 218.36 1.53 20 841.53 75.7% 6.07
30 HS130219:Vegetable saps & extracts (excl. of 1302.11-1302.14) 35 197.56 29.27 21 039.09 76.4% 5.64
31 HS440929:Pegwood; ceiling boards and flooring boards; strips and friezes for parquet flooring, not assembled
43 241.36 1.15 21 280.45 77.3% 5.61
32 HS040390:Buttermilk/curdled milk & cream/kephir & oth. fermented/acidified milk & cream, whether or not concentrated/sweetened/flavoured/cont. fruit/nuts/cocoa
32 178.30 1.18 21 458.74 77.9% 5.57
33 HS843049:Boring/sinking mach. (excl. of 8430.10-8430.40), other than self-propelled 53 294.56 12.74 21 753.31 79.0% 5.56
34 HS482390:Paper, paperboard, cellulose wadding & webs of cellulose fibres, cut to size/shape; oth.arts.of paper pulp/paper/paperboard/cellulose wadding/webs of cellulose fibres, n.e.s.
46 250.50 1.29 22 003.81 79.9% 5.45
35 HS151790:Edible mixts./preps. of animal/veg. fats/oils/fractions of diff. fats/oils of Ch.15, other than edible fats/oils/fractions of 15.16/non-liquid margarine
55 297.05 4.98 22 300.86 81.0% 5.40
36 HS080260:Macadamia nuts 17 86.22 5.27 22 387.08 81.3% 5.07
37 HS780199:Unwrought lead other than refined, n.e.s. in 78.01 18 90.81 14.22 22 477.89 81.6% 5.04
38 HS230230:Bran, sharps & oth. residues, whether or not in the form of pellets, derived from the sifting/milling/oth. working of wheat
21 97.23 54.43 22 575.12 82.0% 4.63
39 HS071310:Peas (Pisum sativum), dried, shelled, whether or not skinned/split 31 136.90 3.63 22 712.02 82.5% 4.42
40 HS720410:Waste & scrap of cast iron 27 117.13 2.44 22 829.15 82.9% 4.34
41 HS830890:Clasps, frames with clasps, buckles, buckle-clasps, and the like, of base metal...(excl. of 8308.10), incl. parts; beads & spangles, of base metal... [see complete text #134]
44 183.56 1.14 23 012.71 83.6% 4.17
42 HS940429:Mattresses of oth. mats. (excl. cellular rubber/plastics) 46 171.72 14.98 23 184.43 84.2% 3.73
43 HS710310:Precious stones (excl. diamonds) & semi-precious stones, unwkd./simply sawn/roughly shaped but not strung/mounted/set
35 129.39 10.03 23 313.82 84.6% 3.70
44 HS090112:Coffee, not roasted, decaffeinated 21 74.26 25.39 23 388.08 84.9% 3.54
45 HS121190:Plants & parts of plants, incl. seeds & fruits, of a kind used primarily in perfumery/pharmacy/for insecticidal/fungicidal/sim. purps., n.e.s. in Ch.12, fresh/dried, whether or not cut/crushed/powdered
46 158.85 21.43 23 546.93 85.5% 3.45
46 HS071333:Kidney beans, incl. white pea beans (Phaseolus vulgaris), dried, shelled, whether or not skinned/split
44 150.66 4.16 23 697.59 86.0% 3.42
47 HS940550:Non-electrical lamps & lighting fittings 31 103.63 1.78 23 801.22 86.4% 3.34
48 HS780191:Unwrought lead other than refined, cont. by wt. antimony as the principal oth. element
19 63.27 1.46 23 864.49 86.6% 3.33
49 HS720610:Iron & non-alloy steel in ingots (excl. iron of 72.03) 9 29.33 6.63 23 893.82 86.7% 3.26
50 HS680100:Setts, curbstones & flagstones, of nat. stone (except slate) 26 84.23 4.28 23 978.05 87.1% 3.24
51 HS722810:Bars & rods of high speed steel 21 67.87 1.48 24 045.92 87.3% 3.23
52 HS460219:Basketwork, wickerwork & oth. arts., made directly to shape from veg. mats./made up from gds. of 46.01; arts. Other
22 68.93 13.50 24 114.84 87.6% 3.13
53 HS950890:Roundabouts, swings, shooting galleries & oth. fairground amusements; 39 121.69 4.23 24 236.54 88.0% 3.12

178 Rwanda TRADE-DSM analysis – Technical study report final draft 31 August 2017
travelling theatres
54 HS253090:Mineral subs., n.e.s. in Ch.25 45 137.95 11.49 24 374.49 88.5% 3.07
55 HS252321:White cement, whether or not artificially coloured 18 52.82 9.75 24 427.31 88.7% 2.93
56 HS440290:Other 41 120.26 2.48 24 547.57 89.1% 2.93
57 HS291830:Carboxylic acids with aldehyde/ketone function but without oth. oxygen function, their anhydrides, halides, peroxides, peroxyacids & their derivs.
28 81.84 2.12 24 629.41 89.4% 2.92
58 HS070610:Carrots & turnips, fresh/chilled 35 99.89 1.40 24 729.29 89.8% 2.85
59 HS920790:Musical instr. (excl. keyboard instruments other than accordions), the sound of which is produced/must be amplified, electrically
41 113.30 1.19 24 842.59 90.2% 2.76
60 HS130239:Mucilages & thickeners (excl. of 1302.31 & 1301.32), whether or not modified, derived from veg. prods.
41 105.20 1.93 24 947.79 90.6% 2.57
61 HS070820:Beans (Vigna spp., Phaseolus spp.), shelled/unshelled, fresh/chilled 41 97.30 15.77 25 045.09 90.9% 2.37
62 HS410621:Tanned/crust hides & skins of goats/kids, without wool/hair on, in the wet state (incl. wet-blue) whether or not split but not furth. prepd.
7 16.37 57.88 25 061.46 91.0% 2.34
63 HS810197:Tungsten (wolfram) waste & scrap 12 27.81 2.50 25 089.27 91.1% 2.32
64 HS841940:Distilling/rectifying plant, whether or not electrically heated 66 152.22 2.71 25 241.49 91.6% 2.31
65 HS740321:Copper-zinc base alloys (brass), unwrought 23 52.58 1.78 25 294.07 91.8% 2.29
66 HS410190:Bovine (incl. buffalo)/equine hides & skins (excl. of 4101.20 & 4101.50), incl. butts, bends & bellies (fresh/salted/dried/limed/pickled/othw. presvd.) [see complete text #39]
20 44.97 25.07 25 339.03 92.0% 2.25
67 HS520819:Woven fabrics of cotton (excl. of 5208.11-5208.13), unbleached, cont. 85%/more by wt. of cotton, weighing not >200g/m2
19 42.52 5.20 25 381.55 92.2% 2.24
68 HS842612:Mobile lifting frames on tyres & straddle carriers 24 52.87 1.20 25 434.42 92.3% 2.20
69 HS040110:Milk & cream, not concentrated/sweetened, fat content by wt. not >1% 32 69.76 6.53 25 504.18 92.6% 2.18
70 HS520842:Woven fabrics of cotton, cont. 85%/more by wt. of cotton, of yarns of diff. colours, plain weave, weighing >100g/m2
21 44.72 1.51 25 548.90 92.8% 2.13
71 HS230210:Bran, sharps & oth. residues, whether or not in the form of pellets, derived from the sifting/milling/oth. working of maize (corn)
6 12.55 17.70 25 561.45 92.8% 2.09
72 HS611300:Garments made up of knitted or crocheted fabrics of 59.03/59.06/59.07 49 102.14 1.34 25 663.59 93.2% 2.08
73 HS200949:Pineapple juice (excl. of 2009.41), unfermented & not cont. added spirit, whether or not cont. added sugar/oth. sweetening matter
26 52.14 1.63 25 715.73 93.4% 2.01
74 HS282590:Inorganic bases other than hydrazine & hydroxylamine & their inorganic salts; oth. metal oxides, hydroxides & peroxides, n.e.s.
45 89.50 239.21 25 805.23 93.7% 1.99
75 HS930320:Sporting/hunting/target-shooting shotguns, incl. combination shotgun-rifles (excl. muzzle-loading)
34 65.08 1.47 25 870.31 93.9% 1.91
76 HS160413:Sardines, sardinella & brisling/sprats, prepd./presvd., whole/in pieces (excl. minced)
19 33.28 25.67 25 903.59 94.0% 1.75
77 HS940410:Mattress supports 41 70.49 181.94 25 974.09 94.3% 1.72
78 HS040299:Milk & cream, concentrated (excl. in powder), sweetened 52 88.30 6.73 26 062.39 94.6% 1.70
79 HS071220:Onions, dried, whole/cut/sliced/broken/in powder but not furth. prepd. 19 32.25 8.39 26 094.64 94.7% 1.70

179 Rwanda TRADE-DSM analysis – Technical study report final draft 31 August 2017
80 HS700100:Cullet & oth. waste & scrap of glass; glass in the mass 26 43.60 4.64 26 138.24 94.9% 1.68
81 HS070810:Peas (Pisum sativum), shelled/unshelled, fresh/chilled 25 39.95 5.79 26 178.19 95.0% 1.60
82 HS261790:Ores & concs. (excl. of 2601.11-2617.10) 9 14.38 52.06 26 192.57 95.1% 1.60
83 HS090122:Coffee, roasted, decaffeinated 32 51.05 1.40 26 243.62 95.3% 1.60
84 HS842831:Continuous-action elevators & conveyors, for gds./mats., specially designed for underground use (excl. of 8428.10 & 8428.20)
15 22.87 14.20 26 266.49 95.4% 1.52
85 HS800300:Tin bars, rods, profiles & wire 53 80.20 4.84 26 346.68 95.7% 1.51
86 HS810110:Tungsten (wolfram) powders 24 36.20 7.66 26 382.88 95.8% 1.51
87 HS845921:Drilling machines other than way-type unit head machines, op. by removing metal, numerically controlled
32 48.19 35.10 26 431.07 96.0% 1.51
88 HS230240:Bran, sharps & oth. residues, whether or not in the form of pellets, derived from the sifting/milling/oth. working of cereals other than maize (corn)/rice/wheat
12 16.99 11.48 26 448.06 96.0% 1.42
89 HS110814:Manioc (cassava) starch 8 10.62 11.26 26 458.68 96.1% 1.33
90 HS392510:Reservoirs, tanks, vats & sim. conts., of a cap. >300 l, of plastics 55 72.31 2.92 26 530.99 96.3% 1.31
91 HS410691:Tanned/crust hides & skins, n.e.s., without wool/hair on, in the wet state (incl. wet-blue) whether or not split but not furth. prepd.
4 5.25 1.25 26 536.24 96.3% 1.31
92 HS900510:Binoculars 46 60.34 10.95 26 596.58 96.6% 1.31
93 HS551311:Woven fabrics of polyester staple fibres, cont. <85% by wt. of such fibres, mixed mainly or solely with cotton, of a wt. not >170g/m2, plain weave, unbleached/bleached
24 31.33 14.75 26 627.91 96.7% 1.31
94 HS292221:Aminohydroxynaphthalenesulphonic acids & their salts 2 2.61 1.73 26 630.52 96.7% 1.30
95 HS240130:Tobacco refuse 22 28.63 2.66 26 659.15 96.8% 1.30
96 HS071029:Leguminous vegetables (excl. of 0710.21 & 0710.22), shelled/unshelled, uncooked/cooked by steaming/boiling in water, frozen
27 33.67 1.80 26 692.82 96.9% 1.25
97 HS722710:Bars & rods, hot-rolled, in irregularly wound coils, of high speed steel 4 4.98 1.60 26 697.80 96.9% 1.24
98 HS250610:Quartz, other than nat. sands 21 26.09 1.20 26 723.89 97.0% 1.24
99 HS090220:Tea, green (not fermented), whether or not flavoured, in immediate packings of a content >3kg
22 27.17 2.10 26 751.07 97.1% 1.24
100 HS251749:Granules, chippings & powder, of stones of 25.15/25.16 (excl. marble), whether or not heat-treated
30 34.56 1.95 26 785.62 97.2% 1.15
101 HS071339:Beans (Vigna spp., Phaseolus spp. (excl. of 0713.31-0713.33)), dried, shelled, whether or not skinned/split
25 28.66 47.11 26 814.29 97.4% 1.15
102 HS740500:Master alloys of copper 25 26.87 24.52 26 841.16 97.4% 1.07
103 HS960329:Shaving brushes, hair brushes, nail brushes, eyelash brushes & oth. toilet brushes for use on the person, incl. such brushes constituting parts of appls.
29 30.94 1.05 26 872.10 97.6% 1.07
104 HS160300:Extracts & juices of meat/fish/crustaceans/molluscs/oth. aquatic invertebrates 22 22.78 14.58 26 894.88 97.6% 1.04
105 HS120810:Flours & meals of soya beans 21 21.62 9.52 26 916.50 97.7% 1.03
106 HS842220:Machinery for cleaning/drying bottles/oth. conts. 53 53.15 4.91 26 969.65 97.9% 1.00
107 HS630510:Sacks & bags, of a kind used for the packing of gds., of jute/of oth. textile bast fibres of 53.03
18 17.05 9.22 26 986.69 98.0% 0.95

180 Rwanda TRADE-DSM analysis – Technical study report final draft 31 August 2017
108 HS200551:Beans (Vigna spp., Phaseolus spp.), shelled, prepd./presvd. othw. than by vinegar/acetic acid, not frozen, other than prods. of 20.06
29 27.01 1.60 27 013.71 98.1% 0.93
109 HS810199:Tungsten (wolfram) & arts. thereof , n.e.s. in 81.01 53 47.96 27.16 27 061.66 98.3% 0.90
110 HS050710:Ivory; ivory powder & waste 4 3.52 1.95 27 065.19 98.3% 0.88
111 HS631090:Used/new rags, scrap twine, cordage, rope & cables & worn out arts. of twine/cordage/rope/cables, of textile mats. (excl. sorted)
31 25.49 1.09 27 090.68 98.4% 0.82
112 HS870520:Mobile drilling derricks 16 12.93 4.34 27 103.61 98.4% 0.81
113 HS720690:Iron & non-alloy steel in primary forms other than ingots (excl. iron of 72.03) 22 17.65 3.75 27 121.26 98.5% 0.80
114 HS401320:Inner tubes, of rubber, of a kind used on bicycles 43 33.94 4.55 27 155.20 98.6% 0.79
115 HS110290:Cereal flour other than of wheat, meslin, rye, maize (corn), rice 37 28.60 19.78 27 183.80 98.7% 0.77
116 HS681011:Building blocks & bricks, of cement/concrete/art. stone, whether or not reinf. 26 19.51 1.15 27 203.32 98.8% 0.75
117 HS701890:Articles of glass beads, imitation pearls, imitation precious/semi-precious stones...; glass eyes (excl. prosthetic arts).; statuettes & oth. ornaments...glass [see complete text #122]
31 23.10 2.47 27 226.42 98.8% 0.75
118 HS490900:Printed/illustrated postcards; printed cards bearing personal greetings/messages/announcements, whether or not illustrated, with/without envelopes/trimmings
33 24.25 4.70 27 250.67 98.9% 0.73
119 HS845310:Machinery for preparing/tanning/working hides/skins/leather 23 16.10 4.36 27 266.77 99.0% 0.70
120 HS846890:Parts of the mach. & app. of 84.68 58 39.99 6.78 27 306.76 99.1% 0.69
121 HS845929:Drilling machines other than way-type unit head machines, op. by removing metal, other than numerically controlled
70 47.03 4.72 27 353.79 99.3% 0.67
122 HS110419:Rolled/flaked grains of cereals other than oats 29 15.26 1.24 27 369.05 99.4% 0.53
123 HS480990:Copying/transfer papers (incl. coated/impregnated paper for duplicator stencils/offset plates), whether or not printed, in rolls/sheets (excl. of 4809.10 & 4809.20)
44 22.56 11.69 27 391.61 99.4% 0.51
124 HS610329:Men's/boys' ensembles, knitted or crocheted, of oth. textile mats. (excl. 6103.21-6103.23)
23 11.74 5.60 27 403.36 99.5% 0.51
125 HS340540:Scouring pastes & powders & oth. scouring preps. 51 24.60 2.14 27 427.95 99.6% 0.48
126 HS844314:Letterpress printing machinery, reel fed (excluding flexographic printing) 18 7.30 2.04 27 435.25 99.6% 0.41
127 HS240290:Cigars, cheroots, cigarillos & cigarettes of tobacco substitutes 8 3.22 1.48 27 438.48 99.6% 0.40
128 HS520951:Woven fabrics of cotton, cont. 85%/more by wt. of cotton, printed, plain weave, weighing >200g/m2
24 9.50 17.68 27 447.97 99.7% 0.40
129 HS420340:Clothing accessories (excl. of 4203.21-4203.30), of leather/composition leather 41 15.58 3.23 27 463.56 99.7% 0.38
130 HS293920:Alkaloids of cinchona and their derivatives; salts thereof 13 4.54 15.78 27 468.09 99.7% 0.35
131 HS950810:Travelling circuses & travelling menageries 10 3.40 504.98 27 471.50 99.7% 0.34
132 HS846120:Shaping/slotting machines working by removing metal/cermets 25 8.46 17.34 27 479.96 99.8% 0.34
133 HS841392:Parts of liquid elevators 42 11.87 2.31 27 491.83 99.8% 0.28
134 HS090190:Coffee husks & skins; coffee substitutes cont. coffee in any proportion 40 10.61 133.00 27 502.44 99.9% 0.27
135 HS960500:Travel sets for personal toilet/sewing/shoe/clothes cleaning 37 9.69 68.70 27 512.13 99.9% 0.26

181 Rwanda TRADE-DSM analysis – Technical study report final draft 31 August 2017
136 HS050100:Human hair, unwkd., whether or not washed/scoured; waste of human hair 10 2.62 1.54 27 514.75 99.9% 0.26
137 HS440420:Hoopwood; split poles; piles, pickets & stakes of wood...non-coniferous [see complete text #48]
24 6.13 114.97 27 520.87 99.9% 0.26
138 HS521213:Woven fabrics of cotton (excl. of 52.08-52.11), dyed, weighing not >200 g/m2 17 3.81 5.83 27 524.69 99.9% 0.22
139 HS071332:Small red (Adzuki) beans (Phaseolus/Vigna angularis), dried, shelled, whether or not skinned/split
14 3.04 9.58 27 527.72 99.9% 0.22
140 HS481720:Letter cards, plain postcards & correspondence cards, of paper/paperboard 26 5.00 64.20 27 532.72 100.0% 0.19
141 HS540120:Sewing thread of man-made filaments, whether or not put up for RS, of art. filaments
21 3.94 2.88 27 536.66 100.0% 0.19
142 HS370239:Photographic film in rolls (excl. film for X-rays & instant print film), without perforations, of a width not >105mm, n.e.s.
16 1.99 2.86 27 538.65 100.0% 0.12
143 HS030510:Flours, meals & pellets of fish, fit for human consumption 19 2.26 5.58 27 540.91 100.0% 0.12
144 HS811219:Beryllium & arts. thereof , n.e.s. in 81.12 9 0.89 10.93 27 541.79 100.0% 0.10
145 HS010420:Live goats 3 0.28 15.17 27 542.07 100.0% 0.09
146 HS851950:Telephone answering machines 12 0.89 13.35 27 542.96 100.0% 0.07
147 HS850630:Primary cells & primary batteries, mercuric oxide 13 0.58 1.23 27 543.54 100.0% 0.04
148 HS021091:Meat & edible meat offal of primates, salted/in brine/dried/smoked, incl. edible flours/meals
1 0.02 2.20 27 543.56 100.0% 0.02
Source: Authors, TRADE-DSM

182 Rwanda TRADE-DSM analysis – Technical study report final draft 31 August 2017
Table 43: Detail on selected outco mes for quadrant 3 – “Blue sky”, extensive margins (product) and extensive margins (market)
Item Product No
REOs Potential RCA
Cumulative Potential
(US$) Cumulative
% Average Potential
(US$)
1 HS090121:Coffee, roasted, not decaffeinated 41 858.38 0.80 858.38 21.3% 20.94
2 HS870390:Vehicles princ. designed for the tpt. of persons (excl. of 87.02 & 8703.10-8703.24), with C-I int. comb. piston engine (diesel/semi-diesel), n.e.s. in 87.03
32 662.77 1.00 1 521.15 37.7% 20.71
3 HS220210:Waters, incl. min. waters & aerated waters, cont. added sugar/oth. sweetening matter/flavoured
43 706.19 0.88 2 227.34 55.2% 16.42
4 HS391590:Waste, parings & scrap, of plastics n.e.s. in 39.15 29 341.39 0.85 2 568.73 63.7% 11.77
5 HS611430:Garments, n.e.s., knitted or crocheted, of man-made fibres 34 250.67 0.83 2 819.40 69.9% 7.37
6 HS810320:Unwrought tantalum, incl. bars & rods obt. simply by sintering; powders 7 43.26 0.91 2 862.66 70.9% 6.18
7 HS711790:Imitation jewellery other than of base metal 32 194.16 0.87 3 056.82 75.8% 6.07
8 HS870310:Vehicles (excl. of 87.02) princ. designed for the tpt. of persons, specially designed for travelling on snow; golf cars & sim. vehicles
38 167.90 0.87 3 224.72 79.9% 4.42
9 HS040291:Milk & cream, concentrated (excl. in powder), unsweetened 31 129.36 0.91 3 354.08 83.1% 4.17
10 HS620452:Women's/girls' skirts & divided skirts (excl. knitted or crocheted), of cotton 33 121.60 0.96 3 475.68 86.1% 3.68
11 HS292242:Glutamic acid & its salts 27 94.38 0.93 3 570.06 88.5% 3.50
12 HS294200:Organic comps. n.e.s. in Ch.29 30 83.27 0.85 3 653.33 90.5% 2.78
13 HS070110:Seed potatoes, fresh/chilled 19 49.55 0.93 3 702.88 91.8% 2.61
14 HS090412:Pepper (genus Piper), crushed/ground 31 60.64 0.95 3 763.52 93.3% 1.96
15 HS100610:Rice in the husk (paddy/rough) 19 36.96 0.95 3 800.49 94.2% 1.95
16 HS340590:Polishes & creams, scouring pastes & powders & sim. preps. (excl. waxes of 34.04; excl. of 3405.10-3405.40)
41 70.97 0.83 3 871.45 95.9% 1.73
17 HS330190:Extracted oleoresins; concs. of essential oils in fats/fixed oils/waxes/the like, obt. by enfleurage/maceration [see complete text #34]
48 72.12 0.89 3 943.58 97.7% 1.50
18 HS551211:Woven fabrics of synth. staple fibres, cont. 85%/more by wt. of polyester staple fibres, unbleached/bleached
16 23.42 0.94 3 966.99 98.3% 1.46
19 HS430390:Articles of furskin other than apparel & clothing accessories 30 23.61 0.96 3 990.60 98.9% 0.79
20 HS760519:Wire of aluminium, not alloyed (excl. of 7605.11) 33 22.72 0.92 4 013.33 99.5% 0.69
21 HS520210:Yarn waste (incl. thread waste), of cotton 16 7.91 0.88 4 021.23 99.7% 0.49
22 HS780420:Lead powders & flakes 7 2.81 0.96 4 024.04 99.7% 0.40
23 HS550999:Yarn other than sewing thread, of synth. staple fibres n.e.s. in 55.09 (excl. of 5509.91 & 5509.92), not put up for retail sale
17 4.57 0.93 4 028.61 99.8% 0.27
24 HS910390:Clocks with watch movements (excl. of 91.04), other than electrically operated 21 4.01 0.98 4 032.61 99.9% 0.19
25 HS010632:Live birds (order Psittaciformes), incl. parrots/parakeets/macaws/cockatoos 22 2.61 0.92 4 035.23 100.0% 0.12
Source: Authors, TRADE-DSM

183 Rwanda TRADE-DSM analysis – Technical study report final draft 31 August 2017
Table 44: Detail on selected outcomes for quadrant 4 – “Grey fields” , extensive margins (product) and intensive margins (market)
Item Product No
REOs Potential RCA
Cumulative Potential
(US$) Cumulative
% Average Potential
(US$)
1 HS040291:Milk & cream, concentrated (excl. in powder), unsweetened 1 40 503.05 0.91 40 503.05 74.3% 40 503
2 HS391590:Waste, parings & scrap, of plastics n.e.s. in 39.15 1 13 978.27 0.85 54 481.32 100.0% 13 978
Source: Authors, TRADE-DSM
***** END OF REPORT *****

Designed by soapbox.co.uk
The International Growth Centre
(IGC) aims to promote sustainable
growth in developing countries
by providing demand-led policy
advice based on frontier research.
Find out more about our work on our website www.theigc.org
For media or communications enquiries, please contact [email protected]
Subscribe to our newsletter and topic updates www.theigc.org/newsletter
Follow us on Twitter @the_igc
Contact us International Growth Centre, London School of Economic and Political Science, Houghton Street, London WC2A 2AE