
Using 3D Models And Discrete Simulations In Infrastructure Security Applications
275
-
Upload
independent -
Category
Documents
-
view
0 -
download
0
Transcript of Using 3D Models And Discrete Simulations In Infrastructure Security Applications


CRITICAL INFRASTRUCTURE PROTECTION II

IFIP – The International Federation for Information Processing IFIP was founded in 1960 under the auspices of UNESCO, following the First World Computer Congress held in Paris the previous year. An umbrella organization for societies working in information processing, IFIP's aim is two-fold: to support information processing within its member countries and to encourage technology transfer to developing nations. As its mission statement clearly states,
IFIP's mission is to be the leading, truly international, apolitical organization which encourages and assists in the development, exploitation and application of information technology for the benefit of all people.
IFIP is a non-profitmaking organization, run almost solely by 2500 volunteers. It operates through a number of technical committees, which organize events and publications. IFIP's events range from an international congress to local seminars, but the most important are: • The IFIP World Computer Congress, held every second year; • Open conferences; • Working conferences. The flagship event is the IFIP World Computer Congress, at which both invited and contributed papers are presented. Contributed papers are rigorously refereed and the rejection rate is high. As with the Congress, participation in the open conferences is open to all and papers may be invited or submitted. Again, submitted papers are stringently refereed. The working conferences are structured differently. They are usually run by a working group and attendance is small and by invitation only. Their purpose is to create an atmosphere conducive to innovation and development. Refereeing is less rigorous and papers are subjected to extensive group discussion. Publications arising from IFIP events vary. The papers presented at the IFIP World Computer Congress and at open conferences are published as conference proceedings, while the results of the working conferences are often published as collections of selected and edited papers. Any national society whose primary activity is in information may apply to become a full member of IFIP, although full membership is restricted to one society per country. Full members are entitled to vote at the annual General Assembly, National societies preferring a less committed involvement may apply for associate or corresponding membership. Associate members enjoy the same benefits as full members, but without voting rights. Corresponding members are not represented in IFIP bodies. Affiliated membership is open to non-national societies, and individual and honorary membership schemes are also offered.

CRITICAL INFRASTRUCTURE PROTECTION II Edited by MAURICIO PAPA University of Tulsa Tulsa, Oklahoma, USA SUJEET SHENOI University of Tulsa Tulsa, Oklahoma, USA
123

Library of Congress Control Number: 2008936479 Critical Infrastructure Protection II Edited by Mauricio Papa and Sujeet Shenoi
p. cm. (IFIP International Federation for Information Processing, a Springer Series in Computer Science)
ISSN: 1571-5736 / 1861-2288 (Internet)
ISBN: 978-0-387-88522-3 eISBN: 978-0-387-88523-0 Printed on acid-free paper
Copyright © 2008 by International Federation for Information Processing. All rights reserved. This work may not be translated or copied in whole or in part without the written permission of the publisher (Springer Science+Business Media, LLC, 233 Spring Street, New York, NY 10013, USA), except for brief excerpts in connection with reviews or scholarly analysis. Use in connection with any form of information storage and retrieval, electronic adaptation, computer software, or by similar or dissimilar methodology now known or hereafter developed is forbidden.
The use in this publication of trade names, trademarks, service marks and similar terms, even if they are not identified as such, is not to be taken as an expression of opinion as to whether or not they are subject to proprietary rights.
9 8 7 6 5 4 3 2 1
springer.com

Contents
Contributing Authors ix
Preface xvii
PART I THEMES AND ISSUES
1
Emergent Risks in Critical Infrastructures 3
Scott Dynes
2
Cyberspace Policy for Critical Infrastructures 17
Hopkinson
PART II INFRASTRUCTURE SECURITY
3
Security Assessment of a Turbo-Gas Power Plant 31
Marcelo Masera, Igor Nai Fovino and Rafal Leszczyna
4
Detecting Cyber Attacks on Nuclear Power Plants 41
Julian Rrushi and Roy Campbell
PART III CONTROL SYSTEMS SECURITY
5
Applying Trusted Network Technology to Process Control Systems 57
Hamed Okhravi and David Nicol
6
Towards a Taxonomy of Attacks Against Energy Control Systems 71
Terry Fleury, Himanshu Khurana and Von Welch
Dorsey Wilkin, Richard Raines, Paul Williamsand Kenneth

vi CRITICAL INFRASTRUCTURE PROTECTION II
7
Attribution of Cyber Attacks on Process Control Systems 87
Jeffrey Hunker, Robert Hutchinson and Jonathan Margulies
8
Modeling and Detecting Anomalies in SCADA Systems 101
Nils Svendsen and Stephen Wolthusen
9
Assessing the Integrity of Field Devices in Modbus Networks 115
Sujeet Shenoi
10
Designing Security-Hardened Microkernels for Field Devices 129
Jeffrey Hieb and James Graham
11
Combating Memory Corruption Attacks on SCADA Devices 141
Carlo Bellettini and Julian Rrushi
12
Mitigating Accidents in Oil and Gas Production Facilities 157
Stig Johnsen
PART IV SECURITY STRATEGIES
13
Automated Assessment of Compliance with Security Best Practices 173
Zahid Anwar and Roy Campbell
14
Collaborative Access Control for Critical Infrastructures 189
Amine Baina, Anas Abou El Kalam, Yves Deswarteand Mohamed Kaaniche
PART V INFRASTRUCTURE INTERDEPENDENCIES
15
Modeling Dependencies in Critical Infrastructures 205
Albert Nieuwenhuijs, Eric Luiijf and Marieke Klaver
16
Metrics for Quantifying Interdependencies 215
Emiliano Casalicchio and Emanuele Galli
Ryan Shayto, Brian Porter, Rodrigo Chandia, Mauricio Papaand

Contents vii
17
An Integrated Approach for Simulating Interdependencies 229
Roberto Setola, Sandro Bologna, Emiliano Casalicchioand Vincenzo Masucci
PART VI INFRASTRUCTURE MODELING AND SIMULATION
18
Simulation of Advanced Train Control Systems 243
Paul Craven and Paul Oman
19
An Integrated Methodology for Critical Infrastructure Modelingand Simulation
257
well, Cody Yeager, Andrew Schumpert and Wray Johnson
20
Using 3D Models and Discrete Simulations in InfrastructureSecu
269
Pierluigi Assogna, Glauco Bertocchi, Alberto Paoluzzi, MicheleVicentino, Giorgio Scorzelli and Roberto Zollo
William Tolone, Seok-Won Lee, Wei-Ning Xiang, JoshuaBlack
rity Applications

Contributing Authors
Anas Abou el Kalam is an Assistant Professor of Network Security at theNational Polytechnic Institute, Toulouse, France. His research interests in-clude security policies and models, intrusion detection, network security andembedded systems security.
Zahid Anwar is a Ph.D. candidate in Computer Science at the Universityof Illinois, Urbana-Champaign, Illinois. His research interests are in the areasof large-scale systems modeling, information assurance and control systemssecurity.
Pierluigi Assogna is a Progam Manager at Theorematica SpA, Rome, Italy.His research interests include knowledge management, document management,manufacturing and control, and system interoperability.
Amine Baina is a Ph.D. student in Computer Security at LAAS-CNRS,Toulouse, France. His research interests include access control policies andmodels, collaboration technologies and critical infrastructure protection.
Carlo Bellettini is an Associate Professor of Computer Science at the Univer-sity of Milan, Milan, Italy. His research interests include information securityand the analysis, specification and design of real-time systems.
Glauco Bertocchi is a Professor of Information and Communications Tech-nology Security at the Sapienza University of Rome, Rome, Italy, and is re-sponsible for security at the Camera dei Deputati (Italian Congress), Rome,Italy. His research interests include systems security, infrastructure safety andsecurity, and crisis management.
Joshua Blackwell is an M.A. student in Geography at the University of NorthCarolina at Charlotte, Charlotte, North Carolina. His research focuses onontological approaches in critical infrastructure protection planning.

x CRITICAL INFRASTRUCTURE PROTECTION II
Sandro Bologna is a Senior Researcher at the Italian National Agency for NewTechnologies, Energy and the Environment (ENEA), Rome, Italy. His researchinterests include dependable computing and critical infrastructure protection.
Roy Campbell is the Sohaib and Sara Abbasi Professor of Computer Scienceat the University of Illinois, Urbana-Champaign, Illinois. His research inter-ests include security, programming languages, software engineering, operatingsystems, distributed systems and networking.
Emiliano Casalicchio is a Computer Science Researcher at the Universityof Rome – Tor Vergata, Rome, Italy. His research interests include complexsystems modeling and simulation, and distributed systems design, modelingand performance evaluation.
Rodrigo Chandia is a Ph.D. student in Computer Science at the Universityof Tulsa, Tulsa, Oklahoma. His research interests include SCADA security,computer security and open source software development methodologies.
Paul Craven is a Professor of Computer Science at Simpson College, Indi-anola, Iowa. His research interests are in the areas of information assuranceand data communications for railroads.
Yves Deswarte is a Research Director at LAAS-CNRS, Toulouse, France.His research interests include distributed systems dependability and security,critical infrastructure protection and privacy-preserving authorization schemes.
Scott Dynes is a Senior Research Fellow at the Center for Digital Strategies,Tuck School of Business, Dartmouth College, Hanover, New Hampshire. Hisresearch interests include information risk management and the resilience ofcritical infrastructures to cyber disruptions.
Terry Fleury is a Research Programmer at the National Center for Super-computing Applications, University of Illinois, Urbana-Champaign, Illinois. Hisresearch interests include grid computing security, computer-supported coop-erative work and human-computer interaction.
Emanuele Galli is a Ph.D. student in Computer Science at the University ofRome – Tor Vergata, Rome, Italy. His research interests include critical infras-tructure modeling and simulation, and agent-based modeling and simulation.

Contributing Authors xi
James Graham is the Henry Vogt Professor of Computer Science and En-gineering at the University of Louisville, Louisville, Kentucky. His researchinterests include information security, digital forensics, critical infrastructureprotection, high performance computing and intelligent systems.
Jeffrey Hieb is an Assistant Professor of Engineering Fundamentals at theUniversity of Louisville, Louisville, Kentucky. His research interests includeinformation security, honeypots, digital forensics, secure operating systems andengineering education.
Kenneth Hopkinson is an Assistant Professor of Computer Science at theAir Force Institute of Technology, Wright-Patterson Air Force Base, Ohio. Hisresearch interests include critical infrastructure modeling and simulation, andvulnerability analyses of power systems.
Jeffrey Hunker is a Professor of Technology and Public Policy at the HeinzSchool of Public Policy and Management at Carnegie Mellon University, Pitts-burgh, Pennsylvania. He previously served as the Senior Director for CriticalInfrastructure, National Security Council, The White House, Washington, DC.His research primarily focuses on information security and homeland security.
Robert Hutchinson is the Manager of the Networked Systems Survivabil-ity and Assurance Department and the Coordinator of Information AssuranceResearch at Sandia National Laboratories, Albuquerque, New Mexico. His re-search interests include hardware-based computer security, supply chain risk,and security through unpredictability.
Stig Johnsen is a Senior Research Scientist at SINTEF, Trondheim, Norway.His research interests include information security, SCADA systems, integratedoil and gas operations, and plant safety.
Wray Johnson is the Chief Software Architect for IntePoint LLC, Charlotte,North Carolina. His research focuses on extensible architectures for integratedmodeling and simulation in support of system-of-systems analyses.
Mohamed Kaaniche is a ResearchDirector at LAAS-CNRS, Toulouse, France.His research interests include the security and dependability of fault-tolerantcomputing systems and critical infrastructure protection.
Himanshu Khurana is a Principal Research Scientist at the InformationTrust Institute, University of Illinois, Urbana-Champaign, Illinois. His research

xii CRITICAL INFRASTRUCTURE PROTECTION II
interests include access control, key management and critical infrastructure pro-tection.
Marieke Klaver is a Senior Researcher at TNO Defence, Security and Safety,The Hague, The Netherlands. Her research interests include information as-surance and critical infrastructure protection.
Seok-Won Lee is an Assistant Professor of Software and Information Sys-tems at the University of North Carolina at Charlotte, Charlotte, North Car-olina. His research areas include software engineering, machine learning andknowledge-based systems.
Rafal Leszczyna is a Scientific Officer at the Joint Research Center of theEuropean Commission, Ispra, Italy, and a member of the Information Assur-ance Group at Gdansk University of Technology, Gdansk, Poland. His researchinterests include computer security, security protocols and software agents.
Eric Luiijf is a Principal Consultant at TNO Defence, Security and Safety, TheHague, The Netherlands. His research interests include information assuranceand critical infrastructure protection.
Jonathan Margulies is a Senior Member of the Technical Staff at Sandia Na-tional Laboratories, Albuquerque, New Mexico. His research interests includesecure system design and control systems security.
Marcelo Masera is a Scientific Officer at the Institute for the Protection andSecurity of the Citizen, Joint Research Center of the European Commission,Ispra, Italy. His research interests include the security of networked systems andsystems-of-systems, risk governance, and control systems and communicationsystems security.
Vincenzo Masucci is a Senior Researcher with the CRIATE Consortiumin Portici, Italy. His research interests include knowledge representation andknowledge management in the critical infrastructure domain.
Igor Nai Fovino is a Scientific Officer at the Institute for the Protection andSecurity of the Citizen, Joint Research Center of the European Commission,Ispra, Italy, and a Lecturer of Operating Systems at the University of Insub-ria, Varese, Italy. His research interests include system survivability, formalmethods for security assessment, secure communication protocols and privacy-preserving data mining.

Contributing Authors xiii
David Nicol is a Professor of Electrical and Computer Engineering at theUniversity of Illinois, Urbana-Champaign, Illinois. His research interests arein the areas of high performance computing, performance analysis, simulationand modeling, and network security.
Albert Nieuwenhuijs is a Senior Researcher at TNO Defence, Security andSafety, The Hague, The Netherlands. His research interests include operationalanalysis and critical infrastructure protection.
Hamed Okhravi is a Ph.D. candidate in Electrical and Computer Engineeringat the University of Illinois, Urbana-Champaign, Illinois. His research interestsinclude cyber security, trusted computing, high assurance systems, cryptogra-phy and simulation.
Paul Oman is a Professor of Computer Science at the University of Idaho,Moscow, Idaho. His research interests include various aspects of informationassurance, especially securing real-time systems used in critical infrastructures.
Alberto Paoluzzi is a Professor of Computer-Aided Design in the Depart-ment of Informatics and Automation at the Third University of Rome, Rome,Italy. His research interests include new methods for modeling complex sys-tems, physically-based object representations using cell decompositions andalgebraic topology methods.
Mauricio Papa is an Associate Professor of Computer Science at the Uni-versity of Tulsa, Tulsa, Oklahoma. His research interests include distributedsystems, information assurance, and network and SCADA systems security.
Brian Porter received his M.S. degree in Computer Science from the Univer-sity of Tulsa, Tulsa, Oklahoma. His research interests include network securityand SCADA systems security.
Richard Raines is a Professor of Electrical Engineering at the Air Force In-stitute of Technology, Wright-Patterson Air Force Base, Ohio. His researchinterests include computer and communications network security and vulnera-bility analysis.
Julian Rrushi is a Research Scholar in the Department of Computer Science,University of Illinois, Urbana-Champaign, Illinois, and a Ph.D. candidate inComputer Science at the University of Milan, Milan, Italy. His research inter-ests are in the areas of computer and network security, and cryptology.

xiv CRITICAL INFRASTRUCTURE PROTECTION II
Andrew Schumpert is an M.A. student in Geography at the University ofNorth Carolina at Charlotte, Charlotte, North Carolina. His research focuseson methodologies for critical infrastructure model development.
Giorgio Scorzelli is a Professor of Computer Graphics in the Department ofInformatics and Automation at the Third University of Rome, Rome, Italy.His research interests include data analysis, topological methods for image seg-mentation, and progressive and multi-resolution techniques for scientific visu-alization.
Roberto Setola is the Director of the Complex Systems and Security Labora-tory at University Campus Bio-Medico of Rome, Rome, Italy. His researchinterests include interdependent infrastructure modeling and analysis, con-trol strategies for complex systems, non-linear estimation, mobile robots andbiomedical systems.
versity of Tulsa, Tulsa, Oklahoma. His research interests include informationassurance and SCADA systems security.
Sujeet Shenoi, Chair, IFIP Working Group 11.10 on Critical InfrastructureProtection, is the F.P. Walter Professor of Computer Science at the Universityof Tulsa, Tulsa, Oklahoma. His research interests include information assur-ance, digital forensics, critical infrastructure protection and intelligent control.
Nils Svendsen is a Postdoctoral Research Fellow at the Norwegian Informa-tion Security Laboratory, Gjovik University College, Gjovik, Norway. His re-search interests include the modeling and simulation of critical infrastructures,graph theory, cryptography and coding theory.
William Tolone is an Associate Professor of Software and Information Sys-tems at the University of North Carolina at Charlotte, Charlotte, North Car-olina. His research interests include modeling and simulation, critical infras-tructure protection, visual analytics, agent-based integration, collaborative sys-tems, information environments and meta-level architectures.
Michele Vicentino is the Technical Director of TRS, Rome, Italy. His re-search interests include functional programming languages and their use inimplementing complex, heterogeneous systems.
Ryan Shayto received his Ph.D. degree in Computer Science from the Uni-

Contributing Authors xv
Von Welch is the Co-Director of Cyber Security at the National Center for Su-percomputing Applications, University of Illinois, Urbana-Champaign, Illinois.His research interests include distributed and federated security architectures.
Dorsey Wilkin, a Captain in the U.S. Air Force, received his M.S. degree inComputer Science from the Air Force Institute of Technology, Wright-PattersonAir Force Base, Ohio. His research interests include information assurance andnetwork security.
Paul Williams is a Major in the U.S. Air Force and an Assistant Professor ofComputer Science at the Air Force Institute of Technology, Wright-PattersonAir Force Base, Ohio. His research interests include machine learning, dataand information security, and computer hardware design.
Stephen Wolthusen is a Professor of Information Security at the NorwegianInformation Security Laboratory, Gjovik University College, Gjovik, Norway,and a Lecturer in the Department of Mathematics at Royal Holloway, Uni-versity of London, London, United Kingdom. His research interests includethe modeling and simulation of critical infrastructures using combinatorial andgraph-theoretic approaches as well as network and distributed systems security.
Wei-Ning Xiang is a Professor of Geography and Earth Sciences at the Uni-versity of North Carolina at Charlotte, Charlotte, North Carolina. His researchinterests include geographic information science, multi-attribute assessmentand evaluation, spatial simulation and modeling, and critical infrastructureprotection.
Cody Yeager is an M.A. student in Geography at the University of NorthCarolina at Charlotte, Charlotte, North Carolina. His research focuses on theidentification of intervention points during critical infrastructure disruptions.
Roberto Zollo is the Controller of Theorematica SpA, Rome, Italy and ChiefExecutive Officer of TRS, Rome Italy. His research interests include criticalinfrastructure protection, environmental control and crisis management.

Preface
The information infrastructure – comprising computers, embedded devices,networks and software systems – is vital to operations in every sector: infor-mation technology, telecommunications, energy, banking and finance, trans-portation systems, chemicals, agriculture and food, defense industrial base,public health and health care, national monuments and icons, drinking waterand water treatment systems, commercial facilities, dams, emergency services,commercial nuclear reactors, materials and waste, postal and shipping, andgovernment facilities. Global business and industry, governments, indeed so-ciety itself, cannot function if major components of the critical informationinfrastructure are degraded, disabled or destroyed.
This book, Critical Infrastructure Protection II, is the second volume inthe annual series produced by IFIP Working Group 11.10 on Critical Infras-tructure Protection, an active international community of scientists, engineers,practitioners and policy makers dedicated to advancing research, developmentand implementation efforts related to critical infrastructure protection. Thebook presents original research results and innovative applications in the areaof infrastructure protection. Also, it highlights the importance of weaving sci-ence, technology and policy in crafting sophisticated, yet practical, solutionsthat will help secure information, computer and network assets in the variouscritical infrastructure sectors.
This volume contains twenty edited papers from the Second Annual IFIPWorking Group 11.10 International Conference on Critical Infrastructure Pro-tection, held at George Mason University, Arlington, Virginia, March 17–19,2008. The papers were selected from forty-two submissions, which were refereedby members of IFIP Working Group 11.10 and other internationally-recognizedexperts in critical infrastructure protection.
The chapters are organized into six sections: themes and issues, infrastruc-ture security, control systems security, security strategies, infrastructure in-terdependencies, and infrastructure modeling and simulation. The coverage oftopics showcases the richness and vitality of the discipline, and offers promisingavenues for future research in critical infrastructure protection.
This book is the result of the combined efforts of several individuals and or-ganizations. In particular, we thank Rodrigo Chandia and Eric Goetz for theirtireless work on behalf of IFIP Working Group 11.10. We gratefully acknowl-

xviii CRITICAL INFRASTRUCTURE PROTECTION II
edge the Institute for Information Infrastructure Protection (I3P), managed byDartmouth College, for nurturing IFIP Working Group 11.10 and sponsoringsome of the research efforts whose results are described in this volume. We alsothank the Department of Homeland Security and the National Security Agencyfor their support of IFIP Working Group 11.10 and its activities. Finally, wewish to note that all opinions, findings, conclusions and recommendations inthe chapters of this book are those of the authors and do not necessarily reflectthe views of their employers or funding agencies.
MAURICIO PAPA AND SUJEET SHENOI

Chapter 1
EMERGENT RISKS IN CRITICALINFRASTRUCTURES
Scott Dynes
Abstract Firms cannot function successfully without managing a host of inter-nal and external organizational and process interdependencies. Part ofthis involves business continuity planning, which directly affects how re-silient a firm and its business sector are in the face of disruptions. Thispaper presents the results of field studies related to information riskmanagement practices in the health care and retail sectors. The studiesexplore information risk management coordinating signals within andacross firms in these sectors as well as the potential effects of cyberdisruptions on the firms as stand-alone entities and as part of a criticalinfrastructure. The health care case study investigates the impact ofthe Zotob worm on the ability to deliver medical care and treatment.The retail study examines the resilience of certain elements of the foodsupply chain to cyber disruptions.
Keywords: Information security, emergent risk, health care, grocery retail
1. Introduction
No man is an island, entire of itself... John Donne (1572–1631)
Donne wrote these words while contemplating the responsibilities of individualsin a shared society (Devotions Upon Emergent Occasions, Meditation XVII).His words are just as applicable today when contemplating the role of individualactors in critical infrastructures. A critical infrastructure is a composite ofvarious entities (firms) that produce products and/or services. Several marketforces are in play so that the ensemble acts in an apparently reliable fashionto provide a critical need. One can think of the resulting good or service asbeing a quasi-emergent property of the ensemble of firms acting individuallyto maximize their (economic) utility. These emergent properties are the resultof a complex set of interactions involving explicit and implicit coordinatingcommunications as well as the transfer of information and physical goods.
Please use the following format when citing this chapter: Dynes, S., 2008, in IFIP Interna tional Federation for Informa tion Processing, Volume 290; Critical Infrastructure Protection II, eds. Papa, M., Shenoi, S., (Boston: Springer), pp. 3–16.

4 CRITICAL INFRASTRUCTURE PROTECTION II
Expanding on the theme of emergent risk requires looking beyond the risksof individual actors. The risk emerges at the level of the ensemble (infrastruc-ture sector) due to a lack of understanding of the interdependencies and theconsequences of various supply and information technology (IT) disruptions onthe ability of the ensemble to produce the required good or service. Certainframeworks such as supply chain risk (e.g., [2, 7]) support the analysis of riskdue to interdependencies. However, this paper focuses primarily on the risk tocontrol mechanisms resulting from their use of the information infrastructure.The approach adopted is not to examine the resilience of the supply chain perse, but that of the communications used to coordinate the supply chain.
This paper examines the richness of coordinating signals relating to theresilience of the information infrastructure used to communicate informationregarding business processes and the effect of the coordinating signals on busi-ness continuity. It investigates how information risk management (IRM) occursamong business participants to produce goods and services. The first hypoth-esis is that a correlation exists between an entity’s dependence on IT and thelevel of IRM coordinating signals – entities more dependent on the informationinfrastructure take more steps to manage the risk due to cyber disruptions.The second hypothesis is that richer IRM coordinating signals result in morerobust inter-entity business processes.
When examining critical infrastructure protection from an information secu-rity or risk perspective, it is also necessary to consider the emergent behaviorof the ensemble. Much research has been devoted to IT risk managementwithin individual firms. These firms are best viewed not as monoliths but asan integrated ensemble of agents whose activities are shaped by the economicforces driving the organization and its products. This view can explain whysophisticated organizations view information security as an exercise in IT riskmanagement – appropriately reducing business risk means that the businesswill probably make more money.
To gain a deeper sense of the issue, it is instructive to view individual busi-nesses and business sectors as a continuum of individual entities with differinglevels of coordinating signals. At the highly coordinated end of the contin-uum is the individual corporation, which has separate departments for produc-tion, marketing, human resources, etc. Figure 1 shows a business as a set ofindividual entities (departments) with highly coordinated activities. Individ-ual entities share information and/or physical goods with other entities in thebusiness. These entities exchange a range of coordinating signals in order tooptimize the production of goods and services. In some firms, the coordinatingsignals are explicitly mapped to enable them to better manage information risk.The emergent risk is reduced due to a decrease in the unknown response of theensemble to specific disruptions.
At the the other end of the continuum are business sectors or supply chainnetworks, where the entity of interest is the firm and the coordinating signalsare few (Figure 2). Interactions between entities in the sector are based onmarket forces or possible collaborations; their efforts are actively optimized for

Dynes 5
Financial
Procurement
Research andDevelopment
Marketing
HumanResources
Production
Sales
Delivery
Consulting
InformationPhysical
Figure 1. Business sector entities with highly coordinated activities.
InformationPhysical Tier 1 Tier 1
Tier 2 Tier 2Tier 2
Tier 3 Tier 3Tier 3
ASP
Transportation
Financial
Procurement
Research andDevelopment
Marketing
HumanResources
Production
Sales
Consulting
Delivery
Financial
Procurement
Research andDevelopment
Marketing
HumanResources
Production
Sales
Consulting
Delivery
Financial
Procurement
Research andDevelopment
Marketing
HumanResources
Production
Sales
Consulting
Delivery
Financial
Procurement
Research andDevelopment
Marketing
HumanResources
Production
Sales
Consulting
Delivery
Financial
Procurement
Research andDevelopment
Marketing
HumanResources
Production
Sales
Consulting
Delivery
Financial
Procurement
Research andDevelopment
Marketing
HumanResources
Production
Sales
Consulting
Delivery
Financial
Procurement
Research andDevelopment
Marketing
HumanResources
Production
Sales
Consulting
Delivery
Financial
Procurement
Research andDevelopment
Marketing
HumanResources
Production
Sales
Consulting
Delivery
Financial
Procurement
Research andDevelopment
Marketing
HumanResources
Production
Sales
Consulting
Delivery
Financial
Procurement
Research andDevelopment
Marketing
HumanResources
Production
Sales
Consulting
Delivery
Figure 2. Business sector entities with loosely coordinated activities.
the good of the individual firms. In fact, interactions between entities maybe limited to arms-length negotiations for goods and services, in which caseIRM coordinating signals will be missing. Many firms are taking a more activeapproach in managing their referred risk (resulting from inadequate IRM prac-tices at other firms) by requiring potential suppliers to fill out questionnairesabout their information security practices [3]. Such assessments and follow-on

6 CRITICAL INFRASTRUCTURE PROTECTION II
gap analyses are examples of high levels of IRM coordinating signals withinbusiness sectors.
In between the two extremes are firms that do not pay much attention toinformation risk and firms (e.g., in the financial sector) that pay a great dealof attention to IRM.
Managing IT risk within firms is a considerable challenge, even when firmstend to be well integrated and have rich coordination mechanisms and man-agement structures that lend themselves to centralized control. In contrast,critical infrastructures such as the energy and retail sectors involve actors thatare much less tightly integrated; control and coordination are achieved throughmarket signals or government intervention as in the financial market. Thepaucity of control and coordination mechanisms at the sector level makes itmore of a challenge for individual firms to manage risk outside their firms.
This paper attempts to elucidate IRM coordinating signals among actors incritical infrastructures and to relate them to emergent risks. First, it examinesa health care institution that was affected by the Zotob worm; this institutionacts like an infrastructure of loosely coupled clinical, business and service (e.g.,IT) departments. Next, it analyzes the supply chain network of a retail grocerychain, examining the information and physical supply chains of the retail gro-cery and dairy suppliers. The paper studies the risk to the supply chain fromcyber events and discusses the relationship between supply chain strategies andsupply chain resilience.
2. Field Study Method
The field study involved a set of interviews with top-level information secu-rity managers, administrators of clinical units and supply chain managers atthe participating firms. The interviews were designed to elicit the knowledgeand beliefs of the individuals. Security audits were not conducted as part ofthe study. Interviews were conducted anonymously and every effort was madeto build a high degree of trust with the interviewees. The same questionswere asked of interviewees at each firm; this facilitated internal consistencychecks and the triangulation of different data sources to arrive at robust con-clusions [6]. The questions were also crafted to expose tactical and strategicissues regarding information security and its role in maintaining the functionalability of the firms.
Questions asked during the interviews focused on the identification and man-agement of information security risk, in particular, the business continuity riskfirms faced as a result of using IT to enable their services and supply chains.These open-ended questions elicited the impact that cyber events had on theability of the interviewees’ divisions to continue to operate. Another focus wasdetermining the risk management culture within the division and the firm asa whole. The topics explored the perceived reliance on technology, the partiesresponsible for managing risk, and the development of contingency plans forcyber events. The results of these conversations were documented and serve asthe basis for the conclusions presented in this paper.

Dynes 7
The health care sector study interviewed eighteen individuals from twohealth care organizations (six clinical divisions, four administrative divisionsand four information security (IS) divisions). The retail study interviewedtwenty managers and directors from seven firms in the supply chain, rangingfrom suppliers of raw goods to a retail grocery chain.
3. Field Study Results
This section presents the results of the field studies in the health care andretail sectors. The goals of the field study interviews were to determine theflows of information and physical goods within firms and with their immediatesuppliers/customers, and to determine the impact of a loss of communicationor local IT capability on their ability to produce goods and services.
The primary questions asked in the field studies were:
What coordinating information flows exist between entities that mightpromote effective risk management?
Is there a correlation between these information flows and the level ofresilience in the critical infrastructures? Note that the focus was on theresilience to cyber disruptions, i.e., the ability of the infrastructure toprovide goods or services in the face of cyber disruptions.
What characteristics of individual entities and their coordinating activi-ties lead to this level of resilience? In particular, are there strategies thatlead to more robust ensembles? Entities within firms presumably haveinternal incentives to address the risk they face from relying on the ITinfrastructure; it is not clear to what extent coordinating signals betweenentities at the sector level are driven by concerns about IT risk. As such,the emergent behavior of the sector is likely not optimized for resiliencein the face of cyber disruptions.
Several other factors affect the ability of these infrastructures to operate,including the availability of the telephone system and transportation (truck-ing companies). Therefore, it is important not to lose sight of the profoundinterdependencies that exist between critical infrastructures.
3.1 Health Care Field Study
The health care organization consists of a main campus housing a hospitaland multiple clinics. The organization also operates several hospitals and clinicsthroughout the geographic region. The main campus provides most of theadministrative functions and serves as the ISP for these hospitals and clinics.
The health care organization has physicians on staff as well as independent,affiliated physicians who have admitting privileges. Staff physicians have accessto assets such as digital patient records, laboratory results and the schedulingsystem via the internal network. Affiliated physicians have access throughInternet-mediated (web-based) interfaces to these applications. Patients mayaccess a limited amount of information via a web-based interface.

8 CRITICAL INFRASTRUCTURE PROTECTION II
SuppliersRemote Clinics
AffiliatedPhysicians
Insurers
Health Care Organization
Clinical and AdministrativeDepartments
EnterpriseApplications
EMRERPFinancialPharmacyetc.
Department−Specific Applications
Win. 2000 WorkstationsInternal IT Group
Department−Specific Applications
Win. 2000 WorkstationsInternal IT Group
Department−Specific Applications
Win. 2000 WorkstationsInternal IT Group
Department−Specific Applications
Win. 2000 WorkstationsInternal IT Group
Department−Specific Applications
Win. 2000 WorkstationsInternal IT Group
Figure 3. Information structure in the health care organization.
Every department is dependent to some extent on IT. In general, depart-ments use software applications for scheduling, patient tracking and other corefunctions. The hospital’s electronic medical record (EMR) system is a collec-tion of databases and information from many applications presented as a unifiedwhole via an end-user interface. The EMR system contains patient informationsuch as medical charts, radiological images and laboratory test results. Accessto the records is available via the Internet for individuals located outside themain campus.
Figure 3 presents an overview of the information structure of the healthcare organization. Administrative and clinical units use enterprise-level appli-cations, mainly the EMR system along with department-specific applications.Affiliated physicians access the EMR system over the Internet. Affiliated clin-ics also access enterprise applications over the Internet. The organization hasseveral thousand workstations that primarily run Windows 2000. These areused to access the EMR system, scheduling and other applications that runon Unix machines, and other network-based applications that are internal orexternal to the hospital.
Information Risk Management Coordinating Signals. The ISand clinical units are loosely connected; many clinical departments have theirown small IS units for developing and running applications. A formal liaisonprogram exists between the hospital-level IS department and each individualclinical unit. However, the level of interaction is fairly low; in particular, thehospital-level IS department does not appear to have a substantive understand-ing of the IT needs of clinical units.
The perceived low level of IRM coordinating signals was reinforced duringconversations with the hospital CIO and administrative directors of the variousdepartments. The CIO was the first point of contact for the field study. Atthe first interview (conducted three months after the Zotob worm event), he

Dynes 9
mentioned that the impact of Zotob was felt almost entirely by the IS staff. Hebelieved that few clinical or administrative personnel would recall the event andthat its impact on the clinical and administrative departments were minimal.However, most of the clinical and administrative directors felt that the impactwas significant. One clinical administrator declared, “All I can tell you is thatit was living hell.”
The IRM coordinating signals between the departments in the hospital ap-pears to be very low. The response to IT reliability issues was primarily todevelop a small departmental IS group rather than to coordinate with thehospital-level IS group. With respect to IRM planning, there is essentially nosystemic risk management effort at the hospital level.
Resilience to the Zotob Event. Computing resources at the hospitalwere infected by the Zotob worm [9] in August 2005. Zotob targeted Windows2000 machines, attempting to replicate itself by searching for other vulnerablemachines on the network. The result was a flood of traffic on the hospital’sintranet, resulting in denial-of-service attacks against the hospital’s internalservers. The IS units were able to make the EMR system available about anhour into the event. However, most applications and the Internet were downfor three days.
Zotob had a significant impact on business processes at the hospital, butthere was little to no impact on the ability of the hospital to offer health care.The clinical and administrative units at the hospital were able to provide normallevels of service based on the volume of patients at the time. The principalexception was the radiology unit, which could take images but not deliverthem via the intranet to physicians; consequently, the radiation oncology unitwas also not operational. The interviewees universally agreed that the qualityof care delivered was not affected by the event; however, they did feel that theevent significantly increased the chances of providing substandard care.
This is not to say that providing medical care was easy. The Zotob wormhad a great impact on operations – physicians did not know which patientsthey were to see and for what complaints; patients could not be scheduled;some medical procedures and services, especially those relying on radiology,were degraded (e.g., emergency room radiological images were viewed on themachines that took them). The hospital was able to function because of thededication and flexibility of the staff. Many interviewees said that they simplyhad to make things happen – not providing medical care was not an option.
Is this resilience due to IRM coordinating signals between the various entitiesthat make up the hospital? The evidence suggests not. Clearly, there was alack of IRM coordinating signals among entities. The resilience was due toindividual initiative and the ethic that medical care had to be provided.
3.2 Retail Grocery Field Study
The retail grocery environment is primarily a supply chain network, reachingfrom producers to retail grocery stores. The goal of the study was to determine

10 CRITICAL INFRASTRUCTURE PROTECTION II
Headquarters
IT Elements− Financial Systems− Daily Movement Tracking− Demand Forecasting− Vendor Ordering− Trucking and Scheduling
TruckingBroker
PhysicalInformation
Retail Grocery Chain
−or−
CenterDistributionCenter
IT Elements:− Warehouse Mgmt. System− Voice Picking System (Scheduling System)
CenterDistributionCenter
IT Elements:− Warehouse Mgmt. System− Voice Picking System (Scheduling System)
CenterDistributionCenter
IT Elements− Warehouse Mgmt. System− Voice Picking System (Scheduling System)
Retail StoresIT Elements− POS Systems− Ordering Interfaces− No Data Storage
Retail StoresIT Elements− POS Systems− Ordering Interfaces− No Data Storage
Retail StoresIT Elements− POS Systems− Ordering Interfaces− No Data Storage
Retail StoresIT Elements− POS Systems− Ordering Interfaces− No Data Storage
Retail StoresIT Elements− POS Systems− Ordering Interfaces− No Data Storage
Figure 4. Schematic view of the retail grocery chain.
the resilience of the grocery supply chain to cyber disruptions. The methodinvolved an analysis of the information and grocery supply chains, and theelucidation of IRM coordinating signals and reactions of entities to the signals.The retail grocery field study is different from the health care study in two keyrespects. First, the interactions of interest are between firms, not departmentswithin the same firm. Second, the view of risk is evaluated proactively, notafter a disruption as in the case of the health care field study. This sectiondiscusses the situation at the grocery retail chain as well as at a dairy supplier.
Retail Grocery Chain
The subject of the study is a U.S. regional grocery chain with more than100 stores and in excess of 10,000 employees. The chain is wholly owned bya parent organization, which also owns and operates grocery chains in otherregions of the country. The chain is fairly representative of others in the sectorwith respect to IT, stock replenishment and supply chain activities.
Figure 4 presents a schematic diagram of the retail grocery chain. It includesa headquarters, a distribution center and retail stores. The chain owns a fleetof trucks, but also contracts trucking firms. An important IT component isthe scheduling system, a distributed system comprising servers located at thechain’s headquarters and at distribution centers.

Dynes 11
The use of IT is central to most of the business activities. At every store,point-of-sale data is used to track the movement of goods and create replenish-ment orders. Store managers of certain departments (e.g., produce) use wirelesstablet devices to communicate their orders to headquarters. IT applications ateach distribution center manage the inventory at the center. Wireless devices atthe distribution centers assist workers in loading pallets; an algorithm optimizespallet loads so that the heaviest items are placed at the bottom.
Practically all the IT systems are located at the chain’s headquarters. Thereare no servers at store locations; the inventory systems used at the distributioncenters are not located at the centers. When a customer swipes a credit ordebit card to pay for a purchase at a store, the data is transmitted to thechain’s headquarters. Applications that run the sales function contact a bankor clearing agent for approval, the approval is received by the application at theheadquarters, which then sends the appropriate commands to the point-of-saledevice at the store.
Communication with vendors is done primarily via electronic data inter-change (EDI) or web-based applications. Examples include sending data aboutthe daily movement of goods to vendors who manage their own inventories andto trucking firms that schedule deliveries to distribution centers and stores. Be-cause of the dependence on IT, the grocery chain has invested in a backup datacenter that enables all data and applications to be quickly reconstituted aftera disruption at the primary data center. The grocery chain also requires everystore to have two ways of obtaining Internet connectivity to the applicationsrunning at its headquarters.
Information Risk Management Coordinating Signals. The gro-cery chain expends considerable effort to optimize its business processes. Ithas applications that optimize store replenishment orders based on the time ofyear and anticipated weather (e.g., hurricanes and snowstorms) and others thatoptimize the placement of products on shelves. There is a certain amount ofpressure to automate business processes to “take the cost out of the business.”
To support these efforts, the chain has a development group whose responsi-bility is to create and deploy applications that support business processes. Theapplication development group works closely with the business side to defineneeds. Part of its task is to assess the levels of availability and redundancyof hardware, networks, disk storage, etc. to provide business continuity; theserequirements are passed on to the infrastructure group.
The grocery chain clearly has a high level of IRM coordinating signals. Busi-ness managers interact with the application development group. The applica-tion development group works on a plan to manage the information risk, whichis then made operational. Interviews with the head of the application develop-ment group indicated that he was very aware of the retail chain’s dependenceon the information infrastructure and that he was proactively taking steps tomanage risk.

12 CRITICAL INFRASTRUCTURE PROTECTION II
In contrast, there are few, if any, IRM coordinating signals between the gro-cery chain and its supply network. At the time the interviews were conducted,the grocery chain made no effort to determine IRM practices at its suppliers.Also, no examples of grocery chain and vendor contingency planning for cyberevents emerged during the interviews.
Resilience to Cyber Events. Given these internal IRM coordinatingsignals, we examine the consequences of various cyber events.
Communications Events: It is extremely important that stores cansend their orders to the data canter. Each store has a leased line to thechain’s headquarters along with a backup modem system that functionsas a transparent failover. When a store does have a connectivity outage,a store manager writes the point-of-sale information on a CD or thumb-drive, takes it to a sister store, and uses the other store’s resources toplace its orders. In the event that the data center does not receive ordersfrom a store, it uses the store’s average order to replenish items at thestore.
Interviews with supply managers revealed that if the Internet were to godown, but the grocery chain’s internal systems were up, and stores anddistribution centers could access systems at the data center, orders tovendors that stocked the distribution centers could be replicated usingtelephone and fax communications. However, if the Internet outage wereto be ongoing, the range of items ordered from vendors would be narrowedover time.
According to the interviewees, an Internet outage that lasts a minutewould pose no problem, nor would one that lasts an hour (no matter whichhour). However, a daylong outage would impact purchase orders sent tovendors, the scheduling of deliveries at distribution centers, and ordersfrom stores for perishable items. Orders for less perishable items andnon perishable items would not be affected. Thus, the communicationsinterruption would impact daily deliveries to stores; the impact to thebusiness would not be serious.
However, an outage that lasts two days would be problematic. Distri-bution centers would not be able to distribute goods or replenish theirstocks; customers would certainly notice the difference. An outage lastingthree days or longer would result in a chaotic situation, especially withregard to replenishing stocks at distribution centers and stores.
If EDI transmissions to vendors were to be interrupted, operations wouldbe manual (telephone and fax) for the first few days. If the interruptionwere to continue, triage would occur and fewer items would be ordered andshipped. The first priority is to ensure that products are on store shelves.Managers believe they could transmit orders to vendors via telephone orfax. However, the resources required for this would be so substantial thatlittle else would be done in the way of business. In any case, it is not

Dynes 13
clear if vendors would be able to accept and process the blizzard of phonecalls and faxes.
Hardware Events: The grocery chain has two data centers, one locatedat its headquarters and the other, a backup center, located a few hoursdrive away. Each data center has a complete data set, but not a completeset of applications. Consequently, if the data center at headquarters wereto have a major hardware failure, stores would be required to re-transmittheir orders to the backup site.
Dairy Supplier
One goal of the study is to follow the supply chain of a staple food froma producer to the retail chain. The dairy supply chain is a good example.Diary products include milk, cream-based products (butter and cheese), drymilk products as well as casein, which is used in processed foods, adhesivesand certain plastics. We primarily focus on liquid dairy products. The supplychain consists of dairy farms, dairy processors that process raw milk from dairyfarms, and grocery stores that receive shipments of milk from dairy processors.
Coordinating Signals and Resilience. The grocery chain is the onlyentity in the dairy supply chain that exhibits IRM coordinating signals. Infact, our conclusion is that the grocery chain has a high level of internal IRMcoordinating signals and acts on these signals. However, despite the lack ofcoordination signals, the evidence suggests that the diary supply chain wouldbe resilient to cyber events, primarily because of its low level of reliance ontechnology. The dairy processor would suffer from a process control systemoutage, but many of the core functions can be performed manually.
4. Discussion
What do the field studies say about the first hypotheses in the introduction?This hypothesis states that entities that are more dependent on the informa-tion infrastructure take more steps to manage the risk they face from cyberdisruptions. The hospital and the retail grocery chain are very dependent ontechnology; cyber disruptions could severely impact their ability to function.This was seen at the hospital during the Zotob worm event. It is also clearthat the grocery chain has much greater levels of IRM coordinating signals.This is evident in the efforts expended by the application development groupto understand business needs and translate them to IT-based applications (andlikely also review the applications that support business processes).
In contrast, the hospital IS organization made few, if any, attempts to un-derstand the risk. Clearly, the hospital’s IS group did take steps to ensure thatcertain applications would continue to run despite IT failures. This “local”view of their responsibility was evident from interviews with the CIO: the factthat applications were not accessible due to the Zotob infection was not asimportant to the CIO as the fact that they were running. The great majority

14 CRITICAL INFRASTRUCTURE PROTECTION II
of hospital departments believe information security to be the responsibility ofthe IS department. While it is not clear if the IS department feels that informa-tion security is its responsibility, it is evident that no IRM coordinating signalsoriginate from the IS department. In fact, the only IRM coordinating sig-nals observed at the hospital came from the materials acquisition department.This department developed a paper-based alternative to the usual web-basedrestocking application, which it distributed to other departments.
The other firms in the field studies are much less dependent on technology.One can argue that the dairy farm’s dependence on electricity for refrigeration,automatic milking machines, etc. is a technical dependency. Diary farms arecertainly very focused on managing this risk by maintaining redundant gen-erators and storing fuel on site. Nevertheless, the conclusion is that the firsthypothesis is false – no correlation exists between an entity’s dependence onthe information infrastructure and its IRM efforts.
Regarding the second hypothesis – Do increased IRM coordinating signalslead to more robust inter-entity business processes? – the results presentedhere and elsewhere [1, 4] indicate that the answer is not clear. The retail gro-cery chain did elect to take some action based on the observed informationrisk. However, there are several examples where increased coordinating signalshave no impact on a firm’s IRM efforts. A recent oil refinery study [5] specifi-cally focused on developing IRM coordinating signals. This study utilized theRiskMAP process [8] to expose the refinery’s business and IS leaders to theimpact IT risk might have on their business. Despite the mapping of IT risk tobusiness risk, the refinery chose not to invest in additional resources to reduceits risk (mainly because it did not perceive a significant threat). The conclusionis that, while IRM coordinating signals are required to increase the resilienceof inter-entity business processes to cyber disruptions, they are not sufficient.The sticking point is that CISOs from major firms indicate that decisions re-garding the acceptable level of risk are made on the basis of instinct. Therefore,increased IRM coordinating signals would lead to more robust inter-entity busi-ness processes only to the extent that a partner entity that makes a securityinvestment sees a threat to its business.
Given the lack of IRM coordinating signals between firms in the field stud-ies, is there emergent risk in these critical infrastructures? Despite the limitednature of the field studies, a recurring theme seen during the interviews was“the will to succeed.” The main focus of all the hospital staff throughout theZotob event was the continuity of patient care. The attitude of the clinicaldepartment managers was, “we can’t stop, we just have to do what it takesto keep on going.” The result was that even though some departments expe-rienced major disruptions, patient care was delivered at normal levels. This isnot to say that the worm event did not affect the delivered care. Intervieweesindicated that while the care delivered was not compromised, the risk of sub-standard care was increased. The administrator of the perioperative unit wasclear about this, saying “if we have to go backwards and do it (record notes,document procedures, phone for lab results) by hand, it sets us up for failure.”

Dynes 15
His concerns centered around the execution of operative procedures (worryingabout waiting two to three times as long for lab results and wondering if nurseswere going to pay attention to the computer screen to make sure an orderfor blood went through) and the documentation of what happened during theprocedures (because of the staff’s lack of experience using paper forms).
The will to succeed was also evident in the retail grocery field study. Despitethe efforts at redundancy, distribution centers suffer from IT failures, which canhave a significant impact on their ability to receive goods and build shipmentsfor individual stores. Nevertheless, the interviews revealed that the distributioncenters had not missed a shipment to a store in more than 40 years. Theinterviewees felt that, because they provide an essential service, they are dutybound to ensure that store shelves are well stocked. A fresh produce vendoralso has the same will to succeed.
5. Conclusions
The field studies suggest that the degree of dependence on the informa-tion infrastructure within a firm and the steps taken by thse firm to man-age information risk are not necessarily coordinated. Also, it is not clear ifincreased IRM coordinating signals lead to more robust inter-entity businessprocesses. IRM coordinating signals are a requirement for increasing the re-silience of inter-entity business processes to cyber disruptions, but they are notsufficient. Therefore, while there may be emergent information risk from poorlyunderstood failure modes, the impact of the risk on the ability of infrastructuresto operate would likely be less than expected.
Acknowledgements
This work was partially supported by the Institute for Information Infras-tructure Protection (I3P) at Dartmouth College, Hanover, New Hampshire,under Award 2003-TK-TX-0003 from the U.S. Department of Homeland Secu-rity.
References
[1] Center for Digital Strategies, Security through Information Risk Manage-ment: A Workshop for Information Security Executives, Tuck School ofBusiness, Dartmouth College, Hanover, New Hampshire (mba.tuck.dartmouth.edu/digital/Programs/CorporateEvents/CISO2007.html) 2007.
[2] M. Christopher and H. Peck, Building the resilient supply chain, Interna-tional Journal of Logistics Management, vol. 15(2), pp. 1–14, 2004.
[3] S. Dynes, Information Security Investment Case Study: The Manufactur-ing Sector, Technical Report, Center for Digital Strategies, Tuck School ofBusiness, Dartmouth College, Hanover, New Hampshire (mba.tuck.dartmouth.edu/digital/Research/ResearchProjects/InfoSecManufacturing.pdf),2006.

16 CRITICAL INFRASTRUCTURE PROTECTION II
[4] S. Dynes, E. Andrijcic and M. Johnson, Costs to the U.S. economy ofinformation infrastructure failures: Estimates from field studies and eco-nomic data, presented at the Workshop on the Economics of InformationSecurity, 2006.
[5] S. Dynes, E. Goetz and M. Freeman, Cyber security: Are economic in-centives adequate? in Critical Infrastructure Protection, E. Goetz and S.Shenoi (Eds.), Springer, Boston, Massachusetts, pp. 15–27, 2007.
[6] J. Gubrium and J. Holstein, Handbook of Interview Research: Context andMethod, Sage Publications, Thousand Oaks, California, 2001.
[7] A. Norrman and R. Lindroth, Categorization of supply chain risk manage-ment, in Supply Chain Risk, C. Brindley (Ed.), Ashgate, Aldershot, UnitedKingdom, pp. 14–27, 2004.
[8] C. Watters, Analyzing corporate risks with RiskMAP, presented at theSecond Annual I3P Process Control Systems Security Workshop, 2006.
[9] Wikipedia, Zotob (computer worm) (en.wikipedia.org/wiki/Zotob), 2005.

Chapter 2
CYBERSPACE POLICY FORCRITICAL INFRASTRUCTURES
Dorsey Wilkin, Richard Raines, Paul Williams and Kenneth Hopkinson
Abstract The first step in preparing any battlespace is to define the domain forattack and maneuver. The various military service components have di-rected authority to focus their efforts in specific domains of operations(e.g., naval operations are mainly in the maritime domain). However,cyberspace operations pose challenges because they span multiple oper-ational domains. This paper focuses on U.S. cyberspace policy relatedto defending and exploiting critical infrastructure assets. Also, it exam-ines the issues involved in delineating responsibility for U.S. defensiveand offensive operations related to critical infrastructures.
Keywords: Critical infrastructure, cyberspace operations, policy
1. Introduction
Protecting and controlling cyberspace are daunting challenges. Cyberspaceis pervasive and has no single owner or controller. Yet, practically every crit-ical infrastructure component relies on cyberspace resources for its operation.Disruption of these resources can dramatically affect industry, government andthe citizenry.
The U.S. Department of Defense (DoD) – like its counterparts in other coun-tries – is responsible for providing the military forces needed to protect thenation’s security. It is, therefore, critical to understand the DoD’s roles andresponsibilities associated with protecting critical infrastructure assets as wellas exploiting those of an adversary in time of war.
This paper examines U.S. cyberspace policy related to defending and ex-ploiting critical infrastructure assets. It traces the evolution of the definitionof critical infrastructure from Executive Order 13010 in 1996 to Homeland Se-curity Presidential Directive 7 in 2003. Also, it analyzes the issues involved indelineating responsibility for U.S. defensive and offensive operations focused oncritical infrastructures.
Please use the following format when citing this chapter: Wilkin, D., Raines, R., William s, P. and Hopkinson, K., 2008, in IFIP International Fe deration for Inform ation Processing, Volume 290; Critical Infrastructure Protection II, eds. Papa, M., Shenoi, S., (Boston: Springer), pp. 17–28.

18 CRITICAL INFRASTRUCTURE PROTECTION II
2. Defining Critical Infrastructure
Several definitions of “critical infrastructure” have been articulated. Forexample, Moteff and Parfomak [10] define it as:
“[t]he framework of interdependent networks and systems comprisingidentifiable industries, institutions (including people and procedures),and distribution capabilities that provide a reliable flow of products andservices essential to the defense and economic security of the [nation], thesmooth functioning of government at all levels, and society as a whole.”
However, in preparation for combat, it is imperative that the battlespacebe well defined and scoped by the applicable authority. Furthermore, areasof responsibility must be explicitly delineated. To ensure proper coordinationbetween government and the private sector in the area of critical infrastructureprotection, nothing less than Presidential direction will suffice.
2.1 Executive Order 13010
Growing concerns about terrorism in the United States – largely due tothe World Trade Center and Oklahoma City bombings in 1993 and 1995, re-spectively – led to serious efforts focused on protecting the nation’s criticalinfrastructure assets. Meanwhile, the massive growth of the Internet duringthe 1990s changed the national defense focus from the physical realm to thecyber realm. To address these issues, President Clinton signed Executive Or-der (EO) 13010 on July 15, 1996 [6]. It emphasized that critical infrastructures“... are so vital that their incapacity or destruction would have a debilitatingimpact on the defense or economic security of the United States.”
EO 13010 expounded on previous documents by categorizing threats as“physical threats,” which are threats to tangible property, or “cyber threats,”which are threats of electronic, radio frequency or computer-based attacks onthe information and/or communications components that control critical in-frastructures.
EO 13010 identified the following infrastructure sectors: telecommunica-tions, electrical power systems, gas and oil storage and transportation, bankingand finance, transportation, water supply systems, emergency services (includ-ing medical, police, fire and rescue) and continuity of government.
Finally, the order established the President’s Commission on Critical In-frastructure Protection (PCCIP) that was tasked with assessing the scope andnature of the vulnerabilities and threats to U.S. critical infrastructures and rec-ommending a comprehensive implementation strategy for critical infrastructureprotection.
2.2 Presidential Decision Directive 63
In response to EO 13010, the PCCIP provided the following recommenda-tions [13]:

Wilkin, Raines, Williams & Hopkinson 19
Table 1. PDD 63 lead agency assignments.
Sector Lead Agency
Information and Communications Department of Commerce
Banking and Finance Department of the Treasury
Water Environmental Protection Agency
Aviation Department of TransportationHighwaysMass TransitPipelinesRailWaterborne Commerce
Emergency Law Enforcement Ser-vices
Department of Justice/FBI
Emergency Fire Services Federal Emergency Management AgencyContinuity of Government Services
Public Health Services Health and Human Services
Electric Power Department of EnergyOil and Gas Production and Storage
Conduct research and development in information assurance, monitor-ing and threat detection, vulnerability assessment and systems analysis,risk management and decision support, protection and mitigation, andincident response and recovery.
Increase the federal investment in infrastructure assurance research to$500 million in FY99 and incrementally increase the investment over afive-year period to $1 billion in FY04.
Establish a focal point for national infrastructure assurance research anddevelopment efforts and build a public/private-sector partnership to fos-ter technology development and technology transfer.
Acting on the PCCIP recommendations, President Clinton signed Presiden-tial Decision Directive (PDD) 63 on May 22, 1998, mandating law enforcement,foreign intelligence and defense preparedness to achieve and maintain criticalinfrastructure protection [7]. PDD 63 was the first document to assign leadagency responsibilities for critical infrastructure protection (Table 1). How-ever, the DoD was not listed.
For three years, PDD 63 was the principal defining document for criticalinfrastructure protection. It was put to the test by the events of September 11,2001.

20 CRITICAL INFRASTRUCTURE PROTECTION II
2.3 Executive Orders 13228 and 13231
Responding to the lack of coordination before, during and after the terroristattacks of September 11, 2001, President George W. Bush signed EO 13228on October 8, 2001 that established the Office of Homeland Security [2]. Theorder gave the Office of Homeland Security the responsibility for coordinatingthe executive branch’s efforts to detect, prepare, prevent, protect, respond andrecover from terrorist attacks within the United States.
EO 13228 explicitly mentioned several critical infrastructure assets:
Energy production, transmission and distribution services and criticalfacilities
Other utilities
Telecommunication systems
Facilities that produce, use, store or dispose of nuclear material
Public and privately owned information systems
Special events of national significance
Transportation systems, including railways, highways, shipping ports andwaterways, airports and civilian aircraft
Livestock, agriculture and systems for the provision of water and food forhuman use and consumption
EO 13228 designated many of the same critical infrastructure assets as PDD63. However, it added nuclear sites, special events and agriculture.
On October 16, 2001, President Bush signed EO 13231 that created the Pres-ident’s Critical Infrastructure Protection Board (PCIPB) [3]. Like the PCCIP,the PCIPB was tasked with coordinating activities related to the protection ofcritical infrastructure assets and recovery from attacks. However, the PCIPB’sprimary function was to serve as the liaison between the President and theOffice of Homeland Security. Interestingly, although EOs 13228 and 13231stemmed from acts of terrorism launched by external enemies, the DoD wasnot mentioned in either executive order.
2.4 PATRIOT Act of 2001
The U.S. Congress passed the PATRIOT Act in 2001 that extended thecapabilities of the newly created Office of Homeland Security. The act sought“[t]o deter and punish terrorist acts in the United States and around the world,to enhance law enforcement investigatory tools, and for other purposes” [17].In Section 1016 of the PATRIOT Act, known as the Critical Infrastructure Pro-tection Act of 2001, Congress updated the definition of critical infrastructureas follows:

Wilkin, Raines, Williams & Hopkinson 21
“... systems and assets, whether physical or virtual, so vital to theUnited States that the incapacity or destruction of such systems andassets would have a debilitating impact on security, national economicsecurity, national public health or safety, or any combination of thosematters.”
The act also appropriated $20 million to the DoD to ensure that any “phys-ical or virtual disruption of the operation of the critical infrastructures of theUnited States [would] be rare, brief, geographically limited in effect, manage-able, and minimally detrimental to the economy, human and government ser-vices, and national security of the United States.”
The PATRIOT Act was the first document to give the DoD some responsibil-ity for critical infrastructure protection. However, it did not give the DoD anyauthority or direction; these would eventually come from future documents.
2.5 National Strategy for Homeland Security
Executive Order 13228 created the Office of Homeland Security, the PA-TRIOT Act gave it broader authority and, on July 16, 2002, President GeorgeW. Bush signed the National Strategy for Homeland Security (NSHS) to orga-nize and prioritize its efforts [11].
The NSHS used the same definition of critical infrastructure as the PA-TRIOT Act. However, it added chemical, postal and shipping services to thelist of critical infrastructures identified by EO 13228 because they “help sustainour economy and touch the lives of Americans everyday.” The NSHS specifiedeight major initiatives related to critical infrastructure protection:
Unify America’s infrastructure protection efforts in the Department ofHomeland Security.
Build and maintain a complete and accurate assessment of America’scritical infrastructure and key assets.
Enable effective partnerships with state and local governments and theprivate sector.
Develop a national infrastructure protection plan.
Secure cyberspace.
Harness the best analytic and modeling tools to develop effective protec-tive solutions.
Guard America’s critical infrastructure and key assets against “inside”threats.
Partner with the international community to protect the transnationalinfrastructure.
The NSHS defined the lead agencies responsible for securing specific sectorsof the U.S. critical infrastructure (Table 2). In particular, it modified the lead

22 CRITICAL INFRASTRUCTURE PROTECTION II
Table 2. NSHS lead agency assignments [11].
Sector Lead Agency
Agriculture Department of AgricultureMeat and Poultry Department of AgricultureOther Food Products Department of Health and Human ServicesWater Environmental Protection AgencyPublic Health Department of Health and Human ServicesEmergency Services Department of Homeland SecurityContinuity of Government Department of Homeland SecurityContinuity of Operations All Departments and AgenciesDefense Industrial Base Department of DefenseInformation and Telecommunica-tions
Department of Homeland Security
Energy Department of EnergyTransportation Department of Homeland SecurityBanking and Finance Department of the TreasuryChemical Industry and HazardousMaterials
Environmental Protection Agency
Postal and Shipping Department of Homeland SecurityNational Monuments and Icons Department of the Interior
agencies designated by PDD 63 for all but three sectors. Also, it required agen-cies to report directly to the newly-created Department of Homeland Security(DHS). Created by the Homeland Security Act of November 25, 2002, DHS is acabinet-level department that united 22 distinct federal entities and absorbedthe responsibilities of the Office of Homeland Security.
The NSHS designated the DoD as the lead authority for the defense in-dustrial base. Also, it extended the scope of critical infrastructure to includetransnational systems and identified cyberspace security as a primary initiative.However, the NSHS did not define the domain of cyberspace.
2.6 National Strategy to Secure Cyberspace
In February 2003, the PCIPB released the National Strategy to Secure Cy-berspace (NSSC) [14]. Developed as an implementation component of theNSHS, the NSSC is intended to “engage and empower Americans to securethe portions of cyberspace that they own, operate, control, or with which theyinteract.”
The NSSC specifically defines cyberspace as the “hundreds of thousandsof interconnected computers, servers, routers, switches and fiber optic cablesthat make ... critical infrastructures work.” Cyberspace is global in designand is, therefore, open to anyone, anywhere in the world. Under the NSSC,the primary strategic objective is to prevent cyber attacks against America’scritical infrastructures. This is to be accomplished by delving deeper into the

Wilkin, Raines, Williams & Hopkinson 23
defense of critical infrastructures in order to detail cyber vulnerabilities and todevelop strategies for mitigating attacks.
The NSSC is currently the highest-level document to identify digital controlsystems (DCSs) and supervisory control and data acquisition (SCADA) sys-tems as vital to operations in the various critical infrastructure sectors. In itsSecurity Threat and Vulnerability Reduction Program, the NSSC states thatsecuring DCSs and SCADA systems is a national priority because “... the in-capacity or destruction of [these] systems and assets would have a debilitatingimpact.”
The NSSC is the first government document to mention offensive cyber oper-ations as a response to cyber attacks. (Up to this point, government documentsonly focused on defensive operations related to critical infrastructure protec-tion.) In particular, the NSSC states:
“When a nation, terrorist group or other adversary attacks the UnitedStates through cyberspace, the U.S. response need not be limited to crim-inal prosecution. The United States reserves the right to respond in anappropriate manner. The United States will be prepared for such con-tingencies.”
Finally, the NSSC lists the major risk factors involved in securing critical in-frastructures from cyberspace attacks. It observes that cyberspace-related vul-nerabilities persist because security implementations require investments thatcompanies cannot afford, security features are not easily adapted to the spaceand/or power requirements of small systems, and security measures often re-duce performance and impact the synchronization of large real-time processes.
2.7 Homeland Security Presidential Directive 7
On December 17, 2003, President George W. Bush signed the Homeland Se-curity Presidential Directive (HSPD) 7 [4], which superseded PDD 63. HSPD-7is the most up-to-date executive document on critical infrastructure identifica-tion, prioritization and protection. It uses the same definition for critical in-frastructure as the PATRIOT Act and lists the same sectors and lead agenciesas the NSHS.
HSPD-7 ordered all federal departments and agencies to develop plans forprotecting the critical infrastructures that they own or operate by July 2004.These plans had to address the identification, prioritization, protection andcontingency planning (including the recovery and reconstitution of essentialcapabilities) of all physical and cyber resources.
2.8 Defense Critical Infrastructure Program
In response to HSPD-7, DoD Directive 3020.40 [8] was issued on August19, 2005 to update policy and assign responsibilities for the Defense CriticalInfrastructure Program (DCIP). The directive defines the defense critical infras-tructure as “DoD and non-DoD networked assets essential to project, supportand sustain military forces and operations worldwide.”

24 CRITICAL INFRASTRUCTURE PROTECTION II
Table 3. DCIP lead agency assignments.
Assignment Lead Agency
Defense Industrial Base Defense Contract Management AgencyFinancial Services Defense Finance and Accounting ServiceGlobal Information Grid Defense Information Systems AgencyHealth Affairs Assistant Secretary of Defense for Health AffairsIntelligence, Surveillanceand Reconnaissance
Defense Intelligence Agency
Logistics Defense Logistics AgencyPersonnel DoD Human Resources ActivityPublic Works U.S. Army Corps of EngineersSpace U.S. Strategic CommandTransportation U.S. Transportation Command
The DCIP identifies ten critical sectors and the lead agencies responsible forthe sectors (Table 3). It also requires the Secretary of every military depart-ment to designate an Office of Primary Responsibility (OPR) for identifying,prioritizing and protecting defense critical infrastructure assets.
3. Offensive Cyber Operations Authority
While defensive measures can protect critical infrastructures, deterrence isnot achieved purely by defensive means. History has shown that, in most cases,offensive operations achieve better results than adopting a completely defensiveposture where attacks are simply endured. If military power is used, the Lawof Proportionality may dictate that an offensive cyber capability be used “inkind”. The NSSC states that when an “adversary attacks the [United States]through cyberspace ... [it] reserves the right to respond in an appropriate man-ner” [14]. The Commander of the U.S. Strategic Command (STRATCOM) hastestified to Congress that “a purely defensive posture poses significant risks”and “the defense of the nation is better served by capabilities enabling [it] totake the fight to [its] adversaries” [5]. A computer network attack capabil-ity is necessary to ensure the defense of critical infrastructures. Cyberspacesuperiority is achieved by simultaneously exploiting the adversary’s critical in-frastructure assets.
3.1 Civilian Authority
In accordance with current law, HSPD-7 and the NSHS, the Department ofHomeland Security (DHS) is the single accountable entity with the “responsi-bility for coordinating cyber and physical infrastructure protection efforts” [11].DHS has created red teams for testing critical infrastructure defenses and train-ing personnel in the private and public sectors [16]. Could DHS red teams beused to attack an adversary’s critical infrastructure assets?

Wilkin, Raines, Williams & Hopkinson 25
The technology exists for DHS red teams to conduct offensive operationswell inside U.S. (or friendly) borders. However, important legal issues must beconsidered before civilians may conduct offensive cyber operations.
The Law of Armed Conflict comprises the Geneva Conventions, the HagueConventions, various treaties and a vast body of case law. The law incorporatesseveral rules that govern the use of civilians during times of war [12]. If a civilianuses software to infiltrate an adversary’s critical infrastructure and negativelyimpact its citizens, the adversary can legally view the infiltration as an “attack”under Article 49.1. According to Article 52.2, software may be classified as aweapon when used in an attack on a critical infrastructure target because “[its]nature, location, purpose or use make [it] an effective contribution to militaryaction.” Also the civilian is a combatant under Article 51.3 because “civiliansshall enjoy the protection afforded by [the Geneva Convention], unless and forsuch time as they take a direct part in hostilities.”
Civilians who are designated as combatants can face serious problems if ap-prehended by an adversary. Under Articles 44.3 and 44.4, if a civilian combat-ant does not distinguish himself from the civilian population while engaged inan attack and if he is apprehended by the adversary while failing to distinguishhimself, he would forfeit his right to be a prisoner of war. Of course, underArticle 45.2, he would have the right to assert his entitlement to prisoner-of-warstatus before a judicial tribunal and to have that question adjudicated. Thetribunal may then consider the civilian as a lawful combatant under Article44.3 of Protocol I of the Geneva Convention [12] or as an unlawful combatantand label him a spy, mercenary or terrorist. An unlawful combatant is not aprisoner of war and can be tried and punished in accordance with local laws.He could be executed by firing squad like the mercenaries in Angola in 1976 [1].
3.2 Department of Defense Authority
Although EO 13010 raised the issue of using cyber operations to attackcritical infrastructure assets as far back as 1996, it was not until 2001 thatthe Quadrennial Defense Review identified information operations (IO), whichincludes cyber operations, as a core capability of future military forces [15].The concept was codified on May 3, 2002, when then Secretary of DefenseRumsfeld signed the classified Defense Planning Guidance (DPG 04) for thefiscal years 2004 through 2009 [15]. DPG 04 directed that “IO become a coremilitary competency, fully integrated into deliberate and crisis action planningand capable of executing supported and supporting operations.” Furthermore,it mandated that the Chairman of the Joint Chiefs of Staff develop an “IORoadmap” that would address the full scope of IO as a core competency andinclude supporting studies focused on policy, plans, organization, education,career force, analytic support, psychological operations, operations security,electronic warfare, military deception and computer network operations.
The Unified Command Plan 02 (Change 2) was approved by the Presidenton January 2, 2003. It identified six core IO capabilities: computer networkattack (CNA), computer network defense (CND), electronic warfare (EW), op-

26 CRITICAL INFRASTRUCTURE PROTECTION II
eration security (OPSEC), psychological operations (PSYOPS) and militarydeception (MILDEC) [15]. Furthermore, it created the new office of the UnderSecretary of Defense (Intelligence) within the Office of the Secretary of De-fense for IO matters. STRATCOM was assigned as the combatant commandresponsible for “integrating and coordinating DoD IO that cross geographic ar-eas of responsibility or across the IO core capabilities.” Subsequently renamedas Offensive Cyber Operations, STRATCOM was responsible for “identifyingdesired characteristics and capabilities for CNA, conducting CNA in supportof assigned missions and integrating CNA capabilities in support of other com-batant commanders, as directed.”
The IO Roadmap developed in response to DPF 04 was approved by DefenseSecretary Rumsfeld October 30, 2003. It concluded that DoD must “fight thenet” by improving CNA capability [15]. It recommended STRATCOM as thecombatant command responsible for centralized IO planning, integration andanalysis. Also, it specified that all the military services, including the SpecialOperations Command must organize, train and equip personnel for assignmentto STRATCOM. Finally, it recommended that IO become “a dedicated militaryoccupation specialty or career field” by designating service and joint IO billets.
Currently, the six IO core competencies are not universally defined, under-stood or applied. However, even if they were defined, each service would developIO specialists that would meet its specific requirements. Also, the IO specialistcommunities within the services are relatively isolated. This results in a lackof knowledge for command-level IO planners and a gap between combatantcommand needs and what is provided by the services.
Entry-level IO personnel have limited, if any, experience in the discipline andrequire significant on-the-job training [15]. Unfortunately, none of the militaryservices are mandated by Title 10 law to provide resources for IO training.Therefore, STRATCOM can request IO personnel from the services, but theservices are not required by applicable law to expend their resources to trainthe IO personnel. For these reasons, the IO career force is progressing slowerthan desired.
3.3 U.S. Air Force Authority
On December 8, 2005, the Secretary of the Air Force and the Chief of Staffof the Air Force released a new mission statement that added cyberspace tothe Air Force’s core responsibilities. When asked why the Air Force was takingthe lead for cyberspace, the Air Force Secretary stated that “the Air Force is anatural leader in the cyber world and we thought it would be best to recognizethat talent” [9]. This statement may be true, but it does not recognize the lackof IO direction in the other services and the need for one service to take thelead in organizing, training and equipping an IO force. If IO is to become anew warfighting domain on par with land, sea and air, then the personnel andequipment ought to come from a single service. This follows from the servicestructure set forth by the Goldwater-Nichols Act of 1986. Also, when multi-ple services are responsible for the same mission, different techniques, tactics,

Wilkin, Raines, Williams & Hopkinson 27
procedures and equipment are developed that not interoperable. Numerous in-stances of these interoperability problems were encountered during the militaryefforts in Vietnam, Grenada, Panama and Iraq [18].
The Air Force has taken charge of the cyberspace domain without Title 10authority or executive directive. In a September 6, 2006 memorandum to allthe major Air Force commands, the Air Force Secretary and the Chief of Staffordered the creation of a new operational command with the sole purpose oforganizing, training and equipping cyberspace forces for combatant comman-ders and STRATCOM. The 8th Air Force created a provisional CyberspaceCommand in September 2007. On par with the Air Combat Command andSpace Command, this new major command is scheduled for permanency byOctober 1, 2008. But only time will tell if the Air Force’s authority over thecyber realm will, in fact, endure.
4. Conclusions
Legal and policy issues related to cyberspace operations are still not com-pletely clear. However, what is clear is that military and civilian organizationsmust be afforded the resources commensurate with the importance of criticalinfrastructure protection. The strategic importance of offensive cyberspace op-erations cannot be overstated. The U.S. Department of Defense has recognizedcyberspace as a domain for attack and maneuver and has begun to integrate itinto wartime planning. Humankind is on the cusp of a new method of warfareand only time will reveal its viability.
References
[1] BBC News, On this Day (11 June 1976): Mercenaries trial begins in An-gola, London, United Kingdom, (news.bbc.co.uk/onthisday/hi/dates/stories/june/11/newsid 2510000/2510947.stm).
[2] G. Bush, Executive Order 13228: Establishing the Office of Homeland Se-curity and the Homeland Security Council, The White House, Washington,DC (fas.org/irp/offdocs/eo/eo-13228.htm), October 8, 2001.
[3] G. Bush, Executive Order 13231: Critical Infrastructure Protection in theInformation Age, The White House, Washington, DC (fas.org/irp/offdocs/eo/eo-13231.htm), October 16, 2001.
[4] G. Bush, Homeland Security Presidential Directive (HSPD) 7, The WhiteHouse, Washington, DC (www.whitehouse.gov/news/releases/2003/12/20031217-5.html), December 17, 2003.
[5] J. Cartwright, Statement of General James E. Cartwright, Comman-der, United States Strategic Command on the United States Strate-gic Command, House Armed Services Committee, U.S. House of Rep-resentatives, Washington, DC (armedservices.house.gov/pdfs/FC032107/Cartwright Testimony032007.pdf), March 21, 2007.

28 CRITICAL INFRASTRUCTURE PROTECTION II
[6] W. Clinton, Executive Order 13010: Critical Infrastructure Protection, TheWhite House, Washington, DC (www.fas.org/irp/offdocs/eo13010.htm),July 15, 1996.
[7] W. Clinton, Presidential Decision Directive 63, The White House, Wash-ington, DC (fas.org/irp/offdocs/pdd/pdd-63.htm), May 22, 1998.
[8] G. England, DoD Directive 3020.40, Defense Critical Infrastructure Pro-gram, Department of Defense, Washington, DC (www.dtic.mil/whs/directives/corres/pdf/302040p.pdf), August 19, 2005.
[9] M. Gettle, Air Force releases new mission statement, Air Force Link,U.S. Air Force, Washington, DC (www.af.mil/news/story.asp?storyID=123013440), December 8, 2005.
[10] J. Moteff and P. Parfomak, Critical Infrastructure and Key Assets: Defi-nition and Identification, Congressional Research Service, The Library ofCongress, Washington, DC (www.fas.org/sgp/crs/RL32631.pdf), 2004.
[11] Office of Homeland Security, National Strategy for Homeland Security, TheWhite House, Washington, DC (www.whitehouse.gov/homeland/book/nat strat hls.pdf), 2002.
[12] Office of the United Nations High Commissioner for Human Rights, Pro-tocol additional to the Geneva Conventions of 12 August 1949 and relat-ing to the protection of victims of international armed conflicts (ProtocolI), Geneva, Switzerland (www.unhchr.ch/html/menu3/b/93.htm), June 8,1977.
[13] President’s Commission on Critical Infrastructure Protection, CriticalFoundations: Protecting America’s Infrastructures, The White House,Washington, DC (chnm.gmu.edu/cipdigitalarchive/files/5 CriticalFoundationsPCCIP.pdf), 1997.
[14] President’s Critical Infrastructure Protection Board, The National Strat-egy to Secure Cyberspace, The White House, Washington, DC (www.whitehouse.gov/pcipb/cyberspace strategy.pdf), 2003.
[15] D. Rumsfeld, Information Operations Roadmap (declassfied in 2006), De-partment of Defense, Washington, DC (www.gwu.edu/∼nsarchiv/NSAEBB/NSAEBB177/info ops roadmap.pdf), 2003.
[16] Sandia National Laboratories, Information Design Assurance Red Team(IDART), Albuquerque, New Mexico (www.idart.sandia.gov).
[17] U.S. Congress (107th Congress), Uniting and Strengthening America byProviding Appropriate Tools Required to Intercept and Obstruct Ter-rorism (USA PATRIOT) Act of 2001, Public Law 107-56, GovernmentPrinting Office, Washington, DC (frwebgate.access.gpo.gov/cgi-bin/getdoc.cgi?dbname=107 cong public laws&docid=f:publ056.107.pdf), Octo-ber 26, 2001.
[18] WGBH Educational Foundation, Frontline: Rumsfeld’s War: The Mil-itary’s Struggles and Evolution, Boston, Massachusetts (www.pbs.org/wgbh/pages/frontline/shows/pentagon/etc/cronagon.html), 2004.

Chapter 3
SECURITY ASSESSMENT OF ATURBO-GAS POWER PLANT
Marcelo Masera, Igor Nai Fovino and Rafal Leszczyna
Abstract Critical infrastructures are exposed to new threats due to the largenumber of vulnerabilities and architectural weaknesses introduced bythe extensive use of information and communication technologies. Thispaper presents the results of an exhaustive security assessment for aturbo-gas power plant.
Keywords: Turbo-gas power plant, security assessment
1. Introduction
Enterprise systems that employ information and communication technologies(ICT) are prone to vulnerabilities that can be exploited by malicious softwareand agents. Considering the massive use of ICT in national critical infrastruc-tures, it is imperative to perform comprehensive risk assessments that evaluatethe main threats and the effectiveness of countermeasures.
Several approaches have been proposed for conducting risk assessments ofICT infrastructures (see, e.g., [1, 4]). The InSAW methodology [4–9] is specifi-cally tailored to analyzing the impact of ICT threats on critical infrastructureassets. Dondossola and colleagues [2] presented the first practical test of theInSAW methodology. They applied an embryonic version of InSAW to ana-lyze the vulnerabilities of a simple, albeit not actually deployed, remote controlstation.
This paper discusses the results of an exhaustive InSAW security assessmentof the ICT infrastructure of a turbo-gas power plant. It also presents a setof ICT attack scenarios that have been successfully implemented in a labo-ratory environment. This environment, which was developed in collaborationwith a major energy company, reproduces the networks, SCADA systems andelectromechanical devices used in the turbo-gas power plant.
Please use the following format when citing this chapter: Masera, M., Fovino, I.N. and Leszczyna, R., 2008, in IFIP International Federati on for Information Processing, Volume 290; Critical Infrastructure Protection II, eds. Papa, M., Shenoi, S., (Boston: Springer), pp. 31–40.

32 CRITICAL INFRASTRUCTURE PROTECTION II
Figure 1. Power plant schematic.
2. System Description
In order to conduct a security assessment, it is necessary to model a complexsystem in terms of functional blocks. Since the focus is on threats derived fromthe use of ICT in a turbo-gas power plant, we focus on the networking aspectsof the power plant architecture.
2.1 Network Architecture
Figure 1 presents the high-level architecture of the turbo-gas power plant.Several major subsystems are relevant from the networking perspective:
Power Plant Backbone: This subsystem contains all the network de-vices that allow the various power plant subnets to communicate. The

Masera, Nai Fovino & Leszczyna 33
principal devices include: (i) layer switches that manage traffic; (ii) pro-cess firewalls that separate and filter the traffic between the field network,process network and external entities; (iii) routers that interconnect var-ious power plant subnets and the corporate intranet; and (iv) Internetfirewalls that separate power plant company networks from the Internet.
Field Network: This network interconnects the sensors and actuatorsthat directly interact with power plant electromechanical devices.
Process Network: This network hosts the SCADA systems used byoperators to control power plant processes.
Demilitarized Zone (DMZ): This area hosts data exchange serversthat receive data from the process network and make it available to op-erators via the power plant intranet.
Secondary Regulation Network: This network hosts remote terminalunits (RTUs) that implement the secondary regulation protocol.
Power Plant Intranet: This branch of the company network providesintranet services to plant operators. It is used for routine office activitiesas well as for remote plant control by providing access to the processnetwork via a VPN through the DMZ.
Company Intranet: This generic network, which typically uses Win-dows platforms, is used for all corporate activities. Note that “company”refers to the entity that owns and operates the power plant.
Data Network: This high availability network is used to directly inter-connect all company assets; it provides services such as DNS and anti-virus software updates.
Internet: This consists of all external computing assets.
2.2 Operational Flows and Dependencies
When analyzing a complex system, it is important to consider the opera-tional flows generated by operator interactions with the system as well as thedependencies between the various subsystems. Due to a lack of space, it is notpossible to discuss these in detail. Therefore, this section presents the opera-tional flows and dependencies that are most relevant to the power plant attackscenarios considered in our work.
Field Network: The field network hosts all the devices (sensors and ac-tuators) that are connected directly to the power plant hardware (e.g., gasturbine and steam system). The data flow uses dedicated communications pro-tocols such as Modbus and Profibus. The field network devices are locatedon the “frontlines” of the ICT system; as such, they are vital to all powerplant control operations. Thus, the device measurements and actions must becommunicated to the higher control level (i.e., SCADA systems).

34 CRITICAL INFRASTRUCTURE PROTECTION II
Process Network: The process network hosts the SCADA servers thatinteract with the field network. They analyze data received from the fieldnetwork and present plant operators with summarized information about thestate of the power plant. The operators use diagnostic systems, which exchangedata with the SCADA servers, to investigate any anomalies that are observed.Based on the results of the analysis, an operator issues commands using theSCADA servers to devices in the field network to effect the appropriate changesto the state of the power plant.
Demilitarized Zone: The DMZ usually hosts a data exchange server.This server receives plant status data from the SCADA servers. Operatorsconnected to the power plant intranet query the server to obtain high-levelinformation about plant operations without having to access the process net-work. Remote access to the DMZ and to the process network is regulated bya properly-configured firewall, which also operates a point-to-point VPN (overRadius). Thus, only authorized operators can remotely access the DMZ andprocess network. Note, however, that traffic flow between the various serversis generally not authenticated.
Remote Terminal Unit Network: The RTU network receives powerproduction data from the data network. The RTUs communicate directly withdevices in the field network using a dedicated analog channel. Note that nomutual authentication is implemented between the RTUs and field networkdevices.
Intranet: The power plant intranet is typically a part of the company in-tranet. In our case study, the intranet uses Windows platforms with a strongset of security and access control policies. Operators connected to the intranetcan establish VPN connections with the process firewall in order to access theprocess servers and DMZ servers. The operators can also access the Internetvia the intranet.
Data Network: The data network connects all the power plant’s processnetworks to facilitate fast data transfer over a private network. It also providesservices such as DNS. Several flows exist between the process and data net-works. The data network is also used by operators to send commands to theRTU network required for production operations and secondary regulation.
Internet: The Internet represents the external world, i.e., everything out-side the company network. However, in our case study, public communicationchannels are used by remote operators to connect to power plant assets (e.g.,for maintenance purposes). This uses Radius authentication over a site-to-siteVPN network. Thus, remote operators appear virtually as “internal operators.”Data flows between the intranet and Internet materialize whenever an internaloperator conducts Internet-related activities. Note that Internet access policies

Masera, Nai Fovino & Leszczyna 35
are role-dependent: some operators are allowed to directly access the Internetwhile others have to pass through a set of proxy servers.
3. Vulnerability Analysis
Based on our security assessment methodology [8], we attempted to identifyall relevant vulnerabilities before postulating attack scenarios. Our analysisidentified several vulnerabilities, which we have organized into three classes:
Architectural Vulnerabilities: These vulnerabilities directly derivefrom weaknesses in the network architecture. Example vulnerabilities in-clude weak separation between the process and field networks; lack of au-thentication between active components (actuators and SCADA servers,actuators and RTUs, SCADA servers and data exchange servers, etc.);and the process firewall itself, which is a single point of failure.
Security Policy Vulnerabilities: These vulnerabilities arise from weaksecurity policies, especially related to users who remotely connect to theintranet (e.g., the machines used by remote users may not have the latestsecurity patches and anti-virus protection). Other vulnerabilities are dueto ambiguous traceability and access policies.
Software Vulnerabilities: Several operating systems are used in thepower plant: Linux, SCO Unix, Windows NT, Windows 2000 Server,Windows XP and Windows 2003 Server. Most of these systems did nothave the latest patches and some unauthorized applications were installed.In all, we identified 240 software vulnerabilities that affected computers,servers, switches and routers. At least 100 of these vulnerabilities couldbe used to seize partial or complete control of the targeted machines.Moreover, more than 70 vulnerabilities could be exploited to block ma-chines.
The results of the vulnerability analysis are not as dramatic as expected.In fact, very few of the identified vulnerabilities could be exploited to launchserious attacks. Nevertheless, the presence of these vulnerabilities highlightshow the extensive use of ICT has significantly increased the number of possible“failure” scenarios.
4. Threat Analysis
The threat analysis component of the power plant study identified the po-tential threats starting from a list of typical hazards. The threats that weredeemed to be the most effective were examined in greater detail. The resultswere then synthesized and the corresponding threat profiles and exposure in-dices developed. The following three phases were involved in the threat analysis:
Threat Hypothesis: The threats are characterized according to theirtype (internal/external), agent (person/object), motivation (intentional,

36 CRITICAL INFRASTRUCTURE PROTECTION II
accidental, etc.), expertise and resources (required to manifest the threat),perceived value, plausibility and severity.
Threat Verification: The identified threats are screened according tothe risks they might pose to the system.
Threat Value: The plausibility and severity values are qualitativelyestimated for each threat.
Note that the “plausibility” of a threat is the likelihood of the existence of themenace that targets a certain vulnerability to produce damage to the system.The “severity” of a threat is the capacity to produce damage by exploiting acertain vulnerability.
No generally accepted definition of a threat exists. From the legal point ofview, a threat by an agent is an unwanted (deliberate or accidental) expressionof intent to execute an action that may result in harm to an asset. Therefore,a threat is the potential occurrence of a negative action, not its actual realiza-tion. The following is a generic list of threat agents that can jeopardize criticalinfrastructure assets [10]:
Crackers, Malicious Hackers, Script Kiddies: These individuals,who have varying levels of technical expertise, break into systems by sub-verting security mechanisms. They may launch attacks for the challengeor thrill of doing so, or for bragging rights in their communities.
Insider Threat: The disgruntled insider is a major threat. An insidermay not have a great deal of knowledge about computer intrusions, buthis knowledge of and access to the targeted system enables him to causeconsiderable damage.
Malware Writers: Malicious code writers produce software (viruses,worms or Trojan horses) designed specifically to damage or disrupt sys-tems. This so-called malware can be specific (i.e., it targets particularsystems or organizations) or it can be generic.
Criminal Groups: Criminal groups frequently attack systems for mon-etary gain. They may attempt to steal sensitive information for re-saleor for purposes of blackmail, extort money by threatening to attack com-puting assets, and commit various types of fraud (e.g., attempting toinfluence stocks) or forgery (e.g., changing payment information in in-voices).
Hacktivists: Hacktivism refers to politically-motivated attacks on com-puting assets. Hacktivists may overload e-mail servers or hack into websites to send political messages. Their actions against infrastructure as-sets are usually motivated by environmental, safety or nationalistic rea-sons.

Masera, Nai Fovino & Leszczyna 37
Table 1. Principal threats.
Threat Expertise Resources Value Plausibility Severity
Insider Minimum Limited High Medium HighInt. Malware Medium Limited Minimum High LowExt. Malware High High Maximum Low LowHackers Medium Limited Maximum Medium HighCriminals High Very High Maximum Medium High
Terrorist Groups: Terrorism is the unlawful use of force or violenceagainst persons or property in order to intimidate or coerce a governmentor civilian population to further certain political or social objectives.
Information Warfare: Several nations are aggressively developing in-formation warfare doctrines, programs and capabilities. These capabili-ties can be used to disrupt the supply chain and inflict considerable dam-age to the various infrastructure sectors, ultimately affecting the economyand the residents of the targeted region or country.
The threats we have identified are presented in Table 1. The plausibilityand severity values assigned to the threats were based on detailed analyses ofpower plant systems and on interviews conducted with plant operators andmanagers. For example, under normal conditions, the severity of an insiderthreat (disgruntled employee) is very high if the individual has direct access tothe process network and to the SCADA systems. On the other hand, even ifthe plausibility of a malware infection is high, its impact on the power plant“core” (i.e., field network) is low. This is because the computing systems inthe field network are less vulnerable to traditional viruses – they run dedicatedservices and use proprietary protocols; even if the systems are compromised, itis possible to bypass them and control the power plant manually. Of course,the evaluation scenario has to be modified if advanced viruses that specificallytarget power plant systems are introduced. Likewise, the severity of a hackingattack is high because a hacker (hypothetically) can seize control of criticalsystems. The same argument holds in the case of attacks launched by criminalgroups.
5. Attack Scenarios
This section presents a high-level description of the attack scenarios thatwe identified and implemented. The purpose is to give an idea of the level ofexposure faced by a typical power plant.

38 CRITICAL INFRASTRUCTURE PROTECTION II
5.1 Radius Server Denial of Service
Denial-of-service attacks limit or block access to specific resources, makingthem, and possibly a larger system, unusable. In this scenario an attackerattempts to consume the bandwidth of a Radius server that is connected to theInternet.
The first step is to perform system fingerprinting, where information is col-lected about a target system. Since the Radius server is connected to theInternet, it is relatively easy to obtain information about it by analyzing theresults of network scans, ICMP packet content, etc. Information about thetargeted system can also be obtained using social engineering techniques onemployees and other individuals familiar with the system and its configuration.
Bandwidth consumption is a simple task: an attacker directs large volumesof traffic to the targeted server. This is accomplished by compromising a suffi-cient number of machines connected to the network and using them to generateattack traffic. Our scenario involves a dedicated Trojan horse that propagatesitself on networks and compromises machines, installing a backdoor in everycompromised machine. The attacker uses the backdoors to seize control ofthe machines and proceeds to establish a “zombie network” for launching dis-tributed denial-of-service attacks. Using the zombie network and the informa-tion gleaned from system fingerprinting and social engineering, the attackerblocks all external access to the company intranet and, thus, external access tothe power plant network.
5.2 Intranet Virus Infection
In the virus infection scenario, the attacker gains control of a computer in thecorporate intranet in order to impersonate a legitimate user. The infected com-puter is directed to perform malicious actions on critical plant networks, suchas launching denial-of-service attacks on the process firewall or data exchangeserver, or corrupting diagnostic systems or SCADA subnets. Virus infectionspotentially affect all systems that are connected to an open network. Anti-virussoftware is the primary defensive mechanism, but even systems with the latestsoftware are vulnerable to attack in the interval between the release of a newvirus and the time the next patch is released.
The first step of the attack is to collect information about the target system(e.g., using system fingerprinting). Next, the attacker obtains a new virus thatis tailored to the targeted system. It is assumed that the attacker has theexpertise to write such a virus or is able to obtain the virus from the hackercommunity.
If the attacker has already gained access to the targeted machine, the viruscan be directly installed on the machine. Alternatively, the attacker exploits avulnerable service at an open port on the firewall or uses social engineering toconvince a legitimate user to install software containing the virus.
If the virus has been designed with a backdoor, the attacker can gain con-trol of the infected machine and impersonate a legitimate user, performing

Masera, Nai Fovino & Leszczyna 39
authorized actions as well as illegal actions that may be permitted by defi-cient security policies. Note that control of the compromised machine is easilymaintained if the attacker is an insider. However, an external attacker wouldhave to penetrate the firewall to reach the infected machine and perform themalicious actions. This poses an obstacle, but it is possible to create a virusthat performs the malicious actions autonomously.
The virus attack can be used to cause damage to the data exchange serverand the SCADA servers. Also, it could be used to steal credentials (user namesand passwords) or deny service to the power plant firewall and other comput-ing assets. Note that the virus infection scenario is developed for the intranetenvironment. A similar scenario may be devised for the data network, DMZor process network. For example, if the infected machine is in the data net-work, which connects all power plant assets, it is possible to conduct a denial-of-service attack on the RTU network and disrupt the secondary regulationprotocol.
5.3 Phishing Attack
In the phishing attack scenario, the attacker steals the credentials of an au-thorized user in order to target the power plant network. A phishing attackmay send a fake e-mail message, display a seemingly legitimate link that ac-tually connects to a malicious website, or poison the DNS server to make thevictim connect to a malicious server.
In our scenario, the attacker has to replicate at least a portion of the sys-tem interfaces and infrastructure, e.g., by creating a fake domain and a dataexchange server for data distribution. Information required to create the fakesite that replicates system interfaces and infrastructure can be obtained viasystem fingerprinting. Once this is done, the attacker collects information onusers and systems, including DNS data. This enables him to implement a DNSpoisoning attack that re-routes users to the fake website instead of the dataexchange server. The fake website provides false information about the stateof the power plant and also captures their credentials, making it possible forthe attacker to connect to the real data exchange server.
6. Conclusions
The security assessment of the operational power plant clearly demonstratesthat ICT introduces a large number of vulnerabilities. Our experiments involv-ing a laboratory testbed that reproduces much of the ICT infrastructure of thepower plant verify that the ICT attack scenarios are feasible and can be verydamaging. In particular, our use of a malware simulation framework [3] hasenabled us to investigate the serious impact of virus infections on power plantsafety and security.
Sophisticated analytic tools are required to identify and address the myriadsecurity problems. Our use of the InSAW methodology in the analysis processhas facilitated the identification of failure-prone relationships in power plant

40 CRITICAL INFRASTRUCTURE PROTECTION II
subsystems; this has helped discover weaknesses, create realistic attack scenar-ios and understand the potential cascading effects of failures. Still, our workis merely the first step in a systematic campaign to address the impact of ICTvulnerabilities on critical infrastructures. Our future research will investigatevulnerabilities in SCADA communication protocols and architectures with thegoal of articulating effective security policies and countermeasures.
References
[1] C. Alberts and A. Dorofee, Managing Information Security Risks: TheOCTAVE (SM) Approach, Addison-Wesley, Boston, Massachusetts, 2002.
[2] G. Dondossola, J. Szanto, M. Masera and I. Nai Fovino, Effects of inten-tional threats to power substation control systems, International Journalof Critical Infrastructures, vol. 4(1/2), pp. 129–143, 2008.
[3] R. Leszczyna, I. Nai Fovino and M. Masera, MalSim – Mobile agent mal-ware simulator, Proceedings of the First International Conference on Sim-ulation Tools and Techniques for Communications, Networks and Systems,2008.
[4] M. Masera and I. Nai Fovino, A framework for the security assessment ofremote control applications of critical infrastructures, Proceedings of theTwenty-Ninth ESReDA Seminar, 2005.
[5] M. Masera and I. Nai Fovino, Emergent disservices in interdependent sys-tems and systems-of-systems, Proceedings of the IEEE International Con-ference on Systems, Man and Cybernetics, vol. 1, pp. 590–595, 2006.
[6] M. Masera and I. Nai Fovino, Models for security assessment and man-agement, Proceedings of the International Workshop on Complex Networkand Infrastructure Protection, 2006.
[7] M. Masera and I. Nai Fovino, Through the description of attacks: A mul-tidimensional view, Proceedings of the Twenty-Fifth International Confer-ence on Computer Safety, Reliability and Security, pp. 15–28, 2006.
[8] I. Nai Fovino and M. Masera, A service-oriented approach for assessinginfrastructure security, in Critical Infrastructure Protection, E. Goetz andS. Shenoi (Eds.), Springer, Boston, Massachusetts, pp. 367–379, 2007.
[9] I. Nai Fovino, M. Masera and A. Decian, Integrating cyber attack withinfault trees, Proceedings of the European Safety and Reliability Conference,2007.
[10] United States General Accounting Office, Critical Infrastructure Protec-tion: Challenges and Efforts to Secure Control Systems, Report GAO-04-354, Washington, DC (www.gao.gov/new.items/d04354.pdf), 2004.

Chapter 4
DETECTING CYBER ATTACKS ONNUCLEAR POWER PLANTS
Julian Rrushi and Roy Campbell
Abstract This paper proposes an unconventional anomaly detection approachthat provides digital instrumentation and control (I&C) systems in a nu-clear power plant (NPP) with the capability to probabilistically discernbetween legitimate protocol frames and attack frames. The stochasticactivity network (SAN) formalism is used to model the fusion of pro-tocol activity in each digital I&C system and the operation of physicalcomponents of an NPP. SAN models are employed to analyze links be-tween protocol frames as streams of bytes, their semantics in terms ofNPP operations, control data as stored in the memory of I&C systems,the operations of I&C systems on NPP components, and NPP processes.Reward rates and impulse rewards are defined in the SAN models basedon the activity-marking reward structure to estimate NPP operationprofiles. These profiles are then used to probabilistically estimate thelegitimacy of the semantics and payloads of protocol frames received byI&C systems.
Keywords: Nuclear plants, intrusion detection, stochastic activity networks
1. Introduction
Digital instrumentation and control (I&C) systems are computer-based de-vices that monitor and control nuclear power plants (NPPs). Analog I&Csystems have traditionally been used to perform monitoring and control func-tions in NPPs. However, Generation III+ and IV reactors are equipped withdigital I&C systems; meanwhile, analog systems in older reactors are beingreplaced with digital systems. In general, NPP control networks communicatewith SCADA systems to coordinate power production with transmission anddistribution demands. The deployment of digital I&C systems and the connec-tivity between NPP control networks and external networks expose NPPs tocyber attacks whose consequences can include physical damage to reactors [3].
Please use the following format when citing this chapter: Rrushi, J. and Cam pbell, R., 2008, in IFIP Internat ional Federation for Information Processing, Volume 290; Critical Infrastructure Protection II, eds. Papa, M., Shenoi, S., (Boston: Springer), pp. 41–54.

42 CRITICAL INFRASTRUCTURE PROTECTION II
In addition, security exercises have underscored the threat of intrusions intoNPP control networks.
This paper focuses on the problem of intrusion detection in NPP controlnetworks. It addresses the following problem: Given a set of protocol dataunits (PDUs) received by a digital I&C system over an NPP control network,how could the digital I&C system assess if every PDU is legitimate and is nota component of attack traffic?
Digital I&C systems considered in this paper communicate via the Modbusprotocol [8]. However, the intrusion detection approach is applicable to anyindustrial protocol. The approach falls in the category of protocol-based andanomaly-based intrusion detection strategies. Such an approach guards againstattacks that use semantically regular PDUs to target an NPP as well as attacksthat use irregular PDUs (e.g., memory corruption attacks).
The first set of attacks can take an NPP to abnormal conditions and initiatephysical damage. NPPs are equipped with reactor protection systems thatmonitor operational variables and shut down systems if pre-defined thresholdsare passed; this reduces the risk of physical damage. Nevertheless, the attacksimpact availability because it takes several hours to restart an NPP. The secondset of attacks, on the other hand, evade reactor protection systems and have thepotential to cause physical damage, mainly because several NPP sensors areshared between I&C systems and reactor protection systems. Thus, attackerscan initiate physical damage to an NPP as well as defeat reactor protectionsystems by passing them fake status data.
2. Operation-Aware Intrusion Detection
This paper proposes operation-aware intrusion detection as an anomaly-based defensive capability for NPPs. Profiles of legitimate behavior of digitalI&C applications are constructed by analyzing payloads of PDUs sent overcontrol and/or fieldbus networks and the semantics of each PDU field in thecontext of NPP operations. Thus, PDUs are analyzed in terms of the bindingsbetween streams of bits and tasks such as withdrawing control rods, changingthe reactor feed pump rate or closing steamline isolation valves. This approachprovides more visibility than model-based detection with regard to the potentialof PDUs being legitimate or malicious. As a matter of fact, PDUs may beperfectly formatted according to the protocol specifications while having thepotential to cause harm to an NPP.
For example, well-formatted PDUs that close the main turbine control valveswhen reactor power goes above 25% take the reactor to an anomalous state inwhich the reactor vessel pressure rises far beyond the maximum allowable value.A turbine bypass valve is supposed to provide for excess steam flow, but the flowcapacity of the bypass valve is normally equivalent to 25% of steam flow. Thisflow capacity is insufficient to return the reactor vessel pressure to normal soonenough to maintain safe NPP conditions. Furthermore, several application-levelattacks can be crafted that comply with protocol specifications. For example,memory addresses and shellcode injected as malicious PDUs in Modbus memory

Rrushi & Campbell 43
corruption attacks could be made to appear as valid coil and/or holding registervalues.
Modbus memory corruption attacks [1] highlight the need for operation-aware protocol-based intrusion detection. These attacks exploit faulty map-pings between the addresses of data items defined by Modbus and the memorylocations where the data items are actually stored. Register addresses andvalues used in such attacks are generally fully compliant with Modbus spec-ifications. Nevertheless, it is unlikely that the attack PDUs will consistentlyhave valid semantics in terms of NPP operation. These operational aspects ofPDUs and the associated NPP states are leveraged by the intrusion detectionapproach described in this paper.
3. Modeling NPP Operations
The stochastic activity network (SAN) formalism [5, 11, 14] as implementedby the Mobius tool [2, 12] is used to model and analyze the operation of a boilingwater reactor (a common type of NPP) along with its digital I&C systemsthat engage the Modbus protocol. The operation of Modbus applications indigital I&C systems, the control of digital I&C systems over NPP componentsand the interactions among NPP components as reflected by NPP operationalvariables are captured using atomic SAN models. Figure 1 presents an excerptof an atomic model developed for a digital I&C system. Discrete inputs, coils,input registers and holding registers are modeled as SAN places, which we call“device places.” The number of tokens in each device place represents the valueof the Modbus data item that corresponds to the SAN place.
Depending on its configuration, a Modbus device may have as many as65,536 data items; the corresponding atomic model would be extremely large.To address this issue, the information contained in PDU data fields is modeledas a set of SAN places, which we call “PDU places.” The numbers of tokensin PDU places represent the values placed in the data fields of PDUs sent todigital I&C systems. PDU function codes are modeled as instantaneous ac-tivities, e.g., write coil, write multiple coils, write register and write multipleregisters. Some of these instantaneous activities have several cases. The prob-ability distributions of case selections for these instantaneous activities dependon the markings of the input places associated with the input gates of theinstantaneous activity under consideration.
In general, case selections indicate the data items accessed from Modbusdevice memory. PDU places are fed with tokens by timed activities (not shownin Figure 1 due to space limitations) that model the behavior of a master de-vice generating Modbus requests. The enabling predicates in the input gatesin Figure 1 check whether the input places associated with the gates are not allzeroed, in which case the corresponding instantaneous activities are enabled.(A PDU that is not sent over the network is modeled using PDU places con-taining zero tokens.) Upon completion of an instantaneous activity, one of theassociated activity cases is selected. In the case of instantaneous activities,when modeling a write function code of any kind, the output functions of out-

44 CRITICAL INFRASTRUCTURE PROTECTION II
Figure 1. SAN model excerpt for a Modbus digital I&C system.
put gates associated with the selected activity case add a number of tokens toone or more device places.
The output functions zero the PDU places that enable the instantaneousactivities modeling function codes associated with the output gates in question.In the case of instantaneous activities, when modeling a read function code,output functions act as identity functions on device places and add tokens toa set of places modeling variables for a master device (not shown in Figure1 due to space limitations). The variables related to the operation of NPPphysical components are also modeled as a set of places, which we call “NPP

Rrushi & Campbell 45
Figure 2. SAN model excerpt of a digital I&C system with two reactor feed pumps.
places.” Examples include temperature and pressure of water and steam for acomponent such as the NPP moderator. The number of tokens in an NPP placerepresents the value of the NPP operational variable modeled by the place. Forexample, the fact that the reactor pressure is 900 psi is modeled as an NPPplace (reactor pressure) that holds 900 tokens.
Figure 2 presents a SAN model excerpt of the operation of a digital I&Csystem that controls two reactor feed pumps. The mechanisms used to operateon the NPP are modeled as timed activities. The two reactor feed pumps areexamples of these mechanisms, which, in terms of NPP operations, raise thepressure of the moderator to make it flow to the reactor vessel. The rates of

46 CRITICAL INFRASTRUCTURE PROTECTION II
these timed activities are generally obtained from the technical specificationsaccompanying the physical equipment modeled by the timed activities andspecific configurations of the Modbus devices that control the equipment.
For example, the rates of the timed activities feed pump 1 and feed pump 2are in the range [0, 8.4]. The maximum capacity of the reactor feed pumpsmodeled by the timed activities is 8.4 million lb/hr. The rates of these timedactivities are calculated based on the markings of the device places acting as in-put places associated with the input gates of the timed activities. The markingsconsidered are those that hold at the moment the timed activities are enabled.The enabling predicates of the input gates associated with feed pump 1 andfeed pump 2 check if the numbers of tokens in the input places are changed bycomparing them with the numbers of tokens in the set of places holding oldvalues (not shown in Figure 2 due to space limitations).
The output functions of output gates associated with cases of timed activities(e.g., OG1 and OG2 in Figure 2) add a number of tokens to one or more NPPplaces and mark as old the numbers of tokens in the input places of the inputgates associated with the timed activities. Correctly modeling transients in aSAN is crucial to constructing profiles of normal NPP operations. Transientsare abnormal events (e.g., loss of feed water for heating, inadvertent initiationof a coolant injection system, pipe breaks, and mechanical or electrical faults)that perturb key NPP operational variables. In most cases, NPP operationcan be returned to normal conditions without initiating a “scram” – a rapidshutdown of the NPP.
NPPs are required to maintain redundant systems, which are activated in theevent of failure to prevent transient conditions from escalating into accidents.Sometimes transients are caused by unrecoverable faults that may result in areactor scram initiated manually by NPP operators or automatically by thereactor protection system. In the nuclear power environment, transients are“normal events” that are expected to occur during NPP operations. Our SANmodel expresses transients as timed activities (e.g., the feed pump trip timedactivity in Figure 2 models the loss of one or two reactor feed pumps). Fromthe intrusion detection point of view, transients must be treated with care sothat they do not become sources of false positives.
Each transient has specific effects on NPP operational variables. Pertur-bations to NPP variables caused by a transient are reflected as changes tothe values of data items stored in the memory of Modbus devices. However,there is always uncertainty whether drastic changes to data items during NPPoperation are caused by transients or attacks. We employ the activity timedistribution functions of timed activities that model possible transients to dis-tinguish between transient effects and attack effects. Note that the estimationof the failure rates of physical NPP components is outside the scope of ourwork since it requires the consideration of electrical, chemical and mechanicalproperties of NPP components.
Condition data monitoring and aggregation techniques [4, 9] can be usedto estimate the failure rates of most of the physical components of an NPP.

Rrushi & Campbell 47
Figure 3. SAN model excerpt of NPP processes.
The time distribution functions of timed activities that model transients maybe used to calculate the failure rates of physical components based on thenumbers of tokens found at the moment of estimation in the SAN places usedto model physical conditions. For example, the failure rate of feed pump trip inFigure 2 is computed based on the numbers of tokens in SAN places denotingvarious conditions of reactor feed pumps. The output functions of output gatesassociated with a timed activity that models a transient, in turn, models theperturbations to NPP operational variables by incrementing or decrementingthe numbers of tokens in NPP places.
NPP operation modeling requires SAN models to be constructed for numer-ous reactor processes. Examples include nuclear fission, reactor cooling and thevarious physical relations between temperature, pressure, density, volume, etc.The rates of timed activities in these SAN models are provided in NPP tech-nical manuals. The SAN models also incorporate timed activities that modelNPP operation measures such as reactor period (time required for the reactorpower to change by a factor of e, where e is the base of the natural logarithm)and reactivity (neutron population change with time). Figure 3 presents anexcerpt of the SAN model developed for a set of reactor processes. The Joinand Replicate operations of Mobius [6] are used to unify the atomic SAN mod-

48 CRITICAL INFRASTRUCTURE PROTECTION II
Figure 4. Composed SAN model excerpt for a boiling water reactor.
els developed for Modbus-based digital I&C systems, their effects on the NPP,and NPP processes.
Thus, a composed SAN model is constructed as a unified cyber-physicalmodel of NPP operation. Figure 4 provides an excerpt of the composed SANmodel developed for the boiling water reactor.
4. Estimating NPP Operation Profiles
Let P denote the set of device places defined in the atomic SAN modelsdeveloped for the boiling water reactor. The set of possible markings of P isthe finite set of functions F = {fn | fn : P → N, n ε N}. We assume that foreach NPP power level lm, where m ε N , P is marked according to a function ηfrom a finite (in most cases small) set of functions Γm, where Γm ⊂ F , and thatΓm can be estimated. The set of functions Γm for a power level lm depends onthe actual values of NPP operational variables during the interval of time thatan NPP has that state and the tasks (e.g., inserting or withdrawing controlrods, changing the rate of water pumps, opening or closing valves) are carriedout on NPP components by digital I&C systems.
NPP operational variables (e.g., nuclear fission data estimated by a neutronmonitoring system) are stored as Modbus data items in the memory of digi-tal I&C systems. On the modeling side, the data values are reflected by thenumbers of tokens in the corresponding device places, which we call “condi-tions device places.” Further, the tasks carried out by digital I&C systems onNPP components are initiated via a series of writes to the memory locationsdesignated for the corresponding Modbus data items. For example, the rateof a reactor feed pump for 100% NPP power can be set by writing a value of(say) 84 in the holding register of a digital I&C system; for 75% NPP power,the value of the holding register may be set to 63, and so on.

Rrushi & Campbell 49
The correspondence existing between values of Modbus data items in thememory of digital I&C systems, operations or tasks carried out by digital I&Csystems on NPP components, and NPP operational variables allows profiles ofnormal NPP operations to be estimated. Thus, given normal values of NPPoperational variables associated with a power level lm, we estimate the possiblevalues of discrete inputs, coils, input registers and holding registers, which maybe considered as legitimate.
We also assume that when an NPP transitions from a power level lm to apower level lm±λ, where λ ε N , the marking of P changes according to a finiteset of marking transition flows, i.e., an ordered sequence of functions fromΓm to Γm±λ. In general, throughout the operation of an NPP, a finite set ofordered sequences of functions from F exist that represent transitions of valuesof Modbus data items in digital I&C systems when the NPP is operated.
We leverage marking transition flows to construct NPP operation profiles.The normal operation of an NPP is simulated along with operational phenom-ena such as transients and the normal marking transition flows are estimated.Given an NPP at a power level lm, the marking transition flow mechanismestimates if the semantics and payload of an arbitrary PDU received by a dig-ital I&C system make sense in the Modbus configuration and will legitimatelychange the values of Modbus data items, respectively.
The set of functions Γm for each NPP power level lm is constructed usingreward models based on the activity-marking reward structure [13]. Each func-tion in the finite set of functions F is assigned a rate of reward. A typicalreward function for an element of F checks for a defined number of tokens inthe conditions device places.
As mentioned above, NPP operational variables are reflected in Modbus dataitems in digital I&C systems that are modeled by conditions device places. Thenumber of tokens in a SAN place represents a link between a power level lm ofan NPP and an element of F . In addition to these places, a reward functionchecks for the defined numbers of tokens in the remaining device places (i.e.,device places that do not model NPP operational variables). In Mobius, thenumbers of tokens in device places are parameterized using global variables.The composed SAN that models NPP operation is solved after all the globalvariables are assigned.
The following block of code implements a reward function:
double reward = 0;
if((PLC1_Modbus->holding_register_1->Mark()==reg_val_int1)&&
(PLC1_Modbus->holding_register_2->Mark()==reg_val_int2) &&
(PLC1_Modbus->holding_register_3->Mark()==reg_val_int3) &&
(PLC1_Modbus->coil_1->Mark() == cval1) &&
(PLC1_Modbus->discrete_input_1->Mark()==dval1) &&
(PLC1_Modbus->input_register_1->Mark()==inp1))
{
reward += 0.1;
}
return (reward);

50 CRITICAL INFRASTRUCTURE PROTECTION II
The rates of reward fall in the interval-of-time category [13], where the totalreward is accumulated during an interval of time covering all possible statetransitions of an NPP. Solutions of the composed SAN model produce a rewardfor each element of F . The set of functions Γm for each power level lm of anNPP consists of all the elements of F that map conditions device places tothe numbers of tokens corresponding to values of NPP operational variables,in turn, identified by lm, and whose accumulated reward is greater than 0.
Let S and Vm denote the set of conditions device places and the set of num-bers of tokens that model values of NPP operational variables correspondingto power level lm. Further, let R be a function that, for each element of F ,returns the reward as estimated by composed SAN model solutions. Then, theset of functions Γm is {µ ε F | µ : S → Vm, R(µ) > 0}.
Marking transition flows are identified by incremental measurement timeintervals in Mobius. For instance, if solutions of the composed SAN modelproduce non-zero rewards of, say, r4,8, r1,2,0 and r1,6,0 for the functions f4,8,f1,2,0 and f1,6,0, respectively, solving the composed model again while settingthe measurement time interval to a value t close to zero may produce zerorewards for these functions. Setting the measurement time interval to t + 1,t + 2, etc. and then solving the composed SAN model may produce a rewardof r1,2,0 for function f1,2,0. Incrementing the measurement time interval againand solving the composed SAN model again may produce rewards of r1,2,0 andr1,6,0 for the functions f1,2,0 and f1,6,0, respectively.
The measurement time interval may be further incremented until the solu-tion of the composed SAN model produces rewards of r4,8, r1,2,0 and r1,6,0 forthe functions f4,8, f1,2,0 and f1,6,0, respectively, leading to the identification ofthe marking transition flow f1,2,0, f1,6,0 and f4,8. The frequency of markingtransitions caused by events such as transients is quite relevant to the attribu-tion of possible losses of equipment during NPP operation. The estimation ofthe frequency of these marking transitions is carried out by defining impulserewards associated with completions of timed activities that model NPP tran-sients. Like the rates of reward, the impulse rewards defined in our work belongto the interval-of-time category of the activity-marking reward structure [13].
5. Deriving Intrusion Detection Rules
Our ultimate objective is to construct a set of practical intrusion detectionrules. These rules scrutinize the values of Modbus data items and PDU fieldsto determine whether incoming PDUs are legitimate or malicious.
The SAN formalism is used to model regularities in Modbus data items andfor marking transition flows so that the resulting SAN model is interpretable.The SAN model (Figure 5) is used to derive intrusion detection rules. Theelements of P are modeled as SAN places. For each power level lm of an NPP,the numbers of tokens in the SAN places are defined by elements of Γm. Theactivities in the SAN model capture individual memory writes carried out byModbus requests.

Rrushi & Campbell 51
Figure 5. SAN model with data item regularities and transition flows.
For example, a PDU with function code 0x10 (write multiple registers) maywrite from 1 to 123 registers depending on the value in the registers field. Eachof these memory writes is modeled by an activity in the SAN model. Thus,a marking transition is modeled as a set of activities. Activity cases modelassignments of defined values to Modbus data items as a result of processingModbus requests. The case distribution function of each activity models theprobability distribution of a defined Modbus data item. Case distribution func-tions are constructed by analyzing the data provided by the set of functionsΓm for each power level lm, marking the transition flows and frequencies ofmarking transitions caused by transients.
These analyses are performed using the Bayesian belief network (BBN) for-malism [10] as implemented by MSBNx [7]. Figure 6 illustrates the estimationof the probability distribution of a holding register using a BBN model. The
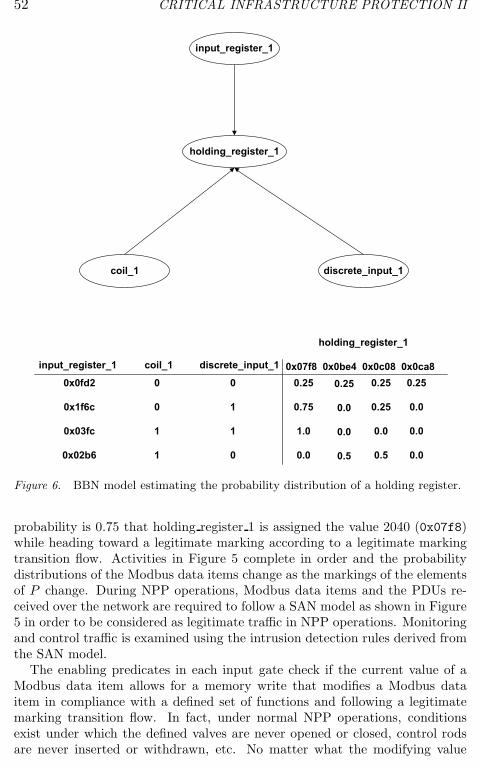
52 CRITICAL INFRASTRUCTURE PROTECTION II
Figure 6. BBN model estimating the probability distribution of a holding register.
probability is 0.75 that holding register 1 is assigned the value 2040 (0x07f8)while heading toward a legitimate marking according to a legitimate markingtransition flow. Activities in Figure 5 complete in order and the probabilitydistributions of the Modbus data items change as the markings of the elementsof P change. During NPP operations, Modbus data items and the PDUs re-ceived over the network are required to follow a SAN model as shown in Figure5 in order to be considered as legitimate traffic in NPP operations. Monitoringand control traffic is examined using the intrusion detection rules derived fromthe SAN model.
The enabling predicates in each input gate check if the current value of aModbus data item allows for a memory write that modifies a Modbus dataitem in compliance with a defined set of functions and following a legitimatemarking transition flow. In fact, under normal NPP operations, conditionsexist under which the defined valves are never opened or closed, control rodsare never inserted or withdrawn, etc. No matter what the modifying value

Rrushi & Campbell 53
is, the very action of modification may not comply with any NPP operationprofile. Case distribution functions of activities and output functions (of outputgates) are used to estimate the probabilities that legitimate values are assignedto Modbus data items. The following block of code consults the values of aninput register, a coil and a discrete input, and returns a probability of 0.75 that2040 (0x07f8) is assigned to the defined holding register in compliance withthe operation profiles:
if((input_register_1->Mark() == 8044) && (coil_1->Mark()==0)
&& (discrete_input_1->Mark() == 1))
return(0.75);
holding_register_1->Mark() = 2040;
6. Conclusions
Operation-aware intrusion detection is a novel anomaly-based approach fordetecting attacks on complex systems such as NPPs. Profiles of NPP operationas controlled and monitored by digital I&C systems are constructed using SANmodels. The SAN formalism effectively models the interactions between aModbus master and digital I&C systems, the operation of digital I&C systemson NPP components, and relevant NPP processes. The formalism also modelsand unifies NPP operation profiles estimated by the SAN model solutions. Theresulting SAN model is interpretable as well as a valuable source of intrusiondetection rules that can distinguish between legitimate protocol frames andattack frames.
Acknowledgements
The research of Julian Rrushi was partially supported by scholarships fromthe University of Milan and (ISC)2.
References
[1] C. Bellettini and J. Rrushi, Vulnerability analysis of SCADA protocol bi-naries through detection of memory access taintedness, Proceedings of theIEEE SMC Information Assurance and Security Workshop, pp. 341–348,2007.
[2] D. Deavours, G. Clark, T. Courtney, D. Daly, S. Derisavi, J. Doyle, W.Sanders and P. Webster, The Mobius framework and its implementa-tion, IEEE Transactions of Software Engineering, vol. 20(10), pp. 956–969,2002.
[3] R. Krutz, Securing SCADA Systems, Wiley, Indianapolis, Indiana, 2006.
[4] J. McCalley, Y. Jiang, V. Honavar, J. Pathak, M. Kezunovic, S. Natti,C. Singh and J. Panida, Automated Integration of Condition Monitoringwith an Optimized Maintenance Scheduler for Circuit Breakers and PowerTransformers, Final Project Report, Department of Computer Science,Iowa State University, Ames, Iowa, 2006.

54 CRITICAL INFRASTRUCTURE PROTECTION II
[5] J. Meyer, A. Movaghar and W. Sanders, Stochastic activity networks:Structure, behavior and application, Proceedings of the International Con-ference on Timed Petri Nets, pp. 106–115, 1985.
[6] J. Meyer and W. Sanders, Specification and construction of performabilitymodels, Proceedings of the Second International Workshop on Performa-bility Modeling of Computer and Communication Systems, 1993.
[7] Microsoft Research, MSBNx: Bayesian Network Editor and Tool Kit,Microsoft Corporation, Redmond, Washington (research.microsoft.com/adapt/MSBNx).
[8] Modbus IDA, MODBUS Application Protocol Specification v1.1a, NorthGrafton, Massachusetts (www.modbus.org/specs.php), 2004.
[9] J. Pathak, Y. Jiang, V. Honavar and J. McCalley, Condition data aggre-gation with application to failure rate calculation of power transformers,Proceedings of the Thirty-Ninth Annual Hawaii International Conferenceon System Sciences, p. 241a, 2005.
[10] J. Pearl, Bayesian networks: A model of self-activated memory for evi-dential reasoning, Proceedings of the Seventh Conference of the CognitiveScience Society, pp. 329–334, 1985.
[11] W. Sanders, Construction and Solution of Performability Models Basedon Stochastic Activity Networks, Ph.D. Dissertation, Department of Elec-trical Engineering and Computer Science, University of Michigan, AnnArbor, Michigan, 1988.
[12] W. Sanders, Integrated frameworks for multi-level and multi-formalismmodeling, Proceedings of the Eighth International Workshop on Petri Netsand Performance Models, pp. 2–9, 1999.
[13] W. Sanders and J. Meyer, A unified approach for specifying measuresof performance, dependability and performability, in Dependable Comput-ing for Critical Applications, A. Avizienis and J. Laprie (Eds.), Springer-Verlag, Berlin-Heidelberg, Germany, pp. 215–237, 1991.
[14] W. Sanders and J. Meyer, Stochastic activity networks: Formal defini-tions and concepts, in Lecture Notes in Computer Science, Volume 2090,Springer, Berlin-Heidelberg, Germany, pp. 315–343, 2001.

Chapter 5
APPLYING TRUSTED NETWORKTECHNOLOGY TO PROCESSCONTROL SYSTEMS
Hamed Okhravi and David Nicol
Abstract Interconnections between process control networks and enterprise net-works expose instrumentation and control systems and the critical in-frastructure components they operate to a variety of cyber attacks. Sev-eral architectural standards and security best practices have been pro-posed for industrial control systems. However, they are based on olderarchitectures and do not leverage the latest hardware and software tech-nologies. This paper describes new technologies that can be applied tothe design of next generation security architectures for industrial con-trol systems. The technologies are discussed along with their securitybenefits and design trade-offs.
Keywords: Process control systems, trusted networks, security architectures
1. Introduction
The increased interconnectivity of industrial control networks and enterprisenetworks has resulted in the proliferation of standard communication protocolsin industrial control systems. Legacy SCADA protocols are often encapsulatedin TCP/IP packets for reasons of efficiency and cost, which blurs the networklayer distinction between control traffic and enterprise traffic. The interconnec-tion of industrial control networks and enterprise networks using commodityprotocols exposes instrumentation and control systems and the critical infras-tructure components they operate to a variety of cyber attacks.
Security surveys reveal significant increases in external attacks that targetcritical infrastructure assets [2] . The entry points in most of the incidents werecorporate WANs, business networks, wireless access points, modems and theInternet.
Several government agencies and industry associations have proposed stan-dards and security best practices for industrial control systems [11, 12, 17, 19].
Please use the following format when citing this chapter: Okhravi, H. and Nicol, D., 2008, in IFIP International Federation for Information Processing, Volume 290; Critical Infrastructure Protection II, eds. Papa, M., Shenoi, S., (Boston: Springer), pp. 57–70.

58 CRITICAL INFRASTRUCTURE PROTECTION II
However, these efforts are based on older technologies and security architecturesthat rely on the differentiation and separation of enterprise and control traffic.While the efforts are, no doubt, important, the underlying security philosophyexposes industrial control systems to attacks that exploit misconfigurations,out-of-band connectivity and blind trust in the identities of traffic sources.
However, new technologies are emerging that provide more pervasive securitywithin networks [10]. These technologies push security from perimeter devicessuch as firewalls to the networked devices themselves. This paper reviewstechnologies that can be applied to designing the next generation of secureindustrial control systems. The technologies are discussed along with theirsecurity benefits and design trade-offs.
2. Control System Security Recommendations
Industrial control systems (ICSs) are highly distributed networks used forcontrolling operations in water distribution and treatment plants, electric powersystems, oil and gas refineries, manufacturing facilities and chemical plants.ICSs include supervisory control and data acquisition (SCADA) systems anddistributed control systems [19]. The main components of an ICS are thecontrol server or master terminal unit (MTU), remote terminal units (RTUs),intelligent electronic devices (IEDs), programmable logic controllers (PLCs),operator consoles or human-machine interfaces (HMIs), and data historians.Generally, an ICS comprises two distinct networks: a process control network(PCN) containing controllers, switches, actuators and low-level control devices,and an enterprise network (EN) incorporating high-level supervisory nodes andcorporate computers.
The National Institute of Standards and Technology (NIST), Institute ofElectrical and Electronics Engineers (IEEE), Instrumentation Systems and Au-tomation (ISA) Society, International Electrotechnical Commission (IEC) andIndustrial Automation Open Networking Association (IAONA) have specifiedguidelines for securing ICSs (see, e.g., [11, 12, 19]). In fact, most security bestpractices recommend the segregation of PCNs and ENs.
Firewalls are often used to segregate PCNs and ENs [1, 18, 19]. A firewallcan be configured to block unnecessary services, protocols and ports, therebyproviding a higher degree of segregation between a PCN and EN. A router maybe positioned in front of the firewall to perform simple packet filtering, leavingthe firewall to perform more sophisticated tasks such as stateful filtering andacting as a proxy.
Using a single firewall between a PCN and EN has a serious drawback. Thisis because the firewall must allow the data historian to have a wide range ofaccess to the PCN. Essentially, each service needs a “hole” in the firewall tooperate correctly. Configuring too many holes in the firewall reduces PCN-ENsegregation and opens the PCN to a slew of attacks. This problem is typicallyaddressed by creating a “demilitarized zone” (DMZ) [1, 18, 19].
An architecture deploying a DMZ has three zones: an outside zone contain-ing the EN, an inside zone containing the PCN, and a DMZ containing the data

Okhravi & Nicol 59
Figure 1. Paired firewall PCN architecture.
historian. Firewall rules are crafted to make the DMZ historian the sole pointof contact between the PCN and EN. The historian can access PCN servicesthat provide it data; in turn, the EN is allowed access to the historian. Firewallrules block PCN access by all other devices. Most attacks originating in (orpassing through) the EN and targeting the historian will not affect the controlsystems; at worst, they would corrupt the historian’s data (a redundant copyof this data is stored elsewhere).
A PCN architecture deploying paired firewalls separated by a DMZ [18, 19] isshown in Figure 1. It simplifies the firewall rules and achieves a clear separationof responsibility as the PCN-side firewall can be managed by the control groupand the EN-side firewall by the IT group [18, 19]. This architecture is highlyrecommended for ICSs, and best practices have been identified for configuringthe firewalls (see, e.g., [1, 11, 12, 19, 21]).
3. Security Challenges
Firewall configuration errors can lead to security vulnerabilities. One prob-lem is that firewalls often have large rule sets that are difficult to verify. Ac-cording to a study by Wool [21], firewall rule sets may have as many as 2,600rules with 5,800 objects, and a significant correlation exists between rule setcomplexity and the number of configuration errors. A second problem is thatfirewalls are usually the main line of defense. Configuration errors enable at-

60 CRITICAL INFRASTRUCTURE PROTECTION II
tackers to exploit holes in a firewall and target the otherwise defenseless devicesinside the network.
Wool [21] notes that 80% of rule sets allow “any” service on inbound traf-fic and insecure access to firewalls. He emphasizes that “the analysis of realconfiguration data shows that corporate firewalls are often enforcing rule setsthat violate well-established security guidelines.” The Wool study and othersdemonstrate that firewall configuration errors pose a real threat to ICS security.
Even properly configured firewalls can be bypassed [3]. This occurs, forexample, when a vendor creates a direct (e.g., dial-up) connection to a de-vice for maintenance, or when unsecured wireless access points exist behind afirewall. Firewalls can also be thwarted by tunneling attack traffic using legit-imate means (e.g., via a corporate VPN) or by using encryption (firewalls donot inspect encrypted packets). A widely-reported firewall breach occurred inJanuary 2003, when the MS SQL Server 2000 worm infected systems at theDavis-Besse nuclear power plant in Oak Harbor, Ohio [16].
Vulnerable devices are typically secured by patching their services, updat-ing software or deploying the latest versions of the devices. However, man-ual patch/update/version management are difficult and costly tasks, especiallywhen careless users introduce vulnerable (wireless) devices into an industrialcontrol network that establish new entry points for attackers.
Unsecured physical access also exposes ICSs to serious security threats.Open wireless access points and Ethernet ports on office walls enable attackersto enter ICS networks and target critical assets. Nothing in the traditional ICSarchitecture prevents suspect devices from connecting to the network; thus,serious threats are posed by devices whose hardware, operating systems, exe-cutables and/or configurations have been tampered with by attackers.
Many ICS vulnerabilities admit malware such as worms, viruses, Trojanhorses and rootkits [15, 16]. ICS security trends reveal that external malwareattacks are becoming increasingly common [2]. Finally, rogue users (insiders)are an ever-present threat to ICSs.
4. Trusted Process Control Networks
In a traditional network access control model, access is granted to a userwithout considering the security state of the user’s machine. Likewise, firewallaccess control is agnostic about the security status of the device that sendstraffic. A port on a machine is opened or not opened to traffic based entirelyon the identity of the source.
A trusted network architecture uses information about the hardware andsoftware states of devices in admission and access control decisions. When adevice first “joins” the network, its hardware and software are checked; basedon these checks, the appropriate access control rules are applied dynamically tothe user, device and traffic. The same principle can be applied to process controlarchitectures. This section discuss technologies that support this concept andtheir application to ICSs.

Okhravi & Nicol 61
4.1 Trusted Networks
A trusted network (TN) architecture uses existing standards, protocols andhardware devices to implement “trust.” TNs provide important security ser-vices such as user authentication, comprehensive network device admission con-trol, end-device status checks, policy-based access control, traffic filtering, au-tomated remediation of non-compliant devices and auditing.
The Trusted Computing Group (TCG) has promulgated industry standardsfor TNs [20]. Several commercial TN technologies have been developed, in-cluding Cisco TrustSec [6], Cisco CleanAccess [7] (formerly known as CiscoNetwork Admission Control (NAC) [5, 8]), and Microsoft Network Access Pro-tection (NAP) [13]. Cisco NAC is interoperable with Microsoft NAP; detailsabout their interoperation can be found in [9].
4.1.1 Trusted Network Components. TN component vendorsuse a variety of names to describe their products. We use generic terms with abias towards those adopted by Cisco CleanAccess.
A TN has the following components:
Client Device: Every client device must be evaluated prior to admissionto a TN.
Network Access Device: All connectivity to a TN is implemented via anetwork access device (NAD), which enforces policy. NAD functionalitymay exist in devices such as switches, routers, VPN concentrators andwireless access points.
Authentication, Authorization and Access Control Server: Theauthentication, authorization and access control (AAA) server maintainsthe policy and provides rules to NADs based on the results of authenti-cation and posture validation.
Posture Validation Servers: Posture validation servers (PVSs) evalu-ate the compliance of a client before it can join a TN. A PVS is typicallya specialization for one client attribute (e.g., operating system versionand patch or virus signature release).
Posture Remediation Servers: These servers provide remediation op-tions to a client device in case of non-compliance. For example, a servermay maintain the latest virus signatures and require a non-compliantclient device to load the signatures before joining a TN.
Directory Server: This server authenticates client devices based ontheir identities or roles.
Other Servers: These include trusted versions of Audit, DNS, DHCPand VPN servers [5, 7, 8].

62 CRITICAL INFRASTRUCTURE PROTECTION II
Figure 2. Trusted process control network.
4.1.2 Trusted Network Protocols. TNs leverage existingstandards and protocols to implement the required security functionality; thisreduces the cost of building TNs. Protocols used in TNs include IPSec forhardening communications [7], EAP and 802.1x for authentication [5, 6], RA-DIUS/LDAP/Kerberos for directory services and authentication [5, 7], HCAPfor compliance communication [5], and GAME for communications betweenAAA and audit servers [4].
4.2 TPCN Architecture
A trusted process control network (TPCN) architecture is presented in Fig-ure 2. A client device intending to join the network communicates its requestto the NAD. The NAD establishes the client device’s identity using EAP overthe 802.1x protocol and sends the results to the AAA server using the RADIUSprotocol. The AAA server returns a list of posture validation requirements andthe addresses of the appropriate PVSs.
The client then validates its posture with each of the PVSs. If the client is incompliance, the results are sent to the AAA server using the HCAP protocol.On the other hand, if the client lacks one or more requirements, the appropriateposture remediation servers suggest remediation actions to the client.

Okhravi & Nicol 63
The directory server determines the client’s group or role. Given all theresults from the PVSs and the directory server, the AAA server determines theset of rules that apply to the client’s access and traffic and sends them to theNAD for enforcement. From this point on, the client is permitted to commu-nicate via the NAD and all its activities are monitored for policy compliance.Interested readers are referred to [5, 7, 8] for additional details.
The policy held by the AAA server is in the form of an authenticationrequirement and a list of posture validation requirements. For example, token-based authentication may be required and postures must be validated with theanti-virus server, patch management server and driver validation server. Whena client device joins the network, a NAD communicates with an AAA serveron behalf of the device. The AAA server authenticates the device and providesrules based on the device’s security postures to the NAD. From this point on,the NAD enforces the policy on all ingress and egress traffic to/from the device.For example, an RTU with valid firmware is allowed to communicate with thehistorian; all other traffic is blocked. The two examples below further clarifythe workings of a TPCN.
Example 1. Consider a scenario where an analyst on a workstation intendsto connect wirelessly to the PCN to access historical data about plant opera-tions. The workstation connects to a wireless access point (AP) in the enterprisenetwork with NAD functionality. The AP applies the default policy, which isto block all traffic except what is needed to establish trust. The workstationthen authenticates with the AP using EAP over the 802.1x protocol to senda stored certificate. The AP uses RADIUS to send the workstation’s identityto the AAA server. The AAA server then sends the user’s identity to the di-rectory server, which knows the user’s role (“analyst”). The AAA server usesRADIUS to send the workstation a list of posture requirements (anti-virus ver-sion number and OS patch history). The workstation uses a trusted platformmodule (TPM) chip to sign and send the posture values to the relevant PVSs,which proceed to validate these values. The patch management PVS discoversthat the workstation OS has a missing patch and coordinates with the remedi-ation server to have the appropriate patch sent to the workstation. The PVSstransmit the results back to the AAA server using the HCAP protocol. If theworkstation is compliant, the AAA sends a rule set to the AP for enforcement.Since the user role is “analyst,” the rule set allows TCP connections to thehistorian but blocks access to all other devices.
Example 2. Consider a scenario where an RTU intends to join the PCN.The RTU connects to a switch on the factory floor via a network cable; theswitch has NAD functionality. The protocols used are the same as in Example1, so we avoid repetition. The switch authenticates the RTU using the RTU’sstored token. The AAA server requires the RTU to validate its configurationwith a configuration management server. The RTU sends its configuration tothe configuration management server, which returns the successful result to the

64 CRITICAL INFRASTRUCTURE PROTECTION II
AAA server. The AAA server, in turn, sends the appropriate rule set for thecompliant RTU to the switch for enforcement. The RTU may now communicatewith other RTUs, the MTU and the historian; the switch blocks all other traffic.
4.3 TPCN Requirements
For added security and separation of duty, a TPCN requires at least twoNADs (switches with firewalls) and a AAA server (Figure 2). An enterprisecan add as many PVSs as required, e.g., an anti-virus validation server to ensurethat devices have up-to-date virus protection, a patch management server tocheck that devices have the correct patches and a software validation server toverify the authenticity of embedded device firmware. Incorporating multiplePVSs adds to the cost of a TPCN, but enhances security.
All NADs (switches, routers, wireless access points, etc.) must supporttrusted network functionality. Many vendors offer products with trusted net-work functionality. Therefore, if an enterprise is already using new equipment,implementing a TPCN may be very cost-effective. Older systems would likelyinvolve significant upgrades, which can be costly. Note that in a TPCN archi-tecture the firewall functionality is integrated in NADs.
Client devices may need software and firmware upgrades to support trustednetwork functionality. A trusted network client is required for authenticationwith the AAA server and for sending posture values. For secure applications,TPM chips can be used to verify configurations and obtain posture signatures.Devices such as RTUs and PLCs do not usually have TPMs; however, as someRTUs already come with built-in web servers, adding TPM to these devices isfeasible, especially if government regulations mandate the implementation oftrusted ICS architectures.
The administrator applies system updates by imposing new requirements inthe AAA and PVSs. The AAA server informs devices of the new policy. If thedevices have the update, they verify this fact with a PVS and remain in thenetwork. Otherwise, the appropriate server provides them with the requiredpatches (or installs the patches automatically), upon which they can enter thenetwork.
TPCNs have the same availability issues as traditional PCNs – applyingpatches can cause components to crash. Therefore, every patch or update mustbe tested thoroughly before being placed on the AAA server. Exact replicas ofTPCN components should be used for testing. If concerns exist after testing,a backup device may be placed in the TPCN. In such a situation, the AAAserver holds two different policies for the device. One policy is associatedwith the actual role and the other policy with the backup role. The backuppolicy does not enforce the new requirement on the backup device until theactual device is verified to function correctly with the patch. It is only thenthat the administrator applies the requirement to the backup device as well.Note that if the actual device is affected by the patch, the backup device canfunction correctly since it is not required by its policy to have the patch inorder to connect to the network. TPCNs do not positively or negatively affect

Okhravi & Nicol 65
system availability; they merely enforce the requirements. It is the testingphase, before the specification of a requirement, that determines whether ornot system availability is affected.
5. TPCN Evaluation
The benefits of a TPCN are best seen in the light of how it addresses the se-curity issues that impact traditional networks. A TPCN addresses the followingsecurity issues either partially or completely.
Firewall Configuration Errors (Partial): A TPCN breaks the setof firewall rules into smaller rule sets associated with each access controlgroup or role. These rule sets are sent by the AAA server to the NADsfor enforcement upon completion of the authentication phase. Accordingto Wool [21], the number of configuration errors decreases logarithmi-cally as the rule set complexity decreases. Because a TPCN has smallerrule sets, the potential for firewall configuration errors is correspondinglylower. Moreover, access rules in a TPCN are defined based on groupsor roles, not just IP addresses; this helps reduce confusion and, conse-quently, configuration errors. Note that configuration errors will never becompletely eliminated; therefore, TPCN only provides a partial solutionto the problem.
Bypassing Firewalls (Complete): TPCNs explicitly address this issueby securing all NADs and requiring them to establish trust relationshipswith client devices before forwarding traffic (including wireless traffic andVPN traffic). Furthermore, the access control and traffic rules are appliedat every access point. It is not possible to bypass the rules by hookinga line behind a firewall; this is because the line’s switch (access point)enforces the rules.
Vulnerable Devices (Partial): In a traditional network architecture,patch/update/version/configuration management is performed manuallyby the network administrator. This is an extremely difficult task for re-mote and mobile devices. As a result, it may be done less frequently thanrecommended or it may be simply ignored. In a TPCN, the state of adevice is checked automatically before it can join the network. Moreover,its behavior is continuously monitored upon entry and status checks canbe performed at the desired frequency. Consequently, a TPCN is less vul-nerable to known attacks. Note, however, that a TPCN is still vulnerableto zero-day attacks.
Unsecured Physical Access (Complete): TPCNs again address thisproblem by enforcing security policies on NAD ports. This is sometimesreferred to as “port-based access control.” Thus, a malicious or carelessuser cannot hook a device to an open Ethernet port and gain entry intothe network. Note also that ports on TPCN switches and wireless access

66 CRITICAL INFRASTRUCTURE PROTECTION II
points do not forward traffic until trust relationships are established withthe communicating entities.
Malware (Partial): The compliance rules enforced on devices beforeand after joining a TPCN reduce the likelihood of infections by malware.A SCADA security study [2] notes that “the majority of worm eventsoccurred months or years after the worm was widely known in IT worldand patches were available.” This implies that the majority of incidentscan be prevented by enforcing compliance rules before a node joins anetwork. Since nearly 78% of the (external) SCADA security incidentsare caused by malware [2], TPCN incidents are reduced dramatically.Nevertheless, a TPCN remains vulnerable to zero-day attacks.
Untrusted Devices (Complete): TPCNs address this problem explic-itly by verifying the signatures of the critical components of a device usingthe TPM chip and also checking the device status. Note that if the TPMchip is trusted, the device can attest its identity.
Untrusted Users (Partial): By using stronger authentication methodsand clearly defining user roles, TPCNs prevent attacks such as passwordcracking/stealing, access violations and impersonation. Also, by blockingall unnecessary accesses, TPCNs partially prevent accidents caused bycareless insiders that account for more than 30% of all security incidents[2].
We employed the Common Attack Pattern Enumeration and Classification(CAPEC) database [14] to further compare the TPCN architecture with tra-ditional PCN designs. CAPEC contains twelve attack categories along withtheir descriptions, prerequisites, methods, consequences and mitigation strate-gies. We consider nine attack categories (with 31 attack patterns), which webelieve are meaningful in the ICS context and showcase the differences betweenTPCNs and traditional PCNs. For example, while buffer overflow attacks areeffective against software applications, they are not relevant when evaluatingnetwork designs.
Tables 1 and 2 present the results of the comparison. The descriptor H (high)means that an attack is performed with little effort and cost; M (medium)implies that an attack is still possible but requires expert knowledge and iscostly; L (low) indicates that an attack is highly unlikely or involves enormouseffort, time and/or cost. The last column in Tables 1 and 2 shows the securitycontrols provided by a TPCN to address the attack (if any).
Considering the 31 total attack patterns, a PCN is vulnerable to nineteen(61.3%) high, nine (29%) medium, and three (9.7%) low feasibility attacks.On the other hand, a TPCN is vulnerable to only two (6.5%) high feasibilityattacks along with nine (29%) medium and twenty (64.5%) low feasibility at-tacks. Note that this is a qualitative comparison of the two architectures; thequantitative assessment of network architectures based on security metrics isan open research problem and is beyond the scope of this paper.

Okhravi & Nicol 67
Table 1. Feasibility of attack patterns.
Category Attack Pattern PCN TPCN TPCN SC
Abuse ofFunctionality
Inducing Account Lock-out
H L Strong Authen-tication
Exploiting Password Re-covery
H L Strong Authen-tication
Trying Common Appli-cation Switches and Op-tions
H L ConfigurationVerification
Exploiting IncorrectlyConfigured SSL SecurityLevels
H L ConfigurationVerification
Spoofing Faking the Data Source M L Message Au-thentication
Spoofing the Principal H L Strong Authen-tication
Man-in-the-MiddleAttack
H L Device Authen-tication
Creating a MaliciousClient
M L Accounting
External Entity Attack H L VPN AccessControl
ProbabilisticTechniques
Brute Forcing Passwords L L Strong Authen-tication
Brute Forcing Encryp-tion
L L N/A
Rainbow Table PasswordCracking
L L Strong Authen-tication
Manipulating OpaqueClient-Based DataTokens
M M N/A
ExploitingAuthentica-tion
Exploiting Session Vari-ables, Resource IDs andOther Credentials
M M Software Verifi-cation
Reflection Attack on Au-thentication Protocol
H H N/A
Bypassing Authentica-tion
H L Port-BasedAccess Control
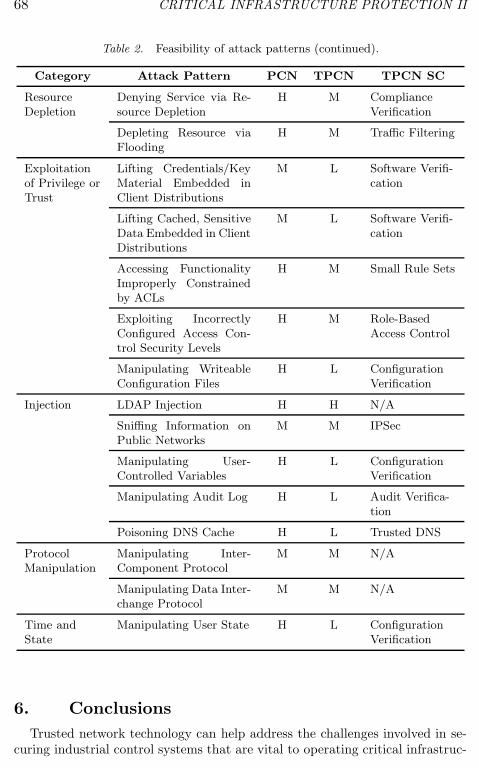
68 CRITICAL INFRASTRUCTURE PROTECTION II
Table 2. Feasibility of attack patterns (continued).
Category Attack Pattern PCN TPCN TPCN SC
ResourceDepletion
Denying Service via Re-source Depletion
H M ComplianceVerification
Depleting Resource viaFlooding
H M Traffic Filtering
Exploitationof Privilege orTrust
Lifting Credentials/KeyMaterial Embedded inClient Distributions
M L Software Verifi-cation
Lifting Cached, SensitiveData Embedded in ClientDistributions
M L Software Verifi-cation
Accessing FunctionalityImproperly Constrainedby ACLs
H M Small Rule Sets
Exploiting IncorrectlyConfigured Access Con-trol Security Levels
H M Role-BasedAccess Control
Manipulating WriteableConfiguration Files
H L ConfigurationVerification
Injection LDAP Injection H H N/A
Sniffing Information onPublic Networks
M M IPSec
Manipulating User-Controlled Variables
H L ConfigurationVerification
Manipulating Audit Log H L Audit Verifica-tion
Poisoning DNS Cache H L Trusted DNS
ProtocolManipulation
Manipulating Inter-Component Protocol
M M N/A
Manipulating Data Inter-change Protocol
M M N/A
Time andState
Manipulating User State H L ConfigurationVerification
6. Conclusions
Trusted network technology can help address the challenges involved in se-curing industrial control systems that are vital to operating critical infrastruc-

Okhravi & Nicol 69
ture assets. Adding trust to industrial control networks eliminates securityproblems posed by inadequate controls, non-compliant devices and malicioususers. It dramatically reduces vulnerabilities to malware attacks that consti-tute the majority of external attacks. Also, the likelihood of internal attacksis reduced via compliance verification, port-based access control, device anduser authentication, and role-based access control. Implementation and main-tenance costs are major issues, especially when deploying security solutions forindustrial control networks containing modern and legacy systems.
References
[1] E. Byres, B. Chauvin, J. Karsch, D. Hoffman and N. Kube, The specialneeds of SCADA/PCN firewalls: Architectures and test results, Proceed-ings of the Tenth IEEE Conference on Emerging Technologies and FactoryAutomation, 2005.
[2] E. Byres, D. Leversage and N. Kube, Security incident and trends inSCADA and process industries: A statistical review of the Industrial Secu-rity Incident Database (ISID), White Paper, Symantec Corporation, Cu-pertino, California, 2007.
[3] E. Byres and J. Lowe, The myths and facts behind cyber security risks forindustrial control systems, Proceedings of the VDE Congress, pp. 213–218,2004.
[4] D. Capite, Self-Defending Networks: The Next Generation of Network Se-curity, Cisco Press, Indianapolis, Indiana, 2006.
[5] Cisco Systems, Implementing Network Admission Control – Phase OneConfiguration and Deployment, Version 1.1, San Jose, California, 2005.
[6] Cisco Systems, Cisco TrustSec: Enabling switch security services, SanJose, California (www.cisco.com/en/US/solutions/collateral/ns340/ns394/ns147/ns774/net implementation white paper0900aecd80716abd.pdf),2007.
[7] Cisco Systems, Cisco NAC Appliance – Clean Access Manager Installa-tion and Configuration Guide, Release 4.1(3), San Jose, California (www.cisco.com/en/US/docs/security/nac/appliance/configuration guide/413/cam/cam413ug.pdf), 2008.
[8] Cisco Systems, Getting started with Cisco NAC network modules in Ciscoaccess routers, San Jose, California (www.cisco.com/en/US/docs/security/nac/appliance/installation guide/netmodule/nacnmgsg.pdf), 2008.
[9] Cisco Systems and Microsoft Corporation, Cisco Network Admission Con-trol and Microsoft Network Access Protection Interoperability Archi-tecture, Redmond, Washington (www.microsoft.com/presspass/events/ssc/docs/CiscoMSNACWP.pdf), 2006.
[10] M. Franz and D. Miller, Industrial Ethernet security: Threats and countermeasures (www.threatmind.net/papers/franz-miller-industrial-ethernet-sec-03.pdf), 2003.

70 CRITICAL INFRASTRUCTURE PROTECTION II
[11] Industrial Automation Open Networking Association, The IAONAHandbook for Network Security, Version 1.3, Magdeburg, Germany(www.iaona.org/pictures/files/1122888138–IAONA HNS 1 3-reduced 050725.pdf), 2005.
[12] Instrumentation, Systems and Automation Society, Integrating ElectronicSecurity into the Manufacturing and Control Systems Environment, AN-SI/ISA Technical Report TR99.00.02-2004, Research Triangle Park, NorthCarolina, 2004.
[13] Microsoft Corporation, Network access protection platform architecture,Redmond, Washington (www.microsoft.com/technet/network/nap/naparch.mspx), 2004.
[14] MITRE Corporation, CAPEC: Common Attack Pattern Enumeration andClassification, Bedford, Massachusetts (capec mitre.org).
[15] North American Electric Reliability Council, SQL slammer worm lessonslearned for consideration by the electricity sector, Princeton, New Jersey(www.esisac.com/publicdocs/SQL Slammer 2003.pdf), 2003.
[16] Office of Nuclear Reactor Regulation, Potential vulnerability of plantcomputer network to worm infection, NRC Information Notice 2003-14,Nuclear Regulatory Commission, Washington, DC (www.nrc.gov/reading-rm/doc-collections/gen-comm/info-notices/2003/in200314.pdf), 2003.
[17] R. Ross, S. Katzke, A. Johnson, M. Swanson, G. Stoneburner and G.Rogers, Recommended Security Controls for Federal Information Systems,NIST Special Publication 800-53, National Institute of Standards andTechnology, Gaithersburg, Maryland, 2005.
[18] M. Sopko and K. Winegardner, Process control network security concernsand remedies, IEEE Cement Industry Technical Conference Record, pp.26–37, 2007.
[19] K. Stouffer, J. Falco and K. Scarfone, Guide to Industrial Control SystemsSecurity, Second Public Draft, NIST Special Publication 800-82, NationalInstitute of Standards and Technology, Gaithersburg, Maryland, 2007.
[20] Trusted Computing Group, Trusted network connect to ensure endpointintegrity, Beaverton, Oregon (www.trustedcomputinggroup.org/groups/network/TNC NI collateral 10 may.pdf), 2005.
[21] A. Wool, A quantitative study of firewall configuration errors, IEEE Com-puter, vol. 37(6), pp. 62–67, 2004.
Chapter 6
TOWARDS A TAXONOMY OF ATTACKSAGAINST ENERGY CONTROL SYSTEMS
Terry Fleury, Himanshu Khurana and Von Welch
Abstract Control systems in the energy sector (e.g., supervisory control and dataacquisition (SCADA) systems) involve a hierarchy of sensing, moni-toring and control devices connected to centralized control stations orcenters. The incorporation of commercial off-the-shelf technologies inenergy control systems makes them vulnerable to cyber attacks. A tax-onomy of cyber attacks against control systems can assist the energysector in managing the cyber threat. This paper takes the first steptowards a taxonomy by presenting a comprehensive model of attacks,vulnerabilities and damage related to control systems. The model ispopulated based on a survey of the technical literature from industry,academia and national laboratories.
Keywords: Energy sector, control systems, attack taxonomy
1. Introduction
Energy control systems involve a hierarchy of sensing, monitoring and con-trol devices connected to centralized control stations or centers. Within thishierarchy, control systems remotely monitor and control sensitive processesand physical functions. Supervisory control and data acquisition (SCADA)systems utilized to monitor power, oil and gas transmission systems are com-mon instantiations of energy control systems. Owing to various commercialand external forces such as deregulation, asset owners are extending the con-nectivity of their control systems by adopting commercial off-the-shelf (COTS)components. Standard operating systems (e.g., Windows and UNIX) and com-munication technologies (e.g., public and private IP networks, public telephonenetworks and wireless networks) are being used more frequently in control sys-tems.
Earlier control systems operated in isolated environments with proprietarytechnologies. Consequently, they faced little to no cyber security risk from
Please use the following format when citing this chapter: Fleury, T., Khurana, H. and Welch, V., 2008, in IFIP Intern ational Federation for Inform ation Processing, Volume 290; Critical Infrastructure Protection II, eds. Papa, M., Shenoi, S., (Boston: Springer), pp. 71–85.

72 CRITICAL INFRASTRUCTURE PROTECTION II
external attackers. However, the adoption of commercial technologies causesprocess control systems in the energy sector to become increasingly connectedand interdependent. This makes energy control systems attractive targets forattack. Along with the cost saving benefits of commercial technologies comesa multitude of vulnerabilities inherit in the technologies. This attracts a rangeof adversaries with the tools and capabilities to launch attacks from remotelocations with significant consequences. Systems are attacked by hackers forglory and attention, by criminals for financial gain, by insiders for retribution,by industrial and government spies for intelligence gathering, and by botnetoperators for inclusion in their bot armies. These adversaries may have sig-nificant resources at their disposal and use them to launch cyber attacks thatexploit vulnerabilities and potentially cause harm.
Cyber attacks can have a significant impact on the operation of controlsystems. For example, denial-of-service attacks can disrupt the operation ofcontrol systems by delaying or blocking the flow of data through communicationnetworks. Attacks that result in corruption of data can lead to propagationof false information to the control centers, which may result in unintendeddecisions and actions.
A large body of technical literature discusses security issues related to controlsystems, especially threats, attacks and vulnerabilities. Our survey has exam-ined research efforts that address specific aspects of control systems security[1, 3, 4, 14, 16–18, 28] as well as work focused on broader security issues [5–8,22, 24, 26, 29]. However, most of these efforts adopt ad hoc approaches to dis-cuss and prioritize the various aspects of attacks. What is needed is an attacktaxonomy that enables researchers and practitioners to have a comprehensiveunderstanding of attacks against energy control systems. The taxonomy wouldhelp answer the following key questions:
What are the different ways of perpetrating attacks against a controlsystem?
What kind of damage can these attacks cause?
What are the challenges involved in defeating these attacks?
What are the requirements for developing adequate defense mechanisms?
This paper takes the first major step towards the creation of a taxonomyby presenting a comprehensive attack model and populating the model basedon an extensive survey of known attacks against control systems. This attack-vulnerability-damage (AVD) model places equal importance on how attackstake place, what vulnerabilities enable these attacks to be performed, and whatdamage these attacks can cause. The model is geared specifically towardscontrol systems and serves as a basis for developing a comprehensive taxonomyof attacks against energy control systems.
2. Energy Control Systems
Energy control systems include SCADA systems, distributed control systems(DCSs) and programmable logic controllers (PLCs). These systems are critical
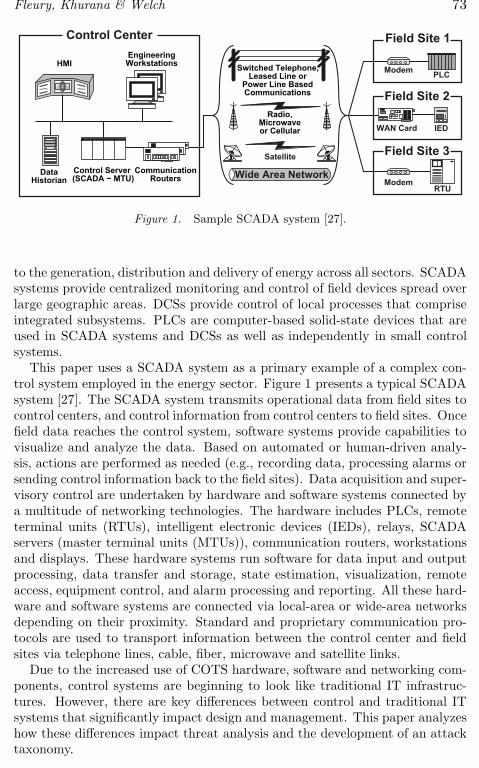
Fleury, Khurana & Welch 73
Control Center Field Site 1
Field Site 2
Field Site 3
ModemRTU
Modem
WAN Card IED
PLC
Satellite
Wide Area Network
Switched Telephone, Leased Line or
Power Line Based Communications
Radio, Microwave or Cellular
DataHistorian
Control Server(SCADA − MTU)
CommunicationRouters
EngineeringWorkstationsHMI
Figure 1. Sample SCADA system [27].
to the generation, distribution and delivery of energy across all sectors. SCADAsystems provide centralized monitoring and control of field devices spread overlarge geographic areas. DCSs provide control of local processes that compriseintegrated subsystems. PLCs are computer-based solid-state devices that areused in SCADA systems and DCSs as well as independently in small controlsystems.
This paper uses a SCADA system as a primary example of a complex con-trol system employed in the energy sector. Figure 1 presents a typical SCADAsystem [27]. The SCADA system transmits operational data from field sites tocontrol centers, and control information from control centers to field sites. Oncefield data reaches the control system, software systems provide capabilities tovisualize and analyze the data. Based on automated or human-driven analy-sis, actions are performed as needed (e.g., recording data, processing alarms orsending control information back to the field sites). Data acquisition and super-visory control are undertaken by hardware and software systems connected bya multitude of networking technologies. The hardware includes PLCs, remoteterminal units (RTUs), intelligent electronic devices (IEDs), relays, SCADAservers (master terminal units (MTUs)), communication routers, workstationsand displays. These hardware systems run software for data input and outputprocessing, data transfer and storage, state estimation, visualization, remoteaccess, equipment control, and alarm processing and reporting. All these hard-ware and software systems are connected via local-area or wide-area networksdepending on their proximity. Standard and proprietary communication pro-tocols are used to transport information between the control center and fieldsites via telephone lines, cable, fiber, microwave and satellite links.
Due to the increased use of COTS hardware, software and networking com-ponents, control systems are beginning to look like traditional IT infrastruc-tures. However, there are key differences between control and traditional ITsystems that significantly impact design and management. This paper analyzeshow these differences impact threat analysis and the development of an attacktaxonomy.

74 CRITICAL INFRASTRUCTURE PROTECTION II
There are three core aspects of energy control systems that lead to uniqueperformance, availability, deployment and management requirements. First,the critical nature of these systems necessitates uninterrupted generation, dis-tribution and delivery of energy. Second, these systems operate under a safety-first paradigm due to hazards to equipment and personnel. Third, the powertransmission system has direct physical interactions with the control system.The three core aspects are not necessarily distinct as they have an overlappingnature. Combined together, they impact control system software, hardwareand networking in two ways.
Performance and Availability: Applications depend on data in a crit-ical manner. This requires control systems to provide a deterministic re-sponse without delays or jitter in data delivery. In turn, the systems thatgenerate and distribute data must be highly reliable and available, andthe delivered data must have high integrity. Additionally, any (cyber)security mechanism, such as one that may provide integrity assurances,must be fail-safe. A failure of the security mechanism should not resultin a failure of the underlying control system.
Deployment and Management: Control systems must be tested ex-tensively in “real” environments before they can be deployed. This isbecause they control physical systems over vast geographic areas and thedeployed equipment typically has a long life (possibly one or two decades).Furthermore, downtime for system maintenance and upgrades (e.g., patchmanagement) is unacceptable without significant advanced planning. Incontrast, traditional IT systems are usually deployed without extensivetesting. Their initial deployment phase often serves as a partial test en-vironment. Also, IT systems have expected lifetimes of a few years andoperate under the assumption that they may be taken down for mainte-nance and upgrades with relatively short notice.
3. Methodology
A model for classifying cyber attacks against control systems must satisfyseveral goals.
The model should be specific to cyber attacks on control systems. Severalresearchers have attempted to classify cyber threats to general computersystems (see, e.g., [11, 15]). Since the energy sector incorporates COTStechnologies (e.g., TCP/IP), much of this research can be applied to en-ergy control systems. However, as discussed above, control systems haveunique features and requirements, and it is important that the modeladdresses these issues.
The model should have a relatively high level of abstraction. Some clas-sification schemes for cyber threats to general computer systems describeattacks in a detailed manner. For example, attack trees/graphs [3, 12, 23,25] break down a single cyber attack into its constituent parts, tracing

Fleury, Khurana & Welch 75
the attack from the source (attacker) through various system componentsto the target. Instead of enumerating every possible attack, the modelshould permit parts of specific attacks to be sorted into generalized cat-egories.
The model should be easily expandable. New attacks are continuallybeing developed. The model should accommodate instances of futureattacks and grow and adapt as necessary.
The model should tolerate incompleteness. Incident reports often provideterse accounts of attacks for reasons of sensitivity. For example, a reportmay mention how an attack was carried out but omit its consequences.Alternatively, a report may describe a system vulnerability and how itsexploitation may cause damage, but it may not discuss how attackersmight conduct the exploit. The model should allow for such omissionswhile incorporating all the reported aspects of cyber threats.
With these goals in mind, we conducted an extensive survey of the techni-cal literature. Nearly all the documents that were examined contained threatdescriptions. Several papers (e.g., [2, 19]) described attacks and the associatedvulnerabilities; others (e.g., [4, 10]) described attacks and their effects. One pa-per [8] discussed vulnerabilities and attack impact or damage. This clusteringof descriptions led us to believe that cyber threats to energy control systemsare best decomposed into three categories: attack, vulnerability and damage.These three categories form the basis of our attack-vulnerability-damage (AVD)model. The Howard-Longstaff approach [9] and the system-fault-risk (SFR)framework [30], in particular, matched our modeling goals and inspired thedevelopment of the AVD model.
4. Attack-Vulnerability-Damage Model
This section describes the AVD model and populates it with examples ofcyber attacks against energy control systems.
The AVD model (Table 1) classifies cyber threats based on three broadcategories. The attack category includes “local” origins and “system” targets toidentify physical control system components that may be the origin of the attack(e.g., compromised or exposed end device) and/or the target (e.g., unauthorizedopening of a relay). The vulnerability category includes configuration andimplementation errors in physical devices (e.g., malfunctioning device). Thedamage category considers the harm caused to computer systems as well asthe physical control system (e.g., electric power relay). Given the time-criticalnature of energy systems, the damage category also considers the performanceeffect and the severity of the attack.
Since control systems face threats that strongly overlap those that affect ITsystems, several categories and descriptions in the AVD taxonomy are commonto those encountered in attack taxonomies developed for IT systems. However,in this paper, we focus on example attacks that are specific to control systemsin the energy sector.

76 CRITICAL INFRASTRUCTURE PROTECTION II
Table 1. Attack-vulnerability-damage (AVD) model.
Attack
Origin Action TargetLocal Probe NetworkRemote Scan Process
Flood SystemAuthenticate DataBypass UserSpoofEavesdropMisdirectRead/CopyTerminateExecuteModifyDelete
Vulnerability
ConfigurationSpecificationImplementation
Damage
State Effect Performance Effect SeverityNone None NoneAvailability Timeliness LowIntegrity Precision MediumConfidentiality Accuracy High
4.1 Attacks
An attack has an origin, an action (taken by the attack) and a target (Table2).
Attack Origin: The attack origin describes the location of the attacker withrespect to the target.
Local: A local attack originates from within the target. Such an attackoccurs when the attacker has physical access to equipment [4, 13, 17] orwhen a malfunction occurs in a nearby piece of equipment [10].
Remote: A remote attack originates outside the target site. Such anattack may involve a dial-up modem [4, 19], open wireless network [2,4, 20, 29], private network and bridge [21] or a connection to a trustedthird-party system [4].

Fleury, Khurana & Welch 77
Table 2. Attack category examples.
Origin
Local RemotePhysical access to equipment Dial-up modemMalfunctioning PLC Open wireless network
Worm via private network and bridgeTrusted third-party connection
Action
Probe ScanMap available equipment Perform simple vulnerability scan
Flood AuthenticateLaunch data storm Guess/crack passwordLaunch denial-of-service attack
Bypass SpoofUse different method to access process Hijack session
Eavesdrop MisdirectMonitor wireless traffic Alarm output not displayed
Read/Copy TerminateDownload business reports Shut down service
Shut down SCADA system
Execute ModifyExploit MS-SQL vulnerability Alter SCADA system metering data
Change protection device settingsDeleteRender data non-retrievable
Target
Network ProcessDeluge network with data Disable safety monitoringWireless transmissions Use computer resources to play games
System DataDigital circuit breaker Business report
UserProfile theft
Attack Action: The attack action describes the activity that the attack per-forms on the target.

78 CRITICAL INFRASTRUCTURE PROTECTION II
Probe: A probe seeks to determine the characteristics of a particularsystem. For example, a probe may attempt to identify the make andmodel of a device or the software services (and versions) running on thedevice [8, 16].
Scan: A scan attempts to access targets sequentially for the purpose ofdetermining specific characteristics. An example is a network scan thatidentifies open ports [2].
Flood: A flood repeatedly accesses a target, overloading it with traffic,possibly disabling it. Examples include data storms [10] and denial-of-service attacks [16].
Authenticate: This involves unauthorized or illicit authentication as avalid user or process in order to access the target. An example is passwordcracking [16].
Bypass: This involves the use of an alternative method to access thetarget (e.g., bypassing standard access protocols).
Spoof: A spoofing attempt assumes the identity of a different user inorder to access the target. An example is session hijacking [16].
Eavesdrop: This involves the passive monitoring of a data stream toobtain information (e.g., sniffing unencrypted wireless traffic [29]).
Misdirect: This involves intercepting communication channels and out-putting bogus information. The recipients are unaware that the outputis not genuine. An example is cross-site scripting where the input isredirected to a malicious site that outputs seemingly correct information.
Read/Copy: This usually refers to a static data source, but could alsorefer to a dynamic data stream. In a “read” attack, the data is read bya human. A “copy” attack duplicates the original data source for laterprocessing by a human or process. An example is downloading privatebusiness reports [2].
Terminate: This involves stopping a running process. It could be asspecific as shutting down a service (e.g., a monitoring or display system[13, 20]) or as broad as shutting down an entire SCADA system [17].
Execute: This involves running a malicious process on the target. Thisbehavior is typical of a virus or worm (e.g., Slammer worm that exploitsan MS-SQL vulnerability [20]).
Modify: This involves changing the contents of the target. Examplesinclude modifying SCADA system data or device protection settings [17].
Delete: This involves erasing data from the target or simply making thedata non-retrievable.
Attack Target: The attack target describes the resource that is attacked.
Network: A network comprises computers and networking equipment con-nected via wires or wirelessly. An attack on a network target typicallyinvolves disrupting communications between computers and network de-vices [10, 29].

Fleury, Khurana & Welch 79
Table 3. Vulnerability category examples.
Vulnerability
Configuration ImplementationAccount management Poor authenticationUnused services Scripting/interface programmingUnpatched components Malfunctioning devicesPerimeter protection Poor logging/monitoring
Design/SpecificationCleartext communicationsPoor coding practicesNetwork addressingWeb servers and clientsEnumeration
Process: A process is a program running on a computing system. Itconsists of program code and data. Example attacks are disabling safetymonitoring software [20] and using computer resources for entertainment(e.g., to play games) [17].
System: A system comprises one or more connected components thatperform computations. A system typically refers to a computer but couldalso describe a device such as a digital circuit breaker [19].
Data: Data consists of information that is suitable for processing by hu-mans and machines. Data can refer to a single resource such as a filestored on a hard drive or packets that are transmitted over a communi-cations network. An example attack is the unauthorized access of datafrom a server [2].
User: A user has authorization to access certain system resources. At-tacks targeting users typically attempt to illicitly gain information forlater use. An example is monitoring network traffic to discover user pass-words [16].
4.2 Vulnerabilities
A vulnerability describes why a particular attack may be successful (Table3). The vulnerability does not specify the actual target, but the weakness thatcan be exploited.
Configuration: An improperly configured resource may enable an attackerto gain unauthorized access to a target. Examples include poor accountmanagement where certain unused accounts [8, 26, 28] and/or services[8] have high-level privileges; components with known flaws that are not

80 CRITICAL INFRASTRUCTURE PROTECTION II
Table 4. Damage category examples.
State Effect
Availability IntegrityCircuit breaker tripped Corrupt data receivedRecirculation pump failure
ConfidentialityBusiness reports downloaded
Performance Effect
Timeliness AccuracyPlant network slowdown Missing alarm data
PrecisionPlant data cannot be viewed
Severity
None LowAttacker does not impact target Attacker gains additional information
Medium HighAttacker degrades performance Attacker acts as a legitimate userAttacker alters system state Attacker gains admin rightsLoss of public confidence in services Attacker disables process
Attacker causes equipment damageAttacker spoofs displays viaman-in-the-middle attack
properly patched [8, 21, 26]; weak or non-existent authentication (includ-ing unchanged passwords) [5, 28]; and misconfigured perimeter protectionand/or access control policies [2, 8, 19, 26].
Design/Specification: Design flaws in a process or component can beutilized in unintended ways to gain access to a target. Examples areinsecure communication protocols used by processes and users [5, 8, 26,29] and flawed code [8, 28].
Implementation: Even when the design of a hardware or software systemis correct, the implementation may be incorrect. This can lead to securityholes [8, 20, 28] or malfunctions [10, 26].
4.3 Damage
The damage caused by an attack has three attributes: state effect, per-formance effect and severity (Table 4). State effects and performance effects

Fleury, Khurana & Welch 81
describe the damage done to the system components. The severity attributeattempts to quantify the overall impact of the attack.
State Effect: A state effect describes the state change that occurs to thetarget because of the attack.
Availability: The availability of an asset refers to its ability to servicerequests. A successful attack disables an asset or increases its responsetime. Example state effects include tripping a circuit breaker [19] anddisrupting a recirculation pump [10].
Integrity: Integrity refers to the correctness of an asset when meetingservice requests. An example state effect is data corruption.
Confidentiality: Confidentiality refers to authorized access to, or use of,an asset. An example state effect is the unauthorized access of businessreports [2].
Performance Effect: A performance effect describes the performance degra-dation that occurs on the target because of the attack.
Timeliness: This is a measure of time from data input to output. A time-liness performance effect has occurred when there is a sustained increasein this measure. An example is plant network slowdown [20].
Precision: This is a measure of the amount of output generated by datainput. A precision performance effect has occurred when the output isnot 100% of the expected output. This may occur, for example, when aprocess is terminated before it completes its execution or when insufficientdata output produces an “Unable to View Plant” error message [4].
Accuracy: This is a measure of the correctness of the output generatedby data input. For example, an accuracy performance effect has occurredwhen control messages or measurements are altered during transmission.
Severity: Severity seeks to quantify the level of impact of an attack.
None: The attack may have been successful, but it has no noticeableimpact on the target [8].
Low: The attack typically gains information that may not be directlyexploitable [2, 3, 8, 29]. An example is the discovery of user names butnot the associated passwords.
Medium: The attack degrades system performance [8, 13, 21] and/oralters the state of the system [3, 20]. State and/or performance effectsmay start to be seen. This may result in a loss of public confidence insystem services [26].
High: The attack enables the perpetrator to gain the privileges of a legit-imate user [8], operator [4, 8] or administrator [3, 8] to disable processes[10, 19] or damage equipment [26].

82 CRITICAL INFRASTRUCTURE PROTECTION II
Table 5. Example attacks in the AVD model.
Attack Origin State Effect
Action Vulnerability Performance Effect
Target Severity
Data Storm [10] Local AvailabilityFlood Specification PrecisionNetwork Medium
Slammer Worm Remote Integrity(Remote) [20] Copy Implementation Accuracy
Process Low
Slammer Worm Local Integrity(Local) [20] Execute Specification Accuracy
System High
Software Bug Local IntegrityXA/21 [21] Terminate Implementation Timeliness
Process Medium
Dial-In Remote AnyPassword [5] Authenticate Configuration Any
User High
Component Local IntegrityData Spoofing [5] Modify Specification Accuracy
Data High
4.4 Example Attacks
Table 5 lists several complete attacks by name and shows how they fit intothe AVD model.
5. Conclusions
Energy control systems are vulnerable to cyber attacks. In order for theenergy sector to deal effectively with these attacks, it is necessary to developa taxonomy of attacks against control systems. The comprehensive model ofattacks, vulnerabilities and damage presented in this paper is a first step todeveloping such a taxonomy.
Our future work on developing the taxonomy will expand the model by con-sidering additional categories and sub-categories as well as analyzing a broaderrange of attack data. Categories for consideration include (i) attack sophisti-cation, i.e., level of expertise required for an attack; (ii) fiscal impact, i.e., thefinancial loss incurred due to the attack; and (iii) protocol and operation sys-

Fleury, Khurana & Welch 83
tem specifics, i.e., details of the attack in terms of the protocols and operatingsystems that are exploited.
Acknowledgements
This research was supported by the National Science Foundation underGrant No. CNS-0524695. The authors also wish to acknowledge the technicalassistance provided by participants in the Trustworthy Cyber Infrastructurefor the Power Grid Project.
References
[1] K. Birman, J. Chen, E. Hopkinson, R. Thomas, J. Thorp, R. van Rennesseand W. Vogels, Overcoming communications challenges in software formonitoring and controlling power systems, Proceedings of the IEEE, vol.93(5), pp. 1028–1041, 2005.
[2] A. Brown, SCADA vs. the hackers, Mechanical Engineering, vol. 124(12),pp. 37–40, 2002.
[3] E. Byres, M. Franz and D. Miller, The use of attack trees in assessingvulnerabilities in SCADA systems, Proceedings of the International In-frastructure Survivability Workshop, 2004.
[4] E. Byres and J. Lowe, The myths and facts behind cyber security risks forindustrial control systems, Proceedings of the VDE Congress, pp. 213–218,2004.
[5] R. Carlson, Sandia SCADA Program: High-Security SCADA LDRD FinalReport, Technical Report SAND2002-0729, Sandia National Laboratories,Albuquerque, New Mexico, 2002.
[6] J. Eisenhauer, P. Donnelly, M. Ellis and M. O’Brien, Roadmap to SecureControl Systems in the Energy Sector, Technical Report, Energetics Inc.,Columbia, Maryland, 2006.
[7] J. Falco, J. Gilsinn and K. Stouffer, IT security for industrial control sys-tems: Requirements specification and performance testing, presented atthe National Defense Industrial Association Homeland Security Confer-ence and Exposition, 2004.
[8] R. Fink, D. Spencer and R. Wells, Lessons Learned from Cyber SecurityAssessments of SCADA and Energy Management Systems, Technical Re-port INL/CON-06-11665, Idaho National Laboratory, Idaho Falls, Idaho,2006.
[9] J. Howard and T. Longstaff, A Common Language for Computer SecurityIncidents, Technical Report SAND98-8667, Sandia National Laboratories,Livermore, California, 1998.
[10] R. Lemos, “Data storm” blamed for nuclear plant shutdown, SecurityFo-cus, May 18, 2007.

84 CRITICAL INFRASTRUCTURE PROTECTION II
[11] U. Lindqvist and E. Jonsson, How to systematically classify computersecurity intrusions, Proceedings of the IEEE Symposium on Security andPrivacy, pp. 154–163, 1997.
[12] R. Lippmann, K. Ingols, C. Scott, K. Piwowarski, K. Kratkiewicz, M.Artz and R. Cunningham, Validating and restoring defense in depth usingattack graphs, Proceedings of the Military Communications Conference,pp. 1–10, 2006.
[13] R. McMillan, Admin faces prison for trying to axe California power grid,PC World, December 15, 2007.
[14] M. McQueen, W. Boyer, M. Flynn and G. Beitel, Quantitative cyber riskreduction estimation methodology for a small SCADA control system, Pro-ceedings of the Thirty-Ninth Annual Hawaii International Conference onSystem Sciences, p. 226, 2006.
[15] J. Mirkovic and P. Reiher, A taxonomy of DDoS attack and DDoS de-fense mechanisms, ACM SIGCOMM Computer Communication Review,vol. 34(2), pp. 39–53, 2004.
[16] P. Oman, A. Risley, J. Roberts and E. Schweitzer, Attack and defend toolsfor remotely accessible control and protection equipment in electric powersystems, presented at the Fifty-Fifth Annual Conference for ProtectiveRelay Engineers, 2002.
[17] P. Oman, E. Schweitzer and J. Roberts, Protecting the grid from cyberattack, Part I: Recognizing our vulnerabilities, Utility Automation & En-gineering T&D, vol. 6(7), pp. 16–22, 2001.
[18] P. Oman, E. Schweitzer and J. Roberts, Protecting the grid from cyber at-tack, Part II: Safeguarding IEDs, substations and SCADA systems, UtilityAutomation & Engineering T&D, vol. 7(1), pp. 25–32, 2002.
[19] K. Poulsen, Sparks over power grid cybersecurity, SecurityFocus, April 10,2003.
[20] K. Poulsen, Slammer worm crashed Ohio nuke plant network, SecurityFo-cus, August 19, 2003.
[21] K. Poulsen, Software bug contributed to blackout, SecurityFocus, February11, 2004.
[22] R. Schainker, J. Douglas and T. Kropp, Electric utility responses to gridsecurity issues, IEEE Power and Energy, vol. 4(2), pp. 30–37, 2006.
[23] B. Schneier, Attack trees, Dr. Dobb’s Journal, vol. 24(12), pp. 21–29, 1999.
[24] F. Sheldon, T. Potok, A. Loebl, A. Krings and P. Oman, Managing securesurvivable critical infrastructures to avoid vulnerabilities, Proceedings ofthe Eighth IEEE International Symposium on High Assurance SystemsEngineering, pp. 293–296, 2004.
[25] O. Sheyner, J. Haines, S. Jha, R. Lippmann and J. Wing, Automated gen-eration and analysis of attack graphs, Proceedings of the IEEE Symposiumon Security and Privacy, pp. 273–284, 2002.

Fleury, Khurana & Welch 85
[26] J. Stamp, J. Dillinger, W. Young and J. DePoy, Common Vulnerabilitiesin Critical Infrastructure Control Systems, Technical Report SAND2003-1772C, Sandia National Laboratories, Albuquerque, New Mexico, 2003.
[27] K. Stouffer, J. Falco and K. Scarfone, Guide to Industrial Control SystemsSecurity, Second Public Draft, NIST Special Publication 800-82, NationalInstitute of Standards and Technology, Gaithersburg, Maryland, 2007.
[28] C. Taylor, P. Oman and A. Krings, Assessing power substation networksecurity and survivability: A work in progress report, Proceedings of theInternational Conference on Security and Management, pp. 281–287, 2003.
[29] D. Watts, Security and vulnerability in electric power systems, Proceedingsof the Thirty-Fifth North American Power Symposium, pp. 559–566, 2003.
[30] N. Ye, C. Newman and T. Farley, A system-fault-risk framework for cyberattack classification, Information-Knowledge-Systems Management, vol.5(2), pp. 135–151, 2005.

Chapter 7
ATTRIBUTION OF CYBER ATTACKSON PROCESS CONTROL SYSTEMS
Jeffrey Hunker, Robert Hutchinson and Jonathan Margulies
Abstract The attribution of cyber attacks is an important problem. Attributiongives critical infrastructure asset owners and operators legal recourse inthe event of attacks and deters potential attacks. This paper discussesattribution techniques along with the associated legal and technical chal-lenges. It presents a proposal for a voluntary network of attributableactivity, an important first step towards a more complete attributionmethodology for the control systems community.
Keywords: Process control systems, cyber attacks, attack attribution
1. Introduction
United States Presidential Decision Directive NSC-63 (PDD 63) [1] listed theinfrastructures that are critical to national security. The directive also stressedthe need for public-private partnerships to identify and mitigate critical infras-tructure (CI) vulnerabilities. Assessment and modeling efforts resulting fromthe recognition of vulnerability as outlined in PDD 63 have revealed signif-icant interdependencies between infrastructures [4]. These efforts have alsoshown that CI protection is a global problem and that the global infrastruc-ture depends on the proper operation of standardized, as well as specialized,information technology.
All the CIs are supported to varying degrees by the global information infras-tructure, much of which is built on commodity technologies such as the TCP/IPprotocol suite and backbone networks. Many CI assets, such as those responsi-ble for energy production and distribution, require specialized control systemsfor safe and reliable operation. The growing convergence of specialized pro-cess control systems with general information and communication technologies(ICTs) is exposing control systems and the CI assets they manage to commonoperating system and Internet threats [5].
Please use the following format when citing this chapter: Hunker, J., Hutchinson, R. and Margulie s, J., 2008, in IFIP Int ernational Federation for Information Processing, Volume 290; Critical Infrastructure Protection II, eds. Papa, M., Shenoi, S., (Boston: Springer), pp. 87–99.

88 CRITICAL INFRASTRUCTURE PROTECTION II
Attack attribution can provide new types of protection for CI assets. Itgives asset owners and operators legal recourse in the event of attacks anddeters malicious activities. The development and application of attributiontechniques can drive law and policy, create incentives for cyber security, reducethreats and manage risk.
2. Attack Attribution
Attribution is the determination of the identity or location of an attackeror an attacker’s intermediary [6]. This paper focuses on attribution techniquesfor attacks launched over computer networks. Attribution is also importantfor physical attacks and social engineering attacks; however, these attacks areoutside the scope of this paper. For the purposes of this paper, we considerattribution to be the identification of intermediaries who may or may not bewilling participants in an attack. Note that determining motivation, partic-ularly by technical means, is difficult at best. This problem is even morechallenging when applied to intermediaries.
2.1 Importance of Attribution
The ability to identify the source of a cyber attack is the basis for takingaction against the perpetrator. Legal and policy frameworks for responding tocyber attacks cannot work unless there is adequate attribution; these frame-works remain incomplete because there is insufficient basis (attribution) toactually use them. Attribution helps create a system of deterrence. Withoutthe fear of being caught, convicted and punished, individuals and organizationswill continue to use the Internet to conduct malicious activities.
Attribution also offers other benefits. Information gained during the processof attribution can be used to improve defensive techniques. Even partial attri-bution can provide the basis for interrupting attacks in progress and defendingagainst future attacks and mitigating their effects.
While attribution is important, non-attribution can be just as vital to pro-tecting radical ideas and minority views in oppressive regimes. The Internethas become a powerful medium for sharing opinions. For many users, theanonymity provided by the Internet – and the consequent freedom from retri-bution – makes it one of the only methods for freely expressing ideas. Mecha-nisms developed to facilitate attribution must enforce non-attribution for thepurposes of sharing opinions and ideas. A well-crafted attribution mechanismshould identify entities who engage in malicious behavior as defined by lawsand/or policy. However, the mechanism should also make it impossible to at-tribute freely exchanged ideas, especially for purposes of retribution.
2.2 Attribution in Process Control Systems
Critical infrastructure owners and operators rely on standard ICTs to mon-itor and control physical processes. The adoption of these technologies in the

Hunker, Hutchinson & Margulies 89
global energy, chemical, transportation and service infrastructures injects ICTvulnerabilities into formerly stand-alone process control systems. This exposesCI assets to a slew of attacks by external entities, including exploits launchedover the Internet. Infrastructure owners and operators are struggling to un-derstand the new risks and incorporate appropriate risk mitigation techniques.ICT-based systems primarily rely on fortification mechanisms (e.g., firewalls,access control lists and physical access controls) to mitigate risk. Applying ICTsecurity mechanisms and risk models to CI control systems is inadequate dueto the major differences that exist between CI and ICT assets in terms of theirphysical layout, operating environments, security goals and threat space.
For reasons of complexity and cost, CI asset owners and operators haveoutsourced significant aspects of their operations. Control system hardwareand software manufactured globally are customized to a particular operation,effectively incorporating vendors into the operational lifecycle. Control systemvendors frequently provide onsite support and are often granted remote accessto monitor system status and perform routine administration tasks. Giventhe number of entities – employees, equipment manufacturers, consultants andemployees from partnering companies – that access CI assets, threats are bettermodeled as originating from malicious insiders than external attackers. Evenso, CI assets are protected by fortification, a strategy that ignores insiders,which are a system’s greatest threat.
Cyber attribution can help protect the essential command, control and com-munication functions of modern infrastructures. Attribution makes it possibleto enforce existing laws and treaties and fine-tune law and policy to betterprotect CI assets. Coupled with the ability to detect malicious cyber activ-ity, attribution and the prospect of penalties deter attackers, thereby reducingthreats. Technology is a necessary component of cyber attribution, but it isinsufficient by itself. To be successful and lasting, an attribution strategy mustacknowledge the need for local and international cooperation while recognizingthat the technical component must evolve with advances in technology.
2.3 Ideal Attribution
To provide a context for our work, it is necessary to define the ideal attri-bution system to which we aspire. As international law, policy and technologyevolve, this definition must evolve as well.
Attribution should exist in a global context with overt support from allnation states and organized entities. Sufficient attribution of malicious cyberactivity should be possible even when some entities do not cooperate fully.Attribution should only be sought for malicious activity.
An ideal attribution system should make it possible to detect all cyber at-tacks and determine the source and intent of each attack with sufficient pre-cision. The results should be verifiable and specific enough to justify any re-sponse that has been agreed to in advance. The attribution system shouldgenerate threat data that informs the development and implementation of CItechnologies and defensive strategies. Finally, the attribution system should

90 CRITICAL INFRASTRUCTURE PROTECTION II
enable new international agreements and pave the way toward comprehensiverisk management.
3. Difficulty of Attribution
The Internet’s architecture and its evolving administrative and governancesystems make the attribution of cyber attacks extremely challenging.
3.1 Internet Architecture
The Internet has no standard provisions for tracking or tracing. A sophisti-cated user can modify information in IP packets and, in particular, forge thesource addresses of packets (which is very simple for one-way communication).Attacks often employ a series of stepping stones where compromised intermedi-ate hosts are used to launder malicious packets. Packets can also be changed athops between hosts; thus, attempting a traceback by correlating similar packetsis ineffective when sophisticated attackers are involved.
3.2 Administrative Issues
Internet attacks exploit an administrative system that was established whenthe Internet community was, in essence, a trusted commune, not the currentglobal virtual city with consequent malefactors and little shared sense of com-munity.
Internet attacks cross multiple administrative, jurisdictional and nationalboundaries with no common framework for cooperation, response or even trustacross jurisdictions. The Internet Engineering Task Force (IETF) does notprovide a global system policy and technical framework that the InternationalTelecommunications Union (ITU) provides for the telephone system. Accordingto Lipson [3]:
“There are no universal technical standards or agreements for performingthe monitoring and record keeping necessary to track and trace attacks.Moreover there are no universal laws or agreements as to what constitutesa cyber attack, and what punishments, economic sanctions, or liabilityshould ensue. There are no universal international agreements for themonitoring, record keeping, and information sharing necessary to trackand trace intruders. No existing privacy laws span the Internet as awhole. Existing international laws and agreements that might touch onthese issues were not written for the Internet and need to be tested oncases involving Internet cyber-attacks.”
3.3 Limited Business Support
Businesses and government agencies routinely respond to malicious cyberactivities by rebooting critical servers, restoring lost data and identifying andeliminating the vulnerabilities. The fundamental goal of IT professionals in in-dustry and government is to maintain operations, and this is particularly true

Hunker, Hutchinson & Margulies 91
with regard to control systems. Because attribution is so difficult, few organi-zations are interested in investigating malicious Internet activity and movingthem through the legal system. The current protection model, therefore, is pri-marily aimed at building improved fortifications and attempting to withstandconstant attempts to overcome the fortifications.
3.4 Technical Impediments
Several technical impediments limit the effective attribution of attacks:
Tunneling impedes tracking, but it is also very useful for creating virtualprivate networks (VPNs) that are important for security.
Hackers often destroy logs and other audit data once they gain systemaccess.
Anonymizing services are valuable to Internet users (e.g., to facilitate po-litical discourse in countries with repressive regimes). While anonymizerscan be defeated in theory, there are numerous practical difficulties toachieving attribution when a sophisticated user desires anonymity.
Even if an attack packet can be attributed to an IP address of a hostcomputer, it is difficult to link the IP address to the actual perpetrator. Aperpetrator can decouple his physical identity from an IP address by usingcyber cafes, public Internet facilities (e.g., libraries) and prepaid Internetaddress cards that can be purchased from service providers without anypersonal identification.
Short storage intervals on routers, especially those located at or nearthe high-speed core of the Internet, require forensic techniques to be ex-tremely rapid (i.e., capture evidence before the router cache is overwrit-ten). Alternatively, new capabilities have to be created to proactivelypreserve routing information.
Sophisticated attacks that are extremely fast or extremely slow (that mayexecute over a period of months) are difficult to detect.
Attribution techniques themselves have to be secured against attacks andsubversion. Software used for authentication and data used for attributionmust be protected. Moreover, attribution techniques should not createadditional avenues for exploitation (e.g., a new DOS attack against thesystem).
3.5 Liability for Attributable Activities
Liability for the causes and consequences of cyber attacks is an undevel-oped field within U.S. jurisprudence. All of the questions related to liabilityfor domestic-only cyber attacks are equally applicable to attacks that traverseinternational boundaries. However, there are no clear answers to cyber attack

92 CRITICAL INFRASTRUCTURE PROTECTION II
liability questions, and relevant case law is sparse. This issue is of great concernto CI owners and operators because their losses due to cyber attacks can beextremely high.
Several important liability questions must be considered [3]: a major issue isthe liability exposure for various entities – perpetrators; vendors whose softwareand/or hardware made the attack possible; owners, operators and administra-tors of intermediate (zombie or anonymizer) systems that participate in theattack or obscured the attack source; and service providers who did not blockthe attack when notified or did not help trace the attack in accordance withinternational agreements.
Another issue is whether certain kinds of waivers on liability exposure shouldbe provided to entities who participate in tracking and tracing. Also, there isthe issue of liability for the owners of systems that participate in attacks withoutthe owners’ knowledge, and entities that provide anonymizing services.
It is clear that liability will eventually form an important component in thepolicy framework for cyber security in general. This framework will affect therange of feasible options for effective attribution of cyber attacks.
3.6 Feasibility of Technical Solutions
Technology alone cannot provide attribution. To demonstrate this fact, weconsider an ideal network with perfect attribution. The perfect attributionnetwork (PAN) is designed and constructed so that all actions taken by aspecific user on a particular machine are fully attributable to that machine anduser.
The PAN foundation provides attribution services that cannot be alteredor bypassed by any user or administrator. Any application installed on thePAN interfaces with the attribution foundation and adopts a complete set ofattribution services. It is impossible for an application to bypass the attributionservices or to alter the services in any way. Moreover, applications (e.g., processcontrol system transaction management) installed on the PAN do not requiremodification to invoke the attribution services. The purpose of developingthe PAN model in this way is to show that even perfect technical attributionservices can be defeated.
Now consider an application installed on the PAN by a community of userswishing to engage in non-attributable actions within and outside of the commu-nity. Each instance of the non-attribution application (NAA) can communicatewith every other instance of the NAA. While every point-to-point message pro-cessed by the NAA is fully attributable to source and destination users by theunderlying PAN, the attribution scope is limited to the immediate source anddestination of each message.
One strategy for achieving non-attribution is to remove the point-to-pointcontext from all messages by applying an NAA overlay (NAAO). As a simpleexample, consider an NAAO configured in a logical ring topology. Messages inthe ring topology flow clockwise and each NAA instance receives all of its in-coming messages from a single NAA instance (the instance that is immediately

Hunker, Hutchinson & Margulies 93
counterclockwise) and transmits all outgoing messages to a different NAA in-stance (the instance that is immediately clockwise). The NAAO provides strongconfidentiality of all messages, generates random messages to maintain roughlyconstant data flow bandwidth regardless of message content, and abstracts theactual message source and destination from the PAN. Direct PAN featurescannot identify which messages are authentic, the real source and destinationof messages or the real source of messages leaving the NAAO. Furthermore,constant bandwidth utilization in the ring topology makes traffic analysis verydifficult (this is not a function of the PAN).
This simple example demonstrates that a purely technical attribution solu-tion does not exist. It is possible to develop features that facilitate attributionsuch as unique communication keys, traceback and logging. However, thesesolutions may not provide sufficient attribution for most instances of maliciousbehavior. Essential to providing attribution services is a user base that is in-terested in supporting the services.
4. Limitations of Current Solutions
Table 1 summarizes the technical solutions for attribution that are currentlybeing employed, developed or considered. Details and drawbacks of these solu-tions are discussed extensively in [2].
The principal drawback is the lack of widespread adoption of new technolo-gies. The record of Internet-wide adoption of new technologies has historicallybeen poor. This is largely due to the new capabilities required of routers,but the problem is of a more general nature. Specific examples include IPv6,DNS security (DNSSec) extensions, and modifications to the Border GatewayProtocol (BGP).
These cases have two common issues. The first is that changes are effectiveonly if they are adopted uniformly across the community. The second is thatthe costs and burden accrue to the individual entity, while the benefits of thechanges are distributed and system-wide. Unlike the telecommunications sectorwhere the ITU has an effective mechanism for creating and enforcing technicalrequirements, IETF’s request for comment (RFC) process is essentially volun-tary. Hence, a major policy issue is how to create incentives or a regulatorysystem that would ensure that system-wide changes are implemented.
5. Attribution Steps
Several options are available for designing an attribution scheme.
Design a scheme similar to that used in telephone systems where attri-bution is automatic – a call is traced back to the originating number. Auser may turn this feature off, but this decision can be overridden by thecourts.
Design a system where users can opt in or opt out without any subsequentrecovery ability by the system.

94 CRITICAL INFRASTRUCTURE PROTECTION II
Table 1. Technical solutions for attack attribution.
Technique Description
Hash-Based IPTraceback
Routers store hash values of network packets. Attribution isdone by tracing back hash values across network routers.
IngressFiltering
All messages entering a network are required to have a sourceaddress in a valid range; this limits the range of possible at-tack sources.
ICMP Returnto Sender
All packets destined for the victim are rejected and returnedto their senders.
OverlayNetwork for IPTraceback
An overlay network links all ISP edge routers to a centraltracking router; hop-by-hop approaches are used to find thesource.
Trace PacketGeneration(e.g., iTrace)
A router sends an ICMP traceback message periodically (e.g.,every 1 in 20,000 packets) to the same destination address asthe sample packet. The destination (or designated monitor)collects and correlates tracking information.
ProbabilisticPacket Marking
A router randomly determines whether it should embed mes-sage route data in a message; this routing data is used todetermine routes.
Hackback Querying functionality is implemented in a host without thepermission of the owner. If an attacker controls the host,this may not alert the attacker; thus, the information is morereliable.
Honeypots Decoy systems capture information about attackers that canbe used for attribution.
Watermarking Files are branded as belonging to their rightful owners.
Design multiple networks, each providing a different level of attribution;some networks may provide no attribution. Users are free to choose thenetworks from which they accept packets.
5.1 Implementing Clean Slate Approaches
The Internet was not designed for the purposes for which it is now used,nor for the security demands created by a user base without shared trust.A number of “clean slate” network projects are now underway, including theNational Science Foundation’s Future Internet Network Design (FIND) andthe Department of Defense’s Global Information Grid (GIG). The goal of theseprojects is to develop new networks of networks that address current and futureneeds.

Hunker, Hutchinson & Margulies 95
The challenge faced by these projects is that network architectures are notjust about technology – they also involve social, legal, administrative and eco-nomic infrastructures. Secure BGP and IPv6 have faced slow acceptance asmuch for technical reasons as for economic and administrative reasons.
No plans exist for the adoption of a clean slate network. Indeed, if someof the current clean slate work is successful, it would – in colloquial terms –be like the dog that chases the car finally catches it! This is not an academicquestion: technical designs that do not consider legal, social, economic andadministrative issues definitely limit the utility of the new networks. Also,legal and/or administrative changes needed to promote the adoption of a newnetwork architecture may take years.
However appealing it may be technically, the consideration of large-scalemodifications to the Internet raises several interesting questions:
What can we learn from other instances of transition from one large-scale infrastructure to another? The history of technological innovationsprovides a rich and varied set of case studies of adoption and failures. Thetransition from the telegraph to the telephone took decades; the adoptionof HDTV required a carefully-crafted political process and major changesin spectrum policy; Sweden switched from driving on the left-hand sideof the road to the right-hand side in a single day.
What are the possible transition paths to a clean slate network? Thesecould, for example, range from creating a DoD-only network to one thatis adopted globally, with the current Internet rapidly phased out.
How do the technical characteristics of clean slate networks match upwith the suite of possible adoption paths? Identifying potential gaps canshape future research directions for clean slate networks.
How do existing administrative structures and economic forces matchwith potential trajectories for clean slate network adoption? This ques-tion takes on even more relevance given the discussion of Internet gover-nance at the World Summit on the Information Society.
It is important to note that we do not believe that widespread modificationsto the existing Internet are inappropriate. Instead, our position is that thechallenges to any modification are not just technical in nature, but involve acomplex set of social, economic, legal and administrative issues that are poorlyunderstood.
5.2 Technical Approach for Limited Attribution
It is possible to construct a logical overlay on the Internet that makes at-tribution possible within a subset of users, in this case, process control systemoperators. All relevant actions taken by an entity electing to join the attri-bution overlay can be fully attributed to that entity. This provides an onlineenvironment in which members are increasingly accountable for their actions.

96 CRITICAL INFRASTRUCTURE PROTECTION II
For control system applications – where transaction accuracy is critical – thevalue of attribution is obvious. The control systems environment provides aunique opportunity to develop and demonstrate a limited attribution servicebecause the drawbacks of attribution are minimal while the benefits are high.The ability to attribute control system activities promotes integrity as well astrust in operational decisions. Attribution also makes it possible to discoverand discourage attempts at compromising process control systems, even thoseperpetrated by insiders.
Clearly, malicious actions taken by a non-member of an attribution networkcannot necessarily be attributed to the offending party, but the attributionoverlay can facilitate an investigation by proving that the action was generatedoutside of the membership community, protecting members from fraudulenttransactions. Also, if an attributed action is repudiated by a member of the at-tribution overlay, that member’s system can be segregated from the attributionoverlay and examined for compromise.
The attribution overlay would provide control systems with greater trans-actional accuracy. Also, it would provide protection from Internet attacksoriginating outside the attribution overlay and protect machines inside the at-tribution overlay. The attribution overlay concept is not a defense against allforms of exploitation, but it is a step in the right direction. As is typicalwith security services, its implementation will inevitably introduce unantici-pated complexities and vulnerabilities, and will, therefore, require continuousrefinement.
One possible implementation of an attribution overlay is to use a root oftrust made available to individual members by an attribution group manage-ment process. The trust root is responsible for authenticating the origin ofinbound messages and sealing attribution data of outbound messages using adigital signature technique. Attribution data must include the member, ma-chine, message content and context, and intended destination. The data mayalso include geo-location, source routing data, required responses and a two-waysecure handshake. To avoid system compromise, the keys used for authenti-cating and sealing attribution data must be protected using a hardware device(e.g., trusted platform module (TPM) or smart card), which may serve as theroot of trust.
This approach seeks to make it more difficult for malicious actors to exploitthe system exclusively using software. Outbound messages that require attri-bution can be presented to the TPM or smart card to verify the message formatand complete the digital signature. Inbound messages can be presented to thedevice to confirm origin, allowing each system an opportunity to ensure thatall messages belong to the attribution overlay network before processing themessages. Note that this implementation would allow participants in the attri-bution overlay to restrict message processing to those messages that originatewithin the attribution overlay. Also, it allows operational security personnel todetermine whether a compromise originated from within the attribution overlay

Hunker, Hutchinson & Margulies 97
or from an outside source. This simple distinction can help protect membersof the attribution overlay from certain types of fraud.
In addition to using a root of trust at each end point, there is value toincorporating trust at multiple points within the network. These additionalpoints of trust can attest (via a similar attribution process) to the existence ofmessages in the network at various times, providing investigators with the rightinformation and strong confidence in the information. This would be similarto the process employed by physical investigators who often rely on recordingdevices: ATM cameras, traffic cameras, credit card records and DHCP data.
An attribution overlay must have a process to enroll and revoke members.This is a difficult problem that is currently being studied by digital identitymanagement experts. Some approximate solutions for managing public keyinfrastructures can serve as the basis for an attribution overlay. However, asnew methods for identity management emerge, the attribution overlay can berevised to take advantage of them. Although attribution overlay shares manychallenges with digital identity management, attribution overlay has the advan-tage of uniform control. Specifically, attribution overlay can be constructed bya single entity (e.g., a control system working group) and managed according toa policy controlled by that entity. Under this model, control system operatorsand service providers can construct logical attribution overlays. Members mayelect to join multiple attribution overlays, making all the actions relevant tothat service provider attributable to the individual member. Note that it isalso possible to use overlay technology to construct a non-attributable networkfor the free exchange of ideas.
Traditional attempts at creating network overlays require all the membersto fully participate in the network overlay. Our approach does not require fullparticipation and is intended to steadily gain acceptance for attribution servicesby providing value to the control systems community over time.
5.3 Reducing the Malicious Noise Floor
Malicious activity may be broadly divided into three categories: nuisance,criminal and politically-motivated (terrorist or nation-state) activities. Thevast majority of reported activity falls in the first two categories; organiza-tions such as the U.S. Computer Emergency Response Team (CERT) devoteconsiderable resources to analyze malicious acts. This is possible because themethods used by actors to conduct nuisance activities and low-level crime arewell understood by the computer security community. Because attribution isnot currently possible, our approach is to measure and track these types of ma-licious activities. The effort expended to track them detracts from the abilityto focus on high-level crime and politically-motivated activities such as terror-ism. Therefore, low-level malicious activity has two undesirable results. First,it consumes valuable resources. Second, it raises the amount of malicious noise,making it difficult to detect more damaging types of activities.
Low-level malicious activity can be discouraged using low-grade attribution.It is not necessary to prosecute every low-level crime and resolve every low-level

98 CRITICAL INFRASTRUCTURE PROTECTION II
malicious activity to the computer and individual. All that is required is toincrease the probability that an individual engaging in malicious activity canbe identified, prosecuted and punished. Many interstate drivers know whichjurisdictions tolerate speeding and which do not. They know where the riskof being caught is high and where the penalties are steep, and they tend toslow down in those jurisdictions. An example of an Internet “speed trap”is the Record Industry Association of America (RIAA) campaign to identifyviolations of copyright through Internet file sharing.
One technical approach for reducing the malicious noise floor is to imple-ment features that make it easier for cooperating Internet service providers totrace individual packets and flows, which would make it possible to issue theequivalent of “Internet traffic tickets.” The legal model of traffic ordinances,which stipulate penalties for violating the rules of proper conduct, may, thus,be extended to Internet activities. But, of course, attribution is key to enablingsuch an approach.
6. Conclusions
Critical infrastructure protection is a global problem. The adoption of com-modity information, computing and networking technologies in critical infras-tructure assets increases the overall risk by growing the space of exploitablevulnerabilities and exposing systems to new threats. While new technologiesshould be developed to help reduce vulnerabilities, it is equally important toseek strategies that manage the threats. Cyber attribution supports threatmanagement by identifying malicious actors and uncovering their motives andmethods, in the process, informing vulnerability reduction efforts. Attribu-tion gives critical infrastructure asset owners and operators legal recourse inthe event of attacks and deters potential attacks. Technological advances alonewill not solve the attribution problem. Effective and lasting attribution servicesrequire active user participation, and sustained legal and policy efforts.
Acknowledgements
This work was partially supported by the Institute for Information Infras-tructure Protection (I3P) at Dartmouth College, Hanover, New Hampshire,under Award 2003-TK-TX-0003 from the U.S. Department of Homeland Secu-rity.
References
[1] W. Clinton, Presidential Decision Directive 63, The White House, Wash-ington, DC (fas.org/irp/offdocs/pdd/pdd-63.htm), May 22, 1998.
[2] J. Hunker, R. Hutchinson and J. Margulies, Roles and Challenges for Suffi-cient Cyber Attack Attribution, Research Report, Institute for InformationInfrastructure Protection, Dartmouth College, Hanover, New Hampshire,2008.

Hunker, Hutchinson & Margulies 99
[3] H. Lipson, Tracking and Tracing Cyber Attacks: Technical Challenges andGlobal Policy Issues, Special Report CMU/SEI-2002-SR-009, CERT Co-ordination Center, Software Engineering Institute, Carnegie Mellon Uni-versity, Pittsburgh, Pennsylvania, 2002.
[4] P. Pederson, D. Dudenhoeffer, S. Hartley and M. Permann, Critical Infras-tructure Interdependency Modeling: A Survey of U.S. and InternationalResearch, Report No. INL/EXT-06-11464, Critical Infrastructure Protec-tion Division, Idaho National Laboratory, Idaho Falls, Idaho, 2006.
[5] T. Samad, P. McLaughlin and J. Lu, System architecture for process au-tomation: Review and trends, Journal of Process Control, vol. 17(3), pp.191–201, 2007.
[6] D. Wheeler and G. Larson, Techniques for Cyber Attack Attribution, IDAPaper P-3792, Institute for Defense Analyses, Alexandria, Virginia, 2003.

Chapter 8
MODELING AND DETECTINGANOMALIES IN SCADA SYSTEMS
Nils Svendsen and Stephen Wolthusen
Abstract The detection of attacks and intrusions based on anomalies is hamperedby the limits of specificity underlying the detection techniques. How-ever, in the case of many critical infrastructure systems, domain-specificknowledge and models can impose constraints that potentially reduceerror rates. At the same time, attackers can use their knowledge ofsystem behavior to mask their manipulations, causing adverse effects toobserved only after a significant period of time. This paper describeselementary statistical techniques that can be applied to detect anoma-lies in critical infrastructure networks. A SCADA system employed inliquefied natural gas (LNG) production is used as a case study.
Keywords: SCADA systems, anomaly detection, multivariate analysis
1. Introduction
Supervisory control and data acquisition (SCADA) networks are a key com-ponent of the critical infrastructure. These systems are used by operators inmodern industrial facilities to continuously monitor and control plant opera-tions. SCADA systems have evolved in terms of the capabilities of their sensorsand actuators as well as in their network topologies. SCADA network topologieshave moved from simple point-to-point links to arbitrary mesh-type networks,including fixed and wireless links that support large numbers of nodes andoverlapping networks.
Although the importance of SCADA systems has been recognized for sometime [21], efforts investigating network security issues in SCADA environmentshave been relatively limited [3, 13]. Igure, et al. [13] identify several securitychallenges that have to be addressed for SCADA networks: access control,firewalls and intrusion detection systems, protocol vulnerability assessment,cryptography and key management, device and operating system security, andsecurity management.
Please use the following format when citing this chapter: Svendsen, N. and Wolthusen, S., 2008, in IFIP International Fede ration for Information Processing, Volume 290; Critical Infrastructure Protection II, eds. Papa, M., Shenoi, S., (Boston: Springer), pp. 101–113.

102 CRITICAL INFRASTRUCTURE PROTECTION II
This paper is concerned with the question of whether the implementation oftraditional security solutions in a SCADA network will provide adequate levelsof security given the constraints and requirements imposed by the applicationarea. The primary requirement is to maintain physical parameters within aset of quality and safety margins and to guarantee suitable reaction times.This is accomplished by gathering data from multiple (possibly hierarchical)sensors and subsystems, and verifying that the readings fall into acceptableranges based on historical data. However, an attacker with the appropriateknowledge and access can alter correlated process variables to bring a systemto a critical state, potentially causing degradation of service or even an outrightfailure. This paper employs applied statistical methods to detect anomalousbehavior in SCADA networks. A case study involving a liquefied natural gas(LNG) production facility is used to demonstrate the utility of the statisticalapproach.
2. Anomaly Detection in Control Systems
This section provides a brief overview of anomaly detection in control sys-tems followed by an overview of applied statistical methods.
2.1 Anomaly Detection
A control system is a device or set of devices used to manage, command,direct and regulate the behavior of other devices or systems. It typically hasfour main components: sensors, analyzers, actuators and a communicationsinfrastructure. Sensors determine the state of the controlled system, analyzersdetermine whether the system is stable or out of control, and actuators areused to maintain the system at (or restore it to) a stable state. Control systemsincorporate feedback loops, which may be positive or negative, depending onthe application.
Anomaly detection [2] involves establishing profiles of normal process be-havior, comparing actual behavior with the established profiles, and identifyingdeviations from the normal. A profile or set of metrics is determined for eachprocess. The metrics are measures of specific aspects of process behavior (e.g.,pressure, temperature or composition).
Anomaly detection methods may be categorized as: statistical methods, rule-based methods, distance-based methods, profiling methods and model-basedapproaches. This paper focuses on statistical methods for anomaly detection.Denning [9] proposed four statistical models for determining whether an ob-servation is abnormal with respect to previous observations. They are: (i)operational model (where abnormality is determined by comparing a new ob-servation against fixed limits); mean and standard deviation model (where anobservation is compared to a confidence interval based on historical observa-tions); multivariate model (where correlations between two or more metrics aretaken into account); and Markov process model (used in discrete systems where

Svendsen & Wolthusen 103
transaction frequencies between states and the probability of going from onestate to another can be determined).
2.2 Univariate Quality Control Charts
Univariate quality control charts (see, e.g., [27]) can be used to determine ifthe performance of a process is at an acceptable level. A quality control chartconsists of data plotted in time order and horizontal lines, called control limits,that indicate the amount of variation due to common causes. Control must beexerted on both the central tendency and variability, which are accomplishedusing an X-chart and an S-chart, respectively.
Assume that the data consists of m samples of size n for which S1, S2, . . . , Sm
are the sample standard deviations. The average values of the sample standard
deviation S are computed along with the overall average X . The correspondingupper and lower control limits for the X-chart to control the central tendencyare:
UCL = X + A3S LCL = X − A3S
where A3 = 3/(c4
√n) and
c4 =
(
2
n − 1
)1/2Γ(n/2)
Γ[(n − 1)/2]
where Γ(·) is the gamma function. For the S-chart, we have:
UCL = B6σ LCL = B5σ
with B5 = c4 − 3√
1 − c24 and B5 = c4 + 3
√
1 − c24. Given the control limits,
the quality control charts are created by plotting the sample means (standarddeviations) in time order in the same plot.
2.3 Multivariate Quality Control Charts
A multivariate approach is used when the data to be analyzed has multipleimportant characteristics. Such an approach may also be used when processesare assumed to be independent. The T 2-chart is commonly applied in thesesituations as it can be applied to a large number of variables. Given the mu-tually independent vectors X1, X2, . . . , Xn of length p where each Xj is dis-tributed as Np(µj , Σ), the control limits of the T 2-chart are set by assumingthat (Xj − X)′S−1(Xj − X) has a chi-square distribution [14]. Note that S isthe covariance matrix and (Xj −X)′ is the transpose of (Xj −X). For the jthpoint, the T 2-statistic is computed as:
T 2j = (xj − x)′S−1(xj − x)
and plotted on the time axis. The lower control limit (LCL) is zero while theupper control limit (UCL) is commonly set to χ2
p(0.05).

104 CRITICAL INFRASTRUCTURE PROTECTION II
3. Liquefied Natural Gas Production
This section briefly describes the process for producing liquefied natural gas(LNG) [23].
Natural gas (NG) is retrieved from wells, each of which is controlled by aset of valves (“Xmas trees”) that adapts the NG pressure from the well to thepressure in the pipeline system. At this point, monoethyleneglycol (MEG) isinjected into the well-stream to inhibit the formation of hydrate, which couldblock the pipeline. MEG is distributed to the Xmas trees through a controldistribution unit (CDU). The CDU also distributes electricity, control signals,hydraulic pressure and chemicals to the Xmas trees. The various well-streamsare assembled at the pipeline end manifold (PLEM), were they gather into asingle well-stream for transport through the main pipeline. The flow in themain pipeline has multiple phases: natural gas liquids (NG), condensate (lightoil) and a mix of water and MEG.
The well-stream in the main pipeline often arrives in spurts, i.e., the gas andliquids separate and the gas arrives between slugs of liquid. A slug catcher istypically used to separate NG condensate and MEG. Carbon dioxide (CO2) isthen removed from the NG as it would freeze to dry ice during gas liquefaction,which could cause damage later in the process. The NG is already moist andthe removal of CO2 further augments its water content, which would form iceduring the cooling process and cause damage. Therefore, the gas is dried beforerefrigeration. Another important pre-treatment process is the removal of verysmall quantities of mercury present in the heavier components. This is becausemercury could cause corrosive damage to metal components and catalysts thatcome into contact with the gas stream.
At this point, the NG is ready for fractionation. This involves the separationof LNG from the heavier gas components, known as natural gas liquids (NGL),and the adjustment of the amounts of various hydrocarbons present in the gas.The gases that remain after NGL removal are passed to a “cold box” for coolingto LNG. This is a three-stage process that primarily employs heat exchangers.A byproduct of this phase is nitrogen, which is purified and released to theatmosphere. After NGL is separated from LNG, the NGL undergoes furtherfractionation to separate ethane and propane from the remaining condensate.Ethane and propane form liquefied petroleum gases (LPG).
LNG/LPG production is energy intensive. The energy requirement to bringthe gas from high pressure and relatively high temperature to low pressureand very low temperature is tremendous as the pressure varies from 220 barto 1 bar and the temperature from 90◦ C to −163◦C. LNG/LPG plants tendto be self-sufficient with regard to energy since they operate gas-driven powerplants; this largely eliminates the dependency on external power suppliers andthe power grid.

Svendsen & Wolthusen 105
4. LNG Process Attack Points
This section identifies possible LNG process attack points. The focus is onattacks that could halt or degrade LNG production. Outright terrorist actsand sabotage, such as blowing up a storage facility, are not included in the listof attack scenarios. Instead, the scenarios mainly involve subtle manipulationsof process control systems and sensors. The scenarios assume that an attackeris knowledgeable about the system.
MEG Dosage: MEG must be present in the well-stream to preventthe water component from freezing. An ice plug could cause a pipelineblockage, resulting in a lengthy shutdown of the plant. Also, the upstreampressure in the pipeline could rise to critical levels.
CO2 Removal: CO2 can freeze into dry ice and cause a pipeline block-age, resulting in a lengthy shutdown. Pipeline pressure could also rise tocritical levels.
Mercury Removal: In this subtle scenario, the presence of mercurycauses pipeline corrosion over the long term. In the best case, this in-creases maintenance costs; in the worst case, the pipeline could rupture.
The remainder of this paper focuses on how an attacker, by altering themoisture content readings for well-streams, could bring the MEG concentrationto a critically low level without it being detected by sensors in the well-heads.The attack is carried out so that the moisture content at each well-head iswithin the control limit of the stream, meaning that it cannot be detected byunivariate analysis. However, it can be detected by observing the correlationbetween the well-heads.
5. Model Description
This section presents two models, one for monitoring well-streams for un-usual fluctuations in the volume flow of water and the other for relating thevolume flow of water and the amount of MEG introduced.
5.1 Moisture Content in Well-Streams
Although it is a continuous phenomenon, the moisture content of a well-stream can be represented as a time series. We employ an elementary time seriesmodel that includes trend, seasonality and random noise [5]. Each observationXt of a time series is of the form:
Xt = mt + st + Yt
where mt is a slowly changing function (trend component), st is a periodicfunction of t with period d (seasonal effect), and Yt is a zero-mean process(random noise and fluctuations). To capture the continuous properties of the

106 CRITICAL INFRASTRUCTURE PROTECTION II
moisture content, we use a random walk to represent fluctuations. For eachwell i, a well-stream Xit is defined. The volume flow from well i is givenby Qi. Thus, the volume flow of water at each time interval is given by theproduct Xit · Qi. Generally, Qi can be made time-dependent, but we chooseto keep it constant for the purpose of our analysis. The attack on the LNGproduction system is accomplished by introducing an extra constant term inthe expression for Xit at time ta during ∆a iterations. Given the amplitude ofthe attack A ∈ [0, 1], the time series has the form:
Xt =
{
mt + st + Yt, if x 6∈ [ta, ta + ∆a]mt + st + Yt + Amt, if x ∈ [ta, ta + ∆a]
5.2 MEG Dosage
In order to create an elementary model that relates the volume flow of waterin a well-stream and the quantity of MEG added, we assume that the well-streams are merged to one stream at the PLEM and that the sensors for mea-suring the water content in the individual well-streams and the joint well-streamare located at the PLEM. The main consequence is that a latency emerges be-tween the time an attack is initiated (i.e., a change occurs in a well-stream)and the time when the attack is detected. The relationship between the MEGdosage and the water volume flow is given by QMEG(t) = f(Qwater(t + ∆t))where f(·) is some function. Due to natural fluctuations in a well-stream, theMEG dosage is not adjusted based on an individual reading, but on a statisticaltest of whether the value of the current MEG dosage corresponds to the meanof the last k well-stream readings. The process is initiated with an expectedwater volume flow µ0. For every water volume flow measurement, a test isperformed to determine whether or not µ0 is the mean of the last k readings.Assuming that the mean of the readings is µ, a one-sided test on a single samplecan be performed using the hypothesis:
H0 : µ = µ0 H1 : µ 6= µ0.
If the H0 hypothesis is rejected, µ0 = µ holds and the MEG flow is alteredaccording to the function f .
6. Simulation Results
Our simulation experiments consider a system with three well-streams. Thissection presents a reference simulation to demonstrate how a well-calibratedmodel is located within the control limits. Next, an attack is launched againstall three well-streams and an attempt is made to detect the attack using qualitycontrol methods.
6.1 Three Wells with Seasonal Component
The following model is used to express the water content in the three wells:

Svendsen & Wolthusen 107
20 40 60 80 100 120 140
20
40
60
80
100
120
(a) Single and joint well-streams.
2 4 6 8 10 12 14
110
120
130
140
(b) X-chart of joint well-stream.
2 4 6 8 10 12 14
10
20
30
40
(c) S-chart of joint well-stream.
20 40 60 80 100 120 140
2
4
6
(d) T 2-chart of joint well-stream.
Figure 1. Characteristic plots of a reference well-stream.
X1t = 0.3 + 0.03 cos
(
iπ
100
)
+ 0.0005Y1t
X2t = 0.4 + 0.04 cos
(
iπ
80+
2π
3
)
+ 0.0005Y2t
X3t = 0.5 + 0.03 cos
(
iπ
60+
4π
3
)
+ 0.0005Y3t
where Yit = Zi1+Zi2+ · · ·+Zit, for t = 1, 2, . . . , 3750 and {Zit} is independentand identically distributed random noise. The generated time series points aresampled at a rate of 1/25. This is done to show that not every point for acontinuous process can be sampled. The points are grouped in samples of fifteenelements before further analysis is performed. Figure 1 shows the characteristicplots of the well-streams and the control charts for the joint well-stream.
An attack is launched simultaneously against all three wells; the attack in-creases the water content of each well-stream by 15%. Note that in order forthe attack to be successful, the attacker must have knowledge of the samplingstrategy and the grouping of samples. The confidence limits for the X-chartand S-chart are set based on historical observations of the process. A total of

108 CRITICAL INFRASTRUCTURE PROTECTION II
20 40 60 80 100 120 140
20
40
60
80
100
120
140
(a) Single and joint well-streams.
2 4 6 8 10 12 14
100
110
120
130
140
(b) X-chart of joint well-stream.
2 4 6 8 10 12 14
20
40
60
80
(c) S-chart of joint well-stream.
20 40 60 80 100 120 140
2
4
6
8
10
12
(d) T 2-chart of joint well-stream.
Figure 2. Characteristics plots of a well-stream being attacked.
25 runs of the reference process described above were carried out to determinethe 95% upper and lower confidence intervals. Figure 2 shows the characteristicplots for the attack, which occurs between iterations 1250 and 1600. As seenin Figure 2(c), the attack can be detected by the change in variance.
Having assumed that the attacker has knowledge about the sampling strat-egy, we now examine the situation where the attack covers full samples. Thismeans that the samples either contain points that are attack points or pointsthat are not attack points. Thus, internal fluctuations in the samples areavoided. Figure 3 shows one such run where the attack produces no morevariation than noise.
6.2 MEG Dosage
The water content is modeled using the series:
Xt = 0.3 + 0.03 cos
(
iπ
100
)
+ 0.0005Y1t.
In the attack, a certain percentage of the expected flow is added to the well-stream. The duration of the attack corresponds to fourteen analyzed samples.

Svendsen & Wolthusen 109
20 40 60 80 100 120 140
20
40
60
80
100
120
140
(a) Single and joint well-streams.
2 4 6 8 10 12 14
10
20
30
40
(b) S-chart of joint well-stream.
Figure 3. Well-streams and S-chart of a well-stream being attacked.
Table 1. Average number of samples before a change is detected.
Amplitude (%) 0 5 10 15 20 25 30Samples to detect 14.6 6.8 4.1 3.6 2.1 2.3 1.6
Using the statistical analysis described above, we determine the average numberof samples that must be considered before the change in the mean is detected(and the MEG quantity is adjusted). The results are presented in Table 1, whichlists the average numbers of samples for expected flow percentages ranging from0% to 30%.
7. Analysis of Scenarios
This section analyzes the simulated scenarios and discusses how the statis-tical approach works in the case of time series with tendencies.
7.1 Three Wells with Seasonal Component
An examination of Figure 2 indicates that the attack is not detected bythe X-chart. Specifically, a peak in the sample mean is present, but it doesnot go over the confidence limits. We ran the attack 25 times and examinedthe fluctuations in the mean value for the joined well-stream. The attack wasdetected in 50% of the cases in the well-stream with the smallest volume flow(i.e., with the greatest sensitivity). This detection rate is only three times thefalse alarm rate in the stream due to random fluctuations. Note, however, thatthe T 2-chart detects the attack in all the cases.
7.2 Three Wells with Tendency
It is reasonable to assume that there is a tendency different from zero inthe water content of a well-stream. Either there is a known model for the

110 CRITICAL INFRASTRUCTURE PROTECTION II
tendency or the tendency can be predicted either by using a time series modelfor forecasting or by smoothing and interpolation.
Using the difference between the observed value and the predicted valuefacilitates an analysis similar to the previous case (three wells with a seasonalcomponent). As a matter of fact, the simulations indicate (but do not confirm)that the smoothing of the signal prior to prediction can help hide attacks.
7.3 MEG Dosage
Seeveral parameters may be adjusted in this scenario. These range fromthe definition of the time series and its fluctuations to details such as samplesize, sampling strategy and sensitivity of hypothesis testing. However, thesimulation results show that delays accumulate in large-scale systems wheresensors and actuators are located in different physical locations and where thenature of the observed system is such that control actions cannot be performedbased on single observations.
8. Related Work
Early work on SCADA security focused almost exclusively on physical at-tacks [17]. However, intrusion detection in SCADA systems has become animportant research area, especially as general-purpose network substrates areemployed in control systems, and control networks are intentionally (and some-times inadvertently) cross-linked with exposed networks. The risks to controlnetworks posed by remote attacks were emphasized in a 1997 White Housedocument [21]. However, much of the research related to SCADA security(see, e.g., [1, 13, 16, 18, 20]) has been driven by security-related incidents thatoccurred in 2001–2004 [11].
Considerable attention has focused on attacks against electrical power sys-tems [26], although security issues related to other infrastructures have alsobeen investigated [22]. The survivability of distributed control systems andtheir resilience to attacks, including subversion, is a major issue [4]. Chong,et al. [6] discuss the use of adaptive network security mechanisms for systemswhere service levels must be maintained during attacks. Significant work re-lated to intrusion tolerance systems has been conducted under the MAFTIAProject [8, 24], which built on the results of the earlier Delta-4 project [10].Lower-level ad hoc strategies have been discussed by Haji and co-workers [12].Bigham, et al. [3] have investigated anomaly detection in SCADA environ-ments based on invariant deduction as well as more commonly used n-gramtechniques. A related approach is discussed by Coutinho, et al. [7].
SCADA systems employ multiple types of sensors that are often widely dis-persed (especially in the case of the power grid and oil and gas pipelines). Kosutand Tong [15] discuss the application of data fusion techniques to sensors forwhich Byzantine behavior cannot be ignored. These security concerns applyto sensor data at rest and in transit as discussed by Subramanian, et al. [25].Nguyen and Nahrstedt [19] have addressed the related issue of attack contain-

Svendsen & Wolthusen 111
ment in large-scale industrial control environments using compartmentalizationand trust groups.
9. Conclusions
Anomaly detection in SCADA systems has primarily focused on applyinggeneral network and host detection techniques. However, the characteristicsof SCADA systems, the constraints imposed by real-time industrial environ-ments, and the sophisticated models underlying industrial processes (e.g., stateestimator models used for the electrical power grid) require high-level detectionapproaches as illustrated in this paper. A parallel threat results because attack-ers with knowledge about process models and SCADA systems can influence orfabricate sensor readings and actuator behavior so that they appear normal tooperators. Such manipulations can degrade or disrupt vital industrial processesor force them to operate closer to the margins where a subsequent attack (e.g.,a physical attack) could cause significant damage.
Statistical techniques, as decribed in this paper, are well suited to detectinganomalous behavior in SCADA systems (and critical infrastructure networks, ingeneral). Simplified models and simulations were used in this work to illustratethe main concepts. Our future research will investigate the application of moreelaborate hierarchical and composite models. We will also explore the use ofmultivariate analysis of variance techniques for detecting anomalies in systemswith multiple dependent variables.
References
[1] M. Amanullah, A. Kalam and A. Zayegh, Network security vulnerabilitiesin SCADA and EMS, Proceedings of the IEEE/PES Transmission andDistribution Conference and Exhibition: Asia and Pacific, pp. 1–6, 2005.
[2] R Bace, Intrusion Detection, Sams, Indianapolis, Indiana, 2000.
[3] J. Bigham, D. Gamez and N. Lu, Safeguarding SCADA systems withanomaly detection, Proceedings of the Second International Workshop onMathematical Methods, Models and Architectures for Computer NetworkSecurity, pp. 171–182, 2003.
[4] P. Bracken, The Command and Control of Nuclear Forces, Yale UniversityPress, New Haven, Connecticut, 1985.
[5] P. Brockwell and R. Davis, Introduction to Time Series and Forecasting,Springer-Verlag, New York, 2002.
[6] J. Chong, P. Pal, M. Atigetchi, P. Rubel and F. Webber, Survivabilityarchitecture of a mission critical system: The DPASA example, Proceedingsof the Twenty-First Annual Computer Security Applications Conference,pp. 495–504, 2005.

112 CRITICAL INFRASTRUCTURE PROTECTION II
[7] M. Coutinho, G. Lambert-Torres, L. da Silva, E. Fonseca and H. Lazarek,A methodology to extract rules to identify attacks in power system crit-ical infrastructure, Proceedings of the IEEE Power Engineering SocietyGeneral Meeting, pp. 1–7, 2007.
[8] M. Dacier (Ed.), Design of an Intrusion-Tolerant Intrusion Detection Sys-tem, MAFTIA Deliverable D10 (Version 4.3), IBM Zurich Research Lab-oratory, Zurich, Switzerland, 2002.
[9] D. Denning, An intrusion-detection model, IEEE Transactions on SoftwareEngineering, vol. 13(2), pp. 222–232, 1987.
[10] Y. Deswarte, L. Blain and J. Fabre, Intrusion tolerance in distributedcomputing systems, Proceedings of the IEEE Symposium on Research inSecurity and Privacy, pp. 110–121, 1991.
[11] D. Dzung, M. Naedele, T. von Hoff and M. Crevatin, Security for industrialcommunication systems, Proceedings of the IEEE, vol. 93(6), pp. 1152–1177, 2005.
[12] F. Haji, L. Lindsay and S. Song, Practical security strategy for SCADA au-tomation systems and networks, Proceedings of the Canadian Conferenceon Electrical and Computer Engineering, pp. 172–178, 2005.
[13] V. Igure, S. Laughter and R. Williams, Security issues in SCADA networks,Computers and Security, vol. 25(7), pp. 498–506, 2006.
[14] R. Johnson and D. Wichern, Applied Multivariate Statistical Analysis,Prentice Hall, Upper Saddle River, New Jersey, 2007.
[15] O. Kosut and L. Tong, Capacity of cooperative fusion in the presence ofByzantine sensors, Proceedings of the Forty-Fourth Annual Allerton Con-ference on Communication, Control and Computation, 2006.
[16] T. Kropp, System threats and vulnerabilities: Power system protection,IEEE Power and Energy, vol. 4(2), pp. 46–50, 2006.
[17] E. Murtoviita, J. Keronen, J. Suni and M. Bjork, Visual aids for substationmonitoring and security control, Proceedings of the Third InternationalConference on Power System Monitoring and Control, pp. 225–227, 1991.
[18] M. Naedele, Addressing IT security for critical control systems, Proceed-ings of the Fortieth Annual Hawaii International Conference on SystemSciences, p. 115, 2007.
[19] H. Nguyen and K. Nahrstedt, Attack containment framework for large-scale critical infrastructures, Proceedings of the Sixteenth InternationalConference on Computer Communications and Networks, pp. 442–449,2007.
[20] P. Palensky and T. Sauter, Security considerations for FAN-Internet con-nections, Proceedings of the IEEE International Workshop on FactoryCommunication Systems, pp. 27–35, 2000.

Svendsen & Wolthusen 113
[21] President’s Commission on Critical Infrastructure Protection, CriticalFoundations: Protecting America’s Infrastructures, The White House,Washington, DC (chnm.gmu.edu/cipdigitalarchive/files/5 CriticalFoundationsPCCIP.pdf), 1997.
[22] G. Shafiullah, A. Gyasi-Agyei and P. Wolfs, Survey of wireless communi-cations applications in the railway industry, Proceedings of the Second In-ternational Conference on Wireless Broadband and Ultra Wideband Com-munications, p. 65, 2007.
[23] StatoilHydro, The long road to LNG, Stavanger, Norway (www.statoilhydro.com/en/NewsAndMedia/Multimedia/features/SnohvitLNG/Pages/default.aspx), 2007.
[24] R. Stroud, I. Welch, J. Warne and P. Ryan, A qualitative analysis of theintrusion-tolerance capabilities of the MAFTIA architecture, Proceedingsof the International Conference on Dependable Systems and Networks, pp.453–461, 2004.
[25] N. Subramanian, C. Yang and W. Zhang, Securing distributed data storageand retrieval in sensor networks, Proceedings of the Fifth Annual IEEEInternational Conference on Pervasive Computing and Communications,pp. 191–200, 2007.
[26] Substations Committee of the IEEE Power Engineering Society, IEEE Rec-ommended Practice for Network Communication in Electric Power Sub-stations, IEEE Standard 1615-2007, IEEE, Piscataway, New Jersey, 2007.
[27] R. Walpole, R. Meyers and S. Meyers, Probability and Statistics for Engi-neers and Scientists, Prentice Hall, Upper Saddle River, New Jersey, 1998.

Chapter 9
ASSESSING THE INTEGRITY OF FIELDDEVICES IN MODBUS NETWORKS
Ryan Shayto, Brian Porter, Rodrigo Chandia, Mauricio Papa andSujeet Shenoi
Abstract Pipeline control systems often incorporate thousands of widely dispersedsensors and actuators, many of them in remote locations. Informationabout the operational aspects (functionality) and integrity (state) ofthese field devices is critical because they perform vital measurementand control functions.
This paper describes a distributed scanner for remotely verifying thefunctionality and state of field devices in Modbus networks. The scan-ner is designed for the Modbus protocol and, therefore, accommodatesthe delicate TCP/IP stacks of field devices. Furthermore, field devicescanning and data storage and retrieval operations are scheduled so asnot to impact normal pipeline control operations. Experimental resultsand simulations demonstrate that the distributed scanner is scalable,distributable and operates satisfactorily in low bandwidth networks.
Keywords: Modbus networks, distributed scanner, field devices, integrity
1. Introduction
The oil and gas industry primarily uses distributed control systems imple-menting the Modbus protocol [6–8] for midstream and transport activities inpipeline operations. A typical midstream application may have 10,000 or morefield devices dispersed over several thousand square miles, including offshoreplatforms and remote wells. On the other hand, a transport application mayhave 1,000 field devices located at various points along a 3,000 mile pipeline.Many of these devices are sensors that measure key process parameters such aspressure, temperature, flow and hydrogen sulfide content. Other field devicesare actuators that perform various pipeline control actions.
Pipeline operators need accurate and timely information about the statusand integrity of field devices [4, 5]. Operational and business decisions are
Please use the following format when citing this chapter: Shayto, R., Porter, B., Chandi a, R., Papa, M. and Shenoi, S., 2008, in IFIP International Federa tion for Information Processing, Volume 290; Critical Infrastructure Protection II, eds. Papa, M., Shenoi, S., (Boston: Springer), pp. 115–128.

116 CRITICAL INFRASTRUCTURE PROTECTION II
adversely affected when large numbers of field devices are non-operational orcorrupted; such a situation could also lead to an industrial accident. Mostenergy companies employ technicians whose only job is to travel to distantsites to verify the condition of field devices and service them. Field devicesmay be audited once a month, often just once a quarter.
This paper describes the design and implementation of a distributed scannerthat remotely verifies the functionality and state of field devices in Modbus net-works. The scanner accommodates the delicate TCP/IP stacks of field devicesand scanning activities can be scheduled to minimize the impact on controloperations. Tests on laboratory-scale and virtual environments indicate thatthe distributed scanner is scalable, distributable and operates satisfactorily inlow bandwidth environments. These features make it an attractive tool forproviding situational awareness in pipeline control networks, including thoseincorporating legacy systems.
2. Modbus Protocol
The Modbus protocol is widely used in the oil and gas sector, especially forcontrolling natural gas and liquids pipelines. The original Modbus protocol [6]was designed in 1979 for serial communications between the control center (mas-ter unit) and field devices (slaves). The Modbus TCP protocol [7], which waspublished in 1999, extends its serial counterpart for use in IP-interconnectednetworks. The extended protocol enables a master to have multiple outstandingtransactions, and a slave to engage in concurrent communications with multiplemasters.
2.1 Modbus Serial Protocol
Modbus implements a strict request/response messaging system between amaster unit and slave devices. The master uses unicast or broadcast messagesto communicate with slave devices. In a unicast transaction, the master sends arequest to a single slave device and waits for a response message from the slave.If a response message is not returned, the master assumes that the request hasfailed. In a broadcast transaction, the master sends a request to all the slavedevices in the network; the slaves perform the requested action but do not sendresponse messages to the master.
A Modbus message has three parts (Figure 1). The first is a header, whichincludes the slave’s address and control information for the slave. The secondpart contains a protocol data unit (PDU), which specifies an application-leveloperation. PDUs have two fields: a function code describing the purpose of themessage and function parameters associated with the request or reply aspectof the message. The third part of a Modbus message is used for error-checking.
The maximum length of a Modbus message is 256 bytes. The slave addressand function code fields use one byte each and the error checking field uses twobytes; this leaves 252 bytes for the function parameters.

Shayto, et al. 117
Slave Address Modbus Application PDU Error Checking
Function Code Function Parameters
Maximum 256 B
1 B 2 B
1 B Maximum 252 B
Figure 1. Modbus Serial message format.
Function codes are used by the master to perform diagnostic operations,configure slaves, perform control operations or obtain process data. Threetypes of function codes are defined in the Modbus protocol: public, user-definedand reserved codes. Public codes in the ranges [1, 64], [73, 99] and [111, 127]correspond to functions documented in the Modbus specification. Because thereis no minimum set of function codes that is required to be implemented, vendorsincorporate function codes in their products as needed. User-defined functioncodes in the ranges [65, 72] and [100, 110] are designated for vendors who wishto implement specialized functions. Reserved codes are used to support legacysystems; they overlap with public codes but cannot be used in new Modbusimplementations.
Function codes in the [128, 255] range are used to denote error conditions.Specifically, if an error condition occurs for a function code x ∈ [0, 127] in arequest from a master to a slave, the corresponding error function code in theslave’s response message is given by y = x + 128. Details about the errorare indicated using an exception response in the data field of the message.Nine exception codes are specified: 1..6, 8 and 10..11. The exception codes1..3 are useful when implementing Modbus network scanners. These codes aregenerated during the pre-processing of Modbus requests, i.e., before any actionis taken by a slave to execute the master’s request. Thus, malformed messagesmay be used by a Modbus scanner to obtain information about slave deviceswithout affecting their state.
Table 1. Modbus memory table types.
Name Data Size Usage
Discrete Input 1 bit Read-Only; Digital InputCoil 1 bit Read-Write; Digital OutputInput Register 16 bits Read-Only; Analog InputHolding Register 16 bits Read-Write; Analog Output
Modbus devices store data in four types of tables: discrete inputs, coils, inputregisters and holding registers (Table 1). The maximum memory available for

118 CRITICAL INFRASTRUCTURE PROTECTION II
Function Code
Function Parameters
1 B Maximum252 B
Modbus Application PDU
Maximum 260 B
MBAP
Modbus
TCP
IP
Ethernet
Transaction ID Protocol Length Unit
ID
2 B 2 B 2 B 1 B
Figure 2. Modbus TCP message format.
each table type is 65,536 addressable items. A device may implement the tablesusing separate or overlapping memory spaces.
2.2 Modbus TCP Protocol
Modbus TCP extends the serial version of the protocol by wrapping messageswith TCP/IP headers. A master is defined as a “client” because it initiates aTCP connection while a slave device is a “server” that passively listens for aconnection on port 502 (or other optional ports). The client and server rolescannot be changed after a TCP connection is established. However, a Modbusdevice can establish a new connection in which it may assume a different role.
A Modbus TCP message uses the Modbus application protocol (MBAP)header instead of the serial message header (Figure 2). The MBAP has fourfields: transaction identifier (2 bytes), protocol identifier (2 bytes), length (2bytes) and unit identifier (1 byte). Since the MBAP takes up seven bytes, themaximum size of a Modbus TCP packet is 260 bytes. This length restrictionarises from legacy implementations of the serial protocol.
The transaction identifier uniquely marks each transaction to permit thematching of paired request and reply messages. The protocol identifier specifiesthe protocol used for the message (this is set to zero corresponding to theprotocol identifier for Modbus). The length field gives the size of the remainingportion of the Modbus message, which includes the unit identifier and the PDU.The unit identifier is used for addressing a slave located behind a gatewaythat bridges an IP network and a legacy serial network. The PDU is largelyunchanged from the serial version. It incorporates the function code and datafields; however, error-checking is provided by the TCP layer.
3. Distributed Modbus Network Scanner
The distributed Modbus network scanner is designed to gather informationabout the functionality and state of field devices. It consists of a master scan-ner, remote sensors and a database, which stores data gathered during networkscanning for further processing and applications support [10]. The master scan-ner controls the remote sensors that perform passive and/or active scans of local

Shayto, et al. 119
Table 2. Remote sensor actions.
Commands Action
Configure Network Interface Set network interface for listening to trafficConfigure Database Set IP address, user name and password for
accessing databaseStart Passive Scanning Open network interface; Process trafficStop Passive Scanning Flush queue of packets; Close network interfaceStart Active Scanning Retrieve assigned records; Begin scanningStop Active Scanning Finish current scan; Close connections
networks. In addition, the master scanner may passively or actively scan itsown network.
3.1 Master Scanner
The master scanner controls remote sensors, schedules active scans, examinesthe network topology and reviews device records. These actions rely heavilyon a relational database, which is ideally located on the same host or subnetas the master scanner.
The master scanner constantly listens for connections from remote sensors.After establishing a connection with a sensor, the master scanner sends com-mands to initiate passive or active scans or to update sensor configuration.
3.2 Remote Sensors
Remote sensors deployed at field sites serve as collectors and filters of Mod-bus messages. Upon receiving the appropriate command from the master scan-ner, a remote sensor may configure its network interface or database connection,start/stop passive scanning or start/stop active scanning. Table 2 summarizesthe actions performed by remote sensors upon receiving commands from themaster scanner.
3.3 Database
A relational database is used to maintain data gathered by the master scan-ner and remote sensors, and to store system status information. The databasecontains tables that model field devices, and store data about device finger-prints and the status of active scans.
Three tables are used to hold information about Modbus field devices. Theprimary table, Modbus Device, stores identifying information about Modbusdevices. The other two tables, Function Codes and Memory Contents, holdinformation about the functionality and state of field devices. In particular,Function Codes maintains records of the implemented function codes andMemory Contents stores the memory maps of field devices.

120 CRITICAL INFRASTRUCTURE PROTECTION II
The Device F ingerprint table stores known fingerprints, including the com-ponents that define the signature. A device signature is based on the im-plemented function codes (device functionality) and the memory map (devicestate). This data enables the comparison of field devices against known finger-prints. The comparison is done using SQL commands, which offload processingfrom the scanner to the database.
The Active Scan State table stores the scanning status of each field device.An active scan involves several steps and may be performed over several daysto conserve network bandwidth. The Active Scan State table provides infor-mation about the progress of a scan and enables scanning to resume in theevent of sensor interruption or failure.
4. Modbus Network Scanning
This section describes the passive and active scanning modes used by thedistributed scanner to collect and store information about Modbus devices.
4.1 Passive Scanning
Passive scanning uses a packet parser to examine the contents of Modbusmessages. Messages are analyzed to determine the identity of the master unitand field devices involved in transactions, and message PDUs are parsed todiscover the state of field devices. Note that traffic generated by the activescanning process (described in Section 4.2) is ignored to prevent the scanningprocess from being designated as a master unit in the database. All the in-formation gathered is stored in the database tables described in the previoussection.
Eventually, passive scanning discovers all the active devices in a Modbusnetwork. The database is updated only when a network packet contains newinformation. Nevertheless, information retrieval and database updates consumesignificant network bandwidth, possibly impacting control system availability.This problem is alleviated by queuing database updates that involve data trans-fers exceeding 1 KB per second.
4.2 Active Scanning
Active scanning determines the functionality and state of devices in a Mod-bus network. In addition, it discovers inactive and disabled devices.
The active scanning algorithm exploits the Modbus protocol to safely de-termine if function codes are implemented by field devices. In the case of afunction code that implements a read operation, the active scanning processsends a request message with the function code; a valid response from the ad-dressed device implies that the function code is implemented by the device. Fora function code corresponding to a write operation, a special malformed packetis sent so that a response is received without altering device memory.

Shayto, et al. 121
Table 3. Sample Active Scan State data.
Device IP Unit Next Next Next Scan TimeAddress ID Phase Number Between
192.168.30.1 1 Function 10 2007-03-28 00:05:00Code 16:40:00
192.168.30.2 3 Coils 0, 32767 2007-03-28 00:09:00Maximum 11:40:00
A slave device always checks the function code before acting on a Modbusmessage [6]. It returns an exception code of 1 if the function code is notimplemented; an exception code of 2 (resp. 3) is returned when the functioncode is implemented, but a malformed request with an illegal data address(resp. illegal data value) was received by the device. The active scanningprocess interprets the exception response and updates the corresponding devicerecord in the database. The function codes implemented by a Modbus deviceare determined by systematically querying the device for every function codein the range [0, 127].
Upon obtaining information about the functionality of a device, the activescanning process determines the range and size of each memory table in thedevice. Read-only requests are used for this purpose and a search is conductedusing the starting and ending addresses to determine the valid addresses in eachmemory table. Note that although the Modbus documentation specifies tableswith 65,536 addresses, some devices may not implement such large tables.
Scanning actions are scheduled so as not to interfere with normal operations.In fact, scanning may be scheduled over several days in the case of a largeModbus network.
An active scan of a device involves fourteen phases. The first phase testswhether or not the device implements function codes from 0 to 127. The nexttwelve phases determine the minimum, maximum and offset values for each ofthe four types of device memory. The final phase tests diagnostic sub-functionsimplemented under function code 8.
Table 3 presents two sample entries from the Active Scan State table. Thefirst entry indicates that the function codes of Device 1 at the IP address192.168.30.1 are being examined; and function code 10 is the next one to betested. The second entry indicates that the maximum value of the coil memorytable of Device 3 at IP address 192.168.30.2 is being identified. The NextNumber field of the table stores the minimum and maximum values of thememory addresses used in the search. The Next Scan value indicates when thenext scan operation will be performed, and the T ime Between value specifiesthe interval between successive scan operations.
Our experiments have shown that a complete scan of a device involves anaverage of 300 request messages. To reduce bandwidth, consecutive messages

122 CRITICAL INFRASTRUCTURE PROTECTION II
are sent after a relatively long time interval (e.g., four minutes apart in ourlaboratory testbed). The time interval should be increased for networks withlarge numbers of field devices.
5. Experimental Results
A major design goal is to ensure that the distributed scanner has minimal im-pact on normal Modbus network operations. This section evaluates the impactof the scanner on a laboratory testbed and a virtual environment intended tomodel a small-scale industrial environment. Scanner performance is evaluatedwith respect to three metrics: scalability, distributability and link utilization.
5.1 Experimental Setup
The distributed Modbus network scanner was evaluated using a laboratory-scale SCADA testbed as well as a larger virtual environment. The SCADAtestbed incorporated two Allen-Bradley PLCs with Logix 5555 processors [1];both devices used Prosoft MVI56-MNET Modbus TCP/IP interface modulesfor communication [9]. The testbed also incorporated two Direct Logic 205PLCs with DL260 processors using D2-DCM Ethernet communication modules[2, 3].
The distributed scanner components used with the SCADA testbed wereexecuted on two computers running Windows XP Service Pack 2. The masterscanner and database were hosted on an Intel Xeon 3 GHz machine with 2 GBRAM. The remote sensor was hosted on an Intel Pentium III 1 GHz machinewith 496 MB RAM.
A virtual experimental facility was created to evaluate the scalability ofthe distributed scanner in industrial environments. Figure 3 illustrates thevirtual SCADA environment. Virtual PLCs were created using Jamod Javalibraries [12]. The master and slave devices were located on separate machines;otherwise, traffic between the master and slaves is transmitted at the operatingsystem level and is not visible to a scanner. Each group of slaves was placed ona separate VMWare guest [11] to ensure that they would only see their networkadapter. Each guest, which was assigned 512 MB RAM, hosted up to 50 slavedevices. The VMWare guests used Windows XP Service Pack 2.
The distributed scanner for the virtual environment incorporated three com-puters (Table 4). One computer created a virtual router using IMUNES, apopular network simulator based on Unix FreeBSD [13]. The other two com-puters, which ran Windows XP Service Pack 2, were configured to communicatethrough the virtual router.
The traffic volumes generated during passive and active scanning of thephysical and virtual environments are summarized in Table 5. Passive scan-ning produces traffic volumes that are within a few hundred bytes for the twoenvironments. The active scanning results are also similar. The minor dif-ferences seen for the two environments may be attributed to lost packets andother network transmission errors. Therefore, it appears that the virtual envi-

Shayto, et al. 123
Figure 3. Virtual environment.
Table 4. Virtual environment components.
Host Role Hardware
Computer 1 Master Scanner andDatabase
Intel Xeon 3 GHz,2 GB RAM
Computer 2 3 VMWare guestswith Remote Sensor,Master and Slaves
Intel Xeon 3 GHz,2 GB RAM
Computer 3 IMUNES virtualrouter
Pentium III 800 MHz,768 MB RAM
Table 5. Scanning results for the physical and virtual environments.
Subnets Passive Scan Active ScanKB Sent KB Sent
Physical1 15.720 528.1912 31.911 1056.350
Virtual1 15.952 528.5112 31.788 1057.051

124 CRITICAL INFRASTRUCTURE PROTECTION II
Table 6. Bytes sent during active and passive scanning.
Slave Passive Scan Active ScanDevices Traffic (KB) Traffic (KB)
1 15.95 528.5110 33.23 3674.0520 52.38 7166.5630 71.63 10531.3840 90.82 13928.1550 107.64 17324.92
Incremental 1.89 342.31Traffic per Device
ronment closely models the physical environment, and the results of tests onthe virtual environment are applicable to real-world Modbus networks.
5.2 Performance Metrics
The three performance metrics considered in this study were scalability,distributability and link utilization. The scanner is deemed to be scalable ifthe volume of scanning traffic increases linearly with the number of devicesin a subnet. The scanner is distributable if the traffic increases linearly asthe number of subnets grows given that each subnet has the same number ofdevices. Link utilization is measured as the fraction of the available bandwidthused by the scanner, i.e., bytes per second divided by link speed.
Scalability The scalability of the distributed scanner was evaluated usingthe virtual environment. Traffic volumes generated during passive and activescanning were measured for subnets with numbers of devices ranging from 1 to50.
Table 6 presents the results obtained for passive and active scanning. In bothcases, the traffic volume grows linearly with the number of devices, which showsthat the scanner is scalable. In the case of passive scanning, each additionaldevice causes an average of 1.89 KB of incremental traffic to be sent from theremote sensor to the master scanner. For active scanning, each device adds anaverage of 342.31 KB of traffic.
Distributability The scanner satisfies the distributability metric when thevolume of traffic it generates grows linearly with the number of subnets. In thetests, the number of subnets ranged from 1 to 3 and the number of devices persubnet were 1, 5 and 10.
The results in Tables 7 and 8 show that the traffic volume generated duringpassive and active scanning is proportional to the number of subnets. Notethat the relationship holds regardless of the number of devices per subnet.

Shayto, et al. 125
Table 7. Traffic generated during passive scanning.
1 Subnet 2 Subnets 3 Subnets
Slaves KB Sent Slaves KB Sent Slaves KB Sent
1 15.952 2 31.788 3 46.9925 23.817 10 47.320 15 69.645
10 33.360 20 66.140 30 100.930
Table 8. Traffic generated during active scanning.
1 Subnet 2 Subnets 3 Subnets
Slaves KB Sent Slaves KB Sent Slaves KB Sent
1 528.511 2 1057.051 3 1584.4565 1926.827 10 3855.527 15 5778.640
10 3674.047 20 7347.702 30 11022.781
Link Utilization Link utilization measures the impact of scanner trans-missions on network bandwidth. In the case of passive scanning, traffic isgenerated by three types of events: (i) when the remote sensor establishes aconnection to the master scanner, (ii) when a new device is detected in thenetwork, and (iii) when the function codes implemented in previously detecteddevices are being determined.
Table 9. Link utilization during passive scanning.
Link Speed Connection New Device Update FCs
52 Kbps 25.38% 1.63% 2.54%128 Kbps 10.31% 0.66% 1.03%384 Kbps 3.44% 0.22% 0.34%768 Kbps 1.72% 0.11% 0.17%1.5 Mbps 0.88% 0.06% 0.09%10 Mbps 0.13% 0.01% 0.01%
The results in Table 9 show that passive scanning uses only a small fractionof the available bandwidth after the initial connection phase. Since the initialconnection occurs only during start up, the operator of the distributed scannercan plan for this situation.
To forestall link flooding, especially during the initial scanning of a network,the distributed scanner imposes a limit on the number of packets sent persecond. Figure 4 shows a graphic of the number of packets transmitted during

126 CRITICAL INFRASTRUCTURE PROTECTION II
0
5
10
15
20
25
30
5 10 15 20 25 30 35 40
Pack
ets
tran
smitt
ed fo
r all
test
cas
es (p
acke
ts/s
)
Time (s)
1 Slave10 Slaves20 Slaves30 Slaves
Figure 4. Device discovery with limited transmissions.
passive scanning of a subnet with the number of slaves ranging from 1 to 30.As expected, there is an initial spike as new devices are detected. However, thelimits imposed on the packet rate soon take effect, helping prevent excessivelink utilization.
Table 10. Link utilization during one active scanning step.
Link Speed % Link Used
52 Kbps 3.32%128 Kbps 1.35%384 Kbps 0.45%768 Kbps 0.22%1.5 Mbps 0.12%10 Mbps 0.02%
Unlike passive scanning, the active scanning process executes its scan stepsfollowing a schedule that prevents excessive link utilization. A typical scanningschedule spreads the active scan over a twenty-four hour period. Measurementsshow that a single scan step produces 1,725 bytes of traffic directed at themaster scanner. Table 10 shows link utilization during active scanning with an

Shayto, et al. 127
unreasonably high rate of one scan step per second. In fact, active scanningconsumes only 3.32% of the bandwidth even for a slow (52 Kbps) link.
6. Conclusions
Despite the scale, cost and significance of the oil and gas pipeline infrastruc-ture, asset owners and operators do not currently have the means to remotelyverify the integrity of the thousands of field devices that are vital to pipeline op-erations. Our distributed scanner addresses this need by remotely conductingstateful analyses of Modbus devices, verifying their configurations and assessingtheir integrity. Tests on a laboratory system and a virtual environment thatmodels a small-scale industrial facility indicate that the distributed scanner isscalable, distributable and operates satisfactorily in low bandwidth environ-ments. Equally important is the fact that the scanner is designed to haveminimal impact on normal pipeline control operations. In particular, the scan-ner accommodates the delicate TCP/IP stacks of field devices and scanningactivities can be scheduled based on network size and bandwidth.
Our future work will focus on testing the distributed scanner in simulatedmoderate-scale and large-scale pipeline control environments. A demonstrationproject involving an operating pipeline is also planned. We hope this workwill spur the development of sophisticated situational awareness systems thatprovide control center operators with a comprehensive view of network topologyalong with detailed information about the configuration, status and integrityof field devices, communications links and control center software.
Acknowledgements
This work was partially supported by the Institute for Information Infras-tructure Protection (I3P) at Dartmouth College, Hanover, New Hampshire,under Award 2003-TK-TX-0003 and Award 2006-CS-001-000001 from the U.S.Department of Homeland Security.
References
[1] Allen-Bradley, Logix5000 Controllers Common Procedures ProgrammingManual, Milwaukee, Wisconsin, 2004.
[2] Automation Direct, D2-DCM Data Communications Module User Manual(web2.automationdirect.com/static/manuals/d2dcm/d2dcm.pdf), 2003.
[3] Automation Direct, DL205 User Manual (Volumes 1 and 2) (www.automationdirect.com), 2003.
[4] J. Gonzalez, Security Strategies for Process Control Networks, Ph.D. Dis-sertation, Department of Computer Science, University of Tulsa, Tulsa,Oklahoma, 2006.
[5] J. Gonzalez and M. Papa, Passive scanning in Modbus networks, in CriticalInfrastructure Protection, E. Goetz and S. Shenoi (Eds.), Springer, Boston,Massachusetts, pp. 175–187, 2007.

128 CRITICAL INFRASTRUCTURE PROTECTION II
[6] Modbus IDA, Modbus Application Protocol Specification v1.1a, NorthGrafton, Massachusetts (www.modbus.org/specs.php), 2004.
[7] Modbus IDA, Modbus Messaging on TCP/IP Implementation Guidev1.0a, North Grafton, Massachusetts (www.modbus.org/specs.php), 2004.
[8] Modbus.org, Modbus over Serial Line Specification and ImplementationGuide v1.0, North Grafton, Massachusetts (www.modbus.org/specs.php),2002.
[9] ProSoft Technology, MVI56-MNET ControlLogix Platform Modbus TCP/IP Interface Module User Manual (www.prosoft-technology.com/content/download/2801/26796/file/mvi56 mnet user manual1.pdf), 2007.
[10] R. Shayto, Industry-Scale Distributed Scanners for Modbus Networks,Ph.D. Dissertation, Department of Computer Science, University of Tulsa,Tulsa, Oklahoma, 2007.
[11] VMWare, VMWare Server Virtual Machine Guide (www.vmware.com/pdf/server vm manual.pdf), 2007.
[12] D. Wimberger, Jamod – Java Modbus Implementation (jamod.sourceforge.net), 2004.
[13] M. Zec, Implementing a clonable network stack in the FreeBSD Kernel,Proceedings of the 2003 USENIX Annual Technical Conference, pp. 137–150, 2003.

Chapter 10
DESIGNING SECURITY-HARDENEDMICROKERNELS FOR FIELD DEVICES
Jeffrey Hieb and James Graham
Abstract Distributed control systems (DCSs) play an essential role in the oper-ation of critical infrastructures. Perimeter field devices are importantDCS components that measure physical process parameters and per-form control actions. Modern field devices are vulnerable to cyber at-tacks due to their increased adoption of commodity technologies andthat fact that control networks are no longer isolated. This paper de-scribes an approach for creating security-hardened field devices usingoperating system microkernels that isolate vital field device operationsfrom untrusted network-accessible applications. The approach, whichis influenced by the MILS and Nizza architectures, is implemented in aprototype field device. Whereas, previous microkernel-based implemen-tations have been plagued by poor inter-process communication (IPC)performance, the prototype exhibits an average IPC overhead for pro-tected device calls of 64.59 µs. The overall performance of field devicesis influenced by several factors; nevertheless, the observed IPC overheadis low enough to encourage the continued development of the prototype.
Keywords: Distributed control systems, field devices, microkernels, security
1. Introduction
Field devices employed in distributed control systems (DCSs) connect sen-sors and actuators to control networks, providing remote measuring and con-trol capabilities. Early DCSs were isolated proprietary systems with limitedexposure to cyber threats. However, modern DCSs often engage commer-cial computing platforms and network technologies, which significantly increasetheir vulnerability to cyber attacks. While major disasters have thus far beenaverted, incidents such as the 2003 Slammer worm penetration of the Davis-Besse nuclear power plant network in Oak Harbor (Ohio) and the 2006 hacker
Please use the following format when citing this chapter: Hieb, J. and Graham, J., 2008, in IFIP Internationa l Federation for Informati on Processi ng, Volume 290; Critical Infrastructure Protection II, eds. Papa, M., Shenoi, S., (Boston: Springer), pp. 129–140.

130 CRITICAL INFRASTRUCTURE PROTECTION II
attack on a water treatment facility in Harrisburg (Pennsylvania) underscorethe significance of the cyber threat.
Field devices are attractive targets for cyber attacks on control systems.Since these devices are used for measurement and control of physical sys-tems, preventing these attacks is essential to securing DCSs and, by exten-sion, the critical infrastructures assets they operate. Unlike early field devices,which were highly specialized systems, modern field devices use commercially-available hardware and software and can be attacked quite easily.
The need to secure field devices and their operating systems has been dis-cussed by several researchers (see, e.g., [8, 10]). Guffy and Graham [2] haveapplied multiple independent layers of security (MILS) to creating security-hardened remote terminal units (RTUs). Hieb and Graham [6] have investi-gated techniques for creating security-hardened RTUs with reduced commercialkernels or microkernels. Hieb, Patel and Graham [7] have discussed securityenhancements for DCSs involving protocol enhancements and a minimal kernelRTU (a reduced version of LyxnOS, a commercial RTOS).
This paper describes an approach for creating security-hardened field de-vices by applying elements of the MILS and Nizza microkernel-based securityarchitectures. The approach protects field device operations and data by iso-lating them from less trustworthy application software that may be networkaccessible. Field device performance is an important issue because DCSs aremuch less tolerant to delays and jitter than traditional IT systems. To enhanceperformance, the approach leverages the inter-process communication (IPC)primitive provided by the microkernel. Preliminary results indicate that theobserved IPC overhead is low enough to warrant further development of thesecurity-hardened microkernel.
2. Microkernel-Based Security Architectures
Multiple independent levels of security (MILS) [1] and Nizza [5] are twomicrokernel-based security architectures. The MILS architecture, which wasdeveloped for high assurance and high performance computing, is based onRushby’s separation kernel [9]; it enforces strict security and separation policieson data and processes within a single processor [14]. The Nizza architectureis based on the L4 microkernel and protects security critical code. The MILSand Nizza architectures are presented in Figures 1 and 2, respectively.
MILS and Nizza employ isolated partitions, each with its own protectiondomain, that allow software and data of different security levels or sensitivityto be decoupled from potentially less secure software. Secure compartmental-ization of components and IPC allow the trusted computing base (TCB) toremain small, comprising only the kernel and security-critical code; applicationsoftware resides outside the TCB. In the MILS architecture, this enables highassurance application layer reference monitors to be inserted between appli-cation software components [1, 4]. In Nizza, security-critical code is removedfrom commercial applications and placed in a protected isolated compartment,

Hieb & Graham 131
MiddlewareOS Services
Processor
CORBA CORBA CORBA CORBA
...
RTOS Micro Kernel (MILS)
ApplicationPartitions
MLSRT
CORBA
MLSDisplayDriver
MLSKBD
Driver
TS(SLS)
S(SLS)
TS(SLS)
S,TS(SLS)
User Mode
Supervisor ModeMILS
SLSMLS
MMU, InterpartitionCommunications,Interrupts
MiddlewareOS Services
MiddlewareOS Services
MiddlewareOS Services
Levels of SecuritySingle Level SecureMultilevel Secure
Multiple Independent−
−−
Figure 1. MILS architecture.
keeping the TCB small. Singaravelu and colleagues [13] describe an applicationof Nizza to the secure signing of email.
Legacy OS
SecureApplication
NetworkDriver Loader GUI
SecureStorage
Small Kernel
LegacyApplications
Figure 2. Nizza architecture.
MILS and Nizza primarily focus on protecting the confidentiality of data.MILS is designed for government and military systems that have multilevelsecurity (MLS) requirements, where independent systems have historically been

132 CRITICAL INFRASTRUCTURE PROTECTION II
used for different security levels. Nizza is aimed at desktop and commoditycomputing applications that require small TCBs, mainly for protecting sensitiveuser data. Availability and integrity – rather than confidentiality – are theprincipal security goals in DCSs. Our research suggests that aspects of MILSand Nizza can be used to develop security-hardened field devices that satisfythese goals.
MILS and Nizza use small kernels that provide minimal services to userprocesses while enforcing strong isolation of system components in separateprotection domains and supporting communication between the domains. Thekernel constitutes a major portion of the TCB; thus, the reliability or assuranceof the overall system largely depends on the level of protection offered by thekernel. Providing strong assurance requires rigorous system testing and/or theapplication of formal methods. These methods do not scale well and are themotivation for using a microkernel.
One approach for creating a minimal kernel is to reduce a commercial op-erating system such as Linux or Windows. Unfortunately, most commercialoperating systems are based on a monolithic design philosophy, which yieldslarge kernels with poor fault isolation [14]. In a monolithic design, all the coreoperating system functionality – memory management, file systems, access con-trol, network stacks, device drivers and interrupt handling – is implemented inthe kernel. Thus, all the software that implements this functionality is exe-cuted in privilege mode by the processor where it is not subject to any securityor protection enforcement. Although it is possible to reduce kernel size, it isdifficult to cut down a monolithic kernel to a size that permits formal methodsto be applied.
Another approach is to create a microkernel, a minimal kernel that imple-ments only the services that cannot be implemented in user space [9]. Threeminimal requirements exist for microkernels: address spaces, IPC and uniqueidentifiers. Microkernel-based systems allow traditional operating system ser-vices to be moved to user space where they are run without privileges. Micro-kernels, by virtue of their size, tend to have significantly less code, making itpossible to apply formal methods, including formal proofs. User-level servicesand applications exchange data using IPC, the primary abstraction providedby the microkernel. However, early microkernels were plagued by poor IPCperformance, which significantly impacted overall system performance.
3. Security-Hardened Field Devices
Our approach is to design a security-hardened field device by enforcing strongisolation between: (i) critical field device resources and operations such asanalog and digital input/output, (ii) software responsible for carrying out localcontrol algorithms, and (iii) network-connected field device applications. Theapplication code that implements network connectivity for field devices includesnetwork drivers and protocol stacks; any exploitation of this code must notaffect other components. This would enable critical field device code to continueto execute even when network components are attacked, resulting in graceful

Hieb & Graham 133
Figure 3. Security-hardened field device with a reduced kernel.
degradation as opposed to complete failure. Our approach also isolates security-critical data and code (e.g., cryptographic keys and cryptographic operations)in a separate compartment where they are protected from unauthorized accessby a compromised network component. Field device integrity can be furtherenhanced by using a device-wide security policy enforcement component placedbetween the critical code and network accessible application code.
The partitioning is provided by a microkernel that supplies primitives forcreating and enforcing the isolated compartments. Note that it is necessary toextract and isolate security-related code from control system software. For ex-ample, in a field device that supports security-enhanced DNP3 [7], the code thatperforms authentication and message integrity checking for DNP3 messagesmust be removed from the main body of code and placed in its own protectedcompartment. The isolation of security-related code has the added benefit of re-ducing the complexity of control applications, especially when security-relatedcode has to be added or upgraded.
The architecture supports the enforcement of a security policy. The policymay include high-level specifications (e.g., RTU role-based access control [7])or low-level device-specific requirements. Figure 3 presents a security-hardenedfield device with a reduced kernel architecture.
It is important to ensure that the security architecture does not impactfield device performance, especially because industrial control systems have avery low tolerance for delay and jitter. IPC overhead (i.e., the time taken forIPC operations) can significantly affect field device performance because IPC isused extensively to implement communications between field device applicationcode and protected operations. Device performance is also negatively impacted

134 CRITICAL INFRASTRUCTURE PROTECTION II
by the inclusion of security-related operations (e.g., access control) that areperformed before control messages are processed.
4. Prototype Development and Testing
This section describes the development of the prototype and the experimen-tal results related to IPC performance.
4.1 OKL4 Microkernel
The OKL4 [12] implementation of the L4 microkernel was used for proto-type development. OKL4 (from Open Kernel Labs) is based on the Pistachio-embedded microkernel developed by National ICT Australia (NICTA). Thekernel supports the L4 version 2 API and is written in C++. It supportsARM, x86 and MIPS processors, and is targeted for embedded systems. OKL4is released under a BSD license, although commercial licensing is also available.
The L4 microkernel provides three abstractions: address spaces, threadsand IPC. Data (except from hardware registers) accessed by a L4 thread iscontained in the thread’s address space. An L4 address space is a partialmapping from virtual memory to physical memory. L4 threads are the basicunit of execution in L4; they share data by mapping parts of their addressspaces to other address spaces. Each thread has a unique identifier (UID) anda register set that includes an instruction pointer and a stack pointer. Threadscommunicate with each other using IPC primitives provided by the L4 kernel;L4 IPC is synchronous and unbuffered. L4 supports the following basic IPCprimitives:
receive(): Wait for a message from a specific thread
reply wait(): Send a reply message to a client thread and wait for thenext request
send(): Send a message to a thread
wait(): Wait for a message from a thread
An L4 system is composed of address spaces populated by threads thatexecute code in their address spaces. Each thread, identified by a thread UID,operates on data stored in its address space. The L4 kernel ensures that threadsdo not execute instructions in other address spaces or access data residing inother address spaces.
4.2 Hardware Platform
Gumstix [3] was selected as the hardware development platform. It providesa range of embeddable computers powered by ARM XScale processors and hasbeen used in a number of commercial devices, indicating the platform mayprovide a path for possible commercialization. The Connex 400 was chosen for

Hieb & Graham 135
Figure 4. OKL4-based security-hardened field device.
the development. It has an XScale PXA 255 (32-bit) processor running at 400MHz with 64 MB RAM and 16 MB of flash memory. In addition to the Gumstixmotherboard, the development platform includes the Netstix and Console STdaughter boards. Netstix provides an Ethernet controller that can be used asa network interface for the field device. The console ST board provides twoUART serial interfaces, one of which serves as a console interface.
4.3 System Development
The approach outlined in Section 3 was applied to the development of aprototype security-hardened field device using the OKL4 microkernel and theXScale PXA 255 processor. Figure 4 provides a high-level view of the de-velopment platform implementation. Protected field device components areimplemented as “servers” as in Iguana [11], a transparent, lightweight interfaceto the L4 kernel included with OKL4. Each server is assigned its own addressspace where it is protected from other system components by the L4 kernel.The security functions and policy enforcement component are both part of asingle security layer address space. This address space provides an interface(via IPC) to user applications and is located in the TCB. User applications

136 CRITICAL INFRASTRUCTURE PROTECTION II
may execute unprivileged instructions on the processor, but are limited by thesecurity architecture from executing privileged instructions or accessing mem-ory outside their address spaces. All privileged actions (e.g., reads) and, inparticular, updates of device points are accessed through the security layerserver.
The L4 IPC provides the path along which the field device servers, securitylayer and field device applications exchange information and cooperate. IPCoverhead is of particular concern, especially with regard to calls from fielddevice applications to protected operations via the security layer. As discussedbelow, IPC overhead was evaluated by implementing one of the servers shownin Figure 4, a limited field device security layer and a simple test applicationprogram.
4.4 IPC Performance
Since our approach makes extensive use of the microkernel’s IPC primitive,IPC overhead must be low enough to ensure that field device performancedoes not affect DCS operations. To evaluate the IPC overhead associated withprotected field device operations, a security layer server and data server wereimplemented using Iguana’s IDL, and a field device application was written.The data server is designated as the point server because it eventually providesaccess to analog and digital I/O for the field device. Under the security archi-tecture, only the point server has access to the memory locations associatedwith connected I/O equipment. Analog I/O is not currently implemented inthe prototype, so the analog input value was stored in a persistent variable.
The primary goal was to determine only the IPC overhead of a call. Thesecurity layer server has access to all the field device servers, enabling it toenforce access control for these resources. It also creates address spaces forfield device applications and maps them to needed resources. Thus, the securitylayer maintains control of the resources available to field device applications.Field device application threads are started by the security layer, which waitsfor an IPC request from a field device application.
Figure 5 shows an example case where the policy enforcement point threadreceives a request to read an analog input. If the request is allowed, then theoperation is performed and the result passed back to the user level thread thatmade the call. This involves several IPC operations as shown in Figure 5.Initially, the field device policy enforcement point thread and the field devicepoint service call IPC Wait (1) and (2) (IPC Wait is a blocking IPC that waitsfor an incoming IPC message). IPC activity is initiated by the applicationthread IPC Send to the policy enforcement point thread (3). When the sendsucceeds, the field device application thread calls IPC Receive to wait for aresponse IPC (4). Next, the policy enforcement point security layer issuesan IPC Send to the appropriate field device server thread (5). The policyenforcement point thread then calls IPC Receive to wait for a response fromthe server (6). The server responds with an IPC Send to the policy enforcementpoint thread (7). Finally, the policy enforcement point thread calls IPC Send

Hieb & Graham 137
(8) IPC_Send
(7) IPC_Send
(6) IPC_Receive
(5) IPC_Send(4) IPC_Receive
(3) IPC_Send
(2) IPC_Wait(1) IPC_Wait
Field DeviceApplication
Thread
Policy EnforcementPoint Thread
Points ServerThread
Figure 5. IPC operations involved in policy enforcement.
to return the response to the field device application thread that initiated theIPC sequence (8).
A code fragment from the test application is shown in Figure 6. The testloop iterates 300 times. Each loop instance records the start and finish timesof a loop instance using the timer current time() call provided by Iguana.Iguana’s time tick is one microsecond and the timer current time() returnsthe current tick count. Subtracting the final time from the start time gives thenumber of microseconds elapsed between (3) and (7). To ensure that protectedoperation calls are indeed reaching the point server and are being correctlyreturned, different values were written to and read from the point server. Theobserved results of the reads and writes were used to confirm that the fielddevice application thread was retrieving values from the point server. No policywas enforced to ensure that only the IPC overhead was measured; the elapsedtime between (3) and (8) represents the total IPC overhead of a protected call.
The elapsed time reported by the code fragment in Figure 6 also includes theoverhead of the timer current time() call. A separate test program withoutthe L4 IPC calls was used, leaving just the two calls to timer current time().This program obtained a measure of the timer overhead, which was determinedto be 59.63 µs. The time was rounded down to 59 µs when calculating the actualIPC overhead so that the rounding error is added to the IPC overhead.
The test program was run a total of four times on the development platform.The first value reported for each run was more than 1,000 µs, but the remainingsample times were closely grouped around 123 µs. The higher elapsed time forthe first measurement of each run is very likely because the kernel performs a

138 CRITICAL INFRASTRUCTURE PROTECTION II
define READ_ANALOG_INPUT_1 0x01
for (i = 0; i < 300; i++)
{
L4_MsgClear(&msg);
L4_Set_MsgLabel(&msg,READ_ANALOG_INPUT_1);
L4_MsgLoad(&msg);
stime = timer_current_time();
tag = L4_Send(thread_l4tid(listener));
assert(L4_IpcSucceeded(tag));
L4_MsgClear(&msg);
tag = L4_Receive(thread_l4tid(listener));
ftime = timer_current_time();
val = L4_Label(tag);
printf("test app read_analog_input_1 call took \%"
PRIu64 " milliseconds, or \%" PRIu64 " microseconds\n",
((ftime - stime)/1000ULL), (ftime - stime) );
}
Figure 6. Test application code fragment.
one-time initialization for thread IPCs. Consequently, the first recorded timewas dropped from the performance calculations.
Table 1. IPC overhead for protected calls.
Description Value
Average reported elapsed time 123.19 µsStandard deviation 0.78490895% confidence interval 0.002Timer overhead 59 µsActual average IPC overheadfor protected operation call
64.19 µs
A total of 500 samples were selected from the remaining times. The resultsare shown in Table 1. The mean value is 123.19 µs with a standard deviation of0.785 and a 95% confidence interval of 0.002. This value includes the 59 µs oftimer overhead. After subtracting the timer overhead, the actual IPC overheadfor the entire sequence shown in Figure 6 is 64.19 µs. Since L4 IPC calls aresynchronous and there are a total of four sends in the sequence, the observedIPC overhead is distributed across four IPC send-receive pairs. Assuming thatthe overhead is evenly distributed, a single IPC from one L4 thread to anothertakes an average of 16.05 µs. These times are significantly better than the 100µs reported for first-generation microkernels and are low enough to encouragefurther prototype development.

Hieb & Graham 139
5. Conclusions
Embedded operating systems used in field devices provide little, if any, se-curity functionality. This exposes industrial control systems and the criticalinfrastructure assets they operate to a variety of cyber attacks. Creatingsecurity-hardened field devices with microkernels that isolate vital monitor-ing and control functions from untrusted applications is an attractive solution.This strategy also produces a small TCB, which reduces vulnerabilities andfacilitates the application of formal methods. Unlike most microkernel-basedimplementations for field devices that have been plagued by poor IPC perfor-mance, the prototype constructed using the OKL4 microkernel running on a400 MHz XScale PXA 255 microprocessor exhibits low IPC overhead (64.59 µs)for protected device calls. While the system is not yet complete and other per-formance issues remain to be considered, the low IPC overhead is encouragingenough to warrant the continued development of the prototype.
References
[1] J. Alves-Foss, C. Taylor and P. Oman, A multi-layered approach to secu-rity in high assurance systems, Proceedings of the Thirty-Seventh AnnualHawaii International Conference on System Sciences, pp. 302–311, 2004.
[2] B. Guffy and J. Graham, Evaluation of MILS and Reduced Kernel SecurityConcepts for SCADA Remote Terminal Units, Technical Report TR-ISRL-06-02, Intelligent Systems Research Laboratory, Department of ComputerEngineering and Computer Science, University of Louisville, Louisville,Kentucky, 2006.
[3] Gumstix, Products, Portola Valley, California (www.gumstix.com/products.html).
[4] N. Hanebutte, P. Oman, M. Loosbrock, A. Holland, W. Harrison andJ. Alves-Foss, Software mediators for transparent channel control in un-bounded environments, Proceedings of the Sixth Annual IEEE SMC Infor-mation Assurance Workshop, pp. 201–206, 2005.
[5] H. Hartig, M. Hohmuth, N. Feske, C. Helmuth, A. Lackorzynski, F. Mehn-ert and M. Peter, The Nizza secure-system architecture, Proceedings of theInternational Conference on Collaborative Computing: Networking, Appli-cations and Worksharing, 2005.
[6] J. Hieb and J. Graham, Security-enhanced remote terminal units forSCADA networks, Proceedings of Nineteenth ISCA International Confer-ence on Computer Applications in Industry and Engineering, pp. 271–276,2006.
[7] J. Hieb, S. Patel and J. Graham, Security enhancements for distributedcontrol systems, in Critical Infrastructure Protection, E. Goetz and S.Shenoi (Eds.), Springer, Boston, Massachusetts, pp. 133–146, 2007.
[8] V. Igure, S. Laughter and R. Williams, Security issues in SCADA networks,Computers and Security, vol. 25(7), pp. 498–506, 2006.

140 CRITICAL INFRASTRUCTURE PROTECTION II
[9] J. Liedtke, On micro-kernel construction, ACM SIGOPS Operating Sys-tems Review, vol. 29(5), pp. 237–250, 1995.
[10] A. Miller, Trends in process control systems security, IEEE Security andPrivacy, vol. 3(5), pp. 57–60, 2005.
[11] National ICT Australia, Project Iguana, Eveleigh, Australia (ertos.nicta.com.au/software/kenge/iguana-project/latest).
[12] Open Kernel Labs, Products, Chicago, Illinois (www.ok-labs.com).
[13] L. Singaravelu, C. Pu, H. Hartig and C. Helmuth, Reducing TCB complex-ity for security-sensitive applications: Three case studies, ACM SIGOPSSystems Review, vol. 40(4), pp. 161–174, 2006.
[14] A. Tanenbaum, J. Herder and H. Bos, Can we make operating systemsreliable and secure? IEEE Computer, vol. 39(5), pp. 44–51, 2006.
Chapter 11
COMBATING MEMORY CORRUPTIONATTACKS ON SCADA DEVICES
Carlo Bellettini and Julian Rrushi
Abstract Memory corruption attacks on SCADA devices can cause significant dis-ruptions to control systems and the industrial processes they operate.However, despite the presence of numerous memory corruption vulner-abilities, few, if any, techniques have been proposed for addressing thevulnerabilities or for combating memory corruption attacks. This paperdescribes a technique for defending against memory corruption attacksby enforcing logical boundaries between potentially hostile data andsafe data in protected processes. The technique encrypts all input datausing random keys; the encrypted data is stored in main memory andis decrypted according to the principle of least privilege just before itis processed by the CPU. The defensive technique affects the precisionwith which attackers can corrupt control data and pure data, protectingagainst code injection and arc injection attacks, and alleviating prob-lems posed by the incomparability of mitigation techniques. An experi-mental evaluation involving the popular Modbus protocol demonstratesthe feasibility and efficiency of the defensive technique.
Keywords: SCADA systems, memory corruption attacks, Modbus protocol
1. Introduction
This paper describes the design and implementation of a run-time systemfor defending against memory corruption attacks on SCADA devices. SCADAsystems are widely used to operate critical infrastructure assets such as theelectric power grid, oil and gas facilities, and water treatment plants. Recentvulnerability analyses of SCADA protocol implementations have identified sev-eral memory corruption vulnerabilities such as buffer overflows and faulty map-pings between protocol elements (handles and protocol data unit addresses) andmain memory addresses [8, 27]. These include [19, 40] for Inter Control CenterProtocol (ICCP) [20, 42] for OLE for Process Control (OPC) [21], respectively.
Please use the following format when citing this chapter: Bellettini, C. and Rrushi, J., 2008, in IFIP Internati onal Federation for Informati on Processing, Volume 290; Critical Infrastructure Protection II, eds. Papa, M., Shenoi, S., (Boston: Springer), pp. 141–156.

142 CRITICAL INFRASTRUCTURE PROTECTION II
Very few defensive techniques have been devised specifically for SCADAsystems. Consequently, most of the techniques discussed in this paper aredrawn from efforts related to traditional computer systems. All these tech-niques, which the exception of pointer taintedness detection [10, 11], focus onprotecting control data (e.g., saved instruction pointers, saved frame pointersand pointers in various control tables) from corruption. The techniques donot protect against attacks that corrupt non-control data, also called “puredata,” which includes user identification data, configuration data and decision-making data [12]. Furthermore, the techniques only protect against pre-definedattack techniques. This problem, which is referred to as the “incomparabilityof defensive techniques” [34], is stated as follows: for any two categories oftechniques A and B there are attacks prevented by A that are not preventedby B, and there are attacks prevented by B that are not prevented by A. Theapproach described in this paper overcomes the limitations of current defensivetechniques in terms of attack vector coverage. Also, it protects against controldata attacks as well as pure data attacks.
We have evaluated our defensive technique using a Modbus protocol [26]implementation running under Linux. In particular, we employed FreeMOD-BUS [44] running on a Debian machine (OS kernel 2.6.15) with 1024 MB mainmemory and an IA-32 processor with a clock speed 1.6 GHz. The Modbusclient and server ran on the same physical machine and communicated via anull-modem cable between /dev/ttyS1 and /dev/ttyS0. The experimentalresults indicate that the defensive technique is both feasible and efficient forreal-time operation in industrial control environments.
2. Related Work
Simmons, et al. [38] have proposed code mutation as a technique for detect-ing buffer overflow exploits in SCADA systems before the exploits are executed.The technique involves altering SCADA executable code without changing thelogic of the original algorithms. Code mutation is one of the first approachesproposed for protecting SCADA systems from memory corruption attacks. Theother techniques discussed below were originally developed for traditional com-puter systems.
Instruction set randomization [6, 23] counters attacks that hijack the exe-cution flow of a targeted program in order to execute injected shellcode. Thisdefensive technique prevents the injected shellcode from being executed by en-crypting program instructions with a random key; the encrypted code is loadedinto memory and is decrypted just before it is processed by the CPU.
Kc, et al. [23] randomize ELF [40] executables by extending the objcopy
utility to create a binary by XORing the original instructions with a 32-bitkey. This key is then embedded in the header of the executable. When a newprocess is generated from a randomized binary, the operating system extractsthe key from the header and stores it in the process control block. After theprocess is scheduled for execution, the key is loaded into a special register of theCPU via a privileged instruction; the key is then XORed with the instructions

Bellettini & Rrushi 143
before they are processed by the CPU. This approach protects against attackson remote services, but not from local attacks. Also, it has a considerableperformance cost and does not handle dynamic libraries. In fact, because akey is associated with a single process, it is difficult to use dynamic librarieswhose code is shared by different processes. A solution is to copy the sharedlibrary code to a memory area where it could be XORed with the key of thecorresponding process; this enables each process to create and use a privatecopy of the shared code. However, the memory consumption is high and thestrategy conflicts with the rationale for having shared libraries.
Barrantes, et al. [6] have developed the RISE tool that generates a pseudo-random key whose length is equal to the total number of bytes of the programinstructions. The instructions are XORed with the key when they are loadedinto the emulator and are decrypted right before being executed. When a pro-cess needs to execute shared library code, the operating system makes a privatecopy of the code, encrypts it and stores the encrypted code in the virtual mem-ory assigned to the process. Thus, the use of shared libraries consumes a largeamount of main memory. RISE is based on valgrind [29] and adds a latencyof just 5% to a program running under valgrind. Instruction set randomiza-tion cannot prevent control data attacks or pure data attacks that operate ina return-into-libc manner because these attacks do not use injected shell-code [28].
The instruction set randomization technique can be subverted. Sovarel, etal. [39] have demonstrated the efficiency of incremental key guessing where anattacker can distinguish between incorrect and correct key byte guesses. Theincremental key guessing exploit injects either a return instruction (which isone byte long for the IA-32 processor) or a jump instruction (two bytes long)encrypted with one or two guessed bytes, respectively. If an attacker employsa return instruction in a stack overflow exploit [1], the stack is overflowed sothat the saved frame pointer is preserved. The saved instruction pointer isthen modified to point to the encrypted return instruction that is preliminar-ily injected and the original saved instruction pointer is stored next to it. Ifthe guess of the encryption byte is correct, the CPU executes the injected re-turn instruction and the vulnerable function returns normally; if the guess isincorrect, the targeted process crashes.
The subversion technique requires knowledge of the saved frame pointer andthe saved instruction pointer. An attacker may also inject a short jump with a-2 offset. If the attacker’s guess of the two encryption bytes is correct, the jumpinstruction is executed and proceeds to jump back to itself, causing an infiniteloop; an incorrect guess causes the targeted process to crash. After successfullyguessing the first byte or the first two bytes, the attacker changes the positionof the byte(s) to be guessed and proceeds as in the previous step. Because afailed key guess causes the targeted process to crash, incremental subversionis possible only for programs that are encrypted with the same key every timethey execute. Incremental subversion is also applicable to programs whose

144 CRITICAL INFRASTRUCTURE PROTECTION II
forked children are encrypted with the same key, in which case the techniqueis directed at a child process.
PointGuard [15] XORs pointers with a 32-bit key when they are stored inmain memory, and XORs them again with the same key right before theyare loaded into CPU registers. The encryption key is generated randomly atload time and is kept secret. An attacker cannot corrupt a pointer with avalue that is useful (from the attack point of view) as the encryption key isnot known. This is because the corrupted pointer is decrypted before beingloaded into a CPU register; thus, it will not accomplish the attacker’s task [15].However, PointGuard does not counter injected shellcode. Also, uncorruptedbytes in a partially-corrupted pointer are decrypted correctly. This meansthat an attacker can corrupt the least significant byte of a pointer in a processrunning on a Little Endian architecture and then employ a brute force techniqueto land in a memory location where shellcode or a program instruction is stored.The subversion may be carried out on any architecture by exploiting a formatbug [18, 30, 37] to corrupt any one byte of a target pointer [2].
StackGuard [16] places a load-time-generated random value or a string ter-minating value (called a “canary”) on the stack next to the saved instructionpointer. The integrity of the canary is checked upon function return. If theoriginal value of the canary has been modified, a stack overflow has occurred,the incident is reported in a log file and program execution is aborted [16].
StackShield [43] creates a separate stack to hold a copy of each saved in-struction pointer. It saves a copy of the saved instruction pointer at functioncall and copies the saved value back to the saved instruction pointer location atfunction return; this ensures that the function correctly returns to its originalcaller. However, Bulba and Kil3r [9] have shown that StackShield can be by-passed by corrupting the saved frame pointer using a frame pointer overwriteattack [24]. Also, StackGuard can be bypassed by attack techniques that donot need to pass through a canary in order to corrupt the saved instructionpointer of a vulnerable function. Examples include heap overflows, longjmpoverflows, format strings and data/function pointer corruption.
The StackGuard limitation can be addressed by XORing a saved instructionpointer with a random canary at function call and at function return. Theattack fails if the saved instruction pointer is corrupted without also modifyingthe corresponding canary. When a function completes its execution, XORingthe canary with the corrupted instruction pointer will not yield a pointer tothe memory location defined by the attacker.
FormatGuard [14] is a countermeasure against format string attacks. Itcompares the number of actual parameters passed to a format function againstthe number of formal parameters. If the number of actual parameters is lessthan the number of formal parameters, FormatGuard reports the fact as anincident in a log file and aborts program execution. Robins [35] has proposedlibformat, a library that aborts program execution if it calls a format functionwith a format string that is writable and contains a %n format directive.

Bellettini & Rrushi 145
Baratloo, et al. [5] utilize the libsafe library to intercepts calls to functionsthat are known to cause buffer overflows and replace each function with one thatimplements the same functionality, but with buffer overflows restricted to thecurrent stack frame. Note that libsafe does not protect against heap overflowsor attacks that corrupt data/function pointers. With regard to format stringvulnerabilities, libsafe rejects dangerous format directives such as %n thatattempt to corrupt saved instruction pointers. Baratloo, et al. [4] have createdthe libverify library that offers the same kind of protection as StackShield.The main difference is in the way the copy of a saved instruction pointer iscompared with the saved pointer on the stack at function return.
Krennmair [25] has developed ContraPolice for protecting against heap over-flows [3, 13, 17, 22]. ContraPolice places a random canary before and after thememory region to be protected. Integrity checks are performed on the canarybefore exiting from a function that copies data to the protected memory region.Program execution is aborted when the canary indicates corruption.
The PaX kernel patch [33] for Linux employs non-executable pages for IA-32to make the stack and heap non-executable [33]. Page privilege flags are used tomark pages as non-executable; a page fault is generated when a process accessessuch a page. PaX then checks if a data access occurred or the CPU tried toexecute an instruction (in which case the program execution is aborted). PaXperforms well against shellcode injection, but not against attacks structured ina return-into-libc manner.
The defensive techniques discussed in this section focus on a few attacks,often on a single attack. None of the techniques can protect against all at-tacks that exploit memory corruption vulnerabilities, which raises the issue ofincomparability of mitigation techniques. To the best of our knowledge, theonly approach capable of protecting a process from control data and pure dataattacks is pointer taintedness detection [10, 11]. A pointer is considered to betainted when its value is obtained via user input or is derived from user input.If a pointer is tainted during the execution of a process, an attack is underwayand a response should be triggered. Pointer taintedness detection is a effectivetechnique, but it requires substantial changes to the underlying hardware toimplement its memory model.
3. Countering Memory Corruption Attacks
The computer security community has traditionally relied on patching mem-ory corruption vulnerabilities to combat control data and pure data attacks.However, software patches only address known vulnerabilities; the patched sys-tems would still be exposed to attacks that exploit vulnerabilities that exist,but that have not been identified or disclosed. Also, patching SCADA systemsoften degrades their real-time performance characteristics.
Intrusion detection and response systems are often used for attack preven-tion. The problem is that an intrusion detection system generally performs itsanalysis and raises alarms after an intrusion has been attempted. Some mod-ern intrusion detection systems (e.g., Snort [36]) perform real-time intrusion

146 CRITICAL INFRASTRUCTURE PROTECTION II
prevention tasks. Similarly, a fast proactive defense mechanism could be usedto block the exploitation of memory vulnerabilities.
Building attack requirement trees for known attacks that target memorycorruption vulnerabilities can assist in developing defensive mechanisms. Anattack requirement tree is a structured means for specifying conditions thatmust hold for an attack to be feasible [7]. The root node of the tree is theattack itself, while every other node is a requirement (or sub-requirement) forthe attack. Internal nodes are either AND nodes or OR nodes. An AND nodeis true when all its child nodes are true; an OR node is true if if any one of itschild nodes is true.
We use an attack requirement tree corresponding to a specific attack asa pattern for characterizing the family of memory corruption attacks. Theexample attack we consider smashes a buffer on a stack to corrupt the savedinstruction pointer and return execution to injected shellcode. The attackrequirement tree highlights two issues:
The main instrument employed to satisfy one or more critical nodes inan attack requirement tree is the input data fed to a targeted process. Inour example, the corrupting value of the saved instruction pointer and theshellcode injected into the address space of a targeted process constitutethe input data (supplied by the attacker).
The nodes are true because the attacker has full control of the inputdata in the address space of the targeted process. In our example, anattacker defines the content of shellcode and the shellcode is stored inmemory in exactly the way the attacker defined it. Furthermore, anattacker can define the value that overwrites the saved instruction pointer.Thus, during a memory corruption attack, a saved instruction pointer isoverwritten by the value defined by the attacker.
Obviously, it is not possible to eliminate the attack instrument. However,it is feasible to eliminate the control that an attacker has on the content ofthe input data stored in main memory. The idea is to prevent the attackerfrom being able to define the bytes stored in memory. As shown in Figure1, the attacker develops shellcode that spawns a shell (Figure 1(a)) and feedsit along with other attack data to a targeted process. Figure 1(b) shows theshellcode stored in the main memory of a Little Endian Intel machine in themanner defined by the attacker. Under these conditions, an attacker couldhijack program execution to the injected shellcode and cause its execution. Ifusers, including malicious users, specify the content of input data while it iswithin the process that defines the content stored in main memory, an attackercannot control the content of input data stored in main memory.
A process should store input data in main memory so that transformeddata is converted to its original form before it is used. Figure 1(c) presentsthe shell-spawning shellcode encrypted in a stream cipher mode using the key0xd452e957 and stored in main memory as ciphertext. The input data storedin main memory is different from the input data defined by an attacker at

Bellettini & Rrushi 147
0x52c031990x732f6e680x2f2f68680xe38969620xe18953520x80cd0bb0
0x0529634d0x24c63cbc0x78c63abc0xb4603bb60xb66001860xd7245964
RAM RAM
"\x99""\x31\xc0""\x52""\x68\x6e\x2f\x73\x68""\x68\x2f\x2f\x62\x69""\x89\xe3""\x52""\x53""\x89\xe1""\xb0\x0b""\xcd\x80"
(a)
(b) (c)
cltdxor %eax, %eaxpush %edxpush $0x68732f62push $0x69622f2fmov %esp, %ebxpush %edxpush %ebxmov %esp, %ecxmov $0xb, %alint $0x80
.................
.................
.................
.................
.................
.................
.................
.................
Figure 1. Potentially hostile data sanitized by stream cipher encryption.
the moment the attack data is provided as input to a targeted process. If theattacker hijacks control to the transformed shellcode, it is highly likely that theCPU will execute it, but the machine instructions in the transformed shellcodewould not be recognized.
This situation also holds for a saved instruction pointer. An attacker is ableto define (in the input data) the address of injected shellcode as the value thatoverwrites an instruction pointer saved on the stack. However, if a targetedprocess transforms the input data before storing it in memory, then the savedinstruction pointer is overwritten with the transformed value, not with theaddress of the injected shellcode that the attacker intended. Consequently,while it is likely that execution will be hijacked, control will not pass to theinjected shellcode. This technique applies to all attack techniques that exploitmemory vulnerabilities by corrupting control data or pure data.
4. Proposed Approach
The principal idea behind enforcing logical boundaries on potentially hostiledata is to encrypt input data before it enters the address space of a protectedprocess. All the data read from sockets, environment variables, files and stan-dard input devices are encrypted and then stored in main memory. The stream

148 CRITICAL INFRASTRUCTURE PROTECTION II
cipher mode is used for encrypting and decrypting input data. Specifically,input data is encrypted by XORing it with a key; the ciphertext is decryptedby XORing it with the same key. Stream cipher encryption using the XORoperation is ideal for real-time systems because it is fast and efficient.
A protected process should preserve input data as ciphertext throughoutits execution. Note that encryption defines a logical boundary in the addressspace of a protected process between potentially hostile data and control/puredata. A protected process should be aware of the logical boundaries of data. Inparticular, the protected process should be able to determine if a buffer neededby a machine instruction contains ciphertext, in which case, the buffer data hasto be decrypted before it is used. Unencrypted buffer data can be used directly.
The decryption of a buffer containing ciphertext should be performed incompliance with the principle of least privilege. At any point in time, only thedata items required by an instruction are decrypted and made available to theinstruction. For example, format functions parse a format string one byte ata time. If the byte read is not equal to %, it is copied to output; otherwise,it means that a format directive (e.g., %x, %d or %n) is encountered and therelated value is retrieved from the stack. In this case, if the format functionneeds to parse a byte of the format string, only that byte is decrypted andmade available; the remaining bytes are in ciphertext.
The principle of least privilege applied at such a low level prevents a func-tion from operating on data other than the data it requires. To alleviate theperformance penalty, the number of bytes decrypted at a time could be slightlygreater than the number of bytes needed by a function – but such an actionshould be performed only if it is deemed safe. The plaintext version of datashould not be preserved after an operation completes; otherwise, plaintext at-tack data (e.g., shellcode) could be exploited in an attack. When a protectedprocess has to copy or move input data to another memory location, the datais stored as ciphertext as well. Data created by concatenating strings, where atleast one string is stored as ciphertext, should also be preserved as ciphertext.
Each process generates a random sequence of bytes that is used as a keyfor encrypting/decrypting input data. This key is generated before the mainfunction is executed. Child processes also randomly generate their own keysimmediately after being forked but before their program instructions are exe-cuted. Thus, parent and child processes generate and use their own keys.
A child process that needs to access ciphertext data stored and handled byits parent process uses the key of the parent process. To counter brute forceattacks, the lifetime of a key should extend over the entire period of processexecution. A brute force attack against a non-forking process or against aparent process would require the key to be guessed correctly at the first attempt.If this is not done, the protected process crashes and a new key is generated thenext time the process is created. The same situation holds for child processes:if the key of the targeted child process is not guessed during the first try, theprocess crashes and a new child process with a new key is forked when the

Bellettini & Rrushi 149
attacker attempts to reconnect to the parent process. A brute force attack failsbecause the new child process generates and uses a new random key.
A key is stored within the address space of the process that created it andis available to the process throughout its execution. Care should be taken toguarantee the integrity of the key when it is stored and loaded from memory.
By encrypting process input, intervention occurs at two vital points of anattack. The first point is when attack data is stored in buffers to execute varioustypes of buffer overflow attacks that corrupt control data or pure data. Thesecond point is when attack data is stored in main memory.
Without the encryption key, an attacker cannot place the correct data re-quired to execute a buffer overflow attack. In addition, the attacker cannotinject valid shellcode because it would have to be in ciphertext (like the origi-nal shellcode). In the case of a format string attack, due to the application ofthe least privilege principle for decryption, when a format function processes adirective (e.g., %n), the bytes to be stored and their starting memory locationare not available. Thus, the attacker loses the ability define a value and theaddress where the value is to be stored.
The second point of intervention is when attack data is stored in memory.This is when an attacker, who has corrupted control data or pure data, couldcause execution to return to shellcode. It is also at this point that an attackercould inject data into the stack by passing it as an argument to a function. Thisis referred to as arc injection (a return-into-libc type of attack). Preservingpotentially malicious data as ciphertext in main memory thus eliminates theability of an attacker to use shellcode or to perform arc injection.
Note that an intervention at the first point prevents an attacker from trans-ferring control to the desired memory location. Therefore, an intervention atthe second point can be considered to be redundant. Nevertheless, we includeit in the specification of our protection strategy as a second line of defense.
5. Experimental Results
Our experimental evaluation of the protection technique employed a Modbuscontrol system. Modbus is an application-layer protocol that enables SCADAdevices to communicate according to a master-slave model using various typesof buses and networks. Modbus was chosen for the implementation becauseit is popular, simple and representative of industrial control protocols. Weinstrumented the code of FreeMODBUS, a publicly available Modbus imple-mentation, to evaluate the feasibility and efficiency of the protection technique.Several vulnerabilities were introduced into FreeMODBUS in order to executememory corruption attacks.
The implementation of the defensive technique involved kernel domain in-tervention and user domain intervention. Kernel domain intervention requiressystem calls to be extended so that all input data to protected processes isencrypted. The second intervention takes place in the user domain, where ad-ditional instructions are introduced to Modbus programs to enable them toaccess and use the encrypted information.
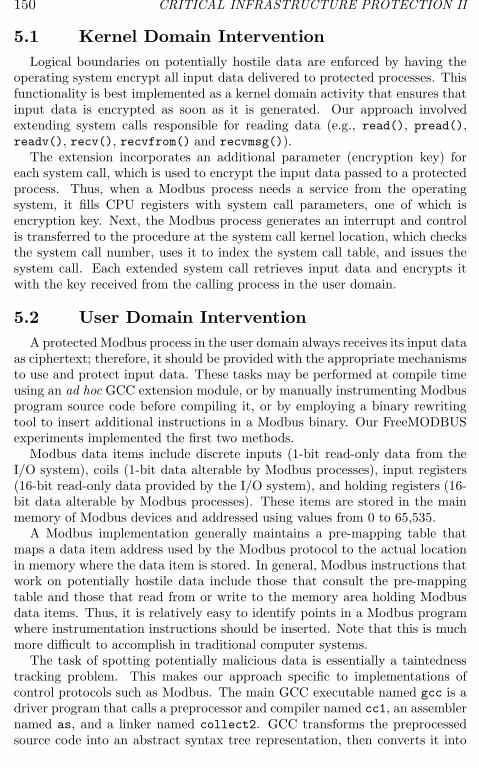
150 CRITICAL INFRASTRUCTURE PROTECTION II
5.1 Kernel Domain Intervention
Logical boundaries on potentially hostile data are enforced by having theoperating system encrypt all input data delivered to protected processes. Thisfunctionality is best implemented as a kernel domain activity that ensures thatinput data is encrypted as soon as it is generated. Our approach involvedextending system calls responsible for reading data (e.g., read(), pread(),readv(), recv(), recvfrom() and recvmsg()).
The extension incorporates an additional parameter (encryption key) foreach system call, which is used to encrypt the input data passed to a protectedprocess. Thus, when a Modbus process needs a service from the operatingsystem, it fills CPU registers with system call parameters, one of which isencryption key. Next, the Modbus process generates an interrupt and controlis transferred to the procedure at the system call kernel location, which checksthe system call number, uses it to index the system call table, and issues thesystem call. Each extended system call retrieves input data and encrypts itwith the key received from the calling process in the user domain.
5.2 User Domain Intervention
A protected Modbus process in the user domain always receives its input dataas ciphertext; therefore, it should be provided with the appropriate mechanismsto use and protect input data. These tasks may be performed at compile timeusing an ad hoc GCC extension module, or by manually instrumenting Modbusprogram source code before compiling it, or by employing a binary rewritingtool to insert additional instructions in a Modbus binary. Our FreeMODBUSexperiments implemented the first two methods.
Modbus data items include discrete inputs (1-bit read-only data from theI/O system), coils (1-bit data alterable by Modbus processes), input registers(16-bit read-only data provided by the I/O system), and holding registers (16-bit data alterable by Modbus processes). These items are stored in the mainmemory of Modbus devices and addressed using values from 0 to 65,535.
A Modbus implementation generally maintains a pre-mapping table thatmaps a data item address used by the Modbus protocol to the actual locationin memory where the data item is stored. In general, Modbus instructions thatwork on potentially hostile data include those that consult the pre-mappingtable and those that read from or write to the memory area holding Modbusdata items. Thus, it is relatively easy to identify points in a Modbus programwhere instrumentation instructions should be inserted. Note that this is muchmore difficult to accomplish in traditional computer systems.
The task of spotting potentially malicious data is essentially a taintednesstracking problem. This makes our approach specific to implementations ofcontrol protocols such as Modbus. The main GCC executable named gcc is adriver program that calls a preprocessor and compiler named cc1, an assemblernamed as, and a linker named collect2. GCC transforms the preprocessedsource code into an abstract syntax tree representation, then converts it into

Bellettini & Rrushi 151
a register transfer language (RTL) representation, before it generates assemblycode for the target platform [31]. A GCC extension module instruments Mod-bus program code by adding additional assembly language instructions duringassembly code generation. The CPU registers are visible at this stage; there-fore, it is easier to repair the assembly instructions that store (on the stack) thecontents of the CPU register that holds the encryption key in order to makethat register available for some other use. Therefore, the additional assem-bly instructions that the GCC extension module inserts into the final Modbusassembly file implement the protection technique without affecting the compu-tations of a protected Modbus program.
Assembly instructions are inserted at several points in a program. Forexample, the GCC extension module inserts in the .init section assemblyinstructions that call an interface to the kernel’s random number generatorthat provides the 32-bit key. These instructions read four bytes from the file/dev/urandom. The .init section is appropriate for this task because it usu-ally holds instructions for process initialization [40]. GCC also inserts assem-bly instructions in .init that issue the mmap() system call to allocate mappedmemory from the Linux kernel.
Other instructions are inserted to store keys at the correct memory locationsand to invoke mprotect() to designate these memory locations as read-only.Instructions that generate and store a key are also inserted in the process thatforks child processes; these instructions are positioned after the child processis forked but before its original instructions are executed.
During our experiments we considered all Modbus data items (includinginput registers and discrete inputs) as potentially hostile; consequently, theywere stored in memory as ciphertext. Just before Modbus instructions pro-cessed data items, their encrypted versions were copied to a mapped memoryregion, where they were decrypted in place. We refer to this portion of memoryas the “temporary storage area.” Note that the GCC extension module insertsinstructions in .init that issue a call to mmap() to allocate the mapped mem-ory used as the temporary storage area, and then issue a call to mprotect()
to designate the memory as non-executable.The GCC extension module thus generates additional assembly language in-
structions for every function that operates on potentially hostile data. Theseadditional instructions are interleaved with the assembly instructions that im-plement the original functions. The additional instructions copy the ciphertextdata to the temporary storage area and decrypt portions of the ciphertext asand when function instructions need them. Some of the original assembly in-structions are modified in order to obtain data from the temporary storage arearather than from the original locations. The GCC extension module also in-serts assembly instructions in the .fini section. These instructions, which areexecuted at process termination, issue a call to munmap() to remove previousmemory mappings.
Another technique for implementing defensive capabilities in a Modbus pro-gram is to instrument its source code. In FreeMODBUS, C instructions that

152 CRITICAL INFRASTRUCTURE PROTECTION II
operate on potentially hostile data are identified and extra C code for de-crypting ciphertext is introduced. Likewise, additional C code is included forgenerating keys and implementing the temporary storage area.
5.3 Performance Overhead
When analyzing the performance costs involved in enforcing logical bound-aries on potentially hostile data, we noticed that most of the overhead is dueto constant invocations of the mmap() and mprotect() system calls. However,these calls can be eliminated if special care is taken when storing keys. Usingmmap() and mprotect() calls to designate the temporary storage area as non-executable is reasonable only if they do not affect the real-time performance ofthe Modbus device being protected.
One question that arises relates to the feasibility of encrypting input dataat the kernel level. Since our technique already compiles a program and makesit pass the encryption key to a system call, the program could directly encryptdata returned from the system call. In other words, there is no need for thekernel to perform the initial encryption of input data.
Our motivation for performing input data encryption at the kernel level is toreduce the memory consumption incurred by the protection strategy. Systemcalls as implemented in most operating systems read input data and store themin internal buffers. Therefore, an encryption extension of a system call wouldencrypt input data in place so that it does not consume additional memory.If a process were to encrypt input data in the user domain, then it certainlywould not place it directly in the destination buffer. This is exactly whatour technique tries to avoid. Consequently, a protected process would have toallocate an additional buffer, place the input data there, encrypt it and copy theencrypted data to the original destination. If the process receiving input datafrom a system call were to encrypt the data itself, it would consume additionalmemory while introducing the overhead of executing extra instructions.
The computational overhead depends on the number of data items in Mod-bus device memory, the number of data items incorporated in Modbus requestframes in typical transactions, and the number of instructions that operateon input data. The instruction counter is a CPU performance equation vari-able [32] that is incremented by our protection technique. In fact, our techniquerequires additional instructions to be inserted in Modbus code. The numberof instructions that perform basic boundary enforcement operations such asgenerating, storing and deleting keys or creating and releasing the temporarystorage area is constant for all protected processes. The number of instruc-tions that transfer data to the temporary storage area and decrypt them theredepends on how often a Modbus protected process operates on ciphertext.
The number of clock cycles per instruction (CPI) and the clock cycle timedepend on the CPU architecture. Enforcing logical boundaries on potentiallyhostile data in a Modbus process has no affect on the pipeline CPI, but itcauses an overhead in the memory system CPI and contributes to the miss ratebecause it uses additional memory. The performance overhead introduced by

Bellettini & Rrushi 153
enforcing logical boundaries on potentially malicious data during the execu-tion of Modbus processes varies from 0.8% for transactions with typical framesthat request a few data items to 2% for transactions with full 253-byte protocoldata units. Furthermore, our protection technique does not rely on complemen-tary defensive techniques such as address space randomization or StackGuard.Consequently our technique avoids the performance penalties introduced byoperational security mechanisms.
6. Conclusions
Control data and pure data attacks can be countered by preserving inputdata as ciphertext in main memory and by instrumenting SCADA device codeto decrypt potentially malicious data before processing according to the princi-ple of least privilege. Our experiments demonstrate that the kernel-level streamencryption of input data using random keys preserves the logical boundary be-tween potentially malicious data and clean data in the address space of pro-cesses. This enforcement of logical boundaries causes attackers to lose theprecision with which they can corrupt control data and pure data. It alsoeliminates the execution of injected shellcode and the use of injected pure datawhile preserving the functionality of the protected processes. To the best of ourknowledge, the protection technique is the only one that is capable of combat-ing pure data attacks on C/C++ implementations of SCADA protocols such asModbus without requiring hardware modification. We hope that this work willstimulate efforts focused on defending against unknown and zero-day attacksthat rely on memory corruption.
References
[1] Aleph One, Smashing the stack for fun and profit, Phrack, vol. 7(49), 1996.
[2] S. Alexander, Defeating compiler-level buffer overflow protection, ;login:The USENIX Magazine, vol. 30(3), pp. 59–71, 2005.
[3] Anonymous, Once upon a free(), Phrack, vol. 10(57), 2001.
[4] A. Baratloo, N. Singh and T. Tsai, Transparent run-time defense againststack smashing attacks, Proceedings of the USENIX Annual TechnicalConference, 2000.
[5] A. Baratloo, T. Tsai and N. Singh, libsafe: Protecting critical elementsof stacks, White Paper, Avaya, Basking Ridge, New Jersey (pubs.research.avayalabs.com/pdfs/ALR-2001-019-whpaper.pdf), 1999.
[6] E. Barrantes, D. Ackley, T. Palmer, D. Stefanovic and D. Zovi, Random-ized instruction set emulation to disrupt binary code injection attacks,Proceedings of the Tenth ACM Conference on Computer and Communica-tions Security, pp. 281–289, 2003.
[7] C. Bellettini and J. Rrushi, SCADA protocol obfuscation: A proactive de-fense line in SCADA systems, presented at the SCADA Security ScientificSymposium, 2007.

154 CRITICAL INFRASTRUCTURE PROTECTION II
[8] C. Bellettini and J. Rrushi, Vulnerability analysis of SCADA protocol bi-naries through detection of memory access taintedness, Proceedings of theIEEE SMC Information Assurance and Security Workshop, pp. 341–348,2007.
[9] Bulba and Kil3r, Bypassing StackGuard and StackShield, Phrack, vol.10(56), 2000.
[10] S. Chen, K. Pattabiraman, Z. Kalbarczyk and R. Iyer, Formal reasoningof various categories of widely exploited security vulnerabilities by pointertaintedness semantics, in Security and Protection in Information Process-ing Systems, Y. Deswarte, F. Cuppens, S. Jajodia and L. Wang (Eds.),Kluwer, Boston, Massachusetts, pp. 83-100, 2004.
[11] S. Chen, J. Xu, N. Nakka, Z. Kalbarczyk and R. Iyer, Defeating memorycorruption attacks via pointer taintedness detection, Proceedings of theInternational Conference on Dependable Systems and Networks, pp. 378–387, 2005.
[12] S. Chen, J. Xu, E. Sezer, P. Gauriar and R. Iyer, Non-control data at-tacks are realistic threats, Proceedings of the Fourteenth USENIX SecuritySymposium, pp. 177–192, 2005.
[13] M. Conover and w00w00 Security Team, w00w00 on heap overflows(www.w00w00.org/files/articles/heaptut.txt), 1999.
[14] C. Cowan, M. Barringer, S. Beattie, G. Kroah-Hartman, M. Frantzen andJ. Lokier, FormatGuard: Automatic protection from printf format stringvulnerabilities, Proceedings of the Tenth USENIX Security Symposium, pp.191–200, 2001.
[15] C. Cowan, S. Beattie, J. Johansen and P. Wagle, PointGuard: Protectingpointers from buffer overflow vulnerabilities, Proceedings of the TwelfthUSENIX Security Symposium, pp. 91–104, 2003.
[16] C. Cowan, C. Pu, D. Maier, H. Hinton, P. Bakke, S. Beattie, A. Grier,P. Wagle and Q. Zhang, StackGuard: Automatic adaptive detection andprevention of buffer overflow attacks, Proceedings of the Seventh USENIXSecurity Symposium, pp. 63–78, 1998.
[17] I. Dobrovitski, Exploit for CVS double free() for Linux pserver, Neo-hapsis Archives (www.security-express.com/archives/fulldisclosure/2003-q1/0545.html), 2003.
[18] Gera and Riq, Advances in format string exploitation, Phrack, vol. 10(59),2002.
[19] iDefense Labs, LiveData Protocol Server heap overflow vulnerability, Ster-ling, Virginia (labs.idefense.com/intelligence/vulnerabilities/display.php?id=523), 2007.
[20] International Electrotechnical Commission, Telecontrol Equipment andSystems – Part 6-503: Telecontrol Protocols Compatible with ISO Stan-dards and ITU-T Recommendations – TASE.2 Services and Protocol, IECPublication 60870-6-503, Geneva, Switzerland, 2002.

Bellettini & Rrushi 155
[21] F. Iwanitz and J. Lange, OPC – Fundamentals, Implementation and Ap-plication, Huthig, Heidelberg, Germany, 2006.
[22] M. Kaempf, Vudo malloc tricks, Phrack, vol. 11(57), 2001.
[23] G. Kc, A. Keromytis and V. Prevelakis, Countering code injection attackswith instruction set randomization, Proceedings of the Tenth ACM Con-ference on Computer and Communications Security, pp. 272–280, 2003.
[24] Klog, Frame pointer overwriting, Phrack, vol. 9(55), 1999.
[25] A. Krennmair, ContraPolice: A libc extension for protecting applicationsfrom heap smashing attacks (synflood.at/papers/cp.pdf), 2003.
[26] Modbus IDA, MODBUS Application Protocol Specification v1.1a, NorthGrafton, Massachusetts (www.modbus.org/specs.php), 2004.
[27] L. Mora, OPC exposed: Part I, presented at the SCADA Security ScientificSymposium, 2007.
[28] Nergal, Advanced return-into-lib(c) exploits: PaX case study, Phrack,vol. 10(58), 2001.
[29] N. Nethercote and J. Seward, valgrind: A program supervision frame-work, Electronic Notes in Theoretical Computer Science, vol. 89(2), pp.44–66, 2003.
[30] NOP Ninjas, Format string technique (julianor.tripod.com/bc/NN-formats.txt), 2001.
[31] D. Novillo, From source to binary: The inner workings of GCC, Red HatMagazine (www.redhat.com/magazine/002dec04/features/gcc), December2004.
[32] D. Patterson and J. Hennessy, Computer Organization and Design, MorganKaufmann, San Francisco, California, 2007.
[33] PaX-Team, Documentation for the PaX Project (pax.grsecurity.net/docs),2008.
[34] J. Pincus and B. Baker, Mitigations for low-level coding vulnerabilities:Incomparability and limitations, Microsoft Corporation, Redmond, Wash-ington, 2004.
[35] T. Robbins, libformat, 2001.
[36] M. Roesch and C. Green, Snort Users Manual 2.3.3, Sourcefire (www.snort.org/docs/snort manual), 2006.
[37] scut and team teso, Exploiting format string vulnerabilities (julianor.tripod.com/bc/formatstring-1.2.pdf), 2001.
[38] S. Simmons, D. Edwards and N. Wilde, Securing control systems withmultilayer static mutation, presented at the Process Control Systems Fo-rum Annual Meeting (www.pcsforum.org/events/2007/atlanta/documents/west.pdf), 2007.
[39] A. Sovarel, D. Evans and N. Paul, Where’s the FEEB? The effectivenessof instruction set randomization, Proceedings of the Fourteenth USENIXSecurity Symposium, pp. 145–160, 2005.

156 CRITICAL INFRASTRUCTURE PROTECTION II
[40] TIS Committee, Tool Interface Standard (TIS) Executable and Link-ing Format (ELF) Specification (www.x86.org/ftp/manuals/tools/elf.pdf),1995.
[41] US-CERT, LiveData ICCP Server heap buffer overflow vulnerability,Vulnerability Note VU#190617, Washington, DC (www.kb.cert.org/vuls/id/190617), 2006.
[42] US-CERT, Takebishi Electric DeviceXPlorer OPC Server fails to properlyvalidate OPC server handles, Vulnerability note VU#926551, Washington,DC (www.kb.cert.org/vuls/id/926551), 2007.
[43] Vendicator, StackShield: A stack smashing technique protection tool forLinux (www.angelfire.com/sk/stackshield), 2000.
[44] C. Walter, FreeMODBUS: A Modbus ASCII/RTU and TCP implementa-tion (v1.3), FreeMODBUS, Vienna, Austria (freemodbus.berlios.de), 2007.

Chapter 12
MITIGATING ACCIDENTS IN OIL ANDGAS PRODUCTION FACILITIES
Stig Johnsen
Abstract Integrated operations are increasingly used in oil and gas productionfacilities to improve yields, reduce costs and maximize profits. Theyleverage information and communications technology (ICT) to facili-tate collaboration between experts at widely dispersed locations. Thispaper discusses the safety and security consequences of implementingintegrated operations for oil and gas production. It examines the in-creased accident risk arising from the tight coupling of complex ICTand SCADA systems, and proposes technological, organizational andhuman factors based strategies for mitigating the risk.
Keywords: Oil and gas production, integrated operations, accident mitigation
1. Introduction
This paper discusses the safety and security consequences of using integratedoperations for oil and gas production. Integrated operations leverage moderninformation and communications technology (ICT) in planning, organizing andperforming tasks. The goal is increased value creation through collaborationacross disciplines, corporations and geography [1].
The implementation of integrated operations is a large-scale change processinvolving technology, human resources and organizational factors. It is leadingto organizational changes and new work processes both onshore and offshore.Significant segments of operations are being moved to a geographically dis-tributed network where the actors are from a variety of organizations, reside indifferent locations and are interconnected by ICT systems. A key technologicalchallenge is to integrate ICT and SCADA systems so that real-time data canbe shared by the various actors and organizations.
This paper presents the results of a theoretical investigation and interviewswith key personnel from the Norwegian oil and gas industry. In particular,it focuses on the increased risk of “normal accidents” due to the complexity
Please use the following format when citing this chapter: Johnsen, S., 2008, in IFIP Intern ational Federation for Inform ation Processing, Volume 290; Critical Infrastructure Protection II, eds. Papa, M., Shenoi, S., (Boston: Springer), pp. 157–170.

158 CRITICAL INFRASTRUCTURE PROTECTION II
Figure 1. Interconnectivity and actors involved in integrated operations.
and tight coupling of ICT and SCADA systems. It also examines the theoryof normal accidents [10] and related work in resilience engineering and highreliability organizations.
Our hypothesis is that the safety and security of integrated operations canbe improved by focusing on resilience and performing mitigating actions thatreduce the probability of normal accidents. We also argue that it is importantto analyze, report and share incidents based on perspectives involving organi-zational, human and technical factors.
2. Integrated Operations
Integrated operations are attractive because they reduce costs, increase in-come and improve the yield from oil and gas fields. Several operations andmaintenance tasks are being outsourced and this trend is likely to increase.Integrated operations provide for better utilization of expertise, facilitating in-teractions between professionals at widely dispersed sites. The increased con-nectivity, geographical distances, outsourcing and use of suppliers lead to anetwork of actors, which by accident, misunderstanding or intention can causeunforeseen incidents or accidents that could result in significant economic loss,environmental damage and casualties.
Figure 1 shows the interconnectivity and principal actors involved in inte-grated operations. The trend has been to move from teams located near the op-erational environment to large-scale remote operations. In remote operations,

Johnsen 159
SCADA System
Common Data Network
Common Power Supply
Process Control Systems (PCSs)
Safety Instrumented Systems (SISs) Process Shutdown
(PSD)−
ICT Infrastructure
Emergency Shutdown (ESD)−
Fires and Gas Emissions (F&G)−
Production− Maintenance− Communications− Sensing− Surveillance−
Figure 2. Systems used in integrated operations.
most team members may not be located at the site of operations, eliminatingpersonal contact with other workers and the awareness of operating conditions(e.g., sound of mechanical equipment and smell of leaking gas) and environ-mental conditions (e.g., storm or calm). This situation poses great challengesbecause technical expertise and situational awareness must be shared to con-duct production operations and to avoid incidents and accidents. Thus, it canbe very difficult to maintain the safety and security of integrated operations.
The technologies used to manage production are changing from proprietarystand-alone systems to standardized IT systems and networks, which are oftenconnected to the Internet. The standardization and increased interconnectivityof production systems, SCADA systems and ICT infrastructures increases thelikelihood of undesirable incidents. Indeed, there has been an increase in thenumber of incidents related to SCADA systems, but the incidents are seldomreported. The incidents range from reduced production at oil and gas platformsto significant health, safety, security and environmental (HSSE) events. Aproduction stoppage of just one day at a Norwegian Continental Shelf facilitycan result in a loss of two to three million dollars.
Figure 2 presents the major technical systems used in integrated operations.They include the ICT infrastructure, process control systems (PCSs) and safetyinstrumented systems (SISs). The ICT infrastructure consists of networks andsupporting systems used for production (e.g., SAP), maintenance, communica-tions (telephones and videoconferencing systems) and sensing and surveillance(radar and CCTV). PCSs are used for production; they include sensors and pro-cess shutdown (PSD) systems. SISs are used for emergency shutdown (ESD)and to deal with fires and gas (F&G) emissions. PCSs and SISs are collectivelycalled “safety and automation systems” or SCADA systems.

160 CRITICAL INFRASTRUCTURE PROTECTION II
We define an undesirable incident as one that leads to a loss of availabilityor integrity in ICT or SCADA systems. The incident may reduce or disruptoil and gas production or may have a health, safety, security or environmentalimpact.
3. Accidents in High Reliability Environments
This section examines several theoretical studies in an attempt to identifythe challenges and the mitigating actions used to improve safety and security inintegrated operations. In Normal Accidents: Living with High Risk Technolo-gies [10], Perrow explored the effects of system interaction and coupling andtheir impact on safety. When the interactions between systems are complexand the couplings tight, Perrow argued that an accident could represent the“normal” outcome. This perspective is relevant because integrated operationslead to increased complexity and increased coupling. Perrow’s theory is basedon “What can go wrong,” but it is also useful to consider “What goes right.”
The study of high reliability organizations (HROs) is beneficial in this con-text. HROs are entities that have (or are required to have) very few incidentsand accidents. The three original HRO entities in the United States were theair traffic control system, nuclear power stations and U.S. Navy nuclear aircraftcarriers. U.S. Navy nuclear aircraft carrier operations are based on the assump-tion that errors have catastrophic consequences. In general, the carriers havemanaged their tasks well despite the technical complexity and the pressure toperform [12].
HROs may be defined (somewhat imprecisely) as “hazardous systems thatproduce near accident-free performance” [9]. It is difficult to use the avail-able data to support the claim of near accident-free performance in HROs.Nevertheless, it is recommended that the oil and gas industry strive for nearaccident-free performance in integrated operations.
Resilience is also an important concept in the context of integrated opera-tions. Resilience is “the intrinsic ability of a system to adjust its functioningprior to or following changes and disturbances, so that it can sustain operationseven after a major mishap or in the presence of continuous stress” [4].
Perrow defines two dimensions of normal accidents, “interaction” and “cou-pling.” Interactions between systems range from linear (expected or familiarsequences) to complex (unexpected or unfamiliar sequences). Complex systemsare characterized by proximity, common mode connections, interconnected sub-systems, limited substitution, feedback loops, multiple and interacting controls,indirect information and limited understanding. A goal for integrated opera-tions should be to design systems whose interactions are closer to linear thancomplex.
Coupling between systems ranges from loose to tight. Loosely coupled sys-tems have flexible performance standards and can handle failures, delays andchanges without destabilization. Tightly coupled systems have no buffering;consequently, what happens in one system directly impacts the other. Thesesystems cannot accommodate delays in processing. They are characterized by

Johnsen 161
invariant sequences and little to no slack with respect to supplies, equipmentand personnel. A goal in integrated operations should be to design systemsthat have tight coupling as opposed to loose coupling (e.g., by incorporatingbuffers and redundancies). Also, it is important to ensure that loosely coupledsystems do not drift to tightly coupled systems due to breakdowns in bufferingor loss of redundancy.
Empirical investigations of HROs have identified several key characteris-tics [9, 12]. HROs generally operate in environments with the potential forconflicting goals; however, when there is an absolute safety commitment fromthe top, conflicting goals are prioritized to ensure safety. HRO operations aredistributed, but there is a focus on shared beliefs and values among the dis-tributed teams; good communication among team members is critical. Publicattention focused on HROs ensures that the key actors are always alert. Also,there is a strong focus on proactive learning about accidents and dormantfaults. HROs generally have relatively abundant resources to deal with change;however, the organizations should be flexible and should handle unplanned ac-tivities in a safe manner. The organizations operate under the assumption thatno individual is perfect; organizational redundancy is maintained in key areas.Although a high degree of system complexity and tight coupling exist, there isextensive system insight and errors are not tolerated.
Ideals such as commitment to safety should be communicated from top man-agement when integrated operations are implemented. The distributed envi-ronment requires the establishment of common shared values and beliefs amongactors. The two issues are also an important part of a safety and security cul-ture [11]. Communication must be tailored to all the groups within and outsidethe organization.
Extensive system insight is a mitigating factor [10] as limited understandingoften contributes to incidents in complex systems. Proactive learning is anexcellent way to gain system insight and maintain readiness. Every undesirableincident should, therefore, be reported and analyzed to foster learning by thevarious actors. To avoid incidents and accidents, it is important to be ever alertand to avoid complacency. Errors should not be tolerated in tightly coupledsystems; this helps ensure a preoccupation with failures [15].
Reason [11] describes four components of a safety culture: a just culture,a reporting culture, a learning culture and a flexible culture. Together, thesefour components create an informed environment where managers and opera-tors have the most current knowledge about human, technical, organizationaland environmental factors that determine the safety of the system as a whole.A just culture fosters an atmosphere of trust where personnel are encouragedto provide essential safety-related information, and a clear line exists betweenacceptable and unacceptable performance. A reporting culture encourages per-sonnel to report their errors and near misses. A learning culture creates anenvironment where there is the willingness and competence to draw the rightconclusions, and the will to implement major reforms when needed. A flexible

162 CRITICAL INFRASTRUCTURE PROTECTION II
culture ensures that control passes to experts during a crisis and reverts to thetraditional bureaucratic hierarchy when the emergency has passed.
Drawing on studies of HROs, Johnsen, et al. [7] have developed the CheckITtool that attempts to measure and improve the safety and security culturethrough group-based discussions and actions. The idea is to improve the cul-ture from one of denial to a rule-based culture to the ideal proactive reportingculture. Cultural improvements can be achieved in many ways; two key ele-ments are management commitment and group discussions that nurture sharedbeliefs and values.
Weick [15] has identified five characteristics of HROs: (i) preoccupation withfailures, (ii) reluctance to simplify, (iii) sensitivity to operations, (iv) commit-ment to resilience, and (v) deference to expertise.
Preoccupation with Failures: Long periods of accident-free opera-tions often breed complacency, but it is during these periods that oneshould be preoccupied with potential failures. HROs scrutinize incidentsand search for possible errors because they may provide signals of pre-cursors to larger failures. Turner [14] notes that a major disaster is oftenpreceded by several serious incidents that are ignored due to complacency.Research in the area of safety also makes the same claim (see, e.g., [11]).An important aspect is a reporting culture where personnel report errors,near misses and unsafe acts. This culture is important in integrated op-erations because of the dependence on technical systems. Unfortunately,there is very limited reporting of ICT and SCADA incidents by the oiland gas industry [5]; this may increase the risk to integrated operations.
Reluctance to Simplify: Simplification increases the likelihood of sur-prises because key details are overlooked or ignored. It is important toobtain accurate information and create a mental model that is completeand nuanced. In HROs, redundancy in personnel and systems are treatedas vital for collecting and interpreting information that is necessary toavert disasters. In a complex environment such as integrated operations,it is important to establish a redundant set of communications systems.
Sensitivity to Operations: In HROs, the entire workforce strives tomaintain situational awareness, to understand what can go wrong andhow to recover when things go wrong. HRO personnel attempt to main-tain a perspective of the entire situation, not just the segments for whichthey are responsible. In integrated operations, situational awareness mustbe shared among all the relevant actors in the virtual organization andshould be leveraged when incidents occur.
Commitment to Resilience: HROs anticipate errors and are not dis-abled by them because they can quickly mobilize themselves to deal witherrors. This should be a goal for integrated operations that is generallyachieved by extensive training using realistic scenarios.

Johnsen 163
Deference to Expertise: In critical situations, decision-making tasksoften migrate to personnel with the most expertise, even if they are lowin the organizational hierarchy. Learning activities must be supportedthroughout the organization. During an incident, decision-making powershould be transferred to personnel who are the most knowledgeable.
Decisions and their premises must be evaluated and explored in a learn-ing environment where the guiding variables are questioned and adjusted [2].Second-order learning [2] should be explored when implementing integratedoperations. This is because experience must be built continuously when newtechnology is implemented and the guiding variables influencing the organiza-tion should be continuously monitored and adjusted.
Resilience [4] requires that an organization be constantly watchful and readyto respond. Also, the organization should continuously update its knowledge,competence and resources by learning from successes as well as failures. Severalissues should be considered in order to design for resilience.
Looking Ahead: This involves anticipation (knowing what to expect)as well as looking for threats and having a constant sense of unease.
Looking Out: This involves constant attention to detail, looking atperformance indicators, having the time to think and perform actions.
Responding: This involves effective response, maintaining plans, pro-cedures, resources, readiness and flexibility.
Learning: This involves knowing what has happened, having report-ing schemes and accident models, and focusing on communication andfeedback.
The studies we have examined provide a foundation for discussing the safetyand security of integrated operations. The principles discerned from our studyare listed below. Note that the principles overlap in many respects and, thus,appear to validate each other.
Commitment to safety and security must come from the top; safety andsecurity are goals.
Focus on communication; establishment of shared beliefs; reluctance tosimplify.
Focus on proactive learning; preoccupation with failures; creation of areporting culture.
Commitment to resilience; importance of being alert and responding ap-propriately; flexible organizations.
Extensive system insight; sensitivity to operations; focus on interactionsranging from simple to complex.

164 CRITICAL INFRASTRUCTURE PROTECTION II
No complacency related to coupling; avoidance of drift from loose couplingto tight coupling; implementation of necessary buffers and barriers; nontolerance of errors.
It is difficult to prove that these principles lead to error-free operations.Nevertheless, it is clear that in practically every incident or accident, one ormore of the principles mentioned were violated.
4. Accidents and Integrated Operations
The consequences of an accident in the oil and gas industry can be veryserious. The 1988 fire at the Piper Alpha production platform on the NorthSea, which was caused by an oil and gas leak, resulted in the loss of 169 lives.
Production processes involved in integrated operations are complex andtightly coupled. Offshore oil and gas production, in particular, is highly com-plex. The complexity is increased by the presence of interconnected systemswith unintended feedback loops and multiple, interacting controls.
Oil and gas production processes are also tightly coupled. They are based oninvariant sequences, delays are unacceptable, and there is often only one methodto achieve the goal. However, it is possible to shutdown the production processusing at least two independent systems, the process shutdown (PSD) systemthat completely shuts down production, and the emergency shutdown (ESD)system.
Three main subsystems are used to manage production, the ICT infrastruc-ture, PCSs and SISs. Our interviews with operators and suppliers have revealedthat ICT systems, PCSs and SISs often use common networks and power sup-plies. PCSs and SISs also share the same operator interfaces on workstations(HMIs). Moreover, when PCSs and SISs are delivered by the same supplier,the systems have many common elements and are very tightly integrated.
PCSs and SISs are interconnected with ICT systems in order to obtain real-time production data and to perform control actions. It is often the case thatfailures in ICT components disrupt PCSs. In one incident on a North Sea plat-form, a malfunctioning computer system flooded a network with error packets,which caused the PCS to crash [5]. In fact, according to data from CERN [6],unanticipated ICT traffic could cause as much as 30% of SCADA network com-ponents to malfunction. The interconnections between ICT systems, PCSs andSISs are seldom tested or certified. A dangerous situation can arise if an SISis rendered non-operational due to erroneous ICT traffic. This may cause theESD to be locked, leading to a serious accident.
The scenario we used to explore what could happen in a production systemis based on a real incident where a supplier connected a laptop infected witha virus to a production network. We applied the STEP methodology [3] todescribe this scenario:
Actors: The actors involved in the incident are identified. These actorsare drawn under each other on the left-hand side of the STEP diagram(Figure 3).
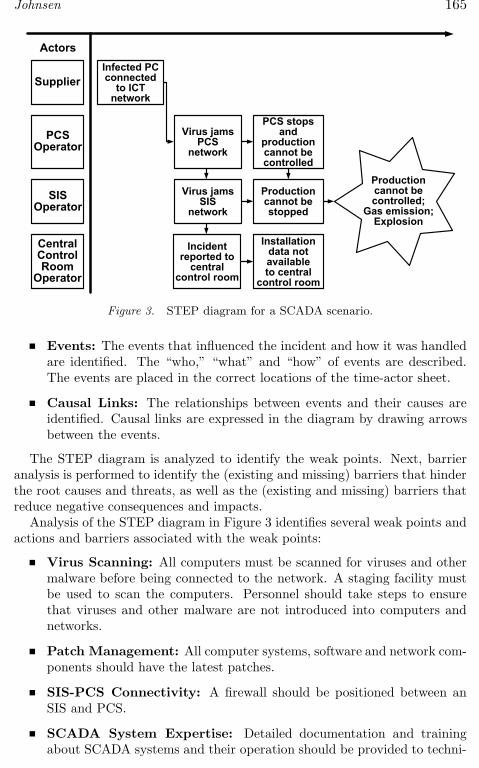
Johnsen 165
Actors
Supplier
PCSOperator
SISOperator
CentralControlRoom
Operator
Production cannot be controlled;
Gas emission; Explosion
Virus jamsPCS
network
Virus jamsSIS
network
Incidentreported to
central control room
PCS stopsand
productioncannot be controlled
Productioncannot bestopped
Installation data not available to central
control room
Infected PCconnected
to ICTnetwork
Figure 3. STEP diagram for a SCADA scenario.
Events: The events that influenced the incident and how it was handledare identified. The “who,” “what” and “how” of events are described.The events are placed in the correct locations of the time-actor sheet.
Causal Links: The relationships between events and their causes areidentified. Causal links are expressed in the diagram by drawing arrowsbetween the events.
The STEP diagram is analyzed to identify the weak points. Next, barrieranalysis is performed to identify the (existing and missing) barriers that hinderthe root causes and threats, as well as the (existing and missing) barriers thatreduce negative consequences and impacts.
Analysis of the STEP diagram in Figure 3 identifies several weak points andactions and barriers associated with the weak points:
Virus Scanning: All computers must be scanned for viruses and othermalware before being connected to the network. A staging facility mustbe used to scan the computers. Personnel should take steps to ensurethat viruses and other malware are not introduced into computers andnetworks.
Patch Management: All computer systems, software and network com-ponents should have the latest patches.
SIS-PCS Connectivity: A firewall should be positioned between anSIS and PCS.
SCADA System Expertise: Detailed documentation and trainingabout SCADA systems and their operation should be provided to techni-

166 CRITICAL INFRASTRUCTURE PROTECTION II
cal personnel to ensure that they can manage normal operations as wellas crisis situations.
Integrated operations require a variety of systems to be interconnected andlarge amounts of information to be shared. ICT and SCADA systems areintegrated, and some subsystems have common mode connections. In general,the implementation of integrated operations renders the overall system morecomplex than linear.
The couplings between ICT and SCADA systems are such that delays areundesirable, mainly because real-time data is required to manage production.Typically, there are at least two independent ways of shutting down production(PSD and ESD).
The integration of ICT and SCADA systems results in the overall systembecoming more complex and more tightly coupled, which increases the prob-ability of normal accidents. This probability can be lowered by reducing thecomplexity of system interactions and by reducing tight coupling.
The following actions can be taken to reduce system complexity:
Common Mode Connections: Common mode connections should bereduced by separating networks, system components and power supplies.The separation of PCSs and SISs should be mandatory, but this is seldomenforced and the status of common faults is rarely explored.
Interconnected Systems: Systems have to be interconnected in or-der to share information, but the interconnections should be simplifiedto the extent possible. For example, “one-way” connections could be es-tablished for data exchange. Also, data exported from SCADA systemsto ICT components should be designated as read-only to enhance secu-rity. Furthermore, changes to SCADA data should be implemented usingredundant systems with human intervention and/or supervision.
System Understanding: It is important to establish a good under-standing of the systems used in integrated operations. ICT and SCADAsystems should undergo comprehensive testing and evaluation under nor-mal and abnormal scenarios, including virus infections and denial-of-service attacks. Information collected about systems and incidents shouldbe disseminated to improve understanding and awareness.
The following actions can be taken to reduce tight coupling between systems:
Processing Delays: The need for real-time data should be criticallyevaluated. Processing delays should be introduced, if possible.
Equipment and Personnel: The introduction of slack with regard toequipment and personnel should be explored. Additional resources maybe needed to provide slack.
Redundancy: Redundancies may be incorporated (e.g., independentshutdown systems) to reduce tight coupling. It is important that theredundant systems are tested regularly.
Johnsen 167
5. Interview Results and Mitigating Actions
We interviewed personnel from several large oil and gas companies in Nor-way to identify the key issues relating undesirable incidents in ICT and SCADAsystems used in production. Several incidents involving virus and worm infec-tions occurred annually. However, these incidents mainly affected ICT systems.In installations implementing integrated operations, there was at most one in-cident each year that impacted offshore SCADA networks.
In practically every installation, ICT and SCADA professionals belong todifferent parts of the overall organization; they have different educational back-grounds and apply different standards and methods. For example, ICT person-nel adopt standards such as ISO/IEC 27002 (Information Technology – Codeof Practice for Information Security Management (formerly ISO/IEC 17799)).On the other hand, SCADA personnel comply with the IEC 61508 (FunctionalSafety of Electrical/Electronic/Programmable Electronic Safety-Related Sys-tems) and ISA SP99 (Manufacturing and Control Systems Security) standards.
Our interviews with industry experts have identified several key safety andsecurity issues along with mitigating actions:
Incident Reporting: Incidents are seldom reported or analyzed. Theredoes not appear to be an open reporting culture; information about unde-sirable accidents is not shared with and between organizations. Clearly,incidents should be analyzed thoroughly and disseminated using a stan-dardized reporting scheme that documents all the major issues. Keyactors such as the control room operators should be alerted to incidentsas they happen. Proactive scenario analyses, as illustrated by the STEPdiagram in Figure 3, should be explored. These analyses should be usedto raise incident awareness and develop mitigation strategies.
Technical, Organizational and Human Factors Issues: Unwantedincidents are regarded as technical issues; organizational and human fac-tors issues are rarely considered. ICT and SCADA professionals adoptdifferent standards and practices. Clear responsibility, unambiguous workprocedures and common situational awareness are important when inci-dents develop into dangerous situations. Common situational awarenessmust be maintained under normal operations as well as during incidents.It is important to focus on organizational and human factors issues suchas common goals, beliefs and values. Incidents should be analyzed andreported using a standardized scheme that documents technical, organi-zational and human factors issues.
Probability of Normal Accidents: Implementing integrated oper-ations increases the probability of normal accidents. ICT and SCADAhave different architectures, and SCADA systems are vulnerable to unan-ticipated ICT traffic. The integration of ICT and SCADA systems resultsin shared networks, power supplies and operator interfaces for ICT, PCSand SIS systems, leading to common cause failures. Integrated systems

168 CRITICAL INFRASTRUCTURE PROTECTION II
are rarely tested and certified for independence and resilience. It is im-portant to perform thorough testing and certification of all systems, andto ensure that all normal accident scenarios are reported and analyzed.
Based on our analysis of the theory and interactions with industry experts,we have identified several barriers that should be explored during accidentanalysis. The following questions should be considered as a starting pointwhen identifying the barriers in an organization:
Organizational Barriers: Is there a management commitment to safetyand security from the top of the organization? Has an open reportingculture been established among operators and suppliers? Has a risk as-sessment been performed for process control, safety and ICT systems andnetworks? Has a practice been established for remote access that ensureshuman supervision from the central control room? Has an incident han-dling team been established and has a short, precise incident handlingplan been established? Is there clear responsibility for ICT/SCADA net-work operations? Are there procedures in place for reporting security andsafety incidents? Has a scenario analysis been performed between the op-erator and suppliers? Have all incidents been documented and analyzedby teams with the relevant actors?
Technical Barriers: Have proactive indicators been established to in-dicate the level of attacks? Have the interconnections between ICT andSCADA systems been tested and certified, and has the SCADA networkbeen tested and certified for ICT traffic? Have firewalls been implementedbased on a best practice scheme and are firewall logs analyzed systemat-ically? Do the process control, safety and ICT systems have adequate,updated and active protection against malware?
Human Factors Barriers: Have all the involved actors been informedabout relevant incidents and have there been open discussions about in-cidents and vulnerabilities in the various systems? Has an analysis ofsafety culture (knowledge, awareness and actions) been performed amongthe relevant actors? Have suppliers and other operators been educatedabout information security requirements, do they know how incidentsshould be handled and do they know about acceptable ICT system useand operations?
6. Conclusions
The implementation of integrated operations in oil and gas production facili-ties in the Norwegian Continental Shelf has contributed to increased complexityand tight coupling between ICT and SCADA systems. Our research has identi-fied three areas of concern: the increased probability of normal accidents due tothe integration of ICT and SCADA systems, the inadequate reporting and anal-ysis of ICT and SCADA incidents, and the designation of undesirable incidents
Johnsen 169
as technical issues that are rarely analyzed in the context of organizational andhuman factors issues.
Normal accidents can be mitigated by building resilient systems and cre-ating high reliability organizations. This can be accomplished by developingdefensive strategies and performing barrier analyses that consider human fac-tors, organizational factors and technical solutions. Incident reporting is alsocritical; strong efforts should be undertaken to document, analyze and shareinformation about incidents among the various actors.
References
[1] K. Andersen, IO in StatoilHydro – Drilling and well, presented at theForum for Human Factors in Control (www.criop.sintef.no/Participants%20and%20projects/0–HFC%20-%20M%C3%B8tereferat%20april%2008.pdf), 2008.
[2] C. Argyris and D. Schon, Organizational Learning: A Theory of ActionPerspective, Addison-Wesley, Reading, Massachusetts, 1978.
[3] K. Hendrick and L. Benner, Investigating Accidents with STEP, MarcelDekker, New York, 1986.
[4] E. Hollnagel, D. Woods and N. Leveson, Resilience Engineering, Ashgate,Aldershot, United Kingdom, 2006.
[5] M. Jaatun, S. Johnsen, M. Line, O. Longva, I. Tondel, E. Albrechtsen andI. Waero, Incident Response Management in the Oil and Gas Industry,SINTEF Report A4086, SINTEF, Trondheim, Norway (www.sintef.no/upload/10977/20071212 IRMA Rapport.pdf), 2007.
[6] S. Johnsen, R. Ask and R. Roisli, Reducing risk in oil and gas productionoperations, in Critical Infrastructure Protection, E. Goetz and S. Shenoi(Eds.), Springer, Boston, Massachusetts, pp. 83–95, 2007.
[7] S. Johnsen, C. Hansen, M. Line, Y. Nordby, E. Rich and Y. Qian, CheckIT– A program to measure and improve information security and safety cul-ture, International Journal of Performability Engineering, vol. 3(1), pp.174–186, 2007.
[8] S. Johnsen, M. Lundteigen, E. Albrechtsen and T. Grotan, Trusler ogmuligheter knyttet til eDrift, SINTEF Report A04433, SINTEF, Trond-heim, Norway (www.sintef.no/upload/Teknologi og samfunn/Sikkerhet%20og%20p%C3%A5litelighet/Rapporter/STF38%20A04433.pdf), 2005.
[9] T. LaPorte and P. Consolini, Working in practice but not in theory: The-oretical challenges of “high-reliability organizations,” Journal of PublicAdministration Research and Theory, vol. 1(1), pp. 19–48, 1991.
[10] C. Perrow, Normal Accidents: Living with High Risk Technologies, Prince-ton University Press, Princeton, New Jersey, 1999.
[11] J. Reason, Managing the Risks of Organizational Accidents, Ashgate,Aldershot, United Kingdom, 1997.

170 CRITICAL INFRASTRUCTURE PROTECTION II
[12] K. Roberts, New challenges in organizational research: High reliability or-ganizations, Organization and Environment, vol. 3(2), pp. 111–125, 1989.
[13] K. Stouffer, J. Falco and K. Scarfone, Guide to Industrial Control Sys-tems (ICS) Security, NIST Special Publication 800-82, National Instituteof Standards and Technology, Gaithersburg, Maryland, 2007.
[14] B. Turner and N. Pidgeon, Man-Made Disasters, Butterworth-Heinemann,Oxford, United Kingdom, 1997.
[15] K. Weick and K. Sutcliffe, Managing the Unexpected: Assuring High Per-formance in an Age of Complexity, Jossey-Bass, San Francisco, California,2001.

Chapter 13
AUTOMATED ASSESSMENT OFCOMPLIANCE WITH SECURITYBEST PRACTICES
Zahid Anwar and Roy Campbell
Abstract Several standards and best practices have been proposed for critical in-frastructure protection. However, the scale and complexity of criticalinfrastructure assets renders manual compliance checking difficult, if notimpossible. This paper focuses on the automated assessment of secu-rity compliance of electrical power grid assets. A security model basedon predicate calculus is used to express infrastructure elements (e.g.,devices, services, protocols, access control implementations) as “facts”and security standards and best practices as “rules” that specify con-straints on the facts. A tool chain is applied to automatically generatethe security model from specifications and to check compliance withstandards and best practices. The tool chain also supports the visu-alization of network topology and security assessment results to revealpossible points of attack.
Keywords: Security best practices, compliance assessment, first order logic
1. Introduction
The Industrial Security Incident Database (ISID) [4] reveals an alarmingnumber of attacks on cyber infrastructures, more than half of them originatingfrom external sites. The electrical power grid is especially vulnerable to attack.An experimental cyber attack on an electrical power plant generator madeheadlines in September 2007 [14]. While the details of the attack have not beenreleased, it is clear that researchers were able to hack into the SCADA networkand change its configuration to cause significant damage to the generator.
To address security problems, the Federal Energy Regulatory Commission(FERC) has approved eight cyber security and critical infrastructure protectionstandards proposed by NERC [9, 20]. However, there is considerable flexibility
Please use the following format when citing this chapter: Anwar, Z. and Campbell, R., 2008, in IFIP International Fede ration for Information Pr ocessing, Volume 290; Critical Infrastructure Protection II, eds. Papa, M., Shenoi, S., (Boston: Springer), pp. 173–187.

174 CRITICAL INFRASTRUCTURE PROTECTION II
with regard to their implementation. For example, CIP-005 Requirement 4(R4) states:
“The responsible entity shall perform a cyber vulnerability assessment ofthe electronic access points to the electronic security perimeter(s) at leastannually.”
Obviously, there are several ways of securing the electronic perimeter. Two ofthe most popular techniques are firewall deployment and access control.
Similarly, CIP-009 Requirement 2 (R2) discusses the security implicationsof operating procedures and disaster recovery procedures, their relative order-ings, timeframes and requirements. While the NERC standards do not discussimplementation, several entities have published guidelines for implementing se-curity best practices for SCADA systems [3, 7, 11, 15, 17]. Most of theseguidelines are informal English descriptions of SCADA infrastructure configu-rations, firewall rules, allowable services and security protocols. Our strategyis to formalize these best practices and to use them in automated conformancechecking of SCADA network configurations.
We use predicate logic to model SCADA and enterprise networks along withtheir security properties. The model creates a comprehensive network depen-dency graph containing information about physical connections (e.g., links)and logical connections (e.g., service dependencies). This information is auto-matically obtained from SCADA specification languages such as the CommonInformation Model (CIM) [8]. Best practices modeled as rules defined in termsof facts are used to determine whether or not the dependency graph satisfiesthe security constraints.
2. Related Work
A survey of SCADA security implementations reveals a lack of authentica-tion mechanisms, limited patch protection and uncontrolled Internet connec-tions [13]. This situation exposes SCADA systems to a variety of exploits,including simple SQL injection attacks. However, even when the vulnerabili-ties of individual components are known, no adequate tools are available forreasoning about the overall security of a system.
The SINTEF CORAS Project [19] has developed a risk analysis method-ology that models threats as unwanted system features. The system and itsassociated threats are modeled using Unified Modeling Language (UML) di-agrams that support security risk assessments. An XML schema is availablefor communicating risk and vulnerability assessment data in a standardizedformat.
Masera and Nai Fovino [12] have proposed a service-oriented architecturefor conducting security assessments. A service-oriented description of a system(where components and subsystems are interconnected by “service chains”) isused to identify attacks and reason about the propagation of faults and failures.Our model is not limited to checking for particular attacks; instead, it allowsfor conformance checking against security standards and best practices thatdefend against a variety of attacks simultaneously.

Anwar & Campbell 175
Chandia and colleagues [5] have proposed a standards-based security ser-vices suite that provides security functionality at different levels of the networkinfrastructure. Their approach involves message monitoring, protocol-basedsolutions, tunneling services, middleware components and cryptographic keymanagement, along with a network forensic system for analyzing attacks. Ourapproach is different in that it involves the static analysis of security confor-mance of implementations instead of implementing security solutions.
While the use of attack graph models to identify vulnerabilities in large-scalenetworks is fairly mature, little work has focused on the automated generationof these models, especially for cyber infrastructures. Also, few researchers haveinvestigated the use of dependency graphs for vulnerability assessment andautomated checking against security standards and best practices.
3. Security Model
Our security model captures the static aspects of SCADA systems, includ-ing network topology, devices, services, connectivity and security properties.A SCADA system is expressed as a dependency graph G and a set of rulesexpressing security standards and best practices.
3.1 Dependency Graph
A dependency graph G is defined as a tuple (D, E, S, V, ST , DT , Sp) whereD is the set of devices, E ⊆ D × D is the set of edges between two physicallyconnected devices, S is the set of services, V is the set of vulnerabilities, ST
is the set of service types, DT is the set of device types and Sp is the set ofsecurity protocols.
The following functions provide attribute mappings to the various devicesand dependencies:
devof : S → D maps a service to the device that hosts it.
hostedsvs : D → P{S} s.t. devof (S ) = D maps a device to the services ithosts.
defsvs : D → S maps a device to its default service.
depdtsvs : S → P{S} maps a service to the set of services on which itdepends.
trusteddevs : D → P{D} maps a device to a set of trusted devices.
secprots : S → P{Sp} maps a service to a set of security protocols it uses.
typeofsvs : S → stype where stype ∈ ST maps a service to its type.
typeofdvs : D → dtype where dtype ∈ DT maps a device to its type.
knownvuls : stype → P{V } maps a service to its set of known vulnerabil-ities.
priv : S → privlvl where privlvl ∈ {none ≤ user ≤ root} maps a serviceto its privilege level.
exploitability : V → likelihood where likelihood ∈ R (0 ≤ n ≤ 1 ) maps avulnerability to the likelihood it will be exploited.

176 CRITICAL INFRASTRUCTURE PROTECTION II
The dependency graph G is modeled as facts in first order predicate logic.
3.2 Security Standards and Best Practices
Security standards and best practices are expressed as rules whose terms areconstraints on G.
Intranet Services. Services between a process control network (PCN), anenterprise network (EN) and the Internet should be allowed strictly on a needbasis. IAONA’s template for protocol access in industrial environments statesthat incoming DNS, HTTP, FTP, telnet and SMTP traffic to a PCN should bediscouraged unless absolutely required [10].
We express this best practice as:
∀d1 , ∀d2 ∈ D [typeof (d1 ,EN ) ∧ typeof (d2 ,PCN ) ∧∀s1 , ∀s2 ∈ S [devof (s1 , d1 ) ∧ devof (s2 , d2 ) ∧ depends(s1 , s2 )⇒ s2 6∈ {dns , http, ftp, telnet , smtp}]]
with the auxiliary functions:
typeof : ∀d ∈ D , ∀x ∈ DT (typeofdvs(d) = x ) ⇒ typeof (d , x )
devof : ∀s ∈ S , ∀d ∈ D(devof (s) == d) ⇒ devof (s , d)
depends : ∀d1 , ∀d2 ∈ D , ∃s1 , ∃s2 ∈ S [devof (s1 , d1 ) ∧devof (s2 , d2 ) ∧ depdtsvs(s1 , s2 ) ⇒ depends(d1 , d2 )].
The rule checks if a service dependency exists from an EN device to a PCNdevice, where both devices are in a substation. If a dependency exists, then itshould not be of the type DNS, HTTP, FTP, telnet or SMTP.
Access Control Implementation. The American Gas Association’sdocument on cryptographic protection of SCADA communications [1] statesthat in a proper access control implementation, a service should provide anauthentication scheme and also use communication protocols that guaranteeconfidentiality and integrity.
We express this best practice as:
∀dalice , ∀di , ∀dj , ∀dbob ∈ D [depends(dalice , dbob) ∧di ∈ path(dalice , dbob) ∧ dj ∈ path(dalice , dbob) ∧ (di , dj ) ∈ E⇒ (secprots(defsvs(di )) ∩ secprots(defsvs(dj ))) 6= ∅ ∧(keys(dalice) ∩ keys(dbob)) 6= ∅]
with the auxiliary functions:
path : path(d1 , dk ) = d1 , d2 , ....dk−1 , dk s.t. ∀1≤i<k−1 (di , di+1 ∈ E )
keys : D → P{K}
where path is a mapping from a pair of devices to the set of paths betweenthem and keys is a mapping from a device to the set of pre-shared keys it haswith other devices.

Anwar & Campbell 177
Table 1. Firewall architectures.
Type (Rating) Description
Dual-Homed Server(1)
This design installs two network interface cards on devicesrequiring access to both networks, which violates the prin-ciple of no direct Internet access from the PCN. This con-figuration was severely affected by the Slammer worm inJanuary 2003.
Dual-Homed HostFirewall (2)
The host-based firewall on a dual-homed machine preventstraffic from traversing the PCN-EN boundary. However,it offers low granularity with multiple shared servers whenremote PCN management is required.
Packet FilteringRouter (2)
This design uses a Layer 3 switch with basic filters to blockunwanted traffic. It offers limited protection because it isnot stateful and assumes that the EN is highly secure.
Two-Port Dedi-cated Firewall (3)
This aggressively configured stateful firewall provides con-siderable security. The shared device is positioned in thePCN or EN and the firewall is configured with the appro-priate rules.
Two-Zone Firewall-Based DMZ (4)
This design positions shared devices in their own DMZs,which eliminates direct communication between the plantfloor and the EN. Multiple DMZs ensure that only desiredtraffic is forwarded between zones. However, compromisedentities in the DMZs may be used as staging points for at-tacks against PCN devices.
Firewall andVLAN Design (4.5)
This design partitions PCNs into subnets so that devicesthat require little or no communication are placed in sepa-rate networks and only communicate via Layer 3 switches.
The best practice predicate checks if a service si implements access control,confidentiality and integrity correctly. It does this by checking if all its depen-dent services have a common shared-key mechanism. The helper function pathchecks if the default service on each pair of devices along the path from thequeried service to the dependent services share common security properties.Function keys checks if all the dependent services use a pre-shared key.
Firewall Deployment. NISCC’s document on SCADA firewall deploy-ment [3] states that traffic from an enterprise LAN must be separated from anindustrial control LAN by a firewall. Table 1 presents five firewall architecturesand their security ratings. We express the firewall best practices as:

178 CRITICAL INFRASTRUCTURE PROTECTION II
∀de , ∀dp , ∀ds ∈ D [typeof (de ,EN ) ∧ typeof (dp ,PCN ) ∧depends(de , ds) ∧ depends(dp , ds) ∧ (ds ∈ path(de , dp)) ∧∃sf ∈ S [devof (sf , ds) ∧ typeof (sf ,firewall) ⇒ dualhomedfirewalled ]]
∀de , ∀dp , ∀ds ∈ D [typeof (de ,EN ) ∧ typeof (dp ,PCN ) ∧depends(de , ds) ∧ depends(dp , ds) ∧∃df1 , ∃df2 , ∃df3 ∈ D [(df1 ∈ path(de , ds)) ∧ (df2 ∈ path(dp , ds)) ∧(df3 ∈ path(de , dp)) ∧ typeof (df1 ,firewall) ∧ typeof (df2 ,firewall) ∧typeof (df3 ,firewall) ⇒ dmz
with the auxiliary predicate:
typeof : ∀s ∈ S , ∀x ∈ ST (typeofsvs(s) = x ) ⇒ typeof (s , x ).
This predicate identifies the shared network devices (e.g., historians, aggrega-tors and access points). Servers accessed by dependent services running ondevices in the PCN and EN are characterized as shared. The proper placementof these devices with respect to firewalls determines the architecture to be used.The first predicate states that if all the paths between the two dependent PCNand EN devices pass through the shared device and the shared device is run-ning a personal firewall service, then a dual-homed host firewall with a securityrating of 2 should be used. The second predicate checks if all possible pathsbetween PCN and ECN devices dp and de, dp and the shared device ds, andde and ds pass through firewalls, in which case, the shared device should beplaced in a isolated DMZ with a security rating of 4. Predicates for the otherfour firewall architectures are specified along the same lines.
4. Tool Chain Architecture and Implementation
This section discusses the architecture and implementation of the securityassessment tool chain (Figure 1).
4.1 Parsing Specification Files
The dependency graph of the SCADA network is generated from annotatedspecifications written in CIM [8] with the help of a parser tool and stored ina Prolog database. CIM is an object-oriented cyber infrastructure modelinglanguage developed by EPRI for representing objects encountered in electricutilities. The objects are represented as classes that have attributes and rela-tionships (with other classes). The CIM RDF schema, which is documented asIEC Standard 61970-501, is self-describing because it is based on XML.
CIM RDF classes are mapped to entities in our security model. Figure 2shows the XML description and the Prolog version of an actuator for a discon-nect switch (DS3). The XML attributes provide detailed information aboutswitch functions and the SCADA elements that control it.
The parser begins by identifying the principal entities such as devices, con-nections and services, and populates their attributes based on the proper-ties and relationships of CIM objects. Some attributes (e.g., inter-service
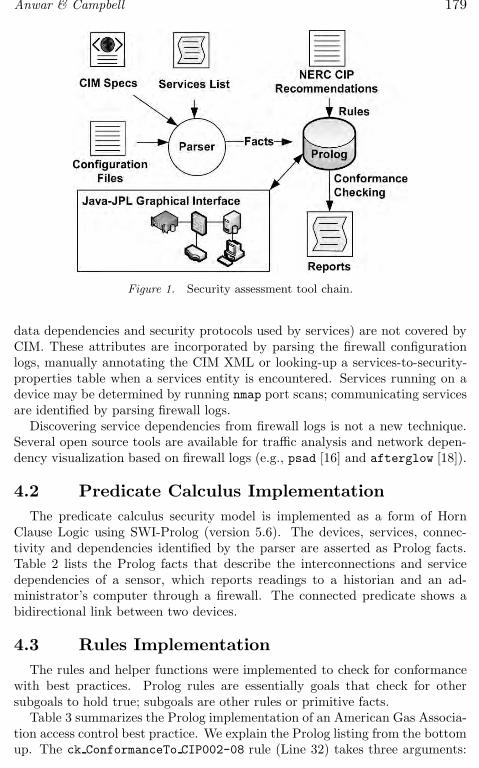
Anwar & Campbell 179
Figure 1. Security assessment tool chain.
data dependencies and security protocols used by services) are not covered byCIM. These attributes are incorporated by parsing the firewall configurationlogs, manually annotating the CIM XML or looking-up a services-to-security-properties table when a services entity is encountered. Services running on adevice may be determined by running nmap port scans; communicating servicesare identified by parsing firewall logs.
Discovering service dependencies from firewall logs is not a new technique.Several open source tools are available for traffic analysis and network depen-dency visualization based on firewall logs (e.g., psad [16] and afterglow [18]).
4.2 Predicate Calculus Implementation
The predicate calculus security model is implemented as a form of HornClause Logic using SWI-Prolog (version 5.6). The devices, services, connec-tivity and dependencies identified by the parser are asserted as Prolog facts.Table 2 lists the Prolog facts that describe the interconnections and servicedependencies of a sensor, which reports readings to a historian and an ad-ministrator’s computer through a firewall. The connected predicate shows abidirectional link between two devices.
4.3 Rules Implementation
The rules and helper functions were implemented to check for conformancewith best practices. Prolog rules are essentially goals that check for othersubgoals to hold true; subgoals are other rules or primitive facts.
Table 3 summarizes the Prolog implementation of an American Gas Associa-tion access control best practice. We explain the Prolog listing from the bottomup. The ck ConformanceTo CIP002-08 rule (Line 32) takes three arguments:

180 CRITICAL INFRASTRUCTURE PROTECTION II
CIM XML Specification
<!-- Describes our Substation Architecture -->
<SubstationArchitecture>
<class name="CIM_LogicalSwitch"
Superclass="CIM_LogicalDevice">
<cim:CIM_LogicalSwitch ID="ActDS3"
cim:type="DisconnectSwitch" cim:State="Closed"
cim:PowerSystemResourceName=
"Disconnect Switch No 3 Actuator"
cim:Manufacturer="General Electric"
cim:Controllerforresource="#DS3">
<class name="CIM_SerialLink" Superclass="CIM_Link">
<cim:CIM_SerialLink ID="SlinkActDS3" cim:source="PLC2"
cim:dest="ActDS3"/> </class>
<class name="CIM_Firmware" Superclass="CIM_Service">
<cim:CIM_Firmware ID="F.wareActDS3"
cim:ver="1.0" cim:type="ModbusSlave"
cim:PowerSystemResourceName=
"Actuator Service for ActDS3"
cim:secprops="TLS" cim:dependsupon="PLC2Master"
cim:port="502"/> </class>
</cim:CIM_LogicalSwitch>
</class>
.
.
</SubstationArchitecture>
Prolog Primitive Facts
device( ActDS3, //ID
DisconnectSwitch, //Type
Closed, //State
FwareActDS3 //Services
).
connected( PLC2, //Start Node
ActDS //End Node
).
service( FwareActDS3,//Service ID
1.0, //Version Number
ModbusSlave, //Service Type
[PLC2Master], //Dependent Upon
[TLS], //Security Protocols
502 //Connecting Port
).
Figure 2. CIM XML and Prolog specifications of a substation.
two communicating devices and a Path variable. It then calls a helper rule path(Line 1), which finds a path (list of nodes) from A to B. This is accomplishedusing a recursive travel rule: a path from A to B is obtained if A and B areconnected (Line 5) and a path from A to B is obtained provided that A isconnected to a node C different from B that is not on the previously visited

Anwar & Campbell 181
Table 2. SCADA device models described as Prolog facts.
1 % dev i c e ( ID ,TYPE,GROUP, SERVICES LIST ,COORDX,COORDY)2 d e v i c e ( adminpc , pc , en , [ ssh1 , s q l c l i e n t 1 ] , 1 0 , 2 0 ) .3 d e v i c e ( h i s t o r i a n , pc , en , [ r l o g i n d1 , p o s t g r e s q l d ] , 1 0 , 3 0 ) .4 d e v i c e ( s en so r , pc , pcn , [ r l o g i n 2 , s q l c l i e n t 2 ] , 3 0 , 1 0 ) .5 d e v i c e ( s e r v i c e p r o x y , r ou t e r , f i r e w a l l , [ f i r e w a l l d ] , 1 0 , 1 0 ) .6
7 % s e r v i c e ( ID ,TYPE,VER, PRIV LEVEL ,PROTOCOL,ACL)8 s e r v i c e ( s q l c l i e n t 1 , d a t a b a s e c l i e n t , 2003 , user , odbc , ) .9 s e r v i c e ( s q l c l i e n t 2 , d a t a b a s e c l i e n t , 2000 , user , odbc , ) .
10 s e r v i c e ( p o s t g r e s q l d , d a t a b a s e s e r v e r , 1998 , root , odbc , [←↩s q l c l i e n t 1 , s q l c l i e n t 2 ] ) .
11
12 % b y d i r e c t i o n l i n k (SRC ,DEST)13 connected ( adminpc , s e r v i c e p r o x y ) .14 connected ( h i s t o r i a n , s e r v i c e p r o x y ) .15 connected ( s en so r , s e r v i c e p r o x y ) .
Table 3. Access control implementation.
1 path (A ,B , Path ) :−2 t r a v e l (A,B , [ A ] ,Q) ,3 r e v e r s e (Q, Path ) .4
5 t r a v e l (A ,B ,P , [ B |P ] ) :−6 connected (A,B) .7
8 t r a v e l (A ,B , V i s i t e d , Path ) :−9 connected (A,C) ,
10 C \== B,11 \+member (C , V i s i t e d ) ,12 t r a v e l (C ,B , [ C | V i s i t e d ] , Path ) .13
14 i s a c c e s s c o n t r o l (DevA , DevB ) :−15 key s (DevA , AuthMechA ) ,16 key s (DevB , AuthMechB ) ,17 match (AuthMechA , AuthMechB ) .18
19 i s e n d 2 e n d c o n f i n t e g ( SecPropsL i s t , [ Head ] ) :−20 d e f s v s (Head , d s e r v i c e ) ,21 s e c p r o t s ( d s e r v i c e , SPL i s t ) ,22 Se cP r op sL i s t = SPL i s t .23
24 i s e n d 2 e n d c o n f i n t e g ( SecPropsL i s t , [ Head | Ta i l ] ) :−25 d e f s v s (Head , d s e r v i c e ) ,26 s e c p r o t s ( d s e r v i c e , SPL i s t1 ) ,27 i s e n d 2 e n d c o n f i n t e g ( SPLis t2 , Ta i l ) ,28 i n t e r s e c t i o n ( SPLis t1 , SPLis t2 , CommonSPList ) ,29 nth0 (0 , CommonSPList , ) ,30 Se cP r op sL i s t=SPL i s t1 .31
32 ck ConformanceTo CIP002−08(DevA , DevB , Path ) :−33 path (DevA , DevB , Path ) ,34 i s a c c e s s c o n t r o l (DevA , DevB ) ,35 i s e n d 2 e n d c o n f i n t e g ( Path ) .
part of the path, and a path is found from C to B (Line 8). Avoiding repeatednodes ensures that the program halts. Once the path is known, checking accesscontrol (Line 14) is a matter of comparing if both the communicating nodes use

182 CRITICAL INFRASTRUCTURE PROTECTION II
Table 4. Java-JPL code for querying and importing path information.
1 Va r i a b l e X = new Va r i a b l e ( ”X” ) ;2 Va r i a b l e Y = new Va r i a b l e ( ”Y” ) ;3 Va r i a b l e P = new Va r i a b l e ( ”P” ) ;4 Term arg [ ] = { X,Y,P } ;5 Query q = new Query ( ” path ” , arg ) ;6
7 wh i l e ( q . hasMoreElements ( ) ) {8 Term bound to x = (Term) ( ( Hash tab l e ) q . nextE lement ( ) ) . g e t (←↩
”P” ) ;9 S t r i n g [ ] s t r a r r a y = j p l . U t i l . a tomL i s tToSt r i ngAr ray (←↩
bound to x ) ;10 f o r ( i n t i =0; i<s t r a r r a y . l e n g t h ; i++) {11 System . out . p r i n t l n ( s t r a r r a y [ i ] ) ;12 }13 }
a pre-shared key or PKI authentication. Checking confidentiality and integrity(Lines 19 and 24) amounts to checking if every pair of consecutive nodes on apath share an encryption channel (e.g., IPSec or TLS).
4.4 Graphical User Interface
A Java-based GUI front-end to Prolog facilitates user interaction with thesystem. The implementation leverages JPL, a set of Java classes and C func-tions, which provides a Java-Prolog interface by embedding a Prolog enginein Java VM. Annotating each device in a CIM specification with (x, y) coor-dinates enables SCADA network data to be imported and viewed in a Javagrid panel. This approach allows for more user interaction than other networkvisualization tools (e.g., Graphviz [2] and CAIDA [6]). For example, a user canhover over a device icon to see a detailed listing of its security attributes or clickon devices of interest and formulate a query. Table 4 presents JPL code thatimports information about all possible paths between two devices in the formof Prolog lists for display (Table 3 describes the predicate implementation).
Three JPL variables (Lines 1–3) are created to hold the two devices and thelist of possible paths between them. A query is then formulated and sent tothe Prolog engine, which populates these values. The JPL library provides sev-eral utility functions such as atomListToStringArray to perform conversionsbetween Java and Prolog types.
5. Evaluation
Our implementation involves approximately 1,620 lines of Prolog code (notincluding network and workflow encodings) and 3,500 lines of Java code. Thetwelve best practices rules took roughly 30 hours to encode in Prolog. Theimplementation was tested with several substation network-level scenarios (in-volving less than 100 machines). Each scenario executed in a few seconds on
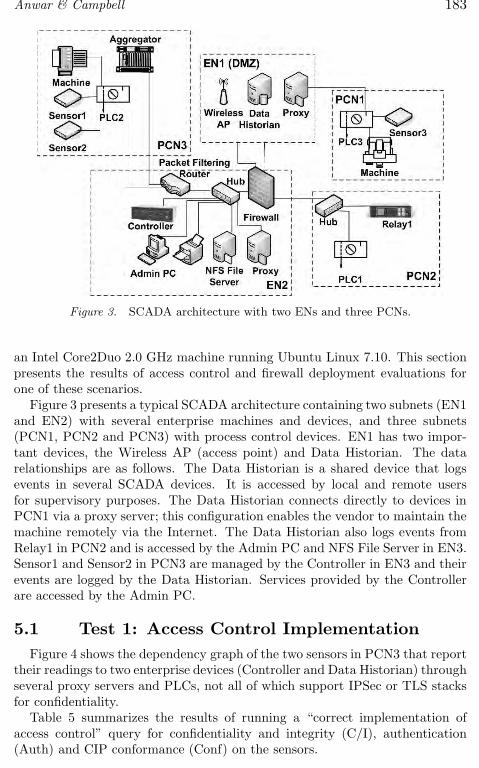
Anwar & Campbell 183
Figure 3. SCADA architecture with two ENs and three PCNs.
an Intel Core2Duo 2.0 GHz machine running Ubuntu Linux 7.10. This sectionpresents the results of access control and firewall deployment evaluations forone of these scenarios.
Figure 3 presents a typical SCADA architecture containing two subnets (EN1and EN2) with several enterprise machines and devices, and three subnets(PCN1, PCN2 and PCN3) with process control devices. EN1 has two impor-tant devices, the Wireless AP (access point) and Data Historian. The datarelationships are as follows. The Data Historian is a shared device that logsevents in several SCADA devices. It is accessed by local and remote usersfor supervisory purposes. The Data Historian connects directly to devices inPCN1 via a proxy server; this configuration enables the vendor to maintain themachine remotely via the Internet. The Data Historian also logs events fromRelay1 in PCN2 and is accessed by the Admin PC and NFS File Server in EN3.Sensor1 and Sensor2 in PCN3 are managed by the Controller in EN3 and theirevents are logged by the Data Historian. Services provided by the Controllerare accessed by the Admin PC.
5.1 Test 1: Access Control Implementation
Figure 4 shows the dependency graph of the two sensors in PCN3 that reporttheir readings to two enterprise devices (Controller and Data Historian) throughseveral proxy servers and PLCs, not all of which support IPSec or TLS stacksfor confidentiality.
Table 5 summarizes the results of running a “correct implementation ofaccess control” query for confidentiality and integrity (C/I), authentication(Auth) and CIP conformance (Conf) on the sensors.

184 CRITICAL INFRASTRUCTURE PROTECTION II
Figure 4. Access control conformance of the SCADA architecture.
Table 5. Access control implementation results.
Source Sink Path C/I Auth Conf
S1 C S1 → PLC → P1 → C Yes Yes YesS1 DH S1 → PLC → P1 → P2 → DH4 No No NoS2 C S2 → PLC → P1 → C No Yes NoS2 DH S2 → PLC → P1 → P2 → DH No No No
The invocation ck ConformanceTo CIP002(sensors,sinks,Paths) revealsthat the data association channel between the sensors and controller enforcesintegrity because of an end-to-end pre-shared key. However the channel betweensensor S2 and the controller does not have confidentiality because the hopbetween S2 and the PLC does not support a confidentiality protocol. A similarproblem occurs along the paths between the sensors and the data historianwhere the hop between the two proxies is not confidential. The only channelthat passes the test successfully is between S1 and the controller because thesensor supports IPSec as an encryption protocol.
5.2 Test 2: Firewall Deployment
Firewall deployment was evaluated by starting with the original configura-tion, identifying the offending link, incorporating the appropriate firewall, andrepeating the conformance checking of the new configuration. Table 6 presentsthe results. The original configuration has a security rating of 2 due to thedirect historian-PCN1 link that was incorporated for vendor convenience. This

Anwar & Campbell 185
Table 6. Firewall deployment results.
Num Substation Architecture Rating Offending Link
1 Original configuration (Fig-ure 3)
2 DH-PCN1
2 Same as 1 with DH-PCN1link removed
2 S2-PacketFilteringRouter-C
3 Same as 2 with router re-placed with a stateful fire-wall
3 C-AdminPC
4 Same as 3 with C moved tothe DH subnet
4 None
link poses a serious threat to the substation as it potentially allows direct In-ternet access to the plant floor. Note that the security rating of the entiresubstation is dependent on the security rating of the weakest link. Removingthis link (by incorporating a new firewall or relocating PCN devices) and re-peating the analysis produces a security rating of 2. This is due to the presenceof a packet filtering router that separates devices in PCN3 from the controllerin EN3. Upon replacing the router with a stateful firewall, the new configura-tion has a security rating of 3 with all the shared devices positioned behind theproper firewalls. Finally, moving the shared controller to same subnet as thehistorian produces a DMZ configuration (security rating 4) with all the shareddevices located in a separate subnet.
6. Conclusions
The predicate-calculus-based security model described in this paper ex-presses infrastructure elements as facts and security standards and best prac-tices as rules that specify constraints on the facts. The implemented tool chainautomatically generates a security model from SCADA infrastructure specifi-cations and checks it for compliance with security standards and best practices.The tool chain provides a rich front-end to the predicate logic engine, whichenables security administrators to compose their own queries during securityassessments. It also supports the visualization of network topology and securityassessment results to reveal possible points of attack.
Although the approach has been tested on infrastructures with less than 100nodes, it is scalable to large infrastructures because best practices are typi-cally specified at the substation level. Moreover, checking system conformanceagainst best practices is a static process that is typically performed offline.
The model allows the implementation of checks against other standards andbest practices with minimal changes; however, the generation of the securitymodel from CIM specifications could be improved. Our future work will focuson integrating security tools such as Nessus that automatically provide details of
186 CRITICAL INFRASTRUCTURE PROTECTION II
services running on devices along with device dependencies and vulnerabilities.Also, the security model will be extended to include SCADA infrastructuresthat are complementary to the power grid (e.g., water supply and telecommu-nications systems).
References
[1] American Gas Association, Cryptographic Protection of SCADA Com-munications; Part 1: Background, Policies and Test Plan, AGA ReportNo. 12 (Part 1), Draft 5, Washington, DC (www.gtiservices.org/security/AGA12Draft5r3.pdf), 2005.
[2] AT&T Research, Graphviz – Graph Visualization Software, Florham Park,New Jersey (www.graphviz.org).
[3] British Columbia Institute of Technology, Good Practice Guide on FirewallDeployment for SCADA and Process Control Networks, National Infras-tructure Security Co-ordination Centre, London, United Kingdom, 2005.
[4] British Columbia Institute of Technology, Industrial Security IncidentDatabase, Burnaby, Canada.
[5] R. Chandia, J. Gonzalez, T. Kilpatrick, M. Papa and S. Shenoi, Securitystrategies for SCADA networks, in Critical Infrastructure Protection, E.Goetz and S. Shenoi (Eds.), Springer, Boston, Massachusetts, pp. 117–131,2007.
[6] Cooperative Association for Internet Data Analysis, The CAIDA web site,La Jolla, California (www.caida.org).
[7] R. Dacey, Critical Infrastructure Protection: Challenges in Securing Con-trol Systems, Report GAO-04-140T, United States General AccountingOffice, Washington, DC (www.gao.gov/new.items/d04140t.pdf), 2004.
[8] Distributed Management Task Force, Common Information Model(CIM) Infrastructure Specification, Document DSP0004 Version 2.3Final, Portland, Oregon (www.dmtf.org/standards/published documents/DSP0004V2.3 final.pdf), 2005.
[9] Federal Energy Regulatory Commission, Mandatory Reliability Standardsfor Critical Infrastructure Protection, Docket No. RM06-22-000; Order No.706, Washington, DC (ferc.gov/whats-new/comm-meet/2008/011708/E-2.pdf), 2008.
[10] Industrial Automation Open Networking Association, The IAONAHandbook for Network Security, Version 1.3, Magdeburg, Germany(www.iaona.org/pictures/files/1122888138–IAONA HNS 1 3-reduced 050725.pdf), 2005.
[11] Instrumentation Systems and Automation Society, Security Technologiesfor Manufacturing and Control Systems (ANSI/ISA-TR99.00.01-2004),Research Triangle Park, North Carolina, 2004.

Anwar & Campbell 187
[12] M. Masera and I. Nai Fovino, A service-oriented approach for assessinginfrastructure security, in Critical Infrastructure Protection, E. Goetz andS. Shenoi (Eds.), Springer, Boston, Massachusetts, pp. 367–379, 2007.
[13] D. Maynor and R. Graham, SCADA security and terrorism: We’re notcrying wolf! presented at the Black Hat Federal Conference, 2006.
[14] J. Meserve, Sources: Staged cyber attack reveals vulnerability in powergrid, Cable News Network, Atlanta, Georgia (www.cnn.com/2007/US /09/26/power.at.risk), September 26, 2007.
[15] National Institute of Standards and Technology, Standards for SecurityCategorization of Federal Information and Information Systems, FIPSPublication 199, Gaithersburg, Maryland, 2004.
[16] M. Rash, psad: Intrusion detection for iptables (www.cipherdyne.com/psad).
[17] R. Ross, A. Johnson, S. Katzke, P. Toth, G. Stoneburner and G. Rogers,Guide for Assessing the Security Controls in Federal Information Systems,NIST Special Publication 800-53A, National Institute of Standards andTechnology, Gaithersburg, Maryland, 2008.
[18] SourceForge.net, AfterGlow (afterglow.sourceforge.net).
[19] Y. Stamatiou, E. Skipenes, E. Henriksen, N. Stathiakis, A. Sikianakis,E. Charalambous, N. Antonakis, K. Stolen, F. den Braber, M. Sodal Lund,K. Papadaki and G. Valvis, The CORAS approach for model-based riskmanagement applied to a telemedicine service, Proceedings of the EuropeanMedical Informatics Conference, pp. 206–211, 2003.
[20] K. Ziegler, NERC cyber security standards to become mandatory in UnitedStates, Electric Energy Industry News, January 21, 2008.

Chapter 14
COLLABORATIVE ACCESS CONTROLFOR CRITICAL INFRASTRUCTURES
Amine Baina, Anas Abou El Kalam, Yves Deswarte and MohamedKaaniche
Abstract A critical infrastructure (CI) can fail with various degrees of severity dueto physical and logical vulnerabilities. Since many interdependencies ex-ist between CIs, failures can have dramatic consequences on the entireinfrastructure. This paper focuses on threats that affect informationand communication systems that constitute the critical information in-frastructure (CII). A new collaborative access control framework calledPolyOrBAC is proposed to address security problems that are specific toCIIs. The framework offers each organization participating in a CII theability to collaborate with other organizations while maintaining controlof its resources and internal security policy. The approach is demon-strated on a practical scenario involving the electrical power grid.
Keywords: Access control, policies, models, collaboration, interoperability
1. Introduction
Critical infrastructures (CIs) are logical/physical facilities that are essentialto public welfare; their disruption or failure could have a dramatic impact on theeconomy and social well-being of a nation. The most significant CIs are thosededicated to electricity generation, transport and distribution (electrical powergrid), telecommunications, supply services (energy, food, fuel, water and gas),transportation systems (roads, railways and airports) and financial services(banks, stock exchanges and insurance companies).
Due to interdependencies existing between the various infrastructures, cas-cading and escalating failures are possible [15, 21]. A cascading failure occurswhen a failure in one infrastructure causes the failure of one or more compo-nents in a second infrastructure. An escalating failure occurs when a failurein one infrastructure exacerbates an independent failure in a second infras-tructure; this second failure has increased severity and/or requires significant
Please use the following format when citing this chapter: Baina, A., El Kalam, A.A., Deswarte , Y. and Kaaniche, M., 2008, in IFIP Inte rnational Federation for Inform ation Processing, Volume 290; Critical Infrastructure Protection II, eds. Papa, M., Shenoi, S., (Boston: Springer), pp. 189–201.

190 CRITICAL INFRASTRUCTURE PROTECTION II
recovery or restoration time. A prime example is the North American blackoutof August 14, 2003 [4]. A small failure in monitoring software prevented anelectrical line incident from being confined; the failures propagated across theelectrical power grid resulting in losses exceeding six billion dollars. In general,failures may occur as a result of accidental faults or malicious actions such asintrusions, denial-of-service attacks and worm propagation.
The North American blackout was caused by a failure in a computer system.Information technology and communications systems are used so widely in thevarious critical infrastructures that they have come to be known as the crit-ical information infrastructure (CII). CIIs involve vulnerable information andcommunication technologies (ICT) that are easily compromised by attackers.Consequently, securing CII assets is an important component of any criticalinfrastructure protection effort.
In Europe, America and elsewhere, regional, national and multinational en-ergy companies may be in competition, but they have to cooperate to produce,transport and distribute electric power. CIIs play a major role in these efforts– they are open, distributed systems that support collaboration between thevarious entities involved in operating critical infrastructures. CIIs are requiredto be flexible and extensible; it is equally important that they implement so-phisticated access control strategies given the diverse entities that share theinformation and communication assets.
This paper focuses on security problems related to access control, collabora-tion and interoperability in CIIs. In particular, it shows how PolyOrBAC [2], asecurity framework based on the OrBAC access control model [1, 18] and webservices technology, can be adapted to cope with CII security needs.
2. CRUTIAL Architecture
This section describes a generic CII architecture (CRUTIAL [10]), whichmodels interconnected infrastructures such as those encountered in the electri-cal power grid, provides an excellent framework for applying PolyOrBAC toprotect CIIs from accidents and as well as from malicious acts.
The CRUTIAL architecture is presented in Figure 1. It can be viewed asa WAN comprising multiple LANs interconnected by CRUTIAL informationswitches (CISs). A LAN incorporates various logical and physical systems; ithas its own applications and access control policy, and provides services toother entities. Each LAN belongs to an organization involving different actorsand stakeholders (e.g., power generation companies, power plants, substations,energy authorities, external maintenance service providers, and transmissionand distribution system operators). Multiple LANs are connected by a singleCIS if they are part of the same organization and located in the same area. Inthis case, each LAN is dedicated to a component (e.g., substation) in order tomanage a different access control policy for each component.
All the CII organizations in the CRUTIAL architecture are interconnectedby CISs. Therefore, to provide controlled cooperation, each CIS must con-tain mechanisms that enforce the local security policy of each collaborating

Baina, Abou El Kalam, Deswarte & Kaaniche 191
Figure 1. Generic CII architecture.
organization. Also, collaboration mechanisms should be implemented usingweb services. These policies and mechanisms must allow authorized access toresources and prevent all unauthorized access.
3. PolyOrBAC Framework
XACML is a popular language for specifying policies and managing accesscontrol in distributed and decentralized systems [16]. However XACML’s flex-ibility and expressiveness comes at the cost of complexity and verbosity. Itis hard to work directly with the language and policy files. Tools are beingdeveloped, but until they are widely available, it will be difficult for averageusers to work with XACML-based systems.
We use the OrBAC access control model as an alternative to XACML to im-plement access control for each CII component and to facilitate collaborationbetween components. Two approaches are possible. One approach is to imposea global, centralized security policy for all the organizations. This approachis not appropriate for a CII because of its dynamic character – organizationsshould be able to join or leave the CII without disturbing the rest of the ar-chitecture. Also, organizations are mutually suspicious. Each organization hasspecific rules and security policies and would prefer to maintain its autonomy.An organization would likely refuse to open its information systems to com-petitors or change its security policy.
The second approach is to use PolyOrBAC [2] to manage collaboration be-tween CII organizations while maintaining the autonomy of individual organi-

192 CRITICAL INFRASTRUCTURE PROTECTION II
zations. PolyOrBAC implements access control and security using local accesscontrol policies specified using OrBAC. Collaboration rules between the variousorganizations are managed using web services. Thus, the approach provides forinteroperability, collaboration and secure sharing of information between CIIcomponents, actors and organizations.
3.1 OrBAC Access Control Policies
The OrBAC [1, 18] model is an extension of RBAC [11, 22]. It enables thestructured, abstracted expression of security policies: subjects are abstractedusing roles (as in RBAC), objects [5, 14] as views (as in VBAC [7, 12]) andactions [5, 14] as activities (as in TBAC [20]). Also, security policy specificationis completely separated from its implementation, which reduces complexity.
In OrBAC, an organization is a structured group of active entities in whichsubjects play specific roles. An activity is a group of one or more actions, aview is a group of one or more objects, and a context is a specific situationthat conditions the validity of a rule. The role entity is used to structure linksbetween subjects and organizations. Similarly, objects satisfying a commonproperty are abstracted as views, and actions are abstracted as activities.
OrBAC rules can express positive/negative authorizations (permissions/in-terdictions) and obligations. Security rules have the following form: Permission(org ; r ; v ; a ; c), Prohibition (org ; r ; v ; a ; c) or Obligation (org ; r ; v ; a ;c). The rules imply that in context c, organization org grants role r permission(or prohibition or obligation) to perform activity a on view v.
OrBAC considers two different levels for the security policy: the abstractlevel and the concrete level. At the abstract level, the security administratordefines security rules using abstract entities (roles, activities, views) withoutworrying about how each organization implements these entities. At the con-crete level, when a user requests an access, an authorization is granted (or not)according to the relevant rules, organization, role, instantiated view/activityand parameters. The derivation of permissions (i.e., instantiation of securityrules) is formally expressed as:
∀org ∈ Organizations, ∀s ∈ Subjects, ∀activ ∈ Activities,∀o ∈ Objects, ∀r ∈ Roles, ∀a ∈ Actions, ∀v ∈ V iew, ∀c ∈ Contexts :Permission (org, r, v, activ, c) ∧ Empower (org, s, r) ∧Consider (org, a, activ) ∧ Use (org, o, v) ∧Hold (org, s, a, o, c) ⇒ is-permitted(s, a, o).
The security rule specifies that if in organization org, role r can perform activityactiv on view v when context c is True; and in organization org, r is assignedto subject s; and in organization org, action a is a part of activity activ; andin organization org, object o is part of view v; and context c is True for (org,s, a, o); then subject s may perform action a on object o.

Baina, Abou El Kalam, Deswarte & Kaaniche 193
3.2 OrBAC Limitations
OrBAC can be used to specify complex security policies that are encounteredin real-world information technology systems. Also, it facilitates security policymanagement and updates.
However, in the CII context, it is necessary to specify security requirementsand rules for each CII organization or subsystem, manage the collaborationbetween organizations, and enforce (within each CIS) the different securitypolicies. OrBAC can handle the first requirement, but not the second. In par-ticular, it is not possible to specify rules pertaining to multiple independentorganizations in a collaborative system using a single OrBAC policy. Also,permissions cannot be associated with users belonging to other partner orga-nizations or sub-organizations. Consequently, while OrBAC can express thesecurity policy of an organization, it is inadequate for modeling collaborationand interoperability between multiple organizations.
3.3 Web Services
Web services technology offers powerful mechanisms for implementing col-laboration. Software applications written in different programming languagesand running on diverse platforms can use web services to exchange data overcomputer networks in a manner similar to inter-process communication on asingle computer. Web services use well-known open standards and protocolssuch as XML [6], SOAP [19], WSDL [17] and UDDI [8], which are readily usedwith current web interfaces. Since web services are based on the HTTP proto-col, they can cross firewalls without changing established security requirements.Moreover, the execution of a web service does not require substantial resources(memory, power and CPU time) and a small quantity of code is sufficient forimplementation. Finally, web services can be easily coupled with OrBAC.
3.4 PolyOrBAC Framework
PolyOrBAC uses OrBAC to specify local access control policies (for eachorganization) and collaboration rules involving multiple organizations. Webservices are used to enforce collaboration. A CII component (organization orsubsystem) may have its own security objectives and can cooperate with theother components. Each organization has its own resources, services and appli-cations with its own objectives, operations, security rules and policy. Figure 2shows a scenario where Alice from Organization A wishes to invoke web serviceService1 offered by Organization B.
During the initial publication step, each organization determines which re-sources and/or services it will provide to external partners. Web services aredeveloped on the organization’s application servers; they are defined in theorganization’s OrBAC security policy and are referenced in the organization’sCIS to be accessible to external users.


Baina, Abou El Kalam, Deswarte & Kaaniche 195
Figure 4. Generic electrical power grid architecture.
The request involves an access (controlled by A’s OrBAC policy) to the localobject WS1-Image representing Service1 as well as a remote access (controlledby B’s OrBAC policy) to B’s actions corresponding to Service1. The CISsbelonging to Organizations A and B check that all exchanges between A and Bare compatible with the agreed contract, and maintain logs of all exchanges toserve as evidence in case of dispute. If the invocation of Service1 is authorized,A sends a SOAP/XML request to the URL of Service1, B executes the request,and sends the result of Service1 to A, which transmits it to Alice.
4. Case Study
This section descibes a case study involving the application of PolyOrBACto an electrical power grid CII.
4.1 Electrical Power Grid Scenario
Figure 4 presents a generic electrical power grid architecture. One or moreelectricity generation companies (GENCOs) – each operating several powerplants — are connected to transmission grids. Each transmission grid, whichis managed by transmission system operators (TSOs), comprises transmissionsubstations monitored by one national and several regional control centers, andis connected to one or more distribution grids. Each distribution grid, which ismanaged by distribution system operators (DSOs), is composed of distributionsubstations monitored by area control centers; the grid provides electricity tosubscribers (industries and residences) over distribution lines [13].
PolyOrBAC is useful when infrastructure components are required to executeremote actions and access resources from other partner organizations. Weemploy a real-world scenario to illustrate the application of PolyOrBAC tothe electrical power grid CII. The scenario considers the possible cascadingeffects caused by attacks on the communication channels between TSO/DSOcontrol centers and their substations during emergency conditions (e.g., lineoverloads). We assume that during emergency conditions a TSO is authorizedby a DSO to activate defensive actions that include load shedding. The scenarioinvolves four classes of organizations: transmission regional control centers (TS


198 CRITICAL INFRASTRUCTURE PROTECTION II
Table 2. Arming request OrBAC rule at TS RCC.
Rule
Permission(TS RCC, TSO for RCC, Access, RCC Dist. Circuits, Emergency) ∧Empower(TS RCC, EMS(Subject), TSO for RCC) ∧Consider(TS RCC, Activate(Action), Access) ∧Use(TS RCC, WS1-Image(Object), RCC Dist. Circuits) ∧Hold(TS RCC, EMS, Activate, WS1-Image, Emergency) ∧⇒ is-permitted(EMS, Activate, WS1-Image)
Table 3. Arming request/activation OrBAC rule at DS ACC.
Rule
Permission(DS ACC, DSO for ACC, Access, ACC Dist. Circuits, Emergency) ∧Empower(DS ACC, Virtual-User1(Subject), DSO for ACC) ∧Consider(DS ACC, Activate(Action), Access) ∧Use(DS ACC, WS2-Image(Object), DS ACC Dist. Circuits) ∧Hold(DS ACC, Virtual-User1, Activate, WS2-Image, Emergency) ∧⇒ is-permitted(Virtual-User1, Activate, WS2-Image)
(Table 3) that manages access control for the Arming Request and Activationweb services at the level of the organization that provides the service (i.e., DSACC).
Table 4. Arming activation OrBAC rule at DS SS.
Rule
Permission(DS SS, DSO for SS, Access, DS SS Dist. Circuits, Emergency) ∧Empower(DS SS, Virtual-User2(Subject), DSO for SS) ∧Consider(DS SS, Activate(Action), Access) ∧Use(DS SS, Object-Arm-MCDTU(Object), DS SS Dist. Circuits) ∧Hold(DS SS, Virtual-User2, Activate, Object-Arm-MCDTU, Emergency) ∧⇒ is-permitted(Virtual-User2, Activate, Object-Arm-MCDTU)
When Virtual-User1 activates object WS-Image2, WS2-Arming-Activationis automatically activated, then Virtual-User2 activates Object-Arm-MCDTUin DS SS, and the physical arming command is executed over the MCDTU. Thisaccess (Virtual-User2 to Object-Arm-MCDTU) is checked against the DS SSpolicy and is granted according to the OrBAC rule (Table 4), which managesaccess control for the Arming Activation web service in DS SS. WS3-Load-Shedding-Activation is negotiated and activated in the same way.

Baina, Abou El Kalam, Deswarte & Kaaniche 199
5. Conclusions
The PolyOrBAC security framework provides excellent support for the ac-cess control and collaboration requirements in CIIs. Web services are leveragedto provide decentralized management of access control policies and to enableorganizations to mutually negotiate contracts for collaboration. Organizationsretain their own resources, services, applications, operating systems, function-ing rules, goals and security policy rules. However, each organization is respon-sible for authenticating its users when they use other organizations’ services.The framework also facilitates the management and integration of new orga-nizations in a CII and ensures user privacy and non-disclosure of data andservices. Moreover, the framework can handle hardware and software hetero-geneities; network segments and physical/logical equipment belonging to thecollaborating CII organizations can be integrated seamlessly [9].
The framework is currently being implemented in a Java environment usingIBM Eclipse IDE and SWI-Prolog. Our future research will focus on meetingavailability requirements using obligation rules and integrity requirements bymonitoring information flows of different degrees of criticality [24]. Our researchwill also attempt to incorporate results from trust negotiation [23] and trust-based access control [3] in the PolyOrBAC framework.
Acknowledgements
This research was partially supported by CRUTIAL, a European FP6-ISTProject and by PolSec, a LAAS Project. The authors also wish to thankFabrizio Garrone and Giovanna Dondossola for their contributions to the casestudy described in this paper.
References
[1] A. Abou El Kalam, S. Benferhat, A, Miege, R. El Baida, F. Cuppens,C. Saurel, P. Balbiani, Y. Deswarte and G. Trouessin, Organization basedaccess control, Proceedings of the Fourth IEEE International Workshop onPolicies for Distributed Systems and Networks, pp. 120–134, 2003.
[2] A. Abou El Kalam, Y. Deswarte, A. Baina and M. Kaaniche, Access controlfor collaborative systems: A web services based approach, Proceedings ofthe IEEE International Conference on Web Services, pp. 1064–1071, 2007.
[3] W. Adams and N. Davis, Toward a decentralized trust-based access controlsystem for dynamic collaboration, Proceedings of the Sixth Annual IEEESMC Information Assurance Workshop, pp. 317–324, 2005.
[4] M. Amin, North America’s electricity infrastructure: Are we ready for moreperfect storms? IEEE Security and Privacy, vol. 1(5), pp. 19–25, 2003.
[5] D. Bell and L. LaPadula, Secure Computer Systems: Unified Expositionand MULTICS Interpretation, Technical Report ESD-TR-75-306, MTR-2997 Rev. 1, MITRE Corporation, Bedford, Massachusetts, 1976.

200 CRITICAL INFRASTRUCTURE PROTECTION II
[6] T. Bray, J. Paoli, C. Sperberg-McQueen, E. Maler, F. Yergeau and J.Cowan (Eds.), Extensible Markup Language (XML) 1.1, Recommenda-tion, World Wide Web Consortium, Cambridge, Massachusetts (www.w3.org/TR/2004/REC-xml11-20040204), 2004.
[7] G. Brose, A view-based access control model for CORBA, in Secure In-ternet Programming: Security Issues for Mobile and Distributed Objects(LNCS 1603), J. Vitek and C. Jensen, Springer-Verlag, London, UnitedKingdom, pp. 237–252, 2001.
[8] L. Clement, A. Hately, C. von Riegen and T. Rogers (Eds.), UDDI Ver-sion 3.0.2, Organization for the Advancement of Structured InformationStandards, Billerica, Massachusetts (uddi.org/pubs/uddi v3.htm), 2005.
[9] F. Cuppens, N. Cuppens-Boulahia, T. Sans and A. Miege, A formal ap-proach to specify and deploy a network security policy, in Formal Aspectsin Security and Trust, T. Dimitrakos and F. Martinelli (Eds.), Springer,Berlin-Heidelberg, Germany, pp. 203–218, 2004.
[10] G. Dondossola, G. Deconinck, F. Di Giandomenico, S. Donatelli, M.Kaaniche and P. Verissimo, Critical utility infrastructural resilience, Pro-ceedings of the Workshop on Security and Networking in Critical Real-Time and Embedded Systems, 2006.
[11] D. Ferraiolo, R. Sandhu, S. Gavrila, D. Kuhn and R. Chandramouli, Pro-posed NIST standard for role-based access control, ACM Transactions onInformation and System Security, vol. 4(3), pp. 224–274, 2001.
[12] T. Fink, M. Koch and C. Oancea, Specification and enforcement of ac-cess control in heterogeneous distributed applications, Proceedings of theInternational Conference on Web Services, pp. 88–100, 2003.
[13] F. Garrone, C. Brasca, D. Cerotti, D. Codetta Raiteri, A. Daidone, G.Deconinck, S. Donatelli, G. Dondossola, F. Grandoni, M. Kaaniche and T.Rigole, Analysis of New Control Applications, Deliverable D2, The CRU-TIAL Project, CESI Ricerca, Milan, Italy (crutial.cesiricerca.it/content/files/Documents/Deliverables%20P1/WP1-D2-final.pdf), 2007.
[14] M. Harrison, W. Ruzzo and J. Ullman, Protection in operating systems,Communications of the ACM, vol. 19(8), pp. 461–471, 1976.
[15] J. Laprie, K. Kanoun and M. Kaaniche, Modeling interdependencies be-tween the electricity and information infrastructures, Proceedings of theTwenty-Sixth International Conference on Computer Safety, Reliabilityand Security, pp. 54–67, 2007.
[16] M. Lorch, S. Proctor, R. Lepro, D. Kafura and S. Shah, First experiencesusing XACML for access control in distributed systems, Proceedings of theACM Workshop on XML Security, pp. 25–37, 2003.
[17] N. Kavantzas, D. Burdett, G. Ritzinger, T. Fletcher, Y. Lafon, and C. Bar-reto (Eds.), Web Services Choreography Description Language Version 1.0,Candidate Recommendation, World Wide Web Consortium, Cambridge,Massachusetts (www.w3.org/TR/2005/CR-ws-cdl-10-20051109), 2006.

Baina, Abou El Kalam, Deswarte & Kaaniche 201
[18] A. Miege, Definition of a Formal Framework for Specifying Security Poli-cies: The OrBAC Model and Extensions, Ph.D. Thesis, Department ofComputer Science, Ecole Nationale Superieure des Telecommunications(TELECOM ParisTech), Paris, France, 2005.
[19] N. Mitra (Ed.), SOAP Version 1.2, Recommendation, World Wide WebConsortium, Cambridge, Massachusetts (www.w3.org/TR/2003/REC-soap12-part0-20030624), 2003.
[20] S. Oh and S. Park, Task-role-based access control model, Information Sys-tems, vol. 28(6), pp 533–562, 2003.
[21] S. Rinaldi, J. Peerenboom and T. Kelly, Identifying, understanding andanalyzing critical infrastructure interdependencies, IEEE Control Systems,vol. 21(6), pp. 11–25, 2001.
[22] R. Sandhu, E. Coyne, H. Feinstein and C. Youman, Role-based accesscontrol models, IEEE Computer, vol. 29(2), pp. 38–47, 1996.
[23] K. Seamons, T. Chan, E. Child, M. Halcrow, A. Hess, J. Holt, J. Jacobson,R. Jarvis, A. Patty, B. Smith, T. Sundelin and L. Yu, TrustBuilder: Nego-tiating trust in dynamic coalitions, Proceedings of the DARPA InformationSurvivability Conference and Exposition, vol. 2, pp. 49–51, 2003.
[24] E. Totel, J. Blanquart, Y. Deswarte and D. Powell, Supporting multiplelevels of criticality, Proceedings of the Twenty-Eighth Annual Symposiumon Fault Tolerant Computing, pp. 70–79, 1998.

Chapter 15
MODELING DEPENDENCIES INCRITICAL INFRASTRUCTURES
Albert Nieuwenhuijs, Eric Luiijf and Marieke Klaver
Abstract This paper describes a model for expressing critical infrastructure de-pendencies. The model addresses the limitations of existing approacheswith respect to clarity of definition, support for quality and the influenceof operating states of critical infrastructures and environmental factors.
Keywords: Critical infrastructures, dependencies, modeling, system analysis
1. Introduction
A critical infrastructure (CI) comprises those assets and parts thereof thatare essential to maintaining vital societal functions, including the supply chain,health, safety, security and the economy [5]. CI dependencies are importantfor understanding the cascading effects in the various CI sectors that can haveserious societal impact.
However, the models and methodologies available for dependency analysisare very limited. Recent studies of the Dutch national infrastructure [7, 11, 12]have demonstrated the need for a clear, methodical understanding of depen-dencies. Moreover, real-world dependencies and event data from CI incidentdatabases (e.g., [16]) contain complexities that are not captured by existingdependency models; these complexities are, therefore, often ignored. Whenimportant aspects of CI dependencies are not modeled adequately, risk assess-ments conducted using these dependencies are suspect at best.
This paper describes a model for expressing CI dependencies that is basedon a system analysis approach. The model addresses the limitations of existingapproaches with respect to clarity of definition, support for quality and theinfluence of operating states of CIs and environmental factors.
Please use the following format when citing this chapter: Nieuwenhuijs, A., Luiijf, E. and Klaver, M., 2008, in IFIP Inte rnational Federation for Info rmation Processing, Volume 290; Critical Infrastructure Protection II, eds. Papa, M., Shenoi, S., (Boston: Springer), pp. 205–213.
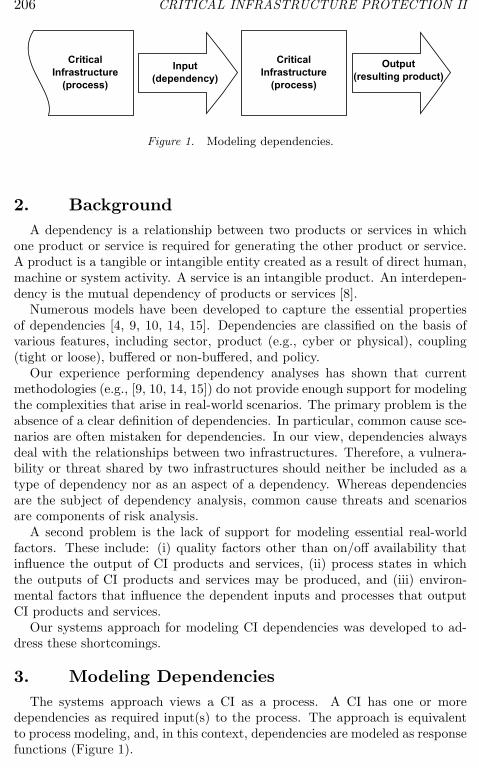
206 CRITICAL INFRASTRUCTURE PROTECTION II
Figure 1. Modeling dependencies.
2. Background
A dependency is a relationship between two products or services in whichone product or service is required for generating the other product or service.A product is a tangible or intangible entity created as a result of direct human,machine or system activity. A service is an intangible product. An interdepen-dency is the mutual dependency of products or services [8].
Numerous models have been developed to capture the essential propertiesof dependencies [4, 9, 10, 14, 15]. Dependencies are classified on the basis ofvarious features, including sector, product (e.g., cyber or physical), coupling(tight or loose), buffered or non-buffered, and policy.
Our experience performing dependency analyses has shown that currentmethodologies (e.g., [9, 10, 14, 15]) do not provide enough support for modelingthe complexities that arise in real-world scenarios. The primary problem is theabsence of a clear definition of dependencies. In particular, common cause sce-narios are often mistaken for dependencies. In our view, dependencies alwaysdeal with the relationships between two infrastructures. Therefore, a vulnera-bility or threat shared by two infrastructures should neither be included as atype of dependency nor as an aspect of a dependency. Whereas dependenciesare the subject of dependency analysis, common cause threats and scenariosare components of risk analysis.
A second problem is the lack of support for modeling essential real-worldfactors. These include: (i) quality factors other than on/off availability thatinfluence the output of CI products and services, (ii) process states in whichthe outputs of CI products and services may be produced, and (iii) environ-mental factors that influence the dependent inputs and processes that outputCI products and services.
Our systems approach for modeling CI dependencies was developed to ad-dress these shortcomings.
3. Modeling Dependencies
The systems approach views a CI as a process. A CI has one or moredependencies as required input(s) to the process. The approach is equivalentto process modeling, and, in this context, dependencies are modeled as responsefunctions (Figure 1).

Nieuwenhuijs, Luiijf & Klaver 207
In the following, we define the “quality” and “response” elements that de-scribe dependencies, along with the “state of operation” and the “environmen-tal” factors that influence dependencies.
3.1 Quality
Most approaches for modeling dependencies implicitly assume the completeavailability or complete non-availability of a CI product or service. However,our experience working on CI incidents around the world [16] and examiningCI incidents described in literature (e.g., [13]) has shown that the dependencyof a CI product or service is characterized by more than just on/off availability.CI products and services that are input to a CI process also need to adhere tocertain levels of quality. These levels of quality may involve various indicators,often specific to a product or service. Key indicators of quality include:
Quantity/volume (of food, water or power)
Speed (of transport or information services)
Reliability (of information)
Temperature (of heating or cooling water)
Pressure (of gas or drinking water supply)
Frequency and voltage (of electrical power)
Biological and chemical purity (of food, drinking water, surface water orchemicals)
Note that when we refer to input(s) or output(s), all the quality aspectsmentioned above are implicitly included.
3.2 Response
A dependency is characterized by the response function that describes theoutput of a CI as a function of its input(s). The response function depends onthe input of products and services and on time.
Input Response. An input response describes the CI output as a functionof the CI products and services used as input. Two types of input response aredistinguished:
Functional behavior describing how the CI output and dependency arerelated when the dependency supply deteriorates.
Functional behavior describing how the CI output and dependency arerelated when the dependency supply recovers.
Note that these input response functions can (but need not) be the same.For example, a gas turbine that generates electrical power normally operates

208 CRITICAL INFRASTRUCTURE PROTECTION II
with a certain input gas pressure θ. It may operate in a reduced output modeall the way down to a reduced gas pressure of 0.5θ. The gas turbine, however,will not start with a gas pressure less than 0.8θ. In this case, the electricalpower output fails (becomes zero) when the gas pressure drops below 0.5θ.When the gas pressure recovers, the power output resumes only after the gaspressure has risen to 0.8θ.
Time Response. A time response describes the output of a CI in termsof its temporal behavior after a partial/complete failure. The time responsefunctional behavior has four aspects:
The time period between the moment the quality of one or more inputs(dependencies) change(s) and the moment this leads to a (quality) changein the CI output.
The extent to which the CI output changes as a function of time inresponse to a change in input quality (or qualities).
The differential aspect of dependencies. This functional behavior de-scribes the effect on the CI output as a consequence of the speed of a(partial) disruption in a dependency. An example of this effect is thestockpiling of a critical commodity like gasoline after a steep price in-crease.
The integrating aspect of dependencies. This functional behavior de-scribes the effect on the CI output as a consequence of the effect thata reduction in the level of satisfaction of dependencies causes a continu-ously increasing lack of product or service output. For example, a fieldthat receives too little water will yield less and less for each day it isunder-watered until the crop eventually dies.
3.3 States of Operation
The state of operation of a CI is one of the main factors that influence adependency. We define four states of operation:
Normal State: This is the state in which the CI operates under normalconditions.
Stressed State: This is the state in which special measures are requiredto keep CI operations under control.
Crisis State: This is the state in which CI operations are out of control.
Recovery State: This is the state in which CI operations are undercontrol but have not been restored to normal conditions.
Figure 2 presents the CI state transition diagram. In each state, the set ofCI products and services on which the CI output depends and the extent to

Nieuwenhuijs, Luiijf & Klaver 209
Figure 2. State transition diagram.
which the CI depends on the (input) services and products will, in general,differ. For example, if computer systems are down due to a power outage,there is no longer a critical dependency on telecommunications for the purposeof data transmission. However, if the data can be communicated verbally usinga telephone, the critical dependency on telecommunications is increased.
We use hypothetical scenarios in an electrical power grid to clarify the CIstates and their transitions. In the power grid, small disturbances occur even inthe “normal” state and no special measures have to be taken to ensure control ofoperations. However, if data communications between the central control roomand substations fail, the state of the power grid cannot be monitored and,therefore, the power grid cannot be controlled from the central location. Thecontingency plan involves dispatching operators to the substations to monitorand control power grid equipment. The operators may use cellular phonesto exchange information with the central control room. Because out-of-the-ordinary measures have been put in place to maintain control of operations,the CI is in a “stressed” state.
If the cellular network fails after some time, central monitoring and con-trol of the grid state becomes impossible. The power grid is out of controland is, therefore, in a “crisis” state. After regaining data communicationswith the substations, the state of the power grid becomes clear at the centralcontrol room. However, due to lack of control, the power grid has split intotwo “islands” and smaller portions of the grid have tripped and, hence, be-come disconnected from the grid. Note that an island is a power grid partitionwith specific voltage/frequency characteristics that are different from its neigh-boring grid(s); this prevents its reconnection with the grid. The operationalprocedures necessary to recover from this situation are well understood, butthey take some time and effort. The power grid is in the “recovery” state untilnormal operations are restored.
The boundaries between states are often not sharply defined and are opento interpretation. Fortunately, this is not a problem when conducting a depen-dency analysis, as long as all the states are considered. States can be defined as

210 CRITICAL INFRASTRUCTURE PROTECTION II
Figure 3. Dependencies as a function of the required output.
needed; it is just that the dependencies that are not considered in one state willbe considered as part of some other state. The important issue is to recognizethat dependencies can vary according to how states are defined, but all thedependencies in all states of operation must be considered in the analysis.
3.4 Environmental Factors
Certain environmental factors that are outside the scope of a CI can influencedependencies. These factors can worsen or alleviate dependencies, change theirresponse or even create new dependencies. Environmental factors can influencedependencies in the following manner:
At very low ambient temperatures, the efficiency of a cooling tower in-creases and a power station may no longer rely on cooling water from ariver (input response).
During rush hour, the effects of a road closure are much more acute thanduring off-hours (time response).
In winter, the amount of gas needed for heating is considerably higherthan what is needed in summer (quality requirement).
4. Modeling Dependencies
Having identified the elements of CI dependencies, it is necessary to modelthe relationships between these elements. Note that the reason for constructinga model is not to generate a mathematical description of dependencies, butto formalize the relationships between the elements that have been identified.Therefore, the model is not intended to be used to analyze operational aspectsor to conduct simulations.
As mentioned above, a dependency deals with the relationship between arequired input for a CI process and the resulting CI process output in the formof products and/or services. This is the domain of process modeling and weemploy its terminology and concepts to construct the CI dependency model asshown in Figure 3.

Nieuwenhuijs, Luiijf & Klaver 211
Figure 4. States and environment as part of the dependency model.
The CI output, O, is a function of input and time, i.e., O = f(I, t), whereI is the input and t is the time. The time variable describes the time aspectsof the inputs, not the changing nature of the dependencies. The dependenciesare assumed to be static; their behavior does not change over time.
In general, the CI output is dependent on n inputs and may be expressed as:O = f(I1...n, t). Since each CI input has its own set of qualitative properties, itis represented as a vector of qualitative indicators; thus, the CI output functionbecomes: O = f(I1...n, t). Since the CI output also has a set of qualitativeproperties, the complete dependency response function can be written as: O =f(I1...n, t).
The set of dependencies and their qualitative properties are, in general,dependent on the state of the system and environmental factors as shown inFigure 4. Therefore, if a function is defined for every combination of state andenvironmental factor, the response function of the CI on its dependencies is:O = fs,e(I1...n, t). This is typically a large set of moderately complex functionsthat, if developed completely, accurately describes how a CI reacts to changesin its dependencies in all possible situations. Note that the model can also beextended for a CI that produces more than one output by adding a subscriptj = 1..m to the output, where m is the number of outputs.
5. Conclusions
The system-analysis-based dependency model provides a classification of theelements and factors that should be considered to completely describe the be-havior of CI dependencies. The dependency model also provides a mechanismfor communicating dependencies in a concise and unambiguous manner. Ourfuture research will apply this theoretical framework to a well-documented casestudy [3]. Also, we will investigate the advantages of combining the dependencymodel with the service-oriented modeling approach used in the EU IRRIISProject [2].

212 CRITICAL INFRASTRUCTURE PROTECTION II
Acknowledgements
This research was partially funded by the EU Commission as part of theSixth Framework Programme Project IRRIIS under Contract No. FP6-2005-IST-4 027568 and by the Netherlands Next Generation Infrastructure Pro-gramme.
References
[1] ACIP Consortium, Final Report: Analysis and Assessment for CriticalInfrastructure Protection (ACIP), Industrieanlagen-Betriebsgesellschaft(IABG), Ottobrunn, Germany (www.iabg.de/acip/doc/wp7/D75 final progress report public.pdf), 2003.
[2] R. Bloomfield, P. Popov, K. Salako, D. Wright, PIA Preliminary Interde-pendency Analysis, in Tools and Techniques for Interdependency Analy-sis (IRRIIS Deliverable D2.2.2) and in Service Oriented InterdependencyAnalysis (IRRIIS Deliverable D2.2.4), IRRIIS Consortium, Fraunhofer In-stitute for Intelligent Analysis and Information Systems, Sankt-Augustin,Germany (www.irriis.org/File.aspx?lang=2&oiid=9138&pid=572), 2007.
[3] E. Ciancamerla and M. Minichino, A Mini Telco Blackout Scenario, inTools and Techniques for Interdependency Analysis (IRRIIS DeliverableD2.2.2), IRRIIS Consortium, Fraunhofer Institute for Intelligent Analy-sis and Information Systems, Sankt-Augustin, Germany (www.irriis.org/File.aspx?lang=2&oiid=9138&pid=572), 2007.
[4] D. Dudenhoeffer, M. Permann and M. Manic, CIMS: A framework forinfrastructure interdependency modeling and analysis, Proceedings of theWinter Simulation Conference, pp. 478–485, 2006.
[5] European Commission, Critical Infrastructure Protection in the FightAgainst Terrorism, Communication COM (2004) 702 Final, Communica-tion from the Commission to the Council and the European Parliament,Brussels, Belgium, 2004.
[6] European Commission, Proposal for a Directive of the Council on theIdentification and Designation of European Critical Infrastructure and theAssessment to Improve its Protection, COM (2006) 787 Final, Communi-cation from the Commission to the Council and the European Parliament,Brussels, Belgium, 2006.
[7] P. Koponen, H. Luiijf, H. Pentikinen, W. Schmitz and T. Uusitale, Re-port of Scenario, Threat and Vulnerability Refinement, IRRIIS DeliverableD1.2.3, TNO Defence, Security and Safety, The Hague, The Netherlands,2007.
[8] H. Luiijf, H. Burger, M. Klaver, Q. Boone, C. Poppe and M. van Eck,Critical Infrastructure Protection in the Netherlands: Quick Scan on Crit-ical Products and Services, Ministry of the Interior and Kingdom Rela-tions, The Hague, The Netherlands (cipp.gmu.edu/archive/NetherlandsCIreport 0403.pdf), 2003.

Nieuwenhuijs, Luiijf & Klaver 213
[9] D. Mendonca, E. Lee and W. Wallace, Impact of the 2001 World TradeCenter attack on critical interdependent infrastructures, IEEE Interna-tional Conference on Systems, Man and Cybernetics, vol. 5, pp. 4053–4058,2004.
[10] H. Min, W. Beyeler, T. Brown, Y. Son and A. Jones, Toward modelingand simulation of critical national infrastructure interdependencies, IIETransactions, vol. 39(1), pp. 57–71, 2007.
[11] A. Nieuwenhuijs, I. Paarlberg, J. Ribbens and H. Luiijf, Risk Analysis,IRRIIS Deliverable D1.2.2, TNO Defence, Security and Safety, The Hague,The Netherlands, 2007.
[12] A. Nieuwenhuijs and R. Verstoep, Methods for (Inter)Dependency Analy-sis, EURAM Project Deliverable, TNO Defence, Security and Safety, TheHague, The Netherlands, 2007.
[13] Raad voor de TransportVeiligheid (Dutch National Transport SafetyBoard), Storing Gasmengstation (Failing Gas Mixing Facility), ReportRVTV-CB-2-02.060, The Hague, The Netherlands, 2002.
[14] S. Rinaldi, J. Peerenboom and T. Kelly, Identifying, understanding andanalyzing critical infrastructure interdependencies, IEEE Control Systems,vol. 21(6), pp. 11–25, 2001.
[15] N. Svendsen and S. Wolthusen, Connectivity models of interdependencyin mixed-type critical infrastructure networks, Information Security Tech-nical Report, vol. 12(1), pp. 44–55, 2007.
[16] TNO Defence, Security and Safety, TNO’s Database on Critical Infras-tructure Incidents and Cascading Events (version 117), The Hague, TheNetherlands.

Chapter 16
METRICS FOR QUANTIFYINGINTERDEPENDENCIES
Emiliano Casalicchio and Emanuele Galli
Abstract The quantification of interdependencies is a major challenge when at-tempting to analyze the behavior of critical infrastructures. This paperpresents a taxonomy of interdependency quantification metrics basedon their information content, decision support and risk analysis capa-bilities, and computational costs. The paper also discusses a systematicapproach for computing metrics and performance indices that measurethe effectiveness of strategies designed to enhance critical infrastructureprotection and resilience. A case study is used to illustrate the compu-tation of the metrics and performance indices, and their application tothe analysis of critical infrastructure interdependencies.
Keywords: Interdependencies, metrics, federated simulation
1. Introduction
A critical infrastructure is a physical system that, if disrupted, can seriouslyaffect the national security, economy and social welfare of a nation. Examplesof critical infrastructures include telecommunications, electric power systems,natural gas and oil, banking and finance, transportation, water supply systems,government and emergency services [1]. Clearly, modern society cannot func-tion if large portions of the critical infrastructure are disrupted or destroyed.
In order to understand the behavior of critical infrastructures, it is necessaryto accurately model and quantify their interdependencies [14]. Researchershave proposed several qualitative and quantitative techniques for analyzinginterdependencies. Qualitative approaches rely on mathematical formalismssuch as Leontief-based models [10], Markov chains [2], Petri nets [8], hierarchicalholographic modeling (HHM) [7, 9] and graph theory [15, 16]. Quantitativeapproaches typically engage discrete simulation or agent-based modeling andsimulation (ABMS) [3–6, 14].
Please use the following format when citing this chapter: Casalicchio, E. and Galli, E., 2008, in IFIP International Federation for In formation Processing, Volume 290; Critical Infrastructure Protection II, eds. Papa, M., Shenoi, S., (Boston: Springer), pp. 215–227.

216 CRITICAL INFRASTRUCTURE PROTECTION II
While considerable research has focused on interdependency modeling andanalysis, very few efforts have examined the issue of quantifying interdependen-cies. Zimmerman [17] has proposed explicit metrics for quantifying interdepen-dencies. One metric measures the “direction” of infrastructure failures as theratio between the number of times one type of infrastructure causes damageto another type of infrastructure and the number of times other types of in-frastructures cause damage to the first type of infrastructure. Zimmerman andRestrepo [18] have specified a metric that measures the duration of cascadingeffects; they use this metric to quantify the effects of U.S. power grid outageson other infrastructures.
This paper presents a taxonomy that classifies interdependency metrics onthe basis of their information content, decision support and risk analysis ca-pabilities, and computational costs. In addition, it describes systematic ap-proaches for computing metrics using system or model observations, and forcalculating performance indices that measure the effectiveness of strategies de-signed to enhance critical infrastructure protection and resilience.
In general, interdependency metrics may be classified as those that measurethe macro characteristics of interdependencies and their impact on system be-havior and those quantify the strengths or weaknesses of infrastructures andinfrastructure components. Metrics in the first category support decision mak-ing at the organizational or strategic level while those in the second categorysupport decision making at the engineering or practical level.
We also use statistical measures, namely the percentile value, cumulativedistribution function (CDF) and complementary cumulative distribution func-tion (CCDF). The percentile value and CDF of an observed state variable areused to quantify the degree of satisfaction or goodness of choice. The CCDFof a set of observed outcomes is used to perform survivability analyses.
We employ a case study to illustrate the computation of metrics and perfor-mance indices, and their use in analyzing critical infrastructure interdependen-cies. Two scenarios are examined, outage propagation in infrastructures andvictim rescue after a terrorist attack.
2. Metrics and Performance Indices
We classify metrics for quantifying critical infrastructure interdependenciesin terms of decision support capabilities, information content and computa-tional cost. In particular, we identify three categories of metrics: (i) shapemetrics that quantify macro or “shape” characteristics of interdependenciessuch as direction [17] and duration [18] (Figure 1(a)); (ii) core metrics thatmeasure the causes and effects of outages for specific infrastructure compo-nents (Figures 1(b) and (c)) and the effectiveness of strategies/mechanismsfor improving critical infrastructures protection and resilience; and (iii) sector-specific metrics that measure the states of infrastructures at the global andcomponent levels.
Figure 2 shows how core, shape and sector-specific metrics are positionedin the three dimensional space of decision support capabilities, information
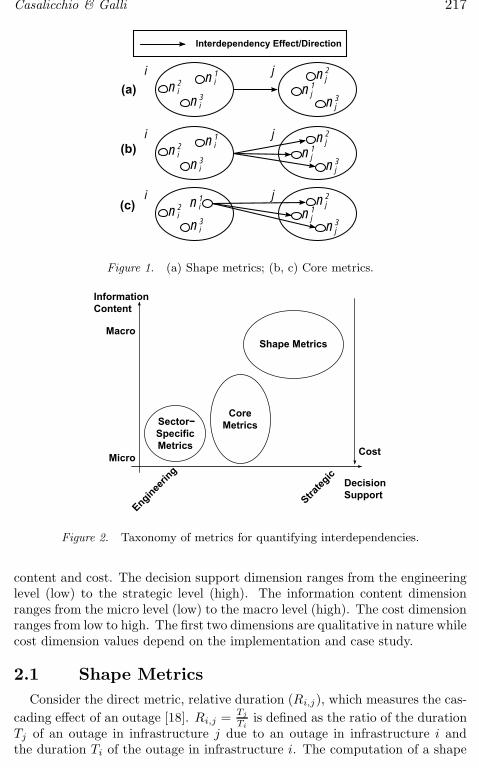
Casalicchio & Galli 217
ini
2 ni1
ni3
(a)
(b)
(c)
j nj2
nj1
nj3
Interdependency Effect/Direction
ini
2 ni1
ni3
ini
2 ni1
ni3
j nj2
nj1
nj3
j nj2
nj1
nj3
Figure 1. (a) Shape metrics; (b, c) Core metrics.
Information Content
Macro
Micro
Engineerin
g
Strateg
ic
Cost
DecisionSupport
Shape Metrics
CoreMetricsSector−
SpecificMetrics
Figure 2. Taxonomy of metrics for quantifying interdependencies.
content and cost. The decision support dimension ranges from the engineeringlevel (low) to the strategic level (high). The information content dimensionranges from the micro level (low) to the macro level (high). The cost dimensionranges from low to high. The first two dimensions are qualitative in nature whilecost dimension values depend on the implementation and case study.
2.1 Shape Metrics
Consider the direct metric, relative duration (Ri,j), which measures the cas-
cading effect of an outage [18]. Ri,j =Tj
Tiis defined as the ratio of the duration
Tj of an outage in infrastructure j due to an outage in infrastructure i andthe duration Ti of the outage in infrastructure i. The computation of a shape

218 CRITICAL INFRASTRUCTURE PROTECTION II
X
X0
XX2
1
tt’1 2 3ttt 1
Duration of the outage effect
Duration of the outage
Figure 3. Relationship between sector-specific and direct metrics.
metric involves measuring Ri,j and quantifying the impact on infrastructure j.The solution is to use sector-specific metrics. Ri,j is a function f(·) of the time tand the set of sector-specific metrics Mj used to measure the performance levelsor capabilities of infrastructure j. In other words, Ri,j = f(t, m1
j , m2j , ..., m
pj )
where mkj ∈ Mj .
Consider the example presented in Figure 3. Suppose that at time t1 thereis a power grid outage (infrastructure i), and at time t′1 ≥ t1, a decrease isobserved in X , the overall throughput of the communication network (infras-tructure j): X(t) = X0 if t ≤ t1 and X(t) ≤ X1 if t ≥ t′1. X1 is the criticalthreshold for network performance, i.e., when X < X1 the network loses theability to provide services. If the power grid outage is fixed at time t2 and,after time t3, the throughput is observed to return to X0, X(t) ≥ X2 at timet3 and X(t) → X0 for t ≥ t3, we assert that, at time t3, the cascading effectof the power grid outage has ended. We assume that, when X(t) ≥ X2, thecommunication network can provide services (obviously, X1 ≤ X2 ≤ X0). Ri,j
is a function f(t, X) of the time and throughput: Rg,n =t3−t′
1
t2−t1where t′1 is such
that X(t) ≤ X1 for t ≥ t′1 and t3 is such that X(t) ≥ X2 for t ≥ t3.As observed by Zimmerman and Restrepo [18], if Ri,j < 1, the infrastructure
j can react on its own to the outage (e.g., reconfigure its services). Otherwise,if Ri,j > 1, the infrastructure j is heavily dependent on the outage and it needssome time to restore its services after the outage ends.
An example of an aggregate measure of a shape metric is the total relativeduration Ri,I of an outage in infrastructure i on a set of infrastructures I .Suppose that the power grid outage impacts the communication network andtransportation system, and that the communication network outage impactscredit card transactions. The cascading effect ends when all the infrastructures

Casalicchio & Galli 219
are restored to their normal operating conditions. Then, the total relativeduration of an outage in infrastructure i is given by Ri,I = maxj∈I,j 6=i {Ri,j}where Ri,j is a function of sector-specific performance indices of infrastructurej.
2.2 Core Metrics
The direct metric Ri,j quantifies a macro characteristic of the interdepen-dencies between infrastructures i and j, but it does not give any informationabout the infrastructure nodes involved in or affected by the outage propaga-tion. Nor does it provide the impact of the failure of a specific infrastructureor infrastructure component. Core metrics quantify the effects of interdepen-dencies at the level of infrastructure nodes or, more deeply, at the level of nodecomponents. Thus, core metrics provide insight into the causes and effects ofoutages.
Two core metrics can be obtained by refining the shape metric Ri,j in orderto identify the weakest node in infrastructure j or the most important node ininfrastructure i. To identify the weakest node in infrastructure j with respectto an outage in infrastructure i, we define Ri,nk
j= f(t, Mk
j ) where nkj is the
kth node of infrastructure j and Mkj is the set of metrics used to measure
the performance or capabilities of nkj . The weakest node is then obtained by
evaluating the expression nlj = maxk∈Nj
{
Ri,nkj
}
where Nj is the set of nodes
comprising infrastructure j.Similarly, to identify the most important node in infrastructure i that affects
infrastructure j, we define Rnhi
,nkj
= f(t, Mkj ) where nh
i is the hth node of
infrastructure i. The most important node in infrastructure i is determined by
evaluating the expression nli = maxh∈Ni
{
Rnhi
,nkj
}
for each k ∈ Nj .
In general, if a sector-specific metric mkj ∈ Mk
j is used, the weakest nodein infrastructure j with respect to an outage in infrastructure i is obtained byevaluating the expression nl
j = maxk∈Nj
{
∆mkj
}
where ∆mkj is the variation
of the sector-specific metric considered. Similarly, the most important nodein infrastructure i that affects the behavior of infrastructure j is obtained byevaluating the expression nl
i = maxh∈Ni
{
∆mkj
}
∀k ∈ Nj . Obviously, depend-ing on the metric considered, the maximization problem can be turned into aminimization problem.
In addition to measuring the loss of performance or capability of an infras-tructure, core metrics can be used to measure the effectiveness of strategies forprotecting critical infrastructures or enhancing their resilience. For example,core metrics can quantify the effects produced by changing a rescue plan, theconsequences of network re-engineering or the effects of a new service reconfig-uration strategy. Also, core metrics can be used to specify the probability thata certain percentage of a population will be rescued after an incident, the per-centage of fatalities in a population or the duration of rescue operations. Theseconcepts cannot be quantified using direct metrics. Other examples that can

220 CRITICAL INFRASTRUCTURE PROTECTION II
RealSystem
DetailedModel
Observer
Observations(Sector−SpecificMetrics)
ShapeMetrics
CoreMetrics
f1,f2,f3,..,fn
1:1
Figure 4. Computing shape and core metrics from sector-specific metrics.
be quantified by core metrics are the number of damaged infrastructure nodes,the time taken to recover node functionality, the time taken to reconfigure asystem or network, and more.
2.3 Computing Shape and Core Metrics
As discussed above, sector-specific metrics are used to compute shape andcore metrics. Figure 4 illustrates the relationships between sector-specific met-rics, core metrics and shape metrics and the processes for computing shape andcore metrics. Parameters that can be used directly as core metrics (i.e., withoutany transformation) are determined by analyzing a real system or a detailedmodel of the system (or both). To compute shape metrics, is necessary toidentify the relevant sector-specific metrics and the appropriate transformationfunctions (f1, ..., fn) as described in Section 2.1.
2.4 Metric Characteristics
Table 1 summarizes the characteristics of shape metrics, core metrics andsector-specific metrics. In particular, it compares the three types of metricsbased on their information content, decision support capabilities and compu-tational cost.
2.5 Statistical Performance Indices
A statistical metric can be used to express the degree of satisfaction withrespect to the X th percentile of a performance index. The X th percentile ofa dataset is defined as the value that is larger than X% of the data. TheXth percentile of a random variable is obtained by inverting its cumulativedistribution function (CDF), which is defined as FX(x) = P{x ≤ X}. For

Casalicchio & Galli 221
Table 1. Summary of interdependency metric characteristics.
Metrics Information Decision CostContent Support
Shape metrics Macro level
Support decisionsat the organiza-tional and strate-gic levels
Low/MediumDetailed modelis not manda-tory
Core metrics Micro level Support decisionsat the engineeringand practicallevels; Quantify thecauses and effectsof outages
Medium/HighDetailed modelis mandatory(typically a simu-lation model)
Sector-specificmetrics
Engineering level
Input for comput-ing shape and coremetrics
example, the 95th percentile of X is τ = F−1
X (0.95). Thus, the percentile ofinterest is easily obtained by plotting the CDF.
For performance indices such as crisis resolution time, rescue time and num-ber of failed nodes it makes sense to measure the degree of satisfaction of a new(counter)measure. On the other hand, for the number of repaired nodes, it ismore appropriate to compute X such that P{x > X} = Y . The value of X iscomputed using the complementary cumulative distribution function (CCDF).The CCDF, which is commonly used in survivability analysis, is defined asFc(x) = 1−FX (x) = Pr{x > X}. Upon inverting Fc, we obtain X = F−1
c (Y ).
3. Case Study
A report by the U.S. Homeland Security Advisory Council [11] emphasizesthat techniques and tools for analyzing critical infrastructure interdependen-cies and their consequences “are of value only if applied within the contextof a clear objective – a desired outcome that is measurable.” We use a casestudy to demonstrate our methodology and, in particular, the application ofinterdependency metrics.
The case study, which is derived from [4, 5], considers three critical infras-tructures: the communication network used for data transmission and voicecalls, the power grid and the transportation network of urban roads. Otherinfrastructures involved in the case study are hospitals and health care cen-ters and the Information System for Civic Emergency Management (IS4CEM),which coordinates recovery in the event of terrorist attacks, catastrophes andinfrastructure outages. IS4CEM also provides information about health carecenter availability, transportation network availability and event evolution.
Two scenarios are examined, outage propagation and victim rescue aftera terrorist attack. The outage propagation scenario only considers the main

222 CRITICAL INFRASTRUCTURE PROTECTION II
infrastructures (power grid, transportation network and communication net-work). The scenario demonstrates how shape metrics can quantify the effect ofa power grid outage on the behavior of a communication network.
On the other hand, the victim rescue scenario illustrates how core metricscan be used to study the evolution of a crisis in the presence of various typesof power grid outages. The scenario assumes several persons have been injuredafter a terrorist attack. The communication network is used by the injuredvictims, citizens, authorities, rescue crews and hospitals. Hospitals and rescuecrews use the IS4CEM to coordinate rescue operations. The transportationnetwork is used by rescue crews to reach the injured and take them to hospitals;the network is also used by injured victims who drive themselves to hospitalsfor first aid. The power grid supplies the communication network, IS4CEM,hospitals, rescue crew stations and the transportation network (traffic lights).
4. Interdependency Analysis
Our simulation experiments using Federated ABMS [5] were designed todemonstrate the ability of core metrics to quantify interdependencies and toverify that the statistical measures used as performance indices are appropriate.Three power grid outage situations were considered for the outage propagationand victim rescue scenarios: no outage, one outage and two outages. Thenodes experiencing outages were selected randomly. In the outage propagationscenario, we assume that the time to fix the outage is constant. In the victimrescue scenario, we assume that the outage is permanent for the duration ofthe simulation.
The scenarios involved three hospitals, ten power grid nodes and ten routersand access points. The victim rescue scenario involved ten rescue team membersand 50 injured victims. A total of 50 simulations were conducted for each casefor each of the two scenarios; each simulation used a different seed for randomnumber generation.
4.1 Outage Propagation Scenario
We assume that at time t = 100 ticks, one or two randomly selected powergrid nodes fail. We also assume that no auxiliary power systems are available;therefore, when a power grid node fails, one or more network nodes (routersor access points) go out of service until they receive power. The time taken torepair a power grid node outage is set at 300 ticks.
Figure 5 compares the overall throughput of the communication networkX =
∑
i∈N Xi where N is the set of nodes in the network and Xi is thethroughput of node i. As expected, X decreases if one or more routers fail. Weassume that the critical threshold for network performance is 8,000 Mbps.
Figure 6 presents the overall throughput at the start (t = 100) of a powergrid outage (left-hand side) and at the end (t = 400) of the outage (right-handside). As shown in Figure 6 (left), when there is one outage, X degrades at t =100; after three ticks X falls below 8,000 Mbps and stabilizes to around 7,000

Casalicchio & Galli 223
Figure 5. Overall throughput of the communication network.
Figure 6. Overall throughput during a power grid outage.
Mbps after 100 additional ticks. When the outage ends at t = 400, four tickspass before normal operating conditions are re-established (Figure 6, right),corresponding to Rg,n ≈ 1. Normal operating conditions are rapidly restoreddue to the robustness of the routing algorithm and also because delays due tonodes being rebooted or damaged during the abnormal shutdown are not takeninto account.
In the case of two outages, a significant degradation in the overall throughputis observed. After three ticks, the overall throughput falls below 6,000 Mbps(Figure 6, left) and after 30 additional ticks, it is below 5,000 Mbps. However,at t = 214, the reconfiguration features of the routing algorithm take effect, andat t = 250, the overall throughput stabilizes to around 5,500 Mbps (Figure 6,right). Also in this case, Rg,n ≈ 1 and normal operating conditions are re-established a few ticks after the power outages end (Figure 6, right).
The time plot of the sector-specific metric is useful for analysis. When thecritical threshold for the throughput is 8,000 Mbps, Rg,n ≈ 1, and the durationof the communication network outage is about the same as that in the power

224 CRITICAL INFRASTRUCTURE PROTECTION II
Figure 7. Crisis resolution time CDF. Figure 8. Rescue time CDF.
grid. However, if the critical threshold is reduced to 5,300 Mbps, Rg,n = 0 inthe case of one outage and Rg,n ≈ 0.35 for two outages (Figure 5).
4.2 Victim Rescue Scenario
We assume that at time t = 0, 50 people are injured in a terrorist attack(Nw = 50). We compare the results for the three cases (no outage, one outageand two outages) using the 90th percentile value, CDF and CCDF.
Figure 9. Percentage of dead CDF. Figure 10. Percentage of rescued CCDF.
Figures 7, 8 and 9 show the CDFs of the crisis resolution time (Tc), rescuetime (Tr) and percentage of dead (Wd%), respectively. The CDF plots givean excellent indication of system behavior and how the outages increase Tc,Tr and Wd. The CCDF is used to analyze the number of injured victimswho are rescued (Figure 10). The CCDF gives the probability that more thanW% of the injured are rescued, i.e., P{Wr > W}. The value of W such thatP{Wr > W} = p is obtained by inverting the CCDF.
Table 2 presents the 90th percentile values for Tc, Tr and Wd. Using the CDFand the concept of percentile is easy to compute the probability pd that W% ofthe injured will die and the probabilities pr and pc that Tr and Tc, respectively,are less than T seconds, i.e., pd = Fd(W ), pr = Fr(T ) and pc = Fc(T ) whereFd, Fr and Fc are the CDFs of Wd, Tr and Tc, respectively.

Casalicchio & Galli 225
Table 2. Tc, Tr and Wd (90th percentile values).
Outages
Metric Zero One Two
Tr (sec) 165.83 187.96 269.44Tc (sec) 350 725 725Wd (%) 34.66 99 100
Table 3. W% values such that P{Wr > W} = p.
Outages
P{Wr > W} Zero One Two
0.90 64% 6% 0%0.75 66% 22% 0%0.50 72% 68% 6%
Table 3 shows the W% values (i.e., more than W% of the injured are rescued)for various values of p = P{Wr > W}. These are obtained by fixing a value forp and extracting the corresponding value of W from the CCDF.
5. Conclusions
The interdependency quantification metrics presented in this paper are use-ful for analyzing and simulating the behavior of critical infrastructures. Shapemetrics, with their macro-level information content, support decision makers atthe organizational and strategic levels. These metrics can be computed basedon engineering-level observation or using high-level system observations thatengage simulation or analytic models. In contrast, core metrics measure thecauses and effects of outages for specific infrastructure components and theeffectiveness of strategies for improving critical infrastructures protection andresilience. They require more computational overhead than shape metrics, butthey give decision makers useful information about outages and direct or in-direct quantification of interdependencies. Sector-specific metrics measure thestates of infrastructures at the global and component levels, and provide inputfor computing shape and core metrics. Statistical measures, such as the per-centile, CDF and CCDF, are also useful for analysis. The case study, involvingsimulations of outage propagation and victim rescue scenarios, demonstrate thevalue of the metrics and statistical measures for analyzing critical infrastructureinterdependencies.

226 CRITICAL INFRASTRUCTURE PROTECTION II
References
[1] I. Abele-Wigert and M. Dunn, International CIIP Handbook, Volume 1,Center for Security Studies, Swiss Federal Institute of Technology, Zurich,Switzerland, 2006.
[2] S. Asavathiratham, B. Lesieutre and G. Verghese, The influence model,IEEE Control Systems, vol. 21(6), pp. 52–64, 2001.
[3] E. Bonabeau, Agent-based modeling: Methods and techniques for simulat-ing human systems, Proceedings of the National Academy of Sciences, vol.99(3), pp. 7280–7287, 2002.
[4] V. Cardellini, E. Casalicchio and E. Galli, Agent-based modeling of inter-dependencies in critical infrastructures through UML, Proceedings of theAgent-Directed Simulation Symposium of the Spring Simulation Multicon-ference, pp. 119–126, 2007.
[5] E. Casalicchio, E. Galli and S. Tucci, Federated agent-based modeling andsimulation approach to study interdependencies in IT critical infrastruc-tures, Proceedings of the Eleventh International Symposium on DistributedSimulation and Real-Time Applications, pp. 182–189, 2007.
[6] D. Dudenhoeffer, M. Permann and M. Manic, CIMS: A framework forinfrastructure interdependency modeling and analysis, Proceedings of theWinter Simulation Conference, pp. 478–485, 2006.
[7] B. Ezell, J. Farr and T. Wiese, Infrastructure risk analysis model, Journalof Infrastructure Systems, vol. 6(3), pp. 114–117, 2000.
[8] O. Gursesli and A. Desrochers, Modeling infrastructure interdependenciesusing Petri nets, Proceedings of the IEEE International Conference onSystems, Man and Cybernetics, vol. 2, pp. 1506–1512, 2003.
[9] Y. Haimes, Risk Modeling, Assessment and Management, Wiley-Inter-science, Hoboken, New Jersey, 2004.
[10] Y. Haimes and P. Jiang, Leontief-based model of risk in complex intercon-nected infrastructures, Journal of Infrastructure Systems, vol. 7(1), pp.1–12, 2001.
[11] Homeland Security Advisory Council, Report of the Critical Infrastruc-ture Task Force, Department of Homeland Security, Washington, DC(www.dhs.gov/xlibrary/assets/HSAC CITF Report v2.pdf), 2006.
[12] K. Hopkinson, X. Wang, R. Giovanini, J. Thorp, K. Birman and D. Coury,EPOCHS: A platform for agent-based electric power and communicationsimulation built from commercial off-the-shelf components, IEEE Trans-actions on Power Systems, vol. 21(2), pp. 548–558, 2006.
[13] M. North, N. Collier and J. Vos, Experiences creating three implementa-tions of the Repast agent modeling toolkit, ACM Transactions on Modelingand Computer Simulation, vol. 16(1), pp. 1–25, 2006.

Casalicchio & Galli 227
[14] S. Rinaldi, J. Peerenboom and T. Kelly, Identifying, understanding andanalyzing critical infrastructure interdependencies, IEEE Control Systems,vol. 21(6), pp. 11–25, 2001.
[15] N. Svendsen and S. Wolthusen, Connectivity models of interdependencyin mixed-type critical infrastructure networks, Information Security Tech-nical Report, vol. 12(1), pp. 44–55, 2007.
[16] N. Svendsen and S. Wolthusen, Multigraph dependency models for het-erogeneous infrastructures, in Critical Infrastructure Protection, E. Goetzand S. Shenoi (Eds.), Springer, Boston, Massachusetts, pp. 337–350, 2007.
[17] R. Zimmerman, Decision-making and the vulnerability of interdependentcritical infrastructures, Proceedings of the IEEE International Conferenceon Systems, Man and Cybernetics, vol. 5, pp. 4059–4063, 2004.
[18] R. Zimmerman and C. Restrepo, The next step: Quantifying infrastructureinterdependencies to improve security, International Journal of CriticalInfrastructures, vol. 2(2/3), pp. 215–230, 2006.
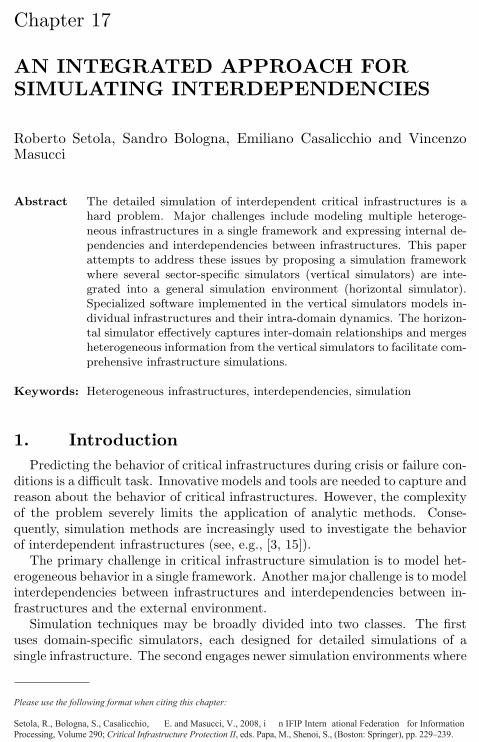
Chapter 17
AN INTEGRATED APPROACH FORSIMULATING INTERDEPENDENCIES
Roberto Setola, Sandro Bologna, Emiliano Casalicchio and VincenzoMasucci
Abstract The detailed simulation of interdependent critical infrastructures is ahard problem. Major challenges include modeling multiple heteroge-neous infrastructures in a single framework and expressing internal de-pendencies and interdependencies between infrastructures. This paperattempts to address these issues by proposing a simulation frameworkwhere several sector-specific simulators (vertical simulators) are inte-grated into a general simulation environment (horizontal simulator).Specialized software implemented in the vertical simulators models in-dividual infrastructures and their intra-domain dynamics. The horizon-tal simulator effectively captures inter-domain relationships and mergesheterogeneous information from the vertical simulators to facilitate com-prehensive infrastructure simulations.
Keywords: Heterogeneous infrastructures, interdependencies, simulation
1. Introduction
Predicting the behavior of critical infrastructures during crisis or failure con-ditions is a difficult task. Innovative models and tools are needed to capture andreason about the behavior of critical infrastructures. However, the complexityof the problem severely limits the application of analytic methods. Conse-quently, simulation methods are increasingly used to investigate the behaviorof interdependent infrastructures (see, e.g., [3, 15]).
The primary challenge in critical infrastructure simulation is to model het-erogeneous behavior in a single framework. Another major challenge is to modelinterdependencies between infrastructures and interdependencies between in-frastructures and the external environment.
Simulation techniques may be broadly divided into two classes. The firstuses domain-specific simulators, each designed for detailed simulations of asingle infrastructure. The second engages newer simulation environments where
Please use the following format when citing this chapter: Setola, R., Bologna, S., Casalicchio, E. and Masucci, V., 2008, i n IFIP Intern ational Federation for Information Processing, Volume 290; Critical Infrastructure Protection II, eds. Papa, M., Shenoi, S., (Boston: Springer), pp. 229–239.

230 CRITICAL INFRASTRUCTURE PROTECTION II
the behavior of different infrastructures is modeled using a single conceptualframework.
We refer to the first class as federated simulators because several “verticalsimulators” exchange data. A vertical simulator considers an infrastructureas an autonomous, isolated system; hence, it provides a vertical (partial butdetailed) view of the infrastructure. A good example of such a federated sim-ulator is EPOCHS [10], which is designed to analyze interactions between theelectric grid and telecommunications networks. Another example is SimCIP,which is being developed under the IRRIIS Project [11].
This class of simulators leverages well-tested simulation packages and dataand models accumulated over years of use, which reduces development costs.Moreover, because each simulator is designed for a specific domain, the knowl-edge elicitation phase is greatly simplified: the simulator and the user engagethe same language and vocabulary (i.e., modeling schemas and paradigms).Furthermore, all the intra-domain dependencies are modeled within verticalsimulators; the simulation environment only manages the inter-domain depen-dencies.
Unfortunately, these simulators are unable to capture all the distinct ele-ments that characterize real-world scenarios. In many cases, they describe in-frastructure interactions only in terms of functional links (e.g., direct exchangesof goods and services), neglecting other types of interdependencies (e.g., geo-graphical or social links) [16]. Also, because vertical simulators cannot manageinformation belonging to other domains (except for possibly changing loads andcertain model parameters), they are able to reproduce only very elementary in-teraction mechanisms.
The second class of simulation approaches uses a sufficiently broad and pow-erful modeling framework to represent multiple heterogeneous infrastructures[1, 5, 8, 14, 17]. We refer to this type of simulator as a “horizontal simulator”because it covers multiple domains. Horizontal simulators engage a variety ofconcepts, structures and solutions, e.g., complex adaptive systems [16], agent-based modeling [2, 4] and entity-relation approaches [5]. These paradigms cap-ture different aspects of the problem to greater or lesser degrees; therefore, thequality of their results vary according to the specific scenarios being evaluated.
Except for NISAC [17] and a few other government initiatives, horizontalsimulators have been tested only on relatively simple scenarios. This is pri-marily due to modeling issues. It is extremely difficult to acquire detailedinformation about infrastructure parameters and the dynamical behavior ofinfrastructures. Part of the problem is that critical infrastructure stakehold-ers are reluctant to release data that they deem to be sensitive. Also, it isdifficult to translate information from infrastructure domains to the abstractformulation adopted by horizontal simulators.
To address the limitations of the two classes of simulation approaches, wepropose a simulation framework that integrates multiple vertical simulators ina general horizontal simulation environment. The architecture, which is pre-sented in Figure 1, has three layers: (i) a user layer where different scenarios

Setola, Bologna, Casalicchio & Masucci 231
Figure 1. Simulation framework.
are described in terms of component elements, links between elements, eventsequences, and simulation tools to be used; (ii) an application layer that man-ages a collection of horizontal simulators (CISIA [5] and FederatedABMS [4]);and an implementation layer that manages a set of vertical simulators (OM-NeT++ [13], ns2 [9] and e-Agora). Specifically, once a scenario is selected, theuser can choose the type of horizontal simulator to be used. Moreover, theuser can choose to reproduce everything within the selected simulator or todelegate part of the simulation effort (e.g., intra-domain dynamics) to verticalsimulators in the implementation layer.
The simulation framework is being developed under the CRESCO Project[12], which is funded by Italian Ministry of Research to enhance the nationalcapability to study complex systems. However, we must emphasize that thisframework is not intended to be a “silver bullet” that comprehensively addressesthe critical infrastructure simulation problem. Rather, it is a proof-of-conceptscheme that, we hope, will constitute the first step to creating a EuropeanInfrastructure Simulation and Analysis Center (EISAC).
2. CRESCO Architecture
The CRESCO architecture is characterized by the presence of horizontalsimulation environments that are used to integrate a set of vertical simulators.

232 CRITICAL INFRASTRUCTURE PROTECTION II
We represent the status of the i-th component of the x-infrastructure as xi,where the status refers to any quantity that describes a characteristic (efficiency,operability, etc.) of the element. In general, an element is described by severalvariables, xi ∈ <ni where ni ≥ 1.
A vertical simulator updates the status of elements by solving an equationof the form:
xi(k + 1) = fX(X(k), u(k), Pxi) (1)
where X = [x1, . . . , xn]T represents the status of all the elements comprising thex-infrastructure, u is the vector of external inputs (e.g., loads), Pxi
is the set ofparameters characterizing the i-th element and fX(·) is a function that describesthe dynamics of the x-infrastructure. The form of the function depends on thenature of the infrastructure and may be expressed via differential equations,algebraic relations, etc. Note that fX(·) also takes into account intra-domainrelationships existing between elements in the x-infrastructure.
If two or more vertical simulators are federated using a simple broker gate-way, Equation 1 is modified to account for the presence of interdependencies.For simplicity, we consider two infrastructures, x and y, and assume that aone-to-one correspondence exists between elements in the two infrastructures(this assumption can be relaxed). In this case, Equation 1 becomes
xi(k + 1) = fX(X(k), u(k) + δ(yi), γ(Pxi, yi)) (2)
where δ and γ are functions that map the values assumed by the state vari-able of the y-infrastructure to load variations or parameter changes for thex-infrastructure element. Hence, the federation process corresponds to a ficti-tious modification of the load u and/or parameters Pxi
, making them dependenton the status assumed by the element of the y-infrastructure that is in directcorrespondence with xi.
As mentioned above, this strategy has several drawbacks. In particular, itonly permits the reproduction of simple interdependency phenomena.
The dynamics of an element in a horizontal simulator is described by:
θi(k + 1) = Γθ(θi(k), u(k), M(Θ)) (3)
where θi ∈ <ni is the state of the i-th element, Θ is the vector of state variablesof elements in the simulation scenario, Γθ is a function describing the dynamicsof each element and M(·) is a function describing the inter- and intra-domainrelationships existing between the i-th element and all the other elements with-out any specific consideration about the nature of the infrastructure. Note thatthe horizontal simulation techniques proposed in the literature differ substan-tially in the methodology used to map interdependencies to the M(·) functionand in the formalism adopted for their representation.
The main difference between Equations 1 and 3 is that fX(·) depends ex-plicitly on all the variables of the system while Γθ depends only on the statevariables of the i-th element; this is because the influence exerted by the other

Setola, Bologna, Casalicchio & Masucci 233
Figure 2. Global behavior of the i-th element.
elements is mediated by M(·), which codifies the relationships between thedifferent elements. Therefore, Equation 3 provides a less detailed and less co-herent representation of intra-domain relationships than Equation 1. However,it is able to describe inter-domain dependencies better because a more generalformalism is adopted.
We believe that some of the drawbacks can be overcome by integrating sev-eral vertical simulators via a horizontal simulation framework. This strategyleverages the capabilities of the vertical simulators that correctly reproduce thebehavior of individual infrastructures and the ability of a horizontal simulatorto model a large class of inter-domain relationships.
Figure 2 illustrates how the global behavior of the i-th element is obtained byusing Equation 3 to model inter-domain relationships along with informationprovided by a set of vertical simulators. Specifically, the overall state of thei-th element (θi) is obtained by incorporating, within the horizontal simulatormodel, information about the “partial” view of the element obtained by consid-ering the x- and y-infrastructure models (xi and yi, respectively). Moreover, θi
is used to update the variables of the vertical simulators in order to propagatethe consequences of inter-domain phenomena in those environments. Formally,we have:
θi(k + 1) = Γθ(θi(k), u(k) + δθu (xi, yi) , M(Θ))
xi(k + 1) = fX(X(k), u(k) + δux(θi), γ(Pxi, θi))
yi(k + 1) = fY (Y (k), u(k) + δuy(θi), γ(Pyi, θi))
(4)
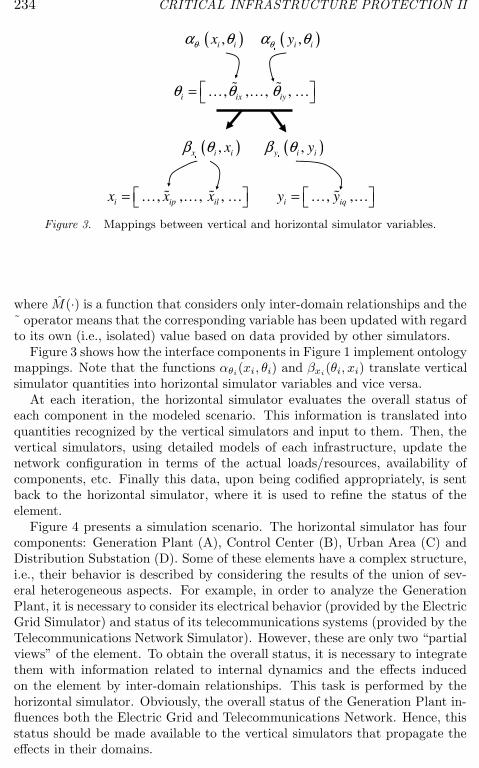
234 CRITICAL INFRASTRUCTURE PROTECTION II
Figure 3. Mappings between vertical and horizontal simulator variables.
where M(·) is a function that considers only inter-domain relationships and the˜ operator means that the corresponding variable has been updated with regardto its own (i.e., isolated) value based on data provided by other simulators.
Figure 3 shows how the interface components in Figure 1 implement ontologymappings. Note that the functions αθi
(xi, θi) and βxi(θi, xi) translate vertical
simulator quantities into horizontal simulator variables and vice versa.At each iteration, the horizontal simulator evaluates the overall status of
each component in the modeled scenario. This information is translated intoquantities recognized by the vertical simulators and input to them. Then, thevertical simulators, using detailed models of each infrastructure, update thenetwork configuration in terms of the actual loads/resources, availability ofcomponents, etc. Finally this data, upon being codified appropriately, is sentback to the horizontal simulator, where it is used to refine the status of theelement.
Figure 4 presents a simulation scenario. The horizontal simulator has fourcomponents: Generation Plant (A), Control Center (B), Urban Area (C) andDistribution Substation (D). Some of these elements have a complex structure,i.e., their behavior is described by considering the results of the union of sev-eral heterogeneous aspects. For example, in order to analyze the GenerationPlant, it is necessary to consider its electrical behavior (provided by the ElectricGrid Simulator) and status of its telecommunications systems (provided by theTelecommunications Network Simulator). However, these are only two “partialviews” of the element. To obtain the overall status, it is necessary to integratethem with information related to internal dynamics and the effects inducedon the element by inter-domain relationships. This task is performed by thehorizontal simulator. Obviously, the overall status of the Generation Plant in-fluences both the Electric Grid and Telecommunications Network. Hence, thisstatus should be made available to the vertical simulators that propagate theeffects in their domains.

Setola, Bologna, Casalicchio & Masucci 235
Figure 4. Two vertical simulators integrated in a horizontal simulation environment.
3. Simulation Framework
The CRESCO architecture provides facilities for defining and configuringsimulation scenarios, a model for analyzing critical infrastructure interdepen-dencies, and middleware that allows sector-specific models to be integrated inorder to simulate the detailed behavior of critical infrastructures. The user layerresides at the top level of the three-layer architecture (Figure 1). It providesan interface for defining and configuring simulation scenarios, entering simu-lation parameters, and manipulating and visualizing simulation results. Twoapproaches are considered, CISIA based on the Entity Resource Model [5] andFederatedABMS, which employs an agent-based model [2, 4]. The lowest imple-mentation layer incorporates vertical models of sector-specific infrastructuresthat are implemented by vertical simulators. These simulators are instantiatedat runtime on one or more nodes of the ENEA GRID.
The vertical simulators currently employed in the CRESCO architecture aredesigned to simulate telecommunications networks, computer systems and theelectric power grid. Open-source simulation frameworks that can be modifiedto work in the CRESCO environment have been adopted to the extent possi-ble. OMNeT++ [13] and ns2 [9] are used for telecommunications network andcomputer systems modeling while e-AGORA [1], a load flow simulation envi-ronment, is used to simulate electricity distribution networks and the powergrid.
Application middleware supports interoperability between horizontal andvertical simulators (Figure 1). The middleware coordinates mappings betweenelements of different simulators. This is facilitated by a common ontology fordata and event exchange between different simulation frameworks (despite theirdisparate representations). The events produced by the horizontal simulators

236 CRITICAL INFRASTRUCTURE PROTECTION II
are mapped via wrappers (an event transcoding plug-in for each interface) toa set of standard events. These quantities are then converted by the appropri-ate transcodifying ontologies module to a format that is compatible with thespecific vertical simulator.
4. Simulator Integration
The most innovative element of the CRESCO architecture is the presence ofhorizontal and vertical simulators in a single framework. This section describeshow horizontal simulators in the application layer are integrated with verticalsimulators in the implementation layer. For reasons of space, we only describethe integration of the CISIA horizontal simulator.
4.1 Rationale
The decision to incorporate multiple horizontal simulators was motivatedby the need to demonstrate a proof-of-concept architecture that is both flex-ible and scalable. Another, more important reason is the ability to correctlymodel various interdependencies and their phenomena. Indeed, as mentionedearlier, existing models do not capture interdependencies, which severely limitsthe fidelity of their simulations. Also, providing users with multiple tools toinvestigate scenarios, enables them to conduct better analyses.
FederatedABMS and CISIA adopt similar conceptual representations; thismakes the scenarios interchangeable and the results comparable. However, thetwo horizontal simulators have several different and complementary character-istics. FederatedABMS is an event-driven simulator while CISIA is a discrete-time simulator. FederatedABMS adopts an agent-based formulation; thus, thefunction M(·) in Equation 3 has the form:
M(Θ) ∼= m(k)Θ. (5)
Since relations between agents can be created or destroyed during a simulation,a time-varying incident matrix is employed to codify these relationships.
On the other hand, CISIA is based on the concept of proximity and employsthe formulation:
M(Θ) ∼=∑
l
Ml(Θ) (6)
where each element Ml(·) in the summation represents a specific mechanismof interrelation. Obviously, neither Equation 5 nor 6 is exhaustive and theimplementations of the two simulators impose further limitations. Nevertheless,they provide two interesting and, in certain respects, complementary views ofinterdependencies. Indeed, the concurrent use of FederatedABMS and CISIAhelps users better understand the phenomena produced by interdependencies.
Setola, Bologna, Casalicchio & Masucci 237
4.2 CISIA Integration
CISIA is a simulation environment designed to analyze complex scenarios in-volving multiple heterogeneous infrastructures with tight interactions. CISIA’sabstract representation decomposes a scenario into macro-components whosebehavior is described in terms of their ability to produce goods and servicesbased on the availability of external resources while taking into account thepresence (and severity) of failures. Each entity computes its “operative level”(i.e., ability to perform its intended job) and the level of severity associatedwith different types of failures based on the internal state and external re-sources; the presence and the severity of internal and external failures are alsoconsidered. These quantities are then exchanged among the macro-componentsto estimate the overall behavior of the system. CISIA’s representation employsfuzzy numbers [5, 14] to accommodate uncertainty and capture the linguisticdescriptions of system states provided by human experts.
CISIA adopts a resource-service paradigm to facilitate the integration ofvertical simulators. Thus, the outputs (xi and yi in Equation 4) can be log-ically managed as external resources. However, it is necessary to translatethese quantities to conform with CISIA’s more abstract representation. Thisis accomplished by aggregating data using the appropriate ontology.
The implementation of information flow from CISIA to the vertical simu-lators is a challenging problem. This is because the software packages werenot designed to be integrated with other simulation environments. Moreover,abstract information that characterizes states in CISIA has to be mapped totangible quantities such as electric power supply parameters. This process in-volves data decomposition, which introduces a degree of arbitrariness. Theprocess is also complicated by the fact that CISIA codifies data in the formfuzzy numbers. While fuzzy numbers facilitate the fusion of data provided byvertical simulators, they render the inverse process almost intractable. Indeed,in such an instance, it is necessary to convert fuzzy numbers to crisp values,but this leads to information loss.
Another important issue is time synchronization. Since CISIA is a discrete-time simulator, the implementation middleware has to operate as a scheduler toactivate the different simulators. Specifically, CISIA performs a simulation forone “time tick”(e.g., one minute in a simulation), then the middleware suppliesthe vertical simulators with the output of CISIA and activates their execution.When the vertical simulators have completed their calculations, the outputsare sent to CISIA, which starts the simulation for next time tick. Note thatwhen a discrete-time vertical simulator (e.g., ns2) is used, the scenario has tobe analyzed in an interrelated manner, which imposes additional constraintson the time tick period.
5. Conclusions
The CRESCO architecture attempts to address the limitations of existingcritical infrastructure simulation methods by integrating multiple vertical sim-
238 CRITICAL INFRASTRUCTURE PROTECTION II
ulators in a general horizontal simulation environment. The vertical simulatorseffectively model individual infrastructures and intra-domain dynamics whilethe horizontal simulators express inter-domain relationships and merge hetero-geneous information from different infrastructures. The architecture is intendedto be a proof of concept, the first step in creating a comprehensive simulationtool for analyzing multiple critical infrastructures that are tightly coupled andhighly interdependent.
Our future research will attempt to develop an ontology that formalizes in-formation flow between vertical simulators and the horizontal simulation envi-ronment. The IRRIIS Project [11] has taken a step in this direction by definingan information flow model that supports interdependency analysis; a more for-mal approach is being investigated by the DIESIS Project [6]. In addition, wewill investigate the granularity of domain models used in vertical simulators.These results will assist in integrating information from multiple heterogeneoussimulators during large-scale critical infrastructure simulations.
Acknowledgements
The authors wish to acknowledge the technical assistance provided by mem-bers of the CRESCO Project: E. Ciancamerla, S. De Porcellinis, S. Di Blasi,G. Di Poppa, E. Galli, A. Jannace, E. Marchei, M. Minichino, S. Podda, S.Ruzzante, A. Tofani and G. Vicoli.
References
[1] C. Balducelli, S. Bologna, L. Lavalle and G. Vicoli, Safeguarding infor-mation intensive critical infrastructures against novel types of emergingfailures, Reliability Engineering and System Safety, vol. 92(9), pp. 1218–1229, 2007.
[2] V. Cardellini, E. Casalicchio and E. Galli, Agent-based modeling of inter-dependencies in critical infrastructures through UML, Proceedings of theAgent-Directed Simulation Symposium of the Spring Simulation Multicon-ference (www.ce.uniroma2.it/publications/ads2007.pdf), 2007.
[3] E. Casalicchio, P. Donzelli, R. Setola and S. Tucci, Modeling and simula-tion of interdependent critical infrastructures: The road ahead, in Com-munication Networks and Computer Systems: A Tribute to Professor ErolGelenbe, J. Barria (Ed.), Imperial College Press, London, United Kingdom,pp. 143–157, 2006.
[4] E. Casalicchio, E. Galli and S. Tucci, Federated agent-based modeling andsimulation approach to study interdependencies in IT critical infrastruc-tures, Proceedings of the Eleventh International Symposium on DistributedSimulation and Real-Time Applications, pp. 182–189, 2007.
[5] S. De Porcellinis, R. Setola, S. Panzieri and G. Ulivi, Simulation of hetero-geneous and interdependent critical infrastructures, International Journalof Critical Infrastructures, vol. 4(1/2), pp. 110–128, 2008.

Setola, Bologna, Casalicchio & Masucci 239
[6] DIESIS Consortium, The DIESIS Project (www.diesis-eu.org).
[7] D. Dubois and H. Prade, Possibility Theory: An Approach to ComputerizedProcessing of Uncertainty, Plenum Press, New York, 1998.
[8] D. Dudenhoeffer, M. Permann and M. Manic, CIMS: A framework forinfrastructure interdependency modeling and analysis, Proceedings of theWinter Simulation Conference, pp. 478–485, 2006.
[9] K. Fall and K. Varadhan, The Network Simulator – ns-2 (nsnam.isi.edu/nsnam/index.php/Main Page).
[10] K. Hopkinson, R. Giovanini, X. Wang, EPOCHS: Integrated commercialoff-the-shelf software for agent-based electric power and communicationsimulation, Proceedings of the Winter Simulation Conference, pp. 1158–1166, 2003.
[11] IRRIIS Consortium, The IRRIIS European Integrated Project, Fraun-hofer Institute for Intelligent Analysis and Information Systems, Sankt-Augustin, Germany (www.irriis.org).
[12] Italian National Agency for New Technologies, Energy and the Environ-ment (ENEA), The CRESCO Project, Rome, Italy (www.cresco.enea.it).
[13] OMNeT++ Community Site, OMNeT++ Discrete Event Simulation Sys-tem (www.omnetpp.org).
[14] S. Panzieri, R. Setola and G. Ulivi, An approach to model complex interde-pendent infrastructures, presented at the Sixteenth IFAC World Congress(www.dia.uniroma3.it/∼panzieri/Articoli/WorldIFAC05-CIIP.pdf), 2005.
[15] P. Pederson, D. Dudenhoeffer, S. Hartley and M. Permann, Critical Infras-tructure Interdependency Modeling: A Survey of U.S. and InternationalResearch, Report No. INL/EXT-06-11464, Critical Infrastructure Protec-tion Division, Idaho National Laboratory, Idaho Falls, Idaho, 2006.
[16] S. Rinaldi, J. Peerenboom and T. Kelly, Identifying, understanding andanalyzing critical infrastructure interdependencies, IEEE Control Systems,vol. 21(6), pp. 11–25, 2001.
[17] Sandia National Laboratories, National Infrastructure Simulation andAnalysis Center, Albuquerque, New Mexico (www.sandia.gov/mission/homeland/programs/critical/nisac.html).

Chapter 18
SIMULATION OF ADVANCEDTRAIN CONTROL SYSTEMS
Paul Craven and Paul Oman
Abstract This paper describes an Advanced Train Control System (ATCS) sim-ulation environment created using the Network Simulator 2 (ns-2) dis-crete event network simulation system. The ATCS model is verifiedusing ATCS monitoring software, laboratory results and a comparisonwith a mathematical model of ATCS communications. The simulationresults are useful in understanding ATCS communication characteris-tics and identifying protocol strengths, weaknesses, vulnerabilities andmitigation techniques. By setting up a suite of ns-2 scripts, an engineercan simulate hundreds of possible scenarios in the space of a few secondsto investigate failure modes and consequences.
Keywords: Railroads, wireless networks, ATCS, ns-2, simulation
1. Introduction
The transportation sector has been categorized as a critical infrastructure [1].Any significant disruption in the movement of goods or people threatens thenation’s defense as well as its economy [25, 26].
The North American surface transportation network is a complex interactingsystem designed to provide safety and efficiency, but it is vulnerable to acci-dents, malicious attacks and natural disasters [28]. Failures at a small numberof “choke points” can impact highway, rail, air and maritime transportationthroughout the network [21].
Given the importance of surface transportation, it is important to identifyand protect the essential components of transportation systems and to ensureresiliency [19]. Simulating failures and analyzing their effects enables engineersto identify critical vulnerabilities, facilitating the construction of reliable, sur-vivable systems [4, 5].
Please use the following format when citing this chapter: Craven, P. and Oman, P., 2008, in IFIP Internat ional Federation for Inform ation Processing, Vol ume 290; Critical Infrastructure Protection II, eds. Papa, M., Shenoi, S., (Boston: Springer), pp. 243–256.

244 CRITICAL INFRASTRUCTURE PROTECTION II
On any given day, the United States surface transportation network moveseight million truckloads of freight across four million miles of roadway using1.5 million railcars on 170,000 miles of track [21]. Containerization makesthe highway and railway freight systems inseparable. Unfortunately, highwayand railway communication control systems are vulnerable to malicious andnuisance cyber attacks [3, 7–9]. Railway control communications, in particular,have evolved in an obscure but benign environment where railroad enthusiastsoften eavesdrop on control signals to track railcar movements [14].
The U.S. rail system uses communication protocols for tasks ranging fromchanging track switches to controlling locomotives [6]. Most rail communica-tion protocols do not have simulation environments, requiring engineers to runexpensive, time-consuming field experiments to analyze their behavior. Forexample, the U.S. rail system is currently testing the Positive Train Control(PTC) system designed to prevent train collisions, derailments and injuries toworkers [11]. Several pilot projects have been launched, including the NorthAmerican Joint PTC for the St. Louis-Chicago corridor that sought to imple-ment PTC using the Advanced Train Control System (ATCS) protocol.
The ATCS is widely used in the rail industry for wireless data communica-tions. However, because no simulation models are available for ATCS, its suit-ability can only be evaluated in physical environments. Unfortunately, time,labor, and safety considerations severely limit the extent of physical testingthat can be performed on railroad systems.
Realistic computer simulations of ATCS could enable engineers to test PTCsystem configurations in the laboratory. The designs could be validated usinga pilot project and further simulations could be run on other track segments.Such an approach would have significantly enhanced the results of the NorthAmerican Joint PTC effort.
Simulation environments also offer effective and safe testbeds for analyzingvulnerabilities. In January 2008, a 14-year-old boy built a wireless device thatenabled him to control switches for a tram system in Lodz, Poland [2]. Heis suspected of causing four derailments, including one in which twelve peoplewere injured. An ATCS simulation model would have enabled engineers todebug these and other problems in a laboratory environment.
This paper describes a network simulation model of the ATCS for wirelessrailroad controls. The ATCS is modeled using Network Simulator 2 (ns-2),a popular discrete event simulation system. The simulation model enablesengineers to gain a better understanding of ATCS strengths and weaknesses aswell as its vulnerabilities and the appropriate mitigation strategies.
2. ATCS Overview
The ATCS is an open standard for wireless railroad data systems [6]. It isused for controlling signals, switches and monitoring trains over several thou-sand miles of rail in the United States [22, 30]. The ATCS specifications [1]span several volumes, covering everything from the dimensions of the hardwareand electrical connectors to upper-level software protocols.

Craven & Oman 245
Figure 1. Example ATCS network.
A typical ATCS configuration involves three types of devices (Figure 1). Thefirst is a cluster controller/front end processor (CC/FEP). The FEP coordinatesall ATCS traffic and is directly controlled by a railway dispatch center. SeveralCCs may be connected to a FEP. The FEPs and CCs are usually combinedinto one unit (CC/FEP). Multiple CC/FEPs can be chained together using aspecialized ATCS packet switch.
The second major device is the base communications package (BCP). EachCC coordinates traffic for multiple BCPs. Communications between CC/FEPsand BCPs usually employ wired lines. Typically, CC/FEPs handle around tenBCPs. While a CC/FEP can handle more BCPs, the effect of losing a CC/FEPis minimized by limiting the number of BCPs that connect to it.
The third type of device is a mobile communications package (MCP), whichis an interface for equipment in locomotives and wayside devices (e.g., trainsignals, switches and track sensors). Locomotives use the BCP to send andreceive information from wayside devices. Each BCP serves a number of MCPs.Communications between MCPs and BCPs is done wirelessly via full duplexusing two separate frequencies. One frequency (typically around 897 MHz) isused for MCP to BCP communications. The other frequency (usually about935 MHz) is for BCP to MCP communications. Other frequencies may beemployed, depending on the licenses obtained by the railroad.
Usually, each MCP is serviced by at least two BCPs; this provides redun-dancy if there is a problem with a BCP or its communications. Also, MCPs areallowed to move between BCPs. Multiple BCPs usually receive transmissions

246 CRITICAL INFRASTRUCTURE PROTECTION II
from an MCP, each BCP relays the data to the CC. When the CC has to senddata to an MCP, it selects one BCP to transmit the data.
3. Network Simulator 2 Overview
Network Simulator 2 (ns-2) is a popular discrete event simulator for net-working research [10]. Its flexible architecture supports 802.3, 802.11 and manyother protocols, including new protocols that may be introduced as plug-ins.The ns-2 system handles protocols all the way from the physical layer (OSILayer 1) to the application layer (OSI Layer 7).
Simulations in ns-2 have three major parts: C++ code for handling network-ing protocols, TCL-based specifications of a network setup, and code for datapost-processing. Coding networking protocols such as TCP/IP and HTTP inC++ allows simulations to run fast. Most of the CPU time during a simulationis spent executing the protocol-handling code. C++ is also excellent for codinglow-level bit manipulations required in network simulations. Networking codeis usually written in C, a subset of C++; thus, the code is easily integratedand tested using ns-2.
Using the TCL scripting language to create nodes and network links allowsquick changes to network setups. TCL also allows ns-2 to be used as a full-fledged development platform for simulations. In particular, a user can useTCL to create a suite of simulations to be run with just one command. Thens-2 system uses OTcl [29], an extension to TCL that supports object-orienteddevelopment.
Network simulations can generate extremely large log files, which may haveto be processed with summarization and analysis tools. Text processing toolssuch as grep, sed, awk and perl can be used for data summarization. ns-2incorporates nam, a network animator program that displays animations ofnetwork traffic. Programs like gnuplot and Excel can be used to create graphs.
4. Modeling ATCS
The ATCS simulator is implemented in ns-2 using four main components:scheduler, event interface, handler interface and TCL/C++ language bindings.The scheduler is the heart of the ns-2 system. All the discrete events, whichinclude packet transmissions, are passed to the scheduler along with the timesthey should be processed. The scheduler then examines each event in order andtriggers a “handler” to process the event. Finally, the ATCS simulator bindsits C++ code to the TCL scripting language using the same method as the restof the ns-2 code.
Most of the C++ classes provided in the ATCS simulator are modeled afterOSI layers. For example, a C++ class is available for modeling the physicallayer, and subclasses are available for wireless and wired modems. Becausemany ATCS applications are low-level in nature, higher OSI layers (e.g., pre-sentation layer) may be combined with other layers to simplify coding.

Craven & Oman 247
Other classes are employed to represent network nodes. These classes followthe “composite pattern” [12]. A class that represents a network node containsmultiple OSI layer objects. The node class itself has the same handler interfaceas the OSI layers.
The next most common class in the ATCS simulator creates the adapter [12]between TCL and C++. The adapter class is static and is responsible forcreating and binding a “shadow” object in C++ for each object of that typecreated in TCL.
While the C++ code models the internals of a working ATCS, specific net-works are set up using TCL code. It takes just 25 lines of TCL code to modelthe communications between the three major types of ATCS nodes: MCP,BCP and CC. Using data files, or even random numbers, makes it easy to puttogether large simulations involving many nodes.
5. Wireless Medium Modeling
This section describes the wireless medium assumptions and characteristicsmodeled with the ATCS simulation code written for ns-2.
5.1 Propagation Models
The ATCS runs full-duplex communications with two frequencies, one foroutgoing data from the BCP and one for incoming data. The two frequenciesare handled independently by the simulator. Propagation can be calculatedbased on free space loss on a flat plane or by using the Longley-Rice model,which takes elevation into account. By default, the network is assumed to beon a flat plane and the coordinates for each node are in the latitude-longitudeformat. The received signal strength is calculated using free space loss and theuser can account for antenna gain and cable loss.
The Longley-Rice propagation model can be used if the simulation requiresterrain effects to be taken into account. This model requires digital elevationmodels (DEMs) [27] and involves more computational overhead than the freespace loss model. The free space loss and Longley-Rice propagation models arediscussed in detail later in this paper.
5.2 Transmitter-Receiver Distance
The code for the wireless medium relays copies of each transmitted packetto the radio receivers listening on the corresponding frequency. The time takenfor the signal to arrive depends on the distance to the receiver. The distancebetween the transmitter and receiver is calculated according to their latitudesand longitudes using an adaptation of the Haversine Formula:
∆lat = lat2 − lat1 (1)
∆long = long2 − long1 (2)

248 CRITICAL INFRASTRUCTURE PROTECTION II
The distance between the transmitter and receiver (in meters) is computedusing the following equations:
a = sin2
(
∆lat
2
)
+ cos(lat1)cos(lat2)sin2
(
∆lon
2
)
(3)
b = 2 · atan2(
√a√
1 − a) (4)
d = Rb (5)
where lati is the latitude of point i (radians), longi is the longitude of pointi (radians), atan2(a, b) is the arctangent of a/b, R is the radius of the Earth(≈ 6,371 km), a is the square of half of the straight-line distance, b is the greatcircle distance (radians), and d is the distance between the transmitter andreceiver (km).
Whether the receiver can actually receive and decode the packet dependson how much power the signal has upon arrival. This is where the user hasthe option to use the free space loss propagation model or the Longley-Ricepropagation model.
5.3 Power Loss
The ATCS model estimates the power loss during transmission between twonodes using the free space loss or Longley-Rice propagation models. The modelsincorporate parameters for antenna gain and signal loss from the cable andconnectors.
Free Space Loss Propagation Free space loss [13] assumes that thereare no obstructions between the two nodes and that the signal is not reflected(that would cause it to propagate further). Free space loss has been shown toprovide a reasonable approximation for distance-dependent loss [24]. However,the model does not account for losses due to terrain obstructions.
The loss, l, is computed as:
l =
(
4πd
λ
)2
(6)
where d is the distance between the nodes and λ is the wavelength of the signal.The source signal spreads out in a sphere whose radius is the distance be-
tween the transmitter and the receiver; this gives the 4πd term in the equation.The longer the wavelength, the larger the antenna and the more signal thatis captured; this gives the 1
λ term in the equation. Also, the signal strengthdrops off in proportion to the square of both terms. Since the radio channelis specified in terms of its frequency rather than wavelength, substituting forλ = c/f , yields:
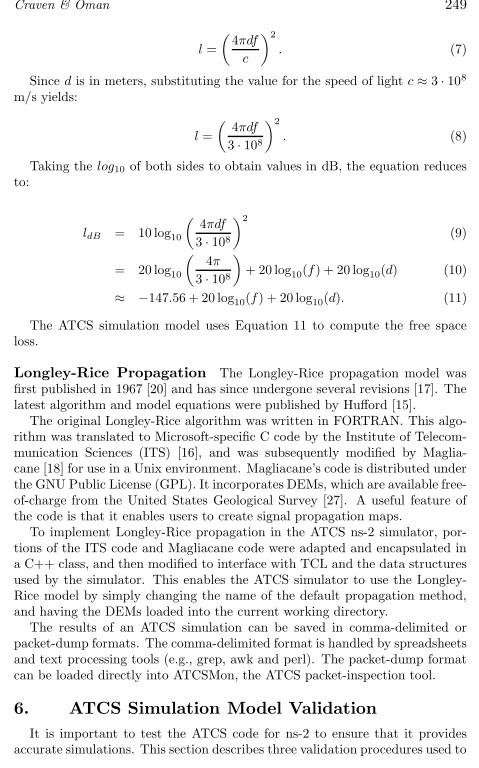
Craven & Oman 249
l =
(
4πdf
c
)2
. (7)
Since d is in meters, substituting the value for the speed of light c ≈ 3 · 108
m/s yields:
l =
(
4πdf
3 · 108
)2
. (8)
Taking the log10 of both sides to obtain values in dB, the equation reducesto:
ldB = 10 log10
(
4πdf
3 · 108
)2
(9)
= 20 log10
(
4π
3 · 108
)
+ 20 log10(f) + 20 log10(d) (10)
≈ −147.56 + 20 log10(f) + 20 log10(d). (11)
The ATCS simulation model uses Equation 11 to compute the free spaceloss.
Longley-Rice Propagation The Longley-Rice propagation model wasfirst published in 1967 [20] and has since undergone several revisions [17]. Thelatest algorithm and model equations were published by Hufford [15].
The original Longley-Rice algorithm was written in FORTRAN. This algo-rithm was translated to Microsoft-specific C code by the Institute of Telecom-munication Sciences (ITS) [16], and was subsequently modified by Maglia-cane [18] for use in a Unix environment. Magliacane’s code is distributed underthe GNU Public License (GPL). It incorporates DEMs, which are available free-of-charge from the United States Geological Survey [27]. A useful feature ofthe code is that it enables users to create signal propagation maps.
To implement Longley-Rice propagation in the ATCS ns-2 simulator, por-tions of the ITS code and Magliacane code were adapted and encapsulated ina C++ class, and then modified to interface with TCL and the data structuresused by the simulator. This enables the ATCS simulator to use the Longley-Rice model by simply changing the name of the default propagation method,and having the DEMs loaded into the current working directory.
The results of an ATCS simulation can be saved in comma-delimited orpacket-dump formats. The comma-delimited format is handled by spreadsheetsand text processing tools (e.g., grep, awk and perl). The packet-dump formatcan be loaded directly into ATCSMon, the ATCS packet-inspection tool.
6. ATCS Simulation Model Validation
It is important to test the ATCS code for ns-2 to ensure that it providesaccurate simulations. This section describes three validation procedures used to

250 CRITICAL INFRASTRUCTURE PROTECTION II
test the simulation model: (i) running simulation data on an ATCS monitoringtool, (ii) comparing simulation data with laboratory data, and (iii) comparingsimulation data with data from a mathematical model.
6.1 ATCSMon-Based Validation
The ATCSMon tool decodes ATCS radio traffic and interprets packets. It issimilar to Ethereal, which is used in TCP/IP networks.
In order to test that the ATCS ns-2 simulation produces valid packets, sup-port was added to save packet traces in the ATCSMon format. The simulatedpackets were compared with real packets to verify that they were similar incontent and timing. The ATCSMon visualization feature helped confirm thatthe simulation data was “realistic.”
6.2 Laboratory-Data-Based Validation
This validation study used test data from an ATCS laboratory maintainedby Wabtec Corporation. The laboratory setup included several MCPs, oneBCP and one FEP/CC; ATCSMon was used to capture data. An identicalsetup was created virtually using ns-2. The data was identical, except for aCRC code and three bytes used to hold session information. The virtual modelwas adjusted to handle these data fields.
Packet timing was also compared. In this case, the results were similar, butnot exact. Rather than transmitting status data at exactly 60-second intervals,the MCPs would drift a few tenths of a second during each cycle. The differenceis significant when large numbers of MCPs are employed. Packet collisionsoccur when two stations transmit at exactly the same time (every 60 seconds).However, fewer collisions occur when the 60-second cycle drifts a little, Thisdifference is seen more clearly when data from the ns-2 model is compared withATCS data generated using a mathematical model of ATCS throughput.
6.3 Mathematical-Model-Based Validation
The Sharif-Furman mathematical model of ATCS throughput [23] was usedin the study. According to the Sharif-Furman model, the throughput shouldchange smoothly depending on the number of MCP nodes that have traffic.The greater the number of MCPs, the greater the number of packet collisions,which reduces the effective throughput.
We tested this characteristic with multiple simulations of the ATCS ns-2model. All the MCPs were set the same distance from the BCP, and supportfor “busy-bit” traffic control was turned off. Simulation runs were performedfor networks with five MCPs up to 25 MCPs; each simulation modeled one hourof traffic. The simulations were run, summarized and graphed in one step usingTCL scripts. The total computation time required to create twenty hours ofsimulated ATCS network traffic was less than five seconds.

Craven & Oman 251
0
50
100
150
200
250
5 10 15 20 25Number of nodes
(a) 60 second interval.
0
20
40
60
80
100
120
140
5 10 15 20 25Number of nodes
(b) 59-61 second interval.
Figure 2. Corrupted packets vs. nodes.
The first group of simulation results did not match the mathematical model.The main reason is that the Sharif-Furman model assumes that packets arescheduled according to a Poisson distribution (i.e., they arrive independently);however, ATCS traffic does not follow a Poisson distribution. Acknowledgementpackets are sent upon packet arrival, and status information is usually sentonce per minute. This results in a mean number of packets over a time intervalthat does not equal the variance, violating one of the criteria for a Poissondistribution. Evidence of this can be seen in Figure 2(a), where the number ofpacket collisions in one hour is plotted against the number of nodes. Instead ofa smooth increase in packet collisions, the collisions jump in multiples of 120.Nevertheless, the Sharif-Furman model provides an upper bound for randomly-scheduled ATCS packets.
The simulations show that packet collisions occur when each node transmitsstatus information once a minute and two nodes on the network are set totransmit at exactly the same time. Thus, two packets are marked as corrupteddue to each collision. Because the time to retry is somewhat random, thesecond attempt at sending the packets usually works. However, as discussedearlier, laboratory tests show that most MCPs do not transmit exactly once perminute. Thus, if the simulation is changed to randomize the interval between59 and 61 seconds, the results are notably different, as shown in Figure 2(b).
Sharif and Furman expressed their results in terms of the throughput thatcould be expected in a given system and provide a graph of the predictedthroughput with 251 byte packets. They used the following equation to com-pute the throughput:
S =U
B + I(12)

252 CRITICAL INFRASTRUCTURE PROTECTION II
where U is the average time spent on successful packets, B is the average busytime and I is average idle time (all in seconds).
On the other hand, we use the following equation to calculate the throughputfor an ATCS model simulation:
S =lbits · n
t · r (13)
where lbits is the packet length (bits), n is the number of packets successfullyreceived, t is the time (seconds) and r is the data rate (bits per second).
The simulated environment used for validation incorporated ten MCP nodesand one BCP node. The results show that the ATCS simulator replicates theconditions imposed by Sharif-Furman. Figure 3(a) compares the Sharif-Furmanmodel results with those obtained with the ATCS simulator. Each point in theATCS simulation results represents an average of 20 runs, each 10 minutes long.
The system load was computed by dividing the bits sent per second dividedby the capacity of the data line. In this case, a load of 1.0 implies that tenMCP nodes generate 1,200 bits to transmit every second on a 1200 baud line.Loads greater than 1.0 indicate more data is sent at a faster rate than thebaud rate of data transmission. Simulated loads were increased in incrementsof 0.05 with busy-bits being transmitted. Note that the 251-byte packets usedby Sharif-Furman were much larger than the ATCS packets, which were lessthan 40 bytes.
The Sharif-Furman results show that the predicted throughput is slightlylarger than the data offered load for many of the lower load values. In otherwords, more data was received than was transmitted; but it is not clear fromthe Sharif-Furman paper what this extra data represents. Consequently, it isdifficult to tell the point at which packets start getting dropped for the Sharif-Furman model. This is important because, in most real-time systems, networksmust be configured so that dropped packets are very rare. In the case of theATCS simulation, packets start getting dropped at a load of 0.2 for a packetlength of 251 bytes.
In general, the simulation results are slightly lower than the results predictedby the Sharif-Furman model. This is expected because the Sharif-Furmanmodel provides the “ideal” upper bound – due to the fact that packets aregenerated at random intervals. The ATCS simulation, on the other hand, gen-erates packets at intervals that are mostly periodic in nature, increasing thechance of packet collisions. ATCS packets do not follow the Poisson distribu-tion expected by the Sharif-Furman model; this is reflected in lower throughputfor the simulated model.
7. Modeling Network Loads
The ns-2 ATCS simulator can also be used to model new situations. Forexample, support for ATCS traffic control can be set to one of three states:(i) BCP busy-bits can be turned off, (ii) BCP transmits only when it hastraffic to send, or (iii) BCP always transmits. Figure 3(b) shows the average

Craven & Oman 253
0
0.2
0.4
0.6
0.8
1
1.2
1.4
0 0.2 0.4 0.6 0.8 1 1.2 1.4
Act
ual l
oad
Offered load
Actual loadDesired load
Sharif-Furman
(a) Predicted/simulated throughput.
0
50
100
150
200
250
300
350
0 5 10 15 20 25 30 35 40 45 50Number of nodes
OffOn
Always
(b) Corrupted packets vs. nodes.
Figure 3. Simulation results.
number of corrupted packets for simulation runs of one hour with the BCP setto each of the three possible states. For each node count in the graph, twentysimulations were run and the results averaged. Each MCP node transmits astatus message over an interval between 59 and 61 seconds. The CC does notsend any control messages to the MCPs. The only packets received by theMCPs are acknowledgement packets.
The results in Figure 3(b) show that always transmitting a busy-bit for trafficcontrol significantly impacts the number of corrupt packets. Transmitting thebusy-bit only when the BCP needs to transmit data does not significantlyimpact the number of corrupted packets. However, it should be noted that thisis the worst-case scenario because the CC usually sends control messages to theMCPs on a periodic basis and this increases the number of busy-bits sent. Thefrequency with which control messages are sent depends on the scenario. It iseasy to run simulations that model the different scenarios.
Figure 4(a) shows the average times for delivering ATCS packets (over 20simulation runs). Packets are not counted unless they arrive. the average timeincreases as more nodes are added to a network. Most packets continue toarrive quickly, but packet collisions and retries drive up the average. Note thattransmitting a busy-bit improves the average packet time fairly significantly.
Figure 4(b) shows the average maximum times for deliver packets (over 20simulation runs). Knowing the expected maximum time for packet delivery isimportant in real-time applications. Note that this time increases quickly evenwhen only a few nodes added to the system.
8. Conclusions
The ATCS ns-2 simulation system is a valuable tool for modeling ATCS net-works and investigating their behavior in a virtual environment. By setting upa suite of ns-2 scripts, an engineer can simulate hundreds of possible scenarios

254 CRITICAL INFRASTRUCTURE PROTECTION II
0 0.1 0.2 0.3 0.4 0.5 0.6 0.7 0.8 0.9
1 1.1
0 5 10 15 20 25 30 35 40 45 50Number of nodes
OffOn
Always
(a) Av. time to deliver packets.
0
5
10
15
20
25
30
35
40
0 5 10 15 20 25 30 35 40 45 50Number of nodes
OffOn
Always
(b) Av. max time to deliver packets.
Figure 4. Average packet times.
in the space of a few seconds. The simulation results are useful for understand-ing ATCS communication characteristics, identifying protocol strengths, weak-nesses and vulnerabilities, and developing mitigation techniques. The fidelity ofthe ATCS simulation model is validated by test results using ATCSMon mon-itoring software, laboratory data and the Sharif-Furman mathematical model.
References
[1] Association of American Railroads, System Architecture: ATCS Spec-ification 100 (Revision 4.0), Washington, DC (www.atcsmon.com/1004 0.htm), 1995.
[2] G. Baker, Schoolboy hacks into city’s tram system, The Daily Telegraph,January 11, 2008.
[3] M. Benke, On the Survivability of Transportation Systems, M.S. Thesis,Computer Science Department, University of Idaho, Moscow, Idaho, 2005.
[4] M. Benke, A. Abdel-Rahim, P. Oman and B. Johnson, Case study of asurvivability analysis of a small intelligent transportation system, Trans-portation Research Record: Journal of the Transportation Research Board,vol. 1944, pp. 98–106, 2006.
[5] S. Butapati, R. Kalidindi, M. Benke, A. Abdel-Rahim, P. Oman andB. Johnson, A case study of critical point identification in the physicaland communication layers of a small urban transportation system, Inter-national Journal of Critical Infrastructures, vol. 2(4), pp. 319–330, 2006.
[6] P. Craven, A brief look at railroad communication vulnerabilities, Proceed-ings of the Seventh International IEEE Conference on Intelligent Trans-portation Systems, pp. 245–249, 2004.
[7] P. Craven, Security of RCL wireless railway communications, Proceedingsof the IEEE Conference on Control Applications, pp. 711–715, 2005.

Craven & Oman 255
[8] P. Craven and S. Craven, Security of ATCS wireless railway communica-tions, Proceedings of the ASME/IEEE Joint Rail Conference, pp. 227–238,2005.
[9] P. Craven and S. Craven, Security of railway EOT systems, Proceedings ofthe ASME/IEEE Joint Rail Conference, pp. 199–204, 2005.
[10] K. Fall and K. Varadhan, The Network Simulator – ns-2 (nsnam.isi.edu/nsnam/index.php/Main Page).
[11] Federal Railroad Administration, Positive train control overview, De-partment of Transportation, Washington, DC (www.fra.dot.gov/us/content/1265).
[12] E. Gamma, R. Helm, R. Johnson and J. Vlissides, Design Patterns: El-ements of Reusable Object-Oriented Software, Addison-Wesley, Boston,Massachusetts, 1995.
[13] D. Green and A. Obaidat, An accurate line of sight propagation perfor-mance model for ad-hoc 802.11 wireless LAN (WLAN) devices, Proceed-ings of the IEEE International Conference on Communications, vol. 5, pp.3424–3428, 2002.
[14] D. Houy, ATCS monitor for Windows (www.atcsmon.com).
[15] G. Hufford, The ITS Irregular Terrain Model (version 1.2.2), Institutefor Telecommunication Sciences, National Telecommunications and In-formation Administration, Boulder, Colorado (flattop.its.bldrdoc.gov/itm/itm alg.pdf), 1999.
[16] Institute for Telecommunication Sciences, C++ code for Longley-Ricepropagation, National Telecommunications and Information Administra-tion, Boulder, Colorado (flattop.its.bldrdoc.gov/itm.html), 2007.
[17] A. Longley and P. Rice, Prediction of Tropospheric Radio TransmissionLoss over Irregular Terrain: A Computer Method, ESSA Technical Re-port ERL 79-ITS 67, Institute for Telecommunication Sciences, NationalTelecommunications and Information Administration, Boulder, Colorado(www.its.bldrdoc.gov/pub/essa/essa erl 79-its 67), 1968.
[18] J. Magliacane, Splat! RF signal propagation, loss and terrain analysis tool(www.qsl.net/kd2bd/splat.html).
[19] N. Mead, R. Ellison, R. Linger, T. Longstaff and J. McHugh, Surviv-able Network Analysis Method, Technical Report CMU/SEI-2000-TR-013,Software Engineering Institute, Carnegie Mellon University, Pittsburgh,Pennsylvania, 2000.
[20] P. Rice, A. Longley, K. Norton and A. Barsis, Transmission Loss Predic-tion for Tropospheric Communication Circuits, Volumes I and II, TechnicalNote 101, Institute for Telecommunication Sciences, National Telecommu-nications and Information Administration, Boulder, Colorado (www.its.bldrdoc.gov/pub/ntia-rpt/tn101), 1967.
[21] L. Ritter, J. Barrett and R. Wilson, Securing Global Transportation Net-works, McGraw-Hill, New York, 2006.
256 CRITICAL INFRASTRUCTURE PROTECTION II
[22] Securities and Exchange Commission, Norfolk Southern Corporation:Form 10-K (Fiscal year ending December 31, 2003), Washington, DC (www.secinfo.com/dwDMq.11q.htm), 2004.
[23] H. Sharif and E. Furman, Analytical model for ATCS inbound RF chan-nel throughput, Proceedings of the Forty-First IEEE Vehicular TechnologyConference, pp. 885–892, 1991.
[24] D. Smith, Digital Transmission Systems, Kluwer Academic Publishers,Norwell, Massachusetts, 2003.
[25] T. Smith, The impact of highway infrastructure on economic performance,Public Roads Magazine, vol. 57(4), pp. 8–14, 1994.
[26] The White House, The National Strategy for the Physical Protectionof Critical Infrastructures and Key Assets, Washington, DC (www.whitehouse .gov/pcipb/physical strategy.pdf), 2003.
[27] United States Geological Survey, 1:250,000-scale digital elevation model(DEM), Reston, Virginia (edcftp.cr.usgs.gov/pub/data).
[28] J. Waite, M. Benke, N. Nguyen, M. Phillips, S. Melton, P. Oman, A. Abdel-Rahim and B. Johnson, A combined approach to ITS vulnerability andsurvivability analyses, Proceedings of the Seventh IEEE Conference on In-telligent Transportation Systems, pp. 262–267, 2004.
[29] D. Wetherall, OTcl (otcl-tclcl.sourceforge.net/otcl).
[30] D. Williams, B. Metzger and G. Richardson, Spec 200 radio code line duct-ing – Cause and effect, Proceedings of the American Railway Engineeringand Maintenance-of-Way Association Conference, 2001.

Chapter 19
AN INTEGRATED METHODOLOGYFOR CRITICAL INFRASTRUCTUREMODELING AND SIMULATION
William Tolone, Seok-Won Lee, Wei-Ning Xiang, Joshua Blackwell,Cody Yeager, Andrew Schumpert and Wray Johnson
Abstract Integral to effective critical infrastructure analysis is the assessment ofinfrastructure vulnerabilities, which provides insights into potential dis-ruptions that can enhance protection plans and response and recoveryoperations. Effective critical infrastructures analysis, however, must ac-count for the complex, multi-dimensional characteristics of infrastruc-tures and the dependencies between infrastructures. This paper presentsa new methodology for integrated modeling and simulation that sup-ports such analysis. An integrated analysis environment that embodiesthis new methodology is presented as a proof of concept.
Keywords: Modeling, simulation, geospatial analysis, ontological analysis
1. Introduction
Critical infrastructures are infrastructures that, if disrupted, can underminea nation’s security, economy, public health and way of life [15]. Recent incidentssuch as the 2003 blackout in the Northeastern United States and SoutheasternCanada and the 2005 hurricanes in Louisiana and Texas demonstrate the catas-trophic impacts of critical infrastructure disruptions. While it is unlikely thatdisruptions can be prevented, effective critical infrastructure analysis can – atthe very least – minimize their impact by improving vulnerability assessments,protection planning and strategies for response and recovery.
Critical infrastructure analysis seeks to provide insights into infrastructurebehavior and potential disruptions that can increase the efficacy of protectionplans and response and recovery operations. The U.S. Government has identi-fied thirteen critical infrastructure sectors (e.g., energy, communications, andbanking and finance) [15]. Each sector is a mission-critical, socio-technicalsystem involving complex, multi-dimensional collections of technologies, infor-
Please use the following format when citing this chapter: Tolone, W., Lee, S.-W., Xiang, W.- N., Blackwell, J., Yeager, C., Schu mpert, A. and Johnson, W., 2008, in IFIP
Shenoi, S., (Boston: Springer), pp. 257–268. International Federation for Inform ation Processing, Volum e 290; Critical Infrastructure Protection II , eds. Pap a, M.,
258 CRITICAL INFRASTRUCTURE PROTECTION II
mation, processes and people. All the sectors are highly interdependent –disruptions in one sector cascade and escalate across the other sectors [12].
In order to account for these characteristics, critical infrastructure analysismust satisfy two important requirements. First, it should emphasize the en-gineering properties and the behavioral properties of each infrastructure. En-gineering properties describe the technical characteristics of an infrastructurein terms of the underlying physics-based properties of the inanimate objectsthat constrain infrastructure operation. Behavioral properties describe the re-lational properties that emerge from business processes, decision points, humaninterventions, information availability, reliability and consistency, in additionto the engineering properties of the infrastructure.
Second, critical infrastructure analysis must be conducted in situ, i.e., incontext. Suchman [13] argues that context gives meaning to action – separat-ing actions from the context in which they are performed causes the meaningsor implications of the actions to be lost. Examining infrastructures in isola-tion ignores the complex dependencies that exist between infrastructures andthe contextual factors that constrain infrastructure behavior. This results invulnerability assessments that are at best incomplete and at worst invalid.
These two requirements must constitute the foundation for any comprehen-sive, holistic and systemic analysis of critical infrastructures, especially mod-eling and simulation activities that support infrastructure protection. Thispaper presents a new methodology for infrastructure modeling and simulationthat addresses the two requirements. The methodology is realized within anintegrated environment that supports effective critical infrastructure analysis.
2. Related Work
Modeling and simulation are important activities that facilitate the explo-ration and analysis of complex phenomena, especially those encountered incritical infrastructure systems. In fact, for many phenomena, modeling andsimulation may be the only viable means for exploration and analysis. This isparticularly true for phenomena that are characterized by organic collectionsof events involving open systems — systems that may include social, economic,technical, civic, environmental, informational and geographic contexts. Effec-tive modeling and simulation of these phenomena often require a system-of-systems approach that recognizes the various dimensions of the phenomenaand the relationships between the dimensions.
A comprehensive survey of critical infrastructure modeling and simulationsolutions can be found in [10]. Several solutions decompose analysis to the ex-ploration of individual infrastructures. Many useful single infrastructure solu-tions exist (see, e.g., [4, 11]). However, decomposition methods fail to recognizethe importance of the behavioral properties of infrastructures and the complexdependencies existing between infrastructures. Furthermore, these solutions aredifficult to generalize due to the unique characteristics of each infrastructure.
Other solutions focus on infrastructure interdependencies (see, e.g., [3, 6]).These solutions attempt to recognize the in situ requirement and model the

Tolone, et al. 259
Figure 1. Integrated modeling and simulation framework.
complex behavior that emerges from the interdependencies. However, thesesolutions do not adequately incorporate the unique behaviors of the underlyinginfrastructures. While interdependencies can lead to cascading and escalatingeffects [12], these effects arise specifically from the interplay of the interdepen-dencies and the individual behavior of infrastructures. When the behavior ofindividual infrastructure is ignored, the fidelity of the model is greatly reduced.
Still other solutions attempt to construct comprehensive models of criticalinfrastructures (see, e.g., [2, 5, 9, 12, 14]). However, detailed comprehensivemodels are difficult to construct due to the unique characteristics of each in-frastructure. As a result, these models emphasize higher levels of analysis atthe cost of detailed analysis.
Recently, there have been efforts to develop hybrid solutions for criticalinfrastructure modeling and simulation (see, e.g., [1, 16]). Pederson and col-leagues [10] describe these efforts as adopting a “coupled modeling” approach.Under this approach, individual infrastructure models are integrated in a gener-alized manner with models of infrastructure dependencies to enable system-of-systems analysis, which couples the fidelity of individual infrastructure modelswith the requirement for in situ analysis. Our modeling and simulation solutionleverages this coupled approach.
3. Modeling and Simulation Methodology
This section describes the modeling and simulation methodology, whichbuilds on our previous work in the area [16]. The methodology leverages exist-ing infrastructure models and a representation of context and behavior.

260 CRITICAL INFRASTRUCTURE PROTECTION II
3.1 Integration Framework
The methodology for modeling and simulation is based, in part, on the abil-ity to integrate separate infrastructure models within a single framework. Theframework is designed around a service-oriented architecture supported by acommon service provider API (Figure 1). Under this framework, each infras-tructure model is integrated by implementing a framework connector, which re-alizes the common service provider API, and registering the connector with theframework’s service registry. The infrastructure models are leveraged duringanalysis via the connectors by the Integrated Modeling Environment (describedbelow), which functions as a service requester. Interaction between the servicerequester and service providers is event-driven. Thus, the methodology enablesdiscrete simulations in support of analysis activities. Individual infrastructuremodels, however, may or may not be event-based. To integrate continuoussimulation models, it is necessary to implement a framework connector thatadapts continuous simulations to discrete simulations.
3.2 Representing Context and Behavior
Because context gives meaning to action [13], examining the behavior of crit-ical infrastructures in isolation and outside of space and time leads to a loss inthe meaning or implication of infrastructure behavior. John Locke’s definitionof “knowledge” inspires our representation of context and the meaning it em-bodies. Locke [8] describes knowledge as the ability to distinguish concepts orideas. In other words, knowledge emerges from relationships among concepts.Our representation leverages this definition and draws on ontology principlesand the notion of a relation to provide a representation of context and behav-ior. Our methodology uses relations to support the specification of contextualand behavioral properties along three dimensions: function, time and space.These dimensions situate infrastructure features and their collective behaviorby answering how, when and where features are related. In this context, aninfrastructure feature is any modeled component of an infrastructure.
Functional Relations Under our methodology, each infrastructure fea-ture may be associated functionally with other infrastructure features. Wedefine functional relations according to a specified commodity and relationalrule, and by leveraging a provider/subscriber paradigm. Commodities are tan-gible or intangible goods or services that may be generated, transported orconsumed by infrastructure features. Relational rules further restrict the rela-tion by constraining the set of origin features that may provide a commodity toa destination feature. Most relational rules constrain this behavior accordingto provider/subscriber proximity.
A functional relation is represented by the tuple, (origin × commodity ×destination × relational rule), which states that the infrastructure featureorigin provides the commodity to infrastructure feature destination accord-ing to the relational rule. Given that the collective critical infrastructure of a

Tolone, et al. 261
region may contain tens of thousands of features, it is not feasible to specify ev-ery functional relation. Therefore, we allow functional relations to be specifiedat a type/subtype level and an instance level using selection sets. A selectionset is a specification that resolves to a set of features according to a specifiedcriterion. For example, functional relations can be specified that state that in-frastructure features of type origin type provide a commodity to infrastructurefeatures of type destination type according to the relational rule.
Temporal Relations Under our methodology, each infrastructure featuremay be associated with temporal latencies for enabling or disabling the fea-ture. A temporal relation is represented by the tuple, (feature× commodity×effect ×duration), which states that when an infrastructure feature loses orgains access to a commodity, the effect (i.e., disable or enable) is delayed by aduration. For example, if an infrastructure feature losses access to the essentialcommodity electricity, the disabling effect of losing the commodity is delayeduntil the specified latency has passed; this latency may model a limited alterna-tive commodity source (e.g., battery backup). Similarly, once an infrastructurefeature gains access to its essential commodities, the enabling effect is delayeduntil the specified latency has passed; this latency can model the startup timerequired to enable the feature. If access to an essential commodity is restoredbefore the disablement latency has expired, then the disable event is discarded.Similar to functional relations, temporal relations for infrastructure featuresmay be specified at the type/subtype or instance levels.
Spatial Relations Finally, our methodology recognizes that infrastruc-ture features, as physical objects, are spatially tangible. Therefore, each in-frastructure feature may be associated with a location in space. Its locationand spatial relationships with other infrastructure features are represented bygeographic coordinates and also, as in many geographic information systems,by topological relationships [7]. A spatial relation is represented by the tuple,(feature × location), which states that infrastructure feature is located atlocation in geographic space. Spatial relations of infrastructure features areused in numerous ways, including for proximity analysis according to relationalrules (e.g., nearest provider in a given radius), spatial correlations (e.g., mapoverlays) and geo-visualizations.
Infrastructure Context and Behavior Ontology Integrating func-tional, temporal and spatial relations leads to an ontology for modeling infras-tructure context and behavior (Figure 2). An ontology models the well-defineddimensions of a domain in terms of objects, attributes and relations. It alsoenables the construction of a common understanding through a common lan-guage and representation for analytical discourse. In our ontology, functionaland temporal relations are represented by the objects in grey. Spatial relationsare modeled by the “Space” association between the “Feature” object and the“Location” object.

262 CRITICAL INFRASTRUCTURE PROTECTION II
Figure 2. Infrastructure context and behavior ontology.
4. Integrated Methodology
Our new methodology leverages the integration framework and the contextand behavior ontology. It involves five steps.
1. Infrastructure Model Identification and Development: Infrastruc-ture models are realized by using third party products (e.g., [4, 11]) or byinstantiating generic infrastructure models that are built into the integrationframework (e.g., utility, transport and channel networks).
2. Connector Development: Each infrastructure model must instantiate aconnector for the model to participate in the integration framework. Theframework provides a simple connector API for connector development.
3. Infrastructure Model Importation: The modeling environment, as aservice requester, requires from each infrastructure model a representationof the infrastructure features for the model for the features to participate inthe context and behavior ontology.
4. Integrated Model Development: Functional, temporal and spatial re-lations are specified (ontology instantiation); relationships are instantiatedbased on these specifications.
5. Integrated Modeling and Simulation: Models are explored, simulationsare executed and analyzed, models are validated and analysis products areconstructed.
These five steps are not necessarily performed in a sequential manner. Eachstep remains ongoing as analysis questions change, infrastructure models evolve(due to data acquisition, verification and validation), and the integrated model


264 CRITICAL INFRASTRUCTURE PROTECTION II
Figure 4. Model Builder interface (Relationships tab).
The third tab, “Simulator,” is visible in Figure 3. This tab allows analysts toselect a course of action, specify a start time and initiate a simulation. As thesimulation executes, the analyst sees on the left-hand side of this tab an eventstream capturing infrastructure feature enable and disable events. Featuresare enabled/disabled as a function of individual infrastructure model behaviorand as a function of the relations specified in the infrastructure context andbehavior ontology. Each simulation event includes a timestamp. The right-hand side of the simulator tab contains a scorecard that aggregates simulationevent stream data along various dimensions (e.g., time, infrastructure and fea-ture type). Saved simulations are listed at the bottom of the tab. As thesimulation executes, analysts can observe the effects in the geo-visualization.Dynamic changes in feature symbology reflect domain model state changes (i.e.,enabling and disabling of features).
To conduct meaningful analysis, however, the context and behavior ontologymust be specified. This activity is supported by a separate Model Builder inter-face palette. The palette includes, among other tabs, interfaces for specifyingcommodities, relationships, latencies and connectors. The “Relationships” tab(Figure 4) enables model builders to specify and manage the functional rela-tions for domain models. The “Latencies” tab provides model builders witha means to manage the temporal relations that specify infrastructure featureenabling and disabling latencies. Finally, the “Connectors” tab provides modelbuilders with a means to manage the participating infrastructure models. Sev-eral infrastructure models have been integrated into the IME via the connectorframework (e.g., [4, 11]). In addition, the IME, by default, provides the afore-mentioned built-in models (utility, transport and channel networks).

Tolone, et al. 265
Figure 5. Example infrastructure models.
6. Critical Infrastructure Analysis
This section presents an example application of our integration methodology.The example involves a small geographic region with several buildings and threecritical infrastructures (natural gas, steam and water). Figure 5 presents eachinfrastructure and a layered view of all three infrastructures.
Table 1. Temporal relations.
Selection Set Commodity Effect Duration
Steam Source Steam Disable 1.00:00:00 (d.h:m:s)
To support integrated modeling and simulation across the infrastructures, itis necessary to geo-code relevant infrastructure features to establish spatial con-text. Next, the commodities that are essential to operating the infrastructuresare identified (steam, gas and water). The temporal latencies for infrastructurefeatures are then specified to establish the temporal context. Table 1 lists thesingle temporal latency specification used in the example.
Table 2. Functional relations.
Origin Commodity Destination Rule
Water Line Water Building #1 Nearest NeighborBuilding #1 Steam Steam Source Nearest NeighborSteam Line Steam Buildings #2 and #3 Nearest NeighborGas Line Gas Building #1 Nearest Neighbor
Finally, the functional relations among the infrastructure features are spec-ified. Table 2 presents the three functional relations used in the example.
During analysis, the Analyst interface (Figure 3) is used to specify objectivesand courses of action, and to execute and explore simulations. In the exam-

266 CRITICAL INFRASTRUCTURE PROTECTION II
Figure 6. Example simulation (disabled features in bold).
ple, the objective is to maintain the operation of Buildings #2 and #3 (i.e.,the analyst specifies an objective with the undesired effects of disabling thesebuildings). The course of action is initiated by a gas line fracture due to on-going construction. Subsequent to the fracture, downstream gas is lost (Panel1 in Figure 6). To contain the leak, a gas valve is closed one hour into thesimulation as scheduled in the course of action. This results in the loss of thegas commodity to Building #1 (Panel 2). The loss of gas to Building #1 haltsthe production of steam (Panel 3). After twenty-four hours, Buildings #2 and#3 cannot function because they have no heat (Panel 4). The integrated mod-eling and simulation behavior demonstrated by the simulation is realized bythe behaviors of the individual infrastructure models and the temporal, spatialand functional relations in the IME context and behavior ontology.
The simulations may be explored further, replayed and saved for subsequentanalysis. Analysts may use the scorecard interface to examine the order of im-pact of simulation events and the plausible impact to each critical infrastruc-ture. In addition, analysts can examine the event trace to understand and/orvalidate the event chain that lead to (un)desired effects. During the analysis,the ontology may be refined, e.g., by adding/deleting/modifying commodities,functional relations and/or temporal latencies, to explore “what-if” scenarios.
7. Conclusions
The new methodology for critical infrastructure modeling and simulationemphasizes the engineering and behavioral properties of individual infrastruc-tures and enables analyses to be conducted in functional, spatial and temporalcontext. The methodology effectively captures the complex, multi-dimensionalcharacteristics of individual infrastructures and the dependencies between in-frastructures, helping provide insights into potential disruptions that can in-crease the efficacy of protection plans and response and recovery operations.
The methodology, as realized in the IME, is being actively used to exploreand analyze critical infrastructures for large-scale geographic regions (> 100,000square km). An integrated model also has been developed for an urban re-

Tolone, et al. 267
gion (> 500 square miles with a population exceeding 800,000); the criticalinfrastructures in the integrated model include electric power, natural gas dis-tribution, water distribution, telecommunications and transportation. Otherapplications include a corporate IT infrastructure model for a Fortune 100company that integrates models for hardware, software, business applications,business processes and business units; and an urban neighborhood model cov-ering roughly 1,000 contiguous acres that serves a population of more than20,000.
Evaluation of the methodology is a priority [17, 18]. Verification and vali-dation are enabled by the methodology’s adherence to the principle of trans-parency. All analysis enabled by the ontology is completely transparent toanalysts; event traces can be explored and questioned by subject matter ex-perts. The result is an ongoing interleaving of analysis with verification andvalidation, which improves the underlying ontology and the resulting analysis.
Current research is focusing on augmenting the methodology and its under-lying framework to accommodate non-deterministic models and infrastructuredegradation. In addition, efforts are underway to enhance the expressivenessof the IME ontology and the IME visualization facility, especially the ability toview multiple infrastructure models along their functional, spatial and temporaldimensions.
References
[1] E. Casalicchio, E. Galli and S. Tucci, Federated agent-based modelingand simulation approach to study interdependencies in IT critical infras-tructures, Proceedings of the Eleventh IEEE International Symposium onDistributed Simulation and Real-Time Applications, pp. 182–189, 2007.
[2] A. Chaturvedi, A society of simulation approach to dynamic integration ofsimulations, Proceedings of the Winter Simulation Conference, pp. 2125–2131, 2006.
[3] D. Dudenhoeffer, M. Permann and M. Manic, CIMS: A framework forinfrastructure interdependency modeling and analysis, Proceedings of theWinter Simulation Conference, pp. 478–485, 2006.
[4] ESRI, ArcGIS Network Analyst, Redlands, California (www.esri.com/software/arcgis/extensions/networkanalyst/index.html).
[5] F. Flentge and U. Beyer, The ISE metamodel for critical infrastructures, inCritical Infrastructure Protection, E. Goetz and S. Shenoi (Eds.), Springer,Boston, Massachusetts, pp 323–336, 2007.
[6] O. Gursesli and A. Desrochers, Modeling infrastructure interdependenciesusing Petri nets, Proceedings of the IEEE International Conference onSystems, Man and Cybernetics, vol. 2, pp. 1506–1512, 2003.
[7] C. Lo and A. Yeung, Concepts and Techniques of Geographic InformationSystems, Prentice Hall, Upper Saddle River, New Jersey, 2007.

268 CRITICAL INFRASTRUCTURE PROTECTION II
[8] J. Locke, An Essay Concerning Human Understanding (books.google.com/books?id=cjYIAAAAQAAJ), 1690.
[9] J. Marti, J. Hollman, C. Ventura and J. Jatskevich, Design for sur-vival: Real-time infrastructures coordination, presented at the Interna-tional Workshop on Complex Network and Infrastructure Protection, 2006.
[10] P. Pederson, D. Dudenhoeffer, S. Hartley and M. Permann, Critical Infras-tructure Interdependency Modeling: A Survey of U.S. and InternationalResearch, Report No. INL/EXT-06-11464, Critical Infrastructure Protec-tion Division, Idaho National Laboratory, Idaho Falls, Idaho, 2006.
[11] PowerWorld Corporation, PowerWorld Simulator, Champaign, Illinois(www.powerworld.com/products/simulator.asp).
[12] S. Rinaldi, J. Peerenboom and T. Kelly, Identifying, understanding andanalyzing critical infrastructure interdependencies, IEEE Control Systems,vol. 21(6), pp. 11–25, 2001.
[13] L. Suchman, Plans and Situated Actions: The Problem of Human-MachineCommunication, Cambridge University Press, Cambridge, United King-dom, 1987.
[14] N. Svendsen and S. Wolthusen, Multigraph dependency models for het-erogeneous critical infrastructures, in Critical Infrastructure Protection, E.Goetz and S. Shenoi (Eds.), Springer, Boston, Massachusetts, pp 337–350,2007.
[15] The White House, National Strategy for Homeland Security, Washington,DC (www.whitehouse.gov/homeland/book/nat strat hls.pdf), 2002.
[16] W. Tolone, D. Wilson, A. Raja, W. Xiang, H. Hao, S. Phelps and W.Johnson, Critical infrastructure integration modeling and simulation, Pro-ceedings of the Second Symposium on Intelligence and Security Informatics(LNCS 3073), Springer, Berlin-Heidelberg, Germany, pp. 214–225, 2004.
[17] A. Weeks, An Assessment of Validation Methods for Critical Infrastruc-ture Protection Modeling and Simulation, M.A. Thesis, Department ofGeography and Earth Sciences, University of North Carolina at Charlotte,Charlotte, North Carolina, 2006.
[18] A. Weeks, A. Schumpert, S. Lee, W. Tolone and W. Xiang, A new approachto verification and validation in CIP modeling and simulation, presentedat the Twenty-Sixth International ESRI User Conference, 2006.

Chapter 20
USING 3D MODELS AND DISCRETESIMULATIONS IN INFRASTRUCTURESECURITY APPLICATIONS
Pierluigi Assogna, Glauco Bertocchi, Alberto Paoluzzi,Michele Vicentino, Giorgio Scorzelli and Roberto Zollo
Abstract Next generation systems for critical infrastructure protection must sup-port capabilities such as behavior analysis, situation modeling and datamining integrated within sophisticated virtual or augmented reality in-terfaces. This paper describes the design goals and implementation of aplatform for critical infrastructure security applications. The platformis designed to support semi-automated 3D modeling of infrastructures,3D integration of sensor networks, situation modeling and visual simula-tion via 3D animation, and advanced situation analysis. Such a systemwould enable operators to recognize preliminary indications of crisissituations and promptly activate the appropriate countermeasures. Itwould also assist them in optimizing normal operations and conductingsimulations for emergency planning and crisis management.
Keywords: Geometric modeling, simulation, infrastructure security
1. Introduction
Visual presentations can offer excellent situation awareness for security ap-plications. An advanced platform, providing a 3D geometric model of thesystem to be protected and facilities for event discovery, tracking and situationevaluation, is an ideal candidate. It could serve as point of reference for inte-grating vision, sensor, tracking and security systems designed for infrastructureprotection. It would provide a reliable basis for high-level situation awarenessand support coordinated and optimized decision making.
Critical transport infrastructures that straddle national borders, such astunnels, bridges, railways hubs and airports, require a novel security approach.Their ability to address threats and react to crises relies on the strong coor-dination of operational activities. This is because security threats may arise
Please use the following format when citing this chapter: Assogna, P., Bertocchi, G., Paoluzzi, A., Vicentino, M., Scorzelli, G. and Zollo, R., 2008, in IFIP International
(Boston: Springer), pp. 269–278. Federation for Information Processing, Volume 290; Critical Infrastructure Protection II , eds. Pap a, M., Shenoi, S.,

270 CRITICAL INFRASTRUCTURE PROTECTION II
not only from malicious attacks but also from natural events (storms, floods,earthquakes) and unexpected events (traffic congestion, accidents). Securityshould always be maintained and the systems should be able to deal with allthe facets of the problem. For this reason, an advanced security system must beable to infer the consequences of events based on the information received andthe inferences should be reliable even when some of the information is missing.
Virtual or augmented reality interfaces [14, 21] can be very useful. Consider,for example, a building on fire or a railroad during a storm, where video feeds arenot available. An advanced security system could use virtual/augmented realityto reproduce the situation and support optimal decision making through mod-eling and simulation. However, existing security systems are typically cleverassemblies of sensor subsystems with limited capabilities for assisting person-nel during normal operations and crises. Moreover, they are not designed tobe used when responsibility is shared between different organizations as in thecase of transnational critical infrastructures.
This paper describes the development goals and implementation directionsof a new platform for infrastructure security applications. The platform isintended to provide: (i) (mostly) automatic 3D modeling of infrastructures; (ii)3D integration of sensor networks, including video surveillance; (iii) situationmodeling though hierarchical event graphs annotated with actor models andbehavior; (iv) visual simulation via 3D animation; (v) situation analysis basedon the divergence of sensor feedback from evolving simulations; and (vi) weaksignals of risky situations deduced by comparing the results of situation analysiswith a knowledge base of past events and scenarios. This paper also discussesthe use of geometric modeling and concurrent programming tools that supportsophisticated modeling, simulation and analysis functionality.
2. Awareness Paradigm
Current security systems are useful for providing alerts and alarms basedon signals from sensor networks. However, they do not offer the high-levelfunctionality needed to accomplish complex tasks such as: (i) identifying un-usual and potentially dangerous or difficult circumstances, (ii) recognizing theweak signals of risky situations, (iii) promptly activating countermeasures, and(iv) assisting personnel in the optimized management of crises. An awarenessplatform with this functionality can be created by integrating:
3D geometric models of an infrastructure that are used as the basis forall information collected about the infrastructure.
An interoperable knowledge framework that captures information aboutthe infrastructure along with its behavior, events, users, resources, etc.,which can be used as a basis for statistical and situational models.
Pre-existing heterogeneous sensor and security systems.
Virtual or augmented reality interfaces and advanced gaming techniques.
A critical infrastructure surveillance system cannot limit itself to a repre-sentation of what is happening; it should also provide tools for analyzing the

Assogna, et al. 271
patterns, rhythms and interplays of events, and for anticipating future impact.This enables automatic as well as human responses to be more effective andproactive. Software agents provide a useful abstraction for a security platform:
ing on devices and alerting security personnel). In particular, we imagine a“holonic,” multi-level organization of agents that maintain and use an aware-ness base represented by the integration of models and sensing, surveillanceand control functions. Note that a “holon” [10] is a component of a systemthat can work autonomously even if detached from it, and that works well incooperation with other holons. According to this vision, the security platformcould represent the intelligence of the controlled infrastructure, almost like aliving organism endowed with self-consciousness [10].
A security platform should enforce modeling capabilities to the maximalextent; this is because all the support provided would be grounded on model-
Permanent situation awareness would be achieved usingtechniques that model an infrastructure, simulate its normal behavior, acquireand track normal and abnormal events, understand the weak signals that indi-cate a crisis and react to them in an optimal manner. The ability to simulateevents, actions and reactions would enable the security platform to maintainthe critical infrastructure in a safe state. Operations personnel could interactwith the platform, adding experience and judgment that cannot be coded orsimulated.
To implement such a platform, we are employing a novel approach for sym-bolic situation modeling. The approach uses (machine- and human-readable)executable and combinable storyboards [2]. The implementation engages theErlang concurrent programming language [1] integrated within an advanced3D modeling environment based on the geometric language PLaSM [15] andaugmented with gaming engines.
3. Spatial Modeling
Howarth [9] has shown that spatial models play a key role when interpretinga dynamic, uncertain world for surveillance applications. We surveyed a num-ber of works dealing with spatial models and their use in security applications.Based on this research, we selected the cellular decomposition of space as afoundation for supporting visual surveillance applications. We use the geomet-ric language PlaSM to handle geometric information. Figure 1 presents thevirtual model of a warehouse district produced using a few pages of PLaSMcode. The runtime evaluation of submodels of buildings or portions of buildingsproduces the 3D scenes.
The design language PLaSM is a geometry-oriented extension of FL, a func-tional language developed by Backus’ group at IBM [4]. Building on theparadigm proposed by Backus in his Turing Award Lecture [3], FL introducesan algebra over programs that provides several interesting features. In partic-ular, existing programs are combined very elegantly to create new programs.Programs that are equivalent to and simpler than the original programs can be
based simulations.
the agents perform all the major activities (e.g., sensing the environment, act-

272 CRITICAL INFRASTRUCTURE PROTECTION II
Figure 1. Virtual model of a commercial district.
created at design time or compilation time. Significant benefits in programmingstyle and efficiency are achieved through the use of program prototyping.
Primitive objects in FL include characters, numbers, truth values and poly-hedral complexes. A polyhedron is a quasi-disjoint union of polytopes (boundedconvex sets). Expressions are either primitive objects, functions, applicationsor sequences. According to the FL semantics, arbitrary PLaSM scripts can bewritten using only three programming constructs:
Application: The application f:x of function f to the value x of aninput parameter (element of the function domain) produces an outputvalue in the function codomain.
Composition: The composition of functions (f∼g∼h):x ≡ (f∼g):
(h:x) ≡ f:(g:(h:x)) produces the pipelined execution of their reversedsequence (Figure 2).
Construction: The construction of a vector function [f,g,h] producesthe parallel execution of its component functions [f, g,h]:x ≡ <f:x,
g:x,h:x> (Figure 2).
4. Model Generation
We capitalize on a novel parallel framework [6] for high-performance solidand geometric modeling that compiles the generating expression of a model intoa dataflow network of concurrent threads, and splits the model into fragmentsthat are distributed to computational nodes and generated independently. Pro-gressive BSP trees are used for adaptive and parallelizable streaming dataflowevaluation of geometric expressions, and associated with polyhedral cells ofhierarchical polyhedral complex (HPC) data structures used by the PLaSMlanguage.
The security platform design makes strong use of spatial models producedby the cellular decomposition of structures (buildings, tracks, lanes, tunnels,bridges, etc.) from 2D plans. Figure 3(a) shows a 2D map of the Palatino Hill

Assogna, et al. 273
evaluation composition application
parametersvalue
f:(g:(h:x))g:(h:x) h:x
composition
xf g h
[f,g,h]:x
value
parallelevaluation application
parameters
<f:x,g:x,h:x> x
f
g
h
Figure 2. Main paradigms of the PLaSM language.
Figure 3. (a) Palatino Hill (2D map); (b) Domus Augustana (3D PLaSM image).
in Rome. Figure 3(b) presents the 3D PLaSM reconstruction of the emperor’spalace (Domus Augustana), a site endowed with the strongest security systemknown in ancient times. Note the enhanced level of awareness provided by the3D model compared with the 2D model.
We are currently working on the automatic generation of PLaSM modelsfrom line drawings in the Autocad format [2]. A geometric representation ofan infrastructure or portion of an infrastructure, progressively generated atincreasing levels of detail, will be produced at runtime by a streaming dataflowprocess.
The generation of models of complex buildings from plans is a difficult andlargely unsolved inverse problem [11]. The difficulty of reconstructing 3D build-ings from architectural plans is confirmed by the rarity of scientific literature onthe topic (see, e.g., [9, 11]). However, a fast semi-automatic solution has beenproposed by Paoluzzi and Scorzelli [17]. Their procedure is as follows. First,

274 CRITICAL INFRASTRUCTURE PROTECTION II
Autocad files with line-drawings of 2D architectural plans are transformed intodouble interval trees and quad trees in order to efficiently answer interactiveproximity queries. Next, semantics is assigned to small line subsets via pattern-based recognition of the components of the building fabric (internal partitions,external enclosures, vertical communication elements, etc); this is subsequentlytranslated into PLaSM scripts. These symbolic scripts are then evaluated toproduce streaming solid models at various levels of detail or adjacency graphsof the critical infrastructure or portions of the infrastructure.
5. Model Simulation
Modeling techniques tend to be found in isolated communities [18]: geomet-ric models are used in computer-aided design (CAD) and computer graphics;dynamic models in computer simulations; and information models in informa-tion technology applications. When models are not included within a singledigital environment, methods for connecting them seamlessly are generally notestablished. One of the major challenges we faced in our research was to identifythe best abstraction for integrating these three different modeling areas.
According to [13], discrete concurrent systems may be modeled and sim-ulated using three paradigms: event graphs and PERT (event scheduling),bipartite graphs and Petri Nets (activity scanning), and finite-state systemsand Markov chains (process interaction). Network programming techniques [5]may be used to animate complex simulations. Here, the behavior of each actoris described by a path in an activity network that codifies the storyboard as adirected acyclic graph and describes causal and temporal relationships betweenevents. Each storyboard arc may be associated with a spline in the configu-ration space of the actor, which models fine behavior permitted by its degreesof freedom. This model is hierarchical, since each arc may be substituted byits (local) storyboard and used to decompose a macro event to a finer level ofdetail. Also, the parameters of the probability distributions of stochastic vari-ables of interest (e.g., the most likely time or the lead/lag time of an event) maybe computed. The depth of the event hierarchy may vary locally depending onthe complexity of events and the degree of realism of a simulation [16].
Petri nets [20] may be used to mathematically describe the evolution of a con-current system. This approach uses networks with two types of nodes (placesand transitions) and arcs where several types of tokens may move within thenetwork. The state of the modeled system is given by the distribution of tokensin places. The annotations of fine behavior are described by splines in configu-ration space, defined by discrete sets of points consisting of at least two knownconfigurations (in the case of linear behavior). Petri nets may be hierarchi-cal and timed. The hierarchical communicating and concurrent state machine(HCSM) framework may be used to plan the behavior of reactive syntheticagents in interactive simulation environments [7]. The HCSM framework iswell suited to modeling the reactions of autonomous agents and directing themto produce the desired simulations.
Assogna, et al. 275
6. Architectural Issues
The main architectural goal is to integrate advanced modeling, simulation,virtual or augmented reality, and gaming and tracking techniques in a central-ized framework. The intent is to provide a platform where the tasks involvedin securing a critical infrastructure can be evaluated and optimized, and wheresecurity personnel are provided with high-level decision-making tools, includinginteroperable tools for situation modeling and simulation.
6.1 Concurrent Programming
The implementation employs PLaSM for geometric programming and Erlangfor simulation. Erlang [1] is a concurrent functional programming language andruntime system, which is characterized by strict evaluation, single assignmentand dynamic typing. Strict, or eager evaluation, means that expressions areevaluated as soon as they are bound to variables and the values are subsequentlyrecalled without evaluation. The language is purely functional, without themutable state that is induced by multiple assignments. Thus, the code is easyto understand and facilitates correctness proofs. Dynamic typing means thattype checking is performed at runtime.
Erlang adopts a mathematical model of computation that uses “actors” asuniversal primitives for concurrent computing [8]. The actor model has beenused both as a theoretical framework for concurrency as well as the basis forseveral practical concurrent systems. An actor can make local decisions, cre-ate other actors, send and receive messages, and determine how to respondto messages. Data structures, functions, semaphores, monitors, ports, descrip-tions, logical formulas, numbers, identifiers, demons, processes, contexts anddatabases are all special cases of actors, whose behavior is described by messagesending.
6.2 Event Processing
The platform is designed to use complex event processing (CEP) techniquesimplemented using Erlang. CEP integration will employ a state-of-the-art ar-chitecture for stream event processing in complex computer systems [12, 19].Different events, combined with different behavior and environments, will elicitadequate responses from the platform so that, even when unattended, it canperform actions to avoid or minimize unwanted scenarios. Optimal control willbe achieved, of course, by combining automatic responses with the experienceand judgment of experts.
This approach to security awareness, providing sensor fusion as well asevent discovery, registration and interpretation, will make strong use of spatialmodels. As discussed earlier, these models are produced as cellular decom-positions of structures generated from PLaSM representations created semi-automatically from 2D line drawings.

276 CRITICAL INFRASTRUCTURE PROTECTION II
The platform will employ advanced techniques for interactive visualizationof, and user interaction with, real-time and recorded surveillance data. Re-search results in the areas of visual perception, 3D interactive computer graph-ics, virtual reality and gaming will be incorporated. State-of-the-art techniquesfor 3D navigation and spatial montage of streaming sensor data will be imple-mented to produce a task-specific interface optimized for situational awareness.
6.3 Management Support
The platform will provide support for workforce management, especially inthe case of crises that require significant manual intervention. The tasks tobe supported will range from routine camera surveillance by operators to adhoc crisis management by decision makers. Different types of users will be ableto access and interact with relevant information provided by the underlyingdatabases and (generated) knowledge.
Flexible, task-specific user interfaces will support the collection, retrievaland presentation of information. A set of guidelines and components for imple-menting highly effective, task-specific user interfaces will be developed. Theseinterfaces will enable automated (software-agent-based) actions as well as hu-man actions directed from an operations control center. In particular, theinterfaces will provide semantically-rich support based on the “newspaper,”“agenda,” “map,” “telephone” and “television” metaphors.
7. Conclusions
Securing critical infrastructures requires sophisticated systems that providecapabilities such as behavior analysis, situation modeling and data mining inte-grated within virtual or augmented reality interfaces. Our advanced situationalawareness system is designed to support semi-automated 3D modeling of in-frastructures, 3D integration of sensor networks, situation modeling and visualsimulation via 3D animation, and advanced situation analysis. In addition tooffering sophisticated functionality, the system is designed to be highly scalableto handle large, complex infrastructures. Our paradigmatic reference for aware-ness, simulation and control of normal and abnormal situations is applicable tooperation planning, security enforcement, crisis management and training. Itcan also be used within product lifecycle management platforms in aerospace,automotive and manufacturing industries, where geometric information is cen-tral to collaborative activities ranging from production to marketing.
References
[1] J. Armstrong, Programming Erlang: Software for a Concurrent World,Pragmatic Bookshelf, Raleigh, North Carolina, 2007.
[2] P. Assogna, G. Bertocchi, A. Paoluzzi, G. Scorzelli and R. Zollo, From 2Dplans to 3D building models for security modeling of critical infrastruc-tures, to appear in International Journal of Shape Modeling, 2008.

Assogna, et al. 277
[3] J. Backus, Can programming be liberated from the von Neumann style? Afunctional style and its algebra of programs, Communications of the ACM,vol. 21(8), pp. 613–641, 1978.
[4] J. Backus, J. Williams and E. Wimmers, An introduction to the program-ming language FL, in Research Topics in Functional Programming, D.Turner (Ed.), Addison-Wesley Longman, Boston, Massachusetts, pp. 219–247, 1990.
[5] C. Bajaj, C. Baldazzi, S. Cutchin, A. Paoluzzi, V. Pascucci and M. Vi-centino, A programming approach for complex animations (Part I:Methodology), Computer-Aided Design, vol. 31(11), pp. 695–710, 1999.
[6] C. Bajaj, A. Paoluzzi and G. Scorzelli, Progressive conversion from B-repto BSP for streaming geometric modeling, Computer-Aided Design andApplications, vol. 3(5), pp. 577–586, 2006.
[7] J. Cremer, J. Kearney and Y. Papelis, HCSM: A framework for behav-ior and scenario control in virtual environments, ACM Transactions onModeling and Computer Simulation, vol. 5(3), pp. 242–267, 1995.
[8] C. Hewitt, P. Bishop, I. Greif, B. Smith, T. Matson and R. Steiger, Ac-tor induction and meta-evaluation, Proceedings of the First Annual ACMSIGACT-SIGPLAN Symposium on Principles of Programming Languages,pp. 153–168, 1973.
[9] R. Howarth, Spatial models for wide-area visual surveillance: Computa-tional approaches and spatial building-blocks, Artificial Intelligence Re-view, vol. 23(2), pp. 97–155, 2005.
[10] A. Koestler, The Ghost in the Machine, Arkana, London, United Kingdom,1967.
[11] R. Lewis and C. Sequin, Generation of 3D building models from 2D archi-tectural plans, Computer-Aided Design, vol. 30(10), pp. 765–779, 1998.
[12] D. Luckham and B. Frasca, Complex Event Processing in Distributed Sys-tems, Technical Report CSL-TR-98-754, Computer Systems Laboratory,Stanford University, Palo Alto, California, 1998.
[13] J. Miller, G. Baramidze, A. Sheth and P. Fishwick, Investigating ontolo-gies for simulation modeling, Proceedings of the Thirty-Seventh AnnualSymposium on Simulation, pp. 55–63, 2004.
[14] R. Ott, M. Gutierrez, D. Thalmann and F. Vexo, Advanced virtual real-ity technologies for surveillance and security applications, Proceedings ofthe ACM International Conference on Virtual Reality Continuum and itsApplications, pp. 163–170, 2006.
[15] A. Paoluzzi, Geometric Programming for Computer-Aided Design, JohnWiley and Sons, Chichester, United Kingdom, 2003.
[16] A. Paoluzzi and A. D’Ambrogio, A programming approach for complexanimations (Part II: Reconstruction of a real disaster), Computer-AidedDesign, vol. 31(11), pp. 711–732, 1999.

278 CRITICAL INFRASTRUCTURE PROTECTION II
[17] A. Paoluzzi and G. Scorzelli, Pattern-driven mapping from architecturalplans to solid models of buildings, presented at the Israel-Italy Bi-NationalConference on Shape Modeling and Reasoning for Industrial and Biomed-ical Applications, 2007.
[18] M. Park and P. Fishwick, Integrating dynamic and geometry model compo-nents through ontology-based inference, Simulation, vol. 81(12), pp. 795–813, 2005.
[19] L. Perrochon, W. Mann, S. Kasriel and D. Luckham, Event mining withevent processing networks, Proceedings of the Third Pacific-Asia Confer-ence on Knowledge Discovery and Data Mining, pp. 474–478, 1999.
[20] J. Peterson, Petri nets, ACM Computing Surveys, vol. 9(3), pp. 223–252,1977.
[21] I. Sebe, J. Hu, S. You and U. Neumann, 3D video surveillance with aug-mented virtual environments, Proceedings of the First ACM SIGMM In-ternational Workshop on Video Surveillance, pp. 107–112, 2003.