User's Guide - Oracle Help Center
876
Oracle ® Smart View for Office User's Guide Release 21.100 F43465-05 November 2021
-
Upload
khangminh22 -
Category
Documents
-
view
0 -
download
0
Transcript of User's Guide - Oracle Help Center

Oracle® Smart View for OfficeUser's Guide
Release 21.100F43465-05November 2021

Oracle Smart View for Office User's Guide, Release 21.100
F43465-05
Copyright © 2004, 2021, Oracle and/or its affiliates.
Primary Author: EPM Information Development Team
This software and related documentation are provided under a license agreement containing restrictions onuse and disclosure and are protected by intellectual property laws. Except as expressly permitted in yourlicense agreement or allowed by law, you may not use, copy, reproduce, translate, broadcast, modify, license,transmit, distribute, exhibit, perform, publish, or display any part, in any form, or by any means. Reverseengineering, disassembly, or decompilation of this software, unless required by law for interoperability, isprohibited.
The information contained herein is subject to change without notice and is not warranted to be error-free. Ifyou find any errors, please report them to us in writing.
If this is software or related documentation that is delivered to the U.S. Government or anyone licensing it onbehalf of the U.S. Government, then the following notice is applicable:
U.S. GOVERNMENT END USERS: Oracle programs (including any operating system, integrated software,any programs embedded, installed or activated on delivered hardware, and modifications of such programs)and Oracle computer documentation or other Oracle data delivered to or accessed by U.S. Government endusers are "commercial computer software" or "commercial computer software documentation" pursuant to theapplicable Federal Acquisition Regulation and agency-specific supplemental regulations. As such, the use,reproduction, duplication, release, display, disclosure, modification, preparation of derivative works, and/oradaptation of i) Oracle programs (including any operating system, integrated software, any programsembedded, installed or activated on delivered hardware, and modifications of such programs), ii) Oraclecomputer documentation and/or iii) other Oracle data, is subject to the rights and limitations specified in thelicense contained in the applicable contract. The terms governing the U.S. Government’s use of Oracle cloudservices are defined by the applicable contract for such services. No other rights are granted to the U.S.Government.
This software or hardware is developed for general use in a variety of information management applications.It is not developed or intended for use in any inherently dangerous applications, including applications thatmay create a risk of personal injury. If you use this software or hardware in dangerous applications, then youshall be responsible to take all appropriate fail-safe, backup, redundancy, and other measures to ensure itssafe use. Oracle Corporation and its affiliates disclaim any liability for any damages caused by use of thissoftware or hardware in dangerous applications.
Oracle, Java, and MySQL are registered trademarks of Oracle and/or its affiliates. Other names may betrademarks of their respective owners.
Intel and Intel Inside are trademarks or registered trademarks of Intel Corporation. All SPARC trademarks areused under license and are trademarks or registered trademarks of SPARC International, Inc. AMD, Epyc,and the AMD logo are trademarks or registered trademarks of Advanced Micro Devices. UNIX is a registeredtrademark of The Open Group.
This software or hardware and documentation may provide access to or information about content, products,and services from third parties. Oracle Corporation and its affiliates are not responsible for and expresslydisclaim all warranties of any kind with respect to third-party content, products, and services unless otherwiseset forth in an applicable agreement between you and Oracle. Oracle Corporation and its affiliates will not beresponsible for any loss, costs, or damages incurred due to your access to or use of third-party content,products, or services, except as set forth in an applicable agreement between you and Oracle.

Contents
Documentation Accessibility
Documentation Feedback
1 Welcome to the Smart View User's Guide
2 Introduction to Smart View
Overview 2-1
Supported Data Source Providers 2-2
Smart View Components 2-3
Ribbons 2-4
Smart View Panel 2-5
Installing Smart View 2-6
Translation Information 2-6
About this Guide 2-7
3 Managing Data Source Connections
Connections 3-1
Shared Connections and Private Connections 3-2
Connecting to Data Sources 3-4
About Connecting to Data Sources 3-4
Connecting Using a Shared Connection 3-7
Connecting Using a Private Connection 3-8
Disconnecting from Data Sources 3-9
Creating Shared Connections 3-10
Creating Private Connections 3-11
Using the Private Connection Wizard 3-11
Using the Quick Connection Method 3-12
Saving Shared Connections as Private Connections 3-13
iii

Private Connection URL Syntax 3-13
Modifying Connections 3-16
Modifying Private Connections 3-17
Modifying Connections within an Office Document 3-18
Modifying Connections for Financial Reporting Images and Fully-Formatted Reports 3-20
Managing Connection URL Mappings 3-22
About Managing Connection URL Mappings 3-22
Adding Connection URL Mappings 3-23
Updating Connection URL Mappings 3-26
Deleting Connection URL Mappings 3-29
Deleting Connections 3-32
About Deleting Connection URLs 3-32
Deleting Connection URLS 3-33
4 Dimensions and Members
About Dimensions and Members 4-2
Dimension and Member Naming Limitation 4-2
Selecting Members from the Member Selector 4-3
Selecting Members from the POV Toolbar 4-7
Displaying the POV Toolbar 4-9
Selecting Members Using the Cell-Based POV 4-11
Entering Members in Free-Form Mode 4-13
Filtering by Attribute 4-14
Filtering by Subsets 4-14
Selecting Period-to-Date Members 4-15
Defining Member Name Display in the Member Selector 4-15
Duplicate Member Names 4-17
Numeric Member Names 4-18
Qualified Name Display in Alternate Hierarchies 4-18
Member Perspective 4-20
Aliases and Alias Tables 4-21
Selecting Alias Tables 4-21
Selecting an Alias Table for the Current Worksheet 4-21
Selecting an Alias Table for the Connection 4-22
Aliases from Different Alias Tables 4-22
Displaying Member Names and Their Aliases in the Grid 4-23
Displaying Aliases in the Member Selector 4-23
Viewing Dimension Properties 4-24
Member Information 4-25
The POV Manager 4-26
iv

Selecting Members for the Default or Background POV 4-27
Members Linked to Smart Lists in the POV 4-28
Copying and Pasting a POV 4-28
Deleting a POV 4-29
5 Data and Data Cells
Refreshing Data 5-2
Refreshing from a Ribbon 5-2
Refreshing Individual Reports from Document Contents 5-3
Using the Submit Data Options 5-10
About the Submit Data Options 5-10
Submitting Data 5-12
Submitting Data Without Refreshing 5-12
Submitting Data Ranges 5-13
Calculating Data 5-14
About Calculating Data 5-14
Calculating Data in Financial Management 5-14
Calculating Data in Essbase 5-14
About Calculating Data in Essbase 5-14
Running Essbase Calculations 5-16
Calculating Asymmetric Grids Using Tuples 5-19
Changing the Solve Order of a Selected POV 5-25
Consolidating Data 5-26
Working with Currencies 5-27
Translating Currencies in Financial Management 5-27
Changing Currency in Planning 5-27
Adjusting Values in Data Cells 5-28
Resolving Data Validation Errors 5-29
Data Perspective 5-31
Working with Smart Lists 5-33
Drill-Through Reports 5-35
Drill-Through Report Guidelines 5-35
Setting the Drill-Through Launch Option 5-36
Accessing Drill-Through Reports 5-37
Drilling Through to Source Data 5-38
Viewing the Drill-Through Report Source POV 5-42
Linked Reporting Objects 5-44
Attaching a Linked Reporting Object to a Data Cell 5-44
Launching a Linked Reporting Object from a Data Cell 5-45
Linked Partitions 5-46
v

Cell Comments 5-46
Cell Comments in EPM Cloud and Oracle Hyperion Planning 5-47
Cell Comments in Financial Management 5-48
Attachments 5-49
Cell History 5-52
6 Ad Hoc Analysis
About Ad Hoc Analysis 6-2
Starting Ad Hoc Analysis 6-2
Inserting Attribute Dimensions on the Sheet 6-3
Inserting Attribute Dimensions on the Sheet--Example 6-4
Notes About Inserting Attributes 6-6
Preserving Excel Formulas in Ad Hoc Grids 6-7
Preserving Excel Formulas Within and Outside of Essbase Ad Hoc Grids 6-8
Formatting Ad Hoc Grids 6-9
Using Smart View Formatting 6-9
Using Excel Formatting 6-10
Enabling Attribute Association Processing in Ad Hoc Grids 6-11
Zooming In and Out 6-13
About Zooming In and Out 6-13
Zooming In 6-15
Zooming in to a Selected Level 6-15
Zooming in to the Default Level 6-16
Zooming in on Shared Members in EPM Cloud 6-16
Zooming Out 6-18
Setting a Default Zoom Level 6-19
Selecting Members to Display when Zooming 6-19
Enabling Double-Click Zooming 6-20
Zooming and Formatting 6-20
Zooming Operations in Cells that Contain Formulas 6-21
Specifying Ancestor Position in Ad Hoc Grids 6-21
Working with Excel Filters on Ad Hoc Sheets 6-24
Pivoting 6-25
Pivoting Dimensions Between Rows and Columns 6-26
Pivoting Dimensions Between the Grid and the POV Toolbar 6-26
Removing Selected Members From the Grid 6-27
Inserting Rows and Columns 6-31
Displaying and Suppressing Repeated Members 6-32
Using the Suppress Repeating Members Option with 11.1.2.2.102 and EarlierWorkbooks 6-34
Multiple Grids on a Worksheet 6-34
vi
About Multiple Grids on a Worksheet 6-34
Creating Multiple-Grid Worksheets 6-36
Converting Ad Hoc Worksheets to Multiple-Grid Worksheets 6-36
Renaming Ranges on Multiple-Grid Worksheets 6-37
Changing Connections in Multiple-Grid Worksheets 6-40
POV on Essbase Multiple-Grid Worksheets 6-41
Multiple-Grid Example: Butterfly Report 6-41
Cascading Reports and Ad Hoc Grids 6-42
Substitution Variables 6-45
Comments and Unknown Members on Essbase Sheets 6-46
Enabling Comment Display in the Sheet 6-47
Viewing Comments in the Sheet 6-47
Editing Comments 6-48
Deleting Comments 6-50
7 Data Forms
Working with Forms in Excel 7-1
Opening Forms in Excel 7-2
Excel Formulas in Forms 7-3
Working with User Variables 7-3
EPM Cloud and Oracle Hyperion Planning Forms 7-4
Planning and EPM Cloud Form Behavior in Smart View 7-5
Displaying the Floating Toolbar in Planning Forms 7-6
Saving Ad Hoc Grids 7-7
Performing Ad Hoc Analysis in Forms 7-8
Using the Drop-down Member Selector on Row Dimensions in Forms 7-8
Inserting Charts 7-11
Cell-Level Security in Smart View 7-14
Working with Valid Intersections 7-15
About Valid Intersections 7-15
Working with Valid Intersections in Page Drop-down Lists 7-15
Working with Valid Intersections in Forms 7-20
Flex Forms 7-23
About Flex Forms 7-23
Working with Flex Forms in Smart View 7-28
Opening a Flex Form in Ad Hoc Mode and Submitting Data 7-30
Financial Management Data Forms 7-31
About Financial Management Members 7-31
Adding Financial Management Members 7-31
vii

Using Financial Management Linked Forms 7-32
8 Books
About the EPM Books Extension 8-1
Setting Up the Books Extension in Smart View 8-3
Downloading and Running the Smart View Installer 8-4
Creating Connections to EPM Cloud Business Processes 8-5
Installing the EPM Books Extension 8-6
Launching the EPM Books Panel in Smart View 8-7
Working with Books 8-9
Importing Books into Smart View 8-9
Working with Downloaded Books in Smart View 8-11
Managing Jobs in the EPM Books Jobs Console 8-13
About the Jobs Console 8-14
Working with Jobs in the Jobs Console 8-15
9 General Operations
Smart View Operations 9-2
Using Undo and Redo 9-2
Specifying the Number of Undo and Redo Actions 9-2
Undo Support By Provider 9-3
Undo Support in Essbase 9-3
Undo Support in Financial Management 9-4
Undo Support in Planning 9-6
Undo Support in Narrative Reporting 9-7
Copying and Pasting 9-9
Copying, Pasting, and Refreshing Smart View Content 9-9
Copying Data Between Excel, Word, and PowerPoint 9-9
Viewing Cell POV and Server Information for Pasted Data Points 9-11
Excel Copy and Paste Guidelines 9-12
Importing Metadata in Office Applications 9-13
Importing Metadata into Copied Worksheets 9-15
Importing Metadata into Copied Word Documents 9-16
Importing Metadata into Copied Slides or Presentations 9-18
Entering Percentage Values in Forms and Ad Hoc Grids 9-20
Enabling Automatic Cell Width and Height Adjustment 9-22
Sheet Information 9-23
Sheet Information Guidelines 9-24
Sheet Information Support By Provider 9-24
viii

Sheet Information Support in Essbase 9-24
Sheet Information Support in Financial Management 9-25
Sheet Information Support in EPM Cloud and Oracle Hyperion Planning 9-26
Document Contents 9-27
Shared Workbooks 9-34
Protected Worksheets 9-35
Opening Large Workbooks in Smart View 9-35
Printing POV Members in the Header and Footer 9-35
Opening Forms and Ad Hoc Grids from Web Applications (Web Launch) 9-36
Enabling and Disabling Smart View 9-37
Enabling and Disabling Smart View Using the Smart View Ribbon 9-37
Enabling and Disabling Smart View from Microsoft Office 9-38
10
Smart Query
About Smart Query 10-1
Creating a Smart Query 10-1
Defining Sets 10-2
Defining Set Filters 10-4
Building the Smart Query 10-4
Completing the Smart Query 10-6
Opening a Smart Query 10-7
Copying and Pasting 10-7
Copying Smart Query Definitions in Excel 10-7
Copying Smart Query Sets and Filters 10-8
Copying Smart Query Reports to Word and PowerPoint 10-8
Sharing Smart Query Definitions 10-8
Executing a Smart Query 10-9
Deleting a Smart Query 10-9
11
Smart Slices
About Smart Slices 11-1
Creating Reports with Smart Slices 11-1
Deleting Reports or Report Objects 11-4
Sliders 11-4
Creating a Slider from One Query 11-4
Creating a Slider from Joined Queries 11-5
Smart Slices, Ad Hoc Analysis, and Forms 11-5
Creating Smart Slices 11-6
Setting Smart Slice Data Boundaries 11-6
ix

Setting Smart Slice Preferences 11-7
12
The Query Designer and MDX Queries
Working with Query Designer 12-1
About the Query Designer 12-1
Creating Queries 12-1
Editing Queries and Rerunning Reports 12-3
Filtering Data 12-4
Analyzing Time-Related Data in Query Designer 12-4
Working with MDX Queries 12-5
About Working with MDX Queries 12-5
Creating and Saving an MDX Query 12-6
Executing MDX Queries 12-8
Modifying Query Connection Information 12-9
Changing the Query List Display 12-9
Deleting MDX Queries 12-10
13
Smart Forms
About Smart Forms 13-1
Creating Smart Forms 13-3
Smart Form Example Scenario 13-4
Excel Functions Supported in Smart Forms 13-9
14
Task Lists
About Task Lists 14-1
Working with Tasks from the Smart View Panel 14-2
Opening a Task List 14-2
Viewing the Task List 14-3
Executing a Task 14-3
Completing a Task 14-3
Creating Task List Reports 14-4
Integrating Task Lists with Microsoft Outlook 14-4
15
Oracle Journals for Financial Management
About Oracle Journals for Financial Management 15-1
Installing the Oracle Journals Extension 15-2
Installing from the Smart View Installation Folder 15-3
Journal Roles 15-3
x

Processing Journals in Smart View 15-4
Creating Journals 15-4
Editing Journal Properties 15-8
Guidelines for Creating Journals from Ad Hoc Grids or Data Forms 15-10
Opening Journals 15-11
Scanning Journals 15-13
Viewing Journal Status 15-14
Modifying List Display in Manage Journals Window 15-14
Editing Journals 15-15
Selecting Dimension Members for Journal Detail 15-16
Copying and Pasting Journal Cells 15-17
Submitting Journals 15-18
Unsubmitting Journals 15-19
Approving Journals 15-19
Rejecting Journals 15-20
Posting Journals 15-21
Unposting Journals 15-22
Journal Validation 15-23
Analyzing Journals 15-24
Deleting Journals 15-25
Entity Detail Reports 15-25
Starting the Entity Detail Report 15-26
Report Point of View 15-26
Selecting Rows for the Report 15-26
Displaying Base Details 15-27
Displaying Line Item Detail 15-28
Linking to Journal Detail 15-28
Displaying Source and Destination Transactions 15-28
Exporting the Entity Details Report to Excel 15-28
Viewing Journal Reports 15-29
Region and Language Settings in Oracle Journals 15-30
16
Smart View and Oracle Hyperion Planning
About Smart View and Oracle Hyperion Planning 16-2
Oracle Hyperion Planning Approvals 16-2
Changing Oracle Hyperion Planning Unit Status 16-2
Finding Oracle Hyperion Planning Units 16-3
Oracle Hyperion Planning Unit Promotional Path 16-4
Oracle Hyperion Planning Unit Annotations 16-5
Out of Office Assistant 16-5
xi

Monitoring Oracle Hyperion Planning Job Status 16-6
Configuring Job Console Autorefresh 16-7
Searching for a Page in Oracle Hyperion Planning Forms 16-8
Copying Versions 16-8
Composite Forms 16-9
Working with Oracle Hyperion Planning Business Rules 16-9
Launching Business Rules in Excel 16-10
Entering Runtime Prompts 16-11
Executing the Calculate Form and Calculate Currencies Business Rules 16-12
Spreading Data 16-13
Spreading Data for Time Periods 16-13
Spreading Data with Cell Locking 16-14
Spreading Values Using Grid Spread 16-14
Spreading Values Using Mass Allocation 16-15
Member Formula 16-17
Supporting Detail 16-17
Adding Supporting Detail 16-18
Working with the Supporting Detail Hierarchy 16-19
Viewing or Changing Supporting Detail 16-20
Synchronizing Supporting Detail with Essbase 16-20
Setting User Preferences 16-21
Saving Native Excel Formatting to Oracle Hyperion Planning 16-22
Saving Excel Formatting on an Oracle Hyperion Planning Form 16-22
Viewing Formatting in Smart View 16-23
Clearing Formatting 16-24
Saving Excel Formatting From an Ad Hoc Grid 16-24
Supported Native Excel Formatting 16-25
Guidelines for Working with Native Excel Formatting and Oracle Hyperion PlanningForms 16-26
Working Offline 16-27
Taking Forms Offline 16-28
Working Offline with Forms 16-29
Synchronizing Data to the Oracle Hyperion Planning Server 16-30
Refreshing the Offline Form Definition and Data 16-31
17
Smart View and EPM Cloud
About Smart View and EPM Cloud 17-2
Planning Approvals 17-2
Changing Planning Unit Status 17-2
Finding Planning Units 17-3
Planning Unit Promotional Path 17-5
xii
Planning Unit Annotations 17-5
Out of Office Assistant 17-6
Monitoring Job Status 17-6
Configuring Job Console Autorefresh 17-9
Searching for a Page in EPM Cloud Forms 17-9
Copying Versions 17-9
Dashboards 17-11
Composite Forms 17-11
Working with Business Rules 17-12
Launching Business Rules in Excel 17-12
Entering Runtime Prompts 17-14
Executing the Calculate Form and Calculate Currencies Business Rules 17-15
Spreading Data 17-15
Spreading Data for Time Periods 17-16
Spreading Data with Cell Locking 17-16
Spreading Values Using Grid Spread 17-17
Spreading Values Using Mass Allocation 17-18
Member Formula 17-19
Supporting Detail 17-20
Adding Supporting Detail 17-20
Working with the Supporting Detail Hierarchy 17-22
Viewing or Changing Supporting Detail 17-23
Synchronizing Supporting Detail with the Cube 17-23
Setting User Preferences 17-24
Saving Native Excel Formatting to EPM Cloud 17-25
Saving Excel Formatting on a Form 17-25
Viewing Formatting in Smart View 17-26
Clearing Formatting 17-27
Saving Excel Formatting From an Ad Hoc Grid 17-27
Supported Native Excel Formatting 17-28
Guidelines for Working with Native Excel Formatting and Forms in EPM Cloud 17-29
Working with Multiple-Grid Worksheets in EPM Cloud 17-30
About Multiple Grids on a Worksheet 17-30
Creating Multiple-Grid Worksheets with EPM Cloud Sources 17-32
Converting EPM Cloud Single-Grid Worksheets to Multiple-Grid Worksheets 17-33
Renaming Ranges on EPM Cloud Multiple-Grid Worksheets 17-34
Changing Connections in EPM Cloud Multiple-Grid Worksheets 17-37
POV Behavior on EPM Cloud Multiple-Grid Worksheets 17-41
Smart View Behavior Options in EPM Cloud 17-41
xiii

18
Smart View and Profitability and Cost Management
About Smart View and Profitability and Cost Management 18-1
Running the Smart View Installer 18-2
Creating Data Source Connections to Profitability and Cost Management 18-3
19
Smart View and Reporting and Analysis
About Importing Reporting and Analysis Documents 19-1
Editing and Refreshing Documents 19-2
Refreshing Reporting and Analysis Documents 19-3
Financial Reporting and Web Analysis Import Formats 19-4
Importing Interactive Reporting Documents 19-5
About Importing Interactive Reporting Documents 19-5
Importing Interactive Reporting Documents into Excel 19-6
Importing Interactive Reporting Documents into Word and PowerPoint 19-7
Editing Interactive Reporting Documents 19-8
Importing Financial Reporting Documents 19-8
Importing Financial Reporting Documents 19-9
Importing Financial Reporting Documents into Excel 19-9
Importing Financial Reporting Documents into Word and PowerPoint 19-12
Editing Financial Reporting Documents 19-15
Creating Templates in PowerPoint Documents 19-16
Refreshing PowerPoint Templates 19-17
Exporting Financial Reporting Reports 19-17
Importing Production Reporting Documents 19-17
About Importing Production Reporting Documents 19-17
Importing Production Reporting Jobs into Excel 19-18
Importing Production Reporting Jobs into Word and PowerPoint 19-19
Importing Production Reporting Job Outputs into Word, and PowerPoint 19-19
Editing Production Reporting Jobs 19-20
Importing Web Analysis Documents 19-20
About Importing Web Analysis Documents 19-21
Importing a Web Analysis Document or Document Objects 19-21
Editing Web Analysis Documents 19-22
20
Smart View and Account Reconciliation
About Using Smart View With Account Reconciliation 20-1
Setting Up Account Reconciliation in Smart View 20-1
Downloading and Running the Smart View Installer 20-2
Creating Connections to Account Reconciliation 20-3
xiv

Installing the Account Reconciliation Extension 20-4
Connecting to Account Reconciliation in Smart View 20-5
Importing Transactions Directly From Excel Using the Smart View Extension forReconciliation Compliance 20-6
21
Smart View and Narrative Reporting
About Narrative Reporting 21-2
Setting Up Narrative Reporting in Smart View 21-3
Downloading and Running the Smart View Installer 21-3
Creating Connections to Narrative Reporting 21-5
Installing the Narrative Reporting Extension 21-7
Connecting to Narrative Reporting in Smart View 21-9
Using Narrative Reporting Home 21-13
Administering Report Packages in Smart View 21-16
About Administering Report Packages in Smart View 21-17
Creating Report Package Structures 21-17
About Creating Report Package Structures in Smart View 21-17
Creating Report Package Structures from Files in a Folder 21-19
Creating Report Package Structures from a File 21-21
Adding Doclets to Report Package Structures 21-25
Adding Sections to Report Package Structures 21-30
Editing Report Package, Doclet, and Section Properties 21-31
Authoring Doclets 21-31
About the Author Phase Process 21-32
About Doclets and Variables 21-33
Authoring Doclets in Smart View 21-35
Checking Out Doclets 21-36
Undoing Checkouts 21-40
Uploading and Working with Page Attributes and Slide Masters 21-41
Checking In Doclets 21-45
Submitting Doclets 21-46
Working with Embedded Content from Reference Doclets 21-47
About Embedded Content From Reference Doclets 21-47
Adding Reference Doclets to a Report Package 21-48
Defining Named Ranges in Excel-based Reference Doclets 21-49
Validating Fonts in Reference Doclets 21-50
Adding Available Content to Excel-based Reference Doclets 21-51
Updating Excel-based Reference Doclet Content 21-54
Deleting Available Content from an Excel-based Reference Doclet 21-57
Embedding Content in a Doclet 21-59
Refreshing Embedded Content in a Doclet 21-63
xv

Removing Embedded Content from a Doclet 21-64
Working with Embedded Content from Reference Files 21-66
About Embedding Content from Reference Files 21-66
Defining Named Ranges in Reference Files 21-67
Registering Reference Files with a Doclet 21-67
Embedding Reference File Content in a Doclet 21-71
Adding Content from Reference Files to Doclets 21-73
Managing Named Ranges for a Reference File 21-78
Updating Available Content in a Reference File 21-79
Remapping Content within Reference Files 21-79
Working with Variables 21-82
About Variables 21-83
Creating Static Variables 21-86
Creating Reference Variables 21-88
Inserting Variables in a Doclet 21-91
Searching for Variables 21-93
Editing Variables 21-95
Filtering Variables 21-97
Highlighting Variables in Doclets 21-98
Inspecting Variables 21-99
Unlinking Reference Variables 21-102
Deleting Variables 21-102
Working with Excel Doclets in PDF-based Report Packages 21-104
Working with Server-Initiated Refresh 21-105
About Server-Initiated Refresh 21-105
Creating and Editing Data Source Connections 21-106
Selecting Sheets for Server-Initiated Refresh 21-108
Initiating Refresh from Narrative Reporting Web 21-110
Guidelines for Working with Server-Initiated Refresh 21-110
Inserting Links and Cross-References to Pages in Doclets 21-118
Working with an Automatic Table of Contents 21-123
Approving or Rejecting Doclets 21-123
Approving Doclets 21-124
Rejecting Doclets 21-125
Recalling Doclets 21-125
Inspecting Doclets 21-126
Reverting to a Prior Version of a Doclet 21-131
Performing Reviews 21-132
About the Review Phase Process 21-132
Collaborative Review Process 21-133
Iterative Review Process 21-133
xvi

Working with Review Instances in Smart View 21-133
Selecting a Review Instance 21-134
Posting Comments 21-135
Filtering and Sorting Comments 21-139
Editing and Deleting Comments 21-140
Attaching Supporting Files and Customizing Comment Text 21-141
Addressing and Closing Review Comments 21-143
Comparing Review Instances 21-144
Marking Reviews Complete 21-146
Working with Distributions 21-147
About Distributions 21-147
Viewing Distributions 21-147
Performing Sign Offs 21-149
About the Sign Off Phase 21-149
Signing Off On or Rejecting a Report 21-149
Refreshing Report Packages 21-150
Saving Office Documents to EPM Cloud in Narrative Reporting in Smart View 21-152
About Saving Office Documents to EPM Cloud 21-152
Setting Up Smart View to Save Office Documents to EPM Cloud 21-154
Creating Folders in the EPM Cloud Library 21-154
Saving Office Documents to EPM Cloud 21-155
Working with Reports in Smart View 21-156
About Working with Reports in Smart View 21-157
Importing Reports as Ad Hoc Queries 21-157
Importing and Working with Fully Formatted Reports 21-159
Editing Prompts in Reports 21-160
Changing the POV in Reports 21-162
Working with Narrative Reporting Data in Smart View 21-165
Example: Working with Narrative Reporting Data in Smart View 21-165
Performing Ad Hoc Analysis with Narrative Reporting Data 21-165
Copying and Pasting Narrative Reporting Data into Doclets 21-172
22
Smart View and Oracle BI EE
About Oracle BI EE and Smart View 22-1
Features and Components of Oracle BI EE in Smart View 22-2
Installing the Oracle BI EE Extension 22-2
For Smart View End Users 22-3
For Smart View Administrators 22-3
Working with Windows System Locales in Oracle BI EE 22-4
Connecting to Multiple Oracle BI EE Data Sources 22-4
xvii

Oracle BI Presentation Catalog 22-5
Working with Oracle BI EE Analyses, Views, and Dashboards 22-7
Supported Oracle BI EE View and Object Types 22-7
Inserting Tables and Pivot Tables 22-9
Inserting Graphs 22-13
Supported Oracle BI EE Chart and Object Types 22-15
Unsupported Oracle BI EE Chart and Object Types 22-15
Inserting Compound Views 22-16
Inserting Dashboards 22-17
Working with Prompts 22-17
Working with Page Prompts 22-21
Specifying Preferences for Refreshing Views 22-22
Refreshing Views 22-24
Masking Data in Views 22-26
Viewing Properties of an Oracle BI EE Object 22-28
Copying and Pasting Oracle BI EE Objects Between Office Applications 22-29
Editing an Analysis in Oracle BI EE 22-30
Copying and Pasting Views From Oracle BI EE to Office 22-30
Editing Views Created in Oracle BI EE 22-31
What Can and Cannot Be Edited 22-31
Editing Pivot Tables Inserted into PowerPoint 22-31
Other Guidelines 22-31
Working with Views Using the View Designer 22-32
Launching the View Designer 22-32
Defining the View Type and Display Style 22-34
Defining the View Layout 22-35
Defining the Filter Expression for Views in View Designer 22-37
Filter Operators 22-39
Publishing Views 22-42
Editing Views Created in View Designer 22-43
About Editing Views Created in View Designer 22-44
Guidelines for Editing Views Created in View Designer 22-44
Accessing the View to Edit 22-44
Determining Where a View was Created 22-45
Editing Views that were Created in View Designer 22-46
Refreshing Data in a View Created in View Designer 22-46
Troubleshooting Connecting to the Oracle BI EE Server 22-47
xviii
23
Smart View and Oracle Analytics Cloud
About Oracle Analytics Cloud and Smart View 23-1
Features and Components of Oracle Analytics Cloud in Smart View 23-2
Installing the Oracle Analytics Cloud Extension 23-3
For Smart View End Users 23-3
For Smart View Administrators 23-4
Working with Windows System Locales in Oracle Analytics Cloud 23-4
Connecting to Multiple Oracle Analytics Cloud Data Sources 23-4
Oracle BI Presentation Catalog 23-5
Working with Oracle Analytics Cloud Analyses, Views, and Dashboards 23-8
Supported Oracle Analytics Cloud View and Object Types 23-8
Inserting Tables and Pivot Tables 23-10
Inserting Graphs 23-13
Supported Oracle Analytics Cloud Chart and Object Types 23-15
Unsupported Oracle Analytics Cloud Chart and Object Types 23-16
Inserting Compound Views 23-16
Inserting Dashboards 23-17
Working with Prompts 23-17
Working with Page Prompts 23-20
Specifying Preferences for Refreshing Views 23-22
Refreshing Views 23-22
Masking Data in Views 23-24
Viewing Properties of an Oracle Analytics Cloud Object 23-27
Copying and Pasting Oracle Analytics Cloud Objects Between Office Applications 23-27
Editing an Analysis in Oracle Analytics Cloud 23-28
Copying and Pasting Views From Oracle Analytics Cloud to Office 23-29
Editing Views Created in Oracle Analytics Cloud 23-29
What Can and Cannot Be Edited 23-29
Editing Pivot Tables Inserted into PowerPoint 23-30
Other Guidelines 23-30
Working with Views Using the View Designer 23-30
Launching the View Designer 23-31
Defining the View Type and Display Style 23-32
Defining the View Layout 23-33
Defining the Filter Expression for Views in View Designer 23-35
Filter Operators 23-37
Publishing Views 23-40
Editing Views Created in View Designer 23-41
About Editing Views Created in View Designer 23-41
Guidelines for Editing Views Created in View Designer 23-41
xix

Accessing the View to Edit 23-42
Determining Where a View was Created 23-42
Editing Views Created in View Designer 23-43
Refreshing Data in a View Created in View Designer 23-43
24
Smart View and Oracle Analytics Cloud - Essbase
About Smart View and Oracle Analytics Cloud - Essbase 24-1
Running the Smart View Installer 24-2
Creating Data Source Connections to Oracle Analytics Cloud - Essbase 24-3
Tracking User Activity with Audit Trail 24-3
About Audit Trail 24-3
Launching Audit Trail 24-6
Export Audit Trail Content to a Sheet 24-8
Refresh the List of Audit Trail Entries 24-8
Starting an Ad Hoc Grid from an Audit Trail Entry 24-9
25
Smart View Options
Setting Smart View Options 25-1
Global Options and Sheet Level Options 25-2
Global Options 25-2
Sheet Options 25-2
Member Options 25-3
Member Options Supported for Planning Forms and Ad Hoc 25-8
Member Options Supported for Financial Management Forms and Ad Hoc 25-9
Member Options Supported for Essbase Ad Hoc 25-10
Member Options Supported for Narrative Reporting Ad Hoc 25-11
Data Options 25-12
Data Options Supported for EPM Cloud and Oracle Hyperion Planning (On-Premises)Forms and Ad Hoc 25-15
Data Options Supported for Financial Management Forms and Ad Hoc 25-16
Data Options Supported for Essbase Ad Hoc 25-17
Data Options Supported for Narrative Reporting Ad Hoc 25-18
Advanced Options 25-19
Formatting Options 25-24
Formatting Options Supported for Planning Forms and Ad Hoc 25-29
Formatting Options Supported for Financial Management Forms and Ad Hoc 25-30
Formatting Options Supported for Essbase Ad Hoc 25-30
Formatting Options Supported for Narrative Reporting Ad Hoc 25-31
Cell Styles 25-31
Cell Style Options Supported for Planning Forms and Ad Hoc 25-33
xx
Cell Style Options Supported for Financial Management Forms and Ad Hoc 25-34
Cell Style Options Supported for Essbase Ad Hoc 25-34
Extensions 25-35
Supported Extensions 25-36
Enabling and Disabling Extensions 25-37
Working with Extension Alerts 25-38
Initially Checking for Available Extensions 25-39
Installing Extensions 25-41
Updating Extensions 25-42
Enabling Logging for Extension Installations 25-43
Overriding the Default URL for the Extension Download 25-43
Uninstalling Extensions 25-44
26
Functions
Using Functions 26-1
Creating Functions 26-3
Creating Functions in the Function Builder 26-3
Using Cell References 26-8
Creating Functions Manually 26-10
Running Functions 26-12
Fixing Links in Functions 26-13
Copying and Pasting HsGetValue Functions 26-13
Function Descriptions 26-15
HsGetValue 26-15
HsSetValue 26-18
HsGetSheetInfo 26-22
HsCurrency 26-23
HsDescription 26-24
HsAlias 26-25
HsLabel 26-26
HsGetText 26-27
HsSetText 26-28
HsGetVariable 26-30
HsGetSharedConnectionURL 26-31
Common Function Error Codes 26-32
27
Free-Form Mode
About Free-Form Mode 27-1
Free-Form Guidelines 27-2
xxi

Free-Form Grid Examples 27-3
Simple Grids 27-3
Column Dimensions 27-6
Stacked Dimensions 27-6
Comments in Free-Form Grids 27-7
Comments in Blank Rows and Columns 27-8
Grid with Complex Comments 27-9
Invalid Placement of Comments 27-9
Comments Inside and Outside of Grid Boundaries 27-10
Formulas in Free-Form Grids 27-11
Duplicate Aliases in Free-Form Mode 27-12
Attribute Dimensions in Free-Form Grids 27-13
Creating Free-Form Reports 27-13
Retrieving Attribute Dimensions in Free-Form Mode 27-14
Creating Asymmetric Reports 27-15
Actions That May Cause Unexpected Behavior 27-16
28
Smart View Diagnostics and Health Check
About Smart View Diagnostics and Health Check 28-1
Displaying the Diagnostics Group in the Smart View Ribbon 28-2
Customizing Diagnostics Features 28-2
Using the Smart View Diagnostics Tools 28-4
Cleaning Up the Diagnostics Folder 28-5
Performing a Health Check On Your System 28-6
Performing a Health Check on Microsoft Office Documents 28-9
About Health Check 28-9
Performing a Health Check 28-11
29
Using Other Applications with Smart View
Crystal Ball EPM 29-1
Working with Crystal Ball EPM Workbooks 29-1
Toolbar Operations 29-2
Repository Options 29-3
Smart View and Spreadsheet Add-in 29-3
30
Migrating Functions
About Migrating Functions 30-1
Converting Workbooks 30-1
Converting One Workbook 30-2
xxii

Converting Multiple Workbooks 30-3
Migrating Connections for Functions 30-3
31
Finding Information
Smart View Accessibility 31-1
Smart View VBA Functions 31-1
Data Provider Information Resources 31-1
xxiii

Documentation Accessibility
For information about Oracle's commitment to accessibility, visit the OracleAccessibility Program website at http://www.oracle.com/pls/topic/lookup?ctx=acc&id=docacc.
Access to Oracle Support
Oracle customers that have purchased support have access to electronic supportthrough My Oracle Support. For information, visit http://www.oracle.com/pls/topic/lookup?ctx=acc&id=info or visit http://www.oracle.com/pls/topic/lookup?ctx=acc&id=trsif you are hearing impaired.
Documentation Accessibility
xxiv

Documentation Feedback
To provide feedback on this documentation, click the feedback button at the bottom of thepage in any Oracle Help Center topic. You can also send email to [email protected].
xxv

1Welcome to the Smart View User's Guide
The User's Guide explains Oracle Smart View for Office features and options includingconcepts, processes, and examples.
It covers Smart View releases 11.1.2.5.600 and later.
To find information:
• From the PDF file, navigate to topics from the table of contents, or use your reader'ssearch functionality.
• From the online help, in the left frame of the browser window, use the Table of Contentsto navigate to topics, or enter a search term in the search text box.
To find information for a specific Smart View release, go to the Enterprise PerformanceManagement page on the Oracle Help Center:
https://docs.oracle.com/en/applications/enterprise-performance-management/index.html
Locate the Smart View for Office section and select a Smart View release library.
1-1

2Introduction to Smart View
Using Oracle Smart View for Office, you can view, import, manipulate, distribute, and sharedata from various data sources using Microsoft Excel, Word, Outlook, and PowerPoint.
Related Topics
• OverviewUsing Oracle Smart View for Office, you can view, import, manipulate, distribute, andshare data from various data sources using Microsoft Excel, Word, Outlook, andPowerPoint.
• Supported Data Source ProvidersOracle Smart View for Office supports connections to several EPM Cloud and EPMSystem data sources, along with Oracle Analytics Cloud and Oracle BI EE data sources.
• Smart View ComponentsThe basic components of Oracle Smart View for Office, from which you connect to yourdata source and access Smart View functionality, are ribbons and the Smart View Panel.
• Installing Smart ViewThis topic contains links to instructions for installing Oracle Smart View for Office.
• Translation InformationThis topic contains translation information for the Oracle Smart View for Office userinterface and documentation.
• About this Guide
OverviewUsing Oracle Smart View for Office, you can view, import, manipulate, distribute, and sharedata from various data sources using Microsoft Excel, Word, Outlook, and PowerPoint.
Smart View gives you the ability to integrate Enterprise Performance Management andBusiness Intelligence data directly from the data source into Microsoft Excel, Word, andPowerPoint. Smart View provides these capabilities:
• Full ad hoc and free-form analysis capabilities for Oracle EPM Cloud data sources,including Planning, Financial Consolidation and Close, and Tax Reporting
• Full ad hoc and free-form analysis for Oracle Hyperion Financial Management, OracleEssbase, Oracle Hyperion Planning, and Oracle Business Intelligence Enterprise Edition
• Data access from Relational or multidimensional sources
• An alternative, Office-based interface for leveraging EPM on-premises and cloud productdata entry forms
• Ability to create data perspectives for end users called Smart Slices
Smart View works with the data sources described in Supported Data Source Providers.
Related Topics:
• Smart View Components
2-1

• Installing Smart View
• Translation Information
Supported Data Source ProvidersOracle Smart View for Office supports connections to several EPM Cloud and EPMSystem data sources, along with Oracle Analytics Cloud and Oracle BI EE datasources.
Smart View with EPM Cloud and Oracle Analytics Cloud Data Sources
Smart View provides a common Microsoft Office interface for these Oracle Cloud andOracle Analytics Cloud data sources:
• Planning
• Planning Modules
• Account Reconciliation
• Financial Consolidation and Close
• Narrative Reporting
• Oracle Hyperion Profitability and Cost Management
• Strategic Modeling (requires the Strategic Modeling extension)
• Tax Reporting
• Oracle Analytics Cloud (requires the Oracle BI EE extension)
• Oracle Analytics Cloud - Essbase
Smart View connected to Oracle Analytics Cloud - Essbase works with the CubeDesigner extension.
Depending on the Oracle Enterprise Performance Management Cloud businessprocess you're connected to, Smart View works with these extensions:
• Oracle Hyperion Financial Reporting extension
• Planning Admin Extension
• Task Manager extension
• Supplemental Data Manager extension
• Narrative Reporting extension
• Reconciliation Compliance extension
• Strategic Modeling extension
• EPM Books extension
• Predictive Planning extension
Smart View with On-Premises Data Sources
Smart View provides a common Microsoft Office interface for these on-premises datasources:
• Oracle Essbase
Chapter 2Supported Data Source Providers
2-2
• Oracle Hyperion Financial Management
• Oracle Hyperion Planning
• Oracle Hyperion Enterprise Performance Management Workspace
• Oracle Hyperion Reporting and Analysis
Includes Financial Reporting (requires the Financial Reporting extension for Smart View),and Oracle Hyperion Web Analysis
• Oracle Hyperion Strategic Finance (requires the Strategic Finance extension)
• Profitability and Cost Management
• Disclosure Management (requires the Disclosure Management extension)
• Oracle Hyperion Financial Data Quality Management, Enterprise Edition
• Oracle Business Intelligence Enterprise Edition (requires the Oracle BI EE extension)
Additionally, Smart View supports several on-premises extensions. See Extensions for moreinformation.
Most of the extensions listed above are discussed in their respective guides (see the OracleHelp Center for more information). The Narrative Reporting extension, ReconciliationCompliance extension, and Oracle BI EE extension are discussed in this guide.
Additionally, in this guide, references to Financial Reporting apply to both the on-premisesand EPM Cloud versions of Financial Reporting.
Note:
Smart View is not supported with shared workbooks. When the Excel option forsharing workbooks is enabled, Smart View operations are not supported. Forexample, attempting to perform a refresh in a shared workbook can cause anexception to occur.
To clear the shared workbook option in Excel, go to the Review ribbon, then clickthe Share Workbook button, and then clear the Allow changes by more than oneuser at the same time check box.
Smart View ComponentsThe basic components of Oracle Smart View for Office, from which you connect to your datasource and access Smart View functionality, are ribbons and the Smart View Panel.
The components displayed depend on the Microsoft Office application that you have open.
Related Topics:
Ribbons
Smart View Panel
Chapter 2Smart View Components
2-3

RibbonsFrom Office applications, you access Oracle Smart View for Office functionalitythrough ribbon commands.
Note:
Smart View is designed to work optimally with the ribbon structure ofMicrosoft Office 2010 or later.
The Smart View ribbon, which contains commands for common Smart View operationsand for Oracle Hyperion Reporting and Analysis operations, is always present.
When you connect to a data source (other than Reporting and Analysis), thecorresponding data source ribbon is also displayed. Each ribbon displays only thecommands supported for that data source and mode. For example, in the followingillustration for Oracle Hyperion Planning, when you access a Planning form, thePlanning ribbon is displayed; when you enter ad hoc analysis (see Ad Hoc Analysis),the Planning Ad Hoc ribbon is displayed.
The ribbons are:
• Smart View
• Essbase
• HFM (Oracle Hyperion Financial Management )
• HFM Ad Hoc
• Planning
• Planning Ad Hoc
• FCCS (Financial Consolidation and Close)
Chapter 2Smart View Components
2-4

• FCCS Ad Hoc
• TRCS (Tax Reporting)
• TRCS Ad Hoc
• Oracle BI EE
• Others—If the administrator has installed and configured your Smart View system withextensions, there may be other ribbons; for example:
– Narrative Reporting
– Narrative Reporting Ad Hoc
– Disclosure Management
– Strategic Finance
Video
Your Goal Watch This Video
Learn about navigating in Smart View, includingworking with ribbons. Navigating Smart View
Smart View PanelFrom the Smart View Panel, you can manage data source connections, access data and tasklists, and create reports.
You can also open Oracle Crystal Ball Enterprise Performance Management workbooks ifyou are licensed for Crystal Ball EPM or related products.
The Smart View Panel, opened from the Smart View ribbon, is displayed by default on theright side of the Microsoft Office application. You can move, resize, or close the Smart ViewPanel from the down arrow in the title bar.
The Smart View Panel contains the following panes:
• Home—A panel that displays links to Shared Connections and Private Connections aswell as a list of recently used items—ad hoc grids, forms, and tasks—that you can click toestablish a connection.
• Shared Connections—A drop-down menu of available connections from OracleHyperion Shared Services and a tree view of the contents of the currently selectedconnection.
• Private Connections—A drop-down menu of available connections saved on the localcomputer and a tree view of the contents of the currently selected connection. You canalso enter a URL to connect directly to a data source here.
• Task Lists—A tree list of tasks from which you can manage your tasks. This pane opensonly when you select a task list from Shared Connections or Private Connections.
• Action Panel—A list of operations available based on the selection in the sharedconnection, private connection, or task list tree.
• Document Contents—A task pane in the Smart View Panel that provides a view of theconnections and content existing in the current Office document.
Chapter 2Smart View Components
2-5

• Other—If the administrator has installed and configured your Oracle Smart Viewfor Office system with extensions, there may be other panels; for example, SmartQuery or Crystal Ball EPM workbooks.
Installing Smart ViewThis topic contains links to instructions for installing Oracle Smart View for Office.
On-premises providers: Refer to the installation scenario you require in "InstallingSmart View" in the Oracle Smart View for Office Installation and Configuration Guide .In the Help Center, select your Smart View release, then select Oracle Smart View forOffice Installation and Configuration Guide , and then locate the "Installing SmartView" chapter.
Oracle Enterprise Performance Management Cloud:
• Users: Downloading and Installing Clients
• Administrators: Download and Install Clients
Oracle Analytics Cloud - Essbase: See Download and Run the Smart View Installer
All providers, Smart View 11.1.2.5.810+: If you plan to use use drill-through reportsor launch Smart View from the web application, you require a browser add-on. In the Help Center, select your Smart View release, then select Oracle Smart View for OfficeInstalling and Configuring Oracle Smart View for Office , and then locate the "InstallingBrowser Add-ons" topic in the "Installing Smart View" chapter.
Also, take note of the information in Windows, Office, and Smart View Locale Settingswhen installing Smart View.
Windows, Office, and Smart View Locale Settings
On your Smart View client machine, the following locale settings should match:
• Smart View language option
• Microsoft Office language
• Windows Regional Settings
• Windows operating system
Running Smart View in a language other than the language of the machine's Windowsoperating system, system locale, or Office language, may result in incorrect data beingreturned. For example, if the Windows operating system, system locale, and Officelanguage are English, and you run Smart View in Russian, reports or chart data maydisplay incorrectly.
Ensure that on your Smart View client machine, the locale settings noted above match.
Translation InformationThis topic contains translation information for the Oracle Smart View for Office userinterface and documentation.
The following items are translated:
• Smart View user interface is translated into Arabic, Chinese (Simplified andTraditional), Czech, Danish, Dutch, Finnish, French, French Canadian, German,
Chapter 2Installing Smart View
2-6

Greek, Hebrew, Hungarian, Italian, Japanese, Korean, Norwegian, Polish, Portuguese,Portuguese (Brazilian), Romanian, Russian, Slovak, Spanish, Swedish, Thai, andTurkish.
Note:
To change the language displayed on the Smart View user interface, open anyMicrosoft Office application (Excel, Word, PowerPoint, or Outlook), and followthese instructions:
1. From an Office application, select the Smart View ribbon, click Options,and select the Advanced tab.
2. In the Language drop-down list, select a new display language.
3. Click OK at the prompt, and then click OK to close the Options dialog.
4. Restart the Office application.
All Smart View-related user interface elements, such as ribbons, panels,and dialog boxes, will display in the new language.
Any other currently-opened Office applications must be restarted in order todisplay Smart View elements in the new language.
• The Smart View online help is translated into Chinese (Simplified and Traditional), Dutch,French, German, Italian, Japanese, Korean, Portuguese (Brazilian), and Spanish. Whenyou use Smart View in any of these languages, the help is also displayed in thatlanguage.
When you use Smart View in any other translated language (for example, Arabic orHebrew), the help is displayed in English.
About this GuideThis guide contains information applicable to both Oracle Enterprise PerformanceManagement System On-Premises providers and Cloud providers.
Throughout this guide, unless otherwise noted:
• References to Planning apply to both Oracle Hyperion Planning on-premises andPlanning for Oracle Enterprise Performance Management Cloud.
• At the beginning of topics where supported data sources are listed:
– Oracle Hyperion Planning on-premises is referred to as Oracle Hyperion Planning.
– Planning for EPM Cloud is referred to as Planning.
• In EPM Cloud, if a feature or functionality is supported by Planning, then it is alsosupported by Planning Modules.
• References to Oracle Hyperion Financial Reporting apply to both on-premises FinancialReporting and Financial Reporting for EPM Cloud.
• References to Oracle Hyperion Reporting and Analysis refer to the functionality accessedfrom the "Reporting Settings" option in Shared Connections.
Chapter 2About this Guide
2-7

3Managing Data Source Connections
Describes the managing data source connections in the Oracle Oracle Smart View for Officefor Office.
Related Topics
• ConnectionsYou connect to data sources, manage your connections, and open grids, forms, and tasklists all from the Smart View Panel.
• Shared Connections and Private ConnectionsYou connect to data sources through shared or private connections in Oracle Smart Viewfor Office.
• Connecting to Data SourcesFrom Oracle Smart View for Office in Excel, Word, and PowerPoint, you can connect tovarious supported data sources, includes Oracle Enterprise Performance ManagementCloud and Oracle Enterprise Performance Management System sources.
• Disconnecting from Data SourcesYou can disconnect from the current connection or from all connections.
• Creating Shared ConnectionsYou create a shared connection using a connection URL provided to you by your OracleSmart View for Office administrator, or a vanity URL.
• Creating Private ConnectionsThere are several ways to create private connections.
• Modifying ConnectionsYou can modify connections in two different ways: modify a private connection or modifythe connection information for individual entities within an Office document. Additionally,you use the Edit Connection command to modify connections for Oracle HyperionFinancial Reporting images and fully-fomatted reports.
• Managing Connection URL MappingsConnection URL Mapping allows you to migrate from one environment to anotherenvironment.
• Deleting ConnectionsDelete connections in the Delete Connections URL dialog box.
ConnectionsYou connect to data sources, manage your connections, and open grids, forms, and task listsall from the Smart View Panel.
Depending on how the administrator configured Oracle Smart View for Office, you may ormay not be required to enter your user name and password as you change data providersand Office applications.
3-1

Video
Your Goal Watch This Video
Learn about Smart View connections. Overview: Leveraging EPM Cloud and
On-Premise Data Using Smart ViewConnections
Related Topics:
Shared Connections and Private Connections
Connecting to Data Sources
Disconnecting from Data Sources
Creating Shared Connections
Creating Private Connections
Modifying Connections
Deleting Connections
Shared Connections and Private ConnectionsYou connect to data sources through shared or private connections in Oracle SmartView for Office.
Generally, you can connect to one provider data source per sheet. However, for thefollowing providers, you can connect to multiple instances of the same data sourcetype per sheet, slide, or document: Planning, Financial Consolidation and Close, TaxReporting, Oracle Analytics Cloud , Oracle Business Intelligence Enterprise Edition,Oracle Analytics Cloud - Essbase , and Oracle Essbase .
As a Smart View user, you may have access to shared connections, privateconnections, or both.
Starting in release 20.200, you can access your connections using vanity URLs, alsoreferred to as custom URLs.
• Shared Connections
You can create shared to connections to Oracle Enterprise PerformanceManagement Cloud sources and on-premises Oracle Hyperion EnterprisePerformance Management Workspace sources.
For EPM Workspace connections, you can connect to multiple provider types perconnection. Figure 3 illustrates this type of connection.
For EPM Cloud sources, there are two ways to use a shared connection:
– One cloud provider per shared connection.
For example, shared Connection "A" connects you to your Planning businessprocess instance; shared Connection "B" connects you to your FinancialConsolidation and Close business process instance.
Figure 1 illustrates this type of connection.
Chapter 3Shared Connections and Private Connections
3-2

– Multiple EPM Cloud providers per shared connection. In this case, all supportedcloud providers must reside on the same domain.
For example, your organization is hosting Planning, Financial Consolidation andClose, and Tax Reporting on the same domain. Shared Connection "C" connects youto all three business process instances.
In Smart View, this type of connection applies only to these EPM Cloud businessprocesses:
* Planning
* Planning Modules
* Financial Consolidation and Close
* Tax Reporting
* Narrative Reporting
* Account Reconciliation
Figure 2 illustrates this type of connection.
EPM Cloud Service Administrators: See Administering Planning , ConnectingEnvironments in EPM Cloud for information on setting up multiple providers on asingle shared connection.
Shared connections are either:
– Accessed from a central server or host location and available to multiple usersthrough the Smart View Panel.
– Stored on each Smart View client machine or on a web server in an XML file createdby an administrator. The connections in the XML file are then available to the userthrough shared connections in the Smart View Panel.
See Accessing Shared Connections from an XML File in the Oracle Smart View forOffice Installation and Configuration Guide for information on preparing anddistributing this XML file.
You cannot edit or rename shared connections, but you can save them as privateconnections, which you can edit and rename.
• Private Connections
Private connections are those that you create by saving a shared connection to your localcomputer, by using a wizard, or by entering a URL to a provider data source. When youcreate a private connection, it becomes the active connection.
Figure 4 illustrates this type of connecting, showing connections created using a wizardand connections created using the Quick Connection method.
Note:
When working with Oracle Analytics Cloud, Oracle BI EE, Oracle AnalyticsCloud - Essbase, and Narrative Reporting, you must use a private connection,or add the private connection information to a shared connection XML file, asdescribed in Accessing Shared Connections from an XML File in the OracleSmart View for Office Installation and Configuration Guide .
Related Topics:
Chapter 3Shared Connections and Private Connections
3-3

Connections
Connecting to Data Sources
Disconnecting from Data Sources
Creating Private Connections
Saving Shared Connections as Private Connections
Modifying Connections
Deleting Connections
Connecting to Data SourcesFrom Oracle Smart View for Office in Excel, Word, and PowerPoint, you can connectto various supported data sources, includes Oracle Enterprise PerformanceManagement Cloud and Oracle Enterprise Performance Management Systemsources.
Related Topics
• About Connecting to Data SourcesFrom Oracle Smart View for Office in Excel, Word, and PowerPoint, you canconnect to various supported data sources, such as Oracle EnterprisePerformance Management Cloud and Oracle Enterprise PerformanceManagement System sources, using a shared or private connection.
• Connecting Using a Shared Connection
• Connecting Using a Private Connection
About Connecting to Data SourcesFrom Oracle Smart View for Office in Excel, Word, and PowerPoint, you can connectto various supported data sources, such as Oracle Enterprise PerformanceManagement Cloud and Oracle Enterprise Performance Management Systemsources, using a shared or private connection.
In this topic, see:
• Videos
• Examples of Shared and Private Connections
• Guidelines for Shared and Private Connections
Videos
Your Goal Watch This Video
Learn about Smart View connections. Overview: Leveraging EPM Cloud and
On-Premise Data Using Smart ViewConnections
Learn about navigating in Smart View,including connecting to a data source. Navigating Smart View
Chapter 3Connecting to Data Sources
3-4

Your Goal Watch This Video
Watch this video to learn how to set upmultiple EPM Cloud business processes ona single connection.
Overview: Customizing Workflow inEPM Cloud
Examples of Shared and Private Connections
Following are examples of the various types of connections and how they would appear inthe Smart View Panel. This will give you an idea of what to expect when you're connecting todata sources in Smart View.
• Shared connection to a single EPM Cloud data source.
In the example drop-down menu in Figure 1, the user has access to a connection to aPlanning data source (this is the EPM Cloud option) and to Financial Reporting (theReporting Settings option).
Figure 3-1 Shared Connection to a Single EPM Cloud Data Source
• Shared connection to multiple EPM Cloud data sources on the same domain.
In the example drop-down menu in Figure 2, the user has access to multiple supportedEPM Cloud data sources; for example, FinPlan connects to a Planning data source,FinClose connects to a Financial Consolidation and Close data source, Wrkforceconnects to a Workforce data source, Recon connects to an Account Reconciliation datasource, and so on.
Your service administrator specifies the data source names you will see in the drop-downmenu.
Figure 3-2 Shared Connection to Multiple EPM Cloud Data Sources
Chapter 3Connecting to Data Sources
3-5

EPM Cloud Administrators: See Administering Planning, Connecting Environmentsin EPM Cloud for information on setting up multiple providers on a single sharedconnection.
• Shared connection in Oracle Hyperion Enterprise Performance ManagementWorkspace.
In the example drop-down menu in Figure 3, the user has access to five EPMSystem data sources, including Oracle Essbase and Oracle Hyperion Planning.
Figure 3-3 Shared Connection in EPM Workspace
• Private connections
The example drop-down menu in Figure 4 shows two connections, for Essbaseand Oracle Hyperion Financial Management, that were created using the PrivateConnection wizard. The remaining connections displayed were created using theQuick Connection method and include, among others, connections to OracleHyperion Planning and Essbase.
Figure 3-4 Various Private Connections
Guidelines for Shared and Private Connections
• Starting in Release 20.200, you can use custom URLs, or vanity URLs to accessdata source providers from Smart View. To configure your custom URL, you use athird-party link shortener, such as T.ly, Bitly, Rebrandly, TinyUrl, or is.gd, or anopen source solution, such as YOURLS. Then, depending on the configuration,
Chapter 3Connecting to Data Sources
3-6

use the custom URL as your shared connection, private connection, or quick connection.
Note:
– When using a vanity URL, there is the possibility of transmitting sensitivedata to your third-party link shortening vendor. For example, whenperforming a refresh or a submit, you may be transmitting passwordinformation during the transaction.
– The extension installation and update command, Check for Updates, Newinstalls, and Uninstalls, in the Options dialog, Extensions tab is notsupported when logged in using a vanity URL.
Administrators or Smart View users can create vanity URLs. For detailed information oncreating vanity URLs, see the documentation from the third-party link shortener of yourchoice.
• For some data sources, you can connect to only one data source per worksheet.Exceptions and other connection guidelines are noted below.
• Planning, Financial Consolidation and Close, and Tax Reporting:
You can connect to multiple databases on a single worksheet, as described in ChangingConnections in EPM Cloud Multiple-Grid Worksheets.
• Oracle Analytics Cloud - Essbase and Essbase
– When connecting to Oracle Analytics Cloud - Essbase, you must use a privateconnection.
– You can connect to multiple Essbase databases on a single worksheet, as describedin Changing Connections in Multiple-Grid Worksheets.
– If external authentication is disabled, for security reasons, you must provide your username and password each time you connect to a different application on the sameserver.
– Once connected to an Essbase database, users can view database notes associatedwith the database. To display database notes, from the Smart View Panel, right-clickthe name of the Essbase database, and then select Database Note. You cannot editthese database notes from Smart View. Database notes can be implemented in VBAby using the VBA function, HypGetDatabaseNote (see the Oracle Smart View forOffice Developer's Guide ).
• Oracle Analytics Cloud and Oracle Business Intelligence Enterprise Edition
– You can connect to multiple catalogs on a single sheet, as described in Connecting toMultiple Oracle Analytics Cloud Data Sources and Connecting to Multiple Oracle BIEE Data Sources .
– When connecting to Oracle Analytics Cloud or Oracle BI EE, , you must use a privateconnection.
• When connecting to Narrative Reporting, you must use a private connection.
Connecting Using a Shared ConnectionTo connect to a data source using a shared connection:
Chapter 3Connecting to Data Sources
3-7

1. From the Smart View ribbon, click Panel.
Note:
To open a recently used item, click an item under Recently Used, and
then skip to step 3. You can click to pin items to this list.
2. From the Smart View Panel or from the drop-down menu displayed when you click
the down arrow next to , select Shared Connections.
3. In the Connect to Data Source dialog or the Login dialog, enter your user nameand password.
Note:
• When accessing a cloud data source, the business process domainname appears next to Welcome in the Login dialog. If you need tochange domains, click the change domain link, enter the new cloudIdentity Domain name, and click Go. Then proceed with enteringyour user name and password.
• Depending on how your administrator configured Oracle Smart Viewfor Office, you may or may not be required to enter your user nameand password as you change data providers and Office applications.
4. In the Shared Connections panel, in the field labeled Select Server to proceed,select a data source type from the drop-down menu.
Once you select a data source type, the connections available for the selecteddata source are displayed in a tree list in the Smart View Panel.
5. In the Smart View Panel, navigate the tree list, and then double-click the item—form, ad hoc grid, Smart Slice, task list, or catalog—that you want to open.
You can also open items by right-clicking them and making a selection; orselecting an option from the Action Panel at the bottom of the Smart View Panel.
6. Optional: After the item is opened on the grid, to easily locate it in the tree view,
click the arrow next to and select Locate Worksheet Connection.
Note:
Depending on how the administrator configured Smart View, you may ormay not be required to enter your user name and password as youchange data providers and Office applications.
Connecting Using a Private ConnectionTo connect to a data source using a private connection:
Chapter 3Connecting to Data Sources
3-8

1. From the Smart View ribbon, click Panel.
Note:
To open a recently used item, click an item under Recently Used, and then
skip to step 4. You can click to pin items to this list.
2. From the Smart View Panel or from the drop-down menu displayed when you click the
down arrow next to , select Private Connections.
3. In the Private Connections panel, in the field labeled Select Server or enter Provider urlto proceed, select a connection from the drop-down menu.
Alternatively, enter a connection URL in the field, and then press Enter. For examples ofthe URL syntax to use, see Private Connection URL Syntax.
4. In the Connect to Data Source dialog or the Login dialog, enter your user name andpassword.
Note:
• When accessing a cloud data source, the business process domain nameappears next to Welcome in the Login dialog. If you need to changedomains, click the change domain link, enter the new cloud IdentityDomain name, and click Go. Then proceed with entering your user nameand password.
• Depending on how your administrator configured Oracle Smart View forOffice, you may or may not be required to enter your user name andpassword as you change data providers and Office applications.
5. In the Smart View Panel navigate the tree list, and then double-click the item—form, adhoc grid, Smart Slice, task list, or catalog—that you want to open.
You can also open items by right-clicking them and making a selection; or selecting anoption from the Action Panel at the bottom of the Smart View Panel.
6. Optional: After the item is opened on the grid, to easily locate it in the tree view, click the
arrow next to and select Locate Worksheet Connection.
Disconnecting from Data SourcesYou can disconnect from the current connection or from all connections.
To disconnect only from the current connection:
1. From the Smart View Panel, select the connection that is currently open in the tree list.
2. Optional: To find this connection quickly, click the arrow next to and select LocateWorksheet Connection.
3. Right-click and select Disconnect.
Chapter 3Disconnecting from Data Sources
3-9

Disconnecting from the current connection does not invalidate single-sign on(SSO).
To disconnect from all connected shared connections and private connections:
1. From the Smart View Panel, click .
2. Select Disconnect All.
This selection invalidates SSO, and you must log in again the next time youconnect.
Related Topics:
Connections
Shared Connections and Private Connections
Connecting to Data Sources
Shared Connections and Private Connections
Creating Private Connections
Saving Shared Connections as Private Connections
Modifying Connections
Deleting Connections
Creating Shared ConnectionsYou create a shared connection using a connection URL provided to you by yourOracle Smart View for Office administrator, or a vanity URL.
When you have the connection URL information, you can complete the procedure inthis topic.
To create a shared connection in Smart View:
1. From the Smart View ribbon ribbon, click Options.
2. In the Options dialog box, select the Advanced tab.
3. In the Shared Connections URL text box, enter the connection URL provided toyou by your Smart View administrator.
The URL syntax for on-premises connections is:
http(s)://<server>:<port>/workspace/SmartViewProviders
The URL syntax for a cloud connection to a single cloud business process is:
http(s)://<serviceURL>/workspace/SmartViewProviders
The URL syntax for a cloud connection to multiple Oracle Enterprise PerformanceManagement Cloud business processes on the same domain is:
http(s)://<serviceURL>/HyperionPlanning/SmartView
Chapter 3Creating Shared Connections
3-10
Note:
EPM Cloud Service Administrators: See Administering Planning , ConnectingEnvironments in EPM Cloud for information on setting up multiple providers ona single shared connection.
Starting in release 20.200, for vanity URLs (also referred to as custom URLs), using thesyntax above, enter the URL you have configured with your third-party link shorteningvendor. The syntax you use in your configuration depends on whether you are connectingto an on-premises data source, a single cloud business process, or multiple cloudbusiness processes on the same domain. For example:
http(s)://<yourVanityURL>
4. Click OK to close the Options dialog box.
5. Connect by following the procedure in Connecting to Data Sources.
Creating Private ConnectionsThere are several ways to create private connections.
• Using the Private Connection Wizard
• Using the Quick Connection Method
• Saving Shared Connections as Private Connections
See also Private Connection URL Syntax.
Related Topics:
Connections
Shared Connections and Private Connections
Connecting to Data Sources
Disconnecting from Data Sources
Modifying Connections
Using the Private Connection WizardTo create a private connection using the wizard:
1. From the Smart View ribbon, click Panel.
2. From the Smart View Panel, click the arrow next to , and then select PrivateConnections.
3. In the Action Panel, click Create new connection to display the Add Connection wizard.
Alternatively, click the arrow next to and select Create new connection.
4. In Add Connection - URL, enter the URL for the private connection, then click Next.
Chapter 3Creating Private Connections
3-11

Follow the syntax guidelines in Private Connection URL Syntax.
5. In Add Connection - Application/Cube, navigate to the application and databaseto work with, select it, and then click Next.
6. In Add Connection - Name/Description, enter a friendly name for the connectionand an optional description.
7. Click Finish.
8. Optional: To select a private connection, click the drop-down arrow in theconnection text box in the Smart View Panel.
Private connections are listed by provider type.
Related Topics:
Using the Quick Connection Method
Saving Shared Connections as Private Connections
Private Connection URL Syntax
Using the Quick Connection MethodYou can create a private connection using the quick connection method if you knowthe URL. URLs are generally provided to you by your Oracle Smart View for Officeadministrator.
To create a private connection using the quick connection method:
1. From the Smart View ribbon, click Panel.
2. From the Smart View Panel, click the arrow next to , and then select PrivateConnections.
3. In the text box, enter the URL or the local storage directory for the data source towhich you want to connect.
Figure 3-5 Text Box for Entering URL when Creating a Quick Connection
The URL syntax for the various data sources is listed in Private Connection URLSyntax. Contact your system administrator for the URL to use.
4. Click .
5. Expand the tree in the Smart View Panel and navigate to the application anddatabase that you want to work with.
If you are prompted to log in, enter your login credentials.
Chapter 3Creating Private Connections
3-12

Example 3-1 Deleting the List of Quick Connections
To delete the entire list of quick connections, click the arrow next to , and then selectClear Quick Connect URL Entries.
Related Topics:
Using the Private Connection Wizard
Saving Shared Connections as Private Connections
Private Connection URL Syntax
Saving Shared Connections as Private ConnectionsAlthough you cannot create shared connections without administrative privileges, you cansave them as private connections if they are enabled for private connections.
To create a private connection from a shared connection:
1. From the Shared Connections tree list, select an item to save as a private connection.
2. From the Action Panel, select Add to private connections.
This option is available only if the selected item is enabled for saving as a privateconnection.
3. Optional: From Save as Private Connection, edit the name and description of theconnection.
4. Click OK.
The connection name is displayed in the following:
• The Shared Connections tree list, indicated as private by a small arrow
• The Private Connections drop-down menu
5. To ensure that the current worksheet is connected to the newly-created privateconnection, in the Smart View ribbon, click Connections, then Active Connections, andthen select the check box next to the new connection name.
Alternatively, once you perform a Oracle Smart View for Office action (for example, selectAd hoc analysis from the Action Panel), the connection is automatically made.
Related Topics:
Using the Private Connection Wizard
Using the Quick Connection Method
Private Connection URL Syntax
Private Connection URL SyntaxThis topic lists the syntax that Oracle Smart View for Office requires for creating privateconnections to on-premises and cloud data sources.
See:
On-premises data sources
Cloud data sources
Chapter 3Creating Private Connections
3-13

On-Premises data sources:
• Oracle Essbase:
http(s)://servername:port/aps/SmartView
• Oracle Hyperion Financial Management:
– Financial Management 11.1.2.4.x and later:
http://servername:port/hfmadf/../hfmadf/officeprovider
– Financial Management 11.1.2.3.x and earlier:
http(s)://servername:port/hfmofficeprovider/hfmofficeprovider.aspx
• Oracle Hyperion Planning:
http(s)://servername:port/HyperionPlanning/SmartView
• Oracle Hyperion Reporting and Analysis - Release 11.1.2.4.7xx and earlier:
http(s)://servername:port/raframework/browse/listXML
• Oracle Financial Reporting Document Repository - Release 11.1.2.4.9xx and later:
http(s)://servername:port/hr/modules/com/hyperion/reporting/web/repository/HRRepositoryXML.jsp
• Oracle Hyperion Financial Close Management:
http(s)://servername:port/fcc/servlets/smartview/fcmsvservlet
• Oracle Hyperion Strategic Finance:
http(s)://servername:port/StrategicPlanning/SmartView
• Oracle Business Intelligence Enterprise Edition:
– Using the Private Connection wizard:
http(s)://servername:port/analytics/jbips
– Using the Quick Connection method:
OBI:http(s)://servername:port/analytics/jbips
Cloud data sources:
• Planning
https://serviceURL/HyperionPlanning/SmartView
Chapter 3Creating Private Connections
3-14

• Planning Modules
https://serviceURL/HyperionPlanning/SmartView
• Oracle Hyperion Financial Reporting (Reporting Settings / Document Repository):
https://serviceURL/hr/modules/com/hyperion/reporting/web/repository/HRRepositoryXML.jsp
• Narrative Reporting
https://serviceURL/epm/SmartView
• Financial Consolidation and Close
https://serviceURL/HyperionPlanning/SmartView
• Profitability and Cost Management:
https://serviceURL/aps/SmartView
• Oracle Sales Planning Cloud:
https://serviceURL/HyperionPlanning/SmartView
• Tax Reporting
https://serviceURL/HyperionPlanning/SmartView
• Task Manager extension (used with Financial Consolidation and Close and TaxReporting)
https://serviceURL/HyperionPlanning/cm/svp
• Supplemental Data Manager extension (used with Financial Consolidation and Close andTax Reporting)
https://serviceURL/HyperionPlanning/sdm/svp
• Strategic Modeling extension
https://serviceURL/HyperionPlanning/SmartView
• Oracle Analytics Cloud:
– Using the Private Connection wizard:
https://serviceURL/analytics/jbips
– Using the Quick Connection method:
OBI:https://serviceURL/analytics/jbips
Chapter 3Creating Private Connections
3-15

• Oracle Analytics Cloud - Essbase:
https://serviceURL/essbase/smartview
Related Topics:
Using the Private Connection Wizard
Using the Quick Connection Method
Saving Shared Connections as Private Connections
Vanity URLs
Starting in release 20.200, For vanity URLs (also referred to as custom URLs), usingthe syntax above, enter the URL you have configured with your third-party linkshortening vendor. The syntax you use depends on whether you are connecting to anon-premises data source or a cloud business process. For example:
http(s)://<yourVanityURL>
Modifying ConnectionsYou can modify connections in two different ways: modify a private connection ormodify the connection information for individual entities within an Office document.Additionally, you use the Edit Connection command to modify connections for OracleHyperion Financial Reporting images and fully-fomatted reports.
• Modify a private connection. You can modify a private connection to change theserver, application, or database information for all data providers associated withthe connection.
The connection information can be changed whether you are connected or not.
For example, you may be working in a test environment using a privateconnection. When you are ready to move to a production environment, youchange the server information for that private connection to access the newenvironment.
This procedure is described in Modifying Private Connections.
• Modify the connection information for individual entities within a document.You can modify the connection information for individual entities within a documentusing the Document Contents panel. You can change connections per sheet. Or, ina sheet containing multiple entities, you can change the server connection for oneor more of the individual entities.
For example, while connected to Oracle Business Intelligence Enterprise Edition,you may have inserted a compound view containing 10 graphs. Now you wouldlike to pull data from a different Oracle BI EE server for three of the graphs. Usingthe Document Contents panel, you can modify the connection information for theeach of the three graphs to point to the new Oracle BI EE server.
This procedure is described in Modifying Connections within an Office Document.
• Modify the connection information for individual Financial Reporting imagesand fully-formatted reports images in Office documents. Using the EditConnection command accessed from the Smart View ribbon, you can change theconnection information for entities in Excel, Word, and PowerPoint. This is useful
Chapter 3Modifying Connections
3-16

when sharing an Office document between departments or when moving from a test to aproduction environment.
See Modifying Connections for Financial Reporting Images and Fully-Formatted Reports.
Note:
When you modify connection information, the new data source that you point tomust contain all the dimensions and members of the previous data source. Anymissing dimensions or members in the new data source will cause errors uponrefresh.
Related Topics:
Connections
Shared Connections and Private Connections
Connecting to Data Sources
Disconnecting from Data Sources
Shared Connections and Private Connections
Shared Connections and Private Connections
Creating Private Connections
Modifying Private ConnectionsUse the Edit Connection wizard to modify a private connection.
To modify a private connection:
1. From the Smart View ribbon, click Panel.
2. From the Smart View Panel, click the arrow next to , and then select PrivateConnections.
3. Click the arrow in the text box to select a private connection to modify, and then click .
Note:
You may modify the private connection even if you are already connected to it.
4. In the Smart View Panel, expand the tree to the connection name, and then select it.
Chapter 3Modifying Connections
3-17

Figure 3-6 Tree Expanded with Connection Name Selected in Smart ViewPanel
5. In the Action Panel, select Modify connection.
Alternatively, right-click the private connection name and select Modifyconnection.
6. In the Edit Connection - URL page, edit the URL as required, and then clickNext.
Optionally, select the Set as default connection check box, and then click Next.
7. In the Edit Connection - Application/Cube page, and navigate the tree to thenew application and cube, select it, and then click Next.
Alternatively, select the Advanced Setup check box and manually enter the newconnection information in the Server, Application, and Cube/Database textboxes, and then click Next.
8. In the Edit Connection - Name/Description page, change the connection nameand description as required, and then click Finish.
Modifying Connections within an Office DocumentFrom the Document Contents pane, you can change connections for Oracle SmartView for Office objects within an Office document. This is useful when sharing anOffice document between departments that point to different servers or when movingfrom a test to a production environment.
You can change the connection properties for all entities in a document that share thesame connection information (for example, all worksheets or grids that point to thesame application and database on a particular server). Or, in an Excel workbook, youcan change the connection information sheet by sheet.
To modify connections from the Document Contents pane:
1. Open the Office document.
Note:
Narrative Reporting: To change the connection information for SmartView content in an Excel doclet, you must open the doclet from thereport package and then check it out. See Checking Out Doclets.
2. In the Document Contents pane, from the drop-down list box, perform an action:
• Select a sheet from a selected document
Chapter 3Modifying Connections
3-18

• Select a particular connection
• Select All Connections
3. Select the Modify Connection link at the bottom of the pane.
Alternatively, right-click a connection name or sheet name and select ModifyConnection. You can also modify connections as follows:
• To modify a connection for all sheets in the workbook, select the top-level tree nodeconnection name in Document Contents
• To modify a connection for a specific sheet, select the connection name under thespecific sheet-level tree node
The Edit Connection - URL page of the wizard is displayed.
4. In the URL drop-down list, select an existing connection or enter a new connection URL.
5. Click Next and in Edit Connection - Application/Cube, expand Servers, and navigateto the application and database to which you want to connect, depending upon theprovider requirements.
Alternatively, select the Advanced Setup check box and manually enter the informationfor Server, Application, and Cube/Database, as the provider requires.
For example, Figure 1 shows the entries for connecting to an Oracle Essbase applicationand database.
Figure 3-7 Edit Connection - Application/Cube Advanced Setup
6. Click Finish.
7. Select the Refresh link at the bottom of the Document Contents pane.
8. To save the modified connection information, save the workbook.
The modified connection information is saved when you save the workbook.
Chapter 3Modifying Connections
3-19

Note:
Narrative Reporting: Be sure to upload and check in the Excel docletyou're working with. The modified connection information is saved whenyou upload and check in the doclet. See Uploading and Working withPage Attributes and Slide Masters and Checking In Doclets.
Modifying Connections for Financial Reporting Images and Fully-Formatted Reports
You can change connections for Oracle Hyperion Financial Reporting fully-formattedreports or images within an Office document using the Private Connections dialog,which is accessed from the Connections button on the Smart View ribbon. This isuseful when sharing an Office document between departments or when moving from atest to a production environment.
Before you begin, ensure the following:
• The data source you're changing to must contain the same folder structure andreport as the original data source.
• You are working with a Financial Reporting report as follows:
– Excel: Fully-formated reports or images
– PowerPoint and Word: Images
Note:
This procedure applies to Financial Reporting fully formatted reports in Excel,Word, or PowerPoint. To modify connections for Financial Reporting query-ready reports and function grids in an Office document, see ModifyingConnections within an Office Document.
To modify the connection for Financial Reporting entities:
1. Select a Financial Reporting entity in Word.
2. In the Smart View ribbon, select Connections, then Reporting and AnalysisDocument, and then Edit Connection.
Chapter 3Modifying Connections
3-20

3. In the Private Connections dialog box, select a data source from the drop-down menu,select the data source name in the tree, and then click OK.
Note:
Depending on the release, the connection syntax differs for Financial Reportingdata sources:
• Oracle Hyperion Reporting and Analysis - Release 11.1.2.4.7xx and earlier:
http(s)://servername:port/raframework/browse/listXML
• Oracle Financial Reporting Document Repository - Release 11.1.2.4.9xxand later:
http(s)://servername:port/hr/modules/com/hyperion/reporting/web/repository/HRRepositoryXML.jsp
4. If you are prompted to log in, then provide your user name and password to the new datasource.
The Import Workspace Document dialog is displayed.
5. In Import Workspace Document, when the Finish button is enabled, click it.
6. Refresh the Office document.
When the refresh is complete, a message notifies you of the number of pages that wereupdated.
7. Repeat this procedure for any other entities within the Office document
Chapter 3Modifying Connections
3-21

Managing Connection URL MappingsConnection URL Mapping allows you to migrate from one environment to anotherenvironment.
Related Topics
• About Managing Connection URL Mappings
• Adding Connection URL Mappings
• Updating Connection URL Mappings
• Deleting Connection URL Mappings
About Managing Connection URL MappingsConnection URL mappings allow you to migrate from one environment to anotherenvironment. Administrators configure mappings that replace old connection URLswith new URLs. The mappings can be managed from the Private Connections drop-down menu by selecting the Manage URL Mappings option.
After mapping, private and named connections are immediately migrated to the newURLs when Microsoft Excel is reopened. The new mappings persist even if a mappingis deleted. Any saved workbooks with functions using these private connections willcontinue to use the new URLs.
Working with Saved Workbook Containing Ad Hoc Grids
• If the mapping is not deleted, workbooks continue to use the new URL.
• If the mapping is deleted and the sheets were not refreshed and saved, then theold URL will be used.
• If you are planning to delete the mapping but still want unnamed connections inthe saved sheet to use a new URL then you must activate each sheet and refreshit before saving the workbook. Ideally, a Refresh All and Save of the workbook isrecommended.
• In saved ad-hoc sheets you need to do a refresh and save for new URL to persistif the map is deleted, for both named and unnamed connection.
Limitations
• Oracle Business Intelligence Enterprise Edition and Oracle Analytics Cloud are notsupported.
• Oracle Hyperion Financial Management will work only if the cluster name andapplication are same with new and old environment.
• Essbase and Oracle Essbase: Sheets created in the cloud environment do notwork in the standalone environment.
• Nested URL mapping is not supported.
• Ensure that you enter the correct URL. URL entries are not validated, so it ispossible to enter an incorrect URL entry.
• If you change the mapping in options, then Oracle recommends restarting theMicrosoft Excel for mapping to take effect.
Chapter 3Managing Connection URL Mappings
3-22

Adding Connection URL MappingsTo add Connection URL Mappings:
1. In the Smart View Panel, select Private Connections.
You can also select Private Connections from the drop-down menu on the Home button,
:
2. Click the arrow next to and select Manage URL Mappings from the drop-downlist.
Chapter 3Managing Connection URL Mappings
3-23
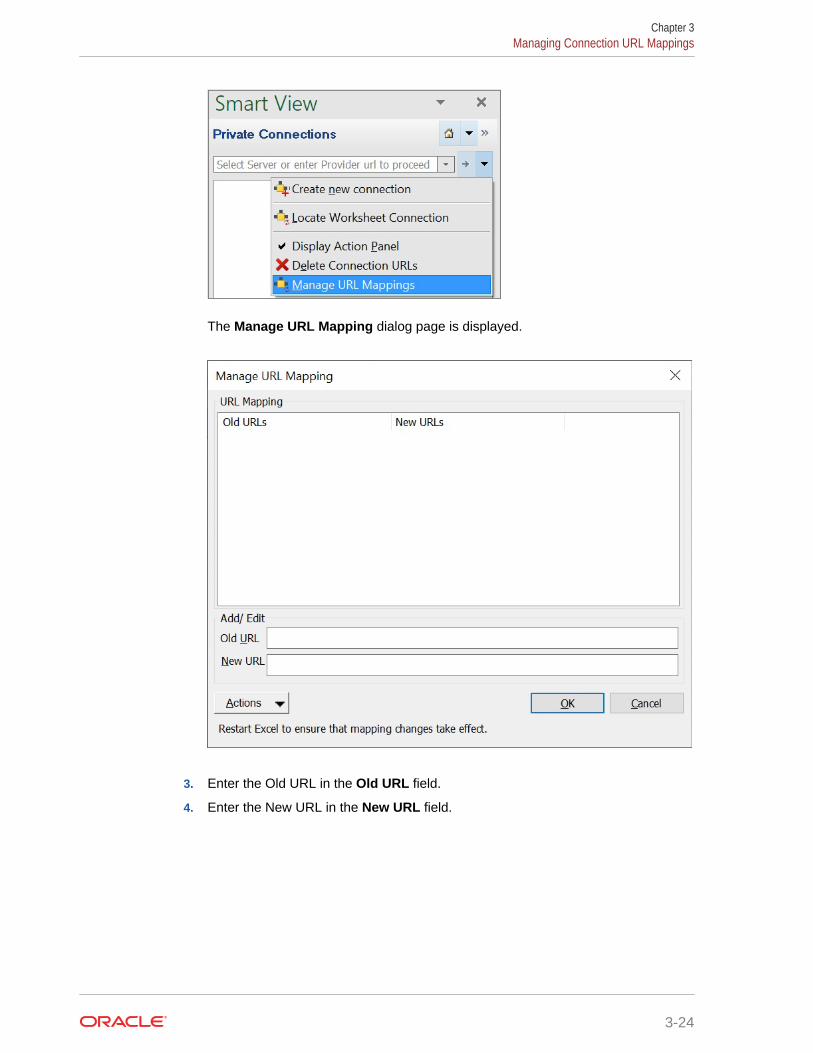
The Manage URL Mapping dialog page is displayed.
3. Enter the Old URL in the Old URL field.
4. Enter the New URL in the New URL field.
Chapter 3Managing Connection URL Mappings
3-24

5. Click
and select Add.
Alternatively, from the Actions drop-down menu, use the up and down arrow keys tonavigate to Add and press Enter.
Chapter 3Managing Connection URL Mappings
3-25

You have successfully added the URL mapping.
Note:
After adding the URL, save and reopen Microsoft Excel to ensure thatthe mapping changes take effect.
Updating Connection URL MappingsTo update Connection URL Mappings:
1. In the Smart View Panel, select Private Connections.
You can also select Private Connections from the drop-down menu on the Home
button, :
2. Click the arrow next to and select Manage URL Mappings from the drop-down list.
Chapter 3Managing Connection URL Mappings
3-26

The Manage URL Mapping dialog page is displayed with the list of added URLmappings.
3. Select the URL Mapping from the list that you want to update and update as perrequirement.
Chapter 3Managing Connection URL Mappings
3-27

4. Click
and select Update.
Alternatively, from the Actions drop-down menu, use the up and down arrow keysto navigate to Update and press Enter.
Chapter 3Managing Connection URL Mappings
3-28

You have successfully updated the URL mapping.
Note:
After updating the URL, save and reopen Microsoft Excel to ensure that themapping changes take effect.
Deleting Connection URL MappingsTo delete Connection URL Mappings:
1. In the Smart View Panel, select Private Connections.
You can also select Private Connections from the drop-down menu on the Home button,
:
2. Click the arrow next to and select Manage URL Mappings from the drop-downlist.
Chapter 3Managing Connection URL Mappings
3-29

The Manage URL Mapping dialog page is displayed with the list of added URLmappings.
3. Select the URL Mapping from the list that you want to delete.
Chapter 3Managing Connection URL Mappings
3-30

4. Click
and select:
a. Delete to delete an URL mapping.
b. Delete ALL to delete all the URL mappings.
Alternatively, from the Actions drop-down menu, use the up and down arrow keys tonavigate to Delete or Delete All and press Enter.
Chapter 3Managing Connection URL Mappings
3-31

You have successfully deleted the URL mapping.
Deleting ConnectionsDelete connections in the Delete Connections URL dialog box.
Related Topics
• About Deleting Connection URLs
• Deleting Connection URLS
About Deleting Connection URLsYou can delete connections using the Delete Connection URLs dialog box.
You can delete the following connection URL types:
• Private connection URLs that were created using the quick creation method
• Shared connection URLs
• Extension update URLs
Understand these guidelines when deleting connection URLs:
• To delete connections URLs as described in Deleting Connection URLS, OracleSmart View for Office 11.1.2.5.620+ is required.
Chapter 3Deleting Connections
3-32

• To begin the process, the Smart View Panel must be in private connection mode, nomatter the URL type that you’re deleting.
• You cannot delete private connections that were created using the Private ConnectionWizard.
• You must first click Delete, and then OK to accept the delete. Clicking Delete only doesnot fully delete the connection or extension update URLs.
• To cancel a delete operation, you can press the Escape key or clicking the X button in thetop right corner of the dialog.
• Clicking the OK button without first clicking the Delete button is the same as cancellingthe action; nothing will be deleted.
• When deleting shared connections URLs, the URL that is currently displayed in theShared Connection URL field of the Options dialog, Advanced tab, will not be deleted.
• If a data source provider gives Smart View the URL from where extension updates canbe obtained, this URL gets added to the local user’s Smart View properties files. Thisoccurs only when the user creates a private connection.
The user may want to delete URLs that are no longer used or that belong to a server thathas been decommissioned to avoid Smart View querying those locations for updates.
If a URL that is deleted needs to be used again, that URL will be added back to the localuser’s properties file the next time a private connection is made to that provider.
Deleting Connection URLSTo delete connection URLs:
1. In the Smart View Panel, select Private Connections.
You can also select Private Connections from the drop-down menu on the Home button,
:
Chapter 3Deleting Connections
3-33

2. Click the arrow next to and select Delete Connection URLs from thedrop-down list.
The Delete Connection URLs dialog box is displayed. Connections that werecreated using the quick connection method are displayed by default:
Chapter 3Deleting Connections
3-34

To select shared connection URLs for deletion, click the drop-down arrow and selectShared Connection URLs.
To select URLs for extension updates for deletion, click the drop-down arrow and selectExtension Updates URLs:
3. In the Delete Connection URLs dialog box, select the check box next to the URLs todelete, and then click Delete.
To select all URLs of a given type for deletion, click the Select All button, and then clickDelete.
Chapter 3Deleting Connections
3-35

Note:
When deleting all shared connections URLs using the Select All button,the URL that is currently displayed in the Shared Connection URL field ofthe Options dialog, Advanced tab, will not be deleted.
To cancel any selected deletions, do not proceed to the next step, butinstead, press Escape or click the X button in the top right corner of thedialog.
You can select URLs for deletion and click Delete, and then switch between URLtypes and make more selections and click Delete, before proceeding to the nextstep, where the deletions will be permanently accepted.
4. To accept the deletions, click OK.
Clicking Delete only does not fully delete the connection or extension updateURLs. You must click OK to accept the deletions.
Chapter 3Deleting Connections
3-36
4Dimensions and Members
Related Topics
• About Dimensions and MembersDimensions are data categories used to organize business data for retrieval andpreservation of values.
• Dimension and Member Naming LimitationThere are some limitations to consider when naming dimensions and members.
• Selecting Members from the Member SelectorYou select members for a variety of purposes within Oracle Smart View for Office: ad hocgrids, functions, and the POV Manager.
• Selecting Members from the POV ToolbarThe POV is the default starting point for dimensions in a data source connection.
• Displaying the POV ToolbarYou can choose whether to display all members on the grid and hide the POV toolbar orto display the POV toolbar containing the POV members.
• Selecting Members Using the Cell-Based POVYou can select members directly from cells in the page dimension row of a grid ratherthan using the POV toolbar.
• Entering Members in Free-Form ModeIf you are familiar with the dimensions and members of your database, you can entertheir names directly into cells using free-form mode.
• Filtering by AttributeIn an ad hoc grid, you can filter by attributes in dimensions that contain attributemembers.
• Filtering by SubsetsFor dimensions that contain attribute members, you can select attributes and setconditions for them to display only those members that meet these conditions.
• Selecting Period-to-Date MembersIn time dimensions, you can set up period-to-date members, called Dynamic Time Seriesmembers, if defined.
• Defining Member Name Display in the Member SelectorYou can change how member names are displayed in the Member Selection dialog boxby choosing a Member Name Display option.
• Duplicate Member NamesDifferent members or member aliases may have identical names.
• Numeric Member NamesUse the tips noted in this topic when working with numeric member names in OracleSmart View for Office.
• Qualified Name Display in Alternate HierarchiesQualified name behavior for alternate hierarchies affects runtime and member selectorbehavior on forms and ad hoc grids.
4-1

• Member PerspectiveUse the Varying Attribute filter to specify member perspective for varying attributeswhen selecting members.
• Aliases and Alias TablesAliases are alternate names for database member names.
• Viewing Dimension PropertiesUsing the Insert Properties command in the Essbase ribbon, you can quicklyview the properties of a dimension in an ad hoc grid.
• Member InformationYou can view detailed information about any member on the grid. The informationdisplayed depends on the data source type to which you are connected.
• The POV ManagerThe POV (Point of View) is the starting point for forms, ad hoc grids, and functions.
About Dimensions and MembersDimensions are data categories used to organize business data for retrieval andpreservation of values.
Dimensions usually contain hierarchies of related members grouped within them. Forexample, a Year dimension often includes members for each time period, such asquarters and months.
You can select members for the grid from the Member Selection dialog box availablefrom the data source ribbon, from the POV toolbar, or by entering the member nameusing free-form mode.
Related Topics:
Dimension and Member Naming Limitation
Selecting Members from the Member Selector
Selecting Members from the POV Toolbar
Entering Members in Free-Form Mode
Dimension and Member Naming LimitationThere are some limitations to consider when naming dimensions and members.
If you use Oracle Smart View for Office cell functions (described in Functions), then donot use these characters in member names, dimension names, or variable names.
• Hash mark (#)
• Semicolon (;)
• Comma (,)
These characters are reserved for delimiters in Smart View cell functions.
Chapter 4About Dimensions and Members
4-2
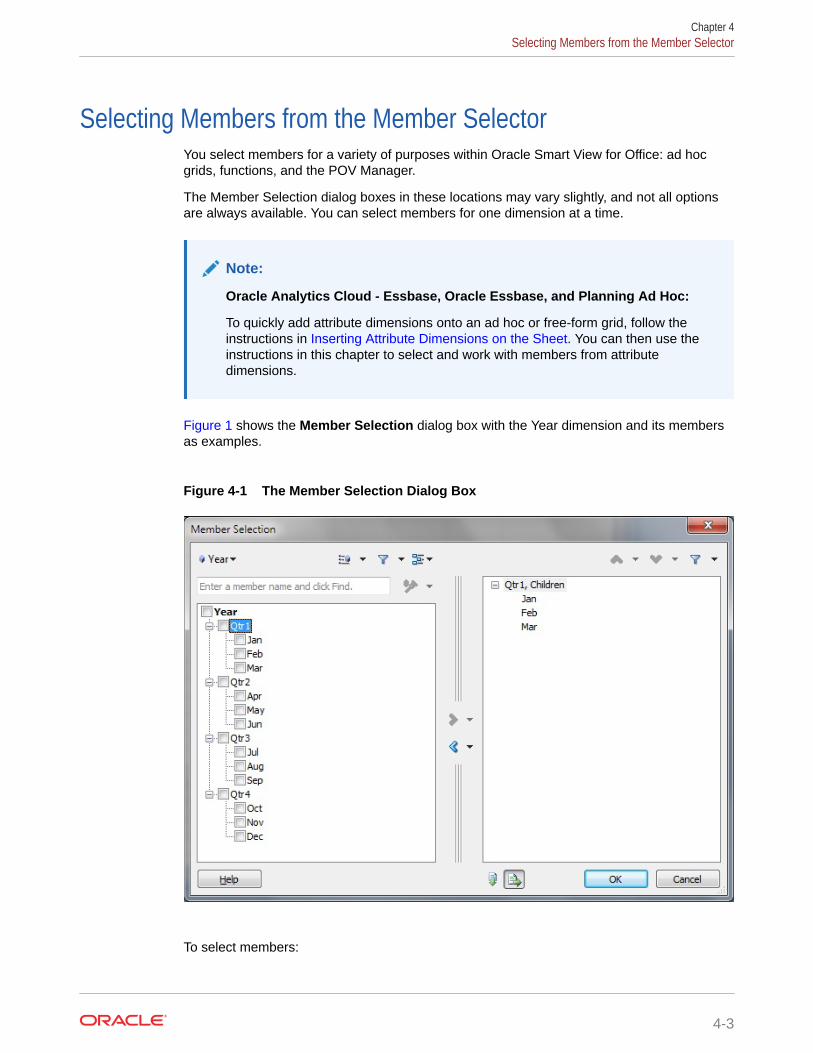
Selecting Members from the Member SelectorYou select members for a variety of purposes within Oracle Smart View for Office: ad hocgrids, functions, and the POV Manager.
The Member Selection dialog boxes in these locations may vary slightly, and not all optionsare always available. You can select members for one dimension at a time.
Note:
Oracle Analytics Cloud - Essbase, Oracle Essbase, and Planning Ad Hoc:
To quickly add attribute dimensions onto an ad hoc or free-form grid, follow theinstructions in Inserting Attribute Dimensions on the Sheet. You can then use theinstructions in this chapter to select and work with members from attributedimensions.
Figure 1 shows the Member Selection dialog box with the Year dimension and its membersas examples.
Figure 4-1 The Member Selection Dialog Box
To select members:
Chapter 4Selecting Members from the Member Selector
4-3

1. To display the Member Selection dialog box, which contains a tree list of availablemembers for the dimension selected, do one of the following:
• Select a dimension or member on the grid, and then from an Ad Hoc or datasource ribbon, click Member Selection.
• From an open dialog box enabled for member selection, click MemberSelection.
• On a blank worksheet, from the Smart View Panel, right-click a cube nameand select Member Selection. Use this method to select members forfunctions and references (see Functions).
• Click on a user variable in a form.
• Oracle Hyperion Financial Management: Click on a selectable dimension, row,or column in a form.
2. From Member Selection, to change the dimension, click the Dimension Selector
button (for example, ) and select a dimension.
Note:
In Planning, with the Smart View Ad Hoc Behavior option set toStandard, and the Smart View Member Name Display option set toMember Name and Alias, the dimension displayed in the MemberSelection dialog will show the default dimension, regardless of thedimension or member you selected for an alias column on the grid.Perform this step to select the dimension you require.
3. Optional: To find a specific member in the tree list, enter a member name in the
search field and click .
Note:
If the alias table for the Member Selection dialog is set to None (see step 6), you may search by member name. If you change the alias tableto Default or to any other alias table, then you must search according tothe corresponding aliases defined for the Default alias table or any otherselected alias table.
Oracle Analytics Cloud - Essbase , Essbase, and Narrative Reporting acceptasterisks (*) and question marks (?) as wild cards. The asterisk can be substitutedfor a group of characters; the question mark can be substituted for only onecharacter.
For example, to search for all member names that start with the word, Total, To*and To?al are valid search strings; however, To? is not.
Chapter 4Selecting Members from the Member Selector
4-4

Note:
The search string cannot begin with an asterisk. For example, *Total and*otal are not supported search strings.
4. Optional: Click the arrow in and select an option to change the criteria fordisplaying members in both the right pane of the Member Selection dialog box and on thegrid or form:
• Oracle Analytics Cloud - Essbase and Essbase :
– Hierarchy—Displays members in standard hierarchy format.
– Attribute—Display members by attributes. See Filtering by Attribute.
– Subset—Display a subset of members based on a set of conditions. Filtering bySubsets.
– Dynamic Time Series—Display members by the latest period on which to basethe to-date calculation. See Selecting Period-to-Date Members.
• Oracle Hyperion Planning, Planning:
– Hierarchy—Display members in standard hierarchy format.
– Attribute—Planning only. Display members by attributes in an ad hoc grid . See Filtering by Attribute.
– Substitution Variables—Display members based on selections made in theUser Variables tab of the Preferences dialog box.
Note:
The Substitution Variables option displays when you access MemberSelection from a user variable in a Planning form.
– Dynamic Time Series—Display members by the latest period on which to basethe to-date calculation. See Selecting Period-to-Date Members.
• Financial Management:
– Hierarchy—Display members in standard hierarchy format.
– Member lists—Display members either by system-generated or user-generatedmember lists. Note that system-generated member lists are designated withbrackets; for example, [member list name].
• Narrative Reporting:
Hierarchy—Display members in standard hierarchy format.
5. Optional: To find a specific member or group of members in the tree list, click and select one of these filters (filter options may vary by data source type):
• Descendants to select all descendents of the selected member
• Descendants Inclusive to include the selected member and all descendents of theselected member
Chapter 4Selecting Members from the Member Selector
4-5

• Children to select only the children of the selected member
• Children Inclusive to include the selected member and only the children ofthe selected member
• Siblings to select all siblings of the selected member
• Siblings Inclusive to include the selected member and all siblings of theselected member
• LSiblings to include only the members that appear before the selectedmember with the same parent
• LSiblings Inclusive to include the selected member and its left siblings
• RSiblings to include only the members that appear after the selected memberwith the same parent
• RSiblings Inclusive to include the selected member and its right siblings
• Parent to select only the parent of the selected member
• Parent Inclusive to include the selected member and only the parent of theselected member
• Ancestors to select all the ancestors of the selected member
• Ancestors Inclusive to include the selected member and all ancestors of theselected member
• Base to select only the bottom-level hierarchy members of a hierarchy
• Level 0 Descendant to display all descendants of the selected member thathave no children
• Level to display the Level dialog box, where you select one level in thehierarchy of members
• Generation to display the Generation dialog box, where you select onegeneration in the hierarchy of members
• UDA to display the UDA dialog box, where you select a user-defined attribute(available only if defined by the administrator)
Note:
Narrative Reporting does not support filters.
6. Optional: To choose display and selection options for members in the Member
Selection dialog box, click and perform an action:
• To place a check in the check box next to the applicable members, choosefrom Check Children, Check Descendants, or Check Base Members.
• To clear all check marks, select Clear Checks.
• To view expanded or collapsed dimensions, select Expand All or CollapseAll.
• To view information about a member, select the member, then select MemberInformation. Click the Alias tab to view alias table information, if available.
Chapter 4Selecting Members from the Member Selector
4-6

Applies to Oracle Analytics Cloud - Essbase, Essbase, Narrative Reporting, OracleHyperion Planning, EPM Cloud Planning Ad Hoc, Financial Consolidation and CloseAd Hoc, and Tax Reporting Ad Hoc.
• To apply an alias table to the members in the Member Selection dialog box, selectAlias Table, and then select an alias table.
Note that alias table selections made in the Member Selection dialog box apply onlyto the dialog box and not to the grid in the Office document.
7. Under Members, select the members that you want to use.
8. Click .
The members are transferred from the member tree list to the selection tree list in thepane on the right.
9. Optional: If this is the first member selection that you make in a blank worksheet, selectone of these buttons:
• to display the selected members vertically, in a column
• to display the selected members horizontally, in a row
10. Click OK to close the Member Selection dialog.
The members selected are displayed in the grid.
11. From the ribbon, click Refresh to update the data on the grid to correspond to theselected members.
Note:
Once the selected members are in the grid, you must perform a Refresh beforeselecting another member in the grid and launching Member Selection again.If you do not refresh the grid, then Member Selection is launched in thecontext of the first dimension of your cube outline.
12. Optional: Repeat this procedure to select additional members, after you first refresh thegrid as instructed in the previous step.
Selecting Members from the POV ToolbarThe POV is the default starting point for dimensions in a data source connection.
From the POV toolbar, you can select members and filters for the dimensions that you wantto include in the grid and move members to and from the grid.
The modified POV applies only to the selected sheet. For existing sheets in the workbook,and any new sheets, the modified POV will not be applied.
Each connection is associated with only one POV. However, the same connection to differentworksheets within a workbook may have different POVs.
POVs can be managed as described in The POV Manager.
Chapter 4Selecting Members from the POV Toolbar
4-7
Note:
Oracle Hyperion Financial Management displays the User Point of View bydefault. See the Oracle Hyperion Financial Management User's Guide forinformation.
For Oracle Analytics Cloud - Essbase , Oracle Essbase, and NarrativeReporting connections, see Displaying the POV Toolbar.
Placing Members and Dimensions from the POV Toolbar onto the Grid
To select dimensions and members from the POV toolbar:
1. Do one of the following:
• Enter the name of a member over its corresponding dimension on the POVtoolbar, and then click Refresh on the POV toolbar.
• Click the down arrow next to a dimension on the POV toolbar, then click theellipsis (...), and then select members as described in Selecting Members fromthe Member Selector.
Note:
In the Member Selection dialog box, it is possible to select morethan 5000 members for the POV. However, be aware that the POVtoolbar can only display the first 5000 selected members.
2. From the POV toolbar, right-click the down arrow next to the member and drag it tothe grid.
To move a member or dimension back to the POV toolbar for editing, right-click itscell and drag it to the POV toolbar.
3. Repeat as necessary to place all dimension and members that you want to includeon the grid.
Note:
The modified POV applies only to the selected sheet. For existing sheetsin the workbook, and any new sheets, the modified POV will not beapplied.
4. To save these POV selections in the worksheet, you must refresh before you savethe worksheet.
5. Optional: To hide the POV toolbar, click POV on the data source ribbon.
The POV button toggles to hide or display the POV toolbar. When you finishworking with the POV toolbar, you can hide it until you need to display it again.
Chapter 4Selecting Members from the POV Toolbar
4-8

Note:
Starting with Oracle Smart View for Office 11.1.2.5.520, when connected toduplicate member databases, the member name only should display by default inthe POV. However, for workbooks saved in Smart View 11.1.2.5.510 and earlier, thequalified member name displays in the POV. To change the display of membernames in the POV, open the Member Selection dialog box from the POV, then clickOK.
Example 4-1 Example POV Usage
Figure 1 shows, from left to right, a POV in the following conditions:
1. Product, Market, and Scenario are the starting dimensions in the POV.
2. Colas is selected as the Product member.
In the Member Selection dialog box, it is possible to select more than 5000 members forthe POV. However, be aware that the POV toolbar can only display the first 5000 selectedmembers.
Although only one dimension member at a time can display in the POV, note that inMember Selection, up to 5000 members can be selected for the drop-down list for adimension in the POV. The members you select are accessible in the POV by clicking thedrop-down arrow for the dimension.
3. Colas has been moved to the grid (and it can be moved back to the POV toolbar), so thatonly Market and Scenario remain in the POV.
Figure 4-2 The POV — using pov2
Displaying the POV ToolbarYou can choose whether to display all members on the grid and hide the POV toolbar or todisplay the POV toolbar containing the POV members.
Cloud data source types: Oracle Analytics Cloud - Essbase, Narrative Reporting
On-premises data source types: Oracle Essbase
By default, all members are displayed on the grid, and the POV toolbar is hidden. Themembers in the first row of the grid are called "page" dimensions. In this mode, you canformat POV member cells the same as you do other member and data cells, and selectmembers using the Member Selection button in the ribbon.
Chapter 4Displaying the POV Toolbar
4-9

When you display the POV toolbar, the page dimensions move to the POV toolbar.When you hide the POV toolbar, the page dimensions move back to the first row of thegrid.
If you choose to display the POV toolbar containing the POV members, you can usethe POV toolbar to select members and move them to and from the grid as describedin Selecting Members from the POV Toolbar.
To display the POV toolbar:
1. Select the Essbase or Narrative Reporting ribbon.
2. Click the POV button.
Figure 1 shows the POV toolbar on the grid. Measures and Year are displayed onthe grid; POV members Product, Market, and Scenario are displayed on thePOV toolbar.
Figure 4-3 POV Toolbar Displayed
To hide the POV toolbar and display all members on the grid:
1. Select the Essbase or Narrative Reporting ribbon.
2. Click the POV button to toggle it off.
Note:
Essbase: On worksheets that contain multiple grids, the POV button isdisabled. In mutiple-grid worksheets, the POV toolbar is hidden, and allmembers are displayed the grid.
In Figure 2, the POV button is toggled off, the POV toolbar is hidden, and allmembers are on the grid.
Chapter 4Displaying the POV Toolbar
4-10
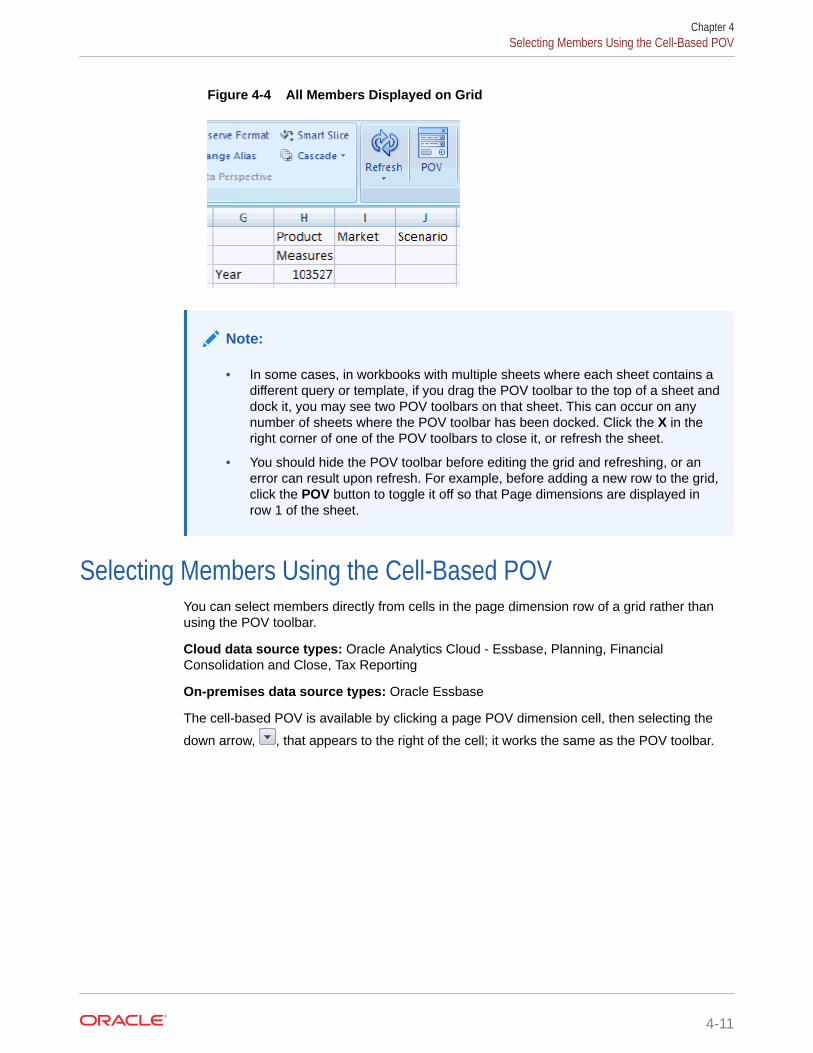
Figure 4-4 All Members Displayed on Grid
Note:
• In some cases, in workbooks with multiple sheets where each sheet contains adifferent query or template, if you drag the POV toolbar to the top of a sheet anddock it, you may see two POV toolbars on that sheet. This can occur on anynumber of sheets where the POV toolbar has been docked. Click the X in theright corner of one of the POV toolbars to close it, or refresh the sheet.
• You should hide the POV toolbar before editing the grid and refreshing, or anerror can result upon refresh. For example, before adding a new row to the grid,click the POV button to toggle it off so that Page dimensions are displayed inrow 1 of the sheet.
Selecting Members Using the Cell-Based POVYou can select members directly from cells in the page dimension row of a grid rather thanusing the POV toolbar.
Cloud data source types: Oracle Analytics Cloud - Essbase, Planning, FinancialConsolidation and Close, Tax Reporting
On-premises data source types: Oracle Essbase
The cell-based POV is available by clicking a page POV dimension cell, then selecting the
down arrow, , that appears to the right of the cell; it works the same as the POV toolbar.
Chapter 4Selecting Members Using the Cell-Based POV
4-11
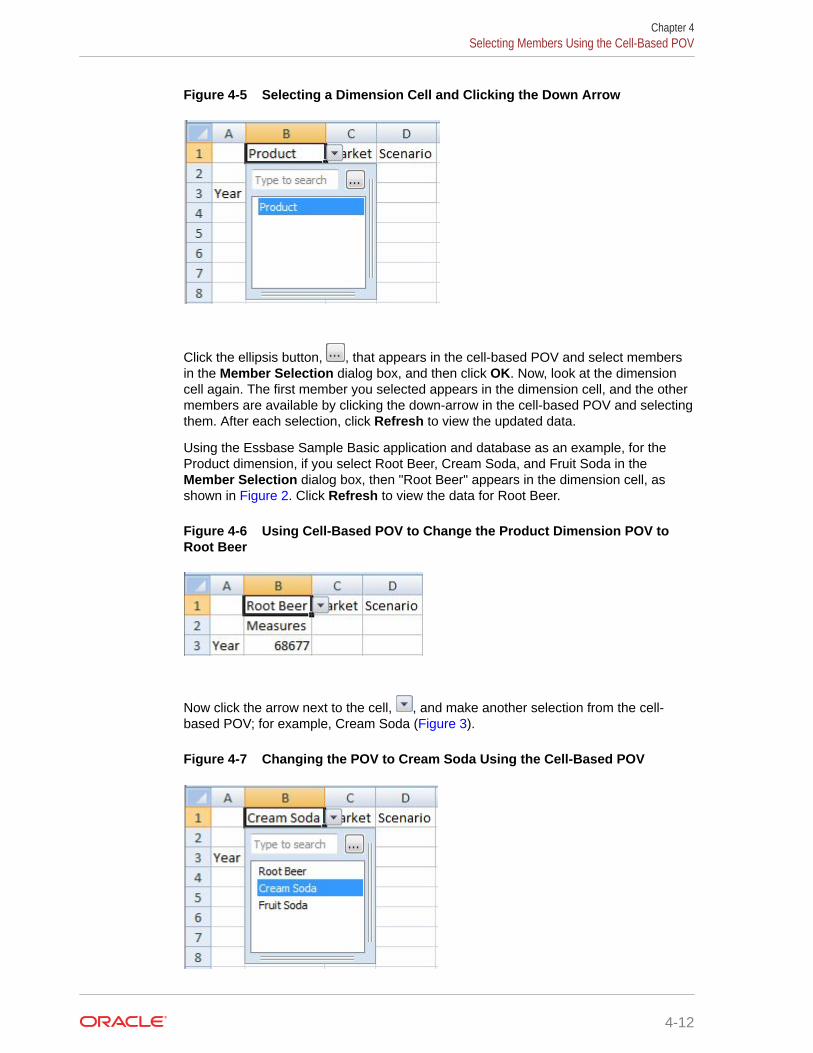
Figure 4-5 Selecting a Dimension Cell and Clicking the Down Arrow
Click the ellipsis button, , that appears in the cell-based POV and select membersin the Member Selection dialog box, and then click OK. Now, look at the dimensioncell again. The first member you selected appears in the dimension cell, and the othermembers are available by clicking the down-arrow in the cell-based POV and selectingthem. After each selection, click Refresh to view the updated data.
Using the Essbase Sample Basic application and database as an example, for theProduct dimension, if you select Root Beer, Cream Soda, and Fruit Soda in theMember Selection dialog box, then "Root Beer" appears in the dimension cell, asshown in Figure 2. Click Refresh to view the data for Root Beer.
Figure 4-6 Using Cell-Based POV to Change the Product Dimension POV toRoot Beer
Now click the arrow next to the cell, , and make another selection from the cell-based POV; for example, Cream Soda (Figure 3).
Figure 4-7 Changing the POV to Cream Soda Using the Cell-Based POV
Chapter 4Selecting Members Using the Cell-Based POV
4-12

Click Refresh to update the data. Notice that the data has changed (Figure 4).
Figure 4-8 Refreshed Data for Cream Soda
You can also directly type a member name in the search field of the cell-based POV drop-down. In this case, you can select only one member at a time. Click Refresh to view updateddata. Type another member name in the search field each time you want to change the POV.
You can still use the POV toolbar as before by toggling the POV button on the providerribbon. The cell-based POV and the POV toolbar selections are automatically synchronized,regardless of where the selections are made. If you change to a different alias table, the cell-based POV is populated with the proper alias names.
Note:
This feature is available only for installations with Essbase and Oracle HyperionProvider Services 11.1.2.1.102 and later.
Entering Members in Free-Form ModeIf you are familiar with the dimensions and members of your database, you can enter theirnames directly into cells using free-form mode.
You can use aliases from the alias table associated with the current grid in free-form mode.
Note:
Oracle Analytics Cloud - Essbase, Oracle Essbase, Planning Ad hoc:
If you enter an alias from a different alias table, it will revert to the alias from thecurrent alias table.
After connecting to a data source, you can enter member names as follows:
• By entering a member name in a blank cell
• By replacing a member name in a cell with a different member from the same dimension
You can still use the POV, member selection, and other ad hoc operations in free-form grids.See Free-Form Mode.
Chapter 4Entering Members in Free-Form Mode
4-13

Filtering by AttributeIn an ad hoc grid, you can filter by attributes in dimensions that contain attributemembers.
Cloud data source types: Oracle Analytics Cloud - Essbase, Planning Ad Hoc,Financial Consolidation and Close Ad Hoc
On-premises data source types: Oracle Essbase
To filter by attribute:
1. Select an attribute dimension on the grid, and then open Member Selection asdescribed in Selecting Members from the Member Selector.
2. Click and select Attribute.
3. From Attribute, click .
4. From Subset, in Dimension, select a dimension; for example, Ounces.
5. In Member, select an attribute member, for example, Ounces_16.
6. Click to display the attribute.
7. Optional: to change the displayed attribute, change the selections in Dimensionand Attribute and click Set.
8. Click OK.
Your selections are displayed in the tree list in Member Selection, where you canselect from among them for inclusion in the grid.
Filtering by SubsetsFor dimensions that contain attribute members, you can select attributes and setconditions for them to display only those members that meet these conditions.
Cloud data source types: Oracle Analytics Cloud - Essbase
On-premises data source types: Oracle Essbase
To filter by condition:
1. Select an attribute member on the grid, and then open Member Selection asdescribed in Selecting Members from the Member Selector.
2. Click and select Subset.
3. From Subset, in Dimension, select an attribute dimension; for example, Ounces.
4. In Member, select an attribute member; for example, True.
5. Click .
6. In Dimension, select another attribute dimension; for example, Pkg Type.
Chapter 4Filtering by Attribute
4-14

7. In Member, select another attribute member; for example, Bottle.
8. Click .
An AND condition statement is created; for example, [True] AND [Bottle].
9. Optional: To change the condition statement, highlight the AND condition statement andselect Operator, and then AND or OR.
10. Optional: Nest conditions by selecting more attributes, then Add, and then Root.
11. Click OK.
Your selections are displayed in the tree list in Member Selection, where you can selectfrom among them for inclusion in the grid.
Selecting Period-to-Date MembersIn time dimensions, you can set up period-to-date members, called Dynamic Time Seriesmembers, if defined.
For example, to see year-to-date data at the end of August, you can set up a Dynamic TimeSeries member that includes data for January through August.
Cloud data source types: Oracle Analytics Cloud - Essbase, Planning, Narrative Reporting
Oracle Essbase, Oracle Hyperion Planning
To select a Dynamic Time Series member:
1. Select a time dimension on the grid, and then open Member Selection as described in Selecting Members from the Member Selector.
2. Click and select Dynamic Time Series to display available Time Series Membersin the member tree list.
3. Select a time series member from the member tree list and click .
4. From Select DTS Member, select the latest period on which to base the to-datecalculation; for example, Aug.
5. Click OK.
6. Optional: Repeat step 3 through step 5 as necessary to add other Dynamic Time Seriesmembers.
7. click OK.
The Time Series Member is displayed on the grid as, in this example, Y-T-D(Aug). Afteryou refresh, the year-to-date data through August is displayed.
Defining Member Name Display in the Member SelectorYou can change how member names are displayed in the Member Selection dialog box bychoosing a Member Name Display option.
Data source types: Oracle Hyperion Financial Management
Chapter 4Selecting Period-to-Date Members
4-15

Using this option allows you to display members in the Member Selection dialog boxdifferently from how they are displayed on the sheet.
The selection you make in the Member Selection dialog box does not affect howmembers are displayed in the worksheet. Members in the sheet are displayedaccording to the setting you choose in the Member Name Display field of the Optionsdialog box, Member Options tab.
For example, when connected to Financial Management, using the Member NameDisplay field in the Options dialog box, you can choose to display member nameswith their descriptions in the worksheet . Separately, in the Member Selection dialogbox, you can choose to display member names without their descriptions.
Note:
Oracle Analytics Cloud - Essbase, Oracle Essbase, Narrative Reporting:Use alias tables to change the member name display. See DisplayingAliases in the Member Selector.
To define how member names are displayed:
1. Display the Member Selection dialog box, as described in Selecting Membersfrom the Member Selector.
2. In the Member Selection dialog, to change the dimension, click the DimensionSelector button in the top left of the dialog box and select a dimension.
3. Click the Options button, then select Member Name Display, and then select anoption:
• Member Name to display qualified names.
Note:
If you select Member Name in free-form mode, in an ad hoc grid, ifyou insert a column and type a member name in the new columnand want to change the alias table for the sheet, you must firstrefresh the sheet before changing the alias table.
• Member Name and Description to display qualified names and descriptions(aliases) in the same cell.
• Description Only to display aliases only.
Note:
If you select Description Only in free-form mode, qualified namesare displayed initially. After you manually add, remove, or edit anycomments and refresh, aliases are displayed.
The member names displayed in the Member Selector are changed according toyour selection.
Chapter 4Defining Member Name Display in the Member Selector
4-16

Duplicate Member NamesDifferent members or member aliases may have identical names.
Cloud data source types: Oracle Analytics Cloud - Essbase, Narrative Reporting
On-premises data source types: Oracle Essbase
For example, a database may have two members named "New York," one for New York Cityand one for New York State. Both members can appear as "New York" in the grid, but if youwant to distinguish between them, you can display their qualified names instead. Qualifiednames include the member name and the names of its ancestors to the level that uniquelydefines the member; for example, [Market].[New York].
When you first perform an ad hoc query on a database that supports duplicate membernames, the default for the Member Name Display display option for members in the bothgrid and the POV is Member Name Only
Perform the procedure in this topic to display qualified member names in the grid and POV.
Note:
In Narrative Reporting, duplicate member names are allowed across dimensions,but they are not allowed within dimensions.
To display the qualified names of duplicate members:
1. From the Smart View ribbon, select Options, and then select Member Options in the leftpanel.
2. From the Member Name Display drop-down menu, select Distinct Member Name.
3. Click OK.
4. Refresh the grid.
Duplicate members in the grid are displayed as qualified names. In this example, NewYork City is displayed as [East].[New York]. New York State is displayed as a sibling ofEast, West, and South: [Market].[New York]:
Chapter 4Duplicate Member Names
4-17

Numeric Member NamesUse the tips noted in this topic when working with numeric member names in OracleSmart View for Office.
Cloud data source types: Oracle Analytics Cloud - Essbase, Planning, PlanningModules, Financial Consolidation and Close, Tax Reporting
On-premises data source types: Oracle Essbase, Oracle Hyperion Planning, OracleHyperion Financial Management
When working with numeric member names in Smart View:
• Prefix numeric member names with an apostrophe (').
• Before entering numeric member names, select the member cells or an entirecolumn, then use Excel to set the format of the selected cells to "Text."
• If you have already entered numeric member names, select the member cells oran entire column, use Excel to set the format of the selected cells to "Text,"thenpress F2 and Enter to trigger Excel to update the cell type.
The tips noted above also need to be used when working with member namesconsisting of Boolean or date values.
Qualified Name Display in Alternate HierarchiesQualified name behavior for alternate hierarchies affects runtime and member selectorbehavior on forms and ad hoc grids.
Cloud data source types: Planning, Planning Modules, Financial Consolidation andClose
About Qualified Member Name Display in Alternate Hierarchies
When connected to Planning, Planning Modules, or Financial Consolidation andClose, alternate hierarchies are supported in the Entity dimension. One entity canhave multiple parents, and contribute differently to each parent. These members arereferred to as partially shared entities, where only a part of input data is shared acrossall instances of the entities.
In Oracle Smart View for Office, displaying partially shared members requires thatmember names and aliases are qualified, so that users can uniquely reference thespecific instance of a member and can then enter appropriate values based on thiscontext. Qualified names include the member name and the names of its ancestors tothe level that uniquely defines the member. The most common example is thePercentage Contribution (PCON) metric used for weighted consolidations in FinancialConsolidation and Close.
The qualified name behavior for alternate hierarchies is explained in these topics:
Expected Runtime Behavior on Forms
Expected Runtime Behavior for Aliases on Forms
Expected Runtime Behavior on Ad Hoc Grids
Expected Runtime Behavior for Aliases on Ad Hoc Grids
Chapter 4Numeric Member Names
4-18

Expected Member Selector Behavior on Ad Hoc Grids
Expected Member Selector Behavior on Forms
Expected Runtime Behavior on Forms
Starting in 17.01, Planning, Planning Modules support the option to qualify member names aspart of form design. This option, Show Qualified Names, is only exposed when you have adimension enabled for Partial Share. This option has three possible values:
• Never
• As Needed
• Always
By default, to maintain backwards compatibility the "Never" option is selected. "Never" is alsoused when this option is not exposed. Note that this is a runtime option and does not impactdesign time member selectors. Here is the expected behavior on forms for each option:
• Never
– PBCS, EPBCS: All member names are not qualified.
– FCCS: All member names are not qualified.
• As Needed
– PBCS, EPBCS: Base members are NOT qualified. Shared members are qualified.
– FCCS: Both base members WITH SHARES and shared members are qualified. Basemember without shares are not qualified.
• Always
– PBCS: All members are qualified.
– FCCS: All members are qualified.
Expected Runtime Behavior for Aliases on Forms
Alias behavior should behave the same as for member names with these exceptions:
• When showing qualified aliases both components (parent and child) must have aliasesotherwise, the member name or qualified member name is returned as per selectedoption.
• Duplicate aliases are also qualified when "As Needed" or "Always" option is selected.
Expected Runtime Behavior on Ad Hoc Grids
Member names are qualified or not based on the Smart View Member Name Display optionsetting. There are two values to support the partial share feature: Distinct Member NameOnly and Member Name Only. Here is the expected behavior for each option:
• Member Name Only
– PBCS, EPBCS: All members are not qualified.
– FCCS: All members are not qualified.
• Distinct Member Name Only
– PBCS, EPBCS: Behaves the same as the "As Needed" option for forms above.
– FCCS: Behaves the same as the "As Needed" option for forms above.
Chapter 4Qualified Name Display in Alternate Hierarchies
4-19

Expected Runtime Behavior for Aliases on Ad Hoc Grids
Alias behavior should be the same as in Expected Runtime Behavior on Forms, butalso subject to the Smart View ad hoc alias options.
• If the "None" alias table option is selected, then you should see same behavior formembers in ad hoc grids as in Expected Runtime Behavior on Forms.
• If an alias table is selected, then the aliases from that table should be used and adhoc options for members apply. Note that alias behavior for aliases on formsapplies as well based on Smart View ad hoc settings.
Expected Member Selector Behavior on Ad Hoc Grids
The Member Selector will work based on the setting in the Smart View "Member NameDisplay" option.
The Member Selector will display the qualified names for shared members by default.
Expected Member Selector Behavior on Forms
The Member Selector will work based on form settings for aliases and behave like the"As Needed" setting on forms.
Member PerspectiveUse the Varying Attribute filter to specify member perspective for varying attributeswhen selecting members.
Cloud data source types: Oracle Analytics Cloud - Essbase
On-premises data source types: Oracle Essbase
Note:
Member perspective may not be enabled in your Oracle Smart View forOffice system. Your options for member perspective are enabled andconfigured by the Administrator.
To specify member perspective:
1. From Member Selection, under Filter, select Varying Attribute.
2. In Filter Arguments, click .
3. Specify an attribute to set the perspective, and then click OK.
4. In Varying Attribute Args under Varying Attribute, click the ellipsis button.
5. In Subset, in Dimension, enter an attribute dimension.
6. In Member, enter an attribute member, and then click Set.
7. Click OK.
8. In Varying Attribute Args, under Perspective, click the ellipsis button.
Chapter 4Member Perspective
4-20

9. From Perspective, select one of the following:
• Snapshot. One set of independent dimension members to identify the members ofbase dimension associated with the varying attribute. Here the start and end tupleare same.
• Range. A finite range of independent dimension members. A range can be specifiedonly for continuous independent dimensions ("Year" is an example). For discreteindependent dimensions, you can make only one selection.
10. Click OK.
Aliases and Alias TablesAliases are alternate names for database member names.
Cloud data source types: Oracle Analytics Cloud - Essbase, Planning, Narrative ReportingFinancial Consolidation and Close, Tax Reporting
On-premises data source types: Oracle Essbase, Oracle Hyperion Planning, OracleHyperion Financial Management
Note:
In Financial Management, aliases are called "descriptions."
Database member names are often stock numbers or product codes; their aliases can bemore descriptive. For example, in the Sample Basic database, the alias name for thedatabase member 100 is Colas. Aliases are stored in alias tables as part of a database.Dimensions can be associated with multiple alias tables.
You can select an alias table for the current worksheet or for a connection.
Selecting Alias Tables
Aliases from Different Alias Tables
Displaying Member Names and Their Aliases in the Grid
Selecting Alias TablesIf more than one alias table has been created in the database, you can select an alias tablefor the current worksheet or for a private connection.
Selecting an Alias Table for the Current Worksheet
Selecting an Alias Table for the Connection
Selecting an Alias Table for the Current WorksheetThe alias table selected here applies only to the current worksheet and not to futureconnections.
To select an alias table for the current worksheet:
1. From a worksheet, connect to a data source.
Chapter 4Aliases and Alias Tables
4-21

2. From the Essbase or ad hoc ribbon, select Change Alias to display a list ofavailable alias tables.
3. Select an alias table for the worksheet.
The new alias table is applied automatically.
Note:
Planning, Financial Consolidation and Close, Tax Reporting: In Nativemode, if the floating toolbar had been displayed and then repositioned onthe sheet, the position will change after applying the new alias table. Ifneeded, you can reposition the floating toolbar again. (Native modemeans that the Smart View Ad Hoc Behavior option for your applicationis set to Native.)
Selecting an Alias Table for the ConnectionYou can select an alias table for private connections only. If you want to select an aliastable for a shared connection, first save the shared connection as a privateconnection. See Saving Shared Connections as Private Connections.
An alias table selected for a private connection is permanent until changed and will beused each time you use this connection.
To select an alias table for the connection:
1. From a worksheet, connect to a data source.
2. In the Smart View Panel private connections, right-click a connection name andselect Set Alias Table.
3. Select an alias table for the connection.
The new alias table is applied the next time you open the connection.
Aliases from Different Alias TablesCloud data source types: Oracle Analytics Cloud - Essbase, Planning Ad Hoc,Narrative Reporting, Financial Consolidation and Close Ad Hoc, Tax Reporting Ad Hoc
On-premises data source types: Oracle Essbase
Essbase, Oracle Analytics Cloud - Essbase, Narrative Reporting: If you enter a namefrom an alias table that is not associated with the current grid, its corresponding aliasfrom the alias table that is associated with the current grid is displayed after yourefresh. For example, if you enter Qtr1 into a grid that is associated with the LongNames alias, then after you refresh, Quarter1 is displayed.
Planning Ad Hoc, Financial Consolidation and Close Ad Hoc, Tax Reporting Ad Hoc:Only one currently active alias table is supported. If you enter a name from an aliastable that is not the active table for the current grid, the alias member is considered anunknown member.
Chapter 4Aliases and Alias Tables
4-22
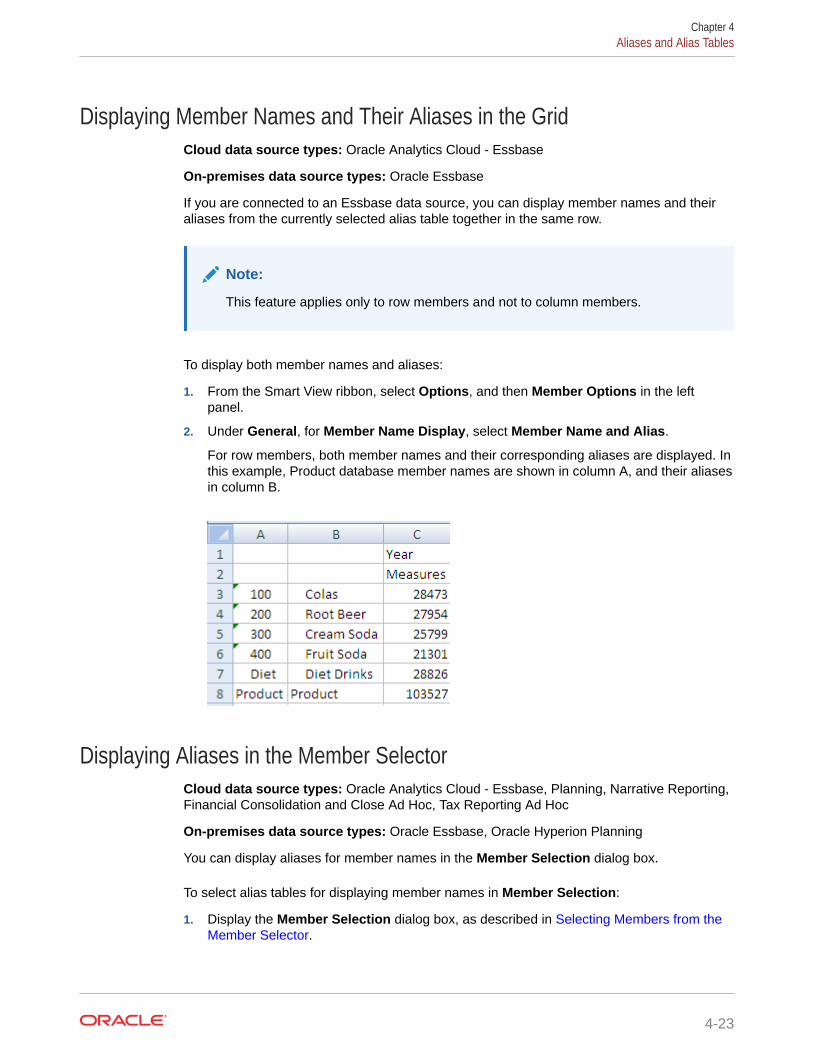
Displaying Member Names and Their Aliases in the GridCloud data source types: Oracle Analytics Cloud - Essbase
On-premises data source types: Oracle Essbase
If you are connected to an Essbase data source, you can display member names and theiraliases from the currently selected alias table together in the same row.
Note:
This feature applies only to row members and not to column members.
To display both member names and aliases:
1. From the Smart View ribbon, select Options, and then Member Options in the leftpanel.
2. Under General, for Member Name Display, select Member Name and Alias.
For row members, both member names and their corresponding aliases are displayed. Inthis example, Product database member names are shown in column A, and their aliasesin column B.
Displaying Aliases in the Member SelectorCloud data source types: Oracle Analytics Cloud - Essbase, Planning, Narrative Reporting,Financial Consolidation and Close Ad Hoc, Tax Reporting Ad Hoc
On-premises data source types: Oracle Essbase, Oracle Hyperion Planning
You can display aliases for member names in the Member Selection dialog box.
To select alias tables for displaying member names in Member Selection:
1. Display the Member Selection dialog box, as described in Selecting Members from theMember Selector.
Chapter 4Aliases and Alias Tables
4-23
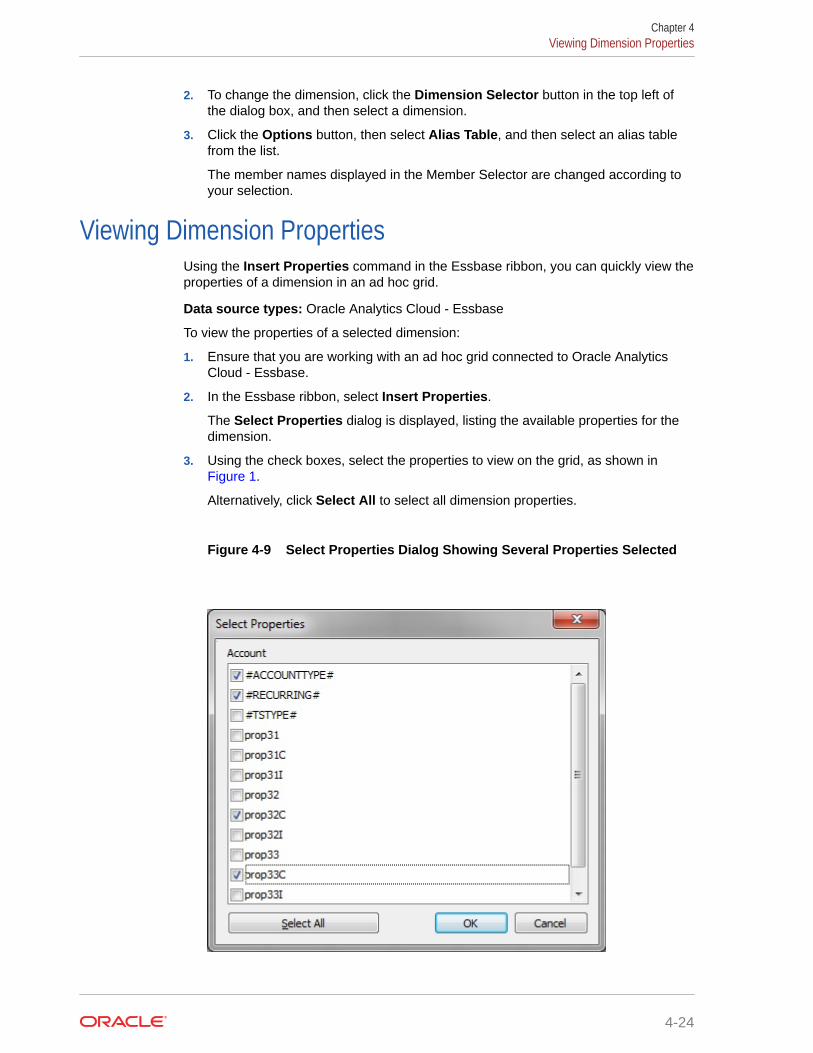
2. To change the dimension, click the Dimension Selector button in the top left ofthe dialog box, and then select a dimension.
3. Click the Options button, then select Alias Table, and then select an alias tablefrom the list.
The member names displayed in the Member Selector are changed according toyour selection.
Viewing Dimension PropertiesUsing the Insert Properties command in the Essbase ribbon, you can quickly view theproperties of a dimension in an ad hoc grid.
Data source types: Oracle Analytics Cloud - Essbase
To view the properties of a selected dimension:
1. Ensure that you are working with an ad hoc grid connected to Oracle AnalyticsCloud - Essbase.
2. In the Essbase ribbon, select Insert Properties.
The Select Properties dialog is displayed, listing the available properties for thedimension.
3. Using the check boxes, select the properties to view on the grid, as shown in Figure 1.
Alternatively, click Select All to select all dimension properties.
Figure 4-9 Select Properties Dialog Showing Several Properties Selected
Chapter 4Viewing Dimension Properties
4-24

4. Click OK.
The selected dimension properties and their values are displayed in the columns to theleft of the selected dimension. In the grid, the dimension properties column headings aredesignated as follows:
Dimension Name:Property NameFor example:
Account:#ACCOUNTTYPE#Account:prop32CIn an example scenario, in the following grid, we select Account in cell A3:
Then click Insert Properties, making the selections shown in Figure 1.
The dimension properties are inserted in the columns to the left of the ad hoc grid. Thead hoc grid now starts in column E. Columns A through D contain the dimension propertyinformation.
You may continue working with the grid using ad hoc commands, such as Zoom In andKeep Only, while the dimension properties are displayed, as long as the properties havebeen inserted to the left of the grid.
Note:
This feature will be supported in an upcoming release of Oracle Analytics Cloud- Essbase.
Additionally, administrators must set up the database in Oracle Analytics Cloud- Essbase for dimension property viewing in Oracle Smart View for Office.
5. Optional: After viewing the dimension properties, you may delete the columns containingthe dimension properties and still continue working in the ad hoc grid.
Member InformationYou can view detailed information about any member on the grid. The information displayeddepends on the data source type to which you are connected.
Cloud data source types: Oracle Analytics Cloud - Essbase
Chapter 4Member Information
4-25

On-premises data source types: Oracle Essbase, Oracle Hyperion FinancialManagement
To view member information:
1. Select a member in the grid.
2. From the data source ad hoc ribbon, select Cell Information.
Information is displayed on the following tabs. Only the tabs that are applicable tothe member and connection are displayed.
• Information: A list of general information about the member such asdimension, level, generation, and so forth
• Aliases: A list of alias tables and corresponding aliases associated with themember
• Attributes: A table of the dimensions, members, and types of attributesassociated with the member
• Formula: The formula associated with the member
• Comments: A list of comments associated with the member
• User Defined Attributes: A list of user defined attributes (attributes of themember defined by the administrator
3. Optional: To save the information in an Excel file, select Save.
4. Click Close.
The POV ManagerThe POV (Point of View) is the starting point for forms, ad hoc grids, and functions.
Cloud data source types: Oracle Analytics Cloud - Essbase, Planning, NarrativeReporting, Financial Consolidation and Close, Tax Reporting
On-premises data source types: Oracle Essbase, Oracle Hyperion Planning, OracleHyperion Financial Management
Using the POV Manager in Oracle Smart View for Office, you can change the defaultPOV for forms and ad hoc grids, and the background POV for functions.
Note:
Always use a private connection when working with the POV Manager. If youhave already connected using a shared connection, use the Add to Privateconnections command to save the current shared connection as private.See Saving Shared Connections as Private Connections.
With the POV Manager, you can perform the following operations:
• Select members for the default POV and edit the default POV (not applicable toFinancial Management)
• Select members for the background POV for functions
• Save a POV to a workbook
Chapter 4The POV Manager
4-26

• Copy a POV and paste it to a different worksheet or workbook
• Edit a POV
• Delete a POV (not applicable to Financial Management)
Video
Your Goal Watch This Video
Learn about integrating data in Office applications,including working with the POV Manager. Integrating Plan Data with Microsoft Office
in Oracle Planning and Budgeting Cloud
Note:
For Financial Management, the last refreshed POV (either in the FinancialManagement web interface or in Smart View) becomes the default POV and is usedby Smart View when accessing a form or ad hoc grid.
Additionally, for Financial Management, the POV Manager can only be used to setthe background POV for functions.
Related Topics:
Selecting Members for the Default or Background POV
Copying and Pasting a POV
Deleting a POV
Selecting Members for the Default or Background POVCloud data source types: Oracle Analytics Cloud - Essbase, Planning, FinancialConsolidation and Close, Tax Reporting
On-premises data source types: Oracle Essbase, Oracle Hyperion Planning, OracleHyperion Financial Management
In the POV Manager, you can select members as follows:
• To use as a default POV for the ad hoc grids of a given connection
• For the background POV for dimensions when you use functions
Oracle recommends a maximum of 1,000 members for the ad hoc POV.
Select members for or edit the POV before starting work on an ad hoc grid.
To select members for the default POV:
1. From the Smart View ribbon, select Function, and then Manage POV.
2. Expand the POVs list.
3. From the Active POV list, select the active connection for which you are changing thePOV.
Chapter 4The POV Manager
4-27

4. Click Member Selector, and then select the members that you want to use for thePOV. See Selecting Members from the Member Selector.
From the POV Manager, you can select only one member per dimension. If youuse aliases, the POV Manager loses the selected members.
5. Click Close.
6. To refresh the worksheet, select Refresh.
7. To save the POV to the workbook, save the workbook.
Note:
After you start working on the ad hoc grid, select or change members asdescribed in Selecting Members from the Member Selector.
Members Linked to Smart Lists in the POVIn Oracle Essbase, if a member linked to a Smart List is in the POV, you may not beable to change some values in the Smart List for some members present in theSpreadsheet.
Copying and Pasting a POVCloud data source types: Oracle Analytics Cloud - Essbase, Planning, FinancialConsolidation and Close, Tax Reporting
On-premises data source types: Oracle Essbase, Oracle Hyperion Planning, OracleHyperion Financial Management
You can use the POV Manager to copy and paste a POV from one workbook toanother if the data source is exactly the same for both workbooks. You must paste thecopied POV to an unconnected worksheet; otherwise the POV has no effect.
To copy and paste a POV:
1. From the Smart View ribbon, select Function, and then Manage POV.
2. In the left window of POV Manager, expand Active, and then select the applicationconnection that you want to copy.
3. From the POV Manager toolbar, click Member Selector, and then select membersfor the POV.
4. Save the workbook.
5. From the POV Manager toolbar, click Copy.
6. In the left window of the POV Manager, expand Saved to select the workbook andworksheet (which must be blank and unconnected) that you want to paste thePOV into.
7. Click Paste.
8. Refresh the worksheet containing the copied POV.
Chapter 4The POV Manager
4-28

Deleting a POVCloud data source types: Oracle Analytics Cloud - Essbase, Planning, FinancialConsolidation and Close, Tax Reporting
On-premises data source types: Oracle Essbase, Oracle Hyperion Planning
To delete a POV that is saved in an Office document:
1. From the Smart View ribbon, select Function, and then Manage POV.
2. Expand the POV list.
3. From the POV drop-down list, select the worksheet that contains the POV that you wantto delete.
4. Select the POV that you want to delete.
5. Click Delete.
6. Click Close.
7. To refresh the worksheet, select Refresh.
Chapter 4The POV Manager
4-29

5Data and Data Cells
Related Topics
• Refreshing DataYou can refresh data using the Refresh button on the Smart View ribbon, and you canrefresh data in individual reports by using the Refresh link in the Document Contentspane.
• Using the Submit Data OptionsSubmit Data options include: submit data, submit data without refresh, and submit datarange.
• Calculating DataAfter submitting new or changed data, the data in the database must be calculated toreflect the changes.
• Consolidating DataConsolidation is the process of gathering data from dependent entities and aggregatingthe data to parent entities.
• Working with CurrenciesIn forms enabled for currency conversion, you can enter data in a currency other than thebase currency of a cell.
• Adjusting Values in Data CellsYou can adjust the value of one or more data cells by a specified number or percentage ifthe cells contain numerical data.
• Resolving Data Validation ErrorsYour administrator can set up data validation rules to ensure that data meets companyguidelines.
• Data PerspectiveData perspective enables you to specify the perspective to use for viewing data ofvarying attributes, which are dimension attributes that vary with respect to independentcontinuous and discrete dimensions.
• Working with Smart ListsYou can enter data using custom drop-down selection lists called Smart Lists, which areaccessed from data cells in forms and ad hoc grids.
• Drill-Through ReportsPredefined by administrators, drill-through reports are available to users from specifiedindividual data cells.
• Linked Reporting ObjectsA linked reporting object is a cell note, external file, or URL that is linked to a data cell inan Oracle Essbase database, and which can be retrieved by Oracle Smart View for Officeusers in Excel.
• Linked PartitionsA linked partition connects two databases by means of a data cell.
• Cell CommentsYou can add comments to data cells.
5-1

• AttachmentsDocuments can be attached to individual data cells by way of URLs (OracleEnterprise Performance Management Cloud and Oracle Hyperion Planning) orfiles (EPM Cloud only).
• Cell HistoryYou can view the history of changes made to a data cell or range of data cells.
Refreshing DataYou can refresh data using the Refresh button on the Smart View ribbon, and you canrefresh data in individual reports by using the Refresh link in the Document Contentspane.
Data source types: All
Note:
Refresh is not supported on protected worksheets.
Related Topics:
• Refreshing from a Ribbon
• Refreshing Individual Reports from Document Contents
Refreshing from a RibbonData source types: All
In Excel, you can retrieve and refresh data for the current worksheet or for allworksheets in the workbook using the Refresh icon on the Smart View ribbon, shownin Figure 1.
This type of refresh action applies to entire sheets, documents and slides and includesdata in all ad hoc grids and reporting objects, such as function grids, tables, or charts.
Figure 5-1 Refresh Icon
Depending on the data provider to which you are connected, the Refresh icon caneither be a split button with Refresh options or a simple, one-function Refresh button.
Chapter 5Refreshing Data
5-2

Note:
• On ad hoc sheets, Excel filters are retained after refresh.
• To refresh individual reporting objects, such as function grids, tables, or charts,see Refreshing Individual Reports from Document Contents.
• Selected POV members are reverted to dimension members after deletingsome columns and refreshing a spreadsheet. To avoid this, click the POVbutton to hide the POV toolbar. Then ensure that you do not delete the columnthat contains the Page members.
To use Refresh, choose an option:
• To refresh the entire current worksheet, from any ribbon, click Refresh.
In Word or PowerPoint, when you click Refresh, all data points copied into the documentor presentation are refreshed.
Note:
In Oracle Essbase worksheets that contain multiple grids, you can also refreshonly a selected range of cells (see About Multiple Grids on a Worksheet).
• Oracle Business Intelligence Enterprise Edition only: To clear the contents of theentire current worksheet and replace it with the latest members and data, click the downarrow in Refresh, and then select Replace and Refresh.
Note:
The Replace and Refresh option applies only to reports in Oracle BI EE andOracle Hyperion Financial Reporting.
• To refresh all worksheets in the current workbook, click the down arrow in Refresh, andthen select Refresh All Worksheets.
Refreshing Individual Reports from Document ContentsData source types: All
You can refresh data in individual reports by using the Refresh link in the DocumentContents pane.
In Oracle Smart View for Office, reports consist of report queries and their associatedreporting objects. These are listed in the Document Contents pane. From DocumentContents, you can individually refresh report queries and their associated reporting objects,such as:
• Function grids
• Tables
Chapter 5Refreshing Data
5-3

• Charts
• Dynamic data points
Note:
The procedures and examples in this topic discuss refreshing individualreports and reporting objects from the Document Contents pane. To refreshall reporting objects in worksheets or workbooks, documents, and slides orpresentations, you can use the Refresh icon on the Smart View ribbon or aprovider ribbon, as described in Refreshing from a Ribbon.
To refresh individual reports in the Document Contents pane:
1. Navigate to the individual report query that contains the associated reportingobjects to refresh.
The Refresh link, , appears in Document Contents only after areporting object has been inserted for an individual report query.
For example, in Figure 1, a function grid is to be refreshed. Note that the "Demo"report query for the function grid is selected, not the function grid itself.
Figure 5-2 Report Query for Function Grid Selected for Refresh
2. In the Document Contents pane, click .
You can also right-click on the report query and select from the contextmenu, as shown in Figure 2.
Chapter 5Refreshing Data
5-4

Figure 5-3 Refresh Using Right-Click Menu
The reporting objects for the selected report query are refreshed; the rest of the reportqueries and associated reporting objects remain unrefreshed.
See Other Refresh Examples.
Example 5-1 Notes About Refreshing Individual Reporting Objects in Excel
• You can refresh report queries individually in Excel with the exception of report queriescontaining function grids.
For example, if two report queries contain function grids, then refreshing one query willrevert the other query's function grid to the #NEED REFRESH (unrefreshed) state. Thisonly occurs with function grids. The other reporting objects, such as tables or charts, willrefresh normally.
For example, on Sheet 1 in Figure 3, refreshing Report Query 1 will refresh theassociated grid and function grid; however, the function grid associated with ReportQuery 2 will convert to the unrefreshed state while the chart refreshes normally. Thereport query and associated reporting objects on Sheet2 are unaffected.
Chapter 5Refreshing Data
5-5

Figure 5-4 Selecting a Report Query to Refresh in Excel Where Two ReportQueries Contain Function Grids
To refresh all items on the sheet, including multiple function grids, select Sheet1 in
the Document Contents, as shown in Figure 4, and then click .
Figure 5-5 Selecting Sheet1 to Refresh All Reporting Objects on a Sheetfrom Document Contents
Chapter 5Refreshing Data
5-6

• In Excel, if a reporting object from a single report query is inserted on multiple sheets,
then selecting the report query and clicking will refresh the reporting object oneach sheet where it appears.
Example 5-2 Other Refresh Examples
The examples in this section use a Word document to describe the refresh options availabledepending on the selection made in the Document Contents pane.
Figure 5 shows a Word document selected in the Document Contents pane. Clicking
will refresh all report queries and their associated reporting objects in thedocument.
Figure 5-6 Word Document Selected for Refresh
Figure 6 shows a report query selected in the Document Contents pane. The report query
contains two reporting objects, a grid and an Office table. Clicking will refresh onlythe selected report query and its two associated reporting objects; other report queries andtheir reporting objects in the document remain unrefreshed.
Chapter 5Refreshing Data
5-7

Figure 5-7 Report Query with Two Reporting Objects Selected for Refresh
Note:
Refreshing an individual sheet or slide will refresh the report queries andreporting objects associated with the selected sheet or slide. For example, ifyou select a sheet that contains multiple report queries, all reporting objectsassociated with the multiple report queries on the selected sheet will berefreshed.
Refreshing an entire document will refresh all the report queries in thedocument and their associated reporting objects.
In Figure 7, two reporting objects are associated with a report query, one reporting
object is selected. Notice that is not available.
Chapter 5Refreshing Data
5-8

Figure 5-8 One of Two Reporting Objects Selected - Refresh Not Available
Figure 8 shows a report query selected in the Document Contents pane. The report query
contains a single reporting object, a function grid. Clicking will refresh only theselected report query and its associated reporting object; other report queries and theirreporting objects in the document remain unrefreshed.
Figure 5-9 Report Query with Single Reporting Object Selected for Refresh
In Figure 9, a single reporting object associated with a report query is selected. Notice that
is not available.
Chapter 5Refreshing Data
5-9

Figure 5-10 Individual Reporting Object Selected - Refresh Not Available
Using the Submit Data OptionsSubmit Data options include: submit data, submit data without refresh, and submitdata range.
Related Topics
• About the Submit Data Options
• Submitting Data
• Submitting Data Without RefreshingSubmit Data Without Refresh allows users to submit all data from the worksheet.
• Submitting Data Ranges
About the Submit Data OptionsCloud data source types: Oracle Analytics Cloud - Essbase, Planning, FinancialConsolidation and Close
On-premises data source types: Oracle Essbase, Oracle Hyperion FinancialManagement, Oracle Hyperion Planning
You can update any type of data in the data source by submitting changed data fromforms and ad hoc grids. If you make changes while disconnected, you can submit thechanges after you reconnect.
Oracle Smart View for Office offers the following options for submitting data:
• Submit Data
• Submit Data Without Refresh
• Submit Data Range
Chapter 5Using the Submit Data Options
5-10

Note:
Submit Data functionality is generally supported by all data source types. However,refer to the individual Submit Data topics for specific data source support.
Video
Your Goal Watch This Video
Learn about the options for submitting data. Overview: Submitting Data With Smart
View
Guidelines for the Submit Data Options
• When using the Submit Data option:
– While connected to Essbase releases 11.1.2.1.102 and later, you can submit datawithout first refreshing in free-form mode.
– While connected to Planning ad hoc, Financial Management ad hoc, or Essbasereleases earlier than 11.1.2.1.102, you must refresh the grid before modifying thedata when you are in free-form mode.
• When working with an aggregate storage database, you can only submit data from thelowest level (level 0) of a hierarchy.
• You can use the Submit Data Without Refresh and Submit Data Range options tosubmit cell data from cells that were modified by a user who does not have Smart Viewinstalled.
• In worksheets that support multiple grids, you can perform the Submit Data commandsfor only one grid at a time.
If you try to submit data for more than one grid at a time—that is, if you have selected cellranges in more than one grid—the first range returned by Excel will be used to determinethe selected grid and the submit will be performed only on that grid.
• If you are submitting data from forms:
– In Planning or Financial Management forms, you can lock any cell or range of cells toprotect the data until the data is refreshed or submitted. In Financial Management,locking the cell does not lock the actual data cube but only the cell in the form. Whenthe data is refreshed or submitted, the cell is no longer locked.
– Some cells may no longer exist in the form definition. This behavior may happen ifform definition or access privileges have changed, or if rows or columns aresuppressed. In these cases, only writable cells that exist in the new form definitionare saved. This behavior applies to both cells and supporting detail changes, andalso applies when working with forms while connected to or disconnected from thedata provider.
– When you are working in a form and you click Submit Data, you are actually writingdata back to the latest POV selected in the POV toolbar. Oracle recommendsperforming a Refresh whenever you make changes to the POV. The refresh updatesthe data on the sheet to reflect the latest POV change.
Chapter 5Using the Submit Data Options
5-11

– On forms opened in Smart View from the web application, some calculatedand read-only cells can be edited without an error message being displayed,although the changed data cannot be submitted.
Submitting DataCloud data source types: Oracle Analytics Cloud - Essbase, Planning, FinancialConsolidation and Close, Tax Reporting
On-premises data source types: Oracle Essbase, Oracle Hyperion FinancialManagement, Oracle Hyperion Planning
Video
Your Goal Watch This Video
Learn about basic Oracle Smart View forOffice functionality, including submitting data. Entering and Saving Plan Data in
Smart View with Oracle Planning andBudgeting Cloud
To submit data:
1. Connect to the data source.
2. Optional: To help you identify modified cells, set a cell style for dirty cells, asdescribed in Cell Styles.
3. Essbase only: If you are working in free-form mode with an Essbase on-premisesrelease earlier than 11.1.2.1.102, from the Essbase ribbon, select Refresh.
4. Modify data as needed.
5. From any ribbon, select Submit Data.
All dirty cells on the worksheet are submitted.
Note:
If you are working with multiple grids on a worksheet, see Guidelines for theSubmit Data Options.
Submitting Data Without RefreshingSubmit Data Without Refresh allows users to submit all data from the worksheet.
Cloud data source types: Oracle Analytics Cloud - Essbase, Planning Ad Hoc
On-premises data source types: Oracle Essbase, Oracle Hyperion Planning Ad Hoc,Oracle Hyperion Financial Management Ad Hoc
Submit Data Without Refresh includes all data cells that you have explicitly modified(made dirty) and those that were not modified. All data cells are marked dirty andsubmitted. Once the submit operation is complete, the entire grid will be refreshed.
To submit data without first refreshing:
Chapter 5Using the Submit Data Options
5-12
1. Connect to the data source.
2. Optional: To help you identify modified cells, set a cell style for dirty cells, as described in Cell Styles.
3. Modify data as needed.
4. From the provider ribbon, select Submit Data, then Submit Data Without Refresh.
Data for all cells on the sheet is submitted, whether or not the cells are dirty.
Note:
If you are working with multiple grids on a worksheet, see Guidelines for the SubmitData Options.
Submitting Data RangesCloud data source types: Planning Ad Hoc, Financial Consolidation and Close Ad Hoc, TaxReporting Ad Hoc
On-premises data source types: Oracle Essbase, Oracle Hyperion Planning Ad Hoc,Oracle Hyperion Financial Management Ad Hoc
You can submit contiguous and non-contiguous single cells or cell ranges.
To submit data:
1. Connect to the data source.
2. Modify data as needed.
Alternatively, you may have opened a workbook that you received from a user who doesnot have Oracle Smart View for Office and modified the worksheet. Smart View cannotdetect those cells as dirty, so you will need to be informed by that user which cells weremodified or added.
3. Optional: To help you identify modified cells, set a cell style for dirty cells, as described in Cell Styles.
4. Select the data ranges you want to submit.
You can select contiguous and non-contiguous single cells or cell ranges.
5. From the provider context ribbon (for example, the Planning Ad Hoc ribbon), selectSubmit, then Submit Data Range.
Only cell data from selected cells is submitted. If there are dirty cells on the sheet outsidethe range of selected cells, the modified value is not submitted and those cells will revertback to the value that was last stored with the provider.
Note:
If you are working with multiple grids on a worksheet, see Guidelines for the SubmitData Options.
Chapter 5Using the Submit Data Options
5-13

Calculating DataAfter submitting new or changed data, the data in the database must be calculated toreflect the changes.
Related Topics
• About Calculating Data
• Calculating Data in Financial Management
• Calculating Data in Essbase
• Changing the Solve Order of a Selected POV
About Calculating DataAfter you submit new or changed data, you need to calculate the data in the databaseto reflect your changes. Your options for calculating data depend on your data source.To calculate data, you must have security access rights to the data.
For information on calculating business rules on Planning forms in Oracle HyperionPlanning, see Executing the Calculate Form and Calculate Currencies BusinessRules.
For information on calculating business rules on forms in Oracle EnterprisePerformance Management Cloud, see Executing the Calculate Form and CalculateCurrencies Business Rules.
See also:
Calculating Data in Financial Management
Calculating Data in Essbase
Calculating Data in Financial ManagementData source types: Oracle Hyperion Financial Management
To calculate data:
1. Select a cell or range of cells for which you want to calculate data.
2. From the data source or data source ad hoc ribbon, select Calculate then selectone of these options:
• To calculate the selected cells, select Calculate.
• Force calculation to run for all selected cells regardless of cell status, selectCalculate then Force Calculate.
Calculating Data in Essbase
About Calculating Data in EssbaseCloud data source types: Oracle Analytics Cloud - Essbase
Chapter 5Calculating Data
5-14

On-premises data source types: Oracle Essbase
In Oracle Smart View for Office, you can use a calculation script to calculate a database inEssbase or Oracle Analytics Cloud - Essbase. Calculation script types can be Essbase orMDX.
Additionally:
• Essbase and MDX calculation scripts are created by your Essbase administrator for yourspecific system.
• When launched, Essbase and MDX calculation scripts can prompt you to enter variableinformation, called runtime prompts.
• Essbase and MDX calculation scripts are supported for aggregate storage and blockstorage databases.
• MDX calculation scripts can contain multiple MDX queries.
• To change the solve order of a member POV before running a calculation, see Changingthe Solve Order of a Selected POV.
• Oracle Analytics Cloud - Essbase only:
– Detailed tracing information can be provided upon execution of an Essbasecalculation script. The tracing information is displayed only if your Oracle AnalyticsCloud - Essbase administrator has configured the calculation script for tracing.
– You can run calculations on asymmetric grids. To do this, your administrator must firstprepare calculation scripts that specify selected tuples to calculate.
To do this, your administrator must first prepare calculation scripts that specifyselected tuples to calculate. See Calculating Asymmetric Grids Using Tuples.
• Administrators:
– Do not use the Manage and Execute Queries dialog to execute multiple MDXqueries at once. Instead, use an MDX script and run it from the Calculation Scriptsdialog.
– Refer to the following guides for information on writing Essbase and MDX calculationscripts .
* Oracle Analytics Cloud - Essbase:
Using Oracle Analytics Cloud - Essbase , Calculate Cubes
Using Oracle Analytics Cloud - Essbase , Analyze and Move Data with MDX
Technical Reference for Oracle Analytics Cloud - Essbase , MDX
For Oracle Analytics Cloud - Essbase documentation, go to the Oracle HelpCenter here:
https://docs.oracle.com/en/cloud/paas/analytics-cloud/books.html
* Essbase on-premises:
Oracle Essbase Database Administrator's Guide , "Calculating Data" chapter
Oracle Essbase Technical Reference , "MDX" chapter
Find your Essbase version on the Oracle Help Center here:
https://docs.oracle.com/en/applications/enterprise-performance-management/index.html
Chapter 5Calculating Data
5-15

– Oracle Analytics Cloud - Essbase: To define Essbase calculation scripts sothat Smart View users can work with runtime prompts, refer to Oracle CloudDesigning and Maintaining Essbase Cubes, Using Runtime SubstitutionVariables in Calculation Scripts Run in Smart View.
– For information on writing scripts for to calculate asymmetric regions in adatabase, see the Oracle Analytics Cloud - Essbase documentation.
Running Essbase CalculationsCloud data source types: Oracle Analytics Cloud - Essbase
On-premises data source types: Oracle Essbase
To select and launch a calculation script:
1. Connect to the Essbase or Oracle Analytics Cloud - Essbase data source andcreate an ad hoc query or open an existing report file.
2. Select the data cell on which you plan to run a calculation script.
3. From the Smart View ribbon, select Calculate.
The Calculation Scripts dialog box is displayed.
4. At the top of the dialog, under Cube, select a database from the list of databasesthat belong to this application.
5. Under Calculation Script, select a script.
The Cube column shows the cube to which the calculation belongs, and the Typecolumn shows the calculation type:
• Script signifies an Essbase calculation
• MDX Calc signifies an MDX calculation.
6. If the calculation script includes runtime prompts, enter or select the input typespecified by the runtime prompt, summarized in the following table.
Note:
Depending on how the runtime prompts have been set up by yourEssbase administrator, information for some prompts can be hand-typed.Ensure that the runtime prompt values that you enter are valid. Youcannot launch a calculation script until all runtime prompt values arevalid.
Chapter 5Calculating Data
5-16

Table 5-1 Runtime Prompt Input Types
Icon Expected Input Type
One member selection—One member in the
dimension can be selected. Click tochoose a single member in the MemberSelection dialog box.Alternatively, if the field is enabled forediting, you may manually enter themember name, enclosed in quotation marks;for example:
"California"
Multiple member selections—Two or moremembers in the dimension can be selected.
Click to choose multiple members in theMember Selection dialog box.Alternatively, if the field is enabled forediting, you may manually enter themember names, enclosed in quotationmarks and separated by a comma; forexample:
"New York", "California"; "West", "Market"
Text value—A text value; for example:
MyGrid
Member names must be enclosed inquotation marks, separated by commas, andinclude a final semicolon (;). For example,type:
"New York","California","West","Market";
or
"Oklahoma";
Chapter 5Calculating Data
5-17

Table 5-1 (Cont.) Runtime Prompt Input Types
Icon Expected Input Type
Numeric value—A numeric value; forexample, type:
1000
or
-2
Date value—A date value in the formatrequired by your system; for example:
mm/dd/yyyy
or
dd/mm/yyyy
7. Click Launch.
A status message tells you if the calculation was successful. For example:
If the calculation was not successful, contact your Essbase or Oracle AnalyticsCloud - Essbase administrator.
8. Click OK to close the message box
9. Oracle Analytics Cloud - Essbase only: If the calculation script was configuringfor tracing, then view the information in the Calculation Result dialog box, andthen click OK to close the dialog.
Alternatively, copy and paste the information from the Calculation Result dialogand save it in your favorite text editor.
The Calculation Result dialog box contains detailed information on thecalculation that was executed when the script was launched. For example:
Chapter 5Calculating Data
5-18

10. Note any changed data cells in the ad hoc grid or report.
11. Click Submit to submit the changed data back to the database.
Calculating Asymmetric Grids Using TuplesData source types: Oracle Analytics Cloud - EssbaseTuple calculation for asymmetric grids lets Smart View users execute calculations for thespecific scope of member selections in a grid or calculation script, avoiding over-calculation.
A calculation tuple is a way to represent a data slice of members, from one or more sparsedimensions, to be used in a calculation FIX statement.
By default, when multiple members from different dimensions are in a calculation FIXstatement, or are part of the grid POV in Oracle Smart View for Office, the calculation scopeis all possible combinations (a Cartesian-product) of all member combinations from differentdimensions. This can result in more calculations than are needed when working withasymmetric grids. With tuple calculations, the scope of calculations can be more precise andefficient.
Administrators set up tuple calculations in Oracle Analytics Cloud - Essbase as they do othercalculations that they create for users to run from Smart View, based on their specific data setand business needs.
As a Smart View user, you run tuple calculations for asymmetric grids as you would any othercalculation. You may be asked to specify runtime prompts, depending on how youradministrator set up the tuple calculation.
Chapter 5Calculating Data
5-19

Note:
You can run tuple calculations on asymmetric grids starting in Smart Viewrelease 11.1.2.5.800. Check that your Oracle Analytics Cloud - Essbasesupports calculation tuples.
Administrators: Using the tuple calculation feature, you can define calculation scopeas selected member tuples in an asymmetric grid. Special syntax in FIX statementshelps you specify which tuples to calculate. Check the Oracle Analytics Cloud -Essbase documentation for more information on calculation tuples.
In Smart View, to run a tuple calculation on an asymmetric grid, follow the instructionsfor running a calculation in Running Essbase Calculations.Select a script written for tuple calculations on asymmetric grids. Your administratorcan advise you which scripts you should run.
Example 5-3 Running Tuple Calculations on an Asymmetric Grid
The examples in this scenario are based on an example gallery template for tuplecalculation. The gallery template is available in Oracle Analytics Cloud - Essbaseversions that support calculation tuples.
Start with the asymmetric grid shown below. The grid is asymmetric because we donot see the same member hierarchies in the row and column dimensions.
Figure 5-11 Starting Asymmetric Grid - All Data Values = 1
The asymmetric grid above is a slice of this symmetric grid, where the hierarchymembers are uniform across rows and columns:
Chapter 5Calculating Data
5-20
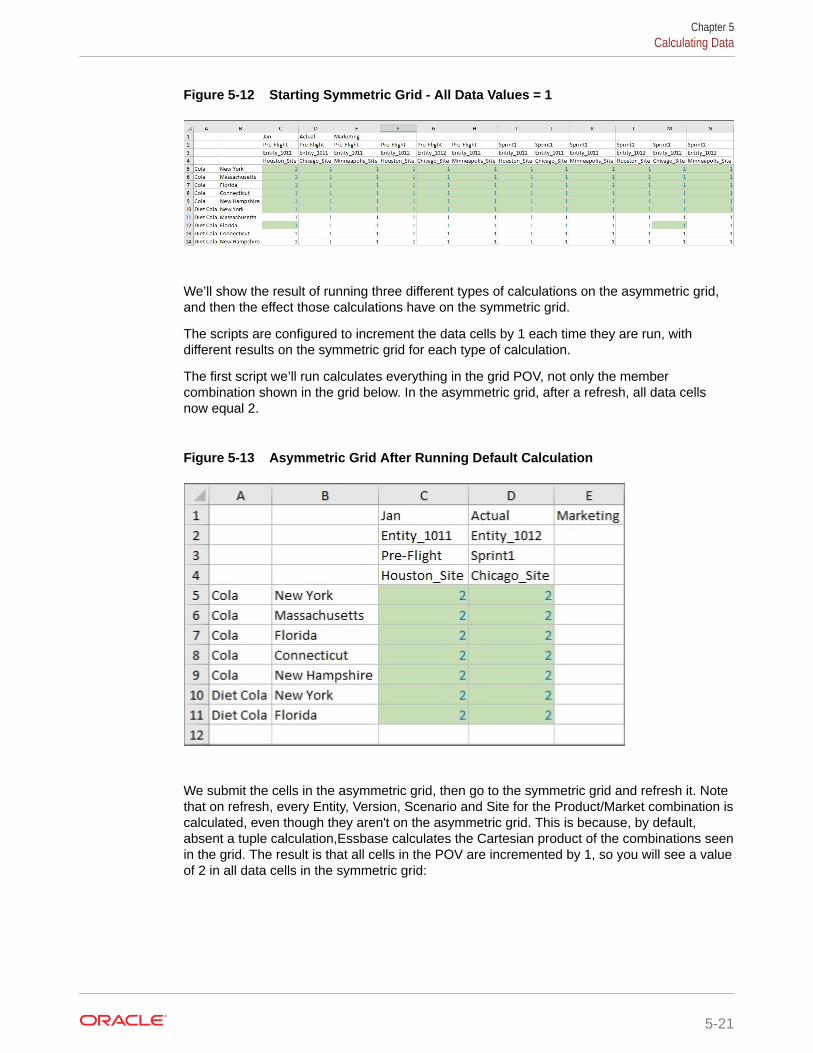
Figure 5-12 Starting Symmetric Grid - All Data Values = 1
We’ll show the result of running three different types of calculations on the asymmetric grid,and then the effect those calculations have on the symmetric grid.
The scripts are configured to increment the data cells by 1 each time they are run, withdifferent results on the symmetric grid for each type of calculation.
The first script we’ll run calculates everything in the grid POV, not only the membercombination shown in the grid below. In the asymmetric grid, after a refresh, all data cellsnow equal 2.
Figure 5-13 Asymmetric Grid After Running Default Calculation
We submit the cells in the asymmetric grid, then go to the symmetric grid and refresh it. Notethat on refresh, every Entity, Version, Scenario and Site for the Product/Market combination iscalculated, even though they aren't on the asymmetric grid. This is because, by default,absent a tuple calculation,Essbase calculates the Cartesian product of the combinations seenin the grid. The result is that all cells in the POV are incremented by 1, so you will see a valueof 2 in all data cells in the symmetric grid:
Chapter 5Calculating Data
5-21

Figure 5-14 Symmetric Grid After Running Default Calculation on AsymmetricGrid and Refresh
Second, we’ll run a more limited calculation on the asymmetric grid, shrinking thecalculation scope to Product and Market grid tuples so that fewer intersections arecalculated. The Calculation Result message shows us the scope of this calculation:
Figure 5-15 Calculation Result Dialog After Running Tuple Calculation on AllProduct and Market Tuples
Refresh, and all data cells in the asymmetric grid are incremented to 3. Submit thedata on the grid.
Chapter 5Calculating Data
5-22

Figure 5-16 Asymmetric Grid After Running Calculation on All Product and MarketTuples
In the symmetric grid, note on refresh that only the Product/Market tuples already included onthe asymmetric grid are calculated, along with all Site/Version/Entity combinations. These areall the columns of rows 5 through 10, and row 12. These cells now show a data value of 3.The Product/Market tuples not shown in our asymmetric grid are not calculated in thesymmetric grid; their data cell value is still 2. For this calculation, only Product and Marketcombinations were specified for tuples. The tuples and all members for unspecifieddimensions (those not specified in the FIX statement) are calculated.
Figure 5-17 Symmetric Grid After Running Calculation on All Product and MarketTuples on Asymmetric Grid and Refresh
Now run the last calculation, which is written to work only on the tuples shown in ourasymmetric grid. The tuple calculation specifies that only the indicated Entity, Site, Market,Product, Version combinations on our asymmetric grid should be calculated. After running thecalculation, the Calculation Result dialog shows an even smaller calculation scope:
Chapter 5Calculating Data
5-23

Figure 5-18 Calculation Result Dialog After Running Calculation on GridProduct and Market Tuples
Values in all cells in the asymmetric grid are incremented to 4. Submit the data on thisgrid.
Figure 5-19 Asymmetric Grid After Running Calculation on Grid Product andMarket Tuples
Move to the symmetric grid and refresh. Remember, the tuple calculation specified thatonly the Entity, Site, Market, Product, Version combinations indicated on ourasymmetric grid should be calculated. On the symmetric grid, you can see that onlyrows 5 through 10 and row 12 and columns C and M, are incremented to 4. These arethe tuples that correspond to the data that was incremented in the asymmetric grid,and are highlighted in yellow below:
Chapter 5Calculating Data
5-24

Figure 5-20 Symmetric Grid After Running Calculation on Grid Product and MarketTuples on Asymmetric Grid and Refresh
The examples in this section showed you the effects of three calculations on an asymmetricgrid and a symmetric grid. We looked at the result of each calculation on each type of grid.We learned that by selecting tuples, you can focus calculations in the active Smart View grid,limiting their scope to specific slices of data in your cube.
Changing the Solve Order of a Selected POVData source types: Oracle Analytics Cloud - Essbase
Using the Cell Information command on the Essbase ribbon, you can view information abouta data cell, such as its POV and data consolidation property. Additionally, you can change thesolve order of the data cell at the member intersection, or POV, that you selected.
Solve order is a value that represents the order, or priority, of a member when a calculation isperformed. Users can view and change the solve order by editing the solve order value in theData Cell Information dialog box.
The selected data cell must contain a dynamic member in the POV.
To change the solve order of a data cell:
1. In an ad hoc grid or report, select a data cell.
2. In the Essbase ribbon, click to view the Data Cell Information dialogbox.
For example, Figure 1 shows a simple ad hoc query based on the Sample Basicapplication and database. We select cell B3, at the intersection of Qtr1 and Profit:
Figure 5-21 Simple Ad Hoc Grid Based on Sample Basic
Chapter 5Calculating Data
5-25

The Data Cell Information dialog is displayed as follows, showing Qtr1 and Profitas the POV members of this intersection, with the operation calculation type forboth set to Dense Consolidation: + (addition). Under Result, a detaileddescription of the current calculation result is displayed.
Figure 5-22 Data Cell Information Dialog Box
3. Select a member row in the Data Cell Information dialog and click Edit.
The cursor is placed in the Solve Order field, where you can type a new value.
Alternatively, double-click the value in the Solve Order field and type a new value.
Valid solve order values are between 0 and 127.
If you enter a value above 127, you will be prompted to enter a value between 0 to127. Note that members with a solve order of zero, 0, will not be listed in thedialog.
4. Optional: To change the solve order value for any other members in the POV,repeat step 3.
5. Click OK to commit all solve order changes.
6. Repeat this procedure to change the solve order of any other data cells.
7. Run the calculation you require, following the instructions in Calculating Data inEssbase.
Consolidating DataConsolidation is the process of gathering data from dependent entities andaggregating the data to parent entities.
Data source types: Oracle Hyperion Financial Management
Chapter 5Consolidating Data
5-26

To consolidate data, you must have security access rights to the data and you must beassigned the Consolidate security role. To Consolidate all data, you must be assigned theConsolidate All security role.
To consolidate data:
1. Select a cell or range of cells for which you want to run consolidation.
2. From the data source ad hoc ribbon, select Consolidate, then select one of the followingoptions:
• Consolidate to consolidate data for the selected entities.
• Consolidate All to consolidate data for all entities, whether or not they contain data
• Consolidate All With Data to consolidate the selected entities only if they containdata.
• Calculate Contribution to calculate contribution values of all dependent entities.
• Force Calculate Contribution to force calculation to run for all selected contributionvalues.
Working with CurrenciesIn forms enabled for currency conversion, you can enter data in a currency other than thebase currency of a cell.
Related Topics:
Translating Currencies in Financial Management
Changing Currency in Planning
Translating Currencies in Financial ManagementData source types: Oracle Hyperion Financial Management
Converting currencies is called "translating data" in Financial Management. You can translatedata from the entity's input currency to any other currency defined in the application.Currencies are not associated with a parent-child entity pair, so you can translate data ondemand, separately from the consolidation process.
In ad hoc grids, if you have security access rights to the data, you can convert, or translate,values from one currency to another. To translate data:
1. Select a cell or range of cells.
2. From the data source ad hoc ribbon, select Calculation, then select one of the following:
• To translate the selected cells, select Translate.
• To force translation to run for all selected cells, select Force Translate.
Changing Currency in PlanningIn forms enabled for currency conversion, you can enter data in a currency other than thebase currency of a cell. Currencies in the drop-down list can be designated as the localcurrency.
Chapter 5Working with Currencies
5-27

Note:
To override the base currency for an entity, the cell must be displayed in thelocal currency, and its version must be bottom-up. The application must be amulti-currency application and the form should support multi-currency.
To enter cell data in a local currency other than the base currency for the cell:
1. In a form, select a local currency member for the cell.
2. Optional: To look up the currency's code, select View, then Currency.
Available Currencies shows the application's currencies. Note the Currency Codefor the currency you want to work with, and close the window.
3. In the right column, HSP_InputCurrency, type the new Currency Code in the datacell.
Typing the currency code in the data cell overrides the base currency for the entity.
4. Click Submit to submit the new currency code to the Oracle Hyperion Planningserver.
5. Enter the currency value in the left column, HSP_InputValue, of the data cell.
6. Click Rules on Form and select the Calculate Currencies rule to calculate andsave the new currency value.
If the Calculate Currencies calc script is set to run when the form is saved, and theform is enabled for multiple currencies, the data value is displayed in the currencyyou selected.
Adjusting Values in Data CellsYou can adjust the value of one or more data cells by a specified number orpercentage if the cells contain numerical data.
If you adjust the value of a cell that contains an Excel formula, the adjusted valueoverwrites the formula.
Cloud data source types: Oracle Analytics Cloud - Essbase, Planning, FinancialConsolidation and Close, Tax Reporting
On-premises data source types: Oracle Essbase, Oracle Hyperion FinancialManagement, Oracle Hyperion Planning
To adjust data values:
1. Click the data cell that contains the value to adjust.
2. From the data source ribbon, select Adjust.
3. From Adjust Data, select an option then enter the number or percentage by whichyou want to adjust the value of the cell.
4. Click Adjust Data.
Chapter 5Adjusting Values in Data Cells
5-28

Resolving Data Validation ErrorsYour administrator can set up data validation rules to ensure that data meets companyguidelines.
Cloud data provider types: Planning, Financial Consolidation and Close, Tax Reporting
On-premises data provider types: Oracle Hyperion Planning
For example, your administrator can set:
• Criteria for the data you enter, called data validation rules
• Background colors to call your attention to data validation errors
• Messages that tell you what the criteria is
The Data Validation pane displays in the Smart View Panel, listing the cells containingvalidation errors, grouped by validation rule.
Figure 1 is an example of these elements.
Figure 5-23 Form Showing Invalid Data Cells, a Data Validation Message, and theData Validation Pane in the Smart View Panel
If the data in a form doesn’t meet the criteria in the data validation rules, follow the steps inthis topic to fix the errors.
To resolve data validation errors in simple forms and composite forms:
1. In a form with errors, hover your cursor over the cell having a non-default coloredbackground to view the validation message.
Your administrator typically calls your attention to cells having data validation rule errorsby displaying them with a colored background. Pop-up text displays the validation rule.
Chapter 5Resolving Data Validation Errors
5-29

2. Click in each data cell that has validation errors and resolve each error based onthe instructions in the data validation message.
You can also locate cells to resolve by reviewing the cells listed in the DataValidation pane of the Smart View Panel.
As you resolve errors, those cells are removed the list.
3. In composite forms, repeat this for each form having data validation errors.
4. If there’s more than one message in a cell, view the pop-up messages and resolvethe errors.
5. When you’ve resolved all errors, submit the data.
The cells’ colored backgrounds and the data validation messages no longerdisplay in the grid and the Data Validation pane no longer displays in the SmartView Panel.
Chapter 5Resolving Data Validation Errors
5-30

Tip:
If your POV doesn't include valid members, you can clear the current members byclicking on the editable dimensions in the POV, and then selecting <ClearSelection>. You can then select members from the dimensions that are included inthe valid intersection definition.
Data PerspectiveData perspective enables you to specify the perspective to use for viewing data of varyingattributes, which are dimension attributes that vary with respect to independent continuousand discrete dimensions.
For example, suppose a cola product is sold in both cans and bottles in several differentgeographical markets over the course of a year. If the packaging (cans or bottles) variesdepending on the market or changes from one type to the other during the year, thepackaging type is a varying attribute. The data associated with the cola would be differentdepending on the time of year and the market.
Cloud data source types: Oracle Analytics Cloud - Essbase
On-premises data source types: Oracle Essbase
Note:
Data perspective may not be enabled in your Oracle Smart View for Office system.Your options for data perspective are enabled and configured by your Smart Viewadministrator.
To specify data perspective:
1. From the Essbase ribbon, select Data Perspective.
2. From Perspective, under Selection, select an option (see Data Perspective Illustrationfor examples of options).
• Reality to display the data with no perspective.
• Last to display the data for the last level 0 member of each continuous independentdimension. For example, if Year is the continuous dimension and December is thelast member of Year, then the data for December is displayed.
• Start to display the data for the first level 0 member of each continuous independentdimension. For example, if Year is the continuous dimension and January is the firstmember of Year, then the data for January is displayed.
• Custom if you want to specify both continuous and discrete members. For thisoption, select a Varying Attribute from the drop-down list. Then, for the dimensionslisted under Independent Dimension, select members under Members. If you selectSet Dimensions Only, all independent dimensions across all varying attribute aredisplayed, enabling you to apply a common perspective to all.
3. Click OK, then refresh the grid.
Chapter 5Data Perspective
5-31

Example 5-4 Data Perspective Illustration
In our example of cola sold in cans and bottles, suppose the Administrator hasspecified the following attributes for the cola packaging types to reflect how the colawas sold in Texas and California markets during the year:
• Can: California, January—December year
• Can: Texas, July—December
• Bottle: Texas, January—June
Figure 1 illustrates the Reality perspective. The data shown for California and Texas isdata for the entire year. Since bottles were not sold in California, no data is returned(indicated here by #Meaningless).
Figure 5-24 Data Perspective: Reality
Figure 2 illustrates the Last perspective and displays data for cans for California andTexas, but none for bottles, because bottles were sold only January through June inTexas.
Figure 5-25 Data Perspective: Last
Figure 3 illustrates the Start perspective and displays data for January. Bottles but notcans were sold in Texas in January, so only data for bottles is displayed. Cans but notbottles were sold in California in January, so only data for bottles is displayed.
Figure 5-26 Data Perspective: Start
Chapter 5Data Perspective
5-32

Working with Smart ListsYou can enter data using custom drop-down selection lists called Smart Lists, which areaccessed from data cells in forms and ad hoc grids.
Cloud data source types: Planning, Planning Modules, Financial Consolidation and Close,Tax Reporting
On-premises data source types: Oracle Hyperion Planning
A Smart List is a drop-down selection list displayed in a form or ad hoc grid cell as analphanumeric text description, but stored in the database as a number. For example, aninteger Smart List for a reporting cycle may have the values 1-5, for Yearly (1), Quarterly (2),Monthly (3), Daily (4), and Hourly (5). The values that are displayed on the form or ad hocgrid are Yearly, Quarterly, Monthly, Daily, and Hourly. When you select one of these values onthe form or ad hoc grid, and submit the data, the number associated with it is stored in thedatabase. This means that you do not have to remember the numeric values associated witheach time period in the reporting cycle.
In Oracle Smart View for Office, you access Smart Lists from custom drop-down lists in formor ad hoc grid cells. When clicking into cells whose members are associated with a SmartList, you click the down arrow that appears directly to the right of the cell, then select a drop-down list option instead of typing data; in fact, you cannot type in a cell that contains a SmartList.
For example, a data form may contain a Smart List called Justification that providesselections for Research, Customer Feedback, and Expansion. When you click into Accountcells named Reason (whose members are associated with the Justification Smart List), adown arrow is displayed. When you click the down arrow, it expands into a drop-down listwith the following selections:
• Research
• Customer Feedback
• Expansion
You then select one of the Smart List options as the value for the cell.
To enter a Smart List value in a form or ad hoc grid cell:
1. Open a form or ad hoc grid in Excel.
See Opening Forms in Excel or Starting Ad Hoc Analysis.
2. In the form or ad hoc grid, click into the data cell for which you want to select a Smart Listoption.
A down arrow is displayed to the right of the cell; for example:
Chapter 5Working with Smart Lists
5-33

Note:
Only cells whose members are associated with Smart Lists containSmart List drop-down lists.
3. Click the down arrow for the cell.
The down arrow expands into a Smart List drop-down list with options from whichyou can choose; for example:
4. From the Smart List, select an option.
The option you select is entered into the data cell.
After selecting a value, the cell becomes "dirty" and the data is ready to submit; forexample:
Guidelines for Working with Smart Lists
• You cannot type in cells that contain Smart Lists. You must enter data by selectinga value from the Smart List.
• In forms containing Smart Lists, after deleting all values in a row in order to enterand submit new data, the Smart Lists in that row are empty.
Workaround: Remove row values, and then perform a Submit (that is, yousubmit #Missing values) or a Refresh. The Smart List drop-down arrows are thendisplayed properly. Now, you can enter new values for the same row.
Chapter 5Working with Smart Lists
5-34
• Smart Lists are supported with the HsGetValue and HsSetValue functions. However, withfunctions, you will not see the Smart List drop-down options. Instead:
– HsGetValue - Simply retrieves the Smart List value as a string value.
– HsSetValue - Submits the value as a string value.
• Smart Lists must be set up and enabled by an administrator before you can use them inSmart View. For more information on enabling Smart Lists for forms and ad hoc grids,see the information Smart Lists in the relevant administration guide; for example:
Administering Planning, "Accessing More Administrative Tasks" chapter, AdministeringSmart Lists
Oracle Hyperion Planning Administrator's Guide , "Working with Planning ApplicationAdministration" chapter, see Using Smart Lists, UDAs, and Member Formulas
Drill-Through ReportsPredefined by administrators, drill-through reports are available to users from specifiedindividual data cells.
Related Topics
• Drill-Through Report Guidelines
• Setting the Drill-Through Launch Option
• Accessing Drill-Through Reports
• Drilling Through to Source Data
• Viewing the Drill-Through Report Source POV
Drill-Through Report GuidelinesCloud data source types: Oracle Analytics Cloud - Essbase, Planning, Planning Modules,Financial Consolidation and Close, Tax Reporting
On-premises data source types: Oracle Essbase, Oracle Hyperion Financial Management,Oracle Hyperion Planning
From Oracle Smart View for Office, you can drill through to the detailed data in a database asfollows:
• Planning, Financial Management, or supported Oracle Enterprise PerformanceManagement Cloud data sources: You can drill through from your application to detaileddata in Oracle Hyperion Financial Data Quality Management, Enterprise Edition or OracleHyperion Financial Data Quality Management data sources.
• Supported EPM Cloud data sources: If you're using Oracle Enterprise Data ManagementCloud to load data for drill-through reports, the Drill-Through Launch option gives youthe choice of selecting whether to launch drill-through reports in a browser or on a newsheet, or to be prompted to make that choice at run time.
The Drill-Through Launch option is located on the Advanced tab of the Options dialog.For more information, see Setting the Drill-Through Launch Option.
• Oracle Analytics Cloud - Essbase:
– You can drill through to relational databases or to URLs.
– You can select multiple cells for drill-through to relational data in Excel sheets.
Chapter 5Drill-Through Reports
5-35
• Essbase on-premises: You can drill through to Oracle General Ledger, to relationaldatabases, or to URLs.
Essbase on-premises administrators:
– For applications created in Oracle Essbase Administration Services, users candrill through to Oracle General Ledger.
– For applications created in Oracle Essbase Studio, users can drill through torelational databases. You can require a user name and password to accessthe drill-through report. You can also configure drill-through to URLs.
Consider these guidelines when working with drill-through reports:
• A cell can be associated with multiple drill-through reports.
• Cells that contain drill-through reports can be indicated on the grid by a cell style(see Cell Styles).
• The data displayed in a drill-through report is dynamic.
• You cannot use alias names for drill-through; you must use member names.
Note:
Drill-through is supported on Microsoft Internet Explorer with no additionalbrowser add-on required.
Mozilla Firefox, Google Chrome, and Microsoft Edge require a browser-specific add-on for drill-through. If your default browser is Firefox, Chrome, orEdge, follow the instructions on installing the add-on for these browsers inthe Oracle Smart View for Office Installation and Configuration Guide , Installing Browser Add-ons.
Setting the Drill-Through Launch OptionData source types: Planning, Planning Modules, Financial Consolidation and Close,Tax Reporting
When connected to a supported Oracle Enterprise Performance Management Cloudservice and using Oracle Enterprise Data Management Cloud to load data for drill-through reports, you can launch the reports in a browser or on a new Excel sheet.
Specify your launch preference using the Drill-Through Launch option, located in theOptions dialog. Advanced tab.
To specify your drill-through launch preference:
1. In the Smart View ribbon, select Options, and then Advanced.
2. For Drill-Through Launch, select your preferred launch method:
• In Web Browser—Always launch in a browser
• In New Sheet—Always launch on a new Excel sheet
• Prompt Me to Choose Target—Prompt me to choose browser launch orExcel sheet launch at runtime
3. Click OK.
Chapter 5Drill-Through Reports
5-36
Note:
Advanced options are global options. Changes to global options become thedefault settings for all existing and new worksheets and workbooks so it is notnecessary to use Save as Default Options or Apply to All Worksheets withglobal options.
4. Launch a drill-through report, as described in Accessing Drill-Through Reports
Accessing Drill-Through ReportsDepending on your data source connection, you can drill through to web pages or Excelsheets.
To access a drill-through report:
1. Select a data cell associated with a drill-through report.
Oracle Analytics Cloud - Essbase: You can select multiple cells for drill-through torelational data in Excel sheets.
Tip:
If you want to display a list of available drill-through reports whenever youmouse over a cell, select Display Drill-Through Report ToolTips on theAdvanced page of the Options dialog box.
2. From the data source ribbon, select Drill-through.
3. If there are multiple drill-through reports associated with the cell, select a report from thelist and click Launch.
If only one drill-through report is associated with the cell, the drill-through report launchesdirectly.
Chapter 5Drill-Through Reports
5-37

Note:
Oracle Essbase on-premises only: If required, enter a user name andpassword. The user name and password fields are displayed only ifrequired to access the drill-through report. If a user name and passwordare not required, then these fields are not displayed.
Planning, Planning Modules, Financial Consolidation and Close,Tax Reporting:
• If connected to a supported Oracle Enterprise PerformanceManagement Cloud service and using Oracle Enterprise DataManagement Cloud to load data for drill-through reports, the report islaunched according to the selection you made in Setting the Drill-Through Launch Option.
• If Internet Explorer is your default browser, then the first time thatyou click a drill-through cell and the browser launches, you will beasked to log in to your cloud service. After login, you may see anHTTP 403 or 500 error. Return to the sheet in Oracle Smart View forOffice and click the drill-through cell again to launch the drill-throughreport.
Drilling Through to Source DataWhen working with Oracle Enterprise Performance Management Cloud data providers,and performing a drill through from Oracle Smart View for Office to display drill data,the system now supports two ways to display the source data:
• Drill through to the source landing web page using a hyperlink. In this case, whenyou initiate a source drill, the system launches the source landing page in yourdefault browser.
• Drill through to the source data using an EPM Integration Agent query. In thiscase, the source data is queried and the data is displayed in a new Excel sheet inSmart View.
This topic focuses on drilling through to source data and displaying it in Excel.
When this drill-through option is enabled, your first drill-through operation takes youfrom your main worksheet to a staging sheet. From the staging sheet, you can drillfurther into a data cell to the source data for the selected cell. Drill-through to source isavailable on any data cell for any dimension/member combination in the staging sheet.From the source sheet, you can navigate back to the staging sheet, and then back tothe main sheet.
Note:
Service Administrators: To use this feature, you must first execute a SQLquery in the source database and display the results in a pop-window insideData Integration. For more information, see Creating a Drill Down to aSource System Without a Landing Page in Administering Data Integration forOracle Enterprise Performance Management Cloud.
Chapter 5Drill-Through Reports
5-38
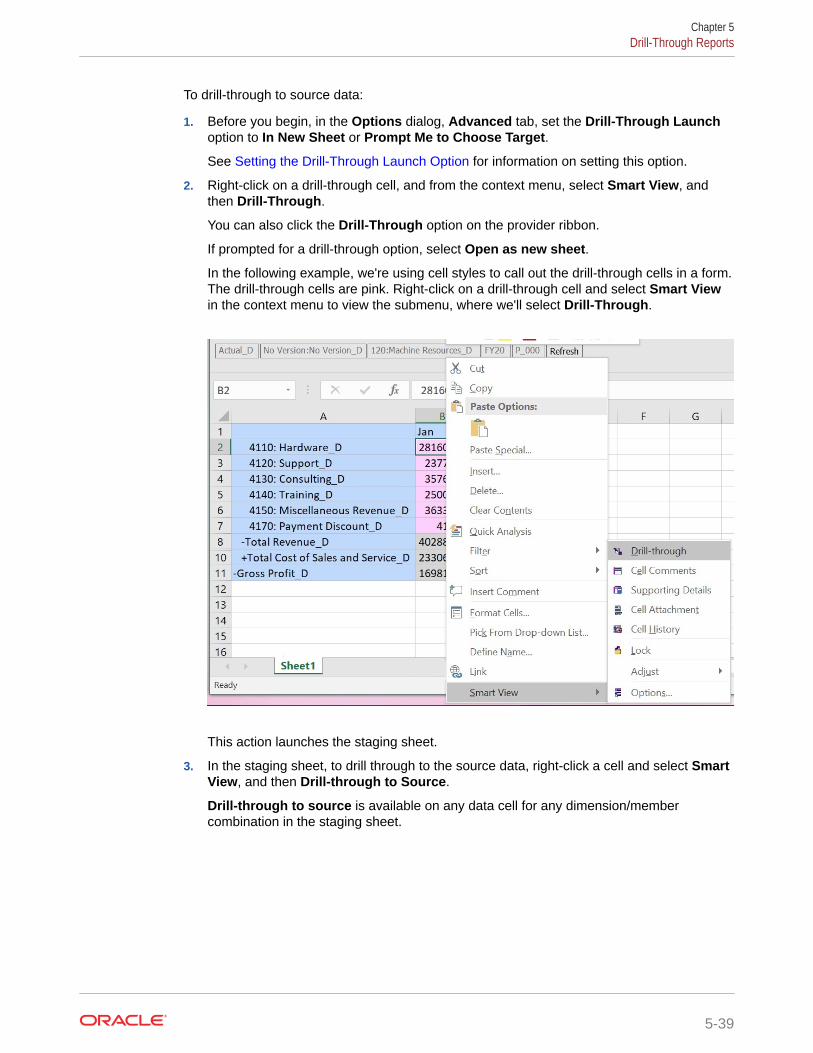
To drill-through to source data:
1. Before you begin, in the Options dialog, Advanced tab, set the Drill-Through Launchoption to In New Sheet or Prompt Me to Choose Target.
See Setting the Drill-Through Launch Option for information on setting this option.
2. Right-click on a drill-through cell, and from the context menu, select Smart View, andthen Drill-Through.
You can also click the Drill-Through option on the provider ribbon.
If prompted for a drill-through option, select Open as new sheet.
In the following example, we're using cell styles to call out the drill-through cells in a form.The drill-through cells are pink. Right-click on a drill-through cell and select Smart Viewin the context menu to view the submenu, where we'll select Drill-Through.
This action launches the staging sheet.
3. In the staging sheet, to drill through to the source data, right-click a cell and select SmartView, and then Drill-through to Source.
Drill-through to source is available on any data cell for any dimension/membercombination in the staging sheet.
Chapter 5Drill-Through Reports
5-39

Optionally, from the Smart View context menu on the staging sheet, you canselect Go to Main Sheet to return to the sheet from which you began.
4. Optional: In the source sheet, to navigate back to the staging sheet, right-click acell and select Smart View, and then Go to Staging Sheet.
Note:
• This navigation works even if you rename the staging or main sheet.
• Be aware that when reusing the main or staging sheet to perform aSmart View action, such as opening a form or starting a new ad hocgrid, the links for the Go to Main Sheet and Go to Staging Sheetcommands still persist. If you rely on those links, and the content onthe main or staging sheet is changed, then you may be directed to acell where there is no drill-through information or the drill-throughinformation is no longer applicable.
Chapter 5Drill-Through Reports
5-40

5. Optional: In the staging sheet, to navigate back to the main sheet, right-click a cell andselect Smart View, and then Go to Main Sheet.
See the context menu options in the illustration in step 3
6. Optional: To view the Sheet Type for the worksheet, staging or source, select the SmartView ribbon, and then Sheet Info to display the Sheet Information dialog.
For example:
Staging Sheet:
Chapter 5Drill-Through Reports
5-41
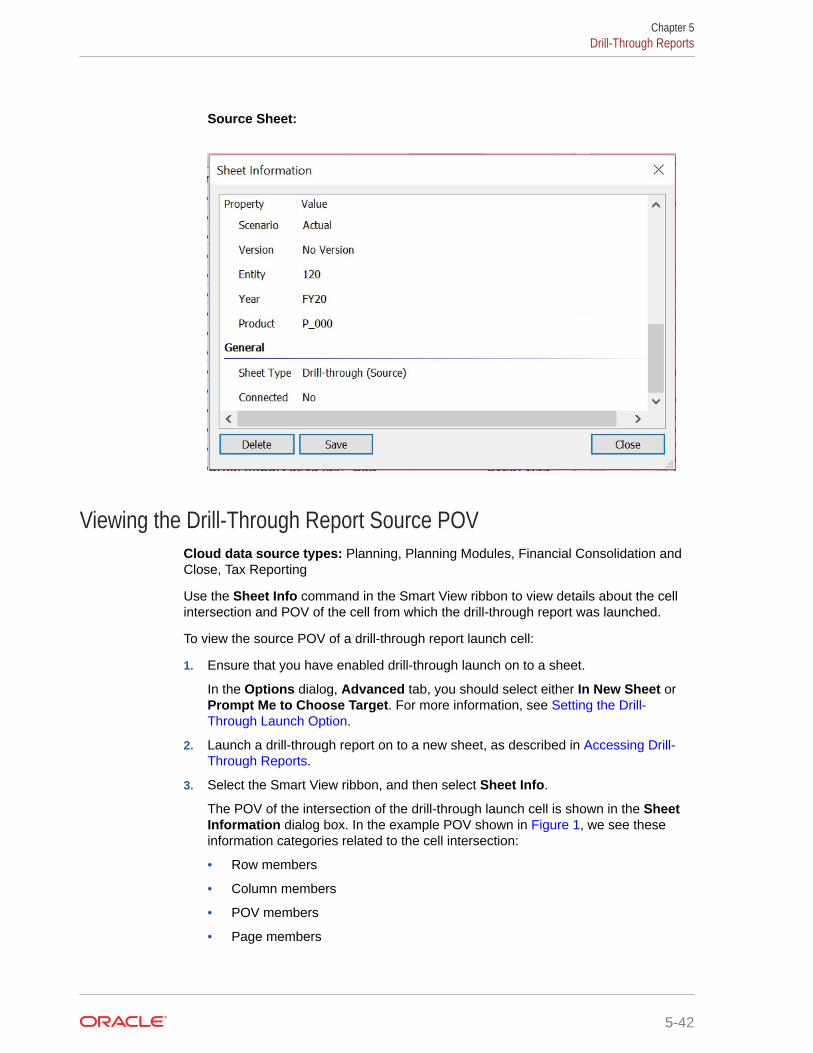
Source Sheet:
Viewing the Drill-Through Report Source POVCloud data source types: Planning, Planning Modules, Financial Consolidation andClose, Tax Reporting
Use the Sheet Info command in the Smart View ribbon to view details about the cellintersection and POV of the cell from which the drill-through report was launched.
To view the source POV of a drill-through report launch cell:
1. Ensure that you have enabled drill-through launch on to a sheet.
In the Options dialog, Advanced tab, you should select either In New Sheet orPrompt Me to Choose Target. For more information, see Setting the Drill-Through Launch Option.
2. Launch a drill-through report on to a new sheet, as described in Accessing Drill-Through Reports.
3. Select the Smart View ribbon, and then select Sheet Info.
The POV of the intersection of the drill-through launch cell is shown in the SheetInformation dialog box. In the example POV shown in Figure 1, we see theseinformation categories related to the cell intersection:
• Row members
• Column members
• POV members
• Page members
Chapter 5Drill-Through Reports
5-42

We also see a General section showing that we we're working with a drill-through sheet.
Figure 5-27 Sheet Information Dialog Showing POV for Drill-Through Launch Cell
Note:
In Oracle Smart View for Office ad hoc mode, when drill-through is launched,the POV section of Sheet Information dialog shows the member namescorresponding to the alias table selected on the ad hoc sheet.
4. Optional: Click Save to save the POV information in a separate sheet in the workbook.
Tip:
Copy and paste the POV information from the new sheet to a permanent file foryour own reference.
Chapter 5Drill-Through Reports
5-43

Linked Reporting ObjectsA linked reporting object is a cell note, external file, or URL that is linked to a data cellin an Oracle Essbase database, and which can be retrieved by Oracle Smart View forOffice users in Excel.
Cloud data source types: Oracle Analytics Cloud - Essbase
On-premises data source types: Essbase
You can set a cell style to identify cells that are associated with linked reportingobjects. See Cell Styles.
See also:
• Linked Partitions
• Attaching a Linked Reporting Object to a Data Cell
• Launching a Linked Reporting Object from a Data Cell
Attaching a Linked Reporting Object to a Data CellYou can attach one or more linked reporting objects to a data cell.
To attach a linked reporting object to a data cell:
1. Ensure that you're working with a connected worksheet.
Note:
If you are working with a saved ad hoc sheet or a grid layout thatcontains no data yet (for example, a free-form grid), you are not requiredto refresh the sheet first. Ensure that you are connected to the dataprovider, then right-click the correct database in the Smart View Panel,and then select Set Active Connection for this Worksheet.
2. Select a data cell.
3. From the Essbase ribbon, select Linked Objects.
4. From Linked Reporting Objects, click and select one of thefollowing:
• Cell Note to attach an annotation to the data cell
• File to attach an external file to the data cell
• URL to attach a URL to the data cell
The dialog box appropriate to your selection is displayed.
5. Enter information as follows:
• Cell Note: Enter text for the note. Then click Close. The first few words of thenote are displayed in the Description column of the Linked ReportingObjects list.
Chapter 5Linked Reporting Objects
5-44

• File: Use the Browse button to navigate to the file that you want to attach to the datacell. You can add a brief description for the file. Then click Close.
• URL: In URL, enter a URL for a web site, a network or local directory, or a documentin a network or local directory. You can add a brief description for the URL. Then clickClose.
6. Repeat the procedure to attach other linked reporting objects as needed.
The objects that you created are displayed in the Linked Reporting Objects list asshown here:
7. Refresh the grid to apply the cell style (if specified) to the cell.
To edit or delete a linked reporting object, use the Edit button or Delete button .Deleting an object removes it from the database.
Related topics:
• Linked Reporting Objects
• Launching a Linked Reporting Object from a Data Cell
Launching a Linked Reporting Object from a Data CellTo launch a reporting object from a data cell:
1. Ensure that you're working with a connected worksheet.
Note:
If you are working with a saved ad hoc sheet or a grid layout that contains nodata yet (for example, a free-form grid), you are not required to refresh thesheet first. Ensure that you are connected to the data provider, then right-clickthe correct database in the Smart View Panel, and then select Set ActiveConnection for this Worksheet.
Chapter 5Linked Reporting Objects
5-45

2. Select the data cell that is associated with the linked object that you want tolaunch.
3. From the Essbase ribbon, select Linked Objects to display Linked ReportingObjects.
4. From Linked Reporting Objects, select the linked object to launch.
5. Click . The linked reporting object launches as follows:
• Cell notes are displayed in the Cell Note dialog box.
• Files are opened.
• URL objects are opened in the default web browser.
• Linked partitions—see Linked Partitions.
Related Topics:
• Linked Reporting Objects
• Attaching a Linked Reporting Object to a Data Cell
Linked PartitionsA linked partition connects two databases by means of a data cell.
Using a data cell associated with a linked partition, you can navigate from thedatabase connected to the current grid to a second database. Because the twodatabases may have different dimensions, you can see the data in different contexts.When you launch a linked partition, a new spreadsheet that displays the dimensionsfrom the linked database opens. From there, you can drill down into the dimensions ofthe linked database.
Cloud data source types: Oracle Analytics Cloud - Essbase
On-premises data source types: Oracle Essbase
To launch a linked partition:
1. Select a data cell associated with a linked partition.
2. From the Essbase ribbon, select Linked Objects.
3. From Linked Reporting Objects, select the linked partition (displayed as Linkedin the list).
4. Click .
The linked partition is launched in a new spreadsheet. From this spreadsheet, youcan drill down to data in the linked database.
Cell CommentsYou can add comments to data cells.
Cloud data source types: Planning, Financial Consolidation and Close, TaxReporting
Chapter 5Linked Partitions
5-46

On-premises data source types: Oracle Hyperion Financial Management, Oracle HyperionPlanning
Related Topics:
Cell Comments in EPM Cloud and Oracle Hyperion Planning (Oracle Enterprise PerformanceManagement Cloud or Oracle Hyperion Planning)
Cell Comments in Financial Management
For Oracle Essbase or Oracle Analytics Cloud - Essbase, see Comments and UnknownMembers on Essbase Sheets.
Cell Comments in EPM Cloud and Oracle Hyperion PlanningYou can add one or more comments per data cell; each data cell can contain comments frommultiple users.
Cloud data source types: Planning, Financial Consolidation and Close, Tax Reporting
On-premises data source types: Oracle Hyperion Planning
In release 11.1.2.5.620 and later, Oracle Smart View for Office conforms to the character limitset in Oracle Enterprise Performance Management Cloud and Oracle Hyperion Planning .Depending on the permission level assigned to you by the administrator, you may be able todo any of the following in a data cell:
• Add comments.
• View the comments that you and other users have added.
• Delete comments that you have entered. You cannot delete comments added by otherusers.
Cells that contain comments can be associated with a cell style. See Cell Styles.
Video
Your Goal Watch This Video
Learn about some basic Smart View functionality,including cell comments. Entering and Saving Plan Data in Smart
View with Oracle Planning and Budgeting Cloud
To add comments to a data cell:
1. Select one data cell or a range of data cells in an ad hoc grid.
Use the Shift key to select a range of data cells. Do not use the Ctrl key to select cellranges.
2. From the provider ribbon or provider ad hoc ribbon, select Cell Actions and thenComments.
3. From Comments, click .
4. If you selected a range of cells in step 1, you can either enter comments for one cell at atime or apply a comment to all selected cells.
• To enter a comment for one cell, select the cell from the drop-down menu.
• To enter a comment for all selected cells, select Apply to all selected cells.
Chapter 5Cell Comments
5-47

5. In the field at the right, enter a comment. If you want to format the comment, useHTML tags.
6. Click to save the comment.
The comment is displayed in the list of comments to the left of the comment field.This list contains comments entered by all users.
7. Click OK.
8. Optional: To delete a comment, click . You can delete only the comments thatyou have entered.
Cell Comments in Financial ManagementCells in ad hoc grids, forms, Smart Slices, and the Query Designer can containmultiple comments. Comments within a cell are differentiated by their labels, which aredefined in Oracle Hyperion Financial Management. You cannot create labels in OracleSmart View for Office.
You select from these defined labels to add and view in Smart View. You cannot edit ordelete labels, but you can edit and delete comments.
Viewing and Adding Cell Comments
To view or add cell comments in Financial Management:
1. Select a cell in the grid.
2. From the ribbon, select Cell Comments.
Any comments currently associated with the cell are displayed in the CellComments list.
3. To add a comment, from Cell Comments, select a label from the drop-downmenu.
4. Click .
The selected cell text label is added to the list of labels.
5. Click in the field under Cell Text and add a comment.
6. Repeat as needed to add other labels.
7. Click OK.
The labels in the list are now associated with the cell.
Note:
After submitting a cell that has a pipe character ( | ) and caret ( ^ ), thesubmitting removes all pipe characters and adds "c" after any caret.
Editing and Deleting Cell Comments
To edit or delete cell comments in Financial Management:
Chapter 5Cell Comments
5-48

1. Select a cell in the grid.
2. From the HFM ribbon, select Cell Comments.
3. From Cell Comments, select a comment in the list and then do one of the following:
• To edit the comment, select . After editing, click .
• To delete the comment from the cell, select the Delete button. The comment isremoved from the list. Deleting a comment removes it only from the selected cell; itremains available for selection from the drop-down menu.
4. Click OK.
Note:
In Financial Management, you can use functions HsSetText and HsGetText tosubmit and retrieve cell text to and from the data source. See Functions.
AttachmentsDocuments can be attached to individual data cells by way of URLs (Oracle EnterprisePerformance Management Cloud and Oracle Hyperion Planning) or files (EPM Cloud only).
Cloud data source types: Planning, Planning Modules, Financial Consolidation and Close,Tax Reporting
On-premises data source types: Oracle Hyperion Planning
Note:
In this topic, "documents" can mean URLs or files.
Each data cell can contain multiple documents attached by one or more users. Depending onthe permission level assigned to you by the administrator, you may be able to do any of thefollowing in a data cell:
• Attach documents by way of URLs (EPM Cloud and Oracle Hyperion Planning).
• Attach documents as files (EPM Cloud only).
Note:
File attachments are not supported for on-premises Oracle Hyperion Planning.
• View the documents that you and other users have attached.
• Edit and delete documents that you have attached. You cannot edit or delete documentsattached by other users.
Cells that contain attachments can be associated with a cell style. See Cell Styles.
Chapter 5Attachments
5-49
Note:
If you are migrating from an on-premises environment to EPM Cloud, andyour forms have Oracle Hyperion Enterprise Performance ManagementWorkspace URL attachments that reference documents uploaded in theEPM Workspace, you cannot access these documents in Oracle Smart Viewfor Office. Instead, you can attach the documents directly to the form.
Video
Your Goal Watch This Video
Learn about using basic Smart Viewfunctionality related to Planning, includingworking with attachments.
Entering and Saving Plan Data inSmart View with Oracle Planning andBudgeting Cloud
To attach documents to a data cell:
1. Select one data cell or a range of data cells in an ad hoc grid or form.
2. From the provider ribbon or provider ad hoc ribbon, select Cell Actions, and thenAttachment.
For example, select Cell Actions, and then Attachment from the Planning ribbonor Planning Ad Hoc ribbon.
3. In the Attachments dialog, click the Attach button, , and select File orURL.
• File—For EPM Cloud data sources only. Continue to step 4.
• URL—For EPM Cloud and Oracle Hyperion Planning data sources. Continueto step 5.
4. EPM Cloud only: If you selected File in step 3, then, in the Select File to Attachto Cell dialog, navigate to the file that you want to attach, select it, and click Open.
The file is uploaded to the selected cell.
Note:
• Each file you attach must have a unique file name, whether you areattaching files to the same cell or to different cells in a range.
• In order for other users to see files that you attach, the files must beselected from a location that is accessible to other users, such as ashared network location.
• To attach files to cells in a range, select a cell from the drop-down listin the Attachments dialog, navigate to the file, select it, and clickOpen to upload the file to the selected cell. Repeat for each differentfile you want to attach to different cells in the range.
Chapter 5Attachments
5-50

5. If you selected URL in step 3, a new row is added where you enter the followinginformation:
• Click in the cell under Description to add a brief description.
• Click in the cell under Reference to enter the URL location of the document or webpage that you want to attach.
When you save the URL attachment in the next step, the User and Date Enteredfields will be automatically populated.
Note:
You can attach a URL to a range of cells. If you select a range of cells, you caneither attach URLs to one cell at a time or attach the same URL to all selectedcells.
• To attach a URL to one cell in the range, select the cell from the drop-downmenu, select Attach, then URL, and then enter the Description andReference.
• To attach one URL to all selected cells in the range, select Apply to allselected cells.
6. If you attached only URLs, or attached a combination of URLs and files, then, to save
your attachment selections, click .
If you attached only files, then a save is not required and the Save button, , is notenabled.
7. Repeat this procedure to add attachments as you require.
8. Optional: For URL attachments, to edit a Reference entry, select the attachment row to
edit, click , edit the reference, and then click .
Editing the Reference entry for File attachments is not supported. Instead, delete theentry (see the next step) and reattach the file, as described in the above steps.
9. Optional: To delete an attachment, select the attachment in the list, then click Delete,
, and then click Save, .
10. Click Close.
Launching Attachments
To launch an attached document:
1. Select the cell that contains the attachment.
2. From the provider ribbon or provider Ad Hoc ribbon, select Cell Actions and thenAttachment.
For example, in the Planning ribbon or Planning Ad Hoc ribbon, select Cell Actions, andthen Attachment.
3. Select an attachment row and, in the left column, click the download link:
Click to launch a file.
Chapter 5Attachments
5-51
Click to launch a URL.
Cell HistoryYou can view the history of changes made to a data cell or range of data cells.
For each change listed, the user who made the change, date, old value, and newvalue are displayed.
Cloud data source types: Planning
On-premises data source types: Oracle Hyperion Planning
Note:
Cell history is available only if data auditing is enabled by the Planningadministrator, as described in the Oracle Hyperion Planning Administrator'sGuide .
To display cell history:
1. Select one data cell or a range of cells in a Planning ad hoc grid.
2. From the Planning Ad Hoc ribbon, select Cell Actions and then Cell History todisplay the Change History screen.
3. If you selected multiple cells in step 1, select one cell at a time from the drop-downmenu in Change History to view its history.
Chapter 5Cell History
5-52

6Ad Hoc Analysis
Related Topics
• About Ad Hoc AnalysisIn ad hoc analysis, you use Oracle Smart View for Office functionality with Excelspreadsheets to retrieve and analyze data.
• Starting Ad Hoc AnalysisConnect to a provider and select Ad Hoc Analysis to display the Ad Hoc ribbon for thatprovider and enable the ad hoc functionality.
• Inserting Attribute Dimensions on the SheetWhen performing ad hoc analysis, you can use the Insert Attributes command to insertattribute dimensions or members on the worksheet.
• Preserving Excel Formulas in Ad Hoc GridsYou can associate Excel formulas with member and data cells in ad hoc grids and set cellstyles to identify such cells.
• Formatting Ad Hoc GridsYou can use either Oracle Smart View for Office or Excel to control grid formatting.
• Enabling Attribute Association Processing in Ad Hoc GridsAttribute association processing allows Essbase cells at intersections associated withattributes to display the value specified for the #Invalid/Meaningless option.
• Zooming In and OutZoom in on members in the grid to display data for their children and descendants.
• Specifying Ancestor Position in Ad Hoc GridsUse the Ancestor Position option to specify the ancestor position for hierarchies as Topor Bottom. The Ancestor Position option is located in the Member Options tab of theOptions dialog.
• Working with Excel Filters on Ad Hoc SheetsExcel filters are retained when performing ad hoc in cases where the ad hoc operationresults in the same set of column dimensions.
• PivotingPivoting changes the orientation of the data on the worksheet. You can move dimensionsbetween rows and columns and between the grid and the POV.
• Removing Selected Members From the GridYou can remove members and their associated data from the grid.
• Inserting Rows and ColumnsIn ad hoc grids, you can insert calculating and non-calculating columns and rows withinor outside the grid.
• Displaying and Suppressing Repeated MembersIf you have stacked dimensions in an ad hoc grid, you can display or suppress repeatedmembers.
6-1
• Multiple Grids on a WorksheetIn Oracle Essbase and Oracle Analytics Cloud - Essbase, you can create multiplead hoc grids on one worksheet.
• Cascading Reports and Ad Hoc GridsYou can create separate reports for any or all of the members of one or moredimensions in a report based on an ad hoc grid or Smart Slice query.
• Substitution VariablesSubstitution variables are global or per-application placeholders that representvariable values.
• Comments and Unknown Members on Essbase SheetsYou can set options in Oracle Smart View for Office to detect comments andunknown members on Oracle Essbase sheets.
About Ad Hoc AnalysisIn ad hoc analysis, you use Oracle Smart View for Office functionality with Excelspreadsheets to retrieve and analyze data.
You do this by selecting members, using functions, and performing a variety ofoperations, including formatting, to design and build your reports.
Note:
Ad hoc operations are not supported on protected worksheets.
Tutorials
Your Goal Watch This Video
Get an introduction to:
• Connecting to Planning• Starting ad hoc analysis• Formatting ad hoc grids• Performing ad hoc analysisThis tutorial is designed for a Planning user inOracle Enterprise Performance ManagementCloud, but many of the concepts presented areapplicable to other data providers.
Analyzing Plan Data using SmartView
Starting Ad Hoc AnalysisConnect to a provider and select Ad Hoc Analysis to display the Ad Hoc ribbon for thatprovider and enable the ad hoc functionality.
Cloud data source types: Oracle Analytics Cloud - Essbase, Planning, FinancialConsolidation and Close, Tax Reporting, Narrative Reporting
On-premises data source types: Oracle Essbase, Oracle Hyperion FinancialManagement, Oracle Hyperion Planning
Chapter 6About Ad Hoc Analysis
6-2

Note:
When you start ad hoc analysis with Essbase, Oracle Analytics Cloud - Essbase, orNarrative Reporting, the alias table named "Default" is selected by default.
Video
Your Goal Watch This Video
Learn about analyzing data using ad hoc analysis. Creating Basic Ad Hoc Reports in Smart
View
To start ad hoc analysis:
1. From Recently Used, Shared Connections, or Private Connections on the SmartView Panel, select one of the following:
• Smart Slice
• Form
• Plan type
• Cube or model
2. From the Action Panel, select Ad hoc analysis.
Alternatively, right-click the object in the Smart View Panel and select Ad hoc analysis.
The data provider ribbon is displayed.
Tip:
If an error appears similar to "Ad hoc grid cannot be opened as there are novalid rows of data," then you should clear the suppress options in the DataOptions tab of the Options dialog box. Ensure that all Suppress Rows andSuppress Columns options are cleared. For Oracle Enterprise PerformanceManagement Cloud and Oracle Hyperion Planning, ensure that the Suppressmissing blocks option is cleared.
3. Use the ribbon buttons to perform ad hoc analysis on the current worksheet.
If you are familiar with the dimensions and members of your database, you can use free-formmode by entering dimension and member names directly into cell to design and create an adhoc grid. See Free-Form Mode.
Inserting Attribute Dimensions on the SheetWhen performing ad hoc analysis, you can use the Insert Attributes command to insertattribute dimensions or members on the worksheet.
Cloud data source types: Oracle Analytics Cloud - Essbase, Planning Ad Hoc
On-premises data source types: Oracle Essbase
Chapter 6Inserting Attribute Dimensions on the Sheet
6-3

To insert attribute dimensions or members on a worksheet:
1. Connect to your database and perform an ad hoc analysis by either selecting theAd hoc analysis option in the Action Panel, or typing members in free-form formaton the worksheet.
2. In the Essbase ribbon or Planning Ad Hoc ribbon, click the Insert Attributesbutton, .
3. In the Insert Attributes dialog box, select the attribute dimensions to add to thesheet, and then click OK.
Optional: All attribute dimensions are selected by default. To add only a subset ofattribute dimensions, perform one of the following tasks:
• Clear the check boxes next to the attribute dimensions to omit from the sheet.
• Click Deselect All, and then select the check boxes next to the attributedimensions to add to the sheet.
4. Optional: To select a single attribute member to add to the sheet (rather than theentire attribute dimension):
a. Click , next to an attribute dimension text box.
b. In the Member Selection dialog box, select the check box next to the attribute
member to add and click .
You can select only one attribute member per dimension.
c. Click OK.
d. Repeat these substeps for each attribute member to add to the sheet.
Note that you can also hand type an attribute member name in the attributedimension text box; however, attribute member names must be correctlycapitalized and spelled in order to be recognized by Oracle Smart View forOffice. If you capitalize a member name incorrectly or otherwise misspell it, anerror occurs.
Now you can work with the attribute dimensions in the same way you would if you hadused the Member Selection dialog box or free-form to place attributes on the sheet.Along with the other dimensions, you can pivot the attribute dimensions between rowsand columns on the grid, and pivot them between the POV and the grid.Related Topics:
• Inserting Attribute Dimensions on the Sheet--Example
• Notes About Inserting Attributes
Inserting Attribute Dimensions on the Sheet--ExampleCloud data source types: Oracle Analytics Cloud - Essbase, Planning Ad Hoc
On-premises data source types: Oracle Essbase
Using Essbase Sample Basic, from the Action Panel, select Ad hoc analysis to placedimensions, including page dimensions, on the worksheet, as shown in Figure 1.
Chapter 6Inserting Attribute Dimensions on the Sheet
6-4

Figure 6-1 Initial Ad Hoc Grid
Now click Insert Attributes, .
In the Insert Attributes dialog box, note that all attribute dimensions are selected by default:
Click OK and you can see, as shown in Figure 2, that the attribute dimensions Caffeinated,Ounces, Pkg Type, Population, and Intro Date have been added to the worksheet as pagedimensions.
Figure 6-2 Ad Hoc Grid After Adding Attribute Dimensions
You can also choose to add attribute members, instead of attribute dimensions, to the sheet.
In the Insert Attributes dialog box, click for an attribute dimension and select an attributemember to use.
In the Insert Attributes dialog box, notice that the attribute dimensions Caffeinated, PkgType, and Populations, the attribute members Caffeinated_True, Bottle, and Medium areselected:
Chapter 6Inserting Attribute Dimensions on the Sheet
6-5

In Figure 3, notice that the attribute members Caffeinated_True, Bottle, and Medium,along with the Ounces and Intro Date attribute dimensions, have been added to theworksheet as page dimensions.
Figure 6-3 Ad Hoc Grid After Adding Attribute Members and Dimensions
See also Notes About Inserting Attributes.
Notes About Inserting AttributesCloud data source types: Oracle Analytics Cloud - Essbase, Planning Ad Hoc
On-premises data source types: Oracle Essbase
Keep in mind the following guidelines when inserting attributes:
• If an attribute is already present on the grid, then it will not be available forselection in the Insert Attributes dialog box.
• The grid must be in refreshed state. If the grid is in free-form state prior to refresh,then Oracle Smart View for Office prompts you to manually refresh.
• When the attributes are inserted on the grid, the grid is automatically refreshed.
• Essbase and Oracle Analytics Cloud - Essbase only: If the POV toolbar istoggled off, and there is no page dimension row present in the sheet, then a pagedimension row will be added to the top of the sheet when inserting the attributedimensions.
• In the Insert Attributes dialog box:
Chapter 6Inserting Attribute Dimensions on the Sheet
6-6

– You can select to insert the entire attribute dimension, or one attribute member froma dimension.
– If a member name is left blank in the attribute text box, then that dimension is in adeselected state and will not be inserted.
• If you have inserted a single attribute member using the Insert Attributes command anddialog box, you can use Member Selection to add other members from the sameattribute dimension to the grid.
• Insert Attributes is supported only for Essbase, Oracle Analytics Cloud - Essbase, andPlanning Ad Hoc.
• The Insert Attributes operation is not supported for Query Designer or Smart Slicedesign sheets.
• Insert Attributes is not supported for multiple grid sheets.
• When filtering on attributes at the Generation 3 level in an attribute dimension, SmartView only displays members up to the Generation 2 level.
See also Inserting Attribute Dimensions on the Sheet--Example.
Preserving Excel Formulas in Ad Hoc GridsYou can associate Excel formulas with member and data cells in ad hoc grids and set cellstyles to identify such cells.
Cloud data source types: Oracle Analytics Cloud - Essbase, Planning, FinancialConsolidation and Close, Tax Reporting, Narrative Reporting
On-premises data source types: Oracle Essbase, Oracle Hyperion Financial Management,Oracle Hyperion Planning
By default, formulas are preserved when you perform ad hoc operations, except for Pivotand Undo.
Note:
• To achieve faster execution of queries, you can disable the preservation offormulas and comments. However, if you disable this option, formulas areoverwritten when you perform ad hoc operations.
• Narrative Reporting: Only Refresh operations are supported when PreserveFormulas and Comments in ad hoc operations (except pivot and undo) isselected. Other ad hoc operations, such as Zoom In or Keep Only, are notsupported.
• After Financial Management 11.1.2.2.xxx, the custom dimensions in FinancialManagement applications are referred via alias names in Oracle Smart View forOffice formulas. Smart View can no longer interpret the formulas. Formulas inthe old format in saved workbooks will not work. The dimension identifiers will,therefore, need to be updated for each formula to reflect the new alias namesfor the custom dimensions.
See also:
Chapter 6Preserving Excel Formulas in Ad Hoc Grids
6-7

• Cell Styles for information on setting cell styles for cells containing formulas
• Oracle Analytics Cloud - Essbase and Essbase : Preserving Excel FormulasWithin and Outside of Essbase Ad Hoc Grids
To specify preservation of formulas in ad hoc grids:
1. From the Smart View ribbon, click Options, and then Member Options in the leftpanel.
2. Do one of the following:
• To preserve formulas in ad hoc grids, select Preserve Formulas andComments in ad hoc operations (except pivot and undo).
• To disable preservation of formulas, clear Preserve Formulas andComments in ad hoc operations (except pivot and undo). Do this only ifyou do not need to preserve formulas and you want faster execution ofqueries.
Note:
Although the Preserve Formulas and Comments in ad hocoperations (except pivot and undo) option appears in MemberOptions, the selection you make applies to formulas in both memberand data cells.
3. Click OK.
Preserving Excel Formulas Within and Outside of Essbase Ad HocGrids
Cloud data source types: Oracle Analytics Cloud - Essbase
On-premises data source types: Oracle Essbase
Formulas Within the Grid
Starting in Oracle Smart View for Office 11.1.2.5.810, formulas will be retained inEssbase grids after performing Undo or Redo.
Note:
Ensure that you have selected the Preserve Formulas and Comments inad hoc operations (except pivot and undo) option in the Options dialog,Member Options tab.
To retain the formulas, you must first perform a Refresh operation on the grid thatcontains formulas. The Refresh action adds the formulas to the undo buffer.
In some cases, an Undo doesn't work as expected after a zoom operation whenformulas are outside of the grid. In this case, for more reliable formula preservation
Chapter 6Preserving Excel Formulas in Ad Hoc Grids
6-8

when performing Undo or Redo after a zoom operation, set up your grid as shown in Formulas Outside the Grid.
Formulas Outside the Grid
For smoother functioning of Essbase ad hoc analysis when formulas are present outside ofthe grid, Oracle recommends that you add a simple comment in any blank cell of the lastcolumn. The formula will be retained when you refresh the grid. The formula will be lost onpivots and undo.
Note:
Ensure that you have selected the Preserve Formulas and Comments in ad hocoperations (except pivot and undo) option in the Options dialog, MemberOptions tab.
In the example below, a formula is added to cell E4, outside of the grid. In order to preservethis formula during refreshes, a comment should be added to a blank cell in column E. In theexample, the word "comment" is added to cell E1.
- A B C D E F
1 East comment2 Scenario3 Profit4 Cola Qtr1 5789 =C45
The comment is needed especially if you are performing an active ad hoc analysis This helpsEssbase and Smart View to keep the content lying outside the grid intact during refresh andother ad hoc operations such as Zoom In and Zoom Out or Keep Only and Remove Only.Without the comment, you may lose the formulas outside the grid when performing these adhoc operations.
Formatting Ad Hoc GridsYou can use either Oracle Smart View for Office or Excel to control grid formatting.
Related Topics
• Using Smart View FormattingOracle Smart View for Office formatting consists of formatting selections made in the CellStyles and Formatting tabs of the Options dialog box.
• Using Excel Formatting
Using Smart View FormattingOracle Smart View for Office formatting consists of formatting selections made in the CellStyles and Formatting tabs of the Options dialog box.
Cloud data source types: Oracle Analytics Cloud - Essbase, Planning, Planning Modules,Financial Consolidation and Close, Tax Reporting, Profitability and Cost Management
Chapter 6Formatting Ad Hoc Grids
6-9

On-premises data source types: Oracle Essbase, Oracle Hyperion FinancialManagement, Oracle Hyperion Planning
To set Smart View formatting options:
1. From the Smart View ribbon, click Options.
2. From Options, to set cell styles, select Cell Styles in the left pane.
Cell styles indicate certain types of member and data cells.
See Cell Styles for more information.
3. To set other Smart View formatting options, select Formatting from the left pane(Use Excel Formatting on this page is not a Smart View formatting option).
See Smart View Options for descriptions of options.
4. Click OK.
To apply Smart View formatting selections to data cells created by zooming:
1. From the grid, select a formatted data cell.
2. From the Essbase or Planning Ad Hoc ribbon, select Preserve Format.
Using Excel FormattingCloud data source types: Oracle Analytics Cloud - Essbase, Planning, NarrativeReporting, Financial Consolidation and Close, Tax Reporting
On-premises data source types: Oracle Essbase, Oracle Hyperion FinancialManagement, Oracle Hyperion Planning
If you use Excel formatting, your formatting selections, including conditional formatting,are applied and retained on the grid when you refresh or perform ad hoc operations.
When you use Excel formatting, Oracle Smart View for Office does not reformat cellsbased on your grid operations, and it does not mark cells as dirty when you changedata values. Smart View does preserve the formatting on the worksheet betweenoperations.
Using Excel formatting is generally preferable for highly formatted reports, and youmust use Excel formatting for data sources whose application-specific colors are notsupported by the Excel color palate.
To use Excel formatting on ad hoc grids:
1. From the Smart View ribbon, select Options.
2. From Options, select Formatting from the left pane.
3. Select Use Excel Formatting.
4. Optional: To copy parent cell formatting to zoomed-in cells, select MoveFormatting on Operations.
With this option selected, formatting also stays with members when you pivot.
Chapter 6Formatting Ad Hoc Grids
6-10

Note:
Formatting can affect performance, especially during ad hoc operations whenMove formatting on operations is enabled. For this reason, selection of thisoption does not persist when moving between sheets in a workbook or betweensessions, and its selection cannot be saved. See the description of Moveformatting on operations in Formatting Options for more information on usingthis option.
5. Click OK.
Example 6-1 Excel Formatting and Merged Cells
To preserve the merged cell formatting during ad hoc operations (except Pivot and Undo),you must select both Use Excel Formatting and Preserve Formulas and Comments in adhoc operations options.
To replicate merged cell formatting during ad hoc operations (except Pivot), you must selectall of Use Excel Formatting, Preserve Formulas and Comments in ad hoc operations,and Formula Fill options.
Example 6-2 Excel Formatting and Member Indentation
With the Use Excel Formatting option selected, and the Member Indentation option set toNone, row members retain their indentation. The loss of indentation applies only to columnmembers.
Note that the Indentation option applies only to ad hoc sheets; it does not apply to forms.See "Indentation" in the table in Member Options.
Note:
In a Windows 8.1, 32-bit with Office 2013, 32-bit environment, while performing adhoc operations, Excel may become unresponsive to right-clicks within the sheet; forexample, when attempting to pivot using drag-and-drop.
Enabling Attribute Association Processing in Ad Hoc GridsAttribute association processing allows Essbase cells at intersections associated withattributes to display the value specified for the #Invalid/Meaningless option.
When you select Enable Attribute Association Processing, the attribute intersection cellsthat are called out have no association with the base dimension. In some cases, these cellsmay be varying attributes.
By default, the Enable Attribute Association Processing option is cleared. When cleared,the data values of attribute cells having no association to the base dimension are displayedas #Missing, instead of displaying the value specified in #Invalid/Meaningless.
Chapter 6Enabling Attribute Association Processing in Ad Hoc Grids
6-11

Note:
When the Enable Attribute Association Processing option is selected, adhoc query performance may be slower.
For example, suppose you create an ad hoc grid showing sales in bottles for allproducts in the Product dimension. For Cola and Diet Cola, bottles are not available,but bottles are available for all the other products in the Product dimension. In thiscase, the attribute Bottle has no association with Cola or Diet Cola.
With the Enable Attribute Association Processing option selected, cells for Colaand Diet Cola sales in bottles would display #Invalid by default, as shown in Figure 1.Note that you could define your own label for these cells.
Figure 6-4 Ad Hoc Grid with Enable Attribute Association Processing Selected
Clear the Enable Attribute Association Processing option, and cells at those sameintersections, where the attribute is not associated with the base dimension, woulddisplay as #Missing, as shown in Figure 2. In this case, you do not know whichattribute cells are actually missing data, and which attribute cells have no associationwith the base dimension and, therefore, would never contain data.
Chapter 6Enabling Attribute Association Processing in Ad Hoc Grids
6-12

Figure 6-5 Ad Hoc Grid with Enable Attribute Association Processing Option Cleared
To enable attribute data cells that have no association with the base dimension to display thelabel defined in #Invalid/Meaningless:
1. From the Smart View ribbon, select Options, and then select Data Options.
2. In the Replacement section:
• Select Enable Attribute Association Processing.
• For the #Invalid/Meaningless option, select #Invalid or specify a label to display inattribute cells that are not associated with the base dimension.
3. Run the ad hoc query and note the cells containing the value you specified for #Invalid/Meaningless; these are the attribute cells that are not associated with the basedimension.
Zooming In and OutZoom in on members in the grid to display data for their children and descendants.
Related Topics
• About Zooming In and Out
• Zooming In
• Zooming Out
• Setting a Default Zoom Level
• Selecting Members to Display when Zooming
• Enabling Double-Click Zooming
• Zooming and Formatting
• Zooming Operations in Cells that Contain Formulas
About Zooming In and OutCloud data source types: Oracle Analytics Cloud - Essbase, Planning, Narrative Reporting,Financial Consolidation and Close, Oracle Hyperion Profitability and Cost Management, TaxReporting
Chapter 6Zooming In and Out
6-13

On-premises data source types: Oracle Essbase, Oracle Hyperion FinancialManagement, Oracle Hyperion Planning
You can zoom in on members in the grid to display data for their children anddescendents.
Note:
Zoom In and Zoom Out operations are not supported in these cases:
• On member formula cells when connected to an aggregate storagedatabase.
Zoom operations on member formula cells are supported only whenconnected to a block storage database.
• On views inserted from Oracle Business Intelligence Enterprise Editionor Oracle Analytics Cloud data sources.
Essbase, Oracle Analytics Cloud - Essbase, and Oracle Enterprise PerformanceManagement Cloud Standard-mode applications, such as Planning: You can zoom into display data for members of the same level, same generation, or sibling level as theselected member.
Essbase and Oracle Analytics Cloud - Essbase: You can zoom in to display data formembers that are defined by the formula of the selected member when connected toblock storage databases.
Note:
In the Zooming In and Out topics, references to EPM Cloud Standard-modeapplications apply to these business processes: Planning, Planning Modules,Financial Consolidation and Close, and Tax Reporting. In an EPM CloudStandard-mode application, the business process application setting, SmartView Ad Hoc Behavior, has been set to Standard.
Related Topics:
Zooming In
Zooming Out
Setting a Default Zoom Level
Selecting Members to Display when Zooming
Zooming and Formatting
Enabling Double-Click Zooming
Zooming Operations in Cells that Contain Formulas
Chapter 6Zooming In and Out
6-14

Zooming InYou can zoom in on one cell at a time.
You can also zoom in on a range of cells when connected to these data sources: OracleEssbase, Oracle Analytics Cloud - Essbase, Narrative Reporting, and Oracle EnterprisePerformance Management Cloud Standard-mode applications.
Related Topics
• Zooming in to a Selected Level
• Zooming in to the Default Level
• Zooming in on Shared Members in EPM Cloud
Zooming in to a Selected LevelTo zoom in to a selected level:
1. Select a member.
You can select a range of members when connected to these data sources: OracleEssbase, Oracle Analytics Cloud - Essbase, Narrative Reporting, and Oracle EnterprisePerformance Management Cloud Standard-mode applications, such as Planning.
2. From the data source ribbon, click the down arrow next to Zoom In, and then select oneof the following options.
• Next Level—To retrieve data for the children of the selected members
• All Levels—To retrieve data for all descendants of the selected members
• Bottom Level—To retrieve data for the lowest level of members in a dimension
These Zoom In options are available for Essbase, Oracle Analytics Cloud - Essbase, andEPM Cloud Standard-mode applications, such as Planning only:
• Same Level—To retrieve data for all members at the same level as the selectedmember
• Sibling Level—To retrieve data for the siblings of the selected members
• Same Generation—To retrieve data for all members of the same generation as theselected members
• Formulas—To retrieve data for all members that are defined by the formula of theselected member. The formula can be a member equation or a consolidation to theparent.
Formulas applies to Essbase and Oracle Analytics Cloud - Essbase only.
Note:
When you zoom in on a page dimension, the page dimension is pivoted to arow dimension.
Related Topics:
Chapter 6Zooming In and Out
6-15

• Zooming Out
• Setting a Default Zoom Level
• Enabling Double-Click Zooming
• Zooming Operations in Cells that Contain Formulas
Zooming in to the Default LevelTo zoom in to the default zoom level, do one of the following:
• Select a member, and then click Zoom In on the data source ribbon.
You can select a range of members when connected to these data sources: OracleEssbase, Oracle Analytics Cloud - Essbase, Narrative Reporting, and OracleEnterprise Performance Management Cloud Standard-mode applications, such asPlanning
To specify a default zoom level, see Setting a Default Zoom Level.
• Double-click a member.
Double-click zooming must be enabled; see Enabling Double-Click Zooming.
Zooming in on Shared Members in EPM CloudData source types: Planning, Financial Consolidation and Close, Tax Reporting
In 16.12 and earlier, Oracle Enterprise Performance Management Cloud did notsupport shared members. When a member was placed on an ad hoc grid, it wasalways considered a base member, even if it was supposed to be a shared member.
EPM Cloud 17.01+ supports shared members in ad hoc grids and recognizes whethera member is a base member or a shared member. If your administrator enables theapplication setting, Allow drill down on shared members in ad hoc, then zooming inon shared members is supported in Oracle Smart View for Office (17.04+). In thiscase, zooming in on shared members is effectively the same as zooming in on thecorresponding base members. You can zoom in on shared members one level at time.
If your administrator enables the application setting, Drill to All Levels in Base(21.09+), and you're working with a Standard mode application, you can zoom inbeyond just the shared members into all levels or only the bottoms levels within thebase hierarchy using the Zoom In options, All Levels and Bottom Level.
Note:
When the Drill to All Levels in Base check box is enabled in theapplication, then the multi-member zoom feature is not supported.
Example Shared Member Zoom In
This example describes the results you will see when your application is set toStandard mode, Allow drill down on shared members in ad hoc is set to Yes, andDrill to All Levels in Base is enabled.
Chapter 6Zooming In and Out
6-16

Figure 1 shows three hierarchies under the Entity dimension. In the entity_10 hierarchy, allmembers descend from entity_10. In the entity_12 hierarchy, all members descend fromentity_12. In the entity_14 hierarchy, there are descendent members of entity_14 as wellas the shared members, entity_10 and entity_12. The shared members include theirdescendents.
Figure 6-6 Entity Dimension Showing Its Hierarchies
Figure 2 shows the difference between zooming in on entity_14:
• Using the Zoom In to All Levels command
• using the Zoom In to Bottom Levels command
In both cases, in Smart View, Member Options, Ancestor Position is set to Top.
Chapter 6Zooming In and Out
6-17

Figure 6-7 Results of Zooming in on entity_14, with Ancestor Position=Top
Note:
In a Native mode application, you can achieve the results shown in the ZoomIn to All Levels example, if Allow drill down on shared members in ad hocset to Yes, and Drill to All Levels in Base disabled; however, you will needto zoom in one level at a time on the shared members till you reach thebottom level of each hierarchy. You will not be able to zoom in directly to thebotton level of the shared members.
Zooming OutZooming out collapses the view to the next upper level.
To zoom out:
1. Select a member.
You can select a range of members when connected to these data sources: OracleEssbase, Oracle Analytics Cloud - Essbase, Narrative Reporting, and OracleEnterprise Performance Management Cloud Standard-mode applications, such asPlanning.
2. From the data source ribbon, click Zoom Out.
Related Topics:
• Zooming In
• Setting a Default Zoom Level
• Enabling Double-Click Zooming
• Zooming Operations in Cells that Contain Formulas
Chapter 6Zooming In and Out
6-18

Setting a Default Zoom LevelYou can specify a default level for zooming operations. This setting applies to the Zoom Inbutton and to double-click zooming if it is enabled (see Enabling Double-Click Zooming).
To set a Zoom In default level:
1. From the Smart View ribbon, select Options, and then select Member Options in the leftpanel.
2. From the Zoom In Level drop-down menu, select one of the following levels:
• Next Level to retrieve data for the children of the selected members
• All Levels to retrieve data for all descendants of the selected members
• Bottom Level to retrieve data for the lowest level of members in a dimension
These Zoom In options are available for Oracle Essbase, Oracle Analytics Cloud -Essbase, and Oracle Enterprise Performance Management Cloud Standard-modeapplications, such as Planning:
• Same Level to retrieve data for all members at the same level as the selectedmember
• Sibling Level to retrieve data for the siblings of the selected members
• Same Generation to retrieve data for all members of the same generation as theselected members
This Zoom In option is available for Essbase and Oracle Analytics Cloud - Essbase only:
Formulas to retrieve data for all members that are defined by the formula of the selectedmember. The formula can be a member equation or a consolidation to the parent.
3. Click OK.
Related Topics:
• Zooming In
• Zooming Out
• Enabling Double-Click Zooming
• Zooming Operations in Cells that Contain Formulas
Selecting Members to Display when ZoomingYou can set options to specify which members are retained and displayed as you zoom inand out.
To set member display options for zooming:
1. From the Smart View ribbon, select Options, and then select Member Options in the leftpanel.
2. Under Member Retention, select:
• Include Selection to display both the selected member and the members retrievedas a result of zooming. For example, zooming in on the selected member Qtr1retrieves data for Jan, Feb, Mar, and Qtr1. If not selected, only the members retrievedas a result of the zoom are displayed: Jan, Feb, and Mar.
Chapter 6Zooming In and Out
6-19

• Within Selected Group to zoom in only on the selected group of cells, leavingthe unselected cells as is. This setting is meaningful only when there are twoor more dimensions down the grid as rows or across the grid as columns.(This setting also applies to Keep Only and Remove Only.)
• Remove Unselected Groups to remove all dimensions and members exceptthe selected member and the members retrieved as a result of zooming.
3. Click OK.
Enabling Double-Click ZoomingIn Oracle Smart View for Office, if double-clicking for ad hoc operations is enabled, youcan zoom in to the default zoom level and zoom out by double-clicking in a membercell.
To enable double-clicking for zooming:
1. From the Smart View ribbon, select Options, and then select Advanced in the leftpanel.
2. Under Mode, select Double-click for Operations.
If you do not select Double-click for Operations, then double-clicking retainsExcel functionality and puts the cell into edit mode.
3. Click OK.
Note:
In blank worksheets, double-clicking the first time retrieves the defaultgrid and thereafter zooms in or out.
Related Topics:
• Zooming In
• Zooming Out
• Setting a Default Zoom Level
• Zooming Operations in Cells that Contain Formulas
Zooming and FormattingYou can apply the formatting of the cell that you zoom in on to the cells that arecreated by zooming. For Oracle Smart View for Office formatting, this ability applies todata cells. For Excel formatting, this ability applies to member cells.
Excel Formatting
To apply Excel formatting selections to member cells created by zooming, from theSmart View ribbon, select Options. Then select all these options:
• From the Formatting page, select these options:
– Use Excel Formatting
– Move Formatting on Operations
Chapter 6Zooming In and Out
6-20

• From the Member Options page, select Preserve Formulas and Comments in ad hocoperations (except Pivot)
• Oracle Essbase only: From the Member Options page, select Formula Fill
Zooming Operations in Cells that Contain FormulasCloud data source types: Oracle Analytics Cloud - Essbase
On-premises data source types: Oracle Essbase
If member or data cells are associated with formulas, you can propagate these formulas tothe cells retrieved as a result of zooming in. For example, if member Qtr1 is associated with aformula, then the formula can be propagated to Jan, Feb, and Mar when you zoom in on Qtr1.
To propagate formulas:
1. From the Smart View ribbon, click Options, and then select Member Options in the leftpanel.
2. Under Comments and Formulas, ensure that Preserve Formulas and Comments inad hoc operations (except pivot) is selected.
3. Select Formula Fill.
Note:
• With the Formula Fill option enabled, some zoom operations may be timeconsuming. For example, a zoom in to the bottom level of a large hierarchy(described in Zooming in to a Selected Level) may take a long time tocomplete.
• Although these options—Preserve Formulas and Comments in ad hocoperations (except pivot) and Formula Fill—appear in Member Options,they apply to formulas in both member and data cells.
4. Click OK.
Related Topics:
• Zooming In
• Zooming Out
• Setting a Default Zoom Level
• Enabling Double-Click Zooming
Specifying Ancestor Position in Ad Hoc GridsUse the Ancestor Position option to specify the ancestor position for hierarchies as Top orBottom. The Ancestor Position option is located in the Member Options tab of theOptions dialog.
Cloud data source types: Oracle Analytics Cloud - Essbase, Planning Ad Hoc, PlanningModules Ad Hoc, Financial Consolidation and Close Ad Hoc, Tax Reporting Ad Hoc
Chapter 6Specifying Ancestor Position in Ad Hoc Grids
6-21

On-premises data source types: Oracle Hyperion Financial Management Ad Hoc,Oracle Hyperion Planning Ad Hoc
Note:
Oracle Analytics Cloud - Essbase only: The ancestor position is set in theapplication by your Essbase administrator. By default, the ancestor positionis set to Bottom. To set the ancestor position to Top, an administrator mustset the application config setting, SSANCESTORONTOP, to True.
• Users: See the example grids in Zoom in Results Selecting AncestorPosition - Top and Zoom in Results Selecting Ancestor Position - Bottom.
• Administrators: To set this option, see SSANCESTORONTOP.
To specify the ancestor position for hierarchies in ad hoc grids:
1. Connect to your database.
For example, in Planning, you may connect to a cube or a form that is enabled forad hoc. In Oracle Analytics Cloud - Essbase, you connect to an application anddatabase.
2. In the Smart View ribbon, select Options, and then select Member Options.
3. In Ancestor Position, select Top or Bottom.
The default is Bottom.
4. Click OK to close the Options dialog.
5. Perform an ad hoc analysis by selecting the Ad hoc analysis option in the ActionPanel.
6. Perform a zoom-in on a dimension or member and check the result.
For example:
• If you select Top, the resulting hierarchy layout should resemble the layoutshown in Figure 1.
• If you select Bottom, the resulting hierarchy layout should resemble the layoutshown in Figure 2.
7. Continue ad hoc operations, such as zoom-in and pivoting.
Note:
• Changing the Ancestor Position setting has no effect on the dimensionand member layout in an existing grid. You will only see the changewhen you perform a zoom-in operation.
• In an existing grid, or in the middle of a series of ad hoc analysisoperations, changing Ancestor Position option (from Bottom to Top orfrom Top to Bottom) can result in non-uniform hierarchy display in thegrid.
Chapter 6Specifying Ancestor Position in Ad Hoc Grids
6-22

Example 6-3 Zoom in Results Selecting Ancestor Position - Top
In this example, we zoom in on the Account dimension. After zooming in, the Accountancestor is shown at the top of its children members. Next, we zoom in on Statistics. Afterzooming in, the Statistics ancestor is shown at the top of its children members.
Figure 6-8 Zooming In with Ancestor Position Set to Top
Example 6-4 Zoom in Results Selecting Ancestor Position - Bottom
In this example, we zoom in on the Account dimension. After zooming in, the Accountancestor is shown at the bottom of its children members. Next, we zoom in on Statistics. Afterzooming in, the Statistics ancestor is shown at the bottom of its children members.
Chapter 6Specifying Ancestor Position in Ad Hoc Grids
6-23

Figure 6-9 Zooming In with Ancestor Position Set to Bottom
Working with Excel Filters on Ad Hoc SheetsExcel filters are retained when performing ad hoc in cases where the ad hoc operationresults in the same set of column dimensions.
Data source types: All supported Oracle Smart View for Office providers, cloud andon-premises, ad hoc only
For example, set filters on the members of the Measures dimension as follows:
If you zoom in on the row dimension, Year, the result set retains the Excel filters thatwere set in the column dimensions because the column dimensions and membersdidn’t change.
Chapter 6Working with Excel Filters on Ad Hoc Sheets
6-24

However, if you zoom in on a column dimension member, such as Inventory, the set ofcolumns in the result set changes, causing you to lose the Excel filters.
Guidelines
• Excel filters are retained for most ad hoc operations, such as Zoom In, Zoom Out,Remove Only, and Keep Only, Undo, and Redo, as long as the same set of columndimensions appear in the result set.
• Excel filters are also retained after a Submit or a Refresh.
• Excel filters are not retained for Pivot or Pivot to POV operations.
• Excel filter retention is not supported on multiple-grid sheets. For example, after creatingfilters in one grid, then moving to a second grid and creating filters on it, the filters on thefirst grid will be lost.
However, there may be some cases where the filters are retained. For example, if twoadjacent grids both start on the same row, then the filters may be retained. Because ofthese variations, Oracle cannot assure that Excel filters will be retained on multiple-gridsheets.
PivotingPivoting changes the orientation of the data on the worksheet. You can move dimensionsbetween rows and columns and between the grid and the POV.
Cloud data source types: Oracle Analytics Cloud - Essbase, Planning, Narrative Reporting,Financial Consolidation and Close, Tax Reporting
On-premises data source types: Oracle Essbase, Oracle Hyperion Financial Management,Oracle Hyperion Planning
Additionally:
• One or more dimensions can be pivoted from the grid to the POV toolbar.
• One dimension at a time can be pivoted from the POV toolbar to the grid.
• A single dimension, and even zero dimensions, can remain on the POV toolbar.
• You can select only one dimension or one member at a time to pivot between rows andcolumns on the sheet. In cases where multiple members from the same dimension are onthe grid, then all members in the dimension will be pivoted.
Chapter 6Pivoting
6-25

• When you pivot a member from the grid to the POV, the member selected on thegrid becomes the POV for that dimension. For example, if pivot Qtr2 of the Yeardimension from the grid to the POV, then Qtr2 becomes the POV for the Yeardimension.
Pivoting Dimensions Between Rows and ColumnsYou can pivot a dimension or members between rows and columns. There must betwo or more dimensions, or members from two or more dimensions, in the row orcolumn that contains the dimension that you want to pivot. That is, you cannot pivotthe last row dimension or the last column dimension on a grid.
When you pivot a member, the other members in its dimension are also pivoted.
When you pivot between rows and columns, Oracle Smart View for Office moves theselected dimension to the outermost row or column on the opposite axis. For example,when you select to pivot a dimension to a row, the system moves the dimension to thetop of the grid.
Note:
When the Use Excel Formatting option is selected (as described in UsingExcel Formatting), member and numeric formats may unexpectedly changeafter pivot operations. For example, member names may be centered andnumeric values may be left justified. You can reset the grid to the properformat using the Excel formatting options.
To pivot a dimension or member:
1. Select a dimension or member.
2. From the data source ribbon, click Pivot.
Alternatively, you can drag a dimension from the row or column and drop it on thetarget row or column.
Row dimensions are pivoted to the topmost column dimension.
Column dimensions are pivoted to the left-most row dimension.
Note:
You pivot members by selecting them from the POV, as described in Selecting Members from the POV Toolbar.
Pivoting Dimensions Between the Grid and the POV ToolbarYou can select to pivot a dimension out of the ad hoc grid to the Point of View (POV),or out of the POV to the grid. You can also pivot a member; if you do so, the othermembers in its dimension are also pivoted.
Chapter 6Pivoting
6-26

To pivot a dimension or members between the POV toolbar and the grid, perform one of thefollowing tasks:
• To pivot a dimension to the POV, select the dimension in the grid. In the provider ribbon,
click the arrow in the Pivot button, , and then select Pivot to POV.
Alternatively, right-click a dimension and drag it from the grid and drop it on the POVtoolbar.
You can also pivot a member. Select one member only; you do not need to select multiplemembers. Selecting one member pivots all members in the dimension.
• To pivot a dimension from the POV to the grid, right click the arrow next to the dimensionname in the POV toolbar, then drag the dimension and drop it on the grid.
Example 6-5 Pivoting Notes
• You can leave any number of dimensions on the POV; for example, 0, 1, or moredimensions can be left on the POV.
• After pivoting the last dimension from the POV toolbar to the grid, the POV toolbar ishidden. You can always bring it back by clicking the POV button in the provider ribbon.
• The grid must always contain at least two dimensions: one row dimension and onecolumn dimensions. When there is only one row dimension and one column dimensionon a grid, you must first pivot the replacement dimension on to the grid before you canpivot a dimension out of the grid.
For example, if you want to pivot the row dimension off of the grid, then you must firstpivot the replacement row dimension on to the grid, and then pivot the unwanted rowdimension off of the grid.
• You can manually type a dimension or member name to replace a dimension or membername in the grid or the POV toolbar.
Similarly, you can delete a dimension or member from the grid, refresh the grid, and thedeleted dimension or member is moved from the grid and will display on the POV toolbar.
• You can pivot members by selecting them from the POV, as described in SelectingMembers from the POV Toolbar.
Removing Selected Members From the GridYou can remove members and their associated data from the grid.
Cloud data source types: Oracle Analytics Cloud - Essbase, Planning, Narrative Reporting,Financial Consolidation and Close, Tax Reporting
On-premises data source types: Oracle Essbase, Oracle Hyperion Financial Management,Oracle Hyperion Planning
To remove members from the grid, use the Remove Only or Keep Only command:
• Select the member cells that you want to remove. Then, from the data source ribbon,click Remove Only. All selected members in the dimension are removed.
• Select the member cells that you want to keep. Then, from the data source ribbon, clickKeep Only. All other members in the dimension are removed.
Keep Only and Remove Only operate on all instances of the selected members in the gridwithin the selected group.
Chapter 6Removing Selected Members From the Grid
6-27
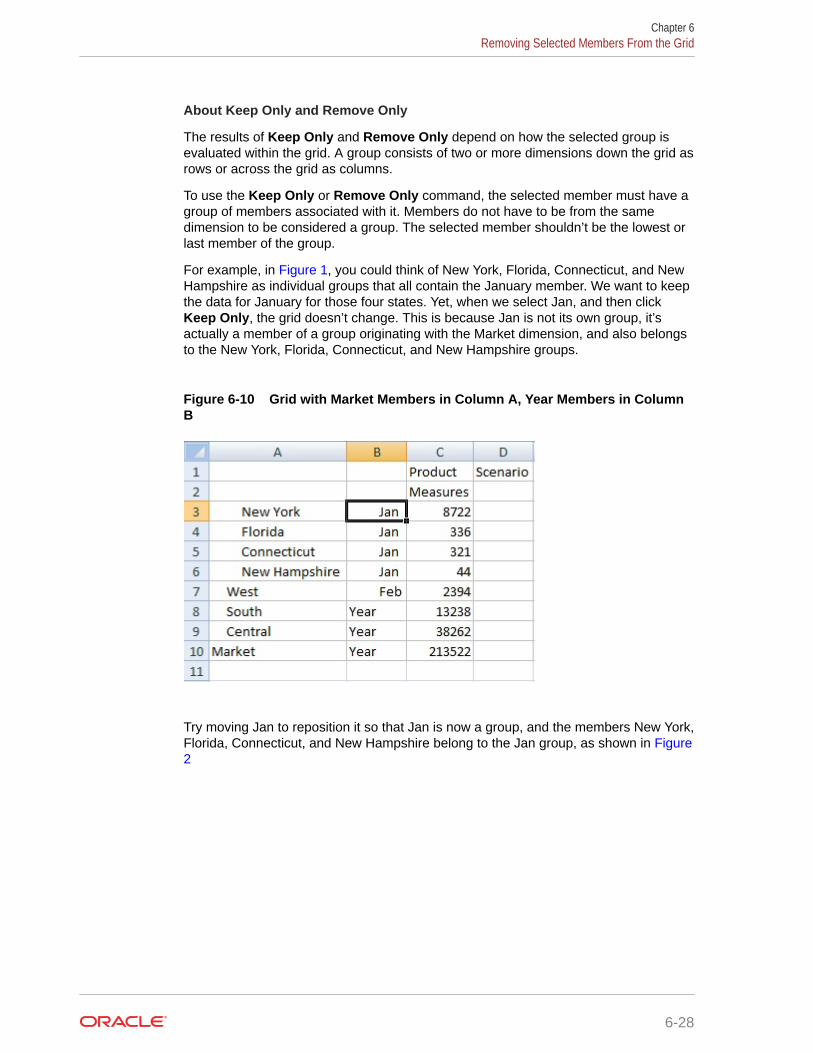
About Keep Only and Remove Only
The results of Keep Only and Remove Only depend on how the selected group isevaluated within the grid. A group consists of two or more dimensions down the grid asrows or across the grid as columns.
To use the Keep Only or Remove Only command, the selected member must have agroup of members associated with it. Members do not have to be from the samedimension to be considered a group. The selected member shouldn’t be the lowest orlast member of the group.
For example, in Figure 1, you could think of New York, Florida, Connecticut, and NewHampshire as individual groups that all contain the January member. We want to keepthe data for January for those four states. Yet, when we select Jan, and then clickKeep Only, the grid doesn’t change. This is because Jan is not its own group, it’sactually a member of a group originating with the Market dimension, and also belongsto the New York, Florida, Connecticut, and New Hampshire groups.
Figure 6-10 Grid with Market Members in Column A, Year Members in ColumnB
Try moving Jan to reposition it so that Jan is now a group, and the members New York,Florida, Connecticut, and New Hampshire belong to the Jan group, as shown in Figure2
Chapter 6Removing Selected Members From the Grid
6-28

Figure 6-11 Grid with Year Members in Column A, Market Members in Column B
Now select a Jan cell and click Keep Only. The resulting layout shows only the Marketdimension members grouped under Jan.
Chapter 6Removing Selected Members From the Grid
6-29

Figure 6-12 Grid with Only Jan Group Members
You can further refine the report to show only the New York, Florida, Connecticut, andNew Hampshire members. Select those members in the grid (see Figure 4).
Figure 6-13 Members Selected for Keep Only
And then click Keep Only. The result is shown in Figure 5.
Figure 6-14 Grid with Only Jan Group Members New York, Florida,Connecticut, and New Hampshire
Chapter 6Removing Selected Members From the Grid
6-30

Note that you can also achieve the result in Figure 5 in another way. Select the West, Southand Central members, and the Market dimension, as shown in Figure 6.
Figure 6-15 Members Selected for Remove Only
And then click Remove Only.
Figure 6-16 Grid with Only Jan Group Members New York, Florida, Connecticut, andNew Hampshire
Remember that the Keep Only and Remove Only commands are always performed on theselected groups, evaluated within the grid.
Inserting Rows and ColumnsIn ad hoc grids, you can insert calculating and non-calculating columns and rows within oroutside the grid.
Cloud data source types: Oracle Analytics Cloud - Essbase
On-premises data source types: Oracle Essbase, Oracle Hyperion Financial Management
Inserted rows and columns, which may contain formulas, text, or Excel comments, areretained when you refresh or zoom in.
Always refresh the grid before inserting rows or columns.
Chapter 6Inserting Rows and Columns
6-31

Displaying and Suppressing Repeated MembersIf you have stacked dimensions in an ad hoc grid, you can display or suppressrepeated members.
Cloud data source types: Oracle Analytics Cloud - Essbase
On-premises data source types: Oracle Essbase
This topic describes using the Repeated Members option in the Options dialog box,Data Options tab, Suppress Rows group. This option only applies to Essbase datasources. To use the other data suppress options in the Suppress Rows and theSuppress Columns group, see Data Options.
When working with stacked dimensions in an ad hoc grid, and the SuppressRepeated Members option is selected, Essbase positions the suppressed memberlabel above the labels in the next row, up to the first column dimension, using the"proximity rule". With the proximity rule, when repeated members are suppressed,Essbase compares the stacked dimensions row by row. It groups the non-repeating,unsuppressed members under the closest suppressed member in the previous row.Essbase can then determine which member is being queried and retrieves the dataaccordingly.
The scenario that follows shows the proximity rule in action.
Using the Sample Basic database, select the Ad hoc analysis option. The Measures,Product, Market, Scenario, and Year dimensions are retrieved on the worksheet asshown in Figure 1.
Figure 6-17 Sample Basic Initial Ad Hoc Analysis Grid
Arrange the dimensions so that there are three "stacked" dimensions and twodimensions side by side, according to Figure 2.
Figure 6-18 Sample Basic Grid with Dimensions Arranged in a StackedConfiguration
Chapter 6Displaying and Suppressing Repeated Members
6-32

By default, in the Data tab of the Options dialog box, the Repeated Members option in theSuppress Rows group is cleared. Zoom in on the Product and Year members, then zoom inon the Market and Scenario dimensions. The resulting grid looks similar to Figure 3.
Figure 6-19 Zooming in on the Dimensions in the Grid Before Selecting the RepeatedMembers Option
Note:
For ease of reading, the South and Central members were removed from the grid in Figure 3 and Figure 4.
Now, from the Smart View ribbon, select Options, then select the Data tab. In the SuppressRows group, select the Repeated Members options. Then refresh the sheet. The resultinggrid looks similar to Figure 4. For each of the column dimensions in rows 1 and 2, wherethere were suppressed repeated members, the member label is centered above the labels inthe next row.
The data in columns C, D, E, F, and G belong to the East member; the data in columns H, I,J, K, and L belong to West. Using the proximity rule, Scenario in column G belongs to Eastbecause it is only two columns from the East member, but three columns from the Westmember.
The Measures dimension label applies to the entire grid.
Figure 6-20 Refresh the Grid After Selecting the Repeated Members Option
Chapter 6Displaying and Suppressing Repeated Members
6-33

Using the Suppress Repeating Members Option with 11.1.2.2.102 andEarlier Workbooks
You must perform the steps in this topic before you begin using your workbooks withOracle Smart View for Office 11.1.2.5.200 and later.
If you are working with spreadsheets that were created and used with version11.1.2.2.102 or earlier of Smart View, Oracle Essbase, and Oracle Hyperion ProviderServices, you must complete the following steps in order to assure that row andcolumn data aligns properly with their parent members:
1. Make a backup copy of your workbook.
2. In the Data tab of the Options dialog box, clear the Repeated Members option.
3. Refresh the workbook. You may refresh the entire workbook or refresh each sheetindividually.
4. Go back to the Data tab of the Options dialog box, and select the RepeatedMembers option.
5. Perform the refresh operation again.
The workbook is ready for use with Smart View version 11.1.2.5.200 and later.
Multiple Grids on a WorksheetIn Oracle Essbase and Oracle Analytics Cloud - Essbase, you can create multiple adhoc grids on one worksheet.
Related Topics
• About Multiple Grids on a Worksheet
• Creating Multiple-Grid Worksheets
• Converting Ad Hoc Worksheets to Multiple-Grid Worksheets
• Renaming Ranges on Multiple-Grid Worksheets
• Changing Connections in Multiple-Grid Worksheets
• POV on Essbase Multiple-Grid Worksheets
• Multiple-Grid Example: Butterfly Report
About Multiple Grids on a WorksheetCloud data source types: Oracle Analytics Cloud - Essbase
On-premises data source types: Oracle Essbase
In Essbase or Oracle Analytics Cloud - Essbase, you can create multiple grids on oneworksheet. These grids can be connected to the same data source or to differentEssbase data sources. You can retrieve data in these grids and shift them on theworksheet.
Chapter 6Multiple Grids on a Worksheet
6-34

Note:
If you are using an Oracle Enterprise Performance Management Cloud data sourceto create multiple ad hoc grids on a sheet, see Working with Multiple-GridWorksheets in EPM Cloud.
Note the following guidelines and limitations in worksheets that support multiple grids:
• You can submit data for only one grid at a time.
If you try to submit data for more than one grid at a time—that is, if you have selected cellranges in more than one grid—the first range returned by Excel will be used to determinethe selected grid and the submit will be performed only on that grid.
• If Preserve Formulas and Comments in ad hoc operations (except pivot and undo)is selected, you can preserve formulas on the sheet using the Undo option on the right-click Smart View context menu from within the grid. This option is only supported after arefresh has been performed once formulas are added to the sheet, and only for one undoaction. This option is only supported for one undo action. The Undo option on the SmartView ribbon is not enabled for multiple-grid sheets. See Preserving Excel FormulasWithin and Outside of Essbase Ad Hoc Grids.
• Multiple-grid worksheets are not supported for Smart Slices.
• Do not use Microsoft Excel's Name Manager or Name Box to rename named ranges.Instead, use one of the following methods to rename named ranges:
– Use the Rename Range command in the Document Contents pane of the SmartView Panel. See Renaming Ranges on Multiple-Grid Worksheets
– Use the VBA function, HypModifyRangeGridName, described in the Oracle SmartView for Office Developer's Guide .
• On multiple-connection multiple grid worksheets, ensure that there is enough spacebetween grids to accommodate pivot and zoom operations on the individual grids.
A loss of metadata may occur on sheets with three or more database connections andwhere grids are placed too close together.
• To ensure that you are refreshing the desired range, use the Document Contents paneto first select the range, and then click the Refresh link in the pane. After refresh, selectthe range again from Document Contents to highlight the updated range.
• These items on the Smart View ribbon are disabled:
– Undo
– Redo
Instead, to access the Undo and Redo commands when working with a multiple-gridsheet, ensure that your cursor is in the affected grid. (Use the Document Contents paneto ensure that you have selected the correct grid.) Then, right-click and select SmartView from the context menu, and then select Undo or Redo, as required.
• These items on the Essbase ribbon are disabled:
– Pivot to POV
– POV
– Preserve Format
Chapter 6Multiple Grids on a Worksheet
6-35

– Data Perspective
– View Comments
Creating Multiple-Grid WorksheetsCloud data source types: Oracle Analytics Cloud - Essbase
On-premises data source types: Oracle Essbase
To create a multiple-grid worksheet:
1. In Excel, connect to an Essbase data source.
2. From any location in the worksheet, select a range of cells.
You must select a range rather than only one cell.
3. From the Smart View Panel, right-click an application, and then select Ad HocAnalysis.
Note:
Multiple-grid worksheets are not supported for Smart Slices.
4. When prompted to change the worksheet to support multiple grids, select Yes.
Note:
If you started with an ordinary single-grid worksheet, and want to addother grids to the sheet, see Converting Ad Hoc Worksheets to Multiple-Grid Worksheets.
5. To create another grid on the worksheet:
a. Select a different range of cells.
b. From the Smart View Panel, right click an application, and then select Ad HocAnalysis.
6. Repeat step step 5 as necessary to add grids to the worksheet.
Note:
Starting in Oracle Smart View for Office 11.1.2.5.400, the creation ofmultiple-grid worksheets using refresh is no longer supported.
Converting Ad Hoc Worksheets to Multiple-Grid WorksheetsCloud data source types: Oracle Analytics Cloud - Essbase
On-premises data source types: Oracle Essbase
To convert an existing ad hoc worksheet to a worksheet that supports multiple grids:
Chapter 6Multiple Grids on a Worksheet
6-36

1. From any location in the worksheet, select a range of cells.
You must select a range rather than only one cell.
2. From the Smart View Panel, right click the application, and then select Ad hoc analysis.
The sheet already contained a grid, so the following dialog is displayed:
Available options are:
• Clear sheet contents and POV
• Reuse sheet contents only to reuse sheet contents only. In this case, the sheetcontent is converted to free-form and the existing POV will be lost.
• Reuse sheet contents and POV. Use this option if the POV of the new ad hocconnection or Smart Slice is consistent with the existing contents.
• Use sheet for multiple grid ad hoc to convert the sheet to one that supportsmultiple range-based grids, retaining any existing ad hoc grid on the sheet.
3. In the dialog, select Use sheet for multiple grid ad hoc.
The second grid is added to the worksheet. The sheet now supports multiple grids.
4. Optional: Repeat step 1 and step 2 to add more grids to the sheet.
Renaming Ranges on Multiple-Grid WorksheetsCloud data source types: Oracle Analytics Cloud - Essbase
On-premises data source types: Oracle Essbase
When you place ranges on a multiple-grid worksheet, Excel assigns each range a name bydefault. The strings used in the name ranges may not be particularly user friendly. Forexample, a range based on the Essbase Demo Basic database might look like this:
Demo_Basic_C2034305_D2AC_449B_B4AE_56EA047EDF05_1
A more user-friendly name would be helpful for all users of the workbook, but changing thename using the Excel Name Manager could cause a loss of metadata in Oracle Smart Viewfor Office.
Chapter 6Multiple Grids on a Worksheet
6-37

Use the Rename Range command in the Smart View Document Contents pane tochange the name to a more descriptive or user-friendly name.
Note:
To change range names in multiple-grid worksheets, you must use theRename Range command in the Document Contents pane.
To rename ranges on a multiple-grid worksheet:
1. In the Document Contents pane, highlight the range to rename in the tree, andthen click Select.
In the following example, EssbaseCluster-1 | Sample | Basic is highlighted inthe tree.
Use the Select command to verify that you are working with the correct grid on thesheet. For example, after highlighting EssbaseCluster-1 | Sample | Basic andclicking Select, the Sample Basic grid on the worksheet is highlighted.
Chapter 6Multiple Grids on a Worksheet
6-38

2. In the Action Panel, click More, and then select Rename Range.
The Rename Range dialog box is displayed, showing the default name that wasassigned to the range by Excel.
3. In Rename Range, type a new range name, and then click OK.
We're renaming the range MySampleBasic.
4. Verify that the range name is changed in the Name Manager in Excel.
Here is an example Name Manager, accessed from the Formula ribbon in Excel:
Chapter 6Multiple Grids on a Worksheet
6-39
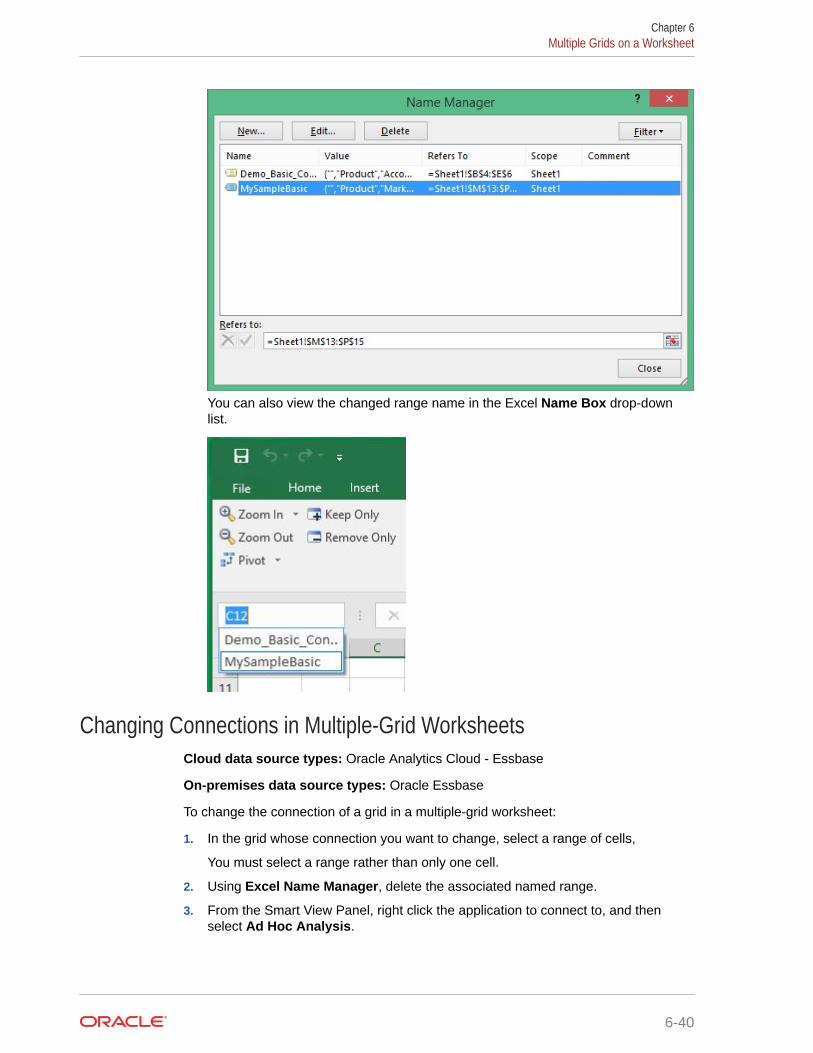
You can also view the changed range name in the Excel Name Box drop-downlist.
Changing Connections in Multiple-Grid WorksheetsCloud data source types: Oracle Analytics Cloud - Essbase
On-premises data source types: Oracle Essbase
To change the connection of a grid in a multiple-grid worksheet:
1. In the grid whose connection you want to change, select a range of cells,
You must select a range rather than only one cell.
2. Using Excel Name Manager, delete the associated named range.
3. From the Smart View Panel, right click the application to connect to, and thenselect Ad Hoc Analysis.
Chapter 6Multiple Grids on a Worksheet
6-40

POV on Essbase Multiple-Grid WorksheetsCloud data source types: Oracle Analytics Cloud - Essbase
On-premises data source types: Oracle Essbase
The POV button is enabled for Essbase multiple-grid worksheets that contain only one grid,making it possible for you to toggle the button to show or hide the POV toolbar. The POVbutton remains disabled on multiple-grid worksheets that contain more than one grid.
On multiple-grid worksheets that contain one grid, the POV dimensions are displayed both inthe grid and in the toolbar. On regular ad hoc worksheets, POV dimensions are displayed inthe grid only if the POV toolbar is hidden.
Multiple-Grid Example: Butterfly ReportCloud data source types: Oracle Analytics Cloud - Essbase
On-premises data source types: Oracle Essbase
Typically, Oracle Smart View for Office grids consist of member names on rows above andcolumns on the left of the data grid. Using the range retrieval capabilities of worksheetsenabled for multiple grids, you can create grids with different layouts.
For example, you can create "butterfly" reports, with a column of members between twocolumns of data cells.
Figure 6-21 Butterfly Report
Chapter 6Multiple Grids on a Worksheet
6-41

Cascading Reports and Ad Hoc GridsYou can create separate reports for any or all of the members of one or moredimensions in a report based on an ad hoc grid or Smart Slice query.
You can then cascade these reports separately across the worksheets of an Excelworkbook. For reports created in the Report Designer, you can also cascade reportsacross slides in a PowerPoint presentation. Worksheets or slides are created asneeded to accommodate all reports.
Cloud data source types: Oracle Analytics Cloud - Essbase, Planning, FinancialConsolidation and Close, Tax Reporting
On-premises data source types: Oracle Essbase, Oracle Hyperion FinancialManagement
Formulas, comments and other text, Smart Slice function grids, charts, tables, andsliders are included in cascaded reports.
Essbase and Oracle Analytics Cloud - Essbase only: Cascading is supported formultiple-grid worksheets.
Note:
When extensions are enabled in Oracle Smart View for Office, cascading areport with a large number of members can cause Excel to stop responding.You may disable any extensions that are installed from the Smart ViewOptions dialog box, Extensions tab. After disabling, restart Excel andrepeat the cascade operation.
Video
Your Goal Watch This Video
Learn about cascading while connected toPlanning. Adding Excel Formulas in Oracle
Planning and Budgeting Cloud
To cascade an ad hoc grid or Smart Slice report:
1. Open an ad hoc grid or Smart Slice report on the worksheet.
2. From the Essbase ribbon or from the data provider ad hoc ribbon (for example,Planning Ad Hoc), select Cascade, and then one of the following:
• Same Workbook to use the current workbook
• New Workbook to use a new workbook
• Different Workbooks to cascade each report to a different workbook
3. In Select Cascade Members, click next to each dimension to launch MemberSelection, where you select the members from each dimension for which youwant to create reports.
Chapter 6Cascading Reports and Ad Hoc Grids
6-42
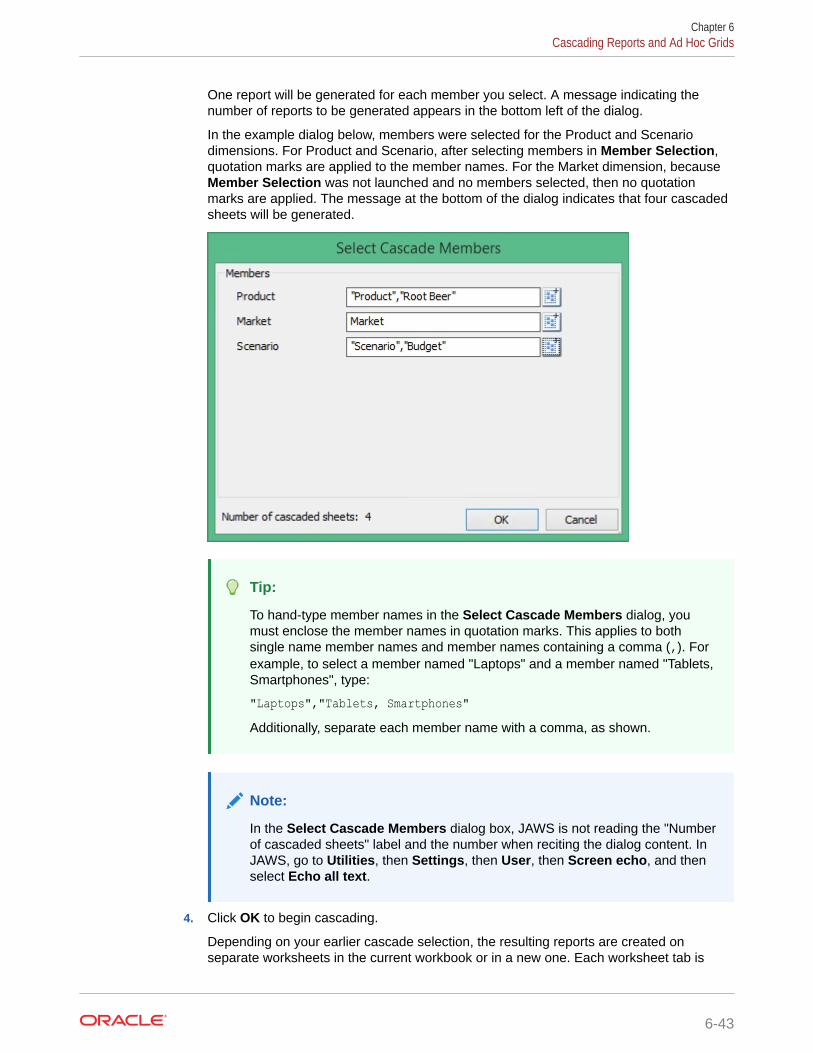
One report will be generated for each member you select. A message indicating thenumber of reports to be generated appears in the bottom left of the dialog.
In the example dialog below, members were selected for the Product and Scenariodimensions. For Product and Scenario, after selecting members in Member Selection,quotation marks are applied to the member names. For the Market dimension, becauseMember Selection was not launched and no members selected, then no quotationmarks are applied. The message at the bottom of the dialog indicates that four cascadedsheets will be generated.
Tip:
To hand-type member names in the Select Cascade Members dialog, youmust enclose the member names in quotation marks. This applies to bothsingle name member names and member names containing a comma (,). Forexample, to select a member named "Laptops" and a member named "Tablets,Smartphones", type:
"Laptops","Tablets, Smartphones"Additionally, separate each member name with a comma, as shown.
Note:
In the Select Cascade Members dialog box, JAWS is not reading the "Numberof cascaded sheets" label and the number when reciting the dialog content. InJAWS, go to Utilities, then Settings, then User, then Screen echo, and thenselect Echo all text.
4. Click OK to begin cascading.
Depending on your earlier cascade selection, the resulting reports are created onseparate worksheets in the current workbook or in a new one. Each worksheet tab is
Chapter 6Cascading Reports and Ad Hoc Grids
6-43

named for the dimensions and members of the report it contains. Click aworksheet tab to view a report.
To see a list of all the worksheets, right-click the left or right arrow at the bottomleft of Excel:
In our example using the "Product", "Market", and "Scenario" dimensions, thefollowing reports were created:
To display a specific report, select the report in the list, and then click OK.
Chapter 6Cascading Reports and Ad Hoc Grids
6-44
Note:
• Worksheet tab naming depends on your cascade selections, and the number ofresulting sheets. Excel creates each sheet name using the first 30 characters ofthe selected dimension names, regardless of the length of the dimensionnames. If this results in more than 30 characters, then the first 28 charactersare used and appended with ~n where n is a unique number (1,2,3,…).
• Do not use any the following special characters in dimension, member or aliasnames:
{ } ( ) [ ] @ \ . - = < + ' " _ |• Cascading may be very slow for large grids.
• When extensions are enabled in Smart View, cascading a report with a largenumber of members can cause Excel to stop responding. You may disable anyextensions that are installed from the Smart View Options dialog box,Extensions tab. After disabling, restart Excel and repeat the cascadeoperation.
Substitution VariablesSubstitution variables are global or per-application placeholders that represent variablevalues.
Cloud data source types: Planning
On-premises data source types: Oracle Essbase, Oracle Hyperion Planning
Application designers or administrators define and manage substitution variables and theircorresponding values; Oracle Smart View for Office users can enter a substitution variableinto the grid and retrieve its value by refreshing.
For example, the designation "&CurMnth" might be a substitution variable representing thecurrent month. Let's suppose the value for substitution variable "&CurMnth" is August. Whenyou enter &CurMnth into a grid, Smart View displays August after a refresh. Later, if the valueis changed to September, then September is displayed after a refresh when you enter&CurMnth.
When connected to Planning, some substitution variables that you enter may representranges. For example, "&NewMnthPeriod" might represent the month range of Octoberthrough December. Or, "&NewQtrPeriod" might represent the quarter hierarchies of Quarter 1and Quarter 2.
For more information about substitution variables, see the Essbase, Oracle Analytics Cloud -Essbase , Oracle Hyperion Planning, or Planning documentation, available in the Oracle HelpCenter.
To retrieve the value for a substitution variable:
1. Enter a substitution variable into a cell in the grid.
Chapter 6Substitution Variables
6-45
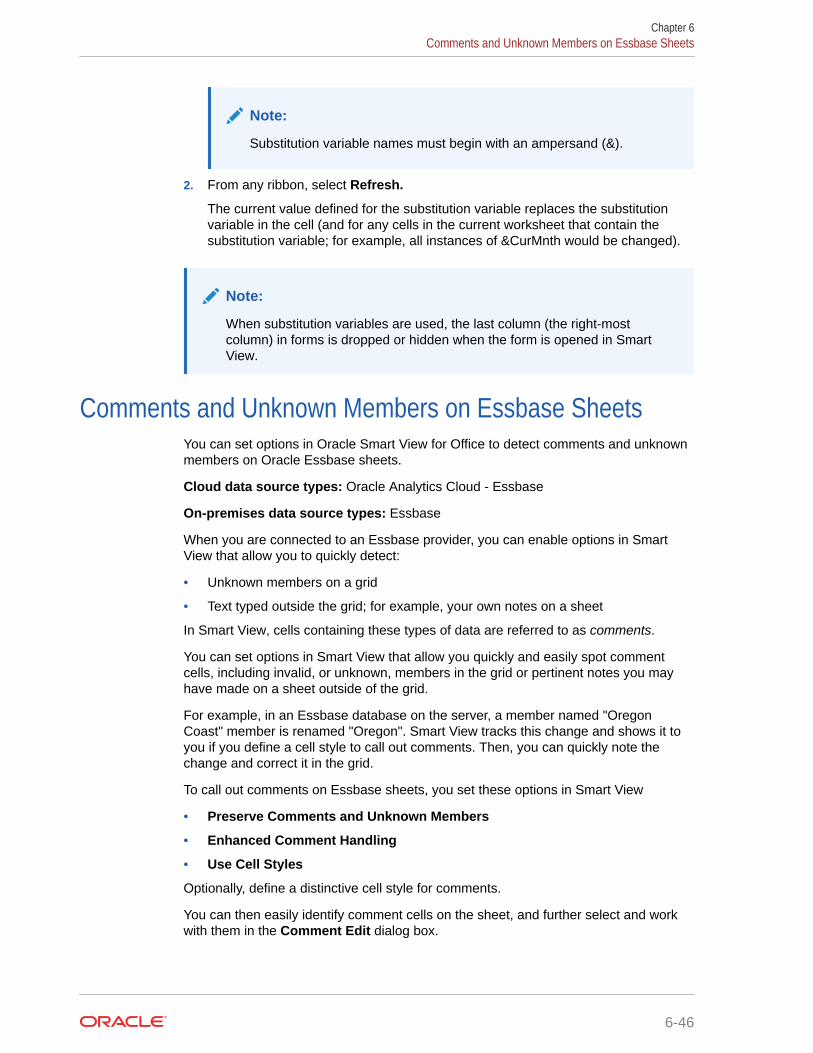
Note:
Substitution variable names must begin with an ampersand (&).
2. From any ribbon, select Refresh.
The current value defined for the substitution variable replaces the substitutionvariable in the cell (and for any cells in the current worksheet that contain thesubstitution variable; for example, all instances of &CurMnth would be changed).
Note:
When substitution variables are used, the last column (the right-mostcolumn) in forms is dropped or hidden when the form is opened in SmartView.
Comments and Unknown Members on Essbase SheetsYou can set options in Oracle Smart View for Office to detect comments and unknownmembers on Oracle Essbase sheets.
Cloud data source types: Oracle Analytics Cloud - Essbase
On-premises data source types: Essbase
When you are connected to an Essbase provider, you can enable options in SmartView that allow you to quickly detect:
• Unknown members on a grid
• Text typed outside the grid; for example, your own notes on a sheet
In Smart View, cells containing these types of data are referred to as comments.
You can set options in Smart View that allow you quickly and easily spot commentcells, including invalid, or unknown, members in the grid or pertinent notes you mayhave made on a sheet outside of the grid.
For example, in an Essbase database on the server, a member named "OregonCoast" member is renamed "Oregon". Smart View tracks this change and shows it toyou if you define a cell style to call out comments. Then, you can quickly note thechange and correct it in the grid.
To call out comments on Essbase sheets, you set these options in Smart View
• Preserve Comments and Unknown Members
• Enhanced Comment Handling
• Use Cell Styles
Optionally, define a distinctive cell style for comments.
You can then easily identify comment cells on the sheet, and further select and workwith them in the Comment Edit dialog box.
Chapter 6Comments and Unknown Members on Essbase Sheets
6-46

See the following topics for more information on working with comments on Essbase sheets:
• Enabling Comment Display in the Sheet
• Viewing Comments in the Sheet
• Editing Comments
• Deleting Comments
Enabling Comment Display in the SheetCloud data source types: Oracle Analytics Cloud - Essbase
On-premises data source types: Oracle Essbase
To enable comment display in an Essbase sheet:
1. In the Options dialog box, perform these tasks:
a. In Member Options, select these options:
• Preserve Comments and Unknown Members
• Enable Enhanced Comment Handling
Note:
The Preserve Formulas and Comments in ad hoc operations (exceptpivot) option must be selected to enable these options.
b. In Formatting, select Use Cell Styles.
c. In Cell Styles, expand Common, and then select the check box next to CommentCells. Optionally, right-click Comment Cells and define a Font, Background, orBorder for cells containing comments.
2. Click OK.
Optionally, click the arrow in the OK button and choose either Save as Default Optionsor Apply to All Sheets. These options are described in "Sheet Options" in Smart ViewOptions.
You are now ready for the steps in Viewing Comments in the Sheet
Viewing Comments in the SheetCloud data source types: Oracle Analytics Cloud - Essbase
On-premises data source types: Oracle Essbase
To view comment cells in an Essbase sheet:
1. Be sure to complete the steps in Enabling Comment Display in the Sheet
2. Open a workbook containing a grid, connect to an Essbase provider, and click Refresh.
3. On the sheet, note the cells containing comments and unknown members.
In the example in Figure 1, cell C4 is an unknown member and Oracle Smart View forOffice marked the cell as a comment. The member name was probably changed in the
Chapter 6Comments and Unknown Members on Essbase Sheets
6-47

underlying Essbase database. The comment style indicates to us that this memberneeds attention.
Additionally, a second comment in the sheet notes that the Oregon Coast membername needs to be changed to Oregon. This comment is a note someone madeoutside of the grid and confirms to us that the member name has been changedon the server and that the member needs to be manually updated in the grid.
Figure 6-22 Grid Showing Cells Marked with Comment Style
4. Continue with Editing Comments or Deleting Comments.
Editing CommentsCloud data source types: Oracle Analytics Cloud - Essbase
On-premises data source types: Oracle Essbase
Be sure to complete the steps in Enabling Comment Display in the Sheet.
Note:
The procedure in this topic shows you how to edit comments on an Essbasesheet using the View Comments command and the Comment Edit dialogbox in Oracle Smart View for Office. You can also edit comments directly inthe grid, without using the Smart View interface elements in this topic.
To edit comments on an Essbase sheet:
1. If you have not already done so, open a workbook containing a grid, connect to anEssbase provider, and click Refresh.
2. Click View Comments in the Essbase ribbon.
Chapter 6Comments and Unknown Members on Essbase Sheets
6-48
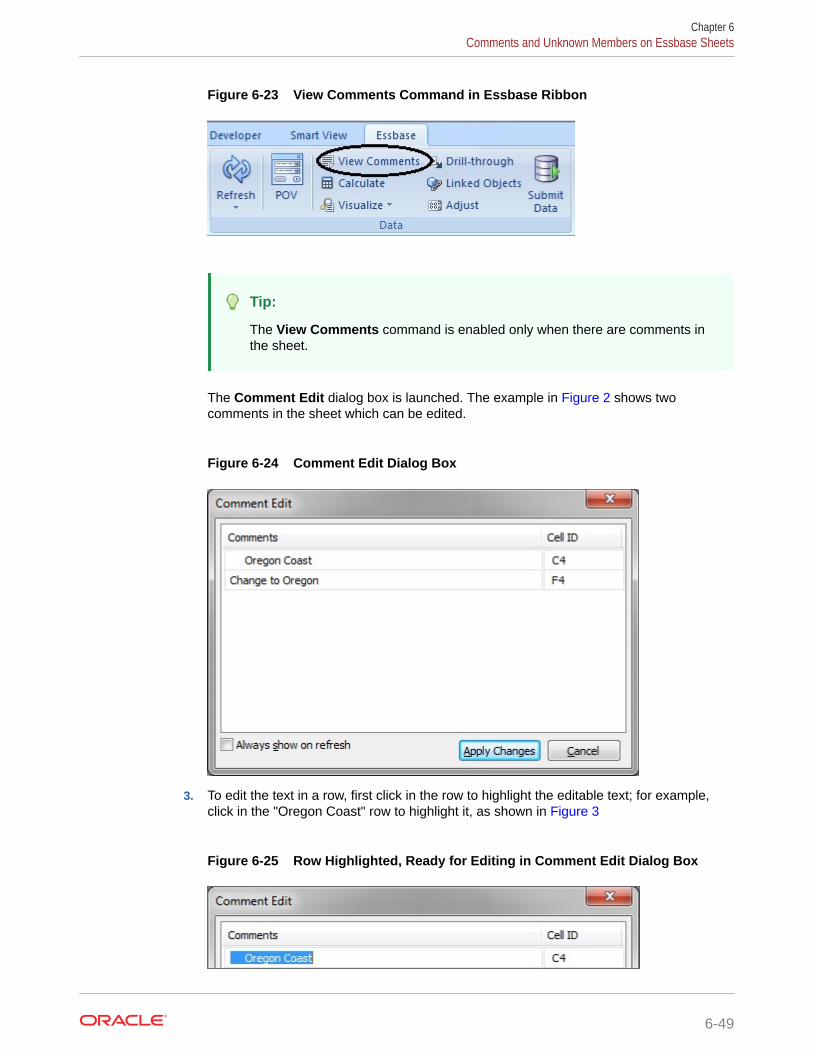
Figure 6-23 View Comments Command in Essbase Ribbon
Tip:
The View Comments command is enabled only when there are comments inthe sheet.
The Comment Edit dialog box is launched. The example in Figure 2 shows twocomments in the sheet which can be edited.
Figure 6-24 Comment Edit Dialog Box
3. To edit the text in a row, first click in the row to highlight the editable text; for example,click in the "Oregon Coast" row to highlight it, as shown in Figure 3
Figure 6-25 Row Highlighted, Ready for Editing in Comment Edit Dialog Box
Chapter 6Comments and Unknown Members on Essbase Sheets
6-49

4. Edit the text as required; in this example, change "Oregon Coast" to "Oregon".
Figure 6-26 Changed Text in Comment Edit Dialog Box
5. Click Apply Changes and note the change in the grid.
In Figure 5, cell C4 still shows as a commented cell, and will until the sheet isrefreshed.
Figure 6-27 Grid After Clicking Apply Changes; Cell C4 Still Commented
6. Click Refresh; the comment style is cleared.
Figure 6-28 Grid After Refresh, Cell Style in Cell C4 Is Cleared; Member isIn Sync with Server
Deleting CommentsCloud data source types: Oracle Analytics Cloud - Essbase
On-premises data source types: Oracle Essbase
Be sure to complete the steps in Enabling Comment Display in the Sheet.
Chapter 6Comments and Unknown Members on Essbase Sheets
6-50
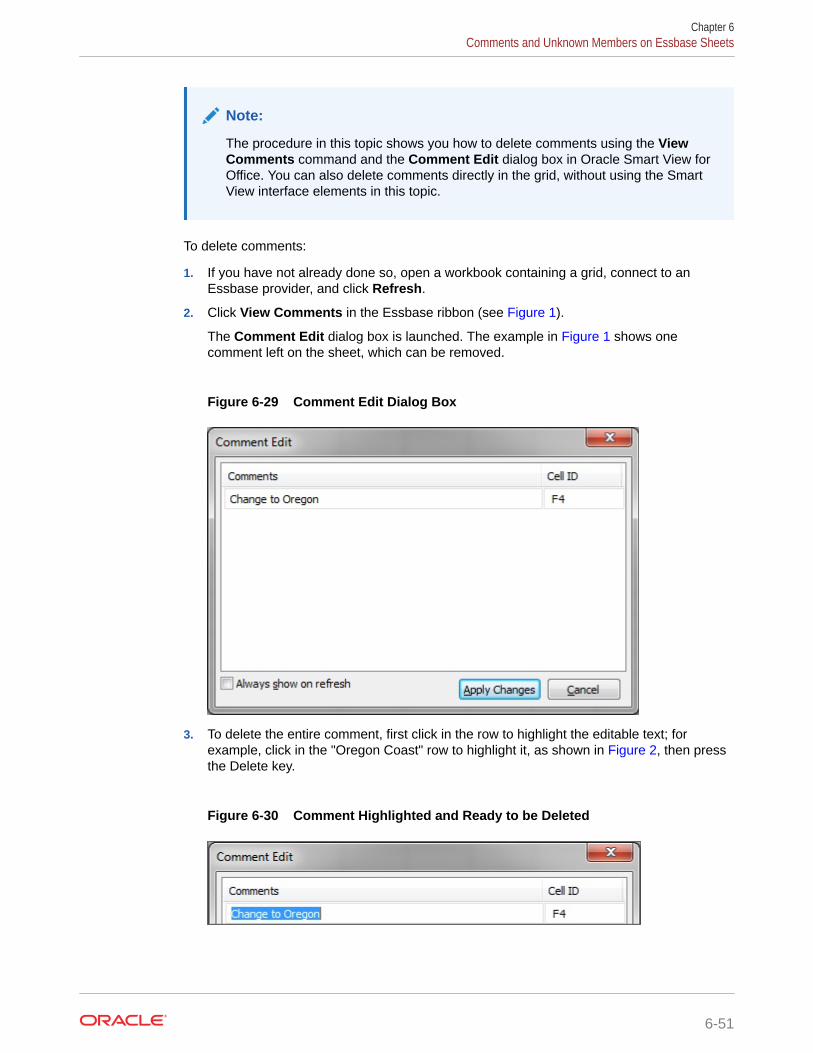
Note:
The procedure in this topic shows you how to delete comments using the ViewComments command and the Comment Edit dialog box in Oracle Smart View forOffice. You can also delete comments directly in the grid, without using the SmartView interface elements in this topic.
To delete comments:
1. If you have not already done so, open a workbook containing a grid, connect to anEssbase provider, and click Refresh.
2. Click View Comments in the Essbase ribbon (see Figure 1).
The Comment Edit dialog box is launched. The example in Figure 1 shows onecomment left on the sheet, which can be removed.
Figure 6-29 Comment Edit Dialog Box
3. To delete the entire comment, first click in the row to highlight the editable text; forexample, click in the "Oregon Coast" row to highlight it, as shown in Figure 2, then pressthe Delete key.
Figure 6-30 Comment Highlighted and Ready to be Deleted
Chapter 6Comments and Unknown Members on Essbase Sheets
6-51

After deletion, the text in the Comments column is removed, but the Cell ID is stilldisplayed (see Figure 3).
Figure 6-31 Comment Deleted, Cell ID Remaining
4. Click Apply Changes and view the changes in the sheet.
In Figure 4, cell F4 still shows as a commented cell, and will until the sheet isrefreshed.
Figure 6-32 Sheet After Clicking Apply Changes; Cell F4 Still Commented
5. Click Refresh; the comment style is cleared.
Figure 6-33 Grid After Refresh, Cell Style in Cell F4 Is Cleared
Chapter 6Comments and Unknown Members on Essbase Sheets
6-52

7Data Forms
Related Topics
• Working with Forms in ExcelForms are grid displays in which you can enter data into the database from Excel andview and analyze data or related text.
• Opening Forms in ExcelYou can open forms in Excel.
• Excel Formulas in FormsYou can create Excel formulas in form cells inside or outside the grid if the cells are notread-only or locked.
• Working with User VariablesYou can make user variable selections from the buttons in the POV toolbar in OracleSmart View for Office.
• EPM Cloud and Oracle Hyperion Planning FormsForms are grids for entering data, which you can then update, analyze, and report on.
• Financial Management Data FormsIf you are unfamiliar with Oracle Hyperion Financial Management, see the FinancialManagement documentation, available on Oracle Help Center.
Working with Forms in ExcelForms are grid displays in which you can enter data into the database from Excel and viewand analyze data or related text.
Certain dimension member values are fixed, giving you a specific view into the data.
Using Oracle Smart View for Office, you can work with forms in Excel with these OracleEnterprise Performance Management Cloud data sources:
• Planning
• Financial Consolidation and Close
• Tax Reporting
And with these Oracle Enterprise Performance Management System data sources:
• Oracle Hyperion Financial Management
• Oracle Hyperion Planning
Note:
Excel worksheets are always protected to prevent entering data for read-only cells.Therefore, some Excel functions, such as AutoSum and F9, are disabled.
7-1

In forms opened in Smart View:
• You can modify data values but not the form structure in forms.
• Values submitted to the database from Excel must be non-formatted data.
• If the administrator changes the form definition while you're working with the formin Excel, Oracle recommends that you close the form and reopen it. This actionensures that the newest form definitions are displayed.
• Customizations made to forms are preserved when you save or refresh only if theyare made outside the grid or if they are made to thousands and decimalseparators.
EPM Cloud users: See also Guidelines for Working with Native Excel Formatting andForms in EPM Cloud.
Oracle Hyperion Planning users: See also Guidelines for Working with Native ExcelFormatting and Oracle Hyperion Planning Forms.
Video
Your Goal Watch This Video
Learn about navigating in Smart View,including opening forms. Navigating Smart View
Opening Forms in ExcelYou can open forms in Excel.
Cloud data source types: Planning, Narrative Reporting, Financial Consolidation andClose, Tax Reporting
On-premises data source types: Oracle Hyperion Financial Management, OracleHyperion Planning
To open a form:
1. Connect to a data source.
2. In the Smart View Panel, perform an action:
• To open one form, expand the tree list and select the form you want to open.Then click Open form on the Action Panel.
• To open multiple forms, expand the tree list and select a forms folder. Thenclick Open forms on the Action Panel. In Select Form, follow the instructionsto open one or more forms.
3. (Planning only) To view any instructions that may be associated with the form,from the Planning ribbon, select More and then Instructions.
Chapter 7Opening Forms in Excel
7-2

Excel Formulas in FormsYou can create Excel formulas in form cells inside or outside the grid if the cells are not read-only or locked.
Cells that contain cell text can contain Excel formulas, but cells containing supporting detail(such as Planning cells) or line item detail (such as Oracle Hyperion Financial Managementcells) cannot.
Formulas are preserved in forms when you refresh the form even without saving the data,later open the saved worksheet, and when you expand or collapse rows and columns.
If you move a referential formula, its cell references are updated to reflect the new location.
In forms, you are prompted to save the workbook as an Excel file if you do any of thefollowing (but you temporarily lose access):
• Change the current page
• Take a Oracle Hyperion Planning form offline
• Select a different form
• Connect to a different data source
Working with User VariablesYou can make user variable selections from the buttons in the POV toolbar in Oracle SmartView for Office.
Cloud data source types: Planning, Financial Consolidation and Close, Tax Reporting
On-premises data source types: Oracle Hyperion Financial Management, Oracle HyperionPlanning
When an Oracle Enterprise Performance Management Cloud or Oracle Hyperion Planningform contains user variables, or when a Financial Management data form has selectabledimensions, rows, or columns, you can modify them in Smart View.
When you click on the user variable buttons, the Member Selection dialog box is displayed.You then select members applicable for the user variable. Any filters that apply to theselected user variable are loaded and viewable from the filter drop-down list. Once selectionsare made, you can easily change one or more of the user variable buttons, thus changing thePOV of a form in Smart View.
Figure 1 shows an example of user variables in a Planning form, where Allocation Expense,Allocation Quarter, and My Segment are user variables that can be modified to change thePOV of the form.
Figure 7-1 Example of User Variables in a Planning Form
In an example scenario, in data form design mode in Financial Management, you can selecteither a member list or multiple members for a dimension, such as Period, and use the Period
Chapter 7Excel Formulas in Forms
7-3

dimension on a row or column with the @CUR function. The Period dimension willthen be represented in Smart View with user variables.
Additionally, if you use the relative time period functionality in a Financial Managementdata form, you can have a member from the same dimension appear on the row,column, and POV. Smart View displays the relative time period members as uservariables in the POV toolbar. For information on using the relative time periodfunctionality and for setting up selectable dimensions, rows, and columns in FinancialManagement, see the Oracle Hyperion Financial Management Administrator's Guide .
To work with user variables for forms:
1. In the Smart View Panel, connect to a data source and open a form.
Notice the available user variables in the POV toolbar across the top of the sheet.Selectable buttons are enabled, non-selectable buttons are grayed out.
2. Click a user variable button to display the Member Selection dialog box.
3. From Member Selection, select one or members to add to the selected uservariable button.
EPM Cloud and Oracle Hyperion Planning : Alternatively, click the arrow in
and select Substitution Variables to select members as substitutionvariables.
4. In the Filter drop-down list, select an applicable filter (if filters are available).
5. Click OK.
6. Repeat step 3 through step 5 for all user variables buttons for which you want toselect members and apply filters.
7. To use the user variable buttons, click each button for which you want to applyselected members, and make a selection from the drop-down list.
8. Click Refresh to view the updated form.
EPM Cloud and Oracle Hyperion Planning FormsForms are grids for entering data, which you can then update, analyze, and report on.
Cloud data source types: Planning, Financial Consolidation and Close, TaxReporting
On-premises data source types: Oracle Hyperion Planning
Unless otherwise noted, in this chapter:
• "Forms" and " Planning forms" refers to forms in on-premises Oracle HyperionPlanning and forms in Oracle Enterprise Performance Management Cloud (EPMCloud).
• EPM Cloud refers to these services:
– Planning
– Financial Consolidation and Close
– Tax Reporting
Chapter 7EPM Cloud and Oracle Hyperion Planning Forms
7-4
Note:
If you are unfamiliar with EPM Cloud, see the " Working With " guides for your cloudservice, available on the Oracle Help Center.
If you are unfamiliar with Oracle Hyperion Planning, see Oracle Hyperion PlanningUser's Guide , available on the Oracle Help Center. To open this library, from theSmart View ribbon, select the arrow next to Help, and then Documentation.
Related Topics:
Planning and EPM Cloud Form Behavior in Smart View
Displaying the Floating Toolbar in Planning Forms
Saving Ad Hoc Grids
Performing Ad Hoc Analysis in Forms
Using the Drop-down Member Selector on Row Dimensions in Forms
Inserting Charts
Working with Valid Intersections
Flex Forms
Planning and EPM Cloud Form Behavior in Smart ViewForms behave differently in Oracle Smart View for Office than they do in Planning and OracleEnterprise Performance Management Cloud applications.
• Attributes in Planning forms are not displayed in Smart View.
• Saving ad hoc grids as forms is not supported for grids containing attributes.
• Multiple levels in an outline are displayed differently in Smart View than pages on the webapplication. Smart View displays up to four levels, while the web application displays upto two levels.
• Excluding members does not affect totals on a form. When a member is excluded in theform definition (layout), the member is only excluded from displaying on the form; themember is not excluded from calculation.
• If an administrator hides a dimension in the row axis of a form, this dimension does notdisplay in the row header of the form in Smart View.
• If an administrator has set up a form to use formatting from the web application, and notfrom Smart View, then no Smart View formatting options (from the Options dialog,Formatting tab) will be applied. This is true whether the Use Cell Styles or Use ExcelFormatting option is selected in Smart View.
• In composite forms, sections that display as charts in the web application will display asgrids in Smart View.
• In forms, the handling of decimal place settings between Excel, Smart View, and OracleHyperion Planning may, at times, cause rounding issues in submitted data. This canoccur even when the decimal precision is set to two decimal places in both Excel and
Chapter 7EPM Cloud and Oracle Hyperion Planning Forms
7-5
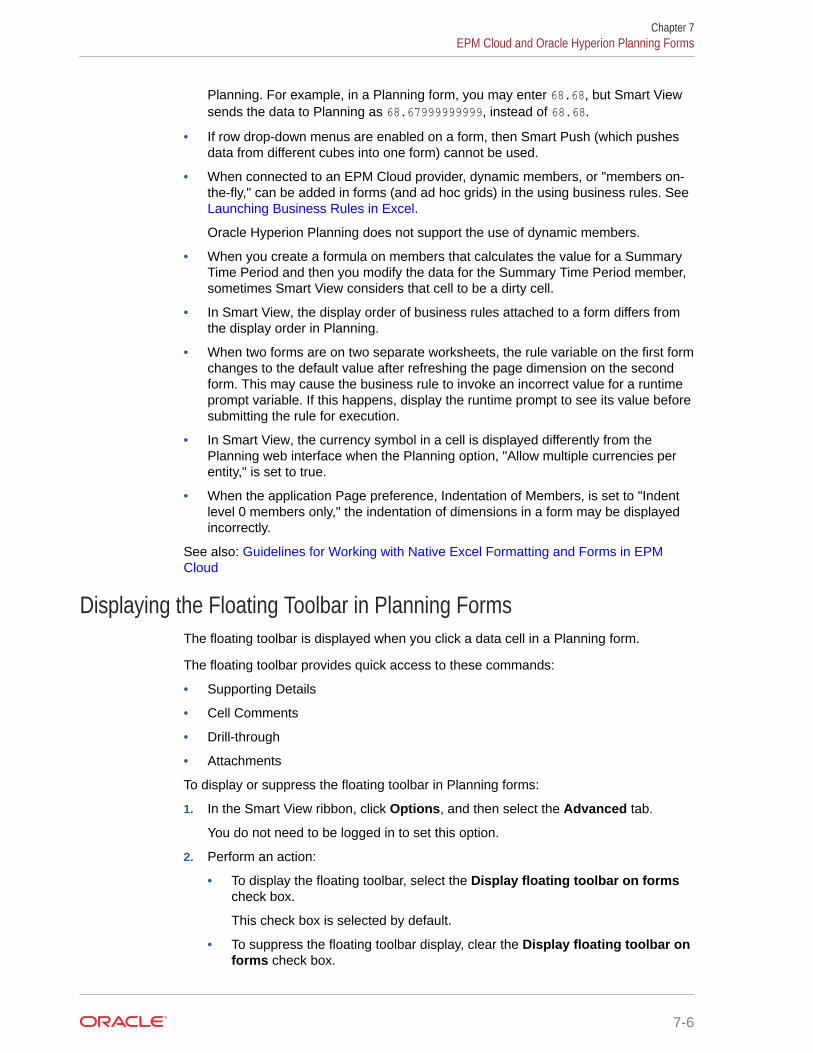
Planning. For example, in a Planning form, you may enter 68.68, but Smart Viewsends the data to Planning as 68.67999999999, instead of 68.68.
• If row drop-down menus are enabled on a form, then Smart Push (which pushesdata from different cubes into one form) cannot be used.
• When connected to an EPM Cloud provider, dynamic members, or "members on-the-fly," can be added in forms (and ad hoc grids) in the using business rules. See Launching Business Rules in Excel.
Oracle Hyperion Planning does not support the use of dynamic members.
• When you create a formula on members that calculates the value for a SummaryTime Period and then you modify the data for the Summary Time Period member,sometimes Smart View considers that cell to be a dirty cell.
• In Smart View, the display order of business rules attached to a form differs fromthe display order in Planning.
• When two forms are on two separate worksheets, the rule variable on the first formchanges to the default value after refreshing the page dimension on the secondform. This may cause the business rule to invoke an incorrect value for a runtimeprompt variable. If this happens, display the runtime prompt to see its value beforesubmitting the rule for execution.
• In Smart View, the currency symbol in a cell is displayed differently from thePlanning web interface when the Planning option, "Allow multiple currencies perentity," is set to true.
• When the application Page preference, Indentation of Members, is set to "Indentlevel 0 members only," the indentation of dimensions in a form may be displayedincorrectly.
See also: Guidelines for Working with Native Excel Formatting and Forms in EPMCloud
Displaying the Floating Toolbar in Planning FormsThe floating toolbar is displayed when you click a data cell in a Planning form.
The floating toolbar provides quick access to these commands:
• Supporting Details
• Cell Comments
• Drill-through
• Attachments
To display or suppress the floating toolbar in Planning forms:
1. In the Smart View ribbon, click Options, and then select the Advanced tab.
You do not need to be logged in to set this option.
2. Perform an action:
• To display the floating toolbar, select the Display floating toolbar on formscheck box.
This check box is selected by default.
• To suppress the floating toolbar display, clear the Display floating toolbar onforms check box.
Chapter 7EPM Cloud and Oracle Hyperion Planning Forms
7-6

3. Click OK to save your selection.
Saving Ad Hoc GridsCloud data source types: Planning, Planning Modules, Financial Consolidation and Close,Tax Reporting
On-premises data source types: Oracle Hyperion Planning
If you have been assigned the ad hoc grid creator role, you can save ad hoc grids.
Note:
In this topic, references to forms apply to Oracle Enterprise PerformanceManagement Cloud Planning, Planning Modules, Financial Consolidation andClose, and Tax Reporting; and to on-premises Oracle Hyperion Planning.
To save an ad hoc grid:
1. With the ad hoc grid active, from the provider ad hoc ribbon, click Save Ad Hoc Grid.
Saving ad hoc grids is not supported for grids containing attributes.
2. In Save Grid As, enter a name, path to the location where you want to save the grid, anddescription for the grid.
3. Optional: Select Submit Formatting to save any Excel formatting or cell style changesthat have been applied to the grid.
See Saving Native Excel Formatting to EPM Cloud for additional notes and guidelinesabout saving formatting in ad hoc grids and forms.
Note:
EPM Cloud applications: If your Service Administrator has set the Smart ViewAd Hoc Behavior option to Standard in your application, then the SubmitFormatting option is not available.
4. Click OK.
The saved grid is displayed in the Smart View Panel tree list in the location that youselected in step 2.
5. To open a saved grid as an ad hoc grid:
• In Oracle Smart View for Office 21.100+, double-click the grid in the tree list. Whendouble-clicking a saved ad hoc grid in the tree, the default is to open it as an ad hocgrid.
• In Smart View 20.200 and earlier, right-click the grid in the tree list and select Ad hocanalysis.
Alternatively, you can right-click the ad hoc grid in the tree and choose to open it as aform.
Chapter 7EPM Cloud and Oracle Hyperion Planning Forms
7-7

Performing Ad Hoc Analysis in FormsCloud data source types: Planning, Financial Consolidation and Close, TaxReporting
On-premises data source types: Oracle Hyperion Planning
If you have been assigned the ad hoc user role by the administrator, you can performad hoc analysis on forms that have been enabled for ad hoc by the administrator.
To perform ad hoc analysis in forms:
1. Do one of the following:
• Open the form and then, from the Smart View ribbon, click Analyze. Thisbutton is enabled only if the current form has been enabled for ad hocanalysis.
• Select the form in the Smart View Panel and click Ad hoc analysis in theAction Panel.
Note:
You may see a difference in the grid POV depending on which methodyou used to launch ad hoc.
2. See Ad Hoc Analysis for information about performing ad hoc analysis.
Using the Drop-down Member Selector on Row Dimensions in FormsData source types: Planning, Financial Consolidation and Close, Tax Reporting
In forms, service administrators and form designers can set up easy-to-use drop-downmember selectors on row dimensions. When these drop-down selectors are enabled,the form users can directly select a member from the drop-down list on the rowdimension in the form.
The drop-down member selector also allows users to add data to member rows thatmay have otherwise been suppressed.
In forms where members have been excluded, drop-down member selectors can beconfigured to display or hide the excluded members.
When using the drop-down member selector, keep in mind the following:
• There is no visual notification as to which members have drop-downs enabled; youmust click a dimension cell and, if a down arrow appears next to the cell, thenthere is a drop-down list enabled.
• The drop-down content (list of members) is controlled by the form definition for thecorresponding segment.
• Selections are not retained. The drop-down selection will be lost on refresh. If youperform a Refresh after selecting a member from the drop-down, the selection islost and the form returns to its original state.
Chapter 7EPM Cloud and Oracle Hyperion Planning Forms
7-8

• The drop-down selection will be lost on saving data. Modifying data cells and saving theExcel worksheet will not retain modified drop-down selections.
• Duplicate member or alias names: The drop-down member selector does not displayduplicate member or alias names in their qualified format. You can select duplicatemember or alias names from the drop-down list, but you cannot submit data for them.
• Composite forms: Using the drop-down member selector with row dimensions is notsupported.
To use this feature in Oracle Smart View for Office requires configuration in the FormDesigner in the web interface. The service administrator or form designer specifies the drop-down selectors as segment properties for particular dimensions. For example, suppose thereare two dimensions placed on row axes, Entities and Line item; the member selector drop-down may be enabled for the Entity dimension members, for the Line item dimensionmembers, or for both. Configuration is described in Administering Planning .
To use the drop-down selector in a form, click on row dimension or member names in a form.If a drop-down arrow appears, click it to view and select members from the drop-down list, asshown in Figure 1.
Figure 7-2 Drop-down Member Selector on a Row Dimension Cell
Example
In this example from Planning, rows with #Missing values are suppressed, and you weretasked with inputting the values for the Sentinal Standard Notebook. It happens that in thedatabase, the values for the Sentinal Standard Notebook for January through June are all#Missing. When you open the form, there is no row for Sentinel Standard Notebook.
Chapter 7EPM Cloud and Oracle Hyperion Planning Forms
7-9

Use the drop-down member selector on a row and choose Sentinal StandardNotebook from the list.
Sentinal Standard Notebook now appears in place of Envoy Standard Netbook. Notethat the data values in the row have not changed. You can type over the existingvalues to input the values you require. In this example, you would type 500 in eachmonth column, January through June.
In the Planning ribbon, click Submit. Note that the row for Sentinal Standard Notebookis added to the form as this row now contains values. Also, the values in the row forComputer Equipment are recalculated. Only the modified values are saved for the
Chapter 7EPM Cloud and Oracle Hyperion Planning Forms
7-10

drop-down member that was changed. No inherited values from other members are changed.
Inserting ChartsStarting in release 11.1.2.5.700, you can insert forms as charts into Microsoft PowerPoint,giving you a graphical display of the information in the form.
Data source types: Planning, Planning Modules, Financial Consolidation and Close, TaxReporting
Oracle Smart View for Office renders the form information as a chart in PowerPoint. You canuse the chart tools in PowerPoint to change the chart design and format. You can insert aSmart View POV reporting object to change the POV of the chart.
Certain forms may or may not make ideal charts. Some form data may not present itself wellin chart format. For example, a balance sheet form may not make a useful chart. However, amonthly revenue form may be a good candidate for the chart format. Oracle recommendsinvestigating with the forms available to you and working with the forms designers to meetyour requirements for charts.
Note:
• The Insert Chart functionality is not available in Word or Excel.
• Smart View does not support directly inserting stepped and curved line charts.When inserting a stepped or curved line chart, Smart View will substitute theclosest match, a default line chart.
To insert and edit a chart in PowerPoint:
1. Launch PowerPoint and connect to the data source.
2. Navigate to the form and select it.
3. In the Action Panel, select Insert Chart.
Alternatively, right-click the form name and select Insert Chart; for example:
Chapter 7EPM Cloud and Oracle Hyperion Planning Forms
7-11

The chart is inserted on the slide, where it can be selected and edited; in thefollowing example, the slide width has been stretched from its initial state:
4. Optional: To change the POV of the chart, insert the POV control and modify thePOV.
a. In the Document Contents pane, select the data source for the chart, thenselect Insert New Reporting Object/Control.
In the following example, the data source is signified by the blue bar:
Chapter 7EPM Cloud and Oracle Hyperion Planning Forms
7-12
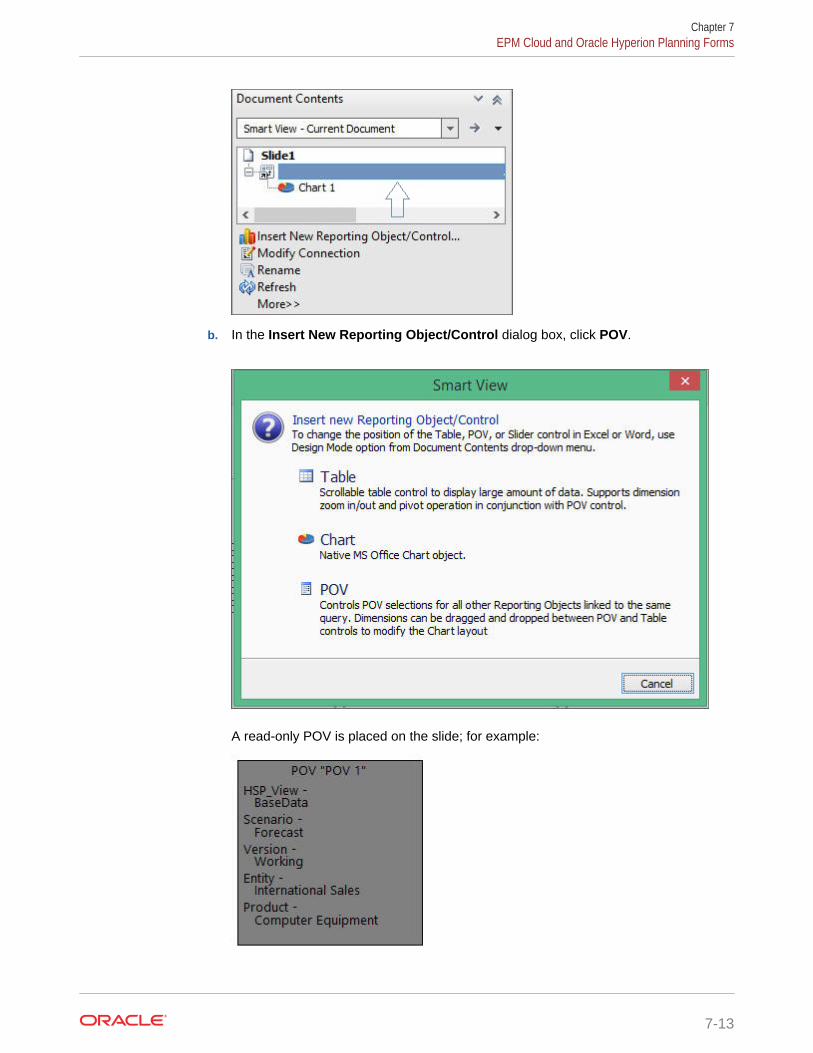
b. In the Insert New Reporting Object/Control dialog box, click POV.
A read-only POV is placed on the slide; for example:
Chapter 7EPM Cloud and Oracle Hyperion Planning Forms
7-13
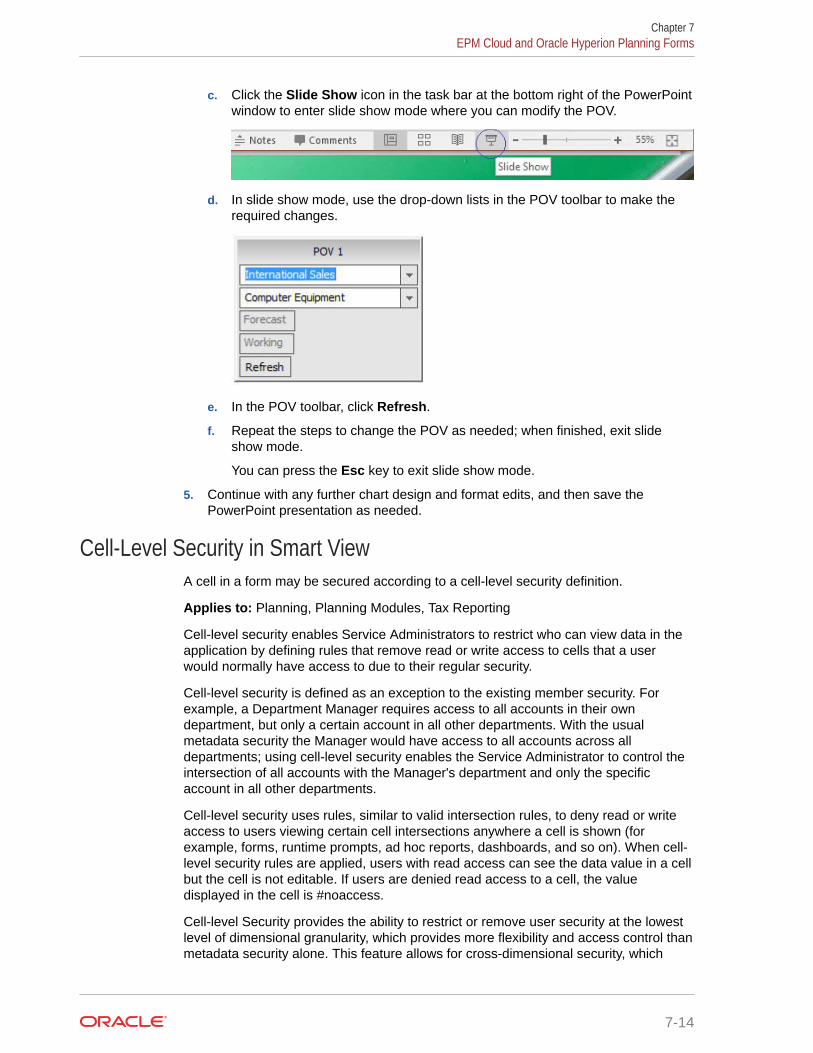
c. Click the Slide Show icon in the task bar at the bottom right of the PowerPointwindow to enter slide show mode where you can modify the POV.
d. In slide show mode, use the drop-down lists in the POV toolbar to make therequired changes.
e. In the POV toolbar, click Refresh.
f. Repeat the steps to change the POV as needed; when finished, exit slideshow mode.
You can press the Esc key to exit slide show mode.
5. Continue with any further chart design and format edits, and then save thePowerPoint presentation as needed.
Cell-Level Security in Smart ViewA cell in a form may be secured according to a cell-level security definition.
Applies to: Planning, Planning Modules, Tax Reporting
Cell-level security enables Service Administrators to restrict who can view data in theapplication by defining rules that remove read or write access to cells that a userwould normally have access to due to their regular security.
Cell-level security is defined as an exception to the existing member security. Forexample, a Department Manager requires access to all accounts in their owndepartment, but only a certain account in all other departments. With the usualmetadata security the Manager would have access to all accounts across alldepartments; using cell-level security enables the Service Administrator to control theintersection of all accounts with the Manager's department and only the specificaccount in all other departments.
Cell-level security uses rules, similar to valid intersection rules, to deny read or writeaccess to users viewing certain cell intersections anywhere a cell is shown (forexample, forms, runtime prompts, ad hoc reports, dashboards, and so on). When cell-level security rules are applied, users with read access can see the data value in a cellbut the cell is not editable. If users are denied read access to a cell, the valuedisplayed in the cell is #noaccess.
Cell-level Security provides the ability to restrict or remove user security at the lowestlevel of dimensional granularity, which provides more flexibility and access control thanmetadata security alone. This feature allows for cross-dimensional security, which
Chapter 7EPM Cloud and Oracle Hyperion Planning Forms
7-14

means the same dimension member from one dimension may have different access basedon combinations of other dimension members.
Note the following when working with cell-level security in Oracle Smart View for Office:
• If a user does not have access to a cell, cell styles are not applied to cells for Commentsand Attachments. However, these styles are applied when using the same form or grid inthe web.
• Ribbon commands, right-click menu commands, and floating toolbar commands in SmartView will still be enabled, even if cell-level security has resulted in the cell containing#NoAccess. For example, if the cell contains #NoAccess, the user can attempt to performa cell-level command, such as Supporting Detail, Attachments, Cell History, or CellComments, but these commands are not valid for #NoAccess.
Service Administrators define cell-level security in the web application. For more information,see Defining Cell-Level Security in Administering Planning.
Working with Valid IntersectionsRelated Topics
• About Valid Intersections
• Working with Valid Intersections in Page Drop-down Lists
• Working with Valid Intersections in Forms
About Valid IntersectionsData source types: Planning
Your Planning administrator can enable applications for valid intersections. In forms, validintersections allow you to view or enter data only at predefined "valid" intersections.
For example, valid intersections might consist of a subset of Segment members which arevalid only with a limited list of departments, or specific programs which are valid only forcertain time periods.
Forms that are enabled for valid intersections can provide faster data entry and simplifiedplan validation resulting in higher quality Planning data, as well as easier maintenance ofdata entry forms. Data integrity is still maintained at "invalid" intersections.
When valid intersections are defined in an application, then cell intersections considered"invalid" are read-only.
Note:
Planning Administrators: In this guide, the topics on valid intersections areprimarily intended for Oracle Smart View for Office end users. For more informationon setting up valid intersections in forms, see "Defining Valid Intersections" inAdministering Planning .
Working with Valid Intersections in Page Drop-down ListsData source type: Planning
Chapter 7EPM Cloud and Oracle Hyperion Planning Forms
7-15

See also:
• Working with Valid Intersections in Page Drop-down Lists
• Working with No Members in Page Drop-down Lists
To select members when valid intersections are enabled in a form:
1. Open a form.
The form renders with member selections as specified in the form definition,adhering to your access rights for dimensions, and applies valid intersectiongroups with the most recently used as current selections.
2. Verify that the form is enabled for valid intersections by looking for the <ClearSelection> option at the bottom of the Page drop-down member selectors.
If an application is enabled for valid intersections, the <Clear Selection> optionappears at the bottom of the Page drop-down member selectors.
For example, in Option in the POV Drop-Down Member Selector, the <ClearSelection> option is highlighted in the Page drop-down list for the Entitydimension.
Figure 7-3 The <Clear Selection> Option in the Page Drop-Down MemberSelector
3. Optional: Select <Clear Selection> in all selectable Page drop-down lists andnote that <Select Member> now appears in the Page member selectors.
For example, in Option in the POV Drop-Down Member Selectors, the <SelectMember> option is displayed in the Page selector for both the Entity and Productdimensions.
Chapter 7EPM Cloud and Oracle Hyperion Planning Forms
7-16

Figure 7-4 The <Select Member> Option in the Page Drop-Down MemberSelectors
4. Make selections in each Page drop-down list, and then click Refresh.
The form generally behaves as any simple Planning form; however, when working withvalid intersections, the selections available to you in the Page selector for a dimensionmay depend on the member you chose in the Page selector for a different dimension.
Example 7-1 Working with Valid Intersections in Page Drop-down Lists
Valid intersection rules are set up by Planning administrators in the Planning web application.In Figure 3, valid intersection rules are set up as follows.
• When the 403:Sales member is selected in the Entity dimension, all products in theProduct dimension are available for selection.
• When the 410:International Sales member is selected in the Entity dimension, then themembers P_260:Game, P_270:Camera, and P_280:Television are not available forselection. All other members are available for selection.
• When the 421:Sales NorthEast member is selected in the Entity dimension, then themembers P_220:Software Suite and P_250:Network Card are not available for selection.All other members are available for selection.
Figure 7-5 Valid Intersections Rules Constructed in Planning Web Application
Chapter 7EPM Cloud and Oracle Hyperion Planning Forms
7-17

Now let's see how the rules set up in Figure 3 are exposed in Oracle Smart View forOffice.
In the following examples, we'll demonstrate the valid intersection rules noted above.We'll select members in Entity and Product to change the point of view of the form,within the scope of the valid intersection rules.
0 shows a newly-opened form. The form has five dimensions. We can change thePage member on two of the dimensions.
Figure 7-6 Planning Form with Access to Member Selection on TwoDimensions
According to the valid intersection rules:
• When the 403:Sales member is selected in the Entity dimension, all products inthe Product dimension are available for selection. For example:
• When the 410:International Sales member is selected in the Entity dimension, thenthe members P_260:Game, P_270:Camera, and P_280:Television are notavailable for selection. All other members are available for selection. For example:
Chapter 7EPM Cloud and Oracle Hyperion Planning Forms
7-18

• When the 421:Sales NorthEast member is selected in the Entity dimension, then themembers P_220:Software Suite and P_250:Network Card are not available for selection.All other members are available for selection. For example:
Example 7-2 Working with No Members in Page Drop-down Lists
The scenario shown in Figure 5, where there are no members to select from in the Productdimension Page drop-down list, might come about in at least a couple of different ways. Forexample, the Planning administrator may have configured any of the following:
• Defined a valid intersection rule that excludes members of the Product dimension when440:Sales Central is selected for the Entity dimension.
• Defined a valid intersection rule that excludes P_260:Game, P_270:Camera, andP_280:Television when 440:Sales Central is selected for the Entity dimension, but theform is designed for only those three members.
In either case, when 440:Sales Central is selected for Entity, there are no Product membersto select from in the Page drop-down list, and only <Select Member> is displayed.
Chapter 7EPM Cloud and Oracle Hyperion Planning Forms
7-19

Figure 7-7 Page Drop-down List with No Available Members to Select
Working with Valid Intersections in FormsData source type: Planning
See also:
Working with Valid Intersections in Forms
1. Open a form.
The form renders with member selections as specified in the form definition,adhering to your access rights for dimensions, and applies valid intersectiongroups with the most recently used as current selections.
2. Verify that the form is enabled for valid intersections by looking for the <ClearSelection> option at the bottom of a Page drop-down list.
See Working with Valid Intersections in Page Drop-down Lists.
3. Enter and submit data in writable cells at valid intersections.
In Figure 1, with the member 420:Sales East selected for the Entity dimension,cells for each product are writable. The cells for P_TP1:Computer Equipment andP_TP2:Computer Accessories are not writable as these cells roll up the total of thedata in the product cells.
Chapter 7EPM Cloud and Oracle Hyperion Planning Forms
7-20

Figure 7-8 Form with Writable Cells, No Invalid Intersections
Example 7-3 Working with Valid Intersections in Forms
• Similar to the examples shown in Working with Valid Intersections in Page Drop-downLists, when the 410:International Sales member is selected in the Entity dimension, theProduct dimension members, P_260:Game, P_270:Camera, and P_280:Television arenot available for editing. In Figure 2, cells at those intersections are signified as noteditable by #Missing.
Other cells in the form are editable and considered valid intersections.
Chapter 7EPM Cloud and Oracle Hyperion Planning Forms
7-21
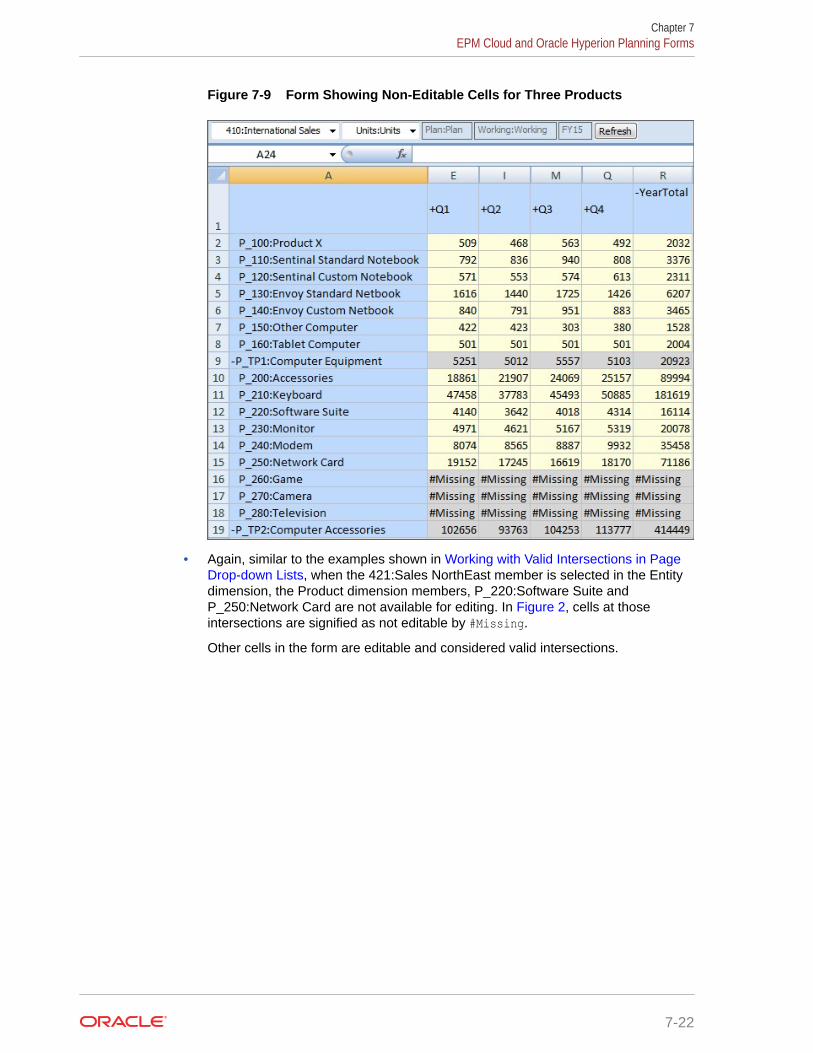
Figure 7-9 Form Showing Non-Editable Cells for Three Products
• Again, similar to the examples shown in Working with Valid Intersections in PageDrop-down Lists, when the 421:Sales NorthEast member is selected in the Entitydimension, the Product dimension members, P_220:Software Suite andP_250:Network Card are not available for editing. In Figure 2, cells at thoseintersections are signified as not editable by #Missing.
Other cells in the form are editable and considered valid intersections.
Chapter 7EPM Cloud and Oracle Hyperion Planning Forms
7-22
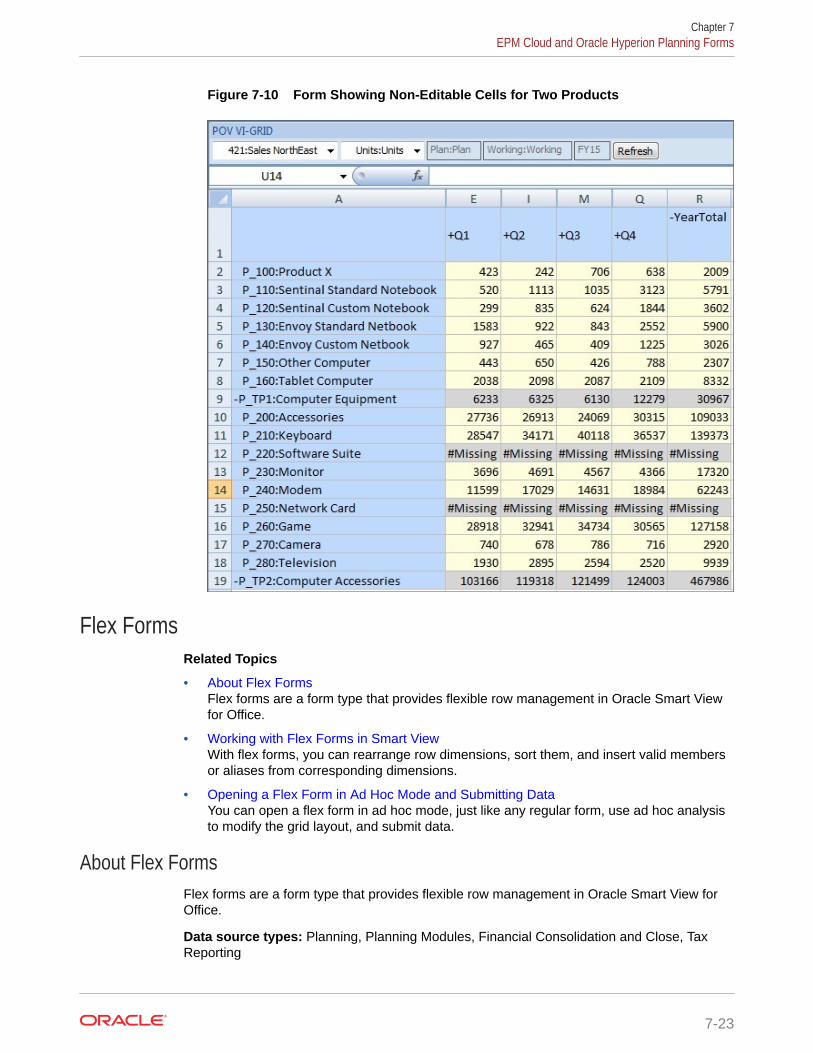
Figure 7-10 Form Showing Non-Editable Cells for Two Products
Flex FormsRelated Topics
• About Flex FormsFlex forms are a form type that provides flexible row management in Oracle Smart Viewfor Office.
• Working with Flex Forms in Smart ViewWith flex forms, you can rearrange row dimensions, sort them, and insert valid membersor aliases from corresponding dimensions.
• Opening a Flex Form in Ad Hoc Mode and Submitting DataYou can open a flex form in ad hoc mode, just like any regular form, use ad hoc analysisto modify the grid layout, and submit data.
About Flex FormsFlex forms are a form type that provides flexible row management in Oracle Smart View forOffice.
Data source types: Planning, Planning Modules, Financial Consolidation and Close, TaxReporting
Chapter 7EPM Cloud and Oracle Hyperion Planning Forms
7-23

Flex forms retain all regular form properties and features, such as running businessrules attached to the flex form. However, using flex forms, you can rearrange rowmembers, and sort or move rows. Modified row order is maintained on refresh andduring submit. You can also filter data using Excel's filtering functionality. Dimensionand member row cells and all data cells in a flex form are unprotected. Columnheaders and the top left blank cells of a flex form are protected.
In the web interface, during form definition, administrators select Enable flex formunder Smart View Options in the Layout tab to enable flex form-specific features.
In Smart View, the Sheet Info dialog displays the Sheet type for flex forms as "Flexform."
Note:
Flex forms are used only in Smart View and not in the web interface.
Related Topics:
• Video
• Requirements
• Guidelines
Video
Your Goal Watch This Video
Learn about how to enable and work with flexforms in Planning Planning with Flex Forms in EPM
Cloud Planning
Requirements
• Oracle Enterprise Performance Management Cloud 20.04 or later
• Smart View 11.1.2.5.910 or later
Guidelines
Following are guidelines for working with flex forms:
• Any modification to a flex form will not be persisted between sessions.
When a user modifies a flex form, the modified grid layout will only be persisted inthe context of the current session. Reopening a flex form reverts the flex formlayout to its original state.
• These form features are not supported for flex forms:
– Segment Properties:
* Hide
* Read-only
* Enable drop-down for dimensions (row dimension drop-downs memberselectors)
Chapter 7EPM Cloud and Oracle Hyperion Planning Forms
7-24

* Suppress hierarchy
Note:
After rows are rearranged or sorted, Segment properties will not beretained.
– Spreading
– Validation Rules
– Row or column formulas
– Using flex forms inside composite forms
• You cannot modify column members. You can only modify row members.
• You may insert and delete rows in a flex form using the Insert and Delete options on theright-click menu in Excel.
• You may delete rows using the Delete key. However, when deleting rows containingmultiple dimension, be sure to select all the dimension members in the row beforepressing Delete.
In the following example, there are three row dimensions on a flex form, Accounts,Market, and Year:
D-Acc US Market FY18D-Acc US Market FY19D-Acc US Market FY20To remove the row for FY18 using the Delete key, be sure to select all three dimensionmembers, D-Acc, US Market, and FY18 using the Ctrl key or Shift key, then press Delete.
• Inserting or deleting columns is not supported on flex forms.
• Copy and paste is limited to the scope of the form definition. Flex forms must adhere tothe hierarchies as defined in the form. Therefore, you cannot have any flex formmembers that are not part of the defined row members of the form.
• Subtotaling calculation scripts and currency conversion calculation scripts will begenerated and executed based on the original form definition.
• Comments are not preserved if they are entered directly below the form. Enter commentsto the right of the grid.
• When working with flex forms with multiple dimensions on rows (when two or moredimensions with multiple members are placed on a row):
– By design, + and - for expand/collapse are not supported for flex forms. Instead, usethe Expand/Collapse command on the right-click Smart View context menu.
– During form definition, to place dimensions members on separate rows, in MemberSelection on the flex form, choose Place selection in separate rows. See SelectingMembers for Forms in Administering Planning.
• Users can select row members to add to a flex form using the Member Selection dialogbox, available from the provider ribbon; for example, from the Planning ribbon. TheMember Selection option is available only on flex forms, not on simple forms.
Chapter 7EPM Cloud and Oracle Hyperion Planning Forms
7-25

Note:
The Member Selection option is available in Smart View 21.100+.
Use the Member Selection dialog to add row members to a flex form, similar toadding members to an ad hoc grid. The members you can add depend on theunderlying form definition for the row dimensions:
– If the Dimension Properties setting, Allow flexible definition, is selected,users may select members outside those specified in the form definition. Forexample, suppose a form includes only the Computer Accessories membersfrom the Product dimension. If Allow flexible definition is selected for theProduct dimension, then users may add other members from Product, such asNotebooks or Tablets, to the flex form. These members will be retained uponrefresh.
– If specific members are excluded from a dimension in a flex form, then, eventhough you may be able to select and add them in the Member Selectiondialog, they will be removed upon refresh.
Member Selection uses the default alias table defined at the application level.When members are inserted on the grid, the members are displayed as membernames until a Refresh is performed, and then aliases are displayed correspondingto the application setting.
• Filtering does not disable Submit Data as it is only hiding certain rows. Sortingdisables Submit Data as it changes member order in the column. After sorting youmust refresh to submit data.
• When a user adds a member that is a parent or child of a member already presenton a flex form and refreshes, the child member will be collapsed, even in caseswhere the Dimension property, Start expanded, is selected during form design. Tothe user, it may look like the child member was removed, but the child membercan be viewed by expanding the parent using the Expand/Collapse commands onthe Smart View context menu.
• When entering numeric member names or shared members on a flex form, enter asingle quotation mark ( ' ) before the member name.
For example, for a numeric member name, such as 4077, enter:
'4077For shared members, enter member names in the format:
'[Parent].[Shared Member]For example:
'[Sales Director 2].[410]'[Default_Sales Director 2].[Default_International Sales]
• To avoid undesirable sorting results, do not apply sorting to an entire column.Instead, select the grid members to sort, and then use Excel's Sort commands,Sort A to Z or Sort Z to A, or perform a custom sort.
• After applying a filter to a row dimension, and then applying a sort within the filterdrop-down dialog, the sort indicator arrow appears on the filter button within thegrid. However, after a Refresh, the sort indicator arrow on the filter button is nolonger displayed.
Chapter 7EPM Cloud and Oracle Hyperion Planning Forms
7-26

• User variables, dynamic user variables or substitution variables are supported on flexform rows. Users should change variables on the POV and perform a refresh for the rowsto update them to the new members.
• Excluded members may be entered on flex form rows. Members that are excluded in theform definition can be entered on flex form rows and users are able to enter values andsubmit.
• During form definition, when the Allow flexible definition property is applied to rowdimensions in flex forms, Smart View users may enter members outside the formdefinition for dimensions within the row axis of the form. This allows flex form users toenter data for members that are not displayed on the flex form. Users must have accessto the valid members that they enter.
For example, using the Vision application, suppose the Product dimension is placed as arow dimension in a flex form. During form definition, only the Sentinal Standard Notebookand Sentinal Custom Notebook members in the Product dimension have been selectedfor display on the form. By enabling the Allow flexible definition option for the Productdimension, Smart View users may enter other products from the Product dimension, suchas Tablet Computer or Keyboard, in the rows in the flex form. As long as they haveaccess to those members, users can either add rows for additional members to theexisting flex form or replace existing Product members with the Product members theyrequire.
During form definition, note the following when enabling the Allow flexible definitionproperty:
– In Dimension Properties, the Allow flexible definition option will only be visible ifthe Enable flex forms option is selected in Smart View Options.
– When there are multiple dimensions on the form rows, Oracle recommends that youselect the Allow flexible definition property for each applicable row dimensionindividually. You may use the Dimension Properties option, Apply to all rowdimensions, to apply the Allow flexible definition property to all dimensions;however, use with care as all other dimension property selections will also be appliedto all other dimensions on the row segment.
See Designing Flex Forms in Oracle Hyperion Planning Administrator's Guide .
• The form definition segment properties Hide and Read-only are supported for columnsonly, not for rows, in flex forms.
• When a flex-enabled form is opened in an ad hoc mode, the row dimension indentation islost on submitting data. Refreshing the data restores the indentation to normal.
• The Suppress Missing Blocks and Suppress Missing Rows options defined in the web fora flex form are applied only when first opening the flex form in Smart View. TheseSuppress options are not applied on Refresh or Save operations in Smart View. Onceyou perform an operation on a flex form, the Smart View option settings for SuppressMissing Blocks and Suppress Missing Rows are applied.
Note:
In Smart View, the Suppress Missing Blocks option is not applied on a Submit.Instead, perform a refresh after saving.
• Data validation rules within forms are not supported when using flex forms. Instead,convert data validation rules to Groovy rules.
Chapter 7EPM Cloud and Oracle Hyperion Planning Forms
7-27

• Smart Push is supported on flex forms.
• On a filtered flex form, Smart Push does not honor the context of the selectedform.
• An administrator can configure action menus to run business rules or open a flexform from a flex form. The action menu items are accessed from the right-clickSmart View context menu. The action menu items may be defined to appear onthe right-click menu anywhere on the flex form or when right-clicking, for example,in specific dimensions, members, rows, columns, or cells.
Right-click menus that are available in the web application for the POV and Pagedimensions are not available on flex forms in Smart View.
In Administering Planning, for information on setting up action menu items for flexforms, see Administering Action Menus; for additional information on flex forms,see Designing Flex Forms.
• Flex forms do not support enabling Show Currency for the Entity dimension.
• Flex forms are not supported for Smart Forms.
• To retain modified members on a flex form after a POV or user variable change,you must enable the Flex Forms: Preserve Grid on POV and User VariableChanges option. In the Smart View ribbon, click Options, then select the MemberOptions tab, and then select the option, Flex Forms: Preserve Grid on POV andUser Variable Changes. If this option is not selected, any added rows in the flexform will be removed upon a POV or user variable change.
After selecting the Flex Forms: Preserve Grid on POV and User VariableChanges option, add or delete members on the flex form grid, and click Refresh.Then change a POV member and click Refresh; or change a user variable andthe flex form refreshes automatically. Your modified members are retained. Youcan now enter and submit data against the modified POV and user variables inany of the members in the flex form, including any newly-added members.Optionally, change the POV or any user variable again and refresh, and thencontinue entering data against the updated POV and user variables.
Working with Flex Forms in Smart ViewWith flex forms, you can rearrange row dimensions, sort them, and insert validmembers or aliases from corresponding dimensions.
Perform a refresh prior to submitting data in the modified form Smart View. Uponrefresh, invalid members, comments, and empty rows are removed and the SubmitData button is enabled.
To work with a flex form:
1. Connect to a data source.
2. In the Smart View Panel, expand the tree list, then right-click the form you want toopen, and then select Open flex form.
In the tree list in the Smart View Panel, the following icon indicates a flex form:
3. Modify the data as per your requirements.
Chapter 7EPM Cloud and Oracle Hyperion Planning Forms
7-28
For example, some actions you may perform are:
• Rearrange or move row members
• Insert rows
• Add members. You can add members using Member Selection (on the providerribbon) or hand-typing member names.
• Sort rows using the Sort button on the Excel Data ribbon
• Filter on row members or data using the Sort & Filter on the Excel Home ribbon orthe Filter button on the Excel Data ribbon
• Sort row members using the Sort & Filter button on the Excel Home ribbon, the Sortbutton on the Excel Data ribbon, or the filter on the form
• Run a business rule from the provider ribbon or from an action menu
• Right-click a member or data cell to access the Smart View context menu; applicablecommands for the cell are available on the menu
• Delete rows
Note:
• The Submit Data button is disabled when you edit row members. Filteringis not considered editing; if you only add filters, you may still submit data.
• In the Smart View Options dialog, Formatting tab, the Repeat MemberLabels is required to be enabled for flex forms. You may attempt to clearthe check box, but upon refresh, the check box will again be selected andthe Repeat Member Labels option will be enabled.
4. Optional: To retain added members on a flex form after a POV or user variable change:
a. In the Smart View ribbon, click Options.
b. In the Options dialog, select the Member Options tab.
c. Select Flex Forms: Preserve Grid on POV and User Variable Changes.
Note:
If this option is not selected, any added rows in the flex form will beremoved upon a POV or user variable change.
d. Optional: Add or delete members in the flex form, and click Refresh.
e. Perform these tasks as you require:
• Change a POV member and click Refresh
• Change a user variable; the flex form refreshes automatically.
Your modified members are retained. You can now enter and submit data against themodified POV and user variables in any of the members in the flex form, includingany newly-added members.
Chapter 7EPM Cloud and Oracle Hyperion Planning Forms
7-29

f. Optional: Change the POV or any user variable again and refresh, and thencontinue entering data against the updated POV and user variables.
5. Optional: Right-click a cell in the form and, from the context menu, select SmartView, and then select a provider action menu item:
• To run a business rule, select the name of the busines rule.
• To open a flex form or simple form, select the form to open.
In flex forms, only the above actions are supported on action menus.
Note:
Action menu options may differ depending on the member or data cellyou select. The selections available depend on the form definition.
6. Click Refresh.
On refresh, Oracle Smart View for Office maintains modifications and removesinvalid members from the form.
Note:
The Submit Data button is enabled only after the refresh. However, themodified form layout is not stored on the server; it is maintained only inthe context of the current session.
7. To submit changed data, in the provider ribbon, click Submit Data.
Note:
The Submit Data button is enabled only after refresh.
8. To revert to the original flex form layout, reopen the flex form.
The modified form is not stored on the server; it is maintained only in the context ofthe current session. Reopening the flex form reverts the flex form layout to itsoriginal state.
Opening a Flex Form in Ad Hoc Mode and Submitting DataYou can open a flex form in ad hoc mode, just like any regular form, use ad hocanalysis to modify the grid layout, and submit data.
To open a flex form in ad hoc mode and submit data:
1. Connect to a data source.
2. In the Smart View Panel, expand the tree list and select the flex form you want toopen in ad hoc mode.
3. Click Analyze.
The form opens in a new sheet in the ad hoc mode.
Chapter 7EPM Cloud and Oracle Hyperion Planning Forms
7-30

4. Modify data and grid layout per your requirements.
5. Click Submit Data.
6. Go back to the sheet with the flex form.
7. Click Refresh.
The original layout and modified data appears in the flex form.
Financial Management Data FormsIf you are unfamiliar with Oracle Hyperion Financial Management, see the FinancialManagement documentation, available on Oracle Help Center.
To open this library, from the Smart View ribbon, click the arrow next to Help, and thenDocumentation.
Related Topics:
About Financial Management Members
Adding Financial Management Members
Using Financial Management Linked Forms
About Financial Management MembersIf you are unfamiliar with Oracle Hyperion Financial Management, see the FinancialManagement documentation, available on the Oracle Help Center. To open this library, fromthe Smart View ribbon, click the arrow next to Help, and then Documentation.
When working with Financial Management 11.1.2.2.300 or later, if you use the relative timeperiod functionality, such as @CUR, in a Financial Management data form, you can have amember from the same dimension appear on the row, column, and POV. Oracle Smart Viewfor Office displays the relative time period members as user variables in the POV toolbar. See Working with User Variables for more information. When working with Financial Managementreleases earlier than 11.1.2.2.300, if you use the @CUR functionality in a data form, when theform is imported into Smart View, the @CUR member is taken from the background POV forthe selected application.
The Active Member option is available only if the application has been set up for Organizationby Period. For information on Organization by Period, see the Financial Managementdocumentation.
Adding Financial Management MembersIf you are unfamiliar with Oracle Hyperion Financial Management, see the FinancialManagement documentation, available on the Oracle Help Center. To open this library, fromthe Smart View ribbon, click the arrow next to Help, and then Documentation.
If enabled by the administrator, you can insert and save additional rows of members anddata. Totals are updated to reflect the new data.
For example, suppose a data form has been defined for an account with transactions for IC1,IC2, and IC4. You could select members IC3 and IC5 for insertion into the form. The form isrefreshed with the new data and the new rows are displayed in the appropriate hierarchicalorder.
Chapter 7Financial Management Data Forms
7-31

To add members to data forms:
1. Open a data form.
2. From the HFM ribbon, click Add Member.
A cell style can be designated for Add Member.
See Cell Styles.
3. From the member selector, select the members for which to enter data.
Note that the selections available in the View and Filters options may not beconsistent with the selections available for the same form in the FinancialManagement web application.
4. Click OK.
The new members are listed in the member list.
Note:
Member search does not work on forms that contain the Add Memberbutton.
Using Financial Management Linked FormsAdministrators can define links in data forms from one form to another to enable drill-through to a more specific data entry view. For example, a form that contains summaryaccount balances can link to a corresponding form with the account details. The linkfrom one form to another applies to an entire row. A form can contain up to 64 linkedforms.
To use linked forms:
1. In a data form, select a row that contains linked forms. Linked forms are indicated
by the following icon:
2. Right-click and select HFM Linked Forms, then select the form name.
A new form is displayed in a separate browser window.
3. When you finish using the linked form, click Close.
Chapter 7Financial Management Data Forms
7-32

8Books
Using the EPM Books extension for Oracle Smart View for Office, you can import Books in toMicrosoft Excel and work with them by changing POV values and refreshing.
Related Topics
• About the EPM Books ExtensionThe EPM Books extension in Smart View allows you to import EPM Cloud Books intoExcel in a refreshable format.
• Setting Up the Books Extension in Smart ViewInstall the EPM Books extension so you can work with EPM Books in Oracle Smart Viewfor Office.
• Launching the EPM Books Panel in Smart ViewFrom Office, you can launch the EPM Books panel whenever you connect to an OracleEnterprise Performance Management Cloud business process that contains Books.
• Working with BooksIn the EPM Books panel, view Book properties, import and download Books in to OracleSmart View for Office, and manage import jobs in Jobs Console.
• Managing Jobs in the EPM Books Jobs ConsoleIn addition to downloading Books from the Jobs Console in the EPM Books panel, youcan also refresh the status of jobs, remove jobs, and display jobs from the currentconnection or all connectons from which you have imported Books.
About the EPM Books ExtensionThe EPM Books extension in Smart View allows you to import EPM Cloud Books into Excel ina refreshable format.
Data source types: Planning, Planning Modules, Financial Consolidation and Close, TaxReporting, Narrative Reporting
In Oracle Enterprise Performance Management Cloud, Books are a collection of one or moreReports, Books, and other documents, that you generate into a single PDF or Excel output(for Excel output caveats, see the Note below).
Using the EPM Books extension for Oracle Smart View for Office, you can import Books in toMicrosoft Excel and work with them by changing POV values and refreshing. You can alsoopen and work with Books that were downloaded in Excel format from the web application.
Note:
Only Reports are included in the Excel Books opened or imported in Smart View.Other documents, such as Word and PDF files, and inserted Books are notavailable for viewing.
8-1

From the Books panel in Smart View, you can view properties for a Book, and importBooks into Excel.
Each Book you import is a "job." Check the Jobs Console in the Books panel for thestatus of the job. You do not need to wait for a job to complete to invoke another job orperform other operations in the panel or elsewhere in Smart View. You can refresh jobstatus, delete selected jobs, or delete all completed jobs in the Jobs Console. You canalso view the status of jobs running on other servers that contain Books in your EPMCloud environment.
Figure 8-1 Example EPM Books Panel
From the Jobs Console, download a Book into Excel. In the downloaded Book, eachReport is placed on an individual worksheet. A table of contents sheet is generatedwith links to the individual Report sheets in the workbook. The worksheet names arebased on the TOC Headings defined in the Properties panel in the Book Designer inthe web application.
Chapter 8About the EPM Books Extension
8-2

Figure 8-2 Example TOC Sheet and Worksheet Tabs in Book Imported into Excel
After importing a Book into Smart View, the Books ribbon is displayed in Excel:
Figure 8-3 Books Ribbon in Smart View
With the Books ribbon, you can change the POV of the Reports in the Book, and refresh thebook content. You can also use the Inspect button to view properties of the Book, includingthe POV.
Guidelines for Working with Books in Smart View
• Changing the POV: Excel currently does not support Member Selection in the SelectPOV dialog if the Book POV definition is set to "All".
If the Book POV definition is set to "Display Selected Values," the list of availablemembers to choose from is displayed in the drop-down list for each dimension.
• Nested Books are not supported in Excel. For example, if there is a Book containedwithin a Book, the inner Book will be suppressed. The resulting Excel workbook will notcontain the content related to the nested inner Book.
• PDF and Word documents inserted as part of a Book are not supported. When a Bookincludes other documents of type PDF or Word, they will be omitted from the Excelworkbook.
Setting Up the Books Extension in Smart ViewInstall the EPM Books extension so you can work with EPM Books in Oracle Smart View forOffice.
Related Topics
• Downloading and Running the Smart View Installer
Chapter 8Setting Up the Books Extension in Smart View
8-3

• Creating Connections to EPM Cloud Business Processes
• Installing the EPM Books Extension
Downloading and Running the Smart View InstallerCloud data source types: Planning, Planning Modules, Financial Consolidation andClose, Tax Reporting, Narrative Reporting
To download and run the Oracle Smart View for Office installer:
1. Start your Oracle Enterprise Performance Management Cloud business process ina web browser, and log in with your user name and password.
2. In the upper-right corner of the web interface, select the arrow next to your username to display the user menu, and then select Downloads.
3. In Downloads, under Smart View, click Download From Oracle TechnologyNetwork.
4. In the Oracle Smart View for Office page, click Download Now.
5. In the Oracle Licence Agreement popup window, select the I reviewed andaccept the Oracle License Agreement check box, and then click the Downloadbutton for the current Smart View release.
Note:
If the Oracle sign-in page is displayed, then sign in with your Oracle username (usually your email address) and password.
6. Follow the steps for your browser to download the ZIP file, and save it to a folderon your computer; for example, save it to the Downloads folder.
7. Navigate to the folder that you used in the previous step, and then double-clickSmartView.exe or right-click SmartView.exe and select Run as administrator tostart the installation wizard.
Note:
Whenever possible, Oracle recommends using the Run asadministrator command when installing Smart View.
8. Select a destination folder for Smart View, and then click OK; for new installations,Smart View is installed by default in:
C:/Oracle/SmartView
Note:
If you are upgrading an installation of Smart View, then the installerdefaults to the folder where you previously installed Smart View.
9. When installation is complete, click OK.
Chapter 8Setting Up the Books Extension in Smart View
8-4

The tab for the Smart View ribbon is displayed the next time you open Microsoft Excel,PowerPoint, or Word.
10. Continue the setup process with "Creating Connections to EPM Cloud BusinessProcesses."
Creating Connections to EPM Cloud Business ProcessesCloud data source types: Planning, Planning Modules, Financial Consolidation and Close,Tax Reporting, Narrative Reporting
After you install Oracle Smart View for Office, as described in , you can create connections tothe Oracle Enterprise Performance Management Cloud business process that you will beusing with Books.Connections require information about your service URL. Your Smart View administratorshould provide you with the information that you need to create the connection.
You can use shared or private connections for most business processes. To connect toNarrative Reporting, use the quick connection method in Smart View.
To create connections to the business processes that you will be using with Books:
1. Launch Microsoft Excel.
2. From the Smart View ribbon, click Panel.
3. To create shared connections to most supported business processes, follow theinstructions in Creating Shared Connections.
You can use shared connections with these business processes:
• Planning
• Planning Modules
• Financial Consolidation and Close
• Tax Reporting
• Narrative Reporting
Note:
Narrative Reporting requires a private connection, described in the nextstep.
4. To create a private connection to any supported business process, see Creating PrivateConnections.
Oracle recommends using the quick connection method when creating privateconnections for Books, described in Using the Quick Connection Method. For the privateconnection syntax appropriate to your supported business processes, see PrivateConnection URL Syntax.
5. Once you've created a connection, expand the tree in the Smart View Panel and navigateto the application and database that you want to work with.
If you are prompted to log in, enter your login credentials.
6. Continue the setup process with "Installing the Books Extension."
Chapter 8Setting Up the Books Extension in Smart View
8-5

Installing the EPM Books ExtensionCloud data source types: Planning, Planning Modules, Financial Consolidation andClose, Tax Reporting, Narrative Reporting
This topic covers installing the EPM Cloud Books extension from within Oracle SmartView for Office.
Before you begin this procedure, complete the steps in "Creating Connections toOracle Enterprise Performance Management Cloud Business Processes."
To install the Books extension from Smart View:
1. In the Smart View ribbon, select Options, and then Extensions.
Note:
If the Extension Alerts dialog was displayed when you completed thesteps in "Creating Connections to EPM Cloud Business Processes", thenyou should already be in the Extensions tab of the Options dialog.
2. Click the Check for Updates, New Installs, and Uninstalls link.
3. In Select Location for Extension Updates, select the check box thatcorresponds to your Books connection, and then click Get Updates.
The dialog box expands to display a message window providing you with theprogress and status of the extension query.
4. Click Close in the Select Location for Extension Updates dialog to return to theExtensions tab of the Options dialog.
5. In the list of extensions in the Extensions tab, locate EPM Cloud Book and click
the Install link, , to launch the installer.
6. In the popup dialog asking "Apply this extension update?", click Yes, and thenclick OK to close the Options dialog, Extensions tab.
A dialog display the progress of the extension installation.
7. In the message dialog informing you that the installation is successful andinstructing you to restart Office, click OK, and then close and restart Office.
For more information on extension installation in Smart View, see the following topics:
• Initially Checking for Available Extensions
• Installing Extensions
After completing the procedure in this topic, you are ready to begin using the Bookextension with Smart View.
Chapter 8Setting Up the Books Extension in Smart View
8-6
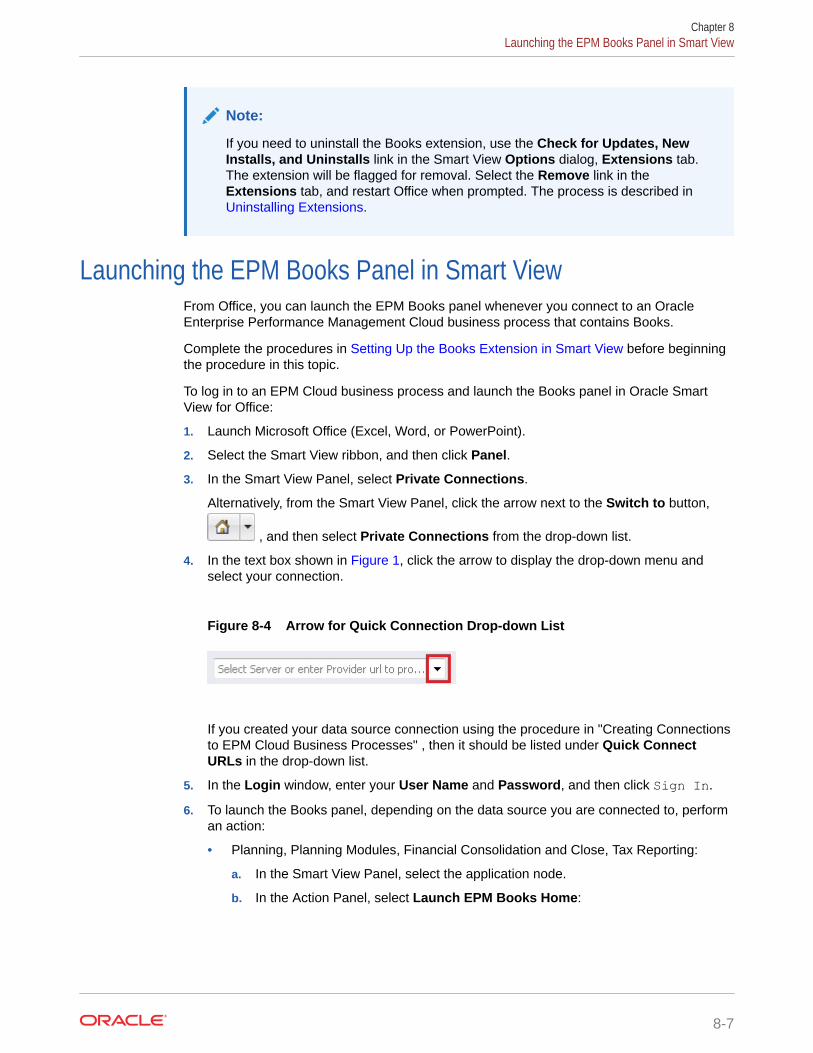
Note:
If you need to uninstall the Books extension, use the Check for Updates, NewInstalls, and Uninstalls link in the Smart View Options dialog, Extensions tab.The extension will be flagged for removal. Select the Remove link in theExtensions tab, and restart Office when prompted. The process is described in Uninstalling Extensions.
Launching the EPM Books Panel in Smart ViewFrom Office, you can launch the EPM Books panel whenever you connect to an OracleEnterprise Performance Management Cloud business process that contains Books.
Complete the procedures in Setting Up the Books Extension in Smart View before beginningthe procedure in this topic.
To log in to an EPM Cloud business process and launch the Books panel in Oracle SmartView for Office:
1. Launch Microsoft Office (Excel, Word, or PowerPoint).
2. Select the Smart View ribbon, and then click Panel.
3. In the Smart View Panel, select Private Connections.
Alternatively, from the Smart View Panel, click the arrow next to the Switch to button,
, and then select Private Connections from the drop-down list.
4. In the text box shown in Figure 1, click the arrow to display the drop-down menu andselect your connection.
Figure 8-4 Arrow for Quick Connection Drop-down List
If you created your data source connection using the procedure in "Creating Connectionsto EPM Cloud Business Processes" , then it should be listed under Quick ConnectURLs in the drop-down list.
5. In the Login window, enter your User Name and Password, and then click Sign In.
6. To launch the Books panel, depending on the data source you are connected to, performan action:
• Planning, Planning Modules, Financial Consolidation and Close, Tax Reporting:
a. In the Smart View Panel, select the application node.
b. In the Action Panel, select Launch EPM Books Home:
Chapter 8Launching the EPM Books Panel in Smart View
8-7
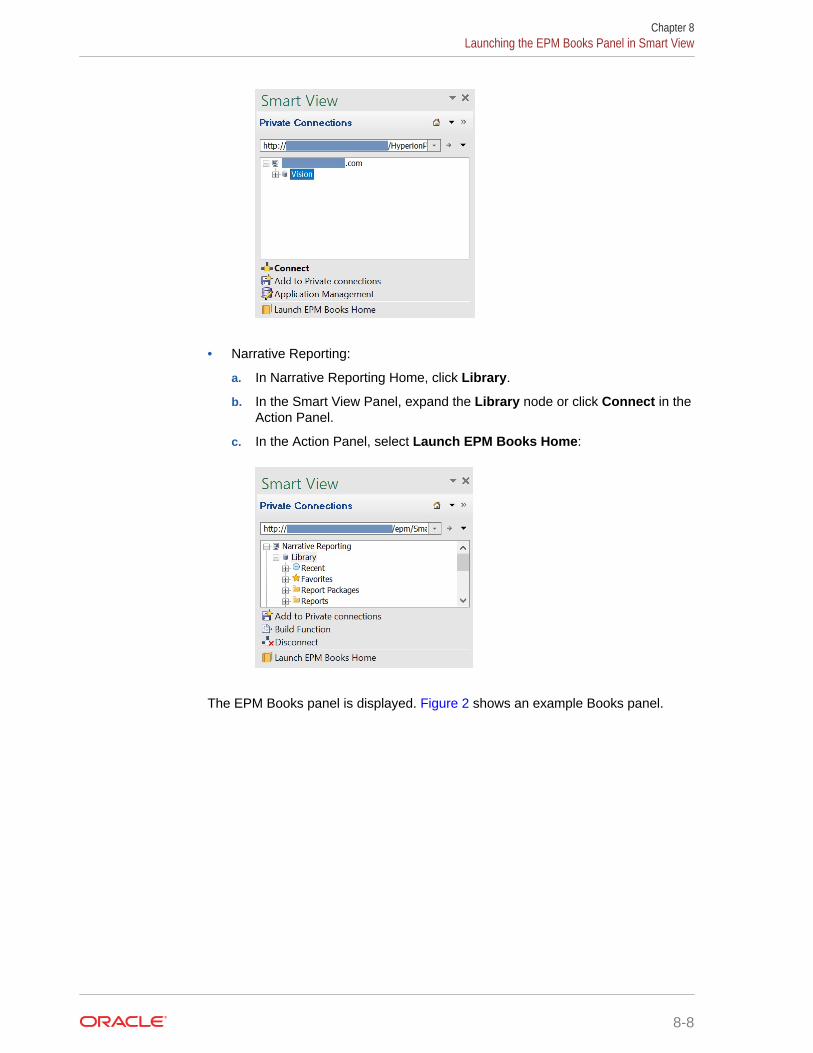
• Narrative Reporting:
a. In Narrative Reporting Home, click Library.
b. In the Smart View Panel, expand the Library node or click Connect in theAction Panel.
c. In the Action Panel, select Launch EPM Books Home:
The EPM Books panel is displayed. Figure 2 shows an example Books panel.
Chapter 8Launching the EPM Books Panel in Smart View
8-8

Figure 8-5 Example EPM Books Panel
You're now ready to begin using the Books functionality available in Smart View.Continue with the topics in Working with Books.
Working with BooksIn the EPM Books panel, view Book properties, import and download Books in to OracleSmart View for Office, and manage import jobs in Jobs Console.
Related Topics
• Importing Books into Smart View
• Working with Downloaded Books in Smart View
Importing Books into Smart ViewTo import Books into Oracle Smart View for Office:Before you begin importing Books, you should have already connected to a data source andlaunched the EPM Books panel, as described in Launching the EPM Books Panel in SmartView.
1. In the list of Books in the EPM Books panel, click next to the Books to import.
Clicking begins the import process.
For each Book you import, a row is added to the Jobs Console pane in the Books panel.
Figure 1 shows the Books panel with three jobs in the Job Console; one with Completedstatus and two in progress with Started status. The panel is expanded so that you cansee all columns in the Jobs Console.
Chapter 8Working with Books
8-9
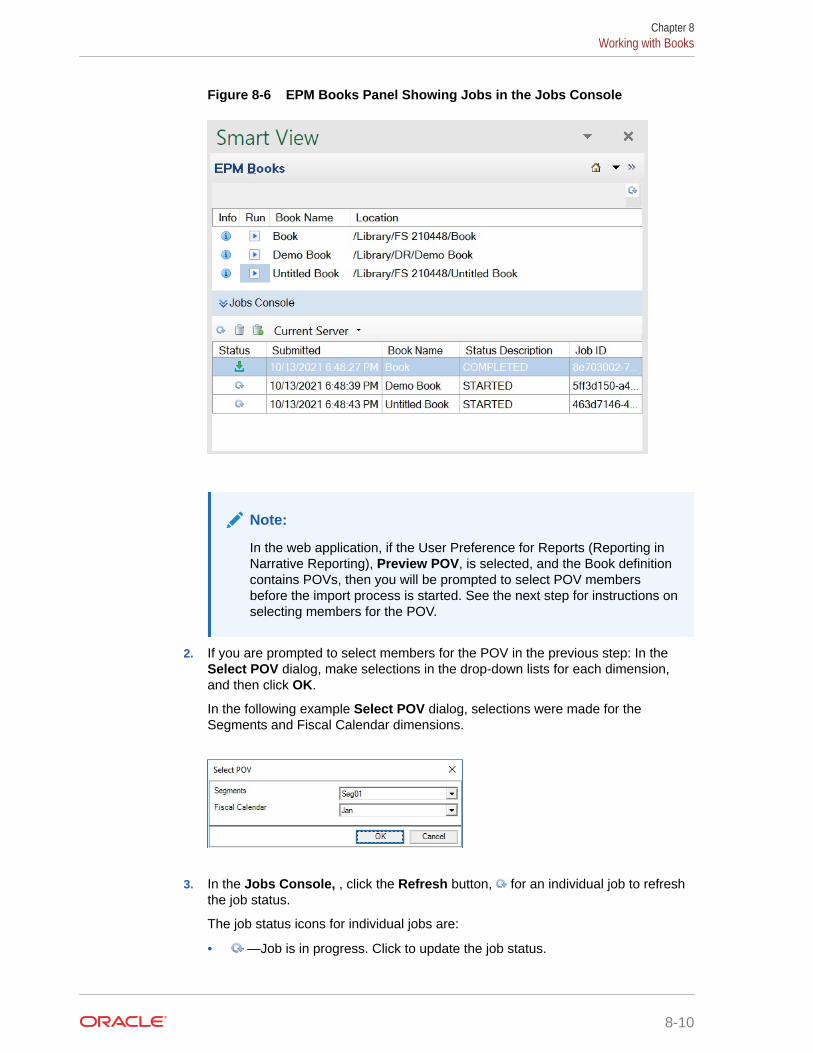
Figure 8-6 EPM Books Panel Showing Jobs in the Jobs Console
Note:
In the web application, if the User Preference for Reports (Reporting inNarrative Reporting), Preview POV, is selected, and the Book definitioncontains POVs, then you will be prompted to select POV membersbefore the import process is started. See the next step for instructions onselecting members for the POV.
2. If you are prompted to select members for the POV in the previous step: In theSelect POV dialog, make selections in the drop-down lists for each dimension,and then click OK.
In the following example Select POV dialog, selections were made for theSegments and Fiscal Calendar dimensions.
3. In the Jobs Console, , click the Refresh button, for an individual job to refreshthe job status.
The job status icons for individual jobs are:
• —Job is in progress. Click to update the job status.
Chapter 8Working with Books
8-10
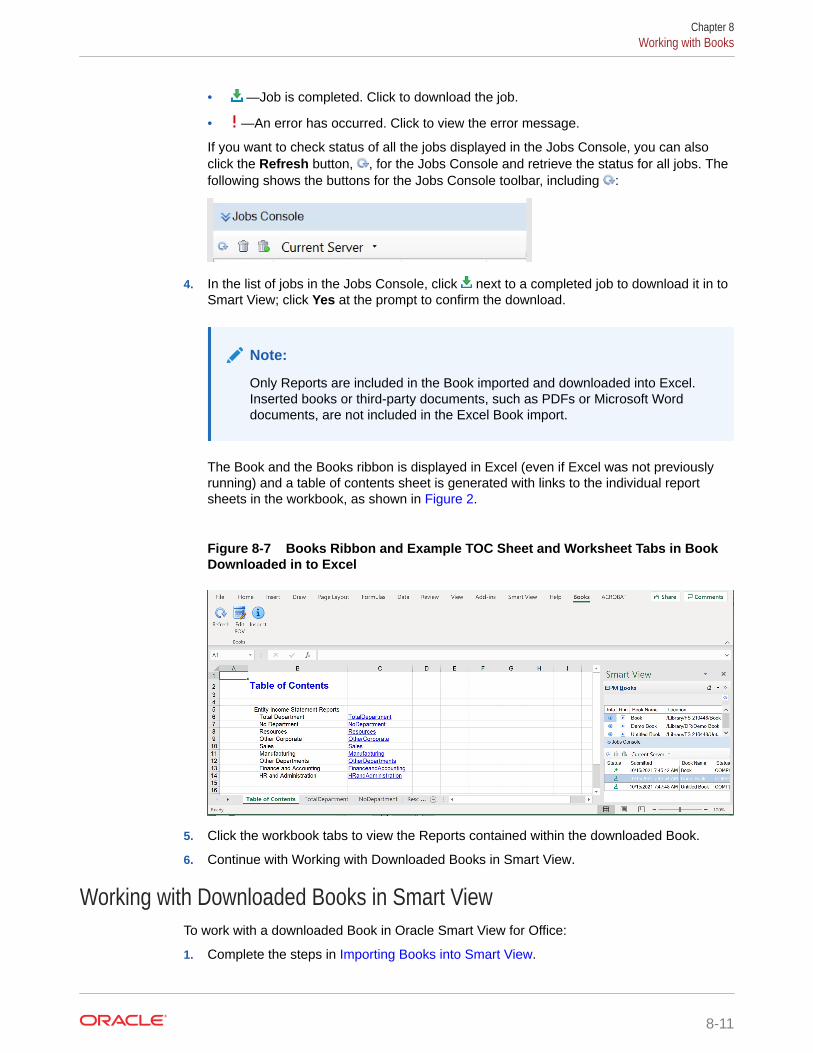
• —Job is completed. Click to download the job.
• —An error has occurred. Click to view the error message.
If you want to check status of all the jobs displayed in the Jobs Console, you can alsoclick the Refresh button, , for the Jobs Console and retrieve the status for all jobs. Thefollowing shows the buttons for the Jobs Console toolbar, including :
4. In the list of jobs in the Jobs Console, click next to a completed job to download it in toSmart View; click Yes at the prompt to confirm the download.
Note:
Only Reports are included in the Book imported and downloaded into Excel.Inserted books or third-party documents, such as PDFs or Microsoft Worddocuments, are not included in the Excel Book import.
The Book and the Books ribbon is displayed in Excel (even if Excel was not previouslyrunning) and a table of contents sheet is generated with links to the individual reportsheets in the workbook, as shown in Figure 2.
Figure 8-7 Books Ribbon and Example TOC Sheet and Worksheet Tabs in BookDownloaded in to Excel
5. Click the workbook tabs to view the Reports contained within the downloaded Book.
6. Continue with Working with Downloaded Books in Smart View.
Working with Downloaded Books in Smart ViewTo work with a downloaded Book in Oracle Smart View for Office:
1. Complete the steps in Importing Books into Smart View.
Chapter 8Working with Books
8-11

The Book is imported in to Smart View and the Books ribbon is displayed, asshown in Figure 2.
2. Click the links in the Table of Contents tab (Figure 2) to view the Reportscontained in the Book.
Each worksheet tab is a report that is part of the Book that was imported anddownloaded to Smart View.
You can also click the worksheet tabs in after the Table of Contents tab to view thevarious Reports in a Book.
Figure 1 shows an example worksheet containing a Report.
Figure 8-8 Books Ribbon and Example Report Contained in BookDownloaded to Excel
3. To change the POV for the current Book:
a. Click the Edit POV button in the Books ribbon.
b. In the Select POV dialog, make selections in the drop-down lists for eachdimension, and then click OK.
In the following example Select POV dialog, selections were made for theSegments and Fiscal Calendar dimensions.
A message notifies you that refresh operation with the newly-selected POV valuesis in progress. Click OK in the message. The Jobs Console will display a new jobrow. You can check the status of the job and download the Book once the job is
Chapter 8Working with Books
8-12
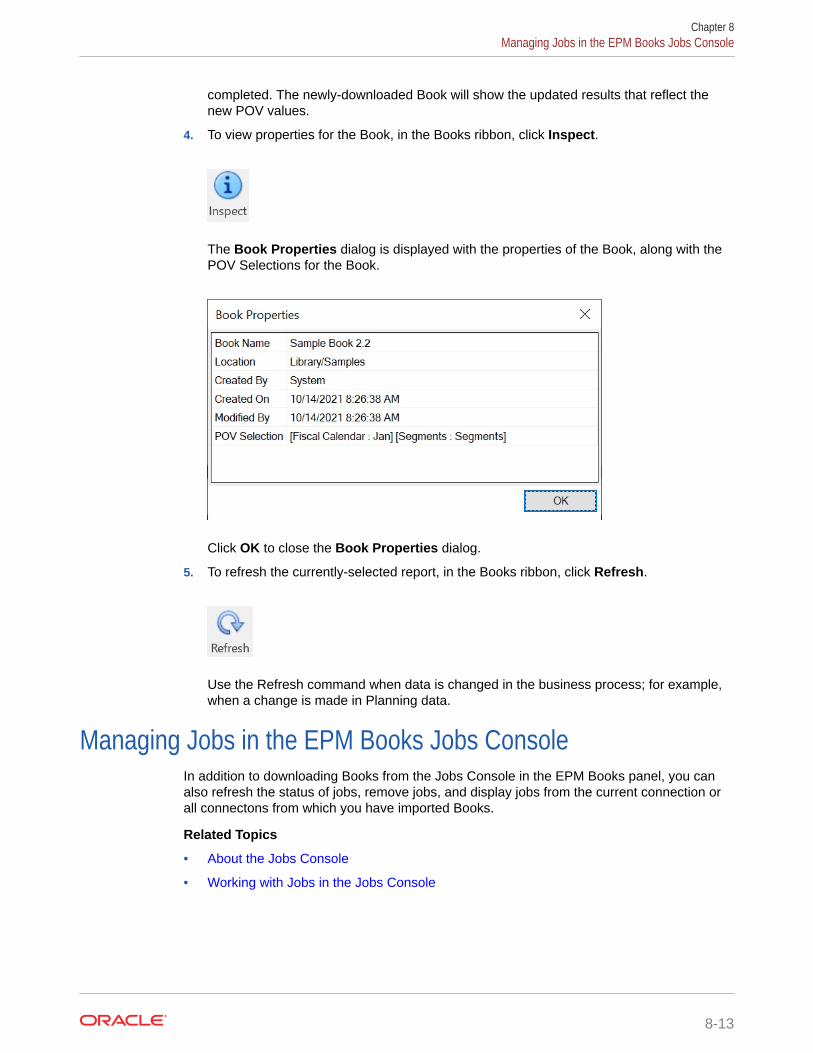
completed. The newly-downloaded Book will show the updated results that reflect thenew POV values.
4. To view properties for the Book, in the Books ribbon, click Inspect.
The Book Properties dialog is displayed with the properties of the Book, along with thePOV Selections for the Book.
Click OK to close the Book Properties dialog.
5. To refresh the currently-selected report, in the Books ribbon, click Refresh.
Use the Refresh command when data is changed in the business process; for example,when a change is made in Planning data.
Managing Jobs in the EPM Books Jobs ConsoleIn addition to downloading Books from the Jobs Console in the EPM Books panel, you canalso refresh the status of jobs, remove jobs, and display jobs from the current connection orall connectons from which you have imported Books.
Related Topics
• About the Jobs Console
• Working with Jobs in the Jobs Console
Chapter 8Managing Jobs in the EPM Books Jobs Console
8-13

About the Jobs ConsoleThe Jobs Console in the EPM Books panel displays a list of jobs. A job represents aprocess of importing a Book in to Oracle Smart View for Office. In the Jobs Console,you can refresh the status of jobs, download imported Books to Smart View, removejobs, and list jobs from the current connection or all connectons from which you haveimported Books.
The top portion of the Books panel lists all Books available for import from the currentdata source connection. Once you import a job, a job is added to the Jobs Console.Each row in the Jobs Console lists the jobs that you have import for the currentconnection. You can also choose to toggle the display to show jobs for all connectionsfrom which you have imported Books.
Figure 1 shows an example of the Books panel with Books listed in the Books list. AllBooks in the current connection have been imported and the jobs are shown in variousstates in the Jobs Console.
Figure 8-9 Example Books Panel with Jobs Listed in the Jobs Console
For each job, the Jobs Console provides the following information:
• Status—The status of the job, indicated by an icon:
– —Job is in progress. Click to update the job status.
Chapter 8Managing Jobs in the EPM Books Jobs Console
8-14

– —Job is completed. Click to download the job.
– —An error has occurred. Click to view the error message.
• Submitted—The date and time the job was submitted for import.
• Book—The name of the Book that was submitted for import.
• Status Description—Valid status descriptions are: Started, Completed, and Error.
• Job ID—An internal ID issued for each job by the business process.
The Jobs Console toolbar, located above the list of jobs, provides options for managing jobs,including a refresh option, delete options, and an option for selecting to display jobs from thecurrent connection or all connections from which you have imported Books. The JobsConsole toolbar is shown in Figure 2.
Figure 8-10 Jobs Console Toolbar
Continue with Working with Jobs in the Jobs Console for information on using the options inthe Jobs Console.
Working with Jobs in the Jobs ConsoleThis topic describes the tasks you can complete in the Jobs Console in the EPM Bookspanel.
Before you begin working with jobs in the Jobs Console, you should have already connectedto a data source that hosts Books and launched the EPM Books panel, as described in Launching the EPM Books Panel in Smart View.
To manage jobs in the Jobs Console in the EPM Books panel, completed any of theseoptional tasks:
1. To display jobs, perform a task:
• To display jobs corresponding to Books that you have imported, but not yet deleted,from any business process that hosts Books, select All Servers from the CurrentServer/All Servers toggle button in the Jobs Console toolbar; for example:
When you select All Servers, the Jobs Console will display all jobs that you haveimported but not yet deleted, from the current connection and any other businessprocesses, even if you are not currently connected.
Chapter 8Managing Jobs in the EPM Books Jobs Console
8-15

• To display jobs from Books that you have imported, but not yet deleted, fromthe current connection, select Current Server from the Current Server/AllServers toggle button in the Jobs Console toolbar.
The Jobs Console will display jobs from imported Books of all status types: in-progress jobs, completed jobs, and jobs that resulted in error.
2. To refresh the status of jobs in the Jobs Console, perform a task:
• To refresh all jobs for the current connection, click the Refresh all jobs button,, in the Jobs Console toolbar:
The status of all jobs that you have submitted from the current connection arerefreshed.
• To refresh a specific job in the Jobs Console list, click in the Status columnon the row for the job. For example,
The status of the selected job is refreshed.
3. To delete completed jobs in the Jobs Console, perform a task:
• To delete all completed jobs from all business processes from which you haveimported jobs, select All Servers from the toggle button in the Jobs Consoletoolbar, and then click .
Completed jobs are deleted from any business process from which you haveimported jobs, including business processes to which you are not currentlyconnected.
• To delete all completed jobs from the business process to which you arecurrently connected, select Current Server from the toggle button in the JobsConsole toolbar, and then click .
Completed jobs are deleted from the current connection.
• To delete a specific completed job from the current connection in the Bookspanel, select the row for the job in the Jobs Console and click .
You can use the Control key to select more than one contiguous or non-contiguous job from the list, and then click .
Toggle between Current Server and All Servers, as you require. You candelete from selected jobs from the current connection or all connections fromwhich you have imported Books.
The selected jobs are deleted from the list of jobs in the Jobs Console
Chapter 8Managing Jobs in the EPM Books Jobs Console
8-16

9General Operations
Related Topics
• Smart View OperationsOracle Smart View for Office provides a set of operations common to all data sourcetypes.
• Using Undo and RedoWhen connected to a data source provider, the Undo option in the Smart View ribbon,undoes the last user action in a cell.
• Copying and PastingYou can copy and paste Oracle Smart View for Office ad hoc, data points, functions, andOracle Business Intelligence Enterprise Edition content between Excel, Word andPowerPoint.
• Importing Metadata in Office ApplicationsMetadata consists of Oracle Smart View for Office artifacts such as the POV, alias tables,and connection information.
• Entering Percentage Values in Forms and Ad Hoc GridsIn forms and ad hoc grids, note the guidelines outlined in this topic when entering valuesin cells defined as percentages.
• Enabling Automatic Cell Width and Height AdjustmentYou can enable the automatic adjustment of Excel column width and row height toaccommodate the contents of member and data cells.
• Sheet InformationIn Sheet Information, you can view connection and other details for the currentworksheet, delete Smart View metadata from a sheet or workbook, save the metadata toanother sheet, and copy list items from the dialog to another sheet or document.
• Document ContentsDocument Contents is a task pane in the Smart View Panel that provides a view of—andallows you to perform actions on—the content existing in the current Office document.
• Shared WorkbooksOracle Smart View for Office does not support Excel shared workbooks.
• Protected WorksheetsOracle Smart View for Office operations, such as refresh and ad hoc, are not supportedon protected sheets.
• Opening Large Workbooks in Smart ViewOracle Smart View for Office may stop responding when opening workbooks containing alarge number of rows and columns, graphical objects, and Excel comments.
• Printing POV Members in the Header and FooterYou can print active POV members in the header or footer of an Excel document.
• Opening Forms and Ad Hoc Grids from Web Applications (Web Launch)From your web application, you can open forms and ad hoc grids in Oracle Smart Viewfor Office. This action is also referred to as web launch.
9-1
• Enabling and Disabling Smart ViewOracle Smart View for Office is enabled by default after installation.
Smart View OperationsOracle Smart View for Office provides a set of operations common to all data sourcetypes.
These include basic operations, functions, and the ability to set preferences.
Using Undo and RedoWhen connected to a data source provider, the Undo option in the Smart View ribbon,undoes the last user action in a cell.
Undo, , and Redo, , behave differently depending on the data sourceto which you are connected. Briefly:
• In ad hoc analysis with Oracle Essbase, Oracle Hyperion Financial Management,or Narrative Reporting data sources, Undo undoes Zoom In, Zoom Out, KeepOnly, Remove Only, or Refresh and restores the previous database view to thegrid. Performing an Undo after modifying member data returns the sheet to itsstate before the last refresh, not to its state before the data modification.
• In forms, Undo undoes the last user action in a cell.
• In ad hoc grids for all providers, Excel formatting is not retained when performingan Undo.
See also Undo Support By Provider.
Note:
You can only undo operations that are performed in Oracle Smart View forOffice. You cannot undo operations that are performed on the providerserver, such as calculation status.
Specifying the Number of Undo and Redo ActionsTo specify the number of permitted undo and redo actions:
1. From the Smart View ribbon, select Options, then select Advanced in the leftpanel.
2. In Number of Undo Actions, specify the number of permissible Undo operations,0 through 100.
This is also the number of Redo operations permitted.
3. Click OK. The setting takes effect after you refresh or perform a drill operation.
Chapter 9Smart View Operations
9-2

Undo Support By Provider
Undo Support in Essbase
Table 9-1 Undo Operations Supported by Essbase - Ad Hoc
Operation Single Grid Multiple Grid VBA Functions
Zoom In Supported N/A N/A N/A
Zoom Out Supported N/A N/A N/A
Keep Only Supported N/A N/A N/A
Remove Only Supported N/A N/A N/A
Pivot Supported N/A N/A N/A
Refresh Supported N/A N/A N/A
Table 9-2 Undo Operations Supported by Essbase - Member Options
Operation Single Grid Multiple Grid VBA Functions
General General General General GeneralZoom In Level Supported N/A N/A N/A
Member NameDisplay
Supported N/A N/A N/A
Indentation Supported N/A N/A N/A
Ancestor Position Supported N/A N/A N/A
Member Retention Member Retention Member Retention Member Retention Member RetentionInclude Selection Supported N/A N/A N/A
Within SelectedGroup
Supported N/A N/A N/A
Remove UnselectedGroups
Supported N/A N/A N/A
Comments andFormulas
Comments andFormulas
Comments andFormulas
Comments andFormulas
Comments andFormulas
Preserve Formulasand Comments in adhoc operations(except pivot)
Preserve ExcelFormulas: NotSupportedPreserve Smart ViewFunctions: NotSupported
N/A N/A N/A
—Formula Fill Preserve ExcelFormulas: NotSupportedPreserve Smart ViewFunctions: NotSupported
—Enable EnhancedComment Handling
Preserve Comments:Supported
Preserve Formula onPOV Change
N/A N/A N/A N/A
Chapter 9Using Undo and Redo
9-3

Table 9-3 Undo Operations Supported by Essbase - Data Options
Data Options Data Options Data Options Data Options Data Options
Rows Rows Rows Rows RowsSuppress No Data/Missing
Supported N/A N/A N/A
Zero Supported N/A N/A N/A
No Access Supported N/A N/A N/A
Invalid Supported N/A N/A N/A
UnderscoreCharacters
Supported N/A N/A N/A
Repeated Members Supported N/A N/A N/A
Columns Columns Columns Columns ColumnsSuppress No Data/Missing
Supported N/A N/A N/A
Zero Supported N/A N/A N/A
No Access Supported N/A N/A N/A
Mode Mode Mode Mode ModeSuppress MissingBlocks
N/A N/A N/A N/A
Table 9-4 Undo Operations Supported by Essbase - Other Actions
Operation Single Grid Multiple Grid VBA Functions
Modify Open Saved Not Supported N/A N/A N/A
Alias Table Supported N/A N/A N/A
Metadata (memberdata)
Not Supported N/A N/A N/A
Cell Style N/A N/A N/A N/A
Undo Support in Financial Management
Table 9-5 Undo Operations Supported by Financial Management - Ad Hoc Options
Operations Form Ad Hoc Data Grid VBA Functions
Zoom In N/A Supported N/A N/A N/A
Zoom Out N/A Supported N/A N/A N/A
Keep Only N/A Supported N/A N/A N/A
Remove Only N/A Supported N/A N/A N/A
Pivot N/A Supported N/A N/A N/A
Refresh N/A Supported N/A N/A N/A
Table 9-6 Undo Operations Supported by Financial Management - Member Options
Operations Form Ad Hoc Data Grid VBA Functions
General General General General General GeneralZoom In Level N/A Supported N/A N/A N/A
Chapter 9Using Undo and Redo
9-4

Table 9-6 (Cont.) Undo Operations Supported by Financial Management - Member Options
Operations Form Ad Hoc Data Grid VBA Functions
Member NameDisplay
N/A Supported N/A N/A N/A
Indentation N/A Supported N/A N/A N/A
Ancestor Position N/A Supported N/A N/A N/A
MemberRetention
MemberRetention
MemberRetention
MemberRetention
MemberRetention
MemberRetention
Include Selection N/A Supported N/A N/A N/A
Within SelectedGroup
N/A Supported N/A N/A N/A
RemoveUnselectedGroups
N/A Supported N/A N/A N/A
Comments andFormulas
Comments andFormulas
Comments andFormulas
Comments andFormulas
Comments andFormulas
Comments andFormulas
PreserveFormulas andComments
N/A Supported N/A N/A N/A
—Formula Fill N/A Supported N/A N/A N/A
—EnableEnhancedCommentHandling
N/A Supported N/A N/A N/A
Preserve Formulaon POV Change
N/A Supported N/A N/A N/A
Table 9-7 Undo Operations Supported by Financial Management - Data Options
Operations Form Ad Hoc Data Grid VBA Functions
Rows Rows Rows Rows Rows RowsSuppress NoData/Missing
N/A Supported N/A N/A N/A
Zero N/A Supported N/A N/A N/A
No Access N/A Supported N/A N/A N/A
Invalid N/A Supported N/A N/A N/A
UnderscoreCharacters
N/A Supported N/A N/A N/A
RepeatedMembers
N/A Supported N/A N/A N/A
Columns Columns Columns Columns Columns ColumnsSuppress NoData/Missing
N/A Supported N/A N/A N/A
Zero N/A Supported N/A N/A N/A
No Access N/A Supported N/A N/A N/A
Mode Mode Mode Mode Mode ModeSuppress MissingBlocks
N/A Supported N/A N/A N/A
Chapter 9Using Undo and Redo
9-5

Table 9-8 Undo Operations Supported by Financial Management - Other Options
Operations Form Ad Hoc Data Grid VBA Functions
Modify OpenSaved
N/A Not Supported N/A N/A N/A
Alias Table N/A Supported N/A N/A N/A
Metadata(member data)
N/A Not Supported N/A N/A N/A
Cell Style N/A Not Supported N/A N/A N/A
Undo Support in Planning
Table 9-9 Undo Operations Supported by Planning - Ad Hoc Options
Operations Form Ad Hoc VBA Functions
Zoom In N/A Supported N/A N/A
Zoom Out N/A Supported N/A N/A
Keep Only N/A Supported N/A N/A
Remove Only N/A Supported N/A N/A
Pivot N/A Supported N/A N/A
Refresh N/A Supported N/A N/A
Table 9-10 Undo Operations Supported by Planning - Member Options
Operations Form Ad Hoc VBA Functions
General General General General GeneralZoom In Level N/A Supported N/A N/A
Member NameDisplay
N/A Supported N/A N/A
Indentation N/A Supported N/A N/A
Ancestor Position N/A Supported N/A N/A
Member Retention Member Retention Member Retention Member Retention Member RetentionInclude Selection N/A Supported N/A N/A
Within SelectedGroup
N/A Supported N/A N/A
Remove UnselectedGroups
N/A Supported N/A N/A
Comments andFormulas
Comments andFormulas
Comments andFormulas
Comments andFormulas
Comments andFormulas
Preserve Formulasand Comments
N/A Supported N/A N/A
—Formula Fill N/A Supported N/A N/A
—Enable EnhancedComment Handling
N/A Supported N/A N/A
Preserve Formula onPOV Change
N/A Supported N/A N/A
Chapter 9Using Undo and Redo
9-6

Table 9-11 Undo Operations Supported by Planning - Data Options
Operations Form Ad Hoc VBA Functions
Data Options Data Options Data Options Data Options Data Options
Rows Rows Rows Rows RowsSuppress No Data/Missing
N/A Supported N/A N/A
Zero N/A Supported N/A N/A
No Access N/A Supported N/A N/A
Invalid N/A Supported N/A N/A
UnderscoreCharacters
N/A Supported N/A N/A
Repeated Members N/A Supported N/A N/A
Columns Columns Columns Columns ColumnsSuppress No Data/Missing
N/A Supported N/A N/A
Zero N/A Supported N/A N/A
No Access N/A Supported N/A N/A
Mode Mode Mode Mode ModeSuppress MissingBlocks
N/A Supported N/A N/A
Table 9-12 Undo Operations Supported by Planning - Other Actions
Operations Form Ad Hoc VBA Functions
Modify Open Saved N/A Not Supported N/A N/A
Alias Table N/A Supported N/A N/A
Metadata (memberdata)
N/A Not Supported N/A N/A
Cell Style N/A Not Supported N/A N/A
Undo Support in Narrative Reporting
Table 9-13 Undo Operations Supported by Narrative Reporting - Ad Hoc
Operation Single Grid Multiple Grid VBA Functions
Zoom In Supported N/A N/A N/A
Zoom Out Supported N/A N/A N/A
Keep Only Supported N/A N/A N/A
Remove Only Supported N/A N/A N/A
Pivot Supported N/A N/A N/A
Refresh Supported N/A N/A N/A
Table 9-14 Undo Operations Supported by Narrative Reporting - Member Options
Operation Single Grid Multiple Grid VBA Functions
General General General General General
Chapter 9Using Undo and Redo
9-7

Table 9-14 (Cont.) Undo Operations Supported by Narrative Reporting - Member Options
Operation Single Grid Multiple Grid VBA Functions
Zoom In Level Supported N/A N/A N/A
Member NameDisplay
Supported N/A N/A N/A
Indentation Supported N/A N/A N/A
Ancestor Position N/A N/A N/A N/A
Member Retention Member Retention Member Retention Member Retention Member RetentionInclude Selection Supported N/A N/A N/A
Within SelectedGroup
N/A N/A N/A N/A
Remove UnselectedGroups
N/A N/A N/A N/A
Comments andFormulas
Comments andFormulas
Comments andFormulas
Comments andFormulas
Comments andFormulas
Preserve Formulasand Comments in adhoc operations(except pivot)
NA N/A N/A N/A
—Formula Fill N/A
—Enable EnhancedComment Handling
N/A
Preserve Formula onPOV Change
N/A N/A N/A N/A
Table 9-15 Undo Operations Supported by Narrative Reporting - Data Options
Operation Single Grid Multiple Grid VBA Functions
Rows Rows Rows Rows RowsSuppress No Data/Missing
Supported N/A N/A N/A
Zero Supported N/A N/A N/A
No Access N/A N/A N/A N/A
Invalid N/A N/A N/A N/A
UnderscoreCharacters
N/A N/A N/A N/A
Repeated Members N/A N/A N/A N/A
Columns Columns Columns Columns ColumnsSuppress No Data/Missing
Not Supported N/A N/A N/A
Zero Not Supported N/A N/A N/A
No Access N/A N/A N/A N/A
Mode Mode Mode Mode ModeSuppress MissingBlocks
N/A N/A N/A N/A
Chapter 9Using Undo and Redo
9-8

Table 9-16 Undo Operations Supported by Narrative Reporting - Other Actions
Operation Single Grid Multiple Grid VBA Functions
Modify Open Saved Not Supported N/A N/A N/A
Alias Table Supported N/A N/A N/A
Metadata (memberdata)
N/A N/A N/A N/A
Cell Style N/A N/A N/A N/A
Copying and PastingYou can copy and paste Oracle Smart View for Office ad hoc, data points, functions, andOracle Business Intelligence Enterprise Edition content between Excel, Word andPowerPoint.
Related Topics
• Copying, Pasting, and Refreshing Smart View Content
• Copying Data Between Excel, Word, and PowerPoint
• Viewing Cell POV and Server Information for Pasted Data Points
• Excel Copy and Paste Guidelines
Copying, Pasting, and Refreshing Smart View ContentThe following Oracle Smart View for Office content can be copied and pasted using the Copyand Paste buttons in the Smart View ribbon, and then refreshed using Smart View Refresh.
• Ad hoc—all applicable providers
• Data points—all applicable providers
• Functions—only HsGetValue (see also Copying and Pasting HsGetValue Functions)
• Oracle Analytics Cloud and Oracle BI EE content
Other content in Smart View will be pasted as static text, including content from Excel pivottables, and forms such as Oracle Hyperion Financial Management forms and Planning forms.
Chart copy and paste is only supported for Oracle Analytics Cloud and Oracle BI EE charts.Charts based on other providers, such as Planning, do not always paste correctly. Forexample, if you insert a chart, then change the format (such as from bar chart to pie chart),and then copy and paste it, the chart will not paste correctly.
Copying Data Between Excel, Word, and PowerPointIn Oracle Smart View for Office, you can copy data from Excel and paste it into Excel, Word,or PowerPoint. The data you copy and paste is dynamic between Office applications. You cancopy and paste data from:
• Excel to Word and PowerPoint
• Excel to Excel (ad hoc only)
• Word to Word and PowerPoint
Chapter 9Copying and Pasting
9-9
• PowerPoint to Word and PowerPoint
The data points retain their original Excel-based query information, enabling you toperform data analysis. Word and PowerPoint can contain data points from multipledata sources, such as Oracle Essbase, Oracle Hyperion Financial Management, andOracle Hyperion Planning within one document.
Notes
• Dynamic data points are maintained only in Word and PowerPoint. If you copy andpaste data points within Excel, the data points are not linked to the Excel grid.
• When copying and pasting from Word to PowerPoint, or vice versa, data isdisplayed in a straight line. The tabular format is preserved only when copyingdata from Excel into Word or PowerPoint.
• Numeric formatting in Excel is preserved when data is pasted into Word andPowerPoint. Apply numeric formatting in Excel before copying and pasting data.
• If the name of the connection to the data source contains a semicolon (;), you maynot be able to paste function data points.
• Copying and pasting data points is limited to use with grids and functions. You cancopy data points from forms or Excel pivot tables, but they will be pasted as statictext.
• When you copy and paste a data cell within Excel, Smart View generates anHsGetValue function that appears in the Excel formula bar when the pasted cell isselected, Functions generated by Smart View contain the SVLink syntax; forexample:
= HsGetValue("", "Measures#Measures", "Year#Year","SVLink15131004130EOL", "Row0", "Col0")When copied and pasted, functions containing the SVLink syntax result in statictext. These functions may, however, be used as a template for creating otherHsGetValue functions, providing that you remove the SVLink syntax and replace itwith the POV dimensions and members you require.
• On computers where Smart View is installed, an error occurs when updating linksin PowerPoint that were copied from Excel to PowerPoint.
• Formatting is not retained when copying and pasting cells from Excel to Word.
• Number formatting is not retained when copying data points from Excel to Word orPowerPoint.
• When working with Financial Management ad hoc, and copying and pasting cellsfrom Excel to Word, formatting is not retained even though the Use ExcelFormatting option is selected.
Video
Your Goal Watch This Video
Learn about integrating data in Officeapplications, including copying and pastingdata points.
Integrating Plan Data with MicrosoftOffice in Oracle Planning and Budgeting Cloud
To copy and paste data from Excel, Word, or PowerPoint to Excel, Word, orPowerPoint:
Chapter 9Copying and Pasting
9-10

1. Select a data cell or range (may or may not include members).
2. From the Smart View ribbon, select Copy.
3. Open a Word or PowerPoint document, or another Excel worksheet or workbook.
4. If asked if you want to create a connection, click Yes.
5. From the Smart View ribbon, select Paste.
6. Refresh.
Note:
If you paste data into a Word document and save it in a different format suchas .htm or .mht, you cannot refresh the data in these other formats.
7. Optional: To change the POV in Word or PowerPoint after you paste the data, clickManage POV and follow the procedure in Selecting Members for the Default orBackground POV.
Retrieving Spreadsheets From Which Data Points Were Copied
To retrieve the Excel spreadsheets from which data points were copied:
1. In a Word or PowerPoint document into which Excel data points were pasted, select adata cell.
2. From the data source ribbon, select Visualize in Excel.
3. If asked to log on the data source, enter the user name and password.
Excel displays the spreadsheet associated with the data cells. You can perform ad hocanalysis on the data.
Viewing Cell POV and Server Information for Pasted Data PointsAfter copying and pasting data points from Microsoft Office applications, and then refreshingthe Office document, you can select data points and view the POV and source serverinformation.
This procedure applies to data points copied from Excel and pasted to Excel, Word, orPowerPoint, or copied and pasted between Word and PowerPoint.
To view the POV and source server information of a pasted data point:
1. In the target Office document, select the data point.
For example, if you copied and pasted an ad hoc grid from Excel to Word, then in Word,select a data point within the pasted and refreshed grid. In some cases, double-clickingthe cell may be sufficient, but if there a decimal point in the cell, then you must select itmanually.The cell POV and server information is displayed as hover text, as shown in Figure 1.
Chapter 9Copying and Pasting
9-11

Figure 9-1 Pasted Grid Showing Hover Text Over Selected Data Cell
2. To close the hover text, click anywhere on your screen.
Excel Copy and Paste Guidelines• In data forms, after copying a cell, only a single paste is allowed. Pasting into
subsequent cells is not supported.
Workaround: After pasting the cell once, you must copy the cell again in order topaste it into another cell.
• In forms or ad hoc grids with hidden columns, you will have unexpected results ifyou attempt to copy two or more consecutive cells from a range containing visibleand hidden cells and paste them into a range of visible and hidden cells. Thecopied cells will be pasted to both the visible and hidden cells. This is Excelbehavior.
For example, suppose you are working with the following Year hierarchy on a form:
Year Quarter Month
On the form, the Quarter members are collapsed, so that the only visible membersare Year and Month. Copy the values from one of the rows under the four Quartercells, and paste them onto another row in another grid or form under Quarter,where the Quarter members are also collapsed.
You may expect to see each of the four Quarter values pasted into the sameposition as on the previous sheet, but this is not the case. The cells will paste intothe first visible cell and into the next three hidden cells (for example, Jan, Feb,Mar).
Chapter 9Copying and Pasting
9-12
Consider also that some Planning forms may also have spreading enabled, which canaffect how the values are updated in the cells.
• Office Copy and Paste is not supported for copying and pasting Oracle Smart View forOffice objects—such as charts, tables, or the POV—between slides, pages, and sheets.Smart View does not always handle the invalid copy gracefully. For example, inPowerPoint, if a Smart View chart is copied using Office Copy and Paste, an errormessage is displayed upon Refresh. Follow these guidelines:
– Do not use Office Copy and Paste to copy Smart View reporting objects. Instead, useSmart View Copy and Paste.
– Do not copy and paste charts inserted using the Insert Chart command inPowerPoint. This applies to both Office Copy and Paste and Smart View Copy andPaste.
• Using the copy and paste functionality in Excel and then performing any Smart Viewoperation (such as Refresh, Zoom In, or Submit) causes Smart View to stop respondingin the following cases:
– Copying a column to multiple columns if the column copied contains a Smart List orthe database to which you’re connected supports duplicate member names
– Copying one Smart List cell to multiple cells
Copying one member cell to multiple cells if the database to which you’re connectedsupports duplicate member names
Workarounds for Office 2010:
– While designing the ad hoc grid and copying and pasting columns or cells, ensurethat the Member Name Display option is set to "Distinct Member Name Only." TheMember Name Display option is in the Member Options tab of the Options dialogbox.
– After pasting, save the workbook and reopen it, then perform the refresh.
Microsoft Fix for Office 2013 and 2016:
The copy and paste cases noted above work as expected in Office 2013 and 2016 if youhave applied the updates described in the following Microsoft Knowledge Base (KB)articles:
– For Excel 2013:
https://support.microsoft.com/en-us/help/3115455/august-9--2016--update-for-excel-2013-kb3115455
– For Excel 2016:
https://support.microsoft.com/en-us/help/3115438/august-9--2016--update-for-excel-2016-kb3115438
If you are experiencing this issue on Excel 2013 or 2016, then you should install theappropriate KB update for your Excel version.
Importing Metadata in Office ApplicationsMetadata consists of Oracle Smart View for Office artifacts such as the POV, alias tables, andconnection information.
Related Topics:
Chapter 9Importing Metadata in Office Applications
9-13

Importing Metadata into Copied Worksheets
Importing Metadata into Copied Word Documents
Importing Metadata into Copied Slides or Presentations
Cloud data source types: Oracle Analytics Cloud - Essbase, Planning, NarrativeReporting, Financial Consolidation and Close, Tax Reporting, Oracle HyperionReporting and Analysis
On-premises data source types: Oracle Essbase, Oracle Hyperion FinancialManagement, Oracle Hyperion Planning, Reporting and Analysis
In a new Office document, you may want to make use of Smart View content in anexisting document that contains not only the formatting and layout that you need, butdata points as well. Instead of recreating the Smart View content from scratch, you canreuse the work that is already available.
When you use the Microsoft Office copy and paste commands to copy Smart Viewcontent within or between Office documents, the static data and formatting is copied;but the Smart View metadata is not copied.
By using the Import Metadata command, after the data is copied, you can import themetadata from the original Office document into the new Office document.
You can use the Office copy and paste commands to copy content within individualOffice applications as follows:
• From an Excel worksheet to another worksheet within the current Excel workbookor to a different workbook
• From a Word document to the same or different page within the current Worddocument or to a different Word document
• From a PowerPoint slide or presentation to a slide within the current PowerPointpresentation or a different presentation
Note the following guidelines when copying, pasting, and importing:
• Excel:
– You can import metadata in the following:
* Ad hoc mode, including Smart Slices
* Forms
* Functions
* Query-bound functions in sheets created by Smart View copy andpaste
* Non-query-bound functions created by the Function Builder
* Worksheets that contain reports imported from Reporting and Analysisproviders
– You cannot import metadata in worksheets that contain Report Designerobjects, but such workbooks can be replicated by cascading as described in Cascading Reports and Ad Hoc Grids.
Chapter 9Importing Metadata in Office Applications
9-14

Note:
This procedure should be performed only by advanced users.
• Word:
– You can copy and paste graphs
– You can copy and paste entire tables containing data points or copy and pasteindividual data points inline, within existing text
– Metadata must be imported from the same object or shape that was copied.
– Metadata is copied only for the copied objects or shapes, only rather than copying allthe metadata present in the source Word document.
– For the Import Metadata command to work, there must be at least one copied SmartView object in the destination document, whether it is the current Word document ora different one.
– Copying the POV or slider within the same Word document will result in incorrectbehavior in the document.
• PowerPoint:
– You must select a single slide to begin the import process. Smart View displays anerror message if you invoke the Import Metadata command when either no slide isselected or multiple slides are selected.
– You must first copy objects before selecting the Import Metadata command;otherwise, Smart View prompts you with a message.
– The slide from which the object is copied and the slide from which the metadata is tobe imported must be the same.
– Metadata is copied only for the copied objects or shapes, only rather than copying allthe metadata present in the source slide.
– You can duplicate a slide containing a POV or slider, but importing the metadata willresult in an error.
– Copying a POV or slider within the same presentation will result in incorrect behaviorin the presentation.
Importing Metadata into Copied WorksheetsCloud data source types: Oracle Analytics Cloud - Essbase, Planning, Narrative Reporting,Financial Consolidation and Close, Tax Reporting, Oracle Hyperion Reporting and Analysis
On-premises data source types: Oracle Essbase, Oracle Hyperion Financial Management,Oracle Hyperion Planning, Reporting and Analysis
Before you begin, be sure to review the content in Importing Metadata in Office Applications.
Note:
This operation cannot be undone.
Chapter 9Importing Metadata in Office Applications
9-15

To import metadata to a copied worksheet:
1. Back up your work.
2. From the Smart View ribbon, select Options, then Advanced, and ensure thatImproved Metadata Storage is selected.
3. Use Excel to copy a worksheet.
This operation copies the visible contents of the source worksheet but not themetadata (connection information, POV selections, alias tables, and such items) tothe destination worksheet.
4. With the destination worksheet active, from the Oracle Smart View for Officemenu, select More, then Import Metadata to display a list of all open workbooksand their corresponding open worksheets.
5. From the list, select the worksheet that contains the metadata that you want toimport to the destination worksheet.
6. Click OK. You will be asked to confirm your selection.
7. Refresh.
8. To refresh the Document Contents pane, click
Importing Metadata into Copied Word DocumentsCloud data source types: Oracle Analytics Cloud, Oracle Analytics Cloud - Essbase,Planning, Planning Modules, Narrative Reporting, Financial Consolidation and Close,Tax Reporting
On-premises data source types: Oracle Essbase, Oracle Hyperion FinancialManagement, Oracle Hyperion Planning, Oracle Business Intelligence EnterpriseEdition, Oracle Hyperion Reporting and Analysis
Before you begin, be sure to review the content in Importing Metadata in OfficeApplications.
Note:
This operation cannot be undone.
To import metadata into a Word document:
1. Back up your work.
2. From the Smart View ribbon, select Options, then Advanced, and ensure thatImproved Metadata Storage is selected.
3. Use the Copy and Paste commands in Word to copy a Oracle Smart View forOffice object, such as a graph or table.
This operation copies the visible contents of the source object, but not themetadata—for example, connection information, POV selections, alias tables, andother such items—to the destination document.
4. With the destination document active, from the Smart View ribbon, click Import
Metadata, .
Chapter 9Importing Metadata in Office Applications
9-16

5. In the Select document dialog box, select the slide or presentation that contains themetadata to import to the destination slide or presentation, and then click Import.
In the following example, import_metadata_word.docx is the document from which wewant to import metadata.
Note:
When importing metadata in Word, the active, or target, document is shown inthe tree in the Select document dialog box. This is because, the activedocument can also be the destination document in cases where metadata isbeing import within a Word document.
A confirmation message is displayed.
6. Click Yes in the confirmation dialog box.
7. Refresh.
Chapter 9Importing Metadata in Office Applications
9-17

When successful, you will see that theDocument Contents pane is updated withmetadata for the document. An example is shown in Figure 1.
Figure 9-2 Document Contents Pane After Importing Metadata
Importing Metadata into Copied Slides or PresentationsCloud data source types: Oracle Analytics Cloud, Oracle Analytics Cloud - Essbase,Planning, Planning Modules, Narrative Reporting, Financial Consolidation and Close,Tax Reporting, Oracle Hyperion Reporting and Analysis
On-premises data source types: Oracle Essbase, Oracle Hyperion FinancialManagement, Oracle Hyperion Planning, Oracle Business Intelligence EnterpriseEdition, Reporting and Analysis
Before you begin, be sure to review the content in Importing Metadata in OfficeApplications.
Note:
This operation cannot be undone.
To import metadata into a PowerPoint slide or presentation:
1. Back up your work.
2. From the Smart View ribbon, select Options, then Advanced, and ensure thatImproved Metadata Storage is selected.
3. Use the PowerPoint copy command to copy information in any of the wayssupported by PowerPoint; for example:
• Copy individual objects and paste to the destination slide. The destinationslide could be a part of source presentation or different presentation.
• Duplicate a slide.
• Copy a complete slide and paste into the same presentation or a different one.
• Drag any slide and drop to another presentation.
Chapter 9Importing Metadata in Office Applications
9-18

• Copy and paste an entire presentation.
This operation copies the visible contents of the source slides but not the metadata—forexample, connection information, POV selections, alias tables, and other such items—tothe destination slide or presentation.
4. With the destination slide or presentation active, from the Smart View ribbon, click Import
Metadata, .
5. In the Select slide dialog box, select the slide or presentation that contains the metadatathat you want to import to the destination slide or presentation, and then click Import.
Note that importing metadata from a presentation may be a time consuming operation,particularly for presentations with large number of slides and Oracle Smart View for Officemetadata.
In the following example, Slide21 from Department Reports.pptx is the slide from whichwe want to import metadata.
Note:
When importing metadata from a slide to the active slide, the active slide is notshown in the tree in the Select slide dialog box. This is because the activeslide is the destination slide where metadata is to be imported and is, therefore,not available for selection. For the same reason, when importing metadata froma presentation to the active presentation, the Import button is disabled whenthe active presentation is selected in the Select slide dialog box.
A confirmation message is displayed.
Chapter 9Importing Metadata in Office Applications
9-19

6. Click Yes in the confirmation dialog box.
7. Refresh.
When successful, you will see that the Document Contents pane is updated withmetadata for each slide. An example is shown in Figure 1.
Figure 9-3 Document Contents Pane After Importing Metadata
Entering Percentage Values in Forms and Ad Hoc GridsIn forms and ad hoc grids, note the guidelines outlined in this topic when enteringvalues in cells defined as percentages.
• When entering a percentage value directly into a cell, enter the percent sign alongwith the percentage value. For example, to express "twenty percent" numerically,in the form or grid cell, enter
20%Be sure to include the % sign, as follows:
Chapter 9Entering Percentage Values in Forms and Ad Hoc Grids
9-20

• When entering a percentage value into the formula bar, enter the decimal point and thevalue, without the percent sign. For example, to express "twenty percent" numerically, inthe formula bar, enter
.20
In either of the above cases, after pressing Enter, 20% is displayed in a dirty cell. Thischanged cell value can be submitted.
You can use the Decimal Places option in the Options dialog, Formatting tab, for a moregranular display of percentages. For example, in the grid below, the values in row 3 show 1%,but in the formula bar, we see the actual value of cell B3 is 0.5%.
Chapter 9Entering Percentage Values in Forms and Ad Hoc Grids
9-21

In the Options dialog, Formatting tab, change the Decimal Places option to 2, andrefresh the grid. This has the effect of adding two decimal places to all values in thegrid. This change may be helpful for viewing the fractional percentage values, but maynot help with reading and interpreting the grid overall:
Follow these guidelines when entering fractional percentages:
• To enter a half percent numerically, in the form or grid cell, enter .5%• To enter a half percent numerically in the formula bar, enter .005In general, Oracle Smart View for Office mimics standard Excel behaviors in handlingpercentages. Read more about Excel and percentages in the Microsoft documentation here.
Enabling Automatic Cell Width and Height AdjustmentYou can enable the automatic adjustment of Excel column width and row height toaccommodate the contents of member and data cells.
1. From the Smart View ribbon, select Options.
2. In Options, from the left panel, select Formatting.
3. Select the Adjust Column Width and Row Height check box.
4. Click OK.
5. From any ribbon, select Refresh to adjust columns in the current sheet.
If Adjust Column Width and Row Height is not selected, you can adjust the width ofcolumns manually.
Chapter 9Enabling Automatic Cell Width and Height Adjustment
9-22

Sheet InformationIn Sheet Information, you can view connection and other details for the current worksheet,delete Smart View metadata from a sheet or workbook, save the metadata to another sheet,and copy list items from the dialog to another sheet or document.
1. From the Smart View ribbon, click Sheet Info.
Depending on the Oracle Smart View for Office data on the sheet, Sheet Informationdisplays details on the following properties:
• Connected—Connection status; Yes if connected, No if not connected.
• Sheet Type—Ad hoc, Multiple grid ad hoc, or Form.
• Server—The name of the server to which the sheet is connected.
• Application—The application to which the sheet is connected.
• Cube—The cube, model, or database to which the sheet is connected.
• URL—The URL string of the data source provider to which the sheet is connected.
• Provider—The data source type to which the sheet is connected; for example,Oracle Hyperion Planning, Oracle Hyperion Financial Management, or AnalyticServices (Oracle Essbase).
• Provider URL—The URL string of the data source provider to which the sheet isconnected; this property is applicable to Analytic Oracle Hyperion Provider Services11.1.1.4.x and earlier releases.
• Friendly Name—For private connections only. The data source connection namespecified by the user when creating or editing a private connection, or when adding ashared connection to private connections.
• Alias Table—The current alias table.
• Associated Ranges—For multiple grid sheets. The sheet name, application,database, and a unique identifier for each grid in the multiple grid sheet. Multiple gridworksheets apply to supported Oracle Enterprise Performance Management Cloudbusiness processes, Essbase, and Oracle Analytics Cloud - Essbase data sourcesonly. To use Sheet Information with multiple grid worksheets, see Sheet InformationGuidelines.
• Description—For private connections only. The optional connection descriptionentered by the person creating or editing the private connection.
• Form Name—The name of the form to which the sheet is connected. This propertiesapplies when connected to forms in Planning and Financial Management only.
• Last Retrieved—The date and time that the last refresh was performed on the sheet.
2. Optional: Select the following options as needed.
• Delete—Provides these options for deleting Smart View information, referred to as"metadata":
– Delete worksheet metadata
– Delete workbook metadata
– Delete all metadata (deletes workbook metadata and all worksheets)
• Save—Saves the Sheet Information content to an Excel spreadsheet.
Chapter 9Sheet Information
9-23

3. Optional: To copy a selected item in the list to the clipboard, press Ctrl+C.
To copy the entire Sheet Information list, ensure that no items are selected inSheet Information, then press Ctrl+C. If you have already selected an item in thelist, then close Sheet Information, reopen it, and press Ctrl+C.
4. Click OK.
5. To view sheet information support by provider, sheet type, and connection status,see Sheet Information Support By Provider.
Sheet Information Guidelines• Friendly names are for private connections only. The friendly name is the data
source connection name specified by the user when creating or editing a privateconnection, or when adding a shared connection to private connections.
• When using the Sheet Info command with multiple grid worksheets:
– To display information on all grids on a multiple grid worksheet, click anywhereoutside of the grid boundaries, or select only one cell within a grid.
– To display information for only one of the grids on a multiple grid worksheet,select the entire grid, and do not select any cells outside of the gridboundaries.
• When connected to Planning, it is not necessary to use the Set as DefaultConnection option to associate the sheet with an active connective. Theassociation is made automatically immediately after connecting.
• When you associate a connection to an ad hoc worksheet using Set ActiveConnection, members may disappear from the worksheet when you refresh.Instead of associating a connection, perform direct ad hoc analysis on theworksheet.
• The Sheet Information dialog box is not supported, or has very limited support,for the following providers: Oracle Business Intelligence Enterprise Edition, OracleHyperion Financial Reporting, and Oracle Hyperion Strategic Finance.
Sheet Information Support By ProviderRelated Topics:Sheet Information Support in Essbase
Sheet Information Support in Financial Management
Sheet Information Support in EPM Cloud and Oracle Hyperion Planning
Sheet Information Support in EssbaseCloud data source types: Oracle Analytics Cloud - Essbase
On-premises data source types: Oracle Essbase
Chapter 9Sheet Information
9-24

Table 9-17 Sheet Information Supported by Essbase
ConnectionStatus
Single Grid Multiple Grid VBA(HypExecuteMenu)
Formulas Functions(HsGetVal,HsGetSheetInfo)
SharedConnection
Yes Yes Yes Yes No
PrivateConnection
Yes Yes Yes Yes No
PrivateConnection—Setas DefaultConnection
Yes Yes Yes Yes No
No Connection,open new blankworksheet
No No No No No
No connection,open a savedworksheet
Yes Yes Yes No No
Set ActiveConnection forthis Worksheet
Yes (see SheetInformationGuidelines )
Yes (see SheetInformationGuidelines)
Yes Yes (see SheetInformationGuidelines)
No
Set as DefaultConnection,before associatewith activeconnection
No (see SheetInformationGuidelines)
Yes (see SheetInformationGuidelines)
Yes Yes (see SheetInformationGuidelines)
No
Set as DefaultConnection, afterassociating withactive connection
Yes (see SheetInformationGuidelines)
Yes (see SheetInformationGuidelines)
Yes Yes (see SheetInformationGuidelines)
No
Last Retrieved Yes
Sheet Information Support in Financial Management
Table 9-18 Sheet Information Supported by Financial Management
ConnectionStatus
Form Ad Hoc Formulas VBA Functions
SharedConnection
Yes Yes Yes Yes No
PrivateConnection
Yes Yes Yes Yes No
PrivateConnection—Setas DefaultConnection
Yes Yes Yes Yes No
No Connection,open new blankworksheet
No No No Not applicable No
Chapter 9Sheet Information
9-25

Table 9-18 (Cont.) Sheet Information Supported by Financial Management
ConnectionStatus
Form Ad Hoc Formulas VBA Functions
No connection,open a savedworksheet
Yes Yes Yes Yes No
Set ActiveConnection forthis Worksheet
Yes Yes Yes Yes No
Set as DefaultConnection,before associatewith activeconnection
Yes Yes Yes Yes No
Set as DefaultConnection, afterassociating withactive connection
Yes Yes Yes Yes No
Last Retrieved Yes Yes
Sheet Information Support in EPM Cloud and Oracle Hyperion PlanningCloud data source types: Planning, Planning Modules, Financial Consolidation andClose, Tax Reporting
On-premises data source types: Oracle Hyperion Planning
Table 9-19 Sheet Information Supported by Planning
ConnectionStatus
Form Ad Hoc Smart Form VBA Rules Functions
SharedConnection
Yes Yes Yes Yes Yes No
PrivateConnection
Yes Yes Yes Yes Yes No
PrivateConnection—Set as DefaultConnection
Yes Yes Yes Yes Yes No
NoConnection,open newblankworksheet
No No No No No No
No connection,open a savedworksheet
Yes Yes Yes Yes Yes No
Set ActiveConnection forthis Worksheet
Yes (see SheetInformationGuidelines)
Yes (see SheetInformationGuidelines)
Yes (see SheetInformationGuidelines)
Yes Yes No
Chapter 9Sheet Information
9-26

Table 9-19 (Cont.) Sheet Information Supported by Planning
ConnectionStatus
Form Ad Hoc Smart Form VBA Rules Functions
Set as DefaultConnection,beforeassociate withactiveconnection
Not applicable(see SheetInformationGuidelines)
Not applicable Not applicable Yes Not applicable Not applicable
Set as DefaultConnection,afterassociatingwith activeconnection
Yes (see SheetInformationGuidelines)
Yes Yes Yes Yes No
Last Retrieved Yes Yes
Document ContentsDocument Contents is a task pane in the Smart View Panel that provides a view of—andallows you to perform actions on—the content existing in the current Office document.
The Document Contents pane displays Office objects in a tree format, allowing you to easilysee and interact with the content in a workbook, presentation, or document, regardless of theprovider or type of content and including content from extensions. Content is displayed basedon the provider connection, or the document layout on sheets, slides, or pages.
Use the drop-down selection list to choose from content in your workbook. The drop-down listin Figure 1 shows a workbook with connections to on-premises Essbase and on-premisesPlanning using a shared connection. A third connection is shown to on-premises OracleBusiness Intelligence Enterprise Edition using a private connection.
The drop-down list for the workbook in Figure 1 displays the content for the sharedconnection sheets, and options for viewing the content on the private Oracle BI EEconnection sheet.
Chapter 9Document Contents
9-27
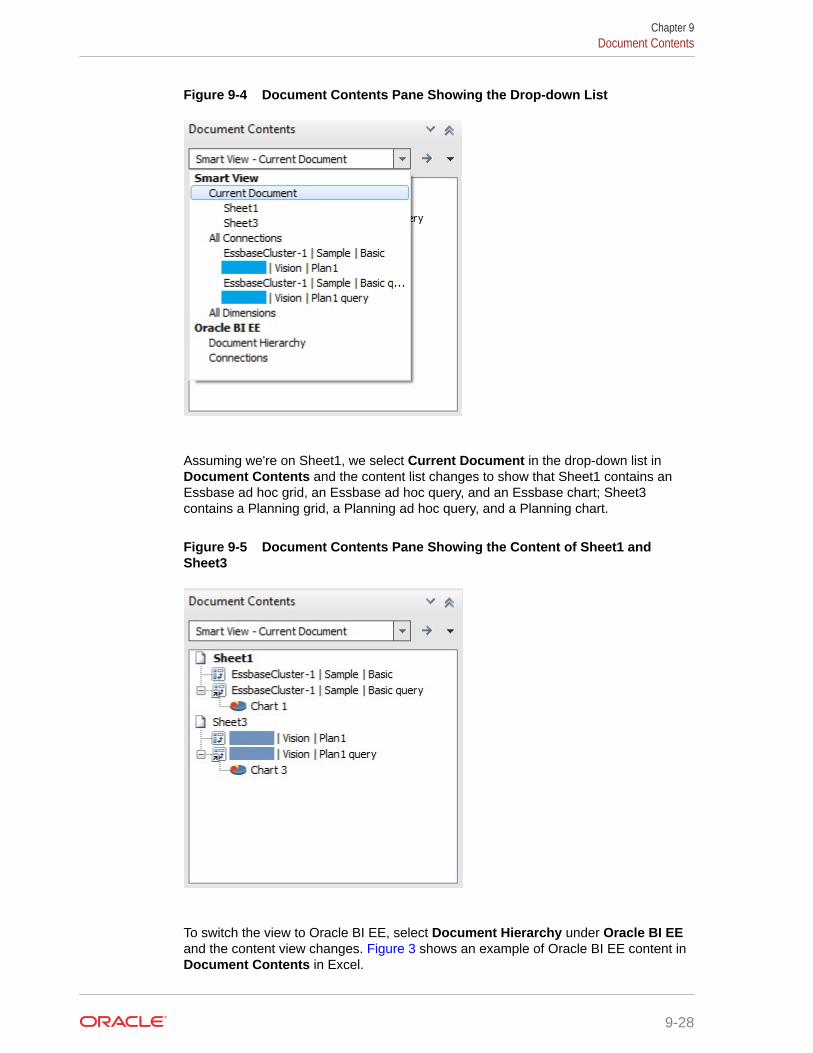
Figure 9-4 Document Contents Pane Showing the Drop-down List
Assuming we're on Sheet1, we select Current Document in the drop-down list inDocument Contents and the content list changes to show that Sheet1 contains anEssbase ad hoc grid, an Essbase ad hoc query, and an Essbase chart; Sheet3contains a Planning grid, a Planning ad hoc query, and a Planning chart.
Figure 9-5 Document Contents Pane Showing the Content of Sheet1 andSheet3
To switch the view to Oracle BI EE, select Document Hierarchy under Oracle BI EEand the content view changes. Figure 3 shows an example of Oracle BI EE content inDocument Contents in Excel.
Chapter 9Document Contents
9-28
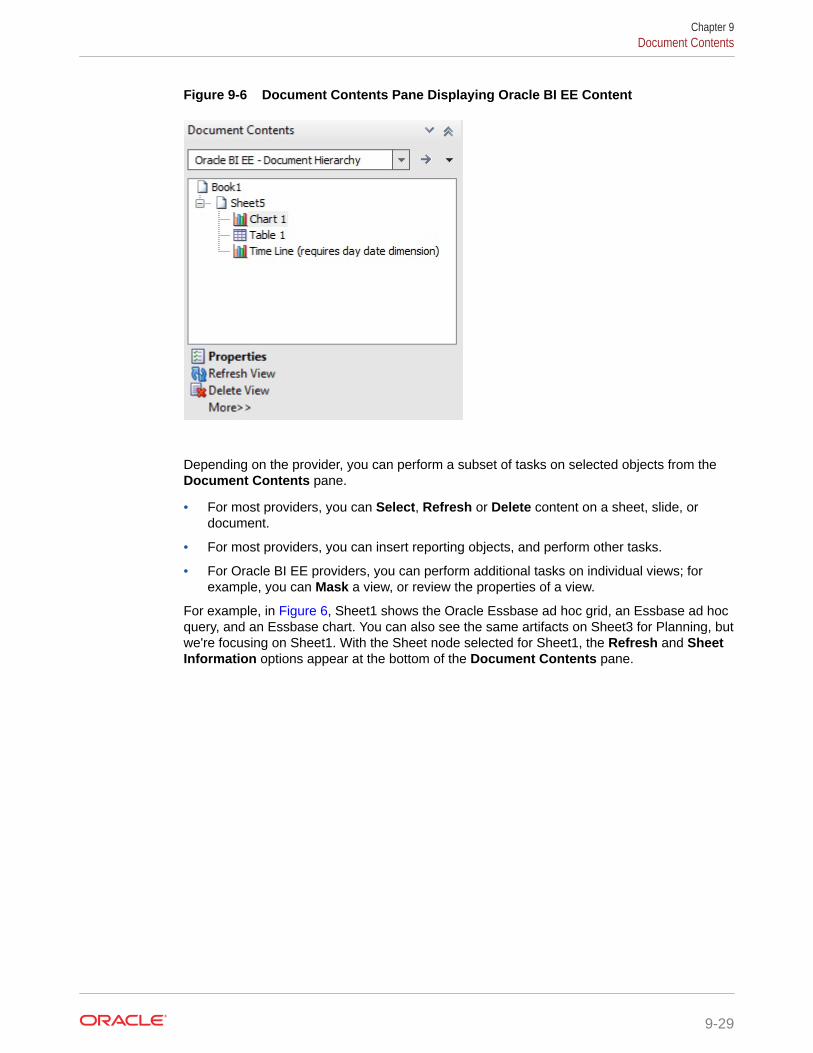
Figure 9-6 Document Contents Pane Displaying Oracle BI EE Content
Depending on the provider, you can perform a subset of tasks on selected objects from theDocument Contents pane.
• For most providers, you can Select, Refresh or Delete content on a sheet, slide, ordocument.
• For most providers, you can insert reporting objects, and perform other tasks.
• For Oracle BI EE providers, you can perform additional tasks on individual views; forexample, you can Mask a view, or review the properties of a view.
For example, in Figure 6, Sheet1 shows the Oracle Essbase ad hoc grid, an Essbase ad hocquery, and an Essbase chart. You can also see the same artifacts on Sheet3 for Planning, butwe're focusing on Sheet1. With the Sheet node selected for Sheet1, the Refresh and SheetInformation options appear at the bottom of the Document Contents pane.
Chapter 9Document Contents
9-29

Figure 9-7 An Essbase Ad Hod Grid with the Sheet Node Selected in DocumentContents
Click Sheet Information to view the Sheet Information dialog box (Figure 5), whereyou can also choose to Save or Delete metadata for the sheet or workbook.
Chapter 9Document Contents
9-30

Figure 9-8 Sheet Information Dialog Box for an Essbase Ad Hoc Grid
Select the object node in Document Contents, and the context changes showing the Select,Insert New Report Object/Control, Refresh, Modify Connection, and Delete options at thebottom of the pane (Figure 6).
Chapter 9Document Contents
9-31

Figure 9-9 An Essbase Ad Hoc Grid Selected in Document Contents
In general, content is grouped by Oracle Smart View for Office providers (Essbase,Oracle Hyperion Financial Management, Oracle Hyperion Planning, and OracleHyperion Reporting and Analysis). Content from Oracle BI EE is grouped separately.In workbooks containing multiple objects from different data sources, you can switchthe view using the Document Contents drop-down menu shown in Figure 7.
Figure 9-10 Available Options in Document Contents Drop-Down Menu
Select the All Connections option and the Document Contents view changes toshow objects sorted by provider (Figure 8).
Chapter 9Document Contents
9-32

Figure 9-11 Smart View Provider Content Listed by Provider in Document Contents
For Smart View provider content, such as Planning or Essbase objects, you can click in thetree area of Document Contents and then hover over an object icon to view connectionproperties, such as Server, Application, Cube, URL, Provider, POV and Alias Table, as shownin Figure 9. Properties vary depending on the provider.
Figure 9-12 Connection Properties of anEssbase Ad Hoc Query
For Oracle BI EE content, select an Oracle BI EE object, and then use the Properties link atthe bottom of Document Contents to launch the View Properties dialog, where you canview connection and other properties (see Figure 3).
For some providers, such as Essbase and Planning ad hoc, you can insert reporting objectssuch as a table native Office chart based on an ad hoc query or grid object. Select the grid or
Chapter 9Document Contents
9-33

query object in Document Contents, and then select Inserting Reporting Object/Control. You are prompted to choose from Table or Chart:
Note:
When inserting 3-D charts for large datasets (for example, more than 3,000cells) from the Document Contents pane, Microsoft Office consumes largeamounts of memory and may fail.
To avoid this issue, Smart View renders the chart as 2-D.
For Smart Slices and Oracle Hyperion Financial Reporting, you can insert reportingobjects such as function grids and slider controls. Refer to the following for moreinformation on inserting these types of reporting objects from Document Contents:
Smart Slices
Smart View and Reporting and Analysis
Shared WorkbooksOracle Smart View for Office does not support Excel shared workbooks.
When the Excel option for sharing workbooks is enabled, Smart View operations arenot supported.
To clear the shared workbook option in Excel, go to the Review ribbon, then click theShare Workbook button, and then clear the Allow changes by more than one userat the same time check box.
Chapter 9Shared Workbooks
9-34

Protected WorksheetsOracle Smart View for Office operations, such as refresh and ad hoc, are not supported onprotected sheets.
For example, you cannot perform Zoom In or Keep Only on protected sheets.
Opening Large Workbooks in Smart ViewOracle Smart View for Office may stop responding when opening workbooks containing alarge number of rows and columns, graphical objects, and Excel comments.
To alleviate this problem, enable the Improve Metadata Storage option by selectingOptions, then Advanced, and then select the Improved Metadata Storage check box.
In addition, when working with larger workbooks, or performing an operation that results in alarge data set, a "not enough resources" error may occur. To alleviate this problem, break upyour workbook into smaller workbooks. Upgrading to Office 64-bit may resolve the issue.
Printing POV Members in the Header and FooterYou can print active POV members in the header or footer of an Excel document.
Cloud data source types: Oracle Analytics Cloud - Essbase, Planning, Planning Modules,Narrative Reporting, Financial Consolidation and Close, Tax Reporting
On-premises data source types: Oracle Essbase, Oracle Hyperion Planning,
Note:
Printing POV members is not supported when connected to Oracle HyperionFinancial Management.
To print the active POV members in the header or footer of an Excel document:
1. In Excel, use your preferred method to add a custom header or footer.
For example, go to the Page Layout ribbon, then select Print Titles, then the Header/Footer tab, and then click Custom Header or Custom Footer.
2. In the header or footer text box, add the following statement:
POV:{}
You may also include any other text that you may require in the header or footer.
When you print the Excel document, the POV members are printed in the header orfooter as specified, along with any other text you may have added.
Chapter 9Protected Worksheets
9-35

Note:
In Excel 2010 and 2013, after adding the POV:{} statement, the POVmembers do not display in Print Preview mode the first time you launchPrint Preview. However, they will print. After printing the sheet, thenreturn to Print Preview to view the POV members in Print Preview mode.
Opening Forms and Ad Hoc Grids from Web Applications(Web Launch)
From your web application, you can open forms and ad hoc grids in Oracle Smart Viewfor Office. This action is also referred to as web launch.
Cloud data source types: Planning, Planning Modules, Financial Consolidation andClose, Tax Reporting
On-premises data source types: Oracle Hyperion Financial Management, OracleHyperion Planning
Note:
Web launch is supported on Microsoft Internet Explorer with no additionalbrowser add-on required.
Mozilla Firefox, Google Chrome, and Microsoft Edge require a browser-specific add-on for web launch. If your default browser is Firefox, Chrome, orEdge, follow the instructions on installing the add-on for these browsers inthe Oracle Smart View for Office Installation and Configuration Guide , Installing Browser Add-ons.
To use web launch to open a form or ad hoc grid in Smart View:
1. In a supported Oracle Enterprise Performance Management Cloud or OracleEnterprise Performance Management System web application, open a form or adhoc grid.
2. From the form or ad hoc grid in the web application, perform an action:
• EPM Cloud: Select Actions, then Open in Smart View.
• EPM System: Select Actions, then Smart View.
If Excel is already open, the form or ad hoc grid is launched on a new sheet in theexisting opened workbook along with the proper ribbon. For example, if you chose toopen a Planning form in Smart View, then the Planning ribbon is displayed.
If not already open, Excel is launched and the form or ad hoc grid appears in SmartView along with the proper ribbon.
Chapter 9Opening Forms and Ad Hoc Grids from Web Applications (Web Launch)
9-36

Note:
Firefox and Chrome: Starting in release 11.1.2.5.720, rather than opening the filedirectly in Smart View, you are prompted as follows:
• Firefox: Select Open or Save File. Optionally, select Do this automaticallyfor files like this from now on to save your choice to avoid making theselection on each web launch
• Chrome: Select Open or Show in folder. Optionally, select Always open filesof this type to open Smart View files automatically.
Enabling and Disabling Smart ViewOracle Smart View for Office is enabled by default after installation.
You can disable Smart View within Smart View for all Microsoft Office applications on yourcomputer or for Outlook alone.
Smart View may also be enabled through Office applications.
Related Topics:
Enabling and Disabling Smart View Using the Smart View Ribbon
Enabling and Disabling Smart View from Microsoft Office
Enabling and Disabling Smart View Using the Smart View RibbonYou can intentionally disable Oracle Smart View for Office from the Smart View ribbon for allMicrosoft Office applications on your computer or for Outlook alone.
To disable Smart View for all Microsoft Office applications (including Outlook):
1. From the Smart View ribbon, select Help.
2. Select About.
3. Clear Enable Add-in to disable Smart View the next time you open an Office application.
The Smart View ribbon remains, containing only the About button.
To enable Smart View for all Microsoft Office applications (including Outlook):
1. Start Excel, Word, or PowerPoint.
2. From the Smart View ribbon, select About.
3. Select Enable Add-in to enable Smart View the next time you open an Office application.
To disable Smart View for Outlook only:
1. From the Smart View ribbon in Excel, Word, or PowerPoint, or from the Smart View menuin Outlook, select Options, then Advanced in the left panel.
2. Under Display, select Disable Smart View add-in in Outlook.
Chapter 9Enabling and Disabling Smart View
9-37

Enabling and Disabling Smart View from Microsoft OfficeYou can enable or disable Oracle Smart View for Office from Add-ins in ExcelOptions. This method is useful in cases where Smart View is disabled unintentionally,through a Microsoft Smart View error.
To enable or disable Smart View for all Microsoft Office applications (includingOutlook):
1. Perform the task appropriate for your Office version:
• 365, 2019, 2016, 2013, 2010: Go to File, then Options, and then Add-ins.
• 2007: Click the Office button in the top left corner of Excel, then select ExcelOptions, and then Add-ins.
2. From Manage, select COM Add-ins, and then Go.
3. In COM Add-ins, perform a task:
• Select the check box to enable the Oracle Smart View for Office add-in, andclick OK.
• Clear the check box to disable the Oracle Smart View for Office add-in.
4. Click OK.
Chapter 9Enabling and Disabling Smart View
9-38
10Smart Query
Related Topics
• About Smart QueryA Smart Query is a multidimensional analysis and reporting tool constructed from multiplesets of members and filters.
• Creating a Smart QueryCreate a Smart Query by defining one or more sets of members from the dimensions inan application.
• Opening a Smart QueryYou can open a Smart Query from a new worksheet or from an existing Smart Queryworksheet.
• Copying and PastingIn Excel, you can copy an entire Smart Query definition from one worksheet to another,and sets and filters to other Smart Queries.
• Sharing Smart Query DefinitionsYou can share Smart Query definitions with other users.
• Executing a Smart QueryExecute saved Smart Queries in the Manage and Execute Queries dialog box.
• Deleting a Smart QueryYou can delete Smart Queries from the list in the Manage and Execute Queries dialogbox.
About Smart QueryA Smart Query is a multidimensional analysis and reporting tool constructed from multiplesets of members and filters.
Cloud data source types: Oracle Analytics Cloud - Essbase
On-premises data source types: Oracle Essbase
Related Topics:
Creating a Smart Query
Opening a Smart Query
Copying and Pasting
Creating a Smart QueryCreate a Smart Query by defining one or more sets of members from the dimensions in anapplication.
To each member set, you can define and apply composite filters to further refine the data tobe returned by the Smart Query. Using these sets and their filters, you can create a highly
10-1

complex query by defining unions, complements, and intersections of data from thedifferent sets.
Once a Smart Query is created, you can use it for ad hoc reporting and analysis. Usethe ad hoc reports created from Smart Queries to submit data. Smart Queries can besaved, reused, and shared. Sets and filters can be saved individually for use in otherSmart Queries.
You cannot submit data directly from a Smart Query.
Creating a Smart Query involves performing the following procedures:
1. Defining Sets
2. Defining Set Filters
3. Building the Smart Query
4. Completing the Smart Query
Defining SetsTo define a set:
1. From the Smart View ribbon, select Panel to open the Smart View Panel.
2. From the Smart View Panel, connect to an Oracle Essbase cube or application.
3. From the Action Panel, select New Smart Query Sheet to display the SmartQuery Panel in place of the Smart View Panel.
You can select the arrow next to to return to the Smart View Panel.
Default dimensions for the connection are displayed in the Smart Query Panel andon the worksheet. The Smart Query ribbon is displayed.
4. Optional: Pivot dimensions by dragging them from one area of the Smart QueryPanel to another.
5. Select the name of a dimension under Row, Column, or Point of View to displayit under Sets for..., where you define the set.
If the dimension exists in Row, Column, or Point of View , you can also start typingthe dimension name in order to select it.
6. In Sets for ...,, click the arrow next to the dimension name and choose SelectBase Members.
For POV dimensions, the members you specify in this step are available forselection from drop-down menus in the Point of View section. You can also enterthese names directly.
7. From the popup menu, select a member level to include in the set or select Otherto open the Member Selector, where you can select specific members.
8. Click the arrow next to the dimension name and select Add Custom Members(not available to Point of View dimensions).
9. Select from among specified values for the set.
Chapter 10Creating a Smart Query
10-2

Note:
When working with very long member names in Essbase, the Smart Queryattempts to verify that the name works with Essbase. During the verificationprocess, a numeric (for example, (1), (2), etc.) is appended to the long membername, signifying the number of verification attempts, up to 10 attempts. Witheach verification attempt, the numeric is incremented by one. Once the 10attempts are completed, Smart Query proceeds with the last attempt, (9), soyou can expect to see (9) appended to the member name.
Optional: Select Other to define members with MDX expressions (see the Essbasedocumentation) in Custom Member Expression.
MDX queries must be at least three characters long to accommodate the simplestmember expression; for example, two operands and an operator. The OK button here isenabled only after the expression entered is validated.
Queries are given default names, but if you choose to rename an MDX query, do not usethe following characters:
• Brackets ([ ])
• Double quotation marks (" ") or their XML-encoded representation (""", """,""", """, """)
• Single quotation marks (') or their XML-encoded representation("'","'","'","'","'")
10. Optional: To allow duplicate members in the set, click the arrow next to the set name andselect Allow Duplicates in Set (not available to Point of View dimensions).
This setting applies only to the set for which it is selected. When there are multiple sets ina Smart Query, members are displayed in the grid for all sets in which they are selectedeven if Allow Duplicates in Set is not selected. For example, if Jan, Feb, and Mar areselected as members for one set, and Level 0 members of Year are selected in anotherset in the same query, then Jan, Feb, and Mar will each appear twice in the grid becausethey are members of both sets.
11. Optional: To rename the set, click the arrow next to the set name and select Rename.
12. To save a set, click the arrow next to the set name, then select Repository, and thenSave Set.
13. In Repository Item, enter a name and description for the member set and click OK.
14. Optional: To add additional member sets for this dimension, click the arrow next to a setname and select Add New Set and repeat the procedure.
15. Select other dimensions from the Smart Query Panel and repeat the procedure asnecessary to add members for other dimensions.
Related Topics:
Defining Set Filters
Building the Smart Query
Chapter 10Creating a Smart Query
10-3

Defining Set FiltersTo define filters for a set:
1. From Sets for..., click the arrow next to a set name and select Add Filter.
A new filter is displayed under Filters for Set...
2. Click the arrow next to the filter name and select one of the following to define thefilter:
• Select Top/Bottom
• Select Based on Value
• Select Based on Value Specified by Members
• String Match (This option does not support qualified member names.)
3. Repeat this procedure as necessary to add more filters to the set.
When you have created the sets and filters that you want to compose the SmartQuery, proceed to Building the Smart Query.
Building the Smart QueryTo build a Smart Query, you apply composite filters to select unions, complements,and intersections of members from the different sets. Unions are selections ofmembers that belong to either but not both of two sets. Intersections are selections ofmembers that belong to all specified sets. Complements are selections of members ofone specified set that are not members of another specified set.
You can use sets and composite filters in any combination to create highly complexSmart Queries.
Union of Sets
To select members that belong to either but not both sets, define two or more filters asdescribed in Defining Set Filters from the dimension in Sets for.... For example, in Figure 1, the query will return only Product, Level 0 members that are either packagedin cans (Product = Can) or are caffeinated (Product = Caffeinated_True).
Chapter 10Creating a Smart Query
10-4

Figure 10-1 Union of Sets
Intersection of Sets
Intersections include only the members that are common to all specified sets.
To select members common to all specified sets:
1. Define a filter for a set as described in Defining Set Filters.
2. Click the arrow next to the filter name and select Add Filter.
3. Additional Filters and a subset filter are displayed.
4. Define the second filter.
In Figure 2, the query will return only Product, Level 0 members that are caffeinated andpackaged in a can.
Figure 10-2 Intersection of Sets
Complement of Sets
To select only members of a set that are not members of another specified set.
1. From Filters for..., click the arrow next to a filter name and select Add Filter.
Additional Filters and a subset filter are displayed.
Chapter 10Creating a Smart Query
10-5

2. Define the second filter.
3. Click the arrow next to Additional Filters. and select Exclude.
In Figure 3, the query will return only Product, Level 0 members that are caffeinatedbut are not packaged in a can.
Figure 10-3 Complement of Sets
When you have built the Smart Query, proceed to Completing the Smart Query.
Completing the Smart QueryTo complete the Smart Query:
1. From the Smart Query ribbon, select options for the Smart Query as follows:
• Indentation (see Member Options)
• Show Distinct Member Names (see Member Options)
• Suppress Rows with No Data (see Data Options)
2. Optional: Select Change Alias to select an alias table.
The full names of duplicate and shared members are shown regardless of theselected alias table (if any). All other member names are shown according to theselected alias table.
3. To save the entire Smart Query definition, from the Smart Query ribbon, selectSave.
4. In Repository, enter a name and description for the Smart Query.
5. Click OK.
Smart Queries are also saved within the workbook, so when you save a workbook,Smart Queries within it are also saved.
6. Optional: To perform ad hoc analysis, from the Smart Query ribbon, selectAnalyze.
Chapter 10Creating a Smart Query
10-6
Opening a Smart QueryYou can open a Smart Query from a new worksheet or from an existing Smart Queryworksheet.
Opening from a New Worksheet
To open Smart Query from a new worksheet:
1. From the Smart View ribbon, select Panel to open the Smart View Panel.
2. From the Smart View Panel, click the arrow next to , and then select Smart Query.
3. From the Smart Query Panel, select Open Definition to display the Repository list ofavailable Smart Queries.
4. Select a Smart Query from the list.
5. Click OK.
Opening from an Existing Smart Query Worksheet
To open an existing Smart Query:
1. From the Smart Query ribbon, select Open to display the Repository list of availableSmart Queries.
2. Select a Smart Query from the list.
3. Click OK.
4. When asked if you want to discard the existing Smart Query on the worksheet, click Yes.
The Smart Query is opened on the current worksheet.
Copying and PastingIn Excel, you can copy an entire Smart Query definition from one worksheet to another, andsets and filters to other Smart Queries.
Copying Smart Query definitions can be used as a means of sharing queries between users.
Related Topics:
Copying Smart Query Sets and Filters
Copying Smart Query Reports to Word and PowerPoint
Sharing Smart Query Definitions
Copying Smart Query Definitions in ExcelYou can copy a Smart Query definition to a different worksheet in the current workbook or inanother workbook. If the worksheet into which you want to paste the definition alreadycontains a Smart Query definition, it will be replaced by the pasted definition.
To copy a Smart Query definition from one worksheet to another:
1. Open the Smart Query worksheet that you want to copy.
Chapter 10Opening a Smart Query
10-7

2. From the Smart Query ribbon, select Copy.
3. Open a new worksheet.
4. Do one of the following:
• To copy the entire definition to a blank worksheet, from the Smart QueryPanel, select Paste.
• To replace a Smart Query definition, from the Smart Query ribbon of theworksheet to be replaced, select Paste.
Copying Smart Query Sets and FiltersTo copy a set, under Sets for..., click the arrow next to a set name and select CopySet. You can then copy the set within the current Smart Query or to a different SmartQuery using Paste Set from the same menu.
To copy a filter, under Filters for Set..., click the arrow next to a filter name and selectCopy Filter. You can then copy the set within the current Smart Query or to a differentSmart Query using Paste Filter from the same menu.
Copying Smart Query Reports to Word and PowerPointYou cannot copy a Smart Query definition from Excel to Word or PowerPoint directly,but you can copy a grid or partial grid defined by a Smart Query from Excel to Word orPowerPoint. To do so, from the Smart Query ribbon, select Analyze. Then copy dataas described in Copying Data Between Excel, Word, and PowerPoint.
Sharing Smart Query DefinitionsYou can share Smart Query definitions with other users.
The Smart Query definition includes definitions for rows, columns, POV, dimensionsets, filters, sorting, and custom members.
The methods for sharing a Smart Query are:
• Email Sharing
• Workbook Sharing
The following topics explain each method.
Email Sharing
To share a Smart Query definition with other users via email:
1. In Excel, open the Smart Query worksheet containing the definition that you wantto copy.
2. From the Smart Query ribbon, select Copy.
3. Open a blank email message and press Ctrl-V.
When pasted into an email message, the query definition will resemble a long lineof alphanumeric characters.
4. Send the email message to the users you are sharing with.
5. Recipients of the Smart Query definition then perform the following tasks:
Chapter 10Sharing Smart Query Definitions
10-8

a. In the email, select the Smart Query definition string and copy it to the Windowsclipboard (use Ctl+C or the Copy command).
b. Open a blank worksheet in a new or existing workbook.
c. Optional: Connect to the appropriate data source.
If you do not connect to a data source, you will prompted to do so when you pastethe definition in the next step.
d. From the Smart View ribbon for the active worksheet, click .
The Smart Query populates the worksheet.
Workbook Sharing
To share a Smart Query in a workbook:
1. Save the Excel workbook that contains the Smart Query to share.
2. Send the Excel workbook to the users you are sharing with or place the workbook file in ashared network location and notify those users.
3. Recipients of the workbook containing the Smart Query definition then perform thefollowing tasks:
a. Open the workbook either directly from the email or from the shared network location.
The Smart Query populates the worksheet.
b. In the Smart View ribbon, click Refresh to be prompted for login credentials in theConnect to Data Source dialog box.
Executing a Smart QueryExecute saved Smart Queries in the Manage and Execute Queries dialog box.
To execute a Smart Q\query:
1. In Excel, connect to an Oracle Essbase or Oracle Analytics Cloud - Essbase data source.
2. From the Essbase ribbon, select Manage and Execute Queries to display the Manageand Execute Queries dialog box.
3. Select a Smart Query from the list in the left frame and click Execute.
The dialog box closes automatically and the Smart Query results appear on the sheet.
Deleting a Smart QueryYou can delete Smart Queries from the list in the Manage and Execute Queries dialog box.
To delete a Smart Query:
1. In Excel, connect to an Oracle Essbase or Oracle Analytics Cloud - Essbase data source.
2. From the Essbase ribbon, select Manage and Execute Queries
3. From the list in the left frame of the Manage and Execute Queries dialog box, select aSmart Query to delete.
4. Click the Delete Query button .
Chapter 10Executing a Smart Query
10-9

5. Click Yes at the prompt to confirm the delete request.
6. Click the X in the upper right corner or click Cancel to close the dialog.
Chapter 10Deleting a Smart Query
10-10
11Smart Slices
Related Topics
• About Smart SlicesA Smart Slice is a reusable perspective of a data source.
• Creating Reports with Smart SlicesSmart Slices are stored centrally and are available to users from the Smart View Panel.
• Smart Slices, Ad Hoc Analysis, and FormsYou can perform ad hoc analysis on a Smart Slice in Excel.
• Creating Smart SlicesAdministrators and database administrators can create, modify, and delete Smart Slices.
About Smart SlicesA Smart Slice is a reusable perspective of a data source.
Cloud data source types: Oracle Analytics Cloud - Essbase
On-premises data source types: Oracle Essbase, Oracle Hyperion Financial Management
It can be composed of a single member, a combination of single members, filters, orcombination of single members and filters in any order. These components serve asboundaries to the data that users can view and work with in the Smart Slice. Any operationthat can be done in Oracle Smart View for Office can be done within the confines of a SmartSlice.
An organization can have as many different Smart Slices as it needs to accommodate thespecific data requirements of its users. For example, Smart Slices can be created for differentsales geographical regions, different product lines, different time frames, or a combination ofany of these dimensions.
You can view and work with any data within the boundaries of a Smart Slice, but not with dataoutside its boundaries. For example, in a Smart Slice that limits sales data to the Westernregion, you could drill down to data for California or Los Angeles, but could not navigateacross to New York.
Creating Reports with Smart SlicesSmart Slices are stored centrally and are available to users from the Smart View Panel.
Cloud data source types: Oracle Analytics Cloud - Essbase
On-premises data source types: Oracle Essbase, Oracle Hyperion Financial Management
An entire report is associated with an Excel workbook, a Word document, or a PowerPointpresentation. One report is associated with an Excel worksheet, a Word page, or aPowerPoint slide. For PowerPoint presentations, Oracle recommends one report type perslide.
11-1

You can create reports from entire Smart Slices or from subsets of data in a SmartSlice. Reports can then be displayed on an Excel spreadsheet, Word document, orPowerPoint slide. You can display as many reports from as many data sources asspace will permit on one sheet.
To create a report from a Smart Slice:
1. From the Smart View ribbon, select Panel.
2. From the Smart View Panel, select a Smart Slice.
3. In the Action Panel, do one of the following.
• To work with the Smart Slice as is, click Insert Smart Slice into report. TheSmart Slice is displayed in Document Contents in the lower portion of theSmart View Panel.
• To create a subset of the Smart Slice for local storage, click Modify SmartSlice and insert into report and use the Smart Slice Designer as describedin Creating Smart Slices.
Note:
If you use Modify Smart Slice to create a Smart Slice, you mustselect the newly-created Smart Slice from the Smart View Panel treelist before performing ad hoc analysis.
4. Click to refresh the Document Contents tree.
5. Select the Smart Slice in Document Contents, right-click and select Insert NewReporting Object/Control.
6. From the Insert New Reporting Object/Control dialog box, select one of thesereport types to place on the grid:
• Function Grid — a dynamic grid format
Function grids can be used with Word, PowerPoint, and Excel. When yourefresh a function grid, data cells are refreshed; members are not. To refreshboth data and members, you must reinsert the function grid into the sheet. Forthis reason, function grids are most useful for reports in which membersremain reasonably static. For reports whose members may change moreoften, tables and charts are better report types. Although you can havemultiple reports on a worksheet, you can have only one function grid.
You can use Excel formulas, for example SUM, with function grids. To retainsuch formulas as part of the function grid, you must leave one empty rowbetween the grid and the cell containing the formula and include the emptyrow in the range of cells selected for the formula definition. This permitsretention of the formula when refreshing the data results in a different numberof rows in the grid.
To format a function grid, use Excel formatting capabilities.
• Office Table
Office tables can be used with Word and PowerPoint. Office tables displayresults in native Microsoft Office table format. When you refresh an Officetable, both members and data are refreshed.
Chapter 11Creating Reports with Smart Slices
11-2

Office tables look and feel like part of the Word or PowerPoint document, but themembers and data in the table cells are connected to the Oracle Smart View forOffice provider. With Office tables, you can work with the Word or PowerPoint tableformatting and styles that you are accustomed to. Insert a POV object into the reportand you can change the POV of the Office table. Refresh the Office table afterchanging formatting or POV and the new POV is reflected in the results and customformatting is retained.
You cannot zoom in or out in an Office table object, and you cannot perform other adhoc operations or use free form.
• Table
Tables can be used with PowerPoint and Excel. Table reports display results in a gridformat that floats on the document and can be moved and re-sized. When yourefresh a table, both members and data are refreshed. Tables are useful fordisplaying large grids in a smaller space; their scroll bars enable you to quicklyaccess rows and columns.
You can zoom in and out in a table report, but you cannot perform other ad hocoperations or use free form.
• Chart
Charts can be used with PowerPoint and Excel. In PowerPoint, contents of chartsand tables are visible only in presentation mode. Chart reports display results in achart format that floats on the document and can be moved and re-sized. When yourefresh a chart, both members and data are refreshed.
7. Optional: To move or re-size a table or chart, in Document Contents, click the down
arrow next to , and from the menu, select Toggle Design Mode.
You can now move objects within the sheet, slide, or page.
8. To insert a report control, select the Smart Slice in Document Contents, right-click andselect Insert New Reporting Object/Control.
9. From the Insert New Reporting Object/Control dialog box, select one of these reportcontrol types:
• POV — a report can contain only one POV
• Slider — a report can contain multiple sliders. See Sliders.
A report can contain a POV or sliders, but not both.
10. Refresh.
11. Optional: To create a separate report for any or all of the members of one dimension inthe report and cascade these reports separately across the worksheets of the workbook,see Cascading Reports and Ad Hoc Grids.
Note:
In reports that contain a chart and a table, cascading may cause the chart andtable to overlap the next time you open the workbook.
Chapter 11Creating Reports with Smart Slices
11-3

Deleting Reports or Report ObjectsTo delete a report:
1. In Document Contents, click
2. Select the object to delete from the link in Document Contents; for example,select a function grid or POV.
Selecting a report also deletes all its report objects.
3. At the bottom of the Document Contents pane, select More, then select Delete.
SlidersFigure 1 shows a slider. The slider displays a selected set of dimension members froma query; when you drag the slider marker to a member, its data is displayed in allreports associated with the query on the sheet. Sliders can contain dimensions frommore than one query in the Report Designer if the dimensions have the sameboundaries.
Figure 11-1 Slider
Related Topics:
• Creating a Slider from One Query
• Creating a Slider from Joined Queries
Creating a Slider from One QueryTo create a slider:
1. Ensure that one or more report type is inserted in the worksheet for the query forwhich you want to create the slider.
2. From the report designer, click Query View and select Query View.
3. In the Report Designer, select the query on which to base the slider.
4. Click and select Slider to open Member Selection.
5. Select a dimension, members, and filters for the slider and click OK.
The slider is displayed on the sheet.
6. Optional: To move or re-size the slider, click and then move or re-size.
Chapter 11Creating Reports with Smart Slices
11-4

Creating a Slider from Joined QueriesYou can create a slider that contains dimensions from multiple queries if, and only if, thedimensions from the different queries have the exact same boundaries.
To create a slider using a dimension from multiple queries:
1. Ensure that one or more report type is inserted in the worksheet for the query for whichyou want to create the slider.
2. Click Query View and select Dimension View. Notice that the Report Designer tree viewis grouped by dimensions rather than by queries. Under each dimension are the queriesthat contain that dimension. If the dimensions do not contain the same boundaries,multiple sliders will be created to accommodate each of them. For example, if the Marketdimension in one query contains a children filter and the Market dimension from anotherquery contains a descendents filter, two Market sliders would be created.
3. In the Report Designer, select the dimension on which to base the query.
4. Click and select Slider to open Member Selection.
5. Select dimension members, and filters for the slider and click OK.
The slider is displayed on the sheet.
6. Optional: To move or re-size the slider, click and then move or re-size.
Smart Slices, Ad Hoc Analysis, and FormsYou can perform ad hoc analysis on a Smart Slice in Excel.
Cloud data source types: Oracle Analytics Cloud - Essbase
On-premises data source types: Oracle Essbase, Oracle Hyperion Financial Management
Select the Smart Slice in the Smart View Panel and click Ad Hoc Analysis in the ActionPanel. Data and POV from the Smart Slice is entered into the worksheet, and you canperform ad hoc analysis.
Note:
Essbase only: Multiple-grid worksheets are not supported for Smart Slices.
To use a form, select the Smart Slice in the Smart View Panel and click Open Form in theAction Panel. Only forms enabled by the administrator may be used for ad hoc analysis.
If you want to locate the Smart Slice source of the data in an ad hoc grid, click and selectLocate Worksheet Connection. The Smart Slice is highlighted in the Smart View Panel.
Chapter 11Smart Slices, Ad Hoc Analysis, and Forms
11-5
Creating Smart SlicesAdministrators and database administrators can create, modify, and delete SmartSlices.
Cloud data source types: Oracle Analytics Cloud - Essbase
On-premises data source types: Oracle Essbase, Oracle Hyperion FinancialManagement
In Essbase, if enabled by the administrator, all users can create, modify and deleteSmart Slices.
Creating Smart Slices involves Setting Smart Slice Data Boundaries and Setting SmartSlice Preferences.
Setting Smart Slice Data BoundariesCloud data source types: Oracle Analytics Cloud - Essbase
On-premises data source types: Oracle Essbase, Oracle Hyperion FinancialManagement
To create a Smart Slice:
1. From the Smart View ribbon, select Panel.
2. Open the Smart View Panel and connect to a data source.
3. Do one of the following:
• From the Action Panel, click Create New Smart Slice, then select an aliastable from the list of alias tables.
• With an ad hoc grid open, from the data source ribbon, select Smart Slice.
The Smart Slice Designer and a New Smart Slice – Design worksheet aredisplayed. You design the Smart Slice from the Smart Slice Designer; results aredisplayed on the worksheet.
On the Smart Slice Designer are Rows, Columns, POV, and Attributes sectionsfor row, column, POV, and attribute dimensions.
4. From the Smart Slice Designer, use any of the following operations to createboundaries for the Smart Slice.
• To select members for row or column boundaries, drag members from thePOV to Rows or Columns as needed on the Smart Slice Designer. To removerow or column members, drag them to the POV. Changes are reflectedimmediately on the grid.
• To select members for dimensions under Rows, Columns, or Attributes,section, click the name of the dimension to open the Member Selection dialogbox.
• To select members for the POV on the Smart Slice Designer, click the arrownext to the dimension name and select the ellipsis to open the MemberSelection dialog box.
5. Click Options and set preferences as described in Setting Smart SlicePreferences.
Chapter 11Creating Smart Slices
11-6

6. Click Done; Member Selection is displayed.
7. In Member Selection, select a dimension member to use as the default POV and clickOK.
8. In the Smart View Panel, in Enter a new name, enter a name for the Smart Slice.
9. Click OK. The Smart Slice is displayed in the tree view of the Smart View Panel under itsdata source.
Setting Smart Slice PreferencesThe preferences that you specify are stored as part of the Smart Slice definition, and theyoverride the global preferences set in the Options dialog box.
To specify Smart Slice preferences:
1. From the Smart Slice Designer, click Options.
2. For each option, enter or select the preference from the drop-down menu.
Users can select the options that are enabled here. See Smart View Options fordescriptions of the options.
Note:
Replacement labels for missing data and other preferences specified in theSmart Slice Options dialog box in this step are not applied to function gridsbased on the Smart Slice (as described in Creating Reports with Smart Slices).Instead, the options specified by Oracle Smart View for Office users in theOptions dialog box are applied to function grids.
Note:
Smart View does not support number formatting of Function Grids importedfrom Smart Slices.
Chapter 11Creating Smart Slices
11-7

12The Query Designer and MDX Queries
Working with Query DesignerUse the Oracle Smart View for Office Query Designer to design the layout of a report.
Related Topics
• About the Query Designer
• Creating Queries
• Editing Queries and Rerunning Reports
• Filtering Data
• Analyzing Time-Related Data in Query Designer
About the Query DesignerCloud data source types: Oracle Analytics Cloud - Essbase, Planning, FinancialConsolidation and Close
On-premises data source types: Oracle Essbase, Oracle Hyperion Financial Management,Oracle Hyperion Planning
The Query Designer is an Oracle Smart View for Office tool from which you can design thelayout of a report by selecting dimensions, members, and attributes for rows, columns, andthe POV from one interface. You can use the Query Designer to create a query from a blankconnected worksheet, which uses the default report as a starting point, or extract a queryfrom a saved report. The Query Designer is available only for ad hoc worksheets.
Creating QueriesCloud data source types: Oracle Analytics Cloud - Essbase, Planning, FinancialConsolidation and Close
On-premises data source types: Oracle Essbase, Oracle Hyperion Financial Management,Oracle Hyperion Planning
To create a query report:
1. Open a worksheet or an existing report in Excel and connect to a data source.
Note:
Workbooks can contain Query Designer worksheets from multiple data sources.However, only one data source can be associated with each worksheet.
12-1

2. From the data source ribbon, select Query, then Query Designer.
The Query Designer and a query worksheet named "Sheetname - Query" (forexample, Sheet1 – Query) are displayed. You design your query on thisworksheet.
The following operations are disabled on the query sheet, but are re-enabled afteryou run the report:
• Formulas
• Asymmetric reports
• Comments
• Blank rows or columns
• Changes to alias tables
• Ad hoc actions such as zoom in and out, keep and remove only, and double-click
The following operations are unavailable in both query sheet and report sheet:
• Filtering of column members
• Changing data sources
If you are working with a duplicate member database, qualified member namesare displayed on the query sheet, but only the member names are displayed afteryou run the report.
3. Use any of the following operations to design your query:
• To select members for the Rows and Columns dimensions displayed on theQuery Designer, click the dimension name to open the Member Selectiondialog box.
• To select members for POV dimensions displayed on the Query Designer,click the arrow next to the dimension name and select the ellipsis to open theMember Selection dialog box.
• To move a dimension from the POV to the grid, drag and drop it from the POVsection to the Columns or Rows section in the Query Designer.
• To remove a dimension from the grid, drag and drop the dimension from theColumns or Rows section to the POV section in the Query Designer.
• To add or remove an attribute dimension, select a dimension from theAttributes drop-down menu and drag and drop to the Rows or Columnssection of the Query Designer.
• Enter members directly into the grid.
Chapter 12Working with Query Designer
12-2

Note:
When working with databases that support duplicate member names, avoidusing member names containing periods. Oracle Smart View for Office detectsperiods (.) as delimiters in Query Designer, resulting in an unknown membererror. If the dimension or member names in your query contain a period, themember will be interpreted as two members, parent and child. For example, themember:
abcd.wxyz
would be interpreted as:
abcd wxyz
4. From the Query Designer, click Apply Query. The resulting report is displayed in a newreport sheet called "Sheetname - Report" (for example, Sheet1 – Report). Operationstemporarily disabled in step 2 are re-enabled.
The report sheet replaces the query sheet, but you can retrieve the query sheet byrepeating step 2.
5. To save the report, save as an Excel .xls or .xlsx file.
Note:
In Oracle Analytics Cloud - Essbase or Essbase , .xls or .xlsx files can beused as a data load data source.
Note:
The Query Designer is not designed to work with Smart Slices.
Editing Queries and Rerunning ReportsRerunning queries regenerates the report; any changes to the original report, such aszooming, comments, and formulas are lost. Formatting is also lost.
You can refresh reports, but this only refreshes the data. It does not rerun the report.
To edit a query and rerun a report:
1. Open the Query Designer query sheet to edit. If the query sheet is hidden, from the datasource ribbon, select Query and then Query Designer.
2. Edit the query.
3. Select Query then Run the Report.
Chapter 12Working with Query Designer
12-3

The report is updated.
Filtering DataCloud data source types: Oracle Analytics Cloud - Essbase
On-premises data source types: Oracle Essbase
Filtering data limits the amount of data returned to a specified top or bottom criterion.Top or bottom ranking enables you to view, for example, the top 10 products in salesfor a given region.
To filter data:
1. In the Query Designer report worksheet, select a dimension.
2. From the Essbase ribbon, select Query and then Data Filter.
3. From Data Filter, under Count, select Top or Bottom and specify a number.
4. Under Set, click .
5. From Member Selection, select a row member for ranking, and click OK to returnto Data Filter.
6. Under Value, click
7. From Member Selection, select a column member to run the ranking against, andclick OK to return to the Data Filter dialog box.
8. Click OK.
An MDX query in the form TopCount( { [Qtr3] }, 10, [Measures].[Profit]), thatrepresents your data filtering settings is inserted into the grid. The example returnsthe top 10 most profitable products in quarter 3.
9. Click Apply Query to display query results.
Analyzing Time-Related Data in Query DesignerCloud data source types: Oracle Analytics Cloud - Essbase
On-premises data source types: Oracle Essbase
Filtering data limits the amount of data returned to a specified top or bottom criterion.Top or bottom ranking enables you to view, for example, the top 10 products in salesfor a given region.
Using Oracle Smart View for Office, you can analyze flash metrics such as sales ofcost of goods sold against time-based metrics. This enables you to look for trends, findaverages for different time periods, and so forth. To do this, you use linked attributeswhich enable periodicity of members. Periodicity is a shared pattern among timedimension members that make them meaningful for time-based analysis (January andApril share periodicity as first months of quarters, for example). Day by month, day byweek, and week by year are examples of linked attributes. You can also set ranges forlinked attributes and apply filters.
To analyze time-related data in Query Designer:
1. Create a query.
Chapter 12Working with Query Designer
12-4

2. From the Query Designer toolbar, select Date-Time dimension and drag it to the grid orwithin the toolbar.
3. Click Date-Time in the Query Designer toolbar to open Member Selection, where youcan select members and apply Period, Range, and other filters.
4. Under Attributes on the Query Designer toolbar, select an attribute or linked attribute inthe drop-down menu, then drag it to the grid or within the toolbar. Repeat as necessaryfor other attributes.
5. To select members and apply filters to an attribute, click the attribute name on the QueryDesigner toolbar to open Member Selection.
6. Click on the POV toolbar.
Working with MDX QueriesCreate and manage MDX query commands using the Manage and Execute Queries dialogbox.
Related Topics
• About Working with MDX Queries
• Creating and Saving an MDX Query
• Executing MDX Queries
• Modifying Query Connection Information
• Changing the Query List Display
• Deleting MDX Queries
About Working with MDX QueriesCloud data source types: Oracle Analytics Cloud - Essbase
On-premises data source types: Oracle Essbase
MDX users can bypass the Query Designer interface and create and manage MDX querycommands using the Manage and Execute Queries dialog box.
In Manage and Execute Queries, you can perform the following tasks:
• Create a query
• Modify an existing query
• Save a query
• Modify a query's connection information
• Delete a query
• Execute a query
You can execute one MDX statement per query.
To execute multiple MDX queries at once, Essbase must create an MDX script, describedin the Oracle Essbase Technical Reference . Oracle Smart View for Office users then runthe script from the Calculation Scripts dialog, as described in Running EssbaseCalculations.
Chapter 12Working with MDX Queries
12-5

Creating and Saving an MDX QueryYou can create an MDX query in the Manage and Execute Queries dialog box.
See the Oracle Essbase or Oracle Analytics Cloud - Essbase documentation forinformation on MDX syntax.
To create an MDX query:
1. In Excel, connect to an Essbase or Oracle Analytics Cloud - Essbase data source.
2. From the Essbase ribbon, select Manage and Execute Queries to display theManage and Execute Queries dialog box.
Figure 12-1 Manage and Execute Queries Dialog Box
3. Click Add Query and type a valid MDX statement in the text box at the right.
For example:
SELECT {[Sales], [Cogs]} on columns, Filter ([Product].Levels( 2 ).Members, AVG([Year].CHILDREN, 9001.0) > 9000.00) on rows
Chapter 12Working with MDX Queries
12-6

Figure 12-2 MDX Query Syntax Entered in the Manage and Execute QueriesDialog Box
4. Click the Save Query button and, in the Save Query dialog box, enter a name andoptional description for the query.
The default name for queries is Query1 [n]. You can change this name.
5. Click Save to save the query.
The newly-saved query is now listed in the left text box of the Manage and ExecuteQueries dialog box.
Chapter 12Working with MDX Queries
12-7

Figure 12-3 Newly-Saved MDX Query Listed in the Manage and ExecuteQueries Dialog Box
You may continue by executing this query or modifying the syntax or connectioninformation.
Executing MDX QueriesYou can execute saved MDX queries or instantly execute a query you have justentered.
To execute an MDX query:
1. In Excel, connect to an Oracle Essbase or Oracle Analytics Cloud - Essbase datasource.
2. From the Essbase ribbon, select Manage and Execute Queries to display theManage and Execute Queries dialog box.
Figure 12-4 Manage and Execute Queries Dialog Box
Chapter 12Working with MDX Queries
12-8
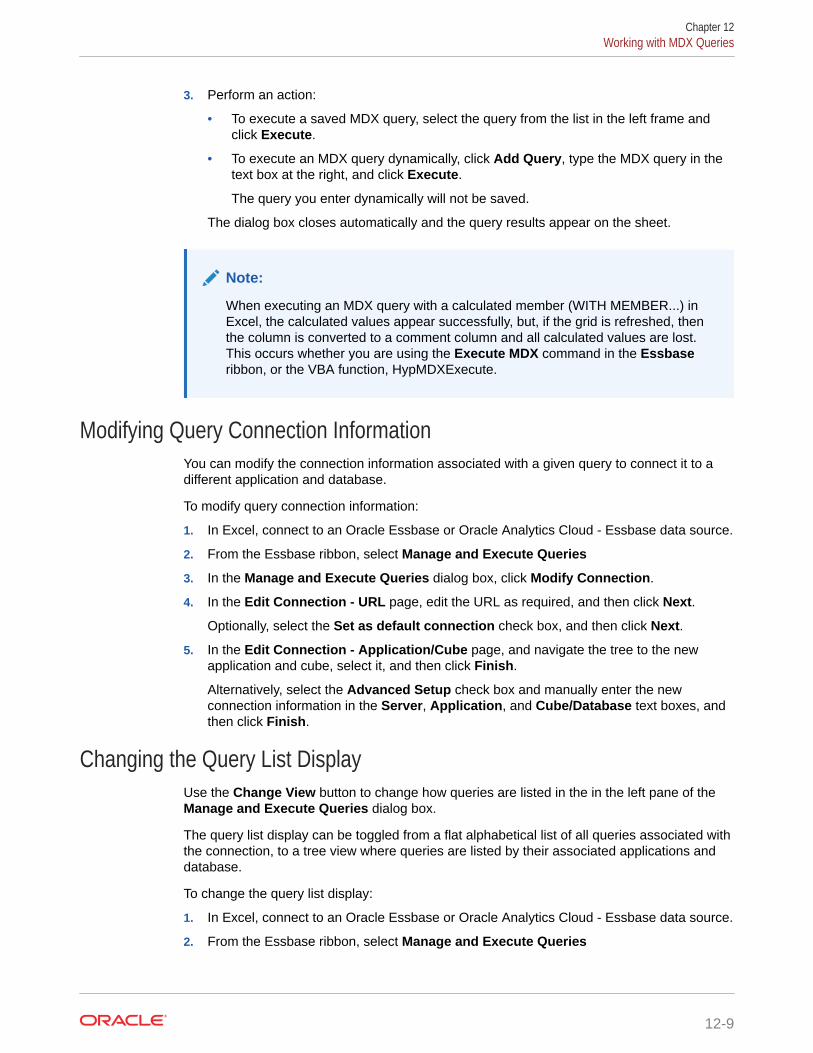
3. Perform an action:
• To execute a saved MDX query, select the query from the list in the left frame andclick Execute.
• To execute an MDX query dynamically, click Add Query, type the MDX query in thetext box at the right, and click Execute.
The query you enter dynamically will not be saved.
The dialog box closes automatically and the query results appear on the sheet.
Note:
When executing an MDX query with a calculated member (WITH MEMBER...) inExcel, the calculated values appear successfully, but, if the grid is refreshed, thenthe column is converted to a comment column and all calculated values are lost.This occurs whether you are using the Execute MDX command in the Essbaseribbon, or the VBA function, HypMDXExecute.
Modifying Query Connection InformationYou can modify the connection information associated with a given query to connect it to adifferent application and database.
To modify query connection information:
1. In Excel, connect to an Oracle Essbase or Oracle Analytics Cloud - Essbase data source.
2. From the Essbase ribbon, select Manage and Execute Queries
3. In the Manage and Execute Queries dialog box, click Modify Connection.
4. In the Edit Connection - URL page, edit the URL as required, and then click Next.
Optionally, select the Set as default connection check box, and then click Next.
5. In the Edit Connection - Application/Cube page, and navigate the tree to the newapplication and cube, select it, and then click Finish.
Alternatively, select the Advanced Setup check box and manually enter the newconnection information in the Server, Application, and Cube/Database text boxes, andthen click Finish.
Changing the Query List DisplayUse the Change View button to change how queries are listed in the in the left pane of theManage and Execute Queries dialog box.
The query list display can be toggled from a flat alphabetical list of all queries associated withthe connection, to a tree view where queries are listed by their associated applications anddatabase.
To change the query list display:
1. In Excel, connect to an Oracle Essbase or Oracle Analytics Cloud - Essbase data source.
2. From the Essbase ribbon, select Manage and Execute Queries
Chapter 12Working with MDX Queries
12-9

3. In the Manage and Execute Queries dialog box, click the Change View button,
.
The default display is a flat alphabetical list. Clicking changes the query list toa tree view, where queries are listed by their associated applications anddatabases, as shown in Changing the Query List Display
Figure 12-5 Queries Listed in Tree Format by Application and Database
4. Optional: Click again to toggle the view back to an alphabetical list.
Deleting MDX QueriesYou can delete MDX queries from the list in the Manage and Execute Queries dialogbox.
To delete an MDX query:
1. In Excel, connect to an Oracle Essbase or Oracle Analytics Cloud - Essbase datasource.
2. From the Essbase ribbon, select Manage and Execute Queries
3. From the list in the left frame of the Manage and Execute Queries dialog box,select a query to delete.
4. Click the Delete Query button .
5. Click Yes at the prompt to confirm the delete request.
6. Click the X in the upper right corner or click Cancel to close the dialog.
Chapter 12Working with MDX Queries
12-10

13Smart Forms
Related Topics
• About Smart FormsCreate and manage Smart Forms in Oracle Smart View for Office.
• Creating Smart FormsIn Oracle Smart View for Office, you create Smart Forms by saving ad hoc grids thatcontain grid labels and business calculations.
• Smart Form Example ScenarioSmart Forms start with an ad hoc grid.
• Excel Functions Supported in Smart FormsSeveral Excel functions are supported in Smart Forms.
About Smart FormsCreate and manage Smart Forms in Oracle Smart View for Office.
Data source types: Planning, Planning Modules, Financial Consolidation and Close, TaxReporting
Starting with an ad hoc analysis grid, you can customize the grid by adding businesscalculations to it, in the form of Excel functions and formulas. These calculations don't affectmetadata in the rest of the source application. The business calculations that you create andsave in the Smart Form can then be executed in both Smart View and the provider webinterface; for example, in Planning. In Smart View, the formulas are evaluated by Excel; in theweb interface, the formulas are evaluated by the provider.
For example, say you're analyzing Planning data in Smart View. You want to calculate theaverage profit margin for four products. You can add a row to the grid, with the grid label of"Average Profit Margin." In the new row, add an Excel function for average profit margin,selecting the profit margin data cells for each of the four products. If the profit margin for eachproduct appears in column D of the grid, then your function may be =AVERAGE(D5:D8). InSmart Forms, the Excel formulas and functions you add are referred to as businesscalculations. After you add the business calculation, the average profit margin is instantlydisplayed in the new row, but the new row will be saved only in the Smart Form, not the restof the application.
To make this ad hoc grid with its grid labels and calculations available as a form in Planning,you select the Save As Smart Form option in the Planning ribbon in Smart View. Thereafter,in Planning or Smart View, you can open and use this Smart Form as a form, including anyrows, columns, and business calculations you added. In Smart View, you can perform ad hocagainst this Smart Form . You can even create a sandbox from a Smart Form.
The sections that follow provide descriptions and guidelines for working with Smart Forms.
Smart Forms
Smart Forms are a type of data form, created in Smart View and based on ad hoc grids, thathave functionality not supported by regular data forms. Smart Forms support grid labels,
13-1

along with business calculations in the form of Excel formulas and functions. In SmartView, you can save these ad hoc grids to the applicable provider, such as Planning, asSmart Forms. The business calculations and grid labels, along with any empty rowsand columns, are saved as a part the Smart Form definition. Additionally:
• Beside calculated cells and empty rows and columns functionality, Smart Formssupport extended Excel formatting features including cell merging.
• Smart Forms can be used by end users in the same way as regular forms in theapplicable web interface or in Smart View.
• Smart Form design, as with form design in the application web interface, is notavailable for end users. You must have the Admin or Interactive User role to savead hoc grids as Smart Forms.
As with regular forms, the administrator must assign read/write access to SmartForms for end users.
• In Smart View, you design Smart Forms in Excel worksheets, meaning you canclearly see the Smart Form layout, even an asymmetric layout. In the provider webinterface, you would need to create separate rows and columns to achieve this.
• When connected using a shared connection, the following Smart View functionsare supported in Smart Forms: HsGetValue, HsSetValue, and HsActive.
When connected using a private connection, Smart View functions are notsupported.
Note: When you open an a Smart Form containing a Smart View function, clickRefresh to update the function cells with their correct values.
• In the provider web interface, while in design mode:
– You can assign business rules to Smart Forms.
– You cannot modify the Smart Form grid layout, Excel formatting, or businesscalculations.
• Smart Form functionality is available for ad hoc grids created with Planning,Financial Consolidation and Close, and Tax Reporting. Check with your serviceadministrator about the availability of Smart Forms in your service.
Business Calculations
In Smart Forms, the Excel functions and formulas that you add to an ad hoc grid arereferred to as business calculations. When a grid is saved as a Smart Form, end userscan execute the business calculations from the Smart View client, without addingmembers to the application metadata.
Business calculations are executed in Smart View utilizing Excel's calculation engine,and do not require queries to the provider. These runtime business calculations aresupported in both Smart View and the data provider. Also note the following:
• Many Excel functions are supported in Smart Forms. If an Excel function is notsupported, a message will notify you when you attempt to save the Smart Form.
• You can apply Excel formatting to the business calculation cells so that the figuresdisplay according to your preferences; for example, with dollar signs or decimalpoints.
• In the grid label row or column, you cannot enter only constants for the businesscalculation cells; for example, 1000 or 0.10 are not supported. If you want to use a
Chapter 13About Smart Forms
13-2

constant in a calculated cell, be sure to prefix it with an equal sign (=); for example, =1000or =0.10.
Grid Labels
Grid labels are used to provide placeholders in a grid for entering business calculations forcorresponding data cell intersections. They are required in order to save an ad hoc grid withbusiness calculations. Additionally:
• You enter grid labels manually in Excel in place of actual members in an ad hoc grid.
• Grid label names cannot match any actual member name in the data source application,or any member alias from any alias table. In case of a match, the actual member name oralias name will take precedence over the grid label name.
• Grid labels cannot consist of only blank spaces.
• Grid labels do not have any dimension properties.
• Grid labels are not visible in the Planning Dimension Editor and they are not sent toOracle Essbase.
• Data cells created by the intersection of actual members with grid labels are referred toas calculated cells.
Creating Smart FormsIn Oracle Smart View for Office, you create Smart Forms by saving ad hoc grids that containgrid labels and business calculations.
Smart Forms are saved to Planning, Planning Modules, Financial Consolidation and Close, orTax Reporting accordingly.
To create a Smart Form:
1. Follow the steps in Starting Ad Hoc Analysis to create an ad hoc grid.
Alternatively, open a form and, from the provider ribbon, click Analyze to convert the formto an ad hoc grid.
2. Add grid labels and business calculations (in the form of Excel formulas and functions), tothe ad hoc grid.
See Smart Form Example Scenario
3. After you have added grid labels and business calculations to an ad hoc grid, in the
provider ad hoc ribbon, click .
4. In the Save Grid As Smart Form dialog box:
• In Grid Name, provide a name for the Smart Form.
• In Grid Path, browse to the location where you want to store the Smart Form.
You can also type a new folder name. The folder appears under the application in theSmart View Panel.
• Optional: Select Submit Formatting to save any custom Excel formatting changesthat have been applied to the grid.
See Saving Native Excel Formatting to EPM Cloud for additional notes andguidelines about saving formatting in ad hoc grids and forms.
Chapter 13Creating Smart Forms
13-3

In the Smart View Panel, Smart Forms are designated with the icon.
Smart Form Example ScenarioSmart Forms start with an ad hoc grid.
The ad hoc grid is created either by opening an Planning, Financial Consolidation andClose, or Tax Reporting form for ad hoc analysis or by starting ad hoc analysis at thecube level, as shown in Figure 1.
Figure 13-1 Form Opened for Ad Hoc Analysis
Add a row by typing "entity2" for the Entity dimension, and the label "accountX" for theAccount dimension on row 13, cells A13 and B13, creating on the row two grid labels.Cells C13:F13 will be calculated cells. In order to be used as grid labels, the membernames "entity2" and "accountX" should not exist in any dimension and there shouldnot be any alias with the same name in any alias table. However, note that in the basicad hoc above, entity2 is a member name, so entity2 will be treated as a member.
Figure 13-2 Grid Labels Added to cells A13 and B13
Chapter 13Smart Form Example Scenario
13-4

Add business calculations, in the form of Excel formulas, for cells C13:F13, created by theintersection of real column dimension members with the grid label’s row 13. Figure 3 showsthat the calculation was entered and executed in cell C13, and the same calculation is copiedto cell D13.
Figure 13-3 Business Calculations Added to Cells C13 and D13, through to Cell F13
Figure 4 shows the business calculation in the Excel formula bar.
Figure 13-4 Business Calculation in the Excel Formula Bar
Chapter 13Smart Form Example Scenario
13-5

Upon refresh, entity2 in cell A13 will take on the properties of a member, accountX incell B13 will take on the properties of a grid label, and cells C13 and D13 will take onthe properties of business calculation cells.
Notes
• You must enter grid labels in order to save an ad hoc grid with businesscalculations in the form of Excel formulas and functions.
• If an empty space is entered instead of a grid label, the grid behavior isdetermined by generic ad hoc rules, such as replacing empty member cell with thesame member from this dimension or displaying an error in case the grid becomesmalformed.
• You can enter grid labels at any dimension location for an axis: innermost,outermost, or any location in the middle.
• You can enter business calculations only on rows and columns created by gridlabels.
• You may type a member name in a grid label row, but it must be placed within thecorrect dimension. If the member name is entered out of place, and is already inuse by the applicable data provider in another dimension, a message is returnedupon Refresh, prompting you to change the label name.
Now you can save the ad hoc grid as a Smart Form, as described in Creating SmartForms. By doing this, our grid labels and business calculations are also saved to theapplicable data provider.
The provider will identify "accountX" as a grid label on refresh by displaying it as an adhoc "comment" row or column (blank cells background). The "entity2" label will take onthe same properties as the other entity2 members in the grid, as this member namealready exists in the provider database.
Other Examples
Using the Vision sample application, here is an example of a Smart Form, saved froman ad hoc grid, then later opened as a form in Oracle Smart View for Office.
In Figure 5, the business calculation was constructed to show the average grossquarterly profit and average gross total profit for two years, FY13 and FY14. It alsoshows cell styles applied to the grid label and business calculations cells.
Chapter 13Smart Form Example Scenario
13-6

Figure 13-5 Originally an Ad Hoc Grid, Saved as a Smart Form, then Opened as aForm in Smart View
Figure 6 shows a Smart Form opened as an ad hoc grid. The grid labels and businesscalculations were added in the middle of the grid, and cell styles were applied.
Figure 13-6 Smart Form Opened as an Ad Hoc Grid in Smart View
Figure 7 is the same ad hoc grid, that was saved as a Smart Form and opened as a form:
Chapter 13Smart Form Example Scenario
13-7
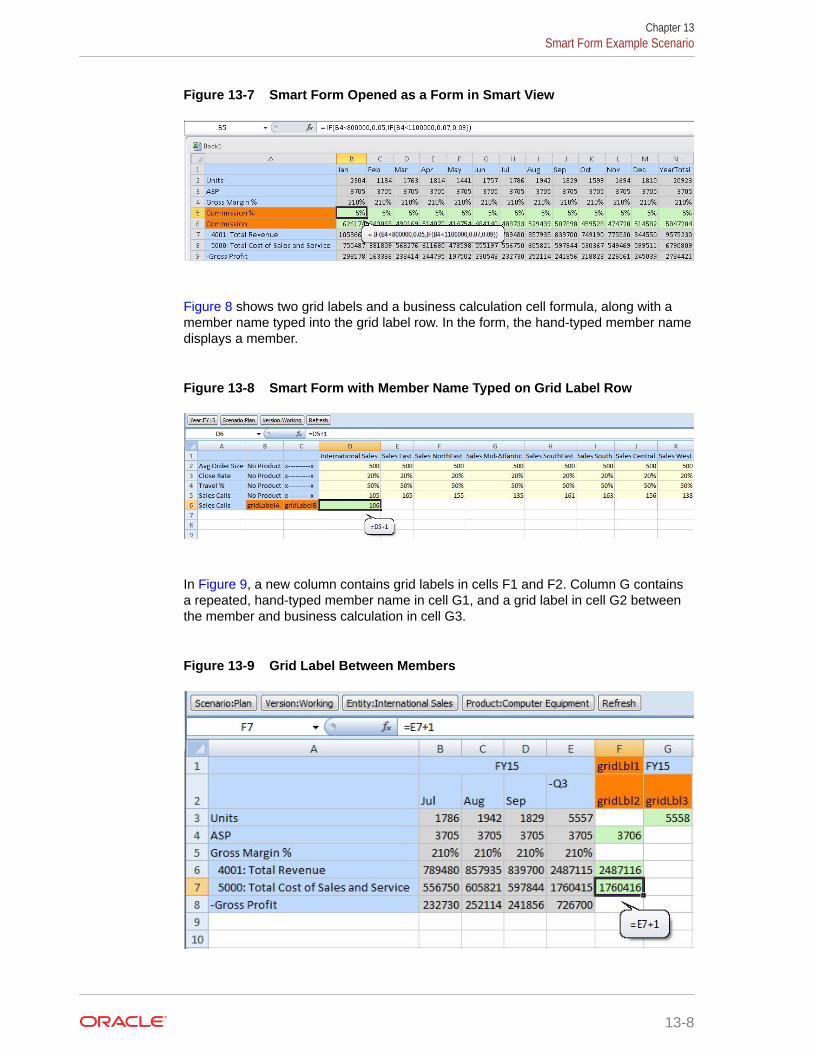
Figure 13-7 Smart Form Opened as a Form in Smart View
Figure 8 shows two grid labels and a business calculation cell formula, along with amember name typed into the grid label row. In the form, the hand-typed member namedisplays a member.
Figure 13-8 Smart Form with Member Name Typed on Grid Label Row
In Figure 9, a new column contains grid labels in cells F1 and F2. Column G containsa repeated, hand-typed member name in cell G1, and a grid label in cell G2 betweenthe member and business calculation in cell G3.
Figure 13-9 Grid Label Between Members
Chapter 13Smart Form Example Scenario
13-8
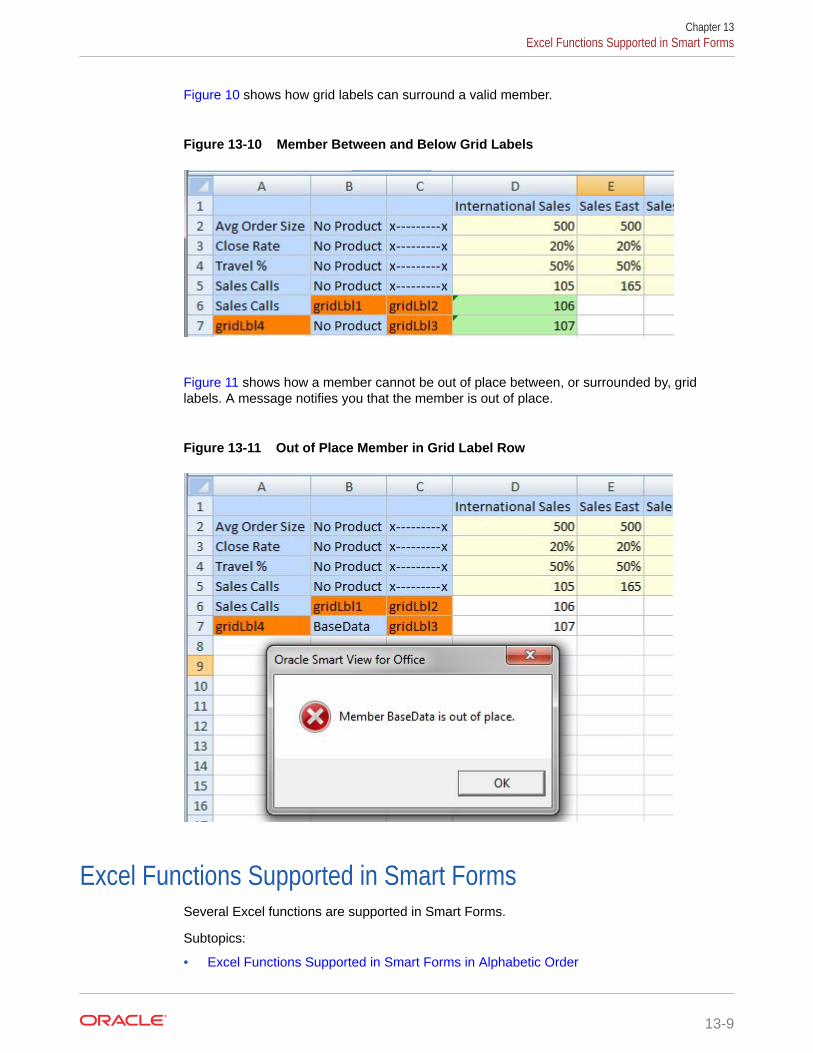
Figure 10 shows how grid labels can surround a valid member.
Figure 13-10 Member Between and Below Grid Labels
Figure 11 shows how a member cannot be out of place between, or surrounded by, gridlabels. A message notifies you that the member is out of place.
Figure 13-11 Out of Place Member in Grid Label Row
Excel Functions Supported in Smart FormsSeveral Excel functions are supported in Smart Forms.
Subtopics:
• Excel Functions Supported in Smart Forms in Alphabetic Order
Chapter 13Excel Functions Supported in Smart Forms
13-9

• Excel Functions Supported in Smart Forms by Category
Excel Functions Supported in Smart Forms in Alphabetic Order
Table 13-1 Alphabetical List of Excel Functions Supported in Smart Forms
Function Category
ABS Math and trigonometryACCRINT FinancialACCRINTM FinancialACOS Math and trigonometryACOSH Math and trigonometryAMORDEGRC FinancialAMORLINC FinancialAND LogicalASIN Math and trigonometryASINH Math and trigonometryATAN Math and trigonometryATAN2 Math and trigonometryATANH Math and trigonometryAVERAGE StatisticalAVERAGEA StatisticalCEILING Math and trigonometryCOMBIN Math and trigonometryCOS Math and trigonometryCOSH Math and trigonometryCOUNT StatisticalCOUNTA StatisticalCOUPDAYBS FinancialCOUPDAYS FinancialCOUPDAYSNC FinancialCOUPNCD FinancialCOUPNUM FinancialCOUPPCD FinancialCUMIPMT FinancialCUMPRINC FinancialDATE Date and timeDAY Date and timeDAYS360 Date and timeDB FinancialDDB FinancialDEGREES Math and trigonometryDISC FinancialDOLLARDE FinancialDOLLARFR FinancialDURATION FinancialEDATE Date and timeEFFECT Financial
Chapter 13Excel Functions Supported in Smart Forms
13-10

Table 13-1 (Cont.) Alphabetical List of Excel Functions Supported in SmartForms
Function Category
EOMONTH Date and timeEVEN Math and trigonometryEXP Math and trigonometryFACT Math and trigonometryFACTDOUBLE Math and trigonometryFLOOR Math and trigonometryFV FinancialFVSCHEDULE *** FinancialGCD Math and trigonometryHOUR Date and timeIF LogicalIFERROR Logical- TRUE Logical- FALSE LogicalINT Math and trigonometryINTRATE FinancialIPMT FinancialIRR FinancialISERR InformationISERROR InformationISPMT FinancialLCM Math and trigonometryLEFT TextLN Math and trigonometryLOG Math and trigonometryLOG10 Math and trigonometryMAX StatisticalMDURATION FinancialMID TextMIN StatisticalMINUTE Date and timeMIRR FinancialMOD Math and trigonometryMONTH Date and timeMROUND Math and trigonometryMULTINOMIAL Math and trigonometryNETWORKDAYS Date and timeNOMINAL FinancialNOT LogicalNOW Date and timeNPER FinancialNPV FinancialODD Math and trigonometry
Chapter 13Excel Functions Supported in Smart Forms
13-11

Table 13-1 (Cont.) Alphabetical List of Excel Functions Supported in SmartForms
Function Category
OR LogicalPI Math and trigonometryPMT FinancialPOWER Math and trigonometryPPMT FinancialPRICE FinancialPRICEDISC FinancialPRICEMAT FinancialPRODUCT Math and trigonometryPV FinancialQUOTIENT Math and trigonometryRADIANS Math and trigonometryRAND Math and trigonometryRANDBETWEEN Math and trigonometryRATE FinancialRECEIVED FinancialRIGHT TextROUND Math and trigonometryROUNDDOWN Math and trigonometryROUNDUP Math and trigonometrySECOND Date and timeSIGN Math and trigonometrySIN Math and trigonometrySINH Math and trigonometrySLN FinancialSQRT Math and trigonometrySQRTPI Math and trigonometrySUM Math and trigonometrySUMSQ Math and trigonometrySYD FinancialTAN Math and trigonometryTANH Math and trigonometryTBILLEQ FinancialTBILLPRICE FinancialTBILLYIELD FinancialTIME Date and timeTODAY Date and timeTRUNC Math and trigonometryWEEKDAY Date and timeWEEKNUM Date and timeWORKDAY Date and timeXIRR FinancialXNPV Financial
Chapter 13Excel Functions Supported in Smart Forms
13-12
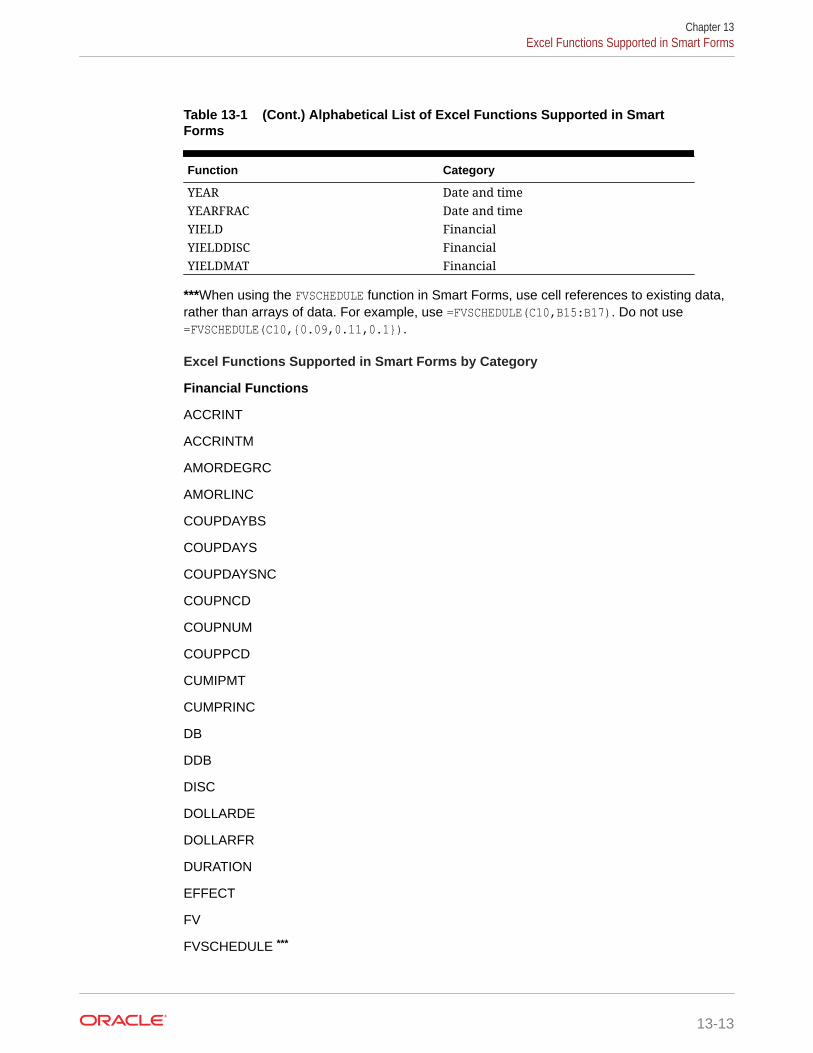
Table 13-1 (Cont.) Alphabetical List of Excel Functions Supported in SmartForms
Function Category
YEAR Date and timeYEARFRAC Date and timeYIELD FinancialYIELDDISC FinancialYIELDMAT Financial
***When using the FVSCHEDULE function in Smart Forms, use cell references to existing data,rather than arrays of data. For example, use =FVSCHEDULE(C10,B15:B17). Do not use=FVSCHEDULE(C10,{0.09,0.11,0.1}).
Excel Functions Supported in Smart Forms by Category
Financial Functions
ACCRINT
ACCRINTM
AMORDEGRC
AMORLINC
COUPDAYBS
COUPDAYS
COUPDAYSNC
COUPNCD
COUPNUM
COUPPCD
CUMIPMT
CUMPRINC
DB
DDB
DISC
DOLLARDE
DOLLARFR
DURATION
EFFECT
FV
FVSCHEDULE ***
Chapter 13Excel Functions Supported in Smart Forms
13-13

INTRATE
IPMT
IRR
ISPMT
MDURATION
MIRR
NOMINAL
NPER
NPV
PMT
PPMT
PRICE
PRICEDISC
PRICEMAT
PV
RATE
RECEIVED
SLN
SYD
TBILLEQ
TBILLPRICE
TBILLYIELD
XIRR
XNPV
YIELD
YIELDDISC
YIELDMAT
***When using the FVSCHEDULE function in Smart Forms, use cell references to existingdata, rather than arrays of data. For example, use =FVSCHEDULE(C10,B15:B17). Do notuse =FVSCHEDULE(C10,{0.09,0.11,0.1}).
Information Functions
ISERR
ISERROR
Logical Functions
Chapter 13Excel Functions Supported in Smart Forms
13-14

AND
IF
NOT
OR
IFERROR
• TRUE
• FALSE
Statistical Functions
AVERAG
AVERAGEA
COUNT
COUNTA
MAX
MIN
Text Functions
LEFT
RIGHT
MID
Date and Time Functions
DATE
DAY
DAYS360
EDATE
EOMONTH
HOUR
MINUTE
MONTH
NETWORKDAYS
NOW
SECOND
TIME
TODAY
WEEKDAY
Chapter 13Excel Functions Supported in Smart Forms
13-15

WEEKNUM
WORKDAY
YEAR
YEARFRAC
Math and Trigonometry Functions
ABS
ACOS
ACOSH
ASIN
ASINH
ATAN
ATAN2
ATANH
CEILING
COMBIN
COS
COSH
DEGREES
EVEN
EXP
FACT
FACTDOUBLE
FLOOR
GCD
INT
LCM
LN
LOG
LOG10
MOD
MROUND
MULTINOMIAL
ODD
Chapter 13Excel Functions Supported in Smart Forms
13-16

PI
POWER
PRODUCT
QUOTIENT
RADIANS
RAND
RANDBETWEEN
ROUND
ROUNDDOWN
ROUNDUP
SIGN
SIN
SINH
SQRT
SQRTPI
SUM
TAN
TANH
TRUNC
Chapter 13Excel Functions Supported in Smart Forms
13-17

14Task Lists
Related Topics
• About Task ListsDepending on the data source, open and manage tasks from the Smart View Panel inExcel or Outlook, or integrate task lists from the data source into Outlook and useOutlook functionality to manage tasks.
• Working with Tasks from the Smart View PanelFrom the Smart View Panel, you can open and view task lists, execute and completetasks, and create task list reports.
• Integrating Task Lists with Microsoft OutlookYou can import task lists into Microsoft Outlook and use Outlook functionality to manageyour tasks.
About Task ListsDepending on the data source, open and manage tasks from the Smart View Panel in Excelor Outlook, or integrate task lists from the data source into Outlook and use Outlookfunctionality to manage tasks.
Cloud data source types: Planning, Planning Modules, Financial Consolidation and Close,Tax Reporting
On-premises data source types: Oracle Hyperion Planning, Oracle Hyperion FinancialManagement, Oracle Hyperion Financial Close Management
Task lists help you organize, track, and prioritize your workload. For example, a task mighthelp you complete forms, launch business rules, or promote approval units. They can alsolaunch a website or internal company page.
• In Planning and Financial Management , you can manage tasks from the Smart ViewPanel in both Excel and Outlook, and integrate task lists into Outlook as described in Working with Tasks from the Smart View Panel.
• In Financial Close Management, you can integrate task lists into Outlook as described in Integrating Task Lists with Microsoft Outlook.
Administrators manage and assign access permissions for task lists. For more information,see the administration documentation for your data source.
Video
Your Goal Watch This Video
Learn about task lists. Managing Task Lists in Smart View with
Oracle Planning and Budgeting Cloud
14-1

Working with Tasks from the Smart View PanelFrom the Smart View Panel, you can open and view task lists, execute and completetasks, and create task list reports.
Opening a Task List
Viewing the Task List
Executing a Task
Completing a Task
Creating Task List Reports
Opening a Task ListCloud data source types: Planning, Planning Modules, Financial Consolidation andClose, Tax Reporting
On-premises data source types: Oracle Hyperion Planning, Oracle HyperionFinancial Management
To open a task list from Excel:
1. From the Smart View ribbon or menu, click Panel.
2. If prompted, enter your user name and password.
3. From the Smart View Panel, do one of the following:
• From Recently Used on Smart View Home, click the name of a task list.
• From Shared Connections or Private Connections, navigate to the task list thatyou want to open, and then click Open Task List on the Action Panel.
To open a task list from Outlook:
1. Ensure that Outlook displays a Oracle Smart View for Office menu. If it does not,do the following:
a. Close Outlook.
b. In Excel, from the Smart View ribbon, click Options, then Advanced in the leftpanel.
c. Clear Disable Smart View add-in in Outlook.
d. Click OK.
e. Reopen Outlook.
2. Ensure that you are connected to a data source as described in Managing DataSource Connections.
3. From the Outlook toolbar, click Smart View, and then select Panel to display theSmart View Panel.
4. From the Smart View Panel, do one of the following:
• From Recently Used on Smart View Home, click the name of a task list.
Chapter 14Working with Tasks from the Smart View Panel
14-2
• From Shared Connections or Private Connections, navigate to the task list that youwant to open, and then click Open Task List on the Action Panel.
Viewing the Task ListCloud data source types: Planning, Planning Modules, Financial Consolidation and Close,Tax Reporting
On-premises data source types: Oracle Hyperion Planning, Oracle Hyperion FinancialManagement
A task list opened in the Task List pane of the Smart View Panel displays the following:
• The individual tasks in the task list. These may contain subordinate tasks. The status ofthe task—complete, incomplete, or overdue—is indicated by color-coding.
Note:
Tasks of type "Copy Version" are not displayed in Oracle Smart View for Office.You must use the web application to view tasks of type "Copy Version."
• A drop-down menu from which you can select any of the other task lists associated withthe current application
• The Action Panel, which displays the actions that are available for the selected task
• Task Details, which opens when you click the double arrows
• A color-coded status bar for the task list
Executing a TaskCloud data source types: Planning, Planning Modules, Financial Consolidation and Close,Tax Reporting
On-premises data source types: Oracle Hyperion Planning, Oracle Hyperion FinancialManagement
To execute a task:
1. Open the task list that contains the task to execute.
2. From the Action Panel, click Execute Task.
3. Task execution varies with the task and data source.
Completing a TaskCloud data source types: Planning, Planning Modules, Financial Consolidation and Close,Tax Reporting
On-premises data source types: Oracle Hyperion Planning, Oracle Hyperion FinancialManagement
After completing task requirements, mark the task complete. To complete a task:
1. Complete the requirements of the task.
Chapter 14Working with Tasks from the Smart View Panel
14-3

2. Open the task list that contains the task to complete.
3. Ensure that any dependent tasks are completed.
4. Select the task to mark complete.
5. From the Action Panel, click Mark Complete.
Creating Task List ReportsCloud data source types: Planning, Planning Modules, Financial Consolidation andClose, Tax Reporting
On-premises data source types: Oracle Hyperion Planning, Oracle HyperionFinancial Management
To review the status of your process, you can create a detailed report of one or moretask lists in an application in PDF or Excel worksheet format.
To create a task list report:
1. From the Smart View Panel, open a task list.
2. Right-click a task and select Create Report.
3. In Report Wizard, use the arrow keys to move all task lists to be included in thereport from Available Task Lists to Selected Task Lists.
4. Click Next.
5. Use the arrow keys to move the users and groups whose status you want to viewfrom Available Users to Selected Users.
Note:
When selecting groups, be aware that all users in the group assigned toa task will be listed in the report. This will result in the same task beinglisted for each user in the group. For example, if a task is assigned to agroup consisting of 10 members, then that task will be listed 10 times inthe report, once for each group member.
6. Click Next.
7. Select options to create your report.
8. Click Finish.
The report is created in PDF or Excel, depending on your selection in step 7.
Integrating Task Lists with Microsoft OutlookYou can import task lists into Microsoft Outlook and use Outlook functionality tomanage your tasks.
Cloud data source types: Planning, Planning Modules, Financial Consolidation andClose, Tax Reporting
On-premises data source types: Oracle Hyperion Planning, Oracle HyperionFinancial Management, Oracle Hyperion Financial Close Management
Chapter 14Integrating Task Lists with Microsoft Outlook
14-4

Changes to the status of tasks are sent back to the data source, but you cannot delete tasksin Outlook.
To import task lists into Microsoft Outlook:
1. Ensure that Outlook displays a Oracle Smart View for Office menu. If it does not:
a. Close Outlook.
b. In Excel, from the Smart View ribbon, click Options, and then Advanced in the leftpanel.
c. Clear Disable Smart View add-in in Outlook.
d. Click OK.
2. Open Outlook.
3. Click Smart View and select Task List.
4. Select Shared Connections or Private Connections.
5. From the Task List, click Select application.
6. In Select Application, from the drop-down menus, select the server and applicationassociated with the task lists to import.
7. Click OK.
All task lists associated with the selected application are displayed in Task List.
8. Double-click a task list to display its individual tasks in Outlook Task Lists.
From here, you can apply Outlook functionality to your tasks. See the Outlook productdocumentation for information on working with tasks in Outlook.
Chapter 14Integrating Task Lists with Microsoft Outlook
14-5

15Oracle Journals for Financial Management
About Oracle Journals for Financial ManagementDuring a financial period, you may need to adjust data after it is entered or loaded into base-level entities.
Data source types: Oracle Hyperion Financial Management
Oracle Journals for Financial Management provide an audit trail of changes made in theapplication and indicate which users made adjustments and which accounts, entities, andtime periods are affected.
With Oracle Journals, you can:
• Create double-sided journal entries by using debits and credits
• Balance entries, or permit single-sided, out-of-balance entries
• Create recurring journals that are repeated for a number of future periods
• Create auto-reversing journals that generate reversing entries in the next time period
• Use the journal approval process to provide accountability
After creating a journal, you submit it to your supervisor for approval before posting it to thedatabase.
In Oracle Smart View for Office, Oracle Journals for Financial Management is an extensionthat supports a subset of the Journals functionality found in the Financial Management webinterface. Before you can use Oracle Journals, you must install and enable the extension.After connecting to a Financial Management data source, right-click a Financial Managementapplication to view two journal commands in the Action Panel:
• Manage Journals—Launches the Manage Journals dialog box. When you select ajournal to work with, the Oracle Journals ribbon is displayed.
• Create Journal—Launches the Create Journal dialog box.
When you select a journal to work with or create a journal, the Oracle Journals ribbon isdisplayed. Ribbon actions are available to you on a context basis; for example, if the journalis available for editing, the Edit button is enabled.
With the Oracle Journals for Financial Management extension in Smart View, you canperform these journal tasks:
• Open a journal and view its properties, such as Status, Type, Balance Type, Group, andClass
• Create a new blank journal or create a journal using a standard or recurring template
• Create a journal from data grids or data forms opened in Excel using the right-click optionin the grid or form, or the Create Journal command in the ribbon
• Create an ad hoc query from within a journal.
15-1

• Edit and save journals
• Submit, Unsubmit, Approve, Reject, Post, Unpost, and Delete journals
• Open an Entity Detail Report from data grids or data forms, and from an EntityDetail report, click on a journal to drill down for further details
Additionally, in Smart View, you can analyze posted journals to see the adjustmentsand totals in an ad hoc grid. You can analyze selected rows, or analyze the entirejournal.
Get started by installing the Oracle Journals for Financial Management extension,following the instructions in Installing the Oracle Journals Extension.
Note:
The Oracle Journals for Financial Management extension works with SmartView version 11.1.2.5.500 and later, and with Financial Management11.1.2.4.100 and later.
The Oracle Journals for Financial Management functionality introduced inSmart View 11.1.2.5.700 requires the following:
• Financial Management 11.1.2.4.204 with the 11.1.2.4.204 PSE25575478
• Smart View 11.1.2.5.700+
• Oracle Journals for Financial Management extension 11.1.2.5.700+(included with Smart View 11.1.2.5.700+)
Installing the Oracle Journals ExtensionYou can install the Oracle Journals extension for Oracle Smart View for Office endusers and for Smart View administrators.
For Smart View End Users
There is more than one method for installing the Oracle Journals extension; yourSmart View administrator will inform you which method you should use.
If you are installing the extension directly from your own Smart View installation folder,see Installing from the Smart View Installation Folder.
If you are installing the extension automatically or optionally, see Installing Extensions.
For Smart View Administrators
Your users can install the Oracle Journals extension directly from the extensionsfolder of their Smart View installation.
Or, you can control how your Smart View end users install the Oracle Journalsextension via the Extensions page of the Smart View Options dialog box. See"Administering Extension Installations and Updates" in the Oracle Smart View forOffice Installation and Configuration Guide for more information on setting upautomatic or manual installations.
Chapter 15Installing the Oracle Journals Extension
15-2

If you choose to set up automatic or manual installations, you should install Smart View in atest environment first, then refer to the UpdateList.xml file, found in the extensions folder ofyour Smart View installation. Use the entry in this file as a guideline for the Oracle Journalsentry you will add to the UpdateList.xml file, as described in "Configuring Manual ExtensionUpdates" in the Oracle Smart View for Office Installation and Configuration Guide .
Installing from the Smart View Installation FolderBefore you install the Oracle Journals extension, you must install Oracle Smart View forOffice.
You do not have to close Office (Excel, Word, or PowerPoint) to install the Oracle Journalsextension using this method.
To install the Oracle Journals for Financial Management directly from your Smart Viewinstallation:
1. Navigate to the folder where you installed Smart View and open the extensions folder.
For example, navigate to:
C:\Oracle\SmartView\extensions
2. Double-click SVFMJournalInstaller.svext.
3. If an Office product is running, follow the prompts to restart Office; for example, if Excel isopen, restart Excel.
If no Office products were open, then start Excel.
Journal RolesThe journal tasks that you can perform depend on the role assigned to you by theadministrator. If a journal task is not available to you, it is disabled.
To open a journal, you must have Read access to one or more of the cells referenced in theline items. If you do not have Read access to the cells, journal reports display NOACCESSstatus for these cells.
To edit a journal, you must have All access to the class for the journal. To post a journal, youmust have All access to the classes of every dimension in the detail lines that use classes.
These default roles pertain to journals:
• Journals Administrator (unrestricted journals access)
• Manage Templates
• Create Journals
• Create Unbalanced Journals
• Generate Recurring
• Read Journals
• Approve Journals
• Post Journals
Chapter 15Journal Roles
15-3

Processing Journals in Smart ViewAfter you set up journals, you can enter journal information and process journals.
See these procedures:
• Creating Journals
– Editing Journal Properties
– Guidelines for Creating Journals from Ad Hoc Grids or Data Forms
• Opening Journals
• Scanning Journals
• Viewing Journal Status
• Modifying List Display in Manage Journals Window
• Editing Journals
• Selecting Dimension Members for Journal Detail
• Copying and Pasting Journal Cells
• Submitting Journals
• Unsubmitting Journals
• Approving Journals
• Rejecting Journals
• Posting Journals
• Unposting Journals
• Deleting Journals
Creating JournalsUse journals to enter adjustments to account balances and maintain an audit trail ofchanges to data.
You create journals by entering a journal label and description, balance type, point ofview, and adjustment amounts. You can also enter a class for the journals, and ajournal group that you can use to filter and sort journals. After you create a journal, itsstatus is Working.
You can drag the Entity, ICP, and all Custom dimensions between the journal grid andthe POV. If all dimensions in the journal detail lines are the same, the dimension ismoved to the POV header information. If they are not the same, they remain in thejournal details. The Account dimension remains on the detail line, and all otherdimensions remain in the header. If you are creating a journal for a single entity, youcan use the entity dimension from the POV header without dragging it to the journalrows.
When you enter journal data, you can scan the journal and verify that the entries arevalid. You can then make any necessary changes before posting the journal. See Scanning Journals.
Chapter 15Processing Journals in Smart View
15-4
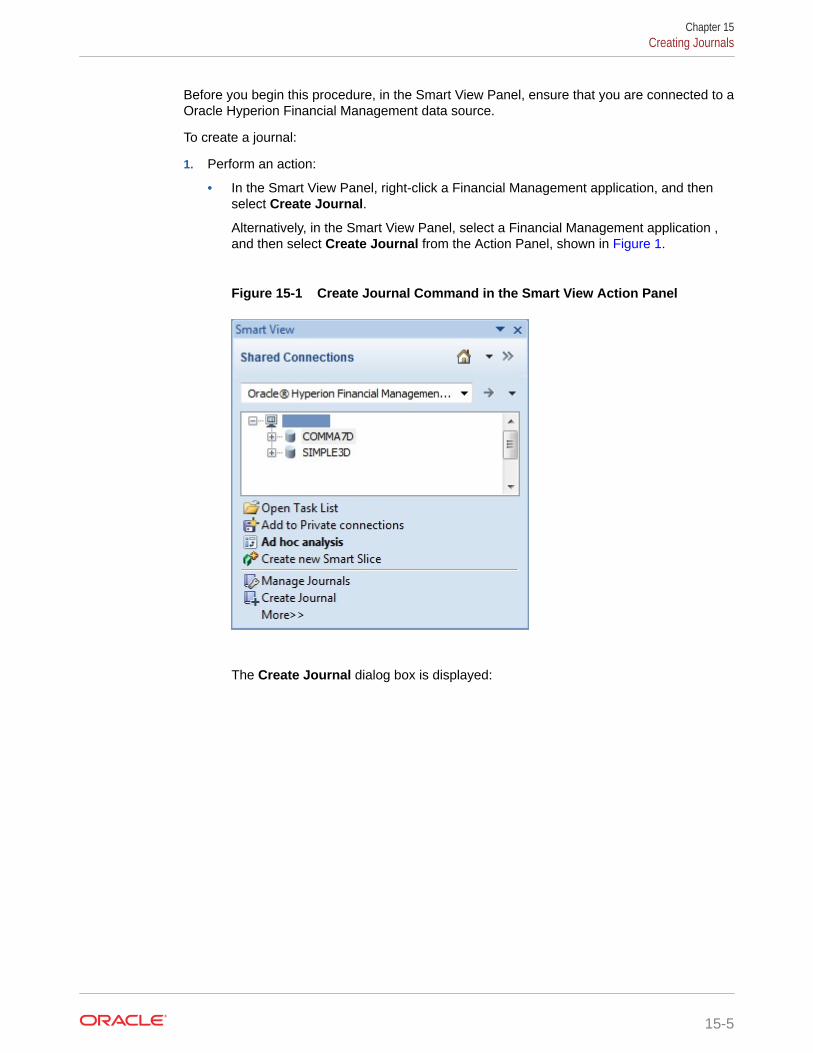
Before you begin this procedure, in the Smart View Panel, ensure that you are connected to aOracle Hyperion Financial Management data source.
To create a journal:
1. Perform an action:
• In the Smart View Panel, right-click a Financial Management application, and thenselect Create Journal.
Alternatively, in the Smart View Panel, select a Financial Management application ,and then select Create Journal from the Action Panel, shown in Figure 1.
Figure 15-1 Create Journal Command in the Smart View Action Panel
The Create Journal dialog box is displayed:
Chapter 15Creating Journals
15-5

Figure 15-2 Create Journal Dialog Box
• From an ad hoc grid or form, select a cell or range of cells on which to basethe journal, and in the HFM Ad Hoc ribbon or HFM ribbon, click Create
Journal, .
Alternatively, right-click a cell or cell range on which to base the journal andselect Smart View, then Journals, and then Create Journal.
Note:
See Guidelines for Creating Journals from Ad Hoc Grids or DataForms for additional information on creating journals using thismethod.
The journal is created and you can now proceed directly to Editing JournalProperties.
Note:
Do not click Refresh or Save if you want to make further changes tothe POV. Once you click Refresh or Save, the POV is locked for thisjournal.
2. In Create Journal, to change the Point of View, click the arrow in the text box nextto a dimension name and select a member.
The dimensions that display in the POV across the top of the Create Journaldialog box (Figure 2) are always the Scenario, Year, Period and Value dimensions.
Chapter 15Creating Journals
15-6
When creating a journal, ensure that the values in Scenario, Year, Period, and Value arethe ones to which you want to enter adjustments.
3. From Template, select an option:
• To create a new blank journal, select Blank Journal.
Note that when you select Blank Journal, the options in the Filters area are notavailable.
Proceed to step 5.
• To use a standard journal template, select Standard Templates, then select atemplate from the list.
Standard templates contain accounts and entities for adjustments that you enterfrequently.
Optional: To filter the list of standard templates, go to step 4. Otherwise, proceed tostep 5.
• To use a recurring journal template, select Recurring Templates, then select atemplate from the list.
You can use a recurring template to create journals automatically. When yougenerate a journal from a recurring template, you receive a confirmation messagethat the journal has been generated. The status of the journal is Approved.
Optional: To filter the list of recurring templates, go to step 4. Otherwise, proceed tostep 5.
Note:
The journal template type you select determines the Type property for thejournal you are creating and is a one-time selection. Once a journal is created,you can view the Type property for the journal, but it cannot be edited.
4. Optional: To filter the standard or recurring templates list, set filters for one or more of
the following criteria, and then click Apply Filters, :
• Entity—Click the Search button, and, in the Member Selection dialog box, selectthe members to filter on.
Or, type the member names, in their qualified format, directly into the text box,separated by a semicolon (;). For example, for EastSales, typeEastRegion.EastSales.
• Group—Enter journal group names, separated by a semicolon (;). The percent sign(%) may be used as a wildcard character. The journal group that you assign mustexist in the application.
• Label—Enter a journal label. The label can contain a maximum of 20 characters. Thepercent sign (%) may be used as a wildcard character. These characters are notallowed: . + - */ # {} ; , @
• Description—Enter a description. The percent sign (%) may be used as a wildcardcharacter.
• Balance Types—Select a type: All, Balanced, Unbalanced, or Balanced by Entity.Selecting All automatically selects all balance types.
Chapter 15Creating Journals
15-7

To clear filters and view the entire template list, click Reset Filters, .
5. Click Create Journal.
The journal is displayed, but the basic properties of the journal are yet to bedefined. Continue with the procedure in Editing Journal Properties.
An example journal is shown in Figure 3, using a standard, balanced template,The POV for this journal is Scenario=Actual, Year=2008, Period=January, andValue=<Entity Curr Adjs>.
Figure 15-3 Journal Example, Balanced Using Standard Template
Additionally, the Oracle Journals ribbon is displayed, where you can access theEdit button to edit properties of the journal you created in this procedure.
6. Continue to Editing Journal Properties.
Editing Journal PropertiesUse this procedure to define the properties of new journals and edit properties ofexisting journals.
To edit a journal:
1. Perform an action:
• To edit the properties of the journal you just created, as described in CreatingJournals (assumes the journal is still open), click Edit in the Oracle Journalsribbon.
• To edit an existing journal, open the journal (see Opening Journals), and thenclick Edit in the Oracle Journals ribbon.
The Journal Properties dialog box is displayed (Figure 1).
Chapter 15Creating Journals
15-8
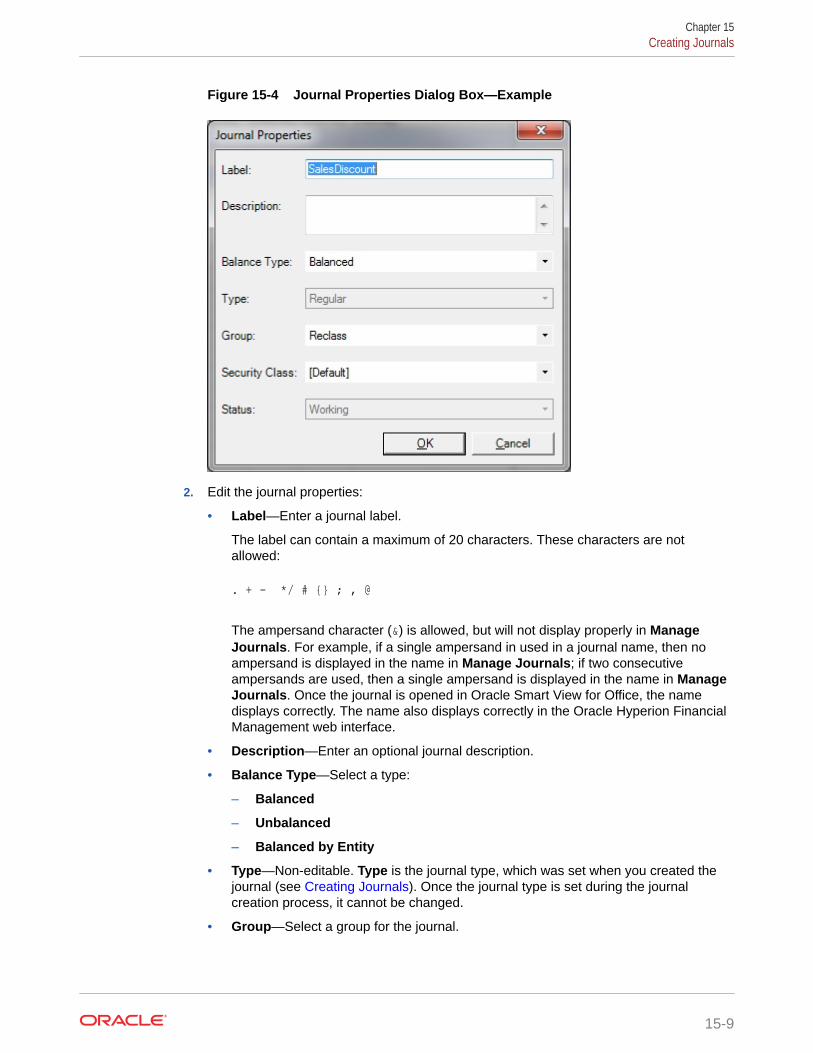
Figure 15-4 Journal Properties Dialog Box—Example
2. Edit the journal properties:
• Label—Enter a journal label.
The label can contain a maximum of 20 characters. These characters are notallowed:
. + - */ # {} ; , @
The ampersand character (&) is allowed, but will not display properly in ManageJournals. For example, if a single ampersand in used in a journal name, then noampersand is displayed in the name in Manage Journals; if two consecutiveampersands are used, then a single ampersand is displayed in the name in ManageJournals. Once the journal is opened in Oracle Smart View for Office, the namedisplays correctly. The name also displays correctly in the Oracle Hyperion FinancialManagement web interface.
• Description—Enter an optional journal description.
• Balance Type—Select a type:
– Balanced
– Unbalanced
– Balanced by Entity
• Type—Non-editable. Type is the journal type, which was set when you created thejournal (see Creating Journals). Once the journal type is set during the journalcreation process, it cannot be changed.
• Group—Select a group for the journal.
Chapter 15Creating Journals
15-9

Use the Group property to help to classify journals by type. Examples ofjournal groups are Allocation or Overhead.
• Class—Select a class or use the Default class.
3. Status—Non editable. The Status field changes when you perform an action inthe Deployment group. Status types are:
• Working
• Submitted
• Approved
• Rejected
• Posted
4. When you have finished updating the journal properties, click OK.
5. In the Oracle Journals ribbon, click the Save button to save the changes to thejournal properties.
Guidelines for Creating Journals from Ad Hoc Grids or Data FormsRefer to this section when creating journals from ad hoc grids or forms, as described in Creating Journals. When you are finished reviewing this topic, you can continue withthe steps in Editing Journal Properties.
You may start the journal creation process by selecting one or more cells in an ad hocgrid or data form. Note that:
• The journal will be displayed with the selected members in the cell intersections asthe line items.
• The selected cells should have valid members in the Value dimension.
• Before saving the journal, make any necessary changes to the POV in the POVtoolbar. Once you save or refresh the journal, you can no longer make anychanges to the POV.
Working with Value Members
• If you select one or more value members from <Entity Currency>, <Entity CurrAdjs>, or <Entity Curr Total>, the new journal will use <Entity Curr Adjs> as theValue member.
• If the selection has one or more members from <Parent Currency>, <Parent CurrAdjs>, or <Parent Curr Total>, the new journal will use Parent Curr Adjs> as theValue member.
• If you select one or more members [Parent], [Parent Adjs] or [Parent Total], thenew journal will use [Parent Adjs] as the Value member.
Chapter 15Creating Journals
15-10
• [Contribution Adjs], will be used if the selection has one or more of the followingmembers: [Proportion], [Elimination], [Contribution], [Contribution Adjs], [ContributionTotal].
• If the selected members contain <Currency>, <Currency>_Adjs, or <Currency>_Total,and the selection has only one Entity member, the following checks are performed:
– If the Entity default currency is the selected Currency, <Entity Curr Adjs> is used asthe Value member.
– If the default currency is not the selected Currency, and the Entity has a singleparent, and if the parent's currency is the selected Currency, use <Parent Curr Adjs>as the Value member.
– If neither of the above conditions are met, an <Entity Currency> and <Parent CurrAdjs> will be available for the selection.
• If the selection does not contain any of the valid members noted above, an errormessage is displayed.
• If the selection contains members from different valid groups—for example, <Entity CurrAdjs> and <Parent Curr Adjs>—you will be given selection options.
Scenario, Period, and Year Members
If the selection contains multiple Scenario, Period, or Year members, you will have the optionto select one of these. Otherwise, the selected value will be used as the POV.
Opening JournalsBefore opening a journal, in the Smart View Panel, ensure that you are connected to a OracleHyperion Financial Management data source.
To open a journal
1. In the Smart View Panel, right-click a Financial Management application, and then selectManage Journals.
Alternatively, in the Smart View Panel, select a Financial Management application , andthen select Manage Journals from the Action Panel, shown in Figure 1.
Chapter 15Opening Journals
15-11
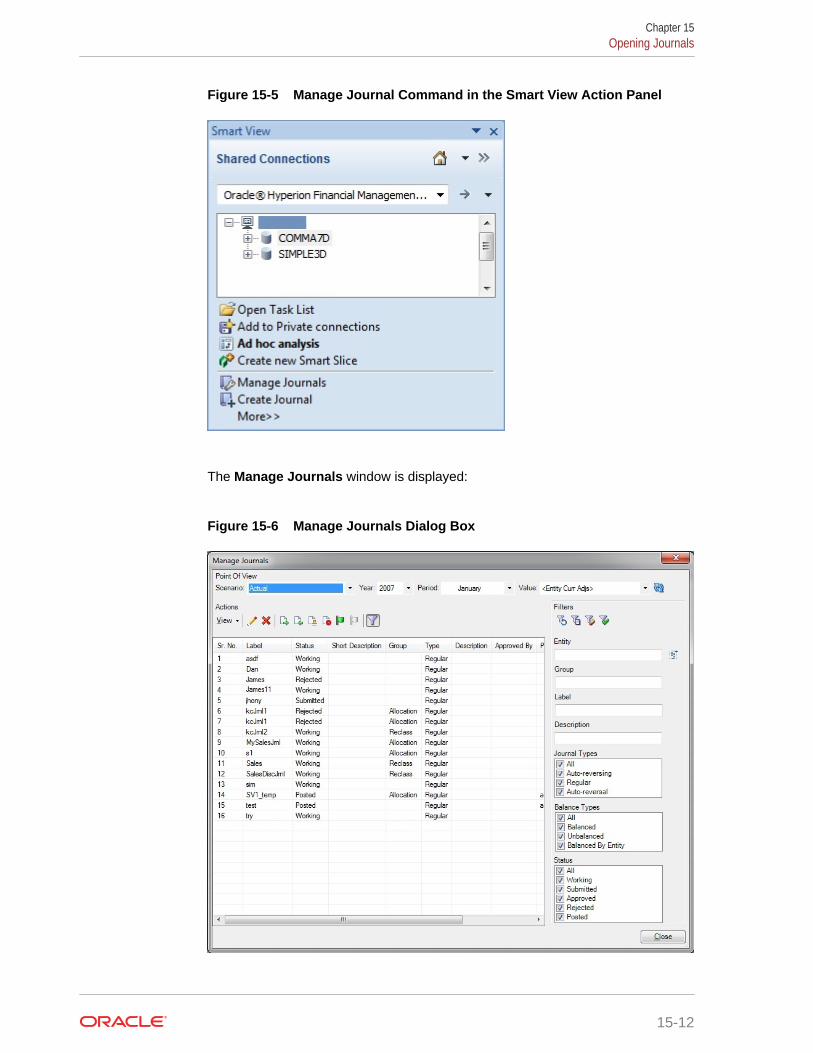
Figure 15-5 Manage Journal Command in the Smart View Action Panel
The Manage Journals window is displayed:
Figure 15-6 Manage Journals Dialog Box
Chapter 15Opening Journals
15-12

2. Optional: To filter the list of journals, set filters for one or more of the following criteria,
and then click Apply Filters,
• Entity—Click the Search button, and, in the Member Selection dialog box, selectthe members to filter on.
Or, type the member names, in their qualified format, directly into the text box,separated by a semicolon (;). For example, for EastSales, typeEastRegion.EastSales.
• Group—Enter journal group names, separated by a semicolon (;). The percent sign(%) may be used as a wildcard character. The journal group that you assign mustexist in the application.
• Label—Enter a journal label. The percent sign (%) may be used as a wildcardcharacter. The label can contain a maximum of 20 characters. These characters arenot allowed: . + - */ # {} ; , @
• Description—Enter a description. The percent sign (%) may be used as a wildcardcharacter.
• Journal Types—Select a type: All, Auto-reversing, Regular, or Auto-reversal.
Note:
An auto reversal journal is a system generated journal. When you create anauto reversing journal, then, the next month, a system-generated journal iscreated with the journal type, "Auto reversal." A newly-created journal willnot be of the Auto-reversal type.
• Balance Types—Select a type: All, Balanced, Unbalanced, or Balanced by Entity.Selecting All automatically selects all balance types.
• Status—Select a status: All, Working, Submitted, Approved, Rejected, or Posted.
To clear filters and view the entire list of journals, click Reset Filters, .
3. Select a journal in the list and click Edit, .
Alternatively, double-click a journal in the list to open it.
From here, you can proceed to other journal tasks, such as Scanning Journals or EditingJournals.
Scanning JournalsAfter you enter journal data, you can scan the journal to verify that all entries are valid.
The scan process enables you to identify errors and make any necessary changes beforeyou post the journal.
Before you begin this procedure, in the Smart View Panel, ensure that you are connected to aOracle Hyperion Financial Management data source.
To scan journals:
1. Create or open a journal.
Chapter 15Scanning Journals
15-13
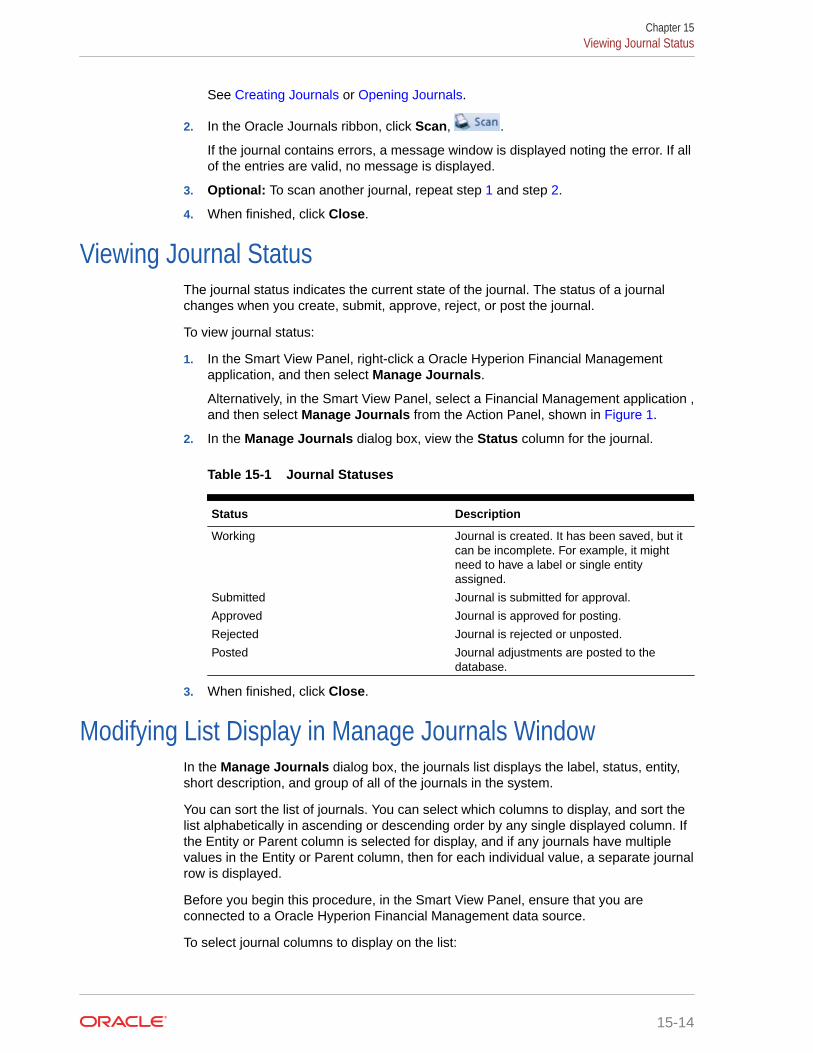
See Creating Journals or Opening Journals.
2. In the Oracle Journals ribbon, click Scan, .
If the journal contains errors, a message window is displayed noting the error. If allof the entries are valid, no message is displayed.
3. Optional: To scan another journal, repeat step 1 and step 2.
4. When finished, click Close.
Viewing Journal StatusThe journal status indicates the current state of the journal. The status of a journalchanges when you create, submit, approve, reject, or post the journal.
To view journal status:
1. In the Smart View Panel, right-click a Oracle Hyperion Financial Managementapplication, and then select Manage Journals.
Alternatively, in the Smart View Panel, select a Financial Management application ,and then select Manage Journals from the Action Panel, shown in Figure 1.
2. In the Manage Journals dialog box, view the Status column for the journal.
Table 15-1 Journal Statuses
Status Description
Working Journal is created. It has been saved, but itcan be incomplete. For example, it mightneed to have a label or single entityassigned.
Submitted Journal is submitted for approval.
Approved Journal is approved for posting.
Rejected Journal is rejected or unposted.
Posted Journal adjustments are posted to thedatabase.
3. When finished, click Close.
Modifying List Display in Manage Journals WindowIn the Manage Journals dialog box, the journals list displays the label, status, entity,short description, and group of all of the journals in the system.
You can sort the list of journals. You can select which columns to display, and sort thelist alphabetically in ascending or descending order by any single displayed column. Ifthe Entity or Parent column is selected for display, and if any journals have multiplevalues in the Entity or Parent column, then for each individual value, a separate journalrow is displayed.
Before you begin this procedure, in the Smart View Panel, ensure that you areconnected to a Oracle Hyperion Financial Management data source.
To select journal columns to display on the list:
Chapter 15Viewing Journal Status
15-14
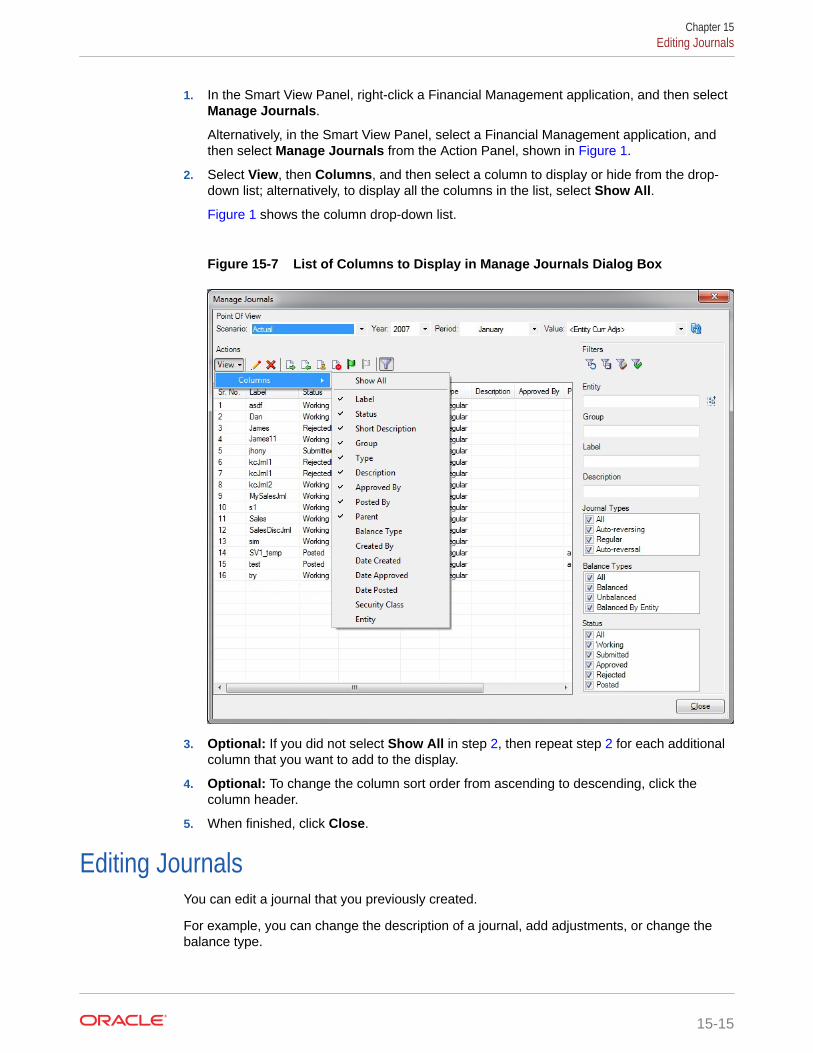
1. In the Smart View Panel, right-click a Financial Management application, and then selectManage Journals.
Alternatively, in the Smart View Panel, select a Financial Management application, andthen select Manage Journals from the Action Panel, shown in Figure 1.
2. Select View, then Columns, and then select a column to display or hide from the drop-down list; alternatively, to display all the columns in the list, select Show All.
Figure 1 shows the column drop-down list.
Figure 15-7 List of Columns to Display in Manage Journals Dialog Box
3. Optional: If you did not select Show All in step 2, then repeat step 2 for each additionalcolumn that you want to add to the display.
4. Optional: To change the column sort order from ascending to descending, click thecolumn header.
5. When finished, click Close.
Editing JournalsYou can edit a journal that you previously created.
For example, you can change the description of a journal, add adjustments, or change thebalance type.
Chapter 15Editing Journals
15-15

You can edit only Working, Submitted, and Rejected journals. You cannot editApproved or Posted journals. You must have All access to the class for a journal toedit the journal. See Journal Roles.
Before you begin this procedure, in the Smart View Panel, ensure that you areconnected to a Oracle Hyperion Financial Management data source.
To edit journals:
1. Open a journal with the status of Working, Submitted, or Rejected.
See Opening Journals.
2. To edit journal properties, in the Oracle Journals ribbon, click Edit, and thencomplete the procedure in Editing Journal Properties.
3. To change the POV of the journal detail:
a. Double-click a member cell within the grid.
b. Select a member in the Member Selection dialog box, and click OK.
c. Repeat step 3.a and step 3.b for each POV change you want to make.
d. Click Refresh,
For more information on member selection, see Selecting Dimension Members forJournal Detail.
4. To update a journal entry, under the Debit or Credit column in the grid, typedirectly into the cell that you want to change.
The figures in the Total and Variance rows are updated automatically.
5. To perform ad hoc analysis with the selected journal, in the Oracle Journals ribbon,
select Analyze, .
For more information, see Ad Hoc Analysis.
6. To scan the journal and verify that the entries are valid, click Scan.
See Scanning Journals.
Selecting Dimension Members for Journal DetailJournal detail contains a set of dimension members that you define to specify the dataaccessed for a specific journal.
Each journal saves the journal detail with dimension information you select, which isdisplayed automatically the next time that you open the journal.
The point of view displays the members for the Scenario, Year, Period, and Valuedimensions. To select members for journal detail, you can select a row and clickMember Selection in the Oracle Journals ribbon. The system displays the point ofview from which you can select the member for each dimension. To create journals forparent adjustments, you select the Parent Adjs member for the Value dimension. Foreach line of journal detail, you must specify a Parent member if the Value dimension isParent Currency Adj, Parent Adj, or Contribution Adj. In addition, you must specify anentity, account, intercompany partner, and Custom dimension.
You can select the journal detail when the journal status is Working, Submitted, orRejected. You cannot make changes to the journal detail when the journal status isApproved or Posted.
Chapter 15Selecting Dimension Members for Journal Detail
15-16

Before you begin this procedure, in the Smart View Panel, ensure that you are connected to aOracle Hyperion Financial Management data source.
To select dimensions for journal detail:
1. Create or open a journal.
The Create Journal or Manage Journals window is displayed.
See Creating Journals or Opening Journals.
2. To change the point of view, at the top of Create Journal or Manage Journals, click thearrow in the drop-down text box for a dimension and select a member.
Repeat this step to change the point of view for the Scenario, Year, Period, and Valuedimensions, as you require.
For example, you could change point of view in the Period dimension from June to July:
3. Click Create or Close.
Copying and Pasting Journal CellsYou can copy and paste the information in the journals grid from one cell to another to createjournal entries.
To copy or paste journal rows:
1. Create or open a journal.
The Create Journal or Manage Journals window is displayed.
See Creating Journals or Opening Journals.
2. Perform an action:
• Select a row in the journals grid.
• Select a cell.
3. In Excel's Home ribbon, click the Copy button.
Alternatively, right-click and select Copy.
Chapter 15Copying and Pasting Journal Cells
15-17

4. Select the row or cell to which to paste the values.
5. From Excel's Home ribbon, click the Paste button.
Alternatively, right-click and select Paste.
6. In the Oracle Journals ribbon, click the Save button to save the changes to thejournal properties.
Submitting JournalsAfter creating journals and entering journal data, you must submit them to yoursupervisor for approval before posting them to the database.
You can submit a journal when you create it, or submit it later by selecting it from thelist of available journals.
You can submit journals one at a time or in batches. After you submit a journal, thestatus changes to Submitted. A reviewer then approves or rejects the journal, and if itis approved, you can post it.
Before you begin this procedure, in the Smart View Panel, ensure that you areconnected to a Oracle Hyperion Financial Management data source.
To submit journals:
1. In the Smart View Panel, right-click a Financial Management application, and thenselect Manage Journals.
The Manage Journals window is displayed.
2. Set the point of view as described in Selecting Dimension Members for JournalDetail.
3. Before proceeding, click Refresh, , to update the list of journals with those thatcorrespond to the selected POV.
Refreshing the journals list helps you to avoid errors that may arise when theselected POV and the listed journals are not in sync.
4. Perform a task:
• To submit unopened journals:
– In the Manage Journals window, press and hold the Ctrl key, then selectjournals with the status, "Working."
Alternatively, select a single journal with the status, "Working."
– Click Submit, .
– When you're finished submitting journals, in the Manage Journalswindow, click Close.
Chapter 15Submitting Journals
15-18

• To submit an opened journal:
a. Open a journal, as described in Opening Journals.
b. In the Oracle Journals ribbon, click .
Unsubmitting JournalsYou can unsubmit a journal that you previously submitted. When you unsubmit a journal, thestatus reverts from Submitted to Working.
Before you begin this procedure, in the Smart View Panel, ensure that you are connected to aOracle Hyperion Financial Management data source.
To unsubmit journals:
1. In the Smart View Panel, right-click a Financial Management application, and then selectManage Journals.
The Manage Journals window is displayed.
2. Set the point of view as described in Selecting Dimension Members for Journal Detail.
3. Before proceeding, click Refresh, , to update the list of journals with those thatcorrespond to the selected POV.
Refreshing the journals list helps you to avoid errors that may arise when the selectedPOV and the listed journals are not in sync.
4. Perform a task:
• To unsubmit unopened journals:
a. In the Manage Journals window, press and hold the Ctrl key, and then selectjournals with the status, "Submitted."
Alternatively, select a single journal with the status, "Submitted."
b. Click Unsubmit, .
c. When you're finished unsubmitting journals, in the Manage Journals window,click Close.
• To unsubmit an opened journal:
a. Open a journal, as described in Opening Journals.
b. In the Oracle Journals ribbon, click .
Approving JournalsAfter you submit a journal, you can approve it for posting.
You can approve a journal from the Oracle Journals ribbon after you create and submit it, oryou can approve it later by selecting it from the journals list.
You can approve journals one at a time or in batches. After you approve a journal, the statuschanges to Approved and the journal cannot be edited.
Before you begin this procedure, in the Smart View Panel, ensure that you are connected to aOracle Hyperion Financial Management data source.
Chapter 15Unsubmitting Journals
15-19

To approve journals:
1. In the Smart View Panel, right-click a Financial Management application, and thenselect Manage Journals.
The Manage Journals window is displayed.
2. Set the point of view as described in Selecting Dimension Members for JournalDetail.
3. Before proceeding, click Refresh, , to update the list of journals with those thatcorrespond to the selected POV.
Refreshing the journals list helps you to avoid errors that may arise when theselected POV and the listed journals are not in sync.
4. Perform a task:
• To approve one or more unopened journals:
a. In the Manage Journals window, press and hold the Ctrl key, and thenselect journals with the status, "Submitted.".
Alternatively, select a single journal with the status, "Submitted."
b. Click Approve, .
c. When you're finished approving journals, in the Manage Journalswindow, click Close.
• To approve an opened journal:
a. Open a journal, as described in Opening Journals.
b. In the Oracle Journals ribbon, click .
Rejecting JournalsAfter a journal is submitted for approval, or approved, you can reject it.
You can reject journals one at a time or in batches. After you reject a journal, thestatus changes to Rejected.
To reject journals:
1. In the Smart View Panel, right-click a Oracle Hyperion Financial Managementapplication, and then select Manage Journals.
The Manage Journals window is displayed.
2. Set the point of view as described in Selecting Dimension Members for JournalDetail.
3. Before proceeding, click to update the list of journals with those thatcorrespond to the selected POV.
Refreshing the journals list helps you to avoid errors that may arise when theselected POV and the listed journals are not in sync.
4. Perform a task:
• To reject one or more unopened journals:
Chapter 15Rejecting Journals
15-20

a. In the Manage Journals window, press and hold the Ctrl key, and then selectjournals with the status, "Submitted" or "Approved."
Alternatively, select a single journal with the status, "Submitted" or "Approved."
b. Click Reject, .
c. When you're finished rejecting journals, in the Manage Journals window, clickClose.
• To reject an opened journal:
a. Open a journal with the status "Submitted" or "Approved," as described in Opening Journals.
b. In the Oracle Journals ribbon, click .
Posting JournalsYou can post a journal after it is approved, after it is submitted, or after it is submitted andapproved.
You can also post it later by selecting it from the list of available journals.
The scenario view to which a journal is posted depends on the setting for the Scenarioattribute "ZeroViewForAdj." If this attribute is set to Periodic, the journal is posted to thePeriodic value. If this attribute is set to YTD, the journal is posted to the YTD value.
You can post journals one at a time or in batches. You must have the journal period openbefore you can post, and you must have All access to the classes of every entity for the detaillines.
Your ability to post a journal also depends on the process level of the data in the journal. Forexample, if you have a process management role of Reviewer 2 and the data that the journalaffects is at Process Level 6, you cannot post the journal. For more information, see "ProcessLevels" in the "Using Process Management" chapter of the Oracle Hyperion FinancialManagement User's Guide .
When you post adjustments from a journal, the adjustment values are stored in the specifiedadjustment member. These four Value dimension members are valid for posting journals:Entity Currency Adjustments, Parent Currency Adjustments, Parent Adjustments, andContribution Adjustments.
You can post a journal to a specific parent and child combination (node) by using one ofthese Value dimensions:
• Parent Adjs—Applied to the node before consolidation.
• Contribution Adjs—Applied to the contribution when determining the contribution total.
Note:
Node adjustments are posted in the currency of the parent.
If more than one journal is posted to the Entity Currency Adjs member for the same account,the results are cumulative. The total from the current journal is added to or subtracted to fromthe existing total in Entity Currency Adjs.
Chapter 15Posting Journals
15-21

When you post a journal, the system recalculates the account balances so that thedatabase reflects the adjustments. The journal status changes to Posted, and you canview the adjustment in a data grid.
Note:
Do not delete or rename a posted journal, as this will result in unresolveddata for the adjustment values that the journal had created.
To post journals:
1. In the Smart View Panel, right-click a Oracle Hyperion Financial Managementapplication, and then select Manage Journals.
The Manage Journals window is displayed.
2. Set the point of view as described in Selecting Dimension Members for JournalDetail.
3. Before proceeding, click Refresh, , to update the list of journals with those thatcorrespond to the selected POV.
Refreshing the journals list helps you to avoid errors that may arise when theselected POV and the listed journals are not in sync.
4. Perform a task:
• To post one or more unopened journals:
a. In the Manage Journals window, press and hold the Ctrl key, and thenselect journals with the status, "Approved."
Alternatively, select a single journal with the status, "Approved."
b. Click Post, .
c. When you're finished posting journals, in the Manage Journals window,click Close.
• To post an opened journal:
a. Open a journal with the status, "Approved", as described in OpeningJournals.
b. In the Oracle Journals ribbon, click .
Unposting JournalsYou can unpost a journal after it is posted.
For example, suppose you post several journals with adjustments to an entity, and youreceive new data for that entity. You can unpost the journals, load the new data, andpost the journals again.
When you unpost a journal, the journal status changes to Rejected. When you unpostan auto-reversal journal, the journal status changes back to Approved.
To unpost journals:
Chapter 15Unposting Journals
15-22
1. In the Smart View Panel, right-click a Oracle Hyperion Financial Management application,and then select Manage Journals.
The Manage Journals window is displayed.
2. Set the point of view as described in Selecting Dimension Members for Journal Detail.
3. Before proceeding, click Refresh, , to update the list of journals with those thatcorrespond to the selected POV.
Refreshing the journals list helps you to avoid errors that may arise when the selectedPOV and the listed journals are not in sync.
4. Perform a task:
• To unpost one or more unopened journals:
a. In the Manage Journals window, press and hold the Ctrl key, and then selectjournals with the status, "Posted."
Alternatively, select a single journal with the status, "Posted."
b. Click Unpost, .
c. When you're finished unposting journals, in the Manage Journals window, clickClose.
• To unpost an opened journal:
a. Open a journal with the status "Posted," as described in Opening Journals.
b. In the Oracle Journals ribbon, click .
Journal ValidationWhen you submit, approve, or post a journal, the system validates the journal.
The system checks for these conditions:
• The period must be a base period for the scenario’s base frequency.
• When you post or unpost a journal, the period must be opened.
• The Value dimension must be an adjustment dimension.
• The journal must have the appropriate status for the action to be performed.
• Line items must exist for the journal.
• The entity and the parent must be valid dimensions. For regular journals, the entity mustallow adjustments. If you are posting a journal to Parent Currency Adjs, you must enter avalid parent. The entity must be a child of the specified parent for the journal entity.
• If you are posting a journal to a node, the parent must allow adjustments for child entities.The entity must be a child of the specified parent.
• Node journals must have valid parent-entity combinations. The system also checks forthe Organization by Period application setting when you attempt to post node journals.The entity must be active for the parent for the period in which you are posting.
• The account must be valid. It must be an Asset, Liability, Revenue, Expense, Balance,Flow, or Balance Recurring account. The account must be a base account and cannot bedesignated as calculated in metadata. It cannot be calculated through a roll-up process;the account cannot have children.
Chapter 15Journal Validation
15-23

• All other dimensions must be valid. The ICP dimension cannot be ICP Top, ICPEntities, or blank, but you can select ICP None. If an ICP is specified, the accountmust be set up as an ICP account.
• The Custom dimensions cannot be designated as calculated in metadata andcannot be calculated through a roll-up process; the Custom dimensions cannothave children.
• For a balanced journal, the total debits must equal the total credits. For abalanced- by-entity regular journal, the total debits must equal the total credits foreach entity. For a balanced-by-entity node journal, the total debits must equal thetotal credits for each node and the parent and children entities must have thesame currency. If the Value dimension is Entity Currency, the parent entities in thejournal can have different currencies, but they must have the same currency astheir children entities.
• All dimension intersections must be valid.
• The subcube of dimensions containing the line item cell cannot be locked.
• The cell cannot be designated as a NoInput cell in rules.
Analyzing JournalsAfter posting journals, you can use ad hoc analysis in Oracle Smart View for Office tocheck the adjustments and totals.
You can analyze one or more rows, or the entire journal. You can analyze journals ofany status: Working, Posted, Submitted, Approved, or Rejected.
When forming the ad hoc grid, the Value dimensions will always be in the column andall other dimensions will be in the row. The row dimensions will appear in the followingorder:
• Entity
• Account
• ICP
• Customs
If your selection has the same members for a dimension, that dimension will appear inthe grid POV.
Before you begin this procedure, in the Smart View Panel, ensure that you areconnected to a Oracle Hyperion Financial Management data source.
To analyze journals:
1. Create or open a journal.
See Creating Journals or Opening Journals.
2. Set the point of view as described in Selecting Dimension Members for JournalDetail.
3. In the journal grid, select one or more dimension, member, or data cells, and click
Analyze, .
Observe that the journal has been converted to an ad hoc grid, where you canperform further ad hoc analysis.
Chapter 15Analyzing Journals
15-24

Deleting JournalsYou can delete unposted journals that you no longer need.
You cannot delete Approved or Posted journals, because that would result in unresolved datafor the adjustment values that the journal had created.
Note:
Before you begin this procedure, in the Smart View Panel, ensure that you areconnected to a Oracle Hyperion Financial Management data source.
To delete journals:
1. In the Smart View Panel, right-click a Financial Management application, and then selectManage Journals.
The Manage Journals window is displayed.
2. Optional: Filter journals by status.
To filter by status, select one or more of the following options, and then click Apply
Filters, :
• Working
• Submitted
• Rejected
You cannot delete Approved or Posted journals
3. Select a journal and click Delete,
Alternatively, use the Shift or Ctrl keys to select multiple journals and click Delete, .
4. At the confirmation prompt, click Yes.
5. Repeat step 2 to step 4 for each journal that you want to delete.
6. Click Close to exit the Manage Journals window.
Entity Detail ReportsEntity Detail Reports provide a full audit detail of the entire consolidation path for a specificdata cell of a specified entity.
The report starts with the source amount entered in the Entity Currency Value dimension andshows all of its related details in each Value dimension, including the journal entriesgenerated in the journal posting process and the audit transaction details generated as partof the consolidation process. If the account contains line item detail, the report also shows therelated line item details entered for the account.
This report provides the capability of viewing transactions, showing the detail of the amountsgenerated from each step of the consolidation process, including currency translations and
Chapter 15Deleting Journals
15-25

intercompany eliminations. It also displays the transaction records for derived datafrom prior periods.
Starting the Entity Detail ReportYou access the Entity Detail Report from an ad hoc grid or data form.
Before you begin, connect to a Oracle Hyperion Financial Management applicationand open an ad hoc grid or form.
To start the Entity Detail Report:
1. From a Financial Management ad hoc grid or form, select the cell for which to viewentity transaction detail.
2. Right-click and select Smart View, then Journals, and then Entity Details.
Alternatively, in the HFM or HFM Ad Hoc ribbon, click .
The Entity Details dialog box is displayed.
Report Point of ViewThe Entity Detail report uses the point of view from the data grid that you are using.The Point of View information used for the report includes the Scenario, Year, Period,Entity, View, Account, ICP, and Custom dimensions. The Value dimension informationis ignored, and all Value members are displayed on the report.
You can only select one account when you run the report. If the account selected is aparent account, the system does not display line item details, journal details, or audittransaction details for the account. The system does not enumerate the details for thebase members of the parent account. The support of base members applies only tothe custom dimensions. For example, if the Intercompany Partner, Custom1 is aParent member, all entries that are posted to all base members of the Parent memberare displayed.
Selecting Rows for the ReportYou can select the rows to display on the report. You can change these selections atany time.
The rows can display Entity Currency, Entity Curr Adjs, Entity Curr Total, ParentCurrency, Parent Curr Adjs, Parent Curr Total, Parent Adjs, Parent Total, Proportion,Elimination, Contribution, Contribution Adjs, and Contribution Total.
The columns display the amount, Custom accounts, ICP, debits, credits, ID, orremarks.
You can suppress the display of some transaction details or dimensions by deselectingthe applicable options. For example, if you want the report to show only the journaldetails, you can deselect all other row display options, leaving only the journals optionselected. If you want to also suppress the Custom columns because they are not usedfor the account, you can deselect these options from the column display.
The Value column contains all of the Value members. If the currency of the parentmember is the same as the currency of the entity, the system skips the display of theParent Currency related Value members because it is duplicate information. The
Chapter 15Entity Detail Reports
15-26
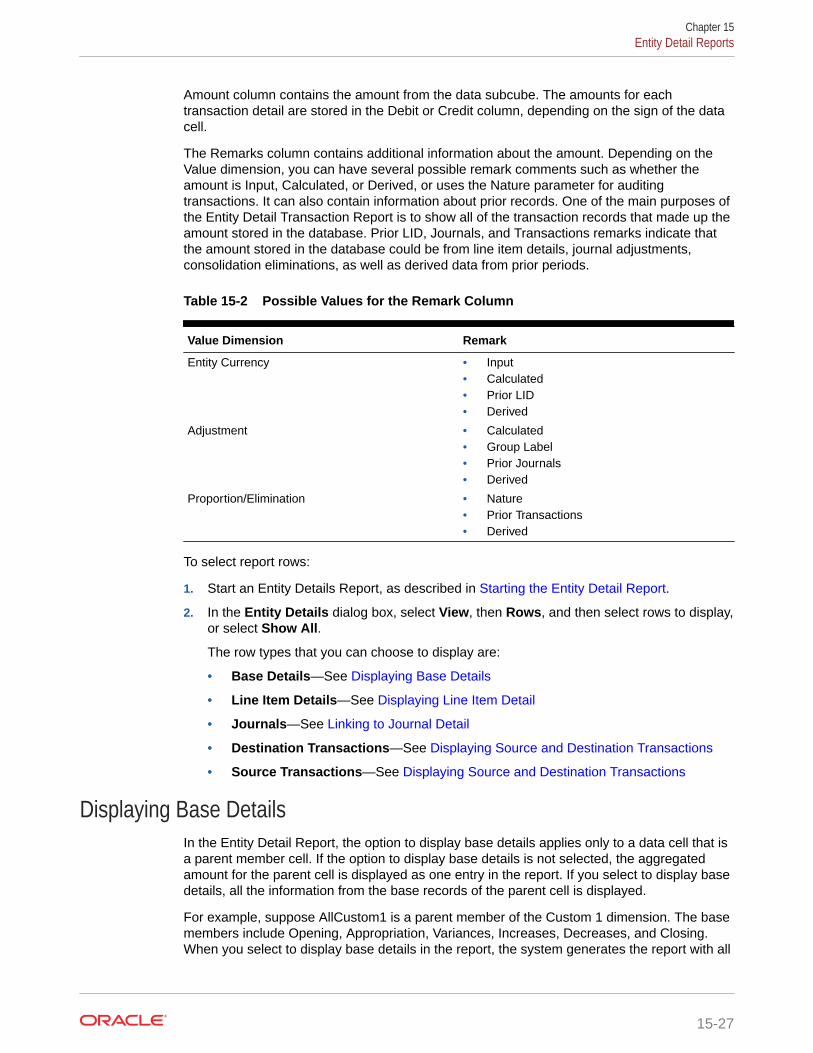
Amount column contains the amount from the data subcube. The amounts for eachtransaction detail are stored in the Debit or Credit column, depending on the sign of the datacell.
The Remarks column contains additional information about the amount. Depending on theValue dimension, you can have several possible remark comments such as whether theamount is Input, Calculated, or Derived, or uses the Nature parameter for auditingtransactions. It can also contain information about prior records. One of the main purposes ofthe Entity Detail Transaction Report is to show all of the transaction records that made up theamount stored in the database. Prior LID, Journals, and Transactions remarks indicate thatthe amount stored in the database could be from line item details, journal adjustments,consolidation eliminations, as well as derived data from prior periods.
Table 15-2 Possible Values for the Remark Column
Value Dimension Remark
Entity Currency • Input• Calculated• Prior LID• Derived
Adjustment • Calculated• Group Label• Prior Journals• Derived
Proportion/Elimination • Nature• Prior Transactions• Derived
To select report rows:
1. Start an Entity Details Report, as described in Starting the Entity Detail Report.
2. In the Entity Details dialog box, select View, then Rows, and then select rows to display,or select Show All.
The row types that you can choose to display are:
• Base Details—See Displaying Base Details
• Line Item Details—See Displaying Line Item Detail
• Journals—See Linking to Journal Detail
• Destination Transactions—See Displaying Source and Destination Transactions
• Source Transactions—See Displaying Source and Destination Transactions
Displaying Base DetailsIn the Entity Detail Report, the option to display base details applies only to a data cell that isa parent member cell. If the option to display base details is not selected, the aggregatedamount for the parent cell is displayed as one entry in the report. If you select to display basedetails, all the information from the base records of the parent cell is displayed.
For example, suppose AllCustom1 is a parent member of the Custom 1 dimension. The basemembers include Opening, Appropriation, Variances, Increases, Decreases, and Closing.When you select to display base details in the report, the system generates the report with all
Chapter 15Entity Detail Reports
15-27

applicable base records for AllCustom1. If you do not select to display base details,the only the amount for the selected parent cell is displayed; for example, the parentcell AllCustom1 is displayed without any base details.
Displaying Line Item DetailIn the Entity Detail Report, the option to display line item detail is only applicable forthe scenario and account defined to use line item detail. Line item detail information isavailable only for the Entity Currency Value dimension.
Linking to Journal DetailWhen the Entity Detail Report contains the journal detail for any of the adjustmentValue members, the debit or credit amount is displayed with the journal ID. You canclick the journal ID link in the ID column to display the Journals Detail page containingall of the information for that journal entry.
To link to journal detail:
1. Start an Entity Details Report, as described in Starting the Entity Detail Report.
2. Click on a Journal ID in the ID column of the report.
A new worksheet opens containing the journal detail for the Journal ID youselected.
Displaying Source and Destination TransactionsFrom the Entity Detail report, you can view the audit transaction detail informationgenerated from the consolidation process. To view the transaction detail, you candisplay Destination Transactions. If you also want to view the Source transactions thatgenerated the amount, you can also display Source Transactions.
You can view these transactions only if you have set up your consolidation rules file tostore these transactions. You must use the HS.CON function with the Natureparameter in the rules file. If the HS.CON function is not used or if the Natureparameter is not specified in the function, the system will not generate any audittransaction detail during the consolidation process. See the Oracle Hyperion FinancialManagement Administrator's Guide.
Exporting the Entity Details Report to ExcelAfter selecting the rows to display in the Entity Details dialog box, you can export thereport content to a sheet in an Excel workbook.
To export the Entity Details report to Excel:
1. Define an Entity Details Report, as described in Starting the Entity Detail Reportand Selecting Rows for the Report.
2. In the Entity Details dialog box, click .
The report is opened in a new Excel workbook.
Note that the exported content is for display purpose only. You cannot connect toOracle Smart View for Office from the exported sheet; however, you may save orprint the workbook.
Chapter 15Entity Detail Reports
15-28
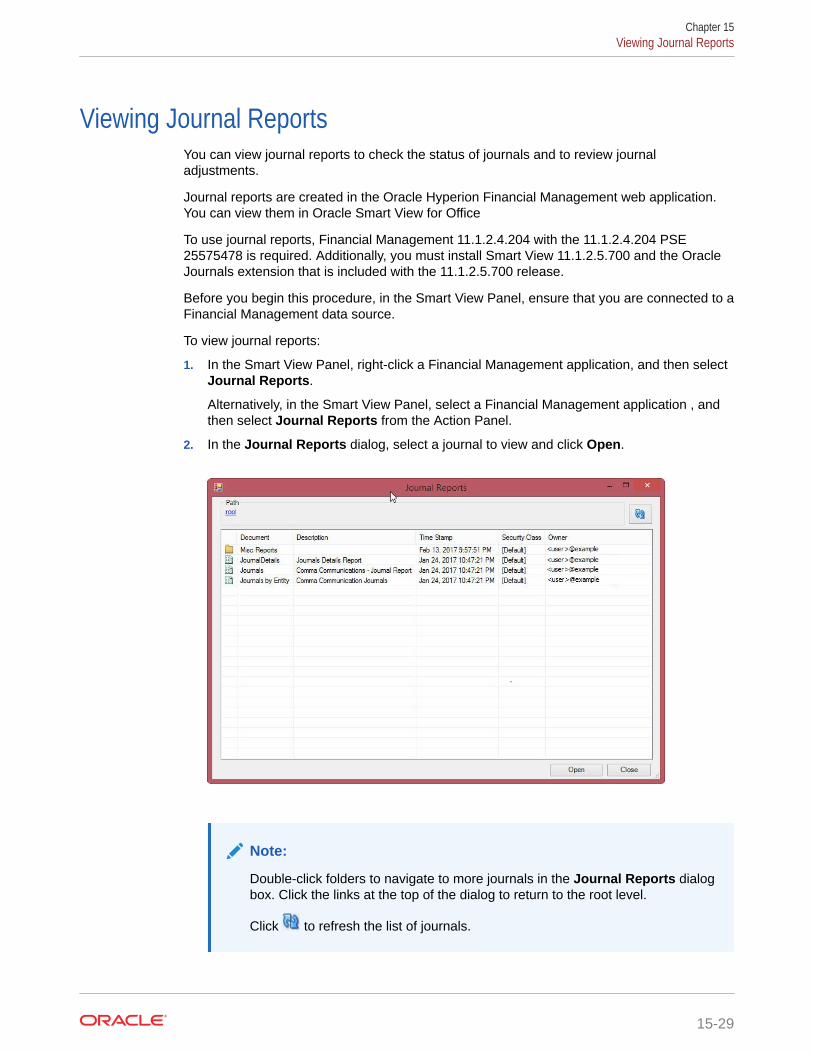
Viewing Journal ReportsYou can view journal reports to check the status of journals and to review journaladjustments.
Journal reports are created in the Oracle Hyperion Financial Management web application.You can view them in Oracle Smart View for Office
To use journal reports, Financial Management 11.1.2.4.204 with the 11.1.2.4.204 PSE25575478 is required. Additionally, you must install Smart View 11.1.2.5.700 and the OracleJournals extension that is included with the 11.1.2.5.700 release.
Before you begin this procedure, in the Smart View Panel, ensure that you are connected to aFinancial Management data source.
To view journal reports:
1. In the Smart View Panel, right-click a Financial Management application, and then selectJournal Reports.
Alternatively, in the Smart View Panel, select a Financial Management application , andthen select Journal Reports from the Action Panel.
2. In the Journal Reports dialog, select a journal to view and click Open.
Note:
Double-click folders to navigate to more journals in the Journal Reports dialogbox. Click the links at the top of the dialog to return to the root level.
Click to refresh the list of journals.
Chapter 15Viewing Journal Reports
15-29
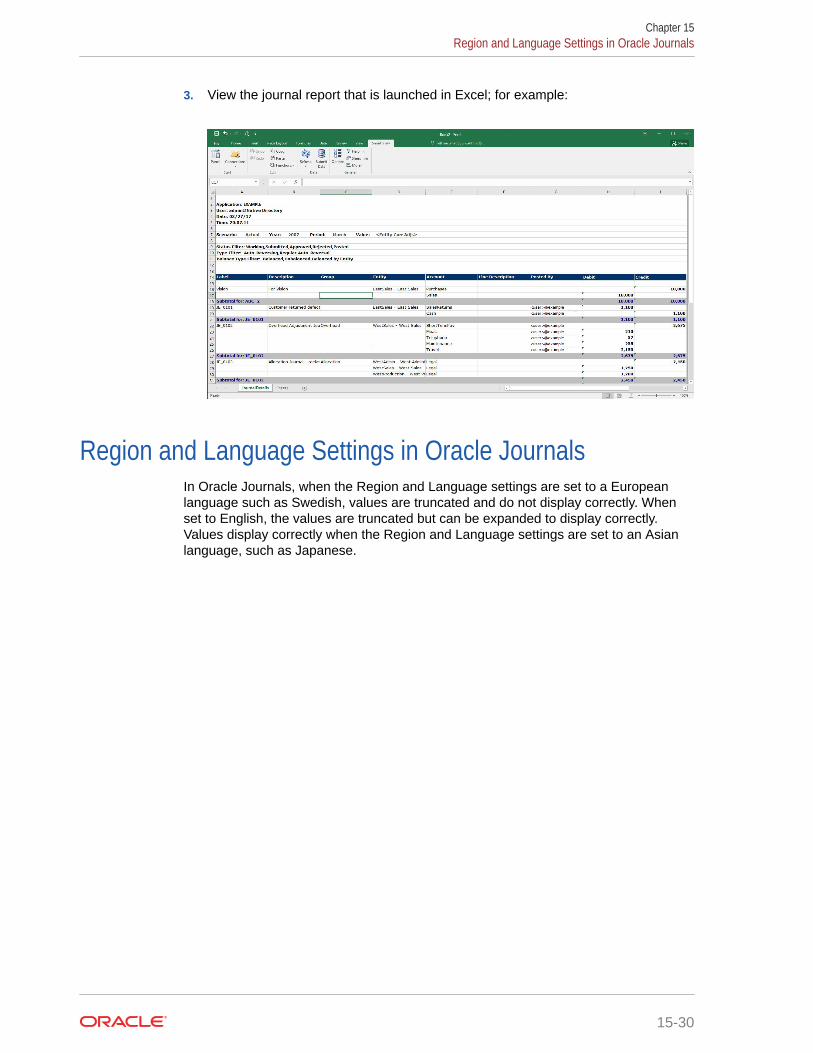
3. View the journal report that is launched in Excel; for example:
Region and Language Settings in Oracle JournalsIn Oracle Journals, when the Region and Language settings are set to a Europeanlanguage such as Swedish, values are truncated and do not display correctly. Whenset to English, the values are truncated but can be expanded to display correctly.Values display correctly when the Region and Language settings are set to an Asianlanguage, such as Japanese.
Chapter 15Region and Language Settings in Oracle Journals
15-30

16Smart View and Oracle Hyperion Planning
Related Topics
• About Smart View and Oracle Hyperion PlanningOracle Smart View for Office supports several Oracle Hyperion Planning features.
• Oracle Hyperion Planning ApprovalsApprovals is the submission, review, and approval process of a planning unit.
• Monitoring Oracle Hyperion Planning Job StatusUse the Job Console to view the execution status of Oracle Hyperion Planning jobs anddelete them if needed.
• Searching for a Page in Oracle Hyperion Planning FormsIf an Oracle Hyperion Planning administrator sets up multiple page dimensions for a form,select the page with the required data from the page drop-down menu.
• Copying VersionsYou can copy data from one bottom-up or target version of a selected scenario to anotherbottom-up or target version within the same scenario.
• Composite FormsYou can open an Oracle Hyperion Planning composite form from Oracle Smart View forOffice.
• Working with Oracle Hyperion Planning Business RulesIn Oracle Hyperion Planning forms and ad hoc grids, you can use business rules tocalculate data in Oracle Essbase.
• Spreading DataYou can spread data for time periods, spread values using grid spread, and spreadvalues using mass allocation.
• Member FormulaYou can view the underlying formula in cells that contain a formula.
• Supporting DetailSupporting detail serves as a built-in calculator for developing data that is not in themember outline.
• Setting User PreferencesSet preferences for application settings, display settings, and user variables.
• Saving Native Excel Formatting to Oracle Hyperion PlanningOracle Smart View for Office provides a way for users to save native Excel formattingback to Oracle Hyperion Planning as part of a form or ad hoc grid.
• Working OfflineIf the Oracle Hyperion Planning offline component is installed and configured for yoursystem, you can take forms offline and perform the same operations as you do whenconnected to an Oracle Hyperion Planning server.
16-1

About Smart View and Oracle Hyperion PlanningOracle Smart View for Office supports several Oracle Hyperion Planning features.
Data source types: Oracle Hyperion Planning
This guide provides only procedural information for using the Oracle HyperionPlanning features that Smart View supports. For detailed information about OracleHyperion Planning, see the Oracle Hyperion Planning User's Guide available on theOracle Help Center. To open this library, from the Smart View ribbon, click the arrownext to Help, and then Documentation.
If you are working with Planning in Oracle Enterprise Performance ManagementCloud, see Smart View and EPM Cloud.
Oracle Hyperion Planning ApprovalsApprovals is the submission, review, and approval process of a planning unit.
Data source types: Oracle Hyperion Planning
If you are assigned the Approvals role, you can perform the Approvals functionsdescribed here. For information about roles, see the administrator.
Related Topics:
Changing Oracle Hyperion Planning Unit Status
Finding Oracle Hyperion Planning Units
Oracle Hyperion Planning Unit Promotional Path
Oracle Hyperion Planning Unit Annotations
Out of Office Assistant
Changing Oracle Hyperion Planning Unit StatusData source types: Oracle Hyperion Planning
You can change the status of one or more planning units at a time.
To view or change the status of a planning unit:
1. Open the appropriate form.
2. From the Planning ribbon, select Approvals.
3. From Manage Approvals, select a Scenario and Version.
4. Click to display the list of planning units to which you have access.
5. Optional: From the view mode button, select one of the following:
• Flat View to display planning units as a list.
• Tree View to display planning units as a hierarchy (available only toadministrators).
Chapter 16About Smart View and Oracle Hyperion Planning
16-2

From the Tree View, you can select Start to start a planning unit and Exclude toexclude a planning unit from the process.
• My Planning Units to display only the planning units that you own.
6. Select the planning unit or units whose status you want to change. If the list is too long tolocate the planning unit easily, you can search or apply filters to the list as described in Finding Oracle Hyperion Planning Units.
7. To view details for the selected planning unit, click Planning Unit Details.
The Approval Status tab displays a history of the process status, owner, actions taken,and the date and times the status changed.
The Annotations tab displays any comments that were entered for the planning unit.See Oracle Hyperion Planning Unit Annotations.
8. To change the planning unit status, click Change Status.
Note:
If you change the status of a parent entity, all of its children change, too, unlessthey were excluded during the First Pass state or were approved.
9. From Approvals - Change Entity's Status, select an action and the next owner for theplanning unit.
10. Optional: Enter comments under Enter Annotation.
11. Click Submit.
12. Optional: To validate the changed planning unit, click . You can validate only oneplanning unit at a time.
Related Topics:
Finding Oracle Hyperion Planning Units
Oracle Hyperion Planning Unit Promotional Path
Oracle Hyperion Planning Unit Annotations
Out of Office Assistant
Finding Oracle Hyperion Planning UnitsData source types: Oracle Hyperion Planning
In Manage Approval, you can locate planning units easily by searching or by applying a filterto the list of planning units. You can use an auto filter or select members or generations asfilter criteria.
To filter the list of planning units:
1. Open Manage Approval and select a scenario and version as described in ChangingOracle Hyperion Planning Unit Status.
2. Click to enable filtering.
Chapter 16Oracle Hyperion Planning Approvals
16-3
The filter bar, which contains filtering tools, is displayed just above the planningunit list.
3. Use one of the following procedures:
• Search
To search for a specific planning unit, enter its name in the Planning Unit field
and click .
• Auto filter
a. From the filter bar, click the arrow in the column header for ApprovalsStatus, Sub-Status, or Current Owner.
b. Select the column value to filter by. You can apply auto filters to more thanone of these columns.
• Filter by member selection
a. From the filter bar, click , and then select Member selector.
b. Click , and then select members for the planning unit list
c. Click to filter the list.
• Filter by generation
a. From the filter bar, click , and then select Generation.
b. Click , and then select one or more generations to display in theplanning unit list.
c. Click to filter the list.
d. Click OK.
4. Optional: To undo your filter selections before applying the filter, click .
Related Topics:
Changing Oracle Hyperion Planning Unit Status
Oracle Hyperion Planning Unit Promotional Path
Oracle Hyperion Planning Unit Annotations
Out of Office Assistant
Oracle Hyperion Planning Unit Promotional PathData source types: Oracle Hyperion Planning
Planning units move from person to person and department to department based onthe following:
• The owners and reviewers assigned to the planning unit
• The planning unit place in the hierarchy
To view the promotional path of a planning unit in graphical form:
Chapter 16Oracle Hyperion Planning Approvals
16-4

1. From the Planning ribbon, select Approvals.
2. From Manage Approvals, select a Scenario and Version.
3. Click Go to display the list of planning units to which you have access.
4. Select a planning unit.
5. Click .
Related Topics:
Changing Oracle Hyperion Planning Unit Status
Finding Oracle Hyperion Planning Units
Oracle Hyperion Planning Unit Annotations
Out of Office Assistant
Oracle Hyperion Planning Unit AnnotationsData source types: Oracle Hyperion Planning
You can add or view comments about data in a planning unit that is started. Annotations canvary by combinations of scenario, version, and entity members.
To add a planning unit annotation:
1. From the Planning ribbon, select Approvals.
2. From Manage Approvals, select a Scenario and Version.
3. Click Go to display the list of planning units to which you have access.
4. Select the planning unit for which you want to add an annotation. To filter the list, see Finding Oracle Hyperion Planning Units.
5. Optional: To view existing annotations for the selected planning unit, click Planning UnitDetails and then the Annotations tab.
6. Click .
7. In Approvals - Add Annotation, enter a title and annotations (up to 1500 characters).On multibyte systems, Oracle recommends limiting annotations to 750 characters. Youcan enter URLs and links as well as text.
8. Click Submit.
Related Topics:
Changing Oracle Hyperion Planning Unit Status
Finding Oracle Hyperion Planning Units
Oracle Hyperion Planning Unit Promotional Path
Out of Office Assistant
Out of Office AssistantData source types: Oracle Hyperion Planning
Chapter 16Oracle Hyperion Planning Approvals
16-5

You can set up the Out of Office Assistant to reassign planning units that arrive whileyou are out of the office.
To set up the Out of Office Assistant:
1. From the Planning ribbon, select Approvals.
2. From Manage Approvals, select Out of Office Assistant.
3. From Out of Office Assistant, select I am Currently Out of Office.
4. From Select Action, select an action and next owner for planning units that arrivewhile you are out of the office.
5. Optional: Enter an annotation.
6. Click Submit.
Related Topics:
Changing Oracle Hyperion Planning Unit Status
Finding Oracle Hyperion Planning Units
Oracle Hyperion Planning Unit Promotional Path
Oracle Hyperion Planning Unit Annotations
Monitoring Oracle Hyperion Planning Job StatusUse the Job Console to view the execution status of Oracle Hyperion Planning jobsand delete them if needed.
Data source types: Oracle Hyperion Planning
Video
Your Goal Watch This Video
Learn about basic Oracle Smart View forOffice functionality related to Planning,including a brief discussion on monitoring jobstatus.
Entering and Saving Plan Data inSmart View with Oracle Planning andBudgeting Cloud
To check the execution status of jobs:
1. From the Planning ribbon or Planning Ad Hoc ribbon, select More, and then JobConsole.
2. By default, all jobs are displayed. To filter the list of jobs, from Filter Criteria, useany of the following job criteria:
• Type: From the drop-down menu, select one of these:
– Business Rule
– Ruleset (for Calculation Manager)
– Sequence (for Business Rules)
– Clear cell detail
– Copy data
Chapter 16Monitoring Oracle Hyperion Planning Job Status
16-6
– Push data
• Status: From the drop-down menu, select Processing, Completed, or Error.
• Job Name
• User Name
• Start Date
• End Date
3. Click Go.
The Job Console displays the jobs matching your selection criteria.
Note:
If you have configured the Job Console window to autorefresh, then the jobsmatching your selection criteria will display after the specified interval. JobConsole autorefresh applies to Smart View 20.200+. See Configuring JobConsole Autorefresh for more information.
4. Optional: To view the application name and plan type of a job, select the job and clickShow Details.
5. Optional: To delete a job, select the job and click Delete.
Configuring Job Console AutorefreshStarting in Oracle Smart View for Office 20.200, you can configure the Job Console windowto autorefresh at the interval you specify in the Windows Registry setting,JobConsoleAutoRefreshInterval.
You can still refresh the Job Console window as often as required using the Go button.However, you can also add the JobConsoleAutoRefreshInterval setting to the Registry andobserve the window updating automatically, without clicking Go.
Add the JobConsoleAutoRefreshInterval setting as a new DWORD in theHKEY_CURRENT_USER Registry folder here:
Computer\HKEY_CURRENT_USER\Software\HyperionSolutions\HyperionSmartView\PreferencesSpecify the time interval you require. The minimum is 15 seconds (where Base is set toDecimal, and Value Data is set to 15000).
After adding the setting, leave the Job Console window open in Smart View and note that thewindow refreshes at the interval specified.
Anyone with permission to modify their computer's Registry can set configure this setting.See Monitoring Job Status for more information on using the Job Console.
Chapter 16Monitoring Oracle Hyperion Planning Job Status
16-7

Searching for a Page in Oracle Hyperion Planning FormsIf an Oracle Hyperion Planning administrator sets up multiple page dimensions for aform, select the page with the required data from the page drop-down menu.
Data source types: Oracle Hyperion Planning
To search for a page in Oracle Hyperion Planning:
1. Click in the page dimension that you want to search to highlight it.
2. From the drop-down menu, select the page name containing the data with whichyou want to work.
Copying VersionsYou can copy data from one bottom-up or target version of a selected scenario toanother bottom-up or target version within the same scenario.
Data source types: Oracle Hyperion Planning
For example, you can create a Best Case version and copy some or all the data in thatversion to a Worst Case version to quickly create a starting point for the new version.
You can copy between bottom-up and target versions.
• When you copy to a bottom-up version, only the selected level 0 members arecopied.
• When you copy to a target version, all selected members are copied.
• To protect data in approved planning units, copying a version does not copy toapproved planning units.
Note:
To successfully copy data, when specifying the copy data criteria, you mustselect at least one member for the Scenario, Account, Entity, Period, andVersion dimensions.
To copy a version:
1. From the Planning ribbon or Planning Ad Hoc ribbon, select Copy Version.
2. From Scenario, select the scenario to copy.
3. From Copy From, select the source version.
4. From Copy To, select the destination version.
5. Click Go to display the available entities (planning units) for the selected sourceversion.
6. Use the arrow keys to select entities from Available Entities. You can copyentities with a Process Status of Not Started or First Pass.
7. Optional: To copy associated information, select any of these options:
Chapter 16Searching for a Page in Oracle Hyperion Planning Forms
16-8

• Copy Account Annotations. Only annotations for selected entities are copied. If youare copying to a bottom-up version, only level 0 entities (and their annotations) arecopied.
• Copy Cell text and Document links
• Copy Supporting Details
8. Click Copy Data.
Note:
Wait for the Copy Version completion message before loading another web page.
Composite FormsYou can open an Oracle Hyperion Planning composite form from Oracle Smart View forOffice.
Data source types: Oracle Hyperion Planning
To open an Oracle Hyperion Planning composite form:
1. Connect to an Oracle Hyperion Planning data source that contains composite forms.
2. From the Connections tree list, double-click a composite form (indicated by ).
The composite form opens in a new Excel workbook with each subform displayed in aseparate worksheet.
Smart View supports Oracle Hyperion Planning master composite forms.
Working with Oracle Hyperion Planning Business RulesIn Oracle Hyperion Planning forms and ad hoc grids, you can use business rules to calculatedata in Oracle Essbase.
Some business rules prompt you to enter information, called a runtime prompt.
Data source types: Oracle Hyperion Planning
Note:
Watch video to get acquainted with some basic Oracle Smart View for Officefunctionality related to Planning, including a brief discussion of business rules.
Video
Your Goal Watch This Video
Learn about basic Smart View functionality relatedto Planning, including a brief discussion ofbusiness rules.
Entering and Saving Plan Data in SmartView with Oracle Planning and Budgeting Cloud
Chapter 16Composite Forms
16-9

Related Topics:
Launching Business Rules in Excel
Entering Runtime Prompts
Executing the Calculate Form and Calculate Currencies Business Rules
Launching Business Rules in ExcelData source types: Oracle Hyperion Planning
To launch a business rule in Excel to recalculate data in Oracle Essbase:
1. Open an Oracle Hyperion Planning ad hoc grid or form (single or composite).
2. Save any unsaved data.
Unsaved data is lost when you launch a business rule.
3. From the Planning ribbon, select Calculate, and then Business Rules.
4. Optional: Filter rules by cube and rule type.
All cubes and rule type options are selected by default. To narrow the search, clearthe check boxes for cubes and rule types that you do not need to see. The list isfiltered according to your selections. For example, selecting only Plan1 and allRule Types, we would see business rules of all types that apply to only the Plan1cube.
5. From Business Rules, under Plan Type, select the plan type associated with therule you want to use.
6. Select a rule from the rules listed for that plan type, and then click Launch.
If the business rule includes runtime prompts, enter the information described in Entering Runtime Prompts.
Note:
Starting in release 11.2.5, users can add dynamic members, also knownas "members on-the-fly," from Oracle Smart View for Office. To adddynamic members, manually type the new member name in theRuntime Prompts text box, and then click Launch.
If the calculation is successful, the values in the database reflect the results of thecalculation.
Chapter 16Working with Oracle Hyperion Planning Business Rules
16-10

Tip:
Oracle Hyperion Planning administrators: During form design in OracleHyperion Planning, rules with runtime prompts directly attached to a compositeform with Run on Save enabled are not supported in Smart View. You shouldalways attach rules to a simple form, enable Run on Save, then attach thebusiness rules from the simple to the composite form. This way, all runtimeprompt values are picked up correctly from the form context and the businessrules launch successfully.
7. Click Close.
8. From the Smart View ribbon, select Refresh.
Related Topics:
Entering Runtime Prompts
Executing the Calculate Form and Calculate Currencies Business Rules
Entering Runtime PromptsData source types: Oracle Hyperion Planning
When launched, a business rule can prompt you to enter variable information, called aruntime prompt. The business rule designer sets up runtime prompts.
To enter a runtime prompt:
1. Launch a business rule having a runtime prompt.
2. Enter or select the input type specified by the runtime prompt, summarized in thefollowing table:
Table 16-1 Runtime Prompts and Expected Input
Icon Expected Input Type
One member selection
Starting in release 11.2.5, to add dynamicmembers, manually type the new member namein the Runtime Prompts text box, and then clickLaunch.
Multiple member selections
Numeric value (either entered or selected fromcell drop-down menu)
Text value—Use only with enhanced calculationscripts, not with graphical scripts
Dimension from the database—Use only withenhanced calculation scripts, not with graphicalscripts
Chapter 16Working with Oracle Hyperion Planning Business Rules
16-11

Table 16-1 (Cont.) Runtime Prompts and Expected Input
Icon Expected Input Type
For Calculation Manager business rulesonly: A member or member combination thatincludes only one member from each dimensionthe designer has set for this runtime prompt (forexample: Sales -> Actual -> Jan refers to themember intersection of Sales, Actual, andJanuary)
For Calculation Manager business rulesonly: A range of members, selectable fromeach dimension the designer has set for thisruntime prompt (for example:IDescendants("Marketing"),FY08)
Ensure that the runtime prompts are valid. You cannot launch a business rule untilall runtime prompt values are valid.
3. Click Launch.
If the calculation is successful, the values in the database reflect the calculationresults.
Related Topics:
Launching Business Rules in Excel
Executing the Calculate Form and Calculate Currencies Business Rules
Executing the Calculate Form and Calculate Currencies BusinessRules
Data source types: Oracle Hyperion Planning
The Calculate Form business rule is created for each form to calculate subtotals. TheCalculate Currencies business rule is created for forms that include multiple currenciesin a row, column, or page to enable the conversion of values among availablecurrencies.
The order in which business rules are launched is important and may affect the data. Ifyou plan to launch both Calculate Form and the Calculate Currencies business rules,always run the conversions before subtotaling the form.
To launch the Calculate Form and Calculate Currencies business rules in Excel:
1. Open a form.
Any data that is not saved on the spreadsheet is lost when you launch thebusiness rule.
2. From the Planning ribbon, select Calculate, and then Rules on Form.
The business rules associated with the form are displayed in the Business Rulesdialog box.
3. Complete one or both of the following actions:
• To convert currencies, select Calculate Currencies
Chapter 16Working with Oracle Hyperion Planning Business Rules
16-12

• To calculate subtotals, select Calculate Form
4. Click Launch.
If the calculation is successful, the values in the database reflect the results of thecalculation.
Related Topics:
Launching Business Rules in Excel
Entering Runtime Prompts
Spreading DataYou can spread data for time periods, spread values using grid spread, and spread valuesusing mass allocation.
Data source types: Oracle Hyperion Planning
• Spreading Data for Time Periods
• Spreading Values Using Grid Spread
• Spreading Values Using Mass Allocation
Spreading Data for Time PeriodsData source types: Oracle Hyperion Planning
In a form, the spreading rules for time periods are set in Oracle Hyperion Planning as part ofthe as part of the dimension property settings. When you work with a form in Excel, anddepending on how the form was set up by the administrator, data values can be spread, ordistributed, in several ways:
• Spread the value of a summary time period to its base time periods or to the first parentor first child of the parent time period
• Spread values among children and parents proportionally, based on existing distribution
• Spread values based on the weekly distribution of a quarter, which could be 4-4-5, 5-4-4,4-5-4, or None (as set up by the budget administrator)
• Temporarily lock the values of certain cells while spreading data over time periods (see Spreading Data with Cell Locking)
• Spread values for different time periods using a different spreading rule for each separatetime period on the same row or column dimension. For example, FY2013 can haveformula fill, and FY2014 can have flow.
This type of spreading requires Oracle Hyperion Planning Release 11.1.2.3.500 or later.
Notes
• You cannot spread data in a summary time period that includes members with mixedcurrency types.
• Excel formulas in child cells are ignored during spreading.
To spread data for time periods:
1. Open a form.
Chapter 16Spreading Data
16-13

2. Select a cell and enter a new value.
The value is distributed according to the rules described in "Adjusting andSpreading Data" in the Oracle Hyperion Planning User's Guide
3. Click Save.
Related Topics:
Spreading Data with Cell Locking
Spreading Values Using Grid Spread
Spreading Values Using Mass Allocation
Spreading Data with Cell LockingData source types: Oracle Hyperion Planning
When spreading data over time periods, you can temporarily lock the values of one ormore cells to preserve their values when other values are recalculated. You canspread data across time periods based on various calculations and visually review thechanges before committing them to the database. For examples of spreading with celllocking, see the Oracle Hyperion Planning User's Guide .
To temporarily lock values:
1. Open a form.
2. In the form, select the cell or group of cells that you want to lock.
3. From the Planning ribbon, select Lock.
A color change indicates that a cell is locked. You can now spread or manipulatedata in the other cells however you want, without affecting the locked cells.
4. To unlock a cell, refresh the grid.
Related Topics:
Spreading Values Using Grid Spread
Spreading Values Using Mass Allocation
Spreading Values Using Grid SpreadData source types: Oracle Hyperion Planning
If your administrator has enabled Grid Spread, you can specify an amount orpercentage to increase or decrease values across multiple dimensions on the grid,based on the existing values in the target cells. When calculating the spread data,read-only and locked cells and cells having supporting detail are ignored. Dataintegrity is ensured because values can be spread only to cells to which you haveaccess.
To spread values using Grid Spread:
1. Put the cursor in the Subtotal or Total source cell whose value you want to spreadto target cells.
2. From the Planning ribbon or Planning Ad Hoc ribbon, select Adjust, and then GridSpread.
Chapter 16Spreading Data
16-14

3. From the drop-down menu, select one of these options:
• Value to increase or decrease values by a specified amount
• Percentage to increase or decrease values by a percentage
4. Select Increase By or Decrease By and enter a value or percentage.
5. In Spread Value, enter the actual spread value that you want.
For example, if the Current Value is 100 and you want the spread value to be 125, enter125 directly in Spread Value and do nothing with the Increase By/Decrease By optionsor text box in step 4.
Alternatively, you can enter 25 in Increase By, and 125 will be displayed in SpreadValue.
Note:
Entering a value in Spread Value has no effect on the Increase By/DecreaseBy text box. But when you enter a value in Increase By/Decrease By, thespread value is reflected in the Spread Value text box.
6. Select a spreading pattern:
• Proportional Spread to spread the value proportionally, based on the existing valuesin the target cells (the default)
• Evenly Split to spread the value evenly among the target cells
• Fill to replace the value in all target cells
Your administrator can add other spreading patterns.
7. Click Spread. The specified value or percentage is spread across the target cells,replacing former values with new ones.
8. To save the new values, click Save.
Related Topics:
Spreading Data with Cell Locking
Spreading Values Using Mass Allocation
Spreading Values Using Mass AllocationData source types: Oracle Hyperion Planning
Using mass allocation, you can spread data to all descendents of a source cell and across alldimensions. Spreading by mass allocation spreads data to cells not displayed on the grid anddoes not require that you have access to the target cells.
Mass allocation is available only for forms, which must be enabled for mass allocation by theadministrator. You must be provisioned with the Mass Allocate role to use mass allocation.
Chapter 16Spreading Data
16-15

Note:
Mass allocation cannot be undone.
To spread values by mass allocation:
1. Put the cursor in the Total or Subtotal cell whose value you want to spread.
2. From the Planning ribbon or Planning Ad Hoc ribbon Oracle Hyperion Planning,select Adjust, and then Mass Allocate.
3. Enter a new value in Spread Value to replace the current value, or from the drop-down menu, select one of the following options:
• Value to increase or decrease values by a specified amount
• Percentage to increase or decrease values by a percentage
4. Select Increase By or Decrease By and enter a value or percentage.
5. In Spread Value, enter the actual spread value that you want.
For example, if the Current Value is 100 and you want the spread value to be125, enter 125 directly in Spread Value and do nothing with the Increase By/Decrease By options or text box in step 4.
Alternatively, you can enter 25 in Increase By, and 125 will be displayed inSpread Value.
Note:
Entering a value in Spread Value has no effect on the Increase By/Decrease By text box. But when you enter a value in Increase By/Decrease By, the spread value is reflected in the Spread Value textbox.
6. Select the Spread Type for allocating the specified value or percentage across thetarget cells:
• Proportional Spread to spread the value proportionally, based on the existingvalues in the target cells (the default)
• Evenly Split to spread the value evenly among the target cells
• Fill to replace the value in all target cells
• Relational Spread to spread into the selected cells based on values that existin a different source location. Selecting this option displays the currentlyselected members for each dimension in the Selected column.
Your administrator can add other spreading patterns.
7. Click Spread. The new values are automatically saved in Oracle Essbase.
Related Topics:
Spreading Data with Cell Locking
Spreading Values Using Grid Spread
Chapter 16Spreading Data
16-16

Member FormulaYou can view the underlying formula in cells that contain a formula.
Such cells can be indicated on the grid by a cell style specified in the Oracle Smart View forOffice Options dialog box, Cell Styles tab.
Data source types: Oracle Hyperion Planning
Note:
In the Oracle Hyperion Planning web interface, the Member Formulas propertymust be enabled in the form before you can view formulas in Smart View. Userswith the proper permissions should open the form in Oracle Hyperion Planning, goto the Layout tab, then Dimension Properties, and then select MemberFormulas.
To view a member formula:
1. Open a form or ad hoc grid.
2. Select the member whose formula you want to view.
3. From the Planning ribbon or Planning Ad Hoc ribbon, select More, and then MemberFormula.
Details of the formula are displayed.
Note:
When a formula is used to reference a member on another sheet, no data isreturned. For example, if the period is in the column on another sheet, and allother sheets reference that cell, no data is refreshed on the other sheets. Inorder to display the data that references a member on another sheet, the Excelcell format for the member formula cell should be set to "General."
Supporting DetailSupporting detail serves as a built-in calculator for developing data that is not in the memberoutline.
It can include text, values, and operators that define how data aggregates.
Data source types: Oracle Hyperion Planning
Related Topics:
Adding Supporting Detail
Working with the Supporting Detail Hierarchy
Viewing or Changing Supporting Detail
Chapter 16Member Formula
16-17

Synchronizing Supporting Detail with Essbase
Adding Supporting DetailData source types: Oracle Hyperion Planning
Use Supporting Details to specify how detail items aggregate to cell values in a form.
Video
Your Goal Watch This Video
Learn about using basic Oracle Smart View forOffice functionality related to Planning,including adding supporting detail.
Entering and Saving Plan Data inSmart View with Oracle Planning andBudgeting Cloud
To add supporting detail that calculates values in a form or ad hoc grid:
1. Open a form or ad hoc grid, and then select the cells.
You can select one cell or a range of contiguous cells in a row or column. Thesection cannot include a combination of rows and columns. Select cells that are inthe local currency so that you can write to them.
2. From the Planning ribbon or Planning Ad Hoc ribbon, select Cell Actions and thenSupporting Detail.
The Supporting Detail window reflects your cell selection.
3. Enter a description over the initial "untitled" text.
The text and its associated operator must be unique among children of the sameparent. By default, you can enter up to 1,500 characters.
4. Use the buttons to create or change the indented hierarchy to reflect the desiredstructure and calculations.
For example, click Add Child to add a line item directly below the selected item.
5. Set the mathematical relationships among the line items by selecting an operatorfor each of them.
Select from these operators:
Operator Function
+ Add
- Subtract
* Multiply
/ Divide
~ Ignore
6. Enter data to set or calculate.
Enter numbers using the same scaling that was set up for the form.
7. Click Submit.
Values are dynamically calculated and aggregated before the data is submitted.Data on the form is also submitted.
Chapter 16Supporting Detail
16-18

Related Topics:
Working with the Supporting Detail Hierarchy
Viewing or Changing Supporting Detail
Synchronizing Supporting Detail with Essbase
Working with the Supporting Detail HierarchyData source types: Oracle Hyperion Planning
The supporting detail hierarchy should reflect the type of information that supports the cellvalues and the mathematical operators that create the relationships.
To create or change the supporting detail hierarchy:
1. In a form, select the cells with supporting detail.
2. From the Planning ribbon or Planning Ad Hoc ribbon, select Supporting Detail.
3. Create or change the rows in the hierarchy that provide the detail for the data values byputting the cursor on an item and clicking the options in this table:
Table 16-2 Supporting Detail Options
Option Result
Add Child Adds an item one level below the selected cell.You can add an unlimited number of children,but consider its potential performance impact.
Add Sibling Adds an item at the same level as the selectedcell. You can add an unlimited number ofsiblings, but consider its potential performanceimpact.
Delete Removes the selected item
Delete All Simultaneously removes all supporting detail
Promote Moves the selected item to the next-higher level
Demote Moves the selected item to the next-lower level
Move Up Moves the selected item to before its siblingpredecessor
Move Down Moves the selected item to after its siblingsuccessor
Duplicate Row Adds a row below the selected item, duplicatingits structure (text, operator, and values)
Fill For rows, copies the data from the current cell tothe cells to its right
Refresh Gets the latest stored database values,restoring the previously saved values, andpossibly overwriting changes you just made.
4. Click Submit.
The submit operation stores the detail text, values, and aggregate values.
Related Topics:
Chapter 16Supporting Detail
16-19

Adding Supporting Detail
Viewing or Changing Supporting Detail
Synchronizing Supporting Detail with Essbase
Viewing or Changing Supporting DetailData source types: Oracle Hyperion Planning
Cells that contain supporting detail can be indicated on the grid by a cell style specifiedin the Options dialog box.
To view or change calculations or supporting data:
1. Open a form, and select the cells for which to view or add detail.
You can select one cell or a range of contiguous cells in a row or column. Thesection cannot include a combination of rows and columns. Select cells that are inthe local currency so that you can write to them.
2. From the Planning ribbon or Planning Ad Hoc ribbon, select Supporting Detail.
3. View or change the line items or calculations that aggregate the data in theselected cells.
Related Topics:
Adding Supporting Detail
Working with the Supporting Detail Hierarchy
Synchronizing Supporting Detail with Essbase
Synchronizing Supporting Detail with EssbaseData source types: Oracle Hyperion Planning
In Oracle Hyperion Planning applications, when you delete supporting detail for a cell,you affect the associated value in the relational database. You specify how to handlethe stored Oracle Essbase value. You can set it to #Missing or leave it as it was beforethe supporting detail was deleted. This feature is useful if you want to use supportingdetail as a scratch pad or calculator.
To synchronize supporting detail with Essbase:
1. Open a form.
2. In the form, click the cell that has the supporting detail you want to remove.
3. From the Planning ribbon or Planning Ad Hoc ribbon, select Supporting Detail.
4. In the Supporting Detail window, delete the information, and then click OK.
5. Select an option from the displayed message to specify how to handle theaggregate value of the deleted supporting detail stored in Essbase:
• To delete the value from Essbase, click Yes, set the value(s) to #Missing.
• To leave the data value in Essbase as is, click No, leave the value(s) as is.
Related Topics:
Adding Supporting Detail
Chapter 16Supporting Detail
16-20
Working with the Supporting Detail Hierarchy
Viewing or Changing Supporting Detail
Setting User PreferencesSet preferences for application settings, display settings, and user variables.
Data source types: Oracle Hyperion Planning
To set user preferences for an Oracle Hyperion Planning application:
1. From the tree list in the Smart View Panel, select an application.
2. Right-click, and then select User Preferences.
3. From Preferences, specify options for the following
• Application Settings—Manage email options, specify alias settings, set options forapprovals, and specify out of office settings.
Note:
Changes to the alias table require you to disconnect from the provider, andreconnect to take effect.
• Display Settings—Set number formatting, remember selected page members, allowa search if the number of pages exceeds a number you specify, set memberindentation, use consolidation operators, perform partial grid fetch, specify number ofmembers on each Dimensions Page, display specified record on each Assign AccessPage, set date formatting.
• User Variables—Variables set up by the administrator to help you navigate largeforms and grids.
To change the selected member for a user variable, click to launch the MemberSelection dialog.
Oracle Smart View for Office 21.100+: You can apply an alias table to the members
in the Member Selection dialog. Click , select Alias Table, and then choose analias table from the list in the popup window. Selecting a table then closes thewindow. Your alias table selection is now applied to the members in MemberSelection dialog. Select a member for the user variable, and then close the dialog.
Changing the alias table in Member Selection affects only the view in the dialogwhen setting user variables.
For more information on using Member Selection, see Selecting Members from theMember Selector.
Chapter 16Setting User Preferences
16-21

Note:
• User preferences for locale, date format, and decimal/numeric format seton forms from within the web application are not honored on forms inSmart View.
• Oracle Hyperion Planning on-premises: You cannot set preferences inoffline mode.
Saving Native Excel Formatting to Oracle Hyperion PlanningOracle Smart View for Office provides a way for users to save native Excel formattingback to Oracle Hyperion Planning as part of a form or ad hoc grid.
Data source types: Oracle Hyperion Planning
Saved formatting is applied in both the Oracle Hyperion Planning browser interfaceand when the form is rendered within Excel. You can then choose how to display theformatting in Smart View. This functionality is in addition to the existing Smart View cellstyles functionality (described in Cell Styles).
These formatting options are available in the Formatting group of the Planning ribbon,shown in Figure 1.
Figure 16-1 Formatting Options
Saving Excel Formatting on an Oracle Hyperion Planning FormData source types: Oracle Hyperion Planning
To save Excel formatting on an Planning form:
1. Open an Planning form for editing in Oracle Smart View for Office.
2. Use native Excel formatting features to apply the formatting to the sheet.
3. On the Planning ribbon, select Save from the Formatting group.
4. Go to Viewing Formatting in Smart View to choose a viewing option.
Related Topics:
Viewing Formatting in Smart View
Clearing Formatting
Saving Excel Formatting From an Ad Hoc Grid
Chapter 16Saving Native Excel Formatting to Oracle Hyperion Planning
16-22

Supported Native Excel Formatting
Guidelines for Working with Native Excel Formatting and Oracle Hyperion Planning Forms
Viewing Formatting in Smart ViewData source types: Oracle Hyperion Planning
Once a form is rendered within Excel, Oracle Smart View for Office provides the options toview the formatting on a sheet. These options are accessed from the Apply button within theFormatting group on the Planning Ad Hoc ribbon.
Tip:
The Apply options are viewing options only and allow you to display the cell stylesand native Excel formatting that were previously saved on a form.
To toggle between formatting view options on an Oracle Hyperion Planning form:
1. Open an Oracle Hyperion Planning form and click the Apply button within theFormatting group on the Planning Ad Hoc ribbon (see Figure 1).
The Apply options are displayed. The initial state before any option is selected is that nooption is selected. Once an option is selected, the last option selection will be preservedthe next time the form is opened.
Figure 16-2 Apply Options
2. Select an option:
• None—Applies no styles (Excel formatting or Smart View cell styles) to the sheet.Though cell styles or custom styles may exist on the sheet, neither are shown whenselecting this option. They are preserved, however, if you want to display them laterusing the Cell styles, Custom styles, or Custom and cell styles options.
• Cell styles—Applies only Smart View cell styles to the sheet, as described in the"Cell Styles" topic.
• Custom styles—Applies only custom user-defined native Excel formatting to thesheet.
• Custom and cell styles—Applies both Excel formatting and Smart View cell stylesto the sheet. Note that when you select Custom and cell styles, cell styles takeprecedent over custom Excel formatting.
Chapter 16Saving Native Excel Formatting to Oracle Hyperion Planning
16-23

Related Topics:
Saving Excel Formatting on an Oracle Hyperion Planning Form
Clearing Formatting
Saving Excel Formatting From an Ad Hoc Grid
Supported Native Excel Formatting
Guidelines for Working with Native Excel Formatting and Oracle HyperionPlanning Forms
Clearing FormattingData source types: Oracle Hyperion Planning
To clear the formatting associated with a form or ad hoc grid, select Clear from theFormatting group on the Planning ribbon.
Selecting the Clear option removes any Excel formatting associated with the form orgrid on the Oracle Hyperion Planning server. Note that you can still work with cellstyles functionality since cell styles are not dependent on any custom formatting that issaved.
Related Topics:
Saving Excel Formatting on an Oracle Hyperion Planning Form
Viewing Formatting in Smart View
Saving Excel Formatting From an Ad Hoc Grid
Supported Native Excel Formatting
Guidelines for Working with Native Excel Formatting and Oracle Hyperion PlanningForms
Saving Excel Formatting From an Ad Hoc GridData source types: Oracle Hyperion Planning
To save formatting from an ad hoc grid:
1. Perform ad hoc analysis to create a grid to save.
2. Use Excel native formatting features to format the grid.
3. From the Planning Ad Hoc ribbon, select Save Ad Hoc Grid.
4. In the Save Grid As dialog box, select the Submit Formatting option whensaving the ad hoc grid as a form.
You can now open the saved form and choose a viewing option as described in Viewing Formatting in Smart View.
Related Topics:
Saving Excel Formatting on an Oracle Hyperion Planning Form
Viewing Formatting in Smart View
Clearing Formatting
Chapter 16Saving Native Excel Formatting to Oracle Hyperion Planning
16-24
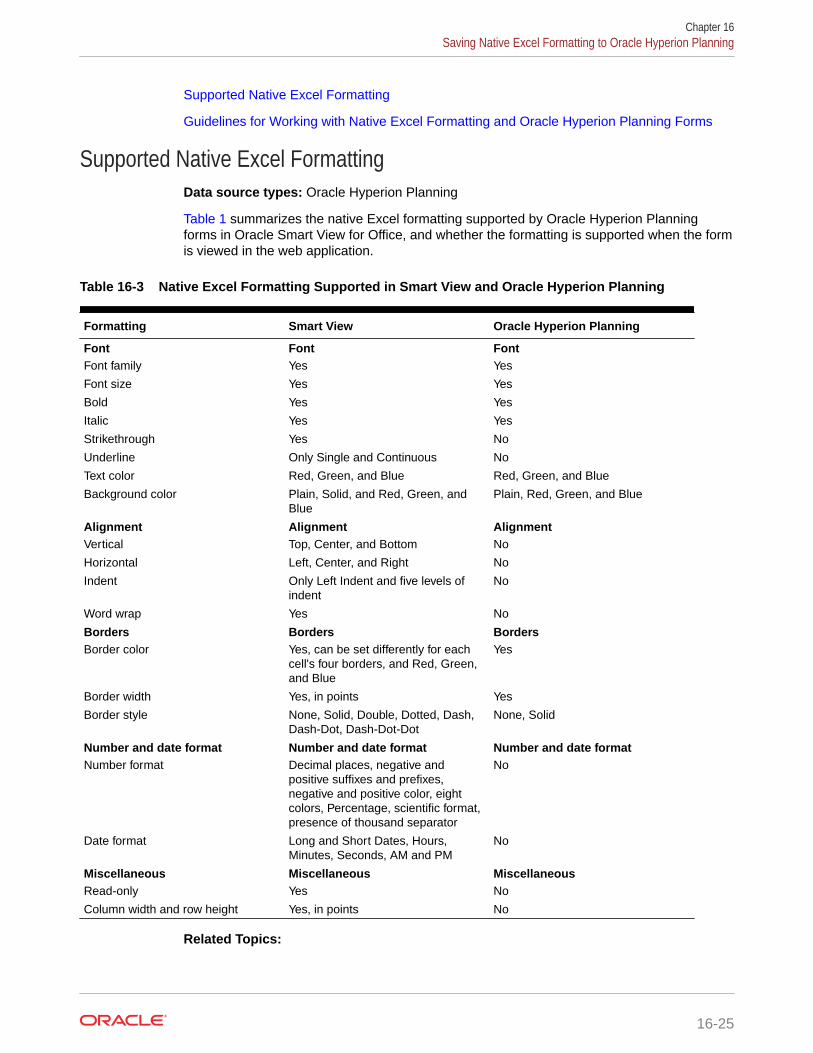
Supported Native Excel Formatting
Guidelines for Working with Native Excel Formatting and Oracle Hyperion Planning Forms
Supported Native Excel FormattingData source types: Oracle Hyperion Planning
Table 1 summarizes the native Excel formatting supported by Oracle Hyperion Planningforms in Oracle Smart View for Office, and whether the formatting is supported when the formis viewed in the web application.
Table 16-3 Native Excel Formatting Supported in Smart View and Oracle Hyperion Planning
Formatting Smart View Oracle Hyperion Planning
Font Font FontFont family Yes Yes
Font size Yes Yes
Bold Yes Yes
Italic Yes Yes
Strikethrough Yes No
Underline Only Single and Continuous No
Text color Red, Green, and Blue Red, Green, and Blue
Background color Plain, Solid, and Red, Green, andBlue
Plain, Red, Green, and Blue
Alignment Alignment AlignmentVertical Top, Center, and Bottom No
Horizontal Left, Center, and Right No
Indent Only Left Indent and five levels ofindent
No
Word wrap Yes No
Borders Borders BordersBorder color Yes, can be set differently for each
cell's four borders, and Red, Green,and Blue
Yes
Border width Yes, in points Yes
Border style None, Solid, Double, Dotted, Dash,Dash-Dot, Dash-Dot-Dot
None, Solid
Number and date format Number and date format Number and date formatNumber format Decimal places, negative and
positive suffixes and prefixes,negative and positive color, eightcolors, Percentage, scientific format,presence of thousand separator
No
Date format Long and Short Dates, Hours,Minutes, Seconds, AM and PM
No
Miscellaneous Miscellaneous MiscellaneousRead-only Yes No
Column width and row height Yes, in points No
Related Topics:
Chapter 16Saving Native Excel Formatting to Oracle Hyperion Planning
16-25

Saving Excel Formatting on an Oracle Hyperion Planning Form
Viewing Formatting in Smart View
Clearing Formatting
Saving Excel Formatting From an Ad Hoc Grid
Guidelines for Working with Native Excel Formatting and Oracle Hyperion PlanningForms
Guidelines for Working with Native Excel Formatting and OracleHyperion Planning Forms
Data source types: Oracle Hyperion Planning
• When designing a grid, care should be taken to avoid conflicts between customExcel formatting and Oracle Smart View for Office cell styles.
• For some ad hoc analysis operations, not all Excel formatting may be preserved.You may need to reapply formatting after performing certain operations.
• When a saved ad hoc grid is opened, Smart View tries to preserve the formattingthat was saved to Oracle Hyperion Planning. For further ad hoc operations,existing formatting options apply; for example, Use Excel formatting or cellstyles.
• To preserve custom Excel formatting on ad hoc operations, select the Use ExcelFormatting and the Move formatting on operations options on the Formattingpage of the Options dialog box.
• Formatting can affect performance, especially during ad hoc operations when theMove formatting on operations option is enabled.
• Saving formatting is not recommended on large forms (for example, forms of20,000 or more cells).
• There are differences between grids rendered in Smart View and those renderedin the browser in Oracle Hyperion Planning. When a saved grid is rendered inOracle Hyperion Planning, some formatting may not appear exactly as it does inSmart View. Oracle Hyperion Planning will attempt to approximate the Smart Viewformatting.
• The Oracle Hyperion Planning administrator may have defined certain formattingon a form. Oracle Hyperion Planning end users can overwrite this formatting andsave it on the form. It can then be merged with the administrator's formattingbased on the option selected for this form in Oracle Hyperion Planning by theadministrator. Refer to the Oracle Hyperion Planning documentation for moreinformation.
• Save formatting functionality is not supported on composite forms.
• Ad hoc analysis started from a saved Oracle Hyperion Planning grid will inherit theformatting options saved as part of the grid.
To use Smart View Cell Styles or the Use Excel Formatting option for an ad hocgrid generated from a saved grid, complete the following steps:
1. Open the saved Oracle Hyperion Planning grid as a form.
2. In the Planning ribbon, Formatting group, select Apply, and then None.
Chapter 16Saving Native Excel Formatting to Oracle Hyperion Planning
16-26
3. Click Save to save the form back to Oracle Hyperion Planning.
4. Now use the saved form to perform ad hoc analysis.
• Excel formatting and custom styles are intended for use with static grids. Changes to thegrid from the following operations can result in invalid formatting:
– POV
– Suppression options
– Merged cells
– Enabling or clearing the Repeat Member Labels options
– Adding members to the form definition
Supported Native Excel Formatting summarizes the native Excel formatting supported byforms in Smart View, and whether the formatting is supported when the form is viewed in theOracle Hyperion Planning web application.
Working OfflineIf the Oracle Hyperion Planning offline component is installed and configured for your system,you can take forms offline and perform the same operations as you do when connected to anOracle Hyperion Planning server.
The changes that you make to offline forms can be synchronized back to the server.
Data source types: Oracle Hyperion Planning
Note:
If you are unfamiliar with Oracle Hyperion Planning, see the Oracle HyperionPlanning User's Guide , available in the Oracle Help Center. To open this library,from the Smart View ribbon, select the arrow next to Help, and thenDocumentation.
Note:
Offline functionality is supported for Oracle Hyperion Planning on-premises only. Itis not supported for Planning in Oracle Enterprise Performance Management Cloud.
Related Topics:
Taking Forms Offline
Working Offline with Forms
Synchronizing Data to the Oracle Hyperion Planning Server
Refreshing the Offline Form Definition and Data
Chapter 16Working Offline
16-27

Taking Forms OfflineData source types: Oracle Hyperion Planning
You can include both online and offline forms in the same Excel workbook.
Note:
Currency conversion is not supported offline.
To take forms offline:
1. In Excel, connect to the Oracle Hyperion Planning data source that contains theforms you want to take offline.
2. From the Planning ribbon, select More, and then Take Offline.
The Take Offline Wizard is displayed; all forms that you can take offline are listed.
3. Expand the Available Forms/Folders and select folders and forms to take offline.
4. Click Next.
5. Double-click a dimension. You can select only one dimension.
If you selected multiple forms, the dimensions displayed are merged from thedimensions available for the selected forms.
6. Select members and system variables from the Member Selection page.
About member relationships:
Table 16-4 Member Relationships
Relationship Members Included on the Form
Member The selected member
Descendants All members below the selected member
Descendants (inc) The selected member and all itsdescendants
Ancestors All members above the selected member
Ancestors (inc) The selected member and all its ancestors
Siblings All members from the same level in thehierarchy as the selected member, excludingthe selected member
Siblings (inc) The selected member and all its siblings
Parents The member in the level above the selectedmember
Parents (inc) The selected member and its parent
Children All members in the level immediately belowthe selected member
Children (inc) The selected member and all its children
Chapter 16Working Offline
16-28
Table 16-4 (Cont.) Member Relationships
Relationship Members Included on the Form
Level 0 Descendants All descendants of the selected member thathave no children
Note:
Different forms may have children and page-member selections. The Pagedrop-down list should contain at least one member for each form from eachdimension.
7. Click OK.
8. Repeat step 5 through step 7 to select members or system variables for each dimensionin the list.
9. Click Next.
10. Supply a unique name and a description for the offline connection.
11. Click Finish to download the selected forms and members.
12. Click OK, and then click Done.
Related Topics:
Working Offline with Forms
Synchronizing Data to the Oracle Hyperion Planning Server
Refreshing the Offline Form Definition and Data
Working Offline with FormsData source types: Oracle Hyperion Planning
To work with forms offline:
1. In Excel, from the Smart View ribbon, select Panel.
2. From the Smart View Panel, select the offline connection.
Online connections specify Planning in the Provider column; offline connections specifyOffline Planning.
3. Right-click and select Connect.
4. Right-click and select Open Form.
Note:
If you have a form open while you are directly connected to the Oracle HyperionPlanning server, and then take the form offline in the same session, you mustreopen the form from the offline connection to work with it offline.
5. In the offline form, add or change data.
Chapter 16Working Offline
16-29

6. From the Planning ribbon, select Submit Data.
The changed data is saved locally. You can exit Excel without losing the changeddata.
Related Topics:
Taking Forms Offline
Synchronizing Data to the Oracle Hyperion Planning Server
Refreshing the Offline Form Definition and Data
Synchronizing Data to the Oracle Hyperion Planning ServerData source types: Oracle Hyperion Planning
When you synchronize to the server, all data changed within a forms taken offlinesince the beginning of the session is saved to the server. You can sync data from allforms at once or from selected forms and members.
To save changed data to the Oracle Hyperion Planning server for all forms andmembers taken offline:
1. From the Planning ribbon, select Forms, and then Sync Back To Server.
2. Log in to the Oracle Hyperion Planning server.
3. Click Sync Back All.
4. Click OK.
To save changed data to the Oracle Hyperion Planning server for selected forms andmembers taken offline:
1. From the Planning ribbon, select Forms, and then Sync Back To Server.
2. Logon to the Oracle Hyperion Planning server.
3. Click Next.
4. Double-click a dimension.
5. From the Member Selection page, select members and system variables.
6. Click OK.
7. Repeat step 4 through 6 to select members or system variables for eachdimension in the list.
8. Select Finish to save data.
9. Click OK, and then Done.
Tip:
After you reconnect to the server, check that the work that you completedoffline is correct in the database. If you lose a row or column of data whenyou refresh a form, contact the administrator.
Related Topics:
Chapter 16Working Offline
16-30

Taking Forms Offline
Working Offline with Forms
Refreshing the Offline Form Definition and Data
Refreshing the Offline Form Definition and DataData source types: Oracle Hyperion Planning
To refresh an offline form definition:
• Updates data on the offline forms with current values from the online forms.
• Adds or deletes members or forms from the ones available during an offline session.
To update offline data and the offline form definition:
1. From the Smart View ribbon, select Panel.
2. From the Smart View Panel, select the connection associated with the current offlinesession.
3. From the Planning ribbon, select More, and then Offline.
Note:
If you are using an offline connection and the Refresh Offline Definition option isnot available, contact the Oracle Hyperion Planning administrator. This option isnot available if you are using an online connection.
4. Enter the user name and password for the online data source.
Because you want to refresh the offline data from the Oracle Hyperion Planning server,you must log on to the server.
5. Do one of the following:
• Click Refresh All to update all members and forms taken offline with current onlinevalues and definitions. Refresh All maintains the current offline form definition. Skipto step 10.
• Click Next to select forms, members, and system variables to update. This selectionmay change the form definition; only members and forms that you select remain partof the definition. Members and forms not selected are no longer available offline.Continue to step 6.
6. Double-click a dimension.
7. From the Member Selection page, select members and system variables.
The list contains members and system variables of the selected dimension.
Use the arrow keys to move members and system variables to or from the SelectedMembers list.
8. Click OK.
9. Repeat step 6 through step 8 to select members or system variables for each dimensionin the list.
10. Click Finish to start the refresh.
Chapter 16Working Offline
16-31
11. Click OK, and then click Done after the refresh is complete.
Related Topics:
Taking Forms Offline
Working Offline with Forms
Synchronizing Data to the Oracle Hyperion Planning Server
Chapter 16Working Offline
16-32

17Smart View and EPM Cloud
Related Topics
• About Smart View and EPM CloudOracle Smart View for Office supports several Oracle Enterprise PerformanceManagement Cloud features.
• Planning ApprovalsPlanning approvals is the submission, review, and approval process of a planning unit.
• Monitoring Job StatusUse the Job Console to view the execution status of jobs in Oracle EnterprisePerformance Management Cloud and delete them if needed.
• Searching for a Page in EPM Cloud FormsIf an administrator sets up multiple page dimensions for a form, select the page with therequired data from the page drop-down menu.
• Copying VersionsYou can copy data from one bottom-up or target version of a selected scenario to anotherbottom-up or target version within the same scenario.
• DashboardsDashboards give you an overview to key information and let you change and save data.
• Composite FormsYou can open Oracle Enterprise Performance Management Cloud composite forms inOracle Smart View for Office.
• Working with Business RulesIn forms and ad hoc grids, you can use business rules to calculate data in the database.
• Spreading DataYou can spread data for time periods, spread values using grid spread, and spreadvalues using mass allocation.
• Member FormulaYou can view the underlying formula in cells that contain a formula.
• Supporting DetailSupporting detail serves as a built-in calculator for developing data that is not in themember outline.
• Setting User PreferencesYou can set user preferences for an application.
• Saving Native Excel Formatting to EPM CloudOracle Smart View for Office provides a way for users to save native Excel formattingback to Oracle Enterprise Performance Management Cloud business process as part of aform or ad hoc grid.
• Working with Multiple-Grid Worksheets in EPM CloudIn Oracle Smart View for Office, you can retrieve multiple ad hoc grids on one worksheet.The grids can all be connected to the same data source, or each grid can be connectedto a different data source.
17-1

• Smart View Behavior Options in EPM CloudYour administrator can set options in the web interface that affect Oracle SmartView for Office behavior.
About Smart View and EPM CloudOracle Smart View for Office supports several Oracle Enterprise PerformanceManagement Cloud features.
EPM Cloud includes the following data sources:
• Planning
• Planning Modules
• Financial Consolidation and Close
• Tax Reporting
This guide provides information about the EPM Cloud features that Smart Viewsupports. For other EPM Cloud information, see the documentation and videosavailable on the Oracle Help Center.
Planning ApprovalsPlanning approvals is the submission, review, and approval process of a planning unit.
If you are assigned the Approvals role, you can perform the Approvals functionsdescribed here. For information about roles, see the administrator.
Data source types: Planning
Note:
If you are unfamiliar with Planning, see the Planning documentation andvideos available on theOracle Help Center.
Related Topics:
Changing Planning Unit Status
Finding Planning Units
Planning Unit Promotional Path
Planning Unit Annotations
Out of Office Assistant
Changing Planning Unit StatusData source types: Planning
You can change the status of one or more planning units at a time.
To view or change the status of a planning unit:
Chapter 17About Smart View and EPM Cloud
17-2

1. Open the appropriate form.
2. From the Planning ribbon, select Approvals.
3. From Manage Approvals, select a Scenario and Version.
4. Click to display the list of planning units to which you have access.
5. Optional: From the view mode button, select one of the following:
• Flat View to display planning units as a list.
• Tree View to display planning units as a hierarchy (available only to administrators).
From the Tree View, you can select Start to start a planning unit and Exclude toexclude a planning unit from the process.
• My Planning Units to display only the planning units that you own.
6. Select the planning unit or units whose status you want to change. If the list is too long tolocate the planning unit easily, you can search or apply filters to the list as described in Finding Planning Units.
7. To view details for the selected planning unit, click Planning Unit Details.
The Approval Status tab displays a history of the process status, owner, actions taken,and the date and times the status changed.
The Annotations tab displays any comments that were entered for the planning unit.See Planning Unit Annotations.
8. To change the planning unit status, click Change Status.
Note:
If you change the status of a parent entity, all of its children change, too, unlessthey were excluded during the First Pass state or were approved.
9. From Approvals - Change Entity's Status, select an action and the next owner for theplanning unit.
10. Optional: Enter comments under Enter Annotation.
11. Click Submit.
12. Optional: To validate the changed planning unit, click . You can validate only oneplanning unit at a time.
Related Topics:
Finding Planning Units
Planning Unit Promotional Path
Planning Unit Annotations
Out of Office Assistant
Finding Planning UnitsData source types: Planning
Chapter 17Planning Approvals
17-3

In Manage Approval, you can locate planning units easily by searching or by applyinga filter to the list of planning units. You can use an auto filter or select members orgenerations as filter criteria.
To filter the list of planning units:
1. Open Manage Approval and select a scenario and version as described in Changing Planning Unit Status.
2. Click to enable filtering.
The filter bar, which contains filtering tools, is displayed just above the planningunit list.
3. Use one of the following procedures:
• Search
To search for a specific planning unit, enter its name in the Planning Unit field
and click .
• Auto filter
a. From the filter bar, click the arrow in the column header for ApprovalsStatus, Sub-Status, or Current Owner.
b. Select the column value to filter by. You can apply auto filters to more thanone of these columns.
• Filter by member selection
a. From the filter bar, click , and then select Member selector.
b. Click , and then select members for the planning unit list
c. Click to filter the list.
• Filter by generation
a. From the filter bar, click , and then select Generation.
b. Click , and then select one or more generations to display in theplanning unit list.
c. Click to filter the list.
d. Click OK.
4. Optional: To undo your filter selections before applying the filter, click .
Related Topics:
Changing Planning Unit Status
Planning Unit Promotional Path
Planning Unit Annotations
Out of Office Assistant
Chapter 17Planning Approvals
17-4

Planning Unit Promotional PathData source types: Planning
Planning units move from person to person and department to department based on thefollowing:
• The owners and reviewers assigned to the planning unit
• The planning unit place in the hierarchy
To view the promotional path of a planning unit in graphical form:
1. From the Planning ribbon, select Approvals.
2. From Manage Approvals, select a Scenario and Version.
3. Click Go to display the list of planning units to which you have access.
4. Select a planning unit.
5. Click .
Related Topics:
Changing Planning Unit Status
Finding Planning Units
Planning Unit Annotations
Out of Office Assistant
Planning Unit AnnotationsData source types: Planning
You can add or view comments about data in a planning unit that is started. Annotations canvary by combinations of scenario, version, and entity members.
To add a planning unit annotation:
1. From the Planning ribbon, select Approvals.
2. From Manage Approvals, select a Scenario and Version.
3. Click Go to display the list of planning units to which you have access.
4. Select the planning unit for which you want to add an annotation. To filter the list, see Finding Planning Units.
5. Optional: To view existing annotations for the selected planning unit, click Planning UnitDetails and then the Annotations tab.
6. Click .
7. In Approvals - Add Annotation, enter a title and annotations (up to 1500 characters).On multibyte systems, Oracle recommends limiting annotations to 750 characters. Youcan enter URLs and links as well as text.
8. Click Submit.
Chapter 17Planning Approvals
17-5
Related Topics:
Changing Planning Unit Status
Finding Planning Units
Planning Unit Promotional Path
Out of Office Assistant
Out of Office AssistantData source types: Planning
You can set up the Out of Office Assistant to reassign planning units that arrive whileyou are out of the office.
To set up the Out of Office Assistant:
1. From the Planning ribbon, select Approvals.
2. From Manage Approvals, select Out of Office Assistant.
3. From Out of Office Assistant, select I am Currently Out of Office.
4. From Select Action, select an action and next owner for planning units that arrivewhile you are out of the office.
5. Optional: Enter an annotation.
6. Click Submit.
Related Topics:
Changing Planning Unit Status
Finding Planning Units
Planning Unit Promotional Path
Out of Office Assistant
Monitoring Job StatusUse the Job Console to view the execution status of jobs in Oracle EnterprisePerformance Management Cloud and delete them if needed.
Data source types: Planning, Planning Modules, Financial Consolidation and Close,Tax Reporting
Video
Your Goal Watch This Video
Learn about basic Oracle Smart View forOffice functionality related to Planning,including a brief discussion on monitoring jobstatus. Concepts are also applicable toFinancial Consolidation and Close and TaxReporting.
Entering and Saving Plan Data inSmart View with Oracle Planning andBudgeting Cloud
Chapter 17Monitoring Job Status
17-6

To check the execution status of jobs:
1. In the Smart View Panel, right-click the application name and select Job Console fromthe context menu.
Alternatively, select the application name, and in the Action Panel, select More, and thenJob Console.
The Job Console is displayed.
By default, all job types and statuses are displayed in the Job Console.
Chapter 17Monitoring Job Status
17-7
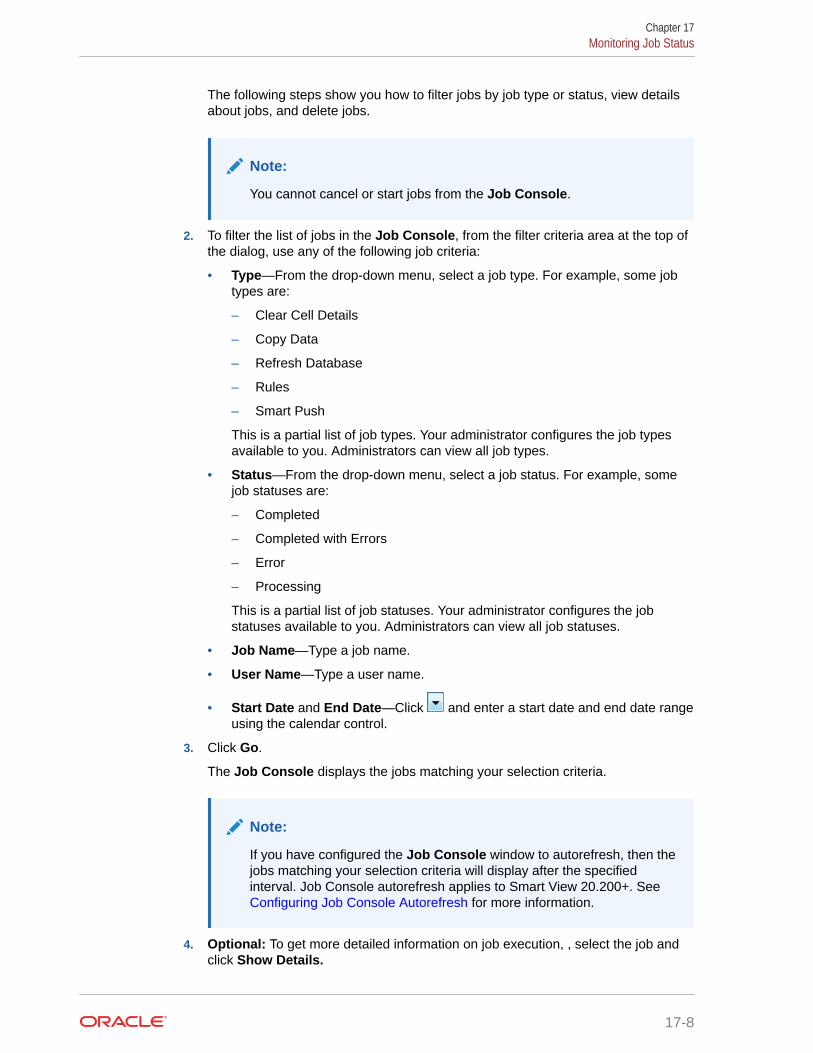
The following steps show you how to filter jobs by job type or status, view detailsabout jobs, and delete jobs.
Note:
You cannot cancel or start jobs from the Job Console.
2. To filter the list of jobs in the Job Console, from the filter criteria area at the top ofthe dialog, use any of the following job criteria:
• Type—From the drop-down menu, select a job type. For example, some jobtypes are:
– Clear Cell Details
– Copy Data
– Refresh Database
– Rules
– Smart Push
This is a partial list of job types. Your administrator configures the job typesavailable to you. Administrators can view all job types.
• Status—From the drop-down menu, select a job status. For example, somejob statuses are:
– Completed
– Completed with Errors
– Error
– Processing
This is a partial list of job statuses. Your administrator configures the jobstatuses available to you. Administrators can view all job statuses.
• Job Name—Type a job name.
• User Name—Type a user name.
• Start Date and End Date—Click and enter a start date and end date rangeusing the calendar control.
3. Click Go.
The Job Console displays the jobs matching your selection criteria.
Note:
If you have configured the Job Console window to autorefresh, then thejobs matching your selection criteria will display after the specifiedinterval. Job Console autorefresh applies to Smart View 20.200+. See Configuring Job Console Autorefresh for more information.
4. Optional: To get more detailed information on job execution, , select the job andclick Show Details.
Chapter 17Monitoring Job Status
17-8
To see details for all jobs in the list, click Select All, and then click Show Details..
5. Optional: To delete a job , select the job and click Delete.
To delete all jobs in the list, click Select All, and then click Delete.
Deleting a job only deletes it from the list in the Job Console. It does not cancel a job.
Configuring Job Console AutorefreshStarting in Oracle Smart View for Office 20.200, you can configure the Job Console windowto autorefresh at the interval you specify in the Windows Registry setting,JobConsoleAutoRefreshInterval.
You can still refresh the Job Console window as often as required using the Go button.However, you can also add the JobConsoleAutoRefreshInterval setting to the Registry andobserve the window updating automatically, without clicking Go.
Add the JobConsoleAutoRefreshInterval setting as a new DWORD in theHKEY_CURRENT_USER Registry folder here:
Computer\HKEY_CURRENT_USER\Software\HyperionSolutions\HyperionSmartView\PreferencesSpecify the time interval you require. The minimum is 15 seconds (where Base is set toDecimal, and Value Data is set to 15000).
After adding the setting, leave the Job Console window open in Smart View and note that thewindow refreshes at the interval specified.
Anyone with permission to modify their computer's Registry can set configure this setting.See Monitoring Job Status for more information on using the Job Console.
Searching for a Page in EPM Cloud FormsIf an administrator sets up multiple page dimensions for a form, select the page with therequired data from the page drop-down menu.
Data source types: Planning, Planning Modules, Financial Consolidation and Close, TaxReporting
To search for a page in an Oracle Enterprise Performance Management Cloud form:
1. Click in the page dimension that you want to search to highlight it.
2. From the drop-down menu, select the page name containing the data with which youwant to work.
Copying VersionsYou can copy data from one bottom-up or target version of a selected scenario to anotherbottom-up or target version within the same scenario.
Data source types: Planning, Planning Modules
For example, you can create a Best Case version and copy some or all the data in thatversion to a Worst Case version to quickly create a starting point for the new version.
You can copy between bottom-up and target versions.
Chapter 17Searching for a Page in EPM Cloud Forms
17-9

• When you copy to a bottom-up version, only the selected level 0 members arecopied.
• When you copy to a target version, all selected members are copied.
• To protect data in approved planning units, copying a version does not copy toapproved planning units.
Note:
To successfully copy data, when specifying the copy data criteria, you mustselect at least one member for the Scenario, Account, Entity, Period, andVersion dimensions.
To copy a version:
1. Perform an action to access the Copy Version dialog box.
• From a Oracle Hyperion Planning form, in the Planning ribbon, select CopyVersion.
• From an ad hoc grid, right-click the application name.
2. From Scenario, select the scenario to copy.
3. From Copy From, select the source version.
4. From Copy To, select the destination version.
5. Click Go to display the available entities (planning units) for the selected sourceversion.
6. Use the arrow keys to select entities from Available Entities. You can copyentities with a Process Status of Not Started or First Pass.
7. Optional: To copy associated information, select any of these options:
• Copy Account Annotations. Only annotations for selected entities arecopied. If you are copying to a bottom-up version, only level 0 entities (andtheir annotations) are copied.
• Copy Cell text and Document links
• Copy Supporting Details
8. Click Copy Data.
Note:
Wait for the Copy Version completion message before loading anotherweb page.
9. Click Cancel to close the Copy Version dialog box.
Chapter 17Copying Versions
17-10

DashboardsDashboards give you an overview to key information and let you change and save data.
Data source types: Planning, Planning Modules, Financial Consolidation and Close, TaxReporting
You can open Oracle Enterprise Performance Management Cloud dashboards in OracleSmart View for Office.
To open a dashboard:
1. Connect to an EPM Cloud data source that contains dashboards.
2. From the Connections tree list, double-click a dashboard (indicated by ).
The dashboard opens in a new Excel workbook with each dashboard object displayed ina separate worksheet.
Note:
• Smart View supports grid and chart type dashboard objects. Chart objectsare displayed in grid format. All other dashboard types will be ignored.
For example, a dashboard consists of these components: one grid, onechart, one note, and one image. Open this dashboard in Smart View andnotice that the workbook has only two sheets, one for the grid, and one forthe chart that is displayed as a grid. The note and image components areignored.
• Smart View supports a master form for the dashboard.
For more information on dashboards:
• Administrators: See the topics on designing dashboards in the Administering guidefor your cloud business process.
• End users: See the topics on using dashboards in the Using guide for your cloudbusiness process .
Composite FormsYou can open Oracle Enterprise Performance Management Cloud composite forms in OracleSmart View for Office.
Data source types: Planning, Planning Modules, Financial Consolidation and Close, TaxReporting
Chapter 17Dashboards
17-11

Note:
Starting in the 21.05 update, EPM Cloud no longer officially supportscomposite forms. As has been announced in the months before 21.05, youare required to use EPM Cloud dashboards instead. Your existing compositeforms will continue to work.
To open a composite form:
1. Connect to an EPM Cloud data source that contains composite forms.
2. From the Connections tree list, double-click a composite form (indicated by ).
The composite form opens in a new Excel workbook with each subform displayedin a separate worksheet.
Note:
Smart View supports master composite forms.
Working with Business RulesIn forms and ad hoc grids, you can use business rules to calculate data in thedatabase.
Data source types: Planning, Planning Modules, Financial Consolidation and Close,Tax Reporting
Some business rules prompt you to enter information, called a runtime prompt. Others,called template-based business rules, prompt you to enter parameter informationusing a guided wizard.
Video
Your Goal Watch This Video
Learn about using basic Oracle Smart View forOffice functionality related to Planning,including a brief discussion of business rules.
Entering and Saving Plan Data inSmart View with Oracle Planning andBudgeting Cloud
Related Topics:
Launching Business Rules in Excel
Entering Runtime Prompts
Executing the Calculate Form and Calculate Currencies Business Rules
Launching Business Rules in ExcelData source types: Planning, Financial Consolidation and Close, Tax Reporting
Chapter 17Working with Business Rules
17-12

To launch a business rule in Excel:
1. Open an ad hoc grid or form (single or composite).
2. Save any unsaved data.
Unsaved data is lost when you launch a business rule.
3. From the provider ribbon, select Calculate, and then Business Rules.
4. Optional: Filter rules by cube and rule type.
All cubes and rule type options are selected by default. To narrow the search, clear thecheck boxes for cubes and rule types that you do not need to see. The list is filteredaccording to your selections. For example, selecting only Plan1 and all Rule Types, wewould see business rules of all types that apply to only the Plan1 cube.
5. From Business Rules, under Plan Type, select the cube associated with the rule youwant to use.
6. Select a rule from the rules listed for that cube, and then click Launch.
Note:
• For business rules that include runtime prompts, enter the informationdescribed in Entering Runtime Prompts.
• For template-based business rules, you define rule parameters using aguided wizard.
• Planning only: Starting in Planning 20.03, users can add dynamicmembers, also known as "members on-the-fly," from Oracle Smart View forOffice. To add dynamic members, manually type the new member name inthe Runtime Prompts text box, and then click Launch.
If the calculation is successful, the values in the database reflect the results of thecalculation.
Tip:
Administrators: During form design in Planning, rules with runtime promptsdirectly attached to a composite form with Run on Save enabled are notsupported in Smart View. You should always attach rules to a simple form,enable Run on Save, then attach the business rules from the simple to thecomposite form. This way, all runtime prompt values are picked up correctlyfrom the form context and the business rules launch successfully.
7. Click Close.
8. From the Smart View ribbon, select Refresh.
Related Topics:
Entering Runtime Prompts
Executing the Calculate Form and Calculate Currencies Business Rules
Chapter 17Working with Business Rules
17-13

Entering Runtime PromptsData source types: Planning
If you are unfamiliar with Planning, see the Planning documentation and videosavailable on the Oracle Help Center.
When launched, a business rule can prompt you to enter variable information, called aruntime prompt. The business rule designer sets up runtime prompts.
To enter a runtime prompt:
1. Launch a business rule having a runtime prompt.
2. Enter or select the input type specified by the runtime prompt, summarized in thefollowing table:
Table 17-1 Runtime Prompts and Expected Input
Icon Expected Input Type
One member selection
To add dynamic members, manually typethe new member name in the RuntimePrompts text box, and then click Launch.
Multiple member selections
Numeric value (either entered or selectedfrom cell drop-down menu)
Text value—Use only with enhancedcalculation scripts, not with graphical scripts
Dimension from the database—Use onlywith enhanced calculation scripts, not withgraphical scripts
For Calculation Manager business rulesonly: A member or member combinationthat includes only one member from eachdimension the designer has set for thisruntime prompt (for example: Sales ->Actual -> Jan refers to the memberintersection of Sales, Actual, and January)
For Calculation Manager business rulesonly: A range of members, selectable fromeach dimension the designer has set for thisruntime prompt (for example:IDescendants("Marketing"),FY08)
Ensure that the runtime prompts are valid. You cannot launch a business rule untilall runtime prompt values are valid.
3. Click Launch.
Chapter 17Working with Business Rules
17-14

If the calculation is successful, the values in the database reflect the calculation results.
Related Topics:
Launching Business Rules in Excel
Executing the Calculate Form and Calculate Currencies Business Rules
Executing the Calculate Form and Calculate Currencies Business RulesData source types: Planning
The Calculate Form business rule is created for each form to calculate subtotals. TheCalculate Currencies business rule is created for forms that include multiple currencies in arow, column, or page to enable the conversion of values among available currencies.
The order in which business rules are launched is important and may affect the data. If youplan to launch both Calculate Form and the Calculate Currencies business rules, always runthe conversions before subtotaling the form.
To launch the Calculate Form and Calculate Currencies business rules in Excel:
1. Open a form.
Any data that is not saved on the spreadsheet is lost when you launch the business rule.
2. From the Planning ribbon, select Calculate, and then Rules on Form.
The business rules associated with the form are displayed in the Business Rules dialogbox.
3. Complete one or both of the following actions:
• To convert currencies, select Calculate Currencies
• To calculate subtotals, select Calculate Form
4. Click Launch.
If the calculation is successful, the values in the database reflect the results of thecalculation.
Related Topics:
Launching Business Rules in Excel
Entering Runtime Prompts
Spreading DataYou can spread data for time periods, spread values using grid spread, and spread valuesusing mass allocation.
Data source types: Planning
• Spreading Data for Time Periods
• Spreading Values Using Grid Spread
• Spreading Values Using Mass Allocation
Chapter 17Spreading Data
17-15

Spreading Data for Time PeriodsData source types: Planning, Planning Modules, Financial Consolidation and Close,Tax Reporting
In a form, the spreading rules for time periods are set in the application as part of theas part of the dimension property settings. When you work with a form in Excel, anddepending on how the form was set up by the administrator, data values can bespread, or distributed, in several ways:
• Spread the value of a summary time period to its base time periods or to the firstparent or first child of the parent time period
• Spread values among children and parents proportionally, based on existingdistribution
• Spread values based on the weekly distribution of a quarter, which could be 4-4-5,5-4-4, 4-5-4, or None (as set up by the budget administrator)
• Temporarily lock the values of certain cells while spreading data over time periods(see Spreading Data with Cell Locking)
• Spread values for different time periods using a different spreading rule for eachseparate time period on the same row or column dimension. For example, FY2013can have formula fill, and FY2014 can have flow.
Notes
• You cannot spread data in a summary time period that includes members withmixed currency types.
• Excel formulas in child cells are ignored during spreading.
To spread data for time periods:
1. Open a form.
2. Select a cell and enter a new value.
The value is distributed according to the rules described in "Adjusting andSpreading Data" in the Oracle Hyperion Planning User's Guide
3. Click Submit to save the new values.
Related Topics:
Spreading Data with Cell Locking
Spreading Values Using Grid Spread
Spreading Values Using Mass Allocation
Spreading Data with Cell LockingData source types: Planning, Planning Modules, Financial Consolidation and Close,Tax Reporting
When spreading data over time periods, you can temporarily lock the values of one ormore cells to preserve their values when other values are recalculated. You canspread data across time periods based on various calculations and visually review the
Chapter 17Spreading Data
17-16

changes before committing them to the database. For examples of spreading with celllocking, see the Oracle Hyperion Planning User's Guide .
To temporarily lock values:
1. Open a form.
2. In the form, select the cell or group of cells that you want to lock.
3. From the provider ribbon, select Lock.
A color change indicates that a cell is locked. You can now spread or manipulate data inthe other cells however you want, without affecting the locked cells.
4. To unlock a cell, refresh the grid.
Related Topics:
Spreading Values Using Grid Spread
Spreading Values Using Mass Allocation
Spreading Values Using Grid SpreadData source types: Planning, Planning Modules, Financial Consolidation and Close, TaxReporting
If your administrator has enabled Grid Spread, you can specify an amount or percentage toincrease or decrease values across multiple dimensions on the grid, based on the existingvalues in the target cells. When calculating the spread data, read-only and locked cells andcells having supporting detail are ignored. Data integrity is ensured because values can bespread only to cells to which you have access.
To spread values using Grid Spread:
1. Put the cursor in the Subtotal or Total source cell whose value you want to spread totarget cells.
2. From the provider ribbon or provider ad hoc ribbon, select Adjust, and then GridSpread.
3. From the drop-down menu, select one of these options:
• Value to increase or decrease values by a specified amount
• Percentage to increase or decrease values by a percentage
4. Select Increase By or Decrease By and enter a value or percentage.
5. In Spread Value, enter the actual spread value that you want.
For example, if the Current Value is 100 and you want the spread value to be 125, enter125 directly in Spread Value and do nothing with the Increase By/Decrease By optionsor text box in step 4.
Alternatively, you can enter 25 in Increase By, and 125 will be displayed in SpreadValue.
Chapter 17Spreading Data
17-17
Note:
Entering a value in Spread Value has no effect on the Increase By/Decrease By text box. But when you enter a value in Increase By/Decrease By, the spread value is reflected in the Spread Value textbox.
6. Select a spreading pattern:
• Proportional Spread to spread the value proportionally, based on the existingvalues in the target cells (the default)
• Evenly Split to spread the value evenly among the target cells
• Fill to replace the value in all target cells
Your administrator can add other spreading patterns.
7. Click Spread. The specified value or percentage is spread across the target cells,replacing former values with new ones.
8. To save the new values, click Save.
Related Topics:
Spreading Data with Cell Locking
Spreading Values Using Mass Allocation
Spreading Values Using Mass AllocationData source types: Planning, Planning Modules, Financial Consolidation and Close,Tax Reporting
Using mass allocation, you can spread data to all descendents of a source cell andacross all dimensions. Spreading by mass allocation spreads data to cells notdisplayed on the grid and does not require that you have access to the target cells.
Mass allocation is available only for forms, which must be enabled for mass allocationby the administrator. You must be provisioned with the Mass Allocate role to use massallocation.
Note:
Mass allocation cannot be undone.
To spread values by mass allocation:
1. Put the cursor in the Total or Subtotal cell whose value you want to spread.
2. From the Planning ribbon, select Adjust, and then Mass Allocate.
3. Enter a new value in Spread Value to replace the current value, or from the drop-down menu, select one of the following options:
• Value to increase or decrease values by a specified amount
Chapter 17Spreading Data
17-18

• Percentage to increase or decrease values by a percentage
4. Select Increase By or Decrease By and enter a value or percentage.
5. In Spread Value, enter the actual spread value that you want.
For example, if the Current Value is 100 and you want the spread value to be 125, enter125 directly in Spread Value and do nothing with the Increase By/Decrease By optionsor text box in step 4.
Alternatively, you can enter 25 in Increase By, and 125 will be displayed in SpreadValue.
Note:
Entering a value in Spread Value has no effect on the Increase By/DecreaseBy text box. But when you enter a value in Increase By/Decrease By, thespread value is reflected in the Spread Value text box.
6. Select the Spread Type for allocating the specified value or percentage across the targetcells:
• Proportional Spread to spread the value proportionally, based on the existing valuesin the target cells (the default)
• Evenly Split to spread the value evenly among the target cells
• Fill to replace the value in all target cells
• Relational Spread to spread into the selected cells based on values that exist in adifferent source location. Selecting this option displays the currently selectedmembers for each dimension in the Selected column.
Your administrator can add other spreading patterns.
7. Click Spread. The new values are automatically saved.
Member FormulaYou can view the underlying formula in cells that contain a formula.
Such cells can be indicated on the grid by a cell style specified in the Oracle Smart View forOffice Options dialog box, Cell Styles tab.
Data source types: Planning, Planning Modules, Financial Consolidation and Close, TaxReporting
Note:
In the Oracle Enterprise Performance Management Cloud web interface, theMember Formulas property must be enabled in the form before you can viewformulas in Smart View. Users with the proper permissions should open the form forediting in the web, go to the Layout tab, then Dimension Properties, and thenselect Member Formula.
Chapter 17Member Formula
17-19

To view a member formula:
1. Open a form or ad hoc grid.
2. Select the member whose formula you want to view.
3. From the provider ribbon, select More, and then Member Formula.
Details of the formula are displayed.
Note:
When a formula is used to reference a member on another sheet, nodata is returned. For example, if the period is in the column on anothersheet, and all other sheets reference that cell, no data is refreshed onthe other sheets. In order to display the data that references a memberon another sheet, the Excel cell format for the member formula cellshould be set to "General."
Supporting DetailSupporting detail serves as a built-in calculator for developing data that is not in themember outline.
It can include text, values, and operators that define how data aggregates.
Data source types: Planning
Note:
If you are unfamiliar with Planning, see the Planning documentation andvideos available on the Oracle Help Center.
Related Topics:
Adding Supporting Detail
Working with the Supporting Detail Hierarchy
Viewing or Changing Supporting Detail
Synchronizing Supporting Detail with the Cube
Adding Supporting DetailData source types: Planning, Planning Modules
Use the Supporting Detail window to set how detail items aggregate to cell values ina form.
Chapter 17Supporting Detail
17-20

Video
Your Goal Watch This Video
Learn about using basic Oracle Smart View forOffice functionality related to Planning, includingadding supporting detail.
Entering and Saving Plan Data in SmartView with Oracle Planning and Budgeting Cloud
To add supporting detail that calculates values in a form or ad hoc grid:
1. Open a form, and then select the cells.
You can select one cell or a range of contiguous cells in a row or column. The sectioncannot include a combination of rows and columns. Select cells that are in the localcurrency so that you can write to them.
2. From the Planning ribbon or Planning Ad Hoc ribbon, select Cell Actions and thenSupporting Detail.
The Supporting Detail window reflects your cell selection.
3. Enter a description over the initial "untitled" text.
The text and its associated operator must be unique among children of the same parent.By default, you can enter up to 1,500 characters.
4. Use the buttons to create or change the indented hierarchy to reflect the desired structureand calculations.
For example, click Add Child to add a line item directly below the selected item.
5. Set the mathematical relationships among the line items by selecting an operator foreach of them.
Select from these operators:
Operator Function
+ Add
- Subtract
* Multiple
/ Divide
~ Ignore
6. Enter data to set or calculate.
Enter numbers using the same scaling that was set up for the form.
7. Click Submit.
Values are dynamically calculated and aggregated before the data is submitted. Data onthe form is also submitted.
Related Topics:
Working with the Supporting Detail Hierarchy
Viewing or Changing Supporting Detail
Synchronizing Supporting Detail with the Cube
Chapter 17Supporting Detail
17-21

Working with the Supporting Detail HierarchyData source types: Planning, Planning Modules
The supporting detail hierarchy should reflect the type of information that supports thecell values and the mathematical operators that create the relationships.
To create or change the supporting detail hierarchy:
1. In a form, select the cells with supporting detail.
2. From the Planning ribbon or Planning Ad Hoc ribbon, select Supporting Detail.
3. Create or change the rows in the hierarchy that provide the detail for the datavalues by putting the cursor on an item and clicking the options in this table:
Table 17-2 Supporting Detail options and Their Results
Option Result
Add Child Adds an item one level below the selectedcell. You can add an unlimited number ofchildren, but consider its potentialperformance impact.
Add Sibling Adds an item at the same level as theselected cell. You can add an unlimitednumber of siblings, but consider its potentialperformance impact.
Delete Removes the selected item
Delete All Simultaneously removes all supporting detail
Promote Moves the selected item to the next-higherlevel
Demote Moves the selected item to the next-lowerlevel
Move Up Moves the selected item to before its siblingpredecessor
Move Down Moves the selected item to after its siblingsuccessor
Duplicate Row Adds a row below the selected item,duplicating its structure (text, operator, andvalues)
Fill For rows, copies the data from the currentcell to the cells to its right
Refresh Gets the latest stored database values,restoring the previously saved values, andpossibly overwriting changes you just made.
4. Click Submit.
The submit operation stores the detail text, values, and aggregate values.
Related Topics:
Adding Supporting Detail
Viewing or Changing Supporting Detail
Chapter 17Supporting Detail
17-22

Synchronizing Supporting Detail with the Cube
Viewing or Changing Supporting DetailData source types: Planning, Planning Modules
Cells that contain supporting detail can be indicated on the grid by a cell style specified in theOptions dialog box.
To view or change calculations or supporting data:
1. Open a form, and select the cells for which to view or add detail.
You can select one cell or a range of contiguous cells in a row or column. The sectioncannot include a combination of rows and columns. Select cells that are in the localcurrency so that you can write to them.
2. From the Planning ribbon or Planning Ad Hoc ribbon, select Supporting Detail.
3. View or change the line items or calculations that aggregate the data in the selectedcells.
Related Topics:
Adding Supporting Detail
Working with the Supporting Detail Hierarchy
Synchronizing Supporting Detail with the Cube
Synchronizing Supporting Detail with the CubeData source types: Planning
In Oracle Enterprise Performance Management Cloud applications, when you deletesupporting detail for a cell, you affect the associated value in the relational database. Youspecify how to handle the stored database value. You can set it to #Missing or leave it as itwas before the supporting detail was deleted. This feature is useful if you want to usesupporting detail as a scratch pad or calculator.
To synchronize supporting detail with the database:
1. Open a form.
2. In the form, click the cell that has the supporting detail you want to remove.
3. From the provider ribbon or provider Ad Hoc ribbon, select Supporting Detail.
4. In the Supporting Detail window, delete the information, and then click OK.
5. Select an option from the displayed message to specify how to handle the aggregatevalue of the deleted supporting detail stored in the cube:
• To delete the value from the cube, click Yes, set the value(s) to #Missing.
• To leave the data value in the cube as is, click No, leave the value(s) as is.
Related Topics:
Adding Supporting Detail
Working with the Supporting Detail Hierarchy
Viewing or Changing Supporting Detail
Chapter 17Supporting Detail
17-23
Setting User PreferencesYou can set user preferences for an application.
Data source types: Planning, Planning Modules, Financial Consolidation and Close,Tax Reporting
To set user preferences for an application:
1. From the tree list in the Smart View Panel, select an application.
2. Right-click, and then select User Preferences.
3. From Preferences, specify options for the following
• Application Settings: Manage email options, specify alias settings, setoptions for approvals, and specify out of office settings.
Note:
Changes to the alias table require you to disconnect from theprovider, and reconnect to take effect.
• Display Settings: Set number formatting, remember selected page members,allow a search if the number of pages exceeds a number you specify, setmember indentation, use consolidation operators, perform partial grid fetch,specify number of members on each Dimensions Page, display specifiedrecord on each Assign Access Page, set date formatting.
• User Variables: Variables set up by the administrator to help you navigatelarge forms and grids.
To change the selected member for a user variable, click to launch theMember Selection dialog.
Oracle Smart View for Office 21.100+: You can apply an alias table to the
members in the Member Selection dialog. Click , select Alias Table,and then choose an alias table from the list in the popup window. Selecting atable then closes the window. Your alias table selection is now applied to themembers in Member Selection dialog. Select a member for the user variable,and then close the dialog.
Changing the alias table in Member Selection affects only the view in thedialog when setting user variables.
For more information on using Member Selection, see Selecting Membersfrom the Member Selector .
Chapter 17Setting User Preferences
17-24

Note:
User preferences for locale, date format, and decimal/numeric format set on formsfrom within the web application are not honored on forms in Smart View.
You may specify a decimal/numeric format for forms in Smart View in the Optionsdialog, Formatting tab by enabling the Use Thousands Separator option, andsetting the Scale and Decimal Places options. For more information, see Formatting Options.
Saving Native Excel Formatting to EPM CloudOracle Smart View for Office provides a way for users to save native Excel formatting back toOracle Enterprise Performance Management Cloud business process as part of a form or adhoc grid.
Data source types: Planning, Planning Modules, Financial Consolidation and Close, TaxReporting
Saved formatting is applied in both the business process browser interface and when theform is rendered within Excel. You can then choose how to display the formatting in SmartView. This functionality is in addition to the existing Smart View cell styles functionality.
See also Cell Styles.
These formatting options are available in the Formatting group of the provider ribbon, shownin Figure 1.
Figure 17-1 Formatting Options
Saving Excel Formatting on a FormData source types: Planning, Planning Modules, Financial Consolidation and Close, TaxReporting
To save Excel formatting on a form:
1. Open a form for editing in Oracle Smart View for Office.
2. Use native Excel formatting features to apply the formatting to the sheet.
3. On the provider ribbon, select Save from the Formatting group.
4. Go to Viewing Formatting in Smart View to choose a viewing option.
Related Topics:
Viewing Formatting in Smart View
Chapter 17Saving Native Excel Formatting to EPM Cloud
17-25

Clearing Formatting
Saving Excel Formatting From an Ad Hoc Grid
Supported Native Excel Formatting
Guidelines for Working with Native Excel Formatting and Forms in EPM Cloud
Viewing Formatting in Smart ViewData source types: Planning, Planning Modules, Financial Consolidation and Close,Tax Reporting
Once a form is rendered within Excel, Oracle Smart View for Office provides theoptions to view the formatting on a sheet. These options are accessed from the Applybutton within the Formatting group on the Planning Ad Hoc ribbon.
Tip:
The Apply options are viewing options only and allow you to display the cellstyles and native Excel formatting that were previously saved on a form.
To toggle between formatting view options on a Oracle Hyperion Planning form:
1. Open a Planning form and click the Apply button within the Formatting group onthe Planning ribbon (see Figure 1).
The Apply options are displayed. The initial state before any option is selected isthat no option is selected. Once an option is selected, the last option selection willbe preserved the next time the form is opened.
Figure 17-2 Apply Options
2. Select an option:
• None—Applies no styles (Excel formatting or Smart View cell styles) to thesheet. Though cell styles or custom styles may exist on the sheet, neither areshown when selecting this option. They are preserved, however, if you want todisplay them later using the Cell styles, Custom styles, or Custom and cellstyles options.
• Cell styles—Applies only Smart View cell styles to the sheet, as described inthe "Cell Styles" topic.
Chapter 17Saving Native Excel Formatting to EPM Cloud
17-26
• Custom styles—Applies only custom user-defined native Excel formatting to thesheet.
• Custom and cell styles—Applies both Excel formatting and Smart View cell stylesto the sheet. Note that when you select Custom and cell styles, cell styles takeprecedent over custom Excel formatting.
The option selection is immediately applied to the form.
3. To clear the selection made in the previous step, click the Clear button within theFormatting group.
See Clearing Formatting for more information.
Related Topics:Saving Excel Formatting on a Form
Clearing Formatting
Saving Excel Formatting From an Ad Hoc Grid
Supported Native Excel Formatting
Guidelines for Working with Native Excel Formatting and Forms in EPM Cloud
Clearing FormattingData source types: Planning, Planning Modules, Financial Consolidation and Close, TaxReporting
To clear the formatting associated with a form or ad hoc grid, select Clear from theFormatting group on the Planning ribbon.
Selecting the Clear option removes any Excel formatting associated with the form or grid,both within Excel and within the web application. Note that you can still work with cell stylesfunctionality since cell styles are not dependent on any custom formatting that is saved.
Related Topics:
Saving Excel Formatting on a Form
Viewing Formatting in Smart View
Saving Excel Formatting From an Ad Hoc Grid
Supported Native Excel Formatting
Guidelines for Working with Native Excel Formatting and Forms in EPM Cloud
Saving Excel Formatting From an Ad Hoc GridData source types: Planning
To save formatting from an ad hoc grid:
1. Perform ad hoc analysis to create a grid to save.
2. Use Excel native formatting features to format the grid.
3. From the Planning Ad Hoc ribbon, select Save Ad Hoc Grid.
4. In the Save Grid As dialog box, select the Submit Formatting option when saving thead hoc grid as a form.
Chapter 17Saving Native Excel Formatting to EPM Cloud
17-27

You can now open the saved form and choose a viewing option as described in Viewing Formatting in Smart View.
Related Topics:
Saving Excel Formatting on a Form
Viewing Formatting in Smart View
Clearing Formatting
Supported Native Excel Formatting
Guidelines for Working with Native Excel Formatting and Forms in EPM Cloud
Supported Native Excel FormattingData source types: Planning, Planning Modules, Financial Consolidation and Close,Tax Reporting
Table 1 summarizes the native Excel formatting supported by forms in Oracle SmartView for Office, and whether the formatting is supported when the form is viewed intheOracle Enterprise Performance Management Cloud web application.
Table 17-3 Supported Native Excel Formatting
Formatting Smart View EPM Cloud
Font Font FontFont family Yes Yes
Font size Yes Yes
Bold Yes Yes
Italic Yes Yes
Strikethrough Yes No
Underline Only single and Continuous No
Text color Red, Green, and Blue Red, Green, and Blue
Background color Plain, Solid, and Red, Green, andBlue
Plain, Red, Green, and Blue
Alignment Alignment AlignmentVertical Top, Center, and Bottom No
Horizontal Left, Center, and Right No
Indent Only Left Indent and five levels ofindent
No
Word wrap Yes No
Borders Borders BordersBorder color Yes, can be set differently for each
cell's four borders, and Red, Green,and Blue
Yes
Border width Yes, in points Yes
Border style None, Solid, double, Dotted, Dash,Dash-Dot, Dash-Dot-Dot
None, Solid
Number and date format Number and date format Number and date format
Chapter 17Saving Native Excel Formatting to EPM Cloud
17-28
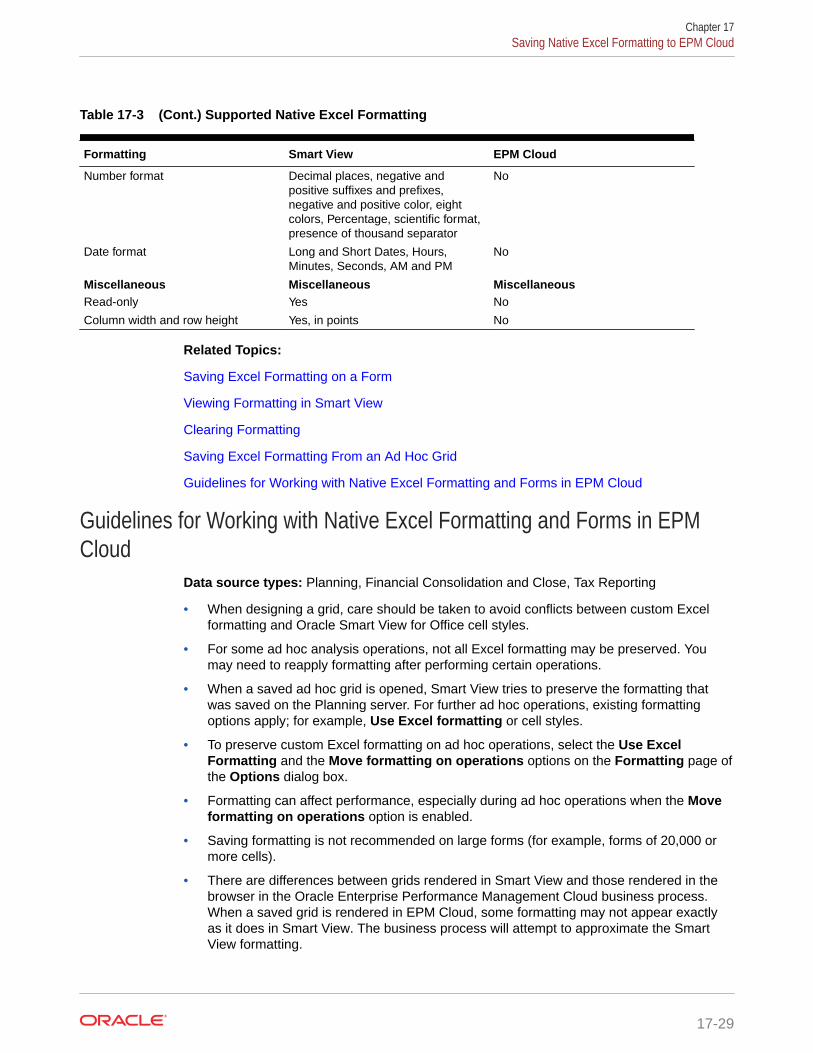
Table 17-3 (Cont.) Supported Native Excel Formatting
Formatting Smart View EPM Cloud
Number format Decimal places, negative andpositive suffixes and prefixes,negative and positive color, eightcolors, Percentage, scientific format,presence of thousand separator
No
Date format Long and Short Dates, Hours,Minutes, Seconds, AM and PM
No
Miscellaneous Miscellaneous MiscellaneousRead-only Yes No
Column width and row height Yes, in points No
Related Topics:
Saving Excel Formatting on a Form
Viewing Formatting in Smart View
Clearing Formatting
Saving Excel Formatting From an Ad Hoc Grid
Guidelines for Working with Native Excel Formatting and Forms in EPM Cloud
Guidelines for Working with Native Excel Formatting and Forms in EPMCloud
Data source types: Planning, Financial Consolidation and Close, Tax Reporting
• When designing a grid, care should be taken to avoid conflicts between custom Excelformatting and Oracle Smart View for Office cell styles.
• For some ad hoc analysis operations, not all Excel formatting may be preserved. Youmay need to reapply formatting after performing certain operations.
• When a saved ad hoc grid is opened, Smart View tries to preserve the formatting thatwas saved on the Planning server. For further ad hoc operations, existing formattingoptions apply; for example, Use Excel formatting or cell styles.
• To preserve custom Excel formatting on ad hoc operations, select the Use ExcelFormatting and the Move formatting on operations options on the Formatting page ofthe Options dialog box.
• Formatting can affect performance, especially during ad hoc operations when the Moveformatting on operations option is enabled.
• Saving formatting is not recommended on large forms (for example, forms of 20,000 ormore cells).
• There are differences between grids rendered in Smart View and those rendered in thebrowser in the Oracle Enterprise Performance Management Cloud business process.When a saved grid is rendered in EPM Cloud, some formatting may not appear exactlyas it does in Smart View. The business process will attempt to approximate the SmartView formatting.
Chapter 17Saving Native Excel Formatting to EPM Cloud
17-29

• The administrator may have defined certain formatting on a form. End users canoverwrite this formatting and save it on the form. It can then be merged with theadministrator's formatting based on the option selected for this form by theadministrator in the EPM Cloud business process. Refer to the EPM Clouddocumentation for more information.
• Save formatting functionality is not supported on composite forms.
• Ad hoc analysis started from a saved grid will inherit the formatting options savedas part of the grid.
To use Smart View Cell Styles or the Use Excel Formatting option for an ad hocgrid generated from a saved grid, complete the following steps:
1. Open the saved grid as a form.
2. In the Planning ribbon, Formatting group, select Apply, and then None.
3. Click Save to save the form back to the EPM Cloud business process.
4. Now use the saved form to perform ad hoc analysis.
• Excel formatting and custom styles are intended for use with static grids. Changesto the grid from the following operations can result in invalid formatting:
– POV
– Suppression options
– Merged cells
– Enabling or clearing the Repeat Member Labels options
– Adding members to the form definition
Supported Native Excel Formatting summarizes the native Excel formatting supportedby forms in Smart View, and whether the formatting is supported when the form isviewed in the web application.
Working with Multiple-Grid Worksheets in EPM CloudIn Oracle Smart View for Office, you can retrieve multiple ad hoc grids on oneworksheet. The grids can all be connected to the same data source, or each grid canbe connected to a different data source.
Related Topics
• About Multiple Grids on a Worksheet
• Creating Multiple-Grid Worksheets with EPM Cloud Sources
• Converting EPM Cloud Single-Grid Worksheets to Multiple-Grid Worksheets
• Renaming Ranges on EPM Cloud Multiple-Grid Worksheets
• Changing Connections in EPM Cloud Multiple-Grid Worksheets
• POV Behavior on EPM Cloud Multiple-Grid Worksheets
About Multiple Grids on a WorksheetData source types: Planning, Planning Modules, Financial Consolidation and Close,Tax Reporting
Chapter 17Working with Multiple-Grid Worksheets in EPM Cloud
17-30
When connected to supported Oracle Enterprise Performance Management Cloud datasources, you can create multiple grids on one worksheet. These grids can be connected tothe same data source or to different EPM Cloud data sources. For example, one grid can beconnected to Planning and another can be connected to Tax Reporting. They can be sourcedfrom cubes or from forms. You can retrieve data in these grids and shift them on theworksheet.
Note:
Administrators: You enable multiple-grid ad hoc for Oracle Smart View for Officeusers by setting the Smart View Ad Hoc Behavior option to Standard in theservice application settings. See the administration documentation for your servicefor more information.
Video
Your Goal Watch This Video
Learn about using multiple ad hoc grids in aworksheet in Smart View. Setting Up Multiple Ad Hoc Grids in Smart
View in Oracle Planning and Budgeting Cloud
The video references Planning as the data source, but the functionality shown is common toall EPM Cloud providers specified above.
Guidelines and Limitations for Multiple-Grid Worksheets
Note the following guidelines and limitations in worksheets that support multiple grids:
• In order to create ad hoc grids from forms, you must have at least the User role. Checkthe role requirements for your individual cloud service.
• You can submit data for only one grid at a time.
If you try to submit data for more than one grid at a time—that is, if you have selected cellranges in more than one grid—the first range returned by Excel will be used to determinethe selected grid and the submit will be performed only on that grid.
• If the member option, Preserve Formulas and Comments in ad hoc operations(except pivot and undo) is selected, you can preserve formulas on the sheet using theUndo option on the right-click Smart View context menu from within the grid. This optionis only supported after a refresh has been performed once formulas are added to thesheet, and for only one undo action. The Undo option on the Smart View ribbon is notenabled for multiple-grid sheets. See Preserving Excel Formulas in Ad Hoc Grids.
• Do not use Microsoft Excel's Name Manager or Name Box to rename named ranges.Instead, use one of the following methods to rename named ranges:
– Use the Rename Range command in the Document Contents pane of the SmartView Panel. See Renaming Ranges on EPM Cloud Multiple-Grid Worksheets
– Use the VBA function, HypModifyRangeGridName, described in the Oracle SmartView for Office Developer's Guide .
• On multiple-connection, multiple grid worksheets, ensure that there is enough spacebetween grids to accommodate pivot and zoom operations on the individual grids,especially if working with large grids.
Chapter 17Working with Multiple-Grid Worksheets in EPM Cloud
17-31

A loss of metadata may occur on sheets with three or more database connectionsand where grids are placed too close together.
• To ensure that you are refreshing the desired range, use the Document Contentspane to first select the range, and then click the Refresh link in the pane. Afterrefresh, select the range again from Document Contents to highlight the updatedrange.
• Smart View does not support mixing Admin Extension grids and ad hoc analysisgrids on a single sheet. When mixing the two grid types on a single sheet, themenu items on the ribbon reflect the last opened grid, regardless of the gridselected in the sheet.
• These items on the Smart View ribbon are disabled:
– Undo
– Redo
Instead, to access the Undo and Redo commands when working with a multiple-grid sheet, ensure that your cursor is in the affected grid. (Use the DocumentContents pane to ensure that you have selected the correct grid.) Then, right-clickand select Smart View from the context menu, and then select Undo or Redo, asrequired.
• These items on the applicable provider ribbon are disabled:
– Pivot to POV
– POV
– Preserve Format
– Smart Slice
– Save Ad Hoc Grid
– Save As Smart Form
– Insert Attributes
– Grid Spread
– Mass Allocate
– More
– Approvals
– Copy Version
– Run Report
– Data Filter
Creating Multiple-Grid Worksheets with EPM Cloud SourcesData source types: Planning, Planning Modules, Financial Consolidation and Close,Tax Reporting
To create a multiple-grid worksheet:
1. In Excel, connect to an Oracle Enterprise Performance Management Cloud datasource.
2. From any location in the worksheet, select a range of cells.
Chapter 17Working with Multiple-Grid Worksheets in EPM Cloud
17-32

You must select a range rather than only one cell.
3. From the Smart View Panel, perform an action:
• Right-click a cube, and select Connect. Right click the cube again, and select Adhoc analysis.
• Right-click a form, and select Ad hoc analysis.
You cannot use composite forms or dashboards as sources for ad hoc grids.
4. Select Yes at the prompt asking to change the worksheet to support multiple grids.
Note:
If you started with an ordinary single-grid worksheet, and want to add othergrids to the sheet, see Converting EPM Cloud Single-Grid Worksheets toMultiple-Grid Worksheets.
5. To create another grid on the worksheet:
a. Select a different range of cells.
b. From the Smart View Panel, right click a cube or a form, and then select Ad hocanalysis.
6. Repeat step 5 as you require to add grids to the worksheet.
Converting EPM Cloud Single-Grid Worksheets to Multiple-GridWorksheets
Data source types: Planning, Planning Modules, Financial Consolidation and Close, TaxReporting
To convert an existing Oracle Enterprise Performance Management Cloud single-grid ad hocworksheet to a worksheet that supports multiple grids:
1. From any location in the worksheet, outside of the existing grid, select a range of cells.
You must select a range rather than only one cell.
2. From the Smart View Panel, right-click a cube or a form, and then select Ad hocanalysis.
The sheet already contained a grid, so the following dialog is displayed:
Chapter 17Working with Multiple-Grid Worksheets in EPM Cloud
17-33
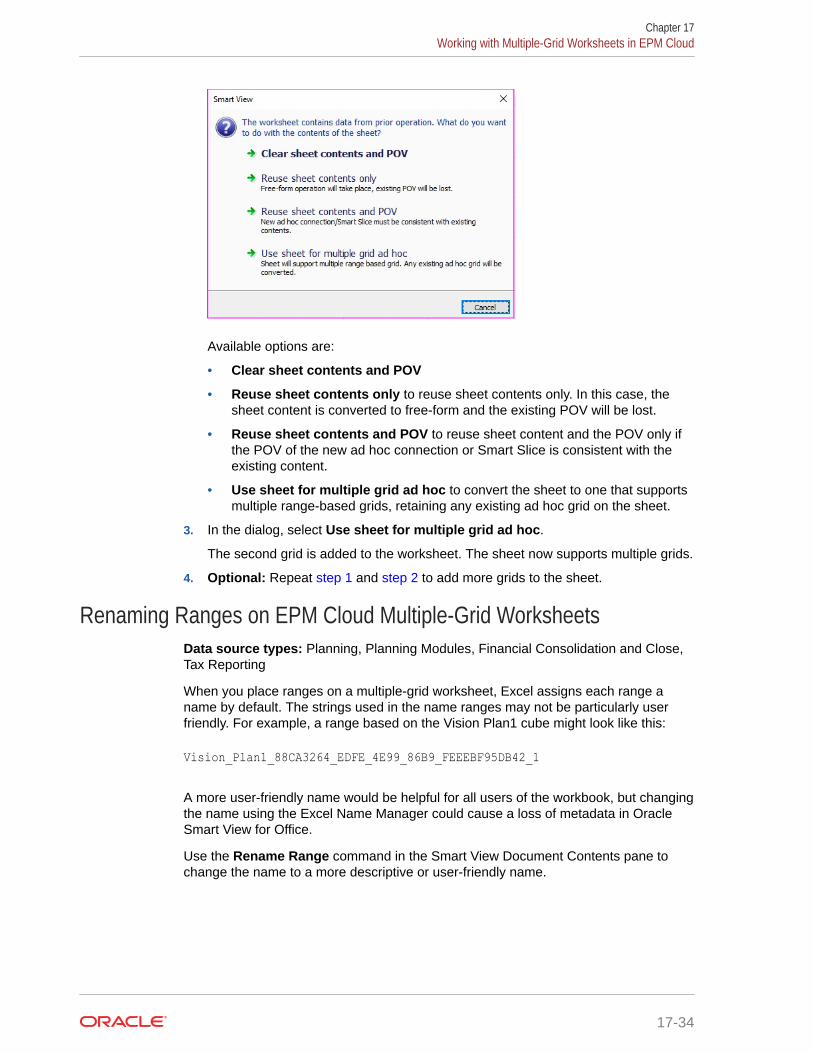
Available options are:
• Clear sheet contents and POV
• Reuse sheet contents only to reuse sheet contents only. In this case, thesheet content is converted to free-form and the existing POV will be lost.
• Reuse sheet contents and POV to reuse sheet content and the POV only ifthe POV of the new ad hoc connection or Smart Slice is consistent with theexisting content.
• Use sheet for multiple grid ad hoc to convert the sheet to one that supportsmultiple range-based grids, retaining any existing ad hoc grid on the sheet.
3. In the dialog, select Use sheet for multiple grid ad hoc.
The second grid is added to the worksheet. The sheet now supports multiple grids.
4. Optional: Repeat step 1 and step 2 to add more grids to the sheet.
Renaming Ranges on EPM Cloud Multiple-Grid WorksheetsData source types: Planning, Planning Modules, Financial Consolidation and Close,Tax Reporting
When you place ranges on a multiple-grid worksheet, Excel assigns each range aname by default. The strings used in the name ranges may not be particularly userfriendly. For example, a range based on the Vision Plan1 cube might look like this:
Vision_Plan1_88CA3264_EDFE_4E99_86B9_FEEEBF95DB42_1
A more user-friendly name would be helpful for all users of the workbook, but changingthe name using the Excel Name Manager could cause a loss of metadata in OracleSmart View for Office.
Use the Rename Range command in the Smart View Document Contents pane tochange the name to a more descriptive or user-friendly name.
Chapter 17Working with Multiple-Grid Worksheets in EPM Cloud
17-34
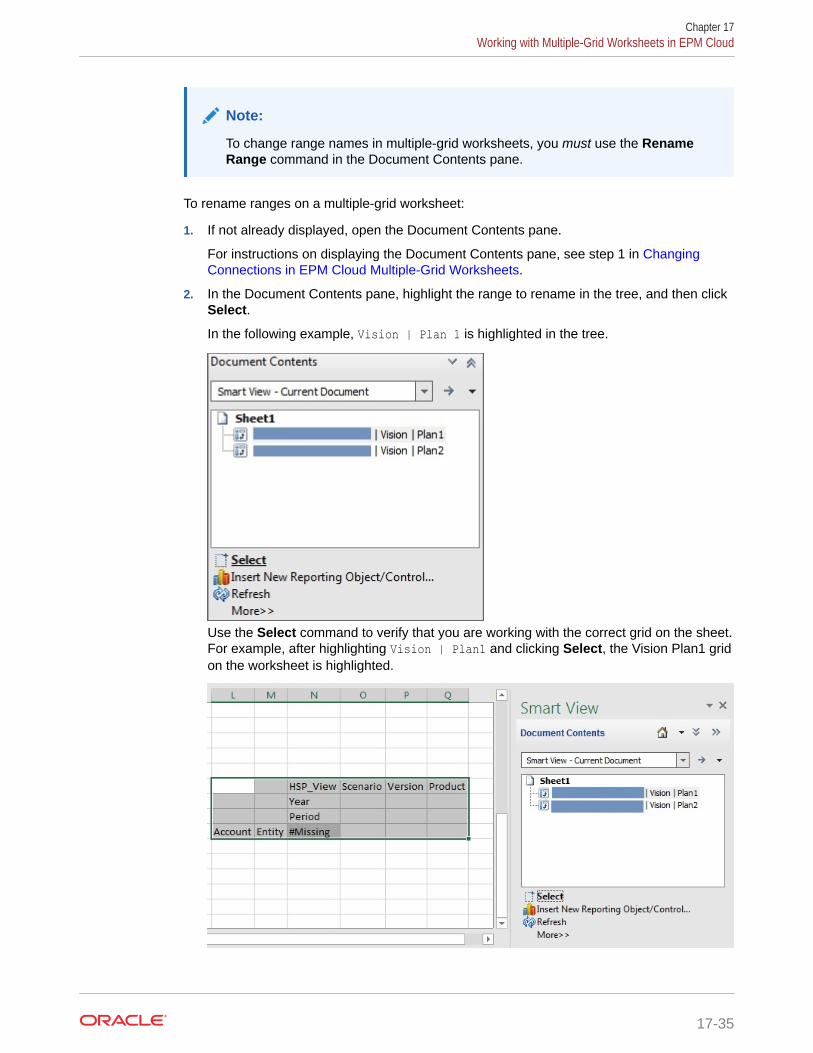
Note:
To change range names in multiple-grid worksheets, you must use the RenameRange command in the Document Contents pane.
To rename ranges on a multiple-grid worksheet:
1. If not already displayed, open the Document Contents pane.
For instructions on displaying the Document Contents pane, see step 1 in ChangingConnections in EPM Cloud Multiple-Grid Worksheets.
2. In the Document Contents pane, highlight the range to rename in the tree, and then clickSelect.
In the following example, Vision | Plan 1 is highlighted in the tree.
Use the Select command to verify that you are working with the correct grid on the sheet.For example, after highlighting Vision | Plan1 and clicking Select, the Vision Plan1 gridon the worksheet is highlighted.
Chapter 17Working with Multiple-Grid Worksheets in EPM Cloud
17-35

3. In the Action Panel, click More, and then select Rename Range.
The Rename Range dialog box is displayed, showing the default name that wasassigned to the range by Excel.
4. In Rename Range, type a new range name, and then click OK.
We're renaming the range MyVisionPlan1Grid.
5. Verify that the range name is changed in the Name Manager in Excel.
Here is an example Name Manager, accessed from the Formula ribbon in Excel:
Chapter 17Working with Multiple-Grid Worksheets in EPM Cloud
17-36

You can also view the changed range name in the Excel Name Box drop-down list.
Changing Connections in EPM Cloud Multiple-Grid WorksheetsData source types: Planning, Planning Modules, Financial Consolidation and Close, TaxReporting
From the Document Contents pane, you can change connections for individual grids within amultiple-grid worksheet. This is useful when sharing a workbook between departments thatpoint to different servers or when moving from a test to a production environment.
You can change the connection properties for all entities in a workbook that share the sameconnection information (for example, all worksheets or grids that point to the same applicationand cube on a particular service). Or you can change the connection information sheet bysheet. To do this, see Modifying Connections within an Office Document.
Use this topic to change connections properties on multiple-grid worksheets grid by grid.
To modify connections of a grid in a multiple-grid worksheet:
1. If not already displayed, open the Document Contents pane.
Chapter 17Working with Multiple-Grid Worksheets in EPM Cloud
17-37

To open the Document Contents pane:
a. In the Smart View Panel, click the arrow next to , and select DocumentContents.
The Document Contents pane is displayed in the area of the Smart ViewPanel
b. To display both the library pane and the Document Contents pane in the Smart
View Panel, click , located at the top of the panel next to .
Chapter 17Working with Multiple-Grid Worksheets in EPM Cloud
17-38
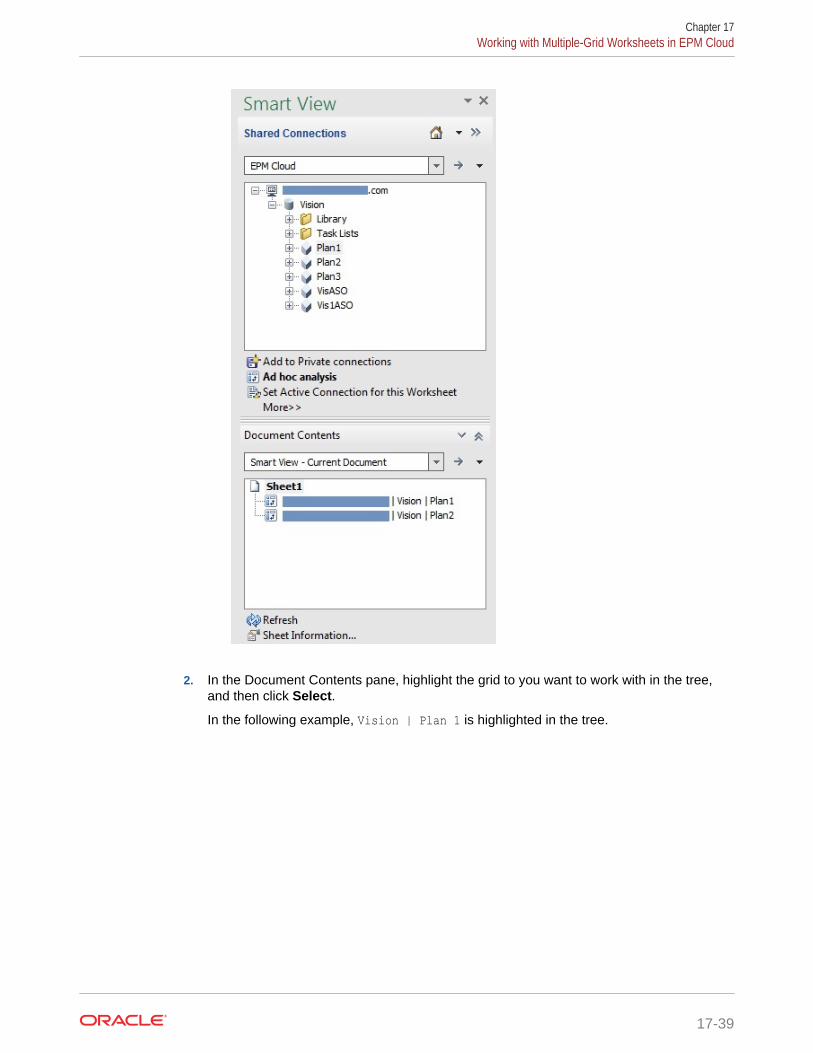
2. In the Document Contents pane, highlight the grid to you want to work with in the tree,and then click Select.
In the following example, Vision | Plan 1 is highlighted in the tree.
Chapter 17Working with Multiple-Grid Worksheets in EPM Cloud
17-39

Use the Select command to verify that you are working with the correct grid on thesheet. For example, after highlighting Vision | Plan1 and clicking Select, theVision Plan1 grid on the worksheet is highlighted.
3. In the Action Panel, click More, and then select the Modify Connection.
Alternatively, right-click a connection name or sheet name and select ModifyConnection.
The Edit Connection - URL page of the wizard is displayed.
4. In the URL drop-down list, select an existing connection or enter a new connectionURL, using private connection syntax.
5. Click Next and in Edit Connection - Application/Cube, expand Servers, andnavigate to the application and database to which you want to connect, dependingupon the provider requirements.
Alternatively, select the Advanced Setup check box and manually enter theinformation for Server (your service URL), Application, and Cube/Database, asthe provider requires.
For example, Figure 1 shows the entries for connecting to an Oracle Essbaseapplication and cube.
Chapter 17Working with Multiple-Grid Worksheets in EPM Cloud
17-40

Figure 17-3 Edit Connection - Application/Cube Advanced Setup
6. Click Finish.
7. In the Action Panel, click Refresh.
8. Repeat this procedure to modify the connection information for any other grids in theworkbook.
9. To save the modified connection information, save the workbook.
The modified connection information is saved when you save the workbook.
POV Behavior on EPM Cloud Multiple-Grid WorksheetsData source types: Planning, Planning Modules, Financial Consolidation and Close, TaxReporting
The POV button is enabled for multiple-grid worksheets that contain only one grid, making itpossible for you to toggle the button to show or hide the POV toolbar. The POV buttonremains disabled on multiple-grid worksheets that contain more than one grid.
On multiple-grid worksheets that contain one grid, the POV dimensions are displayed both inthe grid and in the toolbar. On regular ad hoc worksheets, POV dimensions are displayed inthe grid only if the POV toolbar is hidden.
Smart View Behavior Options in EPM CloudYour administrator can set options in the web interface that affect Oracle Smart View forOffice behavior.
Data source types: Planning, Planning Modules, Financial Consolidation and Close, TaxReporting
The options that affect Smart View behavior are:
• Suppression Mode
• Smart View Ad Hoc Behavior
Chapter 17Smart View Behavior Options in EPM Cloud
17-41

See the administratration documentation for your business process for instructions onsetting these options. For example, for Planning, see What Application and SystemSettings Can I Specify?
Additionally, review the information in these topics:
• Smart View Ad Hoc Behavior Setting and Saved Ad Hoc Grids
• Smart View Ad Hoc Behavior Setting and Non-Admin Access to Valid Members
• Smart View Ad Hoc Behavior Setting and Member Selection
• Smart View Ad Hoc Behavior Setting and Row/Column Suppression Options
• Smart View Ad Hoc Behavior Setting and Additional Zoom In Options
• Smart View Ad Hoc Behavior Setting and Multiple-cell Select for Ad HocOperations
Suppression Mode
The Suppression Mode application setting works with the suppression options for NoData/Missing and Zero in Smart View. In the web application, your administrator canuse the Suppression Mode setting to change suppression behavior.
In the Smart View Options dialog, Data Options tab, you select the No Data/Missingand Zero options for Suppress Rows, Suppress Columns, or both. The settings youmake in Smart View then work with the setting in your web application.
The Suppression Mode options in the web application and their effect inSmart Vieware:
• Suppress Missing values only—In the web application, the administratorenables this option to suppress rows, or columns, or both that contain No Data/Missing.
Suppress Missing values only—In the web application, the administratorenables this option to suppress rows, or columns, or both that contain No Data/Missing.
For example, in Smart View, if the No Data/Missing option for rows is selected,and a row contains only Missing data, then the row is suppressed; it is notdisplayed. If both the No Data/Missing and Zero suppression options are selectedin Smart View for rows, and a row contains both zeroes and Missing data, then therow is displayed; it is not suppressed.
The Suppress Missing values only option was formerly referred to as "Legacy."
• Suppress Missing also Suppresses Zero—In the web application, theadministrator enables this option to suppress rows, or columns, or both thatcontain all No Data/Missing or all Zeros, or a combination of both.
In Smart View, you must enable the No Data/Missing and Zero options forSuppress Rows, Suppress Columns, or both to see the result in an ad hoc grid.
For example, in Smart View, if both the No Data/Missing and Zero suppressionoptions are selected for columns, and a column contains both zeroes and Missinglabels, then the column is suppressed; it is not displayed. Columns that containonly zeroes, and columns that contain only Missing labels are also suppressed;they are not displayed.
The Suppress Missing also Suppresses Zero option was formerly referred to as"Standard."
Chapter 17Smart View Behavior Options in EPM Cloud
17-42

See Data Options for general information on the suppression options available in Smart View.
Smart View Ad Hoc Behavior
In 21.08+, all new applications and all recreated applications use only the Standard settingfor the Smart View Ad Hoc Behavior option. In these cases, the Smart View Ad HocBehavior option is not selectable.
Note:
Existing and migrated applications will not experience any change in behavior, andNative will remain as the default Smart View Ad Hoc Behavior setting, withStandard being an option.
The Native mode Smart View Ad Hoc Behavior setting will eventually be phasedout (timeline is yet to be determined). If you are using the Native mode option,Oracle recommends that you plan on switching your Smart View Ad Hoc Behaviorapplication setting to Standard mode.
Standard mode applications give you these ad hoc features and behaviors:
• In-grid POV—POV members are placed on the POV row (usually the first row) of the gridinstead of in the POV toolbar.
See Selecting Members Using the Cell-Based POV.
• Submit Data—Using the default Submit Data button in the Smart View ribbon, all cells ina grid are submitted, including Smart List values, Text values, and all data cells that havebeen explicitly modified (made dirty). Once the submit operation is complete, the entiregrid will be refreshed.
If the grid is not in a refreshed state, then Smart View will attempt to perform a submitdata without refresh operation.
See Submitting Data Without Refreshing.
• Free-form support—Supports empty columns and rows anywhere in a grid and changingthe alias table. Additionally, supports member auto-refresh where deleted members arereturned to the grid upon refresh.
See Free-Form Mode.
• Saving ad hoc grids—The Save Ad Hoc Grid command is enabled and you can save adhoc grids; however, the Submit Formatting option is not yet available.
See Saving Ad Hoc Grids and Smart View Ad Hoc Behavior Setting and Saved Ad HocGrids.
• Multiple-grid ad hoc—Supports multiple ad hoc grids on the same Excel worksheet. Withmultiple-grid ad hoc, you can submit data from any grid on the sheet. Grids based onaggregate storage cubes and block storage cubes are supported on the same sheet.Each grid is independent; for example, if required, you can change the alias table for onlyone grid on the sheet.
See Working with Multiple-Grid Worksheets in EPM Cloud.
• Additional Zoom In options—Supports these additional Zoom In options: Sibling Level,Same Level, and Same Generation.
Chapter 17Smart View Behavior Options in EPM Cloud
17-43

See Smart View Ad Hoc Behavior Setting and Additional Zoom In Options.
• Multiple-cell select for ad hoc operations—Supports multiple-cell selection forthese ad hoc operations: Zoom In, Zoom Out, Keep Only, and Remove Only.
See Smart View Ad Hoc Behavior Setting and Multiple-cell Select for Ad HocOperations.
When the Ad Hoc Behavior option is set to Standard, the following features andfunctionality are not supported:
• Create Smart Forms
• Open a native mode grid in standard mode; open a standard mode grid in nativemode (see Smart View Ad Hoc Behavior Setting and Saved Ad Hoc Grids)
• HSACTIVE is supported on multiple-grid sheets only when using a privateconnection; HSACTIVE on a multiple-grid sheet using a shared connection is notsupported
• Zoom In on Formulas
• Preserve Formula is disabled in multiple-grid sheets
In existing and migrated web applications, your administrator can choose to enableenhanced ad hoc features and behaviors. The Smart View Ad Hoc Behavior optionsare:
• Native—Does not enable enhanced ad hoc features.
• Standard—Enables enhanced ad hoc features.
Smart View Ad Hoc Behavior Setting and Saved Ad Hoc Grids
The Smart View Ad Hoc Behavior option setting for your application affects whichsaved ad hoc grids users can open and work with.
When administrators switch the Smart View Ad Hoc Behavior option setting betweenNative and Standard, ad hoc grids built and saved in one mode can be opened withlimitations noted in the following table.
Smart View Ad HocBehavior Mode Created andSaved In
Smart View Ad HocBehavior Mode Opened andRefreshed In
Supported
Standard Standard YesStandard Native NoNative Standard YesNative Native Yes
For example:
• When the Smart View Ad Hoc Behavior option is set to Standard, users canopen and refresh saved ad hoc grids that were created while the service was setto Standard or Native.
• When the Smart View Ad Hoc Behavior option is set to Native, users can onlyopen and refresh saved ad hoc grids that were created while the service was setto Native.
Users attempting to open and refresh a grid that was created while the SmartView Ad Hoc Behavior option was set to Standard will see an error message. To
Chapter 17Smart View Behavior Options in EPM Cloud
17-44
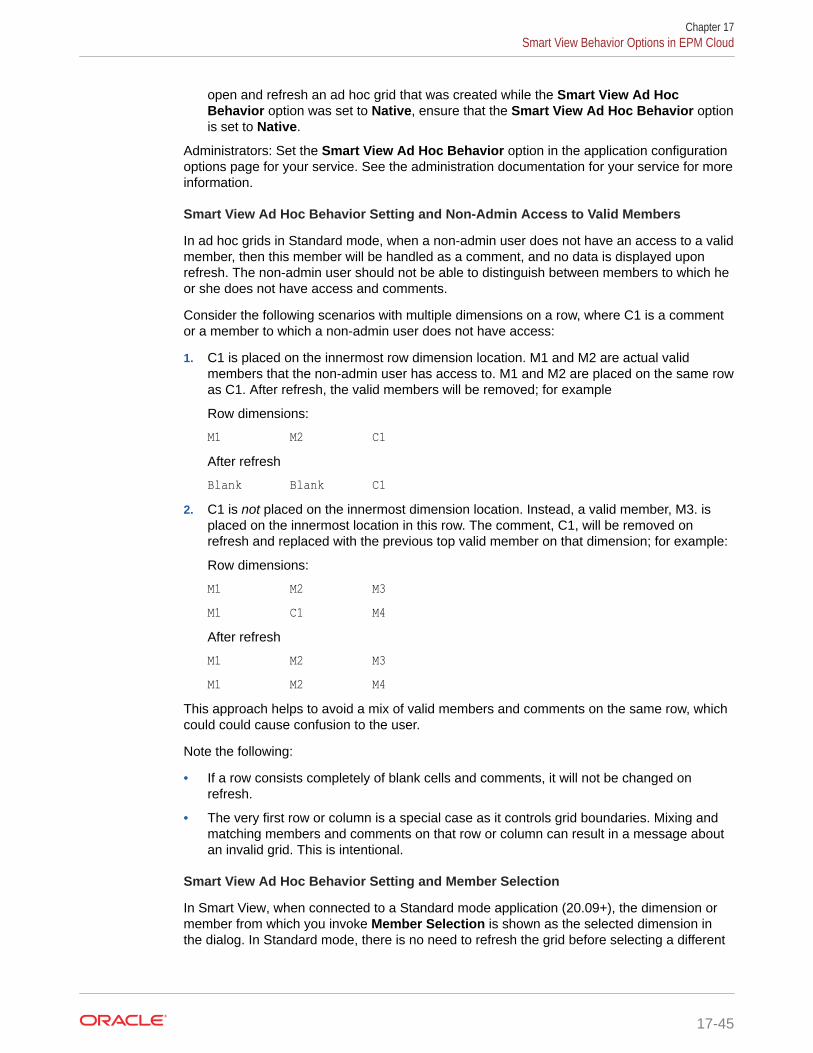
open and refresh an ad hoc grid that was created while the Smart View Ad HocBehavior option was set to Native, ensure that the Smart View Ad Hoc Behavior optionis set to Native.
Administrators: Set the Smart View Ad Hoc Behavior option in the application configurationoptions page for your service. See the administration documentation for your service for moreinformation.
Smart View Ad Hoc Behavior Setting and Non-Admin Access to Valid Members
In ad hoc grids in Standard mode, when a non-admin user does not have an access to a validmember, then this member will be handled as a comment, and no data is displayed uponrefresh. The non-admin user should not be able to distinguish between members to which heor she does not have access and comments.
Consider the following scenarios with multiple dimensions on a row, where C1 is a commentor a member to which a non-admin user does not have access:
1. C1 is placed on the innermost row dimension location. M1 and M2 are actual validmembers that the non-admin user has access to. M1 and M2 are placed on the same rowas C1. After refresh, the valid members will be removed; for example
Row dimensions:
M1 M2 C1After refresh
Blank Blank C12. C1 is not placed on the innermost dimension location. Instead, a valid member, M3. is
placed on the innermost location in this row. The comment, C1, will be removed onrefresh and replaced with the previous top valid member on that dimension; for example:
Row dimensions:
M1 M2 M3M1 C1 M4After refresh
M1 M2 M3M1 M2 M4
This approach helps to avoid a mix of valid members and comments on the same row, whichcould could cause confusion to the user.
Note the following:
• If a row consists completely of blank cells and comments, it will not be changed onrefresh.
• The very first row or column is a special case as it controls grid boundaries. Mixing andmatching members and comments on that row or column can result in a message aboutan invalid grid. This is intentional.
Smart View Ad Hoc Behavior Setting and Member Selection
In Smart View, when connected to a Standard mode application (20.09+), the dimension ormember from which you invoke Member Selection is shown as the selected dimension inthe dialog. In Standard mode, there is no need to refresh the grid before selecting a different
Chapter 17Smart View Behavior Options in EPM Cloud
17-45
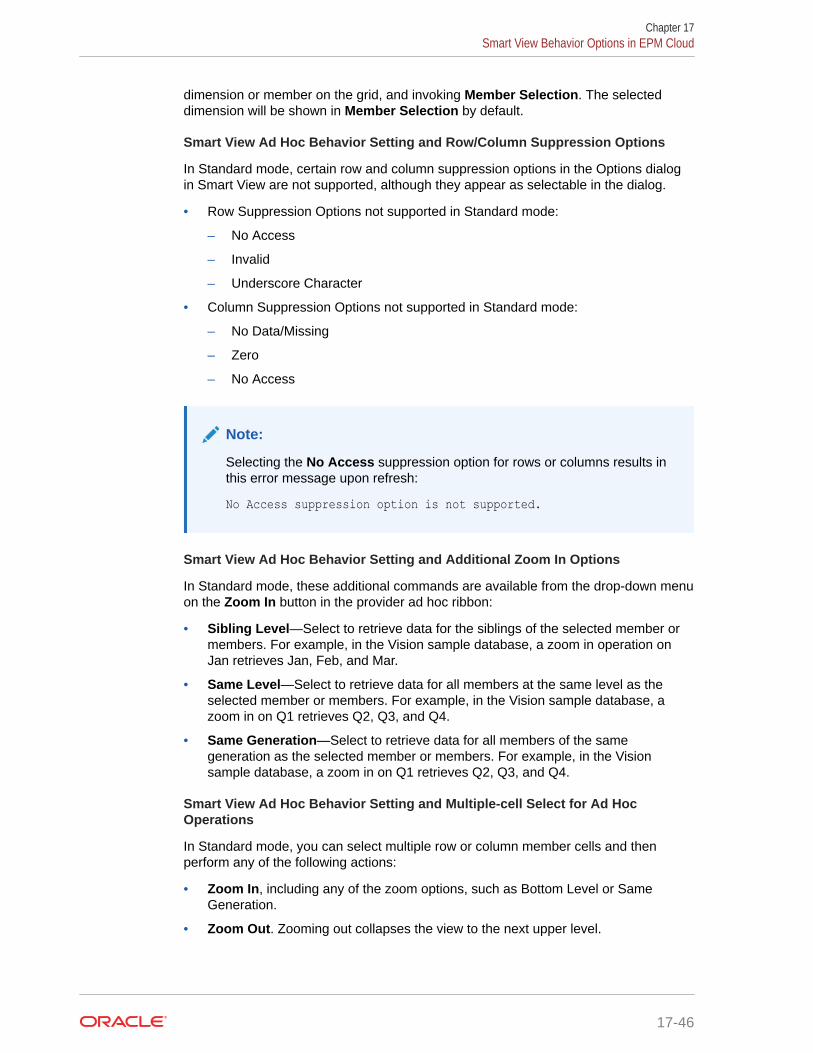
dimension or member on the grid, and invoking Member Selection. The selecteddimension will be shown in Member Selection by default.
Smart View Ad Hoc Behavior Setting and Row/Column Suppression Options
In Standard mode, certain row and column suppression options in the Options dialogin Smart View are not supported, although they appear as selectable in the dialog.
• Row Suppression Options not supported in Standard mode:
– No Access
– Invalid
– Underscore Character
• Column Suppression Options not supported in Standard mode:
– No Data/Missing
– Zero
– No Access
Note:
Selecting the No Access suppression option for rows or columns results inthis error message upon refresh:
No Access suppression option is not supported.
Smart View Ad Hoc Behavior Setting and Additional Zoom In Options
In Standard mode, these additional commands are available from the drop-down menuon the Zoom In button in the provider ad hoc ribbon:
• Sibling Level—Select to retrieve data for the siblings of the selected member ormembers. For example, in the Vision sample database, a zoom in operation onJan retrieves Jan, Feb, and Mar.
• Same Level—Select to retrieve data for all members at the same level as theselected member or members. For example, in the Vision sample database, azoom in on Q1 retrieves Q2, Q3, and Q4.
• Same Generation—Select to retrieve data for all members of the samegeneration as the selected member or members. For example, in the Visionsample database, a zoom in on Q1 retrieves Q2, Q3, and Q4.
Smart View Ad Hoc Behavior Setting and Multiple-cell Select for Ad HocOperations
In Standard mode, you can select multiple row or column member cells and thenperform any of the following actions:
• Zoom In, including any of the zoom options, such as Bottom Level or SameGeneration.
• Zoom Out. Zooming out collapses the view to the next upper level.
Chapter 17Smart View Behavior Options in EPM Cloud
17-46

• Keep Only and Remove Only. Note that the integrity and validity of the grid must bemaintained. If your selections cause an issue with the grid, Smart View display a warningmessage informing you of the issue, and no change is made to the grid.
Chapter 17Smart View Behavior Options in EPM Cloud
17-47
18Smart View and Profitability and CostManagement
Related Topics
• About Smart View and Profitability and Cost ManagementTo maximize profitability, a business must be able to accurately measure, allocate, andmanage costs and revenue.
• Running the Smart View InstallerBefore running the Oracle Smart View for Office installer, review the Smart Viewprerequisites.
• Creating Data Source Connections to Profitability and Cost ManagementAfter you install Oracle Smart View for Office, you can create connections to Profitabilityand Cost Management.
About Smart View and Profitability and Cost ManagementTo maximize profitability, a business must be able to accurately measure, allocate, andmanage costs and revenue.
Profitability and Cost Management is an analytic software tool that manages the cost andrevenue allocations that are necessary to compute profitability for a business segment, suchas a product, customer, region, or branch. Profitability and Cost Management enables you touse cost decomposition, consumption-based costing and scenario-playing to measureprofitability for effective planning and decision support.
Use the topics in this chapter to install and connect to Profitability and Cost Management:
• Running the Smart View Installer
• Creating Data Source Connections to Profitability and Cost Management
Then you are ready to begin working with data in Profitability and Cost Management.Information on using Oracle Smart View for Office with Profitability and Cost Management iscontained throughout this guide:
• Dimensions and Members
• Data and Data Cells
• Ad Hoc Analysis
• General Operations
• Smart Query
• Smart Slices
• The Query Designer and MDX Queries
• Smart View Options
• Functions
18-1

• Free-Form Mode
• Smart View Diagnostics and Health Check
Running the Smart View InstallerBefore running the Oracle Smart View for Office installer, review the Smart Viewprerequisites.
Smart View Prerequisites
• The latest release of Smart View
On the Oracle Technology Network, Downloads tab, the latest release for SmartView is always certified.
• Microsoft Office
• Microsoft .NET Framework
Installing Smart View
1. Start Profitability and Cost Management in a web browser, and log in with youruser name and password.
2. In the upper-right corner of the Profitability and Cost Management web interface,select the arrow next to your user name to display the user menu.
3. From the user menu, select Downloads, and then select Smart View.
4. In Downloads, under Smart View, click Download From Oracle TechnologyNetwork.
Chapter 18Running the Smart View Installer
18-2

5. On the Smart View download page on Oracle Technology Network, click Accept LicenseAgreement, and then click Download Now.
If the Oracle sign-in page is displayed, then sign in with your Oracle user name (usuallyyour email address) and password.
6. Follow the steps for your browser to download the .zip file, and save it to a folder on yourcomputer.
7. Go to the folder that you used in the previous step, and then double click smartview.exeto start the installation wizard.
8. Select a destination folder for Smart View, and then click OK.
For new installations, Smart View is installed by default in: C:\Oracle\smartview. If youare upgrading an installation of Smart View, then the installer defaults to the folder whereyou previously installed Smart View.
9. When the installation is complete, click OK.
Continue the setup process with Creating Data Source Connections to Profitability and CostManagement.
Creating Data Source Connections to Profitability and CostManagement
After you install Oracle Smart View for Office, you can create connections to Profitability andCost Management.
Connections require information about the server and port. Your cloud service administratorshould provide you with the information you need to create the connection. Use the quickconnection method to create a private connection to the cloud service.
To create a private connection using the quick connection method:
1. In Excel, select the Smart View ribbon, and then click Panel.
Chapter 18Creating Data Source Connections to Profitability and Cost Management
18-3
2. On the Smart View Panel, Private Connections.
3. Still in the Smart View Panel, in the text box, enter the URL for the data source towhich you want to connect.
The URL syntax:
https://serviceURL/aps/smartview
4. Click Go, or press Enter.
5. On the login window, enter your login credentials, and then select a data sourcefrom the drop-down menu.
You can now begin working with data in Profitability and Cost Management. See thefunctional areas listed in About Smart View and Profitability and Cost Management formore information.
Chapter 18Creating Data Source Connections to Profitability and Cost Management
18-4

19Smart View and Reporting and Analysis
Related Topics
• About Importing Reporting and Analysis DocumentsUsing Oracle Smart View for Office, you can import Oracle Hyperion Reporting andAnalysis documents into Microsoft Excel, Word, and PowerPoint.
• Editing and Refreshing DocumentsThe Smart View ribbon provides several edit and refresh options.
• Refreshing Reporting and Analysis DocumentsRefreshing updates the report with the latest data.
• Financial Reporting and Web Analysis Import FormatsYou can import Oracle Hyperion Financial Reporting and Oracle Hyperion Web Analysisdocuments as fully-formatted or query-ready HTML.
• Importing Interactive Reporting DocumentsYou can import Oracle Hyperion Interactive Reporting into Excel, Word, and PowerPoint.
• Importing Financial Reporting DocumentsYou can import Oracle Hyperion Financial Reporting documents into Excel, Word, andPowerPoint.
• Exporting Financial Reporting Reports
• Importing Production Reporting DocumentsYou can import Oracle Hyperion SQR Production Reporting documents into Excel, Word,and PowerPoint.
• Importing Web Analysis DocumentsAll Oracle Hyperion Web Analysis data objects (spreadsheets, charts, and pinboards) areimported as Excel spreadsheets.
About Importing Reporting and Analysis DocumentsUsing Oracle Smart View for Office, you can import Oracle Hyperion Reporting and Analysisdocuments into Microsoft Excel, Word, and PowerPoint.
Note:
In this chapter:
• References to Oracle Hyperion Financial Reporting apply to the OracleEnterprise Performance Management Cloud and Oracle Hyperion EnterprisePerformance Management Workspace versions of Financial Reporting.
• References to EPM Cloud apply to these services: Planning, Planning Modules,Financial Consolidation and Close, and Tax Reporting.
19-1
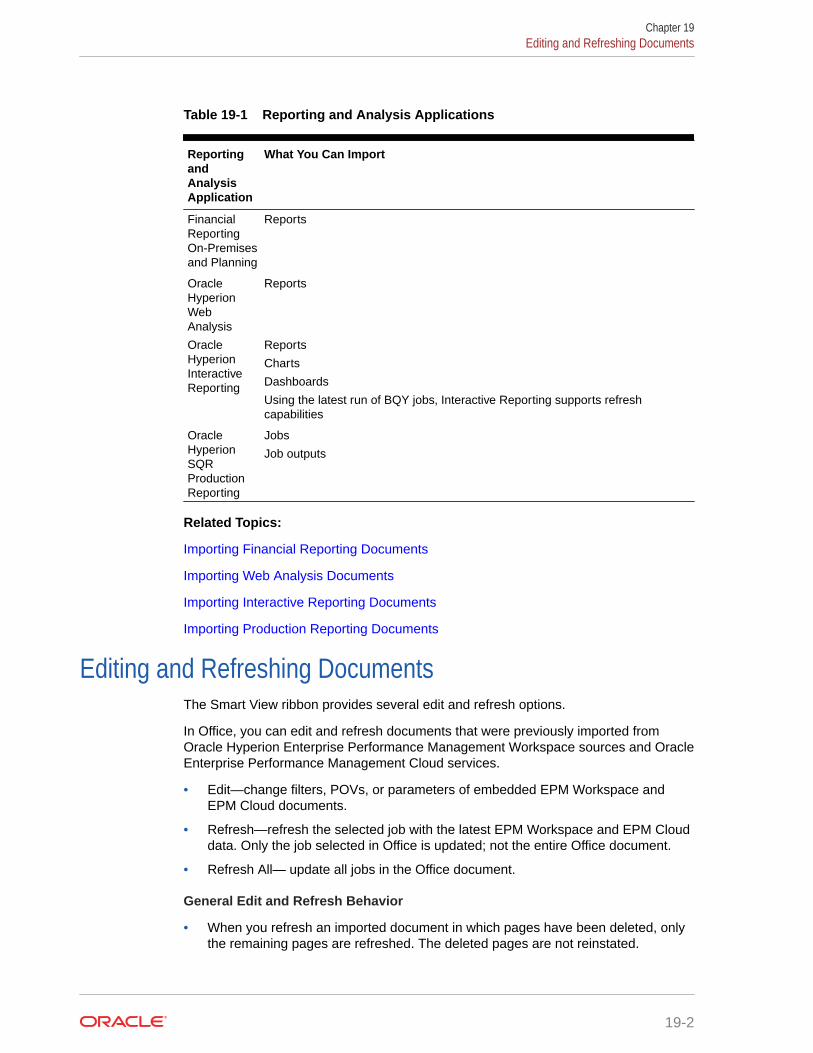
Table 19-1 Reporting and Analysis Applications
ReportingandAnalysisApplication
What You Can Import
FinancialReportingOn-Premisesand Planning
Reports
OracleHyperionWebAnalysis
Reports
OracleHyperionInteractiveReporting
Reports
Charts
Dashboards
Using the latest run of BQY jobs, Interactive Reporting supports refreshcapabilities
OracleHyperionSQRProductionReporting
Jobs
Job outputs
Related Topics:
Importing Financial Reporting Documents
Importing Web Analysis Documents
Importing Interactive Reporting Documents
Importing Production Reporting Documents
Editing and Refreshing DocumentsThe Smart View ribbon provides several edit and refresh options.
In Office, you can edit and refresh documents that were previously imported fromOracle Hyperion Enterprise Performance Management Workspace sources and OracleEnterprise Performance Management Cloud services.
• Edit—change filters, POVs, or parameters of embedded EPM Workspace andEPM Cloud documents.
• Refresh—refresh the selected job with the latest EPM Workspace and EPM Clouddata. Only the job selected in Office is updated; not the entire Office document.
• Refresh All— update all jobs in the Office document.
General Edit and Refresh Behavior
• When you refresh an imported document in which pages have been deleted, onlythe remaining pages are refreshed. The deleted pages are not reinstated.
Chapter 19Editing and Refreshing Documents
19-2
• If editing or refreshing results in fewer pages in an imported document, the removedpages display as blanks pages in Office.
• If editing or refreshing results in more pages in an imported document, those pages areappended to the document in Office.
• Formatting headings and comments are retained when you refresh in Word andPowerPoint but not when you refresh in Excel.
Maintaining Cell References During Document Refresh
In Excel, a customized worksheet that references imported document cells or ranges isupdated when you execute a Refresh All on the imported documents. For example, importedworksheet A and B are referenced in customized worksheet C. When you execute RefreshAll on worksheet A and B, worksheet C is refreshed with updated data from worksheets Aand B.
Refreshing Reporting and Analysis DocumentsRefreshing updates the report with the latest data.
Note:
In this topic, references to Oracle Hyperion Financial Reporting apply to both theon-premises and Oracle Enterprise Performance Management Cloud versions ofFinancial Reporting.
Refresh Behaviors in Production Reporting and Interactive Reporting
• In Word, if a report is selected, the entire report is refreshed. If no report is selected, thefirst report found in the document is refreshed. The first report is not necessarily thereport at the beginning of the document.
• In PowerPoint, if no report is selected, the first report found in the slide is updated.
When refreshing job outputs in Oracle Hyperion SQR Production Reporting, new outputs inOracle Hyperion Enterprise Performance Management Workspace are updated.
Refresh Behaviors in Financial Reporting and Web Analysis
• You must select a page in the report to refresh. In Word and PowerPoint, if you do notselect any pages when refreshing, a message is displaying stating that no pages areupdated.
• If you select Refresh, all pages of the report are refreshed. If you select Refresh All, thenall reports in the document are refreshed.
• An "Invalid Pointer" error results during login when the data source connection has timedout and you attempt to refresh a previously-saved report that contains a function grid. Toworkaround this, close the workbook and Excel. Then, restart Excel, open the workbook,and perform the refresh.
Chapter 19Refreshing Reporting and Analysis Documents
19-3

Refreshing Reporting and Analysis Documents Against Essbase or FinancialManagement Connections
Note:
This applies to Financial Reporting and Oracle Hyperion Web Analysisreports imported into query-ready HTML.
Refreshing against Oracle Essbase or Oracle Hyperion Financial Managementconnections updates the report with the latest data from the provider and enables youto perform ad hoc analysis on the Oracle Hyperion Reporting and Analysis document,such as retrieving, zooming, or pivoting data.
Perform a Refresh on an imported report before you begin working on it in query-ready mode to ensure that the report and the POV are in sync.
Refresh for a report imported in query-ready HTML applies to the current page and notall pages.
Related Topics
Editing Interactive Reporting Documents
Editing Financial Reporting Documents
Editing Production Reporting Jobs
Editing Web Analysis Documents
Financial Reporting and Web Analysis Import FormatsYou can import Oracle Hyperion Financial Reporting and Oracle Hyperion WebAnalysis documents as fully-formatted or query-ready HTML.
Note:
In this topic, references to Financial Reporting apply to both the on-premisesand Planning versions of Financial Reporting.
You can display fully-formatted HTML in Excel. Query-ready HTML enables you toconnect to Oracle Hyperion Financial Management or Oracle Essbase data sourcesand run queries.
Perform a Refresh on an imported report before you begin working on it in query-ready mode to ensure that the report and the POV are in sync.
When you import Oracle Hyperion Reporting and Analysis documents as query-readyHTML, the selected pages of the current data object are converted to HTML, andOracle Smart View for Office-specific formatting is removed. Thus, Smart View can re-query the data source independent of the Web application.
Chapter 19Financial Reporting and Web Analysis Import Formats
19-4

When you import Reporting and Analysis documents as fully formatted HTML, the selectedpages of the current data object are converted to HTML, and Smart View formattingdefinitions and calculated members are retained. Thus, Smart View cannot directly query thedata source, but Smart View content can be leveraged by Microsoft Office applications.
Tip:
After importing an image in Word or PowerPoint, use the Office Format Pictureoption to format it; for example, to crop and resize. The Format Picture settings arepreserved, even after you refresh the image.
Importing Interactive Reporting DocumentsYou can import Oracle Hyperion Interactive Reporting into Excel, Word, and PowerPoint.
Related Topics
• About Importing Interactive Reporting Documents
• Importing Interactive Reporting Documents into Excel
• Importing Interactive Reporting Documents into Word and PowerPoint
• Editing Interactive Reporting Documents
About Importing Interactive Reporting DocumentsImported Oracle Hyperion Interactive Reporting documents are section-specific.
Table 19-2 Interactive Reporting Import Object Types
Section Excel Word, PowerPoint
Table Formatted data N/A
Results Formatted data N/A
Chart Formatted data Image
Pivot Formatted data N/A
Report Formatted data Image
Dashboard Image Image
Query N/A N/A
CubeQuery Query ready (InternetExplorer only, not supportedby Firefox)
Formatted data
N/A
Data model N/A N/A
The following restrictions apply when Interactive Reporting documents are imported intoExcel:
• Hidden sections are displayed during import.
• Importing dashboard sections into Excel resizes A1 cells.
Chapter 19Importing Interactive Reporting Documents
19-5

• Importing report sections into Excel places chart images before tables
• Importing into Excel may not preserve colors correctly.
• Results sections that contain the euro currency format do not import into Excel.
• Results sections with + (plus sign) in their name do not import.
Importing Interactive Reporting Documents into ExcelTo import Interactive Reporting documents into Excel:
1. From the Smart View ribbon, select Panel.
2. In the Smart View Panel, connect to a Oracle Hyperion Enterprise PerformanceManagement Workspace data source.
3. Navigate to the Oracle Hyperion Interactive Reporting document that you want toimport.
4. From the Action Panel, click Open.
The Import Workspace Document wizard is displayed.
Note:
Some wizard screens do not apply to some documents.
5. In Sections, select the section for importing.
6. In Actions, select an option:
• Refresh and Preview, to change filters or values prior to previewing thedocument
• Preview, to preview the document with default settings
If you are importing a CubeQuery section in query ready format, do not selectthis option.
7. Click Next.
8. If you selected Preview in step 6, skip to step 11. If you select Refresh andPreview, continue with the next step.
9. If user authentication is required to change filters, such as variable, value, oroption in the document's settings, in Specify Database Credentials, enter theusername and password, and select Next.
The connection name is displayed in parentheses (for example, Sample.oce).
10. In Specify Filters, select a value and click Next.
11. To import all pages of the document, leave the All Pages field check enabled.
12. If your document contains multiple pages, select Split pages across worksheetsto display each page on a separate Excel worksheet.
13. From the Import Section As drop-down, select one of the following:
• Data to import content as query-ready HTML. The current page of the currentCubeQuery section is converted to HTML and Oracle Smart View for Office
Chapter 19Importing Interactive Reporting Documents
19-6
formatting is removed. This enables you to requery the data source independent ofthe Web application.
• Image to import content as formatted HTML. The current page of the CubeQuerysection is converted to HTML with Smart View formatting definitions and calculatedmembers. Smart View does not directly query the data source. This option isavailable only for a CubeQuery section for Refresh and Preview.
14. Click Finish.
The document is displayed in Excel.
Importing Interactive Reporting Documents into Word and PowerPointTo import Oracle Hyperion Interactive Reporting documents into Word:
1. From the Smart View ribbon, select Panel.
2. In the Smart View Panel, connect to a Oracle Hyperion Enterprise PerformanceManagement Workspace data source.
3. Navigate to the Interactive Reporting document that you want to import.
4. From the Action Panel, click Open.
The Import Workspace Document wizard is displayed.
Note:
Some wizard screens do not apply to some documents.
5. In Select an Action, select an option:
• Refresh and Preview, to change filters or values prior to previewing the document
• Preview, to preview the document with default settings
6. Click Next.
7. If you selected Refresh and Preview:
a. If user authentication is required to change filters, such as variable, value, or option inthe document settings, in Specify Database Credentials, enter the user name andpassword, and click Next.
The connection name is displayed in parentheses (for example, Sample.oce).
b. In Specify Filters, select a value.
8. Click Apply, and click Next.
9. In Preview, to import a page, select a page from the drop-down list located in the upperleft of the data object.
10. Optional: To import all pages of the document, select All Pages.
11. Click Finish.
The document is imported.
Chapter 19Importing Interactive Reporting Documents
19-7

Editing Interactive Reporting DocumentsTo edit Interactive Reporting documents in Excel, Word, and PowerPoint:
1. Open the Oracle Hyperion Interactive Reporting document to edit.
2. From the Smart View ribbon, click the arrow in , then select Reportingand Analysis Document, and then Edit.
The Import Workspace Document wizard is displayed.
Note:
Some wizard screens do not apply to some documents.
3. If you selected Refresh and Preview:
a. If user authentication is required to change filters, such as variable, value, oroption in the document settings, in Specify Database Credentials, enter theuser name and password, and click Next.
The connection name is displayed in parentheses (for example, Sample.oce).
b. In Specify Filters, select a value.
4. Click Apply, and click Next.
5. In Preview, to import a page, select a page from the drop-down list located in theupper left of the data object.
6. Click Finish.
Importing Financial Reporting DocumentsYou can import Oracle Hyperion Financial Reporting documents into Excel, Word, andPowerPoint.
Related Topics
• Importing Financial Reporting Documents
• Importing Financial Reporting Documents into Excel
• Importing Financial Reporting Documents into Word and PowerPoint
• Editing Financial Reporting Documents
• Creating Templates in PowerPoint Documents
• Refreshing PowerPoint Templates
Chapter 19Importing Financial Reporting Documents
19-8
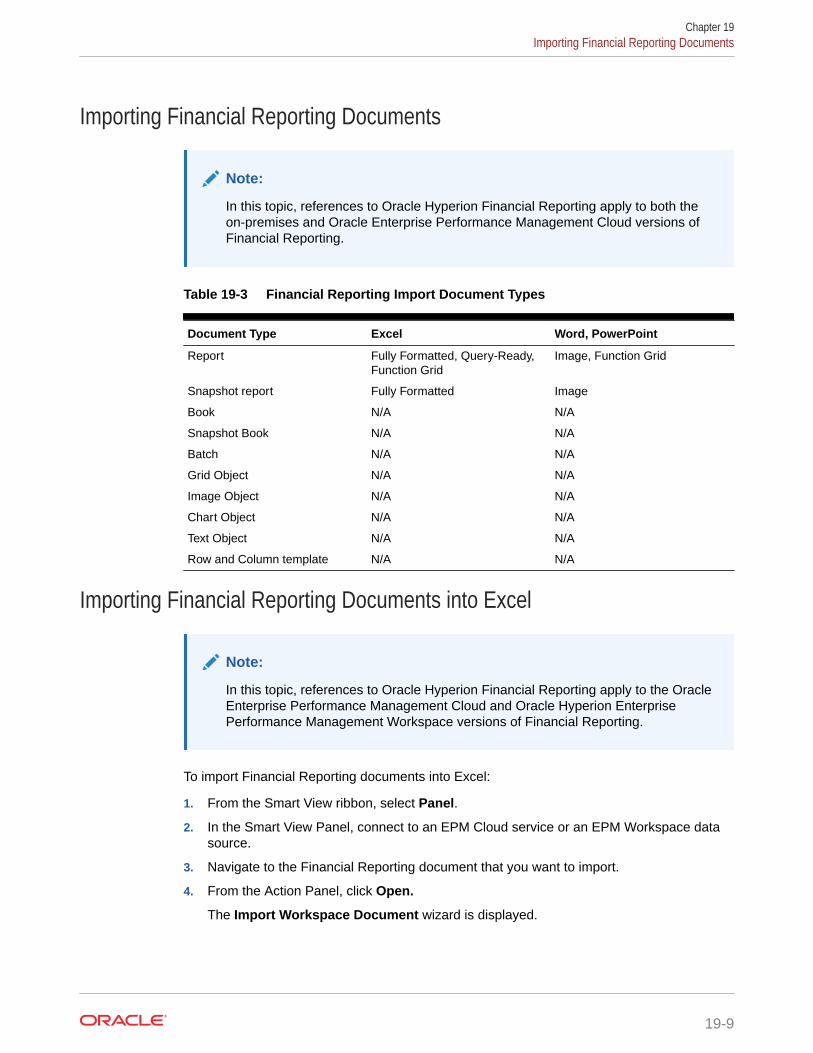
Importing Financial Reporting Documents
Note:
In this topic, references to Oracle Hyperion Financial Reporting apply to both theon-premises and Oracle Enterprise Performance Management Cloud versions ofFinancial Reporting.
Table 19-3 Financial Reporting Import Document Types
Document Type Excel Word, PowerPoint
Report Fully Formatted, Query-Ready,Function Grid
Image, Function Grid
Snapshot report Fully Formatted Image
Book N/A N/A
Snapshot Book N/A N/A
Batch N/A N/A
Grid Object N/A N/A
Image Object N/A N/A
Chart Object N/A N/A
Text Object N/A N/A
Row and Column template N/A N/A
Importing Financial Reporting Documents into Excel
Note:
In this topic, references to Oracle Hyperion Financial Reporting apply to the OracleEnterprise Performance Management Cloud and Oracle Hyperion EnterprisePerformance Management Workspace versions of Financial Reporting.
To import Financial Reporting documents into Excel:
1. From the Smart View ribbon, select Panel.
2. In the Smart View Panel, connect to an EPM Cloud service or an EPM Workspace datasource.
3. Navigate to the Financial Reporting document that you want to import.
4. From the Action Panel, click Open.
The Import Workspace Document wizard is displayed.
Chapter 19Importing Financial Reporting Documents
19-9

Note:
Some wizard screens do not apply to some documents.
5. In Select a Document, expand the repository, select a Financial Reportingdocument, and click OK.
The document is previewed in the Import Workspace Document window.
Note:
Some options may not be available for some documents.
6. If Preview User Point of View is displayed, preview the current POV or changethe members of the POV.
Note:
To display this screen, select Preview for User Point of View in EPMWorkspace preferences or the preferences for your EPM Cloud service.
7. Click Next.
8. Optional: If you want to change the default value, in Respond to Prompts, makea selection for prompts, and click Next.
Note:
This screen is displayed only if the document contains prompts.
9. Optional: In Preview from Grid POV, change the POV by selecting a POV.
10. Change the page dimension by selecting Page.
11. To import all pages of the document, select All Pages.
12. Optional: To refresh the Financial Reporting document using the EPM Cloudservice or EPM Workspace Point of View, select Refresh Using WorkspacePoint of View.
13. In Import Document As, select an option:
• Fully-Formatted—displays reports in a fully-formatted HTML.
• Query-Ready—enables you to run ad hoc analysis on reports whenconnected to Oracle Hyperion Financial Management and Oracle Essbasedata sources.
Chapter 19Importing Financial Reporting Documents
19-10

Note:
Perform a Refresh on an imported report before you begin working on it inquery-ready mode to ensure that the report and the POV are in sync.
• Function Grid—a dynamic grid format, allows you to further select a report option,as described in step 18.
14. To display each page on a separate Excel worksheet, select Split Pages acrossworksheets.
Note:
This option available only if you selected Fully-Formatted in step 13.
15. Click Finish.
Your next steps depend on the option you selected in step 13:
If you selected:
• Fully-Formatted—the document is imported into the Office application, and you canonly view the Reporting and Analysis document.
• Query-Ready—the document is imported into the Office application, and you cannow connect to a Financial Management or Essbase data source, where you canperform ad hoc analysis, such as retrieving, zooming, or pivoting data.
• Function Grid—continue with step 16.
16. Click to refresh the Document Contents pane.
17. Select the function grid object in Document Contents, right-click and select Insert NewReporting Object/Control.
18. From the Insert New Reporting Object/Control dialog box, select one of these reporttypes to place on the grid:
• Function Grid — a dynamic grid format
When you refresh a function grid, data cells are refreshed; members are not. Torefresh both data and members, you must reinsert the function grid into the sheet.For this reason, function grids are most useful for reports in which members remainreasonably static. For reports whose members may change more often, tables andcharts are better report types. Although you can have multiple reports on aworksheet, you can have only one function grid.
You can use Excel formulas, for example SUM, with function grids. To retain suchformulas as part of the function grid, you must leave one empty row between the gridand the cell containing the formula and include the empty row in the range of cellsselected for the formula definition. This permits retention of the formula whenrefreshing the data results in a different number of rows in the grid.
To format a function grid, use Excel formatting capabilities.
• Table
Chapter 19Importing Financial Reporting Documents
19-11

Table reports display results in a grid format that floats on the document andcan be moved and re-sized. When you refresh a table, both members anddata are refreshed. Tables are useful for displaying large grids in a smallerspace; their scroll bars enable you to quickly access rows and columns.
You can zoom in and out in a table report, but you cannot perform other adhoc operations or use free form.
• Chart
Chart reports display results in a chart format that floats on the document andcan be moved and re-sized. When you refresh a chart, both members anddata are refreshed.
19. Optional: To move or resize a table or chart, in Document Contents, click the
down arrow next to , and from the menu, select Toggle Design Mode.
You can now move objects within the sheet, slide, or page.
When you are ready to exit design mode, select Toggle Design Mode again.
20. Refresh.
21. Optional: To create a separate report for any or all of the members of onedimension in the report and cascade these reports separately across theworksheets of the workbook, see Cascading Reports and Ad Hoc Grids.
Note:
In reports that contain a chart and a table, cascading may cause thechart and table to overlap the next time you open the workbook.
Note:
In Office 2016, when connected to Financial Reporting, Microsoft Wordsuspends or terminates unexpectedly after inserting several reportingobjects in succession
Importing Financial Reporting Documents into Word and PowerPoint
Note:
In this topic, references to Oracle Hyperion Financial Reporting apply to theOracle Enterprise Performance Management Cloud and Oracle HyperionEnterprise Performance Management Workspace versions of FinancialReporting.
To import Financial Reporting documents into Word and PowerPoint:
1. From the Smart View ribbon, select Panel.
Chapter 19Importing Financial Reporting Documents
19-12

2. In the Smart View Panel, connect to a supported EPM Cloud or EPM Workspace datasource.
3. Navigate to the Financial Reporting document that you want to import.
4. From the Action Panel, click Open.
The Import Workspace Document wizard is displayed.
5. In Select a Document, expand the repository, select a Financial Reporting document,then click OK.
The document is previewed in the Import Workspace Document window.
Note:
Some screens do not apply to some documents.
6. If the Preview User Point of View screen is displayed, preview the current POV orchange the members of the POV by selecting a member.
Note:
To display this screen, select Preview for User Point of View in EPM Workspacepreferences or the preferences for your EPM Cloud service.
7. Optional: If you want to change the default value, in Respond to Prompts, make aselection for prompts, and click Next.
Note:
This screen is displayed only if the document contains prompts.
8. In Preview from Grid POV, change the POV by selecting a POV.
Note:
Some wizard screens do not apply to some documents.
9. Change the page dimension by selecting Page.
10. Select All Pages to import all pages of the document.
11. Optional: To refresh the Financial Reporting document using Point of View of theconnected EPM Cloud service or EPM Workspace , select Refresh Using WorkspacePoint of View.
12. In Import Document As, select an option:
• Image—To import the document as an image.
• Function Grid—To import a dynamic grid format, which allows you to further select areport option, as described in step 16 (available in Word only).
Chapter 19Importing Financial Reporting Documents
19-13

13. Click Finish.
Your next steps depend on the option you selected in step 12:
If you selected:
• Image—The report is imported into the document as an image and you canonly view the Reporting and Analysis image in the Word.
• Function Grid—Continue with step 14 (Word only).
14. Click to refresh the Document Contents pane.
15. Select the report object in Document Contents, right-click and select Insert NewReporting Object/Control.
16. From the Insert New Reporting Object/Control dialog box, select one of thesereport types to place on the page:
• Function Grid —a dynamic grid format
When you refresh a function grid, data cells are refreshed; members are not.To refresh both data and members, you must reinsert the function grid into thesheet. For this reason, function grids are most useful for reports in whichmembers remain reasonably static. For reports whose members may changemore often, tables and charts are better report types. Although you can havemultiple reports on a worksheet, you can have only one function grid.
You can use Excel formulas, for example SUM, with function grids. To retainsuch formulas as part of the function grid, you must leave one empty rowbetween the grid and the cell containing the formula and include the emptyrow in the range of cells selected for the formula definition. This permitsretention of the formula when refreshing the data results in a different numberof rows in the grid.
To format a function grid, use Excel formatting capabilities.
• Office Table
Office tables can be used with Word only. Office tables display results in nativeMicrosoft Office table format. When you refresh an Office table, both membersand data are refreshed.
Office tables look and feel like part of the Word document, but the membersand data in the table cells are connected to the Smart View provider. WithOffice tables, you can work with the Word table formatting and styles that youare accustomed to. Insert a POV object into the report and you can changethe POV of the Office table. Refresh the Office table after changing formattingor POV and the new POV is reflected in the results and custom formatting isretained.
You cannot zoom in or out in an Office table object, and you cannot performother ad hoc operations or use free form.
• Table
Table reports display results in a grid format that floats on the document andcan be moved and re-sized. When you refresh a table, both members anddata are refreshed. Tables are useful for displaying large grids in a smallerspace; their scroll bars enable you to quickly access rows and columns.
You can zoom in and out in a table report, but you cannot perform other adhoc operations or use free form.
Chapter 19Importing Financial Reporting Documents
19-14

• Chart
Chart reports display results in a chart format that floats on the document and can bemoved and re-sized. When you refresh a chart, both members and data arerefreshed.
17. Optional: To move or re-size a table or chart, in Document Contents, click the down
arrow next to , and from the menu, select Toggle Design Mode.
You can now move objects within the sheet, slide, or page.
When you are ready to exit design mode, select Toggle Design Mode again.
18. Refresh.
Note:
In Office 2016, when connected to Financial Reporting, Microsoft Word suspends orterminates unexpectedly after inserting several reporting objects in succession
Editing Financial Reporting Documents
Note:
In this topic, references to Oracle Hyperion Financial Reporting apply to the OracleEnterprise Performance Management Cloud and Oracle Hyperion EnterprisePerformance Management Workspace versions of Financial Reporting.
To edit Financial Reporting documents in Excel, Word, and PowerPoint:
1. Open the Financial Reporting document to edit.
2. From the Smart View ribbon, click the arrow in , then select Reporting andAnalysis Document, and then Edit.
The Import Workspace Document wizard is displayed.
Note:
Some wizard screens do not apply to some documents.
3. If the Preview User Point of View screen is displayed, preview the current POV orchange the members of the POV.
Chapter 19Importing Financial Reporting Documents
19-15

Note:
To display this screen, select Preview for User Point of View in EPMWorkspace preferences or the preferences for your EPM Cloud service.
4. Optional: In documents that contain prompts, to change the default value, inRespond to Prompts, make a selection for prompts, and click Next.
Note:
Respond to Prompts is displayed only if the document containsprompts.
5. To change the POV, in Preview from Grid POV select a POV.
6. Click Finish.
Creating Templates in PowerPoint Documents
Note:
In this topic, references to Oracle Hyperion Financial Reporting apply to boththe on-premises and Oracle Enterprise Performance Management Cloudversions of Financial Reporting.
You can create PowerPoint template documents that can be saved by importing one ormore Financial Reporting reports to the presentation. Every Create Template actioncreates a new PowerPoint slide with a report name to show where it will be placedwhen Refresh Template is used.
To create a template:
1. Open PowerPoint.
2. Connect to a Reporting and Analysis provider.
3. From the Smart View ribbon, select Panel, then Reporting and AnalysisDocument, and then Create Template.
4. In Import Workspace Document, select a Financial Reporting document.
• Optional: To import all pages of the document, select All Pages. A separateslide is created for each page.
• To import the current screen presentation, clear All Pages.
5. Optional: To use the Oracle Hyperion Enterprise Performance ManagementWorkspace point of view or the point of view for your EPM Cloud service, selectRefresh Using Workspace Point of View.
6. Click OK. The document name is imported into the PowerPoint presentation.
Chapter 19Importing Financial Reporting Documents
19-16

Refreshing PowerPoint Templates
Note:
In this topic, references to Oracle Hyperion Financial Reporting apply to both theon-premises and Oracle Enterprise Performance Management Cloud versions ofFinancial Reporting.
To refresh a template:
1. Open the PowerPoint presentation containing the template.
2. Connect to a Reporting and Analysis provider.
3. From the Smart View ribbon, select Panel, then Reporting and Analysis Document,and then Refresh Template.
4. Edit and save the PowerPoint presentation as needed.
Exporting Financial Reporting ReportsWhen exporting a Oracle Hyperion Financial Reporting report from Oracle HyperionEnterprise Performance Management Workspace to Oracle Smart View for Office, the userPOV for the report is not retained. The user POV defaults to the user POV used mostrecently in Smart View.
Importing Production Reporting DocumentsYou can import Oracle Hyperion SQR Production Reporting documents into Excel, Word, andPowerPoint.
Related Topics
• About Importing Production Reporting Documents
• Importing Production Reporting Jobs into Excel
• Importing Production Reporting Jobs into Word and PowerPoint
• Importing Production Reporting Job Outputs into Word, and PowerPoint
• Editing Production Reporting Jobs
About Importing Production Reporting DocumentsOracle Hyperion SQR Production Reporting documents consist of jobs and job outputs, whichyou can import into Excel, Word, and PowerPoint.
Table 19-4 Production Reporting Import Object Types
Object Type Excel Word, PowerPoint
Job Formatted data Image
Chapter 19Exporting Financial Reporting Reports
19-17

Table 19-4 (Cont.) Production Reporting Import Object Types
Object Type Excel Word, PowerPoint
Job output Formatted data Image
Some limitations exist for importing:
• Images and charts are not imported into Excel.
• Secure jobs are supported, but jobs imported as generic jobs are not supported.
Importing Production Reporting Jobs into ExcelTo import Production Reporting jobs into Excel:
1. From the Smart View ribbon, select Panel.
2. In the Smart View Panel, connect to a Oracle Hyperion Enterprise PerformanceManagement Workspace data source.
3. Navigate to the Oracle Hyperion Interactive Reporting document that you want toimport.
4. From the Action Panel, click Open.
The Import Workspace Document wizard is displayed.
5. In Select a Document, expand the repository, select a Oracle Hyperion SQRProduction Reporting job, then click OK.
The import wizard screen is displayed.
Note:
Depending on the document, some screens may not be applicable.
6. If the Specify Parameters screen is displayed, define the job parameters, andclick Next.
Note:
This screen is displayed only if the job contains parameters.
7. In Preview, to import a page, select a page from the drop-down list located in theupper left of the data object.
8. To import all pages of the job, select All Pages.
9. Select Split Pages across worksheets to display each page on a separate Excelworksheet.
10. Click Finish.
The document is displayed in Excel.
Chapter 19Importing Production Reporting Documents
19-18

Importing Production Reporting Jobs into Word and PowerPointThe procedures for importing Oracle Hyperion SQR Production Reporting jobs into Word andPowerPoint are similar.
To import Production Reporting jobs into Word and PowerPoint:
1. From the Smart View ribbon, select Panel.
2. In the Smart View Panel, connect to a Oracle Hyperion Enterprise PerformanceManagement Workspace data source.
3. Navigate to the Production Reporting document that you want to import.
4. From the Action Panel, click Open.
The Import Workspace Document wizard is displayed.
5. In Select a Document, expand the repository, select a Reporting and Analysisdocument, then click OK.
The import wizard is displayed.
Note:
Some screens may not apply to some documents.
6. If the Specify Parameters screen is displayed, define the job parameters, and clickNext.
Note:
This screen is displayed only if the job contains parameters.
7. In Preview, to import a page, select a page from the drop-down list located in the upperleft of the data object.
8. To import all pages of the job, select All Pages.
For Word, Split pages across pages is disabled. For PowerPoint, Split pages acrossslides is selected and disabled because by default, the pages from jobs or job outputsalways split across pages and slides.
9. Click Finish.
The job is imported.
Importing Production Reporting Job Outputs into Word, and PowerPointTo import Production Reporting job outputs into Excel, Word, and PowerPoint:
1. Connect to a Oracle Hyperion Enterprise Performance Management Workspace datasource.
2. From the Smart View ribbon, select Panel, then Reporting and Analysis Document,and then Import.
Chapter 19Importing Production Reporting Documents
19-19

The Import Workspace Document dialog box is displayed.
3. In Select a Document, expand the repository, select a Oracle Hyperion SQRProduction Reporting job output, then click OK.
The job output is imported.
Editing Production Reporting JobsYou can edit imported Oracle Hyperion SQR Production Reporting jobs, but not joboutputs. You can edit only job parameters.
To edit Production Reporting jobs:
1. Open an imported Production Reporting document.
2. From the Smart View ribbon, click the arrow in , then select Reportingand Analysis Document, and then Edit.
The Import Workspace Document dialog box is displayed.
3. If the Specify Parameters screen is displayed, define the job parameters, andclick Next.
Note:
This screen is displayed only if the job contains parameters.
4. In Preview. view the job.
Note:
If you deleted any imported pages, edit updates only the remainingpages of the job.
5. Click Finish.
The job is updated.
Importing Web Analysis DocumentsAll Oracle Hyperion Web Analysis data objects (spreadsheets, charts, and pinboards)are imported as Excel spreadsheets.
Related Topics
• About Importing Web Analysis Documents
• Importing a Web Analysis Document or Document Objects
• Editing Web Analysis Documents
Chapter 19Importing Web Analysis Documents
19-20

About Importing Web Analysis DocumentsOracle Hyperion Web Analysis includes five data object display types, but Oracle Smart Viewfor Office can import only three (spreadsheet, chart, and pinboard). Smart View cannot importfree-form grid and SQL spreadsheets.
See Financial Reporting and Web Analysis Import Formats.
Table 19-5 Web Analysis Import Document Type
Document Type Excel Word, PowerPoint
Report Fully formatted, query-ready Image
Table 19-6 Web Analysis Import Data Object Type
Data Object Excel Word, PowerPoint
Spreadsheet Data + formatting Image
Chart Data + formatting Image
Pinboard Data + formatting Image
Importing a Web Analysis Document or Document ObjectsUsing Smart View in Excel, you can import one or all document pages or multiple dataobjects with one or more pages from a Oracle Hyperion Web Analysis document residing inthe Oracle Hyperion Enterprise Performance Management Workspace repository. All WebAnalysis data objects (spreadsheet, chart, pinboard) are imported as Excel spreadsheets.Freeform Grid and SQL spreadsheets cannot be imported.
To import Web Analysis data objects:
1. From the Smart View ribbon, select Panel.
2. In the Smart View Panel, connect to a EPM Workspace data source.
3. Navigate to the Web Analysis document that you want to import.
4. From the Action Panel, click Open.
The Import Workspace Document wizard is displayed.
5. In Select a Document, expand the repository, select a Web Analysis document, and clickOK.
6. If database credentials are not saved with the Web Analysis document, then the SpecifyDatabase Credentials page is displayed where you are required to enter valid log oncredentials to data sources used in the report. If a report has only one data source andyou skip entering credentials, the report is not imported. If you have data objects withdifferent data sources in one report and only want to import one of the data objects, youcan enter the credentials for the data objects you want to import and skip credential forthe data object you do not wish to import. Enter the user name and password or selectSkip to skip entering credentials to any of the data sources, and click Next.
Chapter 19Importing Web Analysis Documents
19-21

Tip:
Select Save Credentials to save credentials with a Web Analysisdocument. It enables you to refresh an imported document later.Currently, you cannot refresh imported documents without savingcredentials.
7. In Preview, when selecting objects to import for Microsoft Excel, Word, andPowerPoint:
• Select individual data objects, by clicking the check box located in the top leftcorner of each report object or select all data objects by clicking the AllObjects check box.
• Select Split Objects across worksheets to create a new worksheet for eachreport object or deselect Split Objects across worksheets to placed allreport objects in the same worksheet.
• Select a page to import from the drop-down list located in the top of eachselected to import data objects or select All Pages to import all pages of allselected to import data objects.
• Select Split Pages across Worksheets to create a new worksheet for eachimport page or deselect Split Pages across Worksheets to place all importedpages of each data object in the same worksheet.
8. In Preview, when selecting object to import for Microsoft Word and PowerPoint,select Import Screen to import a screen print of the entire report.
9. For Microsoft Excel, In Import Document As, select an option:
• Fully Formatted (imports reports in fully-formatted HTML). You can connectto Oracle Enterprise Performance Management System at any time andrefresh the imported document for current data.
• Query-Ready (imports reports in query-ready HTML). You can connect toOracle Hyperion Financial Management or Oracle Essbasedata source to getdata directly and perform ad hoc analysis, such as retrieving, zooming, andpivoting data.
10. Click Finish. The document is imported. You can then connect to EPM System atany time and refresh the imported document with current data.
Editing Web Analysis DocumentsTo edit Oracle Hyperion Web Analysis documents:
1. Select a page (Excel) or an image (Word or PowerPoint).
2. From the Smart View ribbon, click the arrow in , then select Reportingand Analysis Document, and then Edit.
3. If database credentials are not saved with the Web Analysis document, then theSpecify Database Credentials page is displayed. In Specify Database
Chapter 19Importing Web Analysis Documents
19-22

Credentials, enter the user name and password, or select Skip, and then click Next.
Tip:
You can select Save Credentials to save them with the Web Analysisdocument.
4. Select a spreadsheet, chart, or pinboard to import.
5. In Preview, to import a page, select a page from the drop-down list located in the upperleft of the data object.
6. Select All Pages to import all pages of the document. Leave the box cleared to importonly the current page.
7. Select Split Pages across worksheets to display each page on a separate worksheet(Excel only).
8. In Import Document As, select:
• Fully Formatted (Excel only)
• Query-Ready (Excel only)
• Image (Word and PowerPoint)
9. Click Finish.
Chapter 19Importing Web Analysis Documents
19-23

20Smart View and Account Reconciliation
Related Topics
• About Using Smart View With Account ReconciliationThis topic introduces and links to the procedures needed in order to install Oracle SmartView for Office, set up the connection, and then download the Smart View extension forReconciliation Compliance, as well as the actual import transactions procedure.
• Setting Up Account Reconciliation in Smart ViewYou can set up Account Reconciliation in Oracle Smart View for Office.
• Connecting to Account Reconciliation in Smart ViewYou can connect to Account Reconciliation anytime you start Microsoft Excel.
• Importing Transactions Directly From Excel Using the Smart View Extension forReconciliation ComplianceThis topic describes how to initialize and import transactions into ReconciliationCompliance using the Smart View Account Reconciliation extension.
About Using Smart View With Account ReconciliationThis topic introduces and links to the procedures needed in order to install Oracle Smart Viewfor Office, set up the connection, and then download the Smart View extension forReconciliation Compliance, as well as the actual import transactions procedure.
You can use Excel to load transactions into Reconciliation Compliance by using the SmartView Account Reconciliation extension. The direct integration requires the base installation ofSmart View plus the Smart View extension for Reconciliation Compliance.
For instructions on how to install Smart View and connect to Account Reconciliation, and theninstall the Smart View extension for Reconciliation Compliance, see the topics in Setting UpAccount Reconciliation in Smart View.
For procedures to load transactions into Reconciliation Compliance, see ImportingTransactions Directly From Excel Using the Smart View Extension for ReconciliationCompliance.
For more information on Account Reconciliation, see the documentation on the Oracle HelpCenter.
Setting Up Account Reconciliation in Smart ViewYou can set up Account Reconciliation in Oracle Smart View for Office.
The topics in this section discuss setting up Account Reconciliation in Smart View. This is theworkflow:
• Download and run the Smart View installer
• Set up a connection to Account Reconciliation
• Install the Account Reconciliation extension
20-1

Downloading and Running the Smart View InstallerTo download and run the Oracle Smart View for Office installer:
1. Start Account Reconciliation in a web browser, and log in with your user name andpassword.
2. In the upper-right corner of the Account Reconciliation web interface, select thearrow next to your user name to display the user menu, and then selectDownloads.
3. In Downloads, under Smart View, click Download From Oracle TechnologyNetwork.
4. On the Smart View information page on Oracle Technology Network, clickDownloads.
5. In the Hyperion Performance Management and BI Downloads page, select theOracle Smart View for Office link.
6. In the Oracle Smart View for Office page, click Download Now.
7. In the Oracle Licence Agreement popup window, select the I reviewed andaccept the Oracle License Agreement check box, and then click the Downloadbutton for the current Smart View release.
Note:
If the Oracle sign-in page is displayed, then sign in with your Oracle username (usually your email address) and password.
8. Follow the steps for your browser to download the ZIP file, and save it to a folderon your computer; for example, the Downloads folder.
9. Navigate to the folder that you used in the previous step, and then double-clickSmartView.exe or right-click SmartView.exe and select Run as administrator tostart the installation wizard.
Note:
Whenever possible, Oracle recommends using the Run asadministrator command when installing Smart View.
10. Select a destination folder for Smart View, and then click OK; for new installations,Smart View is installed by default in:
C:/Oracle/SmartView
Note:
If you are upgrading an installation of Smart View, then the installerdefaults to the folder where you previously installed Smart View.
11. When installation is complete, click OK.
Chapter 20Setting Up Account Reconciliation in Smart View
20-2

The tab for the Smart View ribbon is displayed the next time you open Microsoft Excel,PowerPoint, or Word.Continue the setup process with Creating Connections to Account Reconciliation.
Creating Connections to Account ReconciliationAfter you install Oracle Smart View for Office, as described in Downloading and Running theSmart View Installer, you can create connections to Account Reconciliation.
Connections require information about your service URL. Your Smart View administratorshould provide you with the information that you need to create the connection.
For the connection to Account Reconciliation, use the quick connection method in SmartView.
Note:
Use the procedure in this topic to create connections. Once connections arecreated, use the procedure Connecting to Account Reconciliation in Smart View forconnecting on a routine basis.
To create a private connection to Account Reconciliation using the quick connection method:
1. Open Microsoft Excel, Word, or PowerPoint, and select the Smart View ribbon.
2. From the Smart View ribbon, click Panel.
3. From the Smart View Panel, select Private Connections.
Alternatively, from the Smart View Panel, click the arrow next to the Switch to button,
, and then select Private Connections from the drop-down list.
4. Still in the Smart View Panel, in the text box shown in Figure 1, enter the service URL forthe Account Reconciliation.
Figure 20-1 Quick Connection - Enter a URL
The URL syntax:
https://serviceURL/arm/arcs/svpYour Smart View administrator should provide you with the URL for AccountReconciliation
5. Press Enter.
Alternatively, click the Go button, next to the text box where you entered the serviceURL.
Chapter 20Setting Up Account Reconciliation in Smart View
20-3

6. In the Smart View Panel, expand the ARCS node, then ReconciliationCompliance, then SmartView, and then click Connect in the Action Panel.
7. In the login window, enter your Oracle Cloud Identity Service Domain credentials,and click Sign In.
8. Perform an action:
• If the Extension Alerts dialog is displayed, then click the Go to ExtensionDialog button. The Extension Alerts dialog informs you of the latest AccountReconciliation extension available for installation. To complete the extensionupdate procedure, see Installing the Account Reconciliation Extension.
• If the Extension Alerts dialog is not displayed, continue with Installing theAccount Reconciliation Extension.
Installing the Account Reconciliation ExtensionThis topic covers installing the Account Reconciliation extension from within OracleSmart View for Office.
Before you begin this procedure, complete the steps in Creating Connections toAccount Reconciliation.
Note:
You can also install the extension from the Account Reconciliation webinterface. To install the extension from the web, see:
• Downloading and Installing Clients in Oracle Enterprise PerformanceManagement Cloud Getting Started with Oracle Enterprise PerformanceManagement Cloud for Administrators
• Downloading and Installing Clients in Oracle Enterprise PerformanceManagement Cloud Getting Started with Oracle Enterprise PerformanceManagement Cloud for Users
Downloading the Account Reconciliation extension from the Mozilla Firefoxbrowser may result in a new tab opening with a large amount of code beingdisplayed. This is due to a security policy within the Mozilla Firefox browserrelated to certain file extensions. The workaround is to download theextension using an alternate supported browser (Microsoft Edge or GoogleChrome), or install using the procedure in this topic.
To install the Account Reconciliation extension from Smart View:
1. From the Smart View ribbon, select Options, and then Extensions.
Note:
If the Extension Alerts dialog was displayed when you completed thesteps in Creating Connections to Account Reconciliation, then youshould already be in the Extensions tab of the Options dialog.
Chapter 20Setting Up Account Reconciliation in Smart View
20-4

2. Click the Check for Updates, New Installs, and Uninstalls link.
3. In Select Location for Extension Updates, select the check box that corresponds toyour Account Reconciliation connection, and then click Get Updates.
The dialog box expands to display a message window providing you with the progressand status of the extension query.
4. Click Close in the Select Location for Extension Updates dialog to return to theExtensions tab of the Options dialog.
5. In the list of extensions in the Extensions tab, locate Reconciliation Compliance and
click the Install link, , to launch the installer.
6. In the popup dialog asking "Apply this extension update?", click Yes, and then click OK toclose the Options dialog, Extensions tab.
A dialog display the progress of the extension installation.
7. In the message dialog informing you that the installation is successful and instructing youto restart Office, click OK, and then close and restart Office.
For more information on extension installation in Smart View, see the following topics:
• Initially Checking for Available Extensions
• Installing Extensions
After completing the procedure in this topic, you are ready to begin using the ReconciliationCompliance extension with Smart View.
Connecting to Account Reconciliation in Smart ViewYou can connect to Account Reconciliation anytime you start Microsoft Excel.
Note:
Before you connect to Account Reconciliation, make sure you have completed theprocedures in Downloading and Running the Smart View Installer, CreatingConnections to Account Reconciliation, and Installing the Account ReconciliationExtension.
To connect to Account Reconciliation:
1. Launch Excel, select the Smart View ribbon, and then click Panel.
2. In the Smart View Panel, select Private Connections.
Alternatively, from the Smart View Panel, click the arrow next to the Switch to button,
, and then select Private Connections from the drop-down list.
3. In the text box shown in Figure 1, click the arrow to display the drop-down menu andselect your connection.
Chapter 20Connecting to Account Reconciliation in Smart View
20-5

Figure 20-2 Quick Connection Arrow for Drop-down List
If you created your data source connection using the procedure in CreatingConnections to Account Reconciliation, then it should be listed under QuickConnect URLs in the drop-down list.
4. In the Smart View Panel, expand the ARCS node, then ReconciliationCompliance, then SmartView, and then click Connect in the Action Panel.
5. In the Login window, enter your User Name and Password, and then click SignIn.
Importing Transactions Directly From Excel Using the SmartView Extension for Reconciliation Compliance
This topic describes how to initialize and import transactions into ReconciliationCompliance using the Smart View Account Reconciliation extension.
You can use Excel to load transactions into Reconciliation Compliance by using theSmart View Account Reconciliation extension. The direct integration requires the baseinstallation of Smart View plus the new Smart View Extension for ReconciliationCompliance.
You can either Add to your existing transactions, or use Replace All to replace yourexisting transactions with this new import file.
For instructions on how to install Smart View and how to download the Smart ViewExtension for Reconciliation Compliance, see Setting Up Account Reconciliation inSmart View.
To load transactions, you use the Initialize and then Import options on the Smart ViewReconciliation Compliance ribbon to import the data. Initialize prepares the headerrow (always Row 1) in the spreadsheet for the import based on Transaction Type andselection of formats. Import performs the actual import of the transactions.
You can load any of the following Transaction Types across one or manyreconciliations in one import: Balance Explanations, Adjustment to Source System,Adjustment to Subsystem, and Variance Explanations.
For the procedure to initialize, see Initializing the Import
For the procedure to import the transactions, see Importing the Transactions
Note:
Transactions loaded through Smart View will exhibit exactly the samebehavior as Import Pre-mapped Transactions. See .Import Pre-MappedTransactions
Chapter 20Importing Transactions Directly From Excel Using the Smart View Extension for Reconciliation Compliance
20-6

Initializing the Import
The Initialize option prepares the header row for the import based on specification ofTransaction Type and selecting one or more formats. You can also include Amortizationheaders as well as Action Plan headers.
Note:
If you are loading transactions using the same header row from a previous load,you do not have to use the Initialize option again. You can go directly to the Importoption.
1. Once the Smartview installation steps are complete, open Excel, and establish theprivate connection. Note that you see the Smart View menu option as well asReconciliation Compliance on the Smart View ribbon.
Once you connect. you see the Initialize and Import options are active and ready to use.
2. Click Initialize.
Chapter 20Importing Transactions Directly From Excel Using the Smart View Extension for Reconciliation Compliance
20-7

3. Select a Transaction Type from the drop down and the list of formats display forthat transaction type.
Chapter 20Importing Transactions Directly From Excel Using the Smart View Extension for Reconciliation Compliance
20-8

4. Select one or more Formats. The Formats selected will determine which Attributes arecreated in the header row after the Initialize step is complete.
5. You can select the checkbox to Include Amortization Headers and/or Include ActionPlan Headers. Then click OK. If you leave these blank, they will not be included in theHeader Row.Here's an example of the header row showing the Amortization columns:
Rows and Columns - You can add your own rows and columns to the spreadsheet toinclude pre-import notes, calculations or anything else that may help your work process.Rows without an Account ID and columns without a predefined header will be ignored bythe Import.
Here is a summary of the difference between column headers in Excel and thepremapped Reconciliation Compliance Transaction Import file layout in AccountReconciliation:
Chapter 20Importing Transactions Directly From Excel Using the Smart View Extension for Reconciliation Compliance
20-9

Smart View ExcelTransaction Import
Premapped ReconciliationCompliance TransactionImport File
Notes
Account ID Reconciliation Account ID These are the same.Example: 101-22270
<Sub Segment Name> SubSegmentx Used if one or more of theselected formats is a groupreconciliation. Example:Store
Short Description Short Description These are the same.Example: Contract -AirNow
Long Description Long Description These are the same.Transaction Date Transaction Date These are the same.Close Date Close Date These are the same.<Entered> Amount Amountx For the Smart View
import, use the samecurrency bucket names asspecified in the CurrencyBuckets configuration inAccount Reconciliation.Bucket names areconfigurable. Defaultnames are Entered,Functional, or Reporting.
<Entered> Currency Amount Currencyx For the Smart Viewimport, use the samecurrency bucket names asspecified in the CurrencyBuckets configuration inAccount Reconciliation.Example: USDBucket names areconfigurable. Defaultnames are Entered,Functional, or Reporting.
<Attribute> AttributexAttribute Valuex
For the Smart Viewimport, use the sameAttribute Name asspecified in the Attributesconfiguration in AccountReconciliation.
Amortization Amortization Example: AmortizingAmortization Method Amortization Method Example: Straight LineAmortization Half MonthConvention
Amortization Half MonthConvention
Example: No
Amortization Periods Amortization Periods Example: 7Amortization Start Period Amortization Start Period Example: Jan-19Amortization Start DateAmortization End Date
Amortization Start DateAmortization End Date
Chapter 20Importing Transactions Directly From Excel Using the Smart View Extension for Reconciliation Compliance
20-10

Smart View ExcelTransaction Import
Premapped ReconciliationCompliance TransactionImport File
Notes
Amortization Original<Entered>
Amortization OriginalAmount1
For the Smart Viewimport, use the samebucket name as specifiedin the configuration inAccount Reconciliation.Bucket names areconfigurable. Defaultnames are Entered,Functional, or Reporting.
Action Plan Closed Action Plan Closed Example: Y
Action Plan Closed Date Action Plan Closed Date Example: 1/20/2020Action Plan <Attribute> Action Plan AttributeX
Action Plan AttributeValuex
For the Smart Viewimport, use the sameAction Plan AttributeName as specified in theAttributes configuration inAccount Reconciliation.
Note:
The Smart View import requires the Amount or Date fields to be formatted inExcel as Amount or Date format. They cannot be Text or other format.
Note:
Excel commonly converts Amortization Period names to dates, which will causeerrors on import. To prevent this, format the column as Text (Initialize does thisautomatically) or prefix the Period name with a single quote (ex: 'January 2021)
Importing the Transactions
Once your header row layout is ready, you can load your transactions into ReconciliationCompliance via Smart View.
1. Make sure your Excel header row is ready and you are connected to the AccountReconciliation instance.
2. Create transactions for import in the sheet that has your header row configured.
Chapter 20Importing Transactions Directly From Excel Using the Smart View Extension for Reconciliation Compliance
20-11
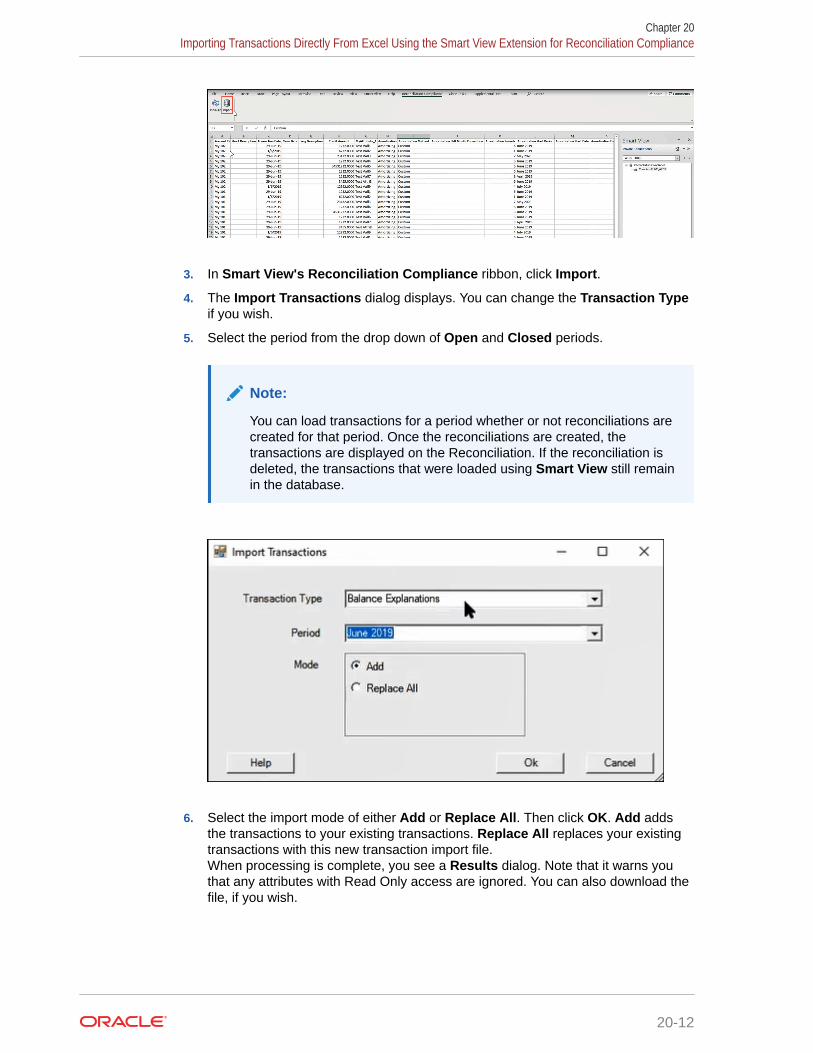
3. In Smart View's Reconciliation Compliance ribbon, click Import.
4. The Import Transactions dialog displays. You can change the Transaction Typeif you wish.
5. Select the period from the drop down of Open and Closed periods.
Note:
You can load transactions for a period whether or not reconciliations arecreated for that period. Once the reconciliations are created, thetransactions are displayed on the Reconciliation. If the reconciliation isdeleted, the transactions that were loaded using Smart View still remainin the database.
6. Select the import mode of either Add or Replace All. Then click OK. Add addsthe transactions to your existing transactions. Replace All replaces your existingtransactions with this new transaction import file.When processing is complete, you see a Results dialog. Note that it warns youthat any attributes with Read Only access are ignored. You can also download thefile, if you wish.
Chapter 20Importing Transactions Directly From Excel Using the Smart View Extension for Reconciliation Compliance
20-12

Note:
Once you set up the header row, if you want to perform another import oftransactions, you can go directly to Import without initializing again.
Chapter 20Importing Transactions Directly From Excel Using the Smart View Extension for Reconciliation Compliance
20-13

21Smart View and Narrative Reporting
Related Topics
• About Narrative ReportingWith Oracle Smart View for Office and the Narrative Reporting extension, you use familiarMicrosoft Office tools to access and work with data in Narrative Reporting.
• Setting Up Narrative Reporting in Smart ViewYou can set up Narrative Reporting in Oracle Smart View for Office.
• Connecting to Narrative Reporting in Smart ViewYou can connect to Narrative Reporting anytime you start Microsoft Excel, Word, orPowerPoint.
• Using Narrative Reporting HomeAfter you create a connection to Narrative Reporting, you can use Narrative ReportingHome.
• Administering Report Packages in Smart ViewYou can administer report packages in Oracle Smart View for Office.
• Authoring DocletsAs a doclet author, you provide report content in Oracle Smart View for Office.
• Performing ReviewsPerform reviews by entering comments and providing your feedback in a review instancein Oracle Smart View for Office.
• Working with DistributionsDistributions enable report package owners to send report content to stakeholders at anypoint in the report package development.
• Performing Sign OffsSigners review the finalized content of a report. They can either sign off on or reject thereport.
• Refreshing Report PackagesYou can refresh the contents of a report package by using the Refresh Report Packagecommand in the Library pane of the Smart View Panel.
• Saving Office Documents to EPM Cloud in Narrative Reporting in Smart ViewIn Oracle Smart View for Office, you can save Microsoft Office documents to the OracleEnterprise Performance Management Cloud Library. Documents you save in the EPMCloud Library can be made accessible to other users. You can also download saved filesfrom the library.
• Working with Reports in Smart ViewReports is a cloud-based reporting solution for creating Oracle Enterprise PerformanceManagement Cloud financial and managerial reports. It enables users to insert chartsand grids utilizing EPM Cloud sources such as Planning, and other sources such asOracle Analytics Cloud - Essbase as well as ERP Cloud Financials, into a report.
21-1
• Working with Narrative Reporting Data in Smart ViewYou can use Oracle Smart View for Office to copy data from Oracle EnterprisePerformance Management System and Oracle Business Intelligence on-premisesand cloud data sources,.
About Narrative ReportingWith Oracle Smart View for Office and the Narrative Reporting extension, you usefamiliar Microsoft Office tools to access and work with data in Narrative Reporting.
You and your colleagues work in a collaborative environment with static PDF files orwith Word, PowerPoint, or Excel files containing refreshable data copied or embeddedfrom Smart View. The Narrative Reporting workflow, consisting of clearly definedassignments and tasks, organizes input from many contributors in one document.Some tasks are performed in the Narrative Reporting web interface, and others arecompleted in Smart View.
With Narrative Reporting:
• Use the web interface or Smart View to create a report package structureconsisting of doclets of various types. In Smart View, create report packages intwo ways
– From a single Word or PDF document, and add more doclets to it later.
– From a set of documents consisting of Word documents, PowerPointpresentation slides, Excel workbooks, and PDF files.
• Use the web interface or Smart View to add regular doclets to a Word-,PowerPoint-, or PDF-based report package.
• Use the web interface or Smart View to add Excel-based reference doclets,containing embeddable content, to a Word-, PowerPoint-, or PDF-based reportpackage.
• Use the web interface to add supplemental doclets, such as Word documents,PowerPoint slides, Excel workbooks, and other file types, such as PDF, HTML,and TXT, to the report package.
• Use the web interface or Smart View to add a Word table of contents to a Word- orPDF-based report package.
• Use the web interface to assign user access and responsibilities, includingtimelines and due dates, for the authoring, review, and approval of each doclet,reference doclet, and supplemental doclet in the report package.
In Smart View, you also have the option of assigning author responsibilities whencreating a report package structure.
• Use Smart View to author Office-based doclet content directly in Microsoft Office.Doclet content is authored in Word or PowerPoint. Embeddable content inreference doclets is authored in Excel. Supplemental doclet content is authored inthe appropriate Office application.
You can work with doclets, reference doclets, and supplemental doclets in SmartView while connected to Narrative Reporting, or you can download doclets of anyOffice type and work with them locally.
Note that Office-based supplemental doclets and Excel-based reference docletsfollow standard doclet workflow tasks, such as checkout, upload, and checkin.
Chapter 21About Narrative Reporting
21-2

• Download PDF doclets from the web or Smart View.
• Leverage Smart View's ability to access various data sources and include individual datapoints, formatted reports, variables, or embedded content within the doclet.
You can retrieve data from Narrative Reporting data sources and other Oracle EnterprisePerformance Management System on-premises and cloud data sources.
• Collaboratively review and comment on assigned review instances either on the webinterface or in Smart View.
• Sign off on the entire report package either on the web interface or in Smart View.
• Finalize the report package in the web interface.
When you work with the doclets, reference doclets, Office-based supplemental doclets, andreference files in an Narrative Reporting report package, you can use Smart View to copy andpaste or embed data from Narrative Reporting data sources and other EPM System datasources, including on-premises and cloud data sources.
For example, you can incorporate data from Oracle Essbase and Planning in the samedoclet. A doclet in a report package in Word or PowerPoint may contain a profit and lossstatement that was created from an Essbase source along with an income statement reportcreated from an Planning source. The data points for the areas that you copy or embed areretained in Word or PowerPoint, so you can refresh the doclet to keep the data up-to-date.
See the Narrative Reporting documentation on the Oracle Help Center for completedescriptions of Narrative Reporting, including overviews and procedural information.
Setting Up Narrative Reporting in Smart ViewYou can set up Narrative Reporting in Oracle Smart View for Office.
The topics in this section discuss setting up Narrative Reporting in Smart View. This is theworkflow:
• Download and run the Smart View installer
• Set up a connection to Narrative Reporting
• Install the Narrative Reporting extension
Videos
Your Goal Watch This Video
Learn about setting up Smart View. Setting Up Smart View
Downloading and Running the Smart View InstallerTo download and run the Oracle Smart View for Office installer:
1. Start Narrative Reporting in a web browser, and log in with your user name andpassword.
2. In the upper-right corner of the Narrative Reporting web interface, select the arrow next toyour user name to display the user menu.
3. From the user menu, select Downloads.
Chapter 21Setting Up Narrative Reporting in Smart View
21-3
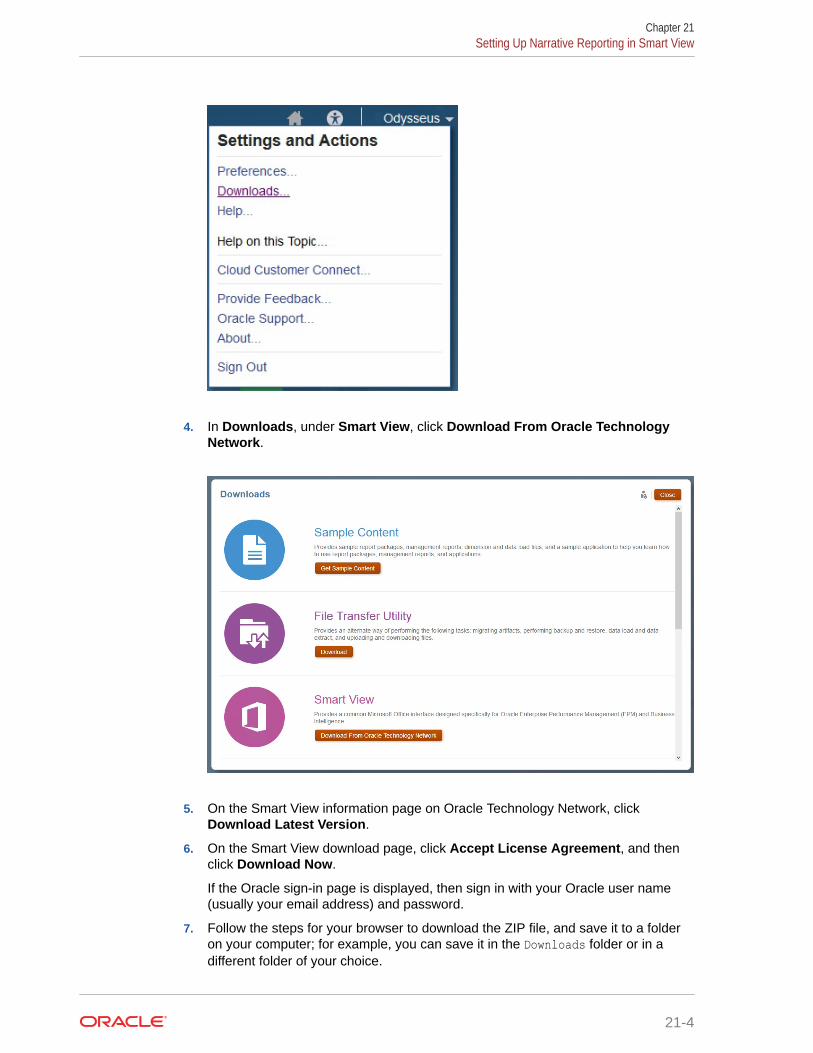
4. In Downloads, under Smart View, click Download From Oracle TechnologyNetwork.
5. On the Smart View information page on Oracle Technology Network, clickDownload Latest Version.
6. On the Smart View download page, click Accept License Agreement, and thenclick Download Now.
If the Oracle sign-in page is displayed, then sign in with your Oracle user name(usually your email address) and password.
7. Follow the steps for your browser to download the ZIP file, and save it to a folderon your computer; for example, you can save it in the Downloads folder or in adifferent folder of your choice.
Chapter 21Setting Up Narrative Reporting in Smart View
21-4

8. Navigate to the folder that you used in step 7, and then double-click SmartView.exe tostart the installation wizard.
9. Select a destination folder for Smart View, and then click OK.
For new installations, Smart View is installed by default in:
C:/Oracle/SmartView
Note:
If you are upgrading an installation of Smart View, then the installer defaults tothe folder where you previously installed Smart View.
10. When installation is complete, click OK.
The tab for the Smart View ribbon is displayed the next time you open Microsoft Excel,PowerPoint, or Word.
Continue the setup process with Creating Connections to Narrative Reporting.
Creating Connections to Narrative ReportingAfter you install Oracle Smart View for Office, as described in Downloading and Running theSmart View Installer, you can create connections to Narrative Reporting.
Connections require information about your service URL. Your Smart View administratorshould provide you with the information that you need to create the connection.
For the connection to Narrative Reporting, use the quick connection method in Smart View.
Note:
Use the procedure in this topic to create connections.
Once connections are created, use the procedure in Connecting to NarrativeReporting in Smart View for connecting on a routine basis.
To create a private connection to Narrative Reporting using the quick connection method:
1. Open Microsoft Excel, Word, or PowerPoint, and select the Smart View ribbon.
2. From the Smart View ribbon, click Panel.
3. From the Smart View Panel, select Private Connections.
Alternatively, from the Smart View Panel, click the arrow next to the Switch to button,
, and then select Private Connections from the drop-down list.
4. Still in the Smart View Panel, in the text box shown in Figure 1, enter the service URL forthe Narrative Reporting.
Chapter 21Setting Up Narrative Reporting in Smart View
21-5

Figure 21-1 Quick Connection - Enter a URL
The URL syntax:
https://serviceURL/epm/SmartView
Your Smart View administrator should provide you with the URL for NarrativeReporting
5. Press Enter.
Alternatively, click the Go button, next to the text box where you entered theservice URL.
6. In the login window, enter your Oracle Cloud Identity Service Domain credentials,and click Sign In.
7. If the Narrative Reporting Home panel is displayed, select Library to launch theSmart View Panel (if the Home panel does not display, skip to the next step).
The Narrative Reporting Home panel will display if you have already installed theNarrative Reporting extension, and are creating other connections to NarrativeReporting. For example, an administrator may be creating connections to a testenvironment and to a production environment.
8. In the Smart View Panel, expand the Narrative Reporting node, then select theLibrary node, and then click Connect.
Chapter 21Setting Up Narrative Reporting in Smart View
21-6

9. Perform an action:
• If the Extension Alerts dialog is displayed, then click the Go to Extension Dialogbutton. The Extension Alerts dialog informs you of the latest Narrative Reportingand Disclosure Management extensions available for installation. To complete theextension update procedure, see Working with Extension Alerts.
• If the Extension Alerts dialog is not displayed, continue with Installing the NarrativeReporting Extension
Installing the Narrative Reporting ExtensionThis topic covers installing the Narrative Reporting extension from within Oracle Smart Viewfor Office.
Before you begin this procedure, complete the steps in Creating Connections to NarrativeReporting.
Chapter 21Setting Up Narrative Reporting in Smart View
21-7
Note:
You can also install the extension from the Narrative Reporting webinterface. To install the extension from the web, see:
• Downloading and Installing Clients in Oracle Enterprise PerformanceManagement Cloud Getting Started with Oracle Enterprise PerformanceManagement Cloud for Administrators
• Downloading and Installing Clients in Oracle Enterprise PerformanceManagement Cloud Getting Started with Oracle Enterprise PerformanceManagement Cloud for Users
Downloading the Narrative Reporting extension from the Mozilla Firefoxbrowser may result in a new tab opening with a large amount of code beingdisplayed. This is due to a security policy within the Mozilla Firefox browserrelated to certain file extensions. The workaround is to download theextension using an alternate supported browser (Microsoft Edge or GoogleChrome), or install using the procedure in this topic.
To install the Narrative Reporting extension from Smart View:
1. From the Smart View ribbon, select Options, and then Extensions.
2. Click the Check for Updates, New Installs, and Uninstalls link.
3. In Select Location for Extension Updates, select the connections to check forextension updates, and then click Get Updates.
Smart View checks for all extensions that your administrator has made available toyou.
To check for available extensions in all your connections, check Select All, andthen click Get Updates.
The dialog box expands to display a message window providing you with theprogress and status of the extension query.
Note:
If you have connections to multiple products from Oracle EnterprisePerformance Management System, Oracle Enterprise PerformanceManagement Cloud, Oracle Business Intelligence Enterprise Edition, andOracle Analytics Cloud, you may select only the check box thatcorresponds to your Narrative Reporting connection.
4. Locate the extension named Narrative Reporting and click the Install link,
, to launch the installer.
5. In the popup dialog asking "Apply this extension update?", click Yes, and thenclick OK to close the Options dialog, Extensions tab.
A dialog display the progress of the extension installation.
Chapter 21Setting Up Narrative Reporting in Smart View
21-8
6. A message dialog is displayed informing you that the installation is successful andinstructing you to restart Office; click OK in this dialog, and then close and restart Office.
For more information on extension installation, see the following topics:
• Initially Checking for Available Extensions
• Installing Extensions
After completing the procedure in this topic, you are ready to begin using Narrative Reportingwith Smart View.
Connecting to Narrative Reporting in Smart ViewYou can connect to Narrative Reporting anytime you start Microsoft Excel, Word, orPowerPoint.
Note:
Before you connect to Narrative Reporting, make sure you have completed theprocedures in Downloading and Running the Smart View Installer and CreatingConnections to Narrative Reporting,
Video
Your Goal Watch This Video
Learn about setting up Oracle Smart View forOffice and connecting to Narrative Reporting. Setting Up Smart View
To connect to Narrative Reporting:
1. Perform an action:
• If you're working with Narrative Reporting report packages, launch Word orPowerPoint, depending on the content of the report package.
Note:
Report packages can consist of either Word documents or PowerPointslides, but not both.
• If you're working with Narrative Reporting models and reports, launch Excel.
2. Select the Smart View ribbon, and then click Panel.
3. In the Smart View Panel, select Private Connections.
Alternatively, from the Smart View Panel, click the arrow next to the Switch to button,
, and then select Private Connections from the drop-down list.
4. In the text box shown in Figure 1, click the arrow to display the drop-down menu andselect your connection.
Chapter 21Connecting to Narrative Reporting in Smart View
21-9

Figure 21-2 Quick Connection Arrow for Drop-down List
If you created your data source connection using the procedure in CreatingConnections to Narrative Reporting, then it should be listed under Quick ConnectURLs in the drop-down list.
5. In the Login window, enter your User Name and Password, and then click SignIn.
The Narrative Reporting Home panel is displayed. Narrative Reporting Homeallows you to quickly access your pending tasks and other work in which you areinvolved. From the Narrative Reporting Home, you can access:
• Incomplete Tasks—Incomplete tasks assigned to you.
• Active Report Packages—These are the active report packages for whichyou have outstanding tasks and responsibilities.
• Recent Items—Items you have recently accessed.
• Library—The library of items in Narrative Reporting, including reportpackages and reporting applications.
• New Report Package—Shortcut to the New Report Package dialog, whereyou define a report package structure.
Figure 2 shows an example of Narrative Reporting Home.
Figure 21-3 Narrative Reporting Home
Chapter 21Connecting to Narrative Reporting in Smart View
21-10

Note:
The next step explains how to access a report package or reporting applicationfrom the Narrative Reporting Library node by clicking Library in NarrativeReporting Home. You can also access report packages and tasks usingIncomplete Tasks, Active Report Packages, and Recent Items. Thoseaccess methods are described in Using Narrative Reporting Home.
6. Click Library and then perform an action:
• To work with report packages in Word or PowerPoint:
a. Expand the Narrative Reporting node, then the Library node, then expand theReport Packages folder, and then select a report package.
You can also locate the report package by navigating to:
– The Recent folder, if you have recently accessed the report package in theNarrative Reporting web interface
– The Favorites folder, if you have designated the report package as a favoritein the Narrative Reporting web interface.
– A user-defined folder, if the report package was saved in a folder created inthe Narrative Reporting web interface.
b. In the Action Panel, select Open Report Package.
Chapter 21Connecting to Narrative Reporting in Smart View
21-11

Alternatively, you can right-click the report package name and select OpenReport Package, or double-click the report package name to open it.
c. To work with report packages, continue with these topics in this chapter:
– Authoring Doclets
– Performing Reviews
– Performing Sign Offs
• To work with Narrative Reporting models in Excel:
a. Expand the Reporting Applications folder, and then expand anapplication, then select a model.
b. In the Action Panel, click Connect.
Alternatively, you can right-click the model name and select Connect, ordouble-click the model name to connect.
c. Refer to Ad Hoc Analysis chapter in this guide for information on workingwith the Narrative Reporting reporting application or applications fromother Oracle providers.
Note:
In Excel, you can also navigate in the Smart View Panel to NarrativeReporting, then Library, and select a report package. Smart View willlaunch the report package in Word or PowerPoint as applicable.
7. Optional: For a brief look at using Narrative Reporting with Smart View, see Example: Working with Narrative Reporting Data in Smart View.
Chapter 21Connecting to Narrative Reporting in Smart View
21-12

Using Narrative Reporting HomeAfter you create a connection to Narrative Reporting, you can use Narrative Reporting Home.
Note:
The procedures in this topic assume that you have created a connection toNarrative Reporting as described in Creating Connections to Narrative Reporting,and connected, following the procedure in Connecting to Narrative Reporting inSmart View
To use Narrative Reporting Home:
1. Connect to Narrative Reporting as described in Connecting to Narrative Reporting inSmart View to display Narrative Reporting Home.
Figure 1 shows an example of Narrative Reporting Home.
Figure 21-4 Narrative Reporting Home
2. To access tasks that require your attention:
a. In Narrative Reporting Home, click Incomplete Tasks or click the corresponding
.
Each item in the Incomplete Tasks list consists of a link to help you access the task.
Chapter 21Using Narrative Reporting Home
21-13
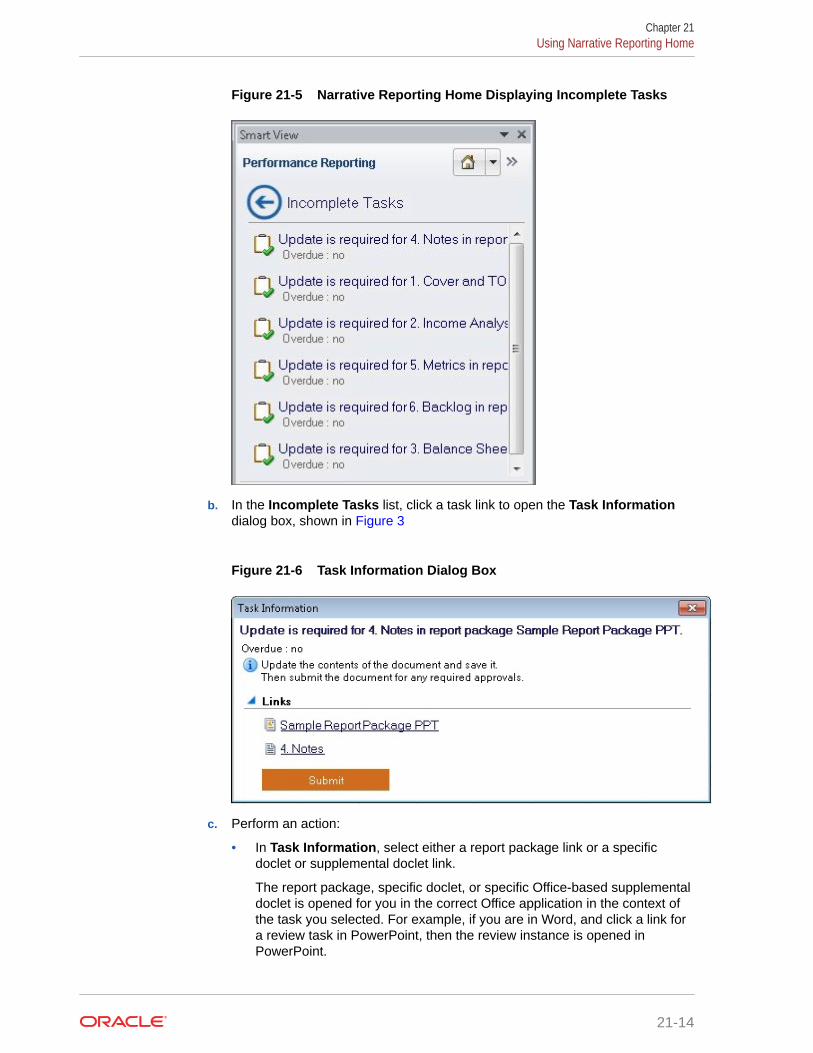
Figure 21-5 Narrative Reporting Home Displaying Incomplete Tasks
b. In the Incomplete Tasks list, click a task link to open the Task Informationdialog box, shown in Figure 3
Figure 21-6 Task Information Dialog Box
c. Perform an action:
• In Task Information, select either a report package link or a specificdoclet or supplemental doclet link.
The report package, specific doclet, or specific Office-based supplementaldoclet is opened for you in the correct Office application in the context ofthe task you selected. For example, if you are in Word, and click a link fora review task in PowerPoint, then the review instance is opened inPowerPoint.
Chapter 21Using Narrative Reporting Home
21-14

Non-Office-based supplemental doclets are downloaded to your downloaddirectory where you can open them manually.
• If the doclet shown in Task Information is ready to be submitted, click theSubmit button.
d. To exit Task Information without performing any actions, click the X in the top rightcorner of the dialog box.
e. To return to Narrative Reporting Home from the Incomplete Tasks list without
performing any actions on tasks in the list, click
3. To access active report packages for which you have a responsibility:
a. In Narrative Reporting Home, click Active Report Packages or click the
corresponding .
Each item in the Active Report Packages list consists of a link to a report packagefor which you have a responsibility.
Figure 21-7 Narrative Reporting Home Displaying Active Report Packages
b. In the Active Report Packages list, click a link to open a report package.
The report package is opened for you in the correct Office application in the contextof your current responsibility. For example, if you are in Word, and click a reportpackage link for which you have a review task in PowerPoint, then the reportpackage is opened for you in PowerPoint with the review instance ready for you toselect in the Report Center.
Alternatively, to return to Narrative Reporting Home from the Active Report
Packages list without opening any report packages in the list, click .
Chapter 21Using Narrative Reporting Home
21-15

4. To access recently-opened items:
a. In Narrative Reporting Home, click Recent items or click the corresponding
.
Each item in the Recent Items list consists of a link to a report package thatyou have recently opened and for which you have a responsibility.
Figure 21-8 Narrative Reporting Home Displaying Active ReportPackages
b. In the Recent Items list, click a link to open a report package.
The report package is opened for you in the correct Office application in thecontext of your current responsibility. For example, if you are in Word, andclick a report package link for which you have a review task in PowerPoint,then the report package is opened for you in PowerPoint with the reviewinstance ready for you work with.
Alternatively, to return to Narrative Reporting Home from the Recent Items list
without opening any report packages in the list, click .
5. To access the Narrative Reporting library, see Connecting to Narrative Reportingin Smart View.
Administering Report Packages in Smart ViewYou can administer report packages in Oracle Smart View for Office.
Related Topics
• About Administering Report Packages in Smart View
• Creating Report Package Structures
• Adding Doclets to Report Package Structures
• Adding Sections to Report Package Structures
• Editing Report Package, Doclet, and Section Properties
Chapter 21Administering Report Packages in Smart View
21-16

About Administering Report Packages in Smart ViewWith report packages in Narrative Reporting, you can structure the content of your report,assign responsibilities to content creators and reviewers, and manage their collaboration andworkflow to produce a unified document.
Report packages are described in detail in Learning About Report Packages, available in theNarrative Reporting library on the Oracle Help Center.
In Oracle Smart View for Office, report package owners can complete these report packageadministration tasks:
• Create report package structures based on either the structure of a folder containingsubfolders and files or based on the heading structure of a single document.
See Creating Report Package Structures from Files in a Folder and Creating ReportPackage Structures from a File.
• Add doclets, with or without author assignments, and add sections to report packages.
See Adding Doclets to Report Package Structures and Adding Sections to ReportPackage Structures.
• Edit the name and description for report packages, doclets, and sections.
Editing Report Package, Doclet, and Section Properties.
Additionally, report package owners and doclet authors can refresh report packages,including content in regular doclets and reference doclets. See Refreshing Report Packages.
Creating Report Package StructuresRelated Topics
• About Creating Report Package Structures in Smart View
• Creating Report Package Structures from Files in a Folder
• Creating Report Package Structures from a File
About Creating Report Package Structures in Smart ViewYou can easily create a Word-, PowerPoint-, or PDF-based report package structure usingOracle Smart View for Office.
With the New Report Package command, available in Narrative Reporting Home, from theNew Report Package command in the Action Panel of Narrative Reporting Library, or fromthe right-click context menu on user folders in the Library, you can use a folder structure or afile as the source of the new report package.
A subset of report package design and creation activities can be performed in Smart View.For example, you use the Narrative Reporting web interface to rearrange doclets in the reportpackage, define development phases, and assign users to those phases. But with SmartView, you can quickly accomplish the task of defining the structure of a report package byadding doclets (regular, supplemental, and reference) and sections in one step.
Smart View provides two methods for creating report packages:
• From a folder
Chapter 21Administering Report Packages in Smart View
21-17

Create a folder on a local or network drive. Under this folder, place subfolders andfiles for the report package. The content and structure of the folder, includingsubfolders and content of subfolders, becomes the doclets and sections of thereport package structure. See Creating Report Package Structures from Files in aFolder.
• From a file
Select a .docx or .pdf file as the basis of your report package structure. Theheadings in the file become doclets at the root level of the report package. See Creating Report Package Structures from a File.
With either method, you have the option to specify name, description, and the type foreach doclet (regular, supplemental, or reference), and assign author responsibilities,before importing the files to create the report package.
After import, the basic structure and content of your report package is defined. You canfurther refine the structure from Smart View by adding more doclets or sections to thereport package and, optionally, assigning author responsibilities to them. Thencontinue with the Narrative Reporting web interface to complete the report packagedefinition.
Video
Your Goal Watch This Video
Learn about creating Narrative Reportingreport package structures in Smart View. Overview: Getting Started With Report
Packages in Smart View for Office
Guidelines for Creating Report Package Structures in Smart View
• You must have the Report Admin role to see the New Report Package command.
• When creating a report package structure from a folder:
– Word-, PowerPoint-, and PDF-based report packages are supported.
– You must supply a style sample document. This can be a file that you plan toadd to the report package structure as a doclet, or it can be a file you speciallycreated to be your style sample file. But you need to select a style sampledocument when creating the report package structure.
– Files within the folder structure cannot be 0 (zero) KB. A 0 KB file can resultwhen creating a Word or PowerPoint file from Windows Explorer using theright-click menu. Remove any such files from your folder structure.
• When creating a report package structure from a file:
– You can only create Word-based report packages.
– Only .docx and .pdf files are supported as the source of the report package.
– Even if the file selected is a .pdf, the resulting doclets will all be of Word type(.docx). No sections will be created in the resulting report package, and all thegenerated doclets will appear at the root level.
– If you are using Smart View on Office 2010, only Word documents aresupported, not PDF files.
– No style sample document is required. Smart View generates a style sampledocument based on the content of the Word document or PDF file.
Chapter 21Administering Report Packages in Smart View
21-18
• The following conditions will result in an error:
– If any required fields are missing input in the New Report Package dialog
– Report package type and doclet type mismatch; for example, if you try to define aPowerPoint file as a regular doclet in a Word-based report package.
– For report package structures based on a folder structure:
* If any folders in the structure are empty. Remove any empty folders from yourfolder structure.
* If any files within the folder structure are 0 (zero) KB. A 0 KB file can result whencreating a new Word or PowerPoint file from Windows Explorer using the right-click menu. Make sure the files are valid Office documents of non-zero file size.
– For report package structures based on a file, if the file is empty, contains invalidcontent, or is password protected.
– A report package with the given name already exists in the system; names must beunique.
– The report package creator does not have permission to the specified library folder.
Creating Report Package Structures from Files in a FolderUse Smart View to create an Narrative Reporting report package structure from filesorganized in a folder.
Note:
Before you begin, launch Oracle Smart View for Office and log in to NarrativeReporting.
To create a report package structure from files in a folder:
1. In Narrative Reporting Home, select New Report Package to launch the New ReportPackage dialog.
Alternatively, in Narrative Reporting Home, click Library, and navigate to the folder whereyou will save the report package, then right-click the folder and select New ReportPackage.
2. To create a new report package structure from a folder and its contents, click the radiobutton next to this icon:
3. Enter a Report Package Name and optional Report Package Description.
4. Select a Report Package Type: Word, PowerPoint, or PDF.
5. For Location to save in Library, click Select, then navigate to the Library folder in whichto save the report package, and then click Select in the Report Package Save Locationdialog.
Chapter 21Administering Report Packages in Smart View
21-19

6. For Report Package Style Sample, click Select File, then navigate to the Wordor PowerPoint style sample file and select the file, and then click Open.
7. In Select folder to import, navigate to the folder that contains the files you wantto use as the basis of the report package structure, then select the folder, and thenclick OK.
In the bottom portion of the dialog, the folder you selected, and its subfolders, isdisplayed in the left pane; the doclets and sections, which will be created from thefiles and subfolders, are displayed in the right pane, as shown in Figure 1.
Figure 21-9 Options for Creating a Report Package Structure from a Folder
The example in Figure 1 shows the New Report Package dialog before clickingthe Import button. In the example, we're using the files in the Report Packagefiles folder to create a report package structure that will be stored in the Monthlyfolder in the Library.
8. At the bottom portion of the dialog, in the right pane, to make any necessarychanges to the doclet type, click the arrow in the cells under Type, and select adoclet type.
Use the folder structure in the left pane to drill down into folders, if present, todisplay more doclets and sections, and then make your changes in the Typecolumn.
For example, after evaluation by Narrative Reporting, a Word document wasdesignated a Regular doclet , but you want to change the designation toSupplemental.
Chapter 21Administering Report Packages in Smart View
21-20

Note:
If you change the report package type at this point, Narrative Reportingreevaluates the type of each doclet per the new report package type. You canthen make any changes you require as described in this step.
9. Optional: At the bottom portion of the dialog, in the right pane, click in the cells underName and Description to change doclet and section names, and to add descriptions tothe doclets and sections.
Use the folder structure in the left pane to drill down into folders, if present, to displaymore doclets and sections, and then make your changes in the Name and Descriptioncolumn.
Alternatively, you can change doclet and section names, and add descriptions to thedoclets and sections later in Smart View; see Editing Report Package, Doclet, andSection Properties.
10. Verify that the information you entered in the New Report Package dialog is correct, andthen click Import.
When the import is completed, you are returned to Narrative Reporting Home, where youcan click the link provided to open the report package in Smart View.
Figure 21-10 Narrative Reporting Panel with Link to New Report Package
Alternatively, if you invoked the New Report Package command by right-clicking on a
Library folder, then click to refresh the panel to view the new report package in thatfolder.
Creating Report Package Structures from a FileUse Smart View to create an Narrative Reporting report package structure from a Word orPDF file.
Chapter 21Administering Report Packages in Smart View
21-21

Note:
Before you begin, launch Oracle Smart View for Office and log in to NarrativeReporting.
To create a report package structure from a Word or PDF file:
1. In Narrative Reporting Home, select New Report Package to launch the NewReport Package dialog.
2. To create a new report package structure from a PDF file or Word document, clickthe radio button next to this icon:
3. Enter a Report Package Name and optional Report Package Description.
4. In Report Package Type, Word is the default and only option available.
5. For Location to save in Library, click Select, then navigate to the Library folderin which to save the report package and select it, and then click Select in theReport Package Save Location dialog.
6. For Document to split and import into a report package, click Select File, thennavigate to the file and select it, and then click Open.
Use the filter control at the bottom right of the Open dialog to filter by documenttype: Word (.docx) or PDF (.pdf).
The example in Figure 1 shows the New Report Package dialog with theVision.pdf file selected for splitting into individual Word files. In the example, thereport package structure we're creating will be stored in the Quarterly folder in theLibrary.
Chapter 21Administering Report Packages in Smart View
21-22

Figure 21-11 Options for Creating a Report Package Structure from a Document,Before Generating Doclets
7. Click Generate Doclets.
A message is displayed informing you that the operation can take some time to complete.To continue, click Yes in the message box.
A second message is displayed informing you that the file will be converted intooptimized, editable documents, and that the documents may not look exactly like theoriginal file, but they can be edited later. To continue, click OK in the message.
Once the file generation process is complete, in the bottom of portion of the dialog, thetemporary folder where the files are being stored is displayed in the left pane; the filesthat were created in the right pane, as shown in Figure 2.
Also, a default style sample is provided based on the file that was just split.
Chapter 21Administering Report Packages in Smart View
21-23

Figure 21-12 Options for Creating a Report Package Structure from aDocument, After Generating Doclets
8. At the bottom portion of the dialog, in the right pane, to make any necessarychanges to the doclet type, click the arrow in the cells under Type, and select adoclet type.
For example, after evaluation by Narrative Reporting, a Word document wasdesignated a Regular doclet , but you want to change the designation toSupplemental.
9. Optional: At the bottom portion of the dialog, in the right pane, click in the cellsunder Name and Description to change doclet names and add descriptions to thedoclets.
If required, you can add descriptions to the doclets later in Smart View; see EditingReport Package, Doclet, and Section Properties.
10. Verify that the information you entered in the New Report Package dialog iscorrect, and then click Import.
When the import is completed, you are returned to the Narrative Reporting Panel,where you can click the link provided to open the report package in Smart View.
Chapter 21Administering Report Packages in Smart View
21-24
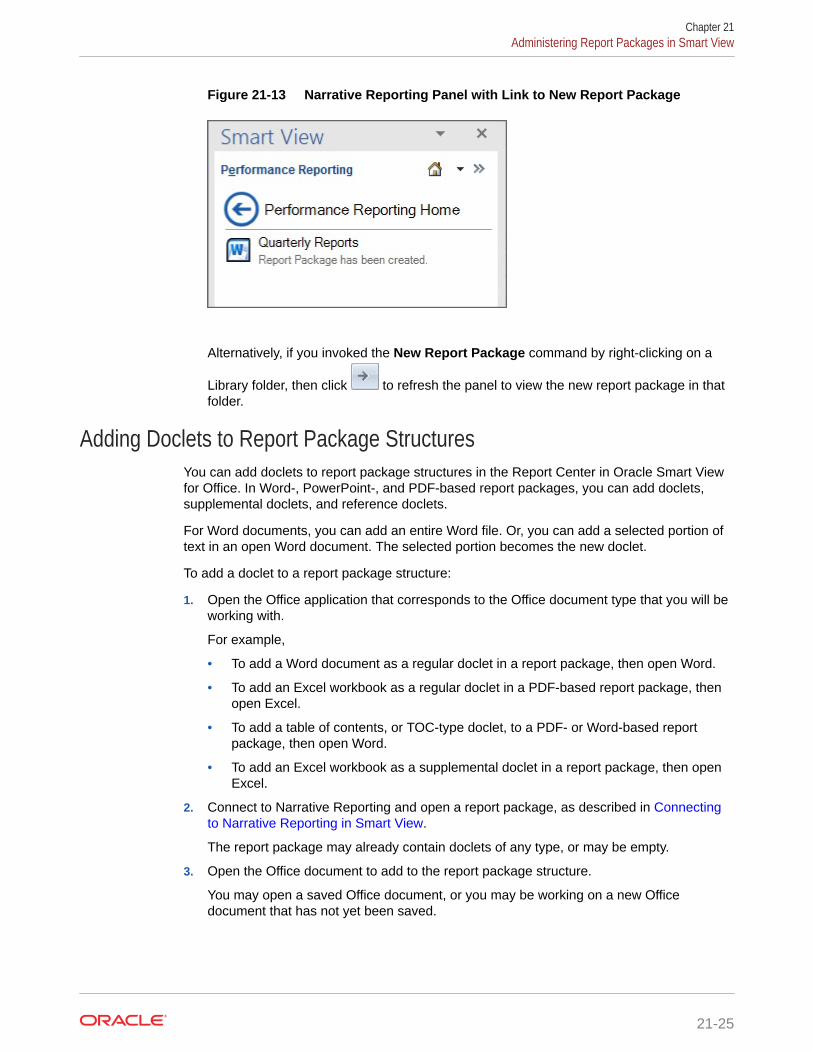
Figure 21-13 Narrative Reporting Panel with Link to New Report Package
Alternatively, if you invoked the New Report Package command by right-clicking on a
Library folder, then click to refresh the panel to view the new report package in thatfolder.
Adding Doclets to Report Package StructuresYou can add doclets to report package structures in the Report Center in Oracle Smart Viewfor Office. In Word-, PowerPoint-, and PDF-based report packages, you can add doclets,supplemental doclets, and reference doclets.
For Word documents, you can add an entire Word file. Or, you can add a selected portion oftext in an open Word document. The selected portion becomes the new doclet.
To add a doclet to a report package structure:
1. Open the Office application that corresponds to the Office document type that you will beworking with.
For example,
• To add a Word document as a regular doclet in a report package, then open Word.
• To add an Excel workbook as a regular doclet in a PDF-based report package, thenopen Excel.
• To add a table of contents, or TOC-type doclet, to a PDF- or Word-based reportpackage, then open Word.
• To add an Excel workbook as a supplemental doclet in a report package, then openExcel.
2. Connect to Narrative Reporting and open a report package, as described in Connectingto Narrative Reporting in Smart View.
The report package may already contain doclets of any type, or may be empty.
3. Open the Office document to add to the report package structure.
You may open a saved Office document, or you may be working on a new Officedocument that has not yet been saved.
Chapter 21Administering Report Packages in Smart View
21-25

Note:
You can only add documents of the Office Open XML formattype .docx, .pptx, and .xlsx.
4. Optional for Word doclets only: To create a doclet from a portion of text within aWord document, select that text.
5. In the Report Center panel, perform an action:
• Select the doclet in the report package structure before which the new docletwill be inserted.
The doclet will be inserted before the doclet that you select.
• Select the section folder into which the new doclet will be added.
The doclet will be added as the last file in the section folder.
• Navigate into a section folder and select the doclet before which the newdoclet will be inserted.
• If there are no doclets yet in the report package, click root in the ReportCenter panel.
If there are doclets in the report package, and you click root, then the docletwill be added as the last doclet in the report package.
6. In the Action Panel, click the Add Doclet link and in Add Doclet to ReportPackage, complete the following:
• Name—Required. You can accept the file name as the doclet name or enter anew name. This is the name that will appear in the report package. Docletnames are limited to 80 characters.
• Type—Required. Select a doclet type from the available options. The optionsavailable depend on the report package type. For example, in a Word-basedreport package, if you are adding a Word doclet, the available types areRegular and Supplemental; for an Excel doclet in a PDF-based reportpackage, the available types are Regular, Supplemental and Reference.
• Table of Content Doclet—Optional. Applies to Word documents in Word- andPDF-based report packages only. Select this check box if you plan to use thecurrently-opened Word document as a table of contents for the reportpackage.
• Description—Optional. Enter a doclet description.
• Suppress Doclet—Select to suppress a doclet's contents within the reportpackage. The suppressed doclet content will not be included in the reportpackage’s output.
Enable this option when a particular doclet within your report package is notrequired for the current reporting period. This allows you to keep the docletdefinition and structure for future executions of the report package when itscontents may be required. After adding the doclet, you can view the optionstatus in the Properties dialog of the doclet (see Inspecting Doclets). You canlater change the option status in the web; see Editing Properties in Creatingand Managing Report Packages for Narrative Reporting.
Chapter 21Administering Report Packages in Smart View
21-26

• Exclude from Author Phase—The state of the option (enabled or disabled)depends on whether an author phase has been defined for the report package.
These are the possible actions:
If the check box is disabled, then an author phase is not defined for the reportpackage. No action is required.
If the check box is enabled, then an author phase is defined for the report package.Take an action:
– Select this check box to exclude the doclet from the author phase, and thencontinue to step 8.
– Clear the check box to assign authors to this doclet. Clearing the check boxshould automatically take you to the Authors tab of the dialog. Continue to thenext step to add authors to this doclet.
This is the dialog with the check box enabled and cleared:
• All Sheets Included—Optional. Enabled and selected by default when adding anExcel workbook as a regular doclet to a PDF-based report package. Clearing thecheck box should automatically take you to the Selected Sheets tab of the dialog,where all sheets in the workbook are listed. Select the check box next to the sheetsthat you want to include in the report package.
Chapter 21Administering Report Packages in Smart View
21-27
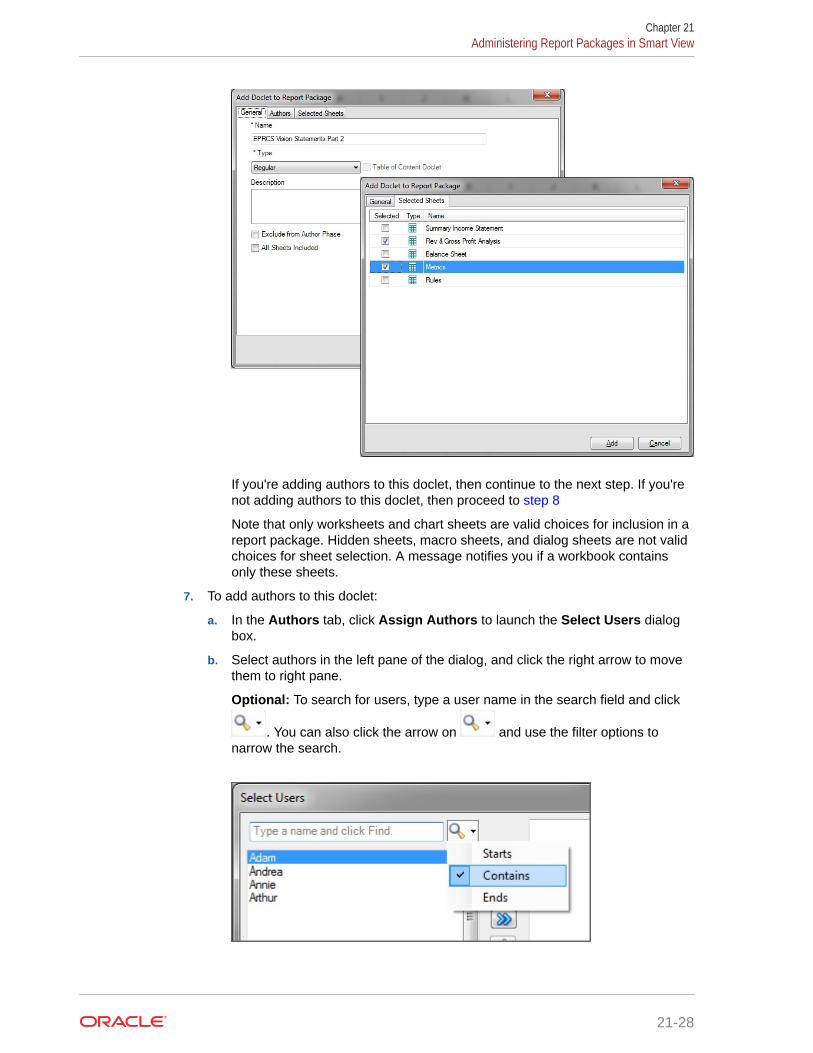
If you're adding authors to this doclet, then continue to the next step. If you'renot adding authors to this doclet, then proceed to step 8
Note that only worksheets and chart sheets are valid choices for inclusion in areport package. Hidden sheets, macro sheets, and dialog sheets are not validchoices for sheet selection. A message notifies you if a workbook containsonly these sheets.
7. To add authors to this doclet:
a. In the Authors tab, click Assign Authors to launch the Select Users dialogbox.
b. Select authors in the left pane of the dialog, and click the right arrow to movethem to right pane.
Optional: To search for users, type a user name in the search field and click
. You can also click the arrow on and use the filter options tonarrow the search.
Chapter 21Administering Report Packages in Smart View
21-28

c. After you've selected and moved all required authors to the right pane, click OK inthe Select Users dialog box.
The user selections are now shown in the Authors tab of Add Doclet to ReportPackage dialog:
You can click the Assign Authors button again to make further changes to theauthor assignments.
8. Click Add to add the doclet to the report package structure.
9. At the prompt, click Yes to open the new to doclet for editing; otherwise, click No.
Whether you click Yes or No, the doclet is added to the report package.
Chapter 21Administering Report Packages in Smart View
21-29

Note:
If you click Yes at the prompt, then to edit the doclet, check it out.
Adding Sections to Report Package StructuresYou can add sections to Word-, PowerPoint-, and PDF-based report packagestructures in the Report Center in Oracle Smart View for Office.
To add a section to a report package structure:
1. Open Office, connect to Narrative Reporting, and open a report package, asdescribed in Connecting to Narrative Reporting in Smart View.
2. In the Report Center, perform an action:
• Select the doclet or section in the report package structure before which thenew section will be inserted.
The section will be inserted before the doclet or section that you select.
• Navigate into a section folder and select the doclet before which the newsection will be inserted.
• If there are no doclets or sections yet in the report package structure, clickroot in the Report Center panel.
If there are doclets or sections in the report package structure, and you clickroot, then the section will be added as the last artifact in the report package.
3. In the Action Panel, click the Add Section link and in Add Section To ReportPackage, complete the following:
• Name—Required. Enter a section name. This is the section name that willappear in the report package.
• Description—Optional. Enter a section description.
Chapter 21Administering Report Packages in Smart View
21-30
4. Click Add.
Editing Report Package, Doclet, and Section PropertiesYou can edit the Name and Description properties for report packages, doclets, and sectionsin Oracle Smart View for Office.
To edit properties for report packages, doclets, and sections:
1. Open Office and connect to Narrative Reporting, as described in Connecting to NarrativeReporting in Smart View.
2. To edit report package properties:
a. From Narrative Reporting Home, select Library, and then navigate to the reportpackage in the Library panel and select it, but do not open it.
b. In the Action Panel, select the Properties link.
c. In Report Package Properties, double-click or press F2 in the Report PackageName and Description fields, and then type your changes.
3. To edit doclet or section properties:
a. From Narrative Reporting Home, select Library, then navigate to the report packagein the Library panel, and then open it.
b. Navigate to the doclet or section and then select it.
c. In the Action Panel, select the Properties link.
d. In Properties, double-click or press F2 in the Name and Description fields, and thentype your changes.
4. Click Save.
Authoring DocletsAs a doclet author, you provide report content in Oracle Smart View for Office.
Related Topics
• About the Author Phase Process
• Authoring Doclets in Smart View
• Working with Embedded Content from Reference Doclets
• Working with Embedded Content from Reference Files
• Working with Variables
• Working with Excel Doclets in PDF-based Report Packages
• Working with Server-Initiated Refresh
• Inserting Links and Cross-References to Pages in Doclets
• Working with an Automatic Table of Contents
• Approving or Rejecting Doclets
• Recalling Doclets
• Inspecting Doclets
Chapter 21Authoring Doclets
21-31
• Reverting to a Prior Version of a Doclet
About the Author Phase ProcessReport packages are made up of subcomponents called doclets. There are threedoclet types: doclets, reference doclets, and supplemental doclets. A report packageowner assigns authors and approvers for each doclet of all types in a report package.The authors and approvers provide and approve content for the doclets.
The author phase follows this process:
1. The report package owner initiates the author phase in the Narrative Reportingweb interface.
2. Notification messages are sent to authors to begin their work.
3. In Oracle Smart View for Office, authors open and then check out Office-baseddoclets of any type. They provide content, add content to reference files, embedavailable content from reference doclets, Reports, and reference files, and thencheck doclets back in.
Authors use the web interface to check out and check in PDF doclets andsupplemental doclets of non-Office type. From Smart View, authors download PDFdoclets and non-Office supplemental doclets.
See About Doclets and Variables for more information.
4. When authors have finished their work, they submit doclets of all types forapproval, if required.
5. If doclet approval is specified, notification messages are sent to approvers toreview and either approve or reject doclets.
6. The report package owner marks the author phase complete.
As an author, in Smart View or in the Narrative Reporting web interface, you can workwith:
• Doclets in Word, PowerPoint, Excel, or PDF format
• Reference doclets in Excel, from which you embed content in Word doclets
• Charts and tables created in the Reports web interface, from which you embedcontent in Word doclets
• Excel doclets in PDF-based report packages
• Excel-based reference files, which contain content that you may want to embed ina Word doclet
• Office-based supplemental doclets with the appropriate Office application
• PDF doclets and non-Office-based supplemental doclets, such as PDF or TXTfiles, which you download and open with the appropriate application (using theweb interface to check out, upload, and check in)
The topics in this section discuss authoring and working with doclets, referencedoclets, supplemental doclets, and reference files in Smart View.
Chapter 21Authoring Doclets
21-32
About Doclets and VariablesReport packages are comprised of subcomponents called doclets, reference doclets,reference files, and supplemental doclets. Additionally, variables can be sourced fromreference doclets and reference files.
• Doclets
Doclets contain the content you require for the report that you’re creating with anNarrative Reporting report package. A report package can consist of one or more doclets.Word-based report packages contain Word-based doclets; PowerPoint-based reportpackages contain PowerPoint-based doclets. PDF-based report packages contain Word-and Excel-based doclets, along with PDF files; however, only the Word and Excel docletscan be authored.
Doclets participate fully in report package workflow, including all author phases, reviewphases, sign off, and report publishing.
• Reference doclets
Reference doclets can be used as containers to store content such as named rangesfrom an Excel file, or charts and graphs created from Reports, which are consumed byone or more doclets in a report package.
Excel-based reference doclets are Excel files that serve as supporting files with contentsuch as Oracle Smart View for Office grids or forms, or static Excel content, that you canregister and then embed directly into Word-based doclets. You specify the embeddablecontent using Excel's Name Manager, then register the named ranges in Smart View.
Reports-based reference doclets consist of tables and charts created and registered asavailable content in the Narrative Reporting web interface.
You can then embed content from either type of reference doclet directly into Word-baseddoclets. Using the embedding process, the layout and format of the content is maintainedin the target doclet just as in the source reference doclet.
Both Excel- and Reports-based reference doclets can be included in Word-based reportpackages. Embedded content is merged in the combined report and can be commentedon during the review phase.
In Smart View, Excel-based reference doclets support the content management andworkflow features of the author phase as follows:
– Reference doclets can be checked out, modified, uploaded, checked in, submitted forapproval, and approved or rejected.
– Word-based doclets containing embedded content can be checked out, modified,uploaded, checked in, submitted for approval, and approved or rejected.
– Embedded content can be synced with updates made to named ranges in thereference doclet.
– Embedded content can be refreshed.
The workflow for Reports-based reference doclets is maintained in the NarrativeReporting web interface; however, these content management and workflow features ofthe author phase are supported in Smart View as follows:
– Word-based doclets containing embedded content can be checked out, modified,uploaded, checked in, submitted for approval, and approved or rejected.
Chapter 21Authoring Doclets
21-33

– Embedded content can be synced with updates made to named ranges in thereference doclet.
– Embedded content can be refreshed.
Note that reference doclets themselves are not available for commenting in thereview or sign off phase; however, in a doclet, you can comment on the embeddedcontent that was sourced from reference doclets, and the embedded content ispart of the final published report.
• Reference files
Reference files are Excel workbooks that contain report content that you canembed into a Word doclet. The reference file is not listed as part of the reportpackage in the same way that doclets, reference doclets, and supplement docletsare. Instead, when you embed content from a reference file into a Word doclet,that reference file becomes part of the properties of the doclet. When you checkout the target Word doclet, Narrative Reporting tracks any changes you make tothe reference file. You can then refresh the content you have embedded in thetarget Word doclet.
Note that reference files themselves are not available for commenting in thereview or sign off phase; however, in a Word doclet, you can comment on theembedded content that was sourced from reference files, and the embeddedcontent is part of the final published report.
• Supplemental doclets
Supplemental doclets are documents which assist in the development of theoverall report, such as source and supporting files. Supplemental doclets can be ofOffice file types, such as Excel, Word, or PowerPoint; or of non-Office file types,such as PDF, TXT, or ZIP. Content from supplemental doclets is not merged intothe combined report.
Supplemental doclets of any file type can be included in both Word-based andPowerPoint-based report packages. For example, Word-based supplementaldoclets can be included in Word- or PowerPoint-based report packages.
In Smart View, supplemental doclets support the content management andworkflow features of the author phase as follows:
– Office-based supplemental doclets can be checked out, modified, uploaded,checked in, submitted for approval, and approved or rejected.
– For supplemental doclets of non-Office file types, Smart View gives assignedauthors easy access to download and view files. However, any otherinteractions with the files, such as checkout, upload, and checkin, must beperformed through the Narrative Reporting web interface.
Note that supplemental doclets of any file type are not available for commenting inthe review or sign off phase, and they are not part of the final published report.
• Variables
Report Package variables provide centralized maintenance of common text,numbers, dates, and data that are displayed in doclets throughout a reportpackage. Variables can also be used to reference content between doclets, suchas inserting Excel data from a reference doclet into a Word doclet.
Two types of variables are available:
– Static variables use static input that is defined by the user, such as a datelabels or a set value, which can be used throughout the report package. These
Chapter 21Authoring Doclets
21-34

static variables can be easily updated, and all doclet instances of the variable valuereflect the change. The static variables help to centrally maintain common dates,numbers and text across the Report Package document content.
– Reference variables are created by referencing another doclet within the reportpackage as the source, and selecting the value for the variable, such as text in aWord paragraph or an Excel cell value. If the source document is subsequentlyupdated, those changes are automatically updated in the inserted instances of thevariable in the report package. Reference variables can be used to insert Excel cellvalues into a paragraph in a Word doclet, or to create Excel formulas to implementcross-footing rules for increased data accuracy, or to create directional words for thereport narrative, such as "an increase" or "a decrease".
Authoring Doclets in Smart ViewAs a doclet author, you provide report content in Oracle Smart View for Office. The authoringprocess follows this workflow:
1. Check out the doclet, reference doclet, or supplemental doclet.
You can check out Office-based supplemental doclets.
2. Update the doclets.
Some suggested Smart View content development tasks:
• Copy and paste data points or data ranges, using Smart View Copy and Pastecommands from Office-based documents and doclets into Word-based orPowerPoint-based doclets, as described in Copying Data Between Excel, Word, andPowerPoint.
• Use the Office copy and paste commands to copy Smart View data and then importSmart View metadata, as follows:
– Use the PowerPoint copy and paste commands to copy a slide or presentationinto a PowerPoint-based doclet or supplemental doclet, then import the metadatafrom the original slide or presentation into the doclet, as described in ImportingMetadata into Copied Worksheets
– Use the Word copy and paste commands to copy Smart View artifacts from Worddocuments, then import the metadata from the original document into the doclet,as described in Importing Metadata into Copied Word Documents.
– Use the Excel copy and paste commands to copy Smart View artifacts fromExcel worksheets, and import the metadata from the original worksheet into areference doclet, as described in Importing Metadata into Copied Worksheets
• In Excel regular doclets in PDF-based report packages, edit sheet content.Additionally, you can specify the sheets to include in the final report package. See Working with Excel Doclets in PDF-based Report Packages.
• In Excel-based reference doclets, make embeddable content available to docletauthors by specifying named ranges and registering them as a available content withNarrative Reporting, as described in Adding Available Content to Excel-basedReference Doclets.
• Embed content from Excel- or Reports-based reference doclets into doclets in Word-based report packages, as described in Embedding Content in a Doclet.
• Create static or reference variables, and insert them into Word-based doclets, asdescribed in Working with Variables
Chapter 21Authoring Doclets
21-35
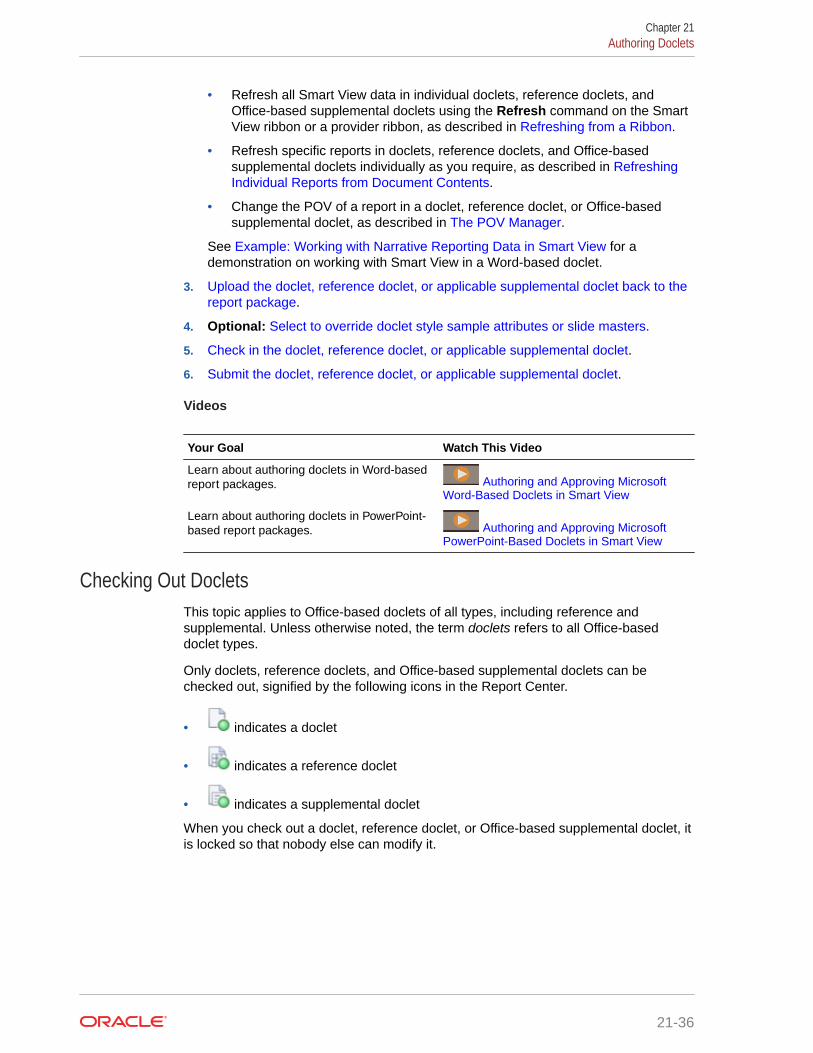
• Refresh all Smart View data in individual doclets, reference doclets, andOffice-based supplemental doclets using the Refresh command on the SmartView ribbon or a provider ribbon, as described in Refreshing from a Ribbon.
• Refresh specific reports in doclets, reference doclets, and Office-basedsupplemental doclets individually as you require, as described in RefreshingIndividual Reports from Document Contents.
• Change the POV of a report in a doclet, reference doclet, or Office-basedsupplemental doclet, as described in The POV Manager.
See Example: Working with Narrative Reporting Data in Smart View for ademonstration on working with Smart View in a Word-based doclet.
3. Upload the doclet, reference doclet, or applicable supplemental doclet back to thereport package.
4. Optional: Select to override doclet style sample attributes or slide masters.
5. Check in the doclet, reference doclet, or applicable supplemental doclet.
6. Submit the doclet, reference doclet, or applicable supplemental doclet.
Videos
Your Goal Watch This Video
Learn about authoring doclets in Word-basedreport packages. Authoring and Approving Microsoft
Word-Based Doclets in Smart View
Learn about authoring doclets in PowerPoint-based report packages. Authoring and Approving Microsoft
PowerPoint-Based Doclets in Smart View
Checking Out DocletsThis topic applies to Office-based doclets of all types, including reference andsupplemental. Unless otherwise noted, the term doclets refers to all Office-baseddoclet types.
Only doclets, reference doclets, and Office-based supplemental doclets can bechecked out, signified by the following icons in the Report Center.
• indicates a doclet
• indicates a reference doclet
• indicates a supplemental doclet
When you check out a doclet, reference doclet, or Office-based supplemental doclet, itis locked so that nobody else can modify it.
Chapter 21Authoring Doclets
21-36

Tip:
To safeguard all of your report content, Oracle strongly recommends that youperform a checkout prior to opening a doclet and making any content modifications.This will ensure that any modifications made by you or other users are notinadvertently overwritten.
Note:
In Oracle Smart View for Office, you can only download PDF doclets and non-Office-based supplemental doclets. To check out PDF doclets and non-Officesupplemental doclets, use the Narrative Reporting web interface.
Before you begin this procedure, you should have already launched an Office application,connected to Narrative Reporting, and opened a report package, as described in Connectingto Narrative Reporting in Smart View.
To check out a doclet, reference doclet, or supplemental doclet:
1. In the Report Center, select the doclet to check out.
Note the following when selecting doclets:
• Clicking the doclet name opens the doclet, but does not check it out.
• Clicking to the right of the doclet name allows you to select the doclet, but not open it.
• If you are using the keyboard to navigate the Report Center, use Ctrl-Tab to navigateto the first doclet icon in the Report Center list, then Tab to the doclet title, and thenuse the up and down arrow keys to navigate to the doclet to select. Use Ctrl-Tab tomove to the Action Panel menu items, then use the up and down arrow keys tonavigate to an Action Panel option, and then press the spacebar to select an option.
When a doclet is selected using keyboard navigation, the selected doclet name has adotted-line box around it:
2. In the Action Panel, select Open and Check Out.
Chapter 21Authoring Doclets
21-37

Selecting this option opens the doclet and checks it out in one operation.
Alternatively, double-click the doclet name to open, then continue with step 3.
Note:
When navigating within the doclet panel, the Action Panel menu itemslisted are relative to—and can change depending on—the itemhighlighted in the panel. If you are using the keyboard to navigate thedoclet panel, note that even though you may have tabbed to a docletpanel item, it is not highlighted, or selected, until you press the spacebar. Pressing the space bar highlights the item with a square bordermeaning that the item is now selected and in focus. Then, the ActionPanel menu items will refresh and display relative to the item you’veselected.
The Narrative Reporting ribbon is displayed in the Office application when youopen:
• A doclet
• A reference doclet
• An Office-based supplemental doclet
Figure 1 shows the Narrative Reporting ribbon for the author phase, in the initialstate, before the doclet is checked out.
Chapter 21Authoring Doclets
21-38
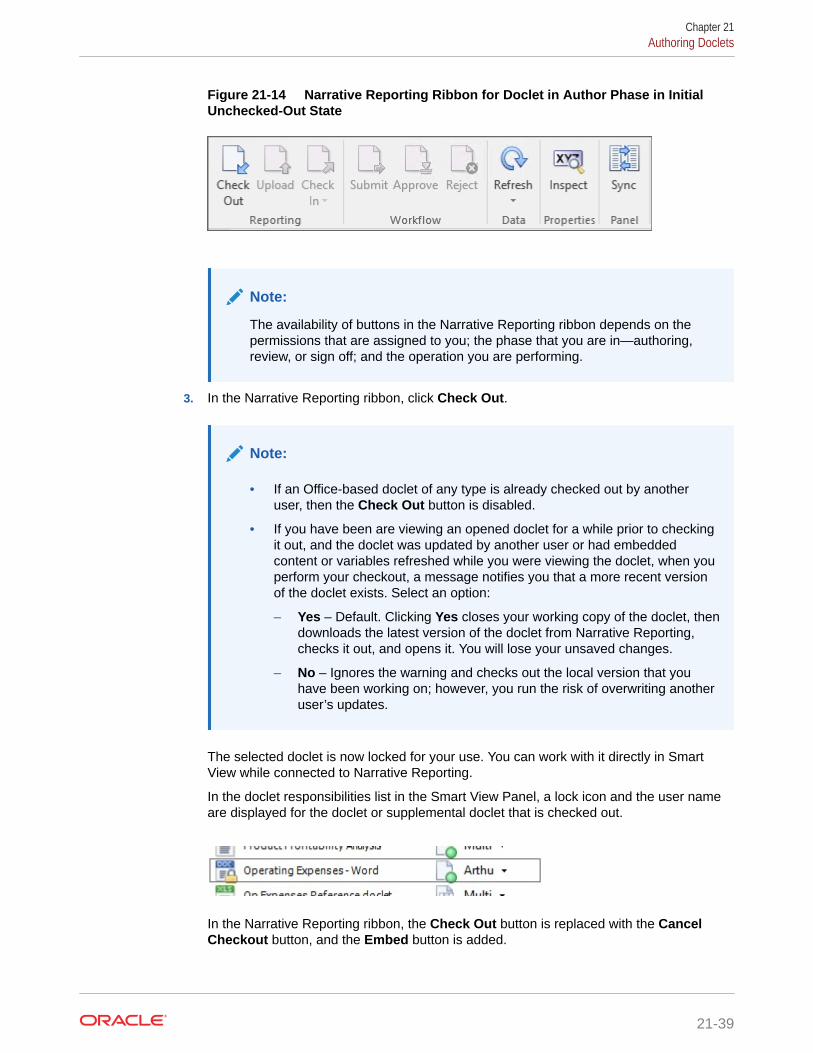
Figure 21-14 Narrative Reporting Ribbon for Doclet in Author Phase in InitialUnchecked-Out State
Note:
The availability of buttons in the Narrative Reporting ribbon depends on thepermissions that are assigned to you; the phase that you are in—authoring,review, or sign off; and the operation you are performing.
3. In the Narrative Reporting ribbon, click Check Out.
Note:
• If an Office-based doclet of any type is already checked out by anotheruser, then the Check Out button is disabled.
• If you have been are viewing an opened doclet for a while prior to checkingit out, and the doclet was updated by another user or had embeddedcontent or variables refreshed while you were viewing the doclet, when youperform your checkout, a message notifies you that a more recent versionof the doclet exists. Select an option:
– Yes – Default. Clicking Yes closes your working copy of the doclet, thendownloads the latest version of the doclet from Narrative Reporting,checks it out, and opens it. You will lose your unsaved changes.
– No – Ignores the warning and checks out the local version that youhave been working on; however, you run the risk of overwriting anotheruser’s updates.
The selected doclet is now locked for your use. You can work with it directly in SmartView while connected to Narrative Reporting.
In the doclet responsibilities list in the Smart View Panel, a lock icon and the user nameare displayed for the doclet or supplemental doclet that is checked out.
In the Narrative Reporting ribbon, the Check Out button is replaced with the CancelCheckout button, and the Embed button is added.
Chapter 21Authoring Doclets
21-39
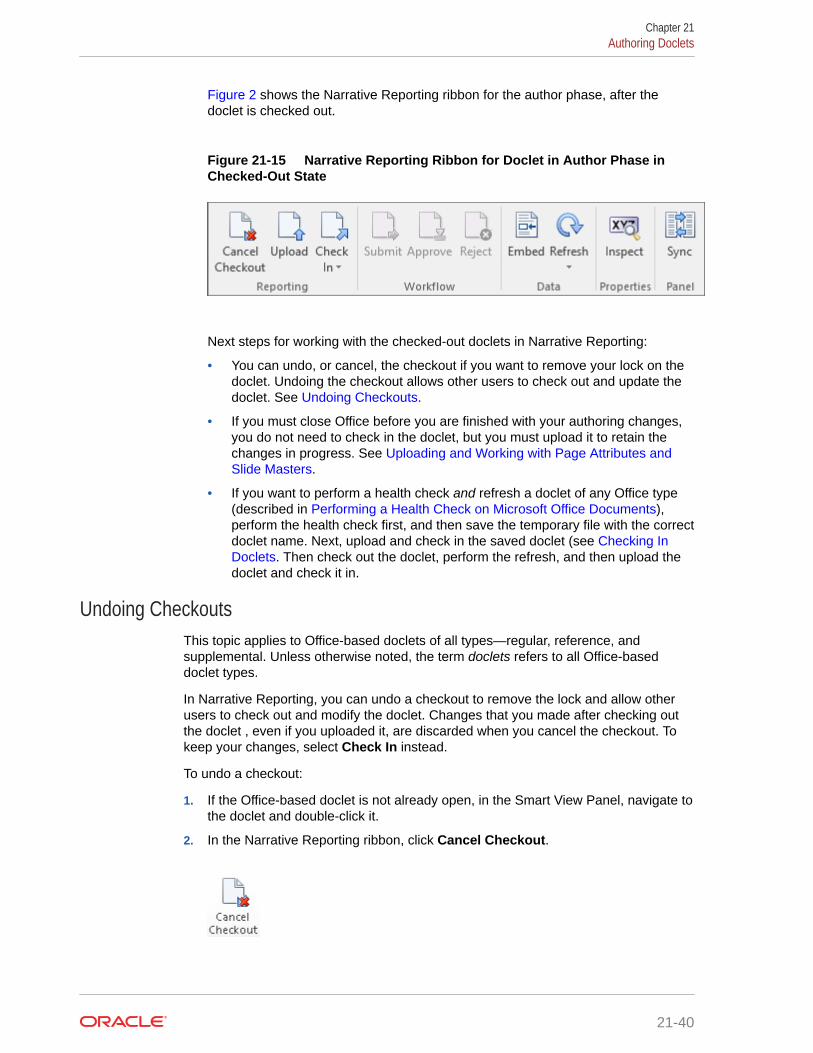
Figure 2 shows the Narrative Reporting ribbon for the author phase, after thedoclet is checked out.
Figure 21-15 Narrative Reporting Ribbon for Doclet in Author Phase inChecked-Out State
Next steps for working with the checked-out doclets in Narrative Reporting:
• You can undo, or cancel, the checkout if you want to remove your lock on thedoclet. Undoing the checkout allows other users to check out and update thedoclet. See Undoing Checkouts.
• If you must close Office before you are finished with your authoring changes,you do not need to check in the doclet, but you must upload it to retain thechanges in progress. See Uploading and Working with Page Attributes andSlide Masters.
• If you want to perform a health check and refresh a doclet of any Office type(described in Performing a Health Check on Microsoft Office Documents),perform the health check first, and then save the temporary file with the correctdoclet name. Next, upload and check in the saved doclet (see Checking InDoclets. Then check out the doclet, perform the refresh, and then upload thedoclet and check it in.
Undoing CheckoutsThis topic applies to Office-based doclets of all types—regular, reference, andsupplemental. Unless otherwise noted, the term doclets refers to all Office-baseddoclet types.
In Narrative Reporting, you can undo a checkout to remove the lock and allow otherusers to check out and modify the doclet. Changes that you made after checking outthe doclet , even if you uploaded it, are discarded when you cancel the checkout. Tokeep your changes, select Check In instead.
To undo a checkout:
1. If the Office-based doclet is not already open, in the Smart View Panel, navigate tothe doclet and double-click it.
2. In the Narrative Reporting ribbon, click Cancel Checkout.
Chapter 21Authoring Doclets
21-40
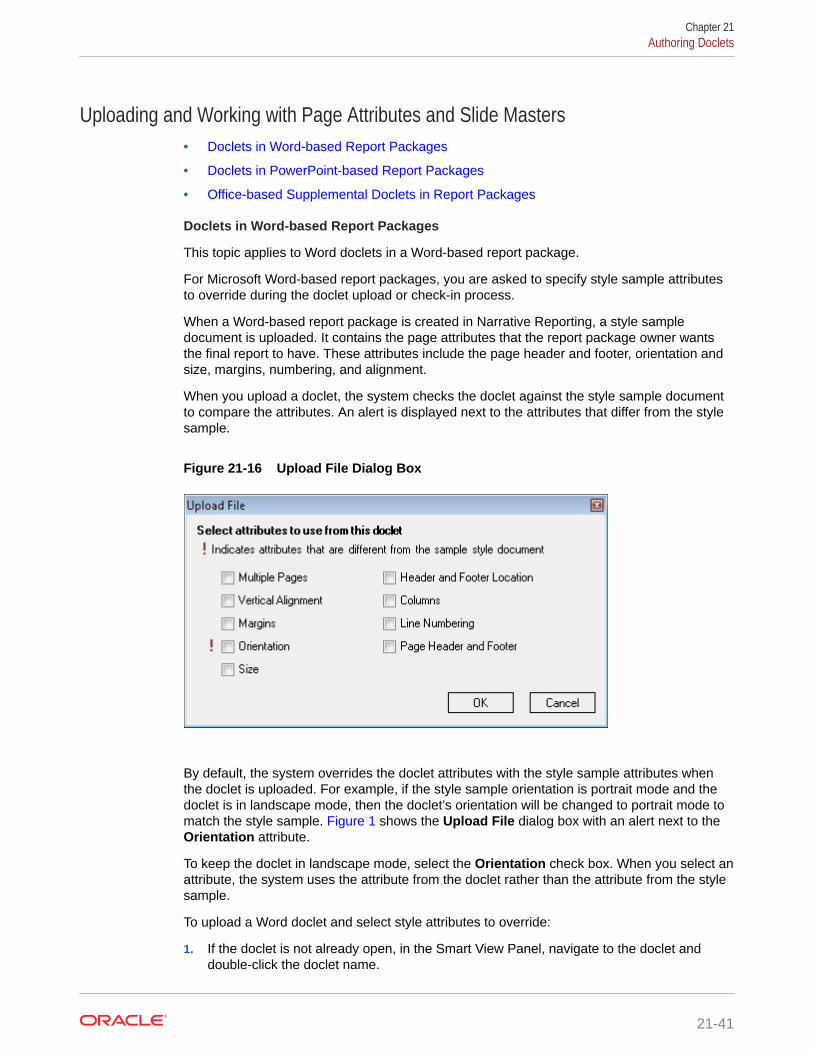
Uploading and Working with Page Attributes and Slide Masters• Doclets in Word-based Report Packages
• Doclets in PowerPoint-based Report Packages
• Office-based Supplemental Doclets in Report Packages
Doclets in Word-based Report Packages
This topic applies to Word doclets in a Word-based report package.
For Microsoft Word-based report packages, you are asked to specify style sample attributesto override during the doclet upload or check-in process.
When a Word-based report package is created in Narrative Reporting, a style sampledocument is uploaded. It contains the page attributes that the report package owner wantsthe final report to have. These attributes include the page header and footer, orientation andsize, margins, numbering, and alignment.
When you upload a doclet, the system checks the doclet against the style sample documentto compare the attributes. An alert is displayed next to the attributes that differ from the stylesample.
Figure 21-16 Upload File Dialog Box
By default, the system overrides the doclet attributes with the style sample attributes whenthe doclet is uploaded. For example, if the style sample orientation is portrait mode and thedoclet is in landscape mode, then the doclet’s orientation will be changed to portrait mode tomatch the style sample. Figure 1 shows the Upload File dialog box with an alert next to theOrientation attribute.
To keep the doclet in landscape mode, select the Orientation check box. When you select anattribute, the system uses the attribute from the doclet rather than the attribute from the stylesample.
To upload a Word doclet and select style attributes to override:
1. If the doclet is not already open, in the Smart View Panel, navigate to the doclet anddouble-click the doclet name.
Chapter 21Authoring Doclets
21-41

To upload changes, you must have the doclet checked out.
2. In the Narrative Reporting ribbon, click Upload.
Alternatively, to upload and check in the doclet, in the Narrative Reporting ribbon,select Check In, and then Upload and Check In.
Whether you select the Upload command or the Upload and Check In command,the Upload File dialog is displayed.
3. In the Upload File dialog box (see Figure 1), select the style attributes that youwant to override, and then click OK.
Style attributes in the doclet that differ from the style sample for the report packageare noted with an exclamation point.
4. Proceed to Checking In Doclets.
Alternatively, you can continue working on the checked-out doclet and repeat theupload procedure in this topic as many times as you require, and then proceed to Checking In Doclets.
Doclets in PowerPoint-based Report Packages
This topic applies to PowerPoint doclets in a PowerPoint-based a report package.
For Microsoft PowerPoint-based report packages, when a report package is created, astyle sample document is uploaded that contains the slide masters and slide layoutsthat the report package owner wants the final report to have. These slide mastersdetermine the overall look and format of the presentation. When you upload a doclet,the system scans the doclet and highlights the slide masters in use. The icon indicatesslide masters that are not in the style sample document.
Note:
The doclet slides must be sized the same as the report package style sampleslides in order to upload the doclet. For example, if your doclet slides aresized for On-Screen Show (4:3) and the report package style sample slidesare sized for On-Screen Show (16:9), you must resize your doclet slidesbefore you can upload the doclet.
To upload a PowerPoint doclet and select a slide master:
Chapter 21Authoring Doclets
21-42

1. If the doclet is not already open, in the Smart View Panel, navigate to the doclet anddouble-click the doclet name.
To upload changes, you must have the doclet checked out.
2. In the Narrative Reporting ribbon, click Upload.
Alternatively, to upload and check in the doclet, in the Narrative Reporting ribbon, selectCheck In, and then Upload and Check In.
Whether you select the Upload command or the Upload and Check In command, theUpload File dialog is displayed.
3. If the doclet uses the same slide master as the style sample document, click OK in theUpload File dialog box, the proceed to step 5; otherwise, proceed to step 4.
4. If the doclet contains a slide master that is not in the style sample document, perform oneof the following:
• To replace the doclet slide master with the report package slide master, click thename of the doclet slide master, and then select the report package slide master toreplace it with.
The system maps the doclet slide layouts to the report package slide master tomaintain a uniform look for the presentation.
• To preserve the doclet slide master, click OK to upload the doclet.
If you preserve the doclet slide master, the system adds it to the merged presentationto ensure that the slides will render correctly. However, that slide master is availablefor use by that doclet only. The doclet slide master is not available to other doclets. If
Chapter 21Authoring Doclets
21-43

you want the doclet slide master to be used by other doclets, the reportpackage owner must add it to the report package style sample document.
5. Proceed to Checking In Doclets.
Alternatively, you can continue working on the checked-out doclet and repeat theupload procedure in this topic as many times as you require, and then proceed to Checking In Doclets.
Note:
When you upload a doclet to the report package, the system resets all slidesto their default layouts. If you have modified any slides from the default slidemaster layout, those modifications are reset back to the default. Forexample, if you have changed the size of a text box on a slide to make roomfor an image, the text box is reset to its original size when you upload thedoclet. However, you can add additional layouts to the doclet slide master,and those new layouts are persisted within the doclet. Therefore, if you wantto preserve the modified text box size, you must add that layout to the docletslide master.
As an example, you are working with a doclet with a slide layout called Titleand Content that contains a text box that spans the entire slide. You want toresize the text box to cover half of the slide so that you can add anaccompanying image. If you were to resize the text box, add the image, andupload the doclet, the system would reset the slide back to the Title andContent default layout, and the text would overlap the image. Instead, add anew slide layout (called, for example, Title, Text, and Image) with the resizedtext box. When you upload the doclet, the new slide master is copied overand persisted for that doclet.
Office-based Supplemental Doclets in Report Packages
This topic applies to Office-based supplemental doclets.
You upload Office-based supplemental doclets for checking in. However, in the uploadprocess, you do not have to overwrite styles or slide masters. You simply upload.
Other supplemental doclet file types, such as ZIPs or PDFs, are not checked out inOracle Smart View for Office; they are only opened or downloaded. Therefore, they donot need to be uploaded.
To upload an Office-based supplemental doclets:
1. If the doclet is not already open, in the Smart View Panel, navigate to the docletand double-click the doclet name.
To upload changes, you must have the doclet checked out.
2. In the Narrative Reporting ribbon, click Upload.
Chapter 21Authoring Doclets
21-44
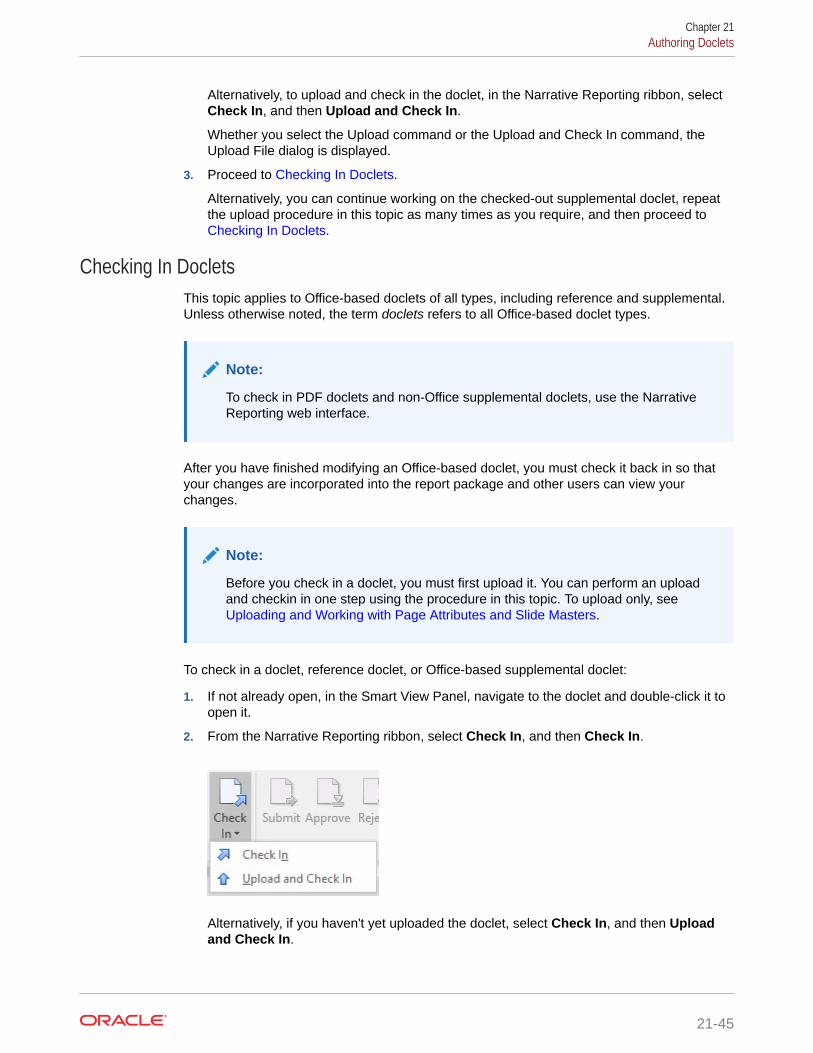
Alternatively, to upload and check in the doclet, in the Narrative Reporting ribbon, selectCheck In, and then Upload and Check In.
Whether you select the Upload command or the Upload and Check In command, theUpload File dialog is displayed.
3. Proceed to Checking In Doclets.
Alternatively, you can continue working on the checked-out supplemental doclet, repeatthe upload procedure in this topic as many times as you require, and then proceed to Checking In Doclets.
Checking In DocletsThis topic applies to Office-based doclets of all types, including reference and supplemental.Unless otherwise noted, the term doclets refers to all Office-based doclet types.
Note:
To check in PDF doclets and non-Office supplemental doclets, use the NarrativeReporting web interface.
After you have finished modifying an Office-based doclet, you must check it back in so thatyour changes are incorporated into the report package and other users can view yourchanges.
Note:
Before you check in a doclet, you must first upload it. You can perform an uploadand checkin in one step using the procedure in this topic. To upload only, see Uploading and Working with Page Attributes and Slide Masters.
To check in a doclet, reference doclet, or Office-based supplemental doclet:
1. If not already open, in the Smart View Panel, navigate to the doclet and double-click it toopen it.
2. From the Narrative Reporting ribbon, select Check In, and then Check In.
Alternatively, if you haven't yet uploaded the doclet, select Check In, and then Uploadand Check In.
Chapter 21Authoring Doclets
21-45

In the Smart View Panel, the lock icon is removed from the doclet in the docletresponsibilities list, indicating that it is no longer checked out.
Note:
• If you want to discard the changes that you made and revert back tothe original version of the doclet, click Cancel Checkout instead(see Undoing Checkouts).
• Doclet versioning is optimized to minimize the impact of multipleautomated check-ins. When multiple automated check-ins areperformed on the doclet due to variable or embedded contentchanges, the system will update the doclet contents but will notgenerate a new version.
Submitting DocletsThis topic applies to Office-based doclets of all types, including reference andsupplemental. Unless otherwise noted, the term doclets refers to all Office-baseddoclet types.
After finishing their work, authors submit Office-based doclets to the report packageowner or, if approval is required, to the doclet approver.
To submit a doclet, reference doclet, or Office-based supplemental doclet:
1. If not already open, in the Smart View Panel, navigate to the doclet and double-click it to open it.
2. In the Narrative Reporting ribbon, click Submit.
Tip:
In cases where multiple authors are assigned to a doclet, ensure that allauthors are finished with their work before submitting the doclet.
If approval is required, the current responsibility for the doclet is updated with thedoclet approvers. If no approval is required, the current responsibility field isempty.
Chapter 21Authoring Doclets
21-46

Note:
If the doclet is not already checked in, then the Submit operation also checks itin for you.
After you submit a doclet, you can no longer check it out, although you can still open andinspect it from Oracle Smart View for Office or the Narrative Reporting web interface.
Note that once a doclet is submitted, the report package owner can check it out for furtherupdates.
Working with Embedded Content from Reference DocletsEmbedded content from a reference doclet allows commonly-used report content to bedefined and then embedded in one or more doclets within your report package.
Related Topics:
About Embedded Content From Reference Doclets
Adding Reference Doclets to a Report Package
Defining Named Ranges in Excel-based Reference Doclets
Validating Fonts in Reference Doclets
Adding Available Content to Excel-based Reference Doclets
Updating Excel-based Reference Doclet Content
Deleting Available Content from an Excel-based Reference Doclet
Embedding Content in a Doclet
Refreshing Embedded Content in a Doclet
Removing Embedded Content from a Doclet
About Embedded Content From Reference DocletsWhat is embedded content? Embedded content starts with common report content createdby reference doclet authors and contained in a reference doclet. This common contentbecomes available content to doclet authors. Using Oracle Smart View for Office or the web,doclet authors embed content into doclets that are part of the published report in Word- orPowerPoint-based report packages.
As a reference doclet author, you create report content, and then define it as availablecontent. In Excel-based reference doclets, you use Excel’s named range functionality. InReports-based reference doclets, you use the web interface. After upload and checkin, thecontent is ready for doclet authors to consume.
As a doclet author, you might think of a reference doclet as a data source of embeddedcontent. A report package can contain multiple reference doclets. You can embed theavailable content from multiple reference doclets in multiple doclets in a report package.
Whenever a reference doclet author checks in a reference doclet, Smart View or the webinterface, the system automatically refreshes any doclet that has embedded content.
Chapter 21Authoring Doclets
21-47

Whenever a doclet author checks in a doclet that has embedded content, the systemautomatically refreshes the embedded content in the doclet.
As the underlying data source of the report is updated, you can view the changes thenext time you open or refresh the reference doclets and doclets containing embeddedcontent.
Note:
For reference doclet authors: Reference doclets are part of a report package,and they are maintained within the report package. Reference doclets havethe same support as any other doclet in a report package such as workflow,security, and versioning.
The basic process flow for working with reference doclets and embedded content is asfollows:
1. The report package owner adds Excel- and Reports-based reference doclets tothe report package.
The reference doclets can already contain report content and, in the case of Excel-based reference doclets, named ranges. Reference doclet authors and docletauthors can also add named ranges later, during the authoring process.
2. In Smart View or from the web interface, Excel-based reference doclet authorscreate report content and define named ranges for data and other content, such astables, graphs, and charts, to include in a report package. They can validate fontsused in the reference doclet to ensure that formatting is retained when content isembedded in doclets.
In the web interface, Reports-based reference doclet authors can add tables orgraphs in the report as available content.
Multiple available content objects can be created within a single reference doclet.For example, you can create more than one named range in a reference doclet.
3. Reference doclet authors upload and check in reference doclets, thus making thereport content available to doclet authors.
4. Doclet authors embed content from the reference doclets in their assigned doclets.
In Smart View, you begin the process with Defining Named Ranges in Excel-basedReference Doclets.
In the Books tab for your Oracle Enterprise Performance Management Cloud businessprocess, see the Reports documentation.
Adding Reference Doclets to a Report PackageThis task is completed by report package owners using the Narrative Reporting webinterface.
To begin working with embedded content, the report package owner adds Excel- orReports-based reference doclets to a report package. Reference doclets are thecontainers to which reference doclet authors add report content and make it availableto doclet authors for embedding.
Chapter 21Authoring Doclets
21-48

Note:
• You must have report package owner privileges to add reference doclets to areport package.
• The reference doclets you add can already contain report content and namedranges, or you can add them later, during the authoring process.
To add reference doclets to a report package:
1. Follow the procedures described in Narrative Reporting documentation.
2. In Oracle Smart View for Office, open the report package and verify that the referencedoclet is included.
Reference doclet authors are now ready to begin working with the Excel-based referencedoclets, as described in Defining Named Ranges in Excel-based Reference Doclets.
To begin embedding content from reference doclets in a doclet, go to Embedding Content ina Doclet.
Defining Named Ranges in Excel-based Reference DocletsThis topic applies only to Excel-based reference doclets.
The reference doclet author creates report content and then defines named ranges aroundthat content in the reference doclet. In general, range names can be created using the NewName dialog box, accessed either from the Name Manager or the Define Name items on theFormula ribbon of Excel. Find out more about range names in the Microsoft documentation.
You can define named ranges before adding a reference doclet to a report package.
Alternatively, you can define named ranges during the author phase, as described in thistopic.
Note:
Prior to beginning this procedure, ensure that the author phase has been initiated.
To define named ranges for Excel-based reference doclets:
1. Open the report package.
2. Open, and then check out the reference doclet.
The reference doclet should open in Excel. If you opened the report package in Word orPowerPoint, Excel is launched when opening the reference doclet.
3. Create the report content.
4. Add range names to selected report content.
You can add range names to any or all report content in the reference doclet. You decidewhich content you want to make available to authors of the report package.
A named range is valid when the named range:
Chapter 21Authoring Doclets
21-49

• Exists within an Excel workbook.
• Is not a hidden name.
• Refers to a range of cells in a worksheet which is not hidden.
• Is not referring to a formula or constant.
• Does not have a dynamically calculated reference, for example the referencemust point to an absolute range of cells, rather than relying on a referenceformula or another named range to dynamically determine the range.
• Does not contain any errors, for example a "#REF!" error.
Remember, named ranges become available content in the report package.
5. Optional: As you add named ranges and edit content in reference doclets,complete the steps in Validating Fonts in Reference Doclets to ensure that fontsyou are using in the reference doclet are also available in the Narrative Reportingservice.
6. When you finish adding report content and named ranges to the report, andvalidating fonts, upload, and then check in the reference doclet.
The reference doclet must at least be uploaded in order to continue with the nextstep.
7. Continue with Adding Available Content to Excel-based Reference Doclets.
Validating Fonts in Reference DocletsThe new Font Validation command, available on the Narrative Reporting ribbon,provides a quick and easy way to confirm that the tables within your Excel referencedoclets will render properly when inserted into a doclet as embedded content.
All fonts used in tables within your reference doclets must be installed to yourNarrative Reporting service. If a font is not available within the service, the systemuses a substitute font. This substitution can introduce significant visual differenceswhen the content is either viewed online or inserted into another doclet.
With the Font Validation command, you are informed if any of the fonts used in theExcel reference doclet are not available in Narrative Reporting. You can then notifyyour service administrator to install the missing font files. A message also notifies youif all font files are in sync.
To validate fonts in a reference doclet:
1. From the report package, open a reference doclet.
You may check out the doclet, but it's not required to validate fonts.
2. Click the Validate Fonts icon:
If there is a discrepancy between the fonts used in the doclets and the fontsavailable in the service, the following dialog is displayed, listing the missing fonts:
Chapter 21Authoring Doclets
21-50

3. Take note of the missing fonts, and click OK.
4. Request that your service administrator installs the missing fonts in your service.
Note:
In some cases, the fonts listed are not used in the reference doclet. These areusually the default Excel fonts; for example, Arial, Calibri, and Calibri Light. Ifyou know you are not using those fonts, you can use your discretion aboutnotifying your service administrator to install them.
Adding Available Content to Excel-based Reference DocletsThis topic applies only to Excel-based reference doclets.
Reference doclet authors or approvers can add available content to a reference doclet.Available content is based on the named ranges specified in the reference doclets (asdescribed in Defining Named Ranges in Excel-based Reference Doclets).
In Oracle Smart View for Office, you use the Properties dialog box to detect the namedranges and specify them as available content. When the reference doclet is checked in to thereport package, an automated refresh is performed that updates any changes that weremade in the reference doclet and to any doclets that have embedded content that points tothe reference doclet.
Chapter 21Authoring Doclets
21-51

Note:
• Prior to beginning this procedure, ensure that the author phase has beeninitiated.
• Doclet authors cannot add available content definitions.
To add available content to a reference doclet in Smart View:
1. Open the report package.
2. Open, and then check out the reference doclet.
The reference doclet should open in Excel. If you opened the report package inWord or PowerPoint, Excel is launched when opening the reference doclet.
3. Click Inspect in the Narrative Reporting ribbon ribbon to launch the Propertiesdialog box.
Alternatively, with the reference doclet selected in the report package list, click theView Properties link to access the Properties dialog box.
4. Select the Available Content tab.
Figure 21-17 Properties Dialog Box - Available Content Tab
5. Click the Add button, , to launch the Add Report Content dialog box.
In Add Report Content, all available content in the reference doclet is displayed.
6. Select the check box next to the content which you want to make available forembedding later.
Chapter 21Authoring Doclets
21-52

For example, in Figure 2, the available range, "MyRange" is selected.
Figure 21-18 Add Report Content Dialog Box
7. Click OK to go back to the Available Content tab of the Properties dialog box.
Figure 21-19 Properties Dialog Box - Available Content Tab with Content Added
8. Click the X in the upper right corner of the dialog to close it.
Chapter 21Authoring Doclets
21-53

9. Upload, and then check in the reference doclet.
The content you just added is now available for embedding into doclets.
10. Continue with Embedding Content in a Doclet.
Optionally, to maintain or delete content in the reference doclet, continue with Updating Excel-based Reference Doclet Content or Deleting Available Contentfrom an Excel-based Reference Doclet.
Updating Excel-based Reference Doclet ContentThis topic applies only to Excel-based reference doclets.
As the author or approver of Excel-based reference doclets, you can update andmodify the available content in reference doclets during the author phase.
For example, you can refresh data or reformat content. Or, you may find that theavailable content that you defined needs to be remapped to different report contentwithin the reference doclet. This may occur if the doclet source was updated, or if anamed range was renamed or deleted, or if the wrong content was selected previously.
Note:
• Prior to beginning this procedure, ensure that the author phase has beeninitiated.
• To update Reports-based content, use the Narrative Reporting webinterface.
To update reference doclet content:
1. Open the report package.
2. Open, and then check out the reference doclet.
The reference doclet should open in Excel. If you opened the report package inWord or PowerPoint, Excel is launched when opening the reference doclet.
3. Optional: Perform Oracle Smart View for Office tasks, such as refresh the datapoints or change the POV in a report.
4. Optional: Perform Excel tasks, such as reformat a grid or chart.
5. Optional: Change the name or the description of available content:a. In the Narrative Reporting ribbon ribbon, click Inspect.
b. In the Properties dialog box, select the Available Contents tab.
c. In Available Contents, click the link for the content you want to change.
For example, we'll update the description for the Monthly_Expenses content,so we'll click the Monthly_Expenses link:
Chapter 21Authoring Doclets
21-54

The Edit dialog box is displayed, where you can change the content name anddescription.
d. In the Edit dialog, make any necessary changes to the content name anddescription.
In the example below, we've added a description.
e. When finished, click OK to close the Edit dialog.
The updated description appears in the Properties dialog box:
f. Repeat to make changes to any other content in the list.
6. Optional: To remap available content within a reference doclet:
a. In the Narrative Reporting ribbon ribbon, click Inspect.
b. In the Properties dialog box, select the Available Contents tab.
c. Click next to the content to remap and select Remap from the drop-downmenu.
For example, below we are selecting to remap Rev_GP2.
Chapter 21Authoring Doclets
21-55

The Remap dialog is displayed.
d. In the Remap dialog, click on the associated Select link for the content toremap.
A list of available content that is not already mapped is displayed. In thefollowing illustration, the list contains two item, Summary_IS and Rev_GP1.
Rev_GP2 is currently mapped to available content called Rev_GP2. We wantto remap to the unmapped content called Rev_GP1.
e. From the Select drop-down list, select an available content item to remap to.
After you make a selection, the range you chose is shown in the Replace withcolumn.
Chapter 21Authoring Doclets
21-56

In the following example, the Rev_GP1 range is now showing in the Replace withcolumn.
f. Repeat step 7.a. through step 7.c. for each available content item that you want toremap.
g. When you're finished remapping content, click OK to close the Remap dialog.
7. Click X in the upper left corner of Properties to close the dialog.
8. When finished with all updates to the reference doclet, upload it and check it in.
Deleting Available Content from an Excel-based Reference DocletThis topic applies only to Excel-based reference doclets.
In the reference doclet, you can remove content from the list of available content, withoutdeleting the range on which it was based. This way, if you need to add the content back atlater, you can do so.
Be aware that if the available content is in use as embedded content in any doclets in thereport package, deleting it from the reference doclet will cause broken links in those doclets.
To delete available content from a Reports-based reference doclet, use the NarrativeReporting web interface.
Note:
Before you begin, ensure that the doclet author phase is initiated.
To delete available content from the reference doclet:
1. Check out the reference doclet.
2. In the Narrative Reporting ribbon ribbon, click Inspect to launch the Properties dialogbox.
Chapter 21Authoring Doclets
21-57

3. In Properties, select the Available Contents tab.
In the example below, there are three ranges listed as available content. We'llremove one of them Yearly_Revenue.
4. In Available Content, click the Delete button, for the content to delete.
The content is removed from the list of available content.
5. Repeat these steps for any other content to delete.
6. Click X in the upper left corner of Properties to close the dialog.
7. When finished, upload it and check it in.
You can always add content back to the reference doclet by following the procedure in Adding Available Content to Excel-based Reference Doclets.
Chapter 21Authoring Doclets
21-58

Embedding Content in a DocletNow that Excel- and Reports-based reference doclets are added to a report package, reportcontent has been created and named ranges defined, and available content has beenidentified, this content can be embedded. You can embed content in Word or PowerPointdoclets. For example, among the available content in the report package, there may be achart or grid that an author wants to add to a doclet.
Note:
Before you begin, ensure that the doclet author phase is initiated.
To embed content in a doclet:
1. Open the doclet and check it out.
We'll call the doclet our "target" doclet.
2. Place the cursor at the point in the target doclet where the embedded content should beinserted.
In Figure 1, the solid green arrow shows the insertion point for the embedded content.
Figure 21-20 Example Target Word Doclet with Cursor at Insertion Point
In a PowerPoint slide, depending on the slide format, you may be embedding a table orgraph onto a slide containing no other text or graphics. In that case, you can simply clickanywhere in the slide. If your embedded content must be inserted at a certain point in aslide within text, then position the cursor at the insertion point, as shown in Figure 2
Chapter 21Authoring Doclets
21-59

Figure 21-21 Example Target PowerPoint Doclet with Cursor at InsertionPoint
3. From the target doclet, click the Embed button in the Narrative Reporting ribbon.
The Embed Contents dialog box is launched.
4. In Embed Contents, select the range to embed.
In the example in Figure 3, we see both Excel- and Reports-based content in thelist. We'll select MyRange, which happens to be Excel-based content.
Chapter 21Authoring Doclets
21-60
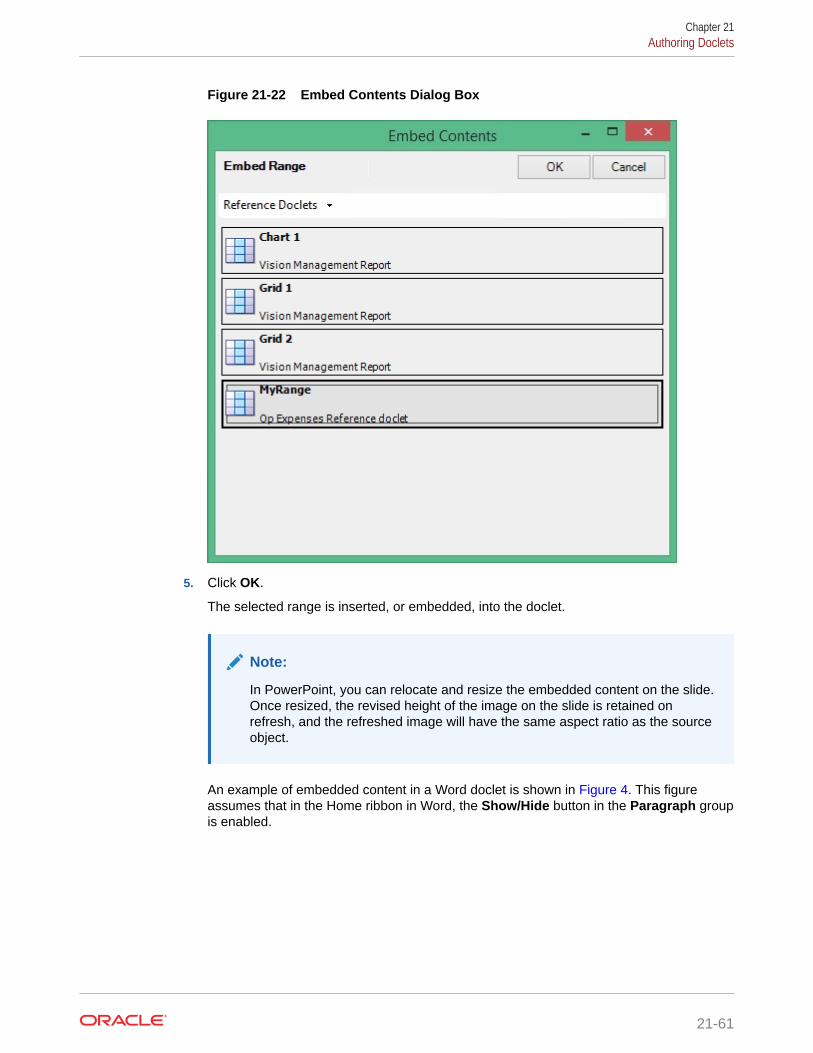
Figure 21-22 Embed Contents Dialog Box
5. Click OK.
The selected range is inserted, or embedded, into the doclet.
Note:
In PowerPoint, you can relocate and resize the embedded content on the slide.Once resized, the revised height of the image on the slide is retained onrefresh, and the refreshed image will have the same aspect ratio as the sourceobject.
An example of embedded content in a Word doclet is shown in Figure 4. This figureassumes that in the Home ribbon in Word, the Show/Hide button in the Paragraph groupis enabled.
Chapter 21Authoring Doclets
21-61

Figure 21-23 Example Target Doclet After Embedding a Range
In Word, note the blank paragraph marker before the embedded content. You candelete the marker to give the doclet a more polished look, as shown in Figure 5.PowerPoint does not have this issue.
Figure 21-24 Example Target Doclet with Extra Paragraph Marker Removed
6. Repeat the steps above for all content you want to embed in the currently openedand checked-out target doclet.
Chapter 21Authoring Doclets
21-62

Note:
Embedded content must not overlay or overlap other instances of embeddedcontent.
7. When your work is completed in the current doclet, upload it, and then check it in.
8. To refresh embedded content, see Refreshing Embedded Content in a Doclet.
Note:
If you place embedded content at the beginning of a Word doclet (the first line andfirst space of the Word document), you cannot embed content before the already-embedded content. You may embed content immediately after the already-embedded content, but not before it. To workaround this:
• Delete the embedded content and then re-embed the content in the correctorder. To delete the embedded content, add a blank line after the embeddedcontent, then select the blank line along with the embedded content, then right-click and select Remove Content Control from the context menu. Next, selectthe blank line and embedded content again, and then press Delete.
• Place a blank line at the beginning of the Word document to ensure that, ifnecessary, you can insert embedded content before the first instance ofembedded content.
Note:
If you embed content consisting of a multiple line grid at the beginning of a Worddoclet (the first line and first space of the Word document), you cannot delete onlythe embedded content. Note that you can delete a single line grid that wasembedded at the beginning of a Word doclet.
To workaround this, add a blank line after the embedded content, then select theblank line along with the embedded content, then right-click and select RemoveContent Control from the context menu. Next, select the blank line and embeddedcontent again, and then press Delete.
Refreshing Embedded Content in a DocletAs a doclet authors, you can refresh the embedded content in your doclets to keep them insync with the content in the reference doclets and the underlying data source. For example,source data can be updated or content can be reformatted.
To refresh embedded content in a doclet:
1. Open, and then check out the doclet that contains the embedded content.
2. Perform an action:
• To refresh embedded content only, without uploading in the same operation:
Chapter 21Authoring Doclets
21-63

In the Narrative Reporting ribbon, select the arrow in the Refresh icon, andthen Refresh Embedded Content.
You do not have to select the embedded content to refresh it. The RefreshEmbedded Content command will refresh all embedded content in thechecked-out doclet.
When you've finished the refresh, and made any other changes to the doclet,click Upload.
• To refresh and upload the doclet immediately:
In the Narrative Reporting ribbon, click Upload.
The upload action automatically refreshes any embedded content in the targetdoclet.
Note:
PowerPoint: If you have resized embedded content, the revised heightof the image on the slide is retained on refresh, and the refreshed imagewill have the same aspect ratio as the source object.
3. Check in the doclet.
Note:
When closing a doclet, particularly if the embedded content consists of animage, you may encounter a message informing you that there is content leftin your clipboard, and confirming that you want to close the doclet. You mayselect Yes in this message; however, if you want to keep the content of theOffice clipboard, ensure that you have pasted the content into another Officedocument before proceeding.
Removing Embedded Content from a DocletAs a doclet author, you can remove embedded content from doclets using the Cutcommand in Word or PowerPoint, or the Delete key on your key board.
To remove embedded content from a doclet:
Chapter 21Authoring Doclets
21-64

1. Open the doclet that contains the embedded content, and check it out.
This is the target doclet, not the reference doclet or any other doclet. The target docletwas discussed in Embedding Content in a Doclet.
2. To remove embedded content from a PowerPoint doclet:
a. In the target doclet, click on the embedded content to highlight it, and then press theDelete key.
b. Edit the slide to make any adjustments to surrounding text, if required.
3. To remove embedded content from a Word doclet:
a. add a blank carriage return either before or after the embedded content.
You will need an extra bit of plain text, such as an empty paragraph marker, whenselecting the embedded content to delete.
b. Select the embedded content, along with the blank paragraph marker you created inthe previous step.
Select the embedded content and the blank paragraph marker, in the same way that,using Word, you would select a table along with a line of text above or below it.
In the following image, the embedded content and the paragraph marker below it areselected. An extra blank paragraph marker at the bottom of the image is not selected.
c. Press the Delete key on your keyboard.
Alternatively, you can use the Cut command from the Home ribbon in Word orPowerPoint.
The following image shows the selected embedded content and paragraph markerremoved; one blank paragraph marker at the bottom of the image remains.
Chapter 21Authoring Doclets
21-65

4. Repeat these steps for all embedded content to remove from the current targetdoclet.
5. When your work is completed in the current doclet, upload it, and then check it in.
Working with Embedded Content from Reference FilesEmbedded content from a reference file allows report content to be sourced from anddefined in your own local or network Excel files, outside of the report package, andthen embedded in one or more doclets within your report package.
Related Topics:
About Embedding Content from Reference Files
Defining Named Ranges in Reference Files
Registering Reference Files with a Doclet
Embedding Reference File Content in a Doclet
Adding Content from Reference Files to Doclets
Managing Named Ranges for a Reference File
Updating Available Content in a Reference File
Remapping Content within Reference Files
About Embedding Content from Reference FilesA doclet author can create their own stylized report content in Microsoft Office Excel,such as grids and charts, and insert that content into doclets using reference files. TheExcel report content is automatically updated in the associated doclet whenever theExcel file is modified. You identify embeddable content in the reference file usingExcel's named ranges functionality. The named range can then be embedded in adoclet. The reference file is attached and saved to a doclet and is associated only withthat doclet.
Reference files are similar to reference doclets in that you can define embeddablecontent in them. The difference is that a reference file is available to and associatedwith a single doclet only whereas a reference doclet is available to all doclet authorswith access to the reference doclet. A single doclet can be associated with multiplereference files.
To summarize this feature in Narrative Reporting, a doclet author can:
• Develop stylized reports within a Microsoft Office Excel workbook, using OracleSmart View for Office or other data access methods
• Define named ranges in the workbook; the named ranges become embeddablecontent candidates
Chapter 21Authoring Doclets
21-66

• Integrate named ranges within doclets
• Easily update the reference file in Excel, which automatically updates the Microsoft OfficeExcel report content in the doclet with which it is associated
• Incorporate multiple ranges from the same or different reference files in a doclet
Defining Named Ranges in Reference FilesThe reference file is an Excel file that can be located in a folder on a local drive or networkdrive, outside of the report package.
The doclet author creates Excel report content and then defines named ranges around thatcontent. In general, range names can be created using the New Name dialog box, accessedeither from the Name Manager or the Define Name items on the Formula ribbon of Excel.Find out more about range names in the Microsoft documentation.
This Excel file is a potential reference file.
Define named ranges in your reference file before you begin working with them in a doclet.
To define named ranges for reference files:
1. In Excel, create the report content.
2. Add range names to selected report content.
You can add range names to any or all report content in the reference file. You decidewhich content you want to make available.
A named range is valid when the named range:
• Exists within an Excel workbook.
• Is not a hidden name.
• Refers to a range of cells in a worksheet which is not hidden.
• Is not referring to a formula or constant.
• Does not have a dynamically calculated reference, for example the reference mustpoint to an absolute range of cells, rather than relying on a reference formula oranother named range to dynamically determine the range.
• Does not contain any errors, for example a "#REF!" error.
Remember, named ranges from your reference file become candidates for embeddedcontent to you as the doclet author.
3. Save the Excel file.
Registering Reference Files with a DocletThere is a two-part process for registering a reference file with a checked-out doclet, andthen, separately, embedding the available content as needed throughout a doclet.
The procedure in this topic covers registering content from a reference file with a checked-outdoclet. See Embedding Reference File Content in a Doclet for instructions on embeddingcontemt from the registered reference file.
Chapter 21Authoring Doclets
21-67

Note:
Before you begin, you should have established ranges in the target referencefile, using Excel's Name Manager feature, as described in Defining NamedRanges in Reference Files. The file should be closed when performing theprocedure below.
You can also register available content and then embed the content in one procedure.For more information, see Adding Content from Reference Files to Doclets.
To register a reference file with a doclet:
1. Open the report package.
2. Open, and then check out the doclet to which you want to register a reference file.
If the doclet is already checked out, you can also select the doclet in the reportpackage panel, and then click View Properties to open the Properties dialog box.
3. Click Inspect in the Narrative Reporting ribbon to open the Properties dialog box.
4. In Properties , click the Embedded Content tab, , and then click theAvailable Files link.
5. On Available Files, click , and then on Add Embedded Content File, click
.
6. Navigate to the Excel file to register as a reference file, select it, and click Open.
The Add Embedded Content File dialog box lists the content "registered" withthe doclet in order to be made available for embedding. For example, in Figure 1,the Excel file that was selected as a reference file contained three named ranges;therefore, these three named ranges can be registered as available content withthe doclet.
Chapter 21Authoring Doclets
21-68

Figure 21-25 The Add Embedded Content File Dialog Box Listing AvailableContent Items
Remember, the available content is content that you specified as named ranges, asdescribed in Defining Named Ranges in Reference Files.
7. Click the range names that you want to make available for embedding in the doclet.
The check mark that appears next to the range name shows that the range is nowregistered with the doclet. For example, in Figure 2, we selected all three availableranges to register them with the doclet.
Chapter 21Authoring Doclets
21-69

Figure 21-26 The Add Embedded Content File Dialog Box After RegisteringRanges
8. Click Close to close the Add Embedded Content File dialog box.
You are returned to the Embedded Contents tab of the Properties dialog. Thereference file is now registered with the doclet, as shown in
Figure 21-27 Properties Dialog, Embedded Content Tab, ShowingRegistered Reference File
Chapter 21Authoring Doclets
21-70

Note that you can choose to embed content in the doclet at this point, from this dialogbox. But this procedure is looking at registering content only. See Embedding ReferenceFile Content in a Doclet for instructions on embedding available content from theregistered reference file.
Embedding Reference File Content in a DocletIn Registering Reference Files with a Doclet, you registered named ranges from an Excel filethat was outside of the report package, making that Excel file a reference file. The referencefile can be located on a network drive or on your local machine.
Now we will embed content from the reference file into a doclet. The process is the samewhether you are embedding content into a Word or a PowerPoint doclet.
To embed content from a reference file into a doclet:
1. Ensure that the report package is opened.
2. If you have not done so already, open, and then check out the doclet to which youpreviously registered a reference file.
You must embed reference file content in the doclet to which you registered the content.You cannot embed the content into other doclets.
3. In the doclet, place your cursor at the point in the text where you want to embed thereference file content.
4. In the Narrative Reporting ribbon, click the Embed button to launch the Embed Contentsdialog box.
5. In the Embed Contents dialog box, select the range to embed.
In Figure 1
Chapter 21Authoring Doclets
21-71

Figure 21-28 Embed Contents Dialog Box, with a Range Selected
6. Click OK to embed the range into the doclet.
Note:
In PowerPoint, you can relocate and resize the embedded content on theslide. Once resized, the revised height of the image on the slide isretained on refresh, and the refreshed image will have the same aspectratio as the source object.
Figure 2 shows an Excel table embedded into a Word doclet under the heading,"Table 1. Operating Expenses."
Chapter 21Authoring Doclets
21-72

Figure 21-29 Content from Reference File Embedded in Word Doclet
Adding Content from Reference Files to DocletsNow that you have defined named ranges in your reference file, you can define candidatesfor embedded content, and instantly embed content in your doclet. The process is the samewhether you are adding content into a Word or a PowerPoint doclet.
To add content from a reference file to a doclet:
1. Open the report package
2. Open, and then check out the doclet.
Open the doclet to which you plan to add the reference file.
Note:
You may want to position your cursor at the point where you want to insert theembedded content you will be defining and adding in this procedure.
3. In the Narrative Reporting ribbon, click the Embed button to launch the Embed Contentsdialog box.
Figure 1 shows one named range available for embedding, sourced from a referencedoclet.
Chapter 21Authoring Doclets
21-73

Figure 21-30 Embed Contents Dialog Box
4. Click New Range to launch the Embed New Content dialog box.
5. In Embed New Content, click the drop-down menu in Source and select LocalFile, as shown in Figure 2.
If you have already added content from reference files, you will see the files listedin the Source drop-down menu.
Chapter 21Authoring Doclets
21-74

Figure 21-31 Embed New Content Dialog Box
6. Click the Choose File button, browse to the location of the Excel file that you plan to useas a reference file, and then select the file.
The names ranges in the file are shown.
7. In the Embed New Content dialog box, select the check box next to the named rangesthat you want to add as embeddable content.
In Figure 3, there was one named range in the reference file, OpExps, and this range isselected.
Chapter 21Authoring Doclets
21-75

Figure 21-32 Embed New Content Dialog Box with a Named RangeSelected
8. Click OK to return to the Embed Contents dialog, and select the newly addedrange.
Chapter 21Authoring Doclets
21-76

Figure 21-33 Embed Contents Dialog Box, with New Range Selected
9. Click OK to embed the range into the doclet.
The example in Figure 5 shows an Excel table embedded into a Word doclet under theheading, "Table 1. Operating Expenses."
Figure 21-34 Content from Reference File Embedded in Word Doclet
Chapter 21Authoring Doclets
21-77

Managing Named Ranges for a Reference FileAs a doclet author, you can add or delete existing report content (named ranges) orrename a named range in a reference file. For example, as a doclet author, you candelete report content that is no longer in use.
To manage named ranges in a reference file:
1. Select and check out the doclet that contains the reference file you would like tomodify.
2. Click Inspect in the Narrative Reporting ribbon to open the Properties dialog box.
3. In Properties , click the Embedded Content tab, , and then click theAvailable Files link.
4. To change the display name and description of named ranges in the reference file:
a. Click next to the reference file with the named ranges you want to workwith, and select Manage Report Content.
b. In the Manage Report Content dialog, click on the reference file name link toexpand it, and make any necessary changes to the Display Name andDescription fields; then click OK.
5. To delete a reference file:
a. Click next to the reference file to delete, and select Delete.
b. At the prompt, click Yes to confirm the delete action.
Deleting the reference file means that any embedded content from thatreference file remains in the doclet, but the links between the embeddedcontent and the reference file is now broken. Any further changes you make to
Chapter 21Authoring Doclets
21-78
the reference file will not be reflected in the embedded content in the doclet. For thisreason, use care when deleting reference files.
6. When you are finished with managing named ranges and delete tasks, close theProperties dialog box, Embedded Content tab.
7. Upload and check in the doclet.
Updating Available Content in a Reference FileYou may, as the reference file author, want to updating existing content in a reference file.
For example, you may need to refresh a profitability report table with new data. Any updatesmade in the reference file are automatically refreshed in the doclet that consumer the reportcontent when the doclet is checked in.
To update content in a reference file:
1. Select and check out the doclet that contains the reference file you would like to modify.
2. Click Inspect in the Narrative Reporting ribbon to open the Properties dialog box.
3. In Properties , click the Embedded Content tab, , and then click the AvailableFiles link.
4. Click next to the reference file with the content you want to work with, and selectDownload.
The file is downloaded by default your Downloads folder. You can close the Propertiesdialog in the doclet for now.
5. Open the file in Excel and make the changes you require, and then save the file.
6. Return to the report package and, in the Narrative Reporting ribbon, click Inspect, and inthe Properties dialog, Embedded Contents tab, Available Files, click next to thereference file with the content you just modified with, and select Upload.
7. In the Upload dialog box, click Choose File and navigate to the location of the modifiedExcel reference file and select it, then click Open
8. Click OK to close the Upload dialog, and the close the Properties dialog.
9. To refresh the embedded content from the recently uploaded reference file, in theNarrative Reporting ribbon, select Refresh, and then Refresh Embedded Content.
10. Upload and check in the doclet.
Remapping Content within Reference FilesAs a reference file author, you may find that the available content that you defined needs tobe remapped to different report content within the file source. This may occur if the referencefile was updated or a named range was renamed or deleted.
Additionally, remapping may be required if the wrong content was selected previously. Youcan remap the available content to other available content within the reference file.
Chapter 21Authoring Doclets
21-79

Note:
Prior to beginning this procedure, ensure that the author phase has beeninitiated.
To remap available content within a reference file:
1. Open the report package.
2. Open, and then check out the doclet which contains the reference file you want toupdate.
The impacted doclet is the doclet that is associated with a reference file in whichyou want to remap available content.
The doclet should open in Word or PowerPoint. If you opened the report packagein Excel, Word or PowerPoint is launched when opening the impacted doclet.
3. Click Inspect in the Narrative Reporting ribbon to launch the Properties dialogbox.
Alternatively, with the doclet selected in the report package list, click the ViewProperties link to access the Properties dialog box.
4. Select to display the Embedded Content tab of the Properties dialog.
5. In the Embedded Content tab, click the Available Sources link.
Note that you can view the available content in use by clicking on the arrow next to"Available Source Objects."
Chapter 21Authoring Doclets
21-80

6. Click next to the content to remap and select Remap from the drop-down menu.
The Remap dialog is displayed.
7. In the Remap dialog, click on the associated Select link for the reference file with contentto remap.
A list of available content that is not already mapped is displayed. In the followingillustration, the list contains one item, OpExp.
The "Current" item is mapped to the available content called Income. We want to remapto the content called OpExp.
8. From the Select drop-down list, select an available content item to remap to.
After you make a selection, the range you chose is shown in the Replace with column.
In the following example, the OpExp range is now showing in the Replace with column.
Chapter 21Authoring Doclets
21-81

9. Repeat step 5 through step 8 for each available content item that you want toremap.
10. When you're finished remapping content, click OK to close the Remap dialog, andthen exit the Properties dialog.
Working with VariablesIn a report package, variables provide centralized maintenance of common text,numbers and dates that are displayed in doclets throughout a report package.Variables can also be used to reference content between doclets, such as insertingExcel data from a reference doclet into a Word paragraph or PowerPoint text box.
Related Topics:
About Variables
Creating Static Variables
Creating Reference Variables
Inserting Variables in a Doclet
Searching for Variables
Editing Variables
Highlighting Variables in Doclets
Filtering Variables
Inspecting Variables
Unlinking Reference Variables
Deleting Variables
Chapter 21Authoring Doclets
21-82

Video
Your Goal Watch This Video
Learn about working with reference variables. Changing Member Selections in Smart
View Queries with Report Package Variables
About VariablesReport package variables may be created using either Narrative Reporting on the web, or theNarrative Reporting extension for Oracle Smart View for Office. However, you can only definereference variable values in Smart View.
Once created, use Smart View to insert the variables into a doclet (in headers, tables, cells,or paragraphs).
Two types of variables are available:
• Static variables use static input that is defined by the user, such as date labels or a setvalue, which can be used throughout the report package. These static variables can beeasily updated, and all doclet instances of the variable value reflect the change. Thestatic variables help to centrally maintain common dates, numbers and text across theReport Package document content.
In the list of variables in the Smart View Panel, this icon, represents static variables.
• Reference variables are created by referencing another doclet or reference file within thereport package as the source, and selecting the value for the variable, such as text in aWord paragraph or an Excel cell value. Reference variables cannot be sourced from anyPowerPoint content. If the source document is subsequently updated, those changes areautomatically updated in the inserted instances of the variable in the report package.Reference variables can be used to insert Excel cell values into a Word or PowerPointparagraph, or to create Excel formulas to implement cross-footing rules for increaseddata accuracy, or to create directional words for the report narrative, such as "anincrease" or "a decrease".
In the list of variables in the Smart View Panel, this icon, represents referencevariables.
Variables can be created by any report package owner or doclet author.
To view a list of all variables defined for a report package, first, open a report package. Fromthe Report Package panel, change the drop-down from Report Center to Variables:
Chapter 21Authoring Doclets
21-83
The list of available variables appears. You can view details such as variable type, thenumber of times the variable is used in the report package (the blue circle containing anumber), and the source for reference variables, as shown in Figure 1.
From the Variables panel, you can:
• Create a variable
• Edit a variable
• Select a variable to insert into a doclet
• Filter to view only static or reference variables
• Filter to view only those variables already in use in the report package
For report packages containing more than 50 variables, use these controls at the topof the panel to locate variables:
• Use the left and right arrows to navigate through the pages
• Use the page number drop-down list to jump to a specific page
Chapter 21Authoring Doclets
21-84

Figure 21-35 List of Variables Defined for a Report Package
After the variable has been created, the variable is managed as follows:
• The report package owner can delete and edit all variables in the report package.
• A doclet author can only delete and edit variables that they created.
• For reference variables, any user with Write access to the source location of the variablevalue can update that variable value.
Chapter 21Authoring Doclets
21-85

• Author users have Read access to variables that they did not create, so they cansee a list of all variables and insert them into doclets to which they have Authoraccess.
Creating Static VariablesA static variable is a string of text, such as a label or paragraph, which can be insertedinto a report package doclet.
As an example, if you create a static variable for the current month called"CurrentMonth", you might enter the text,"August 2016". When you roll over to thereport for the next month, it is a simple matter to update the text in the CurrentMonthvariable to "September 2016," and the change is propagated to all instances of thatvariable throughout the report package.
The static variable can also be created and defined in the Narrative Reporting webinterface; however, it must be inserted into the doclet using Oracle Smart View forOffice.
Note:
Before you begin, ensure that you have opened a report package, andopened and checked out a doclet.
To create a static variable:
1. Open a report package, and in the drop-down list in the Report Package panel,select Variables
2. In the Report Package panel, click Create New Variable, , and then selectStatic Variable from the drop-down list.
The report package panel displays Create Static Variable, where you enter thevariable name and value, and an optional description:
Chapter 21Authoring Doclets
21-86

3. Define the variable as follows:
a. Enter a Name for the variable.
The name must be unique across variables within the report package, and should bedescriptive of the variable to make it easier to find.
b. Optional: Enter a Description for the variable.
c. In the Value field, enter the text for the static variable.
• Static variables can have a maximum size of 255 characters.
• The text string can be a label or paragraph, and the entire string will be displayedas entered in the report package.
In the following example, the user created a static variable with the Name of"CurrentMonth", a Description of "The current month and year for the report", and a Valueof "August 2016". This variable can be inserted in multiple locations showing the date ofthe current month in different usages, as shown below:
This variable can be inserted in multiple locations showing the date of the current monthin different usages; for example:
• Insert the static variable into the text displayed in an internal Operating Expensesdoclet that reads "For the month of <<CurrentMonth>>".
• Insert the static variable into a paragraph in footnote of any of the doclets that reads:"During <CurrentMonth>>, ... ."
The next month, to update all instances of the Current Month date in the report package,modify the variable value to use the new month; for example, September 2016. Thisoption ensures that the change is implemented uniformly, and no incorrect dates for thevalue remain.
4. Click the OK button, .
To cancel creating the variable, click the Cancel button,
Chapter 21Authoring Doclets
21-87

5. Insert the variable into a doclet, following the procedure in Inserting Variables in aDoclet.
Creating Reference VariablesReference variables enable you to reference a source in another document (doclet orreference file) within the report package, such as a single Excel cell or selected Wordtext, and use them as reference variable value sources in your report package doclet.You can then insert the reference variable into one or more doclets. When thereference variable source value is updated, all inserted instances of the variable areautomatically updated.
Note:
• Images and shapes are not supported as reference variable values.
• Reference variable values cannot be sourced from other referencevariables.
• Reference variable values cannot be sourced from embedded content,where a range from an Excel reference doclet is embedded in Word orPowerPoint.
• Reference variables cannot be sourced from any PowerPoint content.
• Reference variable values sourced in Word can have a maximum size of2,000 characters. Reference variable values sourced in Word cannot beinserted into Excel if the number of characters is greater than 255.
• Reference variable values must be single line only. In an Excelspreadsheet, select only one cell. In Word, select text from only one lineor one table cell.
• Reference variable values sourced from Excel can have a maximum sizeof 255 characters.
• Reference variable values sourced from Excel include all of the numberformatted text within the cell (for example, 123,456). If inserted intoanother Excel worksheet, the variable value will be inserted as text andnot a numeric value.
For example, use Excel formulas in Oracle Smart View for Office to generate referencevariable values:
• Use an IF function to return a string of "increase" or "decrease," or "above" or"below", if a data value increases or decreases between the current and priorperiod. Insert the Excel-based directional word variable or results into a Wordparagraph.
=IF(B8<0,"below","above")• Use an IF function, or simple subtraction, to compare the occurrence of a data
value (such as "Revenues" or "Summary Income Statement") that is displayedmultiple times throughout a report package.
='Summary Income Statement'!B4
Chapter 21Authoring Doclets
21-88
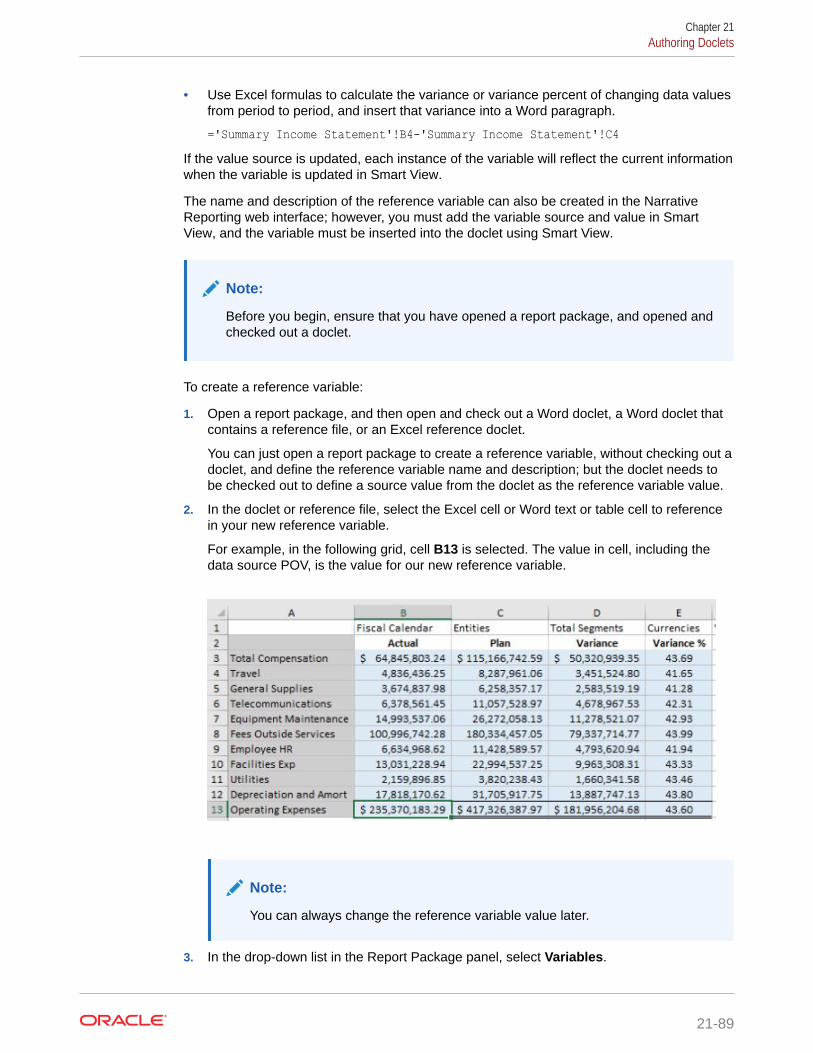
• Use Excel formulas to calculate the variance or variance percent of changing data valuesfrom period to period, and insert that variance into a Word paragraph.
='Summary Income Statement'!B4-'Summary Income Statement'!C4If the value source is updated, each instance of the variable will reflect the current informationwhen the variable is updated in Smart View.
The name and description of the reference variable can also be created in the NarrativeReporting web interface; however, you must add the variable source and value in SmartView, and the variable must be inserted into the doclet using Smart View.
Note:
Before you begin, ensure that you have opened a report package, and opened andchecked out a doclet.
To create a reference variable:
1. Open a report package, and then open and check out a Word doclet, a Word doclet thatcontains a reference file, or an Excel reference doclet.
You can just open a report package to create a reference variable, without checking out adoclet, and define the reference variable name and description; but the doclet needs tobe checked out to define a source value from the doclet as the reference variable value.
2. In the doclet or reference file, select the Excel cell or Word text or table cell to referencein your new reference variable.
For example, in the following grid, cell B13 is selected. The value in cell, including thedata source POV, is the value for our new reference variable.
Note:
You can always change the reference variable value later.
3. In the drop-down list in the Report Package panel, select Variables.
Chapter 21Authoring Doclets
21-89

4. In the Report Package panel, click the Create New Variable button, , and thenselect Reference Variable from the drop-down list.
The report package panel displays Create Reference Variable, where you enterthe variable name and value, and an optional description. As you can see, thevalue is already pre-populated with the value we selected in step 2
5. Define the reference variable as follows:
a. Enter a Name for the reference variable.
The name must be unique across all variables within the report package, andshould be descriptive of the variable to make it easier to find.
b. Optional: Enter a Description for the reference variable.
c. Click to use the value of the currently selected cell as the reference value.
Optionally, you can select another cell on the sheet, verify that the value is
changed in the Value field, and click
6. Click the OK button, , to add the variable to the report package.
7. Upload and check in the doclet or reference file for the variable value to be addedto the system.
Chapter 21Authoring Doclets
21-90

Note:
If the doclet or reference file is not checked in, the value will continue to bedisplayed in the variables panel as Not Committed for the current doclet andother doclets in Smart View. In the Narrative Reporting web interface, the valueis displayed as #Missing.
Inserting Variables in a DocletAfter static and reference variables are created and checked in, they are ready for authors touse in Word or PowerPoint doclets in headers, tables, cells, or paragraphs, or in Excel docletcells.
Note:
Oracle recommends limiting the number of variables inserted into an individualdoclet to 250 or less. If a doclet contains more than 250 variables, then you mayencounter extended processing time while checking in a doclet or, in some cases,the doclet check-in may fail.
To insert a variable into a doclet:
1. Open a report package, and then open and check out a doclet.
2. In the drop-down list in the Report Package panel, select Variables.
Once you select Variables, the list of available variables are displayed in the Smart ViewPanel.Figure 1 shows a short list of variables. See Figure 1 for another example list ofvariables in a report package.
Chapter 21Authoring Doclets
21-91

Figure 21-36 Example List of Variables Available for a Report Package
3. In the doclet, select the point where you want to insert the variable.
4. From the list of variables, select the variable to insert.
When you select a variable in the list, three menu options for the variable aredisplayed, as shown in Figure 1.
5. Click to insert the variable at the selected point in the doclet.
The example in Figure 2 shows a portion of a Word doclet with the variable
insertion point highlighted in yellow. The Insert Variable button, , is circled andthe button tooltip text is displayed.
Figure 21-37 Word Doclet with Variable Insertion Point Highlighted
The example in Figure 3 shows the result of inserting a static variable for thecurrent month, defined as August 2016, into a Word doclet. Also, thefigure $235,370,180.29, shown in the paragraph text is actually a previously-inserted reference variable.
Chapter 21Authoring Doclets
21-92

Figure 21-38 Word Doclet Showing the Result of Inserting a Static Variable forCurrent Month
6. When finished inserting variables into the current doclet, upload and check in the doclet.
7. Repeat the steps in this procedure for each doclet that requires that you insert static andreference variables.
Searching for VariablesUse the search in the Variables panel to locate variables to insert, modify, highlight, or delete
To search for variables:
1. Open the report package.
2. In the drop-down list in the Report Package panel, select Variables.
The list of variables available in the report package is displayed in the panel.
The magnifying glass icon, signifies the variable search text box.
Chapter 21Authoring Doclets
21-93
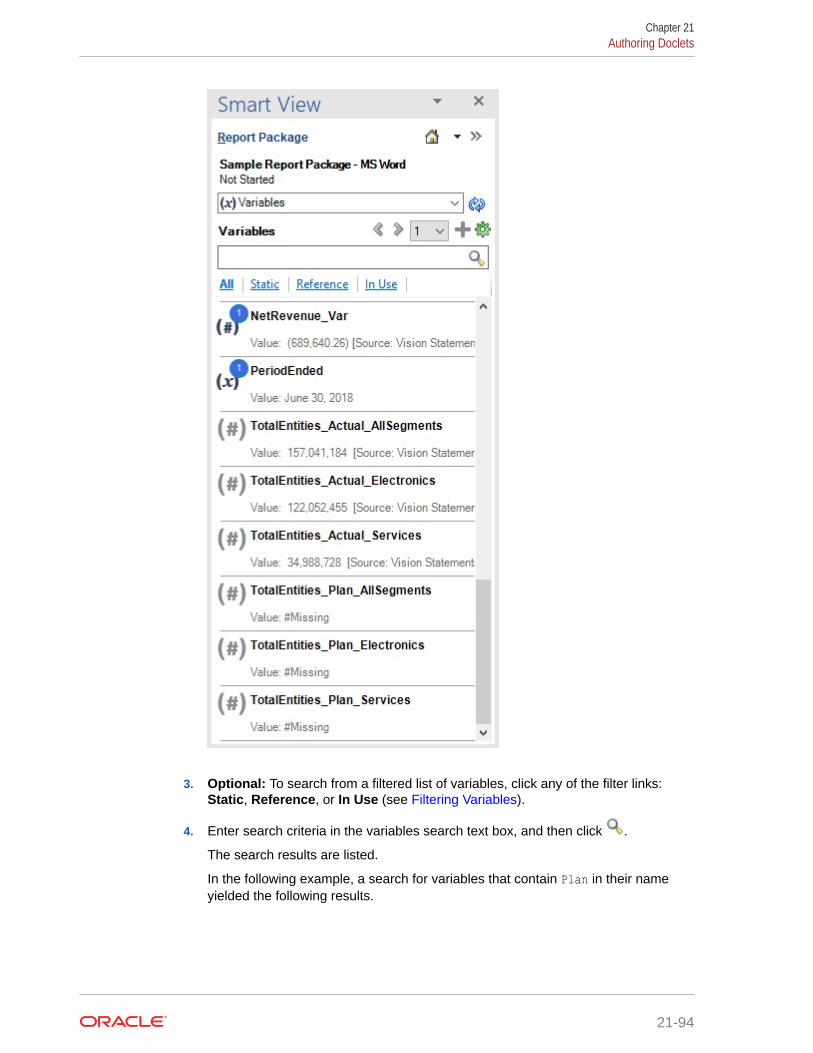
3. Optional: To search from a filtered list of variables, click any of the filter links:Static, Reference, or In Use (see Filtering Variables).
4. Enter search criteria in the variables search text box, and then click .
The search results are listed.
In the following example, a search for variables that contain Plan in their nameyielded the following results.
Chapter 21Authoring Doclets
21-94

Note:
Wildcards symbols, such as asterisks, are not required and should not be usedunless they are part of the variable name.
5. To clear the search results list and restore the full list of variables, click in thevariables search text box, or click the All filter link.
Alternatively, click the Static, Reference, or In Use filter link to return to a filtered list ofvariables.
Editing VariablesOnce created, you can easily edit static and reference variables in Oracle Smart View forOffice.
To edit variables:
1. Open a report package.
• If you plan to edit a static variable, you do not need to check out any doclets.
Chapter 21Authoring Doclets
21-95

• If you plan to edit a reference variable, open and check out the Word or Excelreference doclet or reference file from which the reference variable is sourced.
2. In the drop-down list in the Report Package panel, select Variables.
The list of variables available in the report package is displayed in the panel.
3. Select a variable and click the Edit button, .
Note:
To help to locate the variable to edit, follow the procedure in Searchingfor Variables
The Edit button, , displays whenever you hover over a variable from the list.
In the following illustration, the CurrentMonth variable, a static variable, is selectedfor editing.
Chapter 21Authoring Doclets
21-96
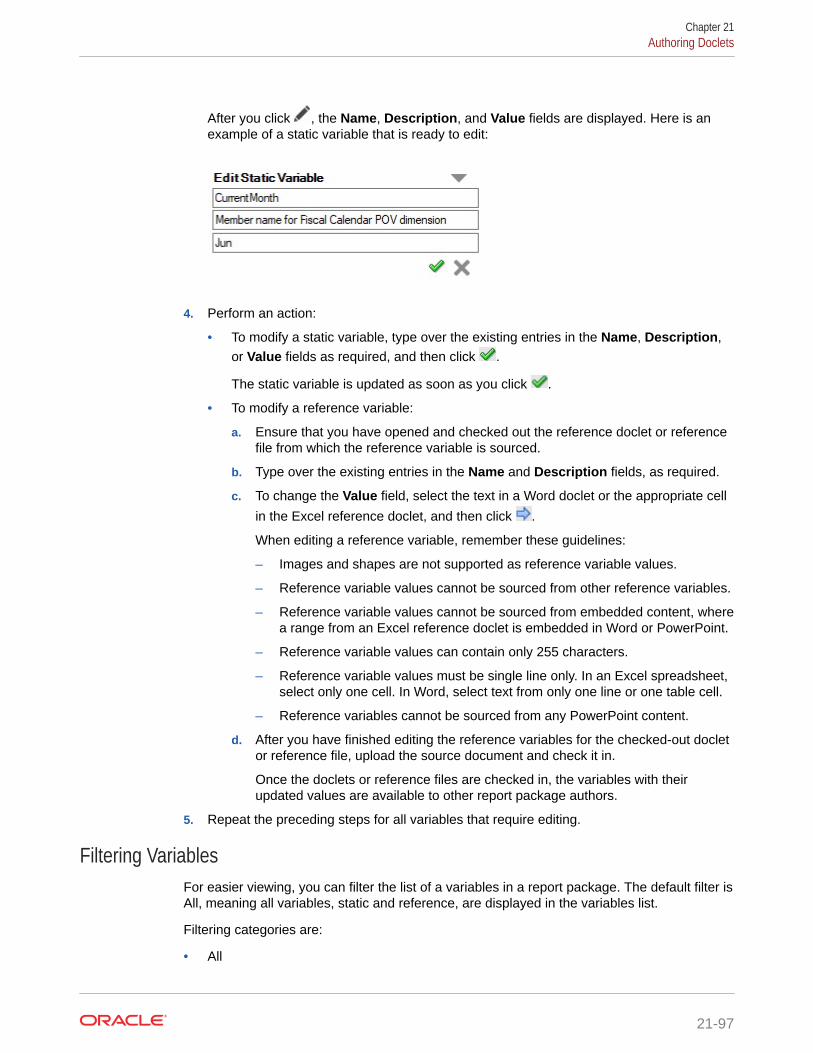
After you click , the Name, Description, and Value fields are displayed. Here is anexample of a static variable that is ready to edit:
4. Perform an action:
• To modify a static variable, type over the existing entries in the Name, Description,or Value fields as required, and then click .
The static variable is updated as soon as you click .
• To modify a reference variable:
a. Ensure that you have opened and checked out the reference doclet or referencefile from which the reference variable is sourced.
b. Type over the existing entries in the Name and Description fields, as required.
c. To change the Value field, select the text in a Word doclet or the appropriate cell
in the Excel reference doclet, and then click .
When editing a reference variable, remember these guidelines:
– Images and shapes are not supported as reference variable values.
– Reference variable values cannot be sourced from other reference variables.
– Reference variable values cannot be sourced from embedded content, wherea range from an Excel reference doclet is embedded in Word or PowerPoint.
– Reference variable values can contain only 255 characters.
– Reference variable values must be single line only. In an Excel spreadsheet,select only one cell. In Word, select text from only one line or one table cell.
– Reference variables cannot be sourced from any PowerPoint content.
d. After you have finished editing the reference variables for the checked-out docletor reference file, upload the source document and check it in.
Once the doclets or reference files are checked in, the variables with theirupdated values are available to other report package authors.
5. Repeat the preceding steps for all variables that require editing.
Filtering VariablesFor easier viewing, you can filter the list of a variables in a report package. The default filter isAll, meaning all variables, static and reference, are displayed in the variables list.
Filtering categories are:
• All
Chapter 21Authoring Doclets
21-97

• Static
• Reference
• In Use
To filter variables:
1. Open a report package, and then open a doclet.
You do not need to check out a doclet in order to filter variables.
2. In the drop-down list in the Report Package panel, select Variables.
The list of variables available in the report package is displayed in the panel.
3. Choose a filtering option by clicking the links at the top of the variable list:
• All—Displays all variable types, static and reference.
• Static—Displays only static variables.
• Reference—Displays only reference variables
• In Use—Displays only those variables that are in use in the currently-openeddoclet.
To help to locate the variables in use in the current doclet, you may choose thehighlight option on individual variables, as described in Highlighting Variablesin Doclets
Highlighting Variables in DocletsYou can quickly view the instances of a variable in a doclet using the Highlightcommand for the selected variable.
To highlight a variable in a doclet:
1. Open a report package, and then open a doclet.
You do not need to check out a doclet in order to highlight variables.
2. In the drop-down list in the Report Package panel, select Variables.
Chapter 21Authoring Doclets
21-98

The list of variables available in the report package is displayed in the panel.
3. Select a variable from the list in the Smart View Panel.
4. Click the Options button, and, from the drop-down menu, select Highlight.
Note:
Highlighting is not supported on variables placed within headers and footers inWord doclets.
In Figure 1, the CurrentMonth variable, a static variable, is selected in the Smart ViewPanel. After selecting Highlight, the CurrentMonth variable is highlighted in the doclet atthe left.
Figure 21-39 Doclet with Highlighting Enabled for a Selected Variable
5. To unhighlight the selected variable, click the Options button, and, from the drop-down menu, select Unhighlight.
Inspecting VariablesYou can inspect for variables at the doclet level, or you can inspect individual variablesselected from the variables list.
To inspect for variables:
1. To inspect for variables in a doclet:
a. Open a report package, select a doclet, and, optionally, open it.
You can inspect for variables without opening the doclet.
Chapter 21Authoring Doclets
21-99

b. In the report package panel, click View Properties to open the Propertiesdialog box.
If you opened a doclet, you can also click Inspect in Narrative Reportingribbon to open the Properties dialog box.
c. In the Properties dialog box, select the Variables tab,
The Variables tab shows you the variables available in a doclet. The bluecircle next to a variable contains the number of times that variable is in use inthe doclet. For example, here is the variables tab from a doclet in a reportpackage:
d. Click the X in the top right corner to close the Properties dialog box.
2. To view the properties of an individual variable:
a. Open a report package, and then open a doclet.
You do not need to check out a doclet in order to highlight variables.
b. In the drop-down list in the Report Package panel, select Variables.
Chapter 21Authoring Doclets
21-100

The list of variables available in the report package is displayed in the panel.
c. Select a variable from the list in the Smart View Panel.
d. Click the Options button, and, from the drop-down menu, select Inspect.
The Properties dialog box for the selected variable is displayed.
The Properties tab shows you basic information about the variable, including whetherit is a static or reference variable. It also shows you the number of times the variableis used in the report package. Following are the example properties of a static and areference variable.
Chapter 21Authoring Doclets
21-101

e. Select the History tab, to view who made changes to the variable, andwhat changes were made.
f. Click the X in the top right corner to close the Properties dialog box.
Unlinking Reference VariablesUnlinking applies to reference variables only. When you unlink a reference variable,Narrative Reporting removes the association between the reference variable value andthe source value in the doclet, and sets the value to #Missing.
To unlink a variable:
1. Open a report package, and then open and check out a doclet.
2. In the drop-down list in the Report Package panel, select Variables.
The list of variables available in the report package is displayed in the panel.
3. In the Smart View Panel, select the reference variable to unlink from the list and
click the Edit Variable button, .
The Edit Variable button, , displays whenever you select a variable from thelist.
4. In the variable editing area, click the Unlink button, .
A warning message is displayed to advise that the selected variable will bepermanently removed from the doclet.
Though the variable values in the selected doclet are no longer managed byNarrative Reporting, the #Missing text remains in the doclet. If required, manuallyremove the #Missing text from the doclet.
5. Repeat the preceding steps for any other variables that you want to unlink.
6. When finished, upload check in the doclet.
Deleting VariablesYou can delete variables from the report package.
To delete a variable from a report package:
1. Open the report package from which you want to delete a variable.
2. In the drop-down list in the Report Package panel, select Variables.
Chapter 21Authoring Doclets
21-102

The list of variables available in the report package is displayed in the panel.
3. Ensure that the variable is no longer used in the report package.
Tip:
To quickly check whether a variable is in use in a doclet, select a doclet in theReport Package panel. In the Action Panel, select Properties, and then select
the Variables tab, . The variables that are used in the selected docletare listed. If required, you must search for each instance of the variable text inthe doclets and manually delete it, and make any necessary edits in the doclet.
4. Click the Options button, and, from the drop-down menu, select Delete.
A warning message is displayed, asking you to confirm the delete action.
5. Click Yes in the warning message to permanently delete the variable.
Chapter 21Authoring Doclets
21-103

If you did not remove the variable from the doclet text, as described in step 3, thevariable is removed from the listing on the variables list, but the variable text is notautomatically removed from the doclets. You must search for each instance of thevariable text in the doclets and manually delete it, and make any necessary editsin the doclet.
Note:
To reinstate a variable, you must re-create it, and then add the variableas required to the appropriate doclets.
Working with Excel Doclets in PDF-based Report PackagesIn PDF-based report packages, you can specify Excel workbooks as regular doclets.Authors and administrators can edit the content in Excel doclets and select sheets thatwill become part of the final report package.
To work with Excel doclets in PDF-based report packages:
1. In the PDF-based report package, open and check out the Excel doclet to workwith.
2. In the Narrative Reporting ribbon, click Select Sheets:
3. In the Select Sheets dialog, use the check boxes to select the sheets to include inthe final report package.
Alternatively, you can select the All sheets selected check box.
In Figure 1, the Select Sheets dialog shows six worksheets available in the Exceldoclet; however, only one, "World Wide," is selected for inclusion in the reportpackage.
Chapter 21Authoring Doclets
21-104

Figure 21-40 Select Sheets Dialog Showing One Sheet Selected for Inclusion inthe Report Package
4. Edit the sheets in the doclet as you require.
For example, you can perform ad hoc analysis or apply formatting.
5. When finished editing the Excel doclet, upload and check it in.
Working with Server-Initiated RefreshRelated Topics
• About Server-Initiated Refresh
• Creating and Editing Data Source Connections
• Selecting Sheets for Server-Initiated Refresh
• Initiating Refresh from Narrative Reporting Web
• Guidelines for Working with Server-Initiated Refresh
About Server-Initiated RefreshWith server-initiated refresh, you can easily refresh the Oracle Smart View for Office dataqueries in all of the Excel-based doclets and reference doclets within a report package usingthe Refresh options in the Narrative Reporting web application.
In Smart View, you specify which Excel doclets and reference doclets to refresh. You canchoose all sheets within a workbook or select only the sheets you require. From the NarrativeReporting web application, you select to refresh data from all defined data sources orselected data sources.
Chapter 21Authoring Doclets
21-105

Only one Narrative Reporting data source is allowed per report package. You can alsosource refreshable data queries from these Oracle Enterprise PerformanceManagement Cloud data sources:
• Planning
• Planning Modules
• Financial Consolidation and Close
• Tax Reporting
Service Administrators set up data sources in the Data Sources folder in NarrativeReporting.
For more guidelines and requirements, see the topics in Guidelines for Working withServer-Initiated Refresh:
• Enabling Server-Initiated Refresh
• Requirements
• Workbook Size Limit
• Grid Design Considerations and Guidelines
• Supported and Unsupported Grid Types
• Workbook Use Case Scenarios
For information on using server-initiated refresh, see:
• Selecting Sheets for Server-Initiated Refresh
• Initiating Refresh from Narrative Reporting Web
Videos
Your Goal Watch This Video
Learn the basics of server-initiated refresh. Server-Initiated Refresh Using Smart
View and Narrative Reporting
Creating and Editing Data Source ConnectionsIn Narrative Reporting web, administrators define data sources for all data queries inall of the Excel-based doclets and reference doclets that will be used with server-initiated refresh.
Oracle Smart View for Office locates the URLs used for each data query on eachsheet that users have selected for server refresh, and maps the URLs to thecorresponding data sources defined in the Data Sources folder in Narrative Reporting.If the data source is not defined in Narrative Reporting web, then the content in SmartView will be ignored (not refreshed)
To create a data source connection in Narrative Reporting:
1. From the Data Sources folder in the Library, click , and select Data Source.
2. In Data Source Name, enter a descriptive identifier for the data source, such as acombination of the source product, server, and application or database.
3. In Type, select the type of data source.
Chapter 21Authoring Doclets
21-106

Currently, only the "Oracle Enterprise Performance Management Cloud" source issupported, which includes these business processes:
• Planning
• Financial Consolidation and Close
• Tax Reporting
4. In Server Name, enter the only data source server name, including the HTTPS protocol.
For example, for Planning, if the data source URL is:
https://<servername>/HyperionPlanningThen the server name is:
<servername>5. In Identity Domain, enter the identity domain of the data source environment.
6. Enter the administrator user ID and password.
Note:
You must log in to Narrative Reporting with the administrator credentials for thedata source that you want to create a connection to. For example, if yourPlanning Modules administrator is PlanAdmin, you must log in to NarrativeReporting with the PlanAdmin credentials to create a data source connectionto the Planning Modules data source. Enter User ID and Password credentialsused for native authentication at the source. Single Sign-on with IdentityAssertion technologies is not supported.
7. Click Test Connection.
8. After a successful connection, you can browse and select the application and cube byselecting for application name and cube name.
After selecting a cube, click on to preview the dimension list.
9. Optional: To edit a data source connection, select the connection and then select Editfrom the Actions menu. When you edit a connection, you can change the connectionname, server, application and cube name.
Note:
• You do not need to specify the data source server protocol (for example,https://) in the Server Name field.
• Changing the connection name does not affect any report objects that usethe connection.
• Changing the server, application, or application or cube names causes anyreport objects that use the connection to point to the new destination.
• For security purposes, you must re-enter the administrator credentials whenediting a data source.
Chapter 21Authoring Doclets
21-107

Selecting Sheets for Server-Initiated RefreshIn Oracle Smart View for Office, you select sheets to be recalculated and refreshedduring server-initiated refresh. You can include sheets from Excel doclets and Excelreference doclets.
To select sheets to include in server-initiated refresh:
1. If you haven't already done so, open your report package.
2. Open and check out the Excel doclet or Excel reference doclet that containssheets that you want to include in server-initiated refresh.
Tip:
You must check out the doclet before you can select sheets.
3. Click Inspect in the Narrative Reporting ribbon to launch the Properties dialogbox.
4. In the Properties dialog, select the Opt In tab.
By default, no sheets in the workbook are selected.
Figure 21-41 Initial Launch of Properties Dialog - Opt In Tab; No SheetsSelected
Chapter 21Authoring Doclets
21-108

Note:
The Opt In tab is visible only if your administrator has enabled server-initiatedrefresh in your service.
5. Perform an action to select sheets in the workbook for inclusion in server-initiated refreshof the doclet:
• Select Include All Sheets
• Select only the specific sheets you require
Note:
The Excel doclet or reference doclet workbook must not exceed 3 megabytes insize. If the workbook exceeds 3 megabytes in size, all check boxes in the OptIn tab are disabled.
In the example below, two sheets that contain unsupported grid layouts are not selectedfor refresh:
Figure 21-42 Example Opt In Tab with Specific Sheets Selected for Server-Initiated Refresh
6. In the Properties dialog, click Save.
7. Upload and check in the doclet by selecting Check In, and then Upload and Check In.
Chapter 21Authoring Doclets
21-109

The sheets you selected are now available for refresh the next time you accessthe report package in the Narrative Reporting web interface.
8. Repeat this procedure for any other applicable Excel doclets or Excel referencedoclets in your report package.
9. To perform the server-initiated refresh on the selected doclets and sheets, go tothe Narrative Reporting web interface.
Use the Refresh options on the Actions menu to choose whether to refresh allselected doclets, or choose to refresh doclets from a selected data source. See Initiating Refresh from Narrative Reporting Web for more information.
Initiating Refresh from Narrative Reporting WebTo refresh Excel-based doclets and reference doclets from the Narrative Reportingweb interface:
1. Open the report package in the Narrative Reporting web interface.
Note:
For instructions on accessing report packages in the Library, see Usingthe Library.
2. From the top right menu, select Refresh, and then select All or selecta data source from the drop-down list.
You can also refresh individual Excel-based doclets and reference doclet inNarrative Reporting.
Select an Excel-based doclet or reference doclet, click the arrow for the doclet,then select Refresh, and then select All or select a data source from the drop-down list.
Guidelines for Working with Server-Initiated RefreshRelated Topics
• Enabling Server-Initiated Refresh
• Requirements
• Data Sources
• Workbook Size Limit
• Grid Design Considerations and Guidelines
• Supported and Unsupported Grid Types
Chapter 21Authoring Doclets
21-110

• Workbook Use Case Scenarios
Enabling Server-Initiated Refresh
Server-initiated refresh is enabled in the Narrative Reporting web application by default.
Requirements
To use the server-initiated refresh feature, the following components are required:
• Oracle Smart View for Office 11.1.2.5.810+
• Narrative Reporting extension for Smart View 19.04+
• Oracle Enterprise Performance Management Cloud 19.07+
Once enabled, the server-initiated refresh options appear in the Narrative Reporting webinterface. In Smart View, once connected to the enabled service, the Opt In tab is available inthe Properties dialog, where you specify sheets to refresh.
Data Sources
Administrators set up data sources in the Data Sources folder in Narrative Reporting. See Creating and Editing Data Source Connections.
Workbook Size Limit
The Excel doclet or reference doclet workbook must not exceed 3 megabytes in size. If theworkbook exceeds 3 megabytes in size, all check boxes in the Opt In tab of Propertiesdialog are disabled.
Grid Design Considerations and Guidelines
In order for server side refresh to work properly, certain considerations need to be designedin to your workbook. You may need to redesign or rebuild to fit these considerations.
Keep in mind the following considerations and guidelines when designing your grids:
• Lay out worksheet elements as follows:
– Data query (ad hoc grid or form) is at the top of the sheet.
– Formulas, functions, and comment cells are placed below the data query area,unless member or data cells that are part of the query reference a formula orfunction.
• The server-initiated refresh only recalculates and refreshes sheets containing Smart Viewcontent from the supported EPM Cloud sources.
From the Narrative Reporting web, you will not be able to select on-premises datasources for refresh, even if you selected an on-premises sheet in Smart View. On-premises data source content and non-Smart View content will be skipped.
• Report package variables may be inserted into the query POV directly or through aformula that references a cell location in the same sheet or in a different sheet within theworkbook.
• HsGetValue functions, function grids, and dynamic data points must be created usingSmart View 11.1.2.5.900 or later and refreshed once to save the connection information.Otherwise, the server-initiated refresh will not be able to evaluate the functions, functiongrids, or data points and a #No Connection message will be returned.
Chapter 21Authoring Doclets
21-111
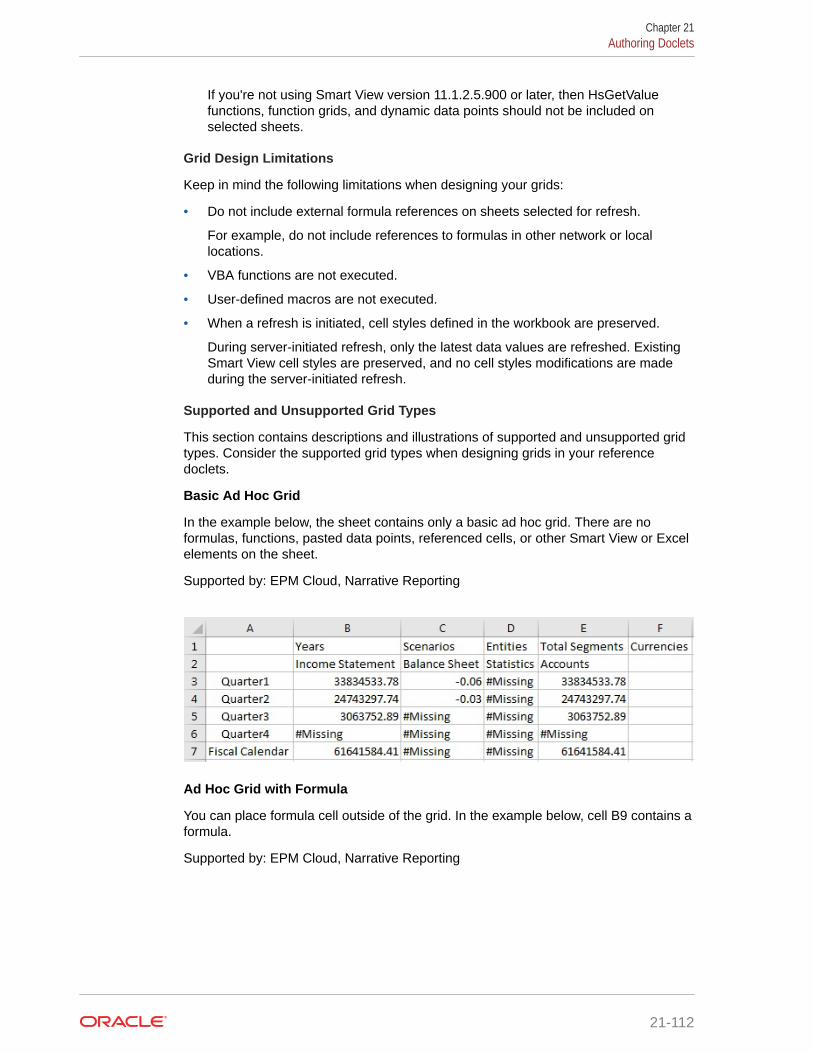
If you're not using Smart View version 11.1.2.5.900 or later, then HsGetValuefunctions, function grids, and dynamic data points should not be included onselected sheets.
Grid Design Limitations
Keep in mind the following limitations when designing your grids:
• Do not include external formula references on sheets selected for refresh.
For example, do not include references to formulas in other network or locallocations.
• VBA functions are not executed.
• User-defined macros are not executed.
• When a refresh is initiated, cell styles defined in the workbook are preserved.
During server-initiated refresh, only the latest data values are refreshed. ExistingSmart View cell styles are preserved, and no cell styles modifications are madeduring the server-initiated refresh.
Supported and Unsupported Grid Types
This section contains descriptions and illustrations of supported and unsupported gridtypes. Consider the supported grid types when designing grids in your referencedoclets.
Basic Ad Hoc Grid
In the example below, the sheet contains only a basic ad hoc grid. There are noformulas, functions, pasted data points, referenced cells, or other Smart View or Excelelements on the sheet.
Supported by: EPM Cloud, Narrative Reporting
Ad Hoc Grid with Formula
You can place formula cell outside of the grid. In the example below, cell B9 contains aformula.
Supported by: EPM Cloud, Narrative Reporting
Chapter 21Authoring Doclets
21-112
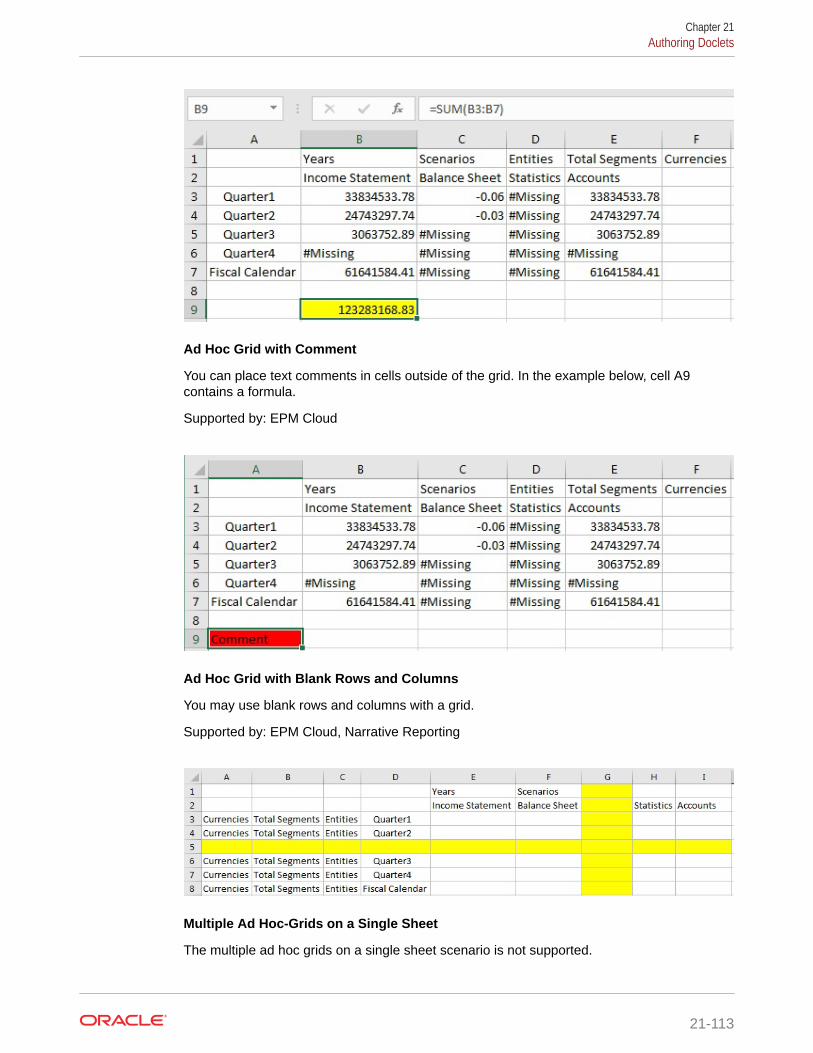
Ad Hoc Grid with Comment
You can place text comments in cells outside of the grid. In the example below, cell A9contains a formula.
Supported by: EPM Cloud
Ad Hoc Grid with Blank Rows and Columns
You may use blank rows and columns with a grid.
Supported by: EPM Cloud, Narrative Reporting
Multiple Ad Hoc-Grids on a Single Sheet
The multiple ad hoc grids on a single sheet scenario is not supported.
Chapter 21Authoring Doclets
21-113

Grid with Referenced Member
This grid contains a member (cell A4) referenced as a formula from another sheet.
Supported by: EPM Cloud, Narrative Reporting
Grid with Members Referenced as Narrative Reporting Variable
This grid, based on an EPM Cloud data source, contains a member (cell C1)referenced as an Narrative Reporting variable.
Supported by: EPM Cloud, Narrative Reporting
Grid Containing Pasted Data Points
This grid, based on an EPM Cloud data source, contains a cell range (cells C3 to E5)consisting of pasted data points. The data points can be copied from another sheetwithin the same workbook or from a different workbook. The data source for the datapoints could be based on the same data source as the original sheet, or a differentdata source.
Supported by: EPM Cloud, Narrative Reporting
Chapter 21Authoring Doclets
21-114
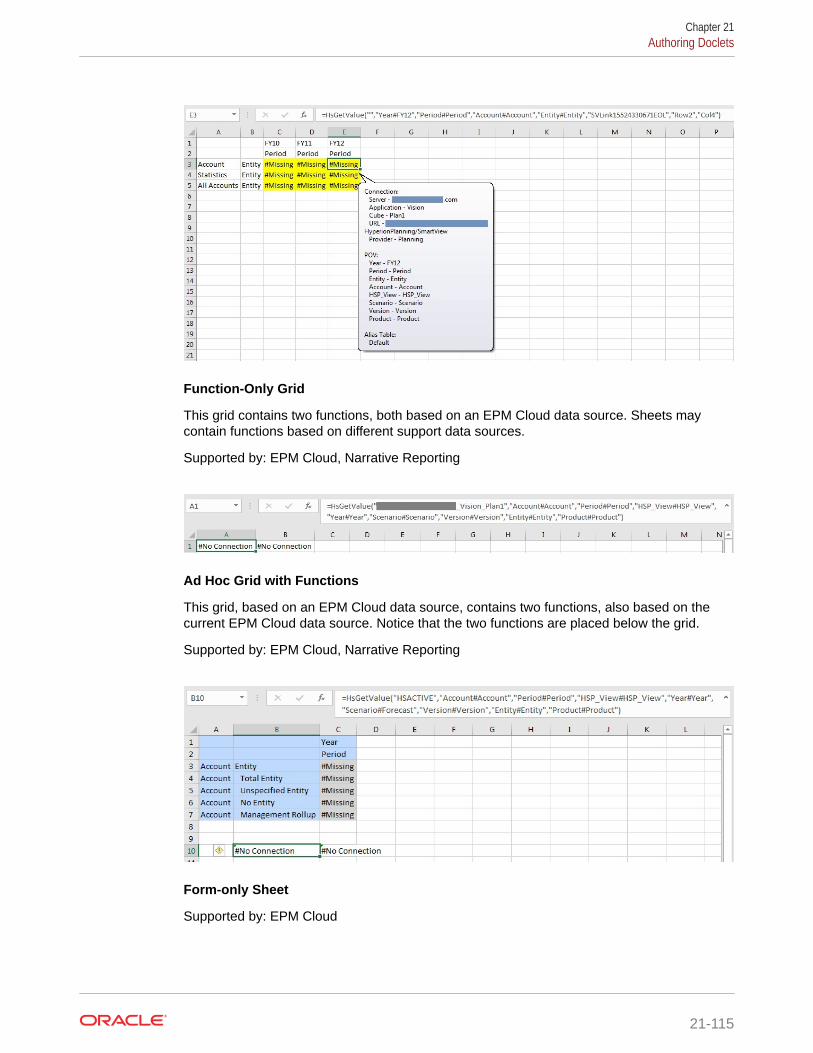
Function-Only Grid
This grid contains two functions, both based on an EPM Cloud data source. Sheets maycontain functions based on different support data sources.
Supported by: EPM Cloud, Narrative Reporting
Ad Hoc Grid with Functions
This grid, based on an EPM Cloud data source, contains two functions, also based on thecurrent EPM Cloud data source. Notice that the two functions are placed below the grid.
Supported by: EPM Cloud, Narrative Reporting
Form-only Sheet
Supported by: EPM Cloud
Chapter 21Authoring Doclets
21-115

Form with Comment and Formula Cells
This grid, based on an EPM Cloud data source, contains both comment cells andformula cells in row 5. Notice that the comment cell and formula cells are placed belowthe form. Sheets containing a form may contain either comment cells, formula cells, orboth.
Supported by: EPM Cloud
Formatted Ad Hoc Grid
Supported by: EPM Cloud, Narrative Reporting
Workbook Use Case Scenarios
In this section, we'll show you example use case scenarios based on a referencedoclet workbook. The workbook contains five sheets, with each sheet containing adata query from a different data source. Data sources are both cloud and on-premises.The scenarios show you the outcome of different combinations of sheet selectionwhen performing a refresh from the Narrative Reporting web application.
The example workbook in the following use case scenarios contains the followingsheets:
• Sheet 1: Planning data query
Chapter 21Authoring Doclets
21-116

• Sheet 2: Narrative Reporting data query
• Sheet 3: Oracle Hyperion Financial Management data query (on-premises data source)
• Sheet 4: No data query
• Sheet 5: Planning data query
Scenario 1—No sheets are selected for server-initiated refresh and recalculation
Upon inspection of the workbook, there should not be any data sources shown as refreshableas nothing has been selected.
From the server side, this is a non-refreshable doclet.
Scenario 2—Only Sheet 1 is selected
Upon inspection of the workbook, the only refreshable data source is Planning.
From the server side, only Planning is shown as a refreshable data source.
Upon refresh, only Sheet 1 will be refreshed and recalculated. Sheet 5, which is also anPlanning sheet, would not be refreshed or recalculated.
Scenario 3—Sheets 1 and 2 are selected
Upon inspection of the workbook, the refreshable data sources are Planning and NarrativeReporting.
From the server side, both Planning and Narrative Reporting are shown as refreshable datasources.
Upon refresh, only Sheets 1 and 2 are refreshed and recalculated. Sheet 5 which is also anPlanning sheet, is not refreshed or recalculated.
Scenario 4—Sheets 1, 2, and 3 are selected
Upon inspection of the workbook, the refreshable data sources are Planning and NarrativeReporting.
From the server side, both Planning and Narrative Reporting are as refreshable data sources.
Upon refresh, Sheets 1 and 2 are refreshed and recalculated. Sheet 3 is recalculated but theFinancial Management query is not impacted. Sheet 5, which is also an Planning sheet, wasnot selected so it is not refreshed or recalculated.
Scenario 5—Sheet 1, 2, 3, and 4 are selected
Upon inspection of the workbook, the refreshable data sources are Planning and NarrativeReporting.
From the server side, both Planning and Narrative Reporting are shown as a refreshable datasources.
Upon refresh, Sheets 1 and 2 are refreshed and recalculated. Sheet 3 will be recalculated butthe Financial Management query is not impacted. Sheet 4 is recalculated. Sheet 5, which isalso an Planning sheet, is not refreshed or recalculated.
Scenario 6—All sheets selected
Upon inspection of the workbook, the refreshable data sources are Planning and NarrativeReporting.
Chapter 21Authoring Doclets
21-117

From the server side, both Planning and Narrative Reporting are shown as refreshabledata sources.
Upon refresh, Sheets 1, 2, and 5 are refreshed and recalculated. Sheet 3 isrecalculated but the Financial Management query is not impacted. Sheet 4 isrecalculated.
Scenario 7 – Sheets 3 and/or 4 are selected
Upon inspection of the workbook, there should not be any refreshable data sourcesreturned to the server as the selected sheets do not contain any refreshable datasources.
From the server side, this is a non-refreshable doclet.
Inserting Links and Cross-References to Pages in DocletsUse Microsoft Word bookmarks to link to and cross-reference page numbers in yourdoclet. You can cross-reference bookmarks as page numbers in a table of contentsdoclet, whether you inserted the cross-references manually or inserted a manual tableof contents and edited the cross-references. If the page number containing thebookmark changes, then the page number cross-references also change.
This topic describes inserting the bookmarks and then the cross-references. Theprocedures can also be used to edit a manual table contents.
Inserting Bookmarks
Before you add a cross-reference or a link, you must insert a bookmark at the locationthat you want to link to.
To insert a bookmark:
1. In a Word document, place your cursor at the location of the bookmark.
2. In the Insert ribbon, select .
3. In Bookmark Name, enter EPRCS_ and a bookmark identifier. For example,EPRCS_Fin_Review.
Chapter 21Authoring Doclets
21-118

4. Click Add.
The bookmark is created.
Inserting Page Number Cross-References or Links in Doclets
After you create the target bookmark, you can insert a page number cross-reference or a linkto that bookmark in the document that you want to link from.
To insert page number cross-references:
1. In the document to link from, place the cursor where you want the cross-reference. In thisexample, we will add a page number cross-reference in the table of contents.
2. Press Ctrl+F9 to insert field brackets. Ensure that the insertion point stays between thebrackets.
Chapter 21Authoring Doclets
21-119

3. Enter pageref, followed by a space and then the bookmark name. For example,pageref EPRCS_Fin_Review.
4. Upload and check the source and target doclets back into the report package.
5. On the Preview tab, select Actions, and then Download Preview to see the pagecross-reference.
6. In the downloaded report package preview in Word, you must refresh the pagereference field to reflect the page number.
Note:
Word may display ‘Error! Bookmark not defined’.
7. Press F9 to refresh the field information.
Chapter 21Authoring Doclets
21-120

Note:
The field is updated to reflect the page number in the report package where youinserted the bookmark in the doclet.
To insert links:
1. Highlight the text to add the link to, and then right-click and select Hyperlink.
2. In the Insert Hyperlink dialog box, for Address, enter #, followed by the bookmarkname. For example, #EPRCS_Fin_Review.
Chapter 21Authoring Doclets
21-121

3. The link is added to the text that you selected. In this example, the link was addedto the Income Analysis text.
4. Upload and check the doclet back into the report package.
5. On the Preview tab, select Actions, and then Download Preview to see the link.
6. Click the link to navigate to the bookmark location.
Chapter 21Authoring Doclets
21-122

Working with an Automatic Table of ContentsWhen you insert a Microsoft Word table of contents into a doclet, you can choose either amanual, automatic, or custom type. For manual types, you can create page number links byusing links and cross-references or by inserting a manual table of contents (see InsertingLinks and Cross-References to Pages in Doclets). For automatic or custom types, the table ofcontents is updated whenever the doclet is merged into the report package. For example,preview the report package or the section that contains the table of contents to view thedynamically updated table of contents.
Note:
If you preview only the doclet that contains the table of contents, no entries aredisplayed in the table. You must preview the report package or the section thatcontains the doclet to see the updated table of contents.
Note:
Automatic and custom tables of contents are available for Microsoft Word reportpackages only.
Approving or Rejecting DocletsThis topic applies to Office-based doclets of all types—regular, reference, and supplemental.Unless otherwise noted, the term doclets refers to all Office-based doclet types.
As approver, you review and approve doclets after the author submits them. You also haveaccess to the same functionality as the author, including:
• Check Out
Chapter 21Authoring Doclets
21-123

• Upload
• Check In
• Inspect
See:
• Approving Doclets
• Rejecting Doclets
Videos
Your Goal Watch This Video
Learn about approving and rejecting doclets inWord-based report packages. Authoring and Approving Microsoft
Word-Based Doclets in Smart View
Learn about approving and rejecting doclets inPowerPoint-based report packages. Authoring and Approving Microsoft
PowerPoint-Based Doclets in Smart View
Approving DocletsThis topic applies to Office-based doclets of all types—regular, reference, andsupplemental. Unless otherwise noted, the term doclets refers to all Office-baseddoclet types.
As approver, if you are satisfied that the doclet is correct, you approve it to complete it.If multiple approvals are required, you, as approver, submit the doclet for furtherapprovals. After approval, authors can no longer check out the doclet, although theycan still download and inspect it.
To approve a doclet, reference doclet, or Office-based supplemental doclet:
1. If not already open, in the Smart View Panel, navigate to the doclet and double-click it to open it.
Note:
In the Report Center, a green arrow, , signifies doclets that requireyour attention as approver.
2. In the Narrative Reporting ribbon, click Approve.
In the Smart View Panel, the approved doclet appears in the doclet responsibilitieslist with a green check mark:
Chapter 21Authoring Doclets
21-124

If a doclet requires multiple levels of approval, the approved artifact appears in the docletresponsibilities list with the rubber stamp icon:
When a doclet is approved by all approvers, its status is updated to Approved in theNarrative Reporting web interface; the green check mark is displayed with the doclet inOracle Smart View for Office.
Rejecting DocletsThis topic applies to Office-based doclets of all types, including reference and supplemental.Unless otherwise noted, the term doclets refers to all Office-based doclet types.
If a doclet is not ready for approval, you can either edit it yourself (check out the doclet,modify it, and check in the corrected version), or you can reject it to send it back to the authorto edit.
To reject a doclet, reference doclet, or supplemental doclet:
1. If not already open, in the Smart View Panel, navigate to the doclet and double-click it toopen it.
2. In the Narrative Reporting ribbon, click Reject.
When a doclet is rejected, its status is updated to Rejected, and the responsibility revertsto the author, and notification is sent to the author. If there are multiple approver levels,notification is sent to all approvers within the approval path.
The author must update the content and resubmit it for approval.
In the Smart View Panel, the rejected doclet appears in the doclet responsibilities list witha red X:
Recalling DocletsIf enabled in the report package, Authors and Approvers may use the Recall Doclet button inthe Narrative Reporting ribbon to restart the Doclet workflow, allowing them to makemodifications to the Doclet content as needed. This action will be available to the Authors andApprovers when the doclet has been marked complete or when the doclet is at a higher levelwithin the approval path; for example, after the doclet has been submitted.
Chapter 21Authoring Doclets
21-125

If the Recall Doclet setting is not enabled in the report package, the Recall Docletbutton does not appear on the Narrative Reporting ribbon. Once an author submittedor an approver approved a doclet, they can no longer update the doclet’s contents ifadditional modifications are needed. The Report Package Owner is required to eitherreject or restart the Doclet workflow.
Recalling a doclet restarts the authoring process for only the selected doclet. Authorsmay continue their modifications, and can submit the updated doclet for approval if anapproval phase is required.
To recall a doclet:
1. Open the doclet to recall.
2. In the Narrative Reporting ribbon, click the Recall Doclet button.
After you click Recall Doclet, the Submit button is again enabled.
3. Continue with authoring process for the doclet; for example, check out the doclet,make modifications, upload, check in, and submit for approval, if required.
Inspecting DocletsThis topic applies to Office-based and non-Office-based doclets of all types, includingreference and supplemental, and of all supported file formats.
For detailed information on doclets, reference doclets, and supplemental doclets, clickInspect in the Narrative Reporting ribbon.
The Inspect button launches the Properties dialog box.
From the Properties dialog box, you can also download previous versions of a doclet,reference doclet-, or Office-based supplemental doclet.
Note:
All steps in the following procedure are optional.
To view information about a doclet, reference doclet, or supplemental doclet:
1. If the report package is not already open, in the Smart View Panel, navigate to thereport package and open it.
2. Select a doclet, reference doclet, or supplemental doclet in the list and click theInspect button in the Narrative Reporting ribbon.
3. In the Properties dialog box, view the information the Properties tab (the defaulttab).
Chapter 21Authoring Doclets
21-126

The Properties tab displays basic information about the doclet, such as the file name,doclet type, suppression status, and the user who created the doclet.
Figure 21-43 Properties for a Doclet
Figure 21-44 Properties for a Reference Doclet
Chapter 21Authoring Doclets
21-127

Figure 21-45 Properties for a Supplemental Doclet
4. Click the Embedded Content tab, , to view a list of the embedded contentthat is being used in the doclet.
5. Click the Version tab, , to download previous versions of Office-baseddoclets.
As new versions of doclets are checked in, the previous versions are stored sothat you can download and view them to see what changed.
Chapter 21Authoring Doclets
21-128
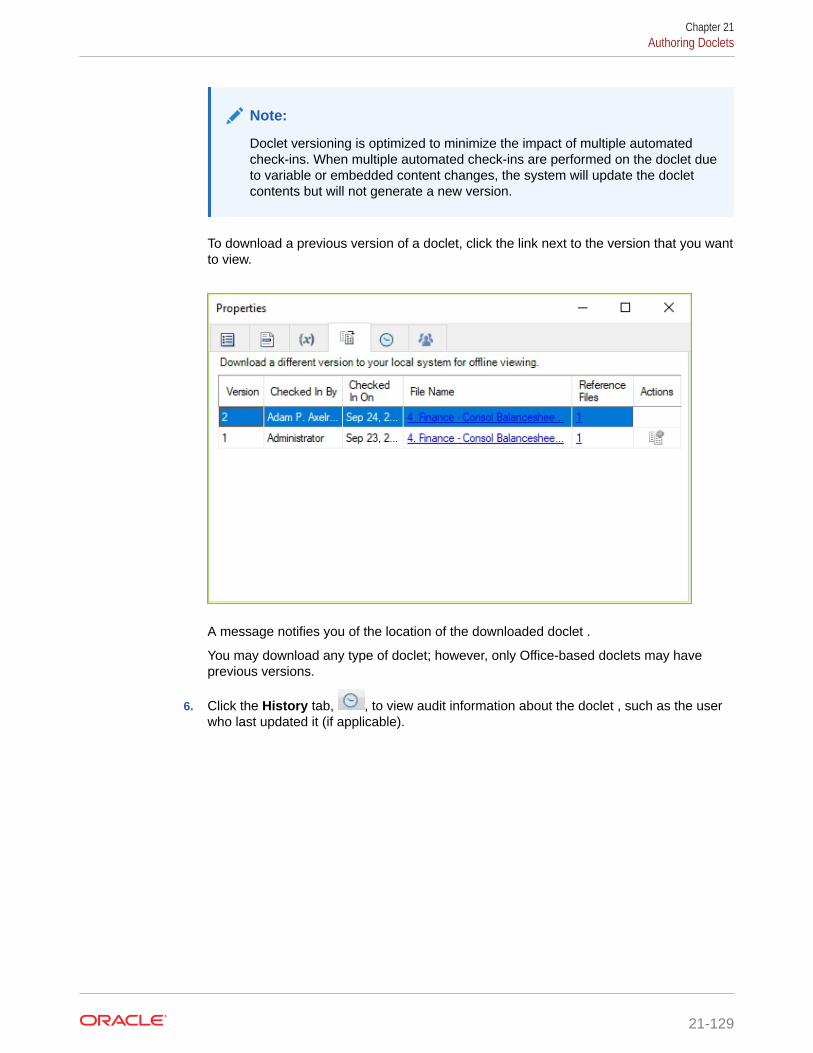
Note:
Doclet versioning is optimized to minimize the impact of multiple automatedcheck-ins. When multiple automated check-ins are performed on the doclet dueto variable or embedded content changes, the system will update the docletcontents but will not generate a new version.
To download a previous version of a doclet, click the link next to the version that you wantto view.
A message notifies you of the location of the downloaded doclet .
You may download any type of doclet; however, only Office-based doclets may haveprevious versions.
6. Click the History tab, , to view audit information about the doclet , such as the userwho last updated it (if applicable).
Chapter 21Authoring Doclets
21-129

7. Click the Actors tab, , to view the actors associated with the doclet.
The Responsibility node shows the user who has currently checked out thedoclet. The Authors node shows the authors assigned to the doclet. TheApprovers node shows the assigned approvers.
In the following illustration, the doclet is currently checked out by Adam P. Axelrod.There are two assigned authors, and there are no assigned approvers.
Chapter 21Authoring Doclets
21-130

Reverting to a Prior Version of a DocletWhen authoring a doclet in a report package and your updates or the outcome is incorrectafter previewing the doclet, you can revert back to a prior doclet version.
You can revert doclets, reference doclets, and supplemental doclets to previous versions.
To revert a doclet to a prior version:
1. Open the report package.
2. Open, and then check out the doclet.
The doclet is opened in the appropriate Office application.
3. Click Inspect in the Narrative Reporting ribbon to launch the Properties dialog box.
Alternatively, with the doclet selected in the report package list, select the ViewProperties link in the Action Panel.
4. In the Properties dialog, click the Version tab, .
5. In the Version tab, click for the version of the doclet you want to make current.
In the following example, we want to make version 2 the current version, so we'll click on the line for version 2.
A new work-in-progress version of the doclet is created based on the selected doclet file.
Chapter 21Authoring Doclets
21-131
6. In the warning prompt, click Yes to confirm.
The report content in the new version is based on the prior version. However, anyembedded content or variables contained in the prior version are refreshed to theircurrent values.
Note:
If you accessed the Properties dialog by selecting the View Propertieslink in the Action Panel, then you must close and reopen the doclet inorder to see the reverted version.
7. Review the doclet to verify it is the correct content.
8. Upload and check the doclet back in to the report package to commit the changesto the report.
Performing ReviewsPerform reviews by entering comments and providing your feedback in a reviewinstance in Oracle Smart View for Office.
Related Topics
• About the Review Phase Process
• Working with Review Instances in Smart View
About the Review Phase ProcessThe review phase enables report stakeholders to review and provide feedback on thecontent in the report package. Reviewers provide commentary on their assigned areasof the report package. This could be the entire report package or a subset consistingof sections or specific doclets. Reviewers can provide their feedback by using OracleSmart View for Office to enter, review, and respond to comments.
The review phase process:
1. The report package owner creates the review instance, and then starts the reviewcycle in the Narrative Reporting web interface.
2. Notification messages are sent to reviewers to begin their work. If the review is iterative, reviewers are notified to begin their work at the start of each iteration.
3. Reviewers view a document called a review instance in Smart View. A reviewinstance includes only the reviewer's assigned content.
Review instances do not include supplemental doclets of any file type.
Note:
Though reviewers see only their assigned content, all comments aremade and retained against the single review instance.
Chapter 21Performing Reviews
21-132

4. Reviewers highlight content and post comments in plain text or in rich text format, whichcan include links and attachments.
5. Reviewers collaborate by adding to other comments in comment threads.
6. Reviewers mark their reviews complete, indicating to the report package owner that theyare finished with their review. If the reviewer wants to add additional comments aftermarking the review complete, the reviewer can "Reopen for comments," indicating to thereport package owner that they are not done with their review.
A report package may have multiple review cycles defined for it. All review cycles followthe same process.
Collaborative Review ProcessAs reviewers, you collaborate by viewing and adding to other reviewers’ comments, creatingcomment threads. For example, a previous reviewer may have asked a question that youknow the answer to. You can add to their comment to provide the answer.
Iterative Review ProcessReviews can be iterative, which means that a report package owner can schedule multiplereview cycles depending on the type of review required.
For example, for a multiple draft review process, the review process may include:
• Multiple review cycles; with three drafts.
• Review assignments that vary by draft; for example:
– First draft for manager level
– Second draft for executive level
– Third draft for CEOs, CFOs, and so on
• Review assignments that vary by area where you can assign users to review:
– Entire report
– Sections
– Doclets
Key points to remember about the iterative review process:
• A new review instance incorporates content modifications.
• Comments persist across review cycles, so reviewers can see previous comments andhow they were addressed.
• The review phase is complete when all review cycles are closed.
Working with Review Instances in Smart ViewYou perform reviews by entering comments and providing your feedback in a review instancein Oracle Smart View for Office. The review instance shows you a draft version of the areasof the report package that you have been assigned to review (see Figure 1). The reviewinstance may consist of the entire report or a subset of the report content. Review instancesdo not include reference doclets or supplemental doclets of any file type.
Chapter 21Performing Reviews
21-133

Before you begin the review procedures, you should have launched Microsoft Word orPowerPoint, connected to Narrative Reporting, and opened a report package, asdescribed in Connecting to Narrative Reporting in Smart View.
Figure 21-46 A Portion of an Example Review Instance in Smart View withWord
Videos
Your Goal Watch This Video
Learn about working with review instances inWord-based report packages. Reviewing Microsoft Word-Based
Report Package Content in Smart View
Learn about working with review instances inPowerPoint-based report packages. Reviewing Microsoft PowerPoint-
Based Report Package Content in Smart View
Selecting a Review InstanceWhen a report package is ready for review, an Narrative Reporting web interfacemessage notifies reviewers that they can begin their work.
For example:
RReview is required for Sample Report Package - MS Word - Review Cycle 2
Chapter 21Performing Reviews
21-134

In this example, "Review Cycle 2" signifies that you will select "Review 02" in the ContentSelector in Oracle Smart View for Office.
To select a review instance in Smart View:
1. In the Smart View Panel, verify that the required review instance is selected in theContent Selector.
When you first open a report package, the active review instance is shown in theContent Selector by default. However, even if you intend to open the active reviewinstance that is showing in the Content Selector, you must still manually select it.
Note:
If only one review cycle is defined for the report package, you must manuallyselect the review instance in the Content Selector.
In Figure 1, "Review 01" and "Review 02" are the available options. The dot next to"Review 02" signifies that this review instance is active and ready for your reviewcomments. Notice that there is no dot next to "Review 01." This signifies that the reviewinstance is closed to new review comments; however, you may open "Review 01" to viewit.
Figure 21-47 Example of Review Instances in the Content Selector
2. If not already selected, select the required review instance.
When you select a review instance, your screen should resemble Figure 1.
You can now begin working with review comments in the review instance.
Posting CommentsSee these topics:
• Posting a New Comment
• Posting a Reply to a Comment
Posting a New Comment
To post a new comment:
Chapter 21Performing Reviews
21-135

1. Perform an action:
• Comments on Text in Word: To post comments on text in a Word-basedreport package, in the review instance, select the text to comment on, and inthe Narrative Reporting ribbon, click Add New Comment.
• Comments on Text in PowerPoint: To post comments on text in aPowerPoint-based report package, place your cursor in the slide you want tocomment on, and in the Narrative Reporting ribbon, click Add New Comment.
A pin is placed in the top left corner of the slide. Click the pin and drag it toposition it on or near the text to comment on. Then, double-click the pin toopen the EPRCS Comments text box.
Note:
If text was selected before clicking Add New Comment, the pin willbe placed at the top left corner of the selection.
• Comments on Graphics in Word: To post comments on graphics in a Word-based report package, in the review instance, select the graphic to commenton, and in the Narrative Reporting ribbon, click Add New Comment.
A pin is placed in the top left corner of the page that contains the graphic. Clickthe pin, and drag and drop it on the desired location within the graphic. Thendouble-click the pin to open the EPRCS Comments text box.
Select only the graphic. Do not select any paragraph markers, text, or emptyspaces around the graphic.
• Comments on Graphics in PowerPoint: To post comments on graphics in aPowerPoint-based report package, in the review instance, select the graphic tocomment on, and in the Narrative Reporting ribbon, click Add New Comment.
A pin is placed in the top left corner of the graphic. Click the pin, and drag anddrop it on the desired location within the graphic. Then double-click the pin toopen the EPRCS Comments text box.
Select only the graphic. Do not select any paragraph markers, text, or emptyspaces around the graphic.
• Comments on Embedded Content in Word: To post comments onembedded content in Word, select a data or text cell within a single instance ofembedded content, and in the Narrative Reporting ribbon, click Add NewComment.
For example, select data or text within an individual cell in an embeddedcontent object. You may select a range of cells, but the pin is placed only onthe first cell in the range (the upper left cell of the range).
Chapter 21Performing Reviews
21-136

To select an entire embedded content object for commenting, select some text fromthe row above the embedded content, along with the entire embedded contentobject.
You may add comments to only one embedded content object at a time. If you mustadd the same comment to other embedded content objects, you must add thecomment separately to each embedded content object.
• Comments in Automatic TOCs (Word only): With the Narrative Reportingextension version 17.07+, commenting on automatic TOCs is not allowed. To addcomments related to an automatic TOC, place the comment as close to the TOC asyou can, and then refer to it in your comment.
With pre-17.07 versions of the Narrative Reporting extension, commenting onautomatic TOCs is allowed in the heading or title only. You cannot comment in thebody of the automatic TOC.
• Comments in Manual TOCs (Word only): Commenting is allowed on both theheading and the body of manual TOCs.
Tip:
The selection area for comments cannot be empty. Select a graphic or at leastone word or number when adding comments.
You cannot select an entire embedded content object only and then add acomment; that selection is considered an empty selection. You must select textabove the embedded content, along with the embedded content, to beconsidered a valid selection area for comments.
2. In EPRCS Comments, enter a comment.
Figure 1 shows an example of an EPRCS Comments text box with text selected forcommenting.
Figure 21-48 EPRCS Comment Text Box in Word with Text Selected
Chapter 21Performing Reviews
21-137

Figure 2 shows an example of an EPRCS Comments text box with a graphicselected for commenting in PowerPoint. Notice that the pin was placed in theupper left corner of the graphic.
Figure 21-49 EPRCS Comment Text Box in PowerPoint with GraphicSelected
Note:
You can add URLs, text formatting, and attachments to comments. See Editing and Deleting Comments and Attaching Supporting Files andCustomizing Comment Text.
3. Click Enter, , to post your comment.
Note:
A comment must contain text, an attachment, or both.
Your comment is added to the list of comments in the comments pane in the Smart
View Panel, and an anchor icon, , is added to the review instance to indicatethat there is a comment.
4. In the top right corner of the EPRCS Comments text box, click Close, , to exit.
Posting a Reply to a Comment
To post a reply to a comment:
Chapter 21Performing Reviews
21-138
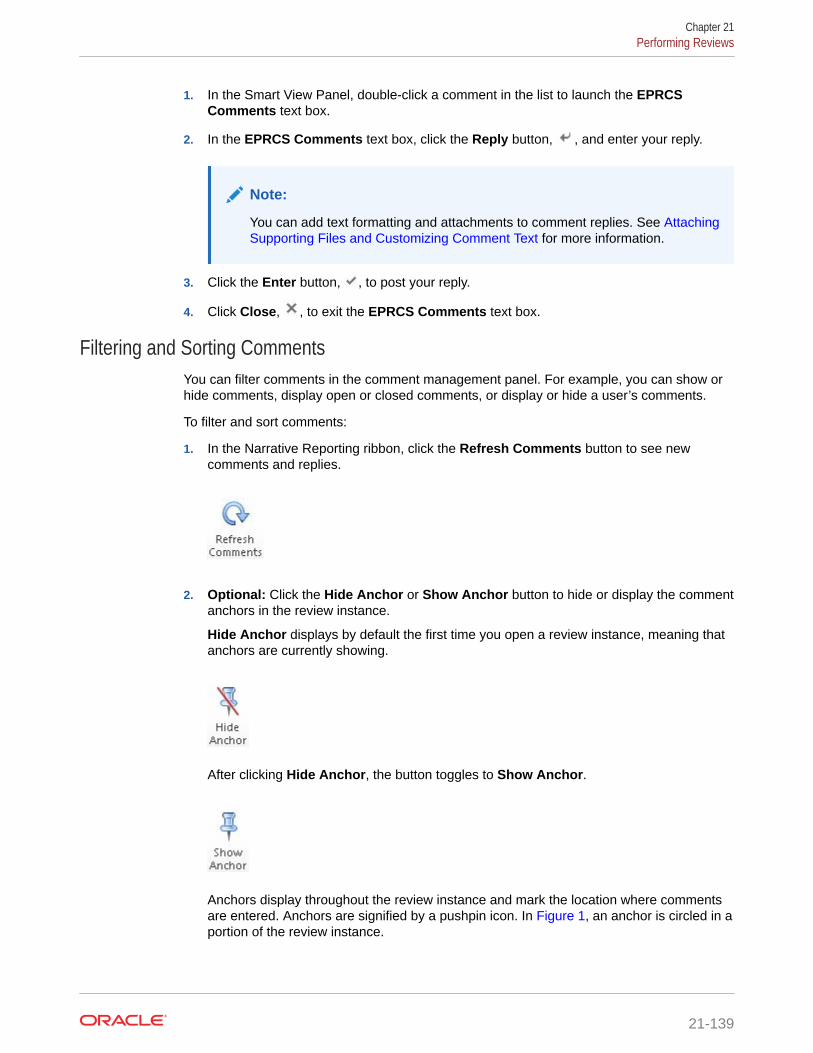
1. In the Smart View Panel, double-click a comment in the list to launch the EPRCSComments text box.
2. In the EPRCS Comments text box, click the Reply button, , and enter your reply.
Note:
You can add text formatting and attachments to comment replies. See AttachingSupporting Files and Customizing Comment Text for more information.
3. Click the Enter button, , to post your reply.
4. Click Close, , to exit the EPRCS Comments text box.
Filtering and Sorting CommentsYou can filter comments in the comment management panel. For example, you can show orhide comments, display open or closed comments, or display or hide a user’s comments.
To filter and sort comments:
1. In the Narrative Reporting ribbon, click the Refresh Comments button to see newcomments and replies.
2. Optional: Click the Hide Anchor or Show Anchor button to hide or display the commentanchors in the review instance.
Hide Anchor displays by default the first time you open a review instance, meaning thatanchors are currently showing.
After clicking Hide Anchor, the button toggles to Show Anchor.
Anchors display throughout the review instance and mark the location where commentsare entered. Anchors are signified by a pushpin icon. In Figure 1, an anchor is circled in aportion of the review instance.
Chapter 21Performing Reviews
21-139
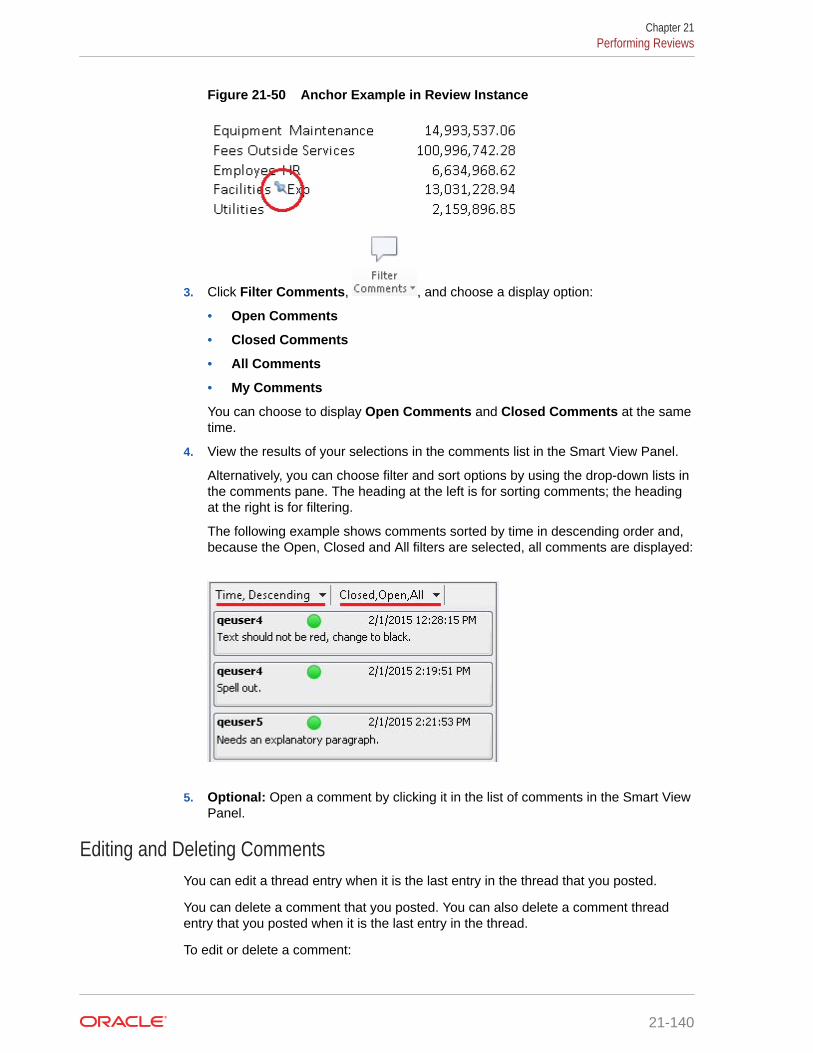
Figure 21-50 Anchor Example in Review Instance
3. Click Filter Comments, , and choose a display option:
• Open Comments
• Closed Comments
• All Comments
• My Comments
You can choose to display Open Comments and Closed Comments at the sametime.
4. View the results of your selections in the comments list in the Smart View Panel.
Alternatively, you can choose filter and sort options by using the drop-down lists inthe comments pane. The heading at the left is for sorting comments; the headingat the right is for filtering.
The following example shows comments sorted by time in descending order and,because the Open, Closed and All filters are selected, all comments are displayed:
5. Optional: Open a comment by clicking it in the list of comments in the Smart ViewPanel.
Editing and Deleting CommentsYou can edit a thread entry when it is the last entry in the thread that you posted.
You can delete a comment that you posted. You can also delete a comment threadentry that you posted when it is the last entry in the thread.
To edit or delete a comment:
Chapter 21Performing Reviews
21-140

1. From the comment list in the Smart View Panel, click a comment that you started.
2. To edit a comment:
a. Click the drop-down list arrow as shown in Figure 1, and then select Modify.
Figure 21-51 Comment Text Box with Drop-Down List Circled
b. Edit the comment text.
Note:
You can add URLs, text formatting, and attachments to comments. See Attaching Supporting Files and Customizing Comment Text.
c. Click Enter, , to update the comment.
d. Click Close, , to exit the EPRCS Comments text box.
3. To delete a comment, select either the comment or the last entry in a comment thread,then click the drop-down list arrow shown in Figure 1 for the comment or the thread entry,and then select Delete.
Note:
You can only delete the last entry in a thread. Deleting the last entry does notdelete the entire comment thread.
4. To cancel modifications, click the Cancel or Close button, in the EPRCS Commentstext box.
Attaching Supporting Files and Customizing Comment TextYou can select a local file from your computer to attach to your comment. For example, youmight want to associate a supporting document with one of your comments. Or, you maywant to customize the text of a comment using the rich text editor. For example, you maywant to make text bold or apply a different font color. You can also add a URL to a comment.
Chapter 21Performing Reviews
21-141
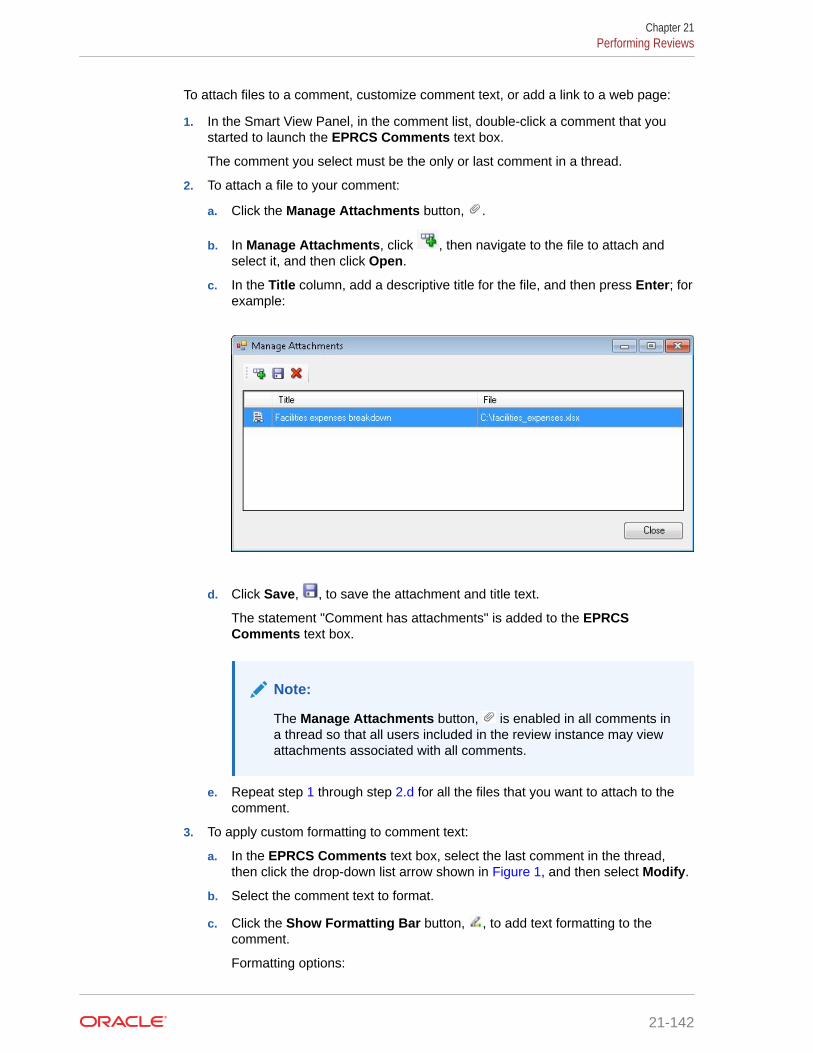
To attach files to a comment, customize comment text, or add a link to a web page:
1. In the Smart View Panel, in the comment list, double-click a comment that youstarted to launch the EPRCS Comments text box.
The comment you select must be the only or last comment in a thread.
2. To attach a file to your comment:
a. Click the Manage Attachments button, .
b. In Manage Attachments, click , then navigate to the file to attach andselect it, and then click Open.
c. In the Title column, add a descriptive title for the file, and then press Enter; forexample:
d. Click Save, , to save the attachment and title text.
The statement "Comment has attachments" is added to the EPRCSComments text box.
Note:
The Manage Attachments button, is enabled in all comments ina thread so that all users included in the review instance may viewattachments associated with all comments.
e. Repeat step 1 through step 2.d for all the files that you want to attach to thecomment.
3. To apply custom formatting to comment text:
a. In the EPRCS Comments text box, select the last comment in the thread,then click the drop-down list arrow shown in Figure 1, and then select Modify.
b. Select the comment text to format.
c. Click the Show Formatting Bar button, , to add text formatting to thecomment.
Formatting options:
Chapter 21Performing Reviews
21-142

• Font style, size, and color
• Bold, italics, and underlining
• Align text to the left or right, or center it
d. Click Enter, , to retain your changes.
4. To add a URL in a comment:
a. In the EPRCS Comments text box, , enter the URL; for example, enter:
http://www.oracle.com
For URLs to be recognized, you must precede them with a valid URL protocolidentifier, such as:
• http://• https://For example:
http://www.oracle.com
Oracle recommends testing URLs in a browser to ensure that they work beforeadding them to comments.
b. Click Enter, .
5. Click Close, , to exit the EPRCS Comments text box.
Addressing and Closing Review CommentsWhen a comment is added to a review instance, the comment status is "Open." When thequestions or concerns raised in a comment have been addressed, users can change thecomment status to "Closed."
Addressing Comments
Some comments may be addressed with a simple reply to the comment. Other commentsmay require revisions to the original doclet. Any user, except for a viewer, can respond to oraddress comments. After you mark your review complete, it prevents you from adding newcomments. However, you can still reply to existing comments. Following are examples of theactions that users can take in response to comments:
• Answer a question and then close the comment.
For example, if a review asked if a figure in a doclet represented an up-to-date number, auser with that knowledge can reply to the comment and mark it closed.
• Edit the doclet content and then close the comment.
For example, if a reviewer suggests an edit, another user can check out and edit thedoclet, and then reply to the comment that the edit was made, and then close thecomment.
• Send the doclet back to the doclet author for additional revisions.
For example, if a reviewer suggests that a doclet is using old data and needs to beupdated with the latest figures, the report package owner can send the doclet back to the
Chapter 21Performing Reviews
21-143

author. When a doclet is restarted, a notification is sent to the doclet authorindicating that the doclet has been reopened, and the doclet status is changed to"Started." Note that the doclet due dates for authors and approvers may bechanged by the report package owner. At this point, the doclet follows the sameworkflow as in the author phase (see Authoring Doclets in Smart View); it is editedand approved by the authors and approvers that were assigned in the authorphase.
Closing Comments
To close a comment:
1. Double-click the comment in the comment list in the Review Center.
2. In the EPRCS Comments dialog box, click Reply, , and enter the reply text.
3. Click the Mark Closed button, to close the comment.
A reply is added, noting that the comment is closed.
To reopen the comment to add additional comments, click Reopen Comment, .
Comparing Review InstancesIn Oracle Smart View for Office, you can compare two review instances to see whatchanges occurred between review cycles, depending on the review cycles to whichyou have access. For example, you can compare between a selected version and theprior version, or you can compare between a selected version and any other earlierversion.
This allows you, as a reviewer, to be more efficient by focusing your review only on thecontent that has been updated, rather than reviewing all your assigned content witheach review cycle.
To compare review instances:
1. Open a report package.
You should have access to two or more review cycle instances in order to use thereview instance compare feature.
2. In the Content Selector, select a review instance on which to base the compare.
The review instances listed depend on the review instances to which you havebeen assigned.
In the following example, there are four review instances listed. We'll selectReview 04. Once you make a selection, the review instance opens in Word.
Chapter 21Performing Reviews
21-144

3. In the Narrative Reporting ribbon, click the arrow on the Compare button to viewCompare changes since, then select a review instance from the drop-down list.
Depending on the review instance selection you make in the Content Selector, you willsee a corresponding list of earlier review instance versions on the Compare drop-downlist. If only one review instance exists, then there will be no earlier versions to compareto.
In the following example, we'll select Review 03. This means that we're going to look atthe changes that occurred in Review 04 since Review 03.
Smart View downloads the two review instances and generates a detailed comparisondocument using Microsoft Word's comparison feature. You can use the Previous andNext button in Word's Review ribbon to navigate through the compare document.
Chapter 21Performing Reviews
21-145

The compare document is for viewing only. You do not need to use the AcceptChanges functionality in order to keep any changes.
You can go back to the current review instance to add any necessary comments,and open and check out any doclets that you want to change.
4. When finished reviewing the changes, close the compare document.
Marking Reviews CompleteIf you are satisfied with your review and you would like to notify the report packageowner, mark your review complete.
After you mark your review complete, it prevents you from adding additionalcomments.
To mark your review complete:
1. Click Mark Review Complete in the Narrative Reporting ribbon.
Note:
The button toggles to Reopen for Comments.
2. Optional: To add more review comments to the report package, click the Reopenfor Comments button.
Chapter 21Performing Reviews
21-146

Working with DistributionsDistributions enable report package owners to send report content to stakeholders at anypoint in the report package development.
Related Topics
• About Distributions
• Viewing Distributions
About DistributionsDistributions enable a report package owner to send report content to stakeholders at anypoint in the report package development. As a recipient, depending on the options that thereport package owner selects, you can view, download in native format, or download as PDFall of the report content that the report package owner assigns to you.
When a report package owner executes a distribution, notifications are sent to the recipients'email and the Messages tab on the Narrative Reporting web interface. The notificationscontain links to access the distributed content from Narrative Reporting. You can click thelinks in the email to view or download the distribution from the web interface.
Or, you can launch Oracle Smart View for Office, open the report package, navigate to theDistributions panel, and view or download the distribution in PDF format from Office.
Report package owners can refer to Narrative Reporting Reviewing, Signing, and ReceivingReport Packages for information on setting up distributions.
Viewing DistributionsWhen a report package owner executes a distribution, notifications are sent to the recipients'email and the Messages tab on the web. The notifications contain links to access thedistributed content. You can also log in to Oracle Smart View for Office and, depending on theoptions selected by the report package owner, download or open the PDF version of thedistribution for viewing.
To view distributions:
1. Connect to Narrative Reporting and open a report package, as described in Connectingto Narrative Reporting in Smart View.
2. In the Report Package panel, select Distributions from the drop-down list.
Chapter 21Working with Distributions
21-147

3. From the list of distributions in the Report Package panel, select a distribution.
4. Perform an action:
• Click Open to view the distribution immediately.
• Click Download as PDF to download the distribution and view anytime.
Chapter 21Working with Distributions
21-148
Performing Sign OffsSigners review the finalized content of a report. They can either sign off on or reject thereport.
Related Topics
• About the Sign Off Phase
• Signing Off On or Rejecting a Report
About the Sign Off PhaseThe goal of the sign off phase is to gather final approvals from your key stakeholders.Stakeholders review finalized content and either sign off on or reject the report. All priorauthoring and review phases must be complete, and all doclets must be checked in andcompleted as well. The sign off phase enables you to lock your report and ensures thatapproved content is not modified. This is beneficial for reports that rely on content to belocked down and to prevent changes.
The sign off phase follows this process:
1. The report package owner creates the sign off instance, and then starts the sign offphase.
2. Notifications are sent to signers to begin their work.
3. Signers review finalized content in the form of a sign off instance, and can either sign offon or reject the report.
Note:
After all the signers provide their approvals, the report package is marked final.
Signing Off On or Rejecting a ReportThe signers review the final report and can either sign off on or reject the report. Additionally,signers can attach a note with details on their action.
Before you begin the procedures in this topic, you should have launched Microsoft Word orPowerPoint, connected to Narrative Reporting, and opened a report package, as described in Connecting to Narrative Reporting in Smart View.
Video
Your Goal Watch This Video
Learn about signing off in a Word-based reportpackage. Signing Off on Microsoft PowerPoint-
Based Report Packages in Smart View
To sign off on or reject a report:
Chapter 21Performing Sign Offs
21-149

1. In the Smart View Panel, Content Selector drop-down list, ensure that Sign Off isselected.
Selecting Sign Off launches the sign off instance document, which you review tosign off on the report.
2. Do one of the following:
• If you are satisfied with your review of the sign off instance document, clickSign Off in the Narrative Reporting ribbon.
When you sign off on the sign off instance document, the report packageprocess is complete, and the report is ready for publication.
• If you are not satisfied with the sign off instance document, click Reject SignOff in the Narrative Reporting ribbon.
The report package owner can take corrective actions to address issues.
3. Optional: Whether you are signing off on or rejecting the report in the sign offinstance document, add a comment in Add Note, and then click Sign Off orReject Sign Off.
After all signers approve the report, the report package status becomes "Final."
Refreshing Report PackagesYou can refresh the contents of a report package by using the Refresh ReportPackage command in the Library pane of the Smart View Panel.
When you select Refresh Report Package, Oracle Smart View for Office takes thefollowing actions for each doclet (regular and reference doclets) in the report package:
• Download
• Checkout
• Refresh of all data points, embedded content, and variables; this includes all datapoints or data sheets within Excel reference and supplemental doclets for alldefined Smart View Panel sources
Chapter 21Refreshing Report Packages
21-150

• Upload
• Checkin
Note:
When you perform a Refresh Report Package, you must have access to all thedoclets, including those that contain Smart View queries. Furthermore, in order torefresh those queries, you may be prompted for login credentials to all the datasources that those queries are accessing.
To refresh a report package:
1. Ensure that you are in the Library pane of the Smart View Panel.
From Narrative Reporting Home, click Library, then expand the EPRCS node, then theLibrary node, then expand the Report Packages folder, and then select a reportpackage.
In the following example, you could select the report package named "Sample ReportPackage - MS Word".
2. With the report package selected, from the Action Panel, click Refresh Report Package.
The Refresh Report Package prompt is displayed letting you know that the process canbe time consuming.
Chapter 21Refreshing Report Packages
21-151

3. Click Yes at the prompt.
Smart View begins the process of opening and checking out doclets; refreshingdata points, data sheets in Excel reference doclets, embedded content, andvariables; and then closing the doclets.
Focus will move between Office applications.
If the refresh is successful for all doclets, Smart View returns you to the Officeapplication from which you began the process.
Saving Office Documents to EPM Cloud in NarrativeReporting in Smart View
In Oracle Smart View for Office, you can save Microsoft Office documents to theOracle Enterprise Performance Management Cloud Library. Documents you save inthe EPM Cloud Library can be made accessible to other users. You can also downloadsaved files from the library.
Related Topics
• About Saving Office Documents to EPM Cloud
• Setting Up Smart View to Save Office Documents to EPM Cloud
• Creating Folders in the EPM Cloud Library
• Saving Office Documents to EPM Cloud
About Saving Office Documents to EPM CloudIn Oracle Smart View for Office, you may save Microsoft Office documents (Word,Excel, and PowerPoint files) to the Oracle Enterprise Performance Management CloudLibrary.
Users often share Office documents by emailing them, or saving them to an internallocation. Storing files in the EPM Cloud Library gives users another option for savingfiles in a central location and facilitates sharing documents with other users.
Documents you save in the EPM Cloud Library follow the access control currently inplace in your environment. By configuring the access control rights, you can use theEPM Cloud Library to share files with other users.
You can also download saved files from the library.
Chapter 21Saving Office Documents to EPM Cloud in Narrative Reporting in Smart View
21-152
Note:
This feature is available to all EPM Cloud business processes that work with SmartView. But currently, only the EPM Cloud Library in Narrative Reporting supports thisfeature. Narrative Reporting must be provisioned in your EPM Cloud subscription;however, the Narrative Reporting extension is not required.
To enable this feature, an update is made to the libraryprovider property in theproperties.xml file, located in the cfg folder of the Smart View installation. Theproperties.xml file must be updated on each individual user’s machine. A ServiceAdministrator will likely complete this task, and then distribute the file to users. See SettingUp Smart View to Save Office Documents to EPM Cloud.
Once the properties.xml file is distributed, users can see the new Save and Save Asoptions on the Smart View ribbon the next time they start Smart View.
Users may organize documents by creating folders in the EPM Cloud Library. They cancreate folders in Narrative Reporting web or in the tree structure in the Smart View Panelunder the Documents node. See Creating Folders in the EPM Cloud Library.
Note:
In order to create folders in Smart View, and to view the folders and files under theDocuments node in the Smart View Panel, users must be connected to theirNarrative Reporting business process.
If users aren't already connected to Narrative Reporting, they will be prompted tosign in when using the Save or Save As options.
Any Word, Excel, or PowerPoint file may be saved to the EPM Cloud Library. The files do notneed to be connected in any way to an EPM Cloud business process.
Note:
If you use Narrative Reporting:
• If you have enabled the Narrative Reporting extension, you will see somefolders under the Library node repeated under the Documents node in theSmart View Panel. This is a virtual view of the folders and does not affect thebehavior of the Save or Save As options. You can access your saved contentfrom either location in the tree.
• When saving a doclet from a report package, the doclet will lose all metadataassociated with Narrative Reporting and the report package; it becomes aregular Office document. Upon Save or Save As, the Office document isclosed. You can reopen the saved document from the location where you savedit by selecting it from the tree in the Smart View Panel.
See Saving Office Documents to EPM Cloud.
Chapter 21Saving Office Documents to EPM Cloud in Narrative Reporting in Smart View
21-153

Setting Up Smart View to Save Office Documents to EPM CloudTo enable saving Office documents to Oracle Enterprise Performance ManagementCloud, an entry is made in the properties.xml file in the cfg folder of the OracleSmart View for Office installation. The properties.xml file must be updated on eachindividual user’s machine. A Service Administrator will likely completely this task, andthen provide the file to the users.
To edit the properties.xml file for saving Office documents to EPM Cloud
1. Open the Smart View properties.xml file with a text editor.
The properties.xml file is located by default in C:\Oracle\SmartView\cfg.
2. Locate the following entry:
<!-- Add support for uploading to NR library - use SV privateconnection url <libraryprovider>http://server:port/epm/SmartView</libraryprovider> -->
3. Copy this line:
<libraryprovider>http://server:port/epm/SmartView</libraryprovider>And place it above the commented text that begins with <!--. For example:
<libraryprovider>http://server:port/epm/SmartView</libraryprovider><!-- Add support for uploading to NR library - use SV private connection url<libraryprovider>http://server:port/epm/SmartView</libraryprovider> -->
4. Replace server:port with your Narrative Reporting service URL.
Note that you may need to change http to https.
For example:
<libraryprovider>https://<serviceURL>/epm/SmartView</libraryprovider>5. Save the updated file.
6. Distribute the file according to your internal processes.
Once the properties.xmlfile is distributed to users, they can use the Save and SaveAs options that will now appear in the Library group on the Smart View ribbon thenext time they start Smart View.
Creating Folders in the EPM Cloud LibraryYou may organize documents by creating folders in the Oracle Enterprise PerformanceManagement Cloud Library. You can create folders in the Narrative Reporting webinterface or in the tree structure in the Smart View Panel under the Documents node.
The procedure in this topic describes creating folders in Oracle Smart View for Office.To create folders in Narrative Reporting web, see Creating Artifacts in the Library inNarrative Reporting Authoring and Approving Doclets .
Chapter 21Saving Office Documents to EPM Cloud in Narrative Reporting in Smart View
21-154

In order to create folders in Smart View, and to view the folders and files under theDocuments node in the Smart View Panel, you must be connected to your NarrativeReporting business process.
To create EPM Cloud Library folders in Smart View:
1. Connect to Narrative Reporting.
See Connecting Using a Private Connection.
2. In the Narrative Reporting Home, select Library.
3. In the Smart View Panel, expand Narrative Reporting, then expand Library.
4. Locate the Documents node in the tree.
5. Right-click the Documents node and select New Folder.
Alternatively, select Documents, and then select New Folder in the Action Panel.
6. In the Create New Folder dialog, enter a folder name, and then click OK.
The folder you just created is displayed under the Documents node.
You can now save files to this folder.
7. Optional: Repeat these steps to add new folders or subfolders.
Note:
If you have enabled the Narrative Reporting extension, you will see somefolders under the Library node repeated under the Documents node in theSmart View Panel. When creating folders and subfolders, be sure to select theDocuments node or a folder under the Documents node to access the NewFolder command.
8. To save files in My Library and the folders you've created, see Saving Office Documentsto EPM Cloud.
Saving Office Documents to EPM CloudIn Oracle Smart View for Office, you may save Microsoft Office documents (Word, Excel, andPowerPoint files) to the Oracle Enterprise Performance Management Cloud Library.Documents you save in the EPM Cloud Library are accessible to other users with the properaccess rights. You can also download saved files from the library.
Before you begin, create any folders you may require. See Creating Folders in the EPMCloud Library.
To save Office documents to EPM Cloud:
1. Open an Office application (Word, Excel, or PowerPoint), and connect to NarrativeReporting.
See Connecting Using a Private Connection.
If you aren't already connected to Narrative Reporting, you will be prompted to sign inwhen you use the Save or Save As options.
2. To save the currently-opened Office document to the My Library folder, click Save.
Chapter 21Saving Office Documents to EPM Cloud in Narrative Reporting in Smart View
21-155

By default, the Save option saves the Office file to My Library, which is yourpersonal folder. A message alerts you to a successful or failed save; click OK inthis message.
Other users will not have access to your My Library folder or the saved file. Youcan download and work with files saved to My Library. After downloading andmodifying a file, click Save to save the file back to the same location in My Library.Use the Save As option to save the file to a folder location accessible to otherswithin the EPM Cloud Library.
Note:
When you click Save, Smart View saves the Office document with thatname that appears on the file. If you have just started a new Officedocument, such as Word, and have not done an Office save to name thefile, the file will be saved with the default Office name. For example, anew Word file would be saved to My Library as Document1 unless youfirst save and name it in Office.
3. To save the currently-opened Office file to the folder you choose in the EPM Cloudlibrary, click Save As, then specify the settings below, and then click Upload.
• Library folder location—Use the Browse button to navigate to the folder tosave the file.
• Artifact name—Enter a name for the file; the name does not need to be thesame as the actual file name.
• Artifact description—Enter an optional description for the saved file.
You and other users can download and work with files saved to folders in the EPMCloud Library. Keep in mind these guidelines:
• After downloading and modifying a file, click Save to save the file back to thesame location in the EPM Cloud Library.
• Use the Save As option to save a downloaded file to a different folder locationaccessible to others within the EPM Cloud Library.
4. Repeat the previous steps for any other Office documents that you want to save toeither My Library or to a folder you choose in the EPM Cloud Library.
Working with Reports in Smart ViewReports is a cloud-based reporting solution for creating Oracle Enterprise PerformanceManagement Cloud financial and managerial reports. It enables users to insert chartsand grids utilizing EPM Cloud sources such as Planning, and other sources such asOracle Analytics Cloud - Essbase as well as ERP Cloud Financials, into a report.
Related Topics
• About Working with Reports in Smart View
• Importing Reports as Ad Hoc Queries
• Importing and Working with Fully Formatted Reports
Chapter 21Working with Reports in Smart View
21-156

About Working with Reports in Smart ViewReports is a cloud-based reporting solution for creating Oracle Enterprise PerformanceManagement Cloud financial and managerial reports. It enables users to insert charts andgrids utilizing EPM Cloud sources such as Planning, and other sources such as OracleAnalytics Cloud - Essbase as well as ERP Cloud Financials, into a report.
Report grids are tables that contain data from external data source connections.Administrators add grids to Reports, defining the dimension layout, selecting members, andthen formatting the grid. Using text, dimensions, members, and formulas, administratorsdefine the grid content.
Using the Narrative Reporting extension in Oracle Smart View for Office for Excel, you can:
• Import the report grids as ad hoc grids.
Perform supported ad hoc operations on the grids, such as pivoting and memberselection, directly against the data source.
The grids can be saved and then used as sources for embedded content in reportpackage doclets.
See Importing Reports as Ad Hoc Queries.
• Import Reports in to Smart View as fully-formatted reports, outside of the report package.
If prompts are included in the report, you specify the prompts upon import.
Note that there will be some differences between reports imported in the web and reportsimported in to Excel, described in Differences between Reports and Reports Imported inExcel in Reports Designing with Reports for Oracle Enterprise Performance ManagementCloud , available on the Oracle Help Center, Books tab, for your EPM Cloud businessprocess.
Once imported, you can:
– Change the POV and refresh the report data, as needed.
– Edit the prompts.
– Distribute the report to others as Excel files.
– Generate an ad hoc grid from the report, and then perform further ad hoc operationsfor the purpose of data analysis.
See Importing and Working with Fully Formatted Reports.
Note:
For more information, see Designing with Reports for Oracle EnterprisePerformance Management Cloud, available on the Oracle Help Center, Books tab,for your EPM Cloud business process.
Importing Reports as Ad Hoc QueriesYou can import Reports in to Oracle Smart View for Office as ad hoc queries, on which youcan then perform available ad hoc operations. The ad hoc grids you create can be saved andused as embedded content in your report package doclets.
Chapter 21Working with Reports in Smart View
21-157

Note:
Before you begin, launch Smart View in Excel and log in to NarrativeReporting.
To import a report in to Smart View as an ad hoc query:
1. In Narrative Reporting Home, select Library.
2. Navigate to the Narrative Reporting node, then the Library node, and then theReports folder.
All reports available on the Narrative Reporting instance can be accessed from theReports folder. Alternatively, if reports are stored in a user-defined folder, you cannavigate to that folder.
3. Expand a report to view the available grids, and then select a grid.
4. In the Action Panel, click the Import as ad hoc query link.
Alternatively, right-click the grid and select Import as ad hoc query.
The report grid is rendered as an ad hoc query in Smart View. The NarrativeReporting Ad Hoc ribbon and POV toolbar are displayed.
Note:
• Formatting that is displayed when the report is viewed in theNarrative Reporting web application is not available when the grid isimported in to Smart View.
• Report grid text and formula rows and columns are not imported intoExcel; only data is imported.
• When working with an Oracle Enterprise Performance ManagementCloud data source that is set to "Native" mode (Smart View Ad HocBehavior option = Native), the POV dimensions are displayed both inthe POV toolbar and as page dimensions on the grid.
Additionally, performing a Change Alias causes a "Member out ofplace" error.
5. Perform ad hoc operations as required.
For example, you can:
• Zoom in on members
• If available, click the POV button in the data provider ad hoc ribbon to displayor hide the POV toolbar
• Pivot POV dimensions or members to the grid
• Use Member Selection to change the grid point-of-view
6. Optional: To view properties for a report or individual grid, select the report or gridin the Library tree, and then, in the Action Panel, select Properties.
Alternatively, right-click a report or grid in the tree and select Properties.
Chapter 21Working with Reports in Smart View
21-158

• If you selected a report, then the Report Properties dialog is displayed. You canview, among other details, the report name, location, description, and the reportmodification history.
• If you selected a grid, then the Grid Properties dialog is displayed. You can view thegrid name, alias table used, the row and column dimensions, and the POVdimensions.
Importing and Working with Fully Formatted ReportsImport reports in to Oracle Smart View for Office as fully-formatted reports, outside of thereport package.
Note:
Before you begin working with fully-formatted reports in Smart View, launch SmartView in Excel and log in to Narrative Reporting.
To import and work with a fully-formatted report:
1. In Narrative Reporting Home, select Library.
2. Navigate to the Narrative Reporting node, then the Library node, and then the Reportsfolder.
All reports available on the Narrative Reporting instance can be accessed from theReports folder. Alternatively, if reports are stored in a user-defined folder, you cannavigate to that folder.
3. Select a report and then, in the Action Panel, click Import Formatted Report.
The fully-formatted report is rendered in to a new workbook.
Note that the report may contain a number of grids, charts, text objects and images laidout across one or more pages. All those objects are brought in to the Excel workbookupon import.
Text boxes in the report are converted to images in the imported Excel worksheet. Insome cases, you may need to manually resize the image box in Excel to match the reportpresentation. To resize an image, use Excel's image formatting tool. Right-click the imageand select Size and Properties. In Format Picture, set Scale Height and Scale Widthto 100%.
If the report contains prompts, continue with step 4. If the report does not containprompts, continue with step 5.
Chapter 21Working with Reports in Smart View
21-159

Note:
When you edit prompts, edit the POV, or refresh the report, the currentworkbook is closed and a new workbook is generated. Any unsavedchanges in the current workbook will be lost. For example, if youperformed an Analyze on one of the reports in the workbook, then thead hoc grid will be lost when you edit the prompts. To keep any unsavedchanges in the workbook, save the workbook, and then proceed to editthe prompts, edit the POV, or refresh the report.
4. If the report contains prompts, you can choose to take the default prompts byclicking OK in the Select Prompt Values dialog; or, you can change the promptsas described in Editing Prompts in Reports.
5. Optional: To edit the POV of a sheet in the rendered report, click the Edit POVbutton in the Narrative Reporting ribbon and follow the procedure in Changing thePOV in Reports.
6. To refresh the report when the underlying data in the report changes during yoursession, click the Refresh button in the Narrative Reporting ribbon.
7. To create an ad hoc grid from an imported grid or chart, select a cell inside the gridor select the chart image and, in the Narrative Reporting ribbon, click Analyze.
In a sheet containing multiple reports, select one report, and then click Analyze.
The ad hoc grid is launched in a separate worksheet.
Note:
• If your report includes percentages, note that percentage formattingis part of the number formatting applied to the values. Importing aformatted report shows applied number formatting. In the ad hocgrid, bare numbers are shown without any formatting.
• Modifications to prompts and POVs are not taken into account whenperforming Analyze. The newly inserted ad hoc grid (or analyzedgrid) will always show the default grid.
• The Analyze command is not supported in these cases:
– On a formatted reported with grouping.
– On an analyzed grid.
See Importing Reports as Ad Hoc Queries for information on working with the adhoc grid.
8. Optional: Use the Excel Save or Save As commands to save the workbook.
Editing Prompts in ReportsIf the report contains prompts, you can choose to take the default prompts whenimporting by clicking OK in the Select Prompt Values dialog
Chapter 21Working with Reports in Smart View
21-160

Or, you can change the prompts.
Note:
Before you begin:
• You should have completed steps 1 through 3 in Importing and Working withFully Formatted Reports.
• Save the workbook if there are changes that you want to keep. The workbookwill be closed and regenerated when you edit prompts.
To change the prompts for a report:
1. In the Select Prompt Values dialog, click the Select button in a row in order to makechanges to the prompt selection for that row.
For example, in the following illustration, the REPORT prompt type is selected for theEntities dimension row.
2. To select vales for a prompt, from the left pane, select a member to add and then click
.
To add all members, click
To remove values from a prompt, from the right pane, select a member to remove and
then click .
To remove all members, click .
Chapter 21Working with Reports in Smart View
21-161
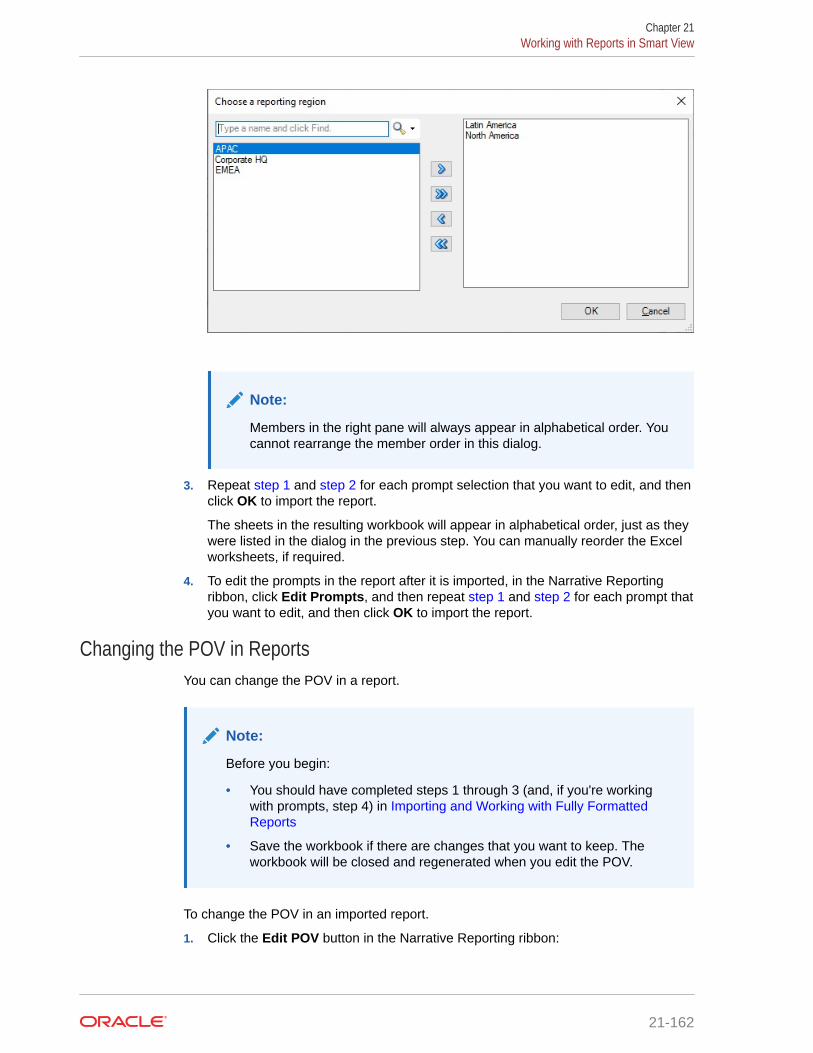
Note:
Members in the right pane will always appear in alphabetical order. Youcannot rearrange the member order in this dialog.
3. Repeat step 1 and step 2 for each prompt selection that you want to edit, and thenclick OK to import the report.
The sheets in the resulting workbook will appear in alphabetical order, just as theywere listed in the dialog in the previous step. You can manually reorder the Excelworksheets, if required.
4. To edit the prompts in the report after it is imported, in the Narrative Reportingribbon, click Edit Prompts, and then repeat step 1 and step 2 for each prompt thatyou want to edit, and then click OK to import the report.
Changing the POV in ReportsYou can change the POV in a report.
Note:
Before you begin:
• You should have completed steps 1 through 3 (and, if you're workingwith prompts, step 4) in Importing and Working with Fully FormattedReports
• Save the workbook if there are changes that you want to keep. Theworkbook will be closed and regenerated when you edit the POV.
To change the POV in an imported report.
1. Click the Edit POV button in the Narrative Reporting ribbon:
Chapter 21Working with Reports in Smart View
21-162

This launches the Select POV dialog:
Use the drop-down arrow in each field to locate drop-down menus indicating that thedimension POV can be changed.
2. If the drop-down list contains a fixed list of options, select an option from the list.
3. If the drop-down list contains a Select option:
a. Click Select to open the Member Selection dialog.
In the example in step 1, the Segments dimension contains a Select option.
b. In the left pane of the Member Selection dialog, expand the members where
necessary, then select a member and click to move it to the right pane, and thenclick OK.
Note:
Only one member from the current dimension can be selected at a time. Toselect a member from a different dimension, you must exit MemberSelection and then select a different dimension in the Select POV dialog.
In the following example, the IN member has been selected and moved to the rightpane.
Chapter 21Working with Reports in Smart View
21-163
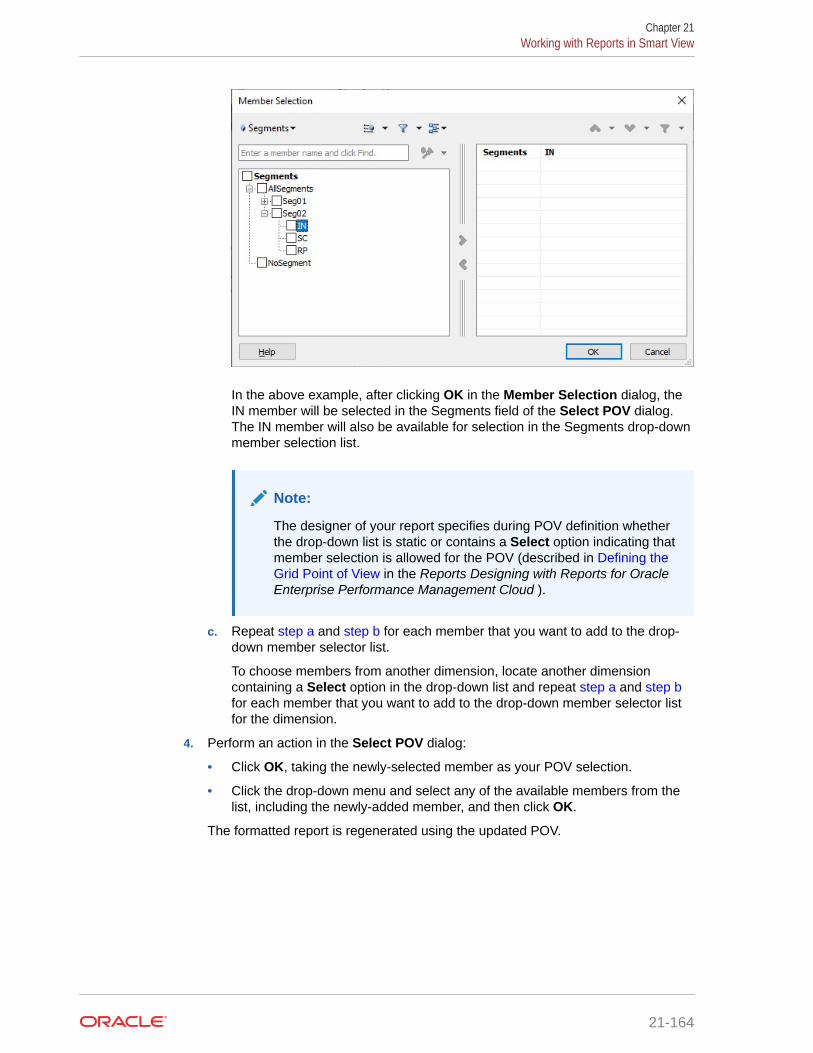
In the above example, after clicking OK in the Member Selection dialog, theIN member will be selected in the Segments field of the Select POV dialog.The IN member will also be available for selection in the Segments drop-downmember selection list.
Note:
The designer of your report specifies during POV definition whetherthe drop-down list is static or contains a Select option indicating thatmember selection is allowed for the POV (described in Defining theGrid Point of View in the Reports Designing with Reports for OracleEnterprise Performance Management Cloud ).
c. Repeat step a and step b for each member that you want to add to the drop-down member selector list.
To choose members from another dimension, locate another dimensioncontaining a Select option in the drop-down list and repeat step a and step bfor each member that you want to add to the drop-down member selector listfor the dimension.
4. Perform an action in the Select POV dialog:
• Click OK, taking the newly-selected member as your POV selection.
• Click the drop-down menu and select any of the available members from thelist, including the newly-added member, and then click OK.
The formatted report is regenerated using the updated POV.
Chapter 21Working with Reports in Smart View
21-164

Working with Narrative Reporting Data in Smart ViewYou can use Oracle Smart View for Office to copy data from Oracle Enterprise PerformanceManagement System and Oracle Business Intelligence on-premises and cloud data sources,.
This includes Narrative Reporting data sources, and paste the data into doclets in a reportpackage.
For example, you can incorporate data from Oracle Essbase and Narrative Reporting in thesame doclet or different doclets within a report package. A doclet in a report package in Wordor PowerPoint may contain a profit and loss statement report that was created from anEssbase source along with an income statement report created from an Narrative Reportingsource. The data points for the areas that you copy are retained in Word or PowerPoint, soyou can refresh the doclet to keep the data up to date.
The scenario in Example: Working with Narrative Reporting Data in Smart View demonstratesusing ad hoc analysis in Excel to create a report, and then copying the data points from thatreport and pasting them into a doclet in Word.
Example: Working with Narrative Reporting Data in Smart ViewThe topics in this section provide a brief look at the following features of Narrative Reporting:
• Performing ad hoc queries and retrieving data from Narrative Reporting data sources.
• Copying and pasting Narrative Reporting data into doclets. You can copy and paste datain the form of grids or data points.
Performing Ad Hoc Analysis with Narrative Reporting DataNarrative Reporting comes with a sample application that consists of a model containingseven dimensions. You create the sample application with a click of a button in the NarrativeReporting web interface.
When connected to the sample model in Oracle Smart View for Office, you can perform adhoc queries that allow you to create data reports containing the information that you want tosee. You can copy and paste data from the reports into doclets in Narrative Reporting reportpackages. You can copy and paste grids or individual data points into doclets.
The scenario in this topic shows you how to create an ad hoc grid and paste individual datapoints and an entire grid into a doclet, in preparation for the doclet being included in a reportpackage in Narrative Reporting.
Video
Your Goal Watch This Video
Learn about analyzing data using ad hoc analysis. Creating Advanced Ad Hoc Reports in
Smart View
To create an ad hoc grid from an Narrative Reporting data source:
1. If you have not already done so, launch Excel, and set up a data source connection asdescribed in Creating Connections to Narrative Reporting.
Chapter 21Working with Narrative Reporting Data in Smart View
21-165
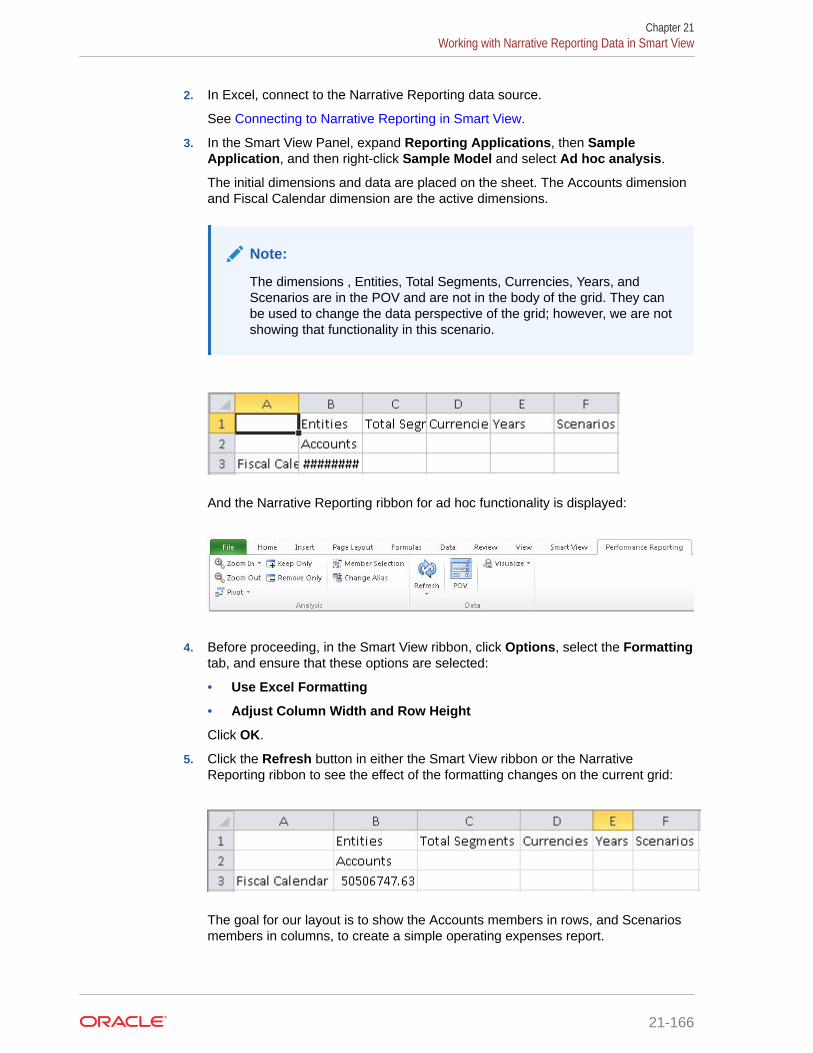
2. In Excel, connect to the Narrative Reporting data source.
See Connecting to Narrative Reporting in Smart View.
3. In the Smart View Panel, expand Reporting Applications, then SampleApplication, and then right-click Sample Model and select Ad hoc analysis.
The initial dimensions and data are placed on the sheet. The Accounts dimensionand Fiscal Calendar dimension are the active dimensions.
Note:
The dimensions , Entities, Total Segments, Currencies, Years, andScenarios are in the POV and are not in the body of the grid. They canbe used to change the data perspective of the grid; however, we are notshowing that functionality in this scenario.
And the Narrative Reporting ribbon for ad hoc functionality is displayed:
4. Before proceeding, in the Smart View ribbon, click Options, select the Formattingtab, and ensure that these options are selected:
• Use Excel Formatting
• Adjust Column Width and Row Height
Click OK.
5. Click the Refresh button in either the Smart View ribbon or the NarrativeReporting ribbon to see the effect of the formatting changes on the current grid:
The goal for our layout is to show the Accounts members in rows, and Scenariosmembers in columns, to create a simple operating expenses report.
Chapter 21Working with Narrative Reporting Data in Smart View
21-166

6. To move the Scenarios dimension to the column, right-click and drag the Scenariosdimension cell, and then drop it on the Accounts dimension cell.
7. To move the Accounts dimension to the row, right-click and drag the Accounts dimensioncell, and then drop it on the Fiscal Calendar dimension cell.
8. Right-click and then drag the Fiscal Calendar dimension to the POV row, and then drop iton the Entities dimension.
In the previous grid, the Scenarios and Accounts dimensions are the active dimensions.The dimensions Fiscal Calendar, Entities , Total Segments, Currencies, and Years are inthe POV. This is the desired dimension layout.
Now let's zoom into row and column members and use the Keep Only and Remove Onlybuttons on the Narrative Reporting ribbon to create the row and column layout that wewant to see.
9. Select the Scenarios dimension, and then either double-click or click Zoom In on theNarrative Reporting ribbon.
10. Press the Ctrl key, select the Forecast and Scenarios members, and then click theRemove Only button in the Narrative Reporting ribbon.
The grid should look like this:
Chapter 21Working with Narrative Reporting Data in Smart View
21-167

Now let's zoom in to the Operating Expenses member.
11. Select Accounts, and then either double-click or click Zoom In from the NarrativeReporting ribbon.
The result of the first zoom in:
12. Continue to zoom in:
a. Click Zoom In on the Income Statement member.
b. Click Zoom In on the Net Income member.
c. Click Zoom In on the Total Pretax Income member.
d. Click Zoom In on the Pretax Income From Operations member.
The grid should look like this:
13. To keep only the Operating Expenses member, we'll select the OperatingExpenses cell and click Keep Only from the Narrative Reporting ribbon.
The grid should look like this:
Chapter 21Working with Narrative Reporting Data in Smart View
21-168

14. Double-click or zoom in on the Operating Expenses member cell.
15. In the expanded grid, select members with #Missing in their rows, Operating ExpenseSynergies and Allocations, and click Remove Only from the Narrative Reporting ribbon.
The grid should look like this:
Now let's format the left column.
16. For a left-aligned list, in the Smart View ribbon, click Options, and then click the MemberOptions tab.
17. In Indentation, select None, and then click OK.
18. In the Smart View ribbon or Narrative Reporting ribbon, click Refresh.
The grid should look like this:
Chapter 21Working with Narrative Reporting Data in Smart View
21-169

Next, we want to remove the POV members from the first row of the report.
19. In the Narrative Reporting ribbon, click the POV button.
Clicking the POV button causes the POV members move to the POV toolbar,which floats on the grid, as shown in Figure 1.
Figure 21-52 POV Toolbar
Note:
The POV toolbar can be moved around on the grid or docked bydragging the POV toolbar to the top, bottom, left, or right of the Excelwindow. You can prevent the POV toolbar from docking by holding theCtrl key as you drag the toolbar.
Now let's apply formatting to the numbers in the grid. Number formatting will carryover when we copy the grid and paste it into Word.
Chapter 21Working with Narrative Reporting Data in Smart View
21-170
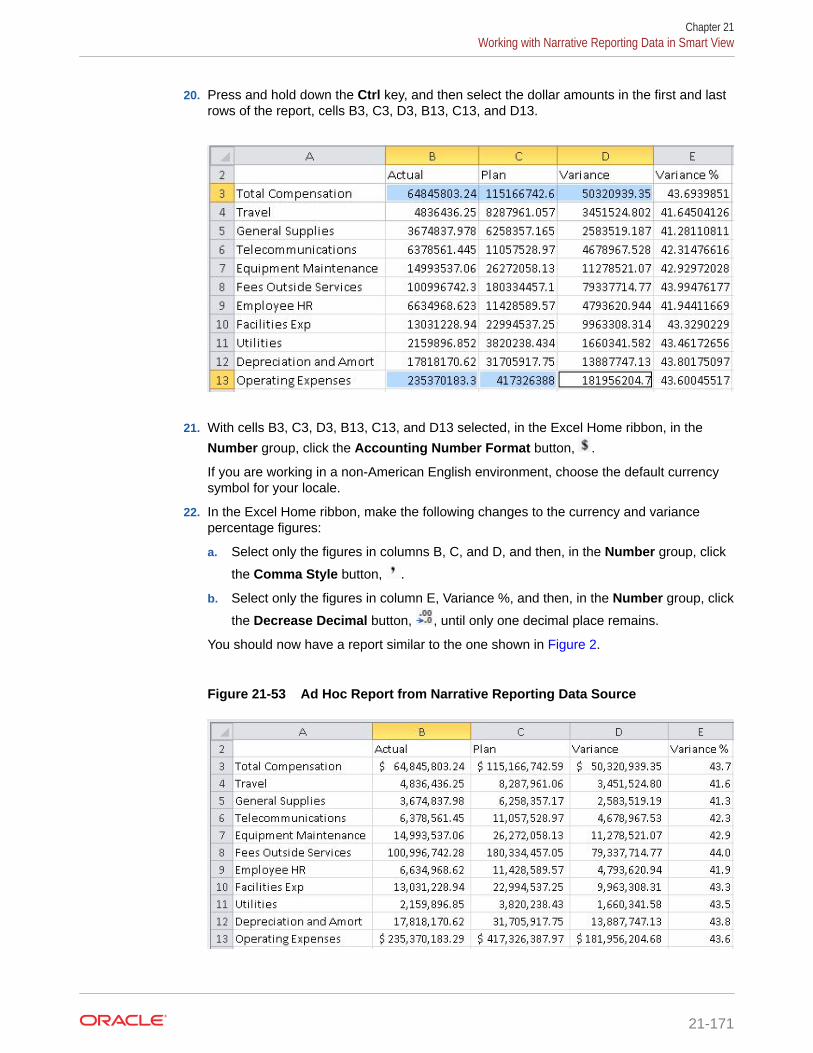
20. Press and hold down the Ctrl key, and then select the dollar amounts in the first and lastrows of the report, cells B3, C3, D3, B13, C13, and D13.
21. With cells B3, C3, D3, B13, C13, and D13 selected, in the Excel Home ribbon, in the
Number group, click the Accounting Number Format button, .
If you are working in a non-American English environment, choose the default currencysymbol for your locale.
22. In the Excel Home ribbon, make the following changes to the currency and variancepercentage figures:
a. Select only the figures in columns B, C, and D, and then, in the Number group, click
the Comma Style button, .
b. Select only the figures in column E, Variance %, and then, in the Number group, click
the Decrease Decimal button, , until only one decimal place remains.
You should now have a report similar to the one shown in Figure 2.
Figure 21-53 Ad Hoc Report from Narrative Reporting Data Source
Chapter 21Working with Narrative Reporting Data in Smart View
21-171
This formatting will carry over to the report package doclet in Word. You'll addmore formatting when you're authoring the doclet in Word (as described in Copying and Pasting Narrative Reporting Data into Doclets).
23. Save the report and continue with Copying and Pasting Narrative Reporting Datainto Doclets.
We'll show you how to copy and paste the dynamic data points from this report into a doclet in an Narrative Reporting report package. This is a typical task that adoclet author performs during the authoring phase of the report package lifecycle.
Copying and Pasting Narrative Reporting Data into DocletsFor this demonstration, we'll work with an example Word-based report package calledDepartment Reports. We'll use the data that we created in Performing Ad Hoc Analysiswith Narrative Reporting Data to create refreshable data points in a doclet called"Operating Expenses." The doclet will contain text interspersed with data points, andthe full grid.
Note:
The procedure in this topic could also be performed in a PowerPoint-basedreport package.
To copy and paste Narrative Reporting data into doclets:
1. In Word, connect to the Narrative Reporting data source, and then open a reportpackage, as described in Connecting to Narrative Reporting in Smart View.
2. In the Smart View Panel, select the doclet to check out.
Chapter 21Working with Narrative Reporting Data in Smart View
21-172

Figure 21-54 Smart View Panel Showing the Operating Expenses DocletsSelected
3. Double-click the doclet name to open it.
Figure 21-55 Doclet Opened from Smart View Panel, Ready to be Checked Out
4. In the Narrative Reporting ribbon, click Check Out.
Chapter 21Working with Narrative Reporting Data in Smart View
21-173

You can now author in the doclet. The example doclet in Figure 2 has placeholderswithin the paragraph for pasting data points. You can paste the entire grid belowthe table caption.
5. To copy and paste a data point:
a. Open and connect to the ad hoc grid that you created in Performing Ad HocAnalysis with Narrative Reporting Data.
b. Select the Actual total operating expenses figure in cell B13, and then click
from the Smart View ribbon.
Tip:
You must be connected to the ad hoc grid, and you must use theCopy and Paste buttons on the Smart View ribbon so that the datayou copy and paste remains dynamic between Office applications.
c. In Word, position the cursor in the paragraph at the required location, andthen, in the Smart View ribbon, click Paste.
The paste operation results in a placeholder, "#NEED_REFRESH".
Chapter 21Working with Narrative Reporting Data in Smart View
21-174

In this scenario, a second data point for plan operating expenses is pasted into theparagraph.
6. To copy and paste a range:
a. Go to the ad hoc grid that you created in Performing Ad Hoc Analysis with NarrativeReporting Data.
b. Select the entire grid, including all members, and then click ; in the examplein Figure 3, you would select cells A2 through E13.
Remember that in Performing Ad Hoc Analysis with Narrative Reporting Data, wemoved the POV dimensions from row 1 to the POV toolbar. That's why the grid thatwe're copying from begins on row 2.
Figure 21-56 Entire Ad Hoc Report Selected for Copying
c. In Word, position the cursor at the location that you require, and in the Smart Viewribbon, click Paste.
The paste operation results in a table in which every cell is populated with theplaceholder, "#NEED_REFRESH", as shown in Figure 4.
Chapter 21Working with Narrative Reporting Data in Smart View
21-175

Figure 21-57 Ad Hoc Grid Range Pasted Below Table Caption
The data points and range are ready to be refreshed.
7. Click Refresh, either in the Smart View ribbon or the Narrative Reporting ribbon.
The resulting doclet page should look like this:
8. Use the tools in Word to format the table in the doclet.
a. Select the entire table and from the Layout ribbon in Word, select AutoFit,and then AutoFit Contents.
b. Center and bold the headings.
Chapter 21Working with Narrative Reporting Data in Smart View
21-176

c. Right-align all the data values in the Actual, Plan, and Variance columns.
d. Center the percentages in the Variance % column.
e. Bold the totals in the Operating Expenses row.
f. Clear the borders from the entire table.
g. Add a single underline under the column headings and under the Actual, Plan,Variance, and Variance % columns in the "Depreciation and Amort" row.
h. Add double underlines under the Actual, Plan, Variance, and Variance % columns inthe "Operating Expenses" row.
After you've applied the Word formatting, the table should resemble the table in Figure 5.
Figure 21-58 Doclet Example Containing Formatted Word Table
Now that you've completed your authoring tasks in the doclet, you can upload it andcheck it in to make it available to other doclet authors.
9. Save the doclet in Word.
10. In the Narrative Reporting ribbon, click Upload.
11. In the Upload File dialog box, select the check box next to any style attributes that youwant to override, and then click OK.
Style attributes in the doclet that differ from the style sample for the report package arenoted with an exclamation point. In this case, there are no style attributes to override.
Chapter 21Working with Narrative Reporting Data in Smart View
21-177
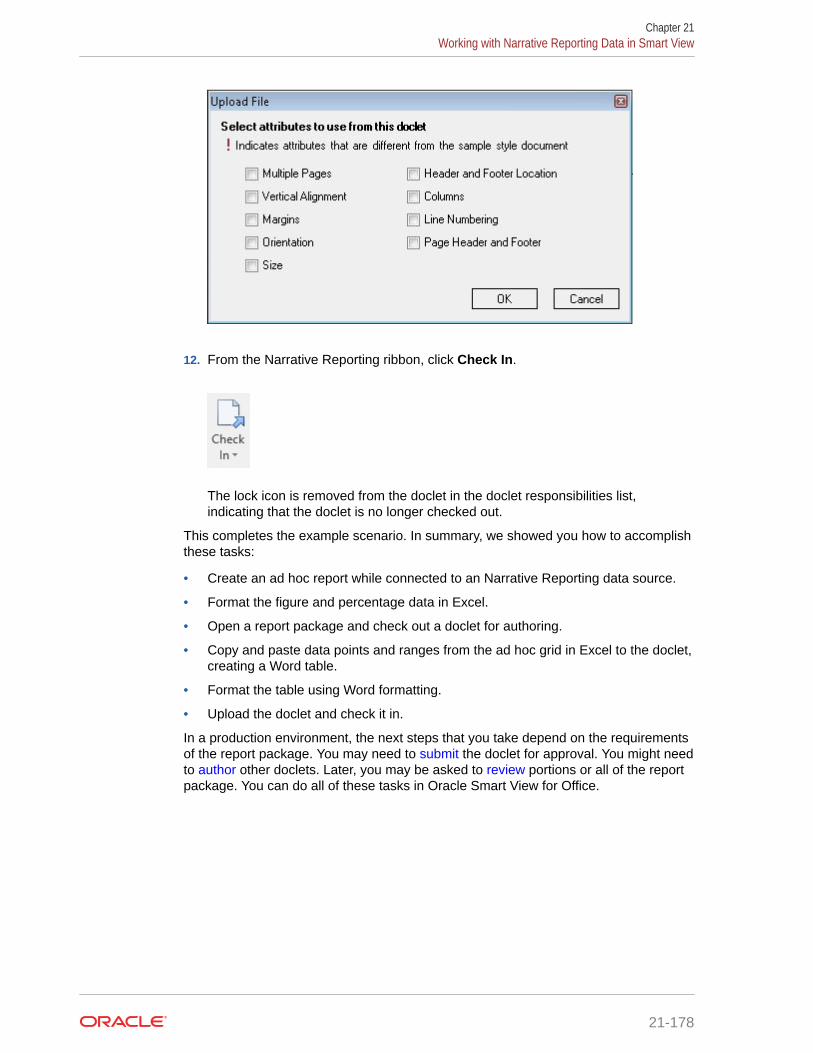
12. From the Narrative Reporting ribbon, click Check In.
The lock icon is removed from the doclet in the doclet responsibilities list,indicating that the doclet is no longer checked out.
This completes the example scenario. In summary, we showed you how to accomplishthese tasks:
• Create an ad hoc report while connected to an Narrative Reporting data source.
• Format the figure and percentage data in Excel.
• Open a report package and check out a doclet for authoring.
• Copy and paste data points and ranges from the ad hoc grid in Excel to the doclet,creating a Word table.
• Format the table using Word formatting.
• Upload the doclet and check it in.
In a production environment, the next steps that you take depend on the requirementsof the report package. You may need to submit the doclet for approval. You might needto author other doclets. Later, you may be asked to review portions or all of the reportpackage. You can do all of these tasks in Oracle Smart View for Office.
Chapter 21Working with Narrative Reporting Data in Smart View
21-178
22Smart View and Oracle BI EE
Related Topics
• About Oracle BI EE and Smart ViewWith Oracle Smart View for Office, users can connect to Oracle Business IntelligenceEnterprise Edition and utilize the content created in dashboards and analyses.
• Features and Components of Oracle BI EE in Smart ViewWhen connected to an Oracle Business Intelligence Enterprise Edition data source inOracle Smart View for Office, you can perform several actions.
• Installing the Oracle BI EE ExtensionHow the Oracle Business Intelligence Enterprise Edition extension is installed dependson whether you are an end user or an administrator.
• Working with Windows System Locales in Oracle BI EEOn each Oracle Smart View for Office client machine, Windows system locales mustmatch that of Smart View in order for any data (numbers, dates, currencies, percentages)to be interpreted correctly.
• Connecting to Multiple Oracle BI EE Data SourcesYou connect to Oracle Business Intelligence Enterprise Edition data sources using privateconnections.
• Oracle BI Presentation CatalogThe Oracle BI Presentation Catalog, also referred to as the catalog or catalog tree, isdisplayed in the Smart View Panel.
• Working with Oracle BI EE Analyses, Views, and DashboardsIn Oracle Business Intelligence Enterprise Edition, analyses are made up of individualviews; dashboards are made up of analyses and individual views.
• Working with Views Using the View DesignerUsing the View Designer in Oracle Smart View for Office, you can create ad hoc viewsbased on an Oracle Business Intelligence Enterprise Edition subject area.
• Troubleshooting Connecting to the Oracle BI EE ServerYou can troubleshoot the connection to the Oracle Business Intelligence EnterpriseEdition server:
About Oracle BI EE and Smart ViewWith Oracle Smart View for Office, users can connect to Oracle Business IntelligenceEnterprise Edition and utilize the content created in dashboards and analyses.
In addition to working with this content, Smart View users can create content in the form ofsimple views with the View Designer, using Oracle BI EE as the data source. The viewscreated can then be published to the Oracle BI Presentation Catalog, where they can beedited further.
Smart View offers Oracle BI EE users a cohesive and consistent experience across all OracleBI EE content providers.
22-1

Features and Components of Oracle BI EE in Smart ViewWhen connected to an Oracle Business Intelligence Enterprise Edition data source inOracle Smart View for Office, you can perform several actions.
• Connect to Oracle BI EE.
• Navigate through the Oracle BI Presentation Catalog.
• Connect to multiple instances of Oracle BI EE and switch between connections.
• Import pre-created views from the Oracle BI Presentation Catalog into MicrosoftExcel, PowerPoint, and Word. For example, you can:
– Insert views—Oracle BI EE tables, pivot tables, and graphs—into Excel asrefreshable, editable objects.
– Insert views from different connections into the same Office document.
– Apply Excel formatting to Oracle BI EE data; formats are retained when yourefresh.
• Copy Oracle BI EE dashboard content and paste it into Smart View clientdocuments. The data, metadata, and view layout are copied.
• Create simple views in Excel using Oracle BI EE as the source for metadata anddata.
• Interact with content imported into Smart View documents, such as drill andprompt selections.
• Manage the imported content in Smart View, including content from multipleconnections; for example, refresh, mask, copy and paste, and document contents.
• Mask data from Oracle BI EE objects in Excel so that users must log in to view thedata. Masked objects can be viewed upon refresh.
• Program using Visual Basic. See the Oracle Smart View for Office Developer'sGuide for more information.
Key components are:
• Ribbon—The Oracle BI EE ribbon contains Oracle BI EE commands for designingand publishing views in Smart View, inserting, and copying and pasting views fromOracle BI EE, editing prompts, masking data, editing, and setting preferences.
• Catalog—The catalog is an expandable tree list of the Oracle BI EE dashboards,analyses, and views that are available to you for insertion into Excel. Eachanalysis expands to display all views available from that analysis. Only views thatare supported and defined in Oracle BI EE, and for which you have permission,are displayed. You can refresh the catalog to display the latest list of availableanalyses and views.
Installing the Oracle BI EE ExtensionHow the Oracle Business Intelligence Enterprise Edition extension is installed dependson whether you are an end user or an administrator.
Related Topics
• For Smart View End Users
Chapter 22Features and Components of Oracle BI EE in Smart View
22-2

• For Smart View Administrators
For Smart View End UsersTo install the Oracle BI EE extension:
1. Install Oracle Smart View for Office as instructed by your Smart View administrator.
Note:
In some cases, your administrator may install Smart View automatically for you.
2. After Smart View is installed, and before you start Microsoft Excel, Word, or PowerPoint,ensure that you are logged in to your computer with your own user name.
Note:
You must be logged in with your own user name, not an administrator's oranyone else's user name, in order to be able to install and use the Oracle BI EEextension correctly.
3. Start Microsoft Excel, Word, or PowerPoint.
Note:
To install the Oracle BI EE extension, you can start Excel, Word, or PowerPoint;the Oracle BI EE extension installation is not launched from Outlook.
See Installing Extensions for details.
4. To verify that the extension is installed, from Excel, Word, or PowerPoint, select theSmart View ribbon, then Options, and then Extensions.
For Smart View AdministratorsAfter Oracle Smart View for Office installation, you must ensure that the intended end user islogged in to Windows before Office is launched.
Or, you can control how your Smart View end users install the Oracle BI EE extension via theExtensions page of the Smart View Options dialog box. See "Administering ExtensionInstallations and Updates" in the Oracle Smart View for Office Installation and ConfigurationGuide for more information on setting up automatic or manual installations.
If you choose to set up automatic or manual installations, you should install Smart View in atest environment first, then refer to the UpdateList.xml file, found in the extensions folder ofyour Smart View installation. Use the entry in this file as a guideline for the Oracle BI EE entryyou will add to the UpdateList.xml file, as described in "Configuring Manual ExtensionUpdates" in the Oracle Smart View for Office Installation and Configuration Guide .
Chapter 22Installing the Oracle BI EE Extension
22-3
Working with Windows System Locales in Oracle BI EEOn each Oracle Smart View for Office client machine, Windows system locales mustmatch that of Smart View in order for any data (numbers, dates, currencies,percentages) to be interpreted correctly.
The following are the applicable Windows system locales:
• Smart View language option
• Microsoft Office language
• Windows Regional Settings
• Windows operating system
When working with Oracle Business Intelligence Enterprise Edition data sources, incases of mismatched Windows system locales, data may display incorrectly, orformatting may be ignored and plain data rendered instead.
An example of a Windows system locale mismatch is the Windows operating system,Regional Settings, and Office language in English, and Smart View in Russian.
When locale mismatches occur, the Smart View log indicates a warning such as thefollowing: "Encountered mismatched locale. Chart will use unformatted data values."
Connecting to Multiple Oracle BI EE Data SourcesYou connect to Oracle Business Intelligence Enterprise Edition data sources usingprivate connections.
See Creating Private Connections for more information on private connections.
To connect using shared connections, the shared connection information must bestored in a file, as described in Accessing Shared Connections from an XML File in theOracle Smart View for Office Installation and Configuration Guide .
Additionally, Oracle Smart View for Office supports multiple Oracle BI EE privateconnections on one Office worksheet, slide, or document.
For example, in one worksheet, you may insert two graphs from two different Oracle BIPresentation Catalogs and refresh the sheet. Each graph will be updated with thelatest data from the two different servers.
When connected to multiple Oracle BI EE servers:
• Users can switch between those connections in the Smart View Panel and browsethe respective catalogs.
• Users can insert views from the different connections into the same Officedocument.
• If View Designer is launched from the Smart View ribbon and no Oracle BI EEview is selected, then View Designer will be connected to the Oracle BI EE serverthat was last used.
• If Paste is invoked from the Smart View ribbon to paste content from Oracle BI EE,the paste action will use the last Oracle BI EE connection that was used.
Chapter 22Working with Windows System Locales in Oracle BI EE
22-4

• When refreshing a document containing views from different connections, the views willbe refreshed against the servers from which they were inserted.
• There can be only one Excel pivot table view per Excel worksheet. Additionally, Excelpivot table views are always inserted onto a new worksheet. This is the expectedbehavior, whether you are working with a single data source connection or with multipleconnections.
To connect to multiple Oracle BI EE private connections:
1. From Smart View Home or from the menu displayed when you click the arrow next to
, click Private Connections
2. In the Private Connections panel, select a connection from the drop-down menu and, inConnect to Data Source, enter your user name and password for the data source.
Assume you have inserted a view from the Oracle BI EE catalog. Continue with step 3
3. Move the cursor to a different part of the worksheet, slide, or document.
4. In the Private Connections panel, select a different connection from the drop-downmenu.
5. In Connect to Data Source, enter your user name and password for the second datasource.
You can now insert a view from the newly-connected data source into the Officedocument
6. Repeat step 3 through step 5 for any other data sources to which you want to connect.
Oracle BI Presentation CatalogThe Oracle BI Presentation Catalog, also referred to as the catalog or catalog tree, isdisplayed in the Smart View Panel.
The catalog tree displays a root node called "Catalog Root" and, by default, two folders called"My Folders" and "Shared Folders".
Figure 22-1 Oracle BI Presentation Catalog, or Catalog Tree
Items that you save to My Folders appear only to you when you expand the folder. Items thatother users save to My Folders appear only to them.
Chapter 22Oracle BI Presentation Catalog
22-5

Items that you save to Shared Folders can be viewed by all users who have logged onwith BI Consumer privileges. If you have BI Consumer privileges, you can also viewthe items that other users have saved in Shared Folders.
To view the properties of any folder to which you have access, including the name ofthe folder creator and the creation date, right-click the folder in the catalog tree andselect View Folder Properties.
The folders in the catalog tree contain a list of analyses, both from Oracle BusinessIntelligence Enterprise Edition and Oracle Smart View for Office, as well as anysubfolders created. Expand an analysis node (for example, "Area chart2" under MyFolders) and the list of views that are stored there is displayed (for example,"Compound View 1" and "Table 1"), as shown in Figure 2.
Figure 22-2 Catalog Tree Showing Views Under an Analysis Node
To view the properties of an analysis, including the name of the analysis creator, thecreation date, and modification date, right-click the analysis in the catalog tree andselect View Analysis Properties.
You can choose to edit any analysis in Oracle BI EE. If the view was created in SmartView, you can also choose to edit the view in Smart View.
To edit an analysis in Oracle BI EE, right-click the analysis in the catalog tree andselect Edit Analysis in Answers.
Selecting this option launches the default browser and opens the analysis editingwizard in Oracle BI EE. If you are not already logged onto Oracle BI EE, a login dialog
Chapter 22Oracle BI Presentation Catalog
22-6

box is displayed where you can enter your credentials. You must have BI Consumerprivileges to edit a view in Oracle BI EE.
To edit an analysis in Smart View, right-click the analysis in the catalog tree and selectLaunch in View Designer.
In this case, the view must have been created in Smart View. See Launching the ViewDesigner for other methods for accessing views for editing.
From the catalog tree, you can also insert table views, pivot table views, graph views, titles,and compound views into Smart View. See Working with Oracle BI EE Analyses, Views, andDashboards.
Working with Oracle BI EE Analyses, Views, and DashboardsIn Oracle Business Intelligence Enterprise Edition, analyses are made up of individual views;dashboards are made up of analyses and individual views.
Related Topics
• Supported Oracle BI EE View and Object Types
• Inserting Tables and Pivot Tables
• Inserting Graphs
• Inserting Compound Views
• Inserting Dashboards
• Working with Prompts
• Working with Page Prompts
• Specifying Preferences for Refreshing Views
• Refreshing Views
• Masking Data in Views
• Viewing Properties of an Oracle BI EE Object
• Copying and Pasting Oracle BI EE Objects Between Office Applications
• Editing an Analysis in Oracle BI EE
• Copying and Pasting Views From Oracle BI EE to Office
• Editing Views Created in Oracle BI EE
Supported Oracle BI EE View and Object TypesYou can insert the following views into Oracle Smart View for Office clients (Excel,PowerPoint, and Word) from the catalog or by copying and pasting.
Note:
Drill operations are not supported on Oracle Business Intelligence EnterpriseEdition views inserted in Smart View. (Drill operations are referred to as Zoom Inand Zoom Out in Smart View.)
Chapter 22Working with Oracle BI EE Analyses, Views, and Dashboards
22-7

• Table Views
Table views display data is in table format, either in a format similar to the displayin Oracle BI EE (also referred to as native format), or as an Excel table.
Using the Insert option, you can insert table views into all Smart View clients innative format. This format offers no sorting or filtering. Cells with the same dataare merged into a single cell.
In Excel, using the Insert as Excel Table command, you can insert a table viewsas an Excel table. With this format, you can perform further analysis operations,such as sorting and filtering.
Notes:
– In Excel, you can insert multiple tables on a worksheet, but you cannot insert atable on top of an existing table. You can, however, do the following:
* To replace a table, select any cell within the table and click the Deletebutton on the Oracle BI EE ribbon. Then insert the table into theworksheet.
* To insert additional tables onto the worksheet, select a cell outside anytable views or other view objects, and then insert the table.
– Excel may not recognize some custom formats in table views and Excel tableviews, resulting in an error when the view is inserted into Excel.
• Pivot Table Views
Pivot table views display data in the grouped format defined in Oracle BI EE,which is also referred to as native format. Features such as page item lists andgroup sectioning are maintained. Data can also be displayed in Excel pivot tableformat.
Using the Insert option, you can insert pivot table views into all Smart View clientsin native format. As with inserting a table view, this format offers no sorting orfiltering; cells with the same data are merged into a single cell.
In Excel, using the Insert as Excel Pivot option, you can also insert a pivot tableview as an Excel pivot table. With this format, you may perform further analysisoperations, such as pivoting, aggregating, drilling, sorting, and filtering.
Notes:
– When working with Excel pivot table views, only views with measure columnsof numerical data type are supported.
– There can be only one Excel pivot table view per Excel worksheet.Additionally, Excel pivot table views are always inserted onto a newworksheet. This is the expected behavior, whether you are working with asingle data source connection or with multiple connections.
– Excel may not recognize some custom formats in Pivot table views, resultingin an error when the view is inserted into Excel.
– Smart View does not have the "Graph Pivoted Results" functionality of OracleBI EE. In order to view a graph of the same row, column and page dimensionsof a particular pivot table, you must create a separate chart view in Oracle BIEE, and then insert that chart view in Smart View.
• Graph Views
Graph views display data by mapping the graph defined in Oracle BI EE graph to agraph type supported by Microsoft Office charts.
Chapter 22Working with Oracle BI EE Analyses, Views, and Dashboards
22-8
Using the Insert as Image option, you can insert graphs directly into Smart View clientsas a static image. The image cannot be edited or refreshed.
Using the Insert option in all Smart View clients, you can edit and refresh graphs. SmartView attempts to match the graph style from Oracle BI EE as closely as possible,including graph properties such as visual effect (2D, 3D), canvas size, chart title, subtitle,axis titles, legend and legend position, axis scale, data format (numeric, date, currencyformat), and title and label formatting.
If a matching Office chart type is not available, you can insert the graph view as animage. See Supported Oracle BI EE Chart and Object Types and Unsupported Oracle BIEE Chart and Object Types.
• Gauge Views and Funnel Graph Views
In Oracle BI EE, gauge views and funnel graph views are separate object types fromgraph views.
Using the Insert as Image option, you can insert gauge and funnel views directly intoSmart View clients as a static image. You cannot edit or refresh the image.
• Title Views
Title views display the title of a report, along with other information that is part of theOracle BI EE.
Title views are typically composed of title text, subtitle text, the analysis name, the dateand time inserted, an optional logo, and an optional URL (for example, a help link). Titleviews are inserted into Smart View clients as a collection of text boxes and imagesgrouped together as a single Office object.
• Compound Views
Compound views display data as an assembly of different views.
You can insert compound views into all Smart View clients. Smart View inserts allsupported views that make up the compound view. Each type of view—table, pivot table,graph, gauge, funnel, filter, and title—is inserted into Smart View clients in its own defaultformat.
In Word, all views are inserted next to and below each other filling pages in the activeWord document.
In Excel or PowerPoint, users are prompted to choose between inserting all the views onone sheet or slide, or inserting each view on a separate sheet or slide.
Inserting Tables and Pivot TablesThe maximum number of rows and columns that you can insert depends on the version ofExcel you are using. See Microsoft Excel documentation for worksheet size limits.
To insert a table or pivot table:
1. Place the cursor at the point in the Excel worksheet, PowerPoint slide, or Word pagewhere you want the table or pivot table to begin.
2. In the catalog tree, right-click a table or pivot table.
3. Select one of the following:
• Insert—The selected table view or pivot table view is inserted in the format defined inOracle Business Intelligence Enterprise Edition. See Figure 1 and Figure 2,
Chapter 22Working with Oracle BI EE Analyses, Views, and Dashboards
22-9

If prompts are defined for the table or pivot table in Oracle BI EE, the PromptSelector dialog box is displayed where you make selections on the data todisplay (otherwise, the table or pivot table is inserted directly). After the initialinsert, you may edit the prompts by clicking the Edit Prompts icon in theOracle BI EE ribbon. See Working with Prompts for more information.
If page prompts are defined for the table or pivot table (view prompts in OracleBI EE), you may edit them by clicking the Edit Page Prompts icon in theOracle BI EE ribbon. See Working with Page Prompts.
Notes:
Figure 22-3 Table View Inserted as Table with Formatting from OracleBI EE
Chapter 22Working with Oracle BI EE Analyses, Views, and Dashboards
22-10

Figure 22-4 Pivot Table Inserted as a Pivot Table with Formatting from OracleBI EE
In Oracle Smart View for Office clients, the table is displayed in the form a grid.
• Insert as Excel Table (table views only)—The selected table view is inserted as anExcel table. Columns in the page prompt edge and section edge, if present, aremoved to the top of the table as drop-down headings. Select this option when youwant to use Excel operations to filter, define formulas, sort, and perform other Exceltasks.
When a table view is inserted as an Excel table, prompts that are defined in Oracle BIEE are not available.
The selected table is inserted on the worksheet. See Figure 3.
Figure 22-5 Portion of a Table View Inserted as an Excel Table
• Insert as Excel Pivot (pivot table views only)—The selected pivot table view isinserted as an Excel pivot table. Columns in the page edge and section edge, ifpresent, are mapped to the report filters area, and columns in the measures edge are
Chapter 22Working with Oracle BI EE Analyses, Views, and Dashboards
22-11

moved to the values area. Select this option when you want to perform furtheranalysis, such as aggregating, pivoting, drilling, sorting, and filtering.
The selected table or pivot table is inserted on the worksheet. See Figure 4.
Notes:
– When a pivot table view is inserted as an Excel Pivot table, prompts thatare defined in Oracle BI EE are not available.
– When working with Excel pivot table views, only views with measurecolumns of numerical data type are supported.
– There can be only one Excel pivot table view per Excel worksheet.Additionally, Excel pivot table views are always inserted onto a newworksheet. This is the expected behavior, whether you are working with asingle data source connection or with multiple connections.
Figure 22-6 Pivot Table Inserted as an Excel Pivot Table
You can edit tables and pivot tables as described in Editing Views Created in Oracle BIEE.
Chapter 22Working with Oracle BI EE Analyses, Views, and Dashboards
22-12
Note:
When pivot tables that contain embedded pivot charts are inserted into Smart View,the embedded pivot charts are not imported. You can either use Excel to create apivot chart based on an inserted Excel pivot table or use Oracle BusinessIntelligence Answers to create a new chart view and insert that view using SmartView.
• To create a pivot chart based on the inserted native Excel pivot table, completethese steps:
1. In Smart View, click in the Excel pivot table and select the Excel Optionsribbon.
2. From the Tools group, click the PivotChart button.
3. In Insert Chart, select a chart style and then click OK.
• To create and insert a separate chart view:
1. In BI Answers, create a new, separate chart view object.
2. In the Office application, use Smart View to insert the newly-created chartview.
Inserting GraphsWhen inserting graphs, Oracle Smart View for Office attempts to map the Oracle BusinessIntelligence Enterprise Edition graph into a chart type supported by Microsoft Office 2007charts. Further, Smart View attempts to match visual effects, such as 2D or 3D, and othergraph properties such as canvas size, axis scale, data format, and formatting in terms of fontstyles and colors.
When a matching chart type is not available, the graph view can only be inserted as image.
See Supported Oracle BI EE Chart and Object Types and Unsupported Oracle BI EE Chartand Object Types.
To insert a graph:
1. From the catalog, right-click a graph view.
2. Select an option:
• Insert—The selected graph is inserted as an Excel chart, which can be edited,masked, and refreshed.
If prompts are defined for the graph in Oracle BI EE, the Prompt Selector dialog boxis displayed where you make selections on the data to display (otherwise, the graphis inserted directly). After the initial insert, you may edit the prompts by clicking theEdit Prompts icon in the Oracle BI EE ribbon. See Working with Prompts.
If page prompts are defined for the graph (view prompts in Oracle BI EE), you mayedit them by clicking the Edit Page Prompts icon in the Oracle BI EE ribbon. See Working with Prompts for more information.
If no prompts are defined for this analysis, then the graph is inserted directly. See Figure 1.
Chapter 22Working with Oracle BI EE Analyses, Views, and Dashboards
22-13

Figure 22-7 A Pie Chart View Inserted as an Excel Chart
You can edit graphs inserted this way as described in Editing Views Created inOracle BI EE.
• Insert as Image—The selected graph is inserted as an image of the graph,which cannot be edited or customized.
When a graph is inserted directly as an image, prompts, page prompts, andsections that are defined in Oracle BI EE are not available.
Note that gauge and funnel objects can only be inserted using the Insert asImage command.
Figure 22-8 A Pie Chart View Inserted as an Image
Once inserted, whether as an Excel chart or as an image, both types of graphs showncan be resized by stretching them.
Chapter 22Working with Oracle BI EE Analyses, Views, and Dashboards
22-14

Note:
Due to a known Microsoft Office issue, when one or more charts are inserted inWord or PowerPoint 2010 (32-bit), the Excel instance that is launched in thebackground does not always close after refresh.
Supported Oracle BI EE Chart and Object TypesThe following chart subtypes are supported:
• Line
• Bar: Vertical, Horizontal, Stacked Vertical, Stacked Horizontal, 100% Stacked Vertical,100% Stacked Horizontal
• Area: Stacked, 100% Stacked
• Pie graph
• Bubble
• Scatter
• Line-bar Combination: Standard, Stacked
• Radar
The following graphs can only be inserted as an image:
• Time Line Series
• Pareto
• Waterfall
The following objects can only be inserted as an image:
• Gauge
• Funnel
Unsupported Oracle BI EE Chart and Object TypesThe following view types are not supported:
• Performance Tiles
• Trellis views
• Map views
• Filters views—You can only view properties for filter views, using the View AnalysisProperties command in the catalog tree.
• Selection Steps
• Column Selector
• View Selector
• Legend
• Narrative
Chapter 22Working with Oracle BI EE Analyses, Views, and Dashboards
22-15

• Ticker
• Static Text
• Logical SQL
• Create Segment
• Create Target List
• Static text, ticker, or HTML views
• Scorecards
• KPIs or KPI watchlists
Inserting Compound ViewsTo insert a compound view:
1. From the catalog, select the compound view to insert.
2. Right-click and select Insert All Views.
3. When prompted, choose an option:
• One object per sheet/slide to insert each object in the compound view on aseparate sheet in Excel, or a separate slide in PowerPoint.
• All objects on one sheet/slide to display all objects on one Excel sheet orPowerPoint slide.
In Excel, objects are inserted on a new sheet or sheets, even if there are unusedsheets in the workbook.
In Word, objects are placed adjacent to and below other objects on a sheet untilthe sheet is filled, and then continues filling as many sheets as required to hold allthe objects.
The default display is selected for the table, pivot table, and graph view types; thatis, the Insert action will be used automatically.
A message notifies you of unsupported view types in the compound view.Unsupported view types are not inserted.
Notes:
• You can do a Refresh and edit prompt and page prompts for selected views.Unselected views from the compound view remain unchanged. See RefreshingViews, Working with Prompts, and Working with Page Prompts.
• In Word and PowerPoint, there can be some overlapping of tables and chartswhen inserting a compound view or when a compound view is either inserted fromthe catalog or copied and pasted. This is especially true when any of the objects inthe compound view are particularly large.
• When inserting multiple objects from a compound view into PowerPoint andselecting the "one object per slide" option, an Excel instance is opened for eachobject and then minimized in the Windows Taskbar. However, when the insertoperation is complete, the Excel instances are not automatically closed. This canclutter the Taskbar when inserting a large number of objects. To minimize thenumber of Excel instances shown in the Taskbar, click the Office button (in theupper left corner of Excel), select Excel Options, and then select the Advancedtab. In Display options, clear the Show all windows in the Taskbar check box.
Chapter 22Working with Oracle BI EE Analyses, Views, and Dashboards
22-16

Inserting DashboardsDashboards are displayed in the catalog tree as folders. A dashboard folder can beexpanded to show dashboard pages; a dashboard page can be expanded to show the list ofanalyses included in that page. You can insert dashboard pages into Excel, PowerPoint, andWord.
To insert dashboard pages into Office applications:
1. From the catalog, right-click a dashboard page and select Insert All Views.
2. When prompted, choose an option:
• One object per sheet/slide to insert each object in the dashboard on a separatesheet in Excel, or a separate slide in PowerPoint.
• All objects on one sheet/slide to display all objects on one Excel sheet orPowerPoint slide.
In Word, objects are placed adjacent to and below other objects on a sheet until thesheet is filled, and then continues filling as many sheets as required to hold all theobjects.
Default display is selected for the table, pivot table, and graph view types; that is, theInsert action is used automatically.
A message notifies of unsupported view types in the dashboard. Unsupported view typesare not inserted.
Note:
You may perform Refresh and edit prompt and page prompts for selected views.Unselected views from the dashboard remain unchanged. See Refreshing Views, Working with Prompts, and Working with Page Prompts.
Working with PromptsPrompts enable users to specify criteria that determines the content of the view that they areinserting. Oracle Smart View for Office supports both prompts and page prompts. See also Working with Page Prompts for information on page prompts.
Prompts in Smart View are the equivalent of prompts in Oracle Business IntelligenceEnterprise Edition. Smart View only supports column prompts.
Prompts are defined at the analysis level in Oracle BI EE. Users are prompted to enter valuesfor these prompts each time a view is inserted in Smart View.
If prompts are defined on an analysis in Oracle BI EE, then when you insert a table, pivottable, or graph view from the analysis into Smart View, you are prompted to select the data tobe displayed for that view. When inserting a compound view from an analysis that hasprompts defined, you are prompted to enter values only one time for all the views in thatcompound view.
For example, a prompt on Year is designated for an analysis, and the years 2010, 2011, and2012 are available to choose from. When you insert a table, pivot table, or graph, you are
Chapter 22Working with Oracle BI EE Analyses, Views, and Dashboards
22-17

prompted to select which year's data to display: 2010, 2011, or 2012. Or, you canchoose to insert the compound view, and the prompt selection you make is applied toall the views inserted. After insertion, you can edit the prompts on each individual viewto select another year's data to display.
Views can only be edited individually. The edit operation will prompt you for the valuesto be selected for each view that is being edited.
You may edit prompts in views that were inserted, or copied and pasted.
Note:
Prompts defined on hierarchical columns in Oracle BI EE are not supportedin Smart View.
To edit prompts:
1. From the worksheet, select a view:
• Graph views—Select the graph.
• Table and pivot table views—Select a cell in the table.
2. From the Oracle BI EE ribbon, select the Edit Prompts button to display youroriginal selections.
Figure 22-9 Edit Prompts Button
If the report definition has changed on the server, your selections are reset, andyou must select all prompts and columns again.
3. In the Prompt Selector, modify the prompt selections.
Depending on how the prompt was set up in Oracle BI EE, you may be selectingdata directly from a drop-down list on the Prompt Selector. You may also bepicking values from the Value Selector dialog box.
Note:
In the Prompt Selector, there is a limit of 256 items that can be displayedin drop-down list controls or option lists. To display a higher number ofitems, increase the value of the setting in Prompts/MaxDropDownValues in instance.config in Oracle BusinessIntelligence Answers.
The following is an example of a Value Selector, where the years 2008, 2009, and2010 were selected for display.
Chapter 22Working with Oracle BI EE Analyses, Views, and Dashboards
22-18

Figure 22-10 Value Selector Dialog Box Showing the Years 2008, 2009, and 2010Selected
After you click OK in the Value Selector, the selections populate the first prompt in theexample Prompt Selector (Figure 3). A second prompt in the example Prompt Selectorrequires that you directly enter an amount; in this example, the amount to display is BilledQuantity greater than $5,000.
The completed Prompt Selector dialog then looks like Figure 3.
Figure 22-11 Filled-In Prompt Selector
In some cases, the data to choose from can be exceedingly long. To accommodateloading large amounts of data in the Value Selector, Smart View presents values in
Chapter 22Working with Oracle BI EE Analyses, Views, and Dashboards
22-19

groups. Scroll and make selections from the first group shown, then click More toview and make selections from the next group. Continue clicking More until youhave viewed and made selections from the entire data list. Figure 4 shows anexample.
Figure 22-12 Value Selector Showing the More Option for Large Amountsof Data
4. Click OK to close the Prompt Selector.
After you make selections and click OK, the view is immediately refreshed andreflects your selections.
5. Repeat this procedure to edit the prompts to change the output displayed.
Chapter 22Working with Oracle BI EE Analyses, Views, and Dashboards
22-20

Note:
• Selection lists specified for prompts in BI Answers (radio button lists and checkbox lists) are converted to list controls in Smart View.
• If a prompt is defined on double columns, and the prompt operator selected is *Prompt User, the following operators do not work at runtime:
– is less than
– is less than or equal to
– is greater than
– is greater than or equal to
– is like
– is not like
To avoid this, do not use the * Prompt User operator. Instead, define theoperator explicitly at design time, using one of the operators listed above. Theoperators will then work.
• A date prompt that was created with user input set to text and the default valueset to SQL that shows the current date results in the current_date SQL beingshown in the prompt and not the actual current date.
Working with Page PromptsPage prompts enable users to specify criteria that determines the content of the view that hasbeen inserted. Oracle Smart View for Office supports both page prompts and prompts. Seealso Working with Prompts.
Page Prompts in Smart View are the equivalent of view prompts in Oracle BusinessIntelligence Enterprise Edition. View prompts are specified on individual views within ananalysis. Smart View supports table prompts, graph prompts, and gauge prompts in Oracle BIEE; these types of prompts are called page prompts in Smart View.
Page prompts may vary on individual views within an analysis. An individual table view withinan analysis may have a page prompt set on Year, and a pivot table view within the sameanalysis may have a page prompt set on Line of Business.
When you first insert a view that contains page prompts, a view state is selected by default.For example, if a prompt on Year is specified on a particular view within an analysis, and theyears 2010, 2011, and 2012 are available to choose from, you are not prompted for these atthe time of insertion. Instead, a default state of the view is inserted. For example, 2010 datamay automatically be inserted, as the first year in the list of years available. You can then editthe page prompts to select another year's data to display for this view.
You may edit page prompts in views that have been inserted, or copied and pasted.
To edit page prompts:
1. From the worksheet, select a view:
• Graph views—Select the graph.
• Table and pivot table views—Select any cell in the table.
Chapter 22Working with Oracle BI EE Analyses, Views, and Dashboards
22-21

2. From the Oracle BI EE ribbon, select the Edit Page Prompts button to display thedefault page prompt selections for a particular view.
Figure 22-13 Edit Page Prompts Button
If the report definition has changed on the server, your selections are reset, andyou must select all page prompts again.
3. In the Page Selector, modify the page prompt selections by selecting from thedrop-down lists.
Figure 2 shows a Page Selector dialog box, where users select a Year and a Lineof Business. In the example, selections were made to display 2010 for the year,and Electronics for the Line of Business.
Figure 22-14 Filled-in Page Selector
4. Click OK to close the Page Selector.
After you make selections and click OK, the view is immediately refreshed andreflects your selections.
5. Repeat this procedure to edit the page prompts to change the output displayed.
Specifying Preferences for Refreshing ViewsYou can specify preferences for refreshing each view. The refresh preferences thatyou set for each view within a worksheet, slide, or page are saved along with theOffice document (Excel workbook, PowerPoint slide presentation, or Word document).
To specify preferences for refreshing a view:
Chapter 22Working with Oracle BI EE Analyses, Views, and Dashboards
22-22
1. Ensure that one or more Oracle Business Intelligence Enterprise Edition views areinserted into Oracle Smart View for Office.
2. In Document Contents, click to refresh the content of the pane.
All views that were inserted into the active Office application are displayed in DocumentContents in a tree format.
3. Select a view in Document Contents, and then select Properties.
4. In Properties, select an option from Refresh Preferences:
• Refresh Data—Refreshes only the data points in the selected view or analysis.
Any changes made to formatting in the sheet, slide, or page are retained.
• Replace View—Replaces the entire view, including any formatting changes set inOracle BI EE.
If you select this option, your prompt and graph selections and custom formatting arelost upon refresh if the view definition has changed.
Note:
If you checked or cleared the Use unified scale option in Oracle BusinessIntelligence Answers, you must use the Replace View option whenrefreshing in Smart View.
• Do not refresh—Refreshing is not allowed.
5. Click OK to save the Refresh Preference selection.
Continue with Refreshing Views.
Note:
Oracle BI EE title views are not included in refresh actions, so all customizations toa title view are retained when you refresh the worksheet or workbook.
Note:
Pie charts are not refreshed after adding or removing a filter in BI Answers if thefilter added is on a dimension that defines the number of pies that display. If there isa change in a filter column that is also defined as a number-of-pies dimension,change the refresh option on the chart view to Replace View, and then performanother refresh. This ensures a correct refresh, updating the number of pies andthe chart titles that correctly reflect the new data.
Chapter 22Working with Oracle BI EE Analyses, Views, and Dashboards
22-23
Refreshing ViewsYou can refresh the data from Oracle Business Intelligence in your inserted views. Youhave the option of refreshing selected views or refreshing all views, depending on theOffice document type, as follows.
Excel
• Individual views
• Individual worksheets
• Entire workbook
PowerPoint
• Individual views
• Individual slides
• Entire presentation
Word
• Individual views
• Entire document
You can refresh views from the Document Contents pane, the Oracle BI EE ribbon, orthe Smart View ribbon.
The refresh action is limited according to the Refresh Preference set for a selectedview. See Specifying Preferences for Refreshing Views for information.
Note that when you refresh, title views are not included in refresh actions, so allcustomizations to a title view are retained when you refresh the Office document.
When there are multiple objects on an Office document, if you attempt to refresh thedocument without having already connected, then you will be prompted for your logincredentials once for all objects. If you choose to cancel instead, the Connect to DataSource dialog box will appear for each object on the sheet, and you must click Cancelfor each object. For example, if there are six objects on the sheet, the dialog box willappear six times, once for each object.
To refresh Oracle Business Intelligence Enterprise Edition views from the DocumentContents pane:
1. In Document Contents , ensure that Oracle BI EE - Document Hierarchy isdisplayed in the drop-down list box.
2. In Document Contents, click to refresh the contents of the tree.
From Document Contents, you can refresh individual views in all Officeapplications, individual worksheets, and individual slides.
3. Perform an action:
• To refresh a selected view in an Excel sheet, PowerPoint slide, or Worddocument, select the view object from the tree in Document Contents, andthen select the Refresh View action from the right-click menu or click theRefresh View link at the bottom of the pane.
Chapter 22Working with Oracle BI EE Analyses, Views, and Dashboards
22-24

Repeat for each view that you want to refresh.
• To refresh all Oracle BI EE views on a selected Excel worksheet or PowerPoint slide,select the sheet or slide from the tree in Document Contents, and then select theRefresh action from the right-click menu or click the Refresh link at the bottom of thepane.
Repeat for each sheet or slide that you want to refresh.
To refresh all Oracle BI EE views on a worksheet or slide, or an entire Word document, usingthe ribbons:
1. Perform an action:
• Select the worksheet or slide to make it active.
• Place your cursor in the Word document to select it.
2. Click Refresh in the Oracle BI EE ribbon or the Smart View ribbon.
To refresh all Oracle BI EE views in an Excel workbook, PowerPoint presentation, or Worddocument:
1. Place your cursor anywhere in the workbook, presentation or document to select it.
2. Perform an action:
• To refresh all Oracle BI EE views in an Excel workbook, click the down arrow inRefresh in theSmart View ribbon and select Refresh all Worksheets. Figure 1shows the Refresh icon with the arrow:
Figure 22-15 Refresh Icon with Down Arrow in Excel and PowerPoint
Alternatively, click the down arrow in Refresh in the Oracle BI EE ribbon and selectRefresh Workbook Data.
• To refresh all Oracle BI EE views in a PowerPoint presentation, click the down arrowin Refresh in the Smart View ribbon and select Refresh All Slides.
Alternatively, click the down arrow in Refresh in the Oracle BI EE ribbon and selectRefresh Presentation Data.
• To refresh all views in a Word document, click Refresh in the Oracle BI EE ribbon orthe Smart View ribbon. The Refresh icon in Word does not contain a down arrow, asshown in Figure 2.
Figure 22-16 Refresh Icon in Word
Chapter 22Working with Oracle BI EE Analyses, Views, and Dashboards
22-25

Note:
If requested, provide your credentials for Oracle BI EE.
Masking Data in ViewsYou can mask data in the Oracle Business Intelligence Enterprise Edition views thatyou insert in Office documents and in views you create using the View Designer. Youhave the option of masking data in:
• Selected views
• All views on sheet or a slide
• All views in an Office document
Using the Mask Data functionality in Oracle Smart View for Office, you can performthese actions:
• Select a single Smart View object in an Excel sheet or PowerPoint slide and maskdata only in that object
• Mask data in the active Excel worksheet or PowerPoint slide
• Mask data in the active workbook, presentation, or Word document
You can invoke Mask Data from these locations:
• Document Contents in the Smart View Panel
• Oracle BI EE ribbon
Masking Data for an Individual View
To mask data in an individual view in an Excel worksheet or PowerPoint slide:
1. In Excel or PowerPoint, click in Document Contents to refresh the contentsof the tree.
Note:
Data in Word documents can only be masked in their entirety; youcannot mask data in individual views in Word.
2. Locate the view with data that you want to mask in Document Contents, and thenselect it.
3. Click the Mask Data link in Document Contents.
In a table object, cells are replaced with the text, "Need refresh"; in a graph, thearea becomes blank and a small lock image is displayed.
4. Save the current workbook or presentation.
The masked state of the view remains intact after saving.
Chapter 22Working with Oracle BI EE Analyses, Views, and Dashboards
22-26

5. To display the data in the masked view, click in Document Contents, select the viewin the tree, and then click the Refresh View link.
Masking Data on a Sheet or Slide
To mask data on an Excel worksheet or PowerPoint slide:
1. Choose a method to select a sheet or slide:
• Place the cursor directly in a sheet or slide
• In Document Contents, click , locate the sheet or slide in the tree, and thenselect it.
2. Choose a method to mask data for all objects on the selected sheet or slide:
• In the Oracle BI EE ribbon, click the Mask Data button.
Figure 22-17 Mask Data Button
• In Document Contents, click the Mask Data link.
Data on the sheet or slide is masked.
Note:
Data in Word documents can only be masked in their entirety; you cannot maskdata on individual pages in Word.
3. Save the current workbook or presentation.
The masked state of the sheet or slide remains intact after saving.
4. To display the data in the masked sheet or slide, click in Document Contents, selectthe sheet or slide in the tree, and then click the Refresh link.
Alternatively, place the cursor in the sheet or slide to refresh, and then click .
Masking Data in an Entire Office Document
To mask data in an entire Office document:
1. From the Oracle BI EE ribbon in the opened Office document, perform an action:
Chapter 22Working with Oracle BI EE Analyses, Views, and Dashboards
22-27

• Excel: Click the down arrow in and select Mask Workbook Data.
• PowerPoint: Click the down arrow in and select Mask PresentationData.
• Word: Click .
Note:
Word documents can only be masked in their entirety; you cannotmask individual pages in Word.
2. Save the current Office document.
The masked state of the workbook, presentation, or document remains intact aftersaving.
3. To display the masked data, click in Document Contents, select the sheet,slide, or document in the tree, and then click the Refresh link.
Alternatively, place the cursor in the sheet, slide, or document to be refreshed, and
then click .
Viewing Properties of an Oracle BI EE ObjectYou can view various properties of a selected object.
To view the properties of an Oracle Business Intelligence Enterprise Edition object:
1. Select an Oracle BI EE object.
Select an actual view object and not a sheet or slide.
2. Click the Properties link at the bottom of the Document Contents pane.
Chapter 22Working with Oracle BI EE Analyses, Views, and Dashboards
22-28

Copying and Pasting Oracle BI EE Objects Between Office ApplicationsYou can copy Oracle Business Intelligence Enterprise Edition objects within and betweenOffice applications as follows:
• Graphs can be copied within and between any Office application.
• Tables and pivot tables can be copied within and between Word and PowerPoint.
• Tables and pivot tables cannot be copied within Excel, from Excel to another Officeapplication, or from another Office application to Excel.
• Tables and pivot tables can only be copied and pasted by sections.
Copying and Pasting a Graph View
To copy and paste a graph view:
1. In Excel, Word, or PowerPoint, select the graph view to copy.
You can use Document Contents to locate the view, but then select the graph directly inthe sheet, slide, or page.
2. From the Oracle BI EE ribbon, click .
3. Access the Office application and position the cursor where you want to paste the graphview.
For example, if you are pasting within an Office application (or if you are copying fromExcel and want to paste into PowerPoint, open PowerPoint), position the cursor at thepoint within the Office document where you want to paste the object.
4. Click .
5. Repeat for all graphs that you want to copy and paste.
Copying and Pasting a Table or Pivot Table View
To copy and paste a table view or pivot table view:
1. In Word or PowerPoint, select the table view or pivot table view to copy.
You can use Document Contents to locate the view, but then select the table or pivottable directly in the slide or page.
2. From the Oracle BI EE ribbon, click .
3. Access the Office application and position the cursor where you want to paste the tableor pivot table view.
For example, if you are pasting within an Office application (or if you are copying fromWord and want to paste into PowerPoint, open PowerPoint), position the cursor at thepoint within the Office document where you want to paste the object.
4. Click .
5. Repeat for all tables or pivot tables that you want to copy and paste.
Chapter 22Working with Oracle BI EE Analyses, Views, and Dashboards
22-29
Editing an Analysis in Oracle BI EEIf the available analysis view does not display the data required, or the data is notdisplayed as desired, you can edit the view in Oracle Business Intelligence EnterpriseEdition.
Note:
To edit a view in Oracle BI EE, you must have the required Oracle BI EEpermissions.
To edit a view in Oracle BI EE:
1. From the Catalog, right-click the view, and then select Edit Analysis in Answers.
2. In the login screen, enter your credentials for Oracle BI EE.
The selected view is displayed in Oracle BI EE.
3. In Oracle BI EE, edit and save the view.
4. Return to the Office application.
5. From the Oracle BI EE ribbon, click Refresh, and verify that your changes arereflected in the view.
Copying and Pasting Views From Oracle BI EE to OfficeYou can copy and paste views from Oracle Business Intelligence Enterprise Edition toOracle Smart View for Office.
When you refresh pasted views, the data is refreshed, but the analysis definition is not,even if its definition has been modified in Oracle BI EE.
Note:
When copying and pasting views from Oracle BI EE to Smart View, someformatting may not be imported to Office.
To copy and paste a view:
1. Ensure that you are logged into Oracle BI EE.
2. From Oracle BI EE or Interactive Dashboards, launch the analysis that you want tocopy.
3. Click the Copy link at the bottom of the analysis (displayed only if the analysis isenabled for copying).
4. Open an Office application, such as Excel, and connect to the appropriate OracleBI EE data source.
Chapter 22Working with Oracle BI EE Analyses, Views, and Dashboards
22-30
5. From the Oracle BI EE ribbon, click .
Editing Views Created in Oracle BI EERelated Topics
• What Can and Cannot Be Edited
• Editing Pivot Tables Inserted into PowerPoint
• Other Guidelines
What Can and Cannot Be EditedNote the following when editing views that were created in Oracle Business IntelligenceEnterprise Edition:
• Table views and graph views that are inserted or pasted as Microsoft objects using theInsert command can be edited in Excel, PowerPoint, or Word.
• Table views that are inserted or pasted as lists, and graphs views that are inserted asimages cannot be edited in Excel.
• Views that are inserted or pasted as images cannot be edited in PowerPoint.
Editing Pivot Tables Inserted into PowerPointConsider the following items when editing pivot table views that were created in OracleBusiness Intelligence Enterprise Edition.
Small Pivot Tables
For small pivot tables in PowerPoint, to change column width and row height, use the mouseto drag column and row borders to the desired height and width.
Large Pivot Tables
To adjust column width and row height in large pivot tables, especially where rows andcolumns are outside of the slide area, use PowerPoint's table editing tools in as follows:
1. Select the pivot table.
2. Select the Layout ribbon in PowerPoint.
3. Select a row or column in the pivot table.
4. Adjust height and width by changing the height and width values in the Cell Size group.
Other GuidelinesNote the following guidelines when editing views that were created in Oracle BusinessIntelligence Enterprise Edition:
• Oracle Smart View for Office does not support duplication of charts or tables through thePowerPoint "Duplicate Slide" command.
In PowerPoint, after duplicating a slide containing a chart, any attempt to update theprompts of either chart result in the prompts for only the original chart being updated. Thechart on the duplicate slide is never updated.
Chapter 22Working with Oracle BI EE Analyses, Views, and Dashboards
22-31

For a pivot table inserted into a PowerPoint slide then duplicated, if you changethe prompt for either pivot table, only the pivot table original slide is updated,whether you changed the prompt in the original slide or the duplicate.
• Some modifications made to graphs using Microsoft Office formatting tools—suchas changes to colors—may not persist when prompts are changed and the graphis refreshed. Smart View does not keep track of such formatting changes; this isdone by Microsoft Office. When a graph series is removed, the format of the seriesis removed by Office as well. Changing prompts can cause the series count andorder to change, which means the formatting will also change. This is expectedbehavior.
• Time zone preferences set in Oracle BI EE account preferences are not exposedin Smart View.
• The precision of digits that Smart View can display in Excel is limited to theprecision of digits allowed by Excel.
For example, the following is an 18-digit number formatted with two decimalplaces:
123456789123456789.12
Because of Excel's 15-digit precision limitation, the digits after the 15th digit arechanged to zeroes in Excel and the number would be displayed as follows:
123456789123456000.00
Working with Views Using the View DesignerUsing the View Designer in Oracle Smart View for Office, you can create ad hoc viewsbased on an Oracle Business Intelligence Enterprise Edition subject area.
Views created in Smart View can be saved to the catalog and edited in either SmartView or Oracle BI EE.
View Designer is available in Microsoft Excel, Word, and PowerPoint.
Launching the View DesignerDepending on whether you are creating a view or editing a view, you can launch theView Designer using the methods described in this topic.
To launch the View Designer:
1. Perform an action:
• To create a new view:
– Right-click the Catalog Root node in the catalog tree, and then selectCreate New View.
– Select the Catalog Root node in the catalog tree, and then select CreateNew View at the bottom of the Smart View Panel.
– From the Oracle BI EE ribbon, click the View Designer icon.
Chapter 22Working with Views Using the View Designer
22-32

Figure 22-18 View Designer Icon
You must already be connected to a view in the catalog tree to enable the OracleBI EE ribbon.
• To edit a view (the view must have been created and inserted from View Designer):
– From the catalog tree, select a view to edit that was created in View Designerand saved to the Oracle BI Presentation Catalog from Oracle Smart View forOffice, and then select the Load view in View Designer link at the bottom of theSmart View Panel.
– Select an existing view on a worksheet in the current or in a saved Officedocument and click the View Designer icon (see Figure 1).
– To edit an Excel Pivot Table, click anywhere in the current or in a savedworksheet, even outside the boundaries of the Excel Pivot Table, and click theView Designer icon (see Figure 1).
Note:
You can only edit views that were created and inserted from the ViewDesigner in Smart View. To edit views created in Oracle BusinessIntelligence Enterprise Edition, you must use Oracle BI EE.
The Design Layout tab of the View Designer is displayed. Figure 2 shows the DesignLayout tab of the View Designer with selections made in the Page, Section, Row,Column, and Measures edges.
Chapter 22Working with Views Using the View Designer
22-33

Figure 22-19 View Designer, Design Layout Tab for Pivot Table Layout
2. Continue the view design process by following the procedure in Defining the ViewType and Display Style.
Defining the View Type and Display StyleWhen you are creating a view, you define the view type and display style. This is doneonly once, during the view creation process. Once the view is created, you cannot editthese two settings.
To define the view type and display style:
1. If you have not already done so, invoke the View Designer (see Launching theView Designer).
2. In View Type, select the type of view that you are creating:
• Table
• Pivot Table (the default)
• Line Graph
• Bar Graph
• Column Graph
• Area Graph
• Pie Chart
• Scatter Chart
• Stacked Column Graph
The selection that you make affects the options available in Display Style alongwith the fields in the layout area.
Chapter 22Working with Views Using the View Designer
22-34
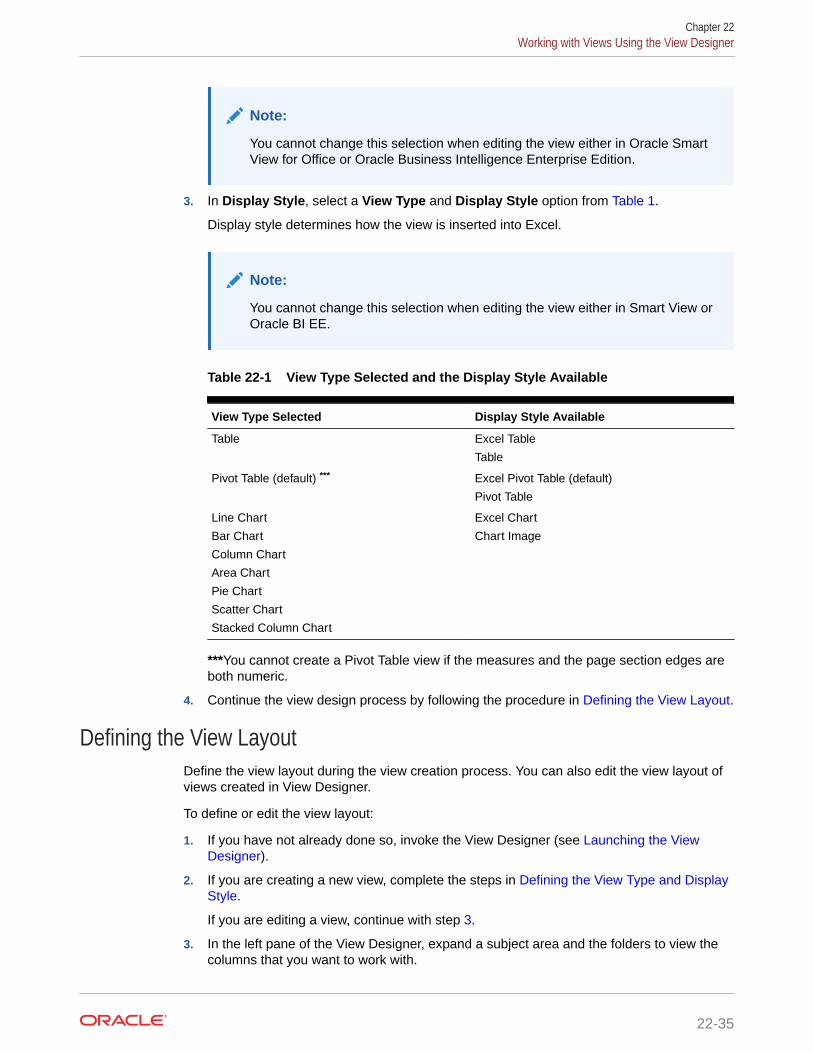
Note:
You cannot change this selection when editing the view either in Oracle SmartView for Office or Oracle Business Intelligence Enterprise Edition.
3. In Display Style, select a View Type and Display Style option from Table 1.
Display style determines how the view is inserted into Excel.
Note:
You cannot change this selection when editing the view either in Smart View orOracle BI EE.
Table 22-1 View Type Selected and the Display Style Available
View Type Selected Display Style Available
Table Excel Table
Table
Pivot Table (default) *** Excel Pivot Table (default)
Pivot Table
Line Chart
Bar Chart
Column Chart
Area Chart
Pie Chart
Scatter Chart
Stacked Column Chart
Excel Chart
Chart Image
***You cannot create a Pivot Table view if the measures and the page section edges areboth numeric.
4. Continue the view design process by following the procedure in Defining the View Layout.
Defining the View LayoutDefine the view layout during the view creation process. You can also edit the view layout ofviews created in View Designer.
To define or edit the view layout:
1. If you have not already done so, invoke the View Designer (see Launching the ViewDesigner).
2. If you are creating a new view, complete the steps in Defining the View Type and DisplayStyle.
If you are editing a view, continue with step 3.
3. In the left pane of the View Designer, expand a subject area and the folders to view thecolumns that you want to work with.
Chapter 22Working with Views Using the View Designer
22-35

4. Drag columns from the expanded subject area tree and drop them in the layoutarea.
The edges in the layout area vary depending on the selections that you made inthe View Type, as described in Table 1.
Table 22-2 View Type Selected and the Edges Available in the Layout Areaof the View Designer
View Type Selection Edges In Layout Area
Table Page, Section, Row, Column, Measures
Optional: In the Row edge, select the RowGrand Total check box.
Pivot Table (default) Page, Section, Row, Column, Measures
Optional: In the Row edge, select the RowGrand Total check box.
Optional: In the Column edge, select theColumn Grand Total check box.
Line Chart Page, Section, Group By (X), Lines (X),Data: Lines (Y)
Bar Chart Page, Section, Group By (X), Bars (X),Data: Bars (Y)
Column Chart Page, Section, Group By (X), Columns(X), Data: Columns (Y)
Area Chart Page, Section, Group By (X), Area (X),Data: Areas (Y)
Pie Chart Page, Section, Pies, Slices, Slice Size
Scatter Chart Page, Section, Group By (X), Vary byColor, Data
Stacked Column Chart Page, Section, Group By (X), Bars (X),Data: Bars (Y)
5. Optional: Perform any of these tasks, as applicable, on the columns you havedragged to edges in the View Designer:
• To move a column between edges, drag the column from one edge and drop iton another; for example, drag a column from the Row edge and drop it on theColumn edge.
• To reposition the column within the edge, click on a column name and selectthe Up or Down arrow.
• To add a subtotal to a column or row in an edge, right-click a column andselect Subtotal.
Note:
The Subtotal option is ignored when applied to the bottom column inan edge, even though the option is selectable in the drop-downmenu.
Chapter 22Working with Views Using the View Designer
22-36

• To add columns to filter criteria for this view, click on a column and select Add toFilter.
The columns that you select are added to the Filter Expression area of the DefineFilters tab, where you can further define them. See Defining the Filter Expression forViews in View Designer for more information.
• To remove a column from an edge, click on the column and select Remove.
6. Optional: If you are working with a table or pivot table view, regardless of the displaystyle:
• Pivot Table view: In the Row and Column edges, select or clear the Row GrandTotal and Column Grand Total check boxes as you require.
• Table view: In the Row edge, select or clear the Row Grand Total check box.
7. Optional: If you are working with a pivot table view that has the pivot table display style,you can perform these actions with the Measure Label element:
• Reorder the Measure Label element within the Column edge.
• Move the Measure Label to any other edge except the Measure edge.
Notes about the Measure Label element:
• The Measure Label element represents the labels for all the Measures columns in theMeasures edge. In the View Designer, the Measure Label element appears by defaultin the Column edge.
• Measure Label is only available when both the View Type and Display Type is PivotTable.
• Experiment with moving the Measure Label element to another edge or reordering itwithin the Column edge. The result may be a more readable pivot table layout.
• Measure Label cannot be removed from the View Designer.
• Measure Label cannot be placed in the Measures edge.
8. To define filters, click the Filters tab and continue with Defining the Filter Expression forViews in View Designer.
If you do not plan to define filters, click OK:
• If you are creating a new view, the view is inserted into Excel.
• If you are editing a view, the old view is removed and the updated view is inserted.
Defining the Filter Expression for Views in View DesignerColumns that you added for filtering in Defining the View Layout are automatically added tothe Filter Expression area of the Define Filters tab in View Designer.
Whether you are creating a new view or editing an existing view, you can add more filtercolumns, and further define and refine filters on all columns.
To define or edit the filter expression for a view created in View Designer:
1. Complete the steps in Defining the View Layout, selecting the Define Filters tab.
The columns that you added for filtering should be displayed on the Define Filters tab.
2. Optional: Add more columns to the Filter Expression area of the Define Filters tab.
3. Select a column in Filter Expression.
Chapter 22Working with Views Using the View Designer
22-37

4. Select a corresponding filter operator from the drop-down list next to the columnname.
The operator list from which you can choose is populated based on the type ofcolumn that you selected.
Guidelines for choosing an operator are described in Filter Operators.
5. Specify a filter value in the last column by clicking and making aselection in the Value Selector.
For example, here is a set of filters based on the Sample Sales database:
The filters that you define are summarized in the Filter Summary pane. Forexample, for the filters defined in this step, the summary looks like this:
In some cases, the data to choose from can be exceedingly long. Toaccommodate loading large amounts of data in the Value Selector, Oracle SmartView for Office presents values in groups. Scroll and make selections from the firstgroup shown, then click More to view and make selections from the next group.Continue clicking More until you have viewed and made selections from the entiredata list. Figure 1 shows an example.
Chapter 22Working with Views Using the View Designer
22-38

Figure 22-20 Value Selector Showing "More" for Large Amounts of Data
6. Optional: If required, click the logical operator button in Filter Expression and make aselection to change the operator:
• AND
• OR
The default logical operator is AND.
Changing the logical operator on one line of the filter expression automatically changesthe operator for all lines in the expression so that the operator is the same for all lines.
7. Optional: To remove a line from the filter expression, right-click the column button in theline, and then select Remove, as shown in Figure 2.
Figure 22-21 Remove Option that is Displayed When Right-clicking a Column in aFilter Expression
8. When you are finished defining filters, click OK to insert the view into Excel.
Filter OperatorsUse the guidelines in Table 1 when choosing an operator and specifying the required values.The operator list from which you can choose is populated based on the function that you areperforming (for example, creating a filter or creating a dashboard prompt) and the type ofcolumn that you selected.
Chapter 22Working with Views Using the View Designer
22-39

Table 22-3 Guidelines for Choosing an Operator When Creating a Column Filter
Operator Usage Guidelines
is equal to / is in Valid for a column that contains text, numbers,or dates. Specify a single value or multiplevalues. Results include only records where thedata in the column matches the value in thefilter.
is not equal to / is not in Valid for a column that contains text, numbers,or dates. Specify a single value or multiplevalues. Results include only records where thedata in the column does not match the value inthe filter.
is less than Valid for a column that contains numbers ordates. Specify a single value. Results includeonly records where the data in the column isless than the value in the filter.
is greater than Valid for a column that contains numbers ordates. Specify a single value. Results includeonly records where the data in the column isgreater than the value in the filter.
is less than or equal to Valid for a column that contains numbers ordates. Specify a single value or multiplevalues. Results include only records where thedata in the column is less than or the same asthe value in the filter.
is greater than or equal to Valid for a column that contains numbers ordates. Specify a single value or multiplevalues. Results include only records where thedata in the column is greater than or the sameas the value in the filter.
is between Valid for a column that contains numbers ordates. Specify two values. Result include onlyrecords where the data in the column isbetween the two values in the filter.
is null Valid for a column that contains text, numbers,or dates. Do not specify a value. The operatortests only for the absence of data in thecolumn. Results include only records wherethere is no data in the column.
Sometimes it might be useful to know whetherany data is present, and using the is nulloperator is a way to test for that condition. Forexample, suppose your business has aworldwide address book and you want toextract the United States addresses only. Youcould do this by checking for the presence orabsence of data in the "State" field. This fieldshould be unpopulated (null) for non-UnitedStates addresses and populated (not null) forUnited States addresses. You can obtain a listof United States addresses without the need tocheck the column for a specific value.
Chapter 22Working with Views Using the View Designer
22-40
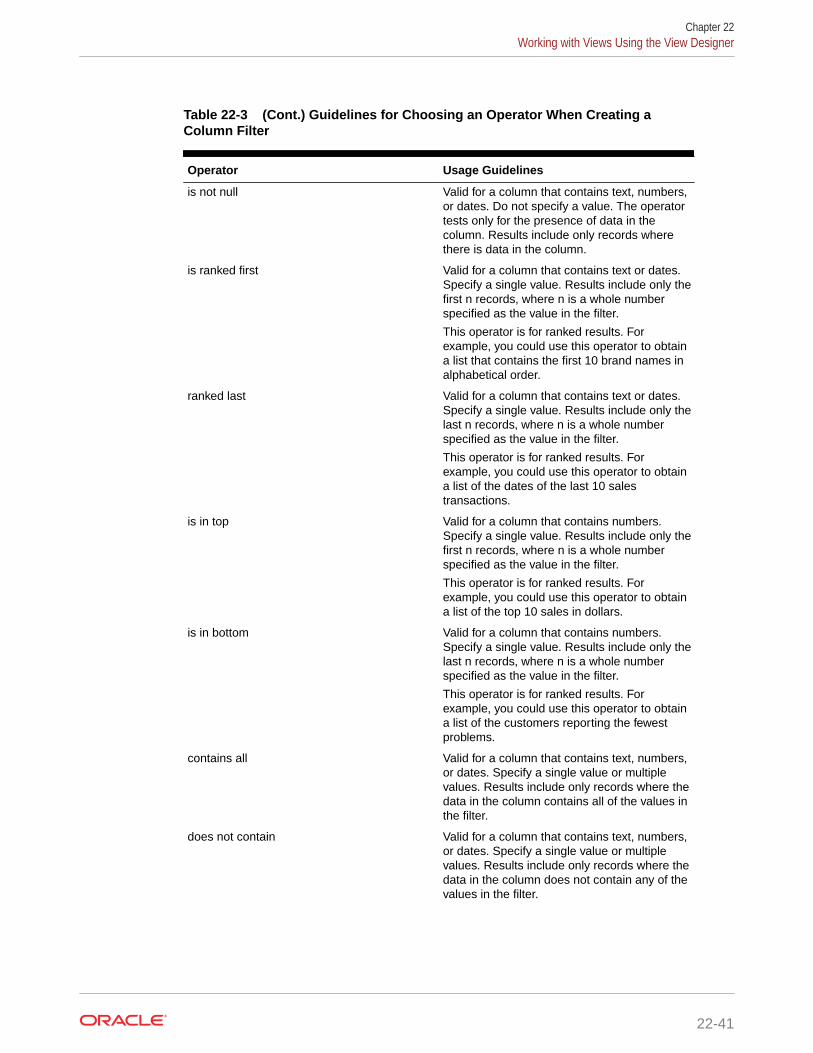
Table 22-3 (Cont.) Guidelines for Choosing an Operator When Creating aColumn Filter
Operator Usage Guidelines
is not null Valid for a column that contains text, numbers,or dates. Do not specify a value. The operatortests only for the presence of data in thecolumn. Results include only records wherethere is data in the column.
is ranked first Valid for a column that contains text or dates.Specify a single value. Results include only thefirst n records, where n is a whole numberspecified as the value in the filter.
This operator is for ranked results. Forexample, you could use this operator to obtaina list that contains the first 10 brand names inalphabetical order.
ranked last Valid for a column that contains text or dates.Specify a single value. Results include only thelast n records, where n is a whole numberspecified as the value in the filter.
This operator is for ranked results. Forexample, you could use this operator to obtaina list of the dates of the last 10 salestransactions.
is in top Valid for a column that contains numbers.Specify a single value. Results include only thefirst n records, where n is a whole numberspecified as the value in the filter.
This operator is for ranked results. Forexample, you could use this operator to obtaina list of the top 10 sales in dollars.
is in bottom Valid for a column that contains numbers.Specify a single value. Results include only thelast n records, where n is a whole numberspecified as the value in the filter.
This operator is for ranked results. Forexample, you could use this operator to obtaina list of the customers reporting the fewestproblems.
contains all Valid for a column that contains text, numbers,or dates. Specify a single value or multiplevalues. Results include only records where thedata in the column contains all of the values inthe filter.
does not contain Valid for a column that contains text, numbers,or dates. Specify a single value or multiplevalues. Results include only records where thedata in the column does not contain any of thevalues in the filter.
Chapter 22Working with Views Using the View Designer
22-41

Table 22-3 (Cont.) Guidelines for Choosing an Operator When Creating aColumn Filter
Operator Usage Guidelines
contains any Valid for a column that contains text, numbers,or dates. Specify a single value or multiplevalues. Results include only records where thedata in the column contains at least one of thevalues in the filter.
begins with Valid for a column that contains text, numbers,or dates. Specify a single value. Resultsinclude only records where the data in thecolumn begins with the value in the filter.
ends with Valid for a column that contains text, numbers,or dates. Specify a single value. Resultsinclude only records where the data in thecolumn ends with the value in the filter.
is LIKE (pattern match) Valid for a column that contains text. Specify asingle value or multiple values. Requires theuse of a percent sign character (%) as awildcard character. You may specify up to twopercent sign characters in the value. Resultsinclude only records where the data in thecolumn matches the pattern value in the filter.
is not LIKE (pattern match) Valid for a column that contains text. Specify asingle value or multiple values. Requires theuse of a percent sign character (%) as awildcard character. You may specify up to twopercent sign characters in the value. Resultsinclude only records where the data in thecolumn does not match the pattern value inthe filter.
Publishing ViewsThe ad hoc view definition that you create in View Designer can be published to theOracle BI Presentation Catalog in Oracle Business Intelligence Enterprise Edition afteryou have inserted it in Oracle Smart View for Office. When you publish an ad hoc view,a new analysis in Oracle BI EE is created with the default views of compound view andtitle view, along with the applicable user-created view.
When publishing a view that you were editing, you have the option of overwriting theview in the Oracle BI Presentation Catalog, or specifying a new name for the view andpublishing the edited version, keeping two versions of the view in Oracle BI EE.
To publish a view to the Oracle BI Presentation Catalog:
1. Position the cursor within the view that you just created or edited in View Designer.
2. In the Oracle BI EE ribbon, click the Publish View icon (Figure 1).
Chapter 22Working with Views Using the View Designer
22-42

Figure 22-22 Publish View Icon
3. In Save Report, click next to Catalog Root, and then navigate to the location in theOracle BI Presentation Catalog where you will save the view.
4. In Analysis Name, provide a name.
If you are publishing an edited view, you have the option of overwriting the view youedited by providing the same name, or providing a new name and keeping the originalversion of the view intact.
5. Click Save.
The default naming convention is applied to the components of the view that is saved; forexample, Table 1, Pivot Table 1, Chart 1, and so on.
Example 22-1 Notes
• If you are publishing a view that was created and then edited in Smart View, you mayoverwrite it.
• An error message is displayed if you attempt to overwrite an existing view in the OracleBI Presentation Catalog if the view was created in Oracle BI EE.
• To view the changes made in Oracle BI EE, you must re-insert the view.
• Once published, you may make changes to the view as follows:
– If the view was created in Oracle BI EE, then use the Oracle BI EE.
– If the view was created in Smart View, you may edit it either in Smart View or OracleBI EE.
• You may refresh the data in views created in View Designer.
Ad hoc views created in View Designer remain as a snapshot and will not be kept in syncwith the analysis published to the catalog.
• Changes made to the view in Oracle BI EE will not be reflected into the ad hoc view thatyou rendered in Excel. You must reinsert the view from the catalog tree into a new sheetin Smart View in order to view the changes that were made in Oracle BI EE.
Editing Views Created in View DesignerRelated Topics
• About Editing Views Created in View Designer
• Guidelines for Editing Views Created in View Designer
• Accessing the View to Edit
• Determining Where a View was Created
• Editing Views that were Created in View Designer
Chapter 22Working with Views Using the View Designer
22-43

About Editing Views Created in View DesignerUse the View Designer in Oracle Smart View for Office to edit the views you created oredited in View Designer.
Do not use the View Designer in Smart View in these cases:
• To edit the views you created in Oracle Business Intelligence Enterprise Edition
• To edit views you created in Smart View and then edited in Oracle BI EE
The process flow for editing views involves the following tasks:
• Reviewing the information in Guidelines for Editing Views Created in ViewDesigner
• Accessing the View to Edit
• Determining Where a View was Created
• Editing Views Created in View Designer
Guidelines for Editing Views Created in View Designer• Only views created and inserted from the View Designer in Oracle Smart View for
Office can be edited using the View Designer.
• Views created in Smart View may also be edited in Oracle Business IntelligenceEnterprise Edition. However, views created in Smart View and then further editedin Oracle BI EE cannot afterward be edited in View Designer.
Note:
To edit views created in Oracle BI EE, use the Oracle BI EE application(see Editing an Analysis in Oracle BI EE).
• When you use View Designer to edit a table view or pivot table view, Smart Viewperforms a replace operation, effectively replacing the view on the sheet with thenewly-edited view; that is, the table on the sheet is deleted and a new table isinserted. If the new table has more rows or columns than the previous table, anycontent or formulas that you may have added to the sheet prior to editing the viewin View Designer may be removed and you will need to add them again.
Accessing the View to Edit
Note:
This procedure applies to views that were created in View Designer.
To access views to edit:
1. Access a view in one of following ways:
Chapter 22Working with Views Using the View Designer
22-44

• During the design session—For example, after you created the view in ViewDesigner and clicked OK to insert the view, select the view in the Office documentand click the View Designer icon to relaunch the View Designer for editing.
• From a view in a saved Office document—Select the view in the Office documentand click the View Designer icon to relaunch the View Designer for editing.
• From a published view in the Presentation Catalog—Use the Load view in ViewDesigner command to load the view from the catalog tree into the View Designer inOracle Smart View for Office. When you select a view, the Load view in ViewDesigner command is available in the Action Panel or from the right-click menu.
Remember, to select a view to edit from the catalog tree, do not try to insert it firstinto the Office document. Be sure to use the Load view in View Designer commandwhen you want to edit.
2. Continue with the processes described in Determining Where a View was Created todetermine if you should edit the view in View Designer.
Note:
Do not use View Designer in Smart View to edit views that were created in OracleBusiness Intelligence Enterprise Edition. Views may not load in cases where theView Designer does not support the formatting and design features that were usedto create the view in Oracle BI EE. For this reason, use the View Designer to editonly those views that were created and inserted using the View Designer in SmartView.
Determining Where a View was CreatedYou need to know if a view was created in the View Designer in Oracle Smart View for Officeif you want to edit it in Smart View.
If you are unsure whether a view on a sheet was created in Smart View or Oracle BusinessIntelligence Enterprise Edition, you can verify the origin of the view in the Document Contentspane.
To determine the origin of a view:
1. Open the Office document containing the view.
2. Locate the view in the Document Contents pane, then right-click the view name, and thenselect Properties.
3. Check that the value in the View Source field is AdHocDesigner.
The possible values are:
• AdHocDesigner—View originates from the View Designer in Smart View
• Catalog—View originates from the Oracle BI Presentation Catalog
• CopyFromAnswers—View was copied from Oracle BI EE and pasted into the SmartView Office document
The views marked AdHocDesigner are the only views that should be edited in ViewDesigner.
Chapter 22Working with Views Using the View Designer
22-45

Note that, in some cases, views created in Oracle BI EE may be loaded in to theView Designer in Smart View. Keep in mind that when you attempt to work in ViewDesigner with views from Oracle BI EE, you are doing so at your own risk; editingthese views in View Designer is not supported. Oracle only supports using theView Designer to edit those views that were created and edited using the ViewDesigner in Smart View.
4. If the View Source property is AdHocDesigner, the view can be edited in ViewDesigner.
If the View Source is Catalog or CopyFromAnswers, edit the view in Oracle BIEE.
Editing Views that were Created in View Designer
Note:
This topic is about editing views that were created in the View Designer inOracle Smart View for Office. If you are working with views that were createdin Oracle Business Intelligence Enterprise Edition, see Editing Views Createdin Oracle BI EE.
When working with views created in the View Designer in Smart View, you can edit theviews using either of the following methods:
• Load the view for editing into View Designer in Smart View, as described in Launching the View Designer or About Editing Views Created in View Designer.
You can edit the layout of the view (for example, add or remove columns) ormodify the filters. See the following topics for information on editing views in SmartView:
– Defining the View Layout
– Defining the Filter Expression for Views in View Designer
• Open the analysis in Oracle BI EE. See the documentation in Oracle BI EE forassistance. Then insert the updated view into Smart View.
Note:
Once a view is created in View Designer and then edited in Oracle BIEE, Oracle recommends that you only edit it thereafter in Oracle BI EE.You should not use Smart View to edit the view. See What Can andCannot Be Edited for guidelines.
Refreshing Data in a View Created in View DesignerYou may refresh views created in View Designer in the same way you refresh viewsthat were inserted into an Office application from the catalog tree.
See Specifying Preferences for Refreshing Views and Refreshing Views forinformation.
Chapter 22Working with Views Using the View Designer
22-46

Troubleshooting Connecting to the Oracle BI EE ServerYou can troubleshoot the connection to the Oracle Business Intelligence Enterprise Editionserver:
When troubleshooting, note the following behaviors:
• When attempting to connect from Oracle Smart View for Office to Oracle BI EE while theOracle BI EE server is down, an error message is displayed. However, after clicking OKin the error message, the Connect to Data Source dialog box is erroneously displayed.Click Cancel to close the dialog box.
• When trying to insert a view after a connection timeout has occurred, the Connect toData Source dialog box is displayed. If you click Cancel, the dialog box is relaunched.Click Cancel and the error message is displayed.
• Clicking OK in the View Designer after the session is timed out returns an objectreference error.
Chapter 22Troubleshooting Connecting to the Oracle BI EE Server
22-47

23Smart View and Oracle Analytics Cloud
Related Topics
• About Oracle Analytics Cloud and Smart ViewWith Oracle Smart View for Office, users can connect to Oracle Analytics Cloud andutilize the content created in Oracle Analytics Cloud dashboards and analyses.
• Features and Components of Oracle Analytics Cloud in Smart ViewWhen connected to an Oracle Analytics Cloud data source in Oracle Smart View forOffice, you can perform several actions.
• Installing the Oracle Analytics Cloud ExtensionHow the Oracle Analytics Cloud extension is installed depends on whether you are anend user or an administrator.
• Working with Windows System Locales in Oracle Analytics CloudOn each Oracle Smart View for Office client machine, Windows system locales mustmatch that of Smart View in order for any data (numbers, dates, currencies, percentages)to be interpreted correctly.
• Connecting to Multiple Oracle Analytics Cloud Data SourcesYou connect to Oracle Analytics Cloud data sources using private connections.
• Oracle BI Presentation CatalogThe Oracle BI Presentation Catalog, also referred to as the catalog or catalog tree, isdisplayed in the Smart View Panel.
• Working with Oracle Analytics Cloud Analyses, Views, and DashboardsIn Oracle Analytics Cloud, analyses are made up of individual views; dashboards aremade up of analyses and individual views.
• Working with Views Using the View DesignerUsing the View Designer in Oracle Smart View for Office, you can create ad hoc viewsbased on an Oracle Analytics Cloud subject area.
About Oracle Analytics Cloud and Smart ViewWith Oracle Smart View for Office, users can connect to Oracle Analytics Cloud and utilizethe content created in Oracle Analytics Cloud dashboards and analyses.
In addition to working with this content, Smart View users can create content in the form ofsimple views with the View Designer, using Oracle Analytics Cloud as the data source. Theviews created can then be published to the Oracle BI Presentation Catalog, where they canbe edited further.
Smart View offers Oracle Analytics Cloud users a cohesive and consistent experience acrossall Oracle Analytics Cloud content providers.
23-1

Note:
To use the Oracle Analytics Cloud-related features in Smart View, you musthave Oracle Analytics Cloud 17.3.2 or later.
Features and Components of Oracle Analytics Cloud inSmart View
When connected to an Oracle Analytics Cloud data source in Oracle Smart View forOffice, you can perform several actions.
• Connect to Oracle Analytics Cloud.
• Navigate through the Oracle BI Presentation Catalog.
• Connect to multiple instances of Oracle Analytics Cloud and switch betweenconnections.
• Import pre-created views from the Oracle BI Presentation Catalog into MicrosoftExcel, PowerPoint, and Word. For example, you can:
– Insert views—Oracle Analytics Cloud tables, pivot tables, and graphs—intoExcel as refreshable, editable objects.
– Insert views from different connections into the same Office document.
– Apply Excel formatting to Oracle Analytics Cloud data; formats are retainedwhen you refresh.
• Copy Oracle Analytics Cloud Dashboard content and paste it into Smart Viewclient documents. The data, metadata, and view layout are copied.
• Create simple views in Excel using Oracle Analytics Cloud as the source formetadata and data.
• Interact with content imported into Smart View documents, such as drill andprompt selections.
• Manage the imported content in Smart View, including content from multipleconnections; for example, refresh, mask, copy and paste, and document contents.
• Mask data from Oracle Analytics Cloud objects in Excel so that users must log into view the data. Masked objects can be viewed upon refresh.
• Program using Visual Basic. See the Oracle Smart View for Office Developer'sGuide for more information.
Key components are:
• Ribbon—The Oracle Analytics Cloud ribbon contains Oracle Analytics Cloudcommands for designing and publishing views in Smart View, inserting, andcopying and pasting views from Oracle Analytics Cloud, editing prompts, maskingdata, editing, and setting preferences.
• Catalog—The catalog is an expandable tree list of the Oracle Analytics Clouddashboards, analyses, and views that are available to you for insertion into Excel.Each analysis expands to display all views available from that analysis. Only viewsthat are supported and defined in Oracle Analytics Cloud, and for which you have
Chapter 23Features and Components of Oracle Analytics Cloud in Smart View
23-2

permission, are displayed. You can refresh the catalog to display the latest list ofavailable analyses and views.
Installing the Oracle Analytics Cloud ExtensionHow the Oracle Analytics Cloud extension is installed depends on whether you are an enduser or an administrator.
Related Topics
• For Smart View End Users
• For Smart View Administrators
For Smart View End UsersTo install the extension for Oracle Analytics Cloud:
1. Install Oracle Smart View for Office as instructed by your Smart View administrator.
Note:
In some cases, your administrator may install Smart View automatically for you.
2. After Smart View is installed, and before you start Microsoft Excel, Word, or PowerPoint,ensure that you are logged in to your computer with your own user name.
Note:
You must be logged in with your own user name, not an administrator's oranyone else's user name, in order to be able to correctly install and use theextension for Oracle Analytics Cloud.
3. Start Microsoft Excel, Word, or PowerPoint.
Note:
To install the Oracle BI EE extension, you can start Excel, Word, or PowerPoint;the Oracle BI EE extension installation is not launched from Outlook.
See Installing Extensions for details.
4. To verify that the extension for Oracle Analytics Cloud is installed, from Excel, Word, orPowerPoint, select the Smart View ribbon, then Options, and then Extensions, andconfirm that the extension named " Oracle BI EE " is listed.
If the extension is not listed, contact your Smart View administrator.
Chapter 23Installing the Oracle Analytics Cloud Extension
23-3
For Smart View AdministratorsAfter Oracle Smart View for Office installation, the Oracle Analytics Cloud extension isinstalled automatically the first time an Office application is launched. You must ensurethat the intended end user is logged in to Windows before Office is launched.
Or, you can control how your Smart View end users install the Oracle Analytics Cloudextension via the Extensions page of the Smart View Options dialog box. See"Administering Extension Installations and Updates" in the Oracle Smart View forOffice Installation and Configuration Guide for more information on setting upautomatic or manual installations.
If you choose to set up automatic or manual installations, you should install SmartView in a test environment first, then refer to the UpdateList.xml file, found in theextensions folder of your Smart View installation. Use the entry in this file as aguideline for the Oracle Analytics Cloud entry you will add to the UpdateList.xml file,as described in "Configuring Manual Extension Updates" in the Oracle Smart View forOffice Installation and Configuration Guide .
Working with Windows System Locales in Oracle AnalyticsCloud
On each Oracle Smart View for Office client machine, Windows system locales mustmatch that of Smart View in order for any data (numbers, dates, currencies,percentages) to be interpreted correctly.
The following are the applicable Windows system locales:
• Smart View language option
• Microsoft Office language
• Windows Regional Settings
• Windows operating system
When working with Oracle Analytics Cloud data sources, in cases of mismatchedWindows system locales, data may display incorrectly, or formatting may be ignoredand plain data rendered instead.
An example of a Windows system locale mismatch is the Windows operating system,Regional Settings, and Office language in English, and Smart View in Russian.
When locale mismatches occur, the Smart View log indicates a warning such as thefollowing: "Encountered mismatched locale. Chart will use unformatted data values."
Connecting to Multiple Oracle Analytics Cloud Data SourcesYou connect to Oracle Analytics Cloud data sources using private connections.
See Creating Private Connections.
To connect using shared connections, the shared connection information must bestored in a file, as described in Accessing Shared Connections from an XML File in theOracle Smart View for Office Installation and Configuration Guide .
Chapter 23Working with Windows System Locales in Oracle Analytics Cloud
23-4

Additionally, Oracle Smart View for Office supports multiple Oracle Analytics Cloud privateconnections on one Office worksheet, slide, or document.
For example, in one worksheet, you may insert two graphs from two different Oracle BIPresentation Catalogs and refresh the sheet. Each graph will be updated with the latest datafrom the two different servers.
When connected to multiple Oracle Analytics Cloud servers:
• Users can switch between those connections in the Smart View Panel and browse therespective catalogs.
• Users can insert views from the different connections into the same Office document.
• If View Designer is launched from the Smart View ribbon and no Oracle Analytics Cloudview is selected, then View Designer will be connected to the Oracle Analytics Cloudserver that was last used.
• If Paste is invoked from the Smart View ribbon to paste content from Oracle AnalyticsCloud, the paste action will use the Oracle Analytics Cloud connection that was last used.
• When refreshing a document containing views from different connections, the views willbe refreshed against the servers from which they were inserted.
• There can be only one Excel pivot table view per Excel worksheet. Additionally, Excelpivot table views are always inserted onto a new worksheet. This is the expectedbehavior, whether you are working with a single data source connection or with multipleconnections.
To connect to multiple Oracle Analytics Cloud private connections:
1. From Smart View Home or from the menu displayed when you click the arrow next to
, click Private Connections
2. In the Private Connections panel, select a connection from the drop-down menu and, inConnect to Data Source, enter your user name and password for the data source.
Assume you have inserted a view from the Oracle Analytics Cloud catalog. Continue withstep 3.
3. Move the cursor to a different part of the worksheet, slide, or document.
4. In the Private Connections panel, select a different connection from the drop-downmenu.
5. In Connect to Data Source, enter your user name and password for the second datasource.
You can now insert a view from the newly-connected data source into the Officedocument
6. Repeat step 3 through step 5 for any other data sources to which you want to connect.
Oracle BI Presentation CatalogThe Oracle BI Presentation Catalog, also referred to as the catalog or catalog tree, isdisplayed in the Smart View Panel.
The catalog tree displays a root node called "Catalog Root" and, by default, two folders called"My Folders" and "Shared Folders".
Chapter 23Oracle BI Presentation Catalog
23-5

Figure 23-1 Oracle BI Presentation Catalog, or Catalog Tree
Items that you save to My Folders appear only to you when you expand the folder.Items that other users save to My Folders appear only to them.
Items that you save to Shared Folders can be viewed by all users who have logged onwith BI Consumer privileges. If you have BI Consumer privileges, you can also viewthe items that other users have saved in Shared Folders.
To view the properties of any folder to which you have access, including the name ofthe folder creator and the creation date, right-click the folder in the catalog tree andselect View Folder Properties.
The folders in the catalog tree contain a list of analyses, both from Oracle AnalyticsCloud and Oracle Smart View for Office, as well as any subfolders created. Expand ananalysis node (for example, "Area chart2" under My Folders) and the list of views thatare stored there is displayed (for example, "Compound View 1" and "Table 1").
Chapter 23Oracle BI Presentation Catalog
23-6

Figure 23-2 Catalog Tree Showing Views Under an Analysis Node
To view the properties of an analysis, including the name of the analysis creator, the creationdate, and modification date, right-click the analysis in the catalog tree and select ViewAnalysis Properties.
You can choose to edit any analysis in Oracle Analytics Cloud. If a view in the analysis wascreated in Smart View, you can also choose to edit the view in Smart View.
To edit an analysis in Oracle Analytics Cloud, right-click the analysis in the catalog tree andselect Edit Analysis in Answers.
Selecting this option launches the default browser and opens the analysis editing wizard inOracle Analytics Cloud. If you are not already logged onto Oracle Analytics Cloud, a logindialog box is displayed where you can enter your credentials. You must have BI Consumerprivileges to edit an analysis in Oracle Analytics Cloud.
To edit a view in Smart View, right-click the view in the catalog tree and select Load view inView Designer.
In this case, the view must have been created in Smart View. See Launching the ViewDesigner for other methods for accessing views for editing.
From the catalog tree, you can also insert table views, pivot table views, graph views, titles,and compound views into Smart View. See Working with Oracle Analytics Cloud Analyses,Views, and Dashboards.
Chapter 23Oracle BI Presentation Catalog
23-7

Working with Oracle Analytics Cloud Analyses, Views, andDashboards
In Oracle Analytics Cloud, analyses are made up of individual views; dashboards aremade up of analyses and individual views.
Related Topics
• Supported Oracle Analytics Cloud View and Object Types
• Inserting Tables and Pivot Tables
• Inserting Graphs
• Inserting Compound Views
• Inserting Dashboards
• Working with Prompts
• Working with Page Prompts
• Specifying Preferences for Refreshing Views
• Refreshing Views
• Masking Data in Views
• Viewing Properties of an Oracle Analytics Cloud Object
• Copying and Pasting Oracle Analytics Cloud Objects Between Office Applications
• Editing an Analysis in Oracle Analytics Cloud
• Copying and Pasting Views From Oracle Analytics Cloud to Office
• Editing Views Created in Oracle Analytics Cloud
Supported Oracle Analytics Cloud View and Object TypesYou can insert the following views into Oracle Smart View for Office clients (Excel,PowerPoint, and Word) from the catalog or by copying and pasting.
Note:
Drill operations are not supported on Oracle Analytics Cloud views insertedin Smart View. (Drill operations are referred to as Zoom In and Zoom Out inSmart View.)
• Table Views
Table views display data in table format, either in a format similar to the display inOracle Analytics Cloud (also referred to as native format), or as an Excel table.
Using the Insert option, you can insert table views into all Smart View clients innative format. This format offers no sorting or filtering. Cells with the same dataare merged into a single cell.
Chapter 23Working with Oracle Analytics Cloud Analyses, Views, and Dashboards
23-8

In Excel, using the Insert as Excel Table command, you can insert a table view as anExcel table. With this format, you can perform further analysis operations, such as sortingand filtering.
Notes:
– In Excel, you can insert multiple tables on a worksheet, but you cannot insert a tableon top of an existing table. You can, however, do the following:
* To replace a table, select any cell within the table and click the Delete button onthe Oracle BI EE ribbon. Then insert the table into the worksheet.
* To insert additional tables onto the worksheet, select a cell outside any tableviews or other view objects, and then insert the table.
– Excel may not recognize some custom formats in table views and Excel table viewsmay not be recognized by Excel, resulting in an error when the view is inserted intoExcel.
• Pivot Table Views
Pivot table views display data in the grouped format defined in Oracle Analytics Cloud,which is also referred to as native format. Features such as page item lists and groupsectioning are maintained. Data can also be displayed in Excel pivot table format.
Using the Insert option, you can insert pivot table views into all Smart View clients innative format. As with inserting a table view, this format offers no sorting or filtering; cellswith the same data are merged into a single cell.
In Excel, using the Insert as Excel Pivot option, you can also insert a pivot table view asan Excel pivot table. With this format, you may perform further analysis operations, suchas pivoting, aggregating, drilling, sorting, and filtering.
Notes:
– When working with Excel pivot table views, only views with measure columns ofnumerical data type are supported.
– There can be only one Excel pivot table view per Excel worksheet. Additionally, Excelpivot table views are always inserted onto a new worksheet. This is the expectedbehavior, whether you are working with a single data source connection or withmultiple connections.
– Excel may not recognize some custom formats in Pivot table views, resulting in anerror when the view is inserted into Excel.
– Smart View does not have the "Graph Pivoted Results" functionality of OracleAnalytics Cloud. In order to view a graph of the same row, column and pagedimensions of a particular pivot table, you must create a separate chart view inOracle Analytics Cloud, and then insert that chart view in Smart View.
• Graph Views
Graph views display data by mapping the graph defined in Oracle Analytics Cloud to agraph type supported by Microsoft Office charts.
Using the Insert as Image option, you can insert graphs directly into Smart View clientsas a static image. The image cannot be edited or refreshed.
Using the Insert option in all Smart View clients, you can edit and refresh graphs. SmartView attempts to match the graph style from Oracle Analytics Cloud as closely aspossible, including graph properties such as visual effect (2D, 3D), canvas size, charttitle, subtitle, axis titles, legend and legend position, axis scale, data format (numeric,date, currency format), and title and label formatting.
Chapter 23Working with Oracle Analytics Cloud Analyses, Views, and Dashboards
23-9

If a matching Office chart type is not available, you can insert the graph view as animage. See Supported Oracle Analytics Cloud Chart and Object Types and Unsupported Oracle Analytics Cloud Chart and Object Types.
• Gauge Views and Funnel Graph Views
In Oracle Analytics Cloud, gauge views and funnel graph views are separateobject types from graph views.
Using the Insert as Image option, you can insert gauge and funnel views directlyinto Smart View clients as a static image. You cannot edit or refresh the image.
• Title Views
Title views display the title of a report, along with other information that is part ofthe Oracle Analytics Cloud title view.
Title views typically include title text, subtitle text, the analysis name, the date andtime inserted, an optional logo, and an optional URL (for example, a help link).Title views are inserted into Smart View clients as a collection of text boxes andimages grouped together as a single Office object.
• Compound Views
Compound views display data as an assembly of different views.
You can insert compound views into all Smart View clients. Smart View inserts allsupported views that make up the compound view. Each type of view—table, pivottable, graph, gauge, funnel, filter, and title—is inserted into Smart View clients inits own default format.
In Word, all views are inserted next to and below each other filling pages in theactive Word document.
In Excel or PowerPoint, users are prompted to choose between inserting all theviews on one sheet or slide, or inserting each view on a separate sheet or slide.
Inserting Tables and Pivot TablesThe maximum number of rows and columns that you can insert depends on theversion of Excel you are using. See Microsoft Excel documentation for worksheet sizelimits.
To insert a table or pivot table:
1. Place the cursor at the point in the Excel worksheet, PowerPoint slide, or Wordpage where you want the table or pivot table to begin.
2. In the catalog tree in the Smart View Panel, right-click a table or pivot table.
3. Select one of the following:
• Insert—The selected table view or pivot table view is inserted in the formatdefined in Oracle Analytics Cloud. See Figure 1 and Figure 2
If prompts are defined for the table or pivot table in Oracle Analytics Cloud, thePrompt Selector dialog box is displayed where you make selections on thedata to display (otherwise, the table or pivot table is inserted directly). After theinitial insert, you may edit the prompts by clicking the Edit Prompts icon in theOracle Analytics Cloud ribbon. See Working with Prompts for moreinformation.
Chapter 23Working with Oracle Analytics Cloud Analyses, Views, and Dashboards
23-10

If page prompts are defined for the table or pivot table (view prompts in OracleAnalytics Cloud), you may edit them by clicking the Edit Page Prompts icon in theOracle Analytics Cloud ribbon. See .Working with Page Prompts.
Figure 23-3 Table View Inserted as Table with Formatting from OracleAnalytics Cloud
Chapter 23Working with Oracle Analytics Cloud Analyses, Views, and Dashboards
23-11

Figure 23-4 Pivot Table Inserted as a Pivot Table with Formatting fromOracle Analytics Cloud
In Oracle Smart View for Office clients, the table is displayed in the form agrid.
• Insert as Excel Table (table views only)—The selected table view is insertedas an Excel table. Columns in the page prompt edge and section edge, ifpresent, are moved to the top of the table as drop-down headings. Select thisoption when you want to use Excel operations to filter, define formulas, sort,and perform other Excel tasks.
When a table view is inserted as an Excel table, prompts that are defined inOracle Analytics Cloud are not available.
The selected table is inserted on the worksheet.
Figure 23-5 Portion of a Table View Inserted as an Excel Table
• Insert as Excel Pivot (pivot table views only)—The selected pivot table viewis inserted as an Excel pivot table. Columns in the page edge and sectionedge, if present, are mapped to the report filters area, and columns in themeasures edge are moved to the values area. Select this option when you
Chapter 23Working with Oracle Analytics Cloud Analyses, Views, and Dashboards
23-12

want to perform further analysis, such as aggregating, pivoting, drilling, sorting, andfiltering.
The selected table or pivot table is inserted on the worksheet. See Figure 4.
Notes:
– When a pivot table view is inserted as an Excel Pivot table, prompts that aredefined in Oracle Analytics Cloud are not available.
– When working with Excel pivot table views, only views with measure columns ofnumerical data type are supported.
– There can be only one Excel pivot table view per Excel worksheet. Additionally,Excel pivot table views are always inserted onto a new worksheet. This is theexpected behavior, whether you are working with a single data source connectionor with multiple connections.
Figure 23-6 Pivot Table Inserted as an Excel Pivot Table
You can edit tables and pivot tables as described in Editing an Analysis in Oracle AnalyticsCloud.
Inserting GraphsWhen inserting graphs, Oracle Smart View for Office attempts to map the Oracle AnalyticsCloud graph into a chart type supported by Microsoft Office 2007 charts. Further, Smart Viewattempts to match visual effects, such as 2D or 3D, and other graph properties such ascanvas size, axis scale, data format, and formatting in terms of font styles and colors.
When a matching chart type is not available, the graph view can only be inserted as image.
See Supported Oracle Analytics Cloud Chart and Object Types and Unsupported OracleAnalytics Cloud Chart and Object Types.
To insert a graph:
1. From the catalog, right-click a graph view.
2. Select an option:
• Insert—The selected graph is inserted as an Excel chart, which can be edited,masked, and refreshed.
If prompts are defined for the graph in Oracle Analytics Cloud, the Prompt Selectordialog box is displayed where you make selections on the data to display (otherwise,
Chapter 23Working with Oracle Analytics Cloud Analyses, Views, and Dashboards
23-13

the graph is inserted directly). After the initial insert, you may edit the promptsby clicking the Edit Prompts icon in the Oracle Analytics Cloud ribbon. See Working with Prompts.
If page prompts are defined for the graph (view prompts in Oracle AnalyticsCloud), you may edit them by clicking the Edit Page Prompts icon in theOracle Analytics Cloud ribbon. See Working with Prompts for moreinformation.
If no prompts are defined for this analysis, then the graph is inserted directly.See Figure 1.
Figure 23-7 A Pie Chart View Inserted as an Excel Chart
You can edit graphs inserted this way as described in Editing Views Created inOracle Analytics Cloud.
• Insert as Image—The selected graph is inserted as an image of the graph,which cannot be edited or customized.
When a graph is inserted directly as an image, prompts, page prompts, andsections that are defined in Oracle Analytics Cloud are not available.
Note that gauge and funnel objects can only be inserted using the Insert asImage command.
Chapter 23Working with Oracle Analytics Cloud Analyses, Views, and Dashboards
23-14
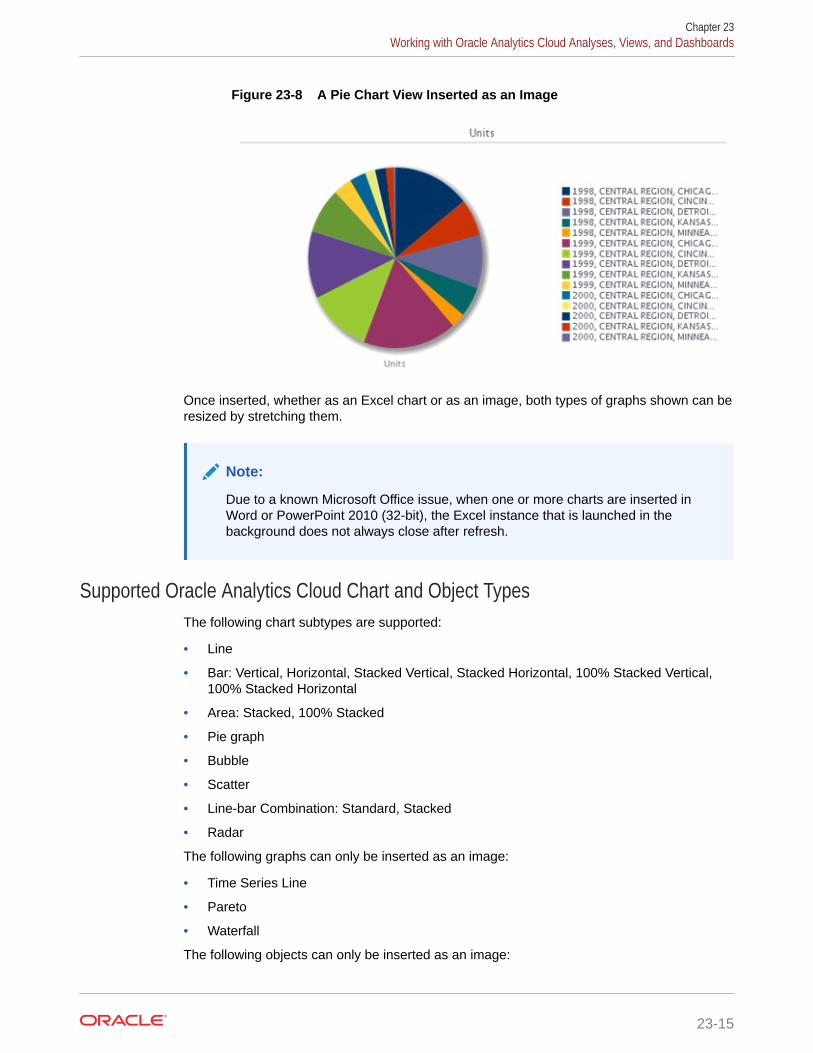
Figure 23-8 A Pie Chart View Inserted as an Image
Once inserted, whether as an Excel chart or as an image, both types of graphs shown can beresized by stretching them.
Note:
Due to a known Microsoft Office issue, when one or more charts are inserted inWord or PowerPoint 2010 (32-bit), the Excel instance that is launched in thebackground does not always close after refresh.
Supported Oracle Analytics Cloud Chart and Object TypesThe following chart subtypes are supported:
• Line
• Bar: Vertical, Horizontal, Stacked Vertical, Stacked Horizontal, 100% Stacked Vertical,100% Stacked Horizontal
• Area: Stacked, 100% Stacked
• Pie graph
• Bubble
• Scatter
• Line-bar Combination: Standard, Stacked
• Radar
The following graphs can only be inserted as an image:
• Time Series Line
• Pareto
• Waterfall
The following objects can only be inserted as an image:
Chapter 23Working with Oracle Analytics Cloud Analyses, Views, and Dashboards
23-15

• Gauge
• Funnel
Unsupported Oracle Analytics Cloud Chart and Object TypesThe following view types are not supported:
• Performance Tiles
• Trellis views
• Map views
• Filters views—You can only view properties for filter views, using the ViewAnalysis Properties command in the catalog tree.
• Selection Steps
• Column Selector
• View Selector
• Legend
• Narrative
• Ticker
• Static Text
• Logical SQL
• Create Segment
• Create Target List
Inserting Compound ViewsTo insert a compound view:
1. From the catalog, select the compound view to insert.
2. Right-click and select Insert All Views.
3. When prompted, choose an option:
• One object per sheet/slide to insert each object in the compound view on aseparate sheet in Excel, or a separate slide in PowerPoint.
• All objects on one sheet/slide to display all objects on one Excel sheet orPowerPoint slide.
In Excel, objects are inserted on a new sheet or sheets, even if there are unusedsheets in the workbook.
In Word, objects are placed adjacent to and below other objects on a sheet untilthe sheet is filled, and then continues filling as many sheets as required to hold allthe objects.
The default display is selected for the table, pivot table, and graph view types; thatis, the Insert action will be used automatically.
A message notifies you of unsupported view types in the compound view.Unsupported view types are not inserted.
Chapter 23Working with Oracle Analytics Cloud Analyses, Views, and Dashboards
23-16

Note:
You may perform Refresh and edit prompt and page prompts for selected views.Unselected views from the compound view remain unchanged. See RefreshingViews, Working with Prompts, and Working with Page Prompts.
Inserting DashboardsDashboards are displayed in the catalog tree as folders. A dashboard folder can beexpanded to show dashboard pages; a dashboard page can be expanded to show the list ofanalyses included in that page. You can insert dashboard pages into Excel, PowerPoint, andWord.
To insert dashboard pages into Office applications:
1. From the catalog, right-click a dashboard page and select Insert All Views.
2. When prompted, choose an option:
• One object per sheet/slide to insert each object in the dashboard on a separatesheet in Excel, or a separate slide in PowerPoint.
• All objects on one sheet/slide to display all objects on one Excel sheet orPowerPoint slide.
In Word, objects are placed adjacent to and below other objects on a sheet until thesheet is filled, and then continues filling as many sheets as required to hold all theobjects.
Default display is selected for the table, pivot table, and graph view types; that is, theInsert action is used automatically.
A message notifies of unsupported view types in the dashboard. Unsupported view typesare not inserted.
Note:
You may perform Refresh and edit prompt and page prompts for selected views.Unselected views from the dashboard remain unchanged. See Refreshing Views, Working with Prompts, and Working with Page Prompts.
Working with PromptsPrompts enable users to specify criteria that determines the content of the view that they areinserting. Oracle Smart View for Office supports both prompts and page prompts. See Working with Page Prompts for information on page prompts.
Prompts in Smart View are the equivalent of prompts in Oracle Analytics Cloud. Smart Viewonly supports column prompts.
Prompts are defined at the analysis level in Oracle Analytics Cloud. Users are prompted toenter values for these prompts each time a view is inserted in Smart View.
Chapter 23Working with Oracle Analytics Cloud Analyses, Views, and Dashboards
23-17

If prompts are defined on an analysis in Oracle Analytics Cloud, then when you inserta table, pivot table, or graph view from the analysis into Smart View, you are promptedto select the data to be displayed for that view. When inserting a compound view froman analysis that has prompts defined, you are prompted to enter values only one timefor all the views in that compound view.
For example, a prompt on Year is designated for an analysis, and the years 2010,2011, and 2012 are available to choose from. When you insert a table, pivot table, orgraph, you are prompted to select which year's data to display: 2010, 2011, or 2012.Or, you can choose to insert the compound view, and the prompt selection you makeis applied to all the views inserted. After insertion, you can edit the prompts on eachindividual view to select another year's data to display.
Views can only be edited individually. The edit operation will prompt you for the valuesto be selected for each view that is being edited.
You may edit prompts in views that were inserted, or copied and pasted.
Note:
Prompts defined on hierarchical columns in Oracle Analytics Cloud are notsupported in Smart View.
To edit prompts:
1. From the worksheet, select a view:
• Graph views—Select the graph.
• Table and pivot table views—Select a cell in the table.
2. From the Oracle Analytics Cloud ribbon, select the Edit Prompts button to displayyour original selections.
Figure 23-9 Edit Prompts Button
If the report definition has changed on the server, your selections are reset, andyou must select all prompts and columns again.
3. In the Prompt Selector, modify the prompt selections.
Depending on how the prompt was set up in Oracle Analytics Cloud, you may beselecting data directly from a drop-down list on the Prompt Selector. You mayalso be picking values from the Value Selector dialog box.
Figure 2 is an example of a Value Selector, where the years 2008, 2009, and2010 were selected for display.
Chapter 23Working with Oracle Analytics Cloud Analyses, Views, and Dashboards
23-18

Figure 23-10 Value Selector Dialog Box Showing the Years 2008, 2009, and 2010Selected
After you click OK in the Value Selector, the selections populate the first prompt in theexample Prompt Selector . A second prompt in the example Prompt Selector requiresthat you directly enter an amount; in this example, the amount to display is Billed Quantitygreater than $5,000.
The completed Prompt Selector dialog then looks like Figure 3.
Figure 23-11 Filled-In Prompt Selector
In some cases, the data to choose from can be exceedingly long. To accommodateloading large amounts of data in the Value Selector, Smart View presents values in
Chapter 23Working with Oracle Analytics Cloud Analyses, Views, and Dashboards
23-19

groups. Scroll and make selections from the first group shown, then click More toview and make selections from the next group. Continue clicking More until youhave viewed and made selections from the entire data list. Figure 4 shows anexample.
Figure 23-12 Value Selector Showing "More" for Large Amounts of Data
4. Click OK to close the Prompt Selector.
After you make selections and click OK, the view is immediately refreshed andreflects your selections.
5. Repeat this procedure to edit the prompts to change the output displayed.
Working with Page PromptsPage prompts enable users to specify criteria that determines the content of the viewthat has been inserted. Oracle Smart View for Office supports both page prompts andprompts. See also Working with Prompts.
Page Prompts in Smart View are the equivalent of view prompts in Oracle AnalyticsCloud. View prompts are specified on individual views within an analysis. Smart Viewsupports table prompts, graph prompts, and gauge prompts in Oracle Analytics Cloud;these types of prompts are called page prompts in Smart View.
Page prompts may vary on individual views within an analysis. An individual table viewwithin an analysis may have a page prompt set on Year, and a pivot table view withinthe same analysis may have a page prompt set on Line of Business.
When you first insert a view that contains page prompts, a view state is selected bydefault. For example, if a prompt on Year is specified on a particular view within ananalysis, and the years 2010, 2011, and 2012 are available to choose from, you arenot prompted for these at the time of insertion. Instead, a default state of the view isinserted. For example, 2010 data may automatically be inserted, as the first year in thelist of years available. You can then edit the page prompts to select another year's datato display for this view.
You may edit page prompts in views that have been inserted, or copied and pasted.
To edit page prompts:
Chapter 23Working with Oracle Analytics Cloud Analyses, Views, and Dashboards
23-20

1. From the worksheet, select a view:
• Graph views—Select the graph.
• Table and pivot table views—Select any cell in the table.
2. From the Oracle Analytics Cloud ribbon, select the Edit Page Prompts button to displaythe default page prompt selections for a particular view.
Figure 23-13 Edit Page Prompts Button
If the report definition has changed on the server, your selections are reset, and you mustselect all page prompts again.
3. In the Page Selector, modify the page prompt selections by selecting from the drop-down lists.
Working with Page Prompts shows a Page Selector dialog box, where users select aYear and a Line of Business. In the example, selections were made to display 2010 forthe year, and Electronics for the Line of Business.
Figure 23-14 Filled-in Page Selector
4. Click OK to close the Page Selector.
After you make selections and click OK, the view is immediately refreshed and reflectsyour selections.
5. Repeat this procedure to edit the page prompts to change the output displayed.
Chapter 23Working with Oracle Analytics Cloud Analyses, Views, and Dashboards
23-21
Specifying Preferences for Refreshing ViewsYou can specify preferences for refreshing each view. The refresh preferences thatyou set for each view within a worksheet, slide, or page are saved along with theOffice document (Excel workbook, PowerPoint slide presentation, or Word document).
To specify preferences for refreshing a view:
1. Ensure that one or more Oracle Analytics Cloud views are inserted into OracleSmart View for Office.
2. In Document Contents, click to refresh the content of the pane.
All views that were inserted into the active Office application are displayed inDocument Contents in a tree format.
3. Select a view in Document Contents, and then select Properties.
4. In Properties, select an option from Refresh Preferences:
• Refresh Data—Refreshes only the data points in the selected view oranalysis.
Any changes made to formatting in the sheet, slide, or page are retained.
• Replace View—Replaces the entire view, including any formatting changesset in Oracle Analytics Cloud.
If you select this option, your prompt and graph selections and customformatting are lost upon refresh if the view definition has changed.
Note:
Oracle Business Intelligence Enterprise Edition title views are notincluded in refresh actions, so all customizations to a title view areretained when you refresh the worksheet or workbook.
• Do not refresh—Refreshing is not allowed.
5. Click OK to save the Refresh Preference selection.
Continue with Refreshing Views.
Refreshing ViewsYou can refresh the data from Oracle Analytics Cloud in your inserted views. You havethe option of refreshing selected views or refreshing all views, depending on the Officedocument type, as follows.
Excel
• Individual views
• Individual worksheets
• Entire workbook
Chapter 23Working with Oracle Analytics Cloud Analyses, Views, and Dashboards
23-22
PowerPoint
• Individual views
• Individual slides
• Entire presentation
Word
• Individual views
• Entire document
You can refresh views from the Document Contents pane, the Oracle BI EE ribbon, or theSmart View ribbon.
The refresh action is limited according to the Refresh Preference set for a selected view. See Specifying Preferences for Refreshing Views for information.
Note that when you refresh, title views are not included in refresh actions, so allcustomizations to a title view are retained when you refresh the Office document.
When there are multiple objects on an Office document, if you attempt to refresh thedocument without having already connected, then you will be prompted for your logincredentials once for all objects. If you choose to cancel instead, the Connect to Data Sourcedialog box will appear for each object on the sheet, and you must click Cancel for eachobject. For example, if there are six objects on the sheet, the dialog box will appear six times,once for each object.
To refresh Oracle Analytics Cloud views from the Document Contents pane:
1. In Document Contents , ensure that Oracle Analytics Cloud - Document Hierarchy isdisplayed in the drop-down list box.
2. In Document Contents, click to refresh the contents of the tree.
From Document Contents, you can refresh individual views in all Office applications,individual worksheets, and individual slides.
3. Perform an action:
• To refresh a selected view in an Excel sheet, PowerPoint slide, or Word document,select the view object from the tree in Document Contents, and then select theRefresh View action from the right-click menu or click the Refresh View link at thebottom of the pane.
Repeat for each view that you want to refresh.
• To refresh all Oracle Analytics Cloud views on a selected Excel worksheet orPowerPoint slide, select the sheet or slide from the tree in Document Contents, andthen select the Refresh action from the right-click menu or click the Refresh link atthe bottom of the pane.
Repeat for each sheet or slide that you want to refresh.
To refresh all Oracle Analytics Cloud views on a worksheet or slide, or an entire Worddocument, using the ribbons:
1. Perform an action:
• Select the worksheet or slide to make it active.
Chapter 23Working with Oracle Analytics Cloud Analyses, Views, and Dashboards
23-23
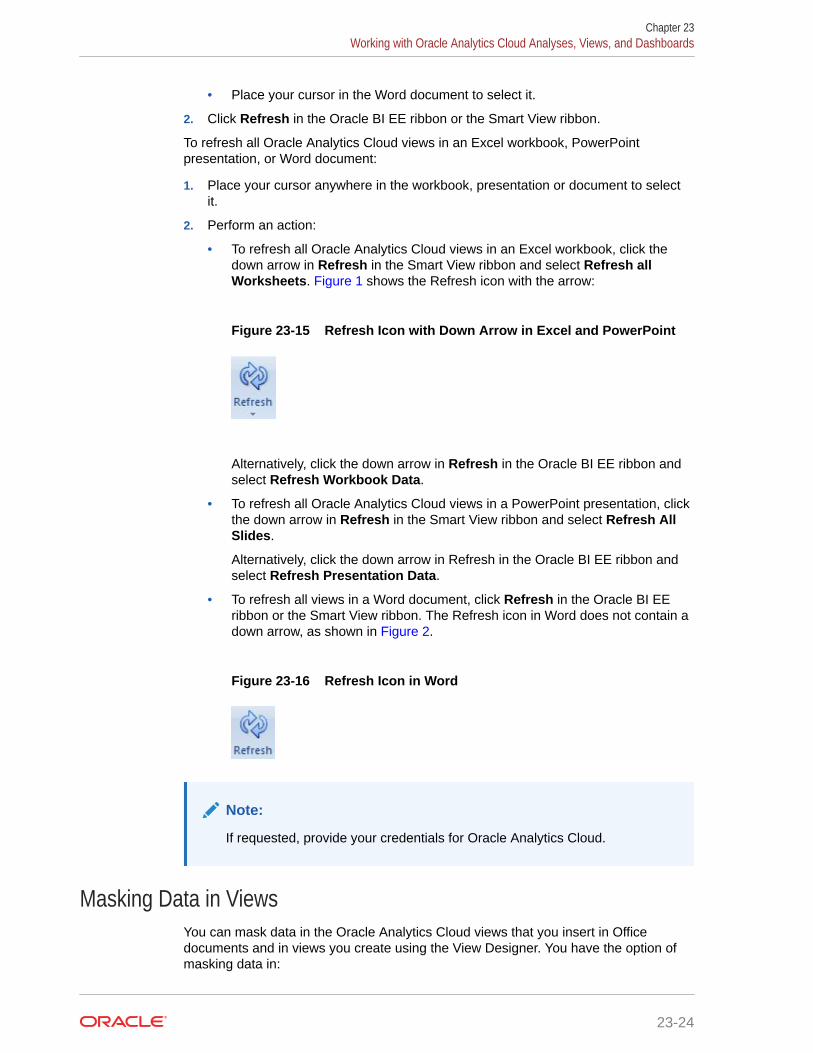
• Place your cursor in the Word document to select it.
2. Click Refresh in the Oracle BI EE ribbon or the Smart View ribbon.
To refresh all Oracle Analytics Cloud views in an Excel workbook, PowerPointpresentation, or Word document:
1. Place your cursor anywhere in the workbook, presentation or document to selectit.
2. Perform an action:
• To refresh all Oracle Analytics Cloud views in an Excel workbook, click thedown arrow in Refresh in the Smart View ribbon and select Refresh allWorksheets. Figure 1 shows the Refresh icon with the arrow:
Figure 23-15 Refresh Icon with Down Arrow in Excel and PowerPoint
Alternatively, click the down arrow in Refresh in the Oracle BI EE ribbon andselect Refresh Workbook Data.
• To refresh all Oracle Analytics Cloud views in a PowerPoint presentation, clickthe down arrow in Refresh in the Smart View ribbon and select Refresh AllSlides.
Alternatively, click the down arrow in Refresh in the Oracle BI EE ribbon andselect Refresh Presentation Data.
• To refresh all views in a Word document, click Refresh in the Oracle BI EEribbon or the Smart View ribbon. The Refresh icon in Word does not contain adown arrow, as shown in Figure 2.
Figure 23-16 Refresh Icon in Word
Note:
If requested, provide your credentials for Oracle Analytics Cloud.
Masking Data in ViewsYou can mask data in the Oracle Analytics Cloud views that you insert in Officedocuments and in views you create using the View Designer. You have the option ofmasking data in:
Chapter 23Working with Oracle Analytics Cloud Analyses, Views, and Dashboards
23-24

• Selected views
• All views on sheet or a slide
• All views in an Office document
Using the Mask Data functionality in Oracle Smart View for Office, you can perform theseactions:
• Select a single Smart View object in an Excel sheet or PowerPoint slide and mask dataonly in that object
• Mask data in the active Excel worksheet or PowerPoint slide
• Mask data in the active workbook, presentation, or Word document
You can invoke Mask Data from these locations:
• Document Contents in the Smart View Panel
• Oracle Analytics Cloud ribbon
Masking Data for an Individual View
To mask data in an individual view in an Excel worksheet or PowerPoint slide:
1. In Excel or PowerPoint, click in Document Contents to refresh the contents of thetree.
Note:
Data in Word documents can only be masked in their entirety; you cannot maskdata in individual views in Word.
2. Locate the view with data that you want to mask in Document Contents, and then selectit.
3. Click the Mask Data link in Document Contents.
In a table object, cells are replaced with the text, "Need refresh"; in a graph, the areabecomes blank and a small lock image is displayed.
4. Save the current workbook or presentation.
The masked state of the view remains intact after saving.
5. To display the data in the masked view, click in Document Contents, select the viewin the tree, and then click the Refresh View link.
Masking Data on a Sheet or Slide
To mask data on an Excel worksheet or PowerPoint slide:
1. Choose a method to select a sheet or slide:
• Place the cursor directly in a sheet or slide
• In Document Contents, click , locate the sheet or slide in the tree, and thenselect it.
2. Choose a method to mask data for all objects on the selected sheet or slide:
Chapter 23Working with Oracle Analytics Cloud Analyses, Views, and Dashboards
23-25

• In the Oracle Analytics Cloud ribbon, click the Mask Data button.
Figure 23-17 Mask Data Button
• In Document Contents, click the Mask Data link.
Data on the sheet or slide is masked.
Note:
Data in Word documents can only be masked in their entirety; youcannot mask data on individual pages in Word.
3. Save the current workbook or presentation.
The masked state of the sheet or slide remains intact after saving.
4. To display the data in the masked sheet or slide, click in DocumentContents, select the sheet or slide in the tree, and then click the Refresh link.
Alternatively, place the cursor in the sheet or slide to refresh, and then click
.
Masking Data in an Entire Office Document
To mask data in an entire Office document:
1. From the Oracle Analytics Cloud ribbon in the opened Office document, performan action:
• Excel: Click the down arrow in and select Mask Workbook Data.
• PowerPoint: Click the down arrow in and select Mask PresentationData.
Chapter 23Working with Oracle Analytics Cloud Analyses, Views, and Dashboards
23-26

• Word: Click .
Note:
Word documents can only be masked in their entirety; you cannot maskindividual pages in Word.
2. Save the current Office document.
The masked state of the workbook, presentation, or document remains intact aftersaving.
3. To display the masked data, click in Document Contents, select the sheet, slide, ordocument in the tree, and then click the Refresh link.
Alternatively, place the cursor in the sheet, slide, or document to be refreshed, and then
click .
Viewing Properties of an Oracle Analytics Cloud ObjectYou can view various properties of a selected object.
To view the properties of an Oracle Analytics Cloud object:
1. Select an Oracle Analytics Cloud view.
Select an actual view object and not a sheet or slide.
2. Click the Properties link at the bottom of the Document Contents pane.
Copying and Pasting Oracle Analytics Cloud Objects Between OfficeApplications
You can copy Oracle Analytics Cloud objects within and between Office applications asfollows:
• Graphs can be copied within and between any Office application.
• Tables and pivot tables can be copied within and between Word and PowerPoint.
• Tables and pivot tables cannot be copied within Excel, from Excel to another Officeapplication, or from another Office application to Excel.
• Tables and pivot tables can only be copied and pasted by sections.
Copying and Pasting a Graph View
To copy and paste a graph view:
Chapter 23Working with Oracle Analytics Cloud Analyses, Views, and Dashboards
23-27
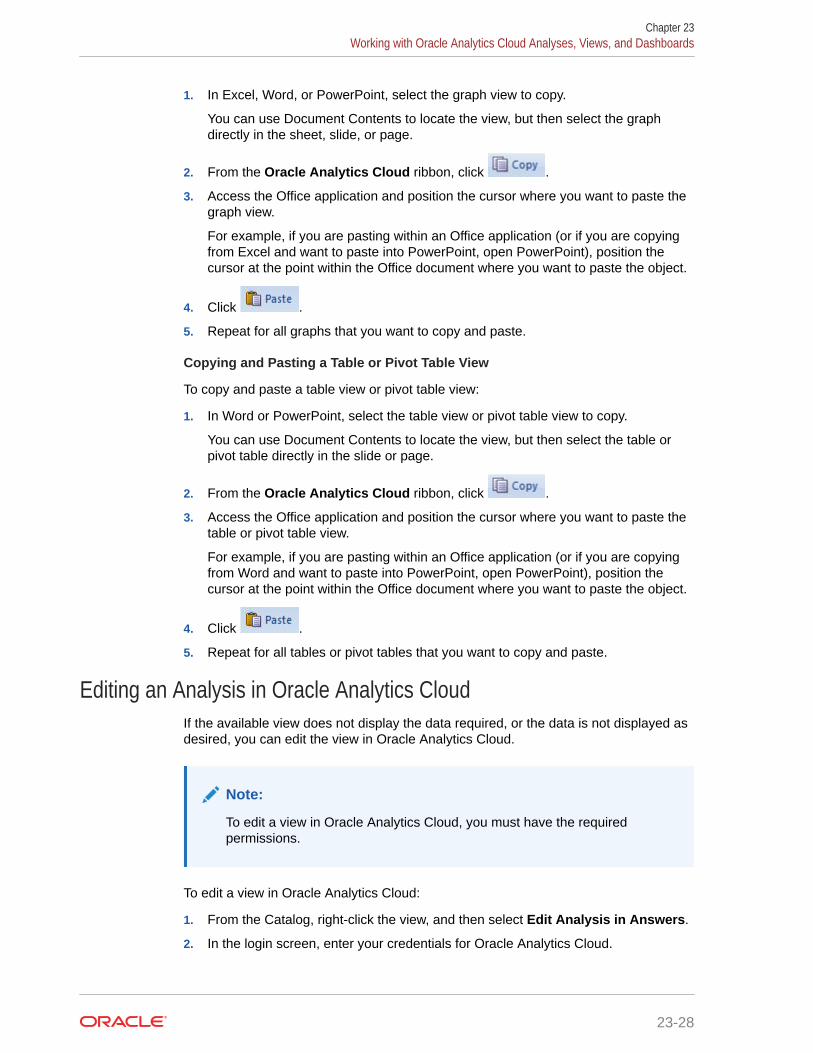
1. In Excel, Word, or PowerPoint, select the graph view to copy.
You can use Document Contents to locate the view, but then select the graphdirectly in the sheet, slide, or page.
2. From the Oracle Analytics Cloud ribbon, click .
3. Access the Office application and position the cursor where you want to paste thegraph view.
For example, if you are pasting within an Office application (or if you are copyingfrom Excel and want to paste into PowerPoint, open PowerPoint), position thecursor at the point within the Office document where you want to paste the object.
4. Click .
5. Repeat for all graphs that you want to copy and paste.
Copying and Pasting a Table or Pivot Table View
To copy and paste a table view or pivot table view:
1. In Word or PowerPoint, select the table view or pivot table view to copy.
You can use Document Contents to locate the view, but then select the table orpivot table directly in the slide or page.
2. From the Oracle Analytics Cloud ribbon, click .
3. Access the Office application and position the cursor where you want to paste thetable or pivot table view.
For example, if you are pasting within an Office application (or if you are copyingfrom Word and want to paste into PowerPoint, open PowerPoint), position thecursor at the point within the Office document where you want to paste the object.
4. Click .
5. Repeat for all tables or pivot tables that you want to copy and paste.
Editing an Analysis in Oracle Analytics CloudIf the available view does not display the data required, or the data is not displayed asdesired, you can edit the view in Oracle Analytics Cloud.
Note:
To edit a view in Oracle Analytics Cloud, you must have the requiredpermissions.
To edit a view in Oracle Analytics Cloud:
1. From the Catalog, right-click the view, and then select Edit Analysis in Answers.
2. In the login screen, enter your credentials for Oracle Analytics Cloud.
Chapter 23Working with Oracle Analytics Cloud Analyses, Views, and Dashboards
23-28

The selected view is displayed in Oracle Analytics Cloud.
3. In Oracle Analytics Cloud, edit and save the view.
4. Return to the Office application.
5. From the Oracle Analytics Cloud ribbon, click Refresh, and verify that your changesare reflected in the view.
Copying and Pasting Views From Oracle Analytics Cloud to OfficeYou can copy and paste views from Oracle Analytics Cloud to Oracle Smart View for Office.
When you refresh pasted views, the data is refreshed, but the view definition is not, even if itsdefinition has been modified in Oracle Analytics Cloud.
Note:
When copying and pasting views from Oracle Analytics Cloud to Smart View, someformatting may not be imported to Office.
To copy and paste a view:
1. Ensure that you are logged into Oracle Analytics Cloud.
2. From Oracle Analytics Cloud or Interactive Dashboards, launch the analysis that youwant to copy.
3. Click the Copy link at the bottom of the analysis (displayed only if the analysis is enabledfor copying).
4. Open an Office application, such as Excel, and connect to the appropriate OracleAnalytics Cloud data source.
5. From the Oracle Analytics Cloud ribbon, click .
Editing Views Created in Oracle Analytics CloudRelated Topics
• What Can and Cannot Be Edited
• Editing Pivot Tables Inserted into PowerPoint
• Other Guidelines
What Can and Cannot Be EditedNote the following when editing views that were created in Oracle Analytics Cloud:
• Table views and graph views that are inserted or pasted as Microsoft objects using theInsert command can be edited in Excel, PowerPoint, or Word.
• Table views that are inserted or pasted as lists, and graphs views that are inserted asimages cannot be edited in Excel.
• Views that are inserted or pasted as images cannot be edited in PowerPoint.
Chapter 23Working with Oracle Analytics Cloud Analyses, Views, and Dashboards
23-29

Editing Pivot Tables Inserted into PowerPointConsider the following items when editing pivot table views that were created in OracleAnalytics Cloud.
Small Pivot Tables
For small pivot tables in PowerPoint, to change column width and row height, use themouse to drag column and row borders to the desired height and width.
Large Pivot Tables
To adjust column width and row height in large pivot tables, especially where rows andcolumns are outside of the slide area, use PowerPoint's table editing tools in asfollows:
1. Select the pivot table.
2. Select the Layout ribbon in PowerPoint.
3. Select a row or column in the pivot table.
4. Adjust height and width by changing the height and width values in the Cell Sizegroup.
Other GuidelinesNote the following guidelines when editing views that were created in Oracle AnalyticsCloud:
• Oracle Smart View for Office does not support duplication of charts or tablesthrough the PowerPoint "Duplicate Slide" command.
In PowerPoint, after duplicating a slide containing a chart, any attempt to updatethe prompts of either chart result in the prompts for only the original chart beingupdated. The chart on the duplicate slide is never updated.
For a pivot table inserted into a PowerPoint slide then duplicated, if you changethe prompt for either pivot table, only the pivot table original slide is updated,whether you changed the prompt in the original slide or the duplicate.
• Some modifications made to graphs using Microsoft Office formatting tools—suchas changes to colors—may not persist when prompts are changed and the graphis refreshed. Smart View does not keep track of such formatting changes; this isdone by Microsoft Office. When a graph series is removed, the format of the seriesis removed by Office as well. Changing prompts can cause the series count andorder to change, which means the formatting will also change. This is expectedbehavior.
Working with Views Using the View DesignerUsing the View Designer in Oracle Smart View for Office, you can create ad hoc viewsbased on an Oracle Analytics Cloud subject area.
Views created in Smart View can be saved to the Oracle BI Presentation CatalogOracle Business Intelligence and edited in either Smart View or Oracle AnalyticsCloud.
Chapter 23Working with Views Using the View Designer
23-30

View Designer is available in Microsoft Excel, Word, and PowerPoint.
Launching the View DesignerDepending on whether you are creating a view or editing a view, you can launch the ViewDesigner using the methods described in this topic.
To launch the View Designer:
1. Perform an action:
• To create a new view:
– Right-click the Catalog Root node in the catalog tree, and then select CreateNew View.
– Select the Catalog Root node in the catalog tree, and then select Create NewView at the bottom of the Smart View Panel.
– From the Oracle BI EE ribbon ribbon, click the View Designer icon.
Figure 23-18 View Designer Icon
You must already be connected to a view in the catalog tree to enable the OracleAnalytics Cloud ribbon.
• To edit a view (the view must have been created and inserted from View Designer):
– From the catalog tree, select a view to edit that was created in View Designerand saved to the Oracle BI Presentation Catalog from Oracle Smart View forOffice, and then select the Load view in View Designer link at the bottom of theSmart View Panel.
– Select an existing view on a worksheet in the current or in a saved Officedocument and click the View Designer icon (see Figure 1).
– To edit an Excel Pivot Table, click anywhere in the current or in a savedworksheet, even outside the boundaries of the Excel Pivot Table, and click theView Designer icon (see Figure 1).
Note:
You can only edit views that were created and inserted from the ViewDesigner in Smart View. To edit views created in Oracle Analytics Cloud,you must use Oracle Analytics Cloud.
The Design Layout tab of the View Designer is displayed. Figure 2 shows the DesignLayout tab of the View Designer with selections made in the Page, Section, Row,Column, and Measures edges.
Chapter 23Working with Views Using the View Designer
23-31
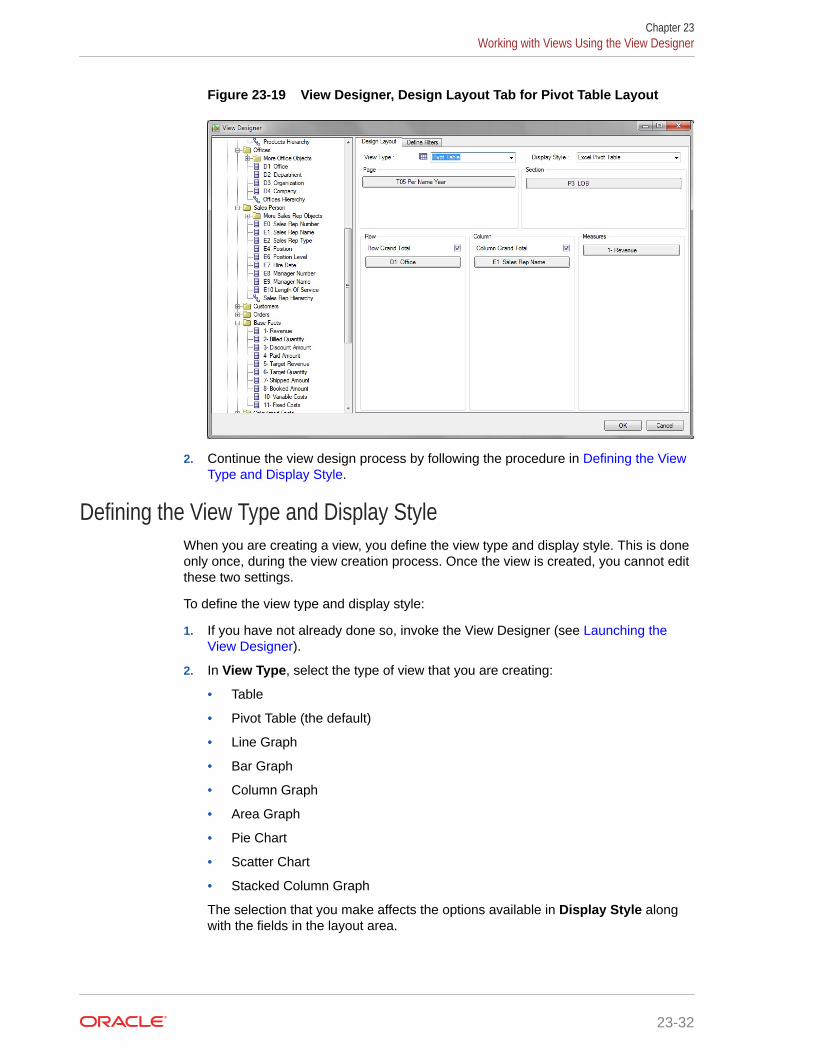
Figure 23-19 View Designer, Design Layout Tab for Pivot Table Layout
2. Continue the view design process by following the procedure in Defining the ViewType and Display Style.
Defining the View Type and Display StyleWhen you are creating a view, you define the view type and display style. This is doneonly once, during the view creation process. Once the view is created, you cannot editthese two settings.
To define the view type and display style:
1. If you have not already done so, invoke the View Designer (see Launching theView Designer).
2. In View Type, select the type of view that you are creating:
• Table
• Pivot Table (the default)
• Line Graph
• Bar Graph
• Column Graph
• Area Graph
• Pie Chart
• Scatter Chart
• Stacked Column Graph
The selection that you make affects the options available in Display Style alongwith the fields in the layout area.
Chapter 23Working with Views Using the View Designer
23-32

Note:
You cannot change this selection when editing the view either in Oracle SmartView for Office or Oracle Analytics Cloud.
3. In Display Style, select a View Type and Display Style option from Table 1.
Display style determines how the view is inserted into Excel.
Note:
You cannot change this selection when editing the view either in Smart View orOracle Analytics Cloud.
Table 23-1 View Type Selected and the Display Style Available
View Type Selected Display Style Available
Table Excel Table
Table
Pivot Table (default) Excel Pivot Table (default)
Pivot Table
Line Chart
Bar Chart
Column Chart
Area Chart
Pie Chart
Scatter Chart
Stacked ColumnChart
Excel Chart
Chart Image
4. Continue the view design process by following the procedure in Defining the ViewLayout .
Defining the View LayoutDefine the view layout during the view creation process. You can also edit the view layout ofviews created in View Designer.
To define or edit the view layout:
1. If you have not already done so, invoke the View Designer (see Launching the ViewDesigner).
2. If you are creating a new view, complete the steps in Defining the View Type and DisplayStyle.
If you are editing a view, continue with step 3.
3. In the left pane of the View Designer, expand a subject area and the folders to view thecolumns that you want to work with.
Chapter 23Working with Views Using the View Designer
23-33
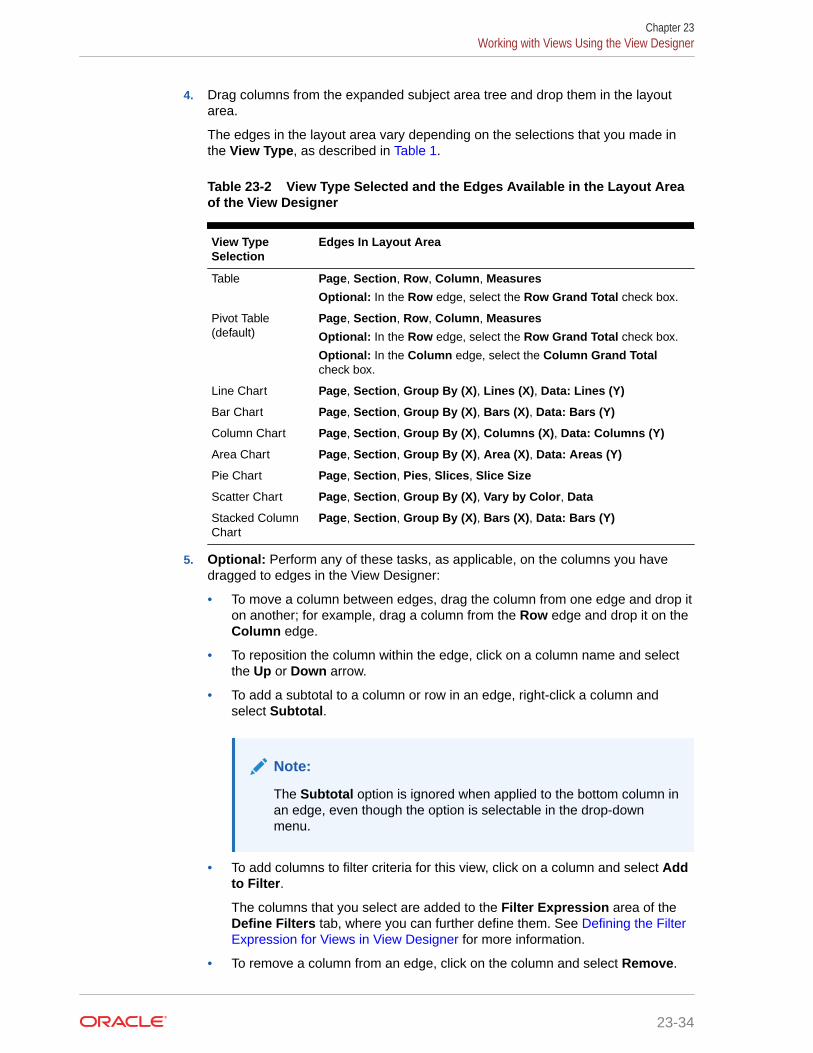
4. Drag columns from the expanded subject area tree and drop them in the layoutarea.
The edges in the layout area vary depending on the selections that you made inthe View Type, as described in Table 1.
Table 23-2 View Type Selected and the Edges Available in the Layout Areaof the View Designer
View TypeSelection
Edges In Layout Area
Table Page, Section, Row, Column, Measures
Optional: In the Row edge, select the Row Grand Total check box.
Pivot Table(default)
Page, Section, Row, Column, Measures
Optional: In the Row edge, select the Row Grand Total check box.
Optional: In the Column edge, select the Column Grand Totalcheck box.
Line Chart Page, Section, Group By (X), Lines (X), Data: Lines (Y)
Bar Chart Page, Section, Group By (X), Bars (X), Data: Bars (Y)
Column Chart Page, Section, Group By (X), Columns (X), Data: Columns (Y)
Area Chart Page, Section, Group By (X), Area (X), Data: Areas (Y)
Pie Chart Page, Section, Pies, Slices, Slice Size
Scatter Chart Page, Section, Group By (X), Vary by Color, Data
Stacked ColumnChart
Page, Section, Group By (X), Bars (X), Data: Bars (Y)
5. Optional: Perform any of these tasks, as applicable, on the columns you havedragged to edges in the View Designer:
• To move a column between edges, drag the column from one edge and drop iton another; for example, drag a column from the Row edge and drop it on theColumn edge.
• To reposition the column within the edge, click on a column name and selectthe Up or Down arrow.
• To add a subtotal to a column or row in an edge, right-click a column andselect Subtotal.
Note:
The Subtotal option is ignored when applied to the bottom column inan edge, even though the option is selectable in the drop-downmenu.
• To add columns to filter criteria for this view, click on a column and select Addto Filter.
The columns that you select are added to the Filter Expression area of theDefine Filters tab, where you can further define them. See Defining the FilterExpression for Views in View Designer for more information.
• To remove a column from an edge, click on the column and select Remove.
Chapter 23Working with Views Using the View Designer
23-34

6. Optional: If you are working with a table or pivot table view, regardless of the displaystyle:
• Pivot Table view: In the Row and Column edges, select or clear the Row GrandTotal and Column Grand Total check boxes as you require.
• Table view: In the Row edge, select or clear the Row Grand Total check box.
7. Optional: If you are working with a pivot table view that has the pivot table display style,you can perform these actions with the Measure Label element:
• Reorder the Measure Label element within the Column edge.
• Move the Measure Label to any other edge except the Measure edge.
Notes about the Measure Label element:
• The Measure Label element represents the labels for all the Measures columns in theMeasures edge. In the View Designer, the Measure Label element appears by defaultin the Column edge.
• Measure Label is only available when both the View Type and Display Type is PivotTable.
• Experiment with moving the Measure Label element to another edge or reordering itwithin the Column edge. The result may be a more readable pivot table layout.
• Measure Label cannot be removed from the View Designer.
• Measure Label cannot be placed in the Measures edge.
8. To define filters, click the Filters tab and continue with Defining the Filter Expression forViews in View Designer.
If you do not plan to define filters, click OK:
• If you are creating a new view, the view is inserted into Excel.
• If you are editing a view, the old view is removed and the updated view is inserted.
Defining the Filter Expression for Views in View DesignerColumns that you added for filtering in Defining the View Layout are automatically added tothe Filter Expression area of the Define Filters tab in View Designer.
Whether you are creating a new view or editing an existing view, you can add more filtercolumns, and further define and refine filters on all columns.
To define or edit the filter expression for a view created in View Designer:
1. Complete the steps in Defining the View Layout, selecting the Define Filters tab.
The columns that you added for filtering should be displayed on the Define Filters tab.
2. Optional: Add more columns to the Filter Expression area of the Define Filters tab.
3. Select a column in Filter Expression.
4. Select a corresponding filter operator from the drop-down list next to the column name.
The operator list from which you can choose is populated based on the type of columnthat you selected.
Guidelines for choosing an operator are described in Filter Operators.
Chapter 23Working with Views Using the View Designer
23-35

5. Specify a filter value in the last column by clicking and making aselection in the Value Selector.
For example, here is a set of filters based on the Sample Sales database:
The filters that you define are summarized in the Filter Summary pane. Forexample, for the filters defined in this step, the summary looks like this:
In some cases, the data to choose from can be exceedingly long. Toaccommodate loading large amounts of data in the Value Selector, Oracle SmartView for Office presents values in groups. Scroll and make selections from the firstgroup shown, then click More to view and make selections from the next group.Continue clicking More until you have viewed and made selections from the entiredata list. Figure 1 shows an example.
Figure 23-20 Value Selector Showing "More" for Large Amounts of Data
6. Optional: If required, click the logical operator button in Filter Expression andmake a selection to change the operator:
Chapter 23Working with Views Using the View Designer
23-36

• AND
• OR
The default logical operator is AND.
Changing the logical operator on one line of the filter expression automatically changesthe operator for all lines in the expression so that the operator is the same for all lines.
7. Optional: To remove a line from the filter expression, right-click the column button in theline, and then select Remove, as shown in Figure 2.
Figure 23-21 Remove Option that is Displayed When Right-clicking a Column in aFilter Expression
8. When you are finished defining filters, click OK to insert the view into Excel.
Filter OperatorsUse the guidelines in Table 1 when choosing an operator and specifying the required values.The operator list from which you can choose is populated based on the function that you areperforming (for example, creating a filter or creating a dashboard prompt) and the type ofcolumn that you selected.
Table 23-3 Guidelines for Choosing an Operator When Creating a Column Filter
Operator Usage Guidelines
is equal to / is in Valid for a column that contains text, numbers, ordates. Specify a single value or multiple values.Results include only records where the data in thecolumn matches the value in the filter.
is not equal to / is not in Valid for a column that contains text, numbers, ordates. Specify a single value or multiple values.Results include only records where the data in thecolumn does not match the value in the filter.
is less than Valid for a column that contains numbers or dates.Specify a single value. Results include onlyrecords where the data in the column is less thanthe value in the filter.
is greater than Valid for a column that contains numbers or dates.Specify a single value. Results include onlyrecords where the data in the column is greaterthan the value in the filter.
is less than or equal to Valid for a column that contains numbers or dates.Specify a single value or multiple values. Resultsinclude only records where the data in the columnis less than or the same as the value in the filter.
Chapter 23Working with Views Using the View Designer
23-37

Table 23-3 (Cont.) Guidelines for Choosing an Operator When Creating a ColumnFilter
Operator Usage Guidelines
is greater than or equal to Valid for a column that contains numbers or dates.Specify a single value or multiple values. Resultsinclude only records where the data in the columnis greater than or the same as the value in thefilter.
is between Valid for a column that contains numbers or dates.Specify two values. Result include only recordswhere the data in the column is between the twovalues in the filter.
is null Valid for a column that contains text, numbers, ordates. Do not specify a value. The operator testsonly for the absence of data in the column. Resultsinclude only records where there is no data in thecolumn.
Sometimes it might be useful to know whether anydata is present, and using the is null operator is away to test for that condition. For example,suppose your business has a worldwide addressbook and you want to extract the United Statesaddresses only. You could do this by checking forthe presence or absence of data in the "State"field. This field should be unpopulated (null) fornon-United States addresses and populated (notnull) for United States addresses. You can obtain alist of United States addresses without the need tocheck the column for a specific value.
is not null Valid for a column that contains text, numbers, ordates. Do not specify a value. The operator testsonly for the presence of data in the column.Results include only records where there is data inthe column.
is ranked first Valid for a column that contains text or dates.Specify a single value. Results include only thefirst n records, where n is a whole numberspecified as the value in the filter.
This operator is for ranked results. For example,you could use this operator to obtain a list thatcontains the first 10 brand names in alphabeticalorder.
ranked last Valid for a column that contains text or dates.Specify a single value. Results include only thelast n records, where n is a whole numberspecified as the value in the filter.
This operator is for ranked results. For example,you could use this operator to obtain a list of thedates of the last 10 sales transactions.
Chapter 23Working with Views Using the View Designer
23-38

Table 23-3 (Cont.) Guidelines for Choosing an Operator When Creating a ColumnFilter
Operator Usage Guidelines
is in top Valid for a column that contains numbers. Specifya single value. Results include only the first nrecords, where n is a whole number specified asthe value in the filter.
This operator is for ranked results. For example,you could use this operator to obtain a list of thetop 10 sales in dollars.
is in bottom Valid for a column that contains numbers. Specifya single value. Results include only the last nrecords, where n is a whole number specified asthe value in the filter.
This operator is for ranked results. For example,you could use this operator to obtain a list of thecustomers reporting the fewest problems.
contains all Valid for a column that contains text, numbers, ordates. Specify a single value or multiple values.Results include only records where the data in thecolumn contains all of the values in the filter.
does not contain Valid for a column that contains text, numbers, ordates. Specify a single value or multiple values.Results include only records where the data in thecolumn does not contain any of the values in thefilter.
contains any Valid for a column that contains text, numbers, ordates. Specify a single value or multiple values.Results include only records where the data in thecolumn contains at least one of the values in thefilter.
begins with Valid for a column that contains text, numbers, ordates. Specify a single value. Results include onlyrecords where the data in the column begins withthe value in the filter.
ends with Valid for a column that contains text, numbers, ordates. Specify a single value. Results include onlyrecords where the data in the column ends withthe value in the filter.
is LIKE (pattern match) Valid for a column that contains text. Specify asingle value or multiple values. Requires the useof a percent sign character (%) as a wildcardcharacter. You may specify up to two percent signcharacters in the value. Results include onlyrecords where the data in the column matches thepattern value in the filter.
is not LIKE (pattern match) Valid for a column that contains text. Specify asingle value or multiple values. Requires the useof a percent sign character (%) as a wildcardcharacter. You may specify up to two percent signcharacters in the value. Results include onlyrecords where the data in the column does notmatch the pattern value in the filter.
Chapter 23Working with Views Using the View Designer
23-39

Publishing ViewsThe ad hoc view definition that you create in View Designer can be published to theOracle BI Presentation Catalog in Oracle Analytics Cloud after you have inserted it inOracle Smart View for Office. When you publish an ad hoc view, a new analysis inOracle Analytics Cloud is created with the default views of compound view and titleview, along with the applicable user-created view.
When publishing a view that you were editing, you have the option of overwriting theview in the Oracle BI Presentation Catalog, or specifying a new name for the view andpublishing the edited version, keeping two versions of the view in Oracle AnalyticsCloud.
To publish a view to the Oracle BI Presentation Catalog:
1. Position the cursor within the view that you just created or edited in View Designer.
2. In the Oracle Analytics Cloud ribbon, click the Publish View icon (PublishingViews).
Figure 23-22 Publish View Icon
3. In Save Report, click next to Catalog Root, and then navigate to the locationin the Oracle BI Presentation Catalog where you will save the view.
4. In Analysis Name, provide a name.
If you are publishing an edited view, you have the option of overwriting the viewyou edited by providing the same name, or providing a new name and keeping theoriginal version of the view intact.
5. Click Save.
The default naming convention is applied to the components of the view that issaved; for example, Table 1, Pivot Table 1, Chart 1, and so on.
Example 23-1 Notes
• If you are publishing a view that was created and then edited in Smart View, youmay overwrite it.
• An error message is displayed if you attempt to overwrite an existing view in theOracle BI Presentation Catalog if the view was created in Oracle Analytics Cloud.
• To view the changes made in Oracle Analytics Cloud, you must re-insert the view.
• Once published, you may make changes to the view as follows:
– If the view was created in Oracle Analytics Cloud, then use Oracle AnalyticsCloud.
– If the view was created in Smart View, you may edit it either in Smart View orOracle Analytics Cloud.
Chapter 23Working with Views Using the View Designer
23-40
• You may refresh the data in views created in View Designer.
Ad hoc views created in View Designer remain as a snapshot and will not be kept in syncwith the analysis published to the catalog.
• Changes made to the view in Oracle Analytics Cloud will not be reflected into the ad hocview that you rendered in Excel. You must reinsert the view from the catalog tree into anew sheet in Smart View in order to view the changes that were made in Oracle AnalyticsCloud.
Editing Views Created in View DesignerRelated Topics
• About Editing Views Created in View Designer
• Guidelines for Editing Views Created in View Designer
• Accessing the View to Edit
• Determining Where a View was Created
• Editing Views Created in View Designer
About Editing Views Created in View DesignerUse the View Designer in Oracle Smart View for Office to edit the views you created or editedin View Designer.
Do not use the View Designer in Smart View in these cases:
• To edit the views you created in Oracle Analytics Cloud
• To edit views you created in Smart View and then edited in Oracle Analytics Cloud
The process flow for editing views involves the following tasks:
• Reviewing the information in Guidelines for Editing Views Created in View Designer
• Accessing the View to Edit
• Determining Where a View was Created
• Editing Views Created in View Designer
Guidelines for Editing Views Created in View Designer• Only views created and inserted from the View Designer in Oracle Smart View for Office
can be edited using the View Designer.
• Views created in Smart View may also be edited in Oracle Analytics Cloud. However,views created in Smart View and then further edited in Oracle Analytics Cloud cannotafterward be edited in View Designer.
Note:
To edit views created in Oracle Analytics Cloud, use the Oracle Analytics Cloudapplication (see Editing an Analysis in Oracle Analytics Cloud).
Chapter 23Working with Views Using the View Designer
23-41

• When you use View Designer to edit a table view or pivot table view, Smart Viewperforms a replace operation, effectively replacing the view on the sheet with thenewly-edited view; that is, the table on the sheet is deleted and a new table isinserted. If the new table has more rows or columns than the previous table, anycontent or formulas that you may have added to the sheet prior to editing the viewin View Designer may be removed and you will need to add them again.
Accessing the View to Edit
Note:
This procedure applies to views that were created in View Designer.
To access views to edit:
1. Access a view in one of following ways:
• During the design session—For example, after you created the view in ViewDesigner and clicked OK to insert the view, select the view in the Officedocument and click the View Designer icon to relaunch the View Designer forediting.
• From a view in a saved Office document—Select the view in the Officedocument and click the View Designer icon to relaunch the View Designer forediting.
• From a published view in the Presentation Catalog—Use the Load view inView Designer command to load the view from the catalog tree into the ViewDesigner in Oracle Smart View for Office. When you select a view, the Loadview in View Designer command is available in the Action Panel or from theright-click menu.
Remember, to select a view to edit from the catalog tree, do not try to insert itfirst into the Office document. Be sure to use the Load view in View Designercommand when you want to edit.
2. Continue with the processes described in Determining Where a View was Createdto determine if you should edit the view in View Designer.
Note:
Do not use View Designer in Smart View to edit views that were created inOracle Analytics Cloud. Views may not load in cases where the ViewDesigner does not support the formatting and design features that were usedto create the view in Oracle Analytics Cloud. For this reason, use the ViewDesigner to edit only those views that were created and inserted using theView Designer in Smart View.
Determining Where a View was CreatedYou need to know if a view was created in the View Designer in Oracle Smart View forOffice if you want to edit it in Smart View.
Chapter 23Working with Views Using the View Designer
23-42

If you are unsure whether a view on a sheet was created in Smart View or Oracle AnalyticsCloud, you can verify the origin of the view in the Document Contents pane.
To determine the origin of a view:
1. Open the Office document containing the view.
2. Locate the view in the Document Contents pane, then right-click the view name, and thenselect Properties.
3. Check that the value in the View Source field is AdHocDesigner.
The possible values are:
• AdHocDesigner—View originates from the View Designer in Smart View
• Catalog—View originates from the Oracle BI Presentation Catalog in OracleAnalytics Cloud
• CopyFromAnswers—View was copied from Oracle Analytics Cloud and pasted intothe Smart View Office document
The views marked AdHocDesigner are the only views that should be edited in ViewDesigner.
Note that, in some cases, views created in Oracle Analytics Cloud may be loaded in tothe View Designer in Smart View. Keep in mind that when you attempt to work in ViewDesigner with views from Oracle Analytics Cloud, you are doing so at your own risk;editing these views in View Designer is not supported. Oracle only supports using theView Designer to edit those views that were created and edited using the View Designerin Smart View.
4. If the View Source property is AdHocDesigner, the view can be edited in ViewDesigner.
If the View Source is Catalog or CopyFromAnswers, edit the view in Oracle AnalyticsCloud.
Editing Views Created in View DesignerRelated Topics
• About Editing Views Created in View Designer
• Guidelines for Editing Views Created in View Designer
• Accessing the View to Edit
• Determining Where a View was Created
• Editing Views that were Created in View Designer
Refreshing Data in a View Created in View DesignerYou may refresh views created in View Designer in the same way you refresh views that wereinserted into an Office application from the catalog tree.
See Specifying Preferences for Refreshing Views and Refreshing Views for information.
Chapter 23Working with Views Using the View Designer
23-43

24Smart View and Oracle Analytics Cloud -Essbase
Related Topics
• About Smart View and Oracle Analytics Cloud - EssbaseOracle Analytics Cloud - Essbase is a subscription-based business analytics solution thatis built for and deployed on Oracle Cloud.
• Running the Smart View InstallerBefore running the Oracle Smart View for Office installer, review the Smart Viewprerequisites.
• Creating Data Source Connections to Oracle Analytics Cloud - EssbaseAfter installing Oracle Smart View for Office, you can create connections to OracleAnalytics Cloud - Essbase.
• Tracking User Activity with Audit TrailAn audit trail tracks user activity on an Oracle Analytics Cloud - Essbase cube.
About Smart View and Oracle Analytics Cloud - EssbaseOracle Analytics Cloud - Essbase is a subscription-based business analytics solution that isbuilt for and deployed on Oracle Cloud.
Using Oracle Smart View for Office, you can interact with Oracle Analytics Cloud - Essbasedata in Microsoft Office to analyze, model, collaborate, and report.
Use the topics in this section to install and connect to Oracle Analytics Cloud - Essbase:
• Running the Smart View Installer
• Creating Data Source Connections to Oracle Analytics Cloud - Essbase
Then you are ready to begin working with data in Oracle Analytics Cloud - Essbase.Information on using Smart View with Oracle Analytics Cloud - Essbase is containedthroughout this guide:
• Dimensions and Members
• Data and Data Cells
• Ad Hoc Analysis
• Enabling Attribute Association Processing in Ad Hoc Grids
• General Operations
• Smart Query
• Smart Slices
• The Query Designer and MDX Queries
• Smart View Options
• Functions
24-1

• Free-Form Mode
• Smart View Diagnostics and Health Check
Information on using Audit Trail is in this chapter. See Tracking User Activity with AuditTrail.
Running the Smart View InstallerBefore running the Oracle Smart View for Office installer, review the Smart Viewprerequisites.
Smart View Prerequisites
• The latest release of Smart View
On the Oracle Technology Network, Downloads tab, the latest release for SmartView is always certified.
• Microsoft Office
• Microsoft .NET Framework
Specific version requirements are noted in Using Oracle Analytics Cloud - Essbase .See "Smart View Prerequisites" in Download and Run the Smart View Installer formore information.
Installing Smart View
1. Log into Oracle Analytics Cloud - Essbase.
2. On the Applications home page, click Utilities.
3. On the Utilities page, select Smart View for Essbase.
4. On the Smart View download page on Oracle Technology Network, click AcceptLicense Agreement, and then click Download Now.
If the Oracle sign-in page is displayed, then sign in with your Oracle user name(usually your email address) and password.
5. Follow the steps for your browser to download the .zip file, and save it to a folderon your computer.
6. Go to the folder that you used in the previous step, and then double clicksmartview.exe to start the installation wizard.
7. Select a destination folder for Smart View, and then click OK.
For new installations, Smart View is installed by default in: C:\Oracle\smartview.If you are upgrading an installation of Smart View, then the installer defaults to thefolder where you previously installed Smart View.
8. When the installation is complete, click OK.
Continue the setup process with Creating Data Source Connections to OracleAnalytics Cloud - Essbase.
Chapter 24Running the Smart View Installer
24-2
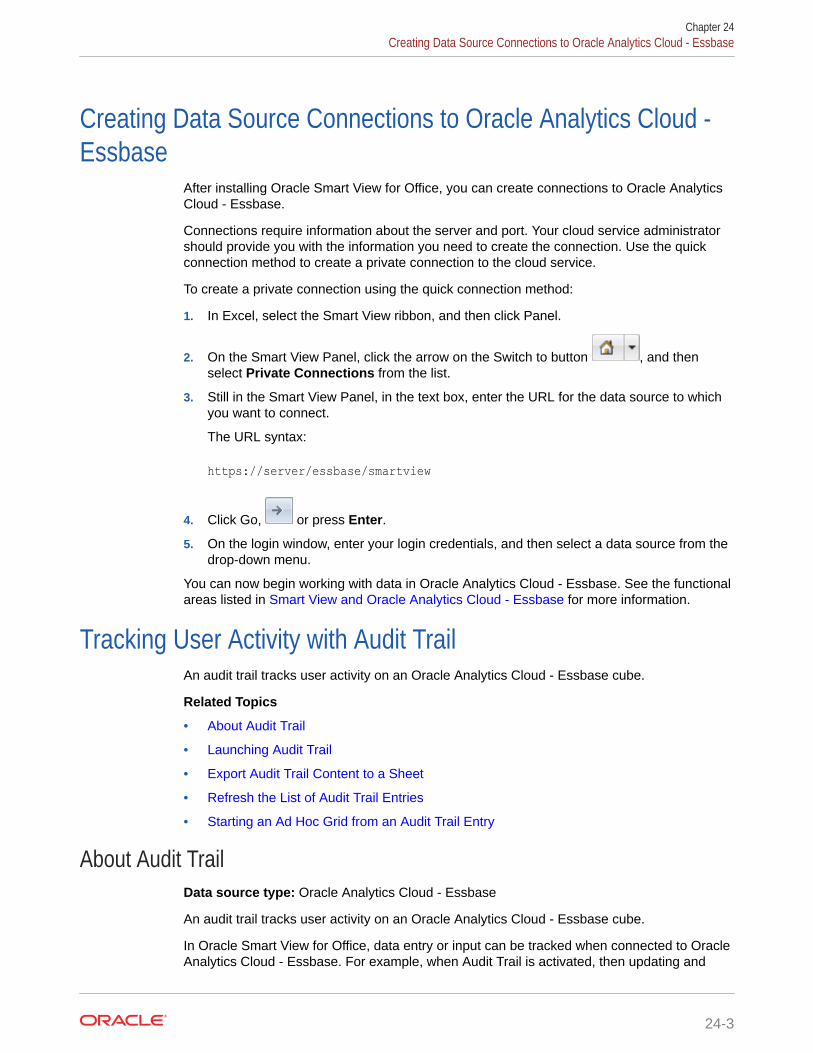
Creating Data Source Connections to Oracle Analytics Cloud -Essbase
After installing Oracle Smart View for Office, you can create connections to Oracle AnalyticsCloud - Essbase.
Connections require information about the server and port. Your cloud service administratorshould provide you with the information you need to create the connection. Use the quickconnection method to create a private connection to the cloud service.
To create a private connection using the quick connection method:
1. In Excel, select the Smart View ribbon, and then click Panel.
2. On the Smart View Panel, click the arrow on the Switch to button , and thenselect Private Connections from the list.
3. Still in the Smart View Panel, in the text box, enter the URL for the data source to whichyou want to connect.
The URL syntax:
https://server/essbase/smartview
4. Click Go, or press Enter.
5. On the login window, enter your login credentials, and then select a data source from thedrop-down menu.
You can now begin working with data in Oracle Analytics Cloud - Essbase. See the functionalareas listed in Smart View and Oracle Analytics Cloud - Essbase for more information.
Tracking User Activity with Audit TrailAn audit trail tracks user activity on an Oracle Analytics Cloud - Essbase cube.
Related Topics
• About Audit Trail
• Launching Audit Trail
• Export Audit Trail Content to a Sheet
• Refresh the List of Audit Trail Entries
• Starting an Ad Hoc Grid from an Audit Trail Entry
About Audit TrailData source type: Oracle Analytics Cloud - Essbase
An audit trail tracks user activity on an Oracle Analytics Cloud - Essbase cube.
In Oracle Smart View for Office, data entry or input can be tracked when connected to OracleAnalytics Cloud - Essbase. For example, when Audit Trail is activated, then updating and
Chapter 24Creating Data Source Connections to Oracle Analytics Cloud - Essbase
24-3

submitting data in all writable cells in an ad hoc grid would be tracked and displayedas a list items of in the audit trail.
Smart View logs audit trail activity in a pane within the Smart View Panel. Afterconnecting to a cube, you access the Audit Trail pane by selecting Audit Trail from theAction Panel.
Figure 24-1 Audit Trail Selected from the Action Panel Context Menu
The Audit Trail pane is displayed within the Smart View Panel. For example:
Chapter 24Tracking User Activity with Audit Trail
24-4

Figure 24-2 Example Audit Trail Pane
For each user activity tracked, the following information is stored:
• User ID
• Date/Time
• Type of Operation
• Comments/Linked Reporting Objects (LRO)
• New Value
• Old Value
• POV Members
Only Date/Time, New Value, LRO, and POV are displayed in the Audit Trail pane. Selectingan log entry within Audit Trail provides additional information at the bottom of the pane. Andyou can export the details of the entry to view all available information for that entry.
Chapter 24Tracking User Activity with Audit Trail
24-5

You can also refresh the list of log entries in the Audit Trail pane, and launch aselected entry on a separate sheet to view the POV for that entry.
Launching Audit TrailYou launch the Audit Trail pane from the Action Panel in the Smart View Panel.
To launch the Audit Trail pane:
1. Sign on to your Oracle Analytics Cloud - Essbase data source using a privateconnection, and connect to the cube.
See Connecting to Data Sources for more information.
2. In the Action Panel, select More, and then select Audit Trail from the popupmenu.
The Action Panel is located at the bottom of the Smart View Panel, and containsaction items specific to the data source and cube to which you are connected.
When you select More, a popup menu is displayed where you can select AuditTrail.
The Audit Trail pane is displayed in the bottom portion of the Smart View Panel
Chapter 24Tracking User Activity with Audit Trail
24-6

Now you can work with the items in the Audit Trail pane using these three buttons at thebottom of the pane:
3. Perform an action:
• Export the contents of the audit trail onto a separate sheet
See Export Audit Trail Content to a Sheet.
• Refresh the list of items in the Audit Trail pane
See Refresh the List of Audit Trail Entries
• Launch an ad hoc sheet based on an item in the audit trail list
See Starting an Ad Hoc Grid from an Audit Trail Entry
Chapter 24Tracking User Activity with Audit Trail
24-7

Export Audit Trail Content to a SheetYou can export the items in an audit trail, including the detail for each entry, to anExcel sheet which you can save and analyze.
To export audit trail content to a worksheet:
1. Launch the Audit Trail pane for a particular Oracle Analytics Cloud - Essbasecube, as described in Launching Audit Trail.
2. At the bottom of the Audit Trail pane, click Export to Sheet, .
All entries, along with the additional detail that is not displayed in the Audit Trail,are exported to a new worksheet. Details include:
• User ID
• Date/Time
• Type of Operation
• Transaction ID
• Scenario
• Comments/Linked Reporting Objects (LRO)
• New Value
• Old Value
• POV Members
The entries on the sheet can be sorted and filtered. Some columns may need tobe widened in order to view the headings and entries.
Following in an example of the content of an audit trail when it is first exported to asheet:
Some columns may need to be widened in order to view the headings and entries.
3. You can save the worksheet, or just close it.
Refresh the List of Audit Trail EntriesAfter launching Audit Trail, you may have performed several actions that were loggedin the audit trail. To view the latest entries, you must refresh the Audit Trail pane.
To refresh the Audit Trail pane:
1. Launch the Audit Trail pane for a particular Oracle Analytics Cloud - Essbasecube, as described in Launching Audit Trail.
Chapter 24Tracking User Activity with Audit Trail
24-8

2. After performing various actions on the sheet, click Refresh, .
3. View the recent entries that have been added to the Audit Trail pane.
Starting an Ad Hoc Grid from an Audit Trail EntryYou an start an ad hoc grid by selecting an entry from the list in the Audit Trail pane. The adhoc grid will be structured according to the POV of the selected audit trail entry.
To start an ad hoc grid from an entry in the audit trail list:
1. Launch the Audit Trail pane for a particular Oracle Analytics Cloud - Essbase cube, asdescribed in Launching Audit Trail.
2. Select an entry in the Audit Trail pane and, at the bottom of the pane, click Ad Hoc on
Selected POV, .
An ad hoc grid based on the POV of the selected entry is launched onto the activeworksheet.
For example, suppose we selected this entry, where the new value is 200, and the POVis Feb, Sales, 100-10, New York, and Actual, as noted under the entry list:
Clicking the would result in the following ad hoc grid:
3. Work with the grid as you would any other ad hoc grid.
4. Repeat these steps for any other audit trail entries, as you require.
Chapter 24Tracking User Activity with Audit Trail
24-9
25Smart View Options
Related Topics
• Setting Smart View OptionsSet Oracle Smart View for Office options in the Options dialog.
• Global Options and Sheet Level OptionsOracle Smart View for Office provides two types of options: global options and sheetoptions.
• Member OptionsMember Options control the display of member cells.
• Data OptionsData Options control the display of data cells.
• Advanced OptionsAdvanced Options are settings for administrative and other advanced tasks.
• Formatting OptionsFormatting options control the textual display of members and data.
• Cell StylesCell Styles control the display of certain types of member and data cells.
• ExtensionsExtensions lists the extensions that are currently installed on your computer.
Setting Smart View OptionsSet Oracle Smart View for Office options in the Options dialog.
Click the Options button on the Smart View ribbon to open the Options dialog.
Figure 25-1 Options Button on the Smart View Ribbon
Video
Your Goal Watch This Video
Learn about navigating in Smart View, includingSmart View options. Navigating Smart View
25-1

Global Options and Sheet Level OptionsOracle Smart View for Office provides two types of options: global options and sheetoptions.
• Global Options
• Sheet Options
Global OptionsGlobal options are options that apply to the entire current workbook, including anynew worksheets added to the current workbook, and to workbooks that are createdlater.
Changes to global option settings also affect existing worksheets and workbooks, andother Office documents.
The following are global options:
• Advanced Options
• Extensions
• Cell Styles
Note:
Use the OK button when saving global options. Changes to global optionsbecome the default settings for all existing and new worksheets andworkbooks so it is not necessary to use Save as Default Options or Applyto All Worksheets with global options. Save as Default Options and Applyto All Worksheets are used with the sheet level option settings only.
Sheet OptionsSheet level options are options that are specific to the worksheet for which they areset. Sheet options are applicable only in Excel. You do not set sheet options in Wordor PowerPoint.
Three options are available for saving sheet level options:
• OK—The sheet level option changes apply only to the current sheet in the currentworkbook. The changes do not apply to existing sheets or to new sheets in thecurrent workbook. They do not affect any existing workbooks or new workbooks.
In PowerPoint or Word, OK only applies to selections made on the Advanced tab(which are global options, not sheet options).
• Save as Default Options—The sheet level options changes are also the defaultoption settings for new worksheets in the current workbook and for any newworkbooks, and any other new Office documents. Changes to sheet level optionsettings do not affect existing worksheets or workbooks.
Chapter 25Global Options and Sheet Level Options
25-2

For example, in Excel, assume you made changes to member options and selected Saveas Default Options. You must access each existing worksheet individually, and makethose same changes, if you want the changes to be propagated to existing worksheets inthe workbook. This allows for different sheet level options on different worksheets.However, the changes are automatically propagated to any new worksheets you createwithin the current workbook and to any new workbooks.
Note:
The Save as Default Options option is not available in PowerPoint or Word.
• Apply to All Worksheets—The sheet level options changes apply to all existingworksheets with Oracle Smart View for Office content within the current workbook. Theydo not apply to any new worksheets within the current workbook, to other existingworkbooks, or to new workbooks.
For example, assume you made changes to member options and selected Apply To AllSheets. The changes are propagated to all existing worksheets with Smart View contentwithin the current workbook. This allows for quick updating of sheet level options in thecurrent workbook. However, these changes are not propagated to any new worksheets inthe current workbook, to existing workbooks, or to new workbooks.
Note:
The Apply to All Worksheets option is not available in PowerPoint or Word.
Save as Default Options and Apply to All Worksheets are accessed in Excel by clickingthe arrow in the OK button in the Options dialog box (see Figure 1).
Figure 25-2 Save as Default Options, Accessed from the OK Button
The following are sheet level options:
• Member Options
• Data Options
• Formatting Options
Member OptionsMember Options control the display of member cells.
Member options are sheet level options, which are specific to the worksheet for which theyare set.
Chapter 25Member Options
25-3
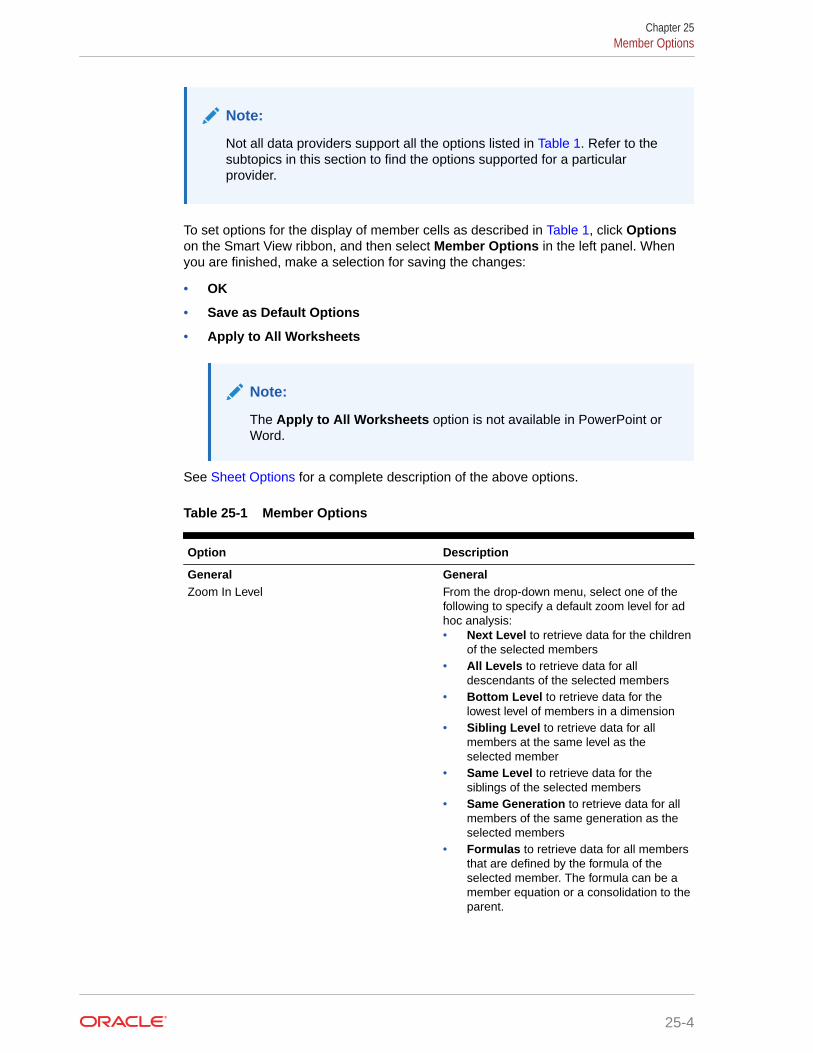
Note:
Not all data providers support all the options listed in Table 1. Refer to thesubtopics in this section to find the options supported for a particularprovider.
To set options for the display of member cells as described in Table 1, click Optionson the Smart View ribbon, and then select Member Options in the left panel. Whenyou are finished, make a selection for saving the changes:
• OK
• Save as Default Options
• Apply to All Worksheets
Note:
The Apply to All Worksheets option is not available in PowerPoint orWord.
See Sheet Options for a complete description of the above options.
Table 25-1 Member Options
Option Description
General GeneralZoom In Level From the drop-down menu, select one of the
following to specify a default zoom level for adhoc analysis:• Next Level to retrieve data for the children
of the selected members• All Levels to retrieve data for all
descendants of the selected members• Bottom Level to retrieve data for the
lowest level of members in a dimension• Sibling Level to retrieve data for all
members at the same level as theselected member
• Same Level to retrieve data for thesiblings of the selected members
• Same Generation to retrieve data for allmembers of the same generation as theselected members
• Formulas to retrieve data for all membersthat are defined by the formula of theselected member. The formula can be amember equation or a consolidation to theparent.
Chapter 25Member Options
25-4
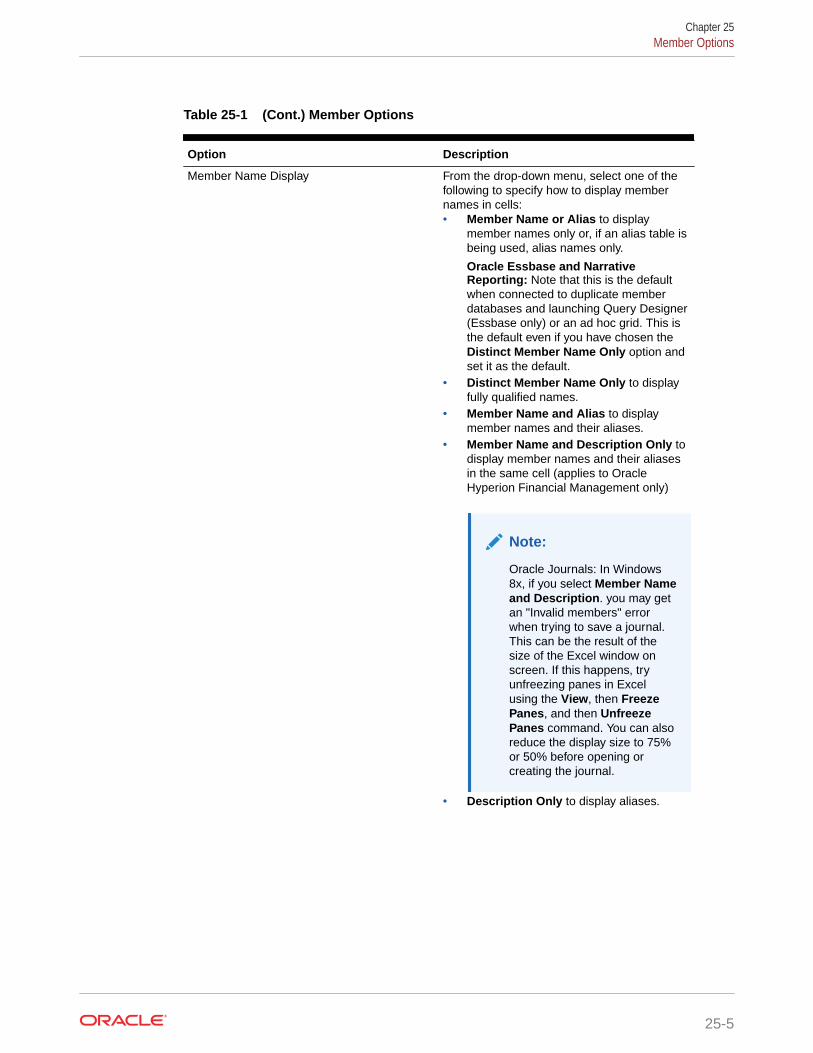
Table 25-1 (Cont.) Member Options
Option Description
Member Name Display From the drop-down menu, select one of thefollowing to specify how to display membernames in cells:• Member Name or Alias to display
member names only or, if an alias table isbeing used, alias names only.
Oracle Essbase and NarrativeReporting: Note that this is the defaultwhen connected to duplicate memberdatabases and launching Query Designer(Essbase only) or an ad hoc grid. This isthe default even if you have chosen theDistinct Member Name Only option andset it as the default.
• Distinct Member Name Only to displayfully qualified names.
• Member Name and Alias to displaymember names and their aliases.
• Member Name and Description Only todisplay member names and their aliasesin the same cell (applies to OracleHyperion Financial Management only)
Note:
Oracle Journals: In Windows8x, if you select Member Nameand Description. you may getan "Invalid members" errorwhen trying to save a journal.This can be the result of thesize of the Excel window onscreen. If this happens, tryunfreezing panes in Excelusing the View, then FreezePanes, and then UnfreezePanes command. You can alsoreduce the display size to 75%or 50% before opening orcreating the journal.
• Description Only to display aliases.
Chapter 25Member Options
25-5

Table 25-1 (Cont.) Member Options
Option Description
Indentation From the drop-down menu, select one of thefollowing to specify how hierarchy levels are tobe indented:• None• Subitems to indent descendants.
Ancestors are left-justified in the column.
For EPM Cloud 21.02+ Standard modeapplications only: If you select theSubitems option, then you should alsoselect the Use Excel Indentation (AdHoc Standard Mode) option describedbelow.
• Totals to indent ancestors. Descendantsare left-justified in the column.
Ancestor Position From the drop-down menu, select one of thefollowing to specify ancestor position inhierarchies:• Top to display hierarchies in order from
highest to lowest level• Bottom to display hierarchies in order
from lowest to highest level
Note:
Essbase (on-premises) doesnot support theAncestorPosition options.
Use Excel Indentation (Ad Hoc StandardMode)
For EPM Cloud 21.02+ Standard modeapplications only: Preserve native Excelformatting used for indentation in ad hoc grids.This option works in conjunction with theIndentation option. When Indentation is setto Subitems, the blank spaces used forindentation may create issues for some users.By enabling Use Excel Indentation, theindentation for subtotals and totals is handledcorrectly.
Member Retention Member RetentionInclude Selection Display the selected member and the
members retrieved as a result of the operation.
Within Selected Group Perform ad hoc operations only on theselected group of cells, leaving unselectedcells as is. This setting is meaningful onlywhen there are two or more dimensions downthe grid as rows or across the grid as columns.For Zoom, Keep Only, and Remove Only.
Chapter 25Member Options
25-6
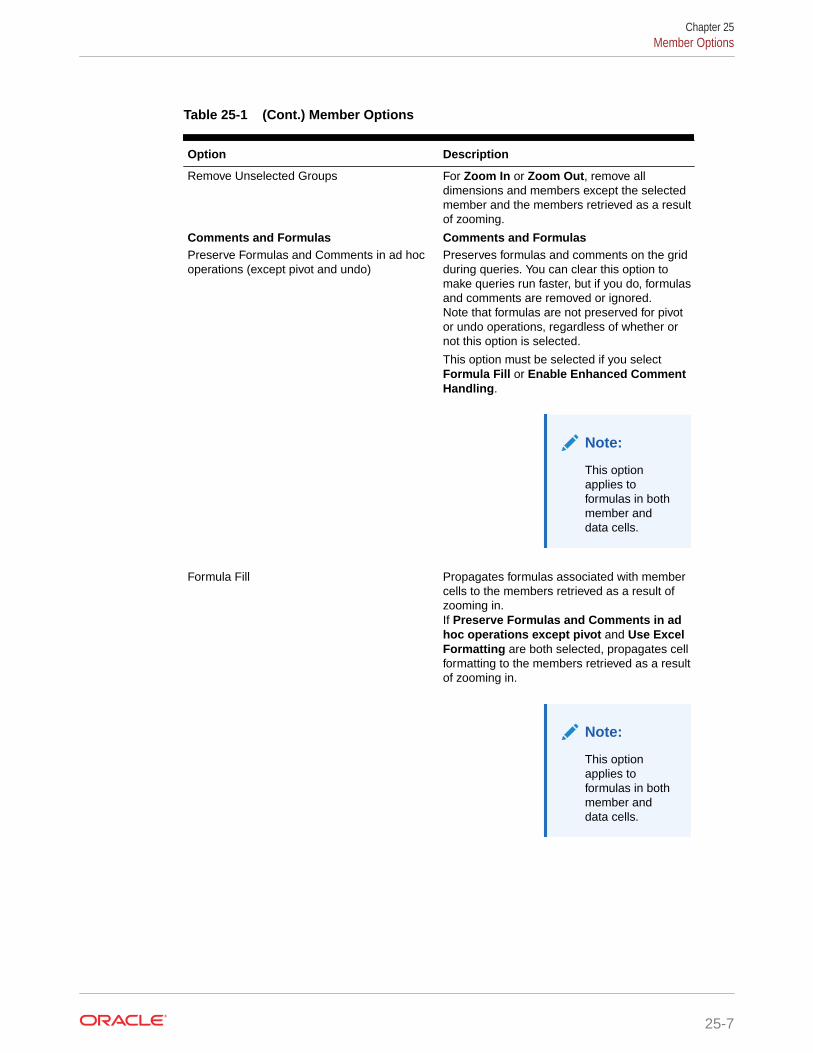
Table 25-1 (Cont.) Member Options
Option Description
Remove Unselected Groups For Zoom In or Zoom Out, remove alldimensions and members except the selectedmember and the members retrieved as a resultof zooming.
Comments and Formulas Comments and FormulasPreserve Formulas and Comments in ad hocoperations (except pivot and undo)
Preserves formulas and comments on the gridduring queries. You can clear this option tomake queries run faster, but if you do, formulasand comments are removed or ignored.Note that formulas are not preserved for pivotor undo operations, regardless of whether ornot this option is selected.
This option must be selected if you selectFormula Fill or Enable Enhanced CommentHandling.
Note:
This optionapplies toformulas in bothmember anddata cells.
Formula Fill Propagates formulas associated with membercells to the members retrieved as a result ofzooming in.If Preserve Formulas and Comments in adhoc operations except pivot and Use ExcelFormatting are both selected, propagates cellformatting to the members retrieved as a resultof zooming in.
Note:
This optionapplies toformulas in bothmember anddata cells.
Chapter 25Member Options
25-7

Table 25-1 (Cont.) Member Options
Option Description
Preserve Comments and Unknown Members Essbase only: Your spreadsheet may containmembers that do not match databasemembers. Selecting this option allows you torefresh an ad hoc grid with no warningmessage about comments or unknownmembers.To display messages about comments andunknown members, ensure that this option iscleared.
Note that when this option is cleared, both theEnable Enhanced Comment Handling optionin this dialog and the View Comments optionin the Essbase ribbon will not be available forthis ad hoc sheet.
Enable Enhanced Comment Handling Enables you to review and correct commentsand member names in ad hoc grids thatcontain comments.
Preserve Formula in POV Change Preserves formulas in cells when you refreshor make changes to the POV. Otherwise, anyformulas in the grid are lost.
The sections that follow list the Member Options supported by provider.
Member Options Supported for Planning Forms and Ad Hoc
Table 25-2 Member Options Supported for Planning Forms and Ad Hoc
Option Forms Ad Hoc
Zoom In Level: Next Level No Yes
Zoom In Level: All Levels No Yes
Zoom In Level: Bottom Level No Yes
Zoom In Level: Sibling Level No No
Zoom In Level: Same Level No No
Zoom In Level: Same Generation No No
Zoom In Level: Formulas No No
Member Name Display: MemberName Only
Yes Yes
Member Name Display: DistinctMember Name
No EPM Cloud: YesOracle Hyperion Planning: No
Member Name Display: MemberName and Alias
No No
Member Name Display: DescriptionOnly
No No
Indentation: None No Column members: YesRow members: No
Indentation: Subitems No Yes
Indentation: Totals No Yes
Chapter 25Member Options
25-8

Table 25-2 (Cont.) Member Options Supported for Planning Forms and Ad Hoc
Option Forms Ad Hoc
Ancestor Position: Top No Yes
Ancestor Position: Bottom No Yes
Use Excel Indentation (Ad HocStandard Mode)
No Yes
Include Selection No Yes
Within Selected Group No Yes
Remove Unselected Groups No No
Preserve Formulas and Comments inad hoc operations (except pivot andundo)
No Yes
Formula Fill No No
Preserve Essbase Comments andUnknown Members
No No
Enable Enhanced CommentHandling
No Yes
Preserve Formula in POV Change Yes No
Member Options Supported for Financial Management Forms and Ad Hoc
Table 25-3 Member Options Supported for Financial Management Forms and Ad Hoc
Option Forms Ad Hoc
Zoom In Level: Next Level No Yes
Zoom In Level: All Levels No Yes
Zoom In Level: Bottom Level No Yes
Zoom In Level: Sibling Level No No
Zoom In Level: Same Level No No
Zoom In Level: Same Generation No No
Zoom In Level: Formulas No No
Member Name Display: MemberName Only
Yes Yes
Member Name Display: DistinctMember Name
No No
Member Name Display: MemberName and Alias
Yes Yes
Member Name Display: MemberName and Description
Yes Yes
Member Name Display: DescriptionOnly
Yes Yes
Indentation: None No Yes
Indentation: Subitems No Yes
Indentation: Totals No Yes
Ancestor Position: Top No Yes
Ancestor Position: Bottom No Yes
Chapter 25Member Options
25-9
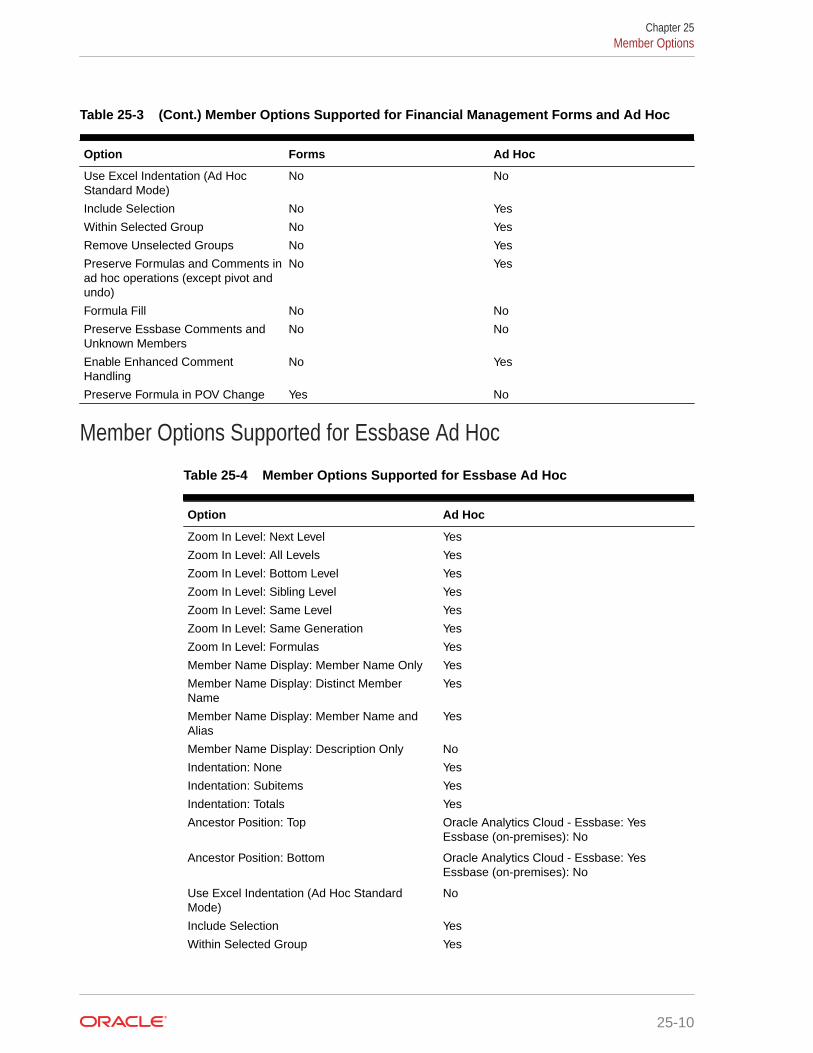
Table 25-3 (Cont.) Member Options Supported for Financial Management Forms and Ad Hoc
Option Forms Ad Hoc
Use Excel Indentation (Ad HocStandard Mode)
No No
Include Selection No Yes
Within Selected Group No Yes
Remove Unselected Groups No Yes
Preserve Formulas and Comments inad hoc operations (except pivot andundo)
No Yes
Formula Fill No No
Preserve Essbase Comments andUnknown Members
No No
Enable Enhanced CommentHandling
No Yes
Preserve Formula in POV Change Yes No
Member Options Supported for Essbase Ad Hoc
Table 25-4 Member Options Supported for Essbase Ad Hoc
Option Ad Hoc
Zoom In Level: Next Level Yes
Zoom In Level: All Levels Yes
Zoom In Level: Bottom Level Yes
Zoom In Level: Sibling Level Yes
Zoom In Level: Same Level Yes
Zoom In Level: Same Generation Yes
Zoom In Level: Formulas Yes
Member Name Display: Member Name Only Yes
Member Name Display: Distinct MemberName
Yes
Member Name Display: Member Name andAlias
Yes
Member Name Display: Description Only No
Indentation: None Yes
Indentation: Subitems Yes
Indentation: Totals Yes
Ancestor Position: Top Oracle Analytics Cloud - Essbase: YesEssbase (on-premises): No
Ancestor Position: Bottom Oracle Analytics Cloud - Essbase: YesEssbase (on-premises): No
Use Excel Indentation (Ad Hoc StandardMode)
No
Include Selection Yes
Within Selected Group Yes
Chapter 25Member Options
25-10

Table 25-4 (Cont.) Member Options Supported for Essbase Ad Hoc
Option Ad Hoc
Remove Unselected Groups Yes
Note:
This option isenabled onlywhen thePreserveFormulasComments inad hocoperations(except pivot)and Formula Filloptions arecleared.
Preserve Formulas and Comments in ad hocoperations (except pivot and undo)
Yes
Formula Fill Yes
Preserve Essbase Comments and UnknownMembers
Yes
Enable Enhanced Comment Handling Yes
Preserve Formula in POV Change No
Member Options Supported for Narrative Reporting Ad Hoc
Table 25-5 Member Options Supported for Narrative Reporting Ad Hoc
Option Ad Hoc
Zoom In Level: Next Level Yes
Zoom In Level: All Levels Yes
Zoom In Level: Bottom Level Yes
Zoom In Level: Sibling Level No
Zoom In Level: Same Level No
Zoom In Level: Same Generation No
Zoom In Level: Formulas No
Member Name Display: Member Name Only Yes
Member Name Display: Distinct Member Name Yes
Member Name Display: Member Name and Alias No
Member Name Display: Description Only No
Indentation: None Yes
Indentation: Subitems Yes
Indentation: Totals Yes
Ancestor Position: Top No
Chapter 25Member Options
25-11

Table 25-5 (Cont.) Member Options Supported for Narrative Reporting Ad Hoc
Option Ad Hoc
Ancestor Position: Bottom No
Use Excel Indentation (Ad Hoc Standard Mode) No
Include Selection Yes
Within Selected Group No
Remove Unselected Groups No
Preserve Formulas and Comments in ad hocoperations (except pivot and undo)
YesSupported only for Refresh operations. Notsupported for other ad hoc operations, such asZoom In or Keep Only.
Formula Fill No
Preserve Essbase Comments and UnknownMembers
No
Enable Enhanced Comment Handling No
Preserve Formula in POV Change No
Data OptionsData Options control the display of data cells.
Data options are sheet level options, which are specific to the worksheet for whichthey are set.
Note:
Not all data providers support all the options listed in Table 1. Refer to theSubtopics listed earlier to find the options supported for a particular provider.
To set options for the display of data cells as described in Table 1, click Options onthe Smart View ribbon, and then select Data Options in the left panel. When you arefinished, make a selection for saving the changes:
• OK
• Save as Default Options
• Apply to All Worksheets
Note:
The Apply to All Worksheets option is not available in PowerPoint orWord.
See Sheet Options for a complete description of the above options.
See also:
Chapter 25Data Options
25-12

• Data Options Supported for EPM Cloud and Oracle Hyperion Planning (On-Premises)Forms and Ad Hoc
• Data Options Supported for Financial Management Forms and Ad Hoc
• Data Options Supported for Essbase Ad Hoc
• Data Options Supported for Narrative Reporting Ad Hoc
Table 25-6 Data Options
Option Description
Suppress Rows To streamline the grid, you can suppress rows that contain types of data thatyou do not need to view.Notes:• In suppressed rows, cell references to Excel formulas are not updated.• Planning: See Data Options Supported for EPM Cloud and Oracle
Hyperion Planning (On-Premises) Forms and Ad Hoc for information onusing the No Data/Missing and Zero row suppression options.
No Data/Missing Suppress rows that contain only cells for which no data exists in the database(no data is not the same as zero. Zero is a data value.)
If you later clear No Data/Missing, suppressed values are returned only fromthat point on. You must zoom out and then zoom in on a member to retrievevalues that were suppressed while this option was selected.
In multiple-grid sheets, submitting data values '0 and &nd does not workproperly when the No Data/Missing is set to '0 or &nd.
Zero Suppress rows that contain only zeroes.
No Access Suppress rows that contain data that you do not have the security access toview.
Note:
This option is only supported by OracleHyperion Financial Management (on-premises)only.
Invalid Suppress rows that contain only invalid values.
UnderscoreCharacters
Suppress rows that contain underscore characters in member names (notavailable in Smart Slice operations).
Repeated Members Suppress rows that contain repeated member names, regardless of gridorientation.
Suppress Columns To streamline the grid, you can suppress columns that contain types of datathat you do not need to view.Notes:• In suppressed columns, cell references to Excel formulas are not
updated.• The Suppress Columns options are not available when connected to an
Oracle Essbase data source.• The Suppress Columns options are not supported when performing ad
hoc with Financial Management data sources.• Planning: See Data Options Supported for EPM Cloud and Oracle
Hyperion Planning (On-Premises) Forms and Ad Hoc for information onusing the No Data/Missing and Zero column suppression options.
Chapter 25Data Options
25-13

Table 25-6 (Cont.) Data Options
Option Description
No Data/Missing Suppress columns that contain cells for which no data exists in the database(no data is not the same as zero. Zero is a data value.)If you later clear No Data/Missing, suppressed values are returned only fromthat point on. You must zoom out and then zoom in on a member to retrievevalues that were suppressed while this option was selected.
Zero Suppress columns that contain only zeroes.
No Access Suppress columns that contain data that you do not have the security accessto view.
Replacement Replacement#NoData/MissingLabel
#NoAccess Label
#Invalid/Meaningless
Data cells may contain missing or invalid data, or data that you do not havepermission to view. In such cells, by default, Oracle Smart View for Officedisplays #Missing, #Invalid, or #No Access, respectively, but you canchange these labels. To do so, in any of these fields, enter one of thefollowing:
• Text of your choice (or leave the default). Text labels have the advantageof being descriptive, but they cause Excel functions to fail.
• #NumericZero to specify numeric zero (0) replacement labels. With#NumericZero, you can use functions, but you cannot submit zeroes tothe database (even if the zeroes are actual zeroes and not replacementlabels) unless you select the Submit Zero option below. Calculations thatare dependent on a cell with a numeric zero label compute correctly andtake the value of the cell as zero.
Note: When you enter #NumericZero, ensure that the Submit Zerooption is selected to ensure that the parent data is deleted whenspreading data for time periods.
The #Missing replacement label allows you to clear data values from cellintersections. For example, to clear the sales data for New York, manually type#Missing in the cell where Sales and New York intersect, and click Submit.This clears the data value from the database. Subsequent queries on thatdatabase will show #Missing at the intersection of Sales and New York.
Submit Zero If you chose #NumericZero for the #Missing label above, select this option ifyou want to be able to submit zeroes to the database.
Display Invalid Data Display actual data even if it is invalid, rather than #Invalid/Meaningless orother replacement text. If no data exists, the cell is left blank.
Enable EssbaseFormat String
If the administrator has created specific formatting for the display of numericaldata, view data in this formatting.
Use Expense Type Essbase only:Inverts the signage (positive to negative or negative to positive) for data incolumns related to revenue, liability, and owner's equity accounts. Supportedfor aggregate storage databases only.
To use this option, ensure that your Essbase administrator has set up yourapplication to display expense type signage.
Enable AttributeAssociationProcessing
Oracle Analytics Cloud - Essbase and Essbase only:Select to display #Invalid or #NumericZero for cells that are empty onlybecause they are not associated with the context attribute or varying attribute.
By default, the Enable Attribute Association Processing option is cleared, andthe empty cells display as #Missing.
See also, Enabling Attribute Association Processing in Ad Hoc Grids.
Mode Mode
Chapter 25Data Options
25-14

Table 25-6 (Cont.) Data Options
Option Description
Cell Display Financial Management only: As an alternative to displaying actual data, youcan display the calculation or process status of the cells:• Data to show actual data• Calculation Status to show whether data needs to be calculated,
translated, or consolidated• Process Management to show the process management level for a
combination of data called process units.
Navigate Without Data Speeds up operations such as Pivot, Zoom, Keep Only, and Remove Only bypreventing the calculation of source data while you are navigating. When youare ready to retrieve data, clear Navigate Without Data.
Suppress MissingBlocks
Suppress blocks of cells for which no data exists in the database.
The sections that follow list the Data Options supported by provider.
Data Options Supported for EPM Cloud and Oracle Hyperion Planning(On-Premises) Forms and Ad Hoc
Note:
In this topic, Oracle Enterprise Performance Management Cloud refers to Planning,Financial Consolidation and Close.
Table 25-7 Data Options Supported for EPM Cloud and Oracle Hyperion Planning(On-Premises Forms and Ad Hoc
Option Forms Ad Hoc
Suppress Rows - No Data /Missing
Yes Yes
Suppress Rows - Zero Yes Yes
Suppress Rows - No Access Yes Yes
Invalid No No
Underscore Characters No No
Repeated Members No Yes
Suppress Columns - No Data /Missing
Yes Yes
Suppress Columns - Zero Yes Yes
Suppress Columns - No Access Yes Yes
#NoData/Missing Label -#Missing
Yes Yes
#NoData/Missing Label -#NumericZero
Yes Yes
#NoAccess Label - #No Access Yes Yes
Chapter 25Data Options
25-15

Table 25-7 (Cont.) Data Options Supported for EPM Cloud and Oracle HyperionPlanning (On-Premises Forms and Ad Hoc
Option Forms Ad Hoc
#NoAccess Label -#NumericZero
Yes Yes
#Invalid/Meaningless -#Invalid No No
#Invalid/Meaningless -#NumericZero
No No
Submit Zero No if #NoData/Missing Label isset to #No Access.Yes if #NoData/Missing Label isset to #NumericZero
No if #NoData/Missing Label isset to #No Access.Yes if #NoData/Missing Label isset to #NumericZero
Display Invalid Data No No
Enable Essbase Format String No No
Use Expense Type No No
Enable Attribute AssociationProcessing
No No
Cell Display No No
Navigate Without Data Yes Yes
Suppress Missing Blocks Yes Yes
Data Options Supported for Financial Management Forms and Ad HocStarting with Oracle Smart View for Office 11.1.2.5.500 and Oracle Hyperion FinancialManagement 11.1.2.4.100, when opening a data form, Smart View honors all row andcolumn suppress options set in the Financial Management web interface, overridingany row and column suppress options that may have already been set in Smart View.
Once a form is launched in Smart View, you may then override the suppress optionsthat were set in the Financial Management interface by selecting or clearing thesuppress options you require in the Data Options tab of the Options dialog box.
Note that once you launch a form in Smart View, if you choose to overwrite the form onthe sheet with an ad hoc grid, the grid will reuse the suppress options that werealready set for the previously-opened form. You may then override the selectedsuppress options as you require.
Table 25-8 Data Options Supported for Financial Management Forms and AdHoc
Option Forms Ad Hoc
Suppress Rows - No Data /Missing
Yes Yes
Suppress Rows - Zero Yes Yes
Suppress Rows - No Access Yes Yes
Invalid Yes Yes
Underscore Characters Yes Yes
Repeated Members No Yes
Chapter 25Data Options
25-16

Table 25-8 (Cont.) Data Options Supported for Financial Management Formsand Ad Hoc
Option Forms Ad Hoc
Suppress Columns - No Data /Missing
Yes No
Suppress Columns - Zero Yes No
Suppress Columns - NoAccess
Yes No
#NoData/Missing Label -#Missing
Yes Yes
#NoData/Missing Label -#NumericZero
Yes Yes
#NoAccess Label - #NoAccess
Yes Yes
#NoAccess Label -#NumericZero
Yes Yes
#Invalid/Meaningless -#Invalid Yes Yes
#Invalid/Meaningless -#NumericZero
Yes Yes
Submit Zero No No
Display Invalid Data Yes Yes
Enable Essbase Format String No No
Use Expense Type No No
Enable Attribute AssociationProcessing
No No
Cell Display - Data Yes Yes
Cell Display - CalculationStatus
Yes Yes
Cell Display - ProcessManagement
Yes Yes
Navigate Without Data Yes Yes
Suppress Missing Blocks No No
Data Options Supported for Essbase Ad Hoc
Table 25-9 Data Options Supported for Essbase Ad Hoc
Option Ad hoc
Suppress Rows - No Data / Missing Yes
Suppress Rows - Zero Yes
Suppress Rows - No Access No
Invalid No
Underscore Characters No
Repeated Members Yes
Suppress Columns - No Data / Missing No
Suppress Columns - Zero No
Suppress Columns - No Access No
Chapter 25Data Options
25-17
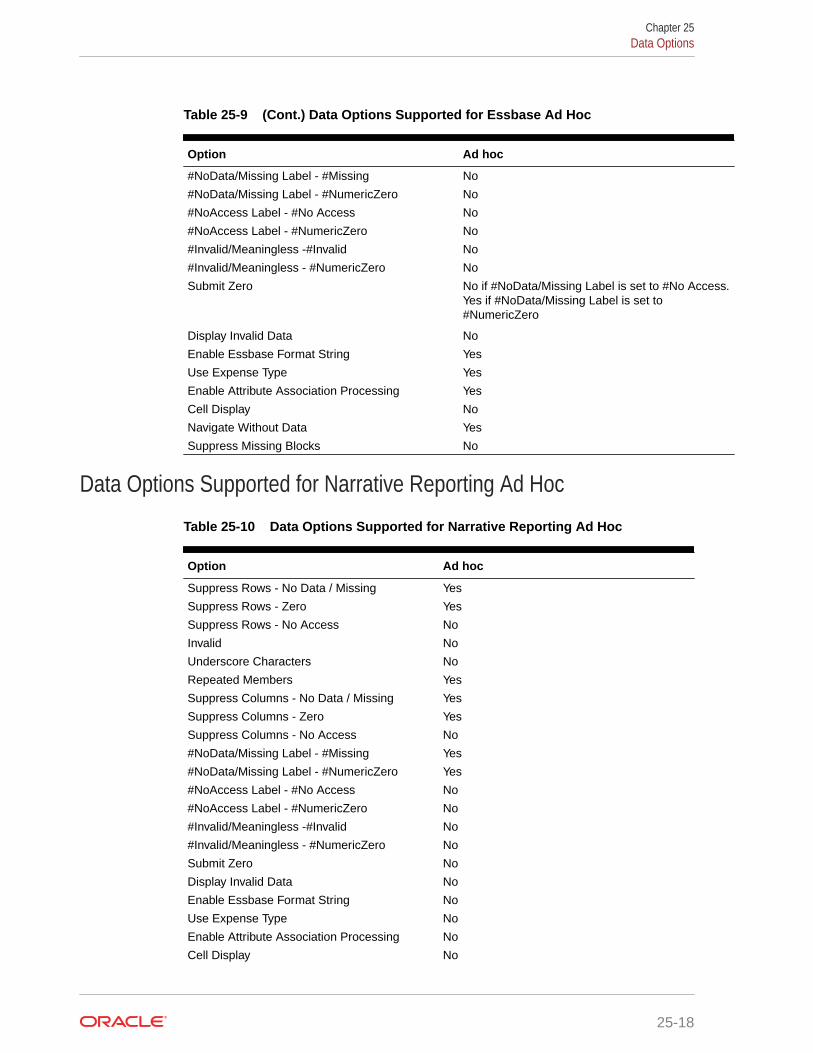
Table 25-9 (Cont.) Data Options Supported for Essbase Ad Hoc
Option Ad hoc
#NoData/Missing Label - #Missing No
#NoData/Missing Label - #NumericZero No
#NoAccess Label - #No Access No
#NoAccess Label - #NumericZero No
#Invalid/Meaningless -#Invalid No
#Invalid/Meaningless - #NumericZero No
Submit Zero No if #NoData/Missing Label is set to #No Access.Yes if #NoData/Missing Label is set to#NumericZero
Display Invalid Data No
Enable Essbase Format String Yes
Use Expense Type Yes
Enable Attribute Association Processing Yes
Cell Display No
Navigate Without Data Yes
Suppress Missing Blocks No
Data Options Supported for Narrative Reporting Ad Hoc
Table 25-10 Data Options Supported for Narrative Reporting Ad Hoc
Option Ad hoc
Suppress Rows - No Data / Missing Yes
Suppress Rows - Zero Yes
Suppress Rows - No Access No
Invalid No
Underscore Characters No
Repeated Members Yes
Suppress Columns - No Data / Missing Yes
Suppress Columns - Zero Yes
Suppress Columns - No Access No
#NoData/Missing Label - #Missing Yes
#NoData/Missing Label - #NumericZero Yes
#NoAccess Label - #No Access No
#NoAccess Label - #NumericZero No
#Invalid/Meaningless -#Invalid No
#Invalid/Meaningless - #NumericZero No
Submit Zero No
Display Invalid Data No
Enable Essbase Format String No
Use Expense Type No
Enable Attribute Association Processing No
Cell Display No
Chapter 25Data Options
25-18

Table 25-10 (Cont.) Data Options Supported for Narrative Reporting Ad Hoc
Option Ad hoc
Navigate Without Data Yes
Suppress Missing Blocks No
Advanced OptionsAdvanced Options are settings for administrative and other advanced tasks.
Advanced options are global options, which apply to the entire current workbook, includingany new worksheets added to the current workbook, and to any workbooks and worksheetsthat are created henceforth. Changes to global option settings become the default for allexisting and new Microsoft Office documents.
It is not necessary to use Apply to All Worksheets or Save as Default Options with theseoptions.
Note:
Not all data providers support all the options listed in the table.
To set options for the administrative and other advanced tasks as described in Table 1, clickOptions on the Smart View ribbon, and then select Advanced in the left panel. When youare finished, click OK.
Table 25-11 Advanced Options
Option Description
General General
Chapter 25Advanced Options
25-19

Table 25-11 (Cont.) Advanced Options
Option Description
Shared Connections URL Specify a default URL for all connections.On-Premises sources: Use the following syntax:
http://servername:19000/workspace/SmartViewProviders
Cloud sources: Use the following syntax:
http(s)://serviceURL/workspace/SmartViewProviders
Note:
For Oracle SmartView for Officeonline help to beavailable, this fieldmust contain a validURL for OracleHyperion EnterprisePerformanceManagementWorkspace or OracleEnterprisePerformanceManagement Cloudservice.
Number of Undo Actions The number of Undo and Redo actions permittedon an operation (0 through 100).See Using Undo and Redo.
Number of Most Recently Used Items The number, 15 or fewer, of your most recentlyused connections to be displayed on Smart ViewHome and the Open menu on the Smart Viewribbon.
Delete All MRU Items Delete all items in your most recently used list,including those that are pinned to the list.
Logging Logging
Chapter 25Advanced Options
25-20

Table 25-11 (Cont.) Advanced Options
Option Description
Log Message Display All error, warnings, and informational messagesfrom the connected data source are displayedwhen they occur, but you can choose which ofthese message levels to record in a log file. Selecta message level to display and record:• Information: All messages, including
warnings and errors — recommended todiagnose problems. May adversely impactperformance.
• Warnings: Warnings and error levelmessages. May adversely impactperformance.
• Errors: Error messages only —recommended for general use. Has minimalimpact on performance.
• None: Suppress all messages.• Extended Info: Information-level messages
plus all server responses and requests.Adversely impacts performance.
Route message to files Save log messages in a file. Click the ellipsisbutton to change the location of the log file.
Clear Log File on Next Launch Clear the log file starting with the next logmessage generation, which will be seen afterExcel is closed.
Tip:
The log file canquickly grow quitelarge in size,particularly if themessage level is setto "Warnings" or"Information". IfRoute message tofiles is selected, andClear Log File onNext Launch iscleared, you shouldperiodically clear thecontents of theSmart View log filemanually. The largefile size canadversely affectperformance.
Show Diagnostics Group on Smart View Ribbon Displays the Diagnostics group options on theSmart View ribbon.See Smart View Diagnostics and Health Check forinformation on using the diagnostics tools.
Chapter 25Advanced Options
25-21

Table 25-11 (Cont.) Advanced Options
Option Description
Display DisplayLanguage Select a language in which to display Smart View.
You must restart the Office application when youchange languages. Default is the languagespecified when Smart View was installed.
Display Smart View Short Cut Menus Only Display only Smart View menu items on shortcutmenus. Otherwise, shortcut menus display bothExcel and Smart View items.
Disable Smart View in Outlook Disable Smart View in Outlook if you do not wantto use Smart View task lists in Outlook.
Enable Ribbon Context Changing Display the active data provider ribbonautomatically after you use a button on the SmartView ribbon.
Display floating toolbar on forms Display the floating toolbar when clicking a datacell in Planning forms.The floating toolbar provides quick access to thesecommands:
• Supporting Details• Cell Comments• Drill-through• AttachmentsThe default is to display the floating toolbar (thecheck box is selected).
To suppress the floating toolbar display, clear thischeck box.
Disable options that are not valid for the activeconnection
Disable options in the Options dialog box that arenot valid for the active connection.
Sort Items in Smart View Panel Sort items in the Smart View Panel by categoryfirst, and then in order within categories. The orderis first numerical, then alphabetical.For example, when this option is selected, theTask List folder is sorted below the Root folder.The items in the Task List folder are sorted inorder first numerically, then alphabetically.
When this option is cleared, items in the SmartView Panel are sorted according to the orderreturned by the provider.
Display Drill-Through Report ToolTips Display by default lists of available drill-throughreports for cells whenever you mouse over them.
Show Progress Information After (seconds) Specify the time, in seconds, after which theSmart View Progress status bar appears whenan operation begins.
Chapter 25Advanced Options
25-22
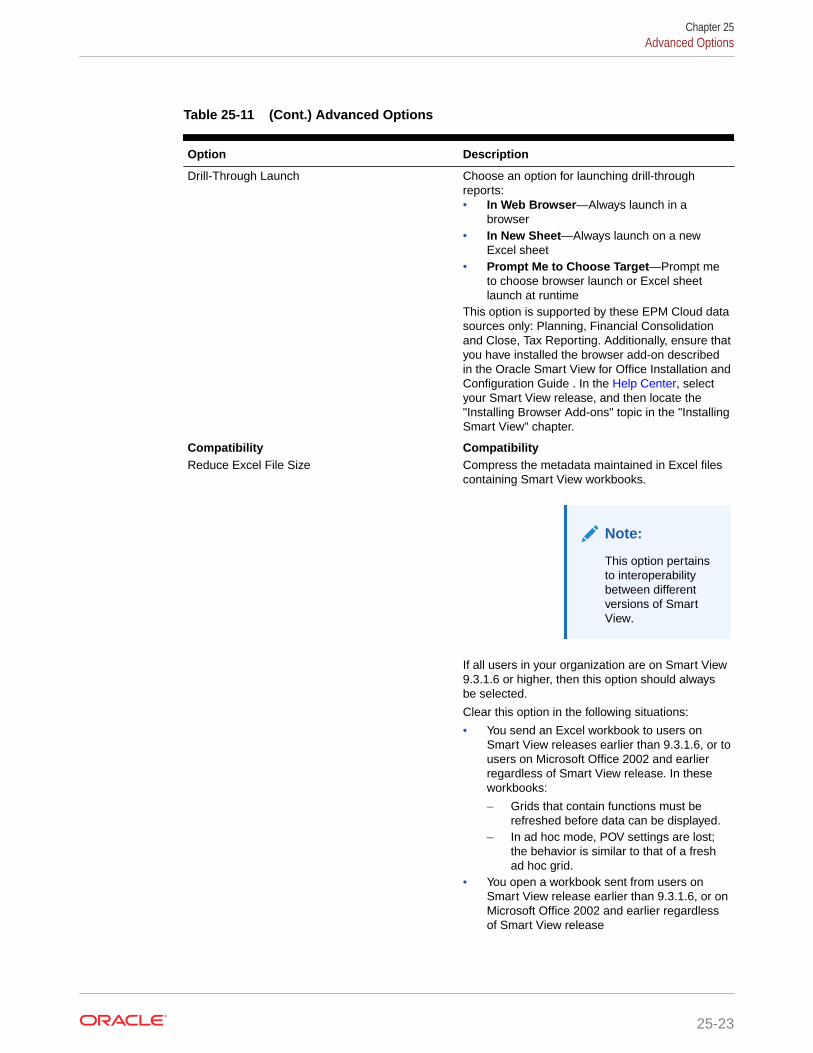
Table 25-11 (Cont.) Advanced Options
Option Description
Drill-Through Launch Choose an option for launching drill-throughreports:• In Web Browser—Always launch in a
browser• In New Sheet—Always launch on a new
Excel sheet• Prompt Me to Choose Target—Prompt me
to choose browser launch or Excel sheetlaunch at runtime
This option is supported by these EPM Cloud datasources only: Planning, Financial Consolidationand Close, Tax Reporting. Additionally, ensure thatyou have installed the browser add-on describedin the Oracle Smart View for Office Installation andConfiguration Guide . In the Help Center, selectyour Smart View release, and then locate the"Installing Browser Add-ons" topic in the "InstallingSmart View" chapter.
Compatibility CompatibilityReduce Excel File Size Compress the metadata maintained in Excel files
containing Smart View workbooks.
Note:
This option pertainsto interoperabilitybetween differentversions of SmartView.
If all users in your organization are on Smart View9.3.1.6 or higher, then this option should alwaysbe selected.
Clear this option in the following situations:
• You send an Excel workbook to users onSmart View releases earlier than 9.3.1.6, or tousers on Microsoft Office 2002 and earlierregardless of Smart View release. In theseworkbooks:
– Grids that contain functions must berefreshed before data can be displayed.
– In ad hoc mode, POV settings are lost;the behavior is similar to that of a freshad hoc grid.
• You open a workbook sent from users onSmart View release earlier than 9.3.1.6, or onMicrosoft Office 2002 and earlier regardlessof Smart View release
Chapter 25Advanced Options
25-23
Table 25-11 (Cont.) Advanced Options
Option Description
Improve Metadata Storage Allow for more efficient storage of internal datastructures.When this option is cleared, Smart View maintainstwo copies of metadata for compatibility purpose,which may result in slower overall performance.
Note:
This option pertainsto interoperabilitybetween differentversions of SmartView.
If all users in your organization are on Smart View9.3.1.6 or higher, then this option should alwaysbe selected.
Clear this option in the following situations:
• You send an Excel workbook to users onSmart View releases earlier than 9.3.1.6, or tousers on Microsoft Office 2002 and earlier,regardless of Smart View release
• You open a workbook sent from users onSmart View releases earlier than 9.3.1.6, orfrom users on Microsoft Office 2002 andearlier, regardless of Smart View release
Refresh Selected Functions and their dependents Execute dependent functions on the same sheetbefore executing the selected functions.
Mode ModeUse Double-click for Operations Double-clicking retrieves the default grid in a blank
worksheet and thereafter zooms in or out on thecell contents. If not selected, double-clickingretains standard Excel functionality and puts a cellinto edit mode.If Oracle Essbase Spreadsheet Add-in and SmartView are installed on the same computer and youhave not completed the steps in Smart View andSpreadsheet Add-in, double-clicking prompts youto log into Spreadsheet Add-in.
Formatting OptionsFormatting options control the textual display of members and data.
Formatting options are sheet level options, which are specific to the worksheet forwhich they are set.
Chapter 25Formatting Options
25-24

Note:
Not all data providers support all the options listed in Table 1. Refer to the Subtopicslisted above to find the options supported for a particular provider.
To set options for cell formatting as described in Table 1, click Options on the Smart Viewribbon, and then select Formatting in the left panel. When you are finished, make a selectionfor saving the changes:
• OK
• Save as Default Options
• Apply to All Worksheets
Note:
The Apply to All Worksheets option is not available in PowerPoint or Word.
See Sheet Options for a complete description of the above options.
Table 25-12 Formatting Options
Option Description
Formatting FormattingUse Thousands Separator Use a comma or other thousands separator in
numerical data. Do not use # or $ as thethousands separator in Excel InternationalOptions.
Use Cell Styles Use formatting that is defined in Cell Styles or bythe data provider. Overrides any user formatting.This option is disabled when Use ExcelFormatting is selected.
See Cell Styles.
Use Excel Formatting Use Excel rather than Oracle Smart View forOffice formatting and retain Excel formatting for adhoc operations.This option is disabled when Use Cell Styles isselected.
Note:
In ad hoc grids for allproviders, Excelformatting is notretained whenperforming an Undo.
See Using Excel Formatting.
Chapter 25Formatting Options
25-25

Table 25-12 (Cont.) Formatting Options
Option Description
Move Formatting on Operations Copy parent cell formatting to zoomed in cells andretain this formatting even if the cell locationchanges after an operation.This option is disabled by default, and it isenabled, but not selected, when Use ExcelFormatting is selected.
Formatting can affect performance, especiallyduring ad hoc operations when Move formattingon operations is enabled. For this reason, theselection of Move Formatting on Operationspersists on a per-sheet, per-session basis. Theselection cannot be saved. If you plan to use Excelformatting, then you must reselect MoveFormatting on Operations every time you open aworkbook, every time you move to a new sheetwithin a workbook, and whenever you return to theoriginal sheet, even if you previously selected it onthat sheet, and even within the same session. Itmust also be reselected every time you open anew or existing workbook.
You may use Save As Default to save the UseExcel Formatting selection, but it will not save theMove Formatting on Operations selection.
The following message is displayed each time youselect Move Formatting on Operations:
Enabling this option may affectperformance and will be resetonce the sheet is changed.See Using Excel Formatting.
Retain Numeric Formatting When you drill down in dimensions, retains theExcel formatting you have set when selecting theExcel Home ribbon, then Format, and thenFormat Cells. For example, if you chose to displaynegative numbers in red, then negative values willbe displayed in red as you drill down on anymember.This option is enabled when Use Cell Styles isselected.
Adjust Column Width and Row Height Adjust column widths and row heights to fit cellcontents automatically.
Chapter 25Formatting Options
25-26

Table 25-12 (Cont.) Formatting Options
Option Description
Scale Applies to ad hoc and forms. Overrides the settingdefined in the form definition.Choose a positive or negative scaling option, andthen click Refresh.
Positive scaling:Divides original values by factors of 10. Forexample:
• 1—All original values are divided by 10:
cell value /10For example, 100/10=10, so 10 will bedisplayed.
• 2—All original values are divided by 100: cellvalue /100For example, 100/100=1, so 1 will bedisplayed after refresh.
• 3—All original values are divided by 1000:
cell value /1000For example, 100/1000=0.1, so 0.1 will bedisplayed after refresh.
The pattern is similar for the remaining positivescaling options.
Note that 0 will be displayed if the Decimal Placesoption is set to Default or 0. However, for a valuesuch as 0.1 to display, the Decimal Places optionmust be set to 1.
Negative Scaling:Multiplies original values by factors of 10. Forexample:
• -1—All original values are multiplied by 10:
cell value *10For example, 100*10=1000, so 1000 will bedisplayed.
• -2—All original values are multiplied by 100:cell value *100For example, 100*100=10000, so 10000 willbe displayed after refresh.
• -3—All original values are multiplied by 1000:
cell value *1000For example, 100*1000=100000, so 100000will be displayed after refresh.
The pattern is similar for the remaining negativescaling options.
Note:
Work with theDecimal Places
Chapter 25Formatting Options
25-27

Table 25-12 (Cont.) Formatting Options
Option Description
option to achieve thedesired displayresult.
Decimal Places Applies to ad hoc and forms. Overrides the settingdefined in the form definition.Specify a decimal scale for the data values.
For example, in Smart View, assume the decimaloption selected is "1". All values will change onedecimal place to the right. If the original value is50.56, then after refresh the value will bedisplayed as 50.6. Similarly, if option selected is"3", then the displayed value will be 50.560.
The decimal settings in the form definition are lostwhen you open the form in Smart View. This isbecause Excel formatting only accepts a singlevalue fixed decimal length/value for precision anddoes not support the minimum, maximum valuedefined in the web application. This is the defaultbehavior of Excel formatting and this is thebehavior in Smart View as well. In Smart View,users must set the Decimal Places option(precision length) to be able to view the decimalvalue in cell.
Note:
Work with the Scaleoption to achieve thedesired displayresult.
Form Form
Chapter 25Formatting Options
25-28

Table 25-12 (Cont.) Formatting Options
Option Description
Repeat Member Labels Facilitates the readability of Oracle HyperionPlanning and Oracle Hyperion FinancialManagement forms by allowing member names toappear on each row of data.In forms where repeated members are mergedinto one cell, member names may be out of thescreen view, necessitating much back and forthscrolling between the member names and the rowdata. Selecting Repeat Member Labels helpsmake forms easier to read and use.
Note:
In forms with rowdimension drop-down memberselectors enabledand in flex forms, theRepeat MemberLabels option isautomaticallyenabled and cannotbe cleared.
The sections that follow list the Formatting Options supported by provider.
Formatting Options Supported for Planning Forms and Ad Hoc
Table 25-13 Formatting Options Supported for Planning Forms and Ad Hoc
Option Forms Ad Hoc
Use Thousands Separator Yes Yes
Use Cell Styles Yes Yes
Use Excel Formatting—Move Formatting onOperations
No Yes
Retain Numeric Formatting Yes Yes
Adjust Column Width and RowHeight
Yes Yes
Scale Yes Yes
Decimal Places Yes Yes
Repeat Member Labels Yes Yes
Chapter 25Formatting Options
25-29

Note:
Planning, Planning Modules, Financial Consolidation and Close, and TaxReporting: If Disable formatting is enabled in the form definition in the webapplication, then the options you select in the Formatting tab in OracleSmart View for Office are not honored in forms.
Formatting Options Supported for Financial Management Forms andAd Hoc
Table 25-14 Formatting Options Supported for Financial Management Formsand Ad Hoc
Option Forms Ad Hoc
Use Thousands Separator Yes Yes
Use Cell Styles Yes Yes
Use Excel Formatting—Move Formatting onOperations
No Yes
Retain Numeric Formatting Yes Yes
Adjust Column Width and RowHeight
Yes Yes
Scale Yes Yes
Decimal Places Yes Yes
Repeat Member Labels Yes Yes
Formatting Options Supported for Essbase Ad Hoc
Table 25-15 Formatting Options Supported for Essbase Ad Hoc
Option Ad Hoc
Use Thousands Separator No
Use Cell Styles Yes
Use Excel Formatting—Move Formatting on Operations
Yes
Retain Numeric Formatting No
Adjust Column Width and Row Height Yes
Scale Yes
Decimal Places No
Repeat Member Labels No
Chapter 25Formatting Options
25-30

Formatting Options Supported for Narrative Reporting Ad Hoc
Table 25-16 Formatting Options Supported for Narrative Reporting Ad Hoc
Option Ad Hoc
Use Thousands Separator No
Use Cell Styles No
Use Excel Formatting—Move Formatting on Operations
Yes
Retain Numeric Formatting Yes
Adjust Column Width and Row Height Yes
Scale Yes
Decimal Places No
Repeat Member Labels No
Cell StylesCell Styles control the display of certain types of member and data cells.
On the Cell Styles page, you can specify formatting to indicate certain types of member anddata cells. Because cells may belong to more than one type (for example, a member cell canbe both parent and child), you can also set the order of precedence for how cell styles areapplied.
Cell style options are global options, which apply to the entire current workbook, includingany new worksheets added to the current workbook, and to any workbooks and worksheetsthat are created henceforth. Changes to global option settings become the default for allexisting and new Microsoft Office documents.
It is not necessary to use Apply to All Worksheets or Save as Default Options with theseoptions.
Note:
Refer to the topics listed below to find the options supported for a particularprovider.
• Cell Style Options Supported for Planning Forms and Ad Hoc
• Cell Style Options Supported for Financial Management Forms and Ad Hoc
• Cell Style Options Supported for Essbase Ad Hoc
Video
Your Goal Watch This Video
Learn about basic Oracle Smart View for Officefunctionality related to Planning, includingspecifying cell styles.
Entering and Saving Plan Data in SmartView with Oracle Planning and Budgeting Cloud
Chapter 25Cell Styles
25-31
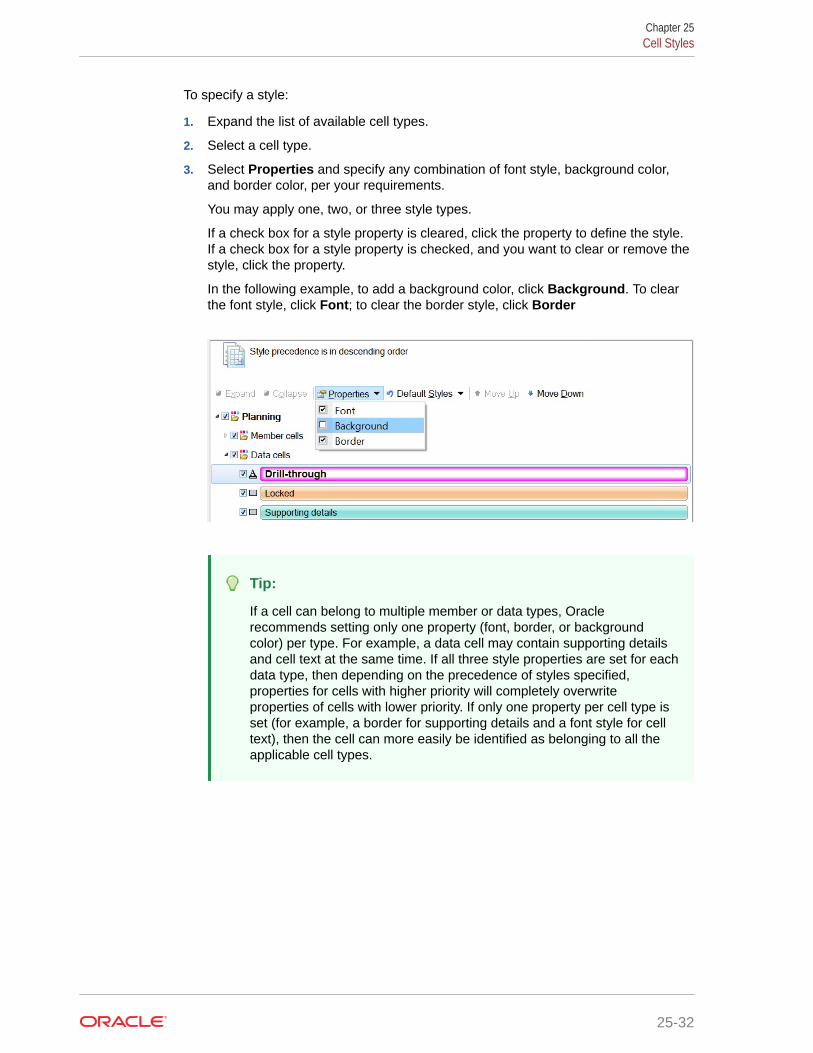
To specify a style:
1. Expand the list of available cell types.
2. Select a cell type.
3. Select Properties and specify any combination of font style, background color,and border color, per your requirements.
You may apply one, two, or three style types.
If a check box for a style property is cleared, click the property to define the style.If a check box for a style property is checked, and you want to clear or remove thestyle, click the property.
In the following example, to add a background color, click Background. To clearthe font style, click Font; to clear the border style, click Border
Tip:
If a cell can belong to multiple member or data types, Oraclerecommends setting only one property (font, border, or backgroundcolor) per type. For example, a data cell may contain supporting detailsand cell text at the same time. If all three style properties are set for eachdata type, then depending on the precedence of styles specified,properties for cells with higher priority will completely overwriteproperties of cells with lower priority. If only one property per cell type isset (for example, a border for supporting details and a font style for celltext), then the cell can more easily be identified as belonging to all theapplicable cell types.
Chapter 25Cell Styles
25-32

Note:
Smart View 20.200+ allows the setting of all three style properties per cell type.For example, you may set a font style, a background color, and a border colorfor Parent members.
Smart View releases earlier than 20.200 allow the setting of only one styleproperty per cell type. For example, you may set a font style or a backgroundcolor or a border color for Parent members, but you cannot set all three stylesfor Parent members.
4. To re-order precedence of cell styles, use the Move Up and Move Down buttons or dragand drop the cell styles.
5. Click OK. The setting takes effect after you refresh or perform a drill operation.
6. Optional: To revert cell styles or precedence to the default styles of the connected SmartView provider, click Default Styles.
7. Optional: To set your selections on this page as default settings, click the arrow in theOK button, and then select Save as Default Options.
The sections that follow list the Formatting Options supported by provider.
Note:
There are no cell styles defined for Narrative Reporting.
Cell Style Options Supported for Planning Forms and Ad Hoc
Table 25-17 Cell Style Options Supported for Planning Forms and Ad Hoc
Option Forms Ad Hoc
Member cells Member cells Member cellsMembers Yes Yes
Formula Yes No
Data cells Data cells Data cellsLocked Yes No
Supporting details Yes Yes
Read-only Yes Yes
Cell Text Yes Yes
Document Attachment Yes Yes
Writable (lowest priority isrecommended)
Yes Yes
Drill-through Yes Yes
Chapter 25Cell Styles
25-33

Cell Style Options Supported for Financial Management Forms and AdHoc
Table 25-18 Cell Style Options Supported for Financial Management Forms andAd Hoc
Option Forms Ad Hoc
Member cells Member cells Member cellsAdd Member Yes No
Linked Form Yes No
Members Yes Yes
Server Calculated No No
Client Calculated No No
Data cells Data cells Data cellsDrill-through Yes Yes
Derived No Yes
Invalid Yes Yes
Locked N/A N/A
Impacted Yes Yes
Read-only Yes Yes
Cell text Yes Yes
Writable (lowest priority isrecommended)
Yes Yes
Server Calculated No No
Client Calculated No No
Supports Allocation No No
Cell Style Options Supported for Essbase Ad Hoc
Table 25-19 Cell Style Options Supported for Essbase Ad Hoc
Option Ad Hoc
Member cells Member cellsAttribute Yes
Dynamic Calculations Yes
Contains Formula Yes
Shared Yes
Child Yes
Parent Yes
Duplicate Member Yes
Member Drill-through Yes
Data cells Data cellsDrill-through Yes
Read-only Yes
Writable (lowest priority is recommended) Yes
Chapter 25Cell Styles
25-34

Table 25-19 (Cont.) Cell Style Options Supported for Essbase Ad Hoc
Option Ad Hoc
Linked Objects Yes
ExtensionsExtensions lists the extensions that are currently installed on your computer.
Extension options are global options—set from Excel, Word, or PowerPoint—which apply tothe entire current document, including any new worksheets added to the current workbook,new slides added to the current presentation, or new pages added to the current document,and to all Microsoft Office documents that are created henceforth, including Excel workbooksand worksheets, PowerPoint presentations and slides, and Word documents. Changes toglobal option settings become the default for all existing and new Microsoft Office documents.
The first time users open the Extensions tab of the Options dialog box, it contains a list ofthe extensions that are currently installed to leverage Oracle Smart View for Officefunctionality for other Oracle products. See Supported Extensions for a complete list ofsupported extensions. Other extensions that can be downloaded and installed are madevisible using the Check for Updates, New Installs, and Uninstalls link on the dialog box.
Video
Your Goal Watch This Video
Learn about working with extensions in SmartView. Overview: Broadening Your Capabilities in
Smart View With Extensions
From Excel, Word, or PowerPoint, complete these tasks in the Extensions tab:
• Enabling and Disabling Extensions
• Working with Extension Alerts
• Initially Checking for Available Extensions
• Installing Extensions
• Updating Extensions
• Enabling Logging for Extension Installations
• Overriding the Default URL for the Extension Download
• Uninstalling Extensions
Chapter 25Extensions
25-35

Note:
• You can enable and disable extensions, and install, update, and uninstallextensions from Excel, PowerPoint, or Word.
• It is not necessary to use Apply to All Worksheets or Save as DefaultOptions with the Extensions options.
• In some Oracle Enterprise Performance Management Cloud products,you can download and install certain extensions from the browser. See Downloading and Installing Clients in Oracle Enterprise PerformanceManagement Cloud Getting Started with Oracle Enterprise PerformanceManagement Cloud for Users for more information.
Tip:
If the windows associated within an installed extension are not renderingproperly in Smart View, go to the Health Check dialog and ensure that theBrowser Emulation Mode option is set to Enabled. To do this:
1. From the Smart View ribbon in Excel, click the arrow next to Help, andthen select Health Check.
2. Click Recommended Settings at the bottom of the dialog.
3. Click Yes in the confirmation dialog.
4. Click Update Settings, and then click Close.
5. Restart Excel and log in.
For more information, see Performing a Health Check On Your System.
Supported ExtensionsThere are two types of extensions that can be installed with Oracle Smart View forOffice, provider extensions and per-user extensions.
Provider Extensions
Provider extensions are dependent on, or integrated with, Oracle EnterprisePerformance Management Cloud components. Examples are the DisclosureManagement and Oracle Hyperion Financial Reporting extensions.
Smart View supports provider extensions for the following EPM Cloud products:
• Disclosure Management
• Financial Reporting
• Oracle Hyperion Strategic Finance
• Predictive Planning extension for Oracle Hyperion Planning
• Predictive Planning extension for Planning
• Oracle Planning Admin Extension for Oracle Hyperion Planning
Chapter 25Extensions
25-36

• Oracle Planning Admin Extension for Planning, Financial Consolidation and Close, andTax Reporting
• Oracle Crystal Ball Enterprise Performance Management
• Narrative Reporting
• Oracle BI EE extension for Oracle Business Intelligence Enterprise Edition
• Oracle BI EE extension for Oracle Analytics Cloud
• Oracle Journals extension for Oracle Hyperion Financial Management
• Cube Designer extension for Oracle Analytics Cloud - Essbase
• Task Manager extension for Financial Consolidation and Close and Tax Reporting
• Supplemental Data Manager extension for Financial Consolidation and Close and TaxReporting
• Strategic Modeling extension
• Reconciliation Compliance extension for Account Reconciliation
• Smart Query
• Oracle BI EE
Narrative Reporting, Oracle BI EE, Oracle Journals, and Reconciliation Compliance aredocumented in this guide. The other extensions listed above are documented in theapplicable Oracle product guide.
The following extensions are packaged with Smart View:
The Smart Query extension is packaged with Smart View and it gets installed automaticallywith Smart View.
Per-user Extensions
Per-user extensions are not dependent on Oracle Enterprise Performance ManagementSystem server components. Per-user extensions may be extensions created in-house byyour Smart View administrator or extensions that the administrator has obtained from Oracleor another organization.
All installed extensions, whether packaged with Smart View or not, should be enabledautomatically when you start Smart View. See Enabling and Disabling Extensions.
Per-user extensions are not documented in this guide.
Refer to the following sections for information on installing, updating, and uninstallingextensions.
Enabling and Disabling ExtensionsTo enable an extension:
1. From the Smart View ribbon, select Options, and then Extensions.
2. Locate the extension in the list and select the Enable check box.
After you select the check box, the label changes to Enabled.
3. Optional: To disable an extension, locate the extension in the list and clear the Enabledcheck box.
Chapter 25Extensions
25-37

Note:
When extensions are enabled in Oracle Smart View for Office, cascading areport with a large number of members can cause Excel to stop responding.To avoid this, from the Smart View Options dialog box, Extensions page,disable any extensions that are installed; then, restart Excel and repeat thecascade operation.
Working with Extension AlertsThe Extension Alerts dialog helps you to keep your installed Narrative Reporting andDisclosure Management extensions up-to-date. If you haven’t already installed theseextensions, the dialog informs you that they’re available for install.
Data source types: Narrative Reporting
To view the Extension Alerts dialog:
1. Connect to Narrative Reporting.
a. Open Office, select the Smart View ribbon, and then click Panel.
b. In the Smart View Panel, select Private Connections, then choose your
connection from the drop-down list, and then click .
If any extensions are already installed (Narrative Reporting, DisclosureManagement, Disclosure Management - HVX), then select Library inNarrative Reporting Home to view the tree and expand the Library node.
If no Narrative Reporting extensions are installed, then in the tree, select theLibrary node.
c. In the Action Panel, click Connect.
Upon connection, Oracle Smart View for Office compares the extensionversions available on the provider environment with the versions installed onyour computer. If there are extensions to install or update, the ExtensionAlerts dialog is displayed. This dialog informs you of the Narrative Reportingand Disclosure Management extensions available for installation or update.
Figure 1
Chapter 25Extensions
25-38

Figure 25-3 Extension Alerts Dialog Showing Extensions Available forInstallation
2. Review the list of available extensions and then perform an action:
• Click Go to Extension Dialog to continue with the extension installation and updateprocess.
• Click Close to close this dialog. You can perform the extension installation andupdate process at any time.
See Updating Extensions to complete the extension installation and update process.
If this is a new Smart View installation, see Initially Checking for Available Extensions.
3. Optional: To disable the Extension Alerts dialog from displaying upon connecting,perform either of the following actions:
• In the Extension Alerts dialog box, select the Do not show this dialog again checkbox.
• In the Options dialog, Extensions tab, select the Suppress extension alerts forupdates when connecting check box.
To enable Extension Alerts to display upon connection, go to the Options dialog,Extensions tab, and clear the Suppress extension alerts for updates whenconnecting check box.
Initially Checking for Available ExtensionsAfter Oracle Smart View for Office is first installed, complete the procedure in this topic tocheck for all available extensions.
Complete the procedure in Updating Extensions to check for updates to your installedextensions.
Chapter 25Extensions
25-39
Note:
• Your Smart View system administrator controls the extensions availablefor you to install, and whether installation is automatic or optional.
• The extension installation and update command, Check for Updates,New installs, and Uninstalls, is not supported when logged in using avanity URL.
To check for extensions after first installing Smart View:
1. Start Excel, Word, or PowerPoint.
2. From the Smart View ribbon, select Options, and then Extensions.
3. Click the Check for Updates, New Installs, and Uninstalls link.
4. In Select Location for Extension Updates, select the data source connections tocheck for extension updates, and then click Get Updates.
Smart View checks all selected data source connections for extensions that youradministrator has made available to you.
To check for extensions in all your data source connections, check Select All.
The dialog box expands to display a message window providing you with theprogress and status of the extension query.
Note:
If you have connections to multiple products from Oracle EnterprisePerformance Management System, Oracle Enterprise PerformanceManagement Cloud, Oracle Business Intelligence Enterprise Edition, andOracle Analytics Cloud, you can select the connection locations for onlythose extensions that you want to update at this time. For example, youmay only want to check for an update for your Narrative Reportingextension. In that case, select only the check box that corresponds toyour Narrative Reporting connection.
5. Click Close to close the Select Location for Extension Updates and return tothe Extensions tab of the Options dialog box.
6. Perform an action:
• Follow the prompts to close the active Office application. Also, check theWindows Task Manager and close any other Office applications or processesthat are running, including Outlook. Then restart Office.
If your administrator has set up extensions to automatically install afterchecking for updates, and closing and reopening Office, then you do not needto do anything further.
• If your administrator has set up optional extension installation, then continuewith step 6 in Installing Extensions.
Chapter 25Extensions
25-40

Installing ExtensionsIf an extension is available for you to install, you can install it from the Extensions tab of theOptions dialog box.
Note:
• Your Oracle Smart View for Office system administrator controls whichextensions are available to you, and whether installation is automatic oroptional. If installation is automatic, then you need only follow the instructions in Initially Checking for Available Extensions. If installation is optional, follow theinstructions in this topic.
• The Oracle BI EE extension, which is compatible with both Oracle AnalyticsCloud and Oracle Business Intelligence Enterprise Edition , installs differentlythan other extensions. Oracle Analytics Cloud users, see Installing the OracleAnalytics Cloud Extension for details. Oracle BI EE users, see Installing theOracle BI EE Extension.
• The extension installation and update command, Check for Updates, Newinstalls, and Uninstalls, is not supported when logged in using a vanity URL.
To install an extension:
1. Start Excel, Word, or PowerPoint.
2. From the Smart View ribbon, select Options, and then Extensions.
3. Click the Check for Updates, New Installs, and Uninstalls link.
Smart View checks for any new or updated extensions and required extensions.
4. In Select Location for Extension Updates, select the data source connections to checkfor extension updates, and then click Get Updates.
Note:
Oracle Journals and Oracle BIEE extensions installation package is installedwith Smart View locally.
Smart View checks all selected data source connections for extensions that youradministrator has made available to you.
To check for extensions in all your data source connections, check Select All.
The dialog box expands to display a message window providing you with the progressand status of the extension query.
5. Click Close to close the Select Location for Extension Updates and return to theExtensions tab of the Options dialog box.
6. Review the list of extensions and where you see , click the Install link to launchthe installer.
Chapter 25Extensions
25-41

Required per-user extensions are designated as follows:
7. Follow the prompts to install the extension.
Tip:
You will be prompted to close the active Office application. All Officeapplications must be closed in order to complete the extensioninstallation correctly. Check the Windows Task Manager and close anyother Office applications or processes that are running, includingOutlook.
Updating ExtensionsIf an extension is available for you to update, you can update it from the Extensionstab of the Options dialog box.
Note:
• The extension installation and update command, Check for Updates,New installs, and Uninstalls, is not supported when logged in using avanity URL.
• Your Oracle Smart View for Office system administrator controls theextensions available to you and your options for updating extensions. Ifinstallation is automatic, then you need only complete the first threesteps in this topic. If installation is optional, complete all the steps in thistopic.
To check for extension updates and install them:
1. From the Smart View ribbon, select Options, and then Extensions.
2. To update extensions, perform one of these tasks:
• Click the Check for Updates, New Installs, and Uninstalls link toimmediately check for updates to all your available extensions and any newextensions.
• Select the Check for updates when Microsoft Office starts check box.
Smart View performs a check for extension updates each time you start anOffice application.
3. In Select Location for Extension Updates, select the data source connections tocheck for extension updates, and then click Get Updates.
Smart View checks all selected data source connections for extension updatesthat your administrator has made available to you.
Chapter 25Extensions
25-42

To check for extension updates in all your data source connections, check Select All.
The dialog box expands to display a message window providing you with the progressand status of the extension update query.
4. Click Close to close the Select Location for Extension Updates and return to theExtensions tab of the Options dialog box.
5. Perform an action:
• Follow the prompts to close the active Office application. Also, check the WindowsTask Manager and close any other Office applications or processes that are running,including Outlook. Then restart Office.
You do not need to do anything further.
• If your administrator has set up optional extension installation updates, then continuewith step 6.
6. Review the list of extensions and where you see , click the UpdateAvailable link to launch the installer.
7. Follow the prompts to install the extension.
When updates are available, you are prompted to download the extension installer, closethe Office application, and run the installer.
Tip:
All open Office applications must be closed in order to complete the extensioninstallation correctly. Check the Windows Task Manager and close any otherOffice applications or processes that are running, including Outlook.
After restarting the Office application, the extension appears as Enabled in theExtensions page of the Options dialog box.
Enabling Logging for Extension InstallationsTo create a log of the extension installation process:
1. From the Smart View ribbon, select Options, and then Extensions.
2. Select the Enable logging for extension installations check box.
3. In the Advanced tab of the Options dialog box, complete these steps:
a. Ensure that the Log Message Display level is set to at least Warnings.
b. Select the Route Messages to File check box and note the location of the log file.
4. Proceed to install or update an extension, as described in Installing Extensions and Updating Extensions.
Overriding the Default URL for the Extension DownloadYour Oracle Smart View for Office administrator may move an extension installer to a non-default location and then notify you of the installer location. If this happens, complete thefollowing procedure.
Chapter 25Extensions
25-43
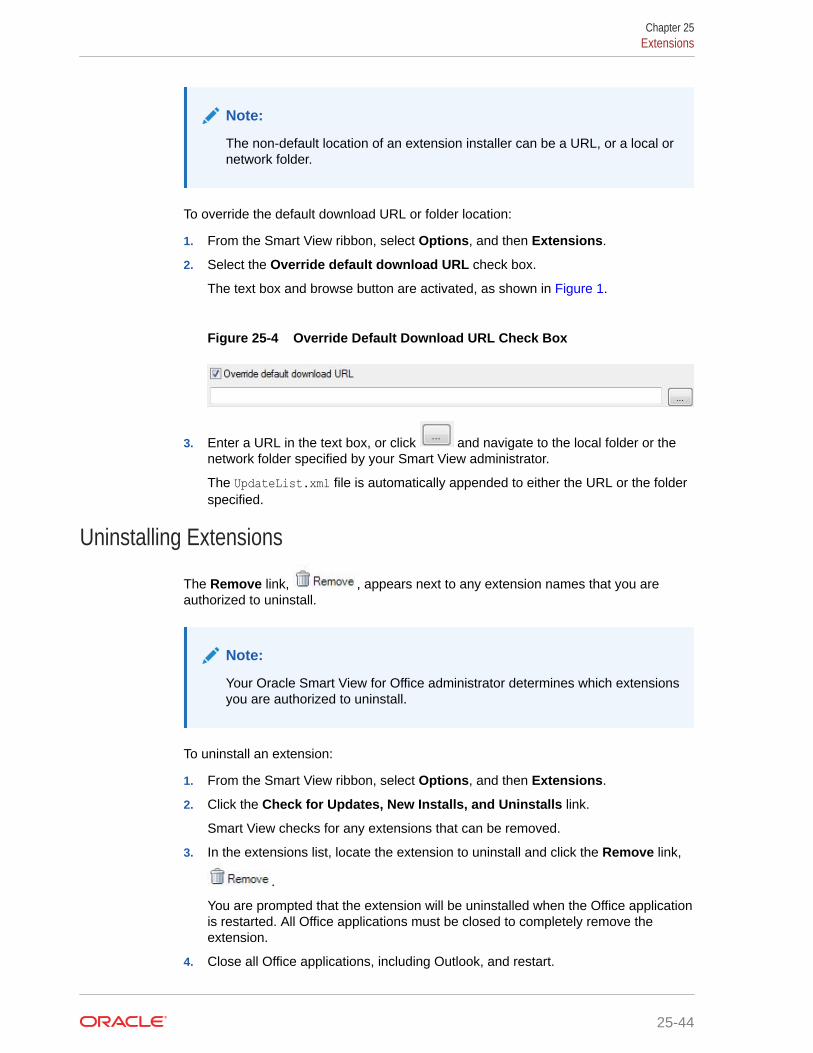
Note:
The non-default location of an extension installer can be a URL, or a local ornetwork folder.
To override the default download URL or folder location:
1. From the Smart View ribbon, select Options, and then Extensions.
2. Select the Override default download URL check box.
The text box and browse button are activated, as shown in Figure 1.
Figure 25-4 Override Default Download URL Check Box
3. Enter a URL in the text box, or click and navigate to the local folder or thenetwork folder specified by your Smart View administrator.
The UpdateList.xml file is automatically appended to either the URL or the folderspecified.
Uninstalling Extensions
The Remove link, , appears next to any extension names that you areauthorized to uninstall.
Note:
Your Oracle Smart View for Office administrator determines which extensionsyou are authorized to uninstall.
To uninstall an extension:
1. From the Smart View ribbon, select Options, and then Extensions.
2. Click the Check for Updates, New Installs, and Uninstalls link.
Smart View checks for any extensions that can be removed.
3. In the extensions list, locate the extension to uninstall and click the Remove link,
.
You are prompted that the extension will be uninstalled when the Office applicationis restarted. All Office applications must be closed to completely remove theextension.
4. Close all Office applications, including Outlook, and restart.
Chapter 25Extensions
25-44

Tip:
All open Office applications must be closed in order to complete theuninstallation correctly. Check the Windows Task Manager and close any otherOffice applications or processes that are running, including Outlook.
Chapter 25Extensions
25-45

26Functions
Related Topics
• Using FunctionsIf you are familiar with the contents of your database, you can use Oracle Smart View forOffice functions to perform operations on specific data in Excel cells.
• Creating FunctionsYou can create Oracle Smart View for Office functions manually or by using the FunctionBuilder.
• Running FunctionsYou can run most Oracle Smart View for Office functions automatically using Refreshcommands. For HsGetValue, use the Submit Data command.
• Fixing Links in FunctionsYou may need to fix broken links in functions.
• Copying and Pasting HsGetValue FunctionsYou may copy cells and ranges of cells containing the HsGetValue function from oneOffice application and paste them into Excel, Word or PowerPoint.
• Function DescriptionsOracle Smart View for Office provides these functions. Click a function name to accessdescription, syntax, and examples.
• Common Function Error CodesThese are some common error codes displayed in functions.
Using FunctionsIf you are familiar with the contents of your database, you can use Oracle Smart View forOffice functions to perform operations on specific data in Excel cells.
Note:
When using the Smart View functions in Table 1, do not use the hash mark (#) orthe semicolon (;) in member names, dimension names, or variable names. Thesecharacters are reserved for delimiters in the functions noted in this chapter.
26-1

Table 26-1 Smart View Functions and Supported Providers
Function Description Supported Providers
HsGetValue Retrieves data from a datasource.
• Oracle Hyperion FinancialManagement
• Oracle Essbase• Oracle Analytics Cloud -
Essbase• Oracle Hyperion Planning• Planning• Planning Modules• Financial Consolidation and
Close• Tax Reporting• Narrative Reporting
HsSetValue Sends values to the data source. • Financial Management• Essbase• Oracle Analytics Cloud -
Essbase• Planning• Planning• Planning Modules• Financial Consolidation and
Close• Tax Reporting
HsGetSheetInfo Retrieves detailed informationabout the current worksheet.
Provider-independent
HsCurrency Retrieves the entity currency forthe selected members.
Financial Management
HsAlias Displays the alias of the specifieddimension member.
• Planning• Planning Modules• Financial Consolidation and
Close• Tax Reporting
HsDescription Displays the description for thedefault member.
• Financial Management• Essbase• Oracle Analytics Cloud -
Essbase• Planning• Planning Modules• Financial Consolidation and
Close• Tax Reporting
HsLabel Displays the label for the defaultmember.
Financial Management
HsGetText Retrieves cell text from the datasource.
Financial Management
HsSetText Sends cell text to the datasource.
Financial Management
Chapter 26Using Functions
26-2

Table 26-1 (Cont.) Smart View Functions and Supported Providers
Function Description Supported Providers
HsGetVariable Retrieves the associated valuefor a substitution variable.
• Essbase• Oracle Analytics Cloud -
Essbase
HsGetSharedConnectionURL Use this to quickly identify theshared connection data sourcethat is being used.
• Financial Management• Essbase• Oracle Analytics Cloud -
Essbase• Planning• Planning• Planning Modules• Financial Consolidation and
Close• Tax Reporting• Narrative Reporting
Creating FunctionsYou can create Oracle Smart View for Office functions manually or by using the FunctionBuilder.
Note that not all functions are available to all providers. See Table 1 for a list of functions andthe supported providers.
Related Topics:
• Creating Functions in the Function Builder
• Creating Functions Manually
Creating Functions in the Function BuilderIn the Function Builder, you select a function and specify the connection and members thatyou want the function to use. The Function Builder then creates the function using the propersyntax and enters it into the selected cell. You can edit these functions.
The selections available to you in a given Function Builder field are limited by your selectionsin other fields of the Function Builder. For example, only the connections supported by theselected function are displayed, and only the dimensions supported by the function you selectare displayed.
A cell reference can be selected for each function argument. If you know argument inputvalues, you can create functions in offline mode. Type-in functionality is available for eachargument.
Function Descriptions
Chapter 26Creating Functions
26-3
Note:
You can use functions that were created in the Function Builder prior toRelease 11.1.2.2.310. However, starting with Release 11.1.2.2.310, theFunction Builder uses commas (,) to separate member list arguments ratherthan semicolons (;). Both characters are supported by the new FunctionBuilder, but when you modify a function created in the previous version, youare prompted to convert to the new comma-separated format. If you choosenot to convert, then none of your modifications to the function are applied.
To create functions using the Function Builder:
1. Connect to the appropriate data source.
Function Builder supports shared, private, and URL connections.
Oracle Essbase, Oracle Analytics Cloud - Essbase : If you are using a privateconnection, and your function is going to use an alias table, you must verify thatthe correct alias table or the "Default" alias table is set for the connection. In theSmart View Panel, right-click the database name, and select Set alias table.Ensure that the correct alias table is selected, and then refresh the sheet.
2. In the sheet, select the cell in which you want to enter the function.
3. In the Smart View Panel, navigate to the database on which you want to base thefunction, right-click the database name, and then select Build Function.
Accessing the Function Builder in this way will prepopulate the Connection field ofthe Function Arguments dialog box with specific connection information, asdescribed in step 4.
Alternatively, from the Smart View ribbon, select Functions, and then BuildFunction.
When you access the Function Builder in this way, the Connection field in theFunction Arguments dialog box is blank. You may provide connectioninformation, as described in step 4. Or, if there is an active connection on thesheet, select HSACTIVE from the drop-down list.
4. In Select Function, select a function from the list and click OK.
Chapter 26Creating Functions
26-4

Figure 26-1 Function Builder, Select Function Dialog Box
Note:
Not all functions are available to all providers. See Table 1 for a list of functionsand the supported providers.
The Function Arguments dialog box is displayed with the Connection fieldautomatically populated with connection information in one of the following formats.
• For shared connections:
WSFN|ProviderType|Server|Application|DatabaseThe WSFN parameter above signifies that this function is a workspace function anduses a shared connection. Workspace functions support Oracle Hyperion EnterprisePerformance Management Workspace or Oracle Enterprise PerformanceManagement Cloud connections.
• For private connections:
PrivateConnectionName
• For URL connections:
URLFN|URL|Server|Application|DatabaseAll the information needed to make a connection is part of the token, as shown above. Ifthe token contains any invalid information, then generally a #NoConnection error isshown, with the following exceptions for the Server token:
• For EPM Cloud business processes, such as Planning, the Server token can beblank (or invalid)
• The Essbase Server token can be blank only
• Oracle Hyperion Financial Management requires the Server token parameter
Chapter 26Creating Functions
26-5

To manually enter the connection info, use the syntax above.
5. In Function Arguments, for each argument in the selected function, do one of thefollowing:
• Click the right-most button, .
For example, for HsGetValue, click to select members from MemberSelection; for HsLabel and HsGetVariable, select from drop-down lists oflabels or variables.
Essbase, Oracle Analytics Cloud - Essbase : Note that when variablenames are duplicated, their fully qualified name is displayed in the drop-downlist. This helps to identify variables defined at the global, application, anddatabase levels.
• To type arguments manually, enter the argument in the text box. For example,to type a member, use the format: dimension#member; such as Year#Qtr1 orYear#Jan.
• To use cell references, follow the procedure in Using Cell References.
Figure 2 shows a completed Function Arguments dialog box for the HsGetValuefunction.
Figure 26-2 Function Builder, Function Arguments Dialog Box forHsGetValue Based on the Essbase Sample Basic Database
The arguments listed in Function Arguments vary depending on the functionselected in the previous step.
Chapter 26Creating Functions
26-6

Note:
• For HsGetSheetInfo, use a cell reference. See Using Cell References formore information.
• For HsSetValue only: Select Data or Cell Reference and enter the value tosubmit.
• For HsGetText and HsSetText only:
– Select Comments or Cell Reference, and then enter the cell text tosubmit
– Select Cell Text Label, and then select a label from the drop-downmenu
• If an active worksheet connection is available, you can select HSACTIVEfrom the Connection drop-down list.
6. Click Validate and correct any errors that may be noted.
Some of the errors you may see are:
• Connection offline or invalid
• Invalid selection
• Member name is invalid or not matching selected alias
• Dimension name is invalid or not matching selected alias
• Incomplete Dimension#Member combination
• Generic "Error" in cases of missing quotation marks or other minor syntax errors
Figure 3 shows errors in the Function Arguments dialog box after clicking the Validatebutton. In the following example from the Financial Management Simple application,there are errors in the syntax for two of the Dimension#Member combinations. The firsterror is that the Dimension name is invalid or not matching the selected alias. The seconderror is that the member name is invalid or not matching the selected alias.
Figure 26-3 Function Builder Validation Errors
7. When the function validation is successful, click OK to insert the function in the selectedcell.
Chapter 26Creating Functions
26-7

8. To execute the function, follow the procedure in Running Functions.
Using Cell ReferencesYou can enter references to single cells for connection, label, data/text, or variablearguments. You can also enter references to two contiguous or noncontiguous cells fordimension/member references. References cannot be made to cell ranges of morethan two cells.
To use cell references:
1. Follow the steps in Creating Functions in the Function Builder to open theFunction Arguments dialog box.
2. In the Function Arguments dialog box, for each argument in the selected
function, click the Cell Reference button, .
Depending on the type of argument selected, a Cell Reference dialog box isdisplayed.
• If you select a connection, label, data/text, or variable argument, the SelectSingle Cell Reference dialog box is displayed.
Figure 26-4 Select Single Cell Reference Dialog Box
• If you select a member list argument, the Cell Reference dialog box for adimension and member name cell reference is displayed.
Figure 26-5 Dimension and Member Name Cell Reference Dialog Box
Chapter 26Creating Functions
26-8

3. In the grid, perform an action:
• For the Single Cell Reference dialog box, depending on the type of argument, clicka single cell to reference; for example, a cell containing a variable.
Figure 3 shows the Single Cell Reference dialog box with a cell selected for a labelargument.
Figure 26-6 Cell Reference Dialog Box with Single Cell for Label ArgumentSelected
• For the Dimension and Member Name Cell Reference dialog box, do one of thefollowing:
– Click a single cell to reference; for example, a cell that contains both a dimensionand a member name.
– Pressing the Ctrl key, select two contiguous or noncontiguous cells; for example,a dimension and a member cell.
You may press Ctrl, click in two cells from different areas of the worksheet or twoadjacent cells. Each cell selection much be performed by a single click while theCtrl key is still pressed.
Figure 4 shows the Dimension and Member Name Cell Reference dialog box withtwo noncontiguous cells selected.
Figure 26-7 Cell Reference Dialog Box with Two Noncontiguous CellsSelected
4. Click OK in the Cell Reference dialog box.
In Function Arguments, the text field for the argument contains the referenced cell orcells in the format shown in Table 1.
Chapter 26Creating Functions
26-9

Table 26-2 Cell Reference Formats
Cell Reference Format in Function Arguments
Single cell ""&A3&""See "Notes" below this table for a fullexplanation.
Two contiguous cells ""&A3&"#"&B3&""Two noncontiguous cells ""&A5&"#"&B9&""
Notes:
• For a single cell reference, if the member name that you selected in step 3 isdisplayed as dimension#member in the grid, then the argument selection iscomplete. For example, if the member is displayed in the grid as Year#Qtr 2in cell A3, then ""&A3&"" is complete.
If only the member name is displayed in the grid, then you must manuallyenter the dimension name followed by # between the first two sets of doublequotation marks. For example, if the member is displayed as Qtr2 in cell A3,then you must enter Year# between the quotation marks: "Year#"&A3&""
• If an argument text field contains text before you select a reference cell, thecell reference text is appended to this text. Therefore, delete any unwantedtext in the field before selecting a cell for reference.
• If a date cell is directly referred as input, then convert the input to the propertext format using a Text function as follows; in this example, cell B3 contains aproper date:
=HsSetValue(TEXT(B3,"dd/mm/yyyy"),"ConnectionName", "dim#member"…)5. Click OK to insert the function in the selected cell.
6. Refresh.
Creating Functions ManuallySee Microsoft documentation and support site for information about character andother Excel function limitations.
To create a function manually:
1. In Excel, click the cell in which you want to enter the function.
2. Enter an equals sign (=).
3. Enter the function name; for example, enter HsSetValue4. Enter parameters for the function according to rules described in Syntax
Guidelines, using the information specific to each function in FunctionDescriptions.
5. To refresh the worksheet, from the Oracle Smart View for Office menu, selectRefresh.
Functions are validated only when you refresh them.
Example 26-1 Syntax Guidelines
See Function Descriptions for the syntax of individual functions.
Chapter 26Creating Functions
26-10

• To work with a shared connection, you must add to the function the WSFN identifier,which specifies a workspace function, along with a connection string. The format is:
"WSFN|ProviderType|Server|Application|Database","POV"
For example, in the HsGetValue function for a shared connection to an Oracle Essbasedata source, the WSFN identifier and connection string is added to the function asfollows:
=HsGetValue("WSFN|Essbase|myserver|Sample|Basic","Market#South")
For ProviderType , use one of the following case-sensitive strings:
– Essbase (for Essbase on-premises only; Oracle Analytics Cloud - Essbase requiresprivate connection syntax)
– HFM (for Oracle Hyperion Financial Management)
– HP (for Oracle Hyperion Planning, Planning, Planning Modules, FinancialConsolidation and Close, Tax Reporting)
For Financial Management, the Database parameter can be omitted, or it can be thesame as the Application parameter. For consistency, Oracle recommends entering theapplication name for the Database parameter.
• To work with a URL connection, you must add to the function the URLFN identifier, whichspecifies a URL function, along with a connection string. The format is:
URLFN|URL|Server|Application|DatabaseFor example the syntax for the HsGetValue function using the URL for a connection to aPlanning business process:
HsGetValue("URLFN|URL|Server|Application|Database","POV")All the information needed to make a connection is part of the token, as shown above. Ifthe token contains any invalid information, then generally a #NoConnection error isshown, with the following exceptions for the Server token:
– For Oracle Enterprise Performance Management Cloud business processes, such asPlanning, the Server token can be blank (or invalid)
– The Essbase Server token can be blank only
– Financial Management requires the Server token parameter
• Private connection parameters can have these values:
– Empty: the default connection
– HsActive: the active associated connection
– The user-defined name for a private connection
If you specify a private connection, it must precede the POV.
• The POV is composed of dimension#member pairs, for example:
Entity#Connecticut
Chapter 26Creating Functions
26-11

• Parent-child relationships are designated by a period, (.); for example:
Entity#UnitedStates.Maine
• The connection and each POV dimension#member pair can be split into separatefunction parameters, each parameter enclosed in quotation marks, ("), andseparated by a comma, (,); for example:
"My_connection","Entity#UnitedStates","Account#Sales"
Alternatively, the connection can be separated from the POV by a comma, (,), withthe entire POV enclosed in quotation marks, ("), and with eachdimension#member pair separated by semicolon, (;); for example:
"My_connection","Entity#UnitedStates;Account#Sales"
• Do not mix a dimension name and its aliases in functions. However, for members,you can either use the member name or its alias from the selected alias table.
Running FunctionsYou can run most Oracle Smart View for Office functions automatically using Refreshcommands. For HsGetValue, use the Submit Data command.
To run functions and retrieve values:
1. Open the worksheet that contains the functions you want to run.
2. Do one of the following:
• For HsSetValue, from the Smart View ribbon, select Submit Data.
• For other functions, select one:
– To run functions and update all worksheets in the workbook, from theSmart View ribbon, select Refresh all Worksheets.
– To run functions and update only the active worksheet, select Refresh.
Chapter 26Running Functions
26-12

Note:
• When opening a workbook containing Smart View functions, users may beprompted to connect if they are not already connected. You may dismiss thisdialog to see the old value for these functions from the last retrieval.
• EPM Cloud Classic Environments: When working with a sheet containingmultiple functions to multiple standalone EPM Cloud business processes andusing the URL connection format, you will be prompted to log in to eachbusiness process as each function on the sheet is refreshed. For example, if asheet contains functions for Planning, Financial Consolidation and Close, andTax Reporting, where each connects to a different service URL, you will beprompted to log in to each business process as functions are being run.
EPM Cloud OCI (Gen 2) Environments: Because different EPM Cloudbusiness processes share the same service URL, you will not be prompted tolog in to each business process as functions are being run.
• When a worksheet that contains saved functions is opened on a differentcomputer from the one on which it was created, the functions include the fullpath of the original computer. Smart View automatically updates these functionpaths when you open the worksheet if all three of the following conditions aremet.
– The worksheet is unprotected.
– The Excel option Ask to update automatic links is cleared.
– When you open a workbook, if prompted to update link automatically, selectContinue or Cancel. Do not select Edit Links.
Otherwise, you must manually update functions using the Excel Links option.
Fixing Links in FunctionsYou may need to fix broken links in functions.
Broken links can occur when you uninstall Oracle Smart View for Office on one drive andinstall it on another drive, or send a Smart View file to a user who installs it on a differentdrive.
To fix broken links in functions:
1. From the Smart View ribbon, select the arrow next to Functions.
2. From the drop-down menu, select Fix Links.
Copying and Pasting HsGetValue FunctionsYou may copy cells and ranges of cells containing the HsGetValue function from one Officeapplication and paste them into Excel, Word or PowerPoint.
Note these guidelines when copying and pasting functions:
• Only cells containing the HsGetValue function may be copied and pasted. You may notcopy and paste cells containing other functions.
Chapter 26Fixing Links in Functions
26-13

• The data point generated will use the connection-level alias.
• Any cell references in the function will be replaced with its evaluated values. Forexample, if a function contains "Year#""&A2&"" for the dim#member combination,and cell A2 contains "Qtr2", then the function generated will have "Year#Qtr2" asthe extracted value.
• Any POV changes applied on the data point query from the POV Manager will beapplied only to the dimensions not present in the data point.
• Function XML may be exported from legacy applications.
• The following copy/paste scenarios are supported:
– Functions from a single connection with no cell references.
– Functions from a single connection with cell references.
– Functions from multiple connections
– Visualize in Excel—a grid with single intersection will be generated using thefunction POV.
– Functions with case insensitive connection names.
• The following copy/paste scenarios are not supported:
– Functions from an ad hoc grid (these will be pasted as static values).
– Nested formulas.
– Formulas with arithmetic operations; for example, divide or multiply.
– Other Excel functions; for example, IF or SUM.
– Functions containing the SVLink syntax. These are functions generated byOracle Smart View for Office as a result of a Smart View copy and paste.Copying and pasting these functions results in static text.
To copy and paste functions:
1. Select the cell or range of cells to copy and perform an action:
• In Excel, click .
• In Word and PowerPoint, click .
2. If not already open, launch the Office application to which you want to paste thecopied function cells.
3. Perform an action:
• In Excel, select the cell where the copied functions will be pasted and, in the
Smart View ribbon, click .
• In Word or PowerPoint, place the cursor at the point in the page or slide where
the copied function will pasted and, in the Smart View ribbon, click .
4. Refresh the sheet, page, or slide.
Chapter 26Copying and Pasting HsGetValue Functions
26-14
Function DescriptionsOracle Smart View for Office provides these functions. Click a function name to accessdescription, syntax, and examples.
HsGetValue: Retrieves data from the data source for selected dimension members of a Pointof View.
HsSetValue: Sends a value to the data source for selected dimension members of a Point ofView.
HsGetSheetInfo: Retrieves detailed information about the current worksheet.
HsCurrency: Retrieves the entity currency for the selected members.
HsDescription: Displays the description for the default Point of View member.
HsAlias: Displays the alias of the specified dimension member.
HsLabel: Displays the label for the default Point of View member.
HsGetText: Retrieves cell text from the data source.
HsSetText: Sends cell text to the data source.
HsGetVariable: Retrieves the value for a substitution variable.
HsGetSharedConnectionURL: Identifies the shared connection data source that is beingused.
HsGetValueDescribes the Smart View function, HsGetValue.
Cloud data source types: Oracle Analytics Cloud - Essbase, Planning, Planning Modules,Financial Consolidation and Close, Tax Reporting, Narrative Reporting
On-premises data source types: Oracle Essbase, Oracle Hyperion Financial Management,Oracle Hyperion Planning
Description
HsGetValue retrieves data from the data source for selected dimension members of a Pointof View (POV).
When HsGetValue retrieves no data, the value specified for the #NoData/Missing Labelreplacement option is used (see Table 1).
When users select Refresh or Refresh All, only HsGetValue is called. When users selectSubmit, HsSetValue is called first, and HsGetValue is then called only if HsSetValue returnssuccessfully.
The HsGetValue function supports the use of one attribute dimension and member withEssbase data sources. In Oracle Smart View for Office 11.1.2.5.710+, HsGetValue extendsattribute support to Planning, Planning Modules, Financial Consolidation and Close, TaxReporting data sources (see Example with Attribute ).
In Smart View 11.1.2.5.720+, HsGetValue can be used to return enumerated data types, suchas Smart List, text, and dates (see Example with Smart List).
Chapter 26Function Descriptions
26-15
Syntax
Private connection:
HsGetValue("PrivateConnectionName","POV")
Shared connection:
HsGetValue("WSFN|ProviderType|Server|Application|Database","POV")
URL connection:
HsGetValue("URLFN|URL|Server|Application|Database","POV")
For detailed syntax information, see Creating Functions Manually.
Example 26-2 Example without Attribute
Cloud data source types: Oracle Analytics Cloud - Essbase, Planning, PlanningModules, Financial Consolidation and Close, Tax Reporting, Narrative Reporting
On-premises data source types: Essbase, Financial Management, Planning
In this example, HsGetValue returns the value from the HFM01 application for thedefault POV.
Private connection:
=HsGetValue("HFM01","Scenario#Actual","Year#2004","Period#July","View#YTD","Entity#UnitedStates.Connecticut","Value#USD","Account#Sales","ICP#[ICP None]","Custom1#GolfBalls","Custom2#Customer2","Custom3#[None]","Custom4#Increases")
Shared connection:
=HsGetValue("WSFN|HFM|hfm_svr|HFM01|HFM01","Scenario#Actual","Year#2004","Period#July","View#YTD","Entity#UnitedStates.Connecticut","Value#USD","Account#Sales","ICP#[ICP None]","Custom1#GolfBalls","Custom2#Customer2","Custom3#[None]","Custom4#Increases")
URL connection:
=HsGetValue("URLFN|http://<servername:port>/hfmadf/../hfmadf/officeprovider|<servername:port>|HFM01|HFM01","Scenario#Actual","Year#2004","Period#July","View#YTD","Entity#UnitedStates.Connecticut","Value#USD","Account#Sales","ICP#[ICP None]","Custom1#GolfBalls","Custom2#Customer2","Custom3#[None]","Custom4#Increases")
Chapter 26Function Descriptions
26-16

Example 26-3 Example with Attribute
Cloud data source types: Oracle Analytics Cloud - Essbase, Planning, Planning Modules,Financial Consolidation and Close, Tax Reporting
On-premises data source types: Essbase
In this example, HsGetValue returns the value from the Vision application, Plan1 database,and the POV includes an attribute dimension and member, Entity_Regions#NA_Reg.
Note:
HsGetValue supports only one attribute dimension and member per function.
Private connection:
=HsGetValue("Vision","Account#Amount","Period#Jan","Years#2017","Scenario#Annual Contract","Version#Final","Entity#AR02-Argentina-IS_Adjustments","Package#Depreciation","Currency#Local Currency","Entity_Regions#NA_Reg")
Shared connection:
=HsGetValue("WSFN|HP|serviceURL|Vision|Plan1","Account#Amount","Period#Jan","Years#2017","Scenario#Annual Contract","Version#Final","Entity#AR02-Argentina-IS_Adjustments","Package#Depreciation","Currency#Local Currency","Entity_Regions#NA_Reg")
URL conection:
=HsGetValue("URLFN|https://<servername:port>/HyperionPlanning/SmartView|<servername:port>|Vision|Plan1","Account#Amount","Period#Jan","Years#2017","Scenario#Annual Contract","Version#Final","Entity#AR02-Argentina-IS_Adjustments","Package#Depreciation","Currency#Local Currency","Entity_Regions#NA_Reg")
Example 26-4 Example with Smart List
Cloud data source types: Planning, Planning Modules, Financial Consolidation and Close,Tax Reporting
In this example, HsGetValue returns a Smart List value from the Vision application, Plan1database. The Smart List in this case is looking for the Driver value for Cleaning andMaintenance. Possible values that can be returned are "% of Revenue," "Units," "FTE Hours,""Sales Calls," "Trips," "Square Feet," and "None."
Private connection:
=HsGetValue("Vision","Account#7440: Cleaning and Maintenance","Period#x---------
Chapter 26Function Descriptions
26-17
x","HSP_View#BaseData","Year#FY15","Scenario#Plan","Version#Driver","Entity#No Entity","Product#No Product")
Shared connection:
=HsGetValue("WSFN|HP|serviceURL|Vision|Plan1","Account#7440: Cleaning and Maintenance","Period#x---------x","HSP_View#BaseData","Year#FY15","Scenario#Plan","Version#Driver","Entity#No Entity","Product#No Product")
URL connection:
=HsGetValue("URLFN|https://<servername:port>/HyperionPlanning/SmartView|<servername:port>|Vision|Plan1","Account#7440: Cleaning and Maintenance","Period#x---------x","HSP_View#BaseData","Year#FY15","Scenario#Plan","Version#Driver","Entity#No Entity","Product#No Product")
HsSetValueDescribes the Smart View function, HsSetValue.
Cloud data source types: Oracle Analytics Cloud - Essbase, Planning, PlanningModules, Financial Consolidation and Close, Tax Reporting
On-premises data source types: Oracle Essbase, Oracle Hyperion FinancialManagement, Oracle Hyperion Planning,
Description
HsSetValue sends a data value from a worksheet to the data source for selecteddimension members of a Point of View (POV). Attribute dimensions and members arenot supported in HsSetValue.
To send data to a data source, you must have the appropriate load rule and have writeaccess for the data source.
In Smart View 11.1.2.5.810+, HsSetValue can be used to send enumerated data types,such as Smart List, text, and dates.
Syntax
Private connection:
HsSetValue (value,"PrivateConnectionName","POV")
Shared connection:
HsSetValue (value,"WSFN|ProviderType|Server|Application|Database","POV")
Chapter 26Function Descriptions
26-18

URL connection:
HsSetValue (value,"URLFN|URL|Server|Application|Database","POV")
For detailed syntax information, see Creating Functions Manually.
Example 26-5 Basic Example
Cloud data source types: Oracle Analytics Cloud - Essbase, Planning, Planning Modules,Financial Consolidation and Close, Tax Reporting
On-premises data source types: Essbase, Financial Management, Planning,
In this example, HsSetValue sends the value from cell H4 to the HFM01 application.
Private connection:
HsSetValue(H4, "HFM01","Scenario#Actual;Year#2004;Period#"&B$2&";View#<Scenario View>;Entity#UnitedStates.Connecticut;Value#<Entity Currency>;Account#"&$A4&";ICP#[ICP None];Custom1#GolfBalls;Custom2#Customer2;Custom3#[None];Custom4#Increases")
Shared connection:
HsSetValue(H4, "WSFN|HFM|hfm_svr|HFM01|HFM01","Scenario#Actual;Year#2004;Period#"&B$2&";View#<Scenario View>;Entity#UnitedStates.Connecticut;Value#<Entity Currency>;Account#"&$A4&";ICP#[ICP None];Custom1#GolfBalls;Custom2#Customer2;Custom3#[None];Custom4#Increases")
URL connection:
HsSetValue(H4, "URLFN|http://<servername:port>/hfmadf/../hfmadf/officeprovider|<servername:port>|HFM01|HFM01","Scenario#Actual;Year#2004;Period#"&B$2&";View#<Scenario View>;Entity#UnitedStates.Connecticut;Value#<Entity Currency>;Account#"&$A4&";ICP#[ICP None];Custom1#GolfBalls;Custom2#Customer2;Custom3#[None];Custom4#Increases")
Example 26-6 Example with Smart List
Cloud data source types: Planning, Planning Modules, Financial Consolidation and Close,Tax Reporting
In this example, the syntax is similar to that used for text, but the text but has to match one ofthe text values in the Smart List.
Chapter 26Function Descriptions
26-19
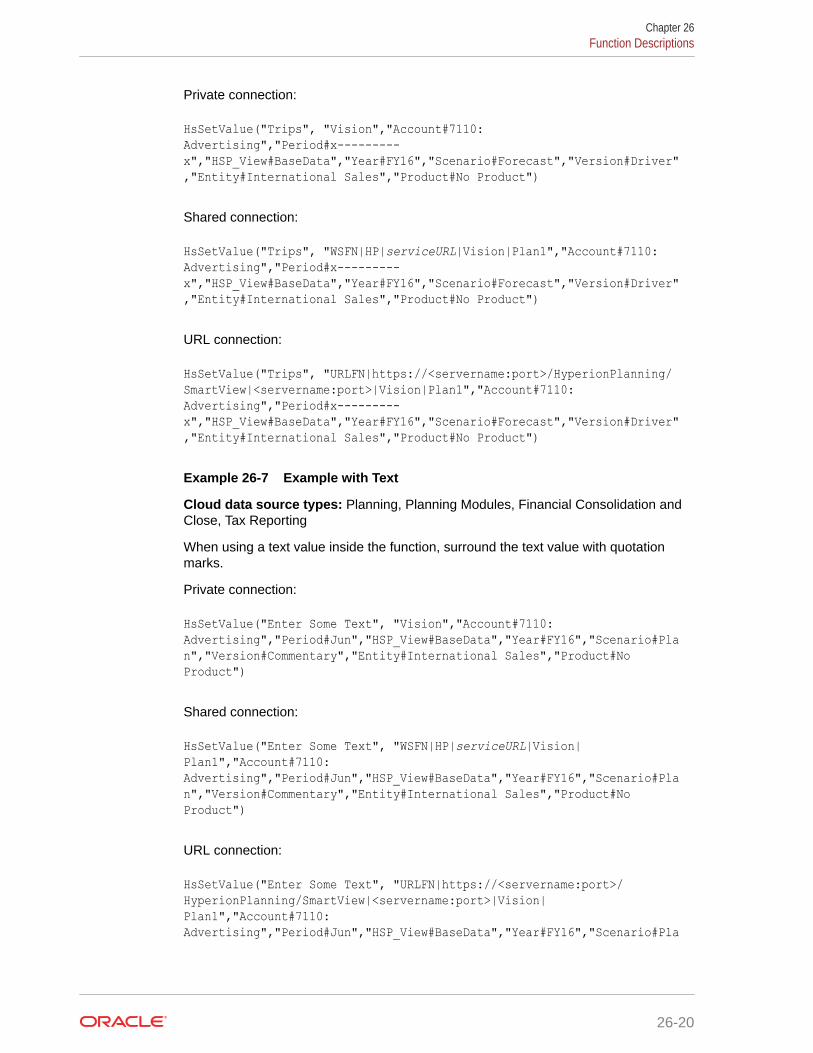
Private connection:
HsSetValue("Trips", "Vision","Account#7110: Advertising","Period#x---------x","HSP_View#BaseData","Year#FY16","Scenario#Forecast","Version#Driver","Entity#International Sales","Product#No Product")
Shared connection:
HsSetValue("Trips", "WSFN|HP|serviceURL|Vision|Plan1","Account#7110: Advertising","Period#x---------x","HSP_View#BaseData","Year#FY16","Scenario#Forecast","Version#Driver","Entity#International Sales","Product#No Product")
URL connection:
HsSetValue("Trips", "URLFN|https://<servername:port>/HyperionPlanning/SmartView|<servername:port>|Vision|Plan1","Account#7110: Advertising","Period#x---------x","HSP_View#BaseData","Year#FY16","Scenario#Forecast","Version#Driver","Entity#International Sales","Product#No Product")
Example 26-7 Example with Text
Cloud data source types: Planning, Planning Modules, Financial Consolidation andClose, Tax Reporting
When using a text value inside the function, surround the text value with quotationmarks.
Private connection:
HsSetValue("Enter Some Text", "Vision","Account#7110: Advertising","Period#Jun","HSP_View#BaseData","Year#FY16","Scenario#Plan","Version#Commentary","Entity#International Sales","Product#No Product")
Shared connection:
HsSetValue("Enter Some Text", "WSFN|HP|serviceURL|Vision|Plan1","Account#7110: Advertising","Period#Jun","HSP_View#BaseData","Year#FY16","Scenario#Plan","Version#Commentary","Entity#International Sales","Product#No Product")
URL connection:
HsSetValue("Enter Some Text", "URLFN|https://<servername:port>/HyperionPlanning/SmartView|<servername:port>|Vision|Plan1","Account#7110: Advertising","Period#Jun","HSP_View#BaseData","Year#FY16","Scenario#Pla
Chapter 26Function Descriptions
26-20

n","Version#Commentary","Entity#International Sales","Product#No Product")
Example 26-8 Example with Date
Cloud data source types: Planning, Planning Modules, Financial Consolidation and Close,Tax Reporting
When using the date value inside the function, surround the date value with quotation marks.
Private connection:
HsSetValue("01/03/2003","Vision","Account#Request Date","Period#x---------x","HSP_View#BaseData","Year#FY16","Scenario#Plan","Version#Working","Entity#No Department","Product#No Product")
Shared connection:
HsSetValue("01/03/2003","WSFN|HP|serviceURL|Vision|Plan1","Account#Request Date","Period#x---------x","HSP_View#BaseData","Year#FY16","Scenario#Plan","Version#Working","Entity#No Department","Product#No Product")
URL connection:
HsSetValue("01/03/2003","URLFN|https://<servername:port>/HyperionPlanning/SmartView|<servername:port>|Vision|Plan1","Account#Request Date","Period#x---------x","HSP_View#BaseData","Year#FY16","Scenario#Plan","Version#Working","Entity#No Department","Product#No Product")
Example 26-9 Example with Date Using TODAY Function for Today's Date
Cloud data source types: Planning, Planning Modules, Financial Consolidation and Close,Tax Reporting
You can also use the TODAY function for today's date.
Private connection:
HsSetValue(TEXT(TODAY(),"mm/dd/yyyy"),"Vision","Account#Request Date","Period#x---------x","HSP_View#BaseData","Year#FY16","Scenario#Plan","Version#Working","Entity#No Department","Product#No Product")
Shared connection:
HsSetValue(TEXT(TODAY(),"mm/dd/yyyy"),"WSFN|HP|serviceURL|Vision|Plan1","Account#Request Date","Period#x---------x","HSP_View#BaseData","Year#FY16","Scenario#Plan","Version#Working","Entity#No Department","Product#No Product")
Chapter 26Function Descriptions
26-21

URL connection:
HsSetValue(TEXT(TODAY(),"mm/dd/yyyy"),"URLFN|https://<servername:port>/HyperionPlanning/SmartView|<servername:port>|Vision|Plan1","Account#Request Date","Period#x---------x","HSP_View#BaseData","Year#FY16","Scenario#Plan","Version#Working","Entity#No Department","Product#No Product")
HsGetSheetInfoDescribes the Smart View function, HsGetSheetInfo.
Data source types: Provider-independent
Description
HsGetSheetInfo retrieves detailed information about the current worksheet, asdescribed in Table 1.
Table 26-3 HsGetSheetInfo Details
Numerical Equivalent String Equivalent Sheet Information
1 Connected Connection status
2 Sheet Type Ad hoc or form
3 Server The server to which the sheetis connected
4 Application The application to which thesheet is connected
5 Cube The cube to which the sheet isconnected
6 URL The URL to which the sheet isconnected
7 Provider The data source type to whichthe sheet is connected
8 Provider URL The provider to which thesheet is connected; applicablefor Oracle Hyperion ProviderServices connections
9 Friendly Name The data source connectionname
10 Alias Table The current alias table
11 User The user name
12 Description The connection description
Syntax
HsGetSheetInfo("<string equivalent>")
HsGetSheetInfo("<numerical equivalent>")
Chapter 26Function Descriptions
26-22

For detailed syntax information, see Creating Functions Manually.
Example
In this example, HsGetSheetInfo tells you whether the worksheet contains an ad hoc grid or aform.
HsGetSheetInfo("Sheet Type")
HsCurrencyDescribes the Smart View function, HsCurrency.
Data source types: Oracle Hyperion Financial Management
Description
HsCurrency retrieves the currency value of the specified dimension member. Entity and Valueare the only valid members for the HsCurrency function.
Syntax
Private connection:
HsCurrency("PrivateConnectionName,Entity;Value")
Shared connection:
HsCurrency("WSFN|ProviderType|Server|Application|Database,EntityMember;ValueMember")
URL connection
HsCurrency("URLFN|URL|Server|Application|Database,EntityMember;ValueMember")
For detailed syntax information, see Creating Functions Manually.
Example
In this example, HsCurrency retrieves the entity currency where the currency for the EastSales entity is USD, and the currency for the UKSales entity is GBR. The EastSales entitydisplays USD, and UKSales displays GBR.
Private connection:
HsCurrency("Comma","Entity#EastRegion.EastSales;Value#<Entity Currency>.")HsCurrency("Comma","Entity#EastRegion.UKSales;Value#<Entity Currency>.")
Shared connection:
HsCurrency("WSFN|HFM|hfm_svr|Comma|Comma","Entity#EastRegion.EastSales;Value#<Entity Currency>.")HsCurrency("Comma","Entity#EastRegion.UKSales;Value#<Entity Currency>.")
Chapter 26Function Descriptions
26-23

URL connection:
HsCurrency("URLFN|https://<servername:port>/hfmadf/../hfmofficeprovider/OfficeProvider|<servername:port>|Comma|Comma","Entity#EastRegion.EastSales;Value#<Entity Currency>.")
HsDescriptionDescribes the Smart View function, HsDescription.
Cloud data source types: Oracle Analytics Cloud - Essbase, Planning, PlanningModules, Financial Consolidation and Close, Tax Reporting
On-premises data source types: Oracle Essbase, Oracle Hyperion FinancialManagement, Oracle Hyperion Planning
Description
HsDescription displays the description of the specified dimension member.
Essbase, Oracle Analytics Cloud - Essbase only: HsDescription returns the aliasname of the specified dimension member.
Syntax
Private connection:
HsDescription ("PrivateConnectionName","Dimension#Member")
Shared connection:
HsDescription ("WSFN|ProviderType|Server|Application|Database","Dimension#Member")
URL connection:
HsDescription ("URLFN|URL|Server|Application|Database","Dimension#Member")
For detailed syntax information, see Creating Functions Manually.
Example
In this example, HsDescription displays the description for Custom 4.
Private connection:
HsDescription("HFM01","Custom4#Increases")
Shared connection:
HsDescription("WSFN|HFM|hfm_svr|HFM01|HFM01","Custom4#Increases")
Chapter 26Function Descriptions
26-24

URL connection:
HsDescription ("URLFN|https://<servername:port>/hfmadf/../hfmofficeprovider/OfficeProvider|<servername:port>|HFM01|HFM01","Custom4#Increases")
HsAliasDescribes the Smart View function, HsAlias.
Data source types: Planning, Planning Modules, Financial Consolidation and Close, TaxReporting
Description
HsAlias displays the alias of the specified dimension member.
Syntax
Private connection:
HsAlias("PrivateConnectionName","Dimension#Member", "OutputAliasTable", "MemberNameFromAliasTable", "FlagToReturnDistinctName")
Shared connection:
HsAlias("WSFN|ProviderType|Server|Application|Database","Dimension#Member", "OutputAliasTable", "MemberNameFromAliasTable", "FlagToReturnDistinctName")
URL connection:
HsAlias("URLFN|URL|Server|Application|Database","Dimension#Member", "OutputAliasTable", "MemberNameFromAliasTable", "FlagToReturnDistinctName")
Note:
For detailed syntax information, see Creating Functions Manually.
Notes
• The connection and Dimension#Member parameters are required.
• For private connections, the OutputAliasTable parameter is optional. If OutputAliasTableis empty, then the connection level alias will be used for OutputAliasTable.
• It is optional to specify which alias table the member is from. IfMemberNameFromAliasTable is empty, then the original member name from the outlinewill be used.
Chapter 26Function Descriptions
26-25

• If the member name is not found in the alias table specified inMemberNameFromAliasTable, then the original member name from the outline willbe used.
• The HsActive keyword within the HsAlias function can only be used on a sheetwith an ad hoc grid.
• Copy and Paste either from Oracle Smart View for Office or Excel is notsupported. Only static text will be pasted.
• The Boolean argument, FlagToReturnDistinctName, determines if the alias outputis a short name or fully qualified name. The default is False.
Example
Private connection:
HsAlias("Planvision","Scenario#Actual", "German", "Default", "True")
Shared connection:
HsAlias("WSFN|HP|svr|Vision|Plan1","Scenario#Actual", "German", "Default" "True")
URL connection:
HsAlias("URLFN|URL|svr|Vision|Plan1","Scenario#Actual", "German", "Default" "True")
HsLabelDescribes the Smart View function, HsLabel.
Data source types: Oracle Hyperion Financial Management
Description
HsLabel displays the default member label for the specified dimension member.
Syntax
Private connection:
HsLabel ("PrivateConnectionName","Dimension#")
Shared connection:
HsLabel ("WSFN|ProviderType|Server|Application|Database","Dimension#")
Chapter 26Function Descriptions
26-26

URL connection:
HsLabel ("URLFN|URL|Server|Application|Database","Dimension#")
For detailed syntax information, see Creating Functions Manually.
Example
In this example, HsLabel function retrieves the label for the Scenario dimension in theComma application:
Private connection:
HsLabel ("Comma","Scenario#")
Shared connection:
HsLabel ("WSFN|HFM|hfm_svr|Comma|Comma","Scenario#")
URL connection:
HsLabel ("URLFN|https://<servername:port>/hfmadf/../hfmofficeprovider/OfficeProvider|<servername:port>|Comma|Comma","Scenario#")
HsGetTextDescribes the Smart View function, HsGetText.
Data source types: Oracle Hyperion Financial Management
Description
HsGetText retrieves cell text from the data source for dimension members, cell references,the default POV, or a combination of all three.
Note:
Users must click Refresh in order to retrieve the cell text.
Syntax
Private connection:
HsGetText ("PrivateConnectionName","POV","CellTextLabel")
Shared connection:
HsGetText ("WSFN|ProviderType|Server|Application|Database","POV","CellTextLabel")
Chapter 26Function Descriptions
26-27

URL connection:
HsGetText ("URLFN|URL|Server|Application|Database","POV","CellTextLabel")
For detailed syntax information, see Creating Functions Manually.
Example
In this example, HsGetText returns the cell text from the HFM01 data source for thedefault POV.
Private connection:
HsGetText("HFM01","Scenario#Actual;Year#2004;Period#"&B$2&";View#<Scenario View>;Entity#UnitedStates.Connecticut;Value#<Entity Currency>;Account#"&$A3&";ICP#[ICP None];Custom1#GolfBalls;Custom2#Customer2;Custom3#[None],Custom4#Increases")
Shared connection:
HsGetText("WSFN|HFM|hfm_svr|HFM01|HFM01","Scenario#Actual;Year#2004;Period#"&B$2&";View#<Scenario View>;Entity#UnitedStates.Connecticut;Value#<Entity Currency>;Account#"&$A3&";ICP#[ICP None];Custom1#GolfBalls;Custom2#Customer2;Custom3#[None],Custom4#Increases")
URL connection:
HsGetText("URLFN|https://<servername:port>/hfmadf/../hfmofficeprovider/OfficeProvider|<servername:port>|HFM01|HFM01","Scenario#Actual;Year#2004;Period#"&B$2&";View# <Scenario View>;Entity#UnitedStates.Connecticut;Value#<Entity Currency>;Account#"&$A3&";ICP#[ICP None];Custom1#GolfBalls;Custom2#Customer2;Custom3#[None],Custom4#Increases")
HsSetTextDescribes the Smart View function, HsSetText.
Data source types: Oracle Hyperion Financial Management
Description
HsSetText sends cell text to a data source. You can use all dimension members, cellreferences, the default POV, or a combination of all three.
Chapter 26Function Descriptions
26-28

Note:
Users must click Submit Data in order to save the cell text.
Syntax
Private connection:
HsSetText("CellTextComments","PrivateConnectionName","POV","CellTextLabel")
Shared connection:
HsSetText("CellTextComments","WSFN|ProviderType|Server|Application|Database","POV","CellTextLabel")
URL connection:
HsSetText("CellTextComments","URLFN|URL|Server|Application|Database","POV","CellTextLabel")
For detailed syntax information, see Creating Functions Manually.
Example
In this example, HsSetText sends the text from cell H3 to the HFM01 application.
Private connection:
HsSetText("H3","HFM01","Scenario#Actual;Year#2004;Period#"&B$2&";View#<Scenario View>;Entity#UnitedStates.Connecticut;Value#<Entity Currency>;Account#"&$A3&";ICP#[ICP None];Custom1#GolfBalls;Custom2#Customer2;Custom3#[None],Custom4#Increases")
Shared connection:
HsSetText("H3","WSFN|HFM|hfm_svr|HFM01|HFM01","Scenario#Actual;Year#2004;Period#"&B$2&";View#<Scenario View>;Entity#UnitedStates.Connecticut;Value#<Entity Currency>;Account#"&$A3&";ICP#[ICP None];Custom1#GolfBalls;Custom2#Customer2;Custom3#[None],Custom4#Increases")
URL connection:
HsSetText("H3","URLFN|https://<servername:port>/hfmadf/../hfmofficeprovider/OfficeProvider|<servername:port>|<servername:port>|HFM01|HFM01","Scenario#Actual;Year#2004;Period#"&B$2&";View#<Scenario View>;Entity#UnitedStates.Connecticut;Value#<Entity Currency>;Account#"&$A3&";ICP#[ICP None];Custom1#GolfBalls;Custom2#Customer2;Custom3#[None],Custom4#Increases")
Chapter 26Function Descriptions
26-29

HsGetVariableDescribes the Smart View function, HsGetVariable.
Cloud data source types: Oracle Analytics Cloud - Essbase
On-premises data source types: Oracle Essbase
Description
HsGetVariable retrieves the associated value for a substitution variable.
You cannot use HsGetVariable with Smart Slices.
Syntax
HsGetVariable can use the default connection name, a private connection name, ashared connection, or an Excel named range on a multiple-range grid, as follows:
• Default connection: HsGetVariable("substitution variable name")• Private connection: HsGetVariable("PrivateConnectionName","substitution
variable name")• Shared connection: HsGetVariable("WSFN|ProviderType|Server|Application|
Database","substitution variable name")• URL connection: HsGetVariable("URLFN|URL|Server|Application|
Database","substitution variable name")• Named range on a multiple-range grid: HsGetVariable("range
name","substitution variable name")For detailed syntax information, see Creating Functions Manually.
Examples
• Default connection: HsGetVariable("CurMonth")• Private connection:
HsGetVariable("myprivateconnection_Sample_Basic","CurMonth")• Shared connection: HsGetVariable("WSFN|Essbase|esbsvr|Sample|
Basic","CurMonth"• URL connection: HsGetVariable("URLFN|https://<servername:port>/aps/
SmartView|<servername:port>|Application|Database","substitutionvariable name")
• Named range:HsGetVariable("myprivateconnection_Sample_Basic","CurMonth")
Note:
An ampersand (&) is generally used to refer to a substitution variable, but isoptional in this function.
Chapter 26Function Descriptions
26-30

Note:
HsGetVariable does not support non-ASCII variable values.
HsGetSharedConnectionURLDescribes the Smart View function, HsGetSharedConnectionURL.
Data source types: All
Description
Use the HsGetSharedConnectionURL function to quickly identify the shared connection datasource that is being used. This can be helpful when you are unsure whether you areconnected, for example, to a production or test environment.
To use the HsGetSharedConnectionURL function, type the function name in any cell andpress the Enter key. The shared connection URL is instantly displayed in the cell.
=HsGetSharedConnectionURL()
You can also enter the function by starting to type the function name into a cell.
=hs
In the drop-down list of functions, double-click HsGetSharedConnectionURL. In the formulabar or directly in the cell in the grid, add the close parenthesis, ), and then press Enter todisplay the shared connection URL.
Note:
After using the function, you may the delete the URL from the cell if it is no longerneeded.
Syntax
HsGetSharedConnectionURL()
For detailed syntax information, see Creating Functions Manually.
Example
Enter:
HsGetSharedConnectionURL()
Chapter 26Function Descriptions
26-31
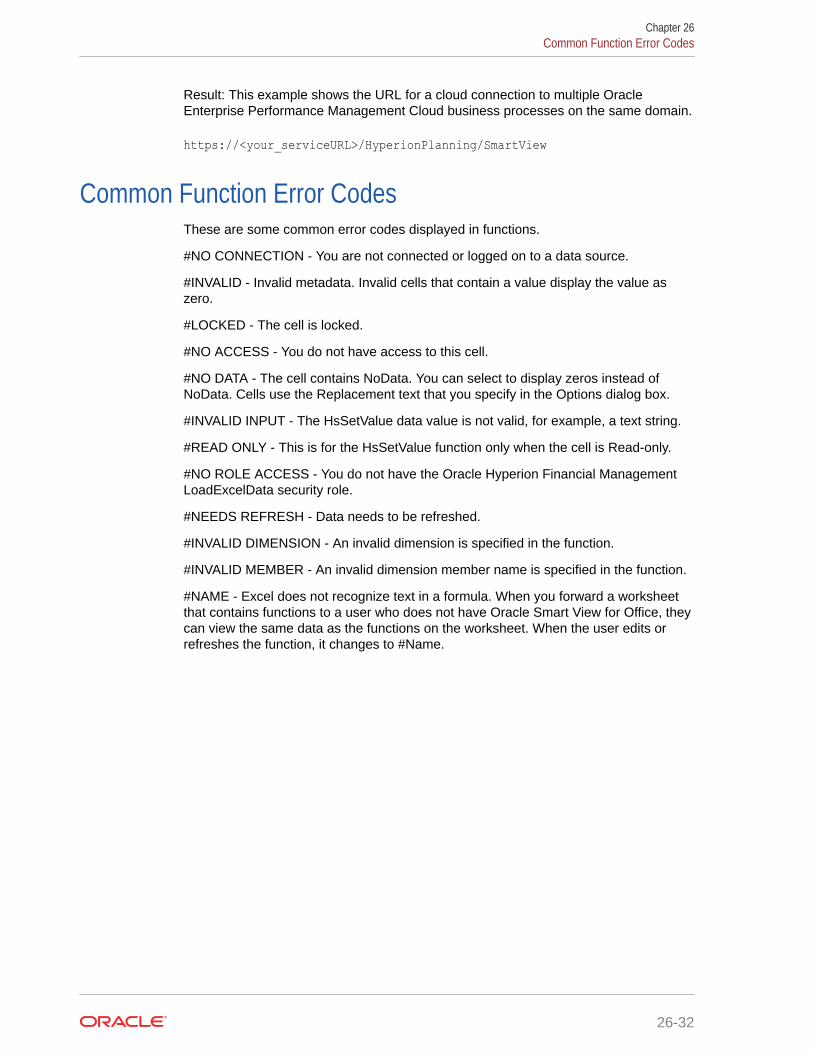
Result: This example shows the URL for a cloud connection to multiple OracleEnterprise Performance Management Cloud business processes on the same domain.
https://<your_serviceURL>/HyperionPlanning/SmartView
Common Function Error CodesThese are some common error codes displayed in functions.
#NO CONNECTION - You are not connected or logged on to a data source.
#INVALID - Invalid metadata. Invalid cells that contain a value display the value aszero.
#LOCKED - The cell is locked.
#NO ACCESS - You do not have access to this cell.
#NO DATA - The cell contains NoData. You can select to display zeros instead ofNoData. Cells use the Replacement text that you specify in the Options dialog box.
#INVALID INPUT - The HsSetValue data value is not valid, for example, a text string.
#READ ONLY - This is for the HsSetValue function only when the cell is Read-only.
#NO ROLE ACCESS - You do not have the Oracle Hyperion Financial ManagementLoadExcelData security role.
#NEEDS REFRESH - Data needs to be refreshed.
#INVALID DIMENSION - An invalid dimension is specified in the function.
#INVALID MEMBER - An invalid dimension member name is specified in the function.
#NAME - Excel does not recognize text in a formula. When you forward a worksheetthat contains functions to a user who does not have Oracle Smart View for Office, theycan view the same data as the functions on the worksheet. When the user edits orrefreshes the function, it changes to #Name.
Chapter 26Common Function Error Codes
26-32
27Free-Form Mode
Related Topics
• About Free-Form ModeIn ad hoc analysis, if you are familiar with the dimensions and members of yourdatabase, you can use free-form mode by typing dimension and member names directlyinto cells.
• Free-Form GuidelinesConsider these guidelines when working in free-form mode.
• Free-Form Grid ExamplesReview the examples in this section when working in free-form mode.
• Comments in Free-Form GridsReview the guidelines in this section when working with comments in free-form grids.
• Formulas in Free-Form GridsReview the guidelines in this topic when working with formulas in free-form grids.
• Duplicate Aliases in Free-Form ModeReview the guidelines and examples in this topic when working with duplicate aliases infree-form mode.
• Attribute Dimensions in Free-Form GridsReview the guidelines and examples in this topic when working with attribute dimensionsin free-form mode.
• Creating Free-Form ReportsFollow the procedure in this topic to create a free-form report.
• Retrieving Attribute Dimensions in Free-Form ModeFollow the procedure in this topic to retrieve attribute dimensions in a free-form report..
• Creating Asymmetric ReportsFollow the procedure in this topic to create asymmetric free-form report..
• Actions That May Cause Unexpected BehaviorReview this topic to learn about actions that may cause unexpected behavior in free-formreports.
About Free-Form ModeIn ad hoc analysis, if you are familiar with the dimensions and members of your database,you can use free-form mode by typing dimension and member names directly into cells.
You can still use the POV, member selection, and other ad hoc operations in free-form grids.
The components of Oracle Smart View for Office grids are described in Table 1.
27-1

Table 27-1 Smart View Grid Components
Grid Component Description
Row Dimension A dimension or member placed down onecolumn across one or more rows in aworksheet
Column Dimension A dimension or member placed on a rowacross one or more columns in a worksheet
Page Dimension A dimension that applies to the entire page(Oracle Essbase only)
Comments Text added by the user
Data Region Areas of the grid that contain data fordimensions or members
Blank Region Areas of the worksheet that contain no entries
Related Topics:
Free-Form Guidelines
Free-Form Grid Examples
Comments in Free-Form Grids
Formulas in Free-Form Grids
Attribute Dimensions in Free-Form Grids
Creating Free-Form Reports
Retrieving Attribute Dimensions in Free-Form Mode
Creating Asymmetric Reports
Actions That May Cause Unexpected Behavior
Free-Form GuidelinesConsider these guidelines when working in free-form mode.
• Grids do not need to start in cell A1.
• A grid must have at least one row dimension and one column dimension.
• Each row dimension can contain members of only one dimension. Each columndimension can contain members of only one dimension.
• Members of one dimension can be entered only in one of the following regions:
– In the same row
– In the same column
– Anywhere in the page dimension region ( Oracle Essbase, Oracle AnalyticsCloud - Essbase only)
• The page dimension region can contain members of different dimensions, but notwo members in the page dimension region can belong to the same dimension( Essbase, Oracle Analytics Cloud - Essbase only).
Chapter 27Free-Form Guidelines
27-2
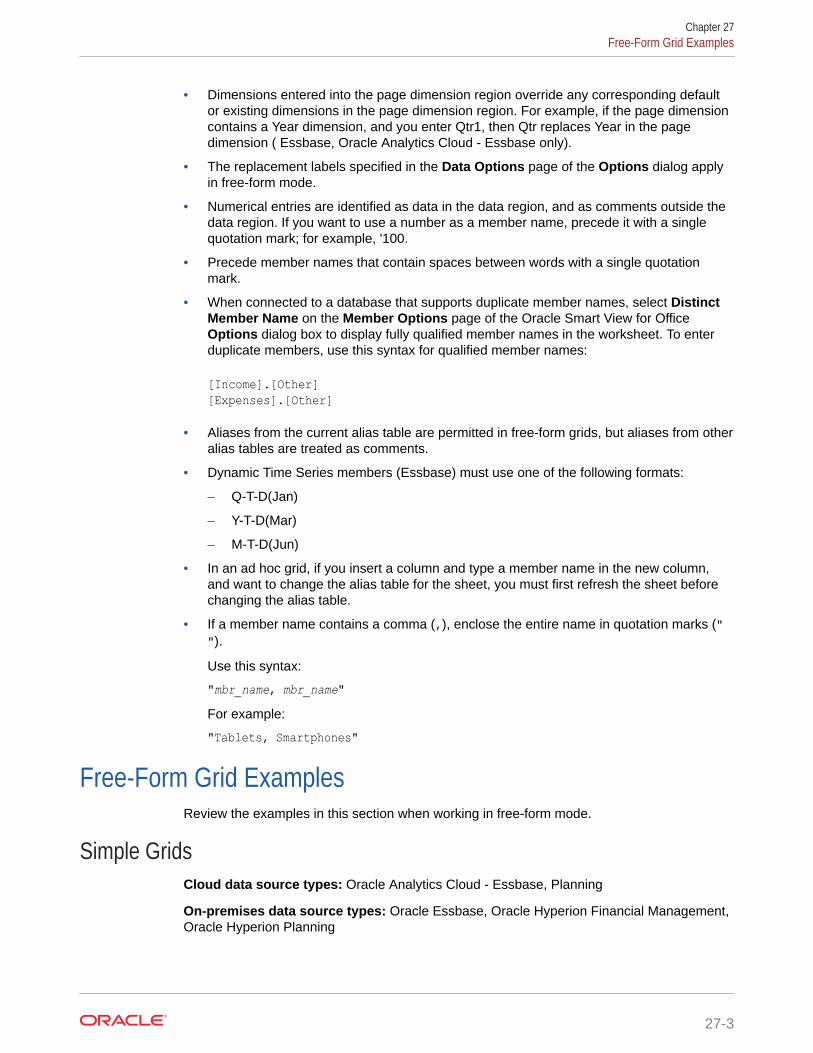
• Dimensions entered into the page dimension region override any corresponding defaultor existing dimensions in the page dimension region. For example, if the page dimensioncontains a Year dimension, and you enter Qtr1, then Qtr replaces Year in the pagedimension ( Essbase, Oracle Analytics Cloud - Essbase only).
• The replacement labels specified in the Data Options page of the Options dialog applyin free-form mode.
• Numerical entries are identified as data in the data region, and as comments outside thedata region. If you want to use a number as a member name, precede it with a singlequotation mark; for example, '100.
• Precede member names that contain spaces between words with a single quotationmark.
• When connected to a database that supports duplicate member names, select DistinctMember Name on the Member Options page of the Oracle Smart View for OfficeOptions dialog box to display fully qualified member names in the worksheet. To enterduplicate members, use this syntax for qualified member names:
[Income].[Other][Expenses].[Other]
• Aliases from the current alias table are permitted in free-form grids, but aliases from otheralias tables are treated as comments.
• Dynamic Time Series members (Essbase) must use one of the following formats:
– Q-T-D(Jan)
– Y-T-D(Mar)
– M-T-D(Jun)
• In an ad hoc grid, if you insert a column and type a member name in the new column,and want to change the alias table for the sheet, you must first refresh the sheet beforechanging the alias table.
• If a member name contains a comma (,), enclose the entire name in quotation marks ("").
Use this syntax:
"mbr_name, mbr_name"For example:
"Tablets, Smartphones"
Free-Form Grid ExamplesReview the examples in this section when working in free-form mode.
Simple GridsCloud data source types: Oracle Analytics Cloud - Essbase, Planning
On-premises data source types: Oracle Essbase, Oracle Hyperion Financial Management,Oracle Hyperion Planning
Chapter 27Free-Form Grid Examples
27-3
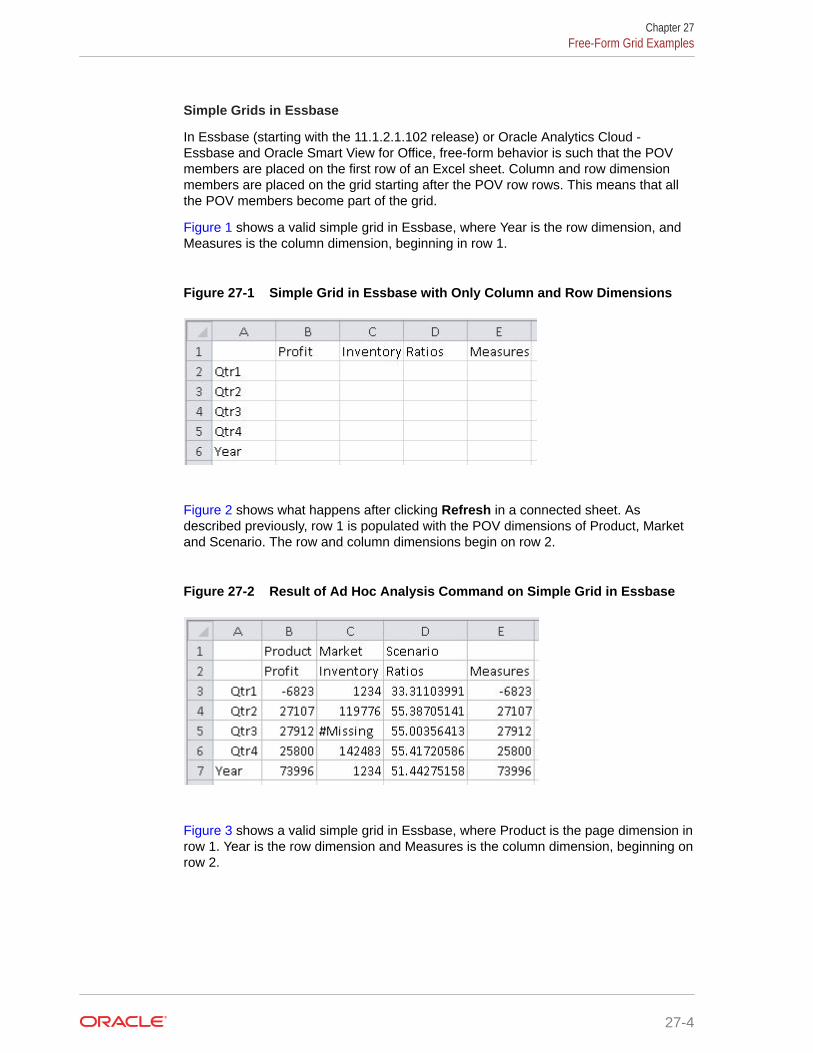
Simple Grids in Essbase
In Essbase (starting with the 11.1.2.1.102 release) or Oracle Analytics Cloud -Essbase and Oracle Smart View for Office, free-form behavior is such that the POVmembers are placed on the first row of an Excel sheet. Column and row dimensionmembers are placed on the grid starting after the POV row rows. This means that allthe POV members become part of the grid.
Figure 1 shows a valid simple grid in Essbase, where Year is the row dimension, andMeasures is the column dimension, beginning in row 1.
Figure 27-1 Simple Grid in Essbase with Only Column and Row Dimensions
Figure 2 shows what happens after clicking Refresh in a connected sheet. Asdescribed previously, row 1 is populated with the POV dimensions of Product, Marketand Scenario. The row and column dimensions begin on row 2.
Figure 27-2 Result of Ad Hoc Analysis Command on Simple Grid in Essbase
Figure 3 shows a valid simple grid in Essbase, where Product is the page dimension inrow 1. Year is the row dimension and Measures is the column dimension, beginning onrow 2.
Chapter 27Free-Form Grid Examples
27-4

Figure 27-3 Simple Grid in Essbase with Dimension in Row 1
Figure 4 shows what happens after clicking Refresh in a connected sheet. In this case,because the Product dimension was already placed on the sheet, it is moved to row 2. ThePOV dimensions are placed on row 1. The row and column dimensions begin on row 3.
Figure 27-4 Result of Ad Hoc Analysis Command on Simple Grid in Essbase withDimension in Row 1
Simple Grid in Planning
Figure 5 shows a valid simple grid in Planning, where Year is the row dimension and Accountis the column dimension.
Figure 27-5 Simple Grid in Planning
Two Column By Two Row Layout
Figure 6 is a basic two columns by two rows layout showing the Product and Marketdimensions in the first row and column, and members of Sales and Year in the second rowand column.
Chapter 27Free-Form Grid Examples
27-5

Figure 27-6 Two Columns by Two Rows Layout
Column DimensionsCloud data source types: Oracle Analytics Cloud - Essbase
On-premises data source types: Oracle Essbase
Column Dimensions Interpreted as Page Dimensions
When there is one row dimension and multiple members, all of different dimensions, inthe same top row, the left-most dimension in the row is treated as column dimensionand the others as page dimensions. Figure 1 shows a valid grid in which Year is therow dimension, Measure is the column dimension, and Product and Market are pagedimensions.
Figure 27-7 Column and Page Dimensions in the First Row
The first members of each column dimension must occur on the same column, and thefirst members of every row dimension must occur on the same row. Figure 2 is invalidbecause cell B2 is on the first column of the column dimensions and must be amember of the Measures dimension, whereas it is a comment.
Figure 27-8 Invalid Placement in Column
Stacked DimensionsCloud data source types: Oracle Analytics Cloud - Essbase
On-premises data source types: Oracle Essbase
Chapter 27Free-Form Grid Examples
27-6

The first row that contains multiple members of the same dimension is a column dimension.All dimensions placed above this row are candidates for page dimension if they comply withthe rules for page dimension. However, dimensions above this column dimension that are inthe same column ("stacked") and have no other members are column dimensions and notpage dimensions. Such grids are not valid.
In Figure 1, Product is a column dimension that is stacked on Profit; Market is a pagedimension, because it is not stacked on Profit. Scenario is a page dimension, even though itis stacked on Profit, because its row is above a page dimension.
Figure 27-9 Stacked Dimensions as Page Dimensions
In Figure 2, Product and Market are stacked above a column dimension and contain no othermembers. Therefore, this grid is not valid.
Figure 27-10 Invalid Stacked Column
Comments in Free-Form GridsReview the guidelines in this section when working with comments in free-form grids.
Cloud data source types: Oracle Analytics Cloud - Essbase, Planning
On-premises data source types: Oracle Essbase, Oracle Hyperion Financial Management,Oracle Hyperion Planning
Note:
Essbase, Oracle Analytics Cloud - Essbase, Planning in EPM Cloud: Youcannot add comments on worksheets that are enabled for multiple grids.
Comments can be placed as follows:
Chapter 27Comments in Free-Form Grids
27-7

• Between row dimensions
• Between column dimensions
• Between page dimensions
• Between dimensions and data cells
• Interleaved with members of page dimensions
• Interleaved with members of row, column and page dimensions
Further, comment rows and comment columns can be interleaved with row andcolumn dimensions.
• To the left, right, top, bottom of the grid.
Comments cannot be placed in data cells or in cells that intersect row and columndimensions in the upper right corner.
When working with comments:
• In Financial Management, comments will shift with Zoom in and Zoom Outoperations, depending on the row or column.
• In Oracle Hyperion Planning or Planning, comments are supported both inside andoutside of the grid boundaries.
Note:
Comments are not saved to the provider server in the free-form worksheet.For example, if you use the Save Ad Hoc Grid command with a Planningfree-form or ad hoc grid, the formulas are not saved. However, you can retainthe comments in a worksheet by performing a Save in Excel and saving theworkbook.
For information about unexpected behavior that may occur, see Actions That MayCause Unexpected Behavior.
Related Topics:
Comments in Blank Rows and Columns
Grid with Complex Comments
Invalid Placement of Comments
Comments Inside and Outside of Grid Boundaries
Comments in Blank Rows and ColumnsCloud data source types: Oracle Analytics Cloud - Essbase
On-premises data source types: Oracle Essbase, Oracle Hyperion FinancialManagement
Figure 1 shows a grid with comments in cells A5, A6, C1, C2, C10, D1, D2, D10, H5,and H6. These comments are retained in retrieval and zoom operations.
Chapter 27Comments in Free-Form Grids
27-8

Figure 27-11 Comments in Blank Rows and Columns
Grid with Complex CommentsCloud data source types: Oracle Analytics Cloud - Essbase
On-premises data source types: Oracle Essbase
Figure 1 shows an example of a combination of the page region, attributes, and comments ona single grid.
Figure 27-12 Grid with Complex Comments
Invalid Placement of CommentsCloud data source types: Oracle Analytics Cloud - Essbase
On-premises data source types: Oracle Essbase
Row and column dimension regions can be interleaved with comment rows and commentcolumns. Figure 1shows a grid that is invalid because the comment in cell C2 does not
Chapter 27Comments in Free-Form Grids
27-9
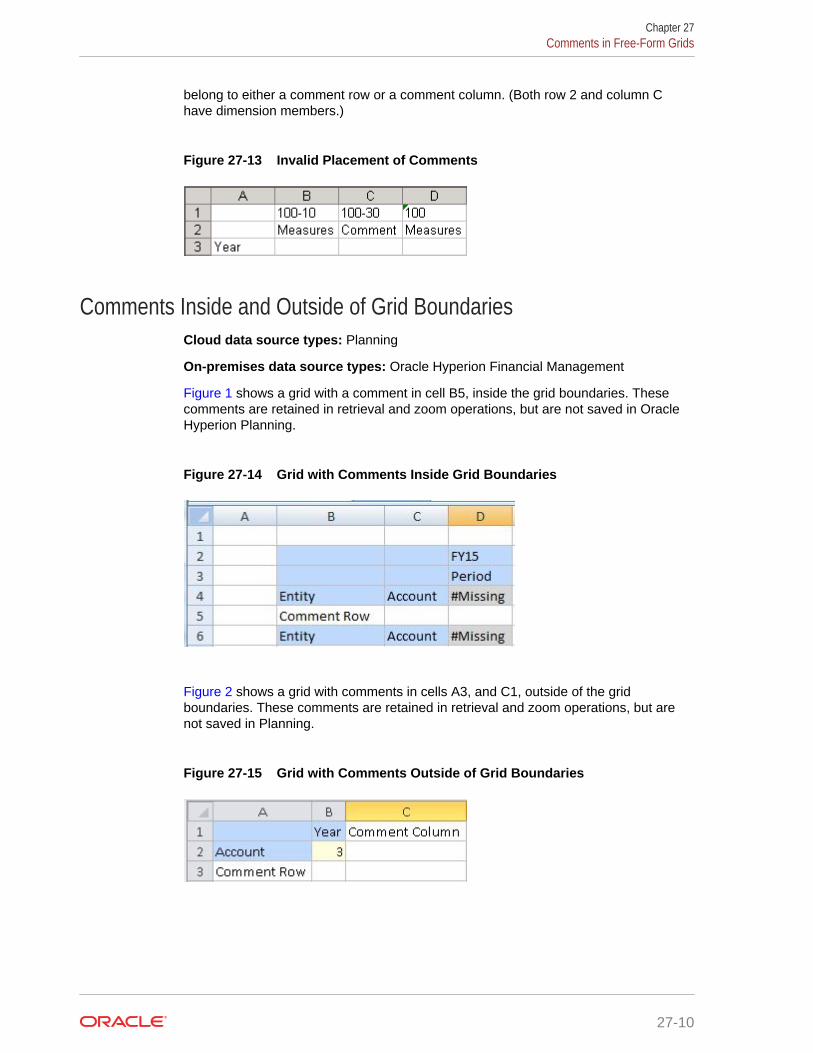
belong to either a comment row or a comment column. (Both row 2 and column Chave dimension members.)
Figure 27-13 Invalid Placement of Comments
Comments Inside and Outside of Grid BoundariesCloud data source types: Planning
On-premises data source types: Oracle Hyperion Financial Management
Figure 1 shows a grid with a comment in cell B5, inside the grid boundaries. Thesecomments are retained in retrieval and zoom operations, but are not saved in OracleHyperion Planning.
Figure 27-14 Grid with Comments Inside Grid Boundaries
Figure 2 shows a grid with comments in cells A3, and C1, outside of the gridboundaries. These comments are retained in retrieval and zoom operations, but arenot saved in Planning.
Figure 27-15 Grid with Comments Outside of Grid Boundaries
Chapter 27Comments in Free-Form Grids
27-10

Formulas in Free-Form GridsReview the guidelines in this topic when working with formulas in free-form grids.
Cloud data source types: Oracle Analytics Cloud - Essbase, Planning
On-premises data source types: Oracle Essbase, Oracle Hyperion Financial ManagementOracle Hyperion Planning
You can enter Excel formulas in cells that can contain comments.
Note:
Excel formulas are not saved to the provider server in the free-form worksheet. Forexample, if you use the Save Ad Hoc Grid command with a Planning free-form orad hoc grid, the formulas are not saved. However, you can retain formulas in aworksheet by performing a Save in Excel and saving the workbook.
Figure 1 shows a grid from an Essbase data source with Excel formulas in cells C8 and F8.
Figure 27-16 Formulas in Essbase Free-Form Grid in Excel
Figure 2 shows a grid from a Planning data source with Excel formulas in cells B8 and C7.
Figure 27-17 Formulas in Planning Free-Form Grid in Excel
Chapter 27Formulas in Free-Form Grids
27-11
For information about unexpected behavior that may occur, see Actions That MayCause Unexpected Behavior.
Duplicate Aliases in Free-Form ModeReview the guidelines and examples in this topic when working with duplicate aliasesin free-form mode.
Data source types: Planning
Planning supports duplicate aliases for members from different dimensions and formembers within dimensions.
To use duplicate aliases, you must have, at a minimum, Oracle Smart View for Office11.1.2.5.600, and you must be connected to Planning version 16.06 or later.
The guidelines are:
• Duplicate aliases are supported across dimensions and within dimensions.
• Aliases can have the same name as a member.
• Member names are still required to be unique so that they can be used in rulesand form design to avoid name collisions.
When typing a duplicate alias name in free-form mode, and then refreshing, amessage appears asking you to resolve the duplicate. You can do this either by usingthe Member Selector to select the correct alias name or by hand-typing the qualifiedname in this format:
[parent_member_name].[alias]or
[parent_alias].[alias]Only duplicate alias names are supported, not duplicate member names; therefore,using the parent member name as a qualifier should be sufficient in many cases.
However, if [parent_alias] is also a duplicate, then the qualified name should beextended up to the first unique ancestor, in this format:
[grand_parent_member_name].[parent_alias].[alias]or
[grand_parent_alias].[parent_alias].[alias]For example, suppose a database has the following Market and Geography dimensionhierarchies, with duplicate alias names at the Region, State, and City level. In thisscenario, East, New York (state), and New York (city) are duplicate alias names, asfollows:
Market Geography East East New York New York New York New York
Chapter 27Duplicate Aliases in Free-Form Mode
27-12

You want to enter the city, New York, from the Market dimension into a free-form grid. To dothis, you could select the city, New York, from the Market dimension in the Member Selector.Or, you could type the qualified name as follows:
[Market].[East].[New York].[New York]
Attribute Dimensions in Free-Form GridsReview the guidelines and examples in this topic when working with attribute dimensions infree-form mode.
Cloud data source types: Oracle Analytics Cloud - Essbase
On-premises data source types: Oracle Essbase
Figure 1 shows an example of both page region and attribute usage. In this example, PkgType (an attribute dimension attached to the base member Product) and Budget are pagedimensions. By drilling down on Pkg Type you can do attribute based analysis on measuresas it relates to specific Product attributes. This can be further used to create a cross-tabanalysis of product SKUs by attribute.
Figure 27-18 Attribute Dimensions in Free-Form Grids
Alternatively, to quickly add attribute dimensions onto a free-form grid, follow the instructionsin Inserting Attribute Dimensions on the Sheet. You can then use the member selectioninstructions in the Dimensions and Members to select and work with members from theattribute dimensions.
Creating Free-Form ReportsFollow the procedure in this topic to create a free-form report.
Cloud data source types: Oracle Analytics Cloud - Essbase, Planning
On-premises data source types: Oracle Essbase, Oracle Hyperion Financial Management,Oracle Hyperion Planning
To construct a free-form report:
1. Open a worksheet and connect to a data source.
Chapter 27Attribute Dimensions in Free-Form Grids
27-13

2. In the worksheet, enter member names according to the rules specified in Free-Form Guidelines.
3. Members may have duplicate names (for example, both East and West marketsmay contain a member named Portland — Maine and Oregon). To enter aduplicate member name:
• In Essbase or Oracle Analytics Cloud - Essbase, use Member Selection toselect members.
• In Financial Management, the Member Name Resolution window is displayedif the member you enter has a duplicate. From the drop-down list, select thedimension of the member you entered and click OK. Repeat as necessary.
4. Refresh the grid, or select Ad hoc analysis.
5. Perform further ad hoc operations and formatting as needed.
Retrieving Attribute Dimensions in Free-Form ModeFollow the procedure in this topic to retrieve attribute dimensions in a free-form report..
Cloud data source types: Oracle Analytics Cloud - Essbase
On-premises data source types: Oracle Analytics Cloud - Essbase
In structured grid processing operations, attribute dimensions are not shown. In free-form, you can type an attribute dimension member in the grid and it will be processedand validated. Only the attribute dimension member that you added will be displayedand used during processing and validation; the remaining attribute dimensionmembers will not be included. Structured grid operations that follow this free-formrequest will retain the attribute dimension member.
If the base dimension exists in the worksheet, you can also retrieve an attributemember by typing the name directly in the worksheet.
To retrieve an attribute dimension in free-form using Member Selection:
1. In a blank worksheet, select a cell.(The worksheet must be blank.)
2. From the data source ribbon, select Member Selection.
3. In the Dimension Name Resolution dialog box, select the attribute dimension.
4. To orient members vertically in the worksheet starting from the cell you selected instep 3, select the Vertical Orientation check box.
This check box is cleared by default; meaning that members will be orientedhorizontally across the sheet from the cell you selected in step 3.
5. Click OK to launch the Member Selection dialog box.
6. Select the members to place on the worksheet.
Note:
You can also add attribute dimensions and members to the sheet.
Chapter 27Retrieving Attribute Dimensions in Free-Form Mode
27-14

Creating Asymmetric ReportsFollow the procedure in this topic to create asymmetric free-form report..
Cloud data source types: Oracle Analytics Cloud - Essbase, Planning
On-premises data source types: Oracle Essbase, Oracle Hyperion Planning
Reports can contain symmetric or asymmetric column groups. The symmetry the symmetryof column groups is determined automatically, based on the members you select.
Symmetric reports, as shown in Figure 1, are characterized by repeating, identical groups ofmembers.
Figure 27-19 Symmetric Report
Asymmetric reports, as shown in Figure 2, are characterized by groups of nested membersthat differ by at least one member. There can be a difference in the number of members or inthe names of members.
Figure 27-20 Asymmetric Report
You can create asymmetric reports as follows:
• Enter member names in free-form mode.
• Zoom in with Within Selected Group selected on the Member Options page of theOptions dialog box.
• Suppress rows that contain missing values, zero values, or underscore characters duringdata retrievals.
Note:
Retrieving data into an asymmetric report may take a long time on large reports.
Chapter 27Creating Asymmetric Reports
27-15

Actions That May Cause Unexpected BehaviorReview this topic to learn about actions that may cause unexpected behavior in free-form reports.
Oracle Smart View for Office tries to preserve all comments, formulas, and customizedreport layouts. Some exceptions that may result in unexpected behavior are when thefollowing actions are performed:
• Zoom in on a page dimension
• Pivot a dimension from the POV to a row or column
• Drag and drop a dimension from the POV to the worksheet
• Pivot a row dimension to a column dimension
• Switch the location of a row dimension to another row
• Switch the location of a column dimension to another column
• Change member aliases using the Change Alias Table command
• With Oracle Essbase or Oracle Analytics Cloud - Essbase data sources, cuttingand pasting from Microsoft Word into an Excel worksheet may cause unexpectedbehavior because of hidden characters. If this happens, contact your administrator,who can identify the issue through logs.
Chapter 27Actions That May Cause Unexpected Behavior
27-16

28Smart View Diagnostics and Health Check
Related Topics
• About Smart View Diagnostics and Health CheckThe Oracle Smart View for Office Diagnostics tools to help you collect information forOracle Support. Health Check can help you to optimize Smart View performance andquickly review information about your system.
• Displaying the Diagnostics Group in the Smart View RibbonYou can choose to display or hide the Diagnostics options in the Smart View ribbon.
• Customizing Diagnostics FeaturesYou can customize certain features of the Diagnostics tools.
• Using the Smart View Diagnostics ToolsUse the Oracle Smart View for Office Diagnostic tools to collect data about your issue inthe form of log files and screenshots.
• Cleaning Up the Diagnostics FolderOnce you have transmitted your diagnostics zip file to Oracle Support, you can clear thefiles in the diagnostics folder.
• Performing a Health Check On Your SystemYou can perform a "health check" on your system to optimize performance.
• Performing a Health Check on Microsoft Office DocumentsYou can perform a "health check" to optimize performance of a Microsoft Excel workbook,Word document, or PowerPoint presentation.
About Smart View Diagnostics and Health CheckThe Oracle Smart View for Office Diagnostics tools to help you collect information for OracleSupport. Health Check can help you to optimize Smart View performance and quickly reviewinformation about your system.
While working with Smart View, an issue may arise that you cannot resolve on your own. Usethe tools in the Diagnostics group in the Smart View ribbon to create and collect files andscreenshots to send to Oracle Support. The files and screenshots you collect are used byOracle Support to troubleshoot and resolve your issue.
You can also use the Health Check dialog to optimize performance and to get informationabout your machine, Microsoft Office version, Smart View version, and the extensions youhave installed.
Related Topics:
Displaying the Diagnostics Group in the Smart View Ribbon
Customizing Diagnostics Features
Using the Smart View Diagnostics Tools
Cleaning Up the Diagnostics Folder
28-1

Performing a Health Check On Your System
Displaying the Diagnostics Group in the Smart View RibbonYou can choose to display or hide the Diagnostics options in the Smart View ribbon.
When you first install Oracle Smart View for Office and open it, the Diagnosticsoptions are not displayed.
To display the Diagnostics group of options:
1. Open the Office application where you are experiencing the issue.
2. From the Smart View ribbon, select Options, and then select the Advanced tab.
3. In Advanced, select Show Diagnostics Group on Smart View Ribbon, and thenclick OK to close the Options dialog box.
The Diagnostics group is automatically displayed in the Smart View ribbon (see Figure 1). You do not need to the restart the Office application.
Figure 28-1 Tools in the Diagnostics Group in the Smart View Ribbon
4. Repeat this procedure in each Office application where you are experiencing theissue.
Note:
You must enable the Diagnostics group in each Office applicationindividually. The Diagnostics group will not display in other Officeapplications until you enable it.
5. Optional: When finished using the Diagnostics tools, to hide the Diagnosticsgroup in the Smart View ribbon, clear the Show Diagnostics Ribbon Tab checkbox in the Advanced tab of the Options dialog box.
Customizing Diagnostics FeaturesYou can customize certain features of the Diagnostics tools.
The procedure in this topic walks you through each of the options available in theDiagnostic Options dialog box.
Chapter 28Displaying the Diagnostics Group in the Smart View Ribbon
28-2

Note:
All steps in the following procedure are optional.
To customize the Diagnostics tools:
1. In the Diagnostics group in the Smart View ribbon, select Diagnostics Options.
The Diagnostics Options is displayed, as shown in Figure 1.
Figure 28-2 Diagnostics Options Dialog Box
2. To hide data values in the Office document, select Mask Data.
Select this option if data values in your output should be hidden for confidentialitypurposes.
Note:
Selecting either Mask Data or Mask Members (see next step), or both, canimpact performance significantly on large grids; for example, on grids of10,000+ cells.
3. To hide member names in the Office document, select Mask Members.
Select this option if member names in your output should be hidden for confidentialitypurposes.
4. To direct the diagnostics output files to a folder other than the default, in Route
diagnostics output to, click and navigate to the folder location to store the files.
You can also enter the folder location manually.
The default folder location is:
C:\Users\username.domain\AppData\Roaming\Oracle\SmartView\Diagnostics
5. To allow automatic screenshots for each warning or error message that is displayed,select an option:
Chapter 28Customizing Diagnostics Features
28-3
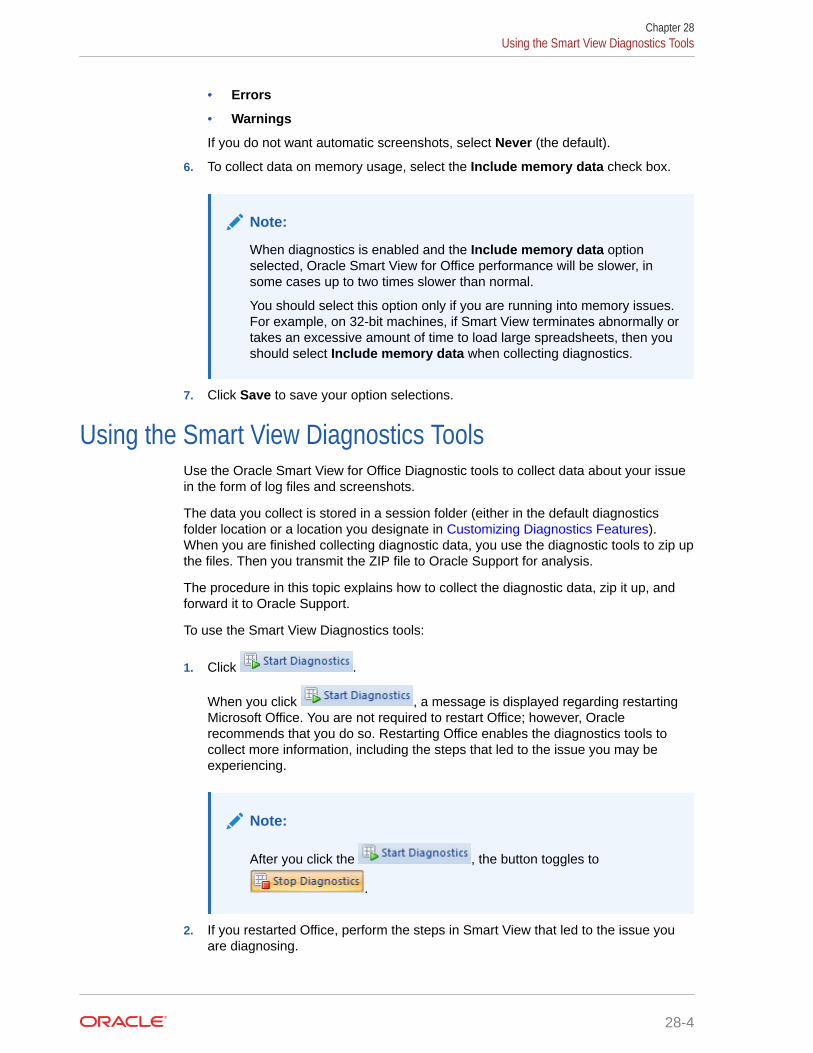
• Errors
• Warnings
If you do not want automatic screenshots, select Never (the default).
6. To collect data on memory usage, select the Include memory data check box.
Note:
When diagnostics is enabled and the Include memory data optionselected, Oracle Smart View for Office performance will be slower, insome cases up to two times slower than normal.
You should select this option only if you are running into memory issues.For example, on 32-bit machines, if Smart View terminates abnormally ortakes an excessive amount of time to load large spreadsheets, then youshould select Include memory data when collecting diagnostics.
7. Click Save to save your option selections.
Using the Smart View Diagnostics ToolsUse the Oracle Smart View for Office Diagnostic tools to collect data about your issuein the form of log files and screenshots.
The data you collect is stored in a session folder (either in the default diagnosticsfolder location or a location you designate in Customizing Diagnostics Features).When you are finished collecting diagnostic data, you use the diagnostic tools to zip upthe files. Then you transmit the ZIP file to Oracle Support for analysis.
The procedure in this topic explains how to collect the diagnostic data, zip it up, andforward it to Oracle Support.
To use the Smart View Diagnostics tools:
1. Click .
When you click , a message is displayed regarding restartingMicrosoft Office. You are not required to restart Office; however, Oraclerecommends that you do so. Restarting Office enables the diagnostics tools tocollect more information, including the steps that led to the issue you may beexperiencing.
Note:
After you click the , the button toggles to
.
2. If you restarted Office, perform the steps in Smart View that led to the issue youare diagnosing.
Chapter 28Using the Smart View Diagnostics Tools
28-4

3. Click to take screenshots that you feel will be helpful in documentingyour issue.
Note:
The screenshot includes the entire screen, not just the application. Be sure tominimize any confidential information that you may have on your screen so thatit is not included in the screenshot.
4. Click to save the currently-opened Office document to the diagnosticsfolder for the current session.
You can perform multiple saves of the document, if necessary. Oracle recommends thatyou save the document at different points during the work you are doing in order to bestdemonstrate and show your issue. Each time you save, Smart View adds a suffix to thefile name, (0), (1), (2), etc.; no documents are overwritten.
The documents are stored in the current diagnostics session folder; the default locationis:
C:\Users\username.domain\AppData\Roaming\Oracle\SmartView\Diagnostics
5. When you are finished gathering the diagnostics you require to adequately document
your issue for Oracle Support, click and in the Create Archive dialogbox, specify a folder to store the archive and a file name, or use the default folder locationand file name.
The files are stored in your system's My Documents folder as follows:
My Documents\Documents
The file is named in the following format:
SmartView_Diagnostics_ddmmyyyy.zip
6. Email the diagnostics zip file to your Oracle support representative.
Cleaning Up the Diagnostics FolderOnce you have transmitted your diagnostics zip file to Oracle Support, you can clear the filesin the diagnostics folder.
Note:
Clearing the diagnostics folder while Diagnostics is running clears all folders exceptfor the current session folders for currently-opened Microsoft Office applications.Clearing the diagnostics folder when Diagnostics is not running clears alldiagnostics folders, including all the latest session folders.
Chapter 28Cleaning Up the Diagnostics Folder
28-5

Clearing All Diagnostics Folders Except the Current Session Folders
To clear all diagnostics folders except the current session folders:
1. Verify that Diagnostics is running.
2. Click .
This action clears all diagnostics folders except those created for the currently-running Office applications.
Clearing All Diagnostic Folders, Including the Latest Session Folders
To clear all diagnostics folders, including the latest session folders:
1. If you have not already done so, in the Diagnostics group in the Smart View
ribbon, click .
2. Close any opened Office applications, including the one in which you areexperiencing an issue.
3. Open any Office application and click .
This action clears all diagnostics folders including the latest session folders forOffice applications.
Performing a Health Check On Your SystemYou can perform a "health check" on your system to optimize performance.
With the Health Check, you can also get information about your machine, such ascertain registry settings, Microsoft Office version, Oracle Smart View for Office version,and the extensions you have installed.
Note:
The Health Check feature is only available when using Smart View withExcel.
To perform a health check:
1. From the Smart View ribbon in Excel, click the arrow next to Help, and then selectHealth Check.
The Health Check dialog is displayed.
2. View the following system information; you cannot edit this information:
• Version Information—Operating System, Excel Version, Smart View Version,Internet Explorer Version, WebView2 Runtime Version
Chapter 28Performing a Health Check On Your System
28-6

Note:
If Microsoft Edge WebView2 Runtime is not installed, then WebView2Runtime Version displays None. See the WebView2 Runtime option inthe Smart View Options group in the next step.
• Hardware Information—RAM Memory, Processor, Smart View Installed Drive Space
• Excel Add-ins—Depends on the Excel add-ins that are installed
• COM Add-ins—Depends on the COM add-ins that are installed
3. Update the following information as you require; if you change any settings, click UpdateSettings to apply the changes.
Optionally, click Recommended Settings to set all options to those most optimal toSmart View.
These are the editable settings:
• Registry Information
HTTP session timeouts can occur when working with large queries that take a longtime to run, or when you are experiencing slower internet connections. To reducetimeout occurrences, you can set timeout values. (If you change any of the timeoutvalues, you must restart all Microsoft Office applications in order for the new value tobe applied.)
– KeepAlive Timeout—The default value is 900 seconds. To change the value,click in the Fix/Update/Info column, enter a new value, and then click UpdateSettings.
– Receive Timeout—The default value is 900 seconds. To change the value, clickin the Fix/Update/Info column, enter a new value, and then click UpdateSettings.
– ServerInfo Timeout—The default value is 900 seconds. To change the value,click in the Fix/Update/Info column, enter a new value, and then click UpdateSettings.
– Current Resolution—Read only. The current resolution of the system display.
– USER Process Handle Quota—Read only. The number of process handles.Process handles regulate Oracle Smart View for Office’s access to systemresources.
– Enable Per Process System DPI—Windows 10 Display Settings only. For drag-and-drop to work correctly if you use Office applications at a scaling leveldifferent than 100%, select Enable. The default value is Disabled.
If you're using a high DPI display as your primary monitor and a regular DPIdisplay as your extended monitor, drag and drop may not work on the extendedregular DPI display monitor. This is due to mouse drivers giving incorrectcoordinates for mouse actions, resulting in faulty drag-and-drop behavior.
– Browser Emulation Mode—Adds the required registry key to all Officeapplications (Excel, Word, PowerPoint, Outlook) so that certain browser-basedscreens in Smart View and Smart View extensions render properly.
Select the option that corresponds to your browser version:
* 12001—Microsoft Edge
Chapter 28Performing a Health Check On Your System
28-7

* 11001—Internet Explorer 11
* 10001—Internet Explorer 10
* Disable
This option is enabled by default and shows the value, Default.
• Smart View Options
– Undo Buffer—The number of Undo and Redo actions permitted on anoperation. The default value is 9. To change the value, click in the Fix/Update/Info column, enter a new value, and then click Update Settings.You can enter a value between 1 and 100. (See Using Undo and Redo).
– Improve Metadata Storage—This option pertains to interoperabilitybetween different versions of Smart View. It allows for more efficientstorage of internal data structures.
The default value is "Checked." If all users in your organization are onSmart View 9.3.1.6 or higher, then this option should always be checked.
When this option is "Unchecked," two copies of metadata are maintainedfor compatibility purposes, which may result in slower overall performance.Uncheck this option in the following situations:
* You send an Excel workbook to users on Smart View releases earlierthan 9.3.1.6, or to users on Microsoft Office 2002 and earlier,regardless of the Smart View release.
* You open a workbook sent from users on Smart View releases earlierthan 9.3.1.6, or from users on Microsoft Office 2002 and earlier,regardless of the Smart View release.
Note: If you change this option to "Unchecked," the value in the Fix/Update/Help Link column changes to "Fix." If you are having issues withyour system and want to optimize performance, you should "fix" thissetting by changing the value back to "Checked."
– WebView2 Runtime—Select Enable to enable Smart View to use theinstalled version of Microsoft Edge WebView2 Runtime.Whether enabled or disabled, the installed WebView2 Runtime version isdisplayed in WebView2 Runtime Version in the Version Informationgroup; if WebView2 Runtime is not installed, then WebView2 RuntimeVersion displays None (see the previous step).
The default is Disable.
When enabled, WebView2 is used by Smart View to assist with someauthentication scenarios at login. During runtime, Smart View detects thepresence of WebView2 Runtime installed on the machine and launchesthe WebView2-based dialog to host the login page.
For WebView2 requirements, see Microsoft Edge WebView2 Support inthe Oracle Smart View for Office Readme .
• Graphic Setting
The following two options improve the user experience by helping to reduceflickering in Microsoft Office:
– Disable Windows Transitions on Addin Task Panes—The default valueis "Enabled." To disable this option, click in the Fix/Update/Help Linkcolumn, select Disable, and then click Update Settings.
Chapter 28Performing a Health Check On Your System
28-8

Note: If you change this option to "Disabled," the value in the Fix/Update/HelpLink column changes to "Fix." If you are having issues with your system andwant to optimize performance, you should "fix" this setting by changing the valueback to "Enabled."
– Disable Animations—This setting disables Office animations. The default valueis "Enabled." To disable this option, click in the Fix/Update/Help Link column,select Disable, and then click Update Settings.
Note: If you change this option to "Disabled," the value in the value in the Fix/Update/Help Link column changes to "Fix". If you are having issues with yoursystem and want to optimize performance, you should "fix" this setting bychanging the value back to "Enabled."
4. Click Update Settings to save the changes you've made
If you select Recommended Settings, you must still click Update Settings to save thechanges.
5. Optional: Click Export to Excel to export the Health Check information to a new Excelspreadsheet.
6. Click Close to close the Health Check dialog box.
7. Restart Excel and log in.
Tip:
If you change any of the information in the Health Check dialog box, and want toget back to the default values, click Recommended Settings. A dialog box displaysthe recommended settings. To accept these settings, click Yes, then click UpdateSettings, then click Close, and then restart Excel.
Performing a Health Check on Microsoft Office DocumentsYou can perform a "health check" to optimize performance of a Microsoft Excel workbook,Word document, or PowerPoint presentation.
Related Topics
• About Health CheckUse the Health Check tool in Oracle Smart View for Office to optimize performance in aMicrosoft Excel workbook, Word document, or PowerPoint presentation.
• Performing a Health Check
About Health CheckUse the Health Check tool in Oracle Smart View for Office to optimize performance in aMicrosoft Excel workbook, Word document, or PowerPoint presentation.
The actions you take with the Health Check tool will fix and/or delete some non-Smart View-related objects, optimizing Smart View performance.
You can also use the Health Check tool to get information about specific items in each Officeapplication, such as named ranges, styles, tags, query objects, and other objects.
Chapter 28Performing a Health Check on Microsoft Office Documents
28-9

You access the Health Check dialog in the General group in the Smart View ribbon.
Health Check Items for Microsoft Office
When you launch the Health Check dialog, a copy of the selected Excel workbook,Word document, or PowerPoint presentation opens, and the dialog lists the followingitems:
• Workbook Health Check for Microsoft Excel
– Named Ranges
– Shapes
– Styles
– Links
– Hyperlinks
– Sheets
• Document Health Check for Microsoft Word
– Tables
– Inline Shapes
– Shapes
– Styles
– Query Objects
Note:
To improve performance, click Fix to remove duplicate queries fordata points pasted into Word.
– Hidden Query Objects
– Comment Objects
– Variables
– Bookmarks
– Content Controls
• Presentation Health Check for Microsoft PowerPoint
– Shapes
– Tags
– Slides
You can preview each item and delete or fix the items accordingly. Any changes aremade in the copy of the Microsoft Excel, Word, or PowerPoint document. Performing aSave will save your changes in the copy. To save the file with the original file name,you must close the original file, and then perform a Save As.
Narrative Reporting: If you want to perform a health check and refresh a doclet of anyOffice type (described in Performing a Health Check on Microsoft Office Documents),perform the health check first, and then save the temporary file with the correct doclet
Chapter 28Performing a Health Check on Microsoft Office Documents
28-10

name. Next, upload and check in the saved doclet (see Checking In Doclets. Then check outthe doclet, perform the refresh, and then upload the doclet and check it in.
Performing a Health CheckYou can perform a "health check" to optimize the performance of a Microsoft Excel workbook,Word document, or PowerPoint presentation. You can also use the Health Check tool to getinformation about specific items in each Office application, such as named ranges, styles,tags, query objects, and other objects.
Note:
The Health Check feature is only available when using Oracle Smart View for Officewith Microsoft Excel, Word, and PowerPoint.
To perform a health check:
1. From the Smart View ribbon, perform a task:
• Excel: Click the arrow next to More, and then select Workbook Health Check.
• Word: Click Document Health Check in the General group.
• PowerPoint: Click Presentation Health Check in the General group.
The Health Check dialog is displayed, and a copy of the active Excel workbook, Worddocument, or PowerPoint presentation opens.
Note:
In the Health Check dialog, the first item is selected by default and displaysinformation about limitations provided by Microsoft Office or Smart View.
2. In the Health Check dialog, select an item, and perform a task:
• Preview—Lists the names or IDs of the selected item.
• Fix—Based on the selected item, fixes the issue.
• Fix All—Deletes applicable non-Smart View-related items and fixes Smart Viewobjects.
• Delete—Deletes the applicable non-Smart View-related objects of the selected item.
3. Click Close to exit the dialog
4. To save the file copy you have been working in, click Save.
A Save will save your changes in the file copy. To save with the original file name, youmust close the original file, and then perform a Save As.
Chapter 28Performing a Health Check on Microsoft Office Documents
28-11

29Using Other Applications with Smart View
Related Topics
• Crystal Ball EPMUse Oracle Crystal Ball Enterprise Performance Management to analyze data fromOracle Smart View for Office data sources in simulation and forecasting workbooks.
• Smart View and Spreadsheet Add-inAvoid mouse control conflicts when both Oracle Smart View for Office and OracleEssbase Spreadsheet Add-in are installed on the same computer.
Crystal Ball EPMUse Oracle Crystal Ball Enterprise Performance Management to analyze data from OracleSmart View for Office data sources in simulation and forecasting workbooks.
These are Excel workbooks that contain one or more worksheets with a Crystal Ball EPMmodel and one or more other worksheets, each of which may be connected to any of thesupported data sources. They are stored in a centralized Oracle Hyperion EnterprisePerformance Management Workspace repository and can be accessed and managedthrough the Smart View Panel.
For more information, see the Crystal Ball EPM documentation set.
Related Topics:Working with Crystal Ball EPM Workbooks
Toolbar Operations
Repository Options
Note:
You can use Crystal Ball EPM with Smart View if you hold the appropriate license.
Working with Crystal Ball EPM WorkbooksPermissions set by the administrator govern Oracle Crystal Ball Enterprise PerformanceManagement simulation and forecasting workbooks operations that you can perform from theSmart View Panel.
To work with data in a Crystal Ball EPM workbook:
1. From the Smart View ribbon, select Panel.
2. In the Smart View Panel, click and select Simulation Workbook.
29-1

3. Click and if requested, log in to the Crystal Ball EPM repository. A tree listcontaining the workbooks for which you have permission is displayed.
4. Double-click a workbook to open.
5. Perform Crystal Ball EPM operations as described in the Crystal Ball EPM productdocumentation.
Oracle recommends keeping the Crystal Ball EPM model on a worksheet separatefrom data source worksheets.
6. Click Submit Data if needed.
Toolbar Operations
Toolbar OperationsUse the Oracle Crystal Ball Simulation Workbook toolbar buttons to perform thefollowing operations on workbooks and folders in the tree list.
• Connect to a repository
• Add, save, and delete workbooks
• Add and rename folders
The characters listed in Table 1 are not allowed in folder names.
Table 29-1 List of Restricted Character in Folder Names
Character Description
\ backslash
/ forward slash
% percent sign
? question mark
+ plus sign
< less than sign
> greater than sign
| vertical bar
' single quotation mark
" double quotation mark
* asterisk
: colon
• Refresh the tree list
• Set options to specify where workbook files are to be stored and the OracleHyperion Enterprise Performance Management Workspace agent with which tocommunicate (these options apply across all sessions running on the server). Todo so, click Options and enter this information:
– URL: the Web Services agent URL. Use this syntax: http://<host>/raframework/services/BiPlus
– Folder: the name of the repository folder to contain the workbook file
Chapter 29Crystal Ball EPM
29-2

Repository OptionsSet repository options to specify where workbook files are to be stored and the OracleHyperion Enterprise Performance Management Workspace agent with which to communicate
The repository options apply across all sessions running on the server.
• URL: the Web Services agent URL. Use this syntax: http://<host>/raframework/services/BiPlus
• Folder: the name of the repository folder to contain the workbook file
Smart View and Spreadsheet Add-inAvoid mouse control conflicts when both Oracle Smart View for Office and Oracle EssbaseSpreadsheet Add-in are installed on the same computer.
When both Smart View and Spreadsheet Add-in are installed on the same computer, mouseactions are interpreted as Spreadsheet Add-in commands. If you want Smart View to controlmouse commands instead, you can instruct Spreadsheet Add-in to respond to commandsonly in Oracle Essbase connections that were established through Spreadsheet Add-in.
To enable Smart View to control mouse commands:
1. Open Excel.
2. Select Essbase, then Options, and then Global.
3. Select Limit to Connected Sheets.
4. Click OK.
Smart View will control mouse commands unless the connection to Essbase isestablished through Spreadsheet Add-in and not Smart View.
Note:
You can connect to data sources from Smart View and Spreadsheet Add-in in thesame workbook but not on the same worksheet.
Chapter 29Smart View and Spreadsheet Add-in
29-3
30Migrating Functions
Related Topics
• About Migrating FunctionsFunctions in Oracle Hyperion Financial Management and Oracle Hyperion Enterprise®
can be converted to current Oracle Smart View for Office syntax with the migration utility.
• Converting WorkbooksYou can convert workbooks that contain Oracle Hyperion Financial Management orOracle Hyperion Enterprise® functions by using the migration utility.
• Converting One WorkbookUse the procedure in this topic to convert a workbook that contains Oracle HyperionFinancial Management or Oracle Hyperion Enterprise® functions.
• Converting Multiple WorkbooksUse the procedure in this topic to convert workbooks that contain Oracle HyperionFinancial Management or Oracle Hyperion Enterprise® functions.
• Migrating Connections for FunctionsIn Oracle Hyperion Financial Management, you can select a connection or connectionreference for functions that do not contain an application reference when you migrate toOracle Smart View for Office.
About Migrating FunctionsFunctions in Oracle Hyperion Financial Management and Oracle Hyperion Enterprise® canbe converted to current Oracle Smart View for Office syntax with the migration utility.
Note:
The Smart View function migration utility is not supported on 64-bit Office. Microsoftis expected to address this issue. Until then, use the 32-bit version of Office.
Converting WorkbooksYou can convert workbooks that contain Oracle Hyperion Financial Management or OracleHyperion Enterprise® functions by using the migration utility.
Data source types: Financial Management, Hyperion Enterprise
You can convert workbooks that contain Financial Management Retrieve Data functions orHyperion Enterprise HP Retrieve and VBA Retrieve functions. For example, you can convertFinancial Management functions such as HFMVal, HFMLnk, HFMLab, HFMDes, andHFMCur and Hyperion Enterprise functions such as HPVal, HPLnk, HPCur, HPHea, HPCde,and HPFul.
30-1
The utility might not be able to convert all of your functions. Some functions mightrequire manual adjustment.
For functions that use cell references, the following functions are converted:
• If every parameter in the function is a cell reference. For example:=HFMVal($B$1&$C$1&$B$2&$C$3&$B$5&$C$5&$B$6&$C$6).
• If the dimension parameters are specified in the function, the members are cellreferences, but the period separator is hard coded in the function. For example:=HFMVal("S#"&D2&".Y#"&D3&".VW#"&D5&".')
The following functions that use cell references are not converted:
• If the dimension parameters are specified in the function and the members andperiod separator are cell references. For example:=HFMVal("S#"&E2&"Y#"&E3&"VW#"&E5), where E2=Actual, E3=2004,E5="<Scenario View>."
• If the dimension parameters are specified in the function, the members are cellreferences, but the period separator is in a separate cell, the function is notconverted. For example: =HFMVal("S#"&F2&C1&"Y#"&F3&C1&"VW#&F5&C1),where C1=. (period separator).
• If the application specified in the function is a cell reference.
• If any cell in a workbook contains more than 1024 characters, the workbook doesnot convert properly. To reduce the size of data in cell, reference multiplefunctions, or remove dimensions that can be set in the background POV.
Before you run the migration utility, ensure that the path is correct (the default path isMIDDLEWARE_HOME\EPMSystem11R1\common\empstatic\wsspace\ ). During migration,Excel inserts the original path of the add-in file to functions. This can make thefunctions too long and cause errors. Excel limits Oracle Smart View for Office functionsto a maximum of 256 characters.
Converting One WorkbookUse the procedure in this topic to convert a workbook that contains Oracle HyperionFinancial Management or Oracle Hyperion Enterprise® functions.
Data source types: Financial Management, Hyperion Enterprise
To convert a workbook:
1. From the Smart View ribbon, select More, then Migrate Active Workbook(Financial Management) or Migrate Active Workbook (Hyperion Enterprise).
If your functions contain application references, you must map the application tothe corresponding connection.
2. Click Convert, then OK.
Migration results are displayed, including a list of any functions that failed toconvert. You can manually adjust those functions.
3. To save the conversion results, click Save Result, select a location to store theresults file, and then click Save.
4. Click Close.
Chapter 30Converting One Workbook
30-2
Converting Multiple WorkbooksUse the procedure in this topic to convert workbooks that contain Oracle Hyperion FinancialManagement or Oracle Hyperion Enterprise® functions.
Data source types: Financial Management, Hyperion Enterprise
To convert multiple workbooks:
1. From the Smart View ribbon, select More, then Migrate Batch (Financial Management)or Migrate Batch (Hyperion Enterprise).
2. In the Migration Wizard, click Add and select the workbooks that you want to convert.
3. Click Next. If your functions contain application references, you must map the applicationto the connection.
Migration results are displayed, including a list of any functions that failed to convert. Youcan manually adjust those functions.
4. In Financial Management, click Save Result, then select a location for the results file,and then click Save.
In Hyperion Enterprise, converted workbooks are automatically saved in the location ofthe original workbooks.
5. Click Done.
Migrating Connections for FunctionsIn Oracle Hyperion Financial Management, you can select a connection or connectionreference for functions that do not contain an application reference when you migrate toOracle Smart View for Office.
Data source types: Financial Management
To migrate connections for functions:
1. From the Smart View ribbon, select More, then Migrate Active Connections (HFM).
2. From Function Migration — Application reference, select an option:
• Do not update functions with a connection reference.
• Add connection name to existing functions, then select a connection name fromthe Connection Name list. This updates all functions with the specified connectionname.
• Update functions with reference to connection list within selected worksheet,then in Cell Reference, enter the cell to reference, for example, A2. This updates allfunctions with a cell reference in the current worksheet.
• Update functions with reference to connection list on a new worksheet, thenenter the Worksheet name, and Cell Reference. This updates all functions with a cellreference to a different worksheet in the workbook.
Chapter 30Converting Multiple Workbooks
30-3

Tip:
You can create a drop-down list in any cell to be used as a referencewithin functions to refer to a connection name. From the Smart Viewribbon, select More, then Insert Connection List to display a list ofconnections from which to choose in the current cell.
3. Click OK.
Chapter 30Migrating Connections for Functions
30-4
31Finding Information
Related Topics
• Smart View AccessibilityInformation about Oracle Smart View for Office accessibility features is available in theOracle Smart View for Office Accessibility Guide .
• Smart View VBA FunctionsInformation about Oracle Smart View for Office VBA functions is in the Oracle Smart Viewfor Office Developer's Guide or Developing Applications for Oracle Smart View for Office .
• Data Provider Information ResourcesOn the Oracle Help Center, you can find documentation and other user assistanceresources for data providers that work with Oracle Smart View for Office.
Smart View AccessibilityInformation about Oracle Smart View for Office accessibility features is available in the OracleSmart View for Office Accessibility Guide .
The Oracle Smart View for Office Accessibility Guide is available for each release on theOracle Help Center. To open this library, from the Smart View ribbon, click the arrow next toHelp and then Documentation.
Smart View VBA FunctionsInformation about Oracle Smart View for Office VBA functions is in the Oracle Smart View forOffice Developer's Guide or Developing Applications for Oracle Smart View for Office .
The on-premises version, Oracle Smart View for Office Developer's Guide is available in the Oracle Help Center . To open this library from the Smart View ribbon, click the arrow next toHelp, and then select Documentation. Scroll to the Smart View for Office section, and clickthe link for your Smart View version.
The cloud-only version, Developing Applications for Oracle Smart View for Office is availableon the Books tab of supported Oracle Enterprise Performance Management Cloud businessprocesses. Go to the Enterprise Performance Management (EPM) Cloud page on the OracleHelp Center, and locate your EPM Cloud business process.
Data Provider Information ResourcesOn the Oracle Help Center, you can find documentation and other user assistance resourcesfor data providers that work with Oracle Smart View for Office.
In general, this guide provides only procedural information for using the data providerfeatures that Smart View supports. For detailed information about the Oracle EnterprisePerformance Management System and Oracle Essbase data providers, see the productdocumentation available on the Oracle Help Center. To open this library, from the Smart Viewribbon, click the arrow next to Help and then Documentation.
31-1

For Oracle Enterprise Performance Management Cloud user assistance, go to the Application Services page on the Oracle Help Center and locate your EPM Cloudproduct under "Enterprise Performance Management."
For Oracle Analytics Cloud and Oracle Analytics Cloud - Essbase user assistance, goto the Oracle Analytics Cloud page on the Oracle Help Center.
Chapter 31Data Provider Information Resources
31-2