Oracle Supply Chain Management Cloud - Oracle Help Center
344
Oracle Supply Chain Management Cloud Using Replenishment Planning 21D
-
Upload
khangminh22 -
Category
Documents
-
view
4 -
download
0
Transcript of Oracle Supply Chain Management Cloud - Oracle Help Center

Oracle SupplyChain ManagementCloud
Using Replenishment Planning
21D

Oracle Supply Chain Management CloudUsing Replenishment Planning
21DPart Number F46154-01Copyright © 2011, 2021, Oracle and/or its affiliates.
Authors: J. Sivamani, R. Chaubey, T. Jayaraj, B. Mise, D. West
This software and related documentation are provided under a license agreement containing restrictions on use and disclosure and are protectedby intellectual property laws. Except as expressly permitted in your license agreement or allowed by law, you may not use, copy, reproduce, translate,broadcast, modify, license, transmit, distribute, exhibit, perform, publish, or display any part, in any form, or by any means. Reverse engineering,disassembly, or decompilation of this software, unless required by law for interoperability, is prohibited.
The information contained herein is subject to change without notice and is not warranted to be error-free. If you find any errors, please reportthem to us in writing.
If this is software or related documentation that is delivered to the U.S. Government or anyone licensing it on behalf of the U.S. Government, thenthe following notice is applicable:
U.S. GOVERNMENT END USERS: Oracle programs (including any operating system, integrated software, any programs embedded, installed oractivated on delivered hardware, and modifications of such programs) and Oracle computer documentation or other Oracle data delivered to oraccessed by U.S. Government end users are "commercial computer software" or "commercial computer software documentation" pursuant to theapplicable Federal Acquisition Regulation and agency-specific supplemental regulations. As such, the use, reproduction, duplication, release, display,disclosure, modification, preparation of derivative works, and/or adaptation of i) Oracle programs (including any operating system, integratedsoftware, any programs embedded, installed or activated on delivered hardware, and modifications of such programs), ii) Oracle computerdocumentation and/or iii) other Oracle data, is subject to the rights and limitations specified in the license contained in the applicable contract. Theterms governing the U.S. Government's use of Oracle cloud services are defined by the applicable contract for such services. No other rights aregranted to the U.S. Government.
This software or hardware is developed for general use in a variety of information management applications. It is not developed or intended foruse in any inherently dangerous applications, including applications that may create a risk of personal injury. If you use this software or hardwarein dangerous applications, then you shall be responsible to take all appropriate fail-safe, backup, redundancy, and other measures to ensure its safeuse. Oracle Corporation and its affiliates disclaim any liability for any damages caused by use of this software or hardware in dangerous applications.
Oracle and Java are registered trademarks of Oracle and/or its affiliates. Other names may be trademarks of their respective owners.
Intel and Intel Inside are trademarks or registered trademarks of Intel Corporation. All SPARC trademarks are used under license and are trademarksor registered trademarks of SPARC International, Inc. AMD, Epyc, and the AMD logo are trademarks or registered trademarks of Advanced MicroDevices. UNIX is a registered trademark of The Open Group.
This software or hardware and documentation may provide access to or information about content, products, and services from third parties. OracleCorporation and its affiliates are not responsible for and expressly disclaim all warranties of any kind with respect to third-party content, products, andservices unless otherwise set forth in an applicable agreement between you and Oracle. Oracle Corporation and its affiliates will not be responsiblefor any loss, costs, or damages incurred due to your access to or use of third-party content, products, or services, except as set forth in an applicableagreement between you and Oracle.
The business names used in this documentation are fictitious, and are not intended to identify any real companies currently or previously in existence.

Oracle Supply Chain Management CloudUsing Replenishment Planning
Contents
Preface i
1 Introduction to Replenishment Planning 1Overview of Oracle Fusion Replenishment Planning ............................................................................................................. 1
Overview of Supply Chain Planning Work Areas ................................................................................................................... 2
Overview of the Replenishment Planning Work Area ........................................................................................................... 3
How to Enable the Replenishment Planning Work Area ...................................................................................................... 4
Access Tasks as Quick Actions on a Home Page .................................................................................................................. 5
Work with Page Layouts in Replenishment Planning ........................................................................................................... 5
Overview of Supply Chain Planning Plan Types .................................................................................................................... 7
How You Define Planners for Supply Chain Planning .......................................................................................................... 8
Assign Time Zones to Locations in Supply Chain Planning ................................................................................................ 8
2 Tables, Graphs, Analysis Sets, Tiles, and Tile Sets 13Overview of Tables, Graphs, Analysis Sets, Tiles, and Tile Sets ........................................................................................ 13
Use Advanced Options in the Selector Tool .......................................................................................................................... 16
Create an Analysis Set ................................................................................................................................................................ 17
Create a Tile in Supply Chain Planning .................................................................................................................................. 17
Set Measure Targets for Use in Tiles ...................................................................................................................................... 18
Create a Tile Set in Supply Chain Planning ........................................................................................................................... 18
Use Table Drilling ......................................................................................................................................................................... 19
Use Table Linking ........................................................................................................................................................................ 19
Graph Layout Options ............................................................................................................................................................... 20
Configure Filters for Graphs ...................................................................................................................................................... 21
Axis Scale Options ...................................................................................................................................................................... 22
Format how Measures are Displayed in Tables and Graphs .............................................................................................. 22
Configure Color by Measure to Display in Graphs .............................................................................................................. 23
How Time Periods Are Calculated and Displayed in Tables, Graphs, and the Selector Tool ....................................... 25
Manage Measure Data in Tables ............................................................................................................................................. 26
Oracle Supply Chain Management CloudUsing Replenishment Planning
3 Planning Analytics 29Overview of Planning Analytics ............................................................................................................................................... 29
Configure Planning Analytics ................................................................................................................................................... 29
Dimensions and Dimension Catalogs ..................................................................................................................................... 31
Measure Catalogs ....................................................................................................................................................................... 34
Levels and Attributes ................................................................................................................................................................. 35
4 Planning Measures 37Predefined Measures in Supply Chain Planning .................................................................................................................. 37
How You Manage Planning Measures ................................................................................................................................... 37
Import Measure Data Into a Planning Table ......................................................................................................................... 39
Configure Units for a Measure ................................................................................................................................................. 41
Configure Currencies for a Measure ....................................................................................................................................... 41
Configure Conditional Formatting for a Measure ............................................................................................................... 42
Manage User-Defined Measures ............................................................................................................................................ 43
5 Supply Network Model 49How You Maintain Your Supply Network Model ................................................................................................................. 49
Publish Order Forecasts to Suppliers ..................................................................................................................................... 50
How You Define the Approved Supplier List for Supply Chain Planning ........................................................................ 51
Associate Calendars with Supplier Sites ................................................................................................................................ 52
Assignment Sets, Sourcing Rules, and Bills of Distribution .............................................................................................. 52
Create an Assignment Set ........................................................................................................................................................ 55
Specify Catalogs for Assignment Sets ................................................................................................................................... 56
Create a Sourcing Rule or Bill of Distribution ....................................................................................................................... 57
Export Planning Data to CSV Files ......................................................................................................................................... 58
Item Attributes and Order Modifiers for Supply Planning ................................................................................................. 59

Oracle Supply Chain Management CloudUsing Replenishment Planning
6 Planning Data Collections 63Overview of Data Collections for Supply Chain Planning .................................................................................................. 63
Global Entities ............................................................................................................................................................................. 64
Data Collection Types for Supply Chain Planning ............................................................................................................... 65
Manage Planning Source Systems for Data Collections .................................................................................................... 66
How the Order Orchestration and Order Promising Processes Use the Collected Planning Data ............................. 68
How You Enable Cross-References of Entities by Data Collections ................................................................................. 68
How Planning Processes Collect Different Work Definitions and Item Structures ....................................................... 69
Enable External Data Collection for the Oracle Fusion Source System ........................................................................... 71
Collect Planning Data from the Oracle Fusion Source System ......................................................................................... 72
Load Planning Data from Others and External Source Systems ...................................................................................... 77
Verify Collection Processes .................................................................................................................................................... 100
Collections for Oracle Fusion Replenishment Planning .................................................................................................... 102
Collection of Consumption Data for Oracle Fusion Replenishment Planning ............................................................. 103
Purge Data .................................................................................................................................................................................. 104
7 Exceptions 109Exceptions in Plans .................................................................................................................................................................. 109
Exceptions and Exception Sets ............................................................................................................................................... 112
Predefined Planning Exceptions ............................................................................................................................................. 114
User-Defined Exceptions .......................................................................................................................................................... 116
8 Segmentation 123Segmentation in Oracle Fusion Replenishment Planning ................................................................................................ 123
Work with Segment Groups .................................................................................................................................................... 125
Run Segmentation .................................................................................................................................................................... 128
View the Segmentation Summary ......................................................................................................................................... 129
Override Segmentation Results ............................................................................................................................................. 130

Oracle Supply Chain Management CloudUsing Replenishment Planning
9 Policy Assignment Sets and Policy Parameter Calculation 133Policy Assignment Sets ............................................................................................................................................................ 133
How You Use Policy Assignment Sets .................................................................................................................................. 136
How Average Daily Demand Is Calculated in Oracle Fusion Replenishment Planning ............................................... 138
How EOQ Is Calculated in Oracle Fusion Replenishment Planning ............................................................................... 140
How Safety Stock Is Calculated in Oracle Fusion Replenishment Planning ................................................................. 142
How You Upload Externally Calculated Safety Stock ........................................................................................................ 143
Static Policies or Time-Phased Policies in Oracle Fusion Replenishment Planning .................................................... 143
Work With Policy Assignment Sets ....................................................................................................................................... 146
10 Policy Comparisons 151Overview of the Policy Comparison Feature ....................................................................................................................... 151
How You Use the Policy Comparison Feature .................................................................................................................... 152
Measures Used for Comparing Policy Parameters ............................................................................................................ 154
Work with the Manage Policy Comparison Table ............................................................................................................... 157
How You Use the Policy Comparison Analytics ................................................................................................................. 160
11 Statistical Forecasts 163Create a Forecasting Profile .................................................................................................................................................... 163
Edit a User-Defined Forecasting Profile ............................................................................................................................... 165
Forecasting Methods ................................................................................................................................................................ 167
Configure Decomposition Groups ......................................................................................................................................... 168
Forecasting Parameters ........................................................................................................................................................... 169
Measures for Bayesian Forecasting ....................................................................................................................................... 171
Disaggregation of Statistical Forecasts ................................................................................................................................ 174
How You Forecast Product Returns ...................................................................................................................................... 180
How You Generate Forecasts from a Product Launch Date ............................................................................................ 180
How You Stop Forecasts from a Product Discontinuation Date ...................................................................................... 181
How You Analyze Forecast Consumption ............................................................................................................................ 183
Forecast Processing in Replenishment Plans ..................................................................................................................... 185
Oracle Supply Chain Management CloudUsing Replenishment Planning
12 Replenishment Plans 193Create a Replenishment Plan ................................................................................................................................................. 193
Open a Replenishment Plan ................................................................................................................................................... 194
Copy a Replenishment Plan .................................................................................................................................................... 195
View a Replenishment Plan .................................................................................................................................................... 196
Manage Plan Options .............................................................................................................................................................. 196
Publish Plan Data ...................................................................................................................................................................... 216
Best Practices for Setting Up Replenishment Plans .......................................................................................................... 217
Example of Replenishment Plans for a Standard Business Scenario ............................................................................ 220
Guidelines for Working with Plan Messages for Replenishment Plans .......................................................................... 221
13 Calculation and Release of Replenishment Orders 229Overview of Replenishment Order Release ........................................................................................................................ 229
Measures Used for Calculating Replenishment Orders .................................................................................................... 229
Support for Sourcing Rules and Bills of Distribution in Oracle Fusion Replenishment Planning ............................ 230
Examples of Replenishment Orders for Different Policy Types ....................................................................................... 231
How Order Modifiers Are Applied When Replenishments Are Calculated ................................................................... 237
Aggregate Planning Buckets and Replenishment Orders ................................................................................................ 238
How Replenishment Orders Are Calculated During Incremental Planning ................................................................... 241
Scheduling of Replenishment Orders .................................................................................................................................. 244
How Replenishment Orders Are Automatically Released ................................................................................................ 246
Manually Release Replenishment Orders ........................................................................................................................... 247
Create and Release Manual Planned Orders ....................................................................................................................... 251
Release Plan Recommendations to an External Execution System ............................................................................... 252
Verify Status of Replenishment Orders ............................................................................................................................... 253
14 Replenishment Planning for Subinventories 255Overview of Replenishment Planning for Subinventories ............................................................................................... 255
How You Set Up Replenishment Planning for Subinventories ....................................................................................... 256
Example of Replenishment Plans for Stores Modeled as Subinventories .................................................................... 259

Oracle Supply Chain Management CloudUsing Replenishment Planning
15 Inventory Rebalancing 261Overview of Inventory Rebalancing ...................................................................................................................................... 261
Inventory Rebalancing Options for Replenishment Plans ............................................................................................... 262
Work with Clusters ................................................................................................................................................................... 263
Measures for Inventory Rebalancing ................................................................................................................................... 266
How Rebalancing Recommendations Are Created ............................................................................................................ 273
How You Use the Inventory Rebalancing Feature ............................................................................................................. 275
How the Projected Inventory Measure Is Calculated ........................................................................................................ 276
How the Excess Inventory and Inventory Shortage Are Calculated .............................................................................. 280
Example of Inventory Rebalancing ....................................................................................................................................... 286
Examples of Inventory Rebalancing and Replenishment Planning ............................................................................... 290
Manually Release Rebalancing Recommendations .......................................................................................................... 299
How You Use the Analytics for Inventory Rebalancing .................................................................................................... 301
16 Simulations for Replenishment Plans 303Overview of Simulations for Replenishment Plans ........................................................................................................... 303
Simulate Changes to Policy Parameters for Segments Within a Replenishment Plan .............................................. 304
Simulate Changes to Policy Values for Items Within a Replenishment Plan ............................................................... 306
How You Simulate Changes to Supplies and Demands in Replenishment Plans ....................................................... 307
How You Simulate Changes to Item Attributes in Replenishment Plans ..................................................................... 309
17 Simulation Sets 311Create a Simulation Set ............................................................................................................................................................ 311
Edit a Simulation Set ................................................................................................................................................................. 311
Edit a Simulation Set from a Spreadsheet ........................................................................................................................... 312
18 Business Insights 315Manage Notes in Supply Chain Planning ............................................................................................................................ 315

Oracle Supply Chain Management CloudUsing Replenishment Planning
19 Extract Plan Data 317Overview of Planning Measure Data Extractions from Plan Output .............................................................................. 317
Configure Plan Extract Parameters ....................................................................................................................................... 318
Files Created by the Plan Extract Process .......................................................................................................................... 320
Dimension Data Files Created by the Plan Extract Process ............................................................................................. 322
Dimension Definition Files Created by the Plan Extract Process ................................................................................... 323
Measure Data Files Created by the Plan Extract Process ................................................................................................ 325
Measure Definition Files Created by the Plan Extract Process ....................................................................................... 327
Dimension Codes Used by the Plan Extract Process ........................................................................................................ 328
Dimensionality Group Codes Used by the Plan Extract Process .................................................................................... 328

Oracle Supply Chain Management CloudUsing Replenishment Planning
Oracle Supply Chain Management CloudUsing Replenishment Planning
Preface
i
PrefaceThis preface introduces information sources that can help you use the application.
Using Oracle Applications
HelpUse help icons to access help in the application. If you don't see any help icons on your page, click your user imageor name in the global header and select Show Help Icons. Not all pages have help icons.
If you don't see Show Help Icons in the Settings and Actions menu, you can access the Oracle Help Center to findguides and videos.
Watch: This video tutorial shows you how to find and use help.
You can also read about it instead.
Additional Resources
• Community: Use Oracle Cloud Customer Connect to get information from experts at Oracle, the partnercommunity, and other users.
• Training: Take courses on Oracle Cloud from Oracle University.
ConventionsThe following table explains the text conventions used in this guide.
Convention Meaning
boldface Boldface type indicates user interface elements, navigation paths, or values you enter or select.
monospace Monospace type indicates file, folder, and directory names, code examples, commands, and URLs.
> Greater than symbol separates elements in a navigation path.
Oracle Supply Chain Management CloudUsing Replenishment Planning
Preface
ii
Documentation AccessibilityFor information about Oracle's commitment to accessibility, visit the Oracle Accessibility Program website.
Videos included in this guide are provided as a media alternative for text-based help topics also available in this guide.
Diversity and InclusionOracle is fully committed to diversity and inclusion. Oracle respects and values having a diverse workforce that increasesthought leadership and innovation. As part of our initiative to build a more inclusive culture that positively impacts ouremployees, customers, and partners, we're working to remove insensitive terms from our products and documentation.We're also mindful of the necessity to maintain compatibility with our customers' existing technologies and the need toensure continuity of service as Oracle's offerings and industry standards evolve. Because of these technical constraints,our effort to remove insensitive terms is ongoing and will take time and external cooperation.
Contacting Oracle
Access to Oracle SupportOracle customers that have purchased support have access to electronic support through My Oracle Support. Forinformation, visit My Oracle Support or visit Oracle Accessibility Learning and Support if you are hearing impaired.
Comments and SuggestionsPlease give us feedback about Oracle Applications Help and guides! You can send an e-mail to:[email protected].

Oracle Supply Chain Management CloudUsing Replenishment Planning
Chapter 1Introduction to Replenishment Planning
1
1 Introduction to Replenishment Planning
Overview of Oracle Fusion Replenishment PlanningThis topic provides an overview of Oracle Fusion Replenishment Planning.Here's what you can do in the Replenishment Planning work area:
• Maintain optimum inventory levels at each node of your supply chain while meeting customer service targets.
• Use automated processes to maintain inventory policy parameters, dynamically update on-hand inventory,reduce costs by calculating the economic order quantity (EOQ) for replenishments, and improve customerservice levels.
• Perform dynamic demand segmentation by grouping item-location combinations into segments that aremeaningful to your business.
• Calculate service level-based inventory policies and thresholds.
• Integrate demand forecasting and time-phased inventory replenishment.
• Rebalance inventories to move items from locations with excess inventory to locations with inventoryshortages.
• Simulate inventory planning.
• Set up and monitor exceptions.
• Use rich, embedded analytics.
Also, with REST services, you can generate replenishment orders, manage segments, and integrate ReplenishmentPlanning with other Oracle Fusion applications.
This table shows how Replenishment Planning integrates with other Oracle Fusion applications:
Oracle Application Entities Collected by ReplenishmentPlanning
Entities Released by ReplenishmentPlanning
Oracle Fusion Inventory Management• On-hand inventory• Inventory transfers• Consumption history
• Inventory transferrecommendations
Oracle Fusion Procurement• Purchase orders• Requisitions
• Buy recommendations
Oracle Fusion Order Management• Sales orders• Shipment history
Not applicable
Oracle Fusion Product Management• Items• Organizations
Not applicable
Related Topics
• Policy Assignment Sets

Oracle Supply Chain Management CloudUsing Replenishment Planning
Chapter 1Introduction to Replenishment Planning
2
• Segmentation in Oracle Fusion Replenishment Planning• Overview of Inventory Rebalancing• Overview of Simulations for Replenishment Plans
Overview of Supply Chain Planning Work AreasThe Oracle Supply Chain Planning Cloud solution is comprised of products designed for specific supply chain planningbusiness processes and tasks. You perform these processes and tasks by using work areas. Each of the Supply ChainPlanning products provides access to one or more work areas.
The Supply Chain Planning work areas that you can use are determined by these factors:
• The products that your enterprise has licensed and configured
• The security privileges assigned to your user account
To use the Supply Chain Planning work areas, you must be aware of these points:
• Navigation to work areas
• List of Supply Chain Planning work areas and the products to which they're applicable
Navigation to Work AreasYou can use different paths to navigate to a specific work area including:
• From the Navigator: Click the Navigator icon to see the work areas that you have access to. The Supply ChainPlanning work areas are listed within the Supply Chain Planning heading. The work area names are links. Click aspecific work area link to access that work area.
• From the Springboard: On your home page you might have one or more springboard icons that representa group of work areas, such as the group of Supply Chain Planning work areas. Click on the Supply ChainPlanning springboard to access a set of icons, each of which represents a specific Supply Chain Planning workarea. Click a specific icon to access that work area.
List of Supply Chain Planning Work AreasThe following table lists the Supply Chain Planning work areas and the Supply Chain Planning products that areapplicable to each of the work areas.
Work Area Products
Demand Management Oracle Fusion Demand Management
Supply Planning Oracle Fusion Supply Planning
Demand and Supply Planning Both of these products must be configured:
• Oracle Fusion Demand Management• Oracle Fusion Supply Planning

Oracle Supply Chain Management CloudUsing Replenishment Planning
Chapter 1Introduction to Replenishment Planning
3
Work Area Products
Planning Central Oracle Fusion Planning Central
Sales and Operations Planning Oracle Fusion Sales and Operations Planning
Backlog Management Oracle Fusion Backlog Management
Production Scheduling Oracle Fusion Production Scheduling
Replenishment Planning Oracle Fusion Replenishment Planning
Plan Inputs Use the Plan Inputs work area to perform tasks that don't require creating or accessing a plan.
This work area can also be opened from other Supply Chain Planning work areas.
Note: The Global Order Promising work area is bundled within the Order Management solution.
Related Topics
• Overview of the Supply Planning Work Area
• Overview of the Demand Management Work Area
• Overview of the Sales and Operations Planning Work Area
• Overview of the Order Promising Work Area
Overview of the Replenishment Planning Work AreaYou use the Replenishment Planning work area to create, configure, and view your replenishment plans and analyzeyour real-world business processes.
Using the Replenishment Planning work area, you can:
• Create and configure replenishment plans.
• View replenishment plans and plan inputs.
• Use predefined or user-defined page layouts to view plan data that's tailored to your business.
To go to the Replenishment Planning work area and open a plan:
1. Open the work area by doing one of the following:
◦ In the Navigator, go to the Supply Chain Planning group, and click Replenishment Planning.
◦ On the home page, click the Supply Chain Planning springboard, and click the icon for ReplenishmentPlanning.

Oracle Supply Chain Management CloudUsing Replenishment Planning
Chapter 1Introduction to Replenishment Planning
4
2. To open a replenishment plan, use one of these methods:
Method Step
Through the Plans drawera. Click the Plans panel tab.b. Expand Plans.c. Right-click a replenishment plan, and select Open.
Note: Only those replenishment plans that have been successfullyrun are shown in the Plans panel tab.
Through the Manage Plans pagea. Click the Tasks panel tab.b. Under Plans, select Manage Plans.
The Manage Plans page appears.c. Select a replenishment plan, and click Actions > Open.
Your replenishment plan opens by default in the Edit Plan page, which consists of a header and configurable pane.
HeaderThe header contains the Page Layout list and drop-down buttons such as Open, Actions, and Save.
Configurable PaneYou can display the contents of your replenishment plan in the configurable pane. The number of panes displayeddepends on the page layout that you're using. Using the Change drop-down button in the header, you can configure thenumber of displayed panes.
How to Enable the Replenishment Planning Work AreaTo enable the Replenishment Planning work area, you must perform two setup tasks.
You can perform these tasks in any order, but you must do both before a user can access the work area.
• Opt in to the Replenishment Planning feature
• Assign a job role to the applicable users
Opt In to the Replenishment Planning FeatureYou perform this opt in one time for your overall site.
• Offering: Supply Chain Planning
• Feature: Replenishment Planning
For more information regarding how to opt in to features, refer to the Using Functional Setup Manager guide, OfferingConfiguration chapter in the Oracle Help Center.
Oracle Supply Chain Management CloudUsing Replenishment Planning
Chapter 1Introduction to Replenishment Planning
5
Assign the Applicable Job Role to the Applicable UsersAssign the predefined Replenishment Planner job role, or a job role with similar privileges that your enterprise defined,to the user associated to each of your replenishment planners.
For more information regarding how to assign job roles to users, refer to the Securing SCM guide, Role Provisioningchapter in the Oracle Help Center.
Related Topics
• Role Provisioning and Deprovisioning
• Overview of Configuring Offerings
Access Tasks as Quick Actions on a Home PageSome tasks that are accessible by using the tasks panel drawer in a supply chain planning work area are also availablefrom the home page as quick actions. Click the Show More link on the home page to display all of the available quickactions for which you have access. You don't have to first navigate to a supply chain planning work area to take anaction. For example, use quick actions to create a sourcing rule to purchase components from a new supplier withouthaving to first select a planning work area.
In addition, there are work area-specific preferences that enable you to change your default page layout without havingto first launch the work area. These preferences are useful if you configured a content-heavy default page layout that'staking too long to load. In such cases, you can change your default page to a different page layout that opens quickerand then edit the content-heavy page layout to make it perform better.
Here's some additional information about quick actions on a home page:
• You must have the applicable privileges associated with the task to see the task as a quick action on thehome page. Each quick action is secured by its related privilege or privileges. For example, if you have theManage Planning Sourcing privilege, then you should see the Manage Sourcing Rules task in the tasks paneldrawer in the work area. You should also see the task as a quick action on the Supply Chain Planning or OrderManagement (in the case of Global Order Promising) home pages.
• You must have access to the work area to see the associated manage preferences quick actions. For example,you must have access to the Supply Planning work area to see the Edit Supply Planning Preferences quickaction.
• You can't navigate to any other UI or open other tabs. When you click a quick access link, the UI opens in thepage, but you aren't in a work area.
• You can only return to the Supply Chain Planning home page when you close out of a task that you initiatedfrom the Supply Chain Planning home page.

Oracle Supply Chain Management CloudUsing Replenishment Planning
Chapter 1Introduction to Replenishment Planning
6
Work with Page Layouts in Replenishment PlanningIn the Replenishment Planning work area, you can create and edit page layouts.
Create a Page LayoutTo create a page layout:
1. In the Replenishment Planning work area, open the replenishment plan for which you want to create a pagelayout.
2. In the header, select Page Layout > Create.
The Create Page Layout dialog box opens.3. Specify the following details:
◦ Enter the page layout name and description.
◦ Select Public to make the page layout accessible to all users, or select Private to restrict the page layoutto yourself.
◦ In the Enable in Work Area field, ensure that Replenishment Planning is selected.
4. Click Save and Close.
The page layout is created with an empty pane.5. Click the Change drop-down button to select a pane layout (for example, Two Pane, Horizontal Split) for your
page layout.6. To add content to a pane, click the Open drop-down button, and select the pane.
The Open Table, Graph, or Tile Set dialog box opens.7. Select a table, graph, or tile set from the displayed list, and click OK.8. Add content to the other panes of the page layout.9. Click the Save Layout drop-down button.
Edit a Page LayoutYou can edit a user-defined page layout using the Save Layout drop-down button in the header or the Manage PageLayouts dialog box that's opened from the Page Layout field. You can't save your changes to a predefined page layoutor a page layout that belongs to another user. If you modify a predefined page layout or a page layout that belongs toanother user, you can save it as a new, user-defined page layout that belongs to you.
After making changes to the page layout, click the Save Layout drop-down button to save your changes. To save yourchanges to a new page layout, click Save Layout > Save As. The Save Layout As dialog box opens, and you can specifythe name, description, access, and work area for the new page layout.
In the Manage Page Layouts dialog box, you can:
• Change the name, description, work area, and access for the page layout.
• Duplicate or delete the page layout.
Note: You can't delete the page layout if it's presently being used by the displayed replenishment plan.
• Make the page layout your default page layout.
Oracle Supply Chain Management CloudUsing Replenishment Planning
Chapter 1Introduction to Replenishment Planning
7
• Add tables, graphs, or tile sets to the page layout.
• Remove tables, graphs, or tile sets from the page layout.
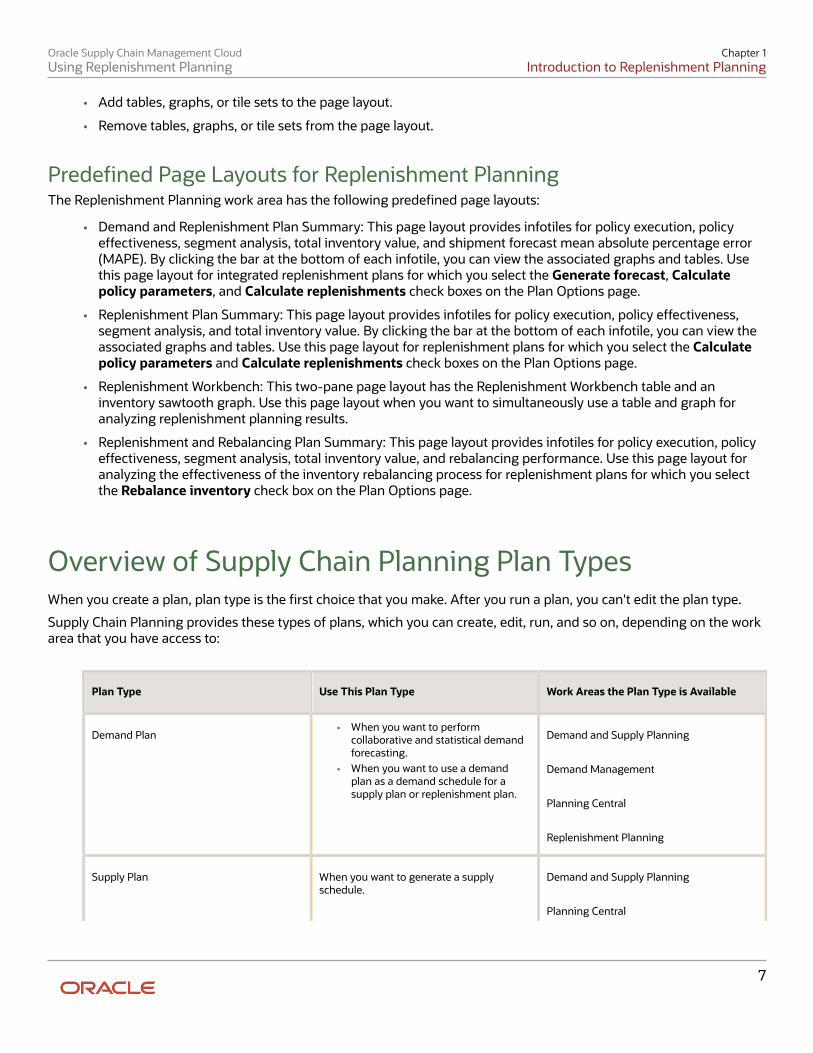
Predefined Page Layouts for Replenishment PlanningThe Replenishment Planning work area has the following predefined page layouts:
• Demand and Replenishment Plan Summary: This page layout provides infotiles for policy execution, policyeffectiveness, segment analysis, total inventory value, and shipment forecast mean absolute percentage error(MAPE). By clicking the bar at the bottom of each infotile, you can view the associated graphs and tables. Usethis page layout for integrated replenishment plans for which you select the Generate forecast, Calculatepolicy parameters, and Calculate replenishments check boxes on the Plan Options page.
• Replenishment Plan Summary: This page layout provides infotiles for policy execution, policy effectiveness,segment analysis, and total inventory value. By clicking the bar at the bottom of each infotile, you can view theassociated graphs and tables. Use this page layout for replenishment plans for which you select the Calculatepolicy parameters and Calculate replenishments check boxes on the Plan Options page.
• Replenishment Workbench: This two-pane page layout has the Replenishment Workbench table and aninventory sawtooth graph. Use this page layout when you want to simultaneously use a table and graph foranalyzing replenishment planning results.
• Replenishment and Rebalancing Plan Summary: This page layout provides infotiles for policy execution, policyeffectiveness, segment analysis, total inventory value, and rebalancing performance. Use this page layout foranalyzing the effectiveness of the inventory rebalancing process for replenishment plans for which you selectthe Rebalance inventory check box on the Plan Options page.
Overview of Supply Chain Planning Plan TypesWhen you create a plan, plan type is the first choice that you make. After you run a plan, you can't edit the plan type.
Supply Chain Planning provides these types of plans, which you can create, edit, run, and so on, depending on the workarea that you have access to:
Plan Type Use This Plan Type Work Areas the Plan Type is Available
Demand Plan• When you want to perform
collaborative and statistical demandforecasting.
• When you want to use a demandplan as a demand schedule for asupply plan or replenishment plan.
Demand and Supply Planning
Demand Management
Planning Central
Replenishment Planning
Supply Plan When you want to generate a supplyschedule.
Demand and Supply Planning
Planning Central

Oracle Supply Chain Management CloudUsing Replenishment Planning
Chapter 1Introduction to Replenishment Planning
8
Plan Type Use This Plan Type Work Areas the Plan Type is Available
Supply Planning
Demand and Supply Plan For an integrated demand and supplyplanning.
Demand and Supply Planning
Planning Central
Sales and Operations Plan For aggregate planning. Sales and Operations Planning
Backlog Plan For backlog management. Backlog Management
Replenishment Plan For replenishment planning. Replenishment Planning
Related Topics
• Actions to Manage Your Plans
How You Define Planners for Supply Chain PlanningPlanners are the people in your organization who are responsible for a set of items, their inventory levels, supply anddemand, and so forth. For example, some typical titles of planners are Material Planner, Supply Chain Planner, andDemand Planner. All supply chain planning products use planners. You can define a specific person as a supply chainplanner for the Oracle Fusion source system or for any other source system. You can also associate a planner to an itemat the organization level.
Use the ScpPlannersImportTemplate.xlsm import template to create the CSV file for the Load Planning Data from Filestask for planners. You can also use the Manage Planners page to define supply chain planners for each source system.Access the Manage Planners page from a Supply Chain Planning work area. Click the Tasks panel drawer and then clickthe Manage Planners link.
For Oracle Fusion source systems, associate the employee identification number with the planner name becauseOracle Fusion Purchasing requires a valid employee identification number. When a planner releases a planned order,purchasing checks the employee identification number before creating the purchase requisition.
For external source systems, determine if the employee identification number is required when releasing plannedorders. If required, use the Manage Planners page to associate the planner with their employee identification number.Or, you can use the ScpPlannersImportTemplate.xlsm template to associate the employee identification number withthe planner name.
Use Oracle Fusion Product Hub to assign planners at the item-organization level. During data collections, the planningprocesses collect the planner-item-organization assignment. Planners can then use the planner name to search thedata on most of the demand and supply planning pages.

Oracle Supply Chain Management CloudUsing Replenishment Planning
Chapter 1Introduction to Replenishment Planning
9
Assign Time Zones to Locations in Supply ChainPlanningYou can view supplies and demands in your Supply Chain Planning work area based on the time zone of theorganization, customer site, or supplier site. In addition, you can calculate precise in-transit time because supply chainplanning considers the time zone difference between the source and destination locations.
The following points discuss in detail how you can collect time zone details and view orders depending on the locations'time zone:
• Update Time Zones Using Data Collections
• Assign Time Zones in Supply Network Model
• Calculate In-Transit Time
• View Time Zones in Supplies and Demands
• Release to Execution
Update Time Zones Using Data CollectionsUse data collections to update organizations, customer site, or supplier site time zones. You can update the time zone inone of following three ways:
• Collect the organization's time zone from an Oracle Fusion source system.
• Collect time zones from an external source system using the organization, customer, and supplier importtemplates.
• Update the time zone on Customers and Suppliers tabs of the Maintain Supply Network Model page.
If you are collecting from an Oracle Fusion source system, then you can update the organization's time zone using thedata collections method only. You cannot manually update the organization's time zone using the Maintain SupplyNetwork Model page in your Supply Chain Planning work area.
Assign Time Zones in Supply Network ModelBefore collecting time zones or converting time zones to a local time, you must first assign time zones to organizations,customer sites, and supplier sites. A new time zone field is available on the Organizations, Customers, and Suppliers tabof the Maintain Supply Network Model page in your Supply Chain Planning wok area.
You cannot collect customer site and supplier site time zones from an Oracle Fusion source system. To update thecustomer site or supplier site time zone, use one of the following options:
• Use the customer or supplier import template to update the customer site or supplier site time zone. You canalso use this template if you are collecting from an external source system.
• Update the customer site and supplier site time zones directly in the Maintain Supply Network Model page.
When you recollect new customer and supplier data from an Oracle Fusion source system, the existing customer siteand supplier site time zone information is preserved. If you do not collect or update the customer site or supplier sitetime zone, then planning calculations assume that the customer site or supplier site is located in the same time zone asthe organization that is associated with the demand or supply.

Oracle Supply Chain Management CloudUsing Replenishment Planning
Chapter 1Introduction to Replenishment Planning
10
When you collect the supplies and demands, collections automatically convert the associated dates from the databaseserver time zone (Coordinated Universal Time or UTC) to the local time zone based on where the event takes place. Inaddition, when you collect shipments and booking history from the Oracle Fusion source system for use in the DemandManagement or the Demand and Supply Planning work area, collections converts the historical data from the databaseserver time zone (UTC) to the associated organization's time zone.
Calculate In-Transit TimeWhen calculating in-transit times, supply chain planning considers the time zone difference between the shippingand receiving locations. The following example shows how supply chain planning calculates the in-transit time. In thisexample, the customer site is located in Sydney (UTC+10) and the shipping organization is in Sacramento, California(UTC-8).
1. When planning collects a sales order with a requested arrival date of 25-March-2018, 21:00 (UTC) on thedatabase server, the requested arrival date is offset to the customer site's time zone. The customer site's timezone is Sydney time zone (UTC+10 hours). The requested arrival date becomes 26-March-2018, 7:00 in planinputs (Sydney time zone).
2. When you run the plan with the Refresh with current data option, the sales order is included in the plan andsupply chain planning uses this date to calculate the scheduled ship date.
3. Consider the in-transit time for the selected shipping method (Air Freight) is 36 hours. Supply chain planningfirst calculates the scheduled ship date as 25-March-2018, 19:00 hours (Sydney time) and then converts thedate to the Sacramento time. The product is shipped from Sacramento. The time zone difference is appliedto the scheduled ship date by subtracting 18 hours. The scheduled ship date becomes 25-March-2018, 1:00Sacramento time, which is used to generate the pegged supplies.
4. After completing the calculations, supply chain planning moves all the dates to the end of the day. All dateshave the time stamp of 23:59:00. The time stamp is not available on the UI, but you can query the time stampfrom the planning database.
Supply chain planning makes similar in-transit calculations when shipping supplies from a supplier site to anorganization, or when transferring product from one organization to another.
View Time Zones in Supplies and DemandsOn the Supplies and Demands page, use the following three columns to view supplies and demands in relation to thetime zone:
• Organization Time Zone
• Source Time Zone
• Destination Time Zone
The columns are not included in any predefined table layout. Create a user-defined table layout and include thesecolumns in your table.
To display supply and demand measure values within a table such as Material Plan or Build Plan, supply chain planningassigns the measure value to the day based on the organization's local time zone. The supply and demand measurevalue is not assigned to a date based on a common time zone.
Release to ExecutionWhen you release orders that are marked for release to Oracle Cloud execution system, the release action offsets thedate from the location's time zone to the database server time zone (UTC).

Oracle Supply Chain Management CloudUsing Replenishment Planning
Chapter 1Introduction to Replenishment Planning
11
For example, when you release a planned make order, supply chain planning converts the need-by date from theorganization's time zone to UTC.
Oracle Supply Chain Management CloudUsing Replenishment Planning
Chapter 1Introduction to Replenishment Planning
12

Oracle Supply Chain Management CloudUsing Replenishment Planning
Chapter 2Tables, Graphs, Analysis Sets, Tiles, and Tile Sets
13
2 Tables, Graphs, Analysis Sets, Tiles, and TileSets
Overview of Tables, Graphs, Analysis Sets, Tiles, and TileSetsYou can configure the entities for tables, graphs, analysis sets, tiles (also referred to as infotiles), or tile sets by using theSelector Tool. You can also create and manage groups on the Selector Tool page and associate your tables and graphswith the group. Navigate to the Selector Tool from an open plan or from the Actions menu on a table or graph toolbar.
To create a table, graph, analysis set, tile set, or tile, open the Selector Tool:
1. From an open plan, click Actions and then select Manage Tables, Graphs, and Analysis Sets.2. In the Manage Tables, Graphs, and Analysis Sets dialog box, click Actions and then select Create.3. Select one of the following to open the Selector Tool:
◦ Table
◦ Graph
◦ Analysis Set
◦ Tile Set
◦ Tile
4. Depending on your selection, the Selector Tool dialog box opens with the following tabs:
Tab Table Graph Analysis Set Tile
Measures Yes Yes Yes Yes
Hierarchies Yes Yes No Yes
Members Yes Yes No Yes
Measure Filters Yes Yes No Yes
Layout Yes Yes No Yes
Comparison Options Yes Yes No No
Details No No Yes No

Oracle Supply Chain Management CloudUsing Replenishment Planning
Chapter 2Tables, Graphs, Analysis Sets, Tiles, and Tile Sets
14
Note: In the Selector Tool, the member values displayed are based on what's configured in the Member Identifier toDisplay column on the Configure Planning Analytics page, Levels and Attributes tab. For example, for item, you canconfigure your tables and graphs to show the item description instead of the item name, which is what also appearswhen you're in the Selector Tool.
MeasuresUse the Measures tab to select measures for a table or graph by moving measures from the Available Measures pane tothe Selected Measures pane. The measures that you select determine the content of the other tabs. The dimensions ofthe measures determine the dimensions available on the Hierarchies tab and the dimension members on the Memberstab. For example, if a measure is the dimension created for Product, Organization, and Time, those dimensions and theirhierarchies are visible on the other tabs. You can display the available measures by measure group or alphabetically byusing the Tree View or List View icon.
A measure is usually a named time series of values that represent the following at a particular intersection of thecustomer, organization, product, supplier, and resource dimensions:
• Historical performance (Bookings History). This measure isn't applicable for supply planning.
• Future projections (Shipments Forecast)
• A key performance indicator (Gross Margin Percentage) or a derived calculation (Projected Available Balance)
The planning process aggregates measure data from lower levels to higher levels or computes KPIs and derivescalculations from other values at the same level as needed. The planning process can also allocate or spread updatesmade at an aggregate level to the affected cells at lower levels. Measures can be expressed in different units of measure,such as inches, dollars, kilos, or liters. Depending on the context, you can display, update, or compare measures that arein different units. The planning process can convert values among different units and among different currencies (formonetary values).
Note: Text-based measures aren't supported in graphs and aren't displayed in the Available Measures list on theMeasures tab of the Selector Tool during the configuration of graphs.
HierarchiesUse the Hierarchies tab to select the dimensions, hierarchies, and levels to include or exclude in the table or graph.
For each dimension, select the hierarchies and levels that you want to include in the graph or table. Checking thebox in the Display column includes that dimension in the table or graph. Expand the dimension to view the availablehierarchies. Expand the hierarchy to view the levels of the hierarchy. Checking a level includes it in the table or graph. Ifmultiple levels are checked, the top level is displayed in the table or graph by default. Each level in the table or graph canbe expanded until all checked levels are visible. The Show Unassociated check box determines whether the measurevalues that aren't associated with a specific dimension in the table or graph are hidden or displayed. For example, atable could include Shipments Forecast and Net Resource Availability. Shipments Forecast has product, organization,and time as dimensions. Net Resource Availability has resource, organization, and time as dimensions. With the checkbox selected, the Resource column displays the word Unassociated when you view Shipments Forecast rows.
MembersYou use the Members tab to manually select dimension members by moving members from the Available Memberspane to the Selected Members pane. If no selections are made on this tab for a dimension, the graph or table displaysthe dimension starting at the top level checked on the Hierarchies tab. For example, if you selected the GregorianCalendar hierarchy with Quarter and Month on the Hierarchies tab, the graph or table displays all quarters; each quarterhas an icon to drill to its months.

Oracle Supply Chain Management CloudUsing Replenishment Planning
Chapter 2Tables, Graphs, Analysis Sets, Tiles, and Tile Sets
15
Measure FiltersUse the Measure Filters tab to filter results based on measure values across dimension member combinations that meetthe criteria that you specify. You can filter your measure data to return only multidimensional combinations that meetthe measure criteria for selected dimensions of the measure.
Note: The measures listed are those that are of data type number, currency, or percent that aren't dimensionedby time. Measures that are time dimensioned and data types date and text are excluded from the list. If the tablecontains any configure-to-order measures, then the Measure Filters tab is disabled.
When you create or edit a table or graph, make your selections on the Measures, Hierarchies, and Members tabs. Next,on the Measure Filters tab, specify the measure criteria to apply across combinations of your dimension selections, suchas Item and Customer. The table or graph displays only the combinations that meet your specified measure criteria.
You can compare measures to fixed values or to other measures, and you can apply multiple measure conditions:
• Multiple AND conditions are allowed
• Multiple OR conditions are allowed
• Combination of AND and OR conditions aren't allowed.
You can apply the measure filters in a table or graph to a linked table or graph in the Manage Links UI. On the To Table,Graph, or Layout page, select the Include measure filters check box. This check box is enabled after you select thePass user-specified parameters check box.
LayoutUse the Layout tab to format tables, graphs, or tiles. The following are the key layout options for tables, graphs, andtiles:
• Tables: Use Table Layout Options to drag and drop dimensions to change the table layout and configure drillsettings.
• Graphs: use Graph Layout Options to select the graph type and the formatting options for the graph type thatyou select. In the Filters section, you can specify the filter criteria that you want displayed in the graph.
• Tiles: Use the Tile Layout Options to select the graph type, and add tables and graphs to the content area of thetile you're creating.
Comparison OptionsThe Comparison Options tab is applicable only for tables and graphs. On the Comparison Options tab, you can compareyour current plan with an archived version or an alternate plan. Use this tab to compare how specific measures havevaried over time. The Comparison Options tab contains three sections: Waterfall Analysis, Trend Analysis, and PlanComparison.
Note: The Comparison Options tab isn't available for Oracle Planning Central Cloud or Oracle Demand ManagementCloud.
• In the Waterfall Analysis section, you can compare selected measures in a table or a graph with an archivedplan.
Select the Use MAPE calculations check box if you have scheduled your plan archival process. MAPEcalculations use the system administrator archive and not an on-demand archive.

Oracle Supply Chain Management CloudUsing Replenishment Planning
Chapter 2Tables, Graphs, Analysis Sets, Tiles, and Tile Sets
16
In the Measure Archives to Use list, select one or more archives to reference. The number of weeks refers tohow long ago the archive was created. The planning process uses the following logic for when to use an archive:
◦ Match the exact dates. If multiple versions of an archive are within the waterfall time frame, use theclosest, most current version.
◦ If no match is found on the exact date, use the match closest inside the range, which is +3/-3 days of aselected weekly waterfall time frame, or +15/-15 days for a monthly archive.
◦ If no match is found within +3/-3 days of a selected weekly waterfall time frame, or +15/-15 days for amonthly archive, then nothing is returned.
For example, if you select 4 weeks ago, the planning process searches for the archive 4 weeks prior to today'sdate, for instance, March 6. If your archives are stored at the month level and nothing is found on February 5,the planning process searches for the most recent archive within +15/-15 days.
• In the Trend Analysis section, you can provide the number of archives that you want to reference. The planningprocess selects the latest archives. For example, you have five archives, where number five is the latest archiveand you have specified the Number of Previous Versions to Include as 3. The planning process selects archivenumber five, four, and three for the comparison. The difference between Waterfall Analysis and Trend Analysisis that in Waterfall Analysis you can choose an archive created within each selected time frame that you wantto compare. In Trend Analysis, you can select the number of archives that you want to compare, and only thelatest archives are used for comparison.
• The Plan Comparison section pertains to both archived plans and alternate plans that you consider forcomparison. You can select the type of difference to display in tables or graphs for comparison. For example,you can choose to view the difference in percentage or absolute percentage.
Related Topics
• How You Use Levels and Attributes in Supply Chain Planning
Use Advanced Options in the Selector ToolYou can use the Advanced Filter dialog box to filter data and select specific members that fulfill some criteria. Clickthe Advanced Filter icon on the Members tab to open the Advanced Filter dialog box. You can use the following filtercriteria tools:
• Levels: Select by level. Select the members in a level such as Customer Site for the Customer dimension, orPeriod for the Time dimension.
• Family: Select parent or child of a dimension member. Select members based on a parent or child relationship,such as selecting the Days in a Week.
• Attributes: Select based on name. For example, select members based on items whose name containsEconomy.
• Measure Criteria: Select based on meeting measure criteria. Select members that meet the criteria, such asProducts for which the gross margin is greater than a particular value.
• Time Range: Select a range of dates. Select time periods based on a range, a start date, or today's date.
The advanced filter criteria tools are used in conjunction with action keywords to refine selections. The following fouractions determine how to apply the criteria:
• Replace with: Replace the current selection, if any, with members meeting the criteria.
Oracle Supply Chain Management CloudUsing Replenishment Planning
Chapter 2Tables, Graphs, Analysis Sets, Tiles, and Tile Sets
17
• Add: Add members meeting the criteria to the current selection.
• Keep: Keep only the members in the current selection that meet the criteria.
• Remove: Remove the members from the current selection that meet the criteria.
You can apply filter criteria tools sequentially to refine your selection. For example, select all the items for a category,and then keep the top 10 items based on sales.
Click the Show Results button to see the filtered list of members based on the criteria. Removed members are shownbelow the filtered list. You have the option of accepting the results or resetting to the previous members.
When you accept the results, the criteria used to retrieve the accepted members appear in the Criteria Steps section onthe tab. These criteria are evaluated when the table or graph is displayed. You can remove criteria steps.
Note: Ensure that the criteria steps defined for each dimension are needed and relevant. Remove all unwanted orunnecessary criteria steps so that your table or graph displays the correct information.
• To remove a step, click the Remove icon in a row.
• To view the result of removing a criteria, click Show Criteria Change.
• To accept the Show Criteria Change results, click Accept and then OK.
• To make the change permanent, click Save or Save and Close.
• To view the results without making the change permanent, click Apply and Close.
Create an Analysis SetAn analysis set is a named set of criteria that can contain selected measures, dimension members, or both measuresand dimension members. Use the Apply Analysis Set and Save as Analysis Set buttons to apply previously madeselections or to save the selections made in the Selector Tool.
Applying an existing analysis set to a table or graph is a quick way to select the measures and dimension members thatyou frequently use.
You have the option to save measures and dimension members. You can save the dimension members as a list or asa script. For example, you can select the top 10 items based on sales for January. If saved as a list, the same 10 itemswould always be displayed in the table or graph, regardless of the current month. However, as sales data changes overtime, you would want to see the top items in the current month in your table or graph. To accomplish this, save thedimension members in a script that would evaluate the criteria whenever the table or graph is displayed.
Create a Tile in Supply Chain PlanningA tile is a component used to present a graphical summary of the data. A tile is also referred to as an infotile in SupplyChain Planning. Each tile has one or more related tables or graphs with predefined drill-to actions to display additionalinformation about that key performance indicator (KPI).
To create a tile:
1. In a Supply Chain Planning work area, open a plan.2. Click Actions > Manage Tables, Graphs, and Analysis Sets.3. In the Manage Tables, Graphs, and Analysis Sets dialog box, in the Search Results region, click Actions and then
select Create > Tile.
Oracle Supply Chain Management CloudUsing Replenishment Planning
Chapter 2Tables, Graphs, Analysis Sets, Tiles, and Tile Sets
18
4. In the Selector Tool - Create Tile dialog box, on the Measures tab, select the required measures and move themfrom the Available Measures pane to the Selected Measures pane.
5. On the Hierarchies tab, select the dimensions, hierarchies, and levels to include or exclude in the tile.6. On the Members tab, select the required dimension members and move them from the Available Members
pane to the Selected Members pane. If you don't select a dimension member, the tile displays the dimensionstarting at the top level selected in the Hierarchies tab.
7. On the Layout tab, do the following:
◦ Select the graph type for the infotile.
◦ Expand the Content Area panel, and then click the Add Row button. You can add up to four tables orgraphs to display them in the content area for that tile.
8. Click Save and Close.
Set Measure Targets for Use in TilesYou can enter or update goals for a measure to track performance against the goals. Set targets by editing a measureand updating the measure goal. When the plan summary displays the measure, the goal or target for that measure isvisible. You can define goals only for measures that are of data type currency, number, or percent.
For global goals, you can provide a low range or a high range. The ranges are displayed on the user interface when youview a measure in comparison with its goal. Global goals are measure level parameters and aren't defined specifically fora data population.
To enter or update measure target goals, follow these steps:
1. Open the Manage Planning Measures page:a. In a Supply Chain Planning work area, open a plan.b. On the Edit Plan page, click the Tasks panel tab.c. In the Tasks panel drawer, click the Manage Planning Measures link.
2. On the Manage Planning Measures page, select the measure and click the Edit icon.3. On the Edit Measure page, navigate to the Advanced tab, Goals subtab.4. In the Goals subtab, select whether low values or high values are better.
For example, high values are better for Gross Margin, but low values are better for Demand at Risk.5. In the Global Goals section, provide a low range or a high range.6. Click Save and Close.
Create a Tile Set in Supply Chain PlanningYou can create a tile set to group individual tiles. Tiles are also referred to as infotiles in Supply Chain Planning. Creatingtile sets can be useful in cases where you want to track various metrics on a single page. You can add tile sets to a panein a page layout.
Tip: Before you create a tile set, check whether you need to create the tiles that you will be adding to the tile set.
To create a tile set:
1. In a Supply Chain Planning work area, open a plan.2. Click Actions > Manage Table, Graphs, and Analysis Sets.
Oracle Supply Chain Management CloudUsing Replenishment Planning
Chapter 2Tables, Graphs, Analysis Sets, Tiles, and Tile Sets
19
3. On the Search table toolbar, from the Actions menu, select Create > Tile Set.4. In the Selector Tool - Create Tile Set dialog box, specify the following details:
◦ Enter a name and description for the tile set.
◦ Select a group for the tile set.
5. From the Available Tiles pane, select the tiles to include in the tile set and move them to the Selected Tiles pane.6. Click Save and Close.
Use Table DrillingAfter you create a table, use drilling in the table to expand and collapse the levels within the hierarchy by which you canview different levels of aggregation. When viewing a table or graph, the dimensions and hierarchies selected on theHierarchies tab are visible. The top selected level is visible; use drilling to view lower levels.
To drill across hierarchies or dimensions, the levels must be adjacent. Drilling is automatically available for the levelswithin the predefined hierarchies, but you can also configure drill pairs to drill across hierarchies or dimensions.
To display a table showing Final Shipments History with the ability to drill from customer to item, the columns Customerand Item must be adjacent:
1. On the Layout tab, use the View menu to select Configure Drill Settings.2. Click the Add Row icon to add a new drill pair.3. In the Drill From column, select Customer. In the Drill To column, select Item.
With this configuration, you can view the shipments history values by item for each customer in the table.
Note: Drilling is only active between the adjacent levels in the table.
Use Table LinkingYou can link a table or graph to another table or graph or a page layout by selecting Manage Links from the Actionsmenu on the toolbar. The links enable you to pass the context of a table or graph to another table or graph or a pagelayout.
In the Manage Links dialog box, there are two tabs:
• To Table, Graph, or Page Layout: Create a link to another table or graph or to a page layout.
• From Table or Graph: Link to the open table or graph from another table or graph.
Use the Add Row icon to add a link.
• Enable dynamic linking: Select this check box to enable dynamic linking. If selected, then the target table orgraph is refreshed when the selections in the source table or graph change.
• Pass highlighted selections and selected members: If you select this option, then whatever you highlight inthe current table or graph is passed as the context along with the filters in the Selector Tool to the target table,graph, or page layout.
Oracle Supply Chain Management CloudUsing Replenishment Planning
Chapter 2Tables, Graphs, Analysis Sets, Tiles, and Tile Sets
20
• Pass user-specified parameters: If you select this option, then you can select the level and context of the sourcetable or graph to pass as link parameters to the target table, graph, or page layout.
• Include measure filters: Select this check box to apply measure filters that you defined in the Measure Filterstab in the Selector Tool to a linked table of graph. This check box is enabled:
◦ After you select the Pass user-specified parameters check box.
◦ If the From Table contains measure filters.
After you define the link, use the Drill icon on the toolbar to drill to the linked table, graph, or page layout.
Graph Layout OptionsThe graph layout option is available in the Selector Tool dialog box, on the Layout tab when you create or edit a graphusing the Manage Tables, Graphs, and Analysis Sets option. In the Graph Layout Options section, you can define thetype of graph and configure layouts and the dimension of axes. In the Filters section you can specify the filter criteriathat you want displayed in the graph.
The layout options vary according to the type of graph. For example, a bar graph has X and Y-axis layout optionswhereas a Pie chart doesn't have any X or Y axis. General Options is common for all layout options and includes genericinformation for a graph such as title, font, and position of the graph. You can also preview a graph from the Layouttab before you save the graph. In the preview mode, you can format measures, change the layout, and modify the drillsettings.
The following types of graphs are available:
• X and Y axes graphs
◦ Vertical bar
◦ Horizontal bar
◦ Line graph
• X and Y axes graphs with additional parameters
◦ Area graph
◦ Combination graph
◦ Bubble graph
• Pie graph
• Sunburst graph and Treemap graph
• Funnel graph and Radar graph
• Gauge graph
For graphs with an X, Y, or dual Y axes, you can select up to three entities in total: measures are mandatory, and you canselect one or two dimension hierarchies. A dual Y-axis graph requires the measures on the Y axis. You must select onemeasure for the Y2 axis in the Y2 -Axis panel. Axis title and tick label rotation options are available for all axes. Tick labeloptions are also available for the X-axis. For example, skip a certain number of labels for legibility. The Formatting panelcontains visual effect options for the graph, such as 2 dimension or 3 dimension, and bar or line style.
Oracle Supply Chain Management CloudUsing Replenishment Planning
Chapter 2Tables, Graphs, Analysis Sets, Tiles, and Tile Sets
21
Here's additional information about some of the graphs:
Graph Type Comments
Combination A Combination graph includes an area, bar, and line. The measures represented by each ofthese options are specified in the Formatting panel.
Bubble A Bubble graph requires selections for the bubble component of the graph in addition to the Xand Y axes options. Select the hierarchy and the bubble sizing measure in the Bubble panel.
Sunburst A Sunburst graph is comprised of rings. Select the number of rings to display. Each ringrepresents a level of the hierarchy. The rings are divided into sectors for each member ofthe level. The size and color of the sector is determined by the measures selected for thoseoptions.
Treemap A Treemap graph is comprised of rectangles. Select the depth of the rectangles for a hierarchy.The rectangles for a level of the hierarchy are nested within the parent level rectangle. The sizeand color of the rectangles are determined by the measures selected for those options.
Funnel and Radar Funnel and Radar graphs require only a hierarchy and measure selection.
Gauge Gauge graphs, which are used in infotiles, require measures with goals defined.
Configure Filters for GraphsYou can configure graphs that specify filter criteria that enables you to page through data in the graph by one or morehierarchy levels. For example, you might want to filter for product category when analyzing your plan. After you analyzeone product category, you can select another product category to review from the filter bar above the graph. Specify thefilter criteria in the Selector Tool dialog box, Layout tab, Filters section.
The hierarchy levels that you selected on the Hierarchies tab are available to select as filters. You can select one or morelevels of a hierarchy for a filter. However, if you also selected the hierarchy for the X-axis or Y-axis, then you can't selectall of the hierarchy levels for filters. At least one hierarchy level must be used for the X-axis or Y-axis.
The members of the levels that you select are used to filter the data shown in your graph. You can select the levelmember value of interest from a set of values in the filter bar above the graph.
Let's work through an example of setting up filters for a graph:
1. In the Selector Tool dialog box, on the Hierarchies tab, select the Time, Product, Organization, and Customerdimensions.All levels are selected by default. The levels that you select for the dimensions become visible in the Filterssection.
2. On the Layout tab, in the X-Axis section, select Gregorian Calendar.3. In the Y-Axis section select the Product hierarchy and Measures.4. In the Filters section, select to filter on Quarter and Zone.5. Click Apply and Close.

Oracle Supply Chain Management CloudUsing Replenishment Planning
Chapter 2Tables, Graphs, Analysis Sets, Tiles, and Tile Sets
22
When you display the graph, you can see the Quarter and Zone filters above the graph. Months are on the X-Axis anditems are on the Y-Axis. The months shown are determined by the selected quarter, based on the Gregorian calendar.So, for Quarter 1, the graph displays January, February, and March on the X-Axis. Levels not selected on the axes or inthe Filters section, such as Organization, aren't included in the graph.
For the X-axis and Y-axis, if one or more levels are selected on the Hierarchies tab, such as Year, Quarter, and Month,the graph displays with the highest level. You can drill to lower levels that aren't selected in the Filters section.
Note: Filters for graphs are similar to filters for tables. However, you can't drag and drop filters onto the X-axis or Y-axis of the graph.
Axis Scale OptionsUsing Axis Scale Options, you can define the minimum and maximum scale values on the Y-axis, and the incrementalvalues between them. You can define the axis scales using the following options: Minimum, Maximum, and Increment.Minimum indicates the starting point of the axis and Maximum indicates the ending point of the axis. Incrementindicates the increase in values that are displayed between maximum and minimum data points. Axis Scale Options isavailable only for Bar, Line, Area, or Combination graphs and it's applicable for Y-axis and Y2-axis.
For each field, you can define either automatic or user-defined values. If you select Automatic, the planning processautomatically adjusts the axis scale for Y-axis and Y2-axis data points. If you select Manual, you have to manuallyspecify the scale for Y-axis and Y2-axis. For example, if you provide Minimum as 3, Maximum as 10, and Increment as 2,then for Y-axis or Y2-axis the graph displays 3 as the lowest value and 10 as the highest value. The graph also displaysdata points 5, 7, and 9 as incremental values.
Format how Measures are Displayed in Tables andGraphsYou can make measure formatting changes to tables and graphs to reflect your individual preferences or requirementsfor how you want the tables or graphs to display. For example, you can override the name of a measure and its measureof unit. When you format measures in a planning table or graph, your measure formatting can't be overridden byanother user. Any formatting changes done by other users, including the owner of the table or graph, don't takeprecedence over your changes. To make user-specific measure formatting changes, open a table or graph and selectView, Format Measures to open the Format Measures dialog box.
If you're the owner of the table or graph, then your formatting changes are visible to you and to other users who haven'tdefined their own formatting. These changes can include overriding the measure label, applying conditional formatting,or changing the unit of measure that you want displayed in your table or graph. Formatting changes made by otherswon't impact your specific measure formatting.
If you're not the owner of the table or graph, then any measure formatting you define takes precedence over theowner's measure formatting and is visible only to you. For example, if you change decimal positions to 0 (zero) for allmeasures in a table, you're the only user that sees those changes. When you save your measure formatting, you'll nolonger see future formatting changes made by the table or graph owner. For example, if you save measure formattingand then the table owner adds conditional formatting on a measure, you won't see that conditional formatting.

Oracle Supply Chain Management CloudUsing Replenishment Planning
Chapter 2Tables, Graphs, Analysis Sets, Tiles, and Tile Sets
23
Use the Reset to Default button in the Format Measures dialog box to remove your user-specific measure formatting.
• If you're the owner of the table or graph, then your measure formatting is removed. Any measure formatting bynon-owners won't be impacted.
• If you're not the owner of the table or graph, then all of your measure formatting is removed. The table or graphdisplays all existing measure formatting saved by the owner of the table or graph.
If you duplicate a measure, the duplicated measure is added as the last measure in the table. For example, you canduplicate a measure with a different currency or unit of measure. If you're the owner of the table, the duplicatedmeasure is visible to you and to other users who haven't defined their own formatting. If you're not the owner of thetable, the duplicated measure is visible only to you. You can reorder the duplicated measures, but you must save yourlayout to preserve the measure order.
You can make user-specific measure formatting changes in the following work areas:
• Demand Management
• Demand and Supply Planning
• Planning Central
• Replenishment Planning
• Sales and Operations Planning
• Supply Planning
Configure Color by Measure to Display in GraphsYou can configure the color by measure and then use that color for every graph that the measure appears in. Forexample, always show Final Shipments Forecast in blue and Final Sales Forecast in green. This functionality is helpfulwhen viewing a specific measure in several graphs in one layout. You can also specify the color to display for a measurein a specific graph.
The configure color by measure to display in graphs functionality is available in the following Supply Chain Planningwork areas:
• Demand Management
• Demand and Supply Planning
• Planning Central
• Replenishment Planning
• Sales and Operations Planning
• Supply Planning
Configure Color by Measure for All GraphsWhen you configure graphs, you can have a consistent color for a specific measure in your graphs. For example, youhave multiple graphs that display the forecast. You can quickly identify the forecast measure by using the same color forthe measure in all of your graphs.
To configure a graph color for a specific measure to use in all graphs, select the graph color for the measure in the EditMeasure dialog box.
1. In a Supply Chain Planning work area, click the Tasks panel tab.2. In the Tasks panel drawer, click the Manage Planning Measures link in the Configuration section.

Oracle Supply Chain Management CloudUsing Replenishment Planning
Chapter 2Tables, Graphs, Analysis Sets, Tiles, and Tile Sets
24
3. On the Manage Planning Measures page, select a measure, click Actions, and then select Edit.4. In the Edit Measure dialog box, click the Advanced tab.5. In the Properties subtab, click the Graph Color drop down arrow and select a color to use for the measure in all
graphs.
Configure Color by Measure for a Specific GraphYou can configure a color for a measure in a specific graph, which overrides the color configured for the measure in theEdit Measure dialog box.
To configure a graph color for a specific measure for a specific graph, select the graph color for the measure in theFormat Measures dialog box.
1. In an open table or graph, click View and then select Format Measures.2. In the Format Measures dialog box, in the Graph Color column, click the drop down arrow and select a color to
use.
Automatically Assign Graph ColorIf a graph color is already configured for a measure for all graphs, but you want the graph color assigned automaticallyfor that measure for a specific graph, then select the Assign Graph Color Automatically check box on the FormatMeasures page.
1. In an open table or graph, click View and then select Format Measures.2. In the Format Measures dialog box, in the Assign Graph Color Automatically column, click the check box in
the row for the measure.
Tips and Considerations for Assigning Graph Colors to MeasuresThe following is additional information about the configure color by measure to display in graphs functionality:
• Duplicate Colors: You might have a situation where you have two measures with the same color in a graph.If the color you configure for a measure is the same color as one of the colors automatically assigned to ameasure in a specific graph, then you must select a different color for the measure you're configuring.
• Predefined measures: By default, predefined measures initially don't have a graph color selected on theManage Planning Measures page. In this case, when used in a graph the planning process automaticallyassigns a color for the measure.
• Bar, line, and radar graphs: Only measures located in the Y-axis display the graph color settings. This is only incase the measures aren't combined with one or more hierarchies in the Y-axis. Automatically-assigned colorsare used in this case.
• Plan Comparison: When comparing plans, the configured measure color in the graph is honored only for themeasure itself. The measures that represent the compared plans get an automatically-assigned color, selectedrandomly by the planning process.
• Archive Plan: When archiving a plan and using Waterfall Analysis or Trend Analysis graphs, the configuredmeasure color is honored only for the measure itself. The measures that represent the archive get anautomatically-assigned color, selected randomly by the planning process.
• Export and Import: When exporting and importing measure settings from one environment to another, theexport and import keeps the graph color settings in Manage Planning Measures and Format Measures.
• Graph Types: The graph color functionality isn't available for the following graph types:
◦ Pie
◦ Sunburst

Oracle Supply Chain Management CloudUsing Replenishment Planning
Chapter 2Tables, Graphs, Analysis Sets, Tiles, and Tile Sets
25
◦ Treemap
◦ Gauge
◦ Funnel
◦ Bubble
Related Topics
• How You Manage Planning Measures
• Predefined Measures in Supply Chain Planning
How Time Periods Are Calculated and Displayed inTables, Graphs, and the Selector ToolThis topic explains how time periods are calculated and displayed in tables, graphs, and the Selector Tool in the DemandManagement, Demand and Supply Planning, Planning Central, Replenishment Planning, and Sales and OperationsPlanning work areas.
Settings That Affect the Calculation and Display of Time PeriodsThe following settings affect the calculation and display of time periods in tables and graphs for a demand, demand andsupply, replenishment planning, or sales and operations plan:
• The value in the Demand History Days field in the Demand: Advanced Options dialog box that you open fromthe Demand tab on the Plan Options page
• The selection on the Time Range tab of the Advanced Filter dialog box that's available on the Members tab inthe Selector Tool
• The selected members for the Time dimension on the Members tab in the Selector Tool
• Shared measures
The following settings affect the calculation and display of available members for the Time dimension on the Memberstab in the Selector Tool for the plan:
• The value in the Demand History Days field
• The planning horizon
The default value for the Demand History Days field is 182 days.
Note: If data isn't available, blank rows are displayed for the time periods included in tables and graphs. Also, theamount of historical data that's considered for the forecast depends on the value in the Historical Buckets field onthe Demand tab on the Plan Options page.
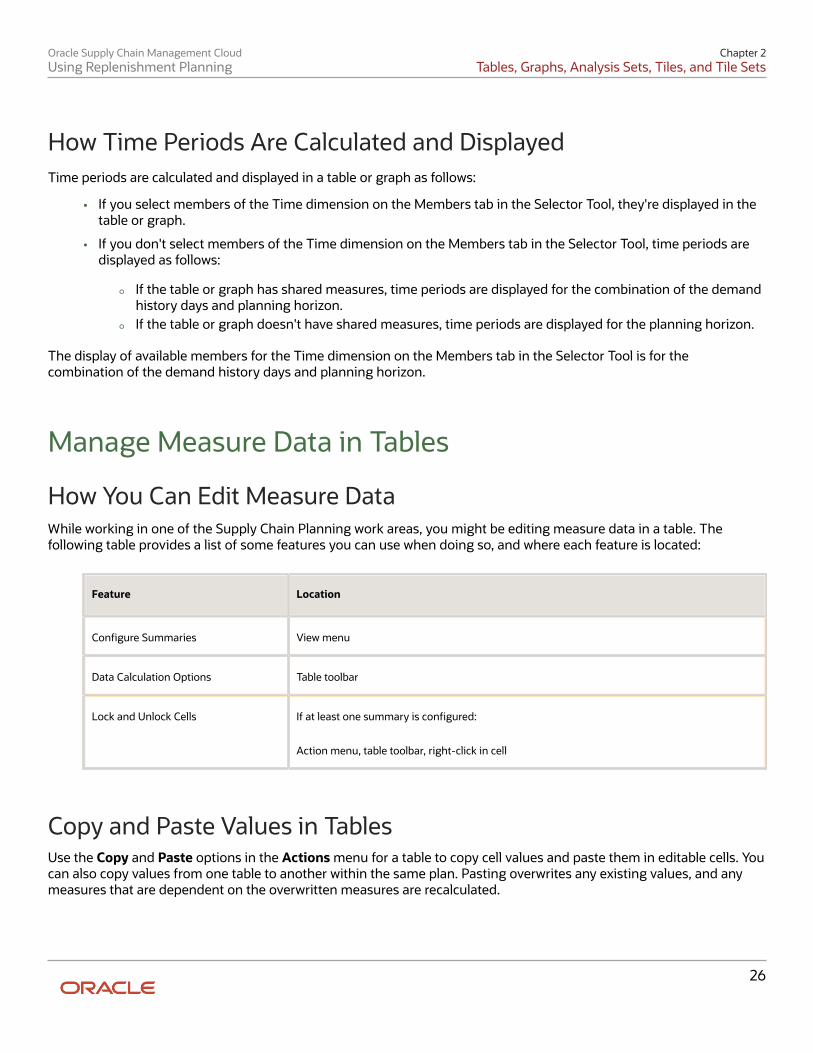
Oracle Supply Chain Management CloudUsing Replenishment Planning
Chapter 2Tables, Graphs, Analysis Sets, Tiles, and Tile Sets
26
How Time Periods Are Calculated and DisplayedTime periods are calculated and displayed in a table or graph as follows:
• If you select members of the Time dimension on the Members tab in the Selector Tool, they're displayed in thetable or graph.
• If you don't select members of the Time dimension on the Members tab in the Selector Tool, time periods aredisplayed as follows:
◦ If the table or graph has shared measures, time periods are displayed for the combination of the demandhistory days and planning horizon.
◦ If the table or graph doesn't have shared measures, time periods are displayed for the planning horizon.
The display of available members for the Time dimension on the Members tab in the Selector Tool is for thecombination of the demand history days and planning horizon.
Manage Measure Data in Tables
How You Can Edit Measure DataWhile working in one of the Supply Chain Planning work areas, you might be editing measure data in a table. Thefollowing table provides a list of some features you can use when doing so, and where each feature is located:
Feature Location
Configure Summaries View menu
Data Calculation Options Table toolbar
Lock and Unlock Cells If at least one summary is configured:
Action menu, table toolbar, right-click in cell
Copy and Paste Values in TablesUse the Copy and Paste options in the Actions menu for a table to copy cell values and paste them in editable cells. Youcan also copy values from one table to another within the same plan. Pasting overwrites any existing values, and anymeasures that are dependent on the overwritten measures are recalculated.

Oracle Supply Chain Management CloudUsing Replenishment Planning
Chapter 2Tables, Graphs, Analysis Sets, Tiles, and Tile Sets
27
If your data is in an external application such as Microsoft Excel, you can use the following procedure to copy and pasteyour data:
1. Copy your data from the external application.2. In your work area table, click the first editable cell from which you want the data to be pasted, and select
Actions > Paste from Clipboard. The Paste from Clipboard dialog box opens.3. Press Ctrl+V to paste your content in the dialog box. You can further edit your data in the dialog box.4. Click Paste and Close. The copied content is pasted into the editable cells of the table.
Alternatively, you can export your table data to Microsoft Excel using the Export icon, work with your data in thatapplication, copy your data, and bring it back into your table by using the Paste from Clipboard option. To copy databetween plans, export the table data to Microsoft Excel from one plan, and use the Paste from Clipboard option tocopy data into the other plan.
Note: You can paste values in only those cells that fall within your plan horizon. The number and orientation of thecells from which data is copied and the cells into which data is pasted must match. Only numeric data can be copiedand pasted. Non-editable cells that are within a range of editable cells are skipped when data is pasted, and a warningis displayed to this effect.
Manage Data Calculations When Editing Measure Data in a SupplyChain Planning TableWhen you are working in a Supply Chain Planning work area, you might be editing measure data in tables that includedependent measures. You can use the Data Calculation Options choices to determine when calculations are performed.You access Data Calculation Options from the table toolbar for the table you are editing.
The Data Calculation Options choices are:
• Enable Automatic Calculations
• Calculate Now
Enable Automatic CalculationsWhen you edit data with this option selected, each time you edit a value, calculations are performed for any applicablesummaries or other measures that include an expression. The Enable Automatic Calculations choice is the defaultselection.
Calculate NowTo choose when calculations are performed, you must first deselect Enable Automatic Calculations. When you makeedits with the Enable Automatic Calculations choice deselected, you must click the Calculate Now choice when you wantcalculations to be performed. Calculations will be performed for all edits made since the last time calculations wereperformed.
If you save a table after making edits, any needed calculations will be performed, but you must refresh the table to seethe results.

Oracle Supply Chain Management CloudUsing Replenishment Planning
Chapter 2Tables, Graphs, Analysis Sets, Tiles, and Tile Sets
28
How You Lock Cells While Editing Measure Data or AllocatingValues in a TableWhen you are working in a Supply Chain Planning work area, you might be editing measure data in a table.
When you have locked cells, edits, including those that spread allocations to other cells, do not change locked cells.
Note: You must configure at least one summary to enable the Lock and Unlock actions.
Lock cells by performing one of the following:
• Click the Lock action in the Actions menu.
• Click the Lock icon on the table toolbar.
• Right-click in an editable cell.
Related Topics
• How do I enable the Lock and Unlock actions for a table while editing measure data in a Supply Chain Planningtable
• Can I unlock all cells at once while editing measure data in a Supply Chain Planning table
How can I highlight editable cells in a table?In the View menu for a table, select Highlight Editable Cells to provide a background color for cells that containeditable measures. Do note that any conditional formatting that has been applied to an editable measure or a tabletakes precedence over the highlight color. You can choose to save your page layout with this setting.

Oracle Supply Chain Management CloudUsing Replenishment Planning
Chapter 3Planning Analytics
29
3 Planning Analytics
Overview of Planning AnalyticsConfiguring planning dimensions and hierarchies on the Configure Planning Analytics page is a key setup to use theanalytics in Supply Chain Planning work areas. It has a unified dimensional hierarchy for various uses. Depending onyour security privilege, you can also open the Configure Planning Analytics page from the Setup and Maintenance workarea by selecting the following:
• Offering: Supply Chain Planning
• Functional Area: Supply Chain Planning Configuration
• Task: Configure Planning Analytics
To run plans successfully, you must complete the following Configure Planning Analytics tasks:
• Set Up Dimension Catalogs
• Set Up Measure Catalogs
• Set Up Levels and Attributes
You can use the default hierarchies for most of the dimensions.
If the default product catalog named Product is not collected, then you must select at least one product hierarchy. If adefault product catalog is collected, then the predefined Product hierarchy is selected as a product hierarchy by default.You can optionally add or change the product hierarchy. You must include at least one product hierarchy when creatinga dimension catalog.
On the Configure Planning Analytics page, Levels and Attributes tab, you can configure your planning table and graphsto display descriptions instead of codes for the following entities: Items, Organizations, Resource, Work Center, andWork Area.
Configure Planning AnalyticsTo run plans successfully, you must set up dimensions and dimension catalogs, measure catalogs, and levels andattributes. You can open the Configure Planning Analytics task from one of the Supply Chain Planning work areas.Depending on your security privilege, you can also open the Configure Planning Analytics page from the Setup andMaintenance work area.
Note: Default Catalog is the name of the predefined dimension catalog. It contains predefined hierarchies. Oraclerecommends that you make a copy of the Default Catalog if changes are required, instead of editing the defaultcatalog.

Oracle Supply Chain Management CloudUsing Replenishment Planning
Chapter 3Planning Analytics
30
To configure planning analytics:
1. In the Navigator, click one of the Supply Chain Planning work areas or click the Setup and Maintenance workarea.
◦ If you clicked one of the Supply Chain Planning work areas, do the following:
i. Click the Tasks panel tab.ii. In the Tasks panel drawer, click the Configure Planning Analytics link.
◦ If you clicked the Setup and Maintenance work area, select the following:
• Offering: Supply Chain Planning• Functional Area: Supply Chain Planning Configuration• Task: Configure Planning Analytics
2. On the Configure Planning Analytics page, Dimension Catalogs tab, do the following:
a. Create a dimension catalog using the Add Row button, or duplicate the default dimension catalog usingthe Duplicate button.
b. Specify what hierarchies to use in the dimension catalog by moving hierarchies from the Available paneto the Selected pane.
c. Assign the dimension catalog to a plan that will use the set of hierarchies for analysis during the plancreation from Manage Plans.
3. Each Supply Chain Planning work area has a default measure catalog. Create a new measure catalog to add orremove measures.
a. Use the Add Row button to create a new catalog or use the Duplicate button to duplicate an existingcatalog.
b. Specify the measures for the catalog by moving the measures from the Available pane to the Selectedpane.
c. Assign the measure catalog to a plan that will use the set of measures during the plan creation fromManage Plans.
After you create and define a measure catalog, you can select the measure catalog for a plan from the Edit PlanOptions page.
4. Click the Levels and Attributes tab and select the desired dimension and hierarchy.
a. In the Dimension list, select a dimension.b. Optionally, in the Hierarchy list, select a hierarchy.c. Click the Search icon button.d. To change how the level name appears in pivot tables and graphs, select the row and enter the level
name in the Level Name to Display field.
Note: You can't edit the Level Name to Display field for the lowest level of the hierarchy.
e. To display a particular member identifier in your tables and graphs, select a dimension (Product,Organization, or Resource) and level, and then select a value in the Member Identifier to Displaycolumn:

Oracle Supply Chain Management CloudUsing Replenishment Planning
Chapter 3Planning Analytics
31
Dimension Level Member Identifier to DisplayOptions
Product Item Item Name, Item Description, ItemName and Description, or ItemDescription and Name
Organization Organization Organization Name or OrganizationCode
Resource Resource Resource Code, Resource Name, orResource Description
Resource Work Center Work Center Code, Work Center Name,or Work Center Description
Resource Work Area Work Area Code, Work Area Name, orWork Area Description
Resource Organization Organization Name or OrganizationCode
Tip: The organization level in the Organization dimension and the organization level in theResource dimension are separate settings. Oracle recommends that you set them to use thesame identifier.
f. To add an attribute for the lowest level of the hierarchy, click the Edit Page button in the Attributescolumn.
i. In the Manage Attribute List dialog box, click the Add Row button.ii. In the Attribute list, select an attribute.
iii. In the Attribute Label text box, enter a label name and click OK.5. On the Configure Analytics page, click the Save and Close button.
Related Topics• How You Use Measure Catalogs in Supply Chain Planning
Dimensions and Dimension Catalogs
How You Use Dimensions and Dimension Catalogs in SupplyChain PlanningOracle Fusion Supply Chain Planning has hierarchy levels by which you can view, compare, and analyze demands andsupplies of your products over various dimensions, such as geography and organizations. Supply Chain Planning uses a

Oracle Supply Chain Management CloudUsing Replenishment Planning
Chapter 3Planning Analytics
32
single set of dimensions and hierarchies to drive aggregation context for demand planning, supply planning, embeddedanalytics, and management analytics.
Supply Chain Planning provides predefined planning dimensions. Each of those dimensions has a predefined hierarchy.When you implement the Supply Chain Planning offering, you must decide which dimensions and hierarchies to use fordemand and supply analysis.
Each dimension catalog has a collection of hierarchies in different dimensions that is enabled for use in the planoptions. By default, all predefined hierarchies are available in Planning Analytics. You can disable certain dimensionsthat are not relevant for your plans. For example:
• If you are only using demand plans, then supplier, resource, and order type dimensions may not be relevant
• If you are using sales and operations plans, then the order type dimension is not relevant
The following hierarchies are predefined in Supply Chain Planning:
• Customer
• Demand Class
• Exception Type
• Order Type
• Organization
• Plan
• Product
• Resource
• Supplier
• Source
• Time
Access the Configure Planning Analytics page from a Supply Chain Planning work area. Depending on your securityprivilege, you can also open the Configure Planning Analytics page from the Setup and Maintenance work area.
• To access the Configure Planning Analytics page from a Supply Chain Planning work area:
a. Click the Tasks panel tab.b. In the Tasks panel drawer, click the Configure Planning Analytics link
• To access the Configure Planning Analytics page from the Setup and Maintenance work area, select thefollowing:
◦ Offering: Supply Chain Planning
◦ Functional Area: Supply Chain Planning Configuration
◦ Task: Configure Planning Analytics
In the Dimension Catalogs tab, several hierarchies are available in various dimensions. You can specify which hierarchyto use in a particular dimension catalog. For example, you can select an organization type hierarchy, a product typehierarchy, or a customer hierarchy to use in plans for analysis. After you define a dimension catalog, you can assign it toa plan that will use the set of hierarchies for analysis.
You can select one of your dimension catalogs to be used as the default dimension catalog in plans. If you do not selecta default catalog, the predefined catalog named Default Catalog is used.

Oracle Supply Chain Management CloudUsing Replenishment Planning
Chapter 3Planning Analytics
33
Related Topics• Why You Disable or Enable Dimensions for Supply Plan Measures
Considerations for Setting Up Dimension CatalogsSupply Chain Planning provides predefined planning dimensions and each of those dimensions have predefinedhierarchies. The predefined hierarchies are included in the default dimension catalog and are available in all plans.
Hierarchy Selections for the Product DimensionA predefined Product hierarchy is included in the default dimension. The default Product hierarchy has three fixedlevels: Item, Category 1, and Category 2. Other Product hierarchies (other item catalogs in Oracle Fusion Product Modelthat are collected into Supply Chain Planning work areas) can be optionally enabled as user-defined product hierarchies.
For Oracle Fusion Sales and Operations Planning, the Lifecycle Phase attribute is also included in the default dimension.
By default, Oracle Fusion Product Model's planning functional area catalog is collected into the Product hierarchy.For the collection to run successfully, you must create the planning functional area catalog in Product Model with thefollowing attributes:
• Controlled at = Master-Level (not Org-Level)
• Allow hierarchy of categories = No
• Default category must be selected
• Allow multiple item category assignments = Not selected
• Catalog Content = Items at Leaf Level
If this catalog is not set up with these attributes, the planning functional area catalog is not collected and the Producthierarchy will not be populated. This will result in the forecasting engine not being able to use the product aggregationand some of the predefined tables and graphs will not work correctly.
Hierarchy Selections for the Organization DimensionEnterprise is the default organization hierarchy and has three fixed levels: Organization, Business Unit, and Legal Entity.This default organization is defined in Oracle Fusion HCM and you can only modify it there. Optionally, you can enableother Organization hierarchies (based on regions, one per country).
Hierarchy Selections for the Customer DimensionThe default Customer hierarchy has three fixed levels: Customer site, Customer, and Customer Class. This defaultcustomer hierarchy is defined in the trading community model and you can only modify it there.
Hierarchy Selections for the Resource DimensionThe default Resource hierarchy has four fixed levels: Resource, Work Center, Work Area, and Organization. This defaultresource hierarchy is defined in Oracle Fusion Manufacturing and you cannot modify it.
Hierarchy Selections for the Supplier dimensionThe default Supplier hierarchy has two fixed levels: Supplier Site and Supplier.
Hierarchy Selections for the Exception Type, Order Type, and Source DimensionsPredefined Exception Type, Order Type, and Source dimensions are included in the Default dimension catalog. Each hasonly a single hierarchy with a single level.
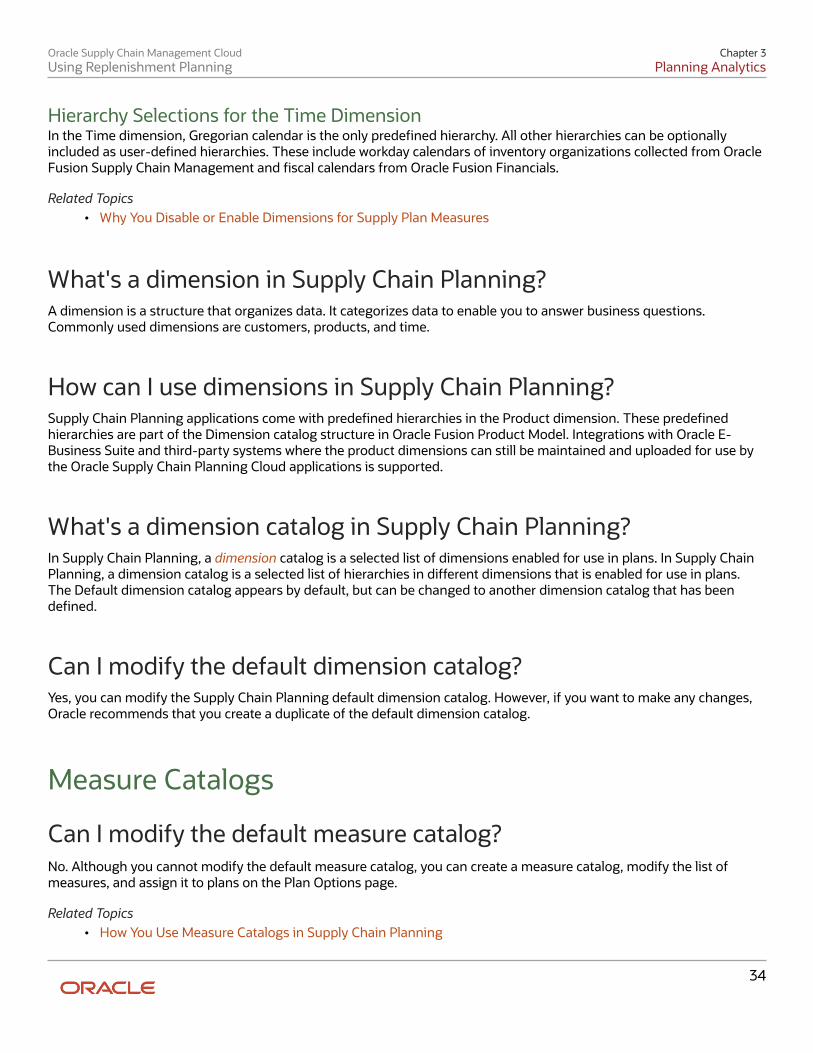
Oracle Supply Chain Management CloudUsing Replenishment Planning
Chapter 3Planning Analytics
34
Hierarchy Selections for the Time DimensionIn the Time dimension, Gregorian calendar is the only predefined hierarchy. All other hierarchies can be optionallyincluded as user-defined hierarchies. These include workday calendars of inventory organizations collected from OracleFusion Supply Chain Management and fiscal calendars from Oracle Fusion Financials.
Related Topics• Why You Disable or Enable Dimensions for Supply Plan Measures
What's a dimension in Supply Chain Planning?A dimension is a structure that organizes data. It categorizes data to enable you to answer business questions.Commonly used dimensions are customers, products, and time.
How can I use dimensions in Supply Chain Planning?Supply Chain Planning applications come with predefined hierarchies in the Product dimension. These predefinedhierarchies are part of the Dimension catalog structure in Oracle Fusion Product Model. Integrations with Oracle E-Business Suite and third-party systems where the product dimensions can still be maintained and uploaded for use bythe Oracle Supply Chain Planning Cloud applications is supported.
What's a dimension catalog in Supply Chain Planning?In Supply Chain Planning, a dimension catalog is a selected list of dimensions enabled for use in plans. In Supply ChainPlanning, a dimension catalog is a selected list of hierarchies in different dimensions that is enabled for use in plans.The Default dimension catalog appears by default, but can be changed to another dimension catalog that has beendefined.
Can I modify the default dimension catalog?Yes, you can modify the Supply Chain Planning default dimension catalog. However, if you want to make any changes,Oracle recommends that you create a duplicate of the default dimension catalog.
Measure Catalogs
Can I modify the default measure catalog?No. Although you cannot modify the default measure catalog, you can create a measure catalog, modify the list ofmeasures, and assign it to plans on the Plan Options page.
Related Topics• How You Use Measure Catalogs in Supply Chain Planning

Oracle Supply Chain Management CloudUsing Replenishment Planning
Chapter 3Planning Analytics
35
Levels and Attributes
How You Use Levels and Attributes in Supply Chain PlanningOn the Levels and Attributes tab, you can enable certain item attributes (standard fields or flexfields) and organizationattributes (standard fields) to be available in Planning Analytics as filters. For example, you can enable PLANNER_CODEto use in an analysis to group metrics and measures by that particular attribute.
You can create a display name to use in the various pivot tables and graph configurations. For example, if thepredefined level name is Product Category 2, you can enter a display name of Laptops. You can also configure whichidentifier to display in tables and graphs for selected hierarchies. For example, you can choose to display item name oritem description in your tables and graphs.
Displaying Descriptions in Tables and GraphsYou can analyze planning data in planning tables and graphs by using the description fields of entities in hierarchies,such as items and organizations. You can use the description fields when their primary identifier is a difficult tounderstand alphanumeric code. You can toggle between the code and description, or display both, in planning tablesand graphs for the following entities:
• Items
• Organizations
• Resources
• Work Centers
• Work Areas
Tip: The organization level in the Organization dimension and the organization level in the Resource dimension areseparate settings. Oracle recommends that you set them to use the same identifier.
Changing a member identifier can impact the advanced criteria in tables and graphs. If you use an advanced filtercriteria in a table or graph, then the criteria will be compared to the new member identifier, which can affect the searchresults. The change to the member identifier can result in different or no members meeting the filter criteria. Forexample, many names might start with AB, but no descriptions start with AB. After you make this change, you shouldverify that any advanced filter criteria used are still valid.
Note: In the Selector Tool, the member values displayed are based on what's configured in the Member Identifier toDisplay column on the Configure Planning Analytics page, Levels and Attributes tab. For example, for item, you canconfigure your tables and graphs to show item description instead of item name, which is what also appears whenyou're in the Selector Tool.

Oracle Supply Chain Management CloudUsing Replenishment Planning
Chapter 3Planning Analytics
36

Oracle Supply Chain Management CloudUsing Replenishment Planning
Chapter 4Planning Measures
37
4 Planning Measures
Predefined Measures in Supply Chain PlanningWhen you use one of the Supply Chain Planning work areas, you have access to many predefined measures.
To review the details of each predefined measure, use the following:
• The Manage Planning Measures task
• A spreadsheet available at My Oracle Support
The Manage Planning Measures TaskOn the Manage Planning Measures page, select a measure, and then select edit. You can review the details of themeasure on the Edit Measure page even if you can't make changes to the measure.
A Spreadsheet Available at My Oracle SupportUse Doc ID 2374816.1, Oracle Supply Chain Planning Cloud: List of Predefined Measures.
The List of Predefined Measures spreadsheet contains only the core measure attributes. You can use the Edit Measurespage to view all the attributes associated with a particular measure.
How You Manage Planning MeasuresUse the Manage Planning Measures task to review Supply Chain Planning measures. You can edit several measures, butsome measures you can only view. You use the pivot table to view the data you edited at different aggregations. Theresults of the edits are stored based on definitions of a measure.
This topic discusses how you can perform these tasks:
• Update the definition of a measure
• Update aggregation parameters
• Update disaggregation parameters
• Edit data of a measure
Update the Definition of a MeasureTo update the definition of a measure:
1. In a Supply Chain Planning work area, click the Tasks panel tab.2. In the Tasks panel, click the Manage Planning Measures link.3. Expand a measure group and scroll manually or use the search option to find all measures that match the
search criteria.4. Select the measure that you want to modify and then click the Edit icon.
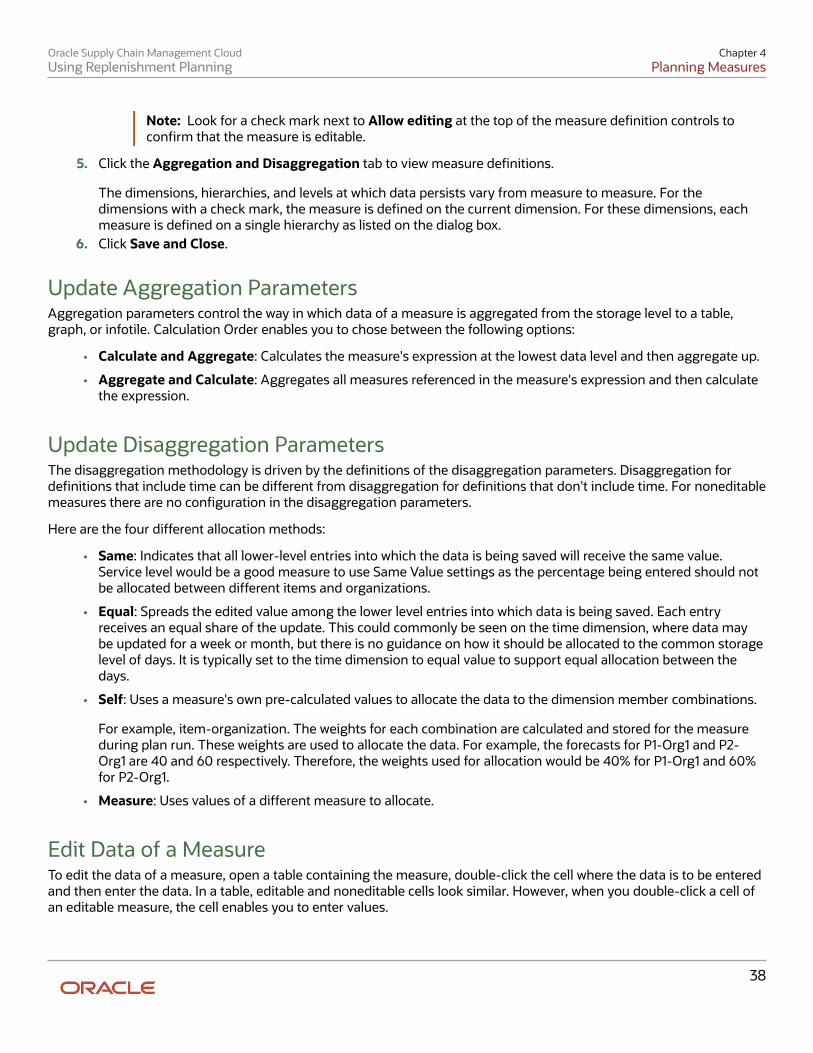
Oracle Supply Chain Management CloudUsing Replenishment Planning
Chapter 4Planning Measures
38
Note: Look for a check mark next to Allow editing at the top of the measure definition controls toconfirm that the measure is editable.
5. Click the Aggregation and Disaggregation tab to view measure definitions.
The dimensions, hierarchies, and levels at which data persists vary from measure to measure. For thedimensions with a check mark, the measure is defined on the current dimension. For these dimensions, eachmeasure is defined on a single hierarchy as listed on the dialog box.
6. Click Save and Close.
Update Aggregation ParametersAggregation parameters control the way in which data of a measure is aggregated from the storage level to a table,graph, or infotile. Calculation Order enables you to chose between the following options:
• Calculate and Aggregate: Calculates the measure's expression at the lowest data level and then aggregate up.
• Aggregate and Calculate: Aggregates all measures referenced in the measure's expression and then calculatethe expression.
Update Disaggregation ParametersThe disaggregation methodology is driven by the definitions of the disaggregation parameters. Disaggregation fordefinitions that include time can be different from disaggregation for definitions that don't include time. For noneditablemeasures there are no configuration in the disaggregation parameters.
Here are the four different allocation methods:
• Same: Indicates that all lower-level entries into which the data is being saved will receive the same value.Service level would be a good measure to use Same Value settings as the percentage being entered should notbe allocated between different items and organizations.
• Equal: Spreads the edited value among the lower level entries into which data is being saved. Each entryreceives an equal share of the update. This could commonly be seen on the time dimension, where data maybe updated for a week or month, but there is no guidance on how it should be allocated to the common storagelevel of days. It is typically set to the time dimension to equal value to support equal allocation between thedays.
• Self: Uses a measure's own pre-calculated values to allocate the data to the dimension member combinations.
For example, item-organization. The weights for each combination are calculated and stored for the measureduring plan run. These weights are used to allocate the data. For example, the forecasts for P1-Org1 and P2-Org1 are 40 and 60 respectively. Therefore, the weights used for allocation would be 40% for P1-Org1 and 60%for P2-Org1.
• Measure: Uses values of a different measure to allocate.
Edit Data of a MeasureTo edit the data of a measure, open a table containing the measure, double-click the cell where the data is to be enteredand then enter the data. In a table, editable and noneditable cells look similar. However, when you double-click a cell ofan editable measure, the cell enables you to enter values.

Oracle Supply Chain Management CloudUsing Replenishment Planning
Chapter 4Planning Measures
39
Copy Data from One Measure to AnotherIn a Supply Chain Planning table, you can update the value of one measure by using values from another measure. Inseveral cases, a measure can have other related measures that enable you to override the value of a base measure. Forexample, Sales Forecast is one of those measures:
• Sales Forecast: Base measure.
• Adjusted Sales Forecast: You can override what's in Sales Forecast.
• Final Sales Forecast: The planning process takes the Adjusted Sales Forecast, if there is one, or uses the SalesForecast. The planning process uses the Final Sales Forecast, which takes into account any manual adjustmentsthat you made.
You can specify the data source whose values you want to copy to the selected range of cells in the target measure.Using a table containing the three measures listed in our previous example, select a range of cells associated with theAdjusted Sales Forecast measure, click Actions and then select Edit. In the Edit Measures dialog box, use the SalesForecast measure as the source measure for Adjusted Sales Forecast and increase it by 10 percent. If your Sales Forecastis 200, then Adjusted Sales Forecast now reflects 220.
For a measure to appear in the list of values for Source Measure in the Edit Measures dialog box, the measure must beincluded in the table. The measure must also conform to the same dimensions as the measure you're editing.
When editing a measure's value at an aggregate level, the value is allocated down to the lowest level. For example, whenediting weekly data, the value will be allocated down to the day.
You can also edit multiple measures at a time; however, you can't have circular references. In the following example,Measure3 is used as a source measure for Measure1. But, Measure3 is also being edited at the same time to increase themeasure by 10 percent.
Measure Source Measure Action Value
Measure1 Measure3 Increase by percentage 10
Measure2 Measure2 Increase by percentage 10
Measure3 Measure3 Increase by percentage 10
In this scenario, the planning engine won't know which value of the source measure to use: the original Measure3 value,or the value of Measure3 after increasing it by 10 percent. To avoid circular references, you must handle these editsseparately.
Related Topics• Configure Color by Measure to Display in Graphs
Import Measure Data Into a Planning TableWhen working with large volumes of data, you can export data from a planning pivot table to Microsoft Excel. After youexport the data, you can edit and make adjustments to any planning measure in the spreadsheet. When you're done

Oracle Supply Chain Management CloudUsing Replenishment Planning
Chapter 4Planning Measures
40
making changes offline in the spreadsheet, you can then import the updated planning data back into the same table. Toinitiate the Upload Planning Table Data scheduled process, click the Import icon on the toolbar in the opened table andthen select the spreadsheet.
The spreadsheet that you import must have the same structure and format as the planning table. The importedspreadsheet can be at any level of aggregation, as long as the levels match all of the levels displayed in the table. Afteryou select the file to import, the Upload Planning Table Data scheduled process updates the table in the background inbatch mode. While the import process uploads data in the background, you can work on other supply chain planningtasks. When the upload process completes, the Import icon in the table displays a green check mark for the planner whouploaded the data.
Note: To see the uploaded data in your planning table, refresh the table after the Upload Planning Table Datascheduled process completes.
Importing data into planning tables is available for all pivot tables in Supply Planning, Sales and Operations Planning,Demand Management, Replenishment Planning, and Planning Central. Importing data isn't available for non-pivotviews like standard grids or other views such as the Build Plan table.
Tips for Importing Measure DataHere are some tips to successfully import data from a spreadsheet into a planning table:
• The imported file must be a Microsoft Excel file with the .xlsx file extension.
• The import process only updates editable measures.
• The imported file must have the exact same format at the planning table. This includes the following:
◦ The uploaded file and the target table must contain the same number of rows and columns.
◦ The levels specified in the spreadsheet must match. The level names, such as Item or Organization, don'thave to appear as the header columns, but the columns and rows that represent the level must match.
◦ The members in each of the level rows and columns must be identical and in the same order. No membercan be omitted and new members can't be added.
◦ The measures column must have the same measures as the planning table for all combinations.
• The imported file must have the exact member combinations and their order listed in the column and rowheaders of the table. All member names, such as item names and time periods, must be present in the sameorder in the file being imported even if there are no updates for those combinations. Typically, you can achievethe required order by exporting the table, making the edits offline, and then using the same file for import.
• All date values must be in the correct date format.
• If you update data directly in a table when the update process is still in progress, your updates can beoverwritten if they're for the same combination and measure.
• If multiple users import files into the same table, the import process that finishes last overrides the others. Forplanning tables that need frequent updates by multiple users, Oracle recommends that you create differenttables with appropriate filters.
Additional Information about the Import ProcessHere's some additional information about importing data into planning tables:
• Tables with page filters aren't enabled for import. To use the table for import, remove the page filter or usemember filters in the table configuration. Filters specified as member filters in the table configuration arerespected.
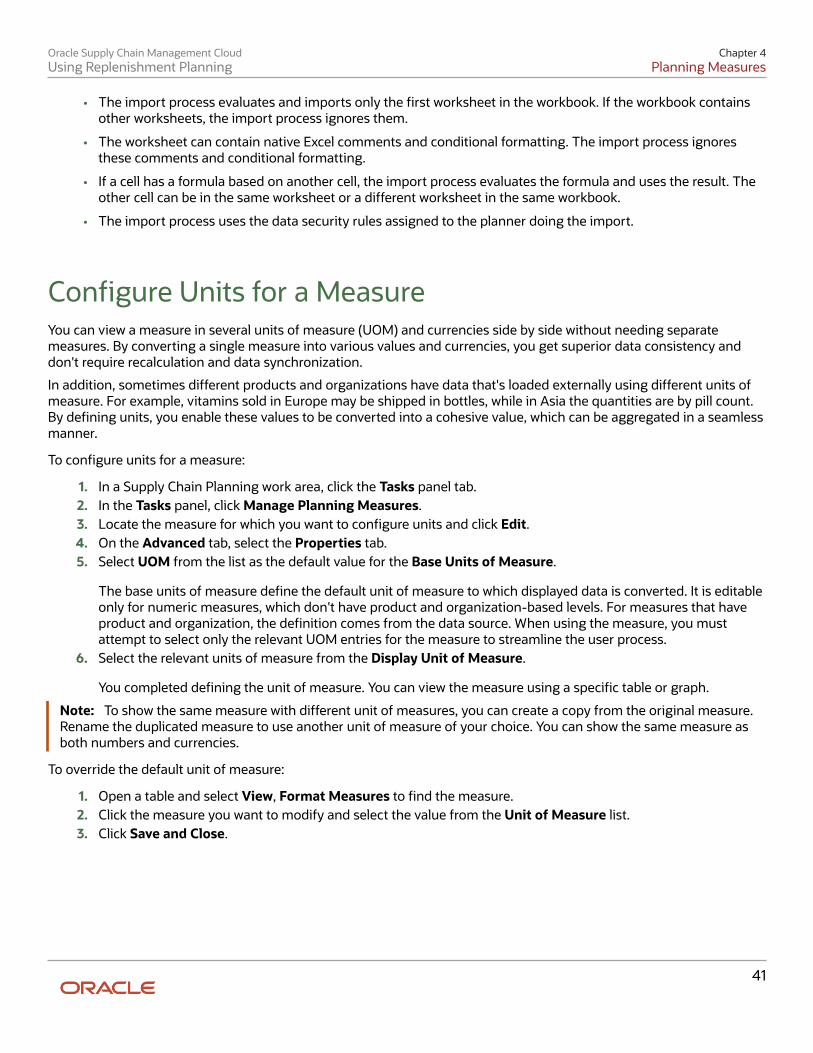
Oracle Supply Chain Management CloudUsing Replenishment Planning
Chapter 4Planning Measures
41
• The import process evaluates and imports only the first worksheet in the workbook. If the workbook containsother worksheets, the import process ignores them.
• The worksheet can contain native Excel comments and conditional formatting. The import process ignoresthese comments and conditional formatting.
• If a cell has a formula based on another cell, the import process evaluates the formula and uses the result. Theother cell can be in the same worksheet or a different worksheet in the same workbook.
• The import process uses the data security rules assigned to the planner doing the import.
Configure Units for a MeasureYou can view a measure in several units of measure (UOM) and currencies side by side without needing separatemeasures. By converting a single measure into various values and currencies, you get superior data consistency anddon't require recalculation and data synchronization.
In addition, sometimes different products and organizations have data that's loaded externally using different units ofmeasure. For example, vitamins sold in Europe may be shipped in bottles, while in Asia the quantities are by pill count.By defining units, you enable these values to be converted into a cohesive value, which can be aggregated in a seamlessmanner.
To configure units for a measure:
1. In a Supply Chain Planning work area, click the Tasks panel tab.2. In the Tasks panel, click Manage Planning Measures.3. Locate the measure for which you want to configure units and click Edit.4. On the Advanced tab, select the Properties tab.5. Select UOM from the list as the default value for the Base Units of Measure.
The base units of measure define the default unit of measure to which displayed data is converted. It is editableonly for numeric measures, which don't have product and organization-based levels. For measures that haveproduct and organization, the definition comes from the data source. When using the measure, you mustattempt to select only the relevant UOM entries for the measure to streamline the user process.
6. Select the relevant units of measure from the Display Unit of Measure.
You completed defining the unit of measure. You can view the measure using a specific table or graph.
Note: To show the same measure with different unit of measures, you can create a copy from the original measure.Rename the duplicated measure to use another unit of measure of your choice. You can show the same measure asboth numbers and currencies.
To override the default unit of measure:
1. Open a table and select View, Format Measures to find the measure.2. Click the measure you want to modify and select the value from the Unit of Measure list.3. Click Save and Close.
Oracle Supply Chain Management CloudUsing Replenishment Planning
Chapter 4Planning Measures
42
Configure Currencies for a MeasureYou can view a measure in several units of measure and currencies side by side without having separate measures. Byconverting a single measure into various values and currencies, you get superior data consistency and don't requirerecalculation and data synchronization.
To configure currencies for a measure:
1. In a Supply Chain Planning work area, click the Tasks panel tab.2. In the Tasks panel, click the Manage Planning Measures link.3. Locate the measure for which you want to configure currencies and click Edit.4. On the Advanced tab, select the Properties tab.5. Select Currency from the list as the default value for the Base Currency.
The base currency defines the default currency to which displayed data is converted and is editable only forcurrency type measures.
6. Select the relevant currencies from the Display Currency.
You completed defining the currencies for a measure. You can view the measure using a specific table or graph.
The currency value is editable only if the measure type is Currency. For numeric measures, you can change the typefrom Number to Currency. Select the currency that you want to use in this instance of the measure.
Note: To show the same measure with different currencies, you can create a copy from the original measure. Renamethe duplicated measure to use another unit of measure of your choice. You can show the same measure as bothnumbers and currencies.
To override the default currency:
1. Open a table and select View, Format Measures to find the measure.2. Click the measure you want to modify and select the value from the Currency list.3. Click Save and Close.
Configure Conditional Formatting for a MeasureUse conditional formatting to change the background color of a cell when a specific condition occurs. Conditionalformatting is useful to draw the attention of the user for information that requires action. You define conditions for anindividual measure. A measure can have one or more formats applied. The condition is evaluated at the table level usingthe configured units and currencies. Two tables with different units of measure or currencies defined can have differentcells trigger the conditional formats.
To configure global conditions:
1. In a Supply Chain Planning work area, click the Tasks panel tab.2. In the Tasks panel, click the Manage Planning Measures link.3. Locate the measure for which you want to apply conditions and click Edit.4. On the Advanced tab, select the Conditional Formatting tab.5. Click the + icon to add a row and complete the information.

Oracle Supply Chain Management CloudUsing Replenishment Planning
Chapter 4Planning Measures
43
Field Name Description
Measure Locate the measure you want to use to evaluate. Conditional format for a measure can bebased on another measure.
Condition Compares the selected measure to a value or another measure
Compare to Measure Measure to which the selected measure is compared
Value When the Compare to Measure is empty, this value is used to compare the selectedmeasure
Color Defines the color for the cell background when the condition is met
6. Click Save and Close.
To configure local overrides to conditions:
1. Open a table and select View, Format Measures.2. Locate the measure that you want to modify and then select the Use Override Conditional Formatting check
box.3. The Conditional Formatting section appears. Select a new conditional format to use in your table.4. For only the Build Plan table accessed through a Supply Planning work area, the Conditional Formatting section
also includes the Apply and Name columns.
In the Apply column, select whether you want the conditional formatting to be highlighted in your Build Plantable all the time or only when you select it from the Highlight Exceptions drop-down list.
For example, if you set up a conditional format named Resource Overload and select When selected, ResourceOverload appears in the Highlight Exceptions drop-down list in your Build Plan.
5. Click Save and Close.
Manage User-Defined Measures
Create Measures and Assign to a Measure CatalogIn addition to reviewing measures, you use the Manage Planning Measure task to create, edit, duplicate, and deletemeasures. You can also create measure groups and add predefined and user-defined measures in them.
This topic discusses the following:
• Creating measures
• Assigning measures to a measure catalog

Oracle Supply Chain Management CloudUsing Replenishment Planning
Chapter 4Planning Measures
44
Create MeasuresIf you have the required privileges, you can create measures if the predefined ones don't meet your requirements. Themeasures that you create have the same features and functionality as predefined measures.
To create a measure:
1. In a Supply Chain Planning work area link, click the Tasks panel tab.
You can create measures from one of the following work areas: Demand Management, ReplenishmentPlanning, Supply Planning, Sales and Operations Planning, Demand and Supply Planning, or Plan Inputs.
2. In the Tasks panel, click the Manage Planning Measures link.3. Click Create from the Actions menu.
a. On the Create Measure page, enter a measure name and description.b. Select a measure group.c. Select a data type.d. Select the Allow editing check box if you want the measure to be editable in a pivot table.e. Select Edit Range to enable the Edit Lock tab, which controls the editable status of the measure
The Edit Range value determines the time range over which the measure is editable. The available valuesare: History, Future, History and Future.
f. On the Aggregation and Disaggregation tab, define the dimension parameters. Select the dimensions,hierarchy, and hierarchy level within the dimension to store the measure data. When a dimension andhierarchy are selected, the default setting for the Stored Level is the lowest level of the dimension'shierarchy. You can modify the level to store by selecting the hierarchy from the list and setting the storedlevel parameter within that hierarchy.
• Aggregation Parameters: The Aggregation parameters control the way a measure's data isaggregated. You have two options:
◦ Calculate and aggregate: Calculate and Aggregate calculates the measure's expression at thelowest data level and then aggregate up.
◦ Aggregate then calculate: Aggregate and Calculate aggregates all measures referenced inthis measure's expression and then calculate the expression.
In the Time Dimension field, select the aggregation function that controls how data is aggregatedfor the time dimension. The Other Dimensions fields are the same as the Time dimension fields.These options control how the data is aggregated across all the dimensions except for time. TheWeighted By field is enabled only if you select Weighted Average as the aggregation parameterfor either Time or Other Dimensions. It enables you to select the measure to drive the weightedaverage calculation.
The aggregation types include: Sum, Average, Weighted Average, Minimum, Maximum, Count,Latest, Median, Variance, and Standard Deviation.
• Disaggregation Parameters: The Disaggregation Parameters control how changes to the data atan aggregated level are allocated down for storage. This is used when data changes are made in apivot table, but also when made by the demand forecast. The weights for each combination, suchas item-organization, are calculated and stored for the measure during plan run. These weightsare used to allocate the data. For example, the forecasts for P1-Org1 and P2-Org1 are 40 and 60respectively. Therefore, the weights used for allocation would be 40% for P1-Org1 and 60% for P2-Org1.

Oracle Supply Chain Management CloudUsing Replenishment Planning
Chapter 4Planning Measures
45
The parameters for the Disaggregation Type field are: By Measure, By Self, Equal, and Same Value.The default parameter is Equal.
The Disaggregation Basis field is enabled only if you select the Disaggregation Type as By Measure.Select the measure to use as the disaggregation basis from the list of measures.
The Secondary Basis field is enabled only if you have selected the Disaggregation Type field asBy Measure or By Self. The values for Secondary Basis are Booking History Average or ShipmentHistory Average.
The Secondary Basis measure is selected in case the basis measure has no value. You can selectonly measures that contain pre-calculated proportions as a secondary basis. That is, they'recalculated during plan run.
g. On the Expression tab, define any new expressions for a measure. You create an expression when youhave to show any value other than its stored information. The expression provides a flexible frameworkfor an extensive variety of calculations and information. An expression for a measure references othermeasures, operators, and numbers.
In the Expressions subtabs:
• The Functions tab lists the available functions, a description, an example of the function's use.• The Measures tab lists the available measures, their descriptions, and data type. The Insert button
inserts the highlighted measure into the expression building area where functions or arithmeticoperations can be specified.
• The Attribute tab lists the attributes available for the Product dimension at Item level. Thedescription and data type of the attribute is shown in the description pane.
After you complete the expression, use the Validate button to ensure the syntax is correct. An error orsucceeded messaged is displayed.
h. On the Edit Lock tab, you can define a new expression similar to the measure expression. The differenceis rather than evaluating and displaying the expression result, the expression result is used to control orrefine the editable status of the measure. If the expression evaluates as true, the measure is locked fromediting. The expression is evaluated every time the table is run, and may change as relevant measures orattributes are modified.
i. On the Advanced tab, click the Properties tab and review the following parameters:
• If you select the Shared measure check box, then the measure is shared across plans. By default,the parameter isn't selected, and the measure is plan-specific.
Note: You can share measures across only demand plans with the day planning time levelor across demand and supply plans. In such plans, shared measures are common, and theentries you make in one plan apply to other plans. For plans of other types, even if you selectthe check box, the measures are plan-specific.
• If you select the Refresh with current data check box, then the current measure value needs aplaceholder to store the result in the application. For example, a noneditable measure where thedata is imported from a legacy or other application. Selecting this check box allocates a space tostore the measure by the defined dimensions.
• Conversion Type enables you to define the valid Unit of Measure (UOM) and Currency conversionsthat are available for a measure in a table.
Oracle Supply Chain Management CloudUsing Replenishment Planning
Chapter 4Planning Measures
46
Base Units of Measure defines the default unit of measure used to convert displayed data. The fieldis editable only for Numeric measures, which don't have Product and Organization-based levels(for measures that have product and organization, the definition comes from the data source).Select any relevant units of measure, which may be useful in a table, graph, or tile. Only the UOMsthat you select are available for selection in a table or graph.
Base currency defines the default currency to which displayed data are converted. The field iseditable for only Currency type measures.
You use Price lists to convert quantities into values, which are then converted to a currency.• Data Lookup value enables you to identify a data lookup source that displays the measure as a list
of value. The source attributes have 3 options: None (Default), Level, and List.
◦ If Source=Level, you must identify the level and the attribute to display in the measure list.
◦ If Source=List, then you can create and maintain the list of values. You can either add orremove members in this list.
j. On the Advanced tab, click the Goals tab to define if low or high values are better for measure goals.k. On the Advanced tab, click the Conditional Formatting tab to define conditional formatting settings for
the measure.4. Click Save and Close.
Assign Measures to a Measure CatalogTo use the user-defined measure in your plan, add the new measure to the plan's measure catalog. Navigate toConfigure Planning Analytics, find the plan's measure catalog on the Measures Catalog tab. In the Available Measurespane, search for the new user-defined measure, and add it to the Selected Measures. After you perform a plan run youcan create a table or use an existing table, and add your new measure to the table.
Duplicate, Edit, and Delete MeasuresYou can duplicate, edit, or delete user-defined measures using the Manage Planning Measures task, which is available inthe Tasks drawer.
To duplicate the measure: Select a measure from the list of measures, select the Action menu on the toolbar, and thenclick Duplicate. Duplicating the existing measure gives you a starting point for creating a new measure definition. Whenyou duplicate a measure the default name is Copy of <original measure name>. Other definitions of the duplicatedmeasure remain the same as the original measure.
To edit the measure: Select a measure from the list of measures, select Actions menu, and then click Edit. Editing ameasure enables you to select an existing measure and edit its attributes.
To delete the measure: Select a measure from the list of measures, select Actions menu, and then Delete. A completelist of all objects including tables and measure groups are be displayed to ensure you are aware of impacts of deleting ameasure.
Oracle Supply Chain Management CloudUsing Replenishment Planning
Chapter 4Planning Measures
47
Create Measure GroupsUse Manage Planning Measures task to create a measure group. Measure groups are created to group measurestogether that you need frequently. Depending on your business need you can create measure groups and associatemeasures with appropriate groups.
To create a measure group:
1. In the Navigator, click a Supply Chain Planning work area link.2. Click the Tasks panel tab.3. In the Tasks panel drawer, click the Manage Planning Measures link.4. Click Create Group from the Actions menu.
◦ Enter a name and description.
◦ From the Available Measures pane you can select measures and move to the Selected Measures pane.
5. Click Save and Close.
You can also create Measure Groups in the Selector tool when you create or edit a table or graph. In the Group field inthe header section, select Manage Groups from the list of values. Use the plus icon, +, to add a row, type a name, andclick Save.
Configure Global Goals for MeasuresYou can define global goals for a measure using the Goals tab when you create or edit a measure. On the CreateMeasure page, click the Advanced tab and then select the Goals tab to configure global goals.
Define if low or high values are better. For example, a high value is good for revenue; a low value is good for expenses.
For global goals, you can provide a low range or a high range.
Goals option is available only for measures of type Currency, Number, and Percent. Using Global Goals, you can firstdefine if low or high values are better for a measure. The ranges are displayed on the page when you are viewing ameasure in comparison with its goal, for example, in an infotile. Global goals are measure level parameters and arenot defined specifically for a subset of the data. For example, you cannot have a goal of 1000 for one organization and50000 for another.

Oracle Supply Chain Management CloudUsing Replenishment Planning
Chapter 4Planning Measures
48

Oracle Supply Chain Management CloudUsing Replenishment Planning
Chapter 5Supply Network Model
49
5 Supply Network Model
How You Maintain Your Supply Network ModelUse the Maintain Supply Network Model page to view your collected data that includes details of organizations,customers, suppliers, carriers, and interlocation shipping networks. To open the Maintain Network Model page, navigateto a Supply Chain Planning work area. Click the Tasks panel tab and then select the Maintain Supply Network Modellink.
You use organizations to represent your business facilities or functions. Typically, if your business has a single physicalfacility that performs two different functions, then you model it as two organizations. For example, you have one facilitythat's a manufacturing plant and a distribution center. You can model them as two separate organizations. Additionally,if your business has one function located in two separate physical facilities, you can model those as one organization. Ifyou modeled your facilities as one organization, you can create separate subinventories to represent inventory for eachfacility.
Review the Collected DataBased on your search results, use the Organization tab to do the following:
• Review organizations, including the time zones associated with the organizations, for all source systems.
• Create customer and supplier associations to organizations. This is used when creating the buy-sell transfers.
• Select the drop ship validation organization. For each source system, you can select only one organization asthe drop ship validation organization. You can also assign a calendar to a drop ship validation organization.
• Set past due parameters for each organization, which include:
◦ Past due forecast days
◦ Past due sales order days
◦ Past due supply days
• Set up organizations for subinventory-level replenishment planning by selecting Yes under PlanSubinventories.
Use the Customers and Supplier tabs to review collected data and assign time zones to customer sites and suppliersites. If the customer site or supplier site doesn't have an associated time zone, then the customer site or supplier site isassumed to be in the same time zone as the organization that's associated with the demand or supply.
Use the Carriers and Interlocation Shipping Networks tabs to review collected data on carriers, shipping methods, andtransit times.
Manage Organization GroupsClick the Manage Organization Groups button on the Organizations tab to create and manage organization groups.Organization groups are managed within the source systems and are used to:
• Limit the net change data collection from a source system to specific organizations.
• Load planning data from files for a specific organization group when collection type is Targeted.

Oracle Supply Chain Management CloudUsing Replenishment Planning
Chapter 5Supply Network Model
50
Enable Inventory Organization Tracking by ProjectThis parameter appears on the Maintain Supply Network Model page only when your organization is enabled forproject-specific supply planning.
The Project Enabled parameter governs whether your inventory organization is enabled for inventory tracking byproject. The value for this parameter can be Yes or No for an organization.
When the parameter value is Yes for an organization, the data collection process collects project-and-task-specificsupplies and demands, and the project-specific planning releases planned orders to the organization. The value for thisparameter is No for a supplier-modeled organization or a contract manufacturing organization.
Buy and Sell TransfersYou can conduct material transfers between two organizations in a single Oracle Fusion source system by using thepurchase order and sales order documents. The sales order at the source organization is used to ship the transfer. Thepurchase order at the destination organization is used to receive the transfer.
In the supply network model for the purchase order supply at the receiver organization:
• Define the supplier to source organization relationship and for the sales order demand at the shippingorganization.
• Define the customer to destination organization relationship.
To model an organization as a supplier, update the Supplier and Supplier Site columns of the associated organization.
To model an organization as a customer, update Customer and Customer Site columns of the associated organization.
Forecast and Consume Internal OrdersTo forecast and consume internal orders, assign a customer and customer site to the organization that's the destinationof the transfers. Use a customer name that makes sense for the destination organization, such as M1 Transfers. Afteryou assign a customer and customer site on the Organizations tab, select the Use Customer and Customer Site forInterorganization Transfers check box for the organization.
Note: To complete the setup to forecast and consume internal orders, you must also do the following:• On the Collect Planning Data page, Parameters tab, Demand Planning Data subtab, select the Organization -
Consumption Inventory Transactions to Include check box.• In the plan options for your plan, select the Include transfer orders check box in the Demand: Advanced Options
dialog box. This check box is only available from a Demand Management, Planning Central, or Demand andSupply Planning work area.
Related Topics
• Overview of Data Collections for Supply Chain Planning
• How You Collect Different Data Types for Supply Chain Planning
• How You Load Planning Data from Files
• Set Up Forecast Consumption for Transfer Orders
Oracle Supply Chain Management CloudUsing Replenishment Planning
Chapter 5Supply Network Model
51
Publish Order Forecasts to SuppliersYou publish order forecasts to your suppliers to enable them to commit supply and indicate their ability to meet thedemand. Collaborating with suppliers by publishing an order forecast enables:
• Suppliers to send supply commits to the Original Equipment Manufacturer (OEM)
• OEMs to receive supply commits as supplier capacity
Collaboration enables suppliers to get an insight into the demand that the OEMs forecast and plan supply chainactivities to meet the demand. Additionally, collaboration with suppliers enables OEMs to plan their downstreamactivities in the supply chain more efficiently.
Use the Collaboration Basis column in the Suppliers tab on the Maintain Supply Network Model page to indicate thebasis on which you want to publish the order forecast to your suppliers. You can choose to publish the order forecast atthe supplier and supplier site levels based on one of the following dates:
• Start date: Suppliers use the start date to know when they need to start manufacturing an order to fulfill theorder on time
• Dock date: Suppliers use the dock date to know the date by which they need to fulfill the order
How You Define the Approved Supplier List for SupplyChain PlanningAn approved supplier list (ASL) is a repository of information that links items to the suppliers and supplier sites thatprovide them to either a specific ship-to organization or the entire enterprise. An ASL can be global or specific to anorganization; however, supply planning only recognizes global ASLs.
To determine the supplier and supplier sites for items, the planning process collects ASLs from the CSV file upload,Oracle Fusion Procurement, or both.
• Use the Load Planning Data from Flat Files process to load data directly into the planning ASL by using theApproved Supplier List CSV template (ScpApprovedSupplierListImportTemplate.xlsm).
• You can also define some ASL attributes in Oracle Fusion Procurement and then upload a CSV file that definesthe attributes that you want supply planning to use. For example, define the following item-to-supplierrelationships and order modifiers in Oracle Fusion Procurement:
◦ Supplier
◦ Supplier site
◦ Minimum order quantity
◦ Fixed lot multiple
To upload additional attributes for supply planning to use, you can create and collect the ASL from purchasing. You canthen use the CSV file upload to define additional attributes such as the following:
• Item-supplier lead time
• Supplier capacity calendar
Oracle Supply Chain Management CloudUsing Replenishment Planning
Chapter 5Supply Network Model
52
• Daily supplier capacity
Oracle Fusion Supply Planning supports the approved supplier list for a base model. However, approved supplier listsaren't supported for configured items and won't be copied into a supply plan.
Related Topics
• Supplier Capacity Options
Associate Calendars with Supplier SitesUse a supplier site calendar to measure processing lead times for purchases from a supplier site. You can associate aSupply Chain Planning calendar with a supplier site to use for all items sourced from that supplier site. The calendar is inthe collected planning data.
You can associate a calendar with supplier sites to use if there is no calendar defined through the Approved Supplier Listupload for a supplier site-item combination. From a Supply Chain Planning work area, navigate to the Maintain SupplyNetwork Model page, Suppliers tab. In the Supplier Site Calendar column for a supplier, select a calendar name fromthe list of collected calendars. You can only edit this field if the supplier row contains a supplier site.
When you run the plan, the planning process uses the selected calendar on the Maintain Supply Network Mode pageif the approved supplier list calendar for the supplier site-item is blank. If the approved supplier list calendar for thesupplier site-item is blank, and you do not associate a calendar with a supplier site on the Maintain Supply NetworkModel page, then the planning process uses the 24/7 calendar.
Assignment Sets, Sourcing Rules, and Bills ofDistributionYou use assignment sets in a Supply Chain Planning work area to link sourcing rules and bills of distribution to items.Using sourcing rules, bills of distribution, and assignment sets together, you can specify how material is supplied,manufactured, and transferred across a supply chain.
Note: This topic is applicable to only the Planning Central, Sales and Operations Planning, Supply Planning, Demandand Supply Planning, and Replenishment Planning work areas.
When you create sourcing rules and bills of distribution, you create descriptions of the means by which you canreplenish items. However, items aren't specified anywhere on the definition forms, and so a defined sourcing rule orbill of distribution can later be assigned to any item or group of items. Use assignment sets to associate specific items,categories, or organizations with the sourcing rules and bills of distribution.
You must use sourcing to describe the supply chain to the planning process. Use the following three structures to do so:
• Sourcing rules
• Bills of distribution
• Assignment sets
Oracle Supply Chain Management CloudUsing Replenishment Planning
Chapter 5Supply Network Model
53
Sourcing RulesSourcing rules and bills of distribution determine the movement of material between organizations. Theseorganizations include supplier, manufacturing, and distribution facilities. You can navigate to a Supply Chain Planningwork area and click Manage Sourcing Rules from the Tasks drawer to create or search for an existing sourcing rule.
The three types of sources are:
• Transfer From: Interorganization shipping functionality accomplishes the transfer between internalorganizations. Enter the source organization in the Organization column.
• Make At: The item is manufactured at this internal organization. Enter the manufacturing organization in theOrganization column.
Oracle Fusion Replenishment Planning doesn't support make at sourcing rules.
• Buy From: Purchase the item from an external enterprise. Data entry in the Supplier and Supplier Site columnsis enabled, and the Organization column is disabled.
Allocation Percent and Rank: The total allocation percentage for all sources within a rank must add up to 100 percent.The sources with the highest rank (lowest numeric value) get the highest priority in allocations. Planning Central andReplenishment Planning only consider sources of rank one. Replenishment Planning also doesn't support sourcingsplits.
Bills of DistributionWhen material flows through three or more organizations, bills of distribution describe supply chain links moreefficiently than sourcing rules. However, any relationship that can be described by bills of distribution can also bedescribed by a set of sourcing rules. Typically, most users use sourcing rules rather than bills of distribution. You cannavigate to a Supply Chain Planning work area and click Manage Bills of Distribution from the Tasks drawer to createor search for existing bills of distribution.
Replenishment Planning supports bills of distribution of only rank one and doesn't support split bills of distribution.
Note: Despite the name, bills of distribution don't describe an outward bound or push type of sourcing relationship.Both sourcing rules and bills of distribution are used only to pull material from sources to destinations.
Assignment SetsYou use assignment sets to link sourcing rules and bills of distribution to items. In other words, you use assignmentsets to link sourcing rules, items and supply nodes. The assignment set creates the sourcing and transfer links betweenorganizations for each item involved in a supply chain plan. Alternative supply chains can be modeled by creatingalternative assignment sets. You can navigate to a Supply Chain Planning work area and click Manage AssignmentSets from the Tasks drawer to create or search for existing assignment sets.
Sourcing Assignment HierarchyThe planning process uses a sourcing assignment hierarchy to determine the actual source of a specific item. You canassign replenishment sources at the following levels. Specific sourcing assignments override general assignment levels.

Oracle Supply Chain Management CloudUsing Replenishment Planning
Chapter 5Supply Network Model
54
The following table lists the supply sourcing hierarchy.
Rank Item or Category Applies to
1 Item - Organization1. Sourcing rule2. Item-organization attributes (Make
or Buy)
2 Category - Organization N/A
3 Item1. Bill of distribution2. Global sourcing rule
4 Category1. Bill of distribution2. Global sourcing rule
5 Organization1. Bill of distribution2. Global sourcing rule3. Item-master attributes (Make or
Buy)
6 Global1. Bill of distribution2. Global sourcing rule
Caution: To use the category in the assignment set, you must set the profile option catalog for sourcing assignmentsto select the catalog that's used for sourcing. Typically, the planning catalog is used. However, any collected catalogcan be selected in the profile option. If the profile option is blank, then the category isn't available in the assignmenthierarchy.
When you source supplies for sales orders and forecasts (independent demands), order promising and planning use themore detailed hierarchy. This hierarchy includes the demand class, customer, and customer site which are dimensionsof independent demand.
The following table lists the demand sourcing hierarchy.
Rank Item or Category
1 Item - Customer / customer site
2 Item - Customer
3 Item - Demand Class
4 Item - Region
5 Category - Customer / customer site
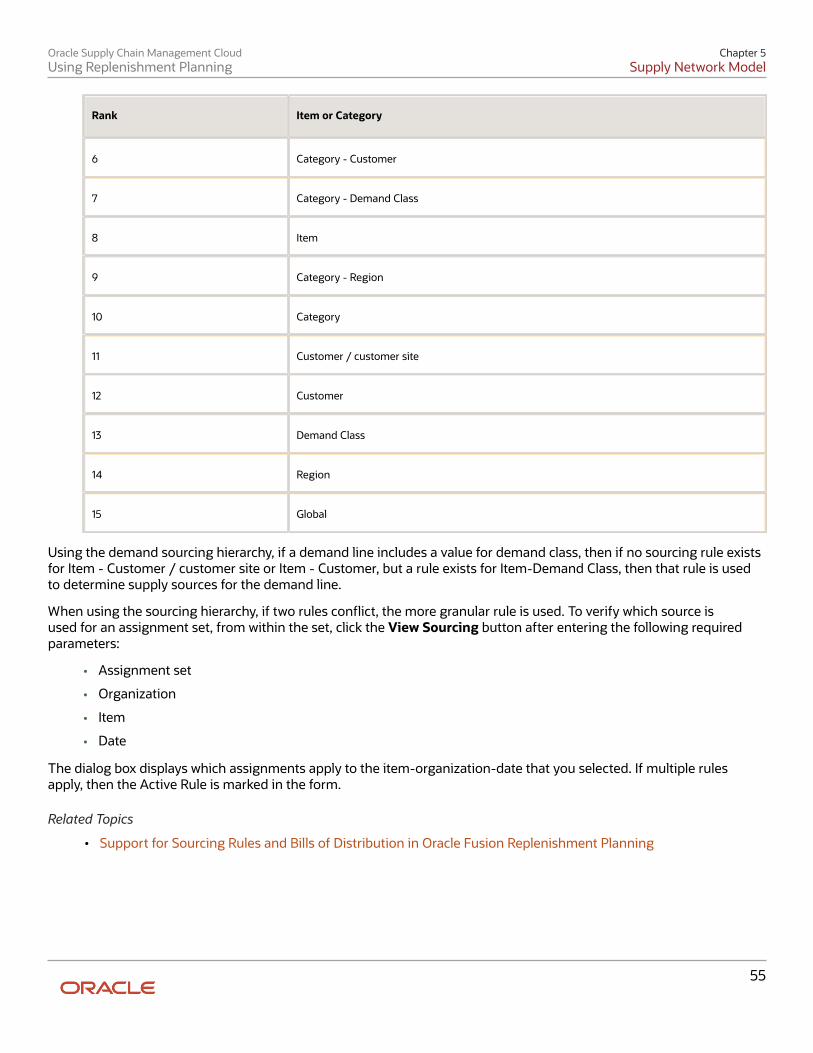
Oracle Supply Chain Management CloudUsing Replenishment Planning
Chapter 5Supply Network Model
55
Rank Item or Category
6 Category - Customer
7 Category - Demand Class
8 Item
9 Category - Region
10 Category
11 Customer / customer site
12 Customer
13 Demand Class
14 Region
15 Global
Using the demand sourcing hierarchy, if a demand line includes a value for demand class, then if no sourcing rule existsfor Item - Customer / customer site or Item - Customer, but a rule exists for Item-Demand Class, then that rule is usedto determine supply sources for the demand line.
When using the sourcing hierarchy, if two rules conflict, the more granular rule is used. To verify which source isused for an assignment set, from within the set, click the View Sourcing button after entering the following requiredparameters:
• Assignment set
• Organization
• Item
• Date
The dialog box displays which assignments apply to the item-organization-date that you selected. If multiple rulesapply, then the Active Rule is marked in the form.
Related Topics
• Support for Sourcing Rules and Bills of Distribution in Oracle Fusion Replenishment Planning

Oracle Supply Chain Management CloudUsing Replenishment Planning
Chapter 5Supply Network Model
56
Create an Assignment SetYou create assignment sets to assign sourcing rules and bills of distribution you defined to specific items, customers,organizations, categories, demand classes, or regions. For each sourcing assignment within an assignment set, you alsoselect an applicable assignment level to implement the scope of the sourcing rule or bill of distribution.
Always plan before you create your assignment sets. Understand the different assignment levels, their level ofgranularity, and how an assignment level overrides another assignment level based on their level of granularity. You canget conceptual information about these aspects in the Sourcing Rules, Bills of Distribution, and Assignment Sets sectionof the guide.
Use these steps to create your assignment set.
1. From a Supply Chain Planning work area, click Manage Assignment Sets in the Tasks panel.2. On the Manage Assignment Sets page, click the Create icon in the Search Results section.3. On the Create Assignment Set page, provide a name and description for the assignment set.4. Select a catalog to use the categories associated with that catalog in your assignment set.5. To assign sourcing rules or bills of distribution at the subinventory level for planning, select Enable for
subinventory-level planning.6. In the Sourcing Assignments section, click the Add Row icon and specify these attributes.
◦ Select the assignment level and specify the value for the attributes applicable to the selected assignmentlevel.
◦ Select the sourcing type. The sourcing type can be a sourcing rule or a bill of distribution.
◦ Select the sourcing rule or bill of distribution.
7. Click Save to save this assignment set or Save and Create Another to save this assignment set and createanother assignment set.
Note: You can create or delete assignment sets using the file-based data import (FBDI) mechanism. To find therelated FBDI templates, go to the Supply Chain Planning Sourcing Rules topic in the Supply Chain Planning chapter ofthe File-Based Data Import for SCM guide.
Specify Catalogs for Assignment SetsA catalog is a collection of categories used to classify items that you can organize into a hierarchy. A catalog can have aflat or single-level structure of categories or you can have a hierarchical structure of categories.
When creating assignment sets, you must specify a catalog for each assignment set. You associate an assignment setwith a catalog to:
• Use the categories associated to that catalog in your assignment set.
• Link the sourcing assignments to the categories associated with the catalog.
If you do not specify a catalog for an assignment set, the assignment set uses the Catalog for Sourcing Assignments(MSC_SRC_ASSIGNMENT_CATALOG) profile option as the default catalog.
To create an assignment set and specify a catalog, use the Manage Assignment Sets task in one of the Supply ChainPlanning work areas.

Oracle Supply Chain Management CloudUsing Replenishment Planning
Chapter 5Supply Network Model
57
Note: Assignment sets are not applicable to the Demand Management work area.
Create a Sourcing Rule or Bill of DistributionCreate sourcing rules or bills of distribution to determine the acceptable fulfillment locations for replenishing items. In asourcing rule or bill of distribution, you only specify how to replenish items. You don't specify which items to replenish.To do that, you create assignment sets.
Always plan before you create your sourcing rules or bills of distribution to avoid managing too many rules. Here's whatyou can do.
• Look at your assignment set requirements to determine how your sourcing rules are applicable to differentitems.
• Design the combination of global and local sourcing rules you must implement in your assignment set. Defineyour global sourcing rule in such a way that you don't have to create too many local sourcing rules to addressexceptions to the global sourcing rule.
• Collect the reference data, such as organizations, items, and so on that you require to create your sourcingrules. Refer to the Planning Data Collection section for details. For order promising, you also must ensure thatthe collected data is up to date on the order promising server.
You can get conceptual information about the different aspects to consider in your rule in the Sourcing Rules, Bills ofDistribution, and Assignment Sets section.
Create Sourcing RulesUse these steps to create a sourcing rule:
1. In a Supply Chain Planning work area, click Manage Sourcing Rules in the Tasks panel.2. On the Manage Sourcing Rules page, click the Create icon in the Search Results section.3. On the Create Sourcing Rule page, provide a name and description for the sourcing rule.4. To define sourcing at the subinventory level for planning, select Enable for subinventory-level planning.
Note: When you select this check box, the Create Movement Requests field is available underSources. For a local sourcing rule of the transfer from type between two subinventories, you can usethis field to release plan recommendations as movement requests.
5. Select the organization assignment type for your sourcing rule. You can create a global sourcing rule or a localsourcing rule. When you create a local sourcing rule, specify the organization to which the rule is applicable.
6. In the Sourcing Rule Effective Dates section, click the Add Row icon and specify the effective dates for thesourcing rule.
7. In the Sources section, click the Add Row icon and specify these attributes.
◦ Select the source type. The source type can be Transfer from, Make at, or Buy from depending on theorganization assignment type you selected for the rule.
Replenishment plans support sourcing rules of only the transfer from or buy from type.
◦ Specify the values for the attributes applicable to the selected source type. You can also set up an option-specific sourcing exclusion for the Transfer from or Make at source type.
8. Click Save to save this rule or Save and Create Another to save this rule and create another sourcing rule.
Oracle Supply Chain Management CloudUsing Replenishment Planning
Chapter 5Supply Network Model
58
Create Bills of DistributionUse these steps to create your bills of distribution:
1. From a Supply Chain Planning work area, click Manage Bills of Distribution in the Tasks panel.2. On the Manage Bills of Distribution page, click the Create icon in the Search Results section.3. On the Create Bill of Distribution page, provide a name and description for the bill of distribution.4. To define sourcing at the subinventory level for planning, select Enable for subinventory-level planning.
Note: When you select this check box, the Create Movement Requests field is available underSources. For a bill of distribution of the transfer from type between two subinventories, you can usethis field to release plan recommendations as movement requests.
5. In the Destinations section, click the Add Row icon and specify the effective dates and the organization.6. In the Sources section, click the Add Row icon and specify these attributes.
◦ Select the type for the bill of distribution. The type can be Transfer from, Make at, or Buy from.
Replenishment plans support bills of distribution of only the transfer from or buy from type.
◦ Specify the values for the attributes applicable to the selected type. You can also set up an option-specificsourcing exclusion for the Transfer from or Make at type.
7. Click Save to save this rule or Save and Create Another to save this bill of distribution and create another bill ofdistribution.
Related Topics
• How You Collect Different Data Types for Supply Chain Planning
• Support for Sourcing Rules and Bills of Distribution in Oracle Fusion Replenishment Planning
Export Planning Data to CSV FilesYou can replicate sourcing rules and assignment set data from your supply chain planning cloud instance to anotherinstance or application without manually reentering data. For example, you can replicate the sourcing rules in yoursupply chain planning cloud production instance into a reporting system or a test instance.
Use the Export Supply Chain Planning Data scheduled process job to extract sourcing rules and assignment set datainto a comma-delimited values (CSV) file format. The generated file is in the standard file-based import (FBDI) fileformat that you can then use to do the following:
• Check for missing or incorrect sourcing rules or sourcing assignments. For example, does a particular item-organization have a valid sourcing assignment?
• Replicate and then modify existing sourcing rules and assignment sets in a spreadsheet. You can then uploadthe new setups into another instance or application to create new sourcing rule and assignment set setups.
• Copy the sourcing rule and assignment set setups from one instance to another instance or application, such asfrom a test instance to a production instance.
The format of the CSV files, including the header content, is the same as the format of the corresponding files in thesource instance. This enables you to import the same data directly into another production or test instance. Use theLoad Planning Data from Files process to upload your imported files to staging tables.
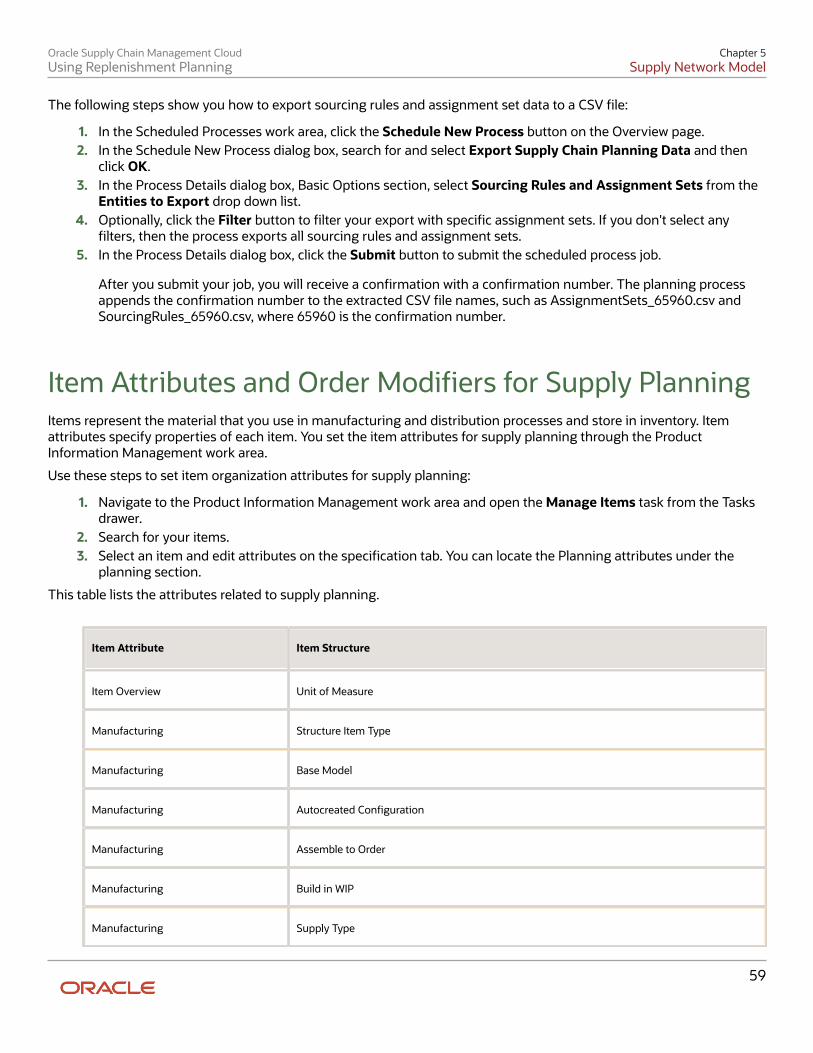
Oracle Supply Chain Management CloudUsing Replenishment Planning
Chapter 5Supply Network Model
59
The following steps show you how to export sourcing rules and assignment set data to a CSV file:
1. In the Scheduled Processes work area, click the Schedule New Process button on the Overview page.2. In the Schedule New Process dialog box, search for and select Export Supply Chain Planning Data and then
click OK.3. In the Process Details dialog box, Basic Options section, select Sourcing Rules and Assignment Sets from the
Entities to Export drop down list.4. Optionally, click the Filter button to filter your export with specific assignment sets. If you don't select any
filters, then the process exports all sourcing rules and assignment sets.5. In the Process Details dialog box, click the Submit button to submit the scheduled process job.
After you submit your job, you will receive a confirmation with a confirmation number. The planning processappends the confirmation number to the extracted CSV file names, such as AssignmentSets_65960.csv andSourcingRules_65960.csv, where 65960 is the confirmation number.
Item Attributes and Order Modifiers for Supply PlanningItems represent the material that you use in manufacturing and distribution processes and store in inventory. Itemattributes specify properties of each item. You set the item attributes for supply planning through the ProductInformation Management work area.
Use these steps to set item organization attributes for supply planning:
1. Navigate to the Product Information Management work area and open the Manage Items task from the Tasksdrawer.
2. Search for your items.3. Select an item and edit attributes on the specification tab. You can locate the Planning attributes under the
planning section.
This table lists the attributes related to supply planning.
Item Attribute Item Structure
Item Overview Unit of Measure
Manufacturing Structure Item Type
Manufacturing Base Model
Manufacturing Autocreated Configuration
Manufacturing Assemble to Order
Manufacturing Build in WIP
Manufacturing Supply Type

Oracle Supply Chain Management CloudUsing Replenishment Planning
Chapter 5Supply Network Model
60
Item Attribute Item Structure
Inventory Inventory Item
Inventory Stockable
Inventory Transactable
Order Management Customer Orders Enabled
Order Management Transfer Orders Enabled
Planning Make or Buy
Planning Safety Stock Method
Planning Planner Code
Planning Planning Method
Planning Forecast Control
Planning Time Fences: Demand
Planning Time Fences: Release
Planning Time Fences: Planning
Planning Cost
Planning Carrying Percentage
Planning Shrinkage Rate
Planning Acceptable Early Days
Planning Lead Times: Processing
Planning Lead Times: Preprocessing
Planning Lead Times: Postprocessing

Oracle Supply Chain Management CloudUsing Replenishment Planning
Chapter 5Supply Network Model
61
Item Attribute Item Structure
Planning Lead Times: Fixed
Planning Lead Times: Variable
Planning Minimum Order Quantity
Planning Maximum Order Quantity
Planning Fixed Order Quantity
Planning Fixed Lot Multiplier
Planning Fixed Days Supply
Planning Rounding
Purchasing Purchasable
Purchasing Approved Supplier List
You can use these attributes for specific purposes:
• Make or Buy: This attribute is used by default if no sourcing rule is present.
• Planning Method: Use either MRP planned or MPS planned as the planning method.
• Time Fences: All are used by planning.
• Buy items use the processing lead times. Make items use fixed and variable.
• Make, buy, transfer all use preprocessing lead time. Buy and transfer use post processing lead time.
• Acceptable Early Days is used if you need to reschedule existing supplies. If the supply due date is within theacceptable early days, then no reschedule out recommendation is issued.
Order ModifiersYou use order modifiers to obtain planned orders that you are more likely to use in your environment. For example, youmay purchase an item from a supplier who only provides it on pallets of quantity 100. If you are short in some quantity,say 72, you can set the planned order quantity to 100 instead of 72 to support your requirement. You can't apply ordermodifiers to phantoms.
These are the order modifiers that you can use:
• Minimum Order Quantity
• Maximum Order Quantity
• Fixed Order Quantity
• Fixed Lot Multiplier
Oracle Supply Chain Management CloudUsing Replenishment Planning
Chapter 5Supply Network Model
62
• Fixed Days Supply
• Rounding
Material planning uses a priority sequence (precedence) of order modifiers. It applies certain order modifiers beforeothers and rules out certain order modifiers based on its using certain other order modifiers. The order modifierprecedence is:
• Fixed Days Supply: One planned order for this item must cover all the shortages for the number of daysspecified in the value. For example, if the net requirements are 50 on Monday, 100 on Wednesday, 70 onThursday, and you have set fixed days supply to five, the planning process creates one planned order, withquantity of 220 (50 + 100 + 70) and due on Monday. The period start dates are not fixed. In the example, thenext period of five days would not always start on the following Monday but would start on the next day afterFriday that has net requirements. You can adjust the fixed days supply value using the other order modifiers.Therefore, the next period of five days could be the following Wednesday through the second Tuesday.
• Fixed Order Quantity: You must always set the planned order quantity with this value. For example, if the netrequirements are one and you have set fixed order quantity to 200, the planning process creates one plannedorder with quantity of 200. If set, the planning process skips to the modifier Round order quantities.
• Fixed Lot Multiplier: You must always have the planned order quantity with this value. For example, if the netrequirements are 400 and you have set fixed lot multiple to 150, the planning process creates one plannedorder with quantity of 450.
• Minimum Order Quantity: The planned order quantity may never be less than this value. For example, if thenet requirements are 100 and you have set minimum order quantity to 150, the planning process creates oneplanned order with quantity of 150. If set, the planning process skips to the modifier Round order quantities.
• Maximum Order Quantity: One planned order for this item may not have a quantity more than this value.For example, if the net requirements are 200 and you have set maximum order quantity to 150, the planningprocess creates two planned orders, one with quantity of 150 and the other with quantity of 50.
• Rounding: The planned order quantity must always be a whole number; the planning process always roundsfractional quantities up to the next highest whole number. For example, if the net requirements are 99.2 andyou have selected round order quantities, the planning process creates one planned order with quantity of 100.
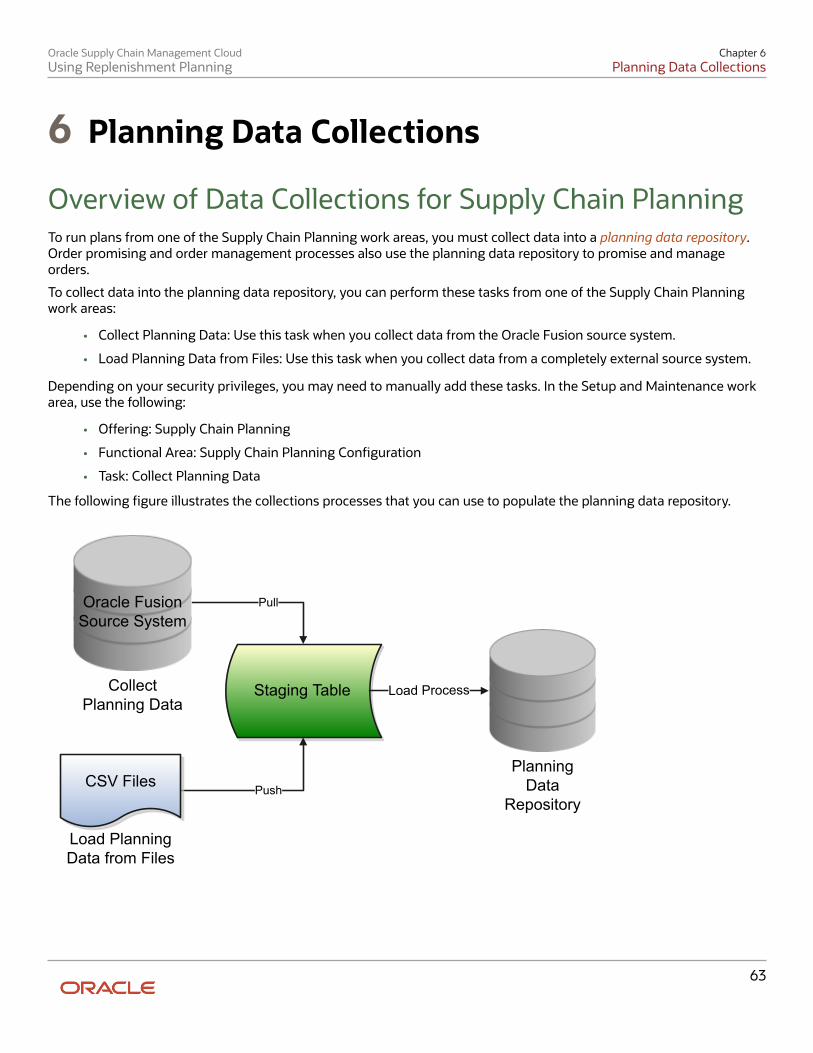
Oracle Supply Chain Management CloudUsing Replenishment Planning
Chapter 6Planning Data Collections
63
6 Planning Data Collections
Overview of Data Collections for Supply Chain PlanningTo run plans from one of the Supply Chain Planning work areas, you must collect data into a planning data repository.Order promising and order management processes also use the planning data repository to promise and manageorders.
To collect data into the planning data repository, you can perform these tasks from one of the Supply Chain Planningwork areas:
• Collect Planning Data: Use this task when you collect data from the Oracle Fusion source system.
• Load Planning Data from Files: Use this task when you collect data from a completely external source system.
Depending on your security privileges, you may need to manually add these tasks. In the Setup and Maintenance workarea, use the following:
• Offering: Supply Chain Planning
• Functional Area: Supply Chain Planning Configuration
• Task: Collect Planning Data
The following figure illustrates the collections processes that you can use to populate the planning data repository.
Collect Planning Data
Planning Data
Repository
Staging Table Load Process
Push
Pull
CSV Files
Oracle Fusion Source System
Load Planning Data from Files

Oracle Supply Chain Management CloudUsing Replenishment Planning
Chapter 6Planning Data Collections
64
Collect Planning DataThere are two steps involved in the data collection process. The Collect Planning Data process first pulls data from theOracle Fusion source system into staging tables. The process then loads data from the staging tables into the planningdata repository.
On the Collect Planning Data page, use the following tabs to select what data you want to collect:
• Reference Data
• Demand Planning Data
• Supply Planning Data
Most of the reference data are global entities. Global entities are common for all source systems. For example, Units ofMeasure (UOM) is common for all source systems. The supply planning and demand planning data are transactionaldata. Most of the transactional data are local entities. Local entities are specific to each source system. For example, On-hand Quantity is specific for each source system.
You can also select collection filters to further refine what data you want to collect. You can save your selections tocollection templates.
Load Planning Data from FilesUse this option to populate the planning data repository using CSV files:
To load the planning data from files, follow these steps:
1. Create the CSV files. To create the CSV files, you can use a predefined set of Microsoft Excel files as importtemplates.
2. Import the CSV files. From the navigator, click File Import and Export, and create a new import. Specify scm/planningDataLoader/Import for the account.
3. Submit the Load Planning Data from Files process. When you submit the process, the process first pushes thedata from the CSV files into the staging tables. The process then loads the data from the staging tables into theplanning data repository.
Related Topics
• Update Existing Setup Data
Global EntitiesWithin data collections, Oracle Fusion Supply Chain Planning refers to certain business entities as global entities. Globalentities are specific for each instance and are common for all source systems. They are common without regard towhether they are collected from the Oracle Fusion source system or collected from an external source system using thefile-based data import (FBDI) method.
When collecting data for a global entity, the planning data repository stores only one record for each instance of theglobal entity. The data collections process removes the source system reference from the global entity and stores thedata in the data repository. If the data collections process collects the same instance of a global entity from more thanone source system, the data repository stores the value from the last collection.

Oracle Supply Chain Management CloudUsing Replenishment Planning
Chapter 6Planning Data Collections
65
For example, the following scenario describes the collection method of the global entity called units of measure (UOM)from three source systems, namely source system A, B, and C respectively.
• Source system A has an instance of UOM. During the collection of UOMs from source system A, the kilogramUOM is collected. This is the first time the kilogram UOM is collected. The data collections process creates akilogram record in the data repository.
• Source system B does not have any instances of UOM. During the collection of UOMs from source system B,the data collections process does not collect the kilogram value. Since there was no record for the kilogramUOM in source system B, the data collections process does not change the kilogram record in the datarepository. The record of the kilogram value from source system A is still valid.
• Source system C has an instance of UOM. During the collection of UOMs from source system C, the kilogramUOM is again collected. The data collections process registers the kilogram record in the data repository tomatch the values from source system C.
Note: When you use the FBDI collection method, the global entity files require a source system. The collectionsframework validates that the source system matches each record's source system. A source system identifier markseach data record.
In Supply Chain Planning, the following entities are classified as global entities:
• Order Orchestration Reference Objects
• Units of Measure and UOM Conversions
• Demand Classes
• Currency and Currency Conversion Class
• Shipping Methods (Carrier, Mode of Transport, Service Level)
• Customer and Customer Site
• Suppliers and Supplier Sites
• Regions and Zones
• Approved Supplier List
• Supplier Capacity
• Planners
Data Collection Types for Supply Chain PlanningWhen you collect planning data, one of the parameters you specify for the Collect Planning Data task is the CollectionType parameter. You can select this task from any of your Supply Chain Planning work areas. For the Collection Typeparameter, you can select one of the following values:
• Targeted: Choose the Targeted collection type when you want to collect a significant volume of source systemdata. Typically, you use the Targeted collection type in scenarios such as bulk upload of transaction data,instance upgrade, and change in collection filters.
• Net change: Choose the Net change collection type when you want to collect changed data and new recordssince the last successful collection cycle.
• Automatic selection: Choose the Automatic collection type when you want the planning process to decide andautomatically select an appropriate collection type for each of the entities.

Oracle Supply Chain Management CloudUsing Replenishment Planning
Chapter 6Planning Data Collections
66
TargetedYou use the Targeted collection type when you want to perform a complete refresh of the data in the data repository.In this mode, the planning process deletes the existing data for the selected entities from the data repository. Next, ifsubsequently collected from the source, the data for the selected entities replaces the deleted data.
Note: For the following data collection entities, you can use only the Targeted collection type: Item Costs, ResourceAvailability, Fiscal Calendars, and all Shipment and Booking History data.
Net changeWhen you use the Net Change collection type, you collect data incrementally. The Net Change collection type collectsonly changed or new data. Collecting data using the Net Change collection type is usually faster than using the Targetedcollection type. You typically use the Net Change collection type when you have previously performed a Targetedcollection, and now you want to keep your planning data current with your execution system data. You cannot select thedemand planning data when the collection type is Net Change.
Automatic selectionYou use the Automatic collection type when you are not sure which collection type to select and you want the planningprocess to decide the collection type for each entity. The planning process evaluates each entity on multiple factors,such as the last collected date for an entity, and decides whether to perform a Targeted or a Net Change collection forthe entity. You can manually select the entities that you want to collect or you can use one of the predefined templatesto select your entities. If you select one of the predefined templates, you can't make any changes in the Reference Data,Demand Planning Data, and Supply Planning Data tabs.
Manage Planning Source Systems for Data CollectionsTo populate the planning data repository, also known as the order orchestration and planning data repository, youcollect data from the Oracle Fusion source system. On the Manage Planning Source Systems page in one of the SupplyChain Planning work areas, enable organizations for collections. Depending on your security privilege, you can alsoenable organizations from the Setup and Maintenance work area.
In the Setup and Maintenance work area, use the following:
• Offering: Supply Chain Planning
• Functional Area: Supply Chain Planning Configuration
• Task: Manage Planning Source Systems
The Oracle Fusion Source SystemThe Oracle Fusion source system is included as a source system for data collection. Supply chain planning, orderorchestration, and order promising processes use data that are stored in the planning data repository. You ensure theCollections Allowed check box is enabled and manage which organizations you enable for collections.
To open the Manage Trading Community Source Systems page, navigate to the Setup and Maintenance work area anduse the following:
• Offering: Supply Chain Planning

Oracle Supply Chain Management CloudUsing Replenishment Planning
Chapter 6Planning Data Collections
67
• Functional Area: Supply Chain Planning Configuration
• Task: Manage Trading Community Source System
External Source SystemsYou can also allow collections for external source systems if you will be loading planning data from files for OracleFusion Global Order Promising. You must first define the external source system on the Manage Trading CommunitySource Systems.
There are two types of external source systems: Others and External.
Version ExternalThe version External source system indicates that the source system is not connected to any other Oracle Fusionapplications. This source system is not integrated with Oracle Fusion Product Data Model, Oracle Fusion TradingCommunity Model, and Oracle Fusion Order Management Cloud. The external source system is also referred as acompletely external source system. You cannot enable any other source system settings that are related to other OracleFusion applications. You can select the Collections allowed check box now or later depending on when you want to startcollecting data. This enables the source system for data collections using the file-based import process.
Version OthersThe version Others source system indicates that the source system is connected to other Oracle Fusion applications.This source system is integrated for Oracle Fusion Product Data Model, Oracle Fusion Trading Community Model, andOracle Fusion Order Management Cloud. The following conditions are applicable when the external source is Others.
• External system data for Items, Item Structures, and Catalogs is uploaded to Oracle Product Data Model Cloud
• External system data for Customers, Customer Sites, Regions and Zones is uploaded to Oracle TradingCommunity Model Cloud
• External system data for Sales Orders is uploaded to Oracle Order Management Cloud
For more information on types of data that can be collected for each source system, see the Import Templates Used toCreate CSV Files for Supply Chain Planning topic.
Organizations Enabled for Data CollectionsThe process for enabling organizations varies depending on the version of the source system.
To enable organizations for data collections when the source system version is Oracle Fusion, perform the followingsteps:
1. Click the Manage Organization List button for your Oracle Fusion source system.2. Click the Refresh Organization List button to update the organizations list3. Select the Enable for Collections check box for the organizations from which you want to collect data.
Tip: When performing collections during your initial setup, collect order orchestration reference objects from thepredefined Oracle Fusion source system, and consider collecting organizations. After enabling organizations forcollection, collect organizations first. You can confirm the collection results on the Supply Network Model page.
To enable organizations for data collections when the source system version is External (completely external sourcesystem), upload organizations using the file-based import process. The organizations are automatically enabled forcollections.

Oracle Supply Chain Management CloudUsing Replenishment Planning
Chapter 6Planning Data Collections
68
To enable organizations for data collections when the source system version is Others, perform the following steps:
1. Define an organization as an item-organization in the product data model.2. Upload the organization using the file-based import process and associate the organization with Others source
system.
Related Topics
• Considerations for Enabling Organizations for Data Collections
• Define Flexfield Mappings
How the Order Orchestration and Order PromisingProcesses Use the Collected Planning DataYou perform data collections to populate the planning data repository. In addition to being used by Supply ChainPlanning processes, the collected data is used by Oracle Fusion Order Management order orchestration processes andby Oracle Fusion Global Order Promising processes.
Data CollectionsYou must perform data collections to populate the planning data repository, also called the order orchestration andplanning data repository, with data from the Oracle Fusion source system or from a completely external source system.When you load data from an external source system, use the XLSM files to organize your data in the required formatand then convert the data into CSV files. You can then upload the CSV files to the planning data repository.
Order OrchestrationOrder orchestration processes use some reference data directly from the planning data repository. You must performdata collections for the order orchestration reference entities even if you are not using the Supply Chain Planning workareas.
Note: Before collecting data from your Oracle Fusion source system, you must define at least one organization forthe source system. After you have set up at least one organization, you must update the organization list on theManage Planning Source Systems page and then enable at least one of the organizations for collections. If you havenot enabled any organization, then the collections process ends with an error.
Order PromisingThe Global Order Promising processes use an in-memory copy of the data from the planning data repository. Whenorder orchestration processes send a scheduling request or a check availability request to Oracle Fusion Global OrderPromising, the order promising processes use the data stored in main memory to determine the response to send backto order orchestration. You must refresh the Global Order Promising data store after every collections so that the mainmemory always reflect the current.
Related Topics
• Refresh the Global Order Promising Server

Oracle Supply Chain Management CloudUsing Replenishment Planning
Chapter 6Planning Data Collections
69
How You Enable Cross-References of Entities by DataCollectionsCross-references enable you to locate the correct source value for each cross-referenced entity. When you enableentities for cross-referencing, data collection pays attention to the cross-references that you have set up for certainvalues.
To enable cross-referencing of entities, click the Manage Planning Data Collection Processes task from your supplychain planning work area. Select the source system from the list, and then enable the available entities that you want tocross-reference during data collections.
You can view the cross-referenced data for each entity on the Cross-Reference Relationships for Collected Data page inthe Plan Inputs work area.
How Planning Processes Collect Different WorkDefinitions and Item StructuresYou may be concerned that the work definition and item structure data in your supply chain planning work area doesnot match with what was defined in Oracle Manufacturing Cloud. You don't need to worry. The planning applicationcollects and uses data based on how the work definitions and item structures are defined and associated in themanufacturing source system.
Work Definitions and Item Structures in the Source SystemThe work definition is a primary source of data for the planning application. The planning process uses the workdefinition of make order items to determine component and resource requirements. In case the work definition is notdefined, the planning process uses the defined item structure, but to plan for components only. If a work definitionis defined and no item structure is associated to it, then you can manually add ad hoc components to it. If an itemstructure is associated to it, you can still add ad hoc components to the work definition, alongside the components inthe item structure. Remember that while a work definition can be associated with only one item structure, one itemstructure can be associated with several work definitions within the parent item.
Work Definitions and Item Structures in the Planning DataRepositoryIn the manufacturing source system, the work definitions and item structures for an item can be defined and associatedin different ways. The following table lists the most common source system combinations and how the collections andrun plan processes proceed accordingly:
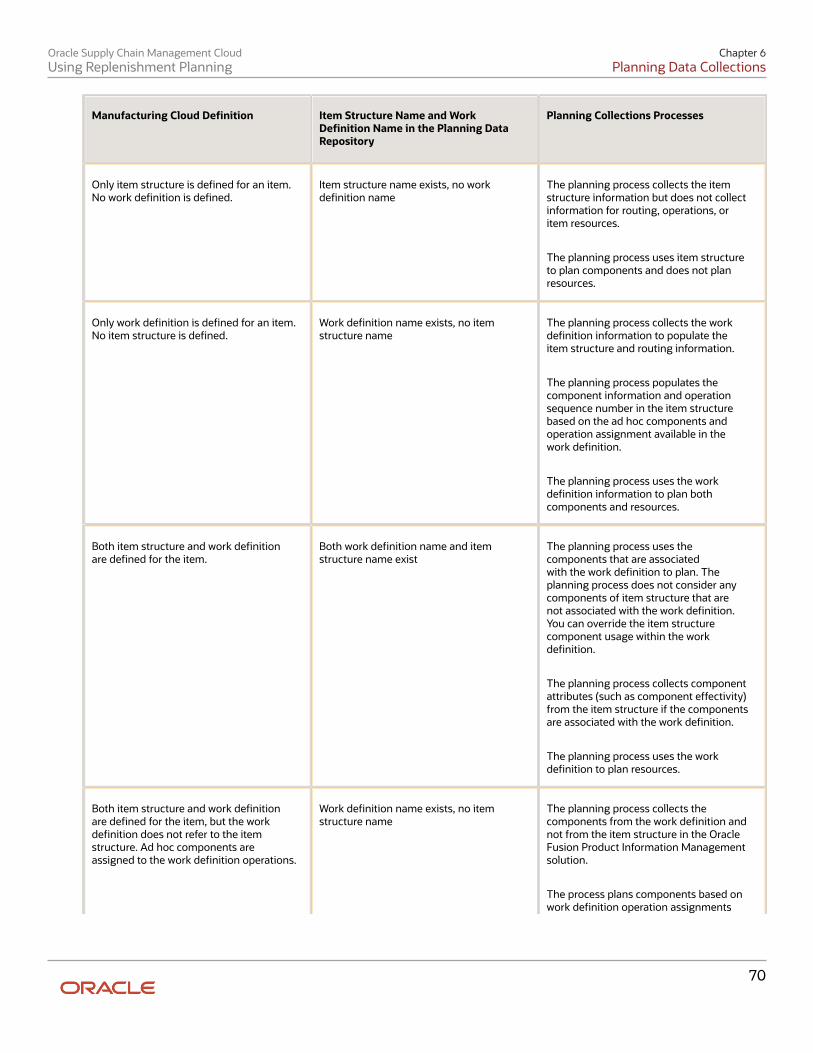
Oracle Supply Chain Management CloudUsing Replenishment Planning
Chapter 6Planning Data Collections
70
Manufacturing Cloud Definition Item Structure Name and WorkDefinition Name in the Planning DataRepository
Planning Collections Processes
Only item structure is defined for an item.No work definition is defined.
Item structure name exists, no workdefinition name
The planning process collects the itemstructure information but does not collectinformation for routing, operations, oritem resources.
The planning process uses item structureto plan components and does not planresources.
Only work definition is defined for an item.No item structure is defined.
Work definition name exists, no itemstructure name
The planning process collects the workdefinition information to populate theitem structure and routing information.
The planning process populates thecomponent information and operationsequence number in the item structurebased on the ad hoc components andoperation assignment available in thework definition.
The planning process uses the workdefinition information to plan bothcomponents and resources.
Both item structure and work definitionare defined for the item.
Both work definition name and itemstructure name exist
The planning process uses thecomponents that are associatedwith the work definition to plan. Theplanning process does not consider anycomponents of item structure that arenot associated with the work definition.You can override the item structurecomponent usage within the workdefinition.
The planning process collects componentattributes (such as component effectivity)from the item structure if the componentsare associated with the work definition.
The planning process uses the workdefinition to plan resources.
Both item structure and work definitionare defined for the item, but the workdefinition does not refer to the itemstructure. Ad hoc components areassigned to the work definition operations.
Work definition name exists, no itemstructure name
The planning process collects thecomponents from the work definition andnot from the item structure in the OracleFusion Product Information Managementsolution.
The process plans components based onwork definition operation assignments

Oracle Supply Chain Management CloudUsing Replenishment Planning
Chapter 6Planning Data Collections
71
Manufacturing Cloud Definition Item Structure Name and WorkDefinition Name in the Planning DataRepository
Planning Collections Processes
and plans resources based on the workdefinition.
Enable External Data Collection for the Oracle FusionSource SystemEnable external data collection if you want to load transactional data from external systems. Typically, you do this ifsome of your supply chain processes are managed in external applications. You load the transactional data from theseapplications using file-based data imports (FBDI).
You can use external data sources for these functional areas: Inventory and Materials Management, Procurement, OrderManagement, and Manufacturing. When you enable external data collection for a functional area, be aware of theserestrictions:
• You can't use configure-to-order, drop shipment, and back-to-back fulfillment.
• The entities associated with the functional area are no longer available for Oracle Fusion source collection. Forexample, if you enable Order Management, the Sales Orders entity won't be available on the Collect PlanningData page for you to select for Oracle Fusion source collection.
This table lists the entities for each functional area.
Functional Area Entities
Inventory and Materials Management On-hand Quantity and Transfer Orders
Procurement Purchase Orders and Requisitions
Order Management Sales Orders and Reservations
Manufacturing Work Order Supplies, Resource Availability, Resources, Work Definitions, and Item Structures
Enable External Data CollectionUse these steps to enable external data collection:
1. Select the Manage Planning Source Systems task in the Tasks panel from any Supply Planning work areapage. Or use this task in the Setup and Maintenance work area:
◦ Offering: Supply Chain Planning
◦ Functional Area: Supply Chain Planning Configuration

Oracle Supply Chain Management CloudUsing Replenishment Planning
Chapter 6Planning Data Collections
72
◦ Task: Manage Planning Source Systems
2. In the list of source systems, select the row that has Oracle Fusion in the Version column.3. In the Actions menu, click Select Data Sources.4. Select the Enable External Data check box, and then select the functional areas that you want to source
transactional entities for.
Note: Every time you enable or disable external data collection, you must run a targeted data collection to ensurecomplete refresh of data in the data repository.
Collect Planning Data from the Oracle Fusion SourceSystem
How You Collect Different Data Types for Supply Chain PlanningWhen you collect data, you collect data from three categories: reference data, demand data, and supply data. On theCollect Planning Data page there is a tab for each of these categories.
The collected data are stored in the planning data repository.
The following figure illustrates the three categories of data that you collect from the Oracle Fusion source system to theplanning data repository.
Planning Data Repository
Reference Data
Supply DataDemand Data
1
32Manufacturing
Procurement
Materials Management
Order Management
Materials Management
Product Information Management
Costing
Explanation of Callouts
1. Reference data is primarily sourced from Oracle Fusion SCM Cloud2. Demand data comes from Oracle Order Management Cloud Service and Oracle Materials Management Cloud
Service
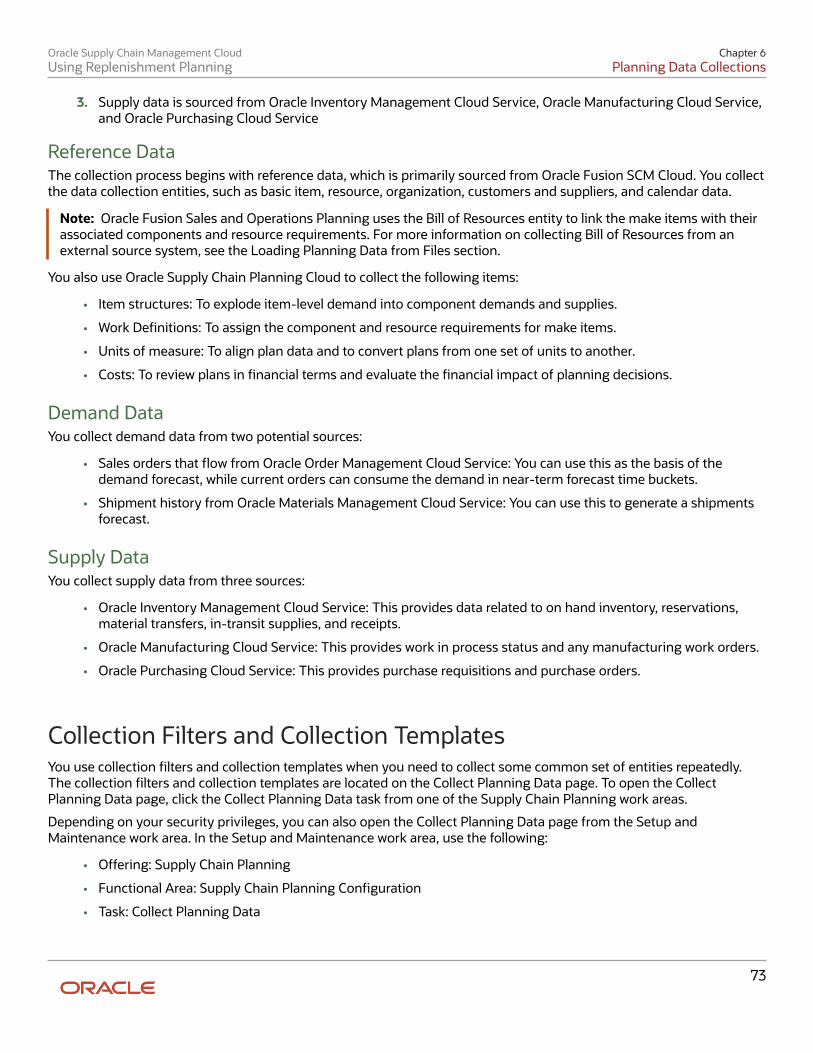
Oracle Supply Chain Management CloudUsing Replenishment Planning
Chapter 6Planning Data Collections
73
3. Supply data is sourced from Oracle Inventory Management Cloud Service, Oracle Manufacturing Cloud Service,and Oracle Purchasing Cloud Service
Reference DataThe collection process begins with reference data, which is primarily sourced from Oracle Fusion SCM Cloud. You collectthe data collection entities, such as basic item, resource, organization, customers and suppliers, and calendar data.
Note: Oracle Fusion Sales and Operations Planning uses the Bill of Resources entity to link the make items with theirassociated components and resource requirements. For more information on collecting Bill of Resources from anexternal source system, see the Loading Planning Data from Files section.
You also use Oracle Supply Chain Planning Cloud to collect the following items:
• Item structures: To explode item-level demand into component demands and supplies.
• Work Definitions: To assign the component and resource requirements for make items.
• Units of measure: To align plan data and to convert plans from one set of units to another.
• Costs: To review plans in financial terms and evaluate the financial impact of planning decisions.
Demand DataYou collect demand data from two potential sources:
• Sales orders that flow from Oracle Order Management Cloud Service: You can use this as the basis of thedemand forecast, while current orders can consume the demand in near-term forecast time buckets.
• Shipment history from Oracle Materials Management Cloud Service: You can use this to generate a shipmentsforecast.
Supply DataYou collect supply data from three sources:
• Oracle Inventory Management Cloud Service: This provides data related to on hand inventory, reservations,material transfers, in-transit supplies, and receipts.
• Oracle Manufacturing Cloud Service: This provides work in process status and any manufacturing work orders.
• Oracle Purchasing Cloud Service: This provides purchase requisitions and purchase orders.
Collection Filters and Collection TemplatesYou use collection filters and collection templates when you need to collect some common set of entities repeatedly.The collection filters and collection templates are located on the Collect Planning Data page. To open the CollectPlanning Data page, click the Collect Planning Data task from one of the Supply Chain Planning work areas.
Depending on your security privileges, you can also open the Collect Planning Data page from the Setup andMaintenance work area. In the Setup and Maintenance work area, use the following:
• Offering: Supply Chain Planning
• Functional Area: Supply Chain Planning Configuration
• Task: Collect Planning Data

Oracle Supply Chain Management CloudUsing Replenishment Planning
Chapter 6Planning Data Collections
74
Collection FiltersUse collection filters to improve the performance and efficiency of the collections process, and to avoid accumulation ofirrelevant data in the planning data repository. You can use several filter criteria while performing collections, such as byemploying catalogs, order types, and price lists. You can also use date-based filters for collecting shipment and bookinghistory information.
Enabling Collection FiltersTo enable collection filters, you must first run the schedule process called Load Filter Names for Planning DataCollection from the Scheduled Processes work area. When you run the scheduled process, the filters get enabled in theCollect Planning Data page. Then, you can apply the filters from the next collection.
Collection TemplatesUse collection templates when you want to collect a set of data repeatedly over a period. You can select either one of thepredefined templates that serves your specific need, or you can create your own template and save it for future use.
When you select a predefined template from the list, the Collection Type field is defaulted to Automatic selection andyou cannot edit the field. Also, when you select a predefined template, the Select Collection Filters field is disabled.
You can create a collection template on the Collect Planning Data page by selecting the data collection entities andsaving the template for future use. For example, if you frequently collect certain supply planning transactional entities,such as On Hand, Purchase Orders, and Purchase Requisitions, then save these entities as a collection template. Itreduces the overhead of selecting the same entities for subsequent collection cycles.
If the template file contains any error during the upload process, rectify the issue found in the log file and upload thetemplate file again.
Collect Data Using the Targeted Collection TypeTo perform a complete refresh of the data repository used by the Supply Chain Planning products, run a targetedcollection. You can run the targeted collection immediately or you can schedule the process to run later. Demandplanning data can only be collected by using the Targeted collection type.
Note: Before collecting demand planning data, you must successfully run the Load Filter Names for Planning DataCollection scheduled process.
Perform the following steps to collect reference data, demand planning data, and supply planning data using theTargeted collection type.
1. Access the Collect Planning Data page from a Supply Planning work area or the Setup and Maintenance workarea.
◦ If you are in one of the Supply chain Planning work areas:
i. Click the Tasks panel tab.ii. In the Tasks panel drawer, click the Collect Planning Data link.
◦ If you are in the Setup and Maintenance work area, then select the following:
• Offering: Supply Chain Planning• Functional Area: Supply Chain Planning Configuration• Task: Collect Planning Data
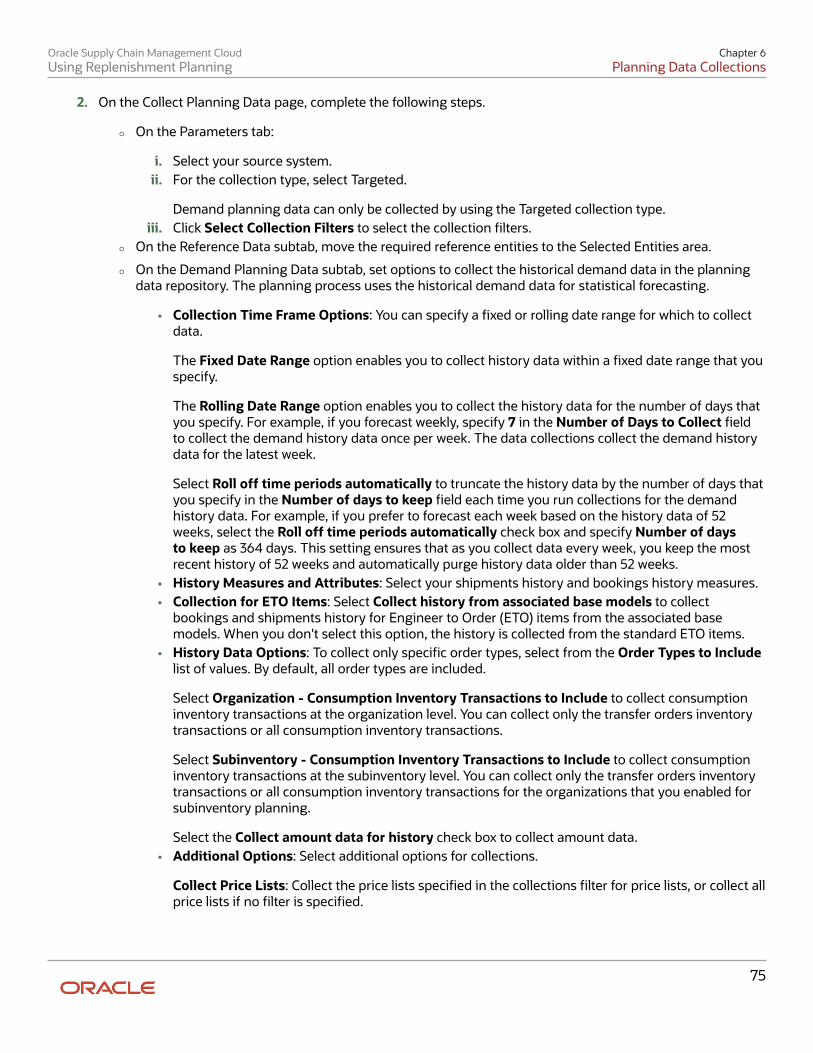
Oracle Supply Chain Management CloudUsing Replenishment Planning
Chapter 6Planning Data Collections
75
2. On the Collect Planning Data page, complete the following steps.
◦ On the Parameters tab:
i. Select your source system.ii. For the collection type, select Targeted.
Demand planning data can only be collected by using the Targeted collection type.iii. Click Select Collection Filters to select the collection filters.
◦ On the Reference Data subtab, move the required reference entities to the Selected Entities area.
◦ On the Demand Planning Data subtab, set options to collect the historical demand data in the planningdata repository. The planning process uses the historical demand data for statistical forecasting.
• Collection Time Frame Options: You can specify a fixed or rolling date range for which to collectdata.
The Fixed Date Range option enables you to collect history data within a fixed date range that youspecify.
The Rolling Date Range option enables you to collect the history data for the number of days thatyou specify. For example, if you forecast weekly, specify 7 in the Number of Days to Collect fieldto collect the demand history data once per week. The data collections collect the demand historydata for the latest week.
Select Roll off time periods automatically to truncate the history data by the number of days thatyou specify in the Number of days to keep field each time you run collections for the demandhistory data. For example, if you prefer to forecast each week based on the history data of 52weeks, select the Roll off time periods automatically check box and specify Number of daysto keep as 364 days. This setting ensures that as you collect data every week, you keep the mostrecent history of 52 weeks and automatically purge history data older than 52 weeks.
• History Measures and Attributes: Select your shipments history and bookings history measures.• Collection for ETO Items: Select Collect history from associated base models to collect
bookings and shipments history for Engineer to Order (ETO) items from the associated basemodels. When you don't select this option, the history is collected from the standard ETO items.
• History Data Options: To collect only specific order types, select from the Order Types to Includelist of values. By default, all order types are included.
Select Organization - Consumption Inventory Transactions to Include to collect consumptioninventory transactions at the organization level. You can collect only the transfer orders inventorytransactions or all consumption inventory transactions.
Select Subinventory - Consumption Inventory Transactions to Include to collect consumptioninventory transactions at the subinventory level. You can collect only the transfer orders inventorytransactions or all consumption inventory transactions for the organizations that you enabled forsubinventory planning.
Select the Collect amount data for history check box to collect amount data.• Additional Options: Select additional options for collections.
Collect Price Lists: Collect the price lists specified in the collections filter for price lists, or collect allprice lists if no filter is specified.

Oracle Supply Chain Management CloudUsing Replenishment Planning
Chapter 6Planning Data Collections
76
Collect Configure to Order Data: If you selected history measures and attributes, then select therelevant check boxes to collect shipment history options and booking history options.
Sales Organization Hierarchy: Select Enable sales organization hierarchy collection to collectone or more sales hierarchies.
◦ On the Supply Planning Data subtab:
i. Move the required supply entities to the Selected Entities area.ii. If you collect resource availability, then select a date range type: Fixed or Relative to collection
run date.
If you selected Fixed, then provide a start date and an end date for collecting resource availability.
If you selected Relative to collection run date, then enter a number of days in the CollectionWindow in Days field. The number that you enter determines a collection window in days tocollect resource availability based on a rolling time window. That rolling time window adjusts itself,based on the date that you run collections. For example, if you specify 90, then resource availabilityis collected for the next 90 days each time from the date of the collection run.
Note: You can save your date range type selection for resource availability collection asa collection template to use later.
iii. You can collect the existing data for the resource availability.iv. You can also regenerate the resource availability data and then collect the data. If you select the
Regenerate data, and then collect option, the collections process runs the Update ResourceAvailability Job scheduled process first and then collects the resource availability data.
3. (Optional) Click the Schedule tab and set collections to run as soon as possible or schedule to run at a differenttime.
4. Click Submit to start the collections process.5. Monitor the collection status using the Scheduled Processes page.6. Review the collected data in the Plan Inputs work area.
Related Topics• Set Up Forecast Consumption for Transfer Orders
Collect Data Using the Net Change Collection TypeYou can collect data from the Oracle Fusion source system by running the net change collection or by scheduling to runthe process later. Before running a Net Change collection, you must run a Targeted collection for the selected entities.After the first Targeted collection, you can run Net Change collections.
Perform the following procedure to collect reference data and supply planning data using the net change collectiontype:
1. If you are in one of the Supply Chain Planning work areas, then click the Tasks panel tab. In the Tasks paneldrawer, click the Collect Planning Data task. If you are in the Setup and Maintenance work area, then use thefollowing:
◦ Offering: Supply Chain Planning
◦ Functional Area: Supply Chain Planning Configuration

Oracle Supply Chain Management CloudUsing Replenishment Planning
Chapter 6Planning Data Collections
77
◦ Task: Collect Planning Data2. Complete the following parameters for the Collect Planning Data process:
a. Select your source system.b. Select the collection type as Net change.
Note: You cannot make any changes to the filter criteria and demand planning data in thenet change collection type.
c. In the Reference Data tab, move the required reference entities to the Selected Entities area.d. In the Supplies Planning Data tab, move the required supply entities to the Selected Entities area.
3. (Optional) Click the Schedule tab and set collections to run as soon as possible or schedule to run at a differenttime.
4. Click Submit to initiate the collections process.5. Monitor the collection status using the Scheduled Processes page.6. Review the collected data in the Plan Inputs work area.
Related Topics• Update Existing Setup Data
Enable Organization Group Collection for the Net ChangeCollection TypeYou can use organization groups to limit the net change data collection from a source system to specific organizations.Using organization groups for collection also eliminates the chances of data overlap when multiple instances of netchange collections are run at a time. Planners can run collections for their organizations without waiting for each other.
Let's take a simple example where your organization considers only the D1 and D2 distribution centers in your sourcesystem for shipments to your customers. In such a case, you can create an organization group, assign D1 and D2 to theorganization group, and collect net change data specifically for this group.
Note: Before you begin, ensure that you have your organization groups created. A supply planner creates andmanages organization groups using the Manage Organization Groups button on the Maintain Supply Network Modelpage.
Do these to collect net change data for an organization group.
1. Access the Collect Planning Data page or Load Planning Data from Files page from a Supply Planning workarea.
2. Select the source system. Organization groups are managed within the source systems.3. Select the Net Change collection type. You can select an organization group for data collection only when the
collection type is Net Change.4. Enable the organization group collection, and then select an organization group.5. Perform the net change data collection. Refer to the Collect Data Using Net Change Collection Type topic in this
chapter for instructions.
Note: After selecting your organization group and other data collection entities, you can also save your selections asa template. Refer to the Collection Filters and Collection Templates topic in this chapter for additional information.
Related Topics• How You Maintain Your Supply Network Model

Oracle Supply Chain Management CloudUsing Replenishment Planning
Chapter 6Planning Data Collections
78
Load Planning Data from Others and External SourceSystems
How You Load Planning Data from FilesYou upload data using CSV files for specific business objects using the targeted or net change method.
Note: To create the CSV files, you can use a set of Microsoft Excel template files that are provided for this purpose.You can download the templates from the File-Based Data Import for SCM Cloud guide in the Oracle Help Center.
You use the targeted mode when you want to refresh data for selected entities in the planning data repository. You usethe net change mode to collect data incrementally. The net change collections mode collects only the changed or newdata. Data collection using the net change mode is fast compared to the targeted mode. The net change mode is usedto retain planning data to current with that of the executing system.
The following figure illustrates the process of collecting data from files.
Prepare the Data Files
Run the Load Process
Verify the Load Process
Review the Loaded Data
To load planning data from files, you perform the following steps:
1. Create CSV files using Microsoft Excel template2. Run the process to load planning data from files

Oracle Supply Chain Management CloudUsing Replenishment Planning
Chapter 6Planning Data Collections
79
3. Verify the load planning data process4. Review the loaded data
Create CSV Files to Load Planning DataTo perform the Load Planning Data from Files task in one of the Supply Chain Planning work areas or Setup andMaintenance work area, you must prepare the data you want to load. You must create the necessary CSV files used tocreate files for import. This procedure explains how to create CSV files to prepare planning data for loading.
1. Locate the applicable file import templates (XLSM files) in the following guide: File Based Data Import for OracleSupply Chain Management Cloud. Extract the templates to a local space.
For additional information about creating and importing CSV files, see the following section in the Oracle SCMCloud Implementing Common Features for Oracle SCM Cloud guide: External Integration chapter, External DataIntegration Services for Oracle Cloud section.
2. Open the template file for the entity you are preparing and complete the file import template worksheet.
You must enable the macros in the template file before generating the CSV file.
Caution: For the cells that contain dates, ensure that the data is set to the correct format in thedata type. For example, date must be set to YYYY/MM/DD.
3. After you finish preparing the data in the worksheet, generate the CSV file. The Generate CSV File button islocated in the Instructions and CSV Generation worksheet of the workbook.
4. When you save the generated CSV file, you must use the suggested name of the entity. You can addunderscore and add additional characters to the file name. For example, you can name the CSV file asShipmentHistory_abc.csv and you can name the file as LoadingCSV.zip.
5. Compress the CSV file into a zipped file format using a compression utility. You can provide any name to thezipped file.
Note: You can include multiple CSV files in a single compressed file for a source system. The loadprocess uploads them in a sequential order. Select the CSV files and compress them directly. Do notcompress the parent folder that contains the files.
This completes the preparation of a file that you will upload to collect planning data.
Data Collection SequenceThis topic explores the sequence that you should follow for data collection. Data collection involves collecting entitiesin a predefined sequence. The collected entities form the basis for supply planning calculations. To have accurate data,you must ensure to collect the entities in a proper sequence. You cannot collect some entities without collecting theirprecursor entities. The data collection sequence is very crucial when you collect data from an external source systemusing CSV files.
If you run targeted collections for all entities, you can ignore the sequence for collections because targeted collectionsautomate the collection sequence for all entities within a single collections request. If you collect many entities in asingle request, collections will process them according to the sequences shown in this topic. If you collect only a few

Oracle Supply Chain Management CloudUsing Replenishment Planning
Chapter 6Planning Data Collections
80
entities, then you must be aware of the collections sequence information. For example, you should not collect workorders before you collect items or resources.
To make the workflow simple, the collection sequence is divided into two parts - Part A and Part B. The collectionentities in Part B are dependent on the collection entities in Part A. You must collect the entities in Part A before youcollect the entities in Part B. Also, the collection entities are grouped together for easier presentation. The data groupsin Part A are:
• Collections Sequence Part A for Item Data
• Collections Sequence Part A for Region, Location, and Customer Data
• Collections Sequence Part A for Currency, Calendar, Demand Class, and UOM Data
The data groups in Part B are:
• Collections Sequence Part B for Sales Order and Assignment Sets
• Collection Sequence Part B for Work Orders, Work Definition, and Item Structure
Every collection sequence in Part A starts with defining a source system where the collected data will reside. If you arecollecting data to the same source system, you define the source system only once. Then, use the same source systemto collect all the entities.
The following figure provides an overview of the data collection sequence. The overview shows how Part A and Part Bfit together to form a complete data collection flow.
Collection Sequence Part A for Item Data
Collection Sequence Part A for Region,
Location, and Customer Data
Collection Sequence Part A for Currency, Calendar, Demand Class, and UOM
Data
Continue to Collection Sequence
Part B
Collection Sequence Part B for Sales
Order and Assignment Sets
Collection Sequence Part B for Work Orders, Work
Definition, Item Structure
Data Collection Sequence Overview
Part A
Part B
Collections Sequence Part A for Item DataThe following image shows the collections sequence to follow while collecting Item data from external source systems.This image represents only half of the entities for collecting Item data.

Oracle Supply Chain Management CloudUsing Replenishment Planning
Chapter 6Planning Data Collections
81
Note: The Organization entity is marked with an asterisk because you can collect other entities such as Planner, ItemCost, Subinventory, Carrier, Calendar Assignment, Supplier, and Supplier Site after collecting Organization. For moreinformation on the collection sequence for these entities, see the Collections Sequence Part A for Currency, Calendar,Demand Class, and UOM Data figure. Refer to the entities that are collected after Organization. Also, ensure that youcollect Location before collecting Supplier Site.
Define Source System Organization*
ItemsLoad Items in PIMLoad UOM
Create Organizations
Item CostsItem RelationshipCustomer Specific Item RelationshipsUOM Class
Conversions
Item Catalog
Catalog Category Association
Item Category
Safety Stock Level
Continue to Collection Sequence
Part B
Item Structure
Item Structure Component
Collection Sequence Part A for Item Data
When you collect the data described here, continue to the collection sequence Part B described in the followingsubsections.
• Collection Sequence Part B for Sales and Order and Assignment Sets
• Collection Sequence Part B for Work Orders, Work Definition, and Item Structure

Oracle Supply Chain Management CloudUsing Replenishment Planning
Chapter 6Planning Data Collections
82
Collections Sequence Part A for Region, Location, and Customer DataThe following image shows the collections sequence to follow while collecting Regions, and Customers data fromexternal source systems. This image represents only half of the entities for Item data.
Define Source System
Customer Region
Load Customer Sites in TCA
Load Customers, Regions in TCA
Sourcing Rules, Sourcing
Assignments, Source Organization,
Receipt Organization
Customer Sites
Calendar Assignments
Ship Methods
Collection Sequence Part A for Region, Location, and Customers Data
Customer Specific Item Relationships
Continue to Collection Sequence
Part B
Location
When you collect the data described here, continue to the collection sequence Part B described in the followingsubsections.
• Collection Sequence Part B for Sales and Order and Assignment Sets
• Collection Sequence Part B for Work Orders, Work Definition, and Item Structure
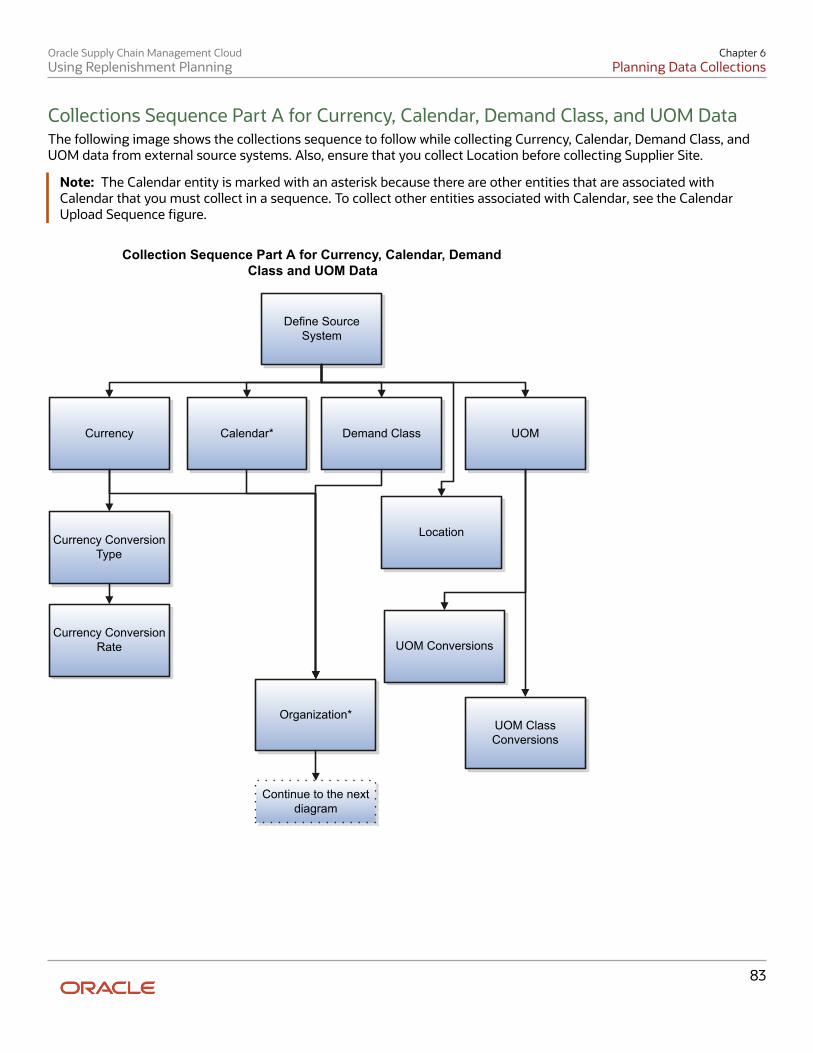
Oracle Supply Chain Management CloudUsing Replenishment Planning
Chapter 6Planning Data Collections
83
Collections Sequence Part A for Currency, Calendar, Demand Class, and UOM DataThe following image shows the collections sequence to follow while collecting Currency, Calendar, Demand Class, andUOM data from external source systems. Also, ensure that you collect Location before collecting Supplier Site.
Note: The Calendar entity is marked with an asterisk because there are other entities that are associated withCalendar that you must collect in a sequence. To collect other entities associated with Calendar, see the CalendarUpload Sequence figure.
Collection Sequence Part A for Currency, Calendar, Demand Class and UOM Data
Currency Calendar*
Define Source System
Currency Conversion Type
Currency Conversion Rate UOM Conversions
UOM Class Conversions
Demand Class UOM
Organization*
Continue to the next diagram
Location

Oracle Supply Chain Management CloudUsing Replenishment Planning
Chapter 6Planning Data Collections
84
Planner Subinventory
Continue from the previous diagram, after Organization
Calendar Assignment
Supplier Site
Continue to Collection Sequence
Part B
Carrier Supplier
Item Cost
When you collect the data described here, continue to the collection sequence Part B described in the followingsubsections.
• Collection Sequence Part B for Sales and Order and Assignment Sets
• Collection Sequence Part B for Work Orders, Work Definition, and Item Structure
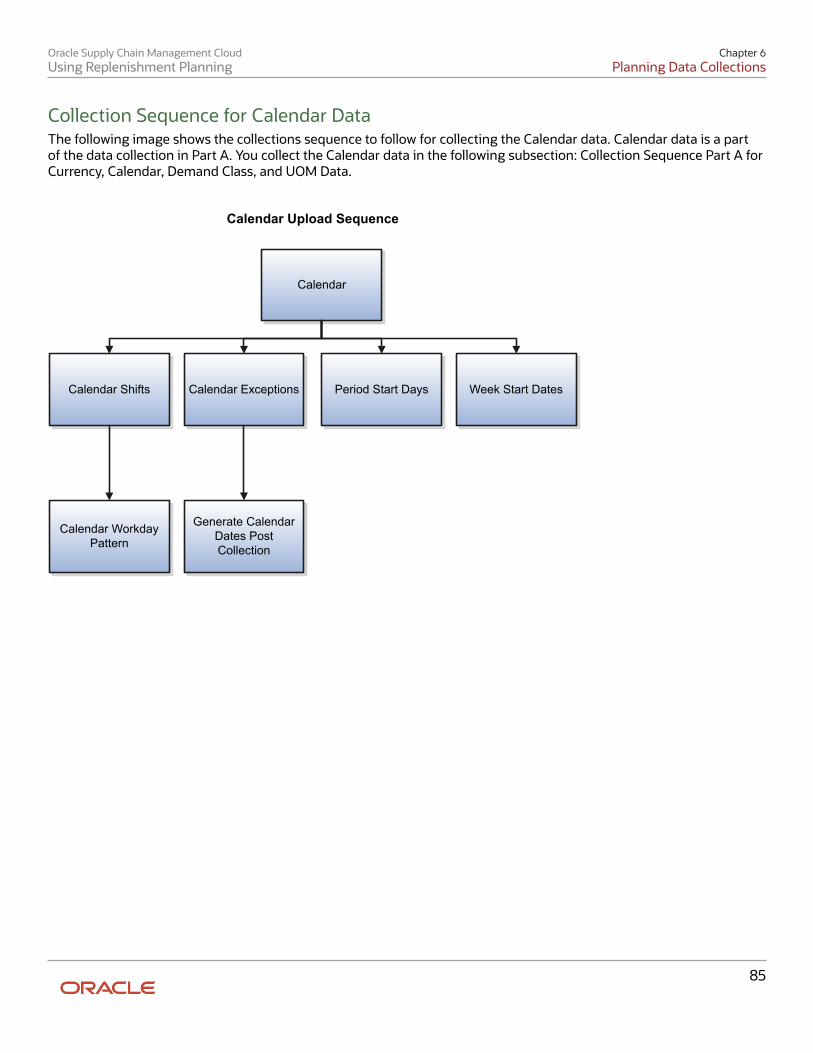
Oracle Supply Chain Management CloudUsing Replenishment Planning
Chapter 6Planning Data Collections
85
Collection Sequence for Calendar DataThe following image shows the collections sequence to follow for collecting the Calendar data. Calendar data is a partof the data collection in Part A. You collect the Calendar data in the following subsection: Collection Sequence Part A forCurrency, Calendar, Demand Class, and UOM Data.
Calendar Upload Sequence
Calendar Shifts Calendar Exceptions
Calendar
Period Start Days Week Start Dates
Calendar Workday Pattern
Generate Calendar Dates Post Collection

Oracle Supply Chain Management CloudUsing Replenishment Planning
Chapter 6Planning Data Collections
86
Collections Sequence Part B for Sales Order and Assignment SetsThe following image shows the collections sequence to follow while collecting Sales Order and Assignment Sets datafrom external source systems. The data entities in Part B are dependent on Part A. So, you must collect entities listed inPart A before you collect the entities in Part B.
Ship Methods
ASL, Supplier Capcity Planned Orders
Forecasts
Sourcing Rules, Sourcing Assignments, Source Organization, Receipt Organization
Reservations
On Hand
Sales Orders
Transfer Order Purchase Orders
Collections Sequence Part B for Sales Orders and Assignments Sets
Continue to Collection Sequence
Part B
Collection Sequence Part
A
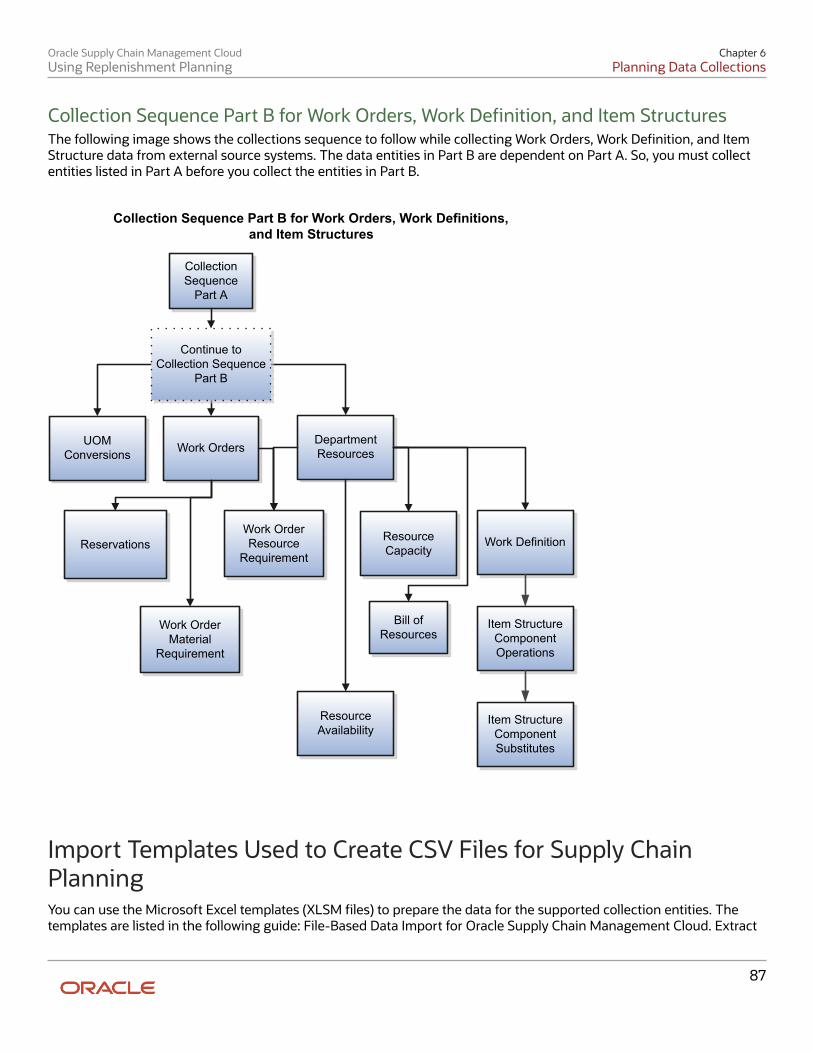
Oracle Supply Chain Management CloudUsing Replenishment Planning
Chapter 6Planning Data Collections
87
Collection Sequence Part B for Work Orders, Work Definition, and Item StructuresThe following image shows the collections sequence to follow while collecting Work Orders, Work Definition, and ItemStructure data from external source systems. The data entities in Part B are dependent on Part A. So, you must collectentities listed in Part A before you collect the entities in Part B.
Item Structure Component Operations
Item Structure Component Substitutes
UOM Conversions
Department Resources
Reservations
Resource Availability
Resource Capacity
Work Definition
Work Orders
Work Order Material
Requirement
Work Order Resource
Requirement
Collection Sequence Part B for Work Orders, Work Definitions, and Item Structures
Collection Sequence
Part A
Bill of Resources
Continue to Collection Sequence
Part B
Import Templates Used to Create CSV Files for Supply ChainPlanningYou can use the Microsoft Excel templates (XLSM files) to prepare the data for the supported collection entities. Thetemplates are listed in the following guide: File-Based Data Import for Oracle Supply Chain Management Cloud. Extract

Oracle Supply Chain Management CloudUsing Replenishment Planning
Chapter 6Planning Data Collections
88
the templates to a local drive, enter appropriate data as described in the template, and generate CSV files. Compressthe CSV files to a zipped file format and upload the .zip file to the Universal Content Manager using the File Import andExport utility. The data is then loaded from the Universal Content Manger to the planning data repository.
Collect Data from the Oracle Fusion Source
The following table lists the collections entities that can be loaded into the planning data repository for the OracleFusion source. The Collection Entity column provides the name of the entities for which you can collect the data.The XLSM File Name column provides the template name that you will download for the respective collection entity.Download the XLSM template from the File-Based Data Import for Oracle Supply Chain Management Cloud guide (FBDIguide). The Link in Data Import Guide column provides the name of the topic in the FBDI guide from where you willdownload the template. For example, to collect data for the Item Costs collection entity, refer to the Item Cost Importtopic in the FBDI guide.
Collections Entity Link in Data Import Guide XLSM File Name
Item Costs Supply Chain Planning Item Cost ScpItemCostImportTemplate.xlsm
Customer Specific Item Relationships Supply Chain Planning Item Substitute ScpItemSubstituteImportTemplate.xlsm
Planners Supply Chain Planning Planners ScpPlannersImportTemplate.xlsm
Item Suppliers Supply Chain Planning Approved SupplierList
ScpApprovedSupplierListImportTemplate.xlsm
Demand Classes Supply Chain Planning Demand Classes ScpDemandClassImportTemplate.xlsm
Allocation Assignments and AllocationRules
Supply Chain Planning Planning AllocationRules
ScpPlanningAllocationRulesImportTemplate.xlsm
ATP Assignments and ATP Rules Supply Chain Planning Available-to-Promise Rules
ScpATPRulesImportTemplate.xlsm
Supply Update Rules Supply Chain Planning Real Time SupplyUpdates
ScpRealTimeSupplyUpdatesImportTemplate.xlsm
Measures Supply Chain Planning Measures ScpMeasuresImportTemplate.xlsm
Note: You must use separate CSV filesto collect measure data for measureswith different dimensional granularity.
Booking History Supply Chain Planning Bookings History ScpBookingHistoryImportTemplate.xlsm

Oracle Supply Chain Management CloudUsing Replenishment Planning
Chapter 6Planning Data Collections
89
Collections Entity Link in Data Import Guide XLSM File Name
Option Booking History Supply Chain Planning Option BookingsHistory
ScpOptionBookingHistoryImportTemplate.xlsm
Shipment History Supply Chain Planning Shipments History ScpShipmentHistoryImportTemplate.xlsm
Option Shipment History Supply Chain Planning Option ShipmentsHistory
ScpOptionShipmentHistoryImportTemplate.xlsm
Price Lists Supply Chain Planning Price List ScpPriceListImportTemplate.xlsm
Causal Factors Supply Chain Planning Causal Factors ScpCausalFactorsImportTemplate.xlsm
Forecast Measures Supply Chain Planning Forecast Measures ScpForecastMeasureImportTemplate.xlsm
Note: This template has beensuperseded by the generic templateScpMeasuresImportTemplate.xlsm, butwill continue to be supported. Futureenhancements will be made only to thegeneric measures template.
Fiscal Calendars Supply Chain Planning Fiscal Calendars ScpFiscalCalendarImportTemplate.xlsm
Forecasts Supply Chain Planning External Forecasts ScpExternalForecastImportTemplate.xlsm
Safety Stock Levels Supply Chain Planning Safety Stock Levels ScpSafetyStockLevelImportTemplate.xlsm
Supplier Capacity Supply Chain Planning Approved SupplierCapacity
ScpApprovedSupplierCapacityImportTemplate.xlsm
Planned Order Supplies Supply Chain Planning Planned OrderSupply
ScpPlannedOrderSupplyImportTemplate.xlsm
Note: This template is only used to loadplanned order supply to Global OrderPromising.
Sourcing Rule and Assignments Supply Chain Planning Sourcing Rules ScpSourcingImportTemplate.xlsm
Cross-Reference Mapping Information Supply Chain Planning Cross-ReferenceData
ScpCrossReferenceDataImportTemplate.xlsm
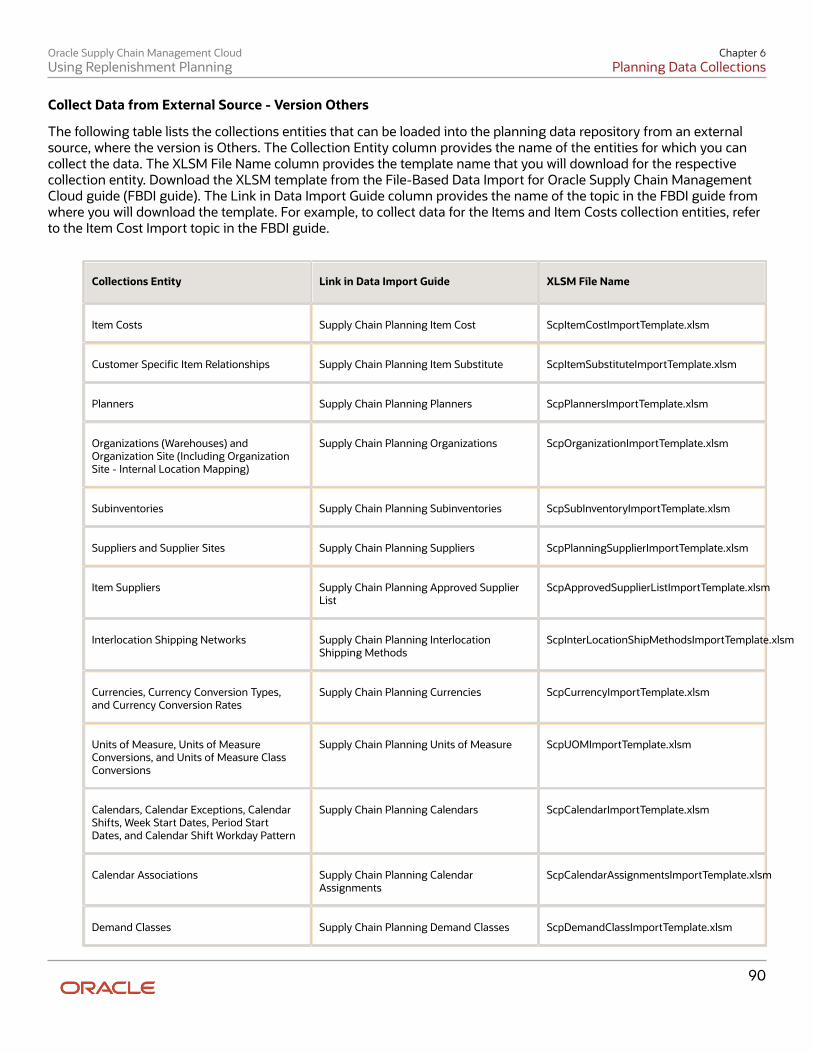
Oracle Supply Chain Management CloudUsing Replenishment Planning
Chapter 6Planning Data Collections
90
Collect Data from External Source - Version Others
The following table lists the collections entities that can be loaded into the planning data repository from an externalsource, where the version is Others. The Collection Entity column provides the name of the entities for which you cancollect the data. The XLSM File Name column provides the template name that you will download for the respectivecollection entity. Download the XLSM template from the File-Based Data Import for Oracle Supply Chain ManagementCloud guide (FBDI guide). The Link in Data Import Guide column provides the name of the topic in the FBDI guide fromwhere you will download the template. For example, to collect data for the Items and Item Costs collection entities, referto the Item Cost Import topic in the FBDI guide.
Collections Entity Link in Data Import Guide XLSM File Name
Item Costs Supply Chain Planning Item Cost ScpItemCostImportTemplate.xlsm
Customer Specific Item Relationships Supply Chain Planning Item Substitute ScpItemSubstituteImportTemplate.xlsm
Planners Supply Chain Planning Planners ScpPlannersImportTemplate.xlsm
Organizations (Warehouses) andOrganization Site (Including OrganizationSite - Internal Location Mapping)
Supply Chain Planning Organizations ScpOrganizationImportTemplate.xlsm
Subinventories Supply Chain Planning Subinventories ScpSubInventoryImportTemplate.xlsm
Suppliers and Supplier Sites Supply Chain Planning Suppliers ScpPlanningSupplierImportTemplate.xlsm
Item Suppliers Supply Chain Planning Approved SupplierList
ScpApprovedSupplierListImportTemplate.xlsm
Interlocation Shipping Networks Supply Chain Planning InterlocationShipping Methods
ScpInterLocationShipMethodsImportTemplate.xlsm
Currencies, Currency Conversion Types,and Currency Conversion Rates
Supply Chain Planning Currencies ScpCurrencyImportTemplate.xlsm
Units of Measure, Units of MeasureConversions, and Units of Measure ClassConversions
Supply Chain Planning Units of Measure ScpUOMImportTemplate.xlsm
Calendars, Calendar Exceptions, CalendarShifts, Week Start Dates, Period StartDates, and Calendar Shift Workday Pattern
Supply Chain Planning Calendars ScpCalendarImportTemplate.xlsm
Calendar Associations Supply Chain Planning CalendarAssignments
ScpCalendarAssignmentsImportTemplate.xlsm
Demand Classes Supply Chain Planning Demand Classes ScpDemandClassImportTemplate.xlsm

Oracle Supply Chain Management CloudUsing Replenishment Planning
Chapter 6Planning Data Collections
91
Collections Entity Link in Data Import Guide XLSM File Name
Ship Mode of Transport, Ship Class ofService, and Carrier
Supply Chain Planning Carriers ScpCarrierImportTemplate.xlsm
Allocation Assignments and AllocationRules
Supply Chain Planning Planning AllocationRules
ScpPlanningAllocationRulesImportTemplate.xlsm
ATP Assignments and ATP Rules Supply Chain Planning Available-to-Promise Rules
ScpATPRulesImportTemplate.xlsm
Supply Update Rule Supply Chain Planning Real Time SupplyUpdates
ScpRealTimeSupplyUpdatesImportTemplate.xlsm
Freight Terms, FOB Points, Invoicing andAccounting Rules, Shipment Priorities,Payment Terms, Return Reason, TaxClassification Code, Tax ExemptionReason, Sales Credit Type, Activity Type,Document Categories, Payment Methods,and Receipt Methods
Supply Chain Planning OrderOrchestration
ScpOrderOrchestrationImportTemplate.xlsm
Measures Supply Chain Planning Measures ScpMeasuresImportTemplate.xlsm
Note: You must use separate CSV filesto collect measure data for measureswith different dimensional granularity.
Booking History Supply Chain Planning Bookings History ScpBookingHistoryImportTemplate.xlsm
Option Booking History Supply Chain Planning Option BookingsHistory
ScpOptionBookingHistoryImportTemplate.xlsm
Shipment History Supply Chain Planning Shipments History ScpShipmentHistoryImportTemplate.xlsm
Option Shipment History Supply Chain Planning Option ShipmentsHistory
ScpOptionShipmentHistoryImportTemplate.xlsm
Price Lists Supply Chain Planning Price Lists ScpPriceListImportTemplate.xlsm
Causal Factors Supply Chain Planning Causal Factors ScpCausalFactorsImportTemplate.xlsm
Forecasts Measures Supply Chain Planning Forecast Measures ScpForecastMeasureImportTemplate.xlsm

Oracle Supply Chain Management CloudUsing Replenishment Planning
Chapter 6Planning Data Collections
92
Collections Entity Link in Data Import Guide XLSM File Name
Note: This template has beensuperseded by the generic templateScpMeasuresImportTemplate.xlsm, butwill continue to be supported. Futureenhancements will be made only to thegeneric measures template.
Fiscal Calendars Supply Chain Planning Fiscal Calendars ScpFiscalCalendarImportTemplate.xlsm
Forecasts Supply Chain Planning External Forecast ScpExternalForecastImportTemplate.xlsm
User-Defined Hierarchies Supply Chain Planning User-DefinedHierarchies
ScpUser-DefinedHierarchyImportTemplate.xlsm
Safety Stock Levels Supply Chain Planning Safety Stock Levels ScpSafetyStockLevelImportTemplate.xlsm
Supply Reservations to Sales Orders Supply Chain Planning Reservations ScpReservationImportTemplate.xlsm
On Hand Supply Chain Planning Supply On Hand ScpOnhandImportTemplate.xlsm
Purchase Orders, Purchase Requisitions,PO in Receiving, and In Transits
Supply Chain Planning Purchase OrderRequisitions
ScpPurchaseOrderRequisitionImportTemplate.xlsm
Transfer Orders Supply Chain Planning Transfer Orders ScpTransferOrderImportTemplate.xlsm
Supplier Capacity Supply Chain Planning Approved SupplierCapacity
ScpApprovedSupplierCapacityImportTemplate.xlsm
Resources and Resource Shifts Supply Chain Planning Resources ScpResourcesImportTemplate.xlsm
Resource Availability Supply Chain Planning ResourceAvailability
ScpResourceAvailabilityImportTemplate.xlsm
Work Definition (Including mappingbetween Item Structures and WorkDefinitions), Work Definition Operations,and Work Definition Operation Resources
Supply Chain Planning Routings ScpRoutingsImportTemplate.xlsm
Work Order Supply Supply Chain Planning Work OrderSupplies
ScpWorkOrderSuppliesImportTemplate.xlsm
Work Order Material Requirements Supply Chain Planning Work OrderComponent Demands
ScpWIPComponentDemandsImportTemplate.xlsm

Oracle Supply Chain Management CloudUsing Replenishment Planning
Chapter 6Planning Data Collections
93
Collections Entity Link in Data Import Guide XLSM File Name
Work Order Resource Requirements Supply Chain Planning Work OrderOperation Resources
ScpWIPOperationResourceImportTemplate.xlsm
Planned Order Supplies Supply Chain Planning Planned OrderSupply
ScpPlannedOrderSupplyImportTemplate.xlsm
Note: This template is only used to loadplanned order supply to Global OrderPromising.
Sourcing Rule and Assignments Supply Chain Planning Sourcing Rules ScpSourcingImportTemplate.xlsm
Cross Reference Mapping Information Supply Chain Planning Cross-ReferenceData
ScpCrossReferenceDataImportTemplate.xlsm
Key Customer Options Supply Chain Planning Key CustomerOptions
ScpKeyCustomerOptionsImportTemplate.xlsm
Collect Data from External Source - Version External
The following table lists the collections entities that can be loaded into the planning data repository from an externalsource, where the version is External. The Collection Entity column provides the name of the entities for which you cancollect the data. The XLSM File Name column provides the template name that you will download for the respectivecollection entity. Download the XLSM template from the File-Based Data Import for Oracle Supply Chain ManagementCloud guide. The Link in Data Import Guide column provides the name of the topic in the File-Based Data Import forOracle Supply Chain Management Cloud guide (FBDI guide) from where you will download the template. For example,to collect data for the Items and Item Costs collection entities, refer to the Item Cost Import topic in the File-BasedData Import for Oracle Supply Chain Management Cloud guide. All the planning-related entity names are prefixed withSupply Chain Planning in the FBDI guide.
Collection Entities Link in FBDI Guide XLSM File Name
Items Supply Chain Planning Items ScpItemImportTemplate.xlsm
Item Costs Supply Chain Planning Item Cost ScpItemCostImportTemplate.xlsm
Item Relationships Supply Chain Planning Item Substitute ScpItemSubstituteImportTemplate.xlsm
Catalogs, Categories, and Item Categories Supply Chain Planning Catalogs ScpCatalogImportTemplate.xlsm.xlsm
Item Structures Supply Chain Planning Item Structures ScpBillofMaterialImportTemplate.xlsm
Bill of Resources Supply Chain Planning Bill of Resources ScpBillOfResourcesImportTemplate.xlsm

Oracle Supply Chain Management CloudUsing Replenishment Planning
Chapter 6Planning Data Collections
94
Collection Entities Link in FBDI Guide XLSM File Name
Planners Supply Chain Planning Planners ScpPlannersImportTemplate.xlsm
Customers and Customer Sites Supply Chain Planning Customers ScpCustomerImportTemplate.xlsm
Regions Supply Chain Planning Regions ScpRegionsImportTemplate.xlsm
Zones Supply Chain Planning Zones ScpZonesImportTemplate.xlsm
Region-Zone Mapping Supply Chain Planning Region ZoneMappings
ScpRegionZoneMappingImportTemplate.xlsm
Locations and Region-Location Mapping Supply Chain Planning Locations ScpLocationsImportTemplate.xlsm
Organizations and Organization Sites Supply Chain Planning Organizations ScpOrganizationImportTemplate.xlsm
Subinventories Supply Chain Planning Subinventories ScpSubInventoryImportTemplate.xlsm
Suppliers and Supplier Sites Supply Chain Planning Suppliers ScpSupplierImportTemplate.xlsm
Item Suppliers (Approved Supplier List) Supply Chain Planning Approved SupplierList
ScpApprovedSupplierListImportTemplate.xlsm
Interlocation Shipping Networks andTransit Times
Supply Chain Planning InterlocationShipping Methods
ScpInterLocationShipMethodsImportTemplate.xlsm
Currencies and Currency Conversions Supply Chain Planning Currencies ScpCurrencyImportTemplate.xlsm
Units of Measure, Units of MeasureConversions, and Units of Measure ClassConversions
Supply Chain Planning Units of Measure ScpUOMImportTemplate.xlsm
Calendars, Calendar Exceptions, Shifts,Shift Workday Pattern, Week Start Dates,and Period Start Dates
Supply Chain Planning Calendars ScpCalendarImportTemplate.xlsm
Calendar Associations Supply Chain Planning CalendarAssignments
ScpCalendarAssignmentsImportTemplate.xlsm
Demand Classes Supply Chain Planning Demand Classes ScpDemandClassImportTemplate.xlsm
Carrier, Ship Mode of Transport, and ShipClass of Service
Supply Chain Planning Carriers ScpCarrierImportTemplate.xlsm

Oracle Supply Chain Management CloudUsing Replenishment Planning
Chapter 6Planning Data Collections
95
Collection Entities Link in FBDI Guide XLSM File Name
GOP Allocation Rules and RuleAssignments
Supply Chain Planning Planning AllocationRules
ScpPlanningAllocationRulesImportTemplate.xlsm
GOP ATP Rules and Rule Assignments Supply Chain Planning Available-to-Promise Rules
ScpATPRulesImportTemplate.xlsm
GOP Supply Update Rules Supply Chain Planning Real Time SupplyUpdates
ScpRealTimeSupplyUpdatesImportTemplate.xlsm
Order Orchestration Reference Objects:Freight Terms, FOB Points, Invoicing andAccounting Rules, Shipment Priorities,Payment Terms, Return Reason, TaxClassification Code, Tax ExemptionReason, Sales Credit Type, Activity Type,Document Categories, Payment Methods,and Receipt Methods
Supply Chain Planning OrderOrchestration
ScpOrderOrchestrationImportTemplate.xlsm
Cross Reference Mapping Information Supply Chain Planning Cross-ReferenceData
ScpCrossReferenceDataImportTemplate.xlsm
Measures Supply Chain Planning Measures ScpMeasuresImportTemplate.xlsm
Note: You must use separate CSV filesto collect measure data for measureswith different dimensional granularity.
Booking History Supply Chain Planning Bookings History ScpBookingHistoryImportTemplate.xlsm
Option Booking History Supply Chain Planning Option BookingsHistory
ScpOptionBookingHistoryImportTemplate.xlsm
Shipment History Supply Chain Planning Shipments History ScpShipmentHistoryImportTemplate.xlsm
Option Shipment History Supply Chain Planning Option ShipmentsHistory
ScpOptionShipmentHistoryImportTemplate.xlsm
Price Lists Supply Chain Planning Price Lists ScpPriceListImportTemplate.xlsm
Causal Factors Supply Chain Planning Causal Factors ScpCausalFactorsImportTemplate.xlsm
Forecast Measures Supply Chain Planning Forecast Measures ScpForecastMeasureImportTemplate.xlsm

Oracle Supply Chain Management CloudUsing Replenishment Planning
Chapter 6Planning Data Collections
96
Collection Entities Link in FBDI Guide XLSM File Name
Note: This template has beensuperseded by the generic templateScpMeasuresImportTemplate.xlsm, butwill continue to be supported. Futureenhancements will be made only to thegeneric measures template.
Fiscal Calendars Supply Chain Planning Fiscal Calendars ScpFiscalCalendarImportTemplate.xlsm
Measures, Sales and Operations PlanningBacklog, Inventory, and Production History
Supply Chain Planning Measures ScpMeasuresImportTemplate.xlsm
Note: You must use separate CSV filesto collect measure data for measureswith different dimensional granularity.
User-Defined Hierarchies Supply Chain Planning User-DefinedHierarchies
ScpUser-DefinedHierarchyImportTemplate.xlsm
Forecasts Supply Chain Planning External Forecasts ScpExternalForecastImportTemplate.xlsm
Sales Orders Supply Chain Planning Sales Orders ScpSalesOrderImportTemplate.xlsm
Safety Stock Levels Supply Chain Planning Safety Stock Levels ScpSafetyStockLevelImportTemplate.xlsm
Supply Reservations to Sales Orders Supply Chain Planning Reservations ScpReservationImportTemplate.xlsm
On Hand Supply Chain Planning Supply On Hand ScpOnhandImportTemplate.xlsm
Purchase Orders, Purchase Requisitions,PO in Receiving, In Transits
Supply Chain Planning Purchase OrderRequisitions
ScpPurchaseOrderRequisitionImportTemplate.xlsm
Transfer Orders (including expense typetransfers)
Supply Chain Planning Transfer Orders ScpTransferOrderImportTemplate.xlsm
Supplier Capacity Supply Chain Planning Approved SupplierCapacity
ScpApprovedSupplierCapacityImportTemplate.xlsm
Resources, Resource Shifts Supply Chain Planning Resources ScpResourceImportTemplate.xlsm
Resource Availability Supply Chain Planning ResourceAvailability
ScpResourceAvailabilityImportTemplate.xlsm

Oracle Supply Chain Management CloudUsing Replenishment Planning
Chapter 6Planning Data Collections
97
Collection Entities Link in FBDI Guide XLSM File Name
Work Definition (including mappingbetween Item Structures and WorkDefinitions), Work Definition Operations,Work Definition Operation Resources
Supply Chain Planning Routings ScpRoutingsImportTemplate.xlsm
Work Order Supply Supply Chain Planning Work OrderSupplies
ScpWorkOrderSuppliesImportTemplate.xlsm
Work Order Material Requirements Supply Chain Planning Work OrderComponent Demands
ScpWIPComponentDemandsImportTemplate.xlsm
Work Order Resource Requirements Supply Chain Planning Work OrderOperation Resources
ScpWIPOperationResourceImportTemplate.xlsm
Planned Order Supplies Supply Chain Planning Planned OrderSupply
ScpPlannedOrderSupplyImportTemplate.xlsm
Note: This template is only used to loadplanned order supply to Global OrderPromising.
Sourcing Rule and Assignments Supply Chain Planning Sourcing Rules ScpSourcingImportTemplate.xlsm
Key Customer Options Supply Chain Planning Key CustomerOptions
ScpKeyCustomerOptionsImportTemplate.xlsm
Run the Load Planning Data from Files ProcessTo load planning data from files, first you must prepare the data you want to load. To prepare the data, download therelevant XLSM template, update the XLSM template with required data, and create the necessary CSV files for upload.This procedure explains how to load planning data from files after you have prepared the data and created CSV files.
1. From the Navigator, use the File Import and Export page to upload the previously prepared and zipped CSVfiles to the Universal Content Manager. Use the account scm/planningDataLoader/Import to upload the zippedfile.
Note: For more information about uploading files to the Universal Content Manager server, see thefollowing section in the Oracle SCM Cloud Implementing Common Features for Oracle SCM Cloudguide: External Integration chapter, External Data Integration Services for Oracle Cloud section.
2. From one of the Supply Chain Planning work areas or Setup and Maintenance work area, Supply ChainPlanning offering, select the Load Planning Data from Files task.
3. Complete the following parameters on the Load Planning Data from Files page:
a. Select the source system.

Oracle Supply Chain Management CloudUsing Replenishment Planning
Chapter 6Planning Data Collections
98
b. Select Collection Type: Net change or Target.c. Select the .zip file you previously imported into the Universal Content Manager.
4. Click Submit. Make a note of the process ID. You will need this process ID to review the status of the process.
Load Planning Data from Files for a Selected Group ofOrganizationsWhen you load planning data from files with the collection type set to Targeted, you can enable organization groupcollection and then select an organization group. Data is collected for only the organizations in the organization group,and the purge of data prior to the load of the new data is also done for only the organizations in the organization group.In other words, previously collected data for organizations that aren't included in the organization group will be retainedwhen you're doing targeted collections using the file-based data import (FBDI) process.
Note: Enabling organization group collection isn't applicable to entities for demand management, such as history,measure, and price list.
Parameters for Load Planning Data from FilesThe parameters for the Load Planning Data from Files task:
• Source System: The source system for the data determines which organization groups are applicable.
• Collection Type: You must select the Targeted collection type to enable organization group collection.
• Data File: The file previously uploaded to the universal content manager.
• Enable Organization Group Collection: You must have selected Targeted for the collection type to select Yes forthis parameter.
• Organization Group: You must have selected Yes for the Enable Organization Group Collection parameter toselect an organization group.
Organization GroupsThe list of organization groups you can select from for the Organization Group parameter is determined by:
• Which source system you select for the Source System parameter
• What organization groups are set up for that source system
Organization groups are set up using the Maintain Supply Network Model task, Manage Organization Groups dialog.On the Maintain Supply Network Model page, Organizations tab, you click the Manage Organization Groups button tocreate or manage organization groups.
ExampleHere's an example that shows how data is retained for organizations in other organization groups when you loadplanning data for a selected organization group.
For this example, let's say you have 3 organizations and 2 organization groups, and the source for your data is the EX1source system.
• Organization group OG1 includes organization M1
• Organization group OG2 includes organizations B1 and B2

Oracle Supply Chain Management CloudUsing Replenishment Planning
Chapter 6Planning Data Collections
99
First you load planning data for the OG1 organization group for the Work Order Supplies entity. 2 rows of data arecollected for the OG1 organization group.
Item Organization Order Type Order Quantity Suggested Due Date
Item 1 EX1:M1 Work order 10 2/14/22
Item 2 EX1:M1 Work order 15 2/11/22
Then you load planning data for the OG2 organization group for the Work Order Supplies entity.
• 3 rows of data are collected for the OG2 organization group
• The 2 rows that were previously collected for the OG1 collection group are retained
Item Organization Order Type Order Quantity Suggested Due Date
Item 1 EX1:M1 Work order 10 2/14/22
Item 2 EX1:M1 Work order 15 2/11/22
Item 1 EX1:B1 Work order 11 2/09/22
Item 1 EX1:B2 Work order 16 1/31/22
Item 2 EX1:B2 Work order 10 2/09/22
Applicable EntitiesYou can use file-based data import (FBDI) to load data for a selected group of organizations using the Targetedcollection type for these entities:
Source Entities
From an SCM Cloud source• External Forecasts• Planned Order Supply• Safety Stock Levels
From an SCM Cloud source only whenthe Enable External Data option hasbeen enabled for the entities in theManage Planning Source System task
• On Hand• Transfer Orders• Purchase Orders and Purchase Requisitions• Sales Order and Associated Reservations• Work Order Component Demands• Work Order Supplies, Work Order By-Product and Co-Product Supplies, Work Order
Operation Resources

Oracle Supply Chain Management CloudUsing Replenishment Planning
Chapter 6Planning Data Collections
100
Source Entities
• Resource Availability
From an external source• External Forecasts• Movement Requests• Planned Order Supply• Purchase Orders and Purchase Requisitions• Reservations• Safety Stock Levels• Sales Orders• Transfer Orders• On Hand• Work Order Component Demands• Work Order Supplies, Work Order By-Product and Co-Product Supplies, Work Order
Operation Resources• Resource Availability
Loading data for a selected group of organization isn't applicable to:
• Entities for demand management, such as History, Measures, Price Lists
• Entities categorized as reference entities
Additional DetailsHere are a few more details to know about loading planning data from files for a selected group of organizations:
• If you have included the History, Measure, or Price List entities in a data file used during a targeted collectionwith organization group collection enabled, targeted collections will be done for these entities, but will be donefor all organizations, not for only the organizations in the group.
• If you have included reference data entities in a data file used during a targeted collection with organizationgroup collection enabled, these entities will be ignored during collections.
• Data security created and enabled at organization level for any role isn't applied to the Manage OrganizationGroups task.
• If you also use the Collect Planning Data task to collect some of your data, note that you can use organizationgroups for the Net Change collection type, but not for the Targeted collection type. For the Targeted collectiontype for the Collect Planning Data task, you use the Organizations Filter for Transaction Data filter instead.
• You can submit the Load Planning Data from Flat Files process multiple times to specify a different organizationgroup for each submission. The submissions are processed serially in the order of submission.
• You can specify an organization group when you submit the Load Planning Data from Flat Files process for theTargeted collection type from the Scheduled Processes work area or when using a scheduled process job set.
• You can specify an organization group when you submit the Load Planning Data from Flat Files process for theTargeted collection type from the Enterprise Resource Planning integration service.
Verify Collection Processes
Oracle Supply Chain Management CloudUsing Replenishment Planning
Chapter 6Planning Data Collections
101
Verify the Load Planning Data from Files ProcessPerform the following steps to verify the process status of the uploaded file and review log file for any errors orwarnings.
1. In the Navigator, click Scheduled Processes.2. In the search area, enter the process ID you noted when you submitted during the Load Planning Data from
Files process. Click Search.3. Monitor the process to verify completion.
If the process completes with warnings, select the request that shows the warning status and click the ViewLog button to review the details.
4. For the rows with errors, resolve the issues found in the log file, and then upload the CSV file again. To load onlythe revised rows, use the Net Change option.
Review Data in the Planning Data RepositoryYou can review the data collected or loaded into the planning data repository using two different options. The optionyou use depends on which data collection entities you want to review.
To review the data collected or loaded into the planning data repository, use one of the following options:
• Review data using the Plan Inputs page layout
• Review data using the Maintain Supply Network Model page
To review the following entities, use the Maintain Supply Network Model page:
• Organizations
• Customers
• Suppliers
• Carriers
• Interlocation Shipping Networks
To review data that's not part of the supply network model, use the Plan Inputs page layout. You can view the followingdata in the Plan Inputs page layout
• Supply data
• Demand data
You can view Carriers and Suppliers using either option.
Review Data Using the Plan Inputs Page LayoutPerform the following steps to review the planning data that you loaded.
1. In the Navigator, click Plan Inputs.

Oracle Supply Chain Management CloudUsing Replenishment Planning
Chapter 6Planning Data Collections
102
2. From the Plans menu, right-click Plan Inputs and click Open.
Tip: You can set the preview pane to Full Pane for viewing your data in full pane. Click Change and selectFull Pane.
3. On the Plan Inputs page, click Open, and click Full Pane.4. On the Open Table, Graph, or Tile Set page, search for the table name.5. Enter the criteria for the data you want to verify and click Search.6. Review the data in the Search Results table.
Review Data Using the Maintain Supply Network Model PagePerform the following steps to review the planning data using the Maintain Supply Network Model page.
1. In the Navigator, click Plan Inputs.2. From the Tasks menu, click Maintain Supply Network Model.3. Enter the criteria for the data you want to verify and click Search.4. Review the data in the Search Results table.
Collections for Oracle Fusion Replenishment PlanningThis topic explains how collections are done for Oracle Fusion Replenishment Planning.
Collections are done at the organization level.
Collections are also done for all subinventories of organizations that are marked for subinventory-level planning on theOrganizations tab on the Maintain Supply Network Model page.
Collected Business Objects That Are Relevant for Replenishment PlanningThis table lists the collected business objects that are relevant for replenishment planning:
Oracle Fusion Application Business Object
Oracle Fusion Procurement andOracle Fusion Inventory Management
• Purchase orders and requisitions• Suppliers• Approved supplier lists• Units of measure (UOMs)
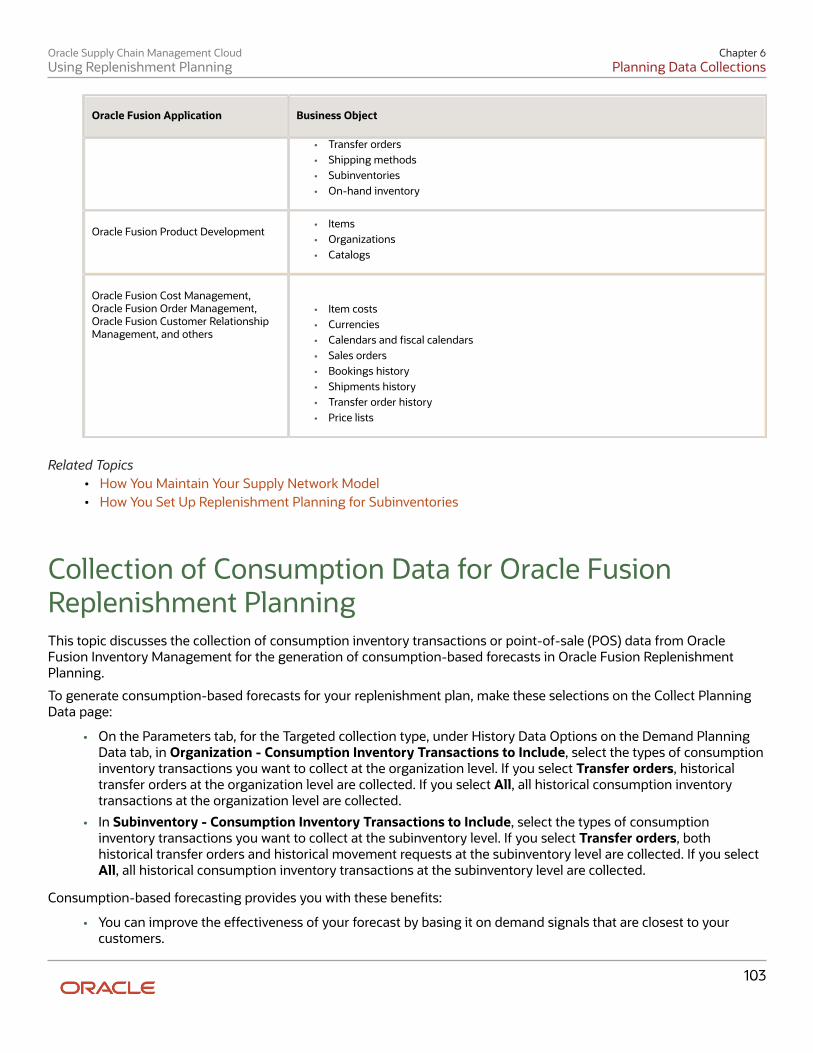
Oracle Supply Chain Management CloudUsing Replenishment Planning
Chapter 6Planning Data Collections
103
Oracle Fusion Application Business Object
• Transfer orders• Shipping methods• Subinventories• On-hand inventory
Oracle Fusion Product Development• Items• Organizations• Catalogs
Oracle Fusion Cost Management,Oracle Fusion Order Management,Oracle Fusion Customer RelationshipManagement, and others
• Item costs• Currencies• Calendars and fiscal calendars• Sales orders• Bookings history• Shipments history• Transfer order history• Price lists
Related Topics• How You Maintain Your Supply Network Model• How You Set Up Replenishment Planning for Subinventories
Collection of Consumption Data for Oracle FusionReplenishment PlanningThis topic discusses the collection of consumption inventory transactions or point-of-sale (POS) data from OracleFusion Inventory Management for the generation of consumption-based forecasts in Oracle Fusion ReplenishmentPlanning.
To generate consumption-based forecasts for your replenishment plan, make these selections on the Collect PlanningData page:
• On the Parameters tab, for the Targeted collection type, under History Data Options on the Demand PlanningData tab, in Organization - Consumption Inventory Transactions to Include, select the types of consumptioninventory transactions you want to collect at the organization level. If you select Transfer orders, historicaltransfer orders at the organization level are collected. If you select All, all historical consumption inventorytransactions at the organization level are collected.
• In Subinventory - Consumption Inventory Transactions to Include, select the types of consumptioninventory transactions you want to collect at the subinventory level. If you select Transfer orders, bothhistorical transfer orders and historical movement requests at the subinventory level are collected. If you selectAll, all historical consumption inventory transactions at the subinventory level are collected.
Consumption-based forecasting provides you with these benefits:
• You can improve the effectiveness of your forecast by basing it on demand signals that are closest to yourcustomers.

Oracle Supply Chain Management CloudUsing Replenishment Planning
Chapter 6Planning Data Collections
104
Thereby, you can also effectively calculate your policy parameters and calculate and release your replenishmentorders.
• In the retail and healthcare sectors, stores and departments can be modeled as subinventories. By collectingconsumption inventory transactions at the subinventory level, you can generate forecasts at this level.
Historical Transaction Collections for Consumption-Based Forecasting atthe Organization LevelAll historical transactions are collected at the organization level from Inventory Management for consumption-basedforecasting except for those listed in this table:
Transaction Action Transaction Source Transaction Type
Issue from stores Purchase Order Return to Supplier
Issue from stores Sales Order Sales Order Issue
Issue from stores Transfer Order Return Transfer Order Return with Scrap
Item Transaction Collections for Consumption-Based Forecasting at theSubinventory LevelAll item transactions are collected at the subinventory level from Inventory Management for consumption-basedforecasting except for those listed in this table:
Transaction Action Transaction Source Transaction Type
Issue from stores Purchase Order Return to Supplier
Issue from stores Transfer Order Return Transfer Order Return with Scrap
Direct organization transfer Transfer Order Return Transfer Order Return Transfer
In-transit shipment Transfer Order Return Transfer Order Return Shipment
Staging transfer Transfer Order Return Transfer Order Return Pick
Purge Data

Oracle Supply Chain Management CloudUsing Replenishment Planning
Chapter 6Planning Data Collections
105
How You Purge Collected Data from the Data Repository forSupply Chain PlanningUse the Purge Data Repository scheduled process to purge data collected by supply chain planning collectionsprocesses into the database tables that comprise the planning data repository. Delete data from these tables to free upspace and improve performance. Use the Scheduled Processes work area to run the process. This topic explains theparameters of the Purge Data Repository process. For info on how to run scheduled processes, refer to the ScheduledProcesses chapter in the Using Common Features guide.
The parameters for the Purge Data Repository scheduled process are in one of these categories:
• The Source System and Purge Global Entities parameters
• Parameters on the Reference Data tab
• Parameters on the Demand Planning Data tab
• Parameters on the Supply Planning Data tab
The Source System and Purge Global Entities ParametersProvide values for these parameters to determine which data records for reference data will be purged from the stagingtables when you run the Purge Staging Tables process.
Parameter Notes
Source System You must select a source system.
• For data collected from the Oracle Fusion source system, select OPS.• For data collected from an external system, select the applicable source system code.
Purge Global Entities You can select Yes if you want to delete data for the entities for which the planning datarepository stores only one record for each instance of the global entity so there's not areference to a source system. The default is No.
Parameters on the Reference Data TabProvide values for these parameters on the Reference Data tab to determine which data records for reference data willbe purged from the staging tables when you run the Purge Staging Tables process.
Parameter Notes
The set of entities categorized asreference entities. The entities youhaven't selected yet are includedin the Reference Entities list on theReference Data tab.
You select which reference entities you want data deleted for. The entities you select areincluded in the Selected Entities list on the Reference Data tab.

Oracle Supply Chain Management CloudUsing Replenishment Planning
Chapter 6Planning Data Collections
106
Parameters on the Demand Planning Data TabProvide values for these parameters on the Demand Planning Data tab to determine which data records for demandplanning data will be purged from the staging tables when you run the Purge Staging Tables process.
Parameter Notes
The set of entities categorized asreference entities. The entries youhaven't selected yet are includedin the Demand Entities list on theDemand Planning Data tab.
You select which demand entities you want data deleted for. The entities you select areincluded in the Selected Entities list on the Demand Planning Data tab.
Limit the Days to Purge You can choose to limit the number of days to purge by selecting one of three choices. Foreach choice you must also specify the additional details needed for that choice:
• By date range, followed by a from date and a to date• By number of days in the future, followed by a number of most recent days to keep• By number of days in the past, followed by either a number of most recent days to keep
or a number of oldest days to purge•
Parameters on the Supply Planning Data TabProvide values for these parameters on the Supply Planning Data tab to determine which data records for supply datawill be purged from the staging tables when you run the Purge Staging Tables process.
Parameter Notes
The set of entities categorized asreference entities. The entities youhaven't selected yet are includedin the Reference Entities list on theReference Data tab.
You select which supply entities you want data deleted for. The entities you select are includedin the Selected Entities list on the Supply Planning Data tab.
How You Purge Staging Tables for Supply Chain PlanningUse the Purge Staging Tables scheduled process to delete data from the staging tables used during collectionsprocesses for supply chain planning. Delete data from the staging tables to free up space and improve performance.Use the Scheduled Processes work area to run the process. This topic explains the parameters of the Purge StagingTables process. For info on how to run scheduled processes, refer to the Scheduled Processes chapter in the UsingCommon Features guide.
Provide values for these parameters to determine which data records will be purged from the staging tables when yourun the Purge Staging Tables process.
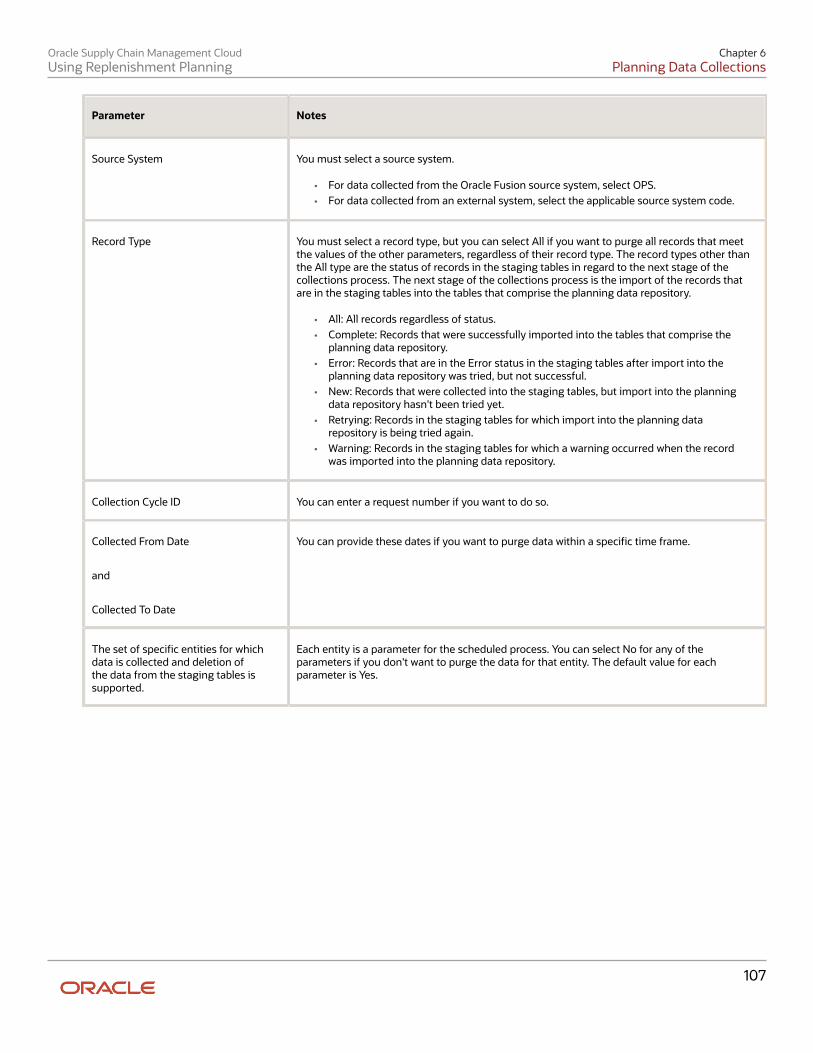
Oracle Supply Chain Management CloudUsing Replenishment Planning
Chapter 6Planning Data Collections
107
Parameter Notes
Source System You must select a source system.
• For data collected from the Oracle Fusion source system, select OPS.• For data collected from an external system, select the applicable source system code.
Record Type You must select a record type, but you can select All if you want to purge all records that meetthe values of the other parameters, regardless of their record type. The record types other thanthe All type are the status of records in the staging tables in regard to the next stage of thecollections process. The next stage of the collections process is the import of the records thatare in the staging tables into the tables that comprise the planning data repository.
• All: All records regardless of status.• Complete: Records that were successfully imported into the tables that comprise the
planning data repository.• Error: Records that are in the Error status in the staging tables after import into the
planning data repository was tried, but not successful.• New: Records that were collected into the staging tables, but import into the planning
data repository hasn't been tried yet.• Retrying: Records in the staging tables for which import into the planning data
repository is being tried again.• Warning: Records in the staging tables for which a warning occurred when the record
was imported into the planning data repository.
Collection Cycle ID You can enter a request number if you want to do so.
Collected From Date
and
Collected To Date
You can provide these dates if you want to purge data within a specific time frame.
The set of specific entities for whichdata is collected and deletion ofthe data from the staging tables issupported.
Each entity is a parameter for the scheduled process. You can select No for any of theparameters if you don't want to purge the data for that entity. The default value for eachparameter is Yes.

Oracle Supply Chain Management CloudUsing Replenishment Planning
Chapter 6Planning Data Collections
108
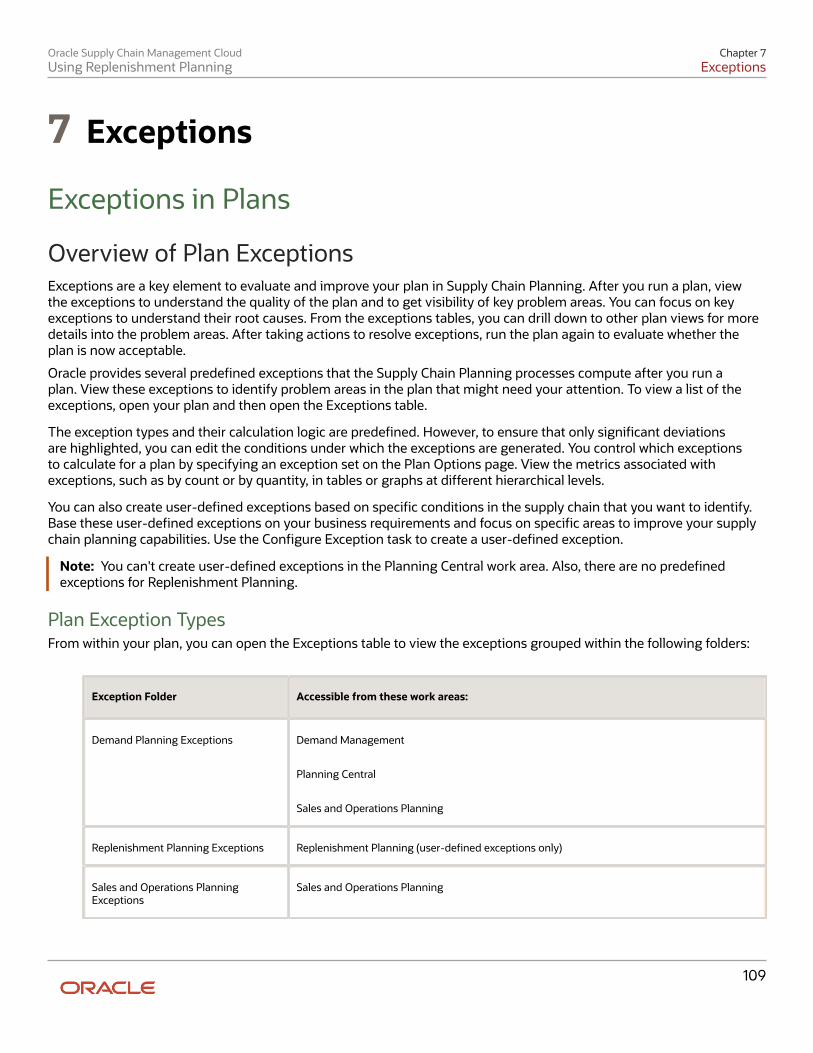
Oracle Supply Chain Management CloudUsing Replenishment Planning
Chapter 7Exceptions
109
7 Exceptions
Exceptions in Plans
Overview of Plan ExceptionsExceptions are a key element to evaluate and improve your plan in Supply Chain Planning. After you run a plan, viewthe exceptions to understand the quality of the plan and to get visibility of key problem areas. You can focus on keyexceptions to understand their root causes. From the exceptions tables, you can drill down to other plan views for moredetails into the problem areas. After taking actions to resolve exceptions, run the plan again to evaluate whether theplan is now acceptable.
Oracle provides several predefined exceptions that the Supply Chain Planning processes compute after you run aplan. View these exceptions to identify problem areas in the plan that might need your attention. To view a list of theexceptions, open your plan and then open the Exceptions table.
The exception types and their calculation logic are predefined. However, to ensure that only significant deviationsare highlighted, you can edit the conditions under which the exceptions are generated. You control which exceptionsto calculate for a plan by specifying an exception set on the Plan Options page. View the metrics associated withexceptions, such as by count or by quantity, in tables or graphs at different hierarchical levels.
You can also create user-defined exceptions based on specific conditions in the supply chain that you want to identify.Base these user-defined exceptions on your business requirements and focus on specific areas to improve your supplychain planning capabilities. Use the Configure Exception task to create a user-defined exception.
Note: You can't create user-defined exceptions in the Planning Central work area. Also, there are no predefinedexceptions for Replenishment Planning.
Plan Exception TypesFrom within your plan, you can open the Exceptions table to view the exceptions grouped within the following folders:
Exception Folder Accessible from these work areas:
Demand Planning Exceptions Demand Management
Planning Central
Sales and Operations Planning
Replenishment Planning Exceptions Replenishment Planning (user-defined exceptions only)
Sales and Operations PlanningExceptions
Sales and Operations Planning

Oracle Supply Chain Management CloudUsing Replenishment Planning
Chapter 7Exceptions
110
Exception Folder Accessible from these work areas:
Supply Planning Exceptions Supply Planning
Planning Central
Views for Multiple Exceptions Supply Planning
Planning Central
Exception CategoriesThere are two categories of exceptions:
• Measure-based exceptions
• Order-based exceptions
Oracle provides several predefined exceptions for most Supply Chain Planning products. You can also create user-defined exceptions from most Supply Chain Planning work areas. The following table lists the Supply Chain Planningproducts, the type of exception, whether the product has predefined exceptions, and whether you can create user-defined exceptions.
Product Type of Exception Predefined Exceptions User-Defined Exceptions
Demand Management Measure-based exceptions Yes Yes
Planning Central Measure-based exceptions Yes No
Replenishment Planning Measure-based exceptions No Yes
Sales and Operations Planning Measure-based exceptions Yes Yes
Supply Planning (constrainedand unconstrained)
Order-based exceptions
Measure-based exceptions
Yes Yes
View Exceptions for Your PlanWhen you open the Exceptions table, you can see the number of exceptions generated within parentheses after theexception name. Click the exception name to view a table with details of the exception. From the Exceptions table, youcan:
• Search for exceptions for a specific item and organization within a specified date range.
• Save the search criteria for future searches.
• Export the table to a spreadsheet, rearrange columns, and perform other standard table actions on the table.

Oracle Supply Chain Management CloudUsing Replenishment Planning
Chapter 7Exceptions
111
Predefined views within the Views for Multiple Exceptions folder enable you to view all exceptions for an item, resource,or supplier within the same table. The Views for Multiple Exceptions folder is available only in the Supply Planning andPlanning Central work areas.
From tables that show exception data, you can navigate in context to other plan data. This navigation capability is usefulwhen, for example, you view exceptions for an item and you also want to see its supply or resource availability.
Configure Exception ThresholdsYou can control the number of exceptions that your plan generates by changing the levels at which an exception iscomputed and its threshold value. A higher threshold value typically results in fewer exceptions.
To configure exception thresholds, do the following:
1. From a Supply Chain Planning work area, select the Configure Exceptions task.2. On the Configure Exceptions page, select an exception.3. Click Actions and then select Edit.
Demand planning, replenishment planning, and sales and operations planning exceptions are measure-basedexceptions. A base measure forms the foundation for these exceptions.
In the Planning Central work area, you can't change the base measure, but you can edit the level at which the exceptionis computed and its threshold value.
Most supply planning exception calculations are for a specific order and aren't associated with a base measure. Forthese types of exceptions, select the fact associated with the exception and modify the condition that specifies when togenerate the exception. Think of a fact as an attribute of the exception. Typical facts are quantity and value.
Create Tables and Graphs for ExceptionsCreate a table or graph for plan exceptions based on their measures, such as number of exceptions generated and thequantity associated with the exception.
Create a Table for Exceptions
1. In a Supply Chain Planning work area, open a plan.2. Click the Actions button and select Manage Tables, Graphs, and Analysis Sets from the list.3. In the Manage Tables, Graphs, Analysis Sets dialog box, click Actions. Next, select Create and then select Table.4. On the Create Table page, do the following:
◦ Enter a name for your table.
◦ Select a group.
◦ Enter a description.
◦ Select the type of access (public or private).
5. On the Measures tab, do the following:
a. In the Available Measures section, expand the Overall Plan Health folder.
The Overall Plan Health folder contains the measures associated with exceptions.b. Select the exception facts that you want to view in the table.

Oracle Supply Chain Management CloudUsing Replenishment Planning
Chapter 7Exceptions
112
6. On the Hierarchies tab, include the Exception Type hierarchy.7. On the Members tab, select the exception types to display in the table.8. Click Save and Close.
Create a Graph for Exceptions
1. In a Supply Chain Planning work area, open a plan.2. Click the Actions button and select Manage Tables, Graphs, and Analysis Sets from the list.3. In the Manage Tables, Graphs, Analysis Sets dialog box, click Actions. Next, select Create and then select
Graph.4. On the Create Graph page, do the following:
◦ Enter a name for your graph.
◦ Select a group.
◦ Enter a description.
◦ Select the type of access (public or private).
5. On the Measures tab, do the following:
a. In the Available Measures section, expand the Overall Plan Health folder.
The Overall Plan Health folder contains the measures associated with exceptions.b. Select the exception facts that you want to view in the graph.
6. On the Hierarchies tab, include the Exception Type hierarchy.7. On the Members tab, select the exception types to display in the graph.8. On the Layout tab, do the following:
a. In the Graph Layout Options section, select a type of graph.b. Configure your graph in the horizontal panels below the Graph Layout Options.
The horizontal panels below the Graph Layout Options section vary, depending on the type of graph thatyou select. For example, if you select Pie Graph for your graph type, the horizontal panels include GeneralOptions, Pie Slice, and Formatting.
9. Click Save and Close.
Related Topics
• Overview of Tables, Graphs, Analysis Sets, Tiles, and Tile Sets
Exceptions and Exception Sets
Overview of Exceptions and Exception SetsOn the Configure Exceptions page, you can select an exception and edit the thresholds for reporting. You can configureonly those exceptions that are relevant to your Supply Chain Planning work area.
On the Configure Exception Sets page, you can restrict the exceptions that are computed as part of the plan run. Youcan also control the organizations, item categories, time period, and so on for which to compute exceptions.

Oracle Supply Chain Management CloudUsing Replenishment Planning
Chapter 7Exceptions
113
A defined exception set is associated with a plan. The plan evaluates the exceptions using the filters associated with theexception set. Select the exception set to use during the plan run on the Plan Options page, Scope tab.
Related Topics
• Define Scope Plan Options
How You Edit ExceptionsTo edit exception parameters, select an exception on the Configure Exceptions page. You can configure only thoseexceptions that are relevant to your Supply Chain Planning work area.
In the Edit Exception dialog box, there is an area for General Properties and Exception Detail. Depending on the SupplyChain Planning work area that you're in, you can see the following tabs in the Exception Detail section:
• Demand Management work area: Level, Threshold, and Notification
• Planning Central work area: Level and Threshold
• Replenishment Planning work area: Level, Threshold, and Notification
• Sales and Operations work area: Level, Threshold, and Notification
• Supply Planning work area: Level, Threshold, and Notification
You can edit Level and Threshold only for those exceptions whose basis is Measure. For exceptions whose basis isOrder, you can edit only the Threshold.
Level TabOn the Level tab, the dimensions for the exception are derived from the base measure. You can edit the default valuesfor hierarchy and level. You can also enable and disable each of the available dimensions to control the level that theexception is evaluated at.
Note: Ensure that the selected hierarchy is in the dimension catalog for the plan. The Configure Exceptions task isoutside of the plan context. It's possible to select a product hierarchy that's not used in the plan's dimension catalog,in which case the plan exceptions output won't display data for items.
Threshold TabOn the Threshold tab, the base measure used in the exception is compared to either a value or another measure. Ifthe threshold is specified in terms of a value, the value is interpreted in terms of the data type of the base measure. Toensure that exceptions return meaningful values, set the threshold to an appropriately high or low value.
Notifications TabOn the Notification tab, set up notification rules for exceptions. Configure exceptions to trigger notifications to specificusers or roles. In the Details section specify the entity and condition for notifications. Notifications are automaticallysent at the end of the plan run.
Configure Exception SetsUse the Configure Exception Sets page to create, modify, or copy an exception set. The set of exceptions and their scopethat's calculated by the plan is configured on the Create or Edit Exception Set page. When creating an exception set,

Oracle Supply Chain Management CloudUsing Replenishment Planning
Chapter 7Exceptions
114
you must first specify the exceptions to include in the set, which can include user-defined exceptions. User-definedexceptions aren't available in Planning Central.
The exception set also enables you to restrict the generation of exceptions for specific organizations, categories,suppliers, and customers. You can then point to the exception set on the Plan Options page for a plan.
When you create a constrained supply plan in Supply Planning, the Exception Set plan option defaults to theConstrained Supply Planning Default exception set.
Use the following steps to configure exception sets:
1. In a Supply Chain Planning work area, click the Tasks panel drawer and click Configure Exception Sets.2. On the Configure Exception Sets page, select an existing exception set. Next, click Actions and select
Duplicate.3. In the Create Exception Sets dialog box:
a. Expand the group of exceptions in the Available Exceptions section. For example, expand SupplyPlanning Exceptions.
b. Select the exception from the Available Exceptions section and move it to the Selected Exceptionssection.
4. Click Save and Close to return to your plan.
Note: To generate exceptions, you must include the exception set in the plan options for your plan.
Set Filters on Planning Dimensions for ExceptionsAfter selecting available exceptions for an exception set to use in a plan, you can add filters on some of the key planningdimensions. The levels on which you can define filters are organizations, categories, suppliers, and customers.
On the Configure Exception Sets page, Filters tab, select one or more organizations, suppliers, categories, andcustomers in each of the tables for which to generate exceptions. If you don't specify a filter for a level, you will generateexceptions for all records in that level. For example, if you don't specify an organization, exceptions will be generated forall planning organizations when you run the plan. If any of the organizations, categories, suppliers, or customers in theexception set aren't available in the plan, they will be ignored.
In the Exception Cutoff Days field, specify the number of calendar days, starting from the plan start date, from whichto generate the exceptions. If this field is blank, exceptions will be generated for the full planning horizon.
Predefined Planning Exceptions
Overview of Predefined Planning ExceptionsThe planning process computes several predefined exceptions after you run a plan. View these exceptions to obtainquick visibility of problem areas in the plan that might need your attention. To view a list of the exceptions, from aSupply Chain Planning work area, open a plan and then open the Exceptions table.
The Exceptions table is grouped into different folders, depending on the plan type:
• Demand Planning Exceptions
• Sales and Operations Planning Exceptions

Oracle Supply Chain Management CloudUsing Replenishment Planning
Chapter 7Exceptions
115
• Supply Planning Exceptions
• Views for Multiple Exceptions: View exceptions for an item, resource, or supplier within the same table. (Thisfolder is available only in the Supply Planning and Planning Central work areas.)
Note: There are no predefined exceptions for Replenishment Planning, only user-defined exceptions that reside inthe Replenishment Planning Exceptions folder.
Related Topics• Predefined Sales and Operations Planning Exceptions• Predefined Supply Planning Exceptions
Predefined Demand Planning ExceptionsThe basis for all predefined demand planning exceptions is Measure. The following table lists the predefined demandplanning exceptions, their descriptions, the base measure used for the exception, the intersection of levels that thecondition is evaluated, the threshold to base measure, and the relevant exception set.
Demand PlanningException Name
Description Base Measure Levels Threshold toBase Measure
Exception Set
Bookings MAPEExceeds Threshold
The BookingsForecast MAPEis greater thanthe specifiedthreshold value.
Bookings ForecastMAPE
Item
Organization
Greater than 0.4 Default
DemandManagement
Shipment MAPEExceeds Threshold
The ShipmentsForecast MAPEis greater thanthe specifiedthreshold value.
ShipmentsForecast MAPE
Item
Organization
Greater than 0.4 Default
DemandManagement
SignificantDeviation betweenActual Salesand ConsensusForecast
The deviationbetween theActual Sales andthe ConsensusForecast issignificant.
Deviation betweenShipment HistoryShipped Items byRequested Dateand ConsensusForecast
Item
Organization
Customer
Week
Greater than 20percent
DemandManagement
SignificantDeviationbetween BookingsHistory and FinalBookings Forecast
The deviationbetween theBookings Historyand the FinalBookings Forecastis significant.
Deviation betweenBookings HistoryBooked Itemsby RequestedDate and FinalBookings
Item
Organization
week
Greater than 20percent
DemandManagement
SignificantDeviation betweenBudget and
The deviationbetween theBudget and the
Deviation betweenBudget Value and
Category Greater than 0.2 DemandManagement

Oracle Supply Chain Management CloudUsing Replenishment Planning
Chapter 7Exceptions
116
Demand PlanningException Name
Description Base Measure Levels Threshold toBase Measure
Exception Set
Final ShipmentsForecast
Final ShipmentsForecast issignificant.
Final ShipmentsForecast Value Organization
Period
SignificantDeviation betweenMarketingForecast andConsensusForecast
The deviationbetween theMarketingForecast andthe ConsensusForecast issignificant.
Deviation betweenFinal MarketingForecast andConsensusForecast
Item
Customer
Period
Greater than 20percent
DemandManagement
SignificantDeviation betweenSales Forecastand ConsensusForecast
The deviationbetween the SalesForecast andthe ConsensusForecast issignificant.
Deviation betweenFinal SalesForecast andConsensusForecast
Item
Customer
Period
Greater than 20percent
Default
DemandManagement
SignificantDeviation betweenSales Forecast andFinal ShipmentsForecast
The deviationbetween the SalesForecast and theFinal ShipmentsForecast issignificant.
Deviation betweenFinal SalesForecast andFinal ShipmentsForecast
Item
Organization
Week
Greater than 20percent
Default
DemandManagement
SignificantDeviation betweenSales Orders andFinal ShipmentsForecast
The deviationbetween the SalesOrders and theFinal ShipmentsForecast issignificant.
Deviation betweenSales Orders byRequest Date andFinal ShipmentsForecast
Item
Organization
Week
Greater than 20percent
Default
DemandManagement
SignificantDeviation betweenShipmentsHistory andFinal ShipmentsForecast
The deviationbetween theShipmentsHistory and theFinal ShipmentsForecast issignificant.
Deviation betweenShipment HistoryShipped Itemsby RequestedDate and FinalShipmentsForecast
Item
Organization
Week
Greater than 20percent
DemandManagement
SignificantDeviation in Yearon Year Sales
The differencebetween thecurrent year'ssales and thepast year'ssales exceedsa specifiedpercentage.
Deviation in SalesYear over Year
Item
Organization
Customer
Period
Greater than 20percent
Default
DemandManagement
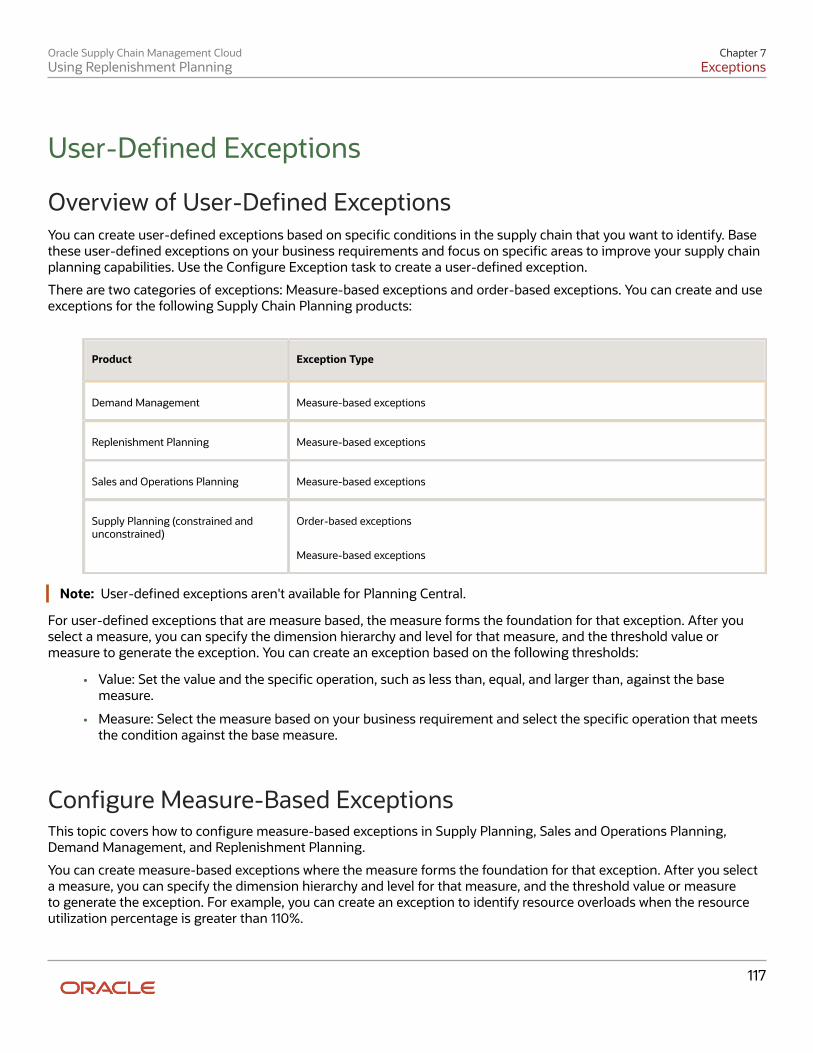
Oracle Supply Chain Management CloudUsing Replenishment Planning
Chapter 7Exceptions
117
User-Defined Exceptions
Overview of User-Defined ExceptionsYou can create user-defined exceptions based on specific conditions in the supply chain that you want to identify. Basethese user-defined exceptions on your business requirements and focus on specific areas to improve your supply chainplanning capabilities. Use the Configure Exception task to create a user-defined exception.
There are two categories of exceptions: Measure-based exceptions and order-based exceptions. You can create and useexceptions for the following Supply Chain Planning products:
Product Exception Type
Demand Management Measure-based exceptions
Replenishment Planning Measure-based exceptions
Sales and Operations Planning Measure-based exceptions
Supply Planning (constrained andunconstrained)
Order-based exceptions
Measure-based exceptions
Note: User-defined exceptions aren't available for Planning Central.
For user-defined exceptions that are measure based, the measure forms the foundation for that exception. After youselect a measure, you can specify the dimension hierarchy and level for that measure, and the threshold value ormeasure to generate the exception. You can create an exception based on the following thresholds:
• Value: Set the value and the specific operation, such as less than, equal, and larger than, against the basemeasure.
• Measure: Select the measure based on your business requirement and select the specific operation that meetsthe condition against the base measure.
Configure Measure-Based ExceptionsThis topic covers how to configure measure-based exceptions in Supply Planning, Sales and Operations Planning,Demand Management, and Replenishment Planning.
You can create measure-based exceptions where the measure forms the foundation for that exception. After you selecta measure, you can specify the dimension hierarchy and level for that measure, and the threshold value or measureto generate the exception. For example, you can create an exception to identify resource overloads when the resourceutilization percentage is greater than 110%.
Oracle Supply Chain Management CloudUsing Replenishment Planning
Chapter 7Exceptions
118
Configure Exceptions That Are Measure BasedUse the following general steps to configure a user-defined exception that's measure based.
1. In a Supply Chain Planning work area, click the Tasks panel drawer and click Configure Exceptions.2. On the Configure Exceptions page, click Actions and then select Create.3. In the Create Exception dialog box, General Properties section, specify or enter information for the following
fields:
a. Exceptionb. Display Namec. Exception Groupd. Base Measure
4. In the Exception Detail section, on the Level tab, select the dimension and its corresponding hierarchy and levelto use for your exception
What you select for levels determines the combination at which the exception condition is evaluated. Forexample, if you select levels Item and Organization, then the exception criteria is evaluated for each uniquecombination of Item and Organization.
Note: Configure Exceptions is a task defined outside of plan context. When configuring exceptions formeasure-based plans, ensure the selected hierarchy is in the plan's dimension catalog in plan options.Otherwise item level exceptions might be blank after running a plan.
5. On the Threshold tab:
a. Select an operation.b. Define a threshold for the base measure, which can be defined based on a value or another measure.
6. On the Notification tab, define the notification attributes.7. When done, click Save and Close.
Exception Detail SectionIn the Create Exception dialog box, the Level tab in the Exception Detail section is populated based on the basemeasure. The Level tab consists of dimension, hierarchy, and level.
For example, for the user-defined exception Fill Rate Shortfall Percentage, the details are populated based on the basemeasure Fill Rate Shortfall Percentage. As defined on the Threshold tab, the planning process generates this exceptionwhen the Fill Rate Shortfall percentage is greater than 10%.
For this exception, the populated dimensions are Organization and Product. You can select dimensions and theircorresponding hierarchy and levels. In this example for the Product dimension, you can select either Item or Category asthe level.
If you select the Item level, the planning process generates this exception for any item with the Fill Rate ShortfallPercentage of greater than 10% as defined in the Threshold tab. This case enables you to analyze the plan output inmore detail. At the same time, the number of exceptions could be large enough that analyzing each exception might notbe possible.
On the other hand, if you select the Category level, the planning process generates this exception for any category withthe Fill Rate Shortfall Percentage of greater than 10%. In this case, the number of exceptions is lower than the item levelscenario. But, potentially some issues that exists at the item level aren't visible since the planning process generates anexception only when the specified criterion holds at the category level.

Oracle Supply Chain Management CloudUsing Replenishment Planning
Chapter 7Exceptions
119
Configure Exceptions for Replenishment PlanningCreate user-defined exceptions in Replenishment Planning by using the same process to configure measure-basedexceptions covered in the User-Defined Exceptions for Measure-Based Plans topic. This topic details how to configure aspecific exception for Replenishment Planning.
Projected Fill Rate Less than 90 PercentThe fill rate is the fraction of customer demand that's met through immediate stock availability, without backorders orlost sales. The planning process generates the Projected Fill Rate Less than 90 Percent exception when the projected fillrate for an item and organization is below 90 percent.
Use these steps to configure a Projected Fill Rate Less than 90 Percent exception for a replenishment plan:
1. Navigate to the Tasks panel. In the Configuration section, click the Configure Exceptions link.2. On the Configure Exceptions page, click Actions and then select Create.3. In the Create Exceptions dialog box in the General Properties section, enter or select the following:
Parameter Value
Exception Projected fill rate less than 90 percent
Display Name Projected fill rate less than 90 percent
Exception Group Replenishment Planning Exceptions
Base Measure Projected Fill Rate
4. On the Level tab, specify the dimension and its corresponding hierarchy and level.5. On the Threshold tab, define the threshold for the base measure as Projected Fill Rate Less than 90%:
◦ In the Operation field, select Less than.
◦ In the Threshold field, select Value and then enter 90.
Configure Exceptions Based on User-Defined MeasuresYou might have a scenario where you need to define a user-defined measure and then configure an exception based onthat measure. For example, you want to identify the items that have demands with a risk of not being satisfied, and thevalue of these demands are 10 percent more than their quarterly revenue.
Step 1: Configure a User-Defined MeasureIn our example, the first step is to define a user-defined measure that represents the percentage value of demands atrisk. This percentage can be calculated as follows:
Demand at Risk Value Percentage = (Demand at Risk Value / Revenue) x 100

Oracle Supply Chain Management CloudUsing Replenishment Planning
Chapter 7Exceptions
120
Use the following steps to configure a user-defined measure.
1. Navigate to the Tasks panel. In the Configuration section, click the Manage Planning Measures link.2. On the Manage Planning Measures page, click Actions and then select Create.3. In the Create Measure dialog box, enter or select the following:
Parameter Value
Measure Demand at Risk Value Percentage
Description Enter a description
Data Type Percent
Enable in Work Area Supply Planning
Measure Groups Overall Plan Health
4. On the Aggregation and Disaggregation tab in the Dimension Parameters section, select the Customer andDemand Class dimensions.
5. On the Expression tab, Functions subtab, define the Demand at Risk Value Percentage equation:
Safe_Division (Demand at Risk Value, Revenue, null) * 100.6. Click Save and Close.
Step 2: Configure a User-Defined ExceptionThe next step is to configure a user-defined exception using Demand at Risk Value Percentage as the base measure.
1. Navigate to the Tasks panel. In the Configuration section, click the Configure Exceptions link.2. On the Manage Planning Measures page, click Actions and then select Create.3. In the Create Exceptions dialog box, in the General Properties section, enter or select the following:
Parameter Value
Exception Demand at Risk Value over 10 Percent of Revenue
Display Name Demand at Risk Value over 10 Percent of Revenue
Exception Group Supply Planning Exceptions
Base Measure Demand at Risk Value Percentage
4. In the Exception Detail section, on the Level tab, specify the dimension and its corresponding hierarchy andlevel.
5. On the Threshold tab, define the threshold for the base measure as Demand at Risk Value Percentage Greaterthan 10%:
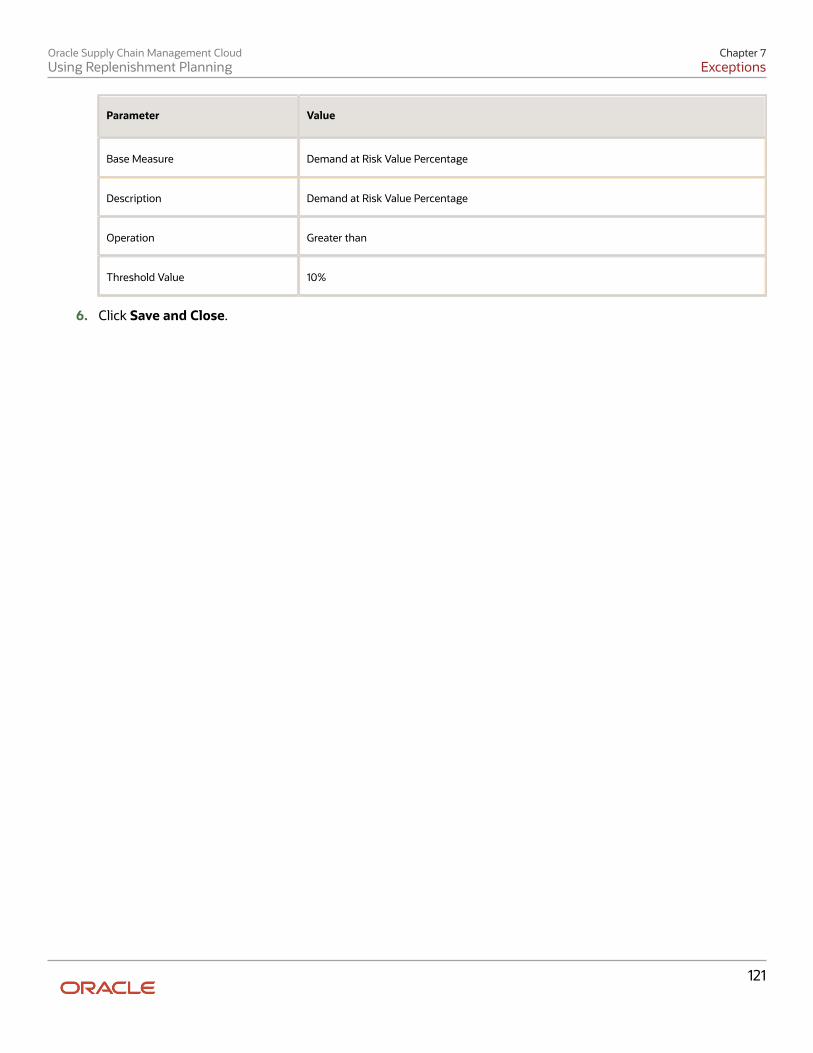
Oracle Supply Chain Management CloudUsing Replenishment Planning
Chapter 7Exceptions
121
Parameter Value
Base Measure Demand at Risk Value Percentage
Description Demand at Risk Value Percentage
Operation Greater than
Threshold Value 10%
6. Click Save and Close.

Oracle Supply Chain Management CloudUsing Replenishment Planning
Chapter 7Exceptions
122

Oracle Supply Chain Management CloudUsing Replenishment Planning
Chapter 8Segmentation
123
8 Segmentation
Segmentation in Oracle Fusion Replenishment PlanningSegmentation is the process of grouping item-location combinations into segments on the basis of user-defined, static,or dynamic attributes. Through segmentation, you can better manage the replenishment requirements for many item-location combinations by grouping them into a few segments.
You do replenishment planning and forecasting and apply policy assignment sets by segment groups. You also viewdata in tables and graphs by segments.
You can also filter data in analysis sets by using segments as filters. Then, you can apply forecasting profiles to specificsegments by selecting the associated analysis sets.
For example, you can perform segmentation by defining segment groups that are based on:
• Intermittency and volatility
• Demand volume and cost
• Item attributes for the Product and Organization dimensions
• User-defined attributes and organizations, regions, and zones
You collect the item-location combinations and associated attributes from Oracle Fusion Product Management. Torestrict segmentation to items for which replenishment planning must be done, you first set the MPS and MRP PlanningMethod attribute of items to Replenishment planning in Product Management. Then, while setting up the criteria forsegments of a segment group, you set the Planning Method attribute for the Product dimension to Replenishmentplanning. After segmentation, only replenishment planning items are grouped into the segments of the segment group.If you don't restrict the scope of segmentation, it happens for all item-location combinations collected from ProductManagement; however, the replenishment plans process only those item-location combinations for which the MPS andMRP Planning Method attribute is set in Product Management.
How You Perform SegmentationHere's what you do during the segmentation process:
1. Set up a segment group and its segments. The segment group has a specific granularity that's applicable tothe segments. You specify dimension-based or measure-based criteria for each segment on the basis of whichitem-location combinations are assigned to the segment.
2. Run the segmentation job for the segment group from the Manage Segment Groups and Criteria page (Actions> Execute Segmentation).
The item-location combinations are grouped into the segments.3. View the results of segmentation, and optionally override the assignment of item-location combinations to
segments to better meet your business requirements.

Oracle Supply Chain Management CloudUsing Replenishment Planning
Chapter 8Segmentation
124
This flow chart summarizes the segmentation process:
Create segment group,segments,
segment criteria
Run segmentation process
Are segmentationresults OK?
Overridesegmentation
results
Yes
NoAre segmentation
results OK?
Use segment group
When the segments are used as members for tables and graphs, for item-location combinations that aren't associatedwith a segment in the segment group, the segment information is shown as "Not available."
What You Do After SegmentationHere's what you do after the segmentation process:
1. Create a policy assignment set, and attach the segment group to the policy assignment set.2. Attach the segment group to a replenishment plan.
Oracle Supply Chain Management CloudUsing Replenishment Planning
Chapter 8Segmentation
125
3. Run the replenishment plan to calculate the unique replenishment requirements for the item-locationcombinations in each segment.
Work with Segment Groups
Create a Segment GroupA segment group consists of segments into which combinations are grouped. The segment group has a granularitythat's also applicable to the segments. You define the segments on the basis of dimension-based or measure-basedcriteria.
In the case of Oracle Fusion Replenishment Planning, the combinations consist of items and locations that are collectedfrom Oracle Fusion Product Management. In the case of Oracle Fusion Demand Management, the combinations couldalso include customers and demand classes that are collected from Oracle Fusion applications and external sources.
To create a segment group, you must:
1. Create the segment group.2. Define the segments.3. Define criteria for the segments.
To restrict segmentation to items for which replenishment planning must be done, you first set the MPS and MRPPlanning Method attribute of items to Replenishment planning in Product Management. Then, while setting up criteriafor segments of the segment group, you set the Planning Method attribute for the Product dimension to Replenishmentplanning. After collection and segmentation, only replenishment planning items are grouped into the segments of thesegment group.
If you're planning replenishments at the item-subinventory level, select the Organization dimension for the segmentgroup. Then, add the dimension to segments of the group, and use the Location attribute of the dimension to includesubinventories in the segments. The subinventories are listed in the <organization>:<subinventory> format.
Create the Segment GroupFollow these steps to create the segment group:
1. On the Tasks panel tab, under Plan Inputs, select Manage Segment Groups and Criteria.
The Manage Segment Groups and Criteria page opens.2. Under Search Results, click Actions > Create.
The Create Segment Group page opens.3. In Segment Group, enter the segment group name.4. In Source System, select the source system for the segment group.
The source system must be the same as that used in the replenishment plan to which you attach the segmentgroup. Only the combinations in the selected source system are available after segmentation in the segmentgroup.
5. In Simulation Set, select a simulation set for the segment group.
If you plan to simulate changes to the same item attributes at the segment group and demand orreplenishment plan levels, preferably, use the same simulation set in both cases.
6. In Description, enter the segment group description.

Oracle Supply Chain Management CloudUsing Replenishment Planning
Chapter 8Segmentation
126
7. Under Segment Granularity, in the Dimension column, select the dimension that you want to specify for thesegment group granularity.
You must select at least one dimension. The lowest levels for the selected dimensions are displayed in the Levelcolumn, and the displayed levels make up the segment group's granularity.
Only the predefined Customer, Demand Class, Organization, and Product dimensions are supported.
If the segment group is to be used with replenishment plans, only the Organization and Product dimensionsshould be selected.
8. Add more dimensions as required by clicking the Add Row icon.9. In Catalog, select the Product Management catalog from which you want to use categories while specifying the
attributes for Product dimension-based criteria of segments in the group.10. Click Save.
Define the SegmentsFollow these steps to create a segment in the segment group:
1. Under Segments, click the Add Row icon.2. Enter the segment name and description.3. Under Rank, accept the default number that's a multiple of 10 or enter a whole number that's unique for the
segment group.
During segmentation, if a combination meets the criteria for more than one segment, the combination isassigned to the segment with the lower rank.
4. Add more segments as required.5. Click Save.
Define Criteria for the SegmentsFollow these steps to define criteria for segments:
1. Under Segments, select the segment for which you want to define criteria.2. Under Segment Criteria, click the Add Row icon.
A row appears for the segment criterion of the segment.3. Set the criterion as follows:
a. In the list under Dimension, if you want the criterion to be based on the selected dimensions for thesegment group:
i. Select a dimension.
The list under Attribute is enabled and displays the attributes for the selected dimension.ii. In the list for attributes, select an attribute for the dimension.
The list under Operator is enabled.
If you selected the Product dimension, and you previously specified a Product Managementcatalog, the list includes Category as an attribute.
iii. In the list for operators, select the operator with which you want to evaluate the attribute.
Depending on your selection, fields or lists under From Value and To Value may be enabled, anddialog boxes may open.

Oracle Supply Chain Management CloudUsing Replenishment Planning
Chapter 8Segmentation
127
iv. Specify the values for the attribute.If you selected Category as an attribute, the categories for the selected Product Managementcatalog are displayed in the list under From Value.
b. In the list under Dimension, if you want the criterion to be based on measures:i. Select Measure-based criteria.
The Search and Select: Plans dialog box appears.ii. In the Available Plans pane, in Type, specify whether demand or replenishment plans are to be
displayed.iii. Click the Find icon.
The demand or replenishment plans are displayed. Only those replenishment plans for which theGenerate forecast check box is selected on the Plan Options page are displayed.The demand or replenishment plans should have been run and contain tables with the requiredmeasures. The tables should have only those dimensions and levels that are in the segment group.
iv. Select and move plans to the Selected Plans pane.v. Click OK to return to the Create Segment Group page.
vi. In Measure Evaluation Table, select the table from which a measure should be selected for thesegment criterion.The tables associated with the selected demand or replenishment plans are available in the list.
vii. In Measure Name, select a measure.viii. In Operator, select the operator with which you want to evaluate the measure value.
Depending on your selection, the From Value field, To Value field, or both are enabled.ix. Specify the values for the measure.
4. Add more rows for segment criteria as required.If you're adding rows, enter a whole number in the field under Group for each row. During segmentation,those rows with the same whole number are processed with the AND operator. Then, the resulting criteria areprocessed with the OR operator.
5. Click Save.
Related Topics• How You Set Up Replenishment Planning for Subinventories
Edit a Segment GroupYou can edit and delete segment groups, segments, and segment criteria.
Edit the Segment GroupYou can duplicate, edit, and delete a segment group.
In the Replenishment Planning work area, you can delete the segment group only if it's not associated with a policyassignment set or replenishment plan.
The changes you can make to the segment group are limited. You can't change the name or source system for thesegment group, and you can't change its granularity by adding or deleting dimensions.

Oracle Supply Chain Management CloudUsing Replenishment Planning
Chapter 8Segmentation
128
Follow these steps to edit the segment group:
1. On the Tasks panel tab, under Plan Inputs, select Manage Segment Groups and Criteria.
The Manage Segment Groups and Criteria page opens.2. Search for the segment group that you want to edit.3. Select the segment group, and click Actions > Edit.
The Edit Segment Group page opens.4. Change the description and simulation set as required.
If you plan to simulate changes to the same item attributes at the segment group and demand orreplenishment plan levels, preferably, use the same simulation set in both cases.
5. In Catalog, select the catalog from Oracle Fusion Product Management from which you want to use categorieswhile specifying the attributes for Product dimension-based criteria of segments in the group.
If you previously selected a catalog and used one of its categories while setting up a Product dimension-basedcriterion, the list is grayed out.
6. Click Save.
Edit the SegmentsYou can add, duplicate, and delete segments and change their names, descriptions, and ranks.
In the Replenishment Planning work area, you can delete segments only if the segment group isn't associated with apolicy assignment set or replenishment plan.
If you change the rank of a segment, you may change how combinations are assigned to segments after you runsegmentation again. During segmentation, if a combination meets the criteria for more than one segment, thecombination is assigned to the segment with the lower rank.
Edit the Segment CriteriaYou can add, edit, and delete criteria for a segment.
For dimension-based criteria, you can change the attributes, operators, and values. For measure-based criteria, you canchange the plans, measure evaluation tables, measures, operators, and values.
Depending on the operator used for a criterion, you can change the values under From Value, To Value, or both.
If you change the value under Group for the criterion, you may affect the segmentation result. During segmentation,those criteria with the same whole number are processed with the AND operator. Then, the resulting criteria areprocessed with the OR operator.
Run SegmentationSegmentation can be run for a segment group from the Manage Segment Groups and Criteria page.
Follow these steps to run segmentation for the segment group:
1. On the Tasks panel tab, under Plan Inputs, select Manage Segment Groups and Criteria.
The Manage Segment Groups and Criteria page opens.2. Search for the segment group for which you want to run segmentation.3. Select the segment group, and click Actions > Execute Segmentation.

Oracle Supply Chain Management CloudUsing Replenishment Planning
Chapter 8Segmentation
129
The Execute Segmentation dialog box opens.4. To retain your segment overrides, select Retain segment overrides.
To save your last segmentation result for display on the Segmentation Summary page, select Save the lastsegmentation result. When you select this check box, the results of the last segmentation run are displayedunder the Previous heading on the Segmentation Summary page, and the results of the segmentation run youare presently submitting are displayed under the Latest heading.
Tip: If you're performing simulations, you may want to repeatedly make changes to yoursegmentation criteria and run segmentation so that you can compare the results of your changeswith the results of the last segmentation run, which are displayed under the Latest heading on theSegmentation Summary page. In such cases, you don't want to select this check box. When youhave finished your simulations and are satisfied with the results of your changes, select this checkbox.
Click Submit.
The Information dialog box opens and provides you with the request number (process ID) of the segmentationrun. You can use this request number to search for the process status and log on the Scheduled Processespage. If the segmentation run fails, see the log for more information and troubleshooting.
5. Click OK.
The Information dialog box closes.6. On the Manage Segment Groups and Criteria page, click View > Refresh to update the status and last run date
of segmentation for the segment group.
View the Segmentation SummaryYou can view segmentation results on the Segmentation Summary page. The results of the latest and previoussegmentation runs are displayed.
In the case of Oracle Fusion Replenishment Planning, the combinations consist of items and locations that are collectedfrom Oracle Fusion Product Management. In the case of Oracle Fusion Demand Management, the combinations couldalso include customers and demand classes that are collected from Oracle Fusion applications and external sources.
View the SummaryFollow this procedure to view the segmentation summary for a segment group:
1. Perform one of these steps:
◦ On the Tasks panel tab, under Plan Inputs, select View Segmentation Summary.
The Segmentation Summary page opens.
◦ On the Manage Segment Groups and Criteria page, select a segment group, and click Actions > ViewSegmentation Summary.
The Segmentation Summary page opens.2. In Segment Group, select the segment group for which you want to view the segmentation summary.
Oracle Supply Chain Management CloudUsing Replenishment Planning
Chapter 8Segmentation
130
The page is refreshed with the segmentation summary for the segment group. The results of the latest andprevious segmentation runs are displayed, along with other details of the combinations for each segment.
You can click a number for a segment under a column to open the Manage Segment Members page and viewthe combinations that meet the criteria for the number that you clicked. If you perform any overrides on theManage Segment Members page, the changes are immediately reflected on the Segmentation Summary page.
If you opened the segmentation summary from the Manage Segment Groups and Criteria page, the field isgrayed out, and you can view segmentation results for only the segment group you selected on the page.
3. Click Done to close the Segmentation Summary page.
Points to Note About Displayed InformationNote these points about the information displayed on the Segmentation Summary page:
• You can use the latest and previous results to understand how and why combinations have moved from onesegment to another. These movements happen because of changes in demands, sales, and consumption. Byidentifying the factors underlying these movements, you can fine-tune the segmentation process and applymanual overrides as required.
• Every time you run segmentation with the Save the last segmentation result check box selected in theExecute Segmentation dialog box, the latest results presently displayed on the Segmentation Summary pageare displayed as the previous results, and the results of the job you just submitted are displayed as the latestresults. Your manual overrides remain unaffected so long as you selected the Retain segment overrides checkbox in the Execute Segmentation dialog box.
• If you have run segmentation for the first time for the segment group, the previous results aren't displayed.
• No previous results are displayed for a segment that's added during the latest segmentation run.
• The values under the Latest Count, Previous Count, Added in Latest Run, and Removed in Latest Runcolumns don't include your manual overrides.
Override Segmentation ResultsYou can override segmentation results by manually assigning combinations to segments.
In the case of Oracle Fusion Replenishment Planning, the combinations consist of items and locations that are collectedfrom Oracle Fusion Product Management. In the case of Oracle Fusion Demand Management, the combinations couldalso include customers and demand classes that are collected from Oracle Fusion applications and external sources.
You can override segmentation results using:
• the Manage Segment Members page
• the edit-in-spreadsheet feature
Changes you make to the segments for combinations are overwritten the next time you run segmentation for thesegment group unless you have selected the Retain segment overrides check box in the Execute Segmentation dialogbox.

Oracle Supply Chain Management CloudUsing Replenishment Planning
Chapter 8Segmentation
131
Override Segmentation Results Using the GUITo override segmentation results through the Manage Segment Members page, follow this procedure:
1. Perform one of these steps:
◦ On the Tasks panel tab, under Plan Inputs, select Manage Segment Members.
The Manage Segment Members page opens.
◦ On the Manage Segment Groups and Criteria page, select a segment group, and click Actions > ManageSegment Members.
The Manage Segment Members page opens and displays the combinations for the segment group.
◦ On the Segmentation Summary page, for the segment of a segment group, click the number underLatest Count, Previous Count, Added in Latest Run, Removed in Latest Run, Manually Added toSegment, Manually Removed from Segment, or Final Count.
The Manage Segment Members page opens and displays the combinations corresponding to thenumber you clicked.
2. On the Manage Segment Members page, under Search, select the segment group for which you want tooverride the segmentation results, and click Search. You can further refine your search by the segment,previous segment, and levels for the dimensions in the segment group.
The page is refreshed with the segmentation results. For each combination, the assigned segment in the latestsegmentation run, assigned segment in the previous segmentation run, and segment override are displayed.
3. For each combination for which you want to override the segmentation results, under Segment Override,select the new segment.
4. Click Save and Close.
Override Segmentation Results Using a SpreadsheetTo override segmentation results through the edit-in-spreadsheet feature, follow this procedure:
Note: You must first download and install the desktop integration installer that's available under Navigator > Tools.Otherwise, you can't override segmentation results using a spreadsheet.
1. Perform one of these steps:
◦ On the Tasks panel tab, under Plan Inputs, select Manage Segment Members.
The Manage Segment Members page opens.
◦ On the Manage Segment Groups and Criteria page, select a segment group, and click Actions > ManageSegment Members.
The Manage Segment Members page opens and displays the combinations for the segment group.
◦ On the Segmentation Summary page, for the segment of a segment group, click the number underLatest Count, Previous Count, Added in Latest Run, Removed in Latest Run, Manually Added toSegment, Manually Removed from Segment, or Final Count.
The Manage Segment Members page opens and displays the combinations corresponding to thenumber you clicked.
2. On the Manage Segment Members page, under Search, select the segment group for which you want tooverride the segmentation results, and click Search.

Oracle Supply Chain Management CloudUsing Replenishment Planning
Chapter 8Segmentation
132
The page is refreshed with the segmentation results.3. Under Search Results, click Edit in Spreadsheet.
A dialog box opens and prompts you to open or save a Microsoft Excel file.4. Open the spreadsheet.
The Connect dialog box opens and prompts you to connect to the application URL.5. Click Yes.
A dialog box opens and prompts you to enter your credentials.6. Sign in with your Oracle Applications Cloud credentials.
The spreadsheet is refreshed with the combinations in the segment group displayed on the Manage SegmentMembers page. For each combination, the assigned segment in the latest segmentation run, assigned segmentin the previous segmentation run, and segment override are displayed.
7. To narrow your search to a combination in the segment group, enter the details in the first table, and clickManage Segment Members > Search.
You can use the percent sign as a wildcard character for your search.8. For each combination for which you want to override the segmentation results, under the Segment Override
column, select the new segment.
A symbol appears in the cell under the Changed column for each changed row.9. To upload your changes to Oracle Fusion Demand Management or Oracle Fusion Replenishment Planning, click
Manage Segment Members > Upload.
The results of the upload for each row are displayed under the Status column.
The symbol in the cell under the Changed column disappears for each successfully uploaded row.10. Save and close the spreadsheet.11. To view your changes on the Manage Segment Members page, click View > Refresh.

Oracle Supply Chain Management CloudUsing Replenishment Planning
Chapter 9Policy Assignment Sets and Policy Parameter Calculation
133
9 Policy Assignment Sets and PolicyParameter Calculation
Policy Assignment SetsA policy assignment set is a group of policy parameters that are defined for each segment of a segment group. Policiesare calculated for item-location combinations on the basis of these policy parameters. The policy assignment set canalso contain policy overrides for segments and item-location combinations.
The policy assignment set is attached to a segment group. You can define multiple policy assignment sets for thesegment group. However, you can specify only one policy assignment set for the segment group on the Scope tab of thePlan Options page in a replenishment plan.
The policy assignment set consists of the following:
• Policy parameters
• Default policy parameters
• Policy parameter overrides
• Item-location level policy overrides
Policy ParametersYou define policy parameters at the segment level.
This table lists the policy types that you can specify:
Policy Type Method for Calculation of Quantities How the Policy Type Is Used
Min-max planning The following is the formula for calculationof the minimum quantity: Demand DuringLead Time + Safety Stock,
where Demand During Lead Time = TotalLead Time * Average Daily Demand
and Total Lead Time = PreprocessingLead Time + Processing Lead Time +Postprocessing Lead Time (taken from theItems table)
The safety stock and average dailydemand are calculated as discussed laterin this guide.
The maximum quantity is calculated asspecified later in this topic.
When the Beginning Inventory Positionmeasure (Projected Available Balance +On Order measures) equals or falls belowthe minimum quantity, a replenishmentorder is triggered.
The quantity of the replenishment orderis what's required to bring the inventoryup to the maximum quantity (provided byMaximum Quantity - (Projected AvailableBalance + On Order)).

Oracle Supply Chain Management CloudUsing Replenishment Planning
Chapter 9Policy Assignment Sets and Policy Parameter Calculation
134
Policy Type Method for Calculation of Quantities How the Policy Type Is Used
Fixed order cycle The maximum quantity is calculated asspecified later in this topic.
The replenishment orders are placed ononly those days on which suppliers cantake orders, according to the associatedfixed order cycle calendar.
When the Beginning Inventory Positionmeasure (Projected Available Balance+ On Order measures) falls below themaximum quantity, a replenishment orderis triggered.
The quantity of the replenishment orderis what's required to bring the inventoryup to the maximum quantity (provided byMaximum Quantity - (Projected AvailableBalance + On Order)).
Reorder point (ROP) and order quantity The following is the formula for calculationof the ROP: Demand During Lead Time +Safety Stock,
where Demand During Lead Time = TotalLead Time * Average Daily Demand
and Total Lead Time = PreprocessingLead Time + Processing Lead Time +Postprocessing Lead Time (taken from theItems table)
The average daily demand and safetystock are calculated as discussed later inthis guide.
The order quantity is taken for the item-location combination from the Fixed OrderQuantity column of the Items table. Ifthis value is unavailable, the default orderquantity specified at the segment level inthe policy assignment set is used.
Therefore, for this policy type, the fixedorder quantity should be correctly definedat the item level.
When the Beginning Inventory Positionmeasure (Projected Available Balance+ On Order measures) equals or fallsbelow the ROP, a replenishment order istriggered.
The quantity of the replenishment order isthe order quantity.
If the fixed order quantity isn't definedin the Items table or the default orderquantity isn't defined at the segmentlevel in the policy assignment set,replenishment orders are created to bringthe inventory to the ROP level. If theinventory is zero, no replenishments arecreated.
ROP and economic order quantity (EOQ) The following is the formula for calculationof the ROP: Demand During Lead Time +Safety Stock,
where Demand During Lead Time = TotalLead Time * Average Daily Demand
and Total Lead Time = PreprocessingLead Time + Processing Lead Time +
When the Beginning Inventory Positionmeasure (Projected Available Balance+ On Order measures) equals or fallsbelow the ROP, a replenishment order istriggered.
The quantity of the replenishment order isthe EOQ.
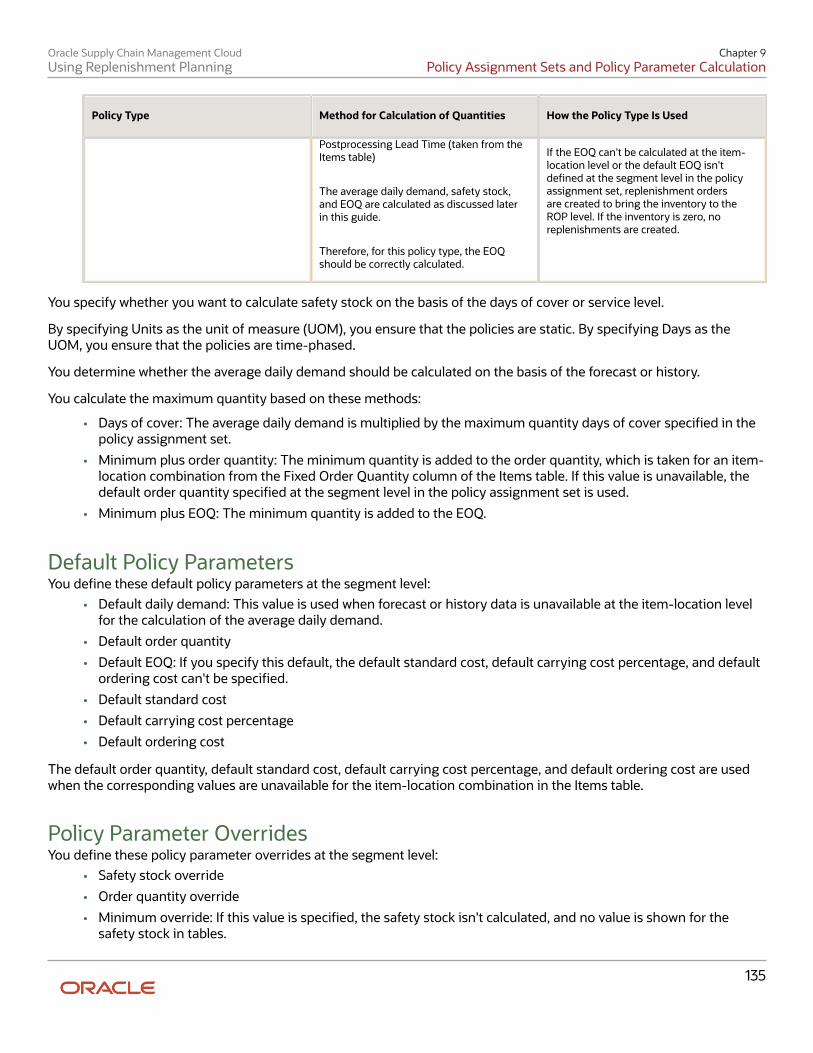
Oracle Supply Chain Management CloudUsing Replenishment Planning
Chapter 9Policy Assignment Sets and Policy Parameter Calculation
135
Policy Type Method for Calculation of Quantities How the Policy Type Is Used
Postprocessing Lead Time (taken from theItems table)
The average daily demand, safety stock,and EOQ are calculated as discussed laterin this guide.
Therefore, for this policy type, the EOQshould be correctly calculated.
If the EOQ can't be calculated at the item-location level or the default EOQ isn'tdefined at the segment level in the policyassignment set, replenishment ordersare created to bring the inventory to theROP level. If the inventory is zero, noreplenishments are created.
You specify whether you want to calculate safety stock on the basis of the days of cover or service level.
By specifying Units as the unit of measure (UOM), you ensure that the policies are static. By specifying Days as theUOM, you ensure that the policies are time-phased.
You determine whether the average daily demand should be calculated on the basis of the forecast or history.
You calculate the maximum quantity based on these methods:
• Days of cover: The average daily demand is multiplied by the maximum quantity days of cover specified in thepolicy assignment set.
• Minimum plus order quantity: The minimum quantity is added to the order quantity, which is taken for an item-location combination from the Fixed Order Quantity column of the Items table. If this value is unavailable, thedefault order quantity specified at the segment level in the policy assignment set is used.
• Minimum plus EOQ: The minimum quantity is added to the EOQ.
Default Policy ParametersYou define these default policy parameters at the segment level:
• Default daily demand: This value is used when forecast or history data is unavailable at the item-location levelfor the calculation of the average daily demand.
• Default order quantity
• Default EOQ: If you specify this default, the default standard cost, default carrying cost percentage, and defaultordering cost can't be specified.
• Default standard cost
• Default carrying cost percentage
• Default ordering cost
The default order quantity, default standard cost, default carrying cost percentage, and default ordering cost are usedwhen the corresponding values are unavailable for the item-location combination in the Items table.
Policy Parameter OverridesYou define these policy parameter overrides at the segment level:
• Safety stock override
• Order quantity override
• Minimum override: If this value is specified, the safety stock isn't calculated, and no value is shown for thesafety stock in tables.

Oracle Supply Chain Management CloudUsing Replenishment Planning
Chapter 9Policy Assignment Sets and Policy Parameter Calculation
136
• EOQ override
• Maximum override
• ROP override: If this value is specified, the safety stock isn't calculated, and no value is shown for the safetystock in tables.
Use policy parameter overrides when all item-location combinations in a segment must have the same policy values.When these overrides are specified, policies aren't calculated for all the item-location combinations of the segment.
Item-Location Level Policy OverridesYou define overrides at the level of individual item-location combinations, and these settings take precedence overthose for the segments to which the item-location combinations belong:
• Policy type
• Policy UOM
• Safety stock override
• Minimum override: If this value is specified, the safety stock isn't calculated, and no value is shown for thesafety stock in tables.
• Maximum override
• ROP override: If this value is specified, the safety stock isn't calculated, and no value is shown for the safetystock in tables.
• Order quantity override
• EOQ override
• Fixed order cycle calendar
Use these policy overrides when you know what values you need for item-location combinations in your business, andyou want to generate replenishment orders on the basis of these values. When these overrides are specified, inventorypolicies aren't calculated for the corresponding item-location combinations.
Hierarchy for Reading Policy Overrides and Item AttributesThe following hierarchy explains how policy overrides and item attributes are read during the policy calculation process:
1. If policy overrides are specified for item-location combinations, these values are used as the policies, andpolicies aren't calculated for these item-location combinations.
2. If policy overrides are specified for segments, these values are used as the policies for all the item-locationcombinations in the segments, and policies aren't calculated for these item-location combinations.
3. If a simulation set is assigned to the replenishment plan to which the policy assignment set is attached, the itemattributes for item-locations combinations are taken from the simulation set.
4. If values are unavailable in the simulation set, the collected item attributes are taken.5. If item attributes are unavailable in the Items table, the default values specified at the segment level in the
policy assignment set are used.
How You Use Policy Assignment SetsThe following is the process for using policy assignment sets in the Replenishment Planning work area:
1. Perform the segmentation process.

Oracle Supply Chain Management CloudUsing Replenishment Planning
Chapter 9Policy Assignment Sets and Policy Parameter Calculation
137
2. Create a policy assignment set, and define the policy parameters for segments and policy overrides for item-location combinations.
3. Attach the policy assignment set to a replenishment plan.4. Run the replenishment plan.
Generate the forecast, calculate the policy parameters, and calculate the replenishments. Refresh the plan withthe current, collected data.
5. Review the calculated policies.6. If the calculated policies aren't satisfactory, follow these steps:
a. Perform simulations, and make changes to the policy parameters for segments or policy overrides foritem-location combinations
b. Run the replenishment plan again.
Calculate the policy parameters and replenishments, and don't refresh the measures with current data.

Oracle Supply Chain Management CloudUsing Replenishment Planning
Chapter 9Policy Assignment Sets and Policy Parameter Calculation
138
The following is the flow chart for using policy assignment sets:
Run segmentation process
Create policy assignmentset, policy parameters,
policy overrides
Are calculatedpolicies OK?
Perform simulations,change policy parameters,
change policy overrides
Run replenishment plan, generate forecast,calculate policies, calculate replenishments
Run replenishment plan,calculate policies,
calculate replenishments
Attach policy assignmentset to replenishment plan
Yes
No
End
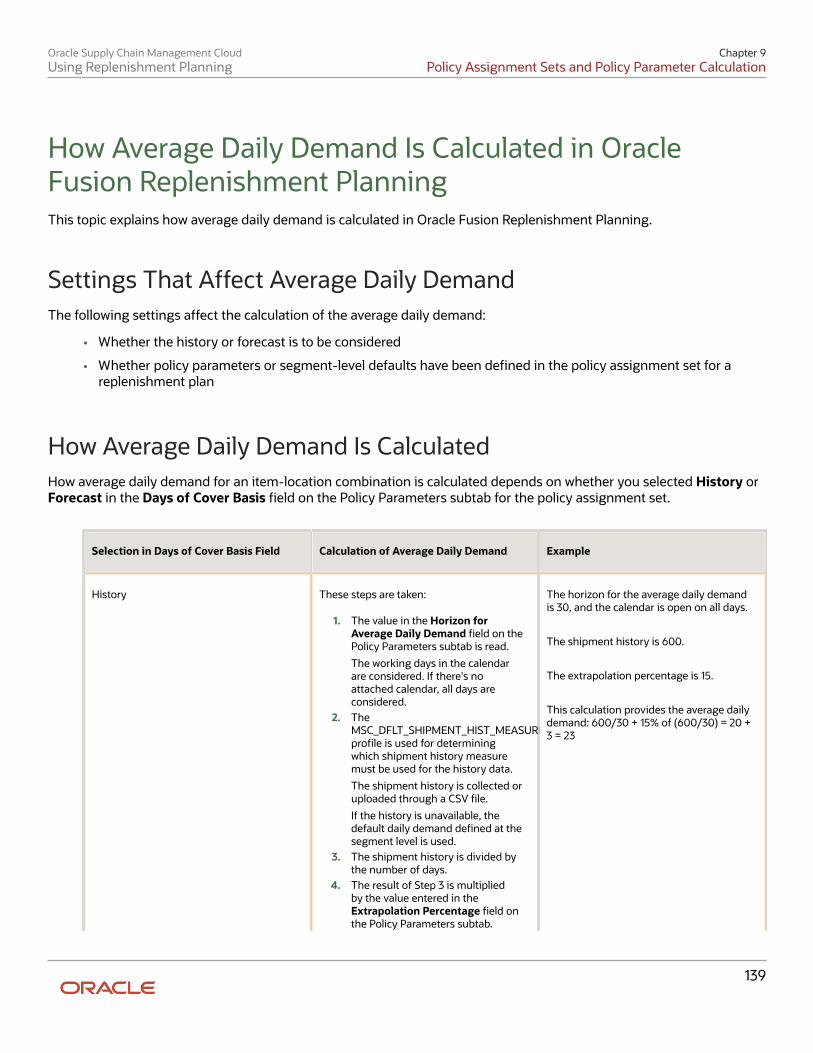
Oracle Supply Chain Management CloudUsing Replenishment Planning
Chapter 9Policy Assignment Sets and Policy Parameter Calculation
139
How Average Daily Demand Is Calculated in OracleFusion Replenishment PlanningThis topic explains how average daily demand is calculated in Oracle Fusion Replenishment Planning.
Settings That Affect Average Daily DemandThe following settings affect the calculation of the average daily demand:
• Whether the history or forecast is to be considered
• Whether policy parameters or segment-level defaults have been defined in the policy assignment set for areplenishment plan
How Average Daily Demand Is CalculatedHow average daily demand for an item-location combination is calculated depends on whether you selected History orForecast in the Days of Cover Basis field on the Policy Parameters subtab for the policy assignment set.
Selection in Days of Cover Basis Field Calculation of Average Daily Demand Example
History These steps are taken:
1. The value in the Horizon forAverage Daily Demand field on thePolicy Parameters subtab is read.
The working days in the calendarare considered. If there's noattached calendar, all days areconsidered.
2. TheMSC_DFLT_SHIPMENT_HIST_MEASUREprofile is used for determiningwhich shipment history measuremust be used for the history data.
The shipment history is collected oruploaded through a CSV file.
If the history is unavailable, thedefault daily demand defined at thesegment level is used.
3. The shipment history is divided bythe number of days.
4. The result of Step 3 is multipliedby the value entered in theExtrapolation Percentage field onthe Policy Parameters subtab.
The horizon for the average daily demandis 30, and the calendar is open on all days.
The shipment history is 600.
The extrapolation percentage is 15.
This calculation provides the average dailydemand: 600/30 + 15% of (600/30) = 20 +3 = 23

Oracle Supply Chain Management CloudUsing Replenishment Planning
Chapter 9Policy Assignment Sets and Policy Parameter Calculation
140
Selection in Days of Cover Basis Field Calculation of Average Daily Demand Example
5. The results of Steps 3 and 4 areadded for the calculation of theaverage daily demand.
Forecast These steps are taken:
1. The gross forecast is read.
The source of the gross forecastcan be one of the following:
◦ A demand plan
◦ A replenishment plan forwhich the Generate forecastcheck box is selected on thePlan Options page
◦ An external forecast
◦ The value in the DefaultDaily Demand field on theDefault Policy Parameterssubtab, if the other forecastsources are unavailable
2. The number of days is identified.The gross forecast is consideredduring these days.
The value in the Horizon forAverage Daily Demand field on thePolicy Parameters subtab is read.
The working days in the calendarare considered. If there's noattached calendar, all days areconsidered. Only those dayswithin the planning horizon of thereplenishment plan are considered.
3. The gross forecast is divided by thenumber of days for the calculationof the average daily demand.
The gross forecast for the next 20 days is500.
The number of days is 20, and thecalendar is open on all days.
This calculation provides the average dailydemand: 500/20 = 25
How EOQ Is Calculated in Oracle Fusion ReplenishmentPlanningThe economic order quantity (EOQ) is the optimal quantity that should be ordered so that inventory holding andordering costs are minimized. In a replenishment plan, you can use the reorder point (ROP) and EOQ policy type tocalculate replenishments on the basis of the EOQ.

Oracle Supply Chain Management CloudUsing Replenishment Planning
Chapter 9Policy Assignment Sets and Policy Parameter Calculation
141
Settings That Affect EOQThe following settings affect the EOQ calculation:
• Whether information is present for an item-location combination in the Items table
• Whether segment-level defaults have been defined in the policy assignment set for the replenishment plan
How EOQ Is CalculatedThe following formula provides the EOQ:
Equation Variable Description
C Fixed cost per order defined at the item-location level
The value of C is read as follows:
1. If the value is present for the item-location combination in the Order Cost column of theItems table, it's used for calculating the EOQ.
2. If the value isn't present for the item-location combination in the Order Cost column, thedefault ordering cost defined for the segment in the policy assignment set is used forcalculating the EOQ.
3. If the value isn't present for the item-location combination in the Order Cost column,and the default EOQ is specified in the policy assignment set, the default EOQ is used.
H Annual carrying cost per item-location combination, which is provided by this calculation:Carrying Cost Percentage * Standard Cost
The value of H is read as follows:
1. If the carrying cost percentage isn't present for the item-location combination in theAnnual Carrying Cost Percentage column of the Items table, the default carrying costpercentage defined for the segment in the policy assignment set is used for calculatingthe EOQ.
2. If the standard cost isn't present for the item-location combination in the Standard Costcolumn of the Items table, the default standard cost defined for the segment in thepolicy assignment set is used for calculating the EOQ.
3. If the values aren't present for the item-location combination, and the default EOQ isspecified in the policy assignment set, the default EOQ is used.

Oracle Supply Chain Management CloudUsing Replenishment Planning
Chapter 9Policy Assignment Sets and Policy Parameter Calculation
142
Equation Variable Description
D Annual demand for the item-location combination, which is provided by this calculation:Average Daily Demand * Total Number of Working Days in a Year
How Safety Stock Is Calculated in Oracle FusionReplenishment PlanningThe safety stock is the quantity of an item that an organization holds as a buffer in the inventory to protect againstfluctuations in demand or supply. This quantity is in addition to that required by normal operations of the organization.
Settings That Affect Safety StockThe value of the safety stock depends on whether it should be calculated based on the days of cover or service level.
How Safety Stock Is CalculatedHow safety stock for an item-location combination is calculated depends on whether you selected Days of cover orService level-based in the Safety Stock Calculation list on the Policy Parameters subtab for the policy assignment set.
• If you selected Days of cover, the following calculation is done: Safety Stock = Average Daily Demand * Days ofCover
The days of cover is taken from the Safety Stock Days of Cover field on the Policy Parameters subtab.
For example, the average daily demand is 30, and the days of cover is 3. The safety stock is 90, which is 30 * 3.
• If you selected Service-level based, and the demand isn't intermittent, a normal distribution formula is used.
These inputs affect the formula's result:
◦ Target service level percentage. If this value isn't present in the Service Level Percentage column of theItems table, it's taken from the Target Service Level Percentage field on the Policy Parameters subtab.
◦ Mean average percentage error (MAPE), which is taken from the demand plan, replenishment plan, orexternal demand schedule that's used as the demand schedule for the replenishment plan
◦ Average daily demand
◦ Replenishment lead time, which is the sum of the Preprocessing Lead Time, Processing Lead Time, andPostprocessing Lead Time columns of the Items table
• If you selected Service level-based, and the demand is intermittent, a Poisson distribution formula is used.
These inputs affect the formula's result:
◦ Number of demands during the replenishment lead time
Oracle Supply Chain Management CloudUsing Replenishment Planning
Chapter 9Policy Assignment Sets and Policy Parameter Calculation
143
◦ Target service level percentage. If this value isn't present in the Service Level Percentage column of theItems table, it's taken from the Target Service Level Percentage field on the Policy Parameters subtab.
How You Upload Externally Calculated Safety StockIf you're computing safety stock in a third-party application, you can upload the computed quantities for use in policyparameter calculations by your replenishment plan. By uploading these computed quantities, you can better alignOracle Fusion Replenishment Planning with your other planning and execution systems.
You can upload externally calculated safety stock quantities using the file-based data import (FBDI) template for supplychain planning safety stock levels.
You can view the uploaded safety stock for item-location combinations in the Safety Stock Quantity column of the Itemstable. However, you can't edit this quantity in the table or simulation sets.
Note these points about uploading safety stock quantities and how they're used:
• You can upload safety stock quantities for only item-organization combinations.
You can't upload safety stock quantities for item-subinventory combinations.
• You can upload safety stock quantities in only units.
If the unit of measure (UOM) is days for the segment that's associated with the item-location combinations,the uploaded safety stock is ignored for those item-location combinations, and the safety stock is calculated byReplenishment Planning.
• If you upload time-phased safety stock quantities, the quantity for which the effective date is on or before theplan run date and that's closest to the plan run date is used.
• The uploaded safety stock quantity is used if it's available for an item-location combination.
Otherwise, the safety stock is calculated by Replenishment Planning.
• The safety stock override you specify at the item-location level in the policy assignment set is used even whenthe externally calculated safety stock is available.
However, any safety stock override you specify at the segment level in the policy assignment set is ignoredwhen the externally calculated safety stock is available, and the uploaded value is used in policy parametercalculations.
• When you simulate changes to policy parameters, the externally calculated safety stock is considered for item-location combinations.
Static Policies or Time-Phased Policies in Oracle FusionReplenishment PlanningThe unit of measure (UOM) you select for a policy assignment set at the segment or item-location level determineswhether the policies are static or time-phased. If you selected Units as the UOM, the policies are static. If you selectedDays, the policies are time-phased.

Oracle Supply Chain Management CloudUsing Replenishment Planning
Chapter 9Policy Assignment Sets and Policy Parameter Calculation
144
In static policies, the values of measures don't vary from day to day. In time-phased policies, these measure values canvary from day to day.
Use static policies when the total demand doesn't drastically change from day to day, and use time-phased policieswhen the total demand can vary from day to day.
If required, you can override the values of these measures for a replenishment plan by using these tables:
• Manage Policy Parameters by Item: Use this table when you want to change the measure values for all days.
• Replenishment Workbench: Use this table when you want to change the measure values for specific days.
Static PoliciesThis table illustrates how static policies are calculated:
Measure Day1
Day2
Day3
Day4
Day5
Day6
Day7
Day8
Day9
Day10
Day11
Day12
Day13
Day14
MinimumQuantity
15 15 15 15 15 15 15 15 15 15 15 15 15 15
AdjustedMinimumQuantity
0 0 0 0 0 0 0 25 25 25 25 25 25 25
FinalMinimumQuantity
15 15 15 15 15 15 15 25 25 25 25 25 25 25
MaximumQuantity
55 55 55 55 55 55 55 55 55 55 55 55 55 55
AdjustedMaximumQuantity
0 0 0 0 0 0 0 80 80 80 80 80 80 80
FinalMaximumQuantity
55 55 55 55 55 55 55 80 80 80 80 80 80 80
This table depicts the calculation of static policies for a replenishment plan with a planning horizon of 14 days.
The minimum quantity is calculated by the following formula: Demand During Lead Time + Safety Stock, whereDemand During Lead Time = Total Lead Time * Average Daily Demand and Total Lead Time = Preprocessing Lead Time+ Processing Lead Time + Postprocessing Lead Time.
The maximum quantity is calculated through the days of cover, minimum plus order quantity, or minimum pluseconomic order quantity (EOQ) method.

Oracle Supply Chain Management CloudUsing Replenishment Planning
Chapter 9Policy Assignment Sets and Policy Parameter Calculation
145
Time-Phased PoliciesThis table illustrates how time-phased policies are calculated:
Measure Day1
Day2
Day3
Day4
Day5
Day6
Day7
Day8
Day9
Day10
Day11
Day12
Day13
Day14
TotalDemand
10 10 10 15 15 15 20 20 20 10 10 10 15 15
MinimumDays
3 3 3 3 3 3 3 3 3 3 3 3 3 3
MaximumDays
6 6 6 6 6 6 6 6 6 6 6 6 6 6
MinimumQuantity(Time-PhasedValue)
30 35 40 45 50 55 60 50 40 30 35 40 40 40
AdjustedMinimumQuantity
0 0 0 0 0 0 0 0 0 0 0 0 0 0
FinalMinimumQuantity(Time-PhasedValue)
30 35 40 45 50 55 60 50 40 30 35 40 40 40
MaximumQuantity
(Time-PhasedValue)
75 85 95 105 100 95 90 85 80 80 80 80 80 80
AdjustedMaximumQuantity
0 0 0 0 0 0 0 0 0 0 0 0 0 0
FinalMaximumQuantity
75 85 95 105 100 95 90 85 80 80 80 80 80 80

Oracle Supply Chain Management CloudUsing Replenishment Planning
Chapter 9Policy Assignment Sets and Policy Parameter Calculation
146
Measure Day1
Day2
Day3
Day4
Day5
Day6
Day7
Day8
Day9
Day10
Day11
Day12
Day13
Day14
(Time-PhasedValue)
This table depicts the calculation of time-phased policies for a replenishment plan with a planning horizon of 14 days.
The total demand is calculated according to the forecast processing logic.
The formula for the calculation of the minimum days is Minimum Quantity (static value)/Average Daily Demand. Theformula for calculation of the maximum days is Maximum Quantity (static value)/Average Daily Demand.
The formulas for the calculation of the static values of the minimum and maximum quantities are the same as thoseused for static policies.
For the calculation of the time-phased minimum quantity for Day X, the minimum days are considered, and the totaldemand is summed up starting from Day X for the minimum days. If the number of days left in the planning horizon isless than the minimum days on Day X, the previous day's time-phased minimum quantity is used. For the calculation ofthe time-phased maximum quantity for Day X, the maximum days are considered, and the total demand is summed upstarting from Day X for the maximum days. If the number of days left in the planning horizon is less than the maximumdays on Day X, the previous day's time-phased maximum quantity is used.
Work With Policy Assignment Sets
Create a Policy Assignment SetThis topic explains how you can create a policy assignment set in the Replenishment Planning work area.
To create the policy assignment set, you perform these steps:
1. Name the policy assignment set, and associate it with a segment group.2. Add segments, and define the following for their item-location combinations:
a. Policy parametersb. Default policy parametersc. Policy parameter overrides
3. Define policy overrides for specific item-location combinations.
Name the Policy Assignment Set and Associate It with a Segment GroupFollow these steps to name the policy assignment set and associate it with a segment group:
1. On the Tasks panel tab, under Plan Inputs, select Manage Policy Assignment Sets.
The Manage Policy Assignment Sets page opens.2. Under Search Results, on the toolbar, click Create.
The Create Policy Assignment Set dialog box opens.3. Enter the name and description of the policy assignment set.4. In Segment Group, select the segment group to which the policy assignment set should be attached.
Oracle Supply Chain Management CloudUsing Replenishment Planning
Chapter 9Policy Assignment Sets and Policy Parameter Calculation
147
Only those segment groups for which the segmentation process has been successfully run are available forselection. The segment groups that use the Customer or Demand Class dimension aren't displayed.
5. Click Save.
Define Policy ParametersFollow these steps to define policy parameters for a segment:
1. On the Segment-Level Policy Parameters Assignment tab, on the toolbar, click Add Row.
A row appears underneath the toolbar.2. In the list under Segment, select a segment of the segment group.3. On the Policy Parameters subtab, under Replenishment Policy, in Policy Type, select the policy type for the
segment.4. In Policy UOM, select the unit of measure (UOM) for the policy type.
The policy parameters are calculated based on the UOM.5. In Fixed Order Cycle Calendar, select a calendar for the policy type.
This list is enabled when you select Fixed order cycle in the Policy Type list.6. Under Safety Stock, in Safety Stock Calculation, select the method for safety stock calculation.7. In Safety Stock Days of Cover, enter the number of days to be covered by the safety stock.
This field is enabled when you select Days of cover in the Safety Stock Calculation list.8. In Days of Cover Basis, select whether the average daily demand should be calculated based on the history or
forecast.9. In Horizon for Average Daily Demand, enter the number of days of the history or forecast for which the daily
demand is averaged.10. In Extrapolation Percentage, enter the value by which the average demand should be increased.
This field is enabled when you select History in the Days of Cover Basis list.11. In Target Service Level Percentage, enter the value for calculation of the safety stock.
This field is enabled when you select Service level-based in the Safety Stock Calculation list.12. Under Maximum Quantity, in Maximum Quantity Calculation Method, select the method for calculation of
the maximum quantity.
This list is enabled when you select Min-max planning or Fixed order cycle in the Policy Type list.13. In Maximum Quantity Days of Cover, enter the number of days for which the maximum quantity must be
held.
This list is enabled when you select Days of cover in the Maximum Quantity Calculation Method list.14. Repeat Steps 1 through 13 for other segments.15. Click Save.
Define Default Policy ParametersFollow these steps to define default policy parameters for item-location combinations in a segment:
1. On the Segment-Level Policy Parameters Assignment tab, under the toolbar, select a segment.2. On the Default Policy Parameters subtab, in Default Daily Demand, enter the default value for the daily
demand.
This value is used if history or forecast data is unavailable for the calculation of the average daily demand.

Oracle Supply Chain Management CloudUsing Replenishment Planning
Chapter 9Policy Assignment Sets and Policy Parameter Calculation
148
3. Enter these values:
If You Selected One of TheseCombinations on the PolicyParameters Subtab
Then on the Default Policy Parameters Subtab
◦ Min-max planning or Fixedorder cycle in the PolicyType list and Minimumplus order quantity inthe Maximum QuantityCalculation Method list
◦ ROP and order quantity inthe Policy Type list
◦ In Default Order Quantity, enter the default value for the order quantity.
◦ Min-max planning or Fixedorder cycle in the Policy Typelist and Minimum plus EOQin the Maximum QuantityCalculation Method list
◦ ROP and order quantity orROP and EOQ in the PolicyType list
◦ In Default EOQ, enter the default economic order quantity (EOQ).
If you specify this default, you can't specify the default standard cost, default carryingcost percentage, and default ordering cost.
◦ In Default Standard Cost, enter the default standard cost.
◦ In Default Carrying Cost Percentage, enter the default carrying cost percentage.
◦ In Default Ordering Cost, enter the default ordering cost.
4. Repeat Steps 1 through 3 for other segments.5. Click Save.
Define Policy Parameter OverridesFollow these steps to define policy parameter overrides for item-location combinations in a segment:
1. On the Segment-Level Policy Parameters Assignment tab, under the toolbar, select a segment.2. On the Policy Parameters Overrides subtab, in Safety Stock Override, enter the override value for the safety
stock.For slow-moving items or items with intermittent demand, you can optionally enter zero as the safety stockoverride.
3. In Order Quantity Override, enter the override value for the order quantity.4. In Minimum Override, enter the override value for the minimum order quantity.
The minimum override must be greater than or equal to the safety stock override.For slow-moving items or items with intermittent demand, you can optionally enter zero as the minimumoverride.This field is enabled when you select Min-max planning in the Policy Type list on the Policy Parameterssubtab.
5. In EOQ Override, enter the override value for the EOQ.6. In Maximum Override, enter the override value for the maximum order quantity.
The maximum override must be greater than or equal to the minimum override and safety stock override.This field is enabled when you select Min-max planning or Fixed order cycle in the Policy Type list on thePolicy Parameters subtab.
7. In ROP Override, enter the override value for the reorder point (ROP).The ROP override must be greater than or equal to the safety stock override.

Oracle Supply Chain Management CloudUsing Replenishment Planning
Chapter 9Policy Assignment Sets and Policy Parameter Calculation
149
This field is enabled when you select ROP and order quantity or ROP and EOQ in the Policy Type list on thePolicy Parameters subtab.
8. Repeat Steps 1 through 7 for other segments.9. Click Save.
Define Item-Location Level Policy OverridesFollow these steps to define overrides at the item-location level for the segment group:
1. On the Item-Location Level Policy Overrides tab, on the toolbar, click Add Row.
A row appears under the column headings.2. In the list under Item, select an item of the segment group.3. In the list under Location, select a location for the item.4. In the list under Policy Type, select a policy type for the item-location combination.5. In the list under Policy UOM, select the UOM for the policy type.6. In the field under Safety Stock Override, enter the override value for the safety stock.
For a slow-moving item or an item with intermittent demand, you can optionally enter zero as the safety stockoverride.
7. In the field under Minimum Override, enter the override value for the minimum order quantity.
The minimum override must be greater than or equal to the safety stock override.
For a slow-moving item or an item with intermittent demand, you can optionally enter zero as the minimumoverride.
This field is enabled when you select Min-max planning in the Policy Type list.8. In the field under Maximum Override, enter the override value for the maximum order quantity.
The maximum override must be greater than or equal to the minimum override and safety stock override.
This field is enabled when you select Min-max planning or Fixed order cycle in the Policy Type list.9. In the field under ROP Override, enter the override value for the ROP.
The ROP override must be greater than or equal to the safety stock override.
This field is enabled when you select ROP and order quantity or ROP and EOQ in the Policy Type list.10. In the field under Order Quantity Override, enter the override value for the order quantity.
This field is enabled when you select ROP and order quantity in the Policy Type list.11. In the field under EOQ Override, enter the override value for the EOQ.
This field is enabled when you select ROP and EOQ in the Policy Type list.12. In the list under Fixed Order Cycle Calendar, select a calendar for the policy type.
This list is enabled when you select Fixed order cycle in the Policy Type list.13. Repeat Steps 1 through 12 for other item-locations combinations.14. Click Save.

Oracle Supply Chain Management CloudUsing Replenishment Planning
Chapter 9Policy Assignment Sets and Policy Parameter Calculation
150
Edit a Policy Assignment SetYou can duplicate, edit, and delete a policy assignment set.
The changes you can make to the policy assignment set are limited. You can't change the policy assignment set's name,and you can't delete it if it's being used in a replenishment plan. To change the segment group, you first have to deleteall the segments from the policy assignment set.
You can duplicate the policy parameters that you have specified for a segment and reuse them in another segment.
Edit the Parameters for a SegmentYou can edit the policy parameters, default policy parameters, and policy parameter overrides defined for a segment ofthe segment group that's attached to the policy assignment set.
Any change that you make to the policy parameters takes effect the next time you run the associated replenishmentplan with the Calculate policy parameters check box selected on the Plan Options page.
Edit the Item-Location Level Policy OverridesYou can edit the item-location level policy overrides defined for the segment group that's attached to the policyassignment set.
Any change that you make to the item-location level policy overrides takes effect the next time you run the associatedreplenishment plan with the Calculate policy parameters check box selected on the Plan Options page.
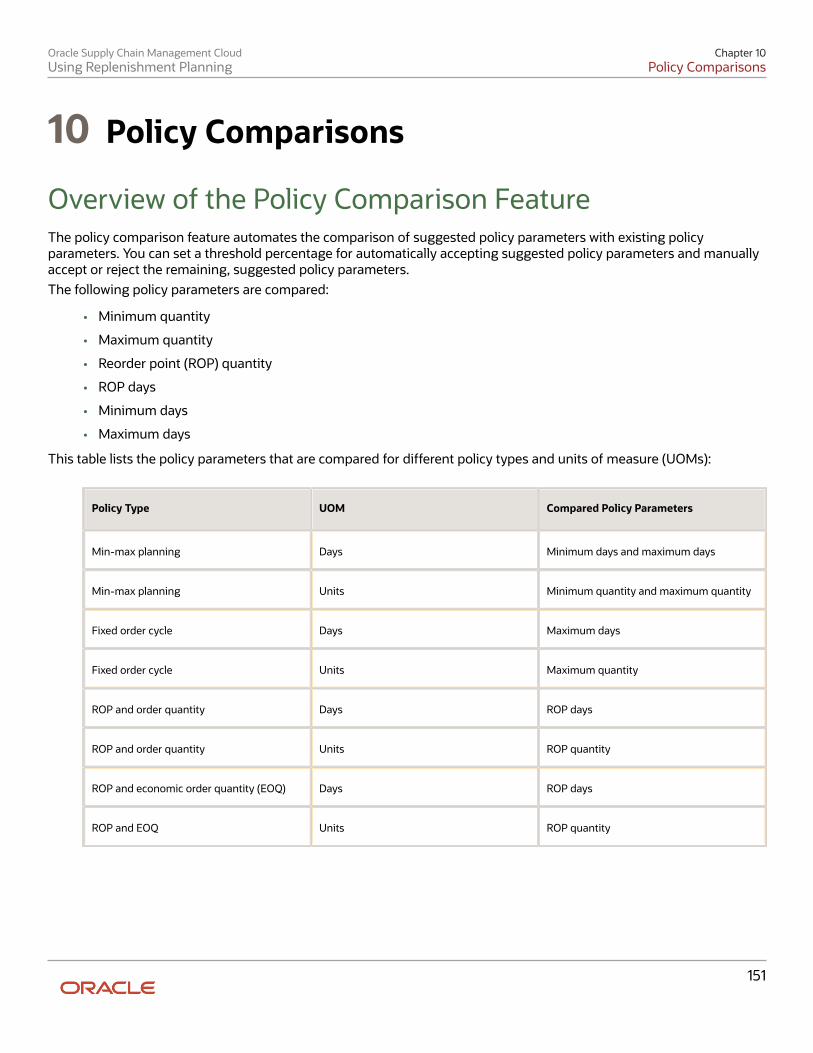
Oracle Supply Chain Management CloudUsing Replenishment Planning
Chapter 10Policy Comparisons
151
10 Policy Comparisons
Overview of the Policy Comparison FeatureThe policy comparison feature automates the comparison of suggested policy parameters with existing policyparameters. You can set a threshold percentage for automatically accepting suggested policy parameters and manuallyaccept or reject the remaining, suggested policy parameters.The following policy parameters are compared:
• Minimum quantity
• Maximum quantity
• Reorder point (ROP) quantity
• ROP days
• Minimum days
• Maximum days
This table lists the policy parameters that are compared for different policy types and units of measure (UOMs):
Policy Type UOM Compared Policy Parameters
Min-max planning Days Minimum days and maximum days
Min-max planning Units Minimum quantity and maximum quantity
Fixed order cycle Days Maximum days
Fixed order cycle Units Maximum quantity
ROP and order quantity Days ROP days
ROP and order quantity Units ROP quantity
ROP and economic order quantity (EOQ) Days ROP days
ROP and EOQ Units ROP quantity

Oracle Supply Chain Management CloudUsing Replenishment Planning
Chapter 10Policy Comparisons
152
Benefits of the Policy Comparison FeatureBy using the policy comparison feature, you can avail of these benefits:
• Automatically accept suggested policy parameters if the percentage of deviation between them and theexisting policy parameters is within the threshold.Therefore, you can avoid having to manually review the suggested policy parameters for millions of item-location combinations and improve the efficiency and accuracy of your policy comparison process.
• Manually accept or reject suggested policy parameters if the percentage of deviation between them and theexisting policy parameters is above the threshold.
• Use embedded analytics to review the policy comparison process.
Note: You can't use the policy comparison feature with the inventory rebalancing feature.
Set Up the Policy Comparison FeatureTo set up the policy comparison feature, you must do the following:
1. Create a policy comparison plan for which the Calculate policy parameters check box is selected, and theCalculate replenishments and the Rebalance inventory check boxes aren't selected on the Plan Options page.Moreover, in the Scope: Advanced Options dialog box, you must select the Enable for policy comparisoncheck box and enter a value in the Threshold Percentage for Policy Comparison field.Optionally, select the Retain policy overrides check box to retain manual policy overrides after thereplenishment plan is run with the Refresh with current data option selected on the Parameters tab in the RunPlan dialog box. The manual overrides are retained even if the deviation percentages between the suggestedand existing policy parameters are within the threshold.
2. Run the policy comparison plan with the Refresh with current data option selected on the Parameters tab inthe Run Plan dialog box.
3. Use the policy comparison plan to provide the updated policy parameters to an integrated replenishment planor automated execution plan.
Related Topics• Create a Replenishment Plan• Set Up Policy Comparisons and Retain Policy Overrides• Best Practices for Setting Up Replenishment Plans
How You Use the Policy Comparison FeatureThe following is the process for using the policy comparison feature:
1. Set up a policy comparison plan.In the Scope: Advanced Options dialog box of the Scope tab of the Plan Options page, select the Enable forpolicy comparison check box, and enter a value in the Threshold Percentage for Policy Comparison field.
2. Run the policy comparison plan.
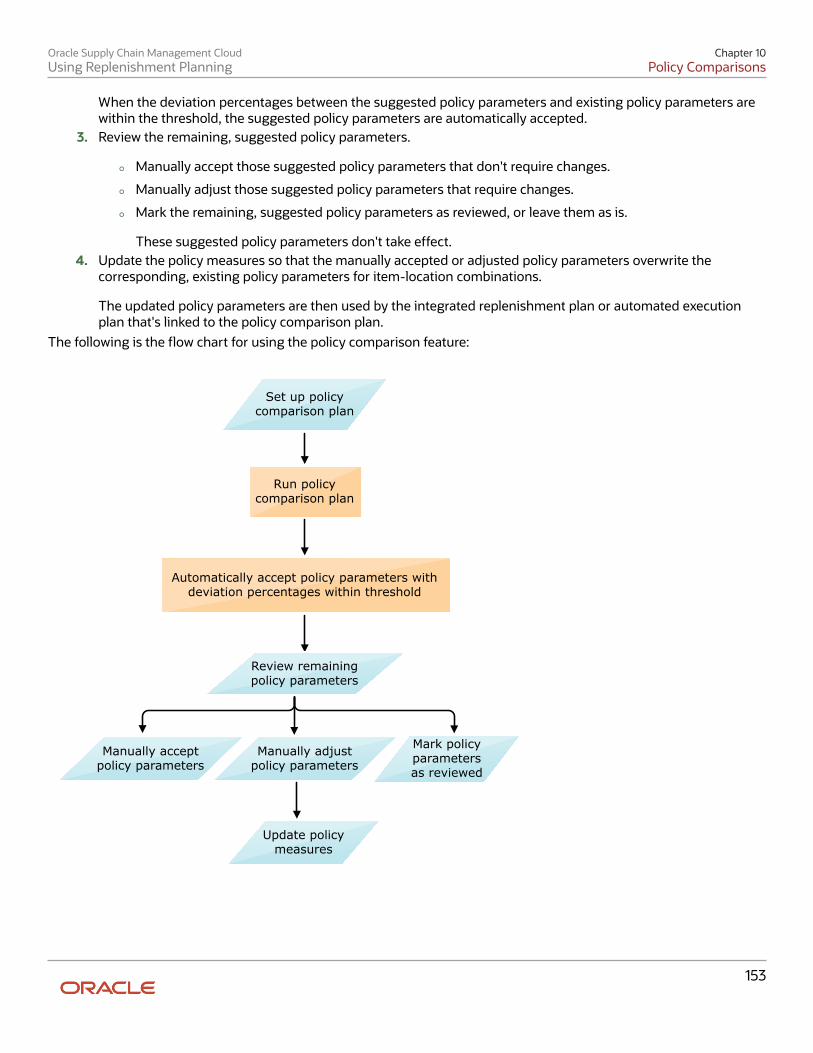
Oracle Supply Chain Management CloudUsing Replenishment Planning
Chapter 10Policy Comparisons
153
When the deviation percentages between the suggested policy parameters and existing policy parameters arewithin the threshold, the suggested policy parameters are automatically accepted.
3. Review the remaining, suggested policy parameters.
◦ Manually accept those suggested policy parameters that don't require changes.
◦ Manually adjust those suggested policy parameters that require changes.
◦ Mark the remaining, suggested policy parameters as reviewed, or leave them as is.
These suggested policy parameters don't take effect.4. Update the policy measures so that the manually accepted or adjusted policy parameters overwrite the
corresponding, existing policy parameters for item-location combinations.
The updated policy parameters are then used by the integrated replenishment plan or automated executionplan that's linked to the policy comparison plan.
The following is the flow chart for using the policy comparison feature:
Set up policycomparison plan
Run policycomparison plan
Automatically accept policy parameters withdeviation percentages within threshold
Manually adjustpolicy parameters
Mark policyparametersas reviewed
Update policymeasures
Manually acceptpolicy parameters
Review remainingpolicy parameters

Oracle Supply Chain Management CloudUsing Replenishment Planning
Chapter 10Policy Comparisons
154
Related Topics
• Best Practices for Setting Up Replenishment Plans
• Run a Replenishment Plan
Measures Used for Comparing Policy ParametersThis topic lists the measures that are used for comparing policy parameters.
These measures provide the following kinds of information:
• Summary of the policy comparison process
• Existing policy parameters and whether they were calculated or adjusted
• Suggested policy parameters
• Percentages of deviation between the existing and suggested policy parameters
Measures that Provide a Summary of the Policy Comparison ProcessThese measures provide a summary of the policy comparison process:
Measure Description
Policies Automatically Accepted Number of item-location combinations with policy parameters that are automatically accepted.
The policy parameters have the Automatically accepted status.
Policies Manually Accepted Number of item-location combinations with policy parameters that are manually accepted.
The policy parameters have the Manually accepted status.
Policies to Review Number of item-location combinations with policy parameters that must be reviewed.
The policy parameters have the To be reviewed status.
Policies Reviewed Number of item-location combinations with policy parameters that are reviewed.
The policy parameters have the Reviewed status.
Policies Adjusted Number of item-location combinations with policy parameters that are manually adjusted(overridden).
The policy parameters have the Adjusted status.
Policies Retained Number of item-location combinations with policy parameter overrides that are retained.

Oracle Supply Chain Management CloudUsing Replenishment Planning
Chapter 10Policy Comparisons
155
Measure Description
The policy parameters have the Retained status.
Policy parameter overrides are retained when the Retain policy overrides check box isselected in the Scope: Advanced Options dialog box on the Scope tab of the Plan Options pagefor a replenishment plan.
Measures for Existing Policy ParametersThese measures provide information about the existing policy parameters and whether they were calculated oradjusted:
Measure Description
Previous Minimum Days Days previously calculated for the Minimum Days measure.
Previous Minimum Days Type Indicator specifying whether the previous value of the Minimum Days measure was calculatedor adjusted.
Previous Maximum Days Days previously calculated for the Maximum Days measure.
Previous Maximum Days Type Indicator specifying whether the previous value of the Maximum Days measure was calculatedor adjusted.
Previous Minimum Quantity Quantity previously calculated for the Minimum Quantity measure.
Previous Minimum Quantity Type Indicator specifying whether the previous value of the Minimum Quantity measure wascalculated or adjusted.
Previous Maximum Quantity Quantity previously calculated for the Maximum Quantity measure.
Previous Maximum Quantity Type Indicator specifying whether the previous value of the Maximum Quantity measure wascalculated or adjusted.
Previous ROP Days Reorder point (ROP) days previously calculated for the ROP Days measure.
Previous ROP Days Type Indicator specifying whether the previous value of the ROP Days measure was calculated oradjusted.
Previous ROP Quantity ROP quantity previously calculated for the ROP Quantity measure.
Previous ROP Quantity Type Indicator specifying whether the previous value of the ROP Quantity measure was calculated oradjusted.

Oracle Supply Chain Management CloudUsing Replenishment Planning
Chapter 10Policy Comparisons
156
Before the policy comparison process begins, the existing policy parameters are copied into these measures.
Measures for Suggested Policy ParametersThese measures provide information about the suggested policy parameters:
Measure Description
Suggested Average Daily Demand Suggested average daily demand.
Suggested EOQ Suggested economic order quantity (EOQ).
Suggested Minimum Days Suggested minimum days.
Suggested Maximum Days Suggested maximum days.
Suggested Minimum Quantity Suggested minimum quantity.
Suggested Maximum Quantity Suggested maximum quantity.
Suggested Order Quantity Suggested order quantity.
Suggested Policy Type Suggested policy type.
The value is the existing policy type.
Suggested Policy UOM Suggested unit of measure (UOM).
The value is the existing UOM.
Suggested ROP Days Suggested ROP days.
Suggested ROP Quantity Suggested ROP quantity.
Suggested Safety Stock Suggested safety stock.
Suggested Safety Stock Days Suggested safety stock days.
You can use the Suggested Replenishment Policy Parameters table for the replenishment plan to view these measures.

Oracle Supply Chain Management CloudUsing Replenishment Planning
Chapter 10Policy Comparisons
157
Measures for Deviation Percentages Between Existing and SuggestedPolicy ParametersThese measures provide the percentages of deviation between the existing and suggested policy parameters:
Measure Description
Minimum Days Deviation Percentage of deviation between the Previous Minimum Days and Suggested Minimum Daysmeasures.
Maximum Days Deviation Percentage of deviation between the Previous Maximum Days and Suggested Maximum Daysmeasures.
Minimum Quantity Deviation Percentage of deviation between the Previous Minimum Quantity and Suggested MinimumQuantity measures.
Maximum Quantity Deviation Percentage of deviation between the Previous Maximum Quantity and Suggested MaximumQuantity measures.
ROP Days Deviation Percentage of deviation between the Previous ROP Days and Suggested ROP Days measures.
ROP Quantity Deviation Percentage of deviation between the Previous ROP Quantity and Suggested ROP Quantitymeasures.
Work with the Manage Policy Comparison TableThis topic explains how you work with the Manage Policy Comparison table for a policy comparison plan.
Manage Policy Comparison TableAfter the policy comparison plan is run, the Manage Policy Comparison table lists the existing and suggested policyparameters for each item-location combination. The percentage of deviation between an existing and a suggestedpolicy parameter is also provided.
The Policy Review Status column indicates the statuses of the policies for the item-location combination:
Status Meaning
Automatically accepted The suggested policy parameters for the item-location combination have been automaticallyaccepted because the percentages of deviation were within the threshold.
This threshold was specified in the Threshold Percentage for Policy Comparison field in theScope: Advanced Options dialog box of the Scope tab of the Plan Options page.

Oracle Supply Chain Management CloudUsing Replenishment Planning
Chapter 10Policy Comparisons
158
Status Meaning
The accepted policy parameters can be seen in the Replenishment Policy Parameters tableand are ready for use by the integrated replenishment plan or automated execution plan that'slinked to the policy comparison plan.
Manually accepted You have accepted the suggested policy parameters for the item-location combination.
To be reviewed The suggested policy parameters for the item-location combination must be reviewed becausethe percentages of deviation are above the threshold.
Reviewed You have reviewed the suggested policy parameters that had the To be reviewed status for theitem-location combination and neither accepted or modified them.
Adjusted You have manually adjusted the suggested policy parameters for the item-locationcombination.
Retained The adjustments you made to the policy parameters for the item-location combination beforethe latest run of the policy comparison plan have been retained.
The adjustments are retained because you selected the Retain policy overrides check box inthe Scope: Advanced Options dialog box of the Scope tab of the Plan Options page. When thischeck box is selected, the adjustments are retained even if the deviation percentages betweenthe suggested and existing policy parameters are within the threshold.
The retained policy parameters can be seen in the Replenishment Policy Parameters table andare ready for use by the integrated replenishment plan or automated execution plan that'slinked to the policy comparison plan.
The Retained status is also used when the item-location combination is subject to an overridethat's specified in the policy assignment set that's attached to the policy comparison plan. Insuch cases, no policy comparison takes place.
Work with the Manage Policy Comparison TableTo work with the Manage Policy Comparison table, follow these steps:
1. Do one of the following to open the policy comparison plan:
◦ To open the policy comparison plan using the Manage Plans page:
i. On the Tasks panel tab, under Plans, select Manage Plans.
The Manage Plans page opens and displays the available replenishment plans.ii. Select the policy comparison plan, and click Actions > Open.
The policy comparison plan opens in a separate tab.
◦ On the Plans panel tab, under Plans, right-click the policy comparison plan, and select Open.
The policy comparison plan opens in a separate tab.2. Click the Open drop-down button.

Oracle Supply Chain Management CloudUsing Replenishment Planning
Chapter 10Policy Comparisons
159
The Open Table, Graph, or Tile Set dialog box opens.3. Search for the Manage Policy Comparison table, select it, and click OK.
The Manage Policy Comparison table opens in a separate subtab of the policy comparison plan.4. Search for the segment that you want to work with.
To narrow your search, filter the rows by the To be reviewed status of the Policy Review Status column.5. Follow these steps to adjust, review, or accept the suggested policy parameters:
Objective Steps
To adjust the policy parameters foran item-location combination
a. Select the row for the item-location combination.
The cells for the adjusted values are enabled for entry. You can perform this stepfor only those item-location combinations that have the To be reviewed or Retainedstatus.
b. For the policy parameter that you want to edit, enter an adjusted value. If the policytype is min-max planning, the adjustments for both the minimum and maximumvalues must be specified.
The final policy parameters for the item-location combination are adjustedaccordingly, and the status is changed to Adjusted.
To mark the suggested policyparameters for the item-locationcombination as reviewed
a. Select the row for the item-location combination.
You can perform this step for only those item-location combinations that have the Tobe reviewed status.
b. Click Actions > Mark as Reviewed.
The status for the item-location combination is changed from To be reviewed toReviewed.
The existing policy parameters for the item-location combination remain unchanged.
To accept the suggested policyparameters for the item-locationcombinations that are displayedafter your search
Click Actions > Accept All, and click Yes in the warning message that appears.
For the item-location combinations with the To be reviewed status, the final policyparameters are updated accordingly, and the status changes to Manually accepted.
To accept the suggested policyparameters for selected item-location combinations
a. Select the rows for the item-location combinations.
The status for these item-location combinations should be To be reviewed.b. Click Actions > Accept Suggested Policies.
The final policy parameters for the item-location combinations are updatedaccordingly, and the status changes to Manually accepted.
6. Click Actions > Update Policy Measures to update the policy parameters for those item-location combinationsfor which you have manually adjusted or accepted the suggested policy parameters.
The updated policy parameters for the item-location combinations take effect when the linked integratedreplenishment plan or automated execution plan is run.
7. Save the Manage Policy Comparison table.
Points to Remember While Working with the Policy Comparison FeatureBe aware of these points while working with the policy comparison feature:
• If policy parameters don't exist for item-location combinations, or if the policy type or unit of measure (UOM) ischanged, the suggested policy parameters are automatically accepted.

Oracle Supply Chain Management CloudUsing Replenishment Planning
Chapter 10Policy Comparisons
160
• Policies aren't compared for those item-location combinations that are covered by overrides in the policyassignment set that's attached to the policy comparison plan.
• For a min-max planning policy, the deviation percentages between the suggested and existing values for boththe minimum and maximum days or quantities must be within the threshold for the policy to be automaticallyaccepted.
• The threshold for automatically accepting suggested policy parameters must be set with care. Permanentlysetting the threshold at a low level can decrease the efficiency of your policy comparison process. Start with alow threshold value, and increase it when you get comfortable with using the policy comparison feature.
Related Topics
• Best Practices for Setting Up Replenishment Plans
• Policy Assignment Sets
• Set Up Policy Comparisons and Retain Policy Overrides
How You Use the Policy Comparison AnalyticsThis topic explains how you use the predefined analytics for the policy comparison feature in a policy comparison plan.
Use the Policy Comparison Summary Tile SetFor using the analytics for the policy comparison feature, you must create a page layout that uses the predefined PolicyComparison Summary tile set. The predefined page layouts don't include this tile set.
The Policy Comparison Summary tile set includes the following:
• Policy Comparison Tile: The tile provides a plan-level summary of the policy parameters that are in the To bereviewed or Automatically accepted status.
• Policy Comparison Summary by Segment Graph: The graph provides a segment-wise breakup of the policyparameters in the Automatically accepted or To be reviewed status. By default, the graph is linked to theManage Policy Comparison and Policy Comparison Summary by Location tables.
• Policy Review Status by Segment Table: The table provides a segment-wise breakup of the policy parametersin various statuses. By default, the table is linked to the Manage Policy Comparison and Policy ComparisonSummary by Location tables.
The following example shows how you use the Policy Comparison Summary tile set to effectively use the policycomparison feature:
1. Run the policy comparison plan.2. Open the page layout that has the Policy Comparison Summary tile set.3. Identify the segment that has the most policy parameters with the To be reviewed status.4. Select the graph bar or table cell for the policy parameters with the To be reviewed status:
◦ To view a list of the locations to which the policy parameters pertain, click Actions > Drill To > DefaultGroup > Manage Policy Comparison Summary by Location.
The Policy Comparison Summary by Location table opens in a subtab and displays the policy parametersthat have the To be reviewed or Automatically accepted status for various locations of the segment.

Oracle Supply Chain Management CloudUsing Replenishment Planning
Chapter 10Policy Comparisons
161
You can select a cell and click Actions > Drill To > Manage Policy Comparison to view policy parametersfor the items in a location and act on them.
◦ To view a list of the item-location combinations to which the policy parameters pertain, and take actionon them, do the following:
i. Click Actions > Drill To > Manage Policy Comparison.
The Manage Policy Comparison table opens in a subtab and displays the segment's item-locationcombinations that have the policy parameters with the searched status.
ii. Select the rows for the item-location combinations, and work with the suggested policyparameters.
iii. Click Actions > Update Policy Measures.5. Return to the page layout that has the Policy Comparison Summary tile set, and click View > Refresh.
The updated information about the policy parameters is displayed.
Oracle Supply Chain Management CloudUsing Replenishment Planning
Chapter 10Policy Comparisons
162

Oracle Supply Chain Management CloudUsing Replenishment Planning
Chapter 11Statistical Forecasts
163
11 Statistical Forecasts
Create a Forecasting ProfileA forecasting profile is a collection of definitions used during the generation of demand forecasts. Each profile includesthe definitions of the forecasting methods used and at what level demand data is aggregated.
Predefined Forecasting ProfilesThis table lists the predefined forecasting profiles:
ForecastingProfile
Work Area Input Measure Output Measure Forecasting Table Use
Forecast Bookings DemandManagement
Demand andSupply Planning
Final BookingsHistory
Bookings Forecast Forecast BookingsDefinitions
For forecastingon the basis ofbookings history
Forecast BookingsIncluding EventActivity
DemandManagement
Demand andSupply Planning
Final BookingsHistory
Bookings Forecast Forecast BookingsDefinitions
For forecastingon the basisof bookingshistory whileincorporating theimpact of events
Feature-BasedBookings Forecastfor New Products
DemandManagement
Demand andSupply Planning
Final BookingsHistory
Feature BasedBookings Forecast
Feature-BasedBookings ForecastDefinitions
For forecastingfor new productson the basis ofhistorical bookingsand featuresthat are used toanalyze effects onproduct demand
ForecastConsumption
ReplenishmentPlanning
Final ConsumptionHistory
ConsumptionForecast
ForecastConsumptionDefinitions
For forecastingon the basis ofconsumptionhistory
ForecastShipments
DemandManagement
Demand andSupply Planning
Final ShipmentsHistory
ShipmentsForecast
ForecastShipmentsDefinitions
For forecastingon the basis ofshipments history
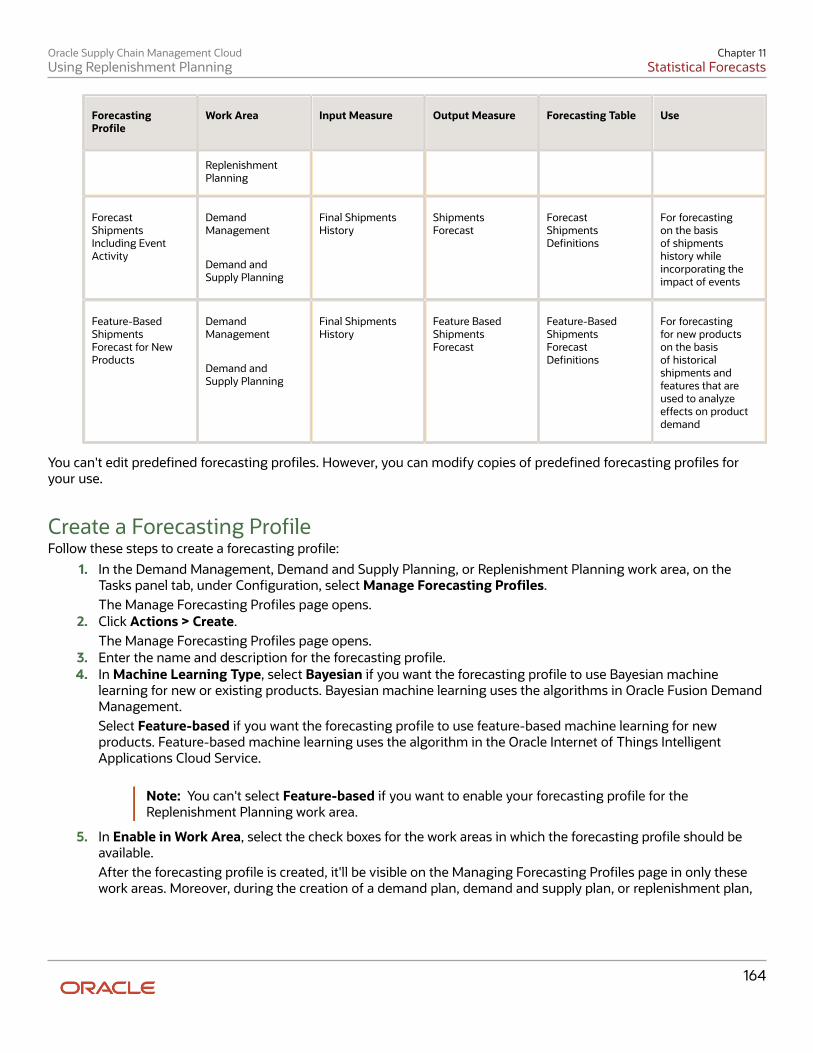
Oracle Supply Chain Management CloudUsing Replenishment Planning
Chapter 11Statistical Forecasts
164
ForecastingProfile
Work Area Input Measure Output Measure Forecasting Table Use
ReplenishmentPlanning
ForecastShipmentsIncluding EventActivity
DemandManagement
Demand andSupply Planning
Final ShipmentsHistory
ShipmentsForecast
ForecastShipmentsDefinitions
For forecastingon the basisof shipmentshistory whileincorporating theimpact of events
Feature-BasedShipmentsForecast for NewProducts
DemandManagement
Demand andSupply Planning
Final ShipmentsHistory
Feature BasedShipmentsForecast
Feature-BasedShipmentsForecastDefinitions
For forecastingfor new productson the basisof historicalshipments andfeatures that areused to analyzeeffects on productdemand
You can't edit predefined forecasting profiles. However, you can modify copies of predefined forecasting profiles foryour use.
Create a Forecasting ProfileFollow these steps to create a forecasting profile:
1. In the Demand Management, Demand and Supply Planning, or Replenishment Planning work area, on theTasks panel tab, under Configuration, select Manage Forecasting Profiles.The Manage Forecasting Profiles page opens.
2. Click Actions > Create.The Manage Forecasting Profiles page opens.
3. Enter the name and description for the forecasting profile.4. In Machine Learning Type, select Bayesian if you want the forecasting profile to use Bayesian machine
learning for new or existing products. Bayesian machine learning uses the algorithms in Oracle Fusion DemandManagement.Select Feature-based if you want the forecasting profile to use feature-based machine learning for newproducts. Feature-based machine learning uses the algorithm in the Oracle Internet of Things IntelligentApplications Cloud Service.
Note: You can't select Feature-based if you want to enable your forecasting profile for theReplenishment Planning work area.
5. In Enable in Work Area, select the check boxes for the work areas in which the forecasting profile should beavailable.After the forecasting profile is created, it'll be visible on the Managing Forecasting Profiles page in only thesework areas. Moreover, during the creation of a demand plan, demand and supply plan, or replenishment plan,

Oracle Supply Chain Management CloudUsing Replenishment Planning
Chapter 11Statistical Forecasts
165
in the Forecast Profiles section of the Demand tab on the Plan Options page, only the forecasting profilesenabled for the work area can be selected.
6. In Forecasting Table, select the forecasting table for the forecasting profile.The forecasting table defines the data aggregation levels that are used in the forecasts.
7. In Input Measure, select the input measure for the forecasting profile.This measure's data is used as the basis of historical demand in forecasts.The measures available for selection are in the selected forecasting table and are dimensioned by time.
8. In Output Measure, select the output measure for the forecasting profile.This measure stores the forecast after the plan is run.The measures available for selection are in the selected forecasting table and are dimensioned by time.Moreover, the available measures can't be shared across plans and are refreshed with current data.
9. In Measure Catalogs, select the measure catalogs for the forecasting profile.Select all the measure catalogs that you anticipate are required for plans that use the forecasting profile.Predefined measure catalogs aren't available for selection.
10. If your forecasting profile is based on Bayesian machine learning, use the Forecasting Methods tab to configurethe forecasting methods and method parameters. For more information, refer to the topic on forecastingmethods for Bayesian machine learning in this chapter.If your forecasting profile is based on feature-based machine learning, accept the default selection of the XGBoost forecasting method on the Forecasting Methods tab. For more information, refer to the topic on theforecasting method for feature-based forecasting in this chapter.
11. If your forecasting profile uses Bayesian machine learning, use the Decomposition Groups tab to select andconfigure decomposition groups. For more information, refer to the topic on decomposition groups in thischapter.If your forecasting profile uses feature-based machine learning, use the Feature Groups tab to select andconfigure measures, levels, and attributes. For more information, refer to the topic on feature groups in thischapter.
12. Use the Forecasting Parameters tab to configure forecasting parameters.For more information, refer to the topic on forecasting parameters for Bayesian machine learning or forecastingparameters for feature-based machine learning in this chapter.
13. Click Save and Close.
Related Topics• Create Measures and Assign to a Measure Catalog
Edit a User-Defined Forecasting ProfileYou can duplicate, edit, or delete a user-defined forecasting profile.
You can't edit a predefined forecasting profile. However, you can duplicate the predefined forecasting profile and editthe copy.
You also can't change the machine learning type for a forecasting profile. If you duplicate the forecasting profile, theMachine Learning Type field is set to the selection for the original forecasting profile and can't be changed.
Oracle Supply Chain Management CloudUsing Replenishment Planning
Chapter 11Statistical Forecasts
166
To delete the user-defined forecasting profile, you must first deselect it for the associated demand, demand and supply,or replenishment plan in the Forecast Profiles section on the Demand tab of the Plan Options page.
Follow these steps to edit the user-defined forecasting profile:
1. In the Demand Management, Demand and Supply Planning, or Replenishment Planning work area, on theTasks panel tab, under Configuration, select Manage Forecasting Profiles.
The Manage Forecasting Profiles page opens.2. Select the forecasting profile, and click Actions > Edit
The Manage Forecasting Profiles page opens.3. Edit the name and description as required.4. In Enable in Work Area, select or deselect the work areas in which the forecasting profile should be available.
You can't deselect a work area if the forecasting profile is associated with a plan in that work area. Beforedeselecting the work area, you must first deselect the forecasting profile for the plan in the Forecast Profilessection on the Demand tab of the Plan Options page.
5. In Forecasting Table, select the forecasting table that defines the data aggregation levels that are used in theforecasts.
6. In Input Measure, select the input measure for the forecasting profile.
This measure's data is used as the basis of historical demand in forecasts.
The measures available for selection are in the selected forecasting table and are dimensioned by time.7. In Output Measure, select the output measure for the forecasting profile.
This measure stores the forecast after the plan is run.
The measures available for selection are in the selected forecasting table and are dimensioned by time.Moreover, the available measures can't be shared across plans and are refreshed with current data.
8. In Measure Catalogs, select the measure catalogs for the forecasting profile.
Select all the measure catalogs that you anticipate are required for plans that use the forecasting profile.Predefined measure catalogs aren't available for selection.
9. If your forecasting profile is based on Bayesian machine learning, use the Forecasting Methods tab to configurethe forecasting methods and method parameters. For more information, refer to the topic on forecastingmethods for Bayesian machine learning in this chapter.
If your forecasting profile is based on feature-based machine learning, accept the default selection of the XGBoost forecasting method on the Forecasting Methods tab. For more information, refer to the topic on theforecasting method for feature-based forecasting in this chapter.
10. If your forecasting profile uses Bayesian machine learning, use the Decomposition Groups tab to select andconfigure decomposition groups. For more information, refer to the topic on decomposition groups in thischapter.
If your forecasting profile uses feature-based machine learning, use the Feature Groups tab to select andconfigure measures, levels, and attributes. For more information, refer to the topic on feature groups in thischapter.
11. Use the Forecasting Parameters tab to configure forecasting parameters.
For more information, refer to the topic on forecasting parameters for Bayesian machine learning or forecastingparameters for feature-based machine learning in this chapter.
12. Click Save and Close.

Oracle Supply Chain Management CloudUsing Replenishment Planning
Chapter 11Statistical Forecasts
167
The edited forecasting profile takes effect the next time you run the associated plan.
Forecasting MethodsYou have 15 forecasting methods for use in statistical forecasting. You can use one or a combination of these forecastingmethods while configuring your forecasting profile.
The following table lists the 15 forecasting methods:
Forecasting Method Representative Letter Enabled in Predefined ForecastingProfiles?
Auto Regressive External Inputs X No
Auto Regressive Integrated External V No
Auto Regressive Logistic A No
Causal Winters B No
Combined Transformation E No
Croston for Intermittent F Yes
Dual Group Multiplicative D No
Holt H Yes
Logistic G No
Modified Ridge Regression M Yes
Multiplicative Monte Carlo Intermittent K No
Multiplicative Monte Carlo Regression C No
Regression R Yes
Regression for Intermittent J Yes
Transformation Regression L Yes

Oracle Supply Chain Management CloudUsing Replenishment Planning
Chapter 11Statistical Forecasts
168
The six forecasting methods that are enabled in predefined forecasting profiles provide the best results in mostbusiness scenarios that are commonly found. You can use the remaining forecasting methods in user-definedforecasting profiles.
To enable you to analyze the generated forecasts, the letters representing the used forecasting methods and theirweights are stored in these measures:
Note: The measures for method weights are populated only when you select the Include details of forecastmethods check box on the Parameters tab in the Run Plan dialog box for a demand or demand and supply plan.
Measure Description Applicable Work Areas
Bookings Forecasting Methods Contains the letters for the forecastingmethods that are used for generating thebookings forecast for an item.
• Demand Management• Demand and Supply Planning• Sales and Operations Planning
Bookings Forecasting Methods Weight Contains the weight (percentage) assignedto a forecasting method during thebookings forecast generation.
• Demand Management• Demand and Supply Planning
Consumption Forecasting Methods Contains the letters for the forecastingmethods that are used for generating theconsumption forecast for an item.
Replenishment Planning
Shipments Forecasting Methods Contains the letters for the forecastingmethods that are used for generating theshipments forecast for an item.
• Demand Management• Demand and Supply Planning• Replenishment Planning• Sales and Operations Planning
Shipments Forecasting Methods Weight Contains the weight (percentage) assignedto a forecasting method during theshipments forecast generation.
• Demand Management• Demand and Supply Planning
For information about forecasting methods, refer to the white paper titled "Oracle Demand Management CloudAnalytical Methods (Forecasting Methods)" that's available in Document ID 2582285.1 on My Oracle Support.
Related Topics
• Statistical Forecasts, Causal Factors, and Decomposition Groups
Configure Decomposition GroupsA decomposition group is a container for the measures that you use as causal factors. Causal factors enableforecasting methods to understand the variation in historical demand and produce an accurate and adoptive forecast.Decomposition groups let you organize measures that have similar effects on a forecast. When using the run planoption to include causal factor details for a demand plan, you can decompose the forecast by causal factors.
Several predefined causal factors (predefined measures) are available for meeting commonly found forecasting needs.You can also use user-defined measures as causal factors. You can easily view and modify the information in causal
Oracle Supply Chain Management CloudUsing Replenishment Planning
Chapter 11Statistical Forecasts
169
factors using tables. Causal factors are the best way for you to add information that drives demand into the forecastingprocess and thereby improve it.
For your user-defined forecasting profile, you can add, edit, or delete decomposition groups. You can also activate anddeactivate all causal factors in a decomposition group using its check box.
For information about causal factors, refer to the white paper titled "Demand Management Forecasting Causal Factors"that's available in Document ID 2551482.1 on My Oracle Support.
Create a Decomposition GroupPerform these steps to create a decomposition group:
1. On the Decomposition Groups tab in your forecasting profile, click Actions > Create.2. In the Create Decomposition Group dialog box, do the following:
◦ Provide a name and description for the decomposition group.
◦ From the Available Measures list, move the required measures to the Selected Measures list.
The available measures are those that are enabled for the work area in which you create thedecomposition group. Ensure that the selected measures are in the measure catalog of the plan that usesthe forecasting profile.
3. Click OK.
Configure Causal Factors in a Decomposition GroupPerform these steps to configure the causal factors in a decomposition group:
1. On the Decomposition Groups tab in your forecasting profile, expand the decomposition group.
The expanded list details the available causal factors.2. Select the check boxes for each causal factor:
◦ Short: Use this setting to assign the causal factor to the Causal Winters, Regression, Regression forIntermittent, and Transformation Regression forecasting methods that use all assigned causal factors.These forecasting methods use a limited set of causal factors and aren't efficient at determining whichcausal factors are useful. You select this check box for most causal factors.
◦ Long: Use this setting to assign the causal factor to forecasting methods that use an extended setof causal factors and are efficient at determining which causal factors are useful. These forecastingmethods are Auto Regressive Logistic, Combined Transformation, Modified Ridge Regression,Multiplicative Monte Carlo Intermittent, and Multiplicative Monte Carlo Regression.
◦ Multiplicative: Use this setting to assign the causal factor to the Dual Group Multiplicative forecastingmethod. If you have enabled this forecasting method, each causal factor of your forecasting profile canuse the Group One or Group Two value of the list. Each of these values should be should be selected forat least one causal factor.
◦ Not Seasonal: Use this setting to assign the causal factor to the Auto Regressive External Inputs and AutoRegressive Integrated External forecasting methods. The only causal factors that should be assigned thissetting are those that aren't predictable functions of time. For example, price varies randomly with timeand can be assigned this setting.
◦ Fill Missing: Use this setting for causal factors when there are missing values for dates, and you want tohave values for these dates. The values that are entered for a causal factor are based on values of thesame causal factor for other dates. Use this setting for causal factors, such as those for price, that shouldalways have a value.

Oracle Supply Chain Management CloudUsing Replenishment Planning
Chapter 11Statistical Forecasts
170
Forecasting ParametersForecasting parameters control several aspects of a demand forecast, such as the handling of missing values, outlierdetection, fit and forecast validation, and sparse data forecasting.
You can improve the default settings for forecasting parameters based on your data analysis and forecast results.
The settings for all forecasting parameters related to time are in days and automatically adjusted for aggregateforecasting time levels. For example, the default setting of 182 days for a forecasting parameter is automaticallyadjusted to 26 days for a weekly forecast.
This table lists the commonly used forecasting parameters.
Forecasting Parameter Description
FillMissingMethod Specifies how to fill any undefined historical values. Parameter values may be 0, 1, 2. 0 for nomissing values field. 1 for linear interpolation based on not missing neighbors. 2 for omittingmissing values.
GlobalAllocationPeriods Specifies the number of days going backward from the history end date that's used forcalculating the average demand (for bookings, consumption, or shipments).
EnableNaiveForecast Specifies whether naive modeling is used, and if so, what type. The parameter value maybe 0 or a positive integer. Use 0 to disable naive modeling. 1 to use Oracle proprietary naivemodeling. Any integer greater than 1 to use the simple moving average with the valuecontrolling the number of historical periods used.
IntermitCriterion Specifies the lowest percentage of zero values in historical demand for which the time seriesare evaluated using intermittent forecasting methods.
WriteFit Specifies whether the forecast is generated for the future or also for the history. Enter 0 towrite the forecast for only the future, or 1 to write the forecast for the future and history. Whenyou enter 1, the fit forecast is written for the entire history used during the forecasting process.
DetectOutlier Specifies whether an attempt should be made to detect and smooth outliers in the timeseries. If extreme highs and lows are acceptable in your demand pattern, you can disable thisforecasting parameter by entering zero.
OutlierSensitivity Specifies the sensitivity of outlier detection. The greater the value, the more liberal thedetection. For common detection, use values less than 2.
RemoveExtremeOutlier Specifies whether aggressive outlier smoothing should be performed, and if extreme valuesshould be removed before being processed by forecasting methods. Enable this forecastingparameter by entering 1 only if there is a clear cause to remove extreme values, if extremevalues are rare or because of data errors, and you want a very smooth forecast.
EnableFitValidation Specifies whether to enable statistical fit validation. 1 to enable validation. 0 to disablevalidation.
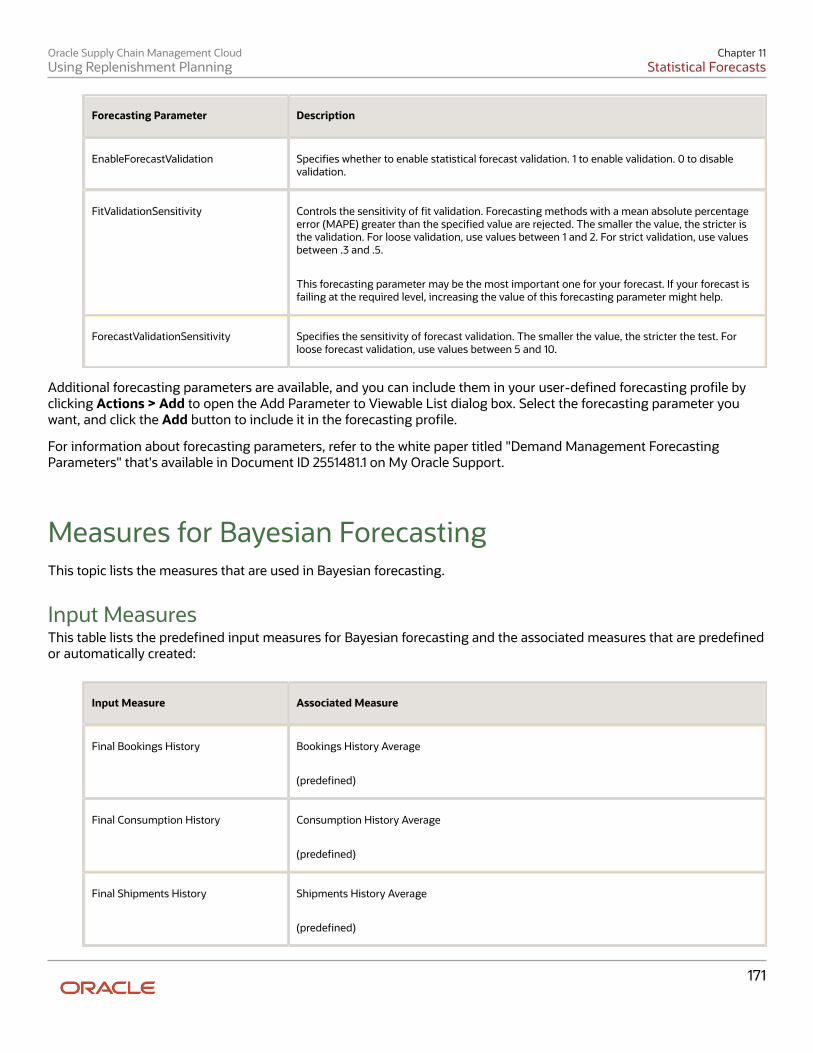
Oracle Supply Chain Management CloudUsing Replenishment Planning
Chapter 11Statistical Forecasts
171
Forecasting Parameter Description
EnableForecastValidation Specifies whether to enable statistical forecast validation. 1 to enable validation. 0 to disablevalidation.
FitValidationSensitivity Controls the sensitivity of fit validation. Forecasting methods with a mean absolute percentageerror (MAPE) greater than the specified value are rejected. The smaller the value, the stricter isthe validation. For loose validation, use values between 1 and 2. For strict validation, use valuesbetween .3 and .5.
This forecasting parameter may be the most important one for your forecast. If your forecast isfailing at the required level, increasing the value of this forecasting parameter might help.
ForecastValidationSensitivity Specifies the sensitivity of forecast validation. The smaller the value, the stricter the test. Forloose forecast validation, use values between 5 and 10.
Additional forecasting parameters are available, and you can include them in your user-defined forecasting profile byclicking Actions > Add to open the Add Parameter to Viewable List dialog box. Select the forecasting parameter youwant, and click the Add button to include it in the forecasting profile.
For information about forecasting parameters, refer to the white paper titled "Demand Management ForecastingParameters" that's available in Document ID 2551481.1 on My Oracle Support.
Measures for Bayesian ForecastingThis topic lists the measures that are used in Bayesian forecasting.
Input MeasuresThis table lists the predefined input measures for Bayesian forecasting and the associated measures that are predefinedor automatically created:
Input Measure Associated Measure
Final Bookings History Bookings History Average
(predefined)
Final Consumption History Consumption History Average
(predefined)
Final Shipments History Shipments History Average
(predefined)

Oracle Supply Chain Management CloudUsing Replenishment Planning
Chapter 11Statistical Forecasts
172
Input Measure Associated Measure
user-defined input measure <user-defined input measure name> History average
(automatically created and added to the measure catalog for the user-defined forecastingprofile)
Output MeasuresThis table lists the predefined output measures for Bayesian forecasting and the associated measures that arepredefined or automatically created:
Output Measure Associated Measures
Bookings Forecast
Consumption Forecast
Shipments Forecast
<predefined output measure name> Average Interarrival Time
<predefined output measure name> Batch Size
<predefined output measure name> Bias
<predefined output measure name> Complexity
<predefined output measure name> Decomposed
<predefined output measure name> Decomposed Outlier
<predefined output measure name> Decomposed Regime Change
Bookings Forecasting Levels/Consumption Forecasting Level/Shipments Forecasting Levels
Bookings Forecasting Methods/Consumption Forecasting Methods/Shipments ForecastingMethods
Bookings Forecasting Methods Weight/Consumption Forecasting Methods Weight/ShipmentsForecasting Methods Weight
<predefined output measure name> Generate Forecast/Consumption Forecast GenerationStatus
<predefined output measure name> Has Outliers
Bookings Forecast Has Regime Change/Shipments Forecast Has Regime Change
<predefined output measure name> Interval Time
<predefined output measure name> Is Intermittent
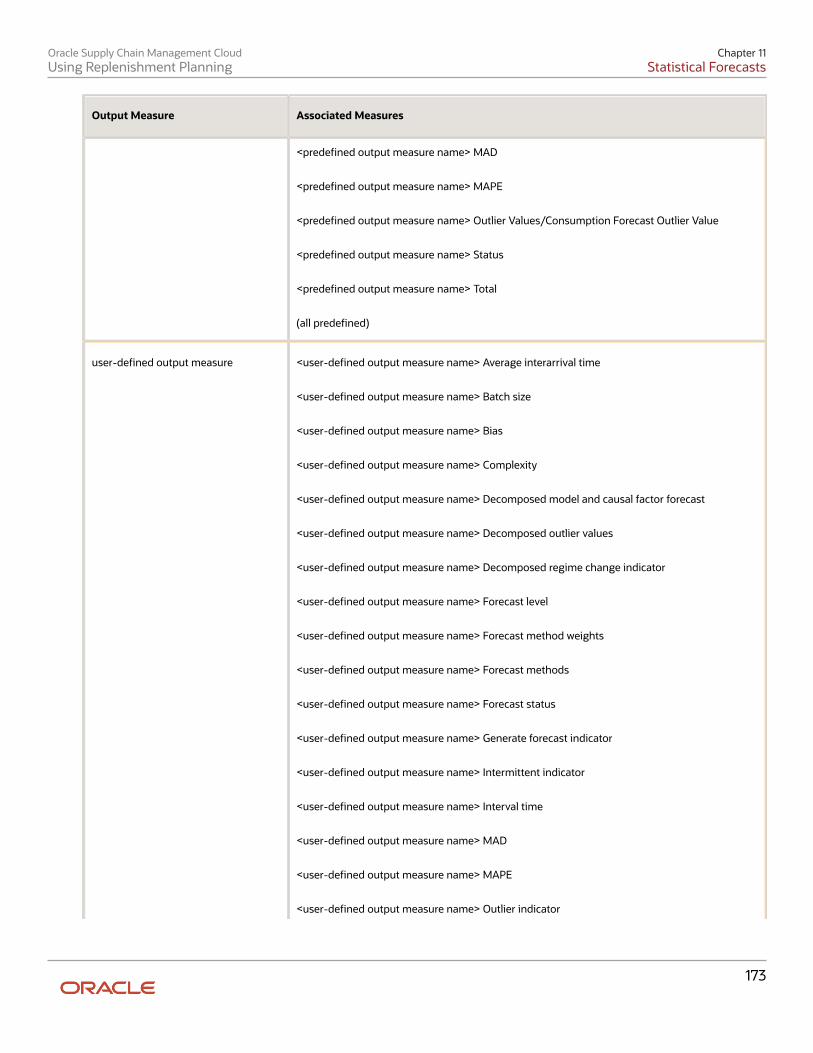
Oracle Supply Chain Management CloudUsing Replenishment Planning
Chapter 11Statistical Forecasts
173
Output Measure Associated Measures
<predefined output measure name> MAD
<predefined output measure name> MAPE
<predefined output measure name> Outlier Values/Consumption Forecast Outlier Value
<predefined output measure name> Status
<predefined output measure name> Total
(all predefined)
user-defined output measure <user-defined output measure name> Average interarrival time
<user-defined output measure name> Batch size
<user-defined output measure name> Bias
<user-defined output measure name> Complexity
<user-defined output measure name> Decomposed model and causal factor forecast
<user-defined output measure name> Decomposed outlier values
<user-defined output measure name> Decomposed regime change indicator
<user-defined output measure name> Forecast level
<user-defined output measure name> Forecast method weights
<user-defined output measure name> Forecast methods
<user-defined output measure name> Forecast status
<user-defined output measure name> Generate forecast indicator
<user-defined output measure name> Intermittent indicator
<user-defined output measure name> Interval time
<user-defined output measure name> MAD
<user-defined output measure name> MAPE
<user-defined output measure name> Outlier indicator
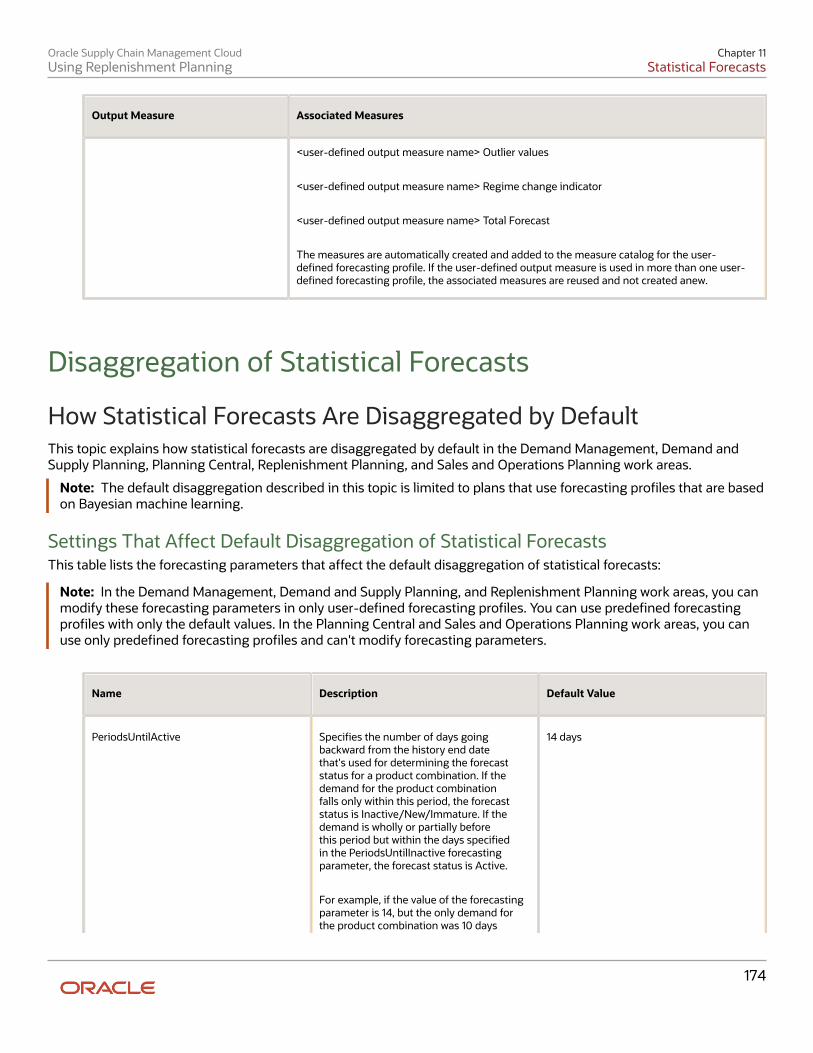
Oracle Supply Chain Management CloudUsing Replenishment Planning
Chapter 11Statistical Forecasts
174
Output Measure Associated Measures
<user-defined output measure name> Outlier values
<user-defined output measure name> Regime change indicator
<user-defined output measure name> Total Forecast
The measures are automatically created and added to the measure catalog for the user-defined forecasting profile. If the user-defined output measure is used in more than one user-defined forecasting profile, the associated measures are reused and not created anew.
Disaggregation of Statistical Forecasts
How Statistical Forecasts Are Disaggregated by DefaultThis topic explains how statistical forecasts are disaggregated by default in the Demand Management, Demand andSupply Planning, Planning Central, Replenishment Planning, and Sales and Operations Planning work areas.
Note: The default disaggregation described in this topic is limited to plans that use forecasting profiles that are basedon Bayesian machine learning.
Settings That Affect Default Disaggregation of Statistical ForecastsThis table lists the forecasting parameters that affect the default disaggregation of statistical forecasts:
Note: In the Demand Management, Demand and Supply Planning, and Replenishment Planning work areas, you canmodify these forecasting parameters in only user-defined forecasting profiles. You can use predefined forecastingprofiles with only the default values. In the Planning Central and Sales and Operations Planning work areas, you canuse only predefined forecasting profiles and can't modify forecasting parameters.
Name Description Default Value
PeriodsUntilActive Specifies the number of days goingbackward from the history end datethat's used for determining the forecaststatus for a product combination. If thedemand for the product combinationfalls only within this period, the forecaststatus is Inactive/New/Immature. If thedemand is wholly or partially beforethis period but within the days specifiedin the PeriodsUntilInactive forecastingparameter, the forecast status is Active.
For example, if the value of the forecastingparameter is 14, but the only demand forthe product combination was 10 days
14 days
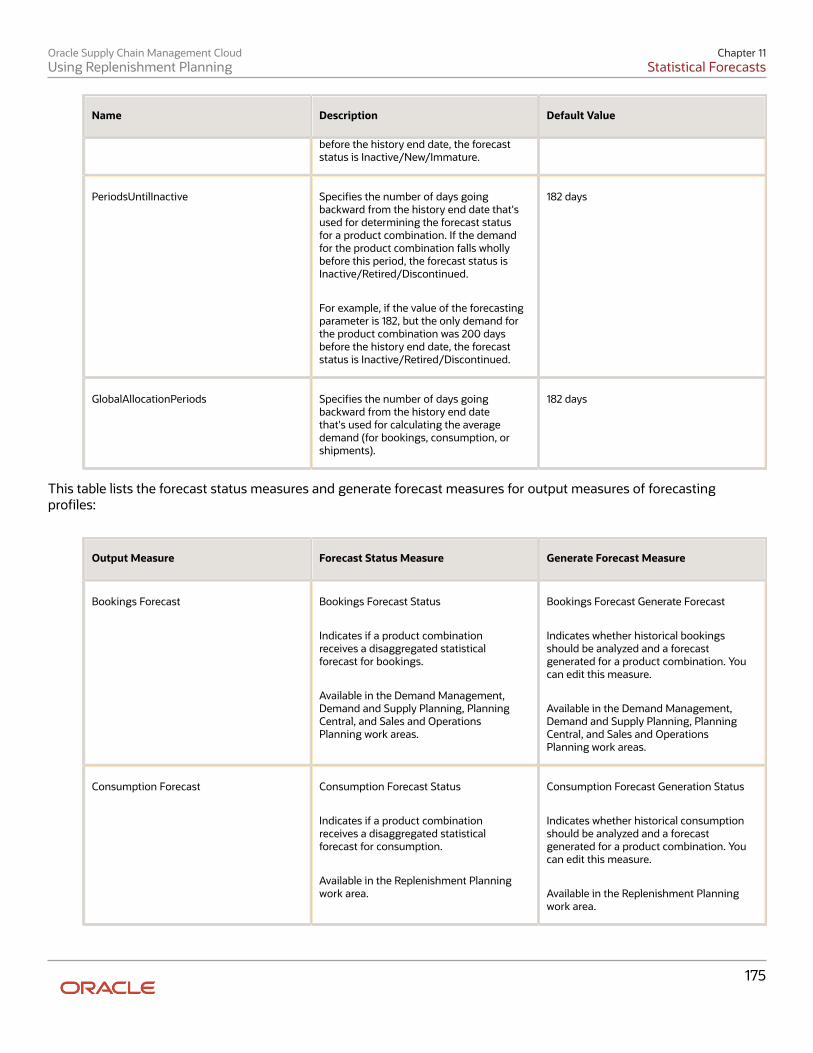
Oracle Supply Chain Management CloudUsing Replenishment Planning
Chapter 11Statistical Forecasts
175
Name Description Default Value
before the history end date, the forecaststatus is Inactive/New/Immature.
PeriodsUntilInactive Specifies the number of days goingbackward from the history end date that'sused for determining the forecast statusfor a product combination. If the demandfor the product combination falls whollybefore this period, the forecast status isInactive/Retired/Discontinued.
For example, if the value of the forecastingparameter is 182, but the only demand forthe product combination was 200 daysbefore the history end date, the forecaststatus is Inactive/Retired/Discontinued.
182 days
GlobalAllocationPeriods Specifies the number of days goingbackward from the history end datethat's used for calculating the averagedemand (for bookings, consumption, orshipments).
182 days
This table lists the forecast status measures and generate forecast measures for output measures of forecastingprofiles:
Output Measure Forecast Status Measure Generate Forecast Measure
Bookings Forecast Bookings Forecast Status
Indicates if a product combinationreceives a disaggregated statisticalforecast for bookings.
Available in the Demand Management,Demand and Supply Planning, PlanningCentral, and Sales and OperationsPlanning work areas.
Bookings Forecast Generate Forecast
Indicates whether historical bookingsshould be analyzed and a forecastgenerated for a product combination. Youcan edit this measure.
Available in the Demand Management,Demand and Supply Planning, PlanningCentral, and Sales and OperationsPlanning work areas.
Consumption Forecast Consumption Forecast Status
Indicates if a product combinationreceives a disaggregated statisticalforecast for consumption.
Available in the Replenishment Planningwork area.
Consumption Forecast Generation Status
Indicates whether historical consumptionshould be analyzed and a forecastgenerated for a product combination. Youcan edit this measure.
Available in the Replenishment Planningwork area.

Oracle Supply Chain Management CloudUsing Replenishment Planning
Chapter 11Statistical Forecasts
176
Output Measure Forecast Status Measure Generate Forecast Measure
Shipments Forecast Shipments Forecast Status
Indicates if a product combinationreceives a disaggregated statisticalforecast for shipments.
Available in the Demand Management,Demand and Supply Planning, PlanningCentral, Replenishment Planning, andSales and Operations Planning work areas.
Shipments Forecast Generate Forecast
Indicates whether historical shipmentsshould be analyzed and a forecastgenerated for a product combination. Youcan edit this measure.
Available in the Demand Management,Demand and Supply Planning, PlanningCentral, Replenishment Planning, andSales and Operations Planning work areas.
User-Defined Output Measure <User-defined output measure name>Forecast Status
(created automatically)
<User-defined output measure name>Generate Forecast Indicator
(created automatically)
The table lists the history average measures for input measures of forecasting profiles:
Input Measure History Average Measure
Final Bookings History Bookings History Average
Contains the average daily bookings over the days before the history end date as specified inthe GlobalAllocationPeriods forecasting parameter.
Available in the Demand Management, Demand and Supply Planning, Planning Central, andSales and Operations Planning work areas.
Final Consumption History Consumption History Average
Contains the average daily consumption over the days before the history end date as specifiedin the GlobalAllocationPeriods forecasting parameter.
Available in the Replenishment Planning work area.
Final Shipments History Shipments History Average
Contains the average daily shipments over the days before the history end date as specified inthe GlobalAllocationPeriods forecasting parameter.
Available in the Demand Management, Demand and Supply Planning, Planning Central,Replenishment Planning, and Sales and Operations Planning work areas.
User-Defined Input Measure <User-defined input measure name> History Average

Oracle Supply Chain Management CloudUsing Replenishment Planning
Chapter 11Statistical Forecasts
177
Input Measure History Average Measure
(created automatically)
How Statistical Forecasts Are Disaggregated by DefaultWhether a product combination receives a disaggregated statistical forecast depends on the forecast status of thecombination, which can be one of the following:
Forecast Status Description
1 Active
A product combination has this forecast status if the demand is wholly or partially before theperiod specified in the PeriodsUntilActive forecasting parameter and wholly or partially withinthe period specified in the PeriodsUntilInactive forecasting parameter.
Only product combinations with this forecast status receive a disaggregated forecast bydefault.
2 Inactive/New/Immature
A product combination has this forecast status if the demand is wholly within the periodspecified in the PeriodsUntilActive forecasting parameter.
3 Inactive/Retired/Discontinued
A product combination has this forecast status if the demand is wholly before the periodspecified in the PeriodsUntilInactive forecasting parameter.
These points explain the default disaggregation of statistical forecasts:
• The forecast status measure is identified on the basis of the output measure for the forecasting profile andcalculated for a product combination after these criteria are considered:
◦ The values of the PeriodsUntilActive and PeriodsUntilInactive forecasting parameters.
◦ The value of the associated generate forecast measure for the product combination.
Note: The generate forecast measure is an override for the forecast status measure. Edit thegenerate forecast measure for only those active product combinations that must not receive aforecast. Don't use this measure if you want inactive product combinations to receive a forecast.
• Depending on the input measure for the forecasting profile, the history average measure is selected. Thehistory average for the product combination is then calculated on the basis of the GlobalAllocationPeriodsforecasting parameter.
• The input history for all product combinations is collected irrespective of their forecast status (Active, Inactive/New/Immature, or Inactive/Retired/Discontinued) and aggregated to active product combinations at a higherlevel for generating the forecast.

Oracle Supply Chain Management CloudUsing Replenishment Planning
Chapter 11Statistical Forecasts
178
• The generated forecast is disaggregated to only active product combinations at the lowest level on the basis ofthe history average (contained in the history average measure) and disaggregation parameters for the outputmeasure of the forecasting profile.
As depicted in this figure, history is collected from active, inactive/new/immature, and inactive/retired/discontinuedproduct combinations and aggregated to active product combinations at a higher level, and the forecast isdisaggregated to only active product combinations at the lowest level.
3
2
1 Active
Inactive/New/Immature
Inactive/Retired/Discontinued
Forecast Disaggregation
3 2 1
1
History Aggregation
3 2 1
1Product Family
Item
How You Configure Disaggregation of Statistical ForecastsThis topic explains how you can configure the disaggregation of statistical forecasts in the Demand Management,Demand and Supply Planning, and Replenishment Planning work areas.
Instead of having the forecast disaggregated by default to active product combinations at the lowest level, you can usea measure to disaggregate the forecast to product combinations of your choice. Thereby, you can override the defaultlogic of using the forecast status measure that corresponds to the output measure of the selected forecasting profile foridentifying active product combinations that receive the disaggregated forecast.
Configuring disaggregation of statistical forecasts is useful when your organization has a product that's frequentlyupdated, but only the latest version is available for ordering. You can generate the forecast using the historical demandfor old product versions that are currently available in the market and disaggregate the forecast to only the latestproduct version.

Oracle Supply Chain Management CloudUsing Replenishment Planning
Chapter 11Statistical Forecasts
179
Note: You can use this feature in only a user-defined forecasting profile that's based on Bayesian machine learning.
Configure Disaggregation of Statistical ForecastsFollow these high-level steps to configure the disaggregation of statistical forecasts:
1. Create a measure as follows:
◦ The measure should be of the Number data type.
◦ The measure should have all dimensions of the output measure of your user-defined forecasting profileexcept for the Time dimension.
Any dependent measures of the created measure must also have the supported dimensions.
◦ The measure expression should return 1 for product combinations that should receive the disaggregatedforecast. For example, the expression could be as follows: Case(Lifecycle Phase When 'Active' Then 1Else 0)
You can also configure the expression using Item-level attributes.
Preferably, the measure expression must not use these functions:
• Archive• Bias• Fpos• Fsum• Lag• Lead• Log• Mad• Mape• MeasureOffset• Moving_Maximum• Moving_Minimum• Moving_Total• Pi• Power• Rand
◦ You can populate the measure through the regular collections process or the file-based data import(FBDI) template for Supply Chain Planning measures.
2. Add the measure to the predefined Output Filters for Forecast Disaggregation measure group.3. Add the measure and its dependent measures to the measure catalog of your plan.
If you're using an Item-level attribute, ensure that it's present in the dimension catalog of your plan.4. Add the ForecastOutputFilter forecasting parameter from the General Settings category to your forecasting
profile.5. Select the measure that you created for the forecasting parameter.
Only these measures are available for the forecasting parameter:
◦ The measures have the Number data type.

Oracle Supply Chain Management CloudUsing Replenishment Planning
Chapter 11Statistical Forecasts
180
◦ The measures have all the dimensions of the forecasting profile's output measure except for the Timedimension.
◦ The measures are in the Output Filters for Forecast Disaggregation measure group.
When the plan is run, the forecast status measure corresponding to the output measure of the forecasting profile isselected for the forecasting parameter, forecast disaggregation occurs according to the default logic, and an errormessage is displayed on the Review Plan Messages page in these situations:
• The measure you selected for the forecasting parameter isn't in the plan's measure catalog.
• The dimensions of the dependent measures of the measure you selected for the forecasting parameter aren'tsupported.
• The Item-level attribute used in the measure you selected for the forecasting parameter isn't in the plan'sdimension catalog.
Related Topics• Create Measures and Assign to a Measure Catalog
How You Forecast Product ReturnsThis topic explains how you can forecast product returns using forecasting profiles that are based on Bayesian machinelearning.
If you must forecast product returns, Oracle recommends that you create two positive history streams, one for productdemand and the other for product returns. Product sales and product returns don't necessarily occur in the same timebuckets, so modeling two separate history streams is advisable. After you forecast the product demand and productreturns with separate forecasting profiles, you can deduct the returns from the demand through a calculated measure.
You can import returns history only by using the file-based data import (FBDI) template for bookings history orshipments history. You can't collect returns history from other Oracle applications.
Note: Oracle doesn't recommend that you import negative values using the FBDI template for bookings history orshipments history to forecast product demand and product returns in one history stream. If you import negativevalues, they're set to zero during the forecasting process.
How You Generate Forecasts from a Product LaunchDateThis topic explains how you can generate a forecast for a new product starting from its launch date.
How to Set Up This FeatureDo the following to set up this feature:
• Load a launch date into the predefined Launch Date measure using the file-based data import (FBDI) templatefor Supply Chain Planning measures.Alternatively, you can manually enter a launch date into the predefined Adjusted Launch Date measure. Youcan also use this measure to override the imported value in the Launch Date measure.

Oracle Supply Chain Management CloudUsing Replenishment Planning
Chapter 11Statistical Forecasts
181
• Add the LaunchDateMeasure forecasting parameter to your user-defined forecasting profile that's based onBayesian machine learning.
This forecasting parameter is in the General Settings category in the Add Parameter to Viewable List dialog box.
Note: You can't use this forecasting parameter in a forecasting profile that uses feature-based machinelearning. You also can't add this forecasting parameter to a predefined forecasting profile.
• Select the predefined Final Launch Date measure or a user-defined measure for the forecasting parameter.
This measure returns the value of the Adjusted Launch Date measure if it has a value. Otherwise, the FinalLaunch Date measure returns the value of the Launch Date measure.
• Optionally, add the Final Launch Date, Adjusted Launch Date, and Launch Date measures to a table so that youcan view and adjust the data.
The forecasting process uses the value of the measure selected for the LaunchDateMeasure forecastingparameter even if the measure isn't present in a table.
Points to ConsiderNote these points while using this feature:
• Ensure the following if you create a measure to use instead of the Final Launch Date measure:
◦ The measure has the same dimensions as those of the output measure of the forecasting profile exceptfor the Time dimension.
◦ You enable the measure for the work areas for which the forecasting profile is enabled.
◦ The measure is in the measure catalog for the plan.
• The forecast is generated from the start of the forecasting horizon if these conditions are met:
◦ The selected measure for the LaunchDateMeasure forecasting parameter doesn't contain a date.
◦ The launch date is before the forecast start date.
• If the launch date falls within a time bucket, the beginning of the time bucket is taken as the launch date.
• The launch date is respected at the lowest level of the forecasting tree of your forecasting profile. For example,if the lowest level is a combination of the Item and Organization levels, the forecast starts on the same launchdate for all customers and demand classes within the same item-organization combination. If the launch datevaries by customer or demand class within the item-organization combination, the earliest launch date is used.
To respect varying launch dates by customers for the same item, configure your forecast tree with the Productand Customer dimensions so that the lowest level is a combination of the Item and Customer Site levels.
Related Topics
• Overview of Forecast Trees

Oracle Supply Chain Management CloudUsing Replenishment Planning
Chapter 11Statistical Forecasts
182
How You Stop Forecasts from a Product DiscontinuationDateThis topic explains how you can stop a forecast for a product starting from a discontinuation date.
How to Set Up This FeatureDo the following to set up this feature:
• Load a discontinuation date into the predefined Discontinuation Date measure using the file-based data import(FBDI) template for Supply Chain Planning measures.
Alternatively, you can manually enter a discontinuation date into the predefined Adjusted Discontinuation Datemeasure. You can also use this measure to override the imported value in the Discontinuation Date measure.
• Add the DiscontinueDateMeasure forecasting parameter to your user-defined forecasting profile that's basedon Bayesian machine learning.
This forecasting parameter is in the General Settings category in the Add Parameter to Viewable List dialog box.
Note: You can't use this forecasting parameter in a forecasting profile that uses feature-based machinelearning. You also can't add this forecasting parameter to a predefined forecasting profile.
• Select the predefined Final Discontinuation Date measure or a user-defined measure for the forecastingparameter.
This measure returns the value of the Adjusted Discontinuation Date measure if it has a value. Otherwise, theFinal Discontinuation Date measure returns the value of the Discontinuation Date measure.
• Optionally, add the Final Discontinuation Date, Adjusted Discontinuation Date, and Discontinuation Datemeasures to a table so that you can view and adjust the data.
The forecasting process uses the value of the measure selected for the DiscontinueDateMeasure forecastingparameter even if the measure isn't present in a table.
Points to ConsiderNote these points while using this feature:
• Ensure the following if you create a measure to use instead of the Final Discontinuation Date measure:
◦ The measure has the same dimensions as those of the output measure of the forecasting profile exceptfor the Time dimension.
◦ You enable the measure for the work areas for which the forecasting profile is enabled.
◦ The measure is in the measure catalog for the plan.
• The forecast is generated through the end of the forecasting horizon if these conditions are met:
◦ The selected measure for the DiscontinueDateMeasure forecasting parameter doesn't contain a date.
◦ The discontinuation date is after the forecast end date.

Oracle Supply Chain Management CloudUsing Replenishment Planning
Chapter 11Statistical Forecasts
183
• If the discontinuation date falls within a time bucket, the beginning of the time bucket is taken as thediscontinuation date.
• The discontinuation date is respected at the lowest level of the forecasting tree of your forecasting profile. Forexample, if the lowest level is a combination of the Item and Organization levels, the forecast stops on the samediscontinuation date for all customers and demand classes within the same item-organization combination.If the discontinuation date varies by customer or demand class within the item-organization combination, thelatest discontinuation date is used.
To respect varying discontinuation dates by customers for the same item, configure your forecast tree withthe Product and Customer dimensions so that the lowest level is a combination of the Item and Customer Sitelevels.
Related Topics
• Overview of Forecast Trees
How You Analyze Forecast ConsumptionThis topic explains how you can use the Past Due Gross Forecast measure to analyze forecast consumption in yourreplenishment plan. By using this measure, you can better understand how forecast is consumed before the plan startdate.
You can specify optimal values for the Past Due Forecast Days and Past Due Sales Order Days fields on theOrganizations tab on the Maintain Supply Network Model page by understanding the forecast consumption process.
In the rest of this topic, the use of this measure is explained, and some related points are provided.
Use the Past Due Gross Forecast MeasureConsider an example in which the value of the Past Due Forecast Days field is 3, the value of the Past Due Sales OrderDays field is 3, and the plan start date is March 15.
The initial calculations for various measures when the replenishment plan is run and which aren't visible are listed in thistable:
Measure March 12 March 13 March 14 March 15 March 16 March 17 March 18
GrossForecast
10 20 15 15 20 10 25
Net Forecast 0 8 15 15 20 10 25
Sales Orders 0 15 0 0 7 0 0
The final calculations for various measures when the replenishment plan is run and which are visible are listed in thistable:

Oracle Supply Chain Management CloudUsing Replenishment Planning
Chapter 11Statistical Forecasts
184
Measure March 12 March 13 March 14 March 15 March 16 March 17 March 18
FinalShipmentsForecast
10 20 15 15 20 10 25
GrossForecast
0 0 0 15 20 10 25
Past DueGrossForecast
0 0 0 45 0 0 0
Net Forecast 0 0 0 38 20 10 25
Sales Orders 0 0 0 15 7 0 0
TotalDemand
0 0 0 53 27 10 25
These points explain how you use the Past Due Gross Forecast measure to understand how the gross forecast isconsumed:
• When the replenishment plan is run on March 15, as shown in the first table, the sales orders of 22 units (15 + 7)consume 10 units of the gross forecast on March 12 and 12 on March 13. After this consumption, the net forecastis set to 8 units on March 13.
• When the replenishment plan is run on March 15, note these calculations in the second table:
◦ The past due net forecast is moved to that date and calculated as 38 units (8 + 15+ 15).
◦ The gross forecast is always shown from the current date and is 15 units on March 15.
◦ The Past Due Gross Forecast measure sums up the gross forecast before the plan start date and is 45units (10 + 20 + 15) on March 15.
• For clarity, you can calculate the total gross forecast as 60 units on March 15 (45 units for the Past Due GrossForecast measure and 15 units for the Gross Forecast measure). When you subtract the sales orders of 22 unitsfrom the total gross forecast of 60 units, you get a figure of 38, which is the value of the net forecast.
Additional Information About the Use of the Past Due Gross ForecastMeasureNote these points about the use of the Past Due Gross Forecast measure:
• If you're using a user-defined measure catalog, add this measure to the catalog.
• Only forecasts that are after the start of the current plan bucket but before the plan start date are considered inthe measure calculation.
Forecasts that are before the start of the current plan bucket but within the past due forecast days aren'tconsidered in the measure calculation.
Oracle Supply Chain Management CloudUsing Replenishment Planning
Chapter 11Statistical Forecasts
185
• Open sales orders that are before the start of the current plan bucket but within the past due sales order daysare carried over to the plan start date. These sales orders don't consume the forecast of the current bucket.
• The past due forecast days and past due sales order days should be set to meaningful values.
If no values are specified for these fields, the values are considered to be zero.
Forecast Processing in Replenishment Plans
Overview of Forecast Processing in Replenishment PlansThis topic explains how forecasts are spread to individual working days within replenishment plans and consumed bysales orders, movement request demands, and transfer order demands before replenishment orders are calculated.
Points About Forecast ProcessingNote these points about how forecasts are spread and consumed in replenishment plans:
• The forecast can be provided through the same or another replenishment plan, a demand plan, or an externalforecast schedule.
• The forecast is spread to individual working days and consumed by sales orders, movement request demands,and transfer order demands before replenishment orders are calculated. Thus, duplication of demand isavoided.
• When the spreading is done, the forecast for nonworking days is aggregated and moved to the previousworking day.
• For the daily, weekly, or period planning time levels, the forecast is spread and consumed within weeks.
For the monthly planning time level, the forecast is spread and consumed within months.
• All available open and shipped sales orders, transfer order demands, and movement request demands areaggregated within the week or month, and the forecast is consumed from the first day of the week or month.
• Past due sales orders are considered according to the value of the Past Due Sales Order Days field onthe Organizations tab on the Maintain Supply Network Model page and moved to the plan start date forconsumption of the forecast.
• Past due forecast is considered according to the value of the Past Due Forecast Days field on theOrganizations tab on the Maintain Supply Network Model page. However, the past due forecast is consideredfrom only the start of the current week or month.
The past due forecast for consideration is brought to the plan start date and stored in the Past Due GrossForecast measure.
• The spread forecast is stored in the Gross Forecast measure, and the final forecast after consumption is storedin the Net Forecast measure.
• The organization's manufacturing calendar is used during forecast processing for an item-locationcombination.
• Demand time fences aren't supported in Replenishment Planning and hence not considered during forecastprocessing.
• The forecast processing functionality is enabled by default.

Oracle Supply Chain Management CloudUsing Replenishment Planning
Chapter 11Statistical Forecasts
186
Process Flow for Forecast ProcessingThis section describes the process for forecast processing.As depicted in the flow chart, the forecast is processed along with the sales orders, movement request demands,and transfer order demands. The consumed forecast is subtracted from the spread forecast for calculation of the netforecast. Finally, the replenishment orders are calculated.
Forecast Processing
Replenishment Order Calculation
Net Forecast(Spread Forecast -
Consumed Forecast)
ForecastSales Orders
Movement Request DemandsTransfer Order Demands
Related Topics
• Scope Plan Options for Replenishment Plans
Examples of Forecast Processing in Replenishment PlansThis topic provides examples of forecast processing in replenishment plans with various planning time levels,forecasting time levels, and calendars.

Oracle Supply Chain Management CloudUsing Replenishment Planning
Chapter 11Statistical Forecasts
187
Example 1In this example, the replenishment plan has a daily planning time level and forecasting time level. In the manufacturingcalendar for the item-location combination, all days of the week are working days.
Day1
Day2
Day3
Day4
Day5
Day6
Day7
Day8
Day9
Day10
Day11
Day12
Day13
Day14
DemandForecast
10 10 10 10 10 10 10 15 15 15 15 15 15 15
SpreadForecast
10 10 10 10 10 10 10 15 15 15 15 15 15 15
SalesOrders
0 0 30 0 5 0 0 20 0 5 0 0 0 0
NetForecast
0 0 0 5 10 10 10 0 5 15 15 15 15 15
TotalDemand
0 0 30 5 15 10 10 20 5 20 15 15 15 15
Note these points:
• The sales orders start consuming the forecast from Day 1.
• The sales orders of 30 units on Day 3 consume the spread forecast (stored in the Gross Forecast measure) onDays 1 through 3. The net forecast is zero on Days 1 through 3.
• The sales orders of 5 units on Day 5 consume the spread forecast on Day 4. The net forecast is 5 units on Day 4.
• The sales orders of 20 units on Day 8 consume the spread forecast on Days 8 and 9. The net forecast is zero onDay 8 and 10 units on Day 9.
• The sales orders of 5 units on Day 10 consume the remaining spread forecast of 10 units on Day 9. The netforecast on Day 9 is 5 units, and the spread forecast and net forecast on Day 10 remain unchanged.
Example 2In this example, the replenishment plan has a daily planning time level and forecasting time level. In the manufacturingcalendar for the item-location combination, only five days of the week are working days.
Day1
Day2
Day3
Day4
Day5
Day6
Day7
Day8
Day9
Day10
Day11
Day12
Day13
Day14
DemandForecast
10 10 10 10 10 10 10 15 15 15 15 15 15 15

Oracle Supply Chain Management CloudUsing Replenishment Planning
Chapter 11Statistical Forecasts
188
Day1
Day2
Day3
Day4
Day5
Day6
Day7
Day8
Day9
Day10
Day11
Day12
Day13
Day14
SpreadForecast
10 10 10 10 30 0 0 15 15 15 15 45 0 0
SalesOrders
0 0 30 0 5 0 0 20 0 5 0 0 0 0
NetForecast
0 0 0 5 30 0 0 0 5 15 15 45 0 0
TotalDemand
0 0 30 5 35 0 0 20 5 20 15 45 0 0
Note these points:
• The sales orders of 30 units on Day 3 consume the spread forecast (stored in the Gross Forecast measure) onDays 1 through 3. The net forecast is zero on Days 1 through 3.
• The sales orders of 5 units on Day 5 consume the spread forecast on Day 4. The net forecast is 5 units on Day 4.
• Days 6 and 7 are nonworking days, and the spread forecast for these days is added to that on Day 5 (10 + 10 +10).
• The sales orders of 20 units on Day 8 consume the spread forecast on Days 8 and 9. The net forecast is zero onDay 8 and 10 units on Day 9.
• The sales orders of 5 units on Day 10 consume the remaining spread forecast of 10 units on Day 9. The netforecast on Day 9 is five units, and the spread forecast and net forecast on Day 10 remain unchanged.
• Days 13 and 14 are nonworking days, and the spread forecast for these days is added to that on Day 12 (15 + 15 +15).
Example 3In this example, the replenishment plan has a daily planning time level and weekly forecasting time level. In themanufacturing calendar for the item-location combination, all days of the week are working days.
Day1
Day2
Day3
Day4
Day5
Day6
Day7
Day8
Day9
Day10
Day11
Day12
Day13
Day14
DemandForecast
0 0 0 0 0 0 70 0 0 0 0 0 0 105
SpreadForecast
10 10 10 10 10 10 10 15 15 15 15 15 15 15
SalesOrders
0 0 30 0 5 0 0 20 0 5 0 0 0 0
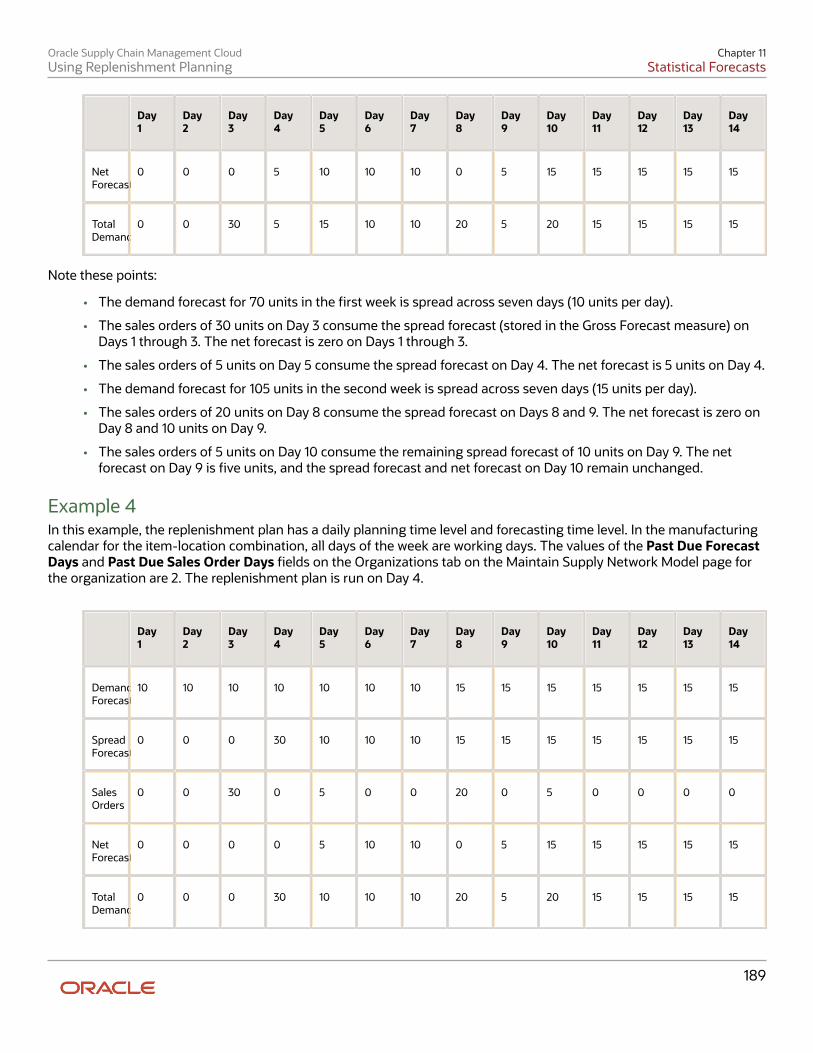
Oracle Supply Chain Management CloudUsing Replenishment Planning
Chapter 11Statistical Forecasts
189
Day1
Day2
Day3
Day4
Day5
Day6
Day7
Day8
Day9
Day10
Day11
Day12
Day13
Day14
NetForecast
0 0 0 5 10 10 10 0 5 15 15 15 15 15
TotalDemand
0 0 30 5 15 10 10 20 5 20 15 15 15 15
Note these points:
• The demand forecast for 70 units in the first week is spread across seven days (10 units per day).
• The sales orders of 30 units on Day 3 consume the spread forecast (stored in the Gross Forecast measure) onDays 1 through 3. The net forecast is zero on Days 1 through 3.
• The sales orders of 5 units on Day 5 consume the spread forecast on Day 4. The net forecast is 5 units on Day 4.
• The demand forecast for 105 units in the second week is spread across seven days (15 units per day).
• The sales orders of 20 units on Day 8 consume the spread forecast on Days 8 and 9. The net forecast is zero onDay 8 and 10 units on Day 9.
• The sales orders of 5 units on Day 10 consume the remaining spread forecast of 10 units on Day 9. The netforecast on Day 9 is five units, and the spread forecast and net forecast on Day 10 remain unchanged.
Example 4In this example, the replenishment plan has a daily planning time level and forecasting time level. In the manufacturingcalendar for the item-location combination, all days of the week are working days. The values of the Past Due ForecastDays and Past Due Sales Order Days fields on the Organizations tab on the Maintain Supply Network Model page forthe organization are 2. The replenishment plan is run on Day 4.
Day1
Day2
Day3
Day4
Day5
Day6
Day7
Day8
Day9
Day10
Day11
Day12
Day13
Day14
DemandForecast
10 10 10 10 10 10 10 15 15 15 15 15 15 15
SpreadForecast
0 0 0 30 10 10 10 15 15 15 15 15 15 15
SalesOrders
0 0 30 0 5 0 0 20 0 5 0 0 0 0
NetForecast
0 0 0 0 5 10 10 0 5 15 15 15 15 15
TotalDemand
0 0 0 30 10 10 10 20 5 20 15 15 15 15

Oracle Supply Chain Management CloudUsing Replenishment Planning
Chapter 11Statistical Forecasts
190
Note these points:
• The spread forecast (stored in the Gross Forecast measure) on Days 2 through 3 is carried over to Day 4, whichis the plan start date. The total spread forecast on Day 4 is 30 (10 + 10 + 10). The spread forecast on Day 1 isn'tconsidered because the Past Due Forecast Days field is set to 2.
On Day 4, the value of the Gross Forecast measure is 10 units, and the value of the Past Due Gross Forecastmeasure is 20 units.
• The sales orders of 30 units on Day 3 are carried over to Day 4, which is the plan start date.
The sales orders of 30 units on Day 4 consume the spread forecast on Day 4. The net forecast is zero units onDay 4.
• The sales orders of 5 units on Day 5 consume the spread forecast on Day 5. The net forecast is 5 units on Day 5.
• The sales orders of 20 units on Day 8 consume the spread forecast on Days 8 and 9. The net forecast is zero onDay 8 and 10 units on Day 9.
• The sales orders of 5 units on Day 10 consume the remaining spread forecast of 10 units on Day 9. The netforecast on Day 9 is five units, and the spread forecast and net forecast on Day 10 remain unchanged.
Example 5In this example, the replenishment plan has a weekly planning time level and forecasting time level. In themanufacturing calendar for the item-location combination, all days of the week are working days.
Day1
Day2
Day3
Day4
Day5
Day6
Day7
Day8
Day9
Day10
Day11
Day12
Day13
Day14
DemandForecast
0 0 0 0 0 0 70 0 0 0 0 0 0 105
SpreadForecast
10 10 10 10 10 10 10 15 15 15 15 15 15 15
SalesOrders
0 0 30 0 5 0 0 20 0 5 0 0 0 0
NetForecast
0 0 0 5 10 10 10 0 5 15 15 15 15 15
WeeklyNetForecast
0 0 0 0 0 0 35 0 0 0 0 0 0 80
TotalDemand
0 0 0 0 0 0 70 0 0 0 0 0 0 105
Note these points:
• The demand forecast for 70 units in the first week is spread across seven days (10 units per day).

Oracle Supply Chain Management CloudUsing Replenishment Planning
Chapter 11Statistical Forecasts
191
• The sales orders of 30 units on Day 3 consume the spread forecast (stored in the Gross Forecast measure) onDays 1 through 3. The net forecast is zero on Days 1 through 3.
• The sales orders of 5 units on Day 5 consume the spread forecast on Day 4. The net forecast is 5 units on Day 4.
• The demand forecast for 105 units in the second week is spread across seven days (15 units per day).
• The sales orders of 20 units on Day 8 consume the spread forecast on Days 8 and 9. The net forecast is zero onDay 8 and 10 units on Day 9.
• The sales orders of 5 units on Day 10 consume the remaining spread forecast of 10 units on Day 9. The netforecast on Day 9 is five units, and the spread forecast and net forecast on Day 10 remain unchanged.
• The net forecast is aggregated at the ends of the weekly buckets.

Oracle Supply Chain Management CloudUsing Replenishment Planning
Chapter 11Statistical Forecasts
192

Oracle Supply Chain Management CloudUsing Replenishment Planning
Chapter 12Replenishment Plans
193
12 Replenishment Plans
Create a Replenishment PlanThis topic explains how you create a replenishment plan in the Replenishment Planning work area.
To create the replenishment plan, follow these steps:
1. Do one of the following:
◦ To create the replenishment plan from the Manage Plans page:
i. On the Tasks panel tab, under Plans, select Manage Plans.
The Manage Plans page opens.ii. Under Search Results, click Actions > Create.
The Plan Options page opens.
◦ To directly create the replenishment plan, on the Plans panel tab, select Plans, and click Actions > Create,or right-click Plans, and select Create.
The Plan Options page opens.2. Enter the name and description of the replenishment plan.3. To make the replenishment plan measures available for reporting in Oracle Transactional Business Intelligence
(OTBI), select the Enable for OTBI reporting check box.
Note: The check box is grayed out if you select a subinventory as a level member. OTBI reportingisn't supported for subinventories.
4. Define the access level.
◦ Select Public to make the replenishment plan available to all users.
◦ Select Private to make the replenishment plan accessible to only yourself or other users to whom youwant to provide access.
If you select Private, the Edit Users icon is enabled. Click this icon to open the Users dialog box in whichyou can edit the list of users who can access the replenishment plan.
5. In Owner, select the replenishment plan's owner.6. Select the check boxes:
Check Box Feature
Enable for incremental planning Select this check box to process only those item-location combinations with net changes insupplies and demands in subsequent plan runs after the initial plan run.
This check box can be used with only the Calculate replenishments check box.

Oracle Supply Chain Management CloudUsing Replenishment Planning
Chapter 12Replenishment Plans
194
Check Box Feature
Generate forecast Select this check box to use the replenishment plan to generate the demand forecast.
If you select this check box, the Demand tab is enabled, and you must select a forecastingprofile on that tab for the replenishment plan.
If you don't select this check box, you can use a demand plan, another replenishment planthat has the Generate forecast check box selected, or an external forecast schedule for thedemand forecast. Under Demand Schedules on the Organizations and Schedules subtab onthe Supply tab on the Plan Options page, select the demand plan, replenishment plan, orexternal forecast schedule, and select the check box under Use for Demand Schedule.
Calculate policy parameters Select this check box to use the replenishment plan to calculate policy parameters.
If you select only this check box, then under Demand Schedules on the Organizations andSchedules subtab on the Supply tab, you must select another replenishment plan that hasthe Generate forecast check box selected, a demand plan, or an external forecast schedule,and select the check box under Use for Demand Schedule.
If you don't select this check box, you can use another replenishment plan that has theCalculate policy parameters check box selected for calculating policy parameters. UnderDemand Schedules on the Organizations and Schedules subtab on the Supply tab, select thereplenishment plan, and select the check box under Use for Policy Parameters.
Calculate replenishments Select this check box to use the replenishment plan to calculate replenishments.
If you select only this check box, then under Demand Schedules on the Organizations andSchedules subtab on the Supply tab, you must select another replenishment plan that hasthe Calculate policy parameters check box selected, and select the check box under Use forPolicy Parameters.
Rebalance inventory Select this check box to use the replenishment plan to rebalance inventory.
If you select this check box, the following happen:
◦ The Inventory Rebalancing tab is enabled, and you can specify the clusters, rules, andsupplies and demands for inventory rebalancing on the tab.
◦ The Enable for incremental planning check box is grayed out.
◦ The Enable for policy comparison check box is grayed out in the Scope: AdvancedOptions dialog box that you open from the Scope tab on the Plan Options page.
If you select only this check box, then under Demand Schedules on the Organizations andSchedules subtab on the Supply tab, you must select another replenishment plan that hasthe Calculate policy parameters check box selected, and select the check box under Use forPolicy Parameters.
To create an integrated replenishment plan, select the Generate forecast, Calculate policy parameters,Calculate replenishments, and Rebalance inventory check boxes.
Refer to other topics in this chapter for information about the Scope, Demand, Supply, and Inventory Rebalancing tabson the Plan Options page.

Oracle Supply Chain Management CloudUsing Replenishment Planning
Chapter 12Replenishment Plans
195
Open a Replenishment PlanYou can open a replenishment plan using the Manage Plans page or Plans panel tab.
You can open only those replenishment plans that have been successfully run. Replenishment plans that haven'tbeen run must be run before they can be viewed. For replenishment plans that haven't been successfully run,you must troubleshoot them and successfully run them before you can open them. Review the plan messages fortroubleshooting.
Once you open replenishment plans, you can view their data and perform other actions.
On the Manage Plans page, replenishment plans are listed irrespective of their run status. On the Plans panel tab, onlythose replenishment plans that have been successfully run are listed.
Do one of the following to open a replenishment plan:
• To open the replenishment plan using the Manage Plans page:
a. On the Tasks panel tab, under Plans, select Manage Plans.
The Manage Plans page opens and displays the available replenishment plans.b. Select the replenishment plan, and click Actions > Open.
The replenishment plan opens in a separate tab.
• On the Plans panel tab, under Plans, right-click the replenishment plan, and select Open.
The replenishment plan opens in a separate tab.
Copy a Replenishment PlanYou can make copies of replenishment plans to save time and perform planning activities incrementally. For example,you have defined the organizations, segments, and policy assignment set for a replenishment plan. You can make acopy of that replenishment plan if the new replenishment plan uses the same entities.
Follow these steps to copy the replenishment plan:
1. To open the Duplicate Plan dialog box, do one of the following:
◦ To open the Duplicate Plan dialog box from the Manage Plans page:
i. On the Tasks panel tab, under Plans, select Manage Plans.
The Manage Plans page opens.ii. Under Search Results, select the replenishment plan that must be copied, and click Actions >
Duplicate.
The Duplicate Plan dialog box opens.
◦ To directly open the Duplicate Plan dialog box, on the Plans panel tab, under Plans, right-click thereplenishment plan that must be copied, and select Duplicate.

Oracle Supply Chain Management CloudUsing Replenishment Planning
Chapter 12Replenishment Plans
196
The Duplicate Plan dialog box opens.
Only replenishment plans that have been successfully run are displayed on the Plans panel tab.2. In Copy Type, select one of the following:
◦ Copy plan options only: This choice is for copying the plan options to the new replenishment plan.However, the plan data isn't copied.
If the source replenishment plan hasn't been successfully run, only this choice is available.
◦ Copy all plan data with no reference to base plan: This choice is for making a full, standalone copy of thereplenishment plan. Both the plan options and plan data are copied.
3. Enter a name and description for the new replenishment plan.4. Select the access level for the new replenishment plan.
If you select Private, the Users icon is enabled. Click this icon to open the Users dialog box in which you canedit the list of users who can open the replenishment plan.
5. In Owner, select the owner of the new replenishment plan.6. Click Save and Close.
View a Replenishment PlanYou can view a replenishment plan using the Manage Plans page or the Plans panel tab.
On the Manage Plans page, you can view all the replenishment plans regardless of whether they have been successfullyrun. You can also search for replenishment plans using various criteria.
On the Plans panel tab, you can view only those replenishment plans that have been successfully run.
Follow these steps to view replenishment plans using the Manage Plans page:
1. On the Tasks panel tab, under Plans, select Manage Plans.
The Manage Plans page opens and displays the available replenishment plans.
You can configure the columns that display information about the replenishment plans.2. In the Search region, specify the criteria by which you want to search for replenishment plans, and click Search.
To view replenishment plans using the Plans panel tab, expand Plans on the panel tab.
Manage Plan Options
Scope Plan Options for Replenishment PlansScope plan options determine the replenishment plan's scope. Define or modify scope plan options on the Scope tab onthe Plan Options page.
The Scope tab includes the following:
• Dimension Catalog field

Oracle Supply Chain Management CloudUsing Replenishment Planning
Chapter 12Replenishment Plans
197
• Plan Organizations section
• Plan Items section
• Plan Parameters section
Dimension CatalogIn the Dimension Catalog field, select the dimension catalog from which hierarchies are made available for thereplenishment plan.
You can use the predefined Default Replenishment Planning Catalog or a dimension catalog that you have createdfor your requirements. The dimension catalog that you use contains the hierarchies that you can select for yourreplenishment plan.
Note that Oracle Fusion Replenishment Planning doesn't support the Customer or Demand Class dimension. Anydimension catalog that contains these dimensions isn't available in the Dimension Catalog field.
Plan OrganizationsSpecify a hierarchy, a level, and level members by which to filter the organizations for the replenishment plan. Only theEnterprise hierarchy can be selected.
You can select both organizations and subinventories as level members. Subinventories are listed in the<organization>:<subinventory> format.
Note: If you select a subinventory as a level member, the Enable for OTBI reporting check box is grayed out.OTBI reporting isn't supported for subinventories. Subinventories are available for selection only if their parentorganizations are enabled for subinventory-level planning on the Organizations tab on the Maintain Supply NetworkModel page.
Also, select the source system to use for filtering legal entities, business units, and organizations. Ensure that theselected source system is the same as that for the segment group that you select in the Segment Group field under thePlan Items section.
Plan ItemsSelect the segment group and segments that must be included in the replenishment plan.
Only those segment groups for which the segmentation process has been successfully run and that don't use theCustomer or Demand Class dimension are available in the Segment Group field.
Only those item-location combinations belonging to the selected segments and organizations selected as levelmembers under the Plan Organizations section are included in the replenishment plan scope. Moreover, the MPS andMRP Planning Method attribute must be set to Replenishment planning for these items. If you selected legal entities orbusiness units as level members, the organizations in these legal entities or business units are considered.
Plan ParametersThe following table describes the plan parameters:
Parameter Definition
Planning Calendar Planning calendar.

Oracle Supply Chain Management CloudUsing Replenishment Planning
Chapter 12Replenishment Plans
198
Parameter Definition
Only those planning calendars that are a part of the selected dimension catalog are availablefor selection. Moreover, the planning calendar can be of the fiscal, Gregorian, or organizationtype.
You can select fiscal calendars when only the Generate forecast check box is selected on thePlan Options page.
Planning Time Level Planning time level.
The planning time levels you can select are day and month for a fiscal calendar, month for aGregorian calendar, and day, week and period for an organization calendar.
Note: If the Rebalance inventory check box is selected, the Planning Time Level field is setto Day and grayed out.
Number of Buckets Number of planning buckets that determines the planning time granularity.
The maximum numbers of planning buckets you can specify are 31 for the day planning timelevel, 26 for the week planning time level, and 12 for the month or period planning time level.
The planning time level and number of planning buckets together determine the planninghorizon that's represented by the plan start date and plan end date on the General subtab onthe Supply tab.
Policy Assignment Set Policy assignment set for the selected segment group.
Policies are calculated on the basis of policy parameters defined in the policy assignment set.
Note: If the Calculate policy parameters check box is selected, you must select a policyassignment set.
Measure Catalog Catalog containing measures used in the replenishment plan output.
By enabling only those measures that are needed for your replenishment plan, you canperform a focused analysis with improved performance.
If the Enable for incremental planning and Calculate replenishments check boxes areselected on the Plan Options page, the Incremental Replenishment Planning Default Catalog isselected, and the field is grayed out.
Exception Set Exceptions computed as a part of the replenishment plan.
By enabling only required exceptions, you can improve the performance of the replenishmentplan.

Oracle Supply Chain Management CloudUsing Replenishment Planning
Chapter 12Replenishment Plans
199
Parameter Definition
You must create exception sets and exceptions because there aren't any predefined exceptionsets and exceptions for Replenishment Planning.
Simulation Set Set of adjustments to item attributes.
Apply a simulation set to your replenishment plan to model different business scenarios.
Related Topics• How You Set Up Replenishment Planning for Subinventories• Segmentation in Oracle Fusion Replenishment Planning• Overview of Inventory Rebalancing• Policy Assignment Sets
Set Up Policy Comparisons and Retain Policy OverridesYou can compare policies and retain policy overrides for a replenishment plan for which the Calculate policyparameters check box is selected on the Plan Options page. Additionally, while the Generate forecast check box mayor may not be selected, the Calculate replenishments and Rebalance inventory check boxes can't be selected.
Follow these steps to set up policy comparisons and retain policy overrides:
1. Open the Plan Options page for the replenishment plan through one of these ways:
◦ Use the Manage Plans page:i. On the Tasks panel tab, under Plans, select Manage Plans.
The Manage Plans page opens.ii. Under Search Results, select the replenishment plan that you want to edit, and click Actions > Edit
Plan Options.◦ On the Plans panel tab, under Plans, right-click the replenishment plan that you want to edit, and select
Edit Plan Options.2. On the Scope tab of the Plan Options page, click Select Advanced Options.
The Scope: Advanced Options dialog box opens.3. Select the Enable for policy comparison check box.
The Threshold Percentage for Policy Comparison field and Retain policy overrides check box are enabled.4. In the Threshold Percentage for Policy Comparison field, enter the deviation percentage for automatically
accepting newly calculated policy parameters.If the deviation percentage between a newly calculated policy parameter and an existing policy parameter isless than the threshold value, the newly calculated policy parameter is automatically accepted.
5. Select the Retain policy overrides check box to retain manual policy overrides after the replenishment plan isrun with the Refresh with current data option selected on the Parameters tab in the Run Plan dialog box.If you don't select this check box, the policy overrides you made are overwritten the next time you run thereplenishment plan and refresh it with current data.
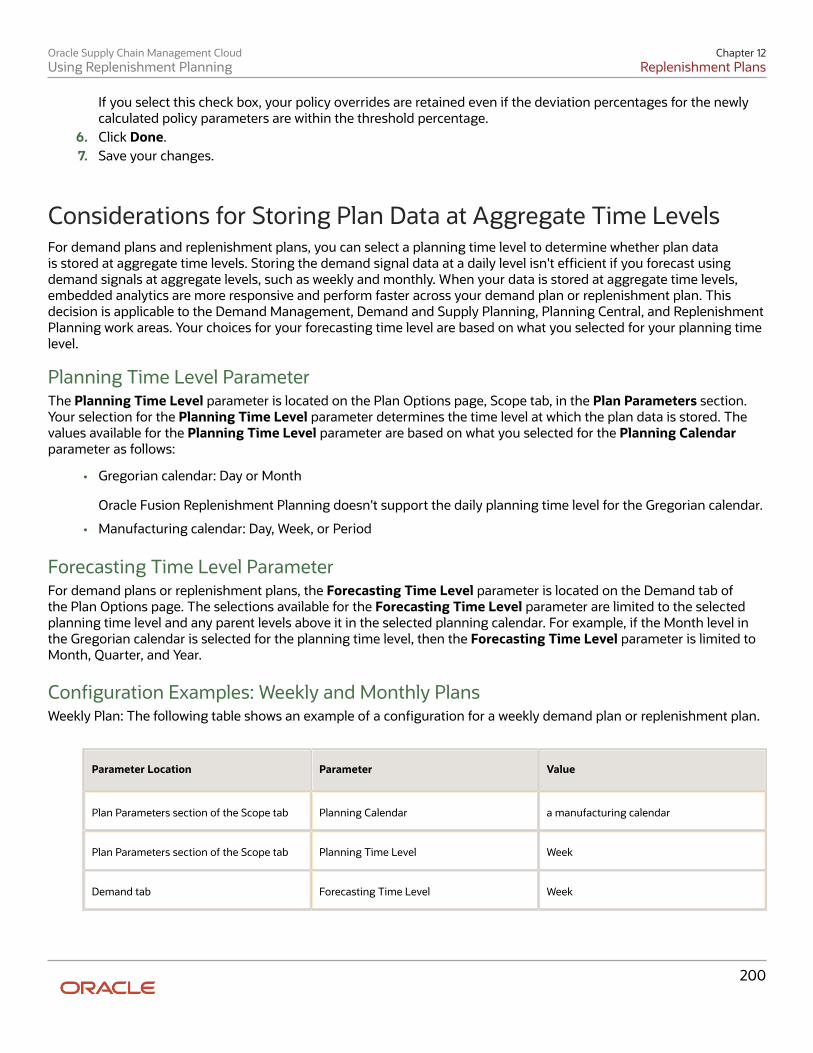
Oracle Supply Chain Management CloudUsing Replenishment Planning
Chapter 12Replenishment Plans
200
If you select this check box, your policy overrides are retained even if the deviation percentages for the newlycalculated policy parameters are within the threshold percentage.
6. Click Done.7. Save your changes.
Considerations for Storing Plan Data at Aggregate Time LevelsFor demand plans and replenishment plans, you can select a planning time level to determine whether plan datais stored at aggregate time levels. Storing the demand signal data at a daily level isn't efficient if you forecast usingdemand signals at aggregate levels, such as weekly and monthly. When your data is stored at aggregate time levels,embedded analytics are more responsive and perform faster across your demand plan or replenishment plan. Thisdecision is applicable to the Demand Management, Demand and Supply Planning, Planning Central, and ReplenishmentPlanning work areas. Your choices for your forecasting time level are based on what you selected for your planning timelevel.
Planning Time Level ParameterThe Planning Time Level parameter is located on the Plan Options page, Scope tab, in the Plan Parameters section.Your selection for the Planning Time Level parameter determines the time level at which the plan data is stored. Thevalues available for the Planning Time Level parameter are based on what you selected for the Planning Calendarparameter as follows:
• Gregorian calendar: Day or Month
Oracle Fusion Replenishment Planning doesn't support the daily planning time level for the Gregorian calendar.
• Manufacturing calendar: Day, Week, or Period
Forecasting Time Level ParameterFor demand plans or replenishment plans, the Forecasting Time Level parameter is located on the Demand tab ofthe Plan Options page. The selections available for the Forecasting Time Level parameter are limited to the selectedplanning time level and any parent levels above it in the selected planning calendar. For example, if the Month level inthe Gregorian calendar is selected for the planning time level, then the Forecasting Time Level parameter is limited toMonth, Quarter, and Year.
Configuration Examples: Weekly and Monthly PlansWeekly Plan: The following table shows an example of a configuration for a weekly demand plan or replenishment plan.
Parameter Location Parameter Value
Plan Parameters section of the Scope tab Planning Calendar a manufacturing calendar
Plan Parameters section of the Scope tab Planning Time Level Week
Demand tab Forecasting Time Level Week

Oracle Supply Chain Management CloudUsing Replenishment Planning
Chapter 12Replenishment Plans
201
Monthly Plan: The following table shows an example of a configuration for a monthly demand plan or replenishmentplan.
Parameter Location Parameter Value
Plan Parameters section of the Scope tab Planning Calendar Gregorian calendar
Plan Parameters section of the Scope tab Planning Time Level Month
Demand tab Forecasting Time Level Month
Demand Plan Options for Demand or Replenishment PlansDefine or modify demand options for a demand plan or replenishment plan on the Demand tab on the Plan Optionspage.
For a replenishment plan, the Demand tab is enabled only when the Generate forecast check box is selected on thePlan Options page.
The following table explains how the Demand tab is used:
Demand Plan Option Explanation
Aggregate Non-Key Customer Data toan All Other Level Member
Select this check box to aggregate data for customers whom you don't identify as keycustomers. When this check box is selected, the data for these non-key customers isaggregated to an All Other member for analysis, and the number of customers and customersites is reduced in the demand plan. While certain customers and customer sites are relevantto your demand plan, most others aren't and only add to the volume of data in your demandplan.
Before using this feature, you first need to use theScpKeyCustomerOptionsImportTemplate.xlsm upload template to identify key customers byhierarchy and level or by customer name and run the collections process.
This check box is available in only the Demand Management work area.
Forecasting Time Level Select the time level at which the forecast is generated. The selections are restricted to theplanning time level that you selected on the Scope tab or higher levels. For example, for aplanning time level of a week, the available forecasting time levels are week and period.
The bucket you select for the forecasting time level is also used for the historical buckets,history offset, forecast buckets, and locked forecast buckets displayed on the Demand tab.
Note: The forecasting time level doesn't apply to forecasting profiles that use feature-basedmachine learning.
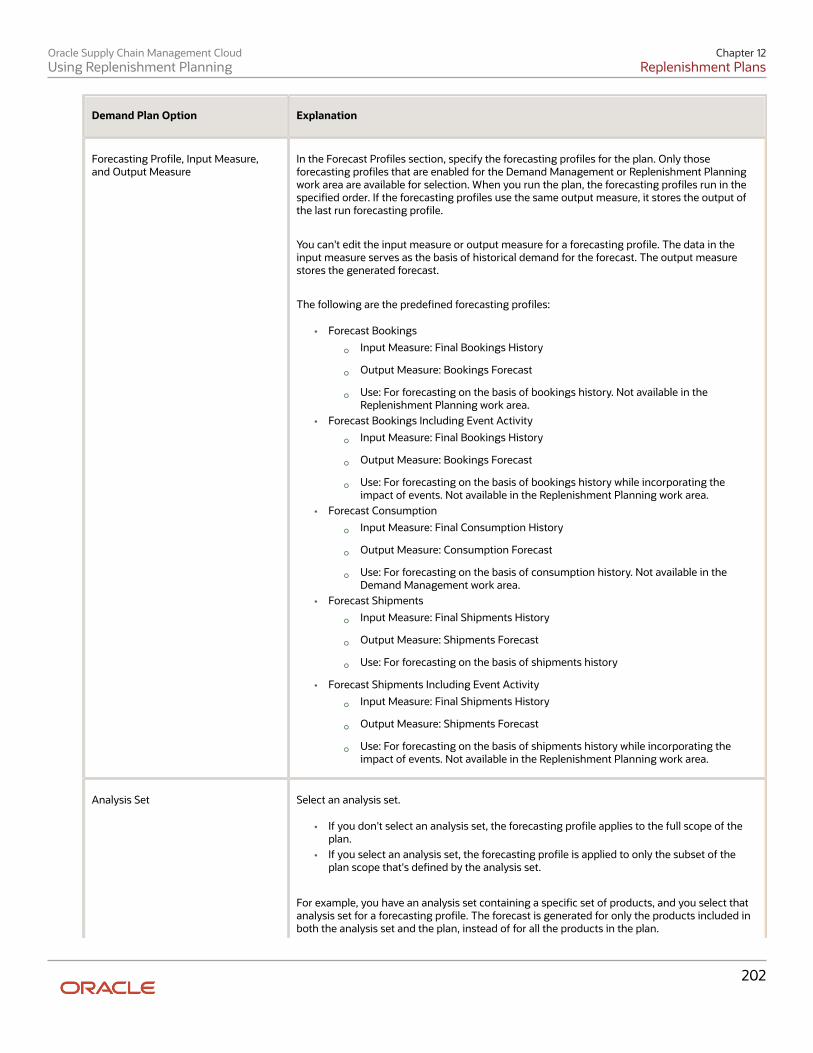
Oracle Supply Chain Management CloudUsing Replenishment Planning
Chapter 12Replenishment Plans
202
Demand Plan Option Explanation
Forecasting Profile, Input Measure,and Output Measure
In the Forecast Profiles section, specify the forecasting profiles for the plan. Only thoseforecasting profiles that are enabled for the Demand Management or Replenishment Planningwork area are available for selection. When you run the plan, the forecasting profiles run in thespecified order. If the forecasting profiles use the same output measure, it stores the output ofthe last run forecasting profile.
You can't edit the input measure or output measure for a forecasting profile. The data in theinput measure serves as the basis of historical demand for the forecast. The output measurestores the generated forecast.
The following are the predefined forecasting profiles:
• Forecast Bookings
◦ Input Measure: Final Bookings History
◦ Output Measure: Bookings Forecast
◦ Use: For forecasting on the basis of bookings history. Not available in theReplenishment Planning work area.
• Forecast Bookings Including Event Activity
◦ Input Measure: Final Bookings History
◦ Output Measure: Bookings Forecast
◦ Use: For forecasting on the basis of bookings history while incorporating theimpact of events. Not available in the Replenishment Planning work area.
• Forecast Consumption
◦ Input Measure: Final Consumption History
◦ Output Measure: Consumption Forecast
◦ Use: For forecasting on the basis of consumption history. Not available in theDemand Management work area.
• Forecast Shipments
◦ Input Measure: Final Shipments History
◦ Output Measure: Shipments Forecast
◦ Use: For forecasting on the basis of shipments history
• Forecast Shipments Including Event Activity
◦ Input Measure: Final Shipments History
◦ Output Measure: Shipments Forecast
◦ Use: For forecasting on the basis of shipments history while incorporating theimpact of events. Not available in the Replenishment Planning work area.
Analysis Set Select an analysis set.
• If you don't select an analysis set, the forecasting profile applies to the full scope of theplan.
• If you select an analysis set, the forecasting profile is applied to only the subset of theplan scope that's defined by the analysis set.
For example, you have an analysis set containing a specific set of products, and you select thatanalysis set for a forecasting profile. The forecast is generated for only the products included inboth the analysis set and the plan, instead of for all the products in the plan.

Oracle Supply Chain Management CloudUsing Replenishment Planning
Chapter 12Replenishment Plans
203
Demand Plan Option Explanation
You can use segments as member filters while configuring the analysis sets. Then, you canapply forecasting profiles to specific segments by selecting the associated analysis sets.
Historical Buckets Define the amount of historical data to use during the forecasting process. The number ofhistorical buckets is multiplied by the forecasting time level for determining the time horizon(number of days between the history start and end dates) for considering the collectedhistorical demand.
The historical buckets substantially affect the demand forecast generated when you run theplan. Use at least 12 months of history, but using 18 to 36 months of history is the best practice.When setting the historical buckets, keep the following in mind:
• Very long history affects the plan runtime and makes the forecast less relevant tocurrent demand patterns.
• Less than one year of history makes determining the impact of seasonal occurrencesand holidays difficult or impossible.
The historical bucket setting is the maximum amount of history used during forecastgeneration. The actual amount depends on the data available for a given item and organizationor item-location combination. For each item and organization or item-location combination,the forecasting process identifies all available historical data, removes any leading zerodemand prior to the first positive demand point, and generates a forecast.
History Offset Define the buckets by which the history start date is moved backward. The forecast start dateis then set to one bucket ahead of the new history end date, and the history start and enddates and forecast end date are automatically updated. The bucket size is determined by yourselection in the Forecasting Time Level field.
You use the history offset when you want to perform out-of-sample forecast tuning or backtesting. By moving the history start and end dates backward, you can generate a forecastfor the period between the history end date and the forecast start date, for which period youalready have data. You can compare your forecast with the actual data to refine your statisticalforecast.
History Start and End Dates For a demand plan, the history end date is determined by the plan run date and the planningcalendar.
For a replenishment plan, the history end date is determined by the plan start date (displayedon the General subtab on the Supply tab on the Plan Options page) and the planning calendar.
The history start date is determined from the history end date and the number of daysbetween the dates. The number of days between the history start and end dates is determinedby multiplying the number of historical buckets by the forecasting time level.
Forecast Buckets Indicates the number of time periods for the demand forecast and is driven by the planninghorizon set for the plan and the forecasting time level.
Locked Forecast Buckets Indicate the number of buckets from the end of historical data that don't receive a new forecastwhen you run the plan. The bucket size is determined by your selection in the ForecastingTime Level field.

Oracle Supply Chain Management CloudUsing Replenishment Planning
Chapter 12Replenishment Plans
204
Demand Plan Option Explanation
Ensure that the number you enter doesn't exceed the displayed number of forecast buckets.
Forecast End Date Indicates the end date for the generated forecast. The end date is set to an end-of-period datebased on the history end date, forecasting buckets, and forecasting time level.
Related Topics
• Create a Forecasting Profile
• Edit a User-Defined Forecasting Profile
• Segmentation in Oracle Fusion Replenishment Planning
• Segmentation in Oracle Fusion Demand Management
Use the History Offset for Out-of-Sample Forecast TuningThis topic explains how you can use the history offset for a forecasting profile for performing out-of-sample forecasttuning or back testing.
You set the history offset in the Forecast Profiles section on the Demand tab of the Plan Options page for a demandplan, demand and supply plan (in the Demand and Supply Planning work area), or replenishment plan. When you setthe history offset, the forecast start date is one bucket after the history end date.
Benefits of Using the History OffsetThe history offset enables you to shift the history end date backward so that you can generate a forecast for the periodfor which you have actual data. By comparing the forecast with your actual data in the period between the historyend date and the current date, you can accurately fine-tune the forecasting methods, causal factors, and forecastingparameters used in your forecasting profile, thereby increasing the reliability of the statistical forecast.
By using this feature, you don't have to wait for several months to collect data and compare it with your forecast so thatyou can fine-tune your forecasting profile.
Points to Note When Using the History OffsetSome points to note when using the history offset are as follows:
• Preferably, create a forecasting profile for using the history offset. Ensure that the output measure isn't used byother forecasting profiles.
This forecasting profile should contain the forecasting methods, causal factors, and forecasting parametersthat are used by the other forecasting profiles that you use for the statistical forecast.
• The history offset uses the time level you specify in the Forecasting Time Level field.
• When you set or change the history offset, the history start date, history end date, and forecast end date areautomatically updated.
• When you use the history offset, you should ensure that the tables and graphs in your plan display historicaldata for enough days to cover the new history start and end dates.
You can control the number of days for displaying historical demand before the plan start date in tables andgraphs by using the Demand History Days field in the Demand: Advanced Options dialog box that you open

Oracle Supply Chain Management CloudUsing Replenishment Planning
Chapter 12Replenishment Plans
205
from the Demand tab on the Plan Options page. Enter the number of days to display historical demand beforethe plan start date in tables and graphs when a time filter isn't specified. The default is 182.
• If your data is seasonal, you preferably should have at least two years of history before the new history end dateso that trends are captured and an accurate statistical forecast is generated. You can't generate an accuratestatistical forecast if you have less than one year of history before the new history end date.
• The history offset isn't considered in the calculation of the measure that stores the history average for theforecasting profile. Instead, the original history end date is used in the calculation of the history average.
• If the plan is used as a demand schedule for a replenishment plan or a supply plan, the history offset isn'tconsidered.
Refine Your Statistical Forecast by Using the History OffsetThese are the high-level steps for using the history offset for refining your statistical forecast:
1. Run your plan with the forecasting profile that you normally use.
On the Parameters tab of the Run Plan dialog box, under Details, select Refresh with current data.2. Create a forecasting profile and output measure for using the history offset.3. Attach the new forecasting profile to the plan, and set the history offset.4. Run the plan with the new forecasting profile.
On the Parameters tab of the Run Plan dialog box, under Details, select Do not refresh with current data. Foras long as you're fine-tuning the statistical forecast, you don't need to select Refresh with current data.
5. Compare the forecast with the actual data, and fine-tune the forecasting methods, causal factors, andforecasting parameters.
6. Make changes to the forecasting methods, causal factors, and forecasting parameters in the forecasting profilethat you want to use for the statistical forecast, and run the plan with the forecasting profile.
Related Topics
• Create a Forecasting Profile
• Run a Demand Plan
Considerations for Configuring Supply Plan Attributes inReplenishment PlansYou can specify generic attributes of a replenishment plan, such as the assignment set and time horizon for demand, inthe Supply Plan Attributes section on the Plan Options page, Supply tab, General subtab.
The Supply tab is enabled only when the Calculate policy parameters, Calculate replenishments, or Rebalanceinventory check box is selected by itself or with other check boxes on the Plan Options page.
Note: If you select only the Calculate policy parameters check box, the Overwrite Firm Planned Orders field isgrayed out. If you select only the Rebalance Inventory check box, except for the Overwrite Firm Planned Ordersfield, all the other fields are grayed out under Supply Plan Attributes.
The plan start and end dates are calculated by the replenishment planning process. The plan start date is set to the dateon which you run the replenishment plan, and the plan end date is calculated from the plan start date on the basis ofthe planning time level and number of buckets defined on the Scope tab. The plan start and end dates are automaticallyadvanced each time you run the replenishment plan. The plan start and end dates together define the planning horizon.

Oracle Supply Chain Management CloudUsing Replenishment Planning
Chapter 12Replenishment Plans
206
Assignment SetUse assignment sets to link sourcing rules and bills of distribution to organizations and items. Using sourcing rules,bills of distribution, and assignment sets together, you specify how material is supplied and transferred across a supplychain.
Select the assignment set that must be used with the replenishment plan.
Overwrite Firm Planned OrdersSpecify whether firm planned orders are retained between replenishment plan runs. When you select All, thereplenishment planning process overwrites all orders, planned and firm planned, from the current replenishment plan.When you select None, the replenishment planning process doesn't overwrite firm planned orders. However, plannedorders that aren't firm are overwritten.
Note: If you select the Rebalance inventory check box on the Plan Options page, firm planned orders are overwritteneven if you select None in the Overwrite Firm Planned Orders field.
Time Horizon for DemandSpecify the time window in which demand is considered for calculating the Beginning Inventory Position measure on agiven day. When you select None, only the current day's demand for an item-location combination is considered. Whenyou select Item lead time, the demand within the lead time for the item-location combination is considered.
Lead Time MultiplierEnter the number by which the lead time for the item-location combination should be multiplied when the time windowfor demand is considered.
When you select Item lead time, the Beginning Inventory Position measure is calculated as Projected Available Balance+ On Order - backlog (open orders within the item lead time). By using the time horizon and lead time multipliertogether, you can determine how many days of backlog are considered during the calculation of the BeginningInventory Position measure.
A large lead time multiplier results in a large inventory.
Supply Cutoff DaysEnter the number of days that must be added to the plan end date. All the existing orders with order due dates that fallwithin the specified period after the plan end date are considered during the calculation of the On Order measure.
This value is required for proper calculation of the On Order measure and prevents excess replenishments from beingcreated when the replenishment plan is run.
The maximum number of supply cutoff days you can specify is 15. If no value is specified, zero is taken as the number ofsupply cutoff days.
Aggregate Planned OrdersFor a replenishment plan with a planning time level higher than a day, the inventory position is nevertheless evaluateddaily so that replenishments are efficiently created. However, the planned orders are moved to the ends of theaggregate planning buckets.
For such a replenishment plan, select Yes to aggregate the planned orders into one large order for each aggregateplanning bucket.
Oracle Supply Chain Management CloudUsing Replenishment Planning
Chapter 12Replenishment Plans
207
If you select No, planned orders aren't aggregated into one large order.
Create Natural Time FenceSelect this check box to create a natural time fence for the replenishment plan. By creating a natural time fence, youensure that a new planned order has a due date that's after the due date for the latest firm purchase order or transferorder.
Related Topics
• Manually Release Replenishment Orders
• Aggregate Planning Buckets and Replenishment Orders
How the Natural Time Fence Controls the Creation of PlannedOrdersEnable a natural time fence for your replenishment plan so that a planned order is created with a due date that's afterthe due date of the latest firm purchase order or transfer order. The natural time fence date is set to the due date of thelatest firm purchase order or transfer order. Therefore, if the demand before the natural time fence date increases, anew planned order is recommended with a due date that's one day or more after the natural time fence date. Thus, thenatural time fence improves the efficiency of generating planned orders.
This feature is useful in scenarios such as these:
• Your supplier might delay the delivery of a purchase order on account of manufacturing issues. Your buyerfirms the purchase order, and you run your replenishment plan again after collecting firm purchase orders. Inthis situation, you don't want to release another planned order with a due date that's before the due date of theexisting, firm purchase order.
• To cater to increased demand, your store may generate a planned order with a due date that's earlier than thatfor an existing, firm purchase order. In this situation, you want to ensure that the due date of the new plannedorder is after that of the existing, firm purchase order.
Settings That Affect the Creation of the Natural Time FenceThese settings affect the creation of the natural time fence:
• The selection of the Create natural time fence check box on the General subtab on the Supply tab on the PlanOptions page for your replenishment plan.
Note: Select this check box for the replenishment plan for which you've selected the Calculatereplenishments check box on the Plan Options page.
• The due date of the latest firm purchase order or transfer order.
How the Natural Time Fence Is CalculatedThese points describe how the natural time fence is calculated:
• The natural time fence is set to the due date of the latest firm purchase order or transfer order.
• New planned orders are created with due dates outside the natural time fence. However, the order dates of theplanned orders can be inside the natural time fence.

Oracle Supply Chain Management CloudUsing Replenishment Planning
Chapter 12Replenishment Plans
208
Example of a Natural Time FenceConsider this example of an item-location combination for which the policy type is min-max planning:
Measure March 12 March 13 March 14 March 15 March 16 March 17 March 18 March 19
TotalDemand
20 120 20 20 20 20 20 30
FinalMinimumQuantity
100 100 100 100 100 100 100 100
FinalMaximumQuantity
180 180 180 180 180 180 180 180
On Hand 60 0 0 0 0 0 0 0
PurchaseOrders
0 0 0 0 0 140 0 80
TotalSupply
60 0 0 0 0 140 160 80
ProjectedAvailableBalance
40 -80 -100 -120 -140 -20 120 170
On Order 0 0 140 140 380 240 80 0
BeginningInventoryPosition
40 -80 40 20 240 220 200 170
PlannedReplenishmentsby OrderDate
0 0 0 160 0 0 0 0
PlannedReplenishmentsby DueDate
0 0 0 0 0 0 160 0
FinalInventoryPosition
40 -80 40 180 240 220 200 170

Oracle Supply Chain Management CloudUsing Replenishment Planning
Chapter 12Replenishment Plans
209
Note these points:
• The replenishment plan is run on March 12.
• The due date of March 17 for the firm purchase order of 140 units is taken as the natural time fence date.
Any new planned order must have its due date after March 17.
• The Beginning Inventory Position measure on March 12 is less than the Final Minimum Quantity measure. But,the planned order isn't created on March 12. Instead, the planned order is created with an order date of March15 and due date of March 18 to ensure that the due date is outside the natural time fence.
Automatic Release OptionsAutomatic release uses scheduled processes to release planned orders automatically after the plan run completes. Thefollowing options are available in the Automatic Release Parameters section on the Plan Options page, Supply Tab,General subtab in one of the Supply Chain Planning work areas:
• Release planned orders automatically
• Include rescheduled and canceled supplies in automatic releases
Release Planned Orders AutomaticallyTo release planned orders automatically, you must perform these steps before you run the plan:
• Select the Release planned orders automatically check box on the Plan Options page, Supply Tab, Generalsubtab.
• Select the Refresh with Current Data option in the Run Plan dialog box.
The planned orders are automatically released after the run plan successfully completes.
For a supply plan or a demand and supply plan, the Release planned orders automatically plan option isn't copiedwhen you copy a plan. The planning process won't release planned orders when you use the duplicated plan to performsimulations.
Note: Release time fence is an item-organization attribute and isn't defined in plan options.
Include Rescheduled and Canceled Supplies in Automatic ReleasesWhen you select the Include rescheduled and canceled supplies in automatic releases check box, the planningprocess automatically releases rescheduled and canceled supplies. This option is active only if you selected Releaseplanned orders automatically.
Note: The Include rescheduled and canceled supplies in automatic releases check box isn't available in theReplenishment Planning work area.
To navigate to the Automatic Release Parameters section, follow these steps:
1. On the Edit Plan page, click the Tasks panel drawer.2. In the Tasks panel drawer, click Manage Plans.3. In the Search area, search for your plan.4. Select the plan from the displayed search result. Click Actions and then click Edit Plan Options.5. On the Plan Options page, click the Supply tab.
The General subtab appears. The Automatic Release Parameters section is a part of this tab.
Oracle Supply Chain Management CloudUsing Replenishment Planning
Chapter 12Replenishment Plans
210
Release Recommendation OptionsUse the Release Recommendations Parameters section in the Supply: Advanced Options dialog box to configure thefollowing supply plan options:
• Compression days tolerance for automatic release
• Requisition load group by
• Transfer load group by
• Released only by user
Access the Release Recommendations Parameters section from a Supply Planning, Demand and Supply Planning,Replenishment Planning, or Planning Central work area.
Compression Days Tolerance for Automatic ReleaseUse this option to indicate the number of compression days allowed for the automatic release of planned orders. Thenumber of compression days applies only to automatic release of planned orders and recommendations. Compressiondays means the number of days reduced between the start date and due date as suggested by the planning process.
The Compression Days Tolerance for Automatic Release field isn't available in the Supply: Advanced Options dialogbox for a replenishment plan.
Requisition Load Group ByUse this option to indicate the requisition load group when loading requisitions to purchasing. For each option, exceptAll, the planning process creates one line for each planned order within each requisition.
• All: The planning process creates one purchase requisition for all recommended orders.
• Item: The planning process creates one purchase requisition for each item.
• Buyer: The planning process creates one purchase requisition for each buyer.
• Supplier: The planning process creates one purchase requisition for each supplier.
• Category: The planning process creates one purchase requisition for each item category.
• Location: The planning process creates one purchase requisition for each location.
• Project: The planning process creates one purchase requisition for each project. This option is available onlywhen the project-specific supply planning is enabled for your enterprise.
Transfer Load Group ByUse this option to indicate the transfer load group when loading transfers to logistics. The value of Transfer LoadGroup By determines how the actual transfer order is created.
• All: The planning process creates all transfers in one transfer order.
• Source and destination and ship date: The planning process creates one transfer order for each Ship Fromand Ship To organization, and each ship date.
• Source and destination, shipping method and ship date: The planning process creates one transfer for eachShip From and Ship To organization pair, and shipping method and ship date.
Oracle Supply Chain Management CloudUsing Replenishment Planning
Chapter 12Replenishment Plans
211
Released Only by UserUse this option to specify whether to restrict implementation of planned orders and recommendations to the currentuser. If you enable this option, the planning process implements only those planned orders and recommendationsthat the current user has marked. If you disable this option, the planning process implements planned orders andrecommendations that are marked by any user.
Note: This option applies only to the manual release of planned orders.
Use these steps to navigate to the Release Recommendations Parameters section in the Supply: Advanced Optionsdialog box:
1. Open a plan:
a. In a Supply Planning, Demand and Supply Planning, Replenishment Planning, or Planning Central workarea, click the Tasks panel drawer.
b. In the Tasks panel drawer, click Manage Plans.c. In the Search area, search for your plan.d. Select the plan from the displayed search result.
2. On the Edit Plan page, click Actions and then click Edit Plan Options.3. On the Plan Options page, click the Supply tab.4. On the General subtab, click Select Advanced Options.
The Supply: Advanced Options dialog box opens, which includes the Release Recommendations Parameterssection.
Technical Control ParametersYou can use multithreading to decrease the overall runtime of a supply plan. In the plan options, navigate to the Supply:Advanced Options dialog box, Technical tab and select the Enable multithreading check box. When selected, theplanning process implements multithreading during the plan run.
Organizations and Schedules Options for Replenishment PlansUse the Organizations and Schedules subtab of the Supply tab of the Plan Options page to configure subinventorynetting for the organizations covered by your replenishment plan. You also use the subtab to select demand plans,replenishment plans, or external forecast schedules for providing the demand forecast and replenishment plans forproviding policy parameters.
The Supply tab is enabled only when the Calculate policy parameters or Calculate replenishments check box isselected by itself or with other check boxes on the Plan Options page.
OrganizationsUse the Organizations section of the subtab to specify the subinventory netting for organizations that are covered bythe replenishment plan.
These organizations are the same as those that you selected in the Level Members dialog box on the Scope tab of thePlan Options page.
For each listed organization, in the Subinventory Netting dialog box, select or deselect the check boxes under EnableNetting to include or exclude subinventories from the supply-demand netting in the replenishment plan. During the

Oracle Supply Chain Management CloudUsing Replenishment Planning
Chapter 12Replenishment Plans
212
collection process, data is collected from the subinventories based on the organization configuration in the sourcesystem. If you enable subinventory netting for a new subinventory in the source system, the replenishment planautomatically includes the new subinventory after the next collection process.
Demand SchedulesUse the Demand Schedules section of the subtab to specify the sources of the demand forecast and the replenishmentplan for calculating policy parameters.
You can select the following for the demand forecast:
• Another replenishment plan that has the Generate forecast check box selected on the Plan Options page andthat has been run
• A demand plan that has been run
• An external forecast schedule
If the replenishment plan is used for incremental planning (the Enable for incremental planning check box is selectedalong with the Calculate replenishments check box on the Plan Options page), you can't select another replenishmentplan, a demand plan, or an external forecast schedule for the demand forecast. Only actual demands (sales orders,transfer orders, and inventory position) are considered during replenishment calculation.
If the Generate forecast check box is selected on the Plan Options page, the replenishment plan is listed in theDemand Schedules section, and the check box under Use for Demand Schedule is automatically selected and can't bedeselected.
If the Calculate policy parameters check box is selected on the Plan Options page, the replenishment plan is listed inthe Demand Schedules section, and the check box under Use for Policy Parameters is automatically selected and can'tbe deselected.
This table explains how you use the Demand Schedules section:
Selected Check Box Selection in Demand Schedules Section
Calculate policy parameters Select a source for the demand forecast.
If you select more than one source, the forecasts from different sources are added up for theitem-location combination.
If you select a replenishment plan, you must select the check box under Use for DemandSchedule. If you select a demand plan or an external forecast schedule, the check box isautomatically selected and grayed out.
For a demand or replenishment plan, you must select an output measure for the forecast in theDemand Plan Output list. The available measures are as follows:
• Approved Final Bookings Forecast• Approved Final Shipments Forecast• Final Bookings Forecast• Final Consumption Forecast• Final Shipments Forecast

Oracle Supply Chain Management CloudUsing Replenishment Planning
Chapter 12Replenishment Plans
213
Selected Check Box Selection in Demand Schedules Section
Calculate replenishments Select another replenishment plan that has been run with the Calculate policy parameterscheck box selected on the Plan Options page, and select the check box under Use for PolicyParameters.
You can select only one replenishment plan for calculating policy parameters.
You can also use the same replenishment plan for generating the forecast and calculatingpolicy parameters if it was run with the Generate forecast and Calculate policy parameterscheck boxes selected on the Plan Options page.
Run a Replenishment PlanWhen you run a replenishment plan, you can specify how you want to refresh the data and if you want to generate theforecast, calculate policy parameters, rebalance the inventory, calculate replenishments, and archive the plan. Also, youcan run the replenishment plan immediately or in the background at a set time or on a repetitive schedule.
Regardless of your plan setup, you use the following sequence for running your replenishment plan:
1. Generate the forecast or specify the following for the forecast:
◦ Another replenishment plan that has been run with the Generate forecast check box selected on thePlan Options page.
◦ A demand plan that has been run.
◦ An external forecast schedule.
2. Calculate the policy parameters.3. Rebalance the inventory.4. Calculate the replenishments.
Consider these examples:
Setup of Replenishment Plans Run Sequence
Replenishment Plan A generatesthe forecast, calculates the policyparameters, and calculates thereplenishments.
Run Replenishment Plan A.
Replenishment Plan Y generates theforecast and calculates the policyparameters, and Replenishment PlanZ calculates the replenishments.
1. Run Replenishment Plan Y to generate the forecast and calculate the policy parameters.2. Run Replenishment Plan Z to calculate the replenishments.
Replenishment Plan M generates theforecast and calculates the policyparameters, and Replenishment
1. Run Replenishment Plan M to generate the forecast and calculate the policy parameters.2. Run Replenishment Plan N to rebalance the inventory and calculate the replenishments.

Oracle Supply Chain Management CloudUsing Replenishment Planning
Chapter 12Replenishment Plans
214
Setup of Replenishment Plans Run Sequence
Plan N rebalances the inventory andcalculates the replenishments.
Data Refresh OptionsThese data refresh options are available under the Details region on the Parameters tab in the Run Plan dialog box:
• Do not refresh with current data: Select this option for simulation planning.
When you select this option, the planning horizon (the plan start and end dates) displayed on the Plan Optionspage, Supply tab, General subtab isn't advanced.
• Refresh with net-changed data: Select this option to perform incremental replenishment planning for onlythose item-location combinations with net changes in demands and supplies. This option is enabled only whenthe Enable for incremental planning and Calculate replenishments check boxes are selected on the PlanOptions page for the replenishment plan.
When you select this option, the planning horizon displayed on the Plan Options page, Supply tab, Generalsubtab is advanced.
• Refresh with current data: Select this option to refresh the replenishment plan with the latest collected data. Ifyou're running the replenishment plan for the first time, only this option is enabled, and it's selected by default.
If you selected only the Calculate policy parameters check box on the Plan Options page and are running thereplenishment plan for the policy comparison process, you must select this option.
When you select this option, the planning horizon displayed on the Plan Options page, Supply tab, Generalsubtab is advanced.
Scope OptionsThese scope options are available under the Details region on the Parameters tab in the Run Plan dialog box:
• Generate forecast: Select this check box to generate the forecast as a part of the plan run. The check box isenabled only when the Generate forecast check box is selected on the Plan Options page. If this check box isenabled, and you're running the replenishment plan for the first time, the check box in the dialog box is selectedby default and can't be deselected.
• Calculate policy parameters: Select this check box to calculate policy parameters as a part of the plan run. Thecheck box is enabled only when the Calculate policy parameters check box is selected on the Plan Optionspage. If this check box is enabled, and you're running the replenishment plan for the first time, the check box inthe dialog box is selected by default and can't be deselected.
• Calculate replenishments: Select this check box to calculate replenishments as a part of the plan run. The checkbox is enabled only when the Calculate replenishments check box is selected on the Plan Options page. If thischeck box is enabled, and you're running the replenishment plan for the first time, the check box in the dialogbox is selected by default and can't be deselected.
• Rebalance inventory: Select this check box to rebalance inventory as a part of the plan run. This check boxis enabled only when the Rebalance inventory check box is selected on the Plan Options page. If this checkbox is enabled, and you're running the replenishment plan for the first time, the check box in the dialog box isselected by default and can't be deselected.
If you select this check box and the Do not refresh with current data option, the Calculate replenishmentscheck box is selected and grayed out.

Oracle Supply Chain Management CloudUsing Replenishment Planning
Chapter 12Replenishment Plans
215
• Archive plan: Select this check box to archive the results of the plan run. This check box is enabled only whenthe Refresh with current data option is selected, and the Enable for archiving check box is selected in theScope: Advanced Options dialog box that you open from the Plan Options page, Scope tab.
Run the Replenishment PlanFollow these steps to run the replenishment plan:
1. Open the Run Plan dialog box through one of these ways:
◦ Use the Manage Plans page:
i. On the Tasks panel tab, under Plans, select Manage Plans.
The Manage Plans page opens.ii. Under Search Results, select the replenishment plan, and click Actions > Run.
◦ On the Plans panel tab, under Plans, right-click the replenishment plan, and select Run.
◦ Open the replenishment plan, and click Actions > Run.
2. Enter submission notes for your plan run.3. On the Parameters tab, under Details, do these steps:
a. Under Data Refresh Options, select an option.
If you select Do not refresh with current data, the Manage Replan Details link is displayed underthe option. Click the link to open the Manage Replan Details dialog box, in which you can see the item-location combinations and segments for which you've made simulation-related changes. Under Replan,deselect the check boxes for the combinations and segments for which you don't want to run thesimulation.
b. Under Scope Options, select check boxes for the type of plan run.4. Under Demand Plan Run Options, under Include, select the check boxes for the forecasting profiles that you
want to use for generating the forecast.
This section is displayed if the Generate forecast check box is selected on the Plan Options page. Theforecasting profiles selected on the Demand tab on the Plan Options page are displayed here.
This section isn't displayed when you select Do not refresh with current data under Data Refresh Options.5. On the Schedule tab, do the following:
◦ To run the plan immediately, select As soon as possible.
◦ To run the plan in the background at a set time, select Using a schedule.
The Frequency field is displayed. Other options are displayed on the basis of the selected frequency.
Specify a schedule for the plan run.6. Click OK to run the replenishment plan.
The Plan Status Details dialog box is displayed.7. Click OK.
Related Topics• Overview of Inventory Rebalancing• Overview of Simulations for Replenishment Plans• Overview of the Policy Comparison Feature
Oracle Supply Chain Management CloudUsing Replenishment Planning
Chapter 12Replenishment Plans
216
Publish Plan DataYou can publish data for a plan in the Demand Management, Demand and Supply Planning, Planning Central,Replenishment Planning, Sales and Operations Planning, or Supply Planning work area to a compressed file. You canthen use the file for data integration between your Supply Chain Planning application and other Oracle or externalapplications.
By submitting a scheduled process from your Supply Chain Planning work area or the Scheduled Processes work area,you can publish the data in a pivot table within your plan to a file on the content server of Oracle Universal ContentManagement (UCM).
Using APIs of Oracle's ERP integration service for automating the data integration between your Supply Chain Planningapplication and an external application, you can submit the scheduled process, check its status, and get the details ofthe published document.
The file name is in the <plan name>_<pivot table name>.zip format.
Publish Plan Data from a Supply Chain Planning Work AreaHere's how you can publish data for your plan from your Supply Chain Planning work area:
1. Do one of the following to open the Publish Data dialog box:
◦ On the Manage Plans page, select the plan and click Actions > Publish Data.
The Publish Data dialog box opens.
◦ Open your plan and click Actions > Publish Data.
The Publish Data dialog box opens.2. Optionally, enter submission notes for your scheduled process.3. On the Parameters tab, optionally, select the Append request number to output file name check box.
Selecting this check box results in the request number being appended to the file name, which enableseasy identification of the file on the content server. The resulting file name (<plan name>_<pivot tablename>_<request number>) is also used as the document title.
If you don't select this check box, the document title is PUBLISHPLANDATA.4. In Table Name, select the pivot table of your plan for which you want to publish data.
The available tables are enabled for the work area of the plan, and you have the required access to these tables.5. In Source System, select the source system that's specified on the Scope tab of the Plan Options page for the
plan.6. On the Schedule tab, specify whether you want to run the process as soon as possible or according to a
schedule.
If you publish the file according to a schedule, you can specify the frequency and start and end dates for theprocess.
7. Click Submit.
The Status dialog box opens and displays the request number. Make a note of this number and then click OK.
You can use this number to search for the result of your request in the Scheduled Processes work area.

Oracle Supply Chain Management CloudUsing Replenishment Planning
Chapter 12Replenishment Plans
217
If you appended this number to the compressed file's name, you can use this number to search for the file inthe File Import and Export work area. You can then download and check the file.
Publish Plan Data from the Scheduled Processes Work AreaHere's how you can publish data for your plan from the Scheduled Processes work area:
1. On the Overview page, click the Schedule New Process button.
The Schedule New Process dialog box opens.2. In Name, select the Publish Plan job, and click OK.
The Process Details dialog box opens.3. To be notified when the process ends regardless of the result, select the Notify me when this process ends
check box.4. Optionally, enter submission notes for your scheduled process.5. On the Parameters tab, in Plan Name, select your plan.6. Optionally, select the Append request number to output file name check box.
Selecting this check box results in the request number being appended to the file name, which enableseasy identification of the file on the content server. The resulting file name (<plan name>_<pivot tablename>_<request number>) is also used as the document title.
If you don't select this check box, the document title is PUBLISHPLANDATA.7. In Table Name, select the pivot table of your plan for which you want to publish data.
The available tables are enabled for the work area of the plan, and you have the required access to these tables.8. In Source System, select the source system that's specified on the Scope tab of the Plan Options page for the
plan.9. To set a schedule for your request and notify other users about the result, click the Advanced button.
The Schedule and Notification tabs are displayed.
◦ On the Schedule tab, specify whether you want to run the process as soon as possible or according to aschedule.
If you publish the file according to a schedule, you can specify the frequency and start and end dates forthe process.
◦ On the Notification tab, specify the recipients to whom result notifications should be sent and theconditions under which the notifications are sent.
10. Click Submit.
The Confirmation dialog box opens and displays the process number. Make a note of this number, and click OK.
You can use this number to search for the result of your request in the Scheduled Processes work area.
If you appended this number to the compressed file's name, you can use this number to search for the file inthe File Import and Export work area. You can then download and check the file.
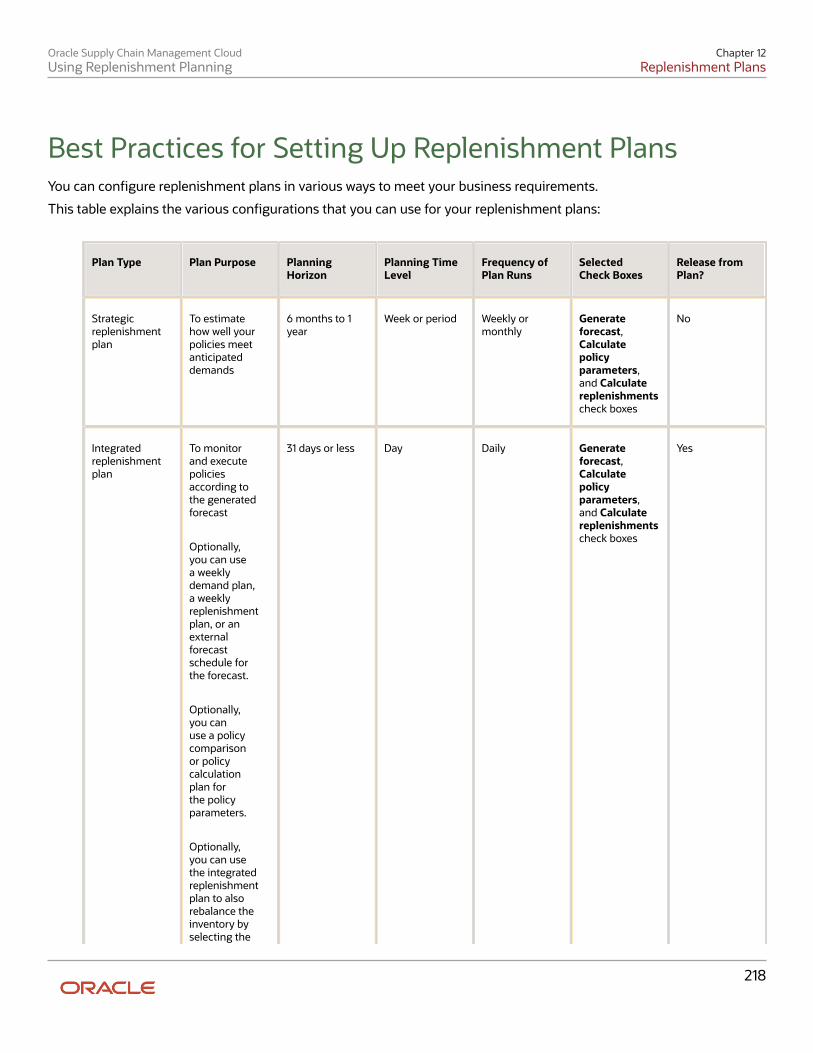
Oracle Supply Chain Management CloudUsing Replenishment Planning
Chapter 12Replenishment Plans
218
Best Practices for Setting Up Replenishment PlansYou can configure replenishment plans in various ways to meet your business requirements.
This table explains the various configurations that you can use for your replenishment plans:
Plan Type Plan Purpose PlanningHorizon
Planning TimeLevel
Frequency ofPlan Runs
SelectedCheck Boxes
Release fromPlan?
Strategicreplenishmentplan
To estimatehow well yourpolicies meetanticipateddemands
6 months to 1year
Week or period Weekly ormonthly
Generateforecast,Calculatepolicyparameters,and Calculatereplenishmentscheck boxes
No
Integratedreplenishmentplan
To monitorand executepoliciesaccording tothe generatedforecast
Optionally,you can usea weeklydemand plan,a weeklyreplenishmentplan, or anexternalforecastschedule forthe forecast.
Optionally,you canuse a policycomparisonor policycalculationplan forthe policyparameters.
Optionally,you can usethe integratedreplenishmentplan to alsorebalance theinventory byselecting the
31 days or less Day Daily Generateforecast,Calculatepolicyparameters,and Calculatereplenishmentscheck boxes
Yes
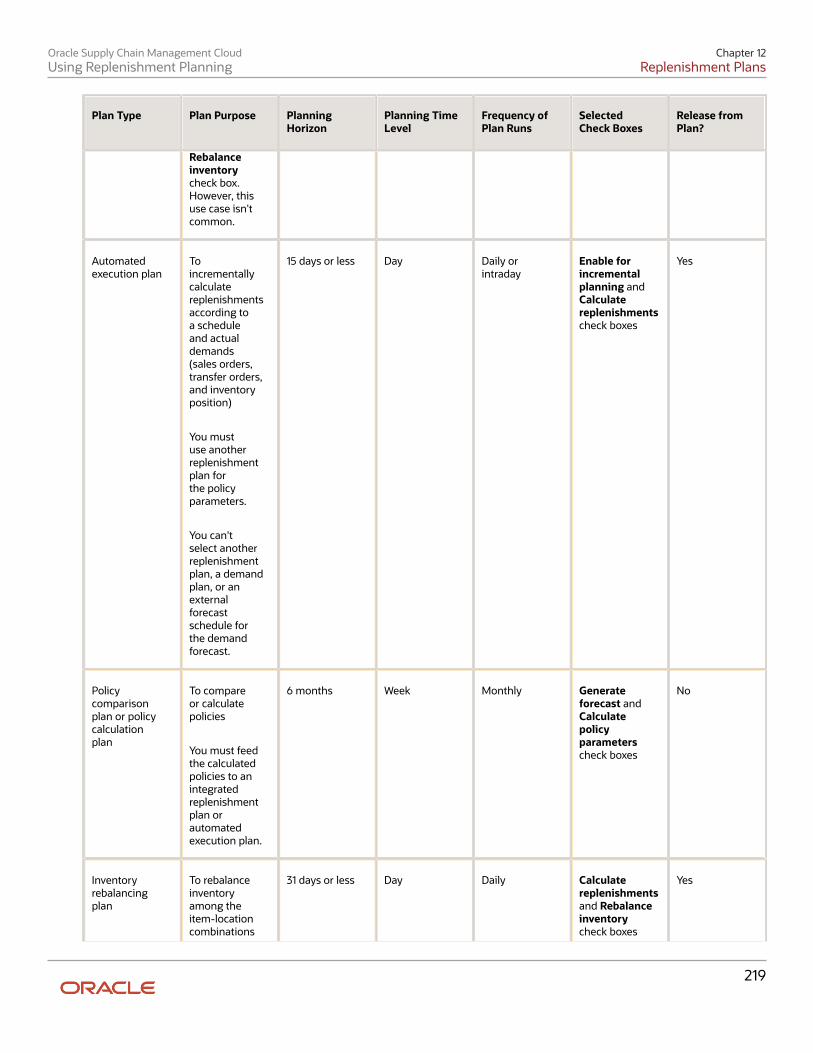
Oracle Supply Chain Management CloudUsing Replenishment Planning
Chapter 12Replenishment Plans
219
Plan Type Plan Purpose PlanningHorizon
Planning TimeLevel
Frequency ofPlan Runs
SelectedCheck Boxes
Release fromPlan?
Rebalanceinventorycheck box.However, thisuse case isn'tcommon.
Automatedexecution plan
Toincrementallycalculatereplenishmentsaccording toa scheduleand actualdemands(sales orders,transfer orders,and inventoryposition)
You mustuse anotherreplenishmentplan forthe policyparameters.
You can'tselect anotherreplenishmentplan, a demandplan, or anexternalforecastschedule forthe demandforecast.
15 days or less Day Daily orintraday
Enable forincrementalplanning andCalculatereplenishmentscheck boxes
Yes
Policycomparisonplan or policycalculationplan
To compareor calculatepolicies
You must feedthe calculatedpolicies to anintegratedreplenishmentplan orautomatedexecution plan.
6 months Week Monthly Generateforecast andCalculatepolicyparameterscheck boxes
No
Inventoryrebalancingplan
To rebalanceinventoryamong theitem-locationcombinations
31 days or less Day Daily Calculatereplenishmentsand Rebalanceinventorycheck boxes
Yes

Oracle Supply Chain Management CloudUsing Replenishment Planning
Chapter 12Replenishment Plans
220
Plan Type Plan Purpose PlanningHorizon
Planning TimeLevel
Frequency ofPlan Runs
SelectedCheck Boxes
Release fromPlan?
in theclusters of areplenishmentplan
You mustuse anotherreplenishmentplan witha planningtime level ofweek, month,or periodto calculatethe policyparameters.
You mustuse anotherreplenishmentplan, a demandplan, or anexternalforecastschedule forthe demandforecast. Theplanning timelevel of theother plancan be week,month, orperiod.
Related Topics• How Replenishment Orders Are Calculated During Incremental Planning• Overview of the Policy Comparison Feature• Policy Assignment Sets• Overview of Inventory Rebalancing
Example of Replenishment Plans for a Standard BusinessScenarioThis topic describes how you set up replenishment plans for a standard business scenario.
In this example, an enterprise has a distribution center that's modeled as an organization. The distribution centerhas buy from sourcing rules. The two warehouses, which are also set up as organizations, source goods from the

Oracle Supply Chain Management CloudUsing Replenishment Planning
Chapter 12Replenishment Plans
221
distribution center using transfer from sourcing rules. The customer demands are fulfilled through the warehouses. Theenterprise uses Oracle Fusion ERP software.
Note these points about this example:
• You can use a single replenishment plan to generate the forecast, calculate the policy parameters, and calculateand release replenishment orders for the distribution center and warehouses.
You can also use separate replenishment plans as follows:
◦ A replenishment plan generates the forecast at the distribution center by using transfer orders historyand shipments history.
This replenishment plan also calculates the policy parameters and calculates and releases thereplenishment orders for the distribution center.
◦ Another replenishment plan generates the forecast at the warehouses by using shipments history.
This replenishment plan also calculates the policy parameters and calculates and releases thereplenishment orders for the warehouses.
• If you're using a single replenishment plan for the distribution center and warehouses, when a planned transferorder is created at the warehouses, an equivalent planned transfer order demand isn't automatically created forthe distribution center.
Planned transfer order demand is created at the distribution center once the planned transfer orders created atthe warehouses are released and collected.
• File-based data import (FBDI) templates can be used for uploading data instead of collecting it.
• At any level, you can use a single or separate replenishment plans to generate the forecast, calculate the policyparameters, and calculate and release the replenishment orders.
Distribution Center(Organization)
Warehouse 1(Organization)
Warehouse 2(Organization)
Transfer Orders
Transfer Orders Shipments
Shipments
BuyOrders

Oracle Supply Chain Management CloudUsing Replenishment Planning
Chapter 12Replenishment Plans
222
Guidelines for Working with Plan Messages forReplenishment PlansThis topic explains what the plan messages for replenishment plans mean and how you should work with them.
In the Replenishment Planning work area, you can view plan messages after a replenishment plan runs. Byunderstanding the root causes why policies and replenishments weren't calculated within the replenishment plan foritem-location combinations, you can take corrective actions.
Plan messages deal with these issues:
• The size and run of the replenishment plan
• The calculation of safety stock
• The calculation of average daily demand
• Other issues, such as the calculation of the economic order quantity (EOQ)
Messages Dealing with the Size and Run of the Replenishment PlanThis table lists plan messages that deal with the size and run of the replenishment plan:
Message Meaning Corrective Action
The following number of item andorganization combinations were includedin the replenishment plan: {COUNT}.
Indicates the number of item-location combinations covered in thereplenishment plan and for whichreplenishment planning is done.
The item-location combinations are in theselected segments and level members onthe Scope tab of the Plan Options pagefor the replenishment plan. Moreover, inOracle Fusion Product Management, theMPS and MRP Planning Method attributeis set to Replenishment planning for theseitems.
-
The plan was run in the Refresh withCurrent Data mode because targetedcollection was run.
Indicates that the replenishment plan isrun with current data even though theEnable for incremental planning checkbox is selected on the Plan Options pageand the Refresh with net-changed dataoption is selected under the Details regionon the Parameters tab of the Run Plandialog box. Current data is used becausethe type of the previous collection wastargeted.
-

Oracle Supply Chain Management CloudUsing Replenishment Planning
Chapter 12Replenishment Plans
223
Messages Dealing with the Calculation of Safety StockThis table lists plan messages that deal with the safety stock for item-location combinations:
Message Meaning Corrective Action
Safety stock wasn't calculated for item{ITEM} in organization {ORG} because theMAPE wasn't available.
Indicates that the safety stock isn'tcalculated for the item-locationcombination.
This plan message is displayed because ofthese reasons:
• In the policy assignment set that'sattached to the replenishmentplan, for the segment to whichthe item-location combinationbelongs, on the Policy Parameterssubtab of the Segment-Level PolicyParameters Assignment tab, youselected Service level-based inSafety Stock Calculation.
• The demand isn't intermittent.• The mean average percentage
error (MAPE) isn't available for theitem-location combination in thedemand plan, replenishment plan,or external demand schedule that'sused as the demand schedule forthe replenishment plan.
Perform these steps:
1. Ensure that the MAPE is availablefor the item-location combinationin the demand plan, replenishmentplan, or external demand schedule.
2. Run the replenishment plan:
◦ Under the Details region onthe Parameters tab of theRun Plan dialog box, selectRefresh with current data.
◦ Select the Calculate policyparameters check box.
Safety stock wasn't calculated for item{ITEM} in organization {ORG} because thetotal lead time was zero.
Indicates that the safety stock isn'tcalculated for the item-locationcombination.
This plan message is displayed because ofthese reasons:
• In the policy assignment set that'sattached to the replenishmentplan, for the segment to whichthe item-location combinationbelongs, on the Policy Parameterssubtab of the Segment-Level PolicyParameters Assignment tab, youselected Service level-based inSafety Stock Calculation.
• The demand isn't intermittent.• The replenishment lead time, which
is the sum of the PreprocessingLead Time, Processing Lead Time,and Postprocessing Lead Timecolumns of the Items table, is zerofor the item-location combination.
Perform these steps:
1. Set the preprocessing, processing,and postprocessing lead times forthe item-location combination inProduct Management.
2. Run the collections process.3. Run the replenishment plan:
◦ Under the Details region onthe Parameters tab of theRun Plan dialog box, selectRefresh with current data.
◦ Select the Calculate policyparameters check box.

Oracle Supply Chain Management CloudUsing Replenishment Planning
Chapter 12Replenishment Plans
224
Message Meaning Corrective Action
Safety stock wasn't calculated for item{ITEM} in organization {ORG} becauseaverage interarrival time wasn't available.
Indicates that the safety stock isn'tcalculated for the item-locationcombination.
This plan message is displayed because ofthese reasons:
• In the policy assignment set that'sattached to the replenishmentplan, for the segment to whichthe item-location combinationbelongs, on the Policy Parameterssubtab of the Segment-Level PolicyParameters Assignment tab, youselected Service level-based inSafety Stock Calculation.
• The demand is intermittent.• The average interarrival time isn't
available for the item-locationcombination in the Items table.
Perform these steps:
1. Ensure that the average interarrivaltime is available for the item-location combination in the Itemstable.
2. Run the replenishment plan:
◦ Under the Details region onthe Parameters tab of theRun Plan dialog box, selectRefresh with current data.
◦ Select the Calculate policyparameters check box.
The intermittent demand indicator foritem {ITEM} in organization {ORG} wasinvalid. Safety stock was set equal toaverage daily demand.
Indicates that the safety stock isn'tcalculated for the item-locationcombination.
This plan message is displayed because ofthese reasons:
• In the policy assignment set that'sattached to the replenishmentplan, for the segment to whichthe item-location combinationbelongs, on the Policy Parameterssubtab of the Segment-Level PolicyParameters Assignment tab, youselected Service level-based inSafety Stock Calculation.
• The value in the IntermittentDemand or Intermittent DemandOverride column of the Items tablefor the item-location combination isinvalid.
• Consequently, the safety stockhas been set to the average dailydemand for the item-locationcombination.
Perform these steps:
1. Ensure that valid values are therein the Intermittent Demand andIntermittent Demand Overridecolumns for the item-locationcombination in the Items table.
2. Run the replenishment plan:
◦ Under the Details region onthe Parameters tab of theRun Plan dialog box, selectRefresh with current data.
◦ Select the Calculate policyparameters check box.
The uploaded safety stock quantity wasn'tconsidered for item-location combinationsin segment {SEG_NAME}.
Instead of the uploaded quantity, thesafety stock defined or calculated for thesegment was used because the policyUOM for the segment is Days and notUnits.
Indicates that the uploaded safety stockquantity isn't considered for the item-location combinations in the specifiedsegment. Instead, the safety stockoverride or calculated safety stock for thesegment is used.
This plan message is displayed becausethe safety stock quantity was uploaded
Perform these steps:
1. In the policy assignment set that'sattached to the replenishmentplan, for the segment, on thePolicy Parameters subtab of theSegment-Level Policy ParametersAssignment tab, select Units inPolicy UOM.
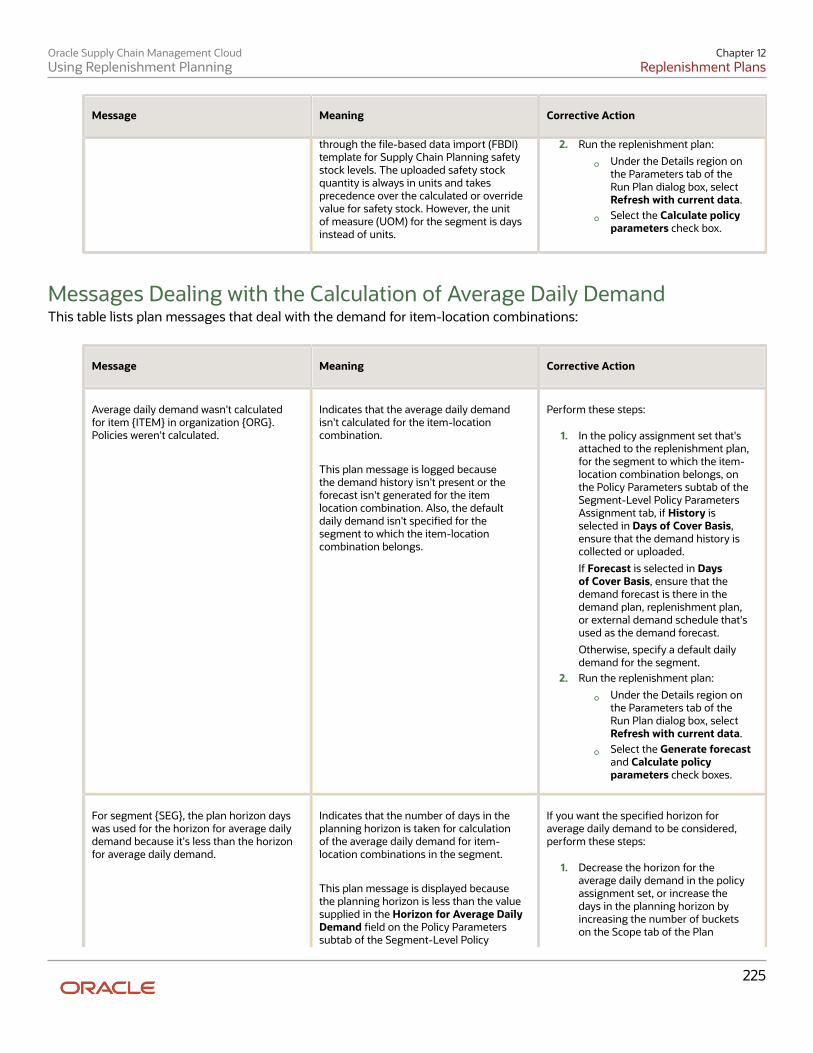
Oracle Supply Chain Management CloudUsing Replenishment Planning
Chapter 12Replenishment Plans
225
Message Meaning Corrective Action
through the file-based data import (FBDI)template for Supply Chain Planning safetystock levels. The uploaded safety stockquantity is always in units and takesprecedence over the calculated or overridevalue for safety stock. However, the unitof measure (UOM) for the segment is daysinstead of units.
2. Run the replenishment plan:
◦ Under the Details region onthe Parameters tab of theRun Plan dialog box, selectRefresh with current data.
◦ Select the Calculate policyparameters check box.
Messages Dealing with the Calculation of Average Daily DemandThis table lists plan messages that deal with the demand for item-location combinations:
Message Meaning Corrective Action
Average daily demand wasn't calculatedfor item {ITEM} in organization {ORG}.Policies weren't calculated.
Indicates that the average daily demandisn't calculated for the item-locationcombination.
This plan message is logged becausethe demand history isn't present or theforecast isn't generated for the itemlocation combination. Also, the defaultdaily demand isn't specified for thesegment to which the item-locationcombination belongs.
Perform these steps:
1. In the policy assignment set that'sattached to the replenishment plan,for the segment to which the item-location combination belongs, onthe Policy Parameters subtab of theSegment-Level Policy ParametersAssignment tab, if History isselected in Days of Cover Basis,ensure that the demand history iscollected or uploaded.
If Forecast is selected in Daysof Cover Basis, ensure that thedemand forecast is there in thedemand plan, replenishment plan,or external demand schedule that'sused as the demand forecast.
Otherwise, specify a default dailydemand for the segment.
2. Run the replenishment plan:
◦ Under the Details region onthe Parameters tab of theRun Plan dialog box, selectRefresh with current data.
◦ Select the Generate forecastand Calculate policyparameters check boxes.
For segment {SEG}, the plan horizon dayswas used for the horizon for average dailydemand because it's less than the horizonfor average daily demand.
Indicates that the number of days in theplanning horizon is taken for calculationof the average daily demand for item-location combinations in the segment.
This plan message is displayed becausethe planning horizon is less than the valuesupplied in the Horizon for Average DailyDemand field on the Policy Parameterssubtab of the Segment-Level Policy
If you want the specified horizon foraverage daily demand to be considered,perform these steps:
1. Decrease the horizon for theaverage daily demand in the policyassignment set, or increase thedays in the planning horizon byincreasing the number of bucketson the Scope tab of the Plan

Oracle Supply Chain Management CloudUsing Replenishment Planning
Chapter 12Replenishment Plans
226
Message Meaning Corrective Action
Parameters Assignment tab of the policyassignment set that's attached to thereplenishment plan.
Options page for the replenishmentplan.
2. Run the replenishment plan:
◦ Under the Details region onthe Parameters tab of theRun Plan dialog box, selectRefresh with current data.
◦ Select the Generate forecastand Calculate policyparameters check boxes.
Messages Dealing with Other IssuesThis table lists plan messages that deal with other issues:
Message Meaning Corrective Action
The following number of items inORG {ORG} were discarded becausetheir planning method isn't set toReplenishment Planning: {COUNT}.
Indicates the number of items in thelocation for which replenishment planningisn't done.
The items are ignored because their MPSand MRP Planning Method attribute isn'tset to Replenishment planning in ProductManagement.
Perform these steps:
1. Set the attribute for the items inProduct Management.
2. Run the collections process.3. Run the replenishment plan:
◦ Under the Details region onthe Parameters tab of theRun Plan dialog box, selectRefresh with current data.
◦ Select the Generateforecast, Calculate policyparameters, and Calculatereplenishments checkboxes.
The plan created 10 supplies on a singleday for item {ITEM} in organization {ORG}.Check the order modifiers.
Indicates that 10 replenishment orders arecreated for the item-location combinationon a day.
This plan message is displayed because ofthese reasons:
• The fixed order quantity ordermodifier or EOQ is used with a verysmall value, and many plannedorders with small quantities aregenerated.
• For reducing the number ofplanned orders and improving thereplenishment plan performance,the first nine planned orders aregenerated according to the ordermodifiers, and the remainingplanned orders are grouped intothe tenth planned order.
Perform these steps:
1. Review and modify the value in theFixed Order Quantity column of theItems table for the item-locationcombination.
Otherwise, review and modify theinputs for calculating the EOQ ordefault EOQ for the item-locationcombination.
2. Run the replenishment plan:
◦ Under the Details region onthe Parameters tab of theRun Plan dialog box, selectRefresh with current data.
◦ Select the Calculatereplenishments check box.

Oracle Supply Chain Management CloudUsing Replenishment Planning
Chapter 12Replenishment Plans
227
Message Meaning Corrective Action
The tenth planned order mightviolate the order modifiers andtherefore won't be released.
Policy parameters weren't found forsegment {SEGMENT}. Policies weren'tcalculated for the item and locationcombinations that were part of thissegment.
Indicates that replenishment policiesaren't calculated for the item-locationcombinations in the segment.
In the policy assignment set that'sattached to the replenishment plan,policy parameters aren't specified forthe segment. Therefore, no policiesare calculated for the item-locationcombinations in the segment.
Perform these steps:
1. In the policy assignment set, specifypolicy parameters for the segment.
2. Run the replenishment plan:
◦ Under the Details region onthe Parameters tab of theRun Plan dialog box, selectRefresh with current data.
◦ Select the Calculate policyparameters check box.
EOQ wasn't calculated for item {ITEM}in organization {ORG}. Check Item costcomponents.
Indicates that the EOQ isn't calculated forthe item-location combination.
This plan message is displayed because ofthese reasons:
• In the policy assignment set that'sattached to the replenishment plan,for the segment to which the item-location combination belongs, thepolicy type is one of the following:
◦ Reorder point (ROP) andEOQ
◦ Min-max planning orfixed order cycle, andthe maximum quantitycalculation method isminimum plus EOQ.
• For the segment to which the item-location combination belongs,the default EOQ isn't specifiedon the Default Policy Parameterssubtab of the Segment-Level PolicyParameters Assignment tab in thepolicy assignment set.
• The fixed cost per order isn'tavailable for the item-locationcombination in the Order Costcolumn of the Items table.
• The annual carrying cost isn'tavailable for the item-locationcombination in the Annual CarryingCost Percentage column of theItems table.
• The standard cost isn't available forthe item-location combination inthe Standard Cost column of theItem table, or the default standardcost isn't specified for the segment
Perform these steps:
1. Check that values are present forthe item-location combinationin the Items table for the variouscomponents of the formula for EOQcalculation.
2. If any values are missing in theItems table, do one of these steps:
◦ Provide the values in theItems table.
◦ In the policy assignment set,enter the required defaultsfor the EOQ formula or thedefault EOQ for the segmentto which the item-locationcombination belongs.
3. Run the replenishment plan:
◦ Under the Details region onthe Parameters tab of theRun Plan dialog box, selectRefresh with current data.
◦ Select the Calculate policyparameters check box.

Oracle Supply Chain Management CloudUsing Replenishment Planning
Chapter 12Replenishment Plans
228
Message Meaning Corrective Action
on the Default Policy Parameterssubtab.
Forecast and policy values haven't beencalculated for items in organization {ORG}.
Valid manufacturing calendar dataisn't available for the organization.To get the forecast and policy values,collect the calendar data, and rerun thereplenishment plan.
Indicates that the forecast and policyvalues aren't calculated for the items in thespecified location.
This plan message is displayed becausethe manufacturing calendar isn't availablefor the location.
Perform these steps:
1. Ensure that the manufacturingcalendar is available for thelocation.
2. Run the collections process.3. Run the replenishment plan:
◦ Under the Details region onthe Parameters tab of theRun Plan dialog box, selectRefresh with current data.
◦ Select the Generateforecast, Calculate policyparameters, and Calculatereplenishments checkboxes.
Related Topics
• How Safety Stock Is Calculated in Oracle Fusion Replenishment Planning
• How Average Daily Demand Is Calculated in Oracle Fusion Replenishment Planning
• Policy Assignment Sets
• How EOQ Is Calculated in Oracle Fusion Replenishment Planning

Oracle Supply Chain Management CloudUsing Replenishment Planning
Chapter 13Calculation and Release of Replenishment Orders
229
13 Calculation and Release of ReplenishmentOrders
Overview of Replenishment Order ReleaseThis topic provides an overview of how replenishment orders are calculated and released.
While setting up your replenishment plan, on the General subtab of the Supply tab of the Plan Options page, you canchoose to release replenishment orders automatically or manually after the plan run.
The released replenishment orders are sent to Oracle Fusion Supply Chain Orchestration, from where the buy orders arereleased to Oracle Fusion Procurement and transfer orders to Oracle Fusion Inventory Management. The replenishmentorders can also be released to external source systems as CSV files.
These are some points to note about replenishment orders:
• Replenishment orders are generated on the basis of policies.
• Replenishment orders are forward-planned according to unconstrained, supply planning logic.
• Once replenishment orders are released, they can't be rescheduled or canceled from the ReplenishmentPlanning work area.
• Reservations, supplier capacity, planning time fences, and demand time fences aren't supported in OracleFusion Replenishment Planning.
• When a planned transfer order is created, the corresponding dependent demand isn't directly created in thesource organization. Instead, when the released transfer order is collected, dependent demand is created in thesource organization.
Related Topics• Automatic Release Options
Measures Used for Calculating Replenishment OrdersThis topic lists the measures that are used for calculating replenishment orders.
Measure Description
Beginning Inventory Position This measure indicates the projected inventory at the beginning of a plan bucket for an item-location combination and drives the creation of replenishment orders.
The calculation of the measure is determined by the selection in the Time Horizon forDemand list on the General subtab of the Supply tab of the Plan Options page for areplenishment plan:
• If the selection is Item lead time, the measure is calculated as follows: ProjectedAvailable Balance + On Order - demand during item lead time.
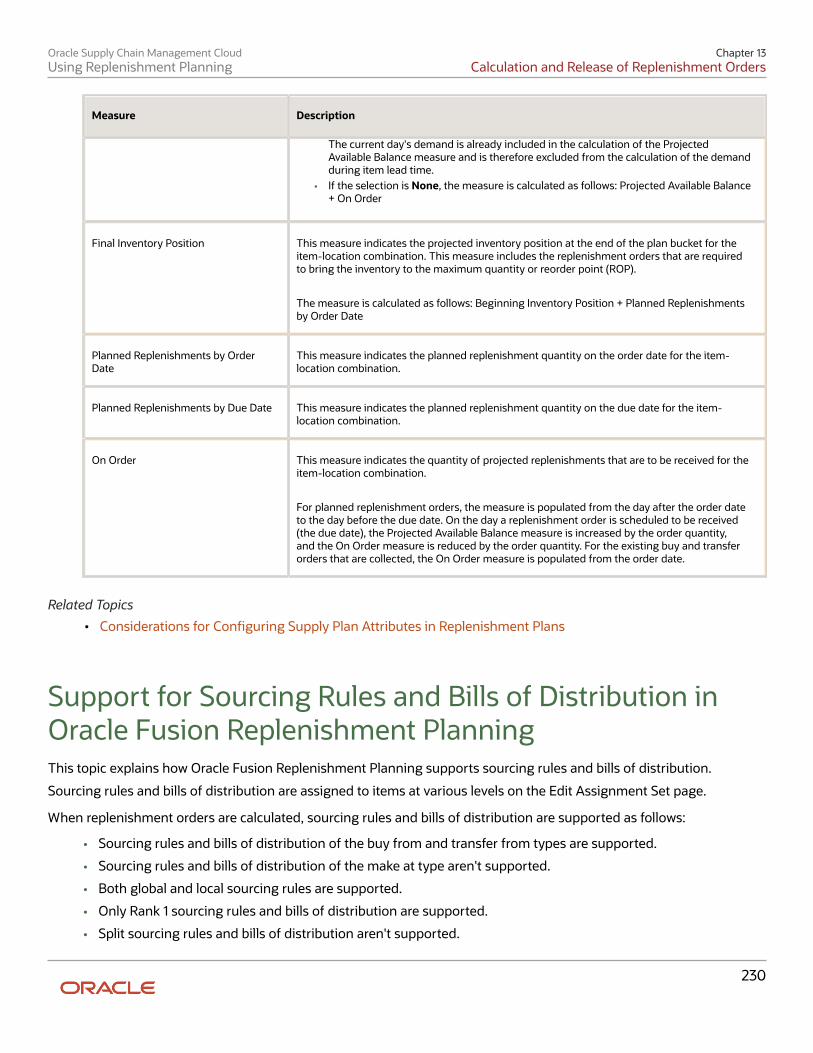
Oracle Supply Chain Management CloudUsing Replenishment Planning
Chapter 13Calculation and Release of Replenishment Orders
230
Measure Description
The current day's demand is already included in the calculation of the ProjectedAvailable Balance measure and is therefore excluded from the calculation of the demandduring item lead time.
• If the selection is None, the measure is calculated as follows: Projected Available Balance+ On Order
Final Inventory Position This measure indicates the projected inventory position at the end of the plan bucket for theitem-location combination. This measure includes the replenishment orders that are requiredto bring the inventory to the maximum quantity or reorder point (ROP).
The measure is calculated as follows: Beginning Inventory Position + Planned Replenishmentsby Order Date
Planned Replenishments by OrderDate
This measure indicates the planned replenishment quantity on the order date for the item-location combination.
Planned Replenishments by Due Date This measure indicates the planned replenishment quantity on the due date for the item-location combination.
On Order This measure indicates the quantity of projected replenishments that are to be received for theitem-location combination.
For planned replenishment orders, the measure is populated from the day after the order dateto the day before the due date. On the day a replenishment order is scheduled to be received(the due date), the Projected Available Balance measure is increased by the order quantity,and the On Order measure is reduced by the order quantity. For the existing buy and transferorders that are collected, the On Order measure is populated from the order date.
Related Topics
• Considerations for Configuring Supply Plan Attributes in Replenishment Plans
Support for Sourcing Rules and Bills of Distribution inOracle Fusion Replenishment PlanningThis topic explains how Oracle Fusion Replenishment Planning supports sourcing rules and bills of distribution.
Sourcing rules and bills of distribution are assigned to items at various levels on the Edit Assignment Set page.
When replenishment orders are calculated, sourcing rules and bills of distribution are supported as follows:
• Sourcing rules and bills of distribution of the buy from and transfer from types are supported.
• Sourcing rules and bills of distribution of the make at type aren't supported.
• Both global and local sourcing rules are supported.
• Only Rank 1 sourcing rules and bills of distribution are supported.
• Split sourcing rules and bills of distribution aren't supported.
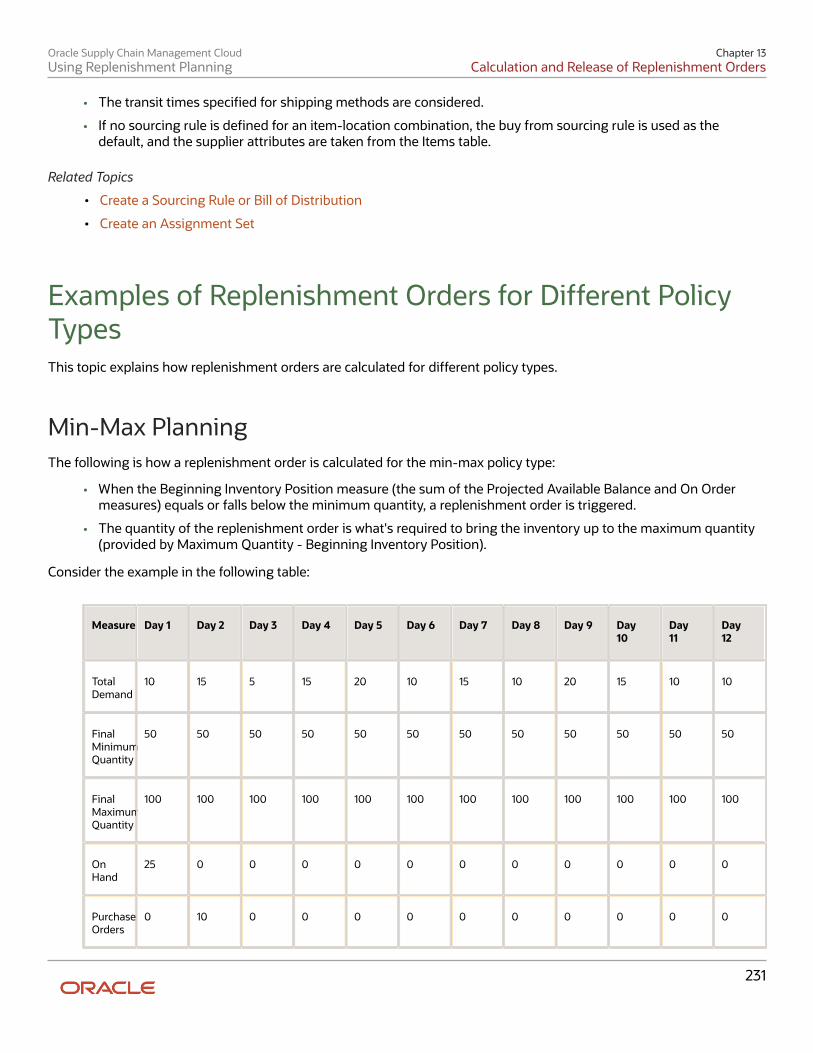
Oracle Supply Chain Management CloudUsing Replenishment Planning
Chapter 13Calculation and Release of Replenishment Orders
231
• The transit times specified for shipping methods are considered.
• If no sourcing rule is defined for an item-location combination, the buy from sourcing rule is used as thedefault, and the supplier attributes are taken from the Items table.
Related Topics
• Create a Sourcing Rule or Bill of Distribution
• Create an Assignment Set
Examples of Replenishment Orders for Different PolicyTypesThis topic explains how replenishment orders are calculated for different policy types.
Min-Max PlanningThe following is how a replenishment order is calculated for the min-max policy type:
• When the Beginning Inventory Position measure (the sum of the Projected Available Balance and On Ordermeasures) equals or falls below the minimum quantity, a replenishment order is triggered.
• The quantity of the replenishment order is what's required to bring the inventory up to the maximum quantity(provided by Maximum Quantity - Beginning Inventory Position).
Consider the example in the following table:
Measure Day 1 Day 2 Day 3 Day 4 Day 5 Day 6 Day 7 Day 8 Day 9 Day10
Day11
Day12
TotalDemand
10 15 5 15 20 10 15 10 20 15 10 10
FinalMinimumQuantity
50 50 50 50 50 50 50 50 50 50 50 50
FinalMaximumQuantity
100 100 100 100 100 100 100 100 100 100 100 100
OnHand
25 0 0 0 0 0 0 0 0 0 0 0
PurchaseOrders
0 10 0 0 0 0 0 0 0 0 0 0

Oracle Supply Chain Management CloudUsing Replenishment Planning
Chapter 13Calculation and Release of Replenishment Orders
232
Measure Day 1 Day 2 Day 3 Day 4 Day 5 Day 6 Day 7 Day 8 Day 9 Day10
Day11
Day12
TotalSupply
25 10 0 75 0 0 0 55 0 0 0 55
ProjectedAvailableBalance
15 10 5 65 45 35 20 65 45 30 20 65
OnOrder
10 75 75 0 0 55 55 0 0 55 55 0
BeginningInventoryPosition
25 85 80 65 45 90 75 65 45 85 75 65
PlannedReplenishmentsbyOrderDate
75 0 0 0 55 0 0 0 55 0 0 0
PlannedReplenishmentsbyDueDate
0 0 0 75 0 0 0 55 0 0 0 55
FinalInventoryPosition
100 85 80 65 100 90 75 65 100 85 75 65
The Beginning Inventory Position measure is evaluated every day. On Day 1, the Beginning Inventory Position measureis 25 units, which is less than the Final Minimum Quantity measure of 50 units. Therefore, a replenishment order of75 units is created (Final Maximum Quantity - Beginning Inventory Position). The order date is Day 1, and the itemlead time is 3 days. Therefore, the Planned Replenishments by Due Date measure is updated for Day 4, while the OnOrder measure reflects 75 units on Days 2 and 3. On Day 4, the order is received in the inventory, and the Total Supplymeasure is updated.
The sequence is repeated on Days 5 and 9.
Fixed Order CycleThe following is how a replenishment order is calculated for the fixed order cycle policy type:
• The replenishment orders are placed on only the open days defined in the associated fixed order cycle calendar.
• When the Beginning Inventory Position measure (the sum of the Projected Available Balance and On Ordermeasures) falls below the maximum quantity, a replenishment order is triggered.

Oracle Supply Chain Management CloudUsing Replenishment Planning
Chapter 13Calculation and Release of Replenishment Orders
233
• The quantity of the replenishment order is what's required to bring the inventory up to the maximum quantity(provided by Maximum Quantity - Beginning Inventory Position).
Consider the example in the following table:
Measure Day 1 Day 2 Day 3 Day 4 Day 5 Day 6 Day 7 Day 8 Day 9 Day10
Day11
Day12
TotalDemand
10 15 5 15 20 10 15 10 20 15 10 10
FinalMaximumQuantity
100 100 100 100 100 100 100 100 100 100 100 100
OnHand
25 0 0 0 0 0 0 0 0 0 0 0
PurchaseOrders
0 10 0 0 0 0 0 0 0 0 0 0
TotalSupply
25 10 0 75 0 0 0 0 0 0 90 0
ProjectedAvailableBalance
15 10 5 65 45 35 20 10 - 10 -25 55 45
OnOrder
10 75 75 0 0 0 0 0 90 90 0 0
BeginningInventoryPosition
25 85 80 65 45 35 20 10 80 65 55 45
PlannedReplenishmentsbyOrderDate
75 0 0 0 0 0 0 90 0 0 0 0
PlannedReplenishmentsbyDueDate
0 0 0 75 0 0 0 0 0 0 90 0
FinalInventoryPosition
100 85 80 65 45 35 20 100 80 65 55 45
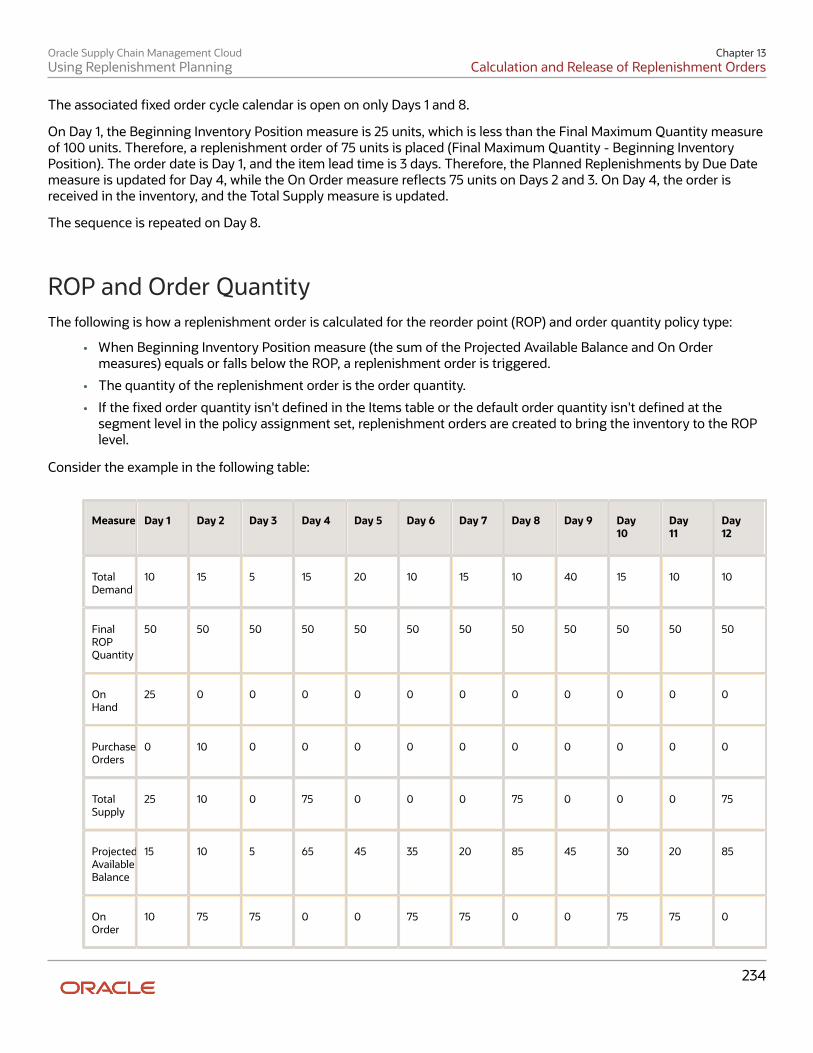
Oracle Supply Chain Management CloudUsing Replenishment Planning
Chapter 13Calculation and Release of Replenishment Orders
234
The associated fixed order cycle calendar is open on only Days 1 and 8.
On Day 1, the Beginning Inventory Position measure is 25 units, which is less than the Final Maximum Quantity measureof 100 units. Therefore, a replenishment order of 75 units is placed (Final Maximum Quantity - Beginning InventoryPosition). The order date is Day 1, and the item lead time is 3 days. Therefore, the Planned Replenishments by Due Datemeasure is updated for Day 4, while the On Order measure reflects 75 units on Days 2 and 3. On Day 4, the order isreceived in the inventory, and the Total Supply measure is updated.
The sequence is repeated on Day 8.
ROP and Order QuantityThe following is how a replenishment order is calculated for the reorder point (ROP) and order quantity policy type:
• When Beginning Inventory Position measure (the sum of the Projected Available Balance and On Ordermeasures) equals or falls below the ROP, a replenishment order is triggered.
• The quantity of the replenishment order is the order quantity.
• If the fixed order quantity isn't defined in the Items table or the default order quantity isn't defined at thesegment level in the policy assignment set, replenishment orders are created to bring the inventory to the ROPlevel.
Consider the example in the following table:
Measure Day 1 Day 2 Day 3 Day 4 Day 5 Day 6 Day 7 Day 8 Day 9 Day10
Day11
Day12
TotalDemand
10 15 5 15 20 10 15 10 40 15 10 10
FinalROPQuantity
50 50 50 50 50 50 50 50 50 50 50 50
OnHand
25 0 0 0 0 0 0 0 0 0 0 0
PurchaseOrders
0 10 0 0 0 0 0 0 0 0 0 0
TotalSupply
25 10 0 75 0 0 0 75 0 0 0 75
ProjectedAvailableBalance
15 10 5 65 45 35 20 85 45 30 20 85
OnOrder
10 75 75 0 0 75 75 0 0 75 75 0

Oracle Supply Chain Management CloudUsing Replenishment Planning
Chapter 13Calculation and Release of Replenishment Orders
235
Measure Day 1 Day 2 Day 3 Day 4 Day 5 Day 6 Day 7 Day 8 Day 9 Day10
Day11
Day12
BeginningInventoryPosition
25 85 80 65 45 110 95 85 45 105 95 85
PlannedReplenishmentsbyOrderDate
75 0 0 0 75 0 0 0 75 0 0 0
PlannedReplenishmentsbyDueDate
0 0 0 75 0 0 0 75 0 0 0 75
FinalInventoryPosition
100 85 80 65 120 110 95 85 120 105 95 85
The order quantity is 75 units, and the Beginning Inventory Position measure is evaluated every day.
On Day 1, the Beginning Inventory Position measure is 25 units, which is less than the Final ROP Quantity measure of 50units. Therefore, a replenishment order of 75 units (the order quantity) is placed. The order date is Day 1, and the itemlead time is 3 days. Therefore, the Planned Replenishments by Due Date measure is updated for Day 4, while the OnOrder measure reflects 75 units on Days 2 and 3. On Day 4, the order is received in the inventory, and the Total Supplymeasure is updated.
The sequence is repeated on Days 5 and 9.
ROP and EOQThe following is how a replenishment order is calculated for the ROP and economic order quantity (EOQ) policy type:
• When the Beginning Inventory Position measure (the sum of the Projected Available Balance and On Ordermeasures) equals or falls below the ROP, a replenishment order is triggered.
• The quantity of the replenishment order is the EOQ.
• If the EOQ can't be calculated at the item-location level or the default EOQ isn't defined at the segment level inthe policy assignment set, replenishment orders are created to bring the inventory to the ROP level.
Consider the example in the following table:

Oracle Supply Chain Management CloudUsing Replenishment Planning
Chapter 13Calculation and Release of Replenishment Orders
236
Measure Day 1 Day 2 Day 3 Day 4 Day 5 Day 6 Day 7 Day 8 Day 9 Day10
Day11
Day12
TotalDemand
10 15 5 15 20 10 15 10 40 15 10 10
FinalROPQuantity
50 50 50 50 50 50 50 50 50 50 50 50
OnHand
25 0 0 0 0 0 0 0 0 0 0 0
PurchaseOrders
0 10 0 0 0 0 0 0 0 0 0 0
TotalSupply
25 10 0 75 0 0 0 75 0 0 0 75
ProjectedAvailableBalance
15 10 5 65 45 35 20 85 45 30 20 85
OnOrder
10 75 75 0 0 75 75 0 0 75 75 0
BeginningInventoryPosition
25 85 80 65 45 110 95 85 45 105 95 85
PlannedReplenishmentsbyOrderDate
75 0 0 0 75 0 0 0 75 0 0 0
PlannedReplenishmentsbyDueDate
0 0 0 75 0 0 0 75 0 0 0 75
FinalInventoryPosition
100 85 80 65 120 110 95 85 120 105 95 85
The EOQ is 75 units, and the Beginning Inventory Position measure is evaluated every day.
On Day 1, the Beginning Inventory Position measure is 25 units, which is less than the Final ROP Quantity measure of 50units. Therefore, a replenishment order of 75 units (the EOQ) is placed. The order date is Day 1, and the item lead time is3 days. Therefore, the Planned Replenishments by Due Date measure is updated for Day 4, while the On Order measure

Oracle Supply Chain Management CloudUsing Replenishment Planning
Chapter 13Calculation and Release of Replenishment Orders
237
reflects 75 units on Days 2 and 3. On Day 4, the order is received in the inventory, and the Total Supply measure isupdated.
The sequence is repeated on Days 5 and 9.
Related Topics
• Policy Assignment Sets
How Order Modifiers Are Applied When ReplenishmentsAre CalculatedThis topic explains how order modifiers are applied when replenishments are calculated for a replenishment plan.
Settings That Affect How Order Modifiers Are Applied toReplenishmentsThe policy type specified in the policy assignment set that's attached to the replenishment plan affects how ordermodifiers are applied to the calculated replenishments.
How Order Modifiers Are Applied to Replenishments
This table describes how order modifiers are applied to replenishments calculated for the replenishment plan when thepolicies are of different types:
Policy Type How Order Modifiers Are Applied Example
Min-max planning The order modifiers specified in the FixedLot Multiplier, Minimum Order Quantity,Maximum Order Quantity, and FixedOrder Quantity columns of the Items tableare applied to the replenishment orderquantity.
The minimum order quantity and fixedlot multiplier can also be defined at thesupplier level.
Here's how the modifiers are used:
• If the replenishment order quantityis less than the minimum orderquantity, the former is increased tothe latter.
If the minimum quantity is 50, maximumquantity is 100, beginning inventoryposition (sum of the projected availablebalance and on order quantity) is 40,and fixed order quantity is 50, thereplenishment order quantity is 60 (100 -40). Two replenishment orders of 50 eachare created.

Oracle Supply Chain Management CloudUsing Replenishment Planning
Chapter 13Calculation and Release of Replenishment Orders
238
Policy Type How Order Modifiers Are Applied Example
• If the replenishment order quantityis more than the maximum orderquantity, the former is decreased tothe latter.
• If the replenishment order quantityisn't a multiple of the fixed lotmultiplier, the former is convertedinto a multiple of the latter.
• If the fixed order quantityis defined, it's used as thereplenishment order quantity.
Fixed order cycle The order modifiers are specified andused as explained for the min-maxplanning policy type.
If the maximum quantity is 100, beginninginventory position (sum of the projectedavailable balance and on order quantity)is 80, and fixed lot multiplier is 50, thereplenishment order quantity is 20 (100- 80). One replenishment order of 50 iscreated.
Reorder point (ROP) and order quantity Not applicable Not applicable
ROP and economic order quantity (EOQ) Not applicable Not applicable
For buy orders, the order modifiers and lead times defined at the item-supplier level are considered before thosedefined at the item-organization level.
Aggregate Planning Buckets and Replenishment OrdersThis topic explains how aggregate planning buckets are used with replenishment orders.
Replenishment Calculation in Aggregate Planning BucketsFor planning buckets at a time level higher than a day, the following is how replenishments are calculated:
• Policies and replenishments are calculated at the daily level and subsequently aggregated and published at thebucket level.
• Measure values are aggregated and displayed at the bucket level.
• Replenishment orders and demands are pushed to the ends of the aggregate planning buckets.
On the General subtab of the Supply tab of the Plan Options page for a replenishment plan, if Yes is selected inAggregate Planned Orders, the planned orders for each day are aggregated into one large order that's pushedto the end of the aggregate planning bucket. While the number of planned orders is reduced, order modifiersmay be violated.
If No is selected, the planned orders generated daily are pushed to the end of the aggregate planning bucket.These planned orders aren't aggregated into one large order and don't violate order modifiers.

Oracle Supply Chain Management CloudUsing Replenishment Planning
Chapter 13Calculation and Release of Replenishment Orders
239
However, if the fixed order quantity order modifier or economic order quantity (EOQ) is used with a very smallvalue, the replenishment plan might generate too many planned orders with small quantities. For reducing thenumber of planned orders and improving the replenishment plan performance, the first nine planned ordersare generated according to the order modifiers, and the tenth planned order is generated for the remainingquantities and may violate the order modifiers. The tenth planned order can't be released. The generatedorders are pushed to the end of the aggregate planning bucket, and this process is followed on every day of theaggregate planning bucket.
• If a replenishment plan with a planning time level higher than a day is used for releasing replenishment orders,the bucket start dates are used as the dock dates.
Normally, such a plan isn't used for releasing replenishment orders.
Example of Replenishment Calculation for Weekly Planning BucketsIn this example, replenishments are calculated for a replenishment plan with weekly planning buckets for the min-maxplanning policy type. The Minimum Quantity measure is 50 units, and the Maximum Quantity measure is 100 units.
Measure Day1
Day2
Day3
Day4
Day5
Day6
Day7
Day8
Day9
Day10
Day11
Day12
Day13
Day14
GrossForecast
0 0 0 0 0 0 70 0 0 0 0 0 0 140
TotalDemand
10 10 10 10 10 10 10 20 20 20 20 20 20 20
OnHand
25 0 0 0 0 0 0 0 0 0 0 0 0 0
PurchaseOrders
0 10 0 0 0 0 0 0 0 0 0 0 0 0
TotalSupply
25 10 0 75 0 0 0 0 0 60 0 0 60 0
ProjectedAvailableBalance
15 15 5 70 60 50 40 20 0 40 20 0 40 20
OnOrder
10 75 75 0 0 0 0 60 60 0 60 60 0 60
BeginningInventoryPosition
25 90 80 70 60 50 40 80 60 40 80 60 40 80
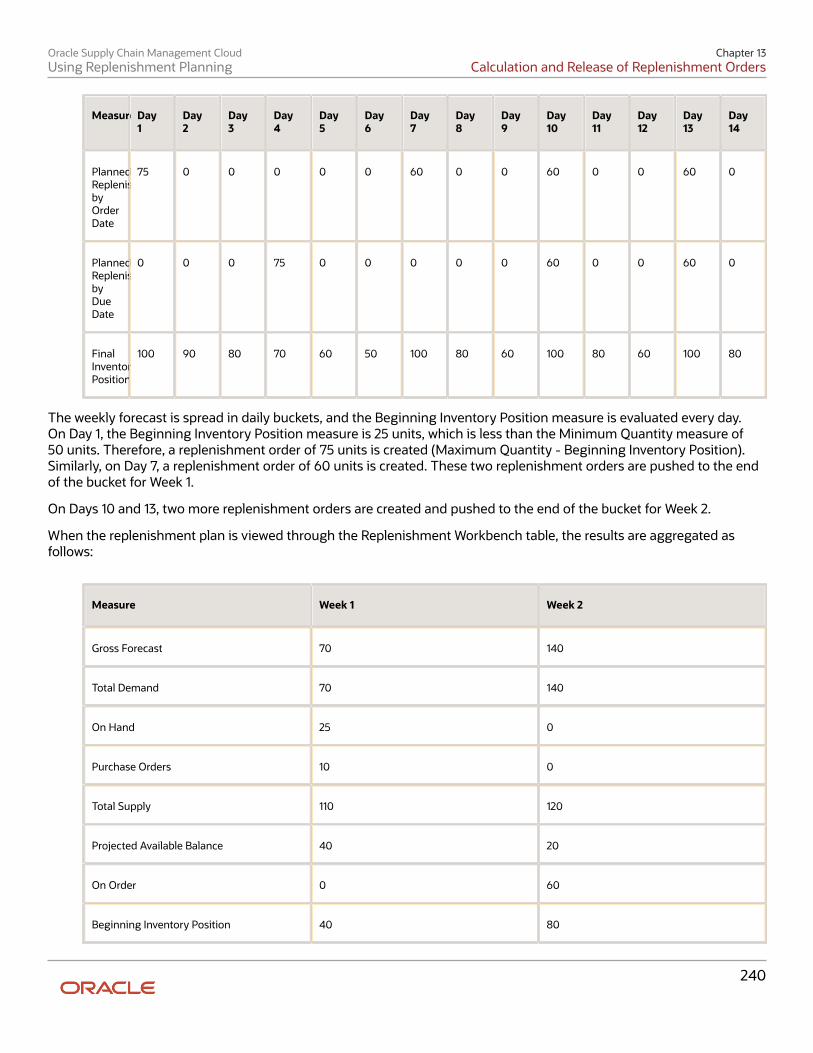
Oracle Supply Chain Management CloudUsing Replenishment Planning
Chapter 13Calculation and Release of Replenishment Orders
240
Measure Day1
Day2
Day3
Day4
Day5
Day6
Day7
Day8
Day9
Day10
Day11
Day12
Day13
Day14
PlannedReplenishmentsbyOrderDate
75 0 0 0 0 0 60 0 0 60 0 0 60 0
PlannedReplenishmentsbyDueDate
0 0 0 75 0 0 0 0 0 60 0 0 60 0
FinalInventoryPosition
100 90 80 70 60 50 100 80 60 100 80 60 100 80
The weekly forecast is spread in daily buckets, and the Beginning Inventory Position measure is evaluated every day.On Day 1, the Beginning Inventory Position measure is 25 units, which is less than the Minimum Quantity measure of50 units. Therefore, a replenishment order of 75 units is created (Maximum Quantity - Beginning Inventory Position).Similarly, on Day 7, a replenishment order of 60 units is created. These two replenishment orders are pushed to the endof the bucket for Week 1.
On Days 10 and 13, two more replenishment orders are created and pushed to the end of the bucket for Week 2.
When the replenishment plan is viewed through the Replenishment Workbench table, the results are aggregated asfollows:
Measure Week 1 Week 2
Gross Forecast 70 140
Total Demand 70 140
On Hand 25 0
Purchase Orders 10 0
Total Supply 110 120
Projected Available Balance 40 20
On Order 0 60
Beginning Inventory Position 40 80
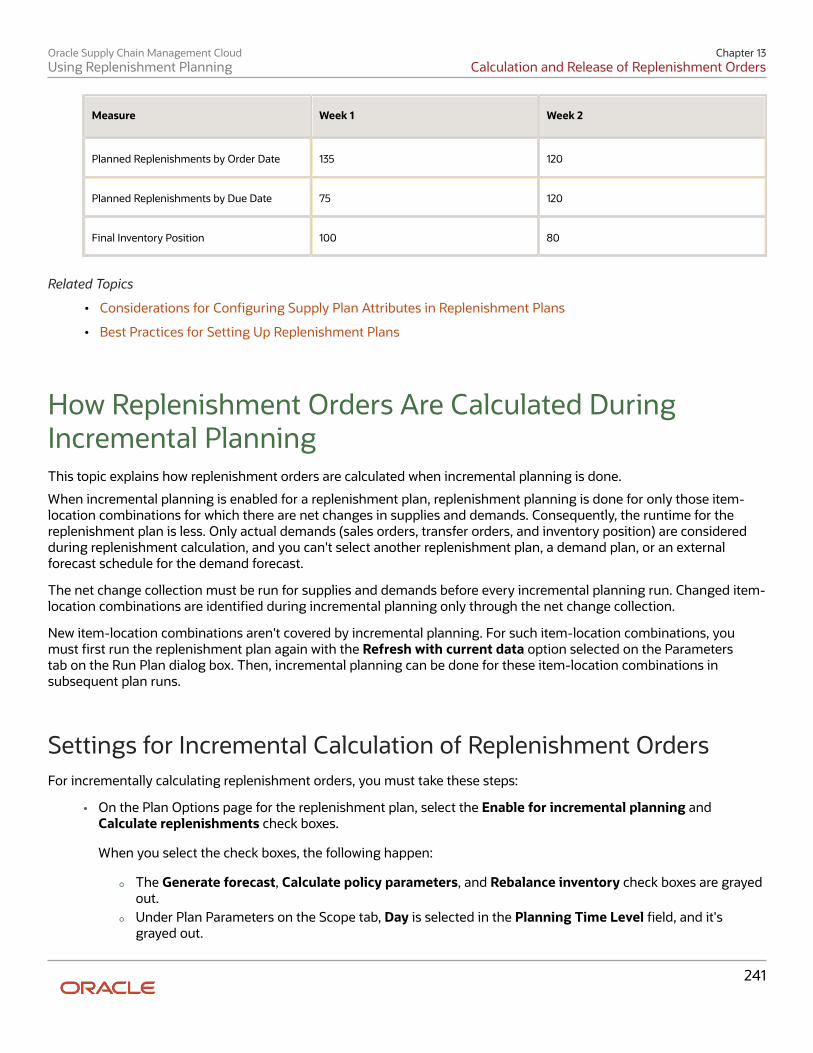
Oracle Supply Chain Management CloudUsing Replenishment Planning
Chapter 13Calculation and Release of Replenishment Orders
241
Measure Week 1 Week 2
Planned Replenishments by Order Date 135 120
Planned Replenishments by Due Date 75 120
Final Inventory Position 100 80
Related Topics
• Considerations for Configuring Supply Plan Attributes in Replenishment Plans
• Best Practices for Setting Up Replenishment Plans
How Replenishment Orders Are Calculated DuringIncremental PlanningThis topic explains how replenishment orders are calculated when incremental planning is done.
When incremental planning is enabled for a replenishment plan, replenishment planning is done for only those item-location combinations for which there are net changes in supplies and demands. Consequently, the runtime for thereplenishment plan is less. Only actual demands (sales orders, transfer orders, and inventory position) are consideredduring replenishment calculation, and you can't select another replenishment plan, a demand plan, or an externalforecast schedule for the demand forecast.
The net change collection must be run for supplies and demands before every incremental planning run. Changed item-location combinations are identified during incremental planning only through the net change collection.
New item-location combinations aren't covered by incremental planning. For such item-location combinations, youmust first run the replenishment plan again with the Refresh with current data option selected on the Parameterstab on the Run Plan dialog box. Then, incremental planning can be done for these item-location combinations insubsequent plan runs.
Settings for Incremental Calculation of Replenishment OrdersFor incrementally calculating replenishment orders, you must take these steps:
• On the Plan Options page for the replenishment plan, select the Enable for incremental planning andCalculate replenishments check boxes.
When you select the check boxes, the following happen:
◦ The Generate forecast, Calculate policy parameters, and Rebalance inventory check boxes are grayedout.
◦ Under Plan Parameters on the Scope tab, Day is selected in the Planning Time Level field, and it'sgrayed out.
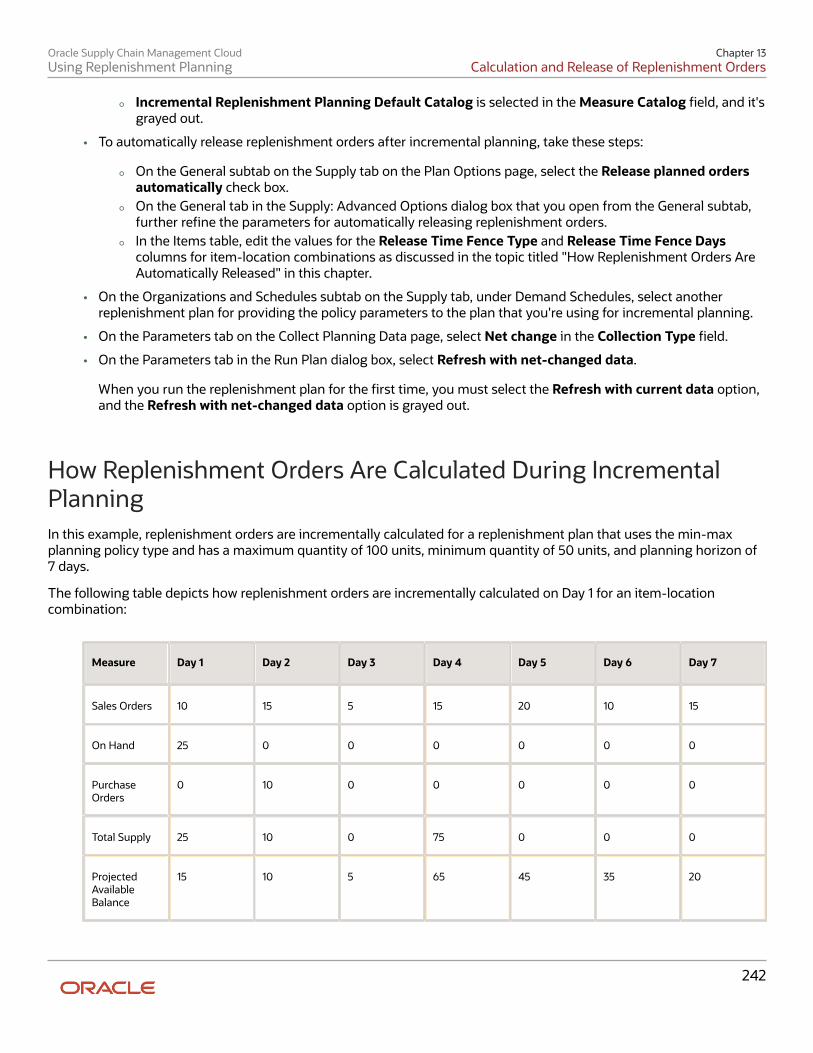
Oracle Supply Chain Management CloudUsing Replenishment Planning
Chapter 13Calculation and Release of Replenishment Orders
242
◦ Incremental Replenishment Planning Default Catalog is selected in the Measure Catalog field, and it'sgrayed out.
• To automatically release replenishment orders after incremental planning, take these steps:
◦ On the General subtab on the Supply tab on the Plan Options page, select the Release planned ordersautomatically check box.
◦ On the General tab in the Supply: Advanced Options dialog box that you open from the General subtab,further refine the parameters for automatically releasing replenishment orders.
◦ In the Items table, edit the values for the Release Time Fence Type and Release Time Fence Dayscolumns for item-location combinations as discussed in the topic titled "How Replenishment Orders AreAutomatically Released" in this chapter.
• On the Organizations and Schedules subtab on the Supply tab, under Demand Schedules, select anotherreplenishment plan for providing the policy parameters to the plan that you're using for incremental planning.
• On the Parameters tab on the Collect Planning Data page, select Net change in the Collection Type field.
• On the Parameters tab in the Run Plan dialog box, select Refresh with net-changed data.
When you run the replenishment plan for the first time, you must select the Refresh with current data option,and the Refresh with net-changed data option is grayed out.
How Replenishment Orders Are Calculated During IncrementalPlanningIn this example, replenishment orders are incrementally calculated for a replenishment plan that uses the min-maxplanning policy type and has a maximum quantity of 100 units, minimum quantity of 50 units, and planning horizon of7 days.
The following table depicts how replenishment orders are incrementally calculated on Day 1 for an item-locationcombination:
Measure Day 1 Day 2 Day 3 Day 4 Day 5 Day 6 Day 7
Sales Orders 10 15 5 15 20 10 15
On Hand 25 0 0 0 0 0 0
PurchaseOrders
0 10 0 0 0 0 0
Total Supply 25 10 0 75 0 0 0
ProjectedAvailableBalance
15 10 5 65 45 35 20
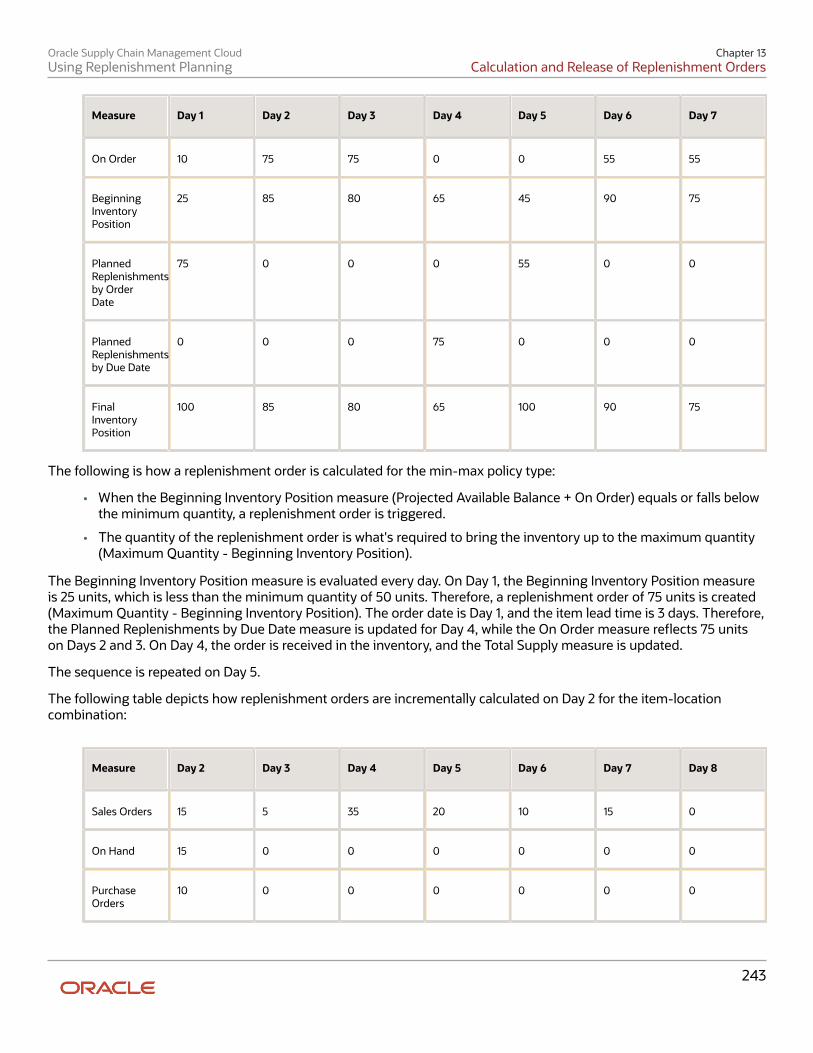
Oracle Supply Chain Management CloudUsing Replenishment Planning
Chapter 13Calculation and Release of Replenishment Orders
243
Measure Day 1 Day 2 Day 3 Day 4 Day 5 Day 6 Day 7
On Order 10 75 75 0 0 55 55
BeginningInventoryPosition
25 85 80 65 45 90 75
PlannedReplenishmentsby OrderDate
75 0 0 0 55 0 0
PlannedReplenishmentsby Due Date
0 0 0 75 0 0 0
FinalInventoryPosition
100 85 80 65 100 90 75
The following is how a replenishment order is calculated for the min-max policy type:
• When the Beginning Inventory Position measure (Projected Available Balance + On Order) equals or falls belowthe minimum quantity, a replenishment order is triggered.
• The quantity of the replenishment order is what's required to bring the inventory up to the maximum quantity(Maximum Quantity - Beginning Inventory Position).
The Beginning Inventory Position measure is evaluated every day. On Day 1, the Beginning Inventory Position measureis 25 units, which is less than the minimum quantity of 50 units. Therefore, a replenishment order of 75 units is created(Maximum Quantity - Beginning Inventory Position). The order date is Day 1, and the item lead time is 3 days. Therefore,the Planned Replenishments by Due Date measure is updated for Day 4, while the On Order measure reflects 75 unitson Days 2 and 3. On Day 4, the order is received in the inventory, and the Total Supply measure is updated.
The sequence is repeated on Day 5.
The following table depicts how replenishment orders are incrementally calculated on Day 2 for the item-locationcombination:
Measure Day 2 Day 3 Day 4 Day 5 Day 6 Day 7 Day 8
Sales Orders 15 5 35 20 10 15 0
On Hand 15 0 0 0 0 0 0
PurchaseOrders
10 0 0 0 0 0 0

Oracle Supply Chain Management CloudUsing Replenishment Planning
Chapter 13Calculation and Release of Replenishment Orders
244
Measure Day 2 Day 3 Day 4 Day 5 Day 6 Day 7 Day 8
Total Supply 25 0 75 0 0 55 0
ProjectedAvailableBalance
10 5 45 25 15 55 55
On Order 75 75 0 55 55 0 0
BeginningInventoryPosition
85 80 45 80 70 55 55
PlannedReplenishmentsby OrderDate
0 0 55 0 0 0 0
PlannedReplenishmentsby Due Date
0 0 75 0 0 55 0
FinalInventoryPosition
85 80 100 80 70 55 55
Day 8 is added to the planning horizon. Day 4 has a new sales order. For that reason, the incremental planning isdone again for the item-location combination. If there had been no change in the supply and demand for the item-location combination, the measure values for Day 7 would have been copied as the measure values for Day 8, and noincremental planning would have been done.
Related Topics
• Scope Plan Options for Replenishment Plans
• Automatic Release Options
• Release Recommendation Options
• Organizations and Schedules Options for Replenishment Plans
• Data Collection Types for Supply Chain Planning

Oracle Supply Chain Management CloudUsing Replenishment Planning
Chapter 13Calculation and Release of Replenishment Orders
245
Scheduling of Replenishment OrdersThis topic explains how buy and transfer replenishment orders are scheduled.
Scheduling of Buy OrdersBuy orders are forward scheduled from the suggested order date.
These points govern the scheduling of buy orders:
• All valid shipping, organization receiving, supplier, transit, and manufacturing calendars are considered.
• The processing lead time defined at the supplier level is first considered. Otherwise, the processing lead timedefined in the Items table is considered. The preprocessing and postprocessing lead times defined in the Itemstable are also considered.
• The preprocessing and postprocessing lead times are calculated according to the manufacturing calendar.
• The transit time is calculated according to the transit calendar.
• The processing lead time is calculated according to the supplier calendar.
• Supplier capacity isn't considered.
This figure depicts how various dates are determined for a buy replenishment order. The preprocessing lead time isadded to the suggested order date for calculation of the suggested start date. The processing lead time is added tothe suggested start date for calculation of the suggested ship date. The transit time is added to the suggested shipdate for calculation of the suggested dock date. The postprocessing lead time is added to the suggested dock date forcalculation of the suggested due date.
PreprocessingLead Time
ProcessingLead Time
TransitTime
PostprocessingLead Time
SuggestedOrder Date
SuggestedStart Date
SuggestedShip Date
SuggestedDock Date
SuggestedDue Date
The suggested order date takes the manufacturing calendar into account, suggested start date takes the suppliercalendar into account, suggested ship date takes the supplier shipping calendar into account, suggested dock datetakes the organization receiving calendar into account, and suggested due date takes the manufacturing calendar intoaccount.
For example, if Saturday and Sunday aren't working days, the suggested dock date is Friday, and the postprocessinglead time is 1 day, the suggested due date is Monday.

Oracle Supply Chain Management CloudUsing Replenishment Planning
Chapter 13Calculation and Release of Replenishment Orders
246
Scheduling of Transfer OrdersTransfer orders are forward scheduled from the suggested order date.
These points govern the scheduling of transfer orders:
• All valid shipping, receiving, transit, and manufacturing calendars are considered.
• The preprocessing lead time defined at the source organization is considered.
• No processing lead time is considered.
• The transit time is taken from the shipping method specified in the sourcing rule.
• The postprocessing lead time defined at the destination organization is considered.
• The preprocessing and postprocessing lead times are calculated according to the manufacturing calendars ofthe source organization and destination organization respectively.
• The transit time is calculated according to the transit calendar.
This figure depicts how various dates are determined for a transfer replenishment order. The preprocessing lead time isadded to the suggested order date for calculation of the suggested start and suggested ship dates. The transit time isadded to the suggested start and ship dates for calculation of the suggested dock date. The postprocessing lead time isadded to the suggested dock date for calculation of the suggested due date.
PreprocessingLead Time
TransitTime
PostprocessingLead Time
SuggestedOrder Date
Suggested Startand Ship Dates
SuggestedDock Date
SuggestedDue Date
The suggested order date and suggested start date take the source organization's manufacturing calendar into account,suggested ship date takes the source organization's shipping calendar into account, suggested dock date takes thedestination organization's receiving calendar into account, and suggested due date takes the destination organization'smanufacturing calendar into account. The suggested start date and suggested ship date are the same.
For example, if Saturday and Sunday aren't working days, the suggested dock date is Friday, and the postprocessinglead time is 1 day, the suggested due date is Monday.

Oracle Supply Chain Management CloudUsing Replenishment Planning
Chapter 13Calculation and Release of Replenishment Orders
247
How Replenishment Orders Are Automatically ReleasedThis topic explains how replenishment orders are automatically released.
Settings That Affect Automatic Release of Replenishment OrdersFor automatically releasing replenishment orders from a replenishment plan, you must take these steps:
• Select the Release planned orders automatically check box on the General subtab of the Supply tab of thePlan Options page.
In the Supply: Advanced Options dialog box, on the General tab, further refine the parameters for automaticallyreleasing replenishment orders.
• In the Items table, for an item-location combination, set these columns:
◦ Release Time Fence Type: Select User-defined time fence or Item total lead time for this column.
◦ Release Time Fence Days: Enter the number of days in this column when the time fence is user-defined.When the time fence is determined by the item total lead time, the preprocessing lead time, processinglead time, and postprocessing lead time are added up and displayed under this column.
How Replenishment Orders Are Automatically ReleasedWhen the replenishment plan is run, the following is how replenishment orders are automatically released:
1. The suggested order date for a planned order for an item-location combination is considered.2. The release time fence days for the item-location combination are added to the plan start date for
determination of the release time fence date.3. When the suggested order date is earlier than or the same as the release time fence date, the replenishment
order is automatically released.
Related Topics• Automatic Release Options• Release Recommendation Options
Manually Release Replenishment OrdersThis topic explains how replenishment orders are manually released for a replenishment plan that's been run.
To manually release replenishment orders, you must use the Supplies and Demands page for the replenishment plan.Before manually releasing replenishment orders, you can edit them using one of the following:
• the Supplies and Demands page
• the edit-in-spreadsheet feature

Oracle Supply Chain Management CloudUsing Replenishment Planning
Chapter 13Calculation and Release of Replenishment Orders
248
Edit and Manually Release Replenishment Orders Using the GUIFollow these steps to edit and manually release a replenishment order using the Supplies and Demands page:
1. Open the replenishment plan through one of these ways:
◦ Use the Manage Plans page:i. On the Tasks panel tab, under Plans, select Manage Plans.
The Manage Plans page opens.ii. Under Search Results, select the replenishment plan that you want to open, and click Actions >
Open.The replenishment plan opens in a separate page.
◦ On the Plans panel tab, under Plans, right-click the replenishment plan that you want to open, and selectOpen.The replenishment plan opens in a separate page.
2. Click the Open drop-down button.The Open Table, Graph, or Tile Set dialog box opens.
3. Search for the Supplies and Demands table, and open it.The Supplies and Demands page opens under the replenishment plan.
4. Under Search, perform a search for item-location combinations for which the value in the Order Type column isPlanned order, and the value in the Release Status column is Release.The replenishment orders generated by the replenishment plan are listed as planned orders on the Suppliesand Demands page.The rows with values under the Source Organization column represent transfer orders, while the rows withvalues under the Supplier and Supplier Site columns represent purchase orders.
5. Select the item-location combination for which you want to manually release the replenishment order.
◦ Follow these steps to make changes before releasing the replenishment order:These changes are lost the next time you run the replenishment plan.
i. Under Search Results, click Actions > Mark for Release.The row is marked with the Changed icon, and the release status for the item-locationcombination changes to Marked for release.The quantity in the Order Quantity column is copied to the Implement Quantity column.
ii. If required, edit the values in the implementation-related and Shipping Method, SourceOrganization, Supplier, and Supplier Site columns.
◦ Follow these steps to firm the planned orders:
Note: You don't always have to firm planned orders before releasing them. Whether you firmplanned orders depends on your business requirements.
i. Under Search Results, click Actions > Mark for Release.
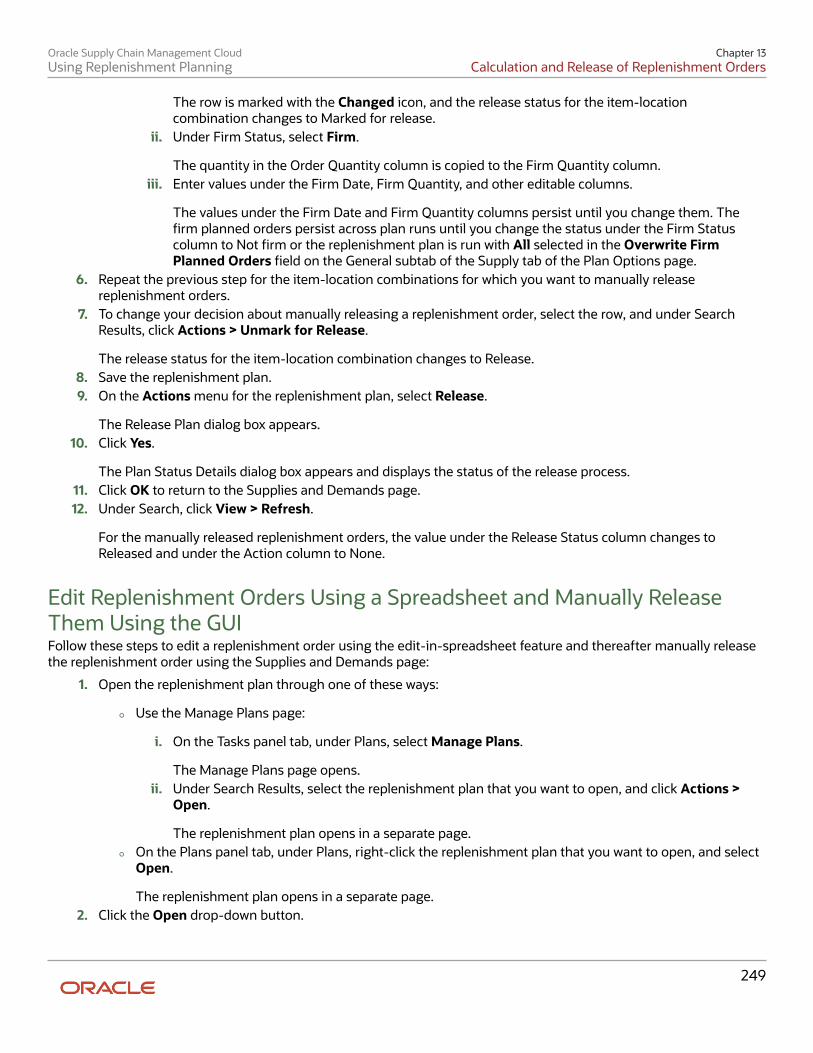
Oracle Supply Chain Management CloudUsing Replenishment Planning
Chapter 13Calculation and Release of Replenishment Orders
249
The row is marked with the Changed icon, and the release status for the item-locationcombination changes to Marked for release.
ii. Under Firm Status, select Firm.
The quantity in the Order Quantity column is copied to the Firm Quantity column.iii. Enter values under the Firm Date, Firm Quantity, and other editable columns.
The values under the Firm Date and Firm Quantity columns persist until you change them. Thefirm planned orders persist across plan runs until you change the status under the Firm Statuscolumn to Not firm or the replenishment plan is run with All selected in the Overwrite FirmPlanned Orders field on the General subtab of the Supply tab of the Plan Options page.
6. Repeat the previous step for the item-location combinations for which you want to manually releasereplenishment orders.
7. To change your decision about manually releasing a replenishment order, select the row, and under SearchResults, click Actions > Unmark for Release.
The release status for the item-location combination changes to Release.8. Save the replenishment plan.9. On the Actions menu for the replenishment plan, select Release.
The Release Plan dialog box appears.10. Click Yes.
The Plan Status Details dialog box appears and displays the status of the release process.11. Click OK to return to the Supplies and Demands page.12. Under Search, click View > Refresh.
For the manually released replenishment orders, the value under the Release Status column changes toReleased and under the Action column to None.
Edit Replenishment Orders Using a Spreadsheet and Manually ReleaseThem Using the GUIFollow these steps to edit a replenishment order using the edit-in-spreadsheet feature and thereafter manually releasethe replenishment order using the Supplies and Demands page:
1. Open the replenishment plan through one of these ways:
◦ Use the Manage Plans page:
i. On the Tasks panel tab, under Plans, select Manage Plans.
The Manage Plans page opens.ii. Under Search Results, select the replenishment plan that you want to open, and click Actions >
Open.
The replenishment plan opens in a separate page.
◦ On the Plans panel tab, under Plans, right-click the replenishment plan that you want to open, and selectOpen.
The replenishment plan opens in a separate page.2. Click the Open drop-down button.

Oracle Supply Chain Management CloudUsing Replenishment Planning
Chapter 13Calculation and Release of Replenishment Orders
250
The Open Table, Graph, or Tile Set dialog box opens.3. Search for the Supplies and Demands table, and open it.
The Supplies and Demands page opens under the replenishment plan.4. Under Search Results, click Actions > Edit in Spreadsheet.
A dialog box opens and prompts you to open or save a Microsoft Excel file.5. Open the spreadsheet.
The Connect dialog box opens and prompts you to connect to the application URL.6. Click Yes.
A dialog box opens and prompts you to enter your credentials.7. Sign in with your Oracle Applications Cloud credentials.
The spreadsheet is refreshed with replenishment orders in the replenishment plan.
The replenishment orders generated by the replenishment plan are listed as planned orders in the spreadsheet.
The rows with values under the Source Organization column represent transfer orders, while the rows withvalues under the Supplier and Supplier Site columns represent purchase orders.
8. In the first table, enter the details for the item-location combinations for which you want to manually releasereplenishment orders.
9. Click Supplies and Demands > Search.
The spreadsheet is refreshed with the item-location combinations that match your search criteria.10. Select an item-location combination for which the value under the Release Status column is Release.
◦ Follow these steps to make changes before releasing the replenishment order:
These changes are lost the next time you run the replenishment plan.
i. Edit the values under the implementation-related and Shipping Method, Source Organization,Supplier, and Supplier Site columns.
A symbol appears under the Changed column for the item-location combination.ii. Under the Release Status column, select Marked for release.
◦ Follow these steps to firm the planned orders:
Note: You don't always have to firm planned orders before releasing them. Whether you firmplanned orders depends on your business requirements.
i. Under the Firm Status column, select Firm.
A symbol appears under the Changed column for the item-location combination.ii. Enter values under the Firm Date, Firm Quantity, and other editable columns.
The values under the Firm Date and Firm Quantity columns persist until you change them. Thefirm planned orders persist across plan runs until you change the status under the Firm Statuscolumn to Not firm or the replenishment plan is run with All selected in the Overwrite FirmPlanned Orders field on the General subtab of the Supply tab of the Plan Options page.
iii. Under the Release Status column, select Marked for release.
Oracle Supply Chain Management CloudUsing Replenishment Planning
Chapter 13Calculation and Release of Replenishment Orders
251
11. Repeat the previous step for the item-location combinations for which you want to manually releasereplenishment orders.
12. Click Supplies and Demands > Upload.
For the successfully updated rows, the symbol disappears under the Changed column. For the rows that aren'tsuccessfully updated, the symbol is retained under the Changed column, and information is displayed underthe Status column.
Save and close the spreadsheet.13. On the Supplies and Demands page, click View > Refresh.
The rows you changed are marked with the Changed icon and reflect the changes you made in thespreadsheet.
14. Select the changed rows, and under Search Results, click Actions > Mark for Release.
The release status for the item-location combinations changes to Marked for release.15. Save the replenishment plan.16. On the Actions menu for the replenishment plan, select Release.
The Release Plan dialog box appears.17. Click Yes.
The Plan Status Details dialog box appears and provides you with the status of the release process.18. Click OK to return to the Supplies and Demands page.19. Under Search, click View > Refresh.
For the manually released replenishment orders, the value under the Release Status column changes toReleased and under the Action column to None.
Related Topics
• Considerations for Configuring Supply Plan Attributes in Replenishment Plans
Create and Release Manual Planned OrdersYou can create manual planned orders for buy, make, and transfer order types. For each planned order type, you canselect your source specifications. After you create the manual planned orders, you can then release the orders to therelevant source application. Creating and releasing manual planned orders enables you to respond quickly to issuesby creating supplies in the source applications. You can create and release manually created planned orders from thePlanning Central, Supply Planning, Demand and Supply Planning, or Replenishment Planning work area.
To create a manual planned order from the Supplies and Demands page, click the Create icon. The Create Order dialogbox opens. In the Create Order dialog box, select the source type. The source type that you select enables additionalparameters for the supply source.
Source Type Additional Parameters
Buy• Supplier• Supplier Site

Oracle Supply Chain Management CloudUsing Replenishment Planning
Chapter 13Calculation and Release of Replenishment Orders
252
Source Type Additional Parameters
• Shipping Method
Make
(Not relevant to Oracle FusionReplenishment Planning)
• Item Structure Name• Work Definition
Transfer• Source Organization• Shipping Method
After you create the manual planned orders, optionally rerun your plan to determine if the new planned orders can beexecuted. You can then mark the manually created planned orders for release on the Supplies and Demands page. Next,run the release process and the planning process releases your manually created planned orders.
Release Plan Recommendations to an External ExecutionSystemYou can release plan recommendations or planned orders from Oracle SCM Cloud applications to an external executionsystem. When you release a planned order, the planning process generates a CSV file for the planned order. Theplanning process attaches the generated CSV file to the scheduled process called Release Planning Recommendations:Release to External Source Systems. You can download the CSV file from the scheduled processes. The planningprocess also saves the CSV file in a .zip file format in the Universal Content Manager. The name of the .zip file isReleasetoExternal.zip.
PrerequisiteBefore you can release planned orders from Oracle SCM Cloud applications to an external execution system, you mustdo the following:
1. Assign your organization as an external source system.2. Run collections from the external source system.
After you successfully run collections, you can plan your orders and release them to the external source system. Therelease process is same for an Oracle Fusion source system and an external source system.
Release Planned OrdersFollow these steps to release the planned orders:
1. From your Supply Chain Planning work area, click the Tasks panel.2. Click Manage Plans and then search your plan.3. Open the plan, mark the orders for release, and then click Actions > Release.
The planning process exports the plan in the CSV format and attaches the CSV file to the scheduled process. Also, theplanning process saves the CSV file in a .zip file format in the Universal Content Manager. You can download the .zip filefrom the File Import and Export link in the Navigator.

Oracle Supply Chain Management CloudUsing Replenishment Planning
Chapter 13Calculation and Release of Replenishment Orders
253
For more information, see Releasing Plan Recommendations to External Systems (Doc ID 2305394.1) on My OracleSupport at https://support.oracle.com.
Verify Status of Replenishment OrdersThis topic explains how the statuses of replenishment orders are verified after they're automatically or manuallyreleased.
On the Scheduled Processes page, the details of automatically released replenishment orders are listed under the RunPlan process and manually released replenishment orders under the Release Plan process.
Follow these steps to verify the statuses of replenishment orders after they're automatically or manually released:
1. On the Scheduled Processes page, search for the released replenishment orders.
Tip: You can enter the replenishment plan name in the Submission Notes field to search for theRun Plan or Release Plan process.
2. Under Search Results, select Hierarchy.3. Expand the Run Plan or Release Plan process under which the replenishment orders are listed.4. Expand the Release Planning Recommendations process.5. Do one of the following:
◦ For buy orders, select the Release Planning Recommendations: Load Interface Tables process for whichthe submission notes are "Loads interface tables with the data related to buy scenarios from planning."
◦ For transfer orders, select the Release Planning Recommendations: Load Interface Tables process forwhich the submission notes are "Loads interface tables with the data related to transfer scenarios fromplanning."
6. For the selected process, under Log and Output, open the attached log file to view the statuses of the releasedreplenishment orders.

Oracle Supply Chain Management CloudUsing Replenishment Planning
Chapter 13Calculation and Release of Replenishment Orders
254

Oracle Supply Chain Management CloudUsing Replenishment Planning
Chapter 14Replenishment Planning for Subinventories
255
14 Replenishment Planning forSubinventories
Overview of Replenishment Planning for SubinventoriesThis topic is an overview of how replenishment planning is done at the subinventory level.These points describe replenishment planning for subinventories:
• Replenishment planning is done for subinventories and organizations in the same way.
• Organizations can be set up so that their subinventories are included for replenishment planning.Replenishment planning can be done for either an organization or its subinventories.
• You can configure assignment sets, sourcing rules, and bills of distribution for subinventories.
• Historical data is collected at the item-subinventory level.The forecast can be based on shipments history or consumption history.The file-based data import (FBDI) templates can also be used for collecting the following information at thesubinventory level:
◦ Item subinventories
◦ Movement requests
◦ Shipments and consumption history transactions
◦ On-hand inventory
◦ Purchase orders, purchase requisitions, and transfer orders
◦ External forecasts
◦ Policy overrides
• If lead times and order modifiers are defined at the item-subinventory level, they're used. Otherwise, lead timesand order modifiers defined at the organization level are used.
• For replenishment planning at the subinventory level, open transactions (purchase orders, purchaserequisitions, transfer orders, and movement requests) have to be available at the subinventory level, and opentransactions at the organization level aren't considered.
• The scope of a replenishment plan can include both organizations and subinventories. Some or all of thesubinventories for an organization can be included in the scope. However, if the scope includes subinventories,the replenishment plan can't be used for Oracle Transactional Business Intelligence (OTBI) reporting.
• The following types of inventory orders are supported:
◦ Interorganization transfer order: From one organization to another, or from one organization to thesubinventory of another organization.
◦ Intraorganization transfer order: From one subinventory of an organization to another subinventory ofthe same organization.
◦ Movement request: From one subinventory of an organization to another subinventory of the sameorganization.

Oracle Supply Chain Management CloudUsing Replenishment Planning
Chapter 14Replenishment Planning for Subinventories
256
◦ Purchase order or purchase requisition: From a supplier to an organization or a subinventory of theorganization.
• The information for subinventories can't be aggregated to the level of the parent organization.
Replenishment Planning Tasks at the Subinventory LevelYou can do these tasks at the item-subinventory level using Oracle Fusion Replenishment Planning:
• Assign item-subinventory combinations to segments, and override segments for the combinations.
• Accurately predict demand on the basis of shipments history or consumption history.
• Compute and view policy parameters.
• Override policies.
• Trigger replenishment orders.
• Review analytics.
Subinventories are listed in the <organization>:<subinventory> format in all predefined analytics, tables, andgraphs and on the Members tab of the Selector Tool.
• Perform simulations.
The collected attributes for item-subinventory combinations can be viewed in the Item Subinventory table inthe Plan Inputs work area.
Pros and Cons of Replenishment Planning at the SubinventoryLevelThese are the benefits of replenishment planning at the subinventory level:
• You have the flexibility to model locations such as retail stores or supply storerooms as organizations orsubinventories on the basis of your business requirements.
You can use movement requests for inventory transfers between subinventories that are located close to eachother. If the subinventories aren't close to each other, and you must create shipment documents, you candesignate the inventory transfers as transfer orders.
• You can increase the overall efficiency of replenishment planning by forecasting demand, computing policyparameters, and calculating and releasing replenishment orders at the lowest nodes of your supply chain.
• You can reduce inventory costs and maintain optimal inventory levels at the lowest nodes of your supply chain.
However, if you plan replenishments at the subinventory level, the number of item-location combinations in yourreplenishment plan increases.
Tip: Oracle recommends that you first do replenishment planning at the organization level. Once you understandhow to use the functionality and user flows, you can perform replenishment planning at the subinventory level to suityour business requirements.

Oracle Supply Chain Management CloudUsing Replenishment Planning
Chapter 14Replenishment Planning for Subinventories
257
How You Set Up Replenishment Planning forSubinventoriesThe following is the high-level process for setting up Oracle Fusion Replenishment Planning to forecast demand,calculate policy parameters, and calculate and release replenishment orders at the subinventory level. Perform all stepsexcept for Step 3 in the Replenishment Planning work area.
Note: When subinventories are available for selection, they're listed in the <organization>:<subinventory> format.
1. Collect setup data at the organization level.
On the Parameters tab on the Collect Planning Data page, for the Targeted collection type, on the ReferenceData subtab, move Items, Organizations, and Subinventories to Selected Entities. Move any other referenceentities that you require to Selected Entities.
Alternatively, use file-based data import (FBDI) templates for uploading setup data at the organization level.2. Enable organizations for replenishment planning at the subinventory level.
On the Maintain Supply Network Model page, on the Organizations tab, select Yes under Plan Subinventoriesfor all organizations for which subinventories should be included for replenishment planning.
3. In the Scheduled Processes work area, submit the Create Trees for Dimensions process for only theOrganization dimension.
After the process runs, Organization dimension trees are recreated with subinventory details.4. Perform these steps on the Collect Planning Data page:
a. To collect order modifiers and lead time at the item-subinventory level, on the Parameters tab, for theTargeted collection type, on the Reference Data subtab, move Item Subinventories to Selected Entities.
If a stocking unit of measure (UOM) is used in Oracle Fusion Inventory Management at the item-subinventory level, the order modifiers are converted to the primary UOM if required after the collectionprocess.
Alternatively, use the FBDI template for Supply Chain Planning item subinventories.
The collected or uploaded order modifiers and lead time at the item-subinventory level can be viewed inthe Item Subinventory table in the Plan Inputs work area.
b. To generate a consumption-based forecast, on the Demand Planning Data subtab, under History DataOptions, in Subinventory - Consumption Inventory Transactions to Include, select the types ofhistory transactions you want to collect at the subinventory level. If you select Transfer orders, bothtransfer orders and movement requests history at the subinventory level are collected. If you select All, allinventory transaction history at the subinventory level is collected.
Alternatively, use the FBDI template for Supply Chain Planning measures to upload data to theConsumption History measure for a consumption-based forecast.

Oracle Supply Chain Management CloudUsing Replenishment Planning
Chapter 14Replenishment Planning for Subinventories
258
Note: In the Organization Level Member Name column of the template, specify thesubinventories in the <organization>:<subinventory> format. If you don't want to specifya customer, enter #ignore in the Customer Level Name and Demand Class Level Namecolumns, and don't enter anything in the Customer Level Member Name, Customer Site LevelMember Name, and Demand Class Level Member Name columns.
To generate a shipments-based forecast, use the FBDI template for Supply Chain Planning shipmentshistory for uploading shipments history at the subinventory level into the Shipments History measure.
c. On the Supply Planning Data subtab, move the supply entities, such as transfer orders and movementrequests, that you want to collect at the subinventory level to Selected Entities.Alternatively, use the FBDI templates for uploading supply entities at the subinventory level.
Note: Replenishment planning is done for only those collected items for which you set theMPS and MRP Planning Method attribute to Replenishment Planning in Oracle Fusion ProductManagement.
5. Configure segment criteria to include subinventory-level information.On the Create Segment Group page, under Segment Criteria, add the Location attribute for the Organizationdimension, and specify the subinventories that should be listed in a segment. If the segment group alreadyhas the Organization dimension, on the Edit Segment Group page, under Segment Criteria, add or modify theLocation attribute for the dimension to include subinventories in a segment.After segmentation is run, you can manually override the segments for item-subinventory combinations.
6. Enable sourcing rules or bills of distribution for subinventory-level planning.
◦ On the Create Sourcing Rule page, select the Enable for subinventory-level planning check box, andprovide the remaining information.
◦ On the Create Bill of Distribution page, select the Enable for subinventory-level planning check box,and provide the remaining information.
7. Enable assignment sets for subinventory-level planning.On the Create Assignment Set page, select the Enable for subinventory-level planning check box, andprovide the remaining information.
8. If required, override policies for item-subinventory combinations.In your policy assignment set, on the Item-Location Level Policy Overrides tab on the Create Policy AssignmentSet or Edit Policy Assignment Set page, select the item-subinventory combinations for which you want tospecify policy overrides.
9. On the Scope tab on the Plan Options page for your replenishment plan, under Plan Organizations, select thesubinventories (level members) for which replenishment planning should be done.
10. Under Plan Items, select the segments that contain the subinventories.11. Run the replenishment plan.
The policies and replenishments are calculated at the subinventory level.
Related Topics• Collect Data Using the Targeted Collection Type• Create a Segment Group• Create a Sourcing Rule or Bill of Distribution

Oracle Supply Chain Management CloudUsing Replenishment Planning
Chapter 14Replenishment Planning for Subinventories
259
• Create a Policy Assignment Set
• Scope Plan Options for Replenishment Plans
Example of Replenishment Plans for Stores Modeled asSubinventoriesThis topic describes how you set up replenishment plans for stores that are modeled as subinventories.
In this example, an enterprise has a distribution center that's modeled as an organization. The distribution centerhas buy from sourcing rules. The two stores, which are set up as subinventories and contained in a placeholderorganization, source goods from the distribution center using transfer from sourcing rules. The customer demands arefulfilled through the stores. The enterprise owns the stores and uses Oracle Fusion ERP software.
Note: While this example describes replenishments for stores that are modeled as subinventories, you could alsomodel the stores as organizations.
Note these points about this example:
• You can use a single replenishment plan to generate the forecast, calculate the policy parameters, and calculateand release replenishment orders for the distribution center and stores.
You can also use separate replenishment plans as follows:
◦ A replenishment plan generates the forecast at the distribution center by using transfer orders historyand shipments history.
This replenishment plan also calculates the policy parameters and calculates and releases thereplenishment orders for the distribution center.
◦ Another replenishment plan generates the forecast at the stores by using consumption or shipmentshistory.
This replenishment plan also calculates the policy parameters and calculates and releases thereplenishment orders for the stores.
• If you're using a single replenishment plan for the distribution center and stores, when a planned transferorder is created at the stores, an equivalent planned transfer order demand isn't automatically created for thedistribution center.
Planned transfer order demand is created at the distribution center once the planned transfer orders created atthe stores are released and collected.
• File-based data import (FBDI) templates can be used for uploading data instead of collecting it.

Oracle Supply Chain Management CloudUsing Replenishment Planning
Chapter 14Replenishment Planning for Subinventories
260
• At the distribution center and store levels, you can use a single or separate replenishment plans to generate theforecast, calculate the policy parameters, and calculate and release the replenishment orders.
Distribution Center(Organization)
Store 1(Subinventory)
Store 2(Subinventory)
Transfer Orders
Transfer Orders Consumptionor Shipments
Consumptionor Shipments
PlaceholderOrganization
BuyOrders
Oracle Supply Chain Management CloudUsing Replenishment Planning
Chapter 15Inventory Rebalancing
261
15 Inventory Rebalancing
Overview of Inventory RebalancingThe inventory rebalancing feature enables you to rebalance an item's inventory across your supply chain. On accountof varying demands and supplies within your supply chain, some locations end up with excess inventory and otherswith inventory shortages. While excess inventory increases your holding costs, inventory shortages result in lost sales.By using the inventory rebalancing feature, you can move items from locations with excess inventory to locations withinventory shortages.You can enable the inventory rebalancing feature for a replenishment plan. Once you enable the feature, it's run as apreprocess before the replenishment planning process.
You can set up your replenishment plan for automatic release or manual release of the planned orders generated afterinventory rebalancing.
Salient Features of Inventory RebalancingYou can do the following using this feature:
• Reposition inventory in your supply chain by using clusters that consist of locations, regions, or zones.If the clusters consist of regions or zones, inventory rebalancing is performed for the locations in these regionsor zones. The locations should be connected with shipping methods.
• Specify the supplies and demands that are used in the calculation of excess inventory and inventory shortages.
• Specify if a check should be made for locations with excess inventory that can completely meet inventoryshortages so that the number of planned orders is reduced.
• Specify if the safety stock for an item-location combination is used in the calculation of the inventory shortage.You can also set a percentage of safety stock that's reserved before excess inventory is calculated for the item-location combination.
• Set windows for computing the excess inventory or inventory shortage for each item within a location of acluster.
• Obtain plan recommendations for moving items from locations with excess inventory to those with inventoryshortages.Planned inbound orders and planned outbound orders are created with the use of defined shipping methodsbetween locations in a cluster. Excess inventory may be transferred to a sweep location that's inside or outsidethe cluster.Oracle Fusion Replenishment Planning recognizes these planned inbound orders as firm supplies beforegenerating planned orders from upstream sources.
• Use embedded analytics to evaluate the effectiveness of inventory rebalancing.
• Optimize inventory levels in your supply chain, and minimize the costs of procuring inventory from suppliers orsourcing inventory from upstream facilities.
• Improve customer satisfaction by fulfilling demands at locations with inventory shortages.
Oracle Supply Chain Management CloudUsing Replenishment Planning
Chapter 15Inventory Rebalancing
262
Additional Points About Inventory RebalancingNote these additional points about inventory rebalancing:
• You needn't define sourcing rules to use the inventory rebalancing feature.
• The feature doesn't support order modifiers.
• You can't use the feature in a replenishment plan that's set up for policy comparison.
• You can't use the feature in a replenishment plan that's set up for incremental planning.
• You can use the feature in only a replenishment plan with the daily planning time level.
The feature doesn't support aggregate planning buckets.
• The excess inventory and inventory shortages are calculated as on the plan start date after consideration of thesupplies and demands within the excess and shortage computation windows. Planned orders are then createdwith the order dates as the plan start date after consideration of the calendars for item-location combinations.
Replenishment Planning doesn't perform time-phased evaluation of excess inventory and inventory shortagesand doesn't make time-phased inventory rebalancing recommendations.
Inventory Rebalancing Options for Replenishment PlansUse the Inventory Rebalancing tab on the Plan Options page to specify the clusters, inventory rebalancing rules, andsupply and demand types for calculating excess inventory and inventory shortages for your replenishment plan.
Select the Rebalance inventory check box on the Plan Options page to enable the Inventory Rebalancing tab.
Note: The Rebalance inventory check box is grayed out if you select the Enable for incremental planning checkbox. The Rebalance inventory check box is also grayed out if you select the Enable for policy comparison checkbox in the Scope: Advanced Options dialog box that you can open from the Scope tab on the Plan Options page.
ClustersYou can add, sequence, and remove the clusters that must be included in your replenishment plan for inventoryrebalancing.
The available clusters are those that you have created on the Manage Planning Clusters page in the ReplenishmentPlanning work area.
Inventory rebalancing is performed for each included cluster according to its sequence number. The items in eachlocation are processed so long as the item-location combinations are also in the selected segments of the segmentgroup that's attached to the replenishment plan.
Note these points while adding or removing clusters:
• Every cluster must have a unique sequence number.
• The sequence number for a cluster must be a whole number that's one or greater than one.

Oracle Supply Chain Management CloudUsing Replenishment Planning
Chapter 15Inventory Rebalancing
263
Inventory Rebalancing RulesNote these points about the inventory rebalancing rules for your replenishment plan:
• Reduce partial recommendations: Select this check box if you want the inventory rebalancing functionalityto try to meet inventory shortages at locations using planned orders from other locations that have enoughexcess inventory to completely meet the shortfall. By selecting this check box, you can reduce the number ofplanned orders generated through inventory rebalancing.
• Move excess to sweep location: Select this check box to move the excess inventory after inventory rebalancingin a cluster to a designated sweep location that may or may not be within the cluster.
• Include safety stock in shortage calculation: Select this check box to include the safety stock for an item-location combination in the calculation of its inventory shortage.
Supplies and Demands for Calculation of Excess Inventory and InventoryShortagesYou must specify the supply and demand types for inclusion in the calculation of the excess inventory and inventoryshortage for an item-location combination.
The selected supply and demand types are used in the calculation of the Projected Inventory measure for the item-location combination.
You must select at least one supply type and one demand type for inventory rebalancing.
Work with Clusters
Create a ClusterThis topic provides information about clusters and how you create them.
About ClustersA cluster is a grouping of locations, regions, or zones.
These are the notable points about clusters:
• Inventory rebalancing is performed for the selected item-location combinations in the cluster. If the cluster isdefined at the level of a region or zone, inventory rebalancing is performed for the item-location combinationsin the selected regions or zones.
If Yes is clicked in the Plan Subinventories column on the Organizations tab on the Maintain Supply NetworkModel page for an organization (location), item-subinventory combinations are available for selection, andinventory rebalancing is performed for the selected item-subinventory combinations.
• After inventory rebalancing is performed for the cluster, the excess inventory can optionally be transferred to asweep location that may or may not be in the cluster.
• You can even define a nested cluster that consists of the sweep locations of other clusters.
• A location can be in more than one cluster.
Oracle Supply Chain Management CloudUsing Replenishment Planning
Chapter 15Inventory Rebalancing
264
• You can use the Cluster dimension to configure your tables and graphs in the Replenishment Planning workarea.
Create a ClusterFollow these steps to create a cluster:
1. On the Tasks panel tab, under Plan Inputs, select Manage Planning Clusters.
The Manage Planning Clusters page opens.2. Click Add Row.
A new row appears for the cluster.3. Enter the name and description for the cluster.4. In Source System, select the source system from which you're going to select locations, regions, and zones for
the cluster.
Ensure that the source system matches that of the replenishment plan with which you're going to use thecluster.
5. In Sweep Location, optionally, select the sweep location to which excess inventory is moved after inventoryrebalancing is performed for the cluster.
The sweep location needn't be a part of the cluster.6. In Lead Time Multiplier for Excess Window, enter the number by which the lead time for an item-location
combination is multiplied for determination of the window within which the item-location combination's excessinventory is calculated.
The lead time is the total of the preprocessing, processing, and postprocessing lead times that're specified forthe item-location combination in the Items table.
Tip: Use a long window for calculating the excess inventory for the item-location combination so thatfuture demands within the total lead time are taken care of.
7. In Lead Time Multiplier for Shortage Window, enter the number by which the lead time for the item-locationcombination is multiplied for determination of the window within which the item-location combination'sinventory shortage is calculated.
Enter a number that's equal to or less than the number in the Lead Time Multiplier for Excess Window field.
The lead time is determined as explained in the previous step.
Tip: Use a short window for calculating the inventory shortage for the item-location combination so thaturgent demands can be met from nearby locations.
8. In Reserved Safety Stock Percentage, enter a whole number for the percentage of safety stock for the item-location combination that's reserved before the item-location combination's excess inventory is calculated.
Only this portion of the safety stock is considered during the calculation of the excess inventory.9. In Location Hierarchy, select the hierarchy for adding members to the cluster.
If you select Region or Zone, inventory rebalancing is performed for the item-location combinations within theselected regions or zones.
10. Under Cluster Members, click Edit: Clusters Members to open the Search and Select: Cluster Members dialogbox.

Oracle Supply Chain Management CloudUsing Replenishment Planning
Chapter 15Inventory Rebalancing
265
Search for the locations, regions, or zones that you want to include in the cluster, move them to the SelectedMembers list, and click OK.
If the organization (location) is enabled for subinventory planning, you can search for and select subinventories.11. Click Assign Location Priority to open the Assign Location Priority dialog box.
You can view the selected locations or locations within the selected regions or zones.12. Under Location Priority, optionally, enter a number for the priority for a location.
During inventory rebalancing, the location with an inventory shortage and the highest priority (lowest number)is first processed. If two locations have the same number or no priority, the location with the larger shortage isfirst processed.
13. Click OK to return to the Manage Planning Clusters page.14. Save the cluster.
Edit a ClusterThis topic provides information about how you edit clusters.
You can duplicate, edit, or delete a cluster.
You can delete the cluster only when it isn't selected on the Inventory Rebalancing tab on the Plan Options page for areplenishment plan.
Edit a ClusterFollow these steps to edit a cluster:
1. On the Tasks panel tab, under Plan Inputs, select Manage Planning Clusters.
The Manage Planning Clusters page opens.2. Search for the cluster you want to edit, and select it.3. Edit the name and description of the cluster.4. In Source System, change the source system.
Note: If you change the source system, the previously selected sweep location and cluster membersare lost. The assigned priorities in the Assign Location Priority dialog box are also lost. The cluster isn'tdisplayed on the Inventory Rebalancing tab on the Plan Options page for replenishment plans thatpreviously included the cluster.
5. In Sweep Location, change the sweep location for the cluster.6. In Lead Time Multiplier for Excess Window and Lead Time Multiplier for Shortage Window, change the
multipliers for calculating the windows for the excess inventory and inventory shortage for an item-locationcombination.
7. In Reserved Safety Stock Percentage, change the percentage of safety stock that's included in the calculationof the item-location combination's excess inventory.
8. In Location Hierarchy, change the hierarchy for adding members to the cluster.
Note: If you change the location hierarchy, the previously selected cluster members are lost. The assignedpriorities in the Assign Location Priority dialog box are also lost.
9. Under Cluster Members, click Edit: Cluster Members to open the Search and Select: Cluster Members dialogbox in which you can add and remove cluster members.

Oracle Supply Chain Management CloudUsing Replenishment Planning
Chapter 15Inventory Rebalancing
266
10. Click Assign Location Priority to open the Assign Location Priority dialog box in which you can change thepriorities for locations.
11. Save your changes.
Measures for Inventory RebalancingThis topic provides information about the measures that are used in inventory rebalancing for replenishment plans.
This table describes the predefined measures for inventory rebalancing:
Measure Description IncludesClusterDimension?
IncludesProductDimension?
IncludesOrganizationDimension?
Includes TimeDimension?
IncludesSourceDimension?
PlannedInboundShipments
Total quantityof plannedorders to bereceived at thedestinationlocation foran item afterinventoryrebalancing.
Yes Yes Yes Yes No
PlannedOutboundShipments
Total quantityof plannedorders to beshipped fromthe sourcelocation foran item afterinventoryrebalancing.
Yes Yes Yes Yes No
Excess BeforeRebalancing
Excessquantity beforeinventoryrebalancingfor an item-locationcombination.The measuremay differfrom the InitialExcess forRebalancingmeasure if theitem-locationcombinationbelongs tomore thanone cluster,and inventoryrebalancinghas previouslybeen
Yes Yes Yes No No
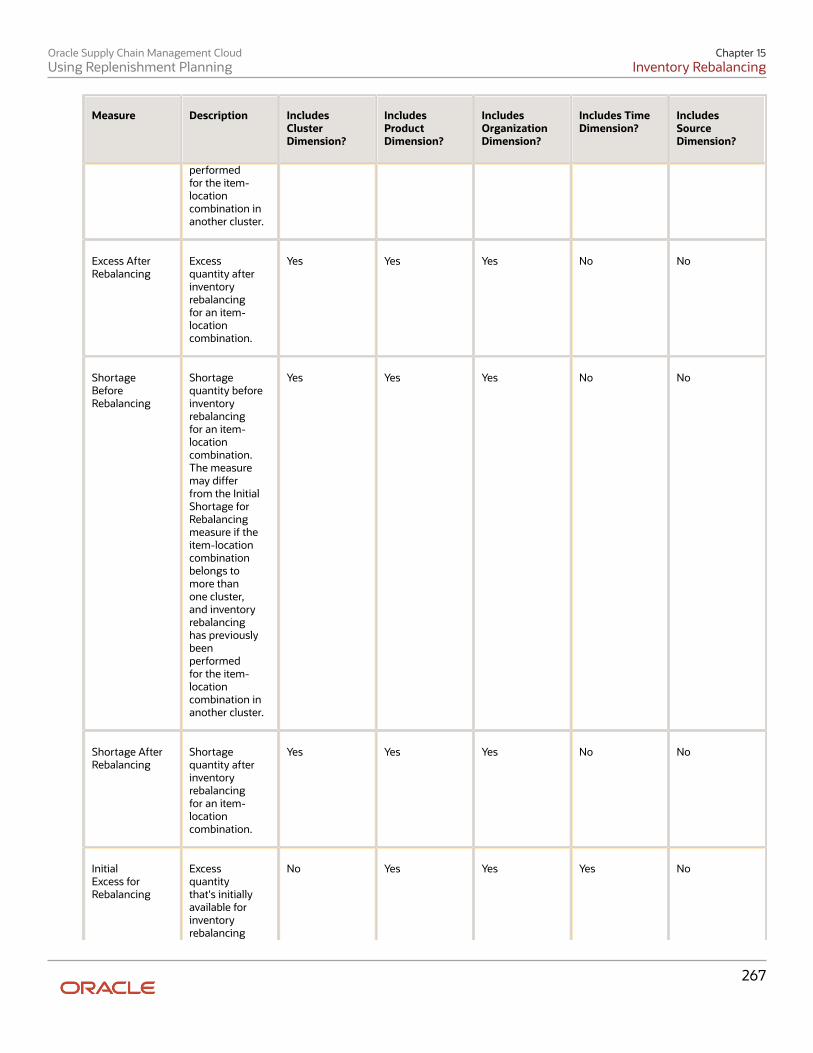
Oracle Supply Chain Management CloudUsing Replenishment Planning
Chapter 15Inventory Rebalancing
267
Measure Description IncludesClusterDimension?
IncludesProductDimension?
IncludesOrganizationDimension?
Includes TimeDimension?
IncludesSourceDimension?
performedfor the item-locationcombination inanother cluster.
Excess AfterRebalancing
Excessquantity afterinventoryrebalancingfor an item-locationcombination.
Yes Yes Yes No No
ShortageBeforeRebalancing
Shortagequantity beforeinventoryrebalancingfor an item-locationcombination.The measuremay differfrom the InitialShortage forRebalancingmeasure if theitem-locationcombinationbelongs tomore thanone cluster,and inventoryrebalancinghas previouslybeenperformedfor the item-locationcombination inanother cluster.
Yes Yes Yes No No
Shortage AfterRebalancing
Shortagequantity afterinventoryrebalancingfor an item-locationcombination.
Yes Yes Yes No No
InitialExcess forRebalancing
Excessquantitythat's initiallyavailable forinventoryrebalancing
No Yes Yes Yes No

Oracle Supply Chain Management CloudUsing Replenishment Planning
Chapter 15Inventory Rebalancing
268
Measure Description IncludesClusterDimension?
IncludesProductDimension?
IncludesOrganizationDimension?
Includes TimeDimension?
IncludesSourceDimension?
for an item-locationcombination.
The calculationof the measureis based onthe ProjectedInventorymeasure.
InitialShortage forRebalancing
Shortagequantitythat's initiallyavailable forinventoryrebalancingfor an item-locationcombination.
The calculationof the measureis based onthe ProjectedInventorymeasure.
No Yes Yes Yes No
TotalRebalancingRecommendations
Number ofplanned ordersrecommendedafter inventoryrebalancingfor an item-locationcombination.
Yes Yes Yes No No
RebalancedInventory Value
Total value ofplanned ordersrecommendedafter inventoryrebalancing.The measureis calculatedfor an item-locationcombinationthroughmultiplicationof the quantityof plannedorders by thestandard costof the item.
Yes Yes Yes No No

Oracle Supply Chain Management CloudUsing Replenishment Planning
Chapter 15Inventory Rebalancing
269
Measure Description IncludesClusterDimension?
IncludesProductDimension?
IncludesOrganizationDimension?
Includes TimeDimension?
IncludesSourceDimension?
ProjectedInventory
Inventoryquantityprojected inthe futurefor an item-locationcombinationbased on theselected supplytypes anddemand types.
No Yes Yes Yes No
ExcessComputationWindow
Time windowin days forcalculationof the excessinventoryfor an item-locationcombination.
This measureis calculatedby multiplyingthe lead timeby the value inthe Lead TimeMultiplierfor ExcessWindow fieldfor a cluster onthe ManagePlanningClusters page.
The leadtime is thetotal of thepreprocessing,processing,andpostprocessinglead times thatare specifiedfor the item-locationcombination inthe Items table.
Yes Yes Yes No No
ShortageComputationWindow
Time windowin days forcalculation ofthe inventoryshortage for anitem-locationcombination.
Yes Yes Yes No No

Oracle Supply Chain Management CloudUsing Replenishment Planning
Chapter 15Inventory Rebalancing
270
Measure Description IncludesClusterDimension?
IncludesProductDimension?
IncludesOrganizationDimension?
Includes TimeDimension?
IncludesSourceDimension?
This measureis calculatedby multiplyingthe lead timeby the value inthe Lead TimeMultiplierfor ShortageWindow fieldfor a cluster onthe ManagePlanningClusters page.
The leadtime is thetotal of thepreprocessing,processing,andpostprocessinglead times thatare specifiedfor the item-locationcombination inthe Items table.
ReservedSafety Stock
Portion of thesafety stockthat's reservedat the locationfor an itemduring thecomputationof the excessinventory.
No Yes Yes Yes No
Item Locationswith ExcessBeforeRebalancing
Number ofitem-locationcombinationsin a clusterwith excessinventorybeforeinventoryrebalancing.
Yes Yes Yes No No
Item Locationswith ExcessAfterRebalancing
Number ofitem-locationcombinationsin a clusterwith excessinventory
Yes Yes Yes No No

Oracle Supply Chain Management CloudUsing Replenishment Planning
Chapter 15Inventory Rebalancing
271
Measure Description IncludesClusterDimension?
IncludesProductDimension?
IncludesOrganizationDimension?
Includes TimeDimension?
IncludesSourceDimension?
after inventoryrebalancing.
Item Locationswith ShortageBeforeRebalancing
Number ofitem-locationcombinationsin a clusterwith inventoryshortagebeforeinventoryrebalancing.
Yes Yes Yes No No
Item Locationswith ShortageAfterRebalancing
Number ofitem-locationcombinationsin a clusterwith inventoryshortage afterinventoryrebalancing.
Yes Yes Yes No No
Percentageof ItemLocations withExcess BeforeRebalancing
Percentage ofitem-locationcombinationsin a clusterwith excessinventorybeforeinventoryrebalancing.
Yes Yes Yes No No
Percentageof ItemLocations withExcess AfterRebalancing
Percentage ofitem-locationcombinationsin a clusterwith excessinventoryafter inventoryrebalancing.
Yes Yes Yes No No
Percentage ofItem Locationswith ShortageBeforeRebalancing
Percentage ofitem-locationcombinationsin a clusterwith inventoryshortagebeforeinventoryrebalancing.
Yes Yes Yes No No
Percentageof ItemLocations with
Percentage ofitem-locationcombinations
Yes Yes Yes No No

Oracle Supply Chain Management CloudUsing Replenishment Planning
Chapter 15Inventory Rebalancing
272
Measure Description IncludesClusterDimension?
IncludesProductDimension?
IncludesOrganizationDimension?
Includes TimeDimension?
IncludesSourceDimension?
Shortage AfterRebalancing
in a clusterwith inventoryshortage afterinventoryrebalancing.
Total ItemLocations forRebalancing
Number ofitem-locationcombinationsin a clusterfor inventoryrebalancing.
Yes Yes Yes No No
PlannedShipmentsQuantity
Total quantityof plannedorders to beshipped fromthe locationfor an itemafter inventoryrebalancing.
The measureis functionallysimilar tothe PlannedOutboundShipmentsmeasure, buthas the Cluster,Organization,Product,and Sourcedimensions.
Yes Yes Yes No Yes
PlannedShipmentsValue
Total valueof plannedorders to beshipped fromthe locationfor an itemafter inventoryrebalancing.The measureis calculatedthroughmultiplicationof the PlannedShipmentsQuantitymeasure withthe standardcost of theitem.
Yes Yes Yes No Yes

Oracle Supply Chain Management CloudUsing Replenishment Planning
Chapter 15Inventory Rebalancing
273
Measure Description IncludesClusterDimension?
IncludesProductDimension?
IncludesOrganizationDimension?
Includes TimeDimension?
IncludesSourceDimension?
The measureis functionallysimilar to theRebalancedInventory Valuemeasure, buthas the Cluster,Organization,Product,and Sourcedimensions.
All these measures are in the Inventory Analysis measure group.
How Rebalancing Recommendations Are CreatedThis topic explains how rebalancing recommendations are created for replenishment plans.
Settings That Affect the Creation of RebalancingRecommendationsThese settings affect the creation of rebalancing recommendations for a replenishment plan:
• The selections on the Inventory Rebalancing tab on the Plan Options page.
• The selections on the Manage Planning Clusters page for the clusters that are selected on the InventoryRebalancing tab.
• The selected segments on the Scope tab on the Plan Options page.
How Rebalancing Recommendations Are CreatedOracle Fusion Replenishment Planning uses this high-level process for creating rebalancing recommendations:
1. The item-location combinations for which the process is performed are selected on the basis of these criteria:
◦ The item-location combinations must be in the selected segments for the replenishment plan, and theMPS and MRP Planning Method attribute for the items should be set to Replenishment planning.
◦ The locations must also be in the selected clusters for the replenishment plan.
2. The forecast is generated or imported for the replenishment plan.3. Inventory balancing is performed for each cluster on the basis of its sequence number on the Inventory
Rebalancing tab.

Oracle Supply Chain Management CloudUsing Replenishment Planning
Chapter 15Inventory Rebalancing
274
4. Within each cluster, locations are selected for processing as follows:
◦ Locations with the highest priority (lowest number) are first processed.
◦ If locations have the same priority or no priority, those with the larger inventory shortages are firstprocessed.
◦ If locations have the same priorities and inventory shortages, the locations are processed in theascending alphanumeric order of their names.
5. For the location being processed, the following steps are taken:
◦ The windows for computation of the excess inventory and inventory shortage for each item in thelocation are determined.
◦ The excess inventory or inventory shortage for each item is calculated.
◦ Rebalancing recommendations are created for each item according to the inventory rebalancing rulesspecified on the Inventory Rebalancing tab:
• If the Reduce partial recommendations check box is selected, a search is performed for thenearest location with enough excess inventory to completely meet the inventory shortage at thelocation being processed.
The proximity between the location being processed and any location with excess inventory isdetermined through the use of the transfer lead time that's specified in the shipping methodbetween the locations.
If no location has enough excess inventory to completely meet the inventory shortage, the nearestlocation with excess inventory to partially meet the inventory shortage is selected.
If the transfer lead times between the location being processed and two locations with excessinventory is the same, the location with more excess inventory is selected.
If there are multiple shipping methods between the locations, and a default shipping method isn'tdefined, the shipping method with the shortest lead time is selected. If different shipping methodshave the same lead time, the first shipping method in the ascending alphanumeric order of namesis selected.
Note: If there's no shipping method between the locations, no rebalancingrecommendations are created.
• If the Include safety stock in shortage calculation check box is selected on the InventoryRebalancing tab, the safety stock for the item is included in the calculation of the inventoryshortage for the item-location combination.
At the end of the shortage window for the item-location combination, the safety stock issubtracted from the value of the Projected Inventory measure for calculation of the inventoryshortage. If the resulting value is less than zero for the item-location combination, that value isconsidered as the shortage.
6. After all the locations in the cluster are processed, if the Move excess to sweep location check box is selectedon the Inventory Rebalancing tab, the excess inventory from locations is moved to a sweep location that may ormay not be in the cluster.
If the cluster has a sweep location in another cluster, and the excess inventory is moved to the sweep location, aplanned inbound order is created for the sweep location.
Oracle Supply Chain Management CloudUsing Replenishment Planning
Chapter 15Inventory Rebalancing
275
7. After inventory rebalancing is performed for the cluster, the next cluster is selected on the basis of its assignedsequence number.All the clusters selected on the Inventory Rebalancing tab are processed in this manner.
8. If the Release planned orders automatically check box is selected on the General subtab on the Supply tabon the Plan Options page, the planned orders with order dates within the release time fence are automaticallyreleased.The release recommendation parameters specified on the General tab in the Supply: Advanced Options dialogbox that you open from the General subtab on the Supply tab are adhered to.
Note: The planned orders can also be manually released on the Manage RebalancingRecommendations page.
9. The measures and analytics for the replenishment plan are calculated.
Related Topics• Segmentation in Oracle Fusion Replenishment Planning• Organizations and Schedules Options for Replenishment Plans• Automatic Release Options• Release Recommendation Options• Scope Plan Options for Replenishment Plans
How You Use the Inventory Rebalancing FeatureThe following is the process for using the inventory rebalancing feature:
1. On the Manage Planning Clusters page, define the clusters for inventory rebalancing.2. Configure your replenishment plan for inventory rebalancing:
◦ On the Plan Options page for the replenishment plan, select the Rebalance inventory check box.
◦ On the Inventory Rebalancing tab on the Plan Options page, select the clusters, rules, and supplies anddemands for inventory rebalancing.
3. Run the replenishment plan with the Refresh with current data option selected on the Parameters tab in theRun Plan dialog box.For every item-location combination in the selected clusters, the excess inventory or inventory shortage iscalculated, and rebalancing recommendations are created.If you selected the Release planned orders automatically check box on the General subtab on the Supply tabon the Plan Options page, the planned orders are automatically released.
4. Review the results of inventory rebalancing by using the following:
◦ The Replenishment and Rebalancing Plan Summary page layout
◦ The Cluster Analysis by Quantity and Cluster Analysis by Value pages
◦ The Manage Rebalancing Recommendations page
◦ The Rebalancing Analysis page
◦ The Rebalancing Details by Item Location page

Oracle Supply Chain Management CloudUsing Replenishment Planning
Chapter 15Inventory Rebalancing
276
5. If required, manually release your planned orders using the Manage Rebalancing Recommendations page.The following figure contains the flow chart for using the inventory rebalancing feature:
Create Clusters
Congure Replenishment
Plan
Run Replenishment
Plan
Calculate Inventory Excess and Shortage,
Create Rebalancing Recommendations
Is Plan Set Up for Auto Release?
Automatically Release Planned
Orders
Review Inventory
Rebalancing Results
Manually Release Planned Orders
Yes
No
Related Topics
• Run a Replenishment Plan
• Automatic Release Options
How the Projected Inventory Measure Is CalculatedThe Projected Inventory measure is used in inventory rebalancing during the calculation of the excess inventory orinventory shortage for an item-location combination in a cluster of a replenishment plan.

Oracle Supply Chain Management CloudUsing Replenishment Planning
Chapter 15Inventory Rebalancing
277
Settings That Affect the Calculation of the Projected InventoryMeasureThe supplies and demands that you select on the Inventory Rebalancing tab on the Plan Options page for yourreplenishment plan affect the calculation of the Projected Inventory measure.
The Projected Inventory measure differs from the Projected Available Balance measure in that you can configure thesupplies and demands that are considered during the calculation of the former.
How the Projected Inventory Measure Is CalculatedThe Projected Inventory measure is calculated according to this formula:
Projected Inventory in Bucket N = Projected Inventory in Bucket (N-1) + Sum of Supplies in Bucket N - Sum of Demandsin Bucket N
where Sum of Supplies = Sum of supplies selected on the Inventory Rebalancing tab
and Sum of Demands = Sum of demands selected on the Inventory Rebalancing tab
The Projected Inventory measure is calculated at the start of the inventory rebalancing process for the item-locationcombination. After the measure is calculated, it isn't updated with inventory rebalancing recommendations. Themeasure is calculated only within the excess computation window.
If the item-location combination is in more than one cluster, the Excess After Rebalancing measure (Excess BeforeRebalancing - Planned Outbound Shipments) for the first cluster is taken as the Excess Before Rebalancing measure forthe item-location combination in the next cluster. Similarly, the Shortage After Rebalancing measure (Shortage BeforeRebalancing - Planned Inbound Shipments) for the first cluster is taken as the Shortage Before Rebalancing measure forthe item-location combination in the next cluster.
Example 1 for Calculation of the Projected Inventory MeasureNote the following about this example:
• The window for calculation of the excess inventory is 4 days.
The inventory rebalancing process is run on Day 1. Therefore, the Projected Inventory measure is calculated upto Day 5 (plan start date + 4 days).
• On the Manage Planning Clusters page, the value in the Reserved Safety Stock Percentage column for thecluster is 50.
• On the Inventory Rebalancing tab, the following have been selected:
◦ Demands: Gross forecast
◦ Supplies: On hand
• The Projected Inventory and Reserved Safety Stock measures are determined only during the window forcalculating the excess inventory.
This table provides the measure values for Example 1:
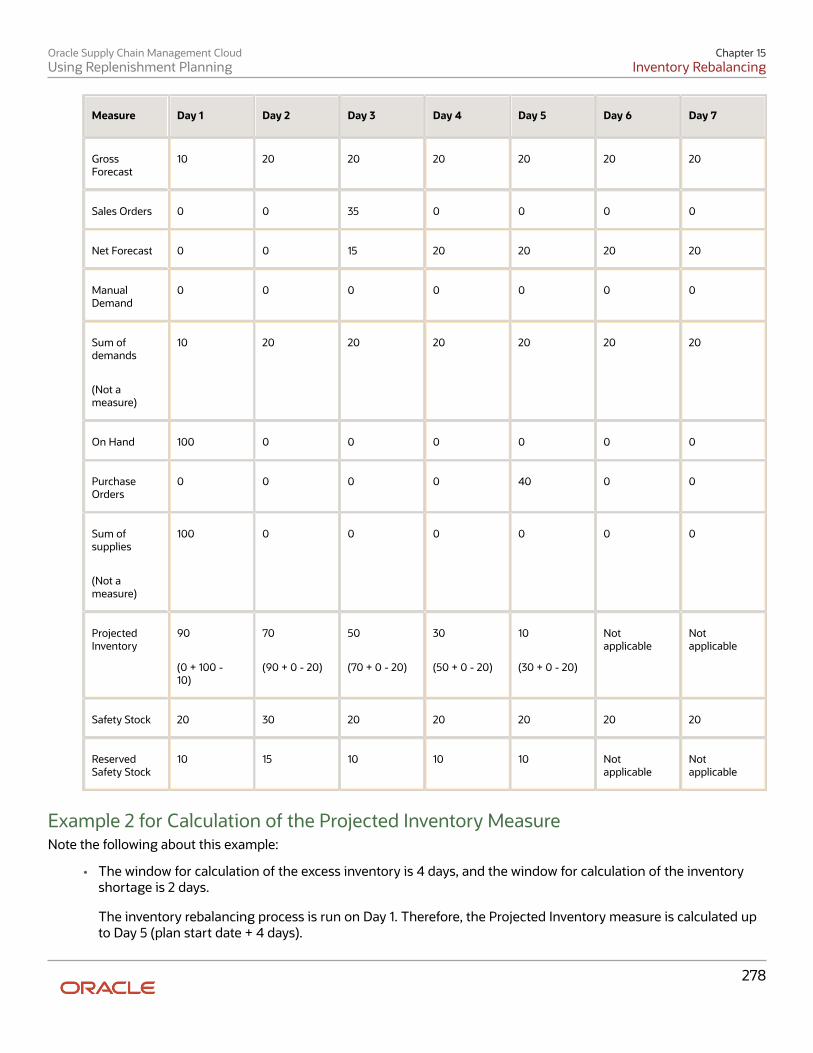
Oracle Supply Chain Management CloudUsing Replenishment Planning
Chapter 15Inventory Rebalancing
278
Measure Day 1 Day 2 Day 3 Day 4 Day 5 Day 6 Day 7
GrossForecast
10 20 20 20 20 20 20
Sales Orders 0 0 35 0 0 0 0
Net Forecast 0 0 15 20 20 20 20
ManualDemand
0 0 0 0 0 0 0
Sum ofdemands
(Not ameasure)
10 20 20 20 20 20 20
On Hand 100 0 0 0 0 0 0
PurchaseOrders
0 0 0 0 40 0 0
Sum ofsupplies
(Not ameasure)
100 0 0 0 0 0 0
ProjectedInventory
90
(0 + 100 -10)
70
(90 + 0 - 20)
50
(70 + 0 - 20)
30
(50 + 0 - 20)
10
(30 + 0 - 20)
Notapplicable
Notapplicable
Safety Stock 20 30 20 20 20 20 20
ReservedSafety Stock
10 15 10 10 10 Notapplicable
Notapplicable
Example 2 for Calculation of the Projected Inventory MeasureNote the following about this example:
• The window for calculation of the excess inventory is 4 days, and the window for calculation of the inventoryshortage is 2 days.
The inventory rebalancing process is run on Day 1. Therefore, the Projected Inventory measure is calculated upto Day 5 (plan start date + 4 days).

Oracle Supply Chain Management CloudUsing Replenishment Planning
Chapter 15Inventory Rebalancing
279
• On the Manage Planning Clusters page, the value in the Reserved Safety Stock Percentage column for thecluster is 50.
• The excess inventory is stored in the Initial Excess for Rebalancing measure and calculated according to thisformula: (lowest value of Projected Inventory within the window for excess inventory calculation) - (highestvalue of Reserved Safety Stock within the window for excess inventory calculation) - 1.
• The Projected Inventory and Reserved Safety Stock measures are determined only during the window forcalculating the excess inventory.
• On the Inventory Rebalancing tab, the following have been selected:
◦ Demands: Sales orders, net forecast
◦ Supplies: On hand, purchase orders
This table provides the measure values for Example 2:
Measure Day 1 Day 2 Day 3 Day 4 Day 5 Day 6 Day 7
GrossForecast
10 20 20 20 20 20 20
Sales Orders 0 0 35 0 0 0 0
Net Forecast 0 0 15 20 20 20 20
ManualDemand
0 0 0 0 0 0 0
Sum ofdemands
(Not ameasure)
0 0 50 20 20 20 20
On Hand 100 0 0 0 0 0 0
PurchaseOrders
0 0 0 0 40 0 0
Sum ofsupplies
(Not ameasure)
100 0 0 0 40 0 0
ProjectedInventory
100
(0 + 100 - 0)
100
(100 + 0 - 0)
50 30
(50 + 0 - 20)
50 Notapplicable
Notapplicable

Oracle Supply Chain Management CloudUsing Replenishment Planning
Chapter 15Inventory Rebalancing
280
Measure Day 1 Day 2 Day 3 Day 4 Day 5 Day 6 Day 7
(100 + 0 -50)
(30 + 40 -20)
Safety Stock 20 30 20 20 20 20 20
ReservedSafety Stock
10 15 10 10 10 Notapplicable
Notapplicable
InitialExcess forRebalancing
14
(30 - 15 - 1)
Notapplicable
Notapplicable
Notapplicable
Notapplicable
Notapplicable
Notapplicable
How the Excess Inventory and Inventory Shortage AreCalculatedThis topic explains how the excess inventory or inventory shortage is calculated for an item-location combination in acluster of a replenishment plan.
Settings That Affect the Calculation of the Excess Inventory andInventory ShortageThe following affect the calculation of the excess inventory or inventory shortage for the item-location combination:
• The sum of the preprocessing, processing, and postprocessing lead times specified for the item-locationcombination in the Items table.
• The values in the Lead Time Multiplier for Excess Window, Lead Time Multiplier for Shortage Window,and Reserved Safety Stock Percentage columns on the Manage Planning Clusters page for the cluster thatcontains the item-location combination.
• The values of the Projected Inventory, Safety Stock, and Reserved Safety Stock measures for the item-locationcombination.
• The selection of the Include safety stock in shortage calculation check box on the Inventory Rebalancing tabon the Plan Options page for the replenishment plan.
How the Excess Inventory and Inventory Shortage Are CalculatedThis table explains the calculations related to the excess inventory or inventory shortage for the item-locationcombination:

Oracle Supply Chain Management CloudUsing Replenishment Planning
Chapter 15Inventory Rebalancing
281
Value for the Item-LocationCombination
Calculation
Window for computing the excessinventory
The value in the Excess Computation Window measure is taken.
The day on which the inventory rebalancing process is run is added to this value.
Only the working days in the calendar for the organization (location) are considered for thiswindow's calculation.
For example, if the value of the Excess Computation Window measure is 3 days, and the plan isrun on Day 1, the excess computation window is up to Day 4.
Window for computing the inventoryshortage
The value in the Shortage Computation Window measure is taken.
The day on which the inventory rebalancing process is run is added to this window.
Only the working days in the calendar for the organization (location) are considered for thiswindow's calculation.
For example, if the value of the Shortage Computation Window measure is 2 days, and the planis run on Day 1, the shortage computation window is up to Day 3.
Initial Excess for Rebalancingmeasure
(lowest value of Projected Inventory measure within the excess computation window) -(highest value of Reserved Safety Stock measure within the excess computation window) - 1
If the value of the calculation is greater than zero, the value is the excess inventory and isstored in the Initial Excess for Rebalancing measure.
Initial Shortage for Rebalancingmeasure
At the end of the shortage computation window, the following are done:
1. If the Include safety stock in shortage calculation check box is selected on theInventory Rebalancing tab, the Safety Stock measure is subtracted from the ProjectedInventory measure.
If the check box isn't selected, only the Projected Inventory measure is considered.2. If the value of the previous step is less than zero, the value is the inventory shortage and
is stored in the Initial Shortage for Rebalancing measure.
Note: If the item-location combination doesn't have excess inventory or an inventory shortage, inventory rebalancingisn't performed for the item-location combination. An item-location combination that has both excess inventory andan inventory shortage is identified as having an inventory shortage.
After the total lead time is multiplied by the multipliers for the excess and shortage computation windows, the resultingvalues are rounded off as follows:
• Standard logic for rounding is applied when the resulting value is greater than one.
• When the resulting value is less than one, the value is rounded off to one.

Oracle Supply Chain Management CloudUsing Replenishment Planning
Chapter 15Inventory Rebalancing
282
Examples for Determination of the Excess and Shortage Computation WindowsThis table provides examples for determining the excess and shortage computation windows for the item-locationcombination:
Total LeadTime
Lead TimeMultiplierfor ExcessWindow
ExcessComputationWindow(BeforeRounding)
ExcessComputationWindow (AfterRounding)
Lead TimeMultiplierfor ShortageWindow
ShortageComputationWindow(BeforeRounding)
ShortageComputationWindow (AfterRounding)
4 3 12 12 2 8 8
4 2.5 10 10 1.5 6 6
4 2.6 10.4 10 1.6 6.4 6
4 2.72 10.88 11 1.72 6.88 7
4 0.5 2 2 0.5 2 2
4 0.21 0.84 1 0.1 0.4 1
4 0.1 0.4 1 0.01 0.04 1
Example 1 for Determination of the Excess Inventory and Inventory ShortageNote the following about this example:
• The value of the Excess Computation Window measure is 2 days.
Therefore, the Projected Inventory measure is calculated for 3 days.
• The value of the Shortage Computation Window measure is 1 day.
Therefore, the shortage is calculated for 2 days.
• The value of the Safety Stock measure is 10.
• The value of the Reserved Safety Stock measure is zero.
• The Include safety stock in shortage calculation check box isn't selected on the Inventory Rebalancing tab.
This table provides inputs for calculating the excess inventory and inventory shortage:
Day 1 Day 2 Day 3 Day 4 Day 5 Day 6
Sum ofdemands
10 10 10 10 10 10
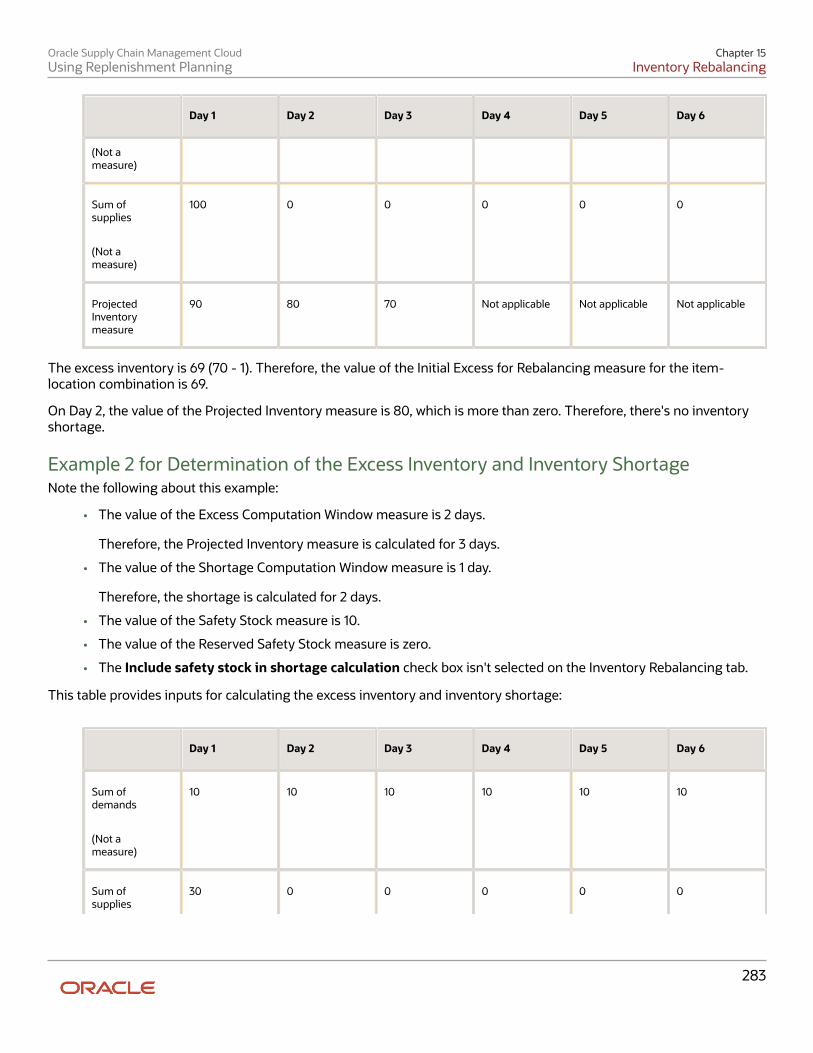
Oracle Supply Chain Management CloudUsing Replenishment Planning
Chapter 15Inventory Rebalancing
283
Day 1 Day 2 Day 3 Day 4 Day 5 Day 6
(Not ameasure)
Sum ofsupplies
(Not ameasure)
100 0 0 0 0 0
ProjectedInventorymeasure
90 80 70 Not applicable Not applicable Not applicable
The excess inventory is 69 (70 - 1). Therefore, the value of the Initial Excess for Rebalancing measure for the item-location combination is 69.
On Day 2, the value of the Projected Inventory measure is 80, which is more than zero. Therefore, there's no inventoryshortage.
Example 2 for Determination of the Excess Inventory and Inventory ShortageNote the following about this example:
• The value of the Excess Computation Window measure is 2 days.
Therefore, the Projected Inventory measure is calculated for 3 days.
• The value of the Shortage Computation Window measure is 1 day.
Therefore, the shortage is calculated for 2 days.
• The value of the Safety Stock measure is 10.
• The value of the Reserved Safety Stock measure is zero.
• The Include safety stock in shortage calculation check box isn't selected on the Inventory Rebalancing tab.
This table provides inputs for calculating the excess inventory and inventory shortage:
Day 1 Day 2 Day 3 Day 4 Day 5 Day 6
Sum ofdemands
(Not ameasure)
10 10 10 10 10 10
Sum ofsupplies
30 0 0 0 0 0

Oracle Supply Chain Management CloudUsing Replenishment Planning
Chapter 15Inventory Rebalancing
284
Day 1 Day 2 Day 3 Day 4 Day 5 Day 6
(Not ameasure)
ProjectedInventorymeasure
20 10 0 Not applicable Not applicable Not applicable
The excess inventory is less than zero (0 - 1). Therefore, there's no excess inventory.
On Day 2, the value of the Projected Inventory measure is 10, which is more than zero. Therefore, there's no inventoryshortage.
The item-location combination has no excess inventory or inventory shortage and isn't included in the inventoryrebalancing process.
Example 3 for Determination of the Excess Inventory and Inventory ShortageNote the following about this example:
• The value of the Excess Computation Window measure is 2 days.Therefore, the Projected Inventory measure is calculated for 3 days.
• The value of the Shortage Computation Window measure is 1 day.Therefore, the shortage is calculated for 2 days.
• The value of the Safety Stock measure is 10.
• The value of the Reserved Safety Stock measure is zero.
• The Include safety stock in shortage calculation check box isn't selected on the Inventory Rebalancing tab.
This table provides inputs for calculating the excess inventory and inventory shortage:
Day 1 Day 2 Day 3 Day 4 Day 5 Day 6
Sum ofdemands
(Not ameasure)
10 10 10 10 10 10
Sum ofsupplies
(Not ameasure)
10 0 0 0 0 0
ProjectedInventorymeasure
0 -10 -20 Not applicable Not applicable Not applicable
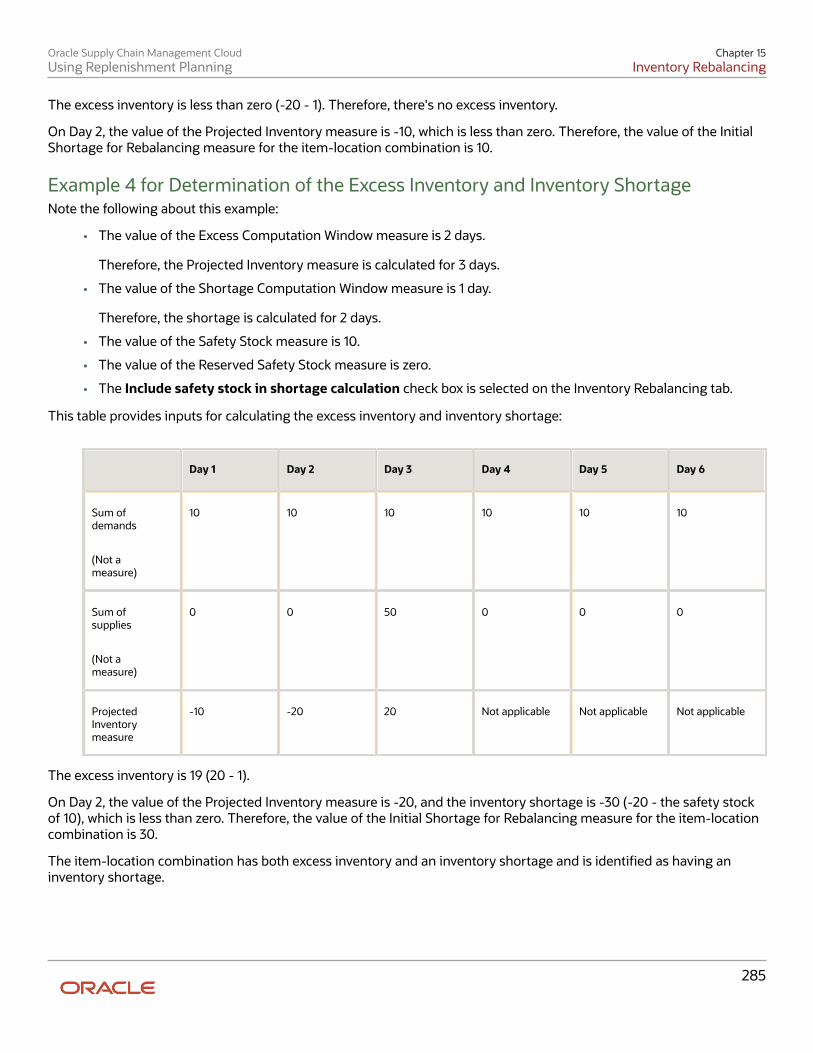
Oracle Supply Chain Management CloudUsing Replenishment Planning
Chapter 15Inventory Rebalancing
285
The excess inventory is less than zero (-20 - 1). Therefore, there's no excess inventory.
On Day 2, the value of the Projected Inventory measure is -10, which is less than zero. Therefore, the value of the InitialShortage for Rebalancing measure for the item-location combination is 10.
Example 4 for Determination of the Excess Inventory and Inventory ShortageNote the following about this example:
• The value of the Excess Computation Window measure is 2 days.
Therefore, the Projected Inventory measure is calculated for 3 days.
• The value of the Shortage Computation Window measure is 1 day.
Therefore, the shortage is calculated for 2 days.
• The value of the Safety Stock measure is 10.
• The value of the Reserved Safety Stock measure is zero.
• The Include safety stock in shortage calculation check box is selected on the Inventory Rebalancing tab.
This table provides inputs for calculating the excess inventory and inventory shortage:
Day 1 Day 2 Day 3 Day 4 Day 5 Day 6
Sum ofdemands
(Not ameasure)
10 10 10 10 10 10
Sum ofsupplies
(Not ameasure)
0 0 50 0 0 0
ProjectedInventorymeasure
-10 -20 20 Not applicable Not applicable Not applicable
The excess inventory is 19 (20 - 1).
On Day 2, the value of the Projected Inventory measure is -20, and the inventory shortage is -30 (-20 - the safety stockof 10), which is less than zero. Therefore, the value of the Initial Shortage for Rebalancing measure for the item-locationcombination is 30.
The item-location combination has both excess inventory and an inventory shortage and is identified as having aninventory shortage.

Oracle Supply Chain Management CloudUsing Replenishment Planning
Chapter 15Inventory Rebalancing
286
Example 5 for Determination of the Excess Inventory and Inventory ShortageNote the following about this example:
• The value of the Excess Computation Window measure is 2 days.
Therefore, the Projected Inventory measure is calculated for 3 days.
• The value of the Shortage Computation Window measure is 2 days.
Therefore, the shortage is calculated for 3 days.
• The value of the Safety Stock measure is 80.
• The value of the Reserved Safety Stock measure is zero.
• The Include safety stock in shortage calculation check box is selected on the Inventory Rebalancing tab.
This table provides inputs for calculating the excess inventory and inventory shortage:
Day 1 Day 2 Day 3 Day 4 Day 5 Day 6
Sum ofdemands
(Not ameasure)
10 10 10 10 10 10
Sum ofsupplies
(Not ameasure)
100 0 0 0 0 0
ProjectedInventorymeasure
90 80 70 Not applicable Not applicable Not applicable
The excess inventory is 69 (70 - 1).
On Day 3, the value of the Projected Inventory measure is 70, and the inventory shortage is -10 (70 - the safety stock of80), which is less than zero. Therefore, the value of the Initial Shortage for Rebalancing measure for the item-locationcombination is 10.
The item-location combination has both excess inventory and an inventory shortage and is identified as having aninventory shortage.

Oracle Supply Chain Management CloudUsing Replenishment Planning
Chapter 15Inventory Rebalancing
287
Example of Inventory RebalancingThis topic provides an example of inventory rebalancing in a replenishment plan.
On the Inventory Rebalancing tab on the Plan Options page for the replenishment plan, the Move excess to sweeplocation check box is selected, but the Reduce partial recommendations check box isn't selected.
This table provides information about the clusters in the replenishment plan:
Sequence Number onInventory Rebalancing Tab
Cluster Name Locations Sweep Location
1 Cluster 1 M1, M2, M3, M4, and M5 M1
2 Cluster 2 S1, S2, S3, S4, and S5 S4
3 Cluster 3 M1 and S4
Within each cluster, the locations don't have any priority.
This table lists some of the lead times between source and destination locations in Cluster 1:
Source Location Destination Location Lead Time
M1 M3 3
M2 M3 2
This table lists some of the lead times between source and destination locations in Cluster 2:
Source Location Destination Location Lead Time
S1 S3 3
S2 S3 2

Oracle Supply Chain Management CloudUsing Replenishment Planning
Chapter 15Inventory Rebalancing
288
Inventory Rebalancing in Cluster 1After the Projected Inventory measure is calculated for an item in the locations of Cluster 1, the excess inventory andinventory shortage are initially computed as follows:
Measure M1 M2 M3 M4 M5
Excess BeforeRebalancing
12 6
Shortage BeforeRebalancing
9 1 7
Note these points:
1. The inventory rebalancing process starts with the location that has the largest inventory shortage: M3.2. M1 and M2 have excess inventory, but the lead time between M2 and M3 is less than the lead time between M1
and M3. Therefore, a planned order for transferring 6 units is created between M2 and M3.
The inventory shortage at M3 is now 3 units (9 - 6), and the excess inventory at M2 is zero (6 - 6).3. A second planned order for transferring 3 units is created between M1 and M3.
The inventory shortage at M3 is now zero (3 - 3), and the excess inventory at M1 is 9 units (12 - 3).
Note: If the Reduce partial recommendations check box were selected on the InventoryRebalancing tab, a planned order for transferring 9 units would have been created between M1 andM3. Consequently, only one shipment would have been created for M3.
4. The inventory rebalancing process picks up the location with the second largest inventory shortage: M5.5. A planned order for transferring 7 units is created between M1 and M5.
The inventory shortage at M5 is now zero (7 - 7), and the excess inventory at M1 is 2 units (9 - 7).6. The inventory rebalancing process picks up the last remaining location with an inventory shortage: M4.
A planned order for transferring 1 unit is created between M1 and M4.
The inventory shortage at M4 is now zero (1 - 1), and the excess inventory at M1 is 1 unit (2 - 1).
This table provides the final computation of the excess inventory and inventory shortage for the item in Cluster 1:
Measure M1 M2 M3 M4 M5
Excess AfterRebalancing
1 0

Oracle Supply Chain Management CloudUsing Replenishment Planning
Chapter 15Inventory Rebalancing
289
Measure M1 M2 M3 M4 M5
Shortage AfterRebalancing
0 0 0
Inventory Rebalancing in Cluster 2After the Projected Inventory measure is calculated for the item in the locations of Cluster 2, the excess inventory andinventory shortage are initially computed as follows:
Measure S1 S2 S3 S4 S5
Excess BeforeRebalancing
8 6
Shortage BeforeRebalancing
9 1 7
Note these points:
1. The inventory rebalancing process starts with the location that has the largest inventory shortage: S3.2. S1 and S2 have excess inventory, but the lead time between S2 and S3 is less than the lead time between S1 and
S3. Therefore, a planned order for transferring 6 units is created between S2 and S3.
The inventory shortage at S3 is now 3 units (9 - 6), and the excess inventory at S2 is zero (6 - 6).3. A second planned order for transferring 3 units is created between S1 and S3.
The inventory shortage at S3 is now zero (3 - 3), and the excess inventory at S1 is 5 units (8 - 3).4. The inventory rebalancing process picks up the location with the second largest inventory shortage: S5.5. A planned order for transferring 5 units is created between S1 and S5.
The inventory shortage at S5 is now 2 units (7 - 5), and the excess inventory at S1 is zero (5 - 5).
This table provides the final computation of the excess inventory and inventory shortage for the item in Cluster 2:
Measure S1 S2 S3 S4 S5
Excess AfterRebalancing
0 0
Shortage AfterRebalancing
0 1 2

Oracle Supply Chain Management CloudUsing Replenishment Planning
Chapter 15Inventory Rebalancing
290
Inventory Rebalancing in Cluster 3These are the initial values for the excess inventory and inventory shortage for the item in Cluster 3:
Measure M1 S4
Excess Before Rebalancing 1
Shortage Before Rebalancing 1
A planned order for transferring 1 unit is created between M1 and S4.
The inventory shortage at S4 is now zero (1 - 1), and the excess inventory at M1 is zero (1 - 1).
This table provides the final computation of the excess inventory and inventory shortage for the item in Cluster 3:
Measure M1 S4
Excess After Rebalancing 0
Shortage After Rebalancing 0
Examples of Inventory Rebalancing and ReplenishmentPlanningThis topic provides examples of inventory rebalancing and the subsequent replenishment planning for replenishmentplans.
Example with No Sweep LocationIn this example, the replenishment plan has a cluster with two locations, Store 1 and Store 2, and none of the locations isa sweep location.
After inventory rebalancing, these are the measure values for an item in Store 1:
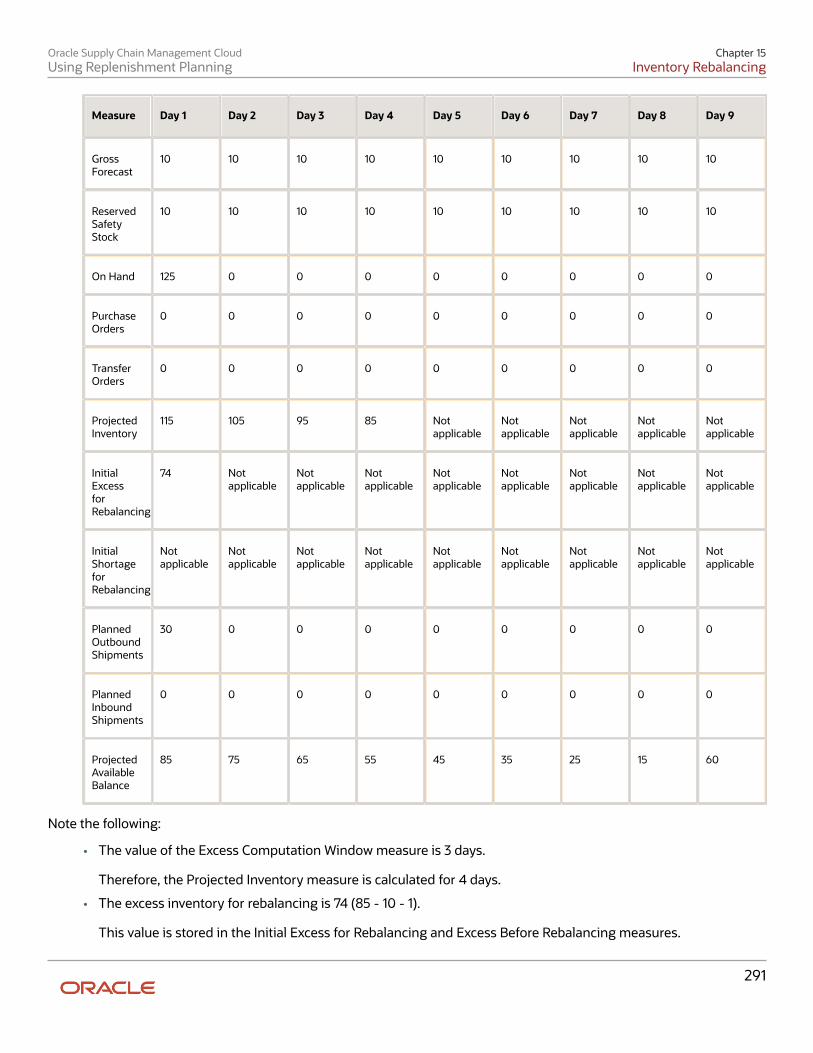
Oracle Supply Chain Management CloudUsing Replenishment Planning
Chapter 15Inventory Rebalancing
291
Measure Day 1 Day 2 Day 3 Day 4 Day 5 Day 6 Day 7 Day 8 Day 9
GrossForecast
10 10 10 10 10 10 10 10 10
ReservedSafetyStock
10 10 10 10 10 10 10 10 10
On Hand 125 0 0 0 0 0 0 0 0
PurchaseOrders
0 0 0 0 0 0 0 0 0
TransferOrders
0 0 0 0 0 0 0 0 0
ProjectedInventory
115 105 95 85 Notapplicable
Notapplicable
Notapplicable
Notapplicable
Notapplicable
InitialExcessforRebalancing
74 Notapplicable
Notapplicable
Notapplicable
Notapplicable
Notapplicable
Notapplicable
Notapplicable
Notapplicable
InitialShortageforRebalancing
Notapplicable
Notapplicable
Notapplicable
Notapplicable
Notapplicable
Notapplicable
Notapplicable
Notapplicable
Notapplicable
PlannedOutboundShipments
30 0 0 0 0 0 0 0 0
PlannedInboundShipments
0 0 0 0 0 0 0 0 0
ProjectedAvailableBalance
85 75 65 55 45 35 25 15 60
Note the following:
• The value of the Excess Computation Window measure is 3 days.
Therefore, the Projected Inventory measure is calculated for 4 days.
• The excess inventory for rebalancing is 74 (85 - 10 - 1).
This value is stored in the Initial Excess for Rebalancing and Excess Before Rebalancing measures.

Oracle Supply Chain Management CloudUsing Replenishment Planning
Chapter 15Inventory Rebalancing
292
• A planned order for transferring 30 units from Store 1 to Store 2 is recommended on account of the inventoryshortage at Store 2.
The value of the Planned Outbound Shipments measure is 30 for Day 1, which is the ship date of the plannedorder.
• The value of the Excess After Rebalancing measure is 44 (74 - 30).
After inventory rebalancing, these are the measure values for the item in Store 2:
Measure Day 1 Day 2 Day 3 Day 4 Day 5 Day 6 Day 7 Day 8 Day 9
GrossForecast
30 30 30 18 30 30 30 18 18
ReservedSafetyStock
10 10 10 10 10 10 10 10 10
On Hand 30 0 0 0 0 0 0 0 0
PurchaseOrders
0 0 0 0 0 0 0 0 0
TransferOrders
0 0 80 0 0 0 0 0 0
ProjectedInventory
0 -30 20 2 Notapplicable
Notapplicable
Notapplicable
Notapplicable
Notapplicable
InitialExcessforRebalancing
Notapplicable
Notapplicable
Notapplicable
Notapplicable
Notapplicable
Notapplicable
Notapplicable
Notapplicable
Notapplicable
InitialShortageforRebalancing
30 Notapplicable
Notapplicable
Notapplicable
Notapplicable
Notapplicable
Notapplicable
Notapplicable
Notapplicable
PlannedOutboundShipments
0 0 0 0 0 0 0 0 0
PlannedInboundShipments
0 30 0 0 0 0 0 0 0

Oracle Supply Chain Management CloudUsing Replenishment Planning
Chapter 15Inventory Rebalancing
293
Measure Day 1 Day 2 Day 3 Day 4 Day 5 Day 6 Day 7 Day 8 Day 9
ProjectedAvailableBalance
0 0 50 12 -18 -48 -78 -96 -114
Note the following:
• The value of the Excess Computation Window measure is 3 days.
Therefore, the Projected Inventory measure is calculated for 4 days.
• The excess inventory is -9 (2 - 10 - 1), and there's no excess for rebalancing.
• The value of the Shortage Computation Window measure is 1 day.
Therefore, the inventory shortage is calculated for 2 days.
• The Include safety stock in shortage calculation check box isn't selected on the Inventory Rebalancing tab onthe Plan Options page for the replenishment plan. Therefore, the inventory shortage for rebalancing is 30.
This value is stored in the Initial Shortage for Rebalancing and Shortage Before Rebalancing measures.
• A planned order for transferring 30 units from Store 1 to Store 2 is recommended on account of the inventoryshortage at Store 2.
The value of the Planned Inbound Shipments measure is 30 for Day 2, which is the due date of the plannedorder.
• The value of the Shortage After Rebalancing measure is 0 (30 - 30).
After replenishment planning, these are the measure values for the item in Store 1:
Measure Day 1 Day 2 Day 3 Day 4 Day 5 Day 6 Day 7 Day 8 Day 9
GrossForecast
10 10 10 10 10 10 10 10 10
NetForecast
10 10 10 10 10 10 10 10 10
SalesOrders
0 0 0 0 0 0 0 0 0
TotalDemand
40 10 10 10 10 10 10 10 10
On Hand 125 0 0 0 0 0 0 0 0
PurchaseOrders
0 0 0 0 0 0 0 0 0

Oracle Supply Chain Management CloudUsing Replenishment Planning
Chapter 15Inventory Rebalancing
294
Measure Day 1 Day 2 Day 3 Day 4 Day 5 Day 6 Day 7 Day 8 Day 9
TransferOrders
0 0 0 0 0 0 0 0 0
PlannedOutboundShipments
30 0 0 0 0 0 0 0 0
PlannedInboundShipments
0 0 0 0 0 0 0 0 0
TotalSupply
125 0 0 0 0 0 0 0 55
On Order 0 0 0 0 0 55 55 55 0
ProjectedAvailableBalance
85 75 65 55 45 35 25 15 60
BeginningInventoryPosition
85 75 65 55 45 90 80 70 60
PlannedReplenishmentsby OrderDate
0 0 0 0 55 0 0 0 0
PlannedReplenishmentsby DueDate
0 0 0 0 0 0 0 0 55
FinalInventoryPosition
85 75 65 55 100 90 80 70 60
AdjustedMinimumQuantity
0 0 0 0 0 0 0 0 0
FinalMinimumQuantity
50 50 50 50 50 50 50 50 50

Oracle Supply Chain Management CloudUsing Replenishment Planning
Chapter 15Inventory Rebalancing
295
Measure Day 1 Day 2 Day 3 Day 4 Day 5 Day 6 Day 7 Day 8 Day 9
AdjustedMaximumQuantity
0 0 0 0 0 0 0 0 0
FinalMaximumQuantity
100 100 100 100 100 100 100 100 100
Note the following:
• On Day 1, the Total Demand measure sums up the Net Forecast and Planned Outbound Shipments measuresand is 40 (10 + 30).
• There's no change to the computation logic for replenishment orders.
After replenishment planning, these are the measure values for the item in Store 2:
Measure Day 1 Day 2 Day 3 Day 4 Day 5 Day 6 Day 7 Day 8 Day 9
GrossForecast
30 30 30 18 30 30 30 18 18
NetForecast
30 30 30 18 30 30 30 18 18
SalesOrders
0 0 0 0 0 0 0 0 0
TotalDemand
30 30 30 18 30 30 30 18 18
On Hand 30 0 0 0 0 0 0 0 0
PurchaseOrders
0 0 0 0 0 0 0 0 0
TransferOrders
0 0 80 0 0 0 0 0 0
PlannedOutboundShipments
0 0 0 0 0 0 0 0 0
PlannedInboundShipments
0 30 0 0 0 0 0 0 0
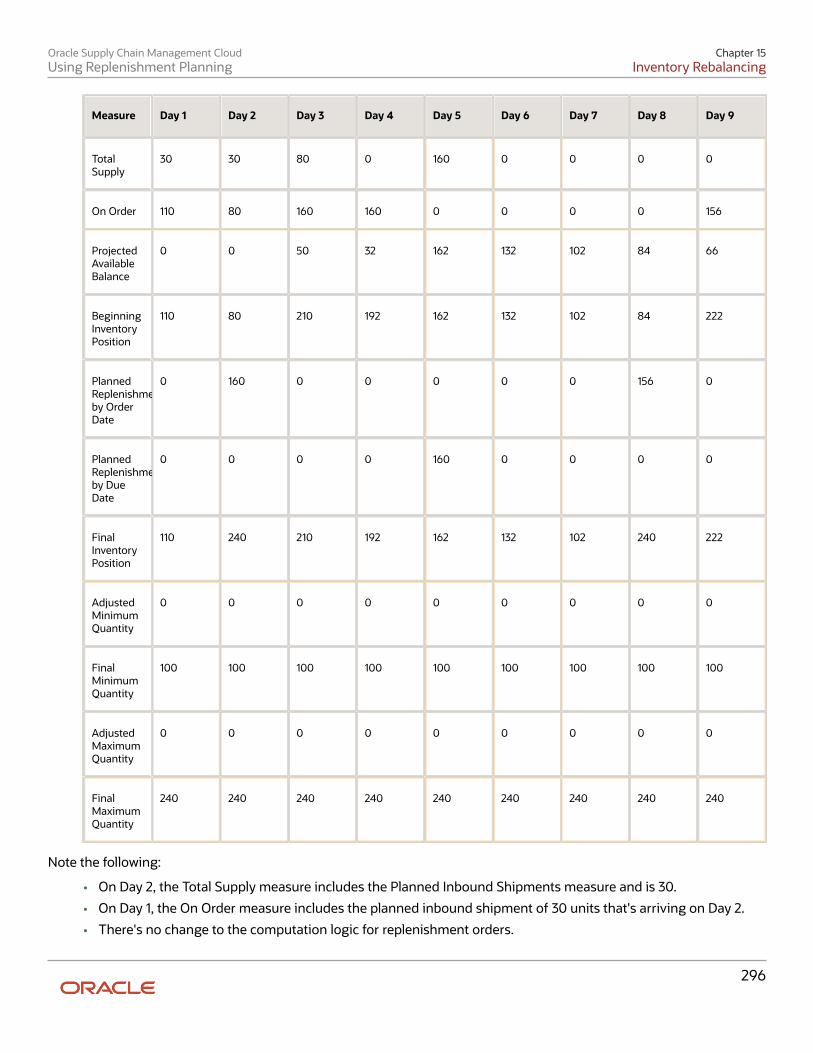
Oracle Supply Chain Management CloudUsing Replenishment Planning
Chapter 15Inventory Rebalancing
296
Measure Day 1 Day 2 Day 3 Day 4 Day 5 Day 6 Day 7 Day 8 Day 9
TotalSupply
30 30 80 0 160 0 0 0 0
On Order 110 80 160 160 0 0 0 0 156
ProjectedAvailableBalance
0 0 50 32 162 132 102 84 66
BeginningInventoryPosition
110 80 210 192 162 132 102 84 222
PlannedReplenishmentsby OrderDate
0 160 0 0 0 0 0 156 0
PlannedReplenishmentsby DueDate
0 0 0 0 160 0 0 0 0
FinalInventoryPosition
110 240 210 192 162 132 102 240 222
AdjustedMinimumQuantity
0 0 0 0 0 0 0 0 0
FinalMinimumQuantity
100 100 100 100 100 100 100 100 100
AdjustedMaximumQuantity
0 0 0 0 0 0 0 0 0
FinalMaximumQuantity
240 240 240 240 240 240 240 240 240
Note the following:
• On Day 2, the Total Supply measure includes the Planned Inbound Shipments measure and is 30.
• On Day 1, the On Order measure includes the planned inbound shipment of 30 units that's arriving on Day 2.
• There's no change to the computation logic for replenishment orders.

Oracle Supply Chain Management CloudUsing Replenishment Planning
Chapter 15Inventory Rebalancing
297
Example with a Sweep LocationIn this example, the replenishment plan has two clusters, Cluster 1 and Cluster 1.
Cluster 1 has the M1 and M2 locations, and M1 is a sweep location. M1 has excess inventory of 34 units of an item, andM2 has an inventory shortage of 30 units of the item.
After inventory rebalancing for Cluster 1, these measure values for the item in M1 are calculated:
Note: The measure values in this table aren't displayed and are provided only for explanation of the inventoryrebalancing logic.
Measure Day 1 Day 2 Day 3 Day 4 Day 5 Day 6 Day 7 Day 8 Day 9
GrossForecast
10 10 10 10 10 10 10 10 10
On Hand 85 0 0 0 0 0 0 0 0
TransferOrders
0 40 0 0 0 0 0 0 0
ProjectedInventory
75 105 95 85 75 65 55 45 Notapplicable
InitialExcessforRebalancing
34 Notapplicable
Notapplicable
Notapplicable
Notapplicable
Notapplicable
Notapplicable
Notapplicable
Notapplicable
InitialShortageforRebalancing
Notapplicable
Notapplicable
Notapplicable
Notapplicable
Notapplicable
Notapplicable
Notapplicable
Notapplicable
Notapplicable
PlannedOutboundShipments
30 0 0 0 0 0 0 0 0
PlannedInboundShipments
0 0 0 0 0 0 0 0 0
ReservedSafetyStock
10 10 10 10 10 10 10 10 10
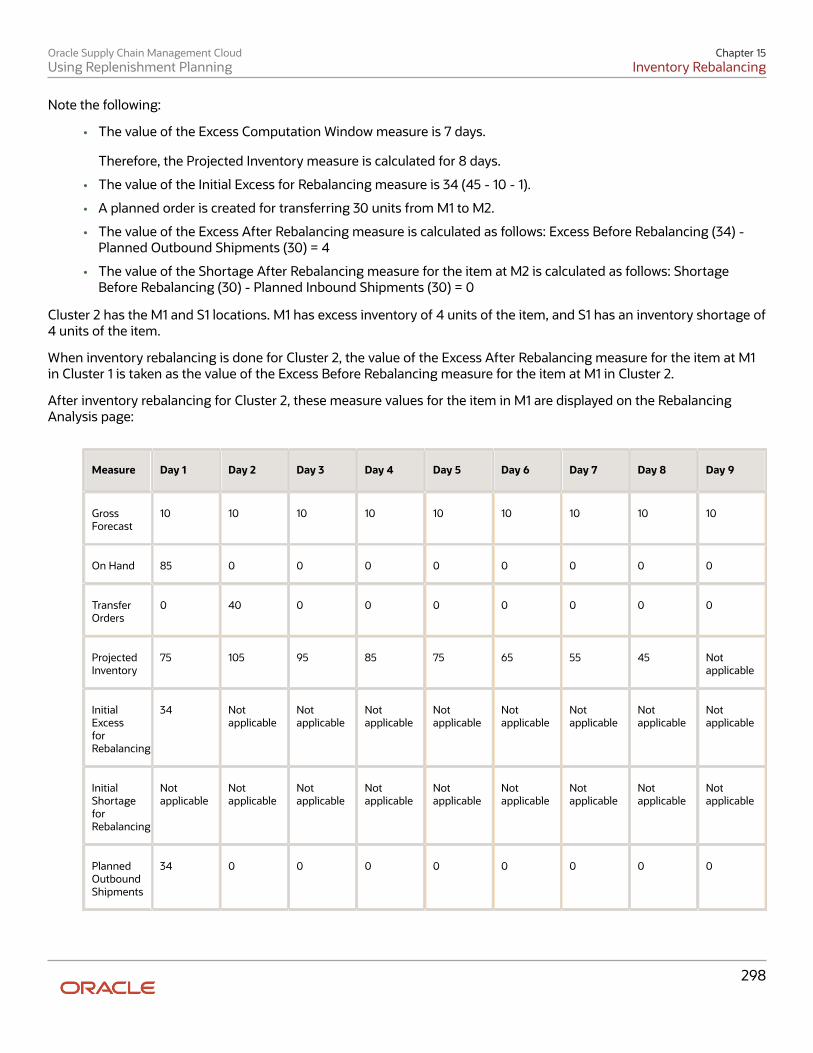
Oracle Supply Chain Management CloudUsing Replenishment Planning
Chapter 15Inventory Rebalancing
298
Note the following:
• The value of the Excess Computation Window measure is 7 days.
Therefore, the Projected Inventory measure is calculated for 8 days.
• The value of the Initial Excess for Rebalancing measure is 34 (45 - 10 - 1).
• A planned order is created for transferring 30 units from M1 to M2.
• The value of the Excess After Rebalancing measure is calculated as follows: Excess Before Rebalancing (34) -Planned Outbound Shipments (30) = 4
• The value of the Shortage After Rebalancing measure for the item at M2 is calculated as follows: ShortageBefore Rebalancing (30) - Planned Inbound Shipments (30) = 0
Cluster 2 has the M1 and S1 locations. M1 has excess inventory of 4 units of the item, and S1 has an inventory shortage of4 units of the item.
When inventory rebalancing is done for Cluster 2, the value of the Excess After Rebalancing measure for the item at M1in Cluster 1 is taken as the value of the Excess Before Rebalancing measure for the item at M1 in Cluster 2.
After inventory rebalancing for Cluster 2, these measure values for the item in M1 are displayed on the RebalancingAnalysis page:
Measure Day 1 Day 2 Day 3 Day 4 Day 5 Day 6 Day 7 Day 8 Day 9
GrossForecast
10 10 10 10 10 10 10 10 10
On Hand 85 0 0 0 0 0 0 0 0
TransferOrders
0 40 0 0 0 0 0 0 0
ProjectedInventory
75 105 95 85 75 65 55 45 Notapplicable
InitialExcessforRebalancing
34 Notapplicable
Notapplicable
Notapplicable
Notapplicable
Notapplicable
Notapplicable
Notapplicable
Notapplicable
InitialShortageforRebalancing
Notapplicable
Notapplicable
Notapplicable
Notapplicable
Notapplicable
Notapplicable
Notapplicable
Notapplicable
Notapplicable
PlannedOutboundShipments
34 0 0 0 0 0 0 0 0
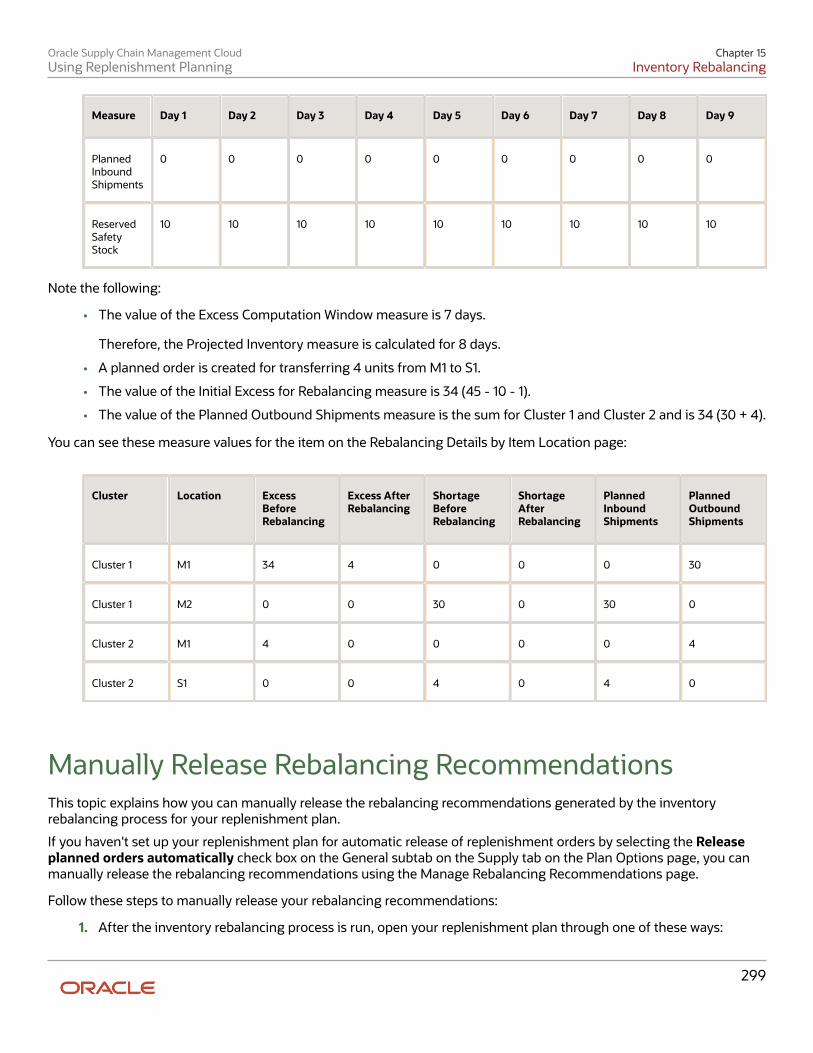
Oracle Supply Chain Management CloudUsing Replenishment Planning
Chapter 15Inventory Rebalancing
299
Measure Day 1 Day 2 Day 3 Day 4 Day 5 Day 6 Day 7 Day 8 Day 9
PlannedInboundShipments
0 0 0 0 0 0 0 0 0
ReservedSafetyStock
10 10 10 10 10 10 10 10 10
Note the following:
• The value of the Excess Computation Window measure is 7 days.
Therefore, the Projected Inventory measure is calculated for 8 days.
• A planned order is created for transferring 4 units from M1 to S1.
• The value of the Initial Excess for Rebalancing measure is 34 (45 - 10 - 1).
• The value of the Planned Outbound Shipments measure is the sum for Cluster 1 and Cluster 2 and is 34 (30 + 4).
You can see these measure values for the item on the Rebalancing Details by Item Location page:
Cluster Location ExcessBeforeRebalancing
Excess AfterRebalancing
ShortageBeforeRebalancing
ShortageAfterRebalancing
PlannedInboundShipments
PlannedOutboundShipments
Cluster 1 M1 34 4 0 0 0 30
Cluster 1 M2 0 0 30 0 30 0
Cluster 2 M1 4 0 0 0 0 4
Cluster 2 S1 0 0 4 0 4 0
Manually Release Rebalancing RecommendationsThis topic explains how you can manually release the rebalancing recommendations generated by the inventoryrebalancing process for your replenishment plan.
If you haven't set up your replenishment plan for automatic release of replenishment orders by selecting the Releaseplanned orders automatically check box on the General subtab on the Supply tab on the Plan Options page, you canmanually release the rebalancing recommendations using the Manage Rebalancing Recommendations page.
Follow these steps to manually release your rebalancing recommendations:
1. After the inventory rebalancing process is run, open your replenishment plan through one of these ways:

Oracle Supply Chain Management CloudUsing Replenishment Planning
Chapter 15Inventory Rebalancing
300
Note: If you aren't using an integrated replenishment plan, open the replenishment plan for whichyou've selected the Rebalance inventory check box on the Plan Options page.
◦ Use the Manage Plans page:i. On the Tasks panel tab, under Plans, select Manage Plans.
The Manage Plans page opens.ii. Under Search results, select the replenishment plan that you want to open, and click Actions >
Open.The replenishment plan opens in a separate page.
◦ On the Plans panel tab, under Plans, right-click the replenishment plan that you want to open, and selectOpen.The replenishment plan opens in a separate page.
2. Click the Open drop-down button.The Open Table, Graph, or Tile Set dialog box opens.
3. Search for the Manage Rebalancing Recommendations table, and open it.The Manage Rebalancing Recommendations page opens under the replenishment plan. Only inventoryrebalancing recommendations are displayed on this page. The value under the Order Type column is Plannedorder, and the value under the Action column is Release.
Note: You can also drill to the Manage Rebalancing Recommendations page from the analytics forinventory rebalancing.
4. Under Search, perform a search for the item-location combinations and clusters for which you want tomanually release rebalancing recommendations.
5. Select a rebalancing recommendation that you want to manually release, and follow these steps:a. Under Search Results, click Actions > Mark for Release.
The row is marked with the Changed icon, and the release status for the item-location combinationchanges to Marked for release.The quantity in the Order Quantity column is copied to the Implement Quantity column.
b. If required, edit the values in the implementation-related and Shipping Method columns.These changes are lost the next time you run the replenishment plan.
6. Repeat the previous step for the item-location combinations for which you want to manually releaserebalancing recommendations.
7. To change your decision about manually releasing a rebalancing recommendation, select the row, and underSearch Results, click Actions > Unmark for Release.The release status for the item-location combination changes to Release.
8. Save the replenishment plan.9. On the Actions menu for the replenishment plan, select Release.
The Release Plan dialog box appears.10. Click Yes.

Oracle Supply Chain Management CloudUsing Replenishment Planning
Chapter 15Inventory Rebalancing
301
The Plan Status Details dialog box appears and displays the status of the release process.11. Click OK to return to the Manage Rebalancing Recommendations page.12. Under Search, click View > Refresh.
For the manually released rebalancing recommendations, the value under the Release Status column changesto Released and under the Action column to None.
Related Topics• Automatic Release Options• Best Practices for Setting Up Replenishment Plans
How You Use the Analytics for Inventory RebalancingYou can use analytics to analyze the effectiveness of the inventory rebalancing process, review the inventoryrebalancing recommendations at various levels, and troubleshoot issues.
Analytics for Inventory RebalancingThese are the analytics for inventory rebalancing:
• The Replenishment and Rebalancing Plan Summary page layout that includes the Rebalancing Performanceinfotile.Use this infotile to access the Shortages by Cluster and Excess by Cluster graphs, using which you can reviewthe counts of item-location combinations in clusters with excess inventory and inventory shortages before andafter inventory rebalancing.
• The Cluster Analysis by Quantity and Cluster Analysis by Value pages.Use these pages to get a high-level view of the inventory rebalancing recommendations by quantity or valueamong source and destination locations in a cluster. A highlight is used for the shipping lanes with inventoryrebalancing recommendations in the top 10% by quantity or value in the cluster. Using these highlighted lanes,you can further analyze the inventory rebalancing results.
• The Manage Rebalancing Recommendations page.Use this page to view and manually release the planned orders recommended by the inventory rebalancingprocess.The Initial Excess at Source column provides the excess inventory at the source location for an item before theplanned order is released. The Initial Shortage at Destination column provides the inventory shortage at thedestination location for the item before the planned order is released.
• The Rebalancing Analysis page.Use this page to analyze the time-phased inventory rebalancing results for an item-location combination.You can analyze how various measures, such as Projected Inventory, Initial Excess for Rebalancing, and InitialShortage for Rebalancing, are calculated. You can also view the inbound and outbound planned shipments.
• The Rebalancing Details by Item Location page.Use this page to view the excess inventory and inventory shortage for an item across the locations of a cluster.The page also provides information about the excess and shortage computation windows.
Oracle Supply Chain Management CloudUsing Replenishment Planning
Chapter 15Inventory Rebalancing
302
Use the Analytics for Inventory RebalancingThe following is a sample workflow for using the inventory rebalancing analytics:
1. After running your replenishment plan, open it, and select the Replenishment and Rebalancing Plan Summarypage layout.
2. Click the Rebalancing Performance infotile.3. Right-click a bar on the Shortages by Cluster or Excess by Cluster graph, and click Drill To > Default Group >
Cluster Analysis by Quantity or Drill To > Default Group > Cluster Analysis by Value.
The Cluster Analysis by Quantity or Cluster Analysis by Value page opens.4. Right-click a shipping lane, and click Drill To > Manage Rebalancing Recommendations.
The Manage Rebalancing Recommendations page opens with the planned orders recommended for the sourcelocation and destination location.
5. Review the planned orders, modify them if required, and release them.
To analyze a planned order before releasing it, do the following:
a. Select the planned order.b. Click Drill To > Default Group > Rebalancing Analysis or Drill To > Default Group > Rebalancing
Details by Item Location.
The Rebalancing Analysis or Rebalancing Details by Item Location page opens.

Oracle Supply Chain Management CloudUsing Replenishment Planning
Chapter 16Simulations for Replenishment Plans
303
16 Simulations for Replenishment Plans
Overview of Simulations for Replenishment PlansUse plan simulations to quickly perform what-if simulations, improve your replenishment plan's performance, resolvesupply issues such as item stockouts, or improve projected fill rates. When you're satisfied with a simulated outcome,you can manually release planned orders with your changes.
Types of Simulations for Replenishment PlansThis table explains the types of simulations you can perform for your replenishment plan:
Type of Simulation Explanation Location Where Simulation IsPerformed
Simulations for policy parameters You perform these simulations forsegments of the segment group that'sattached to your replenishment plan.
You can identify policy parameteralternatives that maximize yourreplenishment plan's performance.
Use the Manage Policy Assignments tablefor the replenishment plan.
If you're satisfied with your changes, youcan save them to the policy assignmentset that's attached to your replenishmentplan for future use.
Simulations for policy values You perform these simulations foritem-location combinations of thesegment group that's attached to yourreplenishment plan.
You can identify policy value alternativesthat maximize your replenishment plan'sperformance.
To simulate changes for all buckets withinyour planning horizon, use the ManagePolicy Parameters by Item table for thereplenishment plan.
To simulate changes for specific bucketswithin your planning horizon, use theReplenishment Workbench table for thereplenishment plan.
Simulations for supplies and demands You perform these simulations for item-location combinations by adding ormodifying supplies and demands.
After changing quantities and dates, youcan compare your baseline and simulatedreplenishment plans.
To simulate changes for all buckets withinyour planning horizon, use the Suppliesand Demands table for the replenishmentplan.
To simulate changes for specific bucketswithin your planning horizon, use theReplenishment Workbench table for thereplenishment plan.
Simulations for item attributes You perform these simulations bychanging item attributes of item-locationcombinations for the segment group that'sattached to your replenishment plan.
Use the Items table for the replenishmentplan.

Oracle Supply Chain Management CloudUsing Replenishment Planning
Chapter 16Simulations for Replenishment Plans
304
Type of Simulation Explanation Location Where Simulation IsPerformed
You can simulate changes to lead timesand order modifiers to resolve supply-related issues such as stockouts.
You can also modify costs, lead times,service-level percentages, and meanabsolute percentage error (MAPE)overrides for policy and projected fill ratesimulations.
If you're satisfied with your changes, youcan optionally save them to a simulationset for future use.
To perform a simulation, you run your replenishment plan by selecting the Do not refresh with current data option onthe Parameters tab in the Run Plan dialog box. Only the following are replanned:
• Item-location combinations for segments whose policy parameters are changed
• Item-location combinations whose policy values, supplies and demands, and item attributes are changed
After you're satisfied with the results of your simulation, you can manually release planned orders.
Replan by Individual PlannersIn your simulation plan, simulations are restricted to the changes done by individual replenishment planners.
This functionality is useful when a replenishment plan has subsets of item-location combinations that are managed bydifferent replenishment planners, and they must frequently run simulations while resolving issues such as stockoutsin storerooms or demand increases caused by promotions at retail outlets. The functionality enables you to identifyinputs that change replenishment plan results, work in parallel with other replenishment planners without affecting theirchanges, and quickly and reliably run simulations.
For example, if you and another replenishment planner are individually changing item attributes, supplies anddemands, policy parameters for segments, and policy parameter overrides for segments and item-locationcombinations, when you run a simulation by selecting Do not refresh with current data on the Parameters tab inthe Run Plan dialog box, only your changes are simulated, and those made by the other replenishment planner aren'tconsidered. Later, when the other replenishment planner runs a simulation, only the changes made by that user aresimulated, and your changes aren't considered.
Further, by using the Manage Replan Details dialog box that you open from the Run Plan dialog box, you can selectwhich of your changes you want to simulate.
Related Topics
• Run a Replenishment Plan
• Manually Release Replenishment Orders

Oracle Supply Chain Management CloudUsing Replenishment Planning
Chapter 16Simulations for Replenishment Plans
305
Simulate Changes to Policy Parameters for SegmentsWithin a Replenishment PlanWithin your replenishment plan, you can simulate changes to policy parameters, default policy parameters, andpolicy parameter overrides at the segment level for the associated policy assignment set by using the Manage PolicyAssignments table.
Note: You can also use the Manage Policy Assignments table to view the policy parameters that were applied to thereplenishment plan when it was last run. You don't have to see the associated policy assignment set for these details.Moreover, these policy parameters in the replenishment plan may differ from those in the policy assignment set,because it may have changed since the replenishment plan was last run.
Follow these steps to simulate changes to parameters, defaults, and overrides at the segment level:
1. Do one of the following to open the replenishment plan for which you want to perform the simulation:
◦ To open the replenishment plan using the Manage Plans page:
i. On the Tasks panel tab, under Plans, select Manage Plans.
The Manage Plans page opens and displays the available replenishment plans.ii. Select the replenishment plan, and click Actions > Open.
The replenishment plan opens in a separate tab.
◦ On the Plans panel tab, under Plans, right-click the replenishment plan, and select Open.
The replenishment plan opens in a separate tab.2. Click the Open drop-down button, and click a pane if you're required to do so.
The Open Table, Graph, or Tile Set dialog box opens.3. Search for the Manage Policy Assignments table, select it, and click OK.
The Manage Policy Assignments page opens.4. On the Segment-Level Policy Parameters Assignment subtab on the page, select the segment for which you
want to perform your simulation, and make your changes.
Note: You can only view details on the Item-Location Level Policy Overrides subtab. To simulatechanges to policy values for item-location combinations, use the Manage Policy Parameters by Itemor Replenishment Workbench table. For slow-moving items or items with intermittent demand, youcan optionally enter zero as the safety stock override and minimum override.
5. Click the Save drop-down button.6. Click Actions > Run to run the replenishment plan.
The Run Plan dialog box opens.
a. On the Parameters tab, under Scope Options, select the Calculate policy parameters and Calculatereplenishments check boxes.
b. Under Data Refresh Options, select Do not refresh with current data.

Oracle Supply Chain Management CloudUsing Replenishment Planning
Chapter 16Simulations for Replenishment Plans
306
The Manage Replan Details link appears under the option.c. Click Manage Replan Details to open the Manage Replan Details dialog box, in which you can see the
segments for which you have made changes. Deselect the check box under Replan for the segments forwhich you don't want to run the simulation.
d. Click Save and Close.e. Click OK in the Run Plan dialog box.
7. If you're satisfied with the simulation results, save your changes to the policy assignment set by clickingActions > Save Changes to Policy Assignment Set.The Save Changes to Policy Assignment Set dialog box opens and displays the changes that you have saved atthe segment level within the replenishment plan but not saved to the policy assignment set.If you don't save the changes, they're lost the next time you run the replenishment plan with the Refresh withcurrent data option selected under Data Refresh Options on the Parameters tab in the Run Plan dialog box.
a. Review the changes that you made for each segment.You can see the old and new values for your changes.
b. Under Changes to Save, select the check boxes for the segments for which you want to save changes tothe policy assignment set.
c. Click OK.
Related Topics• Run a Replenishment Plan
Simulate Changes to Policy Values for Items Within aReplenishment PlanWithin your replenishment plan, you can simulate changes to policy values for item-location combinations of theassociated segment group.
Changes to policy values for item-location combinations within the replenishment plan persist until you override thechanges. These changes also take precedence over the item-location level policy overrides specified in the associatedpolicy assignment set but aren't updated there.
You can use the following tables to simulate changes to policy values for item-location combinations:
• Manage Policy Parameters by Item: Use this table when you want to simulate changes to policy values for allbuckets in your planning horizon. Using this table, you can change the minimum quantity, maximum quantity,minimum days, maximum days, reorder point (ROP) quantity, ROP days, and economic order quantity (EOQ) foran item-location combination by using the corresponding override measures.
• Replenishment Workbench: Use this table when you want to simulate changes to policy values for specificbuckets in your planning horizon.
Note: Using this table, you can also simulate changes to the gross forecast, net forecast, adjustedshipments forecast, and planned replenishments by due date for the item-location combination, but thesesimulations pertain to supplies and demands. Except for the change you make to the adjusted shipmentsforecast, the other changes are lost the next time you run the replenishment plan with the Refresh withcurrent data option selected on the Parameters tab in the Run Plan dialog box.

Oracle Supply Chain Management CloudUsing Replenishment Planning
Chapter 16Simulations for Replenishment Plans
307
Simulate Changes to Policy Values of Item-Location CombinationsFollow these steps to simulate changes to policy values for item-location combinations in the replenishment plan:
1. Do one of the following to open the replenishment plan for which you want to perform the simulation:
◦ To open the replenishment plan using the Manage Plans page:
i. On the Tasks panel tab, under Plans, select Manage Plans.
The Manage Plans page opens and displays the available replenishment plans.ii. Select the replenishment plan, and click Actions > Open.
The replenishment plan opens in a separate tab.
◦ On the Plans panel tab, under Plans, right-click the replenishment plan, and select Open.
The replenishment plan opens in a separate tab.2. Click the Open drop-down button, and click a pane if you're required to do so.
The Open Table, Graph, or Tile Set dialog box opens.3. Search for the Manage Policy Parameters by Item or Replenishment Workbench table, select it, and click OK.
The Manage Policy Parameters by Item or Replenishment Workbench page opens.4. On the toolbar, click View > Highlight Editable Cells to identify the cells that you can edit.5. Filter the rows by a segment and location of the segment group.
On the Replenishment Workbench page, you must also filter the rows by item.6. For an item-location combination for which you want to edit policy values, enter values in the editable cells on
the Manage Policy Parameters by Item page.
On the Replenishment Workbench page, enter values in the editable cells for specific days.7. Repeat Steps 5 and 6 for the item-location combinations for which you want to simulate changes.8. Click the Save drop-down button.9. Click Actions Run to run the replenishment plan.
The Run Plan dialog box opens.
a. On the Parameters tab, under Scope Options, select the Calculate replenishments check box.b. Under Data Refresh Options, select Do not refresh with current data.
The Manage Replan Details link appears under the option.c. Click Manage Replan Details to open the Manage Replan Details dialog box, in which you can see the
item-location combinations for which you have made changes. Deselect the check box under Replan forthe combinations for which you don't want to run the simulation.
d. Click Save and Close.e. Click OK in the Run Plan dialog box.
Related Topics
• Run a Replenishment Plan

Oracle Supply Chain Management CloudUsing Replenishment Planning
Chapter 16Simulations for Replenishment Plans
308
How You Simulate Changes to Supplies and Demands inReplenishment PlansThis topic explains how you can simulate changes to supplies and demands in the Replenishment Planning work area.
In your replenishment plan, you can use these tables to simulate changes to supplies and demands:
• Supplies and Demands: Use this table when you want to simulate changes for all planning buckets in yourplanning horizon.
• Replenishment Workbench: Use this table when you want to simulate changes for specific planning buckets inyour planning horizon.
Simulate Changes with the Supplies and Demands TableYou can simulate changes to supplies and demands for the manual demand, planned order, and on hand order types byediting the Supplies and Demands table for your replenishment plan.
You can do the following while using the Supplies and Demands table for simulations:
• Create and edit manual demands.
• Create and edit orders of the on hand type.
• Create and edit planned orders.
This table lists the columns that you can edit in the Supplies and Demands table from your replenishment plan:
Column Editable in Replenishment Plan?
Customer• Manual Demand: Yes• On Hand: No• Planned Order: No
Customer Site• Manual Demand: Yes• On Hand: No• Planned Order: No
Firm Date• Manual Demand: Yes• On Hand: No• Planned Order: Yes
Firm Quantity• Manual Demand: Yes• On Hand: Yes• Planned Order: Yes
Firm Status• Manual Demand: Yes• On Hand: Yes
Oracle Supply Chain Management CloudUsing Replenishment Planning
Chapter 16Simulations for Replenishment Plans
309
Column Editable in Replenishment Plan?
• Planned Order: Yes
Shipping Method• Manual Demand: No• On Hand: No• Planned Order: Yes
Source Organization• Manual Demand: No• On Hand: No• Planned Order: Yes
Supplier• Manual Demand: No• On Hand: No• Planned Order: Yes
Supplier Site• Manual Demand: No• On Hand: No• Planned Order: Yes
After saving your changes, run your replenishment plan with the Do not refresh with current data option andCalculate replenishments check box selected on the Parameters tab in the Run Plan dialog box. Click Manage ReplanDetails to open the Manage Replan Details dialog box, in which you can see the item-location combinations for whichyou have made changes. Deselect the check box under Replan for the combinations for which you don't want to run thesimulation.
The changes are lost the next time you run the replenishment plan with the Refresh with current data option selectedon the Parameters tab in the Run Plan dialog box.
Simulate Changes with the Replenishment Workbench TableYou can simulate changes to supplies and demands in your replenishment plan by using the Replenishment Workbenchtable.
Use the Adjusted Shipments Forecast, Gross Forecast, and Net Forecast columns to simulate changes to demands andthe Planned Replenishments by Due Date column to simulate changes to supplies.
After saving your changes, run your replenishment plan with the Do not refresh with current data option andCalculate replenishments check box selected on the Parameters tab in the Run Plan dialog box. Click Manage ReplanDetails to open the Manage Replan Details dialog box, in which you can see the item-location combinations for whichyou have made changes. Deselect the check box under Replan for the combinations for which you don't want to run thesimulation.
Except for the change you make to the Adjusted Shipments Forecast column, the other changes are lost the next timeyou run the replenishment plan with the Refresh with current data option selected on the Parameters tab in the RunPlan dialog box.
Related Topics
• Run a Replenishment Plan

Oracle Supply Chain Management CloudUsing Replenishment Planning
Chapter 16Simulations for Replenishment Plans
310
How You Simulate Changes to Item Attributes inReplenishment PlansYou can simulate changes to item attributes by editing the Items table for your replenishment plan.
You can edit these columns in the Items table from your replenishment plan:
• Annual Carrying Cost Percentage
• Average Interarrival Time Override
• Fixed Lot Multiplier
• Fixed Order Quantity
• Intermittent Demand Override
• MAPE Override
• Maximum Order Quantity
• Minimum Order Quantity
• Order Cost
• Preprocessing Lead Time
• Postprocessing Lead Time
• Processing Lead Time
• Selling Price
• Service Level Percentage
• Standard Cost
After saving your changes, run your replenishment plan with the Do not refresh with current data option andCalculate replenishments check box selected on the Parameters tab in the Run Plan dialog box. If required, select theCalculate policy parameters check box. Click Manage Replan Details to open the Manage Replan Details dialog box,in which you can see the item-location combinations for which you have made changes. Deselect the check box underReplan for the combinations for which you don't want to run the simulation.
The changes are lost the next time you run the replenishment plan with the Refresh with current data option selectedon the Parameters tab in the Run Plan dialog box. You can optionally copy the changes you make in the table to asimulation set for future use.
Related Topics
• Run a Replenishment Plan
Oracle Supply Chain Management CloudUsing Replenishment Planning
Chapter 17Simulation Sets
311
17 Simulation Sets
Create a Simulation SetPerform the following steps to create a simulation set from the Plan Inputs work area:
1. In the Navigator, click the Plan Inputs work area link.2. On the Plan Inputs page, click the Open button.3. In the Open Table, Graph, or Tile Set dialog box, do the following:
a. In the Search drop-down list, select: Name.b. In the Search text box, enter the name of a table, such as Items or Resources.c. Click the Search icon button.d. Select the Items (or Research) table and click OK.
4. On the Plan Inputs page, Items tab (or Resources tab), click the Search button.5. In the Search Results region, select one or more rows and do the following:
a. Click Actions and then select Add to Simulation Set.b. In the Add to Simulation Set dialog box, click the Search: Simulation Set down arrow for a list of values,
and then click Create Simulation Set.c. In the Create Simulation Set dialog box, in the Simulation Set field, enter the name of the simulation set
you want to create.d. Click Save and Close.e. In the Add to Simulation Set dialog box, click Save and Close.
Related Topics
• Overview of Simulation Sets
• Simulations in Supply Planning
• Copy Data to Simulation Sets in Supply Planning
• Add Data from Plan Inputs to Simulation Sets
Edit a Simulation SetPerform the following steps to edit a simulation set from the Plan Inputs work area:
1. In the Navigator, click the Plan Inputs work area link.2. On the Plan Inputs page, click the Plans panel tab.3. In the Plans panel drawer, do the following:
a. Expand the list of Simulation Sets.b. Select a simulation set, right-click on it and select Open.
4. On the Simulation Set page, click Open and then select Full Pane.5. In the Open Table, Graph, or Tile Set dialog box, select a table, such as Resources or Items, and then click OK.

Oracle Supply Chain Management CloudUsing Replenishment Planning
Chapter 17Simulation Sets
312
On the Simulation Set page, a new tab opens for the table that you selected, such as the Resources tab or theItems tab.
6. In the Search region, click Search.7. In the Search Results region, select one or more rows. Click Actions and then select Edit from the drop-down
list.
8. In the edit dialog box, you can edit some of the attributes and drill down to additional tables, depending on thetable that you accessed. For example:
◦ For the Resources table, you can change the Bottleneck value. You can also drill down to the ResourceAvailability table.
◦ For the Items table, you can change the Processing Lead Time value. You can also drill down to theSuppliers table.
9. When done, click OK to return to the Simulation Set page. Changed rows and fields are marked with smallcolored dots.
Related Topics
• Overview of Simulation Sets
• Simulate Demand and Supply Changes
Edit a Simulation Set from a SpreadsheetYou can download simulation set data into a spreadsheet, make edits, including certain updates, additions, anddeletions, and then upload it back to the simulation set. In the Plan Inputs work area, while working with the Items orSupplies and Demands table in a simulation set, use the Edit in Spreadsheet option in the Actions menu to downloadthe table rows into a Microsoft Excel file.
Note: Before working with spreadsheets, you must download and install the desktop integration installer that isavailable under Navigator > Tools. Otherwise, you can't download information into or upload information fromspreadsheets.
To edit the data in the Items or Supplies and Demands table of the simulation set in a Microsoft Excel spreadsheet,follow these steps:
1. In the Plan Inputs work area, click the Plans panel tab.
Note: The simulation set can also be edited from the Planning Central, Sales and OperationsPlanning, and Supply Planning work areas. However, the Supplies and Demands table is available inthe simulation set only when it is edited in the Supply Planning work area.
2. In the Plans panel drawer, do the following:
a. Expand the list of simulation sets.b. Select the simulation set that you want to edit, right-click, and click Open. The simulation set opens.
3. In the Open menu, select Full Pane. The Open Table, Graph, or Tile Set dialog box opens.4. Select the Items or Supplies and Demands table, and click OK. The table opens in a page in the simulation set.5. Perform a search for the table rows in the simulation set.6. In the Actions menu for the table, click Edit in Spreadsheet. A dialog box opens and prompts you to save or
open a Microsoft Excel file.

Oracle Supply Chain Management CloudUsing Replenishment Planning
Chapter 17Simulation Sets
313
7. Open the spreadsheet. The Connect dialog box opens and prompts you to connect to the URL for theapplication.
8. Click Yes. A dialog box opens and prompts you to type your credentials.9. Sign in with your Oracle Applications Cloud credentials. The spreadsheet is refreshed with the data in the
simulation set.10. Edit the data.
Task Steps
To add an item to the Items table ofthe simulation set
Click the Add Item icon in the Items menu of the spreadsheet, and provide values in the AddItem dialog box that opens. You can add an existing item or create an item that is based onan existing item.
To create an order in the Suppliesand Demands table of the simulationset
Click the Create Order icon in the Supplies and Demands menu of the spreadsheet, andprovide values in the Create Order dialog box that opens. (Not applicable to sales andoperations planning.)
To edit a row Modify the values in the row cells that are not grayed out. A symbol appears in the cell underthe Changed column for the row.
To delete a row Click the corresponding cell in the Mark for Deletion column. A symbol appears in the cell tomark the table row for deletion. To deselect the row, click the cell again.
11. Click the Upload icon in the Items or Supplies and Demands menu. In the Upload Options dialog box thatappears, select the check boxes for the options that you want to use, and click OK. The data is uploaded to thesimulation set.
12. Save the simulation set. The changes are displayed and marked with colored symbols.13. Save and close the spreadsheet.

Oracle Supply Chain Management CloudUsing Replenishment Planning
Chapter 17Simulation Sets
314

Oracle Supply Chain Management CloudUsing Replenishment Planning
Chapter 18Business Insights
315
18 Business Insights
Manage Notes in Supply Chain PlanningUse Notes in Supply Chain Planning to document and communicate important information about your plan. You canuse notes to provide reasons for any changes made to a plan or to record decisions and assumptions that led to thosechanges. You can save these notes for future reference or to provide details to other users. Participants in the planmanagement process can annotate the data with notes to document changes and assumptions.
Notes functionality is available in the Demand Management, Supply Planning, Planning Central, and Sales andOperations work areas. You can create notes for the following:
• Plans
• Planning level members, such as items, organization, and customers
• Planning combinations, such as a specific item-organization-date-measure combination
• Exceptions
When you create a note, you must specify a note type. Note types enable notes to be categorized, which you can use asa search criteria. The following lists the predefined note types:
• General
• Assumption
• Decision
• Issue
• Possibility
• Risk
• Reference
• Special
You also specify whether the note is private or public. Private notes are visible only to the user who created the note.Public notes are visible to all the users with whom the object is associated.
From the Demand Management or the Sales and Operations work area, you can access the Notes table to displayplanning level members for Product hierarchies. You can create a layout to view the Notes table as part of the layoutinstead of as a dialog box. The Notes table is not available for Supply Planning or Planning Central.
Notes for PlansYou can create notes for plans. When you copy a plan, any notes associated with the plan are copied into the new plan.
To create a note for a plan, do the following:
1. Open the Plan Options page for your plan and click the Manage Notes icon.2. In the Manage Notes dialog box, click Actions > Add.3. In the Add Notes dialog box, add your notes.4. Click OK.5. Click Save and Close.

Oracle Supply Chain Management CloudUsing Replenishment Planning
Chapter 18Business Insights
316
Notes for Planning Level MembersYou can associate notes with planning-level members, such as items, organizations, and customers. You can createnotes at any level of the hierarchy, such as on an individual item, on a brand, or on a product category.
Notes that you create on planning level members at lower levels in the hierarchy are visible when you open ManageNotes from an aggregate level. Notes that you create on level members are not plan-specific. This means that a noteassociated with a level member is visible from any plan that contains that member.
To create a note on a level member, click Create Note from the Actions menu.
To view, edit, or delete an existing note, select the level member, click Manage Notes from the Actions menu.
Notes for Planning CombinationsYou can associate notes for the planning combinations, such as a specific item, organization, date, and measurecombination. Planning combinations appear as cells within a table.
You can create a note at any level; however, they are only visible at the level at which they are created. For example,if you create a note at a brand, month, and measure combination, you cannot view that note at the item, day, andmeasure level.
If you copy a plan, then any plan-specific notes on planning combinations are also copied.
To create a note for the planning combinations, do the following:
1. Select the associated table's cell in the table.2. Click Create Note from the Actions menu.3. Add your notes.4. Click Save and Close.
To view, edit or delete an existing note on a planning combination, do the following:
1. Select the Note icon from the table's cell level.2. Click Manage Notes from the Actions menu.
Note: If you create a note on a planning combination and the associated measure is shared across plans, then thenote is not plan-specific. In this case, the note is visible across all plans. If you create a note on a planning combinationand the associated measure is not shared across plans, then the note is plan-specific. In this case, the note is visiblewithin the plan in which you created it.
Notes for ExceptionsYou can associate notes for exceptions. Notes on exceptions persist across plan runs. If an exception still exists aftera plan is run again, then any notes associated with the exception are retained. When an exception is resolved, theexception is removed from the application. In that case, any notes associated with the exception are also removed.
To create notes for an exception, do the following:
1. Click the Note icon on the table row of the exception.2. Add your notes.3. Click Save and Close.
Related Topics• Overview of Oracle Social Network

Oracle Supply Chain Management CloudUsing Replenishment Planning
Chapter 19Extract Plan Data
317
19 Extract Plan Data
Overview of Planning Measure Data Extractions fromPlan OutputPlanning information is an important component of supply chain analytics. It's important to extract planning measuredata from any plan to build offline reports or integrate with any external system. Planners can use the Export PlanData action from the Manage Plans page to run the Prepare Supply Chain Planning Data for Export scheduled process.You can also run the process or schedule as a job from the Scheduled Processes page under the Tools menu in theNavigator.
When analyzing a plan, you can extract detail supply chain planning multidimensional plan output data, includingmeasures and hierarchies. The extract is based on the measure catalog and dimension catalog assigned to the plan.The Prepare Supply Chain Planning Data for Export scheduled process extracts plan output data into a set of files forexternal reporting and analysis.
The extract process exports plan data to Oracle Universal Content Management in the comma-separated value (CSV)data format. This extract includes measure data, including any measures that you configured that are either stored orcalculated. For calculated measures, the planning process extracts the data after evaluating the measure expressions.The extract is based on the measure catalog and dimension catalog assigned to the plan and includes user-definedhierarchies and levels. Supporting information such as hierarchies for multidimensional analysis is also exported.
Before you can run the Prepare Supply Chain Planning Data for Export scheduled process for a plan, you must:
1. As a one-time setup, create an application integration with login credentials.a. Navigate to Navigator > Others > Setup and Maintenance > Manage Setup Contentb. On the Manage Integration of Additional Applications page, set up the following:
• Application Name: SCP_BICC_REST_CREDENTIALS• Full URL: Enter the host name of the application. For example: https://
example.fa.app.oraclecloud.com• Partner Name: SCP_BICC_REST_CREDENTIALS• Security Policy: oracle/wss_username_token_over_ssl_client_policy
2. Ensure that the user running the extract has access to the Upload and download data from on-premise systemto cloud system role: OBIA_EXTRACTTRANSFORMLOAD_RWD.
3. Configure the extract options for your plan. Navigate to the Plan Options page, Scope tab and click theAdvanced Options button. In the Scope: Advanced options dialog box, in the Extract Options section, configurethe extract parameters.
4. Navigate to the Manage Plans page and select a plan. Select Export Plan Data to run the Prepare Supply ChainPlanning Data for Export scheduled process.
You can extract data at the lowest level from any of these plan types:
• Demand plan
• Demand and Supply plan
• Replenishment plan
• Sales and Operations plan

Oracle Supply Chain Management CloudUsing Replenishment Planning
Chapter 19Extract Plan Data
318
• Supply plan
Configure Plan Extract ParametersBefore you can select the Export Plan Data action from the Manage Plans page, you must configure the extract optionsfor your plan.
1. Navigate to the Plan Options page, Scope tab and click the Advanced Options button.2. In the Scope: Advanced options dialog box, in the Extract Options section, select the Enable for extract check
box to enable plan data to be extracted.3. Configure the extract parameters for the plan.
Dimension Catalog for ExtractSelect a dimension catalog to use for the extract process. The list of values include all dimension catalogs valid forthe plan type. The list of hierarchies included in this list must be a subset of the hierarchies available in the dimensioncatalog associated with the plan. The list of hierarchies includes preconfigured and user-defined hierarchies. Note thefollowing:
• The maximum number of levels per hierarchy is limited to ten levels.
• The maximum number of hierarchies in the segment dimension is limited to two hierarchies.
Measure Catalog for ExtractSelect a measure catalog to use for the extract process. The list of values include all measure catalogs valid for thisplan type. The measure catalog must contain only the measures that are part of the measure catalog for the plan. Theplanning process evaluates measures with expressions and includes the results in the extract.
Extract Time HierarchySelect a time hierarchy to use for the extract process. Data extraction is done only at the lowest level for all dimensionsexcept for the time dimension. You can have only one time hierarchy per plan and it must be part of the dimensioncatalog used for the extract process. If it contains other time hierarchies, the extract process ignores them for extract.
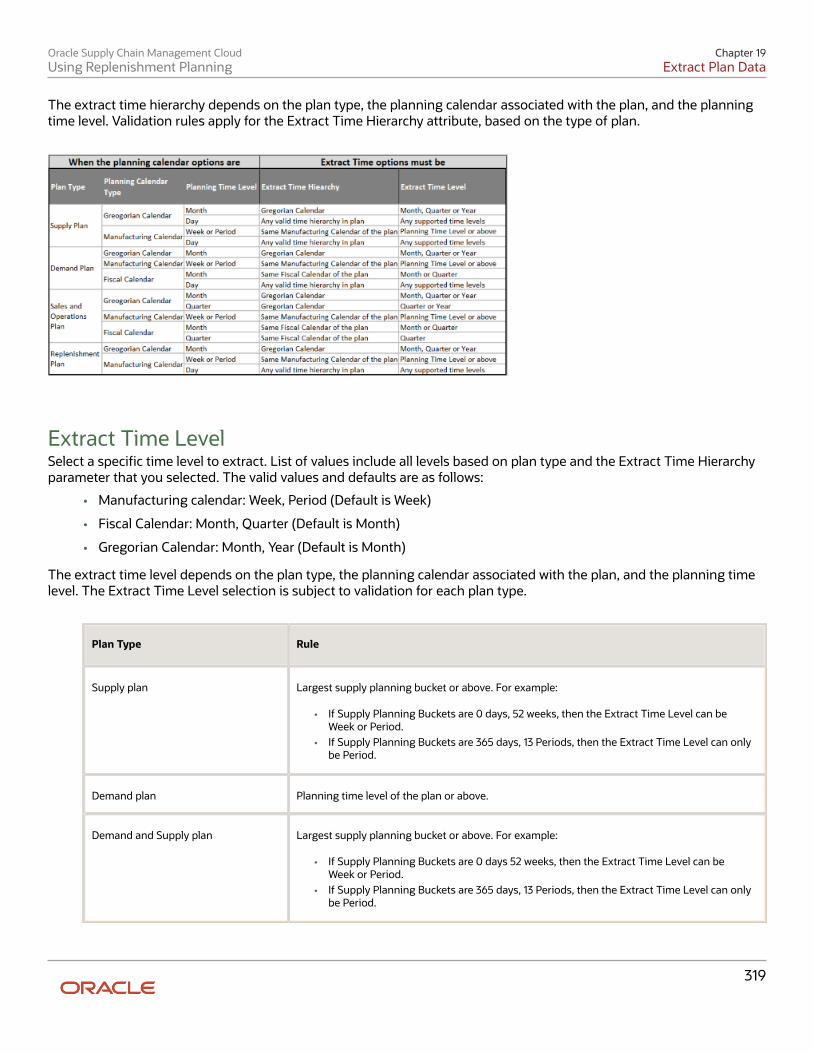
Oracle Supply Chain Management CloudUsing Replenishment Planning
Chapter 19Extract Plan Data
319
The extract time hierarchy depends on the plan type, the planning calendar associated with the plan, and the planningtime level. Validation rules apply for the Extract Time Hierarchy attribute, based on the type of plan.
Extract Time LevelSelect a specific time level to extract. List of values include all levels based on plan type and the Extract Time Hierarchyparameter that you selected. The valid values and defaults are as follows:
• Manufacturing calendar: Week, Period (Default is Week)
• Fiscal Calendar: Month, Quarter (Default is Month)
• Gregorian Calendar: Month, Year (Default is Month)
The extract time level depends on the plan type, the planning calendar associated with the plan, and the planning timelevel. The Extract Time Level selection is subject to validation for each plan type.
Plan Type Rule
Supply plan Largest supply planning bucket or above. For example:
• If Supply Planning Buckets are 0 days, 52 weeks, then the Extract Time Level can beWeek or Period.
• If Supply Planning Buckets are 365 days, 13 Periods, then the Extract Time Level can onlybe Period.
Demand plan Planning time level of the plan or above.
Demand and Supply plan Largest supply planning bucket or above. For example:
• If Supply Planning Buckets are 0 days 52 weeks, then the Extract Time Level can beWeek or Period.
• If Supply Planning Buckets are 365 days, 13 Periods, then the Extract Time Level can onlybe Period.

Oracle Supply Chain Management CloudUsing Replenishment Planning
Chapter 19Extract Plan Data
320
Plan Type Rule
Sales and Operations plans Planning time level of the plan or above.
Replenishment plan Planning time level of the plan or above.
Files Created by the Plan Extract ProcessThe plan extract process generates a set of files. Some files have file names that begin with DATA and have a .csv.gz fileextension. These files are compressed, comma-separated value (CSV) files. The extract process also generates a set offiles with file names that begin with META and have a .mdcsv.gz extension for its internal use. You can ignore the METAfiles.
Every plan extract results in the following DATA files:
File generated Description of file
Dimension Data The plan extract process generates one dimension data file for each dimension selected for theextract process. This file contains all of the level members with their associated relationshipsfor all hierarchies in that dimension.
Dimension Definition The plan extract process generates one dimension definition file for each extract and containsthe names of the hierarchies and levels.
Measure Data The plan extract process generates one measure data file for each set of measures that sharethe same dimensionality. This file contains the measure values by the different dimensions.
Measure Definition The plan extract process generates one measure definition file for each extract and containsthe names, data types, expressions, granularity, and aggregation rules of the measure.
The extract process generates the dimension definition and measure definition files to help you understand thecontent of the data files, but they aren't essential for reporting or analysis. These files contain translatable strings in thelanguage of the planner performing the extract.

Oracle Supply Chain Management CloudUsing Replenishment Planning
Chapter 19Extract Plan Data
321
Naming Conventions for Extracted DATA FilesIn addition to the DATA prefix and .csv.gz file extension, the data file names follow a specific naming pattern. You cansearch the content server for this name pattern to get the required files for download.
• Dimension file name patterns
◦ Dimension data file:
◦ Dimension definition file:
Dimension file name parts Description
jobID The job ID of the extract scheduled process.
planID The ID of the plan. This name is available in log files.
Dimension code The dimension code that the hierarchies in the file belong to. Used in the dimension data file,but not the dimension definition file.
BICCJobID The job ID of the extract scheduled job of the BI Cloud Connector (BICC) tool.
DateTime Date and time the extract scheduled process began.
• Measure file name patterns
◦ Measure data file:
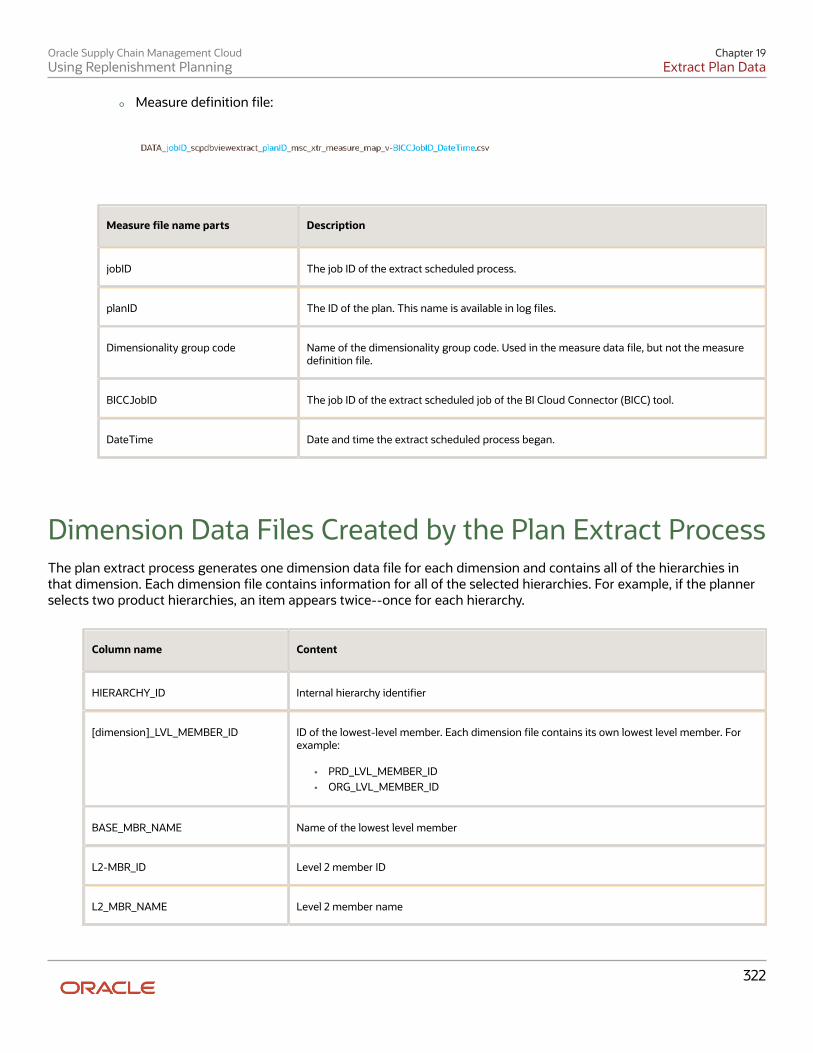
Oracle Supply Chain Management CloudUsing Replenishment Planning
Chapter 19Extract Plan Data
322
◦ Measure definition file:
Measure file name parts Description
jobID The job ID of the extract scheduled process.
planID The ID of the plan. This name is available in log files.
Dimensionality group code Name of the dimensionality group code. Used in the measure data file, but not the measuredefinition file.
BICCJobID The job ID of the extract scheduled job of the BI Cloud Connector (BICC) tool.
DateTime Date and time the extract scheduled process began.
Dimension Data Files Created by the Plan Extract ProcessThe plan extract process generates one dimension data file for each dimension and contains all of the hierarchies inthat dimension. Each dimension file contains information for all of the selected hierarchies. For example, if the plannerselects two product hierarchies, an item appears twice--once for each hierarchy.
Column name Content
HIERARCHY_ID Internal hierarchy identifier
[dimension]_LVL_MEMBER_ID ID of the lowest-level member. Each dimension file contains its own lowest level member. Forexample:
• PRD_LVL_MEMBER_ID• ORG_LVL_MEMBER_ID
BASE_MBR_NAME Name of the lowest level member
L2-MBR_ID Level 2 member ID
L2_MBR_NAME Level 2 member name
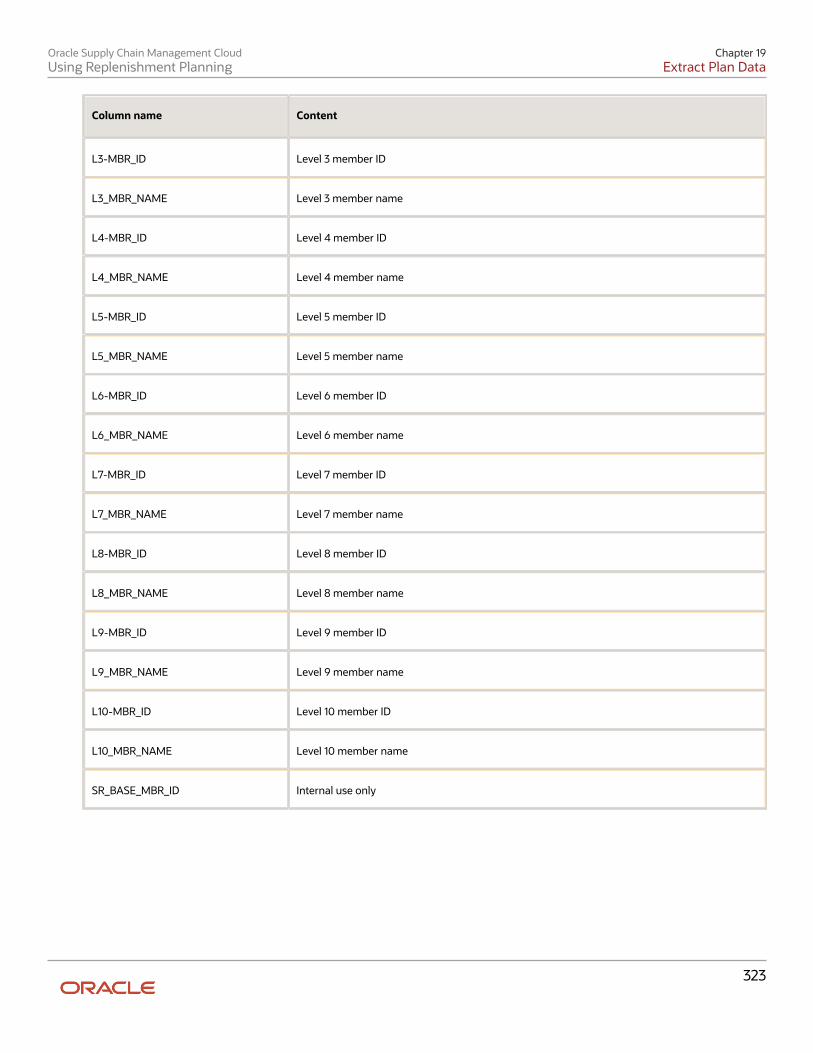
Oracle Supply Chain Management CloudUsing Replenishment Planning
Chapter 19Extract Plan Data
323
Column name Content
L3-MBR_ID Level 3 member ID
L3_MBR_NAME Level 3 member name
L4-MBR_ID Level 4 member ID
L4_MBR_NAME Level 4 member name
L5-MBR_ID Level 5 member ID
L5_MBR_NAME Level 5 member name
L6-MBR_ID Level 6 member ID
L6_MBR_NAME Level 6 member name
L7-MBR_ID Level 7 member ID
L7_MBR_NAME Level 7 member name
L8-MBR_ID Level 8 member ID
L8_MBR_NAME Level 8 member name
L9-MBR_ID Level 9 member ID
L9_MBR_NAME Level 9 member name
L10-MBR_ID Level 10 member ID
L10_MBR_NAME Level 10 member name
SR_BASE_MBR_ID Internal use only
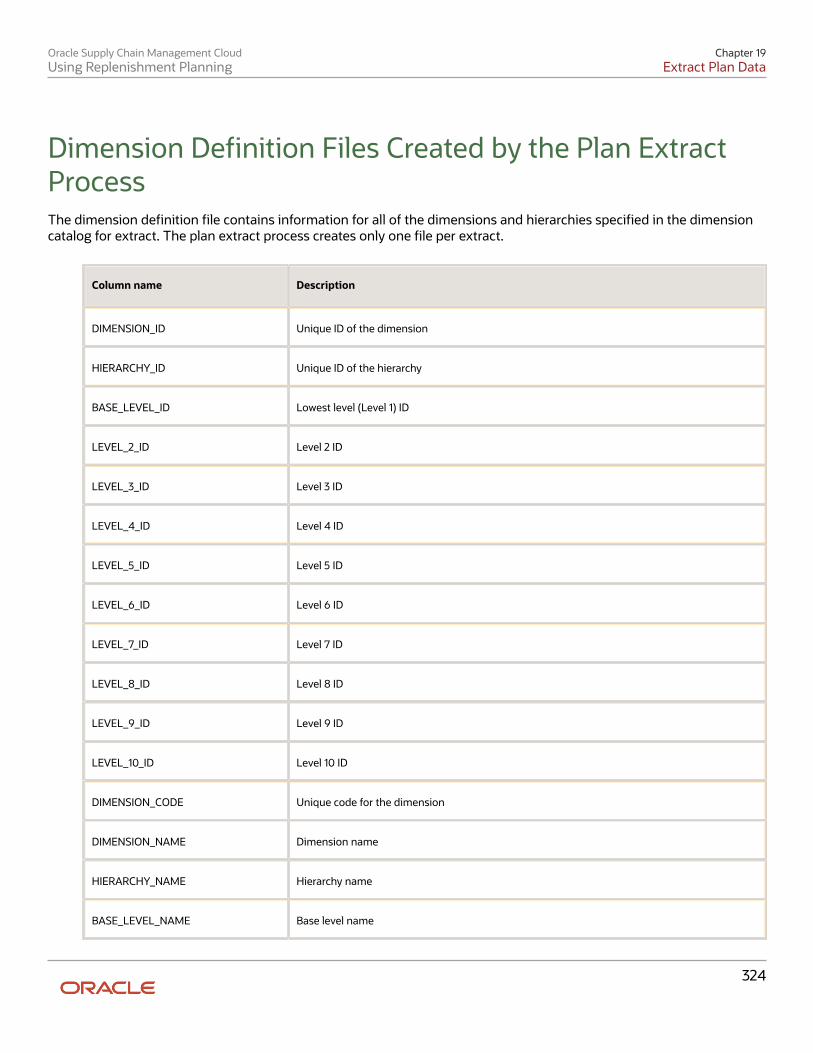
Oracle Supply Chain Management CloudUsing Replenishment Planning
Chapter 19Extract Plan Data
324
Dimension Definition Files Created by the Plan ExtractProcessThe dimension definition file contains information for all of the dimensions and hierarchies specified in the dimensioncatalog for extract. The plan extract process creates only one file per extract.
Column name Description
DIMENSION_ID Unique ID of the dimension
HIERARCHY_ID Unique ID of the hierarchy
BASE_LEVEL_ID Lowest level (Level 1) ID
LEVEL_2_ID Level 2 ID
LEVEL_3_ID Level 3 ID
LEVEL_4_ID Level 4 ID
LEVEL_5_ID Level 5 ID
LEVEL_6_ID Level 6 ID
LEVEL_7_ID Level 7 ID
LEVEL_8_ID Level 8 ID
LEVEL_9_ID Level 9 ID
LEVEL_10_ID Level 10 ID
DIMENSION_CODE Unique code for the dimension
DIMENSION_NAME Dimension name
HIERARCHY_NAME Hierarchy name
BASE_LEVEL_NAME Base level name

Oracle Supply Chain Management CloudUsing Replenishment Planning
Chapter 19Extract Plan Data
325
Column name Description
LEVEL_2_NAME Level 2 name
LEVEL_3_NAME Level 3 name
LEVEL_4_NAME Level 4 name
LEVEL_5_NAME Level 5 name
LEVEL_6_NAME Level 6 name
LEVEL_7_NAME Level 7 name
LEVEL_8_NAME Level 8 name
LEVEL_9_NAME Level 9 name
LEVEL_10_NAME Level 10 name
Measure Data Files Created by the Plan Extract ProcessThe plan extract process generates one measure data file for each set of measures that share the same dimensionalityor granularity. Use the measure definition file to obtain more details about the measure, including its full name,description, aggregation methods, and so on.
The following table is an example measure data file for a specific dimensionality with a selected list of measures. Theactual format depends on the dimensionality and the measures selected by users for extract.
Column name Description
PLAN_ID ID of the plan
PRD_LVL_MEMBER_ID Product dimension lowest level member ID
ORG_LVL_MEMBER_ID Organization dimension lowest level member ID
TIM_LVL_MEMBER_ID Time dimension lowest level member ID
FACT_DATE Date

Oracle Supply Chain Management CloudUsing Replenishment Planning
Chapter 19Extract Plan Data
326
Column name Description
AVG_DAILY_DMD Value of this measure
GROSS_MARGIN_PCT Value of this measure
IN_TRANSIT Value of this measure
INV_TURNS Value of this measure
ITEM_STD_COST Value of this measure
ONHAND Value of this measure
PAB Value of this measure
PAB_VALUE Value of this measure
PO_QTY Value of this measure
PR_QTY Value of this measure
PROJECTED_ONHAND Value of this measure
SCHED_RCPT Value of this measure
SS Value of this measure
TF_QTY Value of this measure
TOTAL_DEMAND Value of this measure
TOTAL_DEMAND_VALUE Value of this measure
TOTAL_SUPPLY Value of this measure
TTL_END_ITEM_CST Value of this measure
GROSS_MARGIN Value of this measure
The extract process generates one measure data file for each set of measures that share the same dimensionality orgranularity. The measure data files contain information for all measures that share that same dimensionality. A list

Oracle Supply Chain Management CloudUsing Replenishment Planning
Chapter 19Extract Plan Data
327
of predefined dimensionality groups is listed in the Dimensionality Group Codes Used by the Plan Extract Processtopic. The lowest level of each of these dimensions appears in each file. They will be different for each dimensionality,based on the dimensions that are part of that group. Each measure column name is a measure code from the measuredefinition file. Use the measure definition file to obtain more details about the measure, including its full name,description, aggregation, and so on.
Measure Definition Files Created by the Plan ExtractProcessThe measure definition file contains information for all of the measures specified in the measure catalog for extract. Theplan extract process creates only one file per extract.
Column name Description
GRANULARITY_ID Dimensionality group ID
POSITION Internal use only
MEASURE_CODE Used as the column name in measure data files
MEASURE_ID ID that uniquely identifies a measure
NAME Name of the measure
DESCRIPTION Brief description of the measure
DATA_TYPE Data type
EXPRESSION Internal use only
AGGR_ORDER Aggregation rule:
1 = Calculate, then aggregate
2 = Aggregate, then calculate
AGGR_METHOD_OTHER Aggregation method on dimensions other than the Time dimension
AGGR_METHOD_TIME Aggregation method on the Time dimension
WEIGHTED_BY ID of the measure to be used when aggregation method is WAVG (weighted average)
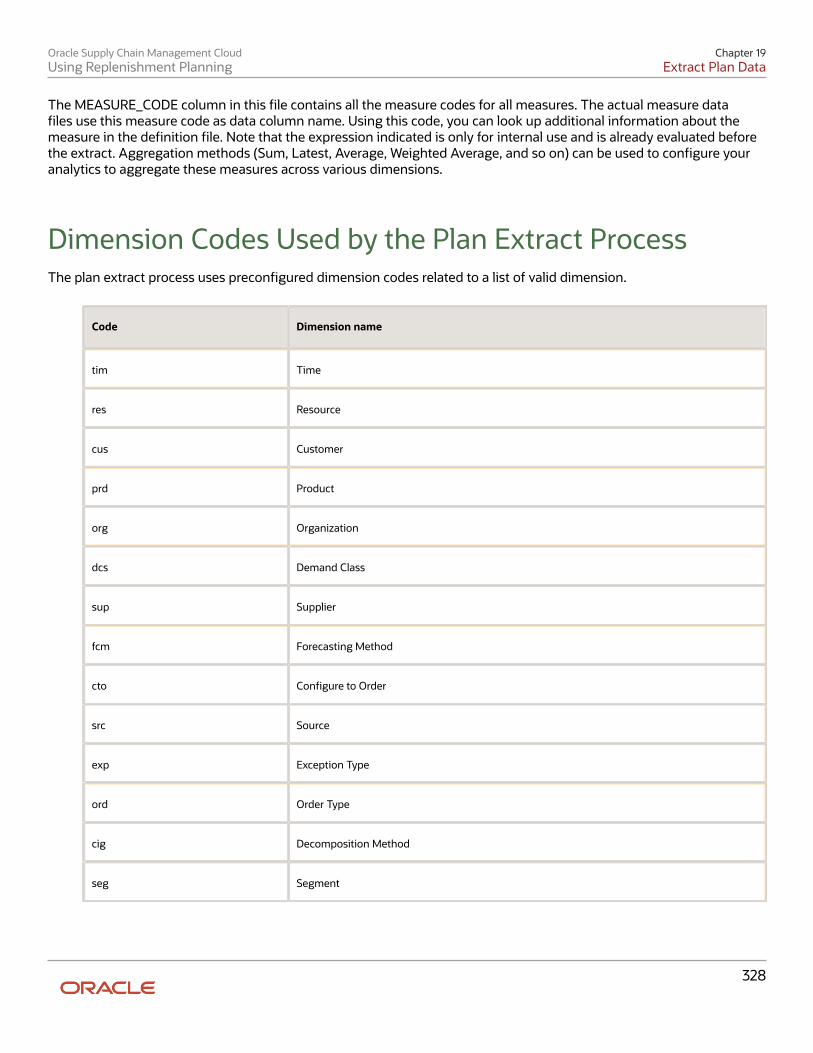
Oracle Supply Chain Management CloudUsing Replenishment Planning
Chapter 19Extract Plan Data
328
The MEASURE_CODE column in this file contains all the measure codes for all measures. The actual measure datafiles use this measure code as data column name. Using this code, you can look up additional information about themeasure in the definition file. Note that the expression indicated is only for internal use and is already evaluated beforethe extract. Aggregation methods (Sum, Latest, Average, Weighted Average, and so on) can be used to configure youranalytics to aggregate these measures across various dimensions.
Dimension Codes Used by the Plan Extract ProcessThe plan extract process uses preconfigured dimension codes related to a list of valid dimension.
Code Dimension name
tim Time
res Resource
cus Customer
prd Product
org Organization
dcs Demand Class
sup Supplier
fcm Forecasting Method
cto Configure to Order
src Source
exp Exception Type
ord Order Type
cig Decomposition Method
seg Segment

Oracle Supply Chain Management CloudUsing Replenishment Planning
Chapter 19Extract Plan Data
329
Dimensionality Group Codes Used by the Plan ExtractProcessThe extracted files use codes related to a list of valid dimensionality groups. Dimensionality group codes shown in thistopic list all of the valid preconfigured dimension groups. For example, code 125 is for all measures that are dimensionedonly by the Organization, Product, and Time dimensions. The measure data file for that dimensionality contains allmeasures extracted for that dimensionality.
Dimensionality Group Code Dimensionality Group
10 org, prd, tim, cus, cto
15 org, prd
20 org, res, tim
25 tim
35 org, prd, tim, cus
40 org, prd, res, tim, cus, sup, exp
45 org, prd, tim, sup
50 org, prd, tim, cus, sup, src
55 org, prd, tim, cus, dcs, ord
60 org, prd, tim, ord
65 org, prd, tim, cus, sup, dcs, ord
70 org, prd, tim, sup, ord
75 org, prd, dcs
95 org, prd, cus, dcs, fcm, clg, tim, cto
100 org, prd, tim, cus, dcs, cto

Oracle Supply Chain Management CloudUsing Replenishment Planning
Chapter 19Extract Plan Data
330
Dimensionality Group Code Dimensionality Group
105 org, prd, cus
110 org, prd, cus, dcs
125 org, prd, tim
130 org, prd, tim, cus
135 org, prd, tim, cus, dcs
145 prd, tim, cus
150 prd, tim, cus, dcs
155 org, prd, tim, cus, sup, dcs
160 prd, cus
165 org, prd, tim, exp
170 org, tim
175 prd
180 org, prd, tim, cus, dcs, fcm, clg
185 org, prd, cus, dcs, fcm, clg
190 org, prd, cus, fcm, clg
Oracle Supply Chain Management CloudUsing Replenishment Planning
Glossary
331
Glossarydimension
A data category used to organize business data for retrieval and preservation of values. Dimensions usually containhierarchies of related members grouped within them. A dimension categorizes and describes measure data. Forexample, a measure named Price might be categorized by Product and Time, so that the price of items can be trackedover time.
planning data repository
The set of data collected from source systems and stored for use by order management, order promising, and supplychain planning processes.
work area
A set of pages containing the tasks, searches, and other content you need to accomplish a business goal.

Oracle Supply Chain Management CloudUsing Replenishment Planning
Glossary
332