Polymer Science Dictionary - Plastics, Resins, Rubber, Gums ...
Upload
khangminh22Category
view
0download
0
USE OF WASTE PLASTICS IN BITUMINOUS LAYER OF PAVEMENT
A DISSERTATION Submitted in partial fulfillment of the
requirements for the award of the degree of
MASTER OF TECHNOLOGY in
CIVIL ENGINEERING (With Specialization in Transportation 'Engineering)
PANKAJ GUPTA
DEPARTMENT OF CIVIL ENGINEERING INnIAN INSTITUTE OF TECHNOLOGY ROORKEE
ROORKEE - 247 667 (INDIA) JUNE, 2007
CANDIDATE'S DECLARATION
I hereby declare that the work which is being presented in the dissertation entitled
"USE OF WASTE PLASTICS IN BITUMINOUS LAYER OF PAVEMENT" in partial
fulfilment of the requirements for the award of degree of Master of Technology in Civil
Engineering with specialisation in Transportation Engineering, submitted in the
department of Civil Engineering, Indian Institute of Technology Roorkee, Roorkee is an
authentic record of my own work 'carried out from September, 2006 to June, 2007 under the
guidance of Dr. Praveen Kumar, Associate Professor, Transportation Engineering Section,
Department of Civil Engineering, Indian Institute of Technology Roorkee, Roorkee, India.
The matter embodied in this dissertation has not been submitted by me for award of
any other degree or diploma.
Place: Roorkee
Dated: June 2 , 2007
CERTIFICATE This is to certify that the above statement made by the candidate is correct to the best
of our knowledge.
(Dr. Praveen Kumar,) Associate Professor, Transportation Engg. Section, Department of Civil Engineering, Indian Institute of Technology Roorkee Roorkee-247667, India.
1
ACKNOWLEDGEMENT
I wish to express my deep sense of gratitude to Dr. Praveen Kumar, Associate
Professor, Transportation Engineering Section, Department of Civil Engineering, Indian
Institute of Technology Roorkee- for his kind help, timely suggestions and constant.
encouragement throughout the course of this dissertation work. I also wish to express my
sincere thanks to the entire faculty members of Transportation Engineering for extending all
the possible help to me.
I am thankful to staff members of Transportation Engineering Laboratory for their
help and co-operation extended by them during various stages of my work. I am also thankful
to Shri Rajpal Sharma and Shri Jwala Prasad Misra for their help in experimental work.
I also wish to express my profound gratitude to all my family members and well
wishers for the faith imposed in me and without whose patience and blessings this thesis
would not have reached its present form.
A word of thanks also goes out to all my friends who have provided valuable
suggestions and inputs during the various phases of my work.
Dated: June 29, 2007 (PAN J G
ii
ABSTRACT
Today the availability of the waste plastics is enormous, as the plastic materials have
become part and parcel of our daily life due to its economic value, easily availability,
easy processability, light-weight, durability and energy efficiency. Therefore as the
use of plastics is increasing day by day, the amount of waste plastic generation is also
increasing at the same rate. Their present- disposal--is -either--by_land filling or by
incineration. Both the process are not Ecofriendly.
Improper disposal of waste plastics can arise the problems like breast cancer,
reproductive problems in humans and animals and genital abnormalities. Under these
circumstances, an alternative use for the waste plastics is also the need of hour. The
better binding property of plastics in its molten state has helped in finding out a
method of safe disposal of waste plastics, by using them in road laying.
In the present study, the plastic bag is taken as the waste plastic and its effect
on the physical properties of bitumen and on the bituminous mix properties has been
studied. The waste plastic is added to three bituminous mixes (Bituminous Macadam,
Semi Dense Bituminous Concrete, and Bituminous Concrete). The bitumen is heated
to around 140°C and to that the waste plastic (plastic bag) after processing, is added.
Plastic gets melted and mixed with the bitumen. Then this mix is added to aggregates
heated to around 170°C. When mixed with hot bitumen, plastics melt to form an oily
coat over the aggregate. Then various tests like Marshall Test, Indirect Tensile
Strength Test, and Fatigue Test etc. have been conducted on the bitumen-polymer-
aggregate mix.
From the test results it has been found that the mix has Higher Tensile
Strength, Higher Fatigue Strength, lower Penetration Value and higher Marshall
Stability etc. The study concludes that saving in bitumen quantity can be achieved by
using these materials.
111
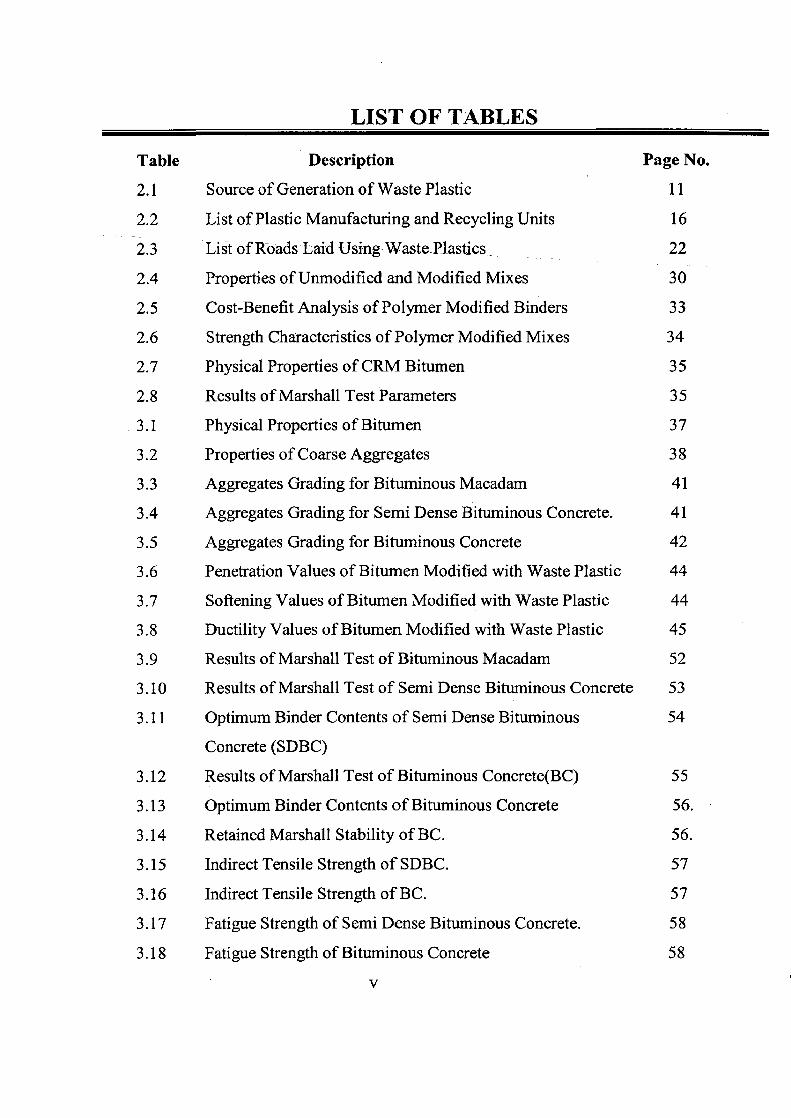
LIST OF TABLES
Table Description Page No.
2.1 Source of Generation of Waste Plastic 11
2.2 List of Plastic Manufacturing and Recycling Units 16
2.3 List of RoadsLaid -Using Waste. Plastics 22
2.4 Properties of Unmodified and Modified Mixes 30
2.5 Cost-Benefit Analysis of Polymer Modified Binders 33
2.6 Strength Characteristics of Polymer Modified Mixes 34
2.7 Physical Properties of CRM Bitumen 35
2.8 Results of Marshall Test Parameters 35
3.1 Physical Properties of Bitumen 37
3.2 Properties of Coarse Aggregates 38
3.3 Aggregates Grading for Bituminous Macadam 41
3.4 Aggregates Grading for Semi Dense Bituminous Concrete. 41
3.5 Aggregates Grading for Bituminous Concrete 42
3.6 Penetration Values of Bitumen Modified with Waste Plastic 44
3.7 Softening Values of Bitumen Modified with Waste Plastic 44
3.8 Ductility Values of Bitumen Modified with Waste Plastic 45
3.9 Results of Marshall Test of Bituminous Macadam 52
3.10 Results of Marshall Test of Semi Dense Bituminous Concrete 53
3.11 Optimum Binder Contents of Semi Dense Bituminous 54
Concrete (SDBC)
3.12 Results of Marshall Test of Bituminous Concrete(BC) 55
3.13 Optimum Binder Contents of Bituminous Concrete 56.
3.14 Retained Marshall Stability of BC. 56.
3.15 Indirect Tensile Strength of SDBC. 57
3.16 Indirect Tensile Strength of BC. 57
3.17 Fatigue Strength of Semi Dense Bituminous Concrete. 58
3.18 Fatigue Strength of Bituminous Concrete 58
u
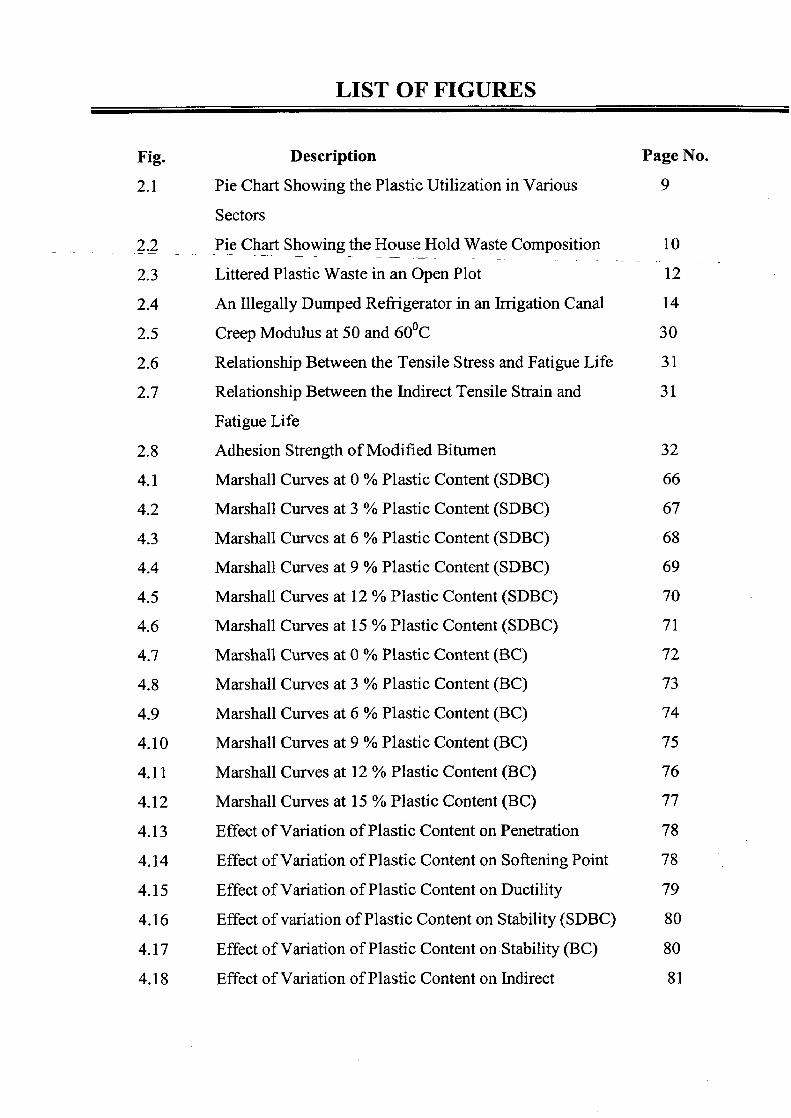
LIST OF FIGURES
Fig. Description Page No.
2.1 Pie Chart Showing the Plastic Utilization in Various 9
Sectors
2.2 Pie Chart Showing the House Hold Waste Composition 10
2.3 Littered Plastic Waste in an Open Plot 12
2.4 An Illegally Dumped Refrigerator in an Irrigation Canal 14
2.5 Creep Modulus at 50 and 60°C 30
2.6 Relationship Between the Tensile Stress and Fatigue Life 31
2.7 Relationship Between the Indirect Tensile Strain and 31
Fatigue Life
2.8 Adhesion Strength of Modified Bitumen 32
4.1 Marshall Curves at 0 % Plastic Content (SDBC) 66
4.2 Marshall Curves at 3 % Plastic Content (SDBC) 67
4.3 Marshall Curves at 6 % Plastic Content (SDBC) 68
4.4 Marshall Curves at 9 % Plastic Content (SDBC) 69
4.5 Marshall Curves at 12 % Plastic Content (SDBC) 70
4.6 Marshall Curves at 15 % Plastic Content (SDBC) 71
4.7 Marshall Curves at 0 % Plastic Content (BC) 72
4.8 Marshall Curves at 3 % Plastic Content (BC) 73
4.9 Marshall Curves at 6 % Plastic Content (BC) 74
4.10 Marshall Curves at 9 % Plastic Content (BC) 75
4.11 Marshall Curves at 12 % Plastic Content (BC) 76
4.12 Marshall Curves at 15 % Plastic Content (BC) 77
4.13 Effect of Variation of Plastic Content on Penetration 78
4.14 Effect of Variation of Plastic Content on Softening Point 78
4.15 Effect of Variation of Plastic Content on Ductility 79
4.16 Effect of variation of Plastic Content on Stability (SDBC) 80
4.17 Effect of Variation of Plastic Content on Stability (BC) 80
4.18 Effect of Variation of Plastic Content on Indirect 81
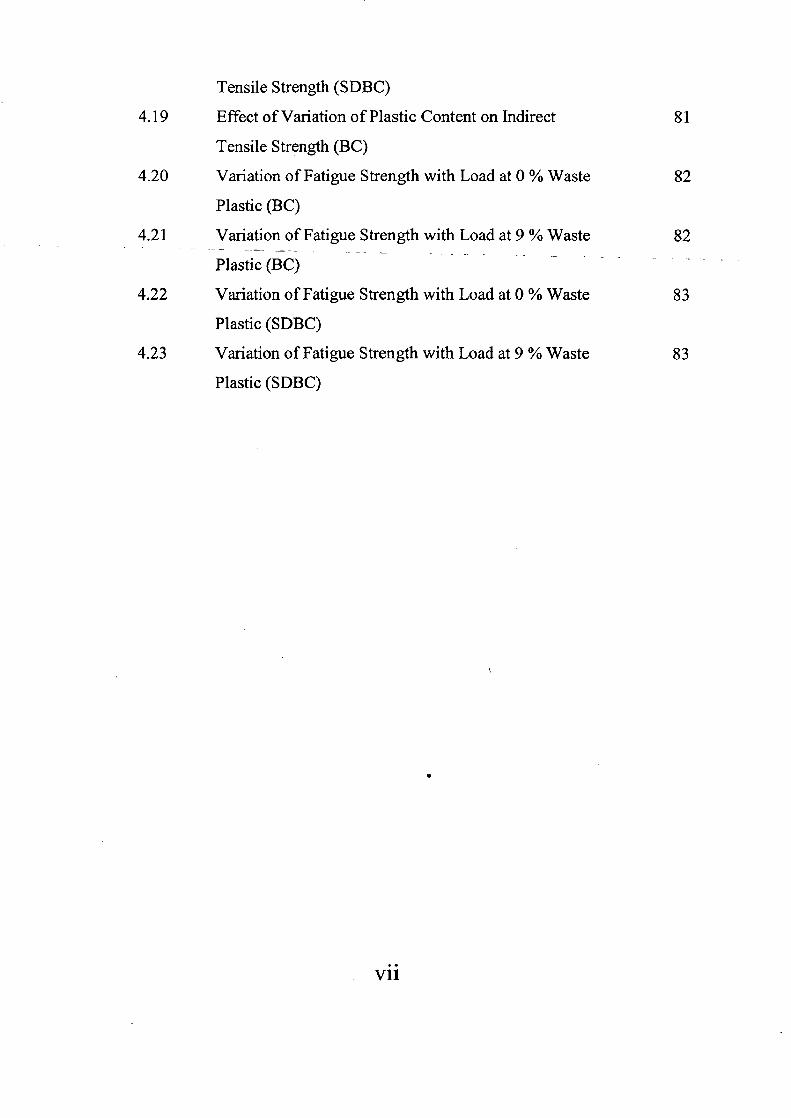
Tensile Strength (SDBC)
4.19 Effect of Variation of Plastic Content on Indirect 81
Tensile Strength (BC)
4.20 Variation of Fatigue Strength with Load at 0 % Waste 82
Plastic (BC)
4.21 Variation of Fatigue Strength with Load at 9 % Waste 82
Plastic (BC)
4.22 Variation of Fatigue Strength with Load at 0 % Waste 83
Plastic (SDBC)
4.23 Variation of Fatigue Strength with Load at 9 % Waste 83
Plastic (SDBC)
•
vii
LIST OF PLATES
Plate No. Description Page No.
3.1 Shredded Plastic Bag 59
3.2 Penetration Test in Progress 59
3.3 Preparation of Marshall Specimen 60
3.4 Marshall Strength-Test in Progress -- 60 - -
3.5 Indirect Tensile Strength Test in Progress 61
3.6 Fatigue Testing in Progress 61
viii
CONTENTS
Chapter Title Page No.
Candidate's declaration i
Acknowledgements ii
Abstract iii
L- ist.of_Tables iv
List of Figures v
List of Plates vi
1. INTRODUCTION 1-5
1.1 General 1
1.2 Use of Waste Plastic in Road Construction 2
1.3 Salient Features of Polymer Waste-Bituminous 3
Mix Road
1.4 Needs of Modified Binders in Road Construction 3
1.5 Objectives and Scope of Study 4
1.6 Organisation of Thesis 5
2. LITERATURE REVIEW 6-36
2.1 Plastics-What are They and How They Behave 6
2.2 Classification of Plastics 6
2.2.1 Organic Polymer 6
2.2.2 Inorganic Polymer 6
2.2.3 Thermoplastic 7
2.2.4 Thermoset 7
2.3 Plastic Fact File 8
2.4 Benefits of Plastics 10
2.5 Source of Generation of Waste Plastics 11
2.6 Litter 11
2.6.1 Source of Litter 12
2.6.2 Effects of Litter 13
2.6.3 What's the Solution? 14
2.7 Methods of Reducing the Waste Plastics 14
3.
0
5.
2.7.1 Recycling of Plastics 15
2.7.2 Reuse of Waste Plastics in Road 21
Construction
2.7.3 List of Road Laid Using Waste PIastics 22
2.8 Studies on Waste Plastics for Road Construction 23-36
EXPERIMENTAL PROGRAMME 37-61
3.1 General 37
3.2 Materials 37
3.2.1 Bitumen 37 3.2.2 Aggregates 38
3.3 Waste Plastic 38
3.4 Test on Bitumen Blended with Plastics 38
3.4.1 Penetration Test 38 3.4.2 Softening Point Test 39 3.4.3 Ductility Test 39
3.5 Tests on Bituminous Mixes 40
3.5.1 Stripping Test 40
3.5.2 Marshall Strength Test 40
3.5.3 Retained Marshall Stability Test 40
3.5.4 Indirect Tensile Strength Test 42
3.5.5 Fatigue Test 43
ANALYSIS AND DISCUSSION OF TEST RESULTS 62-83
4. 1 Penetration Test 62
4.2 Softening Point Test 62
4. 3 Ductility Test 62
4.4 Stripping Test 63
4.5 Marshall Stability Test 63
4. 6 Indirect Tensile Strength Test 64
4. 7 Fatigue Test 64
CONCLUSIONS AND RECCOMENDATIONS 84-85
REFERENCES 86-87
CHAPTER-1
INTRODUCTION
1.1 General
There are several major industries in the country which give rise to
colossal amount of waste materials in the form of by-products, posing serious problems of
disposal as well as causing environmental pollution. Industries have come up in large
numbers to make the country self-sufficient and prosperous during the past four decades. On
the one hand they meet the targeted production of useful materials of various types and on
the other hand they produce a good amount of waste materials like fly ash, Blast Furnace
Slag (BFS), Silica Fumes, Steel tires, Scrap tires and Plastics etc.
These waste materials are generally dumped in the nearby area. With time, the
amount of waste materials dumped starts posing serious problems for their limited space
available for dumping. As a result, there is wastage of many acres of precious land. Having
the harmful and non hygienic impacts on ecological system, these unuseful materials cause
environmental pollution in the air and water of the affected area. Obviously, there will be
inhabitance problems for nearby people and for aquatic animals.
Today disposal of these dumps has become a crying necessity, not only to regain the
vast valuable space occupied by them, but also to reduce the pollution and other hazards.
Therefore to minimize the above problems, many researchers tried to use the waste materials
in road construction. It will not only bring out significant saving in road materials costs but
also help towards tackling the problems of disposal of such waste materials, which tend to be
hazardous in as much as they can cause pollution of both air and water.
Due to high cost of cement concrete roads, preference is usually given to
construction of bituminous roads. Flexible pavements with bituminous surfacing are widely used
in India. Although the proportion of bituminous binder in a road surfacing is much less than that
of aggregate, the quantity and quality of binder have great influence on behavior of bituminous
pavement. An increase in the mad traffic over the last two decades in tams of commercial vehicles and
1
overloading of trucks and significant variation in daily and seasonal temperature of the pavements have
been responsible for early development of distress like raveling, undulations, rutting, cracking, bleeding
and shoving of bituminous surfaces. A factor, which causes further concern in India, is very high and
low pavement temperature in some parts of the country. Under these conditions, flexible pavements
tend to become soft in summer and brittle in winter.
For several years the demand for bitumen has increased tremendously because of rapid
urbanization. The bitumen obtainedfrorn the Indian refineries meets the existing specifications, but does
not provide the desired perfonnance in the field. The premature failure of flexible pavements in India is
mainly occurring due to inability of conventional bituminous mixes to sustain repeated application of
wheel load. On account of increased bitumen demand and non-availability of good quality bitumen fmm
indigenous sources, it is felt imperative to reduce the bitumen consumption. It can be achieved by
enhancing the durability of the existing roads, which will eventually result in reduced maintenance and
renewal operations. The performance of bituminous road surfacing depends upon the properties of the
bitumen. The properties of the bitumen may be modified by using certain modifiers such as polymer,
crumb rubber, sulphur etc.
1.2 Use of Waste Plastics in Road Construction Plastics have become an integral part and parcel of our lives due to its economic value, easy
availability, easy processability, light-weight, durability and energy efficiency, besides other benefits.
Therefore as the use of plastic is increasing day by day, the amount of waste plastics is also increasing at
the same rate. Though the plastics are re-usable and recyclable and hence there should not have been any
problem of disposal of the plastic waste. However, due to our poor littering habits, and inadequate waste
management system, plastic waste disposal continues to be a major problem for the civic authorities
especially in the urban areas. Improper disposal of waste plastics can arise the problems like breast cancer,
reproductive problems in humans and animals, genital abnormalities and even a decline in human sperm
count and quality. So to eliminate the above problems, waste plastics were tried to use in road construction
by many researchers. Tests like Penetration test, Ductility test, Softening point test, etc. were performed on bitumen
and modified bitumen. From the test results they found that modified bitumen shows higher softening
point, lower penetration and better ductility values.
N
Marshall Stability tests, Retained Marshall stability test, Fatigue tests, etc. were conducted on
the bituminous mixes and bituminous mixes blended with plastics. Test results showed that Marshall
stability and the fatigue life of the bituminous mixes increases nearly by 2 times then that of -the
unmodified mixes.
1.3 Salient Features of the Polymer Waste-Bitumen Mix Road: • Road strength is twice stronger than normal roads;
• Resistance towards water stagnation i.e. no potholes are formed;
• Less bleeding during summer;
• Burning of plastic waste could be avoided;
• It doesn't involve any extra machinery;
• Better adhesion between aggregates and binder,
• Higher fatigue life of mixes;
• It doesn't increase cost of road construction; and
• It helps to reduce the consumption of bituminous mix vis-a-vis reduce cost.
• Overall improved performance in extreme climatic conditions and under heavy traffic
conditions.
1.4 Needs of Modified Binders in Road Construction
Investigations in India and abroad have revealed that properties of bitumen and bituminous
mixes can be improved to meet the requirements of the pavement with the incorporation of certain
additives or a blend of additives. These additives are called "Bitumen Modifiers" and the bitumen
treated with these modifiers is known as "Modified Bitumen". Modified bitumen is expected to give 50
to 100 percent higher life to surfacing depending upon the degree of modifications and the type of
additives used. Trial test studies carried out under the aegis of Central Road Research Institute,
NewDelhi, Highway Research Station, Chennai, Rubber Board, Gujarat Engineering Research
Institute, Vadodara and Kerala Public Works Department have shown that the use of modified
bitumen in construction and maintenance of bituminous roads is cost effective, if life cycle cost is
taken into consideration. The choice will thus ultimately be based on life cycle cost of overlays and
renewals for modified bitumen as compared to ordinary bitumen for prevailing traffic and climatic
conditions. With careful selection of modifiers and observing suggested precautions during
3
construction, it is possible to improve the properties of bituminous mixes and enhance the life of the
pavement particularly in areas where high traffic loads are expected.
Bitumen used in road surfacing should have such temperature viscosity characteristics that the
surfacing can resist plastic deformation at high temperatures and brittle cracking at low temperatures.
For many locations in the country, the commercially available bitumen has temperature viscosity
characteristics that are not able to satisfy both the requirements and it results in premature failure of
the bituminous. surfacing If a bituminous mix-used in a surfacing is made somewhat stiffer, it can have
a longer fatigue life and can take traffic loads over a longer period of time. The increase in durability of a
bituminous surfacing will result in economy in consumption of bitumen and other paving materials.
15 Objective and Scope of Study In India and abroad, industries are increasing at a faster rate due to rapid
urbanization. As a result, they produce a vast amount of unuseful materials as by-products
which cause serious problem to disposal and environment. Moreover there has been rapid
development in traffic intensity during last few decades requiring a massive road
development programme. It has been estimated that some 10 lacs more kilometers are
required to be added to the existing roads during the next 5 years. The inputs needed in the
form of quality materials like stone aggregates, bitumen and cement get depleted at a very
fast rate in the construction of new roads and maintenance of existing roads. Therefore,
attempts must be to make use of waste materials in road construction.
The present study has been undertaken with the following objectives:
• To study the effect of utilization of waste plastics on Marshall Stability and Flow
Value of Bituminous Mixes.
• To study the effect of utilization of waste plastics on Indirect Tensile Strength of
Bituminous Mixes at 25°C.
• To study the effect of utilization of Waste Plastics on Fatigue Life of Bituminous
Mixes.
• To evaluate the difference in physical properties of Bitumen by using Waste Plastics.
ru
1.6 Organisation of the Thesis
The present thesis report is documented in five chapters. The first chapter identifies
the problem and defines the scope of the work. The second chapter presents the description of
plastics, its classification and the studies done in the past. In the third chapter the details of the
experimental programme are given.. The fourth chapter presents analysis and discussion of
the test results. The conclusions drawn from this study and recommendations for further work
are given in chapter five.
1
5
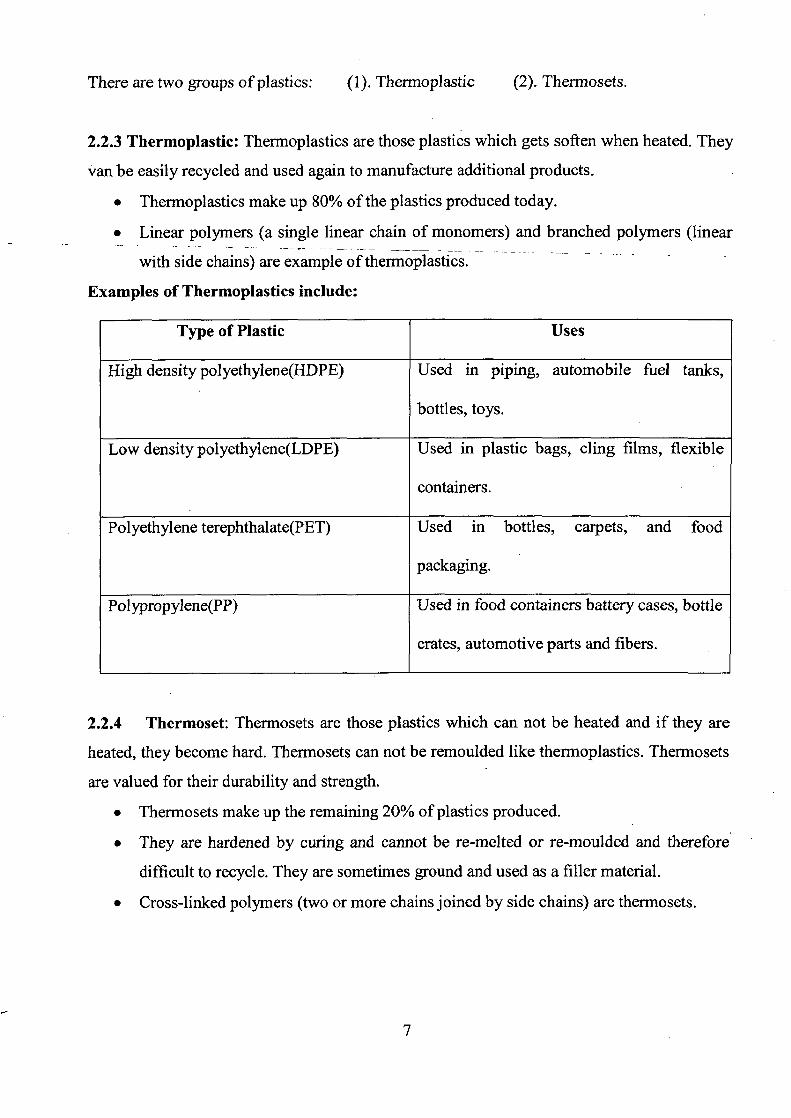
There are two groups of plastics: (1). Thermoplastic (2). Thermosets.
2.2.3 Thermoplastic: Thermoplastics are those plastics which gets soften when heated. They
van be easily recycled and used again to manufacture additional products.
• Thermoplastics make up 80% of the plastics produced today.
• Linear polymers (a single linear chain of monomers) and branched polymers (linear
with side chains) are example of thermoplastics. LL
Examples of Thermoplastics include:
Type of Plastic Uses
High density polyethylene(HDPE) Used in piping, automobile fuel tanks,
bottles, toys.
Low density polyethylene(LDPE) Used in plastic bags, cling films, flexible
containers.
Polyethylene terephthalate(PET) Used in bottles, carpets, and food
packaging.
Polypropylene(PP) Used in food containers battery cases, bottle
crates, automotive parts and fibers.
2.2.4 Thermoset: Thermosets are those plastics which can not be heated and if they are
heated, they become hard. Thermosets can not be remoulded like thermoplastics. Thermosets
are valued for their durability and strength.
• Thermosets make up the remaining 20% of plastics produced.
• They are hardened by curing and cannot be re-melted or re-moulded and therefore
difficult to recycle. They are sometimes ground and used as a filler material.
• Cross-linked polymers (two or more chains joined by side chains) are thermosets.
7
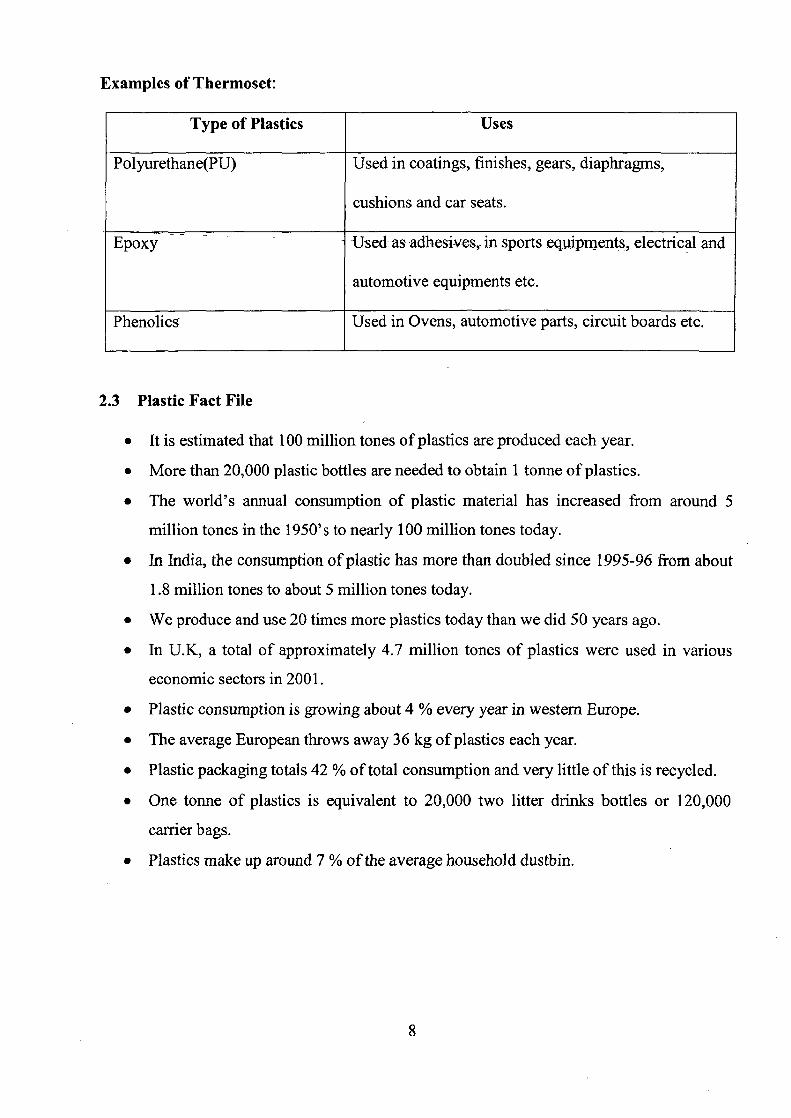
Examples of Thermoset:
Type of Plastics Uses
Polyurethane(PU) Used in coatings, finishes, gears, diaphragms,
cushions and car seats.
Epoxy Used- as adhesives,- in sports equipments, electrical and
automotive equipments etc.
Phenolics Used in Ovens, automotive parts, circuit boards etc.
2.3 Plastic Fact File
• It is estimated that 100 million tones of plastics are produced each year.
• More than 20,000 plastic bottles are needed to obtain 1 tonne of plastics.
• The world's annual consumption of plastic material has increased from around 5
million tones in the 1950's to nearly 100 million tones today.
• In India, the consumption of plastic has more than doubled since 1995-96 from about
1.8 million tones to about 5 million tones today.
• We produce and use 20 times more plastics today than we did 50 years ago.
• In U.K, a total of approximately 4.7 million tones of plastics were used in various
economic sectors in 2001.
• Plastic consumption is growing about 4 % every year in western Europe.
• The average European throws away 36 kg of plastics each year.
• Plastic packaging totals 42 % of total consumption and very little of this is recycled.
• One tonne of plastics is equivalent to 20,000 two litter drinks bottles or 120,000
carrier bags.
• Plastics make up around 7 % of the average household dustbin.
ro
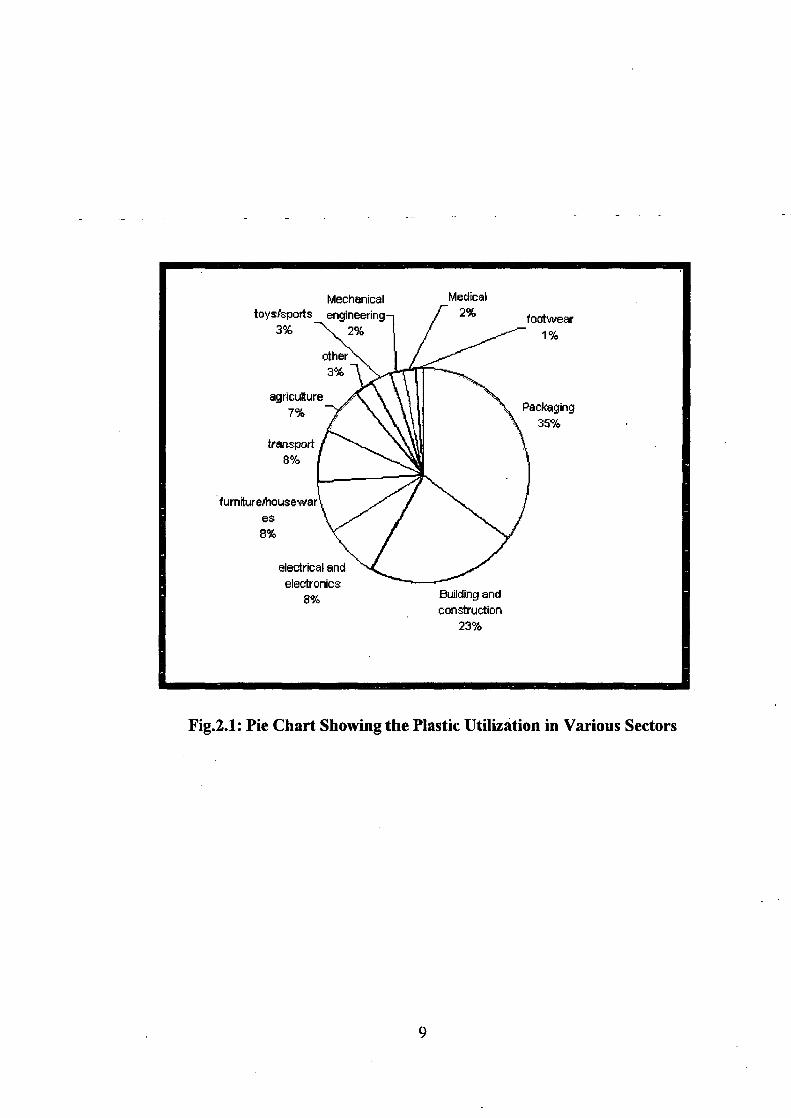
Mechanical Medical toysfsports engineering 2% footwear
3% 2% 1 %
other 3%
agriculture 7% Packaging
35%
transport 8%
furnitureihrousewar es 8%
electrical and electronics
8, Building and construction
23%
Fig.2.1: Pie Chart Showing the Plastic Utilization in Various Sectors
0
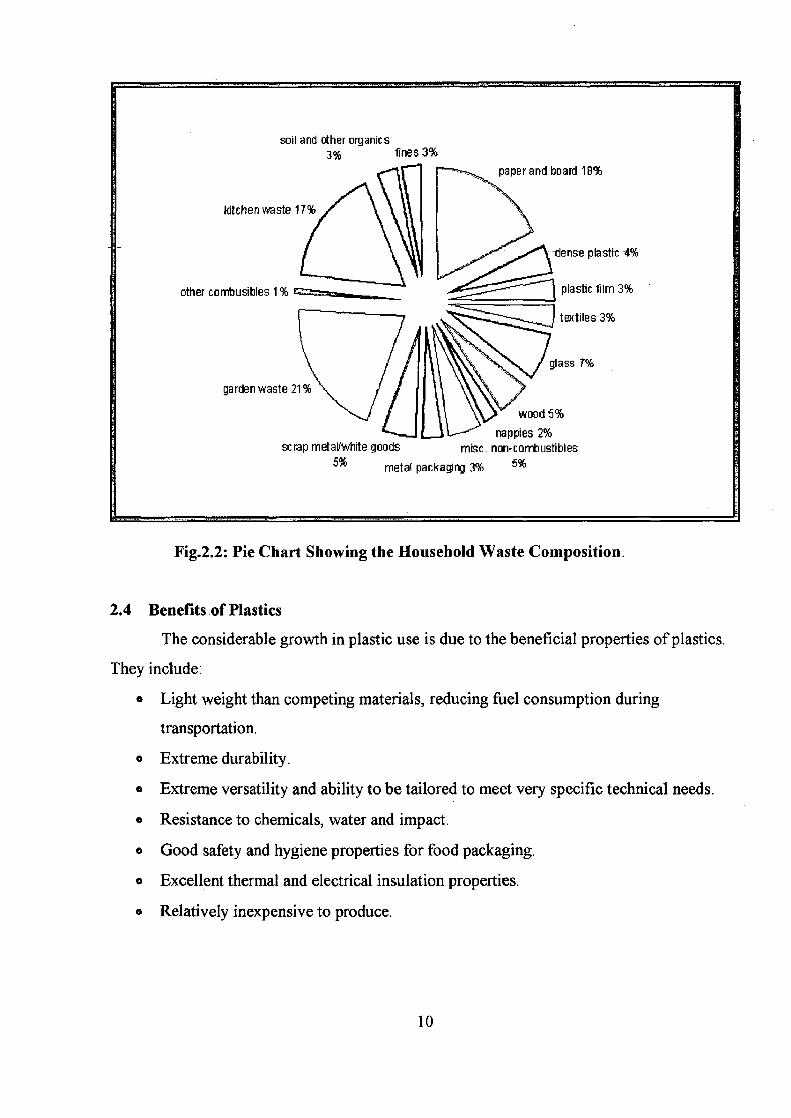
other combusibles 1 %
garden waste 2
soil and other organics 3% fines 3%
paper and board 18%
kitchen waste 17%
-dense plastic 4%
plastic film 3%
textiles 3%
glass T%
wood 5%
nappies 2% scrap metaVWhite goods misc- non-combustibles
5% metal packaging 3% 5%
Fig.2.2: Pie Chart Showing the Household Waste Composition.
2.4 Benefits of Plastics
The considerable growth in plastic use is due to the beneficial properties of plastics.
They include:
e Light weight than competing materials, reducing fuel consumption during
transportation.
o Extreme durability.
o Extreme versatility and ability to be tailored to meet very specific technical needs.
o Resistance to chemicals, water and impact.
o Good safety and hygiene properties for food packaging.
o Excellent thermal and electrical insulation properties.
o Relatively inexpensive to produce.
10
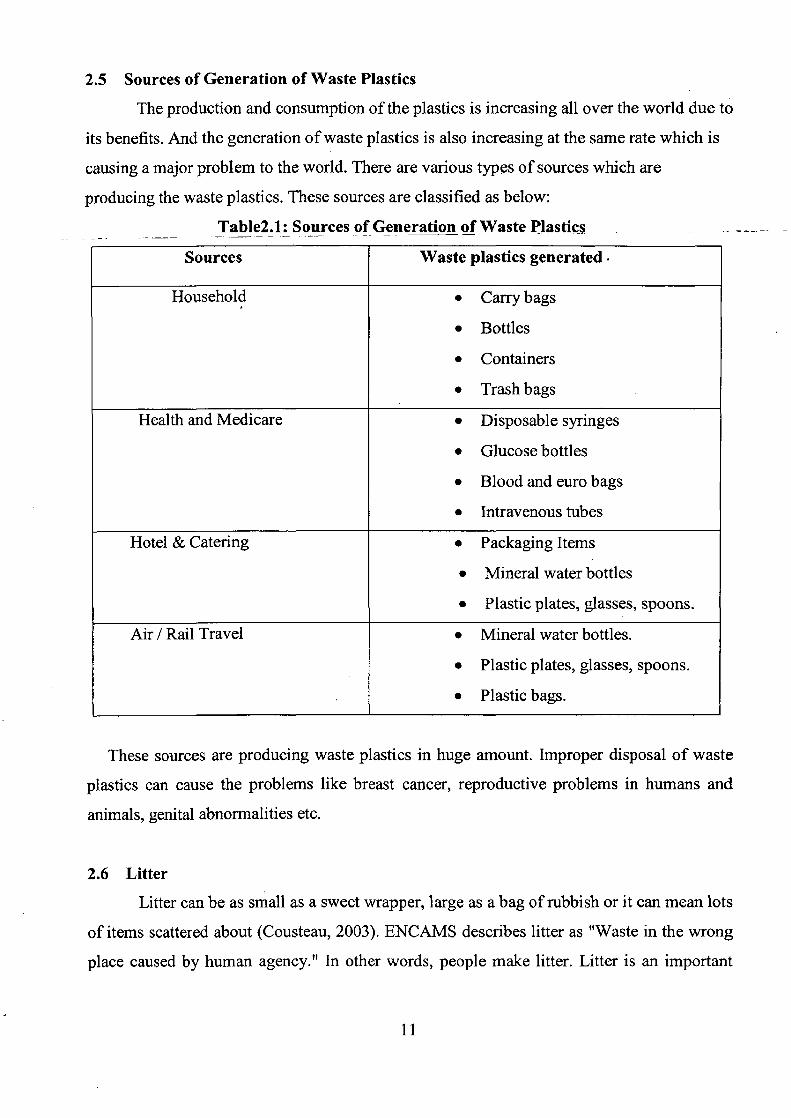
2.5 Sources of Generation of Waste Plastics
The production and consumption of the plastics is increasing all over the world due to
its benefits. And the generation of waste plastics is also increasing at the same rate which is
causing a major problem to the world. There are various types of sources which are
producing the waste plastics. These sources are classified as below:
Table2.1: Sources of Generation of Waste Plastics
Sources Waste plastics generated
Household • Carry bags
• Bottles
• Containers
• Trash bags
Health and Medicare • Disposable syringes
• Glucose bottles
• Blood and euro bags
• Intravenous tubes
Hotel & Catering • Packaging Items
• Mineral water bottles
• Plastic plates, glasses, spoons.
Air / Rail Travel • Mineral water bottles.
• Plastic plates, glasses, spoons.
• Plastic bags.
These sources are producing waste plastics in huge amount. Improper disposal of waste
plastics can cause the problems like breast cancer, reproductive problems in humans and
animals, genital abnormalities etc.
2.6 Litter Litter can be as small as a sweet wrapper, large as a bag of rubbish or it can mean lots
of items scattered about (Cousteau, 2003). ENCAMS describes litter as "Waste in the wrong
place caused by human agency." In other words, people make litter. Litter is an important
11
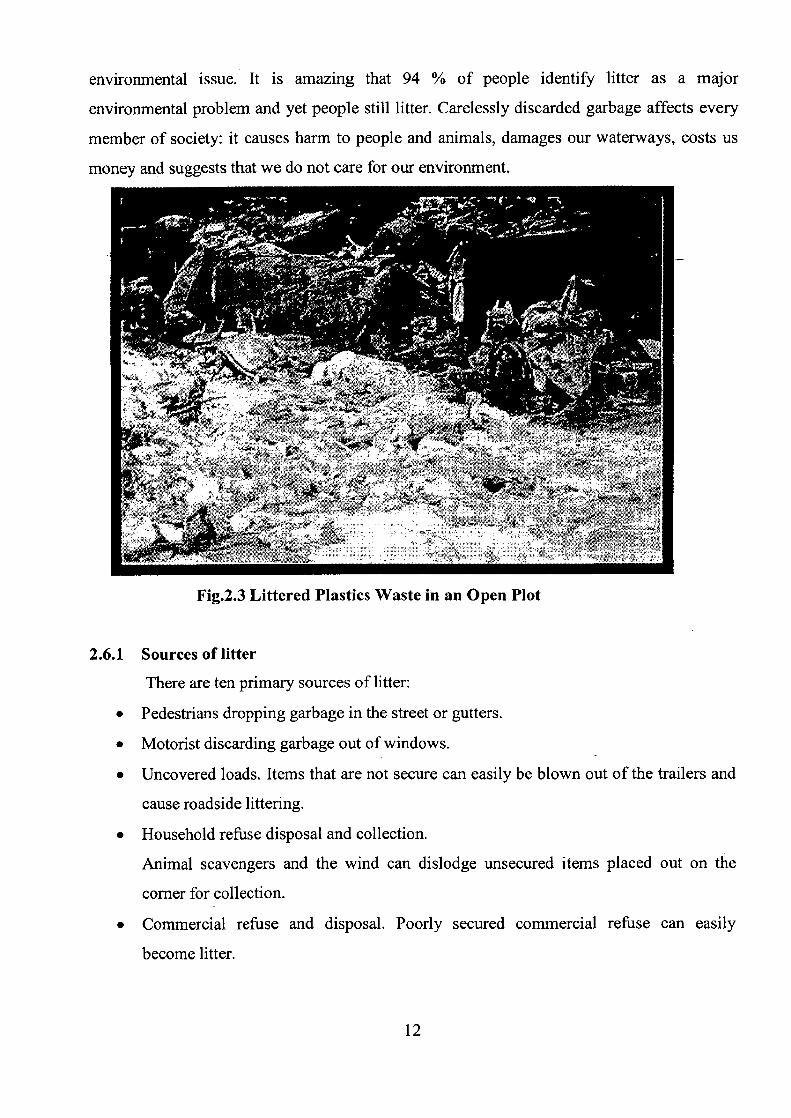
environmental issue. It is amazing that 94 % of people identify litter as a major
environmental problem and yet people still litter. Carelessly discarded garbage affects every
member of society: it causes harm to people and animals, damages our waterways, costs us
money and suggests that we do not care for our environment.
Fig.2.3 Littered Plastics Waste in an Open Plot
2.6.1 Sources of litter There are ten primary sources of litter:
• Pedestrians dropping garbage in the street or gutters.
• Motorist discarding garbage out of windows.
• Uncovered loads. Items that are not secure can easily be blown out of the trailers and
cause roadside littering.
• Household refuse disposal and collection.
Animal scavengers and the wind can dislodge unsecured items placed out on the
corner for collection.
• Commercial refuse and disposal. Poorly secured commercial refuse can easily
become litter.
12
• Construction projects. Litter can come from uncontrolled building waste and workers
lunchtime refuse.
• People at leisure.
• Entertainment events. Events create a large amount of litter, which can overflow onto
neighbouring areas when measures to control it are not carefully planned.
• Illegal dumping. - _ --
. Intentional or habitual littering, for reasons such as laziness or acts of rebellion.
2.6.2 Effects of litter
Litter can cause a whole range of problems for everyone in the community.
• Litter discarded in the streets and parks can travel through the storm water system to
our bays and oceans, where it can cause harm to wildlife.
• Litter costs money. Removing litter from the environment costs everyone money.
• Litter is a threat to public health. Litter attracts vermin and is a breeding ground for
bacteria. Items such as broken glasses and syringes can be a health hazard in public
places.
• Litter can be a fire hazard. Accumulation litter and carelessly discarded cigarette butts
are potential fire hazards.
• Litter looks bad. Litter negatively affects the image of places, especially tourist
locations.
• Litter can harm or kill wildlife. Plastic litter can choke or suffocate birds and marine
life. Carelessly discarded containers can trap small mammals.
13
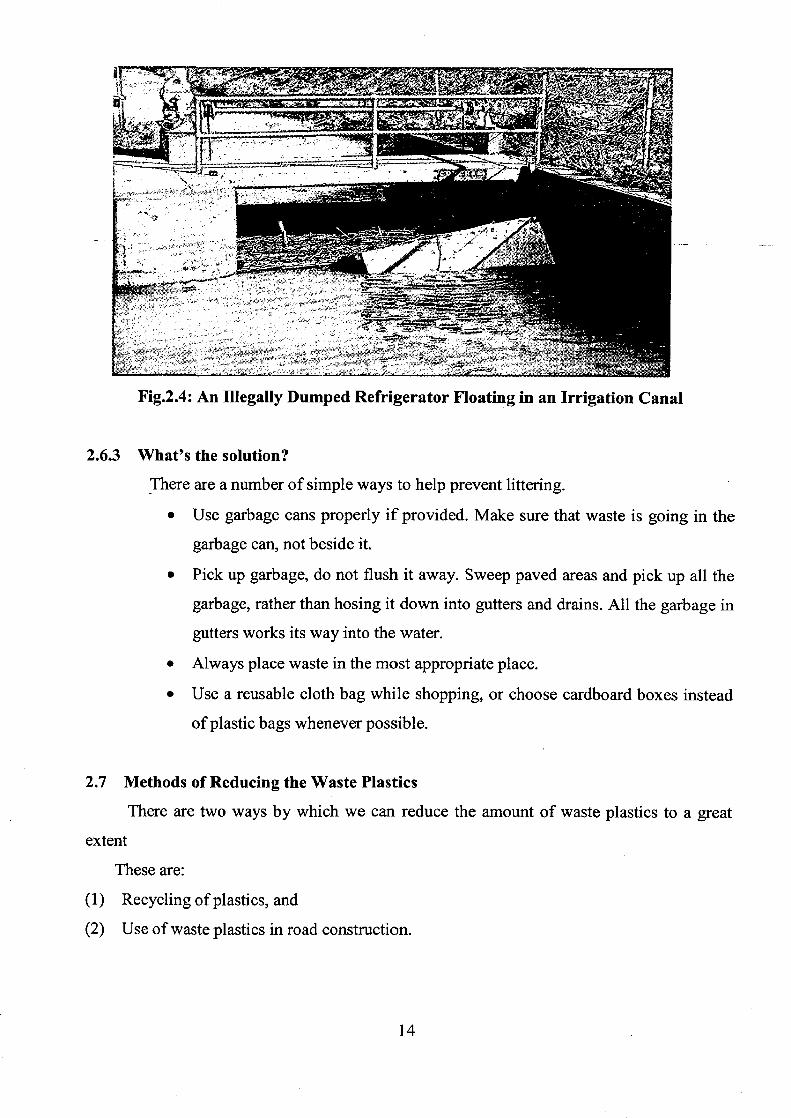
Fig.2.4: An Illegally Dumped Refrigerator Floating in an Irrigation Canal
2.6.3 What's the solution?
There are a number of simple ways to help prevent littering.
• Use garbage cans properly if provided. Make sure that waste is going in the
garbage can, not beside it.
• Pick up garbage, do not flush it away. Sweep paved areas and pick up all the
garbage, rather than hosing it down into gutters and drains. All the garbage in
gutters works its way into the water.
• Always place waste in the most appropriate place.
• Use a reusable cloth bag while shopping, or choose cardboard boxes instead
of plastic bags whenever possible.
2.7 Methods of Reducing the Waste Plastics
There are two ways by which we can reduce the amount of waste plastics to a great
extent
These are:
(1) Recycling of plastics, and
(2) Use of waste plastics in road construction.
14
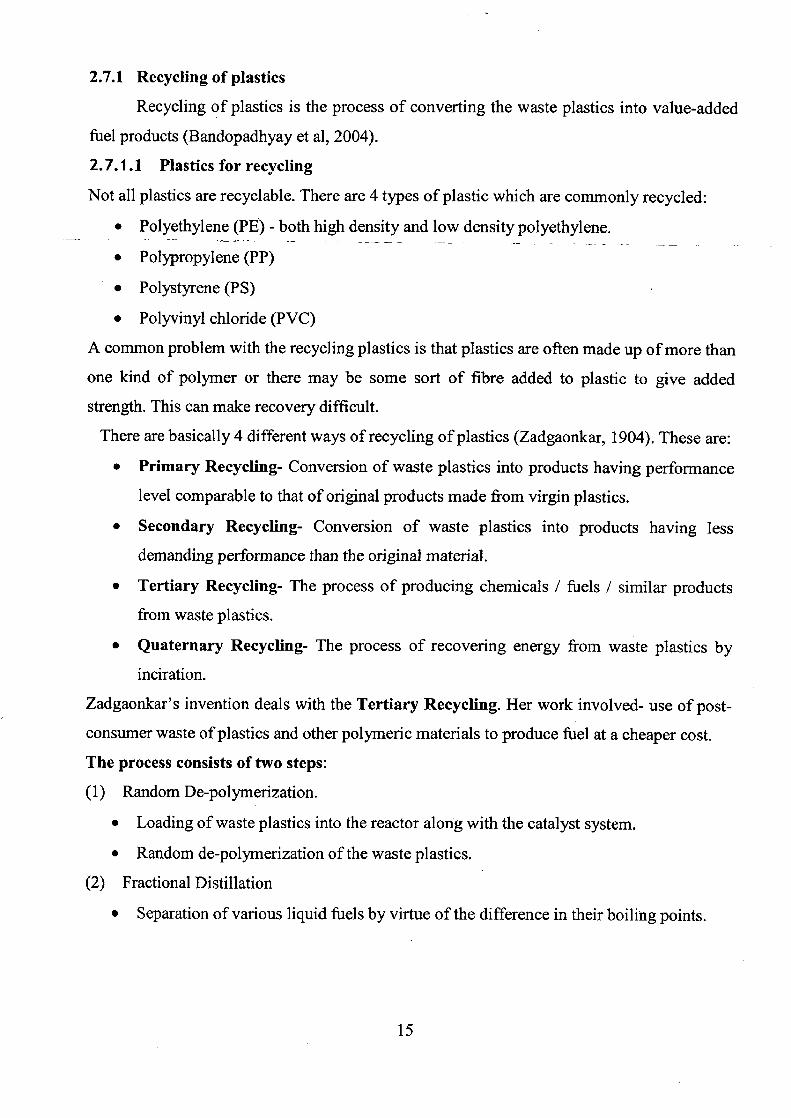
2.7.1 Recycling of plastics
Recycling of plastics is the process of converting the waste plastics into value-added
fuel products (Bandopadhyay et al, 2004).
2.7.1.1 Plastics for recycling
Not all plastics are recyclable. There are 4 types of plastic which are commonly recycled:
• Polyethylene (PE) - both high density and low density polyethylene.
• Polypropylene (PP)
• Polystyrene (PS)
• Polyvinyl chloride (PVC)
A common problem with the recycling plastics is that plastics are often made up of more than
one kind of polymer or there may be some sort of fibre added to plastic to give added
strength. This can make recovery difficult.
There are basically 4 different ways of recycling of plastics (Zadgaonkar, 1904). These are:
• Primary Recycling- Conversion of waste plastics into products having performance
level comparable to that of original products made from virgin plastics.
• Secondary Recycling- Conversion of waste plastics into products having less
demanding performance than the original material.
• Tertiary Recycling- The process of producing chemicals / fuels / similar products
from waste plastics.
• Quaternary Recycling- The process of recovering energy from waste plastics by
inciration.
Zadgaonkar's invention deals with the Tertiary Recycling. Her work involved- use of post-consumer waste of plastics and other polymeric materials to produce fuel at a cheaper cost.
The process consists of two steps:
(1) Random De-polymerization.
• Loading of waste plastics into the reactor along with the catalyst system.
• Random de-polymerization of the waste plastics.
(2) Fractional Distillation
• Separation of various liquid fuels by virtue of the difference in their boiling points.
15
Name of
SPCBs/UTs
No of No. of
Units Registration
Granted
Comments/Suggestions Sr.
No.
121
Andmans &
Nil Nil
Nicobar
Islands
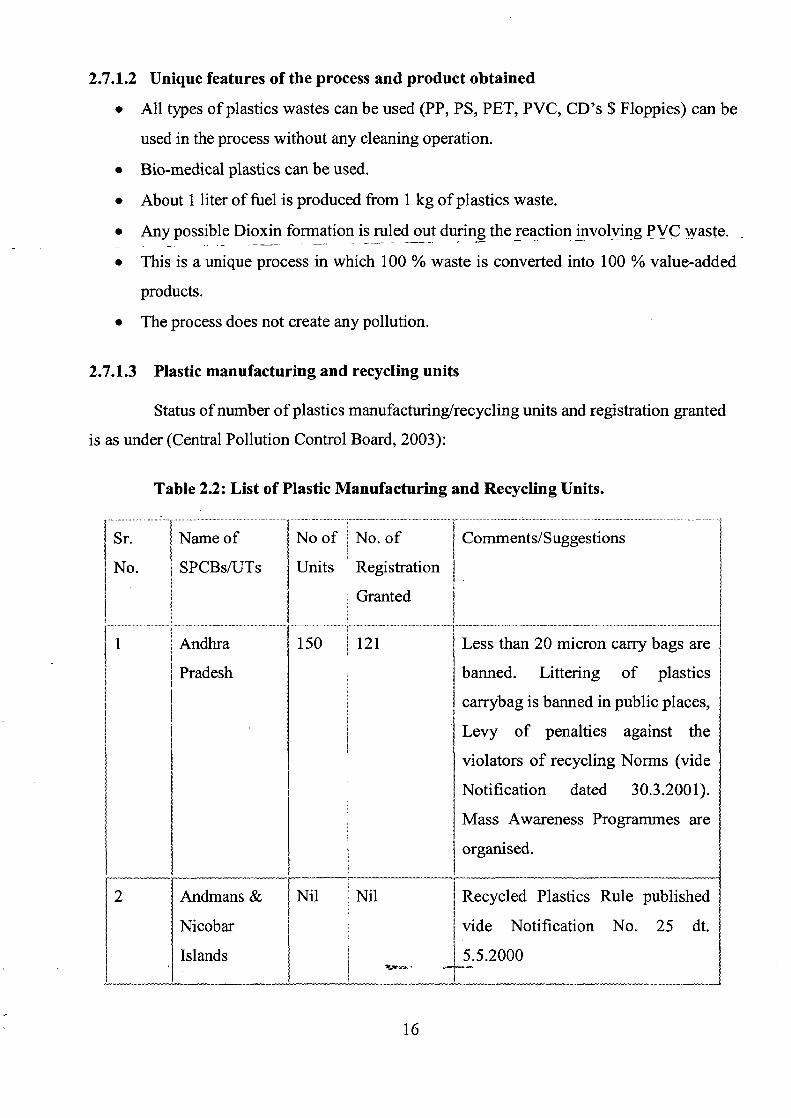
2.7.1.2 Unique features of the process and product obtained
• All types of plastics wastes can be used (PP, PS, PET, PVC, CD's $ Floppies) can be
used in the process without any cleaning operation.
• Bio-medical plastics can be used.
• About 1 liter of fuel is produced from 1 kg of plastics waste.
• Any possible Dioxin formation is ruled out during the reaction involving PVC waste.
• This is a unique process in which 100 % waste is converted into 100 % value-added
products.
• The process does not create any pollution.
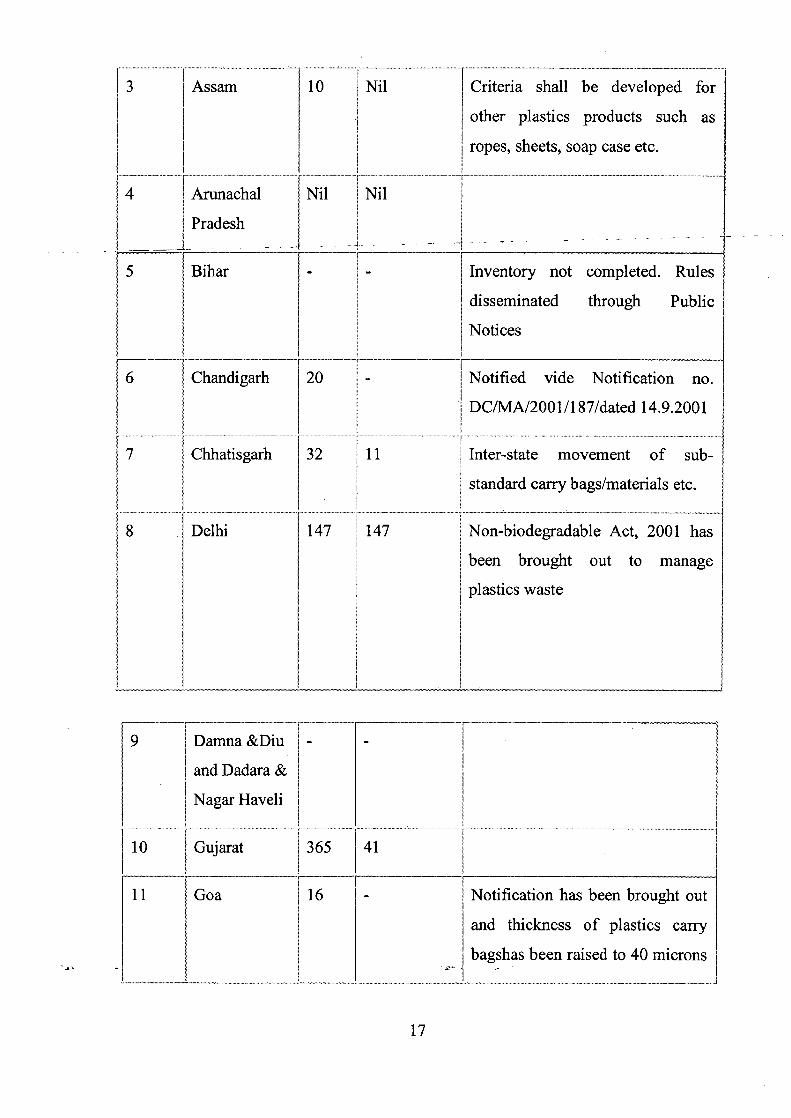
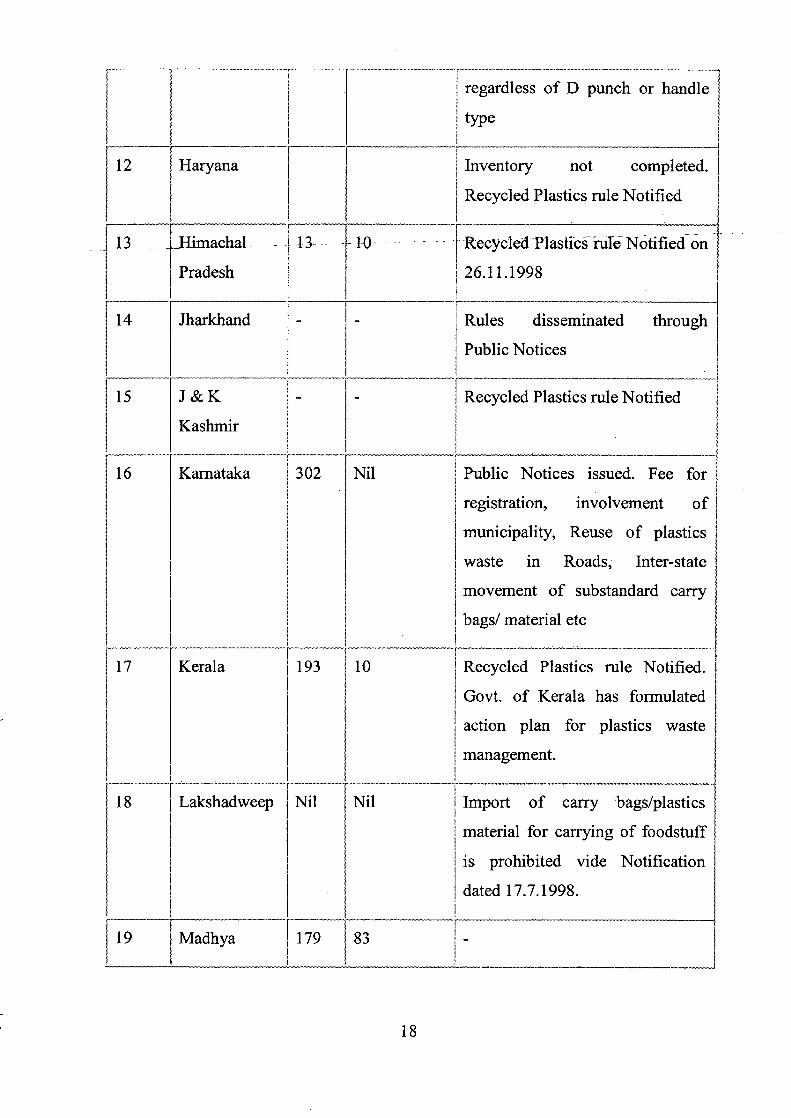
2.7.1.3 Plastic manufacturing and recycling units
Status of number of plastics manufacturing/recycling units and registration granted
is as under (Central Pollution Control Board, 2003):
Table 2.2: List of Plastic Manufacturing and Recycling Units.
Less than 20 micron carry bags are
banned. Littering of plastics
carrybag is banned in public places,
Levy of penalties against the
violators of recycling Norms (vide
Notification dated 30.3.2001).
Mass Awareness Programmes are
organised.
Recycled Plastics Rule published
vide Notification No. 25 dt.
5.5.2000
Lit
it Criteria shall be developed for
other plastics products such as
ropes, sheets, soap case etc.
4 Arunachal
Pradesh
Nil ' Nil
5 Bihar - - j Inventory not completed. Rules
disseminated through Public
Notices
6 Chandigarh 20 - Notified vide Notification no.
............................._....._..............................._ DC/MA/2001/187/dated 14.9.2001
.........._................._..._..... ....._..__ ... _... _......._..... _..... _..........._.... 7 Chhatisgarh 32 11 Inter-state movement of sub-
standard carry bags/materials etc.
~ 8... ___...____._._....~_.__._....._._.._...._..__...._.._.........._.... _.._ .............._.~_
Delhi 1-1-47. 147 Non-biodegradable Act, 2001 has
been brought out to manage
plastics waste
9 Damna &Diu i - - i
and Dadara &
Nagar Haveli
10 Gujarat 3 365 41
11 Goa 16 - Notification has been brought out
and thickness of plastics carry
bagshas been raised to 40 microns
17
........... ..................-_....................................................._......................
{ ..............__............................._.........................................................._..................................-_....._............._............................................_..__........_..._-...._,
regardless of D punch or handle
type
12 Haryana ! Inventory not completed.
Recycled Plastics rule Notified
13 - ..Himachal - - 1.3-- - - -1-0- Recycled -Plastics rule Notified on
Pradesh i 26.11.1998
14 Jharkhand - - Rules disseminated through
Public Notices
15 J & K i - - i Recycled Plastics rule Notified
Kashmir
16 Karnataka 302 Nil Public Notices issued. Fee for 3 3
registration, involvement of
jmunicipality, Reuse of plastics
waste in Roads, Inter-state
3 movement of substandard carry
]
bags/ material etc
17 Kerala 193 10 Recycled Plastics rule Notified.
Govt. of Kerala has formulated
action plan for plastics waste
management.
18 ~
Lakshadweep Nil 3
Nil I Import of carry bags/plastics
i I material for carrying of foodstuff
is prohibited vide Notification
dated 17.7.1998.
19 Madhya 179 83 3 -
Pradesh
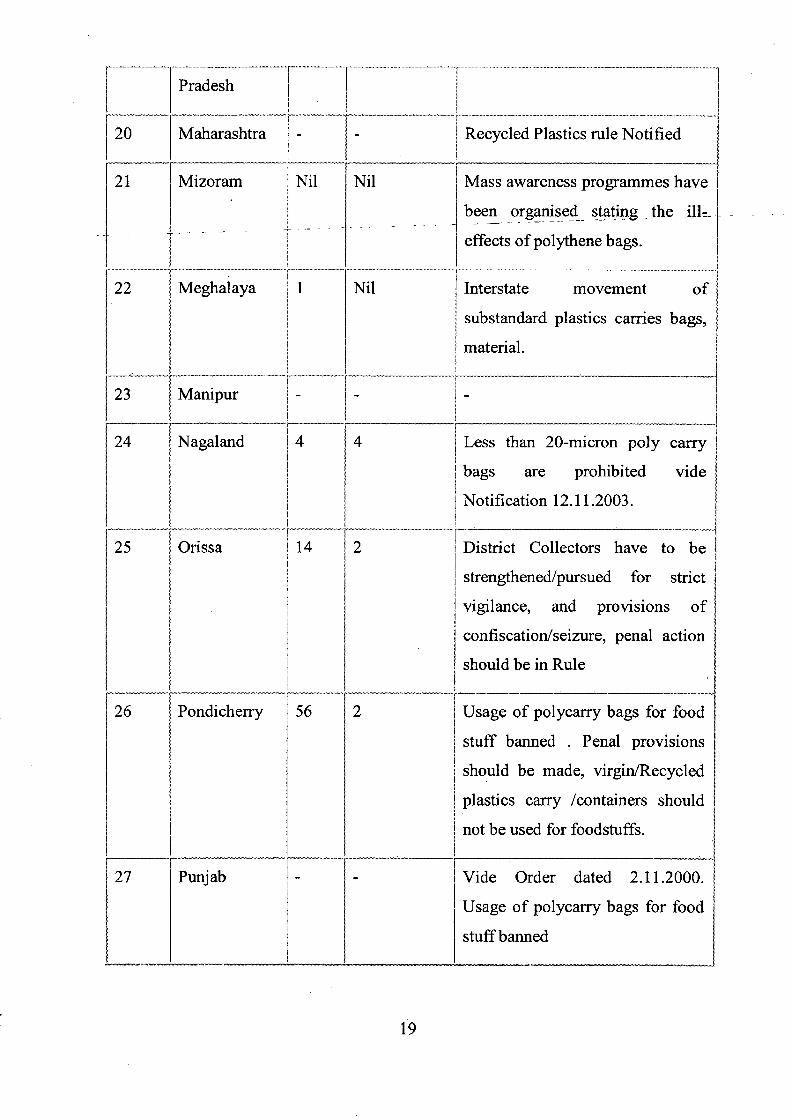
20 Maharashtra - - Recycled Plastics rule Notified
21 Mizoram I Nil Nil Mass awareness programmes have
been organised stating _ the i11=-.~
effects of polythene bags.
22 Meghalaya 1 Nil ' Interstate movement of
substandard plastics carries bags,
material.
23 Manipur - - - 3
24 Nagaland 4 4 Less than 20-micron poly carry
bags are prohibited vide
Notification 12.11.2003.
25 Orissa 14 2 District Collectors have to be
strengthened/pursued for strict
vigilance, and provisions of
confiscation/seizure, penal action
should be in Rule
26 Pondicherry 56 i
2 ; Usage of polycarry bags for food 3
f ~
stuff banned . Penal provisions
1 should be made, virgin/Recycled
plastics carry /containers should
not be used for foodstuffs.
27 Punjab - i Vide Order dated 2.11.2000.
Usage of polycarry bags for food
stuff banned
19
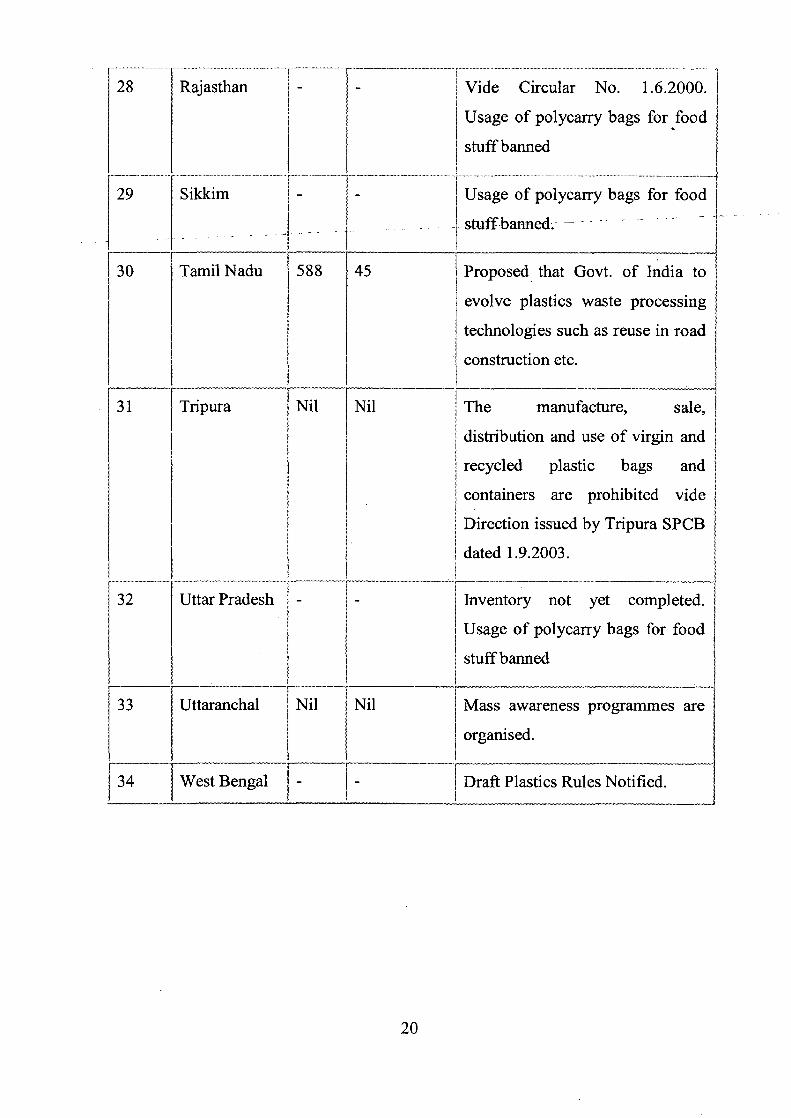
28 ................_......._..........._....._.........
Rajasthan { - _.._ _._..............._.
- i Vide Circular No. 1.6.2000.
Usage of polycarry bags for food
stuff banned
29
I Sikkim ' - - Usage of polycarry bags for food
stuff bann- ed.- -- _
30 i
Tamil Nadu 588 !
45 Proposed that Govt. of India to
Ievolve plastics waste processing
technologies such as reuse in road
construction etc.
31 Tripura Nil Nil The manufacture, sale,
distribution and use of virgin and I
j 3 recycled plastic bags and
containers are prohibited vide
Direction issued by Tripura SPCB
dated 1.9.2003.
32 Uttar Pradesh - - Inventory not yet completed.
Usage of polycarry bags for food
stuff banned
33 Uttaranchal Nil Nil Mass awareness programmes are
organised.
F34 West Bengal - - Draft Plastics Rules Notified.
20
2.7.2 Reuse of waste plastics in road construction
2.7.2.1 Plastic- as binder and modifier
Waste plastics on heating soften around 130-140 degree C. A study using
thermogravimetric analysis has shown that there is no gas evolution in the temperature range
of 130-180 degree C. Moreover the softened plastics have a binding property. Hence, the
molten plastic materials can be used as a binder and or they can be mixed with binder like
bitumen to enhance their binding property. This may be a good modifier for the bitumen,
used for road construction.
2.7.2.2 Process of road laying using polymer-aggregate-bituminous mix The study of using plastic wastes in road construction was performed by Central
Pollution Control Board. The plastic waste (bags, cups, Thermocole) made out of PE, PP
&PS were separated, cleaned if needed and shredded to small pieces. The aggregate was
heated to 170 degree C in the mini hot Mix Plant and the shredded plastic waste was added, it
got softened and coated over the aggregate. Immediately the hot bitumen (160°C) was added
and mixed well. As the polymer and the bitumen were in the molten state, they get mixed and
the blend is formed at the surface of the aggregate. It was observed that addition of plastics
waste up to 10-15 % by weight of bitumen resulted into higher values of softening point and
lower values of penetration, which are appreciable improvements in the properties of the
binder. The mixture was transferred to the road and the road was laid. Then this technique
was extended to Central Mixing Plant too.
21
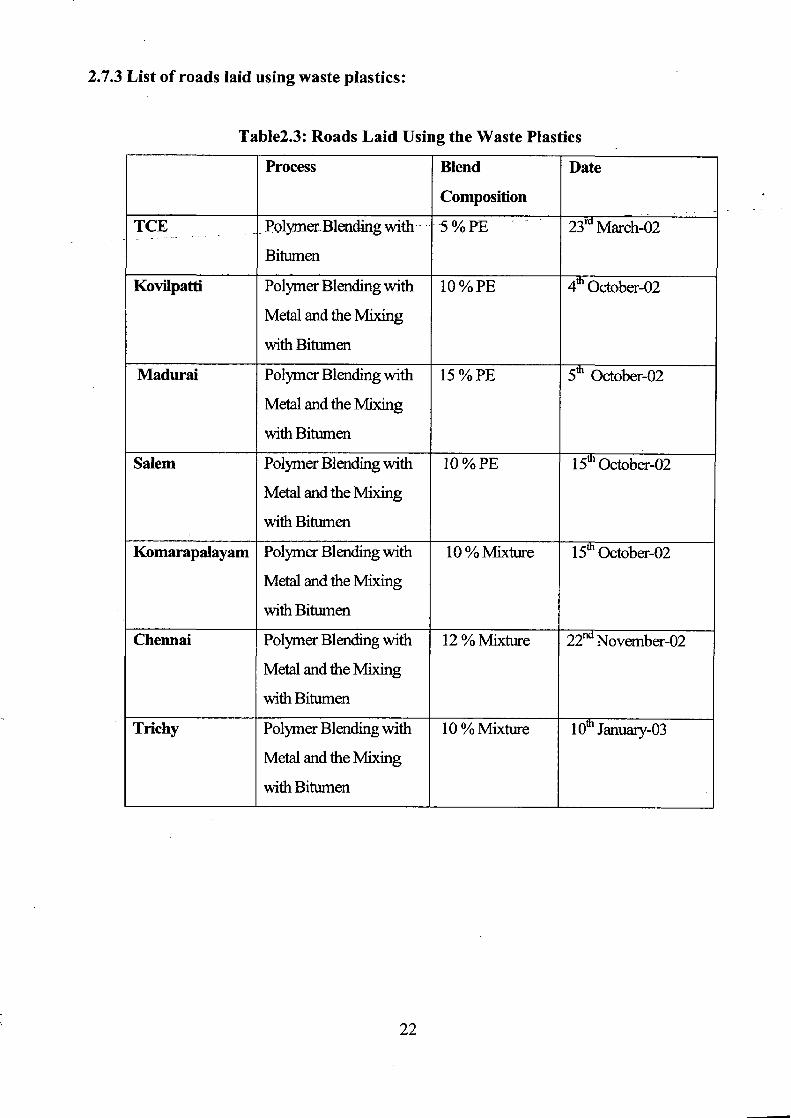
2.7.3 List of roads laid using waste plastics:
Table2.3: Roads Laid Using the Waste Plastics
Process Blend Date
Composition
TCE Polymer. Blending with -5 % PE 23 March-02
Bitumen
Kovilpatti Polymer Blending with 10 % PE 4 October-02
Metal and the Mixing
with Bitumen
Madurai Polymer Blending with 15 % PE 5 October-02
Metal and the Mixing
with Bitumen
Salem Polymer Blending with 10 % PE 1 5th October-02
Metal and the Mixing
with Bitumen
Komarapalayam Polymer Blending with 10 % Mixture 15th October-02
Metal and the Mixing
with Bitumen
Chennai Polymer Blending with 12 % Mixture 22nd November-02
Metal and the Mixing
with Bitumen
Trichy Polymer Blending with 10 % Mixture 10 January-03
Metal and the Mixing
with Bitumen
22
Process Blend Date
Composition
Salem Polymer Blending with 10 % Mixture 17th April-03
Metal and the Mixing
with Bitumen
Erode Polymer Blending with 10 % Mixture 7th May-03
Metal and the Mixing
with Bitumen
Theni Polymer Blending with 10 % Mixture 10th May-03
Metal and the Mixing
with Bitumen
Nagercoil Polymer Blending with 10 % Mixture 16th May-03
Metal and the Mixing
with Bitumen
Madurai- Polymer Blending with 10 % Mixture -
Kombadi Metal and the Mixing
with Bitumen
2.8 Studies on Waste Plastics for Road Construction
2.8.1 Tar road with plastic waste- A successful experiment in Mumbai
ICPE organized a Technical Presentation to the team of road engineers and the
officials of Solid Waste Management (SWM) of Municipal Corporation of Greater Mumbai
(MCGM) on 8th October, 2004. The MCGM officials were satisfied with the technical
presentation and invited ICPE to co-ordinate and assist MCGM in laying the road, using the
low-end plastics waste. Accordingly a trial was organized for mixing of plastics Waste with
stones and bitumen in MCGM's high speed Central Mixing Plant and to use the mixed
aggregate for the construction /repair work of Tar Road.
23
Accordingly the trial was organized on 6th and 7th December, 2004. It was found that
Waste plastics replaced about 7-8% by weight of the bitumen. Stripping tests conducted after,
the mixing operation proved that the adhesion of the "stone-plastics waste-bitumen
aggregate" was good.
1st Road Laying / Repairing place was at Prabhadevi Road (G-S ward).
- 2° Road Laying /-Repairing-Place-was-Opp.-Poonam- Park, Parsee Lane, Lai- Baugh area (F-
S Ward)
It was observed that Plastic waste could be successfully mixed with stones and bitumen
at the high speed asphalt plant and the condition of the tar road, when laid properly, was
good. Cost of waste plastics was around Rs. 6 per kg vis-a-vis cost of bitumen being around
Rs. 14 per kg. Hence there was a saving in cost of tar road construction. Condition of the
road inspected periodically, was found to be good.
After the successful demonstration of the tar road construction where the addition of
plastics waste was by manual method, the Brihanmumbai Municipal Corporation has now
invited ICPE for a large- scale trial using mechanical dosing device for mixing plastics waste
with the aggregate at their asphalt plant. This asphalt mixture will be used for laying longer
stretches of tar roads across Mumbai.
Dr. R. Vacudewin makffi presentation to MCGM officials
ca
ou
im i; Screening of pkzdcs ite to the teqdzd size
25
:.. . -. -.
I ?
r 4
AN
A.
If
4 - r
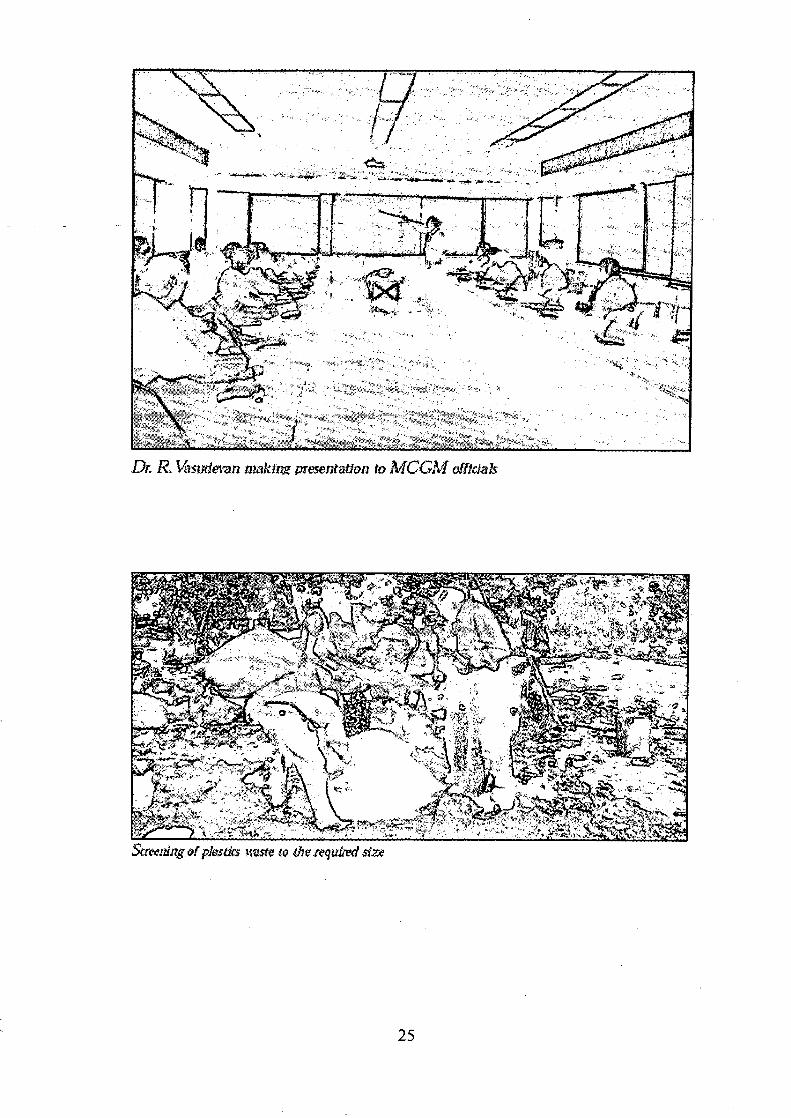
Mixing vIrplastles wow with stone
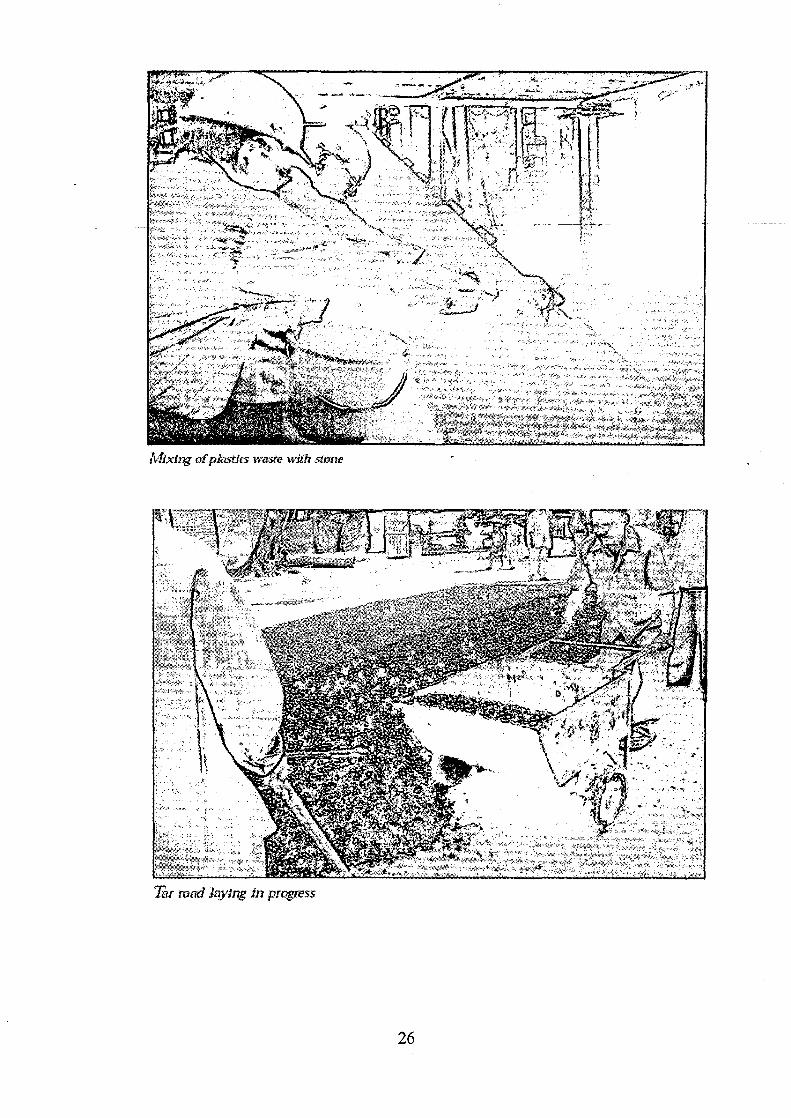
Tor road Jaying In progress
26
--- - -4--- - _____
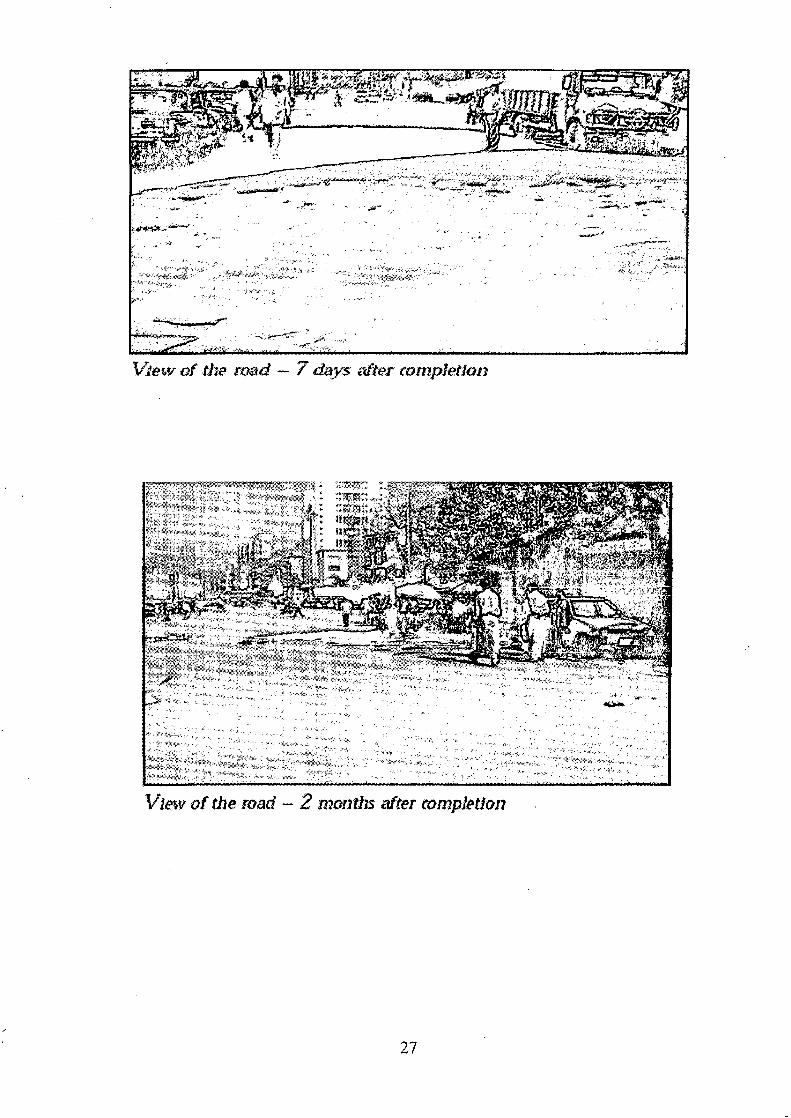
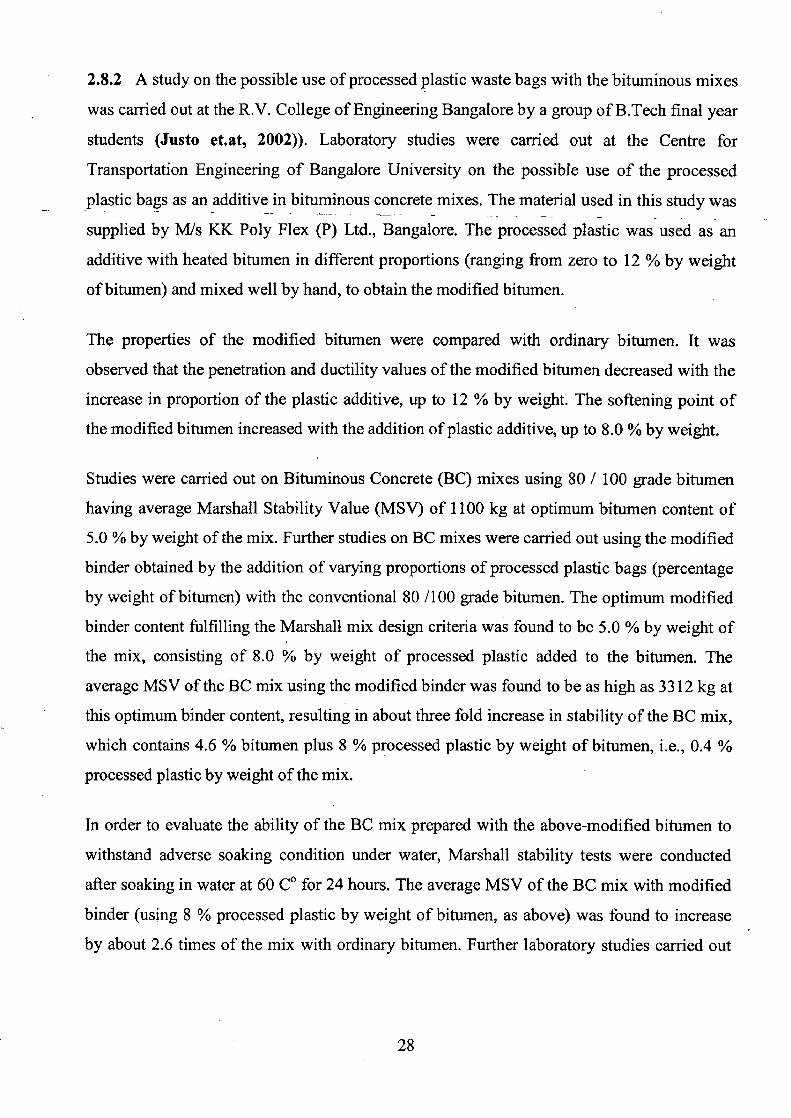
½ew of the road - 7 days after completion
View of the road - 2 months after completion
27
2.8.2 A study on the possible use of processed plastic waste bags with the bituminous mixes
was carried out at the R.V. College of Engineering Bangalore by a group of B.Tech final year
students (Justo et.at, 2002)). Laboratory studies were carried out at the Centre for
Transportation Engineering of Bangalore University on the possible use of the processed
plastic bags as an additive in bituminous concrete mixes. The material used in this study was
supplied by M/s KK Poly Flex (P) Ltd., Bangalore. The processed plastic was used as an
additive with heated bitumen in different proportions (ranging from zero to 12 % by weight
of bitumen) and mixed well by hand, to obtain the modified bitumen.
The properties of the modified bitumen were compared with ordinary bitumen. It was
observed that the penetration and ductility values of the modified bitumen decreased with the
increase in proportion of the plastic additive, up to 12 % by weight. The softening point of
the modified bitumen increased with the addition of plastic additive, up to 8.0 % by weight.
Studies were carried out on Bituminous Concrete (BC) mixes using 80 / 100 grade bitumen
having average Marshall Stability Value (MSV) of 1100 kg at optimum bitumen content of
5.0 % by weight of the mix. Further studies on BC mixes were carried out using the modified
binder obtained by the addition of varying proportions of processed plastic bags (percentage
by weight of bitumen) with the conventional 80 /100 grade bitumen. The optimum modified
binder content fulfilling the Marshall mix design criteria was found to be 5.0 % by weight of
the mix, consisting of 8.0 % by weight of processed plastic added to the bitumen. The
average MSV of the BC mix using the modified binder was found to be as high as 3312 kg at
this optimum binder content, resulting in about three fold increase in stability of the BC mix,
which contains 4.6 % bitumen plus 8 % processed plastic by weight of bitumen, i.e., 0.4 %
processed plastic by weight of the mix.
In order to evaluate the ability of the BC mix prepared with the above-modified bitumen to
withstand adverse soaking condition under water, Marshall stability tests were conducted
after soaking in water at 60 C° for 24 hours. The average MSV of the BC mix with modified
binder (using 8 % processed plastic by weight of bitumen, as above) was found to increase
by about 2.6 times of the mix with ordinary bitumen. Further laboratory studies carried out
on the BC mixes using this modified binder also indicated note worthy increase in fatigue life
under repeated application of loads.
2.8.3 Kumar et.al. (2005) conducted a study on strength characteristics of polymer
modified mixes. Laboratory investigations were performed on the performance of styrene
butadiene-styrene-(SBS)..and_linear low-density polyethylene (LLDPE) modified binders and
mixes. A 60/70 penetration paving grade bitumen was used for development of various
formulations.
Two polymeric materials representing the families of elastomers- SBS and plastomers-
LLDPE were used to develop polymer modified binders. The polymers were supplied in the
form of powder and pellets. The SBS polymer was obtained from Shell Company and the
LLDPE polymer from the Gas Authority of India Limited, New Delhi.
The Marshall test as per ASTM D 1559 (1889) was used for the determination of the
optimum binder content in the mix. The optimum binder content was found to be 5.3 % by
weight of aggregate for unmodified asphalt mix and 5.4 % by weight of aggregate for the
modified mixes. Other tests like Tensile strength test, Dynamic creep test, Hamburg wheel-
tracking test, fatigue tests, etc. were performed on the bitumen aggregate mix.
From the tests conducted, they found that:
• The Marshall Stability of the SBS and the LLDPE modified mix increased by 44 %
and 25 % respectively as compared to unmodified mix.
• The flow value of the modified mixes was lower than the mix prepared with the
unmodified bitumen.
• The tensile strength was found to be higher for the LLDPE modified mix than for the
SBS modified mix.
W
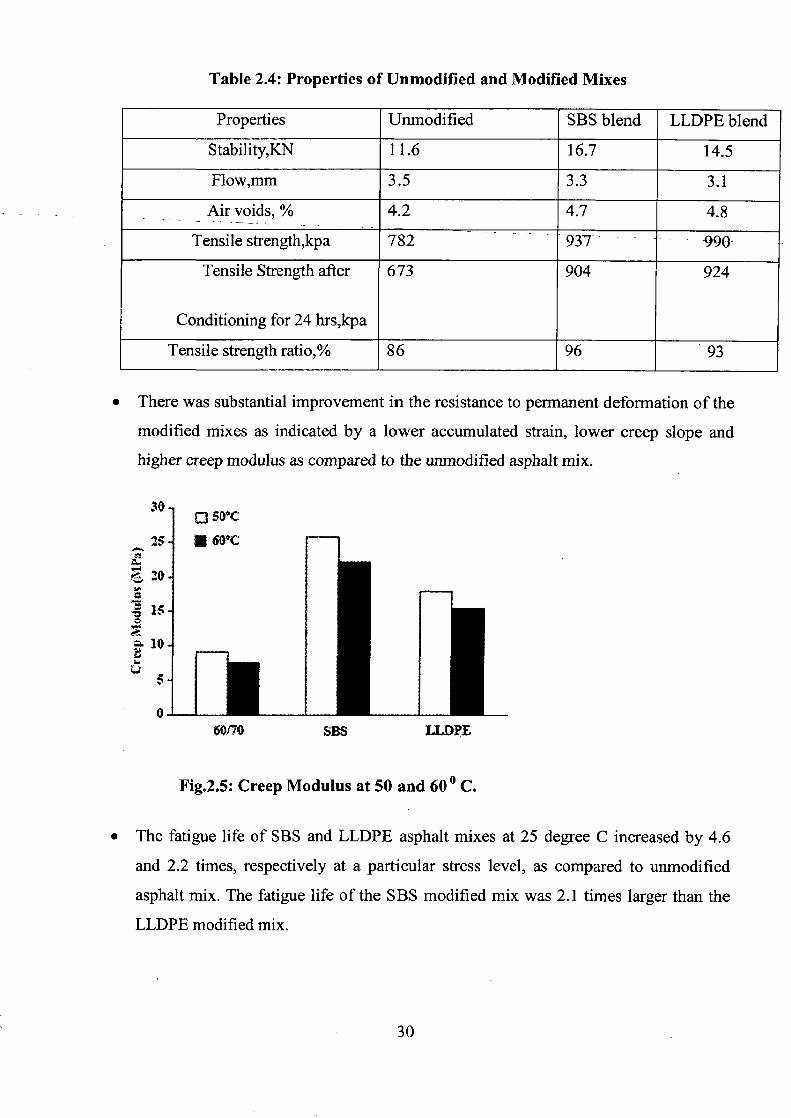
Table 2.4: Properties of Unmodified and Modified Mixes
Properties Unmodified SBS blend LLDPE blend
Stability,KN 11.6 16.7 14.5
Flow,mm 3.5 3.3 3.1
Air voids, % 4.2 4.7 4.8
Tensile strength,kpa 782 -937 990
Tensile Strength after
Conditioning for 24 hrs,kpa
673 904 924
Tensile strength ratio,% 86 96 93
• There was substantial improvement in the resistance to permanent deformation of the
modified mixes as indicated by a lower accumulated strain, lower creep slope and
higher creep modulus as compared to the unmodified asphalt mix.
30
2•S
10
0 60170 SBS LLDPE
Fig.2.5: Creep Modulus at 50 and 60 0 C.
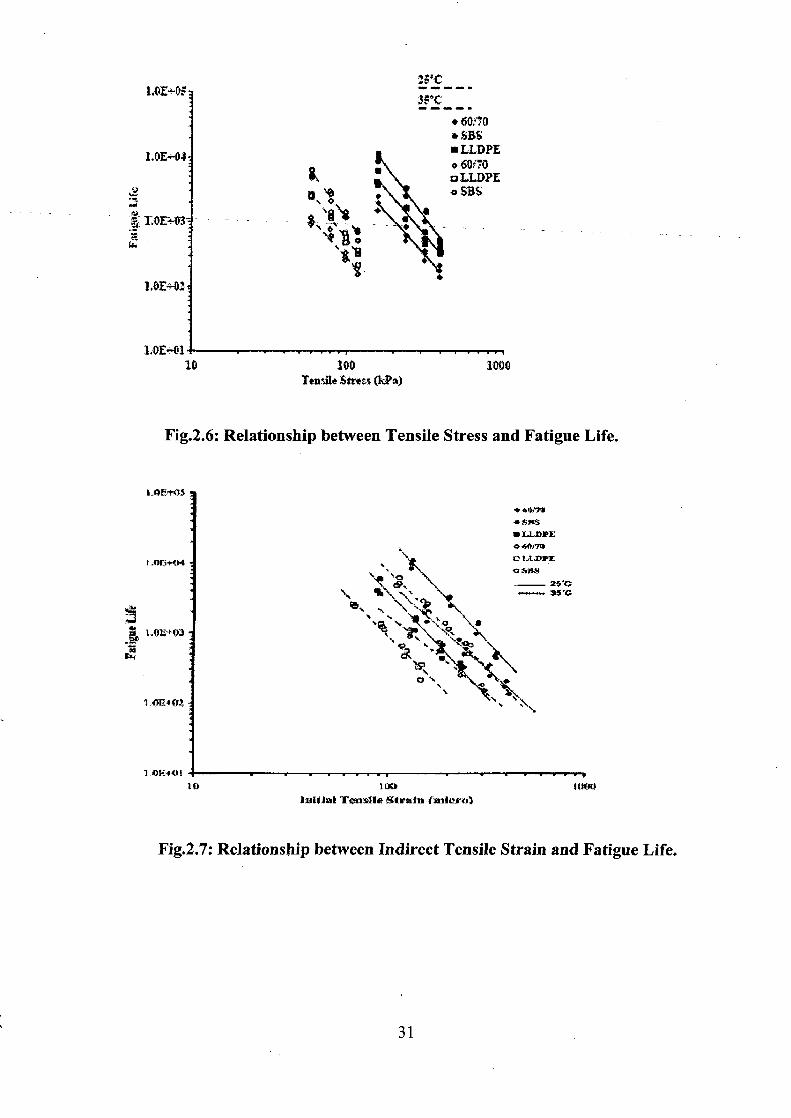
The fatigue life of SBS and LLDPE asphalt mixes at 25 degree C increased by 4.6
and 2.2 times, respectively at a particular stress level, as compared to unmodified
asphalt mix. The fatigue life of the SBS modified mix was 2.1 times larger than the
LLDPE modified mix.
30
s. ~♦ ti 1.
CA "*
a
1.0E401
1,OE= 0:
HOC
• 60:70 • SB
■ LLDPE Q .60/70 ~►s o LLDPE
+> y o SB
48 ~•
1.OE+014- 10
100 1000 Tau file tres.s O Pa)
Fig.2.6: Relationship between Tensile Stress and Fatigue Life.
r _OE POS
ID 11x0 1t,W I,uttliak `Tensile Strain (micro)
Fig.2.7: Relationship between Indirect Tensile Strain and Fatigue Life.
31
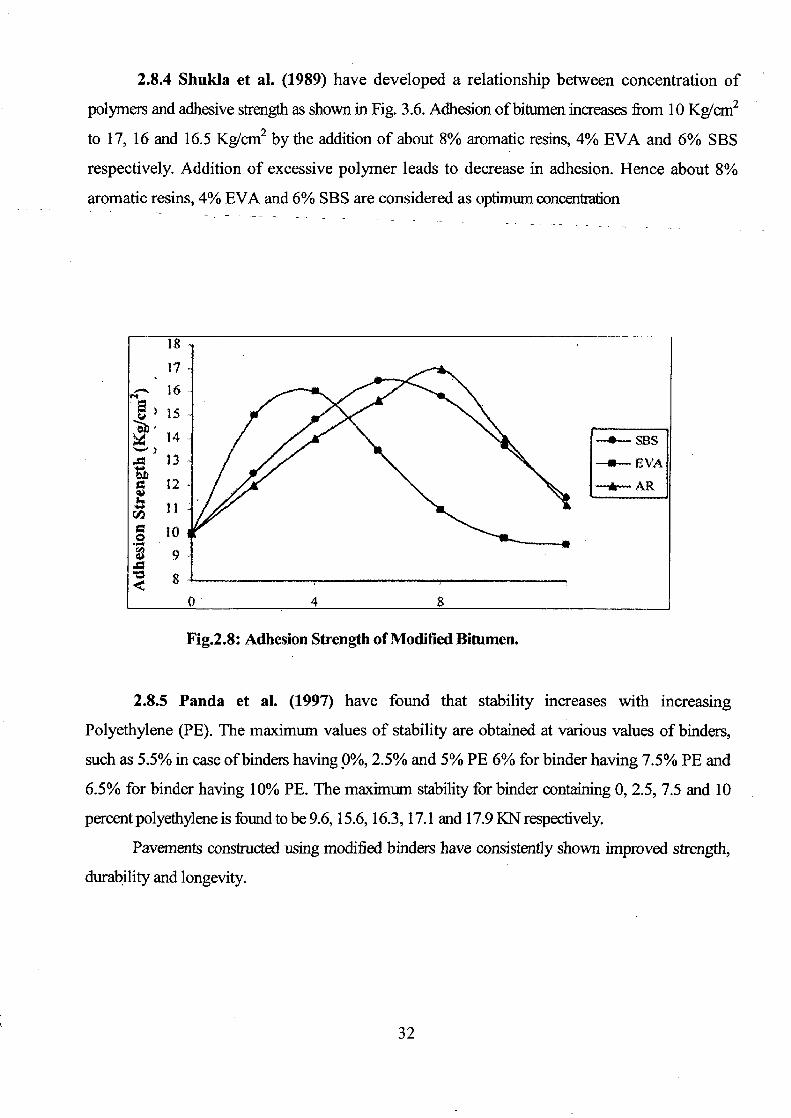
2.8.4 Shukla et al. (1989) have developed a relationship between concentration of
polymers and adhesive strength as shown in Fig. 3.6. Adhesion of bitumen increases from 10 Kg/cm2
to 17, 16 and 16.5 Kg/cm2 by the addition of about 8% aromatic resins, 4% EVA and 6% SBS
respectively. Addition of excessive polymer leads to decrease in adhesion. Hence about 8%
aromatic resins, 4% EVA and 6% SBS are considered as optimum concentration
Fig.2.8: Adhesion Strength of Modified Bitumen.
2.8.5 Panda et al. (1997) have found that stability increases with increasing
Polyethylene (PE). The maximum values of stability are obtained at various values of binders,
such as 5.5% in case of binders having 0%, 2.5% and 5% PE 6% for binder having 7.5% PE and
6.5% for binder having 10% PE. The maximum stability for binder containing 0, 2.5, 7.5 and 10
percent polyethylene is found to be 9.6, 15.6, 16.3, 17.1 and 17.9 KN respectively.
Pavements constructed using modified binders have consistently shown improved strength,
durability and longevity.
32

2.8.6 Banerjee et al. (1995) used novaphalt and reported That the cost increase is about
30% while the extension of useful service life is 50 to 100%. The overall life cycle costs are thus
significantly low.
2.8.7 Jain et al. (1994) conducted cost benefit analysis of road construction using
polymer-modified- binder. Three test sections of 100m- length- and lm width were
considered and life of the pavement with modified binder was taken as 50 percent more than
that of conventional pavement. The cost of overlay requirement for 12 years is shown in
Table 2.5 was computed which indicates that about 33% aggregate, 37% bitumen and 20%
expenditure towards overlay requirement are saved when modified bitumen is used in the
construction.
Table2.5: Cost -Benefit analysis of Polymer Modified Binders
Specification Life (Years) Renewals in Aggregate Bitumen Polymer Cost (Rs) 12 Years (m3) (kg) (Rs.)
PC with 80/100 4 3 99 9000 - 105000 bitumen
PC with SBS 6 2 66 5700 12000 88000 plus bitumen PC with EVA 6 2 66 5580 14700 89200 plus bitumen
2.8.8 Bose and Jain (1989) determined optimum polymer content for each bitumen blends
by Marshall method of mix design. The test results are given in Table2.6.
33
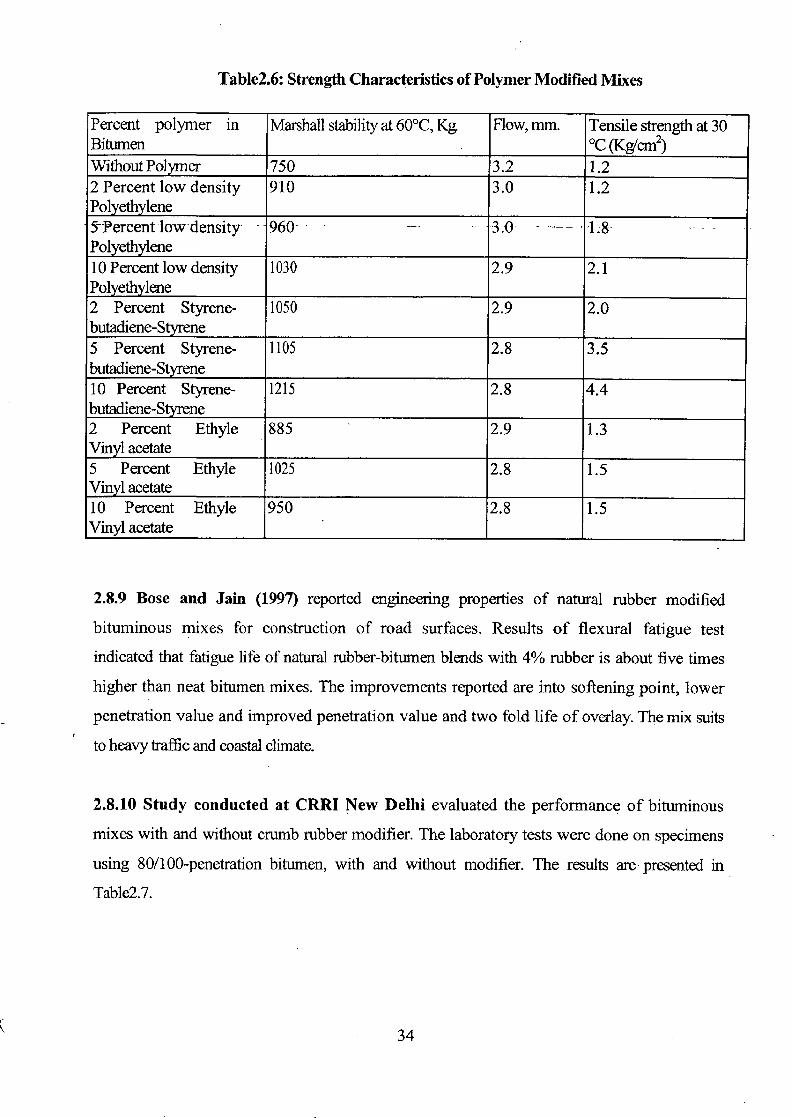
Table2.6: Strength Characteristics of Polymer Modified Mixes
Percent polymer in Marshall stability at 60°C, Kg Flow, mm. Tensile strength at 30 Bitumen °C (Kg/cm2) WithoutPolyrner 750 3.2 1.2 2 Percent low density 910 3.0 1.2 Polyethylene 5 Percent low-density- 960 .3.0 _ 4.8 Polyethylene 10 Percent low density 1030 2.9 2.1 Polyethylene 2 Percent Styrene- 1050 2.9 2.0 butadiene-Styrene 5 Percent Styrene- 1105 2.8 3.5 butadiene-Styrene 10 Percent Styrene- 1215 2.8 4.4 butadiene-Styrene 2 Percent Ethyle 885 2.9 1.3 Vinyl acetate 5 Percent Ethyle 1025 2.8 1.5 Vinyl acetate 10 Percent Ethyle 950 2.8 1.5 Vinyl acetate
2.8.9 Bose and Jain (1997) reported engineering properties of natural rubber modified
bituminous mixes for construction of road surfaces. Results of flexural fatigue test
indicated that fatigue life of natural rubber-bitumen blends with 4% rubber is about five times
higher than neat bitumen mixes. The improvements reported are into softening point, lower
penetration value and improved penetration value and two fold life of overlay. The mix suits
to heavy traffic and coastal climate.
2.8.10 Study conducted at CRRI New Delhi evaluated the performance of bituminous
mixes with and without crumb rubber modifier. The laboratory tests were done on specimens
using 80/100-penetration bitumen, with and without modifier. The results are presented in
Table2.7.
34
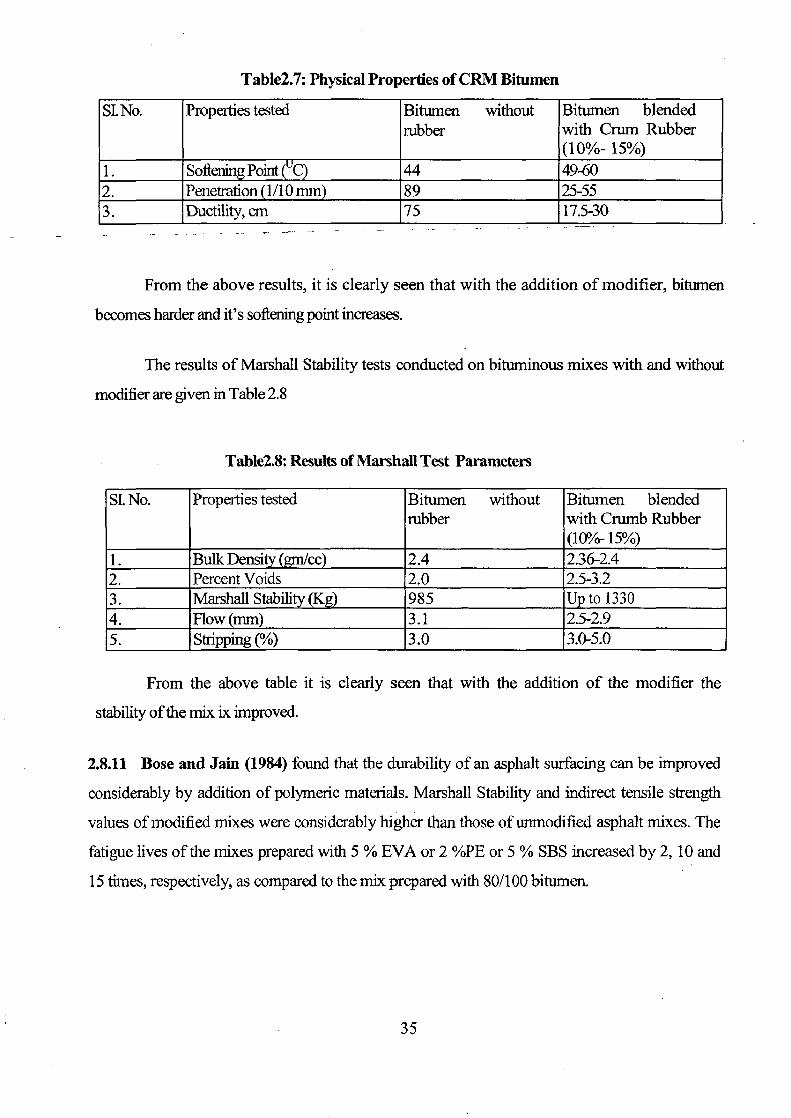
Table2.7: Physical Properties of CRM Bitumen
SL No. Properties tested Bitumen without rubber
Bitumen blended with Crum Rubber (10%- 15%)
1. Softening Point C) 44 49-60 2. Penetration 1/10 mm 89 25-55 3. Ductility, cm 75 17.5-30
From the above results, it is clearly seen that with the addition of modifier, bitumen
becomes harder and it's softening point increases.
The results of Marshall Stability tests conducted on bituminous mixes with and without
modifier are given in Table 2.8
Table2.8: Results of Marshall Test Parameters
SL No. Properties tested Bitumen without rubber
Bitumen blended with Crumb Rubber (10% 15%)
1. Bulk Density (gm/cc) 2.4 2.36-2.4 2. Percent Voids 2.0 2.5-3.2 3. Marshall Stability 985 Up to 1330 4. Flow (mm) 3.1 2.5-2.9 5. Stripping (%) 3.0 3.0-5.0
From the above table it is clearly seen that with the addition of the modifier the
stability of the mix ix improved.
2.8.11 Bose and Jain (1984) found that the durability of an asphalt surfacing can be improved
considerably by addition of polymeric materials. Marshall Stability and indirect tensile strength
values of modified mixes were considerably higher than those of unmodified asphalt mixes. The
fatigue lives of the mixes prepared with 5 % EVA or 2 %PE or 5 % SBS increased by 2, 10 and
15 times, respectively, as compared to the mix prepared with. 80/100 bitumen.
35
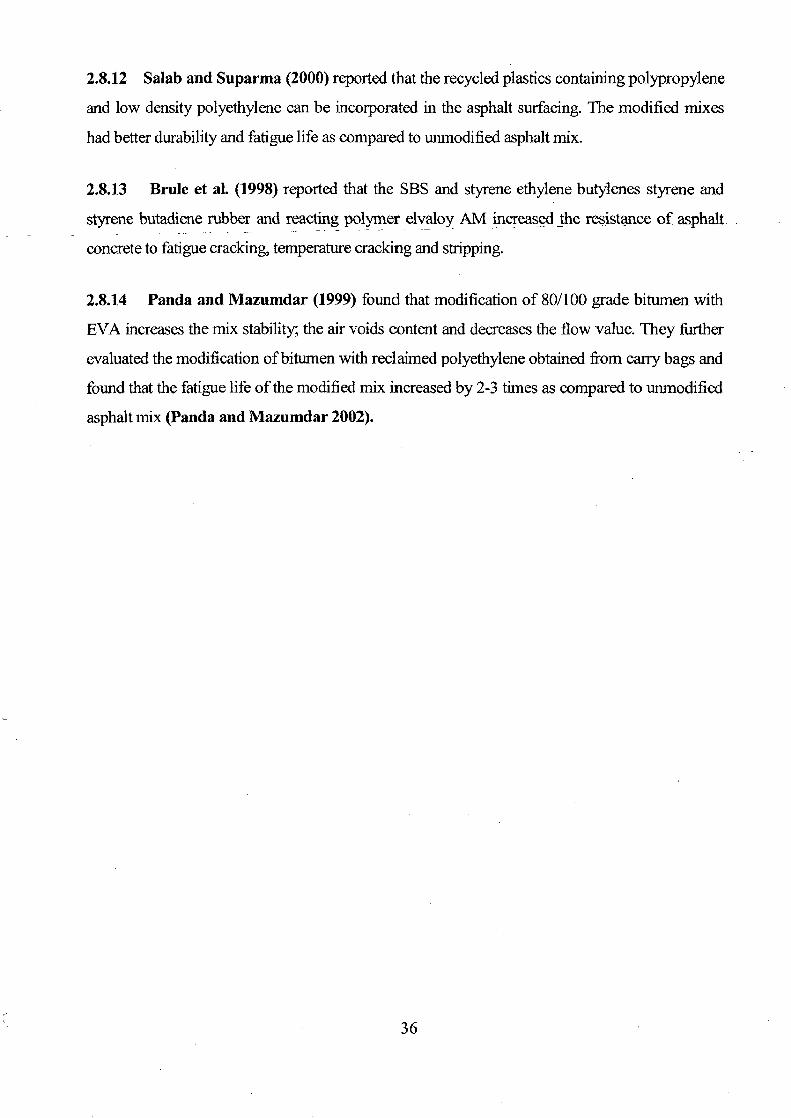
2.8.1.2 Salab and Suparma (2000) reported that the recycled plastics containing polypropylene
and low density polyethylene can be incorporated in the asphalt surfacing. The modified mixes
had better durability and fatigue life as compared to unmodified asphalt mix.
2.8.13 Brule et al. (1998) reported that the SBS and styrene ethylene butylenes styrene and
styrene butadiene rubber and reacting polymer elvaloy AM increased the resistance of asphalt.
concrete to fatigue cracking, temperature cracking and stripping.
2.8.1.4 Panda and Mazumdar (1999) found that modification of 80/100 grade bitumen with
EVA increases the mix stability; the air voids content and decreases the flow value. They further
evaluated the modification of bitumen with reclaimed polyethylene obtained from carry bags and
found that the fatigue life of the modified mix increased by 2-3 times as compared to unmodified
asphalt mix (Panda and Mazumdar 2002).
36
CHAPTER-3
EXPERIMENTAL PROGRAMME
3.1 General "
The aim of present study was to study the various characteristics of bituminous
mixes using waste plastic. The suitability of waste plastic have been tested for three types of
bituminous mixes i.e. Bituminous Macadam (BM), Semi Dense Bituminous Concrete
(SDBC) and Bituminous Concrete (BC). The gradation of coarse and fine aggregates has
been used confirming to MORTH (2001) specifications. The effect of waste plastic in the
bituminous mixes has been investigated based on the following tests:
(1) Marshall Test
(2) Indirect Tensile Strength Test
(3) Fatigue Test.
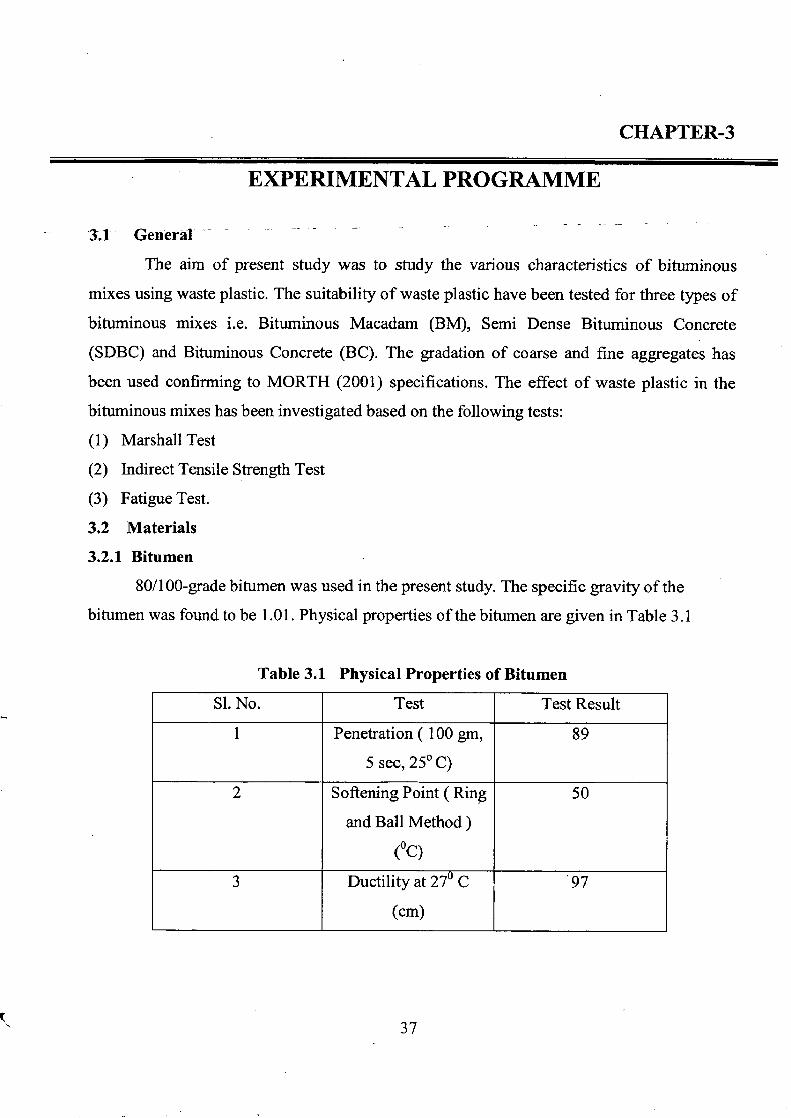
3.2 Materials 3.2.1 Bitumen
80/100-grade bitumen was used in the present study. The specific gravity of the
bitumen was found to be 1.01. Physical properties of the bitumen are given in Table 3.1
Table 3.1 Physical Properties of Bitumen
S1. No. Test Test Result
1 Penetration ( 100 gm, 89
5 sec, 25°C)
2 Softening Point (Ring 50
and Ball Method)
(°C)
3 Ductility at 27 C 97
(cm)
37
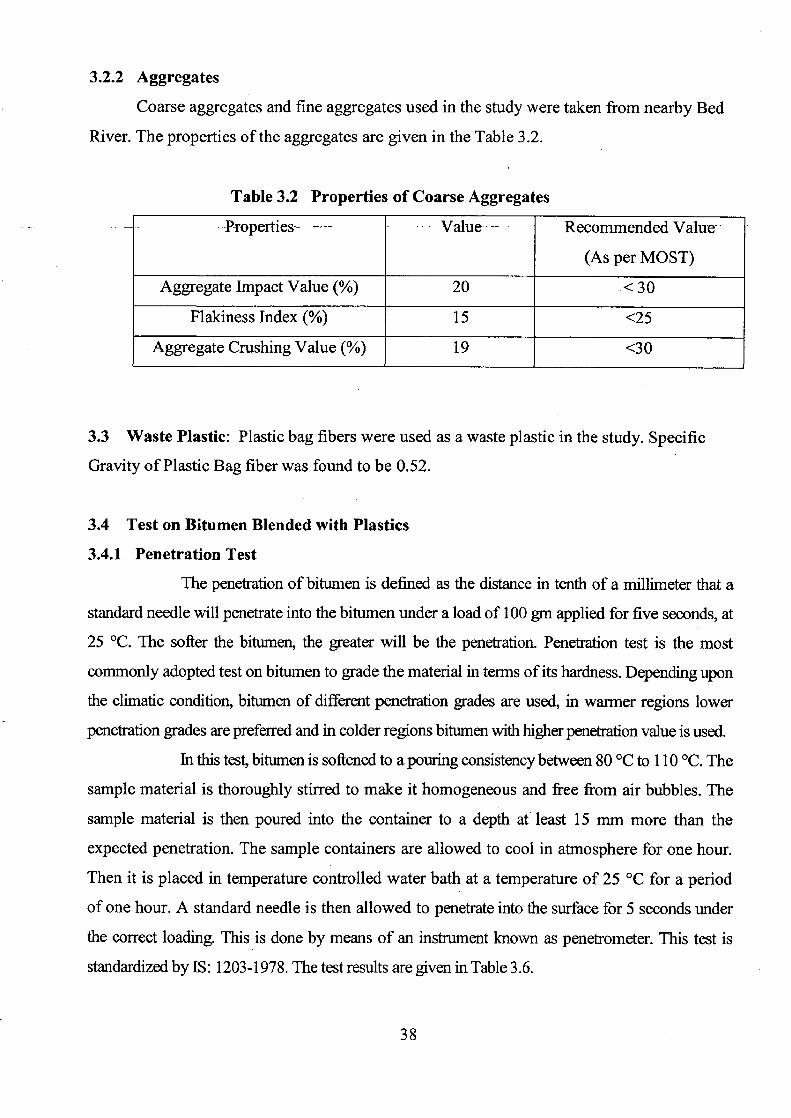
3.2.2 Aggregates
Coarse aggregates and fine aggregates used in the study were taken from nearby Bed
River. The properties of the aggregates are given in the Table 3.2.
Table 3.2 Properties of Coarse Aggregates
Properties- --- Value- -- - Recommended Value-
(As per MOST)
Aggregate Impact Value (%) 20 < 30
Flakiness Index (%) 15 <25
Aggregate Crushing Value (%) 19 <30
3.3 Waste Plastic: Plastic bag fibers were used as a waste plastic in the study. Specific
Gravity of Plastic Bag fiber was found to be 0.52.
3.4 Test on Bitumen Blended with Plastics
3.4.1 Penetration Test
The penetration of bitumen is defined as the distance in tenth of a millimeter that a
standard needle will penetrate into the bitumen under a load of 100 gm applied for five seconds, at
25 °C. The softer the bitumen, the greater will be the penetration. Penetration test is the most
commonly adopted test on bitumen to grade the material in terms of its hardness. Depending upon
the climatic condition, bitumen of different penetration grades are used, in warmer regions lower
penetration grades are preferred and in colder regions bitumen with higher penetration value is used.
In this test, bitumen is softened to a pouring consistency between 80°C to 110 °C. The
sample material is thoroughly stirred to make it homogeneous and free from air bubbles. The.
sample material is then poured into the container to a depth at least 15 mm more than the
expected penetration. The sample containers are allowed to cool in atmosphere for one hour.
Then it is placed in temperature controlled water bath at a temperature of 25 °C for a period
of one hour. A standard needle is then allowed to penetrate into the surface for 5 seconds under
the correct loading. This is done by means of an instrument known as penetrometer. This test is
standardized by IS: 1203-1978. The test results are given in Table 3.6.
c:
3.4.2 Softening Point Test The softening point is the temperature at which the substance attains a particular
degree of softening under specified conditions of test. The softening point of a bituminous
binder is the temperature at which a disc of the binder softens sufficiently to allow a steel ball,
initially placed on the surface, to fall through the disc and a prescribed distance. It is usually
determined byRing-and Bali test. Softening point essentially is a temperature at which binders
have an equal viscosity. Bitumen with higher softening point may be preferred in warmer place.
In this test, two brass rings are filled with hot bitumen and allowed to cool in air for 30
minutes. The excess bitumen is trimmed and the rings are placed in supports. At this time, the
temperature of water is kept at 5 °C for 15 minutes. The temperature of water is raised at
uniform rate of 5 C. per minute with a controlled heating unit, until the bitumen softens and touches
the bottom plate by sinking of balls. The results of softening point test are given in Table 3.7.
3.4.2 Ductility Test In the flexible pavement construction where bitumen binders are used, it is
important that the binders form ductile thin film around the aggregates. This serves as a
satisfactory binder in improving the physical interlocking of the aggregate bitumen mixes.
Under traffic loads the bituminous pavement layer is subjected to repeated deformation and.
recoveries. The binder material which does not possess sufficient ductility would crack and
thus provide pervious pavement surface. Ductility test is carried out on bitumen to test this
property of binder.
The ductility is expressed as the distance in centimeters to which a standard
briquette of bitumen can be stretched before the thread breaks. The bitumen sample is heated
and poured in the mould assembly placed on a plate. The sample along with the moulds are
cooled in air and then in water bath maintained at 27 °C. The mould assembly containing the
sample is replaced in water bath of the ductility testing machine for 85 to 95 minutes. The
sides of the mould are removed, the clips hooked on the machine and the pointer is adjusted
to zero. The distance up to the point of breaking of the thread is reported in centimeters as
the ductility value. The results of ductility test are given in Table 3.8.
M
3.5 Tests on Bituminous Mixes
3.5.1 Stripping Test
For this test a known quantity of aggregate was taken. Then Bitumen in hot
condition was added to the aggregate. The mix was immersed in water. Then after 24 hours
stripping was found out. Again the test was conducted by adding the plastic fibers in the hot
bitumen.-The-waste-plastic-bitumen-aggregate mix was immersed in water. Stripping was
observed after 24 hours.
3.5.2 Marshall Strength Test
Marshall Test was performed over the bituminous mixes prepared by using the
grading specification as per the MOST specification for the following:
(1) Bituminous Macadam
(2) Semi Dense Bituminous Concrete
(3) Bituminous Concrete ( Dense Graded)
Marshall Stability and flow value for different blends were estimated. For Marshall
Test, optimum binder content was determined using the following criterion.
(i) Bitumen content for maximum stability.
(ii) Bitumen content for maximum unit weight of compacted mix.
(iii) Air voids of 4%.
The aggregate gradation for bituminous macadam, semi dense bituminous concrete
and bituminous concrete as given in Ministry of Road Transport and Highway (MORTH,
2001) and reproduced in Tables 3.3-3.5 was used. Specimens were prepared using a mould of
63.5 mm height and 101.6 mm diameter and 75 blows were given at both sides of specimen.
Before testing, the specimens were kept in hot water at 60° C for 30 minutes. Marshall
Stability values and flow values were recorded from dial gauge readings. Results of Marshall
Tests have been given in Tables 3.9-3.13.
3.5.3 Retained Marshall Stability Test
To determine the water susceptibility of bituminous concrete ( dense graded ) mix,
Marshall stability test was again performed on different specimens having optimum binder
content after keeping the sample at 60° in water bath for 24 hours. The Marshall stability

thus found termed as Retained Marshall Stability. Results of retained Marshall Stability have
been given in Table 3.14-3.15.
Table 3.3 Aggregates Grading for Bituminous Macadam
Sieve Size (mm) Percent Passing by Weight
Recommended Grading Used
265 100 100
19 90-100 97
13.2 56-88 70
4.75 16-36 29
2.36 4-19 8
03 2-10 6
0.075 0-8 -
Table 3.4 Aggregates Grading for Semi Dense Bituminous Concrete
Sieve Size (mm) Percent Passing by Weight
Recommended Grading Used
132 100 100
95 90-100 94
4.75 35-51 46
2.36 24-39 33
1.18 15-30 20
03 9-19 16
0.075 3-8 5
41
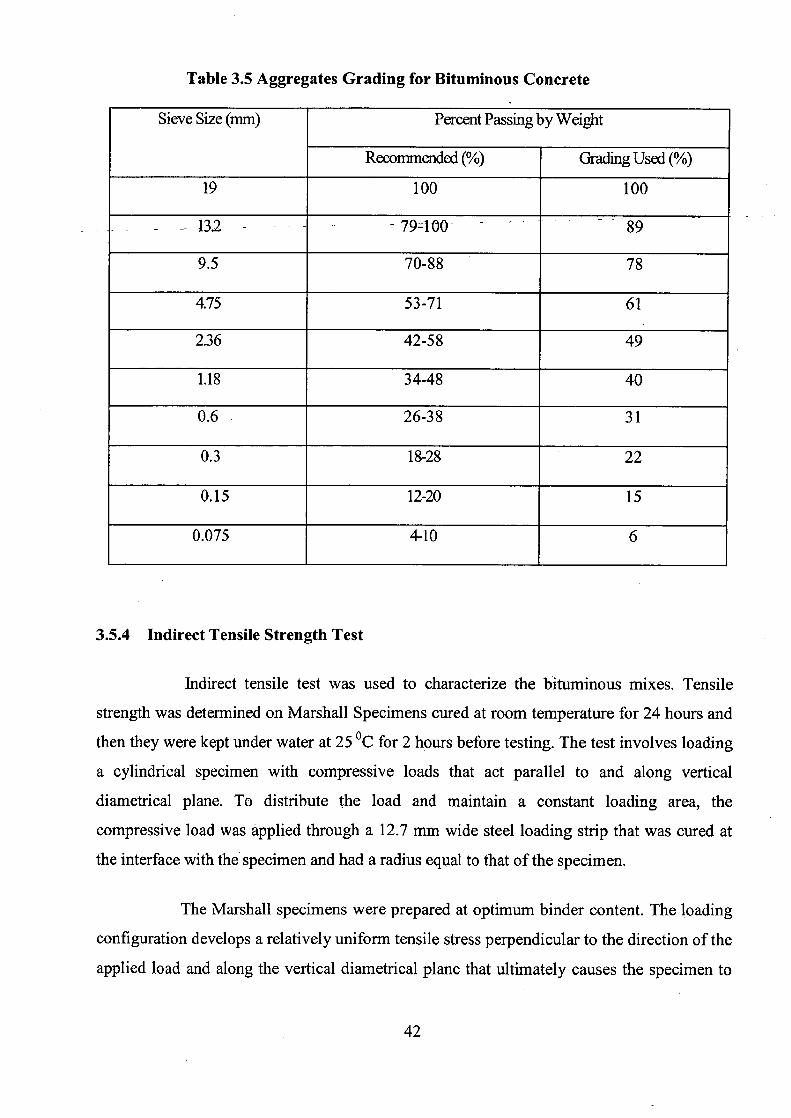
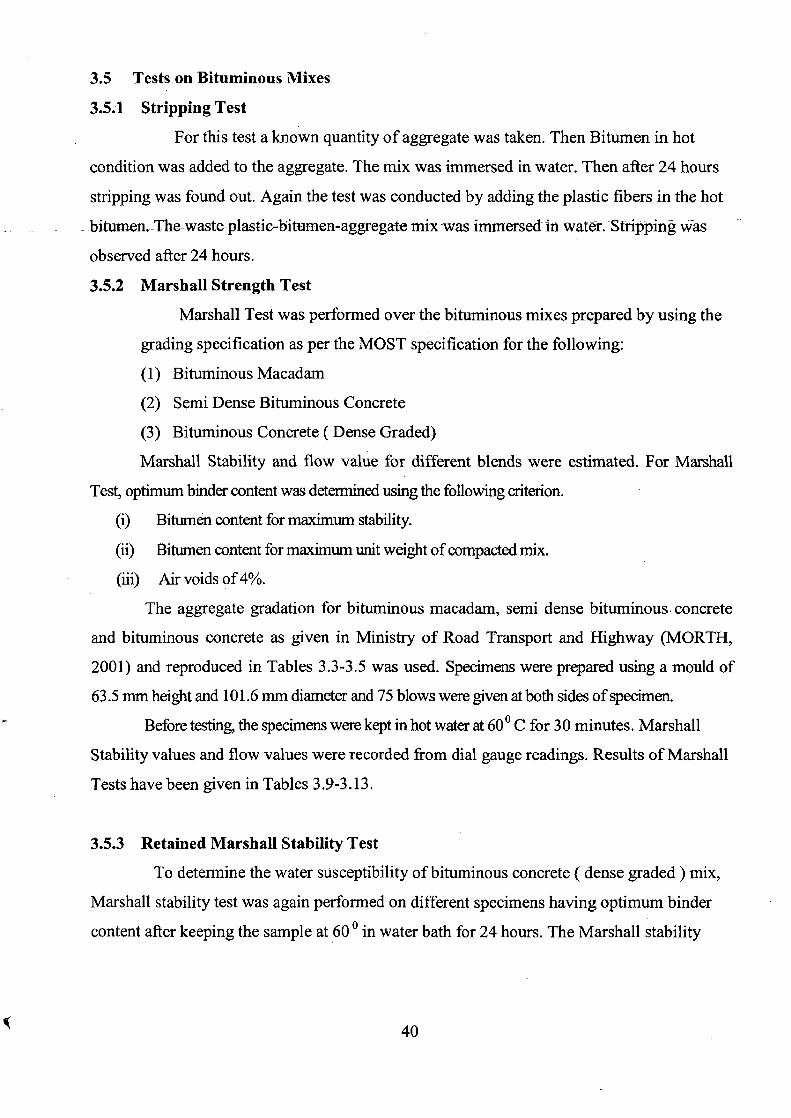
Table 3.5 Aggregates Grading for Bituminous Concrete
Sieve Size (mm) Percent Passing by Weight
Recommended (%) Grading Used (%)
19 100 100
132- - - -79100 —89
9.5 70-88 78
4.75 53-71 61
2.36 42-58 49
1.18 34-48 40
0.6 26-38 31
0.3 18-28 22
0.15 12-20 15
0.075 4-10 6
3.5.4 Indirect Tensile Strength Test
Indirect tensile test was used to characterize the bituminous mixes. Tensile
strength was determined on Marshall Specimens cured at room temperature for 24 hours and
then they were kept under water at 25 °C for 2 hours before testing. The test involves loading
a cylindrical specimen with compressive loads that act parallel to and along vertical
diametrical plane. To distribute the load and maintain a constant loading area, the
compressive load was applied through a 12.7 mm wide steel loading strip that was cured at
the interface with the specimen and had a radius equal to that of the specimen.
The Marshall specimens were prepared at optimum binder content. The loading
configuration develops a relatively uniform tensile stress perpendicular to the direction of the
applied load and along the vertical diametrical plane that ultimately causes the specimen to
►,N
fail by splitting or rupturing along the vertical diameter. By measuring the applied load at
failure, the tensile strength (Sr) of the mix is estimated by equation 3.1.
TensileStrength, Sr = DT (3.1)
Where, = Tensile strength in Kg/ cmZ
P = Total load at failure in Kg
H = Height of specimen in cm
D = Diameter of specimen in cm
3.5.5 Fatigue Test
To determine the failure strength of some of the better performing blends based upon
their Marshall stability, fatigue testing was carried out. The test was conducted using third
point loading on a beam of 50 cm length, 10 cm width and 10 cm height in cross section. The
beam specimen was prepared using grading as that for Marshall testing and optimum binder
content. The material was filled in beam mould, and well compacted. It was kept in open air
for 24 hours before testing. The beam was fixed in clamp of suitable size, which prevents the
beam from permanent deformation, and keeps it in right position. Rate of loading was 70
cycles per minute. Loads of 153 kg, 204 kg and 493 kg were applied to the beam specimens.
The testing was continued at room temperature (15-20°C) and the number of cycles to failure
was noted. The failure was considered to have reached when the beam starts cracking. The
results of fatigue test are given in Table 3.18-3.19.
43
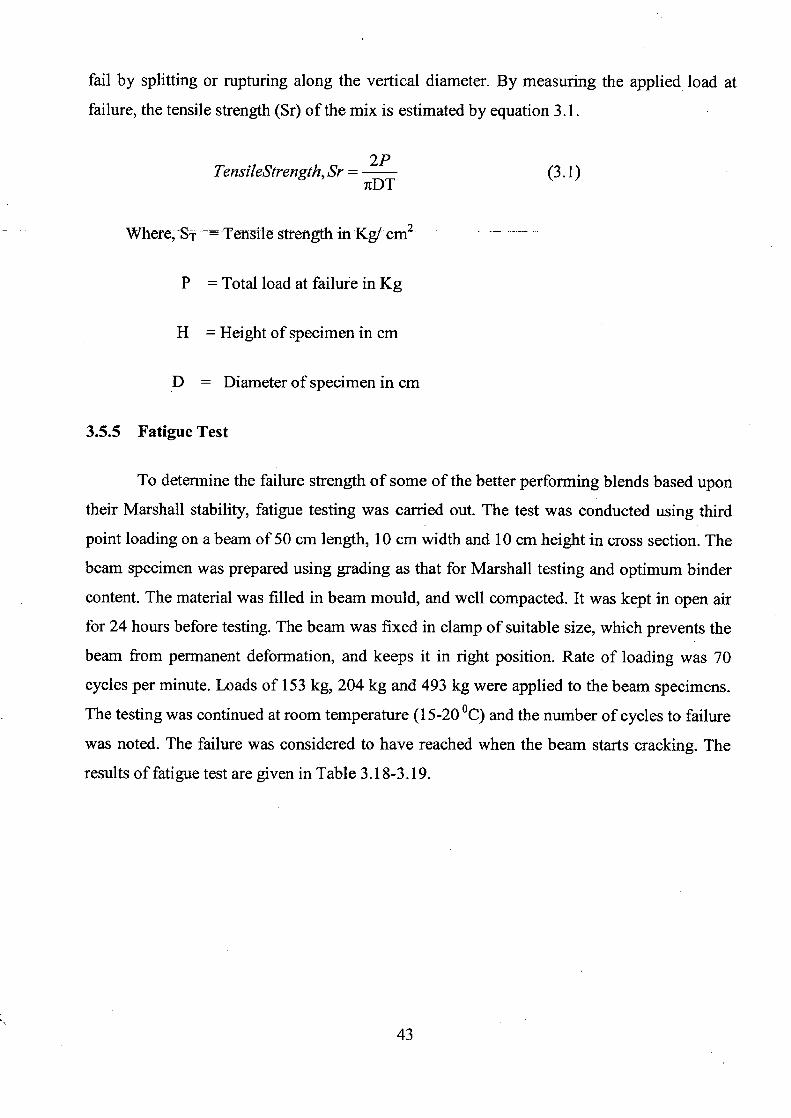
Table 3.6 Penetration values of Bitumen Modified with Waste Plastic Fibers
Waste Plastic + Bitumen Penetration, 0.01 mm
( 100 gm, 5 sec, 25°C)
Only Bitumen 95
3 % Plastic + Bitumen 83
6 % Plastic + Bitumen 71
9 % Plastic + Bitumen 64
12 % Plastic + Bitumen 48
Table 3.7 Softening Point Values of Bitumen Modified with Waste Plastic Fibers
Waste Plastic + Bitumen Softening Point
(Ring & Ball Method) ( °C)
Only Bitumen 50
3 % Plastic + Bitumen 57
6 % Plastic + Bitumen 62
9 % Plastic + Bitumen 68
12 % Plastic + Bitumen 77
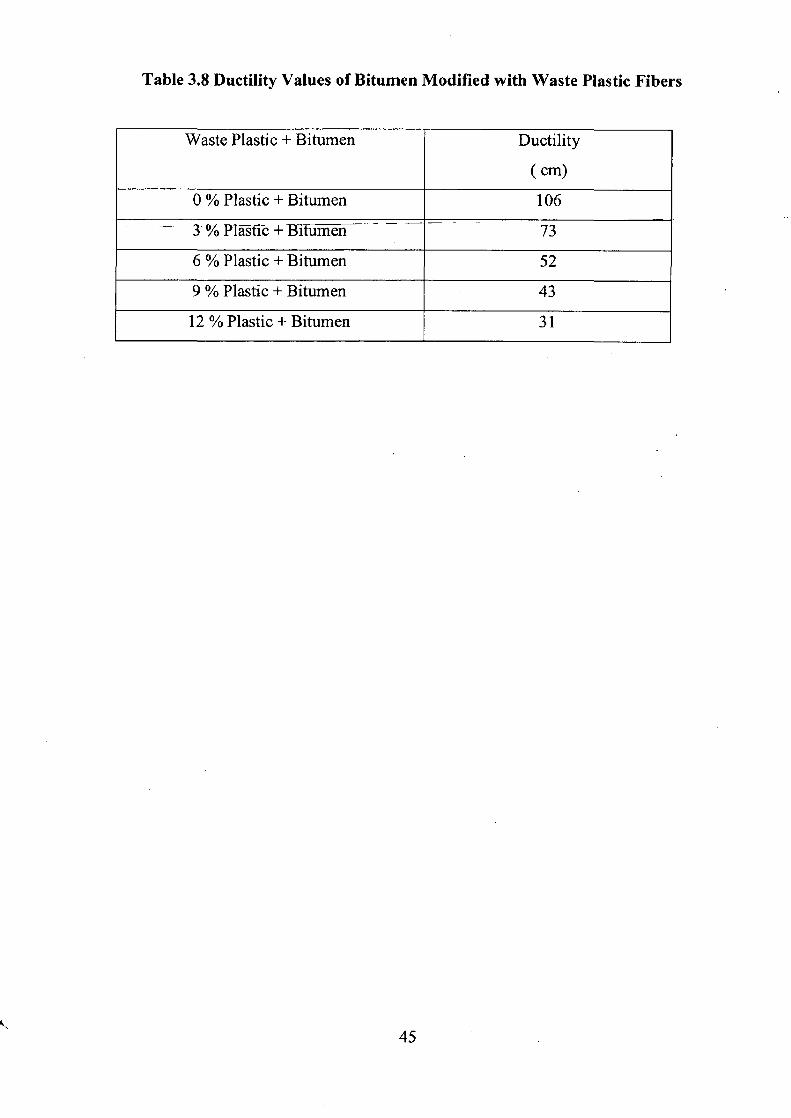
Table 3.8 Ductility Values of Bitumen Modified with Waste Plastic Fibers
Waste Plastic + Bitumen Ductility
( cm)
0 % Plastic + Bitumen 106
3 % Plastic +Bitumen 73
6 % Plastic + Bitumen 52
9 % Plastic + Bitumen 43
12 % Plastic + Bitumen 31
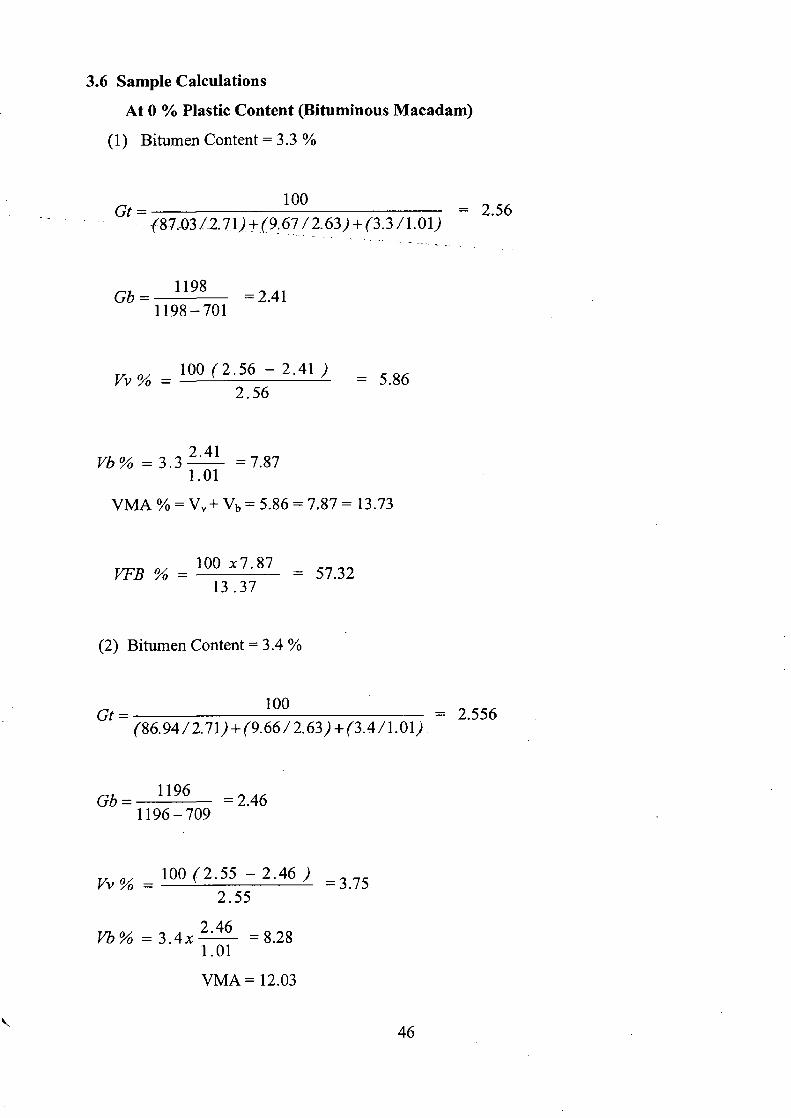
3.6 Sample Calculations
At 0 % Plastic Content (Bituminous Macadam)
(1) Bitumen Content = 3.3 %
Gt= 100
= 2.56 -(87.-03./2.7.1)+(9.67 /2.63)+(3.3 /1.01)
Gb = 1198
= 2.41 1198-701
Vv % — 100 (2.56 —2.41) = 5.86
2.56
Vb% = 3.3 2.41
=7.87 1.01
VMA%=V„+Vb=5.86=7.87= 13.73
VFB % = 100 x7.87 = 57.32
13 .37
(2) Bitumen Content = 3.4 %
100 __ Gt = 2.556
(86.94/2.71)+(9.66/2.63)(3.4/1.01). +
Gb= 1196 =2.46 1196-709
Vv% = 100 (2.55 —2.46)
2.55
Vb% = 3.4x 2.46
8.28 1.01
VMA = 12.03
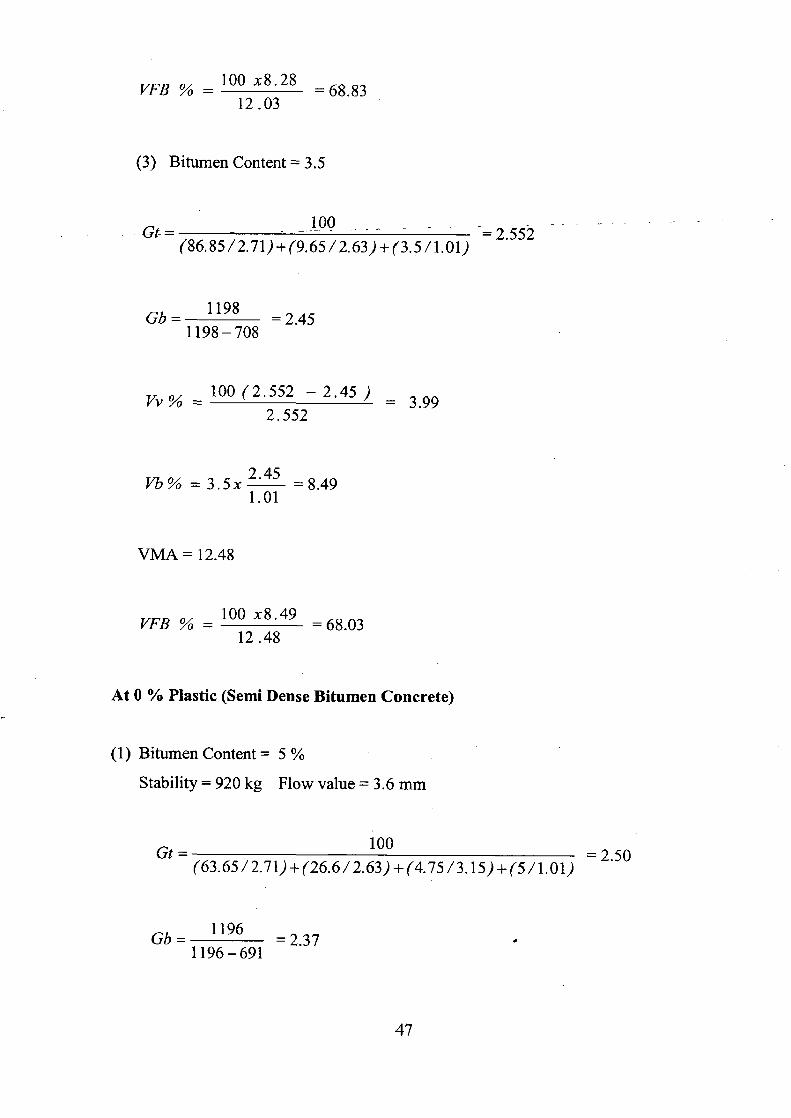
100 x8.28 VFB % = = 68.83
12.03
(3) Bitumen Content = 3.5
100 _ Gt — (86.85/2.71)+(9.65/2.63)+(3.5/1.01)
Gb= 1198 =2.45 1198-708
Vv % = 100 (2.552 — 2.45) = 3.99 2.552
Vb% = 3.5x 2.45 =8.49
1.01
VMA = 12.48
100 x 8.49 VFB % = =68.03
12 .48
At 0 % Plastic (Semi Dense Bitumen Concrete)
(1) Bitumen Content = 5 %
Stability = 920 kg Flow value = 3.6 mm
100 _ Gt = (63.65/2.71)+(26.6/2.63)+(4.75/3.15)+(5/1.01) — 2.50
Gb= 1196 =237 1196-691
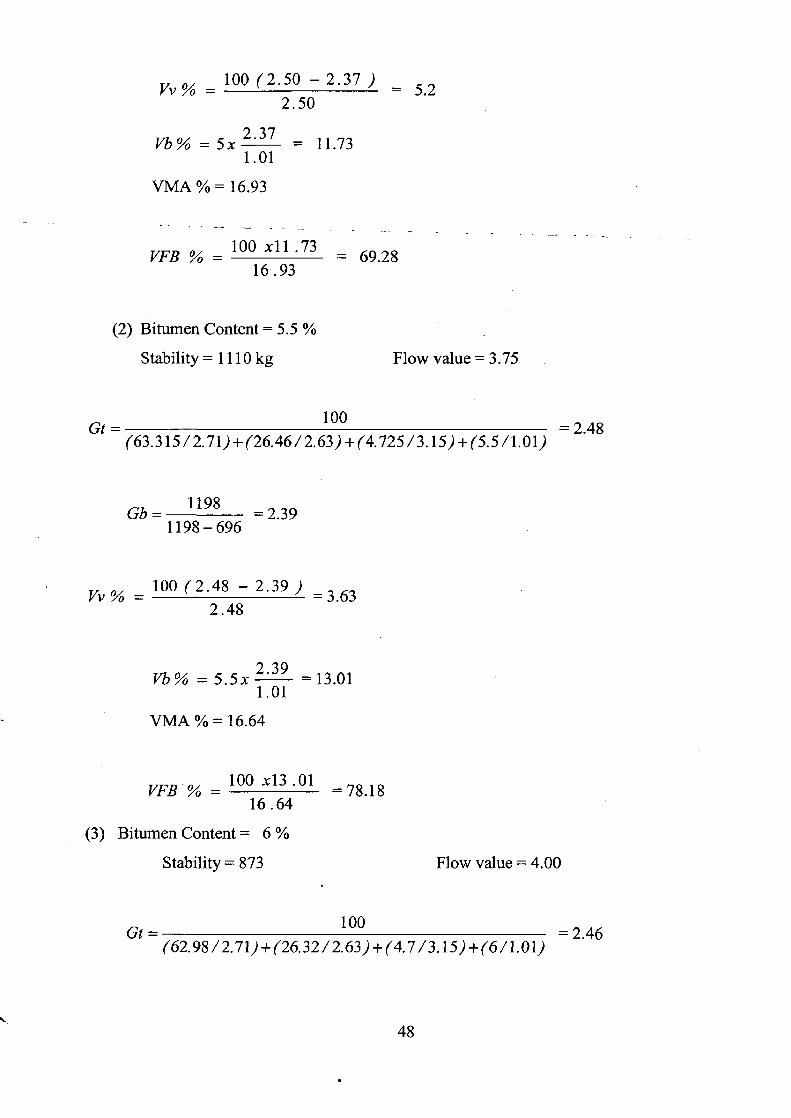
Vv % = 100 (2.50 —2.37) = 5.2 2.50
Vb% = 5x 2.37 = 11.73 1.01
VMA % = 16.93
VFB o = 100 x l 1 .73 =69.28 16.93
(2) Bitumen Content = 5.5 %
Stability = 1110 kg Flow value = 3.75
Gt = 100
= 2.48 (63.315/2.71)+(26.46/2.63)+(4.725/3.15)+(5.5/1.01)
Gb = 1198 = 2.39 1198-696
Vv% = 100(2.48 —2.39) =363 2.48
Vb% =5.5x 2.39 =13.01 1.01
VMA % = 16.64
100 x13 .01
VFB % = =78.18 16.64
(3) Bitumen Content = 6 %
Stability = 873 Flow value = 4.00
Gt = 100 = 2.46
(62.98/2.71)+(26.32/2.63)+(4.7/3.15)+(6/1.01)
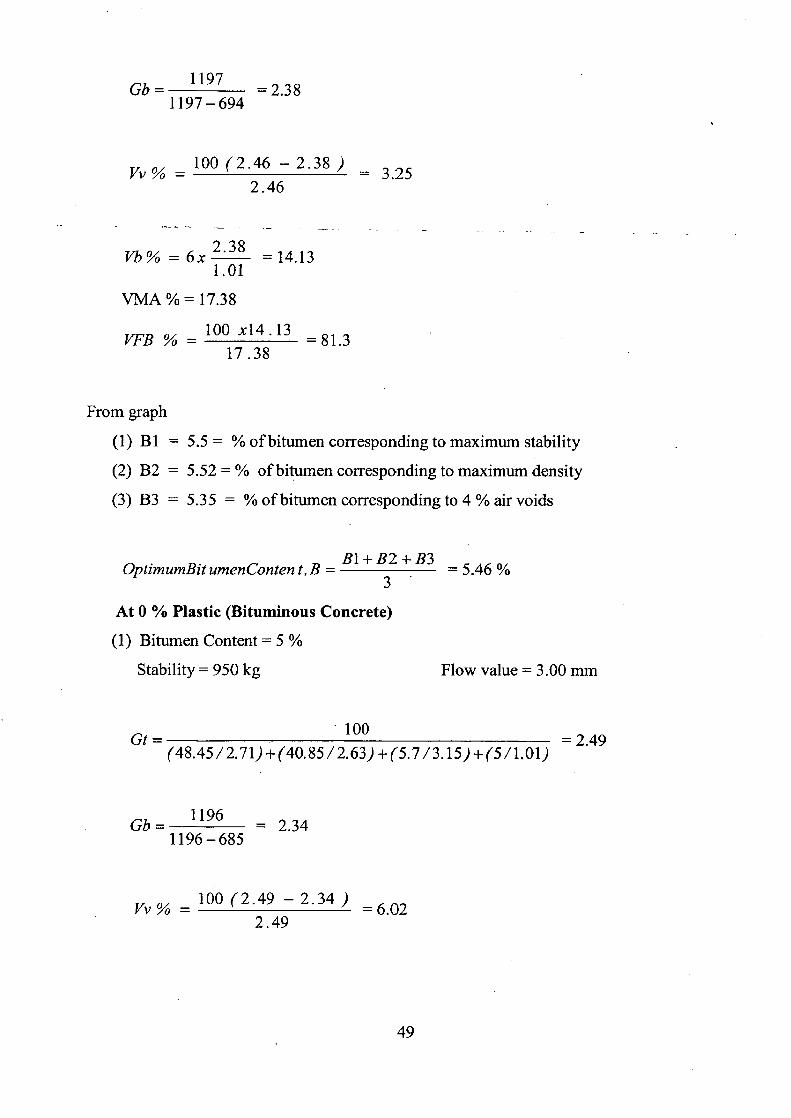
Gb= 1197
=2.38 1197-694
Vv% = 100 (2.46 —2.38) = 3.25 2.46
Vb% = 6x 2.38 = 14.13 1.01
VMA%=17.38
VFB % 100 x14.13 = 81.3 17.38
From graph
(1) B 1 = 5.5 = % of bitumen corresponding to maximum stability
(2) B2 = 5.52 = % of bitumen corresponding to maximum density
(3) B3 = 5.35 = % of bitumen corresponding to 4 % air voids
OptimumBit umenConten t, B = Bl + B2 + B3 = 5.46 %
At 0 % Plastic (Bituminous Concrete)
(1) Bitumen Content = 5 %
Stability = 950 kg Flow value = 3.00 mm
Gt= 100 =2.49
(48.45/2.71)+(40.85/2.63)+(5.7/3.15)+(5/1.01)
Gb = 1196 = 2.34 1196-685
Vv % = 100 (2.49 —2.34) = 6.02 2.49
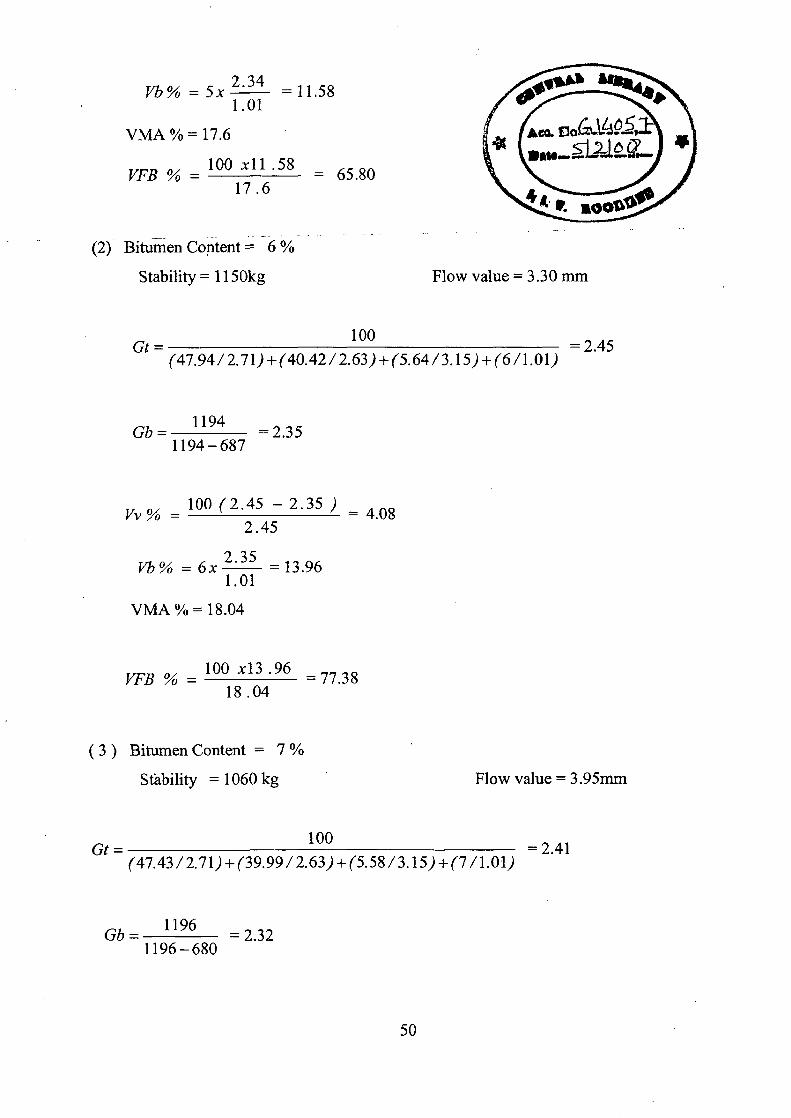
Vb%=5x2.34 11.58
1.01
VMA % = 17.6
100 x11 .58 VFB % =
= 65.80 17.6
(Am 3o .: *-".
(2) Bitumen Content = 6 %
Stability = 1150kg Flow value = 3.30 mm
Gt = 100 =2.45
(47.94/2.71)+(40.42/2.63)+(5.64/3.15)+(6/1.01)
Gb= 1194 =2.35
1194-687
Vv%=100(2.45-2.35) =4.08
2.45
Vb%=6x2'35 =13.96 1.01
VMA % = 18.04
100x13.96 VFB % = = 77.38
18.04
(3) Bitumen Content = 7 %
Stability = 1060 kg Flow value = 3.95mm
Gt= 100 =2.41
(47.43/2.71)+(39.99/2.63)+(5.58/3.15)+(7/1.01)
1196 Gb _ = 2.32 1196 —680
50
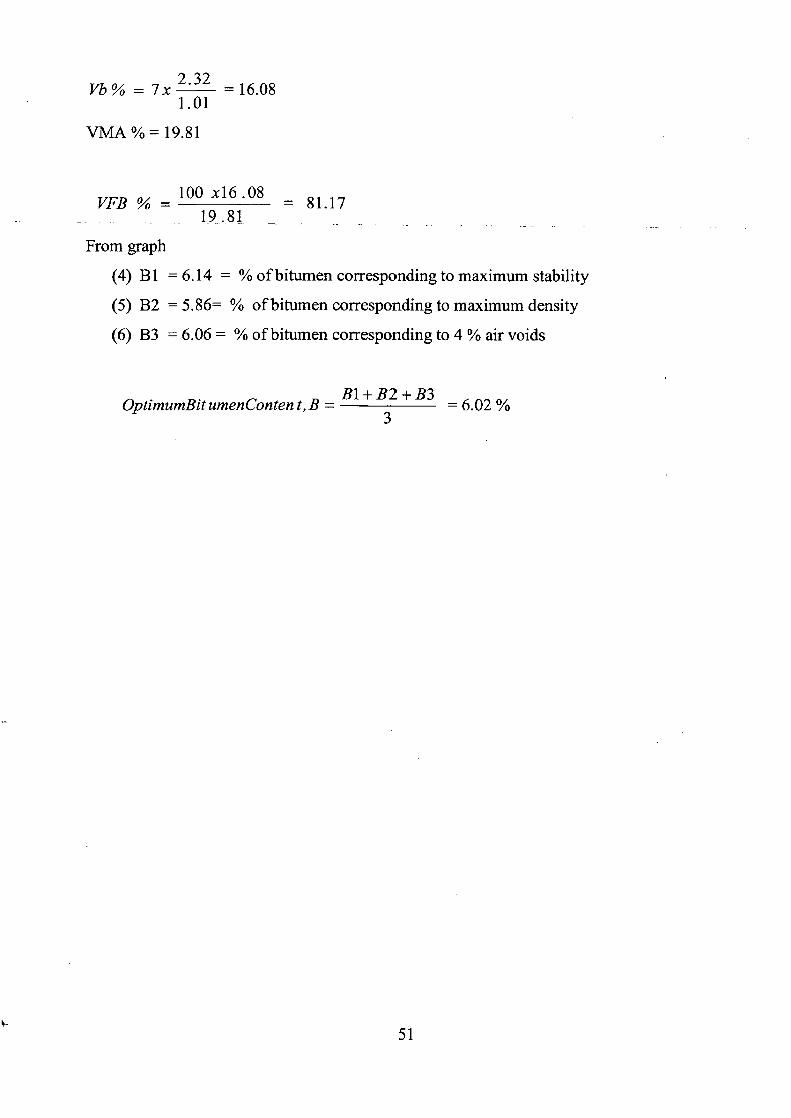
Vb% =7x 2.32 =16.08 1.01
VMA%=19.81
VFB % = 100 x16 .08 = 81.17 19.81
From graph
(4) B 1 = 6.14 = % of bitumen corresponding to maximum stability
(5) B2 = 5.86= % of bitumen corresponding to maximum density
(6) B3 = 6.06 = % of bitumen corresponding to 4 % air voids
OptimumBit umenConten t, B = Bl + B2 + B3 = 6.02 % 3
51
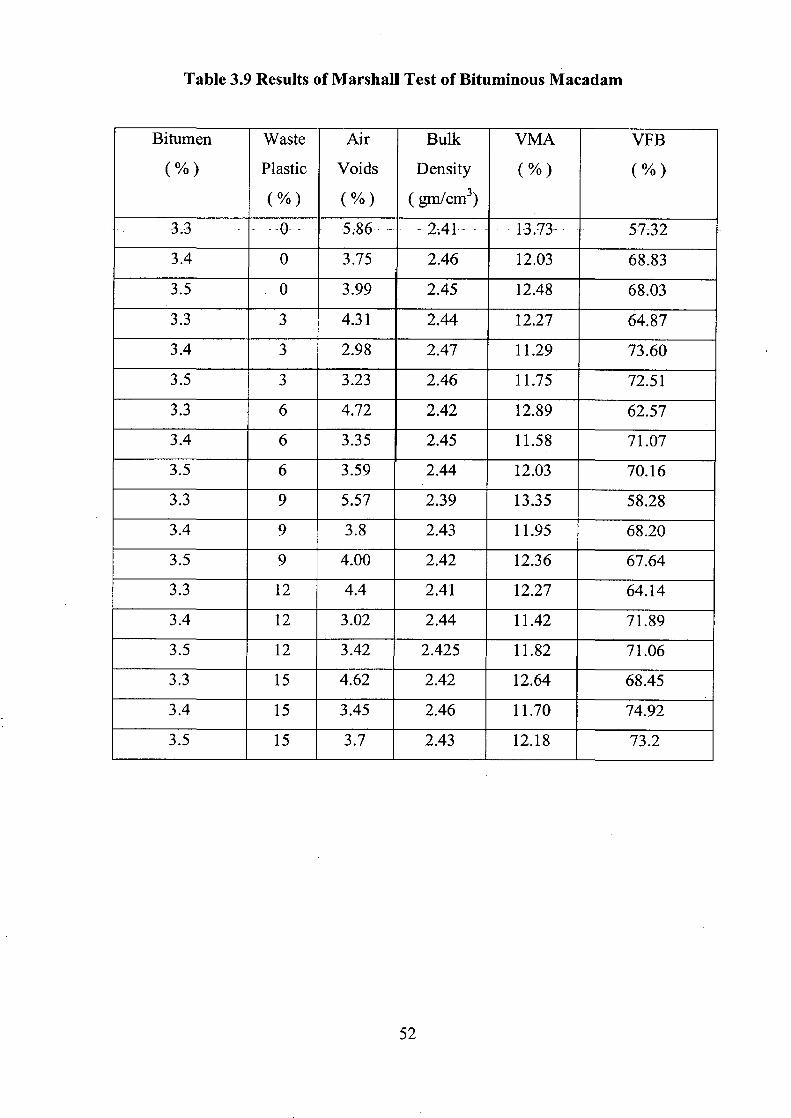
Table 3.9 Results of Marshall Test of Bituminous Macadam
Bitumen
(%)
Waste•
Plastic
(%)
Air
Voids
(%)
Bulk
Density
(gm cm3)
VMA
(%)
VFB
(%)
3.3 - -0 _ 5;86...._- . -. 2.41-.. - ..... 13.73- 57:32
3.4 0 3.75 2.46 12.03 68.83
3.5 . 0 3.99 2.45 12.48 68.03
3.3 3 4.31 2.44 12.27 64.87
3.4 3 2.98 2.47 11.29 73.60
3.5 3 3.23 2.46 11.75 72.51
3.3 6 4.72 2.42 12.89 62.57
3.4 6 3.35 2.45 11.58 71.07
3.5 6 3.59 2.44 12.03 70.16
3.3 9 5.57 2.39 13.35 58.28
3.4 9 3.8 2.43 11.95 68.20
3.5 9 4.00 2.42 12.36 67.64
3.3 12 4.4 2.41 12.27 64.14
3.4 12 3.02 2.44 11.42 71.89
3.5 12 3.42 2.425 11.82 71.06
3.3 15 4.62 2.42 12.64 68.45
3.4 15 3.45 2.46 11.70 74.92
3.5 15 3.7 2.43 12.18 73.2
52
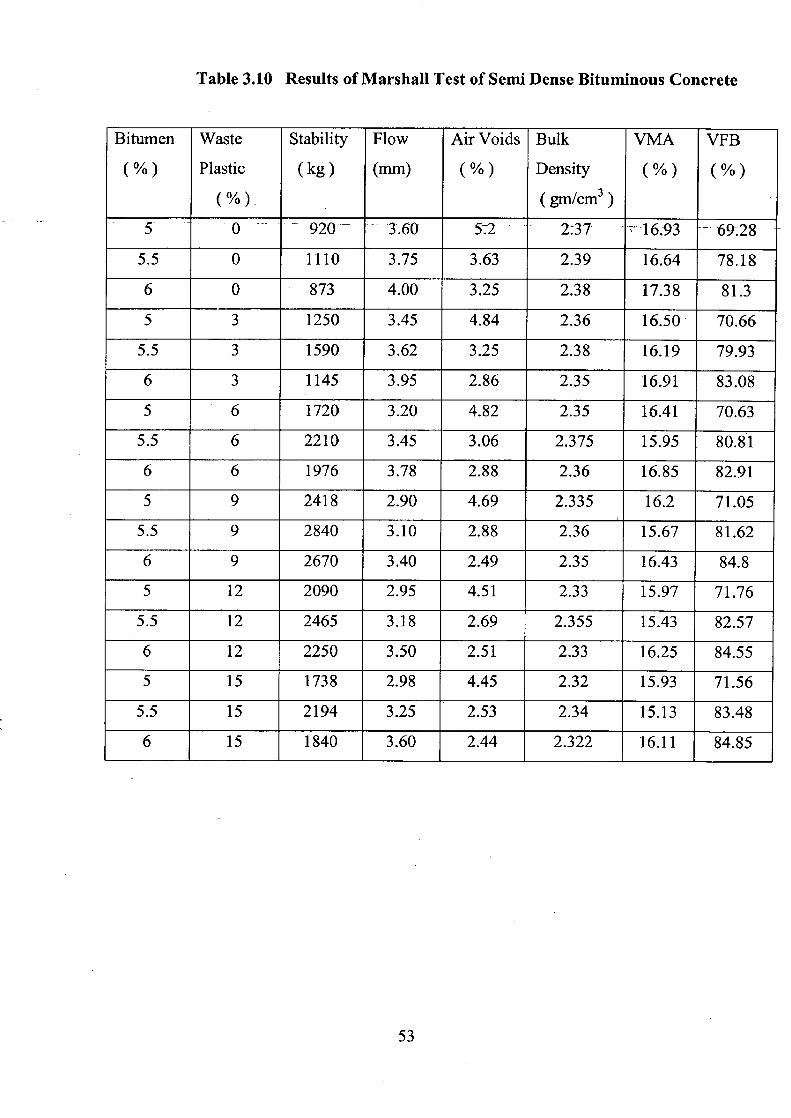
Table 3.10 Results of Marshall Test of Semi Dense Bituminous Concrete
Bitumen
• (%)
Waste
Plastic
M.
Stability
(kg)
Flow
(mm)
Air Voids
(%)
Bulk
Density
(gmcm3 )
VMA
(%)
VFB
(%)
5 - 0 920- 3.60 52 ---2:37 .,.. -16.93 --69.28
5.5 0 1110 3.75 3.63 2.39 16.64 78.18
6 0 873 4.00 3.25 2.38 17.38 81.3
5 3 1250 3.45 4.84 2.36 16.50 70.66
5.5 3 1590 3.62 3.25 2.38 16.19 79.93
6 3 1145 3.95 2.86 2.35 16.91 83.08
5 6 1720 3.20 4.82 2.35 16.41 70.63
5.5 6 2210 3.45 3.06 2.375 15.95 80.81
6 6 1976 3.78 2.88 2.36 16.85 82.91
5 9 2418 2.90 4.69 2.335 16.2 71.05
5.5 9 2840 3.10 2.88 2.36 15.67 81.62
6 9 2670 3.40 2.49 2.35 16.43 84.8
5 12 2090 2.95 4.51 2.33 15.97 71.76
5.5 12 2465 3.18 2.69 2.355 15.43 82.57
6 12 2250 3.50 2.51 2.33 16.25 84.55
5 15 1738 2.98 4.45 2.32 15.93 71.56
5.5 15 2194 3.25 2.53 2.34 15.13 83.48
6 15 1840 3.60 2.44 2.322 16.11 84.85
53
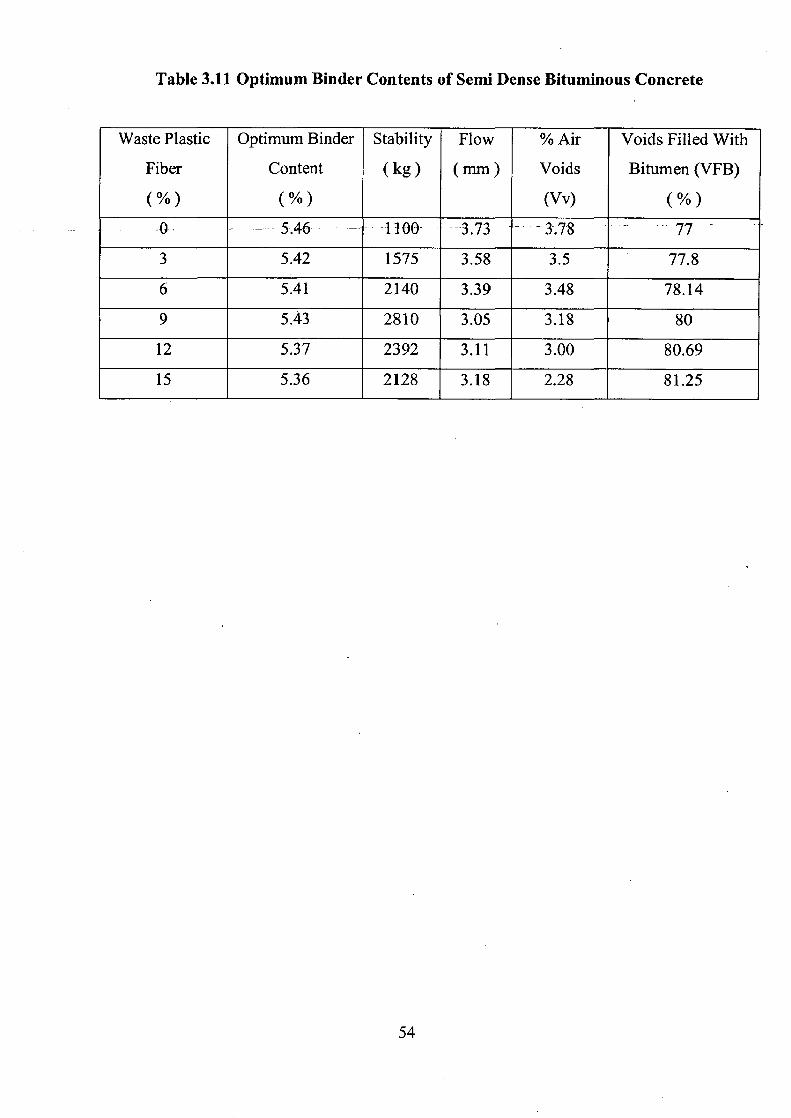
Table 3.11 Optimum Binder Contents of Semi Dense Bituminous Concrete
Waste Plastic
Fiber
(%)
Optimum Binder
Content
(%)
Stability
(kg)
Flow
(mm)
% Air
Voids
(Vv)
Voids Filled With
Bitumen (VFB)
(%)
5.46- - - -1100 - - 3.73 . _ _ 3.7-8 77_
3 5.42 1575 3.58 3.5 77.8
6 5.41 2140 3.39 3.48 78.14
9 5.43 2810 3.05 3.18 80
12 5.37 2392 3.11 3.00 80.69
15 5.36 2128 3.18 2.28 81.25
54
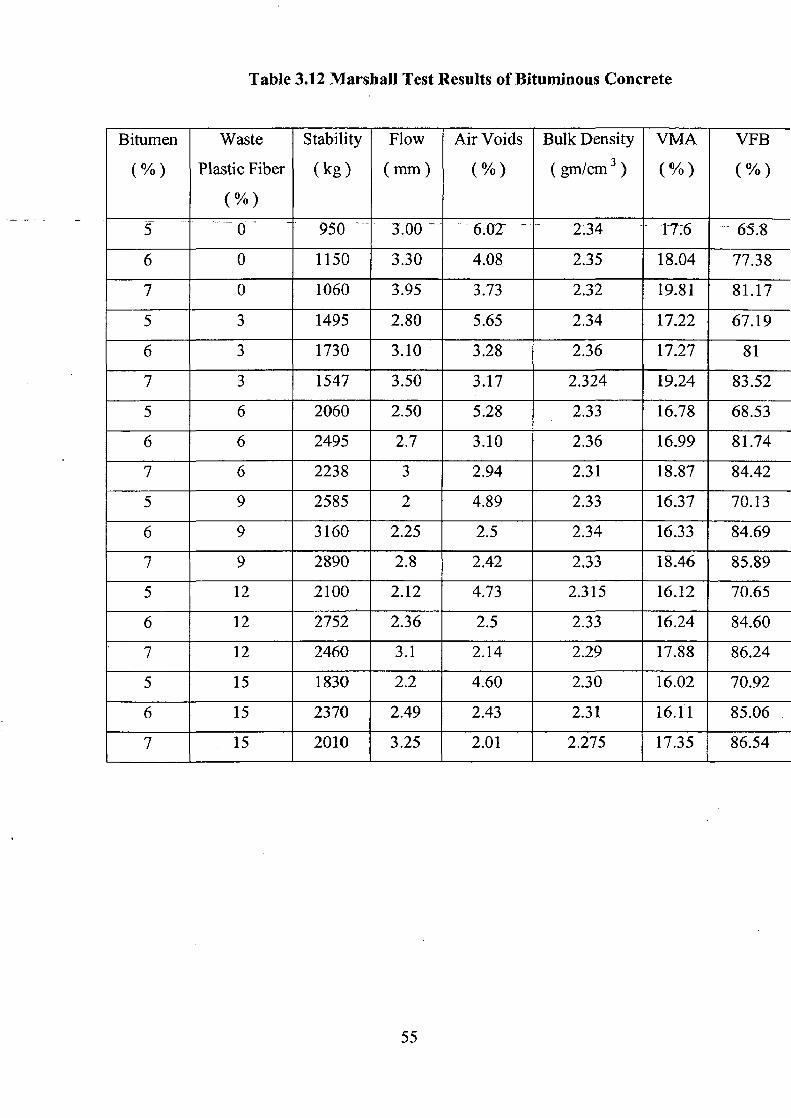
Table 3.12 Marshall Test Results of Bituminous Concrete
Bitumen
• (%)
Waste
Plastic Fiber
(%)
Stability
(kg)
Flow
(mm)
Air Voids
(%)
Bulk Density
(gm/cm 3 )
VMA
(%)
VFB
(%)
5 • 0 950 3.00 _ . - 6.0.2_ -234 17.6 - 65.8
6 0 1150 3.30 4.08 2.35 18.04 77.38
7 0 1060 3.95 3.73 2.32 19.81 81.17
5 3 1495 2.80 5.65 2.34 17.22 67.19
6 3 1730 3.10 3.28 2.36 17.27 81
7 3 1547 3.50 3.17 2.324 19.24 83.52
5 6 2060 2.50 5.28 2.33 16.78 68.53
6 6 2495 2.7 3.10 2.36 16.99 81.74
7 6 2238 3 2.94 2.31 18.87 84.42
5 9 2585 2 4.89 2.33 16.37 70.13
6 9 3160 2.25 2.5 2.34 16.33 84.69
7 9 2890 2.8 2.42 2.33 18.46 85.89
5 12 2100 2.12 4.73 2.315 16.12 70.65
6 12 2752 2.36 2.5 2.33 16.24 84.60
7 12 2460 3.1 2.14 2.29 17.88 86.24
5 15 1830 2.2 4.60 2.30 16.02 70.92
6 15 2370 2.49 2.43 2.31 16.11 85.06
7 15 2010 3.25 2.01 2.275 17.35 86.54
55
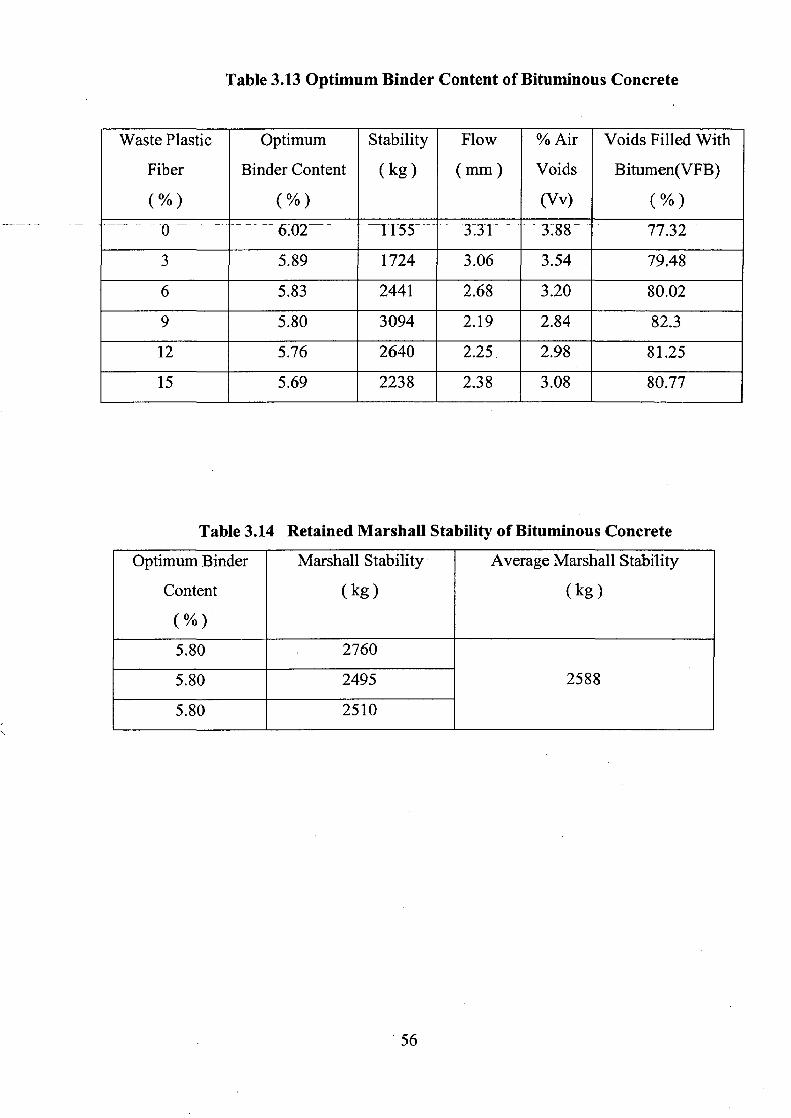
Table 3.13 Optimum Binder Content of Bituminous Concrete
Waste Plastic
Fiber
(%)
Optimum
Binder Content
(%)
Stability
(kg)
Flow
(mm)
% Air
Voids
(Vv)
Voids Filled With
Bitumen(VFB)
(%) 0 — -- —I-F55---- - _ 3.3l - .
3 5.89 1724 3.06 3.54 79.48
6 5.83 2441 2.68 3.20 80.02
9 5.80 3094 2.19 2.84 82.3
12 5.76 2640 2.25. 2.98 81.25
15 5.69 2238 2.38 3.08 80.77
Table 3.14 Retained Marshall Stability of Bituminous Concrete
Optimum Binder
Content
(%).
Marshall Stability
(kg)
Average Marshall Stability
(kg)
5.80 2760
2588 5.80 2495
5.80 2510
56
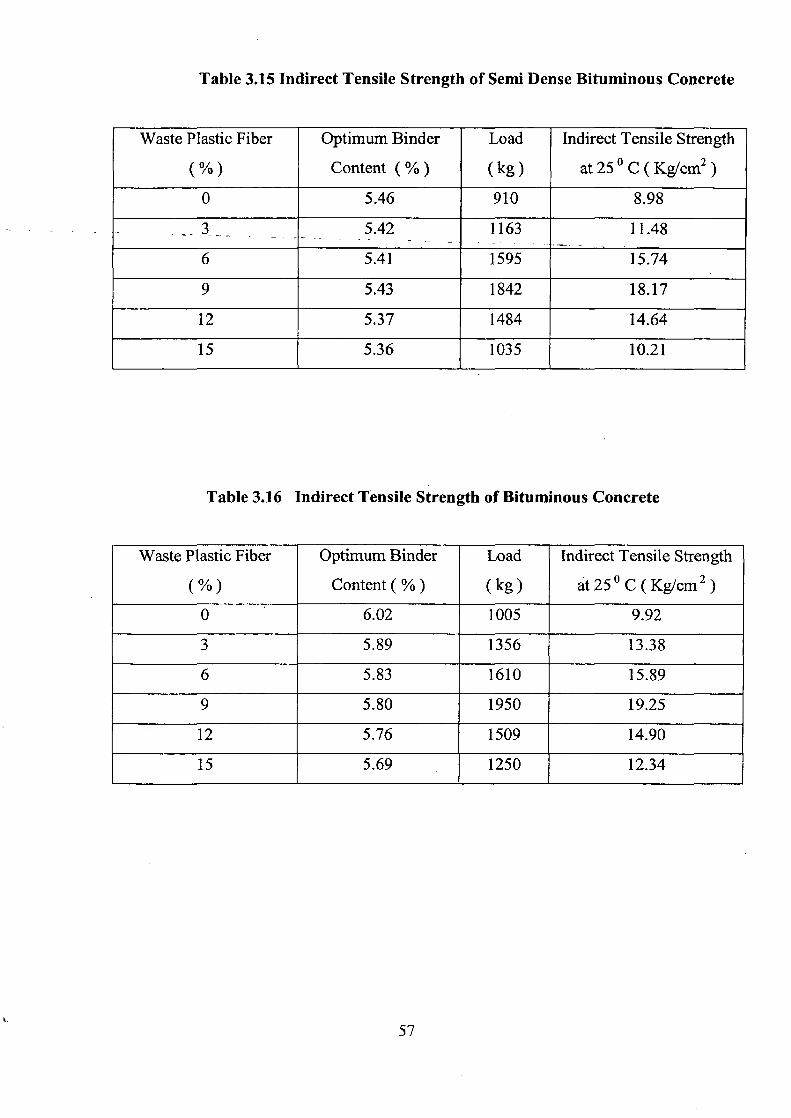
Table 3.15 Indirect Tensile Strength of Semi Dense Bituminous Concrete
Waste Plastic Fiber
(%)
Optimum Binder
Content (%)
Load
(kg)
Indirect Tensile Strength
at25° C(Kg/cm2 )
0 5.46 910 8.98
3 5.42 1163 11.48
6 5.41 1595 15.74
9 5.43 1842 18.17
12 5.37 1484 14.64
15 5.36 1035 10.21
Table 3.16 Indirect Tensile Strength of Bituminous Concrete
Waste Plastic Fiber
(%)
Optimum Binder
Content(%)
Load
(kg)
Indirect Tensile Strength
at25° C(Kg/cm 2 )
0 6.02 1005 9.92
3 5.89 1356 13.38
6 5.83 1610 15.89
9 5.80 1950 19.25
12 5.76 1509 14.90
15 5.69 1250 12.34
57
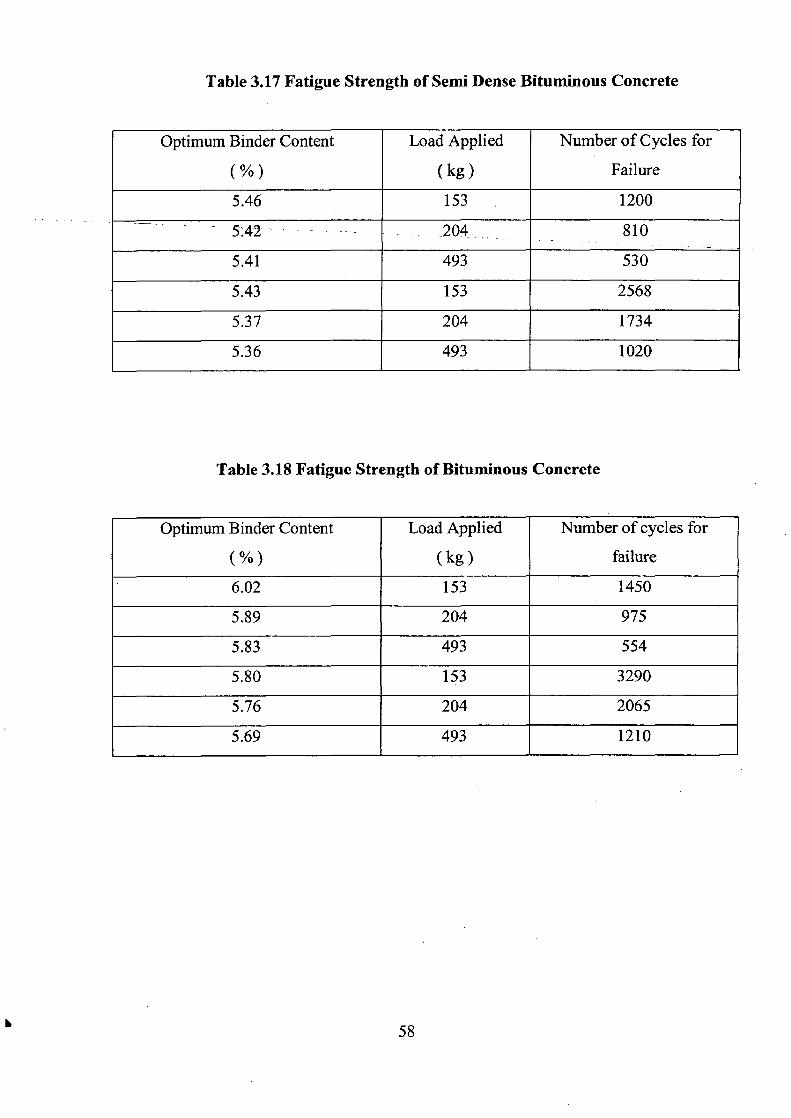
Table 3.17 Fatigue Strength of Semi Dense Bituminous Concrete
Optimum Binder Content
(%)
Load Applied
(kg)
Number of Cycles for
Failure
5.46 153 1200
-204 810
5.41 493 530
5.43 153 2568
5.37 204 1734
5.36 493 1020
Table 3.18 Fatigue Strength of Bituminous Concrete
Optimum Binder Content
(%)
Load Applied
(kg)
Number of cycles for
failure
6.02 153 1450
5.89 204 975
5.83 493 554
5.80 153 3290
5.76 204 2065
5.69 493 1210
/ - ------e d -; / z
[41
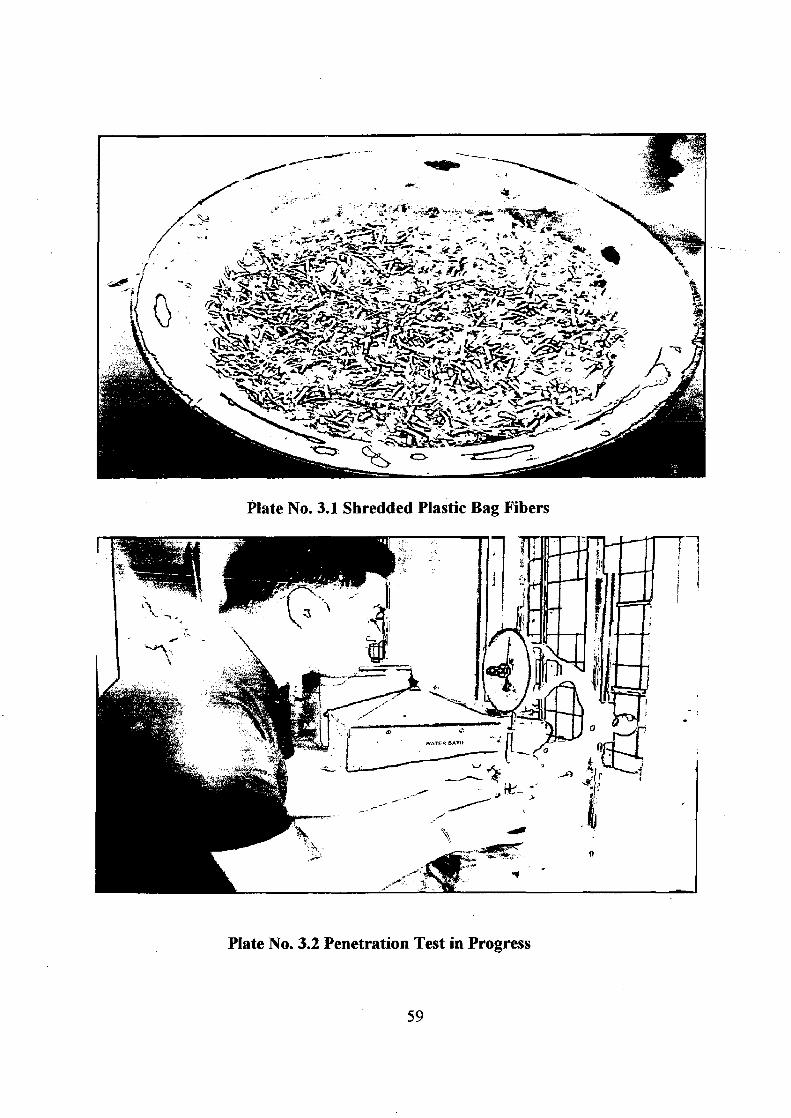
Plate No. 3.1 Shredded Plastic Bag Fibers
Plate No. 3.2 Penetration Test in Progress
59
MARSHALL STABILITY _ n
TESTING MACHINE ..
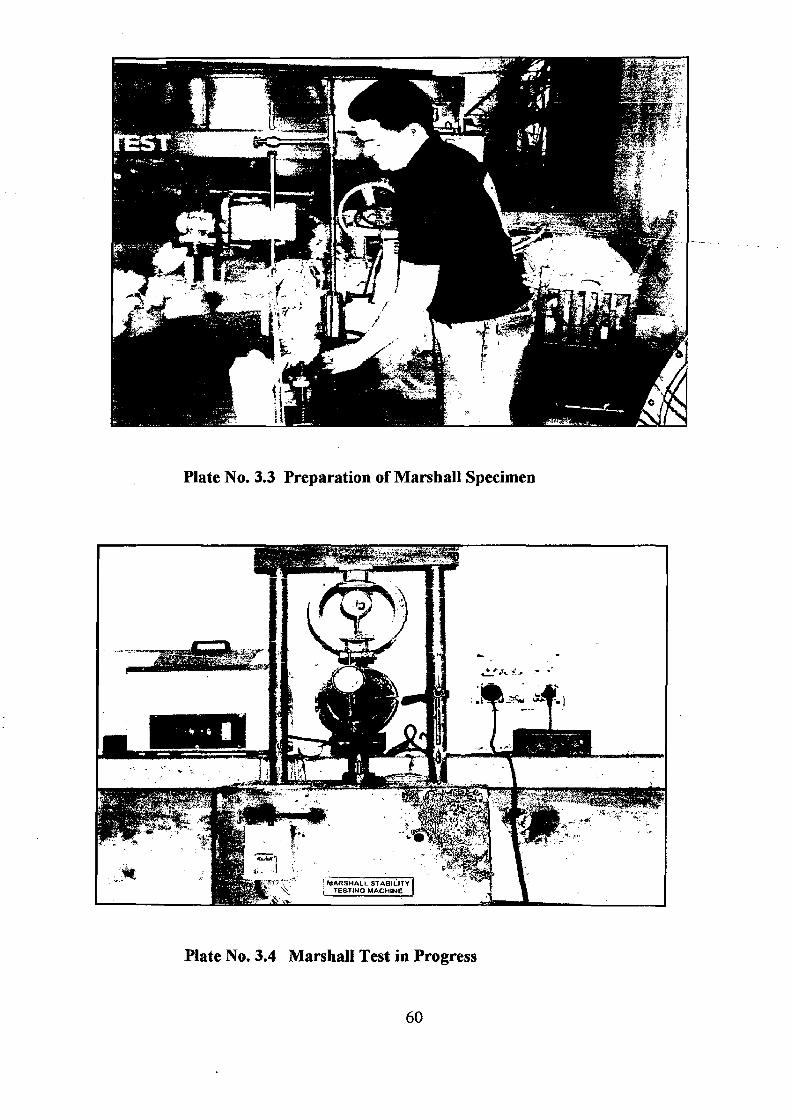
Plate No. 3.3 Preparation of Marshall Specimen
Plate No. 3.4 Marshall Test in Progress
r1]
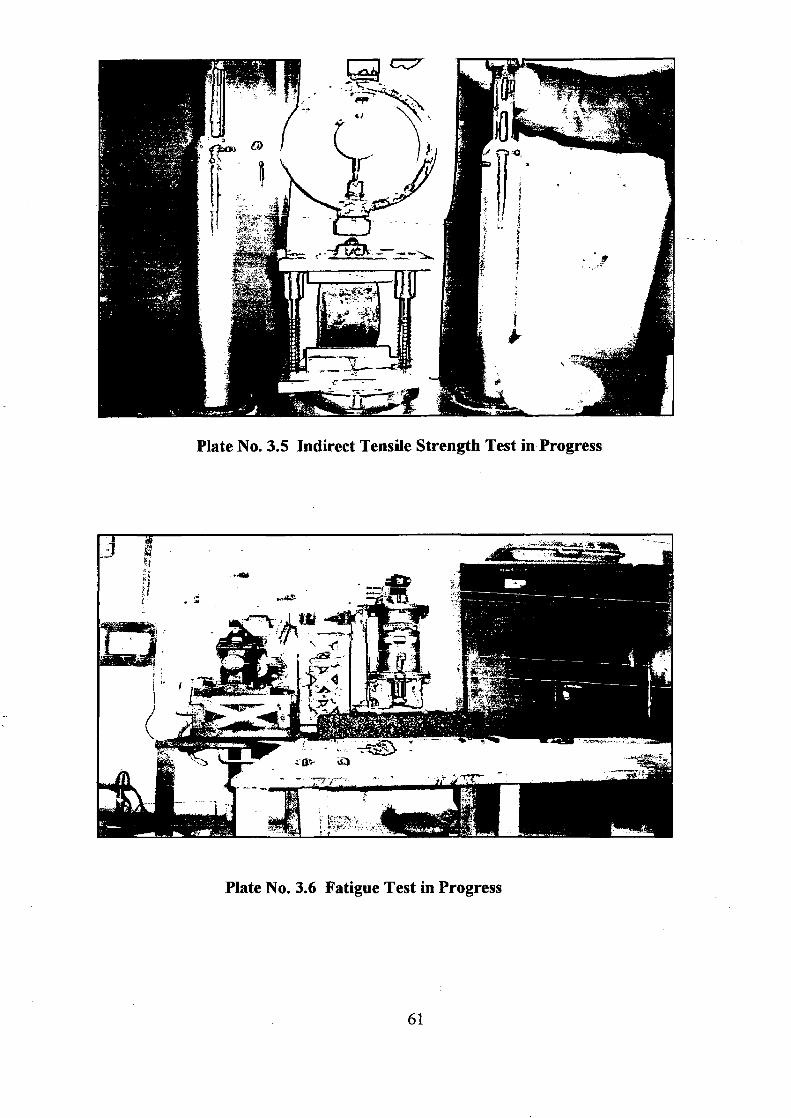
Plate No. 3.5 Indirect Tensile Strength Test in Progress
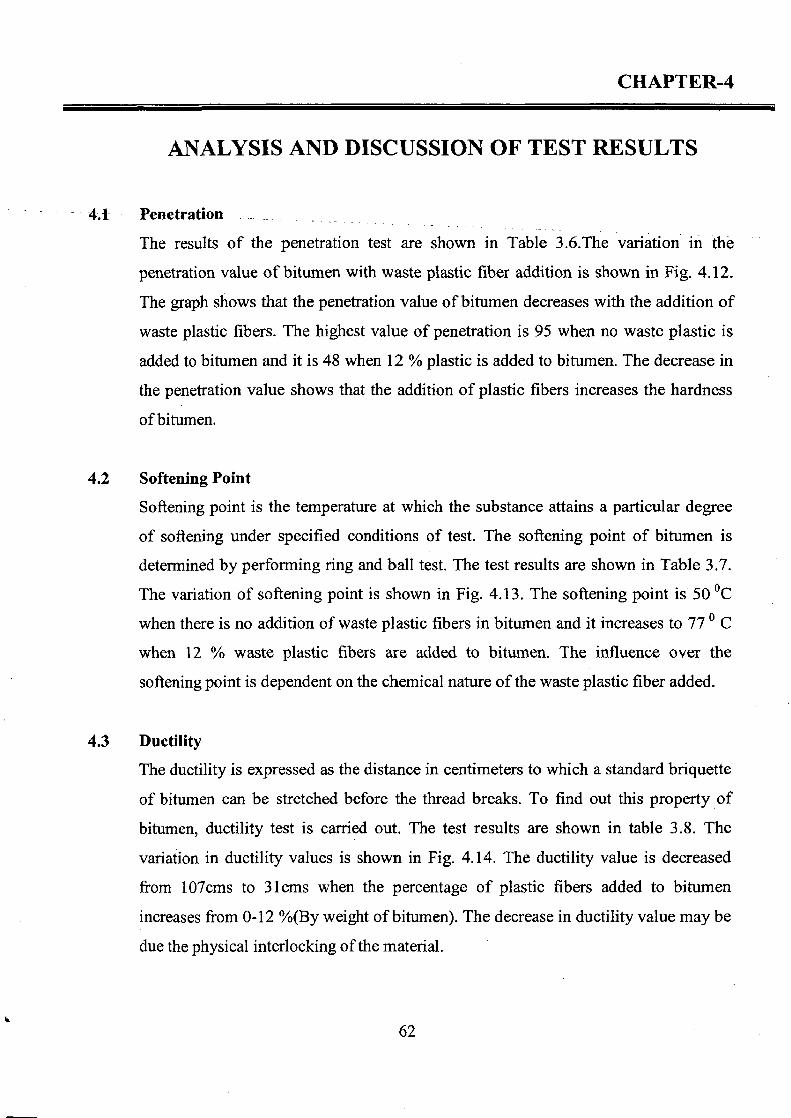
Plate No. 3.6 Fatigue Test in Progress
61
CHAPTER-4
ANALYSIS AND DISCUSSION OF TEST RESULTS
4A Penetration The results of the penetration test are shown in Table 3.6.The variation in the
penetration value of bitumen with waste plastic fiber addition is shown in Fig. 4.12.
The graph shows that the penetration value of bitumen decreases with the addition of
waste plastic fibers. The highest value of penetration is 95 when no waste plastic is
added to bitumen and it is 48 when 12 % plastic is added to bitumen. The decrease in
the penetration value shows that the addition of plastic fibers increases the hardness
of bitumen.
4.2 Softening Point Softening point is the temperature at which the substance attains a particular degree
of softening under specified conditions of test. The softening point of bitumen is
determined by performing ring and ball test. The test results are shown in Table 3.7.
The variation of softening point is shown in Fig. 4.13. The softening point is 50 °C
when there is no addition of waste plastic fibers in bitumen and it increases to 77 ° C
when 12 % waste plastic fibers are added to bitumen. The influence over the
softening point is dependent on the chemical nature of the waste plastic fiber added.
4.3 Ductility The ductility is expressed as the distance in centimeters to which a standard briquette
of bitumen can be stretched before the thread breaks. To find out this property of
bitumen, ductility test is carried out. The test results are shown in table 3.8. The
variation in ductility values is shown in Fig. 4.14. The ductility value is decreased
from 107cros to 31 cros when the percentage of plastic fibers added to bitumen
increases from 0-12 %(By weight of bitumen). The decrease in ductility value may be
due the physical interlocking of the material.
4.4 Stripping
When plastic fiber was not added to bitumen, the stripping was found to be 10
10 % after 24 hours. When plastic fiber was added to the hot bitumen, there was no
stripping when mix checked after 24 hrs. Even after 72 hrs there was no stripping.
4.5 Marshall" Stability
The Marshall Stability is a measure of structural strength of a bituminous mix. Higher
the stability of the mix, greater will be the strength of surfacing. For finding out the
Marshall Stability and other parameters, Marshall specimens were prepared for
Bituminous Macadam (BM), Semi Dense Bituminous Concrete (SDBC) and
Bituminous Concrete (BC) using the bitumen content from 3.3-3.5 % by weight of
total mix for BM, 5-6 % by weight of the total mix for SDBC and 5-7 % by weight of
the total mix for BC. The waste plastic fiber content in the mix is varied from 0-15 %
by weight of bitumen. The specimens were tested after curing at 60 °C in water bath
for 30 minutes. The results of Marshall Test are given in Tables 3.9-3.13. These
results have also been presented in graphical form from Fig. 4.1-4.12 and Fig. 4.15-
4.17.
From the test results, it has have found that
In case of Bituminous Macadam, the samples crumbled when the Marshall specimens
were taken out from water bath after 30 minutes. So the testing of the specimens
could not be performed.
In case of Semi Dense Bituminous Concrete
• Marshall Stability increases from 1100 kg to2810 kg when the plastic fiber
content increases from 0-9 % by weight of the bitumen. Stability is
maximum at 9 % plastic fiber content and afterwards stability decreases. The
increase in the stability is due to the improvements in the physical properties
of bitumen and the coating of the aggregates with the plastic fibers.
63
• The flow value decreases up to 9 % plastic fiber content and after that it
starts increasing.
In case of Bituminous Concrete
• The Marshall Stability increases from 1155 kg to 3094 kg when the
percentage of addition of plastic fiber increases from 09 % by weight of the
bitumen. The maximum stability is obtained at 9 % plastic content and after
wards it starts decreasing.
• The flow value decreases up to 9 % plastic fiber content and after and after
that it starts increasing.
• In case of SDBC and BC, the VFB is slightly exceedingly the standard
value. It can be understood from the fact that some voids are filled by the
plastic fibers also.
4.6 Indirect Tensile Strength
Indirect Tensile Strength tests were carried out on Marshall Specimens made of
SDBC and BC. The specimens were cured at room temperature for 24 hrs and then
kept at 25 °C for 30 minutes. before testing. The Test results are given in Tables 3.15-
3.16.The variations in Tensile strength have been shown in Fig. 4.18-4.19. The
maximum tensile strength is obtained at 9 % plastic fiber added to bitumen in case of
SDBC and BC. At 9 % plastic fiber content the tensile strength increases 1.94 times
in case of SDBC and at 9 % plastic fiber content the strength increases 2.00 times in
case of BC.
4.7 Fatigue Strength
To find out the effect of addition of plastic bag fibers on fatigue strength of
bituminous mixes, fatigue test is conducted. Fatigue test results are shown in Tables
3.17-3.18. These results have also been shown in graphical form from Fig. 4.20-4.23.
From the test results it is find out that with the addition of plastic fibers, the fatigue
life of pavement increases 2.09 times in case of SDBC and 2.2 times in case of BC.
64

E 85
m 80
-- 75
70
LL 65
0 60
4.5 5 5.5 6 6.5 7
Bitumen Content ( %)
1200
Y 1100
1000
900
:es
- 4 E E 3.9
e~ 3.8
3.7 _o iz 3.6
3.5
4.5 5 5.5 6 6.5 4.5
Bitumen Content ( %)
5 5.5 6 6.5 7
Bitumen Content ( %)
2.4
E 2.39 0
2.38
• 2.37
C 2.36
= 2.35
5.5
H 4.5
0
3.5
2.5
4 4.5 5 5.5 6 6.5 7 4 4.5 5 5.5 6 6.5
Bitumen Content (% ) Bitumen Content ( %)
Fig. 4.1: Marshall Curves at 0 % Plastic Content (Semi Dense Bituminous Concrete)
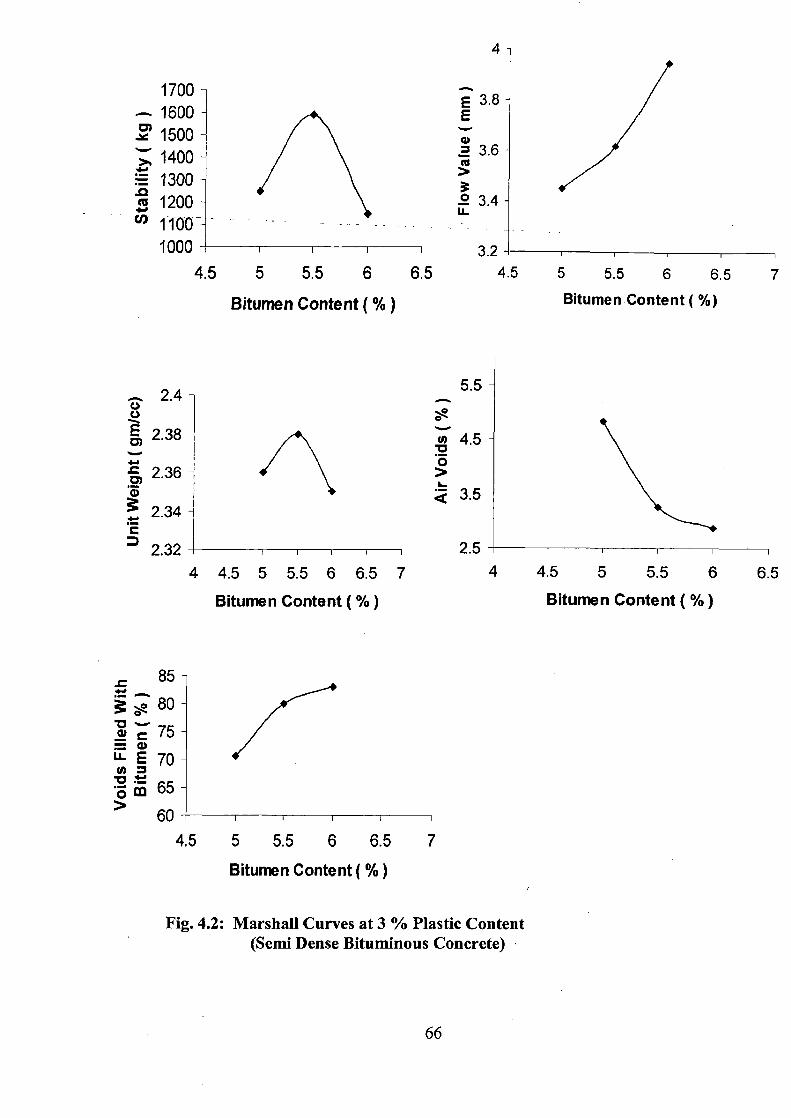
1700 -- 1600
~, 1400 1300 1200
U) 1100- --
1000
4.5 5 5.5 6 6.5
Bitumen Content ( %)
5 5.5 6 6.5 7
Bitumen Content ( %)
d 23.6
L 3.4
E3.8 E
3.2 4.5
4
5.5
4.5 o
a 3.5
2.5
2.4
2.36
2.34
2.32
4 4.5 5 5.5 6 6.5 7
4 4.5 5 5.5 6
6.5
Bitumen Content ( %)
Bitumen Content ( %)
85 80
_ r 75 '-E70 o m 65 > 60
4.5
5 5.5 6 6.5 7
Bitumen Content ( %)
Fig. 4.2: Marshall Curves at 3 % Plastic Content (Semi Dense Bituminous Concrete)
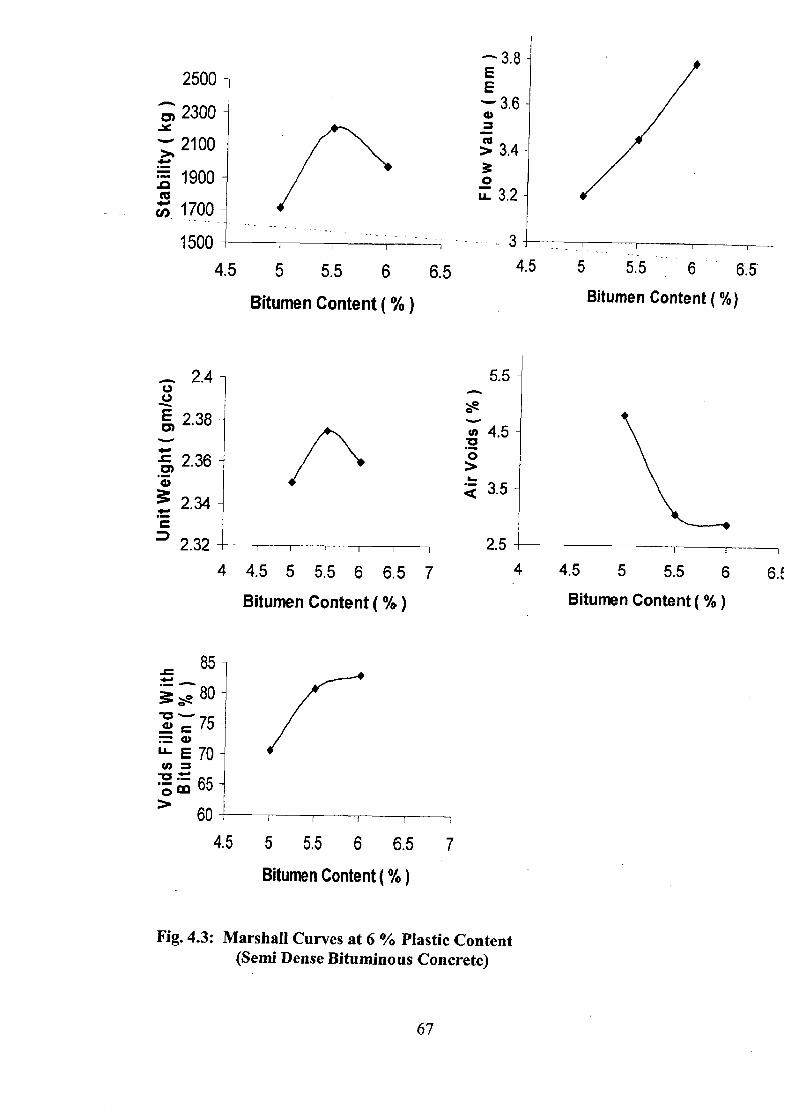
— 3.8 E E
Cu > 3.4
0 u3.2
2500
co 2300 - 2100
1900 cc (I) 1700
1500
4.5
3
6.5 4.5 5 5.5 6 6.5
Bitumen Content ( %)
5 5.5 6 Bitumen Content ( %)
5.5
Q 3.5
2.5
85
~0 80 75
L E 70
o m 65 60
4,5 5 5.5 6 6.5 7
Bitumen Content ( %)
. 2.4 v
E 2.38
2.36
2.34
2.32
4 4.5 5 5.5 6 6.5 7
4 4.5 5 5.5 6 6.;
Bitumen Content ( %)
Bitumen Content (% )
Fig. 4.3: Marshall Curves at 6 % Plastic Content (Semi Dense Bituminous Concrete)
67
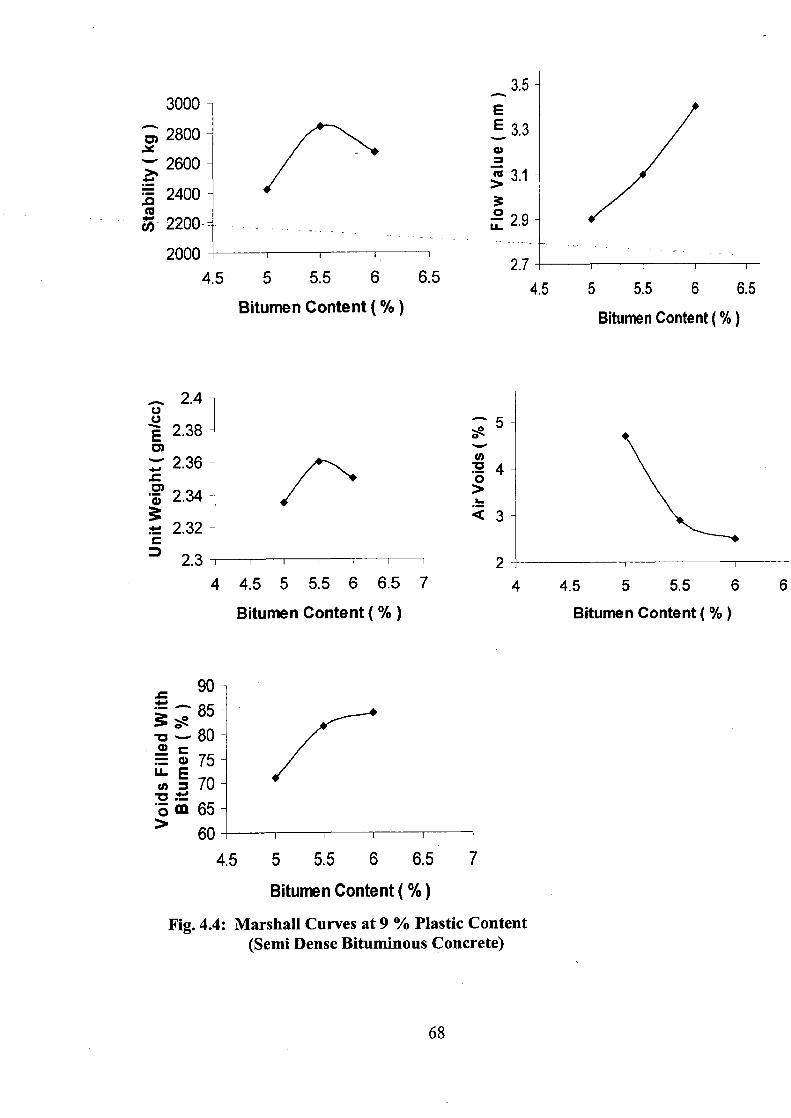
5 5.5 6 6.5
Bitumen Content ( %)
3.5 E E33 C)
3.1
0 2.9 Li
2.7 4.5
3000
2800
2600
2400
0- 2200
2000 H- 4.5 5 5.5 6 6.5
Bitumen Content ( %)
2.4 v C.) E 2.38 a) X 2.36
2.34
2.32
2.3
5
:a 4
<3
2 4 4.5 5 5.5 6 6.5 7
4 4.5 5 5.5 6 6
Bitumen Content ( %)
Bitumen Content ( %)
= 90 = "'85 0--80 = w75 vs~70 Gm 65
60 4.5 5 5.5 6 6.5 7
Bitumen Content ( %)
Fig. 4.4: Marshall Curves at 9 % Plastic Content (Semi Dense Bituminous Concrete)
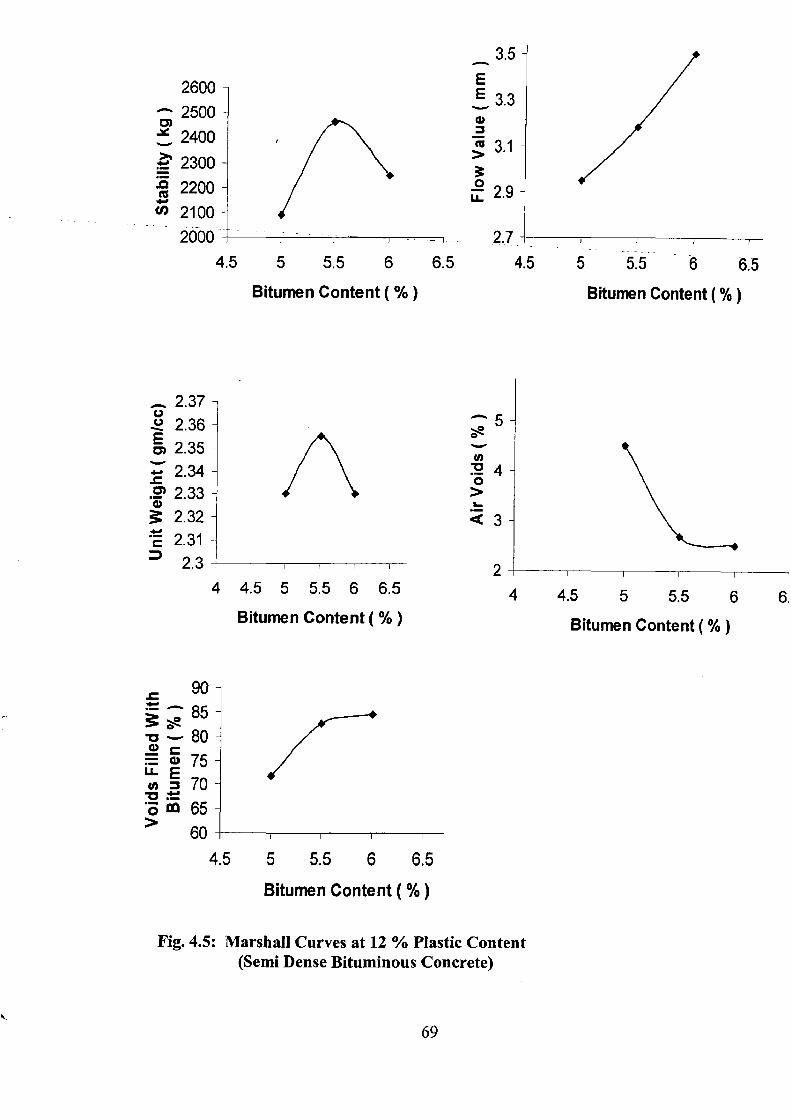
2
2.7 4.5 5
2500 . 2400
2300 2200
N 2100
4.5 5 5.5 6 6.5
Bitumen Content ( %)
3.5 E E33 a>
3.1
a° 2.9
5.5 6 6.5 Bitumen Content ( %)
2.37 2.36 2.35
= 2.34 .a' 2.33
2.32 2.31 2.3
4 4.5 5 5.5 6 6.5
Bitumen Content ( %) 4 4.5 5 5.5 6 6,
Bitumen Content (% )
90
~v--80 = w75 = u70 -a
3m 65 60
4.5 5 5.5 6 6.5
Bitumen Content ( %)
Fig. 4.5: Marshall Curves at 12 % Plastic Content (Semi Dense Bituminous Concrete)
C"
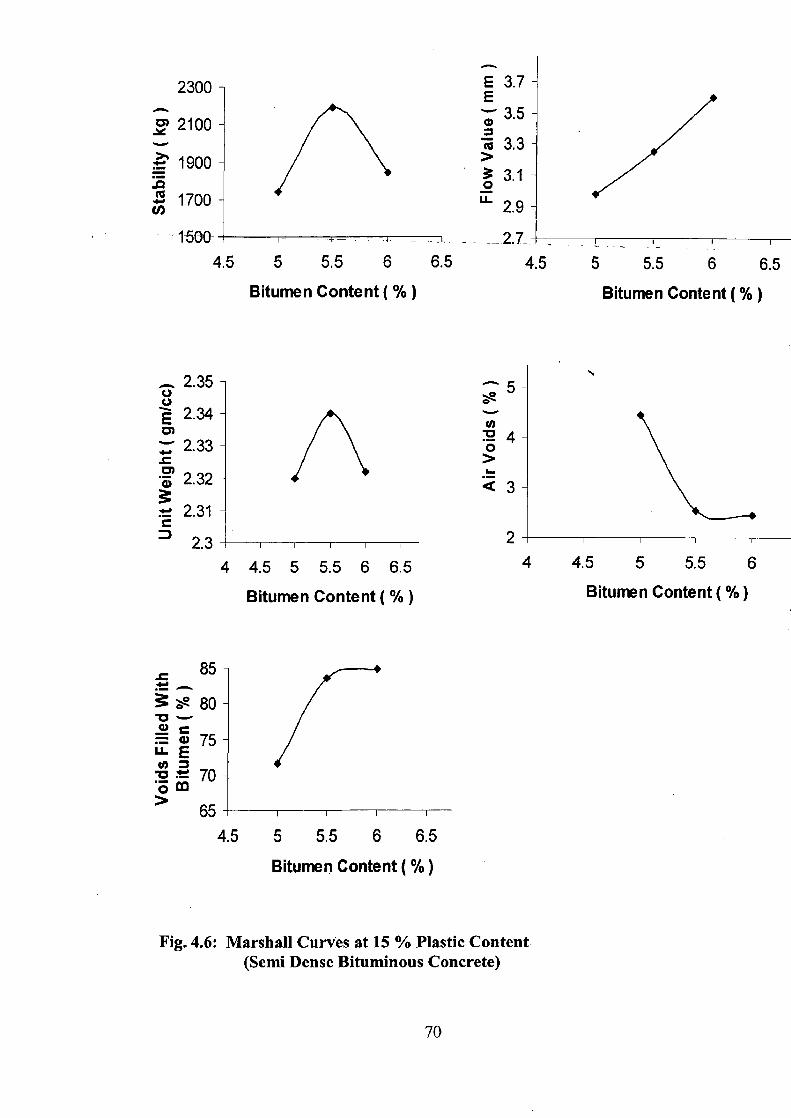
4.5 5 5.5 6
Bitumen Content (% )
E 3.7 E
3.5
R 3.3
0 3.1
" 2.9
6.5 4.5
2300
Y 2100
1900
N 1700
1500
5 5.5 6 6.5
Bitumen Content (% )
ac?
F
U E 2.34
2.33
z 2.32
2.31
D 2.3 4 4.5 5 5.5 6 6.5
Bitumen Content ( %)
4 4.5 5 5.5 6
Bitumen Content ( %)
s 85
0 80 -c-- a~
E75
:2 70
65
M 5 5.5 6 6.5
Bitumen Content ( %)
Fig. 4.6: Marshall Curves at 15 % Plastic Content (Semi Dense Bituminous Concrete)
70
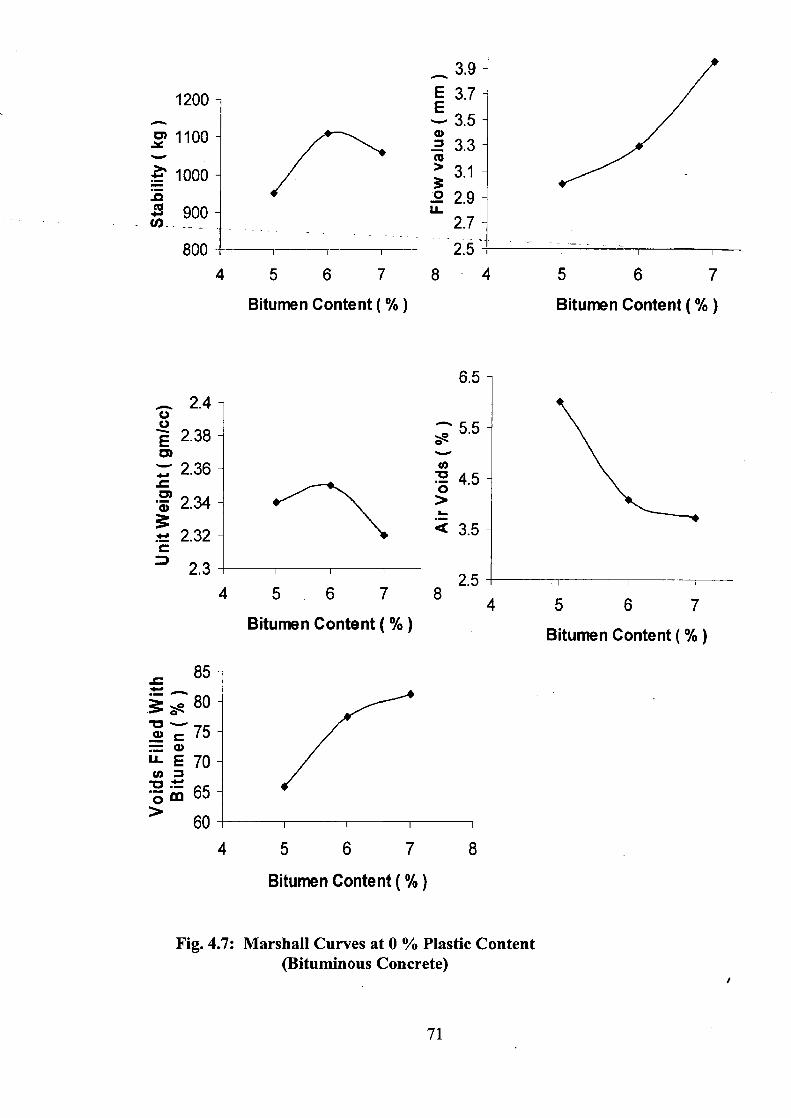
1200
1100
• 1000
M 13 900
800
E 3.7 E . — 3.5
3.3
> 31
2 2.9 U-
2.7
6.5
N
0 4.5
< 3.5
4 5 . 6 7 4 5 6 7
Bitumen Content ( %) Bitumen Content(%)
4 5 6 7
8
4 5 6 7
Bitumen Content ( %)
Bitumen Content ( %)
.. 2.4
E 2.38 C)
2.36
•~ 2.34
2.32
2.3
85
• 80
= 75
U B 70 c om65 60
4 5 6 7 8
Bitumen Content ( %)
Fig. 4.7: Marshall Curves at 0 % Plastic Content (Bituminous Concrete)
71
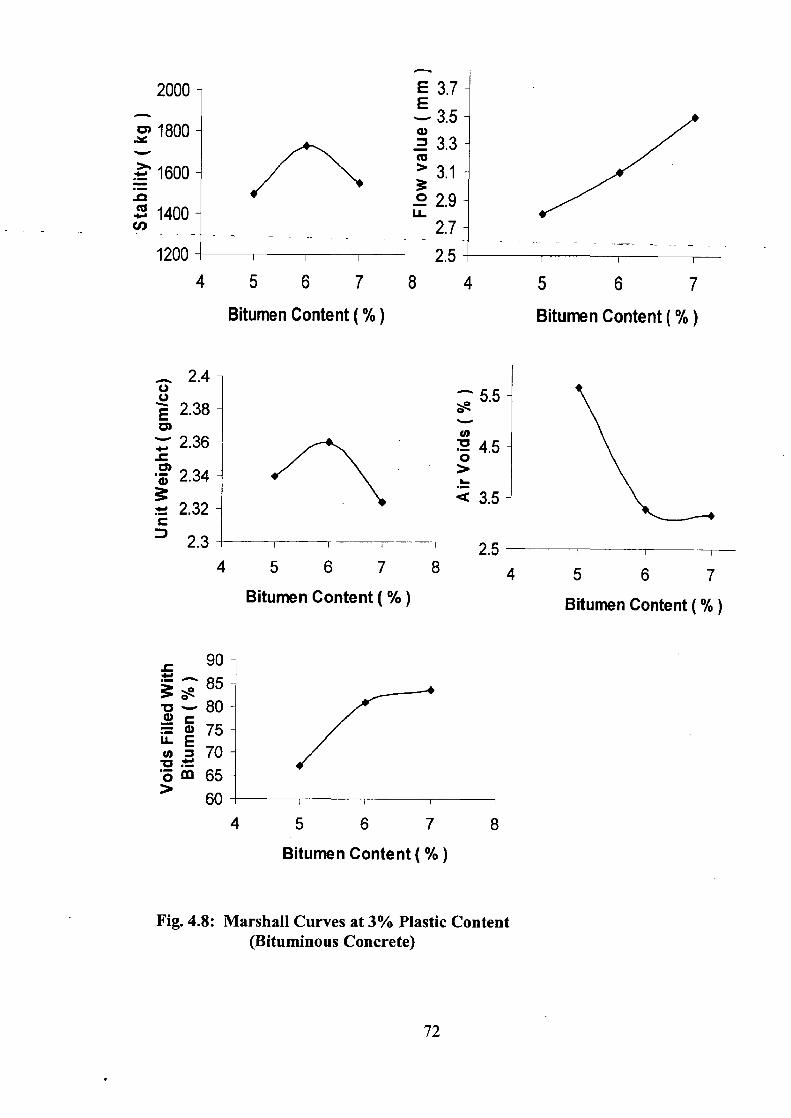
2.4
E 2.38
2.36
z 2.34
2.32 C
D 2.3 4 5 6 7 8
Bitumen Content ( %) 5 6 7
Bitumen Content (% )
<3.5
0 5.5
2.5 4
r 90
U E 75
n70 'S m 65 > 60
4 5 6 7 8
Bitumen Content ( %)
2000
1800
1600
1400
1200 4 5 6 7
Bitumen Content ( %)
E3.7 !3.5
3.3 >3.1 229
2.7 2.5
E 4 5 6 7
Bitumen Content (% )
Fig. 4.8: Marshall Curves at 3% Plastic Content (Bituminous Concrete)
72
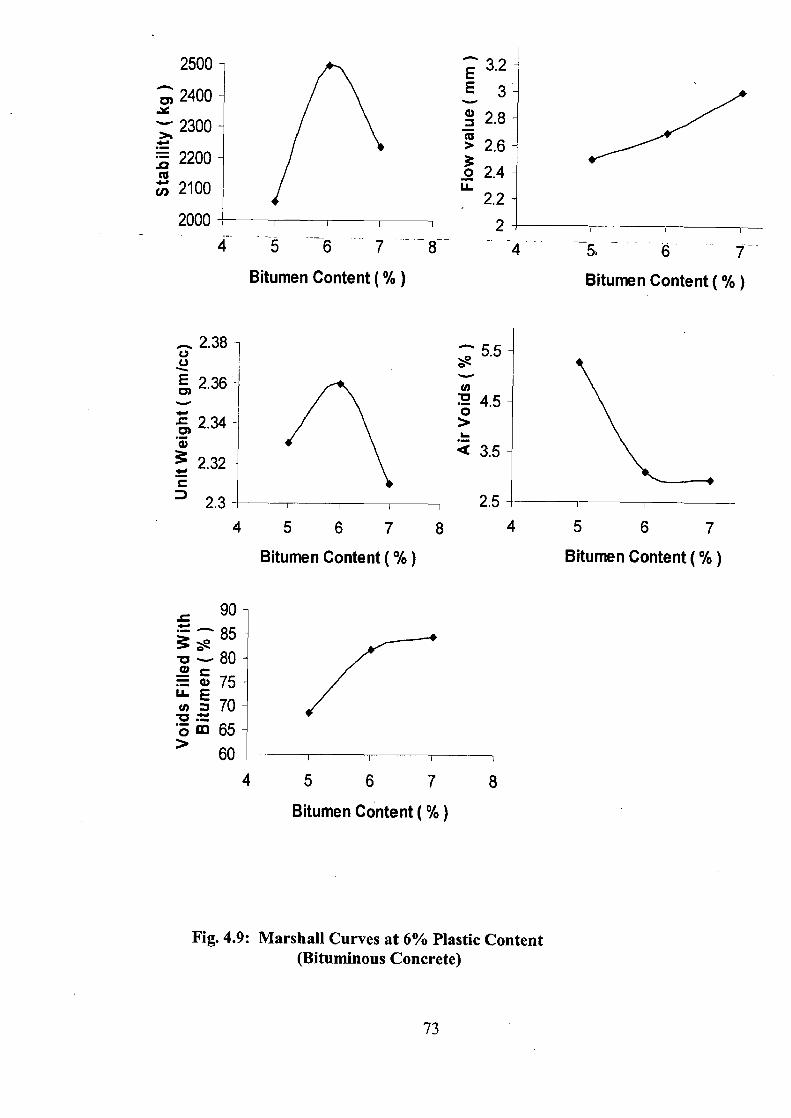
E 3.2 E3
> 2.6
02.4 a_
2.2
2 6 7 8_ - -
4 - 5 -
6 7-
Bitumen Content (%) Bitumen Content ( %)
2500
2400 - 2300
2200
2100
2000
5
_ 2.38
E 2.36
2.34
2.32
2.3
0 5.5 e
0 4.5
I-
<3.5
2.5
4 5 6 7 8
Bitumen Content ( %)
4 5 6 7
Bitumen Content ( %)
90
• -'~ 85
q, 75 cn 70 'om 65
60
4 5 6 7 8
Bitumen Content ( %)
Fig. 4.9: Marshall Curves at 6% Plastic Content (Bituminous Concrete)
73
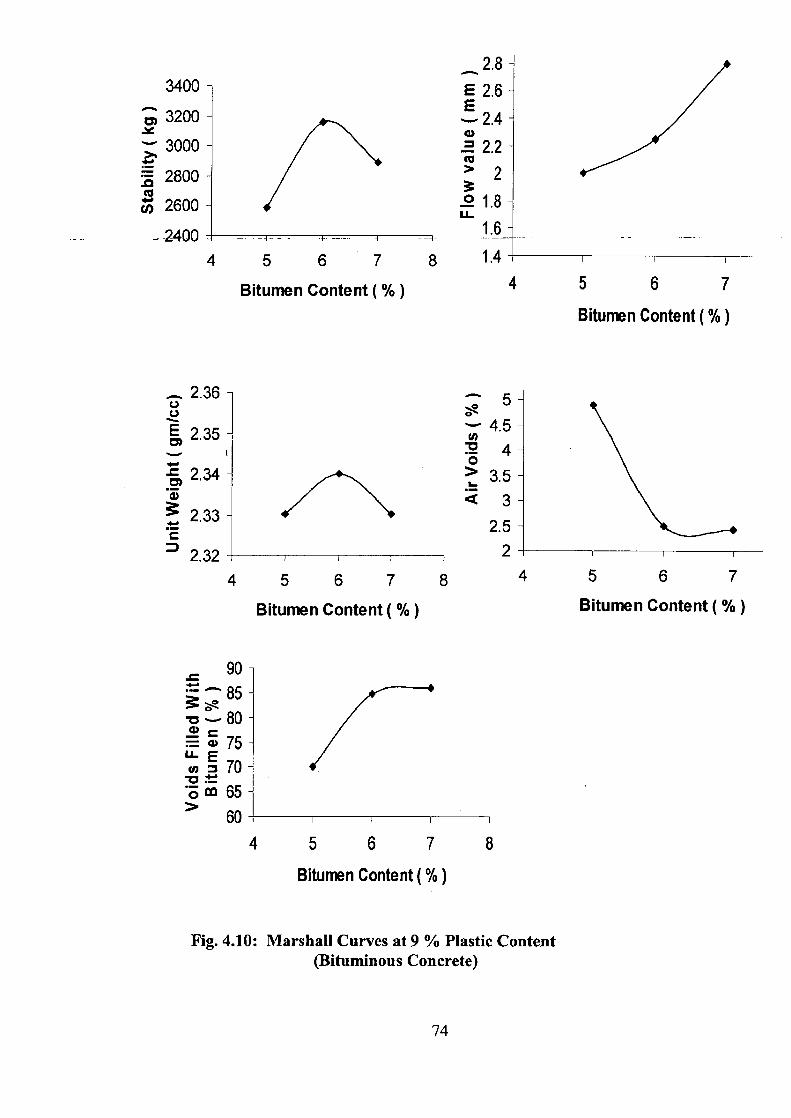
3400
3200
3000
2800 ec N 2600
-2400
2.E
E2.€ B — 2.4 G)
2.2
2
.218 L 1.6 1.4
4 5 6 7 8
Bitumen Content ( %)
4 5 6 7
Bitumen Content ( %)
rc.
E 2.35
2.34
2.33
= 2.32
5 0 0 N 4.5
3.5 a 3
2.5 2
4 5 6 7 8 4 5 6 7
Bitumen Content (% ) Bitumen Content ( %)
90
" 85 0 x--80
LE
a~
70
'o m 65 60
4 5 6 7
Bitumen Content (% )
Fig. 4.10: Marshall Curves at 9 % Plastic Content (Bituminous Concrete)
74
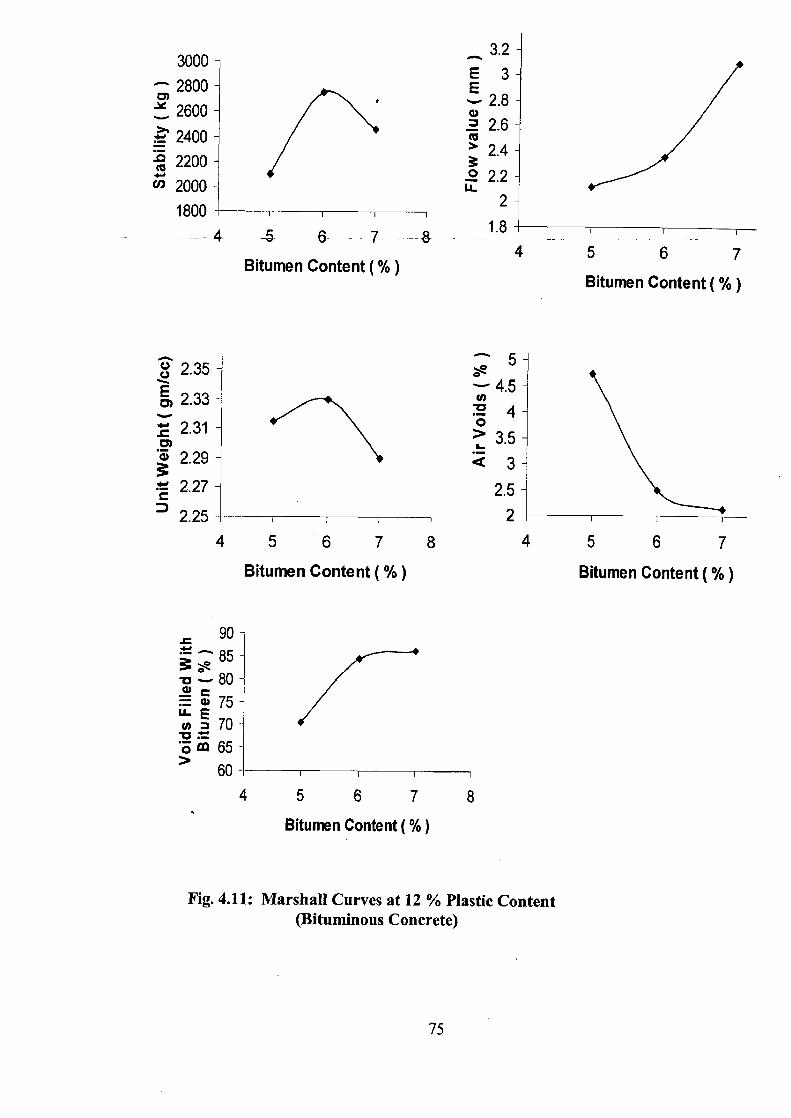
2.35
a, 2.33
t 2.31
Z 2.29
=2.27
-1 2.25
N 4.5
:a 4 0 3.5
<3
2.5
2
3000
^ 2800
2600
2400
2200
CO 2000
1800
-- 4 ---5 6- - - 7 _-8.
Bitumen Content ( %)
3.2
E3
!2.8 2.8
2.6
3 2.4
22.2 U- 2
1.8
4 5 6 7
Bitumen Content (% )
4 5 6 7 8
4 5 6 7
Bitumen Content ( %)
Bitumen Content ( %)
- 90
-o--80 as w 75
U. u, 70 3c0 65
60
4 5 6 7 8
Bitumen Content (% )
Fig. 4.11: Marshall Curves at 12 % Plastic Content (Bituminous Concrete)
75

2500
2300
2100
1900
N 1700
tit 1iII1
E3 E
2.8
2.6
3 2.4
22.2 LL 2
4 56 78
Bitumen Content ( %)
IL]
4
5 6 7
Bitumen Content ( %)
2.35
E 2.33 a)
2.31
•~ 2.29
2.27 C = 2.25
4.8
;4.3 0 3.8
3.3 <2.8
2.3 1.8
4 5 6 7 8
Bitumen Content ( %) 4 5 6 7
Bitumen Content ( %)
9085
-a -- 80 75
LLE 70
'o m 65
60
4 5 6 7 8
Bitumen Content ( %)
Fig. 4.12: Marshall Curves at 15 % Plastic Content (Bituminous Concrete)
W
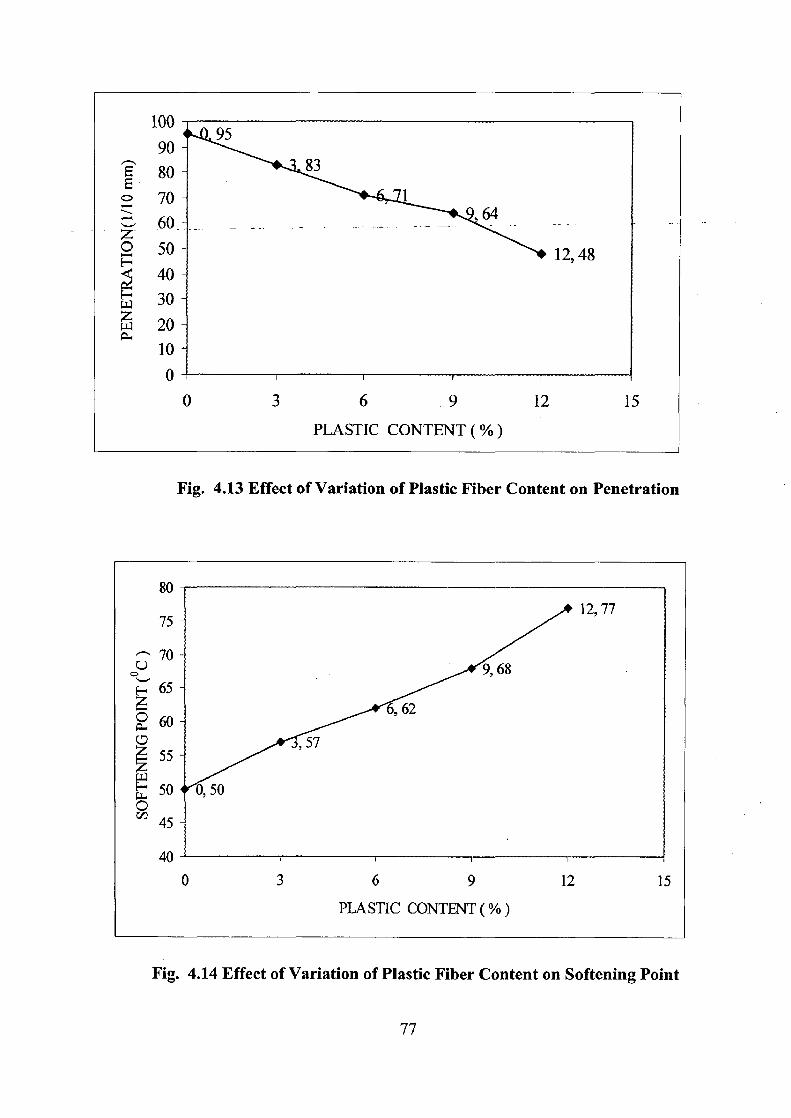
100 90
E 80 E _0 70
z- 6.0 _ 50 40 30 w 20 10 0
95
83
12, 48
0 3 6 .9 12 15
PLASTIC CONTENT (%)
Fig. 4.13 Effect of Variation of Plastic Fiber Content on Penetration
80
75 12,77
70 v
9,68
65 4 6, 62 a 60 CD
, 57 55
w 50 0,50
O I' 45
40
0 3 6 9 12 15
PLASTIC CONTENT (%)
Fig. 4.14 Effect of Variation of Plastic Fiber Content on Softening Point
77
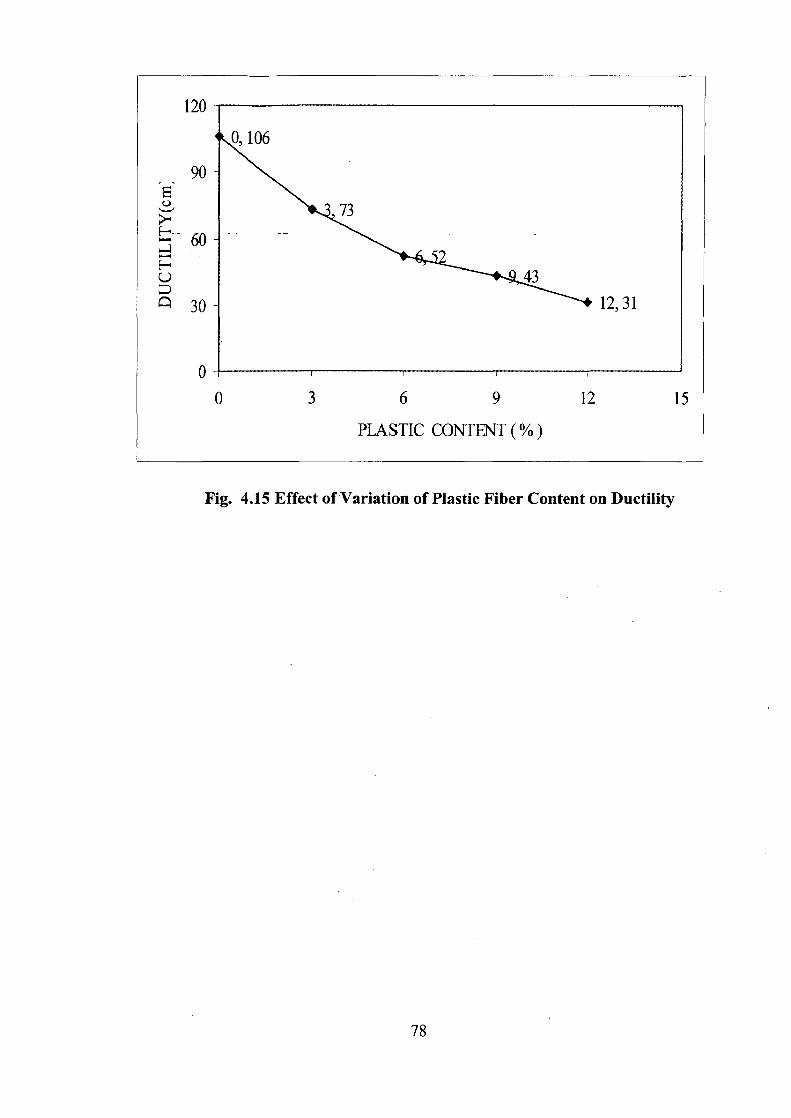
120
0,106
90
73 60
H C-)
30
43
12, 31
0
0 3 6 9 12 15
PLASTIC CONTENT (%)
Fig. 4.15 Effect of Variation of Plastic Fiber Content on Ductility
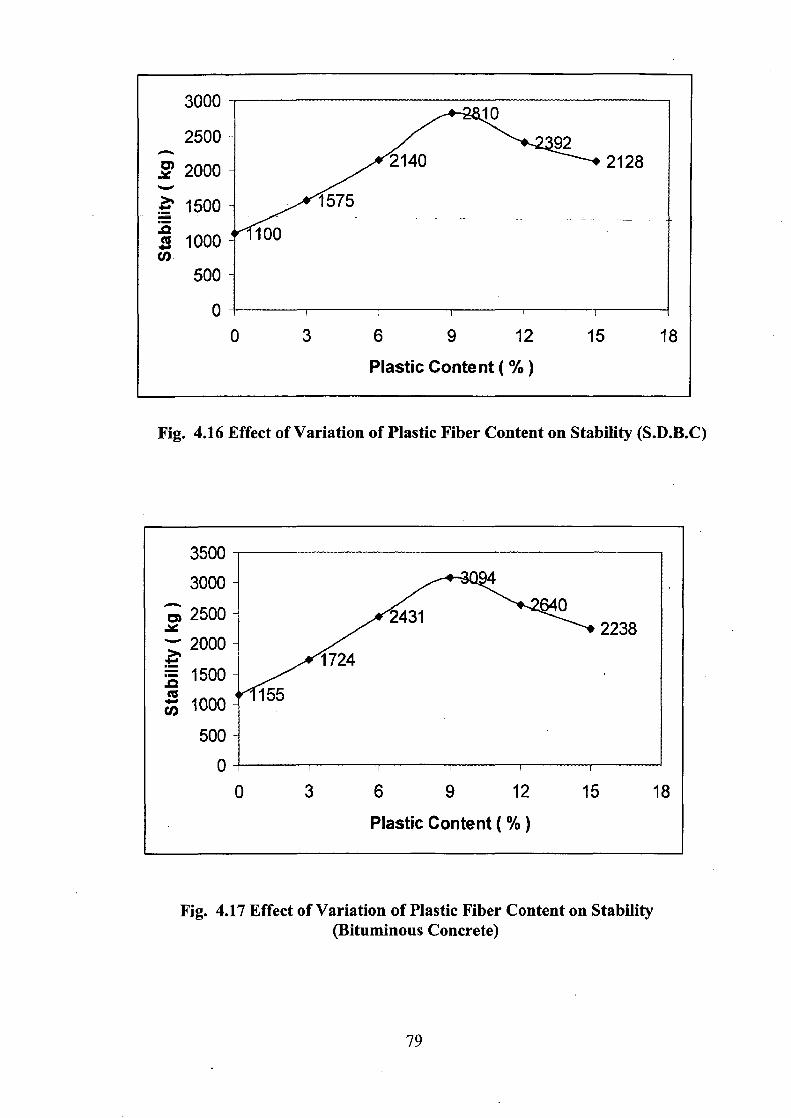
3000 10
2500 92 2:o0 14 22128 2128
' 1500 1575
1000 100
500
0 0 3 6 9 12 15 18
Plastic Content ( %)
Fig. 4.16 Effect of Variation of Plastic Fiber Content on Stability (S.D.B.C)
3500
3000
2500 2431 0 2238
2000 1724
1500
1000 ~155
500
0
0 3 6 9 12 15 18
Plastic Content ( %)
Fig. 4.17 Effect of Variation of Plastic Fiber Content on Stability (Bituminous Concrete)
79
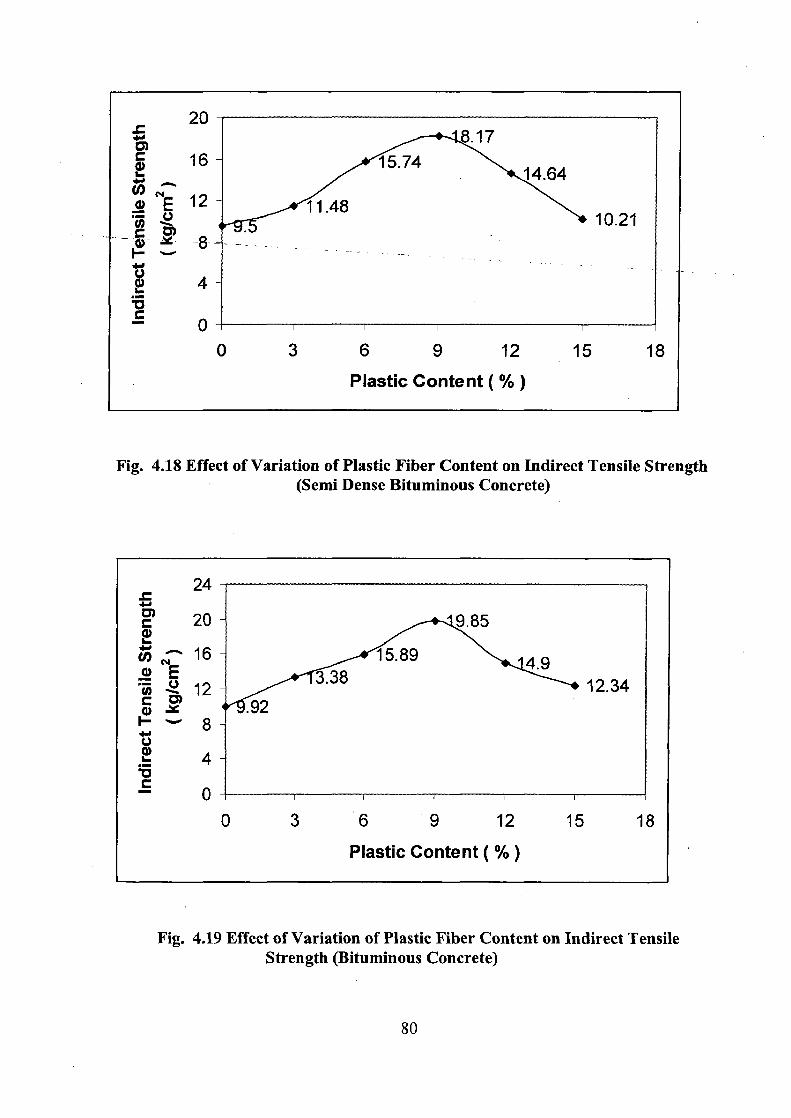
20
16
N~ 12
4
c 0
8.17 15.74
14.64
11.48 10.21
0 3 6 9 12 15 18
Plastic Content ( %)
Fig. 4.18 Effect of Variation of Plastic Fiber Content on Indirect Tensile Strength (Semi Dense Bituminous Concrete)
= 24
20 9.85
a) ^16 15.89 N 4.9
12 3.38 12.34
8
°' 4 V = 0
0 3 6 9 12 15 18
Plastic Content ( %)
Fig. 4.19 Effect of Variation of Plastic Fiber Content on Indirect Tensile Strength (Bituminous Concrete)
:1
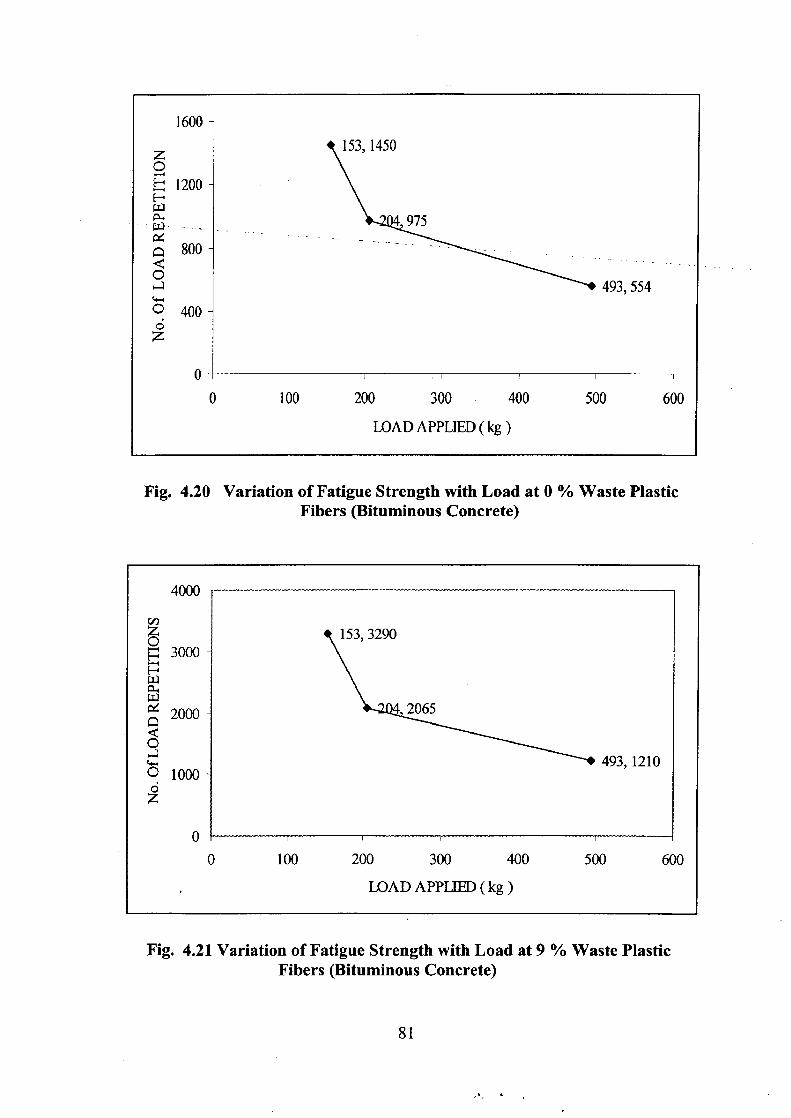
1600
z 153,1450
' 1200
c~ - A 800
O a 493, 554
0 400 • 0 z
0
0 100 200 300 400 500 600
LOAD APPLIED (kg )
Fig. 4.20 Variation of Fatigue Strength with Load at 0 % Waste Plastic Fibers (Bituminous Concrete)
4000
OZ 153, 3290 p3000
aW, 04 2 2065
O493, 1210
2000
0 1000
0
0 100 200 300 400 500 600
LOAD APPLIED (kg )
Fig. 4.21 Variation of Fatigue Strength with Load at 9 % Waste Plastic Fibers (Bituminous Concrete)
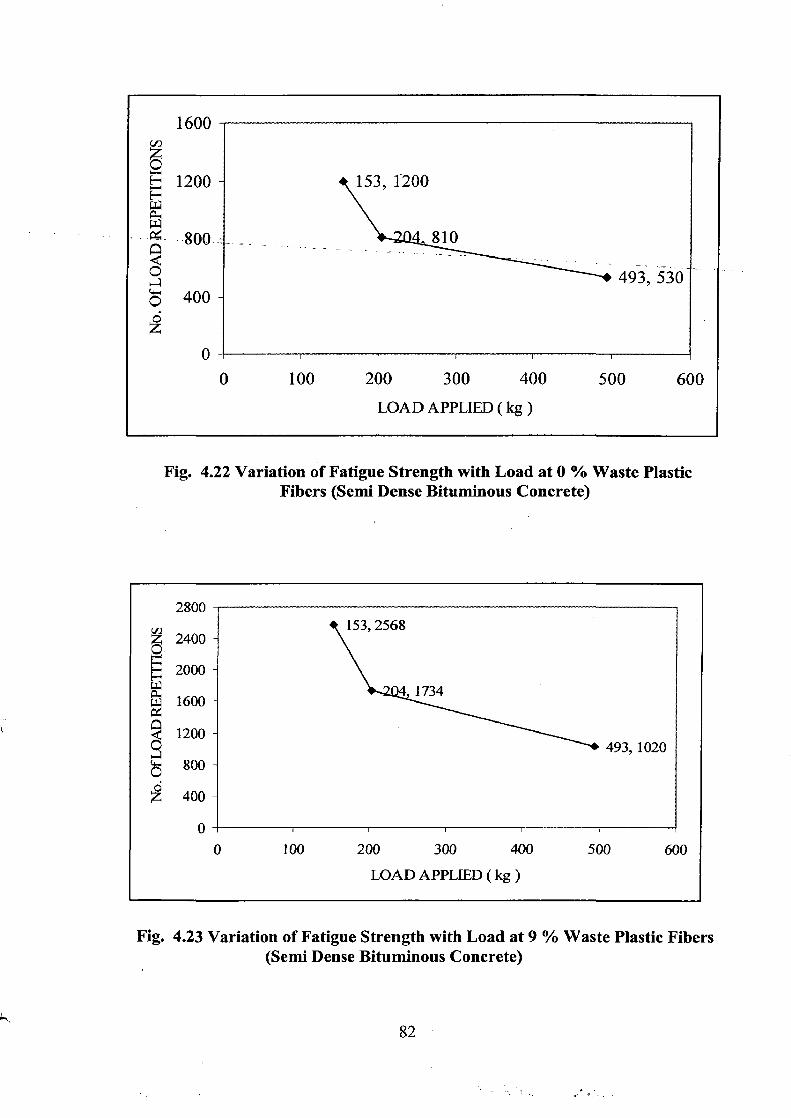
1600
0 1200
1::: 0
153, 1200
slo
493, 530
0 100 200 300 400 500 600
LOAD APPLIED (kg )
Fig. 4.22 Variation of Fatigue Strength with Load at 0 % Waste Plastic Fibers (Semi Dense Bituminous Concrete)
2800
2400 - 2568
2000
4 1734 1600
1200 O 493, 1020 800
400
0
0 100 200 300 400 500 600
LOAD APPLIED (kg)
Fig. 4.23 Variation of Fatigue Strength with Load at 9 % Waste Plastic Fibers (Semi Dense Bituminous Concrete)
82
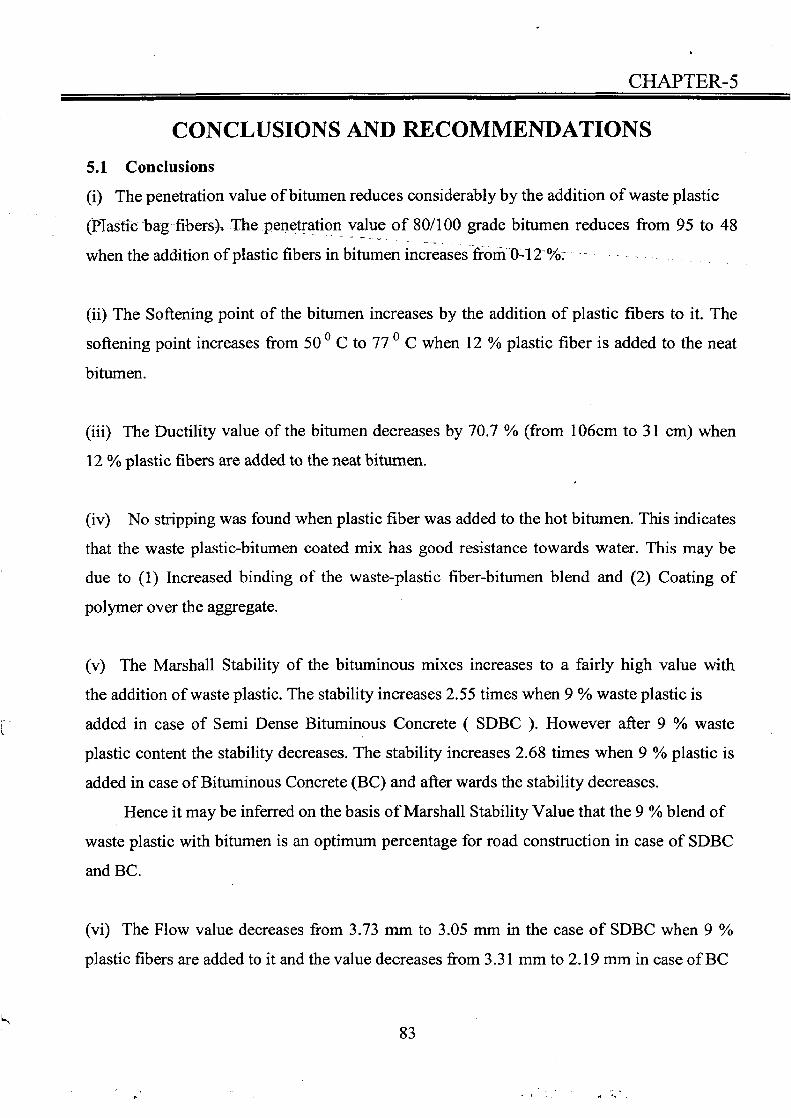
CHAPTER-5
CONCLUSIONS AND RECOMMENDATIONS 5.1 Conclusions
(i) The penetration value of bitumen reduces considerably by the addition of waste plastic
(Plastic bag fiber-s), The .penetration value of 80/100 grade bitumen reduces from 95 to 48
when the addition of plastic fibers in bitumen increases from 0-12-%0. _ .... .
(ii) The Softening point of the bitumen increases by the addition of plastic fibers to it. The
softening point increases from 50 0 C to 77 0 C when 12 % plastic fiber is added to the neat
bitumen.
(iii) The Ductility value of the bitumen decreases by 70.7 % (from 106cm to 31 cm) when
12 % plastic fibers are added to the neat bitumen.
(iv) No stripping was found when plastic fiber was added to the hot bitumen. This indicates
that the waste plastic-bitumen coated mix has good resistance towards water. This may be
due to (1) Increased binding of the waste-plastic fiber-bitumen blend and (2) Coating of
polymer over the aggregate.
(v) The Marshall Stability of the bituminous mixes increases to a fairly high value with
the addition of waste plastic. The stability increases 2.55 times when 9 % waste plastic is
added in case of Semi Dense Bituminous Concrete ( SDBC ). However after 9 % waste
plastic content the stability decreases. The stability increases 2.68 times when 9 % plastic is
added in case of Bituminous Concrete (BC) and after wards the stability decreases.
Hence it may be inferred on the basis of Marshall Stability Value that the 9 % blend of
waste plastic with bitumen is an optimum percentage for road construction in case of SDBC
and BC.
(vi) The Flow value decreases from 3.73 mm to 3.05 mm in the case of SDBC when 9 %
plastic fibers are added to it and the value decreases from 3.31 mm to 2.19 mm in case of BC
when 9 % plastic fibers are added to it. After wards the flow values are decreasing.
(vii) The Average Retained Marshall Stability is found to be 2.24 times in case of BC.
(viii) The Indirect Tensile Strength of the bituminous mixes increases by the addition of
plastic fiber to it. The values increases 1.91 times when 9 % plastic fibers are added to
bitumen 'incase of-SDBC .and-. the strength increases 2 times when 9 % plastic fibers are
added to bitumen in case on BC. After wards the values are decreasing in both- eases.._.-
(ix) The fatigue strength increases 2.09 times in case of SDBC and 2.2 times in case of BC.
(x) The Bituminous mix properties like Marshall Stability, Indirect Tensile Strength and
Fatigue Strength etc. are increasing for both SDBC and BC. But the increments are more in
case of BC as compared to SDBC.
5.2 Recommendations The present study has been conducted using fibers of plastic bags as waste plastics in
bituminous mixes. But there are a number of other waste plastics whose effects on
bituminous mix properties are required to be studied in order to find out which waste plastic
gives maximum increment in the properties of the mix.
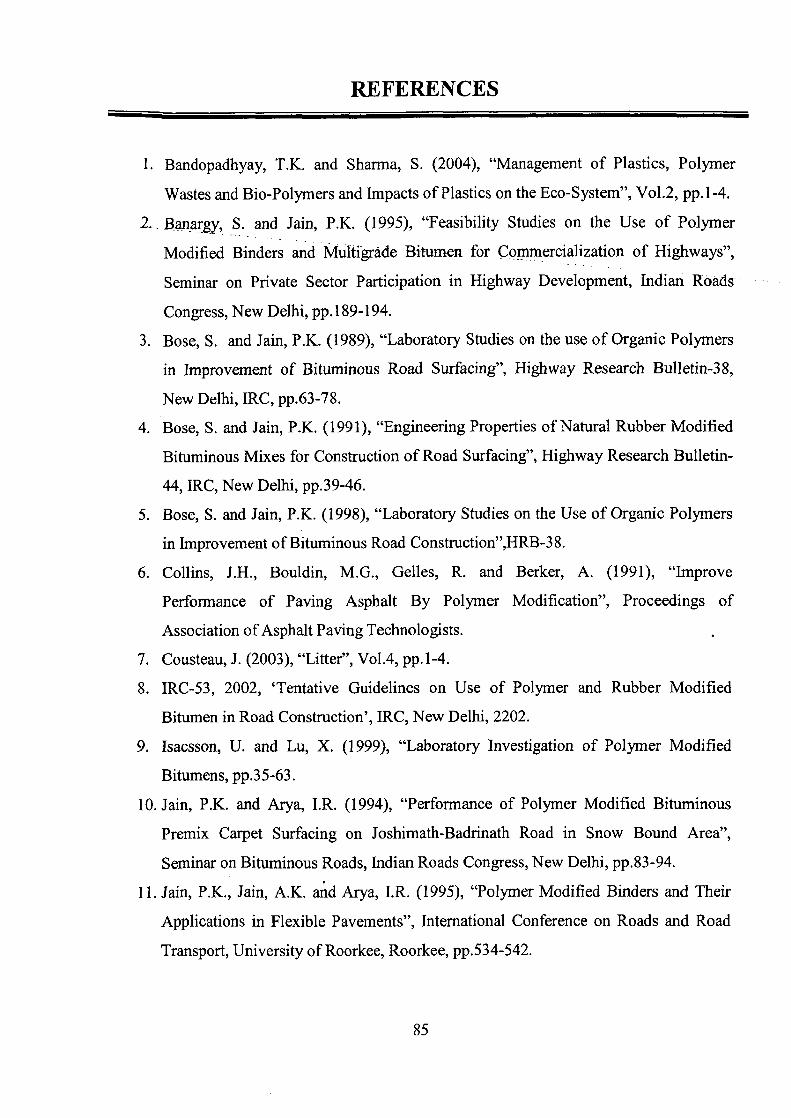
REFERENCES
1. Bandopadhyay, T.K. and Sharma, S. (2004), "Management of Plastics, Polymer
Wastes and Bio-Polymers and Impacts of Plastics on the Eco-System", Vol.2, pp.1-4.
2. Banargy, S. and Jain, P.K. (1995), "Feasibility Studies on the Use of Polymer
Modified Binders and Multigrade Bitumen for Commercialization of Highways",
Seminar on Private Sector Participation in Highway Development, Indian Roads
Congress, New Delhi, pp.189-194.
3. Bose, S. and Jain, P.K. (1989), "Laboratory Studies on the use of Organic Polymers
in Improvement of Bituminous Road Surfacing", Highway Research Bulletin-38,
New Delhi, IRC, pp.63-78.
4. Bose, S. and Jain, P.K. (1991), "Engineering Properties of Natural Rubber Modified
Bituminous Mixes for Construction of Road Surfacing", Highway Research Bulletin-
44, IRC, New Delhi, pp.39-46.
5. Bose, S. and Jain, P.K. (1998), "Laboratory Studies on the Use of Organic Polymers
in Improvement of Bituminous Road Construction",HRB-38.
6. Collins, J.H., Bouldin, M.G., Gelles, R. and Berker, A. (1991), "Improve
Performance of Paving Asphalt By Polymer Modification", Proceedings of
Association of Asphalt Paving Technologists.
7. Cousteau, J. (2003), "Litter", Vol.4, pp.1-4.
8. IRC-53, 2002, `Tentative Guidelines on Use of Polymer and Rubber Modified
Bitumen in Road Construction', IRC, New Delhi, 2202.
9. Isacsson, U. and Lu, X. (1999), "Laboratory Investigation of Polymer Modified
Bitumens, pp.35-63.
10. Jain, P.K. and Arya, I.R. (1994), "Performance of Polymer Modified Bituminous
Premix Carpet Surfacing on Joshimath-Badrinath Road in Snow Bound Area",
Seminar on Bituminous Roads, Indian Roads Congress, New Delhi, pp.83-94.
11. Jain, P.K., Jain, A.K. and Arya, I.R. (1995), "Polymer Modified Binders and Their
Applications in Flexible Pavements", International Conference on Roads and Road
Transport, University of Roorkee, Roorkee, pp.534-542.
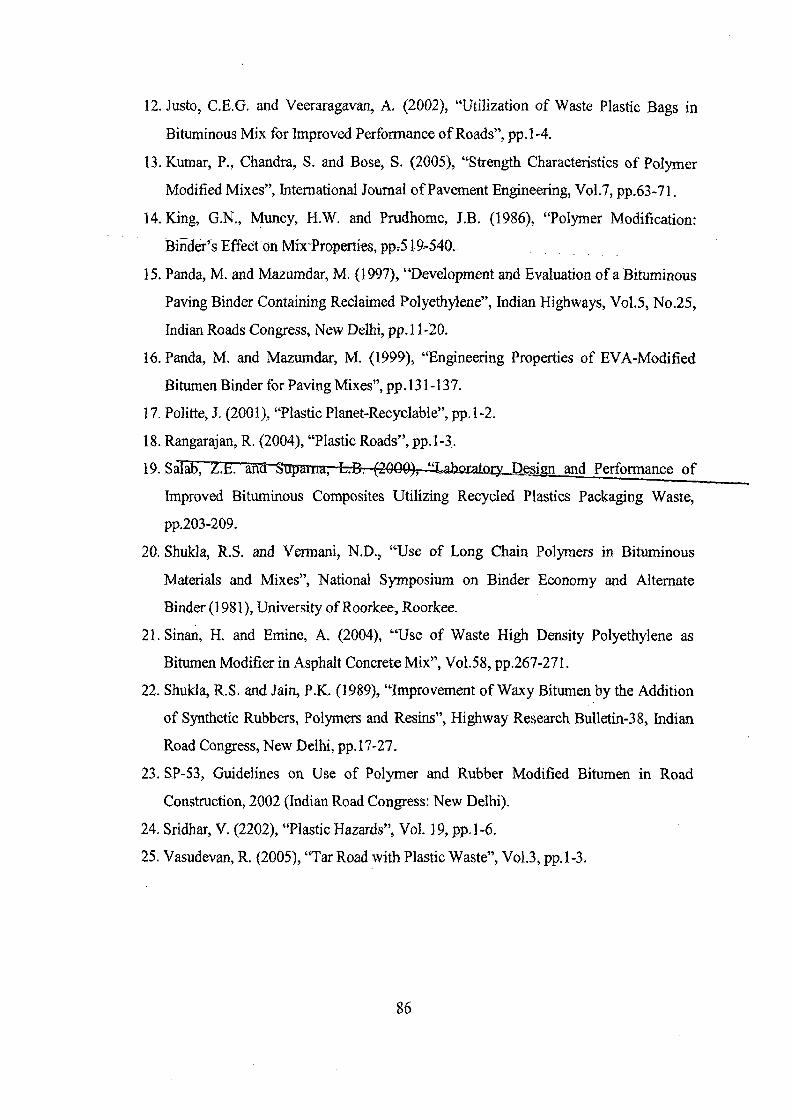
12. Justo, C.E.G. and Veeraragavan, A. (2002), "Utilization of Waste Plastic Bags in
Bituminous Mix for Improved Performance of Roads", pp.1-4.
13. Kumar, P., Chandra, S. and Bose, S. (2005), "Strength Characteristics of Polymer
Modified Mixes", International Journal of Pavement Engineering, Vol.7, pp.63-71.
14. King, G.N., Muncy, H.W. and Prudhome, J.B. (1986), "Polymer Modification:
Binder's Effect on Mix-Properties, pp.51.9-54-0._
15. Panda, M. and Mazumdar, M. (1997), "Development and Evaluation of a Bituminous
Paving Binder Containing Reclaimed Polyethylene", Indian Highways, Vol.5, No.25,
Indian Roads Congress, New Delhi, pp.11-20.
16. Panda, M. and Mazumdar, M. (1999), "Engineering Properties of EVA-Modified
Bitumen Binder for Paving Mixes", pp.131-137.
17. Politte, J. (2001), "Plastic Planet-Recyclable", pp.1-2.
18. Rangarajan, R. (2004), "Plastic Roads", pp.1-3..
19.Sala an ry Design and Performance of
Improved Bituminous Composites Utilizing Recycled Plastics Packaging Waste,
pp.203-209.
20. Shukla, R.S. and Vermani, N.D., "Use of Long Chain Polymers in Bituminous
Materials and Mixes", National Symposium on Binder Economy and Alternate
Binder (1981), University of Roorkee, Roorkee.
21. Sinan, H. and Emine, A. (2004), "Use of Waste High Density Polyethylene as
Bitumen Modifier in Asphalt Concrete Mix", Vol.58, pp.267-271.
22. Shukla, R.S. and Jain, P.K. (1989), "Improvement of Waxy Bitumen by the Addition
of Synthetic Rubbers, Polymers and Resins", Highway Research Bulletin-38, Indian
Road Congress, New Delhi, pp.17-27.
23. SP-53, Guidelines on Use of. Polymer and Rubber Modified Bitumen in Road
Construction, 2002 (Indian Road Congress: New Delhi).
24. Sridhar, V. (2202), "Plastic Hazards", Vol. 19, pp.1-6.
25. Vasudevan, R. (2005), "Tar Road with Plastic Waste", Vol.3, pp.1-3.
Copyright © 2022 FDOKUMEN