US International Trade Commission - Agoa.info
405
-
Upload
khangminh22 -
Category
Documents
-
view
0 -
download
0
Transcript of US International Trade Commission - Agoa.info


U.S. International Trade Commission
Robert A. RogowskyDirector of Operations
COMMISSIONERS
Address all communications toSecretary to the Commission
United States International Trade CommissionWashington, DC 20436
Deanna Tanner Okun, Vice ChairmanStephen Koplan, Chairman
Marcia E. MillerJennifer A. HillmanCharlotte R. LaneDaniel R. Pearson
Robert B. KoopmanDirector of Economics

OMB No.: 3117--0188
12/04
ITC READER SATISFACTION SURVEYU.S. Trade and Investment with Sub-Saharan Africa
Fifth Annual Report
The U.S. International Trade Commission (USITC) is interested in your voluntary com-ments (burden less than 10 minutes) to help assess the value and quality of our reports, and to assistin improving future products. Please return survey by facsimile (202-205-2340) or by mail to theUSITC, or visit the USITC Internet home page(http://reportweb.usitc.gov/reader_survey/readersurvey.html) to electronically submit a Web version ofthe survey.
(Please print; responses below not for attribution):
Your name and title:
Organization (if applicable):
Which format is most useful to you? - CD-ROM - Hardcopy - USITC Internet site
Circle your assessment of each factor below: SA = strongly agree, A = agree, N = no opinion,D = disagree, or SD = strongly disagree.
Value of this report:" Statistical data are useful SA A N D SD. . . . . . . . . . . . . . . . . . . . . . . . . . . . . ." Other non-numerical facts are useful SA A N D SD. . . . . . . . . . . . . . . . . . . ." Analysis augments statistical data/other facts SA A N D SD. . . . . . . . . . . ." Relevant topic(s)/subject matter SA A N D SD. . . . . . . . . . . . . . . . . . . . . . . ." Primary or leading source of information on this subject SA A N D SD. .
Quality of this report:" Clearly written SA A N D SD. . . . . . . . . . . . . . . . . . . . . . . . . . . . . . . . . . . . . . ." Key issues are addressed SA A N D SD. . . . . . . . . . . . . . . . . . . . . . . . . . . . . . ." Charts and graphs aid understanding SA A N D SD. . . . . . . . . . . . . . . . . . ." References cite pertinent sources SA A N D SD. . . . . . . . . . . . . . . . . . . . . . .
Other preferred source of information on this subject:
Specify chapters, sections, or topics in report that are most useful:
Identify any type of additional information that should have been included in report:
Suggestions for improving report:
Please update your mailing and electronic addresses below (voluntary)-
Mailing address:
City, state, and zip code:
E-mail address:

UNITED STATESINTERNATIONAL TRADE COMMISSION
WASHINGTON, DC 20436
OFFICIAL BUSINESSPENALTY FOR PRIVATE, USE $300
FOLD
NO POSTAGENECESSARY
IF MAILEDIN THE
UNITED STATES
BUSINESS REPLY MAILFIRST CLASS PERMIT NO. 12840 WASHINGTON, DC
POSTAGE WILL BE PAID BY ADDRESSEE
U.S INTERNATIONAL TRADE COMMISSION500 E STREET, SW.WASHINGTON, DC 20277--2840
ATTN:OFFICE OF ECONOMICSU.S. Trade and Investment with Sub-SaharanAfrica—Fifth Annual Report

U.S. International Trade CommissionWashington, DC 20436
December 2004
www.usitc.gov
Publication 3741
U.S. Trade and Investment WithSub-Saharan Africa
Fifth Annual ReportInvestigation No. 332-415

This report was principally prepared by
Arona Butcher, Chief, Country and Regional Analysis Division
Nannette Christ, Project LeaderLaura Polly, Deputy Project Leader
Office of EconomicsEdward Wilson, William Greene, and Selamawit Legesse
Office of IndustriesLaura Bloodgood, Cynthia Foreso, Alfred Forstall, John Fry, Amanda Horan,
Eric Land, Christopher Mapes, and Laura Rodriguez
Office of InvestigationsAndrew Rylyk and Barbara Bryan
Office of Information ServicesPatricia Augustine, Barbara Bobbitt, Patricia Holland, and Peggy Verdine
Student InternsKieshan Edwards, Joshua Finfrock, Melissa Ginsberg, Rebecca Havey, Kelly Kowalczyk,
Richard Qualters, Rikki Roullier, Danielle Rust, Jonathan Miner, Katherine Nunley,and Shakira Van Savage
Office of Pubishing
ReviewersCatherine DeFilippoDonnette Rimmer
Supporting assistance was provided by:Cecelia Allen, Office of Economics
Patricia Thomas, Office of Economics

i
EXECUTIVE SUMMARY
This report is the fifth in a 5-year series documenting U.S.-sub-Saharan Africa (SSA)trade and investment flows. The U.S. International Trade Commission (Commission orUSITC) compiled this report at the request of the United States Trade Representative(USTR). In a letter dated April 12, 2000,1 the USTR asked the Commission to submit areport that provides: an analysis of U.S.-SSA merchandise trade and services flows;country-by-country profiles of the economies of each SSA country, includinginformation on major trading partners and a summary of the trade and investmentclimates in each SSA country; a summary of U.S. foreign and total direct investmentand portfolio investment in SSA; information on SSA privatization efforts; updates onprogress in regional integration inSSA, including statistics onU.S. tradewith themajorregional groupings; and a summary of multilateral and U.S. bilateral assistance toSSA countries.
In a supplemental letter dated July 10, 2002, the USTR requested that the Commissionprovide the following additional information: the value ofU.S. imports from SSAunderthe African Growth and Opportunity Act (AGOA) including its Generalized System ofPreferences (GSP) provisions, by beneficiary country and major product categories;information on investment developments related to AGOA; a description and analysisof major SSA export sectors; expanded information on regional integration in SSA,including information on the Communauté Economique et Monétaire de l’AfriqueCentrale (CEMAC); a description of major U.S. trade capacity-building initiativesrelated to SSA; and a description of major non-U.S. trade preference programs forSSA countries.
The U.S.-SSA trade data included in this report generally cover full year 2003,depending on data availability. When possible, data for Africa are provided whenSSA data are not available. In cases where it is useful to show a trend, data for 1999through 2003 are provided. In addition, when possible, up-to-date developments ineconomic, social, trade, and commercial policies are included for the period January2004 through June 2004. Data sources include the U.S. Department ofCommerce, theEconomist Intelligence Unit, the World Bank, the United Nations, and industry-specificdata sources. In addition to the above-mentioned sources, qualitative discussions alsorely on articles sourced from databases such as All Africa and Newsedge.
U.S.-Sub-Saharan Africa Trade
S In 2003, U.S.-SSA merchandise trade rose to $32.1 billion, from $24.1 billionin 2002. This was a result of an increase in both U.S. exports to and U.S.
1 Copies of the request letters are in app. A.

ii
imports from the region. U.S. exports to SSA increased by 13.1 percent in2003 to approximately $6.7 billion, from $5.9 billion in 2002. Similarly, U.S.imports from SSA increased by 39.9 percent to approximately $25.5 billion in2003 from $18.2 billion in 2002.
S The increase in U.S. exports to SSA was attributed primarily to increasedexports of transportation equipment, agricultural products, and electronicproducts and increased exports to Ethiopia, South Africa, and EquatorialGuinea. The increase in U.S. imports from SSA was largely because of anincrease in energy-related products from Nigeria. Nonenergy-relatedimports increased by 20.0 percent to $7.8 billion in 2003.
S In 2002, the United States recorded a $2.2-billion surplus in services tradewith Africa. The primary U.S. cross-border service exports to Africa includedtourism and passenger transport, business services, education, and freighttransport and port services. U.S. service imports from Africa were mainly inthe tourism, passenger transport, business services, and freight transportsectors.
Foreign Direct Investment in Sub-Saharan Africa
S In 2003, SSA received $8.5 billion in new foreign direct investment (FDI), or6.3 percent of global foreign investment flows to developing countries.Political crises, poor weather conditions, and the HIV/AIDS pandemiccontinued to affect the investment climate.
S Net inward portfolio equity flows to SSA totaled $500 million in 2003. As inprior years, South Africa accounted for virtually all foreign portfolioinvestment flows to SSA in 2003.
S U.S. net direct investment flows to Africa totaled $1.4 billion in 2003,representing less than 1 percent of total U.S. direct investment abroad.Equatorial Guinea and Nigeria attracted the largest amounts of U.S. FDIflows, with $823 million and $340 million, respectively. Of the nonpetroleumexporting countries, South Africa and Cameroon attracted the largestamounts of U.S. FDI, with $89 million and $73 million, respectively.
S Reflecting the historically higher level of investment by European countries,many European countries have concluded a number of bilateral investmentagreements with SSA countries.
S Given the important role of investment in long-term economic development, anumber of international investment initiatives focusing on SSA have emerged.Such initiatives include an effort by Standard & Poor’s, working with theUnited Nations Development Programme (UNDP), to secure long-termsovereign ratings2 for SSA countries.
2 “A sovereign credit rating provides [general credit worthiness] as it signifies a country’s overallability to provide a secure investment environment.” Reem Heakal, “What is a Corporate Credit Rating,”found at Internet address http://www.investopedia.com, retrieved Oct. 7, 2004.

iii
African Growth and Opportunity Act
S Total U.S. imports from SSA countries eligible for AGOA benefits (includingGSP provisions) totaled almost $14.1 billion in 2003, an increase of 36.3percent from $9.0 billion in 2002. The largest share of U.S. imports underAGOA came from Nigeria (66.3 percent), followed by South Africa (11.8percent) and Gabon (8.3 percent). Other major suppliers included Lesotho,Republic of the Congo, Madagascar, and Kenya.
S U.S. purchases of energy-related products in 2003 represented 79.5 percentof total AGOA imports in 2003, up from their 75.9-percent share in 2002.Significant value increases were recorded, however, for textiles and apparel,which accounted for 8.5 percent of the total in 2003, down from an8.9-percent share in2002, and transportation equipment, which representeda 5.2-percent share in 2003, compared with a 6.1-percent share in 2002.
S AGOA III amended the textile provisions of AGOA to clarify language in theprior legislation and to expand and extend a number of provisions to provideAGOA countries with additional sourcing flexibility. The extension of the leastdeveloped beneficiary country third-country fabric provision was viewed bymany as the most important feature of AGOA III, as this provision had beenscheduled to expire.
S In anticipation of the AGOA III legislation and its subsequent passage in July2004, AGOA-eligible SSA countries continued to receive investmentsupported, in part, by their access to trade preferences under the AGOAprogram.
S Although a substantial portion of investments continued to target the apparelsector, increased investment has also occurred in the textile, mining, andmotor vehicle industries. Investment patterns also highlight the extension ofAGOA-related investment into small- and medium-sized businesses andefficiency-enhancing technology investment.
Regional Integration
S In 2003, the nine regional organizations in SSA continued to focus efforts onpromoting economic and monetary integration. They also worked towardpolicy harmonization in the telecommunications, transportation, andagricultural sectors. In addition to common investment policies, the regionalorganizations also continued to work toward eliminating regional tariffs inorder to increase intra-SSA trade. Moreover, the creation of exportprocessing zones has encouraged diversification from agricultural toindustrial production. The nine regional organizations are:
- the Economic Community of West African States (ECOWAS);
- the Union Economique et Monétaire Ouest Africaine (UEMOA);
- the Common Market for Eastern and Southern Africa (COMESA);

iv
- the Southern African Development Community (SADC);
- the Southern African Customs Union (SACU);
- the East African Community (EAC);
- the Intergovernmental Authority on Development (IGAD);
- the Indian Ocean Commission (IOC);
- the Communauté Economique et Monétaire de l’Afrique Centrale(CEMAC).
S Regional organizations continued to work toward increased economicintegration, although progress has been slow. ECOWAS continued efforts toestablish a customs union by 2007. In addition, ECOWAS and UEMOAbegan coordinating monetary union efforts. COMESA continued to expandtrade opportunities by launching FTA discussions with the EU. SADC workedtoward establishing regulations, such as single-digit inflation requirements,that would foster more stable integration. The United States and SACUcontinued FTA negotiations, as SACU has continued to expand its list ofpotential FTA partners. The EAC committed to establishment of a commonexternal tariff bySeptember 2004. IGAD focused on food and security issues;and IOC focused on transportation and communication issues. A regionalpassport scheme for CEMAC was implemented in early 2003, and CEMACinaugurated a new stock exchange in mid-2003.
S Current African Union3 (AU) policies focus on economic and exportdiversification. The AU is also seeking todevelop anAfrican CommonMarket.Other AU policies promote peace, economic stability, and regional securityas part of the AU’s poverty reduction efforts.
Multilateral and U.S. Bilateral Assistance
S In 2003, the World Bank lending commitments to SSA totaled $3.7 billion. Ofthe total funding, over 21 percent ($811 million) was for human development(primarily HIV/AIDS-related initiatives), 15 percent was for social protection,and 11 percent was for education. The International Finance Corporation(IFC) committed $164 million to support the expansion of SSA banks andfinancial institutions in FY 2004. Likewise, the World Bank’s MultilateralInvestment Guarantee Agency (MIGA) issued investment guarantees orcoverage for nine projects in Africa totaling $953 million.
S In 2003, the African Development Bank (AfDB) Group approved 16 newprojects and programs with a combined value of $465.1 million. The AfDBalso signed 118 loan and grant agreements valued at $2.6 billion. TheInternational Monetary Fund (IMF) committed $1.9 billion in grants to 23 SSAcountries. In FY 2003, the IMF approved Poverty Reduction and Growth
3 The AU is a successor to the Organization of African Unity.

v
S Facility arrangements for the Democratic Republic of Congo, The Gambia,Senegal, and Uganda.
S Export-Import Bank (Ex-Im Bank) provided loan guarantees and insurance toSSA totaling $572 million. As of September 2003, Ex-Im Bank’s totalexposure in SSA was $3.6 billion. Democratic Republic of the Congoaccounted for 24 percent, Nigeria made up 23 percent, and South Africarepresented 16 percent of total regional Ex-Im Bank exposure. U.S. Trade andDevelopment Agency (TDA) obligations in SSA decreased to $5.9 million inFY 2003 from $9.9 million in FY 2002. TDA’s SSA funding accounted for 11.2percent of all TDA funding in 2003. Overseas Private Investment Corporation(OPIC) invested $384 million in FY 2003. The United States Agency forInternational Development’s (USAID) Development Assistance and otherEconomic Assistance Program obligation for SSA totaled $1.4 billion in FY2003 compared to $1.1 billion in FY 2002. USAID continued to supportseveral programs that started in 2002 including the Initiative to End Hunger inAfrica, the African Education Initiative, and the Anti-Corruption Initiative.
U.S. Trade Capacity-Building Initiatives
S U.S. government agencies continued to fund and implement a broad range oftrade capacity-building initiatives in SSA. SSA received $132.7 million in FY2003, representing 17.4 percent of total U.S. funding for tradecapacity-building initiatives. The level was a 19.3-percent increase over FY2002.
S Numerous individual countries received less direct trade capacity-buildingfunding in FY 2003 as funding increasingly targeted regional organizationsin SSA such as COMESA and SACU. The percent share of the top five fundingrecipients declined from 54.1 percent in FY 1999 to 32.1 percent in FY 2003.
S The primary funding categories were “Human Resources and LaborStandards,” which accounted for 29 percent of FY 2003 total SSA funding,followed by “Trade Facilitation” and “Trade-related Agriculture,” whichaccounted for 25 percent and 15 percent, respectively. The subcategory“Export Promotion” accounted for 32 percent of “Trade Facilitation.”
Industry Sector Profiles
The six industry sectorsdiscussedbeloware:agriculture, fisheries,and forest products;chemicals; petroleum and energy-related products; minerals and metals; textiles andapparel; and certain transportation equipment. These sectors account for the majoritems traded between the United States and SSA. Figure ES-1 provides an overview ofU.S. trade and FDI positions in these sectors.

Agriculture, Petroleum, &Fisheries, and Energy-related Minerals and Textiles and Certain TransportForest Products Chemicals Products Metals Apparel Equipment
S Côte d’lvoire, South S South Africa, S Nigeria, Angola S South Africa S Lesotho, South S South AfricaAfrica, Madagascar Equatorial Guinea Africa, Mauritius
Madagascar, KenyaS Cocoa beans, S Methanol, certain S Crude petroleum S Plantinum-group S Woven cotton S Passenger vehiclesvanilla beans, organic chemicals, metals, diamonds pants/shorts, cottontobacco, coffee, natural rubber topsbeans, cocoa pasteS South Africa, S South Africa S Nigeria, Gabon S South Africa S Lesotho, S South AfricaCôte d’lvoire, Malawi Madagascar, Kenya
Mauritius, SouthAfrica, Swaziland
S Citrus, tobacco, cane S Silicon, titanium S Crude petroleum S Ferroalloys, S Woven cotton S Passenger vehiclessugar, cocoa powder, dioxide pigments, aluminum products pants/shorts, cottonmacadamia nuts car tires topsS Nigeria, South S South Africa S South Africa, S South Africa S South Africa, S South Africa,Africa, Ethiopia Nigeria Equatorial Guinea, Ghana, Nigeria Nigeria
Angola, NigeriaS Cereals S Fertilizers, misc. S Refined petroleum S Precious metals S Used clothing S Passenger vehicles
medicaments, productsisocyanates
S South Africa S South Africa S Equatorial Guinea, S Ghana, Zambia, S Not available S South AfricaChad, Gabon, KenyaNigeria
Figure ES-1SSA sector profiles summary data, 2003
Source: Data compiled from official statistics of the U.S. Department of Commerce (tade data) and Bureau of Economic Analysis (investment data).
Primary Sources
Primary Products
Primary Sources
Primary Products
Primary Markets
Primary Products
Primary FDICountries
U.S
.Exp
orts
AG
OA
Impo
rtsU
.S.I
mpo
rts
0
U.S. importsAGOA importsU.S. exportsU.S. FDI position
Million dollars
NA131
198
17,6
74
11,2
24
4,75
4
2,99
6
vi
2,000
4,000
6,000
8,000
10,00012,000
14,00016,000
18,000
1981,23
5
2741,
277
598
177
343
717
492
166
11,2
24
413
269
47
11,2
24
1,55
2
1,20
2
742
716
412

vii
Agriculture, Fisheries, and Forest ProductsS SSA represents a relatively small market for U.S. exports of agriculture,
fisheries, and forest products, totaling $1.2 billion, or approximately 1 percentof total U.S. sector exports in 2003. Sector exports to SSA increased by 17percent in 2003 compared with 2002. Primary SSA markets for such exportscontinued to be Nigeria (27 percent of the total value), South Africa (20percent), and Ethiopia (13 percent). Cereals such as nondurum wheat andmilled rice accounted for approximately 54 percent of total U.S. sectorexports to SSA in 2003. Food shortages throughout SSA account for theincreasing demand for U.S. cereal exports.
S U.S. sector imports from SSA totaled $1.3 billion in 2003, up by 30 percentfrom the previous year. SSA accounted for about 1 percent of total U.S. sectorimports in 2003, the same share as the previous year. The high price of cocoaduring most of 2003 was the primary contributor to the increase in importvalue. In 2003, the top five import commodities accounted for 57 percent oftotal U.S. sector imports from SSA, and included cocoa beans, vanilla beans,tobacco, coffee beans, and cocoa paste.
S In 2003, the value of U.S. sector imports from SSA under AGOA (includingGSP) was $274 million, representing an increase of 13 percent over theprevious year. Such imports accounted for about 2 percent of total AGOAimports and 21 percent of total sector imports from SSA in 2003. South Africa,Côte d’Ivoire, and Malawi supplied 85 percent of all AGOA imports fromSSA in 2003, up from 82 percent in 2002. Principal products included freshcitrus, unmanufactured tobacco, raw cane sugar, cocoa powder, andmacadamia nuts.
S This sector accounts for a relatively minor share of the total U.S. FDI in theregion in 2003. U.S. FDI in the SSA food sector increased by one-third in2003, reaching $198 million. South Africa continued to be the primary SSAlocation for U.S. sector FDI in the region.
ChemicalsS The South African chemical industry accounts for approximately 77 percent
of SSA chemical production. This industry remains among the largestmanufacturing sectors of the South African economy, maintaining its5-percent share of gross domestic product. The sector is essentially composedof producers of petrochemical products produced in the four petroleumrefineries, producers of agricultural chemicals, pharmaceuticalmanufacturers, and various small firms producing chemical products for thedomestic/regional market.
S The most significant development in the SSA chemical industry during2003-04 was the development of SSA pharmaceutical production capacityalong with the ability to produce active pharmaceutical ingredients (APIs) foruse in generic pharmaceutical products. Aspen Pharmacare, the largestpharmaceutical manufacturer in Africa, received clearance from SouthAfrica’s Competition Commission to vertically integrate using the recently

viii
purchased Fine ChemicalsCorp. facility.Aspen releaseda statement assuringthe public that they would be using the plant to produce APIs, such as theretrovirals that treat HIV/AIDS.
S U.S. chemical sector imports from SSA reached $598 million in 2003, up byone-third from the previous year. U.S. sector imports from SSA accounted forless than 1 percent of total U.S. imports in 2003. Principal SSA sourcesincluded South Africa (58 percent of the total) and Equatorial Guinea (23percent), with Liberia accounting for 9 percent. The three largest U.S. sectorimports from SSA in 2003 were methanol; organic chemicals used asfeedstocks for producing chemical intermediates and chemical products,including unsaturated acyclic hydrocarbons; and natural rubber. In 2003,U.S. chemical sector imports under AGOA (including GSP) totaled $177million, an increase of 30 percent over 2002. These imports representedapproximately 30 percent of total U.S. imports of these products from theSSA. Nearlyall the U.S. chemical imports underAGOA(including GSP) camefrom South Africa.
S In 2003, U.S. chemical sector exports to SSA totaled $717million, an increaseof nearly 3 percent compared with 2002. SSA accounted for less than 1percent of total U.S. sector exports in 2003. The top three SSA markets forU.S. chemical exports in 2003 were South Africa, which accounted for 62percent of U.S. chemical exports, followed by Nigeria (8 percent) and Kenya(5 percent). These shares were similar to those in 2002. The United Statesexported a diverse selection of chemical items to SSA in 2003; the leadingexport items – fertilizers, other nonspecified medicaments, and isocyanates –each only accounted for 4 to 5 percent of total U.S. sector exports to SSA.
S The U.S. FDI position in the chemicals sector increased by 11 percent to $492million in 2003. South Africa accounted for 91 percent of the total.
Petroleum and Energy-Related ProductsS Crude petroleum in Nigeria and Angola, and coal in South Africa continue to
be the primary petroleum and energy-related products produced in SSA.Nigeria and Angola are the region’s first- and second-largest producers ofcrude petroleum, respectively. Coal continues tobe the primary fuel producedand consumed in South Africa and is its largest source of foreign exchange.South Africa accounts for about 4 percent of the world’s recoverable reservesof coal and is the second-largest net exporter of coal to the world market.
S Crude petroleum is the primary export product from SSA. In 2003, the UnitedStates was the primary market for SSA exports of petroleum andenergy-related products, while the EU accounted for most of the remainder.Refined petroleum products are the major products imported into the SSAregion, followed by crude petroleum; the United States and Western Europeare major sources of SSA imports of refined petroleum products.
S Nigeria, one of the world’s leading exporters of crude petroleum, has thepotential to increase its production of crude petroleum significantly in the nextfew years as recent discoveries come onstream. Several joint ventures

ix
between the Nigerian government and multinational petroleum companiesare expected to yield additional production of crude petroleum and naturalgas. In addition, recent discoveries of crude petroleum in Angola arebecoming attractive to the world’s leading production companies.
S The U.S. FDI position in the SSA mining sector (the most comparable sector topetroleum and energy-related products) increased by 20 percent to $4.8billion in2003. Equatorial Guinea, Chad, Gabon, and Nigeria accounted for83 percent of the regional total.
Minerals and MetalsS The minerals and metals sector remains a dominant sector for many SSA
countries. Prices for severalminerals andmetals continued to recover from theextreme lows during 1997 to early 2003, reflecting declining inventoriesarising from a combination of worldwide production shutdowns and risingconsumption. These price increases contributed to the improving economiesofthe SSA metal-producing countries and attracted additional internationalinvestment interest.
S In 2003, the U.S. minerals and metals trade deficit with SSA increased by 12percent, to $2.7 billion, with U.S. imports increasing by 11 percent, to $3.0billion. Sixty-eight percent of U.S. imports from SSA in 2003 wereplatinum-group metals (PGMs), which were almost all from South Africa, anddiamonds, mostly from South Africa, Democratic Republic of the Congo(DROC), and Angola. U.S. imports of iron and steel products also increased,reflecting the continued growth in the iron and steel industries in South Africa,Tanzania, and neighboring countries. AGOA imports (including GSP) totaled$413 million in 2003, up by 11 percent from the previous year. Imports underAGOA accounted for 14 percent of total sector imports from SSA in 2003. Thebulk was supplied by South Africa (96 percent) and Namibia (under 4percent), with iron and steel products, primarily ferroalloys, accounting for59 percent, and aluminum products increasing by 16 percent by value to 21percent of the total.
S The U.S. Clean Diamond Trade Act and the United Nation’s KimberleyProcess Certification Scheme (KPCS) continued to affect diamond trade. TheCentral African Republic joined the 61 member-countries of the KPCS inAugust 2003. DROC was suspended by the United Nations from world tradein diamonds in July 2004. Separately, DeBeers pled guilty to price fixing inU.S. District Court and agreed to pay $10 million to settle a 10-year-oldindictment. This settlement should allow DeBeers to re-establish a directmarketing presence in the United States.
S U.S. sector exports to the region increased marginally (up by 1 percent) to$269 million in 2003, but increased markedly to Equatorial Guinea, Angola,and South Africa. Many countries recorded double-digit declines, largely asa result of economic and political instability. Chad recorded the largestdecline, at $22 million. In the iron and steel sector, exports of oil and gastubular and ancillary products declined the most in value, reflecting less

x
exploration drilling. U.S. exports of structural commodities (steel structures,towers, and masts; and lime and cement products) registered the largestincrease, and were largely to support the oil and gas recovery and refiningfacilities.
S The South African President signed the Broad-Based Black Empowerment Actinto law in January 2004. Coupled with other laws (Mineral Law, Money Bill,Health and Safety Act) passed within the last few years that were intended torestructure the country, it has caused significant valuation and financial riskissues, delaying mine investment in South Africa. To counteract these effects, aBeneficiation Bill has been proposed that aims to promote South Africa’sminerals industry by giving South Africans the opportunity to own basic formsof gold (e.g., bullion), diamonds, and PGMs. This bill is expected to stimulatedownstream processing and fabrication of these basic forms in South Africaby providing producer incentives for locally-manufactured products. SouthAfrican investment in newly committed SouthAfricanmineral-relatedprojectsincreased by 29 percent in 2003, but exploratory investment decreased by 10percent. Eighty-eight percent of exploratory investment, or approximately$2.3 billion, was earmarked for primary mineral production.
S The U.S. FDI position in the SSA primary and fabricated metals sectordecreased by 30 percent to $47 million in 2003. Ghana was the leadingrecipient of U.S. FDI in the region.
Textiles and ApparelS SSA production and exports of textiles and apparel continue to be
concentrated in Mauritius, South Africa, Lesotho, Madagascar, and Kenya.Other countries such as Ethiopia, Ghana, Tanzania, and Swaziland areincreasing activity in the sector, owing to factors such as SSA governmentinitiatives, increased foreign investment, intra-SSA country partnerships, andtrade preferences such as AGOA. The AGOA program has stimulatednumerous foreign investment projects in several SSA textile-producingcountries. Most of the investment has come from Asian sources.
S U.S. sector imports from SSA rose by 37 percent in 2003, reaching $1.6billion. SSA represented 2 percent of total U.S. sector imports. Principal SSAsuppliers included Lesotho, South Africa, Mauritius, Madagascar, andKenya. Primary items included cotton pants and cotton tops. U.S. sectorimports under AGOA totaled $1.2 billion in 2003, up by 50 percent over the2002 level and representing just over three-fourths of total U.S. sector importsfrom SSA and 9 percent of total imports under AGOA. Principal AGOAsuppliers included Lesotho, Madagascar, Kenya, Mauritius, South Africa,and Swaziland.
S The growth of the textile and apparel industries in SSA countries continues tobe constrained by widespread shortages of raw materials and textile inputs,high production costs relative to Asian suppliers, obsolete equipment, andcapacity underutilization. The influx of used clothing and inexpensivesmuggled goods that compete with local production is also a factor in

xi
numerous countries. In addition, the export competitiveness of SSA countriesin the global textile and apparel market has been hampered by high taxes,utility and input costs, and for some SSA countries, currency appreciation. Thecontinued strength of the South African rand (to which the currencies ofSwaziland and Lesotho are pegged) relative to the U.S. dollar weakened thecompetitiveness of textile and apparel exports from these countries in 2003.
S U.S. sector exports to SSA in 2003 rose by 5 percent to $131 million. Suchexports accounted for a negligible share of the U.S. sector total. Primary SSAmarkets included South Africa, Ghana, and Nigeria; used clothing was by farthe major export item.
Certain Transportation EquipmentS South Africa is the dominant producer of, and market for, motor vehicles and
motor-vehicle parts in the SSA region, accounting for 95 percent of SSAmotor vehicle production and 60 percent of motor vehicle sales in 2003. Theautomotive industry in South Africa accounts for nearly 6 percent of thecountry’s gross domestic product, is the largest manufacturer, and is thelargest manufacturing exporter.
S U.S. imports of certain transportation equipment from SSA reached $742million in2003, an increase of $182million, or33percent. SSA accounted forless than 1 percent of the value of total U.S. sector imports in2003. Virtually allU.S. sector imports from SSA in 2003 were supplied by South Africa, withpassenger cars accounting for 84 percent of sector imports from SouthAfrica. Leading components imported from South Africa in 2003 includedroad wheels, miscellaneous auto parts, and miscellaneous engine parts. U.S.transportation equipment imports underAGOA (including GSP) increased by34 percent in 2003, reaching $716 million; the majority of such imports werefrom South Africa. In 2003, imports under AGOA accounted for 97 percentof total U.S. sector imports from SSA.
S In 2003, U.S. transportation equipment exports to SSA reached $412 million,up by 36 percent from the previous year. South Africa accounted fortwo-thirds of U.S. sector exports to SSA, and SSA accounted for less than 1percent of the value of total U.S. sector exports in 2003.
S The U.S. FDI position in the SSA transportation equipment sector decreasedby13 percent to $343 million in 2003. South Africa was the primary location forU.S. FDI in the region.
Country Profiles
S In 2003, SSA’s average GDP growth rate was 3.6 percent, up from 3.2percent in2002. The increasewasattributed to higher investment levels, risingglobal commodity prices, increased agricultural production, and increasing

xii
regional stability stemming from negotiations launched by the regionalorganizations to reduce civil unrest. The HIV/AIDS pandemic, however,continued to curb economic development formany SSA countries by loweringproductivity, inhibiting investment, and increasing social costs.
S Additional barriers to economic growth for many countries in SSA includedlower than expected economic growth in the EU, a major trading partner forSSA countries; a slowdown in tourism for many countries that are seeking todiversify into this sector; and large current account deficits.
S SSA countries’ efforts to increase their level of integration into the globaltrading economy continued to be hampered by a number of obstacles. Inaddition to social and political conflict, inadequate infrastructure, such asdilapidated road networks, congested ports, inefficient customs services, andprohibitively expensive air transport, hampered the national andinternational transport of merchandise. Many SSA countries continued todepend heavily on exports of primary commodity products, such aspetroleum, minerals, and agricultural products.
S For many SSA countries, economic development continued to be hindered bysocial unrest. For example, in 2003, Burundi, Central African Republic, Côted’Ivoire, Democratic Republic of the Congo, Guinea-Bissau, Republic of theCongo, Somalia, and Zimbabwe experienced social and political instabilitythat undermined economic development efforts. The political and socialinstability stemming from government land redistribution and economicpolicies in Zimbabwe resulted in another year of negative economic growth.
S For many other SSA countries, however, economic development continued tofocus on attempts to diversify the economy. For example, initiatives in Angola,Gabon, Nigeria, and São Tomé and Principe focus on diversifying within andaway from the petroleum and energy-related sector; Botswana’s ExportDevelopment and Investment Authority announced plans to encouragenontraditional products such as textiles and apparel, light manufacturing,and tourism; Kenya experienced some success in efforts to encouragediversification into horticultural products; Madagascar, Mauritius, and SãoTomé and Principe are using export processing zones to encouragediversification into aquaculture and tourism (Madagascar), lightmanufacturing and information and communication technology (Mauritius),and fishing (São Tomé and Principe); and Namibia has experienced initialsuccess in promoting local fish processing.
S Several SSA countries established policies that countered the general trendtoward trade liberalization in SSA. For example, trade barriers increasedwhen Angola required that all trade pass through government-controlledposts; Nigeria banned the import of more than 40 products, including certaintextiles, men’s footwear, soap, furniture, assembled bicycles, toothpaste,certain plastic products, vegetable oil, and certain meat products; theGovernment of Zambia increased the number of products subject to qualitymonitoring from 12 to 24, including bottled water, varnishes, hair oils andcreams, asbestos, and glycerine; and Zimbabwe announced an alternatemethod for calculating import duties,which is expected to increase theappliedduties on inputs used by the manufacturing and mining industries.

xiii
S Given the importance of inadequate infrastructure in hindering trade andinvestment, many SSA countries increased efforts to improve transportationinfrastructure. The instability in Côte d’Ivoire had a significant impact on tradein western Africa, further highlighting the general vulnerability of many SSAcountries to limited transport options. Examples of such infrastructure effortsinclude: construction of the Cotonou (Benin) fishing port, construction of theBurkina Faso-Ghana railway, Cameroon’s oil platform repair yardconstruction, Cape Verde’s port expansion, the Mali-Niger railwayextension, the Dubai Port (Djibouti) expansion, port and railway linking andexpansion in Kenya, rehabilitation of the Beira and Nacala ports inMozambique, development of the Walvis Bay Corridor and port in Namibia,and modernization of the port in Senegal.
S Although privatization efforts continued in many SSA countries, progress hasbeen hampered by the lack of transparency and corruption (Angola,Cameroon, Comoros, and Guinea), lack of interested parties (Angola,Cameroon, Gabon, and Guinea), and political resistance or social instability(Ethiopia, Guinea, Mauritius, South Africa, Tanzania, Togo, and Zambia).
S In an effort to increase investment, many SSA countries have pursuedregulatory reform. For example, Botswana passed initiatives to encouragejoint ventures between foreign investors and domestic partners; The Gambiapassed the Money Laundering Bill to improve the transparency of financialinstitutions; Ghana introduced the Foreign Exchange Bill, the Long-TermSavings Bill, the Credit Union Bill, and the Insurance Bill aimed at attractingforeign investment in the financial sector; Kenya passed the Anti-Corruptionand Economic Crimes Bill in mid-2003; Namibia’s new mining policyincreased security of tenure for holders of mining rights and created astandard licensing scheme; and in late 2003, Republic of the Congo adopteda bill that streamlines licensing procedures and reduces the state’s equityshare in mining companies.


xv
TABLE OF CONTENTS
PageExecutive Summary i. . . . . . . . . . . . . . . . . . . . . . . . . . . . . . . . . . . . . . . . . . . .
List of Abbreviations and Acronyms xxv. . . . . . . . . . . . . . . . . . . . . . . . . . . . . . .
Introduction xxvii. . . . . . . . . . . . . . . . . . . . . . . . . . . . . . . . . . . . . . . . . . . . . . . . . .Purpose and organization of the report xxvii. . . . . . . . . . . . . . . . . . . . . . . .Approach xxviii. . . . . . . . . . . . . . . . . . . . . . . . . . . . . . . . . . . . . . . . . . . . . . .Scope of the report xxix. . . . . . . . . . . . . . . . . . . . . . . . . . . . . . . . . . . . . . .
Chapter 1. U.S. trade and investment with sub-Saharan Africa 1-1. . . . . . . . . .U.S. merchandise trade 1-1. . . . . . . . . . . . . . . . . . . . . . . . . . . . . . . . . . . .
U.S. merchandise exports 1-3. . . . . . . . . . . . . . . . . . . . . . . . . . . . . . . .U.S. merchandise imports 1-5. . . . . . . . . . . . . . . . . . . . . . . . . . . . . . . .Merchandise trade balance 1-11. . . . . . . . . . . . . . . . . . . . . . . . . . . . . . .
U.S.-Africa services trade 1-14. . . . . . . . . . . . . . . . . . . . . . . . . . . . . . . . . .Foreign investment in sub-Saharan Africa 1-20. . . . . . . . . . . . . . . . . . . . . .
Global investment in sub-Saharan Africa 1-20. . . . . . . . . . . . . . . . . . . .U.S. investment in sub-Saharan Africa 1-21. . . . . . . . . . . . . . . . . . . . . .Investment by country and by sector 1-21. . . . . . . . . . . . . . . . . . . . . . . .Investment agreements between sub-Saharan African countries
and foreign investment partners 1-24. . . . . . . . . . . . . . . . . . . . . . . .International investment initiatives focused on sub-Saharan
Africa 1-26. . . . . . . . . . . . . . . . . . . . . . . . . . . . . . . . . . . . . . . . . . . .
Chapter 2. AGOA-related imports and investment 2-1. . . . . . . . . . . . . . . . . . .African Growth and Opportunity Act 2-1. . . . . . . . . . . . . . . . . . . . . . . . .
AGOA Forum 2-3. . . . . . . . . . . . . . . . . . . . . . . . . . . . . . . . . . . . . . . . .U.S. imports under AGOA 2-4. . . . . . . . . . . . . . . . . . . . . . . . . . . . . . . . . .AGOA-related investment 2-8. . . . . . . . . . . . . . . . . . . . . . . . . . . . . . . . . .
Chapter 3. Regional integration in sub-Saharan Africa 3-1. . . . . . . . . . . . . . . .Regional integration in 2003 3-1. . . . . . . . . . . . . . . . . . . . . . . . . . . . . . . .Economic Community of West African States 3-5. . . . . . . . . . . . . . . . . . .Union Economique et Monétaire Ouest Africaine 3-7. . . . . . . . . . . . . . . .Common Market for Eastern and Southern Africa 3-9. . . . . . . . . . . . . . . .Southern African Development Community 3-11. . . . . . . . . . . . . . . . . . . . .Southern African Customs Union 3-13. . . . . . . . . . . . . . . . . . . . . . . . . . . . .East African Community 3-15. . . . . . . . . . . . . . . . . . . . . . . . . . . . . . . . . . . .

xvi
TABLE OF CONTENTS—ContinuedPage
Chapter 3. Regional integration in sub-Saharan Africa–ContinuedIntergovernmental Authority on Development 3-17. . . . . . . . . . . . . . . . . . .Indian Ocean Commission 3-19. . . . . . . . . . . . . . . . . . . . . . . . . . . . . . . . . .Communauté Economique et Monétaire de l’Afrique Centrale 3-21. . . . . .
Chapter 4. Multilateral assistance, U.S. bilateral assistance, and othertrade-related initiatives 4-1. . . . . . . . . . . . . . . . . . . . . . . . . . . . . . . . . . . . . . . . .
Sources of multilateral assistance to sub-Saharan Africa 4-1. . . . . . . . . .The World Bank Group 4-1. . . . . . . . . . . . . . . . . . . . . . . . . . . . . . . . . .
The World Bank/International Development Association 4-1. . . . .Multilateral Investment Guarantee Agency 4-8. . . . . . . . . . . . . . . .International Finance Corporation 4-9. . . . . . . . . . . . . . . . . . . . . . .
The African Development Bank Group 4-11. . . . . . . . . . . . . . . . . . . . . . . .International Monetary Fund 4-12. . . . . . . . . . . . . . . . . . . . . . . . . . . . . . . .New Partnership for African Development 4-14. . . . . . . . . . . . . . . . . . . . .Trade capacity-building initiatives of U.S. government agencies 4-17. . . . .
Country coverage 4-17. . . . . . . . . . . . . . . . . . . . . . . . . . . . . . . . . . . . . .Types of trade capacity-building initiatives 4-18. . . . . . . . . . . . . . . . . . .
The Export-Import Bank of the United States 4-31. . . . . . . . . . . . . . . . . . . .U.S. Trade and Development Agency 4-31. . . . . . . . . . . . . . . . . . . . . . . . .Overseas Private Investment Corporation 4-34. . . . . . . . . . . . . . . . . . . . . .U.S. Agency for International Development 4-35. . . . . . . . . . . . . . . . . . . . .
Chapter 5. Industry sector profiles 5-1. . . . . . . . . . . . . . . . . . . . . . . . . . . . . . . .Agricultural, fisheries, and forest products 5-3. . . . . . . . . . . . . . . . . . . . .
Overview 5-3. . . . . . . . . . . . . . . . . . . . . . . . . . . . . . . . . . . . . . . . . . . . .Trade 5-5. . . . . . . . . . . . . . . . . . . . . . . . . . . . . . . . . . . . . . . . . . . . . . . .
Key U.S. import developments 5-7. . . . . . . . . . . . . . . . . . . . . . . . . .Key AGOA trade developments 5-7. . . . . . . . . . . . . . . . . . . . . . . .Key U.S. export developments 5-7. . . . . . . . . . . . . . . . . . . . . . . . . .
Investment 5-8. . . . . . . . . . . . . . . . . . . . . . . . . . . . . . . . . . . . . . . . . . . .Chemicals 5-11. . . . . . . . . . . . . . . . . . . . . . . . . . . . . . . . . . . . . . . . . . . . . .
Overview 5-11. . . . . . . . . . . . . . . . . . . . . . . . . . . . . . . . . . . . . . . . . . . . .Trade 5-12. . . . . . . . . . . . . . . . . . . . . . . . . . . . . . . . . . . . . . . . . . . . . . . .
Key U.S. import developments 5-14. . . . . . . . . . . . . . . . . . . . . . . . . .Key AGOA trade developments 5-14. . . . . . . . . . . . . . . . . . . . . . . .Key U.S. export developments 5-14. . . . . . . . . . . . . . . . . . . . . . . . . .
Investment 5-15. . . . . . . . . . . . . . . . . . . . . . . . . . . . . . . . . . . . . . . . . . . .

xvii
TABLE OF CONTENTS—ContinuedPage
Chapter 5. Industry sector profiles–ContinuedPetroleum and energy-related products 5-17. . . . . . . . . . . . . . . . . . . . . . . .
Overview 5-17. . . . . . . . . . . . . . . . . . . . . . . . . . . . . . . . . . . . . . . . . . . . .Trade 5-18. . . . . . . . . . . . . . . . . . . . . . . . . . . . . . . . . . . . . . . . . . . . . . . .
Key U.S. import developments 5-20. . . . . . . . . . . . . . . . . . . . . . . . . .Key AGOA trade developments 5-20. . . . . . . . . . . . . . . . . . . . . . . .Key U.S. export developments 5-20. . . . . . . . . . . . . . . . . . . . . . . . . .
Investment 5-21. . . . . . . . . . . . . . . . . . . . . . . . . . . . . . . . . . . . . . . . . . . .Minerals and metals 5-23. . . . . . . . . . . . . . . . . . . . . . . . . . . . . . . . . . . . . .
Overview 5-23. . . . . . . . . . . . . . . . . . . . . . . . . . . . . . . . . . . . . . . . . . . . .Trade 5-25. . . . . . . . . . . . . . . . . . . . . . . . . . . . . . . . . . . . . . . . . . . . . . . .
Key U.S. import developments 5-27. . . . . . . . . . . . . . . . . . . . . . . . . .Key AGOA trade developments 5-27. . . . . . . . . . . . . . . . . . . . . . . .Key U.S. export developments 5-27. . . . . . . . . . . . . . . . . . . . . . . . . .
Investment 5-29. . . . . . . . . . . . . . . . . . . . . . . . . . . . . . . . . . . . . . . . . . . .Textiles and apparel 5-33. . . . . . . . . . . . . . . . . . . . . . . . . . . . . . . . . . . . . .
Overview 5-33. . . . . . . . . . . . . . . . . . . . . . . . . . . . . . . . . . . . . . . . . . . . .Trade 5-35. . . . . . . . . . . . . . . . . . . . . . . . . . . . . . . . . . . . . . . . . . . . . . . .
Key U.S. import developments 5-37. . . . . . . . . . . . . . . . . . . . . . . . . .Key AGOA trade developments 5-37. . . . . . . . . . . . . . . . . . . . . . . .Key U.S. export developments 5-37. . . . . . . . . . . . . . . . . . . . . . . . . .
Investment 5-38. . . . . . . . . . . . . . . . . . . . . . . . . . . . . . . . . . . . . . . . . . . .Certain transportation equipment 5-41. . . . . . . . . . . . . . . . . . . . . . . . . . . .
Overview 5-41. . . . . . . . . . . . . . . . . . . . . . . . . . . . . . . . . . . . . . . . . . . . .Trade 5-43. . . . . . . . . . . . . . . . . . . . . . . . . . . . . . . . . . . . . . . . . . . . . . . .
Key U.S. import developments 5-45. . . . . . . . . . . . . . . . . . . . . . . . . .Key AGOA trade developments 5-45. . . . . . . . . . . . . . . . . . . . . . . .Key U.S. export developments 5-45. . . . . . . . . . . . . . . . . . . . . . . . . .
Investment 5-46. . . . . . . . . . . . . . . . . . . . . . . . . . . . . . . . . . . . . . . . . . . .
Chapter 6. Country profiles 6-1. . . . . . . . . . . . . . . . . . . . . . . . . . . . . . . . . . . . .Regional overview 6-1. . . . . . . . . . . . . . . . . . . . . . . . . . . . . . . . . . . . . . . .Tariff structure 6-3. . . . . . . . . . . . . . . . . . . . . . . . . . . . . . . . . . . . . . . . . . .Technical notes 6-5. . . . . . . . . . . . . . . . . . . . . . . . . . . . . . . . . . . . . . . . . .Profiles of 48 sub-Saharan African countries 6-9. . . . . . . . . . . . . . . . . . .
Angola 6-9. . . . . . . . . . . . . . . . . . . . . . . . . . . . . . . . . . . . . . . . . . . . . . .Benin 6-11. . . . . . . . . . . . . . . . . . . . . . . . . . . . . . . . . . . . . . . . . . . . . . . .Botswana 6-13. . . . . . . . . . . . . . . . . . . . . . . . . . . . . . . . . . . . . . . . . . . . .

xviii
TABLE OF CONTENTS—ContinuedPage
Chapter 6. Country profiles–ContinuedProfiles of 48 sub-Saharan African countries—Continued
Burkina Faso 6-15. . . . . . . . . . . . . . . . . . . . . . . . . . . . . . . . . . . . . . . . . .Burundi 6-17. . . . . . . . . . . . . . . . . . . . . . . . . . . . . . . . . . . . . . . . . . . . . .Cameroon 6-19. . . . . . . . . . . . . . . . . . . . . . . . . . . . . . . . . . . . . . . . . . . .Cape Verde 6-21. . . . . . . . . . . . . . . . . . . . . . . . . . . . . . . . . . . . . . . . . . .Central African Republic 6-23. . . . . . . . . . . . . . . . . . . . . . . . . . . . . . . . .Chad 6-25. . . . . . . . . . . . . . . . . . . . . . . . . . . . . . . . . . . . . . . . . . . . . . . .Comoros 6-27. . . . . . . . . . . . . . . . . . . . . . . . . . . . . . . . . . . . . . . . . . . . .Côte d’Ivoire 6-29. . . . . . . . . . . . . . . . . . . . . . . . . . . . . . . . . . . . . . . . . .Democratic Republic of the Congo 6-31. . . . . . . . . . . . . . . . . . . . . . . . . .Djibouti 6-33. . . . . . . . . . . . . . . . . . . . . . . . . . . . . . . . . . . . . . . . . . . . . .Equatorial Guinea 6-35. . . . . . . . . . . . . . . . . . . . . . . . . . . . . . . . . . . . . .Eritrea 6-37. . . . . . . . . . . . . . . . . . . . . . . . . . . . . . . . . . . . . . . . . . . . . . .Ethiopia 6-39. . . . . . . . . . . . . . . . . . . . . . . . . . . . . . . . . . . . . . . . . . . . . .Gabon 6-41. . . . . . . . . . . . . . . . . . . . . . . . . . . . . . . . . . . . . . . . . . . . . . .The Gambia 6-43. . . . . . . . . . . . . . . . . . . . . . . . . . . . . . . . . . . . . . . . . . .Ghana 6-45. . . . . . . . . . . . . . . . . . . . . . . . . . . . . . . . . . . . . . . . . . . . . . .Guinea 6-47. . . . . . . . . . . . . . . . . . . . . . . . . . . . . . . . . . . . . . . . . . . . . . .Guinea-Bissau 6-49. . . . . . . . . . . . . . . . . . . . . . . . . . . . . . . . . . . . . . . . .Kenya 6-51. . . . . . . . . . . . . . . . . . . . . . . . . . . . . . . . . . . . . . . . . . . . . . . .Lesotho 6-53. . . . . . . . . . . . . . . . . . . . . . . . . . . . . . . . . . . . . . . . . . . . . . .Liberia 6-55. . . . . . . . . . . . . . . . . . . . . . . . . . . . . . . . . . . . . . . . . . . . . . .Madagascar 6-57. . . . . . . . . . . . . . . . . . . . . . . . . . . . . . . . . . . . . . . . . .Malawi 6-59. . . . . . . . . . . . . . . . . . . . . . . . . . . . . . . . . . . . . . . . . . . . . . .Mali 6-61. . . . . . . . . . . . . . . . . . . . . . . . . . . . . . . . . . . . . . . . . . . . . . . . .Mauritania 6-63. . . . . . . . . . . . . . . . . . . . . . . . . . . . . . . . . . . . . . . . . . . .Mauritius 6-65. . . . . . . . . . . . . . . . . . . . . . . . . . . . . . . . . . . . . . . . . . . . .Mozambique 6-67. . . . . . . . . . . . . . . . . . . . . . . . . . . . . . . . . . . . . . . . . .Namibia 6-69. . . . . . . . . . . . . . . . . . . . . . . . . . . . . . . . . . . . . . . . . . . . . .Niger 6-71. . . . . . . . . . . . . . . . . . . . . . . . . . . . . . . . . . . . . . . . . . . . . . . .Nigeria 6-73. . . . . . . . . . . . . . . . . . . . . . . . . . . . . . . . . . . . . . . . . . . . . .Republic of the Congo 6-77. . . . . . . . . . . . . . . . . . . . . . . . . . . . . . . . . . .Rwanda 6-79. . . . . . . . . . . . . . . . . . . . . . . . . . . . . . . . . . . . . . . . . . . . . .São Tomé and Principe 6-81. . . . . . . . . . . . . . . . . . . . . . . . . . . . . . . . . .Senegal 6-83. . . . . . . . . . . . . . . . . . . . . . . . . . . . . . . . . . . . . . . . . . . . . .Seychelles 6-85. . . . . . . . . . . . . . . . . . . . . . . . . . . . . . . . . . . . . . . . . . . .Sierra Leone 6-87. . . . . . . . . . . . . . . . . . . . . . . . . . . . . . . . . . . . . . . . . .

xix
TABLE OF CONTENTS—Continued
PageChapter 6. Country profiles–Continued
Profiles of 48 sub-Saharan African countries—ContinuedSomalia 6-89. . . . . . . . . . . . . . . . . . . . . . . . . . . . . . . . . . . . . . . . . . . . . .South Africa 6-91. . . . . . . . . . . . . . . . . . . . . . . . . . . . . . . . . . . . . . . . . . .Sudan 6-95. . . . . . . . . . . . . . . . . . . . . . . . . . . . . . . . . . . . . . . . . . . . . . .Swaziland 6-97. . . . . . . . . . . . . . . . . . . . . . . . . . . . . . . . . . . . . . . . . . . .Tanzania 6-99. . . . . . . . . . . . . . . . . . . . . . . . . . . . . . . . . . . . . . . . . . . . .Togo 6-101. . . . . . . . . . . . . . . . . . . . . . . . . . . . . . . . . . . . . . . . . . . . . . . . .Uganda 6-103. . . . . . . . . . . . . . . . . . . . . . . . . . . . . . . . . . . . . . . . . . . . . .Zambia 6-105. . . . . . . . . . . . . . . . . . . . . . . . . . . . . . . . . . . . . . . . . . . . . .Zimbabwe 6-107. . . . . . . . . . . . . . . . . . . . . . . . . . . . . . . . . . . . . . . . . . . .Primary nongovernment sources for country profiles 6-109. . . . . . . . . . . .
AppendicesA. Request letters from the U.S. Trade Representative A-1. . . . . . . . . . . . . . .B. Trade data B-1. . . . . . . . . . . . . . . . . . . . . . . . . . . . . . . . . . . . . . . . . . . . . .
FiguresES-1. SSA sector profiles summary data, 2003 vi. . . . . . . . . . . . . . . . . . . . . . .1. Map of sub-Saharan Africa xxx. . . . . . . . . . . . . . . . . . . . . . . . . . . . . . . . . .1-1. U.S. trade with sub-Saharan Africa, 1999-2003 1-2. . . . . . . . . . . . . . . . . .1-2. U.S. nonenergy-related trade with sub-Saharan Africa,
1999-2003 1-4. . . . . . . . . . . . . . . . . . . . . . . . . . . . . . . . . . . . . . . . . . . . .1-3. U.S. exports to sub-Saharan Africa by trading partners,
by shares, 2003 1-4. . . . . . . . . . . . . . . . . . . . . . . . . . . . . . . . . . . . . . . . .1-4. U.S. exports to sub-Saharan Africa by commodity sectors,
by shares, 2003 1-6. . . . . . . . . . . . . . . . . . . . . . . . . . . . . . . . . . . . . . . . .1-5. U.S. exports to sub-Saharan Africa: Annual growth rate, by
commodity sectors, 2002-03 1-6. . . . . . . . . . . . . . . . . . . . . . . . . . . . . . .1-6. U.S. imports from sub-Saharan Africa by trading partners,
by shares, 2003 1-10. . . . . . . . . . . . . . . . . . . . . . . . . . . . . . . . . . . . . . . . .1-7. U.S. imports from sub-Saharan Africa by commodity sectors,
by shares, 2003 1-10. . . . . . . . . . . . . . . . . . . . . . . . . . . . . . . . . . . . . . . . .1-8. U.S. imports from sub-Saharan Africa: Annual growth rate,
by commodity, 2002-03 1-14. . . . . . . . . . . . . . . . . . . . . . . . . . . . . . . . . .1-9. U.S. cross-border trade in services with Africa: Exports, imports,
and trade balance, 1999-2002 1-15. . . . . . . . . . . . . . . . . . . . . . . . . . . . .4-1. U.S. trade capacity-building initiatives, by funding categories and
subcategories, FY 2003 4-20. . . . . . . . . . . . . . . . . . . . . . . . . . . . . . . . . . .6-1. Gross national income per capita, 2002 6-4. . . . . . . . . . . . . . . . . . . . . . .

xx
TABLE OF CONTENTS—ContinuedPage
Boxes1-1. Services trade in sub-Saharan Africa, selected investments 1-17. . . . . . . . .4-1. USAID and trade capacity-building initiatives 4-29. . . . . . . . . . . . . . . . . . .
Tables1-1. Sub-Saharan Africa: U.S. exports of domestic merchandise, imports for
consumption, and merchandise trade balance, by major commoditysectors, 1999-2003 1-7. . . . . . . . . . . . . . . . . . . . . . . . . . . . . . . . . . . . .
1-2. Sub-Saharan Africa: U.S. exports by major commodity items,1999-2003 1-8. . . . . . . . . . . . . . . . . . . . . . . . . . . . . . . . . . . . . . . . . . . .
1-3. Sub-Saharan Africa: U.S. imports by major commodity items,1999-2003 1-12. . . . . . . . . . . . . . . . . . . . . . . . . . . . . . . . . . . . . . . . . . . .
1-4. Total Africa and South Africa: U.S. cross-border services exports,1997 and 2002 1-15. . . . . . . . . . . . . . . . . . . . . . . . . . . . . . . . . . . . . . . .
1-5. Total Africa and South Africa: U.S. cross-border services imports,1997 and 2002 1-19. . . . . . . . . . . . . . . . . . . . . . . . . . . . . . . . . . . . . . . .
1-6. Global investment flows to sub-Saharan Africa and developingcountries, 1999-2003 1-21. . . . . . . . . . . . . . . . . . . . . . . . . . . . . . . . . . . .
1-7. U.S. direct investment abroad: Capital flows, 1999-2003 1-22. . . . . . . . . .1-8. U.S. direct investment position on a historical cost basis,
1999-2003 1-22. . . . . . . . . . . . . . . . . . . . . . . . . . . . . . . . . . . . . . . . . . . .1-9. Bilateral investment treaties with sub-Saharan Africa, by selected
investment partner country, 2004 1-25. . . . . . . . . . . . . . . . . . . . . . . . . .2-1. Sub-Saharan African countries designated as beneficiary countries of
AGOA as of December 31, 2003 2-2. . . . . . . . . . . . . . . . . . . . . . . . . .2-2. U.S. imports under AGOA, by sources, 2002, 2003, Jan.-June 2003,
and Jan.-June 2004 2-5. . . . . . . . . . . . . . . . . . . . . . . . . . . . . . . . . . . . .2-3. Major U.S. imports under AGOA, by major commodity sectors, 2002,
2003, Jan.-June 2003, and Jan.-June 2004 2-7. . . . . . . . . . . . . . . . . .2-4. Leading U.S. imports under AGOA, by HTS descriptions, 2002, 2003,
Jan.-June 2003, and Jan.-June 2004 2-9. . . . . . . . . . . . . . . . . . . . . . . .2-5. Selected examples of recent AGOA-related investment and events,
2003 to mid-2004 2-12. . . . . . . . . . . . . . . . . . . . . . . . . . . . . . . . . . . . . .4-1. Summary of general developments in multilateral and U.S. bilateral
assistance for sub-Saharan Africa, 2003 4-2. . . . . . . . . . . . . . . . . . . .4-2. World Bank/IDA: Eligible borrowers in sub-Saharan Africa (37) 4-3. . . .4-3. World Bank (IDA and IBRD) lending commitments in sub-Saharan Africa,
by theme and sector, average FY 1998-99 and FY 2000-03 4-5. . . . . .

xxi
TABLE OF CONTENTS—ContinuedPage
Tables–Continued4-4. World Bank projects approved in sub-Saharan Africa, FY 2003 4-6. . . .4-5. Sub-Saharan African MIGA members and countries in the process
of fulfilling membership requirements, 2003 4-9. . . . . . . . . . . . . . . . . .4-6. MIGA guarantees issued in sub-Saharan Africa, FY 2003 4-10. . . . . . . . .4-7. Total ADF and AfDB projects and programs approved during 2003,
by country 4-13. . . . . . . . . . . . . . . . . . . . . . . . . . . . . . . . . . . . . . . . . . . .4-8. U.S. support for building trade capacity, by geographic region,
FY 1999-FY 2003 4-18. . . . . . . . . . . . . . . . . . . . . . . . . . . . . . . . . . . . . . .4-9. Trade capacity-building initiatives, leading sub-Saharan African
country recipients, FY 1999-FY 2003 4-19. . . . . . . . . . . . . . . . . . . . . . . .4-10. Examples of trade capacity-building initiatives in sub-Saharan Africa,
FY 2003 4-21. . . . . . . . . . . . . . . . . . . . . . . . . . . . . . . . . . . . . . . . . . . . . .4-11. Sub-Saharan Africa: Export-Import Bank exposure, authorizations,
and availability for further support as of December 14, 2003 4-32. . . .4-12. U.S. Trade and Development Agency funds obligated for program
activities in Africa, FY 2003 4-33. . . . . . . . . . . . . . . . . . . . . . . . . . . . . . .4-13. Sub-Saharan Africa: Selected OPIC investment projects, 2003 4-35. . . . . .4-14. USAID funds allocated for sub-Saharan Africa, by major
project categories, FY 2003 4-37. . . . . . . . . . . . . . . . . . . . . . . . . . . . . . .6-1. Aggregate governance index, selected sub-Saharan African countries,
1996 and 2002 6-3. . . . . . . . . . . . . . . . . . . . . . . . . . . . . . . . . . . . . . . .6-2. Tariffs in sub-Saharan African countries, various years 6-6. . . . . . . . . . .B-1. U.S. exports, imports, and trade balance, with sub-Saharan Africa,
by trading partners, 1999-2003 B-3. . . . . . . . . . . . . . . . . . . . . . . . . . .B-2. U.S. exports, imports, and GSP/AGOA imports, by major commodity
sectors, 1999-2003 B-7. . . . . . . . . . . . . . . . . . . . . . . . . . . . . . . . . . . . .Angola B-7. . . . . . . . . . . . . . . . . . . . . . . . . . . . . . . . . . . . . . . . . . . . . . .Benin B-8. . . . . . . . . . . . . . . . . . . . . . . . . . . . . . . . . . . . . . . . . . . . . . . .Botswana B-9. . . . . . . . . . . . . . . . . . . . . . . . . . . . . . . . . . . . . . . . . . . . .Burkina Faso B-10. . . . . . . . . . . . . . . . . . . . . . . . . . . . . . . . . . . . . . . . . .Burundi B-11. . . . . . . . . . . . . . . . . . . . . . . . . . . . . . . . . . . . . . . . . . . . . .Cameroon B-12. . . . . . . . . . . . . . . . . . . . . . . . . . . . . . . . . . . . . . . . . . . .Cape Verde B-13. . . . . . . . . . . . . . . . . . . . . . . . . . . . . . . . . . . . . . . . . . .Central African Republic B-14. . . . . . . . . . . . . . . . . . . . . . . . . . . . . . . . .Chad B-15. . . . . . . . . . . . . . . . . . . . . . . . . . . . . . . . . . . . . . . . . . . . . .Comoros B-16. . . . . . . . . . . . . . . . . . . . . . . . . . . . . . . . . . . . . . . . . . . . .Côte d’Ivoire B-17. . . . . . . . . . . . . . . . . . . . . . . . . . . . . . . . . . . . . . . . . .

xxii
TABLE OF CONTENTS—Continued
PageTables–Continued
Democratic Republic of the Congo B-18. . . . . . . . . . . . . . . . . . . . . . . . . .Djibouti B-19. . . . . . . . . . . . . . . . . . . . . . . . . . . . . . . . . . . . . . . . . . . . . .Equatorial Guinea B-20. . . . . . . . . . . . . . . . . . . . . . . . . . . . . . . . . . . . . .Eritrea B-21. . . . . . . . . . . . . . . . . . . . . . . . . . . . . . . . . . . . . . . . . . . . . . .Ethiopia B-22. . . . . . . . . . . . . . . . . . . . . . . . . . . . . . . . . . . . . . . . . . . . . .Gabon B-23. . . . . . . . . . . . . . . . . . . . . . . . . . . . . . . . . . . . . . . . . . . . . . .The Gambia B-24. . . . . . . . . . . . . . . . . . . . . . . . . . . . . . . . . . . . . . . . . . .Ghana B-25. . . . . . . . . . . . . . . . . . . . . . . . . . . . . . . . . . . . . . . . . . . . . . .Guinea B-26. . . . . . . . . . . . . . . . . . . . . . . . . . . . . . . . . . . . . . . . . . . . . . .Guinea-Bissau B-27. . . . . . . . . . . . . . . . . . . . . . . . . . . . . . . . . . . . . . . . .Kenya B-28. . . . . . . . . . . . . . . . . . . . . . . . . . . . . . . . . . . . . . . . . . . . . . . .Lesotho B-29. . . . . . . . . . . . . . . . . . . . . . . . . . . . . . . . . . . . . . . . . . . . . . .Liberia B-30. . . . . . . . . . . . . . . . . . . . . . . . . . . . . . . . . . . . . . . . . . . . . . .Madagascar B-31. . . . . . . . . . . . . . . . . . . . . . . . . . . . . . . . . . . . . . . . . .Malawi B-32. . . . . . . . . . . . . . . . . . . . . . . . . . . . . . . . . . . . . . . . . . . . . . .Mali B-33. . . . . . . . . . . . . . . . . . . . . . . . . . . . . . . . . . . . . . . . . . . . . . . . .Mauritania B-34. . . . . . . . . . . . . . . . . . . . . . . . . . . . . . . . . . . . . . . . . . . .Mauritius B-35. . . . . . . . . . . . . . . . . . . . . . . . . . . . . . . . . . . . . . . . . . . . .Mozambique B-36. . . . . . . . . . . . . . . . . . . . . . . . . . . . . . . . . . . . . . . . . .Namibia B-37. . . . . . . . . . . . . . . . . . . . . . . . . . . . . . . . . . . . . . . . . . . . . .Niger B-38. . . . . . . . . . . . . . . . . . . . . . . . . . . . . . . . . . . . . . . . . . . . . . . .Nigeria B-39. . . . . . . . . . . . . . . . . . . . . . . . . . . . . . . . . . . . . . . . . . . . . .Republic of the Congo B-40. . . . . . . . . . . . . . . . . . . . . . . . . . . . . . . . . . .Rwanda B-41. . . . . . . . . . . . . . . . . . . . . . . . . . . . . . . . . . . . . . . . . . . . . .São Tomé and Principe B-42. . . . . . . . . . . . . . . . . . . . . . . . . . . . . . . . . .Senegal B-43. . . . . . . . . . . . . . . . . . . . . . . . . . . . . . . . . . . . . . . . . . . . . .Seychelles B-44. . . . . . . . . . . . . . . . . . . . . . . . . . . . . . . . . . . . . . . . . . . .Sierra Leone B-45. . . . . . . . . . . . . . . . . . . . . . . . . . . . . . . . . . . . . . . . . .Somalia B-46. . . . . . . . . . . . . . . . . . . . . . . . . . . . . . . . . . . . . . . . . . . . . .South Africa B-47. . . . . . . . . . . . . . . . . . . . . . . . . . . . . . . . . . . . . . . . . . .Sudan B-48. . . . . . . . . . . . . . . . . . . . . . . . . . . . . . . . . . . . . . . . . . . . . . .Swaziland B-49. . . . . . . . . . . . . . . . . . . . . . . . . . . . . . . . . . . . . . . . . . . .Tanzania B-50. . . . . . . . . . . . . . . . . . . . . . . . . . . . . . . . . . . . . . . . . . . . .Togo B-51. . . . . . . . . . . . . . . . . . . . . . . . . . . . . . . . . . . . . . . . . . . . . . . . .

xxiii
TABLE OF CONTENTS—ContinuedPage
Tables–ContinuedUganda B-52. . . . . . . . . . . . . . . . . . . . . . . . . . . . . . . . . . . . . . . . . . . . . .Zambia B-53. . . . . . . . . . . . . . . . . . . . . . . . . . . . . . . . . . . . . . . . . . . . . .Zimbabwe B-54. . . . . . . . . . . . . . . . . . . . . . . . . . . . . . . . . . . . . . . . . . . .
B-3. Leading changes in sectoral trade, by sectors, 1999 and 2003 B-55. . . . .Angola B-55. . . . . . . . . . . . . . . . . . . . . . . . . . . . . . . . . . . . . . . . . . . . . . .Côte d’Ivoire B-56. . . . . . . . . . . . . . . . . . . . . . . . . . . . . . . . . . . . . . . . . .Equatorial Guinea B-57. . . . . . . . . . . . . . . . . . . . . . . . . . . . . . . . . . . . . .Gabon B-58. . . . . . . . . . . . . . . . . . . . . . . . . . . . . . . . . . . . . . . . . . . . . . .Ghana B-59. . . . . . . . . . . . . . . . . . . . . . . . . . . . . . . . . . . . . . . . . . . . . . .Kenya B-60. . . . . . . . . . . . . . . . . . . . . . . . . . . . . . . . . . . . . . . . . . . . . . . .Mauritius B-61. . . . . . . . . . . . . . . . . . . . . . . . . . . . . . . . . . . . . . . . . . . . .Nigeria B-62. . . . . . . . . . . . . . . . . . . . . . . . . . . . . . . . . . . . . . . . . . . . . .Republic of the Congo B-63. . . . . . . . . . . . . . . . . . . . . . . . . . . . . . . . . . .South Africa B-64. . . . . . . . . . . . . . . . . . . . . . . . . . . . . . . . . . . . . . . . . . .
B-4. U.S. imports under AGOA and GSP, 2002, 2003, Jan.-June 2003,and Jan.-June 2004 B-65. . . . . . . . . . . . . . . . . . . . . . . . . . . . . . . . . . . . .


xxv
List of Abbreviations and Acronyms
ADB Asian Development BankADF African Development FundAfDB African Development BankAGOA African Growth and Opportunity ActATIA African Trade Insurance AgencyATRIP African Trade and Investment Policy ProgramAU African UnionBEA Bureau of Economic Analysis (U.S. Department of Commerce)BIT Bilateral investment treatyCACEU Central African Customs and Economic UnionCEMAC Communauté Economique et Monétaire de l’Afrique CentraleCFA Communauté Financière AfricaineCMA Common Monetary AreaCOMESA Common Market for Eastern and Southern AfricaDROC Democratic Republic of the CongoEAC East African CommunityECOWAS Economic Community of West African StatesEU European UnionEx-Im Bank Export-Import Bank of the United StatesFDI Foreign direct investmentFTA Free trade agreement or free trade areaGATT General Agreement on Tariffs and TradeGDP Gross domestic productGSM Global system for mobile communicationsGSP U.S. Generalized System of PreferencesHIPC Heavily Indebted Poor CountriesHTS Harmonized Tariff ScheduleIBRD International Bank for Reconstruction and DevelopmentIDA International Development AssociationIFC International Finance CorporationIGAD Intergovernmental Authority on DevelopmentIMF International Monetary FundIOC Indian Ocean CommissionJSE Johannesburg Stock ExchangeLDBC Least developed beneficiary countryMOU Memorandum of UnderstandingMIGA Multilateral Investment Guarantee AgencyNEPAD New Partnership for African DevelopmentNGO Nongovernmental organizationNTF Nigerian Trust FundOAU Organization of African UnityOPIC Overseas Private Investment Corporation

xxvi
List of Abbreviations and Acronyms-Cont.
PRGF Poverty Reduction and Growth FacilityPRSC Poverty Reduction Support CreditPRSP Poverty Reduction Strategy PaperROC Republic of the CongoSACU Southern African Customs UnionSADC Southern African Development CommunitySDR Special Drawing RightsSSA Sub-Saharan AfricaTDA U.S. Trade and Development AgencyTRIPS Agreement on Trade-Related Aspects of Intellectual
Property RightsUDEAC L’Union Douanière Et EconomiqueUEMOA Union Economique Et Monétaire Ouest AfricaineUN United NationsUNCTAD United Nations Conference on Trade and DevelopmentUNDP United Nations Development ProgrammeUNECA United Nations Economic Commission for AfricaUNIDO United Nations Industrial Development OrganizationURA Uruguay Round AgreementsUSAID U.S. Agency for International DevelopmentUSDA U.S. Department of AgricultureUSDOC U.S. Department of CommerceUSITC U.S. International Trade CommissionUSTR United States Trade RepresentativeWIPO World Intellectual Property OrganizationWTO World Trade Organization

xxvii
INTRODUCTION
Purpose and Organization of the Report
This is the fifth report in a 5-year series documenting U.S.-sub-Saharan Africa (SSA)trade and investment flows.1 In a letter dated April 12, 2000,2 the United States TradeRepresentative (USTR) asked the United States International Trade Commission(Commission or USITC) to submit, annually for 5 years, a report that provides:
S an analysis of U.S.-SSA merchandise trade and services trade flows;
S country-by-country profiles of the economies of each SSA country, includinginformation on major trading partners, and a summary of the trade andinvestment climates in each;
S a summaryofU.S. foreignand total direct investment and portfolio investmentin SSA;
S information on SSA privatization efforts;
S updates on progress in regional integration in SSA, including statistics onU.S.trade with the major regional groupings; and
S a summary of multilateral and U.S. bilateral assistance to SSA countries.
In a supplementary letter dated July 10, 2002,3USTR asked the Commission to providethe following additional information:
S the value of U.S. imports from SSA under the African Growth andOpportunity Act (AGOA), including the Generalized System of Preferences(GSP) provisions, by beneficiary country and major product categories;
S information on investment developments related to AGOA;
S a description and analysis of major SSA export sectors;
1 In a letter dated June 5, 1996, the USTR asked the Commission to submit, annually for 5 years, thespecified report. A first series of reports resulted from section 134 of the Uruguay Round Agreements Act(URAA), which directed the President to develop a comprehensive trade and development policy for thecountries of Africa, and to report to the Congress annually for 5 years on the steps taken to carry out thatmandate. The Statement of Administrative Action approved by the Congress in the URAA broadlyoutlined the Administration’s plans for this work, and the assistance needed from the Commission for thePresident to fulfill this assignment. The series consisted of five reports, produced over the period1995–1999. See USITC, U.S.–Africa Trade Flows and Effects of the Uruguay Round Agreements and U.S.Trade and Development Policy, Fifth Annual Report, USITC pub. 3250, Oct. 1999.
2 Copy of the request letter is in app. A3 Copy of the supplemental letter is in app. A.

xxviii
S expanded information on regional integration in SSA, including informationon the Communauté Economique et Monétaire de l’Afrique Centrale(CEMAC);
S a description of major U.S. trade capacity-building initiatives related to SSA;and
S a description of major non-U.S. trade preference programs for SSAcountries.
The request letter acknowledged that the information included in the USITC reportswould be useful in USTR’s work and in meeting additional reporting requirementsstemming from AGOA.
This report contains six chapters and two appendices. Chapter 1 presents informationon U.S. merchandise and services trade with SSA. The services trade analysis includesinformation on cross-border and affiliate transactions. Chapter 1 also addressesforeign investment (direct and portfolio investment) in the SSA region. Chapter 2presents information on AGOA-related imports and investment. Chapter 3 updatesthe coverage of integration initiatives in the SSA region provided in the previous seriesofUSITC reports.4 Chapter4 is a compilationof informationonmultilateral assistance,U.S. bilateral assistance, and other trade-related initiatives related to the SSA regionin 2003. Chapter 5 contains a description and analysis of major SSA export sectors:agriculture, fisheries, and forest products; chemicals; petroleum and energy-relatedproducts; minerals and metals; textiles and apparel; and certain transportationequipment. These profiles present information on production, trade, and investment.Chapter 6 contains country profiles for each of the 48 countries of SSA including basiceconomic data as well as an update of economic, trade, and investment andprivatization events for each country. The formal request letter and supplemental letterfrom the USTR to the Commission for this study are included in appendix A. Relevantstatistics on U.S.-SSA trade are in appendix B.
Approach
The data included in this report generally cover either calendar or fiscal year (FY)2003, depending on data availability. In cases where it is useful to show a trend, datafor 1999 through 2003 are provided. Developments in economic, trade, andcommercial policies cover the period from January 2003 through mid-2004, wherepossible.
4 In addition, the previous series of five reports included information on progress on regionalintegration in SSA. See, for example, USITC, U.S.–Africa Trade Flows and Effects of the Uruguay RoundAgreements and U.S. Trade and Development Policy, Fifth Annual Report, USITC pub. 3250, Oct. 1999,pp. 2–22 through 2–34.

xxix
Online webpages dedicated to U.S.-SSA trade data are available at the USITCwebsitehttp://reportweb.usitc.gov/africa. These tablesprovideyear-to-datestatisticsthat update the information contained in certain tables of this report. The website isautomatically updated with quarterly data as they become available from the U.S.Department of Commerce (USDOC).
Various sources were used to compile the data in this report. Annual data on the valueof U.S. exports to and imports from SSA were obtained from the USDOC. Unlessotherwise indicated, “AGOA” trade data reported in this publication includes tradeunder AGOA’s GSP provisions. Data on U.S. investment flows to SSA were obtainedfrom USDOC and the U.S. Department of the Treasury. Information on majordevelopments in the WTO likely affecting U.S.-SSA trade flows was collected from theWTO and other public data sources. Information onU.S. trade and economic activitiespotentially affecting U.S.-SSA trade and investment flows was collected from USDOC;the U.S. Departments of State, Treasury, and Agriculture; the U.S. Agency forInternational Development; the Export-Import Bank of the United States; the OverseasPrivate Insurance Corporation; the U.S. Trade and Development Agency; and otherrelevant U.S. agencies.
Data on trade and economic policy changes in countries in SSA, as well as informationon multilateral project lending, were obtained from USDOC, the U.S. Department ofState, the World Bank, the African Development Bank, the International MonetaryFund, and the Economist Intelligence Unit. In addition, U.S. embassies in the SSAregion provided important trade and investment information.
Scope of the Report
As requested by USTR, the 48 countries that form the SSA region are covered by thisreport. Figure 1 shows the 48 countries in SSA covered in this investigation. Thecountries are:
Angola MadagascarBenin MalawiBotswana MaliBurkina Faso MauritaniaBurundi MauritiusCameroon MozambiqueCape Verde NamibiaCentral African Republic NigerChad NigeriaComoros Republic of the CongoCôte d’Ivoire RwandaDemocratic Republic of the Congo São Tomé and PrincipeDjibouti Senegal

Figure 1Map of sub-Saharan Africa
Angola
Zambia
Eritrea
Ethiopia
Kenya
Tanzania
Democratic Republicof the Congo
Somalia
Sudan
Niger
ChadMali
Mauritania
The GambiaGuinea-Bissau
Guinea
Liberia
Côted’Ivoire
Cape Verde
Ghana
Benin
Togo
Sierra LeoneNigeria
Burkina Faso Cameroon
CentralAfrican Republic
Rwanda
Burundi
UgandaGabon
Madagascar
Namibia Botswana
South Africa
Zimbabwe
Mozambique
Malawi
Swaziland
Lesotho
Djibouti
Mauritius
Comoros
Senegal
São Tomé &Principe
EquatorialGuinea
Republic of the Congo Seychelles
The illustration of the map in this figure is an artisticrepresentation of the countries of sub-Saharan Africa. It isnot drawn to scale, nor is it intended to depict political orgeographical boundaries.
xxx

xxxi
Equatorial Guinea SeychellesEritrea Sierra LeoneEthiopia SomaliaGabon South AfricaThe Gambia SudanGhana SwazilandGuinea TanzaniaGuinea-Bissau TogoKenya UgandaLesotho ZambiaLiberia Zimbabwe
All 48 SSA countries are classified by the World Bank as developing countries.However, although the countries of SSA share many common characteristics, theyvary widely in terms of population, size, geography, natural resources, stage ofdevelopment, and political stability.
At the request of the USTR, this report also covers U.S. trade flows with the followingSSA regional and subregional organizations: the Economic Community of WestAfrican States (ECOWAS), the Union Economique et Monétaire Ouest Africaine(UEMOA), the Common Market for Eastern and Southern Africa (COMESA), theSouthern African Development Community (SADC), the Southern African CustomsUnion (SACU), the East African Community (EAC), the Intergovernmental Authority onDevelopment (IGAD), the Indian Ocean Commission (IOC), and the CommunautéEconomique et Monétaire de l’Afrique Centrale (CEMAC).


1-1
CHAPTER 1U.S. Trade and Investment With Sub-SaharanAfrica
This chapter discusses the pattern of U.S.-SSA merchandise trade from 1999-2003,1
and services trade from 1999-2002 (the most recent years for which services tradedata are available). The pattern of merchandise trade is presented for the SSA regionas a whole, by major trading partners, and by commodity sectors. This chapter alsodiscusses the pattern of foreign investment flows to sub-Saharan Africa (SSA) from1999-2003 (or most recent data available). Foreign investment flows are presentedfor the SSA region, by source, country, and sector, where available. An overview ofbilateral investment agreements and international investment initiatives is alsoprovided. Trade statistics beginning with 1990 are available in prior Commissionreports.2 For additional information regarding specific sectors or countries, see sectoror country profiles in chapter 5 or 6, respectively.
U.S. Merchandise Trade3
Figure 1-1 shows the trend in U.S.-SSA merchandise trade from 1999-2003. Totalmerchandise trade between the United States and SSA increased by 33.3 percent in2003 to $32.1 billion, from $24.1 billion in 2002.4 This increase was the result of a39.9-percent increase in imports, from $18.2 billion in 2002 to $25.5 billion in 2003;and a 13.1-percent increase in exports, from $5.9 billion in 2002 to $6.7 billion in2003. The increase in U.S. imports from SSA was primarily the result of a $5.9-billion,or 50.9-percent, increase in the energy-related products sector. Nigeria accountedfor most of the increase in U.S. imports from the region. U.S. imports from Nigeriaincreased by $4.3 billion, or 73.8 percent, with most of the increase concentrated inthe energy sector (up by $4.3 billion or by 73.7 percent).
1 Merchandise trade data were compiled from official statistics of the U.S. Department ofCommerce.
2 For data series beginning in 1990, see USITC, U.S.-Africa Trade Flows and Effects, First Report,USITC pub. 2938, Jan. 1996, table 2-1, p. 2-2.
3 See app. B, table B-2 for complete data listing by country and sector.4 This report analyzes changes in U.S. merchandise trade on a value basis because aggregate trade
data by quantity are generally not available or meaningful. Consequently, it is possible (if prices changesignificantly) for the value of trade to change considerably, but the quantity of trade to remain the same.

1-2
-20-15-10-505
1015202530
1999 2000 2001 2002 2003
Billion dollarsU.S. exportsU.S. importsTrade balance
Figure 1-1U.S. trade with sub-Saharan Africa, 1999-2003
Source: Compiled from official statistics of the U.S. Department of Commerce.
The overall increase in U.S. imports from SSA was partly offset by decreased importsfrom Ghana and Zimbabwe. U.S. imports from Ghana decreased by $32.0 million, orby 27.7 percent, mostly in agricultural products (down by $17.0 million or 58.5percent) and minerals and metals (down by $17.3 million or 86.1 percent) sectors; lackof infrastructure (such as cold-storage facilities) and regional instability havecontributed to the decline. U.S. imports from Zimbabwe decreased by$32.5million, orby 32.7 percent, primarily in the miscellaneous manufactures (down by $15.0 millionor 53.1 percent) and agricultural products (down by $11.2 million or 33.3 percent)sectors; this decline was primarily because of continued social and political instability,which has resulted in the expropriation of numerous firms and closure of manyfactories.
U.S. exports increased primarily because of increases in transportation equipment (upby $407.9 million or by 21.7 percent), agricultural products (up by $166.6 million orby 17.9 percent), and electronic products (up by $140.8 million or by 22.1 percent).Ethiopia, South Africa, and Equatorial Guinea accounted for most of the increase inU.S. exports to SSA. The increase in U.S. exports to Ethiopia (up by $347.2 million orby 577.5 percent) was primarily because of an increase in the transportationequipment sector (upby$196.6 millionorbymore than3,000 percent). U.S. exports toSouth Africa increased by $252.0 million, or by 10.3 percent, also largely because ofincreased exports of transportation equipment (up by $106.6 million or by 14.3percent). U.S. exports to Equatorial Guinea increased by $228.3 million, or by 212.1percent, also primarily because of increased exports of transportation equipment (upby $115.3 million or by 158.8 percent).

1-3
The increase in total U.S. exports to the region was partly offset by decreased exportsto Kenya, Cameroon, and Chad. U.S. exports to Kenya decreased by $75.0 million, orby 28.0 percent, primarily because of decreased exports of transportation equipment(down by $59.6 million or by 48.1 percent). U.S. exports to Cameroon decreased by$65.9 million, or by 42.5 percent, also primarily because of a decrease intransportation equipment (down by $67.1 million or by 70.7 percent). U.S. exports toChad decreased by$63.4 million, or by50.0percent, primarilybecause ofdecreasedexports of machinery (down by $33.2 million or by 78.4 percent) and minerals andmetals (down by $22.4 million or by 77.6 percent).
In 2003, the U.S. trade deficit with SSA reached$18.8billion, 19.8-percent larger thanin 2002. Following a decline of 4.3 percent to $6.5 billion in 2002, U.S. nonpetroleumimports increased by 20.0 percent to $7.8 billion in 2003. U.S. nonenergy-relatedtrade with SSA is presented in figure 1-2.
U.S. Merchandise Exports5
Figure 1-3 presents U.S. exports to SSA by major trading partners. In 2003, SouthAfrica remained the largest SSA market for U.S. products, accounting for 40.5percent of U.S. merchandise exports to the region, down slightly from 41.5 percent in2002. Other leading SSA markets were Nigeria (15.0 percent), Angola (7.2 percent),Ethiopia (6.1 percent), Equatorial Guinea (5.0 percent), Ghana (3.1 percent), andKenya (2.9 percent).
In 2003, 26 countries in the region increased purchases of U.S. merchandise exports,whereas the other 22 recorded a decrease. The largest increases in 2003 wererecorded by Ethiopia (up by $347.2 million or by 577.5 percent), South Africa (up by$252.0 million or by 10.3 percent), and Equatorial Guinea (up by $228.3 million or by212.1 percent). The largest decreases in U.S. exports to the region in 2003 wererecorded by Kenya (down by $75.0 million or by 28.0 percent), Cameroon (down by$65.9 million or by 42.5 percent), and Chad (down by $63.4 million or by 50.0percent).
Transportation equipment accounted for the largest share of U.S. merchandiseexports to SSA, accounting for 34.3 percent of the total in 2003, compared with 31.9percent of the total in 2002 (figure 1-4). U.S. exports of agricultural productsaccounted for 16.5 percent of the total in 2003, up from 15.8 percent in 2002;electronic products accounted for 11.7 percent of the total in 2003, compared to 10.8percent in 2002; chemicals and related products accounted for 10.8 percent in 2003,down from 11.9 percent in 2002; and machinery products decreased to 10.7 percentof the total in 2003, down from 11.4 percent in 2002.
5 See app. B, table B-2 for complete data listing by country and sector.

1-4
1
2
3
4
5
6
7
8
1999 2000 2001 2002 2003
Billion dollarsU.S. exportsU.S. imports
Figure 1-2U.S. nonenergy-related1 trade with sub-Saharan Africa, 1999-2003
1 Nonenergy-related trade excludes trade classified under “Energy-related products” as definedby the USITC Office of Industries.
Source: Compiled from official statistics of the U.S. Department of Commerce.
Figure 1-3U.S. exports to sub-Saharan Africa trading partners, by shares, 2003
Source: Compiled from official statistics of the U.S. Department of Commerce.
Other 20.2%
Angola 7.2%
Ethiopia 6.1%
South Africa40.5%
Nigeria 15.0%
Kenya 2.9%
Equatorial Guinea 5.0%
Ghana 3.1%

1-5
Inabsolute terms, U.S. merchandise sectors with large export increases toSSA in2003included transportation equipment (up by $407.9 million or by 21.7 percent),agricultural products (up by $166.6 million or by 17.9 percent), and electronicproducts (up by $140.8 million or by 22.1 percent). Only U.S. exports ofenergy-related products (down by $27.0 million or by 14.0 percent) and specialprovisions6 (down by $21.9 million or by 7.6 percent) decreased. Figure 1-5 presentsU.S. export growth rates by commodity sector for 2002-03; table 1-1 provides data onU.S.-SSA exports, imports, and merchandise trade balance by major commoditysectors for 1999-2003; and table 1-2 shows the major U.S. commodity exports to SSAat the 6-digit level of the Harmonized Tariff Schedule (HTS) for the same period.
U.S. Merchandise Imports7
Figure 1-6 shows U.S. imports from SSA by major trading partner. In 2003, Nigeriaremained the largest supplier of U.S. imports from SSA, with $10.1 billion in sales(primarily crude petroleum) to the United States, representing 39.7 percent of U.S.imports from the region. South Africa ranked second, with $4.9 billion in sales and a19.2-percent share. Third was Angola, with $4.2 billion in sales, representing a16.4-percent share. U.S. imports from Gabon totaled $1.9 billion, and imports fromEquatorial Guinea were approximately $918.5 million. For additional data, seeappendix B, table B-3.
A total of 30 countries in SSA increased their sales to the United States in 2003,whereas the other 18 decreased their sales. The largest increases in U.S. imports in2003 were from Nigeria (up by $4.3 billion or by 73.8 percent), Angola (up by$945.2 million or by 29.3 percent), and South Africa (up by $652.0 million or by 15.4percent). The largest decreases in 2003 were from Ghana (down by $32.0 million orby 27.7 percent), and Zimbabwe (down by $32.5 million or by 32.7 percent).
U.S. imports of SSA energy-related products totaled $17.7 billion in 2003, andaccounted for 69.4 percent of all U.S. imports from the region (figure 1-7), up from$11.7 billion (64.3 percent) in 2002 primarily because of increased imports of crudepetroleum from Nigeria. The second-largest import commodity sector was mineralsand metals ($2.9 billion), which accounted for an 11.8-percent share in 2003,compared with a 14.9-percent share in 2002. Textiles and apparel ($1.6 billion)represented 6.1 percent of the total in 2003.
6 The “special provisions” sector represents a number of ad hoc categories of goods whosetreatment is set forth in HTS chapters 98 and 99. For SSA, the two largest categories are “U.S. goodsreturned without having been advanced in value or improved in condition while abroad” (HTS9801.00.10) and “estimated imports of low valued transactions” (HTS 9999.95.00).
7 See app. B, table B-2 for complete data listing by country and sector.

1-6
Figure 1-4U.S. exports to sub-Saharan Africa by commodity sectors, by shares,2003
Source: Compiled from official statistics of the U.S. Department of Commerce.
Other 16.1%
Machinery 10.7%
Electronic products 11.7%
Transportationequipment34.3%
Chemicals and related products 10.8%Agriculture 16.5%
--20 --10 0 10 20 30
Percent
Source: Compiled from official statistics of the U.S.Department of Commerce.
Miscellaneous manufactures
Transportation equipment
Footwear
Agricultural products
Forest produts
Machinery
Textiles and apparel
Chemicals and related products
Minerals and metals
Special provisions
Energy-related products
Total exports
Figure 1-5U.S. exports to sub-Saharan Africa: Annual growth rate, by commoditysectors, 2002-03

1-7
Table 1-1Sub-Saharan Africa: U.S. exports of domestic merchandise, imports for consumption,and merchandise trade balance, by major commodity sectors, 1999-20031
(Thousand dollars)Sector 1999 2000 2001 2002 2003
U.S. exports of domestic merchandise:Agricultural products . . 727,753 768,773 657,105 932,923 1,099,524Forest products . . . . . . . 154,984 158,992 147,568 119,775 135,137Chemicals and related
products . . . . . . . . . . 610,074 709,665 779,700 699,251 716,527Energy-related
products . . . . . . . . . . 150,167 157,501 149,189 193,098 166,078Textiles and apparel . . . 146,319 136,098 130,527 124,419 130,687Footwear . . . . . . . . . . . 16,736 14,183 10,114 12,630 15,167Minerals and metals . . . 221,514 218,889 250,059 265,172 268,525Machinery . . . . . . . . . . 527,463 560,731 669,414 671,827 714,357Transportation
equipment . . . . . . . . 1,695,035 1,795,702 2,856,218 1,876,597 2,284,489Electronic products . . . . 767,724 703,141 700,353 636,918 777,683Miscellaneous
manufactures . . . . . . 69,141 73,292 99,214 69,486 88,762Special provisions . . . . 244,786 266,317 300,703 289,663 267,777
Total . . . . . . . . . . . 5,331,697 5,563,285 6,750,164 5,891,760 6,664,711U.S. imports for consumption:
Agricultural products . . 832,665 874,843 835,736 911,645 1,137,866Forest products . . . . . . . 109,640 140,706 119,394 120,745 139,309Chemicals and related
products . . . . . . . . . . 849,130 1,453,521 659,999 448,054 598,217Energy-related
products . . . . . . . . . . 8,000,648 15,016,274 14,271,302 11,712,706 17,674,388Textiles and apparel . . . 621,955 789,240 997,995 1,136,316 1,552,021Footwear . . . . . . . . . . . 3,423 686 1,497 1,378 1,476Minerals and metals . . . 2,637,108 3,200,500 3,081,792 2,705,009 2,995,478Machinery . . . . . . . . . . 127,736 178,434 263,718 231,298 182,289Transportation
equipment . . . . . . . . 200,773 185,206 399,384 621,041 823,193Electronic products . . . . 56,393 58,339 52,706 49,697 66,302Miscellaneous
manufactures . . . . . . 99,488 97,422 108,558 117,551 123,429Special provisions . . . . 210,755 217,477 268,417 152,605 176,374
Total . . . . . . . . . . . 13,749,714 22,212,649 21,060,499 18,208,044 25,470,342U.S. merchandise trade balance:
Agricultural products . . (104,912) (106,070) (178,631) 21,278 (38,342)Forest products . . . . . . . 45,344 18,286 28,174 (971) (4,172)Chemicals and
related products . . . . (239,056) (743,856) 119,701 251,198 118,310Energy-related
products . . . . . . . . . . (7,850,481) (14,858,773) (14,122,113) (11,519,608) (17,508,310)Textiles and apparel . . . (475,636) (653,142) (867,468) (1,011,897) (1,421,334)Footwear . . . . . . . . . . . 13,314 13,497 8,617 11,252 13,690Minerals and metals . . . (2,415,594) (2,981,612) (2,831,734) (2,439,837) (2,726,953)Machinery . . . . . . . . . . 399,727 382,297 405,695 440,530 532,068Transportation
equipment . . . . . . . . 1,494,262 1,610,496 2,456,834 1,255,556 1,461,295Electronic products . . . . 711,331 644,802 647,646 587,221 711,381Miscellaneous
manufactures . . . . . . (30,348) (24,129) (9,343) (48,065) (34,667)Special provisions . . . . 34,031 48,840 32,285 137,058 91,403
Total . . . . . . . . . . . (8,418,018) (16,649,364) (14,310,335) (12,316,284) (18,805,632)1 Import values based on customs value; export values based on f.a.s. value, U.S. port of export.
Note.-Because of rounding, figures may not add to totals shown.Source: Compiled from official statistics of the U.S. Department of Commerce.

1-8
Table 1-2Sub-Saharan Africa: U.S. exports by major commodity items, 1999-2003
(Dollars)Schedule BNo. Description 1999 2000 2001 2002 20038431.43 Parts for boring or sinking machinery, nesoi . . . . . . . . . . . . . . . 275,529,016 302,866,705 454,715,848 587,386,603 609,743,5851001.90 Wheat (other than durum wheat), and meslin . . . . . . . . . . . . . . 250,978,937 300,270,976 287,165,536 360,313,981 493,963,9208802.40 Airplanes and other aircraft nesoi, of an unladen weight
exceeding 15,000 kg . . . . . . . . . . . . . . . . . . . . . . . . . . . . . . . 422,581,019 539,629,241 1,147,073,529 360,253,329 480,935,3169880.00 Estimate of non-Canadian low value export shipments;
compiled low value shipments to Canada; and shipments notidentified by kind to Canada . . . . . . . . . . . . . . . . . . . . . . . . . 170,295,762 182,989,298 229,079,132 188,334,269 193,725,092
8703.23 Passenger motor vehicles with spark-ignition internalcombustion reciprocating piston engine, cylinder capacityover 1,500 cc but not over 3,000 cc . . . . . . . . . . . . . . . . . . . . 32,432,411 38,974,540 120,942,312 99,837,024 134,040,274
8802.30 Airplanes and other aircraft nesoi, of an unladen weightexceeding 2,000 kg but not exceeding 15,000 kg . . . . . . . . . 126,941,978 79,701,250 72,176,955 96,561,979 123,704,004
8803.30 Parts of airplanes or helicopters, nesoi . . . . . . . . . . . . . . . . . . . 133,636,982 127,299,144 94,188,886 94,134,214 109,396,0358473.30 Parts and accessories for automatic data processing machines
and units thereof, magnetic or optical readers, transcribingmachines, etc., nesoi . . . . . . . . . . . . . . . . . . . . . . . . . . . . . . . 83,915,736 70,864,522 61,677,829 60,062,716 79,892,655
8479.89 Machines and mechanical appliances having individualfunctions, nesoi . . . . . . . . . . . . . . . . . . . . . . . . . . . . . . . . . . . . 24,121,242 36,741,319 36,425,071 33,449,889 71,179,548
2713.12 Petroleum coke, calcined . . . . . . . . . . . . . . . . . . . . . . . . . . . . . . 58,529,148 58,276,265 65,273,651 80,256,428 69,622,5841006.30 Rice, semi-milled or wholly milled, whether or not polished or
glazed . . . . . . . . . . . . . . . . . . . . . . . . . . . . . . . . . . . . . . . . . . 66,826,292 53,468,799 47,107,455 54,017,473 68,068,6688525.20 Transmission apparatus incorporating reception apparatus for
radiotelephony, radiotelegraphy, radio broadcasting ortelevision . . . . . . . . . . . . . . . . . . . . . . . . . . . . . . . . . . . . . . . . 51,256,427 49,111,582 57,064,271 35,857,461 61,610,005
8704.10 Dumpers (dump trucks) designed for off-highway use . . . . . . . . 34,551,607 33,802,382 58,235,525 47,991,522 60,490,2916309.00 Worn clothing and other worn textile articles . . . . . . . . . . . . . . 67,197,046 60,404,283 61,652,761 58,550,750 59,303,8170207.14 Chicken cuts and edible offal (including livers) frozen . . . . . . . . 18,047,189 30,226,265 30,480,808 39,557,285 56,288,0548431.49 Parts and attachments, nesoi, for derricks, cranes, self-
propelled bulldozers, graders etc. and other grading,scraping, etc. machinery . . . . . . . . . . . . . . . . . . . . . . . . . . . . 42,965,382 41,368,008 50,541,811 44,433,259 52,556,856

1-9
Table 1-2—ContinuedSub-Saharan Africa: U.S. exports by major commodity items, 1999-2003
(Dollars)Schedule BNo. Description 1999 2000 2001 2002 2003
8701.20 Road tractors for semi-trailers . . . . . . . . . . . . . . . . . . . . . . . . . . 22,563,549 30,751,285 30,591,017 14,933,330 46,397,5428708.99 Parts and accessories for motor vehicles, nesoi . . . . . . . . . . . . . 39,465,301 89,422,963 206,131,715 35,138,481 45,928,3031901.90 Malt extract; food products of flour, meal, etc. with cocoa
(if any) under 40% and milk or cream products with cocoa(if any) under 50%, nesoi . . . . . . . . . . . . . . . . . . . . . . . . . . . . 10,510,181 21,151,923 17,078,629 13,920,915 45,897,269
8802.12 Helicopters of an unladen weight exceeding 2,000 kg . . . . . . . 4,180,000 0 11,863,690 150,000 43,031,889
8704.22 Motor vehicles for goods transport nesoi, with compression-ignition internal combustion piston engine (diesel), gvwover 5 but not over 20 metric tons . . . . . . . . . . . . . . . . . . . . . 21,898,625 18,383,732 17,532,064 18,250,473 41,844,734
8401.30 Fuel elements (cartridges), non-irradiated, for nuclear reactors,and parts thereof . . . . . . . . . . . . . . . . . . . . . . . . . . . . . . . . . . 8,702 0 23,496,871 34,765,794 40,760,650
8701.90 Tractors, nesoi . . . . . . . . . . . . . . . . . . . . . . . . . . . . . . . . . . . . . . 15,052,864 18,557,284 15,788,873 25,765,741 39,424,6338703.33 Passenger motor vehicles with compression-ignition internal
combustion piston engine (diesel), cylinder capacity over2,500 cc . . . . . . . . . . . . . . . . . . . . . . . . . . . . . . . . . . . . . . . . . 1,221,793 362,738 9,654,378 23,173,427 38,418,280
3100.00 Fertilizers (exports only; includes crude fertilizers from otherareas) . . . . . . . . . . . . . . . . . . . . . . . . . . . . . . . . . . . . . . . . . . 47,245,848 42,599,378 49,930,451 35,550,193 38,023,699
Subtotal . . . . . . . . . . . . . . . . . . . . . . . . . . . . . . . . . . . . . . . . 2,021,953,037 2,227,223,882 3,255,869,068 2,442,646,536 3,104,247,703All other . . . . . . . . . . . . . . . . . . . . . . . . . . . . . . . . . . . . . . . . . 3,309,743,670 3,336,060,651 3,494,295,167 3,449,113,335 3,560,463,091
Total . . . . . . . . . . . . . . . . . . . . . . . . . . . . . . . . . . . . . . . . . .5,331,696,707 5,563,284,533 6,750,164,235 5,891,759,871 6,664,710,794
Note.—Because of rounding, figures may not add to totals shown. The abbreviation “nesoi” stands for “not elsewhere specified or included.”Note. Because of rounding, figures may not add to totals shown. The abbreviation nesoi stands for not elsewhere specified or included.Source: Compiled from official statistics of the U.S. Department of Commerce.

1-10
Figure 1-6U.S. imports from sub-Saharan Africa by trading partners, by shares,2003
Source: Compiled from official statistics of the U.S. Department of Commerce.
Other 11.6%
Gabon 7.6%
Angola 16.4%
Nigeria 39.7%
South Africa 19.2%
Cote d’lvoire 1.9%
Equatorial Guinea 3.6%
Figure 1-7U.S. imports from sub-Saharan Africa by commodity sectors, by shares,2003
Source: Compiled from official statistics of the U.S. Department of Commerce.
Other 2.7%
Agricultural products 4.5%
Textiles and apparel 6.1%
Energy-related products 69.4%
Minerals and metals 11.8%
Transportation equipment 3.2%
Chemicals and related products 2.3%

1-11
In absolute terms, significant increases in U.S. imports from the region were recordedfor energy-related products (up by $6.0 billion or by 50.9 percent), textiles andapparel (up by $415.7 million or by 36.6 percent), agricultural products (up by$226.2 million or by 24.8 percent), and transportation equipment (up by $202.2million or by 32.6 percent). The only decrease in U.S. imports from SSA in 2003 was inthe machinery sector (down by $49.0 million or by 21.2 percent). Table 1-3 showsmajor U.S. commodity imports from SSA at the HTS six-digit level for 1999-2003.Growth rates by commodity sectors are shown in figure 1-8.
Merchandise Trade Balance8
In 2003, the U.S. merchandise trade deficit with SSA increased by $6.5billion to$18.8billion, compared with deficits of $12.3 billion in 2002 and $14.3 billion in 2001.Excluding energy-related products, the U.S. trade deficit with the region increased by$500.7 million, from $796.7 million in 2002 to $1.3 billion in 2003.
The SSA country with which the United States had the largest trade deficit in 2003remained Nigeria, at $9.1 billion, up from $4.8 billion in 2002; followed by Angola($3.7 billion, up from $2.9 billion in 2002); South Africa ($2.2 billion, up from $1.8billion in 2002); and Gabon ($1.8 billion, up from $1.6 billion in 2002). The UnitedStates had trade surpluses with many SSA countries, including Ethiopia ($376.9million), Ghana ($120.8 million), Senegal ($94.6 million), and Mozambique ($53.6million).
On a sectoral basis, the largest U.S. trade deficit with SSA occurred in energy-relatedproducts, with a deficit of $17.5 billion, up from $11.5 billion in 2002. Second wasminerals and metals, with a deficit of $2.7 billion, compared to $2.4 billion in 2002.The U.S. trade deficit in textiles and apparel increased to $1.4 billion in 2003, from$1.0 billion in 2002. Several sectors exhibited a U.S. trade surplus with the region. TheU.S. surplus in transportation equipment was $1.5 billion, up from $1.3 billion in 2002.Electronic products registered a $711.4-million surplus, up from $587.2 million in2002. Other significant U.S. trade surpluses were in machinery products ($532.1million) and chemicals and related products ($118.3 million).
8 See app. B, table B-2 for complete data listing by country and sector.

1-12
Table 1-3Sub-Saharan Africa: U.S. imports by major commodity items, 1999-2003
(Dollars)HTS Description 1999 2000 2001 2002 20032709.00 Petroleum oils and oils from bituminous minerals, crude . . . . . . 5,001,603,197 8,723,257,287 11,763,116,582 10,770,214,844 16,387,595,8637110.11 Platinum, unwrought or in powder form . . . . . . . . . . . . . . . . . . 548,919,598 744,737,163 802,297,889 716,695,235 954,806,6672710.19 Petroleum oils & oils (not light) from bituminous minerals or
preps nesoi 70%+ by wt. from petroleum oils or bitum. . . . . . 28,862,683 83,101,215 79,507,811 589,777,993 619,408,3687102.31 Diamonds, nonindustrial, unworked or simply sawn,
cleaved or bruted . . . . . . . . . . . . . . . . . . . . . . . . . . . . . . . . . . 284,056,284 272,590,846 339,710,363 433,827,817 542,088,4121801.00 Cocoa beans, whole or broken, raw or roasted . . . . . . . . . . . . 296,213,426 270,307,532 246,750,210 265,683,220 383,057,8096204.62 Women’s or girls’ trousers, bib and brace overalls,
breeches and shorts of cotton, not knitted or crocheted . . . . . 111,721,076 116,430,404 195,983,989 205,269,218 340,233,1258703.23 Passenger motor vehicles with spark-ignition internal
combustion reciprocating piston engine, cylinder capacityover 1,500 cc but not over 3,000 cc . . . . . . . . . . . . . . . . . . . . 11,545 22,245,447 54,427 339,059,452 320,893,588
8703.24 Passenger motor vehicles with spark-ignition internalcombustion reciprocating piston engine, cylinder capacityover 3,000 cc . . . . . . . . . . . . . . . . . . . . . . . . . . . . . . . . . . . . . 82,066 1,022,134 255,636,991 132,831,189 303,861,811
6110.20 Sweaters, pullovers, sweatshirts, vests and similar articlesof cotton, knitted or crocheted . . . . . . . . . . . . . . . . . . . . . . . . 90,608,399 139,655,644 214,516,754 241,858,340 299,756,819
6203.42 Men’s or boys’ trousers, bib and brace overalls, breechesand shorts of cotton, not knitted or crocheted . . . . . . . . . . . . . 153,515,459 192,883,121 202,121,753 209,241,787 260,068,660
2711.11 Natural gas, liquefied . . . . . . . . . . . . . . . . . . . . . . . . . . . . . . . . 6,809 41,071,084 176,129,032 21,466,849 228,227,7980905.00 Vanilla beans . . . . . . . . . . . . . . . . . . . . . . . . . . . . . . . . . . . . . . 19,950,548 32,746,566 90,245,008 125,531,900 202,210,0982710.11 Light oils and preparations from petroleum oils & oils from
bituminous min. or preps 70%+ by wt. from petro. oilsor bitum . . . . . . . . . . . . . . . . . . . . . . . . . . . . . . . . . . . . . . . . . 27,540,036 91,499,457 85,131,841 75,276,354 201,514,874
7110.21 Palladium, unwrought or in powder form . . . . . . . . . . . . . . . . . 277,486,130 409,020,685 403,801,756 261,567,623 168,655,7777102.39 Diamonds, nonindustrial, worked, including polished or
drilled . . . . . . . . . . . . . . . . . . . . . . . . . . . . . . . . . . . . . . . . . . . 83,240,870 150,116,206 169,989,767 140,229,977 165,429,6209801.00 Imports of articles exported and returned, not advanced in
value or condition; imports of animals exported andreturned within 8 months . . . . . . . . . . . . . . . . . . . . . . . . . . . . 194,089,224 194,542,730 238,519,496 129,938,954 149,656,011
2620.99 Ash and residues (other than from the manufacture of ironor steel), containing metals or their compounds, nesoi . . . . . . 0 0 0 159,398,071 141,577,044
7110.31 Rhodium, unwrought or in powder form . . . . . . . . . . . . . . . . . . 116,393,462 252,476,583 217,579,069 125,506,256 102,645,2562905.11 Methanol (methyl alcohol) . . . . . . . . . . . . . . . . . . . . . . . . . . . . . 0 0 25,255,933 51,906,186 93,573,9797202.41 Ferrochromium, containing more than 4% (wt.) carbon . . . . . . . 104,030,754 121,185,776 57,821,989 45,103,258 84,433,3077606.12 Aluminum alloy rectangular (including square) plates,
sheets and strip, over 0.2 mm thick . . . . . . . . . . . . . . . . . . . . 9,997,112 44,760,229 56,293,882 70,723,927 79,888,8942901.29 Acyclic hydrocarbons, unsaturated, nesoi . . . . . . . . . . . . . . . . . 39,106,809 75,367,179 77,156,835 55,999,622 70,597,7936110.30 Sweaters, pullovers, sweatshirts, vests and similar articles
of manmade fibers, knitted or crocheted . . . . . . . . . . . . . . . . 10,961,052 14,410,254 23,574,038 41,885,287 64,506,6692401.20 Tobacco, partly or wholly stemmed/stripped 63,060,117 58,641,003 53,627,470 59,490,677 59,392,084

1-13
Table 1-3—ContinuedSub-Saharan Africa: U.S. imports by major commodity items, 1999-2003
(Dollars)HTS Description 1999 2000 2001 2002 2003
2614.00 Titanium ores and concentrates . . . . . . . . . . . . . . . . . . . . . . . . . . 51,959,802 58,468,622 61,110,160 57,450,989 58,045,706
Subtotal . . . . . . . . . . . . . . . . . . . . . . . . . . . . . . . . . . . . . . . . . 7,513,416,458 12,110,537,167 15,835,933,045 15,325,935,025 22,282,126,032
All other . . . . . . . . . . . . . . . . . . . . . . . . . . . . . . . . . . . . . . . . . . 6,236,297,961 10,102,111,716 5,224,566,127 2,882,108,712 3,188,216,356
Total . . . . . . . . . . . . . . . . . . . . . . . . . . . . . . . . . . . . . . . . . . . 13,749,714,419 22,212,648,883 21,060,499,172 18,208,043,737 25,470,342,388Note.—Because of rounding, figures may not add to totals shown. The abbreviation “nesoi” stands for “not elsewhere specified or included.”Source: Compiled from official statistics of the U S Department of CommerceSource: Compiled from official statistics of the U.S. Department of Commerce.

1-14
--40 --20 0 20 40 60
Percent
Source: Compiled from official statistics of the U.S.Department of Commerce.
Energy-related productsTextiles and apparel
Chemicals and related productsElectronic products
Transportation equipmentAgricultural products
Special provisionsForest products
Minerals and metalsFootwear
Miscellaneous manufacturesMachinery
Total imports
Figure 1-8U.S. imports from sub-Saharan Africa: Annual growth rate, bycommodity, 2002-03
U.S.-Africa Services Trade9
The United States recorded a cross-border services trade surplus with Africa of $2.2billion in 2002 (figure 1-9),10 reflecting U.S. cross-border services exports of $4.8billion, and cross-border imports of $2.5 billion. Following steady growth inU.S.-Africa services trade during 1997-2001, U.S. services imports and exports toAfrica fell by 12.1 percent and 5.7 percent, respectively, in 2002. Declines largelyreflected sharply reduced tourism and passenger transport trade. Despite the declinein tourism, the industry continued to account for the largest share of U.S. cross-borderservice exports toAfrica in2002, followed bybusiness services, education, and freighttransport and port services (table 1-4).11 Tourism generated $1.1 billion in U.S. exportsin 2002, or 23.3 percent of all U.S. exports of services to Africa.
9 Services are provided to foreign consumers through cross-border trade and affiliate transactions.Cross-border sales of services occur when a service, or the providers or purchasers of a service, crossnational borders. When a service provider establishes a commercial presence (an affiliate) in a foreignmarket, sales are recorded as affiliate transactions.
10 Data regarding cross-border services trade with the African continent are available through2002. There are no data specific to the SSA region, or to individual countries other than South Africa.
11 USDOC, BEA, Survey of Current Business, Oct. 2003, pp. 80-101, and Nov. 2001, pp. 66-77.

1-15
1
2
3
4
5
6
1999 2000 2001 2002
Billion dollars U.S. exportsU.S. importsTrade balance
Figure 1-9U.S. cross-border trade in services with Africa: Exports, imports, andtrade balance, 1999-2002
Source: U.S. Department of Commerce, Bureau of Economic Analysis, Survey ofCurrent Business, Oct. 2003, pp. 80-81.
Table 1-4Total Africa and South Africa: U.S. cross-border services exports, 1997 and 2002
Africa South Africa
Service 1997 2002
Averageannualgrowth 1997 2002
Averageannualgrowth
(Million dollars) (Percent) (Million dollars) (Percent)Business1 . . . . . . . . . . . . . . . . . . . . . . 825 991 3.7 117 178 8.8Education . . . . . . . . . . . . . . . . . . . . . 400 826 15.6 36 55 8.8Financial services . . . . . . . . . . . . . . . . 128 143 2.2 27 58 16.5Freight transport and port services . . 389 562 7.6 132 121 -1.7Insurance2 . . . . . . . . . . . . . . . . . . . . . 7 14 14.9 4 3 -5.6Passenger transport . . . . . . . . . . . . . . 65 19 -21.8 0 9 (3)Royalties and license fees . . . . . . . . . 232 305 5.6 160 196 4.1Telecommunications . . . . . . . . . . . . . . 143 158 2.0 60 57 -1.0Tourism . . . . . . . . . . . . . . . . . . . . . . . 1,054 1,114 1.1 370 248 -7.7Other4 . . . . . . . . . . . . . . . . . . . . . . . . 238 639 21.8 88 205 18.4
Total5 . . . . . . . . . . . . . . . . . . . . . . . 3,481 4,771 6.5 994 1,130 2.41 Data also reflect professional and technical services.2 Insurance exports are defined as the difference between premiums received from foreign policy-holders and
claims collected by foreign policy-holders.3 Not a meaningful number.4 Includes intracorporate transactions, i.e., U.S. parent firms’ receipts from foreign-based affiliates, and
U.S.-based affiliates’ receipts from foreign parent firms. Large shares of these receipts are in exchange for financial,computer and information, and transportation services. Also includes expenditures of foreign governments andinternational organizations in the United States, and expenditures of foreign residents employed temporarily in theUnited States.
5 Due to rounding or suppression of individual company data, figures may not add to totals shown.Source: U.S. Department of Commerce, Bureau of Economic Analysis, Survey of Current Business, Oct. 2003,pp. 80-101, and Nov. 2001, pp. 66-77.

1-16
Tourism also figured prominently among imports, accounting for $1.0 billion or 41.2percent of U.S. service imports from Africa (table 1-5). Passenger fares, businessservices, and freight transport and port services accounted for significant shares ofU.S. imports from Africa as well, representing 17.9 percent, 14.5 percent, and 8.5percent, respectively, of total services imports from Africa in 2002.
South Africa remained the largest U.S. services trading partner in Africa in 2002,accounting for 23.7 percent of U.S. exports to and 30.7 percent of U.S. imports fromthe continent. Tourism accounted for the largest share of U.S. cross-border exports toSouth Africa (21.9 percent), followed by royalties and license fees (17.3 percent), andbusiness services (15.8 percent). Financial services registered the most rapid growthrate of U.S. cross-border services exports to South Africa during 1997-2002,increasing 16.5 percent on an average annual basis, compared to 2.4 percent for allservice exports. The largest component of U.S. cross-border service imports fromSouth Africa was tourism services (32.0 percent), followed by passenger transport(29.0 percent). Business services registered the fastest growth, with average annualgrowth of 39.4 percent during 1997-2002, compared to 1.5-percent average annualgrowth for all services imports.12
In 2001, majority-owned affiliates of U.S. firms in Africa recorded sales of servicestotaling $3.3 billion. In South Africa, such firms recorded sales of $1.1 billion, or 34.6percent of total sales of services. Data on purchases from African-owned affiliatesoperating in the United States, as well as South African-owned affiliates, are notpublicly available for 2001, the data having been suppressed or withheld to avoiddisclosure of individual company information.13
12 USDOC, BEA, Survey of Current Business, Oct. 2003, pp. 80-101, and Nov. 2001, pp. 66-77.13 Ibid., p. 114.

1-17
Box 1-1Services Trade in Sub-Saharan Africa, SelectedInvestmentsIn 2002, trade in services accounted for more than 20 percent of total merchandiseand services trade with SSA. As a net exporter of energy, the petroleum sector remainsone of the largest in SSA, resulting in investment opportunities for foreign serviceproviders, particularly in the areas of construction services and pipeline transportservices. Firms may construct oil or natural gas pipelines, or facilities where gas istreated and compressed for transport. In addition, they may manage the pipelinetransport of petroleum products. For example, an international consortium consistingof ExxonMobil (U.S.), Petronas (Malaysia), and Chevron Texaco (U.S.) investedapproximately $3.5 billion in the Chad-Cameroon Development Project. Incooperation with the Governments of Chad and Cameroon, and the World Bank, theconsortium developed oil fields in the Doba regionofChad, and constructed a pipelineto the coast of Cameroon.14 The project came online in October 2003, and is expectedto produce approximately 1 billion barrels of oil during its 25-30 year expected lifespan. ExxonMobil has the largest equity stake in the project with 40 percent, andPetronas and Chevron Texaco have 35 percent and 25 percent, respectively.ExxonMobil (EssoChad) is the operator.15 Since coming online, the project hasexported 50 million barrels of oil, resulting in royalties of $109 million for Chad.16
Similar investments include Sasol Limite Group’s (South Africa) $80-million investmentin Mozambique’s petroleum industry in 2003, which created two wholly SouthAfrican-owned firms: Sasol Petroleum Temane Limitada and Mozambique PipelineInvestment Company Ltd. These firms will develop the Temane and Pande gas fields,and build a treatment plant and pipeline to South Africa.17
Trade liberalization and privatization have also resulted in various investmentopportunities. Privatization of state-owned service providers, such astelecommunications firms, utilities, and banks, has increased as countries arebecoming unable or unwilling tomanage debt-ridden firms in light of declining foreignaid and new economic policies.18 For example, in 2001, Tanzania sold Tanzania
14 The World Bank Group, “The Chad-Cameroon Petroleum Development and Pipeline Project:Project Overview,” Apr. 10, 2003, found at Internet addresshttp://www.worldbank.org/afr/ccproj/project/pro_overview.htm/, retrieved July 20, 2004.
15 EssoChad, “ExxonMobile Announces Change of Consortium,” Apr. 3, 2000, found at Internetaddresshttp://www.essochad.com/Chad/Library/News./Chad_NW_030400.asp/, retrieved Aug. 9, 2004;and EssoChad, “Chad/Cameroon Development Project - News Media Fact Sheet,” Oct. 2003, found atInternet address http://www.essochad.com/, retrieved Aug. 9, 2004.
16 EssoChad, “Chad/Cameroon Development Project, Report No. 16, Third Quarter 2004,” foundat Internet address http://www.essochad.com/Chad/Files/Chad/16_allchapters.pdf/, retrievedNov. 21, 2004.
17 MIGA, 2003 Annual Report, “Guarantee Activities: Sub-Saharan Africa,” found at Internetaddress http://www.miga.org/screens/pubs/annrep03/regions.htm#5/, retrieved July 20, 2004.

1-18
Box 1-1Services Trade in Sub-Saharan Africa, SelectedInvestments—ContinuedTelecommunications Corporation Ltd. to Detecom (Germany) and MSI(Netherlands).19 By 2000, Cameroon had privatized all of its banks and insurancecompanies.20 In 2000, the International Finance Corporation, Enterprise InsuranceCompany (Ghana), and African Life Assurance Company (South Africa) established ajoint venture creating Enterprise Life Assurance Company in Ghana.21 In addition,Telenor Management Partners (Norway) contracted to manage Ghana Telecom in2003,22 and the Uganda Communications Commission stated its intention to open thecountry’s fixed line market duopoly to full competition by the end of 2005.23
18 The World Bank Group, “Privatization in Sub-Saharan Africa: Regional Fact Sheet,” found atInternet address http://www.ipanet.net/documents/worldbank/databases/plink/factshe.../, retrievedJuly 20, 2004.
19 Privatization Link, “Privatization in Tanzania, Country Fact Sheet,” found at Internet addresshttp://www.ipanet.net/documents/WorldBank/databases/plink/factsheets/tanzania.htm/, retrievedAug. 10, 2004.
20 Ibid.21 Ghana Homepage, “Enterprise Insurance in Joint Venture,” Nov. 1, 2000, found at Internet
address http://www.ghanaweb.com/GhanaHomePage/economy/artikel.php?ID=11798/, retrievedAug. 10, 2004; and The World Bank Group, World Bank Brief, “Africa: A Regional Perspective,”Apr. 2002, found at Internet address http://www.worldbank.org/afr/africabrief.pdf/, retrieved July20, 2004.
22 “GT Announces Major Network Expansion to Compete on International Stage,” CommunicationsUpdate, June 25, 2004, found at Internet address http://www.primetrica.com, retrieved July 28, 2004.
23 “Wireline Duopoly to End Next Year,” Communications Update, July 20, 2004, found at Internetaddress http://www.primetrica.com, retrieved July 20, 2004.

1-19
Table 1-5Total Africa and South Africa: U.S. cross-border services imports, 1997 and 2002
Africa South Africa
Service 1997 2002
Averageannualgrowth 1997 2002
Averageannualgrowth
(Million dollars) (Percent) (Million dollars) (Percent)Business1 . . . . . . . . . . . . . . . . . . . . . . . 171 368 16.6 21 111 39.4Education . . . . . . . . . . . . . . . . . . . . . . 33 62 13.4 4 15 30.3Financial services . . . . . . . . . . . . . . . . . 37 29 -4.8 9 19 16.1Freight transport and port services . . . 147 217 8.1 29 51 12.0Insurance2 . . . . . . . . . . . . . . . . . . . . . . 5 0 (3) -1 0 (3)Passenger transport . . . . . . . . . . . . . . . 435 455 0.9 239 227 -1.0Royalties and license fees . . . . . . . . . . 18 9 -12.9 12 4 -19.7Telecommunications . . . . . . . . . . . . . . . 345 161 -14.1 54 16 -21.6Tourism . . . . . . . . . . . . . . . . . . . . . . . . 1,269 1,048 -3.8 272 250 -1.7Other4 . . . . . . . . . . . . . . . . . . . . . . . . . 90 197 17.0 87 89 0.5
Total5 . . . . . . . . . . . . . . . . . . . . . . . . 2,550 2,546 0.0 726 782 1.51 Data also reflect professional and technical services.2 Insurance imports are defined as the difference between premiums paid to foreign insurers and claims received
by U.S. policy-holders. Imports are entered as credits on the balance of payments when claims received by U.S. policy-holders exceed premiums paid to foreign insurers.
3 Not a meaningful number.4 Includes intracorporate transactions, i.e., U.S. parent firms’ payments to foreign-based affiliates, and U.S.-based
affiliates’ payments to foreign parent firms. Also includes earnings of foreign residents who are employed temporarilyin the United States.
5 Due to rounding or suppression of individual company data, figures may not add to totals shown.Source: U.S. Department of Commerce, Bureau of Economic Analysis, Survey of Current Business, Oct. 2003,pp. 80-101, and Nov. 2001, pp. 66-77.

1-20
Foreign Investment in Sub-Saharan Africa
Global Investment in Sub-Saharan AfricaIn 2003, SSA attracted an estimated $8.5 billion in new foreign direct investment (FDI)from all sources, an increase of 9.0 percent over the previous year (table 1-6). FDI as apercentage of GDP, however, declined slightly to 2.2 percent from 2.5 percent.Angola, Nigeria, and Sudan together accounted for approximately one-half of allinbound FDI to SSA, which was destined for new investment in the petroleum sector.24
Although the region attracted just 6.3 percent of total FDI to the world’s developingcountries in 2003, its share of FDI directed toward developing countries represents anincrease of 18.9 percent over the 2002 level.25 According to the World Bank, returnsfrom FDI in the SSA region were higher than anywhere else in the world in 2002, withU.S. investors in the region reporting average annual investment returns of 25percent,compared with 12 percent worldwide.26
Foreign portfolio investment flows to SSA measured $500 million in 2003, reversing a$400-million net outflow of portfolio investment flows in 2002,27 but fell well belowthe 1999 and 2000 levels of $9.0 billion and $4.1 billion, respectively. South Africa isthe only SSA country among the top 20 recipients of portfolio equity flows worldwide,and accounts for virtually all portfolio equity flows to the region.28 In 2003, theprivatization of Telecom SA Ltd. attracted $502 million in portfolio equity flows toSouth Africa, and a stock offering by Steinhoff International Holdings Ltd., a retail andconsumer products firm, attracted $156 million.29
The low level of FDI in SSA, compared with FDI in other developing country regions,reportedly reflects investor perceptions of the African investment climate, affected byconcerns regarding political crises and the HIV/AIDS pandemic.30 Investors have alsocited taxation, labor laws, and excessive regulation as factors that discourageinvestment in the region.31 South Africa, Angola, andTanzania were cited by investorsin one survey as the three most favorable destinations for FDI in SSA, with FDIprospects for Africa expected to improve between 2004 and 2007.32
24 World Bank, Global Development Finance 2004, vol. 1, p. 81.25 Ibid., pp. 184 and 198.26 “Funding the Technology Dream,” African Investor Magazine, Mar.-May 2002, p. 54.27 During 1999-2002, South Africa accounted for almost all portfolio equity inflows to SSA. It is
likely that this is also the case in 2003, but country-specific data for 2003 are not yet available. WorldBank, Global Development Finance 2004, vol. 2, p. 472.
28 World Bank, Global Development Finance 2004, vol. 1, pp. 91 and 184.29 Ibid., p. 101.30 “Funding the Technology Dream,” African Investor Magazine, Mar.-May 2002, p. 54.31 World Bank, Global Development Finance 2004, vol. 1, p. 30.32 UNCTAD, “New Take-Off Predicted for FDI,” press release, UNCTAD/PRESS/PR/2004/005,
Apr. 14, 2004, found at Internet address http://www.unctad.org/Templates/, retrieved July 2, 2004.

1-21
Table 1-6Global investment flows to sub-Saharan Africa and developing countries, 1999-2003Country/Region 1999 2000 2001 2002 2003 (est.)
Value (Billion dollars)SSA:
Net inward FDI . . . . . . . . . . . . . . . . . . . . . . . . . . . . 9.3 5.8 14.3 7.8 8.5
Net inward portfolio equity flows . . . . . . . . . . . . . . 9.0 4.1 -1.0 -0.4 0.5
Total . . . . . . . . . . . . . . . . . . . . . . . . . . . . . . . . . . 18.3 9.9 13.3 7.4 9.0
Developing countries:
Net inward FDI . . . . . . . . . . . . . . . . . . . . . . . . . . . . 181.7 162.2 175.0 147.1 135.2
Net inward portfolio equity flows . . . . . . . . . . . . . . 12.6 12.6 4.4 4.9 14.3
Total . . . . . . . . . . . . . . . . . . . . . . . . . . . . . . . . . . 194.3 174.8 179.4 152.0 149.5
Share of total (Percent)Share of SSA:
Net inward FDI . . . . . . . . . . . . . . . . . . . . . . . . . . . . 5.1 3.6 8.2 5.3 6.3
Net inward portfolio equity flows . . . . . . . . . . . . . . 71.4 32.5 -22.7 -8.2 3.5
Total . . . . . . . . . . . . . . . . . . . . . . . . . . . . . . . . . . 9.4 5.7 7.4 4.9 6.0
Source: The World Bank, Global Development Finance 2004, vol. 1: Analysis and Summary Tables, Washington, D.C.,2004, pp. 184 and 198.
U.S. Investment in Sub-Saharan AfricaNet U.S. direct investment flows to SSA measured $1.4 billion in 2003, which was lessthan 1 percent of total U.S. direct investment abroad (table 1-7). Equatorial Guinea,Nigeria, and Gabon, all petroleum-exporting countries, together accounted for 94percent of totalU.S. direct investment flows intoSSA. Investment flows intoSouthAfricatotaled $89 million in 2003.33 The continuation of positive flows of U.S. directinvestment into SSA yielded an increase of 37.2 percent in the U.S. direct investmentposition, which measured $11.4 billion in 2003 (table 1-8). South Africa accounted for$3.9 billion, or 34.4 percent of the overall U.S. direct investment position in SSA. Thefour largest petroleum-exporting countries, Angola, Equatorial Guinea, Gabon, andNigeria, together accounted for $6.2 billion, or 54.9 percent of the overall U.S. directinvestment position.34
Investment by Country and by SectorAccording to one survey of existing investors in SSA, the largest number of investmentsin the region originate with European parent companies, although new investmentfrom Europe has lagged behind new investment from African and Asian investors
33 USDOC, BEA, “U.S. Direct Investment Abroad: Country Detail for Selected Items,” found atInternet address http://www.bea.gov, retrieved July 26, 2004.
34 USDOC, BEA, “U.S. Direct Investment Abroad: Country Detail for Selected Items.”

1-22
Table 1-7U.S. direct investment abroad: Capital flows,1 1999-2003
(Million dollars)
Country/Region 1999 2000 2001 2002 2003
All countries . . . . . . . . . . . . . . . . . . 209,392 142,627 124,873 115,340 151,884
All SSA2 . . . . . . . . . . . . . . . . . . . . . 1,766 249 37 788 1,379Petroleum-exporting countries:
Equatorial Guinea . . . . . . . . . . . 261 -48 114 -462 823Nigeria . . . . . . . . . . . . . . . . . . . -524 137 -192 1,440 340
Gabon . . . . . . . . . . . . . . . . . . . 129 73 2 -42 139Angola . . . . . . . . . . . . . . . . . . . 443 79 342 120 39
Nonpetroleum-exportingcountries:South Africa . . . . . . . . . . . . . . . 1,155 346 -86 103 89
Cameroon . . . . . . . . . . . . . . . . . 94 -68 -120 -6 73Côte d’Ivoire . . . . . . . . . . . . . . . 8 -8 -64 40 34
Kenya . . . . . . . . . . . . . . . . . . . . 27 -19 (3) (3) 9Mauritius . . . . . . . . . . . . . . . . . . 12 -9 29 -121 -34
ROC . . . . . . . . . . . . . . . . . . . . . 97 -48 -8 5 -78Other . . . . . . . . . . . . . . . . . . . . 64 -186 22 -287 -551 Negative numbers indicate inflows of capital into the United States.2 Includes data for Libya, which could not be removed due to suppression of data.3 Suppressed to avoid disclosure of data for individual companies.
Source: USDOC, BEA, “U.S. Direct Investment Abroad: Country Detail for Selected Items,” found at Internet addresshttp://www.bea.gov, retrieved July 26, 2004.
Table 1-8U.S. direct investment position on a historical cost basis, 1999-2003
(Million dollars)
Country/Region 1999 2000 2001 2002 2003
All countries . . . . . . . . . . . . . . . . . . 1,215,960 1,316,247 1,460,352 1,601,414 1,788,911
All SSA1 . . . . . . . . . . . . . . . . . . . . . . 8,431 6,969 8,350 8,274 11,355Petroleum-exporting countries:
Nigeria . . . . . . . . . . . . . . . . . . . 233 470 260 1,753 2,082Equatorial Guinea . . . . . . . . . . . 1,249 1,144 2,316 1,127 1,949
Angola . . . . . . . . . . . . . . . . . . . 1,535 585 1,220 1,493 1,524Gabon . . . . . . . . . . . . . . . . . . . 469 546 555 528 680
Nonpetroleum-exportingcountries:South Africa . . . . . . . . . . . . . . . 3,474 3,562 3,070 3,366 3,902
Côte d’Ivoire . . . . . . . . . . . . . . . 206 194 136 194 237Cameroon . . . . . . . . . . . . . . . . . 313 257 148 135 217
Kenya . . . . . . . . . . . . . . . . . . . . 89 66 (2) 73 92ROC . . . . . . . . . . . . . . . . . . . . . 222 133 126 152 74
Mauritius . . . . . . . . . . . . . . . . . . 119 97 124 (3) -28Other . . . . . . . . . . . . . . . . . . . . 522 -85 399 -544 6261 Includes data for Libya, which could not be removed due to suppression of data.2 Not available.3 Less than $500,000 (+/-).
Source: USDOC, BEA, “U.S. Direct Investment Abroad: Country Detail for Selected Items,” found at Internet addresshttp://www.bea.gov, retrieved July 26, 2004.

1-23
since 2000.35 African companies, most notably South African, represent thesecond-largest source of investment in SSA. According to one estimate, since sanctionswere lifted in 1994, South African firms have invested approximately $1 billionannually, on average, in other African countries.36 In 2002, for example, SouthAfrican Airways paid $20 million for a 49-percent stake in Air Tanzania, and isexpected to invest an additional $410 million in the Tanzanian airline.37 Nigeria’sstate-owned oil company, NNPC, has alsoannounced plans to invest in oil explorationoutside of the country, with Angola, Gabon, and Equatorial Guinea cited as likelydestinations.38
In 2002, the primary sector39 accounted for 53 percent of all African inbound foreigndirect investment stock,40 followed by services with 29 percent, and manufacturingwith 19 percent.41 Primary sector investment is concentrated in petroleum, followed byagriculture. Service sector investment in SSA is wide ranging. In telecommunications,for example, Econet Wireless announced plans to invest approximately $100million inKenya’s third mobile phone company.42 Nigerian government officials haveestimated that investment in the country’s telecommunications industryhad reached$3billion in December 2003.43 In the tourism industry, IFA Hotels & Resorts announcedplans in 2003 to build luxury hotel and beach resorts in South Africa and Zanzibar,Tanzania.44 In the banking industry, Tanzania, Zambia, and Kenya all have plans toprivatize their national banks, which are expected to draw millions of dollars inforeign investment. Standard Chartered and HSBC, two of the world’s largest privatecommercial banks, have also recently opened new branches focused on commerciallending in South Africa, with a view to funding new investment throughout the SSAregion.45
35 UNIDO, “Africa Foreign Investor Survey 2003,” p. 17, found at Internet addresshttp://www.unido.org, retrieved May 2004.
36 “Opportunities, Mostly Missed,” The Economist, Jan. 17, 2004, p. 11, found at Internet addresshttp://web5.epnet.com/, retrieved July 16, 2004.
37 Economist Intelligence Unite (EIU), “What’s New in Your Industry,” Business Africa, Oct. 16th-31st,2002, p. 10.
38 “Nigerian Oil Giant Plans to Buy Oil Blocs,” Business Day (Johannesburg), found at Internetaddress http://www.bday.co/za/bday/content/direct/1,3523,1657513-6078-0,00.html, retrievedJuly 14, 2004.
39 Primary sector includes agriculture and extractive industries.40 Separate data for SSA were not available.41 World Bank, Global Development Finance 2004, vol. 1, p. 82.42 “Econet Increases Stake in Kenya,” Emerging Markets Economy, Jan. 21, 2004, found at Internet
address http://web5.epnet.com/, retrieved July 16, 2004.43 Cletus Akwaya, “$3BN Invested in Telecoms, Says Adebayo,” This Day (Lagos), May 18, 2004,
found at Internet address http://allafrica.com/stories/printable/200405180230.html, retrievedJuly 22, 2004.
44 “IFA Aims High with Major Growth Plan,” Hotels, June 2004, p. 18, found at Internet addresshttp://web5.epnet.com/, retrieved July 17, 2004.
45 Philip Moore, “Setting Standards for Africa,” Euromoney, May 2004, p. 140, found at Internetaddress http://web5.epnet.com/, retrieved July 16, 2004.

1-24
Most manufacturing sector investment in SSA is aimed at production for the localmarket, rather than for export. This situation is beginning to change, however, in largepart because of the U.S. AGOA legislation passed in 2000,46 which reduces barriersto U.S. imports from a number of African countries.47 In the apparel sector, forexample, investors from Mauritius, Germany, and Pakistan have invested in textileand footwear manufacturing for export from Mozambique.48 In the agro-processingsector, export opportunities linked to foreign investment exist in seafood canning andfreezing. Several agricultural crops also present investment opportunities linked toexports, including peanuts in Senegal, andcotton, citrus, and tea inMozambique.49 InGhana, the government removed the state monopoly on cocoa production in 1999, amain export industry, which has drawn investment from at least one Swiss company.50
Investment Agreements Between Sub-Saharan AfricanCountries and Foreign Investment PartnersPotential foreign investors cite trade agreements as an important consideration in theirchoice of investment destination.51 A number of free trade agreements (FTAs), as wellas trade initiatives such as AGOA, have helped to create investment opportunities forexport-oriented industries.52 Consistent with the high level of European directinvestment in SSA, European countries have concluded the largest number of bilateralinvestment treaties (BITs) with SSA countries (table 1-9). For instance, Germany,Switzerland, and the Netherlands have concluded 33, 25, and 18 BITs, respectively,with SSA countries. By contrast, the United States has concluded BITs with only 4 SSAcountries, and Japan has not concluded any such agreements. SSA countries haveconcluded 34 BITs with other SSA countries.53 The lackofa BIT canact as adisincentiveto foreign investment, as these treaties provide a framework of investment regulationsand protections of investor rights. Establishment of a BIT is particularly important indeveloping countries, where the legislative framework surrounding foreign investmentmay not be highly developed, and the investment climate is perceived to be unstable.The closer investment relationship between SSA and Europe likely reflects both thehistoric political and trading relationships and the geographic proximity of the tworegions.
46 UNIDO, “Africa Foreign Investor Survey 2003,” p. xix.47 Ibid., pp. 14-15.48 MIGA, “Shedding New Light on Africa’s Investment Opportunities,” p. 14, found at Internet
address http://www.ipanet.net/, retrieved July 12, 2004.49 Ibid., pp. 12-14.50 Ibid., p. 11.51 UNIDO, “Africa Foreign Investor Survey 2003,” p. xix.52 MIGA, “Shedding New Light on Africa’s Investment Opportunities,” p. 6.53 Compiled by the Commission based on data obtained from UNCTAD, found at Internet address
http://www.unctadxi.org/templates/DocSearch.aspx?id=779, retrieved Aug. 2, 2004.

1-25
Table 1-9Bilateral investment treaties with sub-Saharan Africa, by selected investment partnercountry, 2004
China France Germany Netherlands SwitzerlandUnited
KingdomUnitedStates
Angola . . . . . . . . . . . . . . . . XBenin . . . . . . . . . . . . . . . . . . X X X XBotswana . . . . . . . . . . . . . . X X XBurkina Faso . . . . . . . . . . . . X X XBurundi . . . . . . . . . . . . . . . . X XCameroon . . . . . . . . . . . . . . X X X X X XCape Verde . . . . . . . . . . . . X X XCentral African Republic . . . X XChad . . . . . . . . . . . . . . . . . . X XCôte d’Ivoire . . . . . . . . . . . . X X XDemocratic Republic of the
Congo . . . . . . . . . . . . . . .X X X X X
Djibouti . . . . . . . . . . . . . . . . X XEritrea . . . . . . . . . . . . . . . . . XEthiopia . . . . . . . . . . . . . . . . X X XEquatorial Guinea . . . . . . . . XGabon . . . . . . . . . . . . . . . . XThe Gambia . . . . . . . . . . . . X XGhana . . . . . . . . . . . . . . . . X X X X XGuinea . . . . . . . . . . . . . . . . X X XKenya . . . . . . . . . . . . . . . . . X XLesotho . . . . . . . . . . . . . . . . X XLiberia . . . . . . . . . . . . . . . . . X X XMadagascar . . . . . . . . . . . . X X XMali . . . . . . . . . . . . . . . . . . X XMauritania . . . . . . . . . . . . . X XMauritius . . . . . . . . . . . . . . . X XMozambique . . . . . . . . . . . . X XNamibia . . . . . . . . . . . . . . . X X X XNiger . . . . . . . . . . . . . . . . . X XNigeria . . . . . . . . . . . . . . . . X X X XRepublic of the Congo . . . . . na na na na na XRwanda . . . . . . . . . . . . . . . . XSenegal . . . . . . . . . . . . . . . . X X X X XSierra Leone . . . . . . . . . . . . XSomalia . . . . . . . . . . . . . . . . XSouth Africa . . . . . . . . . . . . X X X X XSudan . . . . . . . . . . . . . . . . . X X X XSwaziland . . . . . . . . . . . . . . X X XTogo . . . . . . . . . . . . . . . . . . X XUganda . . . . . . . . . . . . . . . . X X X X XZambia . . . . . . . . . . . . . . . . X X XZimbabwe . . . . . . . . . . . . . . X X X X
Note.—“na” = information not available in UNCTAD database.
Source: Compiled by the Commission using information obtained from the UNCTAD database on bilateral investmenttreaties, found at Internet address http://www.unctadXi.org/templates/DocSearch.aspX?id=779, retrieved Aug. 2,2004, and Export.gov, “Bilateral Investment Treaties,” found at Internet address http://www.tcc.mac.doc.gov, retrievedDec. 2004.

1-26
International Investment Initiatives Focused onSub-Saharan AfricaSeveral investment-related initiatives by multilateral organizations54 also act tofacilitate private sector investment. Under the New Partnership for AfricanDevelopment (NEPAD), African leaders are endeavoring to improve civil andcorporate governance and to enhance regulatory transparency and political stability,all important factors in attracting foreign investment and other types of assistance tothe region.55 A joint initiative between NEPAD and the International Chamber ofCommerce to promote private investment in SSA has resulted in Business for Africa, acoalitionof business organizations focused onboostingprivate sector investment in theregion. Business for Africa has launched a website (www.africaplc.com) that suppliescountry information and promotes dialogue among private sector investors, and isworking with NEPAD to stimulate investment flows to the region.56
The Multilateral Investment Guarantee Agency (MIGA), part of the World BankGroup,57 provides investment guarantees and political risk insurance to facilitateprivate sector investment in developing countries. Such investment guarantees can actas essential catalysts to foreign investment, particularly in developing countries wherethe risk of war or civil disturbance is an important deterrent. MIGA has madeconcerted efforts to increase its operations in Africa. The African share of MIGA’strade portfolio of guarantees was 17 percent in 2002, with MIGA providingguarantees for $793 million in African investments by the end of its 2002 fiscal year.MIGA’s highest exposure levels in the region are in Tanzania, Mozambique, Kenya,and Nigeria, which together account for 67 percent of its total African exposure.58
Political risk insurance is also available on the private insurance market, but often athigher rates that may be prohibitive for smaller investors; therefore, MIGA’sinvolvement fulfills a need that might otherwise not be met.
54 For further detail on the involvement of multilateral government organizations in Africa, seechapter 4 of this report.
55 See OECD, “The First Advisory Board Meeting of the OECD-Africa Investment Initiative forGrowth and Development,” DAFFE/IME/RD(2003)19, Sept. 16, 2003; and NEPAD Annual Report 2002,found at Internet address http://www.nepad.org/, retrieved July 16, 2004. For additional informationon NEPAD, see chapter 4 of this report.
56 Maria Livanos Cattaui, “Africa Aims to Blend into Global Economy,” Business Day (South Africa),Feb. 5, 2003, found at Internet address http://www.uscib.org/index.asp?DocumentID=2482, retrievedJune 23, 2004; and International Chamber of Commerce, “Business Counterpart to Africa’s NEPADDevelopment Initiative Launched,” Mar. 19, 2002.
57 See chapter 4 of this report for more information on the World Bank Group and MIGA.58 Separate data for SSA are not available. MIGA, “Shedding New Light on Africa’s Investment
Opportunities,” p. 15.

1-27
Because the lack of available information on the investment environment in SSAcountries is likely a deterrent to foreign investment, the UNDP is working with SSAcountries and Standard & Poor’s (S&P) to help the countries secure long-termsovereign ratings from the international ratings agency. As of June 2004, eight SSAcountries had been rated by S&P, with additional ratings expected soon.59 S&Pratings are widely used by investors to assess risk levels and to price bonds and othersovereign financial instruments. Theexistenceof the ratingshelps to integrate countriesinto the international financial markets, even if they do not immediately use them toissue bonds or other financial instruments.60
59 Benin, Burkina Faso, Cameroon, Ghana, Madagascar, and Mali have been rated as a result ofthe joint UNDP/S&P initiative. Senegal and South Africa had previously received S&P ratings. Kenya isamong the countries expected to be rated in the near future. “Sub-Saharan: Ratings Mark Progress,”Emerging Markets Monitor, June 7, 2004, p. 17, found at Internet address http://web5.epnet.com/,retrieved July 16, 2004.
60 Philip Moore, “Setting Standards for Africa.”


2-1
CHAPTER 2AGOA-Related Imports and Investment
This chapter provides information on U.S. trade with SSA beneficiaries of the AfricanGrowth and Opportunity Act (AGOA), including its GSP provisions. U.S. trade underAGOA is presented by major trading partner and commodity sector, as well as for theSSA region as a whole. Trade data were compiled from official statistics of the U.S.Department of Commerce. The chapter also discusses the AGOA legislation andrecent changes, as well as investment developments related to AGOA. Information onAGOA-related investment was obtained primarily from various publications, such asthe EIU Viewswire, and article databases, such as All Africa.com. AGOA-relatedinvestment examples represent reported information from the above-referencedsources, and are not Commission statements, opinions, or assessments.
African Growth and Opportunity Act
The African Growth and Opportunity Act was enacted in May 2000.1 The Actamended the GSP program and authorized the President to provide duty-free andquota-free treatment for certain African products until September 30, 2008, if, afterreceiving advice from the USITC, the President determines that such products are notimport sensitive. On August 2, 2002, President Bush signed the Trade Act of 2002,modifying certain provisions of AGOA and expanding preferential access for importsfrom SSA beneficiary countries.2 Table 2-1 lists the 37 SSA countries designated aseligible for AGOA trade preferences on December 31, 2003.3
On July 13, 2004, President Bush signed the AGOA Acceleration Act of 2004 (AGOAIII) into law (Public Law 108-274).4 AGOA III extends the overall program from 2008to 2015. A substantial focus of AGOA III relates to provisions regarding textile andapparel imports. AGOA III extended the regional fabric provision for 7 more years,
1 Trade and Development Act of 2000, Pub. L. 106-200, Title I, May 18, 2000, 114 Stat. 252.2 For additional information, see USITC, U.S. Trade and Investment With Sub-Saharan Africa, Third
Annual Report, USITC pub. 3552, chapter 2, pp. 19-21.3 Unless otherwise indicated, AGOA trade data include the 38 countries designated as eligible for
trade benefits during 2003 under general note 16 to the HTS. In December 2003, Angola became eligiblefor AGOA trade preferences, and Eritrea and the Central African Republic were removed from theeligibility list. For detailed information on AGOA eligibility requirements, see Internet addresshttp://www.agoa.gov/eligibility/country_eligibility.html.
4 “Summary of AGOA III,” found at Internet addresshttp://www.agoa.gov/agoa_legislation/agoa_legislation3.html, retrieved Aug. 19, 2004.

2-2
through September 30, 2015, and the third-country fabric provision for leastdeveloped beneficiary countries (LDBCs) for 3 more years, through September 30,2007. The extension of the LDBC third-country fabric provision was “considered bymany to be the most important feature” of AGOA III.5 The cap on duty-free benefits forLDBC apparel made with third-country fabrics will remain at 2.3571 percent of totalU.S. apparel imports in the 1-year period beginning October 1, 2003, rise to about 2.6percent and 2.9 percent in the first two 1-year periods of the extension, and thendecline by almost one-half to 1.6 percent in the third and final 1-year period. AGOA IIIreduced the cap on duty-free benefits for apparel of regional fabrics for the 1-yearperiod beginning on October 1, 2003, from 4.7931 percent to 4.747 percent of totalU.S. apparel imports; however, the cap will increase annually in equal increments to 7percent for the 1-year period beginning on October 1, 2007, and remain at that levelfor the duration of AGOA.
AGOA III amended the textile provisions of AGOA to grant duty-free benefits toapparel made with certain nonoriginating, or third-country, components (namely,collars, cuffs, drawstrings, waistbands, belts attached to garments, patches, strapsusing elastic, and padding and shoulder pads). This provision is in addition to anexisting AGOA rule that permits the use of third-country findings and trimmings (e.g.,zippers) if their value is not more than 25 percent of the cost of the components of thearticle. AGOA III also amended the textile provisions of AGOA to increase the deminimis level for nonoriginating, or third-country, fibers and yarns in apparel from the
Table 2-1Sub-Saharan African countries designated as beneficiary countries of AGOA as ofDecember 31, 2003Angola Guinea-Bissau São Tomé & PrincipeBenin Kenya SenegalBotswana Lesotho SeychellesCameroon Madagascar Sierra LeoneCape Verde Malawi South AfricaChad Mali SwazilandCôte d’Ivoire Mauritania TanzaniaDjibouti Mauritius UgandaDROC1 Mozambique ZambiaEthiopia NamibiaGabon NigerThe Gambia NigeriaGhana ROCGuinea Rwanda
1 On Dec. 31, 2002, DROC was added to the eligibility list with delayed implementation of AGOA duty-free tradebenefits. On Oct. 31, 2003, DROC was granted AGOA trade preferences.
Note.—Angola became eligible for trade preferences in Dec. 2003, effective 2004. Eritrea and the Central AfricanRepublic were designated as eligible for AGOA benefits during 2003, but removed from eligibility in 2004.Source: USDOC, “AGOA Eligibility: Country Eligibility,” found at Internet addresshttp://www.agoa.gov/eligibility/country_eligibility.html, retrieved Mar. 31, 2004.
5 U.S. House of Representatives, Committee on Ways and Means, AGOA Acceleration Act of 2004:Report to Accompany H.R. 4103, 108th Cong., 2nd sess., H. Rept. 108-501, p. 19.

2-3
original level of 7 percent to not more than 10 percent of the total weight of the article,which would provide AGOA countries with additional sourcing flexibility.6 AGOA IIIclarifies that AGOA duty-free benefits apply to apparel made in SSA from acombination of U.S. and AGOA fabrics or components. It also clarifies that AGOAbenefits apply to African ethnic printed fabric, even if made by machine, providedsuch fabric meets certain criteria. In addition, AGOA III extends duty-free benefitsretroactively to the date of enactment of AGOA on October 1, 2000, for apparelknit-to-shape in AGOA-eligible countries (the Trade Act of 2002 extended duty-freebenefits to such apparel, but only on a prospective basis).
AGOA III also expressed the sense ofCongress that the Executive Branch, including theBureau of Customs and Border Protection, the Committee for the Implementation ofTextile Agreements, and the U.S. Department of Commerce, should implement andenforce the textile and apparel provisions of AGOA “broadly to expand trade bymaximizing opportunities for imports of such articles” from eligible SSA countries.
Inaddition to the textile and apparel-related provisions, AGOA III mandates a numberof additional, trade-facilitating provisions.7 The legislation encourages SSA countriesto support international trade liberalization efforts, particularly WTO negotiations,and encourages the U.S. government and SSA countries to pursue U.S.-SSA bilateralinvestment agreements. AGOA III also addresses the need for increased tradecapacity-building by encouraging the development of infrastructure projects thatsupport the ecotourism industry. Further, the legislation mandates the promotion ofinfrastructure investment to improve and expand roads, railways, and ports. Thelegislation also identifies the expansion of information and communicationstechnology infrastructure in SSA as an important objective. The U.S. government isalso mandated to encourage the expansion of the agriculture sector in SSA countries.To reinforce the attainment of this goal, another legislation provision requires the U.S.government to assign personnel to SSA to provide assistance in increasing agricultureexports to the United States and to advise countries on meeting sanitary andphytosanitary standards. To further SSA countries’ access to the U.S.market, AGOA IIImandates increased coordination between U.S. and SSA customs services in order toreduce transit time and to increase efficiency and safety procedures.
AGOA ForumThe African Growth and Opportunity Act also established an annual U.S.-AfricaTrade and Economic Cooperation Forum (AGOA Forum). The AGOA Forum providesan opportunity for regular dialogue to strengthen the economic and political relationsbetween the United States and SSA. The inaugural meeting of the Forum was hosted by
6 U.S. House of Representatives, Committee on Ways and Means, AGOA Acceleration Act of 2004,p. 20.
7 “Summary of AGOA III.”

2-4
the Secretaries of State, Treasury, and Commerce, and the USTR on October 29-30,2001, in Washington, D.C. The second Forum was held from January 15-17, 2003, inMauritius. The USTR led the U.S. delegation of senior officials from the Departments ofCommerce, Treasury, Agriculture, and State. Trade, finance, and economic ministersfrom the 38 AGOA-eligible countries also participated, along with representativesfrom African regional organizations. The second AGOA Forum focused on trade,investment, and socio-economic development issues, including measures that theUnited States and SSA countries can jointly take to stimulate trade and investmentflows, to enhance democracy and good governance, and to combat HIV/AIDS.
AGOA mandates increased contact between senior-level officials of the United Statesand SSA governments. Accordingly, the third annual AGOA Forum took place onDecember 9, 2003. Ministers discussed how to strengthen AGOA, as well as marketaccess and regulatory issues. Forum workshops also addressed small- andmedium-enterprise financing in Africa, infrastructure development, initiatives to endhunger, and transportation security. In his opening remarks, Secretary of State ColinPowell indicated that President Bush had requested that the Congress extend AGOAbeyond 2008 to support long-term investments in SSA countries. Secretary Powellestimated that, in the 3 years since AGOA was implemented, direct benefits includedthe creation of 190,000 jobs and the attraction of $340 million in new investment toSSA.8
U.S. Imports under AGOA
U.S. imports under AGOA (including its GSP provisions) totaled over $14.1 billion in2003, an increase of 36.3 percent from almost $9.0 billion in 2002 (table 2-2). In2003, Nigeria ($9.4 billion or 66.3 percent), South Africa ($1.7 billion or 11.8percent), and Gabon ($1.2 billion or 8.3 percent) accounted for 86.4 percent of totalAGOA imports. Other major SSA AGOA suppliers included Lesotho ($372.7 million),ROC ($340.8 million), Madagascar ($187.9 million), and Kenya ($184.4 million).During the first half of 2004, combined imports from Nigeria, Angola, Gabon, andSouth Africa accounted for 89.2 percent of the total, and other countries includingLesotho, Chad, Kenya, Cameroon, and Madagascar continued to increase theirexports under the AGOA program.
AGOA (including GSP) imports continued to be dominated by U.S. purchases ofenergy-related products ($11.2 billion), which represented 79.5 percent of the total in2003, compared to 75.9 percent in 2002 (table 2-3). The second-largest import sectorunder AGOA (including GSP) was textiles and apparel ($1.2 billion), which
8 U.S. Department of State, “Sec. Powell and Foreign Minister of Mauritius Cuttaree Open ThirdAGOA Forum,” Dec. 9, 2003, found at Internet address http://www.usinfo.state.gov, retrieved Sept. 23,2004.

2-5
Table 2-2U.S. imports under AGOA,1 by sources, 2002, 2003, Jan.-June 2003, and Jan.-June 2004
(1,000 dollars)2002 2003 Jan.-June 2003 Jan.-June 2004
Country Name AGOA1 GSP AGOA1 GSP AGOA1 GSP AGOA1 GSP
Angola . . . . . . . . . . . . (2) (2) (2) (2) (2) (2) 1,858,102 1,375,161Benin . . . . . . . . . . . . . . 0 0 0 0 0 0 3 3Botswana . . . . . . . . . . . 4,578 871 6,324 0 2,209 0 7,936 0Cameroon . . . . . . . . . . 115,804 262 147,011 265 33,862 78 125,039 127Cape Verde . . . . . . . . . 51 51 2,465 13 870 13 1,160 0Central African
Republic . . . . . . . . . . 192 192 43 43 0 0 (2) (2)Chad . . . . . . . . . . . . . . 0 0 14,478 40 36 36 187,056 95,664Congo (DROC) . . . . . . 0 0 119,471 119,471 60,257 60,257 47,997 47,997Congo (ROC) . . . . . . . . 106,633 2,825 340,790 2,891 163,090 2,881 100,916 2,312Côte d’Ivoire . . . . . . . . 49,733 22,468 88,037 41,676 25,585 20,013 64,968 19,946Djibouti . . . . . . . . . . . . 23 23 27 27 9 9 33 33Eritrea . . . . . . . . . . . . . 11 11 0 0 0 0 (2) (2)Ethiopia . . . . . . . . . . . . 2,320 1,001 2,885 1,113 1,448 642 2,717 764Gabon . . . . . . . . . . . . 1,145,627 149 1,177,458 26 499,642 8 800,108 0The Gambia . . . . . . . . 0 0 20 20 7 7 14 14Ghana . . . . . . . . . . . . . 34,830 11,829 40,586 11,429 25,718 5,095 28,642 5,750Guinea . . . . . . . . . . . . 68 68 194 194 99 99 34 34Guinea-Bissau . . . . . . . 0 0 0 0 0 0 0 0Kenya . . . . . . . . . . . . . 129,210 4,873 184,441 3,842 89,661 2,124 131,773 2,855Lesotho . . . . . . . . . . . . 318,029 226 372,674 130 166,497 77 198,189 166Madagascar . . . . . . . . 79,728 3,890 187,879 1,692 60,870 753 121,816 1,270Malawi . . . . . . . . . . . . 46,904 5,584 59,256 23,420 19,232 4,624 33,204 13,022Mali . . . . . . . . . . . . . . . 342 341 262 262 112 112 34 34Mauritania . . . . . . . . . 35 35 3 3 0 0 0 0Mauritius . . . . . . . . . . . 114,292 7,764 143,077 7,966 64,238 1,886 75,713 2,545Mozambique . . . . . . . . 5,916 5,729 7,917 5,401 1,707 14 803 0Namibia . . . . . . . . . . . 1,717 174 46,755 14,623 9,203 56 56,499 32,307Niger . . . . . . . . . . . . . . 22 21 63 61 60 60 22 22Nigeria . . . . . . . . . . . . 5,409,660 483 9,356,012 2,098 4,634,726 1,603 6,932,363 429Rwanda . . . . . . . . . . . . 10 10 6 6 0 0 4 4São Tomé & Principe . . 0 0 0 0 0 0 0 0Senegal . . . . . . . . . . . . 499 499 720 709 472 465 296 293See footnotes at end of table.
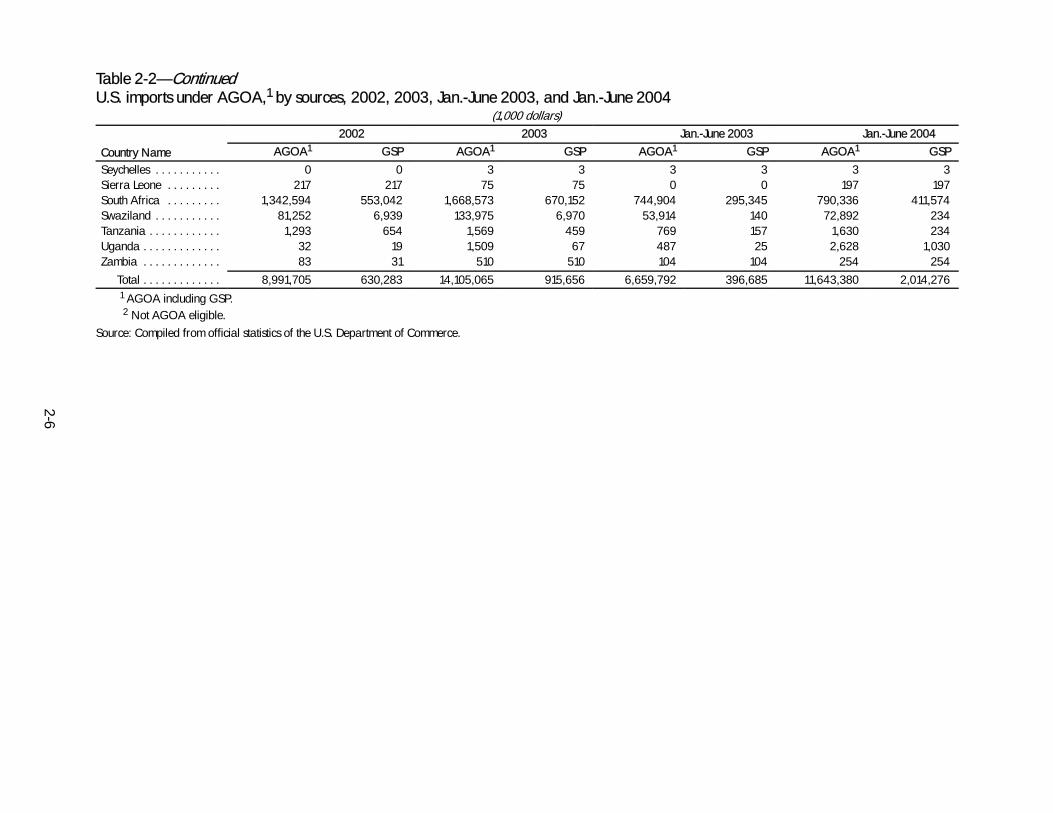
2-6
Table 2-2—ContinuedU.S. imports under AGOA,1 by sources, 2002, 2003, Jan.-June 2003, and Jan.-June 2004
(1,000 dollars)2002 2003 Jan.-June 2003 Jan.-June 2004
Country Name AGOA1 GSP AGOA1 GSP AGOA1 GSP AGOA1 GSP
Seychelles . . . . . . . . . . . 0 0 3 3 3 3 3 3Sierra Leone . . . . . . . . . 217 217 75 75 0 0 197 197South Africa . . . . . . . . . 1,342,594 553,042 1,668,573 670,152 744,904 295,345 790,336 411,574Swaziland . . . . . . . . . . . 81,252 6,939 133,975 6,970 53,914 140 72,892 234Tanzania . . . . . . . . . . . . 1,293 654 1,569 459 769 157 1,630 234Uganda . . . . . . . . . . . . . 32 19 1,509 67 487 25 2,628 1,030Zambia . . . . . . . . . . . . . 83 31 510 510 104 104 254 254
Total . . . . . . . . . . . . . 8,991,705 630,283 14,105,065 915,656 6,659,792 396,685 11,643,380 2,014,2761 AGOA including GSP.2 Not AGOA eligible.
Source: Compiled from official statistics of the U.S. Department of Commerce.

2-7
Table 2-3Major U.S. imports under AGOA1, by major commodity sectors, 2002, 2003, Jan.-June 2003, and Jan.-June 2004
2002 2003 Jan.-June 2003 Jan.-June 2004Sector AGOA1 GSP AGOA1 GSP AGOA1 GSP AGOA1 GSP
(1,000 dollars)Energy-related
products . . . . . . . . . 6,824,776 0 11,223,684 119,220 5,413,882 60,127 10,111,969 1,518,292Textiles and apparel . . 803,332 3,638 1,202,077 4,807 513,121 2,082 700,982 2,654Transportation
equipment . . . . . . . . 544,711 61,358 731,637 97,251 326,412 40,350 287,759 53,573Minerals and metals . . 372,961 234,429 412,519 293,364 185,890 118,875 274,699 231,841Agricultural products . . 212,436 103,523 240,932 119,243 80,807 40,886 103,209 55,207Chemicals and related
products . . . . . . . . . 136,164 131,459 176,786 167,319 91,062 87,085 107,543 97,647Miscellaneous
manufactures . . . . . . 40,593 39,712 59,188 57,372 21,440 20,716 28,419 26,946Forest products . . . . . . 29,771 29,515 33,370 33,110 15,968 15,777 14,700 14,471Electronic products . . . 8,832 8,828 12,934 12,834 4,790 4,786 7,717 7,708Machinery . . . . . . . . . . 17,828 17,820 11,140 11,137 6,003 6,003 5,939 5,936Footwear . . . . . . . . . . . 300 0 800 0 419 0 443 0
Total . . . . . . . . . . . 8,991,704 630,282 14,105,067 915,657 6,659,794 396,687 11,643,379 2,014,275
AGOA imports as a percentage of total sector imports from SSA
Energy-relatedproducts . . . . . . . . . 66.33 0.00 70.82 2.51 72.30 2.82 178.00 83.47
Textiles and apparel . . 64.82 0.83 71.20 0.98 68.06 0.86 76.25 1.20Transportation
equipment . . . . . . . . 29.13 4.42 32.82 6.10 31.72 5.43 25.95 6.12Minerals and metals . . 12.42 8.19 12.40 9.15 11.74 7.84 15.18 13.12Agricultural products . . 13.36 6.99 12.22 6.44 9.11 4.83 10.55 5.93Chemicals and related
products . . . . . . . . . 6.48 6.27 7.04 6.69 7.28 6.98 8.07 7.38Miscellaneous
manufactures . . . . . . 1.72 1.68 1.95 1.89 1.74 1.69 1.70 1.61Forest products . . . . . . 2.77 2.75 2.69 2.67 2.75 2.72 3.08 3.04Electronic products . . . 0.78 0.78 1.31 1.30 1.04 1.04 0.07 0.42Machinery . . . . . . . . . . 1.30 1.30 0.69 0.69 0.87 0.87 0.63 0.63Footwear . . . . . . . . . . . 12.85 0.00 30.91 0.00 28.78 0.00 21.37 0.00
Total . . . . . . . . . . 34.55 3.57 40.92 4.30 41.74 4.09 45.96 17.011 AGOA including GSP.
Note.-Because of rounding, figures may not add to totals shown.Source: Compiled from official statistics of the U.S. Department of Commerce.

2-8
accounted for an 8.5-percent share of the total in 2003, compared with an8.9-percent share in 2002. Transportation equipment ($731.6 million) represented5.2 percent of total AGOA imports in 2003, down from 6.1 percent in 2002; mineralsand metals ($412.5 million) accounted for 2.9 percent in 2003, compared to 4.1percent in 2002; and the share of agricultural products decreased to 1.7 percent in2003, from 2.4 percent in 2002. The remaining AGOA (including GSP) importsconsisted of smaller quantities of chemicals, miscellaneous manufactures, forestproducts, and machinery equipment.
During the first half of 2004, U.S. imports under AGOA (including GSP) increased by$5.0 billion, or by 74.8 percent, to $11.6 billion as compared to the first half of 2003,primarily because of a significant increase in energy-related qualifying imports fromNigeria and Angola. During the first half of 2004, AGOA imports of energy-relatedproducts totaled $10.1 billion, or 86.8 percent of the total, compared to $5.4 billion or82.0 percent during the first half of 2003. Significant increases were also recorded forAGOA imports of textiles and apparel (up by $187.9 million, or by 36.6 percent),minerals and metals (up by $88.8 million, or by 74.8 percent), and agriculturalproducts (up by $22.4 million, or by 27.7 percent) during this period. Chapter 5provides additional details on production, trade, and investment for six sectors:agriculture, fisheries, and forest products; chemicals; petroleum and energy-relatedproducts; minerals and metals; textiles and apparel; and certain transportationequipment. Table 2-4 shows the major commodity items imported under AGOA(including GSP) at the HTS six-digit level.
AGOA-Related Investment
As government officials, companies, and international firms become more familiarwith the advantages of AGOA, SSA continues to benefit from investment driven bycountry access to AGOA benefits. In addition to tariff and quota reductions, theprogram provides for various facilitating services. For example, tradecapacity-building initiatives facilitate SSA exports to the United States by reducinginformation barriers, and the AGOA Forum provides networking opportunities bybringing SSA suppliers and U.S. purchasers together. For example, the East andCentral Africa Hub sponsored 13 SSA handicrafts firms to attend the AGOA Forum onDecember 2003. In addition to exposure to the U.S. market, the firms also met withbuyers. As a result, the companies’ orders from and business relations with U.S.companies increased, including several companies supplying the Smithsonian AfricanArt Museum with merchandise, such as candle holders, ebony carvings, paper macheanimal sculptures, and letter openers.9
9 USAID, “Trade for African Development and Enterprise (TRADE) Initiative,” found at Internetaddress http://www.usaid.gov/locations/sub-saharan_africa/initiatives/trade.html, retrieved July 14,2004.

2-9
Table 2-4Leading U.S. imports under AGOA1, by HTS descriptions, 2002, 2003, Jan.-June 2003, and Jan.-June 2004
(1,000 dollars)
2002 2003Jan.-June
2003Jan.-June
2004
HTS6 Description AGOA1 GSP AGOA1 GSP AGOA1 GSP AGOA1 GSP
2709.00 Petroleum oils and oils obtained frombituminous minerals, crude . . . . . . . . . . . . . . 6,453,099 - 10,620,548 76,482 5,079,797 29,321 9,697,251 1,467,041
2710.19 Oils and preparations from petroleum oils andoils from bituminous minerals, minimum70 percent by weight of such products, notlight . . . . . . . . . . . . . . . . . . . . . . . . . . . . . . . . 316,497 - 444,733 42,728 251,551 30,797 315,179 51,251
8703.23 Passenger motor vehicles with spark-ignitioninternal-combustion reciprocating pistonengine, cylinder capacity over 1,500 but notover 3,000 cc . . . . . . . . . . . . . . . . . . . . . . . . 338,959 - 319,362 - 281,040 - 35,397 -
8703.24 Passenger motor vehicles with spark-ignitioninternal-combustion reciprocating pistonengine, cylinder capacity over 3,000 cc . . . . 132,784 - 303,862 - - - 193,365 -
6204.62 Women’s or girls’ trousers, etc., of cotton, notknitted or crocheted . . . . . . . . . . . . . . . . . . . . 153,938 - 254,654 - 122,320 - 162,284 -
6110.20 Sweaters, pullovers, sweatshirts, waistcoats(vests) and similar articles, knitted orcrocheted, of cotton . . . . . . . . . . . . . . . . . . . . 160,695 - 233,464 - 86,319 - 127,155 -
6203.42 Men’s or boys’ trousers, bib and brace overalls,breeches and shorts not knitted orcrocheted, of cotton . . . . . . . . . . . . . . . . . . . . 161,721 - 214,197 - 98,755 - 124,894 -
2710.11 Light oils and preparations from petroleum oilsand oils from bituminous minerals, minimum70 percent by weight of such products . . . . . 55,180 - 158,394 - 82,524 - 99,539 -
7606.12 Rectangular plates, sheets and strip, over0.2 mm thick, of aluminum alloy . . . . . . . . . . 70,519 70,519 79,790 79,790 35,693 35,693 42,932 42,932
7202.41 Ferrochromium, containing by weight more than4 percent of carbon . . . . . . . . . . . . . . . . . . . 36,531 36,531 72,549 72,549 30,947 30,947 59,552 59,552
6110.30 Sweaters, pullovers, sweatshirts, waistcoats(vests) and similar articles, knitted orcrocheted, of man-made fibers . . . . . . . . . . . 39,547 - 60,677 - 14,941 - 24,553 -
7202.30 Ferrosilicon manganese . . . . . . . . . . . . . . . . . . . 50,749 50,749 49,910 49,910 16,526 16,526 46,937 46,9376109.10 T-shirts, singlets, tank tops, and similar
garments, of cotton, knitted or crocheted . . . . 30,350 - 46,343 - 30,160 - 45,691 -6205.20 Men’s or boys’ shirts of cotton, not knitted or
crocheted . . . . . . . . . . . . . . . . . . . . . . . . . . . 29,657 - 45,845 - 18,667 - 34,728 -7113.19 Articles of jewelry and parts thereof, of precious
metal (excluding silver) . . . . . . . . . . . . . . . . . 30,612 30,612 43,319 43,319 15,038 15,038 21,333 21,333See footnotes at end of table.

2-10
Table 2-4—ContinuedLeading U.S. imports under AGOA1, by HTS descriptions, 2002, 2003, Jan.-June 2003, and Jan.-June 2004
(1,000 dollars)
2002 2003Jan.-June
2003Jan.-June
2004
HTS6 Description AGOA1 GSP AGOA1 GSP AGOA1 GSP AGOA1 GSP
6104.62 Women’s or girls’ trousers, bib and braceoveralls, breeches and shorts, of cotton,knitted or crocheted . . . . . . . . . . . . . . . . . . . . 25,209 - 43,026 - 18,988 - 29,882 -
7202.11 Ferromanganese, containing by weight morethan 2 percent of carbon . . . . . . . . . . . . . . . . 43,305 - 39,394 - 16,552 - 37,476 -
8708.70 Road wheels and parts and accessories thereof,for motor vehicles . . . . . . . . . . . . . . . . . . . . . 18,423 18,423 35,527 35,527 14,571 14,571 15,899 15,899
2804.69 Silicon, containing by weight less than99.99 percent of silicon . . . . . . . . . . . . . . . . . 22,753 22,753 32,314 32,314 16,926 16,926 19,922 19,922
2401.20 Tobacco, partly or wholly stemmed/stripped . . . 31,193 1,729 30,482 19,226 7,976 4,624 19,254 13,5561701.11 Cane sugar, raw, in solid form, not containing
added flavoring or coloring matter . . . . . . . . 43,774 43,774 30,211 30,211 3,293 3,293 3,293 3,2936103.43 Men’s or boys’ trousers, bib and brace overalls,
breeches and shorts of synthetic fibers,knitted or crocheted . . . . . . . . . . . . . . . . . . . . 11,952 - 25,237 - 10,966 - 16,234 -
0802.90 Nuts, nesio, fresh or dried whether or notshelled . . . . . . . . . . . . . . . . . . . . . . . . . . . . . . 13,109 2,702 24,360 5,587 7,283 4,388 13,129 6,753
0805.10 Oranges, fresh or dried . . . . . . . . . . . . . . . . . . 15,335 - 23,612 - 1,797 - 2,077 -1805.00 Cocoa powder, not containing added sugar or
other sweetening matter . . . . . . . . . . . . . . . . 11,399 11,399 23,589 23,589 10,847 10,847 6,352 6,352
Subtotal . . . . . . . . . . . . . . . . . . . . . . . . . . . 8,297,292 289,193 13,255,399 511,231 6,273,477 212,971 11,194,309 1,754,821
All other . . . . . . . . . . . . . . . . . . . . . . . . . . . . . . 694,413 341,090 849,667 404,425 386,314 183,714 449,071 259,455
Total . . . . . . . . . . . . . . . . . . . . . . . . . . . . . 8,991,705 630,283 14,105,065 915,656 6,659,792 396,685 11,643,380 2,014,2761 AGOA i l di GSP1 AGOA including GSP1 AGOA including GSP.AGOA including GSP.
Note.—Because of rounding, figures may not add to totals shown. The abbreviation ”nesoi” stands for ”not elsewhere specified or included.”Source: Compiled from official statistics of the U.S. Department of Commerce.

2-11
Table 2-5 provides selected examples of investments that have, at least in part, beenattributed to AGOA program benefits. A substantial portion of new investmentcontinues to target the apparel sector. For example, apparel-related andAGOA-related investment has begun inGhana andEthiopia, andcontinued inKenya,Madagascar, Mali, and Namibia. Recent examples also underscore increasinginvestment in the textile industry. Textile firms have been investing in Cameroon, Côted’Ivoire, and Mali. Sectors outside the textile and apparel sector have also attractedAGOA-related investment. For example, AGOA has been credited with increasingmining sector investment inCameroon, coffee industry investment inKenya, and motorvehicle industry investment in South Africa. Recent investments, such as in the sheabutter and banana crisps industries in Uganda, also highlight the extension ofAGOA-related investment into small- and medium-sized businesses in SSA.Particularly encouraging for long-term economic development is AGOA-relatedtechnology investment. For example, a Kenyan firm’s installation of a satellite-basedlink is not only expected to increase the firm’s efficiency, but could also provide anexample to other firms on the benefits of increased technology use.

2-12
Table 2-5Selected examples of recent AGOA-related investment and events, 2003 to mid-2004Country Examples
Cameroon “The major AGOA related investment has been in the mining sector. A U.S. firm, GeovicLtd., has obtained a mining permit to extract nickel and cobalt in the eastern part of thecountry. Once this project gets underway in 2007, Geovic expects exports in the range of8,000 tons of minerals a year. ... Of equal importance to Cameroon’s overall trade abilityis the new operations by two shipping companies [with direct links to New York,] whichreduces costs and delivery time to the United States.”1
“The first Cameroonian venture to take advantage of the [AGOA] provisions is about to berealized. The foundation stone of a textile industrial complex was laid in the little locality ofBalevonli near Dschang in the Menoua Division.... The complex, GICATIC-Texile...represents a veritable breakthrough for Cameroon in the AGOA project. ...GICATIC-Textile comprises a knitting mill, a dyeing and finishing section, a garmentcomponent producing section, a garment sewing factory and an embroidery section. Theproject when completed is estimated to cost 10 billion frs and will create 36,000 jobs.”2
Côte d’Ivoire A Chinese/Ivoirian joint venture has invested $9 million in a textile factory to export underAGOA.3
Ethiopia “Ethiopia’s textile sector has benefitted from easier access to US markets under the terms ofthe Africa Growth and Opportunity Act (AGOA), passed in the US in 2001. Thegovernment is encouraging investment in export-oriented textile plants at the AddisIndustrial Village, and in 2003 gave the go-ahead to nine local investors to establishenterprises on the site.”4
Menbere Alemayehu is one of several women taking advantage of AGOA to exporttraditional woven fabrics to the United States. She has also established a partnership withan American entrepreneur, and they “now have their products in about 35 storesthroughout the united states (sic).”5
Ghana “Impact Clothing Ghana Ltd has acquired 20 acres of land within the Presidential SpecialInitiative (PSI) Garment Village for the construction of a garment factory. A leaseagreement was signed...for the project aimed at taking advantage of the Africa Growthand Opportunity Act (AGOA). ...An estimate of over three billion cedis is to be generatedin export revenue over 5 years [from the Garment Village]. The [Impact Clothing] project isestimated to bring into the economy an investment capital of US$3-4 million and also bringexport revenue of US$20 million. The company, expected to start operations from July2004 would bring employment opportunities for over 1000 people.”6
Belin Textiles International, a Ghana-Mauritius partnership company established to exportproducts to the United States under the AGOA program, opened its first factory in July2004. The Ghanaian President added that, “another company from Mauritius hadexpressed the desire to invest about $100 million in sugar production in the Northern partof Ghana.”7
Kenya AGOA has stimulated approximately $12.8 million in FDI in Kenya.8
According to government officials, Kenya is expected to start exporting coffee to the UnitedStates under AGOA. As a result of the agreement signed between Kenya and the UnitedStates, “plans were underway to give the Kenya Planters Cooperative Union the capacity toroast, grade and pack coffee for export” in order to get the higher returns associated withprocessed coffee.9
See footnotes at end of table.

2-13
Table 2-5—ContinuedSelected examples of recent AGOA-related investment and events, 2003 to mid-2004Country Examples
Kenya—Continued According to the EPZ management, investment is expected to increase by Sh20 billion(approximately $263 million) over the next 2 years, increasing the number of workers fromjust over 45,000 to 52,000. The manager “attributed the steady growth in the apparelsindustry to improved access of Kenyan exports in the US market under the African Growthand Opportunity Act.”10
“Jar Kenya (EPZ) Limited has installed an SH8 million [approximately $105,000] advancedsatellite based link for its local operations. The move comes ahead of the anticipatedextension of the African Growth and Opportunity Act (Agoa). Mr. Michel Mouyart, thecompany’s general manager, said the satellite link would help improve the firm’s efficiency.... This, he said, would facilitate faster communication between its warehouse in the UnitedStates and the local factory.”11
Madagascar A significant example of U.S.-origin AGOA-related investment is the Cottonline apparelfactory, formally opened in January 2003 as part of the Groupe Socota-Cotona fabricand apparel complex in Antsirabe. A U.S. investor is a one-quarter joint venture partner inthe Cottonline factory, along with Madagascar-based Groupe Socota and two Sri Lankantextile firms. The factory is a model of vertical integration and remains unique inMadagascar.12
As a result of the political crisis in 2002, “there was, understandably, a sharp dip in thenumber of firms engaged in EPZ exports to the US under the terms of AGOA in 2002. Butas of July 2003 some 37 companies were active in such exports, compared with 30 inDecember 2001, before the political crisis. Moreover, export sales to the US under AGOAdoubled from US$93m in 2001 to US$186m in 2003.”13
Malawi Malawi’s benefit under AGOA has mainly been in the textiles and garment sector. Over7,045 jobs have been created as a result of AGOA-related expansion.14
Mali In February 2004, the President of Mali opened a new spinning factory. It represents a$10.7-million investment by Malian, Mauritian, and French entrepreneurs. The facility is“one of the few outside of South Africa capable of producing quality thread for use inmanufacturing apparel for export to the United States under AGOA... The factory, the firstof its kind in Mali, created 200 new jobs.”15
Mauritius AGOA has stimulated approximately $78 million in FDI in Mauritius.16
Namibia The $300 million “Ramatex, Tai Wah and Rhino [textile and apparel company] investmentscurrently employ some 8,000 Namibians and produce exports worth US$100 million underthe terms of the AGOA.”17
The U.S. Embassy in Namibia, USAID, and the Namibian government have sponsoredvarious workshops focused on helping Namibian handicraft companies benefit underAGOA. Among the companies that attended the workshop, one company that producesKarakul wool carpets will export its first AGOA shipment in 2004.18
Nigeria “One of the largest shoe manufacturers in Italy, Filanto s.p.a, has announced its intentionto set up a plant in Kano [Nigeria] with an initial capacity of between 2,000 and 3,000shoes per day. ... [The plant would] provide export opportunities for Africa, America andEurope. ... [This] is an important step towards diversification of the economy away fromover-dependence on oil.... [Nigeria’s AGOA advisor] said the footwear industry in theUnited States alone stands at $40 billion [and the] AGOA tariff advantage on footwearand foot wear parts are as high as 51 percent.”19
South Africa DaimlerChrysler SA plans to invest in the assembly of left-hand-drive cars at its EastLondon plant. “Large scale assembly of the C-Class... would attract several billion rands’worth of investment.” An attractive aspect of the proposal is duty-free access into the UnitedStates under AGOA. If the group’s South African arm wins the contract, foreign directinvestment in South Africa could total 2 billion rand (approximately $230 million) forretooling requirements at the East London Plant, with additional investment of up to 6billion rand (approximately $695 million) for supplier operations.20
See footnotes at end of table.

2-14
Table 2-5—ContinuedSelected examples of recent AGOA-related investment and events, 2003 to mid-2004
Country Examples
Tanzania A factory producing garments for export under AGOA opened in Tanzania. “Afterinvesting nearly $2 million in machinery and training, production began in December2003. The factory now has 600 machines operated by 650 workers, who can produce upto 6,000 garments per day. By the end of 2004, Korff said, the factory expects to havehired over 1,000 employees with a potential to produce $4 million worth of apparel peryear.” The company is supplying Wal-Mart and plans to supply J.C. Penney.21
Uganda “[The] presidential assistant on AGOA, told Parliament on Tuesday that Tri-Star had signeda new agreement with Sunquest Apparel, a US firm to supply garments worth nearly$10m. She said Sunquest had made a commitment to build a weaving and spinning plantin Uganda to utilise local cotton.”22
“RED House Company, Ltd, a Hong Kong firm plans to set up a state-of-the-art spinningmill in Uganda. The mill will process raw cotton and blend polyester to produce garmentsfor export to the regional and international markets. It will also manufacture garments andfabrics. ... $Our customers from the US chain stores are interested in working with Africa tobenefit from imports under AGOA.’ ”23
“After experimenting with Shea Nut Butter for over four years, [the Ugandan company] istargeting the American markets, whose doors have been opened by the African Growthand Opportunity Act.”24
“[The] Kagugube women’s group in Kampala Central, who have organized themselves in agroup of 20 to make banana crisps for local and foreign markets [stated that their] aim isto export to the AGOA market. ... The women use local tools in Katwe. Their business hasboosted the local banana market.”25
Zambia According to the executive director of the Export Board of Zambia, “Unity Garments has asubstantial order from the US which is being serviced. Zambia-China Mulungushi Textileshas ordered machinery to facilitate production of export quality garments underAGOA.”26
SSA “Consequently, many African countries are set to benefit from AGOA, for instance Kenyaestimates that AGOA will create 50,000 new jobs directly and more than 100,000 jobsindirectly. South Africa anticipates about 100 million dollars in investment in its textile andapparel factories creating 13,000 jobs. Lesotho, one of the smallest countries insub-Saharan Africa, has become one of the biggest beneficiaries of AGOA, attractingover 120 million dollars in new investment.”27
“[The United Nations Industrial Development Report shows that there] has been anencouraging increase in the inflow of large export-driven investors, one-third of whichwere established during the past four years. One key explanation for this is the US’s AfricaGrowth and Opportunity Act (AGOA), which has stimulated new foreign direct investment(FDI), in the clothing and textiles sector particularly. ... A growing number ofAGOA-related investors are focusing on exports, but clothing is one of only two industries– the other being agribusiness – to export upward of 75% of output.”28
“A local thread manufacturer has bagged licensing rights for a key American brand in itsefforts to crack the Agoa market. The deal...will enable [Fine Spinners] to sell thread tolocal garment manufacturers, which sell exclusively to the US under the tariff-free terms ofthe African Growth and Opportunity Act (Agoa). ... $For the first time we’re giving the 38EPZ manufacturers, who have hitherto relied on imports for their stitching thread, a localoption,’ [said the managing director]. ... Under the terms of the partnership,... FineSpinners will manufacture threads for the rest of the region....”29
See footnotes at end of table.

2-15
Table 2-5—ContinuedSelected examples of recent AGOA-related investment and events, 2003 to mid-2004
1 U.S. Department of State telegram, “Cameroon: USITC Study on U.S.-Sub-Saharan African Trade andInvestment,” message reference No. YAOUND01060, prepared by U.S. Embassy, Yaounde, July 2004.
2 Lukong Pius Nyuylime, “New Textile Firm Commissioned,” Cameroon Tribune (Yaounde), Nov. 21,2003, found at Internet address http://allafrica.com/stories/printable/200311210581.html, retrieved Feb.23, 2004.
3 U.S. Department of State telegram, “USITC Study on U.S. Sub-Saharan African Trade and Investment,”message reference No. ABIDJAN 002218, prepared by U.S. Embassy, Abidjan, Sept. 2003.
4 EIU, “Ethiopia: Business: Industry overview: Manufacturing,” Feb. 20, 2004, found at Internet addresswww.viewswire.com, retrieved Aug. 25, 2004.
5 Muluneh Gebre, “Introducing Local Products with Foreign Tastes and Preferences,” Addis Tribune(Addis Ababa), May 28, 2004, found at Internet address http://www.allafrica.com, retrieved Aug. 25,2004.
6 Martin Luther Otu, “Ghana to Export Garments to the International Market,” Public Agenda (Accra),Nov. 3, 2003, found at Internet address http://allafrica.com/stories/printable/200311031059.html,retrieved Feb. 23, 2004.
7 “First Textile and Garments Factory Inaugurated,” July 6, 2004, Accra Mail (Accra), found at Internetaddress http://www.allafrica.com, retrieved Aug. 25, 2004.
8 EIU, “Business Africa: Foreign investment: picking up,” September 16th-30th, 2003.9 Silas Nthiga, “Country Signs Coffee Deal with US,” The Nation (Nairobi), June 10, 2003, found at
Internet address http://allafrica.com/stories/printable/200206100157.html, retrieved June 18, 2003.10 All Africa, “EPZs Target Sh20 Billion Worth of New Investments,” Apr. 15, 2004, found at Internet
address http://www.allafrica.com, retrieved Aug. 25, 2004.11 James Anyanzwa, “Garment Company Upgrades Operations,” The East African Standard (Nairobi),
found at Internet address http://www.allafrica.com, retrieved Aug. 25, 2004.12 U.S. Department of State telegram, “USITC Study on U.S.-Sub-Saharan African Trade and Investment,”
message reference No. ANTANANARIVO 000949, prepared by U.S. Embassy, Antananarivo, Sept. 2003.13 EIU, “Madagascar: Business: Industry overview: Manufacturing,” Aug. 6, 2004, found at Internet
address http://www.viewswire.com, retrieved Aug. 25, 2004.14 U.S. Department of State telegram, “Malawi: USITC Information Request,” message reference No.
LILONG 00664, prepared by U.S. Embassy, Lilongwe, July 2004.15 EIU, “Mali: Regulations: News analysis,” May 4, 2004, found at Internet address
http://viewswire.com, retrieved Aug. 25, 2004.16 EIU, “Business Africa: Foreign investment: picking up.”17 “IPPR Sees More that 4 % Economic Growth this Year,” Namibia Economist, Mar. 26, 2004, found at
Internet address http://www.economist.com.na/2004/26mar/03-26-22.htm, retrieved Aug. 18, 2004.18 U.S. Department of State telegram, “2004 USITC Study on U.S.-Sub-Saharan Trade: Namibian
Update,” message reference No. WINDHOEK 000561, prepared by U.S. Embassy, Windhoek, Aug. 2004.19 Reuben Yunana, “Italian Shoe Firm to Establish Plant in Kano,” Daily Trust (Nigeria), May 13, 2004,
found at Internet address http://www.allafrica.com, retrieved Aug. 25, 2004.20 Carli Lourens, “SA Vies for a Bigger Slice of Daimlerchrysler Pie,” Business Day (Johannesburg), May
26, 2003, found at Internet address http://allafrica.com/stories/printable/200305260321.html, retrievedJune 18, 2003.
21 Jim Fisher-Thompson, “Factory Opening in Tanzania Proves Success of AGOA,” found at Internetaddress http://japan.usembassy.gov/e/p/tp-20040728-22.html, retrieved Sept. 20, 2004.
22 Mary Karugba and Irene Nabusoba, “Tri-Star Scoops Fresh $10m US Garment Contract,” New Vision(Kampala), Jan. 30, 2004, found at Internet addresshttp://allafrica.com/stories/printable/200401300628.html, retrieved Feb. 4, 2004.

2-16
Table 2-5—ContinuedSelected examples of AGOA-related investment and events, 2003 to mid-2004
23 Stephen Ilungole, “Hong Kong Firm Eyes Local Textile Potential,” New Vision (Kampala), Nov. 21,2003, found at Internet address http://allafrica.com/stories/printable/200311210624.html, retrieved Feb.23, 2004.
24 James Oloch, “Guru Nanak to Export Shea Oil to Agoa Markets,” Apr. 22, 2004, found at Internetaddress http://www.allafrica.com, retrieved Aug. 25, 2004.
25 Pidson Kareire, “Chips for Agoa Market!” New Vision (Kampala), July 6, 2004, found at Internetaddress http://www.allafrica.com, retrieved Aug. 25, 2004.
26 Kingsley Kaswende, “Agoa Isn’t Only About Textiles – Michelo,” Aug. 3, 2004, The Post (Lusaka),found at Internet address http://www.allafrica.com, retrieved Aug. 25, 2004.
27 Yohannes Ruphael, “Tapping the US Market,” Addis Tribune (Addis Ababa), Jan. 23, 2004, found atInternet address http://allafrica.com/stories/printable/200402200798.html, retrieved Feb. 23, 2004.
28 EIU, “Tempting Investors,” EIU Viewswire, Dec. 24, 2003, found at Internet addresshttp://viewswire.com, retrieved Feb. 4, 2004.
29 Washington Akumu, “Thread Firm Seals Licensing Deal,” The Nation (Nairobi), Jan. 13, 2004, foundat Internet address http://allafrica.com/stories/printable/200401130370.html, retrieved Feb. 4, 2004.

3-1
CHAPTER 3Regional Integration in Sub-Saharan Africa
This chapter provides information on the African Union (AU), as well as background,recent developments, and trade and investment information for the nine regionalorganizations that operate in sub-Saharan Africa:
S the Economic Community of West African States (ECOWAS);
S the Union Economique et Monétaire Ouest Africaine (UEMOA);
S the Common Market for Eastern and Southern Africa (COMESA);
S the Southern African Development Community (SADC);
S the Southern African Customs Union (SACU);
S the East African Community (EAC);
S the Intergovernmental Authority on Development (IGAD);
S the Indian Ocean Commission (IOC); and
S the Communauté Economique et Monétaire de l’Afrique Centrale (CEMAC).
The data presented have been takenprimarily from the U.S. Department ofCommerce(trade statistics) and the World Bank (FDI). Qualitative information was drawn from avariety of sources, including the Economist Intelligence Unit, United Nations IntegratedRegional Information Network, AllAfrica.com articles, and official regionalorganizations websites. The analysis presented focuses, whenever possible, ondevelopments that occurred from the beginning of 2003 to mid-2004.
Regional Integration in 2003
In September 1999, the heads of state and government for the Organization ofAfrican Unity (OAU) declared their intent to accelerate regional integration effortsthat seek to provide solutions to regional economic, political, and social problems. InJuly 2002, the AU, successor to the OAU, was launched at a meeting of heads of statein South Africa. The stated purpose of the AU is to support socio-economic integrationwithin the continent and to promote peace, security, and stability. Primary goalsinclude the creation of an African Common Market, to be phased in six stages, thepromotion of peace and economic stability through conflict resolution, and theimprovement of humanitarian conditions.1 The AU has 53 member states, and isheadquartered in Addis Ababa, Ethiopia.
The AU seeks to harmonize domestic policies and to renew focus on diversification ofAfrica’s agricultural sector through the 2004-2007 Strategic Framework of the

3-2
African Union Commission that was developed in October 2003. Other activitiesinclude a project with the UNDP Regional Bureau for Africa that was signed in May2004.2 The project, with an estimated cost of $4.3 million, seeks to improve tradecapacity building, to reduce poverty, and to encourage sustainable development. TheAU also signed an agreement with the Government of the Republic of Finland inDecember 2003 and received approximately $848,000 to be used for conflictprevention and peace building. This contribution will also help the Protocol on Peaceand Security Council, which entered into force in early December 2003. In July 2003,the AU voted to integrate NEPAD into its framework.3
Regional trade agreements within SSA focuson commonsectoral policies that will leadto the creation of customs unions and a common currency. One way to achieve thisgoal is to create a common external tariff and to remove existing tariffs betweenregional trading members. Intra-regional trade and common investment policies havebeen increasing and can be attributed to such regional agreements. For example,ECOWAS members are seeking to merge by July 1, 2005, into the CFA Franc Zonecreated by members of UEMOA, and South Africa is coordinating finance andinvestment decisions for SADC members.4 Various regional organizations havereceived outside assistance for such efforts. For example, the EU, through the WTO’strade-related technical assistance program, granted ECOWAS $1.8million tobe usedto accelerate the elimination of tariffs for the creation of an economic union by 2005and a common customs union by 2007. The EU also granted $1.9 million to CEMAC fora macroeconomic surveillance program to be completed by July 2006. The programactivities include studies, workshops, and staff training on customs unionharmonization policies.5
Conflict management is an important policy area for SSA regional organizations. Forexample, CEMAChas hosted numerous summits to examine conflict management andto propose solutions to the civil unrest in Chad and Sudan.6 SADC has also pledged toreduce civil unrest within member states and in the Southern African region. Within theSADC Regional Indicative Strategic Development Plan, common policies include theProtocol on Politics, Defense, Security and Cooperation. Objectives include theprotectionof people, promotionof political cooperation, and promotion of democraticinstitutions and practices. In August 2003, the SADC member states signed a mutualdefense pact that facilitates interaction, joint operations, and a collective response forsecurity in southern Africa.7 IGAD has set a July 2004 deadline for the establishmentof a transitional federal government for Somalia as part of its efforts to resolveregional conflict and to provide security and a stable environment for attractingforeign investment into member states. In May 2004, IGAD also played a central rolein conflict resolutionwhen it chaired peace talks between rebels and the government inthe ongoing conflict in Sudan. The peace talks led to the signing of three accordsbetween the Sudan People’s Liberation Army and the existing government, which willtogether form an interim government for 6 years before devolving power to thestates.8

3-3
The United Nations Economic Commission for Africa (UNECA) has participated innumerous regional organization meetings and provided technical assistance for theintergovernmental bodies through five subregional offices. These subregional officespromote dialogue and support initiatives for harmonization in a number of differentsectors, including poverty reduction, infrastructure development, employment andlabor market growth, export diversification, and the attraction of private sectorinvestment. In 2003, UNECA participated in various heads-of-state summits related topolicy planning, including the SADC Annual Summit, the 13th Meeting of Trade andCustoms Committee of COMESA, the NEPAD Chief Executives Meeting, and the 16th
Meeting of the Council of Ministers of COMESA. UNECA also provides technicalassistance. For example, the subregional office in southern Africa provided technicalassistance to SADC and COMESA during the development stage of the SSA TransportProgram Inter-REC Task Force.9 UNECA helped develop terms of reference for theAfricancountries undertaking institutional reformsand staff trainingwithin civil serviceroles. Other efforts have included assisting the SADC Mining Program and offeringrecommendations to facilitate implementation.10


Status and Structure:ECOWAS was established in 1975 to promote regional economic integration in the transport,telecom,energy,commerce,and agriculturesectors,and to foster trade among its 15 member states.ECOWAS seeks to reduce intra-regional customs duties,to establish an externalcommon tariff, to harmonize economic and financial policies,and to create a monetary union within West Africa.
The Office of the Chairman of ECOWAS is headed by an elected official from a member state.This position is currently held by Dr.Mohamed IbnChambas,a former minister from Ghana.The Secretariat and the Fund for Cooperation,Compensation,and Development are the two maininstitutions designed to implement policies and to ensure progressive development in the member states.
ECOWAS has a 115-member parliament that convenes twice per year to consider issues regarding economic cooperation;and includes acommunity court of justice aimed at peaceful settlement of disputes and a Council of Ministers.
In March 2001,the West African Monetary Institute was created to provide technical assistance that will allow member states to harmonizemonetary policies as they establish a common West African Central Bank to pave the way for a second monetary zone in West Africa.
General Developments:Although progress has been hampered by political instability in a handful of member states such as Côte d’Ivoire,progress has been made inthe transportation sector with many projects near completion.For example,the West African highway network,one of many priority roadtransport programs, is 83-percent completed,and the trans-Sahelian highway is 87-percent completed.
The deadline to merge with the CFA Franc Zone has been rescheduled for July 1,2005,to allow member states to fully comply withrequirements for their financial sectors.
ECOWAS members have pledged to form a common customs union by 2007.
A joint ECOWAS/World Bank task force is to be created to help implement programs as agreed under NEPAD.
ECOWAS
Members: Benin, Burkina Faso, Cape Verde, Côte d’Ivoire, The Gambia, Ghana, Guinea, Guinea-Bissau, Liberia, Mali, Niger, Nigeria,Senegal, Sierra Leone, and Togo.11
Population: 249.4 millionGDP: $102.2 billionGoals: To establish an economic union within West Africa by July 1, 2005, and to focus on transport and communication networks in orderto facilitate the free movement of people, goods, and services.
-15
-10
-5
0
5
10
15
1999 2000 2001 2002 2003
U.S. Trade with ECOWAS
Billion dollars
U.S. exportsU.S. importsTrade balance
3-5
Economic Community of West African States

3-6
Economic Community of West African StatesTrade and Investment:
In 2003,the EU pledged approximately $12 million inloans for the private sector and governments to increaseexports from the West African region to Europeanmarkets.
The World Bank pledged $4.9 billion for projects aimed atimproving infrastructure and capacity building in theenergy and communications sectors.
AGOA Imports from ECOWAS:
ECOWAS member countries that were AGOA eligible in2003 were Benin,Cape Verde,Côte d’Ivoire,The Gambia,Ghana,Guinea,Guinea-Bissau,Mali,Niger,Nigeria,Senegal,Sierra Leone,and Togo.
In 2003,AGOA imports from ECOWAS totaled $9.5 billion,an increase of 73 percent from 2002.
Imports from Cape Verde increased substantially, from$50,599 in 2002 to $2.5 million in 2003.Imports fromSierra Leone totaled $74,756 in 2003,a decrease of 66percent compared to 2002 levels.
Imports of transportation equipment also increasedsubstantially, from $4,303 in 2002 to $220,600 in 2003.U.S.minerals and metals sector imports decreased bynearly 50 percent, from $568,946 in 2002 to $291,080in 2003.
ECOWAS Net Foreign Direct Investment, 1998-2002
0
500
1000
1500
2000
2500
3000
3500
1998 1999 2000 2001 2002
Million dollars
3076.6
2265.0
1792.9 1886.7
1292.7
AGOA Imports in 2003
By Sector
By Country
Nigeria (98.6%)
Energy-related(99.3%)
Ghana (30.6%)Côte d’lvoire(66.5%)
All other (3.2%)
All other (1.0%)
Forest(10.3%)
Cape Verde (1.9%)
Agricultural(75.7%)
Textiles andapparel(10.9%)
$9.5 Billion
All other (0.7%)
All other (1.4%)

3-7
Union Economique et Monétaire Ouest Africaine
Status and Structure:UEMOA was established in 1994 to develop a competitive market based on the free flow of goods,persons,services,and capital.
UEMOA is recognized by the WTO as a regional trade agreement.
In December 1995,UEMOA member countries concluded a preferential trade agreement that was a precursor to the establishment of acustoms union and common external tariff in early 2000.
Members share a common currency,the CFA franc,pegged to the euro.
General Developments:In early 2004,UEMOA members planned to merge their monetary union with the six members of the ECOWAS monetary union.The date forthis merger has been delayed indefinitely.
At a March 2004 summit with ECOWAS ministers,UEMOA ministers declared a shift in priorities to focus on privatization of the energy sectorthrough the elimination of monopolies.
UEMOA’s common external tariff system will serve as the basis for the ECOWAS common external tariff system,which is anticipated to be inplace by 2007.
UEMOAMembers: Benin, Burkina Faso, Côte d’Ivoire, Guinea-Bissau, Mali, Niger, Senegal, and Togo.12
Population: 77.7 millionGDP: $36.3 billionGoals: To increase economic and financial competitiveness through a common market, and to coordinate national policies relating to theagriculture, environment, transport, infrastructure, telecommunications, energy, industry, and mining sectors.
-300-200-100
0100200300400500600
1999 2000 2001 2002 2003
Million dollars
U.S. Trade with UEMOA U.S. exportsU.S. importsTrade balance

3-8
Union Economique et Monétaire Ouest Africaine
AGOA Imports in 2003
By Sector
By Country
Energy-related(52.0%)
Agricultural(46.4%)
All other(0.9%) Chemicals
(0.7%)
Côte d’lvoire(98.8%)
Senegal(0.8%)
All other(0.4%)
Trade and Investment:
In April 2002,the United States signed a Trade and InvestmentFramework Agreement with the eight UEMOA members to promotetrade, investment,and economic reform.
In June 2003,a common strategy was adopted by commerce andagriculture ministers from the member countries to promote cottonproduction in the UEMOA zone.UEMOA members anticipate that,by2010,raw cotton processing will increase by 25 percent,creating50,000 new jobs,and focus on thread production.
The World Bank has committed $408 million to the Capital MarketDevelopment Project.The goal of the project is to create a more stableeconomic environment for investors.Activities include mobilizing publicand private sector financing for infrastructure improvement andproviding technical assistance.
AGOA Imports from UEMOA:UEMOA member countries that were AGOA eligible in 2003 were Benin,Burkina Faso,Côte d’Ivoire,Guinea-Bissau,Mali,Niger,and Senegal.
In 2003,AGOA imports from UEMOA totaled $89.1 million,a 76-percentincrease from 2002.
Niger experienced the largest percentage change, increasing AGOAexports to the United States by more than 100 percent from 2002 to2003 (from $21,803 to $62,517).
In 2003,AGOA imports of transportation equipment from UEMOA morethan tripled from the level in 2002 (from $4,303 to $16,016),whileminerals and metals sector imports decreased by more than 80 percent(from $211,000 to $39,372).
UEMOA Net Foreign Direct Investment, 1998-2002
0
250
500
750
1000
1250
1500
1750
2000
1998 1999 2000 2001 2002
Million dollars
1626.9
587.8 536.1 558.4570.2
$89.1 Million

3-9
Common Market for Eastern and Southern Africa
Status and Structure:COMESA was founded in 1994 as a stepping stone for a regional trade area to replace the Preferential Trade Agreement that had beenestablished in 1981; an FTA has been in place since 2000.
COMESA is recognized as a regional trade agreement by the WTO. The current chairman is emphasizing the export of processed productsfrom the COMESA region.
The Authority of Heads of State and Government formulates general policy for all COMESA members. Interdisciplinary Committees areresponsible for the development and implementation of programs within the following sectors: trade and customs, transport andcommunications, industry and investment, legal affairs, peace and security, and administrative and budgetary matters. A Court of Justice hasalso been established to arbitrate trade disputes in a peaceful manner.
COMESA hopes to achieve a common monetary area by 2025. As adopted in 1992, a formal exchange rate union will be established alongwith a central bank by 2004. Between 2005 and 2010, each member state will be required to fix its exchange rate within a given marginunder the COMESA Exchange Rate Mechanism Plan.
During a meeting of the Council of Ministers in 2001, trade remedy regulations such as safeguard, anti-dumping, subsidy, and countervailingmeasures were adopted.
General Developments:In mid-2004, Namibia withdrew from COMESA, deciding to focus on its SADC membership commitments.
In February 2003, COMESA launched negotiations with the EU to form an Economic Partnership Agreement (EPA).
In January 2003, the EU agreed to provide $2.4 million in grants to support capacity building for trade agreements throughout the region.
In June 2004, COMESA business leaders announced their support for common external tariff implementation by May 2005.
comesa
Members: Angola, Burundi, Comoros, Democratic Republic of the Congo, Djibouti, Egypt, Eritrea, Ethiopia, Kenya, Madagascar, Malawi,Mauritius, Namibia, Rwanda, Seychelles, Sudan, Swaziland, Uganda, Zambia, and Zimbabwe.13
Population: 310.5 million (SSA countries only)GDP: $91.5 billion (SSA countries only)Goals: To implement a free trade area; to create a harmonized and competitive economic community for southern and eastern African na-tions through stronger communications and transport links; to coordinate regional monetary and macroeconomic policies, such as the cre-ation of an FTA and a unified customs network; and to improve the movement of goods, services, and people across borders.
-5-4-3-2-10123456
1999 2000 2001 2002 2003
Billion dollars
U.S. Trade with COMESA U.S. exportsU.S. importsTrade balance

3-10
Common Market for Eastern and Southern Africa
AGOA Imports in 2003
By Sector
By Country
Agricultural(5.9%)
Congo (DROC)(13.6%)
All other (5.9%)
Energy-related(13.6%)
Swaziland (15.2%)
Kenya (21.0%)
Mauritius (16.3%)
Textiles andapparel(77.5%)
All other (3.1%)
Malawi (6.7%)
Madagascar (21.4%)
Trade and Investment:
In March 2003,COMESA signed a Memorandum of Understanding(MOU) with the African Regional Intellectual Property Organization tofacilitate capacity building in the pharmaceutical industry.
In 2003,a Ugandan-owned garment company,with $1 million incapital investment,opened in Kampala and aims to produce men’sand women’s clothing to be shipped predominantly to the COMESAmarket.
In January 2004,Rwanda and Burundi became members of theCOMESA FTA.They continue,however,to impose their own nationaltariff rates on goods imported from outside the COMESA region.
COMESA is to share a $24-million EU grant with EAC, IOC,and IGAD.Funding will enable the members to remove regulatory barriers andto improve communications technology connectivity.
AGOA Imports from COMESA:
COMESA member countries that were AGOA eligible in 2003 wereDemocratic Republic of the Congo,Djibouti,Eritrea,Ethiopia,Kenya,Madagascar,Malawi,Mauritius,Namibia,Rwanda,Seychelles,Swaziland,Uganda,and Zambia.
In 2003,AGOA imports from COMESA totaled $879.8 million,anincrease of 46 percent from 2002.
The largest percentage increase in 2003 was in imports fromUganda,which increased from $31,886 in 2002 to $1.5 million in2003.Imports from Eritrea decreased the most, falling to zero in2003.
AGOA imports of miscellaneous manufactures more than tripled in2003 (from $1.7 million in 2002 to $6.1 million in 2003).Mineralsand metals imports increased substantially in 2003 (from $865,188in 2002 to $15 million in 2003).AGOA imports of footwear,however,registered the largest percentage decline,falling 51.9 percent (from$17,904 in 2002 to $8,604 in 2003).
0
500
1000
1500
2000
2500
3000
3500
4000
1998 1999 2000 2001 2002
COMESA Net Foreign Direct Investment, 1998-2002Million dollars
3201.4
3756.7
2567.02790.4
3590.2
$879.8 Million

3-11
Southern African Development Community
Status and Structure:SADC was launched in 1980 by the governments of nine southern African nations.Five-year Regional Indicative Strategic Development Plansinclude development of the agriculture sector,creation of a common market,harmonization of macroeconomic policies,promotion ofdemocratic governance,and improvement in the quality of health and social welfare.
In 2002,SADC created four “clusters” to centralize the promotion of trade and investment:Trade, Industry,Finance and Investment;Infrastructure and Services;Food,Agriculture and Natural Resources;and Social and Human Development and Special Programs.Finaltransfer of activities to the clusters was completed by mid-2004.
The SADC Protocol on Trade was signed in 1996,and was implemented by 11 countries by 2000.The Protocol aims to enhance theenvironment for domestic,cross-border,and foreign investment within the SADC region.The Protocol’s specific goals include creating an FTAby 2008,a customs union and,ultimately,a common market by 2012.To date,all 14 countries have reduced tariffs under the Trade Protocol,including Angola,which was not an original signatory to the Protocol. In addition,common rules of origin were adopted in 2002,and membersare currently adopting harmonized standards for customs and sanitary and phytosanitary regulations.
General Developments:In 2004,the SADC Trade Protocol is set for a midterm review regarding the progress of tariff and nontariff barrier reduction.This review willalso seek SADC member country central banks to achieve single digit inflation between 2004 and 2008 in the lead up to the creation of theFTA.
In early 2003,guidelines for reforming legislation in the transportation,communications,and meteorology sectors were finalized.Theguidelines address legislative harmonization,the streamlining of licensing procedures and processes,and the promotion of small- tomedium-sized enterprises.
In August 2003,Seychelles requested to withdraw from SADC,citing financial reasons.
In March 2004,SADC announced the launch of a Regional Indicative Strategic Development Plan to attract foreign investment in the miningand agricultural sectors.
sadc
Members: Angola, Botswana, Democratic Republic of the Congo, Lesotho, Malawi, Mauritius, Mozambique, Namibia, Seychelles, SouthAfrica, Swaziland, Tanzania, Zambia, and Zimbabwe.14
Population: 215.4 millionGDP: $221.5 billionGoals: To eliminate poverty, to promote economic development and growth while integrating political and social values, and to maximizeemployment through collective self-reliance policies and interdependence among member states while defending peace, security, and protec-tion of the environment.
-6-4-202468
1012
1999 2000 2001 2002 2003
Billion dollarsU.S. Trade with SADC U.S. exports
U.S. importsTrade balance

3-12
Southern African Development Community
AGOA Imports in 2003
By Sector
By Country
Transportationequipment(28.6%)
Mineralsand metals(16.1%)
Agricultural(7.2%)
Chemicals(6.9%) Textiles and
apparel(32.4%)
South Africa(65.2%)
All other(4.8%)
All other(4.1%)
Swaziland (5.2%)
Lesotho (14.6%)
Energy-related(4.8%)
Mauritius (5.6%)
Congo (DROC)(4.7%)
$2.6 Billion
0
1750
3500
5250
7000
8750
10500
12250
1998 1999 2000 2001 2002
Trade and Investment:
In August 2003,the Summit of SADC Heads of State explored thepossibility of imposing a higher tariff scheme for products of South Africauntil a free trade zone is achieved in 2008,to allow other member statesto develop their manufacturing sectors.
In late 2002,the EU granted SADC $17 million for a 5-year InvestmentPromotion Program that will identify potential growth industries orsectors and encourage investment.
During 2000-05,the EU and SADC ministers are negotiating a potentialEU-SADC FTA to begin after 2010.
In July 2004,the EU proposed an Economic Partnership Agreement withseven of the SADC members to promote trade and development. Initialtalks will establish rules to remove the remaining EU trade barriers forthese SADC countries.South Africa will participate as an observer.
AGOA Imports from SADC:
SADC member countries that were AGOA eligible in 2003 wereBotswana,Democratic Republic of the Congo,Lesotho,Malawi,Mauritius,Mozambique,Namibia,Seychelles,South Africa,Swaziland,Tanzania,and Zambia.
In 2003,AGOA imports from SADC totaled $2.6 billion,a 24-percentincrease from 2002.
In 2003,AGOA imports increased by more than 25 percent from sixSADC countries:Botswana,Malawi,Mauritius,Mozambique,Swaziland,and Zambia.AGOA imports from Namibia increased the most (from $1.7million in 2002 to $46.8 million in 2003).
The footwear sector accounted for the greatest percentage gain inAGOA imports, increasing by more that 150 percent in 2003 (from$303,547 in 2002 to $789,389 in 2003).AGOA imports ofmiscellaneous manufactures were the second-highest gainer,with anearly 50-percent increase (from $38.3 million in 2002 to $57.2 millionin 2003).AGOA imports of machinery registered the greatest decline in2003,decreasing by 38 percent (from $17.8 million in 2002 to $1.0million in 2003).
SADC Net Foreign Direct Investment, 1998-2002
Million dollars
3441.6
5589.3
3380.6
10699.8
3350.2

3-13
Southern African Customs Union
Status and Structure:SACU is the oldest regional agreement in southern Africa,dating back to 1910.In October 2002,after 8 years of negotiations betweenmembers,a revised framework for SACU was signed that would allow joint decision making for tariff and excise duty policies for all members,establish institutions to promote fair competition,and facilitate economic development through common policies.
SACU is recognized as a regional agreement by the WTO.
The Council of Ministers,which consists of one minister from each member,ratifies any change to external trade policy for the regionalagreement that has been recommended by the SACU Tariff Board.A tribunal arbitrates disputes arising from changes in trade policy.
Botswana,Lesotho,Namibia,and Swaziland each will develop national tariff bodies that will conduct tariff and trade remedy investigations andpresent findings to the SACU Tariff Board.
Because Botswana,Lesotho,Namibia,and Swaziland are significantly smaller and collect a larger portion of revenue from customs and exciseduties,the 2002 agreement created a new Revenue Sharing Formula that changed the value of tariff revenue allocated them.
The 2002 agreement also maintains protection for infant industries in Botswana,Lesotho,Namibia,and Swaziland,allowing these countries toimpose duties on imports from South Africa if they are also imposed on goods from outside the SACU region.16 This protection is limited to 8years,but may be extended by the Council of Ministers or coupled with additional measures.
General Developments:In July 2003,the WTO released a trade policy review report emphasizing the importance of economic reform programs for the SACU region.The report commends the SACU members for continued policy harmonization,economic reform,and prudent fiscal policies that have led to astable environment for investment.
sacu
Members: Botswana, Lesotho, Namibia, South Africa, and Swaziland.15
Population: 52.4 millionGDP: $172.4 billionGoals: To create a free trade area among member countries; to promote growth through common economic strategies for industry develop-ment, agricultural sector, competition policy; and to establish policies to address unfair trade practices.
-3000-2000-1000
0100020003000400050006000
1999 2000 2001 2002 2003
Million dollars
U.S. Trade with SACU U.S. exportsU.S. importsTrade balance

3-14
Southern African Customs UnionTrade and Investment:
In November 2002,the United States notified Congress of its intent tolaunch FTA negotiations with SACU.17 Negotiations began in June 2003and should conclude by December 2004.In addition to addressingtariffs,the FTA is expected to cover services, investment,governmentprocurement,electronic commerce, labor,and environment. In the June2004 talks,SACU noted its concerns regarding investment, intellectualproperty rights,and services.
In January 2004,South Africa proposed that SACU initiate FTA talkswith India and China,as well as consider such negotiations with otherAfrican and Middle Eastern nations.
In March 2004,SACU concluded its third round of negotiations with theEU regarding a potential FTA.SACU is seeking greater access for itsagricultural exports to the EU market.
SACU and Mercosur expect that the framework of their FTA will besigned in 2004.Further talks regarding rules of origin will continue totake place.SACU is seeking to increase market access for industriessuch as engineering,agro-processing,and steel.
The United States is providing technical assistance to the SACUcountries to help implement commitments under various WTOagreements.
AGOA Imports from SACU:
All SACU members were AGOA eligible in 2003.
In 2003,AGOA imports from SACU members totaled $2.2 billion,anincrease of 27 percent from 2002.AGOA imports from Namibiaexperienced the greatest increase in 2003 at over 2,600 percent (from$1.7 million in 2002 to $46.8 million in 2003);Swaziland showed thesecond-largest increase,at 65 percent (from $81.3 million in 2002 to$134.0 million in 2003).
AGOA imports of energy-related products registered the largestpercentage increase,over 200 percent (from $866,196 in 2002 to$2.8 million in 2003), followed by the footwear sector with growth inAGOA imports of 170 percent (from $289,997 in 2002 to $789,389 in2003).AGOA imports of machinery registered the greatest percentagedecline,decreasing by 38 percent (from $17.8 million in 2002 to $11.0million in 2003).
010502100315042005250630073508400
1998 1999 2000 2001 2002
SACU Net Foreign Direct Investment, 1998-2002
Million dollars
1161.5
1824.01415.5
7844.3
1042.2
AGOA Imports in 2003
By Sector
By Country
All other (4.5%)Agricultural(6.3%)
Chemicals(7.9%)
South Africa(74.9%)
All other(2.4%)
Minerals andmetals (18.5%)
Transportationequipment(32.8%)
Textiles andapparel(30.0%)
Lesotho(16.7%)
Swaziland(6.0%)
$2.2 Billion

3-15
East African Community
Status and Structure:The EAC has its roots in the Agreement for Division of Assets and Liabilities of the East African Community,which was dissolved in 1977.In1993,an agreement to establish the Tripartite Commission for East African Cooperation was signed.
The EAC is recognized as a regional trade agreement by the World Trade Organization.
The EAC operates on 5-year Development Strategies that detail policy guidelines,programs to be implemented,and timelines for theircompletion.A primary goal of EAC is sequentially creating a customs union,a common market,a monetary union,and a political federation.
Collaboration with other regional organizations such as the AU,COMESA,IGAD,and SADC help EAC realize its goals of regional cooperationand integration.
General Developments:In March 2004,Burundi requested membership in the EAC.No affirmative date has been set for Burundi to make a formal application.
Uganda,Tanzania,and Kenya have agreed to a common external tariff, to enter into force in September 2004.The agreement,signed inMarch 2004,establishes duty-free imports of raw materials,a 10-percent tariff rate on intermediate goods,and a 25-percent tariff rate onfinished goods entering the EAC markets.An agreement has also been reached on rules of origin.
Within the common external tariff scheme,Uganda and Tanzania will receive revenue from surcharges placed on goods from Kenya,which hasa greater level of industrialization and development than its partners.Kenya will also allow duty-free access for imports from Uganda andTanzania.
EACMembers: Kenya, Tanzania, and Uganda.18
Population: 94.7 millionGDP: $28.8 billionGoals: To create a framework for regional cooperation and integration; to establish partnerships with the public sector; and to coordinateactivities in a wide range of areas including trade, investment, industrial development, monetary and fiscal affairs, infrastructure, humanresources, science and technology, agriculture and food security, environment and natural resources management, tourism, and wildlifemanagement.
-1000
100200300400500600700800
1999 2000 2001 2002 2003
U.S. Trade with EAC U.S. exportsU.S. importsTrade balanceMillion dollars

3-16
East African CommunityTrade and Investment:
The EAC received a grant of approximately $670,000 from Germany toaid in the construction of new headquarters in Arusha,Tanzania.
Efforts are currently underway to create a joint stock market among EACmembers.
The EAC has designated the Victoria basin as an economic zone.TheEAC has plans to invest $600 million to improve fishing,to developtourism facilities,and to improve transportation networks.The SwedishInternational Development Agency has also committed $160 million fordevelopment of the economic zone.
The World Bank has approved a loan of between $400 and $500 millionthat will help fund road transportation projects designed to link Tanzania,Kenya,and Uganda.
In July 2004,EAC member states representatives met to developstandards for goods and services originating from the common area.The project is to be funded by PTB (Germany),a national metrologyinstitute,and will help improve the competitiveness of EAC goods andservices.
AGOA Imports from EAC:
All EAC members were AGOA eligible in 2003.
In 2003,AGOA imports from the EAC totaled $187.5 million,anincrease of over 40 percent from 2002.
The largest percentage increase was from Uganda;AGOA imports fromUganda increased from $31,886 in 2002 to $1.5 million in 2003.
AGOA imports of electronic products registered an increase of over 500percent (from $7,878 in 2002 to $48,890 in 2003),and AGOA importsof agricultural products,and textiles and apparel grew by 58 percent and46 percent,respectively (from $3.7 million in 2002 to $5.8 million in2003,and from $122.0 million in 2002 to $178.6 million in 2003,respectively).AGOA imports of chemicals and related products declinedby 79 percent (from $734,224 in 2002 to $152,919 in 2003).
EAC Net Foreign Direct Investment, 1998-2002
0
200
400
600
800
1998 1999 2000 2001 2002
Million dollars
424.3
698.9751.5
522.3440.7
AGOA Imports in 2003
By Sector
By Country
Textilesandapparel(95.2%)
Agricultural(3.1%) All other
(0.7%)
Forest(1.0%)
Kenya(98.4%)
All other(1.6%)
$187.5 Million

3-17
Intergovernmental Authority on Development
Status and Structure:The original agreement,the Intergovernmental Authority on Drought and Development (IGADD),was established to focus on drought anddesertification issues.Members favoring the expansion of this mandate adopted the IGAD charter following a meeting of Heads of State andGovernment in 1996.
In keeping with the objective of ensuring peace and security in support of economic stability and eventual integration,Somalia and Sudanhave established subcommittees to oversee conflict prevention and resolution.These committees are also focused on reducing illegal armsflows within the region.
IGAD was revitalized in 1996 as a regional political,economic,development,and trade entity that would mirror other regional agreementssuch as ECOWAS and SADC.
General Developments:IGAD chaired negotiations between the Sudanese government and the Sudan People’s Liberation Army that led to an agreement to createan integrated governing entity for a period of 6 years before granting power to the states.
To reduce dependence on imported food, IGAD plans to increase investment in the agriculture sector to ensure sustainable foodproduction. IGAD also plans to promote the management of fresh water resources.
IGAD is currently implementing a 5-year strategy (beginning in 2004 and running through the end of 2008) to manage natural resources,including increasing crop production,food marketing efforts,water resources management,and environmental protection.Funding forsectoral projects has been requested from NEPAD.
The EU Development Fund has provided funding for infrastructure development projects,such as modernization of the railway betweenKenya and Uganda, improvement and expansion of the Ethiopian railways container terminals,and rehabilitation of ports throughout theregion.
igad
Members: Djibouti, Eritrea, Ethiopia, Kenya, Somalia, Sudan, and Uganda.19
Population: 177.6 millionGDP: $42.2 billionGoals: To resolve regional conflict, to provide regional security, to restore regional peace, to develop communications and transportationinfrastructure, to protect the environment, and to ensure food security.
0100200300400500600700800900
1999 2000 2001 2002 2003
Million dollars
U.S. Trade with IGAD U.S. exportsU.S. importsTrade balance

3-18
Intergovernmental Authority on Development
AGOA Imports in 2003
By Sector
By Country
Textilesandapparel(95.0%)
Agricultural(3.3%)
All other(1.6%)
Kenya(97.7%)
Ethiopia(1.5%)
All other(0.8%)
Trade and Investment:
In February 2004,IGAD participated in a meeting to launch the firstsession on Economic and Partnership Agreement (EPA) negotiationsbetween 16 eastern and southern African countries and the EU.
Negotiations with the EU regarding the EPA will proceed in three phases.Phase I of the negotiations with the EU (March - August 2004) targeted anumber of sectors for regional cooperation and policy harmonization.PhaseII (September 2004 - December 2005) will include negotiations on theremoval of tariffs and greater market access.The final phase,to begin inJanuary 2006,will cover implementation of the EPA in 2008.IGAD plans touse the EPA to mobilize private sector investment in the region,and toincrease its competitiveness in sectors such as tourism and agriculture.
AGOA Imports from IGAD:
The IGAD member countries that were AGOA eligible in 2003 were Djibouti,Eritrea,Ethiopia,Kenya,and Uganda.
In 2003,AGOA imports from IGAD totaled $188.9 million,a 44-percentincrease from 2002.
AGOA imports from Uganda registered the greatest percentage gain,increasing from $31,886 in 2002 to $1.5 million in 2003).
AGOA imports of electronic products accounted for the greatestpercentage increase,with an 18-fold increase (from $7,878 in 2002 to$146,690 in 2003).AGOA imports of agricultural products also increasedby over 50 percent and such textiles and apparel imports increased by 46percent (from $3.9 million in 2002 to $6.3 million in 2003,and from$123.2 million in 2002 to $179.5 million in 2003,respectively).
IGAD Net Foreign Direct Investment, 1998-2002
0
105
210
315
420
525
630
735
840
945
1050
1998 1999 2000 2001 2002
Million dollars1035.4
709.6
846.4792.8
933.0
$188.9 Million

3-19
Indian Ocean Commission
-800-600-400-200
0200400600800
1999 2000 2001 2002 2003
Status and Structure:The IOC was created in 1984,and original members included Madagascar,Mauritius,and Seychelles. Initially formed to strengthen linksamong the peoples of the member states and to improve the standard of living,the focus of the IOC is currently on promoting cooperation onsocial,economic,cultural,agricultural,and scientific policies.
The foreign ministers of the five member states meet annually to discuss IOC policy direction.A council ratifies or vetoes any proposalssubmitted by the Committee of the Permanent Officers of Connection,which develops and coordinates policies.
General Developments:As part of its focus on promoting social,economic,and cultural cooperation,the IOC is a member of the inter-regional Committee onCoordination that seeks to implement programs in the transportation and communication sectors,as well as to improve existing nationaleducation programs.
The EU provides a substantial part of IOC financing,and as mandated by the Lome Convention guidelines,funds are dispersed by the EuropeanDevelopment Fund (EDF).Since 1975,the EDF has funded projects totaling 118 million or (approximately $134 million).
iOC
Members: Comoros, France (representing the French Overseas Department of Reunion), Madagascar, Mauritius, and Seychelles.20
Population: 19.4 million (SSA countries only)GDP: $12.1 billion (SSA countries only)Goals: To promote cooperation between members states in the areas of diplomacy, economy, trade, agriculture, maritime fishing, conserva-tion of natural resources, education, and culture; and to promote tourism and conservation in coastal and coral reef regions.
Million dollarsU.S. Trade with IOC U.S. exports
U.S. importsTrade balance

3-20
Indian Ocean CommissionTrade and Investment:
The ninth EDF plan is promoting economic integration among memberstates,natural resources development and conservation,andmodernization of transport and communications. IOC also uses EDFfunds for poverty reduction efforts.
The IOC is also involved in the Cross Border Initiative with COMESA,EAC,and SADC.The program seeks to identify and remove barriers tointra-regional trade and investment,and is funded by the AfricanDevelopment Bank,the EU,and the IMF.
AGOA Imports from IOC:
IOC members that were AGOA eligible in 2003 were Madagascar,Mauritius,and Seychelles.
In 2003,AGOA imports from IOC totaled $331.0 million,an increase of71 percent from 2002.
The largest percentage increase in AGOA imports in 2003 was fromMadagascar,with a 136-percent increase (from $79.7 million in 2002to $187.9 million in 2003).
The sector with the largest percentage gain in AGOA imports in 2003was miscellaneous manufactures,with a fivefold increase (from $1.0million in 2002 to $5.3 million in 2003).The largest decline wasregistered by the agricultural sector,with AGOA imports declining bymore than 80 percent in 2003 (from $7.4 million in 2002 to $1.4million in 2003).
IOC Net Foreign Direct Investment, 1998-2002
0
50
100
150
200
250
300
350
400
1998 1999 2000 2001 2002
Million dollars
85.2
163.3
373.8
124.898.8
AGOA Imports in 2003
By Sector
By Country
Textilesandapparel(97.1%)
Miscellaneousmanufactures(1.6%)
All other(1.3%)
Madagascar(56.8%)
Mauritius(43.2%)
$331.0 Million

3-21
Communauté Economique et Monétaire de ľAfrique Centrale
Status and Structure:CEMAC,one of Africa’s oldest regional agreements,became an economic and monetary union in 1994.
CEMAC is composed of two unions,the Economic Union of Central Africa (UEAC) and the Monetary Union of Central Africa (UMAC).AConference of Heads of State determines policy for member states,and a council of ministers develops CEMAC policies.
General Developments:As regional infrastructure and collective security are priorities for CEMAC,in January 2003,the council of ministers stated its intent to createan airline to serve the CEMAC region.
In December 2003,a meeting of the council of ministers proposed a nonaggression pact and the provision of mutual assistance during periodsof civil unrest.
A CEMAC-wide passport scheme was proposed in January 2003,although progress has been slow.
CEMAC ministers are attempting to harmonize education policy. In January 2004,UNESCO organized a workshop for all education ministersfrom the CEMAC member states.The primary goal was to encourage education ministers to coordinate and integrate policies on newtechnology,HIV/AIDS education in schools,and teacher training.
Regulations governing money laundering have been adopted for the financial sector.
In early 2003,the World Bank announced a $100-million Regional Integration Assistance Strategy for CEMAC.The strategy aims to providetechnical assistance for reforming customs practices and transit processes.Other investment projects to be funded include the improvementof existing road networks and the creation of new links to facilitate the flow of goods,services,and people.
cemacMembers: Cameroon, Central African Republic, Chad, Republic of the Congo, Equatorial Guinea, and Gabon.21
Population: 45.5 millionGDP: $30.1 billionGoals: To promote the national markets of member states, to encourage regional and monetary integration through trade liberalization,to establish a common external tariff scheme, to harmonize development policies, and to facilitate the free movement of goods, services, andpeople.
-4-3-2-101234
1999 2000 2001 2002 2003
Billion dollars
U.S. Trade with CEMAC U.S. exportsU.S. importsTrade balance

3-22
Communauté Economique et Monétaire de ľAfrique Centrale
AGOA Imports in 2003
By Country
All other(9.6%)
Gabon(70.1%)
Energy-related(99.8%)
By Sector
All other(4.7%)
Forest(8.0%)
Agricultural(87.3%)
Congo (ROC)(20.3%)
All other (0.2%)
Trade and Investment:
Petroleum is the primary CEMAC export.Many members rely onthis commodity for nearly 80 percent of revenues,followed byagricultural products such as wood,coffee,and cocoa.TheExecutive Secretariat has recognized the need to diversify exportsand has encouraged members to diversify into the manufacturingsector.
Formal regional trade remains relatively low because of high tariffrates between member countries.
In August 2003,work began on two bridges across the NtemRiver and a highway section linking Equatorial Guinea,Cameroon,and Gabon.The project is scheduled for completion in 2006.
In May 2003,the management concession for the Transgabonaisrailway was awarded to Comilog (France). In September 2003,aSpanish firm was awarded a contract to manage the deepwaterports for Gabon,a key port for the Transgabonais railway.
In June 2003,CEMAC inaugurated a small stock exchange,withtrading expected to begin in mid-2004.The new exchange isexpected to merge in late 2004 with another stock exchange thatwas opened in April 2003 in Cameroon.
AGOA Imports from CEMAC:
All CEMAC members were AGOA eligible in 2003.
In 2003,AGOA imports from CEMAC totaled $1.7 billion,anincrease of 23 percent from 2002.AGOA imports from theRepublic of the Congo registered the greatest percentageincrease,over 200 percent (from $106.6 million in 2002 to$340.8 million in 2003);the second-largest increase,27 percent,was in imports from Cameroon (from $115.8 million in 2002 to$147.0 million in 2003).
AGOA imports of energy-related products registered the largestincrease,at over 22 percent (from $1.4 billion in 2002 to 1.7billion in 2003),while miscellaneous manufactures sector importsregistered the largest decline,falling by 70 percent (from$296,599 in 2002 to $86,651 in 2003).
CEMAC Net Foreign Direct Investment, 1998-2002
0250500750
10001250150017502000
1998 1999 2000 2001 2002
Million dollars
542.8378.3
1263.9
1769.0
703.2
$1.7 Billion

3-23
1 African Union, “Advent of the AU,” found at Internet addresshttp://www.african union.org, retrieved July 2004.
2 UNDP, Annual Report 2003, found at Internet addresshttp://www.undp.org/rba, retrieved July 2004.
3 For more information on NEPAD, see the NEPAD section inchapter 4 of this report.
4 ECOWAS press release, “Summit of SecondMonetary Zone forSeptember,” Aug. 2004, found at Internet addresshttp://www.ecowas.int, retrieved Aug. 2004.
5 CEMAC, “Les Bulletins Officiels de la CEMAC,” found at Internetaddress http://www.izf.net/izf/Documentation/JournalOfficiel/Index%20CEMAC.htm, retrieved July 2004.
6 Ibid.7 SADC, “Regional Indicative Strategic Development Plan,” found
at Internet address http://sadc.int, retrieved July 2004.8 “Another StepTowards LastingPeace,”May28,2004, foundat
Internet address http://www.allafrica.com, retrieved July 2004.9 Reform programs under the SSATP Task Force include road
management, railway management, urban transport, trade andtransport, and rural travel transport programs.
10 UNECA, Annual Report 2004, May 2004, found at Internetaddress http://www.uneca.org, retrieved July 2004.
11 U.S. Department of State, Bureau of African Affairs FactSheet, “Economic Community of West African States,” found atInternet address http://www.state.gov, retrieved June 2004.
12 U.S. Department of State, Bureau of African Affairs, “FactSheet: West African Economic and Monetary Union,” found atInternet address http://www.state.gov, retrieved June 2004.
13 U.S. Department of State, Bureau of African Affairs, “FactSheet: Common Market for Eastern and Southern Africa,” found atInternet address http://www.state.gov, retrieved June 2004. AsBurundi and Rwanda did not become members of COMESA until2004, and as Egypt is not classified as a part of SSA for this report,these countries’ data are not included in trade and investmentfigures. As Namibia withdrew membership in mid-2004, it isincluded in 2003 data figures.
14 U.S. Department of State, Bureau of African Affairs, “FactSheet: Southern African Development Community,” found at Internetaddress http://www.state.gov, retrieved June 2004.
15 U.S. Department of State, Bureau of African Affairs,“Southern African Customs Union,” found at Internet addresshttp://www.state.gov, retrieved June 2004.
16 An infant industry is defined by SACU as having beenestablished for no more than 8 years.
17 The Commission conducted a classified study at the requestof USTR concerning the probable economic effect of a U.S.-SACUFTA, USITC, U.S. Southern African Customs Union Free TradeAgreement: Advice Concerning the Probable Economic Effect, Inv.Nos. TA-131-23 and TA-2104-003, Apr. 2003.
18 EAC, “EAC Membership,” found at Internet addresshttp://www.eac.int, retrieved June 2004.
19 U.S. Department of State, Bureau of African Affairs,“Southern African Development Community,” found at Internetaddress http://www.state.gov, retrieved June 2004.
20 IOC, “IOC Membership,” found at Internet addresshttp://www.coi info.org/memberstates, retrieved June 2004.
21 Secretariat of the Central African Economic and MonetaryUnion, “CEMAC Membership,” found at Internet addresshttp://www.izf.net, retrieved June 2004.
TRADE-ContinuedENDNOTES


4-1
CHAPTER 4Multilateral Assistance, U.S. Bilateral Assistance,and Other Trade-Related Initiatives
U.S. trade and investment with SSA is influenced by a number of factors, includingprograms that provide multilateral assistance, bilateral assistance, and othertrade-related initiatives. U.S. trade and investment with countries in SSA are affectedby the policies and programs of the Export-Import Bank (Ex-Im Bank), U.S. Trade andDevelopment Agency (TDA), Overseas Private Investment Corporation (OPIC), andvarious programs operated by the U.S. Agency for International Development(USAID) and the U.S. Department of Agriculture.
Multilateral assistance, through the International Development Association of theWorld Bank and the African Development Fund of the African Development Bank(AfDB), is a significant source of financing for economic development programs in theregion. The United States, as a shareholder in both the World Bank and the AfDB, is animportant voice in the operations of these banks, and U.S. companies are eligible tobid on their funded procurement opportunities.
This chapter summarizes developments in multilateral assistance, U.S. bilateralassistance toSSA, and other trade-related initiatives. Table 4-1 provides a summaryofthese activities.
Sources of Multilateral Assistance to Sub-Saharan Africa
The World Bank Group and the African Development Bank Group are two majorsources of multilateral assistance for SSA. Lending by the World Bank and AfDBfinances specific projects, and therefore, can be generally classified by sector. Inaddition, the International Monetary Fund provides concessional loans to countrieswith balance-of-payments problems. These loans, however, are not classified bysector.
The World Bank Group
The World Bank/International Development AssociationThe World Bank is the leading multilateral institution dedicated to providingdevelopment assistance. The Bank’s main goals are to strengthen the investmentclimate and to invest in poverty reduction. While focusing on project quality, the Bank

4-2
Table 4-1Summary of general developments in multilateral and U.S. bilateralassistance for sub-Saharan Africa, 2003
Institution/activity2003 assistance levels forsub-Saharan Africa Other developments
The World Bank Group:International DevelopmentAssociation
Lending commitments made bythe World Bank to countries insub-Saharan Africa remainedconstant at $3.7 billion in 2002and 2003.
Over 21 percent ($811 million)of the Bank’s lending was forhuman development (notablyHIV/AIDS), 15 percent forsocial protection, and 11percent for education.
The World Bank Group:Multilateral InvestmentGuarantee Agency (MIGA)
In FY 2003, MIGA issuedinvestment guarantees orcoverage for nine projects inAfrica totaling $953 million.
In conjunction with the ForeignAdvisory Service, UNCTAD,and UNIDO, MIGA launched aMulti-Agency Initiative toincrease investment in SSA.
The World Bank Group:International FinanceCorporation (IFC)
The IFC committed to invest$164 million to support theexpansion of SSA banks andfinancial institutions in FY 2003.
The IFC invested in a cellularoperator in the DemocraticRepublic of the Congo and abank in Angola.
African Development BankGroup (AfDB)
In 2003, the AfDB approved 16new projects and programswith a combined value of$465.1 million.
In 2003, AfDB also signed 118loan and grant agreementsvalued at $2.6 billion.
International Monetary Fund(IMF)
As of April 30, 2003, the IMFhad committed $1.9 billion ingrants to 23 SSA countries.
In FY 2003, the IMF approvedPoverty Reduction and GrowthFacility arrangements for theDemocratic Republic of theCongo, The Gambia, Senegal,and Uganda.
Export-Import Bank of theUnited States (Ex-Im Bank)
In FY 2003, Ex-Im Bank supportto SSA consisted of loanguarantees and insurancetotaling $572 million. As ofSeptember 2003, Ex-Im Bank’stotal exposure in SSA was $3.6billion.
The Democratic Republic of theCongo accounted for 24percent, Nigeria represented23 percent, and South Africarepresented 16 percent of Ex-ImBank’s total SSA exposure.
U.S. Trade and DevelopmentAgency (TDA)
TDA’s obligation insub-Saharan Africa decreasedto $5.9 million in FY 2003 from$9.9 million in FY 2002.
SSA funding accounted for 11.2percent of all TDA funding in2003.
Overseas Private InvestmentCorporation (OPIC)
In FY 2003, total investments inSSA were $384 million.
OPIC participated in increasinghousing projects in South Africaand Kenya.
U.S. Agency for InternationalDevelopment (USAID):Development Assistance andother economic assistanceprograms
USAID obligation for SSAtotaled$1.4 billion in FY 2003,compared to $1.1 billion in FY2002.
USAID continued to supportseveral programs that it startedin 2002, including the Initiativeto End Hunger in Africa, theAfrican Education Initiative,and Anti-Corruption Initiative.
Source: Compiled by the Commission from tables and information detailed in this chapter.

4-3
seeks to improve procurement and financial management, and to reduce structuralconstraints to poverty reduction. The International Development Association (IDA), theBank’s concessional lending arm, provides long-term loans at no interest to eligibleborrowers from developing countries. There are 37 countries in SSA that are eligiblefor World Bank loans.1 The World Bank reports that aid flows to Africa declined by 40percent per capita in the past decade. The Bank is, however, attempting to reverse thistrend.2 In 2003, SSA received $3.7 billion in interest-free loans, or 33 percent of theBank’s total lending to developing countries ($11.2 billion).
Whereas the World Bank raises funds through selling securities globally, the IDA isfunded through donations from member countries. The IDA is an integral part of theBank’s poverty reduction mission, lending to and assisting those countries with limitedaccess to capital.3 To be eligible for an IDA loan, a country must be a member of theBank and have an annual per capita income of less than $865. Eligible countries areranked on the basis of their policy performance and effective use of financial aid. TheIDA allocates more funds to the poorest eligible countries, with consideration for acountry’s level of policy performance and institutional capacity. The IDA provides lessdeveloped countries zero-interest rate loans with a 10-year grace period andmaturities of 35 to 40 years.4 SSA countries eligible to borrow from the IDA are listedin table 4-2.
Table 4-2World Bank/IDA: Eligible borrowers in sub-Saharan Africa (37)Angola Ethiopia NigerBenin The Gambia RwandaBurkina Faso Ghana São Tomé and PrincipeBurundi Guinea SenegalCameroon Guinea-Bissau Sierra LeoneCentral African Republic Kenya SomaliaChad Lesotho SudanComoros Liberia TanzaniaCongo (DROC) Madagascar TogoCongo (ROC) Malawi UgandaCôte d’Ivoire Mali ZambiaDjibouti MauritaniaEritrea Mozambique
Source: World Bank, World Bank Annual Report 2003, p. 132.
In 1999, the Poverty Reduction Strategy Program (PRSP) was launched by the WorldBank. This program was designed to increase government participation inprojects thatuse foreign aid. The Bank and IMF perform joint staff assessments on these plans toensure that they are designed to move the country toward international developmentgoals such as applying sound macroeconomic and sectoral policies, protecting the
1 World Bank, “Countries of the Sub-Saharan Africa,” found at Internet addresshttp://www.worldbank.org/afr/countries.htm, retrieved Aug. 2, 2004.
2 World Bank, The World Bank Annual Report 2003, p. 88.3 World Bank, The World Bank Annual Report 2003, p. 19.4 IDA, “International Development Association,” found at Internet address
http://www.worldbank.org/ida/eligible.htm, retrieved Aug. 9, 2004.

4-4
environment, and strengthening social sectors. The Bank then allocates PovertyReduction Support Credits (PRSC) to assist these low-income countries in implementingtheir reforms.
IDA lending for SSA was valued at $3.7 billion in FY 2003 in support of 60 projectsand 10 supplemental credits; this funding represented 21 percent of its total newcommitments to all regions for the year.5 In FY 2003, the IDA committed over 21percent of its funds to SSA for human development, particularly the prevention andtreatment of communicable diseases such as HIV/AIDS. IDA expects its SSA funding toincrease to the point that SSA will eventually account for 50 percent of its resources.
At present, there are 95 projects under implementation in conflict-affected areas ofSSA. For example, DROC received a grant of $50million from the IDA to help stabilizeits economy and to help address issues such as HIV/AIDS. To provide a framework fordisarmament, demobilization, and re-integration, the Bank administers themulti-donor Trust Fund for Demobilization and Reintegration for the Great LakesRegion. Table 4-3 presents IDA’s SSA commitments by theme, sector, and creditsduring FY 1998-2003. In terms of theme, human development received the largestloan commitment for FY 2003, with loans totaling $811.4 million, or 21.7 percent oftotal SSA loans. By sector, health and other social services received the largestallocation, totaling $775.9 million, or 20.8 percent of total loans to SSA.
Table 4-4 shows World Bank projects approved for SSA in FY 2003. There were 71IDA projects undertaken in 27 African countries in 2003. The five countries thatborrowed the most were DROC, Uganda, Ethiopia, Nigeria, and Ghana. DROCborrowed $454 million, which included $44 million in grants for economic recoveryprojects. Uganda borrowed $230 million, mostly for poverty reduction and localgovernment development. Ethiopia borrowed $304 million for energy projects, roaddevelopment, pastoral community development, drought recovery, socialrehabilitation, and capacity building. Nigeria borrowed $230 million for basiceducation, Lagos urban transport projects, and polio eradication. Ghana’s $215million loan was designated for poverty reduction and health.
The Heavily Indebted Poor Countries (HIPC) Initiative, a joint effort of the IMF and theWorld Bank, plays an important role in ensuring and maintaining long-term debtsustainability in eligible countries. According to the World Bank, African economieshave improved in recent years because they were supported by improvedmicroeconomic polices and debt relief under the HIPC initiative. In order to qualify forthe HIPC Initiative, countries must maintain a satisfactory track record in adoptingWorld Bank and IMF adjustment and reform programs. Thirteen countries are in theprocess of meeting these criteria,6 and nine countries have encountered difficulties inimplementing these requirements.7 Only Burkina Faso, Mali, Mauritania,
5 Ibid.6 The 13 countries are Cameroon, Chad, Ethiopia, The Gambia, Ghana, Guinea, Guinea-Bissau,
Madagascar, Malawi, São Tomé and Principe, Senegal, Sierra Leone, and Zambia.7 These countries are Burundi, Central African Republic, Côte d’Ivoire, DROC, Liberia, ROC,
Somalia, Sudan, and Togo.

4-5
Table 4-3World Bank (IDA and IBRD) lending commitments in sub-Saharan Africa,by theme and sector, average FY 1998-99 and FY 2000-03
(Million dollars)
h1998-99
Theme:1998 99
(Average) 2000 2001 2002 2003
Human Development . . . . . . . . . . . . . . . 267.7 208.5 399.4 739.0 811.4
Social Protection and Management . . . . 117.2 140.5 376.4 98.3 543.7
Public Sector Governance . . . . . . . . . . . 291.7 495.3 429.6 851.9 432.4
Urban Development . . . . . . . . . . . . . . . 253.8 154.9 206.1 279.6 425.5
Social Development, Gender, andInclusion . . . . . . . . . . . . . . . . . . . . . .
167.6 210.5 491.8 347.4 420.0
Rural Development . . . . . . . . . . . . . . . . 393.6 151.8 296.3 329.2 384.1Financial and Private Sector
Development . . . . . . . . . . . . . . . . . . .509.0 466.7 625.8 780.7 383.6
Environmental and Natural ResourceManagement
156.0 172.4 110.0 159.9 227.0
Economic Management . . . . . . . . . . . . 165.0 78.2 138.5 138.7 37.8Trade and Integration . . . . . . . . . . . . . . 120.5 53.7 261.5 46.4 37.2
Rule of Law . . . . . . . . . . . . . . . . . . . . . . 21.0 26.7 34.0 22.5 34.5
Total . . . . . . . . . . . . . . . . . . . . . . . . 2,463.2 2,159.1 3,369.6 3,793.5 3,737.2
Sector:Health and Other Social Services . . . . . 273.6 183.1 889.9 616.6 775.9
Law and Justice and PublicAdministration . . . . . . . . . . . . . . . . . .
610.9 834.9 880.8 906.9 721.8
Transportation . . . . . . . . . . . . . . . . . . . . 533.5 263.9 229.8 491.1 690.5
Education . . . . . . . . . . . . . . . . . . . . . . . 304.4 189.8 209.5 472.6 423.6
Energy and Mining . . . . . . . . . . . . . . . . 244.0 176.3 198.0 490.3 324.4
Agriculture, Fishing, and Forestry . . . . . 170.0 111.5 212.0 210.4 303.4
Water, Sanitation, and FloodProtection . . . . . . . . . . . . . . . . . . . . .
142.0 155.9 357.8 112.2 296.3
Industry and Trade . . . . . . . . . . . . . . . . 94.3 104.7 170.6 266.7 92.7
Finance . . . . . . . . . . . . . . . . . . . . . . . . . 53.7 121.7 200.1 192.8 67.2
Information and Communication . . . . . . 36.7 17.3 21.1 33.8 41.4
Total . . . . . . . . . . . . . . . . . . . . . . . . 2,463.2 2,159.1 3,369.6 3,793.5 3,737.2
Note.–Because of rounding, figures may not add to the totals shown.Source: World Bank, The World Bank Annual Report, 2003, Vol. 1, table 5.1.
Mozambique, Tanzania, and Uganda have met the requirements and received mostof their assistance under the HIPC Initiative. As of April 30, 2003, the Bank hadcommitted $1.9 billion (SDR 1.4 billion) to 22 SSA countries. 8 In FY 2003, however, theglobal economic slowdown and a significant decline in many primary commodityprices weakened economic growth contributing to the deteriorationof many countries’external debt indicators.9 Furthermore, the United Nations reports that the HIPCInitiative is a costly process.10
8 IMF, Annual Report 2003, found at Internet addresshttp://www.imf.org/external/pubs/ft/ar/2003/eng/pdf/filed.pdf, retrieved Aug. 9, 2004.
9 World Bank, “The Enhanced HIPC Initiative and the Achievement of Long-Term External DebtSustainability,” found at Internet addresshttp://www.worldbank.org/hipc/hipc-review/Long-Term.pdf, retrieved Aug. 9, 2004.
10 United Nations, “Debt relief needs a bolder approach,” found at Internet addresshttp://www.un.org/ecosocdev/geninfo/afrec/vol14no4/htm/debt_boxes.html, retrieved July 10,2003.

4-6
Table 4-4World Bank projects approved in sub-Saharan Africa, FY 20031
Country/project nameDate ofapproval
Maturitydates
PrincipleamountMilliondollars
AngolaEmergency Demobilization and Reintegration Grant March 27, 2003 n.a. 33.0
Economic Management Technical Assistance Credit March 27, 2003 2013/2042 16.6
BeninPubic Expenditure Reform Supplemental Credit October 27, 2003 2013/2042 10.0
Burkina FasoTransport Sector Investment Credit/Grant April 8, 2003 n.a. 92.1
Utility Reform and Investment Credit March 4, 2003 2013/2042 30.7
Learning Center and Innovation Credit July 29, 2002 2012/2042 2.3
Poverty Reduction Support Credit July 11, 2002 2012/2042 35.0
BurundiSocial Action Supplemental Grant April 8, 2003 n.a. 14.2
Health and Population Supplemental Grant January 16, 2003 n.a. 9.5
Economic Rehabilitation Credit August 29, 2003 2013/2042 54.0
CameroonRailway Investment Credit July 18, 2002 2012/2042 21.4
Structural Adjustment Credit June 6, 2003 2008/2038 3.3
Douala Infrastructure Investment Credit July 18, 2003 2012/2042 56.4
Cape VerdeGrowth and Competitiveness Credit May 13, 2003 n.a. 11.5
Structural Adjustment Supplemental Credit December 12, 2002 2013/2042 4.0
ChadEducation Sector Reform Investment Credit/Grant March 18, 2003 2013/2042 42.3
Structural Adjustment Credit March 18, 2003 2013/2043 40.0
Electricity and Water Service Rehabilitation Credit October 10, 2002 2013/2042 54.8
Democratic Republic of the CongoMulti-sector Rehabilitation and Reconstruction Credit August 6, 2002 2012/2042 454.0
Republic of the Congo
Recovery and Community Support Credit/Grant June 24, 2003 2013/2043 41.0
EritreaEducation Sector Credit June 19, 2003 2013/2043 45.0
Emergency Reconstruction Supplemental Grant June 19, 2003 n.a. 15.0
EthiopiaRoad Sector Development Phase I Grant June 17, 2003 n.a. 126.8
Pastoral Community Development Grant May 20, 2003 n.a. 30.0
Drought Recovery Grant March 27, 2003 n.a. 60.0
Social Rehabilitation and Development Fund I Credit December 17, 2002 2013/2042 28.3
Energy Access Investment Credit September 19, 2002 2012/2042 132.7
Capacity Building for Service Delivery Credit July 23, 2002 2013/2042 26.2
GhanaPoverty Reduction Support Credit/Grant June 24, 2003 2013/2043 125.0
Health Program Specific Credit/Grant February 6, 2003 2013/2042 89.6
GuineaMulti-sector AIDS Grant December 13, 2002 n.a. 20.3
Rural Electrification Learning and Innovation Credit July 2, 2002 2012/2042 5.0
See footnote at end of table.

4-7
Table 4-4—ContinuedWorld Bank projects approved in sub-Saharan Africa, FY 20031
Country/project nameDate ofapproval
Maturitydates
PrincipleamountMilliondollars
KenyaArid Lands Resource Management Phase 2 Credit June 19, 2003 2013/2043 60.0
Free Primary Education Support Credit June 19, 2003 n.a. 50.0
Economic and Public Sector Reform Credit June 5, 2003 2010/2040 0.5
MadagascarMineral Resources Governance Credit May 13, 2003 n.a. 32.0
Emergency Economic Recovery Credit November 11, 2002 2013/2042 50.0
Rural Transport Adaptable Program Credit November 14, 2003 2012/2042 80.0
MalawiSocial Action Fund Adaptable Program Credit/Grant June 10, 2003 2013/2043 60.0
Financial Management, Transparency Credit/Grant March 16, 2003 2013/2043 23.7
Drought Recovery Credit/Grant November 15, 2002 2013/2042 50.0
National Water Development Credit August 8, 2002 2005/2035 3.2
MozambiqueHIV/AIDS Response Grant March 28, 2003 n.a. 55.0
Public Sector Reform Adjustable Program Grant March 18, 2003 n.a. 25.6
Economic Management-Private Sector Credit August 29, 2002 2012/2042 120.0
NigerMulti-sectoral STI/HIV/AIDS Support Grant April 4, 2004 n.a. 25.0
Community Action Program Adjustment Grant March 20, 2003 n.a. 35.0
NigeriaPolio Eradication Credit April 29, 2003 n.a. 28.7Lagos Urban Transport Investment Credit November 21, 2002 2013/2037 100.0
Basic Education Investment Credit September 12, 2002 2013/2037 101.0
RwandaMulti-country AIDS Grant March 31, 2003 n.a. 30.5
Institutional Reform Credit December 3, 2002 2013/2042 85.0
SenegalPrivate Investment Promotion Credit May 20, 2003 n.a. 46.0Sierra LeoneEconomic Rehabilitation and Recovery Credit May 20, 2003 n.a. 30.0
National Social Action Credit April 24, 2003 n.a. 35.0
Health Sector Grant February 25, 2003 n.a. 20.0
Basic Education Specific Investment Grant February 25, 2003 n.a. 20.0
South AfricaMunicipal Financial Management Assistance Loan September 12, 2002 2007/2011 15.0
TanzaniaProgrammatic Structural Adjustment Credit June 27, 2003 2010/2040 0.4
Agricultural Development and Empowerment Credit May 27, 2003 2013/2043 56.6
Dar es Salaam Water and Sanitation Credit May 27, 2003 2013/2043 61.5
UgandaLocal Government Development Credit/Grant May 29, 2003 2013/2043 125.0
Northern Uganda Social Action Investment Credit July 23, 2002 2012/2042 100.0
Poverty Reduction Support Credit July 23, 2002 2012/2042 150.0Protected Areas Investment Credit July 9, 2002 2012/2042 27.0
Lake Victoria Supplemental Credit July 9, 2002 2012/2042 4.5
See footnote at end of table.

4-8
Table 4-4—ContinuedWorld Bank projects approved in sub-Saharan Africa, FY 20031
Country/project nameDate ofapproval
Maturitydates
PrincipleamountMilliondollars
ZambiaEconomic Recovery and Investment Credit June 17, 2003 2013/2043 10.0
Copperbelt Environment Investment Credit/Grant March 20, 2003 2013/2043 40.0ZANARA HIV/AIDS Grant December 30, 2002 n.a. 42.0
Emergency Drought Recovery Grant/Credit November 19, 2002 2013/2042 50.0
Economic Recovery and Investment Credit September 19, 2002 2012/2042 7.5
Total . . . . . . . . . . . . . . . . . . . . . . . . . . . . . . . . . . . . . . 3,585.71 July 2002 to June 2003
n.a. = not available
Source: World Bank, World Bank Annual Report 2003, pp.141-149.
Multilateral Investment Guarantee Agency
The Multilateral Investment Guarantee Agency (MIGA) was established in 1998 as amember of the World Bank Group to address the issue of political instability forinvestors. The purpose of MIGA is to encourage foreign direct investment indeveloping countries by providing investment guarantees and technical assistance.Investment guarantees act as insurance for investors against situations in a hostcountry considered too risky to be profitable by private-sector insurance firms.Examples of economic and social risks include expropriation, breach of contract, andwar and civil disturbance. In addition, MIGA provides technical assistance, onlinedissemination of information on investment opportunities, and investment disputemediation services.
In 2003, MIGA’s membership included 154 industrialized and developing countries.11
Table 4-5 lists those countries in SSA that are currently members of MIGA and thosethat are in the process of fulfilling membership requirements. MIGA issued investmentguarantees to cover eight projects in Africa totaling $953 million during FY 2003, anincrease from$272million in2002.12 Table 4-6outlines theseprojects, which typicallyinvolve privatization efforts and capacity-building activities. In 2003, MIGA allocatedover 19 percent of its outstanding portfolio to the SSA region.13 In order to helpinvestors benefit from recent economic reforms, MIGA opened several mobile officesin central, western, and southern Africa. In addition, the agency organized aU.S.-Africa Business Summit to attract new investment and to build greater institutionalcapacity in the region. MIGA also actively supports the New Partnership for Africa’sDevelopment (NEPAD).14
11 MIGA, “Miga Membership,” found at Internet addresshttp://www.miga.org/screens/pubs/annrep01/members.pdf, retrieved June 3, 2002.
12 World Bank Fact Sheet, “Heavily Indebted Poor Countries Initiative,” March 2003.13 Ibid.14 For additional details, see following section of this chapter on NEPAD.

4-9
Table 4-5Sub-Saharan African MIGA members and countries in the process of fulfillingmembership requirements, 2003
MIGA Member countriesAngola Gabon SeychellesBenin The Gambia Sierra LeoneBotswana Ghana South AfricaBurkina Faso Guinea SudanBurundi Kenya SwazilandCameroon Lesotho TanzaniaCape Verde Madagascar TogoCentral African Republic Malawi UgandaChad Mali ZambiaCongo (DROC) Mauritania ZimbabweCongo (ROC) MauritiusCôte d’Ivoire MozambiqueEquatorial Guinea NamibiaEritrea NigeriaEthiopia Senegal
Countries in the Process of Fulfilling Membership RequirementsGuinea-Bissau NigerLiberia RwandaSource: MIGA, “MIGA Member Countries,” found at Internet addresshttp://www.miga.org/screens/pubs/annrep01/members.pdf, retrieved Aug. 1, 2004.
MIGA initiated assistance programs in 16 of the 40 SSA MIGA member countriesduring FY 2003. Ghana, Mozambique, Senegal, and Tanzania have been selectedfor prioritized technical assistance programs, focusing on capacity-building efforts inthese nations to enable investors to take advantage of increased access to the U.S.market through AGOA, and the EU market through the Cotonou Agreement.15 MIGA,with the Foreign Investment Advisory Service, United Nations Conference on Tradeand Development, and United Nations Industrial Development Organization,launched a multiagency initiative to assist Mali, Mozambique, Tanzania, and Ugandato attract more FDI. Projects in Benin, Mauritania, Nigeria, and Senegal receivedfirst-time coverage from MIGA.
International Finance CorporationThe International Financial Corporation (IFC) was founded in 1956 as a legally andfinancially independent member of the World Bank Group. The main objective of theIFC is to promote sustainable private sector investments.16 The IFC’s strategy,developed in 1998, emphasizes three areas: strengthening the financial sector,expanding private investment in infrastructure, and supporting indigenousentrepreneurship.17
15 MIGA, “Miga Membership,” p. 49.16 IFC, “Introduction,” found at Internet address http://www.ifc.org/ar2003/annual/intro.html,
retrieved Aug. 9, 2004.17 IFC, Annual Report 2003, p. 32.

4-10
Table 4-6MIGA guarantees issued in sub-Saharan Africa, FY 2003
Country Investor Investor country
Guaranteeamount
(Million dollars) Sector
Angola . . . . . . . . . Barlows Tractor United Kingdom 18.4 Manufacturing
Cameroon . . . . . . . Societe Internationale dePlantations d’Hevas
France 5.4 Agribusiness
Equatorial Guinea . UMC Equatorial Guinea Corp. United States 24.0 Oil and gas
Ghana . . . . . . . . . . Unatrac International Egypt 18.0 Services
Guinea . . . . . . . . . Agro-Industrial Investment andDevelopment
Panama 9.0 Flour Milling
Kenya . . . . . . . . . . Mersey Docks and HarbourCompany
United Kingdom 4.7 Services
Madagascar . . . . Hydelec France 2.1 Thermal peaking powerstation
Mauritania . . . . . . Tunisie Télécom Tunisia 68.3 Telecommunicationservices
Mozambique . . . . . Industrial DevelopmentCorporation
South Africa 40.0 Aluminum Smelter
Mozambique . . . . . Industrial DevelopmentCorporation
South Africa 40.0 Agribusiness
Mozambique/Swaziland . . . . . . . Eskom South Africa 69.4 Power
Nigeria . . . . . . . . . MTN International Mauritius 50.0 Telecommunications
South Africa . . . . . Harsco Corp., MultiservInternational
United States,Netherlands
4.5 Manufacturing
Habib Bank AG Switzerland 12.3 Financial
Tanzania . . . . . . . . Barrick Gold Corp. Canada 56.3 Mining
Uganda . . . . . . . . . Starlight Telecommunications United States 2.6 Telecommunicationsg
Clovergem AG Switzerland 0.4 Manufacturing
Source: MIGA, 2003 Annual Report, found at Internet address http://www.miga.org, retrieved Aug. 2004.
In 2003, 47 SSA countries in sub-Saharan Africa were members of the IFC. Thenumber of IFC projects approved for SSA increased from 27 in 2002 to 37 in 2003,18
but the value of financial commitments signed by the IFCdeclined, from $256 million inFY 2002 to $167 million in FY 2003.19 The IFC’s total commitment to the SSA regionalso declined, from $1.8 billion in FY 2002 to $1.7 billion in FY 2003.20 IFC-supportedlending in areas of Africa beset by violence include Angola, where it funded a newmicro-finance bank, and DROC, where it funded a cellular telephone operator. TheIFCalsoassisted KenyanAirways to enlarge its fleet of aircraft, and the Government ofTanzania to privatize Air Tanzania.
18 IFC, “Sub-Saharan Africa, Building Local Capacity and Regional Businesses,” found at Internetaddress http://www.ifc.org/ar2003/pdf/Africa.pdf, retrieved July 2, 2003.
19 IFC, Annual Report 2003, p. 31.20 Ibid.

4-11
The IFCalso supports small and medium enterprises inAfrica byallowing smaller firmsto provide intermediary financial support for direct investments. For example, the IFCassisted in the establishment of a regional holding company to acquire banks throughprivatization that will, in turn, establish micro-finance networks on a national level. InChad, the IFC provided funding for two commercial banks, a new micro-finance bank,and assisted in the implementation of Chad’s small- and medium-enterprises initiative.
The African Development Bank GroupThe African Development Bank Group (AfDB Group) consists of the AfricanDevelopment Bank (AfDB), the African Development Fund (ADF), and the NigerianTrust Fund (NTF). Shareholders include 53 African and 24 non-African countries. Themain goals of the AfDB Group are to promote sustainable economic growth and toreduce poverty in Africa through capital resources and funds raised from capitalmarkets. In addition to dispersing loans, the AfDB Group plays a catalyst role for largecapital flows into Africa through cofinancing, and increases developmenteffectiveness through project preparation and supervision. The AfDB offers financialassistance onnonconcessional terms directed towards low-riskAfrican countries, suchas the northern African countries, South Africa, and Gabon. To complement AfDB, theADF and NTF lend on concessional terms to low-income regional member countries.
In 2003, the AfDB Group approved 16 new projects and programs valued atapproximately $473 million, and it signed 118 loan and grant agreements totaling$2.6 billion. The AfDB attributes this decrease to fewer countries qualifying for theHIPC debt relief program; sociopolitical disruption in Côte d’Ivoire, its host country;and a delay in replenishing the ADF’s reserves which, in turn, led to a decline in ADFoperations in 2002.21 However, the AfDB Group states that its total reserve hasconsistently grown.22
The AfDB Group mandate emphasizes a rigorous development effort in debt relief,health, education, regional integration, agriculture, andrural issues. The largest shareof loans (40 percent) went to the finance sector; 24 percent to water supply andsanitation; 16 percent to power supply; and 15 percent to the transportation sector. Inaddition, AfDB contributed $370 million to NEPAD projects in 2003.23
The AfDB Group agenda addresses human capital-building needs and private sectordevelopment. Projects in these areas aim to facilitate the integration of Africaneconomies with the global economy and enhance African workers’ employmentprospects. To this end, several mechanisms, including venture capital funds,
21 AfDB, 2002 Annual Report, p. 26.22 AfDB, “Financial and Operation Analysis, 2002,” p. 17, found at Internet address
http://www.afdb.org/financial/pdf/adb_financial_presentation_june2003e.pdf, retrieved July 2,2003.
23 AfDB, “ADB to provide US $600 million in support for NEPAD projects,” Press Release, No.SEGL3/B/63/04, July 8, 2004, found athttp://www.afdb.org/knowdlege/pressreleases2004/adb_63_2004e.htm, retrieved Aug. 11, 2004.

4-12
infrastructure funds, and development financial institutions are devoted to expandingand cultivating various segments of the private sector. Additionally, ADF technicalassistance operations continue to assist countries in project-related activities such asfeasibility studies, environmental impact assessments, sector and multisector studies,and detailed engineering studies.
The AfDB Group is actively involved in the movement to provide African countries withdebt relief. The AfDB Group’s collaboration with the World Bank and IMF on theEnhanced HIPC Initiative complements its efforts in that area. Under the EnhancedHIPC Initiative, the AfDB Group relieves regional member countries of up to 80percentof their annual debt. The AfDB Group uses the PRSPs to monitor projects, and povertyreduction strategies are implemented with available funds.24
Table 4-7 summarizes AfDB and ADF approvals of loans and grants for SSA projectsin 2003 (including multinational projects). In 2003, the AfDB Group authorizedfunding for 16 projects at a total cost of $473 million. South Africa received the singlelargest amount of loans and grants, $158 million, with 67percent designated for a lineof credit for the Development Bank of South Africa. In 2003, over $2 million wasauthorized for drought relief and $169 million for lines of credit.
International Monetary FundThe IMF is composed of several lending facilities that tailor their assistance to respondto specific balance-of-payments problems and to help cushion the impact of structuraladjustment. Stand-By Arrangements (SBA) and the Extended Fund Facility (EFF) aretwo traditional examples of such assistance. Member countries requiring a line ofcredit on a short-term basis rely on the SBA; member countries requiring long-termfunding (at least 3 years) rely on the EFF. In FY 2001, the IMF changed the repurchaseschedule for the EFF. Payments must still begin in 4.5 years, but must be repaid after 7years instead of 10. The Supplemental Reserve Facility and the Contingent Credit Lines,established in 1999, provide additional resources to prevent loss of market confidencein a member country or to sustain those experiencing abrupt reversals of investmentflows.25
The IMFhas twomechanisms through which it addressesprotracted paymentsarrears:the HIPC Initiative and the Poverty Reduction and Growth Facility (PRGF). In 1996, theWorld Bank and the IMF combined their resources to provide debt relief moreeffectively through the HIPC Initiative. In 1999, the World Bank and IMF governingboards adopted the Enhanced HIPC Initiative to shorten the time it takes fora country toqualify for relief. The PRGF is the most recent incarnation of the IMF’s concessional
24 AfDB, 2001 Annual Report, pp. 37-40.25 IMF, Annual Report 2001, pp. 38-40.

4-13
Table 4-7Total ADF and AfDB projects and programs approved during 2003, by country
ADF and AfDBLoan & Grant Amounts
(Million dollars)
Country Sector Project Total costLoan & grant
amountsCape Verde Social Assistance to Drought Victims n.a. 0.52
Djibouti Transportation Bulk Terminal Project n.a. 10.30
Eritrea Social Relief to victims of 2002 Drought n.a. 0.53
Ethiopia Social Relief to victims of 2002 Drought n.a. 0.53
The Gambia Social Relief to flood victims n.a. 0.53
Kenya Finance Line of Credit to CFC Bank PLC n.a. 7.28
Social Assistance to 2002 DroughtVictims
n.a. 0.53
Liberia Social Assistance to Civil War Victims n.a. 0.52
Mozambique Industry Moma Mineral Sands Project 252.91 42.90
Republic of theCongo
Social Fight Against Ebola Fever Epidemic n.a. 0.53
South Africa Finance Line of Credit to Development Bankof Southern Africa
n.a. 106.10
Finance Line of Credit to IndustrialDevelopment Corporation
n.a. 51.90
Sudan Social Relief for 2003 Flood Victims n.a. 0.52
Swaziland Agriculture andrural development
Lower Usuthu SmallholderIrrigation Project Phase I
86.04 14.80
Transportation Mbabane Bypass Road 49.60 59.40
Togo Finance Line of Credit to EcobankTransnational Inc.
n.a. 21.60
Multinational(PTA Bank)
Finance Line of Credit to PTA Bank n.a. 30.90
Multinational(EADB)
Finance Line of Credit to East AfricanDevelopment Bank (EADB)
n.a. 41.30
Multinational(South Africa/Mozambique)
Power Supply Sasol Natural Gas Project 858.88 82.50
Multinational(South Africa/Mauritius)
Finance Line of Credit to First Rand BankLimited and RMB (Mauritius)Limited
n.a. 53.54
n.a. = Not available.
Note.–Total does not include multicountry programs and projects approved by the AfDB Group in 2000.
Source: Derived from data in AfDB, Annual Report 2003. U.S. dollar figures calculated by the Commission using aUnit of Account (1AU=US$1.43958).

4-14
lending facility (formerly known as the Structural Adjustment Facility (SAF) in 1986,and the Enhanced SAF in 1987). Launched in November 1999, the PRGF reflects thenew primary objective of the IMF’s concessional lending arm–poverty reduction inlow-income countries. Loan approvals are linked to anti-poverty programs developedby the recipient country in its PRSP.26 To qualify for support, the anti-poverty programsmust be developed bymember countries in collaborationwith civil society andbilateraland multilateral donors.27
As of April 30, 2003, the IMF had committed $1.9 billion in grants to Benin, BurkinaFaso, Cameroon, Chad, Côte d’Ivoire, Ethiopia, TheGambia, Guinea,Guinea-Bissau,Madagascar, Malawi, Mali, Mauritania, Mozambique, Niger, Rwanda, São Toméand Principe, Senegal, Sierra Leone, Tanzania, Uganda, and Zambia. In FY 2003,the IMF approved new PRGF arrangements for DROC, The Gambia, Senegal, andUganda, and it also established regional Africa Technical Assistance Centers inTanzania and Mali.
New Partnership for African DevelopmentNEPAD was launched in 2001 as a comprehensive, integrated, strategic frameworkfor African socioeconomic development. The primary goals of NEPAD are to promoteaccelerated growth and sustainable development, to eradicate widespread andsevere poverty, and to increase Africa’s participation in the globalization process. Toachieve these goals, NEPAD has undertaken a number of initiatives during 2003 andearly 2004.
NEPAD launched a major policy initiative to increase social and food security on thecontinent. In May 2004, it announced a plan to promote cassava and nerica (a newrice variety for Africa) as part of its food security initiative. The intended effect of theprogram is wider distribution of these foods to increase crop and seed productionyields and provide stable food sources. One of the constraints to food security inAfricais low levels of production, a result of the AIDS pandemic.28 NEPAD adopted a newhealth strategy in July 2003 in which African governments agreed to allocate 15percent of their national budgets to health concerns, including the prevention andtreatment of HIV/AIDS. Additional funding for health initiatives came from the WorldHealth Organization and the Global AIDS Fund.29
One of NEPAD’s goals is to facilitate relations between Africa and industrializedcountries, especially with respect to development assistance and market access. InJune 2004, the G8 countries reaffirmed their commitments to NEPAD. The UnitedStates has renewed AGOA through 201530 and provided assistance to eight African
26 The PRSP is a tool first used by the World Bank as part of its strategy to increase the effectiveness offinancial assistance. For more information, see the World Bank Group section of this chapter.
27 IMF, Annual Report 2001, p. 38.28 “Nepad in Food Security Bid,” found at Internet address
http://www.news24.com/News24/Africa/News/0,,2-11-1447_1553041,00.html, retrieved July 15,2003.
29 Ibrahim A. Gambari, “Progress in the Implementation of NEPAD: Issues and Perspectives,”speech presented to the Council on Foreign Relations, Mar. 25, 2004, found at Internet addresshttp://www.un.org/esa/africa/speeches/council.htm, retrieved July 19, 2004.
30 “G8 Reaffirms Support for NEPAD, African Action Plan,” The Daily Champion (Lagos), found atInternet address http://allafrica.com/storeies/printable/200407090760.html, retrieved July 19,2004.

4-15
countries through the Millennium Challenge program.31 France pledged to increase itsdevelopment assistance to Africa by 50 percent and pledged support for NEPAD’sdevelopment objectives. Germany also pledged greater support and expressed aninterest in providing greater market access to the OECD market for Africancountries.32 Ties between the Asian economies and Africa were also strengthened;India committed $200 million to the NEPAD Secretariat in the form of loans to be usedtoward NEPAD objectives.33 In addition, Japan continued to support developmentwork, and a forum on China-Africa cooperation in late 2003 generated over $460million in business partnerships.34
Strengthening intra-African relations and market development is another of NEPAD’sgoals. The African Union (AU) adopted a plan for continental integration with NEPADprograms at its core.35 NEPAD is also supporting efforts to integrate Africa’s scientificcommunity through the creation of a Center of Excellence with a priority in researchinghigh yield, disease resistant crops.36 Additionally, NEPAD has served as a forum forinterested groups to cooperate across African borders. For example, the Kenyan andSouth African investment agencies signed anMOU on joint ventures and exchanges ofemployees between the two countries.37
Central to the African integration efforts of NEPAD has been the improvement ofinfrastructure, with special emphasis on transportation, communication, andtechnological infrastructure. NEPAD has 20 priority infrastructure projects on thecontinent.38 In November 2003, the World Bank approved $1.2 billion in funding fortwo energy sector projects under the NEPAD short-term action plan forinfrastructure.39 A road network project in East Africa was also initiated with $500million from the World Bank over the next 3 years.40 NEPAD also adopted an actionplan for science and technology, with member countries pledging to commit 1 percentof GDP to science and technology funding.41 Funding also came from the AfDB, which
31 “US Ties Aid Boost to Policy,” Business Day (Johannesburg), found at Internet addresshttp://allafrica.com/stories/printable/200405100638.html, retrieved July 2004. The eight countrieseligible for Millennium Challenge funding are Benin, Cape Verde, Ghana, Lesotho, Madagascar,Mozambique, Mali, and Senegal.
32 “German Leader, At ECOWAS Parliament, Backs NEPAD,” Vanguard (Lagos), found at Internetaddress http://allafrica.com/stories/printable/200404260307.html, retrieved July 19, 2004.
33 “France to Increase Her Development Assistance,” General News (Accra), found at Internetaddress http://www.ghanaweb.com, retrieved July 23, 2004.
34 “Asia Seizing New Opportunities in Africa,” The Japan Times, found at Internet addresshttp://www.japantimes.co.jp/cgi-bin/geted.pl5?eo20040717a1.htm, retrieved July 23, 2004.
35 “African Leaders Endorse Integration Plan, Balk at 1.7b dollar budget,” found at Internet addresshttp://www.channelnewsasia.com/stories/afp_world/view/94473/1/.html, retrieved July 23, 2004.
36 “Preparations on to Establish SADC Center of Excellence,” Daily News Online, found at Internetaddress http://www.gov.bw/cgi-bin/news.cgi?d=20040629&i=Preparations_on_to_establish_SADC_centre_of_excellence, retrieved July 23, 2004.
37 “Investment Agencies Sign Agreement,” The Nation (Nairobi), found at Internet addresshttp://allafrica.com/stories/printable/200404230026.html, retrieved July 23, 2004.
38 NEPAD’s infrastructure development plans include electricity power supply, water, gas pipelines,and transportation.
39 Ibrahim A. Gambari, “Progress in the Implementation of NEPAD: Issues and Perspectives.”40 “NEPAD Highlights Infrastructure Needs,” Inter Press Services, found at Internet address
http://ipsnews.net/interna.asp?idnews=24578, retrieved July 23, 2004.41 “NEPAD Adopts Science, Tech Action Plan,” I.T. Web, found at Internet address
http://allafrica.com/stories/printable/200311110274.html, retrieved July 23, 2004.

4-16
provided $300 million for NEPAD infrastructure projects in 2003, and earmarked$600 million for 2004 to fund NEPAD’s short-term action plan, especially in the areasof agriculture, power, tourism, industry, and rural development.42
Increasing the flow of investment into SSA is one of NEPAD’s central developmentgoals. This goal dovetails with NEPAD’s infrastructure development efforts, as basicinfrastructure is necessary to increase investment levels.43 InNovember2003,NEPADand the OECD jointly launched the African Investment Initiative to attract privateinvestment to the continent.44 To date, NEPAD’s 20 priority infrastructure projectshave not attracted private funding.45 NEPAD has, however, contributed to increasinginvestment in the energy sector. In August 2003, Chevron/Texaco announced plans toinvest $20 billion in African projects; the company cited changes in the investmentclimate and infrastructure development resulting from NEPAD efforts as factors in itsdecision.46
A significant deterrent to investing in Africa has been political instability. To addressthis concern, NEPAD has supported the expansion of the African Peer ReviewMechanism (APRM) of the AU. The APRM is a self-monitoring, voluntary mechanismdesigned to ensure that the Declaration on Democracy, Political, Economic, andCorporate Governance is enforced.47 There are now 23 APRM countries.48 In 2003,the process of reviewing all member countries was initiated, andeach member countryagreed to fund the APRM with a minimum of $100,000.49 By December 2004, the firsttwo reviews (Rwanda and Mozambique) under the APRM are expected to becompleted.50 The APRM is consideredbyNEPADand many industrialized countriesas
42 Omar Kabbaj, “Statement to the 11 Heads of State and Government Implementation Committeeon ADB Support to NEPAD,” July 7, 2004 (Addis Ababa, Ethiopia), found at Internet addresshttp://www.afdb.org/knowledge/speeches2004/pdt_speech_nepad_addis_7jul2004e.doc,retrieved Aug. 2, 2004.
43 “Poor Infrastructure Scares Off Investors, Says NEPAD Official,” New Vision, found at Internetaddress http://allafrica.com/stories/printable/200308210329.html, retrieved July 23, 2004.
44 “Initiative to Attract Investment into Africa,” Bau News, found at Internet addresshttp://allafrica.com/stories/printable/200311200486.html, retrieved July 23, 2004.
45 “Access to Capital: Financing Infrastructure Development,” Africa Economic Summit 2004, foundat Internet addresshttp://www.weforum.org/site/knowledgenavigator.nsf/Content/B2F2CE68972109B7C1256EA8003877CBopen&event_id=1166&year_id=2004&PreviewStyle=B4BAD35E15AF148BC1256AC5002CD321&Preview=1, retrieved July 19, 2004.
46 U.S. Department of State, “Chevron Texaco President Points to New Projects for InvestmentOpportunities,” found at Internet address http://allafrica.com/stories/printable/200308150591.html,retrieved July 23, 2004.
47 African Union, “38th Ordinary Session of the Assembly of Heads of State and Government of theOAU,” found at Internet address http://www.au2002.gov.za/docs/summit_council/aprm.htm,retrieved July 27, 2004.
48 Listed in order of ascension, the APRM countries are Algeria, Burkina Faso, Republic of theCongo, Ethiopia, Ghana, Kenya, Cameroon, Gabon, Mali, Mauritius, Mozambique, Nigeria, Rwanda,Senegal, South Africa, Uganda, Egypt, Benin, Malawi, Lesotho, Tanzania, Angola, and Sierra Leone.
49 Ibrahim A. Gambari, “Progress in the Implementation of NEPAD: Issues and Perspectives.”50 “Africa Sees First Political Report Cards by December,” Reuters, found at Internet address
http://www.alertnet.org/printable.htm?URL=/thenews/newsdesk/L07372671.htm, retrieved July 23,2004.

4-17
a strong sign of Africa’s commitment to reform and an important prerequisite toincreased investment.
Trade Capacity-Building Initiatives of U.S. GovernmentAgenciesThe United States is one of the largest providers of trade capacity-building assistancein theworld, implementinga broad range of trade capacity-building initiatives with thegoal of increasing economic growth and reducing poverty through competition,human resources development, technology transfer, and technological innovation.USAID surveys and maintains a database of U.S. government agencies’ tradecapacity-building initiatives in developing and transitional economies.51 The surveyincludes data covering FY 1999 through FY 2003. In FY 2003, U.S. governmentagencies distributed $761 million toward trade capacity-building efforts, an increaseof 19.3 percent over FY 2002. Table 4-8 illustrates that SSA received $133 million in FY2003, which represents 17.4 percent of total U.S. trade capacity-building funding.SSA funding in FY 2003 increased by 25.7 percent from FY 2002.
Country coverageThe number of countries receiving trade capacity-building funding declined in 2003with 12 countries no longer receiving country-specific funding.52 For the most part, thischange can be attributed to a restructuring of funding, with increased allocations toregional trading blocs and a redistribution of funds to include many countries thatreceived little in the past. Of the 12 countries that lost funding in 2003, half aremembers of regional blocs that received funding. Funding to regional blocs increasednearly tenfold, from $765,000 in FY 2002 to $7 million in FY 2003.53 As table 4-9indicates, in FY 2003, the top five recipients represented 32.1 percent; Mali receivedthe largest share in FY 2003 with 10.9 percent. The table shows that since FY 1999, thetop five recipients’ combined percent of total funding has fallen from 54.1 percent to32.1 percent. The countries that received the largest percent increase from FY 2002 toFY 2003 are Burkina Faso, Sierra Leone, Botswana, Benin, and Malawi.54 Four of thetop five recipients of funding inprevious years received a significantly reduced amountin 2003, including Tanzania, Mozambique, Ghana, and Rwanda.55
51 For a discussion and analysis of FY 1999 through FY 2003 trade capacity-building initiatives, seeUSITC, U.S. Trade and Investment With Sub-Saharan Africa 2002, USITC pub. 3552, Dec. 2002, chapter4; and USITC, U.S. Trade and Investment With Sub-Saharan Africa 2003, USITC pub. 2650, Dec. 2003,chapter 4.
52 USAID, “Trade and Investment - Trade Capacity Building Activities,” found at Internet addresshttp://esdb.cdie.org/cgi-bin2/broker.exe?_service=default&_program=tcbprogs.cty_2b.sas&group=reg&cocode=_0SSA+&output=1, retrieved May 14, 2004.
53 USAID, Trade Capacity-Building Database, found at Internet addresshttp://esdb.cdie.org/cgi-bin2/broker.exe?_service=default&_program=tcbprogs.cty_2b.sas&group=reg&cocode=_0SSA+&output=1, retrieved May 17, 2004.
54 USAID, Trade Capacity-Building Database.55 Ibid.

4-18
Table 4-8U.S. support for building trade capacity, by geographic region, FY 1999-FY 2003
(Million dollars)Region/Country FY 1999 FY 2000 FY 2001 FY 2002 FY 2003
Middle East and North Africa . . . . . . . . . . . . . 21.1 110.4 118.3 147.1 179.1Asia . . . . . . . . . . . . . . . . . . . . . . . . . . . . . . . . . 48.5 69.7 114.3 109.9 94SSA . . . . . . . . . . . . . . . . . . . . . . . . . . . . . . . . . 80.8 94.7 64.1 105.5 132.7Former Soviet Republics . . . . . . . . . . . . . . . . . . 97.4 84 97.6 72.1 85Central and Eastern Europe . . . . . . . . . . . . . . 56.6 29.4 38.9 63.4 66.2Latin America and the Caribbean . . . . . . . . . . 52.4 65 61.6 90.8 150.2Nontargeted Global Funding2 . . . . . . . . . . . . . 12.3 51.3 104 49 53.4All Developing and Transition Countries . . . . . 369.1 504.5 598.8 637.8 760.6
1 Because of rounding, figures may not add to totals shown.2 Assistance programs involving countries from two or more regions and for which country and regional
breakdowns were not feasiblebreakdowns were not feasible.Source: USAID Trade Capacity-Building Database, found at Internet address http://qesdb.cdie.org/tcb/overview.html,retrieved May 17, 2004.
Types of Trade Capacity-Building InitiativesU.S. government agencies’ trade capacity-building initiatives cover a broad spectrumof categories. The primary funding category, “Human Resources and LaborStandards,” registered the greatest growth from FY 2002 to FY 2003, representingsubstantial increases in HIV/AIDS education projects and child labor preventionprograms.56 “Human Resources and Labor Standards” includes activities such asprograms to decrease child labor, to combat HIV/AIDS, and to promote labor rights.These types of activities indirectly affect trade through increasing productivity levels.“Trade Facilitation” includes numerous activities such as e-commerce development,customs operations improvement, export promotion, business services and trainingprovision, and regional trade agreement support. Figure 4-1 provides percentages oftotal funding by category for FY 2003 as well as a breakdown of trade facilitationsubcategories. In FY 2003, “Trade Facilitation” and “Human Resources and LaborStandards” represented over 50 percent of funding. The “Export Promotion” and“Support of Regional Trade Agreements” subcategories represented 50 percent of“Trade Facilitation” funding. Table 4-10 provides illustrative examples of U.S. tradecapacity-building initiatives in SSA.
56 USAID, “Trade and Investment - Trade Capacity Building Activities.”

4-19
Table 4-9Trade capacity-building initiatives, leading sub-Saharan African country recipients, FY 1999-FY 2003
FY 1999 FY 2000 FY 2001 FY 2002 FY 2003
RecipientShare
of total RecipientShare
of total RecipientShare
of total RecipientShare
of total RecipientShare
of total
Ghana . . . . . . . . . . . 27.2 Ghana . . . . . . . . . . . 19.1 Ghana . . . . . . . . . . 11 Mozambique . . . . . 10.3 Mali . . . . . . . . . . . . . 10.9
Mozambique . . . . . . 10 Mozambique . . . . . . 9.7 Tanzania . . . . . . . . 9.2 Ghana . . . . . . . . . . 10 Uganda . . . . . . . . . . 7.6
Tanzania . . . . . . . . . 6 Nigeria . . . . . . . . . . 8 Nigeria . . . . . . . . . 9.1 Tanzania . . . . . . . . 9.1 Nigeria . . . . . . . . . . 7.3
Mali . . . . . . . . . . . . . 6 Mali . . . . . . . . . . . . . 8 Zambia . . . . . . . . . 9 Uganda . . . . . . . . . 8.3 South Africa . . . . . . 3.1
Zambia . . . . . . . . . . 4.9 Zimbabwe . . . . . . . . 4.1 Uganda . . . . . . . . . 4.9 Rwanda . . . . . . . . . 4.9 SADC Secretariat . . 3.1
Top 5 total . . . . . . 54.1 Top 5 total . . . . . 48.9 Top 5 total . . . . 43.2 Top 5 total . . . . 42.6 Top 5 total . . . . . 32.1
Notes.–Percentages based on countries for which funding agency can be attributed and category breakouts are available as of May 2004. As a result of updates andrecategorization, percentages may have changed from those reported in previous publications. Because of rounding, figures may not add to totals shown.
Source: USAID Trade Capacity-Building Database, found at Internet address http://qesbd.cdie.org/tcb/index.html, retrieved May 14, 2004.

Business servicesand training10%
Customsoperation andadministration14%
E-Commerce and IT6%
Export promotion32%
Other tradefacilitation20%
Figure 4-1U.S. trade capacity-building initiatives, by funding categories and subcategories, FY 2003
Trade-related agriculture15%
Trade facilitation25%
Other14%
WTO agreements5%
Physical infrastucturedevelopment12%
Human resources andlabor standards29%
Regional tradeagreements18%
Source: USAID Trade Capacity-Building Database, found at Internet address http://qesdb.cdie.org/tcb/index.html, retrieved May 14, 2004.
Trade Capacity-Building Initiatives Trade Facilitation Subcategories
4-20

4-21
Table 4-10Examples of trade capacity-building initiatives in sub-Saharan Africa, FY 20031
Country Category Title DescriptionFunding
(Million dollars)
Benin Human Resources &Labor Standards
Combating ChildTrafficking ThroughEducation
The program aims to combatchild labor by providing accessto quality education.
2.0
Burkina Faso Human Resources &Labor Standards
Combating ChildLabor ThroughEducation
The program aims to combatchild labor by providing accessto quality education. Funded bythe U.S. Department of Labor.
3.0
Ghana Multiple Trade and InvestmentReform Program (TIRP)
TIRP focuses on three majorcomponents: macro, trade &financial sector policy andinstitutional reform; capacity offirms to export selectednon-traditional exports includingtourism; and technical assistancefor countries negotiating the westAfrican gas pipeline. TIRP is a5-year activity aimed atexpanding Ghana’s economy.
3.5
Madagascar Multiple Biologically DiverseEcosystems Conserved
Natural Products Promotion andEcotourism Development are twoactivities carried out to achieveBiologically Diverse ForestEcosystem conservation andsustainable economicdevelopment. Natural ProductsPromotion consists of assistancein product certification thatenables buyers to be guaranteedhigh quality productscorresponding to internationalnorms. In addition, USAIDprovides technical assistance tothe Malagasy professionalorganization of operators inagribusiness of natural andbiological products (PRONABIO).Ecotourism Development isdirectly tied to the National ParkNetwork.
1.0
See footnote at end of table.

4-22
Table 4-10–ContinuedExamples of trade capacity-building initiatives in sub-Saharan Africa, FY 20031
Country Category Title DescriptionFunding
(Million dollars)
Madagascar Multiple Critical Private MarketsExpanded
Activities under this StrategicObjective mostly consist ofsupporting agribusiness, art andcraft, and other selectedcommodities to increaseefficiency of selectedagribusiness and trade flows.Assistance will focus on:(1) improving business skillsdevelopment, (2) increasingaccess to domestic andinternational markets,(3) increasing businessopportunities for new ventures,and (4) creating a favorableenvironment for trade-relatedactivities through policy analysisand trade integration.
1.0
Malawi Multiple National SmallholderFarmers’ Association(NASFAM)Strengthening Project
The NASFAM StrengtheningProject aims to increaseagricultural production of certaincrops for the domestic andexport markets. NASFAM goalsinclude: (1) a rural businessdevelopment system as a fullyindependent input and outputmarketing company; (2) privatesector agribusinessexpansion—expanding linkageswith the private sector to addressexport and value addingproduction services; (3) providingaccess to marketsystems—forming strategicalliances and setting up regionalmarkets; (4) adoption ofdiversified crops, improvedpractices to commercialize newcrops, and introduction of highervalue crops; (5) providingtechnical support to farmers’associations to ensure productionand delivery of quality crops; (6)providing training in businessplanning; and (7) participating inpolicy dialogue to facilitateregional markets for farmersproducts.
2.7
See footnote at end of table.

4-23
Table 4-10–ContinuedExamples of trade capacity-building initiatives in sub-Saharan Africa, FY 20031
Country Category Title DescriptionFunding
(Million dollars)
Mali Business Services &Training
Trade-RelatedAgriculture
Agriculture andLivestock Promotion
The overall objective of thisactivity is to increase theproduction of agricultural andlivestock products for which Malihas a comparative advantage inthe domestic and exportsmarkets. The activity will consistof: (1) promoting irrigatedagriculture for rice andhorticultural crops production,and (2) improving the availabilityand accessibility to qualityanimal feed to increase thecompetitiveness of Mali’slivestock sector.
5.0
Mali Human Resources &Labor Standards
Combating ChildLabor ThroughEducation
The program aims to combatchild labor by providing accessto quality education.
3.0
Mali Multiple Financial ServicesSupport toAgribusiness
The overall objective of thisactivity is to facilitate the accessof Malian agribusinesses tofinancial services. The activity willconsist of: (1) improving access tocommercial credit, (2) improvingthe availability and accessibilityof microfinance services, and (3)improving the policy andinstitutional environment forinvestment.
3.0
Mali Multiple Mali Trade PromotionProgram
The overall objective of thisactivity is to increase Malianexports to the regional andglobal markets. The programgoals of this activity are toimprove the policy andinstitutional environment fortrade and investment andimprove the competitiveness ofMali’s private sector. Throughthis activity, USAID/Mali willprovide technical assistance andtraining to the public and privatesectors.
2.8
Mozambique Export Promotion
Business Services &Training
PhysicalInfrastructureDevelopment
Rural Group EnterpriseDevelopment
Approximately 50% ofUSAID/Mozambique’s support toRural Enterprise Developmentdirectly builds capacity in trade.This occurs under three separatecooperative agreements.
1.2
See footnote at end of table.

4-24
Table 4-10–ContinuedExamples of trade capacity-building initiatives in sub-Saharan Africa, FY 20031
Country Category Title DescriptionFunding
(Million dollars)
Nigeria Human Resources &Labor Standards
Promoting DemocracyThrough FundamentalPrinciples and Rights atWork
The objective of this project is tostrengthen democracy and socialand economic development inNigeria by promotingfundamental principles andrights of men and women atwork and tripartism amonggovernment, employers, andworkers’ organizations. Activitiesinclude: (1) facilitating a reviewof existing labor legislation;(2) equipping and trainingofficials on survey methods andstatistical gathering andreporting; (3) creating acomputerized database for laborinspection reports; (4) trainingtrainers in labor inspection;(5) training trainers in collectivebargaining; and (6) trainingtrainers in gender mainstreamingand developing gender-sensitivepolicies.
1.0
Nigeria PhysicalInfrastructureDevelopment
Support forInfrastructure: NigeriaHoldings
This project is for an electricitygenerating plant in Nigeria.
8.1
Rwanda Trade-RelatedAgriculture
AgribusinessDevelopment Activity inRwanda (ADAR)
The activity supports: (1) addingvalue to key agriculturecommodities targeted for export;(2) building efficiency andexpanding employment withagriculture commodity chains;(3) upgrading managerial andtechnical capability inagribusiness enterprises;(4) improving product qualityand expand access to markets;and (5) developing financingoptions to support agribusinessgrowth.
1.5
Senegal Human Resources &Labor Standards
Senegal TimeboundProgram to Combatthe Worst Forms ofChild Labor
The goal of the TimeboundProgram in Senegal is to combatthe worst forms of child laborwithin a specified period of time.
2.0
See footnote at end of table.

4-25
Table 4-10–ContinuedExamples of trade capacity-building initiatives in sub-Saharan Africa, FY 20031
Country Category Title DescriptionFunding
(Million dollars)
Senegal Multiple Trade and InvestmentPolicy EnvironmentStrengthened
The activity is designed to supportSenegal’s Integrated FrameworkMatrix of Actions. The supportwill primarily focus on:(1) promoting nontraditionalexports; (2) strengtheningSenegal’s capacity to engage inbeneficial international tradenegotiations; and (3) improvingaccess to competitively-pricedtelecommunication services.
1.1
South Africa Trade-RelatedAgriculture
AGRILINK II:Agricultural MarketingProject
The agricultural marketingactivity for commercialization ofemerging black farmers andagribusinesses supports: (1)market development (domestic,regional and internationaltrade); (2) access to finance; and(3) technology transfer.
1.0
Uganda Human Resources &Labor Standards
Combating ChildLabor ThroughEducation
The project aims to combat childlabor in Northern Uganda byproviding access to qualityeducation.
3.0
Uganda Human Resources &Labor Standards
Combating HIV/AIDSin UgandanWorkplaces:Community/Faith-based Org.
This project will provide a $1million grant to one or more”intermediary” organizations todevelop and implement a projectto stem the spread of HIV/AIDSinfection in Uganda, focusing onthe workplace and surroundingcommunities. Eligible”intermediaries” are thosenonprofit, community, and/orfaith-based organizations withestablished working relationshipsto grassroots faith-based andcommunity organizations inUganda working in the field ofHIV/AIDS.
1.0
See footnote at end of table.

4-26
Table 4-10–ContinuedExamples of trade capacity-building initiatives in sub-Saharan Africa, FY 20031
Country Category Title DescriptionFunding
(Million dollars)
Uganda Export Promotion
Trade-RelatedAgriculture
Investment inDeveloping ExportAgriculture (IDEA)
USAID’s Investment inDeveloping Export Agriculture(IDEA) activity seeks to strengthenthe value chain for nontraditionalhigh and low value crops. Areasof focus include flowers, vanilla,maize, beans, chilies,papaya/pepine, and sesame.IDEA works with the whole valuechain for crops, many of whichare exported, and continuallyaddresses issues such asassistance with export promotion,business services for tradefacilitation, regional tradeagreements, and foreigninvestment- especiallytrade-related agriculturaldevelopment.
3.9
Uganda Business Services &Training
Trade-RelatedAgriculture
Gov/ Transparency& Inter-AgencyCoord.
Support for PrivateEnterprise Expansionand Development(SPEED)
The SPEED project is designed toaddress micro, small, andmedium enterprise (MSME)finance and business needs inUganda. Through SPEED, USAIDseeks to increase access tofinancial services, to create andexpand agricultural andnon-agricultural enterprises, andto strengthen legal andregulatory frameworks forbusiness development in thesmall-and medium-size businessand finance service sectors.
1.5
SSA Trade-RelatedAgriculture
Association forStrengtheningAgricultural ResearchinEastern and CentralAfrica
ASARECA is a regional,nonpolitical organization thatbrings together NationalAgricultural Research Institutesfrom 10 countries in eastern andcentral Africa. ASARECA’s mainobjective is to promote regionaleconomic growth by developing,introducing, and disseminatingagricultural technologies.ASARECA also focuses onharmonization of policiesaffecting agricultural trade.
2.9
SSA Multiple East and CentralAfrica GlobalCompetitiveness Hub
Technical assistance will beprovided through the easternand central Africa GlobalCompetitiveness Hub to promotethe six main themes of the Tradefor African Development andEnterprise (TRADE) initiative.
3.5
See footnote at end of table.

4-27
Table 4-10–ContinuedExamples of trade capacity-building initiatives in sub-Saharan Africa, FY 20031
Country Category Title DescriptionFunding
(Million dollars)
SSA Multiple Energy Program forLegal, Regulatory &Policy Assistance toSADC Countries
The main objective of the energysector assistance program is toprovide an enabling frameworkthat reduces legal, institutional,and political barriers tocommercial energy markets.
1.7
SSA Multiple Increased Competition& Liberalization inInformation &CommunicationTechnologies: SADC
This activity is part of a broaderstrategy to assist countries withinSADC to create a harmonizedframework of policies,regulations and procedures forthe purpose of promotingequitable regional integrationand economic growth, buildingon results of two previous phasesof a project funded by USAID’sRegional Centre for SouthernAfrica.
2.0
SSA Export PromotionRegional TradeAgreements
Trade-RelatedAgriculture
Regional AgricultureTrade ExpansionSupport (RATES)
The objective of RATES is toincrease the volume and value oftrade in selected agriculturalcommodities within the easternand southern Africa region. TheRATES Center will addressagricultural trade facilitationactivities in close collaborationwith regional intergovernmentaland private sector organizations.
3.0
SSA Other TradeFacilitation
Human Resources &Labor Standards
PhysicalInfrastructureDevelopment
Safe Skies for Africa -Transportation Project
The purpose of this Presidentialinitiative is to promotesustainable improvements inaviation safety and security inAfrica, and to create theenvironment necessary to fosterthe growth of aviation servicesbetween Africa and the UnitedStates. The initiative recognizesthat safe skies are a prerequisitefor increased trade, investment,and long-term economicdevelopment in Africa. Specificgoals include increasing thenumber of SSA countries thatmeet International Civil AviationOrganization safety standards,improving airport security withinthe region within 3 years, andimproving regional airnavigation services.
8.0
See footnote at end of table.

4-28
Table 4-10–ContinuedExamples of trade capacity-building initiatives in sub-Saharan Africa, FY 20031
Country Category Title DescriptionFunding
(Million dollars)
SSA Human Resources &Labor Standards
Southern AfricaRegional Project toCombat the WorstForms of Child Labor
The Regional Project to Combatthe Worst Forms of Child Laborin Southern Africa includes aTimebound Program in SouthAfrica and capacity- buildingactivities in Botswana, Lesotho,Namibia, and Swaziland.
5.0
SSA Multiple Southern AfricanGlobalCompetitiveness Hub
This activity establishes theSouthern African GlobalCompetitiveness Hub to enhancethe region’s tradecompetitiveness and thereby takegreater advantage of theincreased trading opportunitiesprovided through AGOA andother global trade initiatives.
4.5
SSA Human Resources &Labor Standards
Strengthening LaborSystems in SouthernAfrica
This project is designed toincrease labor law compliance inBotswana, Lesotho, Namibia,and Swaziland by strengtheningthe capacity of labor ministries toenforce national labor laws andincrease the knowledge andcapacity of employers andworkers to apply those laws.
4.2
1 July 2002 to June 2003.Note.–Listed are initiatives for which activity total funds equaled or exceeded $1 million. “Multiple” refers to initiativesthat targeted more than three trade capacity-building categories.Source: USAID Trade Capacity Building Database, Country Trade Reports, found at Internet addresshttp://esdb.cdie.org/cgi-bin/broker.exe?_service=default&_program=tcbprogs.act_cty_1.sas, retrieved May 18, 2004.

4-29
Box 4-1 USAID and Trade Capacity-Building InitiativesUSAID’s multi-year trade capacity-building initiative, Trade for African Developmentand Enterprise (TRADE), was inaugurated in 2002. TRADE promotes regionalintegration and cooperation by strengthening export capabilities. Trade initiatives areaimed at reducing costs and increasing the efficiency of trade-related transportation,and facilitating information flow among traders, investors, and financial institutions.TRADE operates through three Regional Hubs for Global Competitiveness located atUSAID’s three regional missions in Nairobi, Kenya; Accra, Ghana; and Gaborone,Botswana. To increase regional trade, the hubs will also work with regional economicorganizations, such as SADC, COMESA, and ECOWAS.57
The East and Central Africa (ECA) Hub, based in Nairobi, Kenya, has threecomponents: trade capacity building, AGOA business development, andtransportation. The ECA Hub offers training to increase the capacity of countries in theECA region to effectively participate in multilateral trade negotiations, such as theWTO Doha Development Agenda. The Hub also seeks to expand understanding ofAGOA in order to increase trade under the program. To further increase trade, theECA Hub also supports trade initiatives focused on increased participation of countriesin the COMESA FTA. Examples of ECA Hub accomplishments include:58
S The ECA Hub funded nine Kenyan companies to participate in the ASAPGlobal Sourcing Show in Las Vegas in August 2003, leading to negotiationsfor possible sales of approximately $10 million, which could boost KenyanAGOA exports by 9 percent.
S A Kenyan company attended a trade show in the United States and acquiredadditional business. The deals provided employment for 40 new workers,offering steady income to poor rural female workers.
The Southern Africa Hub’s primary objective is to enhance the competitiveness ofsouthern Africa’s products and services. The hub promotes customs and tradefacilitationand transport efficiency. Examplesof thehub’saccomplishments include:59
S In October 2003, Tanzania, Malawi, and Zambia signed the Dar es SalaamCommittee Constitution. The agreement seeks to reduce costs andtransportation delays along the corridor, to increase road safety throughharmonized systems of traffic control, and to unify transit fees along thecorridor through three countries.
57 USAID, “Trade for African Development and Enterprise (TRADE) Initiative,” found at Internetaddress http://www.usaid.gov/locations/sub-saharan_africa/initiatives/trade.html, retrieved July 14,2004.
58 Ann Karara, Representative of Chemonics International, “Executive Summary,” e-mailcommunication to USITC staff, received May 25, 2004.
59 USAID, “Southern African Global Competitiveness Hub,” found at Internet addresshttp://www.satradehub.org/TradeIssues/SuccessStories.aspx, retrieved July 11, 2004; and KarenRoland, “Rosecraft Success Story,” e-mail communication to USITC staff, received June 10, 2004.

4-30
Box 4-1 USAID and Trade Capacity-BuildingInitiatives—Continued
S The hub sponsored 13 local handicrafts firms to attend the AGOA Forum onDecember 2003. In addition to exposure to the U.S. market, the firms had thechance to meet buyers one-on-one. As a result, the companies’ orders fromand business relations with U.S. companies increased. Some supplied theSmithsonian National Museum of African Art with merchandise, includingcandle holders, ebony carvings, paper mache animal sculptures, and letteropeners.
S During President Bush’s tour of the South African Hub, hand-loom textileproducer Rosecraft and others presented their products to the President. Theevent generated new business, including a recent deal with the SmithsonianInstitution. The increased production generated additional demand for labor,and the company is now employing 120 local workers.
The West Africa Trade Hub (WATH), located in Accra, Ghana, focuses on four areas:trade capacity building in areas such as harmonizing sanitary and phytosanitarymeasures, working with ECOWAS and UEMOA to increase regional trade,eliminating corruption, and reducing transit time for cross border movement of goods.AGOA Support Services offer trade facilitation through 13 AGOA Resource Centers.AGOA Export Business Development supports producers of hand-loomed goods,cashews, and shea butter to meet U.S. market requirements, and expands potentialtrade opportunities for indigenous textiles and agricultural commodities within thecontinent and in major U.S. and European markets. Examples of projects include:60
S WATH created general guidelines for successful trade show participation,available in French and English. The guidelines are being used by ECA Hub,South African Hub, and West Africa International Business Linkages toprepare local producers interested in exposure to U.S. markets through tradeshows.
S WATH developed 15 training modules to assist local producers in meetingU.S. Customs regulations. The modules are in English and French andavailable on a WATH-created website, with a database of searchabletechnical assistance and capacity-building initiatives.
60 Charles Nornoo, USAID official, “One Pager,” e-mail communication to USITC staff, receivedMay 26, 2004.

4-31
The Export-Import Bank of the United StatesEx-Im Bank is an independent U.S. government agency that assists the sale of U.S.exports, primarily to emerging markets, through loan financing and other creditmeasures. Specifically, Ex-Im Bank assists exporters by providing fixed-rate loans tocreditworthy international buyers, both privateand public sector, forpurchases ofU.S.goods and services. Medium- and long-term financing is available. Military anddefense items are generally not eligible, nor are most sales to military buyers.61
Ex-Im Bank supported $14.3 billion in U.S. exports to markets worldwide in FY 2003,62
assisting 2,516 U.S. export sales.63 Ex-Im Bank can consider project financing in everySSA country except Sudan.64 In SSA, Ex-Im Bank’s medium- and long-term loanguarantee and direct loan programs, and short- and medium-term insuranceprograms, are available in 39 countries.65 Countries benefitting from financing in2003 included Angola, Benin, Botswana, Burkina Faso, Cameroon, Cape Verde,Chad, Congo, Côte d’Ivoire, Djibouti, Equatorial Guinea, Eritrea, Ethiopia, Gabon,The Gambia, Ghana, Guinea, Guinea-Bissau, Kenya, Lesotho, Madagascar,Malawi, Mali, Mauritania, Mauritius, Mozambique, Namibia, Niger, Nigeria,Rwanda, São Tomé & Principe, Senegal, Seychelles, South Africa, Swaziland,Tanzania, Togo, Uganda, and Zambia.
In addition, Ex-Im Bank signed new master guarantee agreements with Standard Bankof South Africa and the Bank of Africa to broaden its ability to finance the purchase ofU.S. goods and services in Africa.66 Ex-Im Bank also actively participated in the thirdAGOA Forum, which afforded an opportunity for SSA governments to discuss ways toenhance trade relationships between the United States and SSA.67 As of September2003, Ex-Im Bank’s total exposure in SSA was $3.5 billion. DROC accounted for 24percent of total regional Ex-Im Bank exposure, Nigeria, 23 percent, and South Africa,16 percent. Table 4-11 lists Ex-Im Bank exposure, FY 2003 authorizations, andavailability of financing in SSA.
U.S. Trade and Development AgencyU.S. Trade and Development Agency (TDA) is an independent agency that assists U.S.firms by identifying major development projects in developing countries offering largeexport potential, and funding U.S. private sector involvement in project planningactivities which, in turn, helps to position U.S. firms for follow-up activities during the
61 Ex-Im Bank, “Direct Loan,” found at Internet address,http://www.exim.gov/products/directloan.html, retrieved Aug. 5, 2004.
62 Ex-Im Bank, 2003 Annual Report, p. 14.63 Ibid.64 Ex-Im Bank, “Country Limitation Schedule,” found at Internet address
http://www.exim.gov/tools/country _limits.html, retrieved July 7, 2004.65 Ex-Im Bank Press Release, “Ex-Im Bank Short-Term Insurance Now Available in 39 Sub-Saharan
African Countries,” Apr. 1, 2003.66 Standard Bank of South Africa is a leading international bank in southern Africa. Bank of Africa
has its headquarters in Cotonou, Benin. Ex-Im Bank Press Release, “Ex-Im Bank Signs Master GuaranteeAgreements with African Banks,” May 28, 2003.
67 The third AGOA Forum is discussed in chapter 2 of this report.

4-32
Table 4-11Sub-Saharan Africa: Export-Import Bank exposure, authorizations, and availability forfurther support as of December 14, 2003
(Dollars)Country Exposure1 2003 Authorizations Availability2
Angola . . . . . . . . . . . . . . . 103,633,322 (3) P.A.
Benin . . . . . . . . . . . . . . . . . 10,998,663 135,000 P.A.
Burkina Faso . . . . . . . . . . . 2,004,047 2,004,047 Yes
Congo (ROC) . . . . . . . . . . . 22,864,759 (3) P.A.
Congo (DROC) . . . . . . . . . 838,694,509 (3) No
Côte d’Ivoire . . . . . . . . . . . 152,555,702 (3) P.A.
Djibouti . . . . . . . . . . . . . . . 157,500 157,500 P.A.
Ethiopia . . . . . . . . . . . . . . . 226,139,713 226,139,713 No
Gabon . . . . . . . . . . . . . . . 62,549,842 (3) P.A.
The Gambia . . . . . . . . . . . 482,551 (3) No
Ghana . . . . . . . . . . . . . . . . 178,149,372 7,491,761 P.A.
Guinea . . . . . . . . . . . . . . . 8,100,114 300,000 P.A.
Guinea-Bissau . . . . . . . . . . 10,000,000 10,000,000 P.A.
Kenya . . . . . . . . . . . . . . . . 159,277,827 78,466,497 P.A.
Liberia . . . . . . . . . . . . . . . . 5,980,110 (3) P.A.
Madagascar . . . . . . . . . . . 38,871,691 (3) P.A.
Mali . . . . . . . . . . . . . . . . . . 9,028,789 3,084,000 P.A.
Mauritania . . . . . . . . . . . . 470,750 225,000 P.A.
Mauritius . . . . . . . . . . . . . . 23,948,634 (3) P.A.
Namibia . . . . . . . . . . . . . . 76,219,337 (3) Yes
Niger . . . . . . . . . . . . . . . . . 6,154,758 (3) P.A.
Nigeria . . . . . . . . . . . . . . . 813,287,705 62,543,202 P.A.
Rwanda . . . . . . . . . . . . . . . 559,569 (3) P.A.
Senegal . . . . . . . . . . . . . . . 16,662,766 5,682,811 P.A.
South Africa . . . . . . . . . . . 569,656,759 173,410,800 P.A.
Sudan . . . . . . . . . . . . . . . . 28,246,331 (3) P.A.
Tanzania . . . . . . . . . . . . . . 3,818,328 (3) P.A.
Togo . . . . . . . . . . . . . . . . . 2,820 (3) P.A.
Uganda . . . . . . . . . . . . . . . 5,646,732 2,054,145 P.A.
Zambia . . . . . . . . . . . . . . . 150,824,497 (3) No
Zimbabwe . . . . . . . . . . . . . 30,154,829 (3) P.A.
Total . . . . . . . . . . . . . . . 3,555,142,326 571,694,4761 Exposure is defined as authorization of all forms of support minus repayment and cancellations.2 Yes = Available for all six types of financing: short-, medium-, and long-term for both private and public buyers of
U.S. goods and services; No = Country is opened for specifically financed transactions but short-term, medium-term, andlong-term sectors are not open; P.A. = Partially available for some of the six types of financing.
3 Not available.Source: Ex-Im Bank, 2003 Annual Report, pp. 17-22, and Country Limitation Schedule.
implementation phase. Specifically, TDA promotes economic development by fundingfeasibility studies, consultancies, trading programs, and other project planningservices for over 360 development activities each year in emerging markets. TDA’sobligations in SSA totaled $6 million in FY 2003 (table 4-12), a 37-percent decreasefrom the 2002 obligation of $10 million. The agency invested in key tradecapacity-building activities. For example, TDA assisted regional initiatives, such as thefree trade negotiation with SACU; the expanding trade relationship envisioned byAGOA; and projects supported by NEPAD.

4-33
Table 4-12U.S. Trade and Development Agency funds obligated for program activities in Africa,FY 2003
Country Title ActivityFunds obligated
(Dollars)
Botswana Coal Bed Methane Desk Study 4,000
Botswana Coal Bed Methane Feasibility Study 525,000
Cameroon Nickel-Cobalt Mining Third Party Review Technical Assistance 5,300
Cameroon Polyclinique Bonanjo Technical Assistance 289,180
Cameroon Channel Africa Desk Study 2,500
Ethiopia AGOA Manufacturing Orientation Visit 99,610
Ghana AGOA Manufacturing Orientation Visit 777
Ghana Rural Fixed Wireless Desk Study 3,590
Ghana Rural Fixed Wireless Feasibility Study 275,000
Ghana Biomass Power Generation Desk Study 2,500
Ghana Biomass Power Generation Feasibility Study 245,686
Kenya Kenyatta National Hospital Definitional Mission 24,990
Namibia Fishing Sector Orientation Visit 5,516
Namibia Walvis Bay Airport Upgrade Feasibility Study 381,260
Namibia Trans Kalahari Corridor Desk Study 2,495
Namibia Trans Kalahari Corridor Feasibility Study 294,900
Nigeria Port Sector Definitional Mission 250
Nigeria Akwa Ibom State Fertilizer Complex Desk Study 1,500
Nigeria Agricultural Sector Definitional Mission 250
Nigeria River State Fixed Wireless Project Feasibility Study 200,000
Nigeria River State Fixed Wireless Project Desk Study 2,500
Nigeria River State Fixed Wireless Project Technical Assistance 131,854
Nigeria Aluminum Can Manufacturing Desk Study 2,500
Nigeria Aluminum Can Manufacturing Feasibility Study 251,080
Nigeria NITEL Expansion of Digital Network Training 123,600
Nigeria Kano State Agro-Processing Feasibility Study 116,000
Nigeria Mining Sector Definitional Mission 29,200
Nigeria Small Oil Refinery - Anambra Desk Study 2,500
Nigeria Port and Supply Chain Security and Customs Desk Study 4,000
Nigeria Port Harcourt Hospital Development Desk Study 4,000
Rwanda Lake Kivu Methane Gas Desk Study 5,000
Senegal Food Supplement Plant Feasibility Study 143,967
South Africa Forest Oil Offshore Gas - Ibhubesi 3rd Party Review Feasibility Study 10,000
South Africa Entertainment Park Desk Study 4,000
Tanzania Mtibwa Sugar Estate Desk Study 2,500
Togo Sea Point Africa Container Facility Feasibility Study 364,687
Tunisia Vessel Traffic System Desk Study 2,500
Uganda Entebbe Airport Development Desk Study 2,500
Uganda Sukulu Hills Phosphate Desk Study 3,800
Uganda Sukulu Hills Phosphate Desk Study 360,000
Zambia Bus Transportation Desk Study 3,500
African/ME Reg’l North Africa/Middle East Aviation Sector Technical Assistance 1,972
African/ME Reg’l Project Analyst Technical Assistance 51,135
African/ME Reg’l SSA Regional Trade and Devlopment Offfice Technical Assistance 110,490
African/ME Reg’l CNS/ATM Transition Plan Desk Study 2,500
African/ME Reg’l Air Cargo Transport Part I Orientation Visit 1,000
African/ME Reg’l Global Positioning System Desk Study 3,900
African/ME Reg’l Global Positioning System Feasibility Study 460,000

4-34
Table 4-12–ContinuedU.S. Trade and Development Agency funds obligated for program activities in Africa,FY 2003
Country Title ActivityFunds obligated
(Dollars)
African/ME Reg’l ASECNA U.S. Opportunities Desk Study 2,500
African/ME Reg’l Ethiopia/Djibouti Multi-Sector Definitional Mission 39,690
African/ME Reg’l GNSS Project for East Africa Community Desk Study 2,500
African/ME Reg’l GNSS Project for East Africa Community Technical Assistance 199,960
African/ME Reg’l Regional Trade Negotiation Study Tour Orientation Visit 232,380
African/ME Reg’l Integrated Deepwater System Definitional Mission 39,787
African/ME Reg’l CCA U.S.-Africa B.S. Log. & Aviation Workshop Technical Symposium 125,077
African/ME Reg’l CCA U.S.-Africa Bus. Summit NEPAD Workshop Technical Assistance 29,800
African/ME Reg’l Chipata Rail Extension Desk Study 2,500
African/ME Reg’l Chipata Rail Extension Feasibility Study 210,450
African/ME Reg’l Gabon/São Tomé and Principe Definitional Mission 34,998
African/ME Reg’l Atlantic Africa Hydrocarbon and Power Definitional Mission 40,000
African/ME Reg’l Transportation and Trade Security Forum Technical Symposium 406,311
Total 5,928,445
Source: U.S. Trade and Development Agency, 2003 Annual Report.
The agency also continues to build its AGOA-related project portfolio throughorientation visits, project studies, and capacity-building technical assistance in severalmanufacturing and agriculture subsectors in numerous countries.68 The agencyfinanced and assisted the early phase of the Trans Kalahari Corridor projectconnecting Namibia, Botswana, and South Africa. TDA also supported aNEPAD-designated priority project, the Nacala Corridor, by funding a study of thecorridor’s extension from Malawi and Mozambique into Zambia.69 In September2003, TDA, with the Ethio-American Trade and Investment Council, sponsored anEthiopian manufacturing orientation visit to increase trade under AGOA and businesscontacts between the United States and Ethiopia. In addition, the TDA focused onrenewable energy projects to help African global competitiveness, including theBiomass Generation Project in Ghana, the East Africa Geothermal Conference, andthe coal bed methane development projects in Botswana.
Overseas Private Investment CorporationOverseas Private Investment Corporation (OPIC) is a self-sustaining U.S. governmentagency that provides investment funds, project finance, and political risk insurance toU.S. businesses investing in developing nations and emerging markets around theworld (table 4-13). OPIC supports small- and medium-size businesses in Africa. OPIC
68 TDA, “Winter 2003 update,” found at Internet addresshttp://tda.gov/trade/updatewinter2003/africamiddleeast.html, retrieved July 4, 2004.
69 TDA, 2003 Annual Report, p. 24.

4-35
Table 4-13Sub-Saharan Africa: Selected OPIC investment projects, 2003
Country Project Description Support TypeValue
(Dollars)
Angola Flour mill and commodity trading operations Insurance 5,990,962
Ghana Poultry production and distribution Insurance 16,977,600
Dara Salam estate developers Finance 1,200,000
Kenya Housing construction Insurance 4,860,000
Mozambique Resort Insurance 3,668,850
Nigeria Telecommunicationsl
Insurance 200,000,000gTelecommunications Insurance 2,000,000
Sierra Leone Development and expansion of rutile mine Finance 25,000,000
South Africa Financial services Finance 250,000,000
Game park and guest lodge resort Insurance 742,500
Africa Regional African regional on-lending facility Finance 125,000,000
Total 635,439,912
Source: OPIC, 2003 Annual Report, p.16.
investments in SSA totaled $635 million in 2003 and $149 million in 2002.70 OPICfunded several humanitarian-related projects in 2003, such as the project to increasehousing for low-income and HIV-infected South Africans.71 OPIC also pledged toassist the Government of Kenya build 150,000 new residential units as a major steptowards solving its housing shortage. An OPIC loan also will help a U.S.-ownedcompany complete 24 of an anticipated 60 paretically constructed houses in theGhanaian capital city of Accra.
Reflecting the importance of transportation infrastructure is an important ingredient ineconomic development, OPIC signed an agreement with a pan-African consortium tosupport the Nacala Port and Railway Initiative.72 OPIC also aims to enhance medium-to long-term capital availability in SSA. To that end, the agency provided a$125-million guaranty facility to Citibank, so the bank could provide U.S. dollar andlocal currency project and corporate loans throughout the region.73
U.S. Agency for International DevelopmentU.S. Agency for International Development (USAID) implements U.S. foreigneconomic assistance programs that address sustainable broad-based economicdevelopment and the promotion of democratic ideals and values. USAID’s programand management challenges in SSA include responding to the HIV/AIDS pandemic,addressing the effects of violent conflicts and instability, providing greater access toeducation and health services, reducing poverty, and increasing food security.
70 OPIC, “OPIC Investment Funds list,” found at Internet addresshttp://www.opic.gov/investmentfunds/, retrieved July 9, 2003.
71 OPIC Press Release, “OPIC Project In South Africa will Enable HIV+ Homeowners to GetTreatment, Keep Homes,” Feb. 3, 2003.
72 OPIC, 2003 Annual Report, p. 10.73 OPIC, 2003 Annual Report, p. 7.

4-36
In FY 2003, USAID obligations for SSA totaled $2.2 billion. USAID’s assistanceconsisted of $1.2 billion for Public Law 480, Title II (U.S. emergency andnonemergency food aid program), $485 million for child survival and diseaseprograms, $463 million for development assistance programs, and $48 million ineconomic support funds, which provide food assistance and poverty alleviationthrough nonprofit, charitable organizations.74 Table 4-14 contains the FY 2003allocation of USAID funds in SSA.
In 2003, USAID continued to support programs initiated in 2002 designed to combatpoverty, hunger, and corruption, and to improve education. One such program is theInitiative to End Hunger in Africa (IEHA), which aims to halve hunger inAfrica by2015.In FY 2003, a $28-million IEHA initiative will focus on promoting agriculturalproduction.75 There are also plans for a $53-million project to help SSA farmersharness science and technology. IEHA also increased investment in small-scalefarming, from $25 million to $37 million in FY 2003.76 The $185-million AfricaEducation Initiative, “Strengthening Basic Education in Africa,” is designed to improvebasic education for children in Africa. The initiative challenges African educationalprofessionals to find new ways to provide children with opportunities to learn and tobecome productive members of society. The initiative will also ensure that enoughteachers are trained to address the wide variety of student needs.77 A new 5-yearAnti-Corruption Initiative aims to reduce corruption in SSA by addressing corruptionissues. To achieve this goal, the initiative will promote public access to information,encourage civic participation in government action, and emphasize transparent andefficient government oversight institutions. Other regional programs in which USAIDparticipates include the Congo Basin Forest Partnership, which promotes economicdevelopment and poverty alleviation in Cameroon, Central African Republic, DROC,Equatorial Guinea, Gabon, and ROC through natural resource conservation; and theWest African Water Initiative, a partnership to provide potable drinking water andsanitation to villages in Ghana, Mali, and Niger.78
74 USAID, “FY 2003 Country Allocation Summary,” found at Internet addresshttp://www.usaid.gov/pubs/cbj2003/fy03_table4c.html, retrieved July 8, 2003.
75 U.S. Department of State Fact Sheet, “Initiative to End Hunger in Africa,” found at Internet addresshttp://www.state.gov/g/oes/rls/fs/2003/18796pf.htm, retrieved July 8, 2003.
76 U.S. Department of State Fact Sheet, “Initiative to End Hunger in Africa.”77 USAID Fact Sheet, “Strengthening Basic Education in Africa,” found at Internet address
http://www.usaid.gov/press/releases/2002/02fs_afreducation.html, retrieved July 8, 2003.78 For information on the Generalized System of Preferences and the Everything But Arms
programs, see USITC, U.S. Trade and Investment With Sub-Saharan Africa 2002, USITC pub. 3552,Dec. 2002, pp. 108-111.

4-37
Table 4-14USAID funds allocated for sub-Saharan Africa,1 by major project categories, FY 2003
(Thousand dollars)
CountryChild Survival
and Disease
DevelopmentAssistance for
Africa P.L. 480 Title II
EconomicSupport
Funds Total
Angola . . . . . . . . . . . . . . . . . . . 6,825 4,584 104,545 3,550 119,504
Benin . . . . . . . . . . . . . . . . . . . . . 6,638 9,360 4,292 350 20,640
Burkina Faso . . . . . . . . . . . . . . . (2) (2) 6,493 (2) 6,493
Burundi . . . . . . . . . . . . . . . . . . . 750 3,949 23,838 1,150 29,687
Cameroon . . . . . . . . . . . . . . . . . (2) (2) 100 (2) 100
Cape Verde . . . . . . . . . . . . . . . . (2) (2) 3,682 (2) 3,682
Central African Republic . . . . . (2) (2) 204 (2) 204
Chad . . . . . . . . . . . . . . . . . . . . . (2) (2) 5,050 (2) 5,050
Congo (ROC) . . . . . . . . . . . . . . . (2) (2) 655 (2) 655
Congo (DROC) . . . . . . . . . . . . . 17,443 11,374 43,530 3,300 75,647
Côte d’Ivoire . . . . . . . . . . . . . . . (2) (2) 6,296 (2) 6,296
Djibouti . . . . . . . . . . . . . . . . . . . (2) 2,000 3,348 1,999 7,347
Eritrea . . . . . . . . . . . . . . . . . . . . 5,600 4,710 66,245 950 77,505
Ethiopia . . . . . . . . . . . . . . . . . . . 29,452 20,774 352,248 5,250 407,724
The Gambia . . . . . . . . . . . . . . . (2) (2) 1,475 (2) 1,475
Ghana . . . . . . . . . . . . . . . . . . . . 15,990 20,740 20,345 530 57,605
Guinea . . . . . . . . . . . . . . . . . . . 6,860 16,703 9,809 (2) 33,372
Guinea-Bissau . . . . . . . . . . . . . . (2) (2) 1,670 (2) 1,670
Kenya . . . . . . . . . . . . . . . . . . . . 36,663 15,075 34,664 6,200 92,602
Liberia . . . . . . . . . . . . . . . . . . . . 3,246 1,333 17,684 570 22,833
Madagascar . . . . . . . . . . . . . . . 8,293 10,500 10,381 3,595 32,769
Malawi . . . . . . . . . . . . . . . . . . . 17,480 9,918 3,202 400 31,000
Mali . . . . . . . . . . . . . . . . . . . . . . 12,321 26,559 (2) 350 39,230
Mauritania . . . . . . . . . . . . . . . . (2) (2) 16,252 (2) 16,252
Mozambique . . . . . . . . . . . . . . . 19,801 27,542 16,166 750 64,259
Namibia . . . . . . . . . . . . . . . . . . 7,601 4,850 (2) 1,600 14,051
Niger . . . . . . . . . . . . . . . . . . . . . (2) (2) 9,548 (2) 9,548
Nigeria . . . . . . . . . . . . . . . . . . . 43,528 19,640 (2) 2,650 65,818
Rwanda . . . . . . . . . . . . . . . . . . . 16,168 6,750 16,089 1,050 40,057
Senegal . . . . . . . . . . . . . . . . . . . 14,667 15,447 2,146 (2) 32,260
Sierra Leone . . . . . . . . . . . . . . . 874 2,999 19,486 593 23,952
Somalia . . . . . . . . . . . . . . . . . . . 250 3,122 19,128 1,250 23,750
South Africa . . . . . . . . . . . . . . . 28,550 34,775 (2) 939 64,264
Sudan . . . . . . . . . . . . . . . . . . . . 254 13,994 111,316 1,500 127,064
Tanzania . . . . . . . . . . . . . . . . . . 23,464 12,763 22,535 800 59,562
Uganda . . . . . . . . . . . . . . . . . . . 39,334 27,181 75,896 500 142,911
Zambia . . . . . . . . . . . . . . . . . . . 37,904 15,667 (2) (2) 53,571
Zimbabwe . . . . . . . . . . . . . . . . . 5,300 1,924 (2) 1,800 9,024
Total . . . . . . . . . . . . . . . . . . . 405,256 344,233 1,028,318 41,620 1,819,433
1 Only SSA countries receiving direct USAID bilateral assistance are included in this table. These and other SSAcountries may receive USAID assistance indirectly through regional programs.
2 Not available.
Source: Compiled from USAID data found at Internet address http://www.usaid.gov/policy/budget/cbj2004/summa-ry_tables_table4.pdf, retrieved July 2, 2003.

4-38
USAID is a partner in the $15-billion President’s Emergency Plan for AIDS Relief thatwas announced by President Bush in 2003. The initiative aims to provide at least 2million HIV-positive people with anti-retroviral therapy, to provide care for 10 millionpersons infected with HIV, and to prevent new infections in 11 countries in Africa. Thecountries that are eligible for this program are Botswana, Côte d’Ivoire, Ethiopia,Mozambique, Namibia, Nigeria, Rwanda, South Africa, Tanzania, Uganda, andZambia.79 Additionally, the agency assisted the Government of Eritrea in conductinga comprehensive HIV/AIDS study and developing prevention and treatment plans. In2003, USAID allocated $2.3 million for these activities, up from $1.5 million in 2001.80
79 USAID Overview, “The U.S. Government in the World Leader in Responding to the GlobalPandemic of AIDS,” found at Internet addresshttp://www.usaid.gov/our_work/global_health/aids/index.html#, retrieved Aug. 2, 2004.
80 USAID, “Country Profile, HIV/AIDS: Eritrea,” found at Internet addresshttp://www.synergyaids.com/Profiles_Web/Profiles_PDFs/Eritrea_profile_2004_rev2.pdf, retrievedAug. 2, 2004.

5-1
CHAPTER 5Industry Sector Profiles
This chapter provides information and analysis on production, trade, and investmentfor various industry sectors in SSA. The sectors include agriculture, fisheries, and forestproducts; chemicals; petroleum and energy-related products; minerals and metals;textiles and apparel; and certain transportation equipment.1 These sectors account forthe major items traded between the United States and SSA. Each sector discussionprovidesoverview information, including sectorproduction, industryand sector issues,and economic and trade policy developments. Trade information is also provided,including U.S.-SSA trade and global SSA trade. Investment information includesmajor SSA sector policy developments, U.S. foreign direct investment position in SSA,major investments, and investment issues. The information and analysis generallyfocus on developments that occurred during 2003 and early 2004.2
Data on SSA industry sector production were compiled from numerous sources,including the U.S. Department of Commerce, the U.S. Department of Energy, the U.S.Geological Survey, the United Nations, various U.S. and international industry tradeassociations, and various industry-specific statistical publications. Data on SSA globaltrade were compiled from statistics of the United Nations. Data on U.S.-SSA tradewere compiled from official statistics of the U.S. Department of Commerce. Data onU.S. foreign direct investment in SSA were compiled from statistics of the U.S.Department of Commerce, Bureau of Economic Analysis. Unless otherwise indicated,“AGOA” trade data includes its GSP provisions.
1 The sectors generally are in the order of the chapters of the Harmonized Tariff Schedule of theUnited States (HTS). Sector coverage may have changed somewhat from last year’s report.
2 In some cases, the latest available data are for 2002.


5-3
• Food security continues to be a concern in SSA.The United Nationsidentified 24 countries facing food emergencies as of April 2004,owing to civil strife,drought,widespread hunger,economicdisruption because of government policies in Zimbabwe,and civilunrest in western Sudan. In 2003,an estimated 59 percent of thepopulation (381 million people) in SSA were inadequately nourished.Countries in SSA with the largest food needs during 2003 includedDROC,Ethiopia,Somalia,Tanzania,Uganda,and Zimbabwe.6
• The economy of Zimbabwe continues to suffer from governmentland redistribution policies that have lowered agriculturalproductivity,caused shocks to the financial system,and created ablack market for goods.The United Nations estimates that morethan one-third of the population (4.8 million people) will need food aidduring 2004.7
• Many farmers in Zimbabwe who have lost their lands under thegovernment’s controversial land redistribution program arerelocating to other countries in SSA.The Governments ofMozambique,Nigeria,and Zambia,among others,have encouragedthese farmers to relocate with the hope that increased commercialfarming will support food security and economic development.Zimbabwean farmers in Nigeria reportedly are signing 25-yearleases on 1,000-hectare plots in central Nigeria’s state of Kwara.8
• Sugar production in Zimbabwe increased by more than 3 percent inmarketing year (MY) 2003/04 because of favorable weatherconditions.To obtain foreign currency through the export of certaingoods such as sugar,the Government of Zimbabwe has instituteddaily currency auctions that are permitted to trade freely and arenot pegged to the official exchange rate.However,estimates arethat Zimbabwe did not fill any of its U.S.sugar quota in MY2003/04.9
• Swarms of desert locusts affected many areas of northwest Africaduring the 2004 growing season,particularly Chad,Mali,Mauritania,Niger,and Senegal,and extending into Sudan.Theexpected outbreak is considered to be the most serious locustplague in the region since 1987-89,when agricultural damage andpest control costs totaled $300 million and affected 28countries.10
• Cereal food aid pledges to SSA totaled about 2.1 million metric tons(mmt) for MY 2003/04,down from 2.3 mmt in MY 2002/03.Principal recipients included Zimbabwe (17 percent),Mozambique(15 percent),Angola (11 percent),and Ethiopia (7 percent).Principal donors included the World Food Program of the UnitedNations (51 percent of the total),the United States (40 percent),and the EU (5 percent).11
• Although biotechnology in agriculture (e.g.,genetically modifiedorganisms) has yielded benefits for producers around the world interms of greater yields and new crops,farmers in only a fewdeveloping countries are employing such technology. In general, fewbiotechnology research funds are spent on basic food crops suchas cassava,potato,rice,wheat,cowpea,millet,and sorghum.Inadequate regulatory procedures,complex intellectual propertyissues,and poorly functioning markets also inhibit biotechnologyprogress in most developing countries of SSA.
agriculture, fisheries, and
OVERVIEW
1forest products
Source: United Nations, FAOSTAT database.
Share of total (percent)
Source: United Nations, FAOSTAT database.
SSA sector production, by country, 2002(948 million metric tons)
SSA sector production, by product, 2002(948 million metric tons)
0 10 20 30 40 50 60
Crops
Forest products
Livestock
Fish
South Africa 12%All other46%
Nigeria 19%
Ethiopia 9%
Congo (DROC) 8%Uganda 6%
• Although the agriculture,fisheries,and forest products sector is amajor component of the SSA economy, its relative importance hasbeen gradually declining. In 2002,the value added by this sectoraccounted for 18 percent of SSA GDP,down from 19 percent in1998.2
• Sector production rose moderately in 2002,increasing about 1percent,by quantity,over the previous year.Nigeria and South Africaaccounted for 31 percent,and the top five SSA countries accountedfor 54 percent of the total quantity of SSA production in 2002.3
• Agricultural crops again accounted for the largest share of sectorproduction,about 53 percent of the total,by quantity, in 2002.Theleading crops produced in SSA during 2002 included cassava,sugarcane,yams,corn,plantains,and sorghum.Forest productsproduction was the second-leading sector category,accounting forabout 43 percent of the total.Fuel wood accounted for 86 percent offorest products production,by quantity,and 37 percent of totalsector production in SSA.4 Livestock and fishery products accountedfor the remaining 4 percent of sector production.5
53
43
3
1

5-4
AGRICULTURE, FISHERIES, AND FOREST PRODUCTS-CONTINUEDOVERVIEW-Continued
• Commodity prices for certain major SSA export commoditiessuch as coffee,sugar cane,and cotton increased in 2003.Inparticular,the price of cotton,as represented by the Cotlook AIndex,rebounded from 46 cents per pound in 2002 to 63cents per pound in 2003.However,continuing civil strife inCôte d’Ivoire,a major cocoa,coffee,cotton,and sugar caneproducer, is expected to dampen that country’s cottonproduction and exports.Cocoa prices declined in 2003 afterrecord prices the previous year,although the average annualprice for cocoa in 2003 was only slightly below the averagecocoa price in 2002.12
• HIV/AIDS continues to adversely affect the SSA agriculturesector,with an estimated 3 million newly infected people and2.2 million AIDS-related deaths in SSA during 2003.Botswanaand Swaziland have HIV-infection rates of 37.3 percent and38.8 percent,respectively;Lesotho,Zimbabwe,South Africa,and Namibia have HIV-infection rates over 20 percent.Theepidemic has contributed to a food crisis in parts of southernAfrica.Vulnerability assessments conducted during 2002 and2003 showed that farming families with adults that havechronic illnesses such as HIV/AIDS suffer from loweragricultural production and lower incomes.13

5-5
0 10 20 30 40 50 60
Cereals (10)
Fats and oils (15)
Sugar (17)
Dairy, eggs, honey (4)
All other
SSA sector global exports,by HTS chapter, 2002
($16.3 billion)
SSA sector global imports, by country, 2002($9.9 billion)
TRADE
SSA sector global imports,by HTS chapter, 2002
($9.9 billion)
Source: United Nations.
Share of total (percent)
SSA sector global exports, by country, 2002($16.3 billion)
Source: United Nations.
South Africa 17%All other 51%
Nigeria 16%
Ghana 4%
Angola 7%
Source: United Nations.
South Africa 24%
All other 41%
Côte d’lvoire 18%
Zimbabwe 6%Kenya 6%Ghana 5%
0 10 20 30 40 50
Cocoa (18)
Fruits and nuts (8)
Fish (3)
Coffee, tea, spices (9)
Tobacco (24)
All other
Source: United Nations.
Share of total (percent)
Major Share of Major Import Share ofImport Total Item TotalSource (2002) (percent) (6-digit HTS) (2002) (percent)
EU15 39 Wheat,not durum (1001.90) 8. . . . . . . . . . . . . . . . . . . . . . . . .
United States 9 Cane or beet sugar (1701.99) 6. . . . . . . . . . . . . . . . .
South Africa 8 Semi-milled or milled rice (1006.30) 5. . . . . . . . . . . . . .
Brazil 7 Cigarettes (2402.20) 4. . . . . . . . . . . . . . . . . . . . . . . . . . . . . . .
India 4 Palm oil (1511.90) 4. . . . . . . . . . . . . . . . . . . . . . . . . . . . . . . . . .
Argentina 4 Corn (1005.90) 3. . . . . . . . . . . . . . . . . . . . . . . . . . . . . . . . .
Source: United Nations. Source: United Nations.
Major Share of Major Export Share ofExport Total Item TotalMarket (2002) (percent) (6-digit HTS) (2002) (percent)
EU15 60 Cocoa beans (1801.00) 16. . . . . . . . . . . . . . . . . . . . . . . . . . . .
United States 6 Tobacco (2401.20) 6. . . . . . . . . . . . . . . . . . . . . . . . . . .
Japan 4 Cotton (5201.00) 5. . . . . . . . . . . . . . . . . . . . . . . . . . . . . . . . . .
India 2 Cane sugar (1701.11) 4. . . . . . . . . . . . . . . . . . . . . . . . . . . . . . .
Russia 2 Coffee (0901.11) 3. . . . . . . . . . . . . . . . . . . . . . . . . . . . . . . . . . .
Hong Kong 2 Tuna (1604.14) 3. . . . . . . . . . . . . . . . . . . . . . . . . . . . . . . .
18
10
9
7
7
49
20
14
12
7
7
40
Côte d’lvoire 5%
AGRICULTURE, FISHERIES, AND FOREST PRODUCTS-CONTINUED
Beverages, spirits,vinegar (22)

5-6
Source: Compiled from official statistics of theU.S. Department of Commerce.
Source: Compiled from official statistics of theU.S. Department of Commerce.
Source: Compiled from official statistics of theU.S. Department of Commerce.
0 5 10 15 20 25 30 35 40
Cocoa (18)
Coffee, tea, spices (9)
Wood products (44)
Fruit and nuts (8)
Tobacco (24)
Fish (3)
All other
U.S. sector imports fromSSA, by source, 2003
($1.3 billion)
U.S. sector imports from SSA,by HTS chapter, 2003
($1.3 billion)
Share of total (percent)
U.S. sector imports under AGOA(including GSP), by source, 2003
($274 million)
U.S. sector imports under AGOA(including GSP), by HTS chapter, 2003
($274 million)
South Africa 57%
All other 11%
Malawi 13%
Ghana 4%
0 5 10 15 20 25 30
Fruit and nuts (8)
Cocoa (18)
Tobacco (24)
Wood products (44)
Sugar (17)
Beverages, spirits, vinegar (22)
All other
Share of total (percent)
South Africa 21%
All other 32%
Madagascar 14%
Source: Compiled from official statistics of theU.S. Department of Commerce.
37
21
8
6
5
19
24
15
12
11
17
Côte d’lvoire 15%
Côte d’lvoire 33%
AGRICULTURE, FISHERIES, AND FOREST PRODUCTS-CONTINUEDTRADE-Continued
4
11
10

5-7
U.S. sector exports to SSA,by market, 2003($1.2 billion)
Angola 5%
U.S. sector exports to SSA,by HTS chapter, 2003
($1.2 billion)
Source: Compiled from official statistics of theU.S. Department of Commerce.
South Africa 20%
All other 30%
Nigeria 27%
Ghana 5%
0 10 20 30 40 50 60
Source: Compiled from official statistics of theU.S. Department of Commerce.
Key U.S. Import Developments• U.S.sector imports from SSA totaled $1.3 billion in 2003,up
30 percent from the previous year.SSA accounted for about1 percent of total U.S.sector imports in 2003,the sameshare as in the previous year.Large shipments of cocoaduring 2003 were the primary contributor to the increase inimport value.The sector accounted for about 5 percent oftotal U.S. imports from SSA in 2003,down from 6 percentthe previous year.
• In 2003,the top five import commodities at the 6-digit HTSlevel accounted for 57 percent of total imports,by value.Cocoa beans (HTS 1801.00) accounted for 30 percent;vanilla beans (HTS 0905.00),16 percent;stemmed andstripped tobacco (HTS 2401.20),5 percent;coffee beans(HTS 0901.11),4 percent;and cocoa paste (HTS 1803.10),3 percent.
• Côte d’Ivoire and South Africa supplied 54 percent of all U.S.sector imports from SSA in 2003,up from 51 percent in2002.Sector imports from Côte d’Ivoire are highlyconcentrated,with 82 percent accounted for by cocoa beans(HTS 1801). Imports from South Africa are more evenlydistributed,with major items including fresh citrus (HTS 0805,14 percent of the total value);wine (HTS 2204,8 percent);wood doors (HTS 4418,7 percent);fruit juices (HTS 2009,7percent);processed fruits and nuts (HTS 2008,5 percent);leather (HTS 4113,4 percent);and sugar (HTS 1701,4percent).
Key AGOA Trade Developments• In 2003,the value of U.S.sector imports under AGOA was
$274 million,an increase of 13 percent over the previousyear.Such imports accounted for about 2 percent of totalAGOA imports and 21 percent of total sector imports fromSSA in 2003.South Africa was the largest source for sectorimports under AGOA in 2003,accounting for 57 percent ofsuch imports. In aggregate,South Africa,Côte d’Ivoire,andMalawi supplied 85 percent of all AGOA sector imports fromSSA in 2003,up from 82 percent in 2002.
• The principal AGOA products in 2003 were fresh citrus (HTS0805),at $37 million,representing 14 percent of the total;unmanufactured tobacco (HTS 2401),$30 million,or 11percent;raw cane sugar (HTS 1701),$30 million,or 11percent;certain nuts (HTS 0802),$24 million,or 9 percent;and cocoa powder (HTS 1805),$24 million,or 9 percent.
• AGOA imports of raw cane sugar decreased by $14 million,or31 percent, in 2003.The major supplier was South Africa (33percent by value).Virtually all U.S. imports of sugar fromAGOA-eligible countries entered under the U.S.quota program.The quota for these suppliers was only about 66 percent filledin FY 2003,leaving room for future expansion.14 U.S. importsof sugar are subject to a prohibitive over-quota tariff rate.
• Other major AGOA products that showed substantial importgrowth in 2003 include cocoa paste (HTS 1803),up $6million,or 65 percent;wood doors (HTS 4418.20),up $6million,or 40 percent,almost entirely from South Africa;andundenatured ethyl alcohol (HTS 2207.10),up $4 million,or 45percent.
Key U.S. Export Developments• U.S.sector exports to SSA totaled $1.2 billion in 2003,up 17
percent from the previous year.SSA accounted for about 1percent of total U.S.sector exports in 2003,approximately thesame share as 2002.
• The agriculture,fisheries,and forest products sectoraccounted for about 19 percent of total U.S.exports to SSA in2002,up from 18 percent the previous year.The primary SSAmarkets for U.S.sector exports in 2003 continued to beNigeria (27 percent by total value) and South Africa (20percent).The share of U.S.exports accounted for by thesemarkets declined relative to the previous year.
• In 2003,the leading four export commodities at the 6-digitHTS level accounted for 55 percent of total exports,by value.These included wheat other than durum (HTS 1001.90,40percent),milled rice (HTS 1006.30,6 percent), frozen chickencuts and offal (HTS 0207.14,5 percent),and certain foodpreparations (HTS 1901.90,4 percent).
• U.S.cereal exports to SSA countries totaled about $642million in 2003,an increase of 16 percent over 2002.Nigeriawas the primary SSA market,accounting for 42 percent oftotal U.S.cereal exports to SSA.Other markets includedEthiopia (15 percent),South Africa (11 percent),andMozambique (5 percent).About 82 percent of the value of U.S.grain exports to the region in 2003 consisted of wheat,11percent was rice,and the remainder was mostly corn andsorghum.
• The SSA export markets for cereals showing the largestannual percentage increases included Ethiopia (2,718percent),Mauritania (475 percent),Uganda (407 percent),Central African Republic (291 percent),Sudan (211 percent),and Tanzania (166 percent).Annual shifts in U.S.cerealexports to SSA largely reflect patterns in food aid.
Ethiopia 13%
Share of total (percent)
52
10
5
5
4
24
AGRICULTURE, FISHERIES, AND FOREST PRODUCTS-CONTINUEDTRADE-Continued
Certain edible foodpreparations (19)
Wood pulp and recoveredpaper (47)
Cereals (10)
Fats and oils (15)
Meat (2)
All other

5-8
0
30
60
90
120
150
180
210
240
1999 2000 2001 2002 2003
0 30 60 90 120 150 180 210 240
South Africa
Kenya
Botswana
Total
INVESTMENT
• The U.S.FDI position in the SSA food sector totaled $198million in 2003,up from $148 million the previous year.SouthAfrica continued to be the primary SSA destination for U.S.FDIin the sector,accounting for 11 percent of the regional total.The food sector accounts for a minor share of the total U.S.FDI position in SSA,and SSA continued to host a minor shareof the global U.S.FDI position in the food sector.15
• Privatization efforts appear to be slowing in South Africa.TheSouth African government announced in June 2004 that,withthe possible exception of forestry operations, it is no longerplanning to sell off several large,state-owned companies.Aproposal by the Ministry of Agriculture and Land Affairs wouldban the sale of land to foreigners in South Africa;ifimplemented,foreign investors in South Africa’s high-value fruit,vegetable,and flower export sectors would be unable to expandoperations.16
• The International Finance Corporation (IFC),part of the WorldBank Group,developed a new initiative during 2003 to aidsmall businesses in SSA.As part of this effort, IFC createdcommercial microfinance institutions in Chad and Mali toprovide loans to small businesses in many sectors, includingagriculture,forestry,and fisheries. IFC also invested in a fishingoperation in Namibia and provided technical assistance to helpGhanaian agricultural producers increase sales to a majorEuropean grocery chain.17
Millions of U.S. dollars
U.S. sector SSA FDI position, 1999-2003
Millions of U.S. dollars
U.S. sector SSA FDI position, by country, 2003
Note.—Data for some countries are not disclosed owing toconfidentiality. U.S. FDI position may be negative for somecountries. Industry classification basis changed from SIC toNAICS in 2002.
Source: Bureau of Economic Analysis, U.S. Department ofCommerce. Data are for sector defined as “Food.”
Note.—Industry classification changed from SIC to NAICS in 2002;data from 1999 to 2001 have been converted to NAICS. Data for2001 and 2002 have been revised from previous estimates.
Source: Bureau of Economic Analysis, U.S. Department ofCommerce. Data are for sector defined as “Food.”
191
21
AGRICULTURE, FISHERIES, AND FOREST PRODUCTS-CONTINUED
9
3
198
150 152 148
198

5-9
1 This sector includes items classified in Harmonized Tariff Schedulechapters 01 through 24,35,41,43,44 through 49,51,and 52.
2 The World Bank Group,“Sub-Saharan Africa Data Profile,” found atInternet address http://devdata.worldbank.org/external/CPProfile.asp?SelectedCountry=SSA&CCODE=SSA&CNAME=Sub Saharan+Africa&PTYPE=CP,retrieved July 27,2004.
3 Based on data of the Food and Agriculture Organization (FAO) ofthe United Nations.
4 Ibid.5 Ibid.6 Stacey Rosen,“Sub-Saharan Africa (SSA),” U.S.Department of
Agriculture (USDA),Economic Research Service (ERS),Food SecurityAssessment,GFA-15,May 2004,p.14;FAO,Global Information andEarly Warning System on Food and Agriculture,Food Supply Situationand Food Prospects in Sub-Saharan Africa,No.1,Apr.2004,p.2,foundat Internet address http://www.fao.org,retrieved July 26,2004;andShahla Shapouri and Stacey Rosen,“Global Food Security:Prospects andthe Role of Food Aid,” USDA,ERS,Food Security Assessment,GFA-15,May 2004,p.3.
7 “The method behind Mugabe’s madness,” The Economist,June 24,2004,pp.1-2,found at Internet address http://www.economist.com,retrieved July 28,2004.
8 “White Zimbabweans strike deal to farm in Nigeria,” South ChinaMorning Post,July 29,2004,pp.1-2,found at Internet addresshttp://www.scmp.com,retrieved July 29,2004.
9 USDA,Foreign Agricultural Service (FAS),Zimbabwe,Sugar ReportUpdate,2004,GAIN Report #RH4002,May 5,2004,pp.1-2.
10 FAO,“Locust swarms invade West Africa,” July 5,2004,found atInternet address http://www.fao.org,retrieved July 26,2004.
11 FAO,Global Information and Early Warning System on Food andAgriculture,Food Supply Situation and Food Prospects in Sub-SaharanAfrica,No.1,Apr.2004,p.9,found at Internet addresshttp://www.fao.org,retrieved July 26,2004.
12 The World Bank Group,“Commodity Price Data,” July 2004,found at Internet address http://www.worldbank.org/prospects/pinksheets/pink0703.pdf,retrieved July 22,2004;and USDA,FAS,Côted’Ivoire,Cotton and Products Annual,2004,GAIN Report #IV4009,May 14,2004,pp.4-5.
13 WTO,Committee on Agriculture,WTO Negotiations onAgriculture,Poverty Reduction:Sectoral Initiative in Favour of Cotton,TN/AG/GEN/4,May 16,2003;and “African Countries Agree ToNegotiate Cotton in WTO Agriculture Talks,” Inside U.S.Trade,July 23,2004,found at Internet address http://www.insidetrade.com,retrievedJuly 23,2004.
14 In FY 2003,10 countries held U.S.raw sugar import quotastotaling 119,593 mt,of which they exported 78,477 mt,valued at $38million.Sugar and Sweeteners Yearbook,2003,table 23c,found atInternet address http://www.ers.usda.gov/Briefing/Sugar/Data/data.htm,retrieved July 20,2004;and Sugar and Sweeteners Outlook,Jan.2004,table 10,found at http://ers.usda.gov/publications/so/view.asp?f=specialty/sss bb/,retrieved July 29,2004.
15 USDOC,BEA,Direct Investment Position Abroad on aHistorical-Cost Basis:Country Detail by Industry,provided to USITC staff,Sept.16,2004.
16 “On hold?” The Economist,June 24,2004,pp.1-2,found atInternet address http://www.economist.com,retrieved July 28,2004.
17 International Finance Corporation, IFC Regional Reports,“Sub-Saharan Africa:Seeking Sustainable Economic Growth,” pp.31-33,found at Internet address http://www.ifc.org,retrieved July 29,2004.
AGRICULTURE, FISHERIES, AND FOREST PRODUCTS-CONTINUEDENDNOTES

5-10

5-11
0 10 20 30 40 50
Organic chemicals
Rubber and plastics
Inorganic chemicals
Pharmaceuticals
Specialty chemicals
Fertilizers
Miscellaneous chemical products
Source: USITC estimates based on information from Mbendi,Chemical & Engineering News, Statistics South Africa, andU.S. Department of Commerce.
S Dow Chemical has a major presence in the SSA plastics industry,with its primary facility in Sasolburg,South Africa producingpolypropylene and polyethylene base materials.These materials areused for pipe fabrication,packaging,and other industrialapplications.Other major plastics base materials are importedfrom global Dow sites.Dow also produces agricultural chemicals inSouth Africa at the former Sentrachem and Sanachem facilities,which Dow purchased in 1997 (the purchase was effective in2000).4
S A significant development in the SSA chemical industry during2003-04 has been the development of pharmaceutical productioncapacity and the ability to produce active pharmaceuticalingredients (APIs) for use in generic pharmaceutical products.Aspen Pharmacare,the largest pharmaceutical manufacturer inAfrica,received clearance from South Africa’s CompetitionCommission to integrate vertically with the recently purchased FineChemicals Corp.facility.Aspen released a statement assuring thepublic that it would use the plant to produce APIs,specifically theanti-retrovirals that treat HIV/AIDS.5
S Other SSA pharmaceutical companies include Eli Lilly,whichoperates in South Africa and Kenya,and Thembalami,a jointventure between Ranbaxy, India’s largest producer ofpharmaceutical products,and Adcock-Ingram,a South Africanhealth care firm.Thembalami also is registered to produce fiveanti-retrovirals and is actively trying to register an additional sevenHIV/AIDS medications.6
S Recent changes in the SSA chemical industry include arestructuring of Sasol’s chemicals portfolio.7 Changes in productmix and plant operations include a new Sasol acrylates complex atSasolburg,South Africa,from which Sasol has already begunexporting some acrylic products.8 However,Sasol has delayedplans to build a propylene oxide plant utilizing new technology;company officials stated that they needed available capital for otherinvestment opportunities.9 Sasol also plans to build two newpolymer plants to produce low density polyethylene (scheduled forstartup in late 2005) and polypropylene (scheduled for startup inearly 2006).10
S Growth in plastics exports bolstered Uganda’s exports,whichincreased by nearly 12 percent in 2003,primarily because ofincreased exports to EAC and COMESA member countries.Anevaluation by the Ugandan government states that structuralsupply-side inadequacies pose challenges,because Ugandanexporters often cannot guarantee consistent supplies and areunable to adjust rapidly to changing technical quality and standardsrequirements.11
OVERVIEW
1CHEMICALS
Share of total (percent)
Source: USITC estimates based on information fromMbendi, Chemical & Engineering News, StatisticsSouth Africa, and U.S. Department of Commerce.
SSA sector production, by country, 2003($15.0 billion)
SSA sector production, by product, 2003($15.0 billion)
South Africa 77%All other 23%
• The South African chemical industry accounted for approximately 77percent of SSA chemical production in 2003.The South Africanchemical industry remains among the largest manufacturing sectorsof the South African economy,maintaining its 5-percent share of thegross domestic product.The sector is composed of the fourpetroleum refineries,producers of agricultural chemicals,pharmaceutical manufacturers,and various small firms producingchemical products for the domestic and regional markets.2
• There are approximately 70 producers of plastics products in Kenya,most located in Nairobi and Mombasa. Increased domesticproduction of these materials resulted from both technologicaladvances and a general shift in demand to the use of plasticsproducts in lieu of more traditional materials.The Kenyan industryproduces PVC pipes and fittings,polyethylene packaging,andmiscellaneous plastics products such as shoes,crates,floor tiles,household plasticware,and containers. Its products are marketedpredominantly within COMESA.Most of the inputs are imported,mainly from European and Asian sources.3
40
27
9
7
4
2
11

5-12
0 5 10 15 20 25 30 35
SSA sector global exports,by HTS chapter, 2002
($3.5 billion)
0 5 10 15 20 25 30 35
SSA sector global imports, by country, 2002($9.9 billion)
SSA sector global imports,by HTS chapter, 2002
($9.9 billion)
Source: United Nations.
Share of total (percent)
SSA sector global exports, by country, 2002($3.5 billion)
Source: United Nations.
South Africa 36%All other 37%
Nigeria 14%Kenya 5%
Source: United Nations.
South Africa 68%All other 15%
Kenya 3%
Senegal 6%
Source: United Nations.
Share of total (percent)
Major Share of Major Import Share ofImport Total Item TotalSource (2002) (percent) (6-digit HTS) (2002) (percent)
EU15 46 Pharmaceuticals (3004.90) 13. . . . . . . . . . . . . . . . . . . . . . . . .
South Africa 8 Flavorings (3302.10) 5. . . . . . . . . . . . . . . . . . . . . . . . . .
United States 7 Bus and truck tires (4011.20) 3. . . . . . . . . . . . . . . . . .
India 6 Insecticides (3808.10) 2. . . . . . . . . . . . . . . . . . . . . . . . . . . . . . .
China 6 Miscellaneous chemical. . . . . . . . . . . . . . . . . .mixtures (3824.90) 2. . . . . . . . . . . . . . . .
Source: United Nations. Source: United Nations.
21
20
10
31
9
22
15
13
12
28
Côte d’lvoire 4%
Côte d’lvoire 5%
Inorganic chemicals (28)
Organic chemicals (29)
Rubber and articlesthereof (40)
Plastics and articlesthereof (39)
All other
Ghana 4%
9
Guinea 3%
Miscellaneous chemicalproducts (38)
10
Major Share of Major Export Share ofExport Total Item TotalMarket (2002) (percent) (6-digit HTS) (2002) (percent)
EU15 24 Phosphoric and polyphosphoric. . . . . . . . . . . . . . . . .
United States 12 acids (2809.20) 8. . . . . . . . . . . . . . . . . . . . . . . . . .
Zimbabwe 10 Natural rubber (4001.22) 3. . . . . . . . . . . . . . . . . . . . . . .
India 10 Acyclic hydrocarbons (2901.29) 3. . . . . . . . . . . . . . . . . . . . . .
Zambia 5 Aluminum oxide (2818.20) 3. . . . . . . . . . . . . . . . . . . . . . . . . .
Swaziland 4 Nonspecific metallic compounds. . . . . . . . . . . . . .
(and amalgams) (2843.90) 2. . . . . . .
Supported catalysts with metal
components (3815.12) 2. . . . . . . . . . .
Pharmaceuticals (30)
Plastics and articlesthereof (39)
Essential oils, cosmetics,toiletries (33)
Rubber and articlesthereof (40)
Miscellaneous chemicalproducts (38)
All other
chemicals-CONTINUEDTRADE
chemicals-CONTINUED

5-13
0 10 20 30 40 50
Source: Compiled from official statistics of theU.S. Department of Commerce.
Source: Compiled from official statistics of theU.S. Department of Commerce.
Source: Compiled from official statistics of theU.S. Department of Commerce.
0 10 20 30 40 50 60
U.S. sector imports fromSSA, by source, 2003
($598 million)
U.S. sector imports from SSA,by HTS chapter, 2003
($598 million)
Share of total (percent)
U.S. sector imports under AGOA(including GSP), by source, 2003
($177 million)
U.S. sector imports under AGOA(including GSP), by HTS chapter, 2003
($177 million)
South Africa 99%
All other 1%
Share of total (percent)
South Africa 58%
All other 10%
Liberia 9%
Source: Compiled from official statistics of theU.S. Department of Commerce.
49
15
14
22
39
22
13
9
17
Inorganic chemicals (28)
Organic chemicals (29)
Plastics and articlesthereof (39)
Dyes and pigments (32)
All other
Equatorial Guinea 23%
CHEMICALS-CONTINUEDTRADE-Continued
Rubber and articlesthereof (40)
Inorganic chemicals (28)
Organic chemicals (29)
All other

5-14
U.S. sector exports to SSA,by market, 2003($717 million)
U.S. sector exports to SSA,by HTS chapter, 2003
($717 million)
Source: Compiled from official statistics of theU.S. Department of Commerce.
South Africa 62%All other 22%
Nigeria 8%
0 5 10 15 20 25 30
Source: Compiled from official statistics of theU.S. Department of Commerce.
Key U.S. Import DevelopmentsS U.S.chemical sector imports from SSA reached $598 million in
2003,up one-third from the previous year.U.S.sector imports fromSSA accounted for less than 1 percent of total U.S.chemicalimports in 2003.Principal SSA sources included South Africa (58percent of the total),Equatorial Guinea (23 percent),and Liberia (9percent).These shares shifted slightly from the previous year,whenSouth Africa,Equatorial Guinea,and Liberia accounted for 60percent,16 percent,and 10 percent,respectively.
S The three largest U.S.sector imports from SSA in 2003 weremethanol (HTS subheading 2905.11,16 percent of the total);organic chemicals used as feedstocks for producing chemicalintermediates and chemical products, including unsaturated acyclichydrocarbons (HTS subheading 2901.29,12 percent);and naturalrubber (HTS subheading 4001.10,9 percent).
S The leading U.S.chemical imports from individual SSA nations areunsaturated acyclic hydrocarbons (HTS subheading 2901.29),uranium (HTS subheading 2844.10),and titanium dioxide pigments(HTS subheading 3206.11) from South Africa;and methanol (HTSsubheading 2905.11) and propylene (HTS subheading 2901.22)from Equatorial Guinea.
Key AGOA Trade DevelopmentsS In 2003,U.S.chemical sector imports under AGOA totaled
$177 million,an increase of 30 percent over 2002.Nearly allU.S.chemical imports under AGOA came from South Africa.
S The principal sector items imported under AGOA in 2003included silicon (HTS subheading 2804.69,18 percent oftotal sector imports under AGOA),titanium dioxide pigments(HTS subheading 3206.11,8 percent),carbides (HTSsubheading 2849.90,7 percent),and car tires (HTSsubheading 4011.10,5 percent).
S Despite the fact that U.S.sector imports under specific AGOAprovisions (excluding GSP) more than doubled in 2003,suchimports accounted for just 5 percent of the AGOA (includingGSP) total in 2003.
S None of the non-AGOA-eligible SSA countries has significantchemicals production.
Key U.S. Export DevelopmentsS In 2003,U.S.chemical sector exports to SSA totaled $717
million,an increase of nearly 3 percent compared with 2002.SSA accounted for less than 1 percent of total U.S.sectorexports in 2003.
S The top three SSA markets for U.S.chemical exports in 2003were South Africa,which accounted for 62 percent of U.S.chemical exports,followed by Nigeria (8 percent),and Kenya(5 percent).These shares were similar to those in 2002.
S The United States exported a diverse selection of chemicalitems to SSA in 2003;the leading exports items – fertilizers,other nonspecified medicaments,and isocyanates – each onlyaccounted for 4-5 percent of total U.S.sector exports to SSA.
Share of total (percent)
25
21
10
27
Kenya 5%
TRADE-Continued
CHEMICALS-CONTINUED
Côte d’lvoire 4%
10
7
Organic chemicals (29)
Plastics and articles thereof (39)
Pharmaceuticals (30)
All other
Miscellaneous chemicalproducts (38)
Essential oils, cosmetics,toiletries (33)

5-15
S The U.S.FDI position in the SSA chemicals sector totaled$492 million in 2003,up from $442 million the previousyear.South Africa continued to be the primary SSA locationfor U.S.FDI in the sector,accounting for 91 percent of theregional total.The chemicals sector accounted for 4percent of the total U.S.FDI position in SSA,and SSAaccounted for less than 1 percent of the global U.S.FDIposition in the sector during 2003.12
S A major goal of the South African government is toincrease foreign investment in its already strong chemicalindustries.Since 2002,there have been extensive efforts toreform tariffs, increase trade and investment promotion,and implement regulatory reforms including incentives toestablish new businesses.13
S Although Kenya currently imports all of its industrialchemicals,primarily from suppliers in Belgium,Switzerland,and Germany, it plans to encourage U.S. investment inchemical production facilities to supply growing eastern andcentral African markets.14
060
120180240300360420480540
1999 2000 2001 2002 2003
Millions of U.S. dollarsU.S. sector SSA FDI position, 1999-2003
0 100 200 300 400 500 600
South Africa
Kenya
Zambia
Total
Millions of U.S. dollars
U.S. sector SSA FDI position, by country, 2003
Note.-Data for some countries are not disclosed owing toconfidentiality. U.S. FDI position may be negative for somecountries. Industry classification basis changed from SIC to NAICSin 2002.
Source: Bureau of Economic Analysis, U.S. Department ofCommerce. Data are for sector defined as “Chemicals.”
Note.- Industry classification changed from SIC to NAICS in 2002;data from 1999 to 2001 have been converted to NAICS. Data for2001 and 2002 have been revised from previous estimates.
Source: Bureau of Economic Analysis, U.S. Department ofCommerce. Data are for sector defined as “Chemicals.”
448
349
chemicals-CONTINUEDINVESTMENT
10
5
492
448 434
492442

5-16
1 This sector includes items classified in Harmonized TariffSchedule chapters 28 through 40.
2 U.S.Department of Commerce (USDOC),U.S.& ForeignCommercial Service (USFCS),South Africa Country Commercial GuideFY 2004:Investment Climate,found at Internet addresshttp://buyusainfo.net/info.cfm,retrieved July 15,2004.
3 Republic of Kenya,Ministry of Trade and Industry,Sector Profile:Plastics Sub-sector, found at Internet addresshttp://www.tradeandindustry.go.ke/downloads.asp,retrieved July 25,2004.
4 Dow Chemical Company,found at Internet addresshttp://www.dow.com/facilities/africa/southsfrica/index.htm,retrieved July 13,2004.
5 InPharma.com,Africa’s Top Pharma Buys API Facility,July 15,2004,found at Internet address http://www.inpharma.com/news/printnews NG.asp?id=53561,retrieved Aug.3,2004;and “AspenBuyout of FCC Approved,” Business Day (Johannesburg), found atInternet address http://www.bday.co.za/bday/content/1,3523,1657318 6078 0,00.html,retrieved Aug.3,2004.
6 Eli Lilly and Company,found at Internet addresshttp://www.lilly.co.za/About/index.html,retrieved July 29,2004;and“Merck,Thembalami in AIDS Tie-up,” Business Day (Johannesburg),July14,2004,found at Internet address http://www.journ aids.org/reports/20040714c.htm,retrieved July 29,2004.
7 “Sasol Begins Restructuring,” Chemical & Engineering News,Nov.3,2003,p.16.
8 “Sasol Starts Up Acrylates Complex,” Chemical Week,Apr.7/14,2004,p.40.
9 “Sasol Shelves PO Project in South Africa,” Chemical Week,Apr.7/14,2004,p.41.
10 “Sasol Invests in Polymers,” European Chemical News,Mar.22,2004,p.28.
11 Uganda Export Promotion Board,Export Policy Review 2003,found at Internet address http://www.ugandaexportsonline.com/export_review.htm,retrieved Aug.2,2004.
12 USDOC,BEA,Direct Investment Position Abroad on aHistorical-Cost Basis:Country Detail by Industry,provided to USITC staff,Sept.16,2004.
13 USDOC,USFCS,South Africa Country Commercial Guide FY2004:Investment Climate,found at Internet addresshttp://buyusainfo.net/info.cfm,retrieved July 15,2004.
14 USDOC,USFCS,Kenya Country Commercial Guide FY 2004:Leading Sectors for U.S.Exports and Investment,found at Internetaddress http://buyusainfo.net/info.cfm,retrieved July 15,2004.
CHEMICALS-CONTINUEDENDNOTES

5-17
0 10 20 30 40 50 60
ENERGY-RELATED PRODUCTSflared.Despite President Obasanjo’s announcement that Nigeriawould cease the flaring of natural gas in 2004,it is unlikely thatthe practice will stop in the near term because Nigeria lacks thenecessary infrastructure (e.g.,pipelines,separators,and storagefacilities) to utilize the gas.13 However, in the long term,thesituation could change if proposed liquified natural gas projectscome onstream.14
S Production from joint ventures with multinational petroleumcompanies accounts for 95 percent of Nigeria’s crude petroleumproduction.The largest joint venture,operated by Shell (with a45-percent share) and the Nigerian National PetroleumCorporation (NNPC) (55-percent share),accounts for nearly 50percent of Nigeria’s total crude petroleum production.The otherjoint ventures, in which the NNPC holds at least a 60-percentshare,are operated by ExxonMobil,ChevronTexaco,AGIP,andTotalFinaElf.15
S Nigeria’s energy sector faces significant obstacles,such asinsufficient government funding of its joint ventures and politicaland ethnic strife in the Niger Delta region, including violence,kidnapping,sabotage,siphoning of fuel products,and seizure ofpetroleum facilities.This instability has resulted in majordisruptions in the production of crude petroleum.ChevronTexaco,Shell,and TotalFinaElf suspended production and removednonessential personnel from the Niger Delta region beginning inMarch 2003,which resulted in a loss of 817,500 barrels per dayof crude petroleum production.16 Although some of the personnelhave returned,facilities reportedly remain substantiallyunderstaffed.
S Coal continues to be the primary fuel produced and consumed inSouth Africa and is its largest source of foreign exchange.SouthAfrica accounts for about 4 percent of the world’s recoverablereserves of coal and is the world’s second-largest net exporter ofcoal to the world,with the EU as its principal market.
S South Africa is the second-largest refining center in SSA,with atotal capacity of 519,547 barrels of crude petroleum per day. In2003,the capacity expansion at the South African Natref refinerycame onstream,producing low-sulfur diesel fuels.17
S South Africa has a highly developed synthetic fuels industry,whichtakes advantage of the abundant coal reserves and offshorenatural gas and condensate production.Rising crude petroleumprices have benefited Sasol,the world’s largest manufacturer ofoil from coal,as consumers turn to alternative energy sources.18
S Angola is the region’s second-largest producer of crudepetroleum,accounting for 6 percent of the region’s reserves andless than 1 percent of the world’s reserves.Angola has one smalloperating refinery that primarily produces diesel fuels.TheAngolan economy is highly dependent on its crude petroleumsector,which accounts for 50 percent of GDP and over 90percent of total export revenues.19
S Crude petroleum is the primary export product from SSA.Nigeriais a major exporter of crude petroleum.Angola was thesecond-largest SSA exporter and the ninth-largest world supplierof crude petroleum.In 2003,the United States was the primarymarket for SSA exports of petroleum and energy-related products,while the EU accounted for most of the remainder.20
S Refined petroleum products are the major sector productsimported into the SSA region,followed by crude petroleum.TheUnited States and western Europe are major sources of refinedpetroleum product imports,particularly diesel fuels and otherbunker fuels.Most refineries in the region are small facilities thatdo not produce these products.
PETROLEUM AND
OVERVIEW
1
Source: U.S. Department of Energy and the American PetroleumInstitute.
Share of total (percent)
Source: U.S. Department of Energy and the American PetroleumInstitute.
SSA sector production, by country, 2003($76.6 billion)
SSA sector production, by product, 2003($76.6 billion)
South Africa 49%All other 8%
Nigeria 43%
S Crude petroleum in Nigeria and Angola,as well as coal in SouthAfrica,continue to be the primary petroleum and energy-relatedproducts produced in SSA.All three countries have recoverablereserves of the products and have developed export-orientedindustries.
S Nigeria’s economy remains heavily dependent on the petroleumsector,which accounted for nearly 80 percent of governmentrevenues,90 to 95 percent of export revenues,and over 90percent of foreign exchange earnings in 2003.In 2003,Nigeria,amember of OPEC,accounted for about 2 percent of the world’s totalrecoverable reserves of crude petroleum and 3 percent of theworld’s reserves of natural gas.Nigeria accounted for 3 percent ofthe world’s production and 8 percent of OPEC’s production of crudepetroleum in 2003;crude petroleum production averaged 2.12million barrels per day.2
S Nigeria’s four state-owned refineries have a combined capacity torefine 438,750 barrels of crude petroleum per day,or less than 1percent of the world’s total refining capacity.3 During 2003,sabotage,fire,and lack of maintenance resulted in sharplydecreased production.Repair work scheduled for completion in2003 has yet to begin.4
S Nigeria’s reserves of natural gas ranked ninth in the world in 2003;however, it flares,or burns onsite,75 percent of its natural gas anduses most of the remainder to reinject into wells for enhanced oilrecovery.Nigeria accounted for 12.5 percent of the world’s total gas
54
40
4
2
Crude petroleum
Coal
Natural gas
Refined petroleumproducts

5-18
0 20 40 60 80 100
SSA sector global exports,by HTS heading, 2002
($34.8 billion)
0 20 40 60 80 100
SSA sector global imports, by country, 2002($2.6 billion)
TRADE
SSA sector global imports,by HTS heading, 2002
($2.6 billion)
Source: United Nations.
Share of total (percent)
SSA sector global exports, by country, 2002($34.8 billion)
Source: United Nations.
South Africa 20%
All other 39%Nigeria 22%
Source: United Nations.
South Africa 8%
All other 16%
Nigeria 44%
Angola 21%
Gabon 6%
Source: United Nations.
Share of total (percent)
Major Share of Major Import Share ofImport Total Item TotalSource (2002) (percent) (6-digit HTS) (2002) (percent)
EU15 39 Refined petroleum products. . . . . . . . . . . . . . . . .
South Africa 15 (2710.00,2713.12,& 3811.21) 78. . . . . . . . . . . .
Kenya 12 Crude petroleum (2709.00) 5. . . . . . . . . . . . . . . . . . . . . . . . .
United States 7 Coal (2701.12 & 2701.19) 4. . . . . . . . . . . . . . . . . . . .
Brazil 7. . . . . . . . . . . . . . . . . .
Source: United Nations. Source: United Nations.
Major Share of Major Export Share ofExport Total Item TotalMarket (2002) (percent) (6-digit HTS) (2002) (percent)
United States 35 Crude petroleum (2709.00) 85. . . . . . . . . . . . . . . . . .
EU15 27 Refined petroleum products. . . . . . . . . . . . . . . . .
China 8 (2710.00,2713.12 & 3811.21) 4. . . . . . . . . . . . . . . . . . . .
Japan 5 Coal (2701.12 & 2701.19) 6. . . . . . . . . . . . . . . . . . . . . . . . . .
Brazil 4 Liquefied natural gas (2711.11) 1. . . . . . . . . . . . . . . . . . . . . . . .
81
5
4
85
7
4
2
Senegal 7%
10
Refined petroleum products(2710, 2713, & 3811)
Coal (2701)
Crude petroleum (2709)
All other
Refined petroleum products(2710, 2713, & 3811)
Crude petroleum (2709)
Coal (2701)
Natural gas (2711)
All other 2
PETROLEUM AND ENERGY-RELATED PRODUCTS-CONTINUED
Uganda 7%Mozambique 5%
Congo (ROC) 5%

5-19
Source: Compiled from official statistics of theU.S. Department of Commerce.
Source: Compiled from official statistics of theU.S. Department of Commerce.
Source: Compiled from official statistics of theU.S. Department of Commerce.
0 20 40 60 80 100
U.S. sector imports fromSSA, by source, 2003
($17.7 billion)
U.S. sector imports from SSA,by HTS heading, 2003
($17.7 billion)
Share of total (percent)
U.S. sector imports under AGOA(including GSP), by source, 2003
($11.2 billion)
U.S. sector imports under AGOA(including GSP), by HTS heading, 2003
($11.2 billion)
All other 7%
0 20 40 60 80 100 120
Share of total (percent)
Nigeria 57%
All other 20%
Angola 23%
Source: Compiled from official statistics of theU.S. Department of Commerce.
92
5
3
95
5
Nigeria 83%
Refined petroleum products(2710 & 2713)
Crude petroleum (2709)
All other
Crude petroleum (2709)
Refined petroleum products(2710)
Gabon 10%
PETROLEUM AND ENERGY-RELATED PRODUCTS-CONTINUEDTRADE-Continued

5-20
U.S. sector exports to SSA,by market, 2003($166 million)
U.S. sector exports to SSA,by HTS heading, 2003
($166 million)
Source: Compiled from official statistics of theU.S. Department of Commerce.
South Africa 68% All other 19%
Nigeria 13%
0 20 40 60 80 100
Source: Compiled from official statistics of theU.S. Department of Commerce.
Key U.S. Import DevelopmentsS U.S. imports of petroleum and energy-related products from
SSA accounted for about 10 percent of total U.S. imports ofthese products from all sources in 2003.Crude petroleumfrom Nigeria and Angola was the primary U.S. import in thissector from SSA.
S U.S. imports of petroleum and energy-related products fromSSA increased from $11.7 billion in 2002 to $17.7 billion in2003.The increase was primarily because of a $5-per-barrelrise in the price of crude. In addition,the quantity of U.S.imports of crude petroleum from Nigeria increased by about41 percent,from 215 million barrels in 2002 to 304 millionbarrels in 2003,as a result of OPEC production quotaincreases in 2003.
Key AGOA Trade DevelopmentsS U.S. imports of crude petroleum from Nigeria accounted
for 90 percent of total sector AGOA imports from theregion in 2003;the other nations accounted for theremainder of the region’s crude petroleum imports.
Key U.S. Export DevelopmentsS The United States is a major world producer and consumer
of petroleum and petroleum-related products. It accountsfor 2 percent of the world’s estimated proven reserves ofcrude petroleum,3 percent of natural gas reserves,26percent of coal reserves,and 22 percent of the world’srefinery capacity.13
S SSA accounts for less than 1 percent of U.S.exports of theproducts in this sector.14 U.S.exports of petroleum andenergy-related products to SSA declined from $193 millionin 2002 to $166 million in 2003.This decline is primarily aresult of decreased exports of refined petroleum products,particularly distillate and residual fuel oils,to South Africa.Expanded refinery capacity in South Africa in early 2003negated the need for such imports.15
Share of total (percent)
80
10
Primary aromatic petrochemicals(2707)
All other
Refined petroleum products(2710, 2713, & 3811)
10
PETROLEUM AND ENERGY-RELATED PRODUCTS-CONTINUEDTRADE-Continued

5-21
0
1000
2000
3000
4000
5000
6000
1999 2000 2001 2002 2003
0 1000 2000 3000 4000 5000 6000
Equatorial Guinea
Chad
Gabon
Nigeria
Total
Millions of U.S. dollarsNote.—Data for some countries not disclosed owing toconfidentiality. U.S. FDI position may be negative for somecountries. Industry classification basis changed from SIC toNAICS in 2002.
Source: Bureau of Economic Analysis, U.S. Department ofCommerce. Data are for sector defined as “Mining.”
INVESTMENT15
S The U.S.FDI position in the SSA petroleum and energy-relatedproducts sector16 totaled $4.8 billion in 2003,up from nearly $4.0billion the previous year.17 Equatorial Guinea,Chad,Gabon,andNigeria were major SSA locations for U.S.FDI in the sector in 2003,together accounting for 83 percent of the regional total.The sectorcontinued its lead,accounting for 41 percent of the total U.S.FDIposition in SSA in 2003.However,SSA accounted for only about 5percent of the global U.S.FDI position in the sector that year.18
S Nigeria is one of the world’s leading exporters of crude petroleum.Nigeria’s existing and potential reserves make it attractive for jointventures,despite vandalism to pipelines, infrastructure,andproduction facilities;and the siphoning of fuel products for the blackmarket.As a result,there is the potential to increase its productionof crude petroleum significantly in the next few years as recentdiscoveries come onstream.
S ExxonMobil holds a 56.25-percent share in a deepwater field;Shellis the other partner in the development under a production-sharingcontract with NNPC.The $1.1-billion field development is expectedto include a floating production storage and offloading vessel,15producing wells,5 water injection wells,and 4 gas injection wells.
S ExxonMobil holds a 40-percent share in the development of a field;NNPC holds the other 60 percent.The $1.2-billion fielddevelopment is expected to be onstream by late 2004.Associatednatural gas will be reinjected in order to maintain field pressure andeliminate the need to flare the gas.
S In February 2003,ChevronTexaco announced a joint venture withNNPC for a $4-billion development of three deepwater crudepetroleum and natural gas fields.Production is expected to comeonstream by late 2005.
S In March 2003,NNPC announced that repairs to refineries wouldcontinue.NNPC signed an agreement whereby Venezuela’sstate-owned petroleum company (PDVSA) would help maintainNigeria’s refineries;in addition,ChevronTexaco signed anagreement with NNPC to take over the management of therefineries.NNPC will retain ownership with only the maintenanceand day-to-day management signed over to PDVSA andChevronTexaco.
S Angola’s production of crude petroleum is predicted to double by2008 as new deepwater sites are developed.ExxonMobil is themost dominant presence in Angola;it will invest about $4 billion insix new deepwater projects by 2007.Three of the new fieldsoperated by ExxonMobil are expected to begin producing 80,000barrels per day by the end of 2004.
S ChevronTexaco,which accounts for about 15 percent of Angola’sproduction of crude petroleum,announced a joint venture with theAngolan government that is expected to produce 100,000 barrelsof crude per day by 2007.
Millions of U.S. dollars
U.S. sector SSA FDI position, 1999-2003
U.S. sector SSA FDI position, by country, 2003
Note.—Industry classification changed from SIC to NAICS in 2002;data from 1999 to 2001 have been converted to NAICS. Data for2001 and 2002 have been revised from previous estimates.
Source: Bureau of Economic Analysis, Department of Commerce.Data are for sector defined as “Mining.”
1,949
4,186
PETROLEUM AND ENERGY-RELATED PRODUCTS-CONTINUED
732
648
610
4,754
3,040
4,724
3,989
4,754

5-22
1 This sector primarily covers crude petroleum,refined petroleumproducts,natural gas and its components,and coal and coal chemicals(chapter 27 of the HTS).Also included are nuclear fuels (HTS 2844 and2845) and certain octane-enhancing chemicals (HTS 3403,3606,3811,and 3819).
2 “Worldwide Report,” Oil & Gas Journal,Dec.22,2003,p.47.3 Ibid.,pp.64-70;and official statistics of the U.S.Department of
Energy.4 “Worldwide Report,” Oil & Gas Journal,Dec.22,2003,pp.64-70;
and official statistics of the U.S.Department of Energy.5 Official statistics of the U.S.Department of Energy;and U.S.
Department of Energy,Country Reports -Nigeria,Mar.2003.6 Economist Intelligence Unit,“Nigeria:Business:Outlook,” June 9,
2004,found at Internet address http://www.viewswire.com,retrievedSept.1,2004.
7 Official statistics of the U.S.Department of Energy;and U.S.Department of Energy,Country Reports -Nigeria,Mar.2003.
8 Official statistics of the U.S.Department of Energy;and U.S.Department of Energy,Country Reports -Nigeria,Mar.2003.
9 “Worldwide Report,” Oil & Gas Journal,Dec.22,2003,p.47 and64-70;official statistics of the U.S.Department of Energy;and U.S.Department of Energy,Country Reports -South Africa,Dec.2003.
10 U.S.Department of Energy,Country Reports -South Africa,Dec.2003;and “Sasol Out from Under the Barrel,” Financial Times,July 13,2004.
11 Official statistics of the U.S.Department of Energy;and U.S.Department of Energy,Country Reports -Angola,Feb.2004.
12 Official statistics of the U.S.Department of Energy.13 Official statistics of the U.S.Department of Energy.14 U.S.exports of crude petroleum have been prohibited since
1973,except as approved by the U.S.government.15 Official statistics of the U.S.Department of Energy and industry
sources.16 Information provided in this section is derived from industry
contacts,company websites,and official statistics of the U.S.Department of Energy.
17 Data are provided by U.S.Department of Commerce,Bureau ofEconomic Analysis,and are for the sector defined as “Mining.”
18 Although this BEA classification covers products not included inthis sector,the bulk of the FDI position is believed to be accounted for bysector products such as petroleum,natural gas,and coal.
19 USDOC,BEA,Direct Investment Position Abroad on aHistorical-Cost Basis:Country Detail by Industry,provided to USITC staff,Sept.16,2004.
PETROLEUM AND ENERGY-RELATED PRODUCTS-CONTINUEDENDNOTES

5-23
S SSA is a major producer of many of the world’s most importantminerals and metals, including platinum-group metals (PGMs),gold,diamonds,uranium,manganese,chromium,nickel,bauxite (aluminumraw material),and cobalt.SSA’s production of the world’s majornonferrous metals (copper, lead,and zinc) is less significant,althoughcopper mining and processing is an important industry for several SSAcountries.Silver production is also low because silver is largely abyproduct of processing these metals.Approximately 11 percent ofthe world’s bauxite production comes from SSA,but less than half isconverted to alumina (intermediate aluminum oxide material) oraluminum locally.3 Although underexplored,SSA has about 30 percentof the world’s known mineral reserves, including 40 percent of theworld’s gold,60 percent of the world’s cobalt,and 90 percent of theworld’s PGMs.4 SSA also continues to produce much of the world’smine supply of chromite,vanadium,zirconium,titanium,and otherspecialty metals and ores.
S Gemstones account for a large share of SSA mineral production,withdiamonds accounting for 8 percent of the overall sector (andapproximately two-thirds of the $24.8 billion in overall gemstoneproduction).Normally,South Africa is the dominant producer,becauseof its large diamond mining industry.However,according to theInternational Monetary Fund,DROC ($7.4 billion) outproduced SouthAfrica ($6.2 billion) in diamonds in 2003.Seventy-eight percent ofDROC’s production total was artisanal and not production by SociétéMinière de Bakwanga,which is the majority producer historically and is80-percent owned by the government.5 As a result of the UnitedNations’ review of DROC’s diamond trade,the country was suspendedfrom world trade in diamonds in July 2004.6 Significant production ofother gemstones in SSA includes agate (notably Namibia),amethyst,beryl (including emerald),chrysocholla (primarily in DROC and Zambia),emerald,garnet,rose quartz (from Mozambique and Namibia),tourmaline,and topaz (predominantly Nigeria).
S SSA also produces a large portion of the world’s supply of severalindustrial minerals (IMs),such as fluorspar,vermiculite,and variousspecialty alumino-silicates.Other major IM production targeted forexport includes specialty clays (e.g.,kaolin and brickmaking clay),cement, limestone,dolomite,phosphate,and dimension stone (e.g.,marble and granite). IM production consumed locally includes all themajor construction materials,such as aggregates (e.g.,sand andgravel),silica (and some glassmaking operations),and clays.Mostproduction comes from numerous smaller scale facilities gearedtoward meeting local demand.For example,of South Africa’s 707mines and quarries,7 531 produce IMs.8 Total 2003 IM production inSSA was estimated at $4.1 billion,of which $2.4 billion came fromSouth Africa.9
S The iron and steel industry is a significant part of the minerals andmetals sector in SSA, largely due to the natural endowment andproximity of major alloying metals,and the existence of a developedSouth African metals industry that is capable of producing multipletypes and forms of steel products, including stainless.South Africaproduced 9.5 million metric tons of crude steel in 2003 (81 percentof SSA’s total);Zimbabwe,Tanzania,and Nigeria are also notableproducers of both ferroalloys and steel mill products.10 Iron and steelproduction is estimated to have accounted for 19 percent of the$100-billion minerals and metals manufacturing industry in SouthAfrica in 2003.11 Including iron making,ferroalloy production,andstainless steel production,approximately 65 percent ($24.3 billion) ofSSA’s nonmining ferrous industry is in South Africa.
OVERVIEW
1
MINERALS AND METALS
Note.—Data are for mining and refining for reporting countries.
Source: Unpublished data and estimates of the U.S. GeologicalSurvey; and MBendi, Infomine Africa, and the Department ofMinerals & Energy (South Africa).
Share of total (percent)
Note.—Data are for mining and refining for reporting countries.
Source: Unpublished data and estimates of the U.S. GeologicalSurvey; and MBendi, Infomine Africa, and the Department ofMinerals & Energy (South Africa).
SSA sector production, by country, 2003($195.1 billion)
SSA sector production, by product, 2003($195.1 billion)
0 10 20 30 40 50 60
Fabricated forms
Gemstones
Steel
Iron (ore & metal)
Gold
All other
South Africa 63%All other 25 %
DROC 7%
Nigeria 5%
S There are substantial minerals and metals industries in numerousAfrican countries.South Africa,Nigeria,Ghana,Zimbabwe,Tanzania,Zambia,Namibia,and DROC are the largest mineralsand metals producers in SSA,and,with many smaller scaleproducers (e.g.,Botswana,Sierra Leone,Mozambique,andNamibia),derive the majority of export earnings from the sector.As a result,the sector constitutes a large portion of the GDP andemployment for many SSA countries.2
53
13
5
3
3
23

5-24
S In mid-2003 and into 2004,prices for several minerals andmetals continued to recover from the extreme lows of the1997-early 2003 period,reflecting declining inventories arisingfrom a combination of worldwide production shutdowns andcutbacks,and rising consumption. In 2003,aluminum,whichhad declined to $0.62 per pound,averaged $0.67 per pound;gold,which had declined to $294 per troy ounce,averaged$350 per troy ounce;and copper,which had reached a low of$0.59 per pound,averaged $0.82 per pound.The ProducerPrice Index for steel mill products rose over 6 percent in 2003and was up almost 8 percent over the 2001 level.12 Theseprice increases contributed to the improving economies of themetal-producing SSA countries and attracted additional FDI,notably from Australasian (Australian and Chinese) and NorthAmerican (Canadian and U.S.) sources.13
S Prices of most PGMs have increased over the last decadebecause of strong demand from the transportation equipmentsector,which uses these metals in catalytic converters,andalso because of uncertainty regarding Russian supplies of thesemetals.14 As a major producer of PGMs,South Africa hasbenefited from the price increases.However,palladium,rhodium,and ruthenium continued their 2-year price decline in2003,thus negatively affecting South Africa’s PGM industry.15
S South African gold production decreased by 35 percent in thepast decade (from 578 tons in 1993 to 376 tons in 2003),with a corresponding decrease in producing companies (from50 gold producers listed on the Johannesburg Stock ExchangeSecurities Exchange to 14).Employment in the sector alsodeclined significantly.Some analysts expect gold output tomaintain the current level until 2006,and drop by 25 tons peryear thereafter.Because of the long lead time and costliness ofdiscovering and developing new mines,production increasesare not predicted for the near future.16
S Several SSA countries,such as Botswana,Mozambique,andDROC,17 are continuing to implement investment-friendlyregulatory protocols.However,South Africa’s BlackEmpowerment initiatives,coupled with a new mining law thattook effect in 2003 (ceding land ownership back to the state),and the 2004 Mineral and Petroleum Royalty Bill (referred to asthe “Money Bill,” this legislation instituted royalties of 3 percenton gold,4 percent on platinum,and 8 percent on diamonds),18
have created significant valuation and financial risk issues thatare delaying sector investment in South Africa.19 Further,theproposed new Mine Health and Safety Acts are expected toincrease production costs.20 To counteract these effects,aBeneficiation Bill has been proposed to promote South Africa’sminerals industry by granting South Africans the opportunity toown basic forms of gold,diamonds,and PGMs,and possiblyother minerals as well.21 This bill is expected to stimulatedownstream processing and fabrication of these basic forms inSouth Africa by providing producer incentives such as remissionof mining royalties for locally manufactured products.22
S The Geita gold mine in Tanzania became fully operational in late2002.Owned by Geita Gold Mining Limited and operated byAshanti Goldfields (Ghana) and AngloGold (South Africa) under ajoint-venture agreement,Geita now produces about one-half ofTanzania’s gold,making it one of Africa’s largest gold-producingmines.Approximately 655,000 ounces of gold were producedduring 2003.23
MINERALS AND METALS-CONTINUEDOVERVIEW-Continued
S The United States enacted the Clean Diamond Trade Act (PublicLaw 108-19) on April 25,2003,which was initiated byCongress in response to the use of diamonds to fund conflictand human rights violations in parts of Africa.The Act bans theimportation of rough diamonds from any nonparticipant in theKimberley Process Certification Scheme (KPCS).PresidentialExecutive Order 13312,effective July 30,2003,which amendsprior orders on the subject to reflect provisions of the new Act,bans all rough diamonds from Liberia,even if they originatedelsewhere,and removes the prior ban on all rough diamondsfrom Sierra Leone that are controlled through the KPCS.24 TheCentral African Republic joined the 61 member-countries of theKPCS in August 2003.25 As noted above,DROC was suspendedby the United Nations from world trade in diamonds in July2004.26
S On July 13,2004,DeBeers pled guilty to price fixing and agreedto pay $10 million to settle a 10-year-old indictment in U.S.District Court.This settlement is widely anticipated to increaseSouth African diamond exports to the U.S.market by allowingDeBeers to re-establish a direct marketing presence in theUnited States,which would increase U.S. imports from SouthAfrica,because Anglo-American,the largest South Africanmining company, is a subsidiary of DeBeers.27

5-25
0 10 20 30 40 50 60 70
SSA sector global exports,by HTS chapter, 2002
($22.0 billion)
0 5 10 15 20 25 30 35
SSA sector global imports, by country, 2002($7.1 billion)
TRADE
SSA sector global imports,by HTS chapter, 2002
($7.1 billion)
Source: United Nations.
Share of total (percent)
SSA sector global exports, by country, 2002($22.0 billion)
Source: United Nations.
South Africa 32% All other 40%
Angola 4%
Source: United Nations.
South Africa 68%
All other 15%
Mozambique 2%
Congo (DROC) 5%
Botswana 7%
Source: United Nations.
Share of total (percent)
Source: United Nations. Source: United Nations.
27
19
11
57
13
12
7
Kenya 4%
Nigeria 16%
7
6
30
Major Share of Major Import Share ofImport Total Item TotalSource (2002) (percent) (6-digit HTS) (2002) (percent)
EU15 42 Nonindustrial diamonds (7102.31) 7. . . . . . . . . . . . . . . . . . . . . . . . . . .
South Africa 8 Certain portland cement (2523.29) 4. . . . . . . . . . . . . . . . . . . . .
China 7 Iron or steel structures (7308.90) 3. . . . . . . . . . . . . . . . . . . . . . . . . . . . .
India 5 Refined copper cathodes (7403.11) 2. . . . . . . . . . . . . . . . . . . . . . . . . . .
Japan 4 Glazed ceramic tiles (6908.90) 2. . . . . . . . . . . . . . . . . . . . . . . . . . . . . .
Major Share of Major Export Share ofExport Total Item TotalMarket (2002) (percent) (6-digit HTS) (2002) (percent)
EU15 48 Nonindustrial diamonds (7102.31) 26. . . . . . . . . . . . . . . . . . . . . . . . . .
United States 13 Gold (7108.12) 12. . . . . . . . . . . . . . . . . . . . . . . . . . . . . . . . . . .
Japan 9 Platinum (7110.11) 9. . . . . . . . . . . . . . . . . . . . . . . . . . . . . . . . . . . . . . . .
India 9 Aluminum (7601.10) 6. . . . . . . . . . . . . . . . . . . . . . . . . . . . . . . . . . . . . . . .
China 4 Iron ore (2601.11) 4. . . . . . . . . . . . . . . . . . . . . . . . . . . . . . . . . . . . . . . . .
Guinea 3%
3
8
Articles of ironor steel (73)
Iron and steel (72)
Diamonds and preciousmetals (71)
Ceramic products (69)
Industrial minerals (25)
All other
Iron and steel (72)
Diamonds and preciousmetals (71)
Copper (74)
Metal ores andconcentrates (26)
Aluminum (76)
All other
MINERALS AND METALS-CONTINUED
Mozambique 4%

5-26
0 10 20 30 40 50 60 70
Source: Compiled from official statistics of theU.S. Department of Commerce.
Source: Compiled from official statistics of theU.S. Department of Commerce.
Source: Compiled from official statistics of theU.S. Department of Commerce.
0 10 20 30 40 50 60 70 80
U.S. sector imports fromSSA, by source, 2003
($3.0 billion)
U.S. sector imports from SSA, byHTS chapter, 2003($3.0 billion)
Share of total (percent)
U.S. sector imports under AGOA(including GSP), by source, 2003
($413 million)
U.S. sector imports under AGOA(including GSP), by HTS chapter, 2003
($413 million)
All other 4%
Share of total (percent)
South Africa 91%
All other 4%
Guinea 2%
Source: Compiled from official statistics of theU.S. Department of Commerce.
68
11
10
4
South Africa 96%
3
8 8
8
21
59Precious stones andmetals (71)
Aluminum (76)
All other
Metal ores andconcentrates (26)
Iron and steel (72)
Iron and steel (72)
Aluminum (76)
Articles of ironor steel (73)
Zinc (79)
All other
MINERALS AND METALS-CONTINUEDTRADE-Continued
Congo (DROC) 1%Namibia 2%

5-27
U.S. sector exports to SSA,by market, 2003($269 million)
U.S. sector exports to SSA, byHTS chapter, 2003($269 million)
Source: Compiled from official statistics of theU.S. Department of Commerce.
South Africa 39%
All other 24%
Angola 11%
0 10 20 30 40 50 60
Source: Compiled from official statistics of theU.S. Department of Commerce.
Key U.S. Import DevelopmentsS The U.S.trade deficit with SSA in minerals and metals
increased $287 million (12 percent) to $2.7 billion in 2003.U.S. imports increased by $290 million (11 percent) to $3.0billion.South Africa is the leading SSA sector supplier,accounting for 91 percent of U.S.sector imports from SSA in2003.Almost all PGMs are from South Africa,and thecountry is the primary mine source for a majority of specialtymetals (including PGMs) consumed by the U.S.high-tech andtransportation industries.For some of these metals,such aschrome,there are few alternative sources available.
S The largest U.S. import increases,by value,were in diamonds,other gemstones,and precious metals (HTS chapter 71,anincrease of $252 million,or 14 percent);and iron and steel(HTS chapter 72,an increase of $24 million,or 8 percent)reflecting the continued growth in the iron and steel industriesin South Africa,Tanzania,and neighboring countries).SSAlead,zinc,ceramic,and copper product exports to the UnitedStates also rose significantly because of improved metalprices, increased raw material production volume,andincreased downstream product manufacturing.
S Sixty-eight percent of U.S.sector imports from SSA in 2003 werePGMs,which are almost all from South Africa,and diamonds,mostly from South Africa,DROC,and Angola.U.S.PGM importsincreased to $1.3 billion,11 percent by value,to 44 percent of allsectoral imports.U.S. imports of diamonds,of which 97 percentwere natural gemstones,totaled $735 million in 2003,or 25percent of the sector import total.Gold and silver imports (whichare less than 1 percent of the total U.S.sectoral imports fromSSA) decreased by 67 percent, largely in nonmonetary powder andother unwrought forms,offset slightly by increases insemi-manufactured forms.
S The increase in U.S.sector imports in 2003 was largely a result ofhigher gold,platinum,and diamond prices,and the correspondingproduction increases.The strengthening U.S.economy increaseddiscretionary income,which likely promoted increased consumptionof precious jewelry and increased importation of rough diamondsfor finishing.Twelve SSA countries reported increases in sectorexports to the United States.
Key AGOA Trade DevelopmentsS U.S.sector imports under AGOA totaled $413 million in 2003,up
11 percent from 2002.Imports under AGOA accounted for 14percent of total sector imports from SSA in 2003,similar to theprevious year.
S The bulk of U.S. imports of minerals and metals under AGOA weresupplied by South Africa (96 percent) and Namibia (under 4percent),totaling $412 million in 2003.Iron and steel products,primarily ferroalloys,accounted for 59 percent of sector importsunder AGOA in 2003,with aluminum products increasing 16percent,by value,to 21 percent of the total.Varied base metalarticles (mostly manganese for alloying steel) and zinc products(mostly unwrought forms, largely used for galvanizing steel)recorded the largest percentage increases.
Key U.S. Export DevelopmentsS U.S.sector exports to the region increased by $3 million (1
percent) in 2003.By value,U.S.exports increased markedly toEquatorial Guinea (an increase of $27 million,or 189 percent,largely to support oil and gas production),Angola (an increase of$15 million,or 103 percent,to support oil and gas processing),and South Africa (an increase of $14 million,or 16 percent).On apercentage basis,Lesotho,Madagascar,Djibouti,and Eritreaposted the largest percentage increases in purchases of U.S.products.Several countries recorded double-digit declines, largelyas a result of economic problems (e.g.,Swaziland,down 92percent;and Tanzania,down 87 percent) and geopolitical issues(e.g.,DROC,down 98 percent;and Chad,down 78 percent).Chadrecorded the largest decline,by value,at $22 million.
S U.S.exports reflect the significant oil exploration and oilfielddevelopment that is underway in SSA,primarily in Nigeria,Angola,and surrounding areas.U.S.suppliers are heavily involved,and steelmill products are the major exports.However,the drillingoperations leveled off in 2002 and began decreasing in 2003,causing the exports of drilling commodities,such as pipe and tube,tools,mesh,and drilling muds,to decline.The iron and steel articlesgroup (HTS chapter 73) recorded the largest dollar-value decline($4 million),yet remained the largest subsector,accounting for 46percent of U.S.sector exports to SSA.Structural commodities,which are largely semi-fabricated plate,sheet,and strip products,recorded the largest value increase ($12 million,or 167 percent).In particular,steel structures,towers,masts,as well as lime andcement products,showed significant increases.Most of thosewere directed toward oil and gas recovery and refining facilitiesconstruction.
Share of total (percent)
46
15
8
Nigeria 11%
Equatorial Guinea 15%
7
5
19
Articles of ironor steel (73)
Base metal toolsand cutlery (82)
Stone, plaster, etc. (68)
Aluminum (76)
Iron and steel (72)
All other
MINERALS AND METALS-CONTINUEDTRADE-Continued

5-28
S U.S.sector exports to South Africa totaled $104 million,or 39percent of U.S.sector exports to SSA.The largest value increasewas in precious metals,up $8 million,primarilysemi-manufactured forms of platinum and waste and scrap of allPGMs.Although South Africa has significant precious-metalsrefining capacity for unwrought forms (e.g.,doré,bullion,bars,and grains), it must rely on imports of semi-manufactured forms(e.g.,sheets and wire) for the manufacture of downstreamproducts,particularly precious jewelry,coins,and electronicconductors. In contrast,U.S.exports of cut diamonds declined by$6.6 million,or by 97 percent).28
MINERALS AND METALS-CONTINUEDTRADE-Continued

5-29
0102030405060708090
100
1999 2000 2001 2002 2003
-30 -20 -10 0 10 20 30 40 50 60
Ghana
Zambia
Kenya
Zimbabwe
South Africa
Total
INVESTMENT
Millions of U.S. dollars
U.S. sector SSA FDI position, 1999-2003
Millions of U.S. dollars
U.S. sector SSA FDI position, by country, 2003
Note.—Does not include mining and certainprocessing operations or industrial minerals.Industry classification basis changed from SIC toNAICS in 2002.
Source: Bureau of Economic Analysis, U.S.Department of Commerce. Data are for sectordefined as “Primary and Fabricated Metals.”
Note.—Does not include mining and certain processingoperations or industrial minerals. Industry classification basischanged from SIC to NAICS in 2002; data from 1999 to 2001have been converted to NAICS. Data for 2001 and 2002 havebeen revised from previous estimates.
Source: Bureau of Economic Analysis, U.S. Department ofCommerce. Data are for sector defined as “Primary andFabricated Metals.”
51
50
MINERALS AND METALS-CONTINUED
S The U.S.FDI position in the nonmining29 SSA minerals andmetals sector totaled $47 million in 2003,down from $67million in 2002.Ghana continued to be the major SSA country forU.S.FDI in the sector in 2003.The sector accounted for lessthan 1 percent of the total U.S.FDI position in SSA in 2003,andSSA accounted for less than 1 percent of the global U.S.FDIposition in the sector that year.30
S The recent increase in exploration and mine development in SSAhas been largely directed toward gold and diamonds.Major newmines opening or under development in SSA are in South Africa,Ghana,Namibia,Botswana,Tanzania,and Gabon,primarily toproduce gold,diamonds,niobium products,PGMs,chrome,andvarious base metals.Major discoveries over the last year includeseveral potential diamond-bearing ores in Mauritania,andpotential offshore diamond deposits in southern Namibia.31
S The Ghanaian government granted Newmont Mining Corp.(U.S.)a 30-year mining lease for two gold mining operations – Ahafoand Akyem.Newmont later announced its intent to invest $350million to develop the Ahafo mine,targeting annual production ofapproximately 500,000 ounces (providing approximately 1,400jobs) in 2006.32
S The J&WInvestment Group acquired Luanshya Copper MinesPlc and Chambishi Metals Plc (Zambia) from Avmin in 2003 andspent approximately $50 million to rehabilitate the mine facility(scheduled to reopen by 2005).33 Metorex (South Africa)operates the mine.34
S On June 20,2004,Metorex reached an agreement with theGovernment of DROC,Gecamines,and Sentinelle GlobalInvestments to mine and treat the high-grade copper-cobaltorebody and stockpiles in the Katanga Province of DROC.Phase Iis expected to cost $15-18 million.Phase II,pending a feasibilitystudy, is estimated to cost $150-180 million,with a resultingproduction of 120,000 metric tons per month.35
S Metorex continued significant exploratory drilling at BurkinaFaso’s Perkoa Zinc Project,delineating almost 7 million metrictons of ore containing 18 percent zinc.A financial feasibility studyis expected in 2004.36
S On May 13,2004,Alcoa World Alumina LLC (U.S.) and Alcan Inc.(Canada) signed a Memorandum of Understanding to jointlyassess the feasibility of constructing an alumina refinery inGuinea.37
S Although Konkola Copper Mines Plc (KCI,Zambia) was projectedto close in early 2003 (the previous owner,Anglo American,pulled out in 2002),the government has maintained operations.In August 2004,Zambia sold a 51-percent controlling stake toVedanta Resources (India) for $48 million,subject to KCIshareholder approval in October.38
S According to the South African government,the total estimatedinvestment in newly committed mineral-related projects in SouthAfrica in 2003 was R68.5 million (approximately $9.1 billion),up29 percent over 2002.The expected investment in potentialmineral-related projects in South Africa was R19.6 million(approximately $2.6 billion),down 10 percent.39 Of that total,88percent was earmarked for primary mineral production.Platinumaccounts for 61 percent of that total and is led by ImpalaPlatinum’s investment of R5 billion (approximately $661 million),Anglo Platinum/Royal Bafokeng’s R4 billion (approximately $529million) investment,and Anglo Platinum’s R3.7 billion(approximately $489 million) investment.Gold represents 34percent of the total in newly committed primary mineral projects.This expenditure is led by the Placer Dome/Western Areas’ R5billion (approximately $661 million) joint venture,AngloGold’sR3.8 billion (approximately $502 million) investment,andGoldfield’s R2.9 billion (approximately $377 million) investment.Inpotential project development,gold accounts for 98 percent ofthe total,platinum accounts for less than 2 percent,and otherminerals account for 0.3 percent (substantially lower than the77-percent share held in 2002).
9
5
4
-21
47
40
7167
47

5-30
1 This sector includes items classified in Harmonized TariffSchedule chapters 25,26,68 through 76,and 78 through 83.
2 The minerals and metals sector includes clays and earths,sandand gravel,stone,cement and plaster,and nonmetallic minerals;metal-bearing ores,concentrates,ash,and residues;ceramic,glass,andfiberglass articles;gemstones;iron and steel,base metals,preciousmetals,and metal alloys in unwrought and scrap forms;ferrous andnonferrous mill products (shaped by casting,forging,machining,rolling,drawing,or extrusion operations);and certain fabricated metal products(e.g.,containers,wire cables,chain, industrial fasteners,certain kitchenand sewing implements,cutlery,nonpowered hand tools,constructioncomponents,builders’ hardware,etc.).
3 World Bureau of Metal Statistics,World Metal Statistics 2004(Ware,England:World Bureau of Metal Statistics,May 7,2004),pp.9-12.
4 “Africa:Mining,” MBendi, found at Internet addresshttp://www.mbendi.co.za/indy/ming/af/p0005.htm,retrievedJune 16,2004.
5 Derived from “Democratic Republic of the Congo:Selected Issuesand Statistical Appendix,” International Monetary Fund,Country ReportNo.03/175,June 2003,found at Internet addresshttp://www.imf.org/external/pubs/ft/scr/2003/cr03175.pdf,retrieved Aug.31,2004.
6 Daniel Balint-Kurti, “Congo Suspended From World DiamondTrade,” Associated Press,July 10,2004,found at Internet addresshttp://www.mercurynews.com/mld/mercurynews/news/world/9125827.htm1,retrieved July 13,2004.
7 “Minerals,” Infomine Africa Newsletter,Sept.2003,found atInternet address http://www.infomine africa.com/news.asp#Most,retrieved Sept.16,2003.
8 Infomine Africa,found at Internet address http://infomineafrica.com/afrinfogen.asp,retrieved 2001.
9 Data derived from unpublished statistics and estimates of the U.S.Geological Survey,MBendi, Infomine Africa,and the Department ofMinerals and Energy (South Africa).
10 International Iron and Steel Institute,World Steel in Figures,2004 Edition,found at Internet address http://www.worldsteel.org/media/wsif/wsif2004.pdf,retrieved Sept.15,2004.
11 Department of Minerals and Energy,Republic of South Africa,available at Internet address http://www.dme.gov.za/home.asp?menu=main,retrieved July 26,2004.
12 U.S.Geological Survey,“Minerals Information,” found at Internetaddress http://minerals.usgs.gov/minerals,retrieved July 26,2004.
13 U.S.Geological Survey,Mineral Commodity Summary 2004:Ironand Steel, found at Internet address http://minerals.usgs.gov/minerals/pubs/commodity/iron_&_steel/festmcs04.pdf,retrievedSept.15,2004.
14 There have been 3 significant worldwide shifts during the lastdecade in the platinum and palladium markets that are expected tocause continued industry restructuring and market shakeups.First,worldwide efforts to control pollution have caused many developingcountries to mandate use of catalytic technology,which requiresplatinum-group metals.Second,Russian export controls have createdupward price pressures on the world market.Third,the dual reversal ofprices between platinum and palladium (platinum values increaseddramatically in the late 1990s,causing many consumers to switch topalladium,which then increased palladium prices to the point thatconsumers began to switch back to platinum) has caused manycatalytic converter producers to implement technologies allowing foreither metal to be used. In the long run,this should stabilize the market.
15 U.S.Geological Survey,“Minerals Information.”16 According to the Chamber of Mines of South Africa,as reported
in “Gold Production in SA in Decline,” Mining e-News,Dec.2003.
17 “A New Dawn for the DRC?” Metal Bulletin,July 24,2003,p.9.18 “The South African Government Releases Mining Royalty Bill,”
Werkmans UK Limited,Mar.2003,found at Internet addresshttp://www.werksmans.co.za/uk/alert_20030326.pdf,retrievedJuly 27,2004.
19 “Perceived Empowerment Risks Discourage U.S. Investors,”Business Day (South Africa),Aug.18,2003,via NewsEdge Corporation,retrieved Aug.19,2003;and Daniel Thole,“Resources Take a Pounding,”Moneyweb (Johannesburg), found at Internet address http://allafrica.com/stories/printable/200308180609.htm,retrieved Aug.28,2003.
20 According to the Chief Inspector of Mines,as reported in “MostSmall Miners Unable to Comply with Health and Safety Act,” Mininge-News,Feb.2004.
21 See Internet address http://www.polity.org.za/pdf/DraftPrecMet&DiaGenAmenBill.pdf for the bill in its present form;and“Rediscovering SA mineral beneficiation tradition,” Polity,at Internetaddress http://www.polity.org.za/pol/opinion/?show=49446 for adiscussion.
22 “Beneficiation Bill to Encourage Economic Growth,” Infomine AfricaNewsletter,Oct.2003,found at Internet addresshttp://www.infomine africa.com/news.asp#Most,retrieved Nov.2003.
23 “Geita Mine One of Africa’s Largest Gold Mines,” Mining e-News,Feb.2004.
24 Sheryl Katz,“Bush Bans Conflict Diamonds,” DIAMONDS.NET,found at Internet address http://www.diamonds.net/news/newsitem.asp?num=8317&type=all,retrieved Aug.8,2003.
25 “CAR Joins the Kimberley Process,” Mining e-News,Aug.2003.26 Daniel Balint-Kurti, “Congo Suspended From World Diamond
Trade,” Associated Press,July 10,2004,found at Internet addresshttp://www.mercurynews.com/mld/mercurynews/news/world/9125827.htm1,retrieved July 13,2004.
27 Margaret Webb Pressler,“DeBeers Pleads to Price-Fixing:FirmPays $10 Million,Can Fully Reenter U.S.,” Washington Post,July 14,2004,p.E01.
28 U.S.Geological Survey commodity specialists,telephone interviewby USITC staff,Aug.5,2004.
29 The BEA data does not separate mineral and metal mining fromfuel production.Therefore,the FDI number in this section does not includemining activities.These are included in the Petroleum and Energy-RelatedProducts sector profile.Additionally,data for varied countries,notablyROC,Ghana,Kenya,and Zambia,are not disclosed owing to confidentiality.U.S.FDI position is negative for some countries.
30 USDOC,BEA,Direct Investment Position Abroad on aHistorical-Cost Basis:Country Detail by Industry,provided to USITC staff,Sept.16,2004.
31 “Africa:Mining,” MBendi, found at Internet addresshttp://www.mbendi.co.za/indy/ming/af/p0005.htm,retrieved June 16,2004.
32 “Newmont investing $350M in Ghana project,” Denver BusinessJournal,Dec.19,2003,found at Internet address http://denver.bizjournals.com/denver/stories/2003/12/15/daily52.html,retrievedJan.21,2004.
33 Data and reference provided by George Coakley,U.S.GeologicalSurvey,Minerals Information Team,International Minerals Division,Dec.16,2003.
34 Metorex Limited,found at Internet address http://www.metorexgroup.com/Chibuluma.htm,retrieved Dec.17,2003.
MINERALS AND METALS-CONTINUEDENDNOTES

5-31
35 Metorex Limited,found at Internet addresshttp://www.metorexgroup.com/RuashiHoldings.htm,July 29,2004.
36 Metorex Limited,found at Internet addresshttp://www.metorexgroup.com/MtxBurkinaFasoProj.htm,retrievedDec.17,2003.
37 Alcoa press release,May 13,2004,found at Internet addresshttp://www.alcoa.com/global/en/news/news_detail.asp?pageID=241344825&newsYear=2004,retrieved May 17,2004.Bauxite oresare mined for their aluminum oxide,or alumina,content.After cleaningand processing,the alumina is refined to produce pure aluminum metal.
38 “Vedanta pays $48m for Konkola mines,” India Times,EconomicTimes News Network,Aug.21,2004,found at Internet addresshttp://economictimes.indiatimes.com/articleshow/822314.cms,retrieved Sept.15,2004.
39 Directorate:Mineral Economics,“Investment in South Africa’sMineral Sector,” Second Ed.,2003,found at Internet addresshttp://www.dme.gov.za/publications/pdf/annual_reports/R39%20invest_in_sa_2004.pdf,retrieved July 2004.
MINERALS AND METALS-CONTINUEDENDNOTES

5-32

5-33
OVERVIEW
1
TEXTILES AND APPAREL
S SSA accounted for less than 1 percent of world exports of textilesand apparel and incurred a $1.9-billion trade deficit in such goods in2002, based on imports of $4.7 billion and exports of $2.8 billion.SSA’s major textile and apparel export markets were the UnitedStates (43 percent) and the EU (39 percent); the major importsources were China (29 percent of SSA imports), the EU (21percent), and India (13 percent). SSA sector exports wereconcentrated in apparel and among a few countries – Mauritius,South Africa, Lesotho, Madagascar, and Kenya – which togetheraccounted for 85 percent of the total in 2002.
S Prompted by AGOA preferences, the textile and apparel sectors inSSA countries have launched numerous new projects as a result ofSSA government initiatives and loans, increased intra-SSA countrypartnerships, and initiatives by foreign investors.
S Lesotho is the largest SSA supplier of sector goods to the UnitedStates with total shipments of $393 million in 2003, an increase of22 percent from the 2002 level. Its textile and apparel sector hasgrown steadily as a result of AGOA, with employment expanding from19,000 workers in April 2001 to over 54,000 in May 2004, makingit the country’s second-largest employer after the government.2
Lesotho’s first denim mill, Formosa Textiles, began denim and yarnproduction for local and regional markets in April 2004. The millimports most of the cotton used in its production from Malawi andZambia; small amounts are also imported from Ethiopia andZimbabwe.3 Lesotho has an estimated 40-60 textile and apparelplants, most of which are owned by firms in Taiwan and other Asiancountries. The competitiveness of Lesotho largely reflects its lowlabor costs and designation as a least developed country, whichallows apparel producers there to use lower cost third-country(mainly Asian) fabrics in the production of apparel for export to theUnited States. Trade sources also report that Lesotho requires lesspaperwork for work permits and has fewer challenges with laborunions than other SSA countries. Apparel producers in Lesothoreportedly sell garments to such U.S. firms as Gap, Wal-Mart, andTarget.4
S Mauritius, compared with many other SSA countries, has a skilledworkforce and an established industry that reportedly is focusing onhigher value-added goods to help offset its higher wages.5 In thespinning and weaving sector, for example, the average hourly wage(including fringe benefits) of production workers is $1.33, comparedwith $0.62 in Kenya and Ethiopia.6 The move to higher valued goodsis evident, as U.S. imports of sector goods from Mauritius in 2003fell by 4 percent by quantity to 45 million square meter equivalents(SMEs), but rose 6 percent by value, to $269 million. However, U.S.imports of sector goods from Mauritius that entered free of dutyunder AGOA rose by 29 percent in 2003 to $135 million. Currently,49 textile and apparel companies are registered with theGovernment of Mauritius Ministry of Commerce and Cooperativesfor export to the United States under AGOA. These companiesemploy about 50,000 workers and have a production capacity of 15million pieces per month.7 Several new yarn spinning projects werelaunched in 2003 as result of initiatives by foreign investors.
S Textile and apparel manufacturing is increasingly important toEthiopia’s economy; the textile and apparel sectors account for 26percent and 4 percent, respectively, of the country’s totalmanufacturing sector.8 In Ethiopia, in early 2003, the governmentearmarked 1.5 billion birr (approximately $174 million) for a loan toupgrade and improve the country’s textile and apparel sector. Thegovernment has also established an export-processing zone and hasrented the land and manufacturing facilities to the private sector inan effort to encourage textile and apparel exports to the UnitedStates.9 A new firm, the Basic Yarn Ethiopia Plc, began to producetextiles and apparel in 2003.10
S The Government of Ghana, under its Presidential Special Initiative,announced plans to construct a garment village with a largeindustrial park. The project will include a garment factory that, in itsfirst phase, will have an annual production capacity of 3.6 millionjeans, pants, shorts, and dresses for export; 70 percent ofproduction will be exported to the United States and 30 percent toEurope. A new textile firm in Ghana, worth $70 million and plannedfor the Tema Free Zones, is expected to begin production of rawmaterials for the country’s textile and apparel industry in July 2004and employ 1,000 workers on three shifts.11 Ghana’s largestapparel production facility currently in operation is an AGOA-initiatedU.S.-Ghanaian joint-venture project that produces socks.12
S An example of an intra-SSA country partnership prompted by AGOAis the establishment, with investment by Mauritius, of a $1.2-millionfactory located in Accra, Ghana, to produce fabric, trousers, andT-shirts. The factory began trial production in August 2003 and nowproduces about 3,000 T-shirts per day.13 Mauritius investors havealso purchased a declining textile firm in Mozambique, Textile doPungue, and reportedly plan to invest $3 million in renovating thefacility. They expect to employ 600 workers and produce 7,000pairs of jeans per day for the U.S. market under AGOA.14
S In Tanzania, a new factory, Star Apparels, opened in early 2004 as adirect result of AGOA and the Government of Tanzania’s exportprocessing zone policies. The factory has hired 700 employees andexpects to export more than $1 million worth of apparel, more thandoubling its exports under AGOA in 2003. Star Apparel’s first orderof shirts for Wal-Mart was reportedly produced with yarn importedfrom the United States.15
S Although AGOA has prompted numerous new textile and apparelprojects in the SSA countries, some industry sources have voicedconcerns that the impact of AGOA has been uneven,disproportionately benefitting just a few countries.16 Since theimplementation of AGOA in 2000, there reportedly have been nocapital expenditures in the textile industries in Mozambique,Seychelles, and DROC. In contrast, capital expenditures to upgrade,expand, and build new mills in other SSA countries have ranged from$0.5 million in Botswana to about $50 million in Swaziland to asmuch as $150 million in South Africa.17
S The growth of the textile and apparel sectors in SSA countriesreportedly continues to be constrained by widespread shortages ofraw materials and textile inputs, high production costs relative toAsian suppliers, and capacity underutilization. Industry sources at aChinese-owned mill in Lesotho claim that their salary costs, exclusiveof productivity differences, are almost three times greater thanwhat they would pay at a comparable facility in China.18 Kenya’scotton supply reportedly falls short of demand and is viewed as bothexpensive and of insufficient quality.19 The cotton industry inZimbabwe, which is not an AGOA beneficiary, operates at onlyslightly more than 50 percent of capacity.20 Textile industry sourcesin Malawi expressed concern that, if the AGOA third-country fabricprovision had not been extended in 2004 for another 3 years,continued production would have become difficult because ofinadequate domestic supply of yarns and fabrics.
S Even with the extension of the AGOA third-country fabric provision,SSA countries are still concerned about the potential negativeimpact that the quota elimination will have on their textile andapparel industries.21 In early July 2004, Mauritius became the firstcountry to publicly call for a special WTO meeting to investigate theimpact of pending elimination of all remaining textile and apparelquotas among WTO members.22

5-34
S Further hampering the growth of the textile and apparelindustries in numerous SSA countries has been the influx ofused clothing and inexpensive smuggled goods.Sources inUganda state that imports of used clothing,which reportedlyaccount for as much as 85 percent of the Ugandan domesticclothing market,discourage investors.23 In Kenya,manyuntaxed garments are reportedly entering the local marketand competing with local production.24
S SSA countries such as South Africa that had been supplyingtextiles to eastern and southern Africa,have had difficulty inproducing enough textile inputs to meet regional demand andhave not been able to attract investors to offset theinsufficient volume.25 Furthermore,although some SSAcountries produce sufficient domestic supplies of rawmaterials and textile inputs,the quality of these products fallsshort of standards sought in the international marketplace. InUganda,for example,a leading textile firm,Apparel Tri-Star,which had been sourcing fabric from Sri Lanka because ofconcerns about the quality of raw materials used in localproduction,only recently announced plans to start usingfabric produced domestically.26
S Some SSA governments claim that obsolete machinery,which limits their productivity and competitiveness,preventstheir textile and apparel industries from taking full advantageof AGOA preferences.There appears to be a pressing needto modernize factories throughout the region.27 Industrysources in Senegal, for example,report that virtually no milloperates at capacity and that most mills use outmodedequipment for sporadic,noncompetitive production runs ofsimple products such as towels and blankets.Although anumber of companies are reportedly involved in Senegal’syarn and textiles market,some of these firms have beenlargely inactive in recent years and data on capacity areunreliable.None can be considered to have up-to-dateequipment or a skilled workforce.28
S The export competitiveness of SSA countries in the globaltextile and apparel market reportedly has been hampered byhigh taxes,high utility and input costs,and,for some SSAcountries,currency appreciation. Industry sources in Ghanareport that a certain fabric produced in Ghana costs at leastthree times more than a comparable fabric made in China.29
Producers in Ghana assert that taxes account for 30 to 40percent of the cost of their textiles and create the significantprice differential between their products and those of othersuppliers.30 In 2003,textile firms in Nigeria feared the loss of50,000 employees because of a 300-percent rise in theprice of crude oil used by the textile industry.31 Niger andKenya reportedly have relatively high utility costs.Kenya’selectric power costs are an estimated $0.07 per kilowatthour,compared with $0.016 for South Africa;power costs inKenya reportedly account for as much as 30 percent of itsapparel component costs versus 15 percent for those inEgypt and European countries.32
S The strength of some SSA countries’ currencies relative tothe U.S.dollar,particularly that of the South African rand (towhich other SSA currencies such as that of Swaziland arepegged),weakened the competitiveness of textile and apparelexports from these countries in 2003 and reportedly led toan influx of imports of yarns,fabrics,and garments into SSAcountries from Asian suppliers.33 Lesotho’s currency,themaloti, is pegged one-to-one with the South African rand,anddollar costs have been increasing. Industry sources inLesotho speculated that, if the South African rand continuesto strengthen against the U.S.dollar, investors maysignificantly slow, if not drop,plans to build a spinning andweaving mill in Lesotho.34 Kenya’s apparel producersreported revenue losses in 2003 because of the almost10-percent appreciation of the Kenyan shilling against theU.S.dollar.35
TEXTILES AND APPAREL-CONTINUED
OVERVIEW-Continued

5-35
0 10 20 30 40 50
Cotton textiles (52)
Used clothing & made-up textiles (63)
Woven apparel (62)
Man-made staple fibers (55)
Man-made filaments (54)
All other
SSA sector global exports,by HTS chapter, 2002
($2.8 billion)
SSA sector global imports, by country, 2002($4.7 billion)
TRADE
SSA sector global imports,by HTS chapter, 2002
($4.7 billion)
Source: United Nations.
Share of total (percent)
SSA sector global exports, by country, 2002($2.8 billion)
Source: United Nations.
South Africa 23%All other 44%
Togo 5%
Nigeria 15%
Source: United Nations.
South Africa 25%
All other 15%
Kenya 6%
Madagascar 9%
0 10 20 30 40 50
Knit apparel (61)
Woven apparel (62)
Cotton textiles (52)
Wool textiles (51)
Man-made filaments (54)
All other
Source: United Nations.
Share of total (percent)
Source: United Nations. Source: United Nations.
24
13
11
42
35
Benin 7%
10
32
Major Share of Major Import Share ofImport Total Item TotalSource (2002) (percent) (6-digit HTS) (2002) (percent)
China 29 Used clothing (6309.00) 8. . . . . . . . . . . . . . . . . . . . . . . . . . . . . . . . . . . .
EU15 21 Cotton fabrics (5208.52) 4. . . . . . . . . . . . . . . . . . . . . . . . . . . . . . . . . . .
India 13 Dyed cotton fabrics of satin or. . . . . . . . . . . . . . . . .
Indonesia 8 twill weave (5208.39) 4. . . . . . . . . . . . . . . . . . . . . . . . . . . . . . . .
Korea 5 Badges,etc.of man-made. . . . . . . . . . . . . . . . .
fiber (5810.92) 2. . . . . . . . . . . . . . . . . . . . . . .
Cotton T-shirts (6109.10) 2. . . . . . . . . . . . . . . . . .
Major Share of Major Export Share ofExport Total Item TotalMarket (2002) (percent) (6-digit HTS) (2002) (percent)
United States 43 Cotton sweaters (6110.20) 12. . . . . . . . . . . . . . . . . . . . . . . . .
EU15 39 Cotton men’s trousers (6203.42) 11. . . . . . . . . . . . . . . . . . . . . . . . . . .
Zimbabwe 2 Cotton T-shirts (6109.10) 10. . . . . . . . . . . . . . . . . . . . . . . . . . . . . . .
South Africa 2 Cotton women’s trousers (6204.62) 9. . . . . . . . . . . . . . . . . . . . .
Mauritius 2 Men’s/boys’ cotton woven shirts (6205.20) 4. . . . . . . . . . . . . . . .
Lesotho 12%
9
4
7
Mauritius 33%
Mauritius 6%
TEXTILES AND APPAREL-CONTINUED
10 3

5-36
Source: Compiled from official statistics of theU.S. Department of Commerce.
Source: Compiled from official statistics of theU.S. Department of Commerce.
Source: Compiled from official statistics of theU.S. Department of Commerce.
0 10 20 30 40 50 60
Woven apparel (62)
Knit apparel (61)
All other
U.S. sector imports fromSSA, by source, 2003
($1.6 billion)
U.S. sector imports from SSA, byHTS chapter, 2003($1.6 billion)
Share of total (percent)
U.S. sector imports under AGOA(including GSP), by source, 2003
($1.2 billion)
U.S. sector imports under AGOA(including GSP), by HTS chapter, 2003
($1.2 billion)
All other 6%
0 10 20 30 40 50 60
Knit apparel (61)
Woven apparel (62)
All other
Share of total (percent)
South Africa 17%
All other 16%
Kenya 12%
Source: Compiled from official statistics of theU.S. Department of Commerce.
49
48
50
1
South Africa 11%
3
Lesotho 25%
Mauritius 17%
Madagascar 13%
49
Mauritius 11%
Lesotho 31%
Madagascar 15%
Kenya 15%
TEXTILES AND APPAREL-CONTINUED
TRADE-Continued
Swaziland 11%

5-37
U.S. sector exports to SSA,by market, 2003($131 million)
U.S. sector exports to SSA,by HTS chapter, 2003
($131 million)
Source: Compiled from official statistics of theU.S. Department of Commerce.
South Africa 21%
All other 34%
Tanzania 9%
0 10 20 30 40 50 60 70
Source: Compiled from official statistics of theU.S. Department of Commerce.
Key U.S. Import DevelopmentsS In 2003,U.S.sector imports from SSA countries rose by 37
percent to $1.6 billion.Such imports accounted for 2 percent oftotal U.S.sector imports in 2003,up from 1 percent in the previousyear.SSA shipments consisted almost entirely of apparel,particularly cotton goods.Almost 60 percent of shipments werewoven cotton pants and shorts for women and girls (HTSsubheading 6204.62),cotton tops and related goods (6110.20),and woven cotton pants and shorts for men and boys (6203.42).The shipments came mostly from Lesotho (25 percent of the total),South Africa (17 percent),Mauritius (17 percent),and Madagascar(13 percent).For the second consecutive year,Lesotho was thelargest SSA supplier of sector imports in 2003,and has been amajor AGOA beneficiary for sector goods to date.
Key AGOA Trade DevelopmentsS SSA shipments of sector goods under AGOA in 2003 rose 50
percent over the 2002 level to $1.2 billion,representing just overthree-fourths of total U.S.sector imports from SSA and 9percent of total imports under AGOA.AGOA sector shipmentsconsisted primarily of apparel,which came mainly from Lesotho(31 percent of AGOA apparel imports),Madagascar (15percent),Kenya (15 percent),Mauritius (11 percent),SouthAfrica (11 percent),and Swaziland (11 percent).
S Most AGOA apparel imports in 2003 entered under a specialprovision (HTS subheading 9819.11.12) that allows apparel fromleast-developed beneficiary countries (LDBC) to be made ofthird-country fabrics (fabrics of other than U.S.or SSA origin),aprovision that originally covered AGOA’s first 4 years throughSeptember 2004.36 Imports of such apparel totaled $914million,of which 41 percent ($373 million) came from Lesotho,whose sector shipments of $393 million consisted almostentirely of such goods.Other major SSA suppliers of apparelunder HTS subheading 9819.11.12 were Kenya ($176 million),Madagascar ($172 million),and Swaziland ($127 million).All buttwo (Mauritius and South Africa) of the 25 SSA countries thathave met the additional statutory requirements to qualify forAGOA apparel preferences are eligible for the LDBC benefits.
S The rest of the AGOA apparel imports in 2003 consistedprimarily of apparel made from “regional fabrics” produced inSSA countries from U.S.or SSA yarns.SSA shipments of suchapparel totaled $226 million in 2003 and came almost entirelyfrom South Africa ($121 million) and Mauritius ($103 million).These two countries generally must use yarns and fabrics madein SSA or in the United States to qualify for AGOA apparelpreferences.
S AGOA sets an annual limit,or cap,on the quantity of U.S. importsof qualifying apparel articles made from regional or third-countryfabrics that is eligible for duty-free entry.For the 12-month periodending on September 30,2003,the cap was equal to 4.8percent of the total quantity of U.S.apparel imports in thepreceding 12-month period,or 736 million SMEs,of which notmore than 2.1 percent,or 359 million SMEs,can be apparelmade in LDBCs from third-country fabrics.SSA countries filled 36percent of the cap,or 264 million SMEs;the LDBCs filled 62percent of the cap on apparel of third-country fabrics.Mostapparel entered under the cap was made from third-countryfabric (84 percent of the total).
Key U.S. Export DevelopmentsS U.S.exports of sector goods to SSA increased by 5 percent in
2003 to $131 million,or less than 1 percent of total U.S.sectorexports.The major SSA markets for sector exports were SouthAfrica (21 percent of the total),Ghana (10 percent),and Nigeria(10 percent).The principal U.S.sector exports to SSA are usedclothing and other used textile articles (HTS headings 6309 and6310).U.S.exports of such goods to SSA in 2003 totaled $69million,of which $59 million were used clothing.The rest of theexports consisted mainly of textile materials such as yarn andfabric.
Share of total (percent)
58
8
7
Nigeria 10%
Kenya 6%
Angola 5%
5
22
Ghana 10%
Used clothing andmade-up textiles (63)
Man-made filaments/woven fabrics (54)
Nonwovens; rope (56)
Cotton yarns/fabrics (52)
All other
TEXTILES AND APPAREL-CONTINUED
TRADE-Continued
Congo (ROC) 5%

5-38
INVESTMENT
S FDI prompted by AGOA has continued to come primarily fromAsia.Most of the investment has gone into expanding apparelproduction capacity and building yarn and fabric mills.Localtextile production will enable apparel producers in the lesserdeveloped SSA countries to continue to qualify for preferentialtreatment following the scheduled expiration of the third-countryfabric provision on September 30,2007.37
S Taiwanese-owned Lesotho Fancy Garments Group,whichinvested $7 million in apparel production,employs 3,000workers,and produces 1.4 million garments per month,hasreportedly announced plans to increase its investment to $50million and build its own fabric mill.38 The Nien-Shing Group,thelargest textile investor in Lesotho,which currently has threefactories producing 1 million pairs of jeans per month andemploys 7,000 workers,plans to expand its denim production bybuilding additional factories.The company is expected toeventually increase its investment to $2 billion in an operationthat would employ up to 15,000 people.Country sources indicatethat this firm could ultimately create 1 million indirect and directjobs.39
S The Mauritius Board of Investment has approved two spinningmill proposals by Indian and Pakistani investors;the first project isa $20-million joint venture between an Indian textile group and amajor Mauritian firm to set up a spinning unit to produce cottonyarn.The second project involves the Rasheed Group (TOPTEX),acotton-spinning unit with an installed capacity of 24,288 spindles,to produce about 5,000 tons of cotton yarn per year.40 China’sfirst cotton spinning mill in Mauritius (Tianli Spinning Co.) becameoperational in March 2003;it presently produces 2,500 tons ofcombed and carded yarn and employs 230 people.A secondphase expansion of this mill is planned for 2005.41 Otherprojects being planned include the construction of a cottonspinning mill by CMT Ltd.,one of Mauritius’ leading apparelmanufacturers,which is expected to produce about 8,000 tonsof combed cotton yarn annually.42
S The first Cameroonian venture designed to take advantage of theAGOA textile and apparel provisions for this sector wasreportedly launched in late 2003.Industry sources report thatGICATIC-Textile,which is working with a U.S.firm,AF-AM Knitting,Inc., is expected to establish a vertically integrated operation thatwill house a knitting mill,a dyeing and finishing section,a garmentcomponent production section,a garment sewing facility,and anembroidery section.The project will reportedly cost 10 billion CFAfrancs (approximately $17 million) and create 36,000 jobs.43 Inaddition,as part of efforts to promote AGOA and boostCameroon’s capacity to take advantage of AGOA benefits,theCameroonian Federation for Fashion and Ready-To-Wear Apparel(FECCAP) was launched in August 2003 to improve linkagesbetween textile producers,designers,and apparel producers.44
S Ethiopia’s textile and apparel sector has received a grant of 90million birr (approximately $10 million) from Italy to renovateseveral garment and textile factories so they can increase theirexports to Europe,the United States,and Canada.45 A newclothing firm,Umar Textiles,was established in Maputa,Mozambique,by a Pakistani investor,to export exclusively to theUnited States under the AGOA program.46 A new garment plant,the result of a joint venture between Kenya and Qatar,wasinaugurated by Kenya’s president in December 2003.The plantemploys 2,000 workers and has an installed capacity of 7.2million pieces that are targeted for export.47
S Revival Fabrics,a joint venture between Chinese investors and acompany in Zimbabwe (which currently is not eligible for AGOAtextile and apparel trade benefits) to create a multimillion-dollarvertically integrated clothing project,was reportedly set to openin early 2003.The project,which initially involves the constructionof a weaving plant spanning 1,000 acres and costing $10 million,is expected to employ 2,500 people.Spinning and dyeing plantswill be constructed later at an estimated cost of $30 million.48
S Leading Ugandan textile producer,Tri-Star,signed an agreementwith the U.S.firm Sunquest Apparel to supply $10 million worthof garments to the U.S.market.Sunquest has committed tobuilding a weaving and spinning plant in Uganda that will use localcotton.49
S Investors from Mali,Mauritius,and France formed a venture thatestablished a new cotton thread factory,Fitina,near Bamako,Mali.The factory supports 200 new jobs,and is expected toprocess 5,000 metric tons of cotton each year during its firstfive years,and up to 15,000 metric tons in subsequent years.The cotton thread will be exported to several SSA countries,including Mauritius,for use in apparel that could be exported tothe United States,thereby enabling Mali to take advantage of thetrade preferences granted by AGOA.Plans are also underway tobuild a $7.5-million blue jean production facility that will produce15 million SMEs of denim fabric annually.50
TEXTILES AND APPAREL-CONTINUED

5-39
ENDNOTES1 This sector includes items classified in Harmonized Tariff
Schedule chapters 39,40,42,43,50-63,65,70,and 94.2 “Lesotho:Textile Conference in May,” Apr.28,2004,found at
Internet address http://www.bharattextile.com/newsitems/198989703,retrieved July 9,2004.
3 Originally, it was intended that this mill would also import cottonfrom the United States,however,U.S.cotton suppliers have beenshipping their cotton to China.See U.S.Department of State telegram,“AGOA III: Information on Textile and Apparel Capabilities,” messageNo.000144,prepared by U.S.Embassy,Maseru,Mar.4,2004;andU.S.Department of State telegram,“Lesotho (Mostly) WelcomesSenate Passage of AGOA III,But Fears the Strong Rand,” message No.000388,prepared by U.S.Embassy,Maseru,July 3,2004.
4 “Lesotho:Textile Industry Provides Skein of Jobs,” Aug.5,2003,found at Internet address http://www.bharattextile.com/newsitems/1984679,retrieved July 9,2004.
5 U.S.Department of State telegram,“Mauritius Input for 2004President’s Report on AGOA,” message No.000136,prepared byU.S.Embassy,Port Louis,Feb.26,2004.
6 Werner International Management Consultants,“Spinning andWeaving Labor Cost Comparisons,2002,” Werner International2003.
7 U.S.Department of State telegram,“AGOA III: Information onTextile and Apparel Production Capabilities for Mauritius,” messageNo.000159,prepared by U.S.Embassy,Port Louis,Mar.5,2004.
8 U.S.Department of State telegram,“AGOA III:Textile andApparel Production Capabilities in Ethiopia,” message No.000706,prepared by U.S.Embassy,Addis Ababa,Mar.4,2004.
9 Ibid.;and “Ethiopia:Government Earmarks 1.5 Billion Birr forTextile Industry,” Feb.14,2003,found at Internet addresshttp://www.bharattextile.com/newsitems/1986410,retrievedJuly 7,2004.
10 “Ethiopia:Fabrics,Textile Company Established,” Nov.15,2003,found at Internet address http://www.bharattextile.com/newsitems/1986410,retrieved July 7,2004.
11 “Ghana:Textile Company to Be Set Up at Tema Free Zones,”June 19,2003,found at Internet addresshttp://www.bharattextile.com/newsitems/1983872,retrievedJuly 7,2004.
12 U.S.Department of State telegram,“Ghana:AGOA IIIInformation on Textile and Apparel Production Capabilities,” messageNo.000441,prepared by U.S.Embassy,Accra,Mar.2,2004.
13 “Ghana:First Textile and Garments Factory under PSIInaugurated,” July 5,2005,found at Internet addresshttp://www.bharattextile.com/newsitems/1990853,retrieved July7,2004.
14 “Mozambique:Mauritians to Invest $3 Million in ClothingFactory,” Aug.9,2004,found at Internet addresshttp://just style.com/news,retrieved Aug.9,2004.
15 U.S.Department of State telegram,“AGOA III:Textile andApparel Production Capabilities in Tanzania,” message No.000407,prepared by U.S.Embassy,Dar Es Salaam,Mar.5,2004.
16 U.S.Department of State telegram,“AGOA III:Textile andApparel Production Capabilities in Cameroon,” message No.000334,prepared by U.S.Embassy,Yaounde,Mar.4,2004.
17 Joop de Voest,“Third Party Yarn and Fabric Capacity inSouthern and Eastern Africa and Garment Production,” Zambia Tradeand Investment Enhancement Project (ZAMTIE),Contract No.690-C-00-00-00283-00,Apr.2004.
18 U.S.Department of State telegram,“Lesotho (Mostly)Welcomes Senate Passage of AGOA III,but Fears the Strong Rand,”message No.000388,prepared by U.S.Embassy,Maseru,July 3,2004.
19 “Kenya:Export Zones Increase Their Textile Sales to U.S.,”Nov.22,2003,found at Internet address http://www.bharattextile.com/newsitems/1986528,retrieved July 8,2004.
20 “Zimbabwe:Need to Fully Utilize Ginning Capacity,” June 22,2004,found at Internet address http://www.bharattextile.com/newsitems/1990663,retrieved July 20,2004.
21 For more information about the impact of the ATC and theimpact of the elimination of quotas on January 1,2005 on thecompetitiveness of the SSA countries,see Textiles and Apparel:Assessment of the Competitiveness of Certain Foreign Suppliers tothe U.S.Market,vol. I,chapter 3,and appendix K, inv.No.332-448,USITC Publication 3671,Jan.2004.
22 “Mauritius Calls for WTO Meeting on Quota Phase-Out,”WorldTrade/Interactive,July 2,2004,found at Internet addresshttp://www.strtrade.com,retrieved July 2,2004.
23 “Uganda:Textile Sector Not Developing Due to Second HandClothes,” Sept.4,2003,found at Internet addresshttp://www.bharattextile.com/newsitems/1985169,retrievedJuly 20,2004;and “Uganda:High Interest Affecting Textile Sector,”Feb.21,2004,found at Internet address http://www.bharattextile.com/newsitems/1988587,retrieved July 20,2004.
24 “Kenya:Untaxed Asian Textiles Threatens Local Industry,”Mar.30,2004,found at Internet address http://www.bharattextile.com/newsitems/1989210,retrieved July 7,2004.
25 “Malawi:AGOA Deadline Worries Textile Industry,” June 6,2003,found at Internet address http://www.bharattextile.com/newsitems/1983660,retrieved July 7,2004.
26 “Uganda:Apparel Manufacturer to Source Local Fabric,”Apr.2,2004,found at Internet address http://www.bharattextile.com/newsitems/1989274,retrieved July 20,2004.
27 “Mozambique:Local Clothing Industry Facing Crisis,” May 3,2003,found at Internet address http://www.bharattextile.com/newsitems/1983055,retrieved July 20,2004;and “Zimbabwe:Textile Sector Seeks Government Support,” May 26,2004,found atInternet address http://www.bharattextile.com/newsitems/1990187,retrieved July 20,2004.
28 U.S.Department of State telegram,“AGOA III:Senegal Textileand Apparel Production Capabilities,” message No.000375,prepared by U.S.Embassy,Dakar,Feb.18,2004.
29 “Ban on Textile Imports Would be a Mistake,” Dec.2,2003,found at Internet address http://www.bharattextile.com/newsitems/1986875,retrieved July 7,2004.
30 “Ghana:Textile Sector Seeks Check on Imported Textiles,”Dec.12,2003,found at Internet address http://www.bharattextile.com/ newsitems/1986875,retrieved July 7,2004.
31 “Nigeria:Rise in Black Oil Prices Affecting Textile Jobs,” Oct.29,20003,found at Internet address http://www.bharattextile.com/newsitems/1986113,retrieved July 9,2004.
32 “Kenya:Export Zones Increase Their Textile Sales to U.S.,”Nov.22,2003,found at Internet addresshttp://www.bharattextile.com/ newsitems/1986258,retrievedJuly 8,2004.
TEXTILES AND APPAREL-CONTINUED

5-40
ENDNOTES33 ”Swaziland:Textile Sector Facing Crisis,” Apr.1,2004,found at
Internet address http://www.bharattextile.com/newsitems/1989256,retrieved July 9,2004;and Joop de Voest,“Third Party Yarn and Fabric Capacity in Southern and Eastern Africaand Garment Production,” Zambia Trade and InvestmentEnhancement Project (ZAMTIE),Contract No.690-C-00-00-00283-00,Apr.2004.
34 U.S.Department of State telegram,“Lesotho (Mostly)Welcomes Senate Passage of AGOA III,But Fears the Strong Rand,”message No.000388,prepared by U.S.Embassy,Maseru,July 3,2004.
35 “Kenya:Apparel Exporters Hit by Shilling’s Free Float Policy,”June 24,2003,found at Internet address http://www.bharattextile.com/newsitems/1983963,retrieved July 9,2004.
36 AGOA III extended this provision for an additional 3 years,which ends on September 30,2007.See discussion in section onAGOA III legislation in chapter 2.
37 The third-country provision was originally set to expire onSeptember 30,2004,but was extended by AGOA III until September30,2007.See chapter 2 of this report for additional information onthe AGOA III legislation.
38 “Lesotho:Textile Industry Provides Skein of Jobs,” Aug.5,2003,found at Internet address http://www.bharattextile.com/newsitems/1984679,retrieved July 9,2004.
39 Ibid.40 U.S.Department of State telegram,“Mauritius Input for 2004
President’s Report on AGOA,” message No.000136,prepared byU.S.Embassy,Port Louis,Feb.26,2004.
41 U.S.Department of State telegram,“AGOA III: Information onTextile and Apparel Production Capabilities for Mauritius,” messageNo.000159,prepared by U.S.Embassy,Port Louis,Mar.5,2004.
42 Ibid.43 “Cameroon:New Textile Firm Commission,” Nov.22,2003,
found at Internet address http://www.bharattextile.com/newsitems/1986516,retrieved July 7,2004.
44 U.S.Department of State telegram,“AGOA III:Textile andApparel Production Capabilities in Cameroon,” message No.000334,prepared by U.S.Embassy,Yaounde,Mar.4,2004.
45 “Ethiopia: Italy to Support Textile Sector,” Nov.22,2003,foundat Internet address http://www.bharattextile.com/newsitems1986527,retrieved July 7,2004.
46 “Mozambique:Local Clothing Industry Facing Crisis,”May 3,2004,found at Internet address http://www.bharattextile.com/newsitems/1983055,retrieved July 20,2004.
47 “Kenya:President Opens New Garment Plant,” Dec.20,2003,found at Internet address http://www.bharattextile.com/newsitems/1987011,retrieved July 9,2004.
48 “Zimbabwe:Revival Fabrics to Open Multimillion Dollar Project,”Dec.19,2002,found at Internet address http://www.bharattextile.com/newsitems/1980434,retrieved July 20,2004.
49 “Uganda:Tri-Star to Supply Garments to U.S.Firm,”Jan.31,2004,found at Internet address http://www.bharattextile.com/newsitems/1988232,retrieved July 20,2004.
50 U.S.Department of State telegram,“Mali:Update Informationfor 2004 Report on AGOA,” message No.000273,prepared by U.S.Embassy,Bamako,Feb.25,2004;and U.S.Department of Statetelegram,“Mali:AGOA III - Textile and Apparel Production Capabilities,”message No.000319,prepared by U.S.Embassy,Bamako,Mar.4,2004.
TEXTILES AND APPAREL-CONTINUED

5-41
SSA sector production, by country, 2003458,629 vehicles
SSA sector production, by product, 2003458,629 vehicles
S South Africa is the dominant producer of motor vehicles andmotor-vehicle parts in the SSA region,accounting for 95 percent ofSSA production in 2003.Nigeria was the second-leading producerwith 2 percent,and all others accounted for the remaining 3 percent.Other SSA countries with some motor vehicle production orassembly include Ethiopia,Ghana,Côte d’Ivoire,Kenya,Mozambique,Tanzania,and Zambia;these countries assemble trucks on a verysmall scale.South Africa ranks as the 19th-largest motor vehicleproducer in the world.
S The automotive industry in South Africa accounts for nearly 6percent of the country’s gross domestic product,2 and it is thelargest manufacturer,and the largest manufacturing exporter.3South African motor vehicle industry strengths include competitivemanufacturing costs,particularly on low-volume runs;the ability tomanufacture to high-quality specifications;strategic location in theSouthern Hemisphere;expertise in right-hand drive manufacturing;and technological competence in specific areas.4
Source: Automotive News Market Data Book 2004.
South Africa 95%
All other 3%Nigeria 2%
0 15 30 45 60 75
Passenger cars
Trucks
Share of total (percent)
69
31
Source: Automotive News Market Data Book 2004.
S Total motor vehicle production in South Africa has increased steadilyover the past few years.Passenger car production increased by 5percent from 290,500 units in 2002 to 303,500 units in 2003.Truck production also grew steadily, from 127,942 units in 2002 to130,600 units in 2003.5 Most motor vehicle production is fromcompletely knocked down (CKD) kits, incorporating some locallyproduced components.Duties for CKD components are currently 30percent ad valorem,but will decline to 25 percent in 2007 and to 20percent in 2012,as is further discussed below.6
S The automotive industry in South Africa consists of foreignsubsidiaries and local-foreign joint venture operations.Leading SouthAfrican passenger vehicle producers include BMWSouth Africa,DaimlerChrysler SA,Ford Motor Company of Southern Africa,General Motors South Africa,Nissan South Africa,Toyota SouthAfrica,and Volkswagen of South Africa.Leading commercial vehicleproducers include ERF South Africa, Iveco South Africa,MAN Truckand Bus SA,Nissan Diesel,Scania South Africa (Pty) Ltd.,and TycoTruck Manufacturers.
S South Africa is the leading market for motor vehicle sales in the SSAregion,accounting for 54 percent of SSA motor vehicle sales in2003.Nigeria was the second-largest market (6 percent), followedby Zambia (3 percent),Côte d’Ivoire (3 percent),and Sudan (3percent).Total motor vehicle sales in SSA reached 681,195 units in2003.7
S In 2003,total vehicle sales in South Africa reached 371,189 units.The factors contributing to growth in the South African motor vehiclemarket included lower interest rates, improved vehicle affordability,increased disposable income,higher consumer and businessconfidence, intense competition resulting in competitive pricing,andthe prospect of legislation to lower inflation and allow privateleasing.8 Interest rates were cut last year by 5.5 percent,to 11.5percent – the lowest level in over 20 years.9
S In the first half of 2004,South Africa’s new vehicle sales reportedlyrose by almost 20 percent,to 206,046 units.Motor vehicle salesare a leading indicator of economic growth in South Africa,and salesare projected to top 400,000 units for 2004.The strong rand islikely to encourage vehicle price stability,and interest rates areexpected to remain at current levels.10
S In 2003,Toyota garnered the most South African total vehicle saleswith 96,087 units.Toyota also led passenger vehicle sales with60,605 units.Volkswagen was the second-leading passenger vehicleseller with 57,323 units,followed by DaimlerChrysler (28,238 units),and Ford (26,074 units).Toyota also dominated 2003 commercialvehicle sales selling 35,482 units,followed by Nissan (24,373 units),Ford (21,593 units),and GM (19,640 units).11
S There are more than 220 dedicated automotive componentsuppliers in South Africa,and another 150 that supply theautomotive industry as well as other industries.The automotivecomponent industry is highly concentrated,with only 14 firmsaccounting for more than one-half of the industry’s employment andoutput.Export growth rates have remained high,at over 40 percentover the past 10 years.Catalytic converters make up approximately50 percent of component exports;other key exports include stitchedleather car seat covers,tires,mufflers/exhaust pipes,and roadwheels and parts.Germany is the main market for South Africancomponent exports;other major export markets include the UnitedKingdom,the United States,Belgium,Spain,and Zimbabwe.12
OVERVIEW
CERTAIN TRANSPORTATIONEQUIPMENT 1

5-42
Certain Transportation Equipment-continued
S Capacity utilization in the South African motor vehicle industryaverages 73 percent and remained stable during 2001-03,increasing by only 1 percent. In 2003,passenger car capacityutilization was 77 percent;light commercial vehicles,70 percent;medium commercial vehicles 61 percent;and heavy commercialvehicles,86 percent.13
S The motor vehicle industry in South Africa, including the retailbusiness,employs an estimated 304,000 workers.During the last 5years,South African motor vehicle manufacturing employment hasremained fairly constant at around 32,000;however, jobs in thecomponent industry increased from 67,200 in 1999 to 75,000 in2003.14
S Results of the South African government-sponsored Motor IndustryDevelopment Program (MIDP) have been positive;motor vehicleexports have increased from 16,000 to 127,000 units per year,thevalue of parts exports has tripled,and the volume of vehiclesproduced has doubled.The government is presently conducting awide-ranging study into the effect of the MIDP,concentrating on theeffect of free trade agreements on the program’s objectives,as wellas the effect the MIDP has had on employment levels.Results of thisstudy are to be released in late 2004.15
S At the start of the MIDP in 1995,the tariff on cars and lightcommercial vehicles was 65 percent;the current tariff level is 40percent and will be reduced to 30 percent by 2007 and 25 percentby 2012.For CKD components,the tariff at the start of the MIDPwas 49 percent ad valorem;the current tariff level is 30 percentand will be reduced to 25 percent in 2007 and 20 percent by2012.The tariff on medium and heavy commercial vehicles,whichwas 40 percent at the start of the MIDP,decreased to 20 percentin 2000 and will remain at that level through 2007.Mostcomponents for medium and heavy commercial vehicles,excludingtires,are free of duty.16 The MIDP allows international companiesthat import and export motor vehicles and parts to reduce theirimport duties via export credits.17
S Both exports and imports have increased rapidly.By 2008,totalvehicle exports from South Africa are expected to exceed cars builtfor its domestic market.The largest export markets will likely beAustralia,New Zealand,and Asia.18
S Current competitive pressures felt by the South African automotiveindustry include increasing price competition in the globalmarketplace,rising logistical and distribution costs,rising domesticinflationary pressures,a strengthening exchange rate,andincreasing competition from other low-cost manufacturing countriesthat have potentially large or growing markets.
S Shipping problems,both by air and by sea,have reportedly posed athreat to South Africa’s competitive future in the automotiveindustry.The air transport system is not efficient enough to meetthe demand for last-minute specification changes to new vehicles. Inaddition,shipping ports have been at a disadvantage because oflabor problems,delays,and security issues.South Africa reportedlyplans to address its relatively high port costs and abundance ofunnecessary ports.19
OVERVIEW-Continued

5-43
Certain Transportation Equipment-continued
0 20 40 60 80 100
SSA sector global imports,by HTS chapter, 2002
($4.5 billion)
Share of total (percent)
SSA sector global imports, by country, 2002($4.5 billion)
Source: United Nations.
South Africa 61%
All other 23%
Ghana 2%
Kenya 2%
0 20 40 60 80 100
Source: United Nations.
78
Major Share of Major Import Share ofImport Total IIem TotalSource (2002 (percent) (6-digit HTS) (2002) (percent)
EU15 62 Passenger motor vehicles (8703.23) 29. . . . . . . . . . . . . . . . . . . . . . . .
Japan 16 Miscellaneous motor vehicle parts (8708.99) 21. . . . . . . . . . . . . . . .
United States 5 Certain motor vehicle body parts (8708.29) 8. . . . . . . . . . . . . .
South Africa 3 Passenger motor vehicles (8703.24) 7. . . . . . . . . . . . . . . . . . . .
Oman 3 Gasoline-powered engines over. . . . . . . . . . . . . . . . .
Brazil 2 1,000 cc (8407.34) 6. . . . . . . . . . . . . . . . . . . . . . . . . . . . . . . . . . . . . .
Miscellaneous engine parts (8409.99) 5. . . . . . .
Tanzania 2%
22
Nigeria 10%
Source: United Nations.
SSA sector global exports,by HTS chapter, 2002
($2.3 billion)
Source: United Nations.
South Africa 99%
All other 1%
91
9
Source: United Nations.
Major Share of Major Export Share ofExport Total Item TotalMarket (2002) (percent) (6-digit HTS) (2002) (percent)
EU15 42 Passenger motor vehicles (8703.23) 64. . . . . . . . . . . . . . . . . . . . . . . .
Japan 20 Passenger motor vehicles (8703.24) 9. . . . . . . . . . . . . . . . . . . . . . . .
United States 16 Road wheels and parts (8708.70) 4. . . . . . . . . . . . . . . . . . . . .
Australia 9 Certain motor vehicle body parts (8708.29) 4. . . . . . . . . . . . . . . . . .
Hong Kong 2 Miscellaneous motor vehicle parts (8708.99) 3. . . . . . . . . . . . . .
Singapore 1 Gasoline-powered engines over. . . . . . . . . . . . . .
1,000 cc (8407.34) 3. . . . . . . . . . . . . . . . . . . .
Source: United Nations.
SSA sector global exports, by country, 2002($2.3 billion)
Share of total (percent)
TRADE
Motor vehicles and parts (87)
Motor vehicle engines andparts (84)
Motor vehicles and parts (87) Motor vehicles and parts (87)
Motor vehicle engines andparts (84)

5-44
Certain Transportation Equipment-continuedTRADE-Continued
Certain Transportation Equipment-continuedTRADE-Continued
Source: Compiled from official statistics of theU.S. Department of Commerce.
Source: Compiled from official statistics of theU.S. Department Commerce.
Source: Compiled from official statistics of theU.S. Department of Commerce.
0 20 40 60 80 100
Passenger vehicles (8703)
Motor vehicle parts (8708)
All other
U.S. sector imports fromSSA, by source, 2003
($742 million)
U.S. sector imports from SSA,by HTS heading, 2003
($742 million)
Share of total (percent)
U.S. sector imports under AGOA(including GSP), by source, 2003
($716 million)
U.S. sector imports under AGOA(including GSP), by HTS heading, 2003
($716 million)
0 20 40 60 80 100
Passenger vehicles (8703)
Motor vehicle parts (8708)
Engine parts (8709)
All other
Share of total (percent)
South Africa 99%
All other 1%
Source: Compiled from official statistics of theU.S. Department of Commerce.
84
12
87
1
South Africa 99%
4
10
2
All other 1%

5-45
Certain Transportation Equipment-continuedTRADE-Continued
Certain Transportation Equipment-continued
S Virtually all U.S.sector imports from SSA in 2003 were supplied bySouth Africa.Passenger cars accounted for 84 percent of total U.S.sector imports from South Africa in 2003.Leading componentsimported from South Africa in 2003 included road wheels,miscellaneous auto parts,and miscellaneous engine parts.
S There were sizeable increases in U.S. imports of passenger motorvehicles with an engine cylinder capacity exceeding 3,000 cc (anincrease of $171 million or 129 percent),road wheels and theirparts (an increase of $16 million or 79 percent),and miscellaneousmotor vehicle parts (an increase of $10 million or 99 percent). Incontrast,decreases were registered in U.S. imports of passengermotor vehicles with an engine cylinder capacity between 1,501 and3,000 cc (a decrease of $18 million or 5 percent) and mufflers andexhaust pipes (a decrease of $2 million or 24 percent).
Key AGOA Trade DevelopmentsS U.S.transportation equipment imports under AGOA increased by 34
percent in 2003,reaching $716 million;the majority of suchimports were from South Africa. In 2003,imports under AGOAaccounted for 97 percent of total U.S.sector imports from SSA.Theleading U.S.sector import items under AGOA in 2003 includedpassenger motor vehicles (87 percent of the total value) and motorvehicle parts (10 percent).
Key U.S. Export DevelopmentsS In 2003,the United States ran a $304-million deficit with SSA in
certain transportation equipment. In 2002,the U.S.deficit was$257 million;in 2001,the United States ran a $153-million tradesurplus in the sector with SSA.
S In 2003,U.S.exports of certain transportation equipment to SSAreached $412 million,up 36 percent from the previous year.SouthAfrica accounted for two-thirds of U.S.sector exports to SSA,andSSA accounted for less than 1 percent of the value of total U.S.sector exports in 2003.
S The major U.S.sector export items to SSA in 2003 included motorvehicles with an engine cylinder capacity between 1,501 and 3,000cc (HTS subheading 8703.23,33 percent of the total value);roadtractors for semi-trailers (HTS 8701.20,11 percent);and truckswith gross vehicle weight over 5 metric tons but not over 20 metrictons (HTS 8704.22,10 percent).
S In contrast to sizeable increases in U.S.exports of certainpassenger vehicles (HTS 8703.23,an increase of $34 million,or 34percent) and road tractors for semi-trailers (HTS 8701.20,anincrease of $32 million,or 211 percent), large decreases wereregistered in chassis fitted with engines (HTS 8706.00,a decreaseof $4.3 million,or 51 percent);oil or fuel filters (HTS 8421.23,adecrease of $3.9 million,or 40 percent);and heavy-duty trucks (HTS8704.32,a decrease of $2.7 million,or 52 percent).U.S.exports ofthese products may have been replaced by increased localproduction.
TRADE-Continued
Source: Compiled from official statistics of theU.S. Department Commerce.
Source: Compiled from official statistics of theU.S. Department of Commerce.
0 20 40 60 80 100
U.S. sector exports to SSA,by market, 2003($412 million)
U.S. sector exports to SSA, byHTS heading, 2003($412 million)
Share of total (percent)
South Africa 67%
All other 16%
54
12
23
Nigeria 14%
Ghana 3%
11
Passenger vehicles (8703)
Road tractors (8701)
Trucks (8704)
All other
Key U.S. Import DevelopmentsS U.S. imports of certain transportation equipment
from SSA reached $742 million in 2003,anincrease of $182 million over 2002,or 33percent.SSA accounted for less than 1 percent ofthe value of total U.S.sector imports in 2003.
S The principal sector import items that yearincluded passenger motor vehicles with an enginecylinder capacity between 1,501 and 3,000 cubiccentimeters (cc) (HTS subheading 8703.23,43percent of the total value);and passenger motorvehicles with an engine cylinder capacity exceeding3,000 cc (HTS subheading 8703.24,41 percent).Almost all of these imports were BMWvehicles.

5-46
Certain Transportation Equipment-continued
U.S. sector SSA FDI position,by country, 2003
Millions of U.S. dollars
0 50 100 150 200 250 300 350
South Africa
Nigeria
DROC
Total
Note.-Industry classification changed from SIC to NICSin 2002; data from 1999-2001 have been converted toNAICS. Data for 2001 and 2002 have been revisedfrom previous estimates.
Source: Bureau of Economic Analysis, U.S. Departmentof Commerce. Data are for sector defined as“Transportation equipment.”
330
INVESTMENT
Note.-Data for some countries are not disclosed owingto confidentiality. Industry classification basis changedfrom SIC to NAICS in 2002.
Source: Bureau of Economic Analysis, U.S. Departmentof Commerce. Data are for sector defined as“Transportation equipment.”
0
50
100
150
200
250
300
350
1999 2000 2001 2002 2003
343
MillionsofU.S.dollars
U.S. sector SSA FDI position,1999-2003
S U.S.FDI in the SSA transportation equipmentsector totaled $343 million in 2003,down from$394 million the previous year.South Africa wasthe primary SSA location for U.S.sector FDI in2003.The transportation equipment sectoraccounted for about 3 percent of the total U.S.FDIposition in SSA in 2003,and SSA accounted fornearly 1 percent of the global U.S.FDI position inthe sector that year.20
S Capital expenditures in the South African automotiveindustry increased rapidly during 2000-02,from R1.6 billion(approximately $186 million) to R2.7 billion (approximately$256 million),before declining slightly to R2.3 billion(approximately $304 million) in 2003.21
S Free trade agreements with the EU and within SADC;potential agreements with Mercosur,China,Japan,theUnited States,and India;an economic agreement withThailand;and AGOA are creating new investmentopportunities in the South African automotive industry.22
S DaimlerChrysler South Africa,which currently produces42,000 cars per year at its East London facility, is aiming tonearly double its capacity to 80,000 vehicles per year.Currently,the plant focuses on right-hand-drive markets,exporting 45 percent of its output to the United Kingdom,11 percent each to Japan and Australia,and 25 percentfor domestic consumption.The company plans to target theU.S.market,through the AGOA program,with its increasedcapacity.23
S In 2003,GM was granted South African governmentapproval to purchase the remaining 51 percent of Delta tocreate General Motors South Africa (GMSA).The plantmanufactures Suzuki, Isuzu,and Opel brand vehicles.24
GMSA will invest R500 million (approximately $66 million)to produce Isuzu pickup trucks,and the company plans tospend R500 million (approximately $66 million) per yearprocuring locally produced components.Over the next 5years,GMSA reportedly will invest an estimated R1.5 billion(approximately $198 million) to increase production andexports,and upgrade the company’s two productionfacilities.25
S In 2003,Ford announced its plan to invest in exportcapacity in South Africa, joining DaimlerChrysler,BMW,Volkswagen,and Toyota in making South Africa a globalmanufacturing base.The company announced an estimatedR1 billion (approximately $132 million) investment for theproduction of a commercial vehicle by late 2004 and apassenger vehicle in early 2005,both for export.Ford’scapacity will reach 2,700 commercial vehicles and 30,000passenger vehicles per year.26
S Nissan South Africa won a R1 billion (approximately $148million) contract to produce single cab pickup trucks forexport.Nissan estimates production at 4,600 units peryear,with about 65 percent local content.The vehicles willbe exported to Europe,Singapore,Australia,and NewZealand.27
S In 2003,Toyota increased its holding in Toyota South Africafrom 35.7 percent to 74.9 percent.Toyota is beginning toexport vehicles to Australia,and recently opened a R168million (approximately $22 million) stamping facility.28
S Volkswagen South Africa recently won a R12 billion(approximately $1.6 billion),6-year contract to build a totalof 440,000 cars for export to Germany.Volkswagen hasundergone a R750 million (approximately $99 million)factory upgrade.29
S The Gauteng government in South Africa is close tosecuring R800 million (approximately $106 million) inprivate funding for a new automotive supplier park inPretoria.The park would serve BMW,Fiat,Ford,andNissan.30
4
4
343
171144
270
394

5-47
ENDNOTES1 For the purposes of this chapter,certain transportation
equipment is defined as motor vehicles (cars,trucks,and buses),engines,and certain motor vehicle parts.These products account forover 90 percent of all transportation equipment imports from SSA.This sector includes portions of Harmonized Tariff Schedule chapters84 and 87.
2 Ayako Doi,“Nissan To Export Pickups From South African Plant,”The Japan Automotive Digest,Mar.1,2004,p.8.
3 SouthAfrica.info reporter,“SA vehicle exports make inroads,”Oct.8,2003,found at Internet address http://www.southafrica.info.com,retrieved June 6,2004.
4 Chris Wright and Anthony Lewis,“South Africa’s auto industryat a crossroads,” July 2004,found at Internet addresshttp://just auto.com,retrieved July 6,2004.
5 Automotive News,2004 Market Data Book,p.44;andAutomotive News,2003 Market Data Book,p.44.
6 Just-auto.com editorial team,“Where next for South Africa’sautomotive industry?” May 14,2004,found at Internet addresshttp://just auto.com,retrieved May 20,2004.
7 Automotive News,2004 Market Data Book,p.47.8 Just-auto.com editorial team,“Optimists foresee more South
Africa growth,” Jan.15,2004,found at Internet addresshttp://just auto.com,retrieved Jan.29,2004.
9 Just-auto.com editorial team,“New vehicle sales on track forbest year since 1983,” July 5,2004,found at Internet addresshttp://just auto.com,retrieved July 6,2004.
10 Ibid.11 Data supplied by Ward’s Communications.12 Chris Wright and Anthony Lewis,“South Africa’s auto industry
at a crossroads,” July 2004,found at Internet addresshttp://just auto.com,retrieved July 6,2004.
13 NAAMSA,“Quarterly Review of Business Conditions:MotorVehicle Manufacturing Industry:4th Quarter,2003,” found at Internetaddress http://www.naamsa.co.za,retrieved July 20,2004.
14 Chris Wright and Anthony Lewis,“South Africa’s auto industryat a crossroads,” July 2004,found at Internet addresshttp://just auto.com,retrieved July 6,2004.
15 Automotive Industry Development Centre,May 10,2004,found at Internet address http://www.aidc.co.za,retrieved June 3,2004.
16 NAAMSA,Annual Report 2003 and Annual Report2001/2002.
17 Office of the United States Trade Representative,2004National Trade Estimate Report,“South Africa,” found at Internetaddress http://www.ustr.gov,retrieved Aug.3,2004.
18 South Africa Automotive Conference 2004 press release,“Hub ports the way forward,conference told,” May 6 2004,found atInternet address http://www.saac2004.com,retrieved June 3,2004.
19 Chris Wright and Anthony Lewis,“South Africa’s auto industryat a crossroads,” July 2004,found at Internet addresshttp://just auto.com,retrieved July 6,2004.
20 USDOC,BEA,Direct Investment Position Abroad on aHistorical-Cost Basis:Country Detail by Industry,provided to USITCstaff,Sept.16,2004.
21 NAAMSA,“New Vehicle Manufacturing Industry:CapitalExpenditure 2000 – 2004,” Mar.16,2004,found at Internetaddress http://www.naamsa.co.za,retrieved June 4,2004.
22 SouthAfrica.info reporter,“SA auto industry rides MIDPwave,” Oct.8,2003,found at Internet addresshttp://www.southafrica.info,retrieved June 4,2004.
23 Just-auto.com editorial team,“DaimlerChrysler plant hopingfor USA C-class deal,” July 29,2004,found at Internet addresshttp://just auto.com,retrieved July 29,2004.
24 Brian Corbett,“GM to Add Dealers in South Africa,” Ward’sAutomotive Report,Feb.2,2004,p.5.
25 Just-auto.com editorial team,“GM to invest in pickupproduction,” July 6,2004,found at Internet addresshttp://just auto.com,retrieved July 6,2004.
26 Just-auto.com editorial team,“South Africa:Ford plans billionrand export programme,” Sept.2,2003,found at Internet addresshttp://just auto.com,retrieved Sept.2,2003.
27 Ayako Doi,“Nissan To Export Pickups From South AfricanPlant,” The Japan Automotive Digest,Mar.1,2004,p.8.
28 SouthAfrica.info reporter,“SA vehicle exports make inroads,”Oct.8,2003,found at Internet addresshttp://www.southafrica.info.com,retrieved June 6,2004.
29 Chris Wright and Anthony Lewis,“South Africa’s autoindustry at a crossroads,” July 2004,found at Internet addresshttp://just auto.com,retrieved July 6,2004.
30 Ibid.
Certain Transportation Equipment-continued


6-1
CHAPTER 6Country Profiles
This chapter presents economic data on the 48 countries of SSA and consists of foursections. The first section gives a brief overview of the region and identifies commoneconomic trends as it broadly compares the countries. The second section discusses thetariff structure of the SSA region. The third section consist of technical notes related todata collection and information sources. The final section contains the 48 countryprofiles.
Regional Overview
In 2003, the average growth rate for SSA nations was 3.6 percent, up from 3.2percent in 2002.1 This increase is attributed to high prices for certain commodities;progress toward the restoration of peace and stability in countries such as Burundi,Liberia, and Sudan; and the regional focus on improving the infrastructure for trade.However, the reliance on primary commodities such as coffee, cotton, petroleum, andmineral products, combined with fluctuating prices, have contributed to deficits andlittle or negative economic growth in some SSA countries. In 2003, other obstacles toeconomic growth and poverty reduction in SSA included civil unrest, social costs fromHIV/AIDS, and a slowdown in economic growth in the region’s primary tradingpartners.
In the western African region, high prices for gold, cocoa, and petroleum fromNigeria and Ghana contributed substantially to the 3.6-percent regional growth. Thegrowth rate in central Africa declined slightly from 4 percent in 2002 to 3.7 percent in2003. Higher world prices for petroleum, the primary export for Chad and EquatorialGuinea, tempered this decline.2 In July 2003, petroleum began flowing through theChad-Cameroon Petroleum and Pipeline Development Project, a project launched bythe World BankGroup, ExxonMobil, Petronas, and Chevron Texaco.3 The growth ratein the eastern African region also declined, from 3.6 percent in 2002 to 2.5 percent in2003. Much of the economic slowdown in this region can be attributed to a decline inthe construction industry in Uganda.4 However, as part of its commitment under the
1 United Nations, Economic Report on Africa 2004 (Kampala: Uganda, 2004) found at Internetaddress http://www.uneca.org, retrieved June 2004.
2 Ibid.3 World Bank, “Chad-Cameroon Pipeline Represents New Approach,” Press Release, Oct. 10,
2003, found at Internet address http://worldbank.org, retrieved June 2004.4 United Nations, Economic Report on Africa 2004 (Kampala: Uganda, 2004) found at Internet
address http://www.uneca.org, retrieved June 2004.

6-2
EAC regional framework, Uganda is seeking to modernize infrastructure throughprivate sector investment. The growth rate in the southern African regions was 2.5percent. The Southern African region introduced a tighter monetary policy in 2003 inan attempt to control inflation. Public utilities, particularly power companies, havecontributed strongly to growth in southern Africa.5
GDP in SSA grew 3 percent, reaching $319 billion in 2003.6 Several countriesrecorded high rates of growth. For example, Angola’s GDP increased by 15 percent in2003 because of a reduction in civil unrest, an increase in petroleum production, andhigh international petroleum prices. Chad’s GDP grew by 13 percent in 2003 becauseof increased petroleum production. Equatorial Guinea’s GDP grew by 16 percent in2003, driven by booms in the petroleum, gas, and construction sectors.7
Madagascar’s GDP, however, fell by 13 percent in 2003 because of slow growth inexport markets and declining export prices, and Guinea-Bissau’s economycontractedby 7 percent in 2003 because of civil unrest in late 2003, which affected the country’sagriculture, forestry, and fishing industries. SSA countries with low economic growthwere also affected by lower than expected growth in exports to the EU, the maindestination for SSA exports.
The existence of capable institutions to support macroeconomic policies is importantfor countries in SSA because they create an attractive investment climate by protectingproperty rights, encouraging transparency, and reducing corruption. In mid-2003,the World Bank published governance indicators for the period 1996 to 2002.8 Therankings, shown in table 6-1, indicate improvement for countries such as Nigeria,Tanzania, and Cameroon. Zimbabwe, DROC, and Côte d’Ivoire have, however,declined in terms of the quality of their institutions, as denoted by the negativepercentage change in their performance from 1996 to 2002. Zimbabwe saw thelargest decline, 79 percent, followed by Côte d’Ivoire, with a decline of 66 percent.Despite numerous FTAs in the region, intra-regional trade remains relatively low.Inadequate infrastructure, a lack of diversification in export products, and the inabilityof the governments within SSA to provide adequate protection for foreign investorsrestrict intra-regional trade.
Gross national income (GNI) for SSA in 2002 was $307 billion, up from $305 billionin 2001.9 South Africa had the highest GNI for 2002 ($102 billion), followed byNigeria with $41 billion (figure 6-1). The top ranking countries in terms of per capitaGNI were Seychelles, Mauritius, Gabon, Botswana, and South Africa. Countries withthe lowest per capita GNI were DROC, Burundi, Guinea-Bissau, Liberia, and Malawi.
5 Ibid.6 World Bank, Development Indicators Database, 2004.7 EIU Viewswire, “Country Outlook,” May 2004, found at Internet address
http://www.viewswire.com, retrieved June 2004.8 World Bank, Governance Dataset, July 2003, found at Internet address
http://www.worldbank.org, retrieved Aug. 2004.9 World Bank Group, World Development Indicators database. Gross National Income (formerly
Gross National Product) is defined as the sum of all value added by all resident producers plus anyproduct taxes (less subsidies) not included in the valuation of output plus net receipts of primary income(compensation of employees and property income) from abroad. Data are in current U.S. dollars.

6-3
Tariff Structure
Most of the SSA countries are WTO members or are involved as WTO observers.10
Thirty-eight governments in SSA are WTO members, four have established accessionworking parties, and two others have requested accession working parties.11 Inaddition, three governments have typically been granted observer status duringministerial conferences.12
Prior to the advent of the World Integrated Trade Solution database, tariff informationfor SSA was not readily available. Where tariff data are available, however,information can be inaccurate. Available information typically indicates high tariffsthat likely hinder rather than facilitate trade. In addition to high tariffs, extra importcharges, taxes, or fees are common, making the trade environment nontransparent.
Table 6-1Aggregate governance index, selected sub-Saharan African countries, 1996and 20022002Rank Country 1996 2002
Percentchange
1 Botswana . . . . . . . . . . . . . . . . . . . . . . . . 74.56 74.21 -0.52 Mauritius . . . . . . . . . . . . . . . . . . . . . . . . 76.18 73.61 -3.43 South Africa . . . . . . . . . . . . . . . . . . . . . 61.16 63.16 3.34 Namibia . . . . . . . . . . . . . . . . . . . . . . . . 72.55 62.65 -13.65 Madagascar . . . . . . . . . . . . . . . . . . . . . 43.93 51.48 17.26 Ghana . . . . . . . . . . . . . . . . . . . . . . . . . . 45.63 48.69 6.77 Senegal . . . . . . . . . . . . . . . . . . . . . . . . . 37.37 48.54 29.98 Malawi . . . . . . . . . . . . . . . . . . . . . . . . . 33.44 36.94 10.59 Mozambique . . . . . . . . . . . . . . . . . . . . . 27.52 36.94 34.210 Tanzania . . . . . . . . . . . . . . . . . . . . . . . . 24.39 33.24 36.311 Zambia . . . . . . . . . . . . . . . . . . . . . . . . . 35.44 30.11 -15.012 Uganda . . . . . . . . . . . . . . . . . . . . . . . . . 31.22 28.96 -7.213 Ethiopia . . . . . . . . . . . . . . . . . . . . . . . . . 27.75 24.82 -10.614 Kenya . . . . . . . . . . . . . . . . . . . . . . . . . . 27.70 21.47 -22.515 Cameroon . . . . . . . . . . . . . . . . . . . . . . . 13.60 18.30 34.616 Côte d’Ivoire . . . . . . . . . . . . . . . . . . . . . 50.71 17.09 -66.317 Nigeria . . . . . . . . . . . . . . . . . . . . . . . . . 8.10 11.17 37.918 Zimbabwe . . . . . . . . . . . . . . . . . . . . . . . 42.51 8.99 -78.919 Angola . . . . . . . . . . . . . . . . . . . . . . . . . 6.23 7.60 22.020 DROC . . . . . . . . . . . . . . . . . . . . . . . . . . 3.83 1.43 -62.7
Source: World Bank, Governance Dataset, July 2003, found at Internet address http://www.world-bank.org, retrieved Aug. 2004.
10 The following 10 SSA governments are not WTO members: Cape Verde, Comoros, EquatorialGuinea, Eritrea, Ethiopia, Liberia, São Tomé and Principe, Seychelles, Somalia, and Sudan.
11 WTO accession working parties have been established for the following SSA countries: CapeVerde (July 2000), Ethiopia (February 2003), Seychelles (July 1995), and Sudan (October 1994).Equatorial Guinea (April 2002) and São Tomé and Principe (January 2001) have requested and havebeen granted observer status in the WTO, indicating each country’s intention to begin the accessionprocess within 5 years.
12 The three countries are Comoros, Eritrea, and Liberia.

0 1000 2000 3000 4000 5000 6000 7000
Figure 6-1Gross national income per capita, 2002
Ethiopia
BurundiGuinea-Bissau
EritreaNiger
Liberia
ChadMozambique
Mali
MadagascarRwanda
Nigeria
Burkina Faso
Tanzania
Angola
Central African Republic
Togo
Uganda
Gambia, The
Sudan
Comoros
Kenya
Benin
Ghana
Zambia
Mauritania
Guinea
LesothoCameroon
Senegal
DjboutiSwaziland
Namibia
BostwanaGabon
Cape Verde
MauritiusSeychelles
South Africa
Note.—Because of lack of data, Equatorial Guinea, Somalia, and Zimbabwe have not been included.Source: World Bank, African Development Indicators, found at Internet address http://www.worldbank.org,retrieved June 2004.
Malawi
Sierra Leone
DROC
São Tomé and Principe
Côte d’lvoireROC
SSA average
6-4

6-5
Table 6-2 shows recent tariff rates for SSA countries across several groupings. The firstcategory shows most-favored-nation (MFN)13 tariff rates for 35 of the 38 SSA WTOmembers. The average MFN tariff rate for these countries was about 16.8 percent advalorem for agriculture and 13.1 percent ad valorem for industrial goods. A secondcategory reports only bound tariff rates for the other three WTO members during2003, for which no MFN or applied tariff data were available. The average boundtariff rate for these three countries was 68.1 percent ad valorem for agriculture and38.8 percent ad valorem for industrial goods. Lastly, a third group shows tariff ratesfor 4 of the 10 non-WTO member countries that maintain a de facto application of theGeneral Agreement on Tariffs and Trade14 or that have applied for WTO accession.This third group of countries indicates “MFN-like” tariffs of 29.2 percent ad valoremfor agriculture and 21.4 percent ad valorem for industrial goods. All three groupingsare exclusive of other duties and charges.
Technical Notes
Attempts have been made to provide standard and consistently defined measures foreach country profile, but information may vary among the 48 countries and amongsources because of varying statistical methods and data limitations, coverages, andpractices. Consequently, full comparability cannot be assured. In general, thestatistical information should be treated as indicative, and emphasis placed on broadtrends over time. To facilitate cross-country comparisons, values of many nationalcurrencies have been converted from the national currencies into U.S. dollars, usingthe World Bank Atlas methodology.15 Data series are expressed in constant U.S.dollars and exchange rates use a base year of 1995. Most group averages areweighted according to the relative importance of the countries in the group total whereappropriate, and shares and ratios are calculated using current price series.16 Somedata based on estimates in previous editions have been updated or replaced withactual data or improved estimates. In situations where official exchange rates divergeby an exceptional margin from the rate effectively applied to internationaltransactions and a more appropriate conversion factor is estimated, the dollar valueof GDP may not match the local currency GDP value multiplied by the exchange rate.
13 Also called “Normal Trade Relations” duty rates in the United States.14 The General Agreement on Tariffs and Trade (GATT) consists of the multilateral rules governing
international trade, which were first agreed in 1947 (GATT 1947), and which continue in the form of theGATT 1994 (although essentially identical in substance, GATT 1947 and GATT 1994 are nonethelesslegally distinct documents). The World Trade Organization (WTO) was established in 1995 to oversee theGATT 1994.
15 World Bank, Development Indicators Database, 2004.16 Ibid.

6-6
Table 6-2Tariffs in sub-Saharan African countries, various yearsCountry Agriculture Industry Source Year
Percent ad valorem
WTO members (MFN tariff rates)
Angola . . . . . . . . . . . . . . . . 9.4 8.7 UNCTAD TRN 2002
Botswana . . . . . . . . . . . . . . . 9.1 5.3 WTO IDB 2002
Burkina Faso . . . . . . . . . . . . 14.3 11.6 UNCTAD TRN 2003
Burundi . . . . . . . . . . . . . . . . 33.0 21.9 UNCTAD TRN 2002
Cameroon . . . . . . . . . . . . . . 22.0 17.5 UNCTAD TRN 2002
Central African Republic . . . 22.0 17.5 UNCTAD TRN 2002
Chad . . . . . . . . . . . . . . . . . . 22.0 17.5 UNCTAD TRN 2002
Congo (DROC). . . . . . . . . . . 13.0 11.9 UNCTAD TRN 2003
Congo (ROC). . . . . . . . . . . . 22.0 17.5 UNCTAD TRN 2002
Côte d’Ivoire . . . . . . . . . . . . 14.3 11.6 UNCTAD TRN 2003
Djibouti . . . . . . . . . . . . . . . . 20.5 32.6 UNCTAD TRN 2002
Gabon . . . . . . . . . . . . . . . . 22.0 17.5 UNCTAD TRN 2002
Ghana . . . . . . . . . . . . . . . . . 19.9 13.8 UNCTAD TRN 2000
Guinea . . . . . . . . . . . . . . . . 6.6 6.4 WTO IDB 1998
Guinea-Bissau . . . . . . . . . . . 14.3 11.6 UNCTAD TRN 2003
Kenya . . . . . . . . . . . . . . . . . 23.1 18.5 UNCTAD TRN 2001
Lesotho . . . . . . . . . . . . . . . . 9.1 5.3 WTO IDB 2002
Madagascar . . . . . . . . . . . . 5.8 4.4 UNCTAD TRN 2001
Malawi . . . . . . . . . . . . . . . . 14.9 12.8 UNCTAD TRN 2001
Mali . . . . . . . . . . . . . . . . . . . 14.6 10.6 WTO IDB 1999
Mauritania . . . . . . . . . . . . . 12.6 10.6 UNCTAD TRN 2001
Mauritius . . . . . . . . . . . . . . . 19.5 18.3 UNCTAD TRN 2002
Mozambique . . . . . . . . . . . . 16.4 11.4 UNCTAD TRN 2003
Namibia . . . . . . . . . . . . . . . 9.1 5.3 WTO IDB 2002
Niger . . . . . . . . . . . . . . . . . . 14.3 11.6 UNCTAD TRN 2003Nigeria . . . . . . . . . . . . . . . . 52.4 26.6 UNCTAD TRN 2002Rwanda . . . . . . . . . . . . . . . . 12.6 9.5 UNCTAD TRN 2003
Senegal . . . . . . . . . . . . . . . . 14.3 11.6 UNCTAD TRN 2003
South Africa . . . . . . . . . . . . 8.8 7.9 UNCTAD TRN 2001
Swaziland . . . . . . . . . . . . . . 9.1 5.3 WTO IDB 2002
Tanzania . . . . . . . . . . . . . . . 18.1 12.9 UNCTAD TRN 2003
Togo . . . . . . . . . . . . . . . . . . 14.3 11.6 UNCTAD TRN 2003
Uganda . . . . . . . . . . . . . . . . 12.1 8.1 UNCTAD TRN 2003
Zambia . . . . . . . . . . . . . . . . 18.7 13.2 UNCTAD TRN 2003
Zimbabwe . . . . . . . . . . . . . . 25.5 18.7 UNCTAD TRN 2001
Average . . . . . . . . . . . . . 16.8 13.1
WTO members (bound tariff rate ceilings)
Benin . . . . . . . . . . . . . . . . . . 61.8 11.5 UNCTAD TRN 2003
The Gambia . . . . . . . . . . . . 102.2 56.4 UNCTAD TRN 2003
Sierra Leone . . . . . . . . . . . . 40.3 48.5 UNCTAD TRN 2003
Average . . . . . . . . . . . . . 68.1 38.8See footnotes at end of table.

6-7
Table 6-2—ContinuedTariffs in Sub-Saharan Africa countries, various years
Country Agriculture Industry Source Year
Percent ad valorem
Non-WTO members (MFN* tariff rates)
Cape Verde . . . . . . . . . . . . . (1) (1)Comoros . . . . . . . . . . . . . . . (1) (1)Equatorial Guinea . . . . . . . . 22.0 17.5 UNCTAD TRN 2002Eritrea . . . . . . . . . . . . . . . . . (1) (1)Ethiopia . . . . . . . . . . . . . . . . 21.7 18.4 UNCTAD TRN 2002
Liberia . . . . . . . . . . . . . . . . . (1) (1)São Tomé and Principe . . . . (1) (1)Seychelles . . . . . . . . . . . . . . 38.4 26.8 UNCTAD TRN 2001Somalia . . . . . . . . . . . . . . . . (1) (1)Sudan . . . . . . . . . . . . . . . . . 34.6 22.9 UNCTAD TRN 2002
Average . . . . . . . . . . . . . 29.2 21.41 Not available.
Note.–Harmonized System (HS) chapters 1 to 24 constitute agricultural goods, and HS 25 to 97comprise industrial goods. MFN* indicates MFN-like tariff rates of non-WTO members that main-tain a de facto application of the rules of the GATT or that have applied for WTO accession. UNC-TAD TRN indicates the Trade Analysis Information System (TRAINS) database of the United NationsConference on Trade and Development, taken from the World Bank’s WITS database. WTO IDBindicates the Integrated Database of the World Trade Organization, taken from the World Bank’sWITS database. Data shown from the most recent year available; data from the WTO IDB supple-ments that of the UNCTAD TRN database where multiple entries are available for the same year.
Source: World Bank, World Integrated Trade Solution Database, Aug. 2004.

6-8
Statistical data for the 48 countries were sourced from the most recent data availablefrom the Economist Intelligence Unit (EIU) (economic and world trade indicators),17
World Bank Africa database (FDI),18 and the U.S. Department of Commerce(U.S.-SSA trade data).19 Some countries’ “Composition of GDP” charts are dividedinto primary, secondary, and tertiary sector aggregations used by the EIU. Thesesectors are defined as: primary (agriculture, fisheries, mining, and quarrying);secondary (manufacturing, construction, electricity, water, and other utilities); tertiary(primarily services activities, such as retail, financial, real estate, and governmentservices). As a result of rounding, “Composition of GDP” charts may not add to 100.Text references to the “formal” sector indicate activity that is linked to officialadministrative entities (such as through tax collection); and text references to the“informal sector” indicate activity primarily unmonitored by administrative entities(such as cash payments to employees). In addition, some country profiles refer to“Article IV” consultations with the IMF. This term refers to “Articles of Agreement of theInternational Monetary Fund, Article IV – Obligations Regarding ExchangeArrangements.”20 Where U.S. dollar equivalents were not provided in the sourcematerial, IMF exchange rates for relevant years were used to provide estimated U.S.dollar equivalent values.21 Textual update information was drawn from numeroussources, including the Economist Intelligence Unit country profiles and Viewswirearticles, Newsedge articles, Allafrica articles, and U.S. Department of State.22 Allcountry profile text discussions represent reported information from theabove-referenced sources, and are not Commission opinion or assessment.
17 Economist Intelligence Unit, “Sub-Saharan African Countries’ Economic Structure Profiles,”2003. EIU data include both official government data and EIU estimates when official source informationis unavailable.
18 World Bank, Development Indicators Database, 2004, retrieved July 2004.19 Compiled from official statistics of the U.S. Department of Commerce.20 For more information, see IMF, “Articles of Agreement of IMF,” found at Internet address
http://www.imf.org/external/pubs/ft/aa/aa04.htm, retrieved Sept. 23, 2003.21 IMF, IFS Database, found at Internet address http://www.imfStatistics.org, retrieved May 2004.22 For a more detailed list of primary nongovenmental information sources, see source list at the end
of this chapter.

6-9
Economic OverviewEconomic Indicators
2002 2003 Difference
GDP (nominal, Kz bn) 525.7 954.4 428.7
GDP (US$ bn) 12.1 12.7 0.6
CPI Inflation (annual average, %) 106.0 76.6 -29.4
Goods Exports (US$ mn) 8,333.4 9,618.5 1,285.1
Goods Imports (US$ mn) 3,709.0 4,079.9 370.9
Trade Balance (US$ mn) 4,624.4 5,538.6 914.2
Current Account Balance (US$ mn) -632.6 -495.2 137.4
Foreign Exchange Reserves (US$ mn) 375.6 845.0 469.4
Total External Debt (US$ bn) 9.4 9.2 -0.2
Debt Service Ratio, paid (%) 17.2 17.5 0.3
Exchange Rate (Kz/US$) 43.5 75.0 31.5
Origins of GDP (1999)
Agriculture(6.9%)
Oil(61.4%)
Other(12.5%)
Manufacturing(3.5%)
Services(7.0%)
Mining(8.7%)
S Unrest in the Angolan countryside,drought,and relocationcontributed to a decrease in agriculture production in2003.The decline in the agricultural sector contributed toincreased food imports in 2003.
S Production in Angola’s fishing industry continues to declinebecause of government intervention and insufficientinvestment and technology.
S As the second-largest oil exporter in SSA,Angola’spetroleum sector has continued to expand rapidly.
S Despite rapid economic growth,Angola remainsunderdeveloped according to socioeconomic indicators. Inlate 2003,efforts began to improve inadequateinfrastructure hampered by civil unrest in previous years.
S Angola is the world’s fourth-largest diamond producer.S Production within the manufacturing industry continues to
be hampered by high costs,corruption, inadequateservices,and ineffective laws.
S Major government initiatives for 2003 included growth innonpetroleum sectors,specifically agriculture and livestock,and improvement of land and water transportation;energy,water,supply and sanitation;and housing and publicservices, including schools and health clinics.
S Government plans for privatization,tax reforms,and budgetreforms are progressing slowly.
S Post-war rehabilitation continued to improve in early 2004with the third phase of the World Bank’s reconstructionprogram.Co-founded by the World Bank/InternationalDevelopment Association,EU,Norwegian government,U.S.Agency for International Development,and ChevronTexaco(U.S.),Angola received a social action fund of $137 millionto rehabilitate its social and economic infrastructure overthe next four years.
S Continued macroeconomic instability,oil-backed lending,and corruption contributed to Western donor and foreignaid agency reluctance to offer financial assistance forreconstruction after the recent civil unrest.Because ofdecreased financial assistance,the government expressedinterest in establishing a new program with the IMF inMarch 2003.In April 2004,the World Bank grantedAngola $33 million to facilitate societal reintroduction of140,000 soldiers. In October 2003,Angola andneighboring São Tomé,& Principe signed agreementsregarding oil, tourist activity,and financial responsibility. Inearly 2004,DROC and Angola signed cooperationagreements focusing on construction of new roads;rehabilitation of railways;and cooperation in the areas oflegal,social,and political communication.
S In April 2004,Angola and Morocco signed a cooperationprotocol focused on the petroleum sector.
Economic Update
Real GDP Growth Rate
ANGOLA
02468
1012141618
1999 2000 2001 2002 2003
Percent

6-10
Main Trade Partners, percent of total
Markets (2002) Sources (2001)
United States 35.8 Portugal 26.0
China 11.6 South Africa 15.9
France 6.9 United States 17.9
Belgium 5.4 France 8.6
Main Trade Commodities, US$ millions
Exports (1999) Imports (1996)
Crude oil 4,305.0 Consumergoods (exclfood)
712.0
Diamonds 577.0 Capital goods 327.0
RefinedPetroleum
75.0 Intermediategoods
299.0
Liquefiedpetroleum gas
10.0 Food 295.0
ANGOLATrade UpdateS Passenger and freight use of air travel within Angola has
increased because civil unrest in the countryside hashampered ground-based transportation.
S Crown Agents (UK) continued efforts to reform customsprocedures.These efforts contributed to an increase in staterevenue in early 2003.
S In late 2003,Angola announced plans to explore theexportation of liquified natural gas (LNG) as a means ofreducing the flaring of gas,a by-product of oil production.Inadequate infrastructure investment has prevented Angola’sexport of LNG thus far.
S Efforts to eliminate investment and trade barriers and movetoward a market-based economy experienced a setbackwhen the government required all imports to pass throughgovernment-controlled posts.
S In 2003,U.S.exports to Angola consisted primarily ofmachinery and mechanical appliances,aircraft and partsthereof,and meat.U.S.imports from Angola consistedprimarily of mineral fuels and oils,precious or semipreciousstones or metals,and organic chemicals. In 2004,Angolawas designated an AGOA beneficiary country.
Investment and Privatization Update• Representing over 50 percent of the foreign investment in
Angola in 2003,the United States’ investment level wasapproximately $10 billion and is anticipated to reach $20billion by 2008.
S Investment continued to focus primarily on the energy sectorto help alleviate the frequent power outages caused by aninadequately maintained and inefficiently integrated electricitygrid.
• In June 2003, investment in the Angolan oil sector,specifically LNG and refinery operations,was expected toincrease by $23 billion over the next 5 years.A $15-billioninvestment by ExxonMobil (U.S.),after making its seventeenthdiscovery in Angola’s deepwater Block 15,contributed to theexpected increase.
• Investment in Angola’s diamond mining industry alsoincreased.In June 2003,three kimberlite ore depositscontaining diamonds were found at Alto Cuilo by PetraDiamond mine (South Africa). In December 2003,RussianAlrosa began building a $45-million hydroelectric powerplant,due to be completed by mid-2006.The power plant willhelp to increase the number of ore-dressing facilities on theChikapa River and increase the mine’s diamond output.Alsoin December 2003,Empresa de Diamantes (Endiama)announced its partnership with local companies Gelton,Prodminas,and Saccir and Makitara to mine the Cacoloregion for alluvial diamonds.
S Investment in the telecommunications sector increased earlyin 2004 when Telecom Namibia bought 44 percent ofMundo Startel with a commitment of $14 million over thenext 3 years and plans for a national network structure bymid-2006.
S Private sector weakness,a lack of financial andadministrative capacity,and inadequate interest in potentialbuyers continued to constrain the government’s privatizationprogram.The privatization of the state banks, initiallysupported by the IMF,experienced a setback when a tenderfor a consultancy contract was cancelled.The contractincluded plans to oversee the sale of over 50 percent of BCI,the first state bank.
-4500-3600-2700-1800-900
0900
1800270036004500
1999 2000 2001 2002 2003
Millions of U.S. Dollars
U.S. Trade Balance
U.S. exportsU.S. importsTrade balance
0
500
1000
1500
2000
2500
3000
1998 1999 2000 2001 2002
Millions of U.S. Dollars
Net Foreign Direct Investment
Millions of U.S. DollarsMillions of U.S. Dollars

6-11
Economic OverviewEconomic Indicators
2002 2003 Difference
GDP (nominal, CFAfr bn) 1,959.0 2,125.0 166.0
GDP (US$ bn) 2.8 3.7 0.9
CPI Inflation (annual average, %) 2.4 2.8 0.4
Goods Exports (US$ mn) 424.0 484.0 60.0
Goods Imports (US$ mn) 582.0 726.0 144.0
Trade Balance (US$ mn) -158.0 -242.0 -84.0
Current Account Balance (US$ mn) -88.0 -147.0 -59.0
Foreign Exchange Reserves (US$ mn) 615.7 631.0 15.3
Total External Debt (US$ mn) n/a n/a n/a
Debt Service Ratio, paid (%) n/a n/a n/a
Exchange Rate (CFAfr/US$) 697.0 518.2 -115.8
Origins of GDP (2002)
Primary(36.0%)
Secondary(14.0%)
Tertiary(50.0%)
S Benin continued to experience substantial economic growthin 2003.
S The government continues to implement social servicesprojects in areas such as health and education.
S The government’s primary macroeconomic strategyincludes accelerated growth,poverty reduction,andfinancial stability.Government revenue is expected toincrease from the computerization of the customs andexcise department.Customs revenue representsapproximately 50 percent of domestic revenue.The efforts,however,continue to be hampered by lack of efficientimplementation.
S Benin plans to modernize the Adjaralla dam on the MonoRiver in order to increase power supplies.This is a jointproject with Togo and is estimated to cost $162 million.
S In December 2003,Benin received its first internationalcredit rating,receiving a B+ long-term and B short-termsovereign credit rating.
S Millennium Challenge Corporation (U.S.) designated Beninas a country eligible to receive assistance in 2004.
S Benin continued to follow the IMF PRGF program firstinitiated in July 2000.The PRGF’s fifth review wascompleted in October 2003.In addition,the IMF approveddisbursement of $3.7 million towards the PRGF.PRGFtargets for 2003 were expected to be largely met.
S In October 2003,the African Development Bankannounced an $18-million loan to finance a ruralelectrification project costing a total of $23 million.Theproject will provide electricity for 57 rural areas.Thegovernment aims to provide electricity to 29 percent of thepopulation by 2008.
S In February 2004,the West African Development Bank andBenin signed a complementary debt relief agreement worth$8.9 million towards Benin’s poverty eradication efforts andHIV/AIDS alleviation.
S The World Bank/IDA is preparing a PRSC of $20 million.The aim is to support the country’s poverty reductionstrategy.
S The EU allocated a 30 million euro (approximately $39million) grant to support urban road maintenance and roadimprovement policy.
S Nigeria shut down its border with Benin for 2 weeks inAugust 2003 in an attempt to reduce cross-border crime.
Economic Update
Real GDP Growth Rate
BENIN
01234567
1999 2000 2001 2002 2003
Percent

6-12
Main Trade Partners, percent of totalMarkets (2002) Sources (2001)European Union 24.6 European Union 38.1
India 24.2 China (incl HongKong)
31.8
Italy 10.8 France 15.6
China (incl HongKong)
7.3 United Kingdom 4.7
Main Trade Commodities, US$ millions, 2002
Exports Imports
Re-exports 168.8 Food 160.6
Cotton 141.2 Petroleumproducts
130.4
Capitalgoods
104.8
beninTrade Update
S During 2003,Benin’s major port,Cotonou,experienced alarge surge in activity,as Côte d’Ivoire’s Abidjan port activitywas restricted because of civil unrest.
S The IMF and Benin authorities evaluated the requirements ofthe customs administration for pre-shipment inspection.Specifically, the team examined the monitoring of customsvaluation and ”special regimes,” including audit coverage andtransparency of customs procedures.
S France is the largest source of imports for goods includingfood,mineral fuels,chemicals,machinery,and transportequipment. Imports from China have increased substantially.
S Nigeria is the largest re-export market for Benin’s goods.Benin’s low tariffs and good port facilities,and its largeborder with Nigeria,create an informal market for trade.
S In recent years,production of crops such as palm oil,cashewnuts,coffee,cocoa,groundnuts,and shea nuts has increasedsubstantially in northern and central Benin.
S Construction of the Cotonou fishing port is scheduled to becompleted in mid 2004.The modernization project, fundedby Japan and the United States, included installation of arefrigeration plant and the construction of two unloadingdocks and boat-repair and storage facilities.Also planned arean electricity generating plant,a laboratory,and researchoffices.
S In 2005,Benin and UEMOA plan to establish a full economicunion.
S In 2003,U.S.exports to Benin consisted primarily of motorvehicles and parts thereof,machinery and mechanicalappliances,and used clothing and textiles.U.S.imports fromBenin consisted primarily of live animals,cotton yarn orfabric,and wood and articles of wood.In 2003 and 2004,Benin was designated an AGOA beneficiary country, includingqualifying for apparel benefits in 2004.
Investment and Privatization UpdateS Libercom,a state-owned mobile phone operator and the
largest mobile phone operator in Benin,plans to increase itscustomer base from 69,000 in 2002 to 140,000 in 2003.
S The telecommunications industry is still slated forprivatization.In addition,privatization of Continental Bank isstill planned,while two hotels were put up for sale July 2003.
S In July 2003,the government offered for sale ginneriesowned by the state-owned cotton marketing and processingcompany.The company’s processing plants were to be soldin four parts:Bembereke and Glazoue ginneries,Bohicon 1and 2 and Kandi ginneries,Banikoara and Hagoumeginneries,and Parakou 1 and 2 and Savalou ginneries.
S During 2003,the government continued plans to privatizethe Cotonou port.
0
10
20
30
40
50
1999 2000 2001 2002 2003
Millions of U.S. DollarsU.S. exportsU.S. importsTrade balance
U.S. Trade Balance
0
200
400
600
800
1000
1200
1998 1999 2000 2001 2002
Net Foreign Direct Investment
Millions of U.S. DollarsMillions of U.S. DollarsMillions of U.S. Dollars

6-13
Economic OverviewEconomic Indicators
2002 2003 Difference
GDP (nominal, P bn) 35.9 41.2 5.3
GDP (US$ bn) 5.7 8.3 2.6
CPI Inflation (annual average, %) 8.0 9.2 1.2
Goods Exports (US$ mn) 2,368.0 2,544.0 176.0
Goods Imports (US$ mn) 1,704.0 1,753.0 49.0
Trade Balance (US$ mn) 664.0 791.0 127.0
Current Account Balance (US$ mn) 540.0 591.0 51.0
Foreign Exchange Reserves (US$ bn) 5.5 5.8 0.3
Total External Debt (US$ mn) 383.3 417.8 34.5
Debt Service Ratio, paid (%) 1.9 1.8 -0.1
Exchange Rate (P/US$) 6.3 5.0 -1.3
Origins of GDP (2000)Agriculture(2.5%)
Services (incl. gov.) (43.7%)
Manufacturing(4.1%)
Construction, waterand electricity(8.0%)
Mining(36.5%)
Miscellaneous(5.2%)
S In June 2004,the World Economic Forum rankedBotswana as Africa’s top competitive economy because ofthe quality of its public institutions and the openness of theeconomy.
S Botswana earns 80 percent of its foreign exchange fromthe mining sector.Botswana is the world’s largest diamondproducer by value.Diamond production is not laborintensive and accounts for only 5 percent of employment inthe formal sector.A substantial proportion of output ismined by the DeBeers Botswana Mining Company,alsoknown as Debswana,a joint venture between De Beers andthe Government of Botswana.Botswana is expected tomaintain a current account surplus through 2004 becauseof increased output from the mining sector.
S Botswana continues to be hampered by a small consumermarket,and its landlocked location limits the supply ofusable water and also results in high transport costs.
S The spread of HIV/AIDS continues to hinder economicdevelopment,accounting for continued increasing socialcosts. In early 2004,the Central Statistics Office wastasked with conducting a national AIDS impact study.
S In 1999,the Mining and Minerals Act was revised toincrease private sector investment in mining exploration inremote regions.A new policy proposed for 2004 isexpected to reduce investor risk by providing baselinegeological data,as well as streamlining the productionprocess for the mining of raw materials such as diamonds,copper-nickel,soda ash,and coal.
S In February 2004,the finance minister announcedimmediate plans to devalue the local currency,the pula.Thedevaluation is aimed at improving Botswana’s competitiveposition in international markets for the mining sector andestablishing a competitive edge for nonmining activities.
S The government has indicated its intent to decrease thecurrent budget deficit through the sale of the Public DebtService Fund loan book and a reduction in public spending.
S The Ninth National Development Plan was launched in April2003 and will be completed in March 2009.This plan willexplore opportunities to promote investment and toincrease activity in nonmining sectors in order to diversifythe economy away from its reliance on diamond mining.
S The government announced plans to fund a developmentplan to achieve global competitiveness through diversifieddevelopment.Sectors identified by the Botswana ExportDevelopment and Investment Authority include textile andgarment production,glass manufacturing, jewelrymanufacturing, leather tanning,tourism,public sectorreform,and meat products.
S A new diamond mine opened in October 2003 and isexpected to contribute 25,000 carats to the nationaloutput level.
Economic Update
Real GDP Growth Rate
BOTSWANA
0123456789
1999 2000 2001 2002 2003
Percent

6-14
Main Trade Partners, percent of total, 2000
Markets SourcesEuropean FreeTrade Area
87.0 Southern AfricanCustoms Union
74.0
Southern AfricanCustoms Union
7.0 European FreeTrade Area
17.0
Zimbabwe 4.0 Zimbabwe 4.0
Main Trade Commodities, US$ millions, 2000
Exports Imports
Diamonds 2,231.0 Machinery &electrical goods
462.0
Copper &nickel
163.0 Food, beverages &tobacco
293.0
Vehicles 53.0 Vehicles & transportequipment
258.0
Meat & meatproducts
52.0 Chemical & rubberproducts
203.0
botswanaTrade UpdateS In May 2003,the Botswana Meat Commission’s abattoirs
were temporarily closed because of foot-and-mouthdisease.Exports to the EU,Botswana’s largest market,and South Africa were temporarily halted.In July 2003,beef exports to the EU were resumed.Beef is the primaryagricultural export from Botswana,with exports totalingmore than $300 million per year.
S A Tourism Board was established in late 2003 after thepassage of the Tourism Bill.The board’s role will be topromote tourism with the aid of a development fund.Tourism has dwindled because of civil unrest in the regionand political instability in neighboring Zimbabwe.
S In August 2002,Botswana was granted the right underAGOA to source raw materials from third-party countriesfor apparel production because of its limited domesticresources.
S Improved production processes in the mining industryhave increased diamond output,which reached 28.4million carats in 2002 and 30.3 million in 2003.
S In 2003,U.S.exports to Botswana consisted primarily ofaircraft and parts thereof,electrical machinery andequipment,and machinery and mechanical appliances.U.S.imports from Botswana consisted primarily ofprecious or semiprecious stones or metals,apparel,andfootwear.In 2003 and 2004,Botswana was designatedan AGOA beneficiary country, including qualifying forapparel benefits.AGOA (including GSP) imports fromBotswana totaled $6.3 million in 2003.
Investment and Privatization UpdateS Major government initiatives encouraging joint ventures
between foreign investors and domestic partners includefacilitating the issuance of trade licenses,streamlining theprocess for issuing work permits,and allowing taxwrite-offs for employee training.
S Although Botswana allows for free repatriation of profits,has one of the lowest corporate tax rates in the region at25 percent,and has a special corporate tax rate (15percent) for certain categories of manufacturing,the slowprogress of privatization and the slow adoption ofcompetition policy legislation continues to hamperinvestment.
S Gallery Gold (Australia) has signed separate joint ventureagreements with De Beers Prospecting (Botswana) andAlbidon (Australia) that cover exploration work inBotswana’s Tati greenstone belt.
S An 18-month exploration program was announced for thekimberlite region by African Diamonds (Ireland) and is tobe funded through the Alternative Investment Market (UK).The firm,which was also awarded a prospecting licensefor the Damtshaa mine that opened in October 2003,hasindicated its intent to explore ancient river systems in thehope of discovering diamond deposits.
S The original target sale date of the national airline,AirBotswana,was postponed to 2003 from 2001.In late2003,the privatization was further halted because of thedecision of Comair and Air Mauritius to withdraw theirbids.Comair expressed concern over the current state ofthe international airline industry,and Air Mauritius hasundergone changes in senior management.
U.S. Trade Balance
Net Foreign Direct Investment
-20
-10
0
10
20
30
40
50
1999 2000 2001 2002 2003
Millions of U.S. Dollars U.S. exportsU.S. importsTrade balance
0
20
40
60
80
100
1998 1999 2000 2001 2002
Millions of U.S. DollarsMillions of U.S. DollarsMillions of U.S. Dollars

6-15
Economic OverviewEconomic Indicators
2002 2003 Difference
GDP (nominal, CFAfr bn) 2,004.0 2,157.0 153.0
GDP (US$ bn) 2.9 3.7 0.8
CPI Inflation (annual average, %) 2.3 2.0 -0.3
Goods Exports (US$ mn) 236.0 324.0 88.0
Goods Imports (US$ mn) 548.0 699.0 151.0
Trade Balance (US$ mn) -312.0 -375.0 -63.0
Current Account Balance (US$ mn) -313.0 -381.0 -68.0
Foreign Exchange Reserves (US$ mn) 213.0 341.0 128.0
Total External Debt (US$ bn) n/a n/a n/a
Debt Service Ratio, paid (%) n/a n/a n/a
Exchange Rate (CFAfr/US$) 697.0 581.2 -115.8
Origins of GDP (2002)
Livestock (Primary)(9.6%)
Other primary(4.4%)
Other(0.9%) Agriculture (Primary)
(17.8%)
Othersecondary(5.9%)
Mining and manufacturing(Secondary) (12.6%)
Tertiary(48.8%)
S Agriculture remains an important sector of the economy.Approximately 90 percent of the population derives itslivelihood from agriculture and livestock,with over 80percent depending on subsistence agriculture.
S Gold is Burkina Faso’s main mineral resource and limitedamounts are sold commercially. It is the third-largestsource of export receipts,after cotton and livestock.Although Burkina Faso has some manganese deposits,thecountry has yet to invest in their development.
S The government has announced biotech cotton trials aspart of a cooperative agreement with Monsanto (U.S.) andhas agreed to co-host a regional biotech conference.
S In April 2003,along with Mali,Benin,and Chad,BurkinaFaso introduced a plan to end cotton subsidies.
S Government economic policy is expected to focus onmaking primary education compulsory and free,giving localcommunities greater authority and resources,monitoringthe PRSP process, increasing financial support of privateenterprise,and coordinating donor support.
S The most recent PRGF was approved by the IMF on June11,2003.PRGFs have placed significant emphasis onsocial expenditure and rural development. IMF supportedgoals for development under the 2003-06 PRGF includeminimizing the budget deficit,protecting social spending,improving tax collection efficiency,promoting private sectorand rural development,opening the cotton sector to privatemarkets,promoting good governance,fighting corruption,encouraging debate,and facilitating privatization.
S Nine donor agencies, including the World Bank andEuropean Development Bank,have agreed to provide $105million for the construction of a power line betweenOuagadougou,the capital,and Bobo-Dioulasso.
S Grants represent 70 percent of the $2 billion secured toreduce poverty by funding initiatives in education,healthcare,and the campaign against HIV/AIDS.
S In early 2004,the AfDB pledged 3 million euro(approximately $4 million) to Burkina Faso to support landreform efforts.
S India pledged $500 million in low-interest loans in early2004 to help Burkina Faso,Chad,Côte d’Ivoire,EquatorialGuinea,Ghana,Guinea-Bissau,Mali,and Senegal create theTechno-Economic Approach for Africa India Movement,which will focus on generating employment,and promotingpharmaceuticals production and healthcare, informationtechnology and telecommunications,and agriculture.
Economic Update
Real GDP Growth Rate
BURKINA FASO
01234567
1999 2000 2001 2002 2003
Percent

6-16
Main Trade Partners, percent of total, 2002
Markets SourcesFrance 45.3 France 19.6
Côte d’Ivoire 9.2 Côte d’Ivoire 18.8
Indonesia 5.0 Japan 9.3
Mali 4.1 Germany 6.0
Main Trade Commodities, US$ millions, 2002Exports ImportsCotton 127.7 Capital goods 178.6
Animal products 49.3 Petroleumproducts
101.9
Gold 5.7 Food 69.6
burkina faso
Trade UpdateS Despite significant investments in recent years,the
transport system remains inadequately developed.Thegovernment is implementing a transport sectoradjustment program with funding of $92 million fromthe World Bank.Main focal points of this project includedeveloping a policy and regulatory framework andimproving the road and rail networks.
S In September 2003,the border with Côte d’Ivoire wasreopened to commercial and private traffic.Before itsclosing,Burkina Faso extensively used the Abidjan portfor worldwide trade.Route interference,however,contributed to economic hardships in the western partof the country.While the ports were closed,shippersdiverted trade to ports in Ghana and elsewhere in Africa.To alleviate the situation,the government lifted all taxesand duties on the importation of 100 new trucks to beused in the transport of internationally traded goods.
S Plans exist to construct a $750-million railway line fromBurkina Faso to Ghana’s ports on the Atlantic.Thisproject would provide alternative trade transport optionsfor the landlocked country other than the Abidjan port inCôte d’Ivoire.
S In 2003,U.S.exports to Burkina Faso consistedprimarily of electrical machinery and equipment,machinery and mechanical appliances,and cereals.U.S.imports from Burkina Faso consisted primarily of worksof art;edible fruit and nuts;and coffee,tea,mate,andspices.
Investment and Privatization UpdateS A PRSP progress report released in early 2004
delineates steps to improve the country’s businessenvironment and encourage investment.Thegovernment has shortened the time required toestablish a new business from 3 months to 15 days.Plans were developed in meetings with the privatesector with goals to relax bonded warehouse regimes;to fund technical education,occupational training,andapprenticeships;and to provide companies withcomputer equipment.The government is also makingefforts to reduce the cost of electricity,water,telecom,and transport.
S Twenty-six state enterprises were privatized between1992 and 2003,with several on offer and more than adozen placed in liquidation.Most liquidation has takenplace in the manufacturing sector because of stiffcompetition from imports.Onatel (telecommunications),Sonabel (electricity),Sonabhy (energy provider),Onea(water),Cnea (agriculture sector parastatal),a hotel,and the Ougadougou and Bobo-Dioulasso airports stillawait privatization.
S In March 2003,the government announced the sale ofall equipment owned by cotton parastatal Sofitex. Itlaunched the partial privatization of Onatel,a telecomparastatal, in May 2003.The process is expected to becompleted by 2009.
S In mid-2004,Burkina Faso passed legislation toencourage and provide protection for German FDI.
U.S. Trade Balance
Net Foreign Direct Investment
-202468
101214161820
1999 2000 2001 2002 2003
Millions of U.S. DollarsU.S. exportsU.S. importsTrade balance
0
5
10
15
20
25
30
1998 1999 2000 2001 2002
Millions of U.S. Dollars

6-17
Economic OverviewEconomic Indicators
2002 2003 Difference
GDP (nominal, Bufr bn) 567.0 617.0 50.0
GDP (US$ mn) 609.2 599.0 -10.2
CPI Inflation (annual average, %) -1.4 10.2 11.6
Goods Exports (US$ mn) 30.0 40.0 10.0
Goods Imports (US$ mn) 106.0 128.0 22.0
Trade Balance (US$ mn) -76.0 -88.0 -12.0
Current Account Balance (US$ mn) -35.0 -47.0 -12.0
Foreign Exchange Reserves (US$ mn) 58.8 63.3 4.5
Total External Debt (US$ mn) n/a n/a n/a
Debt Service Ratio, paid (%) n/a n/a n/a
Exchange Rate (Bufr/US$) 930.8 1,030.0 99.2
Origins of GDP (2001)
Agriculture(50.0%)
Industry(19.0%)
Services(31.0%)
S Subsistence farming remains predominant.Civil unrest,sanctions, import shortages,and inadequate domesticdemand hamper development of the industrial sector.
S The coffee sector continues to be affected by inadequateagricultural inputs,weak prices,and long-term internationalprice decline.
S In December 2003,the government passed a budget thatbroadly conforms with performance criteria specified by thepost conflict emergency program.
S The government’s economic policy aims to reduce poverty,promote recovery, increase GDP growth,and improvedelivery of public services.The government pledged toreduce the fiscal deficit by promoting price stability,pursuing structural reforms,and increasing expenditureson poverty relief.
S The IMF broadly approved Burundi’s economic progressdespite civil unrest and decreased economic activity.
S In early 2004,the IMF and the Burundi government signedan agreement for $104 million to support the economicreform program for 2004-07.
S Burundi is expected to receive debt relief under the HIPCinitiative upon the IMF’s approval of the PRGF and povertyreduction strategy in late 2004.
S The World Bank pledged to provide a loan of $26 million formacroeconomic support,and $33 million to assist thesocioeconomic reintegration of displaced combatants.
S The World Bank approved an $84-million credit to improveaccess to agricultural production centers,social services,and national and international markets.
S In June 2003,the Burundi External Relations andCooperation minister and the Chinese Ambassador toBurundi signed a $4-million aid agreement.
S In April 2004,the Government of Italy canceled debt owedby Burundi and committed to efforts to restructureBurundi’s remaining international debt.
Economic Update
Real GDP Growth Rate
BURundi
-2-1012345
1999 2000 2001 2002 2003
Percent

6-18
Main Trade Partners, percent of total, 2002
Markets SourcesSwitzerland 28.8 Belgium 12.4
Germany 20.2 Saudi Arabia 12.3
Belgium 9.5 Tanzania 9.3
Kenya 7.7 Kenya 7.7
Main Trade Commodities, US$ millions, 1999Exports ImportsCoffee 44.1 Intermediate
goods50.2
Tea 10.3 Consumergoods
37.4
Manufactures 1.0 Capital goods 30.0
Hides 0.1 Food 10.0
burundi
Trade UpdateS Civil unrest, instability,and sanctions contributed to an
increase in unrecorded exports and imports.Years ofsocial unrest have also substantially reduced Burundi’simports of manufactured goods.The expected reduction incivil unrest should support an environment conducive toincreased trade.
S The government has committed to exchange rate reformsin an attempt to decrease the gap between official andparallel exchange rates.
S The government liberalized regulations for sugar importsand exports because of supply shortages driven by pricediscrepancies with neighboring countries.
S The government has continued to diversify the country’sexport base.For example,nontraditional exporters areexempt from customs duties and are eligible for a 10-yeartax holiday.
S In 2003,U.S.exports to Burundi consisted primarily ofvegetables,cereals,and machinery and mechanicalappliances.U.S.imports from Burundi consisted primarilyof coffee,tea,mate,and spices;fish,crustaceans,andmolluscs;and live animals.
Investment and Privatization UpdateS The government announced plans to privatize the
telecommunications parastatal in early 2001;however,political unrest continues to delay completion of the sale.
S Although the privatization minister has indicated thegovernment’s commitment to privatizing a variety ofenterprises,resistance from public sector workers hasslowed the process.
U.S. Trade Balance
Net Foreign Direct Investment
-15
-10
-5
0
5
10
15
1999 2000 2001 2002 2003
Millions of U.S. DollarsU.S. exportsU.S. importsTrade balance
Millions of U.S. DollarsMillions of U.S. DollarsMillions of U.S. Dollars
0
2
4
6
8
10
12
1998 1999 2000 2001 2002

6-19
Economic OverviewEconomic Indicators
2002 2003 Difference
GDP (nominal, CFAfr bn) 7,132.0 7,581.0 449.0
GDP (US$ bn) 9.7 12.1 2.4
CPI Inflation (annual average,%) 2.7 2.3 -0.4
Goods Exports (US$ mn) 1,884.0 2,170.0 286.0
Goods Imports (US$ mn) 1,858.0 2,247.0 389.0
Trade Balance (US$ mn) 26.0 -77.0 -103.0
Current Account Balance (US$ mn) -550.0 -563.0 -13.0
Foreign Exchange Reserves (US$ mn) 629.7 680.7 51.0
Total External Debt (US$ bn) 7.4 7.3 -0.1
Debt Service Ratio, paid (%) 14.9 9.7 -5.2
Exchange Rate (CFAfr/US$) 697.0 581.2 -115.8
Origins of GDP (2002)
Agriculture(28.3%)
Otherindustry(23.4%)
Services(41.4%)
Oil (Industry)(6.9%)
S In 2003,agriculture, including forestry, livestock,andfishing,was the most important sector of the Cameroonianeconomy.Cocoa,coffee,cotton,palm oil,rubber,bananas,and pineapples are the country’s primary commodity crops.Most of the farming,with the exception of rubber and palmoil, is semi-subsistence and carried out on approximately15 percent of the land.
S The forestry sector continues to play a significant role in theCameroonian economy because of its direct and indirectcontribution to employment,exports,and GDP.
S Cameroon is expected to fall to fifth place in oil productionin the Central African Franc Zone in 2004 after Chad’s oilproduction reaches full capacity.
S The Government of Cameroon is forecasting that thecountry’s oil reserves will be depleted by 2010 unless newreserves are found.
S Parliament passed a law in 2003 to establish anindependent audit court as provided for under the 1996constitution.
S Because of a decline in oil revenue,the government plans toreform its tax codes to boost nonoil revenue by 2005.Thereforms include a broader tax base, improved efficiency ofvalue-added tax and public expenditure, improvedtransparency,a restructuring of the personal income tax,and initialization of a property tax.A computerizedexpenditure tracking system was implemented inSeptember 2003.
S The government remained committed to addressing thecountry’s rising poverty level.Because of the HIPCinitiative’s focus on the national debt,debt-related savingsare being spent on improving healthcare,primaryeducation,and HIV prevention.However,much of themoney freed by the HIPC initiative remained unspent in2003 because of inefficient processes.Less strict controlsand improved efficiencies are expected in 2004,so thatfunds can be spent on public projects and povertyalleviation.
S Poverty alleviation initiatives in 2004 include developing astable economy,enhancing growth through diversificationand privatization, improving infrastructure,enactingenvironmental protection measures,and improvinggovernance.
S In August 2003,the government presented its PRSP to theIMF and World Bank,which specifies the country’s goal ofhalving the number of Cameroon inhabitants living belowthe poverty line by 2015.
S In December 2003,after finishing its review of thegovernment’s reforms and economic policies,the IMFgranted $23 million to the country and an extension of thePRGF program to December 2004.Cameroon received anadditional $4 million because of the current HIPC initiative.The country’s recent economic stability was applauded,butthe IMF encouraged further structural reform andimproved governance.
Economic Update
Real GDP Growth Rate
CAMEROON
0
1
2
3
4
5
6
1999 2000 2001 2002 2003
Percent

6-20
Main Trade Partners, percent of total, 2002
Markets SourcesItaly 16.5 France 28.4
Spain 15.9 Nigeria 12.8
France 12.7 UnitedStates
8.0
UnitedStates
8.3 Germany 5.8
Main Trade Commodities, US$ millions, 2002Exports ImportsCrude oil 827.1 Food &
consumergoods
1,335.9
Timber 254.3 Capital goods 369.7
Cocoa 243.0 Intermediategoods
61.3
Cotton 94.2
cameroon
Trade UpdateS Inadequate transport infrastructure continues to hamper
the international competitiveness of,and trade with,Cameroon.Many areas of the country remain nearlyinaccessible.
S In May 2003,the government announced plans forconstruction of a $200-million oil platform repair yard.
S In July 2003,the Chad-Cameroon oil pipeline,the country’slargest construction project,was finished nearly 7 monthsearlier than expected.Two U.S.firms,ExxonMobil andChevronTexaco,and one Malaysian firm,Petronas,ownthe pipeline.Loans from the World Bank and IFCcontributed to its timely construction.
S By subcontracting port operations to internationalcompanies,the Cameroonian government improvedefficiency at the port of Douala, its busiest port.LesAbeilles (France) was hired in October 2003 to controltowing and anchoring operations,and a consortium ofBollore (France) and Maersk (Denmark) was hired inDecember 2003 to administer the container terminal.
S In 2003,U.S.exports to Cameroon consisted primarily ofmachinery and mechanical appliances,cereals,and opticalor measuring equipment and parts thereof.U.S.importsfrom Cameroon consisted primarily of mineral fuels andoils,cocoa and cocoa preparations,and wood and articlesof wood.In 2003 and 2004,Cameroon was designatedan AGOA beneficiary country, including qualifying forapparel benefits.AGOA (including GSP) imports fromCameroon totaled $147.0 million in 2003.
Investment and Privatization UpdateS Unstable electricity supply and frequent power outages
continue to hinder Cameroon’s investment environment.Investment in the telecommunications sector remainedlow because of factors such as outdated equipment andinefficient service.
S In 2003,government policy continued to focus onimproved governance.The government established anAudit Chamber of the Supreme Court in April 2003,andanti-corruption units in the ministerial departments inAugust 2003.
S In April 2003,the government granted Geovic Cameroon(U.S.) permission to mine the eastern province ofCameroon for cobalt-nickel deposits,which could make thecountry the leading producer of cobalt in the world.
S In general,privatization efforts have been successful overthe past 5 years with the privatization of Camtel Mobile,adivision of the telephone company;railway transportation;electricity parastatals;parastatal firms in rubber and palmproducts;and the tea division of the CameroonDevelopment Corporation.However,privatization effortshave recently slowed,contributing to decreasedinvestment levels.
S Numerous other parastatals are slated for privatization,but progress has been hampered by lack of interestamong potential buyers, financial and legal problems,andthe need for restructuring.Companies to be privatizedinclude Camair,the national airline;Sodecoton,a cottonparastatal;and the nontea divisions of the CameroonDevelopment Corporation.Government efforts to privatizeCamair have been hindered by increasing debt and lack ofpotential investors.
U.S. Trade Balance
Net Foreign Direct Investment
-120-90-60-30
0306090
120150180
1999 2000 2001 2002 2003
Millions of U.S. Dollars U.S. exportsU.S. importsTrade balance
Millions of U.S. DollarsMillions of U.S. DollarsMillions of U.S. Dollars
0102030405060708090
1998 1999 2000 2001 2002

6-21
Economic OverviewEconomic Indicators
2002 2003 Difference
GDP (nominal, CVEsc bn) 73.3 80.0 6.7
GDP (US$ mn) 625.3 819.7 194.4
CPI Inflation (annual average, %) 1.8 2.0 0.2
Goods Exports (US$ mn) 41.8 43.0 1.2
Goods Imports (US$ mn) 278.0 282.0 4.0
Trade Balance (US$ mn) -236.2 -239.0 -2.8
Current Account Balance (US$ mn) -71.5 -65.0 6.5
Foreign Exchange Reserves (US$ mn) 79.8 89.4 9.6
Total External Debt (US$ mn) 338.0 n/a n/a
Debt Service Ratio, paid (%) 13.0 n/a n/a
Exchange Rate (CVEsc/US$) 117.2 97.6 -19.6
02468
101214
1999 2000 2001 2002 2003
Origins of GDP (2001)
Agriculture(9.4%)
Services(72.8%)
Industry(16.9%)
Fishing(0.9%)
S Per capita GDP was estimated at $1,438 in 2003,one ofthe highest in Africa.
S Services accounted for over 70 percent of GDP in 2002.Agriculture and fishing represented a small percent of GDP,but employed 53 percent of the workforce.Tourismcontributes substantially to employment and economicgrowth,representing 10 percent of GDP in 2001.
S Cape Verde’s small domestic market,geographic isolation,and lack of natural resources continue to hinder economicdevelopment.
S The government’s main economic goals include increasedprivatization,control of public spending, increasedcompetitiveness,and improved social services.PRSPpolicies will be designed to promote growth,to increasesocial sector investment,and to attract private investmentto labor-intensive,export-oriented industries.
S As part of a wide series of fiscal reforms,the governmentintroduced a value-added tax in January 2004.
S A new ferry service between Santo Antao and São Vicente,inaugurated in August 2003,dramatically reduces traveltime between the two islands.
S In October 2003,the AfDB released a review of CapeVerde’s 2002-04 Country Strategy Paper,noting thateconomic growth is uneven as the country deals with alarge fiscal deficit and macroeconomic instability.Thereport praised government efforts to lower inflation andstabilize the economy.
S OPEC’s development fund announced plans to finance theconstruction of health centers in Maio,Boa Vista,SantaCruz,Tarrafal,and Mosteiros.This $6-million project isexpected to begin in 2004.
S In May 2004,the Millennium Challenge Corporation votedto make Cape Verde eligible for assistance.
Real GDP Growth Rate
CAPE VERDE
Economic Update
Percent

6-22
Main Trade Partners, percent of total, 2001
Markets SourcesPortugal 90.7 Portugal 52.1
United States 6.3 Netherlands 14.9
Germany 0.7 Belgium 7.0
Main Trade Commodities, US$ millions, 2001
Exports Imports
Fuel(bunkering)
26.0 Food 90.4
Clothing &footwear
11.3 Capital goods 46.3
Fish & fishproducts
0.4 Fuels 15.4
Trade UpdateS Although the country’s transportation infrastructure is
very good by regional standards,Cape Verde’sgovernment continued efforts to improve further thecountry’s roads and port.
S In an effort to boost air traffic,a government initiative of$25 million will be used to upgrade airports,encouragetourism,and improve air safety.
S Although the port of Praia was modernized recently, thegovernment has plans for further expansion.Praia alsohas a new international airport that is due to open in2004;ECOWAS will provide $7 million to construct a VIPterminal at the airport and a road serving the terminal.
S New maritime routes established to Portugal,Spain,northern Europe,and mainland Africa are expected toencourage exports.Cape Verde has also expanded tieswith Asian countries, including Macao.
S In November 2003,TACV,the state airline,and CaboVerde Time,an Italian travel agency,publicized plans tocreate a new air charter company in response to growingtourist demand.In addition,the Tourist Promotion,Investment and Export Centre signed an agreement withPortugal and the Canary Islands to encourage tourism inMaio and Boa Vista.
S In 2003,U.S.exports to Cape Verde consisted primarily ofcereals,aircraft and parts thereof,and machinery andmechanical appliances.U.S.imports from Cape Verdeconsisted primarily of apparel,electrical machinery andequipment,and optical or measuring equipment and partsthereof. In 2003 and 2004,Cape Verde was designatedan AGOA beneficiary country, including qualifying forapparel benefits.AGOA (including GSP) imports from CapeVerde totaled $2.5 million in 2003.
Investment and Privatization UpdateS Cape Verde maintains strong links with Portugal and the
EU and receives investment from Angola,China,Cuba,theGulf States, Israel,Luxembourg,and South Africa.Foreigninvestment is expected to exceed $36 million in 2003.The government hopes to attract investment in the fishingand tourism sectors.
S Although speculators believe there may be oil reserves inCape Verde’s waters,substantial investment has not beenundertaken.
S In October 2003,work began on a $370,000satellite-based Internet service that will eliminate the needfor Internet users to have a telephone line.
S More than 30 state-owned enterprises have beendivested into the private sector.Operators are mostlyforeign.ENAPOR (the port authority),EMPROFAC(pharmaceuticals distribution),CABNAVE (the ship yard),INTERBASE (cold storage facilities),and TACV (thenational airline) are scheduled for upcoming privatization.TACV is currently undergoing restructuring,a process thegovernment expects to take 12-18 months,and isscheduled to be privatized in 2005.
cape verde
U.S. Trade Balance
Net Foreign Direct Investment
0
2
4
6
8
10
12
1999 2000 2001 2002 2003
Millions of U.S. DollarsU.S. exportsU.S. importsTrade balance
Millions of U.S. DollarsMillions of U.S. DollarsMillions of U.S. Dollars
0
10
20
30
40
50
60
1998 1999 2000 2001 2002

6-23
Economic OverviewEconomic Indicators
2002 2003 Difference
GDP (nominal, CFAfr bn) 709.3 746.9 37.6
GDP (US$ mn) 1,017.6 1,285.1 267.5
CPI Inflation (annual average, %) 2.3 7.0 4.7
Goods Exports (US$ mn) 142.0 127.0 -15.0
Goods Imports (US$ mn) 109.0 105.0 -4.0
Trade Balance (US$ mn) 33.0 22.0 -11.0
Current Account Balance (US$ mn) -27.0 -25.0 2.0
Foreign Exchange Reserves (US$ mn) 123.0 123.0 0.0
Total External Debt (US$ mn) n/a n/a n/a
Debt Service Ratio, paid (%) n/a n/a n/a
Exchange Rate (CFAfr/US$) 697.0 581.2 -115.8
Origins of GDP (2002)
Primary(57.9%)
Services(29.5%)
Secondary(12.6%)
Economic Update
S The Central African Republic is primarily a rural economy,with only one significant urban center.Farming,forestry,fishing,and herding are important to the Central AfricanRepublic’s economy and supply the livelihood for most of thepopulation.
S Civil unrest continued in the Central African Republic.AnIMF and World Bank assessment in early 2004 stated thatthe Central African Republic was in a state of crisis,withmost economic sectors in decline and state institutionsexperiencing difficulties.
S In September 2003,the government announced that it wasunable to pay public salaries because of revenue shortfalls.Salaries account for 90 percent of the nation’s budget.
S Military rebellion and rioting throughout 2003 contributedto a rise in inflation and disrupted supply and distributionnetworks.
S Principal government policy goals include economicstabilization,economic cooperation with foreign donors,paying salaries for state employees,and resuming normalstate administration.
S The government is continuing its anti-corruption campaignlaunched in 2003.The campaign focuses on overhaulingthe timber and mining sectors,where licenses werepreviously granted personally and exclusively by thepresident. In addition,the new code allows for theexploitation of gold and other commodities.Thegovernment has extended the use of mining brigades tohelp curb the level of diamond smuggling.
S Many western countries have closed their embassies in theCentral African Republic and withdrawn aid,citing years ofpolitical and economic instability.
S The IMF is expected to introduce a 6-month Staff MonitoredProgram in an effort to establish economic policies thatwould allow for resumption of formal assistance from theIMF and other international financial organizations.
Real GDP Growth Rate
CENTRALAFRICAN REPUBLIC
Percent
-8
-6
-4
-2
0
2
4
1999 2000 2001 2002 2003

6-24
Main Trade Partners, percent of total, 2002
Markets SourcesBelgium 66.8 France 29.9
Spain 6.4 United States 5.1
Kazakhstan 4.0 Cameroon 4.5
Main Trade Commodities, US$ millions, 2002
Exports Imports
Timber 71.2 Oil 11.0
Diamonds 52.1 Nonfactorservices
86.0
Cotton 9.2
Coffee 1.4
Trade UpdateS The Central African Republic’s main export market is
Belgium and the leading export item is diamonds.Thegrowing timber trade may increase Asia’s importance asan export market.Despite the expanding industry,hightransportation costs have inhibited development of theforestry sector.For example,transportationinfrastructure remains inadequate,with less than 3percent of the road network paved.Imports comeprimarily from France,Cameroon,and Belgium.Regionaltrade is substantial,but is not fully recorded in officialaccounts. In addition,regional trade remained disruptedby high levels of social unrest and insecurity.Ongoingsecurity problems have also limited safari tourism andrevenue.
S The government has encouraged exports of veneer,sawnboard,and plywood.However,the wood-processingindustry faces high transportation costs, limited workers,and energy supply shortfalls.
S At a workshop to overhaul the mining industry in July2003,the government announced participation in theKimberly process.It is estimated that,currently, two-thirdsof diamond production is smuggled out of the CentralAfrican Republic.The government is considering workingwith Diamcare (UK) to monitor the production of diamondcollectors.
S In 2003,U.S.exports to the Central African Republicconsisted primarily of cereals,machinery and mechanicalappliances,and organic or inorganic chemicals andcompounds.U.S.imports from the Central AfricanRepublic consisted primarily of precious or semipreciousstones or metals,electrical machinery and equipment,and machinery and mechanical appliances.In 2003,theCentral African Republic was designated an AGOAbeneficiary country;however,AGOA eligibility wasretracted in 2004.AGOA (including GSP) imports fromthe Central African Republic totaled $43,000 in 2003.
Investment and Privatization UpdateS Inadequate utility services,such as sporadic power
outages,continued to hamper the investmentenvironment.
S Minimal progress was made in privatization plans forEnerca,the national electric company.Further activity isnot expected to take place until economic and politicalstability is resumed.
central african republic
U.S. Trade Balance
Net Foreign Direct Investment
-2
0
2
4
6
8
1999 2000 2001 2002 2003
Millions of U.S. DollarsU.S. exportsU.S. importsTrade balance
Millions of U.S. DollarsU.S. exportsU.S. importsTrade balance
Millions of U.S. DollarsMillions of U.S. DollarsMillions of U.S. Dollars
0
1
2
3
4
5
6
1998 1999 2000 2001 2002
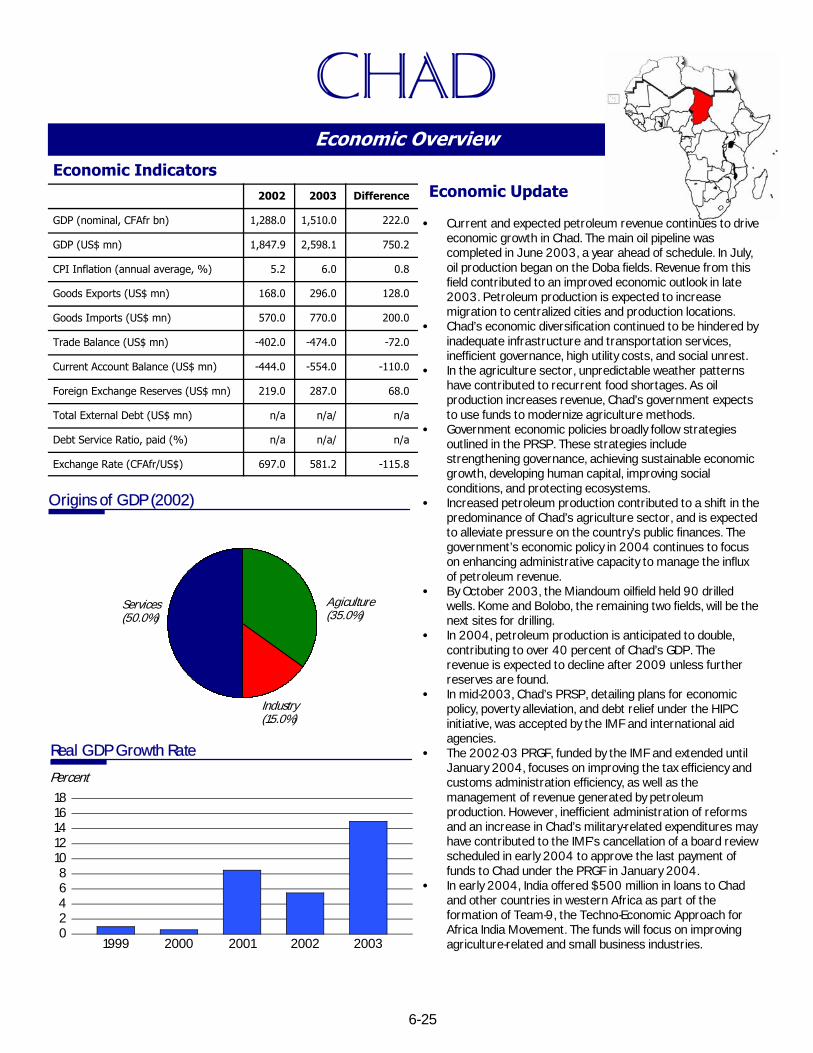
6-25
Economic OverviewEconomic Indicators
2002 2003 Difference
GDP (nominal, CFAfr bn) 1,288.0 1,510.0 222.0
GDP (US$ mn) 1,847.9 2,598.1 750.2
CPI Inflation (annual average, %) 5.2 6.0 0.8
Goods Exports (US$ mn) 168.0 296.0 128.0
Goods Imports (US$ mn) 570.0 770.0 200.0
Trade Balance (US$ mn) -402.0 -474.0 -72.0
Current Account Balance (US$ mn) -444.0 -554.0 -110.0
Foreign Exchange Reserves (US$ mn) 219.0 287.0 68.0
Total External Debt (US$ mn) n/a n/a/ n/a
Debt Service Ratio, paid (%) n/a n/a/ n/a
Exchange Rate (CFAfr/US$) 697.0 581.2 -115.8
Origins of GDP (2002)
Agiculture(35.0%)
Industry(15.0%)
Services(50.0%)
S Current and expected petroleum revenue continues to driveeconomic growth in Chad.The main oil pipeline wascompleted in June 2003,a year ahead of schedule. In July,oil production began on the Doba fields.Revenue from thisfield contributed to an improved economic outlook in late2003.Petroleum production is expected to increasemigration to centralized cities and production locations.
S Chad’s economic diversification continued to be hindered byinadequate infrastructure and transportation services,inefficient governance,high utility costs,and social unrest.
S In the agriculture sector,unpredictable weather patternshave contributed to recurrent food shortages.As oilproduction increases revenue,Chad’s government expectsto use funds to modernize agriculture methods.
S Government economic policies broadly follow strategiesoutlined in the PRSP.These strategies includestrengthening governance,achieving sustainable economicgrowth,developing human capital, improving socialconditions,and protecting ecosystems.
S Increased petroleum production contributed to a shift in thepredominance of Chad’s agriculture sector,and is expectedto alleviate pressure on the country’s public finances.Thegovernment’s economic policy in 2004 continues to focuson enhancing administrative capacity to manage the influxof petroleum revenue.
S By October 2003,the Miandoum oilfield held 90 drilledwells.Kome and Bolobo,the remaining two fields,will be thenext sites for drilling.
S In 2004,petroleum production is anticipated to double,contributing to over 40 percent of Chad’s GDP.Therevenue is expected to decline after 2009 unless furtherreserves are found.
S In mid-2003,Chad’s PRSP,detailing plans for economicpolicy,poverty alleviation,and debt relief under the HIPCinitiative,was accepted by the IMF and international aidagencies.
S The 2002-03 PRGF,funded by the IMF and extended untilJanuary 2004,focuses on improving the tax efficiency andcustoms administration efficiency,as well as themanagement of revenue generated by petroleumproduction.However, inefficient administration of reformsand an increase in Chad’s military-related expenditures mayhave contributed to the IMF’s cancellation of a board reviewscheduled in early 2004 to approve the last payment offunds to Chad under the PRGF in January 2004.
S In early 2004, India offered $500 million in loans to Chadand other countries in western Africa as part of theformation of Team-9,the Techno-Economic Approach forAfrica India Movement.The funds will focus on improvingagriculture-related and small business industries.
Economic Update
Real GDP Growth Rate
CHAD
Percent
02468
1012141618
1999 2000 2001 2002 2003

6-26
Main Trade Partners, percent of total, 2002
Markets SourcesPortugal 28.0 France 38.0
Germany 14.0 United States 38.0
United States 8.0 Germany 7.0
Czech Republic 7.0 Nigeria 6.0
Main Trade Commodities, US$ millions, 2002
Exports Imports
Livestock& meat
75.0 Oil sector 498.0
Cotton 48.0 Nonoilsector
98.0
Trade UpdateS Inadequate transportation facilities continue to hinder
Chad’s international trade performance.Chad has nosufficient methods of transportation over long distances,with limited domestic air transportation and no railwaysystem.
S Inadequate irrigation systems and transportationstructure continue to hinder Chad’s cotton industry,aprincipal export crop for the country.
S Because cotton and cattle have historically been Chad’slargest sources of export revenue,commodity prices andvariations on agricultural production broadly determinedexport performance.According to the IMF,oil exports,however,are expected to represent 86 percent of Chad’stotal exports in 2004.
S In 2003,U.S.exports to Chad consisted primarily ofmachinery and mechanical appliances, iron or steel,andelectrical machinery and equipment.U.S.imports fromChad consisted primarily of mineral fuels and oils;lac,gums,and resins;and electrical machinery andequipment. In 2003 and 2004,Chad was designated anAGOA beneficiary country.AGOA (including GSP) importsfrom Chad totaled $14.5 million in 2003.
Investment and Privatization UpdateS Petroleum production on the Doba fields contributed to an
increase in FDI;FDI was estimated at less than $50million in 1999,but increased to estimates of $700million to $900 million in 2002.
S The Doba oil fields project represents the largestinvestment ever in SSA by the U.S.private sector.
S Improved telecommunications services are expected toimprove nonpetroleum-related investment.High prices,inadequate services,and frequent outages in electricityprovision continued to dissuade nonpetroleum-relatedinvestment.
S Although the government is expected to continueprivatization efforts, it has been reluctant to privatizeparastatals in the cotton,electricity,andtelecommunications industries.Most other state-ownedenterprises have been sold or liquidated.
S Privatization of Soteltchad,a parastatal firm holding amonopoly on the fixed and internationaltelecommunications sector,was hindered by thegovernment’s granting of a license to a second cellularcompany.
S A private consulting firm was hired to privatize the ginningand cotton-export divisions of CottonTchad.In early 2003,a new company was formed from the oil and soapproduction divisions of the large enterprise.
chad
U.S. Trade Balance
Net Foreign Direct Investment
-20
0
20
40
60
80
100
120
140
160
1999 2000 2001 2002 2003
Millions of U.S. DollarsU.S. exportsU.S. importsTrade balance
0100200300400500600700800900
1998 1999 2000 2001 2002
Millions of U.S. Dollars

6-27
Economic OverviewEconomic Indicators
2002 2003 Difference
GDP (nominal, Cfr bn) 128.4 140.5 12.1
GDP (US$ mn) 245.6 322.3 76.7
CPI Inflation (annual average, %) 3.7 7.0 3.3
Goods Exports (US$ mn) 18.9 16.4 -2.5
Goods Imports (US$ mn) 47.5 53.4 5.9
Trade Balance (US$ mn) -28.6 -37.0 -8.4
Current Account Balance (US$ mn) -23.3 -28.0 -4.7
Foreign Exchange Reserves (US$ mn) 79.9 83.0 3.1
Total External Debt (US$ mn) 233.0 243.0 10.0
Debt Service Ratio, paid (%) 5.9 6.5 0.6
Exchange Rate (Cfr/US$) 522.7 435.9 -86.8
Origins of GDP (2002)
Agriculture, fishing & forestry(35.4%)
Industry(10.6%)
Services(54.0%)
Economic Update
S Agriculture and trade are the primary components ofComoros’ economy.Agriculture accounts for approximately40 percent of GDP and is the main source of livelihood.Seventy percent of the population works in rural areas,primarily in subsistence farming.
S Comoros is highly indebted.Interest arrears on long-termdebt totaled $21 million in 2001,with principal arrearstotaling $64 million.High levels of grant aid come fromBelgium,France,the World Bank,the EU,the UNDP,andthe AfDB.The Comorian government has also solicited aidfrom Arab states.
S In July 2003,the World Bank calculated that 691,000euro (approximately $780,000) was needed to fully restorepower to the country.The Arab League has allocated $2million to help rehabilitate the electricity grid.
S In May 2003,a World Bank mission found majorimpediments to establishing a cooperative long-termdevelopment strategy and expressed concern that it wouldhave difficulty soliciting donor assistance.
S In March 2004,the World Bank/IDA announced plans togrant a $20-million aid package to Comoros.The packageis intended to promote infrastructure development,including the restoration of water supply;assist businessdevelopment in rural zones;and support NGOs working toimprove education and healthcare.
Real GDP Growth Rate
COMOROS
Percent
-2
-1
0
1
2
3
1999 2000 2001 2002 2003

6-28
Main Trade Partners, percent of total, 2001
Markets SourcesFrance 31.3 France 25.0
United States 18.8 South Africa 16.7
Singapore 18.8 Kenya 6.7
Germany 6.3 Pakistan 3.4
Main Trade Commodities, US$ millions, 2002
Exports Imports
Vanilla 12.6 Petroleumproducts
9.2
Cloves 3.8 Rice 5.9
Ylang-ylang 2.0 Vehicleparts
5.0
Trade UpdateS Main export crops include vanilla,cloves,and ylang-ylang.
Comoros is the world’s largest producer of ylang-ylang.Thegovernment fixed the price of vanilla in 2003 to preventfluctuation.Major imports include rice,petroleum products,meat,cement,and iron and steel.Primary trading partnersare France,the United States,and Germany.
S Inadequate transportation infrastructure hinders trade.Comoros has no railway system and inadequate domesticand international shipping networks.Most freight toComoros is routed through South Africa. In recent years,the government has undertaken a program to upgraderoads and improve access to rural areas.
S In late 2003,the French construction firm Bouyguesexpressed interest in renovating and managing the Moroniport.The firm has also expressed interest in developing asecond international port in the country,which could expandtrade.
S In 2003,U.S.exports to Comoros consisted primarily ofchemical products,organic chemicals,and plastics andarticles thereof.U.S.imports from the Comoros consistedprimarily of coffee,tea,mate,and spices;essential oil andresinoids;and live animals.
Investment and Privatization UpdateS Comoros has found it difficult to attract investors because
of the small size of the economy and political instability.S The fishing sector is largely underdeveloped.The EU and
Comoros entered into an agreement under which the EUmay catch tuna in Comorian waters.Proceeds from thisarrangement,totaling $411,000,are expected to funddevelopment of the domestic fishing industry.
S In late 2003,China agreed to finance renovation of thePrince Said Ibrahim airport,building a new terminal andaccess roads.The airport is expected to boost tourism inComoros.
S SNPT,the state post and telecommunications company,aims to increase telephone communications.In conjunctionwith Alcatel (France),the parastatal plans to build theinfrastructure for a wireless telecommunications system.
S Although the government has continued efforts to privatizea number of hotels owned by Comotel, lack of transparencyin the privatization process has hindered progress.
comoros
U.S. Trade Balance
Net Foreign Direct Investment
-10
-5
0
5
10
15
1999 2000 2001 2002 2003
Millions of U.S. DollarsU.S. exportsU.S. importsTrade balance
0
1
2
3
4
1998 1999 2000 2001 2002
Millions of U.S. Dollars

6-29
Economic OverviewEconomic Indicators
2002 2003 Difference
GDP (nominal, CFAfr bn) 8,167.0 8,047.0 -120.0
GDP (US$ bn) 11.7 13.8 2.1
CPI Inflation (annual average, %) 3.1 3.3 0.2
Goods Exports (US$ mn) 5,167.0 5,300.0 133.0
Goods Imports (US$ mn) 2,432.0 2,776.0 344.0
Trade Balance (US$ mn) 2,735.0 2,524.0 -211.0
Current Account Balance (US$ mn) 767.0 551.0 -216.0
Foreign Exchange Reserves (US$ mn) 1,863.0 2,100.0 237.0
Total External Debt (US$ bn) 11.0 10.9 -0.1
Debt Service Ratio, paid (%) 13.8 13.5 -0.3
Exchange Rate (CFAfr/US$) 697.0 581.2 -115.8
Origins of GDP (2001)
Tertiary(49.4%)
Primary(29.1%)
Secondary(21.6%)
Economic Update
S Despite the implementation of a UN peacekeeping missionin April 2004, instability in Côte d’Ivoire continues to hindereconomic growth.
S Agriculture,petroleum,and mining are importantcomponents of Côte d’Ivoire’s economy.Côte d’Ivoire hasreserves of 100 million barrels of oil and 1.1 trillion cumeters of gas,along with substantial deposits of gold, iron,and nickel.
S Although Côte d’Ivoire’s road network is one of the mostdeveloped in western Africa, it is fraught with securitycheckpoints and tolls.The World Bank renewed CI-PAST,atransport sector adjustment program,until July 2004,which is expected to enable maintenance and renovation ofthe road network through transport sector financing.
S Under the 2002 PRGF,the government expressed plans toachieve better public expenditure control, tighter fiscalcontrol,measures to streamline the tax structure,and aprogram to pay off debts.
S Minimal progress towards a political settlement hasdelayed the release of $369 million for reconstructioncommitted by donors at January 2003 peace talks.Because of instability,only emergency funds have beenmade available.
S The AfDB,which had maintained its headquarters inAbidjan,has moved most of its personnel and operations toTunisia because of political instability.
S In April 2002,the Paris Club restructured Côte d’Ivoire’spublic external debt,suspending payments until the end of2004,after the government lapsed on payments to nearlyall creditors aside from the World Bank and IMF.By early2004,Côte d’Ivoire also failed to pay debt servicing arrearsof $21 million to the World Bank.The World Bank haltedthe disbursement of further loans.
S The World Bank and the EU have pledged $57 million and30 million euro (approximately $39 million),respectively, toassist in stabilizing the education system.
S India pledged $500 million in low-interest loans in early2004 to help Burkina Faso,Chad,Côte d’Ivoire,EquatorialGuinea,Ghana,Guinea Bissau,Mali,and Senegal create theTechno-Economic Approach for Africa India Movement,which will focus on generating employment.
Real GDP Growth Rate
CÔTE D’IVOIRE
Percent
-4
-3
-2
-1
0
1
2
1999 2000 2001 2002 2003

6-30
Main Trade Partners, percent of total, 2002
Markets SourcesFrance 14.5 France 23.1
Netherlands 12.9 Nigeria 16.9
UnitedStates
7.6 China 8.0
Germany 5.2 Italy 4.2
Main Trade Commodities, US$ millions, 2002
Exports Imports
Cocoa &products
2,257.0 Capitalequipment &raw materials
836.0
Petroleum &products
690.0 Foodstuffs 595.0
Timber 225.0 Petroleum &products
532.0
Coffee &products
119.0 Consumergoods
505.0
Trade UpdateS The reopening of the border with Burkina Faso in
September 2003 is expected to restore regional tradeto its pre-2002 level,allowing neighboring landlockedcountries access to the port of Abidjan.While it wasclosed,these countries diverted their trade throughports in Ghana,Togo,and Senegal.Historically, the portof Abidjan has been the busiest port in francophonewestern Africa.Activity at Abidjan,which accounted fornearly 90 percent of Côte d’Ivoire’s exports before 2002,had fallen by almost two-thirds.
S Plans to extend the railway line to Mali and Niger areexpected to make freight transport more reliable.
S In March 2002,the government implemented a pricestabilization system that raised taxes on cocoa exportsand provided for forward selling.
S In 2003,U.S.exports to Côte d’Ivoire consisted primarilyof machinery and mechanical appliances,cereals,andplastics and articles thereof.U.S.imports from Côted’Ivoire consisted primarily of cocoa and cocoapreparations,mineral fuels and oils,and wood andarticles of wood.In 2003 and 2004,Côte d’Ivoire wasdesignated an AGOA beneficiary country, includingqualifying for apparel benefits.AGOA (including GSP)imports from Côte d’Ivoire totaled $88.0 million in 2003.
Investment and Privatization UpdateS The government hopes to focus investment efforts on
basic health,primary education,roads,and ruralelectrification.
S A contract awarded to build a new terminal in Abidjan isexpected to double Abidjan’s container-handling capacity.Operation of the already existing Vridi container terminalwas awarded to Bollore (France) in January 2004.
S A number of offshore gas and oil fields have beendiscovered in recent years,contributing to increasedpetroleum-related investment in Côte d’Ivoire. In early2004,Côte d’Ivoire signed two petroleumproduction-sharing agreements with Tullow Oil (Ireland)and Africa Petroleum (U.S.).
S In October 2001,Air France purchased a 51-percentstake in Nouvelle Air Ivoire,a previously state-owneddomestic carrier.The remaining 49-percent share is stillstate owned.The state also holds a 49-percent share inCôte d’Ivoire Telecom.
S In 2003,the government announced plans to sell its47-percent stake in SIR,an oil processing company.Gestoci,a petrol storage company,and Petroci,ahydrocarbons company,are also slated for privatization.The government hopes to divest 80 percent ofCIDT-Nouvelle,a textile parastatal, to a farmers’cooperative.The cooperative has thus far been unable toraise the necessary capital.
S In early 2004,the government officially ended thetelecommunication parastatal’s monopoly.Thegovernment instituted a transition period before otherproviders can enter the market, in order to enactadditional legislation.
CÔTE D’IVOIRE
U.S. Trade Balance
Net Foreign Direct Investment
-500-400-300-200-100
0100200300400500600
1999 2000 2001 2002 2003
Millions of U.S. DollarsU.S. exportsU.S. importsTrade balance
0
100
200
300
400
1998 1999 2000 2001 2002
Millions of U.S. Dollars

6-31
Economic OverviewEconomic Indicators
2002 2003 Difference
GDP (nominal, FC bn) 1,911.0 2,309.0 398.0
GDP (US$ bn) 5.5 5.7 0.2
CPI Inflation (annual average, %) 25.0 6.0 -19.0
Goods Exports (US$ mn) 1,109.0 1,260.0 151.0
Goods Imports (US$ mn) 1,405.0 1,489.0 84.0
Trade Balance (US$ mn) -296.0 -229.0 67.0
Current Account Balance (US$ mn) -150.0 -45.0 105.0
Foreign Exchange Reserves (US$ mn) n/a n/a n/a
Total External Debt (US$ mn) n/a n/a n/a
Debt Service Ratio, paid (%) n/a n/a n/a
Exchange Rate (FC/US$) 346.5 405.0 58.5
Origins of GDP (2001)
Agriculture & forestry(57.1%)
Mining(9.8%)
Secondary(9.2%)
Services(23.8%)
Economic UpdateS After more than 5 years of civil unrest that has
discouraged economic development,an early 2004 IMFassessment projected GDP growth for DROC of 6.7percent annually to 2006.
S Timber production grew in 2003.The World Bank hasannounced plans to encourage the exploitation of timberresources to support government expenditures and publicwelfare programs.Timber is potentially a richer source ofstate income than the mining sector.
S In July 2003,DROC became the 27th country to qualify forthe HIPC initiative.The World Bank expects to provide$1.03 billion and the IMF another $472 million.Debt reliefis expected to amount to approximately $10 billion,which isnearly 80 percent of DROC’s total external debt.
S The World Bank has agreed to provide $1.08 billion in2004 and $1.2 billion in 2005 to development projects inDROC;70 percent of these funds are allocated towardinfrastructure development,while 30 percent is intended toimprove social sector services.The World Bank alsoapproved a $200-million IDA Credit in March 2004 to helppay domestic arrears,to pay utility suppliers,and to initiatecivil service reform.
S A 3-year PRGF of $786 million was approved in June 2002,of which the government has already drawn more than$569 million.An IMF review encouraged liquidatinginsolvent banks and ending the lack of governmenttransparency in the use of petroleum revenue.
S The EU has pledged $230 million to aid the new transitionalgovernment.European Development Fund funds weresuspended from 1992 to 2002 because of politicalinstability.The funds are intended to be used for debt relief,rebuilding the health system,and building governmentinstitutions.
S The African Development Fund has appropriated a$64-million loan and a $4.32-million grant to financeeconomic recovery.These funds are to be used to establishmacroeconomic stability and increase the efficiency andtransparency of public expenditure management.
S In November 2003,Switzerland forgave $23.7 million ofdebt owed to it by DROC.
S DROC signed a $10-billion agreement with South Africa inearly 2004 aimed at improving defense and security,theeconomy and finance,and agriculture and infrastructuraldevelopment.
S In early 2004,the Government of Belgium pledged 1.5million euro (approximately $2 million) for the rehabilitationof the Nyemba bridge.This rehabilitation is expected tofacilitate internal agricultural trade and distribution.
Real GDP Growth Rate
DEMOCRATIC REPUBLICof the congo
Percent
-8-6-4-202468
1999 2000 2001 2002 2003

6-32
Main Trade Partners, percent of total, 2002
Markets SourcesBelgium 64.2 South Africa 16.2
United States 13.4 Belgium 14.4
Zimbabwe 6.6 Nigeria 10.2
Finland 4.9 France 9.3
Main Trade Commodities, US$ millions
Exports (2000) Imports (1999)
Diamonds 437.0 Consumergoods
263.0
Crude oil 141.0 Rawmaterials
115.0
Cobalt 97.0 Capitalgoods
110.0
Copper 45.0
Trade UpdateS In early 2004,South Africa surpassed Belgium to become
DROC’s largest source of imports. Increased ties betweenthe two countries in foreign investment,commerce,andtravel have contributed to the growth in trade.
S In May 2004,DROC signed an economic and socialcooperation agreement with Angola.The countries plan tobuild new roads along the border and a railway linking thetwo countries.
S International and internal trade is hindered by inadequateinfrastructure networks.DROC has almost no paved roadsand relies heavily on river transport.Civil unrest has limitedtrade to air transport in many locations.
S In 2003,U.S.exports to DROC consisted primarily ofmachinery and mechanical appliances,electrical machineryand equipment,and cereals.U.S.imports from DROCconsisted primarily of mineral fuels and oils,precious orsemiprecious stones or metals,and works of art. In 2003and 2004,DROC was designated an AGOA beneficiarycountry.AGOA (including GSP) imports from DROC totaled$119.5 million in 2003.
Investment and Privatization UpdateS More than 100 investment applications worth $2.3 billion
were approved in 2002-03,of which 33 percent were filedby domestic investors.These projects reportedly createdover 14,000 local jobs.For one project,Klaxon Power(South Africa) has agreed to construct two dams worthmore than $23 million.
S Mobile telephone firms have set up relays on a mountainnear Kinshasa, lowering the cost of phone calls andfacilitating communication between different parts of thecountry.Vodacom (South Africa, in which Vodafone (UK) hasa large stake) is planning to invest $250 million to expandits mobile-phone network.Rutel (Canada) has invested $3million to establish a satellite-based telecommunicationsservice.
S DROC has significant deposits of gold,diamonds,copper,uranium,and other minerals that may encourageinvestment in the country.DROC signed a $8.4-millionagreement with the South African Chamber of Commerceto aid Gecamines,a DROC-owned mining corporation,toexplore mining opportunities.
S Ashanti Goldfields (Ghana,recently purchased by SouthAfrica’s Anglogold) could invest up to $200 million to launchproduction at Mongbwalu,where reserves are thought to bein excess of 100 tons of gold worth $1.2 billion.
S The World Bank has announced plans to harmonize andcodify mining laws in a dozen African states, including DROC.Streamlined rules are expected to encourage mineralexploration and investment.
S In October 2003,the UN Security Council called for twolarge state-owned mineral resource firms to be broken up,in an effort to end illegal resource exploitation.
S In December 2003,the national coffee office launched a$100-million plan to recapitalize the industry,extend thearea under cultivation,and increase input supply.
S As suggested by the IMF,SNPC,the national oil company,has reorganized its corporate structure to become aholding company with seven subsidiaries in order to providegreater autonomy and improve transparency.
democratic republic of THE CONGO
U.S. Trade Balance
Net Foreign Direct Investment
-240
-180
-120
-60
0
60
120
180
240
1999 2000 2001 2002 2003
Millions of U.S. DollarsU.S. exportsU.S. importsTrade balance
Millions of U.S. Dollars
0
10
20
30
40
50
60
70
1998 1999 2000 2001 2002

6-33
Economic OverviewEconomic Indicators
2002 2003 Difference
GDP (nominal, Dfr bn) 105.2 111.0 5.8
GDP (US$ mn) 592.0 624.6 32.6
CPI Inflation (annual average, %) 1.5 2.0 0.5
Goods Exports (US$ mn) 83.0 86.0 3.0
Goods Imports (US$ mn) 287.0 310.0 23.0
Trade Balance (US$ mn) -204.0 -224.0 -20.0
Current Account Balance (US$ mn) -15.0 -13.0 2.0
Foreign Exchange Reserves (US$ mn) 73.7 85.0 11.3
Total External Debt (US$ mn) 335.0 n/a n/a
Debt Service Ratio, paid (%) n/a n/a n/a
Exchange Rate (Dfr/US$) 177.7 177.7 0.0
Origins of GDP (2002)
Primary (3.5%)Construction & public works(Secondary)(6.9%)
Other secondary(9.1%)
Other tertiary(52.9%) Transport & communications
(Tertiary)(27.6%)
Economic Update
S Djibouti’s close proximity to the Indian Ocean makes it abase for military operations for the United States andFrance.As compensation,over the next decade,thegovernment expects to receive $34 million per year fromFrance and $31 million per year from the United States.
S The services industry is the largest contributor to GDP.Activities include loading and unloading at the port,government civil service activities,and services provided tothe French Military Garrison.
S The port of Djibouti is an important source of revenue forthe country,accounting for almost one-third of GDP.Somalia,Ethiopia,and Eritrea rely heavily on the Djiboutiport for trade.
S In mid-December 2003,the IMF began discussions with theGovernment of Djibouti for a new PRGF program.Successful implementation of the PRGF program isexpected to facilitate admittance to the IMF-World BankHIPC initiative.
S The AfDB is granting a $10-million loan to help finance anew terminal, including a 42,000 grain and wheat storageand processing facility,at the Djibouti port.
S In March 2003,the joint Ethio-Djiboutian Commissionagreed to regular meetings to discuss liberalization ofEthiopia’s export trade in the agriculture sector.
S Djibouti is the top recipient for aid from the United Stateswithin SSA,and will receive $90 million in FY 2003 and2004.
Real GDP Growth Rate
DJIBOUTI
Percent
0
1
2
3
4
1999 2000 2001 2002 2003

6-34
Main Trade Partners, percent of total, 2002
Markets SourcesSomalia 62.0 Saudi Arabia 18.1
Yemen 22.0 Ethiopia 10.5
Pakistan 5.2 United States 9.2
Ethiopia 4.8 France 8.5
Main Trade Commodities, US$ millions
Exports (2002) Imports (2000)
Manufactures 52.9 Food &beverages
75.3
Food & liveanimals
6.8 Machinery &electricalequipment
49.1
Coffee &derivatives
6.5 Petroleumproducts
40.0
Qat 26.7
Trade UpdateS Manufactured goods represent the majority of
merchandise exports,and livestock is the second-largestexport. In early 2004,construction began on a regionalcenter for export of livestock in Damerjog.Management ofthe regional center will be carried out by a private firm.
S Dubai Port International,which holds a 20-year contractfor the management of Djibouti’s port and internationalairport,began work in June 2003 on a container port atDoraleh,which is set to be ready for use by September2004.There are also plans to construct an oil terminaland commercial and industrial free zone,but no targetdate has been set.
S In 2003,U.S.exports to Djibouti consisted primarily ofcereals,books or other printed products,and fertilizers.U.S.imports from Djibouti consisted primarily of animal orvegetable fats and oils,machinery and mechanicalappliances,and milling industry products. In 2003 and2004,Djibouti was designated an AGOA beneficiarycountry.AGOA (including GSP) imports from Djiboutitotaled $27,000 in 2003.
Investment and Privatization UpdateS Djibouti is seeking to diversify its trade infrastructure by
increasing access to other ports in the region.Forexample,Djibouti is seeking to attract investment fromIndependent Petroleum Group (Kuwait) as part of plans toconstruct an oil pipeline from Djibouti to Addis Ababa.Theproject is expected to attract $300 million in investmentfrom international,African,and Arab financial institutions.
S The Government of Djibouti has signed with severaldonors to help modernize infrastructure and reducepoverty. In March 2003,the Arab Fund granted a loan of$10 million to Electricite de Djibouti for the purchase andinstallation of equipment;during the same period,theKuwait Fund agreed to lend $5 million to establish theDjibouti Economic Development Fund.
S In April 2003,the UNDP committed $4.5 million forcapacity building and poverty reduction,and OPECannounced plans to lend $4.5 million to update thenationalized printing company and develop the educationalresearch institute. In May 2003,the Saudi DevelopmentFund agreed to a loan of $4 million for development of arural water supply;in addition,the World Bank/IDAprovided $6 million to support work on the EU-fundedInternational Road Corridor Rehabilitation Projectbetween Djiboutiville and Ethiopia.
S For FY 2004 and 2005,the government proposes theprivatization of public utilities including state-ownedDjibouti Telecom,as well as Electricite de Djibouti, thestate electricity company.The airport and port havealready been privatized.
S The EU is funding a $52-million rehabilitation of the jointDjibouti-Ethiopia railway.The Governments of Djibouti andEthiopia are seeking a private sector partner for themanagement of the railway under a 25-year contract tobegin in June 2005.The EU is also planning to invest $15million to increase container handling facilities beginningin June 2004.
djibouti
U.S. Trade Balance
Net Foreign Direct Investment
0
10
20
30
40
50
60
1999 2000 2001 2002 2003
Millions of U.S. DollarsU.S. exportsU.S. importsTrade balance
0
1
2
3
4
5
1998 1999 2000 2001 2002
Millions of U.S. Dollars

6-35
Economic OverviewEconomic Indicators
2002 2003 Difference
GDP (nominal, CFAfr bn) 1,523.9 1,507.8 -16.1
GDP (US$ mn) 2,186.0 2,602.0 416.0
CPI Inflation (annual average, %) 7.6 6.0 -1.6
Goods Exports (US$ mn) 2,216.0 2,586.0 370.0
Goods Imports (US$ mn) 501.0 1,163.0 662.0
Trade Balance (US$ mn) 1,715.0 1,423.0 -292.0
Current Account Balance (US$ mn) -294.0 -863.0 -569.0
Foreign Exchange Reserves (US$ mn) 88.6 176.0 87.4
Total External Debt (US$ mn) n/a n/a n/a
Debt Service Ratio, paid (%) n/a n/a n/a
Exchange Rate (CFAfr/US$) 697.0 579.5 -117.5
Origins of GDP (2002)
Secondary(91.6%)
Primary(4.3%)
Tertiary(4.1%)
S The discovery of petroleum in the 1990s acceleratedeconomic growth and spurred urbanization.Petroleumaccounted for over 80 percent of GDP in 2002.Althoughpetroleum has become the principal foreign-exchangeearner,timber is still a profitable sector.
S The government has announced plans to create apetroleum reserve fund to secure future income,and it paid$259 million into the fund in 2002.By the end of 2003,thefund contained $733 million.
S Government revenue from the petroleum sector is used inpart to rehabilitate the country’s infrastructure.InNovember 2003,the government announced a program toimprove the road network and to rehabilitate the airport atBata.
S In early 2003,the government implemented a two-tiersystem creating separate wages for all private sectorworkers.
S The government has taken steps to increase transparencyfor petroleum-related transactions in an effort to improvethe country’s relationship with the IMF.
S UNDP is cooperating with the government to provide $5.2million over 4 years to encourage increased access toprimary school.
S In July 2003,Spain agreed to write off $80 million ofEquatorial Guinea’s $134-million debt to Spain.Thecountries also agreed to establish procedures to protectSpanish investment in Equatorial Guinea.
S India pledged $500 million in low-interest loans in early2004 to help Burkina Faso,Chad,C“te d’Ivoire,EquatorialGuinea,Ghana,Guinea Bissau,Mali,and Senegal create theTechno-Economic Approach for Africa India Movement,which will focus on generating employment,pharmaceuticalproduction and healthcare, information technology andtelecommunications,and agriculture.
Real GDP Growth Rate
EQUATORIALGUINEA
Economic Update
Percent
01020304050607080
1999 2000 2001 2002 2003

6-36
Main Trade Partners, percent of total, 2002
Markets SourcesUnited States 28.3 Yugoslavia 29.1
Spain 25.3 UnitedKingdom
15.9
China 17.4 United Sates 14.8
Cameroon 4.9 France 10.4
Main Trade Commodities, US$ millions, 2002
Exports Imports
Petroleumincludinggas
2,103.0 Petroleumsector
356.2
Timber 95.3 Publicinvestment
52.6
Coffee 6.6 Petroleumproducts
16.0
Cocoa 4.4
-600
-400
-200
0
200
400
600
800
1000
1200
1999 2000 2001 2002 2003
Trade UpdateS Incat (UK) is building a port at Luba,and will operate it upon
completion.The port is expected to expand trade.Thegovernment is also planning a facility in the capital that willserve as a port and service center for the oil sector.
S Agriculture for export,primarily cocoa and coffee,has beendeclining in recent years.
S In 2003,U.S.exports to Equatorial Guinea consistedprimarily of machinery and mechanical appliances,aircraftand parts thereof,and articles of iron or steel.U.S.importsfrom Equatorial Guinea consisted primarily of minerals,fuels and oils,organic chemicals,and machinery ormechanical appliances.
Investment and Privatization UpdateS Large deposits of petroleum and gas continue to draw
investment into the country.During 1995-2003,suchinvestments totaled more than $5 billion.Crude oilproduction now exceeds 265,000 barrels per day.Petroleum sector growth has spurred a construction boomin Malabo and expansion in the services sector.
S Growing demand from Asia has contributed to increasedinvestment in the forestry sector.
S Equatorial Guinea may possess substantial deposits of gold,diamonds,bauxite, iron ore,titanium,copper,manganese,and uranium that could lead to increased investment anddevelopment of the mining sector.
S In October 2003,a new terminal opened at the Malaboairport. Iberia (Spain),Spanair (Spain),and KLM(Netherlands) are actively involved in the air travel market.In addition,GEPetrol, the state oil company,agreed withWorld Airways (U.S.) to provide weekly scheduled flightsbetween Houston and Malabo.
S In 2003,Marathon (U.S.),a main player in the energysector,received approval to develop a $1-billion liquidnatural gas plant,which is expected to be completed in2007.GEPetrol announced in early 2004 that it was closeto securing a $400-million loan to finance its 20-percentshare in the project.
S The government has expressed interest in privatizing theelectric utility and GETESA,a telecommunicationsparastatal.
equatorial guINEA
U.S. Trade Balance
Millions of U.S. DollarsU.S. exportsU.S. importsTrade balance
0100200300400500600700800900
1000
1998 1999 2000 2001 2002
Millions of U.S. Dollars
Net Foreign Direct Investment

6-37
Economic OverviewEconomic Indicators
2002 2003 Difference
GDP (nominal, Nfa bn) 9.3 10.7 1.4
GDP (US$ mn) 669.1 764.3 95.2
CPI Inflation (annual average, %) 17.4 12.3 -5.1
Goods Exports (US$ mn) 52.0 56.0 4.0
Goods Imports (US$ mn) 533.0 600.0 67.0
Trade Balance (US$ mn) -481.0 -544.0 -63.0
Current Account Balance (US$ mn) -167.0 -161.0 6.0
Foreign Exchange Reserves (US$) n/a n/a n/a
Total External Debt (US$ mn) 508.0 552.0 44.0
Debt Service Ratio, paid (%) n/a n/a n/a
Exchange Rate (Nfa/US$) 13.9 14.0 0.1
Origins of GDP (2002)Agriculture(11.7%)
Industry(25.0%)
Other services(29.2%)
Distribution services(34.1%)
Economic Update
S Although domestic agricultural production covers just 20percent of the country’s food needs,70 percent of thepopulation relies on agriculture,pastoralism,or fishing forincome.Lack of irrigation,soil erosion,outmodedtechnology,and a lack of financial services,however,constrain agricultural development.
S Main government goals include developing infrastructureand improving food security.
S War with Ethiopia has left the road network and otherinfrastructure inadequate.The link from Massawa toAsmara is the only fully paved road.The government plansto pave the coastal road from Massawa to Assab inmid-2004 to improve and increase intra-country trade andtransport.
S The World Bank has 10 ongoing projects in Eritrea.Over$200 million was disbursed during 2000-03.Currentprograms include an emergency demobilization program($60 million) and an emergency reconstruction project($90 million).The World Bank also has allocated $45million to support investment in education,and plans toprovide $50 million for rural electrification and $30 millionto develop roads.
S A June 2003 IMF report notes Eritrea’s unsustainably highfiscal deficits.The IMF has noted that lack of consistent andreliable economic data inhibits coherent policy formation.
S In late 2003,the Arab Bank for Economic Development inAfrica agreed to a $15-million loan for a water developmentproject.The project, including dams and a water purifyingfacility,will cost $80 million.The Abu Dhabi DevelopmentFund,the Saudi Development Fund,and OPEC are alsoexpected to contribute.
S Italy, the United States,and Denmark are significantbilateral aid donors.In 2002,however,Denmarkannounced that it would stop development assistance by2005 because of human rights violations.
S In August 2003,the United States agreed to provide $6.4million in assistance to improve healthcare and increaseemployment in rural areas.Real GDP Growth Rate
ERITREA
Percent
-15
-10
-5
0
5
10
15
1999 2000 2001 2002 2003

6-38
Main Trade Partners, percent of total, 2002
Markets SourcesSudan 83.0 United Arab
Emirates17.3
Italy 4.9 Saudi Arabia 14.7
Djibouti 2.1 Italy 14.2
Germany 1.1 Germany 4.0
Main Trade Commodities, US$ millions, 2002
Exports Imports
Food & liveanimals
30.0 Machinery &transportequipment
115.0
Raw materials 5.0 Food & liveanimals
103.0
Manufacturedgoods
4.0 Manufacturedgoods
88.0
Chemical &chemicalproducts
29.0
Trade UpdateS Food and live animals accounted for over 70 percent of
exports in 2002.S A trade embargo imposed by Ethiopia has made hard
currency scarce and hindered investment.Prior to theconflict,Ethiopia was Eritrea’s main export partner.
S Apart from food,primary imports include machinery andtransport equipment,manufactured goods,andconstruction materials.
S In 2003,U.S.exports to Eritrea consisted primarily ofaircraft and parts thereof,cereals,and animal or vegetablefats or oils.U.S.imports from Eritrea consisted primarily ofapparel,electrical machinery and equipment,and works ofart. In 2003,Eritrea was designated an AGOA beneficiarycountry.Eritrea was removed from AGOA eligibility in 2004.
Investment and Privatization UpdateS A new airport is being built in Massawa.Eritrean Airlines,
the national carrier,made its first flight in April 2003.S Petroleum exploration has begun with no major
announcements of discovery to date.S Gold reserves are estimated at 17,000 kilograms,which
could spur investment in the sector. In 2003,Sub-SaharaResources (Australia) and Sunridge Gold (Canada)announced plans to jointly explore the Asmara area.
S Eritel, the state phone company, is working with TecoreWireless Systems (U.S.) to implement a GSM service.
S The government has divested 3 of its 11 hotels.
eritrea
U.S. Trade Balance
Net Foreign Direct Investment
0
20
40
60
80
100
1999 2000 2001 2002 2003
Millions of U.S. DollarsU.S. exportsU.S. importsTrade balance
020406080
100120140160
1998 1999 2000 2001 2002
Millions of U.S. DollarsMillions of U.S. DollarsMillions of U.S. Dollars

6-39
Economic OverviewEconomic Indicators
2002 2003 Difference
GDP (nominal, Birr bn) 51.8 56.2 4.4
GDP (US$ bn) 6.0 6.4 0.4
CPI Inflation (annual average, %) 1.5 12.6 11.1
Goods Exports (US$ mn) 480.0 537.0 57.0
Goods Imports (US$ mn) 1,700.0 1,903.0 203.0
Trade Balance (US$ mn) -1,220.0 -1,366.0 -146.0
Current Account Balance (US$ mn) -382.0 -473.0 -91.0
Foreign Exchange Reserves (US$ mn) 882.0 920.0 38.0
Total External Debt (US$ bn) 6.0 6.2 0.2
Debt Service Ratio, paid (%) 7.4 7.4 0.0
Exchange Rate (Birr/US$) 8.6 8.8 0.2
Origins of GDP (2002/2003)
Agriculture & allied activities(39.4%)
Industry(11.9%)
Services(48.7%)
S Agriculture is a key component of the economy,withroughly 85 percent of the population deriving its livelihoodfrom agriculture production.Water shortages andseasonal flooding have limited agricultural productivity.Theindustrial sector grew over 20 percent during 1996-2003,and is expected to become a larger part of the economy.
S Transportation infrastructure is inadequate and hinderseconomic growth.Only 12 percent of roads are paved,which makes access to ports,markets,and servicesdifficult.The first Road Sector Development Program ranfrom 1997-02 and received $1.5 billion in funding.Thesecond program is expected to run during 2003-07 andcost $219 million,with $127 million supplied by the WorldBank.
S The World Bank is expected to approve a $25-million loanfor information and communication technology in 2004.The Ethiopian government has established the EthiopianTelecommunications Authority in an effort to link federal,regional,and local governments in a single network toimprove service to local communities.
S The World Bank’s Country Assistance Strategy pledged$1.5 billion to reform the judiciary and civil service,promoteprivate sector development,and develop transportation andenergy infrastructure during 2003-06.
S In August 2003,the IMF released $14.6 million after thefourth PRGF review;the program is expected to becompleted in mid-2004.Financial sector reform is aprimary goal of the PRGF.
S Ethiopia is expected to complete participation in the HIPCinitiative in 2004.In April 2004,the IMF and World Bankapproved the reduction of Ethiopia’s debt to $2 billion.
S The AfDB awarded $1.5 million to Ethiopia to promotewomen’s rights.Key goals include equal rights for womenand maternal health care.
S The United States granted Ethiopia $18 million for thecampaign against HIV/AIDS.
S In June 2004,the United States announced support forEthiopia’s WTO candidacy.
Economic Update
Real GDP Growth Rate
ETHIOPIA
Percent
-6-4-202468
10
1999 2000 2001 2002 2003

6-40
Main Trade Partners, percent of total, 2002
Markets SourcesDjibouti 11.1 Saudi Arabia 28.8
Italy 7.3 Italy 5.9
Japan 6.5 India 4.8
Saudi Arabia 6.5 United States 3.8
Main Trade Commodities, US$ millions, 2000/2001
Exports Imports
Coffee 171.0 Consumer goods 459.0
Qat 60.0 Capital goods 436.0
Oilseeds 30.0 Fuel 403.0
Pulses 8.0 Semi-finishedgoods
278.0
Trade UpdateS Coffee and livestock are important export products.The
Livestock Marketing Authority is developing a 20-year planwith the AfDB to promote livestock development.Althoughcoffee prices are expected to rise,Ethiopia may bevulnerable to overproduction.
S Conflict with Eritrea blocked access to the port of Assab,Ethiopia’s principal port of entry and exit for trade before1998.Trade has been rerouted through Djibouti,with thehelp of a $6-million World Bank loan to build a road that wascompleted in October 2003.Djibouti currently handles themajority of Ethiopia’s trade.
S The railway link between Ethiopia and Djibouti hasdeteriorated in recent years.The EU provided funds forrehabilitation contingent on reforms,such as theintroduction of private management,but the two countrieshave been slow in implementing requested changes.
S In 2003,U.S.exports to Ethiopia consisted primarily ofaircraft and parts thereof,cereals,and electrical machineryand equipment.U.S.imports from Ethiopia consistedprimarily of coffee,tea,mate,and spices;seeds,grains,andfruit;and apparel. In 2003 and 2004,Ethiopia wasdesignated an AGOA beneficiary country, including qualifyingfor apparel benefits.AGOA (including GSP) imports fromEthiopia totaled $2.9 million in 2003.
Investment and Privatization UpdateS In April 2003,Ethiopia amended its foreign investment
rules.The required minimum level of investment by foreignfirms was reduced,minimal capital requirements were lifted,and a 3-year tax break was extended.
S Ethiopia has significant mineral deposits. Internationalinterest in mining for gold and other metals and petroleumand gas exploration has increased in recent years.
S Ethiopian Airlines received a $350-million commercial loanto purchase 12 new Boeings by mid-2005.The first twoplanes were received in November 2003.The airline alsohas plans to build a new cargo terminal,securing $19million from the Commercial Bank of Ethiopia for thisproject.
S The Ethiopian Electric Power Company has plans to build aseries of dams on the Blue and White Nile.These include a300-mw hyrdroelectric plant that will be built by a Chineseconsortium for $350 million.
S In late 2003,SI Tech International (Jordan) signed anagreement to develop the hydrocarbon sector in Ethiopia.The 25-year,$1.5 million contract includes the constructionof a gas-to-liquids plant with a capacity of 34,000 barrelsper day of petroleum products.
S The Bank of Scotland has agreed to provide managementsupport to the Commercial Bank of Ethiopia,after agreeingto a 2-year deal for $2.5 million.
S Privatization is overseen by the Ethiopian InvestmentAuthority and the Ethiopian Privatization Agency.By 1998,163 privatization projects had been approved,but thedivestment of larger state farms and agro-industrial plantswas delayed by the conflict with Eritrea during 1998-2000.Over 100 enterprises,primarily hotels,state farms,andplantations,are awaiting privatization.
ethiopia
U.S. Trade Balance
Net Foreign Direct Investment
0
50
100
150
200
250
300
350
400
450
1999 2000 2001 2002 2003
Millions of U.S. DollarsU.S. exportsU.S. importsTrade balance
0
50
100
150
200
250
300
1998 1999 2000 2001 2002
Millions of U.S. Dollars

6-41
Economic OverviewEconomic Indicators
2002 2003 Difference
GDP (nominal, CFAfr trn) 4.3 4.3 0.0
GDP (US$ bn) 6.1 7.5 1.4
CPI Inflation (annual average, %) 0.2 0.5 0.3
Goods Exports (US$ mn) 2,608.0 2,891.0 283.0
Goods Imports (US$ mn) 885.0 1,079.0 194.0
Trade Balance (US$ mn) 1,723.0 1,812.0 89.0
Current Account Balance (US$ mn) -169.0 -99.0 70.0
Foreign Exchange Reserves (US$ mn) 140.0 149.0 9.0
Total External Debt (US$ bn) 3.4 3.3 -0.1
Debt Service Ratio, paid (%) 10.8 9.2 -1.6
Exchange Rate (CFAfr/US$) 697.0 579.3 -117.7
Origins of GDP (2002)
Oil (Secondary)(41.3%)
Other secondary(13.7%)
Primary(7.4%)
Tertiary(37.6%)
S Petroleum production continues to decline as reserves arebecoming less productive. In 2003,Equatorial Guineasurpassed Gabon as the third-largest petroleum producerin SSA.Gabon’s reserves are expected to be depleted by2010 unless new sources are discovered.
S Petroleum production accounts for 20 to 50 percent ofGDP,represents over 70 percent of exports,and fundsover 50 percent of government spending.
S Aside from the petroleum sector,the forestry andmanganese sectors continue to contribute greatly to theGabonese economy.Forestry is the nation’s second-largestsource of export revenue after petroleum.The governmenthopes to offset the decline in petroleum production and toboost employment by increasing timber activity,but effortscontinue to be hindered by inadequate transportationinfrastructure and administrative disagreements by variousinterested parties. In 2003,disagreements between thegovernment and the logging companies,an increase in thesurface tax to be implemented in 2004,and a buildup ofpayment arrears by the national timber firm negativelyaffected the timber sector.
S Manganese production is expected to increase from 1.9million tons in 2002 to 2.05 million tons in 2004 afterTrois Rivieres,a subsidiary mining company of CVRD(Brazil),discovered a rich ore deposit near an existingsource in eastern Gabon.Gabon is the third-largestproducer of manganese,possessing 25 percent of theworld’s known reserves.
S Manufacturing in Gabon continues to progress slowly,hindered by high costs, inadequate skills in the labor force,underdeveloped infrastructure,and a small domesticmarket.Government policies in 2003 continued to focus onimproving economic diversity in nonpetroleum sectors.Diversification efforts,however,continue to be hindered byinadequate infrastructure and high utility costs.Majorgovernment initiatives to abate unemployment caused byprivatization, include diversifying exports, increasing timberprocessing,promoting ecological tourism,and establishinga duty-free zone in Mandji.
S In December 2003,the regional bank,the BEAC,decreased the rediscount rate from 6.3 percent to 6.0percent and began encouraging the use of treasury bills todecrease transaction costs and improve administrationefficiency within the country.
S In an effort to secure IMF funds,Gabonese governmentpolicies continued to focus on improving transparency andgovernance.In mid-2003,the government requested IMFaid to alleviate the effects of reduced oil revenue,publicdebt,and poverty through restructuring the judiciarysystem and other public reforms,advancing privatization,and diversifying the economy.
Economic Update
Real GDP Growth Rate
GABON
Percent
-8
-6
-4
-2
0
2
4
1999 2000 2001 2002 2003

6-42
Main Trade Partners, percent of total, 2002
Markets SourcesUnited States 44.6 France 50.9
France 11.1 United States 6.2
China 7.4 Belgium 3.6
NetherlandsAntilles
5.9 Netherlands 3.6
Main Trade Commodities, US$ millions
Exports (2002) Imports (2001)
Crude petroleum 2,052.5 Consumer goods 290.7
Timber 302.5 Preparedfoodstuffs &beverages
160.8
Manganese 135.6 Machinery &mechanicalappliances
157.4
Trade UpdateS In early 2004,China and Gabon signed an oil deal that
guarantees oil exports to China.S Gabon strengthened its ties with the United States,Canada,
Russia,China,and Islamic countries with the goal ofimproving the efficiency of its petroleum production andnonpetroleum exports.
S The government is initiating policies to reform andrestructure the agriculture sector to offset decreased oilproduction.
S A regional stock exchange,the BVMAC,was established inJune 2003 among the six member countries of CEMAC,with plans to begin operation in early 2004.
S In 2003,U.S.exports to Gabon consisted primarily ofmachinery and mechanical appliances,articles of iron orsteel,and mineral fuels or oils and products.U.S.importsfrom Gabon consisted primarily of mineral fuels and oils;ores,slag,and ash;and wood and articles of wood.In 2003and 2004,Gabon was designated an AGOA beneficiarycountry.AGOA (including GSP) imports from Gabon totaled$1.2 billion in 2003.
Investment and Privatization UpdateS In an effort to increase foreign investment,Gabon became a
member of MIGA,which guarantees foreign investmentcoverage.
S In February 2003,the World Bank granted a $100-millionloan to Gabon to improve the current transportationinfrastructure.In August 2003,construction of two bridgesacross the Ntem River and a highway connecting Gabon,Cameroon,and Equatorial Guinea began;the projects arebeing financed by the EU and are scheduled for completionby 2006.
S High oil prices in 2003 and increased interest from the U.S.companies in Gabon’s petroleum sector contributed toincreased investment in 2003 and early 2004.Shell (U.S.)increased investment in the Rabi-Kounga oilfield. Increasedexploration and higher efficiency of production on marginalfields have also contributed to increased investment.
S In late 2003,Southernera Resources (Canada) announcedthat it would begin exploratory drilling for diamonds innorthern,central,and southern Gabon.
S Mining activity is expected to increase in 2004 because ofincreased capacity in the manganese sector.The EuropeanCommission granted Gabon $33 million in January 2003 toreduce the environmental impact of mining.KumbaResources (South Africa) expressed interest in mining theiron-ore deposits in Gabon.Investment in exploiting largedeposits remains hindered by inadequate infrastructure.
S Privatization efforts continue to progress albeit slowly.Companies still slated for privatization include thestate-owned rubber and palm-oil enterprises.The farmingparastatal has not yet been scheduled for privatization.
S High production costs and financial difficulties continue todelay the privatization of Agripog,the state horticulturecompany.
S Because of a lack of investor interest in Sogadel and SIAEB,the state-owned meat companies,privatization efforts werehalted in 2003 and the firms were liquidated.
gabon
U.S. Trade Balance
Net Foreign Direct Investment
Millions of U.S. Dollars
-2500-2000-1500-1000-500
0500
1000150020002500
1999 2000 2001 2002 2003
Millions of U.S. DollarsU.S. exportsU.S. importsTrade balance
-200
-150
-100
-50
0
50
100
150
200
1998 1999 2000 2001 2002
Millions of U.S. DollarsMillions of U.S. DollarsMillions of U.S. Dollars

6-43
Economic OverviewEconomic Indicators
2002 2003 Difference
GDP (nominal, D bn) 7.8 10.9 3.1
GDP (US$ mn) 391.0 401.0 10.0
CPI Inflation (annual average, %) 4.9 10.0 5.1
Goods Exports (US$ mn) 138.0 129.0 -9.0
Goods Imports (US$ mn) 225.0 220.0 -5.0
Trade Balance (US$ mn) -87.0 -91.0 -4.0
Current Account Balance (US$ mn) -22.0 -24.0 -2.0
Foreign Exchange Reserves (US$ mn) 107.0 107.0 0.0
Total External Debt (US$ mn) 501.3 585.0 83.7
Debt Service Ratio, paid (%) 5.4 n/a n/a
Exchange Rate (D/US$) 19.9 27.2 7.3
Origins of GDP (2000)
Agriculture(38.0%)
Industry(13.0%)
Services(49.0%)
S Drought and decreased tourist activity hindered real GDPgrowth in 2003.Increased activity in the agriculture andtourism sectors are expected to contribute to improvedgrowth in 2004.
S Energy shortages, inadequate fiscal management,smallgrowth rates, inflation,and inappropriate expenditurescontinue to hinder The Gambia’s economy and continue toupset progress of the PRGF established by the IMF.
S Government reforms with respect to expenditure reportingand transparency are continuing.
S As indicated under the current PRGF,the governmentincreased domestic revenue in the 2004 budget byincreasing fuel prices,road taxes,fees for firearms,drivingand fishing licences,and customs documents.Also,the2004 budget indicates that development expenditure isexpected to decline because of decreased investor support.
S The third phase of the UNDP’s Economic Management andCapacity Building for Private Sector Development projectwas announced in May 2003.By granting $1.9 million tothe government’s Vision 2020 plan,this project will work inconjunction with the AfDB,the World Bank,and bilateralprojects to improve government efficiency and policyeffectiveness.The project will also promote the provision ofinformation to foreign investors and the improvement ofregulation and services for export-oriented firms.
S In mid-2003,the AfDB announced plans to give The Gambia$25 million over the next 3 years to support education,balance-of-payments,expenditure management skills,andpublic aid.
S As part of the 2003-05 country assistance strategyestablished by the World Bank,major government policiesinclude improving public expenditure management,promoting growth in the private sector,and improvingpublic services.
Economic Update
the gambia
Percent
01234567
1999 2000 2001 2002 2003
Real GDP Growth Rate

6-44
Main Trade Partners, percent of total, 2002
Markets SourcesFrance 21.6 China (incl.
Hong Kong)25.7
United Kingdom 18.8 Senegal 9.5
Italy 10.9 Brazil 7.9
Germany 7.6 United Kingdom 6.7
Main Trade Commodities, US$ millions, 1999
Exports Imports
Re-exports 104.0 Food &beverages
89.4
Groundnutproducts
10.0 Manufactures 53.8
Fish & fishpreparations
3.1 Machinery &transportequipment
46.5
Minerals &fuel
12.4
0
2
4
6
8
10
12
1999 2000 2001 2002 2003
Millions of U.S. DollarsU.S. exportsU.S. importsTrade balance
U.S. Trade Balance
Trade UpdateS Groundnuts continued to be The Gambia’s leading export
product in 2003.Re-exported manufactured goodscontinued to represent a significant portion of The Gambia’strade profile.
S To improve the inadequate transport infrastructure in TheGambia,the OPEC Fund for International Developmentloaned $2.8 million in May 2003 to construct an additionalroad that will reduce the export of goods via the airport,thereby reducing transport costs.
S In 2003,U.S.exports to The Gambia consisted primarily ofmeat,cotton yarn or fabric,and machinery and mechanicalappliances.U.S.imports from The Gambia consistedprimarily of optical or measuring equipment and partsthereof,toy or game equipment and parts thereof,andcotton yarn or fabric. In 2003 and 2004,The Gambia wasdesignated an AGOA beneficiary country.AGOA (includingGSP) imports from The Gambia totaled $20,000 in 2003.
Investment and Privatization UpdateS For 1999-2001,The Gambia was ranked 12th out of 140
countries,and second in Africa for FDI performance by the2003 World Investment Report by the UNCTAD.Thecountry’s active tourist sector and liberal investmentclimate contributed to the high ranking.
S In June 2003,Clemessy (Germany) and Norelec (France)signed contracts with the government to constructtransmission and distribution lines for the national grid asthe second phase of the rural electrification project.TheAfDB financed the $3.3-million project.
S The government created an Insurance Bill to improve theregulation and effectiveness of the insurance industry.Thebill also transfers governance of the industry to the centralbank.
S A Money Laundering Bill was passed in 2003 to improvetransparency of financial institutions by providing supportfor firms reporting suspicious transactions.This regulationis expected to decrease corruption and increase foreigninvestor confidence.
S In early 2003,D.Blankevoort (Netherlands) began a projectfunded by the AfDB and OPEC to ease coastal erosion.Thisproject is expected to improve the coastal transportationinfrastructure and increase tourism.
S As part of the 5-year Global Expansion Project of Gamtel,the state telecommunications agency,$53.9 million will beinvested in increasing fixed-line capacity in 2004.In addition,Alcatel (France) will install 35,500 new lines under a$37.2-million contract,and Airspan Networks (U.S.) willsupply 2,000 wireless telephones to remote locations.
S Privatization of state-owned enterprises is expected tocontinue despite slow progress.
the gambia
Net Foreign Direct Investment
0
10
20
30
40
50
1998 1999 2000 2001 2002
Millions of U.S. Dollars

6-45
Economic OverviewEconomic Indicators
2002 2003 Difference
GDP (nominal, C trn) 44.7 59.7 15.0
GDP (US$ bn) 5.6 6.9 1.3
CPI Inflation (annual average, %) 14.8 26.8 12.0
Goods Exports (US$ mn) 2,015.2 2,641.1 625.9
Goods Imports (US$ mn) 2,705.1 3,239.0 533.9
Trade Balance (US$ mn) -689.9 -597.9 92.0
Current Account Balance (US$ mn) -30.6 214.0 244.6
Foreign Exchange Reserves (US$ mn) 539.7 950.0 410.3
Total External Debt (US$ bn) 7.0 7.4 0.4
Debt Service Ratio, paid (%) 11.7 9.4 -2.3
Exchange Rate (C/US$) 7,932.7 8,676.4 743.7
Origins of GDP (2001)
Agriculture, forestry& fishing(35.2%)
Services(39.4%)
Other industry(16.1%)
Manufacturing(Industry)(9.3%)
S Agriculture represents approximately 30 to 40 percent ofGDP and employs approximately 60 percent of theworkforce.
S The leading export is cocoa,followed by timber,horticultureproducts, fish/seafoods,and pineapple.Removal of pricecontrols and increased prices paid to cocoa farmers hascontributed to growth in the cocoa industry in Ghana.During the 2002-03 growing season,production of cocoareached an estimated 490,000 tonnes,one of the highestlevels recorded in 40 years.Further reform efforts for thesector include increasing the price paid to cocoa producersto 70 percent of the F.O.B.price,as well as establishing arevolving credit fund for farmers.
S The Ministry of Food and Agriculture has set aside $50million to modernize the agriculture sector in an effort toreduce imports and increase food security.Strategies alsoinclude providing incentives for small businesses andgreater access to capital.
S In January 2003,the government increased fuel prices byan average of 90 percent in an effort to reduce the level ofdebt of the country’s sole refinery.
S In 2003,foreign exchange reserves for the countryreached a 30-year high.Cocoa exports recovered,reachingan estimated $772 million in 2003,up from $381 millionin 2001.Gold earnings also increased to $770 million in2003 from $618 million in 2002, in part because of risingglobal gold prices.This contributed to the growth in foreignreserves.Ghana also receives revenue from workerremittances from Ghanaians abroad.
S The government has entered into a new 3-year agreementwith the IMF to fund poverty reduction initiatives.Theprogram,for which the IMF would provide $258 million,requires the government to reduce public expenditure,implement reforms in the financial sector to allow privatesector development,and increase certain utility prices.
S Much of Ghana’s debt has been reduced through the WorldBank’s HIPC initiative.
Economic Update
Real GDP Growth Rate
GHANA
Percent
0
1
2
3
4
5
6
1999 2000 2001 2002 2003

6-46
Main Trade Partners, percent of total, 2002
Markets SourcesNetherlands 15.0 Nigeria 21.4
United Kingdom 10.0 UnitedKingdom
7.2
United States 7.1 United States 6.6
Germany 6.3 China 6.2
Main Trade Commodities, US$ millions, 2002
Exports Imports
Gold 689.1 Nonoil 2,197.0
Cocoa beans &products
463.4 Oil 508.1
Timber &products
182.7
Trade UpdateS Ghana’s ports are being developed as regional trade hubs;a
current project to dredge the port in the city of Tema tobuild a container terminal is already underway.Furtherplans include warehousing facilities,export processingzones,packaging facilities,and haulage zones.
S Under the Industry Revival Scheme,efforts are being madeto diversify exports by focusing on the services and miningsectors.Gold and manganese are potential exportproducts.The diamond sector experienced a setback inSeptember 2003 when the government was banned fromexporting diamonds after it failed to ratify an internationalagreement against the illegal diamond trade.
S In 2003,the Government of Ghana announced itsintentions to extend the rail network to link with BurkinaFaso,Côte d’Ivoire,and Togo for both passenger and freighttravel.This project should help improve access for privatebuyers within the cocoa industry,the largest sector of theeconomy.
S Presidential Special Initiatives were established in 2003 forthe garment,cassava,and palm oil industries using trainingand technical assistance to increase exports and to allowGhana to take advantage of benefits offered under the U.S.AGOA program.
S In 2003,U.S.exports to Ghana consisted primarily ofmachinery and mechanical appliances,cereals,and vehiclesand parts thereof.U.S.imports from Ghana consistedprimarily of wood and articles of wood,mineral fuels andoils,and cocoa and cocoa preparations.In 2003 and 2004,Ghana was designated an AGOA beneficiary country,including qualifying for apparel benefits.AGOA (includingGSP) imports from Ghana totaled $40.6 million in 2003.
Investment and Privatization UpdateS The city of Accra has outlined plans to reform the financial
sector by introducing four new pieces of legislation that aimto attract foreign investment:the Foreign Exchange Bill, theLong-Term Savings Bill, the Credit Union Bill,and theInsurance Bill.The proposed legislation will bring Ghana inline with current international guidelines.
S African Gold (Ireland) purchased a $4-million,70-percentstake in the Konongo Owere gold reserve.In October 2003,the government also approved the $1.4-billion acquisition ofAshanti Goldfields by AngloGold (South Africa),allowing it tobecome the largest producer with output of 7.5 millionounces of gold per year.
S The expansion of the country’s largest international airportwas completed in early 2003 at a cost of $100 million;60percent of the project was financed by the Ghana CivilAviation Authority,and the remainder by private institutions.However,plans to privatize the domestic carrier have beenplaced on hold indefinitely because of the apparent failure ofthe potential partner to meet its obligations.
S Privatization slowed in 2003,with key assets still awaitingbuyers.Proposed sales include the Volta River Authority, theprimary electricity producer and provider;the Ghana WaterCompany;and the Tema Oil Refinery.
ghana
U.S. Trade Balance
Net Foreign Direct Investment
-50
0
50
100
150
200
250
1999 2000 2001 2002 2003
Millions of U.S. DollarsU.S. exportsU.S. importsTrade balance
0
50
100
150
200
250
1998 1999 2000 2001 2002
Millions of U.S. DollarsMillions of U.S. DollarsMillions of U.S. Dollars

6-47
Economic OverviewEconomic Indicators
2002 2003 Difference
GDP (nominal, Gnf bn) 6,350.0 7,064.0 714.0
GDP (US$ mn) 3,215.0 3,506.0 291.0
CPI Inflation (annual average, %) 6.1 14.8 8.7
Goods Exports (US$ mn) 700.0 705.0 5.0
Goods Imports (US$ mn) 650.0 625.0 -25.0
Trade Balance (US$ mn) 50.0 80.0 30.0
Current Account Balance (US$ mn) -208.0 -225.0 -17.0
Foreign Exchange Reserves (US$ mn) 171.0 120.0 -51.0
Total External Debt (US$ mn) n/a n/a n/a
Debt Service Ratio, paid (%) n/a n/a n/a
Exchange Rate (Gnf/US$) 1,976.0 1,990.0 14.0
Origins of GDP (2002)
Primary(18.3%)
Secondary(31.1%)
Indirect taxes(4.2%)
Tertiary(46.3%)
S Guinea is rich in natural resources such as bauxite,gold,aluminum,and diamonds.These mineral deposits were theprincipal exports for the country in 2002,and the topearners of foreign exchange.However,declininginternational prices and reduced foreign investment haveresulted in decreased output,and taxes have been raised torecover the lost revenue.
S Agriculture is another important sector for the economy,much of which is subsistence farming.Paddy rice is thedominant crop.Output has declined mainly because of civilunrest across the border in Sierra Leone.
S In 2002,GDP growth was driven by a strong harvest andgrowth in the construction sector.
S In July 2003,the IMF completed its Article IV consultationreport.The report highlighted a slowdown in privatizationbecause of presidential elections held in 2003.
S In March 2004,the World Bank proposed theharmonization of mining laws within a number of countriesin sub-Saharan Africa, including Guinea.The new codes areaimed at stimulating investment by increasing the ease ofobtaining mineral title deeds.
S The World Bank/IDA announced in mid-June 2004 that itwas suspending further loans and halting field projectsbecause of Guinea’s failure to pay off debt servicing arrearsof $2.4 million.The IDA had supported Guinea with loans of$30 million per year.Guinea had previously lost supportfrom the IMF in 2002 because of financialmismanagement,corruption,and improper economicpractices.
S In 2001,the IMF granted a $81.3-million loan to reducepoverty,promote GDP growth, improve social services,andsupport economic stability.The IMF granted only $17million of the total loan in 2002,however,because oflimited progress by the government in implementingprograms.
S In June 2003,$3.6 million was given to Guinea under theHIPC initiative.
S Guinea sources much of its power through hydroelectricplants. In 2003,the plants experienced frequent poweroutages,which in turn affected water supply.To combatpower shortages,the Islamic Development Bankannounced approval of a $15-million loan to Guinea toreplace an aging generator.Varsila (France) also proposedplans to build a power station at Tombo.
Economic Update
Real GDP Growth Rate
guinea
Percent
0
1
2
3
4
5
1999 2000 2001 2002 2003

6-48
Main Trade Partners, percent of total, 2002
Markets SourcesSpain 10.5 France 19.6
Belgium 10.1 Côte d’Ivoire 11.6
Cameroon 10.1 United States 8.6
United States 9.6 Belgium 7.9
Main Trade Commodities, US$ millions
Exports (2002) Imports (2001)
Bauxite 305.0 Mineralproducts
186.0
Gold 144.0 Chemicals &plastic
74.0
Alumina 128.0 Foodstuffs,beverages &tobacco
60.0
Diamonds 35.0 Machinery 51.0
Trade UpdateS Guinea is a member of the West African Monetary Zone,
the second monetary area to be created in western Africa.The monetary zone is scheduled to be introduced in July2005,with the intention of integrating with the WestAfrican Economic Monetary Union’s CFA Zone to create asingle West African currency by 2007.
S In October 2003,a dispute between the mining companiesand the finance ministry over the VAT that was notreimbursed was resolved.The arrangement between themining firms and the government enumerates that thefirms pay VAT and collect a reimbursement within 45 days.The firms claimed that approximately $17 million in fundshad been held back.
S In 2003,U.S.exports to Guinea consisted primarily ofmachinery and mechanical appliances,vehicles and partsthereof,and cereals.U.S.imports from Guinea consistedprimarily of ores,slag,and ash;precious or semipreciousstones or metals;and electrical machinery and equipment.In 2003 and 2004,Guinea was designated an AGOAbeneficiary country.AGOA (including GSP) imports fromGuinea totaled $194,000 in 2003.
Investment and Privatization UpdateS The banking sector in Guinea has undergone reforms to
promote financial activities.The surge in mining activity hashelped increase medium-term lending, increasingconfidence in the banking sector specifically,and improvingthe general investment climate.
S In 2003,foreign investment in the bauxite mining sectorstrengthened.Russkiy Aluminiy (Russia) proposed financingan aluminum smelter after it won the right to mine bauxiteat Dian-Dian.In early 2003,the company bought a majorityof the 85-percent stake reserved for foreign investors in thestate-owned Guinea Alumina Company.
S GAPCO,a joint venture between Marubeni (Japan),Mitsubishi (Japan),and a U.S.capital venture firm,boughtthe Boke Alumina Corporation and plans to invest $2 billionto add an aluminum refinery and a bauxite mine.Construction is expected to begin in mid-2004 withoperations starting in 2007.
S Gold mining and investment in the sector has increased inrecent years.In 2003,Kenor (Norway),which has an85-percent share in Societe Miniere de Dinguiraye (SMD),was awarded an additional exploration permit for a locationadjacent to the existing SMD mine.
S In 2000,Guinea began substantial privatization efforts,butmany investors have pulled out of the process citinginterference from government officials.Many of the publicutilities that were scheduled for privatization returned tostate control, including the electricity company,Sogel.
S In June 2004,the state liberalized the telecommunicationssector by opening it up to competition.However,there iscurrently only one GSM provider,Sotelgui.
S In May 2003,the national telecommunications company,Sotelgui,signed a contract with Telekom Applied Business(Malaysia) to supply a prepaid fixed line telephone service.
guinea
U.S. Trade Balance
Net Foreign Direct Investment
-90
-60
-30
0
30
60
90
120
150
1999 2000 2001 2002 2003
Millions of U.S. Dollars
U.S. exportsU.S. importsTrade balance
0
10
20
30
40
50
60
70
1998 1999 2000 2001 2002
Millions of U.S. DollarsMillions of U.S. DollarsMillions of U.S. Dollars

6-49
Economic OverviewEconomic Indicators
2002 2003 Difference
GDP (nominal, CFAfr bn) 150.9 146.0 -4.9
GDP (US$ mn) 216.3 251.2 34.9
CPI Inflation (annual average, %) 4.0 4.0 0.0
Goods Exports (US$ mn) 50.7 40.0 -10.7
Goods Imports (US$ mn) 67.9 59.0 -8.9
Trade Balance (US$ mn) -17.2 -19.0 -1.8
Current Account Balance (US$ mn) -32.6 -52.6 -20.0
Foreign Exchange Reserves (US$ mn) 102.7 148.5 45.8
Total External Debt (US$ mn) n/a n/a n/a
Debt Service Ratio, paid (%) n/a n/a n/a
Exchange Rate (CFAfr/US$) 696.9 581.2 -115.7
Origins of GDP (2000)
Agriculture, forestry,& fishing(58.8%)
Industry(10.0%)
Services(31.2%)
S Much of the economy relies on the agriculture sector forGDP growth,with cashew production dominating the exportsector.Much of the country is rural and underdeveloped,with little diversification occurring in crop production.Themining sector is relatively undeveloped,although theconstruction industry has begun to show signs of economicrecovery.
S Given recent political activity,economic policy remainsuncertain. In September 2003,Guinea-Bissau experienceda military coup that replaced the elected President with alegislative council.
S Macroeconomic instability resulting from the coupcontributed to a decline in the services sector and acontraction in GDP growth for 2003.
S A budget for 2004 was drafted before the legislativeelections,and transitional authorities were working with theIMF,World Bank,the UN,the African Development Fund,and bilateral donors such as Portugal, the Netherlands,andFrance,to establish an aid ”trust fund” to support thebudget.Budget implementation is expected to begin in thesecond half of 2004 after the elections.Budgetmanagement would be shared by donor agencies and thelocal government.
S The IMF is working with Guinea-Bissau to reestablish aPRGF,possibly in 2005,and resume technical assistancethat was suspended in May 2001 after emergencyassistance was allegedly used for unauthorizedexpenditures.
S In December 2003,Portugal provided a $1-million grant toGuinea-Bissau to help pay civil servant salaries.While theEU has also proposed assistance to the country, it is barredunder the Cotonou Convention from providing assistance toa government that has taken power by force.
S In March 2003,India pledged to provide eight west Africannations, including Guinea Bissau,with technical assistanceand low-interest loans totaling $500 million for thedevelopment of agricultural and other emerging industries.
Economic Update
Real GDP Growth Rate
guinea-Bissau
Percent
-8-6-4-202468
1012
1999 2000 2001 2002 2003

6-50
Main Trade Partners, percent of total, 2002
Markets SourcesIndia 50.4 Senegal 19.6
Uruguay 19.1 Portugal 19.1
Thailand 19.0 India 15.4
Italy 2.6 China 4.3
Main Trade Commodities, US$ millions, 2001
Exports Imports
Cashew nuts 45.1 Foodstuffs 18.1
Cotton 1.1 Petroleumproducts
6.0
guinea-bissau
Trade UpdateS Guinea-Bissau is a member of several regional frameworks,
including the Cotonou Convention,the community ofPortuguese speaking countries (CPLP),the AU,ECOWAS,theFranc Zone,and UEMOA.
S Senegal is an important import source.Principal importsinclude foodstuffs and petroleum.India is an important exportmarket for Guinea-Bissau.
S In July 2004,the Government of Guinea-Bissau began toimport rice from neighboring Senegal to ease the shortagedriven by farmers who diversified away from staple cropstoward cash crops.
S In 2003,U.S.exports to Guinea-Bissau consisted primarily ofoptical or measuring equipment and parts thereof,machineryand mechanical appliances,and cereals.U.S.imports fromGuinea-Bissau consisted primarily of mineral fuels and oils,edible fruits and nuts,and live animals. In 2003 and 2004,Guinea-Bissau was designated an AGOA beneficiary country.
Investment and Privatization UpdateS Inadequate infrastructure continues to hinder investment,as
much of the transportation networks were neglected duringperiods of civil unrest.
S In early 2004,three firms-Caelux (Portugal),Dataport(Morocco),and Inestcom Holdings(Lebanon/Luxembourg)-completed the bidding process thatwill lead to the introduction of mobile phone services for thecountry.The bids are currently being evaluated,but notimetable has been issued.
S Champion Resources (Canada) is planning to invest $120million to build a phosphate mine in the northwest region ofthe country,near the Senegal border.
S The former Government of Guinea-Bissau had begun theprocess of divesting several state-owned public utility firms toprivate investors.Portugal Telecom currently has a51-percent stake in Guinea-Telecom,and the governmentanticipated further liberalization of the sector. In 2003,thegovernment also announced plans to introduce a cellulartelephone service and extend the telephone network to therural areas.Plans are also under consideration for theprivatization of the state power utility,EAGB,but progress hasbeen slow.The state-owned timber company,Socotram,hasbeen divided into four entities as the government prepares todiversify it.
U.S. Trade Balance
Net Foreign Direct Investment
-2
-1
0
1
2
3
4
1999 2000 2001 2002 2003
Millions of U.S. DollarsU.S. exportsU.S. importsTrade balance
0123456789
1998 1999 2000 2001 2002
Millions of U.S. DollarsMillions of U.S. DollarsMillions of U.S. Dollars

6-51
Economic OverviewEconomic Indicators
2002 2003 Difference
GDP (nominal, KSh bn) 969.4 1,003.0 33.6
GDP (US$ bn) 12.3 13.2 0.9
CPI Inflation (annual average, %) 1.9 9.8 7.9
Goods Exports (US$ mn) 2,169.0 2,513.9 344.9
Goods Imports (US$ mn) 3,181.0 3,704.6 523.6
Trade Balance (US$ mn) -1,012.0 -1,190.7 -178.7
Current Account Balance (US$ mn) -57.0 -315.5 -258.5
Foreign Exchange Reserves (US$ mn) 1,068.0 1,400.0 332.0
Total External Debt (US$ bn) 5.6 5.9 0.3
Debt Service Ratio, paid (%) 10.6 9.1 -1.5
Exchange Rate (KSh/US$) 78.8 75.9 -2.9
Origins of GDP (2002)
Agriculture, forestry & fishing(24.3%)
Manufacturing(13.0%)
Government services(10.5%)
Trade, restaurants & hotels(12.7%)
Transport, storage & communications(6.3%)
Other(33.2%)
S The agriculture sector is the primary source of employmentand accounts for nearly 50 percent of employment in theinformal sector.Agriculture has also been the driving forcefor GDP growth in 2003.Farming and cattle rearing arethe leading activities.Kenya also relies on primarily tea,horticultural products,and coffee.
S Output of horticulture export crops increased in 2003because of the development of new markets such as Asia,the United States,and Australia.
S Flower and plant production is expected to benefit from anagreement between the Dutch certification body,MilieProject Sterteelt,and the Kenya Flower Council that willimprove compliance with international environmentalstandards.
S In November 2003,Kenya developed a 3-year EconomicRecovery Strategy for Wealth and Employment Creationprogram to run from 2003 to 2006.The program allowsKenya to be approved for a $253-million loan from the IMF.This loan represents the first loan given to Kenya since2000 when the IMF,along with the World Bank,frozelending to Kenya over widespread corruption and laxeconomic reform.The action plan details eight targetareas, including reducing the domestic burden,tighteningregulatory controls of commercial banks,widening the taxbase,reforming the minimum wage rate, introducinganti-corruption measures, lowering tariffs,andrestructuring the telecommunications sector.This hasencouraged foreign donors to pledge up to $4.1 billion tohelp revive the economy,with 90 percent of the fundsdirected to reducing government budget deficits.
S In April 2003,two anti-corruption bills were enacted:theAnti-Corruption and Economic Crimes Bill,which applied tothe public and private sector,and the Public Officer EthicsBill,which introduced a code of conduct for all civil servants.
S In June 2003,the Global Fund Against AIDS,Tuberculosisand Malaria allocated $55 million to the Kenya NationalAIDS Control Council.
S Progress has been made in rehabilitating transportationinfrastructure,such as improvements to the main roadbetween Mombasa and Kisumu;however,many projectsare affected by alleged corruption within the government.
S The government is faced with insufficient resources as ittries to balance care for AIDS patients against other healthdemands.The rapid rate of the spread of HIV/AIDS (13percent of the population was affected in 2003) is anincreasing economic and social cost for the government.
S The European Development Fund remains the primarysource of multilateral aid for Kenya.In October 2003,theEU approved a $265-million assistance package for avariety of long-term development projects within Kenya,including macroeconomic development,agriculture sectormodernization,transport and infrastructure improvement,small business expansion,export promotion,tourism,andnongovernmental organizations support.
Economic Group
Real GDP Growth Rate
KENYA
Percent
-1
0
1
2
1999 2000 2001 2002 2003

6-52
Main Trade Partners, percent of total, 2002
Markets SourcesUnited Kingdom 13.5 United
Kingdom12.0
Tanzania 12.5 United ArabEmirates
9.8
Uganda 12.0 Japan 6.5
Netherlands 6.5 India 4.4
Main Trade Commodities, US$ millions, 2002
Exports Imports
Tea 439.0 Industrialmachinery
484.0
Horticulturalproducts
253.0 Crudepetroleum
397.0
Petroleumproducts
157.0 Refinedpetroleumproducts
331.0
Coffee 95.0 Motorvehicles
185.0
kenya
Trade UpdateS Kenya currently has 37 export processing zones,of which
only two are government owned.An export processing zoneis planned for the Lake Victoria basin,which will allow cottonfarmers to take advantage of AGOA.Tea factories are beingconsidered for export processing zone status as the KenyaTea Development Authority plans to spend $326,800 ontea-blending facilities in the hope of penetrating the U.S.specialty tea market.
S In January 2004,fish exports to the EU resumed.A 2-yearexport ban had been introduced after the EU found Kenyahad not met the sanitary conditions of the EU’s committeeon food chain and animal health.
S Kenya Ports Authority is working in conjunction with KenyaRailways to establish a cargo transport system betweenMombasa and Kampala,Uganda.A proposal has been putforward to purchase 200 rail wagons to increase existingservices between the two cities.The World Bank hasagreed to fund a $39.2-million plan to expand Kenya’sairports at Nairobi and Kisumu.
S In 2003,U.S.exports to Kenya consisted primarily ofaircraft and parts thereof,machinery and mechanicalappliances,and fertilizers.U.S.imports from Kenyaconsisted primarily of apparel;coffee,tea,mate,and spices;and lac,gums,and resins.In 2003 and 2004,Kenya wasdesignated an AGOA beneficiary country, including qualifyingfor apparel benefits.AGOA (including GSP) imports fromKenya totaled $184.4 million in 2003.
Investment and Privatization UpdateS Woodside Petroleum (Australia) has agreed to fund 80
percent of new seismic surveys that are to begin inmid-2004.Dana Petroleum,the current offshore licenseholder in the area,will retain a 40-percent stake in theproject and Woodside will keep 40 percent,with StarPetroleum of Kenya taking the remaining 20 percent. In late2003,Woodside signed a farm-in agreement that allows itto explore for oil and fund a $1.3-million seismic survey inexchange for earning a 50-percent stake in the area andbecoming the sole operator.
S A new mining code is being proposed that is expected to beintroduced in December 2004.The legislation is expectedto include lower taxes for investors and to simplify thelicensing process.Tiomin (Canada) has purchased a21-year mining lease to mine titanium near Mombasa.Themining company paid $150 million for the lease,andconstruction is expected to begin in 2006.The Athi RiverMining company plans to invest $6.5 million to open 2 newplants to be operational by late 2005 and early 2006.Diamondworks (Canada) has purchased a 55-percent stakefor $2 million in Spectre International,an ethanol fueladditive plant.
S Coca-Cola (U.S.) entered the market in early 2004 byintroducing its Dasani brand of noncarbonated beverages.South Africa Bottling Company (Sabco) is looking toconsolidate its Kenya operations,and announced plans tobuy a local firm for $20 million.
S The government has proposed a new timetable for theprivatization of Telkom Kenya.In 2005,a 25-percent stakewill be offered to a private investor,with an additional 20percent to be offered on the Nairobi Stock Exchange.Asecond national operator is expected to be licensed by June2005.
U.S. Trade Balance
Net Foreign Direct Investment
-100-50
050
100150200250300350400450500550600
1999 2000 2001 2002 2003
Millions of U.S. DollarsU.S. exportsU.S. importsTrade balance
0
25
50
75
100
125
150
1998 1999 2000 2001 2002
Millions of U.S. DollarsMillions of U.S. DollarsMillions of U.S. Dollars

6-53
Economic OverviewEconomic Indicators
2002 2003 Difference
GDP (nominal, M mn) 7,731.0 8,650.0 919.0
GDP (US$ mn) 736.3 1,138.2 401.9
CPI Inflation (annual average, %) 13.2 6.1 -7.1
Goods Exports (US$ mn) 399.0 450.0 51.0
Goods Imports (US$ mn) 840.0 750.0 -90.0
Trade Balance (US$ mn) -441.0 -300.0 141.0
Current Account Balance (US$ mn) -138.0 -88.0 50.0
Foreign Exchange Reserves (US$ mn) 406.0 460.0 54.0
Total External Debt (US$ mn) 600.0 610.0 10.0
Debt Service Ratio, paid (%) 11.0 10.2 -0.8
Exchange Rate (M/US$) 10.5 7.6 -2.9
Origins of GDP (2002)
Agriculture(17.7%)
Construction (Industry)(14.9%)
Services(41.0%) Manufacturing
(Industry)(17.6%)
Other inudustry(8.8%)
S Lesotho’s economy is closely tied to that of South Africa,with South Africa supplying as much as 85 percent ofLesotho’s imports.Migrant mining workers employed inSouth Africa and livestock contribute to a large share of theGDP.In addition,revenues from the sale of water andhydroelectric power to South Africa also contribute to GNP.Droughts,which began in early 2003,hindered agriculturalproduction.In general, inadequate physical infrastructureand lack of access to bank credit continue to hindereconomic development and diversification.
S Government policy in 2003 focused on land tenure systemreform to increase the security and protection of privateproperty.The Central Bank of Lesotho is committed toincreasing access to financial services for underservedrural areas.In August 2003,the central bank approved theRural Credit Guarantee Fund for banks to back commercialbanks servicing rural communities.
S The HIV/AIDS pandemic may reportedly reduce the GDPgrowth rate by up to 3 percentage points over the nextdecade.The HIV/AIDS pandemic has led to decreasedagricultural production,and increasing the nationalemployment rate continues to be an important objective.Unemployment levels have been estimated at 40-45percent.
S In recent years,Lesotho has substantially increasedexports,especially of clothing and footwear,to the UnitedStates and South Africa.The AGOA program hascontributed significantly to this increase.
S The value-added tax of 14 percent,up from 10 percent,was introduced in July 2003 after the establishment of theLesotho Revenue Authority.As a result,revenues areexpected to increase by 15 percent.
S The government produced an interim PRSP (I-PRSP) toprepare for a full PRSP in November 2003.The IMFreviewed the paper and expressed approval of the country’sprogress,but noted concern regarding the budget deficit,future loss of trade possibilities,and the impact ofHIV/AIDS.
S In October 2003,the government’s auditor-general couldnot verify the 2001-02 accounts because of outdatedinformation and lax reporting standards.This deficiencyalso contributed to waivers of the September 2002performance condition with the IMF relating to therequirements of the Central Bank of Lesotho.
S Lesotho was among the eight African countries whobecame eligible in 2004 for the U.S.-sponsored MillenniumChallenge Account assistance.
Economic Update
Real GDP Growth Rate
LESOTHO
Percent
0
1
2
3
4
5
1999 2000 2001 2002 2003

6-54
Main Trade Partners, percent of total, 2002
Markets SourcesUnited States 76.4 Southern African
Customs Union73.5
SouthernAfricanCustoms Union
22.9 Asia 23.7
European Union 0.2 European Union 1.1
Main Trade Commodities, US$ millions
Exports (2002) Imports (1995)
Clothing 260.0 Capital goods 368.0
Foodstuffs 19.0 Food 328.0
Footwear 13.0 Fuel energy 216.0
Livestockmaterials
6.0
lesothoTrade UpdateS After Mauritius,Lesotho is SSA’s second-largest exporter of
clothing and textiles.Approximately 90 percent of exports goto the United States;the remainder go to other southernAfrican markets. In addition to textiles,apparel,and footwear,Lesotho has increased its exports of handicrafts, furniture,pottery,and tapestries.
S Textiles,clothing, footwear,and leather productioncontributed to the increase in the manufacturing sector’sshare of GDP,which grew from 8 percent in 1980 to 18percent in 2002.Three-quarters of Lesotho’s total exportsare clothing and footwear sent to the United States under theAGOA program.This export growth is largely driven by therelocation of Asian textile manufacturers to Lesotho becauseof AGOA.
S The government has contributed funds for construction ofAfriSki,a ski resort collaboration between Uraban Dynamics,Group 5,Standard Bank Lesotho,and HSP Alpine Service ofAustria.The ski resort is expected to increase tourism and,subsequently, foreign exchange receipts.
S The Lesotho government anticipates increased mineralexports and revenue after the reopening of Letseng-la-Teraediamond mine in 2004.Aided by a loan from South Africa’sIndustrial Development Corporation, full production isexpected by late 2004.
S In 2003,U.S.exports to Lesotho consisted primarily ofmachinery and mechanical appliances,animal or vegetablefats and oils,and vegetables.U.S.imports from Lesothoconsisted primarily of apparel,plastics and articles thereof,and used clothing or textiles. In 2003 and 2004,Lesotho wasdesignated an AGOA beneficiary country, including qualifyingfor apparel benefits.AGOA (including GSP) imports fromLesotho totaled $372.7 million in 2003.
Investment and Privatization UpdateS Aside from the textile and apparel sector,Lesotho continues
to have difficulty in attracting foreign investment.Contributingfactors include lack of government transparency,allegedcorruption,and the HIV/AIDS pandemic.
S Lesotho has benefitted from foreign investment because ofthe AGOA program.For example,the Nien Hsing Companyconstructed a $100-million denim rolling mill in Maseru andanticipates building a $50-million yarn spinning plant.
S With support from the World Bank,the AfDB,and the EU,aprivate management company is working to privatize theLesotho Electricity Corporation (LEC). In 2002,15 companiesexpressed interest in purchasing shares of LEC.Theimmediate goal of privatization is to increase electricityavailability from 100,000 to 400,000 residents. In May2003,the government announced the possibility of offeringLEC as a public service concession in lieu of full privatization.
U.S. Trade Balance
Net Foreign Direct Investment
-400
-300
-200
-100
0
100
200
300
400
500
1999 2000 2001 2002 2003
Millions of U.S. DollarsU.S. exportsU.S. importsTrade balance
0
50
100
150
200
250
300
1998 1999 2000 2001 2002
Millions of U.S. DollarsMillions of U.S. DollarsMillions of U.S. Dollars

6-55
Economic OverviewEconomic Indicators
2002 2003 Difference
GDP (nominal, L$ bn) 34.7 34.4 -0.3
GDP (US$ mn) 561.8 687.4 125.6
CPI Inflation (annual average, %) 14.2 18.0 3.8
Goods Exports (US$ mn) 147.2 100.0 -47.2
Goods Imports (US$ mn) 172.8 250.0 77.2
Trade Balance (US$ mn) -25.6 -150.0 -124.4
Current Account Balance (US$ mn) -50.0 -140.0 -90.0
Foreign Exchange Reserves (US$ mn) 3.3 1.0 -2.3
Total External Debt (US$ mn) n/a n/a n/a
Debt Service Ratio, paid (%) n/a n/a n/a
Exchange Rate (L$/US$) 61.8 50.0 -11.8
Origins of GDP (2002)
Agriculture & fisheries(51.0%)
Forestry(25.9%)
Services(17.7%)
Manufacturing(5.4%)
S Although GDP has grown, it remains less than half of whatit was in 1989,before the period of substantial civil unrestin Liberia .Agriculture and fisheries are the largestcomponent of GDP,but their share has decreased.Approximately 75 percent of the workforce derives itsincome from subsistence agriculture.
S Transportation infrastructure is inadequate.There are fewmain roads, less than 7 percent of roads are paved,andthere is no passenger railway.
S Banks began to open in August 2003 after the resumptionof some stability.The first bank to reopen was state-ownedLiberian Bank for Development and Investment.The closureof the nation’s banks had discouraged commercial activity.
S Despite some improvements,the IMF’s September 2003Article IV report found that economic recovery has stalled,and that growth has been hindered by low productivecapacity, inadequate governance,and minimal foreigninvestment and assistance.Liberia’s IMF voting rights weresuspended in March 2003.
S In late 2003,the UN appealed to the internationalcommunity for $69.1 million to cover Liberia’s immediateneeds:$22 million for food,$9 million for refugees,$8.5million for health,and the remainder for rehabilitation.
S In February 2004,donors pledged $520 million to helpreconstruct infrastructure and to rehabilitate fighters inLiberia. Initial funding will focus on disarmament anddemobilization efforts,but funds have also been earmarkedfor healthcare,education facilities,communication,andtransport.
S EU assistance helped to resume water supply to someareas of Monrovia in August 2003.The rehabilitation of thewater system is expected to have significant public healthbenefits.
S In April 2004,the United States pledged an additional$19.5 million in humanitarian assistance for Liberia.Thefunds are to be used to repatriate and reintegrate internallydisplaced persons,and provide essential medical services,water and sanitation programs,safe transport forreturning refugees,and rehabilitation programs inconflict-affected areas.
Economic Update
Real GDP Growth Rate
LIBERIA
Percent
0
5
10
15
20
25
1999 2000 2001 2002 2003

6-56
Main Trade Partners, percent of total, 2002
Markets SourcesGermany 55.8 South Korea 25.5
Poland 8.9 Japan 17.9
France 8.5 Germany 17.5
China 4.6 France 10.2
Main Trade Commodities, US$ millions, 2002
Exports Imports
Timber 84.9 Food & liveanimals
56.6
Rubber 57.4 Fuels &lubricants
34.5
Miscellaneousmanufacturedgoods
27.7
Machinery 17.5
liberia
Trade UpdateS Rubber and timber accounted for 96 percent of exports in
2002.However,the UN Security Council has extended theban on timber exports, imposed in May 2003,to the end of2004.The UN Security Council has also banned theimportation of diamonds from Liberia as control overdiamond-producing areas contributed to increased conflict.
S Liberia is the world’s second-largest flags of convenience (aforeign flag under which a merchant vessel is registered forpurposes of reducing operating costs or avoidinggovernment regulations),after Panama, in terms oftonnage.Shipping revenue is the primary source of foreignearnings.
S In 2003,U.S.exports to Liberia consisted primarily ofarticles of iron or steel,cereals,and used clothing ortextiles.U.S.imports from Liberia consisted primarily ofrubber and articles thereof,mineral fuels and oils,andprecious or semiprecious stones or metals.
Investment and Privatization UpdateS Liberia has significant endowments of iron ore,diamonds,
gold,timber,and rubber that have not been fully exploitedbecause of social unrest, inadequate infrastructure,socialinstability,and lack of governance.
S The forestry sector has attracted significant amounts offoreign direct investment.Over 30 percent of the country isforested,with wooded land accounting for another 20percent.
S The National Port Authority has indicated that rehabilitationof the port would require a $40-million investment.
S In October 2003,the first act of the National TransitionalGovernment of Liberia was to cancel the import monopolieson rice and petroleum products.Monopolies covering theimportation and wholesaling of petroleum products havealso been removed,and the Liberia Petroleum RefiningCompany has awarded import licenses to five companies.The price structure has not yet been established.
U.S. Trade Balance
-40
-20
0
20
40
60
80
1999 2000 2001 2002 2003
Millions of U.S. DollarsU.S. exportsU.S. importsTrade balance
Net Foreign Direct Investment
Millions of U.S. Dollars
-500
-400
-300
-200
-100
0
100
200
300
1998 1999 2000 2001 2002

6-57
Economic OverviewEconomic Indicators
2002 2003 Difference
GDP (nominal, Mgfr bn) 30,058.0 34,266.0 4,208.0
GDP (US$ bn) 4.4 5.5 1.1
CPI Inflation (annual average, %) 15.9 -1.2 17.1
Goods Exports (US$ mn) 486.0 700.0 214.0
Goods Imports (US$ mn) 603.0 920.0 317.0
Trade Balance (US$ mn) -117.0 -220.0 -103.0
Current Account Balance (US$ mn) -298.0 -265.0 33.0
Foreign Exchange Reserves (US$ mn) 363.3 450.2 86.9
Total External Debt (US$ mn) 3,942.0 3,825.0 -117.0
Debt Service Ratio, paid (%) 8.0 7.0 -1.0
Exchange Rate (Mgfr/US$) 6,832.0 6,210.0 -622.0
Origins of GDP (2001)
Primary(34.3%)
Secondary (incl. manuf.)(13.3%)
Tertiary(52.4%)
S Agriculture, in the form of subsistence farming, is one ofthe largest sources of GDP,employing approximatelyfour-fifths of workers.Rice is the main crop,but productiontechniques are traditional and yields-per-hectare remainlow.Much of the arable land remains underutilized.Underperformance in the agriculture sector hascontributed to poverty in rural areas.
S Light industry is emerging as an alternative source ofemployment and foreign exchange for urban areas.Tourism is also recovering after a slowdown because of civilunrest and a decline in the global travel market.
S In January 2004,the government outlined three key policypriorities as part of the 2004-06 PRSP, including restoringthe rule of law and good governance,promoting economicgrowth,reducing poverty levels,providing human andmaterial security,and protecting the environment.The 15programs identified for implementation are estimated tocost the government and donors $1.9 billion.
S In July 2003,donors pledged $2.3 billion to help implementthe latest stage of the PRSP.The government is aiming toreduce inflation through controlled monetary policy.Donorsare encouraging the government to adopt toughermeasures that will conserve Madagascar’s environmentsuch as tightening controls on logging.
S Legislation to reform the banking sector would allow land tobe used as collateral for loans,establish tougher banksupervision,and develop new rules for micro-financelending.This reform is coupled with the continuedprivatization of state-owned banks.
S Madagascar will benefit from the HIPC initiative under theIMF.An additional $16 million was also granted toMadagascar after the IMF determined it had increasedinvestment for basic social services,health,and education.
S In April 2003,the French and Madagascan economyministers reached an agreement to cancel $55 million incommercial debt owed by Madagascar.
Economic Update
Real GDP Growth Rate
MADAGASCAR
Percent
-15
-10
-5
0
5
10
15
1999 2000 2001 2002 2003

6-58
Main Trade Partners, percent of total, 2002
Markets SourcesFrance 33.6 France 16.7
United States 24.3 Hong Kong 6.7
Germany 6.2 China 5.8
Japan 3.9 Singapore 2.8
Main Trade Commodities, US$ millions, 2001
Exports Imports
EPZ products(mainlytextiles)
344.0 Fuel products 170.0
Vanilla 166.0 Capital goods 166.0
Cloves 97.0 Consumergoods
134.0
Shellfish 94.0 Raw materials 133.0
madagascar
Trade UpdateS In early 2004,a cyclone destroyed much of the nation’s
agricultural resources, including shrimp,rice,and vanilla farmson the north of the island,negatively affecting export earnings.The IMF released an additional $35 million for damagerecovery,bringing total lending to $100 million.
S Madagascar has established export processing zones acrossthe country that have encouraged export diversification intoaqua-culture,such as modern prawn fishing and traditional fishfarming in rice paddies;tourism;and textiles and apparel.
S In mid-2003,the IMF agreed to extend the deadline forMadagascar’s current PRGF from February 2004 to November2004, in part because of damage resulting from cyclone Gafilo.The government also outlined plans to extend growth,to reducepoverty,and to increase income in rural areas that satisfy theIMF-supported PRGF program.The government also outlined amedium-term plan that will diversify its current export baseaway from raw agricultural commodities,as well as develop thesector.Other elements include incentives for staff training andhigh quality recruitment for export sectors,and reform of thecotton sector through the removal of existing protectionistbarriers to take advantage of benefits offered under AGOA.
S In 2003,U.S.exports to Madagascar consisted primarily ofaircraft and parts thereof,animal or vegetable fats and oils,andmachinery and mechanical appliances.U.S.imports fromMadagascar consisted primarily of coffee,tea,mate,andspices;apparel;and salt,sulfur,earths,and stone.In 2003 and2004,Madagascar was designated an AGOA beneficiarycountry, including qualifying for apparel benefits.AGOA(including GSP) imports from Madagascar totaled $187.9million in 2003.
Investment and Privatization UpdateS Infrastructure improvement, in particular the road networks to
and from the capital,are a priority for the government.Many ofthe transport links were damaged during cyclones in 2000 and2004,and further destroyed during periods of civil unrest inearly 2002.
S In mid-2005,Rio Tinto (UK) plans to begin construction on amine at Fort Dauphin.Rio Tinto is also seeking to enter into apublic-private partnership to build a port at Fort Dauphin tosupport activities at the mine.Investment for both projectswould total $400 million.The World Bank has pledged toprovide the bulk of the government’s share.
S In January 2004,the president announced plans to liberalizethe fuel trading sector in an attempt to introduce competitionand keep prices at affordable levels.
S The state-owned firm responsible for Madagascar’s petroleumand gas licensing has recruited TGS-NOPEC in a bid to promotedeep offshore exploration for natural resources.Vanco (U.S.) isalso conducting research to determine potential deposit sites.
S In June 2003,the World Bank agreed to lend $32 million overa 5-year period to the Government of Madagascar to supportthe national mineral resources management project.Thegovernment will sponsor the remaining $5.4 million needed tocomplete the project.
S An April 2004 deadline was set by the government for privateinvestors to submit bids for operation of the national water andpower company.The government would like to privatize thecompany by the end of 2004.
S Sectors targeted for privatization include the state-ownedrailway network,seaport,and national telecommunicationscompany.
U.S. Trade Balance
Net Foreign Direct Investment
-400
-300
-200
-100
0
100
200
300
400
1999 2000 2001 2002 2003
Millions of U.S. DollarsMillions of U.S. DollarsMillions of U.S. Dollars
U.S. exportsU.S. importsTrade balance
Millions of U.S. DollarsMillions of U.S. DollarsMillions of U.S. Dollars
0
20
40
60
80
100
1998 1999 2000 2001 2002

6-59
Economic OverviewEconomic Indicators
2002 2003 Difference
GDP (nominal, MK bn) 139.4 154.8 15.4
GDP (US$ bn) 1.8 1.6 -0.2
CPI Inflation (annual average, %) 14.7 9.5 -5.2
Goods Exports (US$ mn) 422.4 457.1 34.7
Goods Imports (US$ mn) 573.2 505.4 -67.8
Trade Balance (US$ mn) -150.8 -48.3 102.5
Current Account Balance (US$ mn) -200.7 -56.4 144.3
Foreign Exchange Reserves (US$ mn) 162.0 150.0 -12.0
Total External Debt (US$ bn) 2.8 3.0 0.2
Debt Service Ratio, paid (%) 9.3 9.4 0.1
Exchange Rate (MK/US$) 76.7 97.5 20.8
Origins of GDP (2001)
Small-scale agriculture(19.4%)
Other industry(5.0%)
Services(48.1%) Other agriculture
(14.6%)
Manufacturing (Industry)(12.9%)
S The agricultural sector accounts for over 90 percent ofexport earnings and 35-45 percent of GDP.All arable landis currently under cultivation.Farming in marginal areasand land degradation have contributed to flooding,whichimpedes agricultural growth.Small scale agricultureemploys 85 percent of the workforce.The government hasscaled back the starter program that distributes seed andfertilizer packs to smallholder farmers.Typically, the packsinclude maize and other seeds in an effort to encouragefarmers to grow cash crops other than tobacco.
S The manufacturing sector consists primarily of agriculturalprocessing,textiles,clothing, footwear,and building andconstruction materials.Ongoing power disruptions,partlybecause of environmental degradation along the RiverShire,have contributed to significant productivity losses inmid-2004.
S After consultation with the IMF,the government decided toincrease revenue by doubling taxes on petroleum productsto compensate for the fall in international oil prices andincreasing the excise rate on alcohol products.Thegovernment has also pledged to impose fiscal discipline andincrease transparency.
S In October 2003,the IMF resumed dispensing funds underMalawi’s PRGF,which had been frozen since December2000.PRGF funds totaled $9.2 million and assistanceunder the HIPC initiative amounted to $6.6 million.Otherdonors also began to dispense previously frozen fundsbecause of increased stability.
S The EU has provided ongoing assistance since 1998 toconstruct and rehabilitate roads in Malawi. In May 2004,OPEC agreed to lend Malawi $5 million to upgrade a roadthat may boost economic growth in the northern area.Thecurrent road system is inadequate.
Economic Update
Real GDP Growth Rate
MALAWI
Percent
-2-1012345
1999 2000 2001 2002 2003

6-60
Main Trade Partners, percent of total, 2002
Markets SourcesUnited States 17.4 South Africa 43.9
Germany 13.5 Zambia 12.6
South Africa 10.2 United States 5.5
Egypt 6.3 India 4.2
Main Trade Commodities, US$ millions, 2002
Exports Imports
Tobacco 249.0 Intermediategoods
373.0
Tea 33.0 Fuels oils 76.0
Sugar 32.0 Capital goods 75.0
Textiles 2.0 Consumergoods
66.0
malawi
Trade UpdateS Malawi is landlocked and thus most of its trade is routed
through Mozambique.Much of Mozambique’s transportationinfrastructure was destroyed during recent periods of civilunrest and has not been fully rehabilitated.
S Tobacco accounts for 50-70 percent of foreign exchangeearnings;however, low prices and static production havedecreased tobacco-generated export revenue in recentyears.Steps have been taken to reduce farmers’ sellingcosts at auctions.For example, for the 2004 season,theTobacco Control Commission reduced levies and took overthe role of classifying leaf quality at auctions.Some reportssuggest that production,especially of flue-cured tobacco,aswell as prices,may rise in 2004.
S The Sugar Corporation of Malawi (Sucoma),Malawi’s solesugar producer,uses quota access to the U.S.and EUmarkets through several trade agreements.Sucoma’s sugarproduction increased more than 20 percent for the2002-03 season.
S Malawi has increased textile and apparel sector exports tothe United States under the AGOA program.
S In 2003,U.S.exports to Malawi consisted primarily ofmachinery and mechanical appliances,animal or vegetablefats and oils,and milling industry products.U.S.imports fromMalawi consisted primarily of tobacco;apparel;and coffee,tea,mate,and spices.In 2003 and 2004,Malawi wasdesignated an AGOA beneficiary country, including qualifyingfor apparel benefits.AGOA (including GSP) imports fromMalawi totaled $59.3 million in 2003.
Investment and Privatization UpdateS Although Malawi has exploitable deposits of bauxite,
asbestos,graphite,and uranium, it has not yet developedlarge-scale mining activity.The government has created theMining Investment and Development Corporation,which heldits first conference in 2000.Paladin Resources (Australia)began a mining project at Kayelekera.A full study examiningthe feasability of mineral exploitation will be completed in2004.
S Tourism is growing rapidly.Significant investment isunderway to increase the number of hotel beds, improvehotel services,and establish better transport infrastructure.Cresta Hospitality plans to take over management of theCresta Crossroads hotel in Lilongwe.
S Expanding investment is improving access to electricity.Forexample,progress has been made to link Malawi’s electricitygrid to that of Mozambique.The full connection is expected tobe completed in 2006 at a cost of $87 million.
S Between the start of the privatization program in 1995 andthe end of June 2001,42 parastatals were privatized,generating $22 million in revenue.Privatization has beenslow;remaining parastatals employ 500,000 people andaccount for 20 percent of GDP.The government suspendedthe privatization program in July 2001 because of concernover selling strategic areas of the economy to foreigners.
S The Agricultural Development and Marketing Corporationrecently began divesting some of its subsidiaries.S&ABeefmasters bought the Blantyre abbattoir for $230,000 inOctober 2003.The sales of an integrated textile producerand a cereal milling firm are still underway.
U.S. Trade Balance
Net Foreign Direct Investment
-80
-60
-40
-20
0
20
40
60
80
100
1999 2000 2001 2002 2003
Millions of U.S. DollarsU.S. exportsU.S. importsTrade balance
0
10
20
30
40
50
60
1998 1999 2000 2001 2002
Millions of U.S. DollarsMillions of U.S. DollarsMillions of U.S. Dollars

6-61
Economic OverviewEconomic Indicators
2002 2003 Difference
GDP (nominal, CFAfr mn) 2,346.0 2,549.0 203.0
GDP (US$ mn) 3,366.0 4,386.0 1,020.0
CPI Inflation (annual average, %) 5.0 -1.3 -6.3
Goods Exports (US$ mn) 916.0 929.0 13.0
Goods Imports (US$ mn) 715.0 900.0 185.0
Trade Balance (US$ mn) 201.0 29.0 -172.0
Current Account Balance (US$ mn) -132.0 -285.0 -153.0
Foreign Exchange Reserves (US$ mn) 595.0 770.0 175.0
Total External Debt (US$ mn) 2,505.0 2,833.0 328.0
Debt Service Ratio, paid (%) n/a n/a n/a
Exchange Rate (CFAfr/US$) 697.0 581.2 -115.8
Origins of GDP (2002)
Primary(46.1%)
Tertiary(33.8%)
Secondary(20.1%)
S The agricultural sector is an important determinant ofeconomic performance,as 80 percent of the population isemployed or supported by this sector.The Niger Riverprovides irrigation,hydropower,and a transportationsystem for Mali.
S Mali’s inadequate transportation infrastructure wasimproved in recent years as Mali prepared to host theAfrican Nations Cup soccer tournament.Roads wereextended and rehabilitated,and new airstrips were built inareas of the country that had previously been isolated.InMarch 2003,the Governments of Mali and Senegal agreedto sell a 25-year concession to Canac-Getmar (Canada) torun a railway line between the two countries.
S The government’s general economic policy for 2003-07aims to reduce the proportion of the population living inpoverty and improve access to social services.
S A 4-year PRGF,calling for increased liberalization,strengthened fiscal performance and management,andincreased expenditure on poverty reduction programs wascompleted in August 2003.Mali also completedparticipation in the HIPC initiative in 2003.
S In mid-2004,the World Bank announced efforts toharmonize and codify mining law in willing countries,including Mali.This streamlining process is expected toencourage investment in the mining sector.Also inmid-2004,the World Bank approved an IDA grant of $15million to assist in the campaign against HIV/AIDS.
S The UN launched a $350,000 initiative in mid-2004 to helpMali reduce damage from natural disasters.The funds willcover experts,training,and equipment.
S Mali became eligible for Millennium Challenge Accountassistance in mid-2004.
S India pledged $500 million in low-interest loans in early2004 to help Burkina Faso,Chad,Côte d’Ivoire,EquatorialGuinea,Ghana,Guinea Bissau,Mali,and Senegal create theTechno-Economic Approach for Africa India Movement,which will focus on generating employment,and developingthe pharmaceuticals,healthcare, information technology,telecommunications,and agriculture sectors.
Economic Update
Real GDP Growth Rate
MALI
Percent
-4-202468
101214
1999 2000 2001 2002 2003

6-62
Main Trade Partners, percent of total, 2002
Markets SourcesThailand 13.9 Côte d’Ivoire 17.5Italy 9.9 France 13.9India 7.7 Senegal 4.2Brazil 5.6 Germany 3.9
Main Trade Commodities, US$ millions, 2002
Exports Imports
Gold 589.9 Capital goods 263.1
Cotton 208.8 Petroleumproducts
124.4
Livestock &products
39.4 Food 93.0
mali
Trade UpdateS Mali is the largest cotton producer in SSA.Malian cotton is
of fairly high quality and production costs are low.Early2004 figures indicate that Mali could overtake Egypt tobecome largest cotton producer on the African continent.
S Mali is the third-largest gold producer in SSA.In recentyears,gold has been a rapidly growing contributor to theeconomy,overtaking cotton as Mali’s largest export earnerin 2000.However,gold exports began to decline in early2004.
S In early 2004,Mali met the requirements that allow it toreceive preferential access to the U.S.market under AGOA.The country’s AGOA textile and apparel visa system wasimplemented in December 2003.It is expected thatexpanded export opportunities will increase investment inthe textile industry.
S The closure of the road between Abidjan (Côte d’Ivoire) andBamako because of civil unrest in Côte d’Ivoire hinderedtrade,forcing importers to reroute goods to other westernAfrican ports.
S In 2003,U.S.exports to Mali consisted primarily of opticalor measuring equipment and parts thereof,machinery andmechanical appliances,and electrical machinery andequipment.U.S.imports from Mali consisted primarily ofelectrical machinery and equipment,works of art,andmachinery and mechanical appliances.In 2003 and 2004,Mali was designated an AGOA beneficiary country, includingqualifying for apparel benefits.AGOA (including GSP) importsfrom Mali totaled $262,000 in 2003.
Investment and Privatization UpdateS The government is reviewing its Petroleum Code to
encourage investment in hydrocarbon exploration.Maliborders some proven reserves in Algeria,opening thepossibility for petroleum to be found in Mali as well.
S Telecommunications services have expanded rapidly.Malitel,a subsidiary of Sotelma,a telecommunications parastatal, isinvesting $50 million to upgrade its mobile phone service.
S Air Mali,a former parastatal,was liquidated in April 2003.The water and power parastatal was privatized in 2000,and generation of power from the Manantali hydroelectricdam began in January 2002.The Manantali dam is a$600-million collaboration between Mali,Senegal,andMauritania.
S Donors have put pressure on Mali to reform and privatizeCMDT,a vertically organized cotton parastatal that controlsall aspects of cotton production.Liberalization of the sectoris planned for 2006,and would ultimately limit CMDT to itscore activities of ginning and marketing.Additionally,CMDTwill be split into three or four regional companies,each withexclusive rights to purchase cotton in its region.
U.S. Trade Balance
Net Foreign Direct Investment
0
5
10
15
20
25
30
35
1999 2000 2001 2002 2003
Millions of U.S. DollarsU.S. exportsU.S. importsTrade balance
0
20
40
60
80
100
120
140
1998 1999 2000 2001 2002
Millions of U.S. DollarsMillions of U.S. DollarsMillions of U.S. Dollars

6-63
Economic OverviewEconomic Indicators
2002 2003 Difference
GDP (nominal, UM bn) 269.1 293.6 24.5
GDP (US$ mn) 990.0 1,105.0 115.0
CPI Inflation (annual average, %) 3.8 3.5 -0.3
Goods Exports (US$ mn) 330.0 330.0 0.0
Goods Imports (US$ mn) 418.0 472.0 54.0
Trade Balance (US$ mn) -88.0 -142.0 -54.0
Current Account Balance (US$ mn) -51.2 -190.0 -138.8
Foreign Exchange Reserves (US$ mn) 396.0 360.0 -36.0
Total External Debt (US$ mn) n/a n/a n/a
Debt Service Ratio, paid (%) n/a n/a n/a
Exchange Rate (UM/US$) 271.7 263.0 -8.7
Origins of GDP (2002)
Primary(18.3%)
Secondary(23.7%)
Tertiary(49.7%)
Indirect taxes(8.4%)
S Mauritania has limited agrarian resources,as 80 percentof the country is desert and less than 1 percent of the landis arable.Weather volatility contributes to productivityfluctuation;ongoing droughts in some parts of the countryhave decreased agricultural productivity.
S The manufacturing sector is dominated by fish processing;however,the sector remains hindered by a small domesticmarket.
S Mauritania’s PRSP is set to be completed in 2004.Keyobjectives are to reduce the number of people living inpoverty,to accelerate economic growth,to focus publicexpenditure on sectoral development,to improve access tohealthcare and education,and to improve governance.Priority goals are to improve housing,to achieve universalschooling,reduce child mortality rates,and improve thewater supply.
S The IMF initiated a new PRGF in late 2003,with a variety ofmacroeconomic targets for the 2003-04 period.
S In July 2003,the United States provided $100 million tohelp Mauritania combat international terrorism.
S In July 2003,the EU granted $50.7 million for roadconstruction.The European Development Fund,the AfDB,OPEC,and the Mauritanian government have alsocontributed funds towards road development.
S The Islamic Development Bank (IDB) has agreed to fund apetroleum production capacity-building project.The IDB willprovide $2.5 million to be used for technical assistance.
Economic Update
Real GDP Growth Rate
MAURITANIA
Percent
0
1
2
3
4
5
6
1999 2000 2001 2002 2003

6-64
Main Trade Partners, percent of total, 2002
Markets SourcesItaly 14.7 France 20.8
France 14.4 Belgium 8.8
Spain 12.1 Spain 6.7
Germany 10.8 Germany 5.6
Main Trade Commodities, US$ millions, 2002
Exports Imports
Iron ore 183.8 Private sector 270.3
Fish & fishproducts
143.5 Societe NationaleIndustrielle et Miniere
103.8
Others 2.9 Oil explorationequipment
22.0
Public investment & aid 21.9
mauritania
Trade UpdateS Mining and fishing account for nearly all of Mauritania’s
export revenue.Overfishing in the past has contributed tothe introduction of government-mandated annual restperiods during the spawning season.
S Mauritania withdrew from ECOWAS at the end of 2000,and initiated efforts to expand ties and increase trade withNorth Africa and Europe.
S In 2003,U.S.exports to Mauritania consisted primarily ofvehicles and parts thereof,machinery and mechanicalappliances,and electrical machinery and equipment.U.S.imports from Mauritania consisted primarily of fish,crustaceans,and molluscs;apparel;and machinery andmechanical appliances.In 2003 and 2004,Mauritania wasdesignated an AGOA beneficiary country.AGOA (includingGSP) imports from Mauritania totaled $3,000 in 2003.
Investment and Privatization UpdateS Mauritania has significant reserves of iron ore,copper,
cobalt,diamonds,gold,gypsum,and phosphates.Reserveshave yet to be fully surveyed and only iron ore is industriallyexploited.Recent exploration has indicated that there arepetroleum reserves off Nouakchott.Additionally,DanaPetroleum (UK) discovered natural gas reserves in early2004.
S To promote investment,the government adopted a newcode in 2002 that exempts foreign investors from customsduties on equipment and goods imported for a start-up orexport-oriented project,permits the transfer of convertiblecurrencies earned from new investments,provides fornational or international arbitration,and simplifiesadministrative procedures.Mauritania has also grantedfree trade-zone status for companies that are producingfinished goods for export.
S In mid-2004,the World Bank announced efforts toharmonize and codify mining law in willing countries,including Mauritania.This streamlining process is expectedto encourage investment in the mining sector.
S A $26-million project to build mining sector capacity isexpected to strengthen the government’s ability to facilitateand regulate mining activities, increase private investment,improve the country’s capacity to monitor new miningdevelopments,and promote local development andeconomic diversification.The project began in May 2003.
S Petroleum production from a field estimated to holdreserves of 110 million barrels is expected to begin in2005.The $100-million investment project is spearheadedby Woodside Petroleum,Hardman Resources,FusionInvestments,and Roc Oil (all from Australia).Woodside haspledged an additional $600 million for drilling explorationand production wells in Chinguetti.Petroleum pumping isexpected to begin in March 2006.Total (France) signed apetroleum exploration contract with the government in June2003.Most exploration is taking place in offshore areas.
S Privatization has been fairly successful,withtelecommunications and electricity privatizations underwayunder supervision of the World Bank;and privatization of thenational airline completed.Somelec,the state electricity andwater utility,still remains government-owned after a failureto sell shares in mid-2002.The government expects todivest some shares in 2004.
U.S. Trade Balance
Net Foreign Direct Investment
0
10
20
30
40
1999 2000 2001 2002 2003
Millions of U.S. DollarsU.S. exportsU.S. importsTrade balance
-8-6-4-202468
1012
1998 1999 2000 2001 2002
Millions of U.S. DollarsMillions of U.S. DollarsMillions of U.S. Dollars

6-65
Economic OverviewEconomic Indicators
2002 2003 Difference
GDP (nominal, MRs bn) 141.6 156.8 15.2
GDP (US$ bn) 4.7 5.6 0.9
CPI Inflation (annual average, %) 6.7 4.2 -2.5
Goods Exports (US$ mn) 1,830.2 1,941.3 111.1
Goods Imports (US$ mn) 2,018.3 2,093.9 75.6
Trade Balance (US$ mn) -188.1 -152.6 35.5
Current Account Balance (US$ mn) 259.3 260.5 1.2
Foreign Exchange Reserves (US$ mn) 1,277.4 1,577.3 299.9
Total External Debt (US$ bn) 1.8 1.7 -0.1
Debt Service Ratio, paid (%) 5.5 5.0 -0.5
Exchange Rate (MRs/US$) 30.0 27.9 -2.1
Origins of GDP (2002)
Wholesale & retail trade(11.7%)
Other(12.6%)
Financial & businessservices (18.9%)
Agriculture, construction &electricity (14.6%)
Transport &communications (13.8%)
Manufacturing(22.4%)
Restaurants & hotels(6.0%)
S Mauritius’ economy is fairly diversified relative to most SSAcountries.Export-processing zones (EPZ) have contributedto growth throughout the 1990s and have driven the shiftfrom agriculture to manufacturing.Current economicdebate centers over how to diversify the industrial basewithin the EPZs.
S Sugar production in 2003 was less than expected,partlybecause of poor weather, including heavy rains and twocyclones.
S Political crisis in Madagascar in 2002 and early-2003,where a number of Mauritian companies have investments,contributed to low GDP growth.
S Tourism revenues are increasing.Tourist arrivals for thefirst 9 months of 2003 were up 3.8 percent compared tothe same period 2002.
S The 2003-04 budget places significant emphasis on socialprograms,such as housing and education for the poor,social welfare payments,and increased service provisionfor vulnerable groups.
S The government plans to develop information andcommunications technology.Thirty-two local and foreignfirms have booked space at the Cyber Tower for callcenters,business process outsourcing,disaster recoverycenters,training,and software development.A number ofIndian firms are assisting Mauritius in this project.Thegovernment’s efforts to reorient the economy toward morevalue-added,service-based activities is hindered by the lackof people trained in information and communicationtechnology.
S In early 2004,Mauritius and Madagascar signed anagreement to cooperate on investment protection,technology,and tourism.
Economic Update
Real GDP Growth Rate
MAURITIUS
Percent
0
2
4
6
8
10
1999 2000 2001 2002 2003

6-66
Main Trade Partners, percent of total, 2002
Markets SourcesUnited Kingdom 26.3 France 18.8
France 24.3 South Africa 13.8
United States 15.6 India 8.0
Madagascar 5.9 China 5.7
Main Trade Commodities, US$ millions, 2002
Exports Imports
EPZ products 1,207.0 Manufactures 914.0
Sugar 278.0 Machinery &transportequipment
1,047.0
mauritius
Trade UpdateS Mauritius has invested heavily in Madagascar’s textile and
apparel industry in order to access lower-cost labor andspecial import designation under the AGOA program.Consequently, in recent years,a significant amount of textileproduction has shifted to Madagascar away from Mauritius.
S The government has introduced a special incentiveprogram to encourage investment in spinning mills tobenefit from the AGOA program.
S Pakistan has expressed interest in using Mauritius as abase for increasing trade with the rest of Africa.
S In 2003,U.S.exports to Mauritius consisted primarily ofmachinery and mechanical appliances,electrical machineryand equipment,and optical or measuring equipment andparts thereof.U.S.imports from Mauritius consistedprimarily of apparel,precious or semiprecious stones ormetals,and live animals. In 2003 and 2004,Mauritius wasdesignated an AGOA beneficiary country, including qualifyingfor apparel benefits.AGOA (including GSP) imports fromMauritius totaled $143.1 million in 2003.
Investment and Privatization UpdateS Most investment into Mauritius targets the EPZ sector,
with Hong Kong,France,the United Kingdom,Germany,Taiwan,and China as main sources.Chinese multinationalsaccount for 50-60 percent of EPZ exports.
S Kali Steel & Engineering (India) is expected to build akitchenware and appliances plant in Mauritius that will beoperative by the end of 2004.
S The World Bank is assisting Mauritius in obtaining privatesector participation in the water and wastewater sectors.Privatization and parastatal reform are,however,subject tosubstantial political debate.
U.S. Trade Balance
Net Foreign Direct Investment
-300-250-200-150-100-50
050
100150200250300
1999 2000 2001 2002 2003
Millions of U.S. Dollars
U.S. exportsU.S. importsTrade balance
-50
0
50
100
150
200
250
300
1998 1999 2000 2001 2002
Millions of U.S. DollarsMillions of U.S. DollarsMillions of U.S. Dollars

6-67
Economic OverviewEconomic Indicators
2002 2003 Difference
GDP (nominal, MT bn) 82,747.0 102,111.0 19,364.0
GDP (US$ bn) 3.6 4.3 0.7
CPI Inflation (annual average, %) 16.8 14.0 -2.8
Goods Exports (US$ mn) 682.0 795.0 113.0
Goods Imports (US$ mn) 1,263.0 1,270.0 7.0
Trade Balance (US$ mn) -581.0 -475.0 106.0
Current Account Balance (US$ mn) -421.0 -565.0 -144.0
Foreign Exchange Reserves (US$ mn) 819.0 818.0 -1.0
Total External Debt (US$ mn) 966.0 n/a n/a
Debt Service Ratio, paid (%) n/a n/a n/a
Exchange Rate (MT/US$) 23,678.0 23,774.0 96.0
Origins of GDP (2002)
Services(50.1%)
Manufacturing(Industry)(20.2%)
Agriculture, fishing& forestry(15.6%)
Other industry (14.1%)
S Agriculture, fishing,and forestry employ approximately 90percent of the active population.
S Inadequate road infrastructure has hindered agriculturaldevelopment.Areas in the north with food surpluses remainisolated,while the south imports food from South Africa. In2003,a road linking Inchope to Caia was upgraded toall-weather standard and became part of the national roadconnecting the north and south.The government is seekingfinancing to build a bridge over the Zambezi river andindicates it has secured 60 percent of the necessary$70-$90 million.
S In April 2004,the government announced the creation ofthe Tax Administration,an autonomous body that replacedthe National Tax and Audit Directorate.The TaxAdministration aims to prevent tax fraud and evasion,andanalyze the effect of tax policy on the economy.
S Economic policy is guided by the government’s Plan for theReduction of Absolute Poverty.Key goals include improvingeducation,health,and basic infrastructure;developingagriculture and rural areas;and improving governance,andmacroeconomic and financial management.
S Market reform has been ongoing since the implementationof the first structural adjustment program in 1987.Mozambique is considered one of the most successfulreformers in Africa and has received extensive assistancefrom donors.Current policy objectives under the PRSPinclude rapid,private sector-led growth to achievemacroeconomic stability;improved basic public services;reformation of the legal system;and implementation offiscal reforms.In March 2004,the IMF found that thegovernment needed to implement second generationreforms to increase government revenue,removeobstacles to private sector development,and use publicexpenditure more efficiently.
S In October 2003,Mozambique secured pledges of $790million for 2004 from the Consultative Group conference offoreign donors;75 percent of these funds will be in theform of grants.Mozambique is attempting to reduce its useof foreign assistance;such assistance is expected toaccount for 48 percent of government spending in 2004,compared with approximately 60 percent in recent years.
S Mozambique became eligible for Millennium ChallengeAccount assistance in May 2004.
Economic Update
Real GDP Growth Rate
MOZAMBIQUE
PercentPercent
02468
10121416
1999 2000 2001 2002 2003

6-68
Main Trade Partners, percent of total, 2002
Markets SourcesBelgium 25.0 South Africa 27.7
South Africa 9.4 France 9.0
Germany 5.6 United States 7.1
Spain 3.5 Australia 7.0
Main Trade Commodities, US$ millions
Exports (2001) Imports (1997)
Aluminum 335.0 Machinery &equipment
139.0
Prawns 92.4 Vehicles,transport equip.& parts
113.8
Electricity 57.3 Fuel 92.3
Cotton 18.3 Textiles 43.4
mozambique
Trade UpdateS Coastal shipping capacity makes Mozambique a trade
center.Rehabilitation of the Beira and Nacala ports isexpected to increase trade volume.Additionally, in May2004,an Indian consortium won a contract for thereconstruction of the Beira railway line.The World Bank haspledged a loan of $120 million for the 25-year project.
S A $600-million gas pipeline connecting Mozambique toSouth Africa was completed in early 2004.The pipelineexports 85 million gigajoules of gas per year and is expectedto rise to approximately 120 million gigajoules by 2008.Sasol (South Africa) built the pipeline and distributes the gasin South Africa.
S Mozambique was once the world’s largest cashew producer.Cashew production is expected to decline by 20 percent for2003/2004,which could impact Mozambique’s exportearnings.Irregular rainfall and fungal infections havecontributed to the decline.
S In 2003,U.S.exports to Mozambique consisted primarily ofcereals,mineral fuels or oils and products,and machineryand mechanical appliances.U.S.imports from Mozambiqueconsisted primarily of sugars and sugar confectionery,apparel,and edible fruits and nuts. In 2003 and 2004,Mozambique was designated an AGOA beneficiary country,including qualifying for apparel benefits.AGOA (includingGSP) imports from Mozambique totaled $7.9 million in2003.
Investment and Privatization UpdateS Mozambique offers favorable tax and duty incentives in
industrial free-zones to encourage investment. Investors arealso encouraged by inexpensive electricity,natural resourceavailability,and a variety of opportunities.South Africa is thelargest investor in Mozambique.
S Hydroelectricity is a significant resource and has attractedforeign investment.Additionally,Mozambique has confirmedreserves of natural gas that are undergoing exploration.
S Vodacom Mozambique (VM),a subsidiary of Vodafone SouthAfrica,won a contract to expand telecommunicationscoverage in June 2002,but was unable to start operatinguntil late 2003 because of interconnection fees disputes.VM is expected to invest $567 million in the project. Ifpassed,a telecom bill presented to parliament in April 2004could increase competition and investment in the sector.
S The Maputo Port Development Company assumedmanagement of the port from the state port authority inApril 2003.The 15-year contract includes investment of$50-$100 million to improve the port and linkinginfrastructure.
S In 2004,the Nordic Development Bank,with the World Bankand the AfDB,agreed to finance an inventory ofMozambique’s geological potential.A number of investorsbelieve that Mozambique holds significant undiscoveredmining resources.
S Mozambique has privatized over 1,200 smaller companiesand 37 large enterprises since privatization began 10 yearsago.Firms awaiting privatization include TDM(telecommunications parastatal),LAM (state airline),EDM(electricity utility),ENH (energy utility),HCP (electricityproducer),an insurance company,an oil and gas explorationcompany,a port and rail authority,a number of airports,andwater supply overseers.
U.S. Trade Balance
Net Foreign Direct Investment
0
20
40
60
80
100
1999 2000 2001 2002 2003
Millions of U.S. Dollars
U.S. exportsU.S. importsTrade balance
050
100150200250300350400450
1998 1999 2000 2001 2002
Millions of U.S. Dollars

6-69
Economic OverviewEconomic Indicators
2002 2003 Difference
GDP (nominal, N$ bn) 29.3 32.6 3.3
GDP (US$ bn) 2.8 4.3 1.5
CPI Inflation (annual average, %) 11.3 7.3 -4.0
Goods Exports (US$ mn) 1,072.0 1,090.0 18.0
Goods Imports (US$ mn) 1,251.0 1,371.0 120.0
Trade Balance (US$ mn) -179.0 -281.0 -102.0
Current Account Balance (US$ mn) 96.0 63.0 -33.0
Foreign Exchange Reserves (US$ mn) 323.0 345.0 22.0
Total External Debt (US$ mn) 635.0 716.0 81.0
Debt Service Ratio, paid (%) 2.5 2.9 0.4
Exchange Rate (N$/US$) 10.5 7.6 -3.0
Origins of GDP (2002)
Mining & quarrying(15.0%)
Financial, real estate &business services(12.9%)
Other(16.2%)
Manufacturing incl.fish processing (10.9%)
Government(22.1%)
Agriculture & fishing(10.6%)
Wholesale & retail trade(12.3%)
S Namibia is abundant in natural resources including largeconcentrations of diamonds,zinc,uranium,gold,andmarble,particularly along the coastal regions.This has ledto the establishment of a large marine mining industry. In2003,the mining sector was the largest foreign exchangeearner,accounting for 56 percent of all exports.There isalso a large fishing and processing industry.
S Government services are the largest contributor to GDP.Other sectors contributing notably to GDP include mining,wholesale and retail trading, financial services,manufacturing,and offshore fish processing.
S The general decline in global prices for raw materialcommodities and appreciation of the currency havenegatively affected foreign exchange earnings.Increasedimports of production inputs such as fuel and lubricants,and consumer products,have resulted in trade deficits.
S Tourism is a growth sector for Namibia,generating 6percent of GDP in 2003.The largest source of tourismrevenue is Germany, followed by the United Kingdom.
S In December 2003,the government announced plans toimport a 6-month supply of food aid because of a shortfall inthe staple crop,millet.The shortfall is a result of a drygrowing season.The food aid is in addition to a $37-millionrelief program provided by the government that will supportactivities such as transporting livestock to better grazingareas.
S Government long-term economic policy is embodied in theVision 2030 goals.Long-term goals are to be implementedthrough 5-year national development plans.The countryentered the second 5-year development plan in 2001.Targets include reducing poverty, increasing the annualgrowth rate to 4 percent,and promoting small and mediumenterprises to reduce unemployment.The developmentprogram also includes $1.2 billion for infrastructureprojects,such as building railroads and upgrading roadnetworks.The government also introduced medium-termexpenditure frameworks (MTEF) to control spending andreduce the budget deficit.The current MTEF,which runsduring 2004-07,focuses on reducing expenditures onmany public sector services.
Economic Update
Real GDP Growth Rate
NAMIBIA
Percent
0
1
2
3
4
1999 2000 2001 2002 2003

6-70
Main Trade Partners, percent of total, 2002
Markets SourcesUnited Kingdom 48.0 South Africa 80.0
South Africa 23.0 United States 5.0
Spain 15.0 Germany 3.0
France 4.0 Russia 1.0
Main Trade Commodities, US$ millions, 2001
Exports Imports
Diamonds 485.0 Transportequipment
230.0
Prepared &preserved fish
287.0 Chemicalproducts,rubber & plasticproducts
211.0
Metal ores, incl.uranium ore
156.0 Refinedpetroleumproducts
204.0
Beverages,other foodproducts
80.0 Machinery &equipment
166.0
-120-80-40
04080
120160200240280
1999 2000 2001 2002 2003
namibia
Trade UpdateS All petroleum in Namibia is imported.Electricity is derived
from hydropower plants,and during times of drought,electricity is imported from South Africa.
S The Walvis Bay Corridor Transport project is expected to becompleted by mid-2004.The SADC-sponsored project willconnect Namibia to central African markets via anall-weather highway connection.
S In July 2003,Namibia announced that it was withdrawing itsmembership from COMESA,stating that it was notbenefitting from the free trade area as imports fromCOMESA countries were 10 times greater than exports.
S In 2003,U.S.exports to Namibia consisted primarily ofcereals,machinery and mechanical appliances,and articlesof base metal.U.S.imports from Namibia consistedprimarily of apparel,copper and articles thereof,and organicor inorganic chemicals and compounds.In 2003 and 2004,Namibia was designated an AGOA beneficiary country,including qualifying for apparel benefits.AGOA (includingGSP) imports from Namibia totaled $46.8 million in 2003.
Investment and Privatization UpdateS The government is promoting FDI in priority sectors such as
tourism and nontraditional manufacturing.As part of thenational development plan, for 2004-07 the government hasset aside $34.5 million for the ”green valley” irrigationsystem to help support farmers as they diversify farminginto new crops such as grapes,melons,and other citrusfruit.The EU is the primary market for these new crops.Thefishing industry has also succeeded in diversifying bypromoting local fish processing;$79.3 million has beeninvested in a hake processing plant by Pescanova (Spain).
S The Namibian Ports Authority (Namport) has launched astrategic investment program that is seeking to createbusiness opportunities in the port.Projects include a newcontainer terminal,and the deepening of the harbor.
S A new mining policy is to be introduced in late 2004,incorporating certain amendments to the 1992 MineralsAct.The amendments include guaranteeing security oftenure for holders of mining rights and creating of astandard licensing regime.
S The mining industry has grown rapidly because of renewedinvestment and the discovery of mineral deposits. In early2004,the Leviev Group (Israel) proposed a $46-millioninvestment project scheduled to last 3 years.PaladinResources (Australia) completed a prefeasability study in theNamib desert and has proposed the development of acommercial mining operation to boost production in theuranium industry.
S In early 2004,the government outlined plans to expropriatefarms that were underutilized or owned by absentee foreignpersons.
S In July 2004,the Namibian power utility NamPower and theNational Petroleum Company of Namibia have entered intoan agreement with Energy Africa (South Africa) to developgasfields in Kudu.In May 2004,Tullow (Ireland) took overEnergy Africa.Feasability studies are being conducted,withproduction expected to begin in late 2009.
S The partial privatization of the national airline,Air Namibia,has been placed on hold indefinitely because of financiallosses.The airline received an additional $52.6 million for FY2004 from the government to help repay the $80 million inaccumulated debt,and pay for the lease of its Boeingaircraft.
U.S. Trade Balance
Net Foreign Direct Investment
Millions of U.S. DollarsU.S. exportsU.S. importsTrade balance
0
50
100
150
200
250
300
350
400
1998 1999 2000 2001 2002
Millions of U.S. DollarsMillions of U.S. DollarsMillions of U.S. Dollars

6-71
Economic OverviewEconomic Indicators
2002 2003 Difference
GDP (nominal, CFAfr bn) 1,355.0 1,387.0 32.0
GDP (US$ bn) 1.9 2.4 0.5
CPI Inflation (annual average, %) 2.6 -1.6 -4.2
Goods Exports (US$ mn) 280.0 352.0 72.0
Goods Imports (US$ mn) 366.0 477.0 111.0
Trade Balance (US$ mn) -86.0 -125.0 -39.0
Current Account Balance (US$ mn) -159.0 -206.0 -47.0
Foreign Exchange Reserves (US$ mn) 133.9 80.0 -53.9
Total External Debt (US$ mn) n/a n/a n/a
Debt Service Ratio, paid (%) n/a n/a n/a
Exchange Rate (CFAfr/US$) 697.0 581.2 -115.8
Origins of GDP (2002)
Secondary(15.0%)
Tertiary(42.0%)
Primary(43.0%)
S Niger does not have a historically strong agricultural basebecause of the harsh climate and lack of rainfall.During2001-02,high rainfall levels increased output of millet,sorghum,and corn;however,Niger still depended on foodimports in both years.
S Natural resources include uranium,gold,copper,andlithium.Petroleum reserves are also being explored.Theprimary energy sources are wood fuel and thermal energy,with the possibility of a switch to hydroelectric power.
S The government is promoting the President’s SpecialProgram to reform the economic and social infrastructure.The transportation network is the primary focus.Goalsinclude expanding and improving access to the seaports,and improving the current road link to Burkina Faso,whichwill facilitate trade.Much of the current account deficit isbecause of high transportation costs.
S Civil service reforms and privatization face the challenges offinancial malpractice and a lack of institutionaltransparency.Niger is also focusing on improving regionalsecurity after civil unrest in Côte d’Ivoire negatively affectedeconomic growth in previous years.
S The government is also seeking to reform its tax system.Beginning in 2003,taxes on individuals and corporationsare to be harmonized within 3 years to a uniform rate of 35percent.
S Much of the economic policies and reforms outlined by thegovernment have been developed in conjunction with theIMF and the World Bank.In 2000,Niger signed a PRGF for$74 million. In 2003,a new set of policy targets wasoutlined for FY 2004, including an increase in revenue tonearly 11 percent of GDP,an increase in basicexpenditures on social services,and progress toward theprivatization of the state-owned electric company.The IMFalso suggested introducing an excise tax on variousconsumer products and public utilities.As a result ofimproved macroeconomic stability, the IMF approved afurther $16 million to help implement policies aimed atachieving Millennium Development goals.
S In early 2004,the World Bank approved a loan of $14.8million,to be disbursed over 4 years,to reform the financialsector.This technical assistance focuses on banksproviding microfinance services,the postal bank,andservices provided by the insurance sector.
S In 2002,the IMF and World Bank assessed the PRSP,which is set to expire at the end of 2004.Priorities underthe framework include improving budget management,developing and managing natural resources,andmaintaining roads.
S In 2001,the Paris Club agreed to cancel $48 million ofNiger’s debt.An additional $123 million was cancelled byFrance in April 2003.In March 2004,Niger was preparingto complete the HIPC initiative.
Economic Update
Real GDP Growth Rate
NIGER
Percent
-101234567
1999 2000 2001 2002 2003

6-72
Main Trade Partners, percent of total, 2002
Markets SourcesNigeria 41.2 France 20.1
France 37.5 United States 14.7
Belgium 6.2 Côte d’Ivoire 10.4
Japan 2.5 Nigeria 7.2
Main Trade Commodities, US$ millions, 2002
Exports Imports
Uranium 89.9 Food products 97.4
Livestock 45.9 Capital goods 82.4
Cowpeas 20.2 Petroleum 41.7
Trade UpdateS Niger has engaged a private customs monitoring company
to monitor trade along the western and southern borders,resulting in increased customs receipts.
S Niger is a member of UEMOA.UEMOA has outlined reformsthat Niger must complete by 2005 to ensure continuedintegration with UEMOA.These reforms include balancingthe budget to reduce government debt to less than 70percent of GDP,reducing inflation to less than 3 percentannually,and increasing domestically-financed investment.
S In November 2003,the AfDB agreed to lend $12.5 millionto help SML (Niger) finance a mining project to exploit goldand build a processing plant.
S Access to the AGOA program increased exports of gumarabic.
S In 2003,U.S.exports to Niger consisted primarily ofpaperboard,pharmaceutical products,and electricalmachinery and equipment.U.S.imports from Nigerconsisted primarily of animal or vegetable fats and oils,optical or measuring equipment and parts thereof,andpharmaceutical products. In 2003 and 2004,Niger wasdesignated an AGOA beneficiary country, including qualifyingfor apparel benefits.AGOA (including GSP) imports fromNiger totaled $63,000 in 2003.
Investment and Privatization UpdateS Niger’s relatively small domestic market, inadequate
infrastructure,high energy costs,and a lack of skilled laborhinder investment.
S Vivendi has proposed plans to invest $5 million to upgradefacilities and increase the drinking water supply.
S In early 2004,Tamoil (Libya) purchased the Nigeroperations of Exxon Mobil (U.S.), including distribution andstorage facilities.
S In 2003,Exxon Mobil (U.S.) and Petronas (Malaysia),alongwith a consortium of other oil companies,continuedexploratory efforts.
S In September 2003,the government announced plans towithdraw a concession awarded to TG World (Canada) foroil exploration and extraction.TG World began proceedingsat the World Bank’s International Center for the Settlementof Investment Disputes,to which Niger is a signatory,as thecontract was not due to expire until April 2004.
S The national electric power company Nigelec is targeted forprivatization in 2004.The company signed an agreement in2002 with Morocco’s state-owned power utility tocollaborate on distribution of electricity in Niger.
S Other sectors have been earmarked for privatization.In2004,the state-owned company that controls theimportation,storage,and distribution of petroleum intoNiger is slated for privatization,with the government tomaintain a 34-percent stake.The Gaweye Hotel is targetedfor private investment,with bids by Le Meridien (France) andIngra (Croatia) already offered.A mortgage company,Creditdu Niger, is also targeted for privatization in 2004.
niger
U.S. Trade Balance
Net Foreign Direct Investment
Millions of U.S. Dollars
0
5
10
15
20
25
1998 1999 2000 2001 2002
Millions of U.S. DollarsMillions of U.S. DollarsMillions of U.S. Dollars
0
10
20
30
40
50
60
70
1999 2000 2001 2002 2003
U.S. exportsU.S. importsTrade balance

6-73
Economic OverviewEconomic Indicators
2002 2003 Difference
GDP (nominal, N bn) 5,634.0 6,833.0 1,199.0
GDP (US$ bn) 46.7 52.8 6.1
CPI Inflation (annual average, %) 13.6 13.5 -0.1
Goods Exports (US$ mn) 18,016.0 21,796.0 3,780.0
Goods Imports (US$ mn) 12,954.0 14,538.0 1,584.0
Trade Balance (US$ mn) 5,062.0 7,258.0 2,196.0
Current Account Balance (US$ mn) -76.0 1,047.0 1,123.0
Foreign Exchange Reserve (US$ mn) 7,331.0 7,057.0 -274.0
Total External Debt (US$ bn) 29.7 30.7 1.0
Debt Service Ratio, paid (%) 16.8 8.2 -8.6
Exchange Rate (N/US$) 120.6 129.4 8.8
Origins of GDP (2002)
Livestock(5.1%)
Manufacturing(6.0%)
Agricultureexc. livestock(36.1%)
S Petroleum is an important part of the economy;it isestimated that up to 80 percent of federal governmentrevenue is derived from the sector,and that petroleumproducts account for 90 percent of export earnings.Agriculture is still the primary activity for the majority ofNigerians,and accounts for approximately 40 percent ofGDP.There is also a large informal agricultural sector.
S Economic diversification has been hindered by inadequateinfrastructure,energy shortages,and low consumerincome.
S The National Economic Empowerment DevelopmentStrategy is expected to be formally unveiled in 2004.Theplan identifies petroleum,gas,agriculture,solid minerals,manufacturing,and tourism development as key sectors forgrowth and investment.Additionally, it calls for anacceleration of the privatization program,improvement ofgovernance and increased transparency,and reform of thepension system.
S Trade unions have been weakened throughout the 1990sby unemployment and declining real wages.In late 2003,parliament considered a bill to restrict sources of fundingand limit membership.The unions called for a general strikein October 2003,after the government eliminated the pricecaps on petrol,diesel,and kerosene.
S In 2004,construction is expected to begin on amass-transit rail system for Lagos.The $135-million LagosUrban Transportation Project plans to include a rapid lightrail mass-transit system,improved bus services, increasedwater and nonmotorized forms of transport, increasedefficiency of urban roads,and better institutions.
S In early 2004,Nigeria’s health minister announced a$172-million healthcare development program.The WorldBank is expected to provide $127 million and the AfDB,$45 million.The program’s goals are to build basichealthcare capacity, increase health service delivery,andexpand access to maternal care and reproductive health.
S The World Bank plans to launch a program to assist inproviding social services in the Niger Delta,the petroleumproducing region of Nigeria.The UNDP is also exploring thepossibility of cooperating with Shell on social developmentprojects in the same region.The region has experiencedsubstantial social unrest in recent years.
S In March 2004,the World Bank announced plans to invest$75 million in the solid minerals sector,supportinggovernment efforts to diversify the economy.The planencourages the government to increase long-terminstitutional and technical capacity to manage mineralresources and establish poverty reduction and ruraleconomic renewal programs in selected areas of thecountry.
Economic Update
Real GDP Growth Rate
NIGERIA
Percent
0
1
2
3
4
5
1999 2000 2001 2002 2003
Crude petroleumand gas(31.7%)
Finance &insurance(9.8%)
Wholesale &retail trade(11.3%)

6-74
nigeria
Economic Update—ContinuedS At the end of 2003,bilateral agreements for debt
rescheduling had been signed with 14 of the 15 Paris Clubmembers.Negotiations have been ongoing since December2000,and Italy has yet to sign an agreement.
S Nigeria is ineligible for participation in the HIPC initiativebecause its debt burden does not meet the establishedcriteria.
S USAID plans to provide $50 million to promote sustainabledevelopment and economic development activities during2004-09.Additionally,USAID, in conjunction with the ShellPetroleum Development Corporation,has committed $1million to be used to address the threat of cassava mosaicdisease and to develop markets for cassava products.

6-75
Main Trade Partners, percent of total, 2002
Markets SourcesUnited States 37.4 United Kingdom 15.7
Brazil 9.4 United States 15.4
Spain 8.3 China 15.3
France 6.4 France 14.3
Main Trade Commodities, US$ millions, 2002Exports ImportsOil 13,680.0 Manufactured
goods2,990.0
Gas 1,097.0 Machinery &transport
2,471.0
Chemicals 2,297.0
Food & liveanimals
1,160.0
nigeria
U.S. Trade Balance
Trade UpdateS Petroleum has dominated Nigerian trade since the early
1970s,and accounts for 95 percent of total exports ofgoods.Although Europe has been Nigeria’s traditional exportmarket,petroleum production in the North Sea has shiftedexports towards the United States.Nigeria has made effortsto diversify its export base,and has had some success withthe export of LNG.
S Imports of more than 40 products are banned, includingtextiles,men’s footwear,soap,furniture,assembled bicycles,flowers,toothpaste,pencils,plastic products,vegetable oil,and meat products. Import prohibitions may contribute toincreased smuggling across Nigeria’s borders.
S The government reduced port taxes in 2001 and 2003,andhas removed other administrative obstacles to efficienttrade operations.
S In November 2003,the Department of PetroleumResources issued new guidelines for fuel importation,requiring that firms obtain importation permits,displayprices prominently,submit quality certificates,and distributeonly approved products.
S In late 2003,the government approved the implementationof an incentive scheme to boost exports of textiles and otherproducts.The Export Expansion Grant enables firmsexporting at least $3,495 to claim a grant equivalent of 40percent of their total annual exports.Exporters ofunprocessed agricultural commodities and minerals mayreceive a grant of 5 percent of their annual exports.
S The Nigerian National Petroleum Corporation signedproduction-sharing contracts with ChevronTexaco,Petrobras (Brazil),and local firms Famfa,Heritage,and Oiland Gas Company to develop three deepwater oilfields. It isexpected that greater petroleum production capacity willexpand exports.
S Nigeria is engaged in an ongoing territorial dispute withCameroon over the Bakassi Peninsula,which has significantpetroleum resources.In December 2003,Nigeria began tohand over some areas involved in the dispute,not includingthe proper Bakassi.Nigeria also has disputed maritimeborders with Equatorial Guinea and São Tomé and Principe,which affect access to offshore petroleum reserves.
S Nigeria is offering no taxation,no duty,and no restrictions onthe repatriation of profits to businesses that invest in thedevelopment of a leisure resort in an effort to improverecognition of its free trade zone.The $131-million Tinapaproject,conceived in August 2002, is intended to encouragetrade among African states.The zone allows companies toset up businesses within two weeks and is linked to theCalabar port,which is being expanded to carry bigger ships.As of March 2004,the free trade zone had 80manufacturing companies,with plans for additionalcompanies to establish business.Billions of dollars havebeen used to develop zone-related infrastructure such asroads,water,electricity, telecommunication,and sanitation.
S In 2003,U.S.exports to Nigeria consisted primarily ofcereals,machinery and mechanical appliances,andelectrical machinery and equipment.U.S.imports fromNigeria consisted primarily of mineral fuels and oils,cocoaand cocoa preparations,and organic chemicals. In 2003and 2004,Nigeria was designated an AGOA beneficiarycountry.AGOA (including GSP) imports from Nigeria totaled$9.4 billion in 2003.
-12000
-9000
-6000
-3000
0
3000
6000
9000
12000
1999 2000 2001 2002 2003
Millions of U.S. DollarsU.S. exportsU.S. importsTrade balance

6-76
Investment and Privatization UpdateS Political uncertainty,alleged corruption, inadequate
infrastructure,and low per capita income have deterred bothnew and replacement investment.
S The Brass LNG project is expected to be operative by 2008.Itis a joint venture between the Nigeria National PetroleumCorporation,Eni,ChevronTexaco,and ConocoPhillips,and isexpected to expand access to natural gas resources.Slowerprogress is being made on the West African Gas Pipeline,which will carry Nigerian gas to Benin,Ghana,and Togo.
S In mid-2003,the government signed a deal with SolgasEnergy Nigeria to rehabilitate the Delta steel plant andmanage the plant for 10 years.The steel industry hassuffered from inadequate maintenance,despite roughly $10billion in public investment and Russian assistance to build thecenterpiece of the plant,the Ajaokuta complex. In its 20 yearsof operation,the Delta steel plant has rarely operated atgreater than 20 percent of capacity.
S The state-owned Nigeria Airways was liquidated in May 2003,after years of financial mismanagement,misappropriation offunds,and large debts. In October 2003,the governmentintroduced a new national carrier,Nigerian Eagle Airlines.South African Airways was chosen in early 2004 as a partnerfor the national carrier,and owns 30 percent of the firm.Delays have extended the start of the operation beyond theoriginal date of April 2004.
S A new telecommunications law enacted in 2003,and therecent licensing of operators to offer Fixed Wireless Serviceson a regional basis,may allow for expansion of thetelecommunication sector.Over the last 2 years,telecommunications investment has totaled over $4 billionand is expected to continue.Vodacom indicated that it wasexploring operations in Nigeria’s market. In early 2004,Econet Wireless Nigeria signed a $110-million contract withEricsson (Sweden) to boost geographic coverage and toincrease network capacity.
S The Bureau of Public Enterprises (BPE) has outlined threestages for privatization.The first stage could be completed in2004,and involves the sale of stakes in industrial companies,refineries,and some infrastructure operators.The secondphase,to be completed in 2005,calls for the sale of threepaper mills,motor vehicle assembly plants,and fertilizercompanies.The government also intends to sell someinfrastructure providers,such as the port authority, theairport authority,and energy companies, in the second phase.The third phase,to be completed after 2005, involves the saleof the sugar companies,refineries,the National ElectricPower Authority,and Nigerian Railways.
S In October 2003,the government eliminated domestic fuelsubsidies,announcing that it would no longer set fuel pricesand that the market was deregulated.The governmentindicated that it would sell off four domestic refineries ownedby the Nigerian National Petroleum Corporation andencourage investment in privately-owned enterprises.
S In early 2004,more than 110 companies expressed interestin taking over the management of the Nigeria Ports Authorityafter the government announced it would be privatized.
nigeria
Net Foreign Direct Investment
Millions of U.S. DollarsMillions of U.S. DollarsMillions of U.S. Dollars
0
500
1000
1500
1998 1999 2000 2001 2002

6-77
Economic OverviewEconomic Indicators
2002 2003 Difference
GDP (nominal, CFAfr bn) 2,225.0 2,297.0 72.0
GDP (US$ bn) 3.2 4.0 0.8
CPI Inflation (annual average, %) 3.8 2.0 -1.8
Goods Exports (US$ mn) 2,325.0 2,599.0 274.0
Goods Imports (US$ mn) 706.0 724.0 18.0
Trade Balance (US$ mn) 1,619.0 1,875.0 256.0
Current Account Balance (US$ mn) 66.0 180.0 114.0
Foreign Exchange Reserves (US$ mn) 31.6 31.0 -0.6
Total External Debt (US$ mn) n/a n/a n/a
Debt Service Ratio, paid (%) n/a n/a n/a
Exchange Rate (CFAfr/US$) 696.9 581.2 -115.7
Origins of GDP (2000)
Petroleum(43.5%)
Other(8.9%)
Services(37.4%)
Agriculture & fishing(8.2%)
Forestry(2.0%)
S Petroleum is a key component of the economy,accountingfor over 40 percent of the Republic of the Congo’s (ROC)economy.Sixty percent of the population earns a livelihoodfrom the agricultural sector,which benefits from relativelypredictable rainfall.ROC is rich in natural resources.
S Inadequate road and railway systems have made airlines animportant part of internal transportation.The EU offered toprovide $37 million to rehabilitate the road from Brazzavilleto Kinkala,but the funds have yet to be released because ofcivil unrest that began in March 2002.The governmentsigned a peace agreement with the last rebel group inMarch 2003,and the political situation is now viewed asstable.
S Approximately 50 percent of the land is covered in denseforest.ROC is eligible for a $90-million fund to protect landin the region by joining the World Bank’s Congo BasinForest Partnership.The project’s primary objective is tolimit illegal and uncontrolled logging.
S In an October 2003 mission,the IMF discovered $100million in unaccounted funds indicating that little progresshad been made toward achieving financial transparency.The IMF called off further talks and declined to initiate stepstoward introducing a PRGF.
S In July 2003,a conference in Paris resulted in donorpledges of $221 million in new financing for ROC’sreconstruction,provided that government performance issatisfactory.
S In December 2003,the AfDB granted ROC $1.2 million tofight an Ebola outbreak.
S In May 2004,the International Fund for AgriculturalDevelopment agreed to provide a loan of $11.9 million.ROCis expected to use the funds to boost agricultural outputand enhance food security.
Economic Update
Real GDP Growth Rate
CONGO
Percent
REPUBLIC OF THE
-4-202468
10
1999 2000 2001 2002 2003

6-78
Main Trade Partners, percent of total, 2002
Markets SourcesSouth Korea 20.3 France 22.1
China 9.4 Italy 8.5
United States 8.4 China 6.2
Germany 6.6 Belgium 6.0
Main Trade Commodities, US$ millions
Exports (2000) Imports (1998)
Petroleum 2,294.0 Petroleumsector
423.7
Timber 95.2 Other capitalgoods
64.9
Sugar 12.6
Other 47.9
republic of the congoTrade UpdateS The petroleum industry accounts for over 90 percent of
export earnings.S Increasing stability is contributing to renewed transport
networks.For example, in early 2004,the rail service knownas ”Air Pool” commenced services between Brazzaville andLoutete.This service will provide the local population withaccess a larger variety of products.
S The reopening of the Brazzaville-Pointe-Noire railway hassupported timber production,which is expected to increaseto 1.2 million cubic meters in 2004.Timber has thepotential to become an important generator of exportrevenue.
S In 2003,U.S.exports to ROC consisted primarily ofmachinery and mechanical appliances,cereals,andelectrical machinery and equipment.U.S.imports from ROCconsisted primarily of mineral fuels and oils,precious orsemiprecious stones or metals,and sugars and sugarconfectionery. In 2003 and 2004,ROC was designated anAGOA beneficiary country.AGOA (including GSP) importsfrom ROC totaled $340.8 million in 2003.
Investment and Privatization UpdateS Petroleum exploration has moved further offshore and
deeper as existing reserves are exploited.If furtherexploration does not find large reserves in these areas,investment in the petroleum sector may decline.ROC hassignificant reserves of potash and iron ore that have not yetbeen developed.
S In November 2003,the government adopted a bill thatstreamlines licensing procedures and lowers the state’sequity share in mining companies’ investments to 10percent.This bill is expected to encourage foreigninvestment in the sector.
S A Chinese consortium is promoting the construction of ahydroelectric dam at Imboulou dam,which would cost $280million.Magnesium Alloy Corporation (Canada) hasproposed constructing a link to the Inga dam.
S SIAT (France) is making efforts to revive tobacco production,partly by involving local farmers in the production process.
S The government published plans to privatize management ofCFCO,the railway parastatal. In November 2003,thegovernment released the terms for bidding.Final selection isexpected to take place in September 2004.A $34-millioninvestment program has been developed for the company,and the World Bank has earmarked funds to restructurethe workforce.
S The government has announced plans to commercialize themanagement of SNE,the state electricity utility.Thegovernment has released a privatization schedule for 2004that includes completing the sale of downstream activities ofHydro-Congo,completing the sale of SNDE (a water utility),opening ONPT (postal and telecommunications service) tobids,organizing a sale tender for CFCO (the railway),andselling river ports and transport facilities.
U.S. Trade Balance
Net Foreign Direct Investment
-600
-400
-200
0
200
400
600
1999 2000 2001 2002 2003
Millions of U.S. DollarsU.S. exportsU.S. importsTrade balance
0
100
200
300
400
500
600
1998 1999 2000 2001 2002
Millions of U.S. DollarsMillions of U.S. DollarsMillions of U.S. Dollars

6-79
Economic OverviewEconomic Indicators
2002 2003 Difference
GDP (nominal, Rwfr bn) 825.0 916.0 91.0
GDP (US$ bn) 1.7 1.6 -0.1
CPI Inflation (annual average, %) 2.0 7.5 5.5
Goods Exports (US$ mn) 67.3 61.8 -5.5
Goods Imports (US$ mn) 233.7 247.4 13.7
Trade Balance (US$ mn) -166.4 -185.6 -19.2
Current Account Balance (US$ mn) -127.4 -110.0 17.4
Foreign Exchange Reserves (US$ mn) 243.7 215.9 -27.8
Total External Debt (US$ mn) 1,409.6 n/a n/a
Debt Service Ratio, paid (%) n/a n/a n/a
Exchange Rate (Rwfr/US$) 476.3 566.0 89.7
Origins of GDP (2001)
Agriculture(40.5%)
Industry(21.6%)
Services(37.9%)
S Agriculture contributes just under one-half of GDP,yet over90 percent of the population works in the agriculturalsector.Rwanda experienced rapid economic growth from1998 to 2002,but the rate of growth slowed in 2003.In2003,agricultural production registered almost no growth,mining production fell by 28 percent,and manufacturing fellby over 5 percent.Most manufacturing is agriculturalprocessing;food,beverages,and tobacco accounted for 80percent of manufacturing production.
S Because its primary source of export revenue is coffee andtea,Rwanda’s economy is significantly affected by changesin world prices in these products and weather variation.
S During 2004-05,the government plans to achieve rapid,labor-intensive,poverty-reducing growth through theimplementation of the PRSP completed in 2002.PRSPgoals include achieving GDP growth of at least 5 percent,stabilizing prices and other macroeconomic indicators,recapitalizing rural areas,raising rural incomes,andimproving public services.
S In late 2003,the IMF suspended a PRGF program,statingthat Rwanda failed to meet key targets because ofoverspending.This statement reduced aid flow from donorsin early 2004.The IMF has requested that the governmentcut expenditures in order to balance its budget.Thesuspended PRGF aimed to reduce poverty,develop humanresources,promote the private sector,build state capacity,and improve governance.
S Other policies recommended by the IMF and World Bankinclude increasing trade liberalization,continuingprivatization,and facilitating foreign investment.
Economic Update
Real GDP Growth Rate
rwanda
Percent
0
2
4
6
8
10
12
1999 2000 2001 2002 2003

6-80
Main Trade Partners, percent of total, 2002
Markets SourcesIndonesia 30.8 Kenya 34.5
Germany 14.6 Germany 13.2
China 11.6 Belgium 12.5
South Africa 5.5 United States 5.5
Main Trade Commodities, US$ millions, 2002
Exports Imports
Tea 22.0 Consumptiongoods
120.5
Coffee 14.6 Raw materials 44.6
Coltan 14.0 Energy products 36.7
Hides 2.6 Capital goods 35.5
rwanda
Trade UpdateS Rwanda has been slowly opening to increased trade,
reducing its average tariff to 11 percent in 2002.InJanuary 2004,Rwanda joined COMESA.
S Nearly all Rwanda’s exports and imports are transported byland through Kenya or Tanzania.Although,Rwanda’s roadnetwork is fairly well developed,Rwanda has no railways,andtransportation significantly increases overall import costs.
S A free trade zone is expected to begin operations in June2004,creating an estimated 2,000 jobs.Rwanda hasoffered duty relief, tax breaks,repatriation of dividends,andincreased security in an effort to attract investors to thezone.
S In March 2004,Kenya and Rwanda launched an initiative toimprove market access for their agricultural products intheir respective countries.The two countries will cooperatein research,training,technical assistance,and crop andanimal production.
S In 2003,U.S.exports to Rwanda consisted primarily ofanimal or vegetable fats and oils,vegetables,and cereals.U.S.imports from Rwanda consisted primarily of coffee,tea,mate,and spices;ores,slag,and ash;and machinery andmechanical appliances.In 2003 and 2004,Rwanda wasdesignated an AGOA beneficiary country, including qualifyingfor apparel benefits.AGOA (including GSP) imports fromRwanda totaled $6,000 in 2003.
Investment and Privatization UpdateS South Africa is a major source of investment in
telecommunications,aviation,and tourism in Rwanda.Thereis significant potential for expansion of Rwanda’s tourismsector.
S The government has indicated that it is prepared to privatizethe 44 remaining parastatals.The Rwanda PrivatizationSecretariat (RPS) has thus far privatized 30 parastatals;most of these were relatively small,generating revenue of$7 million by the end of 2003.
S Rwandatel, the state telecommunications company,beganthe privatization process in September 2003,with the saleof two-thirds of its 28-percent stake in MTN-Rwandacell, themonopoly mobile phone company.The full privatization ofRwandatel is expected to take place in 2004.Eighty percentof its shares are to be divested to a multinational investor,18 percent are expected to go to Rwandan investors,and 2percent to Rwandatel staff.
S The management of Electrogaz,the energy parastatal,hasbeen transferred to a consortium of private firms thatincludes Lahmayer International and HamburgerWasserwerke (both of Germany).
S Privatization of BCR,the state bank, is moving slowly despiterecapitalization financed by the World Bank.
S Technical offers have been made for the purchase of thePfunda and Mulindi tea estates,but RPS has indicated thatit is waiting for financial offers.
U.S. Trade Balance
Net Foreign Direct Investment
0
10
20
30
40
50
1999 2000 2001 2002 2003
Millions of U.S. DollarsU.S. exportsU.S. importsTrade balance
0
2
4
6
8
10
1998 1999 2000 2001 2002
Millions of U.S. DollarsMillions of U.S. DollarsMillions of U.S. Dollars

6-81
Economic OverviewEconomic Indicators
2002 2003 Difference
GDP (nominal, Db bn) 478.0 530.6 52.6
GDP (US$ mn) 52.6 56.8 4.2
CPI Inflation (annual average, %) 7.0 9.0 2.0
Goods Exports (US$ mn) 5.5 5.7 0.2
Goods Imports (US$ mn) 24.8 26.3 1.5
Trade Balance (US$ mn) -19.3 -20.6 -1.3
Current Account Balance (US$ mn) -5.0 -6.3 -1.3
Foreign Exchange Reserves (US$ mn) 318.0 n/a n/a
Total External Debt (US$ mn) n/a n/a n/a
Debt Service Ratio, paid (%) 17.4 24.5 7.1
Exchange Rate (Db/US$) 9,088.3 9,342.6 254.3
Origins of GDP (2000)
Fisheries(3.7%)
Manufacturing & energy(5.5%)
Services(62.6%)
Agriculture(16.4%)
Other (11.8%)
S São Tomé & Principe has long been one of the poorestnations in Africa.Economic development has been hinderedby inadequate infrastructure,civil unrest,and a lack offoreign investment.The recent discovery of petroleumreserves provides an opportunity for substantial economicgrowth and for the government to develop and implementreform measures.
S The primary export for São Tomé & Principe is cocoa,accounting for almost 85 percent of GDP.In 2003,thevalue of exports of cocoa was above average because ofrelatively high global prices.Despite being small sectors,agriculture and fishing contribute significantly to GDPgrowth.Services,predominantly the tourism sector,hasexpanded to be the second-largest revenue earner for thecountry.
S In 2001,the government finalized a Priority Action Planthat outlined development strategies to be implementeduntil 2005.Policy focus areas include private sectorpromotion,diversification of productive activities,support ofsmall- and medium-sized farms,and reform of publicinstitutions.
S In 2003,the IMF determined that governmentperformance had improved.Overspending, lack oftransparency,and stalled structural reforms had led to thesuspension of the PRGF.The PRGF is due to be reviewed inmid-2004 and, if resumed,would allow the country tobenefit from the HIPC initiative.A condition stipulated by theIMF for a return of the PRGF is legislation for the improvedand transparent management of petroleum revenue.
S São Tomé & Principe is heavily dependent on foreign aid,receiving one of the largest amounts of aid per capita.Portugal is the primary bilateral donor for the country.
Economic Update
Real GDP Growth Rate
SÃO TOMé &PRINCIPE
Percent
0
1
2
3
4
5
6
1999 2000 2001 2002 2003

6-82
Main Trade Partners, percent of total, 2002
Markets SourcesNetherlands 34.6 Portugal 51.4
Canada 10.9 Germany 10.2
Germany 8.4 UnitedKingdom
7.7
Main Trade Commodities, US$ millions
Exports (2000) Imports (1999)
Cocoa 2.9 Capitalgoods
11.8
Other 0.3 Food 4.5
Fuel 4.0
Trade UpdateS The discovery of petroleum is expected to alter significantly
the country’s economy and trade profile.S The government is continuing efforts to diversify the
economy in nonpetroleum sectors.The government isencouraging increased production in the exclusiveeconomic zone established for the fishing sector.Thegovernment hopes the diversification of agriculturalactivities will lead to a reduction of imported food aid,whichis irregular in delivery because of a lack of the deepwaterport at the main harbor.
S The government has renewed efforts to create a free tradezone and to attract foreign investment into the areathrough contracts from the petroleum sector.No date hasbeen established for the completion of the project.SãoTomé & Principe previously attempted to create a freetrade zone with a South African company,but little progresswas made and the project remains incomplete.
S In 2003,U.S.exports to São Tomé & Principe consistedprimarily of electrical machinery and equipment,machineryand mechanical appliances,wood and articles of wood.U.S.imports from São Tomé & Principe consisted primarily ofvehicles and parts thereof, furniture and miscellaneousfurnishings,and books or other printed products. In 2003and 2004,São Tomé & Principe was designated an AGOAbeneficiary country.
Investment and Privatization UpdateS In October 2003,São Tomé & Principe accepted bids from
foreign oil companies worth $500 million for offshoreexploration blocks;$200 million is to be provided by thegovernment.
S In June 2004,the government and the Rivers StateGovernment (Nigeria) announced they would expand a jointdevelopment zone to include petroleum exploration andtourism.The agreement incorporates full disclosure of alltransactions and activities of the companies within thezone,such as bids and other proprietary data, incompliance with the Extractive Industries TransparencyInitiative,created in 2002 at the World Summit onSustainable Development.The first of nine oil fields was soldto Chevron Texaco (U.S.) in October 2003 for $123 million.The company will operate 51 percent of the zone.ExxonMobil (U.S.) will operate in 41 percent of the developmentzone,with Equity Energy Resources (Norway) extracting oilfrom the remaining 9 percent of the designated area.Nigeria will receive 60 percent of the revenue and SãoTomé & Principe will collect the remaining 40 percent.Production is expected to begin by 2005-06.
S The World Bank has recommended privatization of thestate water and electricity company.There are currently 12entities that remain under state ownership andmanagement,with 4, including the water and electricitysupplier,targeted for privatization.
S International telephone links for the recently privatized CSTtelephone company are being upgraded with foreign aid andtechnical assistance.
SÃO TOMÉ AND PRINCIPE
U.S. Trade Balance
Net Foreign Direct Investment
-4
-2
0
2
4
6
8
10
12
1999 2000 2001 2002 2003
Millions of U.S. DollarsU.S. exportsU.S. importsTrade balance
Millions of U.S. DollarsMillions of U.S. DollarsMillions of U.S. Dollars
0
1
2
3
4
5
1998 1999 2000 2001 2002

6-83
Economic OverviewEconomic Indicators
2002 2003 Difference
GDP (nominal, CFAfr bn) 3,512.8 3,648.5 135.7
GDP (US$ bn) 5.0 6.3 1.3
CPI Inflation (annual average, %) 2.3 0.1 -2.2
Goods Exports (US$ mn) 1,108.6 1,233.4 124.8
Goods Imports (US$ mn) 1,513.3 1,765.0 251.7
Trade Balance (US$ mn) -404.7 -531.6 -126.9
Current Account Balance (US$ mn) -264.5 -302.1 -37.6
Foreign Exchange Reserves (US$ mn) 637.4 650.0 12.6
Total External Debt (US$ bn) 3.1 3.0 -0.1
Debt Service Ratio, paid (%) 12.7 8.0 -4.7
Exchange Rate (CFAfr/US$) 697.0 581.2 -115.8
Origins of GDP (2001)
Secondary(20.9%)
Primary(18.7%) Tertiary
(60.4%)
S Agricultural products such as cotton,groundnuts,andhorticulture contribute substantially to GDP.Large scaleagriculture,however, is limited to industrial sugarproduction.After agriculture,the industrial sector is thesecond-largest source of export earnings, includingindustries such as phosphates and derived chemicals.Adrop in agricultural production,weak prices for mineralexports,and a new method of calculating GDP led to adownturn in economic growth for 2002 and into 2003.
S Agricultural diversity is a priority of rural developmentinitiatives proposed by the government.Strategies includeincreasing the number of irrigation schemes,using highyield varieties,and improving water retention basins.Thegovernment plans to construct 50 additional waterretention basins at a cost of $1.7 million.Agriculturaltraining schools and colleges are to be established in ruralareas.In 2003,maize farmers received a boost whendonor funding gave $15.5 million to the industry thatallowed imported hybrid seeds to be used.Japan grantedSenegal $5 million in early 2004 to help improve foodsecurity and to reduce dependence on imported rice.
S Economic reforms for the country are concentrated in fourareas:fiscal policy,structural reforms includingprivatization,poverty alleviation,and the promotion of theprivate sector.UEMOA’s survey of the Senegal economyfound a slowdown in economic activity in the primarysector,specifically agriculture and fishing.These sectorsrequire modernization of existing equipment and farmingtechniques to support sector exports,which are asignificant source of revenue for the country.
S Reform efforts are also concentrated in reducing the publicsector expenditure and improving the revenue collectionsystem to meet goals outlined by UEMOA.In March 2003,UEMOA extended Senegal’s time to meet certain criteria,including a balanced budget,reduced annual inflation toless than 3 percent,and reduced total government debt toless than 70 percent of GDP.
S The IMF approved a new 3-year PRGF in April 2003 thatwill support economic reform until 2005.The $33-milliongrant will support the government’s reform programsaimed at macroeconomic stability and economicdevelopment priorities.The approval allowed Senegal todraw $5 million of the allocated funds immediately,as wellas receive an additional $1.6 million in debt relief under theHIPC initiative. In February 2004,the IMF completed areview of the new PRGF and approved the immediaterelease of $5.2 million.The review advised Senegal tocontinue improving tax and customs procedures,and focuson agriculture sector reform.
Economic Update
Real GDP Growth Rate
SENEGAL
Percent
01234567
1999 2000 2001 2002 2003

6-84
Main Trade Partners, percent of total, 2002
Markets SourcesFrance 16.0 France 24.7
India 13.6 Nigeria 14.5
Italy 13.1 Germany 6.5
Mali 6.9 Italy 5.4
Main Trade Commodities, US$ millions, 2001
Exports Imports
Fish & fishproducts
240.0 Foodproducts
359.0
Phosphates& fertilsers
117.0 Petroleumproducts
317.0
Groundnuts& product
100.0 Capitalgoods
242.0
senegal
Trade UpdateS The port at Dakar is an important regional and international
hub.The port authority is proposing the modernization andexpansion of existing facilities, including a new containerterminal.
S A new airport is also planned outside of Dakar,and will doublethe existing air traffic capacity.
S Road rehabilitation plans are underway, including roads linkingMali and The Gambia with Senegal.The Senegal portion of theDakar-Bamako railway linking Senegal and Mali was postponedin 1998.The government accepted a bid from Canac-Getmar(Canada),valued at $26.7 million,to manage the railway for 25years.Management of the railway was transferred toCanac-Getmar in August 2003.
S Tourism is expanding.Visitors originate primarily fromcontinental Europe, including France,Belgium,Germany,andSwitzerland.The government’s goal is to attract 1.5 millionvisitors by 2010.
S In 2003,U.S.exports to Senegal consisted primarily of vehiclesand parts thereof,machinery and mechanical appliances,andelectrical machinery and equipment.U.S.imports from Senegalconsisted primarily of machinery and mechanical appliances;articles of feather,down,flowers,or human hair. In 2003 and2004,Senegal was designated an AGOA beneficiary country,including qualifying for apparel benefits.AGOA (including GSP)imports from Senegal totaled $720,000 in 2003.
Investment and Privatization UpdateS In early 2004,the government officially launched the
$46-million investment promotion program aimed atincreasing the private investment necessary to reach an8-percent growth rate.The 5-year project is financed by theWorld Bank,and will focus on improving the investmentclimate,targeting sector-specific investments,and supportingeconomic reform initiatives.
S In an effort to encourage the private sector under its long-termeconomic growth plan,the government plans to reform thelegal and judicial systems to remove administrative barriers toinvestment and improving infrastructure;increase productivityin the economy;and stimulate investment in public sectorssuch as petroleum,postal services,and pensions services.InApril 2004,the government submitted revisions of the currenttax code to the national assembly, including a reduction in thecorporate tax rate from 35 percent to 33 percent,and theexclusion of certain capital goods from customs duties.
S The government is also focused on increasing thecompetitiveness of the manufacturing and industrial sectors,with priorities for investment focused on the chemicals,textiles,and agro-processing sectors.
S In September 2003,the first vehicle assembly plant wasopened through a joint venture between Senegalese investorsand Tata International (India).
S In May 2004,Senegal was 1 of 16 countries designated aseligible for Millennium Challenge Account assistance.
S Privatization of state-owned companies is a key component ofSenegal’s new PRGF.In January 2004,a total of 6 state-ownedenterprises had been privatized.The government also plans tosell a majority stake in Sonacos,the state owned groundnutfactory,by mid-2004.In January 2004,potential bidders forSonacos were given the final tender document,with buyerselection to be completed by mid-2004.
S In 2003,the government announced it would no longersubsidize the state-owned cotton plant.
U.S. Trade Balance
Net Foreign Direct Investment
-40
-20
0
20
40
60
80
100
120
1999 2000 2001 2002 2003
Millions of U.S. DollarsU.S. exportsU.S. importsTrade balance
0
20
40
60
80
100
120
140
160
1998 1999 2000 2001 2002
Millions of U.S. DollarsMillions of U.S. DollarsMillions of U.S. Dollars

6-85
Economic OverviewEconomic Indicators
2002 2003 Difference
GDP (nominal, SRs mn) 3,830.0 3,856.0 26.0
GDP (US$ mn) 696.4 701.1 4.7
CPI Inflation (annual average, %) 0.2 3.7 3.5
Goods Exports (US$ mn) 237.0 241.0 4.0
Goods Imports (US$ mn) 376.0 366.0 -10.0
Trade Balance (US$ mn) -139.0 -125.0 14.0
Current Account Balance (US$ mn) -130.0 -74.0 56.0
Foreign Exchange Reserves (US$ mn) 69.7 66.5 -3.2
Total External Debt (US$ mn) 207.0 206.0 -1.0
Debt Service Ratio, paid (%) 2.3 2.1 -0.2
Exchange Rate (SRs/US$) 5.5 5.5 0.0
Origins of GDP (2002)
Agriculture & fishing(2.9%)
Manufacturing(18.2%)
Finance(5.6%)
Other (4.4%)
Construction(10.0%)
Transport, communications &distribution (37.0%)
Hotels & restaurants(9.9%)
Government services(12.0%)
S Services, including transport,communications,commerce,and tourism, is the predominant sector in the Seychelleseconomy.
S In 2003,the government engaged in a macroeconomicpolicy review and appointed a committee that devised the amedium-term Macroeconomic Reform Program,announced on July 1,2003.The program aims to restorefiscal sustainability and undertake structural reform.
S The government imposed a 12-percent tax on goods andservices,which is expected to boost government revenueand to help restore fiscal stability.
S Seychelles Breweries,the largest private company afterIndian Ocean Tuna,continues to experience difficultiesbecause of a scarcity of foreign exchange.As one ofSeychelles’ largest taxpayers,the company’s difficulties maysignificantly impact government revenue.
S Seychelles withdrew from the SADC in mid-2004,statingthat the SADC has failed to meet significant goals.
Economic Update
Real GDP Growth Rate
SEYCHELLES
Percent
-4-3-2-101234
1999 2000 2001 2002 2003

6-86
Main Trade Partners, percent of total, 2002
Markets SourcesUnited Kingdom 31.6 Saudi Arabia 25.4
Germany 23.8 South Africa 9.2
Italy 14.9 Spain 8.3
France 13.8 France 7.2
Main Trade Commodities, US$ millions, 2002
Exports Imports
Canned tuna 154.0 Food & liveanimals
104.5
Re-exports ofpetroleum
48.0 Machinery &transport goods
84.1
Frozen & freshfish
3.3 Manufacturedgoods
80.7
Frozen prawns 1.6 Fuel 50.9
seychelles
Trade UpdateS Canned tuna and tourism are the two most important
sources of foreign exchange.S Stimulated by an increase in international prices,a rapid
expansion in prawn production may increase prawn exports.S In 2003,U.S.exports to Seychelles consisted primarily of
machinery and mechanical appliances,aircraft and partsthereof,and optical or measuring equipment and partsthereof.U.S.imports from Seychelles consisted primarily ofmineral fuels and oils,optical or measuring equipment andparts thereof,and pharmaceutical products. In 2003 and2004,Seychelles was designated an AGOA beneficiarycountry.AGOA (including GSP) imports from Seychellestotaled $3,000 in 2003.
Investment and Privatization UpdateS The Seychelles Investment Bureau was created in July
2004 as a one-stop shop for foreign investors to thecountry.
S The government plans to open a new terminal at the PointeLarue airport in 2007.Increased access to the country maysupport government efforts to attract investment.
S To encourage expansion of the financial services sector,Seychelles has signed double taxation treaties with SouthAfrica,China, Indonesia,Thailand,Zimbabwe,and Oman.Double taxation treaties have been negotiated,but not yetsigned,with Russia,Vietnam,Malaysia,Egypt,andBotswana.Talks are underway with other countries,including Tunisia,Cyprus,Mauritius,Burundi,and the CzechRepublic.
S Although,foreign investment in luxury hotels continued toincrease,Cosproh,the hotel parastatal,retains ownershipof a number of hotels and plans to open a new resort onCerf Island.In late 2003,Seychelles won awards at theWorld Travel Market in London.
S A $10-million recent investment to create new ponds inCoetivy Island has contributed to an increase in prawnproduction.Investment has totaled $30 to $40 million sincethe farm was established in 1994.
S Indian Ocean Tuna is expected to invest in storage facilitiesover the next few years in an effort to smooth seasonalsupply shortages and to increase production.
S Seychelles Petroleum Corporation (oil trading),SeychellesMarketing Board (agriculture),and the Island DevelopmentCorporation await privatization.
U.S. Trade Balance
Net Foreign Direct Investment
-200
20406080
100120140160180200
1999 2000 2001 2002 2003
Millions of U.S. DollarsU.S. exportsU.S. importsTrade balance
0
10
20
30
40
50
60
70
1998 1999 2000 2001 2002
Millions of U.S. Dollars

6-87
Economic OverviewEconomic Indicators
2002 2003 Difference
GDP (nominal, Le bn) 1,491.2 1,707.4 216.2
GDP (US$ mn) 710.4 727.2 16.8
CPI Inflation (annual average, %) -3.2 8.0 11.2
Goods Exports (US$ mn) 48.5 60.2 11.7
Goods Imports (US$ mn) 264.3 284.5 20.2
Trade Balance (US$ mn) -215.8 -224.3 -8.5
Current Account Balance (US$ mn) -142.0 -153.2 -11.2
Foreign Exchange Reserves (US$ mn) 84.7 64.4 -20.3
Total External Debt (US$ mn) n/a n/a n/a
Debt Service Ratio, paid (%) n/a n/a n/a
Exchange Rate (Le/US$) 2,099.0 2,347.9 248.9
Origins of GDP (1999)
Other industry(3.9%)
Manufacturing (Industry)(12.7%)
Services(21.9%)
Agriculture(58.4%)
Import duties(3.1%)
S Mining and agriculture are the leading components of theeconomy.More than 65 percent of the population dependson agriculture for its livelihood.
S Transportation infrastructure is inadequate.Roads aredilapidated,the airport and ports require repairs,and thereis no railway network.
S The Truth and Reconciliation Commission was launched inApril 2003 with the goal of contributing to the developmentof political stability.
S The 2004 budget highlights security,the social sector,andthe procurement of goods and services as key areas.Toincrease revenue,the government intends to increase stafflevels at the National Revenue Authority,re-establish borderposts, introduce more efficient guidelines,and acceleratethe taxing and clearing of imported goods.To spureconomic growth,the government will focus on developingthe private sector, improving the agricultural sector,reviving the mining industry, improving infrastructure,andbuilding human capital.
S Sierra Leone began participation in the HIPC initiative inMarch 2002.The money saved in debt service has beendirected to expenditures on education,healthcare,andrural development,under the requirements of thegovernment’s interim PRSP.In June 2003,the EUannounced that it pledged $257 million to Sierra Leoneover 5 years, in support of the government’s PRSP.In early2004,the IMF approved a $22-million loan as an advanceunder the HIPC initiative.
S In May 2003,the World Bank approved a $30-million loanas part of the Economic Rehabilitation and Recovery Credit.These funds complement loans from the AfDB,the UK’sDepartment for International Development,the EU,and theIMF.They are to be used to consolidate progress made ingovernance,to support the institutional and policy reformagenda,and to fund the import of essential commodities.
S China committed $266 million in mid-2004 to reconstructthe ocean-front Lumlea Beach area near Freetown.Theconstruction project is expected to create thousands ofjobs and boost tourism to the country.
S The United States provided $272 million in 2003 to helpSierra Leone’s recovery and reconstruction.Funds wereused for school and hospital construction,police training,humanitarian assistance,economic development projects,UN peacekeeping operations,and debt relief. In April 2003,the United States signed a debt-forgiveness agreementwith Sierra Leone covering payments owed betweenOctober 1,2001 and September 30,2004,on obligationscontracted prior to June 20,1999.
Economic Update
Real GDP Growth Rate
SIERRA LEONE
Percent
-10-8-6-4-202468
1999 2000 2001 2002 2003

6-88
Main Trade Partners, percent of total, 2002
Markets SourcesBelgium 42.0 Germany 25.0
Germany 28.2 UnitedKingdom
10.9
United Kingdom 3.7 Netherlands 7.5
Italy 2.9 United States 5.7
Main Trade Commodities, US$ millions, 2001
Exports Imports
Diamonds 26.3 Food 51.9
Others 2.9 Fuel &lubricants
43.3
Machinery &transportequipment
37.2
Manufacturedgoods
21.5
sierra Leone
Trade UpdateS The government has been cooperating with the World Bank
to end diamond smuggling.It will attempt to enforceexisting diamond mining and trading legislation andincrease transparency in the sector.Additionally, it willparticipate in the Kimberley Process,which is expected todecrease smuggling by mandating diamond authentication.
S Bangladesh has expressed interest in investing in the textileand pharmaceutical industries to produce for export.
S In 2003,U.S.exports to Sierra Leone consisted primarily ofelectrical machinery and equipment,machinery andmechanical appliances,and cereals.U.S.imports fromSierra Leone consisted primarily of precious orsemiprecious stones or metals,apparel,and machineryand mechanical appliances.In 2003 and 2004,SierraLeone was designated an AGOA beneficiary country,including qualifying for apparel benefits in 2004.AGOA(including GSP) imports from Sierra Leone totaled $75,000in 2003.
Investment and Privatization UpdateS There is evidence of petroleum and gas reserves off the
shores of Bonthe and Sulima.In July 2003,the governmentannounced that three oil companies,Respol (Spain),OrantoPetroleum (Nigeria),and 8Investments (U.S.),submittedbids to explore for oil in coastal waters.The governmentexpects exploratory drilling to begin in 2005.
S In mid-2004,the World Bank announced efforts toharmonize and codify mining law in willing countries,including Sierra Leone.This streamlining process isexpected to encourage investment in the mining sector.
S In March 2003,OPIC announced that it would provide $25million as an investment guarantee to allow Sierra Rutile(U.S.) to engage in mining operations in Mobimbi.
S In July 2003,DiamondWorks (Canada) agreed to partnerwith Magma Diamond Resources (Canada) and invest$14.5 million to reestablish mining operations at the Koidukimberlite project.Drilling began in August 2003.
S In early 2004,Datatel GSM,a joint venture betweenGateway Communications (South Africa) and a SierraLeone operator,was awarded a GSM wireless license.Thecompany expects to construct a wireless network that willoffer mobile, fixed wireless,and data services.
S In late 2002,the government announced that it intended toprivatize 24 state-owned enterprises.The governmentplans to divest those through the stock market,which hasnot yet been created.The firms to be privatized include theGuma Valley Water Company,National Development Bank,the National Power Authority,Sierra Leone Airports’Authority, the Sierra Leone Commercial Bank,Sierra LeoneForest Industries,the Sierra Leone Ports’ Authority, theSierra Leone Road Transport Corporation,and the SierraLeone State Lottery.
Net Foreign Direct Investment
Millions of U.S. Dollars
U.S. Trade Balance
Millions of U.S. Dollars
-10-8-6-4-202468
10
1998 1999 2000 2001 2002
0
5
10
15
20
25
30
35
1999 2000 2001 2002 2003
U.S. exportsU.S. importsTrade balance

6-89
Economic OverviewEconomic Indicators
S Commerce and trade are hindered by factionalization andthe use of multiple currencies.
S In 2003,agreement was reached on a 351-memberFederal Transitional Parliament and a Transitional NationalCharter;the Somali National Salvation Council subsequentlysigned an accord in January 2004 to reduce the number ofseats to 275.Somaliland has refused to partake in any ofthese negotiations.Creation of the Federal TransitionalParliament may lead to increased stability and security inthe country and facilitate economic development.
S In January 2004,the World Bank,the UNDP,and severalother UN agencies launched a series of projects to collectdata on Somalia.These data are expected to provideinformation about the economy and trade,and will serve asan important part of the economic policy developmentprocess.Somalia’s current data and statistics areunreliable.
S Livestock and agriculture are key components of theeconomy.Cattle husbandry is the main source of food andforeign-exchange earnings.Droughts in early 2004contributed to livestock deaths, loss of normal incomesources through milk and meat sales,price increases forwater trucking, increased indebtedness,and limited accessto food.
S In April 2003,the World Bank announced that it wasresuming operations in Somalia,through its Low-IncomeCountries Under Stress initiative.World Bank operations inSomalia were suspended in 1990.
Economic Update
somalia
Origins of GDP
Real GDP Growth Rate
Data not available
Data not available
Data not available

6-90
Main Trade Partners, percent of total, 2001
Markets SourcesSaudi Arabia 32.0 Djibouti 28.0
United ArabEmirates
32.0 Kenya 13.0
Yemen 17.0 India 10.0
Thailand 2.0 Brazil 6.0
Main Trade Commodities, US$ millions, 1990
Exports Imports
Livestock 43.0 Manufactures 204.0
Bananas 28.0 Nonfuelprimaryproducts
104.0
Hides & skins 3.0 Fuels 52.0
somalia
Trade UpdateS In February 2003,the European Commission approved
funding to rehabilitate Somaliland’s core road network.S Saudi Arabia maintains a ban on livestock imports from
Somalia,which was originally imposed in 1998.By late2003,however,the other Gulf States lifted a similar ban.Livestock was an important earner of export revenue forSomalia before the ban,and exports of livestock areexpected to grow as a result of reinstated market access tomost of the Gulf States.
S Somaliland’s planning minister has been exploring thepossibility of exporting livestock to Ethiopia.
S In 2003,U.S.exports to Somalia consisted primarily ofmilling industry products,vegetables,and organicchemicals.U.S.imports from Somalia consisted primarily ofessential oils and resinoids;lac,gums,and resins;andanimal or vegetable fats or oils.
Investment and Privatization UpdateS In September 2003,Somaliland placed an order with a
U.S.-based company to install a GSM network.Thistelecommunications system will connect the region underone network operator.
S Rovagold (UK) and two Chinese firms were given permissionto explore possible petroleum reserves off the coast ofSomaliland.
S In April 2003,discussions began to establish a SomaliLivestock Board that would regulate the industry.Ahygiene-conscious slaughterhouse opened in Burao in2003.
S In mid-2004,construction began on a veterinary school,with funds of $2 million pledged by Italy.
U.S. Trade Balance
0
1
2
3
4
5
6
7
8
1999 2000 2001 2002 2003
Millions of U.S. DollarsU.S. exportsU.S. importsTrade balance
-1.0
-0.5
0.0
0.5
1.0
1.5
2.0
1998 1999 2000 2001 2002
Millions of U.S. Dollars
Net Foreign Direct Investment
Millions of U.S. DollarsMillions of U.S. Dollars

6-91
Economic OverviewEconomic Indicators
2002 2003 Difference
GDP (nominal, R bn) 1,098.7 1,185.9 87.2
GDP (US$ bn) 104.5 156.9 52.4
CPI Inflation (annual average, %) 9.2 5.9 -3.3
Goods Exports (US$ mn) 31,085.0 36,773.4 5,688.4
Goods Imports (US$ mn) 26,712.0 33,901.3 7,189.3
Trade Balance (US$ mn) 4,373.0 2,872.1 -1,500.9
Current Account Balance (US$ mn) 289.0 -1,267.0 -1,556.0
Foreign Exchange Reserves (US$ mn) 5,904.0 6,496.0 592.0
Total External Debt (US$ bn) 24.4 25.9 1.5
Debt Service Ratio, paid (%) 10.1 8.5 -1.6
Exchange Rate (R/US$) 10.5 7.6 -3.0
Origins of GDP (2002)
Manufacturing(20.2%)
Financial services(19.5%)
Other (44.1%)
Construction(3.0%)
Electricity, gas & water(3.5%)
Agriculture, forestry & fishing(4.3%) Mining & quarrying
(5.4%)
S South Africa is probably the most economically diversecountry in SSA.Gold,diamonds, iron,platinum-groupmetals,and coal are important to the economy.Manufacturing accounts for approximately 20 percent ofGDP and is the largest employer,but companies have facedchallenges since the opening of the economy to globalcompetition.
S The role of the agriculture, forestry,and fishing sector inthe economy has been shrinking;it representsapproximately 5 percent of GDP.Maize is a key crop andthe staple food for many rural residents.Recentdiscussions have included the possibility of reintroducingprice controls in the agricultural sector.
S The energy sector accounts for 15 percent of GDP andemploys 250,000 people. In late 2003,the Minister ofMinerals and Energy announced that the government willrestructure the electricity sector to improve access for thepoor.
S South Africa has a well-developed transportationinfrastructure network.Sizeable and efficient ports,anextensive road network,and air links encourage bothdomestic and foreign trade.
S Investment in the tourism sector has been growing,witharrivals up 1.2 percent in 2003 according to the WorldTourism Organization.South Africa was one of a fewdestinations to experience positive growth in 2003.TheSouth African Tourism Board indicated that the growthtook place in all its primary tourism markets.The opening ofCivair,a new airline, in late 2004, is expected to increasetourism.A consortium led by International FinancialAdvisors (Kuwait) has purchased a 50-percent stake in theZimbali Coastal Resort and plans to invest $100 millionover the next 10 years.South Africa is cooperating withMozambique and Swaziland to encourage touristaccessibility of the Lubombo Mountain Range,which thethree countries share.Additionally,South Africa’sgovernment offers low-income loans and grants tocommunities that plan sustainable tourism projects.
S The Broad-Based Black Empowerment (BEE) bill went intoeffect in early 2004.The law aims to redistribute capitaltoward traditionally disadvantaged groups and toaccelerate skill acquisition by these same groups.Thefinance minister has also allocated 10 billion rand(approximately $1.3 billion) to finance black-ownedcompanies.
S A December 2003 budget policy statement increasedspending on HIV/AIDS-related initiatives, labor-basedinfrastructure,crime reduction,and employmentgeneration.The government has expressed plans toincrease spending on social welfare projects andinfrastructure,rather than implementing tax cuts.
Economic Update
Real GDP Growth Rate
SOUTH AFRICA
Percent
0
1
2
3
4
1999 2000 2001 2002 2003

6-92
south africa
Economic Update—Cont.S The Johannesburg Stock Exchange plans to open the first
alternative exchange that would allow for the listing of smalland medium companies.Companies would be required tohave a share capital of approximately $256,140.Participation requires disclosure of company information.
S In late 2003,the South African arm of GlaxoSmithKlineagreed to allow a second manufacturer to produce genericversions of its antiretroviral AIDS medications.It alsoindicated that it would accept applications from other firmsto produce the generic version.
S The Addo Elephant Park is expected to receive $5.5 millionfrom the World Bank in 2004,bringing total investment upto $40 million.The park has an area of 145,000 hectaresand is expected to grow by another 236,000 hectares.Thegovernment has made an effort to increase the number ofterrestrial and marine protected areas.
S The United States Secret Service donated 2.5 million rand(approximately $331,000) worth of electronic equipment toSouth African law enforcement to help crime fightingefforts.The Secret Service has also agreed to providetraining in interviewing skills and report writing.This aid isexpected to reduce financial crime in South Africa.

6-93
Main Trade Partners, percent of total, 2002
Markets SourcesUnited States 11.8 Germany 15.6
United Kingdom 11.3 United States 11.7
Germany 8.6 UnitedKingdom
8.9
Japan 6.8 Japan 6.1
Main Trade Commodities, US$ millions, 1997Exports ImportsMetals & metalproducts
6.3 Machinery &appliances
8.9
Gold 5.6 Mineralproducts
3.7
Diamonds 2.9 Chemicals 3.4
Machinery &transportequipment
2.6 Transport &equipment
1.7
south africa
Trade UpdateS Trade accounts for more than 50 percent of South Africa’s
GDP.South Africa is moving towards a WTO-compliantsystem after its history of import substitution policies.SouthAfrica has committed to a maximum tariff of 15 to 30percent for most items and is halving average tariffs ontextiles. Import permits are currently used primarily to collectinformation,rather than restrict trade.
S Mining is an important foreign-exchange earner,with goldaccounting for over one-third of all exports.South Africa holds80 percent of the world’s reserves of manganese,56percent of platinum-group metals,35 percent of the world’sgold,and 68 percent of the world’s reserves of chromium.The Mineral and Petroleum Resources Development Act of2002 transferred ownership of the country’s mineralresources to the state.
S The Airports Company of South Africa may delay theconstruction of the $305.6-million King Shaka InternationalAirport.Construction of the airport is expected to aid theindustrial development zone and encourage trade.The airportis due to be operational by 2006.
S In March 2004,South Africa signed a pact with India andBrazil to boost trade,aimed at countering the industrializedcountries and promoting policies beneficial to developingcountries.
S The motor vehicle sector has become an important exportsector.There are plans to improve the South African ports tofacilitate increased automotive exports.
S An early-2004 tax change law may encourage South Africancorporations to repatriate profits earned offshore.The lawexempts companies holding more than 25 percent of thetotal equity share capital of a foreign company from taxes ondividends declared by those entities.South Africa is alsoexpected to contribute to international efforts to discourageforeign tax havens.
S In 2003,U.S.exports to South Africa consisted primarily ofmachinery and mechanical appliances,vehicles and partsthereof,and aircraft and parts thereof.U.S.imports fromSouth Africa consisted primarily of precious or semipreciousstones or metals,vehicles and parts thereof,and iron andsteel. In 2003 and 2004,South Africa was designated anAGOA beneficiary country, including qualifying for apparelbenefits.AGOA (including GSP) imports from South Africatotaled $1.7 billion in 2003.
-3000
-2000
-1000
0
1000
2000
3000
4000
5000
1999 2000 2001 2002 2003
Millions of U.S. DollarsU.S. exportsU.S. importsTrade balance
U.S. Trade Balance

6-94
south africa
Investment and Privatization UpdateS The EU accounts for 90 percent of FDI in South Africa.The
government has used industrial development zones as amechanism for attracting FDI.FDI currently accounts for lessthan 6 percent of total investment.
S In April 2003,the government selected Sasol to supply gas toGauteng,Witbank,Middleburg,and KwaZulu-Natal for 25years under a government-controlled pricing regime.Construction of a pipeline from Mozambique is underway andis expected to be operational in 2004.Forest Oil announcedplans to drill appraisal wells,a $30-million project, in theIbhusbesi gasfield.Petro SA,a domestic oil company,hasplans to build a west coast pipeline,which should allow ForestOil to more efficiently reach consumers.The cost of thepipeline,processing plant,and associated infrastructure is$1.2 billion.
S Avmin Alloys began construction of a $17.5-million Allavoyfacility in early 2004 that will provide high-performance alloysfor the Rolls-Royce aerospace division.
S JP Morgan Chase (U.S.) is expected to purchase Tasc,SouthAfrica’s largest third-party fund administrator.The purchasewould give JP Morgan Chase $48.5 billion worth of assetsand an opportunity to expand its local investor services.
S Aquarius Platinum (Australia) is cooperating with GB Mining& Exploration and Sylvania South Africa to establish a$4.0-million chromite tailings project at the Kroondal mine.Inits first year,the project is expected to yield more than20,000 ounces of platinum-group metals.Construction wasexpected to begin in March 2004 and production is expectedto begin in October 2004.
S In late 2003,Mvelaphanda Resources secured $659 millionto finance its 15-percent stake in Gold Fields. In early 2004,Norilsk Nickel (Russia) purchased a 20-percent stake in GoldFields at $1.16 billion,to become Gold Fields’ largest shareholder.Norilsk is the world’s largest producer of nickel andpalladium.
S In early 2004,General Motors (GM) (U.S.) purchased the 50percent of Delta Motor Corporation,South Africa’sfourth-largest motor vehicle manufacturer,that it did notalready own.GM is expected to invest $218.2 million in thecountry over the next few years to promote exports and toincrease market share.
S Restructuring of the Transnet group,which consists of rail,roads,ports,and air interests,and full privatization of portoperations was expected to be completed by the end of2004.In May 2003,Duran’s container terminal was to bethe first of 13 terminals in 7 commercial ports to be sold tothe private sector.By May 2004,the government announcedthat privatization plans would be delayed indefinitely.Thegovernment also indicated that privatization of Eskom,anelectricity parastatal that was undergoing restructuring,would be delayed.The slow privatization process has alsocontributed to low privatization revenue and decreasedinvestment potential.
S Firms still awaiting privatization are Sentech (commercialsignal distributor),MTN (cell phone operator),Telkom(network operator),Mintek (mining and minerals),Durban (acontainer terminal),and Old Mutual (network operator).
0
1000
2000
3000
4000
5000
6000
7000
8000
1998 1999 2000 2001 2002
Millions of U.S. Dollars
Net Foreign Direct Investment
Millions of U.S. DollarsMillions of U.S. Dollars

6-95
Economic OverviewEconomic Indicators
2002 2003 Difference
GDP (nominal, SD bn) 3,559.2 4,130.3 571.1
GDP (US$ bn) 13.5 15.8 2.3
CPI Inflation (annual average, %) 8.4 8.8 0.4
Goods Exports (US$ mn) 1,949.1 2,449.9 500.8
Goods Imports (US$ mn) 2,152.8 2,382.6 229.8
Trade Balance (US$ mn) -203.7 67.3 271.0
Current Account Balance (US$ mn) -960.4 -560.5 399.9
Foreign Exchange Reserves (US$ mn) 440.7 736.0 295.3
Total External Debt (US$ bn) 15.8 16.1 0.3
Debt Service Ratio, paid (%) 1.9 1.7 -0.2
Exchange Rate (SD/US$) 263.3 261.1 -2.2
Origins of GDP (1999)
Agriculture(42.6%)
Construction(6.4%)
Industry & mining(9.8%)
Trade, transport, &communications(25.9%)
Other services(15.3%)
S Agriculture is the most important sector of the economy,employing two-thirds of the population.Consequently, theeconomy is vulnerable to climatic conditions.Moreover,inadequate transportation facilities leave some regions withfood shortages,even as others have surpluses.
S The Al-Gezira program allows for more than 100,000tenant farmers to cooperate with the Sudan Gezira Board,which provides administration,credit,and marketingservices.The Al-Gezira scheme is the world’s largestirrigated agricultural scheme under single management.
S Economic development and data acquisition are hinderedby a history of social unrest.Negotiations betweenKhartoum and the Sudan People’s Liberation Army areunderway,with the United States facilitating the process.Civil unrest continues in the western part of the country.The peace plan provides for the northern and southernregions to share petroleum revenues.
S Sudan’s road infrastructure is inadequate,with many of theroads unpaved.The Islamic Development Bank,the ArabMonetary Fund,and other Arab development organizationshave provided funding for the construction of asphalt roads.In 2002,the Kuwait Fund agreed to provide $110 millionfor a road linking Port Sudan to Atbara,but constructionhas not yet begun.
S The EU provided $14.5 million to support the African Unionpeacekeeping mission in Darfur,the western part of thecountry.
Economic Update
Real GDP Growth Rate
SUDAN
Percent
012345678
1999 2000 2001 2002 2003

6-96
Main Trade Partners, percent of total, 2002
Markets SourcesChina 54.5 China 20.6
Japan 13.9 Saudi Arabia 7.2
Saudi Arabia 5.4 India 5.7
South Korea 3.8 United Kingdom 5.6
Main Trade Commodities, US$ millions, 2002
Exports Imports
Crude oil 1,510.9 Machinery &equipment
620.8
Livestock 117.0 Manufacturedgoods
555.0
Sesame 74.6 Transportequipment
255.8
Cotton 62.2 Wheat & wheatflour
221.3
sudan
Trade UpdateS A $1.5-billion railroad linking Port Sudan to Addis Ababa,
Ethiopia,was proposed in late 2000.Funding for the projecthas not yet become available.The railway would facilitatetrade between the two countries.
S Livestock is the fastest growing sector and became theleading nonpetroleum generator of export revenues in2002.Petroleum generated over 80 percent of exportrevenue in 2003,but cotton and sesame remain importantexport commodities.
S Increasing petroleum production capacity and high prices inlate 2003 contributed to a rise in petroleum exportrevenues.
S In 2003,U.S.exports to Sudan consisted primarily ofcereals,animal or vegetable fats and oils,and vegetables.U.S.imports from Sudan consisted primarily of lac,gums,and resins;articles of iron or steel;and tools, implements,cutlery,and parts of base metal.
Investment and Privatization UpdateS Harbin Power Engineering Company (China) has invested in
a gas-fired power station north of Khartoum.Although theproject was due to be completed by the end of 2003, it wasnot yet operating in early 2004.Dar Ikhtisas (Malaysia) hasplans to fund a separate diesel power station that isscheduled to be operational in 2004.
S In January 2004,several Gulf Arab development fundssigned agreements to provide $600 million for theconstruction of a hydroelectric plant at Merowe.The plantwould double Sudan’s power generation capacity.Workstarted in 2004 and the first unit is expected to beoperational in July 2007.
S In August 2003,the China National Petroleum Corporationwon a contract to upgrade the Al-Jeili refinery,doubling itsoutput capacity.The refinery has been operational since2000.
S In 2002,the Sudan Telecommunications Company (Sudatel)sold shares worth $300 million.The funds have been usedto support development, including the installation of afiber-optic network and the expansion of more services torural areas.Sudatel is cooperating with Thuraya SatelliteTelecommunications Company (UAE) to form a newcompany,Thuraya-Sudatel,which will provide services forThuraya in Sudan.Initial capital in the new venture has beenset at $2.5 million.
S The government has committed itself to privatizingstate-owned enterprises.The Privatization of StateCorporations Act in 1992 earmarked 190 publiccorporations for sale,but by 1995,only 17 had been sold.Most sales have been of small firms, including thedivestment of the Atbara cement factory in late 2001 andthe privatization of the Sudan Duty-Free Zone Company andthe Bridges and Road Corporation in late 2002.Thegovernment has listed the Sudan Railway Corporation asone of the assets it wishes to privatize in the coming years.
U.S. Trade Balance
Net Foreign Direct Investment
0
10
20
30
1999 2000 2001 2002 2003
Millions of U.S. Dollars
U.S. exportsU.S. importsTrade balance
0
100
200
300
400
500
600
700
1998 1999 2000 2001 2002
Millions of U.S. DollarsMillions of U.S. DollarsMillions of U.S. Dollars

6-97
Economic Overview
Economic Indicators 2002 2003 Difference
GDP (nominal, E mn) 12,287.0 13,474.0 1,187.0
GDP (US$ bn) 1.2 1.8 0.6
CPI Inflation (annual average, %) 11.8 7.4 -4.4
Goods Exports (US$ mn) 955.0 900.0 -55.0
Goods Imports (US$ mn) 1,034.0 1,080.0 46.0
Trade Balance (US$ mn) -79.0 -180.0 -101.0
Current Account Balance (US$ mn) -46.0 -78.0 -32.0
Foreign Exchange Reserves (US$ mn) 276.0 278.0 2.0
Total External Debt (US$ mn) 315.0 320.0 5.0
Debt Service Ratio, paid (%) 2.9 3.1 0.2
Exchange Rate (E/US$) 10.5 7.6 -2.9
Origins of GDP (2001)
Other industry(10.8%)
Manufacturing (Industry)(34.4%)
Agriculture & forestry(9.6%)
Government (Services)(16.1%)
Other services(29.1%)
S Swaziland’s economy relies primarily on agriculture andagro-industry,particularly sugar,citrus,and wood pulp.Soft-drink concentrates, food products,textiles,and paperproducts represent potential growth sectors.
S The government is considering a Competition Bill,whichwould control anti-competitive trade practices,protectconsumer welfare,and promote economic growth.The bill,if passed,will establish a Competition Commission.
S In April 2004,the Swaziland Senate passed the IndustrialRelations Act,which removed clauses in earlier editionscriminalizing union activity.The new act is designed tohonor trade treaty obligations and to provide protection forworkers’ rights.
S The government is considering changes to labor legislationthat would provide for the Conciliation,Mediation,andArbitration Commission,which is expected to streamlineand shorten the labor arbitration process.
S Garment and textile workers began to strike in early 2004,demanding salary increases of up to 20 percent.Theindustry employs more than 30,000 people in Swaziland.
S In November 2003,the IMF published preliminary findingsof its 2003 Article IV Consultation.The IMF advisedSwaziland to adopt a fiscal policy that ensuresmacroeconomic stability, to maintain the currency’s peg tothe rand,to reform the Swaziland Development and SavingsBank,to develop strategies to deal with HIV/AIDS,toincrease food security,and to improve governance.
Economic Update
Real GDP Growth Rate
SWAZILAND
Percent
0
1
2
3
4
5
1999 2000 2001 2002 2003

6-98
Main Trade Partners, percent of total, 2000
Markets SourcesSouth Africa 57.9 South Africa 95.6
United States 8.8 European Union 0.9
European Union 8.0 Japan 0.9
Mozambique 6.2 Singapore 0.3
Main Trade Commodities, US$ millions
Exports (2002) Imports (2001)
Miscellaneousedibles
400.0 Machinery &transportequipment
282.0
Textiles 149.0 Manufacturedgoods
251.0
Wood pulp 76.0 Food & liveanimals
168.0
Sugar 56.0 Chemicals 144.0
-200
-150
-100
-50
0
50
100
150
200
1999 2000 2001 2002 2003
swaZILAND
Trade UpdateS In August 2003,the governor of the Central Bank of
Swaziland announced that manufacturing sector activity hadincreased because of export opportunities under the AGOAprogram.
S The government began construction of a new airport in late2003,with hopes that it would boost tourism to Swaziland.The Swaziland aviation industry has registered losses for thepast 30 years.
S In 2003,U.S.exports to Swaziland consisted primarily ofmachinery and mechanical appliances,essential oils andresinoids,and optical or measuring equipment and partsthereof.U.S.imports from Swaziland consisted primarily ofapparel,sugars and sugar confectionery,and iron and steel.In 2003 and 2004,Swaziland was designated an AGOAbeneficiary country, including qualifying for apparel benefits.AGOA (including GSP) imports from Swaziland totaled$134.0 million in 2003.
Investment and Privatization UpdateS The Central Bank of Swaziland announced in August 2003
that it supports the efforts of the Swaziland InvestmentPromotion Authority to attract foreign investment. Inparticular,the Bank called for timely action on threats topreferential market access under the GSP and AGOAprograms.
S The Swaziland Electricity Board has received a $9.3-millionloan from the European Investment Bank to construct ahydroelectric power station at the Maguga dam.The totalcost of the project is estimated at $23.6 million.
S In the FY 2003-04 budget,the government commissioned astudy to examine the process of parastatal privatization.
U.S. Trade Balance
Net Foreign Direct Investment
Millions of U.S. Dollars
0
25
50
75
100
125
150
175
1998 1999 2000 2001 2002
Millions of U.S. DollarsMillions of U.S. DollarsMillions of U.S. Dollars
U.S. exportsU.S. importsTrade balance

6-99
Economic OverviewEconomic Indicators
2002 2003 Difference
GDP (nominal, TSh bn) 9,071.8 9,978.2 906.4
GDP (US$ bn) 9.4 9.6 0.2
CPI Inflation (annual average, %) 4.6 4.4 -0.2
Goods Exports (US$ mn) 902.5 978.0 75.5
Goods Imports (US$ mn) 1,511.3 1,673.7 162.4
Trade Balance (US$ mn) -608.8 -695.7 -86.9
Current Account Balance (US$ mn) -251.3 -502.9 -251.6
Foreign Exchange Reserves (US$ mn) 1,528.8 2,100.0 571.2
Total External Debt (US$ bn) 6.5 6.5 0.0
Debt Service Ratio, paid (%) 7.9 6.6 -1.3
Exchange Rate (TSh/US$) 966.6 1,038.2 71.6
Origins of GDP (2002)
Manufacturing(7.4%)
Services(32.7%)
Other (9.4%)
Construction(4.5%)
Agriculture, forestry& fishing (44.0%)
Mining(2.0%)
S Agriculture is an important part of the economy,andemploys two-thirds of the labor force.Because reliance onsubsistence farming makes the economy vulnerable toprice fluctuations and climatic conditions,the governmenthas taken steps to reduce the impact of external shocks byfostering diversification.Mining is a growing sector of theeconomy,as are the hotel and tourism sectors.Tanzania iseastern Africa’s leading tourism destination.
S The government plans to reform the agricultural sector toimprove the role of government in managing the frameworkin which the sector operates;improve the delivery ofsupport services;boost investment in the sector;andreform the agricultural marketing system,the legalframework,the land tenure system,and agriculture-relatedtaxation.
S In June 2003,the government agreed to a new PRGF.Thisstage of reforms will include the implementation ofagricultural and rural development strategies, improvementof local government structures, increased spending onsocial services,reform of the civil service,and continuedprivatization of infrastructure.In July 2003,the IMFapproved a disbursement of $21 million,and in early 2004,approved a $4.2-million loan to support the PRGF.
S In early 2004,the World Bank agreed to provide $9.47million to repair and upgrade the runway at Zanzibarairport.
S In mid-2004,the World Bank announced efforts toharmonize and codify mining law in willing countries,including Tanzania.This streamlining process is expected toencourage investment in the mining sector.
S In mid-2004,the World Bank approved $150 million inInternational Development Association financing topromote secondary education in Tanzania.The funds willrehabilitate and construct classrooms and schools,providewater and sanitary facilities in new and existing schools,and expand public schools to rural and poor areas.
S In November 2003,the EU agreed to provide $125 millionto support basic education,to improve primary healthcare,to improve rural roads,to provide cleaner water,to supportthe campaign against HIV/AIDS,to support agriculture,and to improve the judiciary system.
Economic Update
Real GDP Growth Rate
TANZANIA
Percent
01234567
1999 2000 2001 2002 2003

6-100
Main Trade Partners, percent of total, 2002
Markets SourcesUnited Kingdom 17.9 South Africa 11.4
France 16.8 Japan 8.3
India 7.1 Kenya 6.7
Netherlands 6.0 India 6.4
Main Trade Commodities, US$ millions, 2002
Exports Imports
Gold 383.0 Consumergoods
369.0
Cashew nuts 47.0 Machinery 368.0
Coffee 35.0 Industrial rawmaterials
208.0
Tea 30.0 Petroleumproducts
196.0
tanzania
Trade UpdateS A decline in world prices for coffee and cotton have lowered
export revenues in recent years.Increased exports ofcashew nuts and tobacco have only partly offset the effectsof diminishing coffee and cotton revenue.
S In early 2004,the government passed the Anti-Dumpingand Countervailing Measures Act,partly as a result ofpressure from the textile and apparel industry to find a wayto limit the ability of traders to import and sell second-handclothes.
S The government plans to upgrade the Mwanza airport byextending the runway so that large aircraft can land.Theairport is well placed to serve the Lake Victoria region andits improvement could boost fishing industry exports.
S In March 2004,the government decided to lift the ban onexports of sea fish and fish products sourced from its IndianOcean waters.Licenses have been granted to 20 marinefishing vessels that are now permitted to export prawns,crabs,and lobsters.
S In 2003,U.S.exports to Tanzania consisted primarily ofused clothing or textiles,machinery and mechanicalappliances,and aircraft and parts thereof.U.S.imports fromTanzania consisted primarily of precious or semipreciousstones or metals;fish,crustaceans,and molluscs;andcoffee,tea,mate,and spices.In 2003 and 2004,Tanzaniawas designated an AGOA beneficiary country, includingqualifying for apparel benefits.AGOA (including GSP) importsfrom Tanzania totaled $1.6 million in 2003.
Investment and Privatization UpdateS There are proven reserves of natural gas in the Songo
Songo field and work on a pipeline is underway.Gas fromSongo Songo is expected to be usable for electricityproduction by 2005.
S Goldstream Mibango,a consortium including GoldstreamMining (Australia) and Lonmin (UK), is opening a platinummine on the eastern shores of Lake Tanganyika. In 2003,the company spent $3.7 million on test drilling.The testssuggest that the area has large platinum deposits.Theproposed platinum mine is expected to be open in 2009.
S Lakota Resources (Canada) signed an agreement withShanta Mining (a local firm owned in part by Sable Gold ofMauritius) to develop a mine.Shanta will pay $245,000 andfund $500,000 worth of exploration over the next 5 years.
S Coeur d’Alene Mines (U.S.), the world’s largest primary silverproducer,has acquired 10 mineral properties covering 815square kilometers in Tanzania. It began exploration activitiesin mid-2004.This exploration represents the company’sfirst African venture.
S Foreign investment is actively courted and a number ofstate-owned enterprises have been privatized.Thegovernment has sold majority stakes in the nationaltelecommunications firm and the national airline.Privateinvestors manage the state electricity and water companies.
S The Parastatal Sector Reform Commission has called forpreliminary expressions of interest in the NationalMicrofinance Bank.CDC Actis (UK) and the AfricanAmerican Employee Partnership Corporation (U.S.) haveexpressed interest. In early 2004,however,parliamentvoiced opposition to the sale of the bank,and privatizationmay be delayed.
U.S. Trade Balance
Net Foreign Direct Investment
0
10
20
30
40
50
60
70
80
1999 2000 2001 2002 2003
Millions of U.S. DollarsU.S. exportsU.S. importsTrade balance
0
100
200
300
400
500
1998 1999 2000 2001 2002
Millions of U.S. DollarsMillions of U.S. DollarsMillions of U.S. Dollars

6-101
Economic OverviewEconomic Indicators
2002 2003 Difference
GDP (nominal, CFAfr bn) 1,021.0 1,030.0 9.0
GDP (US$ mn) 1,465.0 1,772.0 307.0
CPI Inflation (annual average, %) 3.1 -1.0 -4.1
Goods Exports (US$ mn) 419.0 597.0 178.0
Goods Imports (US$ mn) 590.0 746.0 156.0
Trade Balance (US$ mn) -171.0 -149.0 22.0
Current Account Balance (US$ mn) -155.0 -140.0 15.0
Foreign Exchange Reserves (US$ mn) 205.1 257.0 51.9
Total External Debt (US$ mn) 1,491.0 1,548.0 57.0
Debt Service Ratio, paid (%) n/a n/a n/a
Exchange Rate (CFAfr/US$) 697.0 581.2 -115.8
Origins of GDP (2002)
Primary(41.0%)
Secondary(24.0%)
Tertiary(35.0%)
S Togo contains several distinct geographic zones, including acoastal plain,a plateau,a hilly region,and a savannah.These differences, in conjunction with a varying climate,allow for a variety of economic activity. Coffee and cocoaproduction continued to fall in 2004 because of decreasedrainfall and aging plants.
S The manufacturing sector accounts for less than 10percent of GDP and consists predominantly of small- andmedium-size enterprises.
S Main government economic goals include directing publicspending towards poverty reduction and meeting IMFguidelines.The government is taking steps to resumeexternal financial support and negotiate a deal with the IMFthat may allow for debt relief.
S Togo’s road network and railroads,though extensive,require rehabilitation.A World Bank-funded $50-millionproject was launched in 1997,but funds were suspendedin 1998 because of tensions in the relationship withdonors.The Islamic Development Bank provided $9.3million to pave a road in August 2002.
S Donors have provided financing for the re-laying andwidening of the main north-south route in Togo.The road isa regional artery and will facilitate traffic from Burkina Fasoand northern Ghana.AFD,the French development agency,approved the financing in September 2003.In April 2004,Togo conducted talks with the EU in an attempt to end thefreeze on aid and promised to take various steps towarddemocracy. In June 2004,an EU team arrived in Lome toevaluate the progress on measures taken thus far.The EUfact finding mission found that Togo exhibited good faithtoward reform,but did not recommend immediatelyresuming aid.
Economic Update
Real GDP Growth Rate
TOGO
Percent
-10123456
1999 2000 2001 2002 2003

6-102
Main Trade Partners, percent of total, 2002
Markets SourcesGhana 17.7 China (incl
Hong Kong)21.6
Benin 13.3 France 20.3
Burkina Faso 8.2 Netherlands 6.2
Taiwan 6.7 Germany 5.1
Main Trade Commodities, US$ millions, 2002
Exports Imports
Re-exports 110.2 Petroleumproducts
161.1
Cotton 67.0 Capital goods 87.3
Phosphates 42.3 Food 80.2
togoTrade UpdateS Togo is an important transshipment center;roughly 25
percent of its imports are re-exported to Nigeria,Ghana,and Burkina Faso.Traffic through the Lome Port hasincreased in recent years because of civil unrest in Côted’Ivoire and an increase in cotton exports from Burkina Fasoand Mali.A new container terminal built by Sea Point (U.S.)and a West African private consortium for $100 million isexpected to be completed by the end of 2004.
S Below average world cotton prices in mid-2003 reducedTogo’s export earnings.Cotton is a significant cash crop andtypically accounts for 20-25 percent of export earnings.Increasing cotton prices in late 2003 and early 2004 haveboosted cotton production and exports.
S Phosphate production has risen under private managementof the International Fertiliser Group Togo (IFG-Togo),but EUrestrictions on its import may hinder phosphate exports inthe near future.Togo is the world’s third-largest producer ofphosphate.
S In 2003,U.S.exports to Togo consisted primarily ofmachinery and mechanical appliances,vehicles and partsthereof,and used clothing or textiles.U.S.imports fromTogo consisted primarily of precious or semiprecious stonesor metals;live animals;and seeds,grains,and fruit.
Investment and Privatization UpdateS When completed,the West Africa Gas Pipeline,traveling
from Nigeria to Ghana, is expected to supply gas to Togo forindustrial use and gas-fired power stations.
S BIA-Togo was purchased by Bank of Africa in January 2004,giving Bank of Africa a presence in all UEMOA memberstates.
S The government recently amended the Mining Code toencourage exploration,exploitation,and trade of preciousstones and metals,such as gold and diamonds,by privatecompanies.
S The Ibis-Lome Centre hotel opened in early 2004,afterrenovation by Accor (France) to increase the number ofrooms and conference sections.The new hotel is expectedto increase tourism.
S The government announced plans to privatize SNCT,thenational rail company.A Canadian company expressedinterest,but no further progress has been made.
S The privatization of Togo Telecom is expected to becompleted in 2004.
S Attempts to privatize Sotoco,the state cotton company,have been unsuccessful.Sotoco lost its monopoly on cottonprocessing in 1995,but the government is reluctant to sellSotoco because it is the main source of income for 2,000cotton-producing farms.
S The national water agency was restructured in 2002 inpreparation for privatization.The privatization processincludes a 10-year management concession and theintroduction of private marketing and financial managementsystems.
U.S. Trade Balance
Net Foreign Direct Investment
0
5
10
15
20
25
30
1999 2000 2001 2002 2003
Millions of U.S. DollarsU.S. exportsU.S. importsTrade balance
0
10
20
30
40
50
60
70
80
1998 1999 2000 2001 2002
Millions of U.S. DollarsMillions of U.S. DollarsMillions of U.S. Dollars

6-103
Economic OverviewEconomic Indicators
2002 2003 Difference
GDP (nominal, NUSh trn) 10.5 11.8 1.3
GDP (US$ bn) 5.8 6.0 0.2
CPI Inflation (annual average, %) -0.3 7.9 8.2
Goods Exports (US$ mn) 480.7 496.3 15.6
Goods Imports (US$ mn) 1,113.5 1,181.9 68.4
Trade Balance (US$ mn) -632.8 -685.6 -52.8
Current Account Balance (US$ mn) -421.4 -474.7 -53.3
Foreign Exchange Reserves (US$ mn) 934.0 1,080.3 146.3
Total External Debt (US$ bn) 3.8 3.9 0.1
Debt Service Ratio, paid (%) 19.3 19.7 0.4
Exchange Rate (NUSh/US$) 1,797.6 1,963.7 166.1
Origins of GDP (2001)
Services(38.4%)
Monetary agriculture(23.0%)
Industry(19.6%)
Non-monetaryagriculture(19.0%)
S Agriculture is the most important sector in the economyand employs 80 percent of the labor force.More than 75percent of Uganda’s land is arable,and up tothree-quarters of it may be underutilized.Agriculturalproduction has grown consistently over the past 5 years.
S Most manufacturing is based on the processing ofagricultural commodities;production is almost entirely fordomestic consumption.
S Although no comprehensive mineralogical survey of Ugandahas been undertaken,the government believes that Ugandaholds significant exploitable mineral deposits,and hasexpanded efforts to engage in geological mapping andevaluation.The Government of Uganda also reduced feesfor exploration licenses in order to encourage interest.Additionally, the AfDB agreed in May 2004 to provide a$7.7-million credit to fund mineral development programs.Areas have been identified as possibly holding gold,zinc,copper, lead,carbonatite,and nickel.Uganda Gold Mining(Canada) also claims that diamond reserves exist.
S The IMF and World Bank have endorsed the government’spoverty reduction and action plan and have provided two,3-year grants under Uganda’s PRGF.In September 2002,the IMF provided a grant of $17.8 million and in late 2003it released an additional $3 million.These funds are to beused to increase the ability of the poor to raise theirincome, improve the quality of life of the poor,create anenvironment for economic growth,and ensure goodgovernance and security.
S Debt is expected to decline from $3.1 billion in 2003 to$2.9 billion in 2004 as Uganda participates in the HIPCinitiative.
S Three Middle Eastern firms have submitted bids to upgraderoads in Uganda.Construction is expected to begin in late2004.
Economic Update
Real GDP Growth Rate
UGANDA
Percent
0123456789
1999 2000 2001 2002 2003

6-104
Main Trade Partners, percent of total, 2002
Markets SourcesBelgium 16.3 Kenya 44.8
Netherlands 13.8 South Africa 6.7
Germany 7.2 India 5.6
Spain 5.6 UnitedKingdom
5.4
Main Trade Commodities, US$ millions, 2001
Exports Imports
Coffee 98.0 Machinery inclelectrical
310.0
Fish 73.0 Petroleum 158.0
Tea 27.0 Chemicals 130.0
Cotton 15.0 Food 124.0
-10
0
10
20
30
40
50
1999 2000 2001 2002 2003
Trade UpdateS Most of Uganda’s trade passes through Kenya.The
government plans to diversify its import transit sources,andis exploring the development of road and rail links throughTanzania.Uganda is also exploring the possibility ofdeveloping a route through Sudan.
S Although coffee is currently the primary export, fish exportsare expected to become Uganda’s leading generator ofexport revenue.International fish prices have historicallybeen less volatile than coffee prices.
S A feasability study concluded that a petroleum pipeline fromKenya to Kampala would be viable.The pipeline would reducethe cost of petroleum imports and reduce damage to roads.The pipeline is expected to be operational by 2005.
S Research has suggested that Uganda’s ability to capitalize onaccess to the AGOA program has been inhibited byinadequate infrastructure, lack of capital,and limitedentrepreneurial skill capacity.
S In 2003,U.S.exports to Uganda consisted primarily ofmachinery and mechanical appliances,electrical machineryand equipment,and animal or vegetable fats and oils.U.S.imports from Uganda consisted primarily of coffee,tea,mate,and spices;fish,crustaceans,and molluscs;andapparel. In 2003 and 2004,Uganda was designated anAGOA beneficiary country, including qualifying for apparelbenefits.AGOA (including GSP) imports from Uganda totaled$1.5 million in 2003.
Investment and Privatization UpdateS In late 2003,the government waived the compulsory
investment fee of $135,000 for foreign investors and the$50,000 initial capital requirement for local investors.It isexpected that this new flexibility will encourage investment inthe country.
S Rhodia Chimie (France) has been granted a license to minephosphates in eastern Uganda.The group plans tomanufacture a phosphate detergent by 2006.
S Heritage Oil (Canada) has completed an exploratory studythat indicates there may be petroleum reserves in Uganda.Hardman Resources (Australia) has also begun work on anexploratory block.
S Seatankec (Norway) and Polino Holdings (Uganda) haveengaged in a joint venture to invest in fish farming.EastAfrica Fish Farming is expected to invest $15 million toestablish a hatchery, fish farms,a feed mill,and a processingplant.
S British American Tobacco and Universal Leaf Tobacco areinvesting $35 million to create a tobacco-processing plant inUganda.
S The government has stated that all 142 parastatals wouldbe privatized;to date,two-thirds have been sold.
S Privatization of the railways was scheduled for completion bythe end of 2004.The government is considering advice fromCanarail,a consortium of four Canadian firms,on how theprivatization should be implemented.In April 2004,Bombardier Transportation (Canada) declined to renew amanagement contract,slowing the privatization process.
S The Uganda Electricity Board was separated into threecompanies in 2002 that are currently undergoingprivatization.
S Serena Hotels Group (Kenya) took over Uganda’s Nile Hotelin early 2004.The $19-million deal includes 6 months ofrenovation and a 30-year concession agreement.
uganda
Net Foreign Direct Investment
Millions of U.S. DollarsU.S. exportsU.S. importsTrade balance
U.S. Trade Balance
0
50
100
150
200
250
1998 1999 2000 2001 2002
Millions of U.S. DollarsMillions of U.S. DollarsMillions of U.S. Dollars

6-105
Economic OverviewEconomic Indicators
2002 2003 Difference
GDP (nominal, ZK trn) 18.0 23.0 5.0
GDP (US$ bn) 4.2 4.9 0.7
CPI Inflation (annual average, %) 22.2 21.5 -0.7
Goods Exports (US$ mn) 920.0 1,003.0 83.0
Goods Imports (US$ mn) 1,157.0 1,173.9 16.9
Trade Balance (US$ mn) -237.0 -170.9 66.1
Current Account Balance (US$ mn) -265.0 -339.9 -74.9
Foreign Exchange Reserves (US$ mn) 535.1 247.7 -287.4
Total External Debt (US$ bn) 5.9 5.2 -0.7
Debt Service Ratio, paid (%) 43.0 40.9 -2.1
Exchange Rate (ZK/US$) 4,307.0 4,733.8 426.8
Origins of GDP (2003)
Manufacturing(Industry)(10.9%)
Other industry(2.6%)
Services(56.9%)
Construction,electricity, gas& water(6.5%)
Agriculture(15.3%)
Mining(Industry)(7.8%)
S Although the services sector is the largest component ofGDP,most Zambians work in agriculture.Less than 50percent of arable land is cultivated.Zambia is prone todroughts,which make the size of the yearly harvestextremely variable.Small farmers have expressed interestin cash crops such as coffee and tobacco.
S Transportation costs are high,estimated at approximately60 percent of the total production costs,and contribute toproduction inefficiencies.
S Zambia’s PRSP aims to boost school attendance and toimprove educational quality by expanding the BasicEducation Sub-Sector Investment Programme, increasingteacher salaries and improving working conditions,andraising female participation in education.The paper alsosupports increasing healthcare expenditure.Specifically, thegovernment plans to undertake a campaign to combatmalaria,to improve its HIV/AIDS strategy,and to improvereproductive and child health.The PRSP also aims toimprove consultation between the government and people,to create more transparent government,and to make thejustice system more accessible.Zambia’s PRSP has a costof $1.2 billion.
S In mid-2004,the IMF provided $320 million following thecountry’s accession to the PRGF.Funds are to be used toencourage macroeconomic stability.Additionally, the EUannounced a $125-million grant for development projectsunder the program.
S In February 2003,the World Bank announced financialguarantees to develop hydroelectric projects at the KafueGorge Lower,at a cost of $600-$750 million,andItezhi-Tezhi,at a cost of $100-$150 million.
S In early 2004,the World Bank/IDA agreed to loan Zambia$50 million to rehabilitate and expand its road network.Thefunds are part of a $190-million World Bank supportprogram designed to cover 10 years.
S The World Bank and the Norwegian Agency forDevelopment Cooperation agreed in early 2004 to financea $6.3-million development program at Kafue NationalPark.
S In November 2003,the United States waived $34 million ofZambia’s debt. It also pledged $350 million in funds overthe next 7 years to help fight HIV/AIDS,to promote small-and medium-sized enterprises,to improve and expandeducation,to increase access to healthcare,and to improvegood governance.
S China released $2 million to Zambia in December 2003.The funds are part of a $6-million grant to improve theeconomy and to reduce poverty.
Economic Update
Real GDP Growth Rate
ZAMBIA
Percent
0
1
2
3
4
5
6
1999 2000 2001 2002 2003

6-106
Main Trade Partners, percent of total, 2002
Markets SourcesMalawi 10.2 South Africa 64.1
Thailand 9.2 United States 3.7
Japan 9.0 China 3.6
South Africa 7.8 Tanzania 3.5
Main Trade Commodities, US$ millions
Exports (2002) Imports (2003)
Copper 594.0 Metals 292.0
Cobalt 54.0 Others 1,092.0
zambia
Trade UpdateS Although mining is the largest generator of export revenue,
the sector has experienced setbacks because of decliningworld prices.Copper and cobalt account for approximately90 percent of mining production and approximately 65percent of exports.
S In July 2003,the government increased the number ofimported products subject to quality monitoring and controlfrom 12 to 22.The new list includes bottled water,paint,varnishes,hair oils,hair creams,glycerine,and asbestosroofing sheets.
S In early 2004,the Export and Import Bank of India agreed topurchase a 20-percent stake in the Zambian DevelopmentBank at a cost of $1.4 million. India is encouraging increasedexports to Zambia.
S Zambia finalized a deal with Iran for 600,000 tons of crudeoil,Zambia’s entire annual requirement, in 2004.The Indenipetroleum refinery is to be the sole purchaser of crude oilfrom the Naftiran Intertrade Company.The deal is intendedto lower costs for consumers.
S In August 2003,the United States approved imports ofhandmade folklore products from Zambia under the AGOAprogram.
S In 2003,U.S.exports to Zambia consisted primarily ofmachinery and mechanical appliances,chemical products,and aircraft and parts thereof.U.S.imports from Zambiaconsisted primarily of base metals;coffee,tea,mate,andspices;and wood and articles of wood.In 2003 and 2004,Zambia was designated an AGOA beneficiary country,including qualifying for apparel benefits.AGOA (including GSP)imports from Zambia totaled $510,000 in 2003.
Investment and Privatization UpdateS In 2001,a joint British Geological Survey and Geological
Survey of Zambia found significant reserves of barium,calcium,chromium,manganese,nickel,uranium,and zinc.These minerals have yet to be exploited on a largecommercial scale.
S Chambishi,a former part of the Zambia Consolidated CopperMines parastatal,restarted production in July 2003 after a$150-million rehabilitation program.A further investment of$100 million that would double production capacity over 5years is being considered.
S By April 2002,330 state companies had been privatized.Inrecent years,the privatization program has been slow andinconsistent,particularly with respect to Zambia Telecomand the Tazara railway.A contributing factor to recent delayshas been public criticism of the government’s economicliberalization programs.
S In May 2003,the government announced that Zesco,anenergy parastatal,would be commercialized,but wouldremain under state ownership and management.This policyis a change from the previous year,when the governmentpledged to unbundle Zesco into separate energy generation,distribution,and transmission utilities under privatemanagement.
S In late 2003,the government selected Sterlite Industries(India) as the preferred bidder for a 51-percent stake inKonkola Copper Mines (KCM).Sterlite purchased an80-percent stake in KCM in December.
S The government has announced plans to privatize Tazama,apetroleum pipeline from Tanzania,and Indeni,a petroleumrefinery.
U.S. Trade Balance
Net Foreign Direct Investment
-30
-20
-10
0
10
20
30
40
50
1999 2000 2001 2002 2003
Millions of U.S. DollarsU.S. exportsU.S. importsTrade balance
0
50
100
150
200
1998 1999 2000 2001 2002
Millions of U.S. DollarsMillions of U.S. DollarsMillions of U.S. Dollars

6-107
Economic OverviewEconomic Indicators
2002 2003 Difference
GDP (nominal, Z$ bn) 1,067.4 4,508.9 3,441.5
GDP (US$ bn) 4.3 4.0 -0.3
CPI Inflation (annual average, %) 134.5 384.7 250.2
Goods Exports (US$ mn) 1,534.5 1,389.5 -145.0
Goods Imports (US$ mn) 1,822.2 1,704.4 -117.8
Trade Balance (US$ mn) -287.7 -314.9 -27.2
Current Account Balance (US$ mn) -361.7 -325.9 35.8
Foreign Exchange Reserves (US$ mn) 83.4 60.0 -23.4
Total External Debt (US$ bn) 3.5 3.4 -0.1
Debt Service Ratio, paid (%) 13.8 11.1 -2.7
Exchange Rate (Z$/US$) 55.0 727.9 672.8
Origins of GDP (2001)
Transport & communications(10.6%)
Manufacturing(14.0%)
Other(25.0%)
Agriculture, hunting & fishing(25.1%)
Mining & quarrying(1.5%)
Distribution, hotels & resturants(17.1%)
Education(6.7%)
S Zimbabwe continued to experience negative economicgrowth resulting from increasing political unrest and socialinstability,with inflation reaching over 700 percent at theend of 2003.Government reform has been a result of adhoc actions in response to crises.The collapse of theeconomy has led to illegal emigration to neighboringcountries such as Botswana and Mozambique,and anexodus of skilled professionals to Europe and South Africa.In addition,the spread of HIV/AIDS in Zimbabwe hascaused concern.
S Land redistribution policies negatively affected farmingoperations,and have resulted in large food shortages.Thegovernment is also reviewing legislation to facilitateadditional redistribution.Estimates predict a food shortfallof 900,000 tonnes in the coming year,with 5 million peoplerequiring food aid.
S Tobacco production,once the largest earner of foreignexchange,has been affected because of forced evictions ofwhite tobacco farmers.In July 2004,the governmentannounced that $10 billion had been injected into thetobacco industry by the Reserve Bank of Zimbabwe for theyear to date.The funds have been specifically aimed atsmall scale tobacco farmers to increase exports and gainforeign exchange.
S In August 2004,the government announced variouspolicies to combat the persistent cash crisis. Individuals andmerchants will not be allowed to hold more than $6,250 incash;any surplus must be deposited.Local currencytravelers cheques were also introduced.Plans to abolishthe highest denomination of the local currency werepostponed because of cash shortages and the fear ofhoarding.
S Given the increasing inflation, falling currency value,andunstable economic environment, local Zimbabweans havebeen investing in assets,particularly the stock exchangeand real estate. In early 2004,several commercial banksfaced liquidity problems when the Reserve Bank ofZimbabwe announced plans to raise the lending ratebecause of increasing housing prices and a rapidlyincreasing stock market.The banks were,however,bailedout by the Troubled Bank Fund established by the centralbank.
S By December 2003,Zimbabwe had accumulated $275million in debt to the IMF,with little policy change made toimplement the recommended economic reform program.Voting rights were suspended and the IMF beganproceedings to have Zimbabwe suspended from the IMF.InJanuary 2004,Zimbabwe appeared to make efforts atreconciliation by repaying $1.5 million to the IMF.Subsequently, in July 2004,the IMF announced it would notexpel Zimbabwe and had negotiated a payment schedulewith the government.
Economic Update
Real GDP Growth Rate
ZIMBABWE
Percent
-16-14-12-10-8-6-4-20
1999 2000 2001 2002 2003

6-108
Main Trade Partners, percent of total, 2002
Markets SourcesChina 5.8 South Africa 47.7
South Africa 5.6 DROC 5.7
Germany 5.6 Mozambique 5.3
United Kingdom 4.8 UnitedKingdom
3.1
Main Trade Commodities, US$ millions, 2000
Exports Imports
Tobacco 561.9 Machinery &transportequipment
538.1
Gold 291.9 Manufactures 308.8
Ferro-alloys 127.3 Chemicals 306.9
Nickel 81.2 Petroleumproducts &electricity
205.2
zimbabwe
Trade UpdateS Exports are dominated by agricultural products such as
tobacco,sugar,cotton,and maize,as well as minerals andmanufactured goods.Imports primarily include machinery,passenger cars,and production inputs such as fuels.
S Prior to the economic crisis,the country had a diversifiedeconomy with activities in manufacturing,agriculture,mineralresources,and tourism.Until 2002,tobacco was the leadingexport,however,gold has since surpassed tobacco as theleading export commodity.
S In February 2004,the government announced plans to alterthe method used to calculate import duties.Duties will becalculated using the Zimbabwe dollar valuation of theimported product at the auction exchange rate, instead of theprevious method of using the exporters’ rate.This newmethod will lead to an increase in the duties applied tomanufacturing and mining production inputs.
S In 2003,U.S.exports to Zimbabwe consisted primarily ofmachinery and mechanical appliances,motor vehicles andparts thereof,and precious or semiprecious stones or metals.U.S.imports from Zimbabwe consisted primarily of tobacco,iron and steel,and precious or semiprecious stones ormetals.
Investment and Privatization UpdateS The exchange rate regime implemented at the end of 2003
has led to investment flight from the mining industry. In April2004,Anglo American (UK) announced plans to accelerate itswithdrawal and the sale of its 52.9-percent stake in BinduraNickel.Construction industry activity has also declinedbecause of the high cost of building materials resulting fromprice control power outages.
S Despite the withdrawal of several key investors in the miningindustry,certain sectors,such as platinum,have receivedsome investment.
S In August 2003,Zimbabwe signed an investment protectionagreement with the OPEC Fund for International Development.The agreement is aimed at protecting investors from OPECmember countries.
S In late 2003,domestic oil prices were deregulated and privateretailers were allowed to import fuel to combat the fuelshortages faced since 2001.Lack of foreign exchange andhigh international prices have led to erratic supply.Thegovernment plans to continue to import and sell petroleum tothe public transport sectors at controlled prices.
S The state-owned power generating and distribution companyZESA has been hindered by growing debt and the inability toprovide power to meet growing demand.As a result,Zimbabwe has become more reliant on imported energy fromMozambique and South Africa. In early 2004,the governmentgranted ZESA the authority to charge select customers inforeign currencies to help reduce the debt burden.
S Because of financial constraints and lost revenue,thegovernment has proposed privatizing the state-ownedZimbabwe Iron and Steel Company.Two parties haveexpressed interest in purchasing shares in Zisco:China’sExport Import Bank,which had previously loaned Zisco $42million,and Iscor (South Africa).
U.S. Trade Balance
Net Foreign Direct Investment
-100
-50
0
50
100
150
1999 2000 2001 2002 2003
Millions of U.S. DollarsU.S. exportsU.S. importsTrade balance
0
150
300
450
1998 1999 2000 2001 2002
Millions of U.S. DollarsMillions of U.S. DollarsMillions of U.S. Dollars

6-109
Primary nongovernment sources for country profiles
Angola
Economist Intelligence Unit, Country Profile Angola 2003, July 2003.
Economist Intelligence Unit, “Key developments,” Apr. 24, 2004, found at Internet addresshttp://www.viewswire.com, retrieved May 2004.
Economist Intelligence Unit, “Move that could weaken IMF leverage,” Apr. 21, 2004, found atInternet address http://www.viewswire.com, retrieved May 2004.
Economist Intelligence Unit, “New commercial code introduced,” Apr. 1, 2004, found at Internetaddress http://www.viewswire.com, retrieved May 2004.
Economist Intelligence Unit, “Business climate overview,” Apr. 1, 2004, found at Internet ad-dress http://www.viewswire.com, retrieved May 2004.
Economist Intelligence Unit, “No going back,” Jan. 22, 2004, found at Internet addresshttp://www.viewswire.com, retrieved May 2004.
Economist Intelligence Unit, “Phase three of World Bank’s reconstruction programme,” Dec. 23,2003, found at Internet address http://www.viewswire.com, retrieved May 2004.
“Angola, Morocco sign oil agreement,” BBC Monitoring International Reports, May 3, 2004 foundat Internet address http://www.newedge.com, retrieved May 3, 2004.
“Angola is rich in oil, but its people remain poor,” Toronto Star, Feb. 3, 2004 found at Internetaddress http://www.newsedge.com, retrieved Feb. 3, 2004.
“IMF Wants Angolan Oil Co-Audited Before Giving Loans,” Dow Jones News Service,
Nov. 13, 2003 found at Internet address http://www.newsedge.com, retrieved Nov.13, 2003.
“World Bank Impressed With Goverment Strategy Against Poverty,” Africa News Service, Aug.19, 2003, found at Internet address http://www.newsedge.com, retrieved Aug. 19, 2003.
“Angola, DR Congo Sign Economic Development Projects,” Angola Press Agency (Luanda), May7, 2004, found at Internet address http://www.allafrica.com, retrieved May 7, 2004.
“ChevronTexaco And Social Partners Invest USD 40 Million in Agriculture,” Angola Press Agency(Luanda), Apr. 14, 2004, found at Internet address http://www.allafrica.com, retrieved Apr. 14,2004.
Wezi Tjaronda, “Telecom Namibia Goes Cross-Border,” AllAfrica.com, Feb. 27, 2004, found atInternet address http://www.allafrica.com, retrieved Feb. 27, 2004.
Benin
Economist Intelligence Unit, Country Profile Benin 2003, June 2003.
Economist Intelligence Unit, “IMF’s latest performance review,” Feb. 12, 2004, found at Internetaddress http://www.viewswire.com, retrieved May 2004.
Economist Intelligence Unit, “PRGF arrangements,” Nov. 17, 2003, found at Internet addresshttp://www.viewswire.com, retrieved May 2004.
Economist Intelligence Unit, “Cotton privatisation inches forward,” Aug. 26, 2003, found at In-ternet address http://www.viewswire.com, retrieved May 2004.
Economist Intelligence Unit, “HIPC completion point is reached,” Aug. 26, 2003, found at Inter-net address http://www.viewswire.com, retrieved May 2004.

6-110
Economist Intelligence Unit, “IMF completes fourth review under PRGF,” Aug. 26, 2003, foundat Internet address http://www.viewswire.com, retrieved May 2004.
“West Africa bank cuts Benin’s debt by 4.5 billion FCFA,” Panafrican News Agency (PANA) DailyNewswire, Feb. 5, 2004, found at Internet address http://www.newsedge.com, retrieved Feb.5, 2004.
“EU allots Benin 30-million Euro for urban roads,” Panafrican News Agency (PANA) Daily News-wire, Jan. 28, 2004, found at Internet address http://www.newsedge.com, retrieved Jan. 28,2004.
“Outlook for 2004-05/Policy trends,” Country Report Benin, Jan. 13, 2004, found at Internet ad-dress http://www.newsedge.com, retrieved Jan. 13, 2004.
“IMF board grins at Benin’s performance,” Panafrican News Agency (PANA) Daily Newswire,Apr. 1, 2004, found at http://www.newsedge.com, retrieved Apr. 1, 2004.
“Nigeria and Benin agree to re-open border,” AFP English Wire, Aug. 15, 2003, found at Inter-net address http://www.newsedge.com, retrieved Aug. 15, 2003.
Charles Cobb, Jr. And Reed Kramer, “Eight African Nations Eligible For Millennium Challenge Ac-count Assistance,” allafrica.com, May 7, 2004, found at Internet address http://www.allafri-ca.com, retrieved May 7, 2004.
Botswana
Economist Intelligence Unit, Country Profile Botwana 2004, January 2004.
Economist Intelligence Unit, “Key developments,” Apr. 27, 2004, found at Internet addresshttp://www.viewswire.com, retrieved May 2004.
Economist Intelligence Unit, “Air Botswana privatization stalls,” Apr. 1, 2004, found at Internetaddress http://www.viewswire.com, retrieved May 2004.
Economist Intelligence Unit, “Tight ship,” Feb. 23, 2004, found at Internet addresshttp://www.viewswire.com, retrieved May 2004.
Economist Intelligence Unit, “Mining,” Feb. 20, 2004, found at Internet addresshttp://www.viewswire.com, retrieved May 2004.
Economist Intelligence Unit, “Botswana economy: Fiscal squeeze looms,” Feb. 12, 2004, foundat Internet address http://www.viewswire.com, retrieved May 2004.
“Diamonds Are Not Forever,” Africa News Service, Mar. 28, 2004 found at Internet addresshttp://www.newsedge.com, retrieved Mar. 28, 2004.
“Botswana is Africa’s Most Globalized Nation,” Mmegi/The Reporter (Gaborone), Feb. 26, 2004,found at Internet address http://www.allafrica.com, retrieved Feb. 27, 2004.
Kabo Mokoagone, “World Bank Recommends New Investment Laws for Botswana,” Mmegi/TheReporter (Gaborone), Mar. 12, 2004, found at Internet address http://www.allafrica.com, re-trieved May 7, 2004.
Burkina Faso
Economist Intelligence Unit, Country Profile Burkina Faso 2003, July 2003.
Economist Intelligence Unit, “Attracting private enterprise,” Apr. 20, 2004, found at Internet ad-dress http://www.viewswire.com, retrieved May 2004.

6-111
Economist Intelligence Unit, “Worsening poverty spurs policy re-examination,” Jan. 27, 2004,found at Internet address http://www.viewswire.com, retrieved May 2004.
Economist Intelligence Unit, “Mining,” Sept. 18, 2004, found at Internet addresshttp://www.viewswire.com, retrieved May 2004.
Economist Intelligence Unit, “Region joins claim against cotton subsidies,” Jul. 15, 2004, foundat Internet address http://www.viewswire.com, retrieved May 2004.
Economist Intelligence Unit, “Anti-poverty programme progress is satisfactory,” Jul. 15, 2004,found at Internet address http://www.viewswire.com, retrieved May 2004.
Economist Intelligence Unit, “Cote d’Ivoire crisis encroaches,” Jul. 15, 2004, found at Internetaddress http://www.viewswire.com, retrieved May 2004.
“New Delhi pledges US$500 million in aid to West African nations,” AP WorldStream English,Mar. 2, 2004, found at Internet address http://www.newsedge.com, retrieved Mar. 2, 2004.
“Burkina Faso-Ghana: New Rail Line Planned to Link Burkina Faso to the Coast,” UN IntegratedRegional Information Networks, June 11, 2004, found at Internet address http://www.allafri-ca.com, retrieved June 11, 2004.
“Development Partners Pledge $2 Billion for Burkina Faso’s Anti-Poverty Efforts,” United NationsDevelopment Programme (New York), Mar. 12, 2004, found at Internet address http://www.al-lafrica.com, retrieved Mar. 12, 2004.
Burundi
Economist Intelligence Unit, Country Profile Burundi 2003, June 2003.
Economist Intelligence Unit, “Real GDP growth was negative during 2003,” Apr. 22, 2004, foundat Internet address http://www.viewswire.com, retrieved May 2004.
Economist Intelligence Unit, “Economic policy outlook,” Apr. 22, 2004, found at Internet ad-dress http://www.viewswire.com, retrieved May 2004.
Economist Intelligence Unit, “Stabilising the economy is the main objective,” Dec. 23, 2003,found at Internet address http://www.viewswire.com, retrieved May 2004.
Economist Intelligence Unit, “Government faces contradictory fiscal pressure,” Sept. 10, 2003,found at Internet address http://www.viewswire.com, retrieved May 2004.
Economist Intelligence Unit, “Sharp downturn in real GDP growth expected,” Sept. 10, 2003,found at Internet address http://www.viewswire.com, retrieved May 2004.
“Burundi receives 3.6 m-dollar grant from China,” BBC Monitoring International Reports, Jul. 4,2003, found at Internet address http://www.newsedge.com, retrieved Jul. 4, 2004.
“Italy to cancel debt owed by Burundi,” Agence France-Presse English Wire, Apr. 16, 2004,found at Internet address http://www.newsedge.com, retrieved Apr. 16, 2004.
“World Bank to assist Burundi’s economic recovery,” Panafrican News Agency (Pana) DailyNewswire, Feb. 10, 2004, found at Internet address http://www.newsedge.com, retrieved Feb.10, 2004.
“IMF praises Burundi’s “remarkable” handling of budget despite war,” AFP English Wire, Oct.30, 2003 found at Internet address http://www.newsedge.com, retrieved Feb. 10, 2004.
“Burundi: World Bank Approves US$84 Million Credit for Reconstruction,” UN Integrated Region-al Information Networks, Mar. 22, 2004, found at Internet address http://www.allafrica.com,retrieved Mar. 22, 2004.

6-112
Cameroon
Economist Intelligence Unit, Country Profile Cameroon 2003, September 2003.
Economist Intelligence Unit, “Construction and telecoms sectors boost FDI,” May 4, 2004, foundat Internet address http://www.viewswire.com, retrieved May 2004.
Economist Intelligence Unit, “IMF approves three-year US$164m PRGF,” May 4, 2004, found atInternet address http://www.viewswire.com, retrieved May 2004.
Economist Intelligence Unit, “Key developments,” Apr. 13, 2004, found at Internet addresshttp://www.viewswire.com, retrieved May 2004.
Economist Intelligence Unit, “Government completes poverty reduction paper,” Dec. 23, 2003,found at Internet address http://www.viewswire.com, retrieved May 2004.
Economist Intelligence Unit, “HIPC funds will affect economic growth,” Sept. 10, 2003, found atInternet address http://www.viewswire.com, retrieved May 2004.
“The domestic economy/The Chad-Cameroon pipeline is completed,” Country Report Cameroon,Aug. 14, 2003 found at Internet address http://www.newsedge.com, retrieved Aug. 14, 2003.
“Forestry Products to Boost Economy,” All Africa Global Media, Dec. 31, 2003 found at Internetaddress http://www.newsedge.com, retrieved Dec. 31, 2004.
Georgewill Fombe, “Growth Reassured,” Cameroon Tribune (Yaounde), June 10, 2004, found atInternet address http://www.allafrica.com, retrieved June 10, 2004.
Lukong Pius Nyuylime, “IMF/World Bank Mission at Work,” Cameroon Tribune (Yaounde), Apr.29, 2004, found at Internet address http://www.allafrica.com, retrieved Apr. 29, 2004.
Cape Verde
Economist Intelligence Unit, Country Profile Cape Verde 2004, January 2004.
Economist Intelligence Unit, “INE report states that poverty has increased,” Feb. 12, 2004,found at Internet address http://www.viewswire.com, retrieved May 2004.
Economist Intelligence Unit, “AfDB notes economic progress,” Feb. 12, 2004, found at Internetaddress http://www.viewswire.com, retrieved May 2004.
Economist Intelligence Unit, “Government attempts to control public spending,” Feb. 12, 2004,found at Internet address http://www.viewswire.com, retrieved May 2004.
Economist Intelligence Unit, “OPEC development fund to finance health centres,” Feb. 3, 2004,found at Internet address http://www.viewswire.com, retrieved May 2004.
Economist Intelligence Unit, “Air transport infrastructure upgraded,” Dec. 9, 2003, found at In-ternet address http://www.viewswire.com, retrieved May 2004.
Charles Cobb, Jr. and Reed Kramer, “Eight African Nations Eligible For Millennium Challenge Ac-count Assistance,” allafrica.com, May 7, 2004, found at Internet address http://www.allafri-ca.com, retrieved May 7, 2004.
Central African Republic
Economist Intelligence Unit, Country Profile Central African Republic 2003, Oct. 2003.
Economist Intelligence Unit, “Local economy contracted in 2003,” May 4, 2004, found at Inter-net address http://www.viewswire.com, retrieved May 2004.

6-113
Economist Intelligence Unit, “Local economy in state of crisis,” May 4, 2004, found at Internetaddress http://www.viewswire.com, retrieved May 2004.
Economist Intelligence Unit, “Mining code introduced,” Feb. 18, 2004, found at Internet addresshttp://www.viewswire.com, retrieved May 2004.
Economist Intelligence Unit, “Government has financial trouble,” Dec. 23, 2003, found at Inter-net address http://www.viewswire.com, retrieved May 2004.
Economist Intelligence Unit, “Diamond regulation outlined,” Sept. 16, 2003, found at Internetaddress http://www.viewswire.com, retrieved May 2004.
Economist Intelligence Unit, “State administration is key,” Sept. 10, 2003, found at Internet ad-dress http://www.viewswire.com, retrieved May 2004.
Chad
Economist Intelligence Unit, Country Profile Chad 2003, Oct. 2003.
Economist Intelligence Unit, “First payment of oil revenue issued,” May 4, 2004, found at Inter-net address http://www.viewswire.com, retrieved May 2004.
Economist Intelligence Unit, “PRGF lapses Chad economy: IMF cancelled board,” May 4, 2004,found at Internet address http://www.viewswire.com, retrieved May 2004.
Economist Intelligence Unit, “Chad’s poor await oil riches,” Apr. 9, 2004, found at Internet ad-dress http://www.viewswire.com, retrieved May 2004.
Economist Intelligence Unit, “Region prepares to manage oil revenue,” Dec. 23, 2003, found atInternet address http://www.viewswire.com, retrieved May 2004.
“As Oil Eludes Ghana, It Attracts FDI to Chad and Sudan,” Africa News Services, Sept. 9, 2003,found at Internet address http://www.newsedge.com, retrieved Sept. 9, 2003.
“New Delhi pledges US$500 million in aid to West African nations,” AP WorldStream English,Mar. 2, 2004, found at Internet address http://www.newsedge.com, retrieved Mar. 2, 2004.
Comoros
Economist Intelligence Unit, Country Profile Comoros 2003, Oct. 2003.
Economist Intelligence Unit, “Central Bank reports deterioration in trade deficit,” Dec. 23, 2003,found at Internet address http://www.viewswire.com, retrieved May 2004.
Economist Intelligence Unit, “Comoros US20m aid package on its way in March 2004,” Dec. 23,2004, found at Internet address http://www.viewswire.com, retrieved May 2004.
Economist Intelligence Unit, “IMF to send new mission,” Dec. 23, 2004, found at Internet ad-dress http://www.viewswire.com, retrieved May 2004.
Economist Intelligence Unit, “Cellphone service starts up locally,” Sept. 10, 2004, found at In-ternet address http://www.viewswire.com, retrieved May 2004.
Economist Intelligence Unit, “Debt relief is not forthcoming,” Sept. 23, 2004, found at Internetaddress http://www.viewswire.com, retrieved May 2004.
Côte d’Ivoire
Economist Intelligence Unit, Country Profile Côte d’Ivoire 2004, June 2004.
Economist Intelligence Unit, “Key developments,” May 19, 2004, found at Internet addresshttp://www.viewswire.com, retrieved May 2004.

6-114
Economist Intelligence Unit, “Economy probably contracted in 2003,” May 49, 2004, found atInternet address http://www.viewswire.com, retrieved May 2004.
Economist Intelligence Unit, “Donor support programmes to be relaunched,” May 4, 2004,found at Internet address http://www.viewswire.com, retrieved May 2004.
“New Delhi pledges US$500 million in aid to West African nations,” AP WorldStream English,Mar. 2, 2004, found at Internet address http://www.newsedge.com, retrieved Mar. 2, 2004.
“World Bank suspends payments to Ivory Coast over unpaid arrears,” Agence France-PresseEnglish Wire, June 17, 2004, found at Internet address http://www.newsedge.com, retrievedJune 17, 2004.
“Budget for 2004 shows Ivory Coast on the road to recovery/economy minister,” AgenceFrance-Presse English Wire, Feb. 4, 2004, found at Internet address http://www.new-sedge.com, retrieved Feb. 4, 2004.
Democratic Republic of the Congo
Economist Intelligence Unit, Country Profile Democratic Republic of the Congo 2003, June 2003.
Economist Intelligence Unit, “South Africa now largest source of imports,” May 4, 2004, foundat Internet address http://www.viewswire.com, retrieved May 2004.
Economist Intelligence Unit, “Rise in export figures,” May 4, 2004, found at Internet addresshttp://www.viewswire.com, retrieved May 2004.
Economist Intelligence Unit, “Donors pledge US$3.9bn,” May 4, 2004, found at Internet addresshttp://www.viewswire.com, retrieved May 2004.
Economist Intelligence Unit, “Investment planned for mobile phone sector,” May 4, 2004, foundat Internet address http://www.viewswire.com, retrieved May 2004.
Economist Intelligence Unit, “Too good to be true?” Apr. 19, 2004, found at Internet addresshttp://www.viewswire.com, retrieved May 2004.
“DR Congo qualifies for 10 billion dollars debt relief,” AFP English Wire, July 29, 2004, found atInternet address http://www.newsedge.com, retrieved July 29, 2004.
“DR Congo lands USD$4 billion aid from donors,” Panafrican News Agency (Pana) Daily News-wire, Dec. 23, 2003, found at Internet address http://www.newsedge.com, retrieved Dec. 23,2003.
Clive Rubin, “Africa’s New Gold Rush,” Mail & Guardian (Johannesburg), Mar. 3, 2004, found atInternet address http://www.allafrica.com, retrieved Mar. 4, 2004.
Djibouti
Economist Intelligence Unit, Country Profile Djibouti 2003, May 2003.
Economist Intelligence Unit, “Region is main recipient of US aid in Africa,” May 4, 2004, foundat Internet address http://www.viewswire.com, retrieved May 2004.
Economist Intelligence Unit, “Port and transport sectors contribute to GDP growth,” May 4,2004, found at Internet address http://www.viewswire.com, retrieved May 2004.
Economist Intelligence Unit, “Economic policies expected to remain intact 2004-05, ” May 4,2004, found at Internet address http://www.viewswire.com, retrieved May 2004.
Economist Intelligence Unit, “Growth expands in service sector,” Dec. 23, 2003, found at Inter-net address http://www.viewswire.com, retrieved May 2004.

6-115
Economist Intelligence Unit, “Port efficiency improves,” Oct. 22, 2003, found at Internet addresshttp://www.viewswire.com, retrieved May 2004.
Economist Intelligence Unit, “IMF talks,” Oct. 22, 2003, found at Internet addresshttp://www.viewswire.com, retrieved May 2004.
Economist Intelligence Unit, “Government signs several agreements with donors,” July 15,2004, found at Internet address http://www.viewswire.com, retrieved May 2004.
Equatorial Guinea
Economist Intelligence Unit, Country Profile Equatorial Guinea 2004, Feb. 2004.
Economist Intelligence Unit, “Mixed view of oil prospects,” Feb. 24, 2004, found at Internet ad-dress http://www.viewswire.com, retrieved May 2004.
Economist Intelligence Unit, “Budget discipline restored in 2003,” Feb. 24, 2004, found at Inter-net address http://www.viewswire.com, retrieved May 2004.
Economist Intelligence Unit, “IMF praises reformed fiscal habits,” Feb. 24, 2004, found at Inter-net address http://www.viewswire.com, retrieved May 2004.
Economist Intelligence Unit, “Spain cancels 60% of region’s debt,” Nov. 26, 2003, found at In-ternet address http://www.viewswire.com, retrieved May 2004.
“New Delhi pledges US$500 million in aid to West African nations,” AP WorldStream English,Mar. 2, 2004, found at Internet address http://www.newsedge.com, retrieved Mar. 2, 2004.
“$5.2 Million Investment in Equatorial Guinea Aims At Early Achievement of Millennium Educa-tion Goal,” United Nations Development Programme (New York), Mar. 1, 2004, found at Inter-net address http://www.newsedge.com, retrieved Mar. 1, 2004.
Eritrea
Economist Intelligence Unit, Country Profile Eritrea 2004, Apr. 2004.
Economist Intelligence Unit, “A US$15m loan is agreed for Keren water project,” May 4, 2004,found at Internet address http://www.viewswire.com, retrieved May 2004.
Economist Intelligence Unit, “Mobile phone services to be launched,” May 4, 2004, found at In-ternet address http://www.viewswire.com, retrieved May 2004.
Economist Intelligence Unit, “US removes region from AGOA list,” May 4, 2004, found at Inter-net address http://www.viewswire.com, retrieved May 2004.
Economist Intelligence Unit, “Region faces another year of severe food shortage,” May 4, 2004,found at Internet address http://www.viewswire.com, retrieved May 2004.
Economist Intelligence Unit, “Growth prospects are dim,” May 4, 2004, found at Internet ad-dress http://www.viewswire.com, retrieved May 2004.
Ethiopia
Economist Intelligence Unit, Country Profile Ethiopia 2004, February 2004.
Economist Intelligence Unit, “Economy in reverse following worst drought in years,” May 18,2004, found at Internet address http://www.viewswire.com, retrieved May 2004.
Economist Intelligence Unit, “Region struggles to attract FDI,” May 4, 2004, found at Internetaddress http://www.viewswire.com, retrieved May 2004.

6-116
Economist Intelligence Unit, “Region invests in air transport sector,” May 4, 2004, found at In-ternet address http://www.viewswire.com, retrieved May 2004.
Economist Intelligence Unit, “Poverty reduction programme off to slow start,” May 4, 2004,found at Internet address http://www.viewswire.com, retrieved May 2004.
Economist Intelligence Unit, “Coffee trade dominates trade deficit,” May 4, 2004, found at Inter-net address http://www.viewswire.com, retrieved May 2004.
Economist Intelligence Unit, “IMF obligations remain as economic focus,” May 4, 2004, found atInternet address http://www.viewswire.com, retrieved May 2004.
“Ethiopia Textile, Garment And Leather Manufacturers to Visit USA,” Addis Tribune (Addis Aba-ba), Jul. 2, 2004, found at Internet address http://www.allafrica.com, retrieved Jul. 26, 2004.
Helina Megersa, “World Bank, IMF Approve Ethiopia’s $2bln Debt Reduction,” Addis Tribune(Addis Ababa), Apr. 22, 2004, found at Internet address http://www.allafrica.com, retrievedApr. 22, 2004.
Gabon
Economist Intelligence Unit, Country Profile Gabon 2004, January 2004.
Economist Intelligence Unit, “Business climate overview,” Apr. 28, 2004, found at Internet ad-dress http://www.viewswire.com, retrieved May 2004.
Economist Intelligence Unit, “Time runs out,” Apr. 20, 2004, found at Internet addresshttp://www.viewswire.com, retrieved May 2004.
Economist Intelligence Unit, “Oil production forecast is raised,” Mar. 22, 2004, found at Internetaddress http://www.viewswire.com, retrieved May 2004.
Economist Intelligence Unit, “IMF sees signs of economic improvement,” Mar. 22, 2004, foundat Internet address http://www.viewswire.com, retrieved May 2004.
Economist Intelligence Unit, “IMF outlines policy tasks facing government,” Mar. 22, 2004,found at Internet address http://www.viewswire.com, retrieved May 2004. “French envoy hasGabon’s mining potential,” Panafrican News Agency (Pana) Daily Newswire, Oct. 3, 2003, foundat Internet address http://www.newsedge.com, retrieved Oct. 3, 2003.
“The domestic economy/Manganese output will rise but problems remain,” Country Report Ga-bon, Jan. 29, 2004, found at Internet address http://www.newsedge.com, retrieved Jan. 29,2004.
“China signs new energy deal with Gabon to fuel booming Chinese economy,” AP WorldStreamEnglish, Feb. 3, 2004, found at Internet address http://www.newsedge.com, retrieved Feb. 3,2004.
The Gambia
Economist Intelligence Unit, Country Profile The Gambia 2003, Feb. 2003.
Economist Intelligence Unit, “Major expansion in telephone capacity planned,” Mar. 22, 2004,found at Internet address http://www.viewswire.com, retrieved May 2004.
Economist Intelligence Unit, “Worsening imbalances,” Mar. 22, 2004, found at Internet addresshttp://www.viewswire.com, retrieved May 2004.
Economist Intelligence Unit, “Region ranked 12th in FDI index by UNCTAD,” Mar. 22, 2004,found at Internet address http://www.viewswire.com, retrieved May 2004.

6-117
Economist Intelligence Unit, “Region scores higher in WEF’s index,” Mar. 22, 2004, found at In-ternet address http://www.viewswire.com, retrieved May 2004.
Economist Intelligence Unit, “Gamtel investing in new fixed-line capacity,” Feb. 3, 2004, foundat Internet address http://www.viewswire.com, retrieved May 2004.
Economist Intelligence Unit, “Off-track,” Dec. 23, 2003, found at Internet addresshttp://www.viewswire.com, retrieved May 2004.
Economist Intelligence Unit, “World Bank publishes country assistance strategy,” Mar. 22, 2004,found at Internet address http://www.viewswire.com, retrieved May 2004.
“Revelations On Gambia-Australia Mining Deal,” Africa News Service, June 10, 2003, found atInternet address http://www.newsedge.com, retrieved June 10, 2003.
“Gambia’s Economic Situation Worriesome for IMF,” All Africa Global Media, Dec. 23, 2003,found at Internet address http://www.newsedge.com, retrieved Dec. 23, 2003.
“Gambians express mixed feelings over oil discovery,” Panafrican News Agency (Pana) DailyNewswire, Feb. 20, 2004, found at Internet address http://www.newsedge.com, retrieved Feb.20, 2004.
Ghana
Economist Intelligence Unit, Country Profile Ghana 2003, Oct. 2003.
Economist Intelligence Unit, “AngloGold, Ashanti Goldfields to formally launch soon,” Apr. 29,2004, found at Internet address http://www.viewswire.com, retrieved May 2004.
Economist Intelligence Unit, “World Bank to fund work on roads in Accra,” Apr. 29, 2004, foundat Internet address http://www.viewswire.com, retrieved May 2004.
Economist Intelligence Unit, “Financial sector development targeted,” Apr. 21, 2004, found atInternet address http://www.viewswire.com, retrieved May 2004.
Economist Intelligence Unit, “Slow route to prosperity,” Feb.2, 2004, found at Internet addresshttp://www.viewswire.com, retrieved May 2004.
Economist Intelligence Unit, “Current-account deficit has narrowed,” Nov. 25, 2003, found atInternet address http://www.viewswire.com, retrieved May 2004.
Economist Intelligence Unit, “Fiscal performance good in first half of 2003,” Nov. 25, 2003,found at Internet address http://www.viewswire.com, retrieved May 2004.
“Cocoa Exports Soar?” Africa News Service, Aug. 12, 2003, found at Internet addresshttp://www.newsedge.com, retrieved Aug. 12, 2003.
“Industrial Performance Disappointing - Reports,” Africa News Service, Aug. 12, 2003, found atInternet address http://www.newsedge.com, retrieved Aug. 12, 2003.
“Gold brings growth for Ghana,” Business Day (South Africa), Dec. 9, 2003, found at Internetaddress http://www.newsedge.com, retrieved Dec. 9, 2003.
Clive Rubin, “Africa’s New Gold Rush,” Allafrica.com, Mar. 3, 2004, found at Internet addresshttp://www.allafrica.com, retrieved Mar. 4, 2004.
Charles Cobb, Jr. and Reed Kramer, “Eight African Nations Eligible For Millennium Challenge Ac-count Assistance,” Allafrica.com, May 7, 2004, found at Internet address http://www.allafri-ca.com, retrieved May 7, 2004.

6-118
Guinea
Economist Intelligence Unit, Country Profile Guinea 2003, Oct. 2003.
Economist Intelligence Unit, “Economic policy implementation on hold,” Apr. 22, 2004, found atInternet address http://www.viewswire.com, retrieved May 2004.
Economist Intelligence Unit, “VAT dispute rumbles on,” Dec. 30, 2003, found at Internet ad-dress http://www.viewswire.com, retrieved May 2004.
Economist Intelligence Unit, “Outlook for Guinea poor,” Oct. 6, 2003, found at Internet addresshttp://www.viewswire.com, retrieved May 2004.
Economist Intelligence Unit, “Mining and agriculture drive economic growth,” Aug. 26, 2003,found at Internet address http://www.viewswire.com, retrieved May 2004.
Clive Rubin, “Africa’s New Gold Rush,” Allafrica.com, Mar. 3, 2004, found at Internet addresshttp://www.allafrica.com, retrieved Mar. 4, 2004.
Guinea-Bissau
Economist Intelligence Unit, Country Profile Guinea-Bissau 2004, Jan. 2004.
Economist Intelligence Unit, “Economy contracting,” Feb. 24, 2004, found at Internet addresshttp://www.viewswire.com, retrieved May 2004.
Economist Intelligence Unit, “Restoration of international aid is priority,” Feb. 24, 2004, found atInternet address http://www.viewswire.com, retrieved May 2004.
Economist Intelligence Unit, “Bidding complete for mobile phones services,” Feb. 3, 2004, foundat Internet address http://www.viewswire.com, retrieved May 2004.
“New Delhi pledges US$500 million in aid to West African nations,” AP WorldStream English,Mar. 2, 2004, found at Internet address http://www.newsedge.com, retrieved Mar. 2, 2004.
“Guinea Bissau records sharp fall in economy,” Panafrican News Agency (Pana) Daily Newswire,Oct. 29, 2003, found at Internet address http://www.newsedge.com, retrieved Oct. 29, 2003.
Kenya
Economist Intelligence Unit, Country Profile Kenya 2003, Aug. 2003.
Economist Intelligence Unit, “Which comes first, politics or the economy?” Aug. 7, 2003, foundat Internet address http://www.viewswire.com, retrieved May 2004.
Economist Intelligence Unit, “Business climate overview,” Sept. 15, 2003, found at Internet ad-dress http://www.viewswire.com, retrieved May 2004.
Economist Intelligence Unit, ”IMF resumes funding,” Nov. 25, 2003, found at Internet addresshttp://www.viewswire.com, retrieved May 2004.
Economist Intelligence Unit, “Kenya Tea Development Agency adds value in-country,” Nov. 6,2003, found at Internet address http://www.viewswire.com, retrieved May 2004.
Economist Intelligence Unit, “US$4.1bn in donor pledges announced,” Dec. 5, 2003, found atInternet address http://www.viewswire.com, retrieved May 2004.
Economist Intelligence Unit, “Dirt out, cash in,” Dec. 2, 2003, found at Internet addresshttp://www.viewswire.com, retrieved May 2004.
Economist Intelligence Unit, “What’s at the end of the rainbow?” Jan. 22, 2004, found at Inter-net address http://www.viewswire.com, retrieved May 2004.

6-119
Economist Intelligence Unit, “Road to recovery,” Feb. 18, 2004, found at Internet addresshttp://www.viewswire.com, retrieved May 2004.
Economist Intelligence Unit, “BOC Kenya to expand regional operations,” Mar. 8, 2004, found atInternet address http://www.viewswire.com, retrieved May 2004.
Economist Intelligence Unit, “World Bank to help finance water-supply privatisation,” Apr. 292004, found at Internet address http://www.viewswire.com, retrieved May 2004.
Economist Intelligence Unit, “Certification to boost flower exports,” Apr. 21, 2004, found at In-ternet address http://www.viewswire.com, retrieved May 2004.
Economist Intelligence Unit, “Mining code will standardise royalties,” May 18, 2004, found atInternet address http://www.viewswire.com, retrieved May 2004.
“Kenya industries fear collapse in massive trade liberalisation,” Panafrican News Agency (PANA)Daily Newswire, May 10, 2004, found at Internet address http:///www.newsedge.com, retrievedMay 10, 2004.
“Still No Turnaround in Kenyan Economy,” All Africa Global Media, Apr. 29, 2004, found at In-ternet address http:///www.newsedge.com, retrieved Apr. 29, 2004.
”Kenya 2004 - Enriching and Improving Kenya’s Investment Environment,” All Africa Global Me-dia, Mar. 18, 2004, found at Internet address http:///www.newsedge.com, retrieved Mar. 18,2004.
“Kenya’s road to recovery,” Business Africa, Feb. 18, 2004, found at Internet addresshttp:///www.newsedge.com, retrieved Feb. 18, 2004.
“Kenya’s Economy Likely to Improve in 2004,” East African (Kenyan) - AAGM, Jan. 7, 2004,found at Internet address http:///www.newsedge.com, retrieved Jan. 7, 2004.
“Export Zones Increase Their Textile Sales to US,” The Nation (Kenyan) - AAGM, Nov. 19, 2003,found at Internet address http:///www.newsedge.com, retrieved Nov. 19, 2003.
Akumu Washington, “Textile Industry Benefited from AGOA,” The Nation (Nairobi), May, 28,2004, found at Internet address http://www.allafrica.com, retrieved May 28, 2004.
Noel Wandera, “Resilient Tourism Sector Rakes in Sh25.8 Billion,” The East African Standard(Nairobi), May, 28, 2004, found at Internet address http://www.allafrica.com, retrieved May 28,2004.
Isaac Esipisu, “Kenya Given EU Trade Access,” The Nation (Nairobi), May 19, 2004, found atInternet address http://www.allafrica.com, retrieved May 19, 2004.
Isaac Esipisu, “Economic Recovery Strategy Outlined,” The Nation (Nairobi), Mar. 10, 2004,found at Internet address http://www.allafrica.com, retrieved Mar. 10, 2004.
Catherine Riungu, “Flowers: A Growing Sector Amid Recession,” The East African Standard (Nai-robi), Feb. 16, 2004, found at Internet address http://www.allafrica.com, retrieved Feb. 17,2004.
Lesotho
Economist Intelligence Unit, Country Profile Lesotho 2004, Jan. 2004.
Economist Intelligence Unit, “Letseng-la-Terae diamond mine to resume operations,” Nov. 25,2003, found at Internet address http://www.viewswire.com, retrieved May 2004.
Economist Intelligence Unit, “The impact of HIV/AIDS,” Apr. 1, 2004, found at Internet addresshttp://www.viewswire.com, retrieved May 2004.

6-120
Economist Intelligence Unit, “Growth patterns,” Apr. 1, 2004, found at Internet addresshttp://www.viewswire.com, retrieved May 2004.
Economist Intelligence Unit, “Monetary policy affected by widening fiscal deficit,” Feb. 24, 2004,found at Internet address http://www.viewswire.com, retrieved May 2004.
“Lesotho/Growth pattern,” Business Africa, Mar. 30, 2004, found at Internet addresshttp://www.newsedge.com, retrieved Mar. 30, 2004.
“Lesotho sees fast trade growth on US plan,” All Africa Global Media, Feb. 23, 2004, found atInternet address http://www.newsedge.com, retrieved Feb. 23, 2004.
“Lesotho/GDP Has Grown But Challenges Lay Ahead, IMF,” All Africa Global Media, Feb. 13,2004, found at Internet address http://www.newsedge.com, retrieved Feb. 13, 2004.
“Lesotho/IMF Grants Concessional Loan,” All Africa Global Media, Jan. 23, 2004, found at Inter-net address http://www.newsedge.com, retrieved Jan. 23, 2004.
Charles Cobb, Jr. and Reed Kramer, “Eight African Nations Eligible For Millennium Challenge Ac-count Assistance,” Allafrica.com, May 7, 2004, found at Internet address http://www.allafri-ca.com, retrieved May 7, 2004.
Liberia
Economist Intelligence Unit, Country Profile Liberia 2003, Oct. 2003.
Economist Intelligence Unit, “Plans made to help reconstruct region,” May 4, 2004, found at In-ternet address http://www.viewswire.com, retrieved May 2004.
Economist Intelligence Unit, ”Aid-dependent,” Apr. 21, 2004, found at Internet addresshttp://www.viewswire.com, retrieved May 2004.
Economist Intelligence Unit, “Petroleum liberalisation continues,” Mar. 18, 2004, found at Inter-net address http://www.viewswire.com, retrieved May 2004.
Economist Intelligence Unit, “Fighting in Monrovia damages economy,” Nov. 11, 2003, found atInternet address http://www.viewswire.com, retrieved May 2004.
Economist Intelligence Unit, :IMF released 2003 Article IV Consultation report,” Nov. 11, 2003,found at Internet address http://www.viewswire.com, retrieved May 2004.
“Liberia/UN Maintains Diamond And Timber Sanctions,” All Africa Global Media, June 14, 2004,found at Internet address http://www.newsedge.com, retrieved June 14, 2004.
“Rejuvenating the Liberian Economy,” All Africa Global Media, Jan. 12, 2004, found at Internetaddress http://www.newsedge.com, retrieved Jan. 12, 2004.
“US Gives Liberia $19.5 Million More in Humanitarian Assistance,” United States Department ofState (Washington, DC), Apr. 14, 2004, found at Internet address http://www.allafrica.com, re-trieved Apr. 15, 2004.
Madagascar
Economist Intelligence Unit, Country Profile Madagascar 2003, Aug. 2003.
Economist Intelligence Unit, “Cyclone setback to recovery hopes,” Apr. 20, 2004, found at Inter-net address http://www.viewswire.com, retrieved May 2004.
Economist Intelligence Unit, “Region’s corruption rate improves,” Jan. 27, 2004, found at Inter-net address http://www.viewswire.com, retrieved May 2004.

6-121
Economist Intelligence Unit, “Economic recovery gets into stride,” Jan. 27, 2004, found at Inter-net address http://www.viewswire.com, retrieved May 2004.
Economist Intelligence Unit, “Government to promote broad economic growth,” Jan. 27, 2004,found at Internet address http://www.viewswire.com, retrieved May 2004.
Economist Intelligence Unit, “PRSP aims to halve poverty rate in a decade,” Jan. 27, 2004,found at Internet address http://www.viewswire.com, retrieved May 2004.
Economist Intelligence Unit, “Government completes poverty reduction,” Jan. 27, 2004, foundat Internet address http://www.viewswire.com, retrieved May 2004.
Economist Intelligence Unit, “Export performanc maintains steady recovery,” Jan. 27, 2004,found at Internet address http://www.viewswire.com, retrieved May 2004.
Economist Intelligence Unit, “Economy expected to recover slowly,” Jan. 27, 2004, found at In-ternet address http://www.viewswire.com, retrieved May 2004.
“False alarm for sagging economy,” Africa Analysis, Apr. 30, 2003, found at Internet addresshttp://www.newsedge.com, retrieved Apr. 30, 2003.
“Regulatory watch/Madagascar,” Business Africa, Mar. 19, 2004, found at Internet addresshttp://www.newsedge.com, retrieved Mar. 19, 2004.
“Madagascar/ADF Approves Loan for Economic Recovery,” Africa News Service, Sept. 22, 2003,found at Internet address http://www.newsedge.com, retrieved Sept. 22, 2003.
“France writes off debt owed by Madagascar,” Agence France Presse, Apr. 30, 2003, found atInternet address http://www.newsedge.com, retrieved Apr. 30, 2003.
“World Bank grants 32m dollars to Madagascar’s mineral resources project,” BBC MonitoringInternational Reports, June 25, 2003, found at Internet address http://www.newsedge.com,retrieved June 25, 2003.
“US Signs Open Skies Agreement With Madagascar,” United States Department of State (Wash-ington, DC) Press Release, Mar. 10, 2004, found at Internet address http://www.allafrica.com,retrieved Mar. 10, 2004.
Clive Rubin, “Africa’s New Gold Rush,” Mail & Guardian (Johannesburg), Mar. 3, 2004, found atInternet address http://www.allafrica.com, retrieved Mar. 4, 2004.
Charles Cobb, Jr. and Reed Kramer, “Eight African Nations Eligible For Millennium Challenge Ac-count Assistance,” Allafrica.com, May 7, 2004, found at Internet address http://www.allafri-ca.com, retrieved May 7, 2004.
Malawi
Economist Intelligence Unit, Country Profile Malawi 2004, Jan. 2004.
Economist Intelligence Unit, “Tobacco-selling mechanisms altered,” Apr. 29, 2004, found at In-ternet address http://www.viewswire.com, retrieved May 2004.
Economist Intelligence Unit, “Progress made with power grid project,” Feb. 24, 2004, found atInternet address http://www.viewswire.com, retrieved May 2004.
Economist Intelligence Unit, “PRSP spending targets not achieved,” Feb. 24, 2004, found at In-ternet address http://www.viewswire.com, retrieved May 2004.
Economist Intelligence Unit, “IMF resumes lending to region,” Feb. 24, 2004, found at Internetaddress http://www.viewswire.com, retrieved May 2004.

6-122
“IMF weighs resumption of aid to Malawi,” Agence France-Presse English Wire, June 8, 2004,found at Internet address http://www.newsedge.com, retrieved June 8, 2004.
“Economy-Malawi/Farewell to the Golden Leaf,” English IPS News, Dec. 22, 2003, found at In-ternet address http://www.newsedge.com, retrieved Dec. 22, 2003.
“Malawi: IMF Welcomes Commitment to Fiscal Discipline,” UN Integrated Regional InformationNetworks, June 7, 2004, found at Internet address http://www.allafrica.com, retrieved June 7,2004.
“Malawi: OPEC gives $5m for Road Upgrade,” UN Integrated Regional Information Networks,May 13, 2004, found at Internet address http://www.allafrica.com, retrieved May 13, 2004.
Mali
Economist Intelligence Unit, Country Profile Mali 2003, July 2003.
Economist Intelligence Unit, “Region adopts AGOA visa,” May 4, 2004, found at Internet ad-dress http://www.viewswire.com, retrieved May 2004.
Economist Intelligence Unit, “Foreign investment is the key,” Feb. 12, 2004, found at Internetaddress http://www.viewswire.com, retrieved May 2004.
Economist Intelligence Unit, “Reform of cotton sector still on policy agenda,” Jan.27, 2004,found at Internet address http://www.viewswire.com, retrieved May 2004.
Economist Intelligence Unit, “Business climate outlook,” Oct. 6, 2003, found at Internet addresshttp://www.viewswire.com, retrieved May 2004.
“New Delhi pledges US$500 million in aid to West African nations,” AP WorldStream English,Mar. 2, 2004, found at Internet address http://www.newsedge.com, retrieved Mar. 2, 2004.
Clive Rubin, ”Africa’s New Gold Rush,” Mail & Guardian (Johannesburg), Mar. 3, 2004, found atInternet address http://www.allafrica.com, retrieved Mar. 4, 2004.
Charles Cobb, Jr. and Reed Kramer, “Eight African Nations Eligible For Millennium Challenge Ac-count Assistance,” Allafrica.com, May 7, 2004, found at Internet address http://www.allafri-ca.com, retrieved May 7, 2004.
Mauritania
Economist Intelligence Unit, Country Profile Mauritania 2003, Sept. 2003.
Economist Intelligence Unit, “Encouraging oil exploration reports,” Mar. 22, 2004, found at In-ternet address http://www.viewswire.com, retrieved May 2004.
Economist Intelligence Unit, “IMF happy with gains achieved to date,” Mar. 22, 2004, found atInternet address http://www.viewswire.com, retrieved May 2004.
Economist Intelligence Unit, “PRGF sets out macroeconomic targets,” Nov. 25, 2003, found atInternet address http://www.viewswire.com, retrieved May 2004.
Economist Intelligence Unit, “Oil benefits may flow,” Oct. 29, 2003, found at Internet addresshttp://www.viewswire.com, retrieved May 2004.
Joe Sambou, “Mauritania Oil a Reality,” The Independent (Banjul), June 11, 2004, found at In-ternet address http://allafrica.com, retrieved June 11, 2004.
Clive Rubin, “Africa’s New Gold Rush,” Mail & Guardian (Johannesburg), Mar. 3, 2004, found atInternet address http://www.allafrica.com, retrieved Mar. 4, 2004.

6-123
Mauritius
Economist Intelligence Unit, Country Profile Mauritius 2003, July 2003.
Economist Intelligence Unit, “Business climate overview,” Mar. 16, 2004, found at Internet ad-dress http://www.viewswire.com, retrieved May 2004.
Economist Intelligence Unit, “Tourism holds up in tough environment,” Jan. 27, 2004, found atInternet address http://www.viewswire.com, retrieved May 2004.
Economist Intelligence Unit, “Estimate for GDP growth in 2003 cut,” Jan. 20, 2004, found at In-ternet address http://www.viewswire.com, retrieved May 2004.
Economist Intelligence Unit, “No changes to economic policy expected,” Jan. 20, 2004, found atInternet address http://www.viewswire.com, retrieved May 2004.
Economist Intelligence Unit, “Trade preferences on way out?” Nov. 20, 2003, found at Internetaddress http://www.viewswire.com, retrieved May 2004.
Economist Intelligence Unit, “Growth prospectst,” Nov. 20, 2003, found at Internet addresshttp://www.viewswire.com, retrieved May 2004.
Economist Intelligence Unit, “Tourism holds up a tough enviroment,” Nov. 11, 2003, found atInternet address http://www.viewswire.com, retrieved May 2004.
Economist Intelligence Unit, “Domestic private investors are still reticent,” Nov. 11, 2003, foundat Internet address http://www.viewswire.com, retrieved May 2004.
“Stategic networking/Mauritius/S Africa/where do they go from here?” Country Forecast Africa,Nov. 11, 2003, found at Internet address http://www.newsedge.com, retrieved Nov. 11, 2003.
A. Bodo, “Madagascar-Maurice: nouvel accord de coop,ration conclu aprŠs deux siŠcles!” MidiMadagasikara (Antananarivo), Apr. 7, 2004, found at Internet address http://allafrica.com, re-trieved Apr. 7, 2004.
Patrick Hilbert, “Nouvelles technologies: quand la formation ne suit pas la demande,” L’Express(Port Louis), Apr. 9, 2004, found at Internet address http://www.allafrica.com, retrieved Apr. 9,2004.
Mozambique
Economist Intelligence Unit, Country Profile Mozambique 2004, July 2004.
Economist Intelligence Unit, “The South African influx,” Apr. 28, 2004, found at Internet ad-dress http://www.viewswire.com, retrieved May 2004.
Economist Intelligence Unit, “Investor-friendly?” Apr. 28, 2004, found at Internet addresshttp://www.viewswire.com, retrieved May 2004.
Economist Intelligence Unit, “US$790m pledged at Consultative Group,” Mar. 22, 2004, found atInternet address http://www.viewswire.com, retrieved May 2004.
Economist Intelligence Unit, “Efforts to restructure the debt burden,” Mar. 22, 2004, found atInternet address http://www.viewswire.com, retrieved May 2004.
Economist Intelligence Unit, “Duty exemptions for manufacturers,” Sept.16, 2003, found at In-ternet address http://www.viewswire.com, retrieved May 2004.
Economist Intelligence Unit, “Growing peace dividend,” Aug. 21, 2003, found at Internet ad-dress http://www.viewswire.com, retrieved May 2004.

6-124
“Mozambique-South Africa/Investment Climate Generally Favourable - New Report,” All AfricaGlobal Media, June 3, 2004, found at Internet address http://www.newsedge.com, retrievedJune 3, 2004.
“Resettled white Zimbabwe farmers create 4,000 jobs in Mozambique/official,” Agence France-Presse English Wire, Jan. 14, 2004, found at Internet address http://www.newsedge.com, re-trieved Jan. 14, 2004.
“World Bank pledges US$600 million support to Mozambique,” Panafrican News Agency (Pana)Daily Newswire, Jan. 30, 2004, found at Internet address http://www.newsedge.com, retrievedJan. 30, 2004.
“Resettled white Zimbabwe farmers create 4,000 jobs in Mozambique/official,” Agence France-Presse English Wire, Jan. 14, 2004, found at Internet address http://www.newsedge.com, re-trieved Jan. 14, 2004.
“Mozambique to sign three-year fishing accord with EU/minister,” AFP Wire, Oct. 20, 2003,found at Internet address http://www.newsedge.com, retrieved Oct. 20, 2003.
Charles Cobb, Jr. and Reed Kramer, “Eight African Nations Eligible For Millennium Challenge Ac-count Assistance,” Allafrica.com, May 7, 2004, found at Internet address http://www.allafri-ca.com, retrieved May 7, 2004.
Namibia
Economist Intelligence Unit, Country Profile Namibia 2004, June 2004.
Economist Intelligence Unit, “Air Namibia to receive further US$2.6m bailout,” May 18, 2004,found at Internet address http://www.viewswire.com, retrieved May 2004.
Economist Intelligence Unit, “Business climate overview,” Feb. 18, 2004, found at Internet ad-dress http://www.viewswire.com, retrieved May 2004.
Economist Intelligence Unit, “Air Namibia’s part privatisation remains stalled,” Dec. 23, 2003,found at Internet address http://www.viewswire.com, retrieved May 2004.
Economist Intelligence Unit, “Drought relief programme launched,” Dec. 23, 2003, found at In-ternet address http://www.viewswire.com, retrieved May 2004.
Economist Intelligence Unit, “Additional budget raises 2003/04 deficit,” Dec. 23, 2003, found atInternet address http://www.viewswire.com, retrieved May 2004.
Siyumbwa Muyunda, “Imports passing through Namibia cost less,” The Times of Zambia, May3, 2004, found at Internet address http://www.allafrica.com, retrieved May 3, 2004.
“Namibia to pull out of COMESA, regional free trade area,” AFP English Wire, July 25, 2003,found at Internet address http://www.www.newsedge.com, retrieved July 25, 2003
“Namibia slips in global competitiveness ranking,” The Namibian, Nov. 7, 2003, found at Inter-net address http://www.www.newsedge.com, retrieved Nov. 7, 2003
Niger
Economist Intelligence Unit, Country Profile Niger 2003, July 2003.
Economist Intelligence Unit, “Debt relief in sight,” Mar. 26, 2004, found at Internet addresshttp://www.viewswire.com, retrieved May 2004.
Economist Intelligence Unit, “Another good harvest season,” Jan. 20, 2004, found at Internetaddress http://www.viewswire.com, retrieved May 2004.

6-125
Economist Intelligence Unit, “New airline to fly regional and internal routes,” Oct. 6, 2003,found at Internet address http://www.viewswire.com, retrieved May 2004.
Economist Intelligence Unit, “IMF approves US$16m disbursement,” July 15, 2003, found at In-ternet address http://www.viewswire.com, retrieved May 2004.
Mike Oduniyi and Josephin Lahor, “Niger Delta: Chevron Suspends Production,” This Day (Lago& Abuja), Apr. 26, 2004, found at Internet address http://www.allafrica.com, retrieved Apr. 26,2004.
Nigeria
Economist Intelligence Unit, Country Profile Nigeria 2004, Dec. 2003.
Economist Intelligence Unit, “Business environment at a glance,” May 14, 2004, found at Inter-net address http://www.viewswire.com, retrieved May 2004.
Economist Intelligence Unit, “NNPC signs several production-sharing deals,” Apr. 29, 2004,found at Internet address http://www.viewswire.com, retrieved May 2004.
Economist Intelligence Unit, “Shell to boost investment in natural-gas pipelines,” Apr. 19, 2004,found at Internet address http://www.viewswire.com, retrieved May 2004.
Economist Intelligence Unit, “World Bank in Niger Delta development project,” Mar. 23, 2004,found at Internet address http://www.viewswire.com, retrieved May 2004.
Economist Intelligence Unit, “South African team in talks on new national airline,” Mar. 53,2004, found at Internet address http://www.viewswire.com, retrieved May 2004.
Economist Intelligence Unit, “Nigeria set for rapid telecom growth,” Feb. 4, 2004, found at In-ternet address http://www.viewswire.com, retrieved May 2004.
Economist Intelligence Unit, “Import bans introduced,” Feb. 3, 2004, found at Internet addresshttp://www.viewswire.com, retrieved May 2004.
Economist Intelligence Unit, “Window of opportunity,” Jan. 22, 2004, found at Internet addresshttp://www.viewswire.com, retrieved May 2004.
Economist Intelligence Unit, “Textile incentive approved,” Dec. 30, 2003, found at Internet ad-dress http://www.viewswire.com, retrieved May 2004.
Economist Intelligence Unit, “Government unfolds new economic blueprint,” Dec. 23, 2003,found at Internet address http://www.viewswire.com, retrieved May 2004.
“Nigeria woos investors,” Panafrican News Agency (Pana) Daily Newswire, June 7, 2004, foundat Internet address http://www.newsedge.com, retrieved June 7, 2004.
“Economy Yet on Crutches,” All Africa Global Media, June 1, 2004, found at Internet addresshttp://www.newsedge.com, retrieved June 1, 2004.
“Nigeria’s Economy Still Uncompetitive, Says Unido,” All Africa Global Media, Apr. 29, 2004,found at Internet address http://www.newsedge.com, retrieved Apr. 29, 2004.
“Oiling the Economy Through Foreign Investment,” This Day (Nigeria) - AAGM, Apr. 2, 2004,found at Internet address http://www.newsedge.com, retrieved Apr. 2, 2004.
“Nigeria Rate Low On Economic Growth,” All Africa Global Media, Jan. 9, 2004, found at Inter-net address http://www.newsedge.com, retrieved Jan. 9, 2004.
“China to Invest $1bn in Nigeria,” All Africa Global Media, Dec. 16, 2003, found at Internet ad-dress http://www.newsedge.com, retrieved Dec. 16, 2003.

6-126
“Country Vows to Make Privatization an Engine of Growth,” All Africa Global Media, Nov. 27,2003, found at Internet address http://www.newsedge.com, retrieved Nov. 27, 2003.
“Nigeria keen to boost trade ties,” Pakistan Press International, Nov. 3, 2003, found at Internetaddress http://www.newsedge.com, retrieved Nov. 3, 2003.
“ADB wants Nigeria to correct growing macroeconomic imbalances,” Panafrican News Agency(Pana) Daily Newswire, Oct. 29, 2003, found at Internet address http://www.newsedge.com,retrieved Oct. 29, 2003.
“Nigeria and Benin agree to re-open border,” AFP English Wire, Aug. 15, 2003, found at Inter-net address http://www.newsedge.com, retrieved Aug. 15, 2003.
Adaobi Okafor, “China Moves to Establish 50 Factories in Nigeria,” Vanguard (Lagos), May 10,2004, found at Internet address http://www.allafrica.com, retrieved May 10, 2004.
“Seven U.S. Firms Eye Nigeria,” Daily Champion (Lagos), May 5, 2004, found at Internet ad-dress http://www.allafrica.com, retrieved May 5, 2004.
Hamisu Muhammad, “NEPC Moves to Implement EPB Scheme,” Daily Trust, (Abuja), Apr. 27,2004, found at Internet address http://www.allafrica.com, retrieved Apr. 27, 2004.
Babajide Komolafe, “Import Ban, Port Congestion Cripple Fortex Market N137 to $1,” Vanguard(Lagos), Apr. 19, 2004, found at Internet address http://www.allafrica.com, retrieved Apr. 19,2004.
Nneoma Ukeje-Eloagu, “Nigeria, Second Largest Economy in Africa - World Bank,” This Day (La-gos), Apr. 15, 2004, found at Internet address http://www.allafrica.com, retrieved Apr. 15,2004.
Emma Ujah, “World Bank Unveils Plan for Nigeria’s Solid Minerals Sector,” Vanguard (Lagos),Mar. 31, 2004, found at Internet address http://www.allafrica.com, retrieved Mar. 31, 2004.
Mike Oduniyi and Onyebuchi Ezigbo, “Offshore Field: NNPC, US firm Sign Pact,” This Day (Lago& Abuja), Mar. 22, 2004, found at Internet address http://www.allafrica.com, retrieved Mar. 22,2004.
Emeka Ugwuanyi and Chinazo Onwuaso, “FG, World Bank Move to LPG Market...Sets Up Steer-ing Committee,” Vanguard (Lagos), Mar. 16, 2004, found at Internet address http://www.allafri-ca.com, retrieved Mar. 16, 2004.
Hector Igbikiowubo, “Liquefied Natural Gas Begins Gas Export to US,” Vanguard (Lagos), June27, 2003, found at Internet address http://www.allafrica.com, retrieved June 27, 2003.
Republic of the Congo
Economist Intelligence Unit, Country Profile Congo (Brazzaville) 2004, July 2004.
Economist Intelligence Unit, “Railway privatisation schedule released,” Feb. 24, 2004, found atInternet address http://www.viewswire.com, retrieved May 2004.
Economist Intelligence Unit, “Relations with IMF reach impasse,” Feb. 24, 2004, found at Inter-net address http://www.viewswire.com, retrieved May 2004.
Economist Intelligence Unit, “Mining sector to be liberalised,” Feb. 3, 2004, found at Internetaddress http://www.viewswire.com, retrieved May 2004.
“Congo oil revenues exceed expectations by more than 12 million euros,” Agence France-PresseEnglish Wire, May 6, 2004, found at Internet address http://www.newsedge.com, retrieved May6, 2004.

6-127
“Investment Prospects in Congo Brighten,” Africa News Service, Sept. 17, 2003, found at Inter-net address http://www.newsedge.com, retrieved Sept. 17, 2003.
“Congo gets 11.9-million-dollar loan for agricultural projects,” Agence France-Presse English,May 23, 2004, found at Internet address http://www.newsedge.com, retrieved May 23, 2004.
“Congo: Accord Signed for Safe Passage of Rail Traffic in Pool,” UN Integrated Regional Infor-mation Networks, Mar. 1, 2004, found at Internet address http://www.allafrica.com, retrievedMar. 1, 2004.
Rwanda
Economist Intelligence Unit, Country Profile Rwanda 2004, Apr. 2004.
Economist Intelligence Unit, “Privatisation of Rwandatel launched,” May 18, 2004, found at In-ternet address http://www.viewswire.com, retrieved May 2004.
Economist Intelligence Unit, “Privatisation programme has mixed results,” Apr. 22, 2004, foundat Internet address http://www.viewswire.com, retrieved May 2004.
Economist Intelligence Unit, “Real GDP growth lowest since 1994,” Apr. 22, 2004, found at In-ternet address http://www.viewswire.com, retrieved May 2004.
Economist Intelligence Unit, “Expansionary budget announced for 2004,” Apr. 22, 2004, foundat Internet address http://www.viewswire.com, retrieved May 2004.
Economist Intelligence Unit, “Economic objectives set,” Apr. 22, 2004, found at Internet addresshttp://www.viewswire.com, retrieved May 2004.
“Renewed Hope As Recovery Path is Paved,” All Africa Global Media, Apr. 12, 2004, found atInternet address http://www.newsedge.com, retrieved Apr. 12, 2004.
“Rwanda to Focus on the Economy in 2004,” East African (Kenya) - AAGM, Jan. 2, 2004, foundat Internet address http://www.newsedge.com, retrieved Jan. 2, 2004.
“Rwanda’s Economic Growth,” East African (Kenya) - AAGM, Dec. 12, 2003, found at Internetaddress http://www.newsedge.com, retrieved Dec. 12, 2003.
Esther Nakkazi, “$4m Rwanda Free Trade Zone to Be Ready By June,” The East African (Nairo-bi), May 3, 2004, found at Internet address http://www.allafrica.com, retrieved May 4, 2004.
“Rwanda And Kenya Sign Trade Pact,” The Nation (Nairobi), Mar. 17, 2004, found at Internetaddress http://www.allafrica.com, retrieved Mar. 17, 2004.
São Tomé and Pr¡ncipe
Economist Intelligence Unit, Country Profile São Tomé, and Pr¡ncipe 2004, Jan. 2004.
Economist Intelligence Unit, “Oil exploration auction concluded,” Feb. 24, 2004, found at Inter-net address http://www.viewswire.com, retrieved May 2004.
Economist Intelligence Unit, “Free-trade zone project revisited,” Feb. 24, 2004, found at Inter-net address http://www.viewswire.com, retrieved May 2004.
Economist Intelligence Unit, “IMF, World Bank assess performance,” Feb. 24, 2004, found atInternet address http://www.viewswire.com, retrieved May 2004.
Economist Intelligence Unit, “The oil era begins,” Feb. 24, 2004, found at Internet addresshttp://www.viewswire.com, retrieved May 2004.
Economist Intelligence Unit, “Good oil fortune to transform region,” Feb. 24, 2004, found at In-ternet address http://www.viewswire.com, retrieved May 2004.

6-128
Economist Intelligence Unit, “US may upgrade oil-rich area’s port,” Feb. 19, 2004, found at In-ternet address http://www.viewswire.com, retrieved May 2004.
Lere Ojedokun, “Chevron, Mobil, Dangote Seal São Tomê, and Pr¡ncipe Oil Deal,” Daily Cham-pion (Lagos), May 5, 2004, found at Internet address http://www.allafrica.com, retrieved May5, 2004.
Mike Oduniyi, “JDZ: Nigeria, São Tomê, and Pr¡ncipe Target $500m Revenue,” This Day (La-gos), Apr. 21, 2004, found at Internet address http://www.allafrica.com, retrieved Apr. 21,2004.
Senegal
Economist Intelligence Unit, Country Profile Senegal 2004, May 2004.
Economist Intelligence Unit, “Tax and investment revisions,” Apr. 21, 2004, found at Internetaddress http://www.viewswire.com, retrieved May 2004.
Economist Intelligence Unit, “Senelec may build two new power stations, ”Apr. 1, 2004, foundat Internet address http://www.viewswire.com, retrieved May 2004.
Economist Intelligence Unit, “Qualified support from IMF,” Feb. 16, 2004, found at Internet ad-dress http://www.viewswire.com, retrieved May 2004.
“New Delhi pledges US$500 million in aid to West African nations,” AP WorldStream English,Mar. 2, 2004, found at Internet address http://www.newsedge.com, retrieved Mar. 2, 2004.
“Senegal basks in stable socio-economic state, says ADB,” Panafrican News Agency (Pana) DailyNewswire, Oct. 29, 2003, found at Internet address http://www.newsedge.com, retrieved Oct.29, 2003.
“Economic Trends/Senegal - Economic Future Brighter?” Africa Research Bulletin (ARBE), June13, 2003, found at Internet address http://www.newsedge.com, retrieved June 13, 2003.
“IMF/IMF approves US$33 million PRGF arrangement for Senegal,” M2 PRESSWIRE, May 1,2003, found at Internet address http://www.newsedge.com, retrieved May 1, 2003.
“Senegal: Japan Helps to Reduce Dependency On Rice Imports,” UN Integrated Regional Infor-mation Networks, Mar. 31, 2004, found at Internet address http://www.allafrica.com, retrievedMar. 31, 2004.
Charles Cobb, Jr. and Reed Kramer, “Eight African Nations Eligible For Millennium Challenge Ac-count Assistance,” Allafrica.com, May 7, 2004, found at Internet address http://www.allafri-ca.com, retrieved May 7, 2004.
Seychelles
Economist Intelligence Unit, Country Profile Seychelles 2003, July 2003.
Economist Intelligence Unit, “Prawn production on the rise,” Jan. 20, 2004, found at Internetaddress http://www.viewswire.com, retrieved May 2004.
Economist Intelligence Unit, “Tuna production climbs,” Jan. 20, 2004, found at Internet addresshttp://www.viewswire.com, retrieved May 2004.
Economist Intelligence Unit, “Goods and services tax to boost revenue,” Jan. 20, 2004, found atInternet address http://www.viewswire.com, retrieved May 2004.
Economist Intelligence Unit, “Economy to shrink by 5.1%,” Jan. 20, 2004, found at Internet ad-dress http://www.viewswire.com, retrieved May 2004.

6-129
Economist Intelligence Unit, “Double taxation avoidance treaties signed,” Jan. 20, 2004, foundat Internet address http://www.viewswire.com, retrieved May 2004.
Economist Intelligence Unit, “2003 ends on disappointing economic note,” Jan. 20, 2004, foundat Internet address http://www.viewswire.com, retrieved May 2004.
Economist Intelligence Unit, “Government introduces economic reform programme,” Jan. 20,2004, found at Internet address http://www.viewswire.com, retrieved May 2004.
Kabo Mokgoabone, “Seychelles to Pull out of SADC by July,” Mmegi/The Reporter (Gaborone),Apr. 29, 2004, found at Internet address http://www.allafrica.com, retrieved Apr. 30, 2004.
Sierra Leone
Economist Intelligence Unit, Country Profile Sierra Leone 2003, Oct. 2003.
Economist Intelligence Unit, “Local mine to resume full operation by June,” May 4, 2004, foundat Internet address http://www.viewswire.com, retrieved May 2004.
Economist Intelligence Unit, “IMF completes fourth review under the PRGF,” May 4, 2004, foundat Internet address http://www.viewswire.com, retrieved May 2004.
Economist Intelligence Unit, “Main issues of the 2004 budget,” May 4, 2004, found at Internetaddress http://www.viewswire.com, retrieved May 2004.
Economist Intelligence Unit, “Aid runs into millions of dollars,” Nov. 11, 2003, found at Internetaddress http://www.viewswire.com, retrieved May 2004.
Economist Intelligence Unit, “Oil firms submit bid for offshore licenes,” Nov. 11, 2003, found atInternet address http://www.viewswire.com, retrieved May 2004.
Economist Intelligence Unit, “At the bottom of the human development index,” Nov. 11, 2003,found at Internet address http://www.viewswire.com, retrieved May 2004.
Economist Intelligence Unit, “Sierra Rutile receives US investment guarantee,” Aug. 18, 2003,found at Internet address http://www.viewswire.com, retrieved May 2004.
“China committing 266 million to developing Sierra Leone beachfront,” Agence France-PresseEnglish Wire, May 7, 2004, found at Internet address http://www.newsedge.com, retrieved May7, 2004.
“IMF approves release of nearly 200 mn dollars for Sierra Leone,” Agence France-Presse En-glish, Feb. 26, 2004, found at Internet address http://www.newsedge.com, retrieved Feb. 26,2004.
“ADB commends Sierra Leone’s economic recovery measures,” Panafrican News Agency (PANA)Daily Newswire, Oct. 29, 2003, found at Internet address http://www.newsedge.com, retrievedOct. 29, 2003.
“Sierra Leone/Re-Emergence of the Gem of Africa,” Africa News Service, Aug. 13, 2003, foundat Internet address http://www.newsedge.com, retrieved Aug. 13, 2003.
Rodney Weidemann, “Gateway JV Wins Sierra Leone GSM Licence,” ITWeb (Johannesburg),Mar. 18, 2004, found at Internet address http://www.allafrica.com, retrieved Mar. 18, 2004.
Clive Rubin, “Africa’s New Gold Rush,” Mail & Guardian (Johannesburg), Mar. 3, 2004, found atInternet address http://www.allafrica.com, retrieved Mar. 4, 2004.

6-130
Somalia
Economist Intelligence Unit, Country Profile Somalia 2004, Mar. 2004.
Economist Intelligence Unit, “Veterinary school to be built in Somaliland,” May 18, 2004, foundat Internet address http://www.viewswire.com, retrieved May 2004.
Economist Intelligence Unit, “Livestock exports increase at Berbera port,” May 4, 2004, found atInternet address http://www.viewswire.com, retrieved May 2004.
Economist Intelligence Unit, “Humanitarian agencies express concern,” May 4, 2004, found atInternet address http://www.viewswire.com, retrieved May 2004.
“Somalia: Hundreds of Thousands Threatened By Drought,” UN Integrated Regional InformationNetworks, Mar. 1, 2004, found at Internet address http://www.allafrica.com, retrieved Mar. 1,2004.
South Africa
Economist Intelligence Unit, Country Profile South Africa 2003, Aug. 2003.
Economist Intelligence Unit, “Trade regulations,” May 14, 2004, found at Internet addresshttp://www.viewswire.com, retrieved May 2004.
Economist Intelligence Unit, “Investment regulations,” Apr. 27, 2004, found at Internet addresshttp://www.viewswire.com, retrieved May 2004.
Economist Intelligence Unit, “Tourism thriving,” Apr. 21, 2004, found at Internet addresshttp://www.viewswire.com, retrieved May 2004.
Economist Intelligence Unit, “Business environment at a glance,” Apr. 12, 2004, found at Inter-net address http://www.viewswire.com, retrieved May 2004.
Economist Intelligence Unit, “Business environment ranking summary,” Apr. 12, 2004, found atInternet address http://www.viewswire.com, retrieved May 2004.
Economist Intelligence Unit, “More ships take to seas in global boom,” Mar. 17, 2004, found atInternet address http://www.viewswire.com, retrieved May 2004.
Economist Intelligence Unit, “DeBeers polishing its image,” Feb. 27, 2004, found at Internet ad-dress http://www.viewswire.com, retrieved May 2004.
Economist Intelligence Unit, “Steady as she goes,” Feb. 19, 2004, found at Internet addresshttp://www.viewswire.com, retrieved May 2004.
Economist Intelligence Unit, “Foreigners can raise funds on capital markets,” Feb. 19, 2004,found at Internet address http://www.viewswire.com, retrieved May 2004.
Economist Intelligence Unit, “Revving up,” Feb. 13, 2004, found at Internet addresshttp://www.viewswire.com, retrieved May 2004.
Economist Intelligence Unit, “Land restitution bill passed,” Feb. 2, 2004, found at Internet ad-dress http://www.viewswire.com, retrieved May 2004.
Economist Intelligence Unit, ”Africa’s engine needs to do better,” Jan. 16, 2004, found at Inter-net address http://www.viewswire.com, retrieved May 2004.
Economist Intelligence Unit, “Look for double-digit growth in 2004 car sales,” Dec. 30, 2003,found at Internet address http://www.viewswire.com, retrieved May 2004.
Economist Intelligence Unit, ”Growth targets out of reach,” Dec. 24, 2003, found at Internetaddress http://www.viewswire.com, retrieved May 2004.

6-131
Economist Intelligence Unit, “FDI laggard,” Dec. 24, 2003, found at Internet addresshttp://www.viewswire.com, retrieved May 2004.
Economist Intelligence Unit, “The grand rand,” Dec. 15, 2003, found at Internet addresshttp://www.viewswire.com, retrieved May 2004.
Economist Intelligence Unit, “Quick view - Economy picks up momentum,” Nov. 25, 2003, foundat Internet address http://www.viewswire.com, retrieved May 2004.
Economist Intelligence Unit, “Strategic economic infrastructure investment,” Nov. 6, 2003,found at Internet address http://www.viewswire.com, retrieved May 2004.
Economist Intelligence Unit, “Promoting BEE via tax breaks,” Oct. 21, 2003, found at Internetaddress http://www.viewswire.com, retrieved May 2004.
Economist Intelligence Unit, “Mining updates,” Oct. 21, 2003, found at Internet addresshttp://www.viewswire.com, retrieved May 2004.
Economist Intelligence Unit, “Ties with Germany strengthened,” Sept. 4, 2003, found at Inter-net address http://www.viewswire.com, retrieved May 2004.
Economist Intelligence Unit, “Ford to invest up to US$136.8m in exports,” Aug. 27, 2003, foundat Internet address http://www.viewswire.com, retrieved May 2004.
“IMF Gives SA Thumbs Up, But,” All Africa Global Media, June 15, 2004, found at Internet ad-dress http://www.newsedge.com, retrieved June 15, 2004.
Moyiga Nduru, “Environment/South Africa Widens Its Appeal For Tourists,” English IPS News,June 11, 2004, found at Internet address http://www.newsedge.com, retrieved June 11, 2004.
“SA Courting More Foreign Investment,” All Africa Global Media, June 8, 2004, found at Internetaddress http://www.newsedge.com, retrieved June 8, 2004.
“SA ’can be top manufacturing economy,’” Business Day (South Africa), Feb. 23, 2004, found atInternet address http://www.newsedge.com, retrieved Feb. 23, 2004.
“SA’s Agoa-Protected Exports to US Thriving,” All Africa Global Media, Nov. 21, 2003, found atInternet address http://www.newsedge.com, retrieved Nov. 21, 2003.
“Longest Unbroken expansion in SA’s history,” Business Day (South Africa), Oct. 27, 2003,found at Internet address http://www.newsedge.com, retrieved Oct. 27, 2003.
”Brazil/WTO-2/South Africa Wants Trade Deal With Mercosur,” The Nikkei English News Service,Sept. 8, 2003, found at Internet address http://www.newsedge.com, retrieved Sept. 8, 2003.
”Agoa Gives Strong Boost to South African Exports to US,” Africa News Service, Aug. 11, 2003,found at Internet address http://www.newsedge.com, retrieved Aug. 11, 2003.
“AIDS threatens South Africa economy/World Bank,” The Times of India, Jul. 24, 2003, found atInternet address http://www.newsedge.com, retrieved Jul. 24, 2003.
Jabulani Tshindane, “US Boosts SA Fight Against Financial Crime,” BuaNews (Pretoria), Jul. 20,2004 found at Internet address http://www.allafrica.com, retrieved Jul.10, 2004.
Nene Samanhyia, “AngloGold Ashanti Now Eyes the Future with Confidence,” Accra Mail (Ac-cra), Apr. 13, 2004, found at Internet address http://www.allafrica.com, retrieved Apr. 13, 2004
Carli Lourens, “Hard to Float When Shipping Costs Inflate,” Business Day (Johannesburg), Mar.16, 2004, found at Internet address http://www.allafrica.com, retrieved Mar. 16, 2004.

6-132
John Fraser, “Country Takes Lion Share of Nonenergy Exports Under Agoa,” Business Day (Jo-hannesburg), July 15, 2003, found at Internet address http://www.allafrica.com, retrieved July15, 2003.
Peter Draper, “SA And Brazil Find Common Ground On Trade Strategy,” Business Day (Johan-nesburg), June 25, 2003, found at Internet address http://www.allafrica.com, retrieved June25, 2003.
Sudan
Economist Intelligence Unit, Country Profile Sudan 2004, Feb. 2004.
Economist Intelligence Unit, “Africa’s biggest country is in flames,” May 14, 2004, found at In-ternet address http://www.viewswire.com, retrieved May 2004.
Economist Intelligence Unit, “Trade account shows a surplus,” Mar. 26, 2004, found at Internetaddress http://www.viewswire.com, retrieved May 2004.
Economist Intelligence Unit, “Peace audit,” Mar. 26, 2004, found at Internet addresshttp://www.viewswire.com, retrieved May 2004.
Economist Intelligence Unit, “South wins its share of oil wealth,” Mar. 26, 2004, found at Inter-net address http://www.viewswire.com, retrieved May 2004.
Economist Intelligence Unit, “More oil,” Feb. 18, 2004, found at Internet addresshttp://www.viewswire.com, retrieved May 2004.
”As Oil Eludes Ghana, It Attracts FDI to Chad and Sudan,” Africa News Services, Sept. 9, 2003,found at Internet address http://www.newsedge.com, retrieved Sept. 9, 2003.
“Sudan: IGAD Trying to Break Peace -Talks Impasse,” UN Integrated Regional Information Net-works, Apr. 21, 2004, found at Internet address http://www.allafrica.com, retrieved Apr. 21,2004.
Swaziland
Economist Intelligence Unit, Country Profile Swaziland 2003, May 2003.
Economist Intelligence Unit, “Swaziland prepares Competition Bill,” May 18, 2004, found at In-ternet address http://www.viewswire.com, retrieved May 2004.
Economist Intelligence Unit, “IMF publishes preliminary findings,” Dec. 23, 2003, found at Inter-net address http://www.viewswire.com, retrieved May 2004.
Economist Intelligence Unit, “The central bank’s annual report,” Dec. 23, 2003, found at Inter-net address http://www.viewswire.com, retrieved May 2004.
Economist Intelligence Unit, “Amendments planned to labour law,” Dec. 12, 2003, found at In-ternet address http://www.viewswire.com, retrieved May 2004.
Economist Intelligence Unit, “Economic background,” Oct. 16, 2003, found at Internet addresshttp://www.viewswire.com, retrieved May 2004.
Economist Intelligence Unit, “Construction on new airport begins,” Sept. 10, 2003, found at In-ternet address http://www.viewswire.com, retrieved May 2004.
Economist Intelligence Unit, “Government expenditure spirals,” Sept. 10, 2003, found at Inter-net address http://www.viewswire.com, retrieved May 2004.
“Economic Recovery Tied to Political Reform,” Africa News Services, Sept. 16, 2003, found atInternet address http://www.newsedge.com, retrieved Sept. 16, 2003.

6-133
“Swaziland: New Labour Legislation Passed to Retain Agoa,” UN Integrated Regional Informa-tion Networks, Apr. 22, 2004, found at Internet address http://www.allafrica.com, retrievedApr. 22, 2004.
Tanzania
Economist Intelligence Unit, Country Profile Tanzania 2003, May 2003.
Economist Intelligence Unit, “Country risk summary,” Apr. 30, 2004, found at Internet addresshttp://www.viewswire.com, retrieved May 2004.
Economist Intelligence Unit, “Improving port security,” Mar. 8, 2004, found at Internet addresshttp://www.viewswire.com, retrieved May 2004.
Economist Intelligence Unit, “Coeur d’Alene’s first venture,” Mar. 8, 2004, found at Internet ad-dress http://www.viewswire.com, retrieved May 2004.
Economist Intelligence Unit, “Island of (in)stability,” Jan. 22, 2004, found at Internet addresshttp://www.viewswire.com, retrieved May 2004.
Economist Intelligence Unit, “Regional tourism is a mixed picture,” Dec. 23, 2003, found at In-ternet address http://www.viewswire.com, retrieved May 2004.
Economist Intelligence Unit, “Bidding extended for Tanzania Railway Corporation,” Nov. 20,2003, found at Internet address http://www.viewswire.com, retrieved May 2004.
Economist Intelligence Unit, “Aminex begins drilling at offshore Nyuni prospect,” Oct. 21, 2003,found at Internet address http://www.viewswire.com, retrieved May 2004.
Economist Intelligence Unit, “Government courts foreign investors,” Sept. 30, 2003, found atInternet address http://www.viewswire.com, retrieved May 2004.
Economist Intelligence Unit, “Oil exploration moves ahead,” Sept. 30, 2003, found at Internetaddress http://www.viewswire.com, retrieved May 2004.
Economist Intelligence Unit, “New PRGF agreed with the IMF,” Sept. 30, 2003, found at Inter-net address http://www.viewswire.com, retrieved May 2004.
Economist Intelligence Unit, “Government presents 2003/04 budget,” Sept. 30, 2003, found atInternet address http://www.viewswire.com, retrieved May 2004.
Economist Intelligence Unit, “Tanzanite export restrictions soon,” Sept. 16, 2003, found at In-ternet address http://www.viewswire.com, retrieved May 2004.
“Tanzanian economy fails to hit target in 2003 because of drought,” Agence France-Presse En-glish Wire, June 1, 2004, found at Internet address http://www.newsedge.com, retrieved June1, 2004.
“Export Market/Ghana, Tanzania Lead,” This Day (Nigeria) - AAGM, Apr. 30, 2004, found at In-ternet address http://www.newsedge.com, retrieved Apr. 30, 2004.
“Tanzanian Still Fastest Growing Economy in Ea,” East African (Kenya) - AAGM, Jan. 28, 2004,found at Internet address http://www.newsedge.com, retrieved Jan. 28, 2004.
“Tanzanian experiments formalising informal sector,” Panafrican News Agency (PANA) DailyNewswire, Sept. 11, 2003, found at Internet address http://www.newsedge.com, retrievedSept. 11, 2003.
“World Bank Credit of US$100 Million to Promote Secondary Education Development in Tanza-nia,” World Bank (Washington, DC), June 8, 2004, found at Internet address http://www.allafri-ca.com, retrieved June 9, 2004.

6-134
Abduel Kenge, “Tanzania Plans to Lift Export Ban On Sea Fish,” The East African (Nairobi), Mar.8, 2004, found at Internet address http://www.allafrica.com, retrieved Mar. 9, 2004.
Clive Rubin, “Africa’s New Gold Rush,” Mail & Guardian (Johannesburg), Mar. 3, 2004, found atInternet address http://www.allafrica.com, retrieved Mar. 4, 2004.
“Tanzania: IMF Clears Way for US $4.2 Million Loan,” UN Integrated Regional Information Net-works, Feb. 26, 2004, found at Internet address http://www.allafrica.com, retrieved Feb. 26,2004.
Togo
Economist Intelligence Unit, Country Profile Togo 2003, June 2003.
Economist Intelligence Unit, “Business climate overview,” May 18, 2004, found at Internet ad-dress http://www.viewswire.com, retrieved May 2004.
Economist Intelligence Unit, “New ownership for private bank, BIA-Togo,” Mar. 22, 2004, foundat Internet address http://www.viewswire.com, retrieved May 2004.
Economist Intelligence Unit, “Phosphate production rose steadily in 2003,” Mar. 22, 2004, foundat Internet address http://www.viewswire.com, retrieved May 2004.
Economist Intelligence Unit, “Cotton production rose rapidly in 2003/04,” Mar. 22, 2004, foundat Internet address http://www.viewswire.com, retrieved May 2004.
Economist Intelligence Unit, “Growth expected to exceed 3% for 2003,” Mar. 22, 2004, found atInternet address http://www.viewswire.com, retrieved May 2004.
Economist Intelligence Unit, “Ecomarine starts operations,” Nov. 17, 2003, found at Internetaddress http://www.viewswire.com, retrieved May 2004.
Economist Intelligence Unit, “Failure to meet UEMOA’s convergence criteria,” Nov. 17, 2003,found at Internet address http://www.viewswire.com, retrieved May 2004.
Economist Intelligence Unit, “EU maintains freeze on financial assistance,” Nov. 17, 2003, foundat Internet address http://www.viewswire.com, retrieved May 2004.
Economist Intelligence Unit, “West African gas pipeline makes further progress,” Sept. 30, 2003,found at Internet address http://www.viewswire.com, retrieved May 2004.
“Togo ready to end decade-long rift with European Union,” Agence France-Presse English Wire,Apr. 13, 2004, found at Internet address http://www.newsedge.com, retrieved Apr. 13, 2004.
“Benin, Togo to boost joint hydroelectric power supply,” Agence France-Presse English Wire,Feb. 24, 2004, found at Internet address http://www.newsedge.com, retrieved Feb. 24, 2004.
Ebow Godwin, “EU Fact-Finding Mission Says Togo Shows Faith, Ghanaian Chronicle (Accra)June 8, 2004, found at Internet address http://www.allafrica.com, retrieved June 8, 2004.
Uganda
Economist Intelligence Unit, Country Profile Uganda 2004, Feb. 2004.
Economist Intelligence Unit, “Fish farming JV formed,” Apr. 21, 2004, found at Internet addresshttp://www.viewswire.com, retrieved May 2004.
Economist Intelligence Unit, “Key developments,” Apr. 7, 2004, found at Internet addresshttp://www.viewswire.com, retrieved May 2004.
Economist Intelligence Unit, “Thabex licensed to explore for minerals in west,” Mar. 8, 2004,found at Internet address http://www.viewswire.com, retrieved May 2004.

6-135
Economist Intelligence Unit, “Business climate outlook,” Mar. 8, 2004, found at Internet addresshttp://www.viewswire.com, retrieved May 2004.
Economist Intelligence Unit, “External debt has risen,” Feb. 24, 2004, found at Internet addresshttp://www.viewswire.com, retrieved May 2004.
Economist Intelligence Unit, “Foreign investment rules liberalised,” Feb. 24, 2004, found at In-ternet address http://www.viewswire.com, retrieved May 2004.
Economist Intelligence Unit, “Minimum investment waived,” Dec. 12, 2003, found at Internetaddress http://www.viewswire.com, retrieved May 2004.
“Uganda’s non-traditional export sector dips,” Panafrican News Agency (PANA) Daily Newswire,Apr. 27, 2004, found at Internet address http://www.newsedge.com, retrieved Apr. 27, 2004.
“Uganda’s Gets 5-Year Transition Period to New Tariffs,” New Vision (Uganda) - AAGM, Mar. 8,2004, found at Internet address http://www.newsedge.com, retrieved Mar. 8, 2004.
“Rail System to Lift Trade,” Africa News Services, July 22, 2003, found at Internet addresshttp://www.newsedge.com, retrieved July 22, 2003.
Silvia Juuko, “Flowers Industry Threatened,” The Monitor (Kampala), May 11, 2004, found atInternet address http://www.allafrica.com, retrieved May 11, 2004.
Caroline Arinaitwe, “Uganda, India Seal Double Taxation Pact,” New Vision (Kampala), May 4,2004, found at Internet address http://www.allafrica.com, retrieved May 4, 2004.
Esther Nakkazi and David Kaiza, “Uganda Wants New Sea Outlet in Port Sudan,” The East Afri-can (Nairobi), May 3, 2004, found at Internet address http://www.allafrica.com, retrieved May4, 2004.
Emmy Olak, “Uganda Honey for EU,” New Vision (Kampala), May 3, 2004, found at Internet ad-dress http://www.allafrica.com, retrieved May 3, 2004.
Christopher Kiwawulo, “Demand for Organic Exports Soars in US,” New Vision (Kampala), Apr.5, 2004, found at Internet address http://www.allafrica.com, retrieved Apr. 5, 2004.
Zambia
Economist Intelligence Unit, Country Profile Zambia 2003, Aug. 2003.
Economist Intelligence Unit, “Key developments,” May 19, 2004, found at Internet addresshttp://www.viewswire.com, retrieved May 2004.
Economist Intelligence Unit, “Privatisation update,” Apr. 21, 2004, found at Internet addresshttp://www.viewswire.com, retrieved May 2004.
Economist Intelligence Unit, “Banking update,” Apr. 21, 2004, found at Internet addresshttp://www.viewswire.com, retrieved May 2004.
Economist Intelligence Unit, “Promises, promises,” Feb. 20, 2004, found at Internet addresshttp://www.viewswire.com, retrieved May 2004.
Economist Intelligence Unit, “Trials and tribulations,” Jan. 22, 2004, found at Internet addresshttp://www.viewswire.com, retrieved May 2004.
Economist Intelligence Unit, “Free land offered to foreign farmers,” Jan. 20, 2004, found at In-ternet address http://www.viewswire.com, retrieved May 2004.
Economist Intelligence Unit, “New power projects are unveiled,” Jan. 20, 2004, found at Inter-net address http://www.viewswire.com, retrieved May 2004.

6-136
Economist Intelligence Unit, “Spending controls unveiled,” Jan. 20, 2004, found at Internet ad-dress http://www.viewswire.com, retrieved May 2004.
Economist Intelligence Unit, “Broad-based window further liberalises exchange rate,” Nov. 25,2003, found at Internet address http://www.viewswire.com, retrieved May 2004.
Economist Intelligence Unit, “Textiles privatisation planned,” Sept. 16, 2003, found at Internetaddress http://www.viewswire.com, retrieved May 2004.
“Zimbabwe Farmers Aid Zambia Farming Revival,” All Africa Global Media, July 22, 2004, foundat Internet address http://www.newsedge.com, retrieved July 22, 2004.
“Zambia/US Renews Agoa Status,” All Africa Global Media, Jan 20, 2004, found at Internet ad-dress http://www.newsedge.com, retrieved Jan. 20, 2004.
“China provides 2m dollars aid to Zambia,” BBC Monitoring International Reports, Dec. 5, 2003,found at Internet address http://www.newsedge.com, retrieved Dec. 5, 2003.
“US Earmarks $350m for Zambia in Next 7 - Years,” The Post (Zambia) - AAGM, Nov. 11, 2003,found at Internet address http://www.newsedge.com, retrieved Nov. 11, 2003.
“US Waives $34m of Zambia’s Debt/Reaction,” Times of Zambia - AAGM, Nov. 5, 2003, found atInternet address http://www.newsedge.com, retrieved Nov. 5, 2003.
“Zambia’s Economy On Course,” Africa News Service, July 30, 2003, found at Internet addresshttp://www.newsedge.com, retrieved July 30, 2003.
“Imports Control List Soars,” Africa News Service, July 16, 2003, found at Internet addresshttp://www.newsedge.com, retrieved July 16, 2003.
“Zambia: Govt Back on IMF Lending Programme,” UN Integrated Regional Information Net-works, June 16, 2004, found at Internet address http://www.allafrica.com, retrieved June 16,2004.
“Australian Investor to Start Gold Mining,” The Times of Zambia (Ndola), Apr. 15, 2004, foundat Internet address http://www.allafrica.com, retrieved Apr. 15, 2004.
Isaac Esipisu, “Kenya, Zambia Agree Sh23b Power Project,” The Nation (Nairobi), Feb. 28,2004, found at Internet address http://www.allafrica.com, retrieved Feb. 27, 2004.
“How Zambia Can Fully Exploit Agoa Provisions,” The Times of Zambia (Ndola), Feb. 4, 2004,found at Internet address http://www.allafrica.com, retrieved Feb. 4, 2004.
Zimbabwe
Economist Intelligence Unit, Country Profile Zimbabwe 2004, Dec. 2003.
Economist Intelligence Unit, “Country risk summary,” May 14, 2004, found at Internet addresshttp://www.viewswire.com, retrieved May 2004.
Economist Intelligence Unit, “Platinum exports exceed gold exports,” May 4, 2004, found at In-ternet address http://www.viewswire.com, retrieved May 2004.
Economist Intelligence Unit, “Number in need of food aid is raised,” May 4, 2004, found at In-ternet address http://www.viewswire.com, retrieved May 2004.
Economist Intelligence Unit, “Hanging on,” Apr. 30, 2004, found at Internet addresshttp://www.viewswire.com, retrieved May 2004.
Economist Intelligence Unit, “Import duties rise fivefold,” Mar. 18, 2004, found at Internet ad-dress http://www.viewswire.com, retrieved May 2004.

6-137
Economist Intelligence Unit, “Playing the long game,” Mar. 17, 2004, found at Internet address
http://www.viewswire.com, retrieved May 2004.
Economist Intelligence Unit, “Hippo Valley sugar estates to be expropriated,” Feb. 18, 2004,found at Internet address http://www.viewswire.com, retrieved May 2004.
Economist Intelligence Unit, “A banking crisis looms,” Jan. 23, 2004, found at Internet addresshttp://www.viewswire.com, retrieved May 2004.
Economist Intelligence Unit, “Between a rock and a hard place,” Jan. 22, 2004, found at Inter-net address http://www.viewswire.com, retrieved May 2004.
Economist Intelligence Unit, “Tobacco production looks set to fall further,” Jan. 20, 2004, foundat Internet address http://www.viewswire.com, retrieved May 2004.
Economist Intelligence Unit, “Neighbours swamped by illegal immigrants,” Jan. 20, 2004, foundat Internet address http://www.viewswire.com, retrieved May 2004.
Economist Intelligence Unit, “Seizing land may get easier,” Dec. 2, 2003, found at Internet ad-dress http://www.viewswire.com, retrieved May 2004.
Economist Intelligence Unit, “Fiscal crisis,” Nov. 24, 2003, found at Internet addresshttp://www.viewswire.com, retrieved May 2004.
Economist Intelligence Unit, “Harare tightens exchange controls,” Nov. 21, 2003, found at Inter-net address http://www.viewswire.com, retrieved May 2004.
Economist Intelligence Unit, “Export earnings down since economic crisis in,” Oct. 8, 2003,found at Internet address http://www.viewswire.com, retrieved May 2004.
“Gas prices triples in economically distraught Zimbabwe,” The Associated Press, Aug. 29, 2004,found at Internet address http://www.newsedge.com, retrieved Aug. 29, 2004.
“Zimbabwe signs investment agreement with OPEC,” Panafrican News Agency (PANA) DailyNewswire, Aug. 28, 2004, found at Internet address http://www.newsedge.com, retrieved Aug.28, 2004.
“Zimbabwe/IMF Calls for Talks on Economic Crisis,” All Africa Global Media, Apr. 2, 2004, foundat Internet address http://www.newsedge.com, retrieved Apr. 2, 2004.
“The domestic economy/ The Zimbabwe Stock Exchange goes into meltdown,” Country ReportZimbabwe, Mar. 10, 2004, found at Internet address http://www.newsedge.com, retrieved Mar.10, 2004.
“SAfrican mining giant protests move by Zimbabwe government to seize its land,” BBC Monitor-ing International Reports, Feb. 3, 2004, found at Internet address http://www.newsedge.com,retrieved Feb. 3, 2004.
“Economy Least Free in Africa,” Zimbabwe Independent - AAGM, Jan. 19, 2004, found at Inter-net address http://www.newsedge.com, retrieved Jan. 19, 2004.
“US backs expulsion of ’pariah’ Zimbabwe from IMF,” Agence France-Presse English Wire, Dec.5, 2003, found at Internet address http://www.newsedge.com, retrieved Dec. 3, 2003.
“Zimbabwe professionals running away,” Panafrican News Agency (PANA) Daily Newswire, Dec.1, 2003, found at Internet address http://www.newsedge.com, retrieved Dec. 1, 2003.
“Zimbabwean law bans cash holdings of more than 6,250 US dollar,” APF English Wire, Aug. 19,2003, found at Internet address http://www.newsedge.com, retrieved Aug. 19, 2003.

6-138
“Weird economy is consuming itself,” Business Day (South Africa), Aug. 13, 2003, found at In-ternet address http://www.newsedge.com, retrieved Aug. 13, 2003.
“Informal Sector Grows Rapidly As Formal Shrinks,” Africa News Services, July 30, 2003, foundat Internet address http://www.newsedge.com, retrieved July 30, 2003.
“Zimbabwe: Govt moves to Nationalise All Productive Land,” UN Integrated Regional Informa-tion Networks (Johannesburg), June 8, 2004, found at Internet address http://www.allafri-ca.com, retrieved June 8, 2004.
“Zimbabwe: Cotton Replaces Tobacco As Top Forex Earner,” UN Integrated Regional Informa-tion Networks (Johannesburg), May 18, 2004, found at Internet address http://www.allafri-ca.com, retrieved May 18, 2004.
“Zimbabwe: Attempts to Boost Falling Tobacco Production,” UN Integrated Regional InformationNetworks (Bulawayo), Apr. 14, 2004, found at Internet address http://www.allafrica.com, re-trieved Apr. 14, 2004.
Clive Rubin, “Africa’s New Gold Rush,” Mail & Guardian (Johannesburg), Mar. 3, 2004, found atInternet address http://www.allafrica.com, retrieved Mar. 4, 2004.
“Zimbabwe: New Sanctions Imposed by US,” UN Integrated Regional Information Networks (Jo-hannesburg), Mar. 3, 2004, found at Internet address http://www.allafrica.com, retrieved Mar.3, 2004.

APPENDIX ARequest Letters From the U.S. TradeRepresentative

A-2

A-3

A-4

A-5

A-6

APPENDIX BTrade Data

B-2

B-3
Table B-1U.S. exports, imports, and trade balance, with sub-Saharan Africa, by trading partners, 1999-2003Country 1999 2000 2001 2002 2003
DollarsAngola
Exports . . . . . . . . . . . . 251,380,604 224,914,281 274,794,271 370,825,854 482,611,741Imports . . . . . . . . . . . . 2,348,605,815 3,343,375,089 2,775,669,515 3,231,265,752 4,176,429,424Trade balance . . . . . . . -2,097,225,211 -3,118,460,808 -2,500,875,244 -2,860,439,898 -3,693,817,683
BeninExports . . . . . . . . . . . . 30,956,269 26,281,015 31,731,531 34,619,048 29,385,541Imports . . . . . . . . . . . . 17,830,197 2,237,065 1,286,336 680,272 602,399Trade balance . . . . . . . 13,126,072 24,043,950 30,445,195 33,938,776 28,783,142
BotswanaExports . . . . . . . . . . . . 33,399,297 31,165,348 43,017,365 31,500,507 24,681,865Imports . . . . . . . . . . . . 16,939,523 40,509,805 21,117,620 29,731,569 13,641,988Trade balance . . . . . . . 16,459,774 -9,344,457 21,899,745 1,768,938 11,039,877
Burkina FasoExports . . . . . . . . . . . . 10,886,863 15,669,781 4,432,168 18,742,362 10,611,915Imports . . . . . . . . . . . . 2,770,684 2,446,360 5,000,753 2,914,195 892,528Trade balance . . . . . . . 8,116,179 13,223,421 -568,585 15,828,167 9,719,387
BurundiExports . . . . . . . . . . . . 2,266,400 1,667,697 5,295,802 1,710,961 2,943,654Imports . . . . . . . . . . . . 7,003,849 7,994,937 2,788,774 689,333 5,870,408Trade balance . . . . . . . -4,737,449 -6,327,240 2,507,028 1,021,628 -2,926,754
CameroonExports . . . . . . . . . . . . 36,723,807 58,963,050 184,053,753 155,269,697 89,341,517Imports . . . . . . . . . . . . 76,572,705 145,819,782 101,627,151 172,057,111 193,319,382Trade balance . . . . . . . -39,848,898 -86,856,732 82,426,602 -16,787,414 -103,977,865
Cape VerdeExports . . . . . . . . . . . . 7,234,012 7,137,034 7,467,167 8,926,221 7,872,243Imports . . . . . . . . . . . . 75,600 4,213,567 1,495,949 1,810,742 5,639,660Trade balance . . . . . . . 7,158,412 2,923,467 5,971,218 7,115,479 2,232,583
Central African RepublicExports . . . . . . . . . . . . 3,726,770 1,752,964 3,671,103 6,243,575 7,342,800Imports . . . . . . . . . . . . 2,895,754 2,903,654 2,363,674 2,003,797 1,959,194Trade balance . . . . . . . 831,016 -1,150,690 1,307,429 4,239,778 5,383,606
ChadExports . . . . . . . . . . . . 2,683,811 10,779,527 136,466,758 126,971,198 63,522,584Imports . . . . . . . . . . . . 6,911,149 4,780,131 5,653,051 5,700,194 22,434,101Trade balance . . . . . . . -4,227,338 5,999,396 130,813,707 121,271,004 41,088,483
ComorosExports . . . . . . . . . . . . 243,437 699,150 1,371,714 143,891 508,436Imports . . . . . . . . . . . . 2,051,202 3,513,130 10,568,080 5,308,145 4,003,092Trade balance . . . . . . . -1,807,765 -2,813,980 -9,196,366 -5,164,254 -3,494,656
Congo (DROC)Exports . . . . . . . . . . . . 21,033,972 9,982,446 18,508,084 26,612,248 30,383,928Imports . . . . . . . . . . . . 231,913,414 212,239,435 147,713,471 189,691,644 173,867,468Trade balance . . . . . . . -210,879,442 -202,256,989 -129,205,387 -163,079,396 -143,483,540
Congo (ROC)Exports . . . . . . . . . . . . 46,823,518 81,199,774 89,343,835 51,792,696 78,601,102Imports . . . . . . . . . . . . 410,518,438 507,942,861 457,900,881 223,823,987 407,186,135Trade balance . . . . . . . -363,694,920 -426,743,087 -368,557,046 -172,031,291 -328,585,033
Côte d’IvoireExports . . . . . . . . . . . . 98,882,021 92,045,617 93,441,070 74,589,695 100,049,914Imports . . . . . . . . . . . . 343,487,218 367,002,332 319,823,279 381,859,529 490,247,570Trade balance . . . . . . . -244,605,197 -274,956,715 -226,382,209 -307,269,834 -390,197,656

B-4
Table B-1—ContinuedU.S. exports, imports, and trade balance, with sub-Saharan Africa, by trading partners, 1999-2003Country 1999 2000 2001 2002 2003
DollarsDjibouti
Exports . . . . . . . . . . . . 26,555,057 16,609,378 18,573,432 55,945,016 34,287,450Imports . . . . . . . . . . . . 110,152 419,099 950,571 1,915,270 615,451Trade balance . . . . . . . 26,444,905 16,190,279 17,622,861 54,029,746 33,671,999
Equatorial GuineaExports . . . . . . . . . . . . 221,050,338 94,672,721 79,557,987 107,681,184 336,019,227Imports . . . . . . . . . . . . 40,600,986 154,716,660 395,609,104 572,618,644 918,503,060Trade balance . . . . . . . 180,449,352 -60,043,939 -316,051,117 -464,937,460 -582,483,833
EritreaExports . . . . . . . . . . . . 3,697,562 16,236,047 21,428,884 28,591,422 86,488,062Imports . . . . . . . . . . . . 479,950 203,163 88,586 368,930 251,414Trade balance . . . . . . . 3,217,612 16,032,884 21,340,298 28,222,492 86,236,648
EthiopiaExports . . . . . . . . . . . . 164,297,080 165,015,512 60,659,106 60,122,513 407,353,835Imports . . . . . . . . . . . . 30,210,775 28,659,924 29,041,095 25,658,988 30,495,628Trade balance . . . . . . . 134,086,305 136,355,588 31,618,011 34,463,525 376,858,207
GabonExports . . . . . . . . . . . . 44,967,438 63,270,100 74,089,203 65,175,555 61,855,819Imports . . . . . . . . . . . . 1,512,945,075 2,037,921,091 1,731,671,117 1,622,020,949 1,927,714,991Trade balance . . . . . . . -1,467,977,637 -1,974,650,991 -1,657,581,914 -1,556,845,394 -1,865,859,172
The GambiaExports . . . . . . . . . . . . 9,495,993 8,866,814 8,163,538 9,102,842 10,588,092Imports . . . . . . . . . . . . 186,020 341,939 232,353 562,533 134,172Trade balance . . . . . . . 9,309,973 8,524,875 7,931,185 8,540,309 10,453,920
GhanaExports . . . . . . . . . . . . 231,045,490 178,711,739 179,472,853 186,601,016 204,426,210Imports . . . . . . . . . . . . 209,330,416 206,431,143 185,391,288 115,640,877 83,603,492Trade balance . . . . . . . 21,715,074 -27,719,404 -5,918,435 70,960,139 120,822,718
GuineaExports . . . . . . . . . . . . 53,435,468 66,809,924 77,619,498 62,489,353 35,280,407Imports . . . . . . . . . . . . 115,410,504 88,363,076 87,832,253 71,599,652 69,226,213Trade balance . . . . . . . -61,975,036 -21,553,152 -10,212,755 -9,110,299 -33,945,806
Guinea-BissauExports . . . . . . . . . . . . 816,074 283,849 869,909 2,558,586 1,202,972Imports . . . . . . . . . . . . 72,430 41,534 18,933 35,140 1,912,498Trade balance . . . . . . . 743,644 242,315 850,976 2,523,446 -709,526
KenyaExports . . . . . . . . . . . . 187,089,428 235,412,958 573,818,982 267,971,746 193,008,700Imports . . . . . . . . . . . . 106,143,711 109,394,035 128,582,454 189,156,457 249,137,247Trade balance . . . . . . . 80,945,717 126,018,923 445,236,528 78,815,289 -56,128,547
LesothoExports . . . . . . . . . . . . 733,027 836,981 816,942 1,817,585 5,097,676Imports . . . . . . . . . . . . 110,813,785 140,149,739 217,165,247 321,475,459 393,055,901Trade balance . . . . . . . -110,080,758 -139,312,758 -216,348,305 -319,657,874 -387,958,225
LiberiaExports . . . . . . . . . . . . 44,584,887 42,396,828 36,807,432 27,517,221 32,982,617Imports . . . . . . . . . . . . 30,522,939 45,408,107 42,558,194 45,810,442 59,485,404Trade balance . . . . . . . 14,061,948 -3,011,279 -5,750,762 -18,293,221 -26,502,787

B-5
Table B-1—ContinuedU.S. exports, imports, and trade balance, with sub-Saharan Africa, by trading partners, 1999-2003Country 1999 2000 2001 2002 2003
DollarsMadagascar
Exports . . . . . . . . . . . . 106,056,294 15,397,173 20,947,283 15,217,288 45,487,961Imports . . . . . . . . . . . . 80,213,560 157,736,805 271,791,293 215,923,206 383,328,790Trade balance . . . . . . . 25,842,734 -142,339,632 -250,844,010 -200,705,918 -337,840,829
Malawi
Exports . . . . . . . . . . . . 7,355,532 13,626,516 14,334,452 28,626,023 16,507,002Imports . . . . . . . . . . . . 58,604,188 68,125,752 71,800,334 68,109,315 80,075,679Trade balance . . . . . . . -51,248,656 -54,499,236 -57,465,882 -39,483,292 -63,568,677
Mali
Exports . . . . . . . . . . . . 28,585,582 29,740,418 31,818,350 11,031,293 29,915,614Imports . . . . . . . . . . . . 8,866,656 8,438,175 6,205,376 2,582,737 2,394,273Trade balance . . . . . . . 19,718,926 21,302,243 25,612,974 8,448,556 27,521,341
Mauritania
Exports . . . . . . . . . . . . 23,596,940 15,865,546 25,125,619 22,651,540 34,190,677Imports . . . . . . . . . . . . 753,861 354,181 293,539 928,891 929,050Trade balance . . . . . . . 22,843,079 15,511,365 24,832,080 21,722,649 33,261,627
Mauritius
Exports . . . . . . . . . . . . 32,102,550 15,447,506 22,022,185 19,397,952 23,688,707Imports . . . . . . . . . . . . 258,342,946 286,007,589 275,127,009 280,433,293 298,096,092Trade balance . . . . . . . -226,240,396 -270,560,083 -253,104,824 -261,035,341 -274,407,385
MozambiqueExports . . . . . . . . . . . . 33,847,182 57,913,095 28,326,902 97,868,588 62,339,910Imports . . . . . . . . . . . . 10,286,577 24,377,489 7,060,058 8,160,331 8,710,859Trade balance . . . . . . . 23,560,605 33,535,606 21,266,844 89,708,257 53,629,051
Namibia
Exports . . . . . . . . . . . . 194,822,292 78,447,596 249,334,301 53,687,889 26,667,849Imports . . . . . . . . . . . . 29,984,085 42,191,114 37,844,581 57,352,723 123,248,646Trade balance . . . . . . . 164,838,207 36,256,482 211,489,720 -3,664,834 -96,580,797
Niger
Exports . . . . . . . . . . . . 18,394,487 35,670,555 62,886,272 39,319,731 32,365,067Imports . . . . . . . . . . . . 4,836,858 6,971,702 1,426,658 897,131 4,034,239Trade balance . . . . . . . 13,557,629 28,698,853 61,459,614 38,422,600 28,330,828
Nigeria
Exports . . . . . . . . . . . . 624,161,311 712,599,944 947,613,868 1,046,908,082 996,453,350Imports . . . . . . . . . . . . 4,172,321,584 9,680,127,636 8,916,476,316 5,819,603,288 10,113,618,145Trade balance . . . . . . . -3,548,160,273 -8,967,527,692 -7,968,862,448 -4,772,695,206 -9,117,164,795
Rwanda
Exports . . . . . . . . . . . . 47,489,832 18,921,730 17,385,659 10,162,227 7,913,959Imports . . . . . . . . . . . . 3,685,527 5,061,286 7,220,871 3,086,211 2,622,754Trade balance . . . . . . . 43,804,305 13,860,444 10,164,788 7,076,016 5,291,205
São Tomé & PrincipeExports . . . . . . . . . . . . 510,189 961,908 10,613,575 1,921,158 1,242,995Imports . . . . . . . . . . . . 2,693,288 513,147 322,306 391,360 91,319Trade balance . . . . . . . -2,183,099 448,761 10,291,269 1,529,798 1,151,676
Senegal
Exports . . . . . . . . . . . . 62,808,134 80,183,024 78,334,256 71,961,766 98,888,156Imports . . . . . . . . . . . . 17,473,416 4,230,914 102,344,504 3,798,831 4,326,445Trade balance . . . . . . . 45,334,718 75,952,110 -24,010,248 68,162,935 94,561,711

B-6
Table B-1—ContinuedU.S. exports, imports, and trade balance, with sub-Saharan Africa, by trading partners, 1999-2003Country 1999 2000 2001 2002 2003
Dollars
Seychelles
Exports . . . . . . . . . . . . 7,547,023 6,971,295 175,959,266 8,204,220 6,947,089Imports . . . . . . . . . . . . 5,197,403 8,097,349 23,700,765 26,291,014 15,324,113Trade balance . . . . . . . 2,349,620 -1,126,054 152,258,501 -18,086,794 -8,377,024
Sierra LeoneExports . . . . . . . . . . . . 12,984,791 17,790,697 27,790,772 25,005,766 27,465,663Imports . . . . . . . . . . . . 10,334,540 3,806,067 4,640,463 3,832,840 6,477,645Trade balance . . . . . . . 2,650,251 13,984,630 23,150,309 21,172,926 20,988,018
Somalia
Exports . . . . . . . . . . . . 2,813,019 4,861,939 6,591,251 6,161,431 7,012,577Imports . . . . . . . . . . . . 191,956 442,986 343,295 348,030 183,182Trade balance . . . . . . . 2,621,063 4,418,953 6,247,956 5,813,401 6,829,395
South AfricaExports . . . . . . . . . . . . 2,393,997,972 2,829,545,616 2,822,353,542 2,446,169,057 2,698,200,796Imports . . . . . . . . . . . . 3,192,768,012 4,203,656,562 4,429,539,186 4,235,974,093 4,887,962,416Trade balance . . . . . . . -798,770,040 -1,374,110,946 -1,607,185,644 -1,789,805,036 -2,189,761,620
Sudan 8,821,290 16,882,033 17,119,103 10,854,119 26,058,541Exports . . . . . . . . . . . . 57,235 1,808,412 3,385,389 1,350,050 2,775,261Imports . . . . . . . . . . . . 8,764,055 15,073,621 13,733,714 9,504,069 23,283,280Trade balance . . . . . . .
Swaziland
Exports . . . . . . . . . . . . 3,747,598 7,740,519 7,437,663 11,039,914 8,075,049Imports . . . . . . . . . . . . 37,849,249 52,576,931 65,036,011 114,464,222 162,032,709Trade balance . . . . . . . -34,101,651 -44,836,412 -57,598,348 -103,424,308 -153,957,660
Tanzania
Exports . . . . . . . . . . . . 60,682,250 44,548,068 63,740,539 61,799,503 63,639,421Imports . . . . . . . . . . . . 34,495,270 35,287,568 27,229,207 25,343,176 24,234,441Trade balance . . . . . . . 26,186,980 9,260,500 36,511,332 36,456,327 39,404,980
Togo
Exports . . . . . . . . . . . . 25,620,176 10,480,118 16,154,125 13,008,326 13,018,883Imports . . . . . . . . . . . . 3,170,462 5,975,284 12,582,819 2,659,268 5,619,964Trade balance . . . . . . . 22,449,714 4,504,834 3,571,306 10,349,058 7,398,919
Uganda
Exports . . . . . . . . . . . . 24,518,306 26,766,160 32,150,057 22,635,364 42,239,520Imports . . . . . . . . . . . . 20,255,757 29,064,087 17,835,352 15,196,982 34,883,237Trade balance . . . . . . . 4,262,549 -2,297,927 14,314,705 7,438,382 7,356,283
Zambia
Exports . . . . . . . . . . . . 19,699,845 18,769,600 15,487,076 35,490,629 19,001,559Imports . . . . . . . . . . . . 37,857,016 17,726,954 15,584,310 7,789,882 12,468,802Trade balance . . . . . . . -18,157,171 1,042,646 -97,234 27,700,747 6,532,757
Zimbabwe
Exports . . . . . . . . . . . . 57,525,489 52,772,942 31,165,732 49,116,013 40,942,142Imports . . . . . . . . . . . . 135,072,682 113,043,235 90,559,801 99,127,252 66,675,507Trade balance . . . . . . . -77,547,193 -60,270,293 -59,394,069 -50,011,239 -25,733,365
Source: Compiled from official statistics of the U.S. Department of Commerce.

B-7
Table B-2Angola: U.S. exports, imports, and GSP/AGOA imports, by major commodity sectors, 1999-2003
Sector 1999 2000 2001 2002 2003
Change2002-03
Percent
1,000 dollarsAgricultural products
Exports . . . . . . . . . . . . . . . . . . . . . 23,083 54,767 27,960 46,288 65,325 41.1Imports . . . . . . . . . . . . . . . . . . . . . 0 0 0 0 3 naGSP/AGOA imports . . . . . . . . . . 0 0 0 0 0 na
Forest productsExports . . . . . . . . . . . . . . . . . . . . . 4,706 1,873 924 645 275 -57.3Imports . . . . . . . . . . . . . . . . . . . . . 15 0 0 0 0 naGSP/AGOA imports . . . . . . . . . . 0 0 0 0 0 na
Chemicals and related productsExports . . . . . . . . . . . . . . . . . . . . . 10,398 5,823 15,110 11,612 24,155 108.0Imports . . . . . . . . . . . . . . . . . . . . . 18,103 10,431 250 19,552 13,702 -29.9GSP/AGOA imports . . . . . . . . . . 0 0 0 0 0 na
Energy-related productsExports . . . . . . . . . . . . . . . . . . . . . 1,318 1,126 1,453 3,060 3,332 8.9Imports . . . . . . . . . . . . . . . . . . . . . 2,319,748 3,321,320 2,768,666 3,204,081 4,136,580 29.1GSP/AGOA imports . . . . . . . . . . 2,008,608 2,843,469 2,510,654 2,826,108 3,882,922 37.4
Textiles and apparelExports . . . . . . . . . . . . . . . . . . . . . 2,758 4,182 4,402 5,881 6,541 11.2Imports . . . . . . . . . . . . . . . . . . . . . 0 0 0 0 2 naGSP/AGOA imports . . . . . . . . . . 0 0 0 0 0 na
FootwearExports . . . . . . . . . . . . . . . . . . . . . 279 336 174 617 1,002 62.5Imports . . . . . . . . . . . . . . . . . . . . . 0 0 0 0 0 naGSP/AGOA imports . . . . . . . . . . 0 0 0 0 0 na
Minerals and metalsExports . . . . . . . . . . . . . . . . . . . . . 16,705 11,265 20,004 14,570 29,650 103.5Imports . . . . . . . . . . . . . . . . . . . . . 9,286 6,929 0 39 20,647 52,705.6GSP/AGOA imports . . . . . . . . . . 0 205 0 6 0 -100.0
MachineryExports . . . . . . . . . . . . . . . . . . . . . 41,698 33,080 36,195 21,909 31,362 43.1Imports . . . . . . . . . . . . . . . . . . . . . 0 6 77 53 64 19.9GSP/AGOA imports . . . . . . . . . . 0 3 3 0 17 na
Transportation equipmentExports . . . . . . . . . . . . . . . . . . . . . 126,921 78,523 147,604 241,499 279,951 15.9Imports . . . . . . . . . . . . . . . . . . . . . 68 32 3 2,571 5 -99.8GSP/AGOA imports . . . . . . . . . . 0 0 0 0 0 na
Electronic productsExports . . . . . . . . . . . . . . . . . . . . . 17,996 27,169 14,580 15,609 26,622 70.6Imports . . . . . . . . . . . . . . . . . . . . . 18 109 480 334 452 35.3GSP/AGOA imports . . . . . . . . . . 0 0 364 7 9 18.5
Miscellaneous manufacturesExports . . . . . . . . . . . . . . . . . . . . . 883 690 983 662 1,998 201.7Imports . . . . . . . . . . . . . . . . . . . . . 206 58 329 5 100 1,893.3GSP/AGOA imports . . . . . . . . . . 0 0 0 0 0 na
Special provisionsExports . . . . . . . . . . . . . . . . . . . . . 4,634 6,079 5,406 8,473 12,400 46.3Imports . . . . . . . . . . . . . . . . . . . . . 1,162 4,489 5,865 4,630 4,876 5.3GSP/AGOA imports . . . . . . . . . . 0 0 0 0 0 na
All sectorsExports . . . . . . . . . . . . . . . . . . . . . 251,381 224,914 274,794 370,826 482,612 30.1Imports . . . . . . . . . . . . . . . . . . . . . 2,348,606 3,343,375 2,775,670 3,231,266 4,176,429 29.3GSP/AGOA imports . . . . . . . . . . 2,008,608 2,843,677 2,511,022 2,826,122 3,882,948 37.4
See footnote at end of table.

B-8
Table B-2-ContinuedBenin: U.S. exports, imports, and GSP/AGOA imports, by major commodity sectors, 1999-2003
Sector 1999 2000 2001 2002 2003
Change2002-03
Percent
1,000 dollarsAgricultural products
Exports . . . . . . . . . . . . . . . . . . . . . 2,322 3,949 4,488 5,165 4,084 -20.9Imports . . . . . . . . . . . . . . . . . . . . . 15,269 597 707 517 313 -39.4GSP/AGOA imports . . . . . . . . . . 9,572 0 0 0 0 na
Forest productsExports . . . . . . . . . . . . . . . . . . . . . 95 378 96 149 116 -22.2Imports . . . . . . . . . . . . . . . . . . . . . 140 142 266 67 94 41.3GSP/AGOA imports . . . . . . . . . . 110 0 178 0 0 na
Chemicals and related productsExports . . . . . . . . . . . . . . . . . . . . . 4,635 3,626 3,041 2,543 1,923 -24.4Imports . . . . . . . . . . . . . . . . . . . . . 0 0 0 0 0 naGSP/AGOA imports . . . . . . . . . . 0 0 0 0 0 na
Energy-related productsExports . . . . . . . . . . . . . . . . . . . . . 9 0 48 14 6 -58.1Imports . . . . . . . . . . . . . . . . . . . . . 2,106 1,410 0 0 0 naGSP/AGOA imports . . . . . . . . . . 2,106 1,410 0 0 0 na
Textiles and apparelExports . . . . . . . . . . . . . . . . . . . . . 14,172 11,122 7,392 6,101 4,668 -23.5Imports . . . . . . . . . . . . . . . . . . . . . 92 5 33 1 159 22,603.9GSP/AGOA imports . . . . . . . . . . 0 0 0 0 0 na
FootwearExports . . . . . . . . . . . . . . . . . . . . . 60 93 86 225 132 -41.3Imports . . . . . . . . . . . . . . . . . . . . . 0 0 0 0 0 naGSP/AGOA imports . . . . . . . . . . 0 0 0 0 0 na
Minerals and metalsExports . . . . . . . . . . . . . . . . . . . . . 112 140 4,835 4,329 517 -88.1Imports . . . . . . . . . . . . . . . . . . . . . 176 4 0 78 7 -90.4GSP/AGOA imports . . . . . . . . . . 0 4 0 0 0 na
MachineryExports . . . . . . . . . . . . . . . . . . . . . 2,747 1,555 1,217 4,021 3,618 -10.0Imports . . . . . . . . . . . . . . . . . . . . . 0 0 0 0 0 naGSP/AGOA imports . . . . . . . . . . 0 0 0 0 0 na
Transportation equipmentExports . . . . . . . . . . . . . . . . . . . . . 3,474 1,866 3,177 7,653 11,831 54.6Imports . . . . . . . . . . . . . . . . . . . . . 0 0 0 0 0 naGSP/AGOA imports . . . . . . . . . . 0 0 0 0 0 na
Electronic productsExports . . . . . . . . . . . . . . . . . . . . . 1,288 2,231 6,696 3,534 1,486 -57.9Imports . . . . . . . . . . . . . . . . . . . . . 0 5 0 0 0 naGSP/AGOA imports . . . . . . . . . . 0 0 0 0 0 na
Miscellaneous manufacturesExports . . . . . . . . . . . . . . . . . . . . . 683 178 173 133 160 21.0Imports . . . . . . . . . . . . . . . . . . . . . 29 24 23 18 29 55.6GSP/AGOA imports . . . . . . . . . . 0 0 0 0 0 na
Special provisionsExports . . . . . . . . . . . . . . . . . . . . . 1,360 1,143 482 753 844 12.1Imports . . . . . . . . . . . . . . . . . . . . . 18 51 258 0 0 naGSP/AGOA imports . . . . . . . . . . 0 0 0 0 0 na
All sectorsExports . . . . . . . . . . . . . . . . . . . . . 30,956 26,281 31,732 34,619 29,386 -15.1Imports . . . . . . . . . . . . . . . . . . . . . 17,830 2,237 1,286 680 602 -11.4GSP/AGOA imports . . . . . . . . . . 11,788 1,414 178 0 0 na
See footnote at end of table.

B-9
Table B-2-ContinuedBotswana: U.S. exports, imports, and GSP/AGOA imports, by major commodity sectors, 1999-2003
Sector 1999 2000 2001 2002 2003
Change2002-03
Percent
1,000 dollarsAgricultural products
Exports . . . . . . . . . . . . . . . . . . . . . 1,345 1,301 1,026 20 8 -58.4Imports . . . . . . . . . . . . . . . . . . . . . 12 29 122 180 23 -87.0GSP/AGOA imports . . . . . . . . . . 10 28 19 38 0 -100.0
Forest productsExports . . . . . . . . . . . . . . . . . . . . . 155 824 1,157 160 401 150.4Imports . . . . . . . . . . . . . . . . . . . . . 14 10 11 3 34 903.1GSP/AGOA imports . . . . . . . . . . 11 5 0 0 0 na
Chemicals and related productsExports . . . . . . . . . . . . . . . . . . . . . 292 431 701 300 403 34.6Imports . . . . . . . . . . . . . . . . . . . . . 0 0 2 6 4 -29.3GSP/AGOA imports . . . . . . . . . . 0 0 2 0 0 na
Energy-related productsExports . . . . . . . . . . . . . . . . . . . . . 0 10 0 55 55 1.3Imports . . . . . . . . . . . . . . . . . . . . . 0 0 0 0 0 naGSP/AGOA imports . . . . . . . . . . 0 0 0 0 0 na
Textiles and apparelExports . . . . . . . . . . . . . . . . . . . . . 156 378 53 82 10 -87.4Imports . . . . . . . . . . . . . . . . . . . . . 9,763 7,941 2,936 6,353 7,144 12.5GSP/AGOA imports . . . . . . . . . . 0 (1) 0 3,707 6,324 70.6
FootwearExports . . . . . . . . . . . . . . . . . . . . . 0 0 0 18 0 -100.0Imports . . . . . . . . . . . . . . . . . . . . . 0 0 0 0 91 naGSP/AGOA imports . . . . . . . . . . 0 0 0 0 0 na
Minerals and metalsExports . . . . . . . . . . . . . . . . . . . . . 346 614 459 1,257 106 -91.6Imports . . . . . . . . . . . . . . . . . . . . . 1,337 1,201 15,580 21,453 6,037 -71.9GSP/AGOA imports . . . . . . . . . . 0 0 0 98 0 -100.0
MachineryExports . . . . . . . . . . . . . . . . . . . . . 962 273 472 457 496 8.6Imports . . . . . . . . . . . . . . . . . . . . . 3 272 76 0 27 naGSP/AGOA imports . . . . . . . . . . 0 0 8 0 0 na
Transportation equipmentExports . . . . . . . . . . . . . . . . . . . . . 13,545 5,189 13,766 6,862 5,076 -26.0Imports . . . . . . . . . . . . . . . . . . . . . 0 0 0 0 2 naGSP/AGOA imports . . . . . . . . . . 0 0 0 0 0 na
Electronic productsExports . . . . . . . . . . . . . . . . . . . . . 3,412 6,895 6,944 5,664 5,443 -3.9Imports . . . . . . . . . . . . . . . . . . . . . 17 8 0 0 42 naGSP/AGOA imports . . . . . . . . . . 0 0 0 0 0 na
Miscellaneous manufacturesExports . . . . . . . . . . . . . . . . . . . . . 23 309 141 172 121 -29.3Imports . . . . . . . . . . . . . . . . . . . . . 5,295 2,980 1,742 1,414 8 -99.5GSP/AGOA imports . . . . . . . . . . 4,804 2,889 1,191 735 0 -100.0
Special provisionsExports . . . . . . . . . . . . . . . . . . . . . 13,163 14,940 18,297 16,454 12,562 -23.7Imports . . . . . . . . . . . . . . . . . . . . . 498 28,068 649 322 230 -28.6GSP/AGOA imports 0 0 0 0 0 na
All sectorsExports . . . . . . . . . . . . . . . . . . . . . 33,399 31,165 43,017 31,501 24,682 -21.6Imports . . . . . . . . . . . . . . . . . . . . . 16,940 40,510 21,118 29,732 13,642 -54.1GSP/AGOA imports . . . . . . . . . . 4,824 2,922 1,221 4,578 6,324 38.1
See footnote at end of table.

B-10
Table B-2-ContinuedBurkina Faso: U.S. exports, imports, and GSP/AGOA imports, by major commodity sectors, 1999-2003
Sector 1999 2000 2001 2002 2003
Change2002-03
Percent
1,000 dollarsAgricultural products
Exports . . . . . . . . . . . . . . . . . . . . . 6,006 5,025 1,427 7,228 2,927 -59.5Imports . . . . . . . . . . . . . . . . . . . . . 2,455 1,839 79 55 449 718.7GSP/AGOA imports . . . . . . . . . . 0 1,839 8 0 67 na
Forest productsExports . . . . . . . . . . . . . . . . . . . . . 133 192 130 74 25 -66.1Imports . . . . . . . . . . . . . . . . . . . . . 17 112 41 39 60 54.6GSP/AGOA imports . . . . . . . . . . 17 96 33 37 33 -11.3
Chemicals and related products:Exports . . . . . . . . . . . . . . . . . . . . . 81 114 51 110 1,120 916.9Imports . . . . . . . . . . . . . . . . . . . . . 1 32 5 2 0 -100.0GSP/AGOA imports . . . . . . . . . . 0 0 0 0 0 na
Energy-related productsExports . . . . . . . . . . . . . . . . . . . . . 0 0 46 52 162 212.5Imports . . . . . . . . . . . . . . . . . . . . . 0 0 0 0 0 naGSP/AGOA imports . . . . . . . . . . 0 0 0 0 0 na
Textiles and apparelExports . . . . . . . . . . . . . . . . . . . . . 2,871 1,821 706 1,295 1,329 2.6Imports . . . . . . . . . . . . . . . . . . . . . 35 39 9 120 5 -95.6GSP/AGOA imports . . . . . . . . . . 7 8 3 0 (1) na
FootwearExports . . . . . . . . . . . . . . . . . . . . . 0 66 0 0 268 naImports . . . . . . . . . . . . . . . . . . . . . 0 1 0 0 0 naGSP/AGOA imports . . . . . . . . . . 0 0 0 0 0 na
Minerals and metalsExports . . . . . . . . . . . . . . . . . . . . . 12 37 447 48 84 76.5Imports . . . . . . . . . . . . . . . . . . . . . 5 58 13 2,274 25 -98.9GSP/AGOA imports . . . . . . . . . . 5 3 0 5 0 -100.0
MachineryExports . . . . . . . . . . . . . . . . . . . . . 518 659 171 4,420 1,049 -76.3Imports . . . . . . . . . . . . . . . . . . . . . 0 2 0 17 71 324.9GSP/AGOA imports . . . . . . . . . . 0 0 0 0 0 na
Transportation equipmentExports . . . . . . . . . . . . . . . . . . . . . 120 6,397 121 106 150 41.1Imports . . . . . . . . . . . . . . . . . . . . . 0 0 0 3 0 -100.0GSP/AGOA imports . . . . . . . . . . 0 0 0 0 0 na
Electronic productsExports . . . . . . . . . . . . . . . . . . . . . 634 656 849 1,099 2,116 92.6Imports . . . . . . . . . . . . . . . . . . . . . 0 4 3 0 0 naGSP/AGOA imports . . . . . . . . . . 0 0 0 0 0 na
Miscellaneous manufacturesExports . . . . . . . . . . . . . . . . . . . . . 31 40 143 133 9 -93.3Imports . . . . . . . . . . . . . . . . . . . . . 246 273 120 297 249 -16.1GSP/AGOA imports . . . . . . . . . . 47 24 50 11 5 -53.1
Special provisionsExports . . . . . . . . . . . . . . . . . . . . . 482 662 343 4,177 1,373 -67.1Imports . . . . . . . . . . . . . . . . . . . . . 13 86 4,731 107 32 -70.2GSP/AGOA imports . . . . . . . . . . 0 0 0 0 0 na
All sectorsExports . . . . . . . . . . . . . . . . . . . . . 10,887 15,670 4,432 18,742 10,612 -43.4Imports . . . . . . . . . . . . . . . . . . . . . 2,771 2,446 5,001 2,914 893 -69.4GSP/AGOA imports . . . . . . . . . . 76 1,970 94 52 105 101.3
See footnote at end of table.

B-11
Table B-2-ContinuedBurundi: U.S. exports, imports, and GSP/AGOA imports, by major commodity sectors, 1999-2003
Sector 1999 2000 2001 2002 2003
Change2002-03
Percent
1,000 dollarsAgricultural products:
Exports . . . . . . . . . . . . . . . . . . . . . 400 86 2,650 20 1,627 7,979.7Imports . . . . . . . . . . . . . . . . . . . . . 5,913 7,791 2,454 678 5,843 761.8GSP/AGOA imports . . . . . . . . . . 7 0 0 0 0 na
Forest products:Exports . . . . . . . . . . . . . . . . . . . . . 0 15 72 35 0 -100.0Imports . . . . . . . . . . . . . . . . . . . . . 2 0 2 0 0 naGSP/AGOA imports . . . . . . . . . . 0 0 0 0 0 na
Chemicals and related productsExports . . . . . . . . . . . . . . . . . . . . . 86 89 60 16 188 1,094.4Imports . . . . . . . . . . . . . . . . . . . . . 35 29 0 0 0 naGSP/AGOA imports . . . . . . . . . . 0 0 0 0 0 na
Energy-related productsExports . . . . . . . . . . . . . . . . . . . . . 0 0 17 38 0 -100.0Imports . . . . . . . . . . . . . . . . . . . . . 833 0 0 0 0 naGSP/AGOA imports . . . . . . . . . . 0 0 0 0 0 na
Textiles and apparelExports . . . . . . . . . . . . . . . . . . . . . 241 17 61 28 54 96.3Imports . . . . . . . . . . . . . . . . . . . . . 0 8 (1) 8 1 -89.2GSP/AGOA imports . . . . . . . . . . 0 0 0 0 0 na
FootwearExports . . . . . . . . . . . . . . . . . . . . . 0 0 0 3 0 -100.0Imports . . . . . . . . . . . . . . . . . . . . . 0 0 0 0 0 naGSP/AGOA imports . . . . . . . . . . 0 0 0 0 0 na
Minerals and metalsExports . . . . . . . . . . . . . . . . . . . . . 9 4 20 62 3 -95.9Imports . . . . . . . . . . . . . . . . . . . . . 186 12 0 0 0 naGSP/AGOA imports . . . . . . . . . . 0 0 0 0 0 na
MachineryExports . . . . . . . . . . . . . . . . . . . . . 293 40 175 181 64 -64.9Imports . . . . . . . . . . . . . . . . . . . . . 0 0 0 0 0 naGSP/AGOA imports . . . . . . . . . . 0 0 0 0 0 na
Transportation equipmentExports . . . . . . . . . . . . . . . . . . . . . 23 1,064 915 359 39 -89.1Imports . . . . . . . . . . . . . . . . . . . . . 0 0 0 0 0 naGSP/AGOA imports . . . . . . . . . . 0 0 0 0 0 na
Electronic productsExports . . . . . . . . . . . . . . . . . . . . . 293 315 377 409 303 -25.8Imports . . . . . . . . . . . . . . . . . . . . . 5 48 57 0 0 naGSP/AGOA imports . . . . . . . . . . 0 0 0 0 0 na
Miscellaneous manufacturesExports . . . . . . . . . . . . . . . . . . . . . 13 7 20 138 37 -72.9Imports . . . . . . . . . . . . . . . . . . . . . 0 0 46 0 1 naGSP/AGOA imports . . . . . . . . . . 0 0 0 0 0 na
Special provisionsExports . . . . . . . . . . . . . . . . . . . . . 909 30 929 422 628 48.9Imports . . . . . . . . . . . . . . . . . . . . . 30 106 229 3 25 620.2GSP/AGOA imports . . . . . . . . . . 0 0 0 0 0 na
All sectorsExports . . . . . . . . . . . . . . . . . . . . . 2,266 1,668 5,296 1,711 2,944 72.0Imports . . . . . . . . . . . . . . . . . . . . . 7,004 7,995 2,789 689 5,870 751.6GSP/AGOA imports . . . . . . . . . . 7 0 0 0 0 na
See footnote at end of table.

B-12
Table B-2-ContinuedCameroon: U.S. exports, imports, and GSP/AGOA imports, by major commodity sectors, 1999-2003
Sector 1999 2000 2001 2002 2003
Change2002-03
Percent
1,000 dollarsAgricultural products
Exports . . . . . . . . . . . . . . . . . . . . . 8,033 5,596 1,600 4,044 10,512 160.0Imports . . . . . . . . . . . . . . . . . . . . . 7,319 8,354 3,881 15,880 19,301 21.5GSP/AGOA imports . . . . . . . . . . 424 2,646 164 8 38 359.1
Forest productsExports . . . . . . . . . . . . . . . . . . . . . 970 2,281 1,369 472 429 -9.0Imports . . . . . . . . . . . . . . . . . . . . . 5,169 10,020 8,015 8,270 9,476 14.6GSP/AGOA imports . . . . . . . . . . 64 71 160 168 194 15.3
Chemicals and related productsExports . . . . . . . . . . . . . . . . . . . . . 1,830 8,288 6,772 7,236 11,451 58.3Imports . . . . . . . . . . . . . . . . . . . . . 7,026 3,028 2,199 3,127 5,219 66.9GSP/AGOA imports . . . . . . . . . . 0 25 48 0 0 na
Energy-related productsExports . . . . . . . . . . . . . . . . . . . . . 8,308 6,011 5,635 7,817 4,720 -39.6Imports . . . . . . . . . . . . . . . . . . . . . 48,906 118,415 83,031 138,811 146,746 5.7GSP/AGOA imports . . . . . . . . . . 0 0 36,731 115,542 146,746 27.0
Textiles and apparelExports . . . . . . . . . . . . . . . . . . . . . 813 434 645 833 881 5.8Imports . . . . . . . . . . . . . . . . . . . . . 3,097 2,740 1,842 1,133 346 -69.5GSP/AGOA imports . . . . . . . . . . 0 0 0 1 0 -100.0
FootwearExports . . . . . . . . . . . . . . . . . . . . . 104 888 635 499 386 -22.7Imports . . . . . . . . . . . . . . . . . . . . . 1,401 141 14 192 123 -35.9GSP/AGOA imports . . . . . . . . . . 0 0 0 0 0 na
Minerals and metalsExports . . . . . . . . . . . . . . . . . . . . . 563 1,100 3,835 4,053 4,701 16.0Imports . . . . . . . . . . . . . . . . . . . . . 724 71 201 242 233 -3.8GSP/AGOA imports . . . . . . . . . . 0 9 23 5 4 -20.0
MachineryExports . . . . . . . . . . . . . . . . . . . . . 4,331 5,851 8,880 25,688 12,459 -51.5Imports . . . . . . . . . . . . . . . . . . . . . 19 202 117 295 243 -17.7GSP/AGOA imports . . . . . . . . . . 7 0 0 0 0 na
Transportation equipmentExports . . . . . . . . . . . . . . . . . . . . . 7,418 21,483 143,917 94,984 27,866 -70.7Imports . . . . . . . . . . . . . . . . . . . . . 69 15 18 2 33 1,515.2GSP/AGOA imports . . . . . . . . . . 0 0 0 0 0 na
Electronic productsExports . . . . . . . . . . . . . . . . . . . . . 2,861 5,559 6,842 6,349 11,172 76.0Imports . . . . . . . . . . . . . . . . . . . . . 1,159 968 268 1,225 3,684 200.7GSP/AGOA imports . . . . . . . . . . 15 0 0 0 0 na
Miscellaneous manufacturesExports . . . . . . . . . . . . . . . . . . . . . 267 276 2,878 1,563 453 -71.0Imports . . . . . . . . . . . . . . . . . . . . . 1,473 1,048 800 1,484 2,637 77.7GSP/AGOA imports . . . . . . . . . . 64 52 48 79 29 -63.8
Special provisionsExports . . . . . . . . . . . . . . . . . . . . . 1,226 1,197 1,046 1,733 4,312 148.8Imports . . . . . . . . . . . . . . . . . . . . . 211 815 1,240 1,395 5,280 278.4GSP/AGOA imports . . . . . . . . . . 0 0 0 0 0 na
All sectorsExports . . . . . . . . . . . . . . . . . . . . . 36,724 58,963 184,054 155,270 89,342 -42.5Imports . . . . . . . . . . . . . . . . . . . . . 76,573 145,820 101,627 172,057 193,319 12.4GSP/AGOA imports . . . . . . . . . . 574 2,804 37,174 115,804 147,011 26.9
See footnote at end of table.

B-13
Table B-2-ContinuedCape Verde: U.S. exports, imports, and GSP/AGOA imports, by major commodity sectors, 1999-2003
Sector 1999 2000 2001 2002 2003
Change2002-03
Percent
1,000 dollarsAgricultural products
Exports . . . . . . . . . . . . . . . . . . . . . 3,578 1,794 995 2,009 3,247 61.6Imports . . . . . . . . . . . . . . . . . . . . . 49 92 249 83 127 53.2GSP/AGOA imports . . . . . . . . . . 49 0 152 51 60 17.8
Forest productsExports . . . . . . . . . . . . . . . . . . . . . 3 46 4 0 53 naImports . . . . . . . . . . . . . . . . . . . . . 0 0 0 0 0 naGSP/AGOA imports . . . . . . . . . . 0 0 0 0 0 na
Chemicals and related productsExports . . . . . . . . . . . . . . . . . . . . . 164 7 94 6 23 288.1Imports . . . . . . . . . . . . . . . . . . . . . 0 6 0 0 0 naGSP/AGOA imports . . . . . . . . . . 0 0 0 0 0 na
Energy-related productsExports . . . . . . . . . . . . . . . . . . . . . 0 0 0 590 249 -57.8Imports . . . . . . . . . . . . . . . . . . . . . 0 2,760 0 0 0 naGSP/AGOA imports . . . . . . . . . . 0 0 0 0 0 na
Textiles and apparelExports . . . . . . . . . . . . . . . . . . . . . 28 0 5 57 9 -83.5Imports . . . . . . . . . . . . . . . . . . . . . 9 877 1,201 1,651 2,892 75.2GSP/AGOA imports . . . . . . . . . . (1) 0 0 0 2,405 na
FootwearExports . . . . . . . . . . . . . . . . . . . . . 0 0 0 0 63 naImports . . . . . . . . . . . . . . . . . . . . . 0 0 0 3 23 606.0GSP/AGOA imports . . . . . . . . . . 0 0 0 0 0 na
Minerals and metalsExports . . . . . . . . . . . . . . . . . . . . . 0 79 4 0 0 naImports . . . . . . . . . . . . . . . . . . . . . 0 0 11 0 6 naGSP/AGOA imports . . . . . . . . . . 0 0 0 0 0 na
MachineryExports . . . . . . . . . . . . . . . . . . . . . 901 24 4 49 19 -61.0Imports . . . . . . . . . . . . . . . . . . . . . 0 0 0 7 49 572.6GSP/AGOA imports . . . . . . . . . . 0 0 0 0 0 na
Transportation equipmentExports . . . . . . . . . . . . . . . . . . . . . 720 3,856 5,556 5,163 2,652 -48.6Imports . . . . . . . . . . . . . . . . . . . . . 0 0 0 0 16 naGSP/AGOA imports . . . . . . . . . . 0 0 0 0 0 na
Electronic productsExports . . . . . . . . . . . . . . . . . . . . . 557 520 262 469 188 -59.9Imports . . . . . . . . . . . . . . . . . . . . . 18 0 31 24 880 3,530.4GSP/AGOA imports . . . . . . . . . . 0 0 0 0 0 na
Miscellaneous manufacturesExports . . . . . . . . . . . . . . . . . . . . . 70 19 15 5 3 -39.9Imports . . . . . . . . . . . . . . . . . . . . . 0 414 0 38 3 -92.2GSP/AGOA imports . . . . . . . . . . 0 0 0 0 0 na
Special provisionsExports . . . . . . . . . . . . . . . . . . . . . 1,213 792 528 579 1,366 136.0Imports . . . . . . . . . . . . . . . . . . . . . 0 64 3 3 1,644 48,666.0GSP/AGOA imports . . . . . . . . . . 0 0 0 0 0 na
All sectorsExports . . . . . . . . . . . . . . . . . . . . . 7,234 7,137 7,467 8,926 7,872 -11.8Imports . . . . . . . . . . . . . . . . . . . . . 76 4,214 1,496 1,811 5,640 211.5GSP/AGOA imports . . . . . . . . . . 49 0 152 51 2,465 4,771.5
See footnote at end of table.

B-14
Table B-2-ContinuedCentral African Republic: U.S. exports, imports, and GSP/AGOA imports, by major commodity sectors, 1999-2003
Sector 1999 2000 2001 2002 2003
Change2002-03
Percent
1,000 dollarsAgricultural products
Exports . . . . . . . . . . . . . . . . . . . . . 260 0 16 1,875 2,244 19.7Imports . . . . . . . . . . . . . . . . . . . . . 2,589 1,928 458 337 0 -100.0GSP/AGOA imports . . . . . . . . . . 14 0 0 0 0 na
Forest productsExports . . . . . . . . . . . . . . . . . . . . . 75 269 493 71 185 160.7Imports . . . . . . . . . . . . . . . . . . . . . 0 0 34 69 3 -95.5GSP/AGOA imports . . . . . . . . . . 0 0 0 0 0 na
Chemicals and related productsExports . . . . . . . . . . . . . . . . . . . . . 15 100 98 455 1,245 173.6Imports . . . . . . . . . . . . . . . . . . . . . 25 8 127 133 79 -40.8GSP/AGOA imports . . . . . . . . . . 21 8 0 0 0 na
Energy-related productsExports . . . . . . . . . . . . . . . . . . . . . 0 0 20 4 42 1,079.7Imports . . . . . . . . . . . . . . . . . . . . . 0 0 0 0 0 naGSP/AGOA imports . . . . . . . . . . 0 0 0 0 0 na
Textiles and apparelExports . . . . . . . . . . . . . . . . . . . . . 170 59 48 65 134 103.9Imports . . . . . . . . . . . . . . . . . . . . . 1 39 188 21 2 -91.2GSP/AGOA imports . . . . . . . . . . 0 0 0 0 0 na
FootwearExports . . . . . . . . . . . . . . . . . . . . . 0 0 0 5 6 26.7Imports . . . . . . . . . . . . . . . . . . . . . 0 0 0 0 0 naGSP/AGOA imports . . . . . . . . . . 0 0 0 0 0 na
Minerals and metalsExports . . . . . . . . . . . . . . . . . . . . . 363 354 31 811 125 -84.6Imports . . . . . . . . . . . . . . . . . . . . . 24 640 1,414 1,107 946 -14.6GSP/AGOA imports . . . . . . . . . . 0 5 0 0 0 na
MachineryExports . . . . . . . . . . . . . . . . . . . . . 1,066 262 296 804 652 -18.9Imports . . . . . . . . . . . . . . . . . . . . . 2 4 26 48 99 106.7GSP/AGOA imports . . . . . . . . . . 0 0 0 0 0 na
Transportation equipmentExports . . . . . . . . . . . . . . . . . . . . . 345 68 716 713 905 27.0Imports . . . . . . . . . . . . . . . . . . . . . 10 0 15 0 39 naGSP/AGOA imports . . . . . . . . . . 0 0 0 0 0 na
Electronic productsExports . . . . . . . . . . . . . . . . . . . . . 898 374 1,519 676 443 -34.5Imports . . . . . . . . . . . . . . . . . . . . . 0 18 38 62 514 726.9GSP/AGOA imports . . . . . . . . . . 0 0 0 0 0 na
Miscellaneous manufacturesExports . . . . . . . . . . . . . . . . . . . . . 0 0 13 170 326 91.7Imports . . . . . . . . . . . . . . . . . . . . . 67 65 0 197 165 -16.2GSP/AGOA imports . . . . . . . . . . 49 0 0 192 43 -77.5
Special provisionsExports . . . . . . . . . . . . . . . . . . . . . 534 267 423 594 1,037 74.4Imports . . . . . . . . . . . . . . . . . . . . . 177 202 64 29 111 286.5GSP/AGOA imports . . . . . . . . . . 0 0 0 0 0 na
All sectorsExports . . . . . . . . . . . . . . . . . . . . . 3,727 1,753 3,671 6,244 7,343 17.6Imports . . . . . . . . . . . . . . . . . . . . . 2,896 2,904 2,364 2,004 1,959 -2.2GSP/AGOA imports . . . . . . . . . . 83 13 0 192 43 -77.5
See footnote at end of table.
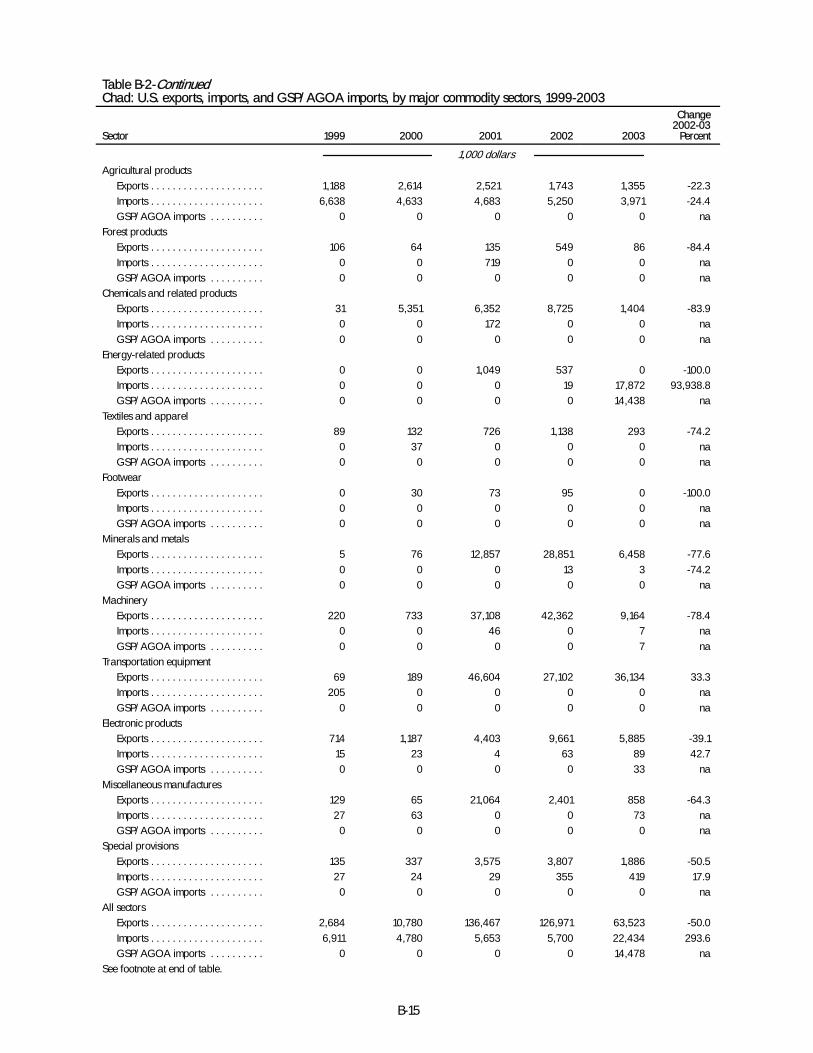
B-15
Table B-2-ContinuedChad: U.S. exports, imports, and GSP/AGOA imports, by major commodity sectors, 1999-2003
Sector 1999 2000 2001 2002 2003
Change2002-03
Percent
1,000 dollarsAgricultural products
Exports . . . . . . . . . . . . . . . . . . . . . 1,188 2,614 2,521 1,743 1,355 -22.3Imports . . . . . . . . . . . . . . . . . . . . . 6,638 4,633 4,683 5,250 3,971 -24.4GSP/AGOA imports . . . . . . . . . . 0 0 0 0 0 na
Forest productsExports . . . . . . . . . . . . . . . . . . . . . 106 64 135 549 86 -84.4Imports . . . . . . . . . . . . . . . . . . . . . 0 0 719 0 0 naGSP/AGOA imports . . . . . . . . . . 0 0 0 0 0 na
Chemicals and related productsExports . . . . . . . . . . . . . . . . . . . . . 31 5,351 6,352 8,725 1,404 -83.9Imports . . . . . . . . . . . . . . . . . . . . . 0 0 172 0 0 naGSP/AGOA imports . . . . . . . . . . 0 0 0 0 0 na
Energy-related productsExports . . . . . . . . . . . . . . . . . . . . . 0 0 1,049 537 0 -100.0Imports . . . . . . . . . . . . . . . . . . . . . 0 0 0 19 17,872 93,938.8GSP/AGOA imports . . . . . . . . . . 0 0 0 0 14,438 na
Textiles and apparelExports . . . . . . . . . . . . . . . . . . . . . 89 132 726 1,138 293 -74.2Imports . . . . . . . . . . . . . . . . . . . . . 0 37 0 0 0 naGSP/AGOA imports . . . . . . . . . . 0 0 0 0 0 na
FootwearExports . . . . . . . . . . . . . . . . . . . . . 0 30 73 95 0 -100.0Imports . . . . . . . . . . . . . . . . . . . . . 0 0 0 0 0 naGSP/AGOA imports . . . . . . . . . . 0 0 0 0 0 na
Minerals and metalsExports . . . . . . . . . . . . . . . . . . . . . 5 76 12,857 28,851 6,458 -77.6Imports . . . . . . . . . . . . . . . . . . . . . 0 0 0 13 3 -74.2GSP/AGOA imports . . . . . . . . . . 0 0 0 0 0 na
MachineryExports . . . . . . . . . . . . . . . . . . . . . 220 733 37,108 42,362 9,164 -78.4Imports . . . . . . . . . . . . . . . . . . . . . 0 0 46 0 7 naGSP/AGOA imports . . . . . . . . . . 0 0 0 0 7 na
Transportation equipmentExports . . . . . . . . . . . . . . . . . . . . . 69 189 46,604 27,102 36,134 33.3Imports . . . . . . . . . . . . . . . . . . . . . 205 0 0 0 0 naGSP/AGOA imports . . . . . . . . . . 0 0 0 0 0 na
Electronic productsExports . . . . . . . . . . . . . . . . . . . . . 714 1,187 4,403 9,661 5,885 -39.1Imports . . . . . . . . . . . . . . . . . . . . . 15 23 4 63 89 42.7GSP/AGOA imports . . . . . . . . . . 0 0 0 0 33 na
Miscellaneous manufacturesExports . . . . . . . . . . . . . . . . . . . . . 129 65 21,064 2,401 858 -64.3Imports . . . . . . . . . . . . . . . . . . . . . 27 63 0 0 73 naGSP/AGOA imports . . . . . . . . . . 0 0 0 0 0 na
Special provisionsExports . . . . . . . . . . . . . . . . . . . . . 135 337 3,575 3,807 1,886 -50.5Imports . . . . . . . . . . . . . . . . . . . . . 27 24 29 355 419 17.9GSP/AGOA imports . . . . . . . . . . 0 0 0 0 0 na
All sectorsExports . . . . . . . . . . . . . . . . . . . . . 2,684 10,780 136,467 126,971 63,523 -50.0Imports . . . . . . . . . . . . . . . . . . . . . 6,911 4,780 5,653 5,700 22,434 293.6GSP/AGOA imports . . . . . . . . . . 0 0 0 0 14,478 na
See footnote at end of table.

B-16
Table B-2-ContinuedComoros: U.S. exports, imports, and GSP/AGOA imports, by major commodity sectors, 1999-2003
Sector 1999 2000 2001 2002 2003
Change2002-03
Percent
1,000 dollarsAgricultural products
Exports . . . . . . . . . . . . . . . . . . . . . 41 0 17 0 0 naImports . . . . . . . . . . . . . . . . . . . . . 1,653 3,232 10,367 5,223 3,895 -25.4GSP/AGOA imports . . . . . . . . . . 0 0 0 0 0 na
Forest productsExports . . . . . . . . . . . . . . . . . . . . . 0 0 0 0 9 naImports . . . . . . . . . . . . . . . . . . . . . 0 0 6 0 0 naGSP/AGOA imports . . . . . . . . . . 0 0 0 0 0 na
Chemicals and related productsExports . . . . . . . . . . . . . . . . . . . . . 16 180 189 29 450 1,464.0Imports . . . . . . . . . . . . . . . . . . . . . 71 274 168 25 94 278.2GSP/AGOA imports . . . . . . . . . . 0 0 0 0 0 na
Energy-related productsExports . . . . . . . . . . . . . . . . . . . . . 0 0 0 40 0 -100.0Imports . . . . . . . . . . . . . . . . . . . . . 316 0 0 0 0 naGSP/AGOA imports . . . . . . . . . . 0 0 0 0 0 na
Textiles and apparelExports . . . . . . . . . . . . . . . . . . . . . 63 4 0 14 0 -100.0Imports . . . . . . . . . . . . . . . . . . . . . 0 0 0 13 0 -100.0GSP/AGOA imports . . . . . . . . . . 0 0 0 13 0 -100.0
FootwearExports . . . . . . . . . . . . . . . . . . . . . 0 0 0 0 0 naImports . . . . . . . . . . . . . . . . . . . . . 0 0 0 0 0 naGSP/AGOA imports . . . . . . . . . . 0 0 0 0 0 na
Minerals and metalsExports . . . . . . . . . . . . . . . . . . . . . 0 0 3 5 0 -100.0Imports . . . . . . . . . . . . . . . . . . . . . 0 0 0 0 0 naGSP/AGOA imports . . . . . . . . . . 0 0 0 0 0 na
MachineryExports . . . . . . . . . . . . . . . . . . . . . 4 199 50 31 12 -61.2Imports . . . . . . . . . . . . . . . . . . . . . 6 0 0 0 0 naGSP/AGOA imports . . . . . . . . . . 0 0 0 0 0 na
Transportation equipmentExports . . . . . . . . . . . . . . . . . . . . . 105 302 116 0 4 naImports . . . . . . . . . . . . . . . . . . . . . 0 0 0 0 0 naGSP/AGOA imports . . . . . . . . . . 0 0 0 0 0 na
Electronic productsExports . . . . . . . . . . . . . . . . . . . . . 3 3 967 5 24 377.6Imports . . . . . . . . . . . . . . . . . . . . . 0 0 0 0 3 naGSP/AGOA imports . . . . . . . . . . 0 0 0 0 0 na
Miscellaneous manufacturesExports . . . . . . . . . . . . . . . . . . . . . 0 0 0 11 0 -100.0Imports . . . . . . . . . . . . . . . . . . . . . 0 0 0 18 0 -100.0GSP/AGOA imports . . . . . . . . . . 0 0 0 0 0 na
Special provisionsExports . . . . . . . . . . . . . . . . . . . . . 12 11 29 9 9 1.9Imports . . . . . . . . . . . . . . . . . . . . . 4 6 27 29 12 -59.1GSP/AGOA imports . . . . . . . . . . 0 0 0 0 0 na
All sectorsExports . . . . . . . . . . . . . . . . . . . . . 243 699 1,372 144 508 253.3Imports . . . . . . . . . . . . . . . . . . . . . 2,051 3,513 10,568 5,308 4,003 -24.6GSP/AGOA imports . . . . . . . . . . 0 0 0 13 0 -100.0
See footnote at end of table.

B-17
Table B-2-ContinuedCôte d’Ivoire: U.S. exports, imports, and GSP/AGOA imports, by major commodity sectors, 1999-2003
Sector 1999 2000 2001 2002 2003
Change2002-03
Percent
1,000 dollarsAgricultural products
Exports . . . . . . . . . . . . . . . . . . . . . 20,508 15,450 12,120 13,038 22,352 71.4Imports . . . . . . . . . . . . . . . . . . . . . 293,603 259,264 226,899 279,954 410,382 46.6GSP/AGOA imports . . . . . . . . . . 8,385 21,591 12,595 21,689 41,266 90.3
Forest productsExports . . . . . . . . . . . . . . . . . . . . . 9,249 8,278 3,905 606 1,929 218.5Imports . . . . . . . . . . . . . . . . . . . . . 5,999 12,673 9,669 10,214 10,178 -0.4GSP/AGOA imports . . . . . . . . . . 243 447 456 500 127 -74.6
Chemicals and related productsExports . . . . . . . . . . . . . . . . . . . . . 19,522 14,160 21,987 22,299 30,690 37.6Imports . . . . . . . . . . . . . . . . . . . . . 4,779 4,446 2,940 3,569 2,109 -40.9GSP/AGOA imports . . . . . . . . . . 0 4 5 2 0 -100.0
Energy-related productsExports . . . . . . . . . . . . . . . . . . . . . 298 213 6,377 821 249 -69.6Imports . . . . . . . . . . . . . . . . . . . . . 34,166 84,220 72,040 78,762 61,128 -22.4GSP/AGOA imports . . . . . . . . . . 0 0 0 27,258 46,347 70.0
Textiles and apparelExports . . . . . . . . . . . . . . . . . . . . . 6,275 3,023 5,481 4,532 2,294 -49.4Imports . . . . . . . . . . . . . . . . . . . . . 1,054 593 527 604 721 19.3GSP/AGOA imports . . . . . . . . . . 481 173 115 187 204 9.1
FootwearExports . . . . . . . . . . . . . . . . . . . . . 425 175 830 661 1,596 141.4Imports . . . . . . . . . . . . . . . . . . . . . 0 1 81 46 0 -100.0GSP/AGOA imports . . . . . . . . . . 0 0 0 0 0 na
Minerals and metalsExports . . . . . . . . . . . . . . . . . . . . . 1,928 2,047 2,468 3,154 7,334 132.5Imports . . . . . . . . . . . . . . . . . . . . . 332 733 854 1,442 373 -74.1GSP/AGOA imports . . . . . . . . . . 2 0 10 3 28 836.8
MachineryExports . . . . . . . . . . . . . . . . . . . . . 14,374 13,284 11,045 10,202 7,767 -23.9Imports . . . . . . . . . . . . . . . . . . . . . 387 273 12 151 187 23.4GSP/AGOA imports . . . . . . . . . . 9 0 0 0 0 na
Transportation equipmentExports . . . . . . . . . . . . . . . . . . . . . 15,416 22,411 15,316 10,846 15,628 44.1Imports . . . . . . . . . . . . . . . . . . . . . 21 26 24 219 633 188.8GSP/AGOA imports . . . . . . . . . . 0 0 2 4 16 272.2
Electronic productsExports . . . . . . . . . . . . . . . . . . . . . 7,484 10,137 11,261 5,818 6,474 11.3Imports . . . . . . . . . . . . . . . . . . . . . 655 2,036 2,968 2,634 363 -86.2GSP/AGOA imports . . . . . . . . . . 71 10 39 0 0 na
Miscellaneous manufacturesExports . . . . . . . . . . . . . . . . . . . . . 596 541 907 619 953 53.9Imports . . . . . . . . . . . . . . . . . . . . . 1,559 2,044 2,283 1,641 2,364 44.0GSP/AGOA imports . . . . . . . . . . 92 91 99 90 49 -45.6
Special provisionsExports . . . . . . . . . . . . . . . . . . . . . 2,808 2,326 1,745 1,993 2,784 39.7Imports . . . . . . . . . . . . . . . . . . . . . 932 693 1,526 2,621 1,810 -30.9GSP/AGOA imports . . . . . . . . . . 0 0 0 0 0 na
All sectorsExports . . . . . . . . . . . . . . . . . . . . . 98,882 92,046 93,441 74,590 100,050 34.1Imports . . . . . . . . . . . . . . . . . . . . . 343,487 367,002 319,823 381,860 490,248 28.4GSP/AGOA imports . . . . . . . . . . 9,284 22,317 13,321 49,733 88,037 77.0
See footnote at end of table.

B-18
Table B-2-ContinuedDemocratic Republic of the Congo: U.S. exports, imports, and GSP/AGOA imports, by major commodity sectors,1999-2003
Sector 1999 2000 2001 2002 2003
Change2002-03
Percent
1,000 dollarsAgricultural products
Exports . . . . . . . . . . . . . . . . . . . . . 3,249 1,713 6,430 6,568 10,206 55.4Imports . . . . . . . . . . . . . . . . . . . . . 1,432 1,830 995 1,536 2,030 32.1GSP/AGOA imports . . . . . . . . . . 501 334 517 671 94 -86.0
Forest productsExports . . . . . . . . . . . . . . . . . . . . . 37 350 1,327 1,792 452 -74.7Imports . . . . . . . . . . . . . . . . . . . . . 48 300 943 343 872 154.4GSP/AGOA imports . . . . . . . . . . 6 17 26 15 17 16.2
Chemicals and related productsExports . . . . . . . . . . . . . . . . . . . . . 714 753 1,141 2,144 1,314 -38.7Imports . . . . . . . . . . . . . . . . . . . . . 1,196 504 148 56 114 102.0GSP/AGOA imports . . . . . . . . . . 0 0 0 0 0 na
Energy-related productsExports . . . . . . . . . . . . . . . . . . . . . 34 0 10 0 24 naImports . . . . . . . . . . . . . . . . . . . . . 106,548 168,656 108,302 152,986 131,572 -14.0GSP/AGOA imports . . . . . . . . . . 97,883 164,361 108,302 143,982 119,210 -17.2
Textiles and apparelExports . . . . . . . . . . . . . . . . . . . . . 1,399 2,420 1,759 2,045 2,753 34.6Imports . . . . . . . . . . . . . . . . . . . . . 10 6 4 0 1 naGSP/AGOA imports . . . . . . . . . . 0 (1) 0 0 0 na
FootwearExports . . . . . . . . . . . . . . . . . . . . . 28 78 0 0 67 naImports . . . . . . . . . . . . . . . . . . . . . 0 0 0 0 0 naGSP/AGOA imports . . . . . . . . . . 0 0 0 0 0 na
Minerals and metalsExports . . . . . . . . . . . . . . . . . . . . . 633 406 545 944 24 -97.5Imports . . . . . . . . . . . . . . . . . . . . . 122,291 39,616 34,807 30,987 34,513 11.4GSP/AGOA imports . . . . . . . . . . 15,408 9,074 9,674 196 108 -44.9
MachineryExports . . . . . . . . . . . . . . . . . . . . . 2,713 446 861 1,054 1,398 32.7Imports . . . . . . . . . . . . . . . . . . . . . 6 24 69 64 0 -100.0GSP/AGOA imports . . . . . . . . . . 0 0 0 0 0 na
Transportation equipmentExports . . . . . . . . . . . . . . . . . . . . . 10,269 1,183 587 1,542 1,806 17.2Imports . . . . . . . . . . . . . . . . . . . . . 0 9 0 5 0 -100.0GSP/AGOA imports . . . . . . . . . . 0 0 0 0 0 na
Electronic productsExports . . . . . . . . . . . . . . . . . . . . . 1,081 2,138 1,500 3,946 10,273 160.4Imports . . . . . . . . . . . . . . . . . . . . . 76 476 162 142 93 -34.5GSP/AGOA imports . . . . . . . . . . 0 0 0 0 0 na
Miscellaneous manufacturesExports . . . . . . . . . . . . . . . . . . . . . 50 60 3,531 12 177 1,427.8Imports . . . . . . . . . . . . . . . . . . . . . 175 494 2,159 3,248 4,545 39.9GSP/AGOA imports . . . . . . . . . . 4 0 7 21 42 105.5
Special provisionsExports . . . . . . . . . . . . . . . . . . . . . 826 435 817 6,567 1,892 -71.2Imports . . . . . . . . . . . . . . . . . . . . . 131 325 125 325 128 -60.7GSP/AGOA imports . . . . . . . . . . 0 0 0 0 0 na
All sectorsExports . . . . . . . . . . . . . . . . . . . . . 21,034 9,982 18,508 26,612 30,384 14.2Imports . . . . . . . . . . . . . . . . . . . . . 231,913 212,239 147,713 189,692 173,867 -8.3GSP/AGOA imports . . . . . . . . . . 113,803 173,787 118,527 144,885 119,471 -17.5
See footnote at end of table.

B-19
Table B-2-ContinuedDjibouti: U.S. exports, imports, and GSP/AGOA imports, by major commodity sectors, 1999-2003
Sector 1999 2000 2001 2002 2003
Change2002-03
Percent
1,000 dollarsAgricultural products
Exports . . . . . . . . . . . . . . . . . . . . . 13,816 2,908 1,981 40,667 12,642 -68.9Imports . . . . . . . . . . . . . . . . . . . . . 103 26 79 54 27 -49.9GSP/AGOA imports . . . . . . . . . . 0 0 0 23 27 16.3
Forest productsExports . . . . . . . . . . . . . . . . . . . . . 145 26 48 3,389 4,967 46.6Imports . . . . . . . . . . . . . . . . . . . . . 0 0 4 0 0 naGSP/AGOA imports . . . . . . . . . . 0 0 0 0 0 na
Chemicals and related productsExports . . . . . . . . . . . . . . . . . . . . . 4,980 5,276 7,867 760 5,639 641.7Imports . . . . . . . . . . . . . . . . . . . . . 1 86 74 2 90 4,956.2GSP/AGOA imports . . . . . . . . . . 0 86 0 0 0 na
Energy-related productsExports . . . . . . . . . . . . . . . . . . . . . 0 20 26 4 0 -100.0Imports . . . . . . . . . . . . . . . . . . . . . 0 0 0 0 0 naGSP/AGOA imports . . . . . . . . . . 0 0 0 0 0 na
Textiles and apparelExports . . . . . . . . . . . . . . . . . . . . . 1,115 2,941 1,568 1,627 827 -49.2Imports . . . . . . . . . . . . . . . . . . . . . 0 0 0 0 0 naGSP/AGOA imports . . . . . . . . . . 0 0 0 0 0 na
FootwearExports . . . . . . . . . . . . . . . . . . . . . 0 0 12 0 18 naImports . . . . . . . . . . . . . . . . . . . . . 0 0 0 0 0 naGSP/AGOA imports . . . . . . . . . . 0 0 0 0 0 na
Minerals and metalsExports . . . . . . . . . . . . . . . . . . . . . 257 182 560 72 377 426.9Imports . . . . . . . . . . . . . . . . . . . . . 0 5 0 9 0 -100.0GSP/AGOA imports . . . . . . . . . . 0 0 0 0 0 na
MachineryExports . . . . . . . . . . . . . . . . . . . . . 2,131 951 856 870 2,404 176.2Imports . . . . . . . . . . . . . . . . . . . . . 6 0 7 4 0 -100.0GSP/AGOA imports . . . . . . . . . . 6 0 0 0 0 na
Transportation equipmentExports . . . . . . . . . . . . . . . . . . . . . 1,691 1,210 4,329 5,586 2,173 -61.1Imports . . . . . . . . . . . . . . . . . . . . . 0 0 0 0 0 naGSP/AGOA imports . . . . . . . . . . 0 0 0 0 0 na
Electronic productsExports . . . . . . . . . . . . . . . . . . . . . 771 2,458 307 1,491 2,706 81.5Imports . . . . . . . . . . . . . . . . . . . . . 0 0 3 91 36 -60.2GSP/AGOA imports . . . . . . . . . . 0 0 0 0 0 na
Miscellaneous manufacturesExports . . . . . . . . . . . . . . . . . . . . . 936 4 18 112 622 453.1Imports . . . . . . . . . . . . . . . . . . . . . 0 0 0 0 3 naGSP/AGOA imports . . . . . . . . . . 0 0 0 0 0 na
Special provisionsExports . . . . . . . . . . . . . . . . . . . . . 713 632 1,002 1,367 1,912 39.9Imports . . . . . . . . . . . . . . . . . . . . . 1 303 783 1,756 459 -73.9GSP/AGOA imports . . . . . . . . . . 0 0 0 0 0 na
All sectorsExports . . . . . . . . . . . . . . . . . . . . . 26,555 16,609 18,573 55,945 34,287 -38.7Imports . . . . . . . . . . . . . . . . . . . . . 110 419 951 1,915 615 -67.9GSP/AGOA imports . . . . . . . . . . 6 86 0 23 27 16.3
See footnote at end of table.

B-20
Table B-2-ContinuedEquatorial Guinea: U.S. exports, imports, and GSP/AGOA imports, by major commodity sectors, 1999-2003
Sector 1999 2000 2001 2002 2003
Change2002-03
Percent
1,000 dollarsAgricultural products
Exports . . . . . . . . . . . . . . . . . . . . . 589 307 1,147 1,110 1,099 -0.9Imports . . . . . . . . . . . . . . . . . . . . . 0 11 0 27 51 91.2GSP/AGOA imports . . . . . . . . . . 0 0 0 0 0 na
Forest productsExports . . . . . . . . . . . . . . . . . . . . . 1,136 93 42 38 191 405.3Imports . . . . . . . . . . . . . . . . . . . . . 724 690 16 48 556 1,068.0GSP/AGOA imports . . . . . . . . . . 0 0 0 0 0 na
Chemicals and related productsExports . . . . . . . . . . . . . . . . . . . . . 1,469 8,181 1,253 1,355 3,334 146.1Imports . . . . . . . . . . . . . . . . . . . . . 5,465 0 37,251 71,219 136,922 92.3GSP/AGOA imports . . . . . . . . . . 0 0 24,954 49,390 93,574 89.5
Energy-related productsExports . . . . . . . . . . . . . . . . . . . . . 103 329 1,328 495 1,382 179.3Imports . . . . . . . . . . . . . . . . . . . . . 33,822 152,534 355,083 495,987 773,612 56.0GSP/AGOA imports . . . . . . . . . . 7,845 136,280 90,985 352,108 670,396 90.4
Textiles and apparelExports . . . . . . . . . . . . . . . . . . . . . 149 145 63 333 387 16.4Imports . . . . . . . . . . . . . . . . . . . . . 0 0 0 0 0 naGSP/AGOA imports . . . . . . . . . . 0 0 0 0 0 na
FootwearExports . . . . . . . . . . . . . . . . . . . . . 4 38 16 50 53 5.7Imports . . . . . . . . . . . . . . . . . . . . . 0 0 0 0 0 naGSP/AGOA imports . . . . . . . . . . 0 0 0 0 0 na
Minerals and metalsExports . . . . . . . . . . . . . . . . . . . . . 38,416 10,991 10,991 14,372 41,510 188.8Imports . . . . . . . . . . . . . . . . . . . . . 13 35 0 16 6 -63.2GSP/AGOA imports . . . . . . . . . . 0 0 0 0 0 na
MachineryExports . . . . . . . . . . . . . . . . . . . . . 6,281 10,001 7,408 12,340 77,510 528.1Imports . . . . . . . . . . . . . . . . . . . . . 0 0 0 10 646 6,558.4GSP/AGOA imports . . . . . . . . . . 0 0 0 0 3 na
Transportation equipmentExports . . . . . . . . . . . . . . . . . . . . . 167,099 59,210 54,674 72,596 187,886 158.8Imports . . . . . . . . . . . . . . . . . . . . . 0 0 0 0 0 naGSP/AGOA imports . . . . . . . . . . 0 0 0 0 0 na
Electronic productsExports . . . . . . . . . . . . . . . . . . . . . 682 3,017 954 1,035 7,327 608.0Imports . . . . . . . . . . . . . . . . . . . . . 0 18 6 26 8 -67.9GSP/AGOA imports . . . . . . . . . . 0 4 6 0 3 na
Miscellaneous manufacturesExports . . . . . . . . . . . . . . . . . . . . . 456 333 405 2,141 10,742 401.7Imports . . . . . . . . . . . . . . . . . . . . . 0 51 0 548 0 -100.0GSP/AGOA imports . . . . . . . . . . 0 0 0 0 0 na
Special provisionsExports . . . . . . . . . . . . . . . . . . . . . 4,666 2,028 1,277 1,818 4,597 152.9Imports . . . . . . . . . . . . . . . . . . . . . 576 1,378 3,253 4,737 6,701 41.4GSP/AGOA imports . . . . . . . . . . 0 0 0 0 0 na
All sectorsExports . . . . . . . . . . . . . . . . . . . . . 221,050 94,673 79,558 107,681 336,019 212.1Imports . . . . . . . . . . . . . . . . . . . . . 40,601 154,717 395,609 572,619 918,503 60.4GSP/AGOA imports . . . . . . . . . . 7,845 136,284 115,945 401,498 763,976 90.3
See footnote at end of table.

B-21
Table B-2-ContinuedEritrea: U.S. exports, imports, and GSP/AGOA imports, by major commodity sectors, 1999-2003
Sector 1999 2000 2001 2002 2003
Change2002-03
Percent
1,000 dollarsAgricultural products
Exports . . . . . . . . . . . . . . . . . . . . . 0 12,091 14,451 23,022 37,652 63.5Imports . . . . . . . . . . . . . . . . . . . . . 347 43 38 35 17 -52.5GSP/AGOA imports . . . . . . . . . . 0 0 0 0 0 na
Forest productsExports . . . . . . . . . . . . . . . . . . . . . 55 17 100 90 528 484.3Imports . . . . . . . . . . . . . . . . . . . . . 0 36 0 0 0 naGSP/AGOA imports . . . . . . . . . . 0 0 0 0 0 na
Chemicals and related productsExports . . . . . . . . . . . . . . . . . . . . . 48 78 870 699 438 -37.3Imports . . . . . . . . . . . . . . . . . . . . . 63 38 4 59 3 -94.6GSP/AGOA imports . . . . . . . . . . 0 0 0 11 0 -100.0
Energy-related productsExports . . . . . . . . . . . . . . . . . . . . . 0 0 0 0 15 naImports . . . . . . . . . . . . . . . . . . . . . 0 0 0 0 0 naGSP/AGOA imports . . . . . . . . . . 0 0 0 0 0 na
Textiles and apparelExports . . . . . . . . . . . . . . . . . . . . . 53 140 32 347 370 6.6Imports . . . . . . . . . . . . . . . . . . . . . 1 80 (1) 2 47 2,380.0GSP/AGOA imports . . . . . . . . . . 0 0 0 0 0 na
FootwearExports . . . . . . . . . . . . . . . . . . . . . 9 0 0 0 0 naImports . . . . . . . . . . . . . . . . . . . . . 0 1 0 0 0 naGSP/AGOA imports . . . . . . . . . . 0 0 0 0 0 na
Minerals and metalsExports . . . . . . . . . . . . . . . . . . . . . 488 52 580 83 404 388.9Imports . . . . . . . . . . . . . . . . . . . . . 38 0 17 0 0 naGSP/AGOA imports . . . . . . . . . . 0 0 0 0 0 na
MachineryExports . . . . . . . . . . . . . . . . . . . . . 382 289 649 435 2,042 369.2Imports . . . . . . . . . . . . . . . . . . . . . 0 0 20 0 0 naGSP/AGOA imports . . . . . . . . . . 0 0 0 0 0 na
Transportation equipmentExports . . . . . . . . . . . . . . . . . . . . . 1,062 200 630 286 36,428 12,623.5Imports . . . . . . . . . . . . . . . . . . . . . 0 0 4 0 2 naGSP/AGOA imports . . . . . . . . . . 0 0 0 0 0 na
Electronic productsExports . . . . . . . . . . . . . . . . . . . . . 1,151 754 2,029 1,987 5,910 197.5Imports . . . . . . . . . . . . . . . . . . . . . 8 4 5 28 42 50.1GSP/AGOA imports . . . . . . . . . . 0 0 0 0 0 na
Miscellaneous manufacturesExports . . . . . . . . . . . . . . . . . . . . . 9 65 18 92 182 99.0Imports . . . . . . . . . . . . . . . . . . . . . 21 2 0 24 28 18.3GSP/AGOA imports . . . . . . . . . . 0 0 0 0 0 na
Special provisionsExports . . . . . . . . . . . . . . . . . . . . . 440 2,551 2,070 1,550 2,519 62.5Imports . . . . . . . . . . . . . . . . . . . . . 2 (1) 0 221 112 -49.2GSP/AGOA imports . . . . . . . . . . 0 0 0 0 0 na
All sectorsExports . . . . . . . . . . . . . . . . . . . . . 3,698 16,236 21,429 28,591 86,488 202.5Imports . . . . . . . . . . . . . . . . . . . . . 480 203 89 369 251 -31.9GSP/AGOA imports . . . . . . . . . . 0 0 0 11 0 -100.0
See footnote at end of table.

B-22
Table B-2-ContinuedEthiopia: U.S. exports, imports, and GSP/AGOA imports, by major commodity sectors, 1999-2003
Sector 1999 2000 2001 2002 2003
Change2002-03
Percent
1,000 dollarsAgricultural products
Exports . . . . . . . . . . . . . . . . . . . . . 29,522 113,990 26,274 10,624 154,581 1,355.0Imports . . . . . . . . . . . . . . . . . . . . . 27,241 25,668 25,336 22,043 26,616 20.7GSP/AGOA imports . . . . . . . . . . 488 888 655 1,004 918 -8.6
Forest productsExports . . . . . . . . . . . . . . . . . . . . . 701 371 318 1,119 1,536 37.3Imports . . . . . . . . . . . . . . . . . . . . . 17 36 9 20 30 55.9GSP/AGOA imports . . . . . . . . . . 7 26 0 12 16 29.5
Chemicals and related productsExports . . . . . . . . . . . . . . . . . . . . . 9,728 9,772 17,276 5,646 4,191 -25.8Imports . . . . . . . . . . . . . . . . . . . . . 299 453 180 169 383 127.0GSP/AGOA imports . . . . . . . . . . 4 2 0 4 25 566.6
Energy-related productsExports . . . . . . . . . . . . . . . . . . . . . 3 126 201 81 55 -31.5Imports . . . . . . . . . . . . . . . . . . . . . 0 0 0 0 0 naGSP/AGOA imports . . . . . . . . . . 0 0 0 0 0 na
Textiles and apparelExports . . . . . . . . . . . . . . . . . . . . . 629 946 223 142 1,791 1,159.5Imports . . . . . . . . . . . . . . . . . . . . . 10 30 735 1,324 1,765 33.2GSP/AGOA imports . . . . . . . . . . 0 1 163 1,297 1,751 35.0
FootwearExports . . . . . . . . . . . . . . . . . . . . . 15 29 5 0 0 naImports . . . . . . . . . . . . . . . . . . . . . 0 (1) 1 (1) 0 -100.0GSP/AGOA imports . . . . . . . . . . 0 0 0 (1) 0 -100.0
Minerals and metalsExports . . . . . . . . . . . . . . . . . . . . . 309 387 163 385 294 -23.8Imports . . . . . . . . . . . . . . . . . . . . . 1,573 2,024 1,911 8 30 298.1GSP/AGOA imports . . . . . . . . . . 0 3 0 0 27 na
MachineryExports . . . . . . . . . . . . . . . . . . . . . 7,878 1,808 2,833 2,134 2,624 22.9Imports . . . . . . . . . . . . . . . . . . . . . 0 0 3 18 41 121.0GSP/AGOA imports . . . . . . . . . . 0 0 0 2 30 1,143.7
Transportation equipmentExports . . . . . . . . . . . . . . . . . . . . . 105,407 16,108 6,311 6,487 203,141 3,031.5Imports . . . . . . . . . . . . . . . . . . . . . 500 0 0 0 14 naGSP/AGOA imports . . . . . . . . . . 0 0 0 0 12 na
Electronic productsExports . . . . . . . . . . . . . . . . . . . . . 6,161 6,606 3,148 5,238 26,422 404.4Imports . . . . . . . . . . . . . . . . . . . . . 0 88 69 2 156 6,321.2GSP/AGOA imports . . . . . . . . . . 0 0 3 0 104 na
Miscellaneous manufacturesExports . . . . . . . . . . . . . . . . . . . . . 373 151 201 141 688 388.8Imports . . . . . . . . . . . . . . . . . . . . . 53 158 186 16 85 431.5GSP/AGOA imports . . . . . . . . . . 18 7 0 0 3 na
Special provisionsExports . . . . . . . . . . . . . . . . . . . . . 3,572 14,721 3,706 28,126 12,031 -57.2Imports . . . . . . . . . . . . . . . . . . . . . 517 203 611 2,059 1,375 -33.2GSP/AGOA imports . . . . . . . . . . 0 0 0 0 0 na
All sectorsExports . . . . . . . . . . . . . . . . . . . . . 164,297 165,016 60,659 60,123 407,354 577.5Imports . . . . . . . . . . . . . . . . . . . . . 30,211 28,660 29,041 25,659 30,496 18.8GSP/AGOA imports . . . . . . . . . . 516 927 822 2,320 2,885 24.3
See footnote at end of table.

B-23
Table B-2-ContinuedGabon: U.S. exports, imports, and GSP/AGOA imports, by major commodity sectors, 1999-2003
Sector 1999 2000 2001 2002 2003
Change2002-03
Percent
1,000 dollarsAgricultural products
Exports . . . . . . . . . . . . . . . . . . . . . 5,443 4,967 4,416 4,383 2,174 -50.4Imports . . . . . . . . . . . . . . . . . . . . . 601 347 638 512 90 -82.4GSP/AGOA imports . . . . . . . . . . 0 0 0 0 0 na
Forest productsExports . . . . . . . . . . . . . . . . . . . . . 39 609 576 454 103 -77.3Imports . . . . . . . . . . . . . . . . . . . . . 4,676 6,217 5,517 6,032 6,963 15.4GSP/AGOA imports . . . . . . . . . . 0 0 65 149 18 -87.6
Chemicals and related productsExports . . . . . . . . . . . . . . . . . . . . . 1,920 1,965 2,236 2,118 3,298 55.7Imports . . . . . . . . . . . . . . . . . . . . . 104,129 116,917 18,172 17,480 1,898 -89.1GSP/AGOA imports . . . . . . . . . . 0 0 0 0 0 na
Energy-related productsExports . . . . . . . . . . . . . . . . . . . . . 242 1,282 1,526 441 3,340 658.3Imports . . . . . . . . . . . . . . . . . . . . . 1,320,410 1,884,421 1,680,342 1,570,697 1,893,711 20.6GSP/AGOA imports . . . . . . . . . . 0 0 938,695 1,145,478 1,177,431 2.8
Textiles and apparelExports . . . . . . . . . . . . . . . . . . . . . 1,145 942 1,495 1,298 1,841 41.9Imports . . . . . . . . . . . . . . . . . . . . . 0 2 13 337 0 -100.0GSP/AGOA imports . . . . . . . . . . 0 0 0 0 0 na
FootwearExports . . . . . . . . . . . . . . . . . . . . . 88 345 582 368 1,660 351.4Imports . . . . . . . . . . . . . . . . . . . . . 0 0 0 0 0 naGSP/AGOA imports . . . . . . . . . . 0 0 0 0 0 na
Minerals and metalsExports . . . . . . . . . . . . . . . . . . . . . 5,041 2,529 3,709 2,918 6,956 138.4Imports . . . . . . . . . . . . . . . . . . . . . 26,213 27,200 21,593 19,013 19,272 1.4GSP/AGOA imports . . . . . . . . . . 0 0 0 0 0 na
MachineryExports . . . . . . . . . . . . . . . . . . . . . 4,541 6,825 8,064 8,173 7,941 -2.8Imports . . . . . . . . . . . . . . . . . . . . . 13 50 2 0 54 naGSP/AGOA imports . . . . . . . . . . 0 10 0 0 0 na
Transportation equipmentExports . . . . . . . . . . . . . . . . . . . . . 17,799 38,567 46,564 40,700 29,274 -28.1Imports . . . . . . . . . . . . . . . . . . . . . 53,127 13 30 59 8 -86.4GSP/AGOA imports . . . . . . . . . . 0 0 0 0 8 na
Electronic productsExports . . . . . . . . . . . . . . . . . . . . . 7,372 2,668 2,874 2,534 3,834 51.3Imports . . . . . . . . . . . . . . . . . . . . . 72 53 2 26 29 11.9GSP/AGOA imports . . . . . . . . . . 0 0 0 0 0 na
Miscellaneous manufacturesExports . . . . . . . . . . . . . . . . . . . . . 246 1,049 389 493 123 -75.0Imports . . . . . . . . . . . . . . . . . . . . . 2,162 912 2,998 1,774 2,346 32.2GSP/AGOA imports . . . . . . . . . . 0 0 0 0 0 na
Special provisionsExports . . . . . . . . . . . . . . . . . . . . . 1,091 1,523 1,658 1,295 1,311 1.2Imports . . . . . . . . . . . . . . . . . . . . . 1,541 1,790 2,365 6,092 3,344 -45.1GSP/AGOA imports . . . . . . . . . . 0 0 0 0 0 na
All sectorsExports . . . . . . . . . . . . . . . . . . . . . 44,967 63,270 74,089 65,176 61,856 -5.1Imports . . . . . . . . . . . . . . . . . . . . . 1,512,945 2,037,921 1,731,671 1,622,021 1,927,715 18.8GSP/AGOA imports . . . . . . . . . . 0 10 938,760 1,145,627 1,177,458 2.8
See footnote at end of table.

B-24
Table B-2-ContinuedThe Gambia: U.S. exports, imports, and GSP/AGOA imports, by major commodity sectors, 1999-2003
Sector 1999 2000 2001 2002 2003
Change2002-03
Percent
1,000 dollarsAgricultural products
Exports . . . . . . . . . . . . . . . . . . . . . 4,095 3,709 3,002 3,292 4,792 45.6Imports . . . . . . . . . . . . . . . . . . . . . 38 196 134 237 5 -98.0GSP/AGOA imports . . . . . . . . . . 0 7 0 0 0 na
Forest productsExports . . . . . . . . . . . . . . . . . . . . . 21 70 121 67 74 10.6Imports . . . . . . . . . . . . . . . . . . . . . 3 12 3 24 25 2.5GSP/AGOA imports . . . . . . . . . . 3 5 0 21 13 -38.1
Chemicals and related productsExports . . . . . . . . . . . . . . . . . . . . . 344 270 469 518 860 65.8Imports . . . . . . . . . . . . . . . . . . . . . 1 0 0 35 0 -100.0GSP/AGOA imports . . . . . . . . . . 0 0 0 0 0 na
Energy-related productsExports . . . . . . . . . . . . . . . . . . . . . 3 10 51 83 39 -52.9Imports . . . . . . . . . . . . . . . . . . . . . 0 0 0 0 0 naGSP/AGOA imports . . . . . . . . . . 0 0 0 0 0 na
Textiles and apparelExports . . . . . . . . . . . . . . . . . . . . . 1,295 1,597 1,677 1,631 1,826 11.9Imports . . . . . . . . . . . . . . . . . . . . . 27 90 65 29 25 -13.5GSP/AGOA imports . . . . . . . . . . (1) (1) 1 0 0 -100.0
FootwearExports . . . . . . . . . . . . . . . . . . . . . 41 39 55 88 160 81.3Imports . . . . . . . . . . . . . . . . . . . . . 0 (1) 0 0 0 naGSP/AGOA imports . . . . . . . . . . 0 0 0 0 0 na
Minerals and metalsExports . . . . . . . . . . . . . . . . . . . . . 135 674 187 146 614 321.6Imports . . . . . . . . . . . . . . . . . . . . . 33 6 0 0 3 naGSP/AGOA imports . . . . . . . . . . 0 0 0 0 0 na
MachineryExports . . . . . . . . . . . . . . . . . . . . . 529 59 189 660 337 -48.9Imports . . . . . . . . . . . . . . . . . . . . . 0 4 6 86 0 -100.0GSP/AGOA imports . . . . . . . . . . 0 0 0 0 0 na
Transportation equipmentExports . . . . . . . . . . . . . . . . . . . . . 306 250 566 1,527 730 -52.2Imports . . . . . . . . . . . . . . . . . . . . . 0 0 0 0 6 naGSP/AGOA imports . . . . . . . . . . 0 0 0 0 0 na
Electronic productsExports . . . . . . . . . . . . . . . . . . . . . 1,951 836 1,555 841 911 8.4Imports . . . . . . . . . . . . . . . . . . . . . 0 0 22 87 46 -46.8GSP/AGOA imports . . . . . . . . . . 0 0 0 0 0 na
Miscellaneous manufacturesExports . . . . . . . . . . . . . . . . . . . . . 49 289 55 102 173 69.8Imports . . . . . . . . . . . . . . . . . . . . . 64 30 0 7 24 229.0GSP/AGOA imports . . . . . . . . . . 8 12 0 2 7 171.3
Special provisionsExports . . . . . . . . . . . . . . . . . . . . . 728 1,063 236 147 71 -51.5Imports . . . . . . . . . . . . . . . . . . . . . 20 3 3 57 1 -98.2GSP/AGOA imports . . . . . . . . . . 0 0 0 0 0 na
All sectorsExports . . . . . . . . . . . . . . . . . . . . . 9,496 8,867 8,164 9,103 10,588 16.3Imports . . . . . . . . . . . . . . . . . . . . . 186 342 232 563 134 -76.1GSP/AGOA imports . . . . . . . . . . 12 24 1 24 20 -17.6
See footnote at end of table.

B-25
Table B-2-ContinuedGhana: U.S. exports, imports, and GSP/AGOA imports, by major commodity sectors, 1999-2003
Sector 1999 2000 2001 2002 2003
Change2002-03
Percent
1,000 dollarsAgricultural products
Exports . . . . . . . . . . . . . . . . . . . . . 53,586 39,815 41,896 47,651 54,749 14.9Imports . . . . . . . . . . . . . . . . . . . . . 42,361 70,890 58,093 29,042 12,033 -58.6GSP/AGOA imports . . . . . . . . . . 2,902 2,951 2,271 3,368 4,696 39.4
Forest productsExports . . . . . . . . . . . . . . . . . . . . . 1,857 5,560 2,848 5,258 2,535 -51.8Imports . . . . . . . . . . . . . . . . . . . . . 22,966 28,700 31,263 35,108 31,539 -10.2GSP/AGOA imports . . . . . . . . . . 2,626 7,448 6,863 7,301 6,150 -15.8
Chemicals and related productsExports . . . . . . . . . . . . . . . . . . . . . 31,209 16,378 29,426 22,220 24,597 10.7Imports . . . . . . . . . . . . . . . . . . . . . 826 8,458 524 690 1,575 128.2GSP/AGOA imports . . . . . . . . . . 0 5 1 2 4 190.8
Energy-related productsExports . . . . . . . . . . . . . . . . . . . . . 15,389 10,825 5,863 1,377 991 -28.0Imports . . . . . . . . . . . . . . . . . . . . . 20,020 46,063 56,145 24,750 29,067 17.4GSP/AGOA imports . . . . . . . . . . 0 0 33,086 22,657 24,871 9.8
Textiles and apparelExports . . . . . . . . . . . . . . . . . . . . . 9,059 6,404 6,863 8,863 12,726 43.6Imports . . . . . . . . . . . . . . . . . . . . . 3,619 508 413 550 4,508 719.1GSP/AGOA imports . . . . . . . . . . 3 8 5 336 4,261 1,167.3
FootwearExports . . . . . . . . . . . . . . . . . . . . . 2,273 538 857 841 813 -3.3Imports . . . . . . . . . . . . . . . . . . . . . 0 2 (1) 5 3 -32.9GSP/AGOA imports . . . . . . . . . . 0 0 0 1 0 -100.0
Minerals and metalsExports . . . . . . . . . . . . . . . . . . . . . 6,795 6,868 4,758 4,574 4,041 -11.6Imports . . . . . . . . . . . . . . . . . . . . . 115,472 46,021 32,482 20,128 2,798 -86.1GSP/AGOA imports . . . . . . . . . . 3,308 2,605 222 350 167 -52.1
MachineryExports . . . . . . . . . . . . . . . . . . . . . 19,448 24,484 14,937 25,479 16,665 -34.6Imports . . . . . . . . . . . . . . . . . . . . . 139 67 74 58 15 -74.2GSP/AGOA imports . . . . . . . . . . 0 0 0 0 0 na
Transportation equipmentExports . . . . . . . . . . . . . . . . . . . . . 62,765 39,328 40,905 40,998 52,378 27.8Imports . . . . . . . . . . . . . . . . . . . . . 21 153 215 267 46 -82.6GSP/AGOA imports . . . . . . . . . . 0 0 2 0 0 na
Electronic productsExports . . . . . . . . . . . . . . . . . . . . . 12,032 15,624 16,711 15,087 18,201 20.6Imports . . . . . . . . . . . . . . . . . . . . . 123 34 45 26 60 127.7GSP/AGOA imports . . . . . . . . . . 0 0 2 0 12 na
Miscellaneous manufacturesExports . . . . . . . . . . . . . . . . . . . . . 2,243 3,821 3,195 4,092 5,350 30.7Imports . . . . . . . . . . . . . . . . . . . . . 1,384 1,268 1,026 1,490 1,342 -9.9GSP/AGOA imports . . . . . . . . . . 798 523 437 815 425 -47.8
Special provisionsExports . . . . . . . . . . . . . . . . . . . . . 14,390 9,067 11,212 10,161 11,379 12.0Imports . . . . . . . . . . . . . . . . . . . . . 2,399 4,266 5,112 3,526 615 -82.6GSP/AGOA imports . . . . . . . . . . 0 0 0 0 0 na
All sectorsExports . . . . . . . . . . . . . . . . . . . . . 231,045 178,712 179,473 186,601 204,426 9.6Imports . . . . . . . . . . . . . . . . . . . . . 209,330 206,431 185,391 115,641 83,603 -27.7GSP/AGOA imports . . . . . . . . . . 9,637 13,539 42,889 34,830 40,586 16.5
See footnote at end of table.

B-26
Table B-2-ContinuedGuinea: U.S. exports, imports, and GSP/AGOA imports, by major commodity sectors, 1999-2003
Sector 1999 2000 2001 2002 2003
Change2002-03
Percent
1,000 dollarsAgricultural products
Exports . . . . . . . . . . . . . . . . . . . . . 17,458 14,534 7,706 9,114 6,777 -25.6Imports . . . . . . . . . . . . . . . . . . . . . 1,143 378 3,565 1,217 454 -62.7GSP/AGOA imports . . . . . . . . . . 30 0 0 10 63 543.0
Forest productsExports . . . . . . . . . . . . . . . . . . . . . 1,202 947 792 818 466 -43.1Imports . . . . . . . . . . . . . . . . . . . . . 201 94 401 164 339 107.4GSP/AGOA imports . . . . . . . . . . 23 70 113 35 61 76.6
Chemicals and related productsExports . . . . . . . . . . . . . . . . . . . . . 4,637 9,225 21,058 7,066 3,241 -54.1Imports . . . . . . . . . . . . . . . . . . . . . 57 155 24 143 20 -86.1GSP/AGOA imports . . . . . . . . . . 0 0 0 0 0 na
Energy-related productsExports . . . . . . . . . . . . . . . . . . . . . 2,184 5,806 2,249 11,380 398 -96.5Imports . . . . . . . . . . . . . . . . . . . . . 5,155 7 0 0 0 naGSP/AGOA imports . . . . . . . . . . 0 0 0 0 0 na
Textiles and apparelExports . . . . . . . . . . . . . . . . . . . . . 3,454 2,250 2,306 2,572 1,836 -28.6Imports . . . . . . . . . . . . . . . . . . . . . 16 171 39 61 20 -66.6GSP/AGOA imports . . . . . . . . . . 0 0 0 0 0 na
FootwearExports . . . . . . . . . . . . . . . . . . . . . 123 309 162 123 171 38.9Imports . . . . . . . . . . . . . . . . . . . . . 3 (1) 1 1 1 42.2GSP/AGOA imports . . . . . . . . . . 0 0 0 0 0 na
Minerals and metalsExports . . . . . . . . . . . . . . . . . . . . . 1,226 2,288 3,851 1,670 1,550 -7.2Imports . . . . . . . . . . . . . . . . . . . . . 107,206 85,097 82,144 69,398 66,913 -3.6GSP/AGOA imports . . . . . . . . . . 0 3 3 0 12 na
MachineryExports . . . . . . . . . . . . . . . . . . . . . 3,328 6,119 9,656 3,978 4,669 17.4Imports . . . . . . . . . . . . . . . . . . . . . 67 36 28 7 13 101.5GSP/AGOA imports . . . . . . . . . . 0 0 22 0 0 na
Transportation equipmentExports . . . . . . . . . . . . . . . . . . . . . 6,507 15,013 14,009 12,233 7,166 -41.4Imports . . . . . . . . . . . . . . . . . . . . . 0 117 88 64 5 -91.6GSP/AGOA imports . . . . . . . . . . 0 0 0 0 0 na
Electronic productsExports . . . . . . . . . . . . . . . . . . . . . 1,830 2,061 2,439 4,186 1,935 -53.8Imports . . . . . . . . . . . . . . . . . . . . . 22 405 74 21 755 3,413.4GSP/AGOA imports . . . . . . . . . . 0 0 0 0 0 na
Miscellaneous manufacturesExports . . . . . . . . . . . . . . . . . . . . . 574 564 1,028 254 270 6.4Imports . . . . . . . . . . . . . . . . . . . . . 618 280 531 67 270 303.4GSP/AGOA imports . . . . . . . . . . 32 26 53 24 57 142.6
Special provisionsExports . . . . . . . . . . . . . . . . . . . . . 10,914 7,694 12,363 9,096 6,803 -25.2Imports . . . . . . . . . . . . . . . . . . . . . 923 1,623 937 459 435 -5.2GSP/AGOA imports . . . . . . . . . . 0 0 0 0 0 na
All sectorsExports . . . . . . . . . . . . . . . . . . . . . 53,435 66,810 77,619 62,489 35,280 -43.5Imports . . . . . . . . . . . . . . . . . . . . . 115,411 88,363 87,832 71,600 69,226 -3.3GSP/AGOA imports . . . . . . . . . . 84 100 191 68 194 184.0
See footnote at end of table.

B-27
Table B-2-ContinuedGuinea-Bissau: U.S. exports, imports, and GSP/AGOA imports, by major commodity sectors, 1999-2003
Sector 1999 2000 2001 2002 2003
Change2002-03
Percent
1,000 dollarsAgricultural products
Exports . . . . . . . . . . . . . . . . . . . . . 694 48 50 846 352 -58.3Imports . . . . . . . . . . . . . . . . . . . . . 0 0 3 27 55 103.6GSP/AGOA imports . . . . . . . . . . 0 0 0 0 0 na
Forest productsExports . . . . . . . . . . . . . . . . . . . . . 0 6 0 49 6 -87.4Imports . . . . . . . . . . . . . . . . . . . . . 0 0 16 0 0 naGSP/AGOA imports . . . . . . . . . . 0 0 0 0 0 na
Chemicals and related productsExports . . . . . . . . . . . . . . . . . . . . . 0 0 22 733 27 -96.3Imports . . . . . . . . . . . . . . . . . . . . . 0 0 0 0 0 naGSP/AGOA imports . . . . . . . . . . 0 0 0 0 0 na
Energy-related productsExports . . . . . . . . . . . . . . . . . . . . . 0 0 0 0 0 naImports . . . . . . . . . . . . . . . . . . . . . 0 0 0 0 1,812 naGSP/AGOA imports . . . . . . . . . . 0 0 0 0 0 na
Textiles and apparelExports . . . . . . . . . . . . . . . . . . . . . 0 0 9 0 8 naImports . . . . . . . . . . . . . . . . . . . . . 0 0 0 0 0 naGSP/AGOA imports . . . . . . . . . . 0 0 0 0 0 na
FootwearExports . . . . . . . . . . . . . . . . . . . . . 0 0 0 0 0 naImports . . . . . . . . . . . . . . . . . . . . . 0 0 0 0 0 naGSP/AGOA imports . . . . . . . . . . 0 0 0 0 0 na
Minerals and metalsExports . . . . . . . . . . . . . . . . . . . . . 0 0 18 40 0 -100.0Imports . . . . . . . . . . . . . . . . . . . . . 72 20 0 0 0 naGSP/AGOA imports . . . . . . . . . . 0 0 0 0 0 na
MachineryExports . . . . . . . . . . . . . . . . . . . . . 43 0 0 10 127 1,220.1Imports . . . . . . . . . . . . . . . . . . . . . 0 0 0 0 0 naGSP/AGOA imports . . . . . . . . . . 0 0 0 0 0 na
Transportation equipmentExports . . . . . . . . . . . . . . . . . . . . . 0 126 0 519 0 -100.0Imports . . . . . . . . . . . . . . . . . . . . . 0 0 0 0 0 naGSP/AGOA imports . . . . . . . . . . 0 0 0 0 0 na
Electronic productsExports . . . . . . . . . . . . . . . . . . . . . 64 98 359 302 664 120.1Imports . . . . . . . . . . . . . . . . . . . . . 0 7 0 8 0 -100.0GSP/AGOA imports . . . . . . . . . . 0 0 0 0 0 na
Miscellaneous manufacturesExports . . . . . . . . . . . . . . . . . . . . . 0 0 0 22 0 -100.0Imports . . . . . . . . . . . . . . . . . . . . . 0 11 0 0 0 naGSP/AGOA imports . . . . . . . . . . 0 0 0 0 0 na
Special provisionsExports . . . . . . . . . . . . . . . . . . . . . 15 5 412 38 19 -49.4Imports . . . . . . . . . . . . . . . . . . . . . 1 4 0 0 46 naGSP/AGOA imports . . . . . . . . . . 0 0 0 0 0 na
All sectorsExports . . . . . . . . . . . . . . . . . . . . . 816 284 870 2,559 1,203 -53.0Imports . . . . . . . . . . . . . . . . . . . . . 72 42 19 35 1,912 5,342.5GSP/AGOA imports . . . . . . . . . . 0 0 0 0 0 na
See footnote at end of table.

B-28
Table B-2-ContinuedKenya: U.S. exports, imports, and GSP/AGOA imports, by major commodity sectors, 1999-2003
Sector 1999 2000 2001 2002 2003
Change2002-03
Percent
1,000 dollarsAgricultural products
Exports . . . . . . . . . . . . . . . . . . . . . 28,167 27,141 18,762 42,698 32,848 -23.1Imports . . . . . . . . . . . . . . . . . . . . . 36,247 34,994 41,055 40,012 41,906 4.7GSP/AGOA imports . . . . . . . . . . 650 833 3,016 2,860 5,309 85.6
Forest productsExports . . . . . . . . . . . . . . . . . . . . . 5,601 4,252 3,933 3,214 2,834 -11.8Imports . . . . . . . . . . . . . . . . . . . . . 2,741 2,476 2,511 3,358 1,810 -46.1GSP/AGOA imports . . . . . . . . . . 2,584 1,997 2,317 2,448 1,582 -35.4
Chemicals and related productsExports . . . . . . . . . . . . . . . . . . . . . 32,392 28,197 41,364 32,604 32,447 -0.5Imports . . . . . . . . . . . . . . . . . . . . . 1,203 1,238 3,099 2,394 1,552 -35.2GSP/AGOA imports . . . . . . . . . . 352 16 1,148 734 153 -79.2
Energy-related productsExports . . . . . . . . . . . . . . . . . . . . . 411 412 234 188 258 36.8Imports . . . . . . . . . . . . . . . . . . . . . 15 236 101 0 76 naGSP/AGOA imports . . . . . . . . . . 0 0 0 0 0 na
Textiles and apparelExports . . . . . . . . . . . . . . . . . . . . . 7,854 6,160 9,047 7,594 7,260 -4.4Imports . . . . . . . . . . . . . . . . . . . . . 39,633 44,089 64,623 126,488 188,148 48.7GSP/AGOA imports . . . . . . . . . . 172 1 51,556 121,881 176,286 44.6
FootwearExports . . . . . . . . . . . . . . . . . . . . . 201 194 210 87 242 178.7Imports . . . . . . . . . . . . . . . . . . . . . 11 35 7 33 10 -70.1GSP/AGOA imports . . . . . . . . . . 0 0 0 6 9 42.8
Minerals and metalsExports . . . . . . . . . . . . . . . . . . . . . 4,429 5,439 9,979 10,805 8,521 -21.1Imports . . . . . . . . . . . . . . . . . . . . . 2,725 2,437 1,430 1,592 1,236 -22.4GSP/AGOA imports . . . . . . . . . . 584 228 162 530 247 -53.4
MachineryExports . . . . . . . . . . . . . . . . . . . . . 14,913 13,464 16,833 10,071 15,162 50.5Imports . . . . . . . . . . . . . . . . . . . . . 250 1,104 259 503 297 -41.0GSP/AGOA imports . . . . . . . . . . 0 9 14 45 39 -14.5
Transportation equipmentExports . . . . . . . . . . . . . . . . . . . . . 67,137 122,495 442,175 123,895 64,246 -48.1Imports . . . . . . . . . . . . . . . . . . . . . 875 319 413 179 183 2.5GSP/AGOA imports . . . . . . . . . . 0 19 0 0 0 na
Electronic productsExports . . . . . . . . . . . . . . . . . . . . . 18,420 20,007 17,873 23,217 18,871 -18.7Imports . . . . . . . . . . . . . . . . . . . . . 13,421 9,925 5,912 4,357 6,128 40.6GSP/AGOA imports . . . . . . . . . . 37 29 29 8 43 444.4
Miscellaneous manufacturesExports . . . . . . . . . . . . . . . . . . . . . 917 1,197 2,622 1,907 1,388 -27.2Imports . . . . . . . . . . . . . . . . . . . . . 3,032 2,943 3,874 2,333 2,508 7.5GSP/AGOA imports . . . . . . . . . . 704 785 630 698 774 10.9
Special provisionsExports . . . . . . . . . . . . . . . . . . . . . 6,647 6,456 10,788 11,692 8,932 -23.6Imports . . . . . . . . . . . . . . . . . . . . . 5,992 9,598 5,298 7,906 5,282 -33.2GSP/AGOA imports . . . . . . . . . . 0 0 0 0 0 na
All sectorsExports . . . . . . . . . . . . . . . . . . . . . 187,089 235,413 573,819 267,972 193,009 -28.0Imports . . . . . . . . . . . . . . . . . . . . . 106,144 109,394 128,582 189,156 249,137 31.7GSP/AGOA imports . . . . . . . . . . 5,082 3,919 58,873 129,210 184,441 42.7
See footnote at end of table.

B-29
Table B-2-ContinuedLesotho: U.S. exports, imports, and GSP/AGOA imports, by major commodity sectors, 1999-2003
Sector 1999 2000 2001 2002 2003
Change2002-03
Percent
1,000 dollarsAgricultural products
Exports . . . . . . . . . . . . . . . . . . . . . 59 492 30 614 2,631 328.2Imports . . . . . . . . . . . . . . . . . . . . . 0 0 0 0 0 naGSP/AGOA imports . . . . . . . . . . 0 0 0 0 0 na
Forest productsExports . . . . . . . . . . . . . . . . . . . . . 82 0 7 3 27 761.2Imports . . . . . . . . . . . . . . . . . . . . . 0 0 27 0 0 naGSP/AGOA imports . . . . . . . . . . 0 0 23 0 0 na
Chemicals and related productsExports . . . . . . . . . . . . . . . . . . . . . 11 12 0 0 0 naImports . . . . . . . . . . . . . . . . . . . . . 0 0 144 274 326 18.8GSP/AGOA imports . . . . . . . . . . 0 0 39 226 74 -67.3
Energy-related productsExports . . . . . . . . . . . . . . . . . . . . . 0 0 0 0 0 naImports . . . . . . . . . . . . . . . . . . . . . 0 0 0 0 0 naGSP/AGOA imports . . . . . . . . . . 0 0 0 0 0 na
Textiles and apparelExports . . . . . . . . . . . . . . . . . . . . . 0 0 0 221 166 -24.9Imports . . . . . . . . . . . . . . . . . . . . . 110,748 140,060 216,776 321,049 392,490 22.3GSP/AGOA imports . . . . . . . . . . 1 0 129,523 317,803 372,600 17.2
FootwearExports . . . . . . . . . . . . . . . . . . . . . 0 0 0 0 0 naImports . . . . . . . . . . . . . . . . . . . . . 0 0 0 0 0 naGSP/AGOA imports . . . . . . . . . . 0 0 0 0 0 na
Minerals and metalsExports . . . . . . . . . . . . . . . . . . . . . 0 0 6 0 3 naImports . . . . . . . . . . . . . . . . . . . . . 6 0 31 0 0 naGSP/AGOA imports . . . . . . . . . . 0 0 8 0 0 na
MachineryExports . . . . . . . . . . . . . . . . . . . . . 0 112 16 31 1,714 5,487.4Imports . . . . . . . . . . . . . . . . . . . . . 0 0 0 0 0 naGSP/AGOA imports . . . . . . . . . . 0 0 0 0 0 na
Transportation equipmentExports . . . . . . . . . . . . . . . . . . . . . 39 74 350 365 333 -8.7Imports . . . . . . . . . . . . . . . . . . . . . 0 0 0 0 0 naGSP/AGOA imports . . . . . . . . . . 0 0 0 0 0 na
Electronic productsExports . . . . . . . . . . . . . . . . . . . . . 525 128 354 525 141 -73.1Imports . . . . . . . . . . . . . . . . . . . . . 0 0 4 0 9 naGSP/AGOA imports . . . . . . . . . . 0 0 0 0 0 na
Miscellaneous manufacturesExports . . . . . . . . . . . . . . . . . . . . . 0 3 20 3 4 50.8Imports . . . . . . . . . . . . . . . . . . . . . 0 0 55 0 39 naGSP/AGOA imports . . . . . . . . . . 0 0 0 0 0 na
Special provisionsExports . . . . . . . . . . . . . . . . . . . . . 18 16 34 56 78 40.6Imports . . . . . . . . . . . . . . . . . . . . . 59 90 127 152 193 26.7GSP/AGOA imports . . . . . . . . . . 0 0 0 0 0 na
All sectorsExports . . . . . . . . . . . . . . . . . . . . . 733 837 817 1,818 5,098 180.5Imports . . . . . . . . . . . . . . . . . . . . . 110,814 140,150 217,165 321,475 393,056 22.3GSP/AGOA imports . . . . . . . . . . 1 0 129,592 318,029 372,674 17.2
See footnote at end of table.

B-30
Table B-2-ContinuedLiberia: U.S. exports, imports, and GSP/AGOA imports, by major commodity sectors, 1999-2003
Sector 1999 2000 2001 2002 2003
Change2002-03
Percent
1,000 dollarsAgricultural products
Exports . . . . . . . . . . . . . . . . . . . . . 16,013 12,320 8,683 9,294 11,832 27.3Imports . . . . . . . . . . . . . . . . . . . . . 294 64 18 59 34 -43.2GSP/AGOA imports . . . . . . . . . . 0 0 0 0 0 na
Forest productsExports . . . . . . . . . . . . . . . . . . . . . 347 548 333 302 29 -90.5Imports . . . . . . . . . . . . . . . . . . . . . 816 78 142 77 128 67.1GSP/AGOA imports . . . . . . . . . . 0 0 0 0 0 na
Chemicals and related productsExports . . . . . . . . . . . . . . . . . . . . . 3,499 1,700 1,978 1,586 2,096 32.2Imports . . . . . . . . . . . . . . . . . . . . . 28,606 43,374 41,158 43,424 55,719 28.3GSP/AGOA imports . . . . . . . . . . 0 0 0 0 0 na
Energy-related productsExports . . . . . . . . . . . . . . . . . . . . . 331 235 204 95 60 -36.9Imports . . . . . . . . . . . . . . . . . . . . . 3 0 0 0 2,174 naGSP/AGOA imports . . . . . . . . . . 0 0 0 0 0 na
Textiles and apparelExports . . . . . . . . . . . . . . . . . . . . . 4,417 3,514 2,970 1,900 3,405 79.3Imports . . . . . . . . . . . . . . . . . . . . . 2 7 3 18 11 -40.5GSP/AGOA imports . . . . . . . . . . 0 0 0 0 0 na
FootwearExports . . . . . . . . . . . . . . . . . . . . . 165 150 143 201 140 -30.5Imports . . . . . . . . . . . . . . . . . . . . . 0 0 0 0 0 naGSP/AGOA imports . . . . . . . . . . 0 0 0 0 0 na
Minerals and metalsExports . . . . . . . . . . . . . . . . . . . . . 4,837 9,810 10,278 7,403 6,073 -18.0Imports . . . . . . . . . . . . . . . . . . . . . 139 586 92 211 781 270.9GSP/AGOA imports . . . . . . . . . . 0 0 0 0 0 na
MachineryExports . . . . . . . . . . . . . . . . . . . . . 3,317 2,449 1,725 478 1,362 185.2Imports . . . . . . . . . . . . . . . . . . . . . 255 100 52 250 7 -97.2GSP/AGOA imports . . . . . . . . . . 0 0 0 0 0 na
Transportation equipmentExports . . . . . . . . . . . . . . . . . . . . . 2,248 1,887 2,423 1,274 1,681 32.0Imports . . . . . . . . . . . . . . . . . . . . . 3 655 2 55 43 -21.6GSP/AGOA imports . . . . . . . . . . 0 0 0 0 0 na
Electronic productsExports . . . . . . . . . . . . . . . . . . . . . 2,833 3,225 2,132 836 1,168 39.8Imports . . . . . . . . . . . . . . . . . . . . . 36 231 130 208 90 -56.6GSP/AGOA imports . . . . . . . . . . 0 0 0 0 0 na
Miscellaneous manufacturesExports . . . . . . . . . . . . . . . . . . . . . 474 296 697 145 167 15.3Imports . . . . . . . . . . . . . . . . . . . . . 59 17 317 558 170 -69.5GSP/AGOA imports . . . . . . . . . . 0 0 0 0 0 na
Special provisionsExports . . . . . . . . . . . . . . . . . . . . . 6,105 6,262 5,243 4,004 4,969 24.1Imports . . . . . . . . . . . . . . . . . . . . . 308 298 643 950 328 -65.5GSP/AGOA imports . . . . . . . . . . 0 0 0 0 0 na
All sectorsExports . . . . . . . . . . . . . . . . . . . . . 44,585 42,397 36,807 27,517 32,983 19.9Imports . . . . . . . . . . . . . . . . . . . . . 30,523 45,408 42,558 45,810 59,485 29.9GSP/AGOA imports . . . . . . . . . . 0 0 0 0 0 na
See footnote at end of table.

B-31
Table B-2-ContinuedMadagascar: U.S. exports, imports, and GSP/AGOA imports, by major commodity sectors, 1999-2003
Sector 1999 2000 2001 2002 2003
Change2002-03
Percent
1,000 dollarsAgricultural products
Exports . . . . . . . . . . . . . . . . . . . . . 1,587 4,962 4,785 7,407 7,384 -0.3Imports . . . . . . . . . . . . . . . . . . . . . 28,090 39,599 83,969 121,478 181,276 49.2GSP/AGOA imports . . . . . . . . . . 3,229 2,598 2,484 2,360 76 -96.8
Forest productsExports . . . . . . . . . . . . . . . . . . . . . 123 87 239 128 88 -31.4Imports . . . . . . . . . . . . . . . . . . . . . 2,004 2,177 2,054 1,526 1,566 2.6GSP/AGOA imports . . . . . . . . . . 863 1,006 1,140 873 1,243 42.3
Chemicals and related productsExports . . . . . . . . . . . . . . . . . . . . . 2,100 1,104 2,630 1,455 2,017 38.6Imports . . . . . . . . . . . . . . . . . . . . . 413 501 1,470 200 733 265.9GSP/AGOA imports . . . . . . . . . . 0 4 0 3 0 -100.0
Energy-related productsExports . . . . . . . . . . . . . . . . . . . . . 30 12 50 36 4 -89.2Imports . . . . . . . . . . . . . . . . . . . . . 0 0 2 0 0 naGSP/AGOA imports . . . . . . . . . . 0 0 0 0 0 na
Textiles and apparelExports . . . . . . . . . . . . . . . . . . . . . 670 432 744 234 626 167.9Imports . . . . . . . . . . . . . . . . . . . . . 46,068 109,907 178,750 89,998 196,375 118.2GSP/AGOA imports . . . . . . . . . . 338 239 92,558 76,128 186,181 144.6
FootwearExports . . . . . . . . . . . . . . . . . . . . . 15 0 0 0 0 naImports . . . . . . . . . . . . . . . . . . . . . 0 3 0 0 0 naGSP/AGOA imports . . . . . . . . . . 0 0 0 0 0 na
Minerals and metalsExports . . . . . . . . . . . . . . . . . . . . . 310 379 812 38 420 1,005.8Imports . . . . . . . . . . . . . . . . . . . . . 1,929 3,111 1,926 1,454 1,542 6.1GSP/AGOA imports . . . . . . . . . . 120 164 231 104 34 -67.1
MachineryExports . . . . . . . . . . . . . . . . . . . . . 1,087 566 2,635 973 1,211 24.5Imports . . . . . . . . . . . . . . . . . . . . . 0 7 0 0 0 naGSP/AGOA imports . . . . . . . . . . 0 0 0 0 0 na
Transportation equipmentExports . . . . . . . . . . . . . . . . . . . . . 98,050 5,894 5,917 2,707 29,306 982.7Imports . . . . . . . . . . . . . . . . . . . . . 0 3 5 0 0 naGSP/AGOA imports . . . . . . . . . . 0 0 0 0 0 na
Electronic productsExports . . . . . . . . . . . . . . . . . . . . . 1,706 1,572 2,500 1,507 3,441 128.3Imports . . . . . . . . . . . . . . . . . . . . . 454 416 360 72 19 -73.4GSP/AGOA imports . . . . . . . . . . 302 370 307 42 0 -100.0
Miscellaneous manufacturesExports . . . . . . . . . . . . . . . . . . . . . 3 51 116 76 81 6.5Imports . . . . . . . . . . . . . . . . . . . . . 648 880 2,305 396 617 56.0GSP/AGOA imports . . . . . . . . . . 221 339 385 217 345 59.0
Special provisionsExports . . . . . . . . . . . . . . . . . . . . . 375 338 519 656 909 38.5Imports . . . . . . . . . . . . . . . . . . . . . 610 1,133 949 799 1,201 50.2GSP/AGOA imports . . . . . . . . . . 0 0 0 0 0 na
All sectorsExports . . . . . . . . . . . . . . . . . . . . . 106,056 15,397 20,947 15,217 45,488 198.9Imports . . . . . . . . . . . . . . . . . . . . . 80,214 157,737 271,791 215,923 383,329 77.5GSP/AGOA imports . . . . . . . . . . 5,073 4,720 97,105 79,728 187,879 135.6
See footnote at end of table.

B-32
Table B-2-ContinuedMalawi: U.S. exports, imports, and GSP/AGOA imports, by major commodity sectors, 1999-2003
Sector 1999 2000 2001 2002 2003
Change2002-03
Percent
1,000 dollarsAgricultural products
Exports . . . . . . . . . . . . . . . . . . . . . 133 2,013 578 12,426 4,356 -64.9Imports . . . . . . . . . . . . . . . . . . . . . 57,274 60,616 59,317 56,565 56,811 0.4GSP/AGOA imports . . . . . . . . . . 24,660 23,216 30,561 35,499 36,858 3.8
Forest productsExports . . . . . . . . . . . . . . . . . . . . . 366 560 956 944 714 -24.3Imports . . . . . . . . . . . . . . . . . . . . . 6 4 12 4 22 433.5GSP/AGOA imports . . . . . . . . . . 0 0 2 0 9 na
Chemicals and related productsExports . . . . . . . . . . . . . . . . . . . . . 931 195 948 252 995 295.2Imports . . . . . . . . . . . . . . . . . . . . . 0 3 0 0 0 naGSP/AGOA imports . . . . . . . . . . 0 3 0 0 0 na
Energy-related productsExports . . . . . . . . . . . . . . . . . . . . . 24 0 0 0 0 naImports . . . . . . . . . . . . . . . . . . . . . 0 0 0 0 0 naGSP/AGOA imports . . . . . . . . . . 0 0 0 0 0 na
Textiles and apparelExports . . . . . . . . . . . . . . . . . . . . . 419 812 862 337 342 1.3Imports . . . . . . . . . . . . . . . . . . . . . 1,204 7,326 12,385 11,432 23,173 102.7GSP/AGOA imports . . . . . . . . . . 0 0 4,799 11,405 22,389 96.3
FootwearExports . . . . . . . . . . . . . . . . . . . . . 0 13 18 22 0 -100.0Imports . . . . . . . . . . . . . . . . . . . . . 0 0 (1) 0 1 naGSP/AGOA imports . . . . . . . . . . 0 0 0 0 0 na
Minerals and metalsExports . . . . . . . . . . . . . . . . . . . . . 5 31 48 206 157 -23.9Imports . . . . . . . . . . . . . . . . . . . . . 48 0 19 0 0 naGSP/AGOA imports . . . . . . . . . . 42 0 0 0 0 na
MachineryExports . . . . . . . . . . . . . . . . . . . . . 402 1,576 2,273 1,528 1,698 11.1Imports . . . . . . . . . . . . . . . . . . . . . 9 0 0 0 0 naGSP/AGOA imports . . . . . . . . . . 9 0 0 0 0 na
Transportation equipmentExports . . . . . . . . . . . . . . . . . . . . . 279 1,344 284 509 1,864 266.0Imports . . . . . . . . . . . . . . . . . . . . . 0 0 0 0 0 naGSP/AGOA imports . . . . . . . . . . 0 0 0 0 0 na
Electronic productsExports . . . . . . . . . . . . . . . . . . . . . 2,077 1,195 3,076 6,480 2,131 -67.1Imports . . . . . . . . . . . . . . . . . . . . . 5 119 2 67 22 -67.3GSP/AGOA imports . . . . . . . . . . 0 0 0 0 0 na
Miscellaneous manufacturesExports . . . . . . . . . . . . . . . . . . . . . 12 25 53 110 7 -94.0Imports . . . . . . . . . . . . . . . . . . . . . 0 2 22 0 1 naGSP/AGOA imports . . . . . . . . . . 0 0 0 0 0 na
Special provisionsExports . . . . . . . . . . . . . . . . . . . . . 2,708 5,862 5,238 5,811 4,243 -27.0Imports . . . . . . . . . . . . . . . . . . . . . 58 57 42 42 46 8.3GSP/AGOA imports . . . . . . . . . . 0 0 0 0 0 na
All sectorsExports . . . . . . . . . . . . . . . . . . . . . 7,356 13,627 14,334 28,626 16,507 -42.3Imports . . . . . . . . . . . . . . . . . . . . . 58,604 68,126 71,800 68,109 80,076 17.6GSP/AGOA imports . . . . . . . . . . 24,711 23,218 35,362 46,904 59,256 26.3
See footnote at end of table.

B-33
Table B-2-ContinuedMali: U.S. exports, imports, and GSP/AGOA imports, by major commodity sectors, 1999-2003
Sector 1999 2000 2001 2002 2003
Change2002-03
Percent
1,000 dollarsAgricultural products
Exports . . . . . . . . . . . . . . . . . . . . . 1,760 5,160 1,774 1,461 1,431 -2.0Imports . . . . . . . . . . . . . . . . . . . . . 2,734 410 618 184 99 -46.2GSP/AGOA imports . . . . . . . . . . 0 0 15 16 0 -100.0
Forest productsExports . . . . . . . . . . . . . . . . . . . . . 28 1,173 73 68 25 -63.0Imports . . . . . . . . . . . . . . . . . . . . . 389 123 241 80 80 -0.2GSP/AGOA imports . . . . . . . . . . 262 123 153 48 65 35.6
Chemicals and related productsExports . . . . . . . . . . . . . . . . . . . . . 6,031 6,679 5,461 4,000 7,436 85.9Imports . . . . . . . . . . . . . . . . . . . . . 46 79 1 7 61 795.9GSP/AGOA imports . . . . . . . . . . 0 58 0 6 0 -100.0
Energy-related productsExports . . . . . . . . . . . . . . . . . . . . . 37 0 20 10 0 -100.0Imports . . . . . . . . . . . . . . . . . . . . . 0 0 0 0 0 naGSP/AGOA imports . . . . . . . . . . 0 0 0 0 0 na
Textiles and apparelExports . . . . . . . . . . . . . . . . . . . . . 1,133 1,166 285 573 384 -33.0Imports . . . . . . . . . . . . . . . . . . . . . 218 261 108 122 155 26.9GSP/AGOA imports . . . . . . . . . . 4 5 4 1 2 73.5
FootwearExports . . . . . . . . . . . . . . . . . . . . . 82 20 72 21 31 44.9Imports . . . . . . . . . . . . . . . . . . . . . 0 18 0 (1) (1) 19.2GSP/AGOA imports . . . . . . . . . . 0 0 0 0 0 na
Minerals and metalsExports . . . . . . . . . . . . . . . . . . . . . 291 993 573 107 123 14.6Imports . . . . . . . . . . . . . . . . . . . . . 38 148 398 252 101 -59.8GSP/AGOA imports . . . . . . . . . . 21 0 81 208 11 -94.6
MachineryExports . . . . . . . . . . . . . . . . . . . . . 7,092 1,313 1,879 1,509 4,829 220.1Imports . . . . . . . . . . . . . . . . . . . . . 92 32 51 20 234 1,062.9GSP/AGOA imports . . . . . . . . . . 0 0 0 0 0 na
Transportation equipmentExports . . . . . . . . . . . . . . . . . . . . . 4,161 8,091 11,230 1,484 2,313 55.8Imports . . . . . . . . . . . . . . . . . . . . . 0 46 5 0 0 naGSP/AGOA imports . . . . . . . . . . 0 0 0 0 0 na
Electronic productsExports . . . . . . . . . . . . . . . . . . . . . 7,351 4,439 7,710 1,562 10,011 540.7Imports . . . . . . . . . . . . . . . . . . . . . 190 1,815 484 584 604 3.4GSP/AGOA imports . . . . . . . . . . 0 0 0 0 0 na
Miscellaneous manufacturesExports . . . . . . . . . . . . . . . . . . . . . 44 126 18 15 183 1,080.8Imports . . . . . . . . . . . . . . . . . . . . . 4,342 4,241 1,946 872 617 -29.3GSP/AGOA imports . . . . . . . . . . 19 200 40 63 184 191.1
Special provisionsExports . . . . . . . . . . . . . . . . . . . . . 577 580 2,723 220 3,150 1,334.0Imports . . . . . . . . . . . . . . . . . . . . . 817 1,265 2,353 460 443 -3.8GSP/AGOA imports . . . . . . . . . . 0 0 0 0 0 na
All sectorsExports . . . . . . . . . . . . . . . . . . . . . 28,586 29,740 31,818 11,031 29,916 171.2Imports . . . . . . . . . . . . . . . . . . . . . 8,867 8,438 6,205 2,583 2,394 -7.3GSP/AGOA imports . . . . . . . . . . 306 387 293 342 262 -23.3
See footnote at end of table.

B-34
Table B-2-ContinuedMauritania: U.S. exports, imports, and GSP/AGOA imports, by major commodity sectors, 1999-2003
Sector 1999 2000 2001 2002 2003
Change2002-03
Percent
1,000 dollarsAgricultural products
Exports . . . . . . . . . . . . . . . . . . . . . 13,076 1,886 2,216 1,418 5,547 291.2Imports . . . . . . . . . . . . . . . . . . . . . 0 49 26 131 546 317.8GSP/AGOA imports . . . . . . . . . . 0 0 0 0 0 na
Forest productsExports . . . . . . . . . . . . . . . . . . . . . 0 5 9 15 0 -100.0Imports . . . . . . . . . . . . . . . . . . . . . 0 0 0 0 0 naGSP/AGOA imports . . . . . . . . . . 0 0 0 0 0 na
Chemicals and related productsExports . . . . . . . . . . . . . . . . . . . . . 130 155 261 427 85 -80.1Imports . . . . . . . . . . . . . . . . . . . . . 0 0 0 0 0 naGSP/AGOA imports . . . . . . . . . . 0 0 0 0 0 na
Energy-related productsExports . . . . . . . . . . . . . . . . . . . . . 72 84 3 174 273 56.9Imports . . . . . . . . . . . . . . . . . . . . . 0 0 0 0 3 naGSP/AGOA imports . . . . . . . . . . 0 0 0 0 0 na
Textiles and apparelExports . . . . . . . . . . . . . . . . . . . . . 34 215 240 361 319 -11.6Imports . . . . . . . . . . . . . . . . . . . . . 11 40 1 30 89 197.2GSP/AGOA imports . . . . . . . . . . 0 0 0 0 0 na
FootwearExports . . . . . . . . . . . . . . . . . . . . . 3 0 0 6 0 -100.0Imports . . . . . . . . . . . . . . . . . . . . . 0 0 0 387 0 -100.0GSP/AGOA imports . . . . . . . . . . 0 0 0 0 0 na
Minerals and metalsExports . . . . . . . . . . . . . . . . . . . . . 1,249 2,244 2,154 269 308 14.4Imports . . . . . . . . . . . . . . . . . . . . . 170 0 0 15 0 -100.0GSP/AGOA imports . . . . . . . . . . 0 0 0 0 0 na
MachineryExports . . . . . . . . . . . . . . . . . . . . . 3,152 4,728 4,577 6,608 13,093 98.1Imports . . . . . . . . . . . . . . . . . . . . . 0 0 0 42 3 -91.8GSP/AGOA imports . . . . . . . . . . 0 0 0 0 3 na
Transportation equipmentExports . . . . . . . . . . . . . . . . . . . . . 4,415 4,458 12,103 11,727 8,913 -24.0Imports . . . . . . . . . . . . . . . . . . . . . 0 3 0 0 0 naGSP/AGOA imports . . . . . . . . . . 0 0 0 0 0 na
Electronic productsExports . . . . . . . . . . . . . . . . . . . . . 913 1,821 2,920 1,053 4,771 353.3Imports . . . . . . . . . . . . . . . . . . . . . 537 15 131 139 136 -2.7GSP/AGOA imports . . . . . . . . . . 0 2 0 35 0 -100.0
Miscellaneous manufacturesExports . . . . . . . . . . . . . . . . . . . . . 0 19 40 63 0 -100.0Imports . . . . . . . . . . . . . . . . . . . . . 0 4 40 0 4 naGSP/AGOA imports . . . . . . . . . . 0 0 0 0 0 na
Special provisionsExports . . . . . . . . . . . . . . . . . . . . . 552 252 602 531 881 65.9Imports . . . . . . . . . . . . . . . . . . . . . 36 243 95 185 148 -19.9GSP/AGOA imports . . . . . . . . . . 0 0 0 0 0 na
All sectorsExports . . . . . . . . . . . . . . . . . . . . . 23,597 15,866 25,126 22,652 34,191 50.9Imports . . . . . . . . . . . . . . . . . . . . . 754 354 294 929 929 0.0GSP/AGOA imports . . . . . . . . . . 0 2 0 35 3 -90.3
See footnote at end of table.

B-35
Table B-2-ContinuedMauritius: U.S. exports, imports, and GSP/AGOA imports, by major commodity sectors, 1999-2003
Sector 1999 2000 2001 2002 2003
Change2002-03
Percent
1,000 dollarsAgricultural products
Exports . . . . . . . . . . . . . . . . . . . . . 443 920 274 550 508 -7.6Imports . . . . . . . . . . . . . . . . . . . . . 8,351 23,382 13,941 10,079 9,554 -5.2GSP/AGOA imports . . . . . . . . . . 3,274 4,836 10,162 5,061 1,302 -74.3
Forest productsExports . . . . . . . . . . . . . . . . . . . . . 716 781 610 420 475 13.1Imports . . . . . . . . . . . . . . . . . . . . . 0 63 117 368 244 -33.8GSP/AGOA imports . . . . . . . . . . 0 5 6 0 5 na
Chemicals and related productsExports . . . . . . . . . . . . . . . . . . . . . 1,129 1,570 1,816 1,490 1,712 14.9Imports . . . . . . . . . . . . . . . . . . . . . 374 762 1,882 1,286 1,074 -16.5GSP/AGOA imports . . . . . . . . . . 0 13 9 37 12 -66.9
Energy-related productsExports . . . . . . . . . . . . . . . . . . . . . 3 99 126 168 120 -28.9Imports . . . . . . . . . . . . . . . . . . . . . 0 0 0 0 0 naGSP/AGOA imports . . . . . . . . . . 0 0 0 0 0 na
Textiles and apparelExports . . . . . . . . . . . . . . . . . . . . . 405 453 2,865 1,501 2,208 47.1Imports . . . . . . . . . . . . . . . . . . . . . 232,109 244,863 238,345 254,653 269,155 5.7GSP/AGOA imports . . . . . . . . . . 17 0 38,925 106,528 135,162 26.9
FootwearExports . . . . . . . . . . . . . . . . . . . . . 0 0 6 5 0 -100.0Imports . . . . . . . . . . . . . . . . . . . . . 8 75 0 2 0 -100.0GSP/AGOA imports . . . . . . . . . . 0 0 0 0 0 na
Minerals and metalsExports . . . . . . . . . . . . . . . . . . . . . 469 444 299 877 744 -15.2Imports . . . . . . . . . . . . . . . . . . . . . 6,622 6,946 7,001 6,689 6,790 1.5GSP/AGOA imports . . . . . . . . . . 48 50 18 16 21 30.6
MachineryExports . . . . . . . . . . . . . . . . . . . . . 2,799 4,327 4,415 3,434 3,751 9.2Imports . . . . . . . . . . . . . . . . . . . . . 0 166 620 517 577 11.6GSP/AGOA imports . . . . . . . . . . 0 0 0 0 0 na
Transportation equipmentExports . . . . . . . . . . . . . . . . . . . . . 2,837 1,536 3,149 2,821 2,190 -22.4Imports . . . . . . . . . . . . . . . . . . . . . 115 1,757 110 102 365 258.0GSP/AGOA imports . . . . . . . . . . 0 0 2 0 49 na
Electronic productsExports . . . . . . . . . . . . . . . . . . . . . 20,312 3,940 6,837 6,338 10,152 60.2Imports . . . . . . . . . . . . . . . . . . . . . 3,685 3,571 4,155 3,630 3,964 9.2GSP/AGOA imports . . . . . . . . . . 3,211 2,928 2,945 1,854 1,611 -13.1
Miscellaneous manufacturesExports . . . . . . . . . . . . . . . . . . . . . 1,507 441 705 790 708 -10.3Imports . . . . . . . . . . . . . . . . . . . . . 4,107 3,544 4,796 1,771 5,496 210.4GSP/AGOA imports . . . . . . . . . . 2,740 1,825 1,908 795 4,914 517.8
Special provisionsExports . . . . . . . . . . . . . . . . . . . . . 1,483 935 920 1,003 1,121 11.8Imports . . . . . . . . . . . . . . . . . . . . . 2,973 876 4,159 1,338 878 -34.4GSP/AGOA imports . . . . . . . . . . 0 0 0 0 0 na
All sectorsExports . . . . . . . . . . . . . . . . . . . . . 32,103 15,448 22,022 19,398 23,689 22.1Imports . . . . . . . . . . . . . . . . . . . . . 258,343 286,008 275,127 280,433 298,096 6.3GSP/AGOA imports . . . . . . . . . . 9,291 9,658 53,975 114,292 143,077 25.2
See footnote at end of table.

B-36
Table B-2-ContinuedMozambique: U.S. exports, imports, and GSP/AGOA imports, by major commodity sectors, 1999-2003
Sector 1999 2000 2001 2002 2003
Change2002-03
Percent
1,000 dollarsAgricultural products
Exports . . . . . . . . . . . . . . . . . . . . . 18,274 30,311 14,979 66,136 39,178 -40.8Imports . . . . . . . . . . . . . . . . . . . . . 8,403 23,901 6,594 6,656 5,576 -16.2GSP/AGOA imports . . . . . . . . . . 78 10,688 5,253 5,713 5,385 -5.7
Forest productsExports . . . . . . . . . . . . . . . . . . . . . 22 151 80 81 34 -58.2Imports . . . . . . . . . . . . . . . . . . . . . 46 7 61 64 27 -57.2GSP/AGOA imports . . . . . . . . . . 0 2 8 16 16 -1.5
Chemicals and related productsExports . . . . . . . . . . . . . . . . . . . . . 1,952 1,338 720 958 1,807 88.6Imports . . . . . . . . . . . . . . . . . . . . . 0 0 (1) 0 14 naGSP/AGOA imports . . . . . . . . . . 0 0 (1) 0 0 na
Energy-related productsExports . . . . . . . . . . . . . . . . . . . . . 49 6,076 2,805 15,791 9,141 -42.1Imports . . . . . . . . . . . . . . . . . . . . . 0 0 0 0 0 naGSP/AGOA imports . . . . . . . . . . 0 0 0 0 0 na
Textiles and apparelExports . . . . . . . . . . . . . . . . . . . . . 2,758 4,495 2,193 1,742 2,357 35.3Imports . . . . . . . . . . . . . . . . . . . . . 44 -1 179 193 2,528 1,208.3GSP/AGOA imports . . . . . . . . . . 0 0 0 186 2,516 1,251.7
FootwearExports . . . . . . . . . . . . . . . . . . . . . 51 175 93 307 676 120.0Imports . . . . . . . . . . . . . . . . . . . . . 0 0 0 0 0 naGSP/AGOA imports . . . . . . . . . . 0 0 0 0 0 na
Minerals and metalsExports . . . . . . . . . . . . . . . . . . . . . 2,821 1,074 166 412 952 131.2Imports . . . . . . . . . . . . . . . . . . . . . 1,065 159 19 952 21 -97.8GSP/AGOA imports . . . . . . . . . . 17 11 16 0 0 na
MachineryExports . . . . . . . . . . . . . . . . . . . . . 3,390 4,709 1,462 5,833 2,981 -48.9Imports . . . . . . . . . . . . . . . . . . . . . 19 0 0 48 10 -79.6GSP/AGOA imports . . . . . . . . . . 0 0 0 0 0 na
Transportation equipmentExports . . . . . . . . . . . . . . . . . . . . . 924 1,473 1,412 3,983 3,165 -20.5Imports . . . . . . . . . . . . . . . . . . . . . 0 0 0 0 0 naGSP/AGOA imports . . . . . . . . . . 0 0 0 0 0 na
Electronic productsExports . . . . . . . . . . . . . . . . . . . . . 2,444 2,287 1,520 1,574 1,125 -28.5Imports . . . . . . . . . . . . . . . . . . . . . 57 71 8 157 109 -30.7GSP/AGOA imports . . . . . . . . . . 0 0 0 0 0 na
Miscellaneous manufacturesExports . . . . . . . . . . . . . . . . . . . . . 83 28 504 39 117 198.2Imports . . . . . . . . . . . . . . . . . . . . . 60 46 34 69 52 -24.2GSP/AGOA imports . . . . . . . . . . 0 0 0 0 0 na
Special provisionsExports . . . . . . . . . . . . . . . . . . . . . 1,079 5,798 2,393 1,013 806 -20.4Imports . . . . . . . . . . . . . . . . . . . . . 592 194 165 22 373 1,609.7GSP/AGOA imports . . . . . . . . . . 0 0 0 0 0 na
All sectorsExports . . . . . . . . . . . . . . . . . . . . . 33,847 57,913 28,327 97,869 62,340 -36.3Imports . . . . . . . . . . . . . . . . . . . . . 10,287 24,377 7,060 8,160 8,711 6.7GSP/AGOA imports . . . . . . . . . . 95 10,701 5,278 5,916 7,917 33.8
See footnote at end of table.

B-37
Table B-2-ContinuedNamibia: U.S. exports, imports, and GSP/AGOA imports, by major commodity sectors, 1999-2003
Sector 1999 2000 2001 2002 2003
Change2002-03
Percent
1,000 dollarsAgricultural products
Exports . . . . . . . . . . . . . . . . . . . . . 67 2,414 4,928 5,651 5,662 0.2Imports . . . . . . . . . . . . . . . . . . . . . 18,406 18,883 12,495 6,456 10,043 55.6GSP/AGOA imports . . . . . . . . . . 341 1 26 0 5 na
Forest productsExports . . . . . . . . . . . . . . . . . . . . . 48 420 187 468 575 23.0Imports . . . . . . . . . . . . . . . . . . . . . 173 186 76 189 155 -17.6GSP/AGOA imports . . . . . . . . . . 76 134 67 161 142 -11.9
Chemicals and related productsExports . . . . . . . . . . . . . . . . . . . . . 946 1,481 4,169 9,315 4,894 -47.5Imports . . . . . . . . . . . . . . . . . . . . . 197 404 48 1 748 57,899.1GSP/AGOA imports . . . . . . . . . . (1) (1) 0 0 0 na
Energy-related productsExports . . . . . . . . . . . . . . . . . . . . . 32 120 138 86 203 136.3Imports . . . . . . . . . . . . . . . . . . . . . 0 13,432 11,302 30,694 18,349 -40.2GSP/AGOA imports . . . . . . . . . . 0 0 0 0 0 na
Textiles and apparelExports . . . . . . . . . . . . . . . . . . . . . 201 77 84 157 582 271.5Imports . . . . . . . . . . . . . . . . . . . . . 40 192 118 6,713 41,972 525.3GSP/AGOA imports . . . . . . . . . . 8 0 0 1,552 32,135 1,971.0
FootwearExports . . . . . . . . . . . . . . . . . . . . . 0 0 3 0 8 naImports . . . . . . . . . . . . . . . . . . . . . 0 0 0 0 0 naGSP/AGOA imports . . . . . . . . . . 0 0 0 0 0 na
Minerals and metalsExports . . . . . . . . . . . . . . . . . . . . . 141 259 676 5,794 2,481 -57.2Imports . . . . . . . . . . . . . . . . . . . . . 9,638 6,968 12,138 11,344 49,639 337.6GSP/AGOA imports . . . . . . . . . . 0 0 0 0 14,465 na
MachineryExports . . . . . . . . . . . . . . . . . . . . . 1,508 1,064 2,420 2,253 1,392 -38.2Imports . . . . . . . . . . . . . . . . . . . . . 94 220 34 79 8 -90.5GSP/AGOA imports . . . . . . . . . . 0 0 0 0 0 na
Transportation equipmentExports . . . . . . . . . . . . . . . . . . . . . 182,338 57,993 176,282 3,287 2,105 -36.0Imports . . . . . . . . . . . . . . . . . . . . . 7 2 0 6 0 -100.0GSP/AGOA imports . . . . . . . . . . 0 0 0 0 0 na
Electronic productsExports . . . . . . . . . . . . . . . . . . . . . 5,944 3,012 10,260 13,601 2,228 -83.6Imports . . . . . . . . . . . . . . . . . . . . . 200 6 10 27 12 -56.5GSP/AGOA imports . . . . . . . . . . 0 0 0 0 0 na
Miscellaneous manufacturesExports . . . . . . . . . . . . . . . . . . . . . 180 725 597 1,688 958 -43.2Imports . . . . . . . . . . . . . . . . . . . . . 57 105 52 71 112 59.5GSP/AGOA imports . . . . . . . . . . 2 18 0 4 7 83.1
Special provisionsExports . . . . . . . . . . . . . . . . . . . . . 3,417 10,882 49,591 11,388 5,581 -51.0Imports . . . . . . . . . . . . . . . . . . . . . 1,173 1,795 1,571 1,775 2,211 24.6GSP/AGOA imports . . . . . . . . . . 0 0 0 0 0 na
All sectorsExports . . . . . . . . . . . . . . . . . . . . . 194,822 78,448 249,334 53,688 26,668 -50.3Imports . . . . . . . . . . . . . . . . . . . . . 29,984 42,191 37,845 57,353 123,249 114.9GSP/AGOA imports . . . . . . . . . . 427 154 93 1,717 46,755 2,622.8
See footnote at end of table.

B-38
Table B-2-ContinuedNiger: U.S. exports, imports, and GSP/AGOA imports, by major commodity sectors, 1999-2003
Sector 1999 2000 2001 2002 2003
Change2002-03
Percent
1,000 dollarsAgricultural products
Exports . . . . . . . . . . . . . . . . . . . . . 432 2,357 4,759 7,184 5,823 -18.9Imports . . . . . . . . . . . . . . . . . . . . . 152 146 6 16 1,999 12,527.4GSP/AGOA imports . . . . . . . . . . 0 0 0 0 0 na
Forest productsExports . . . . . . . . . . . . . . . . . . . . . 228 1,252 2,732 4,090 4,194 2.6Imports . . . . . . . . . . . . . . . . . . . . . 14 51 273 3 10 274.5GSP/AGOA imports . . . . . . . . . . 11 0 0 3 0 -100.0
Chemicals and related productsExports . . . . . . . . . . . . . . . . . . . . . 1,896 2,806 20,006 5,791 5,704 -1.5Imports . . . . . . . . . . . . . . . . . . . . . 121 56 204 94 309 228.1GSP/AGOA imports . . . . . . . . . . 0 16 42 0 36 na
Energy-related productsExports . . . . . . . . . . . . . . . . . . . . . 0 0 5 5 11 129.8Imports . . . . . . . . . . . . . . . . . . . . . 2,455 4,770 0 0 0 naGSP/AGOA imports . . . . . . . . . . 0 0 0 0 0 na
Textiles and apparelExports . . . . . . . . . . . . . . . . . . . . . 8,172 4,287 4,708 3,227 3,222 -0.2Imports . . . . . . . . . . . . . . . . . . . . . 128 42 54 100 129 28.7GSP/AGOA imports . . . . . . . . . . 0 0 0 0 (1) na
FootwearExports . . . . . . . . . . . . . . . . . . . . . 3 5 0 0 0 naImports . . . . . . . . . . . . . . . . . . . . . 1 0 0 0 (1) naGSP/AGOA imports . . . . . . . . . . 0 0 0 0 0 na
Minerals and metalsExports . . . . . . . . . . . . . . . . . . . . . 195 490 947 953 925 -3.0Imports . . . . . . . . . . . . . . . . . . . . . 4 578 126 32 234 625.4GSP/AGOA imports . . . . . . . . . . 4 0 0 0 0 na
MachineryExports . . . . . . . . . . . . . . . . . . . . . 1,838 5,533 7,626 2,166 1,874 -13.5Imports . . . . . . . . . . . . . . . . . . . . . 599 810 55 167 104 -37.8GSP/AGOA imports . . . . . . . . . . 254 0 0 0 0 na
Transportation equipmentExports . . . . . . . . . . . . . . . . . . . . . 1,065 1,865 8,217 5,451 3,511 -35.6Imports . . . . . . . . . . . . . . . . . . . . . 33 12 112 211 74 -65.2GSP/AGOA imports . . . . . . . . . . 0 0 0 0 0 na
Electronic productsExports . . . . . . . . . . . . . . . . . . . . . 2,855 14,032 11,365 7,955 5,306 -33.3Imports . . . . . . . . . . . . . . . . . . . . . 318 139 240 29 481 1,534.2GSP/AGOA imports . . . . . . . . . . 0 0 0 4 0 -100.0
Miscellaneous manufacturesExports . . . . . . . . . . . . . . . . . . . . . 773 584 168 321 277 -13.7Imports . . . . . . . . . . . . . . . . . . . . . 199 24 13 201 171 -14.6GSP/AGOA imports . . . . . . . . . . 11 0 0 15 26 66.7
Special provisionsExports . . . . . . . . . . . . . . . . . . . . . 938 2,459 2,352 2,177 1,518 -30.3Imports . . . . . . . . . . . . . . . . . . . . . 813 344 342 43 522 1,120.7GSP/AGOA imports . . . . . . . . . . 0 0 0 0 0 na
All sectorsExports . . . . . . . . . . . . . . . . . . . . . 18,394 35,671 62,886 39,320 32,365 -17.7Imports . . . . . . . . . . . . . . . . . . . . . 4,837 6,972 1,427 897 4,034 349.7GSP/AGOA imports . . . . . . . . . . 280 16 42 22 63 186.7
See footnote at end of table.

B-39
Table B-2-ContinuedNigeria: U.S. exports, imports, and GSP/AGOA imports, by major commodity sectors, 1999-2003
Sector 1999 2000 2001 2002 2003
Change2002-03
Percent
1,000 dollarsAgricultural products
Exports . . . . . . . . . . . . . . . . . . . . . 172,699 178,734 245,911 303,482 324,575 7.0Imports . . . . . . . . . . . . . . . . . . . . . 8,277 5,227 10,529 16,015 48,058 200.1GSP/AGOA imports . . . . . . . . . . 0 58 153 464 1,767 280.5
Forest productsExports . . . . . . . . . . . . . . . . . . . . . 8,493 14,667 20,944 14,817 12,027 -18.8Imports . . . . . . . . . . . . . . . . . . . . . 1,138 875 477 421 453 7.6GSP/AGOA imports . . . . . . . . . . 0 10 19 13 36 169.3
Chemicals and related productsExports . . . . . . . . . . . . . . . . . . . . . 43,156 55,631 61,726 60,008 60,573 0.9Imports . . . . . . . . . . . . . . . . . . . . . 429,134 943,895 258,960 12,966 20,717 59.8GSP/AGOA imports . . . . . . . . . . 0 0 (1) 0 0 na
Energy-related productsExports . . . . . . . . . . . . . . . . . . . . . 26,321 16,568 24,335 36,515 21,963 -39.9Imports . . . . . . . . . . . . . . . . . . . . . 3,720,249 8,706,166 8,627,161 5,772,765 10,027,991 73.7GSP/AGOA imports . . . . . . . . . . 0 0 5,688,030 5,409,167 9,353,913 72.9
Textiles and apparelExports . . . . . . . . . . . . . . . . . . . . . 12,817 8,384 13,647 15,053 12,464 -17.2Imports . . . . . . . . . . . . . . . . . . . . . 801 572 453 111 455 310.0GSP/AGOA imports . . . . . . . . . . 0 0 (1) 0 1 na
FootwearExports . . . . . . . . . . . . . . . . . . . . . 738 728 1,391 3,590 2,528 -29.6Imports . . . . . . . . . . . . . . . . . . . . . 57 106 186 5 4 -27.7GSP/AGOA imports . . . . . . . . . . 0 0 71 1 1 91.4
Minerals and metalsExports . . . . . . . . . . . . . . . . . . . . . 19,272 25,355 37,884 42,235 29,095 -31.1Imports . . . . . . . . . . . . . . . . . . . . . 972 16,187 12,107 1,108 437 -60.6GSP/AGOA imports . . . . . . . . . . 0 0 0 2 73 2,934.1
MachineryExports . . . . . . . . . . . . . . . . . . . . . 74,239 124,234 151,764 140,803 95,107 -32.5Imports . . . . . . . . . . . . . . . . . . . . . 2,693 55 296 487 48 -90.1GSP/AGOA imports . . . . . . . . . . 0 0 0 0 0 na
Transportation equipmentExports . . . . . . . . . . . . . . . . . . . . . 194,092 228,238 284,261 311,616 285,846 -8.3Imports . . . . . . . . . . . . . . . . . . . . . 0 23 72 1,075 266 -75.3GSP/AGOA imports . . . . . . . . . . 0 0 56 0 205 na
Electronic productsExports . . . . . . . . . . . . . . . . . . . . . 52,304 42,039 86,934 96,832 133,911 38.3Imports . . . . . . . . . . . . . . . . . . . . . 97 92 318 830 157 -81.1GSP/AGOA imports . . . . . . . . . . 0 0 46 3 0 -100.0
Miscellaneous manufacturesExports . . . . . . . . . . . . . . . . . . . . . 9,969 3,590 7,583 8,986 6,984 -22.3Imports . . . . . . . . . . . . . . . . . . . . . 4,710 2,969 1,463 1,635 1,858 13.6GSP/AGOA imports . . . . . . . . . . 0 3 85 10 16 67.6
Special provisionsExports . . . . . . . . . . . . . . . . . . . . . 10,061 14,432 11,234 12,971 11,379 -12.3Imports . . . . . . . . . . . . . . . . . . . . . 4,194 3,961 4,454 12,185 13,176 8.1GSP/AGOA imports . . . . . . . . . . 0 0 0 0 0 na
All sectorsExports . . . . . . . . . . . . . . . . . . . . . 624,161 712,600 947,614 1,046,908 996,453 -4.8Imports . . . . . . . . . . . . . . . . . . . . . 4,172,322 9,680,128 8,916,476 5,819,603 10,113,618 73.8GSP/AGOA imports . . . . . . . . . . 0 71 5,688,461 5,409,660 9,356,012 73.0
See footnote at end of table.

B-40
Table B-2-ContinuedRepublic of the Congo: U.S. exports, imports, and GSP/AGOA imports, by major commodity sectors, 1999-2003
Sector 1999 2000 2001 2002 2003
Change2002-03
Percent
1,000 dollarsAgricultural products
Exports . . . . . . . . . . . . . . . . . . . . . 9,487 16,369 14,325 4,251 13,057 207.1Imports . . . . . . . . . . . . . . . . . . . . . 4,423 3,053 1,196 3,560 4,661 30.9GSP/AGOA imports . . . . . . . . . . 3,083 2,456 0 2,786 2,813 1.0
Forest productsExports . . . . . . . . . . . . . . . . . . . . . 95 6,078 417 158 228 44.5Imports . . . . . . . . . . . . . . . . . . . . . 2,063 1,227 682 461 1,731 275.2GSP/AGOA imports . . . . . . . . . . 21 27 2 0 48 na
Chemicals and related productsExports . . . . . . . . . . . . . . . . . . . . . 1,345 6,365 1,380 1,633 2,347 43.7Imports . . . . . . . . . . . . . . . . . . . . . 16,847 29,720 666 1,675 3,341 99.4GSP/AGOA imports . . . . . . . . . . 0 0 0 0 0 na
Energy-related productsExports . . . . . . . . . . . . . . . . . . . . . 59 348 91 114 138 21.5Imports . . . . . . . . . . . . . . . . . . . . . 367,338 445,822 438,808 200,766 383,446 91.0GSP/AGOA imports . . . . . . . . . . 0 0 128,746 103,808 337,899 225.5
Textiles and apparelExports . . . . . . . . . . . . . . . . . . . . . 5,778 4,949 4,191 3,580 6,244 74.4Imports . . . . . . . . . . . . . . . . . . . . . 14 2 4 7 1 -89.0GSP/AGOA imports . . . . . . . . . . 1 0 2 0 0 na
FootwearExports . . . . . . . . . . . . . . . . . . . . . 129 349 22 13 0 -100.0Imports . . . . . . . . . . . . . . . . . . . . . 0 2 0 0 0 naGSP/AGOA imports . . . . . . . . . . 0 0 0 0 0 na
Minerals and metalsExports . . . . . . . . . . . . . . . . . . . . . 836 4,182 5,601 6,972 3,516 -49.6Imports . . . . . . . . . . . . . . . . . . . . . 16,057 24,840 14,525 16,437 10,341 -37.1GSP/AGOA imports . . . . . . . . . . 3,160 1,847 1,410 14 15 9.7
MachineryExports . . . . . . . . . . . . . . . . . . . . . 7,538 8,437 8,441 6,335 4,860 -23.3Imports . . . . . . . . . . . . . . . . . . . . . 4 76 22 5 24 399.3GSP/AGOA imports . . . . . . . . . . 0 0 0 0 0 na
Transportation equipmentExports . . . . . . . . . . . . . . . . . . . . . 14,393 23,666 46,299 23,914 40,807 70.6Imports . . . . . . . . . . . . . . . . . . . . . 4 9 0 38 11 -70.7GSP/AGOA imports . . . . . . . . . . 0 0 0 0 0 na
Electronic productsExports . . . . . . . . . . . . . . . . . . . . . 3,446 7,460 5,778 2,233 4,761 113.2Imports . . . . . . . . . . . . . . . . . . . . . 3 419 138 40 33 -16.7GSP/AGOA imports . . . . . . . . . . 3 0 0 0 0 na
Miscellaneous manufacturesExports . . . . . . . . . . . . . . . . . . . . . 104 342 227 69 104 50.5Imports . . . . . . . . . . . . . . . . . . . . . 2,124 1,994 1,115 692 1,136 64.1GSP/AGOA imports . . . . . . . . . . 51 50 74 26 15 -41.9
Special provisionsExports . . . . . . . . . . . . . . . . . . . . . 3,612 2,655 2,573 2,522 2,539 0.7Imports . . . . . . . . . . . . . . . . . . . . . 1,642 780 747 142 2,461 1,632.9GSP/AGOA imports . . . . . . . . . . 0 0 0 0 0 na
All sectorsExports . . . . . . . . . . . . . . . . . . . . . 46,824 81,200 89,344 51,793 78,601 51.8Imports . . . . . . . . . . . . . . . . . . . . . 410,518 507,943 457,901 223,824 407,186 81.9GSP/AGOA imports . . . . . . . . . . 6,319 4,380 130,235 106,633 340,790 219.6
See footnote at end of table.

B-41
Table B-2-ContinuedRwanda: U.S. exports, imports, and GSP/AGOA imports, by major commodity sectors, 1999-2003
Sector 1999 2000 2001 2002 2003
Change2002-03
Percent
1,000 dollarsAgricultural products
Exports . . . . . . . . . . . . . . . . . . . . . 17,796 10,186 8,404 7,543 5,652 -25.1Imports . . . . . . . . . . . . . . . . . . . . . 2,007 2,301 3,668 1,899 1,789 -5.8GSP/AGOA imports . . . . . . . . . . 0 0 0 0 0 na
Forest productsExports . . . . . . . . . . . . . . . . . . . . . 8,111 3,917 117 22 85 282.1Imports . . . . . . . . . . . . . . . . . . . . . 0 0 20 10 6 -36.8GSP/AGOA imports . . . . . . . . . . 0 0 20 10 6 -36.8
Chemicals and related productsExports . . . . . . . . . . . . . . . . . . . . . 82 128 324 136 210 53.9Imports . . . . . . . . . . . . . . . . . . . . . 0 0 294 0 41 naGSP/AGOA imports . . . . . . . . . . 0 0 265 0 0 na
Energy-related productsExports . . . . . . . . . . . . . . . . . . . . . 0 0 0 0 0 naImports . . . . . . . . . . . . . . . . . . . . . 0 0 0 0 0 naGSP/AGOA imports . . . . . . . . . . 0 0 0 0 0 na
Textiles and apparelExports . . . . . . . . . . . . . . . . . . . . . 116 201 166 124 125 0.4Imports . . . . . . . . . . . . . . . . . . . . . 17 23 0 2 3 25.8GSP/AGOA imports . . . . . . . . . . 0 0 0 0 0 na
FootwearExports . . . . . . . . . . . . . . . . . . . . . 0 0 0 0 0 naImports . . . . . . . . . . . . . . . . . . . . . 0 0 0 0 0 naGSP/AGOA imports . . . . . . . . . . 0 0 0 0 0 na
Minerals and metalsExports . . . . . . . . . . . . . . . . . . . . . 116 82 196 37 23 -37.9Imports . . . . . . . . . . . . . . . . . . . . . 1,422 2,552 3,134 991 622 -37.2GSP/AGOA imports . . . . . . . . . . 154 324 33 0 0 na
MachineryExports . . . . . . . . . . . . . . . . . . . . . 135 280 91 37 38 3.0Imports . . . . . . . . . . . . . . . . . . . . . 0 0 0 33 68 103.7GSP/AGOA imports . . . . . . . . . . 0 0 0 0 0 na
Transportation equipmentExports . . . . . . . . . . . . . . . . . . . . . 32 1,020 50 284 533 88.0Imports . . . . . . . . . . . . . . . . . . . . . 0 0 0 0 0 naGSP/AGOA imports . . . . . . . . . . 0 0 0 0 0 na
Electronic productsExports . . . . . . . . . . . . . . . . . . . . . 19,550 2,537 6,990 1,491 738 -50.5Imports . . . . . . . . . . . . . . . . . . . . . 39 150 66 119 32 -73.2GSP/AGOA imports . . . . . . . . . . 0 0 0 0 0 na
Miscellaneous manufacturesExports . . . . . . . . . . . . . . . . . . . . . 14 17 75 54 66 22.0Imports . . . . . . . . . . . . . . . . . . . . . 0 0 20 18 54 202.2GSP/AGOA imports . . . . . . . . . . 0 0 0 0 0 na
Special provisionsExports . . . . . . . . . . . . . . . . . . . . . 1,538 554 973 434 444 2.5Imports . . . . . . . . . . . . . . . . . . . . . 201 36 20 14 8 -43.7GSP/AGOA imports . . . . . . . . . . 0 0 0 0 0 na
All sectorsExports . . . . . . . . . . . . . . . . . . . . . 47,490 18,922 17,386 10,162 7,914 -22.1Imports . . . . . . . . . . . . . . . . . . . . . 3,686 5,061 7,221 3,086 2,623 -15.0GSP/AGOA imports . . . . . . . . . . 154 324 318 10 6 -36.8
See footnote at end of table.

B-42
Table B-2-ContinuedSão Tomé & Principe: U.S. exports, imports, and GSP/AGOA imports, by major commodity sectors, 1999-2003
Sector 1999 2000 2001 2002 2003
Change2002-03
Percent
1,000 dollarsAgricultural products
Exports . . . . . . . . . . . . . . . . . . . . . 12 28 318 64 46 -28.2Imports . . . . . . . . . . . . . . . . . . . . . 0 21 0 0 0 naGSP/AGOA imports . . . . . . . . . . 0 0 0 0 0 na
Forest productsExports . . . . . . . . . . . . . . . . . . . . . 319 63 0 190 191 0.9Imports . . . . . . . . . . . . . . . . . . . . . 0 0 0 272 9 -96.7GSP/AGOA imports . . . . . . . . . . 0 0 0 0 0 na
Chemicals and related productsExports . . . . . . . . . . . . . . . . . . . . . 73 65 63 91 134 46.5Imports . . . . . . . . . . . . . . . . . . . . . 59 10 (1) 11 0 -100.0GSP/AGOA imports . . . . . . . . . . 0 0 0 0 0 na
Energy-related productsExports . . . . . . . . . . . . . . . . . . . . . 0 16 38 0 8 naImports . . . . . . . . . . . . . . . . . . . . . 1,616 0 0 0 0 naGSP/AGOA imports . . . . . . . . . . 0 0 0 0 0 na
Textiles and apparelExports . . . . . . . . . . . . . . . . . . . . . 0 108 24 119 0 -100.0Imports . . . . . . . . . . . . . . . . . . . . . 23 3 19 2 1 -67.5GSP/AGOA imports . . . . . . . . . . 0 0 0 0 0 na
FootwearExports . . . . . . . . . . . . . . . . . . . . . 0 0 0 0 0 naImports . . . . . . . . . . . . . . . . . . . . . 0 0 0 0 0 naGSP/AGOA imports . . . . . . . . . . 0 0 0 0 0 na
Minerals and metalsExports . . . . . . . . . . . . . . . . . . . . . 0 91 37 53 3 -94.4Imports . . . . . . . . . . . . . . . . . . . . . 33 46 9 34 2 -93.3GSP/AGOA imports . . . . . . . . . . 0 0 0 0 0 na
MachineryExports . . . . . . . . . . . . . . . . . . . . . 4 137 43 50 203 307.6Imports . . . . . . . . . . . . . . . . . . . . . 758 245 247 12 7 -44.6GSP/AGOA imports . . . . . . . . . . 0 0 0 0 0 na
Transportation equipmentExports . . . . . . . . . . . . . . . . . . . . . 52 190 9,921 1,068 71 -93.4Imports . . . . . . . . . . . . . . . . . . . . . 6 9 0 0 47 naGSP/AGOA imports . . . . . . . . . . 0 0 0 0 0 na
Electronic productsExports . . . . . . . . . . . . . . . . . . . . . 33 106 135 203 103 -49.4Imports . . . . . . . . . . . . . . . . . . . . . 142 116 32 37 16 -58.0GSP/AGOA imports . . . . . . . . . . 0 0 0 0 0 na
Miscellaneous manufacturesExports . . . . . . . . . . . . . . . . . . . . . 0 123 4 24 4 -83.5Imports . . . . . . . . . . . . . . . . . . . . . 7 5 0 3 10 242.3GSP/AGOA imports . . . . . . . . . . 0 0 0 0 0 na
Special provisionsExports . . . . . . . . . . . . . . . . . . . . . 17 34 29 59 481 718.1Imports . . . . . . . . . . . . . . . . . . . . . 49 59 15 19 (1) -98.5GSP/AGOA imports . . . . . . . . . . 0 0 0 0 0 na
All sectorsExports . . . . . . . . . . . . . . . . . . . . . 510 962 10,614 1,921 1,243 -35.3Imports . . . . . . . . . . . . . . . . . . . . . 2,693 513 322 391 91 -76.7GSP/AGOA imports . . . . . . . . . . 0 0 0 0 0 na
See footnote at end of table.

B-43
Table B-2-ContinuedSenegal: U.S. exports, imports, and GSP/AGOA imports, by major commodity sectors, 1999-2003
Sector 1999 2000 2001 2002 2003
Change2002-03
Percent
1,000 dollarsAgricultural products
Exports . . . . . . . . . . . . . . . . . . . . . 14,388 16,895 8,166 9,452 12,591 33.2Imports . . . . . . . . . . . . . . . . . . . . . 994 1,015 6,346 583 442 -24.3GSP/AGOA imports . . . . . . . . . . 0 0 2 50 27 -47.3
Forest productsExports . . . . . . . . . . . . . . . . . . . . . 175 498 878 184 1,036 463.4Imports . . . . . . . . . . . . . . . . . . . . . 171 227 154 184 47 -74.4GSP/AGOA imports . . . . . . . . . . 16 38 58 22 40 78.5
Chemicals and related productsExports . . . . . . . . . . . . . . . . . . . . . 6,617 15,773 17,377 11,206 10,154 -9.4Imports . . . . . . . . . . . . . . . . . . . . . 2,040 767 474 464 772 66.4GSP/AGOA imports . . . . . . . . . . 699 691 407 376 608 61.6
Energy-related productsExports . . . . . . . . . . . . . . . . . . . . . 171 185 535 2,299 4,548 97.9Imports . . . . . . . . . . . . . . . . . . . . . 7,263 0 0 0 0 naGSP/AGOA imports . . . . . . . . . . 0 0 0 0 0 na
Textiles and apparelExports . . . . . . . . . . . . . . . . . . . . . 3,570 4,102 4,142 4,125 3,743 -9.3Imports . . . . . . . . . . . . . . . . . . . . . 171 299 91 158 74 -53.3GSP/AGOA imports . . . . . . . . . . 1 11 3 (1) 1 202.7
FootwearExports . . . . . . . . . . . . . . . . . . . . . 62 97 124 103 152 47.5Imports . . . . . . . . . . . . . . . . . . . . . 8 2 14 14 8 -42.5GSP/AGOA imports . . . . . . . . . . 0 0 0 (1) 1 139.3
Minerals and metalsExports . . . . . . . . . . . . . . . . . . . . . 140 1,976 4,853 1,672 3,238 93.7Imports . . . . . . . . . . . . . . . . . . . . . 156 0 11 0 0 naGSP/AGOA imports . . . . . . . . . . 0 0 0 0 0 na
MachineryExports . . . . . . . . . . . . . . . . . . . . . 8,494 6,801 7,740 6,018 7,364 22.4Imports . . . . . . . . . . . . . . . . . . . . . 17 14 0 4 16 299.2GSP/AGOA imports . . . . . . . . . . 0 0 0 0 8 na
Transportation equipmentExports . . . . . . . . . . . . . . . . . . . . . 9,997 21,551 18,861 26,741 42,489 58.9Imports . . . . . . . . . . . . . . . . . . . . . 0 26 6 0 44 naGSP/AGOA imports . . . . . . . . . . 0 0 0 0 0 na
Electronic productsExports . . . . . . . . . . . . . . . . . . . . . 16,172 9,289 8,463 6,917 8,783 27.0Imports . . . . . . . . . . . . . . . . . . . . . 1,453 204 2,576 571 774 35.5GSP/AGOA imports . . . . . . . . . . 0 0 0 0 9 na
Miscellaneous manufacturesExports . . . . . . . . . . . . . . . . . . . . . 711 363 1,431 870 1,746 100.8Imports . . . . . . . . . . . . . . . . . . . . . 1,337 1,138 1,376 1,116 974 -12.8GSP/AGOA imports . . . . . . . . . . 24 41 97 50 27 -46.4
Special provisionsExports . . . . . . . . . . . . . . . . . . . . . 2,311 2,653 5,765 2,376 3,045 28.1Imports . . . . . . . . . . . . . . . . . . . . . 3,863 539 91,297 704 1,177 67.0GSP/AGOA imports . . . . . . . . . . 0 0 0 0 0 na
All sectorsExports . . . . . . . . . . . . . . . . . . . . . 62,808 80,183 78,334 71,962 98,888 37.4Imports . . . . . . . . . . . . . . . . . . . . . 17,473 4,231 102,345 3,799 4,326 13.9GSP/AGOA imports . . . . . . . . . . 740 781 567 499 720 44.2
See footnote at end of table.

B-44
Table B-2-ContinuedSeychelles: U.S. exports, imports, and GSP/AGOA imports, by major commodity sectors, 1999-2003
Sector 1999 2000 2001 2002 2003
Change2002-03
Percent
1,000 dollarsAgricultural products
Exports . . . . . . . . . . . . . . . . . . . . . 346 363 246 240 311 29.4Imports . . . . . . . . . . . . . . . . . . . . . 96 1,035 15,639 20,179 1,978 -90.2GSP/AGOA imports . . . . . . . . . . 0 0 0 0 0 na
Forest productsExports . . . . . . . . . . . . . . . . . . . . . 29 326 261 65 87 33.7Imports . . . . . . . . . . . . . . . . . . . . . 166 10 24 45 3 -93.4GSP/AGOA imports . . . . . . . . . . 93 0 0 0 3 na
Chemicals and related productsExports . . . . . . . . . . . . . . . . . . . . . 953 656 858 1,804 933 -48.3Imports . . . . . . . . . . . . . . . . . . . . . 0 1 3 47 2,381 4,920.2GSP/AGOA imports . . . . . . . . . . 0 0 0 0 0 na
Energy-related productsExports . . . . . . . . . . . . . . . . . . . . . 0 0 0 0 0 naImports . . . . . . . . . . . . . . . . . . . . . 0 0 0 0 5,087 naGSP/AGOA imports . . . . . . . . . . 0 0 0 0 0 na
Textiles and apparelExports . . . . . . . . . . . . . . . . . . . . . 145 711 1,035 303 228 -24.6Imports . . . . . . . . . . . . . . . . . . . . . 1,041 156 25 (1) 90 23,781.4GSP/AGOA imports . . . . . . . . . . 0 0 0 0 0 na
FootwearExports . . . . . . . . . . . . . . . . . . . . . 0 0 0 0 0 naImports . . . . . . . . . . . . . . . . . . . . . 0 0 0 0 0 naGSP/AGOA imports . . . . . . . . . . 0 0 0 0 0 na
Minerals and metalsExports . . . . . . . . . . . . . . . . . . . . . 1,523 391 295 383 412 7.6Imports . . . . . . . . . . . . . . . . . . . . . 38 291 355 220 113 -48.7GSP/AGOA imports . . . . . . . . . . 10 0 0 0 0 na
MachineryExports . . . . . . . . . . . . . . . . . . . . . 1,063 535 6,613 676 381 -43.7Imports . . . . . . . . . . . . . . . . . . . . . 46 0 36 54 45 -17.4GSP/AGOA imports . . . . . . . . . . 0 0 0 0 0 na
Transportation equipmentExports . . . . . . . . . . . . . . . . . . . . . 280 188 155,029 2,272 1,550 -31.8Imports . . . . . . . . . . . . . . . . . . . . . 0 32 0 31 3 -91.1GSP/AGOA imports . . . . . . . . . . 0 0 0 0 0 na
Electronic productsExports . . . . . . . . . . . . . . . . . . . . . 2,071 3,490 10,888 1,886 2,493 32.2Imports . . . . . . . . . . . . . . . . . . . . . 3,277 5,172 4,880 3,327 3,699 11.2GSP/AGOA imports . . . . . . . . . . 2,497 4,662 4,230 0 0 na
Miscellaneous manufacturesExports . . . . . . . . . . . . . . . . . . . . . 854 32 357 274 356 29.7Imports . . . . . . . . . . . . . . . . . . . . . 81 34 11 0 26 naGSP/AGOA imports . . . . . . . . . . 0 0 0 0 0 na
Special provisionsExports . . . . . . . . . . . . . . . . . . . . . 283 278 376 300 196 -34.5Imports . . . . . . . . . . . . . . . . . . . . . 454 1,366 2,728 2,388 1,900 -20.4GSP/AGOA imports . . . . . . . . . . 0 0 0 0 0 na
All sectorsExports . . . . . . . . . . . . . . . . . . . . . 7,547 6,971 175,959 8,204 6,947 -15.3Imports . . . . . . . . . . . . . . . . . . . . . 5,197 8,097 23,701 26,291 15,324 -41.7GSP/AGOA imports . . . . . . . . . . 2,600 4,662 4,230 0 3 na
See footnote at end of table.
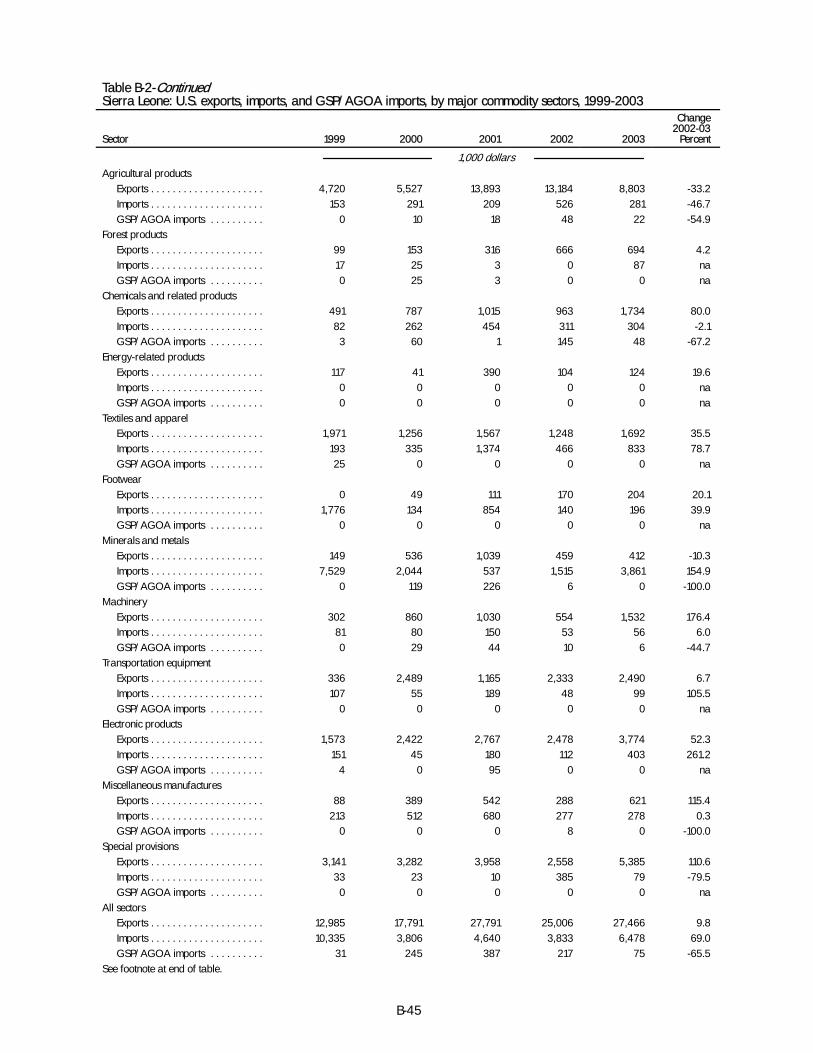
B-45
Table B-2-ContinuedSierra Leone: U.S. exports, imports, and GSP/AGOA imports, by major commodity sectors, 1999-2003
Sector 1999 2000 2001 2002 2003
Change2002-03
Percent
1,000 dollarsAgricultural products
Exports . . . . . . . . . . . . . . . . . . . . . 4,720 5,527 13,893 13,184 8,803 -33.2Imports . . . . . . . . . . . . . . . . . . . . . 153 291 209 526 281 -46.7GSP/AGOA imports . . . . . . . . . . 0 10 18 48 22 -54.9
Forest productsExports . . . . . . . . . . . . . . . . . . . . . 99 153 316 666 694 4.2Imports . . . . . . . . . . . . . . . . . . . . . 17 25 3 0 87 naGSP/AGOA imports . . . . . . . . . . 0 25 3 0 0 na
Chemicals and related productsExports . . . . . . . . . . . . . . . . . . . . . 491 787 1,015 963 1,734 80.0Imports . . . . . . . . . . . . . . . . . . . . . 82 262 454 311 304 -2.1GSP/AGOA imports . . . . . . . . . . 3 60 1 145 48 -67.2
Energy-related productsExports . . . . . . . . . . . . . . . . . . . . . 117 41 390 104 124 19.6Imports . . . . . . . . . . . . . . . . . . . . . 0 0 0 0 0 naGSP/AGOA imports . . . . . . . . . . 0 0 0 0 0 na
Textiles and apparelExports . . . . . . . . . . . . . . . . . . . . . 1,971 1,256 1,567 1,248 1,692 35.5Imports . . . . . . . . . . . . . . . . . . . . . 193 335 1,374 466 833 78.7GSP/AGOA imports . . . . . . . . . . 25 0 0 0 0 na
FootwearExports . . . . . . . . . . . . . . . . . . . . . 0 49 111 170 204 20.1Imports . . . . . . . . . . . . . . . . . . . . . 1,776 134 854 140 196 39.9GSP/AGOA imports . . . . . . . . . . 0 0 0 0 0 na
Minerals and metalsExports . . . . . . . . . . . . . . . . . . . . . 149 536 1,039 459 412 -10.3Imports . . . . . . . . . . . . . . . . . . . . . 7,529 2,044 537 1,515 3,861 154.9GSP/AGOA imports . . . . . . . . . . 0 119 226 6 0 -100.0
MachineryExports . . . . . . . . . . . . . . . . . . . . . 302 860 1,030 554 1,532 176.4Imports . . . . . . . . . . . . . . . . . . . . . 81 80 150 53 56 6.0GSP/AGOA imports . . . . . . . . . . 0 29 44 10 6 -44.7
Transportation equipmentExports . . . . . . . . . . . . . . . . . . . . . 336 2,489 1,165 2,333 2,490 6.7Imports . . . . . . . . . . . . . . . . . . . . . 107 55 189 48 99 105.5GSP/AGOA imports . . . . . . . . . . 0 0 0 0 0 na
Electronic productsExports . . . . . . . . . . . . . . . . . . . . . 1,573 2,422 2,767 2,478 3,774 52.3Imports . . . . . . . . . . . . . . . . . . . . . 151 45 180 112 403 261.2GSP/AGOA imports . . . . . . . . . . 4 0 95 0 0 na
Miscellaneous manufacturesExports . . . . . . . . . . . . . . . . . . . . . 88 389 542 288 621 115.4Imports . . . . . . . . . . . . . . . . . . . . . 213 512 680 277 278 0.3GSP/AGOA imports . . . . . . . . . . 0 0 0 8 0 -100.0
Special provisionsExports . . . . . . . . . . . . . . . . . . . . . 3,141 3,282 3,958 2,558 5,385 110.6Imports . . . . . . . . . . . . . . . . . . . . . 33 23 10 385 79 -79.5GSP/AGOA imports . . . . . . . . . . 0 0 0 0 0 na
All sectorsExports . . . . . . . . . . . . . . . . . . . . . 12,985 17,791 27,791 25,006 27,466 9.8Imports . . . . . . . . . . . . . . . . . . . . . 10,335 3,806 4,640 3,833 6,478 69.0GSP/AGOA imports . . . . . . . . . . 31 245 387 217 75 -65.5
See footnote at end of table.

B-46
Table B-2-ContinuedSomalia: U.S. exports, imports, and GSP/AGOA imports, by major commodity sectors, 1999-2003
Sector 1999 2000 2001 2002 2003
Change2002-03
Percent
1,000 dollarsAgricultural products
Exports . . . . . . . . . . . . . . . . . . . . . 1,936 1,776 3,193 1,609 4,001 148.6Imports . . . . . . . . . . . . . . . . . . . . . 67 14 82 192 55 -71.2GSP/AGOA imports . . . . . . . . . . 0 0 0 0 0 na
Forest productsExports . . . . . . . . . . . . . . . . . . . . . 0 0 6 8 21 177.5Imports . . . . . . . . . . . . . . . . . . . . . 0 5 5 7 0 -100.0GSP/AGOA imports . . . . . . . . . . 0 0 0 0 0 na
Chemicals and related productsExports . . . . . . . . . . . . . . . . . . . . . 68 100 25 808 1,143 41.5Imports . . . . . . . . . . . . . . . . . . . . . 35 56 151 39 80 107.3GSP/AGOA imports . . . . . . . . . . 0 0 0 0 0 na
Energy-related productsExports . . . . . . . . . . . . . . . . . . . . . 0 0 0 0 0 naImports . . . . . . . . . . . . . . . . . . . . . 0 0 12 5 0 -100.0GSP/AGOA imports . . . . . . . . . . 0 0 0 0 0 na
Textiles and apparelExports . . . . . . . . . . . . . . . . . . . . . 228 4 454 304 234 -23.2Imports . . . . . . . . . . . . . . . . . . . . . 28 9 69 5 1 -82.1GSP/AGOA imports . . . . . . . . . . 0 0 0 0 0 na
FootwearExports . . . . . . . . . . . . . . . . . . . . . 0 0 0 0 0 naImports . . . . . . . . . . . . . . . . . . . . . 0 0 0 0 0 naGSP/AGOA imports . . . . . . . . . . 0 0 0 0 0 na
Minerals and metalsExports . . . . . . . . . . . . . . . . . . . . . 138 0 5 137 525 282.4Imports . . . . . . . . . . . . . . . . . . . . . 0 324 6 6 2 -65.3GSP/AGOA imports . . . . . . . . . . 0 324 0 0 0 na
MachineryExports . . . . . . . . . . . . . . . . . . . . . 276 126 51 18 276 1,433.4Imports . . . . . . . . . . . . . . . . . . . . . 0 7 4 0 0 naGSP/AGOA imports . . . . . . . . . . 0 0 0 0 0 na
Transportation equipmentExports . . . . . . . . . . . . . . . . . . . . . 5 517 550 44 45 2.3Imports . . . . . . . . . . . . . . . . . . . . . 0 0 8 11 0 -100.0GSP/AGOA imports . . . . . . . . . . 0 0 0 0 0 na
Electronic productsExports . . . . . . . . . . . . . . . . . . . . . 132 2,137 778 3,062 671 -78.1Imports . . . . . . . . . . . . . . . . . . . . . 36 6 3 79 3 -96.6GSP/AGOA imports . . . . . . . . . . 0 0 0 0 0 na
Miscellaneous manufacturesExports . . . . . . . . . . . . . . . . . . . . . 0 0 10 53 0 -100.0Imports . . . . . . . . . . . . . . . . . . . . . 26 20 2 0 0 naGSP/AGOA imports . . . . . . . . . . 0 0 0 0 0 na
Special provisionsExports . . . . . . . . . . . . . . . . . . . . . 31 201 1,518 117 96 -17.7Imports . . . . . . . . . . . . . . . . . . . . . 0 2 (1) 5 42 801.8GSP/AGOA imports . . . . . . . . . . 0 0 0 0 0 na
All sectorsExports . . . . . . . . . . . . . . . . . . . . . 2,813 4,862 6,591 6,161 7,013 13.8Imports . . . . . . . . . . . . . . . . . . . . . 192 443 343 348 183 -47.4GSP/AGOA imports . . . . . . . . . . 0 324 0 0 0 na
See footnote at end of table.

B-47
Table B-2-ContinuedSouth Africa: U.S. exports, imports, and GSP/AGOA imports, by major commodity sectors, 1999-2003
Sector 1999 2000 2001 2002 2003
Change2002-03
Percent
1,000 dollarsAgricultural products
Exports . . . . . . . . . . . . . . . . . . . . . 186,131 132,718 100,678 150,899 149,169 -1.1Imports . . . . . . . . . . . . . . . . . . . . . 161,980 199,584 173,169 192,160 207,742 8.1GSP/AGOA imports . . . . . . . . . . 29,006 41,229 78,750 123,723 132,655 7.2
Forest productsExports . . . . . . . . . . . . . . . . . . . . . 102,848 98,146 96,753 75,009 94,413 25.9Imports . . . . . . . . . . . . . . . . . . . . . 52,158 66,461 48,456 44,302 66,403 49.9GSP/AGOA imports . . . . . . . . . . 8,889 8,789 9,141 17,467 22,849 30.8
Chemicals and related productsExports . . . . . . . . . . . . . . . . . . . . . 401,563 481,668 460,718 446,993 440,889 -1.4Imports . . . . . . . . . . . . . . . . . . . . . 225,449 283,500 283,066 267,343 344,660 28.9GSP/AGOA imports . . . . . . . . . . 97,971 118,967 126,011 134,334 175,348 30.5
Energy-related productsExports . . . . . . . . . . . . . . . . . . . . . 94,429 107,317 94,076 110,362 112,981 2.4Imports . . . . . . . . . . . . . . . . . . . . . 9,678 62,926 66,489 42,385 45,164 6.6GSP/AGOA imports . . . . . . . . . . 291 0 2,136 866 2,830 226.7
Textiles and apparelExports . . . . . . . . . . . . . . . . . . . . . 32,680 37,633 28,712 26,439 27,418 3.7Imports . . . . . . . . . . . . . . . . . . . . . 126,978 175,579 212,457 214,957 269,531 25.4GSP/AGOA imports . . . . . . . . . . 1,737 2,242 33,621 88,292 131,188 48.6
FootwearExports . . . . . . . . . . . . . . . . . . . . . 10,069 7,674 2,101 1,037 1,336 28.9Imports . . . . . . . . . . . . . . . . . . . . . 91 59 217 461 910 97.3GSP/AGOA imports . . . . . . . . . . 0 0 171 290 789 172.2
Minerals and metalsExports . . . . . . . . . . . . . . . . . . . . . 109,057 118,611 97,323 89,056 103,545 16.3Imports . . . . . . . . . . . . . . . . . . . . . 2,109,370 2,841,397 2,783,624 2,456,462 2,722,387 10.8GSP/AGOA imports . . . . . . . . . . 199,174 268,102 316,565 371,501 397,226 6.9
MachineryExports . . . . . . . . . . . . . . . . . . . . . 259,829 253,428 286,541 302,035 353,685 17.1Imports . . . . . . . . . . . . . . . . . . . . . 121,632 174,431 258,817 227,713 179,030 -21.4GSP/AGOA imports . . . . . . . . . . 15,168 31,500 22,899 17,771 11,048 -37.8
Transportation equipmentExports . . . . . . . . . . . . . . . . . . . . . 534,725 958,392 1,097,239 744,639 851,297 14.3Imports . . . . . . . . . . . . . . . . . . . . . 145,474 181,882 398,018 615,636 821,189 33.4GSP/AGOA imports . . . . . . . . . . 72,265 76,812 300,476 544,706 731,347 34.3
Electronic productsExports . . . . . . . . . . . . . . . . . . . . . 493,454 455,730 394,615 347,703 398,843 14.7Imports . . . . . . . . . . . . . . . . . . . . . 29,780 30,995 28,223 22,957 41,869 82.4GSP/AGOA imports . . . . . . . . . . 17,021 13,499 5,476 6,887 11,083 60.9
Miscellaneous manufacturesExports . . . . . . . . . . . . . . . . . . . . . 44,692 53,895 46,389 35,190 45,653 29.7Imports . . . . . . . . . . . . . . . . . . . . . 36,929 48,939 56,841 62,218 76,900 23.6GSP/AGOA imports . . . . . . . . . . 7,862 22,037 27,997 36,756 52,210 42.0
Special provisionsExports . . . . . . . . . . . . . . . . . . . . . 124,521 124,335 117,209 116,806 118,971 1.9Imports . . . . . . . . . . . . . . . . . . . . . 173,250 137,904 120,163 89,380 112,179 25.5GSP/AGOA imports . . . . . . . . . . 0 0 0 0 0 na
All sectorsExports . . . . . . . . . . . . . . . . . . . . . 2,393,998 2,829,546 2,822,354 2,446,169 2,698,201 10.3Imports . . . . . . . . . . . . . . . . . . . . . 3,192,768 4,203,657 4,429,539 4,235,974 4,887,962 15.4GSP/AGOA imports . . . . . . . . . . 449,384 583,176 923,243 1,342,594 1,668,573 24.3
See footnote at end of table.

B-48
Table B-2-ContinuedSudan: U.S. exports, imports, and GSP/AGOA imports, by major commodity sectors, 1999-2003
Sector 1999 2000 2001 2002 2003
Change2002-03
Percent
1,000 dollarsAgricultural products
Exports . . . . . . . . . . . . . . . . . . . . . 8,399 16,869 16,557 8,984 24,949 177.7Imports . . . . . . . . . . . . . . . . . . . . . 0 1,688 3,337 1,308 2,734 109.0GSP/AGOA imports . . . . . . . . . . 0 0 0 0 0 na
Forest productsExports . . . . . . . . . . . . . . . . . . . . . 56 0 0 70 54 -23.3Imports . . . . . . . . . . . . . . . . . . . . . 0 0 0 0 0 naGSP/AGOA imports . . . . . . . . . . 0 0 0 0 0 na
Chemicals and related productsExports . . . . . . . . . . . . . . . . . . . . . 0 0 122 629 641 1.8Imports . . . . . . . . . . . . . . . . . . . . . 0 0 0 0 0 naGSP/AGOA imports . . . . . . . . . . 0 0 0 0 0 na
Energy-related productsExports . . . . . . . . . . . . . . . . . . . . . 0 0 0 0 0 naImports . . . . . . . . . . . . . . . . . . . . . 0 0 0 0 0 naGSP/AGOA imports . . . . . . . . . . 0 0 0 0 0 na
Textiles and apparelExports . . . . . . . . . . . . . . . . . . . . . 0 0 0 0 11 naImports . . . . . . . . . . . . . . . . . . . . . 0 (1) 2 0 0 naGSP/AGOA imports . . . . . . . . . . 0 0 0 0 0 na
FootwearExports . . . . . . . . . . . . . . . . . . . . . 0 0 0 0 0 naImports . . . . . . . . . . . . . . . . . . . . . 0 0 0 0 0 naGSP/AGOA imports . . . . . . . . . . 0 0 0 0 0 na
Minerals and metalsExports . . . . . . . . . . . . . . . . . . . . . 27 0 6 8 6 -14.1Imports . . . . . . . . . . . . . . . . . . . . . 0 0 0 0 31 naGSP/AGOA imports . . . . . . . . . . 0 0 0 0 0 na
MachineryExports . . . . . . . . . . . . . . . . . . . . . 58 4 116 5 33 560.6Imports . . . . . . . . . . . . . . . . . . . . . 0 0 0 42 0 -100.0GSP/AGOA imports . . . . . . . . . . 0 0 0 0 0 na
Transportation equipmentExports . . . . . . . . . . . . . . . . . . . . . 19 0 20 12 20 69.0Imports . . . . . . . . . . . . . . . . . . . . . 0 0 0 0 0 naGSP/AGOA imports . . . . . . . . . . 0 0 0 0 0 na
Electronic productsExports . . . . . . . . . . . . . . . . . . . . . 51 0 41 10 156 1,507.7Imports . . . . . . . . . . . . . . . . . . . . . 26 4 8 0 10 naGSP/AGOA imports . . . . . . . . . . 0 0 0 0 0 na
Miscellaneous manufacturesExports . . . . . . . . . . . . . . . . . . . . . 0 0 0 11 24 124.1Imports . . . . . . . . . . . . . . . . . . . . . 21 116 0 0 0 naGSP/AGOA imports . . . . . . . . . . 0 0 0 0 0 na
Special provisionsExports . . . . . . . . . . . . . . . . . . . . . 211 9 255 1,125 165 -85.3Imports . . . . . . . . . . . . . . . . . . . . . 10 0 39 0 0 naGSP/AGOA imports . . . . . . . . . . 0 0 0 0 0 na
All sectorsExports . . . . . . . . . . . . . . . . . . . . . 8,821 16,882 17,119 10,854 26,059 140.1Imports . . . . . . . . . . . . . . . . . . . . . 57 1,808 3,385 1,350 2,775 105.6GSP/AGOA imports . . . . . . . . . . 0 0 0 0 0 na
See footnote at end of table.

B-49
Table B-2-ContinuedSwaziland: U.S. exports, imports, and GSP/AGOA imports, by major commodity sectors, 1999-2003
Sector 1999 2000 2001 2002 2003
Change2002-03
Percent
1,000 dollarsAgricultural products
Exports . . . . . . . . . . . . . . . . . . . . . 749 73 398 364 1,248 243.2Imports . . . . . . . . . . . . . . . . . . . . . 8,297 12,539 6,891 7,286 7,641 4.9GSP/AGOA imports . . . . . . . . . . 7,744 11,935 6,487 6,779 6,996 3.2
Forest productsExports . . . . . . . . . . . . . . . . . . . . . 155 321 80 256 33 -87.2Imports . . . . . . . . . . . . . . . . . . . . . 2,122 3,015 2,382 4,449 1,727 -61.2GSP/AGOA imports . . . . . . . . . . 70 0 3 270 52 -80.7
Chemicals and related productsExports . . . . . . . . . . . . . . . . . . . . . 881 807 2,110 1,672 2,412 44.3Imports . . . . . . . . . . . . . . . . . . . . . 1,452 1,866 839 886 1,332 50.3GSP/AGOA imports . . . . . . . . . . 2 22 85 283 478 69.0
Energy-related productsExports . . . . . . . . . . . . . . . . . . . . . 0 0 4 0 0 naImports . . . . . . . . . . . . . . . . . . . . . 0 0 0 0 0 naGSP/AGOA imports . . . . . . . . . . 0 0 0 0 0 na
Textiles and apparelExports . . . . . . . . . . . . . . . . . . . . . 204 160 159 16 80 390.8Imports . . . . . . . . . . . . . . . . . . . . . 23,318 31,898 48,091 89,088 140,510 57.7GSP/AGOA imports . . . . . . . . . . 0 0 8,195 73,901 126,369 71.0
FootwearExports . . . . . . . . . . . . . . . . . . . . . 0 5 0 0 0 naImports . . . . . . . . . . . . . . . . . . . . . 0 0 0 0 0 naGSP/AGOA imports . . . . . . . . . . 0 0 0 0 0 na
Minerals and metalsExports . . . . . . . . . . . . . . . . . . . . . 50 43 384 6,134 499 -91.9Imports . . . . . . . . . . . . . . . . . . . . . 147 207 126 102 5,144 4,939.8GSP/AGOA imports . . . . . . . . . . 120 0 0 19 47 149.5
MachineryExports . . . . . . . . . . . . . . . . . . . . . 367 2,542 138 362 1,784 392.5Imports . . . . . . . . . . . . . . . . . . . . . 539 61 2,256 421 241 -42.7GSP/AGOA imports . . . . . . . . . . 0 0 0 0 0 na
Transportation equipmentExports . . . . . . . . . . . . . . . . . . . . . 459 1,240 1,023 502 195 -61.3Imports . . . . . . . . . . . . . . . . . . . . . 124 3 3 443 59 -86.7GSP/AGOA imports . . . . . . . . . . 0 0 0 0 0 na
Electronic productsExports . . . . . . . . . . . . . . . . . . . . . 640 2,312 2,716 1,421 1,110 -21.9Imports . . . . . . . . . . . . . . . . . . . . . 157 152 258 7,212 387 -94.6GSP/AGOA imports . . . . . . . . . . 28 0 0 0 34 na
Miscellaneous manufacturesExports . . . . . . . . . . . . . . . . . . . . . 51 44 216 70 520 643.8Imports . . . . . . . . . . . . . . . . . . . . . 1,429 2,482 3,897 4,217 4,510 7.0GSP/AGOA imports . . . . . . . . . . 0 0 0 0 0 na
Special provisionsExports . . . . . . . . . . . . . . . . . . . . . 192 194 209 242 194 -19.7Imports . . . . . . . . . . . . . . . . . . . . . 264 355 294 359 483 34.5GSP/AGOA imports . . . . . . . . . . 0 0 0 0 0 na
All sectorsExports . . . . . . . . . . . . . . . . . . . . . 3,748 7,741 7,438 11,040 8,075 -26.9Imports . . . . . . . . . . . . . . . . . . . . . 37,849 52,577 65,036 114,464 162,033 41.6GSP/AGOA imports . . . . . . . . . . 7,964 11,957 14,770 81,252 133,975 64.9
See footnote at end of table.

B-50
Table B-2-ContinuedTanzania: U.S. exports, imports, and GSP/AGOA imports, by major commodity sectors, 1999-2003
Sector 1999 2000 2001 2002 2003
Change2002-03
Percent
1,000 dollarsAgricultural products
Exports . . . . . . . . . . . . . . . . . . . . . 16,548 3,704 9,797 11,672 13,607 16.6Imports . . . . . . . . . . . . . . . . . . . . . 17,165 13,739 12,301 13,253 11,595 -12.5GSP/AGOA imports . . . . . . . . . . 1,026 1,134 636 811 474 -41.5
Forest productsExports . . . . . . . . . . . . . . . . . . . . . 1,095 875 895 523 1,379 163.5Imports . . . . . . . . . . . . . . . . . . . . . 190 561 499 355 347 -2.1GSP/AGOA imports . . . . . . . . . . 75 200 224 239 203 -15.1
Chemicals and related productsExports . . . . . . . . . . . . . . . . . . . . . 2,539 2,269 5,506 1,722 3,830 122.4Imports . . . . . . . . . . . . . . . . . . . . . 341 554 236 122 1,776 1,354.4GSP/AGOA imports . . . . . . . . . . 0 0 21 0 0 na
Energy-related productsExports . . . . . . . . . . . . . . . . . . . . . 92 79 170 198 53 -73.0Imports . . . . . . . . . . . . . . . . . . . . . 0 0 0 0 0 naGSP/AGOA imports . . . . . . . . . . 0 0 0 0 0 na
Textiles and apparelExports . . . . . . . . . . . . . . . . . . . . . 8,262 10,881 9,780 10,236 12,045 17.7Imports . . . . . . . . . . . . . . . . . . . . . 2,658 242 487 371 1,942 423.1GSP/AGOA imports . . . . . . . . . . 6 19 1 127 867 581.7
FootwearExports . . . . . . . . . . . . . . . . . . . . . 1,377 1,106 1,757 2,572 3,087 20.0Imports . . . . . . . . . . . . . . . . . . . . . 0 0 0 3 1 -59.8GSP/AGOA imports . . . . . . . . . . 0 0 0 2 0 -100.0
Minerals and metalsExports . . . . . . . . . . . . . . . . . . . . . 1,253 1,047 5,280 7,499 1,010 -86.5Imports . . . . . . . . . . . . . . . . . . . . . 9,771 14,586 11,528 8,263 7,483 -9.4GSP/AGOA imports . . . . . . . . . . 2,007 13 10 105 10 -91.0
MachineryExports . . . . . . . . . . . . . . . . . . . . . 3,905 4,174 3,935 5,945 4,878 -18.0Imports . . . . . . . . . . . . . . . . . . . . . 0 30 200 0 0 naGSP/AGOA imports . . . . . . . . . . 0 0 0 0 0 na
Transportation equipmentExports . . . . . . . . . . . . . . . . . . . . . 9,284 10,324 16,624 9,076 12,699 39.9Imports . . . . . . . . . . . . . . . . . . . . . 0 2 8 0 0 naGSP/AGOA imports . . . . . . . . . . 0 0 0 0 0 na
Electronic productsExports . . . . . . . . . . . . . . . . . . . . . 11,529 5,269 7,050 6,593 6,449 -2.2Imports . . . . . . . . . . . . . . . . . . . . . 4 51 265 10 36 266.2GSP/AGOA imports . . . . . . . . . . 0 0 2 0 6 na
Miscellaneous manufacturesExports . . . . . . . . . . . . . . . . . . . . . 296 1,830 449 367 486 32.5Imports . . . . . . . . . . . . . . . . . . . . . 3,384 2,927 273 268 259 -3.5GSP/AGOA imports . . . . . . . . . . 0 25 5 8 9 15.2
Special provisionsExports . . . . . . . . . . . . . . . . . . . . . 4,502 2,989 2,497 5,397 4,116 -23.7Imports . . . . . . . . . . . . . . . . . . . . . 981 2,596 1,432 2,699 796 -70.5GSP/AGOA imports . . . . . . . . . . 0 0 0 0 0 na
All sectorsExports . . . . . . . . . . . . . . . . . . . . . 60,682 44,548 63,741 61,800 63,639 3.0Imports . . . . . . . . . . . . . . . . . . . . . 34,495 35,288 27,229 25,343 24,234 -4.4GSP/AGOA imports . . . . . . . . . . 3,114 1,392 899 1,293 1,569 21.4
See footnote at end of table.

B-51
Table B-2-ContinuedTogo: U.S. exports, imports, and GSP/AGOA imports, by major commodity sectors, 1999-2003
Sector 1999 2000 2001 2002 2003
Change2002-03
Percent
1,000 dollarsAgricultural products
Exports . . . . . . . . . . . . . . . . . . . . . 3,020 380 1,212 2,979 300 -89.9Imports . . . . . . . . . . . . . . . . . . . . . 2,081 1,259 1,246 1,510 767 -49.2GSP/AGOA imports . . . . . . . . . . 1,442 233 145 4 4 -11.1
Forest productsExports . . . . . . . . . . . . . . . . . . . . . 36 269 68 90 42 -53.3Imports . . . . . . . . . . . . . . . . . . . . . 3 14 11 9 7 -22.2GSP/AGOA imports . . . . . . . . . . 3 0 11 9 7 -22.2
Chemicals and related productsExports . . . . . . . . . . . . . . . . . . . . . 1,040 507 1,435 1,409 1,506 6.8Imports . . . . . . . . . . . . . . . . . . . . . 0 0 4,568 0 0 naGSP/AGOA imports . . . . . . . . . . 0 0 0 0 0 na
Energy-related productsExports . . . . . . . . . . . . . . . . . . . . . 21 33 33 13 1,115 8,688.5Imports . . . . . . . . . . . . . . . . . . . . . 0 3,118 3,819 0 0 naGSP/AGOA imports . . . . . . . . . . 0 3,118 3,819 0 0 na
Textiles and apparelExports . . . . . . . . . . . . . . . . . . . . . 3,031 2,098 3,165 2,234 1,708 -23.6Imports . . . . . . . . . . . . . . . . . . . . . 42 23 4 6 43 627.9GSP/AGOA imports . . . . . . . . . . (1) 3 0 0 0 na
FootwearExports . . . . . . . . . . . . . . . . . . . . . 275 596 429 745 308 -58.6Imports . . . . . . . . . . . . . . . . . . . . . 1 0 0 0 0 naGSP/AGOA imports . . . . . . . . . . 0 0 0 0 0 na
Minerals and metalsExports . . . . . . . . . . . . . . . . . . . . . 131 619 74 21 63 202.5Imports . . . . . . . . . . . . . . . . . . . . . 2 5 3 8 606 7,373.6GSP/AGOA imports . . . . . . . . . . 0 2 3 0 6 na
MachineryExports . . . . . . . . . . . . . . . . . . . . . 2,687 1,341 4,855 1,096 1,438 31.2Imports . . . . . . . . . . . . . . . . . . . . . 0 10 0 13 0 -100.0GSP/AGOA imports . . . . . . . . . . 0 0 0 0 0 na
Transportation equipmentExports . . . . . . . . . . . . . . . . . . . . . 1,842 2,367 966 2,484 3,418 37.6Imports . . . . . . . . . . . . . . . . . . . . . 0 0 0 0 0 naGSP/AGOA imports . . . . . . . . . . 0 0 0 0 0 na
Electronic productsExports . . . . . . . . . . . . . . . . . . . . . 12,563 1,252 3,203 1,585 2,566 61.9Imports . . . . . . . . . . . . . . . . . . . . . 120 14 2 55 0 -100.0GSP/AGOA imports . . . . . . . . . . 0 0 0 0 0 na
Miscellaneous manufacturesExports . . . . . . . . . . . . . . . . . . . . . 228 96 126 38 168 347.1Imports . . . . . . . . . . . . . . . . . . . . . 378 247 534 295 102 -65.5GSP/AGOA imports . . . . . . . . . . 0 0 0 0 0 na
Special provisionsExports . . . . . . . . . . . . . . . . . . . . . 746 924 589 314 387 23.2Imports . . . . . . . . . . . . . . . . . . . . . 543 1,286 2,396 763 4,095 437.1GSP/AGOA imports . . . . . . . . . . 0 0 0 0 0 na
All sectorsExports . . . . . . . . . . . . . . . . . . . . . 25,620 10,480 16,154 13,008 13,019 0.1Imports . . . . . . . . . . . . . . . . . . . . . 3,170 5,975 12,583 2,659 5,620 111.3GSP/AGOA imports . . . . . . . . . . 1,445 3,355 3,977 14 17 25.5
See footnote at end of table.

B-52
Table B-2-ContinuedUganda: U.S. exports, imports, and GSP/AGOA imports, by major commodity sectors, 1999-2003
Sector 1999 2000 2001 2002 2003
Change2002-03
Percent
1,000 dollarsAgricultural products
Exports . . . . . . . . . . . . . . . . . . . . . 6,901 6,214 8,984 3,942 12,223 210.1Imports . . . . . . . . . . . . . . . . . . . . . 19,225 21,124 15,723 13,738 32,774 138.6GSP/AGOA imports . . . . . . . . . . 26 0 0 13 30 136.0
Forest productsExports . . . . . . . . . . . . . . . . . . . . . 671 316 637 596 704 18.2Imports . . . . . . . . . . . . . . . . . . . . . 10 14 27 19 95 405.1GSP/AGOA imports . . . . . . . . . . 10 14 27 14 39 187.4
Chemicals and related productsExports . . . . . . . . . . . . . . . . . . . . . 2,281 1,942 3,328 1,431 2,694 88.3Imports . . . . . . . . . . . . . . . . . . . . . 47 133 24 20 40 103.2GSP/AGOA imports . . . . . . . . . . 0 0 0 0 0 na
Energy-related productsExports . . . . . . . . . . . . . . . . . . . . . 20 43 5 0 10 naImports . . . . . . . . . . . . . . . . . . . . . 0 0 0 0 0 naGSP/AGOA imports . . . . . . . . . . 0 0 0 0 0 na
Textiles and apparelExports . . . . . . . . . . . . . . . . . . . . . 2,466 2,419 2,386 2,494 2,371 -4.9Imports . . . . . . . . . . . . . . . . . . . . . 0 16 13 1 1,631 158,988.1GSP/AGOA imports . . . . . . . . . . 0 4 0 0 1,433 na
FootwearExports . . . . . . . . . . . . . . . . . . . . . 0 4 11 14 27 88.8Imports . . . . . . . . . . . . . . . . . . . . . 0 0 0 0 0 naGSP/AGOA imports . . . . . . . . . . 0 0 0 0 0 na
Minerals and metalsExports . . . . . . . . . . . . . . . . . . . . . 50 3,733 266 213 285 33.5Imports . . . . . . . . . . . . . . . . . . . . . 742 1,415 1,776 870 117 -86.6GSP/AGOA imports . . . . . . . . . . 0 59 114 0 3 na
MachineryExports . . . . . . . . . . . . . . . . . . . . . 1,639 2,425 2,457 2,120 4,230 99.6Imports . . . . . . . . . . . . . . . . . . . . . 0 0 4 0 0 naGSP/AGOA imports . . . . . . . . . . 0 0 0 0 0 na
Transportation equipmentExports . . . . . . . . . . . . . . . . . . . . . 2,919 1,075 1,453 1,511 9,664 539.5Imports . . . . . . . . . . . . . . . . . . . . . 0 2 0 0 0 naGSP/AGOA imports . . . . . . . . . . 0 0 0 0 0 na
Electronic productsExports . . . . . . . . . . . . . . . . . . . . . 6,330 6,949 9,597 7,275 8,189 12.6Imports . . . . . . . . . . . . . . . . . . . . . 8 292 9 7 10 44.6GSP/AGOA imports . . . . . . . . . . 3 0 0 0 0 na
Miscellaneous manufacturesExports . . . . . . . . . . . . . . . . . . . . . 70 260 237 612 200 -67.3Imports . . . . . . . . . . . . . . . . . . . . . 45 23 51 84 60 -28.6GSP/AGOA imports . . . . . . . . . . 6 2 0 6 4 -33.7
Special provisionsExports . . . . . . . . . . . . . . . . . . . . . 1,172 1,386 2,788 2,427 1,643 -32.3Imports . . . . . . . . . . . . . . . . . . . . . 180 6,046 206 459 157 -65.8GSP/AGOA imports . . . . . . . . . . 0 0 0 0 0 na
All sectorsExports . . . . . . . . . . . . . . . . . . . . . 24,518 26,766 32,150 22,635 42,240 86.6Imports . . . . . . . . . . . . . . . . . . . . . 20,256 29,064 17,835 15,197 34,883 129.5GSP/AGOA imports . . . . . . . . . . 45 78 141 32 1,509 4,631.9
See footnote at end of table.

B-53
Table B-2-ContinuedZambia: U.S. exports, imports, and GSP/AGOA imports, by major commodity sectors, 1999-2003
Sector 1999 2000 2001 2002 2003
Change2002-03
Percent
1,000 dollarsAgricultural products
Exports . . . . . . . . . . . . . . . . . . . . . 500 485 765 14,092 1,629 -88.4Imports . . . . . . . . . . . . . . . . . . . . . 2,004 1,385 1,213 1,200 1,341 11.8GSP/AGOA imports . . . . . . . . . . 134 229 95 60 53 -11.9
Forest productsExports . . . . . . . . . . . . . . . . . . . . . 3,266 400 231 295 418 41.8Imports . . . . . . . . . . . . . . . . . . . . . 1,231 852 1,261 494 678 37.3GSP/AGOA imports . . . . . . . . . . 2 132 677 20 435 2,047.4
Chemicals and related productsExports . . . . . . . . . . . . . . . . . . . . . 961 2,913 2,208 3,434 3,008 -12.4Imports . . . . . . . . . . . . . . . . . . . . . 0 0 0 6 11 103.2GSP/AGOA imports . . . . . . . . . . 0 0 0 0 0 na
Energy-related productsExports . . . . . . . . . . . . . . . . . . . . . 11 67 0 37 0 -100.0Imports . . . . . . . . . . . . . . . . . . . . . 0 0 0 0 0 naGSP/AGOA imports . . . . . . . . . . 0 0 0 0 0 na
Textiles and apparelExports . . . . . . . . . . . . . . . . . . . . . 933 929 935 1,133 455 -59.8Imports . . . . . . . . . . . . . . . . . . . . . 8 258 227 5 14 174.4GSP/AGOA imports . . . . . . . . . . 0 0 0 0 0 na
FootwearExports . . . . . . . . . . . . . . . . . . . . . 106 53 139 146 28 -80.8Imports. . . . . . . . . . . . . . . . . . . . . . . 0 2 0 0 0 naGSP/AGOA imports . . . . . . . . . . 0 0 0 0 0 na
Minerals and metalsExports . . . . . . . . . . . . . . . . . . . . . 132 427 156 187 73 -61.0Imports . . . . . . . . . . . . . . . . . . . . . 33,955 14,031 12,384 5,819 10,180 74.9GSP/AGOA imports . . . . . . . . . . 185 98 2 0 21 na
MachineryExports . . . . . . . . . . . . . . . . . . . . . 2,175 1,798 2,060 3,340 2,429 -27.3Imports . . . . . . . . . . . . . . . . . . . . . 0 0 0 6 0 -100.0GSP/AGOA imports . . . . . . . . . . 0 0 0 0 0 na
Transportation equipmentExports . . . . . . . . . . . . . . . . . . . . . 4,970 4,189 3,915 7,819 3,478 -55.5Imports . . . . . . . . . . . . . . . . . . . . . 0 0 0 14 0 -100.0GSP/AGOA imports . . . . . . . . . . 0 0 0 0 0 na
Electronic productsExports . . . . . . . . . . . . . . . . . . . . . 3,397 4,306 3,124 2,601 3,284 26.3Imports . . . . . . . . . . . . . . . . . . . . . 0 3 1 65 7 -88.8GSP/AGOA imports . . . . . . . . . . 0 0 0 0 0 na
Miscellaneous manufacturesExports . . . . . . . . . . . . . . . . . . . . . 233 57 196 81 344 324.8Imports . . . . . . . . . . . . . . . . . . . . . 93 97 18 15 6 -60.0GSP/AGOA imports . . . . . . . . . . 0 6 0 2 0 -100.0
Special provisionsExports . . . . . . . . . . . . . . . . . . . . . 3,016 3,146 1,758 2,325 3,856 65.8Imports . . . . . . . . . . . . . . . . . . . . . 566 1,099 481 166 231 39.3GSP/AGOA imports . . . . . . . . . . 0 0 0 0 0 na
All sectorsExports . . . . . . . . . . . . . . . . . . . . . 19,700 18,770 15,487 35,491 19,002 -46.5Imports . . . . . . . . . . . . . . . . . . . . . 37,857 17,727 15,584 7,790 12,469 60.1GSP/AGOA imports . . . . . . . . . . 321 466 775 83 510 515.3
See footnote at end of table.

B-54
Table B-2-ContinuedZimbabwe: U.S. exports, imports, and GSP/AGOA imports, by major commodity sectors, 1999-2003
Sector 1999 2000 2001 2002 2003
Change2002-03
Percent
1,000 dollarsAgricultural products
Exports . . . . . . . . . . . . . . . . . . . . . 8,893 3,813 317 16,620 11,456 -31.1Imports . . . . . . . . . . . . . . . . . . . . . 37,179 21,376 27,369 33,714 22,480 -33.3GSP/AGOA imports . . . . . . . . . . 10,535 14,076 10,247 13,337 2,784 -79.1
Forest productsExports . . . . . . . . . . . . . . . . . . . . . 1,294 1,465 2,346 1,259 362 -71.2Imports . . . . . . . . . . . . . . . . . . . . . 4,192 3,213 2,942 3,647 3,501 -4.0GSP/AGOA imports . . . . . . . . . . 2,442 2,362 2,872 0 3,464 na
Chemicals and related productsExports . . . . . . . . . . . . . . . . . . . . . 4,889 4,751 6,082 10,840 5,136 -52.6Imports . . . . . . . . . . . . . . . . . . . . . 609 1,476 18 216 17 -92.2GSP/AGOA imports . . . . . . . . . . 11 70 7 115 0 -100.0
Energy-related productsExports . . . . . . . . . . . . . . . . . . . . . 47 9 28 16 7 -56.0Imports . . . . . . . . . . . . . . . . . . . . . 0 0 0 0 0 naGSP/AGOA imports . . . . . . . . . . 0 0 0 0 0 na
Textiles and apparelExports . . . . . . . . . . . . . . . . . . . . . 2,121 1,695 651 277 419 51.5Imports . . . . . . . . . . . . . . . . . . . . . 18,727 19,872 15,332 8,132 5,031 -38.1GSP/AGOA imports . . . . . . . . . . 2 10 11 15 7 -50.7
FootwearExports . . . . . . . . . . . . . . . . . . . . . 13 0 0 0 8 naImports . . . . . . . . . . . . . . . . . . . . . 66 104 122 86 105 22.0GSP/AGOA imports . . . . . . . . . . 0 0 0 3,386 0 -100.0
Minerals and metalsExports . . . . . . . . . . . . . . . . . . . . . 551 538 395 898 368 -59.0Imports . . . . . . . . . . . . . . . . . . . . . 49,549 51,971 27,460 24,425 21,992 -10.0GSP/AGOA imports . . . . . . . . . . 41,088 35,034 18,750 11,551 13,627 18.0
MachineryExports . . . . . . . . . . . . . . . . . . . . . 10,869 6,825 6,611 2,294 4,674 103.8Imports . . . . . . . . . . . . . . . . . . . . . 0 46 50 11 0 -100.0GSP/AGOA imports . . . . . . . . . . 0 34 50 11 0 -100.0
Transportation equipmentExports . . . . . . . . . . . . . . . . . . . . . 17,078 20,604 8,916 7,019 9,039 28.8Imports . . . . . . . . . . . . . . . . . . . . . 5 0 36 0 0 naGSP/AGOA imports . . . . . . . . . . 0 0 0 0 0 na
Electronic productsExports . . . . . . . . . . . . . . . . . . . . . 9,860 10,876 4,150 4,038 4,168 3.2Imports . . . . . . . . . . . . . . . . . . . . . 7 13 73 204 42 -79.4GSP/AGOA imports . . . . . . . . . . 5 0 0 5 0 -100.0
Miscellaneous manufacturesExports . . . . . . . . . . . . . . . . . . . . . 208 300 655 3,874 4,351 12.3Imports . . . . . . . . . . . . . . . . . . . . . 22,826 13,938 16,576 28,153 13,197 -53.1GSP/AGOA imports . . . . . . . . . . 21,185 9,665 12,100 26,461 11,836 -55.3
Special provisionsExports . . . . . . . . . . . . . . . . . . . . . 1,702 1,897 1,014 1,981 954 -51.8Imports . . . . . . . . . . . . . . . . . . . . . 1,913 1,034 583 540 311 -42.5GSP/AGOA imports . . . . . . . . . . 0 0 0 0 0 na
All sectorsExports . . . . . . . . . . . . . . . . . . . . . 57,525 52,773 31,166 49,116 40,942 -16.6Imports . . . . . . . . . . . . . . . . . . . . . 135,073 113,043 90,560 99,127 66,676 -32.7GSP/AGOA imports . . . . . . . . . . 75,268 61,251 44,037 54,881 31,720 -42.2
1 Positive value less than $500.na = Value is undefined (divided by 0).Source: Compiled from official statistics of the U.S. Department of Commerce.

B-55
Table B-3Angola: Leading changes in sectoral trade, by sectors, 1999 and 2003
Change, 2003 from 1999
Sector 1998 2002 Absolute Percent1,000 dollars
U.S. imports:Electronic products . . . . . . . . . . . . . . . . . . 18 452 434 2,369Special provisions . . . . . . . . . . . . . . . . . . 1,162 4,876 3,714 320Minerals and metals . . . . . . . . . . . . . . . . 9,286 20,647 11,361 122Energy-related products . . . . . . . . . . . . . . 2,319,748 4,136,580 1,816,831 78Chemicals and related products . . . . . . . . 18,103 13,702 -4,401 -24Miscellaneous manufactures . . . . . . . . . . 206 100 -107 -52Transportation equipment . . . . . . . . . . . . 68 5 -63 -93Forest products . . . . . . . . . . . . . . . . . . . . . 15 0 -15 -100Agricultural products . . . . . . . . . . . . . . . . 0 3 3 naTextiles and apparel . . . . . . . . . . . . . . . . 0 2 2 naFootwear . . . . . . . . . . . . . . . . . . . . . . . . . 0 0 0 naMachinery . . . . . . . . . . . . . . . . . . . . . . . . 0 64 64 na
Total . . . . . . . . . . . . . . . . . . . . . . . . . . . 2,348,606 4,176,429 1,827,824 78
U.S. exports:Footwear . . . . . . . . . . . . . . . . . . . . . . . . . 279 1,002 723 259Agricultural products . . . . . . . . . . . . . . . . 23,083 65,325 42,241 183Special provisions . . . . . . . . . . . . . . . . . . 4,634 12,400 7,765 168Energy-related products . . . . . . . . . . . . . . 1,318 3,332 2,014 153Textiles and apparel . . . . . . . . . . . . . . . . 2,758 6,541 3,783 137Chemicals and related products . . . . . . . . 10,398 24,155 13,756 132Miscellaneous manufactures . . . . . . . . . . 883 1,998 1,114 126Transportation equipment . . . . . . . . . . . . 126,921 279,951 153,030 121Minerals and metals . . . . . . . . . . . . . . . . 16,705 29,650 12,944 77Electronic products . . . . . . . . . . . . . . . . . . 17,996 26,622 8,626 48Machinery . . . . . . . . . . . . . . . . . . . . . . . . 41,698 31,362 -10,336 -25Forest products . . . . . . . . . . . . . . . . . . . . . 4,706 275 -4,431 -94
Total . . . . . . . . . . . . . . . . . . . . . . . . . . . 251,381 482,612 231,231 92
Total trade:Footwear . . . . . . . . . . . . . . . . . . . . . . . . . 279 1,002 723 259Special provisions . . . . . . . . . . . . . . . . . . 5,796 17,275 11,479 198Agricultural products . . . . . . . . . . . . . . . . 23,083 65,327 42,244 183Textiles and apparel . . . . . . . . . . . . . . . . 2,758 6,543 3,785 137Transportation equipment . . . . . . . . . . . . 126,989 279,956 152,967 120Minerals and metals . . . . . . . . . . . . . . . . 25,991 50,297 24,306 94Miscellaneous manufactures . . . . . . . . . . 1,090 2,097 1,008 92Energy-related products . . . . . . . . . . . . . . 2,321,067 4,139,912 1,818,845 78Electronic products . . . . . . . . . . . . . . . . . . 18,014 27,074 9,060 50Chemicals and related products . . . . . . . . 28,501 37,857 9,356 33Machinery . . . . . . . . . . . . . . . . . . . . . . . . 41,698 31,426 -10,272 -25Forest products . . . . . . . . . . . . . . . . . . . . . 4,721 275 -4,446 -94
Total . . . . . . . . . . . . . . . . . . . . . . . . . . . 2,599,986 4,659,041 2,059,055 79

B-56
Table B-3—ContinuedCôte d’Ivoire: Leading changes in sectoral trade, by sectors, 1999 and 2003
Change, 2003 from 1999
Sector 1998 2002 Absolute Percent1,000 dollars
U.S. imports:Transportation equipment . . . . . . . . . . . . 21 633 612 2,897Special provisions . . . . . . . . . . . . . . . . . . 932 1,810 878 94Energy-related products . . . . . . . . . . . . . . 34,166 61,128 26,962 79Forest products . . . . . . . . . . . . . . . . . . . . . 5,999 10,178 4,180 70Miscellaneous manufactures . . . . . . . . . . 1,559 2,364 805 52Agricultural products . . . . . . . . . . . . . . . . 293,603 410,382 116,779 40Minerals and metals . . . . . . . . . . . . . . . . 332 373 41 12Textiles and apparel . . . . . . . . . . . . . . . . 1,054 721 -333 -32Electronic products . . . . . . . . . . . . . . . . . . 655 363 -292 -45Machinery . . . . . . . . . . . . . . . . . . . . . . . . 387 187 -200 -52Chemicals and related products . . . . . . . . 4,779 2,109 -2,670 -56Footwear . . . . . . . . . . . . . . . . . . . . . . . . . 0 0 0 na
Total . . . . . . . . . . . . . . . . . . . . . . . . . . . 343,487 490,248 146,760 43
U.S. exports:Minerals and metals . . . . . . . . . . . . . . . . 1,928 7,334 5,406 280Footwear . . . . . . . . . . . . . . . . . . . . . . . . . 425 1,596 1,171 276Miscellaneous manufactures . . . . . . . . . . 596 953 358 60Chemicals and related products . . . . . . . . 19,522 30,690 11,167 57Agricultural products . . . . . . . . . . . . . . . . 20,508 22,352 1,844 9Transportation equipment . . . . . . . . . . . . 15,416 15,628 212 1Special provisions . . . . . . . . . . . . . . . . . . 2,808 2,784 -24 -1Electronic products . . . . . . . . . . . . . . . . . . 7,484 6,474 -1,010 -13Energy-related products . . . . . . . . . . . . . . 298 249 -48 -16Machinery . . . . . . . . . . . . . . . . . . . . . . . . 14,374 7,767 -6,607 -46Textiles and apparel . . . . . . . . . . . . . . . . 6,275 2,294 -3,980 -63Forest products . . . . . . . . . . . . . . . . . . . . . 9,249 1,929 -7,319 -79
Total . . . . . . . . . . . . . . . . . . . . . . . . . . . 98,882 100,050 1,168 1
Total trade:Footwear . . . . . . . . . . . . . . . . . . . . . . . . . 425 1,596 1,171 276Minerals and metals . . . . . . . . . . . . . . . . 2,260 7,707 5,447 241Energy-related products . . . . . . . . . . . . . . 34,464 61,377 26,913 78Miscellaneous manufactures . . . . . . . . . . 2,155 3,317 1,163 54Agricultural products . . . . . . . . . . . . . . . . 314,111 432,734 118,623 38Chemicals and related products . . . . . . . . 24,302 32,799 8,497 35Special provisions . . . . . . . . . . . . . . . . . . 3,740 4,594 854 23Transportation equipment . . . . . . . . . . . . 15,437 16,261 824 5Electronic products . . . . . . . . . . . . . . . . . . 8,139 6,837 -1,302 -16Forest products . . . . . . . . . . . . . . . . . . . . . 15,247 12,108 -3,140 -21Machinery . . . . . . . . . . . . . . . . . . . . . . . . 14,761 7,954 -6,808 -46Textiles and apparel . . . . . . . . . . . . . . . . 7,329 3,015 -4,313 -59
Total . . . . . . . . . . . . . . . . . . . . . . . . . . . 442,369 590,297 147,928 33

B-57
Table B-3—ContinuedEquatorial Guinea: Leading changes in sectoral trade, by sectors, 1999 and 2003
Change, 2003 from 1999
Sector 1998 2002 Absolute Percent1,000 dollars
U.S. imports:Chemicals and related products . . . . . . . . . . . 5,465 136,922 131,457 2,405Energy-related products . . . . . . . . . . . . . . . . . 33,822 773,612 739,789 2,187Special provisions . . . . . . . . . . . . . . . . . . . . . 576 6,701 6,124 1,063Forest products . . . . . . . . . . . . . . . . . . . . . . . . 724 556 -168 -23Minerals and metals . . . . . . . . . . . . . . . . . . . 13 6 -7 -53Agricultural products . . . . . . . . . . . . . . . . . . . 0 51 51 naTextiles and apparel . . . . . . . . . . . . . . . . . . . 0 0 0 naFootwear . . . . . . . . . . . . . . . . . . . . . . . . . . . . 0 0 0 naMachinery . . . . . . . . . . . . . . . . . . . . . . . . . . . 0 646 646 naTransportation equipment . . . . . . . . . . . . . . . 0 0 0 naElectronic products . . . . . . . . . . . . . . . . . . . . . 0 8 8 naMiscellaneous manufactures . . . . . . . . . . . . . 0 0 0 na
Total . . . . . . . . . . . . . . . . . . . . . . . . . . . . . . 40,601 918,503 877,902 2162
U.S. exports:Miscellaneous manufactures . . . . . . . . . . . . . 456 10,742 10,286 2,256Footwear . . . . . . . . . . . . . . . . . . . . . . . . . . . . 4 53 49 1,289Energy-related products . . . . . . . . . . . . . . . . . 103 1,382 1,279 1,245Machinery . . . . . . . . . . . . . . . . . . . . . . . . . . . 6,281 77,510 71,229 1,134Electronic products . . . . . . . . . . . . . . . . . . . . . 682 7,327 6,645 974Textiles and apparel . . . . . . . . . . . . . . . . . . . 149 387 238 160Chemicals and related products . . . . . . . . . . . 1,469 3,334 1,866 127Agricultural products . . . . . . . . . . . . . . . . . . . 589 1,099 511 87Transportation equipment . . . . . . . . . . . . . . . 167,099 187,886 20,787 12Minerals and metals . . . . . . . . . . . . . . . . . . . 38,416 41,510 3,094 8Special provisions . . . . . . . . . . . . . . . . . . . . . 4,666 4,597 -70 -1Forest products . . . . . . . . . . . . . . . . . . . . . . . . 1,136 191 -945 -83
Total . . . . . . . . . . . . . . . . . . . . . . . . . . . . . . 221,050 336,019 114,969 52
Total trade:Miscellaneous manufactures . . . . . . . . . . . . . 456 10,742 10,286 2,256Energy-related products . . . . . . . . . . . . . . . . . 33,925 774,994 741,069 2,184Chemicals and related products . . . . . . . . . . . 6,934 140,256 133,322 1,923Footwear . . . . . . . . . . . . . . . . . . . . . . . . . . . . 4 53 49 1,289Machinery . . . . . . . . . . . . . . . . . . . . . . . . . . . 6,281 78,156 71,875 1,144Electronic products . . . . . . . . . . . . . . . . . . . . . 682 7,336 6,654 975Textiles and apparel . . . . . . . . . . . . . . . . . . . 149 387 238 160Special provisions . . . . . . . . . . . . . . . . . . . . . 5,243 11,298 6,055 115Agricultural products . . . . . . . . . . . . . . . . . . . 589 1,151 562 95Transportation equipment . . . . . . . . . . . . . . . 167,099 187,886 20,787 12Minerals and metals . . . . . . . . . . . . . . . . . . . 38,429 41,516 3,087 8Forest products . . . . . . . . . . . . . . . . . . . . . . . . 1,861 748 -1,113 -60
Total . . . . . . . . . . . . . . . . . . . . . . . . . . . . . . 261,651 1,254,522 992,871 379

B-58
Table B-3—ContinuedGabon: Leading changes in sectoral trade, by sectors, 1999 and 2003
Change, 2003 from 1999
Sector 1998 2002 Absolute Percent1,000 dollars
U.S. imports:Machinery . . . . . . . . . . . . . . . . . . . . . . . . . . . 13 54 41 312Special provisions . . . . . . . . . . . . . . . . . . . . . 1,541 3,344 1,803 117Forest products . . . . . . . . . . . . . . . . . . . . . . . . 4,676 6,963 2,287 49Energy-related products . . . . . . . . . . . . . . . . . 1,320,410 1,893,711 573,301 43Miscellaneous manufactures . . . . . . . . . . . . . 2,162 2,346 183 8Minerals and metals . . . . . . . . . . . . . . . . . . . 26,213 19,272 -6,941 -26Electronic products . . . . . . . . . . . . . . . . . . . . . 72 29 -44 -60Agricultural products . . . . . . . . . . . . . . . . . . . 601 90 -511 -85Chemicals and related products . . . . . . . . . . . 104,129 1,898 -102,231 -98Transportation equipment . . . . . . . . . . . . . . . 53,127 8 -53,118 -100Textiles and apparel . . . . . . . . . . . . . . . . . . . 0 0 0 naFootwear . . . . . . . . . . . . . . . . . . . . . . . . . . . . 0 0 0 na
Total . . . . . . . . . . . . . . . . . . . . . . . . . . . . . . 1,512,945 1,927,715 414,770 27
U.S. exports:Footwear . . . . . . . . . . . . . . . . . . . . . . . . . . . . 88 1,660 1,572 1,789Energy-related products . . . . . . . . . . . . . . . . . 242 3,340 3,098 1,278Forest products . . . . . . . . . . . . . . . . . . . . . . . . 39 103 64 163Machinery . . . . . . . . . . . . . . . . . . . . . . . . . . . 4,541 7,941 3,400 75Chemicals and related products . . . . . . . . . . . 1,920 3,298 1,378 72Transportation equipment . . . . . . . . . . . . . . . 17,799 29,274 11,475 64Textiles and apparel . . . . . . . . . . . . . . . . . . . 1,145 1,841 696 61Minerals and metals . . . . . . . . . . . . . . . . . . . 5,041 6,956 1,915 38Special provisions . . . . . . . . . . . . . . . . . . . . . 1,091 1,311 220 20Electronic products . . . . . . . . . . . . . . . . . . . . . 7,372 3,834 -3,538 -48Miscellaneous manufactures . . . . . . . . . . . . . 246 123 -122 -50Agricultural products . . . . . . . . . . . . . . . . . . . 5,443 2,174 -3,269 -60
Total . . . . . . . . . . . . . . . . . . . . . . . . . . . . . . 44,967 61,856 16,888 38
Total trade:Footwear . . . . . . . . . . . . . . . . . . . . . . . . . . . . 88 1,660 1,572 1,789Special provisions . . . . . . . . . . . . . . . . . . . . . 2,632 4,655 2,023 77Machinery . . . . . . . . . . . . . . . . . . . . . . . . . . . 4,554 7,994 3,440 76Textiles and apparel . . . . . . . . . . . . . . . . . . . 1,145 1,841 696 61Forest products . . . . . . . . . . . . . . . . . . . . . . . . 4,715 7,066 2,351 50Energy-related products . . . . . . . . . . . . . . . . . 1,320,653 1,897,051 576,399 44Miscellaneous manufactures . . . . . . . . . . . . . 2,408 2,469 61 3Minerals and metals . . . . . . . . . . . . . . . . . . . 31,254 26,228 -5,026 -16Electronic products . . . . . . . . . . . . . . . . . . . . . 7,445 3,863 -3,582 -48Transportation equipment . . . . . . . . . . . . . . . 70,926 29,282 -41,644 -59Agricultural products . . . . . . . . . . . . . . . . . . . 6,044 2,264 -3,780 -63Chemicals and related products . . . . . . . . . . . 106,049 5,196 -100,853 -95
Total . . . . . . . . . . . . . . . . . . . . . . . . . . . . . . 1,557,913 1,989,571 431,658 28

B-59
Table B-3—ContinuedGhana: Leading changes in sectoral trade, by sectors, 1999 and 2003
Change, 2003 from 1999
Sector 1998 2002 Absolute Percent1,000 dollars
U.S. imports:Transportation equipment . . . . . . . . . . . . . . . 21 46 25 118Chemicals and related products . . . . . . . . . . . 826 1,575 749 91Energy-related products . . . . . . . . . . . . . . . . . 20,020 29,067 9,047 45Forest products . . . . . . . . . . . . . . . . . . . . . . . . 22,966 31,539 8,574 37Textiles and apparel . . . . . . . . . . . . . . . . . . . 3,619 4,508 889 25Miscellaneous manufactures . . . . . . . . . . . . . 1,384 1,342 -42 -3Electronic products . . . . . . . . . . . . . . . . . . . . . 123 60 -63 -51Agricultural products . . . . . . . . . . . . . . . . . . . 42,361 12,033 -30,328 -72Special provisions . . . . . . . . . . . . . . . . . . . . . 2,399 615 -1,784 -74Machinery . . . . . . . . . . . . . . . . . . . . . . . . . . . 139 15 -124 -89Minerals and metals . . . . . . . . . . . . . . . . . . . 115,472 2,798 -112,674 -98Footwear . . . . . . . . . . . . . . . . . . . . . . . . . . . . 0 3 3 na
Total . . . . . . . . . . . . . . . . . . . . . . . . . . . . . . 209,330 83,603 -125,727 -60U.S. exports:
Miscellaneous manufactures . . . . . . . . . . . . . 2,243 5,350 3,108 139Electronic products . . . . . . . . . . . . . . . . . . . . . 12,032 18,201 6,169 51Textiles and apparel . . . . . . . . . . . . . . . . . . . 9,059 12,726 3,668 40Forest products . . . . . . . . . . . . . . . . . . . . . . . . 1,857 2,535 678 37Agricultural products . . . . . . . . . . . . . . . . . . . 53,586 54,749 1,163 2Machinery . . . . . . . . . . . . . . . . . . . . . . . . . . . 19,448 16,665 -2,783 -14Transportation equipment . . . . . . . . . . . . . . . 62,765 52,378 -10,388 -17Special provisions . . . . . . . . . . . . . . . . . . . . . 14,390 11,379 -3,011 -21Chemicals and related products . . . . . . . . . . . 31,209 24,597 -6,611 -21Minerals and metals . . . . . . . . . . . . . . . . . . . 6,795 4,041 -2,754 -41Footwear . . . . . . . . . . . . . . . . . . . . . . . . . . . . 2,273 813 -1,460 -64Energy-related products . . . . . . . . . . . . . . . . . 15,389 991 -14,398 -94
Total . . . . . . . . . . . . . . . . . . . . . . . . . . . . . . 231,045 204,426 -26,619 -12Total trade:
Miscellaneous manufactures . . . . . . . . . . . . . 3,627 6,693 3,066 85Electronic products . . . . . . . . . . . . . . . . . . . . . 12,156 18,261 6,106 50Forest products . . . . . . . . . . . . . . . . . . . . . . . . 24,823 34,075 9,252 37Textiles and apparel . . . . . . . . . . . . . . . . . . . 12,678 17,235 4,557 36Machinery . . . . . . . . . . . . . . . . . . . . . . . . . . . 19,587 16,680 -2,907 -15Energy-related products . . . . . . . . . . . . . . . . . 35,409 30,059 -5,350 -15Transportation equipment . . . . . . . . . . . . . . . 62,787 52,424 -10,362 -17Chemicals and related products . . . . . . . . . . . 32,034 26,173 -5,862 -18Special provisions . . . . . . . . . . . . . . . . . . . . . 16,789 11,994 -4,795 -29Agricultural products . . . . . . . . . . . . . . . . . . . 95,947 66,782 -29,165 -30Footwear . . . . . . . . . . . . . . . . . . . . . . . . . . . . 2,273 816 -1,457 -64Minerals and metals . . . . . . . . . . . . . . . . . . . 122,267 6,839 -115,428 -94
Total . . . . . . . . . . . . . . . . . . . . . . . . . . . . . . 440,376 288,030 -152,346 -35

B-60
Table B-3—ContinuedKenya: Leading changes in sectoral trade, by sectors, 1999 and 2003
Change, 2003 from 1999
Sector 1998 2002 Absolute Percent1,000 dollars
U.S. imports:Energy-related products . . . . . . . . . . . . . . . . . 15 76 61 423Textiles and apparel . . . . . . . . . . . . . . . . . . . 39,633 188,148 148,515 375Chemicals and related products . . . . . . . . . . . 1,203 1,552 349 29Machinery . . . . . . . . . . . . . . . . . . . . . . . . . . . 250 297 46 18Agricultural products . . . . . . . . . . . . . . . . . . . 36,247 41,906 5,659 16Footwear . . . . . . . . . . . . . . . . . . . . . . . . . . . . 11 10 -1 -9Special provisions . . . . . . . . . . . . . . . . . . . . . 5,992 5,282 -710 -12Miscellaneous manufactures . . . . . . . . . . . . . 3,032 2,508 -523 -17Forest products . . . . . . . . . . . . . . . . . . . . . . . . 2,741 1,810 -930 -34Electronic products . . . . . . . . . . . . . . . . . . . . . 13,421 6,128 -7,292 -54Minerals and metals . . . . . . . . . . . . . . . . . . . 2,725 1,236 -1,489 -55Transportation equipment . . . . . . . . . . . . . . . 875 183 -692 -79
Total . . . . . . . . . . . . . . . . . . . . . . . . . . . . . . 106,144 249,137 142,994 135
U.S. exports:Minerals and metals . . . . . . . . . . . . . . . . . . . 4,429 8,521 4,091 92Miscellaneous manufactures . . . . . . . . . . . . . 917 1,388 471 51Special provisions . . . . . . . . . . . . . . . . . . . . . 6,647 8,932 2,285 34Footwear . . . . . . . . . . . . . . . . . . . . . . . . . . . . 201 242 41 20Agricultural products . . . . . . . . . . . . . . . . . . . 28,167 32,848 4,680 17Electronic products . . . . . . . . . . . . . . . . . . . . . 18,420 18,871 452 2Machinery . . . . . . . . . . . . . . . . . . . . . . . . . . . 14,913 15,162 249 2Chemicals and related products . . . . . . . . . . . 32,392 32,447 55 0Transportation equipment . . . . . . . . . . . . . . . 67,137 64,246 -2,891 -4Textiles and apparel . . . . . . . . . . . . . . . . . . . 7,854 7,260 -594 -8Energy-related products . . . . . . . . . . . . . . . . . 411 258 -153 -37Forest products . . . . . . . . . . . . . . . . . . . . . . . . 5,601 2,834 -2,767 -49
Total . . . . . . . . . . . . . . . . . . . . . . . . . . . . . . 187,089 193,009 5,919 3
Total trade:Textiles and apparel . . . . . . . . . . . . . . . . . . . 47,488 195,409 147,921 311Minerals and metals . . . . . . . . . . . . . . . . . . . 7,154 9,757 2,603 36Footwear . . . . . . . . . . . . . . . . . . . . . . . . . . . . 211 251 40 19Agricultural products . . . . . . . . . . . . . . . . . . . 64,414 74,753 10,340 16Special provisions . . . . . . . . . . . . . . . . . . . . . 12,639 14,215 1,576 12Machinery . . . . . . . . . . . . . . . . . . . . . . . . . . . 15,163 15,459 295 2Chemicals and related products . . . . . . . . . . . 33,595 33,999 403 1Miscellaneous manufactures . . . . . . . . . . . . . 3,949 3,896 -53 -1Transportation equipment . . . . . . . . . . . . . . . 68,012 64,429 -3,583 -5Electronic products . . . . . . . . . . . . . . . . . . . . . 31,840 25,000 -6,841 -21Energy-related products . . . . . . . . . . . . . . . . . 425 334 -92 -22Forest products 8,341 4,644 -3,697 -44
Total . . . . . . . . . . . . . . . . . . . . . . . . . . . . . . 293,233 442,146 148,913 51

B-61
Table B-3—ContinuedMauritius: Leading changes in sectoral trade, by sectors, 1999 and 2003
Change, 2003 from 1999
Sector 1998 2002 Absolute Percent1,000 dollars
U.S. imports:Transportation equipment . . . . . . . . . . . . . . . 115 365 250 217Chemicals and related products . . . . . . . . . . . 374 1,074 700 187Miscellaneous manufactures . . . . . . . . . . . . . 4,107 5,496 1,389 34Textiles and apparel . . . . . . . . . . . . . . . . . . . 232,109 269,155 37,046 16Agricultural products . . . . . . . . . . . . . . . . . . . 8,351 9,554 1,204 14Electronic products . . . . . . . . . . . . . . . . . . . . . 3,685 3,964 279 8Minerals and metals . . . . . . . . . . . . . . . . . . . 6,622 6,790 168 3Special provisions . . . . . . . . . . . . . . . . . . . . . 2,973 878 -2,095 -70Footwear . . . . . . . . . . . . . . . . . . . . . . . . . . . . 8 0 -8 -100Forest products . . . . . . . . . . . . . . . . . . . . . . . . 0 244 244 naEnergy-related products . . . . . . . . . . . . . . . . . 0 0 0 naMachinery . . . . . . . . . . . . . . . . . . . . . . . . . . . 0 577 577 na
Total . . . . . . . . . . . . . . . . . . . . . . . . . . . . . . 258,343 298,096 39,753 15
U.S. exports:Energy-related products . . . . . . . . . . . . . . . . . 3 120 117 3,738Textiles and apparel . . . . . . . . . . . . . . . . . . . 405 2,208 1,803 445Minerals and metals . . . . . . . . . . . . . . . . . . . 469 744 275 59Chemicals and related products . . . . . . . . . . . 1,129 1,712 583 52Machinery . . . . . . . . . . . . . . . . . . . . . . . . . . . 2,799 3,751 952 34Agricultural products . . . . . . . . . . . . . . . . . . . 443 508 66 15Transportation equipment . . . . . . . . . . . . . . . 2,837 2,190 -647 -23Special provisions . . . . . . . . . . . . . . . . . . . . . 1,483 1,121 -362 -24Forest products . . . . . . . . . . . . . . . . . . . . . . . . 716 475 -241 -34Electronic products . . . . . . . . . . . . . . . . . . . . . 20,312 10,152 -10,161 -50Miscellaneous manufactures . . . . . . . . . . . . . 1,507 708 -799 -53Footwear . . . . . . . . . . . . . . . . . . . . . . . . . . . . 0 0 0 na
Total . . . . . . . . . . . . . . . . . . . . . . . . . . . . . . 32,103 23,689 -8,414 -26
Total trade:Energy-related products . . . . . . . . . . . . . . . . . 3 120 117 3,738Chemicals and related products . . . . . . . . . . . 1,503 2,786 1,283 85Machinery . . . . . . . . . . . . . . . . . . . . . . . . . . . 2,799 4,328 1,529 55Textiles and apparel . . . . . . . . . . . . . . . . . . . 232,513 271,362 38,849 17Agricultural products . . . . . . . . . . . . . . . . . . . 8,793 10,063 1,269 14Miscellaneous manufactures . . . . . . . . . . . . . 5,614 6,204 590 11Minerals and metals . . . . . . . . . . . . . . . . . . . 7,091 7,534 443 6Forest products . . . . . . . . . . . . . . . . . . . . . . . . 716 719 3 0Transportation equipment . . . . . . . . . . . . . . . 2,952 2,554 -397 -13Electronic products . . . . . . . . . . . . . . . . . . . . . 23,997 14,116 -9,881 -41Special provisions . . . . . . . . . . . . . . . . . . . . . 4,455 1,999 -2,457 -55Footwear . . . . . . . . . . . . . . . . . . . . . . . . . . . . 8 0 -8 -100
Total . . . . . . . . . . . . . . . . . . . . . . . . . . . . . . 290,445 321,785 31,339 11

B-62
Table B-3—ContinuedNigeria: Leading changes in sectoral trade, by sectors, 1999 and 2003
Change, 2003 from 1999
Sector 1998 2002 Absolute Percent1,000 dollars
U.S. imports:Agricultural products . . . . . . . . . . . . . . . . . . 8,277 48,058 39,781 481Special provisions . . . . . . . . . . . . . . . . . . . . 4,194 13,176 8,982 214Energy-related products . . . . . . . . . . . . . . . . 3,720,249 10,027,991 6,307,742 170Electronic products . . . . . . . . . . . . . . . . . . . . 97 157 60 62Textiles and apparel . . . . . . . . . . . . . . . . . . 801 455 -346 -43Minerals and metals . . . . . . . . . . . . . . . . . . 972 437 -535 -55Forest products . . . . . . . . . . . . . . . . . . . . . . . 1,138 453 -684 -60Miscellaneous manufactures . . . . . . . . . . . . 4,710 1,858 -2,852 -61Footwear . . . . . . . . . . . . . . . . . . . . . . . . . . . 57 4 -53 -93Chemicals and related products . . . . . . . . . . 429,134 20,717 -408,417 -95Machinery . . . . . . . . . . . . . . . . . . . . . . . . . . 2,693 48 -2,645 -98Transportation equipment . . . . . . . . . . . . . . 0 266 266 na
Total . . . . . . . . . . . . . . . . . . . . . . . . . . . . . 4,172,322 10,113,618 5,941,297 142
U.S. exports:Footwear . . . . . . . . . . . . . . . . . . . . . . . . . . . 738 2,528 1,790 242Electronic products . . . . . . . . . . . . . . . . . . . . 52,304 133,911 81,606 156Agricultural products . . . . . . . . . . . . . . . . . . 172,699 324,575 151,876 88Minerals and metals . . . . . . . . . . . . . . . . . . 19,272 29,095 9,823 51Transportation equipment . . . . . . . . . . . . . . 194,092 285,846 91,755 47Forest products . . . . . . . . . . . . . . . . . . . . . . . 8,493 12,027 3,535 42Chemicals and related products . . . . . . . . . . 43,156 60,573 17,418 40Machinery . . . . . . . . . . . . . . . . . . . . . . . . . . 74,239 95,107 20,868 28Special provisions . . . . . . . . . . . . . . . . . . . . 10,061 11,379 1,318 13Textiles and apparel . . . . . . . . . . . . . . . . . . 12,817 12,464 -353 -3Energy-related products . . . . . . . . . . . . . . . . 26,321 21,963 -4,358 -17Miscellaneous manufactures . . . . . . . . . . . . 9,969 6,984 -2,985 -30
Total . . . . . . . . . . . . . . . . . . . . . . . . . . . . . 624,161 996,453 372,292 60
Total trade:Footwear . . . . . . . . . . . . . . . . . . . . . . . . . . . 796 2,532 1,737 218Energy-related products . . . . . . . . . . . . . . . . 3,746,570 10,049,953 6,303,384 168Electronic products . . . . . . . . . . . . . . . . . . . . 52,401 134,067 81,666 156Agricultural products . . . . . . . . . . . . . . . . . . 180,977 372,633 191,656 106Special provisions . . . . . . . . . . . . . . . . . . . . 14,255 24,555 10,300 72Transportation equipment . . . . . . . . . . . . . . 194,092 286,112 92,020 47Minerals and metals . . . . . . . . . . . . . . . . . . 20,244 29,532 9,288 46Forest products. . . . . . . . . . . . . . . . . . . . . . . . 9,630 12,480 2,850 30Machinery . . . . . . . . . . . . . . . . . . . . . . . . . . 76,932 95,155 18,223 24Textiles and apparel . . . . . . . . . . . . . . . . . . 13,618 12,919 -699 -5Miscellaneous manufactures . . . . . . . . . . . . 14,679 8,842 -5,837 -40Chemicals and related products . . . . . . . . . . 472,289 81,290 -390,999 -83
Total . . . . . . . . . . . . . . . . . . . . . . . . . . . . . 4,796,483 11,110,071 6,313,589 132

B-63
Table B-3—ContinuedRepublic of Congo: Leading changes in sectoral trade, by sectors, 1999 and 2003
Change, 2003 from 1999
Sector 1998 2002 Absolute Percent1,000 dollars
U.S. imports:Electronic products . . . . . . . . . . . . . . . . . . . . . 3 33 30 929Machinery . . . . . . . . . . . . . . . . . . . . . . . . . . . 4 24 20 548Transportation equipment . . . . . . . . . . . . . . . 4 11 7 198Special provisions . . . . . . . . . . . . . . . . . . . . . 1,642 2,461 819 50Agricultural products . . . . . . . . . . . . . . . . . . . 4,423 4,661 238 5Energy-related products . . . . . . . . . . . . . . . . . 367,338 383,446 16,108 4Forest products . . . . . . . . . . . . . . . . . . . . . . . . 2,063 1,731 -332 -16Minerals and metals . . . . . . . . . . . . . . . . . . . 16,057 10,341 -5,716 -36Miscellaneous manufactures . . . . . . . . . . . . . 2,124 1,136 -988 -47Chemicals and related products . . . . . . . . . . . 16,847 3,341 -13,505 -80Textiles and apparel . . . . . . . . . . . . . . . . . . . 14 1 -13 -94Footwear . . . . . . . . . . . . . . . . . . . . . . . . . . . . 0 0 0 na
Total . . . . . . . . . . . . . . . . . . . . . . . . . . . . . . 410,518 407,186 -3,332 -1
U.S. exports:Minerals and metals . . . . . . . . . . . . . . . . . . . 836 3,516 2,679 320Transportation equipment . . . . . . . . . . . . . . . 14,393 40,807 26,414 184Forest products . . . . . . . . . . . . . . . . . . . . . . . . 95 228 133 141Energy-related products . . . . . . . . . . . . . . . . . 59 138 79 133Chemicals and related products . . . . . . . . . . . 1,345 2,347 1,002 74Electronic products . . . . . . . . . . . . . . . . . . . . . 3,446 4,761 1,315 38Agricultural products . . . . . . . . . . . . . . . . . . . 9,487 13,057 3,570 38Textiles and apparel . . . . . . . . . . . . . . . . . . . 5,778 6,244 466 8Miscellaneous manufactures . . . . . . . . . . . . . 104 104 0 0Special provisions . . . . . . . . . . . . . . . . . . . . . 3,612 2,539 -1,072 -30Machinery . . . . . . . . . . . . . . . . . . . . . . . . . . . 7,538 4,860 -2,678 -36Footwear . . . . . . . . . . . . . . . . . . . . . . . . . . . . 129 0 -129 -100
Total . . . . . . . . . . . . . . . . . . . . . . . . . . . . . . 46,824 78,601 31,778 68
Total trade:Transportation equipment . . . . . . . . . . . . . . . 14,397 40,818 26,422 184Electronic products . . . . . . . . . . . . . . . . . . . . . 3,449 4,794 1,345 39Agricultural products . . . . . . . . . . . . . . . . . . . 13,911 17,719 3,808 27Textiles and apparel . . . . . . . . . . . . . . . . . . . 5,792 6,245 452 8Energy-related products . . . . . . . . . . . . . . . . . 367,397 383,584 16,187 4Special provisions . . . . . . . . . . . . . . . . . . . . . 5,254 5,000 -254 -5Forest products . . . . . . . . . . . . . . . . . . . . . . . . 2,158 1,958 -199 -9Minerals and metals . . . . . . . . . . . . . . . . . . . 16,893 13,857 -3,036 -18Machinery . . . . . . . . . . . . . . . . . . . . . . . . . . . 7,542 4,884 -2,658 -35Miscellaneous manufactures . . . . . . . . . . . . . 2,228 1,240 -988 -44Chemicals and related products . . . . . . . . . . . 18,192 5,688 -12,504 -69Footwear . . . . . . . . . . . . . . . . . . . . . . . . . . . . 129 0 -129 -100
Total . . . . . . . . . . . . . . . . . . . . . . . . . . . . . . 457,342 485,787 28,445 6

B-64
Table B-3—ContinuedSouth Africa: Leading changes in sectoral trade, by sectors, 1999 and 2003
Change, 2003 from 1999
Sector 1998 2002 Absolute Percent1,000 dollars
U.S. imports:Footwear . . . . . . . . . . . . . . . . . . . . . . . . . . . . 91 910 819 901Transportation equipment . . . . . . . . . . . . . . . 145,474 821,189 675,715 464Energy-related products . . . . . . . . . . . . . . . . . 9,678 45,164 35,485 367Textiles and apparel . . . . . . . . . . . . . . . . . . . 126,978 269,531 142,553 112Miscellaneous manufactures . . . . . . . . . . . . . 36,929 76,900 39,971 108Chemicals and related products . . . . . . . . . . . 225,449 344,660 119,211 53Machinery . . . . . . . . . . . . . . . . . . . . . . . . . . . 121,632 179,030 57,399 47Electronic products . . . . . . . . . . . . . . . . . . . . . 29,780 41,869 12,089 41Minerals and metals . . . . . . . . . . . . . . . . . . . 2,109,370 2,722,387 613,017 29Agricultural products . . . . . . . . . . . . . . . . . . . 161,980 207,742 45,762 28Forest products . . . . . . . . . . . . . . . . . . . . . . . . 52,158 66,403 14,245 27Special provisions . . . . . . . . . . . . . . . . . . . . . 173,250 112,179 -61,070 -35
Total . . . . . . . . . . . . . . . . . . . . . . . . . . . . . . 3,192,768 4,887,962 1,695,194 53
U.S. exports:Transportation equipment . . . . . . . . . . . . . . . 534,725 851,297 316,573 59Machinery . . . . . . . . . . . . . . . . . . . . . . . . . . . 259,829 353,685 93,857 36Energy-related products . . . . . . . . . . . . . . . . . 94,429 112,981 18,552 20Chemicals and related products . . . . . . . . . . . 401,563 440,889 39,326 10Miscellaneous manufactures . . . . . . . . . . . . . 44,692 45,653 961 2Special provisions . . . . . . . . . . . . . . . . . . . . . 124,521 118,971 -5,550 -4Minerals and metals . . . . . . . . . . . . . . . . . . . 109,057 103,545 -5,512 -5Forest products . . . . . . . . . . . . . . . . . . . . . . . . 102,848 94,413 -8,435 -8Textiles and apparel . . . . . . . . . . . . . . . . . . . 32,680 27,418 -5,263 -16Electronic products . . . . . . . . . . . . . . . . . . . . . 493,454 398,843 -94,611 -19Agricultural products . . . . . . . . . . . . . . . . . . . 186,131 149,169 -36,962 -20Footwear . . . . . . . . . . . . . . . . . . . . . . . . . . . . 10,069 1,336 -8,732 -87
Total . . . . . . . . . . . . . . . . . . . . . . . . . . . . . . 2,393,998 2,698,201 304,203 13
Total trade:Transportation equipment . . . . . . . . . . . . . . . 680,199 1,672,486 992,287 146Textiles and apparel . . . . . . . . . . . . . . . . . . . 159,658 296,948 137,290 86Energy-related products . . . . . . . . . . . . . . . . . 104,107 158,145 54,037 52Miscellaneous manufactures . . . . . . . . . . . . . 81,621 122,552 40,931 50Machinery . . . . . . . . . . . . . . . . . . . . . . . . . . . 381,460 532,716 151,255 40Minerals and metals . . . . . . . . . . . . . . . . . . . 2,218,427 2,825,932 607,505 27Chemicals and related products . . . . . . . . . . . 627,012 785,549 158,536 25Forest products . . . . . . . . . . . . . . . . . . . . . . . . 155,006 160,816 5,810 4Agricultural products . . . . . . . . . . . . . . . . . . . 348,111 356,911 8,801 3Electronic products . . . . . . . . . . . . . . . . . . . . . 523,234 440,712 -82,522 -16Special provisions . . . . . . . . . . . . . . . . . . . . . 297,771 231,151 -66,620 -22Footwear . . . . . . . . . . . . . . . . . . . . . . . . . . . . 10,160 2,246 -7,914 -78
Total . . . . . . . . . . . . . . . . . . . . . . . . . . . . . . 5,586,766 7,586,163 1,999,397 36na = Value is undefined (divided by 0).Note.-Calculations based on unrounded data.Source: Compiled from official statistics of the U.S. Department of Commerce.

B-65
Table B–4U.S. imports under AGOA1 and GSP, 2002, 2003, Jan.–June 2003, and Jan.–June 2004
2002 2003 Jan.–June 2003 Jan.–June 2004
Sector/Country AGOA GSP AGOA GSP AGOA GSP AGOA GSPDollars
Agricultural productsSouth Africa . . 123,722,536 47,160,024 132,655,151 29,322,997 43,190,667 8,587,384 50,769,548 12,977,404
Côte d’Ivoire . . 21,688,834 21,681,834 41,265,664 41,251,664 19,761,150 19,747,150 19,817,076 19,799,176
Malawi . . . . . . 35,499,271 5,583,659 36,858,262 23,411,165 8,715,457 4,624,029 19,459,529 13,020,829
Swaziland . . . . 6,779,206 6,573,302 6,995,610 6,746,023 152,166 0 122,981 0
Mozambique . . 5,713,206 5,713,206 5,384,711 5,384,711 0 0 0 0
Kenya . . . . . . . 2,860,074 1,247,514 5,309,129 1,032,977 1,447,629 682,221 4,339,381 1,328,790
Ghana . . . . . . 3,368,470 3,355,642 4,695,699 4,666,569 1,815,625 1,815,625 2,710,307 2,694,467
Congo (ROC) . 2,785,829 2,785,829 2,812,979 2,812,979 2,812,979 2,812,979 2,305,165 2,305,165
Nigeria . . . . . . 464,454 464,454 1,767,052 1,767,052 1,341,846 1,341,846 133,746 133,746
Mauritius . . . . . 5,061,297 5,061,297 1,301,974 1,301,974 492,807 492,807 837,811 837,811
Ethiopia . . . . . . 1,004,377 982,656 917,767 896,473 471,925 467,275 903,850 763,570
Tanzania . . . . . 811,319 300,653 474,274 215,195 344,815 97,736 564,395 101,597
Congo (DROC) 0 0 93,750 93,750 93,750 93,750 22,000 22,000
Madagascar . . 2,360,377 2,360,377 75,698 75,698 35,164 35,164 64,912 64,912
Guinea . . . . . . 9,850 9,850 63,340 63,340 34,431 34,431 4,190 4,190
Cape Verde . . 50,599 50,599 59,608 12,500 45,608 12,500 0 0
Zambia . . . . . . 60,328 8,678 53,140 53,140 11,000 11,000 0 0
Cameroon . . . . 8,324 8,324 38,213 38,213 8,851 8,851 7,974 6,924
Uganda . . . . . 12,506 0 29,512 21,144 4,888 0 1,007,766 1,007,766
Djibouti . . . . . . 23,035 23,035 26,779 26,779 8,616 8,616 33,208 33,208
Senegal . . . . . . 50,376 50,376 26,539 21,979 13,929 9,369 38,809 38,809
Sierra Leone . . 47,826 47,826 21,549 21,549 0 0 60,855 60,855
Namibia . . . . . 0 0 4,744 4,744 2,923 2,923 5,992 5,992
Botswana . . . . 38,250 38,250 0 0 0 0 0 0
Mali . . . . . . . . 15,700 15,700 0 0 0 0 0 0
Total . . . . . . 212,436,044 103,523,085 240,931,144 119,242,615 80,806,226 40,885,656 103,209,495 55,207,211
Chemical and related productsSouth Africa . . 134,334,265 130,446,977 175,347,572 166,189,264 90,314,565 86,337,427 106,561,962 96,666,384
Senegal . . . . . . 376,332 376,332 608,020 608,020 417,220 417,220 207,800 207,800
Swaziland . . . . 282,582 95,713 477,565 169,005 135,131 135,131 232,120 232,120
Kenya . . . . . . . 734,224 103,555 152,919 152,919 105,382 105,382 370,136 370,136
Lesotho . . . . . . 226,014 226,014 73,836 73,836 42,160 42,160 91,144 91,144
Sierra Leone . . 145,232 145,232 47,620 47,620 0 0 0 0
Niger . . . . . . . 0 0 36,445 36,445 36,445 36,445 0 0
Ethiopia . . . . . . 3,800 3,800 25,331 25,331 1,651 1,651 0 0
Mauritius . . . . . 37,369 37,369 12,355 12,355 9,839 9,839 968 968
Ghana . . . . . . 1,503 1,503 4,371 4,371 0 0 0 0
Côte d’Ivoire . . 2,080 2,080 0 0 0 0 2,440 2,440
Eritrea . . . . . . . 11,250 11,250 0 0 0 0 NAE NAE
Madagascar . . 3,267 3,267 0 0 0 0 68,868 68,868
Mali . . . . . . . . 6,048 6,048 0 0 0 0 1,200 1,200
Malawi . . . . . . 0 0 0 0 0 0 750 750
Rwanda . . . . . 0 0 0 0 0 0 4,164 4,164
Uganda . . . . . 0 0 0 0 0 0 600 600
Total . . . . . . 136,163,966 131,459,140 176,786,034 167,319,166 91,062,393 87,085,255 107,542,152 97,646,574
See footnote at end of table.

B-66
Table B–4—ContinuedU.S. imports under AGOA1 and GSP, 2002, 2003, Jan.–June 2003, and Jan.–June 2004
2002 2003 Jan.–June 2003 Jan.–June 2004Sector/Country AGOA GSP AGOA GSP AGOA GSP AGOA GSP
DollarsElectronic products
South Africa . . 6,886,799 6,884,587 11,083,132 11,016,595 3,676,374 3,672,243 6,929,287 6,919,927
Mauritius . . . . . 1,853,755 1,853,755 1,611,446 1,611,446 962,197 962,197 756,022 756,022
Ethiopia . . . . . . 0 0 103,800 103,800 103,800 103,800 0 0
Kenya . . . . . . . 7,878 5,600 42,890 42,890 3,312 3,312 18,000 18,000
Swaziland . . . . 0 0 33,567 0 0 0 0 0
Chad . . . . . . . . 0 0 32,940 32,940 29,242 29,242 0 0
Ghana . . . . . . 0 0 11,636 11,636 0 0 0 0
Senegal 0 0 8,730 8,730 8,730 8,730 0 0
Tanzania . . . . . 0 0 6,000 6,000 6,000 6,000 0 0
Madagascar . . 42,075 42,075 0 0 0 0 0 0
Mauritania . . . 35,298 35,298 0 0 0 0 0 0
Niger . . . . . . . 3,625 3,625 0 0 0 0 0 0
Nigeria . . . . . . 2,648 2,648 0 0 0 0 14,100 14,100
Total . . . . . . 8,832,078 8,827,588 12,934,141 12,834,037 4,789,655 4,785,524 7,717,409 7,708,049
Energy–related productsNigeria . . . . . . 5,409,166,504 0 9,353,913,106 0 4,633,121,265 0 6,931,934,358 0
Gabon . . . . . . 1,145,478,260 0 1,177,431,094 0 499,634,297 0 800,107,543 0
Congo (ROC) . 103,308,158 0 337,898,690 0 160,209,221 0 98,603,514 0
Cameroon . . . . 115,542,306 0 146,745,936 0 33,784,083 0 124,911,152 0
Congo (DROC) 0 0 119,210,156 119,210,156 60,117,369 60,117,369 47,473,797 47,473,797
Côte d’Ivoire . . 27,257,725 0 46,346,627 0 5,558,091 0 45,002,250 0
Ghana . . . . . . 22,657,164 0 24,870,591 0 18,627,906 0 18,785,413 0
Chad . . . . . . . . 0 0 14,438,044 0 0 0 187,055,718 95,663,670
South Africa . . 866,196 0 2,829,584 9,630 2,829,584 9,630 0 0
Angola . . . . . . NAE NAE NAE NAE NAE NAE 1,858,095,512 1,375,154,530
Total . . . . . . 6,824,276,313 0 11,223,683,828 119,219,786 5,413,881,816 60,126,999 10,111,969,257 1,518,291,997
FootwearSouth Africa . . 289,997 0 789,389 0 411,410 0 412,373 0
Kenya . . . . . . . 6,024 0 8,604 0 6,860 0 24,631 0
Senegal . . . . . . 450 0 1,077 0 0 0 3,368 0
Nigeria . . . . . . 522 0 999 0 999 0 0 0
Ethiopia . . . . . . 320 0 0 0 0 0 0 0
Ghana . . . . . . 1,190 0 0 0 0 0 0 0
Tanzania . . . . . 1,990 0 0 0 0 0 0 0
Côte d’Ivoire . . 0 0 0 0 0 0 2,160 0
Total . . . . . . 300,493 0 800,069 0 419,269 0 442,532 0
Forest productsSouth Africa . . 17,467,365 17,442,803 22,849,058 22,827,022 11,152,577 11,140,354 10,044,460 10,026,659
Ghana . . . . . . 7,301,451 7,297,460 6,149,819 6,149,819 2,904,082 2,904,082 2,770,346 2,770,346
Kenya . . . . . . . 2,447,583 2,447,583 1,581,797 1,575,384 796,927 790,514 663,534 663,270
Madagascar . . 873,360 650,848 1,242,597 1,014,302 580,947 410,371 503,130 292,147
Zambia . . . . . . 20,278 20,278 435,457 435,457 93,241 93,241 254,027 254,027
Tanzania . . . . . 239,229 239,229 203,190 203,190 51,032 51,032 98,979 98,979
Cameroon . . . . 168,009 168,009 193,752 193,752 43,170 43,170 81,208 81,208
Namibia . . . . . 161,491 161,491 142,345 142,345 46,061 46,061 82,410 82,410
Côte d’Ivoire . . 499,563 499,563 126,991 126,991 95,917 95,917 62,320 62,320
See footnote at end of table.

B-67
Table B–4—ContinuedU.S. imports under AGOA1 and GSP, 2002, 2003, Jan.–June 2003, and Jan.–June 2004
2002 2003 Jan.–June 2003 Jan.–June 2004
Sector/Country AGOA GSP AGOA GSP AGOA GSP AGOA GSPDollars
Forest products–cont.Mali . . . . . . . . 48,025 48,025 65,137 65,137 41,412 41,412 31,925 31,925
Guinea . . . . . . 34,640 34,640 61,171 61,171 21,370 21,370 12,500 12,500
Swaziland . . . . 270,049 270,049 52,245 51,550 2,877 2,182 2,080 2,080
Congo (ROC) . 0 0 48,129 48,129 48,129 48,129 0 0
Senegal . . . . . . 22,209 22,209 39,653 37,953 9,716 9,716 41,340 41,340
Uganda . . . . . 13,621 13,621 39,146 39,146 20,785 20,785 16,575 16,575
Nigeria . . . . . . 13,248 8,586 35,672 35,672 8,631 8,631 8,711 8,711
Gabon . . . . . . 149,133 149,133 18,432 18,432 0 0 0 0
Congo (DROC) 0 0 16,920 16,920 12,200 12,200 0 0
Ethiopia . . . . . . 12,485 12,485 16,169 16,169 13,709 13,709 0 0
Mozambique . . 16,273 16,273 16,025 16,025 13,883 13,883 0 0
Gambia . . . . . 0 0 13,000 13,000 7,000 7,000 14,000 14,000
Malawi . . . . . . 0 0 9,304 8,413 891 0 0 0
Rwanda . . . . . 10,100 10,100 6,385 6,385 0 0 0 0
Mauritius . . . . . 0 0 4,800 4,800 0 0 0 0
Seychelles . . . . 0 0 2,967 2,967 2,967 2,967 0 0
Niger . . . . . . . 2,774 2,774 0 0 0 0 4,999 4,999
Sierra Leone . . 0 0 0 0 0 0 4,552 4,552
Central AfricanRepublic . . . 0 0 0 0 0 0 NAE NAE
Benin . . . . . . . . 0 0 0 0 0 0 3,000 3,000
Total . . . . . . 29,770,886 29,515,159 33,370,161 33,110,131 15,967,524 15,776,726 14,700,096 14,471,048
MachinerySouth Africa . . 17,770,826 17,762,797 11,047,660 11,044,283 5,965,980 5,965,980 5,646,452 5,643,277
Kenya . . . . . . . 45,052 45,052 38,520 38,520 0 0 0 0
Ethiopia . . . . . . 2,381 2,381 29,613 29,613 21,473 21,473 0 0
Senegal . . . . . . 0 0 8,496 8,496 8,496 8,496 0 0
Chad . . . . . . . . 0 0 6,616 6,616 6,616 6,616 0 0
Sierra Leone . . 10,104 10,104 5,587 5,587 0 0 26,677 26,677
Mauritania . . . 0 0 3,433 3,433 0 0 0 0
Mauritius . . . . . 0 0 0 0 0 0 20,500 20,500
Nigeria . . . . . . 0 0 0 0 0 0 245,900 245,900
Total . . . . . . 17,828,363 17,820,334 11,139,925 11,136,548 6,002,565 6,002,565 5,939,529 5,936,354
Minerals and metalsSouth Africa . . 371,500,868 233,199,174 397,226,057 278,118,061 185,405,096 118,403,533 241,717,911 198,878,320
Namibia . . . . . 0 0 14,465,416 14,465,416 0 0 32,206,076 32,206,076
Kenya . . . . . . . 530,105 320,957 247,025 247,025 148,827 148,827 37,389 37,389
Ghana . . . . . . 349,542 349,542 167,323 167,323 157,276 157,276 47,971 42,787
Congo (DROC) 0 0 108,331 108,331 5,500 5,500 485,231 485,231
Nigeria . . . . . . 2,398 0 72,757 72,757 41,571 41,571 22,874 22,874
Swaziland . . . . 18,648 0 46,522 2,282 15,753 2,282 0 0
Madagascar . . 103,947 103,947 34,203 31,203 31,203 31,203 96,286 96,286
Côte d’Ivoire . . 3,000 3,000 28,103 28,103 28,103 28,103 0 0
Ethiopia . . . . . . 0 0 26,623 26,623 19,050 19,050 0 0
Zambia . . . . . . 0 0 20,930 20,930 0 0 0 0
Mauritius . . . . . 15,998 15,998 20,891 20,891 0 0 0 0
See footnote at end of table.

B-68
Table B–4—ContinuedU.S. imports under AGOA1 and GSP, 2002, 2003, Jan.–June 2003, and Jan.–June 2004
2002 2003 Jan.–June 2003 Jan.–June 2004
Sector/Country AGOA GSP AGOA GSP AGOA GSP AGOA GSPDollars
Minerals and metals–cont.Congo (ROC) . 13,740 13,740 15,076 15,076 15,076 15,076 0 0
Guinea . . . . . . 0 0 11,628 11,628 11,628 11,628 0 0
Mali . . . . . . . . 208,000 208,000 11,269 11,269 6,274 6,274 0 0
Tanzania . . . . . 105,271 105,271 9,500 9,500 0 0 0 0
Cameroon . . . . 5,405 5,405 4,324 4,324 4,324 4,324 2,247 2,247
Uganda . . . . . 0 0 3,000 3,000 0 0 13,057 0
Botswana . . . . 97,778 97,778 0 0 0 0 0 0
Sierra Leone . . 6,006 6,006 0 0 0 0 60,567 60,567
Niger . . . . . . . 0 0 0 0 0 0 3,249 3,249
Angola . . . . . . NAE NAE NAE NAE NAE NAE 6,198 6,198
Total . . . . . . 372,960,706 234,428,818 412,518,978 293,363,742 185,889,681 118,874,647 274,699,056 231,841,224
Miscellaneous manufacturesSouth Africa . . 36,755,871 35,892,077 52,210,175 50,432,512 20,013,586 19,313,438 25,981,965 24,651,733
Mauritius . . . . . 795,401 795,401 4,914,206 4,914,206 372,073 372,073 930,190 930,190
Kenya . . . . . . . 698,272 692,590 774,185 744,154 405,477 386,247 545,601 405,629
Ghana . . . . . . 814,703 813,191 425,110 423,050 215,311 213,251 235,998 233,428
Madagascar . . 217,149 217,149 345,259 345,259 215,288 215,288 587,870 587,870
Mali . . . . . . . . 63,298 61,827 184,274 183,924 62,786 62,436 0 0
Guinea . . . . . . 23,700 23,700 57,490 57,490 31,860 31,860 17,439 17,439
Côte d’Ivoire . . 90,306 90,306 49,115 49,115 9,504 9,504 9,604 9,604
Central AfricanRepublic . . . 191,774 191,774 43,097 43,097 0 0 NAE NAE
Congo (DROC) 0 0 42,312 42,312 28,177 28,177 15,624 15,624
Cameroon . . . . 79,276 79,276 28,706 28,706 21,834 21,834 36,479 36,479
Senegal . . . . . . 49,746 49,746 26,666 22,653 12,753 10,683 4,755 4,755
Niger . . . . . . . 15,404 15,004 25,672 23,872 23,872 23,872 13,770 13,770
Nigeria . . . . . . 9,834 7,462 16,486 16,486 5,943 5,943 2,900 2,900
Congo (ROC) . 25,549 25,549 14,848 14,848 4,823 4,823 7,000 7,000
Tanzania . . . . . 7,838 6,348 9,029 9,029 2,024 2,024 9,903 9,903
Namibia . . . . . 3,953 0 7,237 7,237 7,237 7,237 12,300 12,300
Gambia . . . . . 0 0 6,783 6,783 0 0 0 0
Uganda . . . . . 5,759 5,759 3,820 3,820 3,820 3,820 4,644 4,644
Ethiopia . . . . . . 0 0 3,095 3,095 3,095 3,095 0 0
Botswana . . . . 734,987 734,987 0 0 0 0 0 0
Sierra Leone . . 7,810 7,810 0 0 0 0 0 0
Zambia . . . . . . 2,209 2,209 0 0 0 0 0 0
Seychelles . . . . 0 0 0 0 0 0 2,750 2,750
Total . . . . . . 40,592,839 39,712,165 59,187,565 57,371,648 21,439,463 20,715,605 28,418,792 26,946,018
TransportationSouth Africa . . 544,706,434 61,353,875 731,346,848 96,960,977 326,138,713 40,076,543 287,707,790 53,522,045
Nigeria . . . . . . 0 0 204,584 204,584 204,584 204,584 0 0
Mauritius . . . . . 0 0 48,916 48,916 48,916 48,916 0 0
Côte d’Ivoire . . 4,303 4,303 16,016 16,016 0 0 0 0
Ethiopia . . . . . . 0 0 12,000 12,000 12,000 12,000 0 0
Gabon . . . . . . 0 0 8,047 8,047 8,047 8,047 0 0
Sierra Leone . . 0 0 0 0 0 0 44,667 44,667
Tanzania . . . . . 0 0 0 0 0 0 6,615 6,615
Total . . . . . . 544,710,737 61,358,178 731,636,411 97,250,540 326,412,260 40,350,090 287,759,072 53,573,327
See footnote at end of table.

B-69
Table B–4—ContinuedU.S. imports under AGOA1 and GSP, 2002, 2003, Jan.–June 2003, and Jan.–June 2004
2002 2003 Jan.–June 2003 Jan.–June 2004Sector/Country AGOA GSP AGOA GSP AGOA GSP AGOA GSP
DollarsTextiles and apparel
Lesotho . . . . . . 317,803,078 0 372,600,486 56,592 166,455,175 34,704 198,097,397 74,664
Madagascar . . 76,127,920 511,965 186,181,046 225,090 60,007,522 60,829 120,494,469 160,027
Kenya . . . . . . . 121,880,573 10,386 176,286,039 8,178 86,746,363 7,858 125,773,879 31,568
Mauritius . . . . . 106,527,814 0 135,162,249 51,311 62,352,183 0 73,167,285 0
South Africa . . 88,292,479 2,899,363 131,188,156 4,231,055 55,805,149 1,838,866 54,564,440 2,288,244
Swaziland . . . . 73,901,023 0 126,369,084 726 53,608,211 0 72,535,057 0
Namibia . . . . . 1,551,705 12,402 32,135,107 2,973 9,147,198 0 24,192,180 0
Malawi . . . . . . 11,404,806 295 22,388,748 0 10,515,846 0 13,743,578 0
Botswana . . . . 3,707,452 0 6,323,660 0 2,209,170 0 7,936,328 0
Ghana . . . . . . 336,248 12,093 4,261,311 6,721 1,997,301 4,431 4,091,966 8,850
Mozambique . . 186,167 0 2,516,333 0 1,693,291 0 803,464 0
Cape Verde . . 0 0 2,405,300 0 824,034 0 1,160,264 0
Ethiopia . . . . . . 1,297,077 0 1,750,717 0 801,454 0 1,812,677 680
Uganda . . . . . 0 0 1,433,346 0 457,163 0 1,585,203 0
Tanzania . . . . . 127,180 2,824 866,991 16,159 365,174 0 950,260 16,439
Côte d’Ivoire . . 187,077 187,077 204,041 204,041 131,830 131,830 72,303 72,303
Mali . . . . . . . . 979 979 1,699 1,699 1,699 1,699 721 721
Nigeria . . . . . . 0 0 1,393 1,393 858 858 300 300
Senegal . . . . . . 375 375 1,135 1,135 1,135 1,135 0 0
Niger . . . . . . . 0 0 400 400 0 0 0 0
Cameroon . . . . 525 525 0 0 0 0 0 0
Zambia . . . . . . 0 0 0 0 0 0 367 367
Nigeria . . . . . . 0 0 0 0 0 0 300 300
Total . . . . . . 803,332,478 3,638,284 1,202,077,241 4,807,473 513,120,756 2,082,210 700,982,438 2,654,463
Grand total . 8,991,204,903 630,282,751 14,105,065,497 915,655,686 6,659,791,608 396,685,277 11,643,379,828 2,014,276,265
1 AGOA includes the GSP provisions.NAE = “Not AGOA Eligible”
Note.—Calculations based on unrounded data.Source: Compiled from official statistics of the U.S. Department of Commerce.