Singapore and the New Regionalism: Bilateral Trade Linkages with Japan and the US
32
UNCORRECTED PROOF © Blackwell Publishing Ltd 2003, 9600 Garsington Road, Oxford, OX4 2DQ, UK and 350 Main Street, Malden, MA 02148, USA 1 TWEC 575 Pages: 31 Singapore and the New Regionalism: Bilateral Trade Linkages with Japan and the US Ramkishen S. Rajan, Rahul Sen and Reza Siregar 1. INTRODUCTION S INGAPORE has enjoyed one of the highest rates of growth in the world over the past three decades, with its GDP appreciating at an annual average rate of about eight per cent during the period 1970–1999 (Table 1). A key component of the city-state’s growth strategy has been its outward orientation, particularly its openness to trade and investment flows. With a trade-to-GDP ratio of over 250 per cent in 1999, Krugman (1995) places the country in the league of ‘super-trading’ nations. Accordingly, Singapore has been a leading advocate of global trade liberalisation and the free flow of goods and services across inter- national borders. Nonetheless, recognising that it has highly limited influence in the multilateral arena, where recent progress on many important issues relating to trade and investment liberalisation is perceived to have been disappointingly slow and negotiations rather protracted and cumbersome (Sager, 1997), Singapore has simultaneously pursued a second track to liberalisation by means of the regional route. Regionalism has involved both the Southeast Asian region via the ten-member ASEAN grouping and the larger Asia and Pacific region via the twenty-one members APEC grouping. 1 However, the recent financial crisis in Southeast and East Asia in 1997–98 has held up the pace if not commitment by some of the ASEAN members to trade RAMKISHEN S. RAJAN is from the School of Economics, University of Adelaide, Australia. RAHUL SEN is from the Institute of Southeast Asian Studies, Singapore. REZA SIREGAR is from the School of Economics, University of Adelaide, Australia. Valuable comments by two anony- mous referees are much appreciated. The usual disclaimer applies. 1 ASEAN refers to the Association of Southeast Asian Nations and APEC refers to Asia Pacific Economic Cooperation. Chang and Rajan (1999) discuss the responses of ASEAN and APEC to crisis-hit member economies.
-
Upload
independent -
Category
Documents
-
view
0 -
download
0
Transcript of Singapore and the New Regionalism: Bilateral Trade Linkages with Japan and the US

SINGAPORE AND THE NEW REGIONALISM 1UNCO
RRECTED P
ROO
F
© Blackwell Publishing Ltd 2003© Blackwell Publishing Ltd 2003, 9600 Garsington Road, Oxford, OX4 2DQ, UKand 350 Main Street, Malden, MA 02148, USA 1
TWEC 575 Pages: 31
Singapore and the New
Regionalism: Bilateral Trade
Linkages with Japan and the US
Ramkishen S. Rajan, Rahul Sen and Reza Siregar
1. INTRODUCTION
SINGAPORE has enjoyed one of the highest rates of growth in the world
over the past three decades, with its GDP appreciating at an annual averagerate of about eight per cent during the period 1970–1999 (Table 1). A key
component of the city-state’s growth strategy has been its outward orientation,
particularly its openness to trade and investment flows. With a trade-to-GDP ratioof over 250 per cent in 1999, Krugman (1995) places the country in the league of
‘super-trading’ nations. Accordingly, Singapore has been a leading advocate of
global trade liberalisation and the free flow of goods and services across inter-national borders. Nonetheless, recognising that it has highly limited influence in
the multilateral arena, where recent progress on many important issues relating
to trade and investment liberalisation is perceived to have been disappointinglyslow and negotiations rather protracted and cumbersome (Sager, 1997), Singapore
has simultaneously pursued a second track to liberalisation by means of the
regional route. Regionalism has involved both the Southeast Asian region viathe ten-member ASEAN grouping and the larger Asia and Pacific region via the
twenty-one members APEC grouping.1
However, the recent financial crisis in Southeast and East Asia in 1997–98 hasheld up the pace if not commitment by some of the ASEAN members to trade
RAMKISHEN S. RAJAN is from the School of Economics, University of Adelaide, Australia.RAHUL SEN is from the Institute of Southeast Asian Studies, Singapore. REZA SIREGAR is fromthe School of Economics, University of Adelaide, Australia. Valuable comments by two anony-mous referees are much appreciated. The usual disclaimer applies.
1 ASEAN refers to the Association of Southeast Asian Nations and APEC refers to Asia PacificEconomic Cooperation. Chang and Rajan (1999) discuss the responses of ASEAN and APEC tocrisis-hit member economies.

2 RAMKISHEN S. RAJAN, RAHUL SEN AND REZA SIREGAR
UNCORRECTED P
ROOF
© Blackwell Publishing Ltd 2003
liberalisation and appears to have depleted the institution’s collective economicstrength;2 while APEC has become large and unwieldy and appears ill-equipped
to handle substantive trade and investment liberalisation issues effectively
(Ravenhill, 2000). Accordingly, Singapore policy makers have underscoredthe need to explore alternative (i.e. third and fourth track) liberalisation paths.
Free Trade Agreements (FTAs) have, therefore, become an integral part of
Singapore’s trade policy.3
FTAs appear to be increasingly regarded by policymakers around the world as
effective and expeditious instruments for achieving trade liberalisation among
‘like minded’ trading partners (Schiff et al., 2000). Formation of bilateral FTAsamong such partners is also seen as a way to overcome the so-called ‘convoy
problem’, whereby the pace and depth of trade integration is held back by the‘least willing member.’4 FTAs are viewed as a means of maintaining forward
momentum towards trade and investment liberalisation, failing which it was feared
that there might be a lapse into protectionism, i.e. the so-called ‘bicycle theory’(Bergsten, 1998). To the extent that contracting parties to an FTA agree to move
beyond their respective WTO commitments, there may be a demonstration effect
that motivates future rounds of broader multilateral negotiations under the
2 As reportedly noted by Singapore Deputy Prime Minister, Lee Hsien Loong:‘the crisis caused some ASEAN countries to hold back from pushing ahead with the ASEAN FreeTrade Area (AFTA) and the ASEAN Investment Area (AIA), to give struggling domestic industriessome breathing space . . . ASEAN members who were doing relatively better – such as Thailand,Malaysia, Singapore and Brunei – should take the lead and work to put ASEAN cooperation ontrack again (Business Times, Singapore, 1 December, 2000).3 Given the definition of FTAs, Jagdish Bhagwati notes that term ‘preferential trade areas’ (PTAs)is a more apt description (Bhagwati, 1995).4 Or, as it is sometimes said, ‘those who can run faster should run faster and ought not to be heldback by those who choose not to run or do so at a snail’s pace’. While the argument that negotiatingregional trade pacts are easier to conclude and can be done at a faster pace than global negotiationsmay not hold true as a general rule (Baldwin, 1997; and Bhagwati, 1995), it does seem appropriatein the case of Singapore which sets strict deadlines for completion of discussions (though this mayhave its own problems; see Section 5).
TABLE 1Singapore: Major Macroeconomic Indicators 1970–99
1970 1980 1990 1995 1999 1970– 1970– 1980– 1990– 1995–
99 80 90 95 99
Real GDP growth (%) 14.60 9.70 9.00 8.70 5.40 8.0 9.4 7.6 8.7 5.9Exports growth (%) 0.32 33.98 9.29 13.70 5.73 14.1 23.2 11.4 11.7 5.8Imports growth (%) 20.70 33.90 13.36 12.74 7.57 12.9 22.2 10.7 10.6 4.1Inflation rate (%) 1.70 8.50 3.50 1.70 0.00 3.7 6.7 2.9 2.7 1.0
Source: The World Bank, World Development Indicators CD-Rom.

SINGAPORE AND THE NEW REGIONALISM 3UNCO
RRECTED P
ROO
F
© Blackwell Publishing Ltd 2003
auspices of the WTO. Since trade agreements nowadays go well beyond tradein goods to encompass an increasing number of complex areas and issues, FTAs
could act as a ‘testing ground or pilot project for exploring complex trade issues’
and establish some sort of precedent or benchmark for trade negotiations involv-ing a larger number of countries, including one at the multilateral level (Sager,
1997, p. 242).
A ‘first-mover advantage’ in forming FTAs with a large number of differentcountries early on takes the shape of a ‘hub’ of overlapping arrangements
(Wonnacott and Lutz, 1989). Producers in the hub have cost advantages vis-à-vis
producers in the ‘spokes’, being able to obtain more of their intermediate goodsat lower prices. Further, since exports originating from Singapore are given
preferential access to a number of other markets (with which Singapore has trade
pacts), this may encourage the transshipment of goods through Singapore ports,hence fortifying its already dominant role as an entrepot point. Of course, it is for
this very reason that FTAs have special provisions or rules of origin (ROOs) that
are meant to prevent goods being re-exported from the lower tariff country to thehigher tariff country one (i.e. trade deflection). However, this in turn may lead
to a shift of export platforms from other regional developing economies to
Singapore in order to enjoy duty-free market access.5
Singapore has already established a bilateral FTA with New Zealand and is
in the process of implementing another one with Japan. It is also negotiatingFTAs with the US, Australia, the European Free Trade (EFTA), Chile, Mexico
and many other countries worldwide. This paper examines the shift in Singapore
trade policy towards FTAs in general, with particular focus on the city-state’sbilateral trade relations and proposed trade pacts FTAs with Japan and the US.
While there are several important issues pertaining to the interests that the US
and Japan have in formation of trade pacts generally and with specific refer-ence to Singapore, this paper is much more narrowly focused on the Singapore
perspective.
Why are Singapore’s bilateral trade initiatives with the US and Japan of par-ticular significance? As will be discussed in the following sections, Singapore’s
interests in freer trade with Japan and the US reflect its de facto close trade and
investment linkages with and dependence on the two markets. Entering intobroad-ranging trade pacts with these two economic superpowers is not only seen
as a means of gaining greater market access (with Japan in particular), but also as
a way of avoiding the imposition of possible protectionist measures in the future(with regard to the US in particular) and managing future trade tensions (includ-
ing establishing orderly dispute settlement mechanisms). Being among the first
5 Care must however be taken to ensure that ROOs are not manipulated in a way that partners gainde facto protection for their goods in the Singapore market.

4 RAMKISHEN S. RAJAN, RAHUL SEN AND REZA SIREGAR
UNCORRECTED P
ROOF
© Blackwell Publishing Ltd 2003
few countries to establish a number of FTAs with these two and other econom-ically significant economies also ensures that Singapore is not discriminated
ex-post in the event that its ‘competitors’ form FTAs with third countries.6
While the US has signed a series of bilateral FTAs with Canada, Israel, Mexicoand Jordan, most recently, the announcement of the US-Singapore FTA is
considered especially significant as it is the first such one that the US may
sign with an Asian economy. The conclusion of a Japan-Singapore FTA is ofsignificance as Japan and Hong Kong have been the only two economies that
have hitherto not participated in any FTAs. A possible Japan-Singapore FTA is
interpreted by some as an important signal of Japan’s weakening adherence tonon-discriminatory multilateralism, not unlike the shift in the trade policy stance
by the US in the 1980s, which led to the proliferation of regional blocs. In
addition, rightly or wrongly, the Japan-Singapore FTA has been viewed asa precursor to the formation of an East Asia-wide FTA between countries in
Southeast Asia plus Japan, Korea and China (ASEAN plus Three or APT).7
Having outlined the main rationale for Singapore’s recent surge in interestin forming FTAs, the rest of this paper is organised as follows. Section 2
examines various aspects of Singapore’s trade linkages with the two economic
superpowers in some detail. Section 3 considers the determinants of Singapore’smerchandise exports to the US and Japan as well as estimates the impact of
these exports on the city-state’s overall aggregate demand. Section 4 offers anoverview of the so-termed ‘Japan-Singapore Economic Partnership Agreement’
or JSEPA for short. As the discussion will highlight, the trade agreement is
highly multifaceted, also encompassing services trade, issues relating to invest-ment (principles of national treatment and the right of establishment) and many
other dimensions. Popular discussion of FTAs gives one the appearance that such
a trade policy is entirely benign. Accordingly, Section 5 concludes the paper bysounding a cautionary note, highlighting some reasons to be concerned with
Singapore’s recent embracement of the ‘new regionalism’.8 Two technical appen-
dices (A and B), which describe the construction of variables for the exportdemand functions and examine empirically the impact of growth variations in
the US and Japan on the city-state, follow the main-text.
6 Analysis of trade patterns generally reveals that Taiwan, in particular, but also Malaysia, Koreaand Hong Kong are among Singapore’s closest export competitors.7 In a recent meeting in Singapore it was agreed that the APT would explore the possibility ofholding an East Asian summit as well as consider the establishment of an APT FTA and investmentarea (Business Times, Singapore, 25 November, 2000). The APT has taken some concrete stepstoward enhancing monetary and financial cooperation (Chang and Rajan, 2001).8 The term ‘regionalism’ is not meant to have any geographic connotation, referring to any tradeinitiatives that are not multilateral in nature.

SINGAPORE AND THE NEW REGIONALISM 5UNCO
RRECTED P
ROO
F
© Blackwell Publishing Ltd 2003
2. MERCHANDISE TRADE LINKAGES: TRENDS, PATTERNS AND COMPOSITION
It is critical that pre-FTA trade patterns are carefully documented so as to be
able to investigate the changes attributable to Singapore’s FTAs with the US andJapan in the future. This being said, the intention here is not to systematically
evaluate the welfare consequences for Singapore of these bilateral FTAs in the
conventional sense (i.e. trade creation versus trade diversion). Indeed, Singaporehas one of the most liberal trade and investment regimes in the world, and the
near zero tariff rates on most goods (and limited non-tariff barriers) implies that
the scope for trade diversion (i.e. replacement of lower cost suppliers from non-member countries) from Singapore’s vantage point is quite small.9
a. Trade Flows
Figures 1 and 2 exhibit trends in Singapore’s total merchandise trade with theUS and Japan respectively over the period 1980–99. Together they constituted
FIGURE 1Singapore’s Merchandise Trade with the US
Source: IMF, Direction of Trade Statistics Yearbook, various issues.
9 Assuming of course that the ROOs are not prohibitive. ROOs are discussed in more detail inSection 5. Ninety nine per cent of Singapore’s imports are not dutiable. Tariffs are only imposed onalcoholic beverage imports while excise duties are imposed on tobacco products, automobiles andgasoline. During the Uruguay Round, Singapore agreed to bind 70 per cent of its tariff lines.

6 RAMKISHEN S. RAJAN, RAHUL SEN AND REZA SIREGAR
UNCORRECTED P
ROOF
© Blackwell Publishing Ltd 2003
FIGURE 2Singapore’s Merchandise Trade with Japan
Source: Calculated from IMF, Direction of Trade Statistics Yearbook, various issues.
one third of Singapore’s total merchandise trade (the US, 18 per cent and Japan,
12 per cent). While the share of Japan in Singapore’s overall trade has not variedby much over the entire period under consideration, that with the US increased
by over eight per cent in the early 1990s, declined slightly thereafter, but in-
creased again from 1995 onwards. In contrast, trade with Singapore constituteda mere two per cent of the US’s global trade in 1999 and three per cent in the
case of Japan. Nevertheless, despite the city-state’s microscopic physical size, it
was the US’s tenth largest export market and the twelfth largest source of importsin 1998. Singapore was the sixth largest export market for Japanese goods and
Japan’s thirteenth largest import source in 1999 (IMF, 2000).
While growth of Singapore’s exports to Japan have outpaced that to the USas well as Singapore’s global trade as a whole, given the relatively lower base,
exports to Japan as a share of Singapore’s world exports declined from 11 per
cent in 1982 to nearly eight per cent by 1999 (Figure 3). In contrast, the share ofexports to the US increased sharply from 13 per cent in 1982 to nearly 20 per
cent of Singapore’s global exports by 1999.
Since Singapore is an entrepot economy, it is necessary to disaggregate Singa-pore’s exports into its two component parts, viz. domestic exports and re-exports
(i.e. little or no value-added/transformation in Singapore) (Table 2). Nearly a

SINGAPORE AND THE NEW REGIONALISM 7UNCO
RRECTED P
ROO
F
© Blackwell Publishing Ltd 2003
FIGURE 3Singapore’s Merchandise Exports to the US and Japan
Source: Calculated from IMF, Direction of Trade Statistics Yearbook, various issues.
quarter of Singapore’s exports to the US included an entrepot component, this
figure being about a third in the case of Singapore’s exports to Japan.
On average, Japan and the US respectively, constituted about 20 and 15 percent of Singapore’s total imports. However, averages fail to capture the entire
picture. For instance, imports from the US have appreciated from 15 per cent in
1995 to almost 20 per cent in 1998, while those from Japan declined from 21 percent to 17 per cent over the same period (Figure 4).
b. Trade Balances
Singapore has recorded a persistent and growing bilateral trade balance withthe US since the mid 1980s, peaking at slightly over US$ 3 billion in 1998–99
(Figure 1). These surpluses are a relatively low share of overall US-Singapore
trade, averaging about nine per cent). In contrast, Singapore has been runningpersistent bilateral deficits with Japan which have been increasing both in mag-
nitude as well in terms of Singapore’s total trade with Japan, especially during
the period 1985–94. The deficit was around US$ 10 billion in 1999, constitutingabout 45 per cent of Singapore’s bilateral trade with Japan (Figure 2).
Persistent trade deficits with Japan might at least partly be a reflection of the
inability of foreign (including Singapore) exporters to penetrate the Japanese

8 RAMKISHEN S. RAJAN, RAHUL SEN AND REZA SIREGAR
UNCORRECTED P
ROOF
© Blackwell Publishing Ltd 2003
TA
BL
E 2
Sin
gap
ore
’s D
om
esti
c E
xport
s to
US
and J
apan
, 198
4–
99
Yea
rT
ota
lA
nnual
Tota
lA
nnual
Tota
lA
nnual
Share
of
Share
of
Dom
esti
cG
row
thD
om
esti
cG
row
thD
om
esti
cG
row
thT
ota
l D
Ux
Tota
l D
J xE
xport
s to
Rate
Exp
ort
sR
ate
Exp
ort
s to
Rate
in T
ota
lin
Tota
lth
e W
orl
d(P
er c
ent)
to U
S(P
er c
ent)
Japan (
DJ x
)(P
er c
ent)
Sin
gapore
Sin
gapore
(DW
x)
(DU
x)
Do
mes
tic
Do
mes
tic
Exp
ort
sE
xport
s
1984
15517
3718
1862
24.0
12.0
1985
14807
−4.6
3709
−0.3
1755
−5.7
25
.01
1.8
1986
14707
−0.7
4356
17.4
1515
−13
.62
9.6
10
.31987
18517
25.9
5801
33.2
1966
29.8
31.3
10.6
1988
24654
33.1
7769
33.9
2426
23.4
31.5
9.8
1989
28334
14.9
8479
9.1
2851
17.5
29.9
10.1
1990
34671
22.4
9212
8.6
3431
20.4
26.6
9.9
1991
38222
10.2
9525
3.4
3493
1.8
24.9
9.1
1992
40723
6.5
10787
13.2
3135
−10
.32
6.5
7.7
1993
46661
14.6
11907
10.4
3591
14.5
25.5
7.7
1994
57962
24.2
14225
19.5
4556
26.9
24.5
7.9
1995
69476
19.9
17083
20.1
6386
40.2
24.6
9.2
1996
73465
5.7
18219
6.6
6942
8.7
24.8
9.4
1997
72424
−1.4
18
08
2−0
.75358
−22
.82
5.0
7.4
1998
63287
−12
.61
65
98
−8.2
4151
−22
.52
6.2
6.6
1999
68628
8.4
16858
1.6
5303
27.8
24.6
7.7
Sourc
e: C
om
pute
d f
rom
Sin
gap
ore
Tra
de
Dev
elopm
ent
Boar
d,
Sin
gapore
Tra
de
Sta
tist
ics,
Sin
gap
ore
and I
MF
, D
irec
tion o
f T
rade
Sta
tist
ics
Yea
rbook,
var
ious
issu
es.

SINGAPORE AND THE NEW REGIONALISM 9UNCO
RRECTED P
ROO
F
© Blackwell Publishing Ltd 2003
FIGURE 4Singapore’s Merchandise Imports from the US and Japan
Source: Calculated from IMF, Direction of Trade Statistics Yearbook, various issues.
10 Since the focus of this paper is on Singapore, the potential welfare effects of possible tradediversion in the case of Japan (or the US) is not tackled here.11 This being said, insofar as the bulk of Singapore’s exports to the US have been concentrated inthe SITC 76 and 84 categories (TDB, 1992), and most of US import restrictions have generallyfallen on those categories (DeRosa, 1986, p. 180), Singapore may be especially vulnerable toprotectionist measures that might be imposed by the US.
market due to the maintenance of both official and (especially) unofficial non-
tariff barriers (NTBs) (Lawrence, 1987). Indeed, these barriers have in turn often
led to the accusation that Japan ‘imports too little’ from its trading partners(Takeuchi, 1989), with a survey of Singapore exporters in the late 1980s revealing
them to be ‘generally overawed by the Japanese “closed market” image’ (Lim,
1988, p. 100). In the context of a Japan-Singapore FTA, this factor could be ofpotential importance, as a bilateral FTA ought to provide Singapore preferential
access to the Japanese market.10 Conversely, given continued aggregate trade
deficits faced by the US, protectionist pressures in case of an economic slowdownmay emerge in that country. Thus, a US-Singapore FTA might serve as an ‘insur-
ance policy’ against the future imposition of US unilateral trade barriers.11
1

10 RAMKISHEN S. RAJAN, RAHUL SEN AND REZA SIREGAR
UNCORRECTED P
ROOF
© Blackwell Publishing Ltd 2003
The assemble-and-export strategy, whereby Japanese multinationals in EastAsia import intermediate products and capital goods from Japan, assemble them
locally and re-export the finished goods to the US and other third countries, is
a further reason for Japan’s persistent bilateral trade surplus with Singapore aswell as the rest of East Asia.12 On the other hand, US subsidiaries abroad have
contributed to the US trade deficit with East Asian economies as they exported
relatively more back to the US (i.e. ‘reverse imports’) than they sourced from it(Encarnation, 1992). This phenomenon appears to be especially true in the case
of Singapore, with early studies suggesting that between four and 60 per cent of
output by US multinationals in Singapore has been exported back to the US,while the corresponding figure in the case of Japan is estimated at only around
five per cent (Hill and John, 1985).13
c. Commodity Composition of Merchandise Trade
The preceding analysis focuses only on broad trends in aggregate traderelations. An examination of the commodity composition of trade is necessary
to obtain a fuller understanding of Singapore’s trade linkages with Japan and
the US.Table 3 compares the composition of Singapore’s overall imports and exports
to the US and Japan specifically by commodity groups at the SITC 3-digit levelin 1999. Singapore’s global exports are concentrated in five product categories,
viz. Electronics and petroleum refined products (SITC 776, 752, 759, 334 and
764), which constituted nearly 60 per cent of Singapore’s total world exports.Electronic valves (SITC 776) itself accounted for about 20 per cent of Singa-
pore’s global exports as well as exports to the US and Japan specifically, making
it the second most important Singapore export to both markets. Data ProcessingMachines (SITC 752), which is the second most important Singapore export
globally, but was the most important one to both the US and Japan. This product
accounted for nearly 20 per cent of Singapore’s exports to Japan and 40 per centof Singapore’s exports to the US. The top five product categories of Singapore’s
overall exports noted above are among the highest categories of Singapore’s
exports to the US and Japan, accounting for almost three-quarters and one half ofthe city state’s total exports to both trading partners, respectively. In fact, seven
of the top ten exports from Singapore to both the US and Japan overlap, indicat-
ing a high degree of similarity in commodity composition of Singapore’s exports
12 It is this phenomenon which is thought to have contributed to an increase in Singapore’s importsfrom Japan particularly after 1987–88, with Singapore being one of the largest recipients of JapaneseFDI due to various push factors in Japan (Rajan, 1996).13 Julius (1990, p. 75) has suggested that about 50 per cent of the US imports from Singapore andMalaysia were from US affiliates in Singapore.

SINGAPORE AND THE NEW REGIONALISM 11UNCO
RRECTED P
ROO
F
© Blackwell Publishing Ltd 2003
TABLE 3Singapore’s Leading Product Groups of Exports to the World, US and Japan in 1999
(SITC 3-digit level)
Rank Product Code Product Description Exports to the WorldShare (Per cent)
1 776 Electronic Valves 20.12 752 Data Processing Machines 17.33 759 Parts for Office & D/P Machines 8.84 334 Petroleum Products Refined 7.55 764 Telecommunications Equipment 4.56 772 Electrical Circuit Apparatus 2.57 778 Electrical Machinery 2.18 898 Musical Instrument & Parts 1.79 515 Organo-inorganic Compounds 1.410 931 Special Transactions 1.1
Rank Product Code Product Description Exports to USShare (Per cent)
1 752 Data Processing Machines 39.32 776 Electronic Valves 20.03 759 Parts for Office & D/P Machines 12.74 764 Telecommunications Equipment 3.55 772 Electrical Circuit Apparatus 1.86 515 Organo-inorganic Compounds 1.77 334 Petroleum Products Refined 1.58 845 Apparel Articles of Textile 1.59 931 Special Transactions 1.210 874 Measuring Instruments 1.1
Rank Product Code Product Description Exports to JapanShare (Per cent)
1 752 Data Processing Machines 20.82 776 Electronic Valves 16.13 898 Musical Instrument & Parts 10.34 759 Parts for Office & D/P Machines 7.75 334 Petroleum Products Refined 5.26 764 Telecommunications Equipment 2.67 931 Special Transactions 2.48 112 Alcoholic Beverages 2.39 772 Electrical Circuit Apparatus 1.510 716 Electric Plant & Parts 1.4
Source: Singapore Trade Development Board, Singapore Trade Statistics, December 1999.
14 This result remains unaltered even if periods prior to the crisis in 1997–98 are considered.
to both countries.14 Of these, petroleum products are of relatively lower importance
in Singapore’s exports to the US compared to the former’s exports to Japan. Thisis true even if focus is limited to Singapore’s domestic exports to these countries.

12 RAMKISHEN S. RAJAN, RAHUL SEN AND REZA SIREGAR
UNCORRECTED P
ROOF
© Blackwell Publishing Ltd 2003
TABLE 4Singapore’s Leading Product Groups of Imports from the World, US and Japan in 1999
(SITC 3-digit level)
Rank Product Code Product Description Imports from the WorldShare (Per cent)
1 776 Electronic Valves 19.92 759 Parts for Office & D/P Machines 7.93 333 Petroleum Crude 4.84 752 Data Processing Machines 4.75 334 Petroleum Products Refined 4.26 764 Telecommunications Equipment 3.97 772 Electrical Circuit Apparatus 3.08 778 Electrical Machinery 2.59 792 Aircraft 2.010 874 Measuring Instruments 1.9
Rank Product Code Product Description Imports from USShare (Per cent)
1 776 Electronic Valves 18.22 792 Aircraft 8.93 759 Parts for Office & D/P Machines 6.74 874 Measuring Instruments 5.55 898 Musical Instrument & Parts 4.86 752 Data Processing Machines 4.67 723 Civil Engineering Equipment & Parts 4.58 728 Specialised Machinery 3.39 931 Special Transactions 3.010 772 Electrical Circuit Apparatus 2.7
Rank Product Code Product Description Imports from JapanShare (Per cent)
1 776 Electronic Valves 21.82 764 Telecommunications Equipment 5.33 759 Parts for Office & D/P Machines 5.14 778 Electrical Machinery 4.95 772 Electrical Circuit Apparatus 4.66 728 Specialised Machinery 4.37 752 Data Processing Machines 4.28 793 Ships & Boats 2.89 874 Measuring Instruments 2.510 882 Photographic Supplies 1.9
Source: Singapore Trade Development Board, Singapore Trade Statistics, December 1999.
Table 4 documents the commodity composition of Singapore’s imports from
the US and Japan in 1999. While Electronic Valves (SITC 776) is the top ranked
product in Singapore’s overall imports, constituting nearly one-fifth of the total,the import shares of other electronic products and refined petroleum products are
much smaller compared to their corresponding export shares. Seven commodity
groups, six of them in the categories of electrical and electronic goods and
SINGAPORE AND THE NEW REGIONALISM 13UNCO
RRECTED P
ROO
F
© Blackwell Publishing Ltd 2003
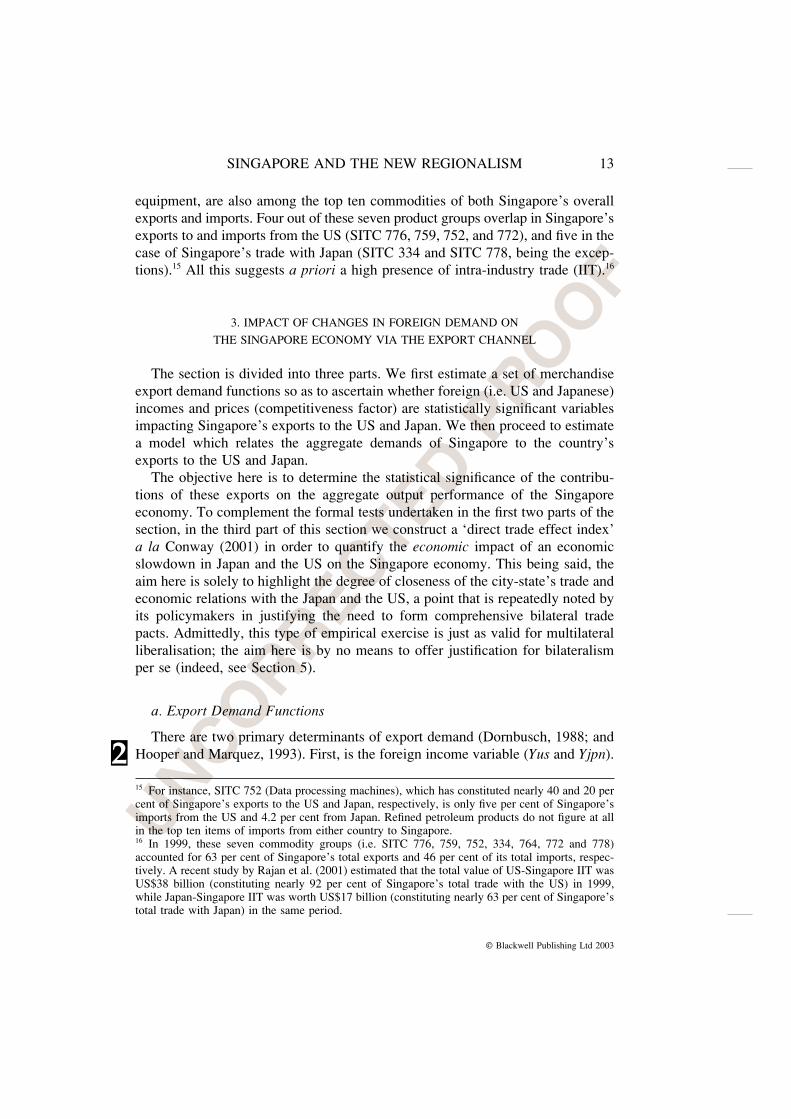
equipment, are also among the top ten commodities of both Singapore’s overallexports and imports. Four out of these seven product groups overlap in Singapore’s
exports to and imports from the US (SITC 776, 759, 752, and 772), and five in the
case of Singapore’s trade with Japan (SITC 334 and SITC 778, being the excep-tions).15 All this suggests a priori a high presence of intra-industry trade (IIT).16
3. IMPACT OF CHANGES IN FOREIGN DEMAND ON
THE SINGAPORE ECONOMY VIA THE EXPORT CHANNEL
The section is divided into three parts. We first estimate a set of merchandise
export demand functions so as to ascertain whether foreign (i.e. US and Japanese)
incomes and prices (competitiveness factor) are statistically significant variablesimpacting Singapore’s exports to the US and Japan. We then proceed to estimate
a model which relates the aggregate demands of Singapore to the country’s
exports to the US and Japan.The objective here is to determine the statistical significance of the contribu-
tions of these exports on the aggregate output performance of the Singapore
economy. To complement the formal tests undertaken in the first two parts of thesection, in the third part of this section we construct a ‘direct trade effect index’
a la Conway (2001) in order to quantify the economic impact of an economicslowdown in Japan and the US on the Singapore economy. This being said, the
aim here is solely to highlight the degree of closeness of the city-state’s trade and
economic relations with the Japan and the US, a point that is repeatedly noted byits policymakers in justifying the need to form comprehensive bilateral trade
pacts. Admittedly, this type of empirical exercise is just as valid for multilateral
liberalisation; the aim here is by no means to offer justification for bilateralismper se (indeed, see Section 5).
a. Export Demand Functions
There are two primary determinants of export demand (Dornbusch, 1988; and
Hooper and Marquez, 1993). First, is the foreign income variable (Yus and Yjpn).
15 For instance, SITC 752 (Data processing machines), which has constituted nearly 40 and 20 percent of Singapore’s exports to the US and Japan, respectively, is only five per cent of Singapore’simports from the US and 4.2 per cent from Japan. Refined petroleum products do not figure at allin the top ten items of imports from either country to Singapore.16 In 1999, these seven commodity groups (i.e. SITC 776, 759, 752, 334, 764, 772 and 778)accounted for 63 per cent of Singapore’s total exports and 46 per cent of its total imports, respec-tively. A recent study by Rajan et al. (2001) estimated that the total value of US-Singapore IIT wasUS$38 billion (constituting nearly 92 per cent of Singapore’s total trade with the US) in 1999,while Japan-Singapore IIT was worth US$17 billion (constituting nearly 63 per cent of Singapore’stotal trade with Japan) in the same period.
2

14 RAMKISHEN S. RAJAN, RAHUL SEN AND REZA SIREGAR
UNCORRECTED P
ROOF
© Blackwell Publishing Ltd 2003
TABLE 5Variable Description (quarter 1, 1981–quarter 4, 1996)
Variable Descriptions Source
Ysg Gross Domestic Product of Singapore IFS CD-RomXsgus Export of Singapore to the US market IMF, Direction of trade statisticsYus Gross Domestic Product of the US IFS CD-RomPsgus Terms of Trade of Singapore’s products Authors’ own calculations. The primary
against the US products data to construct the index are from IFSCD-Rom
Xsgjpn Export of Singapore to the Japanese market IMF, Direction of trade statisticsYjpn Gross Domestic Product of Japan IFS CD-RomPsgjpn Terms of Trade of Singapore’s products Authors’ own calculations. The primary
against the US products data to construct the index are from IFSCD-Rom
Vus Real Exchange Rate Volatility Index of the Authors’ own calculationsSingapore dollar against the US dollar
Vjpn Real Exchange Rate Volatility Index of the Authors’ own calculationsSingapore dollar against the Japanese Yen
17 See Appendix A for the constructions of volatility index.18 Since the variables Xsgus, Xsgjpn, Yus, Yjpn, Psgus and Psgjpn are integrated of order 1 (i.e.their means and variances do not fluctuate around a constant), while the variables Vus and Vjpn arestationary (constant mean and variance), the results of the regressions of these variables in levelsmay represent a totally spurious relationship. The R-square may be high, but more often than not,one finds the Durbin-Watson to be very low (indicating the presence of serial correlations). Toaddress this problem, we regress the relevant variables in terms of first differences, except for thevolatility index (as shown in equations (1) and (2)).
Second, is the relative price or terms of trade variable (competitiveness factor)
with respect to the US products (Psgus) and the Japanese products (Psgjpn)
(Appendix A). Forbes (2001) has emphasised that price and income effects areamong the most important determinants explaining trade fluctuations between
economies. In addition, sharp gyrations in the foreign exchange markets in thelast decade (Bird and Rajan, 2001) necessitate that the exchange rate volatility be
taken into account as another explanatory variable in the export demand function
(Chowdhury, 1993; Chou, 2000; Daly, 1998; and McKenzie, 1998). We do so byconstructing a volatility index (Vus and Vjpn).17
Descriptions of the variables and sources of the data are presented in Table 5
and Appendix A. ∆ denotes the first difference of the log forms of the variables.Before constructing an empirical model it is necessary to examine the basic unit-
root properties of the relevant variables. Based on the ADF-statistics, we con-
clude that all the variables are integrated of order 1 or are I(1), with the exceptionof the volatility index of the real exchange rate which is I(0) (Table 6). In order
to discount the possibility of the regressions capturing spurious movements in the
variables, we construct the export demand functions in the following manner:18

SINGAPORE AND THE NEW REGIONALISM 15UNCO
RRECTED P
ROO
F
© Blackwell Publishing Ltd 2003
TABLE 6ADF Unit-Root Test
∆ ∆X t X Xt t t i t
i
k
= + + + +− −=∑δ δ δ δ ε1 2 3 1 1
1
Variablea ADF-statistics (Xt) ADF-statistics (Xt − Xt−1)
Ysgc −1.1124 (lags = 2)b −5.2012 (lags = 2)Xsgusc −1.2475 (lags = 2) −6.2064 (lags = 2)Yusc −2.9938 (lags = 2) −3.7485 (lags = 2)Psgusc −1.5363 (lags = 4) −5.1177 (lags = 4)Xsgjpnc −2.7714 (lags = 1) −7.3959 (lags = 1)Yjpnc −2.5202 (lags = 2) −3.7049 (lags = 2)Psgjpnc −2.2834 (lags = 4) −3.9561 (lags = 4)Vusd −3.9965 (lags = 1) – not relevant –Vjpnd −4.1253 (lags = 2) – not relevant –
Notes:a All variables are in the log-forms.b The number of lags is determined by Akaike Information Criterion (AIC).c These variables are found to be an integrated of order 1 series (I(1)) at five per cent critical value.d These variables are found to be an integrated of order 0 series ((I(0)) at five per cent critical value.
∆ Xsgust = α1 + β11∆Yust−i + β12∆Psgust−i + β13Vust−i +β14∆ Xsgust−i + β15Du + ε1t, (1)
∆ Xsgjpn = α2 + β21∆Yjpnt−i + β22∆Psgjpnt−i + β23Vjpnt−i +β24∆ Xsgjpnt−i + β25Du + ε2t. (2)
Following Chowdhury (1993) and Daly (1998), we also include a lag variable
of change in exports (∆ Xsgust−i and ∆ Xsgjpnt−i). The inclusion of this variable ismeant to capture the impact of past export growth on current exports, i.e. a
so-called ‘adjustment factor’ a la Goldstein and Khan (1976).
It is important to note that the Monetary Authority of Singapore (MAS) switchedto a policy of a steady appreciation of the local currency against its key trading
partners’ currencies in the early 1980s, culminating with the recession in 1985–
86 (Rajan and Siregar, 2002). Accordingly, we include a Dummy variable (Du)to capture the impacts of the shift in this exchange rate policy and the 1985–86
recession. This variable is equal to 0 from quarter 1, 1981 to quarter 4, 1986; other-
wise it is equal to 1. ε1t and ε2t are error terms, while α1 and α2 are constant terms.
(i) Theoretical preliminaries
A priori we expect the coefficient estimates for β11 and β21 to be positive, asrising aggregate demand (income) in Japan and the US ought to stimulate Singa-
pore’s exports to the respective markets. As for the coefficient estimates for β12
and β22, the signs are expected to be negative. The rise in the price of the domestic

16 RAMKISHEN S. RAJAN, RAHUL SEN AND REZA SIREGAR
UNCORRECTED P
ROOF
© Blackwell Publishing Ltd 2003
good relative to the foreign good worsens the competitiveness of, and therefore thedemand for the local (Singapore) good in the foreign markets (Japan and the US).
The coefficient of the Volatility index (β13 and β23) can either be positive or
negative (Bailey, 1987; Daly, 1998; and Giovannini, 1988). If firms are risk-averse, exchange rate volatility acts as a negative shock, causing the export price
to rise and the export volume to fall. On the other hand, risk-neutral firms
with export prices invoiced in domestic currency may cut prices in response toexchange rate volatility, hence causing the export demand (volume) to rise. The
coefficient estimates for β14 and β24 are expected to be negative as high growth
in export demands during the period (t − i) will, in all likelihood, lead to weakerexport demand at period (t).
Our observation period covers the time prior to the breakout of the 1997/1998
East Asian crisis (quarter 1, 1980 to quarter 2, 1997). We conduct the standardOLS tests on both equations. Following the commonly used process of general-
to-specific methodology (see Hendry, 1974 and 1977), we include four-quarter
lags (t − 4) of the key explanatory variables in the first stage of the OLS test. Onthe next sequential stages, we drop all the insignificant lags and only consider the
significant ones for the final stage of the estimating equation.19
(ii) Results
The main results of the regressions are as follows (Tables 7 and 8). Thecoefficient estimates for the determinant variables (income, price and volatility
index variables (for the Japan case)) are statistically significant and theoretic-
ally consistent. We dropped the Dummy variable due to low t-statistics. TheF-statistics and the R-square confirm the overall soundness of the model, in the
sense that all the explanatory variables in each equation contribute significantly
in explaining the variations in the export demands of Singapore to Japan and US.In addition, we are able to reject any presence of serial correlation problems
in both regressions on the bases of the Durbin-Watson and the Arch-LM test
statistics (equations (1) and (2)).The roles of both the US and Japanese aggregate demands (incomes) are
statistically significant explanatory variables in the performance of the Singapore’s
exports to the respective markets. The estimated coefficients for the foreignincome variable for each export function are found to be the largest among all
the explanatory variables. The relative price (competitiveness) factors also play
an important role in Singapore’s exports to both Japan and the US. In addition,we find that an increase in the volatility of the real exchange rate impedes exports
of Singapore to Japan and to the US. Based on the t-statistics of the coefficient
19 We tried to go beyond four quarters-lag, but none of those extra lags is found to be significant.This process of ‘general-to-specific’ methodology was introduced by Hendry (1974 and 1977) andhas since become commonplace (for instance, see Chowdhury, 1993; and Daly, 1998).

SINGAPORE AND THE NEW REGIONALISM 17UNCO
RRECTED P
ROO
F
© Blackwell Publishing Ltd 2003
TABLE 7Export Function Model (For Singapore – the US)
Dependent Variable: ∆Xsgust
Sample Period: Quarter 1, 1980 – Quarter 2, 1997
Variable Coefficient t-statistics
∆Xsgust−1 −0.321 −2.8317∆Yust−2 1.508 1.6274∆Psgust−1 −0.556 −1.8865Vust−2 −0.036 −1.2826Constant 0.033 2.7902
Notes:R-squared = 0.2051; F-statistics = 4.2574; Durbin-Watson = 2.0834;ARCH-LM = 0.7605 (Probability of no serial correlation = 0.3832).
20 From the standard text-book construction of the aggregate demand (income) of an open economy,we can express the aggregate demand function from the expenditure approach:
Y = C + I + G + (X − M)
estimates, the volatility index appears more significant in case of Singapore’s
exports to Japan than in the case of Singapore’s exports to the US market.
b. Significance of Foreign Exports to Aggregate Demand in Singapore
Having formally confirmed the significance of the US and the Japanese in-comes in explaining the performance of Singapore’s merchandise exports to both
markets, we proceed to evaluate the role of these exports in explaining the growth
performance of the Singapore economy. To formally capture this second link, wewill test the following empirical model:20
TABLE 8Export Function Model (For Singapore – Japan)
Dependent Variable: ∆Xsgjpnt
Sample Period: Quarter 1, 1980 – Quarter 2, 1997
Variable Coefficient t-statistics
∆Xsgjpnt−1 −0.348 −3.1347∆Yjpnt−2 2.222 1.8592∆Psgjpnt−2 −0.731 −1.7075Vjpnt−4 −0.112 −1.7107Constant −0.003 −0.1576
Notes:R-squared = 0.2242; F-statistics = 4.696; Durbin-Watson = 1.8049;ARCH-LM = 0.0628 (Probability of no serial correlation = 0.8021).

18 RAMKISHEN S. RAJAN, RAHUL SEN AND REZA SIREGAR
UNCORRECTED P
ROOF
© Blackwell Publishing Ltd 2003
TABLE 9Cointegration Test
Sample Period: Quarter 1, 1982 – Quarter 2, 1997
Eigne value Likelihood Ratio 5 Per Cent Critical Value
0.2792 31.05a 29.680.1612 10.69 15.410.0004 0.316 3.76
Notes:a Likelihood Ratio test indicates 1 cointegrating equation at the five per cent significance level.Normalised Cointegrating Coefficients:
Ysgt = 6.219 + 0.4936 Xsgjpnt + 0.4138 Xsgust;(0.1885) (0.1763)
( ) represents the standard errors.
where: Y is the aggregate demand; C is the household’s consumption; I is the investment variable;G is the government expenditure; X is total exports; and M is total imports. Since our main interestis to estimate the role of export in explaining the performance of the aggregate demand, our generalempirical model can be simplified as in equation (3).
Ysgt = αt + F(X(i→j )t) + εt (3)
where: F(.) represents a general functional form; Ysg denotes aggregate demand
of Singapore. (X(i→j)t) are exports of Singapore to the US and Japan (Xsgust andXsgjpnt); α t and εt are respectively an intercept and an error term.
(i) Long run relationships
Since all the relevant variables in equation (3) are integrated of order 1 or I(1),
we proceed to test the possible existence of long run or cointegrating relationshipbetween the three variables in question (using log forms). The Johansen Maxi-
mum Likelihood test results are summarised in Table 9. We conclude that there
exists one cointegrating relationship between these three variables. Furthermore,from the normalised coefficient estimates, we can further confirm that the vari-
ables Xsgus and Xsgjpn contribute significantly and positively to the overall
fluctuations of Singapore’s aggregate demand/output during the period of quarter2, 1982 to quarter 2, 1997.
(ii) Error correction model: short run scenario
We proceed to examine the case of the short run. To understand the short run
impact of Xsgus and Xsgjpn on Singapore’s output, we test the following error
correction model (ECM):
∆Ysgt = δ11∆ Xsgust−i + δ12∆Xsgjpnt−i + δ13Du + δ14ECMt−1 + δ1t. (4)

SINGAPORE AND THE NEW REGIONALISM 19UNCO
RRECTED P
ROO
F
© Blackwell Publishing Ltd 2003
TABLE 10OLS Test on the Error Correction Model
Dependent Variable: ∆Ysgt (GDP of Singapore)Sample Period: Quarter 2, 1982 – Quarter 2, 1997
Variable Coefficient t-Statistics
∆Xsgjpnt 0.0461 2.4436∆Xsgust 0.0986 3.2558ECMt−1 −0.0307 −2.1038Constant 0.0139 4.6695
Notes:R-squared = 0.2240;F-statistics = 5.4849;Durbin-Watson statistics = 2.0546;ARCH-LM = 1.0762 Probability (of no serial correlations) = 0.5838.
21 Ásg is an estimated level of aggregate demand. It is derived using the coefficient estimatesreported in Table 9.
The definitions of the variables have all been fully described earlier. Du is the
same dummy variable used in equations (1) and (2). The variable ECMt−1 repres-ents a long run relationship (Ysg(t−1) − Ásg(t−1)).
21 As in the case of the export
function tests, we begin with four quarters lag (t − 4) and drop all the insignific-
ant variables. The OLS test results are posted in Table 10.Consistent with the previous results reported for the two export demand func-
tions, we find the dummy variable to be an insignificant explanatory variable inexplaining the performance of the Singapore’s GDP and was dropped in the final
estimating equilibrium. We find that both Xsgus and Xsgjpn contribute positively
and significantly to the changes in the aggregate demand variable (Ysg) even inthe short run. In addition, the significance of coefficient δ14 confirms the presence
of a long-run relationship between the three variables (Xsgus, Xsgjpn and Ysg).
As in the case of export functions, we do not find more than four quarters lagvariables to be significant.
c. Direct Trade Effects of a US and Japan Slowdown on the Singapore
Economy
In the preceding analysis we have established the statistical significance
of foreign demands on Singapore’s exports to the US and Japan and the city-
state’s overall income. It would be useful to determine the economic significance
of the findings. In other words, to what extent is Singapore affected by aneconomic slowdown in Japan and the US via the merchandise exports channel?
To answer this question, we select two recent periods of economic slowdown
in Japan and the US and compute the direct trade effect estimates a la Conway
20 RAMKISHEN S. RAJAN, RAHUL SEN AND REZA SIREGAR
UNCORRECTED P
ROOF
© Blackwell Publishing Ltd 2003
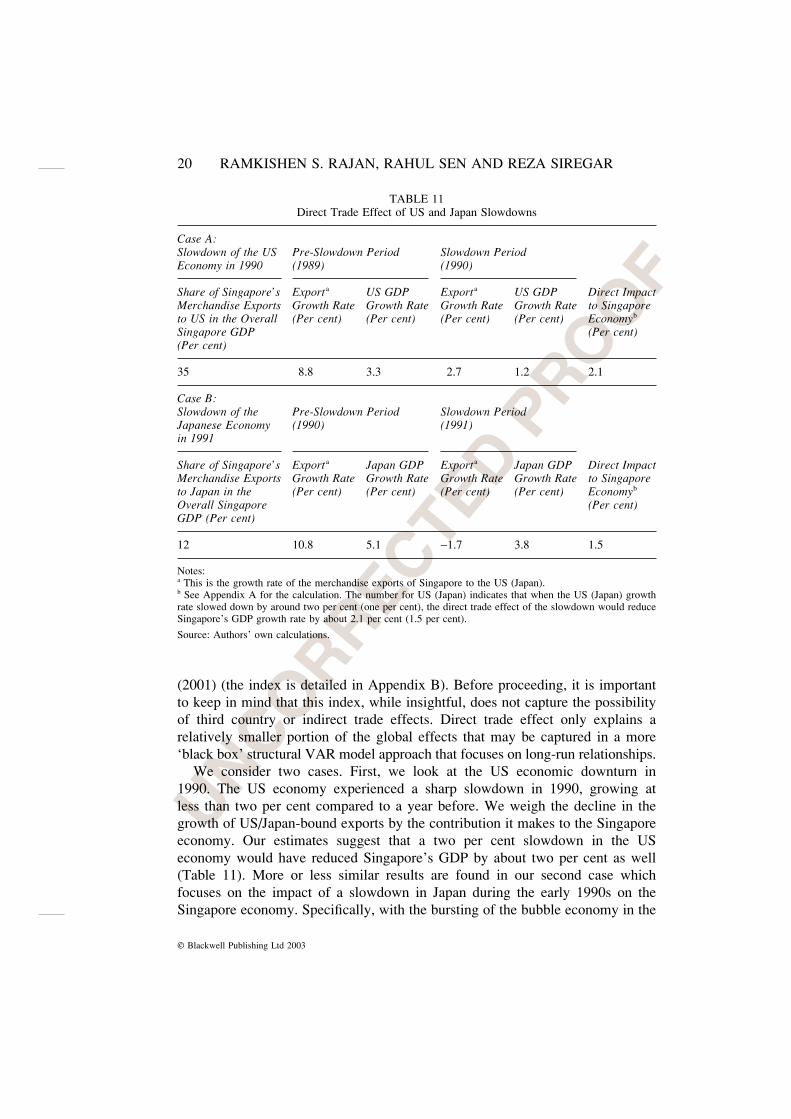
TABLE 11Direct Trade Effect of US and Japan Slowdowns
Case A:Slowdown of the US Pre-Slowdown Period Slowdown PeriodEconomy in 1990 (1989) (1990)
Share of Singapore’s Export a US GDP Exporta US GDP Direct ImpactMerchandise Exports Growth Rate Growth Rate Growth Rate Growth Rate to Singaporeto US in the Overall (Per cent) (Per cent) (Per cent) (Per cent) Economyb
Singapore GDP (Per cent)(Per cent)
35 8.8 3.3 2.7 1.2 2.1
Case B:Slowdown of the Pre-Slowdown Period Slowdown PeriodJapanese Economy (1990) (1991)in 1991
Share of Singapore’s Export a Japan GDP Exporta Japan GDP Direct ImpactMerchandise Exports Growth Rate Growth Rate Growth Rate Growth Rate to Singaporeto Japan in the (Per cent) (Per cent) (Per cent) (Per cent) Economyb
Overall Singapore (Per cent)GDP (Per cent)
12 10.8 5.1 −1.7 3.8 1.5
Notes:a This is the growth rate of the merchandise exports of Singapore to the US (Japan).b See Appendix A for the calculation. The number for US (Japan) indicates that when the US (Japan) growthrate slowed down by around two per cent (one per cent), the direct trade effect of the slowdown would reduceSingapore’s GDP growth rate by about 2.1 per cent (1.5 per cent).
Source: Authors’ own calculations.
(2001) (the index is detailed in Appendix B). Before proceeding, it is important
to keep in mind that this index, while insightful, does not capture the possibilityof third country or indirect trade effects. Direct trade effect only explains a
relatively smaller portion of the global effects that may be captured in a more
‘black box’ structural VAR model approach that focuses on long-run relationships.We consider two cases. First, we look at the US economic downturn in
1990. The US economy experienced a sharp slowdown in 1990, growing at
less than two per cent compared to a year before. We weigh the decline in thegrowth of US/Japan-bound exports by the contribution it makes to the Singapore
economy. Our estimates suggest that a two per cent slowdown in the US
economy would have reduced Singapore’s GDP by about two per cent as well(Table 11). More or less similar results are found in our second case which
focuses on the impact of a slowdown in Japan during the early 1990s on the
Singapore economy. Specifically, with the bursting of the bubble economy in the
SINGAPORE AND THE NEW REGIONALISM 21UNCO
RRECTED P
ROO
F
© Blackwell Publishing Ltd 2003
late 1980s, Japan’s GDP growth rate dropped substantially in the early 1990sand continued to be weak for the whole decade of the 1990s. Japan’s GDP
growth rate fell below four per cent in 1991 from more than five per cent a year
earlier. Consequently, Singapore’s merchandise exports to Japan contracted byalmost two per cent. The poor performance of the exports to Japan transmitted
the adverse consequences of the fall in the GDP growth rate in Japan (by about
1.3 per cent) into an equal percentage drop in the Singapore GDP growth ratein 1991 (Table 11). Certainly, the magnitudes of direct-trade effect index will
depend on the periodical cases of economic slowdowns that we select. How-
ever, based on two events in 1990 (for the US) and in 1991 (for Japan), wemight be able to conclude that the direct trade effects from economic slow-
downs in the two economic powers would have adverse consequences on the
economy of Singapore. A key driving factor here is the high trade dependencethat Singapore has on the two markets, reflected by high export shares in the
overall Singapore GDP.
4. SALIENT FEATURES OF THE JAPAN-SINGAPORE ECONOMIC
PARTNERSHIP AGREEMENT (JSEPA)
Having examined available trade data on bilateral linkages, we go on to high-light actual elements of the Japan-Singapore trade agreement which has recently
been agreed to and is in the process of being implemented. While Singapore has
already implemented a wide-ranging trade pact with New Zealand, this is the firsttrade pact that Japan has agreed to with any country. The so-termed ‘Japan-
Singapore Economic Partnership Agreement’ or JSEPA for short has been viewed
in many circles as a possible template for other trade agreements in Asia, andtherefore warrants closer examination.
The idea of the JSEPA was first mooted in December 1999 by the Singapore
Prime Minister to his Japanese counterpart. A Joint Study Group was establishedto study the viability of the proposal. The group completed its work in September
2000 and the governments of Japan and Singapore entered into formal negoti-
ations on a trade agreement in October of that year. Following a series of negoti-ating rounds, the Agreement was signed in January 2002 in Singapore and is to
come into effect by the middle of this year once the legal and administrative
procedures related to its implementation are completed by both countries.23 TheAgreement comprises a number of elements pertaining to the liberalisation and
facilitation of trade in goods and services and investment flows as well as a
number of other elements dealing with broader economic cooperation.
23 ‘Japan Singapore Free Trade Pact to Start Mid-2002’, 11 May, Reuters Ltd. (Singapore).

22 RAMKISHEN S. RAJAN, RAHUL SEN AND REZA SIREGAR
UNCORRECTED P
ROOF
© Blackwell Publishing Ltd 2003
a. Trade in Goods
Tariffs: The JSEPA eliminates tariffs on goods covering 98.5 per cent ofcurrent trade between the two countries, much higher than the WTO zero-tariff
commitments, which currently covers about 65 per cent of current Japan-
Singapore trade. Singapore has committed to grant zero-tariff treatment on allimports from Japan. In turn, Japan has more than doubled its zero-tariff commit-
ments to Singapore from the current 34 per cent to 77 per cent of total tariff lines.
While preferential tariff-free market access has been granted to an extensiverange of products, agriculture is the one area where tariff concessions have lagged
because of the extreme political sensitivity of this sector in Japan, on the one
hand, and its relative unimportance to Singapore, on the other. Both countries areprohibited from maintaining any export duties that may distort bilateral trade.
Customs Procedures and Paperless Trading: Complex and non-uniform customs
procedures are seen as significant non-tariff barriers to the movement of goodsacross borders. The JSEPA commits both countries to improve the speed and
efficiency of customs clearance of goods on a mutual basis by streamlining and
simplifying existing procedures and via the use of informational technologies. Thetwo countries have thus agreed to replace the current paper-based supporting trade
documents with more cost-effective electronic versions. Steps will be taken to
ensure that the necessary infrastructure is put in place to support ‘paperless trading’.Mutual Recognition: Differences in testing and certification standards is
another important barrier to the trade in goods across borders. In recognition ofthis, both countries have agreed to take steps to ensure the mutual recognition of
test results and certification by accredited conformity assessment bodies in either
country. Once this is in place, exporters can have their products tested and certi-fied by assessment bodies locally and not have to duplicate the procedures in the
importing country. Specific focus is on electrical and electronic and telecom pro-
ducts which is a major area of bilateral trade as well as pharmaceuticals. The latteris not only an area of growing importance in terms of bilateral trade but is also of
strategic relevance in view of the rapidly ageing populations in both countries.
b. Trade in Services
Since the services sector is of particular significance to both economies, the
JSEPA discusses a number of provisions for the liberalisation and facilitation of
transactions in this sector. The agreement thus includes commitments by bothcountries that go well beyond those agreed under the WTO (in over 130 sectors).24
24 Specific services that Japan has committed for liberalised trade under the JSEPA are professionalservices, construction services, computer services, distribution services, telecommunication ser-vices, financial services, and transport services.

SINGAPORE AND THE NEW REGIONALISM 23UNCO
RRECTED P
ROO
F
© Blackwell Publishing Ltd 2003
Since non-tariff and non-quantitative barriers hinder cross-border services trademuch more than tariff barriers, steps have been taken to ensure that ‘behind the
border’ impediments to trade and investment flows (i.e. trade facilitation meas-
ures) are eased. The committed sectors are subject to market access, nationaltreatment and domestic regulation disciplines. Given the degree of internation-
alisation of the Singapore economy, the JSEPA has been extended to include
permanent residents and multinational firms, which have ‘substantive businessoperations in Singapore’. While a number of services sectors are expected to
benefit from the agreement, it is noteworthy that four sectors have come in for
special attention.Tourism: In an effort to promote the tourism sectors in both countries, the
JSEPA has proposed the establishment of a Joint Committee on Tourism. More
concretely, the countries have agreed to a Memorandum of Understanding (MOU)on the twinning of Ginza and Orchard Road which are the premier shopping
districts of Japan and Singapore, respectively. The aim of this is not only to
promote the two areas to one another’s citizens and those in third countries butalso to undertake joint promotions and special events to showcase the arts and
cultures of both Asian countries.
Information, Communication Technology (ICT): Both Japan and Singapore areamong the leaders in ICT trade and its day-to-day utilisation.25 Undoubtedly one
of the reasons for the depiction of the JSEPA as being ‘New Age’ is its emphasison cooperation and facilitation of this sector. The JSEPA has put in place steps
to: (a) fortify the market access in Japan for Singapore-based businesses deliver-
ing ICT products and services and vice versa; (b) augment the knowledge ofbusiness environments in both countries and provide a more level playing field
for businesses dealing in Telecommunication Services; (c) reduce technical and
technological obstructions to ICT trade; (d) offer an additional and alternativeroute to orderly Dispute Settlement; and (e) catalyse and facilitate the ongoing
expansion of e-Commerce transactions.
Broadband: Cooperation in the area of media and broadcasting has also beenidentified as a key area of cooperation in which Japan and Singapore can help
one another in the development and provision of innovative media and broad-
casting technologies.Financial Services: Singapore, Tokyo and Hong Kong are the three important
financial centres in Asia. In an effort to give one another’s financial sectors a
boost in terms of turnover and cost efficiency, the JSEPA has put in place anumber of initiatives to enhance bilateral cooperation to promote financial sector
and capital market development.
25 Service exports comprising ICT related activities accounted for nearly half of total serviceexports for Singapore and more than that amount for Japan in 1998.

24 RAMKISHEN S. RAJAN, RAHUL SEN AND REZA SIREGAR
UNCORRECTED P
ROOF
© Blackwell Publishing Ltd 2003
c. Investment Facilitation and Movement of Natural Persons
Singapore is highly dependent on FDI, and Japan is the second largest
investor in the city-state (Tables 12A and 12B). Thus, the JSEPA also contains
a set of detailed provisions on investment promotion and protection aimed atfostering an open international environment for cross-border investment and
providing access to each other’s markets. Issues covered include national treat-
ment, prohibition of performance requirements, expropriation and compensa-tion, transfers of profits and other funds, and investor-to-state dispute settlement
mechanism and procedures. As with trade in services, the agreement spans both
citizens and permanent residents of Singapore and encompasses firms formed ineither Japan or Singapore which are owned or controlled by non-Singaporeans/
Japanese and ‘engaged in substantive business operations’. Steps have also been
put in place to encourage cooperation and business alliances between small and
TABLE 12BSingapore’s Investment Commitments in Manufacturing by US and Japan
(US $ billion)
Country 1992 1993 1994 1995 1996 1997 1998 1999
United States 0.7 0.9 1.6 1.5 1.7 1.6 1.4 2.1(43.96) (45.71) (56.66) (42.78) (40.33) (40.62) (43.98) (57.32)
Japan 0.5 0.5 0.6 0.8 1.4 1.4 1.1 0.7(31.39) (24.53) (21.12) (23.75) (33.88) (34.07) (34.95) (18.86)
Total Foreign 1.7 2.0 2.8 3.4 4.1 4.0 3.1 3.7Direct Investment 2.1 2.4 3.8 4.8 5.7 5.7 4.7 4.7Total Direct Investment
Note:Figures in parentheses indicates shares in total Foreign Direct Investment (FDI).
Source: Calculated from Singapore International Chamber of Commerce, Annual Report 1999–2000.
TABLE 12ASingapore: Inward Stock of Foreign Direct Equity Investment by Country
(US $ billion)
1987 1992 1995 1997 1987 1992 1995 1997 1987–92 1992–95 1995–97
Amount Shares in Total (Per cent) C.A.G.R
US 3.8 5.9 10.0 14.0 26.6 17.0 16.9 18.4 9.4 19.2 18.0EU 3.0 8.0 12.2 15.4 20.8 23.1 20.6 20.3 22.1 15.1 12.0Japan 2.2 8.1 12.0 13.7 15.3 23.3 20.1 18.1 30.1 13.9 7.0ASEAN 0.8 1.9 4.0 4.6 5.4 5.4 6.7 6.0 19.5 28.9 6.9Total Direct 14.2 34.8 59.3 75.8 19.6 19.5 13.0Equity Investment
Notes:C.A.G.R: Compound Annual Growth Rates.
Source: Calculated from Yearbook of Statistics, Singapore, various issues.

SINGAPORE AND THE NEW REGIONALISM 25UNCO
RRECTED P
ROO
F
© Blackwell Publishing Ltd 2003
medium sized enterprises (SMEs) between the two countries so as to gain greatermarket shares in one another’s economies as well as penetrate in third country
markets.
Trade in services and investments invariably require complementary move-ment of natural persons. The JSEPA will grant Singaporeans and permanent
residents of Singapore guaranteed entry and stay in Japan to work and to ad-
minister their investments under fairly liberal conditions. Similarly, Japaneseprofessionals will be able to practice in Singapore. Measures are also being taken
towards the mutual recognition of professional qualifications.
Besides these measures and other specific ones to promote trade and invest-ments (by enhancing facilities for export credit insurance and overseas invest-
ment reinsurance), the JSEPA has taken steps to: (a) promote mutual recognition
of and cooperation with regard to competition policies; (b) put in place a set ofprocedures and regulations pertaining to government procurement; (c) under-
take collaborative measures and cooperative activities on Intellectual Property
(IP); (d) step up cooperation in Science and Technology and human resourcedevelopment; and (e) establish provisions for orderly dispute settlement. In
addition, the agreement has also established norms for the liberalisation and
facilitation of trade and investment in the services sector. Given the relativelylow penetration of FDI in this sector in Japan, Singapore, which has a grow-
ing comparative advantage here, can be expected to reap significant economicgains.
Significantly, this trade pact should also attract foreign companies to be based
in Singapore, since under the JSEPA, foreign subsidiaries based in Singapore areto be treated in the same manner as indigenous Singapore companies with respect
to all the provisions as discussed, and provides them with an opportunity to enter
the Japanese market, especially in the services sector, where high entry barriersexist for foreign producers. This ought to further enhance Singapore’s attractive-
ness as a destination for multinational companies (MNCs) to establish OHQs/
RHQs. Conversely, trade and investment diversion remains a real concernparticularly with regard to the services sector. This could potentially hurt third
countries if not the two countries directly concerned. In response, apart from
repeatedly asserting the primacy of the multilateral trading system, policy makersin both Japan and Singapore have often expressed the view that the JSEPA is
open to other ‘like-minded’ countries in Southeast Asia and elsewhere. None-
theless, the presence of these ‘new’ trade issues pertaining to harmonisation ofinvestment and intellectual property rights regimes as well as the large-scale
exclusion of agriculture products does make one doubt the extent to which these
agreements can be extended to other countries. The relatively lax and vagueWTO rules regarding regional trade agreements ensures that the JSEPA is not
inconsistent with them, but then again, virtually none of the other 170 trade pacts
that dot the global trading system are either.

26 RAMKISHEN S. RAJAN, RAHUL SEN AND REZA SIREGAR
UNCORRECTED P
ROOF
© Blackwell Publishing Ltd 2003
5. SINGAPORE AND THE NEW REGIONALISM: SOME CONCLUDING,
CAUTIONARY NOTES
The preceding sections have highlighted the existence of pronounced tradeand investment linkages between Singapore and the two largest economies in
the world, Japan and the US. In some ways, the proposed bilateral trade pacts by
Singapore with these two economies are a formalisation of the de facto extensiveand deep linkages that already exist. In other words, it might be argued that such
FTAs are essentially ‘market-driven’. The reasons for Singapore’s recent turn
to the ‘new regionalism’ have been discussed in some detail. Among the mostimportant are the continued weaknesses in the neighbouring Southeast Asian
economies and Singapore’s consequent need to diversify its economic linkages.
As noted, despite the fact that Singapore already has low tariffs and other barriers(implying that a number of negative conventional welfare effects may be of
limited relevance to the city state), it would certainly be a leap of faith to con-
clude that there are no ill effects whatsoever. What are some potential concernsof Singapore’s recent eagerness to form FTAs?
While we have noted that trade diversion may be expected to be minimal from
Singapore’s standpoint given its low tariffs (and ignoring the issue of ROOs),conversely, the gains from discriminatory liberalisation vary inversely with the
pre-union tariff levels (Panagariya, 1998).26 The proliferation of a number ofoverlapping FTAs also raises many technical problems with respect to the imple-
mentation of ROOs (Krueger, 1997). Even with a single FTA, a concern is that
ROOs with a particular country, say the US, may be sufficiently prohibitive so asto induce Singapore exporters to source their inputs from US than some other
developing country in Asia. In other words, the US exports its external tariffs to
Singapore. This appears to have been the case with NAFTA, where the USnegotiated a ROO on Mexican assemblers of automobiles. ROOs also give rise
to significant costs due to the need for administrative surveillance and imple-
mentation (see Krueger, 1995 and 1997; Lloyd, 1993; Schiff et al., 2000; andWonnacott, 1996a and 1996b). In practice, ROOs are particularly complex as
they have to take into account tariffs on imported intermediate goods used in
products produced within the FTA. The bookkeeping and related costs rise sharplyas production gets more integrated internationally.
Apart from the issue of ROOs, a large number of FTAs may leave investors
confused as to which rules, obligations and incentives correspond to which partner.Worse still, there is the possibility that membership in multiple trade pacts may
26 In addition, in the case of its FTA with Japan, some East Asian economies may actually beworse off. This is so as Japan has provided extensive trade preferences to a number of East Asianeconomies on a GSP (Generalised Preference System of Preferences) basis, and with an FTA, thesebenefits may be revoked along with a lowering of tariffs (Panagariya, 1998).

SINGAPORE AND THE NEW REGIONALISM 27UNCO
RRECTED P
ROO
F
© Blackwell Publishing Ltd 2003
create ‘obligations made in one that contradict those made by others’ (Schiffet al., 2000). Bergsten (2000) highlights this point in the context of compatibility
of subregional agreements with the APEC’s goals of regionwide trade liberalisa-
tion (i.e. the Bogor declaration of free and open trade by 2010/2020).Time and efforts spent on negotiating and implementing a series of bilateral
and trilateral FTAs may divert scarce resources from the multilateral rounds.
Potentially more important than the direct impact of this ‘scarce negotiatorresources argument’ to Singapore is the fact that, by being involved in a number
of FTAs, Singapore must accept at least partial responsibility for diverting
attention of trade partners away from multilateral negotiations. For instance, theUS Trade Representative (USTR) paying more attention to a number of bilateral
FTAs will mean that much less attention at the margin being paid to the WTO
or APEC.Singapore appears to be willing and able to negotiate FTAs fairly quickly.
However, this rapid pace apparently hinges on Singapore’s readiness to accept a
number of conditions in the context of the bilateral pacts set forth by the largerpartners, such as labour and environmental standards, in the case of the FTA with
the US (said to be modelled after the US-Jordan agreement), or exclusion of
agriculture in the case of the FTA proposals with Japan (as noted above).27,28
While acceptance of these conditions may not be problematic in the case of
Singapore (given its high environmental standards and negligible agriculturalsector), if they are eventually included in the trade pacts, Singapore may be doing
a disservice to developing economy interests in multilateral negotiations at large.
Bhagwati’s (1995) discussion of the US FTA strategy during NAFTA negoti-ations is prescient:
NAFTA’s passage . . . was subject to Mexico’s acceptance of supplemental agreements onenvironmental and labour standards . . . (W)hy should such agreements be a precondition forfreer trade? . . . (The) US was a superpower bargaining one-on-one with a vastly inferior power.In turn, those supplemental agreements have encouraged the environmental and labour lobbiesto argue that because NAFTA required them, so must the WTO . . . In short, NAFTA has madethe WTO’s business more complex, not less . . . (T)he United States can first force Mexico tobuckle under to those demands and then tell Chile and others, ‘This is how NAFTA is, so youmust accept these “nontrade” terms and conditions if you wish to come on board.’ . . . (T)hat‘Take-them-one-by-one’ strategy works so much better than trying to impose extraneous, indeedharmful, conditions through multilateral trade negotiations where all countries facing suchdemands negotiate together and have more bargaining power (pp. 12–13).
27 Indeed, the absence of many sensitive areas between two countries like agriculture and forestryand fisheries appears to have been the main reason for Japan’s willingness to embark on a prefer-ential trade agreement with Singapore. Other reasons might include similarity of income levels,geographic proximity as well as Singapore’s experience with negotiating agreements with othercountries.28 See Perroni and Whalley (1994) who formally show how large countries have dominated nego-tiations with FTAs with smaller countries (i.e. the former has the bargaining power in FTAs).

28 RAMKISHEN S. RAJAN, RAHUL SEN AND REZA SIREGAR
UNCORRECTED P
ROOF
© Blackwell Publishing Ltd 2003
More narrowly, such supplemental agreements may not be as readily accept-able to other ASEAN members. Accordingly, Singapore-based FTAs may not be
an appropriate model for future agreements by other Asian nations, and could
make these FTAs de facto exclusionary to other ASEAN members despite ‘assur-ances’ by Singapore policy makers that the FTAs would be left open for others
to join.29
APPENDIX A
Data Constructions for the Export Demand Functions
Export volume: The most accessible data on exports are in value rather than in
volume terms. However, the theory suggests that volume rather than value is the
appropriate dependent variable (Learner and Stern, 1970). To derive the exportvolume, we divide the value series by a measure of price. For an example, the
volume of Singapore’s exports to US is computed in the following way:
Xsgust
tUS
t
= XVAL
XP(A.1)
where Xsgus is the quantity of export to the US, XVALUS is the value of exportto the US, and XP is the country’s export price. The same step is used to calcu-
late the quantity of Singapore’s exports to Japan.Terms of Trade: The variable is constructed as the ratio of Singapore’s export
price to the US export price (to capture the proxy for import price of Singapore
from the US), where both prices are denominated in US dollar:
Psgust
t
tUS
= XP
XP(A.2)
where Psgus is the terms of trade with US, XPt is Singapore’s export price, and
XPtUP is the US export price.
Real exchange rate volatility is constructed by the moving sample standarddeviation of the growth rate of the real exchange rate:
29 Paradoxically, as noted, while it may be in Singapore’s best interest to remain as a hub with anumber of other spokes it may be in the best interests for other countries not to join an existingSingapore-based FTA. Wonnacott (1996a and 1996b) caution that while spokes are certainly worseoff in a hub-and-spoke regime compared to a ‘full’ or complete FTA, it is unclear as to whetherhubs are better or worse off. This is so, as the collective incomes of a hub-and-spoke arrangementtend to be smaller (given the inefficiencies caused by overlapping FTAs), the share of benefitsaccruing to the hub is larger than a full FTA.

SINGAPORE AND THE NEW REGIONALISM 29UNCO
RRECTED P
ROO
F
© Blackwell Publishing Ltd 2003
V m Q Qt t i t i
i
m
= −
+ − + −=∑ ( / ) (log )
/
1 1 22
1
1 2
(A.3)
where Q is the real exchange rate and m = 8 quarters. This index has been used in
previous studies including Kenen and Rodrik (1986), Koray and Lastrapes (1989)and Chowdhury (1993).
As for income variables, real GDP of the US and Japan are considered as
proxies for Yus and Yjpn.
APPENDIX B
The Direct Trade Effect Index
The Direct effect of a US slowdown on the exports of Singapore to the US can
be computed in the following manner (Conway, 2001):
∆X XUS USSUS
NSUS= − ( ).0 ˛ ˛ (B.1)
∆ denotes the first difference of the log forms of the variables. Equation (B.1)measures the change in Singapore’s exports to the US, with X0
US denoting exports
from Singapore to the US in period 0 and ( )˛ ˛SUS
NSUS− denoting the difference in
the growth rate of exports in the event of a slowdown (denoted by subscript ‘S’)
and a non-slowdown (denoted by subscript ‘NS’)
The effect of exports to the US on Singapore’s GDP growth is given by:
∆
∆y
=
− −
−−
Y X Y
Y
Y Y
Y
US1 0
0
1 0
0
(B.2)
where Y0 denotes Singapore’s GDP in period 0 and Y1 denotes the same in period
1. Substituting (A.1) in (A.2), one gets:
∆y ˛ ˛= − ( )
X
Y
US
SUS
NSUS0
0
(B.3)
which implies that the impact of a slowdown of Singapore’s exports to US
depends on the differences in the growth rate of exports between a slowdown anda non-slowdown period, weighted by the shares of Singapore’s exports to US in
Singapore’s GDP. The direct impact on Singapore due to a slowdown in Japan
is calculated in the same manner.

30 RAMKISHEN S. RAJAN, RAHUL SEN AND REZA SIREGAR
UNCORRECTED P
ROOF
© Blackwell Publishing Ltd 2003
REFERENCES
Bailey, M. (1987), ‘The Impact of Exchange Rate Volatility on Export Growth: Some TheoreticalConsiderations and Empirical Results’, Journal of Policy Modeling, 9, 225–43.
Baldwin, R. (1997), ‘The Causes of Regionalism’, The World Economy, 20, 865–88.Bergsten, F. (1998), ‘Fifty Years of the GATT/WTO: Lessons from the Past for Strategies for the
Future’, Working Paper No. 98-3 (Institute for International Economics).Bergsten, F. (2000), ‘Back to the Future: APEC Looks at Subregional Trade Agreements to Achieve
Free Trade Goals’, speech given at the Pacific Basin Economic Council luncheon (Washington,DC, 31 October).
Bhagwati, J. (1995), ‘U.S. Trade Policy: The Infatuation with Free Trade Areas’, in The DangerousDrift to Preferential Trade Agreements (Washington, DC: The AEI Press).
Bird, G. and R. Rajan (2001), ‘International Currency Taxation and Currency Stabilisation inDeveloping Countries’, Journal of Development Studies, 37, 21–38.
Chang, L. L. and R. Rajan (1999), ‘East Asian Cooperation in Light of the Regional Crises: A Caseof Self-Help or No-Help?’, Australian Journal of International Affairs, 53, 261–81.
Chang, L. L. and R. Rajan (2001), ‘The Economics and Politics of Monetary Regionalism in Asia’,ASEAN Economic Bulletin, 18, 103–18.
Chou, W. (2000), ‘Exchange Rate Variability and China’s Exports’, Journal of ComparativeEconomics, 28, 61–79.
Chowdhury, A. (1993), ‘Does Exchange Rate Volatility Depress Trade Flows? Evidence fromError-Correction Models’, The Review of Economics and Statistics, 75, 700–6.
Conway, P. (2001), ‘US Slowdown: Implications for the New Zealand and AustralianBusiness Cycles’, Occasional Paper (Westpac Institutional Bank, Wellington, New Zealand,April).
Daly, K. (1998), ‘Does Exchange Rate Volatility Impede the Volume of Japan’s Bilateral Trade?’,Japan and the World Economy, 10, pp. 333–48.
DeRosa, D. (1986), ‘ASEAN-US Trade Relations’, ASEAN Economic Bulletin, 3, 169–88.Dornbusch, R. (1988), Exchange Rates and Inflation (The MIT Press, Cambridge).Encarnation, D. (1992), Rivals Beyond Trade: America Versus Japan in Global Competition ( Ithaca,
NY: Cornell University Press).Forbes, K. (2001), ‘Are Trade Linkages Important Determinants of Country Vulnerability To
Crises?’, Working Paper 8194 (NBER).Giovannini, A. (1988), ‘Exchange Rates and Traded Goods Prices’, Journal of International
Economics, 24, 45–68.Goldstein, M. and M. Khan (1976), ‘Large versus Small Price Changes in the Demand for Imports’,
International Monetary Fund Staff Paper, 23, 200–25.Hendry, D. (1974), ‘Stochastic Specification in an Aggregate Demand Model of the United
Kingdom’, Econometrica, 42, 559–78.Hendry, D. (1977), ‘On Time Series Approach to Econometric Model Building’, in C. Sims (ed.),
New Methods in Business Cycle Research (Federal Reserve Bank of Minneapolis, MN).Hill, H. and B. John. (1985), ‘The Role of Foreign Direct Investment in Developing East Asian
Countries’, ASEAN-Australia Working Papers No. 8 (ASEAN-Australia Joint Research Project,Kuala Lumpur, Malaysia).
Hooper, P. and J. Marquez (1995), ‘Exchange Rates, Prices, and External Adjustment in the UnitedStates and Japan’, in P. Kenen (ed.), Understanding Interdependence: The Macroeconomics ofthe Open Economy (Princeton, NJ: Princeton University Press).
International Monetary Fund (IMF) (2000), Direction of Trade Statistics Yearbook.Julius, D. (1990), Global Companies and Public Policy: The Growing Challenge of Foreign Direct
Investment (London: Pinter Publishers).Kenen, P. and D. Rodrik (1986), ‘Measuring and Analyzing the Effects of Short-Term Volatility in
Real Exchange Rates’, The Review of Economics and Statistics, 68, 311–5.Koray, F. and W. Lastrapes (1989), ‘Real Exchange Rate Volatility and U.S. Bilateral Trade: A
VAR Approach’, The Review of Economics and Statistics, 71, 708–12.

SINGAPORE AND THE NEW REGIONALISM 31UNCO
RRECTED P
ROO
F
© Blackwell Publishing Ltd 2003
Krueger, A. (1995), ‘NAFTA: Strengthening or Weakening the International Trading System?’, inThe Dangerous Drift to Preferential Trade Agreements (Washington, DC: The AEI Press).
Krueger, A. (1997), ‘Problems with Overlapping Free Trade Area’, in T. Ito and A. Krueger (eds.),Regionalism versus Multilateral Trade Arrangements (Chicago: The University of ChicagoPress).
Krugman, P. (1995), ‘Growing World Trade: Causes and Consequences’, Brookings Papers onEconomic Activity, 1, 327–62.
Lawrence, R. (1987), ‘Imports in Japan: Closed Markets or Minds?’, Brookings Papers on Eco-nomic Activity, 2, 517–58.
Learner, E. and R. Stern (1970), Quantitative International Economics (Boston: Allyn and Bacon).Lim, H. (1988), ‘Singapore-Japan Trade Frictions’, in ASEAN-Japan Relationship Towards the
21st Century (Japanese University Graduates Association of Singapore), 91–121.Lloyd, P. J. (1993), ‘A Tariff Substitute for Rules of Origin in Free Trade Areas’, The World
Economy, 16, 6, 699–712.McKenzie, M. (1998), ‘The Impact of Exchange Rate Volatility on Australian Trade Flows’,
Journal of International Financial Markets, Institutions and Money, 8, 21–38.Panagariya, A. (1998), ‘East Asia and the New Regionalism’, The World Economy, 17, 817–39.Perroni, C. and J. Whalley (1994), ‘The New Regionalism: Trade Liberalization or Insurance?’,
Working Paper No. 4626 (NBER).Rajan, R. (1996), ‘Singapore’s Merchandise Trade Linkages with Japan and the United States:
Trends, Patterns and Comparisons’, Asian Economic Journal, 10, 133–63.Rajan, R. and R. Siregar (2002), ‘Choice of Exchange Rate Regime: Currency Board (Hong Kong)
or Monitoring Band (Singapore)?’, forthcoming in Australian Economic Papers.Rajan, R., R. Sen and R. Siregar (2001), Singapore and Free Trade Agreements: Economic
Relations with Japan and the United States (Institute of Southeast Asian Studies, Singapore).Ravenhill, J. (2000), ‘APEC Adrift: Implications for Economic Regionalism in Asia and the
Pacific’, The Pacific Review, 13, 319–33.Sager, M. A. (1997), ‘Regional Trade Agreements: Their Role and the Economic Impact on Trade
Flows’, The World Economy, 20, 2, 239–52.Schiff et al. (2000), Trade Blocs (Washington, DC: The World Bank).Singapore Economic Development Board (2000), ‘Promoting Singapore as the premier HQ
location’, Singapore Investment News (30 April).Singapore Trade Development Board, Singapore Trade Statistics (various issues).Takeuchi, K. (1989), ‘Does Japan Import Less than it Should?: A Review of the Econometric
Literature’, Asian Economic Journal, 3, 138–70.Wonnacott, R. (1996a), ‘Free-Trade Agreements: For Better or Worse?’, American Economic
Review, 86, 62–6.Wonnacott, R. J. (1996b), ‘Trade and Investment in a Hub-and-Spoke System Versus a Free Trade
Area’, The World Economy, 19, 3, 237–52.Wonnacott, R. J. and M. Lutz (1989), ‘Is there a Case for Free Trade Areas?’, in J. Schott (ed.),
Free Trade Areas and US Trade Policy (Washington, DC: Institute for International Economics).

Author Queries From
Title of Journal: The World Economy
Paper Ref. No.: TWEC575
Dear Author,During the copy-editing of your paper, the following queries arose. Please
respond to these by marking up your proofs with the necessary changes/addi-tions. Please write your answers on the query sheet if there is insufficientspace on the page proofs. Please write clearly and follow the conventionsshown on the attached corrections sheet. If returning the proof by fax do notwrite too close to the paper’s edge. Please remember that illegible mark-upsmay delay publication.
Many thanks for your assistance.
Query Refs. Query Remarks
1 (On p. 9) TDB 1992 – not in the Reference list.
2 (On p. 13) Hooper and Marquez 1993 – in theReference list it is 1995