How Has Regionalism in the 1990s Affected Trade
30
W__& al POLICY RESEARCH WORKING PAPER 2156 How Has Regionalism in the Theresultsofarnodified gravity model suggest that 1990s Affected Trade? the "new wave" of regionalism has not boosted Isidro Soloaga intra-bloc trading significantly. Trade liberalization in Latin L. Alan Wintters America did have a positive impact on the imports of bloc members, although MERCOSUR's exports did poorly over the mid-I 990s. The 'World Bank Development Research Group Trad& H August 1999 Public Disclosure Authorized Public Disclosure Authorized Public Disclosure Authorized Public Disclosure Authorized
-
Upload
independent -
Category
Documents
-
view
0 -
download
0
Transcript of How Has Regionalism in the 1990s Affected Trade
W__& alPOLICY RESEARCH WORKING PAPER 2156
How Has Regionalism in the Theresultsofarnodifiedgravity model suggest that
1990s Affected Trade? the "new wave" of
regionalism has not boosted
Isidro Soloaga intra-bloc trading significantly.Trade liberalization in Latin
L. Alan WinttersAmerica did have a positive
impact on the imports of bloc
members, although
MERCOSUR's exports did
poorly over the mid-I 990s.
The 'World Bank
Development Research Group
Trad& HAugust 1999
Pub
lic D
iscl
osur
e A
utho
rized
Pub
lic D
iscl
osur
e A
utho
rized
Pub
lic D
iscl
osur
e A
utho
rized
Pub
lic D
iscl
osur
e A
utho
rized

I POLICY RESEARCH WORKING PAPER 2156
Summary findings
Soloaga and Winters apply a gravity model to data on Trade liberalization efforts in Latin America have hadannual nonfuel imports for 58 countries for the years a positive impact on the imports of bloc members1980-96, to quantify the effects on trade of recently (Andean Group, Central American Common Market,created or revamped preferential trade agreements Latin American Integration Association, and(PTAs). MERCOSUR). Increasing propensities to export
They modify the usual gravity equation to identify the generally accompanied increasing propensities to import,separate effects of PTAs on intra-bloc trade, members' suggesting that general trade liberalization had a strongtotal imports, and members' total exports. They also effect. The exception was MERCOSUR, for whichformally test the significance of changes in the estimated import and export propensities displayed oppositecoefficients before and after the blocs' formation. movements, with exports performing worse than
Their estimates give no indication that the "new wave" expected over the mid-1990s. Although MERCOSURof regionalism boosted intra-bloc trade significantly. members have undoubtedly liberalized since the mid-
They found convincing evidence of trade diversion 1980s, these results suggest that their trade performanceonly for the European Union and the European Free has been influenced more by competitiveness than byTrade Association. For the same blocs they also observed trade policy."export diversion," which would be consistent with theseblocs' imposing a welfare cost on the rest of the world.
This paper - a product of Trade, Development Research Group - is part of a larger effort in the group to study the effectsof regional integration. Copies of the paper are available free from the World Bank, 1818 H Street NW, Washington, DC20433. Please contact Lili Tabada, room MC3-333, telephone 202-473-6896, fax 202-522-1159, Internet [email protected]. Policy Research Working Papers are also posted on the Web at http://www.worldbank.org/html/dec/Publications/Workpapers/home.html. The authors may be contacted at [email protected] or [email protected]. August 1999. (26 pages)
The Policy Research Working Paper Series disseminates the findings of work in progress to encourage the exchange of ideas aboutdevelopment issues. An objective of the series is to get the findings out quickly, even if the presentations are less than fully polished. Thepapers carry the names of the authors and should he cited accordingly. The findings, interpretations, and conclusions expressed in thispaper are entirely those of the authors. They do not necessarily represent the view of the World Bank, its Executive Directors, or thecountries they represent.
Produced by the Policy Research Dissemination Center

How Has Regionalism in the 1990s Affected Trade? #
Isidro Soloaga * and L. Alan Winters *
JEL classification: FIO, F13, F15
* Isidro Soloaga is with the World Bank, Development Research Group, Trade Research Team.1818 H St. NW, Washington DC, 20433, Room MC3-307. Tel.:(202) 473-8085; Fax: (202) 522-1159; E-mail: [email protected].** L. Alan Winters is Professor of Economics, School of Social Sciences, University of Sussex,Falmer, BRIGHTON, BNI 9SN, UK. Tel.: +44(0)1273 877273; Fax: +44(0) 1273673563/678466; E-mail: L.A.Winters(d)@Sussex.ac.uk; Centre for Economic Policy Research,90-98 Goswell Road, London, EC IV 7DB, UK; and Centre for Economic Performance, LondonSchool of Economics, Houghton Street, London WC2A 2AE, United Kingdom.
# The bulk of this work was done while the authors were respectively Consultant and ResearchManager in the Development Economics Group of the World Bank. The authors are grateful toHomi Kharas, to colleagues in the World Bank Trade Research Team, and to participants in aWorld Bank Trade seminar for comments and suggestions.
Introduction
During the last 10 years, regionalism has re-emerged as a major issue in the policy
agenda. In the Americas, the new Common Market of the South (MERCOSUR, 1991) and the
North American Free Trade Association (NAFTA, 1994) were created while old Preferential
Trade Agreements (PTAs) like the Andean Pact (ANDEAN) and the Central American Common
Market (CACM) started a process of renewal in the late 80's and early 90's. In Africa new PTAs
were formed on the basis of old ones (e.g., in 1994 the Union Economique et Monaitarie de
l'Africa Occidentale-UEMOA-was created out of the Communaute Economique de l'Afrique
Occidentale-CEAO-, and the Common Market of Eastern and Southern Africa-COMESA-
revived and expanded the Preferential Trade Area for Eastern and Southern African States -PTA)
and old ones were revamped (e.g., in the early 90's the Union Duaniere et Economique d'Afica
Centrale -UDEAC). In Asia, countries in the Association of Southeast Nations (ASEAN) formed
in 1992 the ASEAN Free Trade Area (AFTA).
Although we are experiencing this 'second wave' of regionalism, the effect of PTAs on
trade is still an open question. Do they really increase trade among members? Will the second
wave of PTAs differ from the first? Do they contribute to further trade liberalization with non-
members countries or undermine it? Do they harm non-member countries? This paper aims to
provide answers to some of these questions by exploring the effects of recent and revived PTAs
on intra- and on extra-bloc trade.
We consider nine PTAs'. Five of them were either created (MERCOSUR, NAFTA) or
revamped (ASEAN, CACM, ANDEAN) during the 90's and one other deepened significantly
(EU). By using data up to 1996 we can compare blocs' patterns of trade "before and after" this
second wave of regionalism and assess-for first time to our knowledge-the wave's effect on
blocs' trade. We use the gravity model to quantify the trade effects, but refine it relative to
previous exercises. Existing gravity-model approaches to this issue have identified bloc effects
on intra-bloc trade and on total bloc trade. We go beyond that by identifying separate effects on
intra-bloc trade, members' total imports and their total exports, the latter being the crucial
determinant of blocs' welfare effects on the Rest of the World (ROW). We also innovate by
formally testing the significance of changes in the estimated coefficients before and after blocs'
1 See Annex I for the list of PTAs and country members.
2

formation. Finally we comment on a number of misconceptions-about the specification of gravity
models in the literature.
The paper begins with a statement of the model, follows with a brief description of the
data used and recent developments in the PTAs modeled, and then presents the results. The final
section summarizes the findings and conclusions.
The gravity model
In the basic gravity model, trade between two countries depends on their size (GDP,
population, land area) and on transaction costs (distance, cultural similarities). Its empirical
robustness has made it the work-horse for investigations of the geographical patterns of trade.
Tinbergen (1962), PoyhBnen (1963) and Linneman (1966) provided initial specifications and
estimates of the determinants of trade flows and Aitken (1973) applied it to PTAs. More recently,
Anderson (1979), Bergstrand (1985), Helpman and Krugman (1985) and Deardorff (1997) have
provided partial theoretical foundations for the gravity equation, although none of the models
generate exactly the equation generally used in empirical work.
When used to address the effect of a PTA on the direction of trade, the basic model was
first extended with a dummy variable to capture its effect on intra-bloc trade - that is the sum of
trade-creation and trade-diversion for the PTA (e.g. Aitken, 1973; Braga, Safadi and Yeats,
1994). More recently, researchers have added a second set of dummies to capture the PTA effect
on trade of bloc members with non-members (Bayoumi and Eichengreen, 1995; and Frankel,
1997). By combining the two dummies (intra-bloc trade and extra-bloc trade) these authors were
able to separate cases where PTAs were trade-creating only (that is, they caused intra-bloc trade
to increase above 'normal' levels without changes in extra-bloc trade) from those where a PTAs'
increase in intra-bloc trade came at the expense of lower extra-bloc trade. These authors
identified the latter effect with 'trade diversion', but since these dummies for extra-bloc trade
covered both imports and exports they were capturing diversionary consequences on flows in
both directions. This is legitimate, but it does not correspond precisely to most theoretical
analyses of trade diversion. Moreover, bloc members' imports and exports could follow different
patterns.
To address this issue we extend the basic gravity model by defining three sets of dummy
variables for each trade bloc: one that captures intra-bloc trade, a second that captures imports by
members from all countries (members and non-members), and a third that captures exports by
bloc members to all countries. The last two dummies reflect respectively overall bloc "openness"
3

to imports and exports, while the intra-bloc dummy reflects the additional effect of a given PTA
on members' trade. By summing the intra-bloc coefficient with that of the overall bloc imports
we can get an indication of how different from 'normality' ('normality' being defined by the
gravity variables and the average behavior of countries in the sample) are total intra-bloc imports.
In our model, the 'traditional' trade-diversion effect will be identified by a falling propensity to
import from all sources coupled with an increase in the overall propensity to import from
members. If the latter outweighs the former we also have trade creation.
The set of dummies for bloc exports to all countries differentiates our research from
previous exercises. Winters (1997) argues that, in assessing the welfare effects of PTAs on non-
members, the appropriate indicator is the latter's imports-i.e., members' exports-rather than the
more commonly considered non-members' exports to members -members' imports. This aspect
has generally been neglected in ex-post empirical studies of PTAs and is, to our knowledge,
treated here for the first time with a gravity equation.3 A negative coefficient on the dummy for a
given PTA's exports to non-members would indicate that, relative to the norm defined by the
gravity equation, the PTA is harmful to non-member countries.4 For want of a better term, we
name this effect 'export diversion'.
Our gravity model explains bilateral trade between a country (i), the importer, and a
specific trading partner (j), the exporter, in terms of the following equation:
(I) X BY/NJNfl 2 y6 3 N' 4D 6667 812t r ki , PLY k -.j 1 k
k k k
where
2 In defining the dummies, we could equivalently have chosen the bloc imports and bloc exports dummiesto reflect only extra-bloc trade (bloc imports from and bloc exports to, non-members). In that case,we would have interpreted the intra-bloc dummy as total (not the additional) bloc trade, and identified'traditional' trade diversion with a falling propensity to import from non-members coupled with anincreasing propensity to import from members. Again, if the latter effect outweighs the former wecan also identify trade creation. One can switch from the dummy defnition used in the paper to thisalternative definition by adding to the intra-bloc dummy coefficient the sum of the coefficients forimports and exports. What is important though, is that by modeling three bloc dummies, we canidentify more appropriately trade diversion and trade creation.
3 For other non gravity model approaches to this issue, see, for instance, Foroutan (1998), Yeats (1998),and Chang and Winters (1999).
4 Of course, this effect could be off-set by improvements in the rest of the world's terms of trade, althoughin general one expects PTAs to worsen these - see Winters and Chang(forthcoming)
4

X. is the value of imports of country i from countryj,
Ym is the Gross Domestic Product of country m,
Nm is the population of country m,
D, is the average distance of country i to exporter partners, weighted by exporters' GDP share
in world GDP ("remoteness" of country i)5,
Dj is the distance between the economic center of gravity of the respective countries,
A,i is a dummy that takes value 1 if countries i and] share a land border and 0 otherwise
T. is the land area of country m,
Im is a dummy that takes value I when country m is an island,
L,j is a dummy for cultural affinities, proxied by the use of the same language in countriesi andj
(one dummy for each one of the following languages: English, Spanish, Arabic and Portuguese).
P,,j is a dummy variable representing the kth preference relationship between countries i and j.
This variable takes the value 1 if both countries i and], belong to the same bloc k; it captures the
additional effect of the PTA on bloc trade,
Pk, j is a dummy variable that takes the value I when the importer country i belongs to the kth
preference trade agreement. This variable represents the overall "openess" to imports of bloc k,
Pk-if is a dummy variable that takes the value 1 when the exporter country j belongs to the kth
preference trade agreement. This variable represents the overall "openess" to exports of bloc k
B,A to/A1 2 'Ykj,'Yk-j and Yk-iI are parameters, and
C. is a log-normally distributed error term with E(Lnc,) = 0.
As indicated above, the gravity variables of the model (GDP, population, area, distance,
cultural similarities) control for those factors that are assumed to explain 'normal' trade between
countries. Thus, the relationship between trade and these variables for the sample countries
defines the anti-monde for PTA members: in the absence of a PTA members' trade would have
5 The hypothesis is that, after controlling for distance between i and j, the further is country i from all itspartners , the greater will be its imports from countryj (Polak, 1996). One might expect to seeAustralia and New Zealand trading more with each other than an other pair of countries separated bythe same distance but with lots of other trading partners close to hand (Spain and Poland, forinstance).
5

the same relationship to the gravity variables as the other countries in the sample. In this setting,
the bloc-related dummy variables pick up 'abnormal' levels of trade that could be attributed to a
PTA or to unobservable characteristics of country members.
The Data
We used annual non-fuel imports data for 58 countries (Annex I shows the list of
countries) for 1980 to 1996 from the UN-COMTRADE database. This set of countries represents
around 70% of total world imports in the period covered. The distance variable, generously
provided by Lant Pritchett, is the great circle distance between economic centers. The source for
the rest of variables utilized is the World Bank's Economic and Social Data (BESD).
The Econometric Approach
Because trade values are bounded from below by zero, the appropriate estimation
procedure is a Tobit model6 .
The estimated equation is:
(2) LnXA' = a + ,B1 LnY, + /I2LnN, + /33LnYj + 634LnNj + /35LnDf, + 836LnD. +
/37LinA, ±+±8LnT, + 89LnTj + /lOLnI, +,/1 lLnIj + f12LnL +Erkrj LnPjk
+ y Yk-jLnPk j + Er k-i LnPAk- + Ln+kE k
We start our sample in 1980 and explore the existence of both 'anticipation effects' (i.e.,
the level of trade between country members rising above 'normal' levels before the PTA is
formally commenced-as indicated, for instance, in Freund and McLaren ,1998), and any non-
PTA relationships between members that may have been at work since well before the PTAs
were created/revived. While the former can be thought of as a 'genuine' PTA effect, the latter is
not; it just reflects the possibility that the PTA is formed between countries that already have long
standing economic ties. Table 1 provides a brief description of main developments in the nine
PTAs analyzed, and identifies different periods for their (expected) effects on trade. It seems
appropriate for our purposes to center our 'before and after' analysis of 'new-wave' regionalism
6 See, for example, Maddala [1992] for a discussion of the bias in OLS estimates in models with limiteddependent variables.
6

on the years 1989-94, and also to use the earlier years of our sample for the cases of EU, EFTA
and GULFCOOP.
We made two different sets of estimates of equation (2). The first is a set of 17 separate
regressions-one for each year-for the annual data 1980-96, and is presented in Table 2. From
these we seek to identify not only the 'level' effect on trade of PTAs but also any variation of this
effect through time, in particular around the years marked in the last column of Table 17. This
permits us to make an 'event study' around those years, in the belief that seventeen years gives
enough time 'before' and 'after' the various PTA 'events' to offer a good chance of determining
whether the observed 'abnormalities' in trade are directly associated with preference effects8 .
Second, we averaged values of all variables for 1980-82, 1986-88 and 1995-96, pooled
the data and estimated a single regression allowing for all the coefficients to be different in the
three periods9. From this we tested whether the estimates obtained for the 1995-96 period
(considered as post-integration/revival years) were different from those obtained for 1986-88 (the
pre-integration/revival years)' 0. Results from the pooled data are presented in Table 3. Thus we
use annual estimates to 'visualize' the trade patterns, identifying whether or not there are key
turming points, and average data to test statistically for the significance of changes.
Once we pool data over time movements in the real exchange rate and competitiveness
become important, and so we add a real exchange rate variable to the equation. Country's iO) real
exchange rate was defined as the local currency value of 1 US$, multiplied by the US GDP
deflator and divided by country's ia) GDP deflator, where i is the importer country andj the11exporter
Real exchange rate and price variables make no sense in a purely cross-sectional context,
because the data reflect only movements through time (usually relative to the base year of the
7 As in Frankel (1997), to make the coefficients estimated comparable, we include the same set of regionaldummies every year, even when the PTA was not yet in effect.8 This is a key feature present in many gravity models since Aitken's (1973) pioneering work.
9 The use of period averages smoothes the effects that transient phenomena (e.g. business cycle oreconomic shocks) may have on any particular year.10Additionally, we tested whether parameters for 1986-88 were different from those estimated for 1980-82. This is relevant for the older and well established PTAs in the sample (EU and EFTA) and for GCC.
Results (not presented here) did not change when using the IMF's real effective exchange ratemeasurement, which is a single measure by country that weights all trading partners' bilateralexchange rate by their share in imports.
7

index used) with no indication of whether a country's currency-is over-valued or undervalued'2.
To try to eliminate the spurious cross-section effect, therefore, we specify our real exchange
variables such that their means over the three observations (1980-82, 86-88 and 95-96) are zero.
This is equivalent to assuming that countries are in exchange rate equilibrium at the means and
identifying the exchange rate effects only by the movements through time relative to those
means.
We also add time dummies for two of our three periods (the third is, of course rolled into
the constant). This makes our model similar to Matyas' (1997) fixed-effects model, although he
includes time-invariant fixed effects for each individual country where we include dummies for
each (bloc x time) combination. Matyas states that in a correctly specified gravity model, bloc
dummies are mere linear combinations of the fixed effects (p.365). Even with country-specific
dummies this is not correct because the bloc dummies pertain to flows between a set of importers
and only a subset of their supplying exporters, and so can not be represented by variables which
treat all partners symmetrically. Thus below, contrary toMatyas' claim, we can identify, estimate
and interpret dummies on trade between bloc members in addition to the fixed effects.
Results
Table 2 presents the estimated parameters and the asymptotic significance tests for the set
of 17 annual regressions. As in many other applications the central variables of the gravity model
-the level of GDP of countries i and j, the area of these countries, and the absolute distance
between i andj-- have the expected sign and are all significant at 1%: trade increases with the
level of GDP of the importer and exporter and decreases with size and distance. The variables
reflecting population (of importer and of exporter) were positive and almost always significant.
The degree of 'remoteness' of the importer country from its suppliers had the expected
positive sign and was always significant. The estimated parameters forcommon land borders
were not significant in any year of the sample, reflecting probably some colinearity with the,13parameter for 'remoteness'
12 Thus, it seems to us that Bergstrand's (1985,1989) attempts to incorporate price effects into the gravitymodel are not informative. Only if one appeals to some concept of absolute PPP can exchange rate orprice variables be interpreted in cross-sectional estimates.
13 When the model was estimated without the variable 'remoteness', border turned out positive andstatistically significant.
8

The coefficient for importer is an island was negative and statistically significant only
in the period 1986-1992 and in 1995, whereas the coefficient for exporter is an island was in
general positive and only significant in 1992-93 and in 199614. Regarding the proxies used for
'cultural similarities' (common language), only Spanish and Arabic turned out to be positive and
significant all the years of the sample, with English positive and significant only in 1987 and
1995.
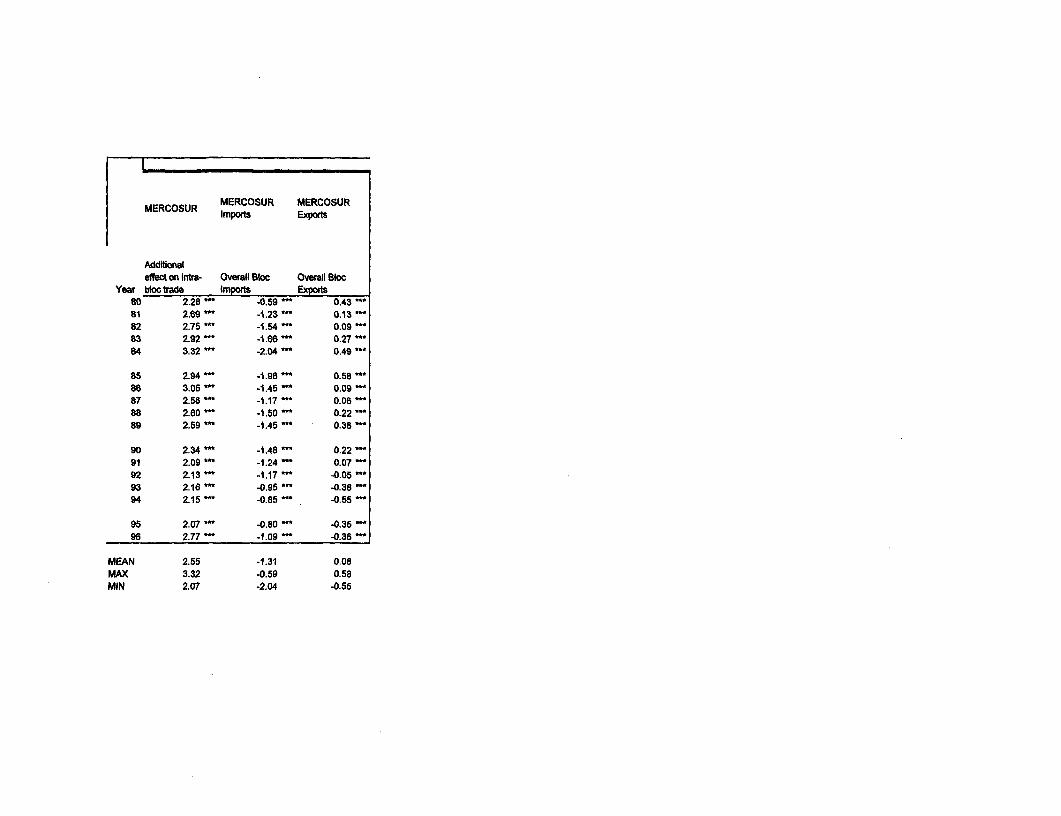
The model was estimated in logs. Thus the percentage equivalent for any dummy is:
[exp(Dummy coefficient)-1]*100. For example, the intra-bloc parameter for MERCOSUR in
1996 is 2.77, indicating that MERCOSUR members traded between themselves about fifteen
times [=(exp(2.77)- 1)* 100] more than expected from the gravity and overall bloc trade variables
alone. Similarly, their imports from non-members were 66% below what could be expected and
their exports 30% below expected levels. The net effect of the three dummies is that in 1996,
MERCOSUR members traded 418% [=(exp(2.77-1.09-0.36)-1)* 100] more with each other than
would be predicted by the basic gravity model. This is not saying that MERCOSUR increased
intra-trade by 418%, however. What matters analytically is less the level of these effects than
their changes around the periods of integration.
From table 2 it is clear that the results are far from homogenous across PTAs. In the
period 1980 to 1996 we have that:
* In all the cases involving only Latin American countries-CACM, LAIA, ANDEAN, and
MERCOSUR-the intra-bloc trade coefficient was positive and statistically significant for the
whole sample. For NAFTA it was positive and never significant whereas for GULFCOOP it
was positive and significant only in 1980 and in 1992-96. The coefficient for the intra-bloc
trade was negative for EU, EFTA and ASEAN, but consistently significant only in the case
of EU. Thus, after controlling for gravity variables and general trade behavior, only a few
PTAs trade significantly more with themselves than expected.
* The coefficients for overall bloc imports (from members as well as from non-members) were
almost always statistically significant (the exception was GULFCOOP). This coefficient was
14 Not all the researchers use a dummy for island. Its inclusion here is based only on a wish to becomprehensive so that our PTA effects of interest are not biased by unwanted exclusions .Regardingits sign, some authors found the dummy for Island to be positive and significant for the importer aswell as for the exporter (Montenegro and Soto, 1996) whereas others found that the sign depends onthe direction of trade- positive when imports are modeled as the independent variable, and negativefor exports (Havrylyshyn and Pritchett, 1991).
9

negative for the four Latin American PTAs and positive in the other cases (EU, EFTA,
ASEAN and NAFTA)
* The coefficients for overall bloc exports were negative and almost always statistically
significant in five of the nine PTAs (GULFCOOP, NAFTA, CACM, LAIA, and ANDEAN),
always positive and significant for ASEAN, and always positive but significant only in
1980-86 and 1993 for EFTA. The bloc export coefficients for the EU were positive and
significant over 1980-86 and negative after 1990. Something similar happened in the case of
MERCOSUR, the dummy was positive up to 1991 and negative in 1992-96, significantly so
since 1993
To answer the questions posed at the beginning of the paper, however, we need to go beyond
the absolute level of the estimated dummies and consider whether there is a noticeable change in
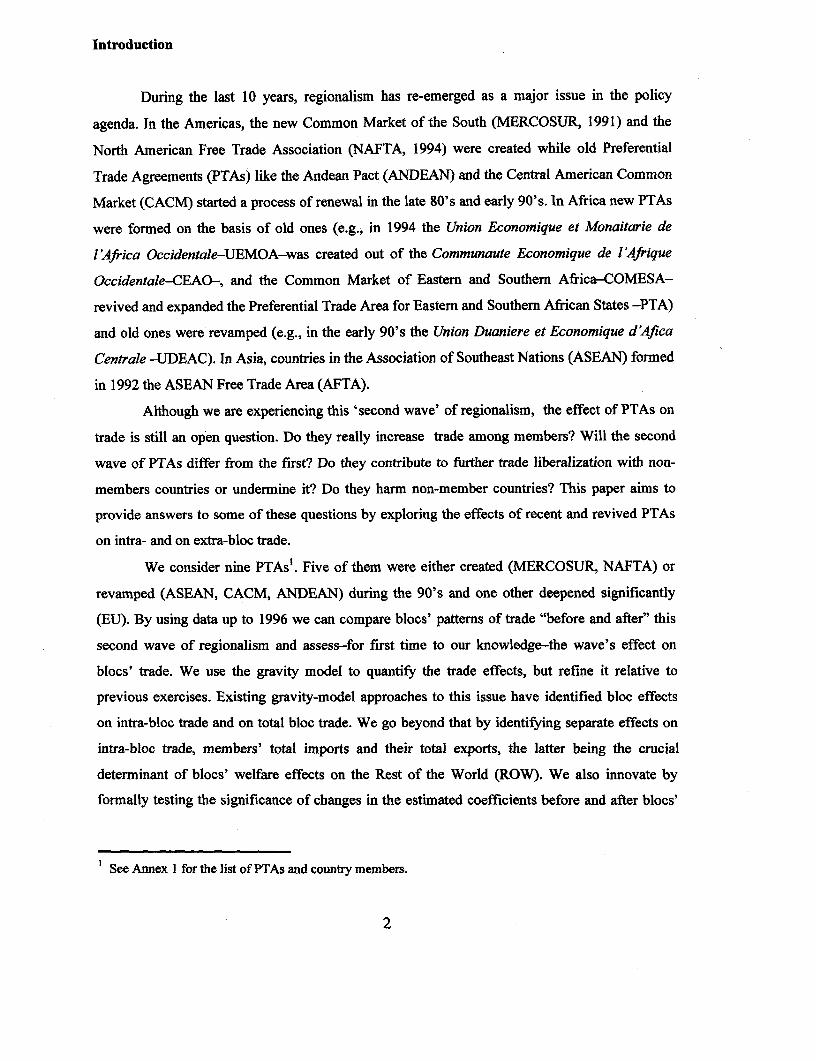
their level around the years indicated in Table 1. A useful way of looking to the results is to
group the PTAs by levels of development and continent. To ease exposition, the annual dummy
coefficients of table 2 are plotted over time in Figurel. In addition, Table 3 reports tests on
whether they have varied significantly over 1980-96, using averaged data.
a) Europe. The temporal pattern of trade is almost identical for EU and EFTA. Intra-bloc
trade is always below 'normal' and has a strong positive trend since 1985 (EU) and 1986
(EFTA). Although the annual coefficients are statistically significant for the EU, the pooled
equation shows that for neither bloc were the coefficients for the average of years 1980-82, 1996-
98, and 1995-96 statistically different from one another"5 . For both European PTAs, although
overall bloc imports and exports were above 'expected' levels, they showed a strong negative
trend since 1986. Also for both PTAs the pooled coefficients for imports in 1995-96 were
significantly lower than those for the average of 1980-82, while the propensity to export was
lower in 1986-88 and 1995-96 than in 1980-82.
These results are somewhat similar to those of Sapir (1997), who found that increased
integration within the EU has impacted negatively on EU imports from European non-members
and prompted their application for EU membership. In addition, we have identified the presence
of 'export-diversion' in both PTAs
15 Although the average of 1995-96 was different to that of 1980-82 for the EU at the 90% confidencelevel.
10

h) South-South PTAs in the Americas: The situation in Latin America is different. All
four PTAs show intra-bloc trade above expected levels. The annual estimates suggest that,
although these coefficients were always statistically significant, they did not vary much over the
whole sample, as the results from the pooled data corroborated when comparing coefficients
statistically over 1986-88 and 1995-96.
All four PTAs exhibit a positive trend in members' propensity to import since the late
80s, but only for CACM and for MERCOSUR was this coefficient statistically higher in 1995-96
than in 1986-88.
In CACM, LAIA and ANDEAN, the coefficient for bloc exports also showed a positive
trend since the early 90's, while the trend was negative for MERCOSUR. In none of the cases,
however, were the estimates for 1995-96 statistically different from those of 1986-88.
Thus, when we control for the impact of the gravity variables such as GDP, population,
etc, the revamping (CACM and ANDEAN) or launching (MERCOSUR) of PTAs in Latin
America does not seem to have been accompanied by a noticeable increase in intra-bloc trade
propensities. The positive trend in the estimated coefficients for bloc members' imports,
significant in the cases of CACM and MERCOSUR, presumably reflects the unilateral trade
liberalization that swept Latin America in the late 80's and early 90's. The increases in CACM
and ANDEAN members' overall export coefficients also reflect liberalization, while the opposite
trend in MERCOSUR, suggests that its members' trade performance was dominated by currency
overvatuation rather than trade policy.
c) NAFTA. Besides EFTA, NAFTA is the only bloc where the coefficients for intra-bloc
trade were never significant. Annual results show an upward trend practically since the beginning
of our sample. The coefficient for overall imports showed a negative trend since 1986 and was
statistically significant for virtually the whole period (except for 1991). The export coefficients
turned from positive in 1980-83 to negative in 1984-86, without appreciable changes since 1986.
Although we observe some indication of export-diversion in the annual data (in 1992 and 1994-
1995 ), none of the three dummies differed significantly in 1995-96 from its value in 1986-88.
Thus, it seems that the key developments NAFTA members' trade policies (Mexico's unilateral
liberalization in mid 80's, CUSFTA in 1988 and NAFTA itself signed by the end of 1992) were
1I
not associated with appreciable changes in intra or extra bloc trade, once we take into account the
'normal' variation in trade levels that follows changes in the gravity variables'6.
d) ASEAN. The annual estimates show that the intra-bloc trade coefficient was in general
negative, with a pronounced negative trend between 1987 and 1995. The coefficient for bloc
imports was almost always positive, and significant since 1987, while the coefficient for bloc
exports was always positive and significant. The estimates on averaged data showed that the
bloc's propensity to import from bloc members was significantly lower and to import overall
significantly higher in 1995-96 than in 1986-88 (and than in 1980-82).
e) GULF COOPERATION COUNCIL. The intra-bloc trade coefficient was always
positive (except for 1985), significant in 1980 and in 1992-96, and trending upwards since 1986.
The coefficient for bloc imports was only significant in 1996, with a negative trend since 1993,
while the coefficient for bloc exports was always negative and statistically significant, showing a
sharp positive trend up to 1986. In table 1 we marked 1982 as the key year for this PTA. The test
run on the pooled data showed that only the export propensity was statistically different (higher)
in 1986-88 than in 1980-82.
These results are similar to some of Frankel's (1997), the piece of literature most closely
related to ours. He estimated several variants of his model and got widely varying results. His
estimates for a series of single years suggest the existence of significant trade diversion (e.g. table
4.2), but the specification on which he bases his policy conclusions, which assumes constant
effects over the period 1970-92 (!), suggests little diversion and a good deal additional trade due
to PTAs (e.g. p.226-7). We find the former set of results more persuasive than the latter.
6The coefficient for exports was statistically lower in 1995-96 and 1986-88 than in 1980-82, which mightconceivably be an anticipatory effect of CUSFTA.
12

Conclusions
We have applied a gravity model to annual non-fuel imports data for 58 countries
representing more than 70% of world imports. The effects of PTAs were captured by dummies
that reflected intra-bloc trade as well as, separately, bloc imports and bloc exports. These bloc-
related coefficients were statistically tested for changes "before and after" blocs
revival/formation.
In summary,
1. When we allow for gravity and overall trade effects, we found no indication that the 'new
wave' of regionalism boosted intra-bloc trade significantly. When testing intra-bloc trade
"before and after" years of bloc revamping/creation we found no statistically significant
change in the propensity for intra-bloc trade.
2. Only for EU and EFTA did we find convincing evidence of trade diversion. After controlling
for gravity variables, the EU's and EFTA's propensity to import were significantly lower in
1995-96 than in 1980-82. On the other hand, in the four Latin American PTAs we observed a
positive trend in the estimated coefficients for bloc members' overall imports, although the
increment was statistically significant only for CACM and MERCOSUR.
3. We also found evidence of export-diversion in EU and EFTA, which would be consistent
with their imposing a welfare cost on the ROW. In Latin America increasing propensities to
export generally accompanied increasing propensities to import, suggesting strong effects
from general trade liberalization. The exception was MERCOSUR, for which import and
export propensities displayed opposite movements. While MERCOSUR members have
undoubtedly liberalized since the mid-1980s, these results suggest that their trade
performance has been influenced more by competitiveness than by trade policy.

References
Aitken, N.D. [1973], "The Effect of the EEC and EFTA on European Trade: A Temporal cross-section Analysis". American Economic Review, Vol. 63, pp. 881-892.
Anderson, J. [1979] "A theoretical foundation of the gravity model".American Economic Review69(1), 106-16.
Bhagwati, J., and Arvind Panagariya [1996] "Preferential Trading Areas and Multilateralism-Strangers, Friends, or Foes?" Ch. 1 in The Economics of Preferential Trade Arrangemets Ed. byJagdish Bhagwati and Arving Paragariya. The AEI Press. Washington DC.
Bergstrand, J. [1989] "The Generalized Gravity Equation, Monopolistic Competition, and theFactor-Proportions Theory in International Trade" The Review of Economics and Statistics 71,143-53.
Bergstrand, J. [1985] "The gravity equation in international trade: some microeconomicfoundations and empirical evidence". The Review of Economics and Statistics 20, 474-81.
Bayoumi T., and Barry Eichengreen [1995]. "Is Regionalism Simply a Diversion? Evidence fromthe Evolution of the EC and EFTA." IMF Working Paper # 109. Washington DC.
Chang, W. and L. A. Winters [1999]. "The Price Effects of Regional Integration: Non-Memberreaction to MERCOSUR." World Bank. DECRG.
Deardorff, A. [1997] "Determinants of Bilateral Trade: Does Gravity Work in a ClassicalWorld?" In The Regiona-ization of the World Economy ed. by Jeffrey Frankel. Chicago:University of Chicago Press.
Foroutan, F. [1998] "Does Membership in a Regional Preferential Trade Arrangement Make aCountry More or Less Protectionist?" World-Economy;21(3), May 1998, pp. 305-35..
Frankel, J.A [1997] Regional Trading Blocs in the World Economic System. Institute forInternational Economics. Washington. DC.
Freund, C., and McLaren, J. [1998] "On the Dynamics of Trade Diversion: Evidence from FourTrade Blocs". Mimeo.
Havrylyshun, 0. and Pritchett, L. [1991] "European Trade After the Transition". PRD WorkingPaper Series 748, World Bank.
IDB [1997] "Periodic Note on Integration." Mimeo.
IMF [1994] International Trade Policies. The Uruguay Round and Beyond. Volume II.Bacground Papers.

Linneman, H [1966] An Econometric Study of International Trade Flows. Amsterdam: NorthHolland.
Maddala G.S. [1992] Limited Dependent and Qualitative Variables in Econometrics,Econometric Society Monographs No. 3 (Cambridge: Cambridge University Press).
Matyas L (1997) "Proper econometric specification of the gravity model", The World Economy,vol. 20, pp.363-368.
Montenegro C., and R. Soto [1996] "How distorted is Cuba's trade? Evidence and predictionsfrom a gravity model" The Journal of International Trade & Economic Development 5:1 45-68.
Ng, F [1997] "Notes on Unilateral Trade Reforms and Practices for Developing Countries."World Bank-DECRG. Mimeo.
Primo Braga, C.A., R. Sadafi and A. Yeats [1994] "Regional integration in the Americas: DejjVu all over again?" World Economy (U.K); 17, pp. 577-60 1.
Polak, J.J.,[1996] "Is APEC a Natural Regional Trading Bloc?", The World Economy, Sept. pp.533-43.
P6yhonen, P. [19633 "A tentative model for the flows of trade between countries".Weltwirtschatftliches Archiv 90(1).
Thoumi, F. E. [1989] "Bilateral Trade Flows and Economic Integration in Latin America and theCaribbean" World Development, Vol 17, No. 3, pp. 421-429.
Tinbergen, J. [1962] Shaping the World Economy: Suggestions for an International EconomicPolicy. New York: The Twentieth Century Fund.
Wang Z.K., and L. A. Winters [1992] "The trading potential of Eastern Europe." Journal ofEconomic Integration 7(2) Autumn 1992, 113-136.
Winters L. A. [1997] "Integration and the Rest of the World: The Irrelevance of the Kemp-WanTheorem". Oxford Economic Papers, vol. 49, pp. 228-34.
Winters L. A. and Chang W. [forthcoming] "Regional integration and import prices: anempirical investigation", Jouwral of International Economics.
Wyplosz, Ch. [1997] "EMU: Why and How It Might Happen." Journal of EconomicPerspectives Volume 11, Number 4- Fall 1997, pp. 3-22.
Yeats, A.J. "Does Mercosur's Trade Performance Raise Concerns about the Effects of RegionalTrade Arrangements?" World Bank Economic Review,12(1), January 1998, pp. 1-28..
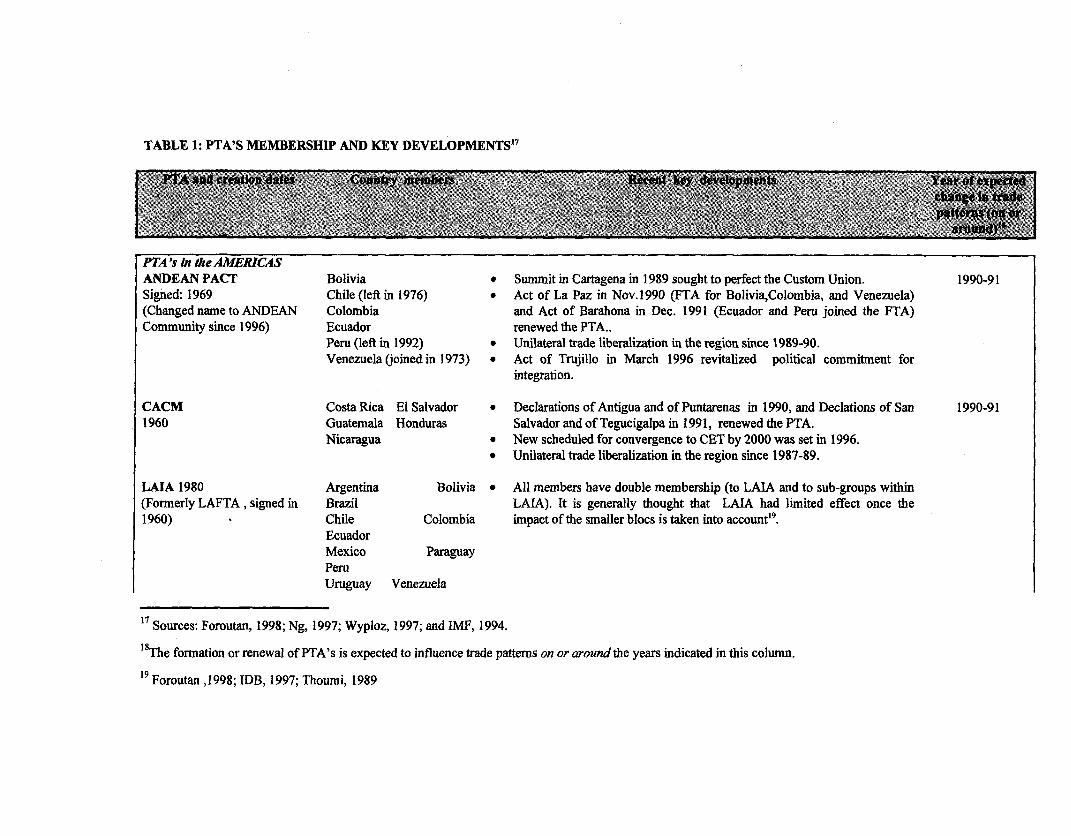
TABLE 1: PTA'S MEMBERSHIP AND KEY DEVELOPMENTS'7
PTA's in theAMERICASANDEANPACT Bolivia * Summit in Cartagena in 1989 sought to perfect the Custom Union. 1990-91
Signed: 1969 Chile (left in 1976) * Act of La Paz in Nov.1990 (FTA for Bolivia,Colombia, and Venezuela)
(Changed name to ANDEAN Colombia and Act of Barahona in Dec. 1991 (Ecuador and Peru joined the FTA)
Community since 1996) Ecuador renewed the PTA..Peru (left in 1992) * Unilateral trade liberalization in the region since 1989-90.Venezuela (joined in 1973) * Act of Trujillo in March 1996 revitalized political commitment for
integration.
CACM Costa Rica El Salvador * Declarations of Antigua and of Puntarenas in 1990, and Declations of San 1990-91
1960 Guatemala Honduras Salvador and of Tegucigalpa in 1991, renewed the PTA.
Nicaragua * New scheduled for convergence to CET by 2000 was set in 1996.* Unilateral trade liberalization in the region since 1987-89.
LAIA 1980 Argentina Bolivia * All members have double membership (to LAIA and to sub-groups within
(Formerly LAFTA, signed in Brazil LAIA). It is generally thought that LAIA had limited effect once the
1960) Chile Colombia impact of the smaller blocs is taken into account'9.
EcuadorMexico ParaguayPeruUruguay Venezuela
17 Sources: Foroutan, 1998; Ng, 1997; Wyploz, 1997; and IMF, 1994.
18The formation or renewal of PTA's is expected to influence trade patterns on or around the years indicated in this column.
19 Foroutan ,1998; IDB, 1997; Thoumi, 1989

TABLE 1: PTA'S MEMBERSHIP AND KEY DEVELOPMENTS"
MERCOSUR Argentina * Argentina-Brazil protocols 1986-1989. 1991Signed: March 1991 Brazil * Unilateral trade liberalization started during 1988-90 in Argentina, BrazilInternal trade liberalization: Paraguay and Uruguay.1991-95. Uruguay * Treaty of Asuncion- March 1991.Schedule for convergence to * Agreement of Ouro Preto- Dec. 1994 (CET for 85% of tariff lines).CET and to Free Trade started * Bolivia and Chile joined MERCOSUR as associated members in 1996.in 1995
NAFTA Canada * Mexico's unilateral trade liberalization started in 1985. 1994Signed: December 1992 Mexico * Canada-US-FTA started in 1988.Effective: January 1994 US * NAFTA negotiations started in 1990.
PTA in ASMI:ASEAN FTA Indonesia Malaysia * Changed from 'Economic Cooperation' to FTA in 1977.Very little intra- 19921992 Singapore Thailand bloc liberalization(Formerly ASEAN, signed in Philippines * AFTA created in Jan-1992.1967) * Unilateral trade liberalization in some countries: tariffs levels in 1994 were
1/2 of the average level in 1986-90 in Thailand; 2/3 in Philippines andabout the same in Indonesia and Malaysia.
PTA in MIDDLE EAST:GULF COOPERATION Bahrain Kuwait * Virtual elimination of customs tariffs by 1982 and liberalization of trade 1982-83COUNCIL- Signed in Oman Qatar and services by 1983.May 1981 Saudi-Arabia
United Arab Emirates(UAE)

TABLE 1: PTA'S MEMBERSHIP AND KEY DEVELOPMENTS17
PTA 's in EUROPEEFTA 1960 Austria (left in 1995) * Lost many members to the EC. 1985-86 (impact
Denmark (left in 1972) * The European Economic Area, in effect since 1994, created a FTA between of the Single
Norway remaining EFTA members (with the exception of Switzerland) and EU. European Act),
Portugal (left in 1985) (An agreement of free trade in manufactures between EEC and EFTA was 1994
Sweden (left in 1995) in place since 1974).SwitzerlandUnited Kingdom (left in1972)Iceland (joined in 1970)Finland (associated in 1961,full membership in 1986,left in 1995)
Liechtenstein (joined in1991)
EU (since 1993) * Single European Act (1986-87) set the goal of a single European market 1985-86,
(Originally EEC, signed in France for goods, labor and capital in Europe in 1992 (to be known as "1992"). 1992-93
1957) Germany * Maastricht Treaty, (Dec. 1991). Countries agreed on a formal plan to create
Belgium a closer economic and political union. The economic component of the
Italy treaty mainly involves the adoption of a single currency by 1999.
Luxembourg * Enactment of the Maastricht Treaty (Nov. 1993)Netherlands
United Kingdom (oined in1973)Denmark (joined in 1973)Ireland (joined in 1973)

TABLE 1: PTA'S MEMBERSHIP AND KEY DEVELOPMENTS' 7
EU (Cont)Greece aoined in 1981)Spain (joined in 1986)Portugal (oined in 1986)
Austria (oined in 1995)Finland aoined in 1995)Sweden (joined in 1995)

TABLE 2GRAVITY MODEL ESTIMATESEquation (2_
Gravity variables
Log Log Dummy=1 um Dummy=
Log GDP at Log GDP at Log Log Average Absolute Dmy 1I if 1 ifINTERCEPT current prices, t Populaion Populaion d n distane d Importer Eporter Area
importer (i eporeres, importer (i) exporter (i) of countryr i between i share is an is anImotr Epteexporter ~~~~~from adj borders Island Island
exporters
Pseudo-Year R2 _
80 0.71 -17.53 1.12" 1.37 0.10 0.10 1.29 - -0.96 - -0.06" -0.04 0.21 " -0.21 - -0.22
81 0.71 -16.24 1.11 " 1.35 0.08 * ' 0.17 1.11 " -0.98 " 0.08 -0.11 0.04 - -0.18 " -0.21
82 0.71 -11.96 1.12- 1.34" 0.15 0.19" 0.46 -0.93- 0.22 - -0.03 0.09 -0.18 -0.20
83 0.72 -13.55 1.16 - 1.36- 0.04 0.18 - 0.74" -0.99 - 0.05" -0.11 0.09 -0.16 -0.21
84 0.72 -15.58 1.15 1.36 - 0.12 0.30 0.87- -1.06 -0.08" -0.17 0.01 -0.16 -0.18 "
85 0.72 -18.37 1.11 1.32 0.09 0.31 1.21 -1.04 -0.13 - -0.22 0.10 -0.14 -0.1586 0.74 -15.71 1.12 - 1.33 0.10 0.29 ''' 0.88 -1.00 -0.03 - -0.21 0.06 0.19 * -0.13
87 0.74 -15.05 1.12 " 1.31 - 0.08 " 0.24 0.86 -1.01 -0.06" -0.35 0.00 -0.19 -0.11
88 0.74 -14.01 1.06 -* 1.28" 0.20 0.26 0.67 -1.03 -0.02 - -0.22 -0.09 -0.14 -0.10
89 0.75 -15.98 1.06 " 1.24 - 0.16 0.28 - 0.92 -1.02 -0.03 -0.26 -0.02 -0.12 -0.11
90 0.76 -15.98 1.02 - 1.25 - 0.11 " 0.25 - 0.94 -0.97 0.04 -0.29 0.02 -0.09 -0.1291 0.76 -17.24 1.02 1.28 0.17 0.21 1.03 -1.03 -0.10 - -0.29 ' 0.13 -0.08 -0.11
92 0.76 -17.44 - 1.08 1.26 0.08 0.24 1.11 -1.07 -0.10" -0.30 0.20 -0.11 -0.08
93 0.77 -17.62 1.07 - 1.27 0.10 - 0.19 1.14 -1.08 -0.11 -0.10 0.24 -0.10 -0.08
94 0.76 -17.09- 1.03 1.23 0.13 0.21 ''' 1.07 " -1.09 -0.12" -0.08 0.08 -0.08 " -0.04
95 0.76 -16.95 1.00 - 1.17 " 0.18 " 0.28 - 0.88 - -1.02 -0.28 -0.24 -0.05 -0.04 -0.01
96 0.72 -17.91 0.95 1.19 0.34 0.48 - 0.56 -0.90" -0.19 0.01 0.35 -0.05 -0.03
MEAN -16.13 1.08 1.29 0.13 0.25 0.92 -1.01 -0.05 -0.18 0.09 -0.13 -0.12
MAX -11.96 1.16 1.37 0.34 0.48 1.29 -0.90 0.22 0.01 0.35 -0.04 -0.01
MIN -18.37 0.95 1.17 0.04 0.10 0.46 -1.09 -0.28 -0.35 -0.09 -0.21 -0.22
Tobit estimates on annual data. Each year was run separately.Each PTA has three dummies: one for intra-bloc trade (both countries I andJ arein the PTA); one for imports from extra-bloc countries (country i is in the PTA);and for exports to extra-bloc countries (countryj is in the PTA).Number of obs.: 3306Statistical significance: 99%, -5W1seudo R2 -1-(Sum See/Syy)

DumTr- If Common language in counbies i and j Preferental Trade Agreements I
SPANISH ENGLISH ARABIC PORTUGUE EU EFTA Exports EFTA- EFTA- ASEAN l EAN- OPImports Exports imports Exports Imports Exports OP
Additional Additional Additonal Additionaleffect on Overall Overall eflect on Overall Overall effect on Overall Overall effect oninta-bloc Bloc Bloc intra-bloc Bloc Bloc intra-bloc Bloc Bloc intra-bloc
Year __ trade Imports Exports trade Imports Exports trade Imports Exports trade80 1.99" 0.38 - 1.91 " 1.05 -1.78 - 1.88" 0.55" -0.74 1.60" 0.96 -0.01 0.08" 0.75" 2.2081 1.83" 0.34 " 2.42" 1.17 -1.77 1.61 0.72" -0.64 - 1.22- 0.90" -0.33- 0.26" 0.68" 1.3082 2.01 - 0.25 - 1.85" 0.73 -1.71 - 1.19" 0.81 -0.74 " 0.88" 0.95" 0.11 - 0.23 0.568 1.5683 1.96" 0.30" 2.80" 1.11 -1.79 " 1.46" 0.85 " -0.87 1.14" 1.09 " -0.09 - 0.16" 0.63" 0.4084 1.84" 0.24" 2.69" 1.22 -1.88" 1.38" 0.73" -0.92 0.94" 0.82 0.20" -0.04 0.49 0.81
85 2.22 0.21 - 1.72" 0.95 -1.83" 1.65" 0.77" -0.95" 1.19" 0.86" 0.20" -0.21 - 0.65" -0.0386 1.83 0.38" 2.12" 1.41 -1.48" 1.21 - 0.24" -0.84- 0.95" 0.40" 0.53- 0.19" 0.78" 1.1087 1.95" 0.52" 1.90" 0.76 -1.37" 1.10" 0.14" -0.78" 0.88" 0.27" 0.32" 0.30 - 0.88" 1.5788 1.94 0.35" 2.08" 0.84 -1.38" 0.98 0.05" -0.80" 0.59" 0.17" -0.01" 0.51 0.98" 1.3189 1.81 " 0.27" 2.29" 0.35 -1.32 - 1.15 0.08" -0.74 - 0.69" 0.16" 0.04" 0.47 0.85 t 1.52"
90 1.84 " 0.33" 2.25" 0.44 -1.13 1.17 -0.13" -0.59" 0.68" 0.06 " -0.44" 0.65 0.88 " 1.42"91 1.94" 0.29" 2.16" 0.54 -1.10" 1.06 -0.22" -0.61 " 0.53" 0.10" -0.65" 0.56 0.94" 1.49"92 1.98" 0.36" 1.61 " 0.39 -1.09 " 0.97 -0.23" -0.61 " 0.65" 0.08 " -0.76" 0.47 0.91 " 1.97"93 2.03 - 0.36" 2.17" 0.56 -1.27 " 0.99 0.00" -0.54" 0.61 - 0.33" -0.90" 0.49" 0.94" 1.57"94 1.77 0.25" 2.21 - 0.51 -1.16 0.90 -0.04 -0.52" 0.57" 0.18" -0.74" 0.47" 0.83" 1.72"
95 1.78 - 0.46" 2.18 - 0.43 -1.01 " 0.77" -0.05" -0.33" 0.34" 0.04" -1.32" 0.92 1.01 " 2.0096 2.05 -0.12" 2.94" 1.05 -0.80" 0.50" -0.19" -0.43" 0.02" 0.08" 0.20" 0.44 0.80" 2.76
MEAN 1.93 0.30 2.19 0.80 -1.41 1.17 0.24 -0.69 0.79 0.44 -0.21 0.35 0.80 1.45MAX 2.22 0.52 2.94 1.41 -0.80 1.86 0.85 -0.33 1.60 1.09 0.53 0.92 1.01 2.76MIN 1.77 -0.12 1.61 0.35 -1.88 0.50 -0.23 -0.95 0.02 0.04 -1.32 -0.21 0.49 -0.03

TPreferential Trade Agreements 1 Preferential Trade Agreements
GC- GC- NAFTA NAFTA- NAFTA- CACM- CACM- LAIALA LAA- ANDEAN ANDEAN- ANDEAN-
Imports Exports CACM Imports Exports Imports ExLrt Imp Ex,ports Imports Exports
Additional Additonal Additional AdditionalOverall Overall effect on Overall Overall effect on Overall Overall effect on Overall Overall effect on Overall Overall
Bloc Bloc intra-bloc Bloc Bloc intra-bloc Bloc Bloc intra-bloc Bloc Bloc intra-bloc Bloc Bloc
Year Imports Exports trade Imports Exports trade Imports Exports trade Imports Exports trade Imports Exports
80 -0.27- -5.20" 0.368 1.52 0.92 - 3.48 - -0.65" -0.64- 1.43 -2.28- -2.59 - 2.67" -0.62- -1.08
81 0.04" -5.21 " 0.25- 1.27 - 0.69 - 3.96 -0.59" -0.49- 1.75 -2.10" -2.90" 2.67" -1.02 -1.31
82 0.35- -4.52" 0.42 0.69 0.61 " 4.24" -0.98 - -0.53 1.85- -1.88- -2.46- 2.42 -1.03 -1.17
83 0.45 - -4.36- 0.60 0.89 - 0.468 4.37- -0.97 -0.83 - 1.89" -2.86 -1.59" 2.44 -1.27 -1.09
84 0.15 -4.49 0.60 0.80" -0.04 - 4.24" -1.17 -0.95" 2.14 -2.64" -1.49 2.24 -1.10 -1.07
85 -0.12 -3.99- 0.81 " 0.94" -0.18" 3.76 -1.25 -1.09 - 1.97 - -2.74- -1.53 2.02" -1.34 -1.16
86 0.04 -3.03" 0.73- 0.95 -0.48 3.22 -1.05 - -0.53" 1.77 -2.05 -0.52 - 2.16" -0.88 -1.14
87 0.13" -3.13" 0.83" 0.82 -0.48- 3.29" -0.968 -1.02" 1.688 -2.33" -0.31 - 1.88" -0.73 -1.10
88 0.25 -2.79 " 0.58 0.66" -0.49 3.23" -0.93" -0.90" 1.73 -1.76" -0.29" 2.27" -0.91 -1.11
89 0.05" -3.00" 0.66" 0.53 -0.42" 3.67" -0.55" -0.74 1.84 - 1.81 -0.50" 2.29 -1.23 - .0.83"
90 -0.23 - -2.81 - 0.62 0.66 -0.33" 3.78" -0.74" -0.58 - 1.66" -1.76 -0.81 " 2.32 -1.36 -0.51 "
91 -0.09 -3.34 1.03 0.43" -0.40" 3.57 -0.63 -0.62 1.72" -1.95" -1.08 2.24 -0.97 -0.64"
92 0.15 -3.21 0.88" 0.59 -0.45" 3.43 -0.61 -0.52 1.53" -1.52" -1.12 1.96 -0.88" -0.77"
93 -0.02 -2.90- 1.06" 0.63" -0.39" 3.52" -0.55 -0.71 1.49" -1.60" -1.43 1.77" -0.62" -0.78"
94 -0.24" -2.968 0.90" 0.70" -0.53- 3.47" -0.57" -0.63" 1.35 -0.968 -1.18" 2.00" -0.55" -0.85"
95 -0.28 -2.92" 1.05 0.44" -0.49" 3.42" -0.56" -0.48" 1.41 - -0.80" -0.05" 2.48" -0.60" -1.04"
96 -1.50 -2.85" 1.44" 0.52" -0.26 - 3.86 -0.43" -0.09 - 1.50" -2.29" -0.27" 2.36 -0.64 " -0.42"
MEAN -0.07 -3.57 0.75 0.77 -0.13 3.68 -0.78 -0.67 1.69 -1.96 -1.18 2.25 -0.93 -0.95
MAX 0.45 -2.79 1.44 1.52 0.92 4.37 -0.43 -0.09 2.14 -0.80 -0.05 2.67 -0.55 -0.42
MIN -1.50 -5.21 0.25 0.43 -0.53 3.22 -1.25 -1.09 1.35 -2.86 -2.90 1.77 -1.36 -1.31
MERCOSUR IMERCOSUR MERCOSURMERCOSUR Imports Exports
Addtionaleffect on intra- Overall Boc Overall Blc
Year bloc trade Imports Exports80 2.28 -0.59 0.4381 2.69 - -. 23 - 0.13 -82 2.75 -1.54 0.0983 2.92 -1.86 0.27 -84 3.32 -2.04 0.49
85 2.94 -1.98 0.5886 3.05 -1.45 0.0987 2.58 -1.17 0.0688 2.80 -1.50 0.2289 2.59 -1.45 - 0.36
90 2.34 -1.48 0.2291 2.09 -1.24 - 0.0792 2.13 -1.17 -0.0593 2.16 -0.95 -0.3894 2.15 -0.85 -0.55
95 2.07 -0.80 - 0.3598 2.77 -1.09 -0.36
MEAN 2.55 -1.31 0.08MAX 3.32 -0.59 0.58MIN 2.07 -2.04 -0.55

TABLE 3GRAVITY ESTIMATIONS: YEAR AVERAGES
Test of difference 0Estimates Estimates Estimates coefficients:
Variables Avg.86-88 Sign. Avg.86-88 Sign. Avg.95-96 Sign. 1=2 1=3 2=3(1) (2) (3)
INTERCEPT -12.85 0.21 -3.84LogGDPlmporter 1.12 - 1.16 1.18LogGDP Exporter 1.41 1.51 1.69LogPopulation Importer -0.02 -0.09 -0.19LogPopulation Reporter -0.18 -0.29 -0.35LogAvg.Distance Importer 0.77 0.62 0.84LogDistance ij -0.92 -0.97 -0.99LogAreaRep. -0.17 -0.16 -0.06LogAreaPart. -0.15 -0.09 - -0.07
LogDev.RealExchRate Importer 0.21LogDev.RealExchRate Exporter 1.35
Dummy Common Land Border 0.07 0.02 -0.24Dummy Importer is an Island 0.10 -0.04 0.05Dummy Exporter is an Island -0.07 -0.23 -0.14Dummy lor Spanish 1.78 1.64 1.70Dummy fhr English 0.34 0.39 0.19DummyforArabic 1.68 1.82 2.11Dummy fhr Portuguese 0.59 0.97 0.88
EC -1.45 -1.17 - -0.88EC-imports 1.25 " 0.89 0.72EC-Exports 0.49 0.07 -0.15
EFTA -0.46 -0.60 -0.27EFTA4mports 1.02 - 0.63 " 0.26EFTA-Exports 0.62 0.15 -0.03
ASEAN 0.18 0.09 -1.06ASEAN-Imports 0.15 0.30 0.82ASEAN-Exports 0.70 - 0.67 0.99
GULFCOOP 1.42 1.20 2.07GC-lmports 0.27 0.15 -0.48GC-Exports -4.18 - -3.02 -3.21
NAFTA 0.43 0.72 1.17NAFTA-Imports 0.91 0.65 0.48NAFTA-Exports 0.49 -0.58 " -0.73
CACM 3.84 2.93 3.43CACM-lmports -0.84 -0.94 -0.50CACM-Exports -0.56 -0.50 -0.32
LAFTA 1.42 1.50 1.38 -LAFTA-Imports -1.83 -1.86 -1.10 -LAFTA-Exports -2.18 - -0.67 -0.06
ANDEAN 2.03 1.77 2.36 -ANDEAN-imports -0.76 -0.72 - -0.55ANDEAN-Exports -0.80 -1.08 - -0.79 -
MERCOSUR 2.28 2.49 - 2.15 -MERCOSUR-imports -1.06 - -1.32 - -0.71MERCOSUR-Exports 0.27 -0.03 -0.06
Tobit estimates of one single regression.Number of observations=9918. Number of Censored Observations=588. Significance: 99%, "95%. ' 90%Pseudo R2=1-(See/Syy)=0.76Each PTA has three dummies: one when both countries i and j are in the PTA;another dummy when the importer country i is member of the kIh bloc, indicated in the table as PTA-imports;and a third dummy when the exporter country j is member of the kth bloc, indicated as PTA-Exports.
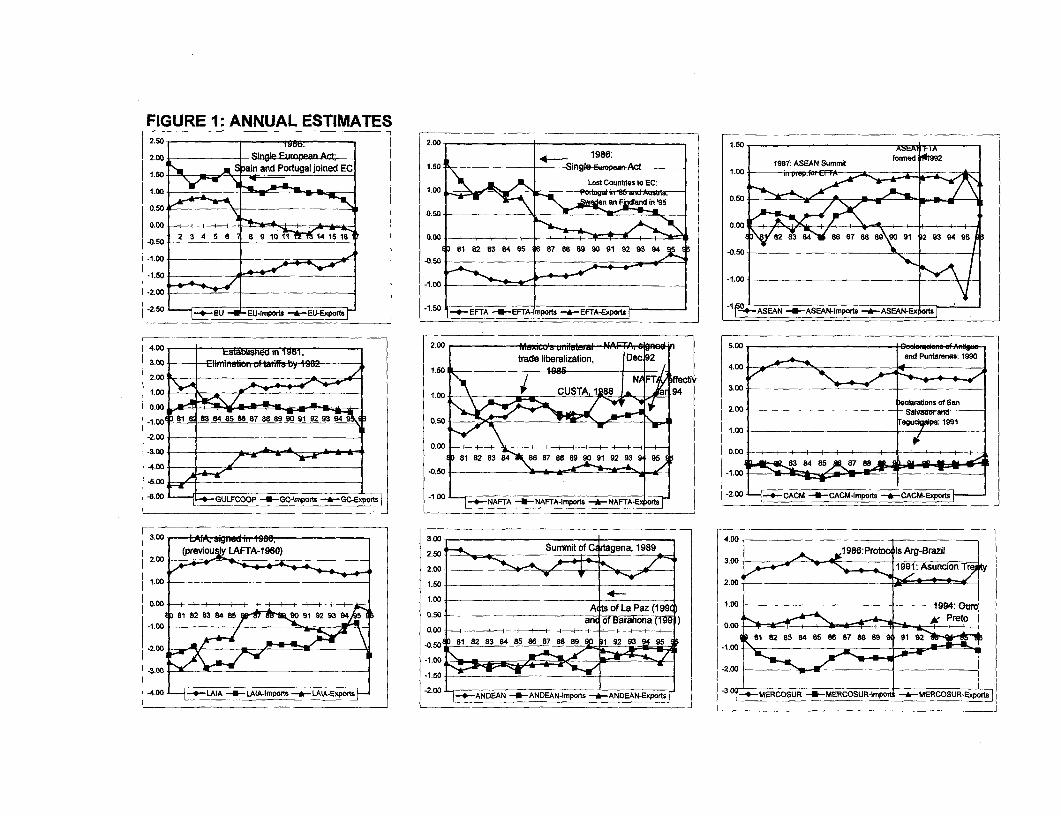
FIGURE 1: ANNUAL ESTIMATES_~ ~ ~ ~ ~ ~ ~~~~~20 _ . _____________________
2.00 _ _ _ _ _ __ _ _ __ _ _1988.tfnW 1
pain and Portugal joined EC 50 1987: ASEAN Summit1.50 Lost Count_eo o t to 1.00 h0 :or EF A
81 8283s8485s1 87 888989091 9293s94 s, -o.so0
-0.50~ ~ ~ ~ ~~~~~~~~~~~~~~~05
-00 . .1.00 .yL
a -. 00
-25 t --150 I_EFTA 1U ETA- m -81-ASEAN -ASEAN-Imps A ASEAN-
4.0 - StaDilSre in iY 1 -'.0 k 0
2.00A, 5.00 Dlr s*i3.00o- =Ellimmation oftaEy92- .0 Mxcts,;aerlNFDc 2.4.00 \ anPnrns19902
1.00' CUT, 88~ N 8.94 f fet 3.00 ____| |_
000 ~ ~ ~ ~ ~ ~ ~ ~ ~ ~~~~~~10
-200 I18 838485888788899091929949 0.50
-300 - S | 3.00r -94 |3* | 4.W0-0
| | (previous,yLAFTA-1960) l l ^ zso | 1986:ProtorzisArg-B~~~~~~~~- I >K ration of Sa
OM 8 8 813 8 4 85-*--a2.00alvac8234 8 89 12 95 838485
-400 -0.80 ________________99
-2.00 - ~~~~~~~~~~~~~~~~~~~~~~~~~~~~~~~1.00
1 -2 0 0 L N f - 4 1 s-esot 8r s2 ~~83 84 ss 91 92 93 994 , 2 95 28S8 58 7 88 t9-4.3.o_
5&+]00 -
ad-ML8 84 8
-500 A I A -200 -AiA-mrAorls AU CA M-mp ri -A*-CACM-Expot ts_A N DrA N b A N D E A N -l m rJ orls _ _ = _
-5.00 ~ ~ ~ ~ ~ ~ ~ ~ ~ ~ ~ ~ ~ ~ ~ ~ ~ ~ ~ ~ ~ ~ ~ ~~~~~~0
3.0 revious .i.1C,30Summit of C~ rtagena, 1989 98Pt IsA-Bai(peiosy LAFTA-1960) 2.50 18:rtc tAgBai2.00 203.00 1991: Asnoion T
1.00 -.. .1.50 __ _ _ _ _ _2.00
_ _ _ _ _ _ _ _ _ _ _1.00 40.0 82 S 4 : A(t of La Paz(199 1.00 19:Ot
1828848590 91 92 939 050 anc of Barahiona (1A) Preto-1.00 T )0.00
0.00 i i i ii
-2.00 -0.50 81 82 83 8485 8687 8889 901?9293 -495 -1.0 882 8364 85 8687 8889 9192i
-3.00 - 0-2.00-1.50
-40 --4Li 0-0AAImots-- 2AExOls-.00 4-NEA U-NEA-mors-*ADENExots7ANDEANSU UME OSRlrp --- MR0SREsoi
Annex 1
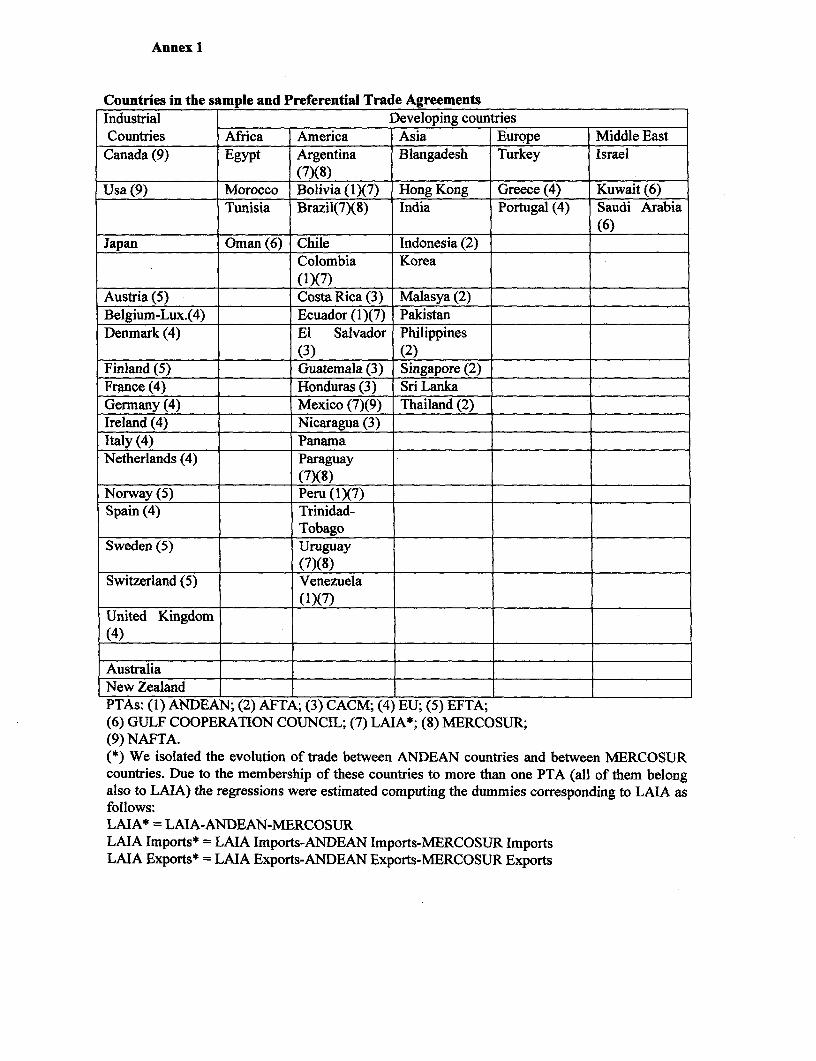
Countries in the sample and Preferential Trade AgreementsIndustrial Developing countriesCountries Africa America Asia Europe Middle East
Canada (9) Egypt Argentina Blangadesh Turkey Israel(7)(8)
Usa (9) Morocco Bolivia (1 )(7) Hong Kong Greece (4) Kuwait (6)Tunisia Brazil(7)(8) India Portugal (4) Saudi Arabia
(6)Japan Oman (6) Chile Indonesia (2)
Colombia Korea(1)(7)
Austria (5) Costa Rica (3) Malasya (2)Belgium-Lux.(4) Ecuador (1)(7) PakistanDenmark (4) El Salvador Philippines
(3) (2)Finland (5) Guatemala (3) Singapore (2)France (4) Honduras (3) Sri LankaGermany (4) Mexico (7)(9) Thailand (2)Ireland (4) Nicaragua (3) _
Italy (4) PanamaNetherlands (4) Paraguay
(7)(8) _ lNorway (5) Peru (1)(7) ___Spain (4) Trinidad-
TobagoSweden (5) Uruguay
(7)(8)Switzerland (5) Venezuela
(1)(7)United Kingdom(4)
AustraliaNew ZealandPTAs: (1) ANDEAN; (2) AFTA; (3) CACM; (4) EU; (5) EFTA;(6) GULF COOPERATION COUNCIL; (7) LAIA*; (8) MERCOSUR;(9) NAFTA.(*) We isolated the evolution of trade between ANDEAN countries and between MERCOSURcountries. Due to the membership of these countries to more than one PTA (all of them belongalso to LAIA) the regressions were estimated computing the dummies corresponding to LAIA asfollows:LAIA* = LAIA-ANDEAN-MERCOSURLAIA Imports* = LAIA Imports-ANDEAN Imports-MERCOSUR ImportsLAIA Exports* = LAIA Exports-ANDEAN Exports-MERCOSUR Exports

Policy Research Working Paper Series
ContactTitle Author Date for paper
WPS2136 An Empirical Analysis of Competition, Scott J. Wallsten June 1999 P. Sintim-AboagyePrivatization, and Regulation in 38526Telecommunications Markets inAfrica and Latin America
WPS2137 Globalization and National Andres Solimano June 1999 D. CortijoDevelopment at the End of the 8400520'h Century: Tensions and Challenges
WPS2138 Multilateral Disciplines for Bernard Hoekman June 1999 L.TabadaInvestment-Related Policies Kamal Saggi 36896
WPS2139 Small States, Small Problems? William Easterly June 1999 K. LabrieAart Kraay 31001
WPS2140 Gender Bias in China, the Republic Monica Das Gupta June 1999 M. Das GuptaOf Korea, and India 1920-90: Li Shuzhuo 31983Effects of War, Famine, andFertility Decline
WPS2141 Capital Flows, Macroeconomic Oya Celasun July 1999 L. NathanielManagement, and the Financial Cevdet Denizer 89569System: Turkey, 1989-97 Dong He
WPS2142 Adjusting to Trade Policy Reform Steven J. Matusz July 1999 L. TabadaDavid Tarr 36896
WPS2143 Bank-Based and Market-Based Asli DemirgOu-Kunt July 1999 K. LabrieFinancial Systems: Cross-Country Ross Levine 31001Comparisons
WPS2144 Aid Dependence Reconsidered Jean-Paul Azam July 1999 H. SladovichShantayanan Devarajan 37698Stephen A. O'Connell
WPS2145 Assessing the Impact of Micro-credit Hassan Zaman July 1999 B. Mekuriaon Poverty and Vulnerability in 82756Bangladesh
WPS2146 A New Database on Financial Thorsten Beck July 1999 K. LabrieDevelopment and Structure Ashl Demirgi,-Kunt 31001
Ross Levine
WPS2147 Developing Country Goals and Constantine Michalopoulos July 1999 L. TabadaStrategies for the Millennium Round 36896
WPS2148 Social Capital, Household Welfare, Christiaan Grootaert July 1999 G. OchiengAnd Poverty in Indonesia 31123

Policy Research Working Paper Series
ContactTitle Author Date for paper
WPS2149 Income Gains to the Poor from Jyotsna Jalan July 1999 P. SaderWorkfare: Estimates for Argentina's Martin Ravallion 33902Trabajar Program
WPS2150 Who Wants to Redistribute? Russia's Martin Ravallion July 1999 P. SaderTunnel Effect in the 1990s Michael Lokshin 33902
WPS2151 A Few Things Transport Regulators Ian Alexander July 1999 G. Chenet-SmithShould Know about Risk and the Cost Antonio Estache 36370Of Capital Adele Oliveri
WPS2152 Comparing the Performance of Public Antonio Estache July 1999 G. Chenet-Smithand Private Water Companies in the Martin A. Rossi 36370Asia and Pacific Region: What aStochastic Costs Frontier Shows
WPS2153 The Mystery of the Vanishing Martin Ravallion July 1999 P. SaderBenefits: Ms. Speedy Analyst's 33902Introduction to Evaluation
WPS2154 Inter-Industry Labor Mobility in Howard Pack August 1999 H. SladovichTaiwan, China Christina Paxson 37698
WPS2155 Lending Booms, Reserves, and the Barry Eichengreen August 1999 S. KpundehSustainability of Short-Term Debt: Ashoka Mody 39591Inferences from the Pricing ofSyndicated Bank Loans