Examining relationships between external linkages ... - CORE
356
•
-
Upload
khangminh22 -
Category
Documents
-
view
0 -
download
0
Transcript of Examining relationships between external linkages ... - CORE

Loughborough UniversityInstitutional Repository
Examining relationshipsbetween external linkages,absorptive capacity andgains in new product
knowledge and impacts onnew product innovativeness
This item was submitted to Loughborough University's Institutional Repositoryby the/an author.
Additional Information:
• A Doctoral Thesis. Submitted in partial ful�llment of the requirementsfor the award of Doctor of Philosophy of Loughborough University.
Metadata Record: https://dspace.lboro.ac.uk/2134/6916
Publisher: c© Shih-Tung Shu
Please cite the published version.

This item is held in Loughborough University’s Institutional Repository (https://dspace.lboro.ac.uk/) and was harvested from the British Library’s EThOS service (http://www.ethos.bl.uk/). It is made available under the
following Creative Commons Licence conditions.
For the full text of this licence, please go to: http://creativecommons.org/licenses/by-nc-nd/2.5/

Examining Relationships Between External
Linkages, Absorptive Capacity and Gains in
New Product Knowledge and Impacts on
New Product Innovativeness
By
Shih-Tung Shu
A Doctoral Thesis
Submitted in partial fulfillment of the requirements for the award of Doctor of Philosophy
Business School, Loughborough University
2003

Abstract
This thesis investigates relationships between external linkages and new product
innovativeness focusing particularly on the perspective of a knowledge-enabled view
of new product development. Building on organisational learning theory and
knowledge-based theories of inter-firm collaboration, this thesis argues that the effects
of external linkages on new product innovativeness vary and these are largely
contingent upon a finn's absorptive capacity. The finn's level of absorptive capacity
determines how effectively knowledge from external collaborators relevant to the new
product project is absorbed, resulting in the creation of new knowledge that the finn
can apply for its own commercial use. It considers why some firms are more effective
than others at absorbing new product related knowledge from external collaborators to
facilitate more innovative product development.
Based on an empirical study of 116 new product development projects in
Taiwanese Information Technology (IT) firms, the thesis assesses the relative
importance of external linkages in increasing new product innovativeness. The results
show that the impact of horizontal links (that is, collaboration with other companies,
research institutes, and universities) on gains in new product related knowledge is
greater than that of vertical linkages (that is, supplier and customer involvement).
Compared to links with customers, universities, and research institutes, corporate
linkages play the most prominent and consistent role in enhancing the accumulation
of new product related knowledge. This knowledge namely pertains to
predevelopment assessment, R&D, manufacturing and marketing. The thesis confirms
that the firm's absorptive capacity positively affects its gains in new product related
knowledge. In addition, absorptive capacity's interactions with corporate linkages
have significant, positive effects on gains in new product related knowledge. However,
ii

such interaction effects were not observed for the other external linkages, with
exception of industry-based research institute linkage. Moreover, the results confinn
that the positive impacts of absorptive capacity, corporation linkages, and supplier
linkages on new product innovativeness are mediated by the extent of new product
related knowledge gained.
This thesis bridges the gap between theories of organisational absorptive
capacity and the effective generation of new products. It contributes to our
understanding of the role of a firm's absorptive capacity in NPD research. It examines
this issue from a knowledge-enabled view of new product development. The findings
will assist managers to more effectively formulate NPD strategy by incorporating
firms' internal learning capacity with the complementary knowledge and technology
that external collaborators can provide.
Key ivords: New product development; external linkages; absorptive capacity; new
product innovativeness; NPD collaboration; Taiwanese IT industry
iii

Table of Contents
List of Tables ................................................................................... viii
List of Figures .................................................................................. x
List ofAbbreviations ........................................................................ X1
Chapter 1 Introduction 1.1 Background .......................................................................
1 1.2 Research Objectives an Contributions ........................................
3 1.3 Thesis Overview ................................................................
4 1.4 Organisation of the Thesis ..................................................... 7
Chapter 2 Literature Review 2.1 introduction 9 2.2 Organisational Leaming and Product Innovation ........................... 11
2.2.1 Content of Organisational Learning - Cognition vs. Behaviour ............................................................... II
2.2.2 Levels of Learning ....................................................
13
2.2.3 Types of Learning ..................................................... 17
2.2.4 Technological Learning and Product Innovation .................. 24
2.2.4.1 Towards A Definition of Technological Learning.... 24
2.2.4.2 Internal and External Learning .......................... 25
2.2.4.3 The Impact of Technological Learning on Product
Innovativeness ............................................. 27
2.3 Knowle dge Management and Product Innovation .......................... 32
2.3.1 Organisational Learning and Organisational Knowledge ........ 32
2.3.2 The Dynamics of Organisational Knowledge Creation .......... 35
2.3.3 The Impact of Knowledge on Product Innovativeness ........... 38
2.4 Product Innovation: An External Linkage Perspective ..................... 44
2.4.1 The Importance of External Linkages .............................. 44
2.4.2 Modes of External Linkage and Sourcing Technological Knowledge ............................................................. 47
2.4.3 External Linkages for Knowledge Accumulation and Product Innovation ................................................... 52 2.4.3.1 Classification of External Linkages .....................
52 2.4.3.2 NPD Leaming Through Vertical Linkages ............
54
iv

2.4.3.3 NPD Learning Through Horizontal Linkages ......... 59
2.5 Absorptive Capacity and External Knowledge Acquisition ............... 65
2.5.1 Concept of Absorptive Capacity ................................... 66
2.5.1.1 The ability to recognise and value new external knowledge .................................................
67 2.5.1.2 The ability to assimilate new external technology 67 2.5.1.3 The ability to commercialise new
external knowledge ....................................... 68
2.5.1.4 Development of absorptive capacity .................. 69 2.5.2 The Impact of Absorptive Capacity on External Knowledge
Acquisition ............................................................ 70
2.5.3 Other Constructs of Knowledge Acquisition Capability ....... 74 2.6 Conceptual Framework ......................................................... 78 2.7 Summary ......................................................................... 80
Chapter 3 Research Hypotheses 3.1 Introduction ...................................................................... 82 3.2 External Linkages and New Product Innovativeness ......................
83 3.2.1 The Effects of Horizontal and Vertical Linkages on Gains
in New Product Knowledge ........................................ 83 3.2.2 The Mediating Role of Gains in New Product Knowledge.... 90
3.3 Absorptive Capacity and External Knowledge Absorption ............... 91 3.3.1 The Direct Effect of Absorptive Capacity on Gains in New
Product Knowledge ................................................. 91 3.3.2 The Moderation Role of Absorptive Capacity ................... 94
3.4 Summary ......................................................................... 95
Chapter 4 Research Method 4.1 Introduction ...................................................................... 96 4.2 Instrument Development
....................................................... 96
4.3 Unit of Analysis and Sampling Frame ....................................... 97
4.4 Measurement of Variables ...................................................... 100 4.4.1 Measures of Absorptive Capacity
................................. 100
4.4.2 Measures of External Linkages ....................................
104
4.4.3 Measures of Gains in New Product Knowledge ................. 105
4.4.4 Measures of New Product Innovativeness ........................
108
4.4.5 Control Variables ..................................................... 110
4.5 Analytical Methodology .......................................................
V

4.5.1 Hierarchical Regression Analysis ................................. III
4.5.2 Moderated Regression Analysis ................................... 112
4.5.3 Mediated Regression Analysis ..................................... 116
4.6 Summary ......................................................................... 118
Chapter 5 Pilot Study, Large-scale Survey and Assessment of Measurement Instrument
5.1 Introduction ..................................................................... 119
5.2 Questionnaire Development and Pre-pilot Testing ........................ 119
5.3 Pilot Study ...................................................................... 121
5.4 Pilot Study Results and Item Modification ................................. 123
5.4.1 Absorptive Capacity ................................................ 125
5.4.1.1 Item Purification .......................................... 126
5.4.1.2 Factor Analysis ............................................ 128
5.4.1.3 Item Revision ............................................. 129
5.4.2 Gain in New Product Knowledge ................................. 130
5.4.2.1 Item Purification and Factor Analysis ...........................................
131
5.4.2.2 Item Revision ............................................. 132
5.4.3 New Product Innovativeness ....................................... 133
5.4.3.1 Item Purification and Exploratory Factor Analysis.. 133
5.4.3.2 Item Revision ............................................. 134
5.4.4 A Summary of The Pilot Study .................................... 134
5.5 Large-scale Survey Administration .......................................... 135
5.5.1 Development of the Survey Mail List ............................. 135
5.5.2 Questionnaire Packet ................................................ 136
5.5.3 Follow-up Procedures ............................................... 137
5.6 Profile of Respondents ........................................................ 137
5.7 Tests for Non-response Bias .................................................. 138
5.8 Assessment of The Measurement Instrument ..............................
140
5.8.1 Instrument Validation of Absorptive Capacity ................... 141
5.8.2 Instrument Validation of Gains in New Product Knowledge ... 150
5.8.3 Instrument Validation of New Product Innovativeness ......... 155
5.9 Conclusion: The Final Measurement Scales ................................. 158
Chapter 6 Descriptive Findings and Hypothesis Testing 6.1 Introduction ......................................................................
160
6.2 Sample Profiles and Descriptive Statistics ................................... 161
vi

6.2.1 Company Profiles .................................................... 161
6.2.2 Project Profiles ...................................................... 165
6.3 Data Examination ............................................................... 168
6.3.1 Assumptions in Multiple Regression Analysis ................... 168
6.3.2 Assessing Multicollinearity and Identifying Influential
Observations .......................................................... 168
6.4 Testing the Direct Effects of External Linkages on Gains in New
Product Related Knowledge ................................................... 171
6.5 Testing the Direct and Moderating Effects of Absorptive Capacity .........................................................................
177
6.5.1 Moderator - Absorptive Capacity ................................. 177
6.5.2 Results of Hierarchical Moderated Regression Analysis ...... 179
6.6 Testing the Mediating Effects of Gains in New Product Related
Knowledge ...................................................................... 191
6.7 Summary ........................................................................ 198
Chapter 7 Discussion of the Results 7.1 Introduction ..................................................................... 199 7.2 Effects of External Linkages on Gains in New Product Knowledge 200 7.3 The Direct Effect and Moderating Effect of Absorption Capacity ...... 204 7.4 The Mediating Effect of Gains in New Product Knowledge .............. 209 7.5 Summary ........................................................................
212
Chapter 8 Conclusion and Implications 8.1 Introduction .....................................................................
214 8.2 Summary of Key Research Findings .........................................
214 8.3 Key Contributions and Theoretical Implications ............................ 216 8.4 Managerial Implications .......................................................
221 8.5 Limitations of the Study .......................................................
225
8.6 Suggestions for Future Research ............................................. 228
Bibliography .............................................................................. 233
Appendix A Survey Questionnaires and Cover Letters ......................... 250
Appendix B An Outline of Taiwanese IT Industry ...... 272
........................ Appendix C Residual Plots for Regression Equations ..........................
291
vii

List of Tables
Table 2.1 Summary of Types of Organisational Learning and Changes....... 23
Table 2.2 Learning Skills and Innovation/Learning Leve ....................... 28
Table 2.3 Organisational Learning Process and Organisational Knowledge.. 34
Table 2.4 Summary of Impact of Knowledge on Product Innovation.......... 40
Table 2.5 Summary of Constructs Pertaining to Absorptive Capacity ......... 77
Table5.4.1.1 Absorptive Capacity- Initial Questionnaire Items .................... 125
Table 5.4.1.2 Absorptive Capacity - Item Purification Results ...................... 128
Table 5.4.1.3 Absorptive Capacity - Dimension-Level Factor Analysis........... 129
Table 5.4.2.1 Gains in New Product Knowledge - Initial Questionnaire Items .........................................................................
130
Table 5.4.2.2 Gains in New Product Knowledge - Item Purification Results.... 131
Table 5.4.2.3 Gains in New Product Knowledge - Dimension-level Factor Analysis ..................................................................... 132
Table 5.4.3.1 New Product Innovativeness -Initial Questionnaire Items .......... 133 Table 5.4.3.2 New Product Innovativeness Atem Purification Results ............. 134
Table 5.4.3.3 New Product Innovativeness - Construct-level Factor Analysis .... 134 Table 5.6.1 The Profile of Respondents .............................................. 138 Table 5.7.1 t-Test for Non-Response Bias ........................................... 139 Table 5.8.1.1 Absorptive Capacity (AC) - Questionnaire Items .................... 142 Table 5.8.1.2 Absorptive Capacity - Reliability Analysis Results .................. 143 Table 5.8.1.3 Absorptive Capacity - Factor Analysis Results (1) ................... 145 Table 5.8.1.4 Absorptive Capacity - Factor Analysis Results (2) .................. 146 Table 5.8.1.5 Absorptive Capacity - Factor Analysis Results (3) .................. 147 Table 5.8.1.6 Summary of Goodness-of-Fit Statistics for Absorptive Capacity
(Second-Order CFA) ..................................................... 148
Table 5.8.2.1 Gain in New Product Knowledge (PK)- Questionnaire Items...... 150 Table 5.8.2.2 Gain in New Product Knowledge - Factor Analysis Results (1) ... 151 Table 5.8.2.3 Gain in New Product Knowledge - Factor Analysis Results (2) ... 152 Table 5.8.2.4 Summary of Goodness-of-Fit Statistics for Gains in New Product
Knowledge (First-Order CFA) .......................................... 153
Table 5.8.3.1 New Product Innovativeness (PI) - Questionnaire Items ............ 155
Table 5.8.3.2 New Product Innovativeness - Reliability Analysis Results ........ 155
Table 5.8.3.3 New Product Innovativeness- Factor Analysis Results .............. 156
Table 5.8.3.4 Summary of Goodness-of-Fit Statistics for New Product
viii

Innovativeness (First-Order CFA) ..................................... 157
Table 5.9.1 Summary of the Final Scales ............................................
157
Table 6.2.1.1 Profile of the Firms ....................................................... 162
Table 6.2.1.2 Industry Sectors of the Sample .......................................... 163
Table 6.2.1.3 Results of ANOVA: Industrial Sectors and Firms' Characteristics 164
Table 6.2.1.4 Results of ANOVA: Industrial Sectors and Variables ................ 165
Table 6.2.2.1 Product types of the Sample ............................................. 166
Table 6.2.2.2 Results of ANOVA: Product Types and Firms' Characteristics.... 167 Table 6.2.2.3 Results of ANOVA: Industrial Sectors and Variables ................ 167 Table 6.4.1 Correlation Matrix ......................................................... 174 Table 6.4.2 Results of Hierarchical Regression Analysis: Effects of
External Linkages on Gains in New Product Knowledge (1) ....... 175 Table 6.4.3 Results of Hierarchical Regression Analysis: Effects of
External Linkages on Gains in New Product Knowledge (2) ....... 176 Table 6.5.1.1 Summary of Pairwise Comparisons: Four Dimensions of
Absorptive Capacity ...................................................... 178 Table 6.5.1.2 Summary of ANOVA: Four Dimensions of Absorptive Capacity.. 178 Table 6.5.1.3 Correlations for Absorptive Capacity .................................. 179 Table 6.5.2.1 Results of Regression Analysis: Effect of Control Variables ....... 183 Table 6.5.2.2 Results of Moderated Regression Analysis: Predicting Gain in
R&D Knowledge ......................................................... 184 Table 6.5.2.3 Results of Moderated Regression Analysis: Predicting Gain in
Manufacturing Knowledge .............................................. 186
Table 6.5.2.4 Results of Moderated Regression Analysis: Predicting Gain Pre-development Assessment Knowledge ............................. 187
Table 6.5.2.5 Results of Moderated Regression Analysis: Predicting Gain in Marketing Knowledge ...................................................
188 Table 6.6.1 Results of Mediated Regression Analysis: Predicting
Technological Innovativeness ........................................... 194 Table 6.6.2 Results of Mediated Regression Analysis: Predicting
Market Innovativeness ................................................... 195
Table 6.7 Summary of the Results of Hypothesis Testing ....................... 198
ix

List of Figures
Figure 2.1 Team Leaming Patterns for Product Innovation ...................... 29 Figure 2.2 Styles of Leaming, Knowledge Sources and Learning Foci .........
30
Figure 2.3 The Dynamics of Organisational Knowledge Creation - An External Knowledge Acquisition Perspective ..................... 37
Figure 2.4 Levels of Linkage and New Technology Capabilities ................ 50 Figure 2.5 Knowledge Sources of External Linkage for Product Innovation.. 54 Figure 2.6 Absorptive Capacity and External Technology .......................
69
Figure 2.7 The Conceptual Framework ............................................. 79
Figure 5.1 The Second-Order Diagram of Absorptive Capacity Model ....... 149 Figure 5.2 The First-Order Diagram of Gains in New Product Knowledge
Model ...................................................................... 154 Figure 5.3 The First-Order Diagram of New Product Innovativeness
Model ...................................................................... 157 Figure 6.1 An Illustration of Hypothesis Testing
.................................. 160 Figure 7.1 The Impacts of External Linkages and Absorptive Capacity
on Gains in New Product Knowledge ................................. .
207
x

List of Abbreviations
AC Absorptive capacity ANOVA Analysis of variance CD-RW Compact disk- read and write CIA Conf innatory factor analysis CITC Corrected item-to-total correlation CPU Central processing units DRAM Dynamic random assess memory ICS Integrated circuits ICVs Inter-firm cooperative ventures IT Information technology
LAN Local area network LCD Liquid crystal display
M&A Merge and acquisition MNCs Multi-national companies MRA Moderated regression analysis NICs Newly developed countries NPD New product development
OEM Original equipment manufacturers ODM Original design manufacturers PAK Pre-development assessment knowledge
PC Personal computer R&D Research and development
ROE Return on earning SMCS Small and medium-sized companies SRAM Static random access memory VCS Venture capital companies WAN Wide (broad band) area network
xi

Chapter 1 Introduction
Chapter I
Introduction
1.1 Background
Continuously developing and launching more state-of-the-art products than one's
competitors is one of the most challenging activities facing firms today. Their ability
to generate product innovations increasingly relies on the effective acquisition of new
product knowledge through external linkages (Bierly and Chakrabarti, 1996;
Leonard-Barton, 1995; Rothwell, 1992). However, new knowledge is often tacit,
un-codified, and contains 'sticky' information (Nonaka, 1994; Nonaka and Takeuchi,
1995; von Hippel, 1994; von Hippel, 1998). This thesis explores ways in which firms
gain new sets of knowledge or learn from potential partners in order to improve
existing technology bases and develop more innovative products.
Organisational learning literature highlights the importance of external integration
and boundary learning expansion efforts in enabling fin-ns to explore new
theory-in-use (Argyris and Schon, 1978) as well as knowledge, which can then lead to
radical innovation (Leonard-Barton, 1995; McKee, 1992). Along with this need for
external integration, scholars of the knowledge-based view of the firm (Grant, 1996;
Conner and Prahalad, 1996) advocate that the organisation's ability to innovate
depends on its capacity to integrate knowledge residing both inside and outside its
boundaries. However, for a given new product development (NPD) project, it is
unlikely that potential links with external parties, including customers, suppliers,
competitors, research institutes, and universities, will affect such
knowledge-integration and learning to an equal degree. Hence, external linkages may
vary in their relevance to, as well as their impacts upon, product innovativeness.
Moreover, the latter may depend not only on a new set of complementary product

Chapter I Introduction
knowledge that external links or alliances can provide, but also on the firrn's learning
ability or absorptive capacity (Cohen and Levinthal, 1990). This ability refers to the
extent to which the firm is equipped to absorb the new knowledge that it is available.
Arguably, both external linkages and internal absorptive capacity to access and gain
new product knowledge are necessary to facilitate innovative NPD.
Drawing on organisational. learning theory and the theory of knowledge-based
views of the finn, the thesis argues that the effects of external linkages on new
product innovativeness vary and are largely contingent upon a finn's absorptive
capacity. The firm's level of absorptive capacity determines how effectively
knowledge relevant to the new product project is absorbed from its external
collaborators, resulting in the creation of new knowledge that the firm can apply for
its commercial use. New product innovativeness is conceptualised as the extent of
newness of the technology embraced by the new product and of the market served
(Cooper, 1979). Past studies of product innovativeness have largely focused on
organisational learning factors, with much interest centering on the types of linkages A
or internal team learning skills (Bierly and Chakrabarti, 1996; Madhavan and Grover,
1998). Although previous organisational learning literature has examined inter-unit
knowledge transfer within an organisation. and the role of absorptive capacity in
enhancing a business unit's innovation performance (e. g., Tsai, 2001), less attention
has been focused on the interaction effects between absorptive capacity and
alternative external knowledge sources and impacts on new product innovativeness.
Previous research on technology transfer has also highlighted the need for strong
absorptive capacity when firms seek to leverage and benefit from the technical
know-how acquired from external suppliers of technology (Lane et al., 2001; Mowery
et al., 1996). However, inadequate attention has focused on distinguishing between
the types of external sources of new knowledge and impacts on new product
2

Chapter I Introduction
innovativeness. Moreover, few studies have delineated the mediating effects of new
knowledge or knowledge gain in explaining the impacts of external linkages on new
product innovativeness. There continues to be a need for product level research that
distinguishes between alternative external sources of knowledge, absorptive capacity,
and their influence on the effectiveness of learning activities in NPD.
1.2 Research Objectives and Contributions
The primary objective of this research is to explore the complex relationships
among external linkages, absorptive capacity, gain in new product knowledge, and
new product innovativeness. A secondary objective is to examine which types of
external linkages are most important in supporting the development of more
innovative products. More specifically, this thesis tests the important relationships
including: (1) the direct impact of a firm's absorptive capacity on the effectiveness of
gain in new product knowledge; (2) the direct impacts of firms' external linkages on
the effectiveness of gain in new product knowledge; (3) the moderating impact of
absorptive capacity between external linkages and gain in new product realted
knowledge; and, (4) the mediating impact of gain in new product related knowledge
in the relationship between external linkages and new product innovativeness.
A major contribution of this thesis to NPD literature is its integration of two
research streams: the theories of organisational absorptive capacity and the effective
generation of new products. It does this in order to bridge a gap in current
understanding of the role of a firm's absorptive capacity in new product development.
The thesis has implications for managers because it addresses a key issue for dynamic,
technology-based industries: that is, how firms can absorb new knowledge effectively
from external collaborators to achieve more innovative product development. The
research findings will assist managers in identifying - the factors that most affect a
3

Chapter 1 Introduction
firm's effectiveness in accumulating new product knowledge and technology,
enabling more effective use of existing NPD collaborators, and achieving greater new
product performance.
1.3 Thesis Overview
This thesis explores two related research questions: (1) what types of external
linkages most influence a NPD project's product innovativeness? and, (2) what is the
role that absorptive capacity plays in the relationship between a NPD project's
external linkages and new product innovativeness? A conceptual framework is
proposed depicting links between external linkages, absorptive capacity, gains in new
product knowledge and new product innovativeness. Effective new product
development requires a spectrum of know-how covering pre-development planning,
concept development and evaluation, marketing research, technical development,
pre-test, market launch (Cooper and Kleinschmidt, 1987; Song and Parry, 1996 &
1997). New product knowledge gained in a NPD project mediates the relationship
between external linkages and new product innovativeness. This rationale is based on
the fact that the primary objectives of external linkages in NPD are to gain access to
complementary technologies (Hamel, 1991; Link and Tassey, 1987; Rothwell and
Dodgson, 1991; Powell et al., 1996), to assess and acquire a new set of
complementary product-specific know-how, and to fill the gap between the product
domain and technology domain (Grant and Baden-Fuller, 1995). These linkages lead
to an increase in product knowledge stock. A novel product development requires new
product know-how (both marketing and technological). If the technology gap between
the new product know-how and the firm's existing product know-how can be
narrowed, the firm increases the probability of developing a more innovative product.
The conceptual framework regards absorptive capacity as a moderator (a quasi
4

Chapter I Introduction
moderator) residing between the relationship of external linkages and gains in new
product knowledge. Absorptive capacity is defined as a firm's ability to recognise the
value of new knowledge, assimilate it and apply it to commercial ends (Cohen and
Levinthal, 1990). Firms with a strong absorptive capacity are more able to assimilate
new product knowledge from external collaborators, resulting in more innovative
product development.
The researcher adapted the newness-to-the-firm approach to measure the level of
new product innovativeness. The constructs representing external linkages include
vertical linkages (i. e., customer linkage and supplier linkage) and horizontal linkages
(i. e., corporation linkage, research institute linkage, and university linkage). The
constructs of gains in new product related knowledge consist of gain in research and
development (R&D) knowledge, gain in manufacturing knowledge, gain in
predevelopment assessment knowledge and gain in marketing knowledge. Absorptive
capacity is a multi-faceted construct comprising existing knowledge base, knowledge
scanning ability, communications network, and communications climate. The
conceptual framework informs the development of hypotheses concerning the
relationships among the study's key constructs. Accordingly, this research is designed
to collect and analyse data for testing the proposed hypotheses.
The unit of research is a NPD project. The key informant method is used to
collect data through questionnaires. Because of the reflective nature of questionnaire
answering, the key infon-nants must have been closely involved in the NPD project
that is being referred to in their responses. Informants include R&D managers, new
product managers and vice presidents of R&D. In the questionnaire, they were asked
to select a NPD project that was launched in the past two years and with which they
were closely involved.
The initial questionnaire was developed from an extensive literature search and
5
Chapter I Introduction
pre-pilot tested with both NPD academics and practitioners. The measurement
instrument was then piloted with a sample of 72 managers who were R&D managers,
product managers and NPD project managers. The piloted results were used to
provide preliminary assessments on the reliability and validity of the instrument.
Taiwanese information technology (IT) industry was chosen as the primary context
for this research on the grounds that it is the third largest IT product producer in the
world, and that it represents the major ODM (original design and manufacturing)
source for international IT competitors'. Most NPD projects in this industry involve a
certain amount of networking for new technology acquisition (Wong et al., 1998). The
two most frequently used IT company index sources - the 2000 directory of Hsinchu
Science-based Industrial Park and the 2000 Top 1000 Taiwanese Manufacturing Firnis
of the Commonweath - were selected to form a sampling frame. The sampling frame
consists of firms, including four sub-industries - semiconductors, computer and
peripherals, telecommunications and software. With the help of high-tech venture
capital companies and investment banks, a list of 230 NPD related managers' names
was compiled. Administration of the survey followed a variation of Dillman's Total
Design Method (Dillman, 1978). Of the returned questionnaires, one hundred and
sixteen were usable, resulting in 50.43% response rate.
Both factor analysis and the corrected itern-to-total correlation analysis were
used to purify the multi-item measurement scales in order to ensure these scales'
validity and reliability. For research hypothesis testing, the summated scores from the
purified scales were submitted for hierarchical regression analysis.
On the whole, the results of empirical investigation support the framework
presented in the research model. The findings reflect the fact that the range and types
1 According to Asia IT report (2000), Taiwan is the third largest IT hardware producers worldwide next to the US and Japan. However, OENVODM orders represented more than 65% of IT exports in 1999.
6

Chapter I Introduction
of external linkages deployed in a NPD project characterise its external knowledge
acquisition potential. Horizontal linkages offer more opportunities for firms to gain
access to complementary knowledge that tends to lead to more innovative product
development. Absorptive capacity moderate's the effects of external linkages, in
particular the corporation linkage and research institute linkage, on gains in new
product knowledge. Moreover, the findings also confirm that the development of
more innovative products is mediated by the project unit's ability to learn from
external collaborators and to gain additional R&D, manufacturing, predevelopment
assessment, and marketing knowledge that facilitates more innovative product
development. In conclusion, this research explores the relationship between external
linkages and absorptive capacity in a sample of Taiwanese IT-industry based new
product development projects. It offers insights into the relative importance of
external linkages and the moderating influences of absorptive capacity in the
relationships between external linkages and new product innovativeness.
1.4 Organisation of the Thesis The thesis is organised into eight chapters. Following this introduction, Chapter
Two presents a review of the extant literature in new product innovation from the
perspectives of organisational learning and knowledge management. The literature
review informs the construction of a conceptual framework that integrates key
constructs of external linkages, gain in new product knowledge, absorptive capacity
and new product innovativeness.
Chapter Three proposes the research hypotheses of this study based on the
conceptual framework. The rationale underlying each hypothesis is discussed.
Chapter Four addresses the research methodology relating to research design,
operational isation of the constructs, and analytical techniques.
7

Chapter 1 Introduction
Chapter Five discusses the development of the questionnaire, its refinement,
pre-testing, and piloting. A preliminary examination of reliability and validity of the
measurement instrument is reported. In addition, it details the administration of the
large-scale survey and the purification of the construct items, as well as the validation
of the purified measures.
Chapter Six covers the main body of empirical analysis. It examines the direct
effects of external linkages on new product knowledge accumulation, and the
moderating role of absorptive capacity as well as the mediating role of gain in new
product knowledge between external linkages and new product innovativeness.
Empirical findings of the current study are summarised in Chapter Seven, where
the results are discussed in the light of relevant literature. Lastly, Chapter Eight
presents the implications, contributions, and limitations of the study, as well as future
research directions. Research instruments, the residual and normality plots of
regression analyses, and the outline of Taiwanese IT industry are provided in the
appendices.
T
8

Chapter 2 Literature Review
Chapter 2
Literature Review
2.1 Introduction
Knowledge management- the way companies generate, communicate, and
leverage their intelligent assets - has only recently emerged as an essential source of
competitive advantage. New product development, from this viewpoint, has
something to do with the continual process of creating, enlarging and retrieving the
repository of NPD knowledge that eventually leads to a competitive edge for firms in
the marketplace (Nonaka, 1991; Takeuchi and Nonaka, 1986). Learning theorists
(McKee, 1992; Malerba, 1992; Lynn et al., 1996; Leonard-Barton, 1995) with
technological innovation perspectives see NPD as a corporate-wide leaming process,
where multi-discipline knowledge is created, accumulated, and shared between
functional departments. Moreover, as suggested by organizational learning theory that
a double-loop mechanism challenges the validity of an established knowledge base
(Argyris, 1977), the development of truly innovative NPD knowledge requires that
firms allocate vast resources to boundary expansion and external integration (Kogut
and Zander, 1992; Leonard-Barton, 1995). As such, network studies emphasize the
importance of a firm's history of technological networking and cumulative stream of
technological projects in innovation implementation (Pennings and Harianto, 1992a &
1992b). Networking is deemed critical for facilitating access to strands of technology
that are unknown to a firm. Therefore, external partners can provide complementary
technologies and may participate in NPD alliances to implement innovations covering
multiple technologies (Grant and Banden-Fuller, 1995). This chapter reviews the
literature relevant to this research in order to establish a theoretical foundation for the
9

Chapter 2 Literature Review
development of a conceptual model that delineates the relationships between a firm's
external learning activities, NPD knowledge acquisitions and its product
innovativeness. This review particularly focuses on the theory of technological
learning and the knowledge-based theory of inter-firm collaboration, which are
applied to explain how and why technological learning and the acquisition and
assimilation of NPD knowledge affects a firm's product innovation efforts.
Section 2.2 starts with a discussion of organisational. learning and its relationship
to new product innovation. This section aims to investigate the concept that different
learning orientations (i. e. external and internal) lead to a distinct degree of product
innovativeness. More specifically, that external learning contributes more
significantly to product innovativeness than internal learning. These learning activities
lead the generation of organisational knowledge. Section 2.3 considers how
organisational knowledge is created through learning, how external knowledge is
assimilated and internalized, and what impact knowledge has on a firm's product
innovativeness.
Section 2.4 discusses factors affecting product innovation from an external
linkage perspective. Specifically, this section explores the reason why external
linkages differ in their effects on the degree of product knowledge accumulation that
accounts for a firm's product innovativeness. Section 2.5 discusses the concept of
absorptive capacity and its influence on the effectiveness of external knowledge
acquisition as well as product innovation. On the basis of the literature, Section 2.6
presents a conceptual framework, which delineates the relationship between external
linkages, absorptive capacity, gains in new product related knowledge and new
product innovativeness.
10

Chapter 2 Literature Review
2.2 Organisational Learning and Product Innovation
Organisational learning has generated great interest among organisational
theorists, management scientists, sociologists, and psychologists. Various definitions
have been proposed including the organisational learning as a process for detecting
and correcting errors (Argyris and Schon, 1978: 2), and as a process for improving
actions through better knowledge and understanding (Fiol and Lyles, 1985: 803). Still
other theories have argued that it is a process of learning by encoding inferences from
historical experiences into routines that guide behaviour (Levitt and March, 1988:
319), leaming through shared insights, knowledge, and mental model building on past
knowledge and experience (i. e. on memory) (Stata, 1989). Yet others refers to it as the
approach that organisations take in order to adapt and develop organisational
efficiency by improving utilization of their workforce's skills (Dodgson, 1993a: 319).
Huber (1991) argues "organisational learning occurs in an organisation if, through its
processing of information, the range of the organisation's potential behaviour
changes" (p. 89). The extent of these potential changes provides management
researchers with two fundamental conceptions, cognition and behaviour, to realise
theoretical avenues into an organisational learning study.
ZZI Content of Organisational Learning - Cognition vs. Behaviour
Management theorists, with a cognitive view of learning, posit that learning has
occurred when there has been an adjustment or change in the way organisations or
individuals process information, develop shared meaning, and interpret events, with a
focus on changes in knowledge and beliefs (Argyris and Schon, 1978; Crossan et al.,
1999; Fiol and Lyles, 1985; & Kim, 1993). In other words, learning has occurred if
there is a change in thought processes - an unobservable phenomenon. In contrast,
behavioural theorists postulate that learning has occurred if there is a noticeable
change in behaviour or action - observable factors, with a focus on the adaptation of
11

Chapter 2 Literature Review
systems and strategies (Daft and Weick, 1984; Daft and Huber, 1987; & Huber, 1991).
An organisation's cognitive systems are quite different from those of an
individual. Hedberg (1981: 19), adopting a cognitive perspective on organisational
learning, states that: " Organisations do not have brains, but they have cognitive
systems and memories. As individuals develop their personalities, personal habits,
and beliefs over time, organisations develop world-views and ideologies. Members
come and go, ... but organisations' memories preserve certain behaviours, mental
maps, norms, and values over time". The cognitive systems of organisations are
frequently referred to as shared mental models (Kim, 1993), belief systems, mental
maps (Argyris and Schon, 1978), or cognitive frameworks (Bartunek, 1984).
Fiol and Lyles suggest that learning involves changes in cognition, while
adaptation involves changes in behaviour. They state that: "it is essential to note the
difference between cognition and behaviour, for not only do they present the different
phenomena, but also one is not necessarily an accurate reflection of the other" (Fiol
and Lyles, 1985: 806). According to Cangelesi and Dill (1965), a behavioural
approach regards learning as synonymous with adaptation, which involves bringing
action in line with previous new needs. The adaptation (of behaviour) perspective on
learning assumes that changes in knowledge will ultimately be related to changes in
actions or behaviour (Crossan et al., 1995). By contrast, the interpretation (of
cognition) perspective on learning assumes that learning refers to when one assesses
something and then acts on it accordingly.
Although the perspectives of "cognitiorf' and "behaviour" are instrumental to
realising a conceptual i sation of a learning theory, most concepts of leaming theory
recognise the relevance of both approaches (Crossan et al., 1995). For example,
Garvin's comments reflect this phenomenon. He states that: "Organisational learning
can be traced through three overlapping stages. The first step is cognitive. Members
12

Chapter 2 Literature Review
of an organisation who are exposed to new ideas expand their knowledge, and begin
to think differently. The second is behavioural. Employees begin to internalize new
insights and alter their behaviour. And the third step is performance improvement,
with changes in behaviour leading to measurable improvements in results: superior
quality, better delivery, increased market share, or other tangible gains. Because
cognitive and behavioural changes typically precede improvements in performance, a
complete learning must include all three. " (Garvin, 1993: 90). Kim (1993) suggests
that in the context of technological learning for innovation, it is sufficient to put
forward the acquisition of "know-how" (which implies the physical ability to produce
some activities) as behavioural (operational) leaming, and the acquisition of
"know-why" (which implies the ability to articulate a conceptual understanding of an
experience) as cognitive (conceptual) leaming. Both cognition and behaviour
approaches allow organisational learning theorists to examine learning results
according to the extent of the learning object which an organisation has achieved.
2.2.2 Levels ofLearning
The literature on organisational learning is for the most part divided over
whether learning occurs at an individual level, or at a group level, or at the level of
the organisation as a whole. However, theories of learning by individuals, groups, and
organisations are crucial for understanding organisational. learning. The following
three sections will examine these theories in detail.
Individual-level Learning
Much of the research on individual learning comes from psychological studies of
human behaviour. Behaviourists provided some of the earliest theories of learning in
tenns of stimulus-response models of behaviour (Skinner, 1938). Cognitive theorists
then offered an interpretation of concepts like memorising, and forgetting under the
model of stimulus-response generalizations (Postman, 1963, Underwood, 1964). The
13

Chapter 2 Literature Review
information processing perspective of cognitive psychology (with an emphasis on
problem-solving) viewed learning as a change in states of knowledge, rather than a
change in probabilities of response (Bruner et al., 1956). The research focus then
shifted to investigate memory structures, processing of information, the organisation,
and acquisition of and the search for information in problem solving (Klahr and
Wallance, 1976, Newell and Simon, 1972).
March and Olson (1975) advanced an individually based perspective to
organisational learning that focuses on information exposure, memoM retrieval,
learning incentives, and belief structures of an organisation's members. They
developed a conceptual model of learning based on the assumption that the
individual's belief (which affects individual action and is, in turn, affected by
environmental response) influences the actions of organisations (ibid, 1975).
According to this view, a complete cycle of organisational learning should be a tight
chain between individual action, organisational action, environmental response and
individual beliefs. Likewise, Simon offers a straightforward interpretation of
organisational learning that suggest: "all learning takes places inside individual
human heads; an organisation learns in only two ways: (a) by the learning of its
members, or (b) by ingesting new members who have knowledge the organisation
didn't previously have" (Simon, 1991: 125). This interpretation holds that internal
learning- that is, transmission of information/knowledge from one organisational
member or group of members to another, is a fundamental part of organisational
learning. However, this stream of theory omits consideration of a crucial element of
organisational learning - external learning - which radical innovations rely upon.
Group-level Learning
Several organisational learning theorists have recognised that learning occurs not
only at the individual level, but at the group level as well. These theorists assert that
14

Chapter 2 Literature Review
organisational learning would be incomplete if no information was disseminated
(Shrivastava, 1983; Daft and Weick, 1984; Stata, 1989; Huber, 1991; & Kim, 1993).
This notion of group learning emphasises the transmission of information among
group members. For instance, Daft and Huber (1987) suggest that organisations
would need to design two learning systems -a logistical system to handle the
processing of data, and an interpretive system to enable an appropriate perception and
understanding of data. Another perspective of group-based learning focuses on the
change and development of organisational knowledge (Duncan and Weiss, 1979;
Nonaka, 1994). Duncan and Weiss suggest that organisational learning is possible
only to the extent that there is communication among individuals who engage in
organisational activities and formulate action-outcome knowledge. Moreover, Nonaka
(1995) proposes a middle-up-down management, emphasising the dynamic role
middle managers play in communicating information upwards and downwards to
facilitate knowledge creation, which is required in a learning organisation. Clearly,
learning theorists with a group-based perspective tend to focus on how data,
infonnation and knowledge flow amongst organisational members to achieve
effective organisational learning.
Organisation-level Learning
A widely accepted view of organisational level learning is that the systems,
structures, and procedures of an organization affect learning (Fiol and Lyles, 1985).
Hedberg (198 1) asserts that systems, structures, and procedures of an organisation are
the repositories for learning. The recognition of an organisational level component
within organisational learning leads proponents of this view to suggest that unless the
knowledge gained from a system is encoded and institutionalized, only individuals
but not organisations learn (Argyris and Schon, 1978). That is, a transfer of
knowledge from the individual to the organisation results in learning at an
15

Chapter 2 Literature Review
organisational level as distinct from learning at the individual level. Levitt and March
state that organisations learn "by encoding inferences from history into routines that
guide behaviour" (Levitt and March, 1988: 320). Likewise, Shrivastava (1983)
explains this process as the "conversion of individual knowledge and insights into a
systematic organisational knowledge base which informs decision-making" (1983:
18).
Studies of learning at the organisational. level primarily focus on "organisational
routines. " This stream of research maintains that organisational learning involves the
development of new and continually improved routines (March and Olsen, 1975;
Levitt and March, 1988; Kim, 1993). These new routines may well be the outcome of
trial and error that results from leaming about old routines, and/or arises from
incomplete socialisation of organisational members (March and Olsen, 1975).
Routines, for example, that are held in the organisational memory include collective
norms nil about appropriate behaviour, myths and technology, and may be simple or
complex in their components. Routines that specify the nature of production runs may
be fairly simple and those that prescribe the way that organisations view themselves
in relation to other firms in the marketplace may be complex (Levitt and March,
1988). Organisational routines, such as standard operating procedures, are generally
viewed as an important part of an organisation's memory, a repository of its past
leaming (Kim, 1993).
Theorists of the strategic renewal perspective have tended to develop a learning
framework at the organisational level. For example, Kim (1993) and Crossanm et al.
(1999) suggest that through shared mental models, the thoughts constructed affect
how people and organisations operate in the world, and it is these results of learning
that can then be institutionalised. The learning models of this stream of research tend
to apply both cognitive and behavioural approaches to integrate the three learning
16
Chapter 2 Literature Review
levels (i. e. individual, group, and organisational) in order to achieve a holistic view of
organisational leaning.
ZZ3 Types ofLearning
Researchers in management have proposed a variety of dyadic types of learning,
which can be used to distinguish the effectiveness of learning. In these dyadic types
of learning, there has been much argument about the nature of incremental and radical
(or transfonnational) learning (Argyris and Schon, 1978; Miner and Mezias, 1996).
Both learning types are differentiated primarily on the basis of the degree of change to
observed patterns of organisational behaviour. Simply put, incremental learning
manifests itself by small changes in patterns of behaviour, whilst radical learning
manifests itself in fundamental changes in behaviour patterns (Crossan et al., 1995).
Similarly, this distinction often applies to new product development, as this may
involve either incremental or radical innovations (McKee, 1992).
Single-loop versus Double-loop Learning
The distinction between single-loop and double-loop learning, as developed by
Argyis and Scheon (1978), is a seminal learning concept, which is widely referred to
and frequently discussed in strategic and innovation management literature. In
single-loop learning, an organisation learns by means of its long established values
(i. e. its theory-in-use) and the validity of the theory is judged by its effectiveness in
enacting oganisational values (Argyris, 1977). Single-loop learning occurs when
errors are detected and corrected within an existing set of governing variables. In
double-loop learning, however, organisations not only detect errors but also question
espoused theories (Argyris, 1977). Double-loop learning occurs when, in addition to
the detection and correction of errors, an organisation is involved in changing
governing variables. This suggests that double-loop learning involves fundamental
changes to frames of reference or theories-in-use that have previously prevailed.
17

Chapter 2 Literature Review
On the whole, single-loop learning is linked to incremental change, by which an
organisation tries out new methods and actions and attempts to receive rapid feedback
on their consequences for making continuous adjustments and adaptations (Argyris,
1977, Fiol and Lyles, 1985). This process has been referred to as "lower-level
learning" by Fiol and Lyles (1985) and "adaptive learning" by Senge (1990).
Double-loop learning, on the other hand, is associated with radical changes, which
might involve major alternations to a firm's strategic direction (Argyris, 1977). This
type of learning may be linked to the development of a new product line involving the
overhaul of a firm's new product technologies. Radical changes in a firm's technology
platforms, which are the results of this type of learning, require an entirely new
process of strategic planning as well as cognitive changes of top management. These
platform changes may lead to the development of radical innovations. Double-loop
learning is referred to as labeled "higher-level learning" by Foil and Lyles (1985), and
64 generative learning" by Senge (1990).
According to Argyris and Scheon's definition, both types of learning involve
cognitive and behavioural changes. Specifically, double-loop leaming involves
cognitive and behavioural changes that are outside of an existing strategic paradigm,
whereas single-loop learning encompasses change but that change takes place within
an existing paradigm. Double-loop learning is commonly considered to be more
crucial to an organisation's long-term viability than single-loop learning (Argyris,
1996; Miner and Mezias, 1996). Argyris states that: "Single-loop learning and
routines, although they dominate organisational life, are the enemy of organisations
solving difficult problems, that they are embarrassing and threatening. It is variables
such as these that temper human beings and limit their commitment" (1996: 78). He
further contends that organisations tend to create defensive routines that inhibit
double-loop learning and only by continuously questioning their norms, objectives,
18

Chapter 2 Literature Review
and paradigms can they curtail these routines.
Lower-level versus Higher-level Learning
Within a cognition development perspective, Fiol and Lyles (1985) propose a
dyad of learning: lower- and higher-level learning. Lower-level learning occurs within
a given set of rules and leads to the development of a fundamental association
between behaviour and outcome. Its impact is short-term and reaches only part of an
organisation. Such a process of learning is the result of routines and repetition and
involves association building (ibid. p. 807). Higher-level learning, on the other hand,
refers to an adjustment of fundamental rules and norms rather than an adjustment of
specific activities or behaviours (ibid. p. 808). It typically provides a long-term impact
on the organisation as a whole.
Lower-level learning is similar to what Duncan (1974) calls "behavioural-level
learning, " a level of learning that is involved with adjustments to a firm as it adapts to
an environment, and to what Argyris (1977) calls "single-loop learning. " In contrast,
higher-level learning occurs through the use of heuristics, skill development, and
insight (Fiol and Lyles, 1985). Foil and Lyles argue that, some types of crisis, for
example, a competence-destroying technology that has been developed, or a
revolution from within, can be driving forces for higher-level learning. The
consequences related to this type of learning do not lead to any particular behavioural
outcome, but rather, to the development of a new frame of reference (Shrivastava and
Schneider, 1984) or a new cognitive framework within which decisions are made
(Bartunek, 1984). Therefore, higher-level learning is a more cognitive process than
lower-level learning, the latter being simply the result of repetitive behaviour (ibid.
p. 808). Higher-level learning, based on the extent of change in cognition and
behaviour can, at times, be linked to radical learning. In contrast, however,
lower-level learning is referred to as incremental learning.
19

Chapter 2 Literature Review
Conceptual versus Operational Learning
Building on experiential learning theory, Kim (1993) suggests a dyad of learning:
conceptual and operational learning. Operational learning accumulates from and
changes routines (ibid. p. 40). Operational learning represents learning at a procedural
level, where for example, one learns the steps necessary to complete a particular task.
In this process, the know-how or the physical ability to produce some action (ibid.
p. 38), is captured in routines. By contrast, conceptual learning involves the cognitive
thinking behind an action that sometimes challenges prevailing conditions,
procedures, or conceptions, and leads to a new framework being ascribed to the
mental model (ibid. p. 40). Kim maintains that the new framework, in turn, can
provide opportunities for discontinuous steps of improvement, whereby a problem is
reframed in radically different ways. In this process, the know-why or the ability to
articulate a conceptual understanding of an experience (ibid. p. 38), is captured in a
new framework. Simply put, operational learning produces new or revised routines to
replace old ones. Conceptual leaming, on the other hand, creates changes to the
mental framework, which leads to new ways of perceiving the world. Operational
learning can be considered relative to incremental learning, whilst conceptual learning
is associated with radical leaming.
Learning versus Unlearning
Building on theories of environmental adaptation, Hedberg (1981) advocates the
concept of organisational unlearning. He argues that learning is the process that
occurs when organisations interact with their environments, where each action adds
information and strengthens or weakens linkages between stimuli and responses.
Leading from this he defines "unlearning" as "a process through which learners (both
individuals or organisations) discard knowledge ... which makes way for new
responses and mental maps" (Hedberg 1981: 18). In his stimuli-response framework
20
Chapter 2 Literature Review
(ibid. p. 10), he proposes that unlearning has three rnodesý of operation. The first
involves the disassembly of mechanisms for selecting or identifying stimuli. The
second mode induces a disconfirmation of connections between stimuli and responses
and the third mode involves a disconfirmation of connections between responses. In
this process, when unlearning occurs, a new theory of action (i. e., theory-in-use)
replaces the old one.
Unlearning poses particular problems to organisations that move from stable,
benevolent environments into unstable, hostile ones (Hedberg et al., 1976) because
habitually successful organizations are often unable to unlearn obsolete knowledge, in
spite of strong disconfinnations. Therefore, unlearning that establishes new
organisational practices becomes more difficult as firms age because new knowledge
contends with a firm's existing approaches to operations, or its "dominant logic"
(Bettis and Prahalad, 1995).
Organisational unleaming is normally problem-triggered (Hedberg, 1981: 19).
Company crises, such as falling revenues, eroding market share, diminishing popular
support or-public criticism, often trigger unlearning within an organisation (Nystrom
and Starbuck, 1984). Also, new myths and/or substantial problems can be triggers for
unlearning (Bettis and Prahalad, 1995). In a similar vein, Bettis and Prabalad (1995)
maintain that organisations far away equilibrium that helps to increase adaptability is
suggestive of conditions that facilitate unlearning. Unleaming ability makes room for
organisations to take on more adequate interpretative frameworks. The development
of a new set of dominant logic for a newly changed environment can then be held in
the organisational memory, whilst learning ability generates new knowledge and
updates existing knowledge. Some scholars of knowledge-based theory of the firm
suggest that the generation of new organisational knowledge is maximized in close to
the domain of existing knowledge, in conditions under which there are few existing
21

Chapter 2 Literature Review
organisational routines to unlearn and organisational assimilation and subsequent
retrieval of the knowledge occurs in an intense and repetitive fashion (Cohen and
Levinthal, 1990; Bettis and Prahalad, 1995). Hedberg (1981: 20) concludes that the
balance between an organisation's ability to learn and unlearn indicates its long-term
survival. This seminal concept of unlearning has directed management theorists to
develop several important managerial concepts such as competence trap (Levitt and
March, 1988), core capabilities and core rigidities (Leonard-Barton, 1992), and the
dominant logic (Bettis and Prahalad, 1995). On a broad scale, unlearning is similar to
what Argyris (1977) calls- "double-loop learning" and thus can be classified as
"radical learning. "
Tactical versus Strategic Learning
In the context of technological learning, Dodgson (1991) proposes that leaming,
on the basis of organisational aims, could be classified as strategic or tactical. Tactical
learning relates to an immediate problem-solving action, such as an operational or
product problem. The aim of this learning process is identifiable and the time-scale is
short. In contrast, strategic learning involves an organisation developing skills and
competences which provide the basis for future projects (ibid. p. 140). Simply put,
tactical learning is concerned with immediate problems, where as strategic learning
involves the accumulation of technology/knowledge for its future potential. This
theory bears some similarity to Argyris and Schon's (1979) distinction between
"single-loop" and "double-loop" learning. Likewise, tactical learning can be
categorized as "incremental learning" whilst, strategic learning can be associated with
"radical learning. "'
Table 2.1 summarises the dyadic types of learning discussed above. In general, a
learning process that leads towards more changes in cognition or long-term effects
can be classified as radical learning. By contrast, learning that involved behavioural
22

Chapter 2 Literature Review
changes or short-term improvement can be categorized as incremental learning. Both
types of learning are not mutually exclusive but overlapped. Learning leading towards
cognitive changes triggers behavioural changes. In contrast, the results of behavioural
changes could also evoke cognitive changes.
Table 2.1 Summarv of Tvpes of OrIjanisational Learning and Changes
Types of Learning Incremental vs. Radical Behavioural vs. Cognitive Changes Changes
Single-loop Learning Incremental More behavioural Double-loop Learning Radical More cognitive (Argyris, 1978) Low-level Leaming Incremental More behavioural Higher-level Leaming Radical More cognitive (Fiol and Lyles, 1985) Operational Learning Incremental Behavioural Conceptual Learning Radical Cognitive (Kim, 1993) Leaming Incremental More behavioural Unleaming Radical More cognitive (Hedberg, 1981) Adaptive Leaming Incremental More behavioural Generative Learning Radical More cognitive (Senge, 1990) Tactical Learning Incremental More behavioural Strategic Learning Radical More cognitive (Dodgson, 1991)
1 Learning scholars have claimed that both types of learning can enhance or
hinder an organisation's survival and prosperity depending on certain
conditions(Miner and Mezias, 1996). incremental learning may put an organisation
into a competency trap' (Levitt and March, 1988), whereas radical learning may
engender organisational chaos if, for example, the organisation lacks funds to sustain
this learning process. March (199 1) suggests that firms should pay particular attention
to the related trade-off between an allocation of resources to exploit existing practices
(i. e. incremental learning) or to explore new alternatives (i. e. radical learning). That is,
1 Levitt & March (1988: 322) suggest that: "a competency trap can occur when favourable performance with an inferior procedure leads an organization to accumulate more experience with it, thus keeping experience with a superior procedure inadequate to make it rewarding to use... Competency traps are likely to lead to maladaptive specialisation if newer routines are better than older ones. "
23

Chapter 2 Literature Review
focusing more on internal learning allows the firm to develop its own core
competencies and appropriate more profits. Alternatively, external learning is required
for the firm to guide more radical changes, develop a broader knowledge base and
keep abreast of cutting-edge technologies (Grant, 1996b).
224 Technological Learning and Product Innovation
As previously discussed, no comprehensive model of organisational leaming is
widely accepted and conceptualisations of this topic tend to be diverse. However, by
focusing on learning from the perspective of a firm's development of its technology, a
better understanding of how an organisation's technological learning ability affects its
product innovation has been gained.
2.2.4.1 Towards a Definition of Technological Learning
Dodgson defines "technological learning" as "the way which firms build and
supplement their knowledge-base about technologies, products and processes, and
develop and improve the use of broad skills present within their work forces" (1991:
135). He further states that technological learning includes two elements: invention
and innovation. The former is characterized by search routines designed to bring
knowledge into the firm, or to generate it internally. The latter is essentially
concerned with providing a particular new product, or service for customers.
Consistent with this reasoning, Bierly and Chakrabati define technological learning as
" the acquisition and generation of explicit and tacit knowledge, which is used in
improving either the development of new products or the production of current
products" (1996a: 369). In developing a topology of technological leaming, Malerba
(1992) proposes six types of technological learning processes carried out by firrns:
learning by doing, by using, by searching, from advances in science and technology,
from inter-industry spillovers and by interacting. The first three processes are internal
24

Chapter 2 Literature Review
to firms and are related to production activities, such as the use of products,
machinery, inputs, and R&D functions in generating new knowledge. The latter three
processes are external to firms and relate to the absorption of new product knowledge
through collaboration with research institutes and strategic alliances, interacting with
suppliers, users, and monitoring the movement of competitors and other firms in the
industry (ibid. p. 848). In brief, technological learning is a process for enhancing an
organisation's technological capability. The development of such an ability is linked
to different sources of knowledge that may either be internal or external to the firm.
These definitions suggest that organisations take two different but complementary
learning routes -internal and external - to achieve their product/process innovation.
2.2.4.2 Internal and External Learning
The results of internal learning are the generation of new knowledge within the
organisation through the integration or recombination of functional know-how such as
MD, marketing, and production experiences (Bierly and Chakrabarti, 1996b). The
outcome includes not only the extension of a specific knowledge area, but also the I
combination of existent knowledge in a new way. Learning at all three levels (i. e.,
individual, group, and organisational) is intrinsic to internal learning. Individuals
learn from the organization and their work group as they become socialised to
organisational beliefs, norms, rules, and procedures that make up organisational
culture (March, 1991). However, work groups can also learn from individuals within
that group, and this process is referred to as "intra-functional learning". Workgroup
may also learn from other parts of the organization and this is known as
"inter-functional learning" (Bierly and Chakrabarti, 1996b). Intra-functional learning
creates new knowledge through the process of co-operative problem solving.
Inter-functional learning is a function of the formal and informal communication
systems within an organisation. It requires specialists from different areas to
25

Chapter 2 Literature Review
communicate information and develop their understanding of each other's knowledge
so as to facilitate a successful integration of different specialties. When the
dependence between different work groups is tightened and the difference between
the cognitive frames of these groups is increased, then the need for inter-functional
learning escalates (Daft and Lengel, 1986). An organisational culture that encourages
communication and sharing is crucial for inter-functional teaming (Mintzberg, 1991).
Easterby-Smith (1986) emphasises the importance of evaluative activities in
management that may contribute directly to this learning process.
External teaming refers to the process of bringing knowledge from outside an
organisation's boundaries into the organisation and integrating it into the
organisation's internal knowledge base (Dodgson, 1991; Bierly and Chakrabarti,
1996b). It primarily occurs through boundary spanning individuals who search and
link an organisation's internal network to external sources of information (Tushman,
1977). Tushman and Scanlan (1981) note that a boundary- spanning individual must
have strong network links both outside an organisation and among peers so that
he/she can transfer knowledge to others within an organisation. External teaming may
also take place through strategic alliances with other firrns (Koza and Lewin, 1998),
co-development with lead users and suppliers, and research collaboration with
sources outside the industry such as, research institutes or universities (von Hippel,
1988, Leonard-Barton, 1995). As such, external teaming enables firms to view issues
from different perspectives whereas internal teaming is mainly based on established
organisational routines and biases. Leonard-Barton (1995) maintains that a firm
without an effective external teaming system could run the risk of losing its
adaptability to environmental changes, obsoleting existing knowledge, thus
jeopardizing its long-term survival.
26

Chapter 2 Literature Review
2.2.4.3 The Impact of Technological Learning on Product Innovativeness
Learning theorists (Malerba, 1992; Bierly and Chakrabarti, 1996b; DiBella et al.,
1996; Lynn et al., 1996; Lynn, 1997; Leonard-Barton, 1995) have greatly contributed
to our understanding of how technological learning influences product innovativeness.
These studies can be categorised in respect of. (1) learning skills (2) team learning
strategy (3) learning process (4) learning styles and (5) learning factors.
In examining how a technological learning process affects product innovation,
McKee (1992) developed a framework that integrates the learning skills required at
each innovation/learning level (see Table 2.2). A firm's learning skills for incremental
innovations, as illustrated, focus on inter-functional contacts within the organisation,
to analyse problems in depth and to maintain current organisational structures, nonns,
and bases of technology. By contrast, an organisation. committing itself to radical
innovations requires a completely new set of learning skills (i. e. double-loop learning
skills) because innovation that implies radical change is often accompanied by
ambiguity, complexity, and re-orientation (Norman, 1971). Since radical innovations
are inherently unpredictable and uncertain (Rice et al., 1998), learning skills linked to
environmental contacts, exploratory methods and environmental adaptation capacity
at individual, group and organisational levels, become critical. Thus, a focus on the
development of marketing and technical capabilities enabling radical innovation is
more external than internal.
27

Chapter 2 Literature Review
Table 2.2 Learning Skills and InnovationfLearninp- Level
Learning Skills Innovation/Learning Level Incremental/Single-loop Radical/Double-loop Inter-functional Contact Environment Contact
Inter-personal -Inter-functional teams -Out-rotation -Job rotation -Outsider involvement
-Communication rewards -Boundary-spanning rewards Analytic Depth Analytic Width
Analytic -Analytic training -Skill acquisition -Conclusion methods -Exploratory methods -Competency trap avoidance -Confrontational methods System Maintenance Organisational Adaptability
Organisational -Systern stability -Unlearning, Error tolerance -Camouflage avoidance -Slack resources
Source: Adapted from McKee (1992)
Research on R&D team learning in association with new product development
reveals three forms of new product team learning: within-team, cross-team (i. e., teams
learn from other teams within their own firms), and cross-company learning (i. e.,
teams learn from other players outside their own firms) (Lynn, 1997, Lynn, 1998).
Lynn (1997) proposed that within-team learning is the focal point when an
organisation is involved in the development of incremental products because such
products are sold to existing customers and cost reduction is of a primary concern, as
observed in Figure 2.1. On the other hand, when a company tries to develop and
commercialise new products which combine new technologies with new markets,
both within-team and cross-company learning become critical because teams must
complete thorough external technical analysis to learn about available technology and
conduct comprehensive market surveys to analyse the competitors' marketing mix.
This study also illustrates that innovations involving more than one dimension
newness (i. e. technology and market) require cross-company learning. In other words,
the learning orientation of those organisations involved in either new technology or
new market development tends to be external rather than internal. Although indicating
the importance of cross-company learning for radical innovation, this research
contributes less to questions about how radical innovation necessitates external team
28

Chapter 2 Literature Review
learning and what key elements are generated from this learning. The latter question
informs the knowledge-based view of the firm whose focus is on the development of
organisational knowledge and the impact of a firm's innovation. To a great extent,
findings derived from team learning strategy in truly innovative NPD projects are
consistent with the importance of interpersonal learning skills proposed by McKee
(1992) because the injection of both new market and technological knowledge is
required. Figure 2.1 Team Learning Patterns for Product Innovation
Existing (Technology) New
Evolutionary Market Innovation Radical Innovation
New Cross-Company Learning Cross-Company Learning,
Within-Team Learning
(Market) Incremental Tn-novation Evolutionaly _T_e_cFn_oTo, -, -FqI. '
Within-Team Learning Innovation
Existing Cross-Company Learning,
Cross-Team Learning
Source: Adapted from Lynn (1997)
Malerba (1992) classifies the process of technological learning according to
sources of knowledge as internal learning processes (learning by doing, learning by
using, and learning by research) and external learning processes (learning by
interacting, learning from advances in science and technology, learning from
inter-industry spillovers). External learning processes are essential to more novel
innovations. For instance, learning by interacting with users can stimulate trajectories
of horizontal product differentiation. Learning from advances in science and
technology and inter-industry spillovers that allow new trajectories of product
technologies leads firms to develop a really new product line that cannot be realised
with current technologies. However, learning by searching particularly through
internal R&D permits vertical product differentiation in terms of quality and
Evolutionary Market Innovation Radical Innovation
Cross-Company Learning Cross-Company Learning,
Within-Team Learning
Incremental Innovation Evolutionarv TechnoloRical
Within-Team Learning Innovation
Cross-Company Learning,
Cross-Team Learning
29

Chapter 2 Literature Review
performance. On the whole, external learning processes lead towards more significant
changes than internal learning processes.
By focusing on the source of knowledge and the extent of change, Dibella et al.
(DiBella et al., 1996) propose four learning styles as shown in Figure 2.2. When
organisations need external knowledge for a transformative (i. e. radical) innovation, a
certain extent of "acquisition" is recommended. "Adaptation" occurs when
organisations take on incremental innovation as the basis of external knowledge.
When organisations learn from their own product/process development and use that
knowledge transformatively, they create "innovations" of their own. In brief, radical
innovation, in addition to applying internal knowledge more transformatively,
requires more external links to facilitate the acquisition of external knowledge than
incremental innovation. When the development of a product/service is concerned with
incremental innovation, a firm's learning focus is more internal than external.
However, this matrix framework lacks a link indicating how firms are capable of
converting internal knowledge into radical innovation. This link requires theories
from the knowledge-based view of the firm where the development of knowledge is
considered a dynamic process of internal and external learning.
Figure 2.2 Styles of Learning, Knowledge Sources and Learning Foci
Extemal (Knowledge Source)
Intemal
Adaptation Acquisition
Correction Innovation
Incremental Transformative (i. e. Radical)
(Leaming Focus)
Source: Dibella et al. (1996)
On the whole, radical innovations not only require more external product
30

Chapter 2 Literature Review
technologies to realize product development but also need more external market
information for product marketing. As radical innovation is frequently associated with
risk and uncertainty (Tushman and Anderson, 1986), Lynn et al. (1986) suggests that
a learning process for marketing radical products places less emphasis on analysis and
more on "probe and learning" from experiences (gained through exploring the
external environment at every subsequent "probe"). Similarly, Bierly and Chakrabarti
I- (1996b) empirically confirm that the correlation between technological learning and
radical product development is higher when there is less commitment to current
marketing efforts. Effective current marketing efforts may be a mobility barrier for a
firm that is attempting to enter an unfamiliar market (Porter, 1980). Thus, exposure to
external information is more crucial in marketing radical products than for
incremental products.
A firm's ability to process market information and turn it into marketing
knowledge also plays a key role in deciding the success of NPD projects. Cooper's
(1979) NewProd projects identifies that effectively processing customer knowledge is
a critical part in enriching new product characteristics. Li and Calantone (1998) also
confirm that firms' marketing competencies in terms of market information
acquisition, integration and application lead to greater product advantage. In his triple
stream NPD process, Crawford (1997) further maintains that marketing ability
starting from identifying target market to new product launch management is no less
important in effectively handling the entire NPD process. Hence, the element of
marketing knowledge informs technological knowledge acquisition.
This section briefly reviewed the impact of technological learning on product
innovativeness. The empirical findings of the studies of technological learning
approaches can be briefly summarized as:
(1) Learning by interaction with external actors is more critical than with internal
31

Chapter 2 Literature Review
actors when a radically new product is involved (Malerba, 1992, McKee,
1992, Lynn, 1997, Lynn, 1998).
(2) External learning is the focal point for radical innovation, whilst internal learning
is more concerned with incremental innovation (McKee, 1992, Bierly and
Chakrabarti, 1996b, Lynn, 1997, Lynn, 1998).
(3) The focus for technical and market contacts to sources of information in radical
innovation is more external than internal (McKee, 1992, Lynn et al., 1996).
(4) Exposure to external information is more critical for both developing and
marketing radical products than incremental ones (McKee, 1992, Lynn et al.,
1996).
2.3 Knowledge Management and Product Innovation
As the transition from an industrial to a knowledge-based economy takes place,
the basic economic resource for a firm is no longer capital, natural resources, or
labour, but is knowledge (Drucker, 1993). Knowledge affects the organisation as a
whole but it is particularly important for new product development. Learning theorists
taking the perspective of organisational knowledge have generated extensive
explorations of product innovation, which are considered in this section particularly
in relation to a firm's new product innovativeness.
Z3.1 Organisational Learning and Organisational Knowledge
Learning theorists (Duncan and Weiss, 1979; Huber, 1991; Garvin, 1993), who
consider organisational. learning to be about the effective processing, interpretation of
and response to infon-nation and knowledge both inside and outside the organisation.
have noted that knowledge is the outcome of organisational. learning. For instance,
Garvin defines a learning organisation as "an organisation skilled at creating,
acquiring, and transferring knowledge and insights" (1993,80). Similarly, Huber
argues that organisational. learning occurs when: "an entity learns if, through its
32

Chapter 2 Literature Review
processing of information, the range of its potential behaviour is changed... and an
organisation learns if any of its units acquire knowledge that it recognizes as
potentially useful to the organisation. " (1991,89). Organisational. knowledge in these
cofitexts is viewed as information and knowledge available for decision-making and
relevant to organisational activities. Learning leads to new knowledge development
that in turn changes organisational behaviour.
The growth and change of organisational knowledge is particularly associated
with the organisational learning process (Duncan and Weiss, 1979; Huber, 1991;
DiBella et al., 1996; Drongelen et al., 1996; Sinkula et al., 1997). Daft and Weick
(1984) propose that this process consists of three sequential phases: scanning,
interpretation, and action taken. Using this widely accepted model, Table 2.3
summarizes several conceptual interpretations that attempt to bridge the gap between
organisational learning and the evolving process of organisational knowledge
development.
33

Chapter 2 Literature Review
Table 2.3 Organisational. Learning Process and Organisational Knowledge
Sources Acquisition -00, - interpretation --kearning (Action (Scanning) Taken)
Huber (199 1) Knowledge acquisition Information interpretation Organisational memory
-Congenital learning -Cognitive maps & framing -Storing & retrieving
-Experiential learning -Media richness information
-Vicarious learning -Information overload -Computer-based
-Grafting organisational memory
-Search & noticing Duncan & Knowledge acquired by Knowledge evaluated Knowledge integrated
Weiss (1979) individuals Navis et al. Knowledge acquisition Knowledge sharing Knowledge utilization (1995) (The development or (The dissemination of what (The integration of
creation of skills, insights, has been learned) learning so that it is
relationships) broadly available and can
be generalized to fit new
situations. )
Drongelen et From new information to -Sifted knowledge Conveyed knowledge
al. (1996) internalized information -Stored knowledge
-Opened up knowledge
Sinkula Market information Market knowledge Marketing programme (1997) generation (affected by dissemination dynamics (organisational
learning orientation) actions)
In the first phase, scanning (knowledge acquisition) occurs through congenital
learning, experiential learning, vicarious learning and searching and noting (Huber,
1991), or individual learning (Duncan and Weiss, 1979) which then results in the
development of skills, insights, and relationships (Nevis et al., 1995). Drongelen et al.
(1996) interpret this stage as a move from new information to internalised
information. Sinkula et al. (1997) suggest that an organisational learning orientation
such as commitment to learning, shared vision and open-mindedness affects
information generation that, as a consequence, affects knowledge acquisition.
Interpretation occurs where new knowledge is interpreted via cognitive maps
34

Chapter 2 Literature Review
and framing (Huber, 1991). Knowledge is then evaluated and disseminated (Duncan
and Weiss, 1979; Nevis et al., 1995). Drongelen et al. (1996) propose that knowledge
at this stage is sifted, stored and opened up to become conveyed knowledge. Finally,
new knowledge is assimilated and stored as "organisational memory" (Huber, 1991).
The act of learning provides new knowledge and information for interpretation.
Feedback from organisational actions may provide new collective insights for an
organisation's members. This dynamic integration of learning encourages growth and
change in organisational knowledge. At the macro level, this three-stage interpretation
model highlights a link in the relationship between organisational learning and
organisational knowledge development.
Z3.2 The Dynamics of Organisational Knowledge Creation
Traditional theories of organisational economics (e. g., Williamson's transitional
cost) (Williamson, 1979) have limitations in explaining the phenomena and behaviour
of inter-firm collaboration prevalent in today's highly dynamic industries. A number
of scholars (e. g., Demsetz, 1991; Kogut and Zander, 1992; Nonaka, 1994; & Grant,
1996b) have suggested an alternative theory: "the knowledge-based view of the firm".
This can be understood as a theory of the existence, organisation and competitive
advantage of the firm based on the role of firms in creating, storing, and applying
knowledge. A key issue in this stream of research has been an attempt to conceptualise
how firms acquire, assimilate and accumulate their knowledge. For instance, Nonaka
(1994) has suggested that knowledge creation is a process of transformation from
individual tacit knowledge to firm-level explicit knowledge, and finally to everyone's
tacit knowledge within the firm. Using product development cases from several
Japanese large-sized companies, he proposes a model in which knowledge creation
takes place through the dynamic processing of four modes of conversion (socialisation,
exterrialisation, combination and intemalisation) between tacit and explicit knowledge
35
Chapter 2 Literature Review
(ibid, p. 20). He further suggests that facilitative conditions of creative chaos,
redundancy of information and requisite variety are required to enable the process to
occur. This model is widely referred to in knowledge management literature as
describing the processes involved in a firm's knowledge creation. However, this
model does not describe how firms interact with and absorb external knowledge
because it does not address how a firm can effectively scan, import and assimilate
external knowledge.
In contrast, by focusing on the development of core capability, Leonard-Barton
(1995) proposes four critical activities- (1) problem solving (present), (2)
implementing and integrating (internal), (3) experimenting (future), and (4) importing
knowledge (external)- which together make up a firm's knowledge creation process.
The first three activities are internally focused. The last activity (importing and
absorbing technological knowledge from outside of the firm) is externally focused and
considered to be the most critical for filling a firm"s technology gap. This model
makes a good attempt at delineating managerial practices for the development of a
firm's core capabilities through external knowledge importation, although it does not
take the detailed dimensions of knowledge into account.
More recently, Grant (1996b) suggested two primary mechanisms - direction and
organisational routines - to integrate the various knowledge dimensions. Direction
provides the integration of knowledge through each specialist establishing rules,
guidelines, and directives for members of organisations. This involves the codifying
of tacit knowledge into explicit knowledge (Grant and Baden-Fuller, 1995).
Organisational routines permit the integration of knowledge through patterns of
interaction between different specialists. Routine is advantageous in econornising the
communication of tacit knowledge. However, the application of these two
mechanisms in interpreting the dynamic process of organisational. knowledge creation
36

Chapter 2 Literature Review
(e. g., how external knowledge is acquired through various linkages and internally
assimilated and how an organisation creates its own knowledge from individuals to
the organisation as a whole) is somewhat limited.
Figure 2.3 The Dynamics of Organisational Knowledge Creation -An External Knowledge Acquisition Perspective
External
Knowledge
Sources
External
Knowledge
Acquisition
Through
-External Integration
-Boundary Expansion
Internal Knowledge (Tacit & Explicit)
Absorptive
Capacity
Explicit Knowledge(EK)
-Existing Socialisation
knowledge base
-Abilit to
Articulation
bi ti T y om na on
assimilate external e , mz emationalisation knowledge
-Ability to Tacit Knowledge(TK)
commercialise new
knowledge Individual p,. Organisation
.................................................................................................... Organisation Boundary
Sources: Adapted from Levinthal & Cohen (1990), Nonaka (1994), Leonard-Barton
(1995), Kim (1998) and McKee (1992)
Scholars (Loenard-Barton, 1995; Hamel, 1991) with the perspective of the
knowledge-based view of firms suggest that importing knowledge beyond a firm's
boundaries leads to building its core competencies. In particular, inter-firm
collaborations facilitate integrating external explicit knowledge as well as bridge the
gap between a firm's knowledge and product domains (Grant and Baden-Fuller, 1995).
External knowledge acquisition is then becoming an increasingly critical element in a
firm's knowledge-creating system.
Figure 2.3 is a simplified model that integrates external knowledge sources into
knowledge creating processes. It shows that firms acquire external knowledge
37

Chapter 2 Literature Review
through external linkages (e. g., close contact with scientific communities, alliances
networks, and R&D contracts) and activities of boundary expansion (e. g.,
competitor/non-competitor benchmarking, hiring experts, external consultants). The
extent of external knowledge absorption in both tacit and explicit dimensions depends
on a firm's absorptive capacity (Cohen and Levinthal, 1990). Knowledge creation
tends to occur faster and become larger in scale as firms are equipped with related
prior knowledge and the abilities of assimilating and commercialising external
knowledge. The outcome of knowledge conversion and creation (internalized
knowledge) feeds back to absorptive capacity and in turn increases its level.
By integrating the elements of external knowledge sources and "absorptive
capacity", this model further assists us in conceptualising how a firm creates
knowledge. The key element of the model is the role of absorptive capacity that
bridges the gap between external knowledge and internal knowledge. This
conceptual isation of absorptive capacity goes beyond conventional interpretations of
how firms acquire and assimilate external knowledge and convert it into internalised
knowledge. Although the importance of acquiring external technology/knowledge is
well known in NPD research (Cooper, 1992; Day, 1991; Li and Calantone, 1998;
Kotabe and Swan, 1995; Pennings and Harrianto, 1992a; Pennings and Harrianto,
1992b), few have investigated how and to what extent absorptive capacity, together
with external linkages, affect a firm's product innovation. The subject of external
knowledge assimilation in association with absorptive capacity will be discussed in
Section 2.5.
Z3.3 The Impact of Knowledge on Product Innovativeness
There is an enormous list of criteria concerned with factors that affect the
success of new product development (e. g., Rothwell et al., 1974; Cooper, 1979a;
Maidique and Zirger, 1984; Maidique and Zirger, 1985; Cooper and Kleinschimidt,
38

Chapter 2 Literature Review
1987; and Ziger and Maidique, 1990). For instance, the SAPPHO study (Rothwell et
al., 1974) proposes that product success is primarily dependent upon the following
five factors:
(1) Understanding of user need
(2) Attention to marketing and publicity
(3) Efficiency of development
(4) Effective use of outside technology and external scientific communication,
and
(5) Seniority and authority of responsible managers.
By way of contrast, the three general areas strongly correlated with new product
success, as indicated by the results of the Project NewPro (Cooper, 1979a), are:
(1) Product uniqueness and superiority
(2) Market knowledge and marketing proficiency, and
(3) Technical and production synergy and proficiency.
In addition, the Stanford Innovation Project (Maidique and Zirger, 1984) suggests that
market knowledge, proximity of new product technologies and markets to existing
strengths, and planning and coordination of new product processes are key factors
that affect product outcome. The findings of these early large-scale studies suggest
that the following two types of product knowledge are associated with NPD success:
first, marketing knowledge gained through customer interaction; and second
technological knowledge (for both product and process) developed internally and
externally. Based on these studies, the impact, in particular, of external knowledge on
product innovation demands special attention.
Given the learning nature (i. e., a firm's knowledge creation) of NPD activities,
there is increasing application of organisational knowledge development to the study
of NPD. Table 2.4 summarises the findings of recent research that both conceptually
39

Chapter 2 Literature Review
and empirically* examine how different knowledge (in terms of sources and
dimensions) influence a firm's capacity for product innovation.
Table 2.4 Summary of Impact of Knowledge on Product Innovation Source Knowledge Dimensions Impact of Other Týpes of
Sources of Knowledge on Contextual Products Knowledge Product Factors
Innovation Bierly & Internal: R&D, Internal The narrower the R&D Manufacturing I ndustrial Chakrabati production, Technology; knowledge base, the flexibility, financial products (1996) marketing External higher the product f lexibility,
External: Users, Technology innovativeness. marketing Suppliers, Science flexibility & Technology Linkage
Li & External: Market Market knowledge Customer Software Calantone Customers, Knowledge competence has a demandingness, (1998) Competitors Competence significant influence on competition
Internal: new product advantage intensity, Marketing-R&D (i. e., quality, reliability, technology changes Interface newness, and top management's
uniqueness) perceptions of market knowledge
Madhavan & NPD Team Tacit The more innovative the Endogenous Conceptual Grover(1998) Knowledge; product is, the more Variables: Development
Explicit tacit knowledge there is Trust in team Knowledge to be converted. Thus, members,
the greater the impact of information T and A-shaped skills of redundancy, rich team members. personal interaction
Exogenous Variables: T and A-shaped skills, shared mental models, NPD routines
Malerba Internal: R&D, Internal Both internal and Industrial life cycle Industrial (1992) production, Technology; external technologies Demand variables products
marketing External have a positive impact External: users, Technology on a firms' incremental suppliers, science & product innovation. technology links
Pennings & External: External Technological Industrial factors Banking Karianto technological technology networking has a Organisation size (1992) alliances positive relationship Intensity of
with a firm's Competition technological innovation. Firms with extensive networking are more likely to implement innovation externally.
Souderand Internal: R&D, Internal The majority of a Consumer Chakrabarti marketing & sales, Technology product's origins and (1979) top management External depends upon internal industrial
External: Technology knowledge sources. products competitors, customers, suppliers, technical
I lagents I
40

Chapter 2 Literature Review
Using the notion of tacit knowledge, Madhavan and Grover (1998) propose that
NPD is the process of converting embedded knowledge into embodied knowledge
(explicit knowledge). The development of more novel products entails further efforts
to more effectively convert tacit knowledge. Therefore, more NPD team members
equipped with T and A-shaped skills 2 are required to facilitate this conversion process.
Madhavan and Grover's study may be the first that attempted to theorise tacit
knowledge within the context of new product innovation.
Another strand of research centres on the impact of market knowledge
competence on new product advantage (Day, 1991; Cooper, 1992; and Li and
Calantone, 1998). For instance, by testing the relationship between new product
advantage and market knowledge competence (as composed of customer knowledge
process, competitor knowledge process, and the market-R&D interface) Li and
Calentone (1998) reveal that each component of market knowledge competence is
positively associated with product advantage in terms of quality, reliability, newness
and uniqueness. Similarly, Day (1994) confirms the importance of customer
knowledge for the success of new product development in several industrial settings.
Research on technological alliances (Bierly and Chakrabati, 1996a; Deeds and
Hill, 1996; Kotabe and Swan, 1995; Li and Calantone, 1998; Pennings and Harrianto,
1992a; Pennings and Harrianto, 1992b; Rothwell and Dodgson, 1991) has particularly
extended the understanding of ways that external knowledge affects a firm's new
product development performance. For example, Souder and Chakrabati (1979)
suggest that the correlation between a firm's capability for technological learning
2 Individuals with T-shaped skills are those who are not only experts in specific technical areas but those who are also intimately acquainted with the potential systemic impact of their particular task. On the one hand, they have a deep knowledge of discipline like ceramic materials engineering (for example), represented by the vertical stroke of the T. On the other hand, these ceramic specialists also know how their discipline interacts with another, such as polymer processing- this is represented by the T's horizontal top stroke (lansiti 1993: 139). Leonard-Barton (1995: 77) describes A-shaped skills as: some individuals embody technology fusion. Some people actually learn more than one discipline
(although more than two is unlikely) and so have two different disciplinary 'legs' on which to stand. "
41
Chapter 2 Literature Review
(both internal learning and external learning) and its radical product development is
higher when this correlation is compared with incremental product development. In
addition, the breadth of a firm's R&D intensity moderates the relationship between
technological learning and the level of product innovativeness for both incremental
and radical product development. That is, given a technological learning opportunity,
firms with a broad base of R&D knowledge in their product domain are more likely to
develop relatively new products. Bierly and Chakrabati (1996: 377) conclude that: "it
is more important for organisations to develop a dominant strength in one area of
expertise so that firms have a core competence than it is for them to have a wider
knowledge base for increased flexibility. " In general, empirical findings from these
studies demonstrate that knowledge gained through technological networking, such as
licensing, joint ventures and long-term contracts greatly influence a firm's novel
product development as well as its tendency for adopting new innovative technology.
These findings highlight the importance of absorbing external knowledge (through
inter-firm learning) and networking to respectively boost product innovativeness of
the firm's technological innovations and, facilitate access to strands of technological
knowledge that may be alien.
In brief, empirical studies concerned with the impact of product knowledge
(both marketing and technological knowledge) on the nature of product innovation
have arrived at divergent results. Most of this research centres on the level of product
innovativeness or product advantage that is influenced by internal and/or external
acquired knowledge. There is, however, little research addresses ways in which a
firm's accumulation of its stock of new product knowledge through external linkages
contributes to new product performance. The following questions remain unanswered.
First, are the mechanisms of knowledge creation within internal subunits and with
external parties for new product development different? Second, is it the case that
42

Chapter 2 Literature Review
extensive internal effort is crucial for effective knowledge acquisition? Although
Souder and Chakrabati (1996) reveal the moderating role of a firm's R&D intensity in
the relationship between its technological alliances and product innovativeness, they
do not show what constitutes the outcome of the firm's technological learning effort.
Neither, do they illustrate the extent to which the results of this learning effort
influence product innovativcness. There is also no consideration of whether R&D
intensity moderates or mediates the relationship between the extent of technological
linkages and the results of this learning effort. This suggests that there is a need to
revisit the dominant conceptual framework, and, more explicitly, the mechanisms
whereby firms assimilate external knowledge. To this end, it is important to reassess
the role of absorptive capacity. Accordingly, following on discussion on the role of
external linkages in product innovation (Section 2.4), Section 2.5 is devoted to a
review of the concept of absorptive capacity and its impact on a firm's acqusition of
external knowledge.
43
Chapter 2 Literature Review
2.4 Product Innovation: An External Linkage Perspective
This section considers NPD learning in relation to external linkages, such as
customers, suppliers, cooperating firms, research institutes and universities. In
particular, the emphasis is on how and to what extent various types of external
linkages contribute to firms' gains in new product related knowledge and NPD efforts.
Z4.1 The Importance ofExternal Linkages
Jack Welsh of General Electric argues that the traditional boundaries of hierarchy,
function and geography are no longer appropriate for tasks confronting business day
(Barlett and Ghoshal, 1995). He advocates a new organisational. mode - "a
boundaryless company. " Similarly, Leonard-Barton (1995: 135-136) states that: "very
few, if any, companies can build core capabilities without importing some knowledge
from beyond their boundaries. Therefore, successfully absorbing technological
knowledge from beyond the periphery of the firm is as important a managerial
activity as integrating it across internal boundaries - and no less difficult. " Empirical
evidence from innovation management literature confirms that firms that do not
expand into new technical sub-fields tend to perforrn poorly in their established
businesses, and firms that expand beyond their established business survive longer
and achieve a greater subsequent market share (Michell and Singh, 1993; Bierly and
Chakrabarti, 1996b). Organisational learning literature also advances the importance
of multi-disciplinary involvement with the learning process (Argyris, 1977; Fiol and
Lyles, 1985; Senge, 1990; Garvin, 1993). For instance, Marquardt and Reynolds
(1994) argue that the ultimate purpose of multidisciplinary networks is to transform
firms into teaming organisations, the teaming disposition of which facilitates and
maximises the exploitation of both internal and external knowledge. Moreover, strong
linkages to external resources not only stimulate learning but also allow firms an
44

Chapter 2 Literature Review
opportunity to rethink the validity of their "theory-in-use"; justifying the relevance of
their current operations. As such, these linkages provide ample opportunities for
firms' double-loop learning (Argyris, 1977), or high-level learning (Fiol and Lyles,
1985).
Moreover, strategic researchers confirm that sustaining a competitive advantage
under conditions of dynamic competition requires continuous integration, by
extending existing capabilities to encompass new knowledge outside a firm's
boundaries and reconfiguring existing knowledge with new patterns of integration
(Porter, 1980; Kogut and Zander, 1992; Grant, 1996a). Grant (1996b) proposes three
basic alternatives for' the knowledge transfer and integration of organisational
capability: (1) internalization within the firm, (2) market contract, and (3) relational
contacts (which create various forms of firm networks). The latter two alternatives
emphasise the need for external linkages for knowledge integration. Other researchers
(Link and Tassey, 1987; Hamel, 1991; Rothwell and Dodgson, 1991; Powell et al.,
1996) discuss the importance of complementary technologies from different industrial
sectors and consider collaborative practices from external linkages (such as strategic
alliances, R&D consortia, networks) as a powerful method for knowledge creation
and transfer, in spite of the risk of knowledge erosion. For instance, Link (1987)
suggests that a firm's internal R&D functions and external technology sources should
be united into one focused development process as they are continuously facing more
"competence-destroying" technological change (Tushman and Anderson, 1986).
Internal R&D serves as. the development of firm-specific technical knowledge,
whereas external sources are utilised to acquire generic technological knowledge.
Rothwell and Dogson (1991: 128) argue that "it is not only in-house R&D
commitment that should be a focus of corporate technology strategies; also of
extreme importance is having an external orientation directed towards creating a
45

Chapter 2 Literature Review
network of linkages plugging the firm into appropriate sources of complementary
technological information and expertise. " Similarly, Teece (1986) maintains that
association with external knowledge sources facilitates the process of gaining access
to and acquiring complementary knowledge.
Empirical evidence shows that external information from the marketplace (such
as customers and key suppliers) is not only beneficial in defining product projects, but
also pivotal in guiding the rest of the NPD process (Dougherty, 1990; Song and Parry,
1992). Scholars within this discipline, therefore, suggest that a close link between
customers and market intelligence sources is required for product innovation
(Gemunden et al., 1992; Peacock, 1993). Japanese firms are more adept at carrying
out innovation based on their integrating NPD activities with external collaborators
such as key users in the marketplace (Nonaka. & Takeuchi, 1995). For instance,
Matsushita Electric Co., in working with several professional pastry bakers,
introduced the first fully automatic bread-making machines for home use. The
advantage of Japanese system is attributed to firms' external integration skills, such as
their better communication systems and more effective supplier networks between
functional departments within the firm and the marketplace (Nonaka, 1994).
The creation and accumulation of knowledge cannot exist without quality
information processing. Technology-related information is indeed the driving force
that makes product innovation possible (Fish, 1979; Baston, 1987). Research suggests
that external linkages with universities and national research institutes are vital
sources of technological infon-nation (Wigand and Frankwick, 1989; Gemunden et al.,
1992). In addition, joint research with firms from other industries benefits a firm in its
absorption of new technology (Kodama, 1992; Gemunden et al., 1992; Samuels, 1994)
and in its development of more innovative products, which may require multi-faceted
technologies.
46

Chapter 2 Literature Review
This shows there is a need for contemporary organisations to establish linkages
with relevant external parties. Today's increasingly competitive environment has
made this imperative for continual development of innovative products. These
linkages both activate learning and provide a new perspective for firms to revalidate
their current domain knowledge and technology. As a result, firms are able to generate
more up-to-date knowledge (both marketing and technological knowledge) that is
vital in their next run of new product development.
Z4.2 Modes ofExternal Linkage and Sourcing Technological Knowledge
Rothwell (1992: 232) states: "Today it seems progressively less meaningful to
consider solely 'firm A and innovation' or 'firm B and innovation' when it is
becoming evident that innovation increasingly derives from a network of companies
interacting in a variety of ways. " The trend for establishing various forms of alliances
is indeed quite evident in today's industries, particularly in those highly dynamic
sectors such as computers, communications and biotechnology. Firms form alliances
for various reasons. Proponents of knowledge-based view of the firm highlight the
need for inter-firm collaboration because of a gap between the firm's product domain
and knowledge domain. For instance, Grant and Baden-Fuller (1995) posit four sets of
circumstances for inter-firm collaboration: (1) integrating explicit knowledge (2)
incongruent product and knowledge domains (3) the role of uncertainty in
knowledge-product linkage and (4) dynamic effects in knowledge-product linkages.
Other innovation scholars (Tidd et al., 1997) view the need for inter-firm
collaboration from the perspective of the improvement of a firm's productivity. These
includes factors such as the cost of technological development, the timing of market
entry, the risk of development and/or market entry, scale economies in production, and
the time taken to develop and commercialise new products (ibid, p. 198). In his study
of 4192 strategic technology alliances, Hagedoorn (1993) notes that complementary
47

Chapter 2 Literature Review
technologies, reductions of time-span for innovation, and market access and/or
influence to the market structure are firms' most frequently cited motives for
inter-firm collaboration. His findings further indicate that firms in more dynamic
industries such as IT consider complementary technology and a reduction of time
span for innovation as their primary motives for technological partnering, whereas
firms from mature industries such as the chemical, consumer electronic, and food and
beverage list market access and restructuring as major determinants in entering an
alliance. Along with the perspective of complementary technology/knowledge in the
contexts of NPD, the primary consideration for collaboration particularly for those
firms in dynamic industries lies in the accumulation of both technological and
marketing knowledge, leading to the effectiveness and efficiency of product and
market development.
Previous literature has examined a variety of modes for inter-firm collaboration
such as subcontracting, licensing, collaborative R&D, long-term contracting, strategic
alliances, and joint ventures. Hagedoom (1993), examined technological alliances in
various industries and confirmed that complex inter-organisational. modes of
cooperation, such as joint ventures and minority investment, are motivated by
long-term market and tecbnology-mediated objectives. In contrast, contractual
alliances, such as sub-contracting and licensing are primarily aimed at short-term
technological achievements. Consistent with this line of research, Tidd et al. (1997)
argue that in practice, most sub-contracting or outsourcing arrangements are based on
potential and/or a desire to save costs. Hill's study (1992) indicates that the speed of
imitation, the extent of first mover advantages, and the transaction costs of licensing
play a major role in a firm's decision to license or not. Licensing may offer a firm the
opportunity to exploit the intellectual property of another firm, but it tends to be
restricted by the licenser. A survey using data from the chemical, engineering and
48

Chapter 2 Literature Review
pharmaceutical industries found that the primary reason behind licensing is related to
speed of access, rather than cost (Atuahene-Gima and Patterson, 1993).
The benefits of collaborative R&D for firms are linked to the complexity and
costliness of product development, the need for input from outside expertise, and
shorter development time (Gugler, 1992, Bruce et al., 1995). Amongst those benefits,
the most commonly cited is that organisations gain access to new technology and
expertise to complement their product development (Dodgson, 1993b). The increasing
phenomenon of technology convergence or "technology fusion" (Kodama, 1992) may
partly account for R&D collaboration (Blonder and Pritzl, 1992). Rothwell (1991)
maintains that firms taking part in collaborative R&D have a tendency to actively seek
external ideas or technologies. Furthermore, Dodgson (1993) argues that R&D
alliances may serve as means of overcoming barriers to entry into overseas markets.
The rationale for joining an R&D consortium, a special form of collaborative R&D
(consisting of a number of organisations working together on a relatively specific
project), includes pooling scarce expertise, sharing the risk of research and conducting
pre-competitive research and setting standards (Tidd and Trewhella, 1997). Tidd et al.
suggest that R&D consortia tend to focus on more basic research issues, whereas
strategic alliances in NPD (that typically take the form of an agreement between two
or more firms to co-develop a new technology or product) involve commercialised
development projects. Thus, clearly, R&D linkage activities in this type of
collaboration (i. e. collaborative R&D, strategic alliances, joint ventures) are more
strategic in nature.
In general, collaborative modes, such as sub-contracting and licensing, tend to
result in a short-term, tactical achievement; whereas those modes that require a
relative degree of integration, such as strategic alliances, collaborative R&D and joint
ventures, are likely to generate long-term, strategic achievement (Tidd and Trewhella,
49

Chapter 2 Literature Review
1997). The latter modes, which take strategic significance into account, are more
appropriate mechanisms for technological learning than those simply for tactical
purposes.
Leonard-Barton (1995) suggests the following framework to show the
relationships that exist between the potential for new technological capabilities,
modes of linkage, and a firm's commitment. As Figures 2.4 indicates, technological
observation, licensing, and R&D contracts are generally less likely to achieve new
technological capabilities. These linkages, primarily, provide windows of access to
new technology. In contrast, equity acquisitions or co-development that offer
opportunities for firms to examine technology in depth, and joint ventures or merge
and acquisition (M&A) that directly transfer technology in its full context, provide
firms with new technology and capabilities (Leonard-Barton, 1995: 153-154). In other
words, the more integrative modes of collaboration, including joint ventures, R&D
co-development and equity acquisitions, provide more effective channels for
acquiring new technology than less integrative modes, such as contracting and
licensing. As a result, the acquisition and accumulation of new technology, that a firm
lacks, through more integrative modes is likely to lead to a more innovative product
development when fused with its technological expertise. Figure 2.4 Levels of Linkage and New Technology Capabilities
High M&A New capability Joint Ventures
Co-development New product/process (Commitment) Equity Acquisitions access window
R&D Contracts
Licensing
Low Observation Low High
(Potential for New Technology Capability)
(Source: Leonard-Barton, 1995)
50

Chapter 2 Literature Review
Tidd and Trewhella (1997) offer another perspective of firms' attitudes towards
technology acquisition by identifying four dimensions of characteristics of technology:
(1) competitive significance of the technology (2) complexity of the technology (3)
codiflability (how easily the technology is embodied) (4) credibility (political profile
of the technology). Basically, the more complex a product's technology is (i. e. a
product with a high number of component technologies), the greater the tendency for
a firm to acquire technology through collaborative arrangements such as R&D
collaboration and joint ventures. This is due to the specialisation of know-how. By
contrast, in less complex product technology situations, firms simply engage in
sub-contracting or licensing to gain advantages associated with the division of labour.
However, when a product's technology is of less codifiability nature (a high degree of
tacitness in its nature) its transfer requires experience and face-to-face interaction. In
this case, inter-firm linkage modes, such as joint ventures and/or equity acquisition,
are effective in gaining tacit knowledge (ibid. 1997).
Investigation into how that corporate strategies affect a firm's tendency to
acquire technology suggest that the strategy of technology diversification is a key
factor that gives rise to increasing external linkages (Granstrand et al., 1992). The
underlying rationale is that since the technology diversification strategy leads to a
broader requirement for different component technologies, firms need to develop
more linkages.
The technology life cycle also affects a firm's decision regarding its acquisition
strategy. For instance, Lambe and Spekman (1997) argue that firms are more inclined
to enter into technology sourcing alliances when facing new technology that has
already taken hold. But, as the technology cycle moves into its later stages, firms
often shift their focus from alliances to internal development because the technology
and market requirements become more stable.
51

Chapter 2 Literature Review
24.3ExteritalLiiikagesforKyiowledgeAcquisitioti and Product Innovation
2.4.3.1 Classification of External Linkages
Firms' external linkages can be distinguished in different ways. For instance, on
a broad industry scale Porter and Fuller classify 'X forrn' and 'Y fonn' coalitions
between competitors. They state that: "... in X coalitions, firms divide the activities
within an industry between themselves. In Y coalitions, the firms share the actual
performance of one or more value activities" (1986: 336). Tidd et al. (1997a) suggest
a traditional classification: vertical or horizontal. They propose that vertical
relationships are to cooperate with and/or integrate suppliers and customers while
horizontal relationships are to collaborate with potential competitors, research
institutes, and universities, over cost and timeliness advantages, complementary
technology or marketing know-how.
Hennart, based on the theory of transaction cost, identifies two contrasting
purposes for differentiating joint ventures- scale or link types. He states: "scale joint
ventures are created when two or more firms enter together a contiguous stage of
production or distribution or new market... (whilst) in link joint ventures, the position
of the partners is not symmetrical" (1988: 362). On this basis, Dussauge et al. (2000)
further explain that scale alliances allow partners to achieve economies of scale and to
reduce excess capacity. In contrast, link alliances aim at integrating complementary
skills and resources in a way where each partner contributes. Similar to Hennart's
classification, Sakakibaba (1997) defines alliances according to either cost-sharing or
skill-sharing motives and found that firms with homogeneous capabilities tend to form
cost-sharing alliances, whilst those with heterogeneous capabilities tend to form
skill-sharing alliances. Moreover, Nicholls-Nixon (1993) classifies alliances in two
categories: equity-based and non-equity based. Equity-based alliances refer to joint
ventures, R&D partnerships, minority investment and acquisitions; whereas
52

Chapter 2 Literature Review
non-equity based alliances refer to contracts and licensing agreements. Equity-based
alliances are considered to be a more effective mechanism for acquiring technology
that is more complex, un-codified, and difficult to be assimilated than non-equity
based ones.
The classifications reviewed above are tailored to service each research's
particular purpose. There is as yet no empirical work examining the nature of vertical
versus horizontal alliances and how this affects a firm's product innovativeness as
well as the effectiveness of its new knowledge accumulation. Thus this research
adapts Tidd et al. 's (1997a) perspective with an attempt to investigate this relationship.
Figure 2.5 briefly illustrates knowledge sources of external linkage for product
innovation by categorising them into horizontal and vertical linkages. In this
classification, parties to vertical linkages are those involved in a product/project's
value chain activities. Typically, a NPD project's upstream suppliers and downstream
customers or channel members are in this category. In contrast, parties to horizontal
linkages are those, which a firm has no direct business relationship but can gain
access to them through contract arrangements, strategic alliances and/or equality
acquisitions. This category in the context of NPD includes industrial research
institutes, universities, cooperating finns and third party technical consultants.
A detailed discussion concerning the effect of each linkage on both gains in new
product knowledge (both marketing and technological) and the level of product
innovativeness in the context of new product development follows.
53
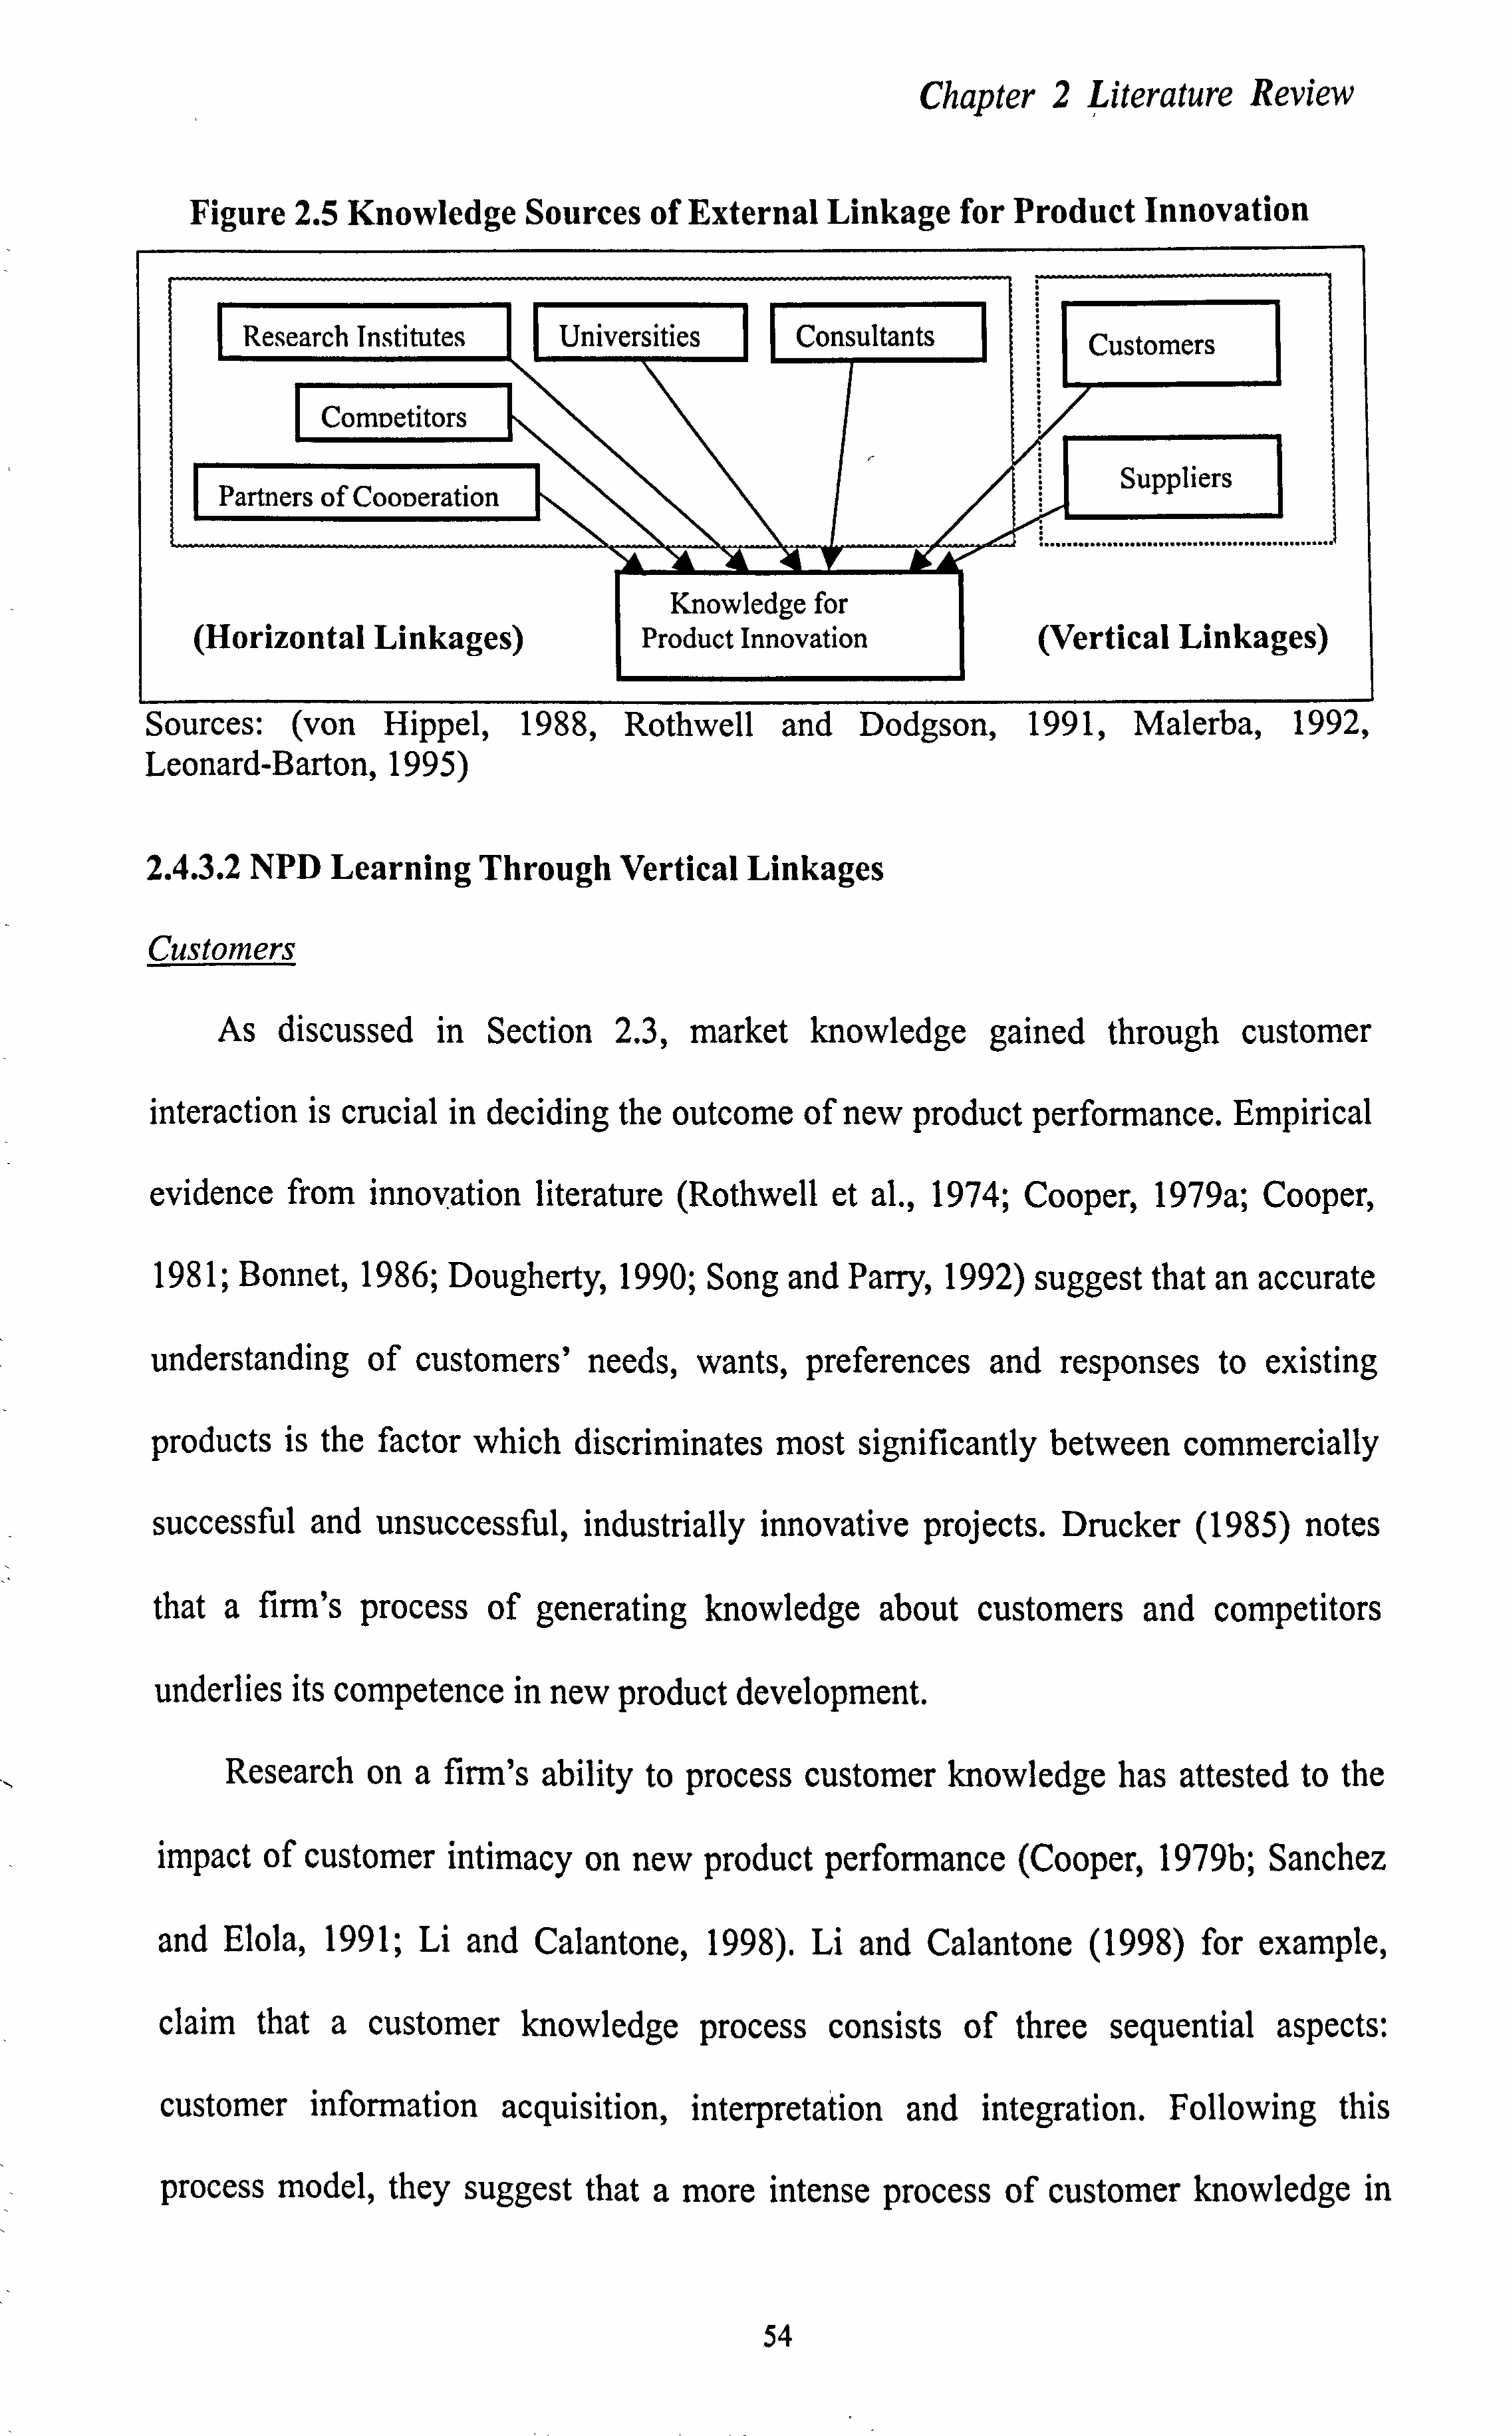
Chapter 2 ýiterature Review
Figure 2.5 Knowledge Sources of External Linkage for Product Innovation
I Research Institutes I
I ComDetitors I
I Partners of CooDeration I
(Horizontal Linkages)
Universities Consultants LI
ý\X\
A Knowledge for
Product Innovation
Customers
Suppliers
(Vertical Linkages)
Sources: (von Hippel, 1988, Rothwell and Dodgson, 1991, Malerba, 1992, Leonard-Barton, 1995)
2.4.3.2 NPD Learning Through Vertical Linkages
Customers
As discussed in Section 2.3, market knowledge gained through customer
interaction is crucial in deciding the outcome of new product performance. Empirical
evidence from innovation literature (Rothwell et al., 1974; Cooper, 1979a; Cooper,
1981; Bonnet, 1986; Dougherty, 1990; Song and Parry, 1992) suggest that an accurate
understanding of customers' needs, wants, preferences and responses to existing
products is the factor which discriminates most significantly between commercially
successful and unsuccessful, industrially innovative projects. Drucker (1985) notes
that a firm's process of generating knowledge about customers and competitors
underlies its competence in new product development.
Research on a firm's ability to process customer knowledge has attested to the
impact of customer intimacy on new product performance (Cooper, 1979b; Sanchez
and Elola, 1991; Li and Calantone, 1998). Li and Calantone (1998) for example,
claim that a customer knowledge process consists of three sequential aspects:
customer information acquisition, interpretation and integration. Following this
process model, they suggest that a more intense process of customer knowledge in
54

Chapter 2 Literature Review
new product development leads to greater product advantage. Similarly, Sanchez and
Elola (1991), in a study of 56 industrial organisations, argue that a finn's activities
regarding the market knowledge process provide great stimuli to innovation. Cooper
(1979), in his research on NewProd projects, notes that an effective process of
attaining customer knowledge plays a crucial part in enhancing new product
characteristics. Ottum and Moore (1997) further suggest that understanding customer
wants and needs ultimately comes down to a company's capability for gathering,
sharing, and using market information, which in turn plays a pivotal role in
dI etermining the success and failure of new products. Although the integration of
customer knowledge into the design process has a decisive role in new product
performance, there is little research devoted to investigating the extent to which this
integration accounts for the level of product innovativeness in comparison with other
external links.
The success of innovative products in many industrial sectors is closely
associated with active user involvement in defining product specification or testing a
prototype (von Hippel, 1976; von Hippel, 1978; Rothwell, 1986; von Hippel, 1986;
Brown, 1991). Von Hippel (1976 and 1978) suggests that industrial users (in sectors
such as scientific instruments, medical equipment and semiconductor process
machinery) do not only play a dominant role in innovation, but they also play an
active part in re-innovation. Therefore, instead of a traditional manufacturer-active
paradigm for consumer products, von Hippel (1978) argues for a customer-active
para gm, in which the user plays the key product-initiating role for the generation of
industrial product ideas. In addition, he further urges industrial finns to identify,
analyse, and work closely with lead users for the source of new product concepts (von
Hippel, 1986).
In his widely referred to model (coupling model/fifth model) of the innovation
55

Chapter 2 Literature Review
process, Rothwell (1986: 112) emphasises the importance of user-technology
provider-producer links and states: "the overall pattern of the innovation process can
be thought of as a complex net of communication paths, both intra-organisational and
inter-organisational, linking together the various in-house functions and linking the
firm to the broader scientific and technical community and to the marketplace. In
other words, the process of innovation represents the confluence of technological
capabilities and market needs within the framework of the innovating firm. " This
model strongly suggests that industrial firms couple their technological capabilities to
user need at the earliest possible stage. Even as the project develops, the firm must
remain coupled to the marketplace in order that changing market requirements can be
detected and fed back to the development process to produce a modified design.
However, this stream of research mainly uses cases from traditional industrial sectors
such as instruments, equipments, and automobiles where speed of technology change
is somewhat slow. In comparison, in today's IT industry, product technologies are
evolving rapidly. IT users' knowledge is limited to currently available products and is
therefore of limited use in guiding new product design.
Suppliers
Relations with suppliers are one of the five forces driving industrial competition
(Porter, 1980). Porter groups suppliers with functional units into the upstream
value-chain, a model that detects a firm's competitive advantage (Porter, 1985).
Special supplier firms in some industries design, develop, and build specialised inputs
for production, and interact closely with their (often large) technically progressive
customers. In Silicon Valley, for example, computer firms and their suppliers build
collaborative relationships so as to spread the costs and risk of developing new
products, whilst at the same time enhancing their ability to rapidly adapt to changing
markets and technologies (Saxenian, 1991). Von Hippel (1988) suggests that suppliers
56

Chapter 2 Literature Review
as well as customers are primary sources for innovation ideas. The links to suppliers,
indeed, have an important role to play in product innovation.
Early comparative research on Japanese and US car manufacturers confirms the
importance of supplier integration on new product development (Aoki, 1986;
Blenkhom and Noori, 1990; Kamath and Liker, 1994; Dyer, 1996). For instance, Dyer
(1996) claims that differences in asset specialisation within supplier networks may
explain performance gaps between Japanese and US car manufacturers. His findings
suggest that human asset co-specialisation of the supplier-automaker network has a
positive association with both new product quality and cycle time. He, therefore,
argues that a tightly integrated supplier network, characterised by proximity and a
high level of human co-specialisation outperforms a loosely integrated supplier
network (Dyer, 1996: 271). In testing the effects (as to the extent to which a new
product is based on unique parts developed in-house) on new product development
performance, Clark (1989) concludes that amongst Japanese car manufacturers
intensive supplier involvement and a high level of unique parts (such as those used in
engineering) accounts for a significant part of their advantage in lead-time and costs
over their US counterparts. In particular, intensive supplier involvement allows auto
firms to benefit from a supplier's know-how and to capture it more effectively in the
design of the product and in the conduct of the development process. Blenkhom and
Noori (1990) note that Japanese parts-suppliers participate in an early stage of NPD,
often in advance of their OEM partners. This early and intensive involvement allows
the supplier's NPD processes of designing, prototyping, testing and specification
setting to be carried out in conjunction with their OEM customers, in much the same
way as partners in a project design team would operate. As such, these lines of
research commonly suggest that the degree and stage of supplier involvement in NPD
is a prime contributor to differing performance between Japanese and US automakers.
57

Chapter 2 Literature Review
However, more recently the empirical work of Takeishi (2001) indicates that the
significance of the automaker's integrated problem-solving process with suppliers is
related to effective internal coordination inside the automaker's organization,
particularly within various engineering functions and between engineering and
purchasing functions. This implies that effective external integration also needs
effective internal capacity to effect the success of new key part development. In other
words, a relative internal capacity and an early supplier involvement together affect
an automaker's new product performance.
The integration of key suppliers in the NPD process is deemed an important
resource for developing quality new products faster and at a lower cost (Clark, 1989;
De Mayer and van Hooland, 1990; Ragatz et al., 1997; Droge et al., 2000). In
examining supplier-involvement mechanisms, such as timing of a supplier's
involvement, suppliers' design responsibility and communication frequency in
assembly industries, Hartley et al. (1997) suggest that early supplier involvement
increases the supplier's perceived contributions to product development, regardless of
whether a standard or customer component is used. This is because the supplier
perceives its own contribution as well as feels to be part of the development team,
which leads to them to be more committed to the product development in the process.
Dorge et al. (2000) also confirm that the extent of supplier integration (which consists
of supplier development, supplier partnership and just-in-time purchasing) is
significantly related to a firm's ability to reduce design cycle time. But, the level of
product innovativeness can also impact on the effectiveness of early supplier
involvement in NPD process. Eisenhardt and Tabrizi (1990) empirically examine
time-compression strategies for accelerating the development of certain (mature) and
uncertain (innovative) projects. They suggest that for less predictable projects (more
innovative products), early involvement may be difficult to achieve because there is
58

Chapter 2 Literature Review
less certainty as to exactly for what purposes suppliers will be needed. In contrast, for
predictable projects (less innovative products) key suppliers are more likely to be
identified at an initial stage of development, and as a result, early involvement for the
sake of speeding up NPD design cycle is much possible to be achieved. Not only can
the involvement of key parts/components suppliers contribute to product innovation,
but also R&D equipment suppliers and suppliers of manufacturing equipment may act
as major contributors to a firm's technological progress, particularly for vertical
product differentiation (Malerba, 1992).
Broadly speaking, research in this area has revealed that the main advantages of
supplier linkages are cost reduction, timeliness, quality and risk sharing. These
linkages are more effective in incremental innovations than in radical innovations.
However, there have been few investigations concerning the extent to which
integration of different sorts of suppliers (i. e. key parts/material, R&D equipments
and manufacturing equipments) affects a firm's product innovation and the ways in
which a firm can effectively utilise and integrate key suppliers' knowledge to enhance
its NPD capability.
2.4.3.3 NPD Learning Through Horizontal Linkages
Partners of Cooperation
The inter-disciplinary nature of new product development is a characteristic
present in all high-technology industries (e. g., biotechnology, telecommunications,
and semiconductor) (Mowery and Rosenberg, 1989). This characteristic has
increasingly induced such firms to form alliances with non-competing or competing
organisation units to assist in their NPD projects. Empirical research on inter-firm
collaboration in association with innovation has been well documented (Arora and
Gambardella, 1990; Arora and Gambardella, 1994; Decarolis and Deeds, 1999; Deeds
59

Chapter 2 Literature Review
and Hill, 1996; Granstrand et al., 1992; Hagedoom and Schalenraad, 1994; Pennings
and Harrianto, 1992a; Pennings and Harrianto, 1992b; Shan et al., 1994). Primarily
the motives for inter-firm collaboration include gaining access to complementary
know-how, reducing time-spans and lowering costs or risks of technology
development (Tidd et al., 1997; Hagedoorn, 1993; Beesley and Rothwell, 1987; Grant
and Baden-Fuller, 1995, Arora and Gambardella, 1990; Arora and Gambardella, 1994).
The rationale for technology alliances lie in the fact that no company has an
all-embracing competence in every field of technology and therefore an evaluation of
possible synergies might at some stage of a particular technological trajectory warrant
collaboration with another company. The reduction of cost and minimising and
sharing uncertainty is inherent to the characteristics of NPD projects. The advantage
of the division of global labour accelerates particularly, the adoption of transnational
collaboration projects (Subramaniam and Venkatraman, 2001). This measure allows
firms to keep abreast of their competitors in launching new products and at the some
time to minimise uncertainty.
Shan et al. 's (1994) study examining the biotechnology industry confirms a
positive relationship between the number of inter-firm alliances entered into and the
innovation output (number of patents) made by the firm. Along with this line of
research, Deeds and Hill suggest that an inverted U-shape relationship exists between
the number of alliances that a firm has entered into and the rate of new product
development. They further explain: "given bounded rationality, it is likely that
management's ability to properly screen partners and monitor alliances will be
inversely related to the number of alliances in which the firm is involved" (Deeds
Hill 1996: 44). This rationale implies a diminishing return result, relative to an
increase in the number of alliances.
In their examination of ways in which different alliance strategies of a firm may
60
Chapter 2 Literature Review
be complementary, Arora and Gambardella (1990 and 1994) claim that large
companies tend to form R&D collaborative alliances with small research firms, for
product-specific projects, but sign basic research agreements with universities when
more basic research issues are involved. These findings are consistent with
Hagedoorn's (1993) argument that corporate basic research is of little relevance to
inter-firm technology cooperation. Arora and Gambardella make two main points in
their central argument. First, basic research is to provide a technological infrastructure
on which universities probe further. On the other hand, basic research is an essential
corporate activity, because in R&D intensive industries, it comes close to a company's
corporate core and as such it is not a desirable subject for collaboration. The work of
Granstrand et al. (1992) also reveals that strategies for external technology acquisition
are positively correlated to development strategies that emphasise product
diversification and R&D investment. In other words, the strategy of technology
diversification is a fundamental causal factor that gives rise to both increasing
external technological alliances and increasing R&D budgets.
Findings taken from the implementation of electronic banking illustrate that
banks, having accumulated more technological networking skills (as inferred by their
magnitude of strategic alliances), are likely to offer more innovative services
(Pennings and Harrianto, 1992a; Pennings and Harrianto, 1992b). In studying the
differences of alliances across industries, Hagedoom and Schakenraad (1994)
conclude that firms having effectively absorbed technology through R&D
collaboration alliances, then generate a higher rate of profit. In addition, the intensity
of these alliances tends to rise relative to an increase in the size of companies. In other
words, firm size reflects the degree to which firms seek and flnd external
opportunities in inter-firm linkages.
In the context of product innovation, one of the prime advantages of leaming
61

Chapter 2 Literature Review
through R&D collaboration is to gain access to complementary technology/knowledge.
These learning opportunities permit firms to acquire existing technologies from
outside sources, and integrate them with their own technologies. This allows the
application of newly assimilated knowledge to the successful development of new
products, or to the improvement of current products and processes. Although past
research provides rich empirical evidence on the relationship between inter-firm
collaboration and innovative capability (Rothwell, 1992; Bierly and Chakrabarti,
1996b), there has been less investigation with respect to particular organisational
characteristics, such as the capability to absorb external technology and knowledge
, through collaboration. Neither, has the impact of these collaborative sources on the
extent of product innovativeness been explored. The investigation of these two issues
will form part of the objectives of the present study. The subject of a firm's learning
capacity with respect to acquiring and absorbing external technology/knowledge-
absorptive capacity will be discussed in the section 2.5. av
Competitors
On a broad scope, firms take two routes by which to assess and absorb
competitors' technological knowledge: observation and collaboration. Observation
through a firm's competitor intelligence system (which consists of various functional
groups) facilitates competitive analysis. In his seminal book, Michael Porter (1980: 72)
asserts the need for "competitive analysis" in the modem corporation, and hence "the
need for an organisation mechanism - some sort of competitive intelligence system -
to ensure that the process is efficient. " Researchers have sought to investigate the
components of a firrn's competitive intelligence system and competitive analysis. For
example, Ghoshal and Westney (1991) identify six different functions of competitor
analysis in organisations: decision-making, planning, inspiration, legitimation,
benchmarking and sensitisation. Amongst these functions, competitive benchmarking
62

Chapter 2 Literature Review
provides a set of specific measures by which to compare competitors against aspects
of core technology, product cost/performance ratio, quality and productivity. This
benchmarking always influences and challenges a firm's basic assumptions (e. g.
currently employed technology, product specification, unit production costs, etc)
(Leonard-Barton, 1995). Change to these basic assumptions then invites the
implementation of innovation.
Firms may collaborate with competitors by means of various forms e. g. joint
ventures, out-sourcing agreements, product licensing, co-operative research). This
"competitive collaboration" (Hamel et al., 1989) is considered a low-cost route for
both new and current competitors to gain technology and market access when the new
technology is highly complex, and time to market is crucially important. In addition,
this collaboration eases alliance firms' benchmarking as a result of close proximity.
Consequently, competitive collaboration results in advantages such as inter-finn
learning, new capability acquisition and the creation of markets. However, the
competitive element of such cooperation is likely to affect the knowledge transfer
process. Khanna et al. (1998) suggest that a firm's ratio of private to common benefits
would decide the competitive aspects of alliances. A high ratio leads to an acute
learning relationship.
Universities, Research Institutes, and Consultants
Research collaboration between industrial firms and universities as well as
industrial research institutes has been widely noted. Close proximity to the university
scientific community offers firms better access to knowledge that may have great
value in the marketplace and can contribute to a firm's performance (Mowery and
Rosenberg, 1989; Decarolis and Deeds, 1999). Universities and industry-oriented
research institutes having multi-disciplinary scientists provide important support for,
particularly, cross-disciplinary research projects. Firms usually employ both
63

Chapter 2 Literature Review
university and industrial institute research to conduct either fundamental research or
to develop more speculative in-house new technology, which may have a strategic
significance complementary to their core technologies but cannot be justified
internally because of the high risk involved or limited resources (Tidd et al., 1997).
Firms establish links with universities and industrial research institutes for a
variety of reasons. These include access to specialist technical support; extension of
in-house research; and the provision of a window on emerging technologies (Tidd and
Trewhella, 1997). In testing the hypothesis that external linkage strategies employed
by biotechnology firms with other parties are complementary to one another, Aurora
and Gambardella (1990) observe that most development agreements signed with other
companies tend to be product-specific, whereas the agreements with universities tend
to focus on more basic research objectives. The former centres on rather downstream
product-specific development activities, the latter provides the firms with access to
basic scientific knowledge and opportunities to interact with university scientists for
recruitment purposes. They suggest that universities are more often useful sources of
scientific information and capabilities than other sources of new innovation in this
industry (Arora and Gambardella, 1994). Similarly, Beesley and Rothwell (1987) note
that R&D activities carried out with public sector organisations, such as universities
and industry-oriented research institutes, provide high-tech small and medium-sized
enterprises (SMEs) with a useful means by which to gain access to state-of-the-art
research and knowledge.
Other unique knowledge sources, such as consultants and/or consulting
organisations are often used to find leads, evaluate alternative technology, and
provide missing pieces of technological information (Chatterji and Manuel, 1993).
Professional consultation seems to be an effective and efficient method to acquire
external knowledge, when a firm encounters technological barriers. However,
64

Chapter 2 Literature Review
Hauschuldt & Nesta (1999: 109) state: "the expertise of consulting experts only
covers a small segment of the innovative problems. In integrative innovations the
consultant is rather a seeker, not a knower of truth. " This argument implies that the
resolution of tacit parts of NPD projects still calls for internal expertise. Here, a firm's
absorptive capacity has a fundamental role to play in effectively acquiring external
knowledge and then engendering technological innovation. A detailed discussion of
"absorptive capacity" follows in the next section.
2.5 Absorptive Capacity and External Knowledge Acquisition
The continual development of more innovative products requires firms to import
some knowledge from beyond their boundaries through various linking mechanisms,
as previously discussed. However, increased external. integration or boundary
expansion activity does not guarantee better accumulation and creation of knowledge
for innovative product development. The ability of a firm to recognise the value of
new external knowledge, assimilate it and apply it to commercial ends, which is
known as "absorptive capacity", is perceived to be the most crucial element in a
firm's process of knowledge absorption (Cohen and Levinthal, 1989). This capacity
considerably distinguishes between firms that are capable of identifying, assessing
and assimilating new knowledge from those who are not.
As Fiol (1996: 1012) states: "Organisations, like sponges, must have the capacity
to absorb inputs in order to generate outputs. Researchers have developed theories of
organisational absorptive capacity; researchers have also developed models of the
effective generation of new products. The challenge lies in integrating the two
research streams. " Indeed, a firm's knowledge absorption and diffusion is like the
soaking of a sponge. Firms need to continuously identify new sources of knowledge
that complement existing core technologies. The absorption of this complementary
65

Chapter 2 Literature Review
technology/knowledge, which is subsequently turned into part of new NPD capability,
allows firms to squeeze out new products. The concept of "absorptive capacity" has
been increasingly researched and now represents one of the most crucial constructs in
distinguishing a firm's ability to absorb external knowledge (Fiol, 1996; Cockburn
and Henderson, 1998; Lee, 1999; Tu, 1999; Sivadas and Dwyer, 2000). As yet little
attention has been placed on a NPD model, which identifies the role of absorptive
capacity and assesses its impact on product innovation (Fiol, 1996). In this section,
the perspective of knowledge-enabled NPD is used to investigate absorptive capacity,
and its relationship with both knowledge acquisition and new product innovativeness.
Z5.1 Concept ofAbsorptive Capacity
The term "absorptive capacity" originally referred to the ability of an economy
to utilise and absorb external information and resources (Adler, 1965). Cohen and
Levinthal (1989) first adapted this concept to organisational innovation and defined a
firm's "absorptive capacity" as "the firm's ability to identify, assimilate, and exploit
knowledge from the environment. " They later redefined the term as "the ability of a
firm to recognize the value of new, external information, assimilate it and apply it to
commercial ends" (Cohen and Levinthal, 1990: 128).
2.5.1.1 The ability to recognise. and value new external knowledge
A firm's ability to recognise external knowledge is dependent upon two criteria:
(1) a prior knowledge that is closely related to new knowledge and (2) some fraction
of that knowledge that is diverse enough to allow an effective utilisation of the new
knowledge (ibid. p. 136). Cohen and Levinthal (1994) suggest that firms with a
sufficient prior knowledge base will have the ability to pro-actively envisage future
technological advances, particularly those close to the domain of existing knowledge,
thus improving absorptive capacity. On the other hand, firms where prior knowledge
is non-existent may be discouraged by this uncertainty from further developing their
66

Chapter 2 Literature Review
-I- absorptive capacity for an unfamiliar domain. That is, if a firm lacks investment in an
area of expertise, its future development of the technical capability in that area will be
foreclosed as the development of absorptive capacity is path/history-dependent.
Empirical studies confirm that possession of complementary knowledge (i. e.,
diversity in knowledge domains that are complementary) is a prerequisite for a
knowledge search (Cockburn and Henderson, 1998; Shenkar and Li, 1999). In their
study of the US biotechnology industry, Arora. and Gambardella (1990) observe that
the level of a firm's internal knowledge (as measured by the number of patents) has
positive impacts on its ability to evaluate and exploit knowledge that is generated
outside its organisational boundaries. Likewise, Sen and Rubenstein (1989) find that
the success of a finn's international technology licensing largely depends on its R&D
unit's awareness of developments in external technology, as well as its corresponding
technologies that play a facilitative role in the overall process of implementation. This
evidence suggests, that to an extent, firms tend to stay in the same industrial sector
and find it hard to shift to a new frontier.
2.5.1.2 The ability to assimilate new external technology
Once they recognise the value of external knowledge that is strategically
important and can act as a bridge to a new frontier business, firms then need a
productive process to intemalise it. Cohen and Levinthal (1990: 131-132) argue that
this internalisation process is largely affected by structures of communication between
the external environment and the organisation, and the character and distribution of
expertise within the organisation. For instance, technological gatekeepers (Tushman,
1977) and an organic structure that facilitates communications help the assimilation
process. Similarly, other researchers (e. g. Leonard-Barton, 1995; Madhavan and
Grover, 1998)) suggest that engineers or managers with T-shaped skills, A-shaped
skills of team leaders and team members having shared mental models are some of
67

Chapter 2 Literature Review
the key elements required for the formation of an effective NPD team engaging in the
development of novel innovations. This is because multi-disciplinary expertise as well
as good communications in a NPD team can effectively facilitate the interpretation of
diverse, external technology/information. In general, the most difficult part of
knowledge assimilation lies in its tacit nature. The conversion of tacit knowledge into
coded knowledge that can then be distributed within organisational units determines a
firm's ultimate level of external technology/knowledge acquisition. Nonaka (1991)
suggests that the conscious overlapping of a company's complementary functions for
creating "redundancy" of knowledge and information is imperative because this
redundancy helps create a common cognitive ground between employees and thus
facilitates the transfer of tacit knowledge.
2.5.1.3 The ability to commercialise new external knowledge
The innermost phase of absorptive capacity is the ability to commercially apply
the assimilated knowledge to achieve organisational objectives, such as innovative
product development. To this end, firms' R&D capability plays a critical role. Cohen
and Lenvinthal (1990: 140) claim: "when outside knowledge is less targeted to a
firm's particular needs and concerns, a firm's own R&D becomes more important in
permitting it to recognize the value of knowledge, assimilate, and exploit it. " This
R&D capability mainly consisting of design and development, manufacturing,
marketing abilities not only enables a firm to implement and commercialise newly
acquired technologies but also allows the firm to seek particular needs in its next
phase of NPD projects.
In sum, a firm's absorptive capacity can be symbolised as the central processing
unit of a firm's knowledge-absorbing system, like that of a computer (see Figure 2-6).
This unit enables the firm to recognise and value external technologies (i. e., input),
assimilate them, and convert them into internalised technologies (output). The amount
68

Chapter 2 Literature Review
of external technology/knowledge assimilated depends on the effectiveness of a firm's
absorptive capacity. Once more valuable -external technologies are imbued and
assimilated into the system, the stock of new knowledge is increased. This increase
not only allows firms to generate more innovations but also reciprocally reinforces
their absorptive capacity. In other words, this knowledge-absorbing system is a
feedback, self-learning knowledge generating system.
Figure 2.6 Absorptive Capacity and External Technology
(Absorptive Capacity)
Ability to recognise new external knowledge
(Input) -Prior knowledge base (Output)
-Diverse knowledge External Ability to assimilate new external knowre-Fg-e Internalised Technologies -Communication structure between external Technologies
environment and the organisation
-The mechanism of knowledge transfer across and within subunits
Ability to commercialise new external knowledge
-Firms' overall integrated ability in new
product development
(Source: the current study)
2.5.1.4 Development of Absorptive Capacity
Absorptive capacity can be developed and maintained as a by-product of routine
activities, such as R&D and manufacturing in the current knowledge domain (Cohen
and Levinthal, 1990). In addition, a firm can further foster its absorptive capacity by
hiring technical experts, sending employees for advanced training, and encouraging
employees to study technical journals. Cohen and Levinthal. (1990: 132) reason that
the accumulation of a firm's absorptive capacity is dependent upon three major
69

Chapter 2 Literature Review
factors. First, a firm's direct interface with the external environment initiates
boundary-spanning activities. External sources include industrial research laboratories,
public research institutes, universities, consulting firms, buyers, suppliers, and
competitors amongst others. Second, a firm's subunits, which interact together,
transfer knowledge across and within each other. Third, a firm's communication
structure, between the external environment and the organisation, as well as between
the subunits of the organization, also determines absorptive capacity building.
Although absorptive capacity is mainly the function of a prior knowledge base,
intensification of learning efforts is also needed to foster the building of absorptive
capacity (Kim, 1998). However, as the accumulation of absorptive capacity tends to
be within a firm's domain, a critical question is: how far should a firm invest in its
absorptive capacity of that particular domain before falling into a competency trap
(Levitt and March, 1988). Leonard-Barton (1992: 118) contends that: "value, skills,
managerial systems, and technical systems that served the company well in the past
and may still be wholly appropriate for some projects or parts of projects, are
experienced by others as core rigidities - inappropriate sets of knowledge. " These
may explain why established fin-ns often encounter difficulties once dominant designs
of their product lines change. The details of how the development of absorptive
capacity leads to competency trap invite more empirical investigation.
Z5.2 TheImpactofAbsorptive Capacity ots ExteriialKiiowledgeAcqiiisitioii
A growing body of research has provided empirical evidence as to the effect of
absorptive capacity on external knowledge acquisition (Arora, and Gambardella, 1990;
Atuahene-Gima, 1992; Atuahene-Gima, 1993; Mowery et al., 1996; Luo, 1997;
Veugelers, 1997; Cockburn and Henderson, 1998; Lane and Lubatkin, 1998;
Mangematin and Nesta, 1999; Shenkar and Li, 1999). Most research investigates how
various forms, such as; inter-firm cooperative ventures (ICVs), strategic alliances,
70

Chapter 2 Literature Review
networking and learning with public institutes, could effectively enhance the
acquisition of external technological knowledge. For instance, Mowery et al. (1996),
using data from 792 alliances, studied inter-firm knowledge transfers and concluded
that absorptive capacity significantly influences the acquisition of capabilities through
alliances. In particular, alliances with prior experience in related technological areas
have proved to be an important determinant of absorptive capacity (i. e.
path-dependent and firm-specific). That is, the basic requirement for enriching
effective inter-organisational learning in an alliance lies in having learning partners
equipped with the requisite absorptive capacity (Levinson and Asahi, 1995). In
addition, continually enhancing the absorptive capacity of the alliance is critical if a
planned change is to be successfully implemented.
Koza and Lewin (1998) suggest that absorptive capacity is particularly more
important for exploratory alliances (i. e. those having an exploratory objective) than in
exploitative alliances (i. e., those with objectives such as cost reduction, risk sharing
and economies of scale). In a research model of differential learning within the
dynamics of a strategic alliance, Kumar and Nti (1998) hypothesise that the
knowledge appropriated by an alliance partner depends on its absorptive capacity and
the volume of alliance generated knowledge to which it is exposed. That is, greater
absorptive capacity assists a firm in appropriating more knowledge when exposed to a
given volume of alliance generated knowledge. This is because with exposure to
multiple sources of knowledge, an alliance firm with a higher absorptive capacity
gains greater leverage. Furthermore, Kumar and Nti (ibid. ) suggest that a firm's
ability to appropriate knowledge from an alliance depends on the quality of its
employees, its knowledge base, the resources at its disposal, and its management
systems, all of which constitute major elements in a firm's overall absorptive capacity.
A stream of research focuses on how firms differ particularly in their absorption
71

Chapter 2 Literature Review
of applied and basic/generic types of knowledge. Based on the empirical results from
112 R&D cooperation projects between the National Scientific Research Institute and
industrial firms in France, Mangernatin and Nesta (1999) argue that a firm with high
absorptive capacity facilitates the assimilation of both applied and basic knowledge.
In addition, a higher absorptive capacity is more critical for absorbing basic research
knowledge than applied research knowledge. Also, an increasing absorptive capacity
essentially diversifies firms' absorption mechanisms. Cockburn and Henderson (1998),
in a study related to the transfer of public technological knowledge, further confirm
that a firm needs to conduct a similar research internally first (i. e. to foster its
absorptive capacity relating to/close to the knowledge/technology to be absorbed)
before taking advantage of publicly generated cutting-edge research, labeled basic
knowledge.
Although absorptive capacity is the crucial factor in absorbing external
knowledge/technology, it may not directly drive a firm to develop more external
linkages. Atuahene-Gima (1993) investigated firms' decisions on inward technology
licensing and found that, if equipped with a relatively high level of internal R&D
capability (i. e. one of major elements of a firm's absorptive capacity), firms are more
likely to internalise new product developments than to have co-operative R&D
projects. This is because of the tendency towards "not-invented-here" syndrome (Katz
and Allen, 1982) among internal R&D staff, which inhibits the consideration of
external sources of technology. The development of "not-invented-here" syndrome
must be confined when firms have accumulated sufficient levels of absorptive
capacity in their design domains.
Absorptive capacity also determines a firm's internal knowledge transfer
capability (i. e. within-organisation diffusion of knowledge). For instance, Szulanski
(1996) identifies three major barriers influencing internal knowledge transfer: (1) the
72

Chapter 2 Literature Review
recipient's lack of absorptive capacity, (2) causal ambiguity, and (3) an arduous
relationship between the source and the recipient. Obviously a firm's internal subunits,
without having adequate absorptive capacity, could have difficulties in knowledge
transfer between them even though they are organizationally closed.
Although previous research highlights the importance of absorptive capacity in
both acquiring external knowledge and effecting internal knowledge transfer, few
have attempted to examine the relationship between absorptive capacity and a firm's
new product innovativeness. The paucity of this type of research may be because
NPD researchers have not yet investigated how and to what extent external
knowledge (e. g., from alliances) affects the effectiveness of new product development.
More recently, Sivadas and Dwyer (2000) developed a construct -cooperative
competency- derived from the concept of absorptive capacity and relational capacity
and tested whether it determines the success of new product development in
alliance-based processes. This research suggests that "cooperative competency"
(relative absorptive capacity) is positively related to NPD success in both internally
and externally conducted projects. Other influential factors include institutional
support for cooperative competency, administrative mechanisms, and mutual
dependence. They suggest that more research on absorptive capacity in the context of
NPD needs to be conducted for both theory development and managerial application.
Absorptive capacity, therefore, plays a crucial role in a firm's acquisition of
external technologies whether knowledge transfers takes place in inter-firm
cooperation or organisational subunits. It enables a firm not only to envisage
industrial technological trends, but also to effectively assimilate external
knowledge/technology that may significantly contribute to its new product
development, particularly, radically innovative projects in the long run. The
development of absorptive capacity results from a prolonged process of investment
73

Chapter 2 Literature Review
and knowledge accumulation. As Cohen and Levinthal argue (1990), the ability to
explore and exploit external knowledge is often a by-product of R&D investment.
Firms investing more in their own R&D increase their ability to generate more
innovative projects. Subsequently, this investment reciprocally helps their
development of a higher capacity for absorbing external knowledge. Firms with
relatively high innovative culture, such as creating a conductive knowledge-creation
environment, encouraging external knowledge scanning, and open communications
with external parties, are more capable of recognising and acquiring relative
technology/knowledge (Tu, 1999). The accumulation of new product
technology/knowledge will encourage more innovative NPD projects and thus,
reciprocally increase firms' level of absorptive capacity.
Z5.3 Other Concepts ofKnowledgeAcquisition Capability
On a broad front, scholars with both a resource-based and a knowledge-based
view of the firm have conceptualised similar constructs regarding capabilities for both
external and internal knowledge acquisition. For instance, Henderson and Clark (1990)
develop two types of innovation capabilities - component versus architectural3.
Architectural capability is recognised as a key ability by which firms can integrate
external knowledge effectively for architectural innovation. In their empirical
examination of pharmaceutical companies, they identified two particularly important
forms of architectural capabilities as sources of advantage in research productivity:
the ability to access new knowledge from beyond the boundaries of the organisation
and the ability to integrate knowledge flexibly across disciplinary boundaries and
3 Henderson and Clark (1990: 10-11) argue that the development of a new product requires two types of knowledge - component knowledge and architectural knowledge. The latter concerns the way in which a set of components in the product are integrated and linked together to form a coherent whole. Henderson and Cockburn (1994: 65) define "component capability" as "local abilities and knowledge that are fundamental to day-to-day problem-solving", and "architectural capability" as "the ability to use these component capabilities - to integrate them effectively and to develop fresh component capabilities as they are required".
74

Chapter 2 Literature Review
product ideas within an organisation (Henderson and Cockburn, 1994). Similarly,
Kogut and Zander (1992) introduce the concept of "combinative capability" as a
firm's ability to synthesise and apply current and acquired knowledge through both
internal and external learning. Innovations, under this notion, are products of a firm's
combinative capabilities to generate new applications from existing knowledge.
In contrast to the ability to recognise and exploit external technology as
suggested by absorptive capacity, Garud and Nayyar (1994) propose the construct of
"transformative capacity" and stress that this ability allows a firm to continually
redefine its product portfolio based on the technological opportunities created within.
They further contend that absorptive capacity alone is not enough to sustain firms'
competitive advantage "when: (1) path-dependent, cumulative knowledge is involved;
(2) entry timing is important, (3) a firm operates in a continually changing
environment in which it does not just react to external changes, but instead, creates
them on its own, " (ibid, p. 367). In these circumstances, the development of
transformative capacity is required to maintain corporate vitality. Admittedly, this
argument is based on a few specific observations taken from cases of giant MNCs and
cannot be extended to SMEs. The latter in fact do not have the necessary resources to
create diverse technologies without commercial applications over an uncertain period.
Thus, "transformative capacity" may serve as an important capability for MNCs but
definitely not for SMEs.
More recently, Lorenzoni and Lipparini (1999), using the concept of relational
rents by Dyer and Singh (1998), coined the term "relational capability"- meaning the
ability to interact effectively with other companies. They argue that a high level of
relational capacity between a lead firm and networking parties helps to accelerate a
lead finn's access and transfer of knowledge, as well as contributing to the growth and
innovation of network parties. The development of this relational capability further
75

Chapter 2 Literature Review
helps managers of a lead firm to internalize specialised knowledge across a network
of firrns whilst at the same time managing the inter-organisational network.
By re-conceptualising the concept of absorptive capacity, Lane and Lubatkin
(1998) coined the term "relative absorptive capacity". They suggest that one finn's
ability to learn from another depends upon "the similarity of both firms' knowledge
bases, organisational structures and compensation policies, and domain logics" (p.
461). This is because the tacit part of knowledge, which is unique and inimitable and
is embedded in a firm's social context, cannot be easily absorbed (Beaumard, 1999).
Learning or acquiring such un-codified complex knowledge requires more than just a
firm's absorptive capacity. Hence, to gain better learning performance, both student
and teacher firms need to have a high degree of relative absorptive capacity. This
ability enables alliance firms to achieve an effective learning process for knowledge
sharing from the stage of know-what, know-how through to the final stage of
know-why. The concept provides useful guidance for firms in search of learning
alliance partners for external knowledge acquisition. However, researchers applying
the construct of "relative absorptive capacity" to the study of knowledge acquisition
through collaborations with, for example, universities or industry-based research
institutes could encounter difficulties. Since universities and research institutes
operate in a way that differs from profit-oriented enterprises, identifying resembled
relative absorptive capacity amongst them could require great research efforts.
Table 2.5 surnmarises different terms pertaining to absorptive capacity proposed
in the existing literature. In short, except for transformative capacity, the constructs of
combinative, architectural, and relational capabilities place the emphasis on how a
firm's competence can be achieved by combining/integrating both internal and
external knowledge, rather than on what affects the acquisition and assimilation of
external technology/knowledge. The latter is more concerned with a finn's ability in
76

Chapter 2 Literature Review
generating innovative products. As such, the construct of "absorptive capacity",
proposed and defined by Cohen and Liventhal, more precisely conveys and captures
the essence of external knowledge acquisition, particularly in a NPD research model,
than the other constructs do.
Table 2.5 Summary of Constructs Pertaining to Absorptive Capacity
Sources Label Description Cohen & Absorptive Capacity The ability of a firm to recognise the value of Levinthal new, external information, assimilate it, and (1990) apply it to commercial ends
Lane & Lubatkin Relative Absorptive, The ability of a firm to learn from another (1998) Capacity firm depends on the similarity of both firms'
(1) knowledge bases, (2) organisational structures and compensation polices, and (3) dominant logiCS4
Kogut & Zander Combinative The ability of a firm to synthesize and apply (1992) Capability current and acquired knowledge
Henderson & Architectural The ability of a firm to integrate existing Clark (1990) Capability competencies and to generate new
knowledge
Lorenzoni & Relational The ability of a firm to interact and share Lipparini (1999) Capability knowledge with other companies Garud & Nayyar Transformative The ability of a firm to redefine its product (1994) Capacity portfolio based on the technological
opportunities created within
4 Prahalad and Bettis (1986 & 1994) define the dominant logic as "the way in which managers in a firm conceptualise the business and make critical resource allocations decisions... " It is stored via shared schemas, cognitive maps or mind sets and was determined by the managers' pervious experiences; but was largely unrecognised by the managers themselves. Prahalad and Bettis also confirmed that it refers to belief structures, and frames of reference as being intimate aspects of a dominant logic.
77

Chapter 2 Literature Review
2.6 Conceptual Framework
As indicated in preceding sections, there has been a wealth of research
concerning the ability of organisations to absorb external knowledge. Knowledge that
is acquired externally and assimilated assists a firm to further enhance its product
innovation. The literature on external learning suggests that external information is
crucial to radical innovation (McKee, 1992; Bierly and Chakrabarti, 1996b; Lynn et
al., 1996; Lynn, 1997). Other research (Bierly and Chakrabarti, 1996b; Li and
Calantone, 1998; Pennings and Harrianto, 1992a; Pennings and Harrianto, 1992b)
suggests that the nature of external linkages is key to understanding a firm's
technological innovation. Grant and Banden-Fuller (1995) argue that a firm's
capability to develop more innovative products consists of the interaction between its
existing knowledge bases and the extent to which external, new complementary
knowledge can be integrated. The higher complementarities of new product
technology and the firm's technology domain enable innovative product development.
The importance of external linkages, particularly relating to external knowledge
acquisition, is widely acknowledged in various disciplines. Importantly, this study
reconceptualises the relationship between external linkages and new product
innovativeness. Specifically, this thesis revisits the concept of absorptive capacity and
investigates the how and to what extent linkages and absorptive capacity influence
new product innovativeness. The thesis addresses the following questions. First, what
types of external linkages significantly influence industrial product innovation? For
example, does the horizontal linkage contribute more to a firm's accumulation of new
product knowledge, and thus lead to more innovative product development than the
vertical linkage does? Second, does absorptive capacity influence the relationship
between a firm's external linkages' and new product innovativeness? What is the role
78

Chapter 2 Literature Review
of absorptive capacity in these relations? Third, does the extent of a firm's external
linkages enable us to predict its gain in new product knowledge? A review of the
existing literature suggests that these questions have not been sufficiently empirically
examined and thus remain, at least in part, unanswered. Therefore, the following
conceptual framework (Figure 2.7) has been developed to depict the proposed
relationships, which are examined in the following chapters. Figure 2.7 The Conceptual Framework
Absorptive Capacity
External Linka2es Vertical linkages:
-Suppliers -Customers
Horizontal Linkages: -Cooperating firms -Universities -Industrial Research
Institutes
Gains in New Product Related Knowledae -Gain in design & development
knowledge -Gain in manufacturing
knowledge -Gain in marketing knowledge
Product Innovativeness -Technological
innovativeness -Market
innovativeness
In the framework, derived from the knowledge creation school of innovation
(Nonaka, 1994; Grant and Baden-Fuller, 1995; Leonard-Barton, 1995), gains in new
product knowledge mediate the link between external linkages and product
innovativeness. This is because the primary motives behind external linkages are to
gain access to complementary technologies (Link and Tassey, 1987: Hamel, 1991;
Rothwekk and Dodgson, 1991; Powell et al., 1996) to fill the gap between the product
and knowledge domains (Grant and Banden-Fuller, 1995), and to acquire
complementary knowledge (Teece, 1986), thus resulting in an increase in product
knowledge stock. These complementary technologies include design & development
know-how, manufacturing know-how, marketing know-how and pre-development
assessment knowledge know-how that transfer a new product concept into a viable,
79

Chapter 2 Literature Review
commercialized product (Crawford, 1997). The increase of new product knowledge
stock in design & development, manufacturing and marketing know-how
subsequently predicts the level of product innovativeness (Leonard-Barton, 1995;
Nonaka, 1994). This framework reflects the assumption that a difference in the
accumulation of new product knowledge (both marketing and technological) in a NPD
project exists across various types/forms of external linkages (Eisenhardt and Tabrizi,
1990; Hennart, 1988; Dussauge et al., 2000; Sakakibara, 1997; Tidd and Trewhella,
1997).
Absorptive capacity is included to examine the relationship between external
linkages and new product innovativeness. Absorptive capacity has been empirically
examined and confirmed to be a crucial factor influencing the effectiveness of
external knowledge acquisition (Arora and Gambardella, 1994; Mowery et al., 1996;
Veugelers, 1997; Lane and Lubatkin, 1998; Mangematin and Nesta, 1999). Firms, as
learning systems, must have the capacity to absorb inputs in order to generate outputs.
Finns that possess relevant prior knowledge are likely to effectively value and acquire
relevant external technologies that can help them generate new ideas resulting in more
innovative product development. As a result, firms with a high level of absorptive
capacity are more likely to explore and exploit technologies acquired through
collaboration with external partners than those with less. Following this line of logic,
absorptive capacity is constructed as a predictor/moderator variable, one that not only
affects a firm's gain in new product knowledge, but which also moderates the impact
of the external linkages on the level of new product knowledge accumulation.
2.7 Summary . This chapter reviews the literature related to product innovation primarily based
on organisitional learning theory and the knowledge-based theory of inter-firm
80

Chapter 2 Literature Review
collaboration. The objective there is to establish a conceptual framework for analysing
how and to what extent external linkages influence a firm's level of accumulation of
new product knowledge, and subsequently, how this affects the level of new product
innovativeness. This chapter lays the foundation for a critical response to Fiol's (1996)
call for research integrating theories of absorptive capacity into NPD. The research
framework outlined here forms the basis for a series of hypotheses, which are
presented in the following chapter.
81

Chapter 3 Research Hypotheses
Chapter 3
Research Hypotheses
3.1 Introduction
Drawing on theoretical and empirical perspectives from organisational learning,
knowledge management, product innovation and inter-firm alliances, chapter two
proposes a conceptual framework to delineate the relationship between factors
including: vertical linkages, horizontal linkages, gains in new product related
knowledge (about a given NPD project), absorptive capacity and new product
innovativeness. This framework proposes that the effects of external linkages on gain
in new product knowledge are largely contingent upon a firm's absorptive capacity.
New product knowledge gained through collaboration in a NPD project mediates the
relationship between external linkages and new product innovativeness. This chapter
uses this framework to develop and discuss four sets of hypotheses.
The chapter begins by considering the effect of external linkages on gains in new
product knowledge that in turn contribute to new product innovativeness. Section 3.2
starts with a discussion of empirical evidence from studies of organisational learning.
Following this, I discuss empirical works drawn from the fields of knowledge
management and inter-firm. collaboration. Hypotheses concerning the relationships
between external linkages and gains in new product knowledge are then presented.
Next, the rationale and hypothesis regarding the mediating role of gains in new
product knowledge, as depicted in the conceptual framework, is discussed.
Section 3.3 centres on the direct and moderating effects of absorptive capacity as
well as the direct effects of external linkages on gains in new product knowledge. This
section elaborates on the effect of absorptive capacity on external knowledge
absorption. The empirical evidence discussed here is primarily drawn from studies of
82

Chapter 3 Research Hypotheses
inter-organisational learning, inter-firm alliances and product innovation management.
3.2 External Linkages and New Product Innovativeness
3. ZI The Effects of Horizontal and Vertical Linkages on Gains its New Product
Knowledge
Past research, from a learning perspective, has highlighted the importance of
external learning for effective product innovation (McKee, 1992; DiBella et al., 1996;
Lynn et al., 1996; Lynn, 1997). McKee (1992) argues that radical innovations rely
more on external learning practices such as staff involvement with outside experts and
external skills acquisition than those required for incremental innovations. Similarly,
Lynn (1997 &1998) suggests that when a firm develops and commercialises radically
new products, that encompass new technology and serve new markets, cross-company
learning (i. e. inter-organisational learning) becomes more critical than in the
development of incremental products. Dibella et al. (1996) posit that for
"transformative innovation" (i. e. radical innovation) a certain degree of acquisition of
external knowledge is required. Lynn et al. (1996) even argue that firms in technology
intensive industries should put more emphasis on experiences gained from the "probe
and learning" process of exploring external environments when marketing radical
products. The implication of this evidence is that developing truly innovative products
requires a firm to foster more external links to facilitate the influx of external
knowledge, than in the development of incremental products.
Empirical studies on inter-firm collaboration also provide some evidence of this
relationship regarding the effectiveness of product innovation. Pennings' (1992 &
1992a) studies of electronic banking applications show that those banks that have
accumulated more technical networking skills tend to display a higher tendency of
implementing new innovation. Complementing this view, Deeds and Hill (1996)
83
Chapter 3 Research Hypotheses
(1996) propose that the productivity of a firm's new product development efforts is
positively associated with the extent of its inter-firm alliances. Furthermore, the
empirical works of Deeds and Hill (1996) and Shan et al. (1994) also reveal a positive
relationship between the number of strategic alliances that a firm has and the
productivity (measured in terms of products on market, new products in the pipeline
and patents) of new product development in the biotechnology industry. However,
they suggest that this relationship might be depicted as an inverted U-shape due to the
result of diminishing returns relative to an increase in the number of alliances that
increases the burdens on management (Deeds and Hill, 1996). In brief, the advantages
of inter-firm collaboration for new product innovation lie in two respects. First,
alliances offer firms a set of complementary technologies that are needed in the
development of a relatively new product. Second, alliances are an effective
mechanism for enabling the integration of these complementary technologies with a
firm's existing technology.
Research on knowledge management has greatly contributed to the
understanding of the way in which various sources of knowledge affect product
innovation. Knowledge of external sources, such as customers, suppliers, and
competitors, has been shown empirically to have a significant impact on product
perfonnance (Grant and Baden-Fuller, 1995; Madhavan and Grover, 1998; Pennings
and Harrianto, 1992a; Pennings and Harrianto, 1992b). For instance, Pennings (1992,
1992a) state that new knowledge gained through technological networking such as
licensing, joint ventures and long-term contracts is positively associated with a firm's
implementation of new technological innovation. However, the difficulty of this
knowledge absorption resides in gaining the tacit part of knowledge. For example,
some researchers (Grant and Baden-Fuller, 1995; Madhavan and Grover, 1998) argue
that the success of R&D collaborative projects depends on converting tacit knowledge
84

Chapter 3 Research Hypotheses
into explicit knowledge to which learning parties can interpret and apply. That is, the
more innovative a new product, the more tacit knowledge there is to be converted by
collaborative parties (Madhavan and Grover, 1998).
The conversion of tacit knowledge requires certain extensive and deep linkages,
such as R&D collaboration and joint ventures, as these alliances offer firrns an
effective mechanism with which to learn about the tacit skills of other firms (Hamel et
al., 1989). The rationale of this effectiveness is that R&D collaboration or joint
ventures provide more opportunities for experience sharing and face-to-face
discussions and these may facilitate a firm's assimilation of, in particular, tacit
know-how that is often accompanied by a product with complex technology. In I
addition, firms engaged in collaboratively developing highly innovative products also
require a high standard of learning ability to effectively convert tacit know-how into
explicit know-how (Madhavan and Grover, 1998). In line with this, Badaracco (1991)
also suggests that tactical alliances (i. e., sub-contracting and licensing, which are less
integrative forms of collaboration) are appropriate for bringing in explicit knowledge.
However, he argues that more strategic links (i. e., joint ventures and cooperative
research) are necessary to acquire tacit or embedded knowledge as the latter offers
more opportunities or R&D experience sharing. Furthermore, Grant (1995) posits
that a more integrative mode of collaboration, as opposed to market transactions, such
as contracting or licensing, is a more efficient way to transfer explicit knowledge, as
well as to embody tacit knowledge. In contrast, in less complex product technology
situations, firms simply take on a less integrative form of cooperation, e. g.
sub-contracting or licensing. As such, it can be concluded that the more
innovativeness within the new product is, and then a greater degree of external
linkages (such as collaborative development and joint ventures) will be needed. This
greater linkage allows more intimate knowledge sharing, experience exchanging and
85

Chapter 3 Research Hypotheses
frequent communications, which facilitate the assimilation of tacit part of new product
knowledge.
Besides the extent of an external linkage, the object of that linkage also affects
the type and extent of new knowledge that a firm is to absorb. For instance, Tidd et al.
(1997) argue that the primary motives for vertical linkages (i. e. collaboration with
suppliers and customers) are cost reduction, sharing risks, and timeliness. The
effectiveness of vertical linkages primarily lies in the fact that a new product project is
relatively less innovative. Industrial goods firms, for instance, such as the automobile
industry often work closely with their specialist suppliers to improve the quality and
reduce the costs of sub-contracted products (Aoki, 1986; Blenkhom and Noori, 1990;
Kamath and Liker, 1994; Dyer, 1996). The work of Dyer (1996) stresses that a tightly
integrated supplier network (featuring proximity and a high level of human
co-specialization) outperforms a loosely integrated supplier network from the aspect
of project costs and cycle time. The studies of Clark (1989) and Blenkhom and Noori
(1990) also found that intensive supplier involvement and participation at an early
stage of NPD is one of the primary factors that distinguish Japanese car manufacturers,
who enjoy cost and quality advantages, in comparison with their American
counterparts. Moreover, Eienhardt and Tabrizi's (1990) empirical work confirms that
less innovative products (i. e. predictable projects) are more likely to achieve the
results of reduction in cost or timeliness associated with a supplier's early
involvement in NPD process, than relatively more innovative products (i. e.
unpredictable projects). That is, an effective process of supplier involvement in NPD
relies on the extent to which the technology of the new product employed is mature
and stable. Under such conditions, firms' absorption of relatively new product
knowledge/technology through these types of projects tends to be minimal. The
product knowledge that a firm can further gain through supplier linkages is therefore
86

Chapter 3 Research Hypotheses
more useful for incremental products than relatively innovative ones.
Although several studies (Rothwell et al., 1974; Cooper, 1979; Cooper, 1981;
Bonnet, 1986; Dougherty, 1990; Song and Parry, 1992) suggest that an accurate
understanding of customers' needs, wants, preferences and responses to existing
products is the factor which discriminates most strongly between commercially
successful, industrially innovative projects and those which fail. Other views have
been put forward. O'Connor (1998), for example, argues that the weight of market
learning through the current users seems less apparent if the NPD project involves a
really new project (i. e. radical innovation). This lack of contribution is primarily due
to the fact that current users are incapable of describing their requirements for a
product that is entirely new to the market. Therefore, the effectiveness of user
involvement in a NPD project tends to be less significant in radical types of
innovations than in incremental types since the primary concerns of the latter are cost
reduction, quality improvement or time to the market, where current users can, to a
greater degree, make some contributions.
In contrast to vertical linkages, the primary advantage for a firm's horizontal
linkages is to gain access to a wide range of complementary know-how (Tidd et al.,
1997). This complementary know-how, which includes knowledge/technology in
respect of technological, marketing, and manufacturing know-how, is necessary to
translate an innovative R&D project into a visible product (Teece, 1986). The
implementation of a novel product development increasingly involves a set of
multi-disciplinary processes that require the integration of knowledge from various
external sources (Mowery and Rosenberg, 1989). For instance, developing links with
university research allows firms to access specialist technical support, to extend
in-house research and to provide a window on emerging technology (Tidd et al.,
1997). Tidd et al. (1997) contend that firms utilise university research not only to
87

Chapter 3 Research Hypotheses
conduct a more basic types of research but also to explore a more speculative new
technology, which cannot be justified internally because of limited resources or
because of the high risk involved. Similarly, Beesley and Rothwell (1987) find that
R&D activities carried out with industry-oriented research institutes and universities
are particularly effective ways for high-tech SMEs to gain access to state-of-the-art
research and knowledge. Aurora and Gamgardella (1990) also identify that most
development agreements signed with universities tend to be centred on more basic
research objectives, rather than ready-to-market applications in the biotechnology
industry. On the whole, these studies suggest that the NPD projects that deploy
horizontal links with universities and research institutes, aimed at exploiting
complementary technology to fulfill firms' technology gaps, tend to be more
innovative.
Entering into alliances enables a firm to learn about the skills of other firms
(Hamel et al., 1989). Studies (Sinha and Cusumano, 1991; Dussauge et al., 2000) of
R&D alliances, comprising a group of competing or non-competing firms, suggest
that learning new skills and/or acquiring know-how would be more effective between
partners if alliance firms were to contribute different capabilities. In addition,
Sakakibara (1997) confirms empirically that the skill-sharing motive is likely to
increase in R&D consortia displaying heterogeneous capabilities. This evidence
highlights the importance of complementary technology from alliances of competing
or non-competing firms, whose technologies, once integrated with internally existing
technologies, permit the firm to develop a more innovative product.
The theoretical arguments and empirical evidence discussed above indicates that
horizontal links with potential competitors, non-competitors (e. g., OEM/ODM
1 OEM stands for original equipment manufacturers. This term has been used frequently in the high-tech industry and connotes the meanings of contracted manufacturing. An ODNI (original design
88
Chapter 3 Research Hypotheses
partners), universities, and industry-intensive research institutes all tend to provide
firms with complementary technology and/or novel technology that cannot be verified
and developed internally. Just as complementary knowledge can boost a firm's
innovative productivity (Teece, 1992), a more innovative NPD project tends to be
associated with a relatively high extent of horizontal linkage that, in consequence,
results in the absorption of relatively high extent of novel product knowledge. By
contrast, the vertical linkages, which are less to do with gaining new
product/technology knowledge, are more likely to be associated with incremental
product innovations, involving more stable and mature technology. Hence, the first
hypothesis is put forth as:
Hypothesis 1: The positive effects of horizontal linkages on gains in new product
knowledge will be stronger than those of vertical linkages.
In order to develop new products, a firm has also to develop a body of
technological know-how with commercial possibilities. To transform this know-how
into a viable product, the firm must integrate a set of abilities that include
complementary design/development know-how, manufacturing know-how, and
marketing know-how into its NPD process (Crawford, 1997; Teece, 1986).
Complementary design/development know-how is crucial because, increasingly, new
product development involves several specialist technologies that need to be
effectively integrated. Manufacturing know-how is also crucial for two reasons. First,
it allows the firms to assemble new product more efficiently in order to meet the
cost/performance ratio set by the marketplace. Second, it is one of the key drivers in
converting an engineering prototype into a mass production unit (Cooper, 1999).
and manufacturing) is a firm that not only manufactures but also designs/develops new products for its international customers, which market these products under their own brands. ODM firms develop their
Own R&D capability and gain more competitiveness than OEM firms.
89

Chapter 3 Research Hypotheses
Furthermore, marketing know-how is critical since the firm needs to understand
customer's needs and wants, which should be designed into new product
specifications, and also the firm must be able to distribute the new product to the
target customers efficiently. Hence, the three sub-hypotheses are:
HIA: The positive effects of horizontal linkages on gains its R&D knowledge
will be stronger than those of vertical linkages.
HIB: The positive effect of horizontal linkages on gains in marketing
knowledge will be stronger than those of vertical linkages.
HIC The positive effect of horizontal linkages on gains in manufacturing
knowledge will be stronger than those of vertical linkages.
3.22 The Mediating Role of Gains in New Product Knowledge
As the primary aims of external linkages are to gain access to complementary
technologies (Rothwell and Dodgson, 1991; Powell et al., 1996), to assess and acquire
a range of complementary product-specific know-how (Teece, 1986), and to fill the
gap between the product domain and knowledge domain, these linkages, therefore,
lead to an increase of product knowledge stock. Subsequently, as the technology gap
between the new product know-how and the finn's existing product know-how
disappears, a relatively innovative product can then be realized. That is, the larger the
technology gap that exists in a NPD project, the more innovative a new product will
be if the gap vanishes. The logic is that while external linkages are important, it is the
extent of absorption of new, complementary product-specific knowledge that decides
the new product's innovativeness. In other words, an increase in design &
development, manufacturing and marketing knowledge stock as a result of external
linkages leads to the development of a more innovative new product in a NPD project.
Thus, the next hypothesis is proposed as:
90
Chapter 3 Research Hypotheses
Hypothesis 2: The positive effects of external linkages and absorptive capacity on new
product innovativeness are mediated by gains in new product related (that is, design
& development, manufacturing and marketing) knowledge.
H2A: The positive effects of external linkages and absorptive capacity on
technological innovativeness are mediated by gains in new Product related
knowledge.
H2B: The positive effects of external linkages and absorptive capacity on market
innovativeness are mediated by gains in new product related knowledge.
3.3 Absorptive Capacity and External Knowledge Absorption
3.3.1 The Direct Effect ofAbsorptive Capacity on Gains in New Product Knowledge
A firm engaged in more innovative product development requires not only a
great deal of learning opportunities from its alliances, but also a high standard of
learning ability to effectively convert, in particular, tacit know-how into explicit
know-how (Madhavan and Grover, 1998). This learning ability - absorptive capacity -
is considered one of the most crucial factors influencing the effectiveness of external
knowledge acquisition (Arora and Gambardella, 1990; Atuahene-Gima, 1992;
Atuahene-Gima, 1993; Arora and Gambardella, 1994; Mowery et at., 1996; Veugelers,
1997; Luo, 1997; Lane and Lubatkin, 1998; Mangernatin and Nesta, 1999).
Absorptive capacity provides firms, first, with the ability to recognize the value of
new, external technology (Cohen and Levinthal, 1990). Cohen and Leventhal (1990:
136) state, "if the firm does not develop its absorptive capacity in some initial period,
then its beliefs about the technological opportunities present in a given field will tend
not to change over time, because the firm may not be aware of the significance of
signals that would otherwise revise its expectations. " Several empirical studies (Arora
91

Chapter 3 Research Hypotheses
and Gambardella, 1990; Arora and Garnbardella, 1994) indicate that the level of a
firm's internal knowledge has a positive impact on its ability to evaluate emerging
external technology. Sen and Rubenstein (1989) point out that a firm's R&D unit's
awareness of future development concerning external technology is a crucial factor
that often decides the success of international technology alliances. Cohen and
Levinthal (1994) further stress that absorptive capacity also, to a certain extent,
improves a firm's ability to correctly predict its future technological advances.
Secondly, in addition to recognising the value of external technology, this ability
allows firms to assimilate newly recognized technologies. For instance, Mangernatin
and Nesta (1999) argue that a firm with higher absorptive capacity more easily
assimilates fundamental or scientific/basic knowledge while they engage in R&D
collaboration with research institutes. Moreover, Cockburn and Henderson (1998)
suggest that a firm needs to equip itself with a relative knowledge in advance (i. e. a
proper absorptive capacity) prior to taking advantage of publicly generated research
(i. e. basic technology). However, the difficulty in assimilating external technology lies
in the tacit part of the knowledge, the acquisition of which requires extensive
experience sharing and face-to-face discussion. Therefore, a certain extent of in-depth
linkages between learning parties is needed.
Finally, absorptive capacity enables a firm to apply assimilated knowledge to
commercial ends as well as for the creation of firm-specific new knowledge (Cohen
and Levinthal, 1990). For instance, Sivadas and Dwyer (2000) confirm that NPD
success in both internally and externally conducted projects is positively associated
with absorptive capacity. An extensive body of research, particularly, from the field of
inter-firm collaboration has investigated the effect of absorptive capacity on a finn's
performance in absorbing external technology through various forms of alliances
(Levinson and Asahi, 1995; Mowery et al., 1996; Koza and Lewin, 1998; Kumar and
92

Chapter 3 Research Hypotheses
Nti, 1998). For instance, Levinson (1995) suggests that learning partners who are
equipped with the requisite absorptive capacity are necessary in order to carry out
effective inter-organizational learning through an alliance network. The empirical
study of Mowery et al. (1996) illustrates that absorptive capacity significantly affects
the acquisition of technology through alliances. In particular, the coincidence of
alliances where there is prior experience in related technological areas is a crucial
factor that determines the quality of inter-firm learning. Nicholls-Nixon (1993) also
suggests a positive relationship between a firm's use of multiple types of
technological sourcing linkages and its absorptive capacity. This evidence in general
confirms the crucial role of absorptive capacity in external knowledge acquisition
through alliances, and absorptive capacity is highly associated with the effectiveness
of technology assimilation as well as knowledge acquisition between learning partners.
In other words, a firm with a relatively high absorptive capacity would be more able
to assimilate new product knowledge from external collaborators in a NPD project.
Hence,
Hypothesis 3: A firm ý level of absorptive capacity is positively related to its gains in
new product related knowledge (design & development, manufacturing, and
marketing) in a NPD project.
Hypothesis 3A: A firm ý level of absorptive capacity is positively related to its
gains in R&D knowledge in a NPD project.
Hypothesis 3B: A firms level of absorptive capacity is positively related to its
gains in marketing knowledge in a NPD project
Hypothesis 3C. - A firm ý level of absorptive capacity is positively related to its
gains in manufacturing knowledge in a NPD project..
93

Chapter 3 Research Hypotheses
3.3.2 The Moderating Role ofAbsorptive Capacity
Absorptive capacity is also likely to moderate the effect of external linkages on
gains in new product knowledge. Although external linkages provide access to new,
complementary knowledge that is required when developing new products, their
impact on the amount of new knowledge absorbed and developed is dependent on the
level of the firm's absorptive capacity. Firms may gain access to new knowledge
'though collaboration, yet be unable to absorb the knowledge if they do not have a
relative, complementary set of absorptive capacity. As new product knowledge tends
to be more tacit, uncodified (Nonaka, 1994; Nonaka and Takeuchi, 1995) and
essentially contains "sticky" information (von Hippel, 1994; von Hippel, 1998), the
level of complementary absorptive capacity decides the amount of knowledge
absorption. Kumar and Nti (1998) hypothesise that knowledge appropriated by a firm
through an alliance arrangement relies upon its absorptive capacity as well as the
volume of exposure of alliance-generated knowledge. In other words, the greater the
absorptive capacity of a firm, the more knowledge it can appropriate when exposed to
a given volume of alliance-generated knowledge. When a NPD project is a radical
innovation and requires an extensive association of knowledge from its R&D
collaborators, absorptive capacity becomes crucial in determining the extent of such
knowledge absorbed. In contrast, when a NPD project is an incremental innovation
requiring less external linkage, the role of absorptive capacity becomes less
significant since less knowledge of external collaborators is to be absorbed. That is,
absorptive capacity moderates the relationship between external linkages and the
extent of new knowledge absorbed. Hence,
Hypothesis 4: A firm ý level of absorptive capacity moderates the positive effects of
94

Chapter 3 Research Hypotheses
external linkages on its gains in itew product related knowledge in a NPD project.
Hypothesis 4A: A firm ý level of absorptive capacity moderates the positive
effects of external linkages on gabis M R&D knowledge.
Hypothesis 4B: A firm ý level of absorptive capacity moderates the positive
effects of external linkages on gains in marketing knowledge.
Hypothesis 4C. - A firm ý level of absorptive capacity moderates the positive
effects of external linkages on gains in manufacturing knowledge.
3.4 Summary
This chapter focuses on the development of the research hypotheses, which are
derived from the conceptual framework presented in Section 2.6. Hypotheses I A, I B,
I C, 2A and 2B refer to the proposed relationship between external linkages, new
product innovativeness and gains in new product related knowledge. Hypotheses 3A,
3B, 3C, 4A, 413, and 4C consider the role of absorptive capacity that not only
moderates the relationship between external linkages and gains in new product
knowledge, but also positively affects the extent of gains in new product knowledge.
The next chapter presents the research methods related to the development of
survey instrument, data collection, and statistical methods for hypothesis testing.
95

Chapter 4 Research Method
Chapter 4
Research Method
4.1 Introduction
This chapter describes the research design, procedures for collecting data and the
analytical methodology for hypotheses testing. Section 4.2 explains the process of
instrument development for a questionnaire survey. Section 4.3 discusses the survey
design. The measures for constructs are described and illustrated in Section 4.4.
, Finally, Section 4.5 details the analytical methodology for hypothesis testing and
focuses on the analytical techniques of both moderated and mediated regression
analysis.
4.2 Instrument Development The research process for the instrument development, guided by Churchill
(1979), includes four phases: (1) Item generation, (2) Pre-pilot study, (3) Pilot study
and (4) Full-scale survey and instrument validation. These four items are discussed
below.
(1) Item Generation
The literature reviewed in Chapter 2 is used to identify the main content of
constructs in the research framework and to generate initial items and the definition of
each construct. A fundamental requirement for a good measure is content validity,
which means the measurement items in an instrument should cover the major content
domain of a construct (Churchill, 1979). Content validity is usually achieved through
comprehensive literature review and interviews with practitioners and academic
experts. An early version of questionnaire was designed and ready for the pre-pilot
after this phase.
96

Chapter 4 Research Method
(2) Pre-pilot Study
Using a preliminary version of the questionnaire, the pre-pilot study involved
semi-structured interviews with NPD practitioners and academic experts with the aim
of refining contents of measurement items of each construct.
(3) Pilot Study
The third phase was to pilot the questionnaire by sending it to a sample of
qualified senior project managers. These managers were greatly involved in their
finns' NPD activities. Returned questionnaires were then used to examine initial
reliability and validity of the measuring instruments. Based on the feedback of the
pilot study, the instruments were further refined. The details concerning the pre-pilot,
the pilot study and instrument development will be discussed in Chapter 5.
(4) Large-scale Data Analysis and Instrument Validation
A sampling frame was constructed for the development of a mailing list by using
several public Taiwanese IT company data books. Before mailing out the
questionnaires, the mailing list was further refined to remove unqualified companies,
such as multiple names from the same company or companies that do not engage in
new product development. The survey instrument used in the large-scale study was
submitted to rigorous reliability and validity assessment using the response data. In
the large-scale study, the sample size was large enough for construct level
confirmatory factor analysis to examine unidimensionality, that is, convergent validity
of each measuring instrument. Chapter 5 details the large-scale survey and the
assessment of the measurement instrument.
4.3 Unit of Analysis and Sampling Frame
The term, a unit of analysis, is used to refer to the variables or phenomena under
study and the research problem ascribed, about which data is collected and analysed
97

Chapter 4 Research Method
(Hussey and Hussey, 1997). The major objective of this research is to examine the
impacts of various forms of leaming linkages involved in a firm's NPD project, as
well as its absorptive capacity on the level of new product innovativeness. In this case,
the unit of research is a new product project. Because of the reflective nature of
questionnaire answering, a qualified respondent must be a senior manager who has
been greatly involved in the complete process of a NPD project. In addition, the new
product derived from such a NPD project needs to meet conditions such as the
product being launched successfully within two years and its NPD processes carried
out within the firm.
, In the current study, firms in the IT industry were selected as research objects for
two reasons: (1) IT firms operate in a highly dynamic environment and they are
involved in a multidisciplinary NPD process that naturally requires them to need
access to a broad range of knowledge sources (Mowery and Rosenberg, 1989;
Mowery et al., 1996); and, (2) these firm are more inclined to collaborate with
external sources of technology to assist in new product development (Hagedoorn,
1993; Hagedoorn and Schalenraad, 1994; DiBella et al., 1996; Lynn et al., 1996). For
instance, in his examination of 4129 strategic alliances across various industries,
Hagedoon (1993) found that technological alliances in these so-called high-tech
sectors (i. e. biotechnology, microelectronics, computers, telecommunications, and
software) are strongly related to R&D co-operation, particularly, for the development
of new products and/or new technology. This suggests there may be a prevalence of
technological alliances within the IT industries.
Following on Wong et al. 's (1998) and Sher's (1998) previous surveys of
Taiwanese IT firms, this study focuses on the knowledge-absorption activities of
selected firms'NPD projects. The Taiwanese IT firms in the study were selected for
several reasons. First, Taiwan is ranked the third largest IT producer in the world and
98

Chapter 4 Research Method
re . presents the major OEM/ODM source for global IT competitors (Asia IT Report,
2000). 'More than sixty-five percent of its IT production is exported. Taiwan is an
island without rich natural resources and is a newly developed country with an
export-oriented economy. Against this background, IT firms in Taiwan are well used
to establishing links with international technology sources from places such as Japan
and the west coast of the United States in order to acquire either new product ideas or
related product technologies. Furthennore, these IT firms operate in a severely
competitive environment where a continuous, quick release of new products to the
market is a way of business life and the effectiveness of new product development
plays a crucial role in future viability. These fin'nS tend to collaborate with external
sources of technology for NPD projects (Wong et al., 1998). Another reason for
choosing Taiwan is the researcher's own advantage. The researcher has been involved
in the NPD collaboration of some of these IT firms for many years. This long
experience of involvement offers both insights and connections that have proved
useful throughout the research process. Finally, Taiwanese IT firms are aggregated in
the northern part of island within a radius of 50 miles. This condition particularly
facilitates carrying out face-to-face interviews for the pilot study.
The sampling frame of this research was comprised of IT firms listed in three
sources: the 2000 Directory of the Hin-Chu Science-based Industrial Park, the 2000
Directory of the Taipei Computer Association and the Top 1000 Manufacturing Firrns
in 2000 compiled by the most well-known economic monthly in Taiwan,
Commonwealth. Firms from these sources cover four IT sub-industry sectors:
computers (both PC and servers) and peripherals, telecommunications,
semi-conductors and software. The number of IT firms qualifying for the survey in
the sampling frame was estimated at around 550. With a relatively small sample and
the low response rate expected of industrial surveys (Kanuk and Berenson, 1975;
99

Chapter 4 Research Method
Krysan et al., 1994), a random sampling procedure might prevent the current study
from collecting adequate samples needed for a significantly statistical analysis with a
statistical power that is selected. Chapter 5 details how a sample list was composed to
meet the requirement of a minimal sample size.
4.4 Measurement of Variables
4.4.1 Measures ofAbsorptive Capacity
Cohen and Levinthal (1990) define absorptive capacity as the ability to
recognise the value of new, external technological knowledge and assimilate it and
apply it for commercial ends (see section 2.5.1). Absorptive capacity per se is a
complex, multifaceted construct, as the diversity of research themes in the literature
suggests and these range from knowledge intensity to innovative culture. No generally
accepted approach to the measurement of absorptive capacity has yet been developed.
Objective indicators of absorptive capacity, such as number of patents and R&D
intensity (i. e. R&D expenditure divided by sales) have problems of instability
(Spender and Grant, 1996). For instance, start-up finns tend to allocate a high
proportion of budget in R&D expenditures. Similarly, in a period of economy
downturn R&D expenditure is oflen disproportionately high due to slack sales. The
number of patents possessed may sometimes reflect a firm's strategic stance in R&D
corporative alliance rather than its absorptive capacity. The use of subjective measures
for absorptive capacity in this case is preferred to objective proxies. As Spender and
Grant stated, "There is a growing realization that the variables which are most
theoretically interesting are those which are least identifiable and measurable" (1996:
8). Researchers will continue to face such dilemmas when conducting
knowledge-based research.
Following Tu's mass custornisation study (1999), the current study defines
100

Chapter 4 Research Method
absorptive capacity as a firm's ability to identify, communicate and assimilate relevant
external and internal knowledge and technology. Under this definition, absorptive
capacity is a function of the firm's existing knowledge base, knowledge scanning
ability, and effectiveness and efficiency of its knowledge communication processes.
Cohen and Levinthal (1990) suggest that prior related knowledge will be a major
determinant of absorptive capacity. They further suggest that firms with sufficient
prior knowledge, which is closely related with new knowledge, will have the ability to
proactively envisage future technological advances (Cohen and Levinthal, 1994). A
firm's NPD related prior knowledge base might depend upon its engineers' and
managers' prior working experience, educational level, and overall job competence in
a related technology field.
A firm's NPD knowledge scanning ability is defined as a leaming system that
enable a firrn to effectively link and exploit relevant internal and external knowledge
and technology for its NPD purposes. Leonard-Barton (1995: 155-160) identifies five
measures to enhance this ability: (1) encouraging knowledge scanning activities; (2)
providing for continuous interaction with related technology or knowledge; (3)
nurturing technological gatekeepers; (4) nurturing boundary-spannes; and (5) fighting
"not-invented-here" syndrome. Cohen and Levinthal (1994) also suggest that firms
who send employees for advanced technical training or encourage them to monitor
and read the appropriate technical literature also benefit their development of
absorptive ability. Furthermore, the establishment of close relationships with external
sources (e. g. R&D collaborator, suppliers, buyers) that link information channels and
expose employees to new ideas can also contribute to a firm's knowledge scanning
ability (Cohen and Levinthal, 1990; Leonard-Barton, 1995).
The effectiveness of an organisation's knowledge communication processes
depends upon its communications networks and culture (ibid., Levinson and Asahi,
101

Chapter 4 Research Method
1995; Nonaka and Takeuchi, 1995). For instance, functional integration, redundancy
of information, and knowledge diversity are critical requirements to enable effective
communication processes (Cohen and Levinthal, 1990; Nonaka, 1994). An open
communication culture facilitates information flow leading to an effective learning
organisation (Levinson and Asahi, 1995) and resulting in increased absorptive
capacity.
A five-dimension model of absorptive capacity, consisting of the engineer
knowledge base, management knowledge base, knowledge scanning ability,
communication network, and communication climate was adapted from Tu's
measurement items, as well as the work of Leonard-Barton (1995). A 29-item
reflective scale was used to measure the construct of absorptive capacity. Respondents
were asked to indicate the degree to which they agree with the items on seven-point
Likert scales where I= strongly disagree and 7= strongly agree. A conventional,
objective scale, R&D intensity, was also used to cross validate this reflective scale.
Engineer Knowledge Base (Existing Knowledge Base) (Tu, 1999)
1. The general knowledge level of our engineers is high.
2. The overall technical knowledge of our engineers is high.
3. The general educational level of our engineers is high.
4. The overall job competence of our engineers is high.
Management Knowledge Base (Existing Knowledge Base) (Tu, 1999)
1. The knowledge of our managers is adequate when managing daily operations.
2. The knowledge of our managers is adequate when solving technical problems.
3. The knowledge of our managers is adequate when dealing with new
technology.
4. The knowledge of our managers is adequate when making business decisions.
102

Chapter 4 Research Method
Knowledge Scanning Ability
1. We seek to learn from benchmarking best practices in our industry. (Tu, 1999)
2. We seek to learn from trying out new technologies. (Tu, 1999)
3. We seek to learn from our buyers, suppliers, and R&D collaborators.
(Leonard-Barton, 1995)
4. We seek to learn from tracking new market trends in our industry. (Tu, 1999)
5. We seek to learn from conducting R&D activities. (Tu, 1999)
6. We seek to learn from taking new business opportunities. (Tu, 1999)
7. We seek to learn from the routine search of useful information. (Tu, 1999)
8. We seek to nurture technological gatekeepers for various new technologies.
(Leonard-Barton, 1995)
9. We seek to fight the not-invented-here syndrome. (Leonard-Barton, 1995)
10. We seek to nurture boundary spanners. (Leonard-Barton, 1995)
Communications Climate (Tu, 1999)
1. Our employees tend to trust each other.
2. Our employees are willing to accept changes.
3. Our employees bave no difficulty accepting new ideas.
4. Our employees share ideas freely with each other.
5. Our employees are supportive of each other.
6. Our employees have strong feelings of belonging to our organisation.
Communications Network (Tu, 1999)
1. The communications among functional areas are frequent.
2. The communications among functional areas are extensive.
3. The communications between supervisors and the subordinates are extensive.
4. The communications between supervisors and the subordinates are frequent.
5. The communication of new ideas from one department to another is extensive.
103

Chapter 4 Research Method
4.4.2 Measures ofExternal Linkages
The degree of an external linkage is defined as the extent to which it is involved
in the development of the NPD project. Adapted from Tidd et al. 's (1997a)
classification, the external linkages studied included: two fonns of vertical linkages
(customers and suppliers) and three forms of horizontal linkages (cooperating firms,
industry-based research institutes, and universities). The customers in the external
linkages are defined as end-users, channel members, and down-stream manufacturing
customers. Similarly, the suppliers in the external linkages are defined as a NPD
project's upstream suppliers that may supply key components, materials, testing
equipments and manufacturing facilities. The cooperating firms are defined as firms
that are either competitors or non-competitors, which are involved in any
development stage (from initial concept development to final product launch) of the
NPD project to be studied. This includes technical consulting companies, OEM and
ODM customers, and new project co-developers. The industry-based research
institutes and universities in the external linkages are research institutes and
universities that are involved in any development stage of the surveyed NPD project.
Although many researchers postulate that successful product development
requires a chartered set of steps (Cooper and Kleinschimidt, 1986; Cooper and
Kleinschimidt, 1991; Dwyer and Mellor, 1991), no author has claimed that there is
only one particular set of activities required for all firms. The current study adapts
Cooper and Kleinschmidt's (1986) new product process model, which forms a set of
13 activities. Therefore, a thirteen-item, formative scale was employed. The following
is an examPle of a 13-itern scale to measure the degree of external linkage from
customers. Respondents were asked to indicate the degree to which they agree with
the items on seven-point Likert scales where I= strongly disagree and 7= strongly
agree in relation to each linkage.
104

Chapter 4 Research Method
1. Our customers provided their expertise in helping out the project's initial go/no go
decision.
2. Our customers provided their expertise in the project's preliminary market
assessment.
3. Our customers provided their expertise in the project's preliminary technical
assessment.
4. Our customers assisted us in conducting a detailed market study/market research.
5. Our customers provided their expertise in a financial or business analysis leading to
a go/no go decision prior to product development.
6. Our customers were closely involved in the design and development of the product,
resulting in, e. g., a prototype or sample product.
7. Our customers were closely involved in testing the product in-house: in the lab or
under controlled conditions.
8. Our customers were closely involved in testing the product under real life
conditions, e. g., with customers and/or in the field.
9. Our customers provided their expertise in the product's test market/trial sell.
10.0ur customers were closely involved and provided their expertise in a trial
production run to test the product facilities.
11. Our customers were closely involved in a financial analysis, following product
development but prior to full-scale production.
12. Our customers were closely involved and provided their expertise in the start-up
of full-scale production.
13. Our customers were closely involved and provided their expertise in the launch of
the product.
105

Chapter 4 Research Method
4 4.3 Measures of Gains in New Product Knowledge
Some scholars have viewed product development as a process of reducing
uncertainty through information processing (Clark and Fujimoto, 1991; Clark and
Wheelwright, 1993). Others have increasingly envisaged product development as a
process of organisational learning involving the acqusition, dissemination, and
utilisation of information (Leonard-Barton, 1992; Nonaka, 1994; Moorman and Miner,
1997) that eventually leads to the reduction of the gap between the new product domain and the firm's knowledge domain. As product development includes a series
Of uncertain activities, resolving all these uncertainties encompasses developing a new
set Of know-how, including design/development know-how, manufacturing know-how,
and marketing know-how (Teece, 1986; Henderson and Clark, 1990; O'Connor,
1998).
Gain in new product knowledge is defined as the extent to which a firm's
familiarity of new product know-how in design/development, marketing and
manufacturing in comparison with prior knowledge of the NPD project. A 20-itern
reflective scale was developed to capture this construct from the related literature
(Song and Parry, 1996; Song and Parry, 1997; Cooper and Kleinschimidt, 1987).
The scale was primarily derived from Song and Parry's (1997) six proficiency
scales (proficiency of the predevelopment planning process, proficiency of concept
development and evaluation, proficiency of marketing research, pre-test proficiency,
market launch proficiency, technical proficiency) and Cooper and Kleinschmidt's
(1987) three proficiency scales (proficiency of pre-development activities, proficiency
of technological activities, and proficiency of market-related activities). These
Proficiency scales, which were used to assess a firm's competence and dexterity
during key stages of the product development process, cover the complete range of
the development of new product know-how. These scales formed four dimensions of
106

Chapter 4 Research Method
NPD knowledge: predevelopment assessment knowledge, marketing knowledge,
design and development knowledge, and manufacturing knowledge. A seven-point
scoring fonnat (I = strongly disagree; 7= strongly agree) was used for all 20 items.
Gain in Predevelopment Assessment Knowledge
1. We have gained new knowledge in preliminary market assessment of the product.
(Cooper and Kleinschimidt, 1987; Song and Parry, 1996)
2. We have gained new knowledge in determining marketing characteristics and
trends. (Cooper and Kleinschimidt, 1987; Song and Parry, 1996)
3. We have gained new knowledge in the preliminary business/financial analysis.
(Cooper and Kleinschimidt, 1987; Song and Parry, 1996)
4. We have gained new knowledge in initial screen techniques. (Cooper and
Kleinschimidt, 1987; Song and Parry, 1996)
5. We have gained new knowledge in handling the after-service programme. (Items
recommended by NPD practitioners)
6. We have gained new knowledge in handling testing of the product prototype.
(Song and Parry, 1996)
7. We have gained new knowledge in the preliminary engineering and technical
assessments. (Song and Parry, 1996; Song and Parry, 1996)
Gain in Marketing Knowledge
8. We have gained new knowledge in detailed market study/market research of the
product. (Song and Parry, 1996; Cooper and Kleinschimidt, 1987; Song and Parry,
1997)
9. We have gained new knowledge in identifying "appeal" characteristics that would
differentiate and sell the product. (Song and Parry, 1996; Song and Parry, 1997)
10. We have gained new knowledge in executing test market programs in line with the
107

Chapter 4 Research Method
plans for commercialisation of the product. (Song and Parry, 1996; Cooper and
Kleinschimidt, 1987; Song and Parry, 1997)
11. We have gained new knowledge in launching and introducing new products into
the targeted marketplace - selling, promoting and distributing of the product. (Song
and Parry, 1996; Song and Parry, 1997)
Gain in Design and Development Knowledge
12. We have gained new knowledge in building the product to designated or revised
specifications. (Song and Parry, 1996; Song and Parry, 1997)
13. We have gained new knowledge in evaluating laboratory tests to determine basic
performance against specifications of the product. (Song and Parry, 1996; Song
and Parry, 1997)
14. We have gained new knowledge in executing prototype or "in-house" sample
product testing of the product. (Song and Parry, 1996; Cooper and Kleinschimidt,
1987; Song and Parry, 1997)
15. We have gained new knowledge in determining the final product design and
specifications of the product. (Song and Parry, 1996; Song and Parry, 1997)
16. We have gained new knowledge in working continuously for cost reduction and
quality control of the product. (Song and Parry, 1996; Song and Parry, 1997)
Gain in Manufacturing Knowledge
17. We have gained new knowledge in conducting preliminary manufacturing
assessments of the product. (Song and Parry, 1996)
18. We have gained new knowledge in executing trial/pilot production of the product.
(Cooper and Kleinschimidt, 1987)
19. We have gained new knowledge in conducting production start-up of the product.
(Cooper and Kleinschimidt, 1987)
20. We have gained new knowledge in controlling manufacturing quality of the
108

Chapter 4 Research Method
product. (Item recommended by NPD practitioners)
4.4.4 Measures ofNew Product Innovativeness
Previous research suggests that new product innovativeness be investigated from
a perspective of inherent product attributes: 'newness to the market', 'newness to the
firm', or a combination of both (Booz, 1982). Studies that seek to distinguish types of
innovation by how drastically the product has changed, such as radical innovation
versus incremental innovation or revolutionary versus evolutionary innovation
(Utterback and Abernathy, 1975) have mostly adopted the schema of 'newness to the
market. ' This approach classifies innovations by their effects on established usage
patterns. Research that focuses on the change of a firm's innovation capability from
its previous products has taken on the schema of 'newness to the firm. ' Although this
framework cannot fully reflect a product's impact on either competitors or consumers,
this measure, from a broader perspective, captures the ability of the firm to service
and continue to update technology which is vital to its long-tenn survival and future
growth. The third schema is a combination of 'newness to the market' and 'newness
to the firm' frameworks developed by Booz, Allen and Hamilton (1982). The
framework is divided into a six-level scale along the two dimensions to reflect a
dynamic interaction between the firm and the marketplace. The six levels of product
innovativeness include cost reductions to existing company product, repositionings of
existing company product, improvements/revisions to existing products, additions to
an existing company product, product lines new to the firm, and new-to-the-world
products. Boon, Allen and Hamilton's framework is particularly useful in analysing a
finn's product strategy.
This study adopted the newness-to-the-firm approach to measure the level of
new product innovativeness. Newness of the product in each NPD project was
109

Chapter 4 Research Method
measured with an eight-item multidimensional scale drawn from Cooper (1979a &
1979b) on the seven point "strongly disagree - strongly agree" Likert scales.
Respondents were asked to indicate their perception of degree of product newness in
comparison with other products developed within the firm in two dimensions: market
and technology.
Technological Innovativeness (Cooper, 1979a & 1979b)
In comparison to the existing product range, the product class was new to our
firm.
2. In comparison to the existing product range, the pr I oduct use (need served) was
new to our finn.
3. In comparison to the existing product range, the product production process was
new to our firm.
4. In comparison to the existing product range, the product design/technology was
new to our finn.
Market Innovativeness (Cooper, 1979a & 1979b)
5. In comparison to the existing product range, our customers for the product were
new to our firm.
6. In comparison to the existing product range, distribution and sales force for the I
product were new to our firm.
7. In comparison to the existing product range, advertising and promotion for the
product was new to our firm.
8. In comparison to the existing product range, the product's competitors were new
to our finn.
4.4.5 Control Variables
Control variables including firm size, sub-industry sector and type of new
110

Chapter 4 Research Method
product are taken into consideration in the survey. Firm size may affect the project
unit's resources and capability to gain leverage over external knowledge sources
which enhance the unit's propensity to generate more innovative products
(Damanpour, 1996). Ettlie and Rubenstien (1987) confirm that larger firms are more
likely to adopt ambitious new technologies to introduce new products. In this study,
H- the number of employees is used as the indicator for firm size. Types of new products
comprise system products, sub-assemblies, components/parts and software. Since a
system product is developed by combining a set of sub-assemblies or parts from a
variety of key suppliers, its NPD project tends to involve more technological
I collaboration activities. The study then sought to control the effect of product types in
the later statistical analyses.
4.5 Analytical Methodology Hierarchical multiple regression analysis was utilised to analyse four hypotheses.
This is instrumental in testing complex relationships involving moderating and
mediating effects while analysing a set of dependent variables and predictor variables.
Although a structural equation modeling analysis is considered to be more effective in
examining a series of dependence relationships simultaneously (Hair et al., 1998),
both sample size requirements and the limitation of the measuring scale deters the
choice of this technique. Since the foci of this research are to examine the moderating
effect of absorptive capacity as well as the mediating effect of gains in product
knowledge between external linkages and new product innovativeness, both
moderated regression and mediated regression analyses adequately serve these
purposes and are therefore employed.
4.5.1 Hierarchical Regression Analysis
The following two regression models are used to test the direct effect of external
III

Chapter 4 Research Method
linkages on gains in new product knowledge.
1. PKk = Bo + BICVi
2. PKk = Bo + BICVj + B2 ELj+ e
Where PK =a measure of gains in new product knowledge,
CV = control variables, and
EL =a measure of external linkage.
The employment of the two equations is to confirm that EL (predictor variable)
further predicts gains in new product knowledge (PK, dependent variable) after CV
explains the variance when there exists high correlations between PK and CV. The
direct effects of EL on gains in new product knowledge are certain when an increase
of F-value from Equation 1 (reduced model) to Equation 2 (full model) is statistically
significant and the coefficients (B2) of EL are significant.
4.5.2 Moderated Regression Analysis and Sub-Group Analysis
The hypotheses propose that external linkages have a positive impact on gains in
new product knowledge, and this relationship is moderated by absorptive capacity.
Both moderated regression analysis (MRA) and sub-group analysis are utilised to test
the moderating effects of absorptive capacity. Each of these techniques provides
different insights into the relationship being studied as well as the explanation of
different theoretical supports. Also, each technique possesses certain limitations that
must be taken into account.
The main distinction between the two techniques is the ability to test between the
"degree " of relationship between two variables X and Y and the 'fibrm" of the
relationship between the same variables. The regression coefficient B, is the index of
the form of relationship, while the correlation coefficient r., y is the index of the degree
of the relationship (Zedeck, 1971, Sharma et al.; 1981, Arnold, 1982). Specifically,
the moderated regression analysis (MRA) is used to determine existence of a
112
Chapter 4 Research Method
moderating effect, and subgroup analysis is utilised to test the degree/strength of
moderation (Baron and Kenny, 1986; Venkatraman, 1989).
MRA requires the following three regression models to test moderating effects
(Zedeck, 1971; Sharma et al., 1981; Cohen and Cohen, 1983):
I. DV= 80+i6lCV+)32 IV
2. DV= )30+)31CV+t82lV+j83MV
3. DV= 80+, 81CV+, 821V+)33MV+i84(IVXMV)
Where MV = Moderating Variables,
DV = Dependable Variables,
IV = Independent Variables, and
CV = Control Variables.
Here IVxMV reflects the joint effect of IV and MV. The moderation hypothesis (the
form of relationship) is supported if Equations 2 and 3 are significantly different from
each other and the coefficient of the cross-product term (i. e. IV x MV) differs
significantly from zero (i. e., ý4 0- 0). If Equations 2 and 3 are significantly
different from Equation 1, but not from each other (i. e., 83 :00; .84 "'ý 0), then the
MV is an independent predictor, not a moderating variable. Sharma et al. (1981)
further point out that for MV to be a pure moderator variable Equations I and 2
should not be different from each other, but should be different from Equation 3 (i. e., R3 ý-- 0; 84 :A 0). For MV to be identified as a quasi moderator, Equations 1,2,3
should be different from one another (i. e., R3 4-L 0; R40 0)-
The procedures of subgroup analysis are, first, to split the sample into groups
based on hypothesised moderators and then, following this, to compare correlation
coefficients between subgroups. The degree/strength of moderation is supported when
statistically significant differences exist in the value of correlation coefficients. One
appropriate statistic that can be employed to test significant difference in rxy for two
113

Chapter 4 Research Method
subgroups is (Amold, 1982):
z=(r, - r2) / (I /n, -I+ I /n2 -I) 1/2
t
Where
r, = r, in Group 1;
r2 = r,, y in Group 2;
n, = sample size of Group 1;
n, = sample size of Group 2;
Z= distributed byN(0,1).
In testing the equality of correlation coefficients across more than two subgroups, the
following chi-squared statistic can be applied:
x2= E(ni- 1) r'i -[ E(ni- 1) ( ri) I/ E( ni- 1)
Where
ni = sample size for subgroup i,
ri= r, for Subgroup
However, subgroup analysis has its limitations. First, it presumes that the
variables have equal variance at each level of the moderator. Second, the amount of
measurement error in the dependent variable can cause the correlations between the
independent variables and dependent variables to differ spuriously if it varies as a
function of the moderating variable (Baron and Kenny, 1986). Zedeck (1971) argues
that the differences in errors of estimate for different subgroups, in addition to
correlation coefficients, should be examined. Third, the problem of subgroup sample
sizes affects the performance of significance tests. The number of different subgroups
should be carefully formed. As a solution, Zedeck (1971) proposes that we consider
several moderators simultaneously as the basis for subgroups or to use a single
multiple moderated regression equation, which maintains the total sample size in the
114

Chapter 4 Research Method
analyses.
Venkatraman (1989: 426) suggests that four analytical issues are to be addressed
when an empirical researcher takes the moderation perspective: (1) the distinction
between form and strength of moderation, (2) the impact of multi-collinearity, (3) the
comparison of main versus interaction effects, and (4) the requirement of partialling
out quadratic effects for testing the moderating effects.
The form and degree/strength of moderation implies different meanings of the
hypothesis. If a researcher specifies that the predicting outcome is jointly affected by
the interaction of the predictor variables and the moderator, then the hypothesis
reflects the form of moderation. In contrast, if the hypothesis indicates that the
outcome differs across different subgroups according to the effect of moderator, then
the one that adopts the degree/strength perspective can apply the subgroup analysis.
The problems of multicollinearity in the presence of cross-product terms, such as
(MVxIV) which is likely to be strongly correlated with IV and MV, are longstanding
issues in regression analysis. When the predictors' means (relative to their standard
deviation) are far from zero, a regression analysis is likely to encounter substantial
multicollinearity. Therefore, mean-centred scores of predictors are recommended to
replace raw scores to reduce the level of correlation between the cross-product term
and the predictor variables while testing a moderating effect (Cronbach, 1987;
Venkatraman, 1989). But if the variables are measured using ratio scales, such a
transformation changes the meanings of the measures and cannot be so applied
(Southwood, 1978). Researchers now tend to mean-centre data of both dependent and
independent variables while applying moderated regression analysis (e. g., Mohr et al.,
1996; Otturn and Moore, 1997).
The simultaneous assessment of main and interaction effects (moderation effects)
while using MRA cannot be accomplished at an interval-level of measurement. This is
115

Chapter 4 Research Method
because of the arbitrary scale of origin for interval measurement as well as
incapability in comparing the relative weights of the standardized coefficients
(Venkatraman, 1989). Therefore, MRA can test only for the existence of interaction
effects but cannot compare the relative influence of main and interaction effects.
The fourth issue relates to partialling out the quadratic effects of IV and MV in
order to confirm the presence of multiplicative effects (i. e. MV x IV). Southwood
(1978) suggests that the following regression model should be employed which
simultaneously uses the terms IV, MV, IV2' MV2 and IV x MV,
Full model: DV = IV + MV + IV2 +, MV2 + IV X MV
A test of the partial correlation coefficient between DV and IV x MV, after partialling
out the effects of IV, MV, IV2 , and MV2, provides support for multiplicative effects.
Similarly, to test whether a relationship of curvilinearity exists, both the test of the
partial correlation coefficients (a) between DV and IV2 , after partialling out the effects
of IV MV MV2 and IV x MV, and the test of partial correlation coefficients between
MV2 of IV MV IV2 (b) DV and after partialling out the effects and IV x MV, should
be applied.
4.5.3 Mediated Regression Analysis
A hypothesised variable is classified as functioning as a mediator to the extent
that it accounts for the relation between the predictor and the dependent variables. In
general, the following three regression models (a path-analytic framework) are used to
test whether a variable functions as a mediator (Alwin and Hauser, 1975; James and
Brett, 1984; Baron and Kenny, 1986):
1. DV= ý0+ ýICV+ R21V
2. Me= 80+ 81CV+ R21V
116
Chapter 4 Research Method
3. DV= 8o+ 81CV+ 821V+ R3Me
Where Me = Mediating Variable,
DV = Dependent Variable,
IV = Independent Variable, and
CV = Control Variable.
A mediating effect is supported when the following conditions are held: (a) the
coefficients of IV in the first model must be significant (i. e., R2 ýA 0); (b) the
coefficients of IV in the second model must be confirmed to be significant (i. e., ý2
: t- 0); (c) the coefficients of Me in the third model must be significant (i. e., ý30 0);
and (d) the effect of IV on DV must be less in the third model than in the second. If
coefficient of IV in Model 3 is not statistically different from zero (i. e., R2 ý'- 0), the
strongest support for the mediating effects of Me is obtained and this is termed the
complete mediational model. This indicates that most effects of IV are transferred to
the mediator. Alternatively, if the coefficient of IV is different from zero and the
aforementioned conditions are all held, a relationship of partial mediation exists,
implying a partial mediational model.
In Model 3 both IV and Me should be correlated and can produce the problem of
multicollinearity because Me is assumed to regress on IV in Model 1. The result of
multicollinearity can reduce power in the test of coefficients in Model 3. Baron and
Kenny (1986) suggest that not only the significance of the coefficients, but also
absolute size should be examined simultaneously.
The use of mediated regression to examine the hypothesized mediator must
address the two assumptions: (a) there was no measurement error in the mediator and
(b) the criterion variable did not cause the mediator (Baron and Kenny, 1986).
In examining a mediation model that combines moderation (e. g., the conceptual
framework illustrated in Figure 2.7), the aforementioned regression models are to be
117

Chapter 4 Research Method
reconstructed as follows (James and Brett, 1984, Baron and Kenny, 1986):
4. DV= 8o+ j8lCV+
821V+ 84MO+ R5MOXIV
5. Me= 8o+ 81CV+ R21V++ 84MO+ 85MOXIV
6. DV= 8o+ SICV+ 821V+ 83Me+ 84MO+ 85MOXIV
7. DV= 8o+ RICV+ 821V+ 83Me+ 84MO+ i85MOXIV
+186 Me x IV
Where Mo = Moderating variable,
Mo x IV = Cross-product of Mo and IV
Me x IV = Cross-product of Me and IV
The function of Equations 4,5 and 6 is similar to the function of Equations 1,2 and 3
when trying to examine a mediation model. For instance, if 65 in both model 4 and 5
are significant but are insignificant or less significant in Model 6, then it can be
confirmed that Me mediates the Mo x IV effect on DV, James and Brett (1984) termed
it mediated moderation. Similarly, Me can also mediate the effect of IV on DV, The
additional Equation 7 is identical to Equation 6 but the interaction term (i. e., Me x IV)
is added. It is utilised to assess the moderating effect between the mediator (i. e., Me)
and the predictor variables (i. e., IV) that might occur. If Mo x IV has less of an effect
on DV in Equation 7 than at Equation 6 and R6 is significant, then it can be
explained that the Mo x IV effect on DV can be funneled through the Me x IV.
4.6 Summary
This chapter has detailed the research design and analytical methodology
undertaken by this study. The questionnaire survey method was employed to collect
data from Taiwanese IT industry. Chapter 5 discusses the process of questionnaire
development, the pre-pilot test, the pilot study and the results of the large-scale
survey.
118

Chapter 5 Pilot Study, Large-scale Survey and Assessment ofMeasurement Instrument
Chapter 5
Pilot Study, Large-scale Survey and Assessment of Measurement Instrument
5.1 Introduction
A research instrument will be useful only if the instrument is carefully developed
to serve its purpose. This chapter discusses the development of the questionnaire, its
refinement, pre-testing, piloting, and the administration of the large-scale survey. The
instrument development process consists of the initial development of the
questionnaire, refinement after considering expert opinions, translation, and piloting.
The pre-testing and piloting processes aim to ensure both validity and reliability of the
measuring instrument prior to conducting a large-scale survey. Section 5.4 details the
process of item purification for the instrument through both the calculation of the
corrected item-to-total correlation and factor analysis using piloted data. Sections 5.5 to
5.7 address the administration of the large-scale survey, the examination of the profile
of respondents, and tests for non-response bias. Section 5.8 details the purification of
the original set of construct items as well as the validation of the purified measures. The
importance of this validation is to generate scores that reflect actual differences in the
characteristics of the NPD projects to be measured prior to testing the hypothesis
(Churchill, 1979).
5.2 Questionnaire Development and Pre-Pilot Testing A pre-piloted questionnaire was developed based on an extensive literature search
and interviews with NPD researchers. In order to minimise biases from the respondents,
particular attention was focused on the wording, scale and general appearance of the
questionnaire. Dillman's Total Design Method for the construction of an effective
119

Chapter 5 Pilot Study, Large-scale Survey and Assessment ofMeasurement Instrument
questionnaire has been followed (Dillman, 1978). The pre-piloted questionnaire has
five sections. It begins with a short description of the qualifications of the targeted unit
of the research. In brief, it asked about the most recent NPD project with which
respondents were closely involved and if that product was launched within the previous
two years. Section A of the questionnaire comprises of items relating to the company
and project background information. Section B is formatted as items-in-a-series
questions. It is constructed to measure a firm's level of absorptive capacity. Section C
has five sub-sections. Each sub-section is designed to probe the extent to which a
particular type of linkage is involved with the project along thirteen ordered-step NPD
processes. The first two sub-sections deal with horizontal linkages including customers
and suppliers. The other three sub-sections, comprising of cooperative companies,
universities and industrial research institutes are constructed to measure horizontal
linkages. Sections D and E consist of questions in the same format as Section B.
Section D is designed to measure a firm's gain in new product knowledge during the
new product development project. Section E aims to measure the level of
innovativeness of the new product in comparison with other product lines within the
finn.
After developing an initial measurement instrument, pre-testing was carried out to
ensure each construct's relevance by conducting informal interview with five academic
researchers and industrial practitioners as suggested by Churchill (1979). It was
suggested that: (1) the research unit for measuring "Absorptive Capacity" focus on a
NPD project basis instead of the whole company; (2) the number of measurement items
for the absorptive capacity construct needs to be increased because it covers a wide
range of dimensions. This construct was then modified to include more measures
through a series of iterations. It finally consisted of 30 measurement items.
The pre-piloted questionnaire was initially developed in English since most
120

Chapter 5 Pilot Study, Large-scale Survey and Assessment ofMeasurement Instrument
existing measures were written in English. Due to cultural differences, literal
word-by-word translation was not effective. In addressing this problem, Taiwanese
literature using the same measurements was searched. Some measures relating to the
constructs of both product innovativeness and product knowledge familiarity that have
been translated and tested in Taiwanese manufacturing industries by Chung (1999) and
Wu (2000) were then used. The questionnaire was then translated from English into
Chinese by a team of professional translators using the parallel double-back translation
procedure (Craig and Douglas, 2000).
Twelve experienced senior NPD managers from public listed IT firms in Taiwan
pre-tested the Chinese language questionnaires. Each interviewee completed the
pre-piloted questionnaire in the presence of the researcher. While completing the
questionnaire, he/she was invited to comment on questions regarding wording of
measurement items, the overall organisation of the instrument, and their feeling about
the research itself Three measurement items that involved the use of academic terms,
particularly in the construct of "Absorptive Capacity", were identified as unclear to the
respondents. These items went through another process of double-back translation, and
the final translations were then agreed. The managers in the pre-piloting phase
confirmed that the questionnaire was clear and presented no completion difficulties.
5.3 Pilot Study
The key informant method outlined by Phillips (1981) suggests that researchers
interview one or more respondents identified as appropriate for collecting information
on a social system about which these respondents have special qualifications. This data
collection technique, according to Phillips, can be utilised in survey contexts to obtain
quantifiable responses. The qualifications of the key informants are assessed in terms of
(1) their formal role in the company, (2) the time they have worked for the company, (3)
121

Chapter 5 Pilot Study, Large-scale Survey and Assessment ofMeasurement Instrument
their knowledge about the phenomena of interest, and (4) their degree of involvement
in the company's decision making with respect to the surveyed topic (ibid. ).
, The current study follows past research (Song and Parry, 1996; Song and Parry,
1997; Song et al., 1997) that identifies managers, such as R&D managers, NPD project
managers and/or vice presidents of R&D, as key informants for NPD project research.
Because they are involved in the daily operation of core confidential business, these
managers tend to be highly cautious in answering questions asked by outsiders
regarding their internal NPD projects. Drawing from the 2000 Directory of the Hin-Chu
Science-based Industrial Park (the high-tech centre in Taiwan), the researcher
contacted R&D managers, NPD project managers and/or vice presidents of R&D of
each firm through investment banks as well as venture capital firms and government
officers in the Ministry of Economics. A total of 72 sample respondents agreed to
participate in the pilot questionnaire survey. The researcher visited each firm's site and
delivered the questionnaires. Prior to respondents filling in the questionnaires, he
explained how it is constructed and explained about the qualifications required for a
NPD project.
There were 70 responses to the survey, of which 62 were complete and usable. The
following issues were raised as the result of the pilot study:
(1) A significant number of NDP projects did not involve external linkages, such as
universities or research institutes, and therefore respondents left those measurement
items unanswered. This prompted the inclusion of an extra question to ask if each
type of external linkage is applicable to the NPD project.
(2) Respondents tended to bias their selection towards more interesting, significant and
hence more relatively innovative NPD projects. To solve this type of bias, more
instructions were given on the front page of the questionnaire instructing
respondents that they should not be concerned about whether the project selected is
122

Chapter 5 Pilot Study, Large-scale Survey and Assessment ofMeasurement Instrument
innovative. It is suggested that they discuss a project that has recently been
completed.
(3) Respondents were confused about whether OEM/ODM (Original Equipment
Manufacturer/ Original Design & Manufacturing) partners are categorised as
customers or cooperative companies. Judging from business characteristics of
OEM/ODM types of NPD projects and referring to previous research (Sher, 1998),
,. the researcher then decided to define them within the category of cooperative
companies.
(4) Meanings of terms such as "not-invented-here", "boundary spanners" and
"technology gatekeepers" were not clear to technology-oriented R&D managers
and/or vice presidents of R&D after translation. The measurement item associated
with 'not-invented-here' syndrome was then abandoned because this measure item
conveys more the connotation of a firm learning intention than its knowledge
scanning ability. It addition, it was not grouped in the construct of knowledge
scanning ability of absorptive capacity in the factor analysis. The measurement
items related with "technology gatekeepers" were for instance revised to "R&D
specialists who screen the ins and outs of new, key technologies".
(5) The last section (measuring the level of product innovativeness) of the
questionnaire was found to be inadequately laid out. All measurement items in this
section were relocated and grouped on the same page.
The returned questionnaires were then coded and keyed in SPSS. This sample was used
to provide preliminary assessments on the reliability and validity of the pilot study
instrument, as well as offering indications on how to further refine the instrument items.
5.4 Pilot Study Results and Item Modification The key task when analysing data collected from a pilot study is item purification
123

Chapter 5 Pilot Study, Large-scale Survey and Assessment ofMeasurement Instrument
to ensure scale reliability and unidimensionality'. In the current study, item purification
was achieved through the calculation of the Corrected Item-to-Total Correlation (CITC)
for the items of the respective scale (Kerlinger, 1986). A commonly used threshold
value for CITC is 0.5 while the inter-item correlations (the correlation among items)
exceeds 0.3 (Hair et al., 1998). A slightly lower CITC may be acceptable if that item is
considered to be important to the construct. For a multi-dimensional construct,
item-to-total correlation needs to be calculated for individual dimensions separately.
Therefore, measurement items against constructs of Absorptive Capacity and New
Product Innovativeness, both of whose dimensions were pre-defined, were put forth for
CITC analyses. After the CITC analysis, a dimension-level factor analysis was applied
to assess the unidimensionality of each measurement scale for the purpose of further
purifying measurement items. Dimensional-level factor analysis also indicates possible
merging or splitting of existing construct dimensions. Since the pilot sample size meets
the minimal requirement of the five-to-one ratio against variables that are concerned
(Hair et al., 1998: 98-99), construct-level factor analysis was then employed to assess
discriminant validity of new product innovativeness.
Reliability refers to the internal consistency of the measurement instrument that
I demonstrates the extent to which measuring scales are free from random errors and
convey repeatedly consistent measuring results (Peter, 1979). Among various
approaches to reliability, Cronbach's alpha is an often-recommended measure
(Churchill, 1979; Peter, 1979). Rules of thumb suggest that the lower limit for
11 1 Cronbach's alpha exceeds 0.7 while it may decrease to 0.60 in exploratory research
(Hair et al., 1998). As Cronbach's alpha increases along with the number of items,
researchers should be vigilant when using these scales with large number of items (Hair
' Unidimensionality refers to the existence of a single trait or construct underlying a set of measures (Hattie, 1985).
124

Chapter 5 Pilot Study, Large-scale Survey and Assessment ofMeasurement Instrument
et al., 1998). Nevertheless, a slightly lower value for a scale consisting of a smaller
number of items may be acceptable during the pilot study.
The data collected from the 62 pilot responses were coded and entered into an
SPSS database for item purification following the methodology described above.
Sections 5.4.1 to 5.4.4 discuss the pilot study results for the following constructs:
'Absorptive Capacity', 'Gains in New Product Knowledge' and 'Product
Innovativeness. 'For each construct, since its dimensions are pre-defined, the following
three tables represent the analysis results of- (1) initial questionnaire items; (2)
dimension-level CICT scores, and dimension-level Cronbach's alpha scores; and, (3)
dimension-level or construct-level factor loading scores.
5.4.1 Absorptive Capacity
Adapted from both Tu's (1999) measures and Leonard-Barton's (1995: 155-160)
empirical findings, the construct of Absorptive Capacity initially included five
dimensions (see Section 4.4.1) consisting of 29 items. These are: (1) Engineer
Knowledge Base (4 items) (2) Management Knowledge Base (4 items) (3) Knowledge
Scanning Ability (10 items) (4) Communications Climate (6 items) and (5)
Communications Network (5 items). The dimensions and items are listed in Table
5.4.1.1. Tnhip JUA -1 Ahvnrntive Canacitv - Initial Onestiormaire Items
Cqde Questionnaire Items Engineer Knowledge Base
ACI The overall technical knowledge of our engineers was high AC2 The general knowledge level of our engineers was high AC3 The general educational level of our engineers was high AC4 The overall job competence of our engineers was high
Management Knowledge Base AC5 The knowledge of our managers regar managing the daily operations was high
AC6 The knowledge of our managers for solving technical problems was high
AC7 The knowledge of our managers for dealing with new technology AC8 The knowledge of our managers when making business decisions was high
Knowledge Scanning Ability A The project team concerned sought to learn from benchma g best practices in the
125

Chapter 5 Pilot Study, Large-scale Survey and Assessment ofMeasurement Instrument
industry I ACIO The project team concerned sought to learn from trying out new technologies ACII The project team concerned sought to learn from our customers and suppliers AC12 The project team concerned sought to learn from tracking new market trends in our
industry AC13 The project team concerned sought to learn from conducting R&D activities AC14 The project team concerned sought to team from taking new business opportunities AC15 The project team concerned sought to learn from the routine search of useful information AC16 The project team concerned sought to nurture technological gatekeepers for various
technologies AC17 I The project team concerned sought to fight the not-invented-here syndrome ; ýC- 1-8 The project team concerned sought to nurture boundary spanners,
Communications Climate AC19 All members involved in the project tended to trust each other AC20 All members involved in the project were willing to accept changes AC21 All members involved in the project had no difficulty accepting new ideas AC22 All members involved in the project were supportive each other AC23 All members involved in the project shared ideas freely each other
: ýA ý2ý All members involved had a strong feeling of belonging to our organisation
Communications Network AC25 The communications among functional areas was frequent AC26 The communications among functional areas were extensive AC27 The communications between supervisors and subordinates were extensive AC28
- The communications between supervisors and subordinates were frequent
C29 FA TFe communication of new ideas from one department to another for thýý concerned were extensive
5.4.1.1 Item Purirication
Examination of CITC scores for the five dimensions in the Absorptive Capacity
construct revealed that one Engineer Knowledge Base item (AC3), one Management
Knowledge Base item (AC5), three Knowledge Scanning Ability items (AC13, AC14,
AC17), and one Communications Climate item (AC21) were deleted due to their
relatively low CITC scores. The CITC scores for all remaining items in the Engineer
Knowledge Base, Management Knowledge Base and Communications Network
dimensions were all above 0.5. The CITC score (0.48) of AC20 in the Communications
Climate dimension was slightly below 0.5. It was however retained. On the Knowledge
Scanning Ability dimension, the CITC scores for most items (five of seven) were below
0.5 even after item purification. These CITC scores could not be improved by simply
removing items. It indicates that there is a need for some item revisions and rewording
in this dimension. The final alphas were 0.82 for Engineer Knowledge Base, 0.77 for
126

Chapter 5 Pilot Study, Large-scale Survey and Assessment ofMeasurement Instrument
Management Knowledge Base, 0.72 for External Knowledge Scanning, 0.87 for
Communications Climate and 0.90 for Communications Network. Table 5.4.1.2 shows
the item purification results.
127

Chapter 5 Pilot SmdY, Large-scalc Sun, cY and Assessment of'Measurcmcni Instrument
Tabic 5.4.1.2 Absorptive Capacity - Item Purification Results
erns It Initial ('11' Final CH -T Cronhach's Alpha Scores
Engineer Kno,, N, Iedge Base ACI 0.67 0.75 AC2 0.70 0.75 ctA. 82 X-C3- 0.39 Deleted TC 4 (08 (01)
- - -- Management KnONN ledge Base
X C 5 0.27 Deleted AC6 0.66 0.64 (x--0.77
--ýýC7 -
0.60 0.65 - -- TC 8 0. S ý30.55
-- External Knowledg Se
- anning
XC9 0.48 0.46 - 0.4 6 0.45
0.41 0.39 Yý6 2 0.56 u7 ACI 3 0.34 Deleted AC14 0.44 Deleted X-C] 5 0.47 (), ý 1'ý ACI 6 0.45 0.45
: KCj ý7 0.36 Deleted ACIS 0.48 0.47
- _ Communications Climate
ýýF, 9 0.61 0.63 A( 20
- 0.48
-X-C'2 1 -
0.39 Deleted ot-0.84 ;ý C22 0.75 (). 73 AC23 0.78 0.76 TC'2 4 0.69 0.71
Communications Netwo rk AC25 0.73) 0.73 A C") C'26 0.86 0.86 ACý27 0.68 0.68 (1-0.90 A ýCý2 8 0.75 0.75 AC29 0.71 0.71
ri. 4.1.2 Factor Analysis
A diniciision-Icvel factor analysis was applied to each oftlic five diniciisions in
Absorptive CapUlty III order to further CIISLII-C the unidirricrisionality ofeach diniclision.
All five dimensions displayed a single factor respectively with most t, actor loadings
above 0.7. As expected, the factor loadings for the dimension of Knowledge Scanning
Ability are lower than those ofthe other dimensions and its first component is only able
to explain the 42')/, ) of variance. Table 5.4.1.3 presents the factor analysis results.
128

Chapter 5 Pilot Study, Large-scale Survey and Assessment ofMeasurement Instrument
Table 5.4.1.3 Absorptive Capacity - Dimension-Level Factor Analysis Items Factor Loadingsa % Variance Extracted by First
Component Engineer Knowledge Base
ACI 0.91 AC2 0.91 74% AC4 0.75
Management Knowledge Base AC6 0.73 AC7 0.74 70% AC8 0.61
Knowledge Scanning Ability AC9 0.64 ACIO 0.65 ACII 0.57 42% AC12 0.72 AC15 0.65 AC18 0.65 AC16 0.66
Communications Climate AC19 0.77 AC20 0.64 AC22 0.86 64% AC23 0.87 AC24 0.84
Communications Network AC25 0.83 AC26 0.92 AC27 0.80 71% AC28 0.85 AC29 0.81
'2 Extraction Method: Principal Component Analysis, one component extracted
5.4.1.3 Item Revision
Although both the Engineer Knowledge Base and Management Knowledge Base
measures demonstrated good reliability and unidimensionality, each scale consists of
only three items. More items for these two dimensions were required. A closer
examination of deleted items (AC3, AC5) revealed that the wording of AC5 was
I unclear and the conceptualisation of AC3 needs to be redesigned from a different
spectrum of the Engineer Knowledge Base. The Knowledge Scanning Ability
dimension gained low scores in both CITC scores and factor loadings after deleting 3
items. it was then determined that a major revision on the wording of all items in this
dimension was required. A closer examination of items AC20 and AC21 revealed that
129

Chapter 5 Pilot Study, Large-scale Survey and Assessment ofMeasurement Instrument
the conceptualisation of these two items is in the same domain of organization's
innovative climate. However, the wording of the AC21 was obscure. After deleting
AC21, the Communications Climate dimension showed fair internal consistency.
Among the five dimensions, the Communications Network measure has the most
internal consistency and requires no further revision.
5.4.2 Gain in New Product Knowledge
initially, four dimensions consisting of 20 items represented the construct of Gain
in New Product Knowledge: Pre-development Assessment Knowledge (7 items), R&D
Knowledge (5 items), Marketing Knowledge (4 items), and Manufacturing Knowledge
(4 items). The initial 20 items and their corresponding code names are presented in
Table 5.4.2.1.
Table 5.4.2.1 Gains in New Product Knowledge- Initial Questionnaire Items
Code Questionnaire Items
Pre-development Assessment Knowledge PKI The preliminary market assessment of the product PK2 Determining Market characteristics and trends PK3 The preliminary business/financial analysis PK4 Initial screen techniques PK5 Handling after-service programme PK7 Handling customer testing of the product prototype PKI I The preliminary engineering and technical assessments
Marketing Knowledge PK6 The detailed market studv/market research PK8 Executing test market programs in line with the plans for product commercial isation PK9 Launching and introducing new products into our targeted marketplace- selling,
promoting, and distributing the product PKIO Identifying "appeal" characteristics that would differentiate and sell the product
R&D Knowledge PK12 Building of the product to designated or revised specifications
_ PK13 Evaluating laboratory tests to determine basic performance against the product's specifications
PK14 Executing prototype or "in-house" sample product testing PK15 Determining the final product design and specifications PK16 Working continuously for cost reduction and quality improvement
_ Manufacturing Knowledge PK17 Conducting preliminary manufacturing assessments of the product
_ PKIS Executing product trial/pilot production _ PK19 Conducting production start-up which is now better than before PK2) Executing the product quality assurance program which is now better than before
130

Chapter 5 Pilot Study, Large-scale Survey and Assessment ofMeasurement Instrument
5.4.2.1 Item Purification & Dimension-level Factor Analysis
The analysis of CITC scores for the four dimensions in this construct suggested
that no items were to be deleted. The CITC scores for all items in the four dimensions
were all above 0.5. The final alphas were 0.88 for Pre-development Assessment
Knowledge, 0.88 for Marketing Knowledge, 0.90 for R&D Knowledge and 0.92 for
Manufacturing Knowledge. These indicate good internal consistency for the construct.
The CITC scores of the four dimensions are listed in Table 5.4.2.2.
Table 5.4.2.2 Gain in New Product Related Knowled2e - Item Purification Results Items Initial CITC FinalCITC Cronbach'sAlpha
Scores Pre-developMent Assessment Kn wledge
PKI 0.74 0.74 PK2 0.71 0.71 cc=0.88 PK3 0.84 0.84 PK4 0.70 0.70 PK5 0.60 0.60 PK7 0.55 0.55 PKII 0.58 0.58
Marketing Knowledge PK6 0.65 0.65 PK8 0.81 0.81 a=0.88 PK9 0.81 0.81 PKIO 0.71 . 0.71
R&D Knowledge PK12 0.77 0.77 PK13 0.73 0.73 PK14 0*72 0.72 PK15 0.85 0.85 CL=0.90 PK16 0.69 0.69
Manufacturing Knowlefte PK17 0.84 0.84 PK18 0.83 0.83 PK19 0.88 0.88 (x=0.92 PK20 0.73
. 73
To further ensure the unidimensionality of each dimension in the Gain in New
Product Knowledge construct, a dimension-level factor analysis was performed. A
single factor extracted for all dimensions with factor loadings above 0.60 was
confirmed. Except for Pre-development Assessment Knowledge (PAK), the first
factors of all other dimensions account for more than 70 per cent variance. The PK7
I
131

Chapter 5 Pilot Study, Large-scale Survey and Assessment ofMeasurement Instrument
item in PAK dimension was identified as having the least extraction in its factor
analysis. Table 5.4.2.3 presents the factor loadings as well as percentage of variance
extracted by the first component. Table 5.4.2.3 Gains in New Product Knowledge- Dimension-Level Factor Analysisa
Items Factor Loadings % Variance Extracted by First Component
Pre-development Assessment Knowledge PKI 0.83 PK2 0.79 PK3 0.92 PK4 0.81 60% PK5 0.70 PK7 0.65 PKII 0.79
Marketing Knowledge PK8 0.90 PK9 0.90 74% PKIO 0.83 PK6 0.79
R&D Knowledge PKI5 0.91 PKI2 0.86 PK13 0.84 72% PK14 0.83
-ýO Manufacturing Knowledge
PK19 0.94 Pp K17 0.92 Pp KI8 0.91 81% p0 PK20 0.83
' Extraction Method: Principal Component Analysis, one component extracted
5.4.2.2 Item Revision
Although no further purification was carried out based on CITC analysis, the
dimension-level factor analysis indicated that some items (namely PKS, PK7) in the
pAK dimension could be improved. A closer examination of both items suggested that
PK5, as conceptualised, tend to relate to Marketing Knowledge and PK7 is identified
with R&D Knowledge. It was decided, therefore, that PK7 could be reasonably deleted
from the construct of Gain in New Product Knowledge and the wording of PK5 item
could be revised to convey a more fully explicated conceptual isation. The design of
new items based on further literature searches was needed.
132

Chapter 5 Pilot Study, Large-scale Survey and Assessment ofMeasurement Instrument
5.4.3 New Product Innovativeness
The New Product Innovativeness construct was represented by two dimensions:
Technological Innovativeness (4 items) and Market Innovativeness (4 items). The 8
items and their corresponding codes are presented in Table 5.4.3.1.
Tahle 5.4.3.1 New Product Innovativeness - Initial Ouestionnaire Items
Code Questionnaire Items Technological Innovativeness
P12 Product class was new to our firm P13 Product use (need served) was new to our firm P14 Product production process was new to our firm P15 Product design/development technology was new to our firm
Market Innovativeness PH Customers for the product were new to our firm P16 Distribution and sales force for product was new to our firm P17 Advertising and promotion for product was new to our firm P18 Product competitors were new to our firm
5.4.3.1 Item Purification and Exploratory Factor Analysis
The CITC scores for both Technological Innovativeness and Market
Innovativeness dimensions were all above 0.5 except P13 item. The final Cronbach
alphas are 0.82 for Market Innovativeness and 0.78 for Technological Innovativeness.
The CITC scores for all items in this construct are listed in Table 5.4.3.2. As the ratio of
the sample size to the number of variables is larger than 5 (Hair et al., 1998: 98-99), an
exploratory factor analysis was applied to check if two factors could be clearly
extracted. There were exactly two factors extracted with no significant cross loading
(i. e. the difference of factor loadings between any two measurement item is larger than
0.3). Factor loadings for all items are above 0.6 indicating a sound unidimensionality
for the New Product Innovativeness construct. Table 5.4.3.3 represents the results of
factor analysis.
133

Chapter 5 Pilot Study, Large-scale Survey and Assessment ofMeasurement Instrument
Table 5.4.3.2 New Product Innovativeness - Item Puriflcation Results Items Initial CITC -T Final CITU nbach's Alpha ý
Scores Technological Innovativeness
P12 0.69 0.69 P13 0.47 0.47 cc=0.78 P14 0.52 0.52 P15 0.66 0.66
Market Innovativeness PH 0.58 0.58 P16 0.76 0.76 (x=0.82 P17 0.68 0.68 P18 0.55 0.55
Table 5.4.3.3 New Product Innovativeness - Construct-level Fartnr Annivek Items Factor Loadingsa % Variance Extracted by
TWo Components Factorl Factor 2
Technologi al Innovativeness P15 0.85 0.01 P12 0.84 0.18 P14 0.66 0.35 P13 0.62 0.25
Market Innovativeness 65% P17 0.23 0.81 P18 0.01 0.81 P16 0.43 0.77 Pil 0.37 0.64
a Extraction Method: Principal Component Analysis; Rotation Method: Varimax with Kaiser Normalization
5.4.3.2 Item Revision
The New Product Innovativeness items demonstrated good unidimensionality.
However, due to a marginally low CITC score the P13 item could be further improved
in term of its wordings. A revision of the P13 item was then undertaken to further
articulate its conceptualisation for respondents.
5.4.4 A Summary of The Pilot Study
The pilot study results in the elimination of six items (AC3, AC5, AC13, AC14,
AC 17 and AC2 1) from the construct of Absorptive Capacity and minor revision of P 13
item from New Product Innovativeness. In particular, three items (AC13, AC14 and
134

Chapter 5 Pilot Study, Large-scale Survey and Assessment ofMeasurement Instrument
AC17) in the dimension of knowledge-scanning ability of AC were deleted. Items
AC 13 and AC 14 were shown to be more related to NPD leaming than NPD knowledge
scanning ability. ACITs wording (e. g. to fight the not-invented-here syndrome) needs
to be further revised subsequent to its translation, as it was not clear to questionnaire
respondents. After item purification, the Cronbach's alpha scores of the two constructs
are at least above 0.72, demonstrating sound scale reliability. Dimensional-level factor
loading scores for the construct of Absorptive Capacity ranging between 0.57 and 0.91
indicate sound unidimensionality, while construct-level factor loading scores for New
Product Innovativeness are also all above 0.62.
Results of the pilot study were then discussed with three academic researchers and
five NPD related project/product managers, who offered to assist with the pre-pilot and
pilot study by commenting on the revised items. The revision process went on until the
feedback comments were integrated into the final survey questionnaire. This final
questionnaire was then used for the large-scale survey, which is discussed in the
following sections.
5.5 Large-scale Survey Administration
5.5.1 Development of the Stirvey Mail List
The large-scale survey carried out following the Total Design Method (Dillman,
1978) was conducted between May and August 2001. Considering the low response
rate anticipated of industrial surveys (Kanuk and Berenson, 1975, Krysan et al., 1994)
and in order to collect questionnaires more effectively, the researcher invited seven
IT-based venture capital companies (VCs) and two investment banks to provide contact
persons within IT firms that fitted the sampling frame and were involved with new
product development. The venture capital firms and investment banks are shareholders
in the surveyed IT firms and some are regularly involved in the IT firms' board
135

Chapter 5 Pilot Study, Large-scale Survey and Assessment ofMeasurement Instrument
meetings. Working with the VCs and banks enabled the researcher to correspond
directly with a firm's NPD-related key person. A list of 168 IT firms was collected. Ten
firms that were doubly selected were deleted. The final mailing list comprised of 230
firms, including the companies that participated in the pilot.
S. S. 2 Questionnaire Packet
The mail pack comprised the questionnaire, an accompanying cover letter (see
Appendix A), and a self-address, freepost, first-class return envelope. The main
sections of the questionnaire are: Section I General Information, Section 2 Level of
External Linkages, Section 3 New Product Knowledge Accumulated, Section 4 Product
Newness, Section 5 Level of Absorptive Capacity (see Appendix A). The questionnaire
begins with instructions that respondents should base their replies on (1) a particular,
individual new product project that has been launched within the last two years, and (2),
that this should be a project with which they have been closely involved. It also stated
that the survey is an international research project conducted jointly by Loughborough
University and National Kaohsiung First University (the university that the researcher
was employed by in Taiwan), thus stressing its unique position. The last section of the
questionnaire asked for respondents' contact details so that a summary of the research
findings could be sent to them. The covering letter indicated that the survey was
sponsored by two universities, and supported by the venture capital firm or investment
bank associated with the IT firm. Next, it also spelt out the purpose of the research. A
social utility appeal, emphasising the worthiness and benefit of the research, was
outlined to inspire cooperation. The importancý of the co-operation of respondents and
their replies was emphasised, and assurances of anonymity and confidentiality were
given. Finally, the researcher's contact details were listed should any questions arise
from the questionnaire. An express mail was used to send the questionnaire pack,
indicating its importance.
136

Chapter 5 Pilot Study, Large-scale Survey and Assessment ofMeasurement Instrument
5.5.3 Follow-up Procedures
To encourage a good response rate, the survey was administered in three stages.
First, the researcher telephoned each contact person about the current study and asked
her or him to participate the survey. Then, the questionnaire pack, as stated in Section
5.5.2, was mailed out. Second, a week later, a follow-up letter was mailed to each of the
target respondents to remind them to complete the survey. Those with e-mail addresses
also received the follow-up letter electronically. Those who responded were then
removed from the original mailing list. Third, after another two weeks, a second
follow-up letter with a copy of the questionnaire was sent to those who still had not
responded. Again, the researcher telephoned and asked for the questionnaires to be
completed as soon as possible. In addition, a third follow-up letter, together with an
e-mail letter (if applicable), was sent out again to remind them to complete the
questionnaire.
A total of 139 questionnaires were returned. Of these, six were incomplete. Eight
were answered by administrative managers or assistants and were considered invalid.
Three NPD projects were not at market launch stage. They were invalid for the survey
and abandoned. After checking the pattern of the industrial sector responding to the
survey, it was identified that only four responses were based in software sector. They
were deleted from the data analysis because they were too few to form a legitimate
sample. Therefore, the final number of complete and usable responses was 118,
representing an overall response rate of 51.3 percent. The remainder of this chapter
discusses only these 118 usable responses.
5.6 Prorile of Respondents Responses indicated that 74.14 percent of respondents are currently R&D or NPD
project managers; 14.65 percent are vice president or presidents; and, 11.21 percent are
137

Chapter 5 Pilot Study, Large-scale Survey and Assessment ofMeasurement Instrument
product marketing or product application managers. On average, respondents had been
involved in new product management for 5.6 years. A profile of the respondents is
shown in Table 5.6.1. Most of respondents in the sample, according to theirj ob title, are
directly involved with the project that they discussed in the questionnaire. A small
percentage of respondents were company presidents, but where their firm was
identified as an SME with less than 50 employees, they were eligible to be respondents.
This is because R&D management and/or involvement with NPD projects is one of
their major job functions particularly in high-tech SMEs. The profile, which is
consistent with that of previous research (Sher, 1998), shows that the potential for
problems with key informant bias is not severe in this study. Table 5.6.1 The Proflle of Respondents
Job Title Frequency Percentage of respondents R&D or NPD project manager 86 71.49
Vice president-R&D 12 10.83 President 5 4.31 Product marketing or product 13 11.21 manager
Length of NPD experience Frequency Percentage of respondents Less than 3 year 8 6.90
3-5 years 63 54.31 6- 10 years 30 25.86 More than 10 years 15 12.93
5.7 Tests for Non-response Bias
The existence of non-response bias can greatly reduce the generalisation of the
results from the respondent sample to the entire population (Filion, 1976, Armstrong
and Overton, 1977, Wallace and Mellor, 1988). In order to test for non-response bias,
the present study has adopted the extrapolation method proposed by Arrnstrong and
138

Chapter 5 Pilot Study, Large-scale Survey and Assessment ofMeasurement Instrument
Overton (1977)2 . The first quartile of usable questionnaires (30 cases), defined as
earlier respondents, was compared to the last quartile ones. The two-tailed Wests on
five demographic variables and all relationship variables were performed. Results
showed that the equality of all variable means across the two groups is insignificant at
the 0.0 1 level (see Table 5.7.1). These results confinn that non-response bias is unlikely
to be an issue in the current study.
Table 5.7.1 t-Test for Non-Response Bias Relationship Variables t-valuc p Demographic Variables t-value p
Customer linkage . 211 . 834 Number of R&D engineers . 842 . 403
Supplier linkage -1.191 . 238 Annual revenue . 891 . 377
Corporation linkage 1.441 . 156 % of R&D expenditure 1.547 . 128
Research institute linkage . 539 . 592 Industry sectors -. 802
. 426
University linkage 1.272 . 209 Number of employees . 806 . 423
Absorptive capacity . 178 . 859 Product types . 815 . 370
R&D knowledge -1.064 . 292
Manufacturing knowledge . 116 . 908
Pre-development -. 064 . 524
assessment knowledge
Marketing knowledge . 211
. 834
Technological . 022 . 983
innovativeness
Market innovativeness -1.139 . 260
2 Armstrong and Overton (1977) reviewed the literature on non-response bias in mail surveys and summarised three methods for estimating non-response bias: (1) comparing with known values for the population, (2) subjective estimates, and (3) extrapolation methods. Because the difficulty of gaining independent records of the population or the sample frame which can provide a more definitive picture of the characteristics of the non-respondents, the method of extrapolation, which is to construct a measure of non-response bias based on the pre-assumption that "late" responses are reasonable "surrogates" of non-respondents, are more popularly employed.
139

Chapter 5 Pilot Study, Large-scale Survey and Assessment ofAleasurement Instrument
5.8 Assessment of the Measurement Instrument
Measurements are inevitably associated with a certain amount of error, and these
may be either random or systematic errors (Churchill, 1979). Measures including
sizeable errors constitute threats to the validity of research findings. The survey
instrument used in the large-scale survey was rigorously screened for reliability and
validity assessment using 118 responses. The reliability assessment process was similar
to that of the pilot study. The major difference lies in the instrument validation process.
In the large-sale study, the sample size was sufficient for construct level factor analysis
to assess the unidimensionality, convergent validity and discriminant validity of each
measurement instrument that was developed.
The purification of the instrument items first examined the corrected item-to-total
correlation (CITC) scores of each item with respect to the specific dimension of a
construct. As a general rule, items with a CITC score of lower than 0.50 should be
removed. After the CITC analysis, the remaining items of each construct dimension
were submitted as a group to dimension-level exploration factor analysis to ensure the
unidimensionality and convergent validity of measurement instrument. Factor analysis
allows the examination of interrelationships among a number of variables and then
explains these variables in terms of their common underlying dimensions. The widely
accepted Principal Component analysis method was selected to extract factors and the
correlation matrix was used as input. The number of factors to be extracted was decided
by including only those factors with eigenvalues greater than I (Hair et al., 1998). The
orthogonal rotation method- VARIMAX- was employed for interpreting the extracted
factors. Items of the same scale that failed to exhibit significant loading on the focal
factor or that cross-loaded highly on other factors were eliminated. A cutoff value of
above 0.5 was adopted as a criterion for examining significant factor loading. The
determination of the value was based on a 0.05 significance level, a power level of 0.80,
140

Chapter 5 Pilot Study, Large-scale Survey and Assessment ofMeasurement Instrument
and the sample size of 120 (Hair et al., 1998).
The following subsections present the large-scale instrument validation results.
For each construct three types of tables were provided to present the results: (1) the
initial large-scale measurement items for the construct; (2) the dimension-level CITC
scores and Cronbach's alpha; and, (3) the construct level of exploratory factor analysis
results. After exploratory analyses, the validity of the constructs was further tested
through a series of confirmatory factor analyses (CFA) because adequate measurements
are a premise for the assessment of valid structural relationship (Churchill and Peter
1984). Schumacker and Lomax (1996) stated that confirmatory factor analysis reflects
the entire measurement models, in which observed variables define constructs. Thus,
the CFA provides useful and relevant information about the actual number of latent
constructs and factorial complication, particularly, the overall model fit. In the current
study, the confirmatory factor analysis was conducted using the maximum likelihood
estimation method in AMOS 4.0. The different fit indices reported are: Chi-Square
(X 2); Comparative Fit Index (CFI); Goodness-of-Fit Index (GFI); Adjusted
Goodness-of-Fit Index (AGFI); Nonned Fit Index (NFI); and Root Mean Square
Residual (RMR).
5.8.1 Instrument Validation ofAbsorptive Capacity
The construct of Absorptive Capacity initially included five dimensions consisting
of 23 items. The five dimensions are (1) Engineer Knowledge Base (4 items), (2)
Management Knowledge Base (4 items), (3) Knowledge Scanning Ability (10 items),
(4) Communications Climate (6 items) and (5) Communications Network (5 items) as
listed in the following Table 5.8.1.1.
Initial reliability analysis for each of the five dimensions showed that the CITC
scores for all items were above 0.50 (see Table 5.8.1.2). Examining the "Alpha if item
deleted" scores indicated that removing AM would largely improve the reliability of
141

Chapter 5 Pilot Study, Large-scale Survey and Assessment ofMeasurement Instrument
the management knowledge base scale. However, considering the importance of this
item to this dimension as well as the relatively few measurment items, AC7 was
retained at this stage. The final Cronbach's Alpha scores were 0.89 for engineering
knowledge base, 0.80 for management knowledge base, 0.87 for knowledge scanning
ability, 0.80 for communication climate, and 0.85 for communication network.
Table 5.8.1.1 Absorntive Canacitv (AC) - Ouestiormaire Items Code Questionnaire Items
Engineer Knowledge Base
ACI The overall technical knowledge of our engineers was high AC2 The general knowledge level of our engineers was high AC5 The general educational level of our engineers was high AC6 The overall job competence of our engineers was high
Management Knowledge Base
AC3 The knowledge of our managers for solving technical problems was high AC4 The knowledge of our managers for dealing new technology was high AC7 1
. _The knowledge of our managers when making business decisions was high
Knowledge Scanning Ability
AC8 The project team concerned sought to learn from benchmarking best practices in the industry AC12 The project team concerned sought to learn from trying out new technologies AC13 The project team concerned sought to learn from our customers and suppliers AC18 The project team concerned sought to learn from tracking new market trends in our industry AC19 The project team concerned sought to learn from the routine search of useful information AC20 I The project team concerned sought to nurture technological gatekeepers for various technologies AC9
_ LThe project team concerned sought to nurture boundary spanners
Communications Climate
ACIO All members involved in the project tended to trust each other ACII All members involved in the project were supportive each other AC14 All members involved in the project shared ideas freely each other AC16 All members involved had a strong feeling of belonging to our organisation
Communications Network
AC15 Communications among ftinctional areas were frequent AC21 Communications among functional areas were extensive AC17 Communications between supervisors and subordinates were extensive
AC22 Communications between supervisors and subordinates were frequent
AC23 The communication of new ideas from one department to another about the project concerned was extensive
142

Chapter 5 Pilot Study, Large-scale Survey and Assessment ofMeasurement Instrument
Table 5.8.1.2 Absorptive Capacity - Reliability Analysis Results Items T Initial CITC (Corrected
ltem to Total Correlation) I Final
CITC Alpha if Item
Deleted Cronbach's
Alpha Scores Engineer Kno ledge Base
ACI 0.78 0.78 0.86 AC2 0.81 0.81 0.85 (x=0.89 AC5 0.75 0.75 0.88 AC6 0.76 0.76 0.87
Management Knowledge Ba e AC3 0.72 0.72 0.68 AC4 0.71 0.71 0.68 cL=0.80 AC7 0.56 0.5T 0.84
Knowledge Sca ning Abilit AC8 0.54 0.54 0.86 AC12 0.70 0.70 0.84 AC13 0.62 0.62 0.85 AC18 0.66 0.66 0.85 (x=0.87 AC19 0.68 0.68 0.84 AC20 0.73 0.73 0.84 AC9 0.57 0.57 0.86
Communications Climate ACIO 0.61 0.61 0.75 ACH 0.73 0.73 0.69 AC14 0.57 0.57 0.77 a=0.80 AC16 0.55 0.55 0.78
Communications Network AC15 0.68 0.68 0.83 AC21 0.67 0.67 0.81 AC17 0.72 0.72 0.80 a=0.85 AC22 0.61 0.61 0.83 AC23 0.71 0.71 0.70
143

Chapter 5 Pilot Study, Large-scale Survey and Assessment ofMeasurement Instrument
5.8.1.1 Exploratory Factor Analysis
The first exploratory factor analysis was performed on all 23 items of absorptive
capacity. The initial results showed a five-factor structure. Cross-loadings were
identified on items AC8, AC 17, AC22, AC16, and AC3, all of which, except AC 22,
were removed (see Table 5.8.1.3) and a new exploratory factor analysis was performed.
Four factors emerged from the second factor analysis with most factor loadings above
0.60 (see Table 5.8.1.4). It appeared that the measurement items of both the engineer
knowledge base and the management knowledge base were merged. This new factor
was titled as "existing knowledge base. " However, the AC4 and AC7 in the new factor
were observed fiom Table 5.8.1.4 to have several high loadings. Thus, the two items
were removed. The final exploratory factor analysis results are presented in Table
5.8.1.5. All factor loadings were above 0.57. The Kaiser-Meyer-Olkin 2 (KMO)
measure of sampling adequacy was 0.83. The extracted four factors explain 68.77
percent of total variance. The four dimensions- knowledge scanning ability, existing
knowledge base, communication network, and communication climate- consisting of
17 items, constitute the measure of the absorptive capacity construct which is presented
to subsequently confin-natory factor analyses.
2 The Kaiser-Meyer-Olkin (KMO) measure of sample adequacy is used to ensure that the effective sample size is adequate for the current factor analysis. Generally, a KMO score in the 0.90's is considered outstanding, the 0.80 or above as meritorious, the 0.70 or above as middling, 0.60 and above as mediocre, 0.50 or above as miserable, and below 0.5 as unacceptable (Hair et al., 1998).
144

Chapter 5 Pilot Study, Large-scale Survey and Assessment ofMeasurement Instrument
Table 5.8.1.3 Absorptive Capacity - Factor Analysis Results (1) Items I Factor 1 Factor 2 Factor 3 Factor 4 Factor 5
Knowledge Scanning Ability
AC20 . 779 . 713 . 188 . 203 -. 016
AC19 . 738 . 138 . 260 . 153 -. 028
AC13 . 699 . 113 . 105 . 223 . 093 AC18 . 679
. 183 . 276 . 150 . 092
AC12 . 674 . 139
. 131 . 260 . 313
AC9 . 665 . 070 -. 041
. 095 . 306
AC8 603 057 . 255 -. 223 . 393
Engineer Knowledge Base
AC2 . 085 . 863
. 073 . 052
. 229
ACI . 064
. 861 . 044
. 056 . 177
AC5 . 167 . 882
. 086 . 119
. 114
AC6 . 196 . 820 . 196
. 124 - 055
Communications Network
AC23 . 199 . 168 . 809
. 042 . 140
AC21 . 234 197 . 761 . 158
. 115
AC15 . 099 . 007 . 676
. 391 . 003
AC17 . 158 . 099
. 606 - 503 130
AC22 . 418 -. 027 . 571 - 272 . 055
Communications Climate
ACH . 187 . 049
. 185 . 813 . 229
AC14 . 315 . 071
. 217 . 693 -. 056
ACIO . 195
. 201 . 181 . 648
. 216
AC16 - 071 - 182
- 467 560 . 086
Management Knowledge Base
AC4 . 214
. 296
. 004
. 253 . 763
AC7 . 222
. 237 . 323
. 068 . 668
AC3 . 164 . 501
. 092 . 262 . 630
Eigen value 8.645 2.705 1.936 1.234 1.058
% of Variance
Explained
37.586 11.762 8.418 5.367 4,600
Cumulative %
of Variance
37.586 49.348 57.766 63.133 67.733
Kaiser-Meyer-Olkin (KMO) Measure of Sampling Adequacy = 0.859.
Bartlett's Test of Sphericity = 1564.37, Significance = 0.000
145

Chapter 5 Pilot Study, Large-scale Survey and Assessment ofMeasurement Instrument
Table 5.8.1.4 AbsorDtive CaDacitv - Factor Annivsk Repailtv. (2) Items Factor 1 Factor 2 Factor 3 Factor 4
Knowledge Scanning Ability
AC20 . 769 . 123 . 258 . 049 AC12 . 739 . 201 . 106 . 248 AC9 . 725 . 141 -. 080 . 144 AC13 . 701 . 105 . 188 . 165 AC19 . 695 . 102 . 327 . 084 AC18 - 652
- 200 . 290 . 178 Existing Knowledge Base
AC2 . 091 . 893 . 049 . 086
ACI . 083 . 873 . 035 . 042 AC5 . 148 . 818 . 116 . 112 AC6
. 184 . 799 . 207 . 067
AC4 . 349 . 468 - 057 . 439 AC7 . 346 . 431 . 193
. 237 Communications Network
AC23 . 208
. 216 . 809 . 018
AC21 . 208
. 244 . 761 . 201
AC15 . 078 -. 072 . 735 . 331
AC22 F- 442 -. 010 . 508 238 Communications Climate --
ACH . 207
. 080 . 237 . 858
ACIO . 146
. 245 . 213 . 786
AC14 . 332
. 016 . 341 . 530
Eigen value 7.277 2.452 1.551 1.169 % of Variance
Explained
38.300 12.907 8.164 6.155
Cumulative % of Variance
38.300 51.207 59.371 I 65.525 I
Kaiser-Meyer-Olkin (KMO) Measure of Sampling Adequacy = 0.845
Bartlett's Test of Sphericity = 1201.563, Significance = 0.000
146

Chapter 5 Pilot Study, Large-scale Survey and Assessment ofMeasurement Instrument
Table 5.8.1.5 Absorptive Capacity - Factor Analysis Results (3) Items Factor 1 Factor 2 Factor 3 Factor 4
Knowledge Scanning Ability
AC20 . 808 . 127 . 229 . 078 AC12 . 741 . 180 . 106 . 228
AC9 . 725 . 122 -. 060 . 101 AC13 . 705 . 091 . 179 . 163 AC19 . 707 . 105 . 300 . 115 A18 . 661 . 192 . 264 . 200
Existing Knowledge Base
AC2 . 111 . 898 . 047 . 089 ACI . 101 . 875 . 029 . 050 AC5 . 168 . 825 . 115 . 116 AC6 - 209 814 . 179 . 106
Communications Network
AC23 . 206 . 188 . 850 . 002
AC21 . 215 . 229 . 756 . 224
AC15 . 085 -. 012 . 727 . 354 AC22 - 428 - 019 - 562 - 264
Communications Climate ---
ACH . 221 . 084
. 200 . 866 ACIO . 168
. 259 . 164 . 812
AC14 . 346 . 024
. 289 . 572
Eigen value 3.732 3.198 2.596 2.164
% of Variance
Explained
39.052 14.050 9.086 6.576
Cumulative % of Variance
39.052 53.102 62.189 68.765
Kaiser-Meyer-Olkin (KMO) Measure of Sampling Adequacy = 0.831
Bartlett's Test of Sphericity = 1081.094, Significance = 0.000
5.8.1.2 Confirmatory Factor Analysis
Different from the exploratory factor analyses, the confirmatory approach began
with a second-order confirmatory analysis of the absorptive capacity indicators. This
confirmatory model was applied to test the theoretical validity of a two-level construct
structure of absorptive capacity. This framework of a higher-level factor, absorptive
147

I- Chapter 5 Pilot Study, Large-scale Survey and Assessment ofMeasurement Instrument
capacity, comprises of four lower level traits: knowledge scanning ability, existing
knowledge base, communications clime, and communications network (Tu, 1999).
An initial second-order factor analysis with the maximum likelihood estimation
method was performed using all 17 indicators from the four subscales of absorptive
capacity generated through exploratory factor analyses. The fit indices (see Table
5.8.1.6) did not show a good fit of the model. The value of GFI (0.86), AGFI (0.80), and
NFI (0.83) was below 0.90 (Kelloway, 1998: 23-33). The chi-square value of the
specified model was significant (X2= 194.26, df= 115, p<0.001). It could be improved
by deleting the AC15 that cross-loaded with several indicators. The model was
therefore re-specified, indicating an adequate fit result with X2 (100) = 128.355 (p
= . 03), CFI = 0.97, GFI = 0.89, AFGI = 0.84, NFI = 0.88, and RMR = 0.05. The fit
statistics confirmed the second-order structure of absorptive capacity (see Figure 5.1)
as proposed by Tu (1999). As such, scores of the four subscales were averaged to
represent absorptive capacity in ensuing regression analyses.
Table 5.8.1.6 Summary of Goodness-of-Fit Statistics for Absorptive Capacity (Second-Order CFA, 17 items)
Fit Indices
-
2 x df p value CFI GFI AGFI NFI RMR
-FM odeI )
Initial 194.26 115 0.000 0.92 0.86 0.81 0.83 0.06
Altemative 128.36 100 0.03 0.97 0.89 0.84 0.88 0.05 (AC15
deleted)
Note: X'= Chi-Square; df = Degree of Freedom; CFI = Comparative Fix Index; AGFI = Goodness-of-Fit Index; AGFI = Adjusted Goodness-of-Fit Index; NFI = Normed Fit Index; RMR = Root
Mean Square Residual.
148

Chapter 5 Pilot Study, Large-scale Survey and Assessment ofMeasurement Instrument
. 19 Ac I1 .
15
-C-oýmmunicafion
Climate ACIO
. 21
.7 AC14 . 52
.2
Absorp,
Ytive
'y Capacity
. 00
0 ommunications m AC23 Network
A . 22
AC22 . 37
.4 AC2 . 28
1.0 *
ACI 45 Existing I. I t . Knowledge AC5 27 Base .
. 92 AC6 . 11
. 1,;
AC2 4 . 23
AC12 14
. 32
AC9 1.4 . 63
5z
AC13 14 . 44
oWledge Scanning Ability P, AC19 4
. 38
. 82 AC18
. 29
Figure 5.1 The Second-Order Diagram of the Absorptive Capacity Model
149

Chapter 5 Pilot Study, Large-scale Survey and Assessment ofMeasurement Instrument
5.8.2 Instrument Validation of Gains in New Product Knowledge
Four dimensions - predevelopment assessment knowledge, marketing knowledge,
R&D knowledge, and manufacturing knowledge - comprising 20 items in te
large-scale survey initially represented the Gains in New Product Knowledge (PK)
construct. The original 20 items and their corresponding code names are listed in Table
5.8.2.1.
Table 5. 8.2.1 Gains in New Product Knowledge (PK)- Questionnaire Items Code Questionnaire Items
PKI Preliminary market assessment of the product PK2 Determining market characteristics and trends PK3 Preliminary business/financial analysis PK4 Initial screen techniques PK5 Handling after-service programme PK9 Preliminary engineering and technical assessments PK6 Detailed market study/market research PK7 Executing test market programmes in line with plans for product commercialisation PK8 Launching and introducing new products into targeted marketplace- selling, promoting,
and distributing the product PKIO Identifying "appeal" characteristics that differentiate and sell the product PKII Conducting detailed design and development
-FK 1 ý2 Building of the product to designated or revised specifications PK13 Evaluating lab tests to determine basic performance against the product's specifications PK14 Executing prototype or "in-house" sample product testing PK15 Determining the final product design and specifications PK16 Working continuously for cost reduction and quality improvement
PK17 Conducting preliminary manufacturing assessments of the product PK18 Executing product trial/pilot production PK19 Conducting production start-up which is now better than before
PK20 Executing the product quality assurance programme which is now better than before
5.8.2.1 Exploratory Factor Analysis
These 20 items of the gain in new product knowledge construct were submitted to
exploratory factor analysis. A four-factor structure emerged with all factor loadings
above the threshold of 0.50 except for PK9, which cross-loaded on factor 3 (see Table
150

Chapter 5 Pilol Stuth, Large-scale Survey andAsscssment ol'Measurcnicni Instrunictit
5.8.2.2). PK9 was then dcleted and a new factor analysis was carried out using the
remaindcr. According to the factor loadings, the four factors were labeled: factor 1,
R&D ktlowIcdgc-, fi actor 2, niallUfacturing know1cdge; factor 3, marketing knowledgc;
and factor 4, prc-dcvelopment assessment knowledgc. The rcsults of thc sccond
exploratory factor analysis are shown in Table 5.8.2.3. All factor loadings were above
0.54. The KMO score of 0.86 indicated \, cry good sampling adequacy. The four factors
explain 67.24 percent variance.
Table 5.8.2.2 Gains in New Product Knowledge - Factor Analysis Results (1) Items Factor I Factor 2 Factor 3 Factor 4
PK 13 . 833 . 163
. 095 . 159
PK 14 . 817 . 104
. 144 . 154
PK15 . 762 . 189
. 178 . 106
PK 12 .7 35 . 239
. 286
. 026
PK 11 . 664 . 218
. 306 . 039
PK 16 . 589 . 286
. 074 . 241
PK9 . 538
. 187
. 491 . 160
PK 20 . 259
. 832 . 095 .
127
PKIS . 227
. 815 . 222 . 126
PK 17 . 156
. 808 . 197 . 082
pm 9 . 277
. 788 . 132 .
072
PK2 . 244
. 131
. 789 . 151
PK3 . 144
. 219 . 779 .
253
PK4 . 241
. 097
. 717 . 288
PK 1 . 144
. 214
. 603
PK 7 . 164
. 069
. 215 . 811
PK6 . 046
- F)O 3
. 105 . 804
PK8 . 216 -. 02-1
. 279 . 713
PK 5 . 049
. 193 . 155 . 706
PK 1 . 242 1
. 320 . 523
ýAL'ell value 8.133 2.327 L657 1.1
of' Variance Fx 1) la in ed
40.667 11.635 8.287 5.980
- ('11111tilatiNe vo of Variance
40.667 52.302 60.589 66.568
Kalser-McYcr-Olkin (KMO) Measure Of'Sal"PlilIg Adequacy = 0.854
Bartlett's Test of'Splicricity = 1377.386, Signiticance ý
151

Chapter 5 Pilot Study, Large-scale Survey and Assessment ofMeasurement Instrument
Table 5.8.2.3 Gains in New Product Knowlpdfyp - Fnetar Annlvdq Re-milte. (2) Items Factor 1 Factor 2 Factor 3 Factor 4
R&D Knowledge
PK13 . 829 . 167 . 165 . 130 PK14 . 821 . 103 . 154 . 172 PK15 . 765 . 188 . 104 . 052 PK12 . 745 . 236 . 023 -. 007 PKI 1 . 658 . 225 . 050 . 051 PKI . 592 . 284 . 239 . 196
Manufacturing Knowledge
PK20 . 257 . 831 . 126 . 071 PK17 . 145 . 816 . 093 . 065 PK18 . 231 . 813
. I 23 . 109 PK19
. 278 . 787 _ _ . 075 . 027
Marketing Knowledge
PK6 . 034
. 101 . 814 . 083 PK7
. 167 . 067 . 807
. 220 PK8
. 214 -. 021 . 714 . 277 PK5
.. 048 . 157 . 699
. 167 PKIO
. 236 . 137 . 535
. 373 Pre-development Assessment Knowledge
PK2 . 245
. 134 . 154 . 790
PK3 . 187
. 220 . 254
. 783 PK4
. 244 . 088
. 289 . 720 PKI
. 151 . 213 . 295 . 673
Eigen value 7.642 2.325 1.675 1,247 % of Variance
Explained
40.220 12.239 8.569 6.210
Cumulative % of V
40.220 52.459 61.028 67.239
Kaiser-Meyer-Olkin (KMO) Measure of Sampling Adequacy = 0.857
Bartlett's Test of Sphericity = 1276.513, Significance = 0.000
5.8.2.2 Confirmatory Factor Analysis
The 19 indicators of R&D knowledge, manufacturing knowledge, marketing
knowledge, and pre-development assessment knowledge were subjected, as a group, to
first-order factor confirmatory factor analyses. The specified four-factor structure did
not fit very well (X2 (146) = 228.09 (p = . 000), CFI = 0.92, GFI = 0.84, AFGI = 0.79,
NFI = 0.81, and RMR = 0.06). The modification indices suggested room for
improvement in model fit. PK2 (determining market characteristics and trends) was
152

Chapter 5 Pilot Study, Large-scale Survey and Assessment ofMeasurement Instrument
cross-loaded with PK7 (executing test market programmes in line with plans for
product commercialisation), PK8 (launching and introducing new products into
targeted marketplace - selling, promoting and distributing the product), PK15
(determining the final product design and specifications) and PK16 (working
continuously for cost reduction and quality improvement). PK13 (evaluating lab tests
to detennine basic perfortnance against the product's specifications) was cross-loaded
with PK14 (executing prototype or in-house sample product testing) and PK8
(launching and introducing new products into targeted marketplace - selling,
promoting and distributing the product) while PK9 (preliminary engineering and
technical assessments) was also cross-loaded with PKI (preliminary market assessment
of the product), PK13 (evaluating lab tests to determine basic performance against the
product's specifications), PK16 (working continuously for cost reduction and quality
improvement) and PK18 (launching and introducing new products into targeted
marketplace - selling, promoting and distributing the product). The original model was
re-specified after deleting PK2, PK13 and PK9. The resulting model (Figure 5.2)
adequately fits the data, with the model fit indices as follows: X2 (9 8) = 119.04 (p
=. 07), CFI = 0.97, GFI = 0.89, AFGI = 0.85, NFI = 0.87, and RMR = 0.05 (see Table
5.8.2.4).
Table 5.8.2.4 Summary of Goodness-of-Fit Statistics for Gains in New Product Knowledu (First-Order CFA. 19 itemq)
Fit Indices x2 p value CF1 GF1 AGFI NFI RMR
(Model )
Initial 228.09 146 0.000 0.92 0.84 0.79 0.81 0.06 Alternative 119.04 98 0.07 0.97 0.89 0.85 0.87 0.05 (PK2, PK 13
and PK9
deleted)
iNote: X= t-ni-bquare; cit = Degree of Freedom; CFI = Comparative Fix Index; AGE Goodness-of-Fit Index; AGFI = Adjusted Goodness-of-Fit Index; NFI = Normed Fit
Index; RMR = Root Mean Square Residual.
153

Chapter 5 Pilot Study, Large-scale Survey and Assessment ofMeasurement Instrument
. 51
. 49
. 33
. 57
. 70
. 20
. 28
. 29
. 55
. 25
. 55
. 19
. 44
. 48
. 27
. 45
Figure 5.2 The First-Order Diagram of the Gains in New Product Knowledge Model
154

Chapter 5 Pilot Study, Large-scale Survey and Assessment ofMeasurement Instrument
5.8.3 Instrument Validation OfNew Product Innovativeness
The construct of new product innovativeness, consisting of 8 items, included two
dimensions. These are: (1) technological innovativeness (4 items) and (2) market
innovativeness (4 items) as listed in Table 5.8.3.1.
Table 5.8.3.1 New Product Innovativeness (I'D - Ouestionnaire Items
-_Lýýueýslionnýaire IýIems
Technological Innovativeness PH Product class was new to our firm P12 Product use (need served) was new to our firm P15 Product production process was new to our firm P16 Product design/development technology was new to our firm
Market Innovativeness P14 Customers for the product were new to our firm P17 Distribution and sales force for the product was new to our firm P18 Advertising and promotion for the product was new to our firm P13 Product competitors were new to our firm
Initial reliability analysis was carried out on each of the two new product
innovativeness dimensions. The CITC scores for all items were above 0.52 (see Table
5.8.3.2). The Cronbach's alpha scores were 0.86 for technological innovativeness and
A 0.88 for market innovativeness, indicating sound reliability. Table 5.8.3.2 New Product Innovativeness - Reliabilitv Analvsi-; Results Items Initial CITC I Final CITC I Alpha If
Item Deleted Cronbach's
Alpha Scores Technological nnovativeness
P12 0.79 0.79 0.79 P13 0.73 0.73 0.82 cL=0.86 P15 0.52 0.52 0.86 P16 0.66 0.66 0.83
Market Innovativeness . 74 0.74 0.88
P17 0 . 80 00.880 0 0.80 0.85 cL=0.88 P18 0.74 0. 0.74 0.74 0.82 P13 0.64 0. 0.6j_ 0.64 0.83
5.8.3.1 Exploratory Factor Analysis
The eight measurement items were submitted to an exploratory factor analysis. As
expected, two factors emerged from the analysis with factor loadings above 0.72,
indicating good discriminant and convergent validity. No cross loading was observed.
The results of the factor analysis are showed in Table 5.8.3.3. The KMO score was 0.8 1,
155

Chapter 5 Pilot Study, Large-scale Survey and Assessment ofMeasurement Instrument
indicating very good sampling adequacy. The two factors account for 73 percent of
variance. Thus, the two dimensions - technological innovativeness, market
innovativeness - consisting of 8 items constitute the measure of the new product
innovativeness construct.
Table 5.8.3.3 New Product Innovativeness- Factor Analysis Results Items Factor 1 Factor 2
Market Innovativeness
P17 . 885 . 193 P18 . 849 . 281 P14 . 832 . 223 P13
- . 735 . 255 -Te chnological Innovativeness
PH . 286 . 846
P12 . 235 . 834
P16 . 154 . 834
P15 . 280 . 729
Eigen value 4.475 1.368
% of Variance Explained
55.933 17.105
Cumulative % of Variance
55.933 73.038
Kaiser-Meyer-Olkin (KMO) Measure of Sampling Adequacy = 0.817 Bartlett's Test of Sphericity = 562.082, Significance = 0.000
5.8.3.2 Confirmatory Factor Analysis
The CFA results demonstrate that the two-factor structure is adequately supported
(( X2 (19) = 52.18 (p = . 000), CFI = 0.94, GFI = 0.90, AFGI = 0.8 1, NFI = 0.9 1, and
RMR = 0.06). Modification indices indicated that the removal of P12 (product use was
new to our firm) can further improve the fit of the model. The resulting goodness-of-fit
statistics in the alternative model (presented in Table 5.8.3.4) are: X2 (13) = 22.41 (p
CFI = 0.98, GFI = 0.95, AFGI = 0.90, NFI = 0.95, and RMR = 0.10.
Figure 5.3 illustrates the structural model of new product innovativeness. The
construct of technological innovativeness therefore comprises of 3 items, PI I (product
class was new to our firm), P16 (product design/development technology was new to
our firm) and P15 (product production process was new to out firm). The indicators for
156

Chapter 5 Pilot Study, Large-scale Survey and Assessment ofMeasurement Instrument
market innovativeness remain as P13 (product competitors were new to out firm), P14
(customers for the product were new to our firm), P17 (distribution and sales force for
the product was new to our firm) and P18 (advertising and promotion for the product
was new to our firm). These seven items constitute the final measure of the new product
innovativeness construct. Table 5.8.3.4 Summary of Goodness-of-Fit Statistics for New Product
Innovativeness (First-Order CFA, 8 items) Fit Indices 2
x df p value CH GF1 AGFI NFI RMR
(Model)
Initial 52.81 19 0.000 0.94 0.90 0.81 0.91 0.14 Alternative 22.42 13 0.05 0.98 0.95 0.90 0.95 0.10
(P12 deleted) ----------- -; r- Note: X '= Chi-Square; df = Degree of Freedom; CFI = Comparative Fix Index; AGFI = Goodness-of-Fit Index; AGFI = Adjusted Goodness-of-Fit Index; NFI = Normed Fit Index; RMR = Root Mean Square Residual.
. 97
1.11
. 84
1.03
. 51
1.66
. 64
Figure 5.3 The First-Order Diagram of New Product Innovativeness Model
157

Chapter 5 Pilot Study, Large-scale Survey and Assessment ofMeasurement Instrument
5.9 Conclusion: The Final Measurement Scales
This chapter discussed the results and processes of pilot study, large-scale survey
and the validation of measurement instrument. The discussion of the sample
characteristics included profile of respondent, response rates, and tests for
non-response bias.
After the construct validation, there are seven multi-item measurement scales that
were refined. The final Cronbach's alpha scores for all construct dimensions range from
0.77 to 0.89, demonstrating internal reliability (see Table 5.9.1).
The measure for both the customer linkage and the supplier linkage used a
formative scale. The measure focused on the extent to which each linkage was involved
in each step of NPD activities (see Section 4.4.2). A total of 13 formative indicators (i. e.,
13 different, sequential NPD activities) formed the measure of each linkage. The score
of each linkage was computed by averaging scores on the 13 items.
The surveyed data showed that not all NPD projects had associations with each
type of horizontal linkage. Therefore, the three horizontal linkages could not be
measured with a formative scale similar to that of the vertical linkages. The measuring
scores of these three linkages were then converted into binary data (YES= with such a
linkage, NO= without such a linkage); that is, a binary nominal scale was adopted.
The construct Table 5.9.1 presents a summary of the large-scale instrument
validation results and the final scales. The final measurement scales were subsequently
used in the regression analysis for testing hypotheses. Surnmated scales were used for
all variables in the regression models except corporation linkage, research institute
linkage, and university linkage. Chapter 6 discusses in detail the results of the tests
applied.
158

Chapter 5 Pilot Study, Large-scale Survey and Assessment ofMeasurement Instrument
Table 5.9.1 Summary of the Final Scales Construct Dimension Name # of Items Cronbach's a
Knowledge scanning ability 6 0.86 Absorptive Existing knowledge base 4 0.89
Capacity Communications network 3 0.79 Communications climate 3 0.78
Gains in New Predevelopment assessment knowledge 4 0.77 Product Marketing knowledge 5 0.78
Knowledge R&D knowledge 5 0.83 Manufacturing knowledge 3 0.84
New Product Technological innovativeness 3 0.82 Innovativeness Market innovativeness 4 0.88
Vertical Customer linkage Formative scale N. A. Linkages Supplier linkage Formative scale N. A.
Horizontal Corporation linkage Binary (Yes, No) N. A. Linkages Research institute linkage Binary (Yes, No) N. A.
, University linkage Binary (Yes, No) N. A.
N. A. = Not Applicable
159

Chapter 6 Descriptive Findings and Hypothesis Testing
Chapter 6
Descriptive Findings and Hypothesis Testing
6.1 Introduction
Following Chapter 5, this chapter focuses on descriptive findings of the sample
and the testing of the proposed hypotheses. Section 6.2 describes the sample profile.
Section 6.3 discusses data examination for the application of regression analysis.
Section 6.4 details testing the direct effects of external linkages on the accumulation
of new product knowledge. Section 6.5 presents the results of testing both the
moderating and the direct effects of absorptive capacity on new product knowledge
accumulation. Finally, Section 6.6 reports the testing of the mediating effects of gains
in new product related knowledge on the relationship between external linkages and
new product innovativeness. Figure 6.1 summarises the relationships among this
study's variables and proposed hypotheses.
Figure 6.1 An Illustration of Hypothesis Testing
Absorptive
Capacity &3c)
External Linkages (H4a, 4b &4c) Gains in New Product New Product Related Knowledge Innovativeness
Horizontal Linkages: -R&D knowledge Technological
. Cooperation linkage -Manufacturing innovativeness
-Research institute linkage knowledge
-University linkage -Pre-development -Market Hla, lb & Ic) assessment knowledge innovativeness
Vertical Linkages: -Marketing knowledge
-Custorner linkage
-Supplier linkage
(H2a &2b)
160

Chapter 6 Descriptive Findings and Hypothesis Testing
6.2 Sample Profiles and Descriptive Statistics
6. ZI Company profiles
In this research, the majority of data were collected from small- and
medium-sized enterprises (SMEs) (See Table 6.2.1.1). Only 16.1 percent of firms in
the surveyed sample have annual revenues exceeding one billion new Taiwan dollars
(around 20 million Sterling Pounds; exchange rate: NT$ 50 =f 1). In addition, more
than 66 percent of the surveyed firms employ less than 500 people. The majority of
SMEs in the sample have similarities consistent with previous research (Sher, 1998),
reflecting certain inherent characteristics of Taiwanese IT industries. For instance,
small firms are more likely to seek technological convergence with dominant designs'
(Suarez and Utterback, 1995) instead of developing their own technologies. Due to
limited resources, they tend to acquire new product know-how/technology externally.
Therefore, the development of external linkages with major multi-national companies
(MNCs) and/or industrial research institutes has become one of their major tactics in
seeking and acquiring new technologies for upgrading their innovation and, most
importantly, for their survival in a dramatically competitive IT environment. This also
explains the reason why the majority of IT firms in Taiwan are OEM/ODM
manufacturers, who concentrate their limited, valuable resources on product design
and manufacturing activities and, in doing so, allocate less resources to brand
marketing and/or channel development. As a result, these firms tend to predominantly
acquire and absorb R&D-related knowledge instead of product marketing knowledge.
Finns with less than three percent of their revenue in R&D represent 22.9
percent of the sample. On the whole, up to 43 percent of firms invest less than five
'A dominant design is a specific path along an industry's design hierarchy, which establishes dominance among competing design paths (Suarez and Utterback, 1995). A dominant design has the cffect of enforcing standardisation so that production economies can be sought. Effective competition then takes place on the basis of cost as well as product performance. The innovation of new products in the presence of dominant designs is more incremental than radical.
161

Chapter 6 Descriptive Findings and Hypothesis Testing
percent of their revenue in R&D (see Table 6.2.1.1). These f igures reveal that the
R&D budget of Taiwanese IT firms is relatively less than that of their counterparts in
industrialised countries (Cooper, 1999: 16-17). Taiwanese firms' R&D investment is
concentrated on product design engineering in order to meet the requirement of
speedy rollouts instead of being focused on applied and/or basic research. This
tendency guides the NPD activities of these firms towards incremental innovation
projects as opposed to radical innovations. Finns investing more than 20 percent of
their revenue in R&D represent only 6.8 percent of the sample. The majority of the
sample firms (42.4%) invest five to ten percent of their revenue in R&D. Overall,
fIrms in both the PC/peripherals and the semiconductors sectors employ more R&D
engineers than those of the telecommunications sector (See Table 6.2.1.3). This may
be due to the different sizes of the firms in Taiwanese IT industry, rather than the
extent of R&D intensity.
Cumulative %
Firm size (by revenue) Less than NT $ 100 million 6.8 (6.8%) NT $100-500 million 27.1 (33.9%) NT $501-750 million 35.6 (69.5%) NT $75 1 -1000 million 14.4 (83.9%) More than NT $ 1000 million 16.1 (100%)
Number of employees Less than 100 16.1 (16.1%) 100-500 50.0 (66.1%) 501-1000 13.6 (79.7%) 1000 -5000 20.3 (100%)
Number of R&D engineers Less than 10 5.9 (5.9%) 11-50 46.6 (52.5%) 51-100 23.7 (76.2%) 101-200 13.6 (89.8%) More than 200 10.2 (100%)
R&D intensity Less than 3% 22.9 (22.9%) 3.01-5% 19.5 (42.4%) 5.01-10% 42.4 (84.8%) 10.01-20% 8.5 (93.3%) More than 20% 6.8 (100%)
162

Chapter 6 Descriptive Findings and Hypothesis Testing
The industry sectors of the firms are tabulated in Table 6.2.1.2. Among the four
different industrial sectors, the PC and Peripherals sector, at nearly 64% of the sample
firms, is ranked as the dominant group. Twenty-six firms (21.3% of the sample firms)
belong to the semiconductors sector where firms are DRAM (dynamic random access
memory), SRAM (static random access memory), flashing memories manufacturers,
IC design houses (firms specialising at designing semiconductors) and IC foundries
(firms owning silicon-wafer-fabrication plants and speicalising in IC manufacturing
services). Fourteen firms (11.5% of the total) are in the communications sector where
they design and produce IT products such as LAN/WAN (local/wide area network)
cards, communication hubs, modems, optic fibers, wireless communication modules,
mobile phones and communication managers. Only four firms are in the software
industry sector. As there was a relatively small sample of the software group, the NPD
projects from this group were abandoned in the later statistical analyses. Table 6.2.1.2 Industry Sectors of the SamIale
industry Sector Frequency Percentage PC & Peripherals 78 63.9 Semiconductors 26 21.3 Communications 14 11.5 Software 4 3.3
122 100.0
Finns in the semiconductors and PC and peripherals sectors employ more people
and have higher revenues than those in the telecommunications sector (see Table
6.2.1.3). However, semiconductors firms invest significantly more revenue in R&D
than those in PC and peripherals and telecommunications sectors. On average,
semiconductors firms invest more than 12% of revenue in R&D, highlighting the
knowledge-intensive characteristics of competition in this sector. Based on whether or
not firms own silicon-wafer-fabrication plants, semiconductors firms are normally
categorised as one of two types - the fabrication chip companies and the fabless chip
163

Chapter 6 Descriptive Findings and Hypothesis Testing
companies. The latter do not own their plants. Instead, they contract the
manufacturing out to foundries, companies that own IC plants. That means that they
can focus their investment on IC chip design and development, rather than on
expensive equipment. In the surveyed sample, some of these chip design companies
invest more than 20 percent of revenue on R&D, which may account for the higher
percentage of R&D investment in this sector.
Table 6.2.1.3 Resu lts of ANO VA: Industrial S ectors and F irms' Ch aracterisfi _ Industrv Sectors (2) (3) ýb Duncan
Firms' Characteristics PC and Semiconductors Telecom- Resultsa Peripherals munications (n=78) (n=25) (n= 13)
Number of 6.05 6.04 4.09 5.07*** (1), (2) > (3) Employees (log) (1.22) (1.31) (. 99)
Revenue (log) 3.02 3.45 1.99 3.31** (1), (2)> (3) (in NT$100 million) (. 69) (. 79) (. 83)
R&D Intensity (log) 1.78 2.27 1.82 3.83** (2)> (3), (1) (. 82) (. 71) (. 66)
Number of R&D 4.40 4.22 3.05 6.22*** (1), (2) > (3) FnQineers flog) (. 94) (1,32) (. 85) Cells are means with standard deviations in parentheses.
1 (1), (2) > (3) denotes that the means of group (1) and group (2) are significantly larger than the mean
of group (3), based on p<0.05 level.
*p<0.05, **p<0.01, ***p<0.001.
As indicated in Table 6.2.1.3, the mean differences of firms' characteristics
across the three industry sectors are significant. it is important to observe the
differences in the variable means of interest across the three industry sectors.
One-way ANOVA shows that the only significant variable is that of market
innovativeness (see Table 6.2-1-4). Duncan's range test indicates that the level of
market innovativeness of the NPD projects in both telecommunications and PCs and
peripherals tends to be higher than that of those in semiconductors.
164

Chapter 6 Descriptive Findings and Hypothesis Testing
NOVA: Ind Industrv Sectors
Variables (1)
PC and Peripherals (n=78)
(2) Semiconductors
(n=25)
(3) Telecom- munications (n= 13)
Fb Duncan Resultsa
Zia-inin Manufacturing 2.31 2.32 2.15 0.22 N. S. Knowledge (. 82) (. 79) (. 87)
Gain in R&D 2.47 2.47 2.25 0.43 N. S. Knowledge (. 79) (1.03) (. 63)
Gain in Pre-development 2.23 2.04 2.19 0.59 N. S. Assessment Knowledge (. 76) (. 84) (. 58)
Gain in Marketing 2.07 2.01 2.38 1.29 N. S. Knowledge (. 71) (. 73) (. 74)
Market 4.03 3.22 4.02 3.22** (1), (3) > (2) Innovativeness (1.42) (1.49) (1.15)
Technological 4.81 4.23 4.69 1.79 N. S. Innovativeness (1.29) (1.51) (1.24)
Absorptive Capacity 5.54 5.61 5.57 0.13 N. S. (. 52) (. 61) (. 58)
Cells are means with standard deviations in parentheses. (1), (3) > (2) denotes that the means of group (1) and group (3) are significantly larger than the mean of group (2), based on p<0.1 level. N. S.: Not Significant
b *p<0.05, **p<0.01, ***p<0.001
6. Z2 Projectproftles
NPD projects were broken down into four categories: parts/components,
sub-assemblies, system products, and software. Basically, developing system products
requires various types of product technologies that are integrated. For instance, image
scanner manufacturers normally need to possess technologies such as electronic
design, scanning mechanism, optic design, firmware control and software driver
programming to be capable of designing a scanner product. By contrast,
part/component, such as ICs (integrated circuits) and connectors, producers focus on
relatively few types of product technologies, but may put more emphasis on the
automation of manufacturing process. Therefore, the scope of multi-disciplined
technologies may influence a firm's tendency to use external sources for product
innovation. Of the 122 NPD projects studied, forty-one (33.6%) belong to the
165

Chapter 6 Descriptive Findings and Hypothesis Testing
personal computers and peripherals (see Table 6.2.2.1). These firms develop and
manufacture products ranging from active components such as IC chips, chip sets
(printed circuit devices that include several special functions on the boards) to passive
components such as capacitors, resistors, and connectors. Fifteen projects (12.3%)
belong to the sub-assemblies. The main products in this group include: printed circuit
boards, LAN cards, communications hubs, hard disk modules, switching power
suppliers, PC cabinets, CD-RW drives, LCD (liquid crystal display) modules and
laser printer. The system products represent more than 50% (62 projects) of the
sample. The firms in this group design and manufacturer IT products covering
notebooks, PCs, industrial PCs, servers, image scanners, digital cameras, MVD/DVD
players, LCD monitors, mouse, track balls, communication managers and so on. Four
NPD projects are involved in designing application software products. These are
primarily image processing/animation and anti-virus software. Table 6.2.2.1 Product types of the Samj&
ProducttvDe Frequency Percentage Parts/Components 41 33.6 Sub-assemblies 15 12.3 System products 62 50.8 Software 4 3.3 Total 122 100.0
The results of ANOVA show that there is no significant difference between the
surveyed firms' number of employees, revenue and R&D intensity and the three
product types except for the number of R&D engineers employed (see Table 6.2.2.2).
None of the F values were found to be significant at the p<0.05 level. The results in
general indicate that the type of NPD projects is not associated with firms'
characteristics in the current study. Further testing of the differences in variable means
of interest across the three product types shows that market innovativeness is
significant at p<0.05 level (see Table 6.2.2.3). Duncan's range test suggests that the
166

Chapter 6 Descriptive Findings and Hypothesis Testing
level of market innovativeness of the NPD projects of both system products and
subassemblies tends to be higher than that of those of parts/components. Table 6.2.2.2 Re sults of AN OVA: Product lCylaes and F irms' Cha racteristics
Product MMes (2) (3) Fa Duncan
Firms' Characteristics Parts/ Subassemblies System Results b Components products (n=40) (n=14) (n=62)
Number of 5.97 5.67 5.95 0.31 N. S. Employees Qn) (1.25) (1.18) (1.29)
Revenue (In) 3.02 2.48 3.11 0.79 N. S. (in NT$ I 00million) (. 69) (1.37) (1.75)
R&D Intensity (In) 1.88 1.73 1.93 0.38 N. S. (. 82) (. 74) (. 81)
Number of R&D 3.74 3.66 4.18 2.92* N. S. Engineers (In) (1.191 (. 96) (-97) Cells are means with standard deviations in parentheses. " *P<O. 1, b NS: Not Significant. Duncan results are based on p<0.05 comparisons
Indusqy Sectors (2) (3) Fb Duncan
Firnis' Characteristics Parts/ Components (n=40)-
Subassemblies
(n= 14)
System products (n--62)
Resultsa
Gain in Manufacturing 2.36 2.21 2.27 0.20 N. S. Knowledge (. 80) (. 84) (. 82)
Gain in R&D 2.36 2.61 2.47 0.55 N. S. Knowledge (. 77) (. 99) (. 83)
Gain in Pre-development 2.01 2.45 2.24 2.04 N. S. Assessment Knowledge (. 74) (. 66) (. 78)
Gain in Marketing 2.03 2.14 2.12 0.21 N. S. Knowledge (. 69) (. 80) (. 73)
Market 3.22 4.21 4.18 6.55*** (3), (2)>(I) Innovativeness (1.34) (1.10) (1.44)
Technological 4.37 4.52 4.90 2.06 N. S. Innovativeness (1.39) (1.13) (1.34)
Absorptive Capacity 5.52 5.66 5.56 0.35 N. S. . 52) (. 49) (ý57)
Cells are means with standard deviations in parentheses. (3), (2) > (1) denotes that the means of group (3) and group (2) are significantly larger than the
mean of group (1), based on p<0.05 level. N. S.: Not Significant, b **p<0.05, ***p<0.01
167

Chapter 6 Descriptive Findings and Hypothesis Testing
6.3 Data Examination
6.3.1 Assumptions in Multiple Regression Analysis .
Most statistical tests are founded on several assumptions about the sample data to
which they are applied. The application of regression analysis to test hypotheses
requires a set of assumptions to be satisfied including (Hair et al., 1998: 172-176): (1)
normality of the error term distribution, (2) linearity of the phenomenon measured, (3)
independence of the error terms, and (4) constant variance of the error terms. Any
violations of assumptions can result in inappropriate tests of the significance of
coefficients and inaccurate predictions of the dependent variables.
By testing the appropriateness of each regression model, a scatter-plot of
studentized residuals (i. e., the difference between the predicted and the observed
values for the dependent variable) was placed against predicted variables and
or/independent variables to evaluate assumptions regarding the linearity,
independence and constant variance of error terms (ibid. ). The residual plots of the
regression models in this study (see Appendix C) did not display any specific patterns
and appeared to be randomly scattered around a horizontal line through zero,
indicating the existence of meeting these assumptions.
Both a histogram of residuals and a normal probability plot of residuals were
utilised for examining normality. If the data are a sample from a normal distribution,
the residuals are expected to fall on or close to a straight diagonal line (ibid.,
pp. 175-176). In this study, the histogram and normal probability plots (see Appendix
Q did not provide a basis for rejecting the normality assumption for all regression
models constructed.
6.3.2 Assessing Multicollinearity and Identifying Influential Observations
Multicollinearity (or collinearity) refers to the correlations among independent
variables. The presence of high collinearity in the data can lead to large standard error
168

Chapter 6 Descriptive Findings and Hypothesis Testing
of the estimated regression coefficients so that predictions may become unstable
and/or incorrect (ibid., pp. 188-189). The tolerance value and its inverse - the variance
inflation factor (VIF) - are two widely accepted statistics for examining
multicollinearity. Tolerance value indicates the degree to which the variance of each
independent variable is not explained by the other independent variables. A variable
with a small tolerance (i. e. high VIF) indicates high collinearity. A common cut-off
threshold indicating existence of collinearity, suggested by Hair et al. (ibid., p. 193), is
a tolerance value below 0.1, which corresponds to VIF values above 10.
The examination of the condition index (which represents the collinearity of
combinations of variables in the data set) and the decomposition of regression
coefficient variance (i. e. the proportion of variance for each regression coefficient
attributable to each condition index) is another instrumental method to diagnose
variables exhibiting high multicollinearity. Collinearity is indicated when the
identified condition index is above 30, accounting for a sizable proposition of
variance (0-9 or above) for two or more coefficients (ibid., p. 220). Then the
proportion of the coefficient variance matrix is used to identify the exact variables
demonstrating substantial collinearity.
As discussed in Section 4.5.2, if interaction terms are significant, the regression
model is likely to encounter the problem of multicollinearity because of high
correlations among predictors (i. e. independent, moderator and interaction terms). In
this study in order to avoid multicollinearity, both independent variables including
moderators and dependent variables are all mean-centered before entering the
regression run. All regression models performed were examined for their VIF and
tolerance values. VIF values of all predictor variables ranged from 3.362 to 1.051
with corresponding tolerance values ranging from 0.297 to 0.951 in the regression
models. These values indicate that multicollinearity was not a significant problem as
169

Chapter 6 Descriptive Findings and Hypothesis Testing
all are far above the cutoff thresholds.
Outliers can have a disproportionate influence on the estimated parameters in a
regression equation. In this study, three methods of checking outliers and influential
observations were utilised. First, residual plots were used to spot outliers quickly. In
general, studentized residuals exceeding an absolute value of three are considered
outliers. Second, hat values (the diagonal elements of the least-square project matrix)
were used to identify leveraging points, which were observations with unusual
combinations of values of the independent variables. It is suggested that when a hat
value is greater than 2p/n, where p is the number of independent variables plus one
and n is the sample size, the observation is considered to be a potential leverage point
in the sample size exceeding 50 [ibid., p. 224]. The third method involves using the
DFBETA (in SPSS) to single out an observation demonstrating substantial change on
each regression coefficient. The guidance (ibid., p. 225) for identifying particularly
high values of DFBETA suggest that a threshold of I 2V-n I be applied to medium or
large data sets .
Applying the above three methods revealed that six cases generated potential
influentials in the regression models. To detect the impact of these variables, a series
of regression analyses was carried out without these cases, and the best fit in terms of
R2was found when two cases were deleted. The subsequent results for regression
analyses for hypothesis testing are based on 116 cases of projects.
170

Chapter 6 Descriptive Findings and Hypothesis Testing
6.4 Testing the Direct Effects of External Linkages on Gains in New
Product Related Knowledge
Hla: The positive effects of horizontal linkages on gains in R&D knowledge
will be stronger than those of vertical linkages.
Hlb: The positive effect of horizontal linkages on gains in marketing knowledge
will be stronger than those of vertical linkages.
Hlc: The positive effect of horizontal linkages on gains in manufacturing
knowledge will be stronger than those of vertical linkages.
The following three hierarchical regression models were developed to test
hypotheses I a, I b, and I c. Table 6.4.1 reports the means and standard deviations of the
variables and their Pearson correlations. The Pearson coefficients between absorptive
capacity and gains in manufacturing, R&D and pre-development assessment
knowledge variables are significant at p< 0.01 level. Therefore, absorptive capacity
and company size together with the control variables of both industrial sectors and
product types, which were dummy-coded, were first entred into regression equations
to partial out their effects on dependent variables (i. e., gains in new product related
knowledge) (see Model 1). Next, two vertical linkage variables were entered into
regression equations to examine their effects on the increase in Rý to determine the
unique amount of variance explained (see Model 2). As variables of external linkage
relative to corporation, industrial research institute and university are dichotomised,
three dummy variables were last introduced into the regression equations (see Model
3). Model 3 is used to examine the effects of horizontal linkages on the increase in R2
to determine the unique amount of variance explained for predicting gains in new
product knowledge variables. A comparison of the increase in W between the effects I of vertical linkages and horizontal linkages determines which has greater impact on
gains in new product related knowledge.
171

Chapter 6 Descriptive Findings and Hypothesis Testing
Model (1):
Gain in New Product Knowledge = Company size Industrial sectors (PC & Peripherals, Semiconductors)
Product types (Components, Sub-assemblies)
Absorptive capacity Where in industrial sector,
Variable: PC & Peripherals
Variable: Semiconductors
Where in product type, Variable: Components
Variable: Sub-assemblies
I if a firm operates in this category 0 if a firm operates in telecommunications
or semiconductors I if a firm operates in this category 0 if a firm operates in telecommunications
or PC & Peripherals
=I if a new product belongs to this category =0 if a new product belongs to
sub-assemblies or system products =I if a new product belongs to this category =0 if a new product belongs to components
or system products (Two dummy variables are utilised in the regression equations since there are three different categories
in both product type and industrial sector. )
Model (2): Gain in New Product Knowledge = Company size
" Industrial sectors (PC & Peripherals, Semiconductors)
" Product types (Components, Sub-assemblies)
" Absorptive Capacity
" Vertical linkages (Customer linkage and Supplier linkage)
Model (3): Gain in New Product Knowledge = Company size
" Industrial sectors (PC & Peripherals, Semiconductors)
" Product types (Components, Sub-assemblies)
+Absorptive Capacity
+Vertical linkages
+Horizontal linkages (Corporation linkage, Research institute
linkage and University linkage)
Where, Variable: Corporation linkage
Variable: Research institute linkage
Variable: University linkage
=I if any cooperating firm involved in the project 0 if no cooperating firms involved
=I if any research institute involved 0 if no research institute involved
=I if any university involved 0 if university involved
(Since corporation, industrial research institute and university are dichotomous variables, one dummy
variable for each variable was assigned in the regression equations. )
172

Chapter 6 Descriptive Findings and Hypothesis Testing
Hypotheses la, lb and Ic posit that the magnitude of the positive effects of
horizontal linkages on gains in R&D, manufacturing and marketing knowledge will
be stronger than those of vertical linkages. When predicting the gain in R&D
knowledge, the amount of variance explained by the horizontal linkages (A Rý = . 16,
p< 0.01) was larger than that of the vertical linkages (AR2= . 01) (see Table 6.4.2).
Similarly, the increase in W due to the horizontal linkages (AR2= . 06, p<0.05) was
higher than the increase due to the vertical linkages (AR2 = . 03, p>0.1) when
predicting gain in manufacturing knowledge (see Table 6.4.2). The results confirm
that the effects of the horizontal linkages on gains in new technical related knowledge
(R&D and manufacturing) are higher than those observed for vertical linkages. Thus,
Hypotheses Ia and Ic are strongly supported.
By a similar analysis, when predicting gain in pre-development assessment
knowledge, the unique amount of variance explained by the horizontal linkages (A Rý
= . 15, p<0.01) was also larger than that of the vertical linkages (AR= . 01, p>0.05)
(see Table 6.4.3). Although examining the R square (112 = 0.13, p>O. 1) for the
complete model is not significant when predicting gain in marketing knowledge (see
Table 6.4.3), the increase in R2 due to the horizontal linkages (A R2 = . 08, p<0.05)
was higher than the increase due to the vertical linkages (A Rý = .01, p>O. I ). The
results lend support to Hypothesis lb.
173

I C) C)
C> N 117 4 rn C4
C> 'IT C> N c
tn It
0 en
cq C) eq W) 't cq cq
o 0 C,
C> 0 11)
C14 CA
C> 0 It C) as 14 c! C'i C-1 C9 el
x
-1 ti)
;I It W
B
. . " l 1 6 1 C i 0* C) It C14 ON C14 00 oc
0 C> tn tn It 00
1400 Cý - Cý
C14 en C14 -q t-. tn
C> 0
14 o5 00 m tn Cs
00 C> r4 C) r4 c, m \0 00 00 r-4 ý10
tQ CN Itt .q-
C-i Cý Vi q - ýo C)
en N
Cý (=> . 0 (=> 1
0 00 t-
C) W) W-) eq
W) r- 't ON en " t- qtt -t
en CIP) 00 00
0 00
00 r- -. 4
r- Itt '
\C 0oo00c;
(=; C; 6 C; (=; 4=; C; t
M 00 00 ýý clý rn nt 00 --4 tý. C, 4 rn r4 00 rlý rq rn &A eý V) ýo " rn - V) 00 xt r- N le (N Gn
ti c; C: 5 d c; vi r,; r,; cý c5 rý cý (, i 2 10
CO) r. V 4) (L) , r. P. u r. 6 öz J., 9) zi 0- to u GA u0 (Z ci , g) t4 ýi- -U ý: r. > cu =u _b4 1-, cu Q
cu t2 cn c2ý r CU cu . ýd m . - ci r. _b4 , cLý 5ý ýo .-=r. .-eu 22 u0- cu u0. t-) ý-, V > t4 , t4 i. ==r. Q) 7-.
- to > KZ� -0 a -r- -0 'u Eý , .-0 ce- bEM 12. -0 iZ ,>EMý, ' 0-- 0U r- Z 9) -- du Ibý 0--
um0-D U) 5: A> 0Z%: w zi =>0 C)
teý, )2 .
r- 0 ) 02 Eý"C, 02 & -0 cn cn ý00 r- N r) 0 s)
.0: i nw 0 - 0, ' AA < c2 u -i -. qv e (-Z 92. >ýr, l',
ce
0
;j
Cý
CIS 0
; 7.

Chapter 6 Descriptive Findings and Hypothesis Testing
Table 6.4.2 Results of Hierarchical Regression Analysis: Effects of External Linkages on Gains in New Product Knowledge (1)
Independent Variable
Gain in R&D Knowledge
Model Model Model 1-1 1-2 1-3
Gain in Manufacturing Knowledge
Model Model Model 2-1 2-2 2-3
Log firm size -. 05 -. 05 -. 08 . 01 . 01 -. 01
PC & Peripherals . 08 . 07 . 06 . 10 . 09 . 04
Semiconductors . 11 . 13 . 12 . 01 . 05 . 01
Components -. 08 -. 08 -. 07 . 10 . 10 . 13
Subassemblies . 04 . 03 . 03 -. 01 -. 03 -. 02
Absorptive capacity (AC) . 28**
. 29** . 29** . 32** . 33** . 32**
Vertical Linkages:
Customer linkage -. 02 -. 08 -. 01 -. 04
Supplier linkage . 13 . 10 . 19, .1 8t
11orizontal Linkages:
corporation iinKage . 33** . 25**
Research institute linkage . 11
. 04
University linkage . 10 -. 06
R2 . 10 . 11 . 27** . 11
. 14 . 20**
AR 2 . 01 . 16**
. 03 . 06*
df 6,109 8,107 11,104 6,109 8,107 11,104
F ratio 1.90, 1.64 3.55** 2.20* 2.19* 2.40**
Cells are standardized regression coefficients.
tp<. 1, *p< . 05, **p< .01, all two-tailed test
175

Chapter 6 Descriptive Findings and Hypothesis Testing
Table 6.4.3 Results of Hierarchical Regression Analysis: Effects of External Linkages on Gains in New Product Knowledge (2)
Gain in Pre-development Gain in Marketing Assessment Knowledge Knowledge
Independent Variable Model Model Model Model Model Model 3-1 3-2 3-3 4-1 4-2 4-3
Log firm size (Control) -. 05 -. 05 -. 09 -. 08 -. 08 -. 11
PC & Peripherals . 21
. 01 -. 01 -. 18 -. 16 -. 21
Semiconductors -. 03 -. 06 -. 08 -. 15 -. 14 -. 19
Components -. 12 -. 13 -. 11 -. 08 -. 17
. 04
Subassemblies . 08 . 09 . 09 . 03 -. 04 . 05
Absorptive capacity (AC) . 23*
. 22* . 22* . 11 . 11 . 10
Vertical Linkages: Customer linkage
. 06 . 00 -. 06 -. 10
Supplier linkage -. 09 -. 10 -. 02 -. 03
Horizontal Linkages:
Corporation linkage . 32**
. 25*
Research institute linkage . 181
. 14
University linkage . 01 -. 11
R2 . 10 . 11 . 26** . 04 . 05 . 13
AR 2
. 01 . 15** . 01 . 08*
df 6,109 8,107 11,104 6,109 8,107 11,104
F ratio 1.91, 1.55 3.35 0.88 0.71 1.39
Cells are standardized regression coefficients. tp<
. 1, *p< . 05, ** p< . 01, all two-tailed test
176

Chapter 6 Descriptive Findings and Hypothesis Testing
6.5 Testing the Direct and Moderating Effects of Absorptive Capacity
6.5.1 Moderator-Ahsorptive Capacity
As discussed in the Section 5.8.1, the construct of absorptive capacity is
composed of, namely, existing knowledge base, knowledge scanning ability,
communications climate and communications networking. Absorptive capacity, on the
whole, in the surveyed sample was above the moderate level, i. e. above 5 on a 7-point
scale (see Table 6.5.1.1). This result indicates that the majority of IT firms maintain a
receptive communication climate to support new product/idea development. The
results of ANOVA (through the procedure of repeated measures of general linear
model in SPSS 10.0) showed a significant difference among four dimensions (see
Table 6.5.1.2). Duncan's range tests (see Table 6.5.1.1) showed that the mean value of
"communications climate" was significantly higher than in the other three dimensions.
Differences were also _found
between "communications climate" and "existing
knowledge base" as well as "knowledge scanning ability". Communications network,
representing the extent to which a firin establishes an effective conduit for absorbing
external knowledge/technology, was ranked as the lowest among the four dimensions.
These differences suggest that further improvement of a firm's communications
network along the interface between internal and external environments can
effectively augment its absorptive capacity.
177

Chapter 6 Descriptive Findings and Hypothesis Testing
Table 6.5.1.1 Summary of Pairwise Comparisons:
tour vimensions oi ADsorUtive ualaacury b
sultsa Mean SD F-ratio Duncan Re
(1) Existing Knowledge Base 5.56 . 86
(2) Knowledge Scanning Ability 5.59 . 69 19.49*** (3)> (2), (1) > (4)
(3) Communication Climate 5.74 . 66
(4) Communication Network 5.21 . 79
(3) > (2), (1) > (4) denotes that the mean of group (3) is significant larger than the means of groups (2), (1) and (4); and the means of groups (3), (2) and (1) are all significantly larger than that of group (4), based on p<0.05 level. And, no significant difference in the means of group (2) and group (1) is identified.
b ***p<0.01.
Table 6.5.1.2 Summ ary of ANOV A: Four Dimen sions of Absorptive Callacity _ Source of Sum of Degrees of Mean F-ratio
Variation Squares Freedom Square
Observed cases 153.52 115 1.34
Dimension (Predictor) 18.27 3 6.09 19.49***
Residual Error 107.81 345 . 31 *** p<0.01
In order to further revalidate the construct of absorptive capacity, a traditional
measure of absorptive capacity - R&D intensity - was also included in the surveyed
questionnaire to examine whether any significant correlation exists between R&D
intensity and aggregate absorptive capacity. A logarithm transformation of R&D
intensity was performed to reduce the skewness in distribution (kurtosis: 19-75and
skewness: 4.04). None of Pearson's correlation coefficients between R&D intensity
and other variables were significant at p<0.05 level. Nevertheless, positive
correlations are displayed (see the bottom row of Table 6.5.1.3). This observation is
not surprising since it is consistent with the work of Spender and Grant (1996) who
illustrated the instability of using R&D intensity as a proxy for a knowledge-based
construct.
178
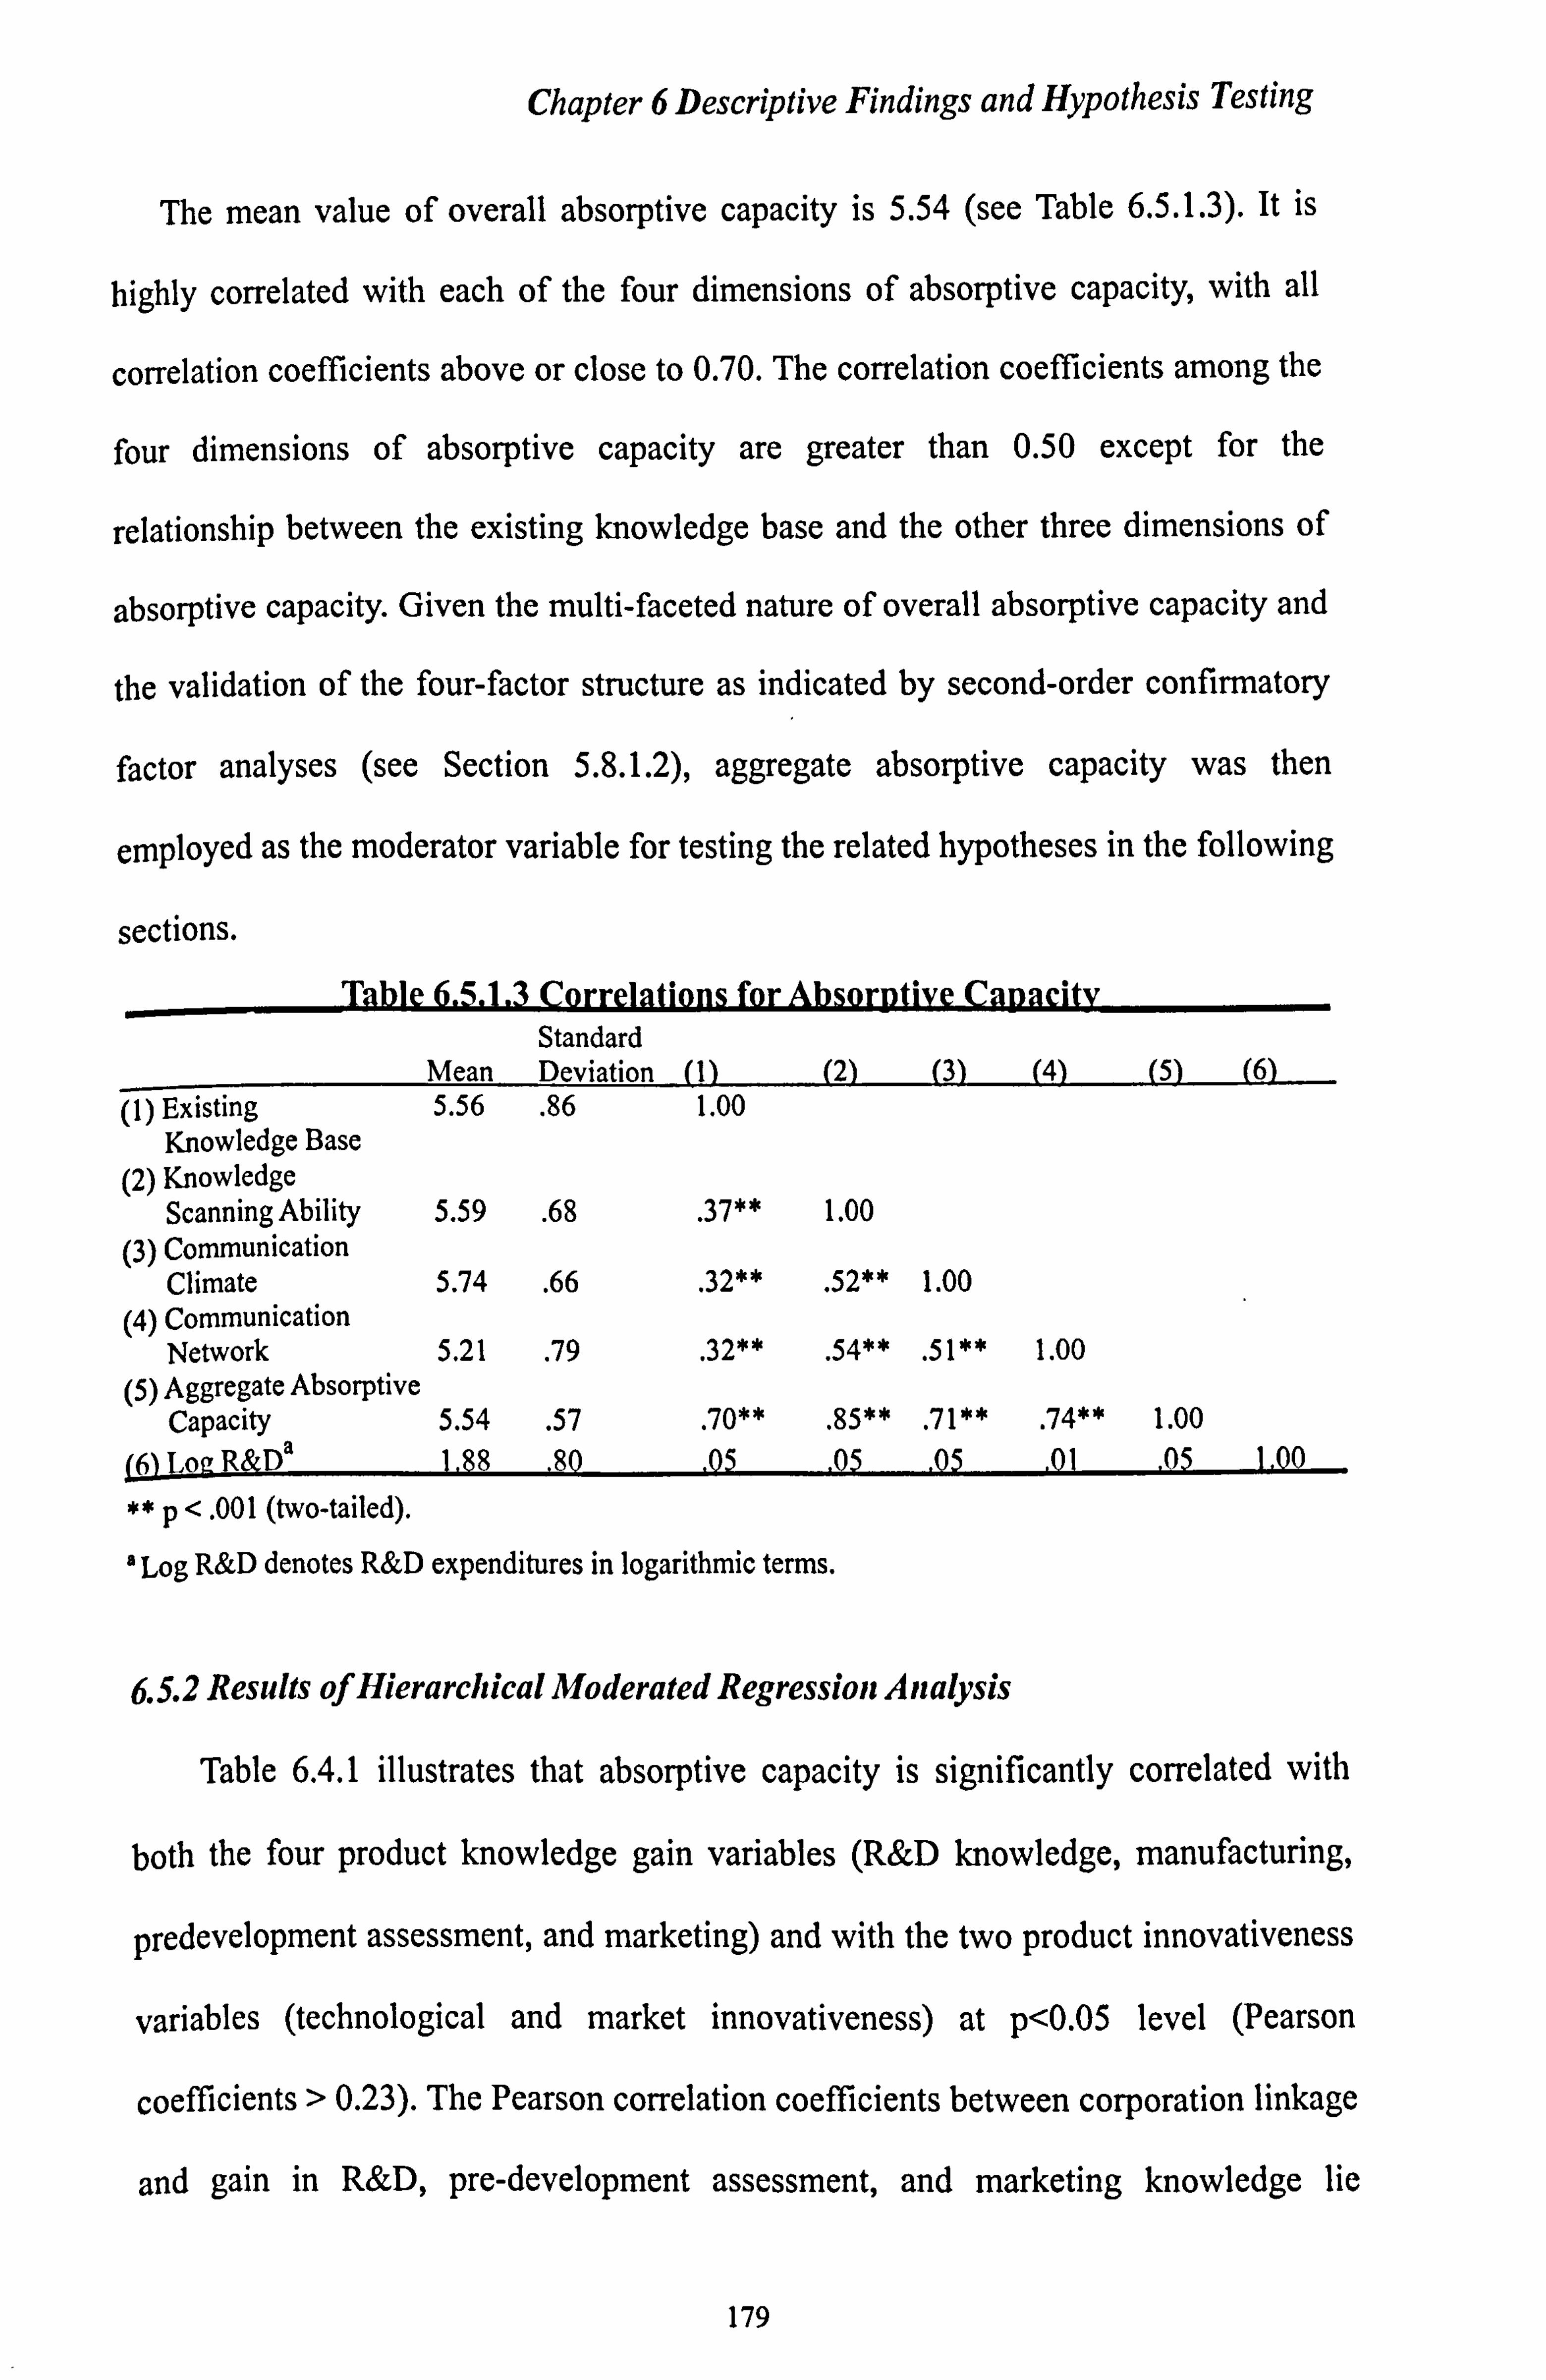
Chapter 6 Descriptive Findings and Hypothesis Testing
The mean value of overall absorptive capacity is 5.54 (see Table 6.5.1.3). It is
highly correlated with each of the four dimensions of absorptive capacity, with all
correlation coefficients above or close to 0.70. The correlation coefficients among the
four dimensions of absorptive capacity are greater than 0.50 except for the
relationship between the existing knowledge base and the other three dimensions of
absorptive capacity. Given the multi-faceted nature of overall absorptive capacity and
the validation of the four-factor structure as indicated by second-order confirmatory
factor analyses (see Section 5.8.1.2), aggregate absorptive capacity was then
employed as the moderator variable for testing the related hypotheses in the following
sections. Table 6.5.1. 3 Correlati ons for Absorpt ive Capacity
Standard Mean Deviation (1) (2) (3) (4) (5) (6)
(1) Existing 5.56 . 86 1.00 Knowledge Base
(2) Knowledge Scanning Ability 5.59 . 68 . 37** 1.00
(3) Communication Climate 5.74 . 66 . 32** . 52** 1.00
(4) Communication Network 5.21 . 79 . 32** . 54** . 51** 1.00
(5) Aggregate Absorptive Capacity 5.54 . 57 . 70** . 85** . 71** . 74** 1.00
(6) Log R&Da 1.88 . 80 . 05 . 05 . 05 . 01 '05 1.00
**p< . 00 1 (two-tailed)
'Log R&D denotes R&D expenditures in logarithmic terms.
6.5.2 Results ofHierarchical Moderated Regression A nalysis
Table 6.4.1 illustrates that absorptive capacity is significantly correlated with
both the four product knowledge gain variables (R&D knowledge, manufacturing,
predevelopment assessment, and marketing) and with the two product innovativeness
variables (technological and market innovativeness) at p<0.05 level (Pearson
coefficients > 0.23). The Pearson correlation coefficients between corporation linkage
and gain in R&D, pre-development assessment, and marketing knowledge lie
179

Chapter 6 Descriptive Findings and Hypothesis Testing
between 0.19 (p<0.05) and 0.3 5 (p<0.0 1). These may provide support for the positive
effects of both absorptive capacity and corporation linkage on gains in new product
knowledge. Corporation linkage is also significantly correlated with the two product
innovativeness variables (p< 0.05). In addition, the strong correlation (Pearson
coefficients ranging from 0.24 to 0.54) between the four product knowledge gain
variables and the two product innovativeness variables supports that the four product
knowledge variables may possibly mediate the relationship between external linkages
and the two product innovativeness variables.
The following three hierarchical regression models were developed to test
hypotheses 3a, 3b, 3c, 4a, 4b and 4c (derived in Chapter 3). Model I (below) is
developed to examine and partial out the effects of control variables on dependent
variables. Model 2 (below) is employed to detect the direct effects of both external
linkages and absorptive capacity. Model 3, with the inclusion of interaction terms
between absorptive capacity and each type of external linkages, is used to examine
the moderating effect of absorptive capacity. Because of the high collinearity across
the interaction terms, an equation with all of the interaction terms entered
simultaneously yields no significant coefficients. Thus, all metric independent and
dependent variables were mean-centred (Venkatraman, 1989) and the interaction
terms were entered one at a time.
Model (1):
Gains in New Product Knowledge (R&D, manufacturing, marketing and predevelopment assessment)
= Company size
+ Industrial sectors (PC & Peripherals, Semiconductors)
+ Product types (Components, Sub-assemblies)
Model (2):
Gains in New Product Knowledge = Control Variables
180

Chapter 6 Descriptive Findings and Hypothesis Testing
(Company size +Industrial sector +Product type)
+Absorptive Capacity
5 External Linkage Variables (Customer, Supplier,
Corporation, Industrial research institute, University)
Model (3):
Gains in New Product Knowledge = Control Variables
(Company size +Industrial sector +Product type)
+Absorptive Capacity
+5 External Linkage Variables
+Interaction Terms
(Absorptive Capacity X Customer Linkage, Absorptive Capacity X Supplier linkage,
Absorptive Capacity XCorporation Linkage, Absorptive Capacity X Research Institute
Linkage, Absorptive Capacity X University Linkage)
181
Chapter 6 Descriptive Findings and Hypothesis Testing
6.5.2.1 Test for Hypothesis 3a, 3b and 3c- the Direct Effects of Absorptive
Capacity
H3a A firm's level of absorptive capacity is positively related to its gains in R&D
knowledge in a NPD project.
H3b A firm's level of absorptive capacity is positively related to its gains in
marketing knowledge in a NPD project.
H3c A firm's level of absorptive capacity is positively related to its gains in
manufacturing knowledge in a NPD project.
Hypotheses 3a, 3b and 3c predict that a firm's absorptive capacity is positively
related to its gains in new product related knowledge. The Pearson correlations (see
Table 6.4.1) between absorptive capacity and the four product knowledge gain
variables (R&D knowledge, manufacturing knowledge, pre-development assessment
knowledge, marketing knowledge) are all significant, ranging from 0.31 to 0.11 (p <
0.05). Control variables were then entered into the regression equations to examine
their effects on the criterion variables (i. e. the four product knowledge gain variables).
In each regression model, R2 was not significant at p <0.05 (see Table 6.5.2.1),
indicating that the control variables do not significantly affect gain in new product
knowledge. Next, absorptive capacity and five predictors - external linkage
variables - were subjected to regression analysis.
A multiple regression analysis using gain in R&D knowledge as the criterion
variable showed associations between the gain in R&D knowledge with that of
absorptive capacity and corporation linkage (F 5, no = 6.36 ,p<0.01, R2 = 0.26) (see
Model I shown in Table 6.5.2.2). The standardised regression coefficients were 0.29
(t=3.57, p< 0.01) and 0.34 (t=3.93, p< 0.01) respectively. These results demonstrated
that absorptive capacity is positively correlated with gain in R&D knowledge. In
182

Chapter 6 Descriptive Findings and Hypothesis Testing
addition, the NPD projects that involved collaboration with corporations shows
stronger effects for gain in R&D knowledge than those without such linkages.
Table 6.5.2.1 R esults of Regre ssion Analysis: E ffect of Control Va riables (Gains in New Product Related Knowledge)
R&D Manufacturing Pre-development Marketing knowledge knowledize assessment knowledge knowledge
Control Variables: Employee (Log) -. 04 . 02 -. 04 -. 07
(-. 37) (. 17) (-. 45) (-. 75) PC & Peripherals . 06 . 08 -. 01 -. 18
(. 41) (. 52) (-. 04) (-1.23) Semiconductors . 12 . 05 -. 02 -. 15
(. 78) (. 03) (-. 15) (-. 95) Components -. 10 . 08 -. 14 -. 09
(-. 89) (. 64) (-1.19) (-. 78) Sub-assemblies . 05 . 01 . 09 . 03
(. 49) (. 03) (. 93) (. 30)
R' . 02 . 01 . 04 . 03
F (5-110) . 37 (N. S. ) . 15 (N, S. ) . 99 (N. S. ) . 78 (N. S. )
Cells are standardised regression coefficients with t-values in parentheses.
N. S.: Not Significant, two-tailed test.
183

Chapter 6 Descriptive Findings and Hypothesis Testing
Table 6.5.2.2 Results of Moderated Regression Analysis: Predicting Gain in R&D Knowledot-
Model 123456
Main Effects: (1) Customer Linkage -. 07 -. 06 -. 08 -. 08 -. 08 -. 08
(-. 86) (-. 73) (-. 87) (-. 95) (-. 92) (2) Supplier Linkage . 11 . 11 . 11 . 12 . 06 . 10
(1.28) (. 12) (1.28) (1.42) (. 74) (1.11) (3) Corporation Linkage . 34*** . 34*** . 33*** . 34** . 34*** . 34***
(3.93) (3.93) (3.88) (4.09) (4.19) (3.97) (4) Industrial Research . 09 . 08 . 09 . 08 . 04 . 10
Institute Linkage (. 86) (. 81) (. 89) (. 75) (. 39) (. 94) (5) University Linkage . 10 . 12 . 10 . 12 . 17 . 11
(. 96) (1.01) (. 98) (1.21) (1.65) (1.01) (6) Absorptive Capacity
. 29*** . 29*** . 30*** -. 09 . 13 . 25** (3.57) (3.46) (3.56) (-. 58) (1.32) (2.68)
Interaction Terms Absorptive Capacity X (1) -. 11
(-. 13) Absorptive Capacity X (2) -. 03
(-. 37) Absorptive Capacity X (3)
. 46*** (3.06)
Absorptive Capacity X (4) . 32*** (3.28)
Absorptive Capacity X (5) . 10 (1.00)
R2 . 26 . 27 . 26 . 32 . 33 . 27 JR 2
. 01 . 00 . 06*** . 07*** . 01 F ratio 6.36*** 5.72*** 5.43*** 7.20*** 7.48*** 5.59*** Cells are standardized regression coefficients with t-values in parentheses.
p<. 10, ** p< . 05, *** p< .01, two-tailed test AR 2iS the difference in R2 value between model I and the model with the interaction term.
Similar regression procedures were applied by using gain in manufacturing
knowledge, gain in pre-development assessment knowledge and gain in marketing
knowledge separately as criterion variables. A significant correlation between gain in
manufacturing knowledge and absorptive capacity, corporation linkage as well as
supplier linkage (F 5,11o= 4.25, p<0.01, Rý= 0.19) was identified in Table 6.5.2.3 (see
Model I in the table). The beta coefficients of absorptive capacity, corporation
linkage and supplier linkage are positive. The effect of absorptive capacity (ý=0.32,
t--3.60, p< 0.01) on gain in manufacturing knowledge was stronger than that of
supplier linkage (, 8= 0.16, t=1.82, p< 0.10).
184

Chapter 6 Descriptive Findings and Hypothesis Testing
Additionally, a correlation between gain in pre-development assessment
knowledge and the predictors (F 5,110= 4.91, p<0.01, Rý= 0.21) was also recognised.
(see Model I shown in Table 6.5.2.4). The coefficient of absorptive capacity is
significant and positive (R=0.23, t=2.61, p<0.01), confirming its positive
relationship with the criterion variable - gain in predevelopment assessment
knowledge. However, a correlation between gain in marketing knowledge and the
predictors was not confirmed (F 5,110 = 1.72, Rý= 0.09, p> 0.05), although the
association between absorptive capacity and gain in marketing knowledge was
positive (R =0.11, t= 1.18) as shown in Table 6.5.2.5 (see Model I in the table).
In sum, absorptive capacity has a positive and significant effect on the extent of
gain in R&D, manufacturing and pre-development assessment knowledge, with the
exception of gain in marketing knowledge. Therefore, hypotheses 3a and 3c were
supported and hypothesis 3b was not supported.
185

Chapter 6 Descriptive Findings and Hypothesis Testing
Table 6.5.2.3 Results of Moderated Regression Analysis: Predicting
Gain in Manufacturin2 Knowledee Model 23456
Main Effects:
(1) Customer Linkage -. 01 -. 01 -. 01 -. 01 -. 01 -. 03
(-. 13) (-. 04) (-. 10) (-. 14) (-. 14) (-. 32)
(2) Supplier Linkage . 16* . 16* . 16* . 17* . 14 . 14
(1.82) (1.9) (1.78) (1.84) (1.56) (1.55)
(3) Corporation Linkage . 24*** . 24*** . 25*** . 24** . 24*** . 25***
(2.67) (2.66) (2.77) (2.67) (2.70) (2.77)
(4) Industrial Research . 05 . 04 . 03 . 04 . 02 . 06
Institute Linkage (. 41) (. 33) (. 27) (. 37) (. 19) (. 55)
(5) University Linkage -. 05 -. 04 -. 06 -. 04 -. 02 -. 04
(-. 45) (-. 35) (-. 57) (-. 39) (-. 15) (-. 37)
(6) Absorptive Capacity . 32*** . 31*** . 31*** . 20 . 24** .
24**
(3.60) (3.52) (3.57) (1.23) (1.87) (2.43)
interaction Terms Absorptive Capacity X (1) -. 08
(-. 87)
Absorptive Capacity X (2) . 12
(1.37)
Absorptive Capacity X (3) . 14
(. 87)
Absorptive Capacity X (4) . 15
(1.41)
Absorptive Capacity X (5) . 16*
(1.67)
R2 . 19 . 20 . 20 . 20 . 20 . 21
AR 2 . 01 . 01 . 01 . 01 . 02
F ratio 4.25*** 3,74** 3.97** 3,73*** 3.96*** 4.10***
Cells are standardized regression coefficients with t-values in parentheses.
*p<. 10, ** p <. 05, *** p <. Ol, two-tailed test
AR2 is the difference in R2 value between model I and the model with the interaction term.
186

Chapter 6 Descriptive Findings and Hypothesis Testing
Table 6.5.2.4 Results of Moderated Regression Analysis: Predicting Gain in Pre-development Assessment Knowledge
Model 123456
Main Effects: (1) Customer Linkage -. 02 -. 03 -. 03 -. 03 -. 03 -. 03
(-. 27) (-. 32) (-. 09) (-. 33) (-. 28) (-. 32)
(2) Supplier Linkage -. 06 -. 06 -. 06 -. 05 -. 07 -. 06
(-. 66) (-. 64) (-. 64) (-. 59) (-. 78) (-. 71)
(3) Corporation Linkage . 34*** . 34*** . 33*** . 34** . 34*** . 34***
(3.82) (3.81) (3.76) (3.95) (3.83) (3.82)
(4) Industrial Research . 14 . 15 . 15 . 13 . 13 . 15
Institute Linkage (1.32) (1.33) (1.36) (1.23) (1.18) (1.34)
(5) University Linkage . 01 . 00 . 01 . 03 . 02 . 01
(. 06) (. 01) (. 11) (. 25) (. 22) (. 09)
(6) Absorptive Capacity . 23*** . 23*** . 23*** -. 11 . 18* . 21**
(2.61) (2.63) (2.62) (-. 72) (1.76) (2.09)
Interaction Terms
Absorptive Capacity X (1) -. 04
(-. 47)
Absorptive Capacity X (2) -. 04
(-. 51)
Absorptive Capacity X (3) . 40**
(2.57)
Absorptive Capacity X (4) . 08
(. 76)
Absorptive Capacity X (5) . 04
(. 43)
R2 . 21 . 21 . 22 . 26 . 22 . 21
JR 2 . 00 . 01 . 05** . 01 . 00
F-ratio 4,91*** 4.21*** 4.22*** 5.37*** 4.27*** 4.20***
Cells are standardized regression coefficients with t-values in parentheses.
p<. 10, **p -< . 05, ***p< .01, two-tailed test
AR 2iS the difference in R2 value between model I and the model with the interaction term.
187

Chapter 6 Descriptive Findings and Hypothesis Testing
Table 6.5.2.5 Results of Moderated Regression Analysis: Predicting Gain in Marketing Knowledge
Model 123456
Main Effects: (1) Customer Linkage -. 11 -. 10 -. 12 -. 12 -. 11 -. 12
(-1.19) (-1.06) (-1.21) (-1.23) (-1.20) (-1.29)
(2) Supplier Linkage -. 01 -. 02 -. 01 -. 01 -. 03 -. 03
(-. 15) (-. 18) (-. 12) (-. 07) (-. 34) (-. 29)
(3) Corporation Linkage . 24** . 24** . 23** . 24** . 24** . 24**
(2.50) (2.49) (2.43) (2.57) (2.53) (2.54)
(4) Industrial Research . 09 . 08 . 10 . 08 . 07 . 10
Institute Linkage (. 75) (. 70) (. 83) (. 65) (. 57) (. 82)
(5) University Linkage -. 07 -. 05 -. 06 -. 05 -. 04 -. 06
(-. 58) (-. 45) (-. 51) (-. 41) (-. 34) (-. 54)
(6) Absorptive Capacity . 11 . 10 . 12 -. 26 . 04 . 06
(1.18) (1.08) (1.21) (-1.52) (. 38) (. 60)
Interaction Terms Absorptive Capacity X (1) -. 11
(-1.18)
Absorptive Capacity X (2) -. 08
(-. 82)
Absorptive Capacity X (3) . 43**
(2.58)
Absorptive Capacity X (4) . 13 (1.10)
Absorptivc Capacity X (5) . 10
(. 95)
R2 . 09 . 10 . 09 . 14 . 10 . 09
AR2 . 01 . 00 . 05** . 01 . 00
F ratio 1.72(N. S. ) 1.68(N. ) 1.57(N. s. ) 2.50** 1.65(N. S. ) 1.63(N. S, )
Cells are standardized regression coefficients with t-values in parentheses.
p <. 10, ** p <. 05, *** p <. Ol; N. S.: Not Significant (two-tailed test) AR2 is the difference in R2 value between model I and the model with the interaction term.
188

Chapter 6 Descriptive Findings and Hypothesis Testing
6.5.2.2 Test for Hypothesis 4a, 4b and 4c - the Moderating Effects of Absorptive
Capacity
H4a A firm's level of absorptive capacity moderates the positive effects of extemal
linkages on gains in R&D knowledge.
I14b A firm's level of absorptive capacity moderates the positive effects of extemal
linkages on gains in marketing knowledge.
H4c A firm's level of absorptive capacity moderates the positive effects of extemal
linkages on gains in manufacturing knowledge.
Hypotheses 4a, 4b and 4c posit that a firm's level of absorptive capacity
moderates the relationship between external linkages and gains in R&D knowledge,
marketing, and manufacturing knowledge. Moderated regression analysis was
conducted for all of the possible combinations between absorptive capacity and each
of the five external linkage variables; that is, five interaction variables (see models
2-6 in Tables 6.5.2.2 - 6-5.2.5) were generated for each of the four criterion variables
(gain in R&D, manufacturing, pre-development assessment, and marketing
knowledge). Each interaction variable was entered into the regression equation
individually. A significant partial correlation on the interaction variable together with
significant change in W confirms the existence of moderation (Cohen and Cohen,
1983, Venkatraman, 1989, Amold, 1982).
Inspection of Table 6.5.2.2 (criterion variable = gain in R&D knowledge)
indicates that two of the five interaction variables are significant at the p< 0.01.
Specifically, the interaction terms, 'absorptive capacity x corporation linkage' (R
=0.46, t=3.06, p<0.01) and 'absorptive capacity x research institute linkage' (R
=0.32, t=3.28, p<0.01) were statistically significant. Rý changes (0.06 and 0.07) in
both regression equations were also significant at p<0.01. Positive standardized
regression coefficients confirm that absorptive capacity positively moderates the
189

Chapter 6 Descriptive Findings and Hypothesis Testing
effects of corporate linkage and research institute linkage on gain in R&D knowledge.
Examination of Table 6.5.2.3 (criterion variable = gain in manufacturing
knowledge) revealed that only one of the five interaction variables is significant at
p<0.10. Specifically, the interaction tenn, 'absorptive capacity x university lin age9
(ý=0.16, t=1.67, p<0.10) was statistically significant. However, R2 change (0.02) in
this regression equation was not significant at p<0.05. This indicates weak evidence
to support the moderating effect of absorptive capacity in the relationship between
university linkages and gain in manufacturing knowledge.
inspection of Table 6.5.2.4 (criterion variable = gain in pre-development
assessment knowledge) indicated that the interaction term, 'absorptive capacity
corporation linkage' (, 8 =0.40, t=2.57, p<0.05) was statistically significant. k2 change
(0.03) in this regression equation was significant at p<0.05.
inspection of Table 6.5.2.5 (criterion variable = gain in marketing knowledge)
revealed that the interaction tenn, 'absorptive capacity x corporation linkage' (R
=0.43, t=2.58, p<0.05) was statistically significant. R2 change in this regression
equation was significant at p<0.05. The positive regression coefficient confirms that
absorptive capacity positively moderates the effects of the corporate linkage on gain
in marketing knowledge.
In sum, absorptive capacity moderates the relationship between the corporation
linkage and gains in R&D, predevelopment assessment, and marketing knowledge,
with the exception of gain in manufacturing knowledge. The effect of the research
institute linkage on gain in R&D knowledge is also moderated by absorptive capacity.
it is worth noting that absorptive capacity did not appear to moderate the relationship
between the vertical linkages (i. e., customer linkage and supplier linkage) and gains in
all four categories of new product knowledge. Thus, hypotheses 4a, 4b and 4c were
partially supported.
190

Chapter 6 Descriptive Findings and Hypothesis Testing
1
6.6 Testing the Mediating Effects of Gains in New Product Related
Knowledge
H2a The positive effects of external linkages and absorptive capacity on technological
innovativeness are mediated by gains in new product related knowledge
H2b The positive effects of external linkages and absorptive capacity on market
innovativeness are mediated by gains in new product related knowledge
The previous section has identified that absorptive capacity moderated the
relationship between horizontal linkages and gains in R&D, manufacturing and
pre-development assessment knowledge. To test the mediating effect of gains in new
product related knowledge between external linkages and product innovativeness
while considering the moderating role of absorptive capacity, the following three
regression models were constructed (James and Brett, 1984, Baron and Kenny, 1986):
Model 1: Gain in New Product Related Knowledge
(R&D, Manufacturing, Pre-development Assessment, and Marketing)
=R 0+ RIi External linkages +R 2i Absorptive Capacity X External linkages
Model 2: Product Innovativeness (Technological Innovativeness, Market Innovativeness)
=R0+RIi External linkages+ R 2i Absorptive Capacity X External linkages
Model 3: Product Innovativeness (Technological Innovativeness, Market Innovativeness)
=ý0+RIi External linkages+ ý 2i Absorptive Capacity X External linkages
3i Gain in New Product Knowledge
In this analysis, the mediator variable (e. g., gain in R&D knowledge) must be a
significant predictor of product innovativeness in the third model in order to
demonstrate the existence of mediation. Thus, the coefficient R 3i must differ
significantly from zero. In addition, regression coefficients of both external linkages
(ýI j) and interaction variables U 20 in Models 1 and 2 must be significant and their
191

Chapter 6 Descriptive Findings and Hypothesis Testing
effects on product innovativeness should be lower in the third model than in the
second.
In Table 6.6.1, technological innovativeness (before inclusion of mediators) was
first regressed on each of the external linkage variables and the interaction variables
which were found to be significant predictors of the dependable variables - gain in
R&D, manufacturing, predevelopment assessment, and marketing knowledge - in
previous moderated regression analyses. Then, each mediator was added to the
regression equation accordingly (after the inclusion of the moderators). This
procedure generated eight regression equations.
Hypothesis 2a predicts that the extent of gain in new product related knowledge
mediates the relationship between external linkages and technological innovativeness.
Table 6.6.1 shows that gain in R&D knowledge was significantly associated with
technological innovativeness (, 8=0.47, t--4.72, p<0.01). The significance of the
effects of both the corporation linkage (from 8=0.20, t=2.19, p< 0.05 toR=0.04,
t=0.48, p>0.1) and the interaction of absorptive capacity and corporation linkage
(from R =0.32, t=1.79, p<0.05 to R =0.18, t=1.06, p<0.10) on technological
innovativeness was substantially reduced, whereas Rý increased from 0.13, p<0.01 to
0.28, p<0.01. The results show that the extent of gain in R&D knowledge in a NPD
project mediates the relationship between the corporation linkage, the interaction of
absorptive capacity and corporation linkage and technological innovativeness. That is,
the greater the corporation linkage developed in a NPD project and the greater the
absorptive capacity possessed by a firm, the more likely it is that accumulation of new
R&D knowledge contributes to the level of technological innovativeness of the new
product developed.
Similarly, when technological innovativeness was regressed on supplier linkage,
corporation linkage, absorptive capacity, the interaction of university linkage and
192

Chapter 6 Descriptive Findings and Hypothesis Testing
absorptive capacity, and the mediator - gain in manufacturing knowledge - the
significant effects of the supplier linkage and the corporation linkage were reduced
(from ý=0.24, t=2.78, p<0.01 to R=0.18, t--2.24, p<0.05; from 8=0.20, t--2.23,
p<0.05 to R=0.09, t=1.01, p>0.10). However, the Rý increased from 0.14, p<0.01
(before the inclusion of the mediator) to 0.30, p<0.01 (after the inclusion of the
mediator). In particular, the effect of corporation linkage on technological
innovativeness was extensively mediated by the gain in manufacturing knowledge.
Significant relations were also observed between gain in manufacturing knowledge
and technological innovativeness (, 6=0.45, t=4.99, p<0.01). This indicates that the
extent of gain in manufacturing knowledge mediates the relationship between
supplier linkage, corporation linkage and technological innovativeness.
By similar regression analyses (see columns PDA and MK before and after the
inclusion of the mediators, in Table 6.6.1), the coefficients of both gain in
pre-development assessment knowledge (, 8=0.31, t=3.20, p< 0.01) and gain in
marketing knowledge (R=0.25, t=2.71, P<0.05) were found to be significant when
they were entered into each of the regression equations. Consequently, the significant
effects of the corporation linkage and the interaction of absorptive capacity and
corporation linkage on gain in pre-development assessment knowledge were largely
reduced (from R=0.21, t=2.38, p<0.05 to R=0.10, t--1.05, p>0.10; from R=0.41,
t=2.47, p<0.05to R=0.29, t=1.74, p<0.10), whereas W increased from 0.11, p<0.01
to 0.19, p<0.01. The significant effects of the corporation linkage and the interaction
of absorptive capacity and corporation linkage on gain in marketing knowledge were
also reduced (from R=0.21, t=2.38, p<0.05 to R=0.15, t=1.71, p< 0.05; from R
=0.41, t=2.47, p<0.05 to 8=0.30, t=1.81, p<0.01), whereas R2 increased slightly
from 0.11, p<0.01 to 0.17, P<0.01. The results confirm that both gains in
predevelopment assessment and marketing knowledge during a NPD project mediate
193

Chapter 6 Descriptive Findings and Hypothesis Testing
the relationship between corporation linkage and the technological innovativeness as
well as that between the interaction term (absorptive capacity X corporate linkage)
and technological innovativeness.
Table 6.6.1 Results of Mediated Regression Analysis: Predicting
Before Mediators After Mediators Variables RD MF PDA MK RD MF PDA MK
Supplier Linkage . 24*** . 18** (2.78) (2.24)
Corporation Linkage . 20** . 20** . 21** . 21** . 04 . 09 . 10 . 15** (2.19) (2.23) (2.38) (2.38) (. 48) (1.01) (1.05) (1.71)
Research Institute . 05 -. 02 Linkage (. 52) (. 23) Absorptive Capacity (AC) -. 22 . 12 -. 20 -. 20 -1.17 . 12 -. 17 -. 14
(-1.29) (1.23) (-1.22) (-1.28) (-1.08) (. 13) (-1.06) (-. 85)
AC X Corporation . 32** . 41** . 41** . 18 . 29* . 30***
Linkage (1.79) (2.47) (2.47) (1.06) (1.74) (1.81)
AC X Research Institute . 16 . 05
Linkage (1.40) (. 50)
AC X University . 08 . 01
Linkage (. 79) (. 09)
Mediator Variables:
Gain in R&D . 47***
Knowledge (RD) (4.72)
Gain in Manufacturing . 45***
Knowledge (NIF) (4.99)
Gain in Pre-development . 31***
Assessment Knowledge (PDA) (3.20)
Gain in Marketing . 25**
Knowledge (NIK) (2.71)
R2 2 .
13 . 14
. 11
. 11
. 28
. 30
. 19 .
17 AR
. 15***
. 17***
. 08***
. 06**
F ratio 3.36*** 4.42*** 4.2*** 4.82*** 7.04*** 9-? R*** 6 4R*** 5 66*** Cells are standardized regression coefficients with t-values in parentheses.
p , -' - 10, **p ,' . 05, ***P< .01, two-tailed test. ,6R2 is the difference in R2 value between the model with the mediator and the model without the mediator.
194

Chapter 6 Descriptive Findings and Hypothesis Testing
Table 6.6.2 Results of Mediated Regression Analysis: Predicting
Before Mediators After Mediators Variables RD MF PDA MK RD MF PDA MK
Supplier Linkage . 12 . 10 (1.28) (1.11)
Corporation Linkage . 18* . 20** . 20** . 20** . 12 . 17* . 07 . 15 (1.96) (2.15) (2.24) (2.24) (1.21) (1.78) (. 75) (1.61)
Research Institute Linkage Absorptive Capacity (AC)
AC X Corporation Linkage
AC X Research Institute Linkage
AC X University Linkage
Mediator Variables:
Gain in R&D
Knowledge (RD)
Gain in Manufacturing
Knowledge (MF)
Gain in Pre-development
. 08 . 06 (. 89) (. 60) -. 04 . 15 -. 03 -. 03 -. 02 (-. 23) (1.44) (-. 15) (-. 15) (-. 11)
. 15 . 23 . 25 . 09 (. 89) (1.34) (1.34) (. 49)
. 14* . 10 (1.20) (. 82)
. 06 (. 54)
Assessment Knowledge (PDA)
Gain in Marketing
Knowledge (MK)
. 19*
(1.69)
. 12 . 01 . 04 (. 15) (. 08) (. 21)
. 08 . 13 (. 50) (. 73)
. 04 (. 36)
. 11
(1.08)
36***
(3.69)
24**
(2.50)
R2 lo . 09 . 08 . 08 . 13 io . 18 13
, AR 2
. 03* . 01 . 10*** . 05** 17 rifin 2.25** 2.66** 3.41 **3.41 ** 2.61** 2.37** 6.24***4.24*** Cells are standardized regression coefficients with t-values in parentheses. *p<. 10, ** p< . 05, *** p <. Ol, two-tailed test. AR 2iS the difference in R2 value between the model with the mediator and the model without the
mediator.
Table 6.6.2 shows that while market innovativeness was regressed as the
dependable variable, the test of the mediating effect of gain in manufacturing
knowledge failed since the mediator's regression coefficients (ý=0.11, t=1.08, p>
0.10) were insignificant. The finding indicates that the extent of gain in
manufacturing knowledge did not mediate the relationship between corporate linkage,
absorptive capacity and market innovativeness as well as that between the interaction
term (absorptive capacity X corporate linkage) and market innovativeness.
195

Chapter 6 Descriptive Findings and Hypothesis Testing
The regression coefficient of gain in R&D knowledge was only significant
(Table 6.6.2, after mediator) at the p< 0.10 level (ý3=0.19, t--l. 69, p< 0.10; AR 2
=0.03, p< 0.10) . This indicates that gain in R&D knowledge to a lesser extent
mediates the relationship between market innovativeness and corporation linkage and
the interaction of absorptive capacity and research institute linkage.
When market innovativeness was regressed on corporation linkage, absorptive
capacity and the interaction of absorptive capacity and corporation linkage together
with either gain in pre-development assessment knowledge or gain marketing
knowledge, both the coefficients of gain in pre-development assessment knowledge
(, 8=0.36, t=3.69, p<0.01) and gain in marketing knowledge (, 6=0.24, t=2.50, p<0.05)
were significant. As a result, the significant effect of corporation linkage on gain in
pre-development assessment knowledge was reduced (from 8 =0.20, t=2.24, p<0.05
to ý=0.07, t=0.75, p>0.10), whereas R2 increased from 0.08, p<0.05 to 0.18, p<0.01.
Similarly, the significant effect of corporation linkage on gain in marketing
knowledge was reduced (from 8=0.20, t=2.24, p<0.05 to 6=0.15, t=1.61, p>0.10),
whereas R2 increased from 0.08, p<0.05 to 0.13, p<0.01. The results demonstrate that
both gain in pre-development assessment knowledge and gain in marketing
knowledge mainly mediate the relationship between corporation linkage and market
innovativeness of the new product. That is, NPD projects with corporate linkages are
more likely to accumulate new pre-development knowledge and marketing
knowledge than those without corporate linkages. This knowledge gain through the
corporate linkages leads to more market innovativeness of the new product
developed.
In sum, the mediating roles of gains in new product related knowledge (i. e.,
R&D knowledge, manufacturing knowledge, pre-development assessment knowledge
and marketing knowledge) are more consistently displayed only between corporation
196

Chapter 6 Descriptive Findings and Hypothesis Testing
linkage, the interaction of absorptive capacity and corporation linkage, and
technological innovativeness. Gain in manufacturing knowledge also significantly
mediates the relationship between supplier linkage and technological innovativeness.
Thus, hypothesis 2a was partially supported.
The effect of the interaction terms (corporation linkage X absorptive capacity,
research institute linkage X absorptive capacity) on market innovativeness were not
significantly mediated by gains in R&D, manufacturing, pre-development assessment
and marketing knowledge. By contrast, while the effects of the mediators on the
criterion variable, marketing innovativeness, were examined, gains in
pre-development assessment knowledge and marketing knowledge were identified as
more relevant mediators of the relationship only between corporation linkage and
market innovativeness. Therefore, hypothesis 2b was also partially supported.
197

Chapter 6 Descriptive Findings and Hypothesis Testing
6.7 Summary
This chapter discussed the data analysis and presented descriptive findings and
the results of hypothesis testing. The latter results are surnmarised in Table 6.7. In
summary, certain of the theoretically drawn hypotheses received some empirical
support, but not all hypothesised relationships received strong support. The discussion
and implications of the results of the hypothesis testing are presented in Chapter 7 and
Chapter 8 respectively.
Table 6.7 Summary of the Results of Hyj2othesis T esting Hla Horizontal linkages lead to more gain in R&D Supported
knowledge than vertical linkages
Hlb Horizontal linkages lead to more gain in marketing Supported
knowledge than vertical linkages
HIc Horizontal linkages lead to more gain in manufacturing Supported
knowledge than vertical linkages
H2a The positive effects of external linkage and absorptive capacity Partially Supported
on technological innovativeness are mediated by gains in
new product related knowledge
H2b The positive effects of external linkage and absorptive capacity Partially Supported
on marketing innovativeness are mediated by gains in
new product related knowledge
H3a A firm's absorptive capacity is positively associated with the extent of Supported
gain in R&D knowledge
H3b A firm's absorptive capacity is positively associated with the extent of Not Supported
gain in marketing knowledge
113c A firm's absorptive capacity is positively associated with the extent of Supported
gain in manufacturing knowledge
114a Absorptive capacity moderates the relationship between external Partially Supported
linkages and the extent of gain in R&D knowledge
H4b Absorptive capacity moderates the relationship between external Partially Supported
linkages and the extent of gain in marketing knowledge
H4c Absorptive capacity moderates the relationship between external Partially Supported
linknes and the extent of izain in manufacturing knowledge
198

Chapter 7 Discussion of the Results
Chapter 7
Discussion of the Results
7.1 Introduction
This study responds to Fiol's (1996) call for research to integrate the theories of
organisational absorptive capacity and new product innovation. Building on the
theories of organisational learning and the knowledge-based view of the firm, this
study develops a model in which the external linkages that a firm develops to
facilitate new knowledge development lead to a high level of new product
innovativeness. Absorptive capacity is integrated into the model as a predictor
variable that not only moderates the relationship between a firrn's accumulation of
new product knowledge and the extent of external linkages, but also positively relates
to new product knowledge accumulation. This study emphasises that in IT firms using
complex product and/or process technologies, no single firm is likely to master all the
relevant technologies for its new product projects. The ability to tap into the
complementary knowledge and expertise of external learning parties, for
design/development, manufacturing or marketing, is likely to lead to better product
capabilities and, ultimately, better products.
The empirical findings in Chapter 6 provide insights into this intricate
relationship. On the whole, the results of the empirical investigation support the
framework presented in the research model (see Table 6.7). The following sections
discuss the empirical findings as they relate to the hypotheses of interest. The
discussions are structured to review the rationale for the supported hypotheses and
provide with some explanations for the unsupported hypotheses.
199

Chapter 7 Discussion of the Results
7.2 Effects of External Linkages on Gains in New Product Knowledge
In this research, the horizontal linkage is defined as a NPD project that has
associations with horizontal collaborators, such as third-party companies,
industry-based research institutes, and universities. The vertical linkage is construed
as a NPD project's processes having association with suppliers and customers. A NPD
project's extent and type of external linkages characterizes its external knowledge
assess. Horizontal linkages offer more opportunities for firms to gain access to the
complementary knowledge that tends to lead to more innovative product development.
The empirical results particularly support the claims of past research (Deeds and Hill,
1996; Dodgson, 1993; Kotabe and Swan, 1995; Pennings and Harrianto, 1992; Shan
et al., 1994) that horizontal linkages are primary sources for providing both technical
(i. e., R&D and manufacturing) and marketing know-how for the development of more
innovative products. Of the three types of horizontal linkages, the corporation linkage
was found to be the most significant contributor to both the technical and marketing
knowledge. That is, this particular form of linkage provided the firms involved in this
survey with product knowledge that can soon be used for commercial ends.
This result specifically reflects the fact that the unique business characteristics of
Taiwanese IT firms, where OEM/ODM projects play the most important role in the
NPD activities, drive the direction of their external technology acquisition. For
instance, the following Taiwanese IT hardware products have garnered a greater than
sixty percent share of their respective products' global production volume in 1999:
notebook PCs (60%), PC motherboards (64%), hubs (66%), keyboards (68%), power
suppler units (70%), PC cabinets (75%), and scanners (91%)'. However, up to
sixty-five percent of the production was contributed by OEM/ODM orders (see
I The Marketing Research Center (MRC) of the Institute for ' Information Industry, the largest IT
market research organisition in Taiwan, provides figure on revenue of global IT hardware products. These show that, in 1999, with 21 billion US dollars in sales, Taiwan ranked third, behind the US and Japan.
200

Chapter 7 Discussion of the Results
Appendix B: An outline of Taiwanese IT industry). Most of these IT firms play key
roles in the business-to-business supply chain and vertical marketplace of the IT
industry. These firms are not skilled at brand and distribution management so they
have been unable to develop their own brands in the now mature PC market. Few
internationally well known IT brands originated in Taiwan. Instead, Taiwanese firms
concentrate more resources on the R&D and manufacturing side of technologies than
on marketing. Specifically, their R&D activities are more
design/development-oriented than research-oriented. NPD projects in collaboration
with international IT partners become one of the primary sources for the acqui5ition
of new complementary technology/knowledge. For example, United Microelectronics
Corporation (UMC), the world's second largest independent semiconductor foundry
company based in Taiwan, is dedicated to providing manufacturing services for
advanced ICs 2. UMC's only product is its IC manufacturing services. It teams up with
Advanced Micro Devices (AMD), the world's second largest CPU Company, to
develop the 90-nenometer CMOS process technology for semiconductor logic
products. This alliance allows UMC to gain access to AMD's know-how in
developing new manufacturing processes for high-speed logic ICs. In return, AMD
secures a manufacturing capacity for its own brand IC production.
From the perspective of the value chain, the process of OEM/ODM-oriented new
product development can be divided into five major functions: product definition,
detailed development, product manufacturing, logistics and distribution, and product
marketing. Taiwanese IT firms particularly specialise in middle-process functions:
detailed development, product manufacturing and logistics and distribution.
OEM/ODM customers excel at product definition and product marketing. The
2 The world's largest IC foundry firm is Taiwan Semiconductors Corporation (TSMC). According to Market Research Center, both TSMC and UMC together had more than 75% of global market share in this type of manufacturing services in 2000.
201

Chapter 7 Discussion of the Results
specialist capabilities of both Taiwanese IT firms and OEM/ODM customers are
highly complementary. They form a sort of loose strategic alliances and compete with
other similar alliances in the global market. Co-developing new products with these
OEM/ODM cooperating firms, which excel at product definition and product
marketing, may offer Taiwanese firms tremendous opportunities to gain access to a
new set of product knowledge. For instance, Taiwanese applied this model to establish
business relationships with global IT competitors such as IBM, Dell and HP. Under
this business model, Taiwanese IT firms receive product specifications from
customers and concentrate on the design, manufacturing and delivery of finished
products. These OEM/ODM customers market the products under their own brand
names. According to MIC statistics (see Appendix B), OEM/ODM orders represented
more than sixty-five percent of Taiwanese IT exports in 1999. The largest Taiwanese
notebook PC maker- Quanta Computer- does not own its product brand, but designs
and manufactures products for nine of the top ten international PC brands. It produced
more than 4 million units of notebook PCs in 2001. This might explain why the
corporation linkage is the most significant of the linkages that contributes to the
accumulation of NPD knowledge. To a certain extent, these OEM/ODM customers
can be viewed as some sort of industrial users or lead users (von Hippel, 1976&1978)
that typically play an active part in OEM/OEM manufacturers' new product
innovation since they act not only as the gate keeper but the evaluator in each phase of
the NPD processes. New product features or concepts are automatically considered
and designed in the next OEM/ODM project.
NPD projects in association with industry-based research institutes significantly
differ only in gain in pre-development assessment knowledge when compared with
projects that do not involve such an association. Linkages involving universities show
no significant difference in gains in all four categories of new product related
202

Chapter 7 Discussion of the Results
knowledge. The relatively insignificant impacts of these two linkages on the
accumulation of new product knowledge confirm the argument that IT firms employ
university and industrial institute research to conduct either fundamental research or
more speculative in-house new technology, which is less product-specific and results
in less effect on the development of near market products (Tidd et al., 1997). These
findings are also consistent with Arora and Gambardella's (1994) argument that the
university linkage appears to be more important as a source of scientific information
and capabilities, rather than as a source of new innovations. The nature of the
product-specific project lies in producing a successful new product that requires
various technologies covering a complete set of product commercialization
knowledge, such as pre-development assessment, design and development,
manufacturing and marketing.
However, the two linkages play a somewhat different role in the innovation
process. The advantage of university and industry-oriented research institute linkages
is more specific in developing a new set of R&D capabilities in order to build up a
new technology platform or to have better ability to evaluate future technologies. This
rationale may account for results which show that NPD projects involving association
with industry-based research institutes lead to gains in pre-development assessment
and design/development knowledge, but not the knowledge that is important in
commercialising a new technology, such as marketing and manufacturing. The other
factor that may account for the relative insignificance of both linkages may derive
from the fact that the majority of firms in the sample are SMEs (more than sixty
percent). Rothwell and Dodgson (1991) suggest that one area in which SMEs can
suffer a marked disadvantage is when establishing a network of appropriate contacts
with external sources of scientific and technological expertise and advice. This
disadvantage results from SMEs' inability to identify and evaluate complementary
203

Chapter 7 Discussion of the Results
technologies, difficulties in funding long-term R&D, and a lack of qualified scientists
and engineers in collaborating with scientific or basic research sources. As such, both
university and research institute linkages in this study are less associated with these IT
firms' accumulation of new product-specific knowledge.
This study indicates that supplier linkage has a significant impact on gain in
manufacturing knowledge. This finding, to a certain extent, is in consonance with
conventional evidence that computer firms and their suppliers build collaborative
relationships in order to spread the costs and risks of developing new products
(Saxenian, 1991). This relationship enhances their ability to adapt rapidly to changing
technologies. Key component and equipment suppliers need to collaborate closely
with manufacturing customers to ensure that their services will be continued in the
next generation of NPD projects. This collaboration helps firms to enhance the
technological aspect of a new product development, such as manufacturing, but not
the marketing aspects.
The effect of customer linkage does not show a significant impact on gains in
new product knowledge in the current study. The insignificance may confirrn the
argument that current users (such as channel members or end-users) are less
informative in providing their requirements for innovative IT products (O'Connor,
1998). In a highly dynamic industry such as IT, the involvement of customers in the
NPD process would be useful only when users have used the product extensively.
Customers' knowledge can mainly contribute to current product-related features (i. e.,
for an extension of the product line). Therefore, the impact of this linkage is relatively
negligible on a firm's gains in both new technical and marketing knowledge.
7.3 The Direct Effect and Moderating Effect of Absorptive Capacity
A firm's internal learning capacity- its absorptive capacity- determines the extent
204

Chapter 7 Discussion of the Results
to which it can absorb new product knowledge from external collaborative parties.
The results demonstrate that absorptive capacity significantly affects gains in new
product knowledge in terms of R&D, manufacturing and pre-development assessment
knowledge. These findings, to a greater extent, concur with the latest empirical works
(Sivadas and Dwyer, 2000; Tsai, 2001) that show that absorptive capacity is a
prerequisite for the success of collaborative NPD projects as well as for the release of
more innovative products that require the infusion of new technologies. For example,
Microtek, one of the surveyed sample and the most innovative optic-electronic
companies in Taiwan, has developed a mini-handheld scanning accessory to the
I-Zone instant camera for Polaroid. The NPD manager in charge of the project stated:
"The success of developing this unique and innovative product is twofold. First,
we are able to interpret Polaroid's product requirements technologically. Second,
both team members contribute required technologies to implement the product
specifications set by Polaroid's marketing group. "
Microtek has the ability to technologically interpret the cooperating firm's product
specifications because it has adequate absorptive capacity relevant to the project. A
firm's internal learning capacity- absorptive capacity, determines not only the extent
to which it can absorb new knowledge from external linkages (Cohen and Levinthal,
1990), but also the degree to which it integrates existing knowledge with newly
acquired knowledge and converts these into the firm's context-specific knowledge
(Kogut and Zander, 1992). Therefore, investing in absorptive capacity allows a firm to
effectively assimilate and apply external knowledge for its own use, resulting in more
innovative product development.
However, the statistical findings do not indicate a significant correlation between
absorptive capacity and gain in marketing knowledge. The insignificance of this effect
may be due to the contextual factor. As IT firms generally need to be equipped with
205

Chapter 7 Discussion of the Results
not only R&D and manufacturing, but also marketing know-how in order to
commercialise a new industrial product, this requirement particularly applies to firms
that are engaged in branded product marketing. However, IT firms in Taiwan (see
Appendix B), whose main business is in non-brand or OEM/ODM types of business,
focus more of their resources on R&D and manufacturing. The acquisition of product
marketing knowledge through external NPD collaborators constitutes a relatively low
priority. On the other hand, the acquisition of marketing knowledge may be more
contextual than that of technical knowledge. Particularly, the former requires firms to
be equipped with sufficient marketing resources, such as own brand channels, years of
marketing implementations and marketing culture so that they are then able to acquire
marketing knowledge from external collaborators. This may explain the insignificant
impact of absorptive capacity on gain in marketing knowledge. In general, the results
suggest that high absorptive capacity is associated with a better opportunity to
effectively acquire and assimilate R&D, manufacturing and pre-development
assessment knowledge from external linkages.
Absorptive capacity not only directly affects new product knowledge
accumulation, but also moderates the effects of external linkages on gains in new
product knowledge. Specifically, the empirical results demonstrate that absorptive
capacity moderates the effect of the corporation linkage on gains in R&D,
pre-development assessment, and marketing knowledge. Moreover, absorptive
capacity also moderates the effect of the university linkage on gain in manufacturing
knowledge. No effect from vertical linkages (i. e., customer linkage and supplier
linkage) on gains in new product knowledge is identified at different levels of
absorptive capacity. Figure 7.1 illustrates a general relationship of the interactive
impacts of external linkages and absorptive capacity on gains in new product
knowledge. The positive impacts of absorptive capacity on gains in new product
206

Chapter 7 Discussion of the Results
knowledge through horizontal linkages will be stronger in firms that have a stronger
level of absorptive capacity than those with a lower level of absorptive capacity.
Comparing with horizontal linkages, these positive impacts on gains in new product
knowledge through vertical linkages will be less significant even for firms that
contain a relatively high level of absorptive capacity. In firrns with a relatively low
level of absorptive capacity, these interactive impacts on new product gains through
horizontal linkages will not be as weak as through vertical linkages.
Figure 7.1 The Impacts of External Linkages and Absorptive Capacity un, k., ains in view rroauct mnowieui! e
(Vertical Linkages) (Horizontal Linkages)
Weaker or Stronger
Absorptive (High) No Impact
Capacity
(Low) No Impact Weaker
The implications of the current findings are twofold. First, the moderating effect
of absorptive capacity will be significant only when the impact of a linkage is crucial
to the provision of a set of complementary knowledge. For instance, the moderating
impact of absorptive capacity on the effect of corporation linkage on gains in all four
categories of product related knowledge existed in the current study only when such
linkages could offer a new and critical set of knowledge to which collaborating firms
were exposed. Absorptive capacity, however, did not demonstrate its moderating
effect on the relationship between research institute linkage and gains in marketing,
pre-development assessment and manufacturing knowledge since the linkage was not
able to offer such a set of strategically complementary knowledge. Second, absorptive
Weaker or No Impact
Stronger
No Impact Weaker
207

Chapter 7 Discussion of the Results
capacity must reach a certain threshold level for it to significantly display its
moderating effects. This suggests that a firm may have access to complementary
knowledge through external NPD collaborators but may not have enough ability to
absorb such knowledge. It also implies that firms with higher absorptive capacity are
more able to codify collaborators' product knowledge that can then be assimilated and
distributed within (Madhavan and Grover, 1998; Tunisini and Zanfei, 1998). These
findings are consistent with the latest empirical work that demonstrates that a firm's
absorptive capacity is crucial when it is exposed to an opportunity to assimilate
innovative technology/knowledge from outside sources (Cockburn and Henderson,
1998; Koza and Lewin, 1998; Kumar and Nti, 1998; Mangematin and Nesta, 1999).
Although the supplier linkage demonstrates a significant, direct effect on
manufacturing knowledge, the interactive effect of this linkage with absorptive
capacity was found to be insignificant on manufacturing knowledge. The
insignificance may be due to the relatively less direct effect of supplier linkage (t=
0.16; p<0.10). That is, the impact of supplier linkage is not suff iciently significant to
demonstrate that absorptive capacity can moderate its effect on manufacturing
knowledge. The less direct effect further confirms Eisenhardt and Tabrizi's (1990)
assertion that the involvement of supplier linkage is more effective in less innovative
projects as the specifications and the technologies employed are relatively certain and
stable. This linkage contributes more to a new product's reduction of cost or
timeliness but less to new complementary knowledge.
The effect of industrial research institute linkage on gain in R&D knowledge was
significantly moderated by absorptive capacity. This finding indicates that NPD
projects with research institute linkages are more likely to accumulate new R&D
related knowledge if firms have a relatively high level of absorptive capacity. On the
other hand, this finding also suggests a limited role of this linkage to acquire
208

Chapter 7 Discussion of the Results
marketing and manufacturing related knowledge.
Absorptive capacity was found to only moderate the effect of university linkage
on gain in manufacturing knowledge to a lesser extent. This result further suggests a
limited role for university linkage in acquiring product-specific technologies (e. g.,
marketing and pre-development assessment technologies) since such linkages tend to
provide scientific knowledge that is less readily exploited for commercial purposes
(Arora and Gambardella, 1990). As one respondent stated:
"We mainly collaborate with universities to train our engineers in order to gain a
set of fundamental knowledge that will be crucial to our development or
understanding of a new technology platform. Those technologies possessed by
universities are too distant to be converted into immediate product
development. "
7.4 The Mediating Effect of Gains in New Product Knowledge
The results of this study indicate that the four mediating variables (gain in R&D
knowledge, manufacturing knowledge, pre-development assessment knowledge, and
marketing knowledge) significantly mediate the relationship between absorptive
capacity, the corporation linkage and technological innovativeness. That is, the effects
of absorptive capacity, the corporation linkage and their interactive effect indirectly
affect the level of technological innovativeness via gains in both new technical and
marketing knowledge. These findings, to some extent, support empirical evidence
(Deeds and Hill, 1996; Shan et al., 1994) that found a positive relationship between
the intensity of a firm's NPD alliance and the research productivity because alliance
firms provide access to complementary knowledge for immediate projects. It is this
increase in a firm's level of new product knowledge that 'determines how
technologically innovative a new product will be. Additionally, the results confirm
209
Chapter 7 Discussion of the Results
that horizontal linkages lead to a higher level of product innovativeness than vertical
linkages as the former is more likely to be strategically motivated to improve
long-term product technology (Kotabe and Swan, 1995). These findings also imply
that, once new product related knowledge is accumulated through collaborative NPD
projects with partnering firms, the development of more innovative products becomes
likely, as the infusion of new knowledge enhances the generation of new product
ideas and helps to overcome barriers to design or development (Tunisini and Zanfei,
1998).
The significance of the indirect interaction effect of the corporation linkage and
absorptive capacity on technological innovativeness, on the one hand, indicates that a
firm's absorptive capacity shapes the extent to which it acquires and assimilates new
product knowledge through the corporation linkage. That is to say that, a higher level
of absorptive capacity will intensify a firm's gain in both new technical and marketing
knowledge through NPD collaboration with other cooperating firms. The increase in
both technical and marketing knowledge in turn contributes to the level of the new
product's technological innovativeness. On the other hand, the significance implies
that when both the NPD project firm and the cooperating firm possess higher level of
absorptive capacity, the complementary technologies they provide for the NPD
project will help to enhance each firm's new product knowledge accumulation, further
resulting in a more technologically innovative product development (Ingham and
mothe, 1998).
Gain in new manufacturing knowledge significantly mediates the relationship
between the supplier linkage and technological innovativeness. This result implies
that increasing the extent of the supplier linkage in NPD projects builds up the
accumulation of new manufacturing knowledge, which, in turn, positively impacts on
the level of new products' technological innovativeness. Manufacturing knowledge,
210

Chapter 7 Discussion of the Results
including pilot-run production, mass production set-up and quality control of the new
product, enhances the technological aspect of innovativeness as a result of ensuring
new product quality. The accumulation of manufacturing knowledge from
cooperating suppliers may be due to the supply of more reliable parts or equipment
that facilitates the setting up of mass production. This facilitation further enhances the
quality level of new product innovativeness. This rationale finds support in Malerba's
(1992) empirical work, which found that the involvement of both key components'
suppliers and R&D equipment suppliers contributes to a firm's technological progress.
This progress in turn leads to more innovative product development in terms of
technological innovativeness.
Of the three horizontal linkages in this study, only the relationship between the
corporation linkage and market innovativeness is significantly mediated by gains in
R&D knowledge, pre-development assessment knowledge and marketing knowledge.
Consistent with the proposed hypothesis, increasing the extent of corporation linkages
strengthens the acquisition of new R&D, marketing and pre-development assessment
knowledge from cooperating firms in a NPD project. This, in turn, positively affects
levels of market innovativeness. However, in testing the indirect interaction effect of
corporation linkage and absorptive capacity on market innovativeness, this effect was
not associated with any gains in R&D, manufacturing, pre-development assessment,
and marketing knowledge. In other words, a firm's absorptive capacity does not shape
the effect of corporation linkage on the extent of a NPD project's market
innovativeness via new product related knowledge. The knowledge of R&D,
pre-development assessment and marketing that is gained through corporation
linkages does, however, lead to a high level of market innovativeness in the new
product project.
There are two potential reasons for these contrasting findings. One possible
211

Chapter 7 Discussion of the Results
explanation is that the construct composition of absorptive capacity used in the
current study is less able to capture a firm's ability to acquire marketing knowledge
than technical knowledge. The scale for absorptive capacity included items measuring
engineering knowledge, management knowledge, communication climate, knowledge
scanning ability, and communication network. It did not however, include items
clearly measuring prior knowledge concerning marketing-related abilities and this
may have affected the relationship, which was discovered between the indirect
interaction effect of absorptive capacity and external linkages on market
innovativeness. An alternative explanation for the relative insignificance of the
indirect interaction effect may be due to the unique characteristics of the Taiwanese IT
industry where absorbing marketing knowledge is not a primary concern. This may
have impacts on measuring marketing related abilities of the construct of absorptive
capacity. The issue of more precisely measuring the absorptive capacity construct in
the context of NPD requires future research attention.
7.5 Summary
By emphasizing the importance of complementary knowledge from outside
sources, the empirical results demonstrate that of the five external linkages, the
corporation linkage is the most significant in distinguishing gains in new product
knowledge (both in term of technical and marketing), which, in turn, affect the level
of both technological and market innovativeness. The interaction effects of absorptive
capacity and the corporation linkage have a significant, positive impact on gains in
both technical and marketing knowledge, leading to technological innovativeness but
not market innovativeness. This finding also demonstrates that the supplier linkage
has a significant effect on gain in manufacturing knowledge, resulting in a higher
level of technological innovativeness. In contrast, the customer linkage, university
212

Chapter 7 Discussion of the Results
linkage, and industry-oriented research institute linkage have no direct impact on the
level of new product innovativeness.
This chapter has discussed the empirical findings in relation to the proposed
hypotheses. It has recapitulated the underlying rationale for both the supported and
unsupported hypotheses. Based on this discussion, Chapter 8 explores the
implications of this study for practice and theory, highlights the limitations of the
research and suggests directions for future research.
213

Chapter 8 Conclusion and Implications
Chapter 8
Conclusion and Implications
8.1 Introduction
This research was designed to explore two related research questions: first, the
extent to which a NPD project's different external linkages affects its product
innovativeness and second, which factors relative to knowledge acquisition influence
the relationship between these linkages and product innovativeness. These two
questions are crucial from a managerial perspective in that the answers should guide
managers towards effectively improving the performance of collaborative NPD
pKojects. The answers to these questions also provide an empirical base for NPD
researchers to further investigate these relationships in order to develop a
knowledge-enabled research model. The findings of this present research offer some
insightful answers to these research questions.
This chapter begins with discussion on key research findings and then discusses
both theoretical contributions and managerial implications of the research model. This
is followed by a discussion on the limitations of the study; finally, some suggestions
are advanced regarding the direction of future research.
8.2 Summary of Key Research Findings
The research provided empirical findings that supplement anecdotal and case
evidence on the role of external linkages on product innovativeness. The survey
results particularly, supported the claims of past research on horizontal linkages
(Deeds and Hill, 1996; Dodgson, 1993; Pennings and Harrianto, 1992a; Pennings and
Harrianto, 1992b; Shan et al., 1994; Shan, 1990). These earlier researches showed that
NPD project's association with corporation, industry-based research institutes, and
214

Chapter 8 Conclusion and Implications
universities is a primary source in providing technical and marketing know-how, that
is essential for the development of more innovative products. Of the three types of
horizontal linkages identified here, corporation linkage was found to be the most
significant contributor to both technological and market innovativeness of NPD
projects. University linkage did not lead to an increase in new product knowledge, but
its interaction with absorptive capacity showed a positive effect on gain in
manufacturing knowledge.
Past studies (Clark, 1989; Blenkhom and Noori, 1990) demonstrate the positive
impact of vertical linkages (i. e., NPD project associations with suppliers and
customers) on af irm's product innovation. This research found that within the IT
industry, supplier linkage positively affected a firm's gain in new manufacturing
knowledge while customer linkage showed no effect on new product knowledge
accumulation. However, the effect of supplier linkage on the accumulation of new
manufacturing knowledge was not associated with the market innovativeness of NPD
projects, indicating a weak correlation between a NPD's supplier linkage and its
degree of market innovativeness in the IT industry.
In this study, the construct of absorptive capacity, which is defined as " the
nil ability of a firm to recognise the value of new external knowledge, assimilate it and
apply it to commercial ends" (Cohen and Levinthal, 1990), was integrated into the
research model as both an explanatory variable and a moderator that predicts the level
of gain in new product knowledge. The findings indicate that absorptive capacity
positively affects a firm's gains in R&D, pre-development assessment, and
manufacturing knowledge. In other words, greater absorptive capacity probes a
greater capability to acquire and exploit external technology and knowledge.
Furthermore, a firm's absorptive capacity shapes the relationship between gains in
new product knowledge and external linkages in particular when a linkage is
215

Chapter 8 Conclusion and Implications
strategically important, i. e. when its impact on the integration of complementary
knowledge for a NPD project is substantial. The more novel the new product
knowledge from collaborative arrangements is, the more critical the firm's absorptive
capacity will be. However, this interaction effect between absorptive capacity and the
corporation linkage is primarily associated with the technological innovativeness of a
NPD project rather than its market innovativeness.
8.3 Key Contributions and Theoretical Implications Studies in NPD can be classified as "generalist" studies that identify a set of
critical success factors or "specialist" studies that examine in depth one or more
variables identified by the generalist studies (Craig and Hart, 1992). This research
follows the specialist style in that it has tested a narrow set of variables that contribute
to the level of innovativeness of new product projects carried out in collaboration.
This research extends the literature by exploring and addressing the differential
relationship between external linkages, gains in new product knowledge in a NPD
project, absorptive capacity and new product innovativeness. These issues have been
discussed in the literature but have not been documented empirically. In particular, the
research attempts to bridge the gap in theories between organisational absorptive
capacity and product innovation (Fiol, 1996) by developing a model that advances our
understanding of these relationships. This model emphasises the importance of the
moderating role of absorptive capacity as well as the mediating role of gains in new
product knowledge in a firm's NPD project. It implies that a firm's new product
innovativeness is decided not only by the extent of its various types of external
linkages, but also by the firm's ability to absorb new knowledge from collaborative
partners, to integrate it with existing knowledge, and to apply this newly generated
product knowledge to the NPD project. This model therefore highlights the important
216

Chapter 8 Conclusion and Implications
role of absorptive capacity when the impact of external linkages on new product
innovation is to be examined in NPD research. In addition, although the importance of
absorptive capacity has been underlined, most of these NPD research investigated the
success of new product development in alliance-based processes (e. g.,
Atuahene-Gima, 1993; Sivadas and Dwyer, 2000) without considering what types of
new product knowledge absorption would be mostly affected by a firm's level of
absorptive capacity. This study explored this issue by further probing the impact of
absorptive capacity on the absorption of four different categories of new product
knowledge. This research has tested causality in doing mediational/moderational
analyses.
Previous studies on organisational learning have emphasised the role of external
learning in developing radical innovations (McKee, 1992; Malerba, 1992; Bierly and
Chakrabarti, 1996b; Lynn, 1997; Lynn, 1998). This research further bisected external
learning sources into vertical and horizontal linkages and empirically examined the
impact of these two types of linkages on product innovativeness. The results of this
research are largely consistent with previous views on how external linkage supports
product innovation (Rothwell and Dodgson, 1991; Rothwell, 1992). However, the
findings also suggest some different conclusions from the conventional view of
external linkages. First, these findings contrast with the findings of previous research,
which emphasised the importance of customers and suppliers as sources of new
technology (von Hippel, 1976; von Hippel, 1978; von HiPpel, 1986; von Hippel,
1988). Vertical linkages in the current study are less relevant to the development of
complementary knowledge in NPD projects. This may be due to the sector-specific
focus of much of the previous work. The role of vertical linkages in IT industries is
quite distinct from that of traditional industries, such as the automobile industry,
where key suppliers are deeply involved in the design of parts of an integrative system
217

Chapter 8 Conclusion and Implications
(Dyer, 1996; Kamath and Liker, 1994; Takeishi, 2001). The contribution made during
this early involvement is therefore important to the success of new product
development in terms of the benefits, such as, reducing design cycle time and cost
advantage. Second, in the current study it is the horizontal linkages - particularly
corporation linkage - that significantly influence a firm's accumulation of new
product knowledge on which a relatively new product is developed. A NPD project's
association with industry-based research institutes and universities is not correlated
with the level of the new product's innovativeness. This result is not in line with the
claims of the previous literature (Arora and Gambardella, 1994; Arora and
Gambardella, 1990; Hartley et al., 1997) that tend to focus on how western finns
behaved in certain industries (e. g. pharmaceutics). An IT industry such as the one in
Taiwan, where in order to compete in a hyper-competitive IT market, most IT firms
focus their resources on certain specific activities of the value chain and tend to form
special types of co-development projects with international OEM/ODM partners,
demonstrated a different pattern of external knowledge acquisition. For theory to be
advanced, future research should extend the analysis to include industries and country
contexts.
Another contribution of this research is highlighting the moderating role of
absorptive capacity as a source of influence on new product innovation. Even though
the role of absorptive capacity in acquiring external knowledge and creating internal
new knowledge has recently been the subject of interest in the literature (George et al.,
2001 & Stock et al., 2001), its interactive effects with different linkages on new
product innovativeness has not been carefully documented in empirical research. The
empirical results relating to the effect of absorptive capacity on the acquisition and
accumulation of external knowledge in this study is consistent with other studies that
have demonstrated the importance of absorptive capacity on strategic alliance and
218

Chapter 8 1ýonclusion and Implications
external technology transfer (Levinson and Asahi, 1995; Mowery et al., 1996; Koza
and Lewin, 1998; Mangernatin and Nesta, 1999). However, these results further
indicate that the impact of absorptive capacity is more significant on acquiring new
product knowledge in respect of R&D and manufacturing than on marketing
knowledge. Although this result could be industry-specific and/or country bounded,
an in-depth investigation on these disparities might pave the way for a better
understanding of the effect of absorptive capacity on marketing knowledge
acquisition. The moderating effect findings are, to a certain extent, also in consonance
with studies that have demonstrated that a certain level of absorptive capacity is a
prerequisite for external linkages to take effect in absorbing external
knowledge/technology (Bierly and Chakrabarti, 1996b; Koza and Lewin, 1998). This
research further contributes to our understanding of how absorptive capacity affects
external product knowledge accumulation in two respects. First, absorptive capacity
was empirically tested as a moderator variable between various types of external
linkages and gains in new product related knowledge (i. e., R&D, manufacturing,
pre-development assessment and marketing knowledge). The findings suggest that the
moderating role of absorptive capacity is more significant on the relationship between
gains in new product knowledge and horizontal linkages, as observed from a
comparison with vertical linkages. The role of the moderating variable confirms a
contingency perspective for absorptive capacity in future NPD studies when the
constructs of external linkages or knowledge absorption-related variables are to be
included in a research model. Second, the results suggest that absorptive capacity not
only has a moderating effect, but also has a direct effect on the accumulation of new
product knowledge and the level of new product innovativeness. That is, absorptive
capacity is a quasi moderator variable rather than a pure moderator variable (Shanna
et al., 1981). Therefore, when constructing a research model involving a knowledge
219

Chapter 8 Conclusion and Implications
absorption-related variable, this study's findings suggest that researchers
simultaneously consider both the direct and moderating effects of this variable on a
target dependent variable.
Previous studies in NPD and strategic alliances primarily examined how various
types of external linkages affect new product performances. In addition to analyzing
the moderating role of absorptive capacity, this study introduced the construct of gains
in new product related knowledge that act as variables that mediate the impact of
external linkages on new product innovativeness. The mediating effects of gains in
new product knowledge corresponds with the requirement to absorb new, external
knowledge in order to foster more innovations. The research findings suggest that
both the interaction effect of horizontal linkages (i. e., particularly corporation linkage)
and absorptive capacity and the main effect of horizontal linkages directly and
indirectly affect technological innovativeness. The indirect effect is primarily
transferred through the extent to which new product knowledge has been gained in a
NPD project. Absorptive capacity becomes crucially important when a firm requires
acquiring and assimilating a relatively new set of external knowledge or technology.
The testing of the mediating role of gains in new product knowledge in the
relationship of product innovativeness and the interaction of external linkages and
absorptive capacity further examines this relationship.
These contributions should be viewed in the context of inadequate empirical
testing in prior studies of the role of absorptive capacity within research on NPD. As
Fiol (1996: 1012) states: "researchers have developed theories of organizational
absorptive capacity; researchers have also developed models of the effective
generation of new product. The challenge lies in integrating the two research
streams. " This study adds to address this gap in the literature by examining 116 NPD
projects of IT firms.
220

Cha ter 8 Conclusion and Implications p
8.4 Managerial Implications
This research investigated the impact of external linkages, absorptive capacity
and gains in new product knowledge on the level of product innovativeness of a NPD
project. The research findings provide several guidelines for managers, particularly in
the IT industry, for the effective planning and execution of their NPD activities. First,
managers need to be aware that various forms of external linkages or alliances
provide firms with opportunities to expose themselves to different types of
technologies. Each of these linkages has its impacts on new product innovativeness.
This impact primarily depends on the extent of the involvement of the external
linkage, type of unique knowledge/technologies that the linkage furnishes, and the
firm's ability to absorb external product-related technologies. Although the results of
this research demonstrated that horizontal linkages more significantly affect a firm's
product innovativeness than vertical linkages, managers should explicitly consider
whether innovativeness, timeliness or cost reduction is the primary objective of a
NPD project before allocating resources to a particular type of linkage, because each
form of linkage has its particular advantages.
Second, managers should assess the extent of NPD project innovation in
accordance with the required amount of external new technologies, such as, product
design/development, manufacturing, or marketing. This must take place prior to
applying more effective managerial practices, for instance, differentiating
mechanisms (i. e., job specification, hierarchy) or socio-integrative mechanisms (i. e.,
cross-functional team and co-location, etc. ) (Olsen et al., 1995; Liker et al., 1999).
This assessment enables the utilisation of an effective organisational mechanism that
is in alignment with the specific objectives of a NPD project. For instance, more
innovative projects, which may establish some close links with OEM/ODM parties or
221

Chapter 8 Conclusion and Implications
industrial research institutes in order to acquire and/or develop some complementary
technologies, may be executed more effectively using socio-integrative mechanisms.
On the other hand, an incremental project whose external linkages tend to be with
existing suppliers or customers (i. e. vertical linkages) for the sake of cost reduction,
timeliness or quality improvement can be executed more efficiently by a hierarchy
team.
Third, this research explored the role of absorptive capacity relative to a firm's
ability to assess and assimilate external knowledge that subsequently contributes to its
new product innovativeness. The research findings indicate that absorptive capacity
conditions the extent to which the firm acquires and assimilates new product
knowledge when a critical knowledge source is available. The effects of external
linkages on the knowledge-absorbing process are realized only when the firm has
been equipped with a certain amount of absorptive capacity. In other words, when the
linkage is strategically important and the impact of its knowledge/technology on new
product development is substantial, absorptive capacity plays a decisive role in
ensuring the success of this novel innovation. This result suggests that before
allocating extensive resources to pursue strategically important collaborative projects,
a finn should carefully evaluate if its absorptive capacity is relevant and
complementary to the source knowledge and if it is capable of both providing its
complementary technologies and absorbing new know-how from the alliances. In this
respect, the ability of in-house R&D in evaluating and utilising both technological
and scientific knowledge is extremely important.
Furthermore, firms should construct appropriate alliance strategies, based on
ac ieving synergy between in-house technological accumulation and external inputs
which enables existing products to be updated and new product arenas to be exploited.
This means that it is not only in-house development of absorptive capacity that should
222

Chapter 8 Conclusion and Implications
be a focus of corporate technology strategies; also of crucial importance is having an
external orientation directed towards creating a network of technology linkages.
These linkages let the firrn gain access to complementary technological know-how
and expertise.
Fourth, the results of this research suggest that IT firms particularly in newly
industrialised countries (NICs) such as Taiwan, where most of these fin-ris are SMES,
must assign greater efforts not only to pursue horizontal linkages but also to foster
absorptive capacity in order to learn effectively. This applies particularly to the
absorption of specialty knowledge from alliance partners when developing and
launching more innovative products becomes crucial. Managers must therefore
continuously probe their organisational boundaries to determine how absorbent they
are to admitting the influx of external knowledge. Company culture and
organisational. structures that facilitate the diffusion of technological capability as
well as the absorption of external knowledge are essential to technological learning.
Therefore, in order to facilitate the elevation of absorptive capacity, these firms
should endeavour to create a conducive knowledge-creating environment by
encouraging more external knowledge scanning activities, nurturing technological
gatekeepers or boundary spanners (Leonard-Barton, 1995), and establishing a more
effective communication network (Tu, 1999; Sher, 1998). These mechanisms cover
both internal and external management and may often involve long-term efforts,
conflict with existing corporate values, and face trade-offs with other objectives.
Despite this, the use of such mechanisms should endow firms with a set of unique
strategic assets that are difficult for competitors to imitate. A study of exterrial
linkages and innovation based on high-tech SMEs in the UK (Rothwell and Dodgson,
1991) pointed out that the most important factors determining these SMEs'
propensities and ability to access external sources of technology are the employment
223

Chapter 8 Conclusion and Implications
of qualified scientists and engineers and the proactive characteristics of management.
Qualified scientists and engineers may enable a SME to build up its ability to
successfully access external know-how for external technology acquisition. Therefore,
information and technology SMEs particularly in NICs should consider employing
in-house qualified scientists and engineers so that they are capable of scanning
up-to-date technologies and are receptive to external sources of knowledge. Moreover,
to effectively utilize these scientists, top management must be proactive in accepting
external ideas.
Fifth, NPD managers must also realize that the involvement of external parties in
more innovative project developments helps to reinforce the NDP team's absorptive
capacity. NPD managers are encouraged to pursue co-development opportunities, in
particular, with industrial research institutes or international OEM/ODM partners.
Such a strategy will become increasingly relevant as these firms seek to strengthen
their global competitiveness by engaging in more radical or truly innovative product
development. However, it must be understood that the management of external
technological linkages is a challenging undertaking. This includes the identification of
areas for collaborative development, the selection of compatible learning partners, the
productive management of the collaboration, and ensuring benefits accrue from the
joint activities. All of these factors will entail considerable management of resources
and expertise. A crucial requirement for managers is to have the ability to motivate
and effectively organise creative collaborative activities.
IT firms in newly developed countries have gradually developed their specialty
in global business systems to become a part of the multi-national companies' (MNCs)
international division of technical labour. Taiwanese IT firms under such systems are
observed to be more capable of absorbing the technical dimension of product
knowledge than the marketing knowledge. Finally, but not last, these firms should
224

Chapter 8 Conclusion and Implications
consider developing their own marketing ability not only to further strengthen their
absorptive capacity relative to marketing capabilities, but also to put in place
strategically interesting assets (generally a variety of competencies) to attract MNCs
in a collaboration project involving both technical and marketing development.
The lack of any significant effect on new product technological knowledge
observed in this research suggests that industrial research institutes and universities
are not playing an important role in producing product-specific knowledge/technology.
This result has implications for Taiwanese government's public policy making. lansiti
and West (1997: 79) point out: "an R&D organisation resides in a given geographic
environment, and its effectiveness is linked to its ability to leverage local expertise,
customer, and traditions. " Therefore, a policy that encourages the development of
more IT incubators inside public research institutes or universities and of more
collaborative R&D projects between public research institutes and private firms
should be useful for facilitating the transfer of up-to-date technologies to private IT
firms. In addition, some public funds could be allocated to direct more applied
research that is product- specific and can be financially realized in a shorter period
than basic, fundamental research.
a 8.5 imitations o the Study
The generalisability of this study's results is limited by industry and country. The
positive impact, as well as the moderation effects, of absorptive capacity on product
knowledge accumulation and external linkages is more likely to exist in industries
experiencing rapid innovation (such as IT and biochemical industries) (Mangematin
and Nesta, 1999; Shenkar and Li, 1999) because in such industries a continual
updating of a firm's knowledge and the technology that it currently employs is
required to meet competitors' offerings. In stable manufacturing industries (such as
225

Chapter 8 Conclusion and Implications
the car and steel industries), an increase in absorptive capacity beyond a certain level
may not be effective. This is because demands in these industries are relatively
unchanging and product specifications are well defined. The additional costs of
developing knowledge-based activities may put a firm in a situation of cost or
economy of scale disadvantage relative to competitors.
In newly developed countries where IT firms depend largely on collaborative
new development projects with MNCs of developed countries for the source of
innovative technologies, the importance of absorptive capacity and development links
with international corporations is more likely to be manifest in product innovativeness.
The pattern of significant interaction between absorptive capacity and external
linkages may very according to data which is collected from, for example,
phannaceutical firms in a developed country or IT firms in a country where the
OEM/ODM business model is not dominantly adopted. This analysis needs to be
repeated in other industries or nations, preferably ones with, for example, different
industry characteristics and industry structures so that contextual factors could be
further analysed.
The findings should be interpreted cautiously as the explanatory power (R) of
the models is relatively weak. Strictly from a statistical point of view, the use of
categorical variables reduces the model's explanatory power, but generates more
conservative results than the use of quantitative variables. Thus, these findings should
be considered conservative.
The limitations of this research are partially inherent in the design and subject
context. The first limitation concerns the use of a single key informant per unit of
analysis. The single-source issue is less of a concern when measured variables are
objective and/or factual in nature. On the other hand, it becomes a more serious
concern when most variables have the nature of perceptual judgments (Summers,
226

Chapter 8 Conclusion and Implications
2001). Measurement items for several variables used in this study are perceptual in
nature. Although qualified respondents such as NPD managers, vice presidents of
R&D, and product managers, who are closely involved in their respective new
product projects, were selected, the use of information from a single source to
generate information about an entire new product project might produce biased
findings. In addition, these respondents could bias the extraction of more
R&D-oriented information than new product marketing knowledge. However, the
quality of the survey method applied in this study and the use of highly
knowledgeable participants in the project are mostly consistent with other
methodologies typically found in literature.
Second, the research used subjective measures of absorptive capacity in
preference to objective proxies (such as R&D spending or number of patents) because
the latter has been criticized on the grounds of its imprecision (Spender and Grant,
1996). Considering the multi-faceted characteristics of the absorptive capacity
construct, this study chose the subjective, multiple measurement items for the
construct. Nevertheless, the choice of the subjective measures did show construct
validity and internal reliability. As knowledge or learning-based approaches to
research progress, researchers will continue to face such dilemmas. Subjective
measures were also applied to the items in the product knowledge accumulation
construct. This application may also involve the disadvantages of self-reporting
and/or key-informant reports from a single source (Summers, 2001).
Third, the focus of this study was to investigate the moderating and direct effect
of absorptive capacity on product innovativeness. Because of the limitation of the
sample size as well as its cross-sectional nature, this study did not attempt to examine
either the possibility of feedback effect of product knowledge accumulation on
absorptive capacity or the correlative effects among variables by applying techniques
227

Chapter 8 Conclusion and Implications
of structural equation modeling. Future research should expand the dataset across
different new product development cycles (i. e. time cycles) in a firm so as to explore
the feedback effect.
8.6 Suggestions for Future Research
Based on this exploratory study, several avenues for future work can be
identified. One direct extension of this framework is to further examine the
relationship between absorptive capacity and the accumulation of new product
knowledge found in this study. As the development of absorptive capacity is a
by-product of routine activities (Cohen and Levinthal, 1990; Kim, 1998), an
intensification of current efforts to develop new product knowledge would
reciprocally elevate the level of absorptive capacity. Although this study reflects the
role of absorptive capacity as both a direct predictor and a moderator, there may exist
a reciprocal causation between absorptive capacity and product knowledge
accumulation. Specifically, effective gain in new product knowledge reinforces
absorptive capacity and elevates absorptive capacity. A longitudinal research with a
time-series analysis should be able to reveal this relationship.
In this research, the focus has been -on ways in which the interaction between
external linkages and absorptive capacity affects product knowledge accumulation
and, in turn, how this affects product innovativeness. Previous empirical evidence
(Ottum and Moore, 1997) found that product newness is, a significant factor that
moderates the relationship between. NPD performance and the amount of market
information gathered, shared and used. This implies that the level of product newness
may moderate the effects of absorptive capacity on the external knowledge that is
assimilated. By extending the current research model to include new product newness
as a moderating variable (recursive design), future studies could further explore this
228

Chapter 8 Conclusion and Implications
issue.
Boundary-spanning activities initiate a firm's accumulation of its absorptive
capacity (Cohen and Levinthal, 1990). This research may be extended to investigate
whether firms with a higher absorptive capacity have a tendency towards more
external linkages in their NPD activities. In other words, absorptive capacity may be
hypothesized as a direct predictor of external linkages, the effect of which
subsequently contributes to gain in new product knowledge. This accumulation of
new product knowledge reinforces absorptive capacity. Under this relationsbip, a
study of cyclical recursive designs involving feedback loops would be necessary for
such a research framework. For instance, a possible relationship can be
mathematically expressed as: absorptive capacity =f (gain in new product
knowledge); gain in new product knowledge =f (external linkages); and external
linkages =f (absorptive capacity), the relations of which establish a cyclical feedback
loop.
Other empirical works (Atuahene-Gima, 1992; Atuahene-Gima, 1993;
Atuahene-Gima and Patterson, 1993) suggest that absorptive capacity might not
directly drive a firm to develop more external linkages. This is because a
"not-invented-here" (Katz and Allen, 1982) syndrome, inhibiting the consideration of
external sources of technology, may have developed among internal R&D staff. The
growth of "not-invented-here" syndrome in a firm or in its R&D department may
indicate that the engineers are complacent about the capabilities relevant to the
design/technology domain that has been developed. An interesting research question
emerges as to what managerial measures a firrn can take without falling into a
competency trap (Levitt and March, 1988). Organisational learning theory suggests
that unlearning ability makes room for more adequate interpretative frameworks to be
held in the organisational memory, whilst learning ability generates new knowledge
229

Chapter 8 Conclusion and Implications
and updates existing knowledge (Hedberg, 1981). Researchers may explore the issues
of developing "not-invented-here" syndrome and the difficulties in unlearning ability
in dealing with such a managerial dilemma - i. e. the need to strike a balance between
maintaining core technology and investing in a newly emerging and relevant
technology.
Another research direction is to examine the impact of absorptive capacity on the
various types of knowledge acquisition. Several empirical studies confirm that
absorptive capacity is more critical for collaboration with basic and scientific research
as well as for exploitative alliances (Koza and Lewin, 1998; Mangernatin and Nesta,
1999). But, whether the impact of absorptive capacity is more significant on tacit
types of knowledge than on explicit types of knowledge remains empirically
unconfirmed. The insights of knowledge management should encourage investigation
of this issue.
One of the key abilities of absorptive capacity lies in granting firms the ability to
effectively recognise and value new technologies (Cohen and Levinthal, 1990).
Empirical evidence confirms that possession of complementary knowledge, i. e.
diversity in knowledge domains that are complementary, affects a firm's search for
new knowledge (Cockburn and Henderson, 1998; Shenkar and Li, 1999). The
advantages of productively recognising valuable new technologies may enable and
drive firms to develop a broad spectrum of product families. The implication of these
findings may direct researchers to postulate that absorptive capacity could affect
product diversification strategies. In other words, finns with relatively higher
absorptive capacity may tend to develop a variety of product families for market
compe i ion.
It would be useful to attempt to cross-validate the model advocated in the current
research by using data from different industries or different countries. For example,
230

Chapter 8 Conclusion and Implications
case studies from the biochemical industry highlight the importance of research
collaboration between industrial firms and universities as well as industrial research
institutes (Decarolis and Deeds, 1999; Mowery et al., 1996; Bierly and Chakrabarti,
1996a). In addition, several empirical studies in the car industry suggest the
significant role of supplier integration in product innovation (Aoki, 1986; Blenkhorn
and Noori, 1990; Kamath and Liker, 1994; Dyer, 1996). However, the current study
predominantly identified the significant impact of corporation linkages on product
innovativeness in an IT context. A cross-country comparative study, particularly
between OEM/ODM-dominated and non-OEM/ODM-dominated IT industries, may
provide researchers with more precise and unique suggestions for managerial
practices.
In a similar vein, the concept of absorptive capacity can be extended to
investigate service innovation. For instance, it would be interesting to consider the
effects of absorptive capacity on the perfonnance of a retailing chain's service
technology transfer both within and from outside its units, the level of its service
innovation, and the amount of customer feedback being processed to reduce customer
complaints. But, this would require a different conceptual isation of absorptive
capacity because learning behaviour in service contexts is less R&D-oriented.
The most challenging part of this research was in determining appropriate
measures of the multi-faceted concept of absorptive capacity, and further studies with
different types of measures are needed to better define this construct. Past studies
(Tsai, 2001; Mowery et al., 1996; Koza and Lewin, 1998) utilised an objective
indicator such as R&D spending as the proxy for absorptive capacity, but they have
been shown to have problems of accuracy (Spender and Grant, 1996). The moderating
effects of the absorptive capacity variable have been partially supported in this study
because only a few of the more simplistic elements of the construct were measured.
231
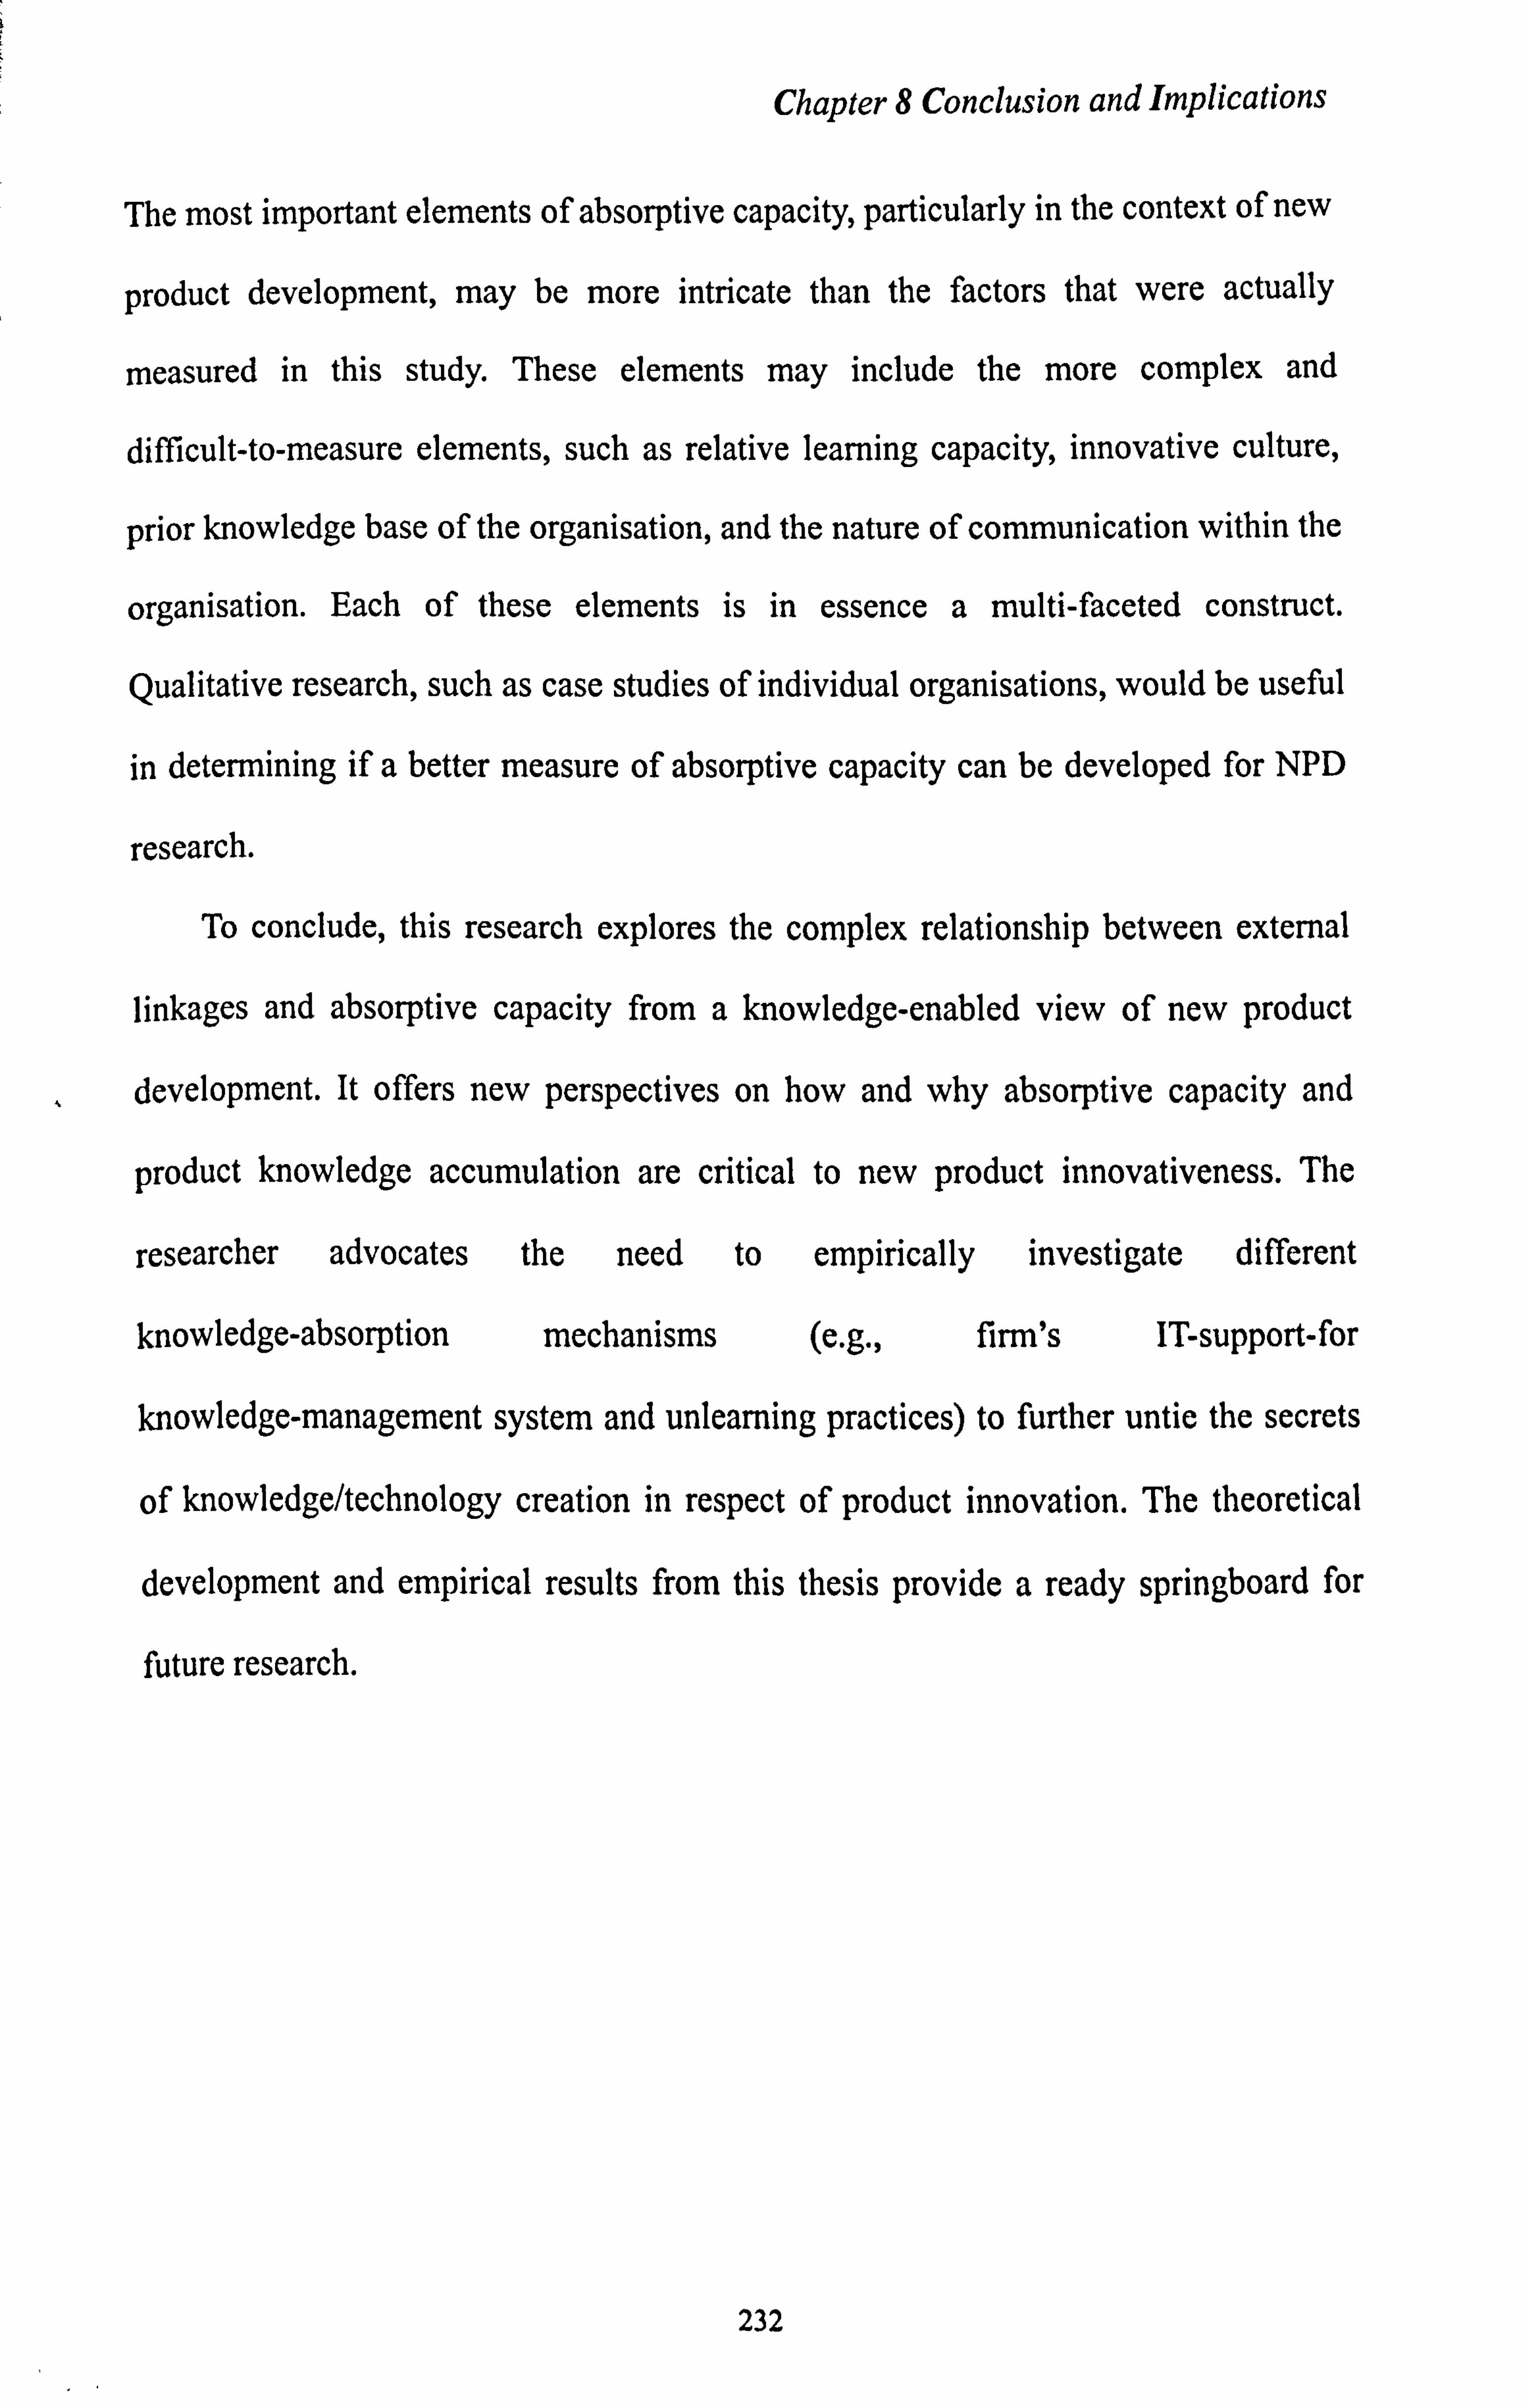
Chapter 8 Conclusion and Implications
The most important elements of absorptive capacity, particularly in the context of new
product development, may be more intricate than the factors that were actually
measured in this study. These elements may include the more complex and
difficult-to-measure elements, such as relative learning capacity, innovative culture,
prior knowledge base of the organisation, and the nature of communication within the
organisation. Each of these elements is in essence a multi-faceted construct.
Qualitative research, such as case studies of individual organisations, would be useful
in determining if a better measure of absorptive capacity can be developed for NPD
research.
To conclude, this research explores the complex relationship between external
linkages and absorptive capacity from a knowledge-enabled view of new product
development. It offers new perspectives on how and why absorptive capacity and
product knowledge accumulation are critical to new product innovativeness. The
researcher advocates the need to empirically investigate different
knowledge-absorption mechanisms (e. g., firm's IT-support-for
knowledge-management system and unlearning practices) to further untie the secrets
of knowledge/technology creation in respect of product innovation. The theoretical
development and empirical results from this thesis provide a ready springboard for
future research.
232

Bibliography
Adler, J. H. (1965), Absorptive Capacity: The Concept and its Determinants,
Brookings Institution, Washington.
Alwin, D. F. and Hauser, R. M. (1975), "The Decomposition of Effects in Path
Analysis", American Sociological Review, 40 (February), pp. 37-47.
Aoki, M. (1986), "Horizontal vs. Vertical Information Structure of the Firrn", The
American Economic Review, 76 (5), pp. 971-983.
Armstrong, J. S. and Overton, T. S. (1977), "Estimating Non-response Bias in Mail
Survey", Journal ofMarketing Research, 14 (August), pp. 396-402.
Argyris, C. (1977), "Double Loop Learning in Organizations", Harvard Business
Review, 5, pp. 115-125.
Argyris, C. (1996), "Unrecognized Defenses of Scholars: Impact on Theory and Research", Organization Science, 7 (1), pp. 78-87.
Argyris, C. and Schon, D. A. (1978), Organization Learning: A Theory ofAction Perspective, Addison-Wesley, Reading, MA.
Arnold, H. J. (1982), "Moderator Variables: A Clarification of Conceptual, Analytic,
and Psychometric Issues", Organizational Behavior and Human Performance, 29, pp. 143-174.
Arora, A. and Gambardella, A. (1990), "Complementary and External Linkages: Strategies of the Large Firm in Biotechnology", Journal ofIndustrial Economics, 38 (4), pp. 361-379.
Arora, A. and Gambardella, A. (1994), "Evaluating Technological Information and Utilizing it: Scientific Knowledge, Technological Capability, and External Linkages in Biotechnology", Journal ofEconomic Behavior and Organization, 24, pp. 91-114.
Asia IT Report (2000), MIC Institute for Information Industry, Taipei, Taiwan Atuahene-Gima, K. (1992), "Inward Technology Licensing as an Alternative to
Internal R&D in New Product Development: A Conceptual Framework", Journal
ofProduct Innovation Management, 9 (2), pp. 15 6-167.
Atuahene-Gima, K. (1993), "Determinants of Inward Technology Licensing Intensions: An Empirical Analysis of Australian Engineering Firms", Journal of Product Innovation Management, 10, pp. 230-240.
Atuahene-Gima, K. and Patterson, P. (1993), "Managerial Perceptions of Technology Licensing as an Alternative to Internal R&D in New Product Development: An Empirical Investigation", R&D Management, 23 (4), pp. 327-336.
Badaracco, J. I. (199 1), The Knowledge Link How Firms Compete through Strategic Alliances, Harvard Business School Press, Boston, Massachusetts.
233

Barlett, C. A. and Ghoshal, S. (1995), Managing Across Broader, Hos Press,
Cambridage, Massachusetts.
-Baron, R. M. and Kenny, D. A. (1986), "The Moderator-Mediator Variable Distinction
in Social Psychological Research: Conceptual, Strategic, and Statistical Considerations", Journal ofPersonality and Social Psychology, 51 (6), pp. 1173-1182.
Bartunek, J. M. (1984), "Changing Interpretive Schemes and Organizational
Restructuring: The Example of a Religious Order", Administrative Science
Quarterly, 29, pp. 355-372.
Baston, R. G. (1987), "Characteristics of R&D Management which Influence Information Needs", IEEE Transactions on Engineering Management, 34 (3), pp. 178-183.
Baumard, P. (1999), Tacit Knowledge in Organization, Sage Publications, London, pp. 212-223.
Beesley, M. and Rothwell, R. (1987), "Small Linkages in the United Kingdom", In Innovation, Adaptation and Growth (Eds, Rothwell, R. and Beesant, J. ), Elsevier, Amsterdam, pp.
Bettis, R. A. and Prahalad, C. K. (1995), "The Dominant Logic: A Retrospective and Extension", Strategic Management Journal, 16, pp. 5-14.
Bierly, P. E. and Chakrabarti, A. K. (1996a), "Generic knowledge Strategic Strategies in the U. S. Pharmaceutical Industry", Strategic Management Journal, 17 (winter Special Issue), pp. 123 -135.
Bierly, P. E. and Chakrabarti, A. K. (1996b), "Technological Learning, Strategic Flexibility, and New Product Development in Pharmaceutical Industry", IEEE Transactions on Engineering Management, 43 (4), pp. 368-380.
Blenkhorn, D. L. and Noori, A. H. (1990), "What It Takes to Supply Japanese OEMS", Industrial Marketing Management, 19, pp. 21-30.
Blonder, C. and Pritzl, R. (1992), "Development of Strategic Alliances: A conceptual Framework for Successful Cooperation", European Management Journal, 10 (4),
pp. 412-42 1.
Bonnet, D. C. (1986), "Nature of the R&D/Marketing Cooperation in the Design of Technologically Advanced New Industrial Products", R&D Management, 16 (2),
pp. 117-126. Booz, A. H. (1982), New Product Development in the 1980s, Booz, Allen & Hamilton,
New York. Brown, J. S- (199 1), "Research That Reinvents the Corporation", Harvard Business
Review, (January-February), pp. 102-111. Bruce, M., Leverick, F., Little, D. and Wilson, D. (1995), "Success Factors for
234

Collaborative Product Development: A Study of Suppliers of Information and Communication Technology", R&D Management, 25 (1), pp. 33-44.
Bruner, J. S., Goodnow, J. J. and Austin, G. A. (195 6), A Study of Thinking, Wiley, New York.
Cangelosi, V. E. and Dill, W. R. (1965), "Organizational Learning: Observations Toward a Theory", Administrative Science Quarterly, 10, pp. 175-203.
Chatterji, D. and Manuel, T. A. (1993), "Benefiting from External Sources of Technology", Research Technology Management, (November-December), pp. 21-26.
Chesbrough, H. W. and Teece, D. J. (1996), "When is Virtual Virtuous? Organizing for Innovation", Harvard Business Review, January - February, pp. 65-73
Chung, C. (1999), Investigating the Relationship between Resource Allocation during New Product Process and NPD Performance: An Empirical Study of Taiwanese Manufacturing Industry, Unpublished PhD Thesis, National Chang-Chi University, Taipei, Taiwan.
Churchill, G. A. (1979), "A Paradigm for Developing Better Measures of Market Constructs", Journal ofMarketing Research, 16, pp. 64-73.
Clark, K. B. (1989), "Project Scope and Project Performance: The Effect of Parts Strategy and Supplier Involvement on Product Development", Management Science, 35 (10), pp. 1247-1263.
Clark, K. B. and Fujimoto, T. (1991), Product Development Performance, Harvard Business School Press, Boston.
., Clark, K. B. and Wheelwright, S. C. (1993), Managing New Product and Process Development, Free Press, New York.
Cockburn, 1. M. and Henderson, R. M. (1998), "Absorptive Capacity, Coauthoring Behavior, and the Organization of Search in Drug Discovery", The Journal of Industrial Economics, 46 (2), pp. 157-183.
Cohen, J. and Cohen, P. (1983), Applied Multiple Regressionl Correlation Analysisfor the Behavioral Sciences, Lawrence Erlbaum Associates, Hillsdale, New Jersey.
Cohen, W. M. and Levinthal, D. A. (1989), "Innovation and Learning: The Two Faces
of R&D", Economic Journal, 99 (September), pp. 568-596. Cohen, W. M. and Levinthal, D. A. (1990), "Absorptive Capacity: A New Perspective
on Learning and Innovation", Administrative Science Quarterly, 35, pp. 128-152. Cohen, W. M. and Levinthal, D. A. (1994), "Fortune Favors the Prepared Firm",
Management Science, 40 (2), pp. 227-25 1.
Conner, K. R. and Prahalad, C. K. (1996), "A Resource-based Theory of the Firm: Knowledge versus Opportunism", Organization Science, 7 (5), pp. 477-501.
Cooper, R. G. (1979a), "The Dimensions of Industrial New Product Success and
235

Failure", Journal ofMarketing, 43, pp. 93-103.
Cooper, R. G. (1979b), "Identifying Industrial New Product Success: Product
NewProd", Industrial Marketing Management, 8, pp. 124-135.
Cooper, R. G. (198 1), "The Components of Risk in New Product Development:
Project NewProd", R&D Management, 11 (2), pp. 47-54.
Cooper, R. G. (1992), "The NewProd System: The Industry Experience", Journal of Product Innovation Management, 9 (2), pp. 47-54.
Cooper, R. G. and Kleinschimidt, E. J. (1986), "An Investigation into the new Product
Process: Steps, Deficiencies, and Impact", Journal ofProduct Innovation Management, 3, pp. 71-85.
Cooper, R. G. and Kleinschimidt, E. J. (1987), "What Makes a New Product a Winner:
Success Factors at the Project Level", R&D Management, 17 (3), pp. 175-189.
Cooper, R. G. and Kleinschimidt, E. J. (199 1), "New Product Processes at Leading
Industrial Firms", Industrial Marketing Management, 20, pp. 137-147.
Cooper, R. G. (1999), Product Leadership: Creating and Launching Superior New
Products, Perseus Books, Cambridge, Massachusetts
Craig, A. and Hart, S. (1992), "Where To Now in New Product Development
Research", European Journal ofMarketing, 26 (11), pp. 1-49.
Craig, C. S. and Douglas, S. P. (2000), International Marketing Research, John Wiley
& Sons Ltd., West Sussex, England.
Crawford, C. M. (1997), New Product Management, The McGraw-Hill Companies,
Chicago.
Cronbach, L. J. (1987), "Statistical Tests for Moderator Variables: Flaws in Analyses
Recently Proposed", Psychological Bulletin, 102 (3), pp. 414-417.
Crossan, M. M., Lane, H. W. and White, R. E. (1999), "An Organizational Learning Framework: From Intuition to Institution", Academy ofManagement Review, 24 (3), pp. 522-537.
Crossan, M. M., Lane, H. W., White, R. E. and Djurfeldt, L. (1995), "Organizational Learning: Dimension for A Theory", The International Journal of Organizational Analysis, 3 (4), pp. 337-360.
Daft, R. L. and Huber, G P. (19 87)', "How Organization Learn: A Communication Framework", Research in the Sociology of Organizations, 5, pp. 1-36.
Daft, R. L. and Lengel, R. H. (1986), "Organizational Information Requirement,
, Media Richness, and Structural Design", Management Science, 5, pp. 554-571.
Daft, R. L. and Weick, K. E. (1984), "Toward a Model of Organizations as Interpretation Systems", Academy ofManagement Review, 9 (2), pp. 284-295.
Damanpour, F. (1996), "Organizational Complexity and Innovation: Developing and
. Testing Multiple Contingency Models", Management Science, 42 (5), pp.
236

693-716. Day, G S. (199 1), "Learning About Markets", Marketing Science Institute Report, 117
(June), pp. 1-23.
De Mayer, A. and van Hooland, B. (1990), "The Contribution of Manufacturing to
Shortening Design Cycle Times", R&D Management, 20 (3), pp. 229-239.
Decarolis, D. M. and Deeds, D. L. (1999), "The Impact of Stocks and Flows of
Organizational Knowledge on Firm Performance: An Empirical Investigation of
the Biotechnology Industry", Strategic Management Journal, 20, pp. 953-968.
Deeds, D. L. and Hill, C. W. L. (1996), "Strategic Alliances and The Rate of New
Product Development: An Empirical Study of Entrepreneurial Biotechnology
Firms". Journal ofBusiness Venturing, 11, pp. 41-55.
Demsetz, H. (199 1), "The Theory of the Firm Revisited", In The Nature of the Firm
(Eds, Williansom and Winter), Oxford University Press, New York, pp. 159-179.
DiBella, A. J., Nevis, E. C. and Gould, J. A (1996), "Understanding Organizational
Leaming Capacity", Journal ofManagement Studies, 33 (3), pp. 361-379.
Dillman, D. A. (1978), Mail and Telephone Surveys: The Total Design Method,
Wiley-Interscience Publication, New York.
Dodgson, M. (1991), "Technology Learning, Technology Strategy and Competitive
Pressures", British Journal ofManagement, 2, pp. 133-149.
Dodgson, M. (1993 a), "Organizational Learning: A Review of Some Literatures",
Organizational Studies, 14, pp. 375-394.
Dodgson, M. (1993b), Technology Collaboration in Industry, Routledge, New York.
Dougherty, D. (1990), "Understanding New Markets for New Products", Strategic
Management Journal, 11, pp. 59-78.
Droge, C., Jayaram, J. and Vickery, S. K. (2000), "The Ability to Minimize the
Timing of New Product Development and Introduction: An Examination of Antecedent Factors in the North American Automobile Supplier Industry",
Journal ofProduct Innovation Management, 17, pp. 24-40.
Drongelen, L C. K. -V., Weerd-Nederhof, P. d. W. -N. and Fisscher, 0. A. M. (1996)9 "Describing the Issue of Knowledge Management in R&D: Towards a Communication and Analysis Tool", R&D Management, 26 (3), pp. 213-230.
Drucker, P. F. (1985), Innovation and Entrepreneurship: Practice and Principles, Harper & Row, New York.
Drucker, P. F. (1993), Post- Capitalist Society, Harper Business, New York.
Duncan, R. B. (1974), "Modifications in Decision Structure in Adapting to the Environment: Some Implications for Organizational Learning", Decision Sciences,, pp. 705-725.
Duncan, R. B. and Weiss, A. (1979), "Organizational Learning: Implications for
237

organizational Design", In Research in Organizational Behavior (Ed, Straw, B. ),
JAI Press, Greenwich, CT, pp. 75-124.
D ussauge, P., Garrette, B. and Mitchell, W. (2000), "Learning From Competing
Partners: Outcomes and Durations of Scale and Link Alliances in Europe, North
America and Asia", Strategic Management Journal, 2 1, pp. 99-126.
Dwyer, L. and Mellor, R. (1991), "Organizational Environment, New Product Process
Activities, and Project Outcomes", Journal ofProduct Innovation Management, 8, pp. 39-48.
Dyer, J. F. (1996), "Specialized Supplier Networks as A Source of Competitive Advantage: Evidence From the Auto Industry", Strategic Management Journal, 17, pp. 271-291.
Dyer, J. F. and Singh, H. (1998), "The Relational View: Cooperative Strategy and Sources of Inter-organizational Competitive Advantage", Academy of Management Review, 23 (4), pp. 660-679.
Easterby-Smith, M. (1986), Evaluation ofManagement Education, Training and Development, Gower Publishing Company Limited, England, UK
Eisenhardt, K. M. and Tabrizi, B. N. (1990), "Accelerating Adaptive Processes: Product Innovation in the Global Computer Industry", Administrative Science
Quarterly, 40, pp. 84-110. Ettlie, J. E. and Rubenstein, A. H. (1987), "Firm Size and Product Innovation",
Journal ofProduct Innovation Management, 4, pp. 89-108.
Filion, F. L. (1976), "Estimating Bias Due to Nonresponse in Mail Surveys", Public Opinion Quarterly, 40 (Winter), pp. 482-492.
Fiol, C. M. (1996), "Squeezing Harder Doesn't Always Work: Continuing the Search for Consistency in Innovation Research", Academy ofManagement Review, 21 (4), pp. 10 12-102 1.
Fiol, C. M. and Lyles, M. A. (1985), "Organizational Learning", Academy of Management Review, 10 (4), pp. 803-813.
Fish, W. A. (1979), "The Acquisition for Technical Information by R&D Managers for Problem Solving in Non-routine Contingency Situations", IEEE Transactions on Engineering Management, 26 (February), pp. 8-14.
Garud, R. and Nayyar, P. R. (1994), "Transformative Capacity: Continual Structuring by Inter-temporal Technology Transfer", Strategic Management Journal, 15, pp. 365-385.
Garvin, D. A. (1993), "Building a Learning Organization", Harvard Business Review, (July-August), pp. 78-81.
Gemunden, H. G., Heydebreck, P. and Herden, R. (1992), "Technological Interweavement: A Means of Achieving Innovation Success", R&D Afanagement,
238

22 (4), pp. 359-376.
Geroge, G., Zahra, S. W., Kathleen, K. W., and Khan, R. (2001), "The Effects of Alliance Portfolio Characteristics and Absorptive Capacity on Performance: A
Study of Biotechnology Firms", The Journal offfigh Technology Management
Research, 12, pp. 205-226. Ghoshal, S. and Westney, D. E. (199 1), "Organizing Competitor Analysis Systems",
Strategic Management Journal, 12, pp. 17-3 1.
Granstrand, 0., Bohin, E., Oskarsson, C. and Sjoberg, N. (1992), "External
Technology Acquisition in Large Multi-Technology Corporations", R&D Management, 22 (2), pp. 111- 133.
Grant, R. M. (1996a), "Prospering in Dynamically-Competitive Environments:
Organizational Capacity as Knowledge Integration", Organization Science, 7 (4),
pp. 375-387.
Grant, R. M. (1996b), "Toward a Knowledge-based Theory of The Firm", Strategic
Management Journal, 17 (Winter Special Issue), pp. 109-122.
Grant, R. M. and Baden-Fuller, C. (1995), "A Knowledge-based Theory of Inter-Firm Collaboration", Academy ofManagement Journal, (Best Paper Proceedings), pp. 17-22.
Gugler, P. (1992), "Building Transnational Alliances to Create Competitive
Advantages", Long Range Planning, 25 (1), pp. 90-99.
Hagedoorn, J. (1993), "Understanding the Rationale of Strategic Technology
partnering: Inter-organizational Modes of Cooperation and Sectional Differences", Strategic Management Journal, 14, pp. 371-3 85.
Hagedoom, J. and Schalenraad, J. (1994), "The Effect of Strategic Technology Alliances on Company Performance", Strategic Management Journal, 15, pp. 291-309.
Hair, J. F., Anderson, R. E., Tatham, R. L. and Black, W. C. (1998), Multivariate Data Analysis, Prentice-Hall, Upper Saddle River, New Jersey.
Hamel, G. (1991), "Competition for Competence and Inter-Partner Learning within International Strategic Alliances", Strategic Management Journal, 12 (Summer Special Issue), pp. 83-103.
Hamel, G., Doz, Y. L. and Prahalad, C. K. (1989), "Collaborate With Your Competitors and Win", Harvard Business Review, (January-February), pp. 133-139.
Hartley, J. L., Meredith, J. R., McCutheon, D. and Karnath, R. R. (1997), "Suppliers' Contributions to Product Development: An Exploratory Study", IEEE Transactions on Engineering Management, 44 (3), pp. 25 8-266.
Hattie, J. (1985), "Methodology Review: Assessing Unidimensionality of Tests and
239

Items", Applied Psychological Measurement, 9 (June), pp. 139-164.
Hedberg, B. (198 1), "How Organizations Learn and Unlearn", In Handbook of Organizational Design (EdsNystorm, P. C. and Starbuck, W. H. ), Oxford University Press, New York, pp. 3-27.
Hedberg, B., Nystorm, P. C. and Starbuck, W. H. (1976), "Camping on Seasaws:
Prescriptions for a Self-Designing Organizations", Administrative Science Quarterly, 21, pp. 41-65.
Henderson, R. M. and Clark, K. B. (1990), "Architectural Innovation: The Reconfiguration of Existing Product Technologies and The Failure of Established Firms", Administrative Science Quarterly, 35, pp. 9-30.
Henderson, R. M. and Cockburn, 1. M. (1994), "Measuring Competence? Exploring
Firm Effects in Pharmaceutical Research", Strategic Management Journal, 15
(Winter Special Issue), pp. 63-84.
Hennart, J. F. (198 8), "A Transaction Cost Theory of Equity Joint Ventures", Strategic Management Journal, 9 (4), pp. 361-374.
Hill, Charles W. L. (1992), "Strategies for Exploiting Technological Innovations: When and When Not to License", Organization Science, 3 (3), pp. 428-441
Huber, G P. (199 1), "Organizational Learning: The Contributing Processes and The Literatures", Organization Science, 2 (1), pp. 88-115.
Ilussey, J. and Hussey, R. (1997), Business Research, MacMillan Press Ltd,
Basingstoke, UK.
Ingham, M. and Mothe, C. (1998), "How to Learn in R&D Partnerships? ", R&D Management, 28 (4), pp. 249-261.
James, L. R. and Brett, J. M. (1984), "Mediators, Moderators, and Tests for Mediation", Journal ofApplied Psychology, 69 (2), pp. 3 07-3 2 1.
Kamath, R. R. and Liker, J. K. (1994), "A Second Look at Japanese Product Development", Harvard Business Review, (November-December), pp. 154-170.
Kanuk, L. and Berenson, C. (1975), "Mail Surveys and Response Rates: A Literature Review", Journal ofMarketing Research, 12 (November), pp. 440-453.
Katz, R. and Allen, T. J. (1982), "Investigating the Not Invented Here (NIII) Syndrome: A Look at the Performance, Tenure, and Communication Patterns of 50 R&D Project Groups", R&D Management, 12 (1), pp. 7-19.
Kelloway, E. K. (1998), Using LISRELfor Structural Equation Modeling- A Researcher's Guide, Sage Publications, Inc., Thousand Oaks, California.
Kerlinger, F. N. (1986), Foundations ofBehavioral Research, McGraw Hill, New York.
Kim, D. H. (1993), "The Link Between Individual and Organizational Leaming", Sloan Management Review, (Fall), pp. 37-50.
240
Kim, L. (1998), "Crisis Construction and Organizational Learning: Capability
Building in Catching-up at Hyundai Motor", Organization Science, 9 (4), pp. 506-521.
Khanna, T., Gulati, R. and Nohria, N. (1998), "The Dynamics of Learning Alliances:
Competition, Cooperation, and Relative Scope", Strategic Management Journal,
19, pp. 193 -2 10 Klahr, D. and Wallance, J. G. (1976), Cognitive Development: An Information
Processing View, Halsted Press, New York.
Kodama, F. (1992), "Technology Fusion and the New R&D", Harvard Business
Review, (July-August), pp. 70-78.
Kogut, B. and Zander, U. (1992), "Knowledge of the Firm, Combinative Capabilities,
and the Replication of Technology", Organization Science, 3, pp. 383-397.
Kotabe, M. and Swan, K. S. (1995), "The Role of Strategic Alliances in
High-Technology New Product Development", Strategic Management Journal,
16, pp. 621-636.
Koza, M. P. and Lewin, A. Y. (1998), "The Co-evolution of Strategic Alliances",
Organization Science, 9 (3), pp. 255-264.
Krysan, M., Schuman, H., Scott, L. J. and Beatty, P. (1994), "Response Rates and Response Content in Mail versus Face-to-Face Survey", Public Opinion
Quarterly, 58, pp. 381-399.
. K-urnar, R. and Nti, K. 0. (1998), "Differential Learning and Interaction in Alliance
Dynamics: A Process and Outcome Discrepancy Model", Organization Science, (3), pp. 356-367.
Lambe, C. J. and Spekman, R. E. (1997), "Alliances, External Technology Acquisition,
and Discontinuous Technological Change", Journal of Product Innovation
Management, 19, pp. 461-477.
Lane, P. J. and Lubatkin, M. (1998), "Relative Absorptive Capacity and Inter-organizational Learning", Strategic Management Journal, 19, pp. 461-477.
Lane, P. J., Salk, J. E. and Lyles, M. A. (2001), "Absorptive Capacity, Learning, and Performance in International Joint Ventures", Strategic Management Journal, 22,
pp. 1139-1161.
Lee, Z. (1999), Knowledge Creation, Innovation and Information Technology:
, Revitalizing Roles ofMiddle Managers in Large Hierarchical Organizations, Doctoral Thesis, University of South California, Las Angles.
Leonard-Barton, D. (1992), "Core Capabilities and Core Rigidities: A Paradox in Managing New Product Development", Strategic Management Journal, 13, pp. 111-125.
Leonard-Barton, D. (1995), Wellsprings offhowledge: Building and Sustaining the
241

Sources ofInnovation, Harvard Business School Press, Boston.
Levinson, N. S. and Asahi, M. (I 995)j "Cross-national Alliances and Inter-organizational Learning", Organizational Dynamics, 24 (2), pp. 50-64.
Levitt, B. and March, J. G. (1988), "Organizational Leaming", Annual Review of Sociology, 14, pp. 319-340.
Li, T. and Calantone, R. J. (1998), "The Impact of Market Knowledge Competence on New Product Advantage: Conceptualization and Empirical Examination",
Journal ofMarketing, 62 (October), pp. 13-29.
Liker, J. K., Collins, P. K. and Hull, F. M. (1999), "Flexibility and Standardization:
Test of a Contingency Model of Product Design-Manufacturing Integration",
Journal ofProduct Innovation Management, 16, pp. 248-267.
Link, A. and Tassey, G. (1987), Strategiesfor Technology-based Competition,
Lexington Books, Lexington, Massachusetts.
Lorenzoni, G. and Lipparini, A. (1999), "The Leveraging of Inter-firm Relationships
as A Distinctive Organizational Capacity: A Longitudinal Study", Strategic
Management Journal, 20, pp. 317-338.
Luo, Y. (1997), "Partner Selection and Venturing Success: The Case of Joint Ventures
with Firms in the People's Republic of China", Organization Science, 8 (6), pp. 648-662.
Lynn, G. S. (1997), "Organizational Team Learning for Really New Product
Development", Marketing Science Institute Report, (July), pp. 97-113.
Lynn, G. S. (1998), "New Product Team Learning", California Management Review,
40 (4), pp. 74-93.
Lynn, G. S., Morone, J. G. and Paulson, A. S. (1996), "Marketing and Discontinuous
Innovation: The Probe and Learn Process", California Management Review, 38
pp. 8-37.
Madhavan, R. and Grover, R. (1998), "From Embedded Knowledge to Embodied Knowledge: New Product Development as Knowledge Management", Journal of Marketing, 62 (October), pp. 1- 12.
Maidique, M. A. and Zirger, B. J. (1984), "A Study of Success and Failure in Product Innovation: The Case of US Electronics Industries", IEEE Transactions on Engineering Management, EM-31 (4), pp. 192-203.
N4aidique, M. A. and Zirger, B. J. (1985), "The New Product Learning Cycle", Research Policy, 14, pp. 299-313.
N4alerba, F. (1992), "Learning by Firms and Incremental Technical Change", The Economic Journal, 102 (July), pp. 845-859.
N4angernatin, V. and Nesta, L. (1999), "What Kind of Knowledge Can A Firm
-, Absorb? ", International Journal of Technology Management, 18 (3/4), pp.
242

149-172. Mansfield, E. (1988), "The Speed and Cost of Industrial Innovation in Japan and the
United States: External vs. Internal Technology", Management Science, 34 (10),
pp. 1157-1168.
March, James G. (1991), "Exploration and Exploitation in Organization Leaming", Organization Science, 2, pp. 71-87
March, J. G. and Olsen, J. P. (1975), "Organizational Learning Under Ambiguity", European Journal ofPolicy Review, 12 (4), pp. 147-17 1.
Marquardt, M. and Reynolds, A. (1994), The Global Learning Organization, Irwin, Burr Ridge, Illinois.
McKee, D. (1992), "An Organizational Learning Approach to Product Innovation", Journal ofProduct Innovation Management, 9, pp. 232-245.
Michell, W. and Singh, K. (1993),, "Death of the Lethargic: Effects of Expansion into New Technical Subfields on Performance in A Firms Base Business". Organization Science, 4 (2), pp. 152-180.
Miner, A. S. and Mezias, S. J. (1996), "Ugly Duckling no More: Pasts and Futures of Organizational Learning Research", Organization Science, 7 (1), pp. 88-99.
Mintzberg, H. (1991), "The Effective Organization: Forces and Forms", Sloan Management Review, (Winter), pp. 54-67.
Mohr, J. J., Fisher, R. J. and Nevin, J. R. (1996), "Collaborative Communication in Interfirm Relationships: Moderating Effects of Integration and Control", Journal
ofMarketing, 60 (July), pp. 103-115. Moorman, C. and Miner, A. S. (1997), "The Impact of Organizational Memory on
New Product Performance and Creativity", Journal ofMarketing Research, 34 (February), pp. 91-106.
Mowery, D. C., Oxley, J. E. and Silverman, B. S. (1996), "Strategic Alliances and Inter-firm Knowledge Transfer", Strategic Management Journal, 17 (Winter
special issue), pp. 77-91.
Mowery, D. C. and Rosenberg, N. (1989), Technology & The Pursuit ofEconomic Growth, Cambridge University Press, Cambridge, UK.
Nevis, E. C., Debella, A. J. and Gould, J. M. (1995), "Understanding Organizations as Learning Systems", Sloan Management Review, (Winter), pp. 73-85.
Newell, A. and Simon, H. A. (1972), Human Problem-solving, Prentice Hall, Eaglewood, N. J.
Nicholls-Nixon, C. L. (1993), Absorptive Capacity and Technology Sourcing: Implicationsfor Responsiveness ofEstablished Firms, Unpublished PhD Dissertation, Purdue University.
Nonaka, 1. (1994), "A Dynamic Theory of Organizational Knowledge Creation",
243

Organization Science, 5 (1), pp. 14-37.
Nonaka, I. and Takeuchi, H. (1995), The Knowledge-Creating Company, Oxford
University Press, New York. Norman, R. (197 1), "Organizational Innovativeness: Product Variation and
,, Reorientation", Administrative Science Quarterly, 16, pp. 203-215.
Nystrom, P. C. and Starbuck, W. H. (1984), "To Avoid Organizational Crisis, Unlearn", Organizational Dynamics, (Spring), pp. 53-65.
O'Connor, G. C. (1998), "Market Leaming and Radical Innovation: A Cross Case Comparison of Eight Radical Innovation Projects", Journal ofProduct Innovation Management, 15, pp. 151-166.
Olsen, E. M., Walker Jr., 0. C. and Ruekert, R. W. (1995), "Organizing for Effective New Product Development: The Moderating Role of Product Innovativeness", Journal ofMarketing, 59 (January), pp. 48-62.
Otturn, B. D. and Moore, W. L. (1997), "The Role of Market Infonnation in New Product Success/Failure", Journal ofProduct Innovation Management, 14, pp. 258-273.
Peacock, N. (1993), "Communication between R&D and Its Customers -A Study of BT Laboratories", R&D Management, 23 (4), pp. 302-312.
Pennings, J. M. and Harrianto, F. (1992a), "The Diffusion of Technological Innovation in the Commercial Banking Industry", Strategic Management Journal, 13, pp. 29-46.
Pennings, J. M. and Harrianto, F. (1992b), "Technological Networking and Innovation Implementation", Organization Science, 3 (3), pp. 356-382.
Peter, J. P. (1979), "Reliability: A Review of Psychometric Basics and Recent Marketing Practices", Journal ofMarketing Research, 16 (February), pp. 64 7.
Phillips, L. W. (1981), "Assessing Measurement Error in Key Informant Reports: A
- Methodological Note on Organizational Analysis in Marketing", Journal of Marketing Research, 18 (November), pp. 395-415.
porter, M. E. (1980), Competitive Strategy, The Free Press, New York. porter, M. E. (1985), Competitive Advantage, The Free Press, New York. Porter, M. E. and Fuller, M. B. (19 8 6), " Coalitions and Global Strategy", In
Competition in Global Industries (Ed., Porter, M. E. ), Harvard University Press, Cambridge, MA, p. 336
postman, C. (1963), "On-Trial Learning", In Verbal Behavior and Learning: Problems
and Processes (Eds, Confer, C. N. and Musgrave, B. S. ), McGraw-Hill, New York, pp. 295-321
Powell, W. W., Koput, K. W. and Smith-Doerr, L. (1996), "Inter-organizational Collaboration and the Locus of Innovation: Networks of Learning in
244

Biotechnology", Administrative Science Quarterly, 4 1, pp. 116-145.
Prahalad, C. K. and Bettis, R. A. (1986), "The Dominant Logic: A New Linkage between Diversity and Performance", Strategic Management Journal, 7 (6), pp. 485-501.
Ragatz, G L., handfield, R. B. and Scannell, T. V. (1997), "Success Factors for Integrating Suppliers into New Product Development", Journal ofProduct
" Innovation Management, 14, pp. 190-202. Ricie, M. P., O'Connor, G C., Peters, L. S. and Morone, J. G. (1998), "Managing
Discontinuous Innovations", Research Technology Management, 41 (3), pp. 52-58.
Rothwell, R. (1986), "Innovation and Re-Innovation", Journal ofMarketing Management, 2 (2), pp. 109-123.
Rothwell, R. (1992), "Successful Industrial Innovation: Critical Factors for the 1990s' R&D Management", R&D Management, 22 (3), pp. 221-239.
Rothwell, R. and Dodgson, M. (1991), "External Linkages and Innovation in Small
and Medium-Sized Enterprises", R&D Management, 21 (2), pp. 125-137. Rothwell, R., Freeman, C., Horseley, A., Jervis, V. T., Roberton, A. B. and Townsend,
J. (1974), "SAPPHO Updated - Project SAPPHO, Phase IP, Research Policy, 3,
pp. 258-291.
Sakakibara, M. (1997), "Heterogeneity of Firm Capabilities and Cooperative Research and Development: An Empirical Examination of Motives", Strategic Management Journal, IS (Summer Special Issue), pp. 143-164.
Samuels, R. J. (1994), "Pathways of Technological Diffusion in Japan", Sloan Management Review, (Spring), pp. 21-34.
Sanchez, A. H. and Elola, L. N. (199 1), "Product Innovation Management in Japan", Journal ofProduct Innovation Management, 8 (1), pp. 49-56.
Saxenian, A. (199 1), "The Origins and Dynamics of Production Networks in Silicon Valley", Research Policy, 20, pp. 423-437.
Schumacker, R. E., and Lomax, R. G. (1996), A Beginner's Guide to Structural LI - Lquation Modeling, L. ErIbaum Associates, Mahwah, N. J.
Sen, F. and Rubenstein, A. H. (1989), "External Technology and In-House R&D
1, - Facilitative Role", Journal ofProduct Innovation Management, 6 (2), pp. 123-138.
Senge, P. M. (1990), The Fifth Discipline, Doubleday, New York. Shan, W. (1990), "An Empirical Analysis of Organizational Strategies by
Entrepreneurial High-Technology Firms", Strategic Management Journal, 11, pp. 129-139.
Shan, W., Walker, G. and Kogut, B. (1994), "Inter-firm Cooperation and Startup
245

Innovation in the Biotechnology Industry", Strategic Management Journal, 15,
pp. 387-394. Sharma, S., Durand, R. M. and Gur-Arie, 0. (198 1), "Identification and Analysis of
, Moderator Variables", Journal ofMarketing Research, 18 (August), pp. 291-300.
Shenkar, 0. and Li, J. (1999), "Knowledge Search in International Cooperation",
_. Organization Science, 10 (2), pp. 134-143.
Sher, J. P. (1998), Technology Assimilation as A Leveraging Strategy: The Case of Taiwanese Firms, Unpublished PhD Thesis, University Warwick, Warwick, UK.
Shrivastava, P. (1983), "A Typology of Organizational Learning Systems", Journal of Management Studies, 20 (1), pp. 7-28.
Shrivastava, P. and Schneider, S. (1984), "Organizational Frames of Reference", Human Relations, 37, pp. 795-807.
Sinha, D. K. and Cusumano, M. A. (1991), "Complementary Resources and Cooperative Research: A Model of Research Joint Ventures Among Competitors", Management Science, 37 (9), pp. 1091-1106.
Simon, H. A. (199 1), "Bounded Rationality and Organizational Learning", Organization Science, 2, pp. 125-133.
Sinkula, J. M., Baker, W. E. and Noordewier, T. (1997), "A Framework for Market-Based Organizational Learning: Linking Values, Knowledge, and Behavior", Journal of the Academy ofMarketing Science, 25 (4), pp. 305-318.
Sivadas, E. and Dwyer, F. R. (2000), "An Examination of Organizational Factors Influencing New Product Success in Internal and Alliance-Based Processes", Journal ofMarketing, 64 (January), pp. 31-49.
Skinner, B. F. (1938), The Behavior of Organisms: Experimental Analysis, Appleton-Century-Crofts, New York.
Song, N. M. and Parry, M. E. (1992), "The R&D Marketing Interface in Japanese High-technology Firms", Journal ofProduct Innovation Management, 9, pp. 91-112.
Song, X. M. and Parry, M. E. (1996), "What Separates Japanese New Product' Winners From Losers", Journal ofProduct Innovation Management, 13, pp. 422-439.
Song, X. M. and Parry, M. E. (1997), "The Determinants of Japanese New Product Successes", Journal ofMarketing Research, 34 (February), pp. 64-76.
Song, X. M., Souder, W. E. and Dyer, B. (1997), "A Causal Model of the Impact of Skills, Synergy, and Design Sensitivity on New Product Performance",, Journal ofProduct Innovation Management, 14, pp. 8 8- 10 1.
Souder, W. E. and Chakrabarti, A. K. (1979), "Industrial Innovations: A Demographical Analysis", IEEE Transactions on Engineering Management, 26
246

(4), pp. 10 1- 109.
Southwood, K. E. (1978), "Substantive Theory and Statistical Interaction: Five
Models", American Journal ofSociology, 83, pp. 1154-1203. Stata, R. (1989), "Organizational Learning: The Key to Management Innovation",
Sloan Management Review, 30 (3), pp. 63-74.
Stock, G. N., Greis, N. P. and Fisher, W. B. (2001), "Absorptive Capacity and New Product Development", The Journal offfigh Technology Management Research, 12, pp. 77-91.
Suarez, F. F. and Utterback, J. M. (1995), "Dominant Design and The Survival of Fin-ns", Strategic Management Journal, 16, pp. 415-430
Subramaniam, M. and Venkatraman, N. (2001), "Determinants of Transnational New Product Development Capability: Testing the Influence of Transferring and Deploying Tacit Overseas Knowledge", Strategic Management Journal, 22, pp. 359-378.
Summers, J. 0. (2001), "Guidance for Conducting Research and Publishing in
,, Marketing: From Conceptual ization Through the Review Process", Journal of the Academy ofMarketing Science, 29 (4), pp. 405-415.
Szulanski, G. (1996), "Exploring Internal Stickiness: Impediments to the Transfer of Best Practice within the Firm", Strategic Management Journal, 17, pp. 27-43.
Takeishi, A. (2001), "Bridging Inter- and Intra-Firm Boundaries: Management of Supplier Involvement in Automobile Product Development", Strategic Management Journal, 22, pp. 403-433.
Teece, D. J. (1986), "Profiting from Technological Innovation: Implications for
Integration, Collaboration, Licensing and Public Policy", Research Policy, 15, pp. 285-305.
Teece, D. J. (1992), "Competition, Cooperation and Innovation: Organizational Arrangements for Regimes of Rapid Technological Progress", Journal of Economic Behavior and Organization, 18 (1), pp. 1-25.
Tidd, J., Bessant, J. and Pavitt, K. (1997), Managing Innovation: Integrating Technological, Market and Organizational Change, John Wily & Sons Ltd., West Sussex, England.
Tidd, J. and Trewhella, M. (1997), "Organizational and Technological Antecedents for Knowledge Acquisition", R&D Management, 27, pp. 135-148.
Tsai, W. (2001), "Knowledge Transfer in Intraorganizational Networks: Effects of Network Position and Absorptive Capacity on Business Unit Innovation and Performance", Academy ofManagement Journal, 44 (5), pp. 996-1004.
Tu, Q. (1999), Achieving Mass Customization through Technology Application and i Absorptive Capacity: A Customer- Oriented Framework, Doctoral Dissertation,
247

The University of Toledo, Toledo, Ohio.
Tunisini, A. and Zanfei, A. (1998), "Exploiting and Creating Knowledge through Customer- Supplier Relationships: Lessons from A Case Study", R&D Management, 28 (2), pp. 111- 118.
Tushman, M. L. (1977), "Special Boundary Roles in the Innovation Process", Administrative Science Quarterly, 22, pp. 587-605.
Tushman, M. L. and Anderson, P. (1986), "Technological Discontinuities and
ýý Organizational Environments", Administrative Science Quarterly, 24 (2), pp. 289-305.
Tushman, M. L. and Scanlan, T. J. (198 1), "Boundary Spanning Individuals: Their Role in Information Transfer and Their Antecedents", Academy ofManagement Journal, 24 (2), pp. 289-305.
Underwood, B. J. (1964), "The Representation of Role Verbal Learning", In Categories ofHuman Learning (Ed, Melton, A. ), Academic Press, New York, pp. 47-78
Utterback, J. M. and Abernathy, W. J. (1975), "A Dynamic Model of Product and Process Innovation", Omega, 36, pp. 639-656.
Venkatraman, N. (1989), "The Concept of Fit in Strategy Research: Toward Verbal
and Statistical Correspondence", Academy ofManagement Journal, 14 (3), pp. 423-444.
, Veugelers, R. (1997), "Internal R&D Expenditures and External Technology Sourcing", Research Policy, 26 (3), pp. 303-315.
, von Hippel, E. (1976), "The Dominant Role of Users in the Scientific Instrument Innovation Process", Research Policy, 5, pp. 212-239.
von Hippel, E. (1978), "Successful Industrial Products From Customer Ideas",
Journal ofMarketing, 40 (January), pp. 39-49.
, Von Hippel, E. (1986), "Lead Users: A Source of Novel Product Concepts", Management Science, 32 (7), pp. 791-805.
von Hippel, E. (1988), The Sources ofInnovation, Oxford University Press, New York.
von Hippel, E. (1994), "'Sticky Information' and the Locus of Problem Solving: Implications for Innovation", Management Science, 40 (5), pp. 429-439.
von Hippel, E. (1998), "Economics of Product Development by Users: Impact of "Sticky" Local Information", Management Science, 44 (5), pp. 629-644.
.Q Wallace, R. S. and Mellor, C. J. (1988), "Nonresponse Bias in Mail Accounting Surveys: A Pedagogical Note", British Accounting Review, 20, pp. 131-139.
Wigand, R. T. and Frankwick, G. L. (1989), "Inter-Organizational Communication and Technology Transfer: Industry-Government-University Linkages", International
248

Journal of Technology Management, 4 (1), pp. 63-76.
Wong, V., Shaw, V. and Sher, P. J. H. (1998), "Effective Organization and Management of Technology Assimilation: The Case of Taiwanese Information
I Technology Firms", Industrial Marketing Management, 27, pp. 213-227. Wu, C. (2000), Product Innovation Types, Departmental Involvement and New
Product Performance: An Empirical Study, Unpublished PhD Thesis, National Chang-Chi University, Taipei, Taiwan.
Zedeck, S-0 97 1), "Problems with The Use of "Moderator" Variables", Psychological Bulletin, 76 (4), pp. 295-3 10.
Ziger, B. J. and Maidique, M. A. (1990), "A Model of New Product Development: An Empirical Test", Management Science, 36 (7), pp. 867-883.
249

Appendix A
Survey Questionnaires and Cover Letters
250

External Linkages, Absorptive Capacity and Product Innovativeness
(Questionnaire for R&D Executives or Project Team Leaders)
General Instructions The unit of this research is a new product development project. External linkage refers
to the joint activities and relationships created together with external partners such as
customers, suppliers or universities during the period of project development. Please
on (1) the situations of a particular, individual new product ched within last three years, and (2) one such project tha
ed with.
This questionnaire is divided into five sections. Each question ask you to choose the
alternative that best fits your views on the topic. We estimate that it will take about 30
minutes to complete the questionnaire. No additional file search is needed to answer the questions. The information provided will be treated in the strictest confidence. your responses will entere in a coded format and only be used to aggregated statistical
analyses.
Section 1 General Information
For the following set of questions please tick that category which best describes your firm's situation. Where a blank is left, please complete the answer.
1. Your job title:
2. How many years have you been involved in a company's new product project management ?
Years
3 Please indicate what year the new product of this project (which you refer to il in e following fI th
questions) was launched. DOCIO
4. - Please indicate the category that best describes your product type:
0 Components/parts, 0 Sub-assemblies, 0 Software, 0 System Products Size of your company:
(a) Approximate number of total employees:
- in R&D department:
(b) Annual Sales in 1999: - million NT$
6. What is R&D expenditure as a percentage of total sales in your company?
7. For which quality standards is your company certificated (tick all that apply)? 13 IS09001 0 IS09002 IIIS014000
0 Others (Please specify)
251
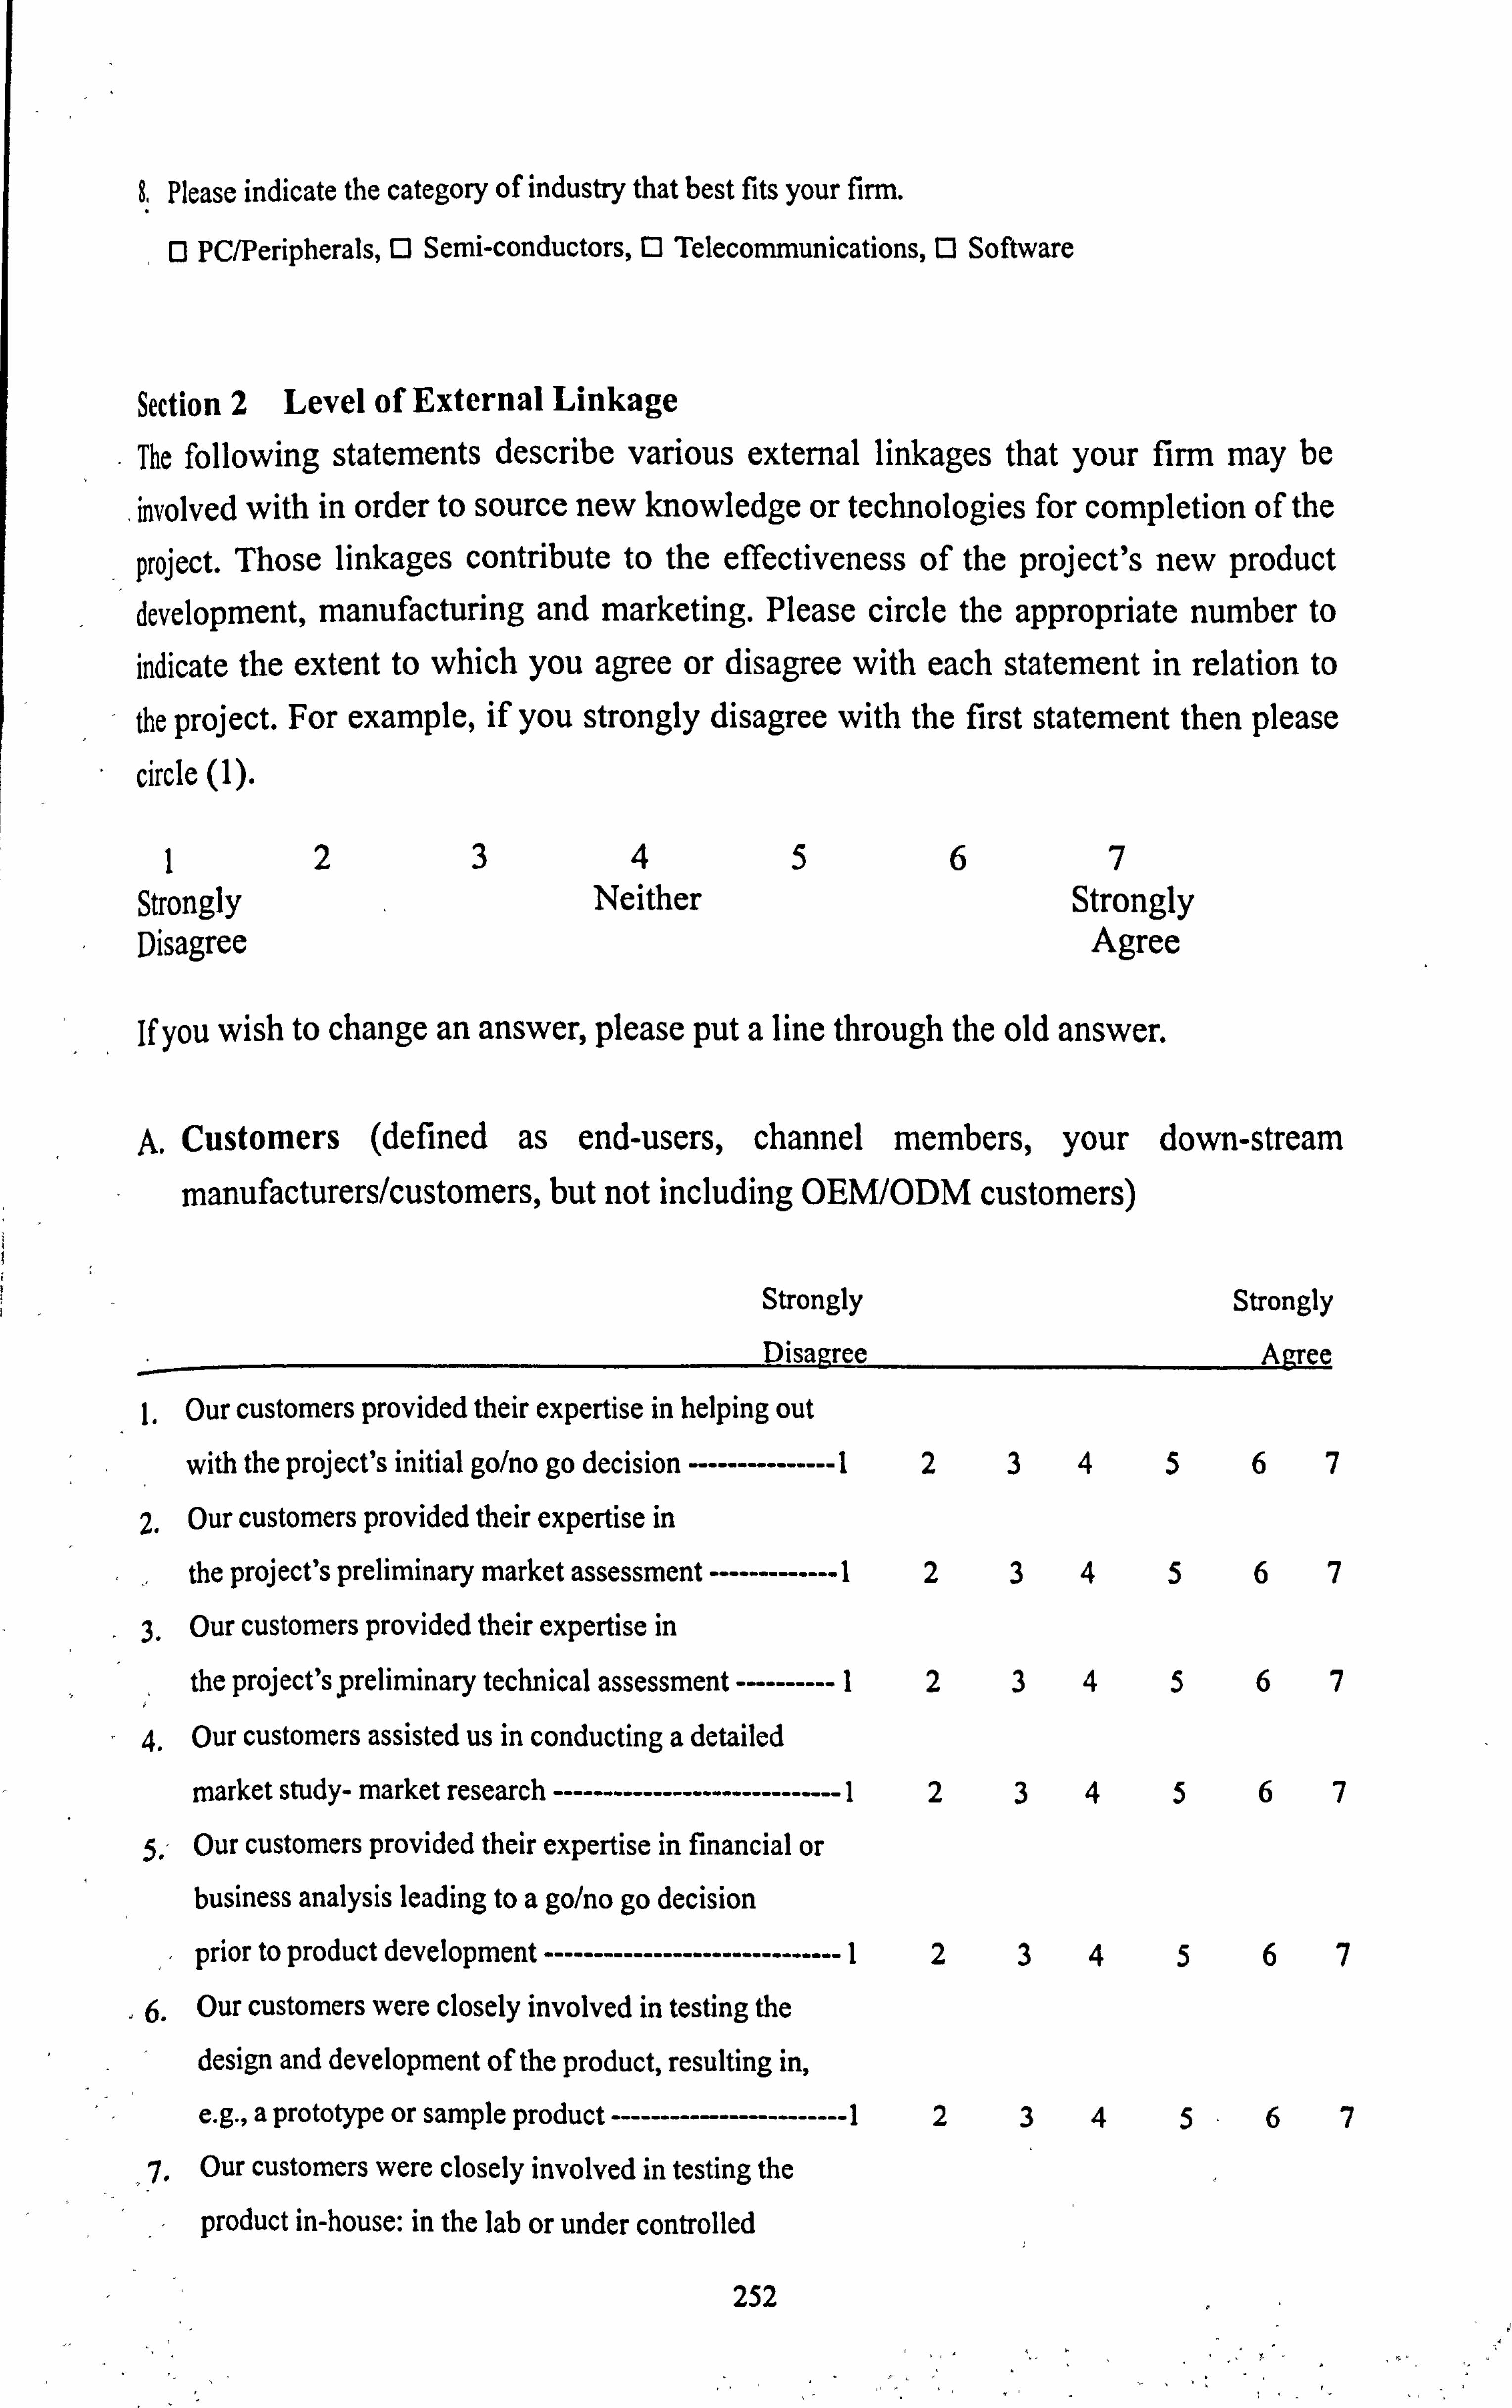
8, Please indicate the category of industry that best fits your firm.
[3 PC/Peripherals, 13 Semi-conductors, 13 Telecommunications, 0 Software
Section 2 Level of External Linkage
The following statements describe various external linkages that your firm may be
involved with in order to source new knowledge or technologies for completion of the
project. Those linkages contribute to the effectiveness of the project's new product development, manufacturing and marketing. Please circle the appropriate number to
indicate the extent to which you agree or disagree with each statement in relation to
the project. For example, if you strongly disagree with the first statement then please
circle (I).
1234567 Strongly Neither Strongly Disagree Agree
ýý if you wish to change an answer, please put a line through the old answer.
A. Customers (defined as end-users, channel members, your down-stream
manufacturers/customers, but not including OEM/ODM customers)
Strongly
Disajzree
Strongly
Agree
Our customers provided their expertise in helping out
with the project's initial go/no go decision --------------- 1 234567
2. Our customers provided their expertise in
the project's preliminary market assessment ------------- 1 234567
Our customers provided their expertise in
the project's preliminary technical assessment ---------- 1 234567
4. Our customers assisted us in conducting a detailed
market study- market research ----------------------------- 1 234567
5., Our customers provided their expertise in financial or business analysis leading to a go/no go decision
prior to product development ------------------------------ 1 234567
, 6. Our customers were closely involved in testing the
design and development of the product, resulting in,
e. g., a prototype or sample product ------------------------ 1 234567
7. Our customers were closely involved in testing the
product in-house: in the lab or under controlled
252

conditions ---------------------------------------------------- 1
8. ' Our customers were closely involved in testing the
product under real life conditions, e. g., with customers
and/or in the field --------------------------------------------- I
9. Our customers provided their expertise in the product's
test market/trial sell ------------------------------------------ I
10. Our customers were closely involved and provided
their expertise in a trial production run to test the
product facilities ---------------------------------------------- I
Our customers were closely involved in financial
analysis, following product development but prior to
full-scale production ---------------------------- - ----------- 1
12. Our customers were closely involved and provided
their expertise in the start-up of full-scale production -- 1
13. Our customers were closely involved and provided
their expertise in the launch of the product ------------- I
]3. Suppliers
234567
234567
23z, 567
234567
2 3 4 5 6 7
2 3 4 5 6 7
2 3 4 5 6 7
Strongly
Disagree
Strongly
Agree
I our suppliers provided their expertise in helping out
with the project's initial go/no go decision -------------- 1234 567
2. our suppliers provided their expertise in
the project's preliminary market assessment ------------- 1234 567
3. our suppliers provided their expertise in
the project's preliminary technical assessment ---------- 1234 567
4. our suppliers assisted us in conducting a detailed
market study- market research ----------------------------- 1234 567
5. our suppliers provided their expertise in financial or
business analysis leading to a go/no go decision
prior to product development ------------------------------ 1234 567
6. our suppliers were closely involved in testing the
design and development of the product, resulting in,
e. g., a prototype or sample product ------------------------ 1234 567
7. our suppliers were closely involved in testing the
product in-house: in the lab or under controlled
conditions ---------------------------------------------------- 1234 567
8. Our suppliers were closely involved in testing the
253

I product under real life conditions, e. g., with customers
and/or in the field --------------------------------------------- I
9. Our suppliers provided their expertise in the product's
test market/trial sell ------------------------------------------ I
10. Our suppliers were closely involved and provided
their expertise in a trial production run to test the
product facilities ------------------------------------- - ------- I
11. our suppliers were closely involved in financial
analysis, following product development but prior to
full-scale production ----------------------------------------- I
12. Our suppliers were closely involved and provided
their expertise in the start-up of full-scale production -- I
13. Our suppliers were closely involved and provided
their expertise in the launch of the product ------------- I
234567
234567
234567
2 3
2 3
2 3
C. Third-party Companies
(Third-party companies here are defined as firms that are either non-competitors of
your firm, which have had some sort of contracted or non-contracted relationship
with the project, such as OEM/ODM customers, and have contributed their expertise to the development of the project. ) If the situation not applicable, please tick the left
box D. Strongly
Disagree
Strongly
Agree
1. Our cooperating companies provided their expertise in
helping out with the project's initial
go/no go decision ------ - ------------------------------------- 1 234567
2. Our cooperating companies provided their expertise in
the project's preliminary market assessment ------------- 1 234567
I Our cooperating companies provided their expertise in
the project's preliminary technical assessment ---------- 1 234567
4. Our cooperating companies assisted us in conducting
a detailed market study- market research ----------------- 1 234567
5. Our cooperating companies provided their expertise in
financial or business analysis leading to a go/no go decision prior to product development -------------- 7 ----- 1 234567
6. - Our cooperating companies were closely involved in
testing the design and development of the product,
resulting in, e. g., a prototype or sample product --------- 1 234567
254

7. Our cooperating companies were closely involved in
testing the product in-house: in the lab or under
controlled conditions ----------------------------------------- 1
8. Our cooperating companies were closely involved
in testing the product under real life conditions, e. g.,
with customers and/or in the field ---------- - -------------- 9. Our cooperating companies provided their expertise
in the product's test market/trial sell --------------------- I
10. Our cooperating companies were closely involved
and provided their expertise in a trial production run
to test the product facilities --------------------------------- I
11. Our cooperating companies were closely involved
in financial analysis, following product development
but prior to full-scale production --------------------------- I
12. Our cooperating companies were closely involved and
provided their expertise in the start-up of
full-scale production ---------------------------------------- 1
13. Our cooperating companies were closely involved and
provided their expertise in the launch of the product --- I
234567
234567
234567
234567
234567
234567
234567
Universities (If not applicable, please tick the left box Strongly
Disagree
Strongly
Agree
The university with which we cooperated on the project
provided their expertise in helping out with
the project's initial go/no go decision --------------------- 1234 567
2. The university with which we cooperated on the project
provided their expertise in the project's preliminary
market assessment ------------------------------------------- 1234 567
, 3. The university with which we cooperated on the project
provided their expertise in the project's preliminary
technical assessment ---------------------------------------- 1234 567
4. The university with which we cooperated on the project
assisted us in conducting a detailed market study
market research -------------------------------------------- 1234 567
5. The university with which we cooperated on the project
provided their expertise in financial or business analysis
leading to a go-no go decision
255

prior to product development ----- - ----------------------- 1 234567
6. The university with which we cooperate on the project
was closely involved in testing the design and development of the product, resulting in, e. g.,
a prototype or sample product ----------------------------- 1 234567
7. The university with which we cooperated on the project
was closely involved in testing the product in-house:
in the lab or under controlled conditions ------------------ 1 234567
8. The university with which we cooperated on the project
was closely involved in testing the product under real life
conditions, e. g., with customers and/or in the field ------ 1 234567
9, The university with which we cooperated on the project
provided their expertise in the product's
test market/trial sell ---------------------- - ------------------ 1 234567
10. The university with which we cooperated on the project
was closely involved and provided their expertise in a trial production run to test the product facilities ----- 1 234567
11. The university with which we cooperated on the project
was closely involved in financial analysis, following
product development but prior to full-scale production-1 234567
12. The university with which we cooperated on the project
was closely involved and provided their expertise in the start-up of full-scale production -------------------- 1 234567
13. The university with which we cooperated on the project
was closely involved provided their expertise in the launch of the product --------------- - --------------- 1 234567
]E. Research Institutes (If not applicable, please tick the left box Strongly Strongly
Disapree Ajzree
The research institute with which we cooperated on
the project provided their expertise in helping out
with the project's initial go/no go decision --------------- 1 234567
2. The research institute with which we cooperated on
the project provided their expertise in
the project's preliminary market assessment ------------- 1 2 3- 456,7 The research institute with which we cooperated on
the project provided their expertise in the project's
256

preliminary technical assessment -------------------------- 1234567
4. The research institute with which we cooperated on
the project assisted us in conducting a detailed
market study- market research ----------------------------- 1234567
5., The research institute with which we cooperated on
the project provided their expertise in financial or business analysis leading to a go/no go decision
prior to product development ------------------------------ 1234567
6. The research institute with which we cooperated on
the project was closely involved in testing the design and development of the product, resulting in, e. g.,
a prototype or sample product ---------- - -- - ------------- 1234567
7. The research institute with which we cooperated on
the project were closely involved in testing the product in-house: in the lab or under controlled conditions ------ 1234567
8. The research institute with which we cooperate on
the project were closely involved in testing the product
under real life conditions, e. g., with customers
and/or in the field --------------------------------------------- 1234567
9. The research institute with which we cooperated on
the project provided their expertise in the product's
test market/trial sell ------------------------------------------ 1234567
10. The research institute with which we cooperated on the
project was closely involved and provided their
expertise in a trial production run to test the product facilities ------------------------------------------------------- 1234567
The research institute with which we cooperate on the
project was closely involved in financial analysis, following product development but prior to full-scale
production ----------------------------------------------------- 1234567
12. The research institute with which we cooperated on
the project was closely involved and provided
their expertise in the start-up of full-scale production -- 1234567
13. ' The research institute with which we cooperated on
the project was closely involved and provided
their expertise in the launch of the product -------------- 1234567
257

Section 3 Gains in New Product-related Knowledge
This section presents a set of NPD activities. Please circle the appropriate number to indicate the extent of your project team's familiarity with each activity prior to and
after the project. (Before the project) (After the project) Very Very Very Very
low high low hiah
1. Preliminary market assessment ------------------ 12 345671234567
2. Market trend study or market research ---------- 12 345671234567
3. Handling the customer test of prototype -------- 12 345671234567
4. New product screening techniques -------------- 12 345671234567
5. 'After-service analysis for the new product ----- 12 345671234567
6. Detailed market study/market research --------- 12 345671234567
7. Executing test market prior to mass launch ---- 12 345671234567
8. introducing the new product into the target
marketplace - selling, promoting and distributing the products -------------------------- 12 345671234567
9., Preliminary assessment of R&D technologies 12 345671234567
10. Defining and analysing the new product's differential features -------------------------------- 12 345671234567
11. Detailed product design and development ------ 12 345671234567
12. Building the engineering control file for the
new product's detailed specifications
and its revision -------------------------------------- 12 345671234567
13. Evaluating lab tests to determine basic
performance against specifications of
the product ----------------------------------------- 12 345671234567
14. Executing prototype or 'in-house' sample
product testing of the product ------------------- 12 345671234567
15. Determining the final product design and
specifications of the product -------------------- 12 345671234567
16. Working continuously on cost reduction and " better quality and features ----------------------- 12 345671234567
17. Conducting preliminary manufacturing
assessment of the product ------------------------ 12 345671234567
18. Executing trial/pilot production of the
product --------------------------------------------- 12 34567 1ý 234,5 67
258

19. Conducting production start-up of
the product ---------------------------------------- 12345671234567
20. Controlling and manufacturing quality of
the product ---------------------------------------- 12345671234567
21. Our overall familiarity with the new product's
technologies --------------------------- - --------- 12345671234567
Section 4 Product Newness
The following statements describe the level of your firm's familiarity with the product
of this project in comparison with the existing product range. Please circle the
appropriate number to indicate the extent to which you agree or disagree with each
statement as applicable to the product. Strongly Strongly
Disagree Aizree
I.. ' in comparison with other existing product ranges,
product class of the project is new to our firm ----------- 12 34567
2. In comparison with other existing product ranges,
product use (need served) of the project is new to
our firm ------------------------------------------------------- 12 34567
3. In comparison with other existing product ranges,
the product's competitors are new to our firms --------- 12 34567
4. In comparison with other existing product ranges,
the product's potential customers are new to
our firm ------------------------------------------------------- 12 34567
5. In comparison with other existing product ranges,
the product's production process is new to our firm ---- 12 34567
6. In comparison with other existing product ranges,
the product's technology is new to our firm ------------- 12 34567
-7- In comparison with other existing product ranges,
the product's channel and sales forces are new to
our firm -------------------------------------------------------- 12 34567
8., - In comparison with other existing product ranges, the product's advertising and promotion are new to
our firm -------------------------------------------------------- 12 34567
91 overall, product newness of the project is very high ---- 12 3456,7
259

Section 5 Level of Absorptive Capacity The following statements describe typical characteristics of a firm's capacity to absorb new knowledge and technology. Please circle the appropriate number to indicate the extent to which you agree or disagree with each statement as applicable to your organization.
Strongly Strongly DisaRree Asuee
The overall technical knowledge of our first-line engineers is high ------------------------------ 1 234567
2. The general knowledge level of our first-line engineers is high ------------------------------ 1 234567
3. The knowledge of our managers is adequate when solving technical problems --------------------------- 1 234567
4. The knowledge of our managers is adequate when dealing with new technology ------------------------ 1 234567
5. The general educational or technical level of our first-line engineers is high ------------------------------ 1 234567
6. The overall job competence of our first-line
engineers is high ---------------------------------------------- 1 234567
7. The knowledge of our managers is adequate when making business decisions --------------------------- 1 234567
8. We seek to learn from benchmarking best practices in our industry ------------------------------------------------- 1 234567
9. We seek to nurture boundary spanners for various new technologies ---------------------------------------------- 1 234567
10. Our project members tend to trust each other ------------- 1 234567
11. Our project members are supportive of each other ------- 1 234567
12. We seek to learn from trying out new technologies ------ 1 234567
13. We seek to learn from our customers and suppliers ------ 1 234567
14. Our project members share ideas freely with each other-I 234567 15. The communications among functional areas are
extensive ------------------------------------------------------- 1 234567 16. Our employees have a strong feeling of belonging
to our organisation ------------------------------------------- 1 234567 17. The communications between supervisors and
their subordinates are extensive --------------------------- 1 234567 18. We seek to learn from tracking new market trends
in our industry ------------------------------------------------- 1 234567
260

19. ' We seek to learn from systematically collecting
new technologies --------------------------------------------- 1 234567
20. We seek to nurture gatekeepers for various
new technologies ---------------------------------------------- 1 234567
21. The communications among our firm's functional areas
are frequently -------------------------------------------------- 1 234567
22. There is frequent communications between supervisors
and their subordinates ---------------------------------------- 1 234567 S-
23. ' The communication of new ideas from one department to another is extensive ------------------------- 1 234567
24. in general, all members in the project are equipped with
the ability to explore and absorb new knowledge --------- 1 234567
End of Questionnaire Thank you for your assistance with this research. If you wish to receive a summary of the research findings, please enter your name and address below or attach a business
card.
Name: Tel. No.:
Company Name:
Address:
261

&, 2 Ath A VIA 1212
If 7VT
A0 All 7VT
0- At -9 - <lp- Ir * RT ru
12 4* A *AJA, 9) fol t&
-A %112 it If It r-9 44ý* -T 0 ; pf*-IL *
ag
Alt
(2) J7JJ I:.. iti:
& "h4 -e #, 41
* A-P #: T; pf %M-M If ým M /4*- r]. halT S, I tit-11Z 0, AM A &'1113k
J-- 4t tA At t-[ (Dxff A 144 4 ft: A SL AaZ- 44 41A 4ý 444 ký A $, 14 Loughborough
University fri4lff Z 4,,, u )
-* *,, S* Ilk 0 (a) 44, AA-4:
12,9
Alit El -1: b-4 m fa-1111-4 El hý, Akh-va E-14tti
(; k. 0) It:!: gp'fl (a) Mk A -T-
), tt
, (b) 2000* fk, Ae, :
lw A $4 -1,,. %11
-3: - 4t J
A v'2rp; % It 4* R L-ý 0
%
Li ISO 9001 ISO 9002 El ISO 14000 E]jt, 7.1%
262

L* A&E AW1 Yll -e- IM 4, X it ' 4, e, 4t lf, lf `ýý a--1 iMt AAX9*4t He , .4t9 , -4avxý , er
. 4. Miiie(9p : e41-41ýtli - V-it4-týtli , e4A4iýti) ,
41- ffi it 4f 0, &1*-* -41 if If T P1.8-41491 A SL ( AAAIý lip
17
;i, 410,9--1 li ' 0' te-4 93 Ire-/ UN p9 413A m. OEM/ODM4Ae) . Z-ý
0 ;9 40 0
1., 1 2 3 4 5 6 7 1 2 3 4 5 6 7
3.14 IP -41- 4T 1* 1 2 3 4 5 6 7
4. 1 2 3 4 5 6 7 5.44 (A iU T MA 1 2 3 4 5 6 7
U Wat A,. r, ff 0 1 2 3 4 5 6 7 1 2 3 4 5 6 7
2 3 4 5 6 7 9. AM 1 2 3 4 5 6 7 lo. itxh- - 1 2 3 4 5 6 7 I -. -L
I A"T 40 am Z- -M Ar. Jý- 41 - 1 2 3 4 5 6 7
-12. " 1 2 3 4 5 6 7 va 13-ýAA " J---4F 0 1 2 3 4 '5 6 7
A'm 0 gf A
tt x& Xb ý t- t
j. 234567
263

2-47-tVlfllfl*ýý-irr 0 1 2 3 4 5 6 7
3 . 14 IPAAIITI*ýý-* 0 1 2 3 4 5 6 7
4. im M 4ý zff Pu 2 3 4 5 6 7
5. tý (-I, itf T- 2 3 4 5 6 7
2 3 4 5 6 7
7., T2, $11 2 3 4 5 6 7 2 3 4 5 6 7
9. tkih - 1 2 3 4 5 6 7
10. 1 2 3 4 5 6 7
su 40 3A -t wem, 1 2 3 4 5 6 7
12. A -1 A -t 11 SL - 1 2 3 4 5 6 7
3.44 AA -L
1 2 3 4 5 6 7
C. OENVODM A A* -TA4k#vA, - 1-1 ili) -t-A #A* A JR, PHI 1-1 It TýI ; tTt -, -"U
W-1 ;A AV T- it A V, - UFA*-* It it 4ttr-ItT A]: AT 1-13 14 H'kS)
1. 1 2 3 4 5 6 7
2. 1 2 3 4 5 6 7
3. 1 2 3 4 5 6 ,7
. 4. Pf 1 2 3- 4 5 6 T Tý- ýý- 4rF (-Jt' -Tý -T -rT ---t 1'- 2 3 4 5 6 7
412-T- 411110 A Iff 1 2 3 4 5 6 7
7. -% 2ý (--OA 42 *1 If-, A T) 't 41- ýT 11 Vt a 1 2 3 4 5 6 7
8. M 011,44 - 1 2 3 4 5 6 7
9. 1 2 3 4 5 6 7 Io 1 2 3 4 5 6 7 il. -L
40 am $i 1 2 3 4 5 6 7 12 -tL 0 1 2 3 4 51 6 7 13. Ah-%W-h-, V0 1 2 3 4 5ý 6 7

gLPý7*i, 7*ýXL? 7-47*1 (
"b --1-9 M'W l* '* tM fe '*
4e) JL, l13 *
UA Of
I-Iýz it M VM All *. * *Witt[ItT : 11 Av : E: l ,AT1 -13 A El M. -P
1234567 44 IP I jilif I* 44T 0 1234567
, 1473 10* Aký 'I"T 4* ýN4 " 1234567
4. V Xff 1234567
Ot 5. 1234567
- AM- --t $)LI 1)
6. Xv -T- I11,15'! 1t 01; 9 11 1234567 U All A 1234567
1234567 1234567
- 10. -s-A A- 1234567 1234567
1234567 13.0 1234567
E -Ail it -AIf*'QTrL* (4PJk'-f- IfftM**) 4L. M QT*tA*A_ 4mmt- AITM; * t A SAM AA flil A
I**a -#-, to tT *a &A PA * P 71 AT 1-13 14 M kA.
1234_, 5 67 44T 0 12345,6 7
3 tV iLlk: it 4* ýý- 41 . . 1234567 4. im -0 Ir XJf PL 0 1234567 5. AM -4
14ýý-44 (IM' TIPA A 1234567 OIL
12345,6 7
-t 12345 -6
7 9- It M 11 "A 123.6 7
-9., 12 -3 - 4, -567
II, "-- 10. RA '. 12ý3 4- 5' 67
265

3.
1 2 3 4 5 6 7
1 2 3 4 5 6 7 1 2 3 4 5 6 7
-I- Ai 41 If SL 1
_4 4FL a rL In If 7E. rA J-- IL
100%, 1-t- , wl P, 4= TAu, otit! Pq AIM -M., A31 i8i, T4 I lik
jffTLf&OEM/ODM4A9
13. -#, LA -9
ý rLy
OEM/ODM rol
ru -* wit tý -, ýý' -, ý,
kde -, Z hz, -: 10 0%
-F PI 20 TA If AM &Vr AT It "k r-I A tik 44 A X7 -t
* Ff F1 0- , If
10 J& oil I* AL ý--- -L- AA k -qr 9% mi w Ali) k-4t A fu AIX)
1 2 3 4 5 6 7 1 2 3 4 5ý 6 7 2. 1 2 3 4 5 6 7 1 2 3 4 5 6 7
012 A If IFITAMA-ALM, *ýý-4fr 1 2 3 4 5 6 7 .1
2 3 4 5' 6 7
'4. iff 1 2 3 4 5 6 7 1 2 3 4 5 6 7
5. t 1ARA 1 2 3 4 S 6 7, 1 2 3 4' 5' 6' 7 6. to M li * Pf 1 2 3 4 5 6 7 1 2 3 4 5 6 7 7., ;kI -E -Ir
Ilt 1 1 2 3 4 5 `6 7' 1 2 3 4' 5 6 7
1 2 3 4 5 6 7 1 2 3 4 5 6 7
9. 2 3 4 5 6 7 1 2' 3 4, 5 ,6 7
266

1% AM AIT) (AL 10. OF 1234567 1234567
fie 1234567 1234567
12. t-tL&AA-J`12A4&llTXAL 1234567 1234567
If WX A% 2ý AI Alf a11234567 1234567 A0 lb-
k1b k4
4.3 L/` v"%3 ( -A
4, ý *A) -'- A 11 A12'34567 1234567
5. IT 1234567 1234567
16. AT Fý -AL loP It A41234567 1234567
"It ex 17. In IP X 1VT 4iii'llf 4* 1234567 1234567
18. AX/gh--ý-'VOt 1234567 1234567
19. P- fE -P, - 0 ; k'l AA 4tL #Lj 1234567 1234567
go T 20.1 234567 1234567
21 44 A ull-ý-ROLT I-"- f! IA All Ax- 1234567 1234567
A A JOALMA
vao t Iý M- A. 0 tt f-r* -
TZ A-1 Al 1. If * "k 61 irn 8, &Al
$4 A- Z11 1234567
L 2. If 61 frill, M AT AA2 . 4ý 1234567
i ra - 82- 11, A $4 A
vva; týftj 1234567
II oi-440, a+* - '4. 1234567
Vr 5
-'ý If i1i I. - A
ý4 A J12 IAV li 4t #Lf A: )j ýk, 123,4 567
6. A J'a --t -M lt Al *R OLT A: /1 1214 5- 67
ýN40- -SIXII-ItAM4, U4 7. If 6-1 tru ý4 A JR2 A 4ý t 1234567
A. I18. If 69. NO IS' I IPW A 1234567
91 If Ik rl, rr 1i -Ek MA
Vol 12
-3 -4 .5 -6 7
267
N

a it Tji m az ot
#
T- TZ
AA A- A- A- 1.4tjFjO- -T-jYL9ý; Ljjkj%7ý-*O- - 1234567
2. A IM 0- -T- U4 -JL, 14 A *- iý 0 AVA 1234567
3.1; -4
0, L 41 #1 F-I MA 111 ; L, 44 A ^w- 00 &1 6, - 1234567
4. It 01 A IM -A E If- 14 iaa 0- -10 IS A0 1234567
5. R#Lf 'Aý if, 4 it 1234567
6. A 14 67L 10, A Pý h0 1234567
7- n- I$ AL 1 1234567 1234567
1234567
-- 10. -1krl,; qf*4L OTIWkiblM41- - 1234567
11. - 1234567 1234567
13. A IM *A 16 4 "M -V- A IJIL, A- M- A- 4-ý V* 1234567
14. EW+, 2UJqf4AR, 0 1234567 FI F-I 4 it A it IDIA 1234567
6.61 Pf ft fA If 5ý if A0 r-I IZA - 1234567
17. igiLCULAM 0 1234567 1234567
19. 1234567
20. Am f4401io T ri A 1234567 1234567
al I p"MA F-I 4i&Mp - 1234567 ýA-A -X, -M PI 91 ýF M PI 23. M At IZ -A- 1234567
4IM-fl-RAM 0 2,4. Alt. Ift J-- M4 t- A 234567
f4 W, Ail ý- 0 ft rt Pb )J.
268

----------------------------------- ful 4 it AL -----------------------------------
ýZ ýX, :
Aal
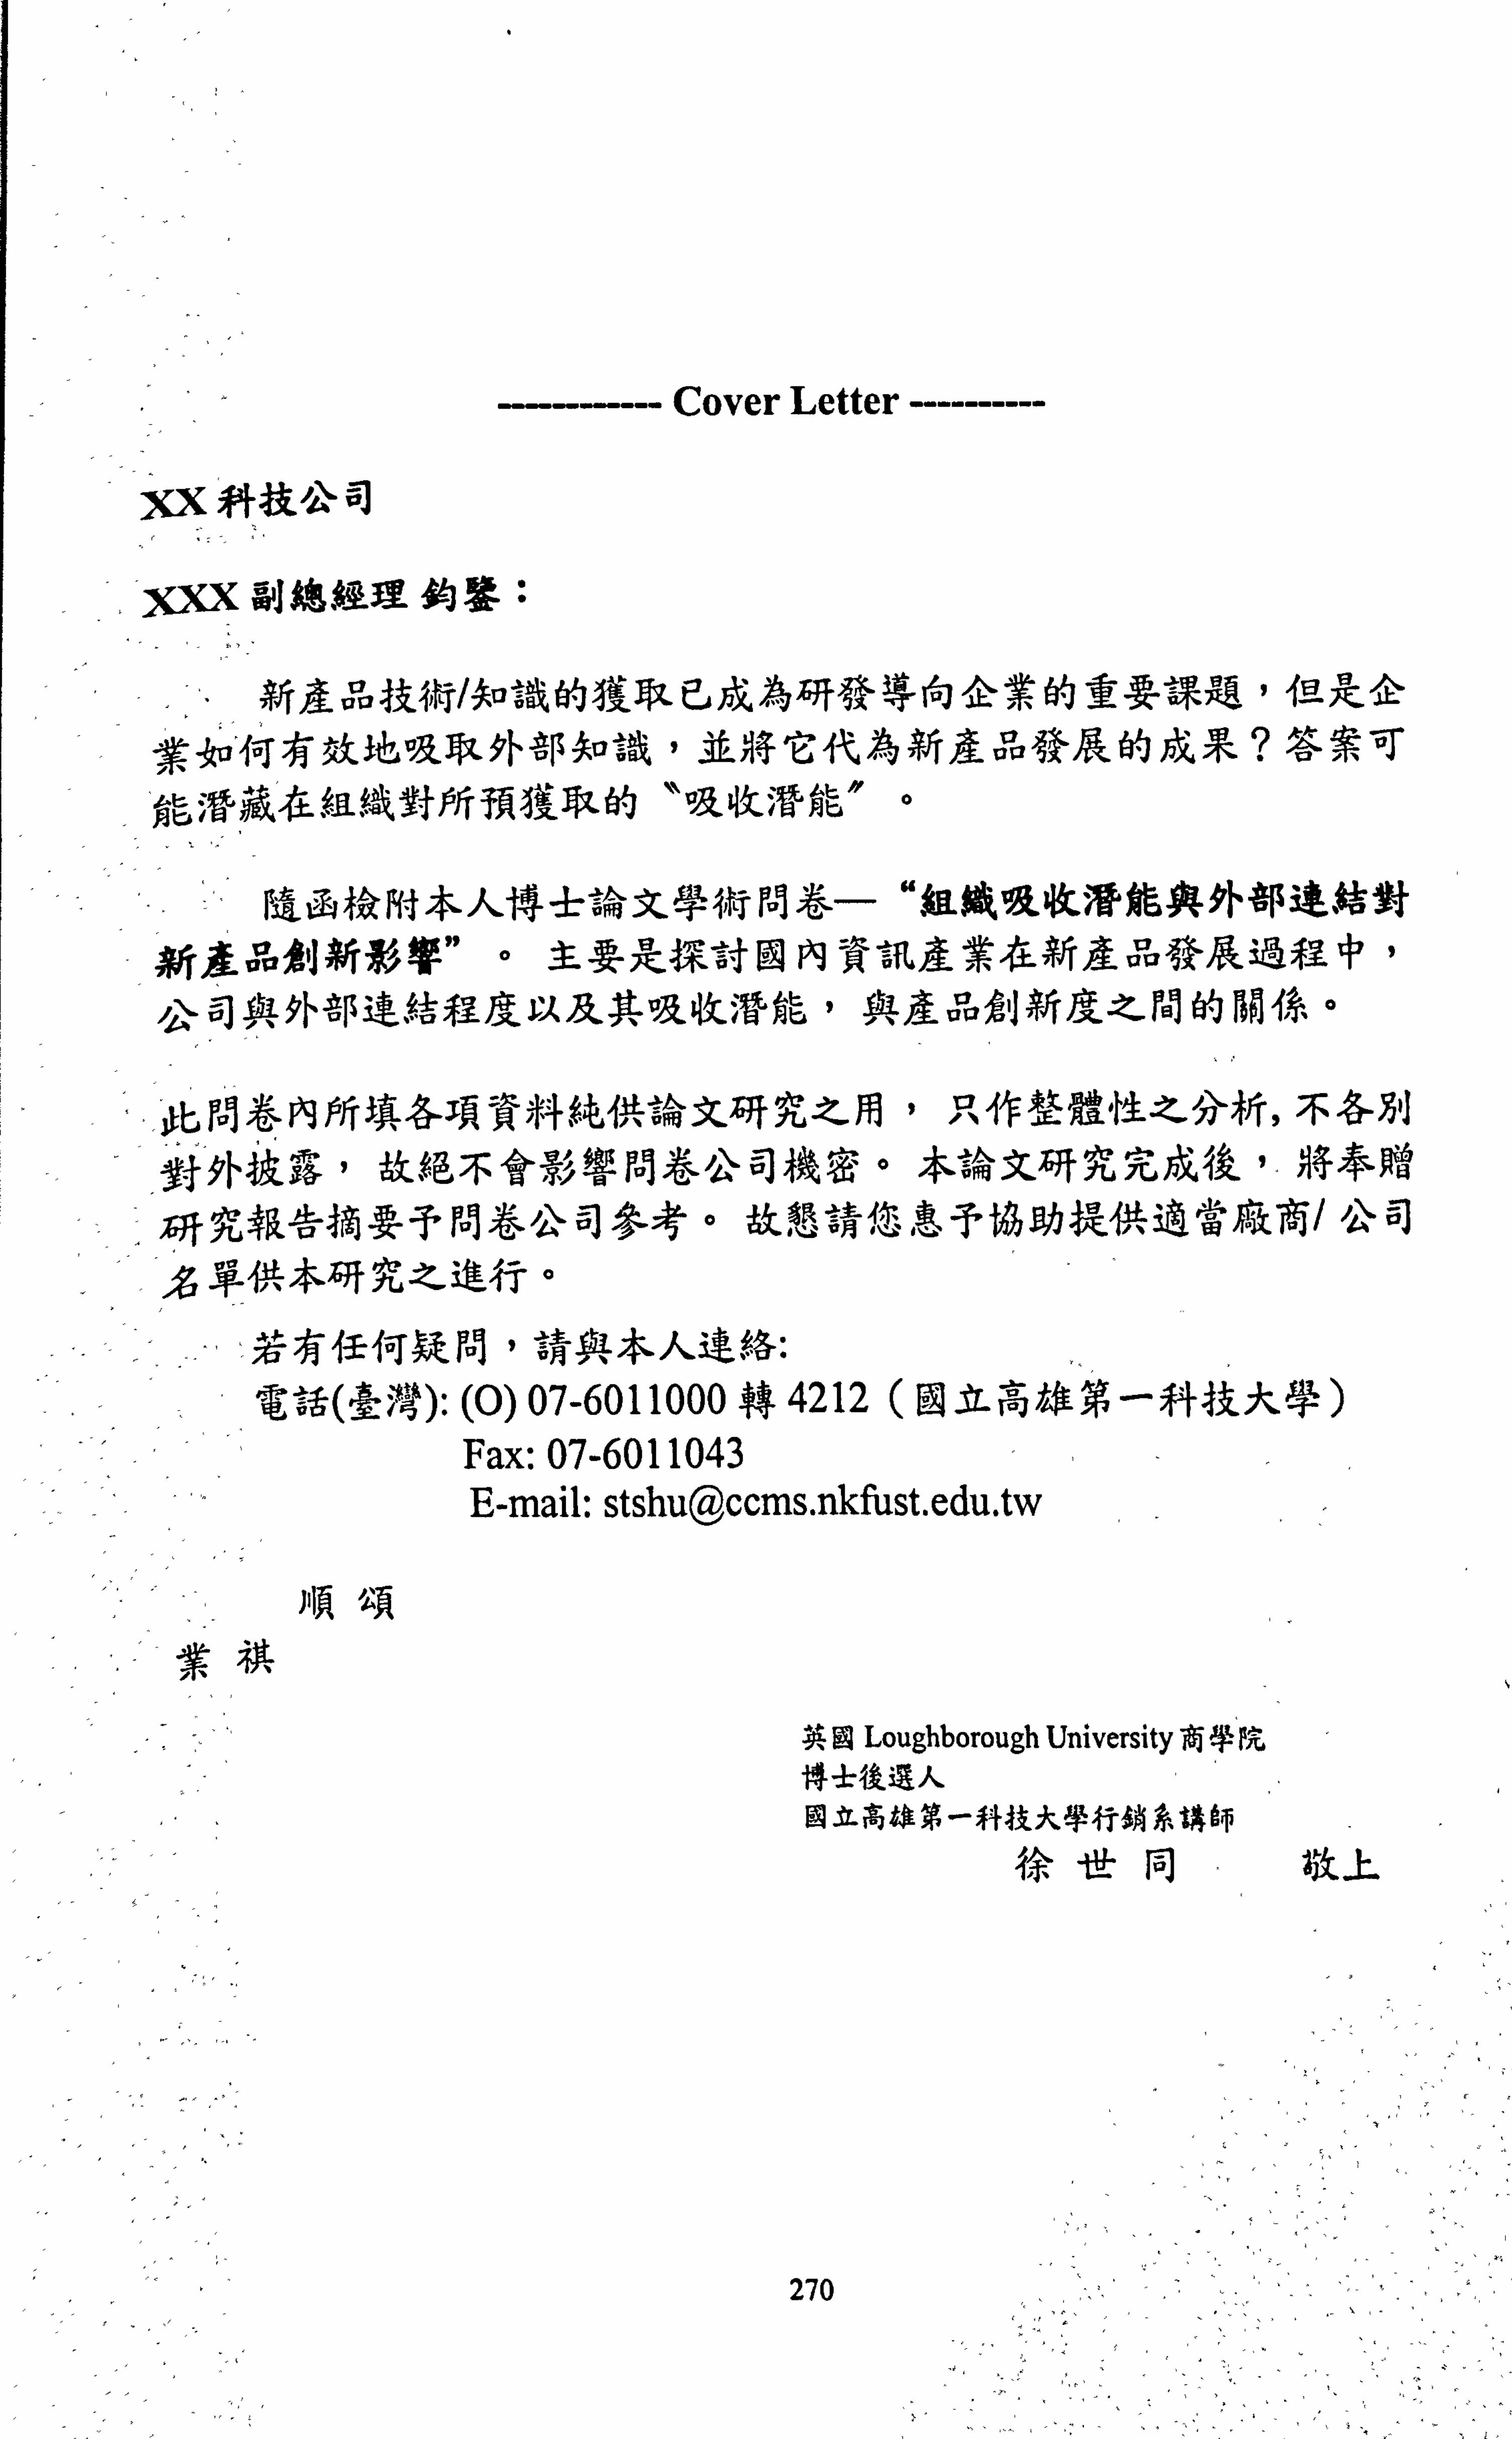
---- Cover Letter ----------
xxx it Ail A I-
ý4AV, 212*)Ao. AT-
5ta 4L)., L F-14- I'a
Ab M; t P6 JA JTA
W44
V If *700 ýLA4 t9k,, 4, ff ýý 4k M4-', 4 79
o %if Vk, -4A 9 -t. ;; t -114 lur -T_ SM A*I A 16-"- -It A
IE Iq It '-*4): (0)07-6011000#4212
Fax: 07-6011043 E-mail: stshu@ccms. nkfust. edu. tw
J1
4 10 Loughborough University jq 4p ft
19 -tL Aa

Dear
Cover Letter (English Translation)
Acquiring the new product technology/knowledge has always been one of major tasks I of R&D-intensive firms. How can firms effectively absorb external new knowledge
and convert it into their NPD results? The answer could lie in their absorptive
capacity for the pursued technology.
This study aimed at exploring the impact of external linkages and absorptive capacity
on new product innovativeness is an international research proj ect conducted j ointly by Loughborough University and National Kaohsiung First University. Your company
1[ias been recognized as one of the leading high-tech firms in IT industry; hence we
would be pleased if you could response to the questionnaire enclosed.
The current study is deemed important, as it will help to generate a profile of raiwanese IT firms' tendency in the process of new technology acquisition and
,, enhance the implementation and effectiveness of the external networking for NPD.
]please be assured that the information provided will be treated in the strictest
confidence. No individual cases will ever be reported. If you would like to have a
. Sllmmary of the results, please indicate accordingly at the end of questionnaire.
I greatly appreciate your help in advancing this research endeavour. Should you have
anY question, please feel free to contact me at: (office) 07-6011000 extension 4212;
(110ine) 07-7400763; and (e-mail) s. t. shuna-lboro. ne. uk.
Sincerely,
Shih-Tung Shu
poctoral Researcher
13usiness School
][,, O, ughborough University
271

Appendix B
An Outline of the Taiwanese IT Industry

A Glance at Taiwan's Foreign Trade and IT Industry
Taiwan is an island with scarce natural resources and a small-scale domestic
niarket. Its economic development largely depends on the export of its products.
According to the 2000 yearbook of Global Trade of the World Trade Organisation,
Taiwan is ranked as the 13'h largest trading country in the world. In 2000, Taiwan's
total trading amount was US$288.3 billion with a trade surplus of US$8.3 billion. By
way of trade volume, its 10 major trading countries are U. S. A., Germany, Japan,
France, U. K., Canada, China, Italy, Netherlands, and Hong Kong respectively. Also in
2000, Taiwan ranked as the third largest player in the Japanese import market,
enjoýing 4.69 % of share and as the eighth largest in US the import market, with
3.33% share. '
The major import and export trading items for Taiwan are electronics products,
production machines, electrical products, telecommunications products, and home
appliances, all of which accounted for 54-42% and 44.34% of 2001 import and export
value respectively. Electronic and telecommunication products consistently dominate
cxport value (see Table 1). The percentage of production equipment in the total import
volume remained stable at more than 10% each year from 1998 to 2001, indicating a
I-lighly manufacturing-oriented economy. However, this pattern of economic growth
through the export of IT products has been gradually changing. Notably in
comparsion with the export figure of 2000, Taiwan suffered an export growth
of -17.17% in 2001. This is mainly due to two causes: (1) worldwide economic
recession, and (2) most Taiwanese IT firms now export products not directly from
Taiwan but from Chinese plants to the global market in order to take advantage of
cheaper land and labour cost. Currently, Taiwan is the fourth largest investor in China,
Source: Quarterly Economic Review (2001), Department of Statistics, Ministry of Economic Affairs,, Taiwan, p. 25
273

following Hong Kong, Japan and U. S. A. Most investment comes directly from
Taiwanese IT firms. These firms have developed a business operation model which
keeps the functions of R&D, marketing and finance in headquarters and focuses
rnanufacturing and purchasing activities in China. Therefore, it is estimated that
China's IT hardware export will have a quantum leap in next few years, whereas
Taiwan's export of IT products will slow down.
Table 1 Major Import/Export by Commodity in Taiwan
(Year) 1998 1999 2000 2001 Aggregated total (Import) 104665.3 110689.9 140013.6 107242.9
(100%) Nlachineries & Electrical 42925.8 50598.4 66034.2 47549.5 equipments (44.34%) 1. Electronic products 18055.0 19818.1 27282.8 21027.9
(19.61%) 2. Production machineries 12050.3 13517.5 17604.7 10488.2
(9.78%) 3. Electrical products 3969.5 4146.0 5354.7 4282.8
(3.99%) 4. Information, & 5296.5 8524.2 11282.5 8119.6
communication products (7.58%) 5. Home appliances 395.3 421.4 504.2 448.5
(0.42%)
-; ýg--gregated total (Export) 110582.3 121591.0 148375.9 122901.5 (100%)
N4achineries & Electrical 55274.0 64161.9 82601.8 66876.1 equipments (54.42%) 1. Electronics products 16900.6 21832.5 31.699.4 23610.2
(19.21%) 2. Production machineries 7807.3 7921.1 9676.2 8345.4
(6.71%) 3. Electrical products 4351.4 4601.1 5394.3 4667.1
, (3.80%) 4.1nformation & 13757.8 15141.7 19556.0 15670.3
communication products (12.75%) 5. Home appliances 663.8 690.9 650.5 575.4
(0.47%) ýSource: Annual statistics, Taiwan, available at www. moea. ov. tw/merq/-t. 'It , 01 June, 2002., (Unit: in million US dollars)
In terms of the overall IT industry, Taiwan has an output of US$21,023 million
which ranks it as the world's third largest IT producer, widening its lead over
Singapore (see Table 2). However, its offshore production, most of which comes from,
274

China, rose quickly. Market Intelligence Center (MIC), a non-profit IT market survey
agency in Taiwan, claimed that China's overall IT hardware production exceeded Taiwan's in 2001. On the other hand, the development and integration of offshore
plants in China has further strengthened Taiwanese IT firms' competitive edge in
global market. This tendency keeps Taiwan as a major hub for the worldwide IT
industry. It will still dominate production in areas such as semiconductors, PCs and
peripherals, and data communications equipment, even with extensive division of
labour between Taiwan and China.
Table 2 Major IT Hardware Producers Worldwide
1999 Rank Country 1999 (unit: in US$ million) I USA 96161 2 Japan 44051 3 Taiwan 21023 4 Singapore 18474 5 China 18455
Source: Asia IT Report (2000), Market Intelligence Center, Institute for Information
industry, Taiwan, p. 35
2. Characteristics of the Taiwanese IT Industry
Taiwan's first wave of electronics production developed in the early 1960's,
stimulated by television manufacturing investments by Philips, Matsushita, NEC,
Sanyo and Mitsubishi. The ensuing light industry skills base was utilised over
subsequent years to extend production beyond black and white televisions into tape
recorders, transistor packaging and transistor radios. But it was not until late 1966 that
IJS firms opened the island's first semiconductor assembly line. In 1969, there was an
electronic trade-balance shift to positive for the first time when Taiwan shipped its
first domestically manufactured colour television. Throughout the 1970's and 1980's
electronic manufacturing in Taiwan continued to boom with advancements in
275

:J :1 producing electronic watches and calculators in addition to earlier product lines. This
was reinforced by developing sophisticated electronic components such as Integrated
Circuits (IC), Cathode Ray Tubes (CRTs), colour monitors and magnetic drums for
VCRs-
Taiwan's second wave of electronics production started with the establishment of
the Hsinchu Science-based Industrial Park (HSIP) in the early 1980's. This rapidly
became a key driver for the development of island's high-technology products. Due to
the timely mixture of incentives and cluster-effects, the HSIP became a giant magnet
that drew in overseas investment and proved a fertile spawning ground for local
start-ups. For instance, the world's top two chip-foundry operations, Taiwan
Semiconductors Manufacturing Company and United Microsystem Corporation
which specialised in semiconductor components for all MM clones, were established
here in 1980's. Both companies went on to revolutionise worldwide semiconductor
productions by offering dedicated wafer foundry services to global IC designers
through manufacturing process management from the possession of propriety
technologies. By the late 1980s, the electronics industry had become the island's
lumber one export sector and the island had become the fifth-largest supplier of PC
and peripherals in the worldwide market.
In the mid 1990s, Taiwan emerged as a world computer-manufacturing centre,
with a diverse range of companies specialising in activities throughout the value line.
This includes opto-electronics sector and digital storage industry sector. Two major
areas of optoelectonic potential are the advanced display technology and fiber optic
C , onimunications equipment. According to the China External Development Council
(CETRA), the island's thin-film-transistor liquid-crystal-display,, (TFT-LCD
production was worth US$702 million in 2000, and attracted about US$3.6 billion in
irivestment. In 2000, Taiwan produced about 11 million digital and PC cameras' , worth
276

;! I
about US$812 million, and 25 million scanners, worth about US$1.35 billion. These
constituted about 92% of the world production. CETRA also noted that in 2000,
Taiwan manufactured about 48% of the world's CD-ROM drives, worth US$1.85
billion. Since 2000, in addition to wireless communication products, IC design has
en-jerged as a key growth sector in Taiwan. With US$3.4 billion in sales, Taiwan
ranked second behind the U. S. in revenues of chip-design companies in 2001.2
What makes Taiwan a major IT producer in global market? The unique
characteristics of the Taiwanese IT industry, compared with those of other developed
countries, can be attributed to: (1) focusing on OENVODM type of business model
and maintaining long-term strategic partnerships with major international vendors (2)
flexibility or the ability to react quickly, (3) a complete upstream, midstream and
downstream clustering of manufacturing systems, (4) production sites that extend
worldwide (mainly in low-cost labour countries, such as China, Thailand, Malaysia
and the fonner Eastem Block).
I_ The OEM/ODM business model has prevailed in Taiwan's garment and shoe
industries since 1960's. Taiwanese IT firms applied this model to establish business
- relationships with global IT competitors such as IBM, Dell, H. P. Under this business
rnodel, Taiwanese IT firms receive product specifications from customers and
concentrate on the design, manufacturing and delivery of finished , products.
CU stlomers market the products under their own brand names. From the perspective of
the value chain, the process of OEWODM-oriented new product development can be
divided into five ma or functions: product definition, detailed development, product
Inanufacturing, logistics and distribution, and product marketing. Taiwan IT, firms
particularly specialise in middle-process functions: detailed development, product
rnanufacturing and logistics and distribution. OENVODM customers excel-at product
sources: BusinessWeek, 25 February, 2002, p. 27.
277

definition and product marketing. The specialist capabilities of both Taiwanese IT
firms and OEMJODM vendors are highly complementary. They form strategic
alliances and compete with other similar alliances in the global market.
A Taiwan manufacturers are not skilled at brand and distribution management so
they have been unable to develop their own brands in the down-stream PC market.
For instance, MIC statistics show that OENVODM orders represented more than 65%
of IT exports in 1999. The share of OENVODM shipments in 1999 for desktop PCs
was 77% and for notebook PCs, 87%. The largest Taiwanese notebook PC maker-
Quanta Computer- does not own its product brand, but designs and manufactures
products for nine of the top ten international notebook PC brands. It produced more
than 4 million units of notebook PCs in 2001.3 This may explain why few
international IT brands originate from Taiwan. These Taiwanese firms zero in on
different stages of the IT value chain. As there is no direct conflict with brand name
IT players, Taiwanese IT firms therefore have established trusting long-term
relationships with international OENVODM partners.
Taiwanese IT firms compete in the global market not only offering low-cost
rnanufacturing, but also providing services with very short NPD cycles by integrating
tlicir own specialist technologies, thus forming a highly efficient supply, chain.
J: Zesponding rapidly to market changes, this supremely flexible system handles
everything from research and development to manufacturing, assembly and delivery
of goods. This manufacturing system is more vertically integrated and more flexible
t1jan that of the Silicon Valley, Japan and Korea. Upstream sectors handle design,
production, and packaging of integrated circuits, as well 'as the design and
rnanufacture of active and passive components and connectors for computers'. The
3 Source: IT Market Report (2001), Market Intelligence Center (MIC), Institute for Inforrnation 111dustry, Taiwan, available at NvNvw. coinplutex. com. tw/roundup, April 03,2002
278

nlidstream sector designs and manufactures intennediate goods such as motherboards,
printed-circuit boards, displays and power supplies. The downstream sector
researches, develops and manufactures terminal products such as personal computers,
rnonitors, scanners, CD-ROM drives, PC mice, cable and telecommunications
equipment, and customer-premise equipment. The tight vertical integration between
the different sectors of this manufacturing system allows these small to medium-sized
Taiwanese IT companies to focus on key R&D areas, manufacturing and logistics.
Any international IT firms which intend to grab a fast-to-market advantage gain
leverage from Taiwan's unique, fast manufacturing system. For instance, Dell and
Apple turn to Quanta Computer for outsourcing production of notebook PCs. Nokia
signed Hon-Hai Precision Inc. (the largest connector maker in Taiwan and the number
2 in worldwide market) to make their mobile phones. Sony has its PlayStation2
manufactured by ASUSTEK COMPUTER. It is not simply that Apple, Dell, ý Nokia
and ý Sony count on the manufacturing or designing ability of these individual
-raiwanese firms but rather that they rely on the unique capability of a complete
upstream, midstream and downstream clustering of IT manufacturing systems in
Taiwan.
Western IT firms' continuous search for low-cost solutions to compete in the
global market results in more reliance on outsourcing production to Taiwanese firms.
Taiwanese IT firms have long been accustomed to focusing resources on competitive
strength in areas of cost and speedy design/development. By 2001, more, than 74
percent of Taiwanese firms have invested in China. 4. Manufacturing in Chinese plants
further enhances these firms' low-cost competitive ability. They have also taken
adv antage of a low-cost engineering workforce by setting up R&D facilitie's in China.
130th low labour cost and super-efficient manufacturing ability enables Taiwanese IT
Source: Daily Roundup News, available at www. cornputex. corntw/roundup, March 12,2002.
279

firms to attract more OEWODM arrangements with international brand name players.
In this regard, Taiwan plays an international role in designing and manufacturing IT
products for brand name players who look to outsourcing production or product
development when a price war begins.
3. The Current Status of the Taiwanese IT Industry
Taiwanese hardware products that garnered a greater than 60% share of their
respective product's global production volume in 1999 were: notebook PCs (60%),
motherboards (64%), communication hubs (66%), keyboards (68%), power supply
units (70%), PC cabinets (75%), and scanners (91%)5. Among these products,
Notebook PCs, monitors, desktop PCs and motherboards remained as the top four in
island's 2000 IT production list (see Table 3). The top four products accounted for
85% of Taiwan's IT hardware output. However, still more of these products were
manufactured outside Taiwan. Cuffently, Notebook PCs, special ICS,
telecommunications equipment and opto-electronics sectors have gained importance
at locally manufactured IT products. IC design, IC foundry service and TFT/LCD
related sub-sectors have emerged as the next wave of major investment. For instance,
the building of 12-inch wafer plants, each of which costs at least US$30 billion, will
be focal projects in next few years. It is estimated that in the next five years, Taiwan
will have ten 12-inch wafer plants, which will make it the pre-eminent centre for
12-inch wafer plants using the advanced wafer manufacturing technology. Due to the
formation of a complete manufacturing cluster, an increasing demand for flat screens
and large panels, and Japanese firms' withdrawal from the market, local TFT/LCD
manufacturers have speeded up their investment in the building of new generation
5 Source: Asia IT Report (2000), Market Intelligence Center, Institute for Information Industry, Taiwan
280

plants. According to ITIS, five major TFT-LCD makers in Taiwan forecast shipment if
around 28 million panels in 2002, generating a total revenue of NT$ 253 billion, up
f-rom NT$ 102.7 billion last year. The IC design sub-sector with a high growth rate as
well as a well-developed local wafer foundry service will become a lucrative, new
area of IT investment. In contrast, there will be less investment in other sectors
rnanufacturing products such as PC motherboards, switching power supply, scanners,
Iceyboards, ' PC mouse and other add-on cards. This is because the majority of these
products are now being manufactured in China.
Table 3 1999 Sales of Taiwan's Major IT Hardware Products
Ranking Product Value (in US$ million) Volume (in 1000 units) Notebook PC 10,198 9,355
2ý Monitor 9,330 58,729 3 Desktop PC 7,188 19,457
-4 PC Motherboard 4,854 64,378 5 Switching Power 1,744 80,221
supply 6 CD/DVD 1,740 48,190 7 PC Cabinets 1,423 75,768 8 Scanner 925 21,901
-9 Graphic Card 848 18,583
10 Keyboard 512 79,445 11 Universal Power 370 3,008
supply 12 PC Mouse 155 68,160 13,, Sound Card 78 8,481 14 Video Card 33 1,102
Source:,, The Retrospect and Prospect of Taiwanese Manufacturing Industry (2001),
Industrial Technology Infonnation Service (ITIS), Taiwan, pp. 107-122
Semiconductor (IC) sector
Taiwan is the fourth IC vendor worldwide next to the US, Japan, and Korea. The
,. Cvenue of the Taiwan IC industry in 2000 reached NT$714.4 billion, a growth of 68.7
percent or about NT$290 billion more than 1999 (see Table 4). Of the total revenue,
the IC design segment contributes NT$115.2 million, a growth of 55.3 pqrcent, IC
ckaging NT$97.8 billion, 48.4 percent, and IC testing NT$32.8 billion, 77.3 percent. Pa
281

The production value of IC manufacturing accounted for 66 percent of total 2001 IC
output, which was primarily contributed by the IC foundry service.
Table 4 Taiwan IC Industry Performance (Unit: in billion NT dollars)
Year 1999 2000 2001 2002' Design 74.2 115.2 84.4 104.8
Manufacturing 264.9 468.6 356.7 404.9 Packaging 65.9 97.8 77.6 90.9
Testing 18.5 32.8 23.6 25.8 Total 423.5 714.4 542.3 608.5
Source: The Retrospect and Prospect of Taiwanese Manufacturing Industry (2001), Industrial Technology Information Service, Taiwan, pp. 9-26 e: estimated.
The world's top two IC foundries, Taiwan Semiconductor Manufacturing
Corporation and United Microelectronics Corporation, dominate the foundry service,
having more than 70 percent worldwide share. Both have state-of-the-art wafer
fabn"cation labs located near many chip-design firms in the Hinchu science park,
Taiwan's high-tech hub. With this advantage, the Taiwan IC-desip sector has grown
quickly. This sector's revenue in 1999 was about NT$74.2 billion and expected to
reach to NT$104.8 billion by 2002. At present, the output of the Taiwan IC design
industry remains second only to the US in the global market. Nearly 70 percent of
Taiwanese products are concentrated in the field of information6, which primarily
consists of internal memory ICs, logic and analogue ICs. However, local IC designer
houses have also advanced into the markets of network and communication wafers.
Strategically important products include wafer groups, network wafers and wafers for
ordinary consumers. In addition, Taiwan is a key supplier of wafers for video-disc
recorders and wafers for ordinary consumers in global market. Facing thechallenge of
rnoderate growth in the global PC market, these IC'design'h6usýes need'to compete I
with other western countries. Key strategic moves for major IC design firms'will be:
6 Source: The Prospect and Retrospect of Taiwanese Manufacturing Industry (2001), Industrial , rechnology Inforrnation Service, Taiwan, p. 9-25
282

focusing on communication and system-on-chip design; and, establishing a model of
division of labour on primary and advanced design between China and local R&D
centers.
In 2002, Taiwanese IC firms' capital investments will reach US$90 billion,
ranking it third in the global IC industry. The focus of the IC foundry service is the
rnajor capital investment where three 12-inch wafer plants are to be in operation by
2003 while fewer investments concentrate on DRAM and non-DRAM memory ICs.
Large capital expenditure in the fifth-generation wafer plants maintains Taiwan's lead
in foundry service and may further boost the local fabless IC design industry.
Table 5 Capital Investments in the Global IC Industry
1999 2000 2001 2002
M arket 1998 Capital Growth Capital Growth Capital Growth Capital Growth
Investment Rate Investment Rate Investment - Rate Investment Rate
S. Korea 12.4 19.9 +60.2% 27.9 +41.0% 35.7 +28.1% '42.1 +17.9%
Taiwan 32.3 45.2 +39.9% 62.7 +37.6% 78.7 +24.6% 90.0 +12.5%
Japan 46.6 55.2 +18.4% 76.0 +37.6% 94.7 +24.6% 106.4 +12.5%
America 74.9 74.4 -0.5% 100.7 +35.2% 122.6, - +21.8% 134.5 +9.7%
Europe 28.3 32.4 +14.2% 42.9 +32.5% 122.6 +21.8% 134.5 ý +9.7%
Others 20.8 27.9 +34.1% 38.3 +37.5% 48.6 +28.1% 55.6 14.4%
Source: www. coml)utex. com. tw/roundup, 18 February, 2002
3.2 Telecommunications Sector
Taiwan's communication industry has been at a stage of high growth since 1999.
I-Cey component technologies for new products in this sector have been gradually
I
PI erfected. In particular, mobile telephone and wireless broadband receiving products,
are seen to bring rapid growth. According to ITIS Survey, the domestic production
value of the top ten products reached up to NT$177.67 billion in 2001, upl 28.5%
283

since 2000 (see Table 6). Among the top ten communication products, broadband
receiving and wireless products, such as ADSL and WLAN, etc., showed high growth
in 2001. The sharp increase, particularly in WLAN products, in combination with the
production of mobile phones not only makes wireless products the largest-scale
communication sector, but also greatly elevates the - production value of
communication in ustry.
Of the top ten products, the mobile phone is the largest value contributor wit4 an
annual value of NT$36.76 billion, up 113.7% since 2000, while modems, which held
, lumber one in 2000, fell to third place in 2001 due to continued price decreases. The
growth rate of modems, with an annual value of production of NT$15.25 billion in
; Zoo I, dropped by 41.7% as compared with that in 2000. ý WLAN achieves. a
production value of NT$12.1 billion in 2001, up 204% since 2000 and putting it in
fifill place. According to estimates of the Information Technology Research Institute
(ITRI), Taiwan's WLAN products account for 50-60% of the'global market in 2001
and that will grow to 80% by 2005.
Table 6 Taiwan's Top Ten Communication Products
Product
-
Rank in Rank in 2001 2000
2000 Production 2001 Production Value (in NT$ Value(inNT$
100 million) 00 million) Ratio(2001) GrowthRate
bile Phone -7-go 1 2 17.2 367.6 20.7% 113.7%, LAN Switch 2 3 109.3 179.0 10.1% 64.5%
Modem' 3 1 261.4 152.5 8.6% -41.7% ADSL 4 13 31.6 130.8 7.4% 314.6% WLAN 5 12 39.8 121.0 6.8% 204.2%
fthemet Adapters 6 4 106.0 107.2, 6.0%, 1.1%" Cable Modem 7 5 105.4 90.2 5.1% '-14.4%
Hub 8 6 94.7 80.2 4.5%' -15.3% Router 9 8 65.0 71.2 4.0% 9.6% GPS 10 7 93.2 68.9 3.9% -1.4%
Others 272.6 407.3 22.9% 24.2% Total 1382.9 1776.7 100% 28.5%
Source: The Retrospect and Prospect of Taiwanese Manufacturing Industry (2001), ' Itidustrial Technology Information Service, Taiwan, pp. 894 06,,
284

3.3 PC Sector
Taiwan's global market share for notebook PCs was estimated to reach 56.3% in
2 01 wi production of around 13 million units. The next nearest manufacturers were
an and South Korea. The mature manufacturing system cluster for notebook PCs 7
11as made Taiwan the major outsourcing production centre for international IT
flagships, such as Dell, Hewlett Packard, Compaq, Apple, IBM and eMachines. MIC
ý'Iairn that Taiwanese notebook manufacturers are set to control 60 percent of, global C
notebook market in 2002 due to their production bases in China. 'As p ces of ri
notebook PCs are falling and coming close to those of desktop PCs, more outsourcing
-global market because, of 41 production orders will maintain Taiwan's lead ý in the
excellent cost-down capability of local firms. MIC estimate that Taiwan's annual
output of notebook PCs will reach 20.33 million units and hold a market share of 63
percent in 2003.
Table 7A Comparison of Global Notebook PC Production Country 1999 2000 2001" Taiwan 48.8% 52.5%,,,, 56.3%, Japan 35.2% 33.7% 31.9%
South Korea 1.8% 3.8% 4.2%
. Others 15.8% 10% 7.6%
Source: The Retrospect and Prospect of Taiwanese Manufacturing, Industry (2001),
Jýndustrial Technology Information Service, Taiwan, pp. 107-122
estimated
The wave of Internet popularity has increased PC demand particularly for the
low-priced or free PC model. This trend will boost the production of Taiwan's desktop
pCs to more than 28 million units in 2002 according to the MIC market report (Table
8). In addition, the improving global logistics systems of Taiwanese PC companies
Ilave prompted local producers to shift assembly closer to end markets (the US and
]F, urope) and to low-cost areas, such as China. Thus, as low-cost PCs lead the growth
of the desktop PC market, OENVODM sales continue to be the main business for
285

Taiwan desktop PC makers. Taiwanese PC makers' adeptness in fulfilling orders for
low-cost PCs will continue to be their key competitive advantage.
The output of Taiwan's motherboard industry in 2001 was around 81 million
Units, a drop of 4.5% compared with the 84.37 million produced in 2000. The output
value reduced to UD$ 5.6 billion. Taiwan's motherboard producers, in general, have Iý solid R&D ability, large-scale production lines, complete components supply chain
ýLnd competitive cost and product quality. Therefore, the market share of Taiwanese
otherboard producers in the global OENVODM market grew from 49% in 1998 to
0007 4% in 2 However, the majority of motherboard makers now manuficture
'products in China. ITIS confirms that China's motherboard output exceeded Taiwan's
2001 although the aggregated domestic and overseas production units by Taiwanese
rnakers still maintain the lead in global share.
Table 8 Taiwan's Notebook PC, Desktop PC and Motherboard Production
2000 2001' 20021-, ,ýA Segment Volume Value Volume Value Volume Value
(in 1000 (in UD$ (in 1000 (in UD$ - jin 1000 (in UD$
units) million) units) million) units) illion) --i4otebook 12,707 13,548 12,934 12,078 13,543 11,570
PC - pesktop PC 27,660 7,797 25,829 6,612 ., 28,722, 7,209
N4otherboard 84,372 5,674 80,566 5,646 85,439 5,625 Source: Taiwan Hardware IT Survey (2001), MIC, Institute for Information Industry. ' e: estimated, f: forecasted
_1.4 Opto-electronic Sector
The top eight segments of Taiwan's opto-electronics industry, by value, were,
, TFT-LCDs, recordable compact disks (CD-Rs), image scanners, read-only memory
Cornpact-disk drives, light emitting diodes (LEDs),, digital cameras, printers, LCOS
rojectors. Of all segments, TFT-LCD has the highest growth rate at 273% with'an
output value of NT$98.1 billion (see Table 9). A recent prediction by the Industrial
-Y Source: Asia IT Report (2001), MIC, Institute for Information Industry,
286

F, conomics and Knowledge Center (IEK) argues that Taiwanese makers of large-size
in TFT-LCD panels will become the third, fourth, and fifth-largest suppliers in the
orld. 'They are AU Optronics Corp., Chi-Mei Optoelectronics Corp., and Chunghwa
picture Tubes Ltd., which produce 12.3 %, I I%, and 7.7 % of global TFT-LCD panel
supplies respectively. Taiwan is also expected, to unseatJapan as the second-largest
&oducer of TFT-LCD panels, in terms of value and volume, as the island's share of
the global market grows to 36% by 2002.
Taiwan occupied 57.8 percent of worldwide CD-ROM market with an output of
9 million units in 20008. However, up to 98 percent of this quantity was produced at
i overseas sites. The production of DVD-ROM did not grow as fast as that of CD-ROM,
Capturing a global market share of only 4.5 percent., The low growth of this segment
was due to. the fact that most key components of DVD-ROM are still tightly supplied
and controlled by Japanese manufacturers. Local DVD-ROM makers now concentrate
resources on the research and development of laser diode, optic pick-up head, micro
rnotor and special application chips in order to build a'comýlete key'component
,, upply system. Taiwan exported 3,578 million CD-R disks in 2000 with a global
rnarket share of 86.3 percent. ITIS estimate that output of CD-R disks could reach
4,017 million units in 2001, maintaining a share of 86 percent.
Along with the global PC growth, Taiwan scanner makers have I produ - ced 25.3
.,, Ilion units of image scanners in 2000 with more than 90 percent of global share.
Of, NVODM business is the focus of this segment. Because of low-profit margin . S,
S, Canner makers have directed R&D resources to the development of Intcmet-basCd
applicýtion models and have moved factories to China in order to further' lower
rvanufacturing costs. As optic technologies are quite similar, local'big-size scanner
9 Source: The Retrospect and Prospect of Taiwanese Manufacturing Industry' (2001), Industrial , rechnology Inforniation Service, Taiwan, p. 45-46
287

firms have advanced into the research and development of digital camera,
multi-platform machine and LCOS projectors.
Taiwan's annual output of digital cameras reached 4 million units in 2000, with
31.5 percent global market share. However, these manufacturers mainly dominate
low-end models such as those with less than I million pixels. Local firms face a
supply problem in that key components come from Japan, such as auto-zoom Icns and
CCD scnsor, and the development of these will decide future growth of this scgMent. Table 9 Taiwan's Output of Opto-electronic Industry in 2000
Segment 1999 2000 Growth Rate (inNTSIOO million) (inNTSIOO million) N
LCD Display 395 981 273 CD-ROM/DVD-ROM 503 609 21
Image Scanner 399 447 12 CD-R Disk 374 423 13
LED 236 295 25 Digital Camera 123 268 217
Printcr 91 154 73 LCOS Projcctor 56 85 151
Source: The Retrospect and Prospect of Taiwanese Manufacturing Industry (200-1), Industrial Technology Information Service, Taiwan, p. 44 3.4 Soffivare Sector
Taiwan's domestic market for the software industry was NTS152.2 billion in
2001 (Table 10). It is cstimatcd that an aggrcgatcd 28.2% growth rate would be
cxpcctcd in 2002 with an output value of NTSI95.1 billion. Of the three scgmcnts, the
scrvicc scgmcnt (i. e., nctworking and processing scrviccs) was cstimatcd to have a
high growth rate, at 48 pcrccnt. This was primarily a result of the improvement or
13-to-C cnvironmcnts, the entrance or more application service providers (ASP), and
the coming of low-priccd and broadband services. This high growth is cxpcctcd to
continue for the ncxt few years.
The software product segment (i. e., packaged sollwarc and turnkey sys1cm) is
cxpcctcd to have a relatively low growth rate of 18% in 2002 as c-commucc
288

gradually replaces the traditional channel of packaged software. However, of tile three
segments, the packaged software remains the dominant export item, representing 86%
of total software export sales revenue in 2001, with a value of NT$ 87 million. Of this,
41% was contributed by anti-virus software. The rest was contributed by multi-mcdia
software and font-generating software9. Some multinational companies, such as Cisco
System, Intel and Computer Associates are now forging alliances with the Taiwanese
government and local leading software firms. Most are focusing on Chinese language
related software projects in order to penetrate the Asian regional markets for both
commercial and e-commerce service software.
The project segment (i. e., system integration and professional services) is
cxpectcd to achieve a 29% growth rate in 2002. The services of this segment mainly
limits in the domestic market. The export of software-relatcd projects and services is
dependent upon customers' requirements for particular system developments, which
usually involves a large amount of labour hours. Taiwan's soflwarc compan ics, to
some extent, arc not as competitive as countries such as China and India in this
scgmcnt.
Table 10 Taiwan's 1997-2001 Software Market (unit: NTS million) and Growth Rate Segment 1997 1998 1999 2000 2001(c) 2002-2001
(Gromh Network Service & 9,576 14,291 19,781 28,089 41,571 48% Processing service (Service Segment)
System integration & 19,646 20,213 26,816 33,520 43,240 29% Professional service (Project Segment)
Packaged software & 28,596 38,887 48,840 57,119 67,400 18% Turn-kcy system
(Product Segment Total
7ý9 57,818 1
73,391 95.437 118,728 152,212 -L8 -2 Source: The Retrospect and Prospect of Taiwanese Manufacturing Industry (2001), Industrial Technology Infounation Service, Taiwan, p. 133
9 Source: Tle Retrospect and Prospect of Thi%-anesc Manufacturing Industry (200 1), Industrial Technology Information Service, Thi%%2n, pp. 123-150
289

4 Summary
The OEM/ODM business model characterises the Taiwanese IT industry. The
low priced PC theme has created opportunities that make Taiwan one of the top three
IT hardware producers. Major brand players continue their outsourcing practices with
Taiwan. On the one hand, these OEM/ODM arrangements stimulate the growth of
Taiwan's IT industry. On the other hand, Taiwan's increasing reliance upon these
companies will increase the risk of being tied to the ups and downs of these partners.
Taiwanese IT firms are often confronted a severe choice once these brand players
have a dominant market share. Therefore, it is critical that Taiwanese IT firms, in
addition to continuously slashing costs, examine whether this OEM/ODM relationship
has developed at the expense of their businesses' flexibility and competence.
Although Taiwanese IT firms dominate major IT hardware production, they still
cannot capitalise upon the profit from software application, product marketing or
unique product design. Facing the shift from quantity to quality in the IT industry and
to cope with future challenges, Taiwanese IT firms should focus on rcnovating
manufacturing and marketing practices as well as restructuring product positioning
and channel strategies.
Most Taiwanese IT firms have taken the advantage of intcrnational divisions or
labour by dcploying manufacturing sitcs in China, which further strengthen their
competitive edge in global OEM/ODM business. These practices also enable
Taiwanese IT firms to develop their own channels or brands in the Chinese market.
With the scale economy of this market, it may be that Taiwanese finns could begin to
practice and develop their own brand marketing skills before taking the full stcp into
global marketing.
290

Appendix C
Residual Plots for Regression Equations
291

16
14
12
10
6
4
cr 2 0
Std. Dcv v . 97 Mean U 0.00 MMJjMML161ý Na 116.00
L 63, '. 0 VVV'. A*. *. 0 y, .. Z ", *; '? ý
'00 * -ýr *+ "& *00 Lr -Ib I? r *00 Zr
Regression Standardized Residual
Normal P-P Plot of Standardizeditesidual
Dependent Variable: R&D Knowledge 1.00 1
. 75
.0 0 . 50 06.
ä
"0 . 25 ti u
vevo
Or, , ft
0.00 . 25 . 50 . 15 1100
Observed Cum Prob
a Ln 0.00
Scatterplot Dependent Variable: R&D Knowledge
3
c2
g .1
12
.3
u
go
a0 13 $also 93
a 40 aM
ft an t1amr, giso, a O 93
sbo g3
C93r%3 0 941 u M g3o
a0 coo 430 u
M0
-2 .10
Regression Standardized Predicted Value
3
Regression Model 1-1 of Table 6.4.2
Histogram Of Residuals Dependent Variable: R&D Knowledge

Histogram of Residuals Dependent Variable: RO Knowledge
20 1
10
cr
LLI
Std. Dev mM I Mcan a 0.00 ýImm
Nz 116.00
Regression Standardized Residual
Mornal P-P Plots of Standardized Residual
Dependent Variable: UD Knowledge 1.00
75
50 4d
lu 25
u
0.00 . 25 . 50
Observcd Cum Prob
x LZ 0.00
Scatterplot Dcpcndent Variablc: R&D Knowlcdge
got M 410 ou"Op 09114a a
to
a
41 dy.
qU
41
ve
n na
U
. 75 1.00
-3 -2 .10
Regression Standardized Predicted Value
Regression Model 1-2 of Table 6.4.2
I
293

cr
LL4
100
Histogram of Residuals Dependent Variable: UD Knowledze
16 14 12 10
8 6 4 Sid. Dev a .
95
2 MCAM a 0.00
0
jjjjjjý LNa
116.00
Regression Standardized Residual
Noffnal P-P Plot of Standardized Residual
Dependent Variable: R&D Knowledge
Ci. E
'9 is
000 -4 Im
Observed Cum Prob
Scatterplot Dependent Vadable: R&D Knowledge
Jo
U)
.2
to to 94 CA to
93 u gas U to
93 cl 94, " of 0 u $to 411, to " to to
990 "40 " to goes Do 919111 0a0 go
CA IS u to we Ise
9343 to go"
CA as gels to to
Is to to
of to
Regression Standardized Predicted Valuo
Regression Model 1-3 of Table 6.4.2
294

U
g
I.
16
14
12
10
a
6
4
2 0
Std. Dev a . 97 Mean a 0.00
JJMMIJIILL Na 116-00 0
00 * ! 'r 00 ýr '6' , 00 ýr
Regrcssion Standardind Rcsidual
Nonnal P-P Plot of Standardized Residual
Dependent Variable: Manufacturing Knowledge 1.00
0.00 . 25 . 50
Obscrvcd Cum Prob
. 75
. 50
. 25
0.00 . 75 1.00
Scatterplot Dependent Variable: Manufacturing Knowledge
3.
Jo
1
9A
ca tot to m
ri
a to IJ gkj go., 1
91 a
93 u 4%3 "0
Go is ail ff 61
CU uu Go Go 93 n30 oft#
to got is
Go to so 63 Uu C"
DO 94.9
0-u
Is
Gil
93 U 93 it
Go u
.2. I
Regression Standardized Predicted Value
Regression Model 2-1 of Table 6.4.2
23
295
Histogram of Residuals Dependent Variable: Manufacturing Knowledge

16 14 12
to
Sid. Dev m . 96 mean a 0.00
jmdmmlbllý
Wa 116.00
V I/ VV*. -... 5ý40 , -, .1 .1 MV tLj -0 q&, + "r
Regression Standardized Residual
Nomal P-P Plot of Standardized Residual M-Aoni Varishle. - LIsnufacturimp KnnwWLe
LOD
. 75
1 -50 -
9 ad
Obscrvcd Cum Prob
Scattcrplot Dependcnt Variabic: Manufacturing Knowlcdgc
3
0
.1
.2
I)
U
aa on C3 a0a
an o", a ca u 93 CU C" au00
aa 93 $1 C%xs =aaa U3
a 93 VX3 00 991 ap
0 43 a00 a 93 a
4b colvell a
$I a 0
Do a0 L93 C0a
a
.2 .10
Regression Standardized Predicted Value
Regression Model 2-2 of Table 6.4.2
23
296
Histogram of Residuals Dependent Variable: Manufacturing Knowledge
. so M 1100

16
14
12
to
Sid. Dcv a . 95 Mean a 0.00 dmmmm6LJ Na 116.00
.A*0 . "), .+.. >. ,, ool Vý '0 '42 VVV'. ' '. ** Zr
ý
'00'-ýr Zr -ro *,? t *Ib Zt 00 Ner 1+ -ýr
Regression Standardized Residual
Nomial P-P Plot of Standardized Residual
Dependent Variable. Manufacturing Kno%ledge 1.00
. 75
0.00 . 25 . 50 . 75
Observed Cum Prob
.0
ul 0. oo 1.00
ScattcTlot Dependent Variable: Manufacturing Knowledge
3
u
cu a or) gain flags am 93 -1 U gas 0 Cl 11413
ua
0 tlg, %Il own 1.,. '40 all 0
930 ck: 1 0 faso uu 00 0 01,00 0
C3 91%,
a gas
.4 -3 .2.10
Rcgrcssion Standardind Prcdictcd Valuc
Regression Model 2-3 of Table 6.4.2
23
297
Histogram of Residuals Dependent Variable: Manufacturing Knowledge

16 14 12 10
9 6 4 2 0
Std. Dev w . 97 Mcan 0 0.00 Na 116.00
Regression Standardized Residual
1.00
. in -75
- 50
23
0.00
Nonnal P-P Plot of Standwdized Residual
Dependent Variable:
Pre-development Assessment Knowledge
a
0.00 . 25 . 50
Obscrved Cum Prob
Scatterplot
. 75 1100
Dependent Variable:
Predcvclopmcnt Assessment Knowledge X 'Z
C4 -2
U
a0 nn .. 93 a Ono U""041
a Ocs ts a to n to gaes a n 930 1.91
aa 8$ u cgs as r%3 EV a na no n ru
'as C3 tj tal a0 ago no
n
.4 -3 .2 .10
Rcgrcssion Standardind Prcdictcd Valuc
Regression Alodel 3-1 of Table 6.4.3
2
298
Histogram of Residuals Dependent Variable:
Pre-development Assessment Knowledge
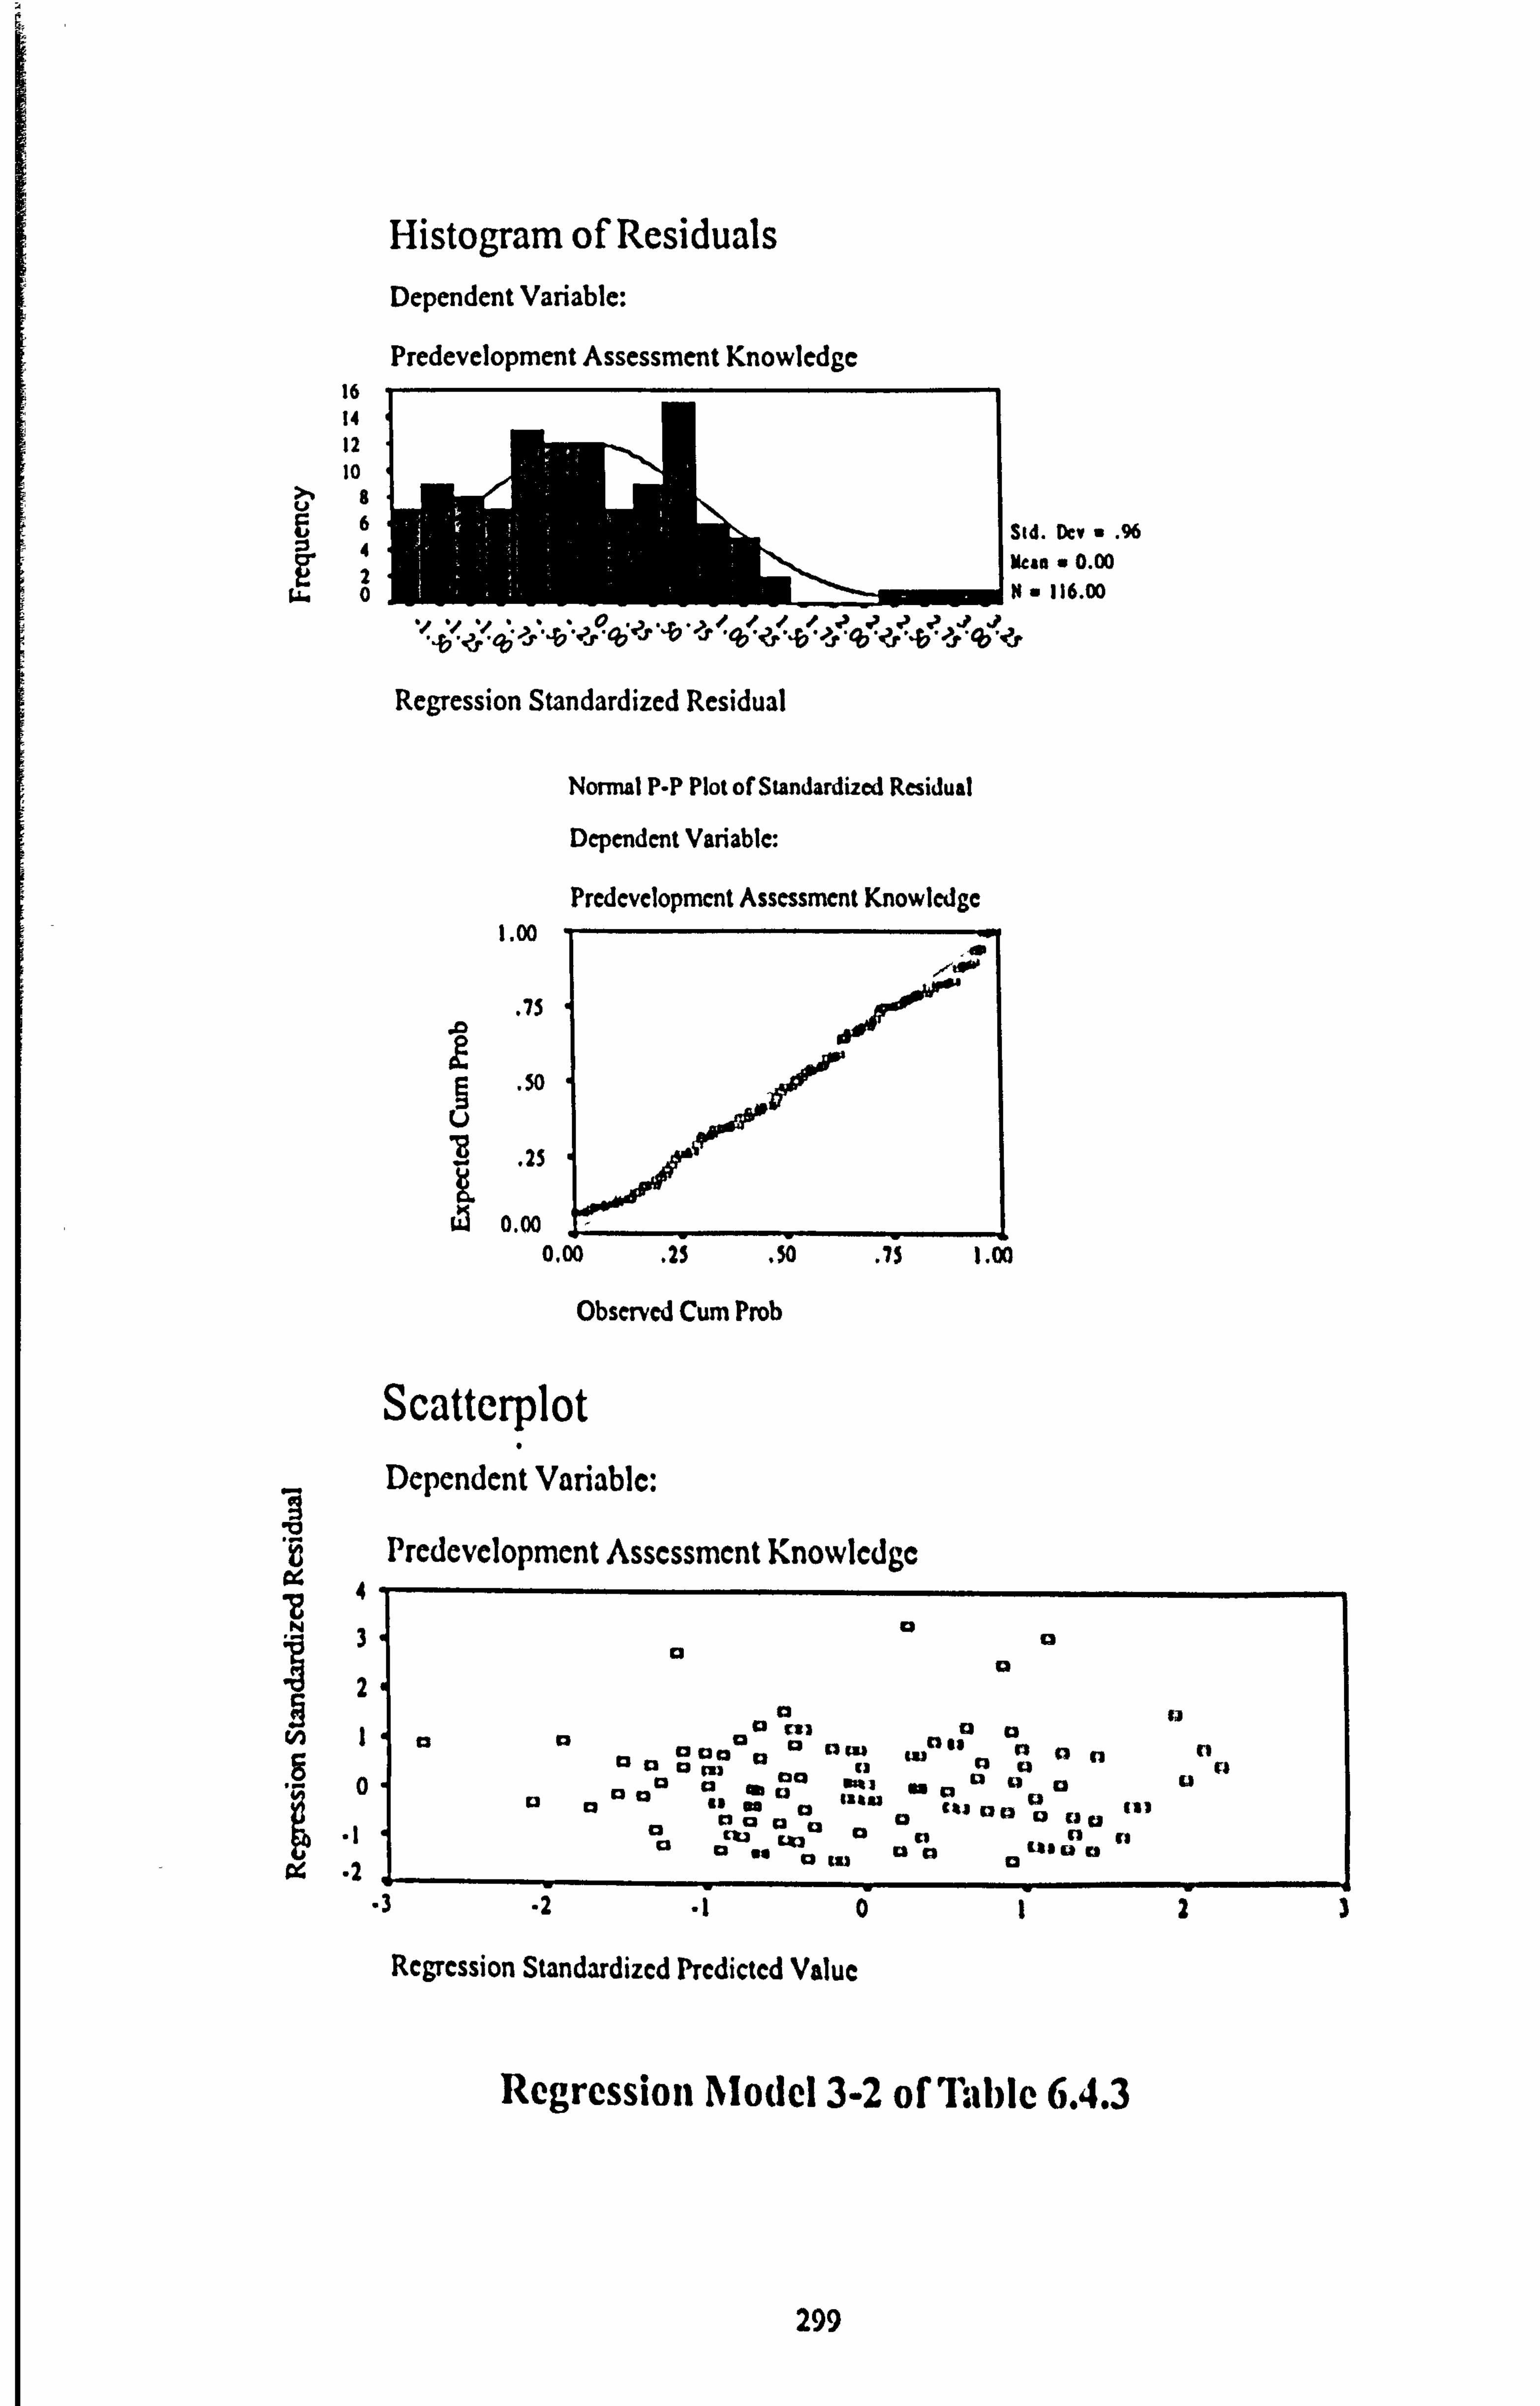
16 14 12 10
8
:14 92
gi. 0
Sid. Dev a . 96 mean a 0.00 8a 116.00
0
Regression Standardized Residual
Normal P-P Plot of Standardized Residual
Dependent Variable:
Predevelopmcnt Assessment Knowledge 1.00
dp
1-1ý
oo?
-04w-
1
oloo . 25 . 50 . 75 1.00
Observed Cum Prob
. 75 JD
Scatterplot
'§ Dependent Variable:
12 Prcdevelopmcnt Assessment Knowlcdgc
vJ 1 g0
a
0 83 0 rin 00 93 0 93 gl n ei n 93 a00a cu m 91 u Uu 93 U
M au Kai 92 auu 93 U CU tu 91 n 93
93 Ltau
a
-2 .10
Regression Standardized Predicted Value
Regression Model 3-2 of Table 6.4.3
23
299
Histogram of Residuals Dependent Variable:
Prcdevclopment Assessment Knowledge

16 14 12 10
6 4 2 0
Std. Dev m . 95 McAn a 0.00 JdIIMLkI: Na 116.00
Y*/*.. >. %, , ýr ,ý Y* 'r
Lr ZF
Regression Standardized Residual
Normal P-P Plot of Standardized Residual
Dependent Variable:
Predcvclopment Assessment Knowledge 1.00
0.00 . 25 . 50
Observed Cum Prob
. 73 13
0.00
Scatterplot Dcpcndent Variabic:
. 75 1.00
I Predevelopment Assessment Knowledge 4
to ego "0
91 91
1
-2 .1
Regression Standardized Predicted Value
Regression Model 3-3 of Table 6.4.3
23
300
Histogram of Residuals Dependent Variable:
Prcdcvclopmcnt Assessmcnt Knowlcdge

Std. D" a . 97 Men u 0.00
2
oNa 116.00
Histogram of Residuals Dependent Variable:
Marketing Knowledge 14 12 10
9 6
Nomial P-P Plot of Standardized Residual
Dependcal Variable:
Gain in Marketing Krim% ledge IM
.0 73
23
.//, v .I. 0., / ."//1.2 1-' .2 93,
Regression Standardized Residual
olm . 50
Observed Cum Prob
Scatterplot Depcndcnt Variabic:
Gain in Markoing Knowlcdge
. 73 1.00
�/1
0 l'
:0 . -. 4, *0.0
eb 0
a a a
a a
a a . . a
a - . a - a
04
Regression Standardized Predicted VAluc
.1
Regression Model 4-1 of Table 6.4.3
301

Histogram of Residuals Dependent Variable:
Gain in Marketing Knowledge 16 14 12 to
>. 8 qII
Mai" E0mI Std. Dev - . 96
4 Man = 0.00 2Na 116.00 0
MINNOILIJOA"
.., ., V. I. t? ., ý, xo .. 6, ýýýý .. a., ý . 47 .2a ýý . 5.0 zr ýr 0
Regrcssion Standardind Rcsidual
1.00
0 . 75
. 50 L) T t;
. 25
w O, OD
Nonnal P-P Plot of Standardized Residual
Depcndcnt Variabic:
Gain in Markcting Knowlcdgc
0.00 . 23 . 50
Observed Cum Prob
Scatterplot
. 73 1.0
I Depcndcnt Variablc:
Gain in Markcting Knowlcdge W. T n C)
91 0unu 93 u ei
92 12
u 93" 0 93 93 93
0 c3 et ei@ cm g3 CM gl 93 cl u cs 93
83 U g3 C, «, u0 gl u 410 gi 93 Cis MIN u tIel
93 e, AUB&
cl C3C3439fL2
8, wu 0 Cl fl cl el U 93t182
93 93 41 arl gel gl u 93 Cb
.2 .10
Regression Standardized Predicted Value
Regression Model 4-2 of Table 6.4.3
I,
U H
34
302

Histogram of Residuals Dependent Variable:
Gain in Marketing Knowledge 20 v
10 Sid. Dev a . 95 Mcan a 0.00 Na 116.00
0
Regression Standardized Residual
Normal P-P Plot of Standardized Residual
Dependent Variable:
Gain in Marketing Knowledge 1.00
0.00 . 25 . 50
Observed Cum Prob
. 75
50
. 25
0.00
Scatterplot
. 73 1,00
Dependent Variable: 1
Gain in Marketing Knowledge
.2
u a to
a 93 00 03 a am goal, to is
ci It to thiom to
t3 0 41 n via
to cl: ý I*) 4's '3 C3
"U1 63 Coll as
a 98 Me$ to to ow 00 too U ", a a
u al go
-3 -2 .10
Regression StarklaTdiUd Predicted Value
Regression Model 4-3 of Table 6.4.3
31
303
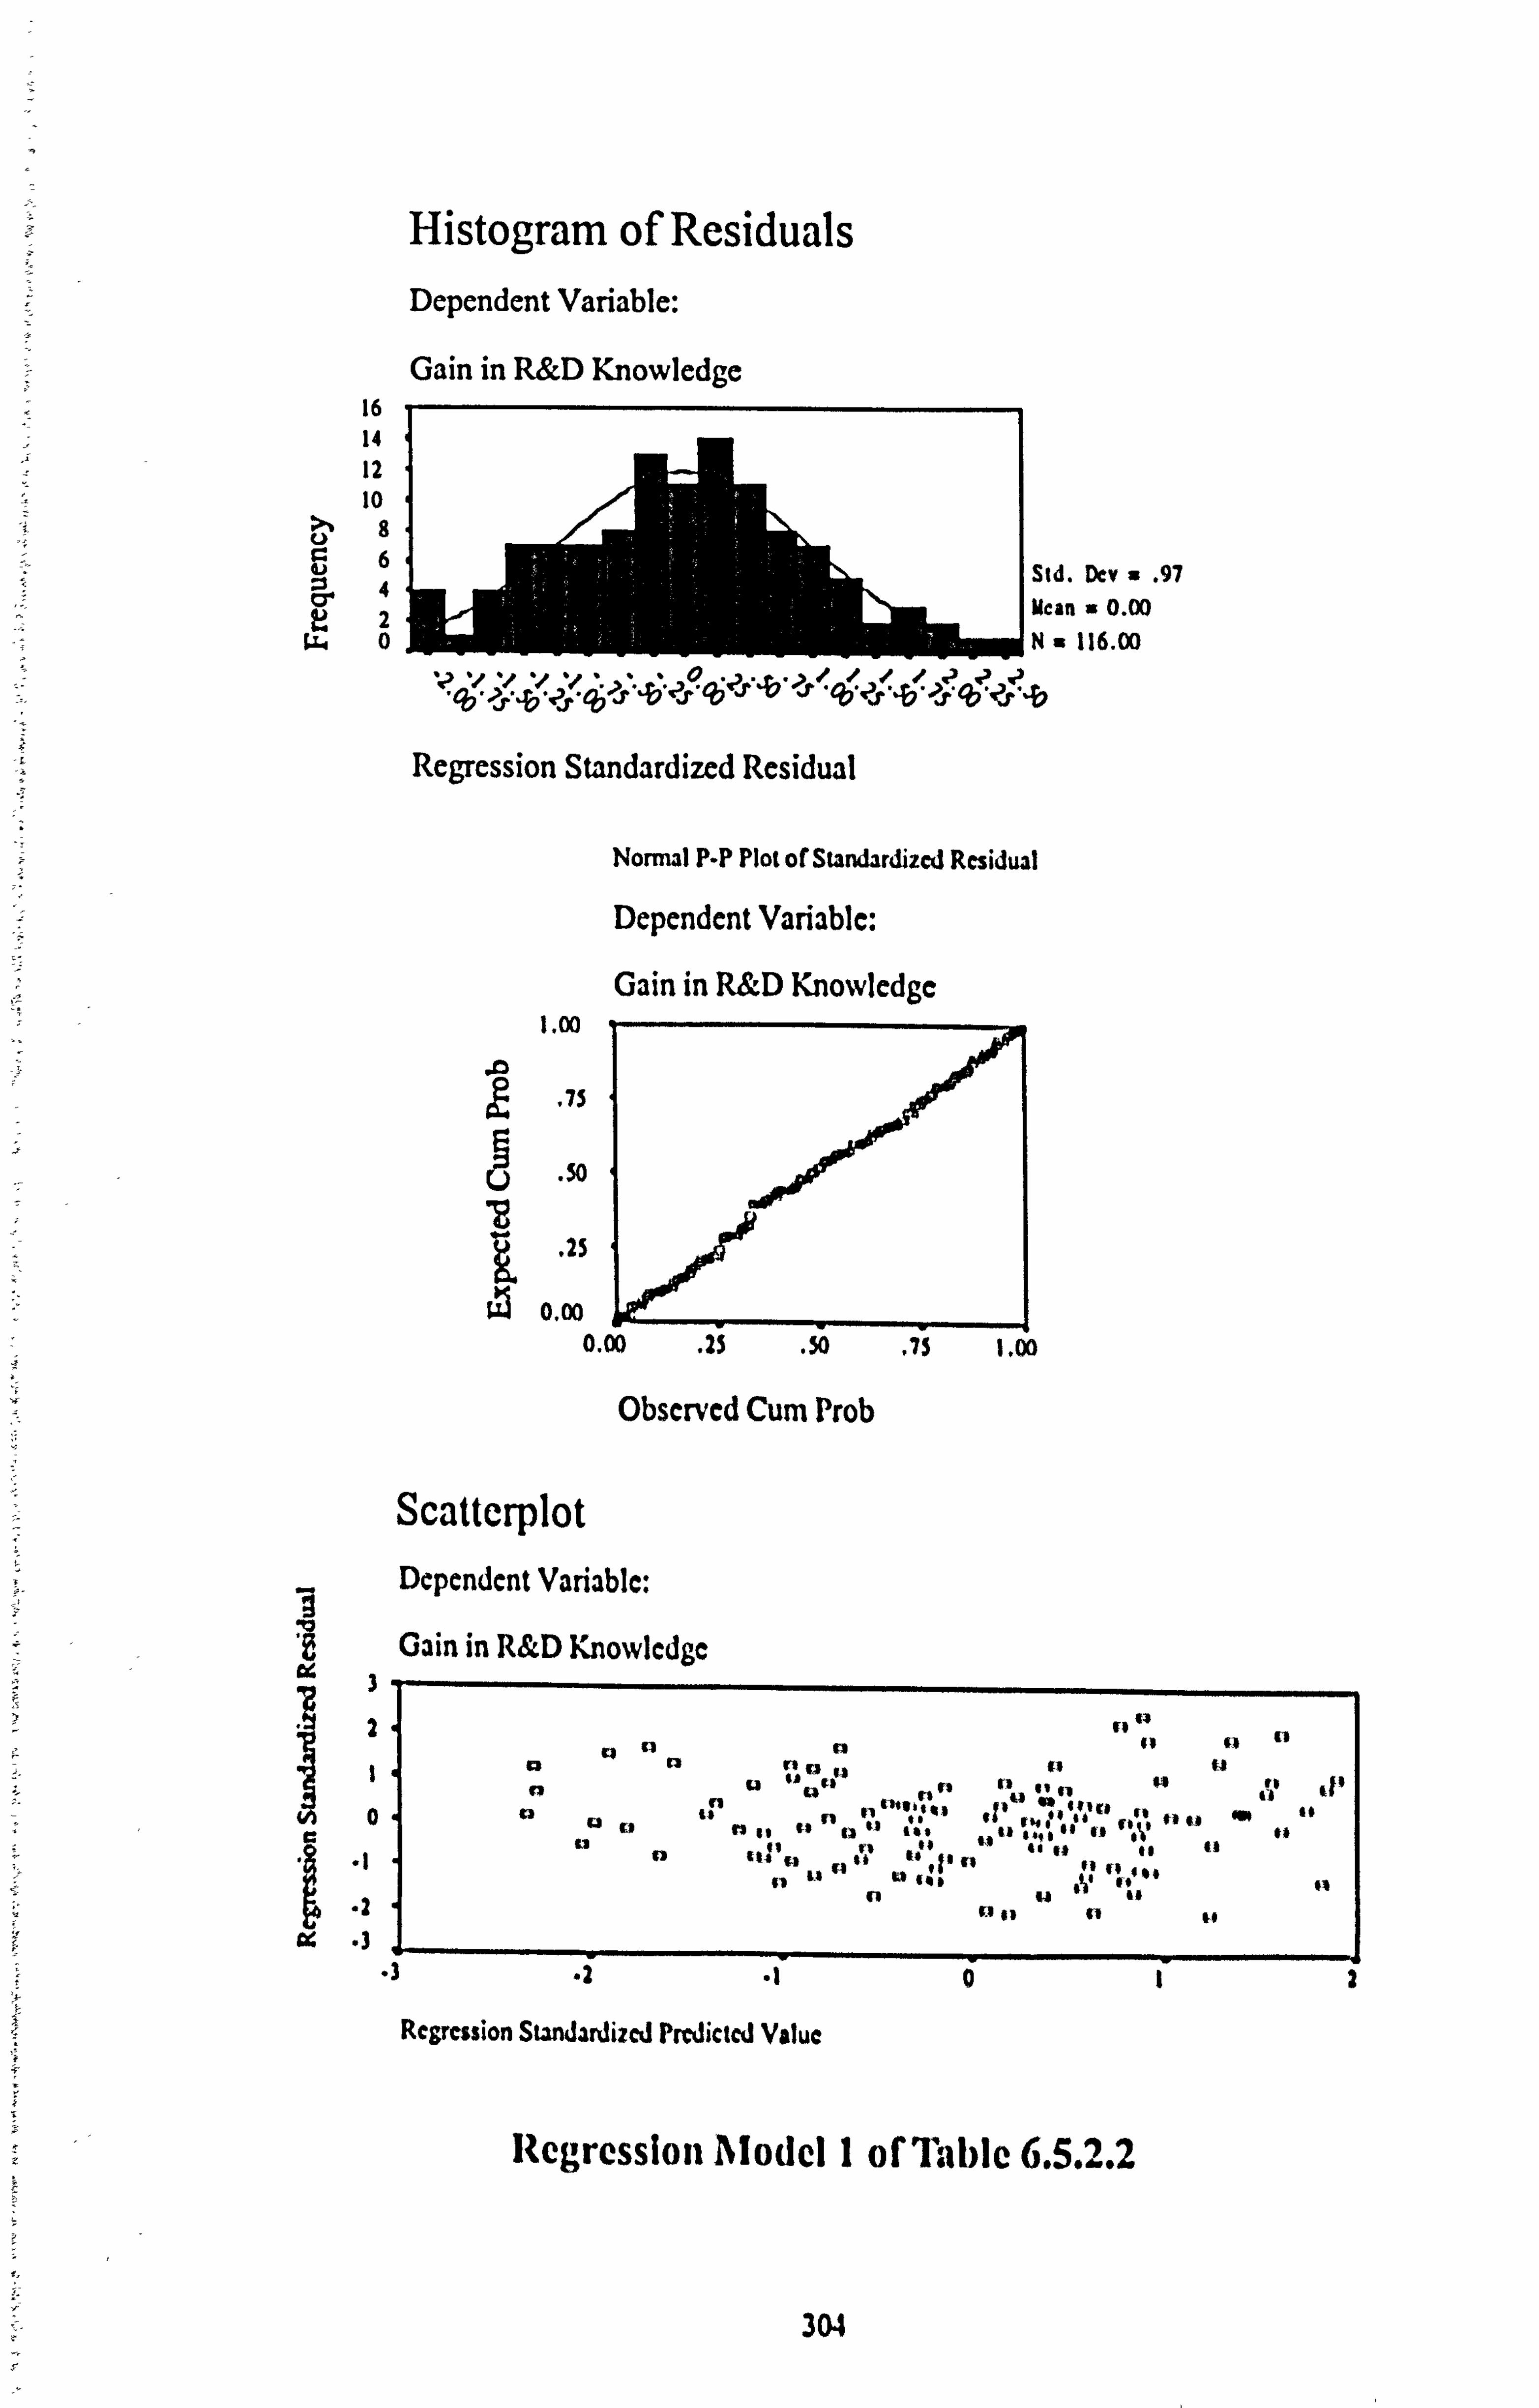
16 14 12 10
8 C) 6 f)
2 0
Std. Dev a . 97 Mean U 0.00
Na 116.00
Regression Standardized Residual
1.00
j3 - 75
-50
0. oo
Nomial P-P Plot of Standardized Residual
Dependent Variable:
Gain in R&, D Knowledgc
0.00 . 25 . 50
Obscrvcd Cum Prob
Scatterplot Dependent Variable:
Gain in R&D Knowledge i 2
1
.10
, 75 1.00
to 44
u It It to I's 43 40 is ý
It
ts 4: 11 "11c, I. of
91 41 It
to I# If
to 94 of 91
too #4 %1
to III It
.3 .2 .1
Regression Standardized Prcdicted Value
Regression Model I of Table 6.5.2.2
12
304
Histogram of Residuals Dependent Variable:
Gain in R&D Knowledge

16 14 12 to
8 6 4 2 0
Regression Standardized Residual
1.00
It Std. Dev = . 97
Mean = 0.00
N= 116.00 -----------------
00
Normal P-P Plot of Standardized Residual
Dependent Variable:
Gain in R&D Knowledge
.0 . 75 2
. 50
0.00 . 25 . 50
Obscrved Cum Prob
10 . 25
LU 0.00
Scatteiplot Dependent Variable:
Gain in R&D Knowledge
oj C4
L 0 cd
. 75 1.00
0 cl
C3
0 00 000C, a
IC3 0a 13 me] a: % 13 r. 3 0
C3 M 13 t, r. 3 -. -13 - 0-
13 00 0
CX3 0 [3 C3
r. 30 113or3g: 3 0 C%3 C3
0 A.
183 C3 am
-2 -I
Regression Standardized Predicted Value
Regression Model 2 of Table 6.5.2.2
305
1
/, I
Histogram of Residuals Dependent Variable:
Gain in R&D Knowledge

Histogram of Residuals Dependent Variable:
Gain in R&D Knowledge 16 14 12 10
8 66, Std. Dev = . 97
4 ean = 0.00
2 EMMIý 0N= 116.00
0 -10, -ýi' 00 "00
Regression Standardized Residual
Normal P-P Plot of Standardized Residual
Dependent Variable:
Gain in R&D Knowledge 1.00 1
In Mr 0 tý . 75 Oro
. 50 "a
.2 . 25
00
0.00 1 0.00 . 25 . 50 . 75 1.00
Observed Cum Prob
Scatterplot Dependent Variable:
Gain in R&D Knowledge C4 i
10 ri r] cl 93
cl r., 92 Cl cl 93
cl r cl Cl
r3 r] w ra
cl 92 r2
92 ti . -. --- ?..
r- ... r 12 c2
r] cm 2 tr im
93 Z, r]
Z, r3 ci
Ei in 12 m',
EI K3 c2 K3 cl Ei ll ri r3 r.,
cm rl ria
93 ch Im g2 qh
-3 -2
Regression Standardized Predicted Value
Regression Model 3 of Table 6.4.3
2
306

-4
-f
I
16 14 12 10
8 6
1.00
ýa . 75 0
50 u
. 25
x w 0.00 75 1.00 0.00 . 25 . 50
Observed Cum Prob
Scatterplot Dependent Variable:
It: $
(U Gain in R&D Knowledge 10 1
10 1
Nonnal P-P Plot of Standardized Residual
Dependent Variable:
Gain in R&D Knowledge
0 93 a C3
0 [a] DC3 E3 0 a r. ] 0Ma
cl 0 a 13 a000a0
Dt3 0 Ct3 C3 0 ck3 013 P Cl ' 93 Do 00
a 93 00 r] U" 13 aDa0
000a .3a
13 CID Ck3 0 r3 00r or] IC3 00
C13 a sm tit] 0 DM 93 M r3 0
93
-3 -2 -1 023
Regression Standardized Predicted Value
Regression Model 4 of Table 6.5.2.2
307
Histogram of Residuals Dependent Variable:
Gain in R&D Knowledge

Histogram of Residuals Dependent Variable:
Gain in R&D Knowledge 20
10
0
1.00
Scatterplot
.0 0 . 75
0.4 aropoo 9
. 50 . 00op U IC3
1
ýl 0.00 lo-po-
I 0.00 . 25 . 50 75 1.00
Observed Cum Prob
I Dependent Variable:
Gain in R&D Knowledge 19 1
ri r3 cm CU c3 93
CP E3 r3 c3 0 EI 92 93 cm
cl ri 12 c3 1212 cm -
-ý ý-ge-"m ýý 'n 93
Std. Dev = . 97 Mean = 0.00 N= 116.00
Normal P-P Plot of Standardized Residual
Dependent Variable:
Gain in R&D Knowledge
cl 83
ll c12 M EI am
c2 13 cm CX2
92
12 cl
-2 -10
Regression Standardized Predicted Value
Regression Model 5 of Table 6.5.2.2
23
308
'., & "" Regression Standardized Residual

16 14 12 10
8 6 4 2 0
1.00
.0 . 75
. 50
10 . 25
Normal P-P Plot of Standardized Residual
Dependent Variable:
Gain in R&D Knowledge
0.00 . 25 . 50
Observed Cum Prob
Scatterplot Dependent Variable:
Gain in R&D Knowledge 10 3
10 1
75 1.00
0 qt3 M
aM C3 C3 t3C3
93 a CT t3as cp, IT c4n M CZ3 g: 3 0
C3 0M '3,93 -a
13 Crp 00
r. 3 r. 3
3 C3 C3 13 0
a 13 V3 0
-3 -2 .1
Regression Standardized Predicted Value
Regression Model 6 of Table 6.5-2.2
a
C3
309
Histogram of Residuals Dependent Variable:
Gain in R&D Knowledge

16 14 12 10
8 6 4 2 0
1.00
Normal P-P Plot of Standardized Residual
Dependent Variable:
Gain in Manufacturing Knowledge
iz . 75
. 50 10
. 25
w 0. ()o bý-- 0.00 . 25 . 50
Observed Cum Prob
Scatterplot Dependent Variable:
"a .m U Gain in Manufacturing Knowledge
,aI
. 75 1.00
cl 93
c3 r] 93 1: 3 cl el c2 cl cl tram cl ci cyck, c3 c3
c3 EI 93 Cl cl c3 Cl c3 a CICI
[2 qb au c21 93
cm c3 cl cm Z] 92
c3 , r3 zu
g2 tu
f2 ci
13 93 rZ7M 122 Cl cm 92 c] r2 Emr. 3cl CZ2 92
-3 -2 -I
Regression Standardized Predicted Value
Regression Model 1 of Table 6.5.2.3
0
3
310
Histogram of Residuals Dependent Variable:
Gain in Manufacturing Knowledge
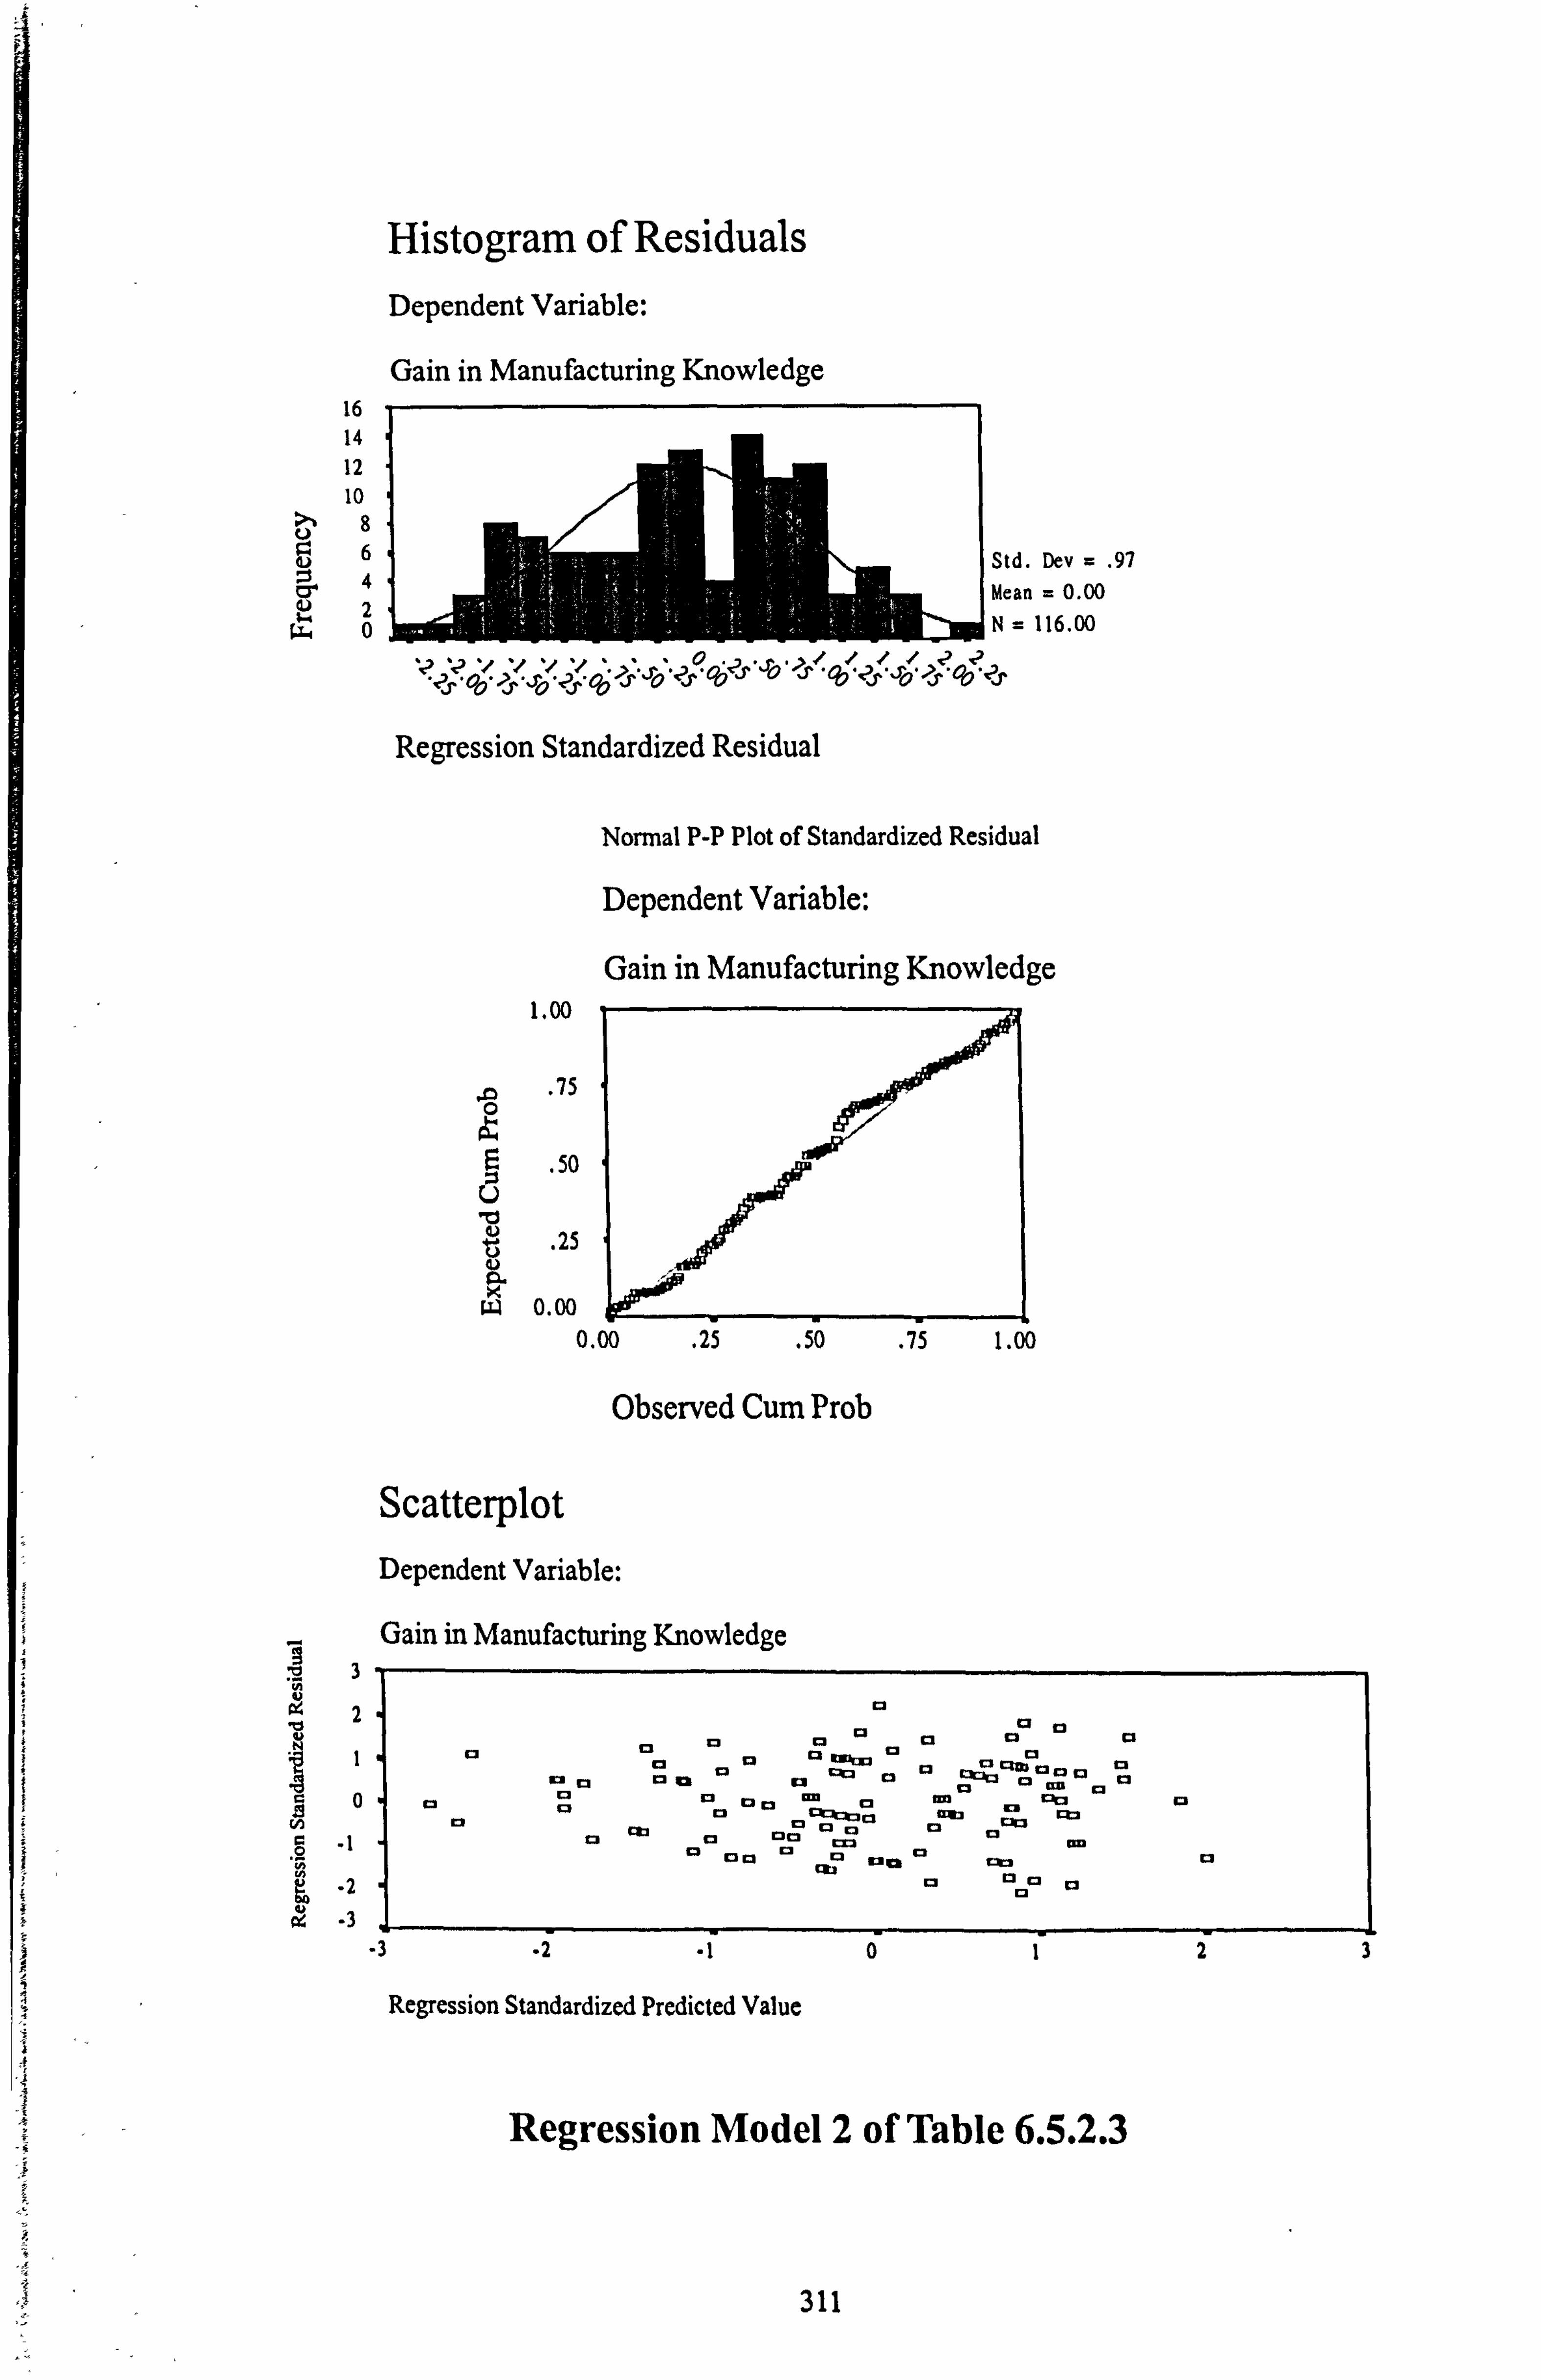
16 14 12 10
8 C)
C) 2
. L1 0
1.00
-2 . 75
. 50
"0
. 25
W 0.00 0.00 . 25 . 50 . 75 1.00
Observed Cum Prob
-t
-t
Scatterplot Dependent Variable:
Gain in Manufacturing Knowledge
rA
L
Nonnal P-P Plot of Standardized Residual
Dependent Variable:
Gain in Manufacturing Knowledge
r3
cl ci c3
93 12 c2 Kokm c3 r3
K3 x, 12 C2M c2 t] ci c4b ' cl c3 tm
83 -ja ' 'm ri 92
92 cm c3 lEn
93 r30
ci
CX: 7cxacl glea K: u iti EI 92 9293
cl C3C2 ci
cz g2 ci m t= c2
cm E2 1, qm gal Mcl
r3 93 c2 ,
.2. I
Regression Standardized Predicted Value
Regression Model 2 of Table 6.5.2.3
311
a
a
2: - 3
Histogram of Residuals Dependent Variable:
Gain in Manufacturing Knowledge

16 14 12 10
8 6
Regression Standardized Residual
1.00
0 . 75
-50 10
w 0.00
Normal P-P Plot of Standardized Residual
Dependent Variable:
Gain in Manufacturing Knowledge
0.00 . 25 . 50
Observed Cum Prob
Scattetplot Dependent Variable:
Gain in Manufacturing Knowledge Iti 3
"0 1
75 1.00
12 ci
c2 cl all 92 ri 12 C: 33
r. Inn 920 93
ri ti EIK3
0a r3 12 cm cl
cm 12 ca
92
93 t)
cm 93 91 91
c3 ch ci CMC3 K2
1: icir 12 C7M qxa cl £3
92 ti ti coym 93 c3 , EI 'Im r. 3
Cm 93 c3
92 z2 93 12 ri
ci c3 g, 0 cm
M
-3 -2 -1
Regression Standardized Predicted Value
Regression Model 3 of Table 6.5.2.3
23
312
Histogram of Residuals Dependent Variable:
Gain in Manufacturing Knowledge

14 12
10
8 U
4 2
.l0
1.00
. 75
. 50
"0
25 u
w 0.00
Normal P-P Plot of Standardized Residual
Dependent Variable:
Gain in Manufacturing Knowledge
0.00 . 25 . 50
Observed Cum Prob
Scatterplot Dependent Variable:
.m 0 Gain in Manufacturing Knowledge 10 1 4) N
10
75 1.00
0 MDM00
00 13 00 00
C%3 0 13 0 Ck3
0 130 r.,
tM 0000 r3 M0 Mtlo
0a 00 a ob Ilb 130
CX3 C3 . tm im 0 91 CZ3 C3 0MQ0 42 C30 D1 C3
00 , r. 3 13 C3 0 13 0
Cb 0 KI M C%3
0
-2 -10
Regression Standardized Predicted Value
Regression Model 4 of Table 6.5.2.3
313
D
0
3
Histogram of Residuals Dependent Variable:
Gain in Manufacturing Knowledge

14 12
10
8 0
4) 4
)2 I-
0
1.00
fo
. 75
. 50 "0
0.00
Nonnal P-P Plot of Standardized Residual
Dependent Variable:
Gain in Manufacturing Knowledge
0,00 . 25 . 50
Observed Cum Prob
Scatterplot Dependent Variable:
Gain in Manufacturing Knowledge '0 1
1: 1 2 ,0
10 1 m
75 1.00
ti cl
c3 12 13 93 92 K3 r]
12 alb ci EI C], '. t3 92 tl CM t'
KJ, 2 C3C3 , r] 92 cl CYM t3C3
ri cl 12 1, t] a, gIn 12
Clan CU 3 1: 3 r. 3 r. 3 mw
Ei r2 E,
0 r3 Ki tl g3 cl cl c2 ' ci cl cl
M Cl oze t] m 93 rk2m
ri
-3 -2 -1
Regression Standardized Predicted Value
Regression Model 5 of Table 6.5.2.3
I 314
0
0
23
Histogram of Residuals Dependent Variable:
Gain in Manufacturing Knowledge

16 14 12 10
6 4
Regression Standardized Residual
1.00
iz . 75
. 50 Ici
p- w 0.00
Leý 1 0.00 . 25 . 50 . 75 1.00
Observed Cum Prob
Scatterplot Dependent Variable:
19 Gain in Manufacturing Knowledge 3
Nonnal P-P Plot of Standardized Residual
Dependent Variable:
Gain in Manufacturing Knowledge
93 cl
13
ci c3 "am 93 MM %
1,3 r3 c3
j13 rIm
Cb . r2 qb 93
91 83
cl ri:,
Q ri qb
12 r KICX,
c3 c3 a
93 ll cl
r. 2 r3cm" t2 r2
93 93
-3 -2 -1
Regression Standardized Predicted Value
Regression Model 6 of Table 6.5.2.3
315
23
Histogram of Residuals Dependent Variable:
Gain in Manufacturing Knowledge

16 14 12 10
8 6 4 2 o
Std. Dev = . 97 Mean = 0.00 N= 116.00
',,, r
Regression Standardized Residual
1.00
. 75
. 50
"0 u
0.00
Norinal P-P Plot of Standardized Residual
Dependent Variable:
Gain in Predevelopment Assessment Knowledge
0.00 . 25 . 50
Observed Cum Prob
Scatterplot Dependent Variable:
. 75 1.00
Gain in Predevelopment Assessment Knowledge
Ici k3
.0
0 C3 13
Cl= Cl Ei 93 93m r3 cm EI 93 Elticl
92 92 93 c122
r. 3 m ta
t3 c3 Cm cx. um: i
. cm
93 Mm. c= 913 0 r3 l,
"0
r3 92 0 92 cl ti r
«, , c3 c3 " Cka
c3 .3
93 m 92
c3 m. 12 K,
93 c20 im EI c3 '
-2 .I
Regression Standardized Predicted Value
Regression Model 1 of Table 6.5.2.4
316
Histogram of Residuals Dependent Variable:
Gain in Predevelopment Assessment Knowledge

16 14 12 to
6 4 2 0
Std. Dev = . 97 Mean = 0.00
mN= 116.00
Y",
Regression Standardized Residual
1.00
'8 . 75
. 50
. 25
w 0.00
Normal P-P Plot of Standardized Residual
Dependent Variable:
Gain in Predevelopment Assessment Knowledge
0.00 . 25 . 50
Observed Cum Prob
ScatteTlot Dependent Variable:
Gain in Predevelopment Assessment Knowledge
-2
.0
75 1.00
93
ri Cm c] Kmi untl c3 cm
E3 cl 12 EI 12 93 93
83 u. cl
C3C3 ý 12 Cl 12 93 ", ci
Cm m] ". Elcl
cl c3 23 cl CICM 93 t2 93 93 82
43 12 r .I. i-M t' -
Ei 1
-3 .2 -1 0
Regression Standardized Predicted Value
Regression Model 2 of Table 6.5.2.4
317
1
Histogram of Residuals Dependent Variable:
Gain in Predevclopment Assessmcnt Knowlcdge

14 12 10
8 6 4 2 0
Nonnal P-P Plot of Standardized Residual
Dependent Variable:
Gain in Predevelopment Assessment Knowledge
1.00
.0 . 75
. 50
"0
. 25
ok, a e- w 0.00
to
0.00 . 25 . 50
Observed Cum Prob
Scatterplot Dependent Variable:
Gain in Predevelopment Assessment Knowledge .6 In
3 4)
"1 -2
. 75 1.00
013 00
13 0 13 00
C3 'C' 13010 13 Vj 13 13 D g. 1313 13
13 CM r. 20 00
cam 0 C3
g3 Mr.
3 10 C3CS 93
13 C3 C3 0 93 C3 0
C%23 0 0 coo 13 C3 g3
C3 00
C313 CZ3 0 9300 00
0 C2 0 C%3
C3 00
-2 .1
Regression Standardized Predicted Value
Regression Model 3 of Table 6.5-2.4
318
1
Histogram of Residuals Dependent Variable:
Gain in Predevelopment Assessment Knowledge

Histogram of Residuals Dependent Variable:
Gain in Predevelopment Assessment Knowledge 16 14 12 10
8 6 4 2 0
1.00
iz . 75
- 50
. 25
0.00
Normal P-P Plot of Standardized Residual
Dependent Variable:
Predevelopment Assessment Knowledge
Std. Dev = . 97 Mean = 0.00 N= 116.00
0.00 . 25 . 50
Observed Cum Prob
ScatteTlot Dependent Variable:
. 75 1.00
Gain in Predevelopment Assessment Knowledge 4
3
1) -2 cz .3
00 a
Q3 00 00 0 oc, 00 0 C3 M00
13 D 1112 tmo
43 MOOD
0 93 00 03 C3 M0
13 C3 C3 93 00 C13 r0
13 C113 0 qt3 Cl 00 . 430 000
0 C3 Q3-
0G0 9%m C"3
0 r. 3 13 a CX3 C3
0
-2 -10
Regression Standardized Predicted Value
Regression 4 of Table 6.5.2.4
I 319
23
'ý? 00 'ý + 00 . "ro q 00 "ý' ý00 'ý+ 'ý00 '? + 'ý00
Regression Standardized Residual
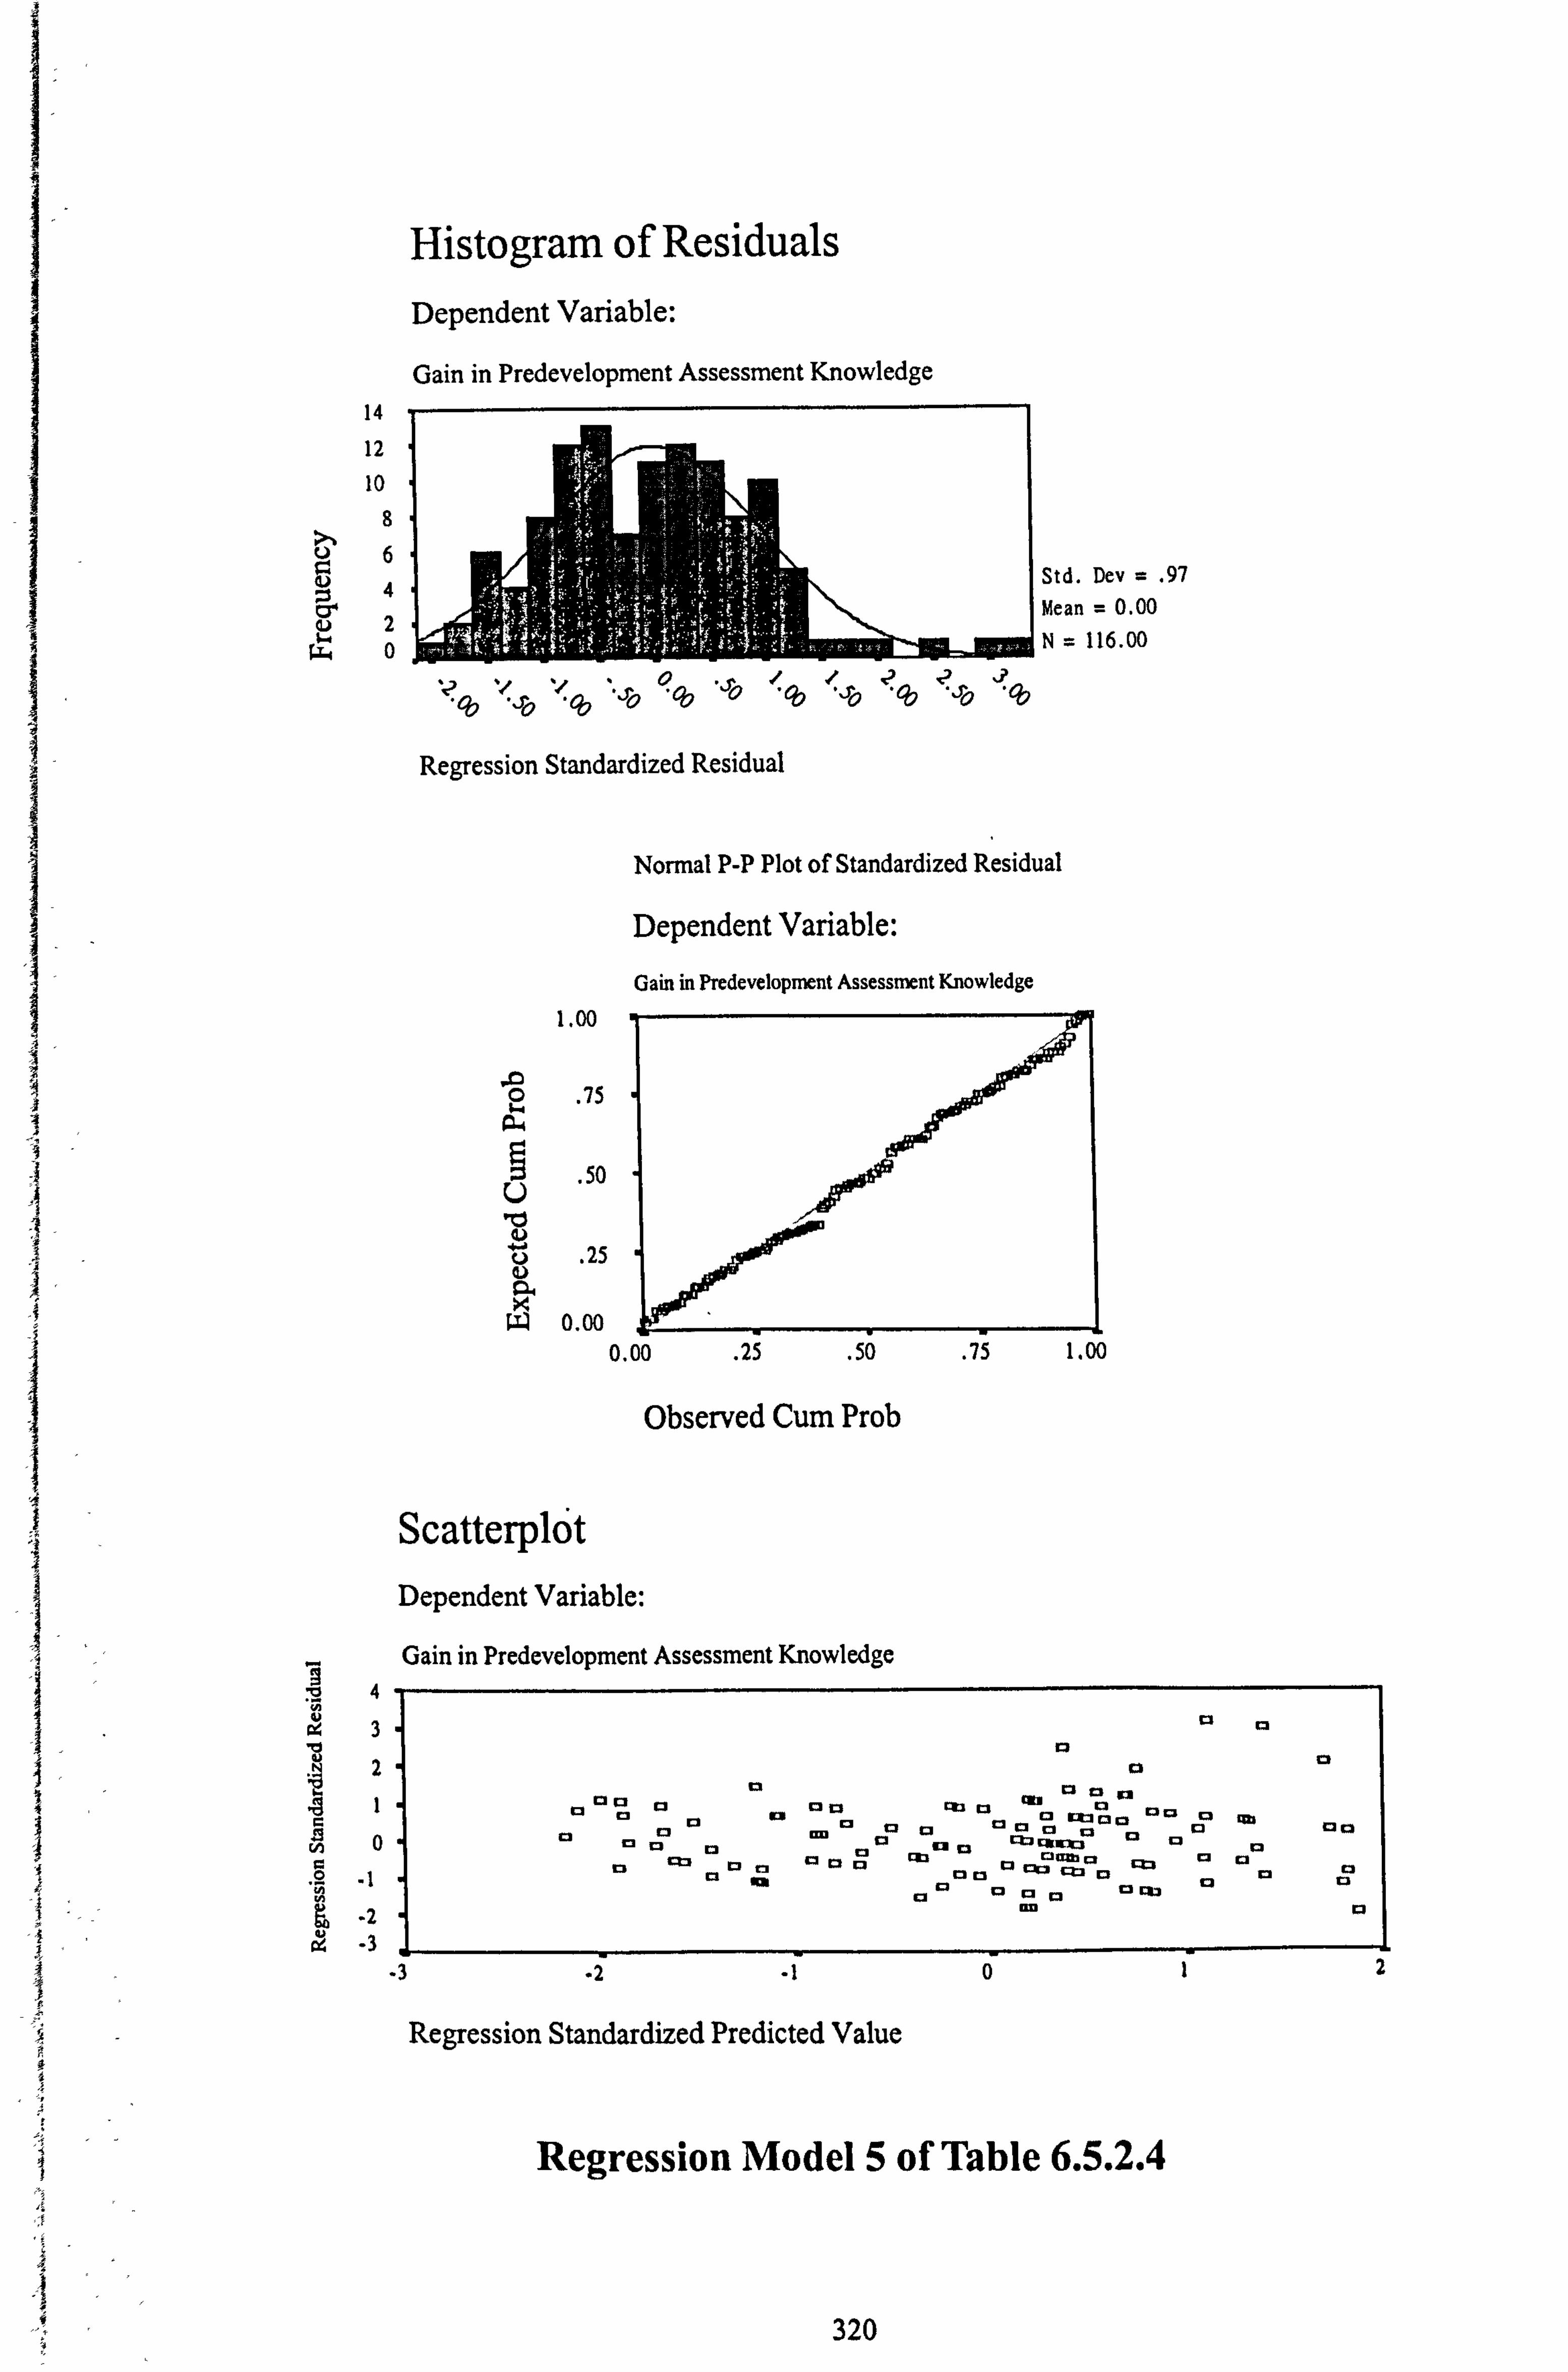
Histogram of Residuals Dependent Variable:
Gain in Predevelopment Assessment Knowledge 14
12 10
8 6
4 2 0
Std. Dev = . 97 Mean = 0.00 N= 116.00
Normal P-P Plot of Standardized Residual
Dependent Variable:
Gain in Predevelopment Assessment Knowledge 1.00
.a . 75
LY
. 50
llý
. 25
0.00 0.00 . 25 . 50
Observed Cum Prob
ScatteTlot Dependent Variable:
Gain in Predevelopmcnt Assessment Knowledge 4.
rA
75 1.00
M0 ri
c3 cl Cl g3 Ptz r3 cn
m ri ,. mr. 2 Cl EX: § r3 ,2M C) qb c3 tl r] Cl 92 ci " c3
r7M r&Wjrj 93 c3 g2 ri
cu C: 3
MUM M Cl ti r3 n 1212 Ctl 12 cl ci Na r3 93 c3 clu c2
m
.2.10
Regression Standardized Predicted Value
Regression Model 5 of Table 6.5.2.4
I 320
0
*ý? qý 'ý< -ro
*ý<00 '*-10' qOO "'0 ý00 '<-Ib 'ýOb 'ý40 'ýOb
Regression Standardized Residual

>% 10
v Std. Dev me . 97 :3
Mean - 0.00 114 0Nm 116.00
?
Regression Standardized Residual
Nonnal P-P Plot of Sundardized Residual
Dependent Vafiable:
Gain in Piedevelopmt Amessamt Knowledge
0.00 . 25 . 50 . 75 1.00
Observed Cum Prob
1.00
. 75 .0
'Z . 25
0.00
Scatterplot Dependent Variable:
Gain in Predevelopment Assessment Knowledge
gI
00
00 co 00 ati C%3 m00, 00
0 an, qb r. 3r. 3 0 E13
a3 C13 1 r.,
M cu 00 C3
C3 . Q13 [luck, a
r. 3 a 13 Ctl 00 a C3 0 C3 a0 Cb3 M=0 13
00 C3 0 00 0 00 OC3 13
13 ob
00 t3r. ]
0
0 C3
-2 .10
Regression Standardized Predicted Value
Regression Model 6 of Table 6.5.2.4
321
2
Histogram of Residuals Dependent Variable:
Gain in Prodevelopment Assessment Knowledge 20 .

16 14 12 10
8 6 4
Std. Dev = . 97 Mean = 0.00 jjWNNjftIMW=J
N= 116.00
Regression Standardized Residual
1.00
Nonnal P-P Plot of Standardized Residual
Dependent Variable:
Gain in Marketing Knowledge
.0 2 . 75
. 50
"o
. 25
0.00 0.00 . 25 . 50
Observed Cum Prob
Scatterplot Dependent Variable:
Gain in Marketing Knowledge .91
C3 0 tg
75 1.00
EI r2 cl cm c2
ti Cam c2 13
ci cl r3
IM unt2cm r]
Im cl KZ, c3 rt: im UM c.
cm ci Im
t3 EI t%b
r. 3
-3 -2 -1 0
Regression Standardized Predicted Value
Regression Model 1 of Table 6.5-2.5
C3
322
Histogram of Residuals Dependent Variable:
Gain in Marketing Knowledge

20
ft, lo
1.00
Nonnal P-P Plot of Standardized Residual
Dependent Variable:
Gain in Marketing Knowledge
. 92 2
. 75
. 50
"0
. 25
0.00 0.00 . 25 . 50
Observed Cum Prob
Scatterplot Dependent Variable:
ij Gain in Marketing Knowledge
2
.1
-2
. 75 1.00
M
C3 0a0 13
C3 00 0 RXID D0
13 C3 0000
00 ICNOzt, CS C33 , C03 0 Dq3 a 00,00
cl 0 MIC%3. Q3 C3 C: k' 1 13 00a Mt3 0 r3 93
tspc%M, 3
qM3 r, 0,1.3 13 930K,
000 0 C3
i
-2 .102
Regression Standardized Predicted Value
Regression Model 2 of Table 6.5.2.5
34
323
Histogram of Residuals Dependent Variable:
Gain in Marketing Knowledge

30
20
10
1.00
2 . 75
. 50
"0 25
w 0.00 75 1.00 0.00 . 25 . 50
Observed Cum Prob
Scatterplot Dependent Variable:
Gain in Marketing Knowledge ..
"2 U
I .2
Normal P-P Plot of Standardized Residual
Dependent Variable:
Gain in Marketing Knowledge
13 C3
3 C3 0
00U C3
0 C70 13CM r. 3 C3
C3rt3 C3 0 ot" r. 3
93 00 13
nOC3 CRX3
00 r7aM 13 93
0 En C13 C3 000
c1b C3 a t2 0
-3 -2 -10
Regression Standardized Predicted Value
C3
13
Regression Model 3 of Table 6.5.2.5
324
Histogram of Residuals Dependent Variable:
Gain in Marketing Knowledge

16 14 12 10
8 6
Regression Standardized Residual
1.00
iz 0 . 75
. 50
25
w 0.00
Normal P-P Plot of Standardized Residual
Dependent Variable:
Gain in Marketing Knowledge
0.00 . 25 . 50
Observed Cum Prob
Scatterplot Dependent Variable:
Gain in Marketing Knowledge .-
"2 N
41
. 75 1.00
92 12 cl E3
EI r] im 12 cl
im cl inri , c3
c3 cl
im 93
12 g3
rkl CMUC3 r. 2 92 EI , c3 93 cm cl cl 12 Im83 qm CM K] CX2
M ci Ei Cb Ei C],
CX2 13 92 tu
cm livi cl cl
Cl c3 r3 t%2 cl 92
-3 -2 .10
Regression Standardized Predicted Value
D
a a a
a
a a
3
Regression Model 4 of Table 6.5.2.5
325
Histogram of Residuals Dependent Variable:
Gain in Marketing Knowledge

Histogram of Residuals Dependent Variable:
Gain in Marketing Knowledge 16 14 12 10
8
:3 IStd. Dev = . 97
4: 2 Mean = 0.00 0
IJEIEM"It-ý N= 116.00
1,1,1 1.0.., >. /ýýýpý? c? %-7 ,2X -A -'ro .,? 00 Zr v Zr . 00 6, x 00 & 'ro Lr zr v
Regression Standardized Residual
Nonnal P-P Plot of Standardized Residual
Dependent Variable:
Gain in Marketing Knowledge 1.00 1 FW
.0 . 75
9u
. 50
. 25
ýl 0.00 0.00 . 25 . 50
Observed Cum Prob
i Scatterplot Dependent Variable:
Gain in Marketing Knowledge . ;43 Iti
.00
75 1.00
93
r3 91 "- m 93
«3 '- Rt3 12
r3 92 ---
ci EI:, m an 93 '
.3 -2 .10
Regression Standardized Predicted Value
Regression Model 5 of Table 6.5.2.5
23
326

Std. Dev - . 97
C, Jrj 4m-0.00 2
16.00 0
id
I. UU
Nonnal P-P Plot of Standardized Residual
Dependent Variable:
Gain in Marketing Knowledge
"40, *,: ýp q 00""-' *"0 * 6, *ý
Regression Standardized Residual
ýo 75 .
. 50 "C
. 25
w 0.00 Týý 0.00 . 25 . 50
Observed Cum Prob
Scatterplot Dependent Variable:
Gain in Marketing Knowledge 3
. 75 1.00
ti cl 92
r] 12 ri
cl ci cl
c12 Cl c3 cl 93
rIrl r3 c] 92 cl U., tz
cm CU Cl CM 12
t' 92 qb 93 gl
Cl CU EI r] qtl t3C3
cl t, um Ci cit, r3 c2 cirl ý qb c3 12 a c12
Cl 1,
-4 -3 -2 .10
Regression Standardized Predicted Value
Regression Model 6 of Table 6.5.2.5
327
23

Histogram of Residuals Dependent Variable: Technological Innovativeness
Before the Mediator: R&D Knowledge 16 14 12 10
u Std. Dev m . 98 & -, IM 2 ean = 0.00
0N= 116.00
.. L -ýr
X &. 0 ýr " . S. -ro 00. -, &-Oý vv
Regression Standardized Residual
1.00
Normal P-P Plot of Standardized Residual
Dependent Vaiiable: Technological Innovativeness
Before the Mediator: R&D Knowledge
.0 0 . 75
so U ,a
'0ýýe . 25
W 0.00 0.00 . 25 . 50
Obscrvcd Cum Prob
75 1.00
Scatterplot Dependent Variable: Technological Innovativeness
Before the Mediator: R&D Knowledge
aI
C3
B0 OW
r. ] a ly
13 t2 , 13 00M
M0w-aaJ 0M
ýcs 11
a
'00 0 cP 93 BX3 t3 r. 3
0 [3
0000 tm 000 0 C3r. 3 00
0 C3 M
C2 cl
-3 -2 .1023
Regression Standardized Predicted Value
Regression Model 'Before the Mediator - RD' of Table 6.6.1
ii 3
2
10 M0
-2 c4 -3
328

A
30
20
10
1.00
. 75
-50
10
. 25
0.00 75 1.00 0.00 . 25 . 50
Observed Cum Prob
Scatterplot Dependent Variable: Technological Innovativencss
Before the Mediator: Manufacturing Knowledge :33
0 iN
g
0
Nomal P-P Plot of Standardized Residual
Dependent Variable: Technological Innovativeness
Before the Mediator: Manufacturing Knowledge
ga cl 93 m ti Ei Cl
cm t2 93
CI[2 92 c3 cl £2 -. - Au- -
12 t21
12 g: 3 c3 r'
1, & Cl i
r. 2 g3 12 EI la
A. -p-
93 r, f
c2 Ein m& CYM ci g2 t3 r2 92 rp 12
ri Im r. ' Cl Ei 12 93
r3 r3 r Z, Ei cl
93
C3C3 12 ri
-3 -2 .102
Regression Standardized Predicted Value
3
Regression Model 'Before the Mediator: MFI of Table 6.6.1
329
Histogram of Residuals Dependent Variable: Technological Innovativeness
Before the Mediator: Manufacturing Knowledge

Histogram of Residuals Dependent Variable: Technological Innovativeness
Before the Mediator: Predevelopment Assessment Knowledge
20 1
10
1.00
. 75
.0
. 50
. 25
0.00
Normal P-P Plot of Standardized Residual
Dependent Variable: Technological Innovativeness
Before the Mediator: PredevAssessment Knowledge
0.00 . 25 . 50 . 75 1.00
Observed Cum Prob
Scatterplot Dependent Variable: Technological Innovativcness
Before the Mediator: PredeV Assessment Knowledge W. 3 10 u
10 1
Cl ta r]
tp cl 12 13 cl ma - r. 3 j3
c2 im 92 C,
r3 c3 r. 3 ...
. 13
ý:. ý 13 Cl ' til, 93
titi ' ri ri ri c3 cl
ci Ka cl g2
13
-3 -2 .102
Regression Standardized Predicted Value
Regression Model 'Before the Mediator- PDA7 of Table 6.6.1
330
4

Histogram of Residuals Dependent Variable: Technological Innovativeness
Before the Mediator: Marketing Knowledge
16 14 12 10
8 9
/JL
lwý 0.98 0 Std. Dev =. 4 Mean = 0.00 2 0N= 116.00
I/. Zr ., 5, ý vV I'll I, *'Zr
Y ýr 1ý -ý., Z, *Iýr *I& '-ýp "& Zp
Regression Standardized Residual
Normal P-P Plot of Standardized Residual
Dependent Variable: Technological Innovativeness
Before the Mediator: Marketing Knowledge
1.00 -1
75
.0 0 t.
. 50
U "tj
. 25
w 0.00
Z,
0.00 . 25 . 50
Observed Cum Prob
Scatterplot
7; Dependent Variable: Technological Innovativeness
G Before the Mediator: Marketing Knowledge
,0
9 vi 0 P.,
92 ci
t3 1112
12 A
r. 3 Cl
c3 2mr 12E3 13 �, ýpa
cl [2C]H-, p 66
r, 0. c2 a Ei ri
ri e 91 c3. L9 r
fl ci lb
-2 .10
Regression Standardized Predicted Value
Regression Model 'Before the Mediator-MKI of Table 6.6.1
331
. 75 1.00
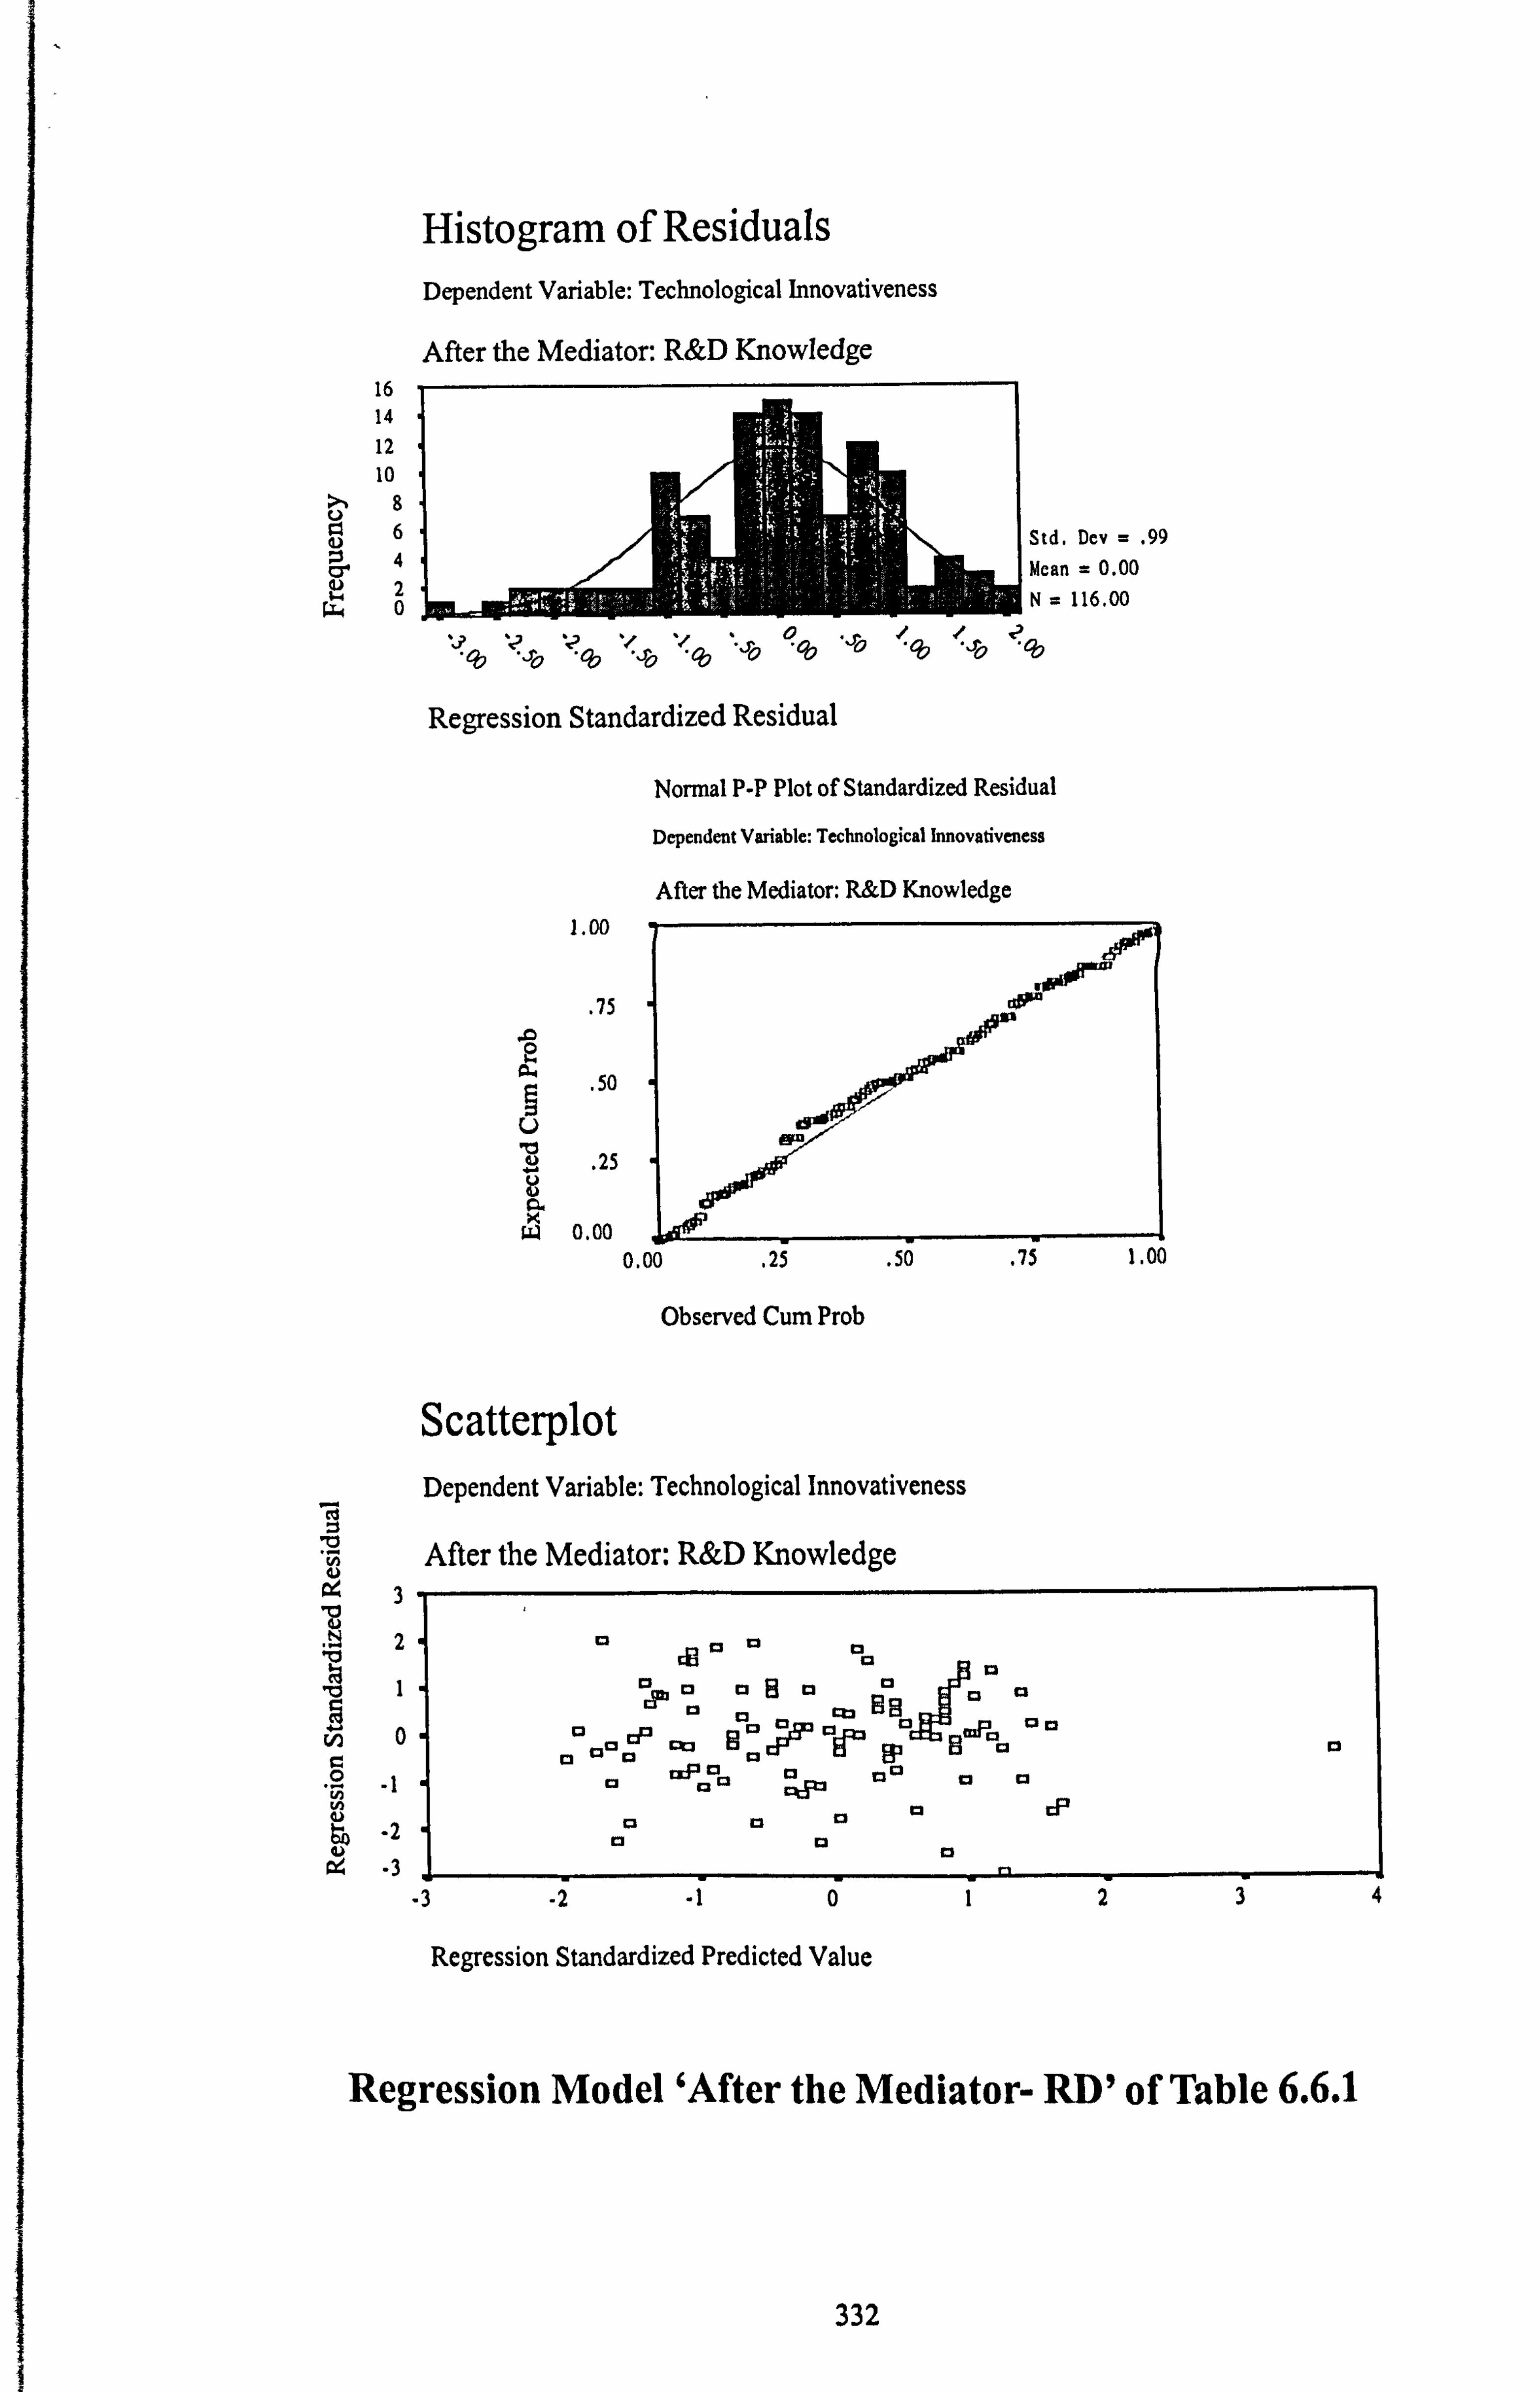
I,
16 14 12 10
6
Histogram of Residuals Dependent Variable: Technological Innovativeness
After the Mediator: R&D Knowledge
Std. Dev = . 99 Mean = 0.00 N= 116.00
I-? `ý `ýO "ý-, O "ý00 "-'0 L?
00 . -ro -ý00 ý+ ýq2 00 +0 Regression Standardized Residual
1.00
. 75
.0 04 9' DU
u 10
. 25
Normal P-P Plot of Standardized Residual
Dependent Variable: Technological Innovativeness
After the Mediator: R&D Knowledge
0.00 . 25 . 50
Observed Cum Prob
Scatterplot Dependent Variable: Technological Innovativeness
. 75 1.00
"a After the Mediator: R&D Knowledge
. ýi , li
la 1 9 vl
u3 CE
z3 93 tIra
cl EI aa t3 c3
1C3 Cla EI 2,2
cl 93 93 EP cl -%l2. cl r] cl 92
c3 92 cl cl rp
cl 93
-3 -2 -1 02
Regression Standardized Predicted Value
Regression Model 'After the Mediator- RD' of Table 6.6.1
4
332

C.
16 14 12 10
8 6 4 2 0
1.00
. 75
. 50
10 . 25
X w 0.00
Std. Dev m . 98
Nomal P-P Plot of Standardized Residual
Dependent Variable: Technological Innovativeness
After the Mediator. Manufacturing Knowledge
0.00 . 25 . 50
Observed Cum Prob
ScatteTlot Dependent Variable: Technological Innovativeness
After the Mediator: Manufacturing Knowedge
I
4
75 1.00
C3 13 C3 C3
r .3 13 cp Im ctp C3
r. 3 13
M VP C3 P
%Q On
a 13 C3 M
CM 93
0 a3
0 13
. 1: 3 El
0
.2
OC3
C3
.2 -1 023
Regression Standardized Predicted Value
Regression Model 'After the Mediator-MFI of Table 6.6.1
-g
-I
.2
.3
333
Histogram of Residuals Dependent Variable: Technological Innovativeness
After the Mediator: Manufacturing Knowledge

Histogram of Residuals - Dependent Variable: Technological Innovativeness
After the Mediator: Predcve Assessment Knowledge 16 14 12 10
8 6 4 2 0
Std. Dev = . 99
1.00
. 75
.0
Ju
10
Normal P-P Plot of Standardized Residual
Dependent Variable: Technological Innovativeness
After the Mediator Predeve Assessment Knowledge
0.00 . 25 . 50
Observed Cum Prob
Scatterplot Dependent Variable: Technological Innovativeness
After the Mediator: Predeve Assessment Knowledge Zi
c2 Cm Ei ti3
c3 ci
83 cl ri r3 r3
C7M BB r] r] c3 L3 c]
cp c2 r3
ZZ3 ri
ti Eici r-P c2.2a EP c3 £3 CP cE
ti
r
92 cl
12 Ei cm
13-
-2 .10
Regression Standardized Predicted Value
1: 3
Regression Model 'After the Mediator-PDA! of Table 6.6.1
. 75 1.00
334

1.
20
>, 10 U
U Std. Dev = . 98 Mean = 0.00 N= 116.00
VVVVVVV -x . 00 v -Y-rO, I, YOOI-Y-POI'&*00 Zr 0 ýr 0011&1-ro* oy, 00
Regression Standardized Residual
1.00
. 75
so . 25
0.00
Nonnal P-P Plot of Standardized Residual
Dependent Variable: Technological Innovativeness
After the Mediator Marketing Knowledge
0.00 . 25 . 50 . 75 1.00
Observed Cum Prob
Scatterplot
Iz Dependent Variable: Technological Innovativeness 72
After the Mediator: Marketing Knowledge
93
.3
"a
Regression Standardized Predicted Value
Regression Model 'After the Mediator- MKI of Table 6.6.1
335
Histogram of Residuals Dependent Variable: Technological Innovativeness
After the Mediator: Marketing Knowledge

:4
16 14 12 10
6 4 2 o
1.00
. 75
'50
. 25
w 0.00 75 1.00 0.00 . 25 . 50
Observed Cum Prob
Scatterplot Dependent Variable: Market Innovativeness
Before the Mediator: R&D Knowledge
"a I
Normal P-P Plot of Standardized Residual
Dependent Variable: Market Innovativeness
Before the Mediator: R&D Knowledge
r3 13
00
0 CP
13 13 013
0
0 13 00
cit, 5ý0
zu as
la 0 00a Yý 00 --- 13 M
tw 03 t23
0 0 C3
a
0
a
.2-10
Regression Standardized Predicted Value
Regression Model 'Before the Mediator- R&D'of Table 6.6.2
336
Histogram of Residuals Dependent Variable: Market Innovativeness
Before the Mediator: R&D Knowledge

J
Histogram of Residuals Dependent Variable: Market Innovativeness
Before the Mediator: Manufacturing Knowledge 20 -1
>% 10
1.00
. 75
. 50
. 25
w 0.00 0.00 . 25 . 50 . 75 1.00
Observed Cum Prob
I
Scatterplot Dependent Variable: Market Innovativeness
Before the Mediator: Manufacturing Knowledge
V
Normal P-P Plot of Standardized Residual
Dependent Variable: Market Innovativeness
Before the Mediator Manufacturing Knowledge
t3 113 93 c2
cl Z] m' 12 cl 12 t2 rk: t3, cl
m cl r] r] c2
92 cl
13 EI . CIM E6 FF- % r2 r ., cl
c2
r] r] 93 c2 d2 92 12
12 M 12 ci Cl 12 z2
-2 .102
Regression Standardized Predicted Value
0
0
0
3
Regression Model 'Before the Mediator: MFI of Table 6.6.2
337

Histogram of Residuals Dependent Variable: Market Innovativeness
Before the Mediator: Predeve Assessment Knowledge
14 12 10
8 6
Std. Dev = . 98 4 2 Mean = 0.00
0 ilimmmijk6owN = 116.00
Regression Standardized Residual
1.00
. 50
u
. 25
w 0.00
Normal P-P Plot of Standardized Residual
Dependent Variable: Market Innovativeness
Before the Mediator. Predeve Assessment Knowledge
. 75
0.00 . 25 . 50
Observed Cum Prob
Scatterplot Dependent Variable: Market Innovativeness
Before the Mediator: Predeve Assessment Knowledge
M
II
g
75 1.00
EP 13
010 93 93, r0"
Mo anuo
00 5P 0 two M0 00 gm
C3 K2 93 13
93
,rc0 C30 P0
0 can a C3 00
E3 0
-3 -2 .10
Regression Standardized Predicted Value
Regression Model 'Before the Mediator-PDA! of Table 6.6.2
3
338

Histogram of Residuals Dependent Variable: Market Innovativeness
Before the Mediator: Marketing Knowledge 20 1
10
0 Std. Dev = . 98 Mean = 0.00
0N= 116.00
00 - -,? r 00 Zr . -ro 0 00 , 'Iýr -ro -'zr * 00 , : ýr
Regrcssion Standardized Residual
Normal P-P Plot of Standardized Residual
Dependent Variable: Market Innovativeness
Before the Mediator Marketing Knowledge
1. UU
. 75
. Xi
10 . 25
w 0.00 0.00 . 25 . 50 . 75 1.00
Observed Cum Prob
Scatterplot Dependent Variable: Market Innovativeness
Before the Mediator: Marketing Knowledge
,u -2 1
93 c3 EI '6 ci
2
cl 93 cl %
12 c3 g3
%, g2 c3
CXJ 11 a Cl a K]t2
91 c3
"2 .
&. j.
cl
c3 qll & IB
92
im %
cl a 92 Cl =3 92
c3 EI c2
-3 -2 -1 02
Regression Standardized Predicted Value
Regression Model 'Before the Mediator-MKI of Table 6.6.2
3
I 339

Histogram of Residuals Dependent Variable: Market Innovativencss
After the Mediator: R&D Knowledge 16 14 12 10
Ub Std. Dev = . 99 4 Mean = 0.00 2 oLimomiLgio, N= 116.00
Y 0b, -"r*-rOI--? "0*-Y*-rO
Regression Standardized Residual
1.00
. 75
iz
0.00
Normal P-P Plot of Standardized Residual
Dependent Variable: Market Innovativencss
After the Mediator: R&D Knowledge
orfp
0.00 . 25 . 50 . 75 1.00
Observed Cum Prob
Scatterplot of Residuals Dependent Variable: Market Innovativeness
.0 After the Mediator: R&D Knowledge
. Z; -1
Ce.
c3 93 Cl g3 Ei .m'
c3 ýa rp
>Z
. cl cs c2 .. EI= 23 r= Ei ' rx3 ci
93 = EI c3 c2 92
E2
-3 .2 -1
Regression Standardized Predicted Value
D
23
Regression Model 'After the Mediator-RD'of Table 6.6.2
340

Histogram of Residuals Dependent Variable: Market Innovativeness
After the Mediator: Manufacturing Knowledge 16 14 12 10
0 Std. Dev = . 98 =s 4 cr Mean = 0.00
2 oN= 116.00
G? 17 Iýx
00 ý so -110 00 `ý00 'ý-ro '-ý00 0 I Regression Standardized Residual
Nonnal P-P Plot of Standardized Residual
Dependent Variable: Market Innovativeness
After the Mediator: Manufacturing Knowledge
1.00
. 75
50
25
0.00
. 00 0.00 . 25 . 50 . 75 1.00
Observed Cum Prob,
Scatterplot Dependent Variable: Market Innovativcness
"0 After the Mediator: Manufacturing Knowledge
"0 1
Iti 1 9
ti
C]
glem C, t] 13 93
93 cl K, 93 a
12 ri 12
cl 93
2ý 93 d% a 92
CX3 91 c3
93 Ci clawm ,a
ri r3 13 2p
r] Cl cl r3 F3: 1
.103
Regression Standardized Predicted Value
4
Regression Model 'After the Mediator- MFI of Table 6.6.2
341

Histogram of Residuals Dependent Variable: Market Innovativeness
After the Mediator: Predeve Assessment Knowledge 16 14 12 10
8 5 Std. Dev a . 99
41 Mean - 0.00 2 0 IJIJMMIMLLMJ N= 116.00
0 Zr 'D " "6r, 00 -ro ýr QO*, &, -rO, -"r*OO*-, 'r'-Eý
Regression Standardized Residual
Normal P-P Plot of Standardized Residual
Dependent Variable: Market Innovativeness
After the Mediator: Predeve Assessment Knowledge 1.00 1
. 75
iz
, zi
w 0.00 0.00 . 25 . 50 . 75 1.00
Observed Cum Prob
Scalfterplot Dependent Variable: Market Innovativeness
110 After the Mediator: Predeve Assessment Knowledge
"0
C4
93 ri t2
, 93 91 12 ca 12
cm cm co t3
00 aa mo El
0 rp C im
1.. 12 . t' r]
t mýev
& r2 B CFM
5g -a a
t2 ti cl E. - r. 3 c2 c]
93
,2
13 am 12
t] 93
93 cl
aI
-3 -2 -102
Regression Standardized Predicted Value
3
Regression Model 'After the Mediator- PDA7 of Table 6.6.2
342

Histogram of Residuals Dependent Variable: Market Innovativeness
After the Mediator: Marketing Knowledge 16 14 12 10
8 A"m u,. Std. Dev z . 98
4 Mcan = 0.00 2 0N= 116.00
. 75
. 50
u '8
. 25
0.00 0.00 . 25 . 50
Observed Cum Prob
Scatterplot Dependent Variable: Market Innovativeness
After the Mediator: Marketing Knowledge .61 (a
2 U N
'2
1 .2 .3
, ý> 1ý3 */ *01,1.0 1? 1.? . 00 -"0 0 00 Q0
Regression Standardized Residual
Normal P-P Plot of Standardized Residual
Dependent Variable: Market Innovativeness
After the Mediator. Marketing Knowledge 1.00 1M
75 1.00
ci c3 cl cl cm, MP CL Cm
r cm 92 cp r. 3t3
c2, C3C3 a ý9r3 53 EP
93
ä. Ei 22 . CI 92 r3 0 12
ci C3E1 13 r]
.j .2.102
Regression Standardized Predicted Value
Regression Model 'After the Mediator-MKI of Table 6.6.2
343