form 6-k us securities and exchange commission - Nomura
128
FORM 6-K U.S. SECURITIES AND EXCHANGE COMMISSION Washington, D.C. 20549 Report of Foreign Private Issuer Pursuant to Rule 13a-16 or 15d-16 of the Securities Exchange Act of 1934 Commission File Number: 1-15270 For the month of February 2021 NOMURA HOLDINGS, INC. (Translation of registrant’s name into English) 13-1, Nihonbashi 1-chome Chuo-ku, Tokyo 103-8645 Japan (Address of principal executive offices) Indicate by check mark whether the registrant files or will file annual reports under cover Form 20-F or Form 40-F. Form 20-F X Form 40-F Indicate by check mark if the registrant is submitting the Form 6-K in paper as permitted by Regulation S-T Rule 101(b)(1): Indicate by check mark if the registrant is submitting the Form 6-K in paper as permitted by Regulation S-T Rule 101(b)(7):
-
Upload
khangminh22 -
Category
Documents
-
view
2 -
download
0
Transcript of form 6-k us securities and exchange commission - Nomura

FORM 6-K
U.S. SECURITIES AND EXCHANGE COMMISSION
Washington, D.C. 20549
Report of Foreign Private Issuer
Pursuant to Rule 13a-16 or 15d-16 of
the Securities Exchange Act of 1934
Commission File Number: 1-15270
For the month of February 2021
NOMURA HOLDINGS, INC. (Translation of registrant’s name into English)
13-1, Nihonbashi 1-chome
Chuo-ku, Tokyo 103-8645
Japan
(Address of principal executive offices)
Indicate by check mark whether the registrant files or will file annual reports under cover Form 20-F or Form 40-F.
Form 20-F X Form 40-F
Indicate by check mark if the registrant is submitting the Form 6-K in paper as permitted by Regulation S-T Rule 101(b)(1):
Indicate by check mark if the registrant is submitting the Form 6-K in paper as permitted by Regulation S-T Rule 101(b)(7):

Information furnished on this form:
EXHIBITS
Exhibit Number
1. (English Translation) Quarterly Securities Report Pursuant to the Financial Instruments and Exchange Act for the Nine Months Ended
December 31, 2020.
2. (English Translation) Confirmation Letter.
The registrant hereby incorporates Exhibits 1 and 2 to this report on Form 6-K by reference in the prospectus that is part of the Registration
Statement on Form F-3 (Registration No. 333-229191) of the registrant, filed with the SEC on January 11, 2019.

SIGNATURES
Pursuant to the requirements of the Securities Exchange Act of 1934, the registrant has duly caused this report to be signed on its behalf by the
undersigned, thereunto duly authorized.
NOMURA HOLDINGS, INC.
Date: February 25, 2021 By: /s/ Yoshifumi Kishida
Yoshifumi Kishida
Senior Managing Director

Exhibit 1
Quarterly Securities Report Pursuant to the Financial Instruments and Exchange Act for the Nine Months Ended December 31, 2020
Items included in the Quarterly Securities Report
Page
Part I Corporate Information 1
Item 1. Information on Company and Its Subsidiaries and Affiliates 1
1. Selected Financial Data 1
2. Business Overview 1
Item 2. Operating and Financial Review 2
1. Risk Factors 2
2. Operating, Financial and Cash Flow Analyses by Management 4
3. Significant Contracts 20
Item 3. Company Information 21
1. Share Capital Information 21
2. Directors and Executive Officers
Item 4. Financial Information 23
Preparation Method of Consolidated Financial Statements and Quarterly Review Certificate 23
1. Consolidated Financial Statements 24
(1) Consolidated Balance Sheets (UNAUDITED) 24
(2) Consolidated Statements of Income (UNAUDITED) 27
(3) Consolidated Statements of Comprehensive Income (UNAUDITED) 29
(4) Consolidated Statements of Changes in Equity (UNAUDITED) 30
(5) Consolidated Statements of Cash Flows (UNAUDITED) 32
Notes to the Consolidated Financial Statements (UNAUDITED) 34
2. Other 117
Part II Information on Guarantor of the Company
Quarterly Review Report of Independent Auditors 118
Note: Translations for the underlined items are attached to this form as below.

Part I Corporate Information
Item 1. Information on Company and Its Subsidiaries and Affiliates
1. Selected Financial Data
Nine months
ended
December 31,
2019
Nine months
ended
December 31,
2020
Three months
ended
December 31,
2019
Three months
ended
December 31,
2020
Year ended
March 31,
2020
Total revenue (Mil yen) 1,582,733 1,389,263 497,450 455,872 1,952,482
Net revenue (Mil yen) 1,050,359 1,231,837 334,978 402,092 1,287,829
Income before income taxes (Mil yen) 272,979 396,771 69,687 131,333 248,261
Net income attributable to Nomura Holdings, Inc. (“NHI”)
shareholders (Mil yen) 251,473 308,524 57,066 98,366 216,998
Comprehensive income attributable to NHI shareholders (Mil yen) 222,119 201,949 66,105 54,392 219,943
Total equity (Mil yen) 2,789,623 2,853,392 — — 2,731,264
Total assets (Mil yen) 46,242,334 44,592,245 — — 43,999,815
Net income attributable to NHI shareholders per share
—basic (Yen) 77.36 101.03 18.07 32.16 67.76
Net income attributable to NHI shareholders per share
—diluted (Yen) 75.65 98.30 17.63 31.16 66.20
Total NHI shareholders’ equity as a percentage of total assets (%) 5.8 6.3 — — 6.0
Cash flows from operating activities (Mil yen) 419,277 667,296 — — (15,943)
Cash flows from investing activities (Mil yen) 217,804 (72,848) — — 216,336
Cash flows from financing activities (Mil yen) (159,920) (383,636) — — 332,062
Cash, cash equivalents, restricted cash and restricted cash
equivalents at end of period (Mil yen) 3,152,558 3,367,676 — — 3,192,310
1 The selected financial data of Nomura Holdings, Inc. (the “Company”) and other entities in which it has a controlling financial interest
(collectively referred to as “Nomura”, “we”, “our”, or “us”) are stated in accordance with the accounting principles generally accepted in the
United States of America (“U.S. GAAP”).
2 Taxable transactions do not include consumption taxes and local consumption taxes.
3 As the consolidated financial statements have been prepared, selected financial data on the Company are not disclosed.
2. Business Overview
There were no significant changes to the businesses of the Company and its 1,284 consolidated subsidiaries for the nine months ended
December 31, 2020.
There were 13 affiliated companies which were accounted for by the equity method as of December 31, 2020.
1
Item 2. Operating and Financial Review
1. Risk Factors
Significant changes in our Risk Factors which were described on the annual securities report are stated below. The titles below correspond to the
titles of “Part I Corporate Information—Item 2. Operating and Financial Review—2. Risk Factors” in the annual securities report. The discussion below
contains future matters that are based on the assessments made as of the date of submission of this report (February 15, 2021), unless noted separately.
Our business may be materially affected by financial markets, economic conditions and market fluctuations in Japan and elsewhere around the
world
Brexit may adversely affect our business on various fronts
On January 31, 2020, the United Kingdom (“U.K.”) withdrew from the European Union (“EU”) under the Withdrawal Agreement between the
U.K. and the EU (“Brexit”). On December 31, 2020, a transition period during which the rules and regulations of the EU continued to apply to the U.K
expired. Although the U.K. and EU entered a trade and cooperation agreement governing their relationship prior to the expiration of the transition
period, such agreement does not comprehensively address the financial industry, and there continues to be substantial uncertainty as to the consequences
that Brexit have on our business. We conduct a substantial level of business throughout Europe, where London is our regional hub, and, accordingly, the
outcome of the ongoing negotiations between U.K. and the EU on financial services following Brexit may adversely affect our business on various
fronts. Following the end of the transition period, our regulated activities in the European region are carried out mainly through Nomura International
plc (“NIP”), our broker-dealer arm established in London, and Nomura Financial Products Europe GmbH (“NFPE”), our licensed broker-dealer in the
Federal Republic of Germany. Previously, NIP had provided the entire European Economic Area (“EEA”) cross-border services pursuant to
“passporting rights” granted under the relevant EU single market legislation. Following the end of the transition period, NIP lost its EEA passporting
rights, and NFPE serves all EEA clients, except where local exemptions exist that allow NIP to continue in certain countries. Should those exemptions
lapse before we are able to find alternative arrangements, or clients not be willing to migrate to NFPE, our revenue and profitability from business in the
European region may be adversely affected. This situation would also similarly apply to other group entities operating in the European region. Further
potential risks are associated with timely migration of European clients to NFPE, which is continuing into 2021, and NFPE’s ability to provide clients
the same level of service as NIP. Moreover, a lapse of existing exemptions and lack of further agreements between the U.K. and the EU on other areas
of the financial services industry may adversely affect our business in the European region. In addition, as discussed below, a number of uncertainties
affecting our business in the European region remain.
For example, as a result of continuing uncertainty, financial stability both in the U.K. and the wider European region may be adversely affected.
Any market turmoil and increased volatility may adversely affect our business, with potential liquidity and operational pressures on our financial
position, particularly in the short term. For example, market participants may postpone or cancel transactions or other activities that they would
otherwise engage in, which may adversely affect our revenues and profitability.
Depending on the content of any future agreement between the U.K. and the EU, the wider financial system and regulatory and supervisory
regime in the European region may also be substantially changed, which could adversely affect our business as well. Euro-denominated financial
transactions in particular may be affected by any regulatory regime emerging going forward, in terms of the physical location for financial market
infrastructure, liquidity provision and pricing. Operating conditions for financial institutions and financial market infrastructures may also become more
stringent for all market participants depending on the content of any such new regulatory or supervisory regime.
These potential changes in the relevant regulatory or supervisory regimes in the wider financial system may accelerate fragmentation of the
financial markets and, as a result, we may be adversely affected due to increasing operating costs, which could impact our profitability. Such increased
operating costs may result from a number of factors, including the introduction or modification of regulatory requirements such as regulatory capital,
liquidity, governance, risk management control and overall entity structure planning.
Overall, the final form that the U.K. – EU relationship will take poses a high level of potentially prolonged uncertainties both politically and
economically. There may also be certain extraterritorial effects in markets outside of the region. These uncertainties, together with other potential
developments such as rising trade tensions, may add further downward pressure to the world economic growth and global financial stability and, as a
result, we may see lower liquidity in financial markets, an unexpected increase in volatility across various asset classes, higher funding costs, a trend
towards increasing risk averseness in investment activities and negative business sentiment, all of which may adversely affect our business.
2

Event risk may cause losses in our trading and investment assets as well as market and liquidity risk
Event risk refers to potential losses we may suffer through unpredictable events that cause large unexpected market price movements such as
natural or man-made disasters, epidemics, acts of terrorism, armed conflicts or political instability, as well as adverse events specifically affecting our
business activities or counterparties. These events include not only significant events such as the Great East Japan Earthquake in March 2011, the
increasing tensions on Korean Peninsula following North Korean nuclear tests in 2017, sudden and unexpected developments in global trade or security
policies such as tensions between the United States and China in 2018 and 2019, and the COVID-19 pandemic in 2020 but also more specifically the
following types of events that could cause losses in our trading and investment assets:
• sudden and significant reductions in credit ratings with regard to financial instruments held by our trading and investment businesses by
major rating agencies,
• sudden changes in trading, tax, accounting, regulatory requirements, laws and other related rules which may make our trading strategy
obsolete, less competitive or no longer viable, or
• an unexpected failure in a corporate transaction in which we participate resulting in our not receiving the consideration we should have
received, as well as bankruptcy, deliberate acts of fraud, and administrative penalty with respect to the issuers of our trading and
investment assets.
Furthermore, new policies or regulatory changes pursued or enacted by the new presidential administration in the United States and the effects of
the introduction of the National Security Law enacted in Hong Kong in June 2020 could have a major impact on the overall situation in Asia or globally
and our business and strategy.
3
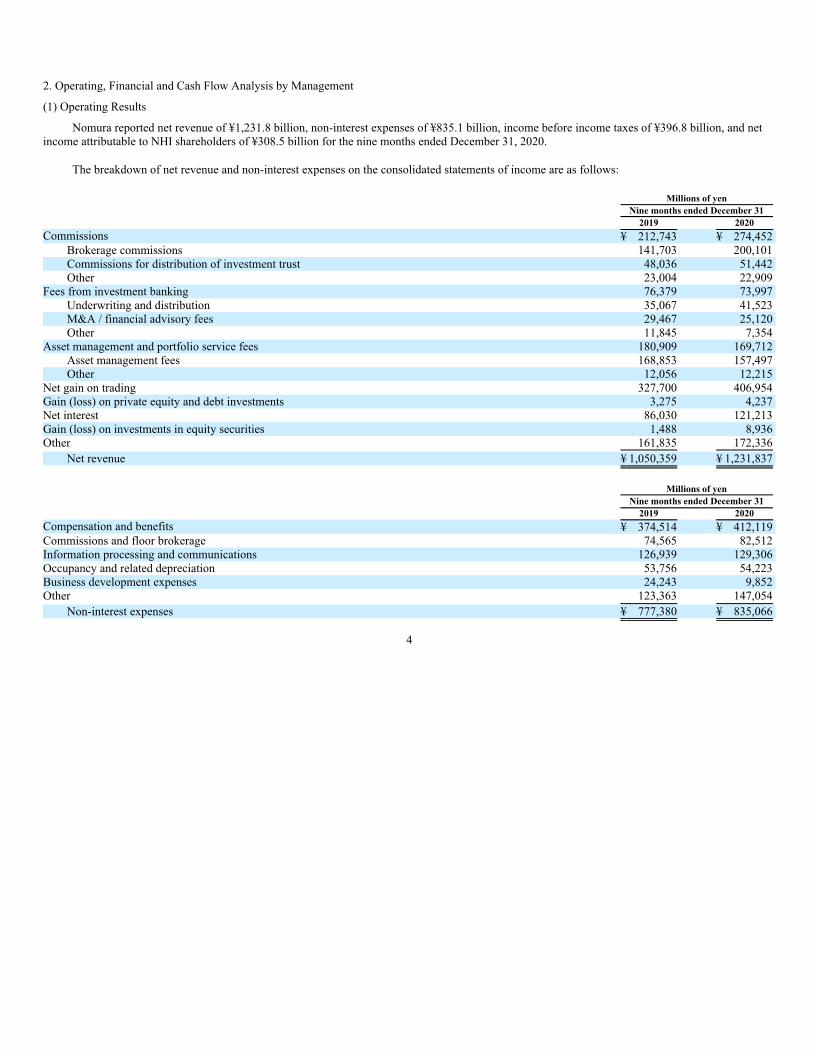
2. Operating, Financial and Cash Flow Analysis by Management
(1) Operating Results
Nomura reported net revenue of ¥1,231.8 billion, non-interest expenses of ¥835.1 billion, income before income taxes of ¥396.8 billion, and net
income attributable to NHI shareholders of ¥308.5 billion for the nine months ended December 31, 2020.
The breakdown of net revenue and non-interest expenses on the consolidated statements of income are as follows:
Millions of yen
Nine months ended December 31
2019 2020
Commissions ¥ 212,743 ¥ 274,452
Brokerage commissions 141,703 200,101
Commissions for distribution of investment trust 48,036 51,442
Other 23,004 22,909
Fees from investment banking 76,379 73,997
Underwriting and distribution 35,067 41,523
M&A / financial advisory fees 29,467 25,120
Other 11,845 7,354
Asset management and portfolio service fees 180,909 169,712
Asset management fees 168,853 157,497
Other 12,056 12,215
Net gain on trading 327,700 406,954
Gain (loss) on private equity and debt investments 3,275 4,237
Net interest 86,030 121,213
Gain (loss) on investments in equity securities 1,488 8,936
Other 161,835 172,336
Net revenue ¥ 1,050,359 ¥ 1,231,837
Millions of yen
Nine months ended December 31
2019 2020
Compensation and benefits ¥ 374,514 ¥ 412,119
Commissions and floor brokerage 74,565 82,512
Information processing and communications 126,939 129,306
Occupancy and related depreciation 53,756 54,223
Business development expenses 24,243 9,852
Other 123,363 147,054
Non-interest expenses ¥ 777,380 ¥ 835,066
4
Business Segment Information
Results by business segment are noted below.
Reconciliations of Net revenue and Income (loss) before income taxes on segment results of operations and the consolidated statements of income
are set forth in Item 4. Financial Information, 1. Consolidated Financial Statements, Note 17. “Segment and geographic information.”
Net revenue
Millions of yen
Nine months ended December 31
2019 2020
Retail ¥ 247,565 ¥ 272,028
Asset Management 85,581 98,181
Wholesale 502,711 692,113
Other (Incl. elimination) 219,279 162,614
Total ¥ 1,055,136 ¥ 1,224,936
Non-interest expenses
Millions of yen
Nine months ended December 31
2019 2020
Retail ¥ 216,546 ¥ 205,819
Asset Management 48,073 45,300
Wholesale 420,580 461,896
Other (Incl. elimination) 92,181 122,051
Total ¥ 777,380 ¥ 835,066
Income (loss) before income taxes
Millions of yen
Nine months ended December 31
2019 2020
Retail ¥ 31,019 ¥ 66,209
Asset Management 37,508 52,881
Wholesale 82,131 230,217
Other (Incl. elimination) 127,098 40,563
Total ¥ 277,756 ¥ 389,870
Retail
Net revenue was ¥272.0 billion primarily due to an increase in commissions from sales of stocks and investment trusts in the favorable market
conditions. Non-interest expenses were ¥205.8 billion and income before income taxes was ¥66.2 billion. Retail client assets were ¥121.0 trillion as of
December 31, 2020, a ¥17.0 trillion increase from March 31, 2020.
Asset Management
Net revenue was ¥98.2 billion. Non-interest expenses were ¥45.3 billion and income before income taxes was ¥52.9 billion. Assets under
management were ¥61.2 trillion as of December 31, 2020, a ¥11.9 trillion increase from March 31, 2020, primarily due to market appreciation and net
inflow into funds such as ETF.
5
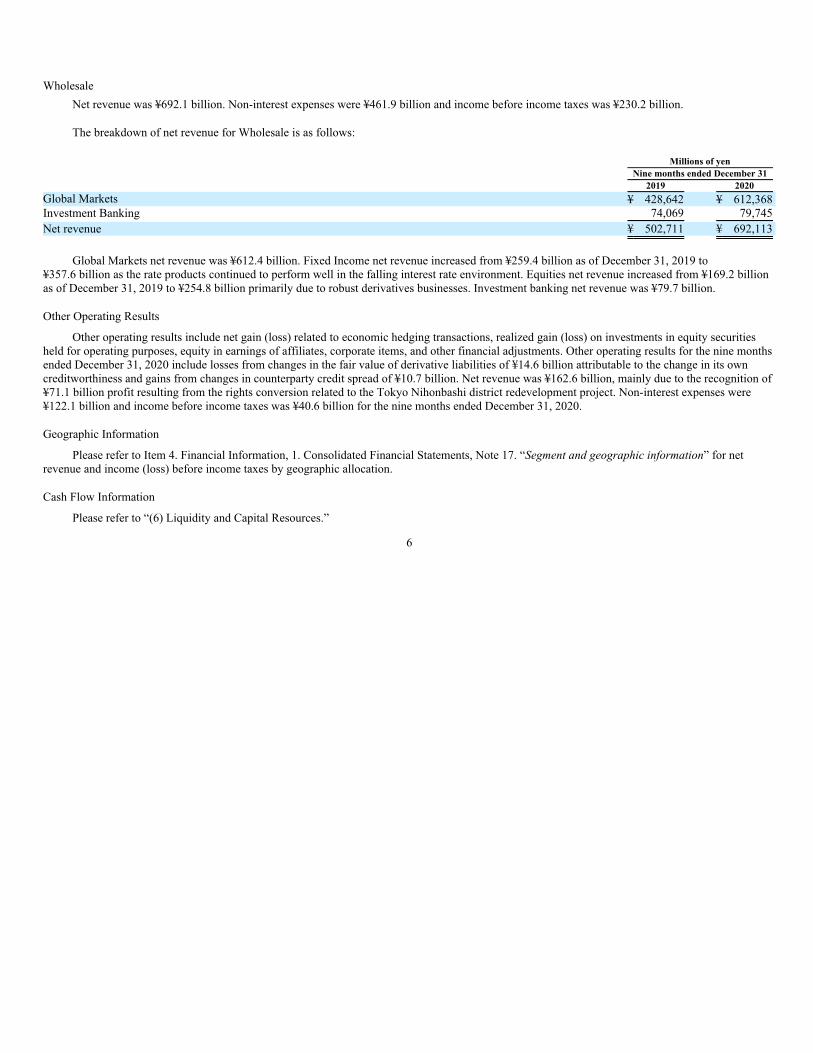
Wholesale
Net revenue was ¥692.1 billion. Non-interest expenses were ¥461.9 billion and income before income taxes was ¥230.2 billion.
The breakdown of net revenue for Wholesale is as follows:
Millions of yen
Nine months ended December 31
2019 2020
Global Markets ¥ 428,642 ¥ 612,368
Investment Banking 74,069 79,745
Net revenue ¥ 502,711 ¥ 692,113
Global Markets net revenue was ¥612.4 billion. Fixed Income net revenue increased from ¥259.4 billion as of December 31, 2019 to
¥357.6 billion as the rate products continued to perform well in the falling interest rate environment. Equities net revenue increased from ¥169.2 billion
as of December 31, 2019 to ¥254.8 billion primarily due to robust derivatives businesses. Investment banking net revenue was ¥79.7 billion.
Other Operating Results
Other operating results include net gain (loss) related to economic hedging transactions, realized gain (loss) on investments in equity securities
held for operating purposes, equity in earnings of affiliates, corporate items, and other financial adjustments. Other operating results for the nine months
ended December 31, 2020 include losses from changes in the fair value of derivative liabilities of ¥14.6 billion attributable to the change in its own
creditworthiness and gains from changes in counterparty credit spread of ¥10.7 billion. Net revenue was ¥162.6 billion, mainly due to the recognition of
¥71.1 billion profit resulting from the rights conversion related to the Tokyo Nihonbashi district redevelopment project. Non-interest expenses were
¥122.1 billion and income before income taxes was ¥40.6 billion for the nine months ended December 31, 2020.
Geographic Information
Please refer to Item 4. Financial Information, 1. Consolidated Financial Statements, Note 17. “Segment and geographic information” for net
revenue and income (loss) before income taxes by geographic allocation.
Cash Flow Information
Please refer to “(6) Liquidity and Capital Resources.”
6

(2) Assets and Liabilities Associated with Investment and Financial Services Business
1) Exposure to Certain Financial Instruments and Counterparties
Market conditions continue to impact numerous products to which we have certain exposures. We also have exposures to Special Purpose Entities
(“SPEs”) and others in the normal course of business.
Leveraged Finance
We provide loans to clients in connection with leveraged buy-outs and leveraged buy-ins. As this type of financing is usually initially provided
through a commitment, we have both funded and unfunded exposures on these transactions.
The following table sets forth our exposure to leveraged finance with unfunded commitments, presenting funded and unfunded
portions by geographic location of the target company as of December 31, 2020.
Millions of yen
December 31, 2020
Funded Unfunded Total
Europe ¥ 2,858 ¥ 50,883 ¥ 53,741
Americas 4,211 79,769 83,980
Asia and Oceania 14,429 3,515 17,944
Total ¥ 21,498 ¥ 134,167 ¥ 155,665
Special Purpose Entities
Our involvement with these entities includes structuring, underwriting, as well as, subject to prevailing market conditions, distributing and selling
debt instruments and beneficial interests issued by these entities. In the normal course of securitization and equity derivative activities business, we also
act as a transferor of financial assets to, and underwriter, distributor and seller of repackaged financial instruments issued by these entities. We retain,
purchase and sell variable interests in SPEs in connection with our market-making, investing and structuring activities. Our other types of involvement
with SPEs include guarantee agreements and derivative contracts.
For further discussion on Nomura’s involvement with variable interest entities (“VIEs”), see Item 4. Financial Information, 1. Consolidated
Financial Statements, Note 6. “Securitizations and Variable Interest Entities.”
2) Fair Value of Financial Instruments
A significant amount of our financial instruments are carried at fair value, with changes in fair value recognized through the consolidated
statements of income or the consolidated statements of comprehensive income on a recurring basis. Use of fair value is either specifically required under
U.S. GAAP or we make an election to use fair value for certain eligible items under the fair value option.
Other financial assets and financial liabilities are carried at fair value on a nonrecurring basis, where the primary measurement basis is not fair
value. Fair value is only used in specific circumstances after initial recognition, such as to measure impairment.
In accordance with Accounting Standard Codification (“ASC”) 820 “Fair Value Measurements and Disclosures”, all financial instruments
measured at fair value have been categorized into a three-level hierarchy based on the transparency of inputs used to establish fair value.
7

Level 3 financial assets as a proportion of total financial assets, carried at fair value on a recurring basis was 4% as of December 31, 2020 (5% as
of March 31, 2020) as listed below:
Billions of yen
December 31, 2020
Level 1 Level 2 Level 3
Counterparty
and
Cash Collateral
Netting Total
Financial assets measured at fair value
(Excluding derivative assets) ¥9,315 ¥ 8,697 ¥ 604 ¥ — ¥18,616
Derivative assets 32 17,008 171 (16,041) 1,170
Total ¥9,347 ¥25,705 ¥ 775 ¥ (16,041) ¥19,786
Please refer to Item 4. Financial Information, 1. Consolidated Financial Statements, Note 2. “Fair value measurements” for further information.
(3) Trading Activities
Assets and liabilities for trading purposes
Please refer to Item 4. Financial Information, 1. Consolidated Financial Statements, Note 2. “Fair value measurements” and Note 3. “Derivative
instruments and hedging activities” regarding the balances of assets and liabilities for trading purposes.
Risk management of trading activity
We adopt Value at Risk (“VaR”) for measurement of market risk arising from trading activity.
1) Assumptions on VaR
• Confidence Level: 99%
• Holding period: One day
• Consideration of price movement among the products
2) Records of VaR
Billions of yen
March 31, 2020 December 31, 2020
Equity ¥ 8.9 ¥ 3.1
Interest rate 22.3 8.5
Foreign exchange 5.1 4.2
Subtotal 36.3 15.8
Diversification benefit (11.0) (6.5)
VaR ¥ 25.3 ¥ 9.3
Billions of yen
Nine months ended December 31, 2020
Maximum(1) Minimum(1) Average(1)
VaR ¥ 27.0 ¥ 7.0 ¥ 13.9
(1) Represents the maximum, average and minimum VaR based on all daily calculations over the nine-month period.
8

(4) Deferred Tax Assets Information
Details of deferred tax assets and liabilities
The following table presents details of deferred tax assets and liabilities reported within Other assets—Other and Other liabilities, respectively, in
the consolidated balance sheets as of December 31, 2020.
Millions of yen
December 31, 2020
Deferred tax assets
Depreciation, amortization and valuation of fixed assets ¥ 20,584
Investments in subsidiaries and affiliates 2,078
Valuation of financial instruments 78,238
Accrued pension and severance costs 23,951
Other accrued expenses and provisions 62,748
Operating losses 276,270
Lease liabilities 54,455
Other 12,208
Gross deferred tax assets 530,532
Less—Valuation allowance (361,315)
Total deferred tax assets 169,217
Deferred tax liabilities
Investments in subsidiaries and affiliates 96,080
Valuation of financial instruments 45,390
Undistributed earnings of foreign subsidiaries 2,533
Valuation of fixed assets 25,796
Right-of-use assets 54,020
Other 4,369
Total deferred tax liabilities 228,188
Net deferred tax assets (liabilities) ¥ (58,971)
Calculation method of deferred tax assets
In accordance with U.S. GAAP, we recognize deferred tax assets to the extent we believe that it is more likely than not that a benefit will be
realized. A valuation allowance is provided for tax benefits available to us, which are not deemed more likely than not to be realized.
9

(5) Qualitative Disclosures about Market Risk
1) Risk Management
Nomura defines risks as (i) the potential erosion of Nomura’s capital base due to unexpected losses arising from risks to which its business
operations are exposed, such as market risk, credit risk, operational risk and model risk, (ii) liquidity risk, the potential lack of access to funds or higher
cost of funding than normal levels due to a deterioration in Nomura’s creditworthiness or deterioration in market conditions, and (iii) strategy risk, the
potential failure of revenues to cover costs due to a deterioration in the earnings environment or a deterioration in the efficiency or effectiveness of its
business operations.
A fundamental principle established by Nomura is that all employees shall regard themselves as principals of risk management and appropriately
manage these risks. Nomura seeks to promote a culture of proactive risk management throughout all levels of the organization and to limit risks to the
confines of its risk appetite. The risk management framework that Nomura uses to manage these risks consists of its risk appetite, risk management
governance and oversight, the management of all risk classes, and processes to measure and control risks.
2) Global Risk Management Structure
The Board of Directors has established the “Structure for Ensuring Appropriate Business of Nomura Holdings, Inc.” as the Company’s basic
principle and set up a framework for managing the risk of loss based on this. In addition, they are continuously making efforts to improve, strengthen
and build up our risk management capabilities under this framework. Moreover, the Group Integrated Risk Management Committee (“GIRMC”), upon
delegation from the Executive Management Board (“EMB”), has established the Risk Management Policy, describing Nomura’s overall risk
management framework including the fundamental risk management principles followed by Nomura.
Market Risk Management
Market risk is the risk of loss arising from fluctuations in the value of financial assets and liabilities (including off-balance sheet items) due to
fluctuations in market factors (interest rates, foreign exchange rates, prices of securities and others). Effective management of market risk requires the
ability to analyze a complex and evolving portfolio in a constantly changing global market environment, identify problematic trends and ensure that
appropriate action is taken in a timely manner.
Nomura uses a variety of statistical risk measurement tools to assess and monitor market risk on an ongoing basis, including, but not limited to,
VaR, Stressed VaR (“SVaR”) and Incremental Risk Charge (“IRC”). In addition, Nomura uses sensitivity analysis and stress testing to measure and
analyze its market risk. Sensitivities are measures used to show the potential changes to a portfolio due to standard moves in market risk factors. They
are specific to each asset class and cannot usually be aggregated across risk factors. Stress testing enables the analysis of portfolio risks or tail risks,
including non-linear behaviors and can be aggregated across risk factors at any level of the group hierarchy, from group level to business division, units
or desk levels. Market risk is monitored against a set of approved limits, with daily reports and other management information provided to the business
units and senior management.
Credit Risk Management
Credit risk is the risk of loss arising from an obligor’s default, insolvency or administrative proceeding which results in the obligor’s failure to
meet its contractual obligations in accordance with agreed terms. This includes both on and off-balance sheet exposures. It is also the risk of loss arising
through a credit valuation adjustment (“CVA”) associated with deterioration in the creditworthiness of a counterparty. Nomura manages credit risk on a
global basis and on an individual Nomura legal entity basis
The measurement, monitoring and management of credit risk at Nomura are governed by a set of global policies and procedures. Credit Risk
Management (“CRM”), a global function within the Risk Management Division, is responsible for the implementation and maintenance of these policies
and procedures. These policies are authorized by the GIRMC and/or Global Risk Strategic Committee (“GRSC”), prescribe the basic principles of credit
risk management and set delegated authority which enables CRM personnel to set Credit limits.
Credit risk is managed by CRM together with various global and regional risk committees. This ensures transparency of material credit risks and
compliance with established credit limits, the approval of material extensions of credit and the escalation of risk concentrations to appropriate senior
management.
10

CRM operates as a credit risk control function within the Risk Management Division, reporting to the Chief Risk Officer. The process for
managing credit risk at Nomura includes:
• Evaluation of likelihood that a counterparty defaults on its payments and obligations;
• Assignment of internal credit ratings to all active counterparties;
• Approval of extensions of credit and establishment of credit limits;
• Measurement, monitoring and management of Nomura’s current and potential future credit exposures;
• Setting credit terms in legal documentation;
• Use of appropriate credit risk mitigants including netting, collateral and hedging.
For regulatory capital calculation purposes, Nomura has been applying the Foundation Internal Rating Based Approach in calculating credit risk
weighted asset since the end of March 2011. The Standardized Approach is applied to certain business units or asset types, which are considered
immaterial to the calculation of credit risk weighted assets.
The exposure calculation model used for counterparty credit risk management has also been used for the Internal Model Method based exposure
calculation for regulatory capital reporting purposes since the end of December 2012.
Operational Risk Management
Operational risk is the risk of financial loss or non-financial impact arising from inadequate or failed internal processes, people and systems, or
from external events. Operational risk includes in its definition Compliance, Legal, IT and Cyber Security, Fraud, Third Party and other non-financial
risks. Operational risk does not include strategic risk and reputational risk, however, some operational risks can lead to reputational issues and as such
operational and reputational risks may be closely linked.
Nomura adopts the industry standard “Three Lines of Defence” for the management of operational risk, comprising the following elements:
1) 1st Line of Defence: The business which owns and manages its risks
2) 2nd Line of Defence: The Operational Risk Management (“ORM”) function, which co-ordinates the Operational Risk Management
framework and its implementation.
3) 3rd Line of Defence: Internal and External Audit, who provide independent assurance
An Operational Risk Management Framework has been established in order to allow Nomura to identify, assess, manage, monitor and report on
operational risk. The GIRMC, with delegated authority from the EMB has formal oversight over the management of operational risk.
Nomura Group uses the Standardized Approach for calculating regulatory capital for operational risk. This involves using a three-year average of
gross income allocated to business lines, which is multiplied by a fixed percentage (“Beta Factor”) determined by the Financial Services Agency of
Japan (“FSA”), to establish the amount of required operational risk capital.
Model Risk Management
Model Risk is the risk of financial loss, incorrect decision making, or damage to the firm’s credibility arising from Model errors or incorrect or
inappropriate Model application.
To effectively manage the Firm’s Model Risk, Nomura has established a Model Risk Management Framework to govern the development,
ownership, validation, approval, usage, ongoing monitoring, and periodic review of the Firm’s Models. The framework is supported by a set of policies
and procedures that articulate process requirements for the various elements of the model lifecycle, including monitoring of model risk with respect to
the Firm’s appetite.
New models and material changes to approved models must be independently validated prior to official use. Thresholds to assess the materiality
of model changes are defined in Model Risk Management’s procedures. During independent validation, validation teams analyze a number of factors to
assess a model’s suitability, identify model limitations, and quantify the associated model risk, which is ultimately mitigated through the imposition of
approval conditions, such as usage conditions, model reserves and capital adjustments. Approved models are subject to Model Risk Management’s
annual re-approval process and ongoing performance monitoring to assess their continued suitability. Appropriately delegated Model Risk Management
Committees provide oversight, challenge, governance, and ultimate approval of validated Models.
11

(6) Liquidity and Capital Resources
Funding and Liquidity Management
Overview
We define liquidity risk as the risk of loss arising from difficulty in securing the necessary funding or from a significantly higher cost of funding
than normal levels due to deterioration of the Nomura Group’s creditworthiness or deterioration in market conditions. This risk could arise from
Nomura-specific or market-wide events such as inability to access the secured or unsecured debt markets, a deterioration in our credit ratings, a failure
to manage unplanned changes in funding requirements, a failure to liquidate assets quickly and with minimal loss in value, or changes in regulatory
capital restrictions which may prevent the free flow of funds between different group entities. Our global liquidity risk management policy is based on
liquidity risk appetite formulated by the Executive Management Board (“EMB”). Nomura’s liquidity risk management, under market-wide stress and in
addition, under Nomura-specific stress, seeks to ensure enough continuous liquidity to meet all funding requirements and unsecured debt obligations
across one year and 30-day periods, respectively, without raising funds through unsecured funding or through the liquidation of assets. We are required
to meet regulatory notice on the liquidity coverage ratio issued by the FSA.
We have in place a number of liquidity risk management frameworks that enable us to achieve our primary liquidity objective. These frameworks
include (1) Centralized Control of Residual Cash and Maintenance of Liquidity Portfolio; (2) Utilization of Unencumbered Assets as Part of Our
Liquidity Portfolio; (3) Appropriate Funding and Diversification of Funding Sources and Maturities Commensurate with the Composition of Assets;
(4) Management of Credit Lines to Nomura Group Entities; (5) Implementation of Liquidity Stress Tests; and (6) Contingency Funding Plan.
Our EMB has the authority to make decisions concerning group liquidity management. The Chief Financial Officer (“CFO”) has the operational
authority and responsibility over our liquidity management based on decisions made by the EMB.
12
1. Centralized Control of Residual Cash and Maintenance of Liquidity Portfolio.
We centrally control residual cash held at Nomura Group entities for effective liquidity utilization purposes. As for the usage of funds, the CFO
decides the maximum amount of available funds, provided without posting any collateral, for allocation within Nomura and the EMB allocates the funds
to each business division. Global Treasury monitors usage by businesses and reports to the EMB.
In order to enable us to transfer funds smoothly between group entities, we limit the issuance of securities by regulated broker-dealers or banking
entities within the Nomura Group and seek to raise unsecured funding primarily through the Company or through unregulated subsidiaries. The primary
benefits of this strategy include cost minimization, wider investor name recognition and greater flexibility in providing funding to various subsidiaries
across the Nomura Group.
To meet any potential liquidity requirement, we maintain a liquidity portfolio, managed by Global Treasury apart from other assets, in the form of
cash and highly liquid, unencumbered securities that may be sold or pledged to provide liquidity. As of December 31, 2020, our liquidity portfolio was
¥5,829.8 billion which sufficiently met liquidity requirements under the stress scenarios.
2. Utilization of Unencumbered Assets as Part of Our Liquidity Portfolio.
In addition to our liquidity portfolio, we had unencumbered assets comprising mainly of unpledged trading assets that can be used as an additional
source of secured funding. Global Treasury monitors other unencumbered assets and can, under a liquidity stress event when the contingency funding
plan has been invoked, monetize and utilize the cash generated as a result. The aggregate of our liquidity portfolio and other unencumbered assets was
sufficient against our total unsecured debt maturing within one year.
3. Appropriate Funding and Diversification of Funding Sources and Maturities Commensurate with the Composition of Assets
We seek to maintain a surplus of long-term debt and equity above the cash capital requirements of our assets. We also seek to achieve
diversification of our funding by market, instrument type, investors, currency, and staggered maturities in order to reduce unsecured refinancing risk.
We diversify funding by issuing various types of debt instruments—these include both structured loans and structured notes with returns linked to
interest rates, currencies, equities, commodities, or related indices. We issue structured loans and structured notes in order to increase the diversity of
our debt instruments. We typically hedge the returns we are obliged to pay with derivatives and/or the underlying assets to obtain funding equivalent to
our unsecured long-term debt.
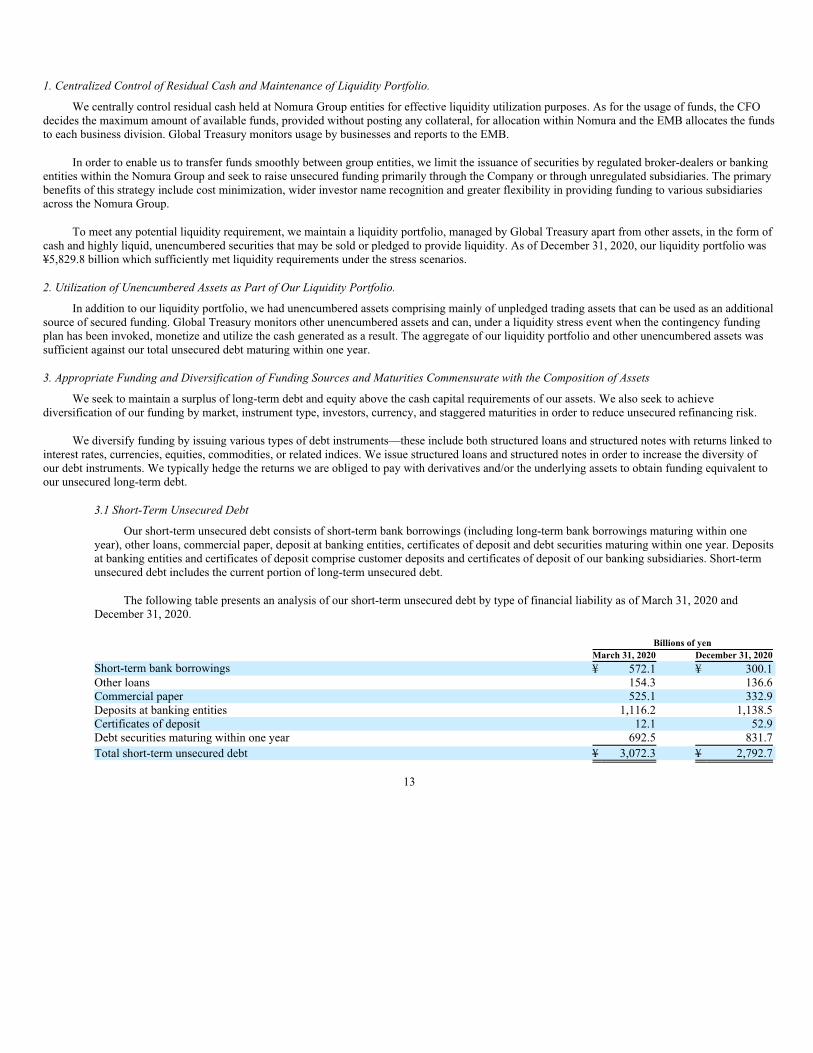
3.1 Short-Term Unsecured Debt
Our short-term unsecured debt consists of short-term bank borrowings (including long-term bank borrowings maturing within one
year), other loans, commercial paper, deposit at banking entities, certificates of deposit and debt securities maturing within one year. Deposits
at banking entities and certificates of deposit comprise customer deposits and certificates of deposit of our banking subsidiaries. Short-term
unsecured debt includes the current portion of long-term unsecured debt.
The following table presents an analysis of our short-term unsecured debt by type of financial liability as of March 31, 2020 and
December 31, 2020.
Billions of yen
March 31, 2020 December 31, 2020
Short-term bank borrowings ¥ 572.1 ¥ 300.1
Other loans 154.3 136.6
Commercial paper 525.1 332.9
Deposits at banking entities 1,116.2 1,138.5
Certificates of deposit 12.1 52.9
Debt securities maturing within one year 692.5 831.7
Total short-term unsecured debt ¥ 3,072.3 ¥ 2,792.7
13

3.2 Long-Term Unsecured Debt
We meet our long-term capital requirements and also achieve both cost-effective funding and an appropriate maturity profile by
routinely funding through long-term debt and diversifying across various maturities and currencies.
Our long-term unsecured debt includes senior and subordinated debt issued through U.S. registered shelf offerings and our U.S.
registered medium-term note programs, our Euro medium-term note programs, registered shelf offerings in Japan and various other debt
programs.
As a globally competitive financial services group in Japan, we have access to multiple global markets and major funding centers. The
Company, Nomura Securities Co. Ltd., Nomura Europe Finance N.V., Nomura Bank International plc, Nomura International Funding Pte.
Ltd., and Nomura Global Finance Co., Ltd. are the main group entities that borrow externally, issue debt instruments and engage in other
funding activities. By raising funds to match the currencies and liquidities of our assets or by using foreign exchange swaps as necessary, we
pursue optimization of our funding structures.
We use a wide range of products and currencies to ensure that our funding is efficient and well diversified across markets and investor
types. Our unsecured senior debt is mostly issued without financial covenants, such as covenants related to adverse changes in our credit
ratings, cash flows, results of operations or financial ratios, which could trigger an increase in our cost of financing or accelerate repayment of
the debt.
The following table presents an analysis of our long-term unsecured debt by type of financial liability as of March 31, 2020 and
December 31, 2020.
Billions of yen
March 31, 2020 December 31, 2020
Long-term deposits at banking entities ¥ 147.9 ¥ 8.7
Long-term bank borrowings 2,591.5 2,622.6
Other loans 82.5 79.7
Debt securities(1) 3,522.1 3,791.8
Total long-term unsecured debt ¥ 6,344.0 ¥ 6,502.8
(1) Excludes long-term debt securities issued by consolidated special purpose entities and similar entities that meet the definition of
variable interest entities under ASC 810 “Consolidation” and secured financing transactions recognized within Long-term borrowings
as a result of transfers of financial assets that are accounted for as financings rather than sales in accordance with ASC 860 “Transfer
and Servicing.”
3.3 Maturity Profile
We also seek to maintain an average maturity for our plain vanilla debt securities and borrowings greater than or equal to three years. A
significant amount of our structured loans and structured notes are linked to interest rates, currencies, equities, commodities, or related
indices. These maturities are evaluated based on internal models and monitored by Global Treasury. Where there is a possibility that these
may be called prior to their scheduled maturity date, maturities are based on our internal stress option adjusted model. The model values the
embedded optionality under stress market conditions in order to determine when the debt securities or borrowings are likely to be called.
3.4 Secured Funding
We typically fund our trading activities through secured borrowings, repurchase agreements and Japanese “Gensaki Repo” transactions.
We believe such funding activities in the secured markets are more cost-efficient and less credit-rating sensitive than financing in the
unsecured market. Our secured funding capabilities depend on the quality of the underlying collateral and market conditions. While we have
shorter term secured financing for highly liquid assets, we seek longer terms for less liquid assets. We also seek to lower the refinancing risks
of secured funding by transacting with a diverse group of global counterparties and delivering various types of securities collateral. In
addition, we reserve an appropriate level of liquidity portfolio for the refinancing risks of secured funding maturing in the short term for less
liquid assets. For more detail of secured borrowings and repurchase agreements, see Note 5 “Collateralized transactions” in our consolidated
financial statements.
14
4. Management of Credit Lines to Nomura Group Entities
We maintain and expand credit lines to Nomura Group entities from other financial institutions to secure stable funding. We ensure that the
maturity dates of borrowing agreements are distributed evenly throughout the year in order to prevent excessive maturities in any given period.
5. Implementation of Liquidity Stress Tests
We maintain our liquidity portfolio and monitor the sufficiency of our liquidity based on an internal model which simulates changes in cash
outflow under specified stress scenarios to comply with our above mentioned liquidity management policy.
We assess the liquidity requirements of the Nomura Group under various stress scenarios with differing levels of severity over multiple time
horizons. We evaluate these requirements under Nomura-specific and broad market-wide events, including potential credit rating downgrades at the
Company and subsidiary levels. We call this risk analysis our Maximum Cumulative Outflow (“MCO”) framework.
The MCO framework is designed to incorporate the primary liquidity risks for Nomura and models the relevant future cash flows in the following
two primary scenarios:
• Stressed scenario—To maintain adequate liquidity during a severe market-wide liquidity event without raising funds through unsecured
financing or through the liquidation of assets for a year; and
• Acute stress scenario—To maintain adequate liquidity during a severe market-wide liquidity event coupled with credit concerns regarding
Nomura’s liquidity position, without raising funds through unsecured funding or through the liquidation of assets for 30 days.
We assume that Nomura will not be able to liquidate assets or adjust its business model during the time horizons used in each of these scenarios.
The MCO framework therefore defines the amount of liquidity required to be held in order to meet our expected liquidity needs in a stress event to a
level we believe appropriate based on our liquidity risk appetite.
As of December 31, 2020, our liquidity portfolio exceeded net cash outflows under the stress scenarios described above.
We constantly evaluate and modify our liquidity risk assumptions based on regulatory and market changes. The model we use in order to simulate
the impact of stress scenarios includes the following assumptions:
• No liquidation of assets;
• No ability to issue additional unsecured funding;
• Upcoming maturities of unsecured debt (maturities less than one year);
• Potential buybacks of our outstanding debt;
• Loss of secured funding lines particularly for less liquid assets;
• Fluctuation of funding needs under normal business circumstances;
• Cash deposits and free collateral roll-off in a stress event;
• Widening of haircuts on outstanding repo funding;
• Additional collateralization requirements of clearing banks and depositories;
• Drawdown on loan commitments;
• Loss of liquidity from market losses;
• Assuming a two-notch downgrade of our credit ratings, the aggregate fair value of assets that we would be required to post as additional
collateral in connection with our derivative contracts; and
• Legal and regulatory requirements that can restrict the flow of funds between entities in the Nomura Group.
15

6. Contingency Funding Plan
We have developed a detailed contingency funding plan to integrate liquidity risk control into our comprehensive risk management strategy and to
enhance the quantitative aspects of our liquidity risk control procedures. As a part of our Contingency Funding Plan (“CFP”), we have developed an
approach for analyzing and quantifying the impact of any liquidity crisis. This allows us to estimate the likely impact of both Nomura-specific and
market-wide events; and specifies the immediate action to be taken to mitigate any risk. The CFP lists details of key internal and external parties to be
contacted and the processes by which information is to be disseminated. This has been developed at a legal entity level in order to capture specific cash
requirements at the local level—it assumes that our parent company does not have access to cash that may be trapped at a subsidiary level due to
regulatory, legal or tax constraints. We periodically test the effectiveness of our funding plans for different Nomura-specific and market-wide events.
We also have access to central banks including, but not exclusively, the Bank of Japan, which provide financing against various types of securities.
These operations are accessed in the normal course of business and are an important tool in mitigating contingent risk from market disruptions.
Liquidity Regulatory Framework
In 2008, the Basel Committee published “Principles for Sound Liquidity Risk Management and Supervision.” To complement these principles, the
Committee has further strengthened its liquidity framework by developing two minimum standards for funding liquidity. These standards have been
developed to achieve two separate but complementary objectives.
The first objective is to promote short-term resilience of a financial institution’s liquidity risk profile by ensuring that it has sufficient high-quality
liquid assets to survive a significant stress scenario lasting for 30 days. The Committee developed the Liquidity Coverage Ratio (“LCR”) to achieve this
objective.
The second objective is to promote resilience over a longer time horizon by creating additional incentives for financial institutions to fund their
activities with more stable sources of funding on an ongoing basis. The Net Stable Funding Ratio (“NSFR”) has a time horizon of one year and has been
developed to provide a sustainable maturity structure of assets and liabilities.
These two standards are comprised mainly of specific parameters which are internationally “harmonized” with prescribed values. Certain
parameters, however, contain elements of national discretion to reflect jurisdiction-specific conditions.
In Japan, the regulatory notice on the LCR, based on the international agreement issued by the Basel Committee with necessary national revisions,
was published by the FSA. The notices have been implemented since the end of March 2015 with phased-in minimum standards. Average of Nomura’s
LCRs for the three months ended December 31, 2020 was 231.5%, and Nomura was compliant with requirements of the above notices. As for the
NSFR, it is not yet implemented in Japan.
Cash Flows
Cash, cash equivalents, restricted cash and restricted cash equivalents’ balance as of December 31, 2019 and as of December 31, 2020 were
¥3,152.6 billion and ¥3,367.7 billion, respectively. Cash flows from operating activities for the nine months ended December 31, 2019 were inflows of
¥419.3 billion due primarily due to an increase in Trading liabilities and the comparable period in 2020 were inflows of ¥667.3 billion primarily due to
an increase in Trading liabilities. Cash flows from investing activities for the nine months ended December 31, 2019 were inflows of ¥217.8 billion
primarily due to a decrease in Investments in affiliated companies, net and the comparable period in 2020 were outflows of ¥72.8 billion primarily due
to an increase in Loans receivable at banks, net. Cash flows from financing activities for the nine months ended December 31, 2019 were outflows of
¥159.9 primarily due to a decrease in Deposits received at banks, net and the comparable period in 2020 were outflows of ¥383.6 billion primarily due
to a decrease in Short-term borrowings.
Balance Sheet and Financial Leverage
Total assets as of December 31, 2020, were ¥44,592.2 billion, an increase of ¥592.4 billion compared with ¥43,999.8 billion as of March 31,
2020, primarily due to increases in Securities borrowed and Trading assets. Total liabilities as of December 31, 2020, were ¥41,738.9 billion, an
increase of ¥470.3 billion compared with ¥41,268.6 billion as of March 31, 2020, primarily due to an increase in Trading liabilities. NHI shareholders’
equity as of December 31, 2020, was ¥2,793.6 billion, an increase of ¥140.2 billion compared with ¥2,653.5 billion as of March 31, 2020, primarily due
to an increase in Retained earnings.
We seek to maintain sufficient capital at all times to withstand losses due to extreme market movements. The EMB is responsible for
implementing and enforcing capital policies. This includes the determination of our balance sheet size and required capital levels. We continuously
review our equity capital base to ensure that it can support the economic risk inherent in our business. There are also regulatory requirements for
minimum capital of entities that operate in regulated securities or banking businesses.
16

As leverage ratios are commonly used by other financial institutions similar to us, we voluntarily provide a Leverage ratio and Adjusted leverage
ratio primarily for benchmarking purposes so that users of our annual report can compare our leverage against other financial institutions. Adjusted
leverage ratio is a non-GAAP financial measure that Nomura considers to be a useful supplemental measure of leverage.
The following table sets forth NHI shareholders’ equity, total assets, adjusted assets and leverage ratios:
Billions of yen, except ratios
March 31, 2020 December 31, 2020
NHI shareholders’ equity ¥ 2,653.5 ¥ 2,793.6
Total assets 43,999.8 44,592.2
Adjusted assets(1) 28,092.7 27,639.9
Leverage ratio(2) 16.6x 16.0x
Adjusted leverage ratio(3) 10.6x 9.9x
(1) Represents total assets less Securities purchased under agreements to resell and Securities borrowed. Adjusted assets is a non-GAAP financial
measure and is calculated as follows:
(2) Equals total assets divided by NHI shareholders’ equity.
(3) Equals adjusted assets divided by NHI shareholders’ equity.
Billions of yen
March 31, 2020 December 31, 2020
Total assets ¥ 43,999.8 ¥ 44,592.2
Less:
Securities purchased under agreements to resell 12,377.3 12,522.3
Securities borrowed 3,529.8 4,430.0
Adjusted assets ¥ 28,092.7 ¥ 27,639.9
Total assets increased by 1.3% reflecting primarily increases in Securities borrowed and Trading assets. NHI shareholders’ equity increased by
5.3% primarily due to an increase in Retained earnings. As a result, our leverage ratio declined from 16.6 times as of March 31, 2020 to 16.0 times as of
December 31, 2020.
Adjusted assets decreased primarily due to a decrease in Loans receivable and Receivables from other than customers. As a result, our adjusted
leverage ratio declined from 10.6 times as of March 31, 2020 to 9.9 times as of December 31, 2020.
17
Consolidated Regulatory Capital Requirements
The FSA established the “Guideline for Financial Conglomerates Supervision” (“Financial Conglomerates Guideline”) in June 2005 and set out
the rules on consolidated regulatory capital. We started monitoring our consolidated capital adequacy ratio in accordance with the Financial
Conglomerates Guideline from April 2005.
The Company has been assigned by the FSA as a Final Designated Parent Company who must calculate a consolidated capital adequacy ratio
according to the Capital Adequacy Notice on Final Designated Parent Company in April 2011. Since then, we have been calculating our consolidated
capital adequacy ratio according to the Capital Adequacy Notice on Final Designated Parent Company. The Capital Adequacy Notice on Final
Designated Parent Company has been revised to be in line with Basel 2.5 and Basel III since then. We have calculated a Basel III-based consolidated
capital adequacy ratio from the end of March 2013. Basel 2.5 includes significant change in calculation method of market risk and Basel III includes
redefinition of capital items for the purpose of requiring higher quality of capital and expansion of the scope of credit risk-weighted assets calculation.
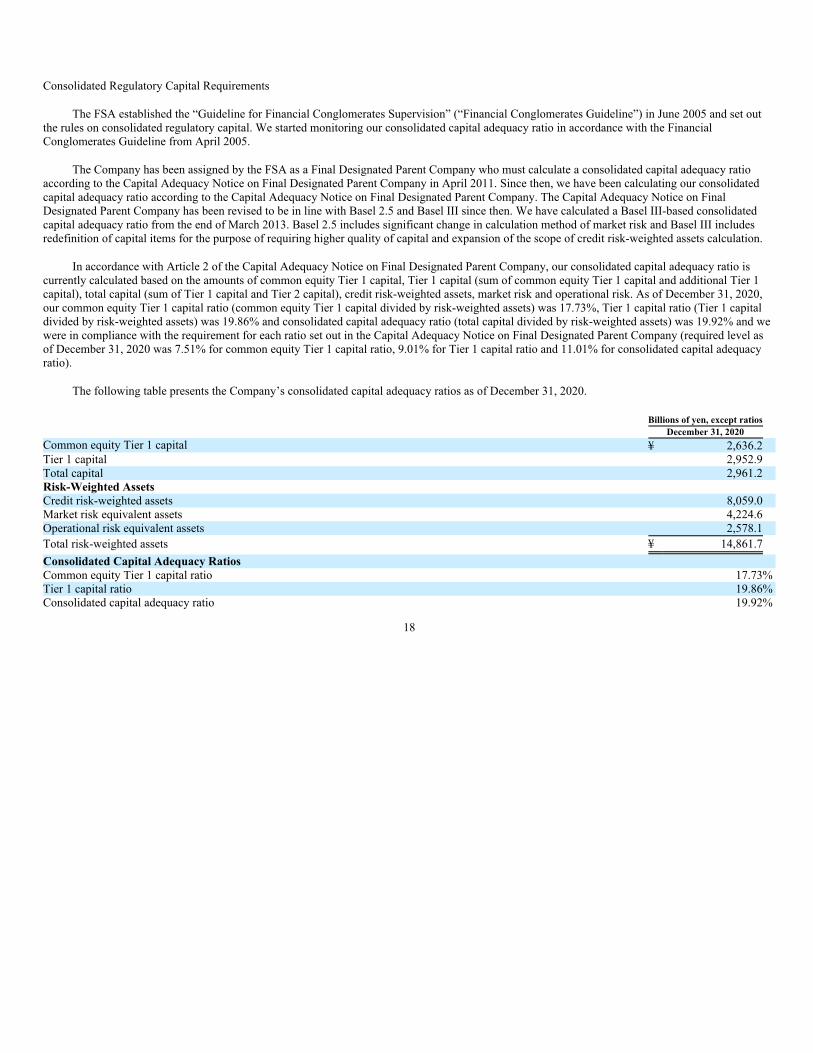
In accordance with Article 2 of the Capital Adequacy Notice on Final Designated Parent Company, our consolidated capital adequacy ratio is
currently calculated based on the amounts of common equity Tier 1 capital, Tier 1 capital (sum of common equity Tier 1 capital and additional Tier 1
capital), total capital (sum of Tier 1 capital and Tier 2 capital), credit risk-weighted assets, market risk and operational risk. As of December 31, 2020,
our common equity Tier 1 capital ratio (common equity Tier 1 capital divided by risk-weighted assets) was 17.73%, Tier 1 capital ratio (Tier 1 capital
divided by risk-weighted assets) was 19.86% and consolidated capital adequacy ratio (total capital divided by risk-weighted assets) was 19.92% and we
were in compliance with the requirement for each ratio set out in the Capital Adequacy Notice on Final Designated Parent Company (required level as
of December 31, 2020 was 7.51% for common equity Tier 1 capital ratio, 9.01% for Tier 1 capital ratio and 11.01% for consolidated capital adequacy
ratio).
The following table presents the Company’s consolidated capital adequacy ratios as of December 31, 2020.
Billions of yen, except ratios
December 31, 2020
Common equity Tier 1 capital ¥ 2,636.2
Tier 1 capital 2,952.9
Total capital 2,961.2
Risk-Weighted Assets
Credit risk-weighted assets 8,059.0
Market risk equivalent assets 4,224.6
Operational risk equivalent assets 2,578.1
Total risk-weighted assets ¥ 14,861.7
Consolidated Capital Adequacy Ratios
Common equity Tier 1 capital ratio 17.73%
Tier 1 capital ratio 19.86%
Consolidated capital adequacy ratio 19.92%
18
Consolidated Leverage Ratio Requirements
In March 2019, the FSA set out requirements for the calculation and disclosure and minimum requirement of 3% of a consolidated leverage ratio,
and the publication of “Notice of the Establishment of Standards for Determining Whether the Adequacy of Leverage, the Supplementary Measure to
the Adequacy of Equity Capital of a Final Designated Parent Company and its Subsidiary Corporations, etc. is Appropriate Compared to the Assets
Held by the Final Designated Parent Company and its Subsidiary Corporations, etc., under Paragraph 1, Article 57-17 of the Financial Instruments and
Exchange Act” (2019 FSA Regulatory Notice No. 13; “Notice on Consolidated Leverage Ratio”), through amendments to revising “Specification of
items which a final designated parent company should disclose on documents to show the status of its sound management” (2010 FSA Regulatory
Notice No. 132; “Notice on Pillar 3 Disclosure”). We started calculating and disclosing a consolidated leverage ratio from March 31, 2015 in
accordance with these Notices. We have also started calculating a consolidated leverage ratio from March 31, 2019 in accordance with the Notice on
Pillar 3 Disclosure, Notice on Consolidated Leverage Ratio and other related Notices. In June 2020, in coordination with the monetary policy of the
Bank of Japan in response to the impact of coronavirus (“COVID-19”) pandemic, the FSA published amendments to the Notice on Consolidated
Leverage Ratio. Under these amendments, deposits with the Bank of Japan have been excluded from the total exposure measure used to calculate the
leverage ratio during the period from June 30, 2020 to March 31, 2021. Management receives and reviews this consolidated leverage ratio on a regular
basis. As of December 31, 2020, our consolidated leverage ratio was 5.61%.
Credit Ratings
On May 13, 2020, Fitch Ratings placed the bbb+ viability ratings of the Company and NSC on negative watch.
On July 28, 2020, Fitch Ratings changed the Outlook on Japan from Stable to Negative. Accordingly, on August 5, 2020, the Outlook of the A-
Issuer Default Rating of the Company and NSC was changed from Stable to Negative.
On September 14, 2020, Moody’s Investors Service changed the Outlook of the Baa1 Long Term Issuer Rating of the Company and the A3 Long
Term Issuer Rating of NSC from Negative to Stable.
On November 13, 2020, Fitch Ratings changed the Outlook of the A- Issuer Default Rating of the Company and NSC from Negative to Stable and
removed the negative watch on the bbb+ viability ratings.
(7) Current Challenges
There is no significant change to our current challenges nor new challenges for the nine months ended December 31, 2020 and until the
submission date of this report.
19

3. Significant Contracts
Not applicable.
20
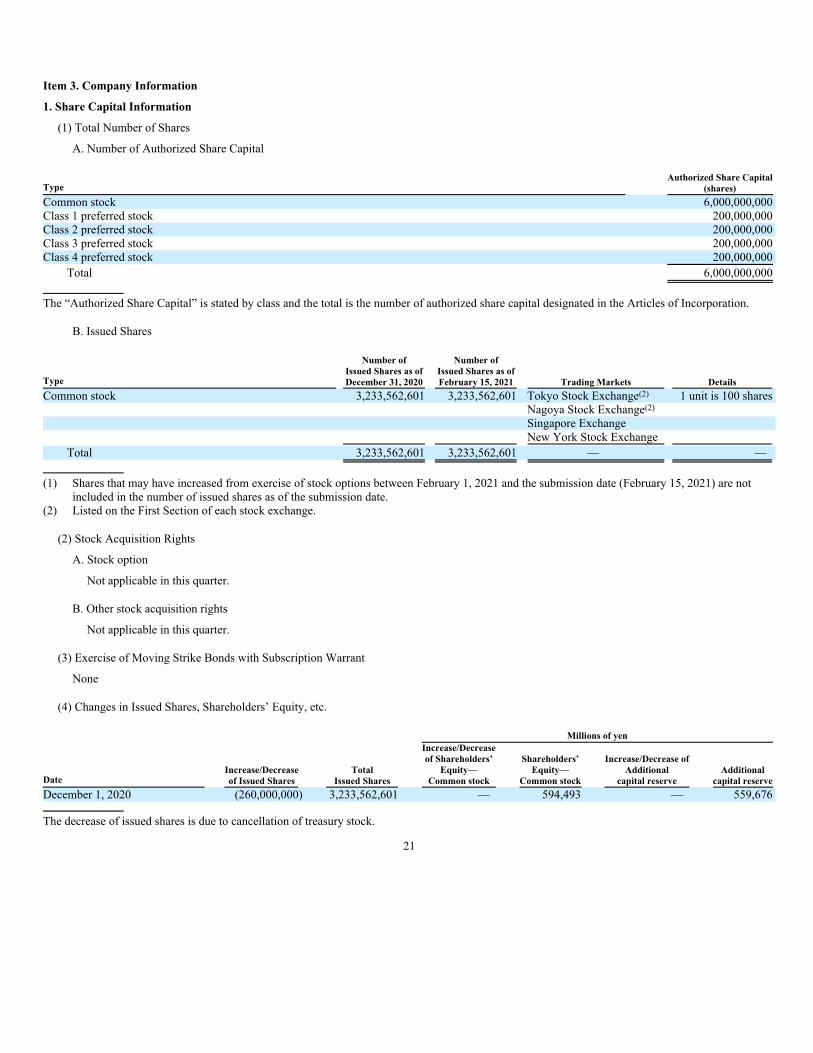
Item 3. Company Information
1. Share Capital Information
(1) Total Number of Shares
A. Number of Authorized Share Capital
Type
Authorized Share Capital
(shares)
Common stock 6,000,000,000
Class 1 preferred stock 200,000,000
Class 2 preferred stock 200,000,000
Class 3 preferred stock 200,000,000
Class 4 preferred stock 200,000,000
Total 6,000,000,000
The “Authorized Share Capital” is stated by class and the total is the number of authorized share capital designated in the Articles of Incorporation.
B. Issued Shares
Type
Number of
Issued Shares as of
December 31, 2020
Number of
Issued Shares as of
February 15, 2021 Trading Markets Details
Common stock 3,233,562,601 3,233,562,601 Tokyo Stock Exchange(2) 1 unit is 100 shares
Nagoya Stock Exchange(2)
Singapore Exchange
New York Stock Exchange
Total 3,233,562,601 3,233,562,601 — —
(1) Shares that may have increased from exercise of stock options between February 1, 2021 and the submission date (February 15, 2021) are not
included in the number of issued shares as of the submission date.
(2) Listed on the First Section of each stock exchange.
(2) Stock Acquisition Rights
A. Stock option
Not applicable in this quarter.
B. Other stock acquisition rights
Not applicable in this quarter.
(3) Exercise of Moving Strike Bonds with Subscription Warrant
None
(4) Changes in Issued Shares, Shareholders’ Equity, etc.
Millions of yen
Date
Increase/Decrease
of Issued Shares
Total
Issued Shares
Increase/Decrease
of Shareholders’
Equity—
Common stock
Shareholders’
Equity—
Common stock
Increase/Decrease of
Additional
capital reserve
Additional
capital reserve
December 1, 2020 (260,000,000) 3,233,562,601 — 594,493 — 559,676
The decrease of issued shares is due to cancellation of treasury stock.
21

(5) Major Shareholders
Not applicable as this is the third quarter.
(6) Voting Rights
The “Voting Rights” as of the end of the current third quarter is presented as of September 30, 2020, the most recent cutoff date, because the
number of beneficiary shareholders as of December 31, 2020, could not be ascertained.
A. Outstanding Shares
As of September 30, 2020
Number of Shares Number of Votes Description
Stock without voting right — — —
Stock with limited voting right (Treasury stocks, etc.) — — —
Stock with limited voting right (Others) — — —
Stock with full voting right (Treasury stocks, etc.) Common stock 435,408,400 — —
Stock with full voting right (Others) Common stock 3,056,604,100 30,566,041 —
Shares less than 1 unit
Common stock 1,550,101 —
Shares less than 1 unit
(100 shares)
Total Shares Issued 3,493,562,601 — —
Voting Rights of Total Shareholders — 30,566,041 —
(1) Stock with full voting right (Others) includes 2,000 shares held by Japan Securities Depository Center, Inc. Shares less than 1 unit includes 40
shares of treasury stock.
(2) 260,000,000 shares of treasury stock was cancelled on December 1, 2020. As a result of the cancellation, the total issued shares as of
December 31, are 3,233,562,601.
B. Treasury Stocks
As of September 30, 2020
Name Address
Directly
held
shares
Indirectly
held
shares Total
Percentage of
Issued Shares
(%)
Nomura Holdings, Inc. 1-9-1, Nihonbashi, Chuo-ku,
Tokyo, Japan 435,408,400 — 435,408,400 12.46
Total 435,408,400 — 435,408,400 12.46
(1) The Company transferred its registered headquarters to 1-13-1, Nihonbashi, Chuo-ku, Tokyo, Japan as of October 1, 2020.
(2) Number of treasury stock as of December 31, 2020 is 173,919,424 shares due mainly to cancellation of 260,000,000 shares of treasury stock
conducted on December 1, 2020.
22
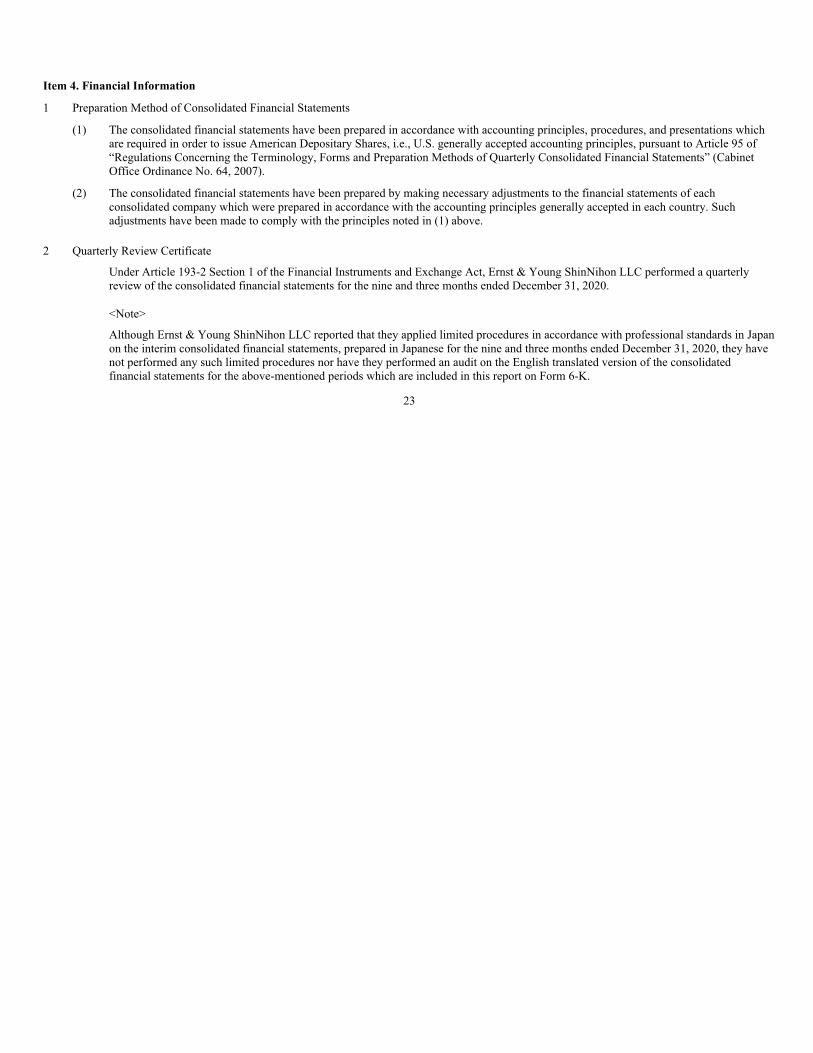
Item 4. Financial Information
1 Preparation Method of Consolidated Financial Statements
(1) The consolidated financial statements have been prepared in accordance with accounting principles, procedures, and presentations which
are required in order to issue American Depositary Shares, i.e., U.S. generally accepted accounting principles, pursuant to Article 95 of
“Regulations Concerning the Terminology, Forms and Preparation Methods of Quarterly Consolidated Financial Statements” (Cabinet
Office Ordinance No. 64, 2007).
(2) The consolidated financial statements have been prepared by making necessary adjustments to the financial statements of each
consolidated company which were prepared in accordance with the accounting principles generally accepted in each country. Such
adjustments have been made to comply with the principles noted in (1) above.
2 Quarterly Review Certificate
Under Article 193-2 Section 1 of the Financial Instruments and Exchange Act, Ernst & Young ShinNihon LLC performed a quarterly
review of the consolidated financial statements for the nine and three months ended December 31, 2020.
<Note>
Although Ernst & Young ShinNihon LLC reported that they applied limited procedures in accordance with professional standards in Japan
on the interim consolidated financial statements, prepared in Japanese for the nine and three months ended December 31, 2020, they have
not performed any such limited procedures nor have they performed an audit on the English translated version of the consolidated
financial statements for the above-mentioned periods which are included in this report on Form 6-K.
23

1. Consolidated Financial Statements
(1) Consolidated Balance Sheets (UNAUDITED)
Millions of yen
Notes
March 31,
2020
December 31,
2020
ASSETS
Cash and cash deposits:
Cash and cash equivalents ¥ 3,191,889 ¥ 3,367,528
Time deposits 309,373 269,681
Deposits with stock exchanges and other segregated cash 373,686 289,866
Total cash and cash deposits 3,874,948 3,927,075
Loans and receivables:
Loans receivable (including ¥805,141 million and ¥739,417 million measured at fair value by applying
the fair value option as of March 31, 2020 and December 31, 2020, respectively) *2, 7 2,857,405 2,559,519
Receivables from customers (including ¥11 million and ¥92,060 million measured at fair value by
applying the fair value option as of March 31, 2020 and December 31, 2020, respectively) *2, 4 541,284 442,696
Receivables from other than customers 1,731,236 733,653
Allowance for doubtful accounts *7 (13,012) (9,816)
Total loans and receivables 5,116,913 3,726,052
Collateralized agreements:
Securities purchased under agreements to resell (including ¥548,043 million and ¥324,084 million
measured at fair value by applying the fair value option as of March 31, 2020 and December 31,
2020, respectively) *2 12,377,315 12,522,320
Securities borrowed 3,529,797 4,430,006
Total collateralized agreements 15,907,112 16,952,326
Trading assets and private equity and debt investments:
Trading assets (including securities pledged as collateral of ¥5,332,640 million and ¥6,775,495 million
as of March 31, 2020 and December 31, 2020, respectively; including ¥12,407 million and
¥9,002 million measured at fair value by applying the fair value option as of March 31, 2020 and
December 31, 2020, respectively) *2, 3 16,853,822 17,553,773
Private equity and debt investments (including ¥6,395 million and ¥5,543 million measured at fair
value by applying the fair value option as of March 31, 2020 and December 31, 2020, respectively) *2 44,278 56,518
Total trading assets and private equity and debt investments 16,898,100 17,610,291
Other assets:
Office buildings, land, equipment and facilities (net of accumulated depreciation and amortization of
¥397,114 million and ¥372,912 million as of March 31, 2020 and December 31, 2020, respectively) 440,512 458,602
Non-trading debt securities *2 455,392 415,082
Investments in equity securities *2 112,175 115,714
Investments in and advances to affiliated companies 367,641 398,075
Other (including ¥144,756 million and ¥142,579 million measured at fair value by applying the fair
value option as of March 31, 2020 and December 31, 2020, respectively) *2, 10 827,022 989,028
Total other assets 2,202,742 2,376,501
Total assets ¥ 43,999,815 ¥ 44,592,245
24

(1) Consolidated Balance Sheets—(Continued) (UNAUDITED)
Notes
Millions of yen
March 31,
2020
December 31,
2020
LIABILITIES AND EQUITY
Short-term borrowings (including ¥376,910 million and ¥630,363 million measured at fair value by applying
the fair value option as of March 31, 2020 and December 31, 2020, respectively) *2 ¥ 1,486,733 ¥ 1,335,006
Payables and deposits:
Payables to customers *4 1,467,434 1,349,856
Payables to other than customers 1,653,495 1,811,503
Deposits received at banks (including ¥14,392 million and ¥37,831 million measured at fair value by
applying the fair value option as of March 31, 2020 and December 31, 2020, respectively) *2 1,276,153 1,200,047
Total payables and deposits 4,397,082 4,361,406
Collateralized financing:
Securities sold under agreements to repurchase (including ¥111,609 million and ¥122,618 million
measured at fair value by applying the fair value option as of March 31, 2020 and December 31,
2020, respectively) *2 16,349,182 15,361,464
Securities loaned (including ¥105,968 million and ¥129,144 million measured at fair value by applying
the fair value option as of March 31, 2020 and December 31, 2020, respectively) *2 961,446 1,472,905
Other secured borrowings 717,711 394,182
Total collateralized financing 18,028,339 17,228,551
Trading liabilities *2, 3 8,546,284 9,767,775
Other liabilities (including ¥9,183 million and ¥37,813 million measured at fair value by applying the fair
value option as of March 31, 2020 and December 31, 2020, respectively) *2, 10 1,034,448 1,181,101
Long-term borrowings (including ¥3,707,643 million and ¥4,019,255 million measured at fair value by
applying the fair value option as of March 31, 2020 and December 31, 2020, respectively) *2 7,775,665 7,865,014
Total liabilities 41,268,551 41,738,853
Commitments and contingencies *16
Equity:
Nomura Holdings, Inc. (“NHI”) shareholders’ equity:
Common stock
No par value share
Authorized—6,000,000,000 shares as of March 31, 2020 and December 31, 2020
Issued—3,493,562,601 shares as of March 31, 2020 and 3,233,562,601 shares as of December 31,
2020
Outstanding–3,038,587,493 shares as of March 31, 2020 and 3,059,293,177 shares as of
December 31, 2020 594,493 594,493
Additional paid-in capital 683,232 690,208
Retained earnings 1,645,451 1,734,915
Accumulated other comprehensive income *15 (26,105) (132,680)
Total NHI shareholders’ equity before treasury stock 2,897,071 2,886,936
Common stock held in treasury, at cost—454,975,108 shares as of March 31, 2020 and 174,269,424 shares
as of December 31, 2020 (243,604) (93,313)
Total NHI shareholders’ equity 2,653,467 2,793,623
Total NHI shareholders’ equity 77,797 59,769
Total equity 2,731,264 2,853,392
Total liabilities and equity ¥ 43,999,815 ¥ 44,592,245
25

(1) Consolidated Balance Sheets—(Continued) (UNAUDITED)
The following table presents the classification of consolidated variable interest entities’ (“VIEs”) assets and liabilities included in the consolidated
balance sheets above. The assets of a consolidated VIE may only be used to settle obligations of that VIE. Creditors do not typically have any recourse
to Nomura beyond the assets held in the VIEs. See Note 6 “Securitizations and Variable Interest Entities” for further information.
Billions of yen
March 31,
2020
December 31,
2020
Cash and cash deposits ¥ 10 ¥ 14
Trading assets and private equity and debt investments 1,172 1,091
Other assets 39 63
Total assets ¥ 1,221 ¥ 1,168
Trading liabilities ¥ 19 ¥ 19
Other liabilities 4 2
Borrowings 947 884
Total liabilities ¥ 970 ¥ 905
The accompanying notes are an integral part of these consolidated financial statements.
26
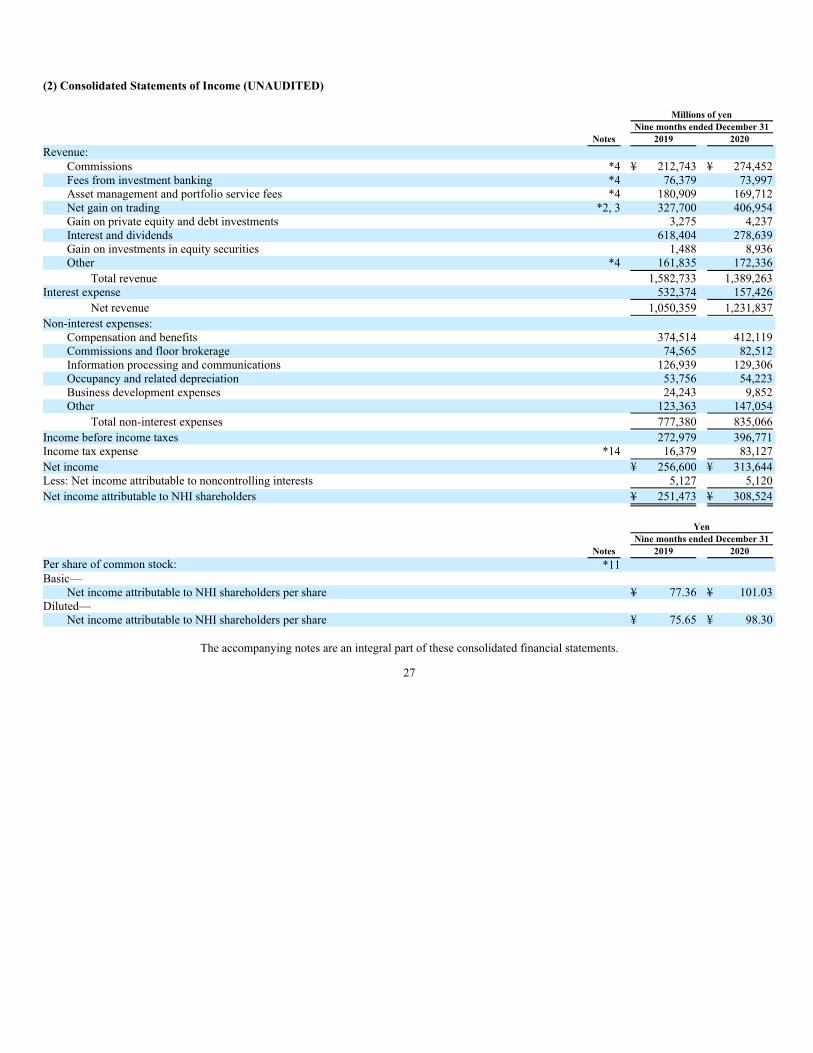
(2) Consolidated Statements of Income (UNAUDITED)
Notes
Millions of yen
Nine months ended December 31
2019 2020
Revenue:
Commissions *4 ¥ 212,743 ¥ 274,452
Fees from investment banking *4 76,379 73,997
Asset management and portfolio service fees *4 180,909 169,712
Net gain on trading *2, 3 327,700 406,954
Gain on private equity and debt investments 3,275 4,237
Interest and dividends 618,404 278,639
Gain on investments in equity securities 1,488 8,936
Other *4 161,835 172,336
Total revenue 1,582,733 1,389,263
Interest expense 532,374 157,426
Net revenue 1,050,359 1,231,837
Non-interest expenses:
Compensation and benefits 374,514 412,119
Commissions and floor brokerage 74,565 82,512
Information processing and communications 126,939 129,306
Occupancy and related depreciation 53,756 54,223
Business development expenses 24,243 9,852
Other 123,363 147,054
Total non-interest expenses 777,380 835,066
Income before income taxes 272,979 396,771
Income tax expense *14 16,379 83,127
Net income ¥ 256,600 ¥ 313,644
Less: Net income attributable to noncontrolling interests 5,127 5,120
Net income attributable to NHI shareholders ¥ 251,473 ¥ 308,524
Notes
Yen
Nine months ended December 31
2019 2020
Per share of common stock: *11
Basic—
Net income attributable to NHI shareholders per share ¥ 77.36 ¥ 101.03
Diluted—
Net income attributable to NHI shareholders per share ¥ 75.65 ¥ 98.30
The accompanying notes are an integral part of these consolidated financial statements.
27

Notes
Millions of yen
Three months ended December 31
2019 2020
Revenue:
Commissions *4 ¥ 79,289 ¥ 96,687
Fees from investment banking *4 26,803 36,138
Asset management and portfolio service fees *4 61,020 58,639
Net gain on trading *2, 3 109,266 136,402
Gain on private equity and debt investments 1,503 1,362
Interest and dividends 203,050 89,602
Gain on investments in equity securities 2,243 3,523
Other *4 14,276 33,519
Total revenue 497,450 455,872
Interest expense 162,472 53,780
Net revenue 334,978 402,092
Non-interest expenses:
Compensation and benefits 128,987 136,816
Commissions and floor brokerage 24,568 26,326
Information processing and communications 42,821 43,484
Occupancy and related depreciation 16,276 18,109
Business development expenses 8,509 3,388
Other 44,130 42,636
Total non-interest expenses 265,291 270,759
Income before income taxes 69,687 131,333
Income tax expense *14 10,337 30,910
Net income ¥ 59,350 ¥ 100,423
Less: Net income attributable to noncontrolling interests 2,284 2,057
Net income attributable to NHI shareholders ¥ 57,066 ¥ 98,366
Notes
Yen
Three months ended December 31
2019 2020
Per share of common stock: *11
Basic—
Net income attributable to NHI shareholders per share ¥ 18.07 ¥ 32.16
Diluted—
Net income attributable to NHI shareholders per share ¥ 17.63 ¥ 31.16
The accompanying notes are an integral part of these consolidated financial statements.
28
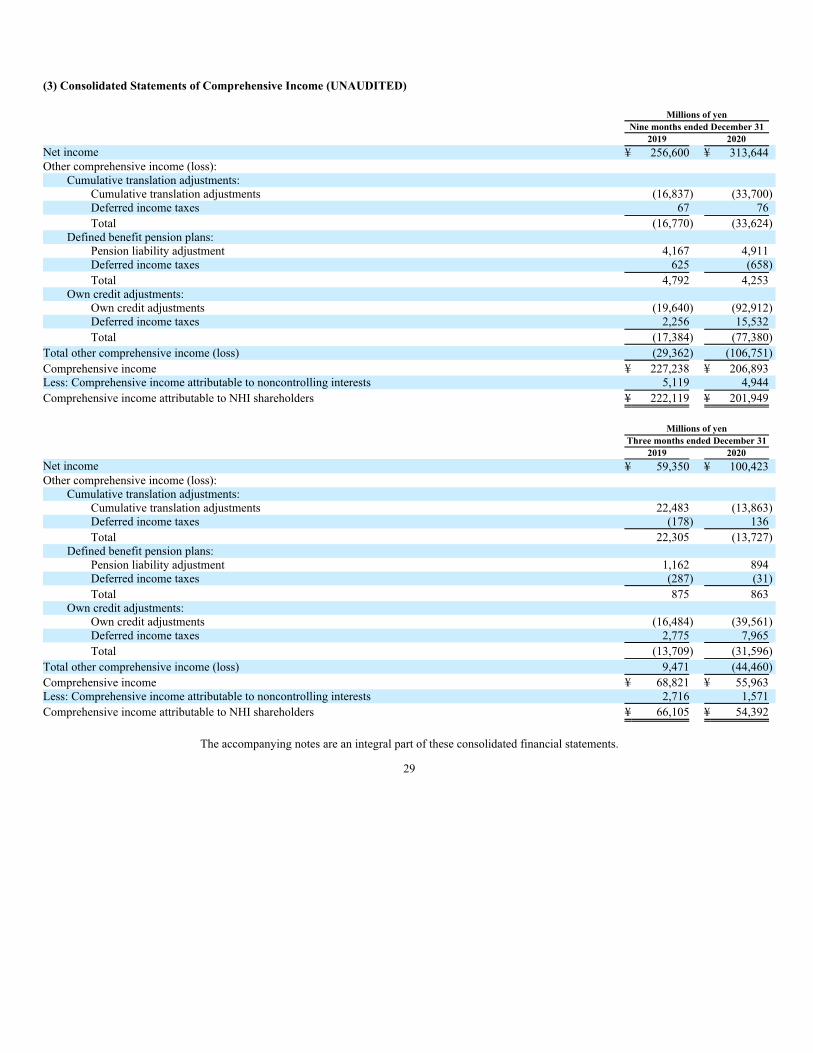
(3) Consolidated Statements of Comprehensive Income (UNAUDITED)
Millions of yen
Nine months ended December 31
2019 2020
Net income ¥ 256,600 ¥ 313,644
Other comprehensive income (loss):
Cumulative translation adjustments:
Cumulative translation adjustments (16,837) (33,700)
Deferred income taxes 67 76
Total (16,770) (33,624)
Defined benefit pension plans:
Pension liability adjustment 4,167 4,911
Deferred income taxes 625 (658)
Total 4,792 4,253
Own credit adjustments:
Own credit adjustments (19,640) (92,912)
Deferred income taxes 2,256 15,532
Total (17,384) (77,380)
Total other comprehensive income (loss) (29,362) (106,751)
Comprehensive income ¥ 227,238 ¥ 206,893
Less: Comprehensive income attributable to noncontrolling interests 5,119 4,944
Comprehensive income attributable to NHI shareholders ¥ 222,119 ¥ 201,949
Millions of yen
Three months ended December 31
2019 2020
Net income ¥ 59,350 ¥ 100,423
Other comprehensive income (loss):
Cumulative translation adjustments:
Cumulative translation adjustments 22,483 (13,863)
Deferred income taxes (178) 136
Total 22,305 (13,727)
Defined benefit pension plans:
Pension liability adjustment 1,162 894
Deferred income taxes (287) (31)
Total 875 863
Own credit adjustments:
Own credit adjustments (16,484) (39,561)
Deferred income taxes 2,775 7,965
Total (13,709) (31,596)
Total other comprehensive income (loss) 9,471 (44,460)
Comprehensive income ¥ 68,821 ¥ 55,963
Less: Comprehensive income attributable to noncontrolling interests 2,716 1,571
Comprehensive income attributable to NHI shareholders ¥ 66,105 ¥ 54,392
The accompanying notes are an integral part of these consolidated financial statements.
29

(4) Consolidated Statements of Changes in Equity (UNAUDITED)
Millions of yen
Nine months ended December 31
2019 2020
Common stock
Balance at beginning of year ¥ 594,493 ¥ 594,493
Balance at end of period 594,493 594,493
Additional paid-in capital
Balance at beginning of year 687,761 683,232
Stock-based compensation awards (4,457) 5,860
Changes in an affiliated company’s interests in its subsidiary — 1,116
Balance at end of period 683,304 690,208
Retained earnings
Balance at beginning of year 1,486,825 1,645,451
Cumulative effect of change in accounting principle (1) 5,592 (18,200)
Net income attributable to NHI shareholders 251,473 308,524
Cash dividends(2) (48,477) (61,156)
Gain (loss) on sales of treasury stock (231) (500)
Cancellation of treasury stock — (139,204)
Balance at end of period 1,695,182 1,734,915
Accumulated other comprehensive income (loss)
Cumulative translation adjustments
Balance at beginning of year 17,833 (26,274)
Net change during the period (16,762) (33,448)
Balance at end of period 1,071 (59,722)
Defined benefit pension plans
Balance at beginning of year (71,107) (62,571)
Pension liability adjustment 4,792 4,253
Balance at end of period (66,315) (58,318)
Own credit adjustments
Balance at beginning of year 24,224 62,740
Own credit adjustments (17,384) (77,380)
Balance at end of period 6,840 (14,640)
Balance at end of period (58,404) (132,680)
Common stock held in treasury
Balance at beginning of year (108,968) (243,604)
Repurchases of common stock (117,720) (7)
Sales of common stock 0 0
Common stock issued to employees 13,280 11,094
Cancellation of common stock — 139,204
Balance at end of period (213,408) (93,313)
Total NHI shareholders’ equity
Balance at end of period 2,701,167 2,793,623
Noncontrolling interests
Balance at beginning of year 49,732 77,797
Cash dividends (1,483) (989)
Net income attributable to noncontrolling interests 5,127 5,120
Accumulated other comprehensive income (loss) attributable to noncontrolling interests (8) (176)
Purchase / sale of subsidiary shares, net 16,090 450
Other net change in noncontrolling interests 18,998 (22,433)
Balance at end of period 88,456 59,769
Total equity
Balance at end of period ¥ 2,789,623 ¥ 2,853,392
(1) Represents the adjustments to initially apply Accounting Standards Update (“ASU”) 2016-02, “Leases” and ASU 2016-13, “Measurement of
Credit Losses on Financial Instruments” for the nine months ended December 31, 2020, respectively.
(2) Dividends per share Nine months ended December 31, 2019 ¥15.00 Nine months ended December 31, 2020 ¥20.00
The accompanying notes are an integral part of these consolidated financial statements.
30
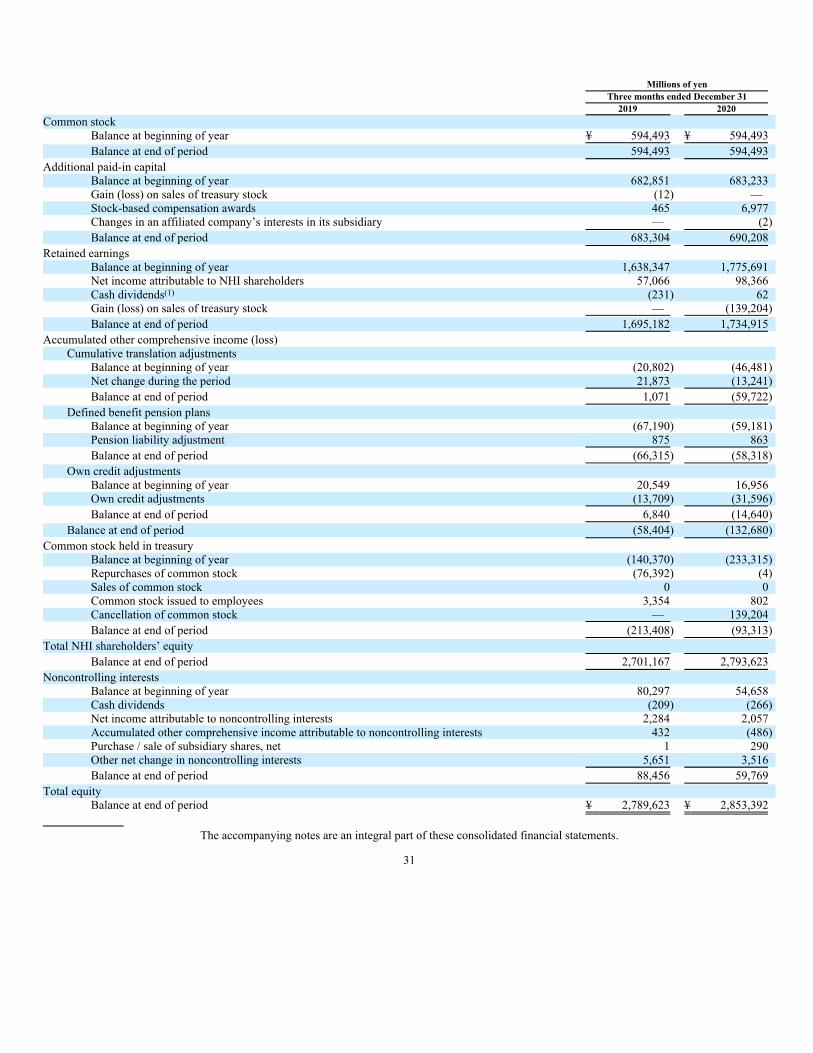
Millions of yen
Three months ended December 31
2019 2020
Common stock
Balance at beginning of year ¥ 594,493 ¥ 594,493
Balance at end of period 594,493 594,493
Additional paid-in capital
Balance at beginning of year 682,851 683,233
Gain (loss) on sales of treasury stock (12) —
Stock-based compensation awards 465 6,977
Changes in an affiliated company’s interests in its subsidiary — (2)
Balance at end of period 683,304 690,208
Retained earnings
Balance at beginning of year 1,638,347 1,775,691
Net income attributable to NHI shareholders 57,066 98,366
Cash dividends(1) (231) 62
Gain (loss) on sales of treasury stock — (139,204)
Balance at end of period 1,695,182 1,734,915
Accumulated other comprehensive income (loss)
Cumulative translation adjustments
Balance at beginning of year (20,802) (46,481)
Net change during the period 21,873 (13,241)
Balance at end of period 1,071 (59,722)
Defined benefit pension plans
Balance at beginning of year (67,190) (59,181)
Pension liability adjustment 875 863
Balance at end of period (66,315) (58,318)
Own credit adjustments
Balance at beginning of year 20,549 16,956
Own credit adjustments (13,709) (31,596)
Balance at end of period 6,840 (14,640)
Balance at end of period (58,404) (132,680)
Common stock held in treasury
Balance at beginning of year (140,370) (233,315)
Repurchases of common stock (76,392) (4)
Sales of common stock 0 0
Common stock issued to employees 3,354 802
Cancellation of common stock — 139,204
Balance at end of period (213,408) (93,313)
Total NHI shareholders’ equity
Balance at end of period 2,701,167 2,793,623
Noncontrolling interests
Balance at beginning of year 80,297 54,658
Cash dividends (209) (266)
Net income attributable to noncontrolling interests 2,284 2,057
Accumulated other comprehensive income attributable to noncontrolling interests 432 (486)
Purchase / sale of subsidiary shares, net 1 290
Other net change in noncontrolling interests 5,651 3,516
Balance at end of period 88,456 59,769
Total equity
Balance at end of period ¥ 2,789,623 ¥ 2,853,392
The accompanying notes are an integral part of these consolidated financial statements.
31
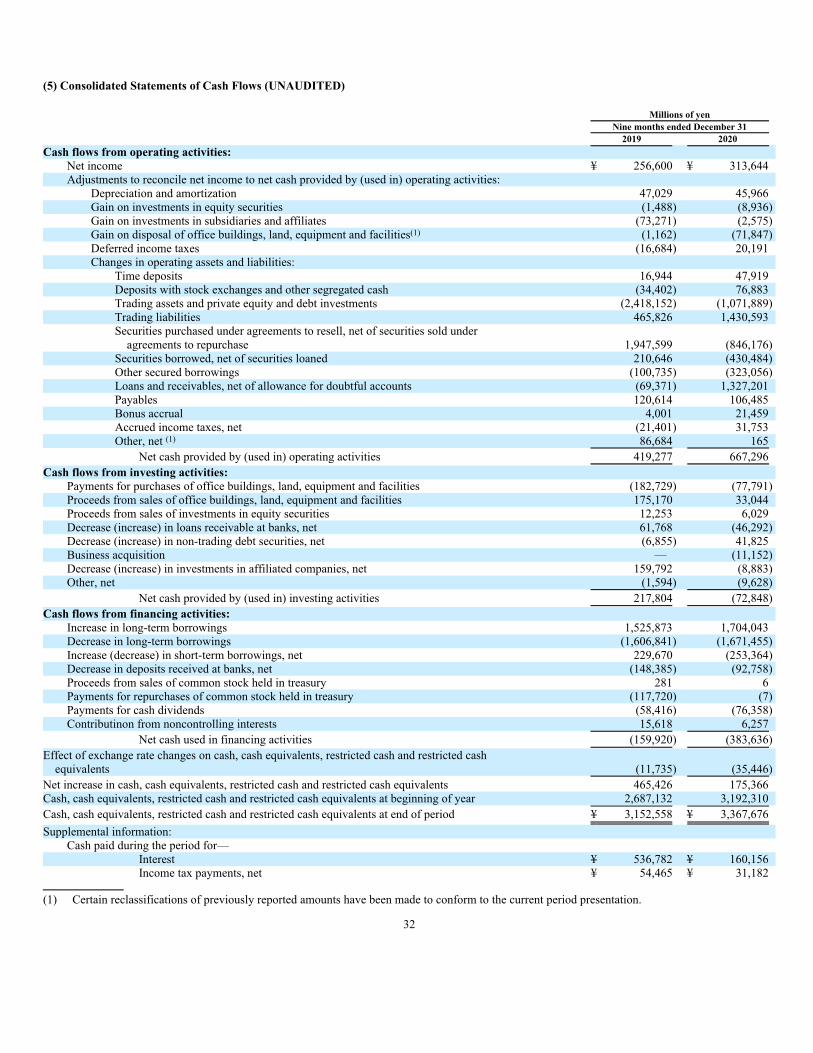
(5) Consolidated Statements of Cash Flows (UNAUDITED)
Millions of yen
Nine months ended December 31
2019 2020
Cash flows from operating activities:
Net income ¥ 256,600 ¥ 313,644
Adjustments to reconcile net income to net cash provided by (used in) operating activities:
Depreciation and amortization 47,029 45,966
Gain on investments in equity securities (1,488) (8,936)
Gain on investments in subsidiaries and affiliates (73,271) (2,575)
Gain on disposal of office buildings, land, equipment and facilities(1) (1,162) (71,847)
Deferred income taxes (16,684) 20,191
Changes in operating assets and liabilities:
Time deposits 16,944 47,919
Deposits with stock exchanges and other segregated cash (34,402) 76,883
Trading assets and private equity and debt investments (2,418,152) (1,071,889)
Trading liabilities 465,826 1,430,593
Securities purchased under agreements to resell, net of securities sold under
agreements to repurchase 1,947,599 (846,176)
Securities borrowed, net of securities loaned 210,646 (430,484)
Other secured borrowings (100,735) (323,056)
Loans and receivables, net of allowance for doubtful accounts (69,371) 1,327,201
Payables 120,614 106,485
Bonus accrual 4,001 21,459
Accrued income taxes, net (21,401) 31,753
Other, net (1) 86,684 165
Net cash provided by (used in) operating activities 419,277 667,296
Cash flows from investing activities:
Payments for purchases of office buildings, land, equipment and facilities (182,729) (77,791)
Proceeds from sales of office buildings, land, equipment and facilities 175,170 33,044
Proceeds from sales of investments in equity securities 12,253 6,029
Decrease (increase) in loans receivable at banks, net 61,768 (46,292)
Decrease (increase) in non-trading debt securities, net (6,855) 41,825
Business acquisition — (11,152)
Decrease (increase) in investments in affiliated companies, net 159,792 (8,883)
Other, net (1,594) (9,628)
Net cash provided by (used in) investing activities 217,804 (72,848)
Cash flows from financing activities:
Increase in long-term borrowings 1,525,873 1,704,043
Decrease in long-term borrowings (1,606,841) (1,671,455)
Increase (decrease) in short-term borrowings, net 229,670 (253,364)
Decrease in deposits received at banks, net (148,385) (92,758)
Proceeds from sales of common stock held in treasury 281 6
Payments for repurchases of common stock held in treasury (117,720) (7)
Payments for cash dividends (58,416) (76,358)
Contributinon from noncontrolling interests 15,618 6,257
Net cash used in financing activities (159,920) (383,636)
Effect of exchange rate changes on cash, cash equivalents, restricted cash and restricted cash
equivalents (11,735) (35,446)
Net increase in cash, cash equivalents, restricted cash and restricted cash equivalents 465,426 175,366
Cash, cash equivalents, restricted cash and restricted cash equivalents at beginning of year 2,687,132 3,192,310
Cash, cash equivalents, restricted cash and restricted cash equivalents at end of period ¥ 3,152,558 ¥ 3,367,676
Supplemental information:
Cash paid during the period for—
Interest ¥ 536,782 ¥ 160,156
Income tax payments, net ¥ 54,465 ¥ 31,182
(1) Certain reclassifications of previously reported amounts have been made to conform to the current period presentation.
32

The following table presents a reconciliation of cash, cash equivalents, restricted cash and restricted cash equivalents as reported within the
consolidated balance sheets to the total of the same such amounts shown in the statements of cash flows above. Restricted cash and restricted cash
equivalents are amounts where access, withdrawal or usage by Nomura is substantively prohibited by a third party entity outside of the Nomura group.
Millions of yen
Nine months ended December 31
2019 2020
Cash and cash equivalents reported in Cash and cash equivalents ¥ 3,152,017 ¥ 3,367,528
Restricted cash and restricted cash equivalents reported in Deposits with stock exchanges and other
segregated cash ¥ 541 ¥ 148
Total cash, cash equivalent, restricted cash and restricted cash equivalents ¥ 3,152,558 ¥ 3,367,676
Non-cash—
Total amount of Right- of use assets recognized during the nine months ended December 31, 2019 and December 31, 2020 were ¥13,267 million
and ¥53,347 million, respectively.
The accompanying notes are an integral part of these consolidated financial statements.
33

Notes to the Consolidated Financial Statements (UNAUDITED)
1. Basis of accounting:
In December 2001, Nomura Holdings, Inc. (“the Company”) filed a registration statement, in accordance with the Securities Exchange Act of
1934, with the United States Securities and Exchange Commission (“SEC”) in order to list its American Depositary Shares (“ADS”) on the New York
Stock Exchange. Since then, the Company has had an obligation to file an annual report on Form 20-F with the SEC in accordance with the Securities
Exchange Act of 1934.
Therefore, the Company and other entities in which it has a controlling financial interest (collectively “Nomura”) prepares consolidated financial
statements in accordance with the accounting principles, procedures and presentations which are required in order to issue ADS, i.e., U.S. generally
accepted accounting principles (“U.S. GAAP”), pursuant to Article 95 of “Regulations Concerning the Terminology, Forms and Preparation Methods of
Quarterly Consolidated Financial Statements” (Cabinet Office Ordinance No. 64, 2007).
The following paragraphs describe the major differences between U.S. GAAP applied by Nomura and accounting principles generally accepted in
Japan (“Japanese GAAP”) for the nine and three months ended December 31, 2020. Where the effect of these major differences are significant to
Income before income taxes, Nomura discloses as (higher) or (lower) below the amount by which Income before income taxes based on U.S. GAAP was
higher or lower than Japanese GAAP, respectively.
Scope of consolidation—
Under U.S. GAAP, the scope of consolidation is mainly determined by the ownership of a majority of the voting interests in an entity or by
identifying the primary beneficiary of variable interest entities. Under Japanese GAAP, the scope of consolidation is determined by a “financial
controlling model”, which takes into account the ownership level of voting interests in an entity and other factors.
Unrealized gains and losses on investments in equity securities—
Under U.S. GAAP applicable to broker-dealers, minority investments in equity securities with readily determinable fair values are measured at
fair value with changes in fair value recognized in earnings. Under Japanese GAAP, these investments are also measured at fair value, but unrealized
gains and losses, net of applicable income taxes, are reported in other comprehensive income. Income (loss) before income taxes prepared under U.S.
GAAP, therefore, was ¥3,662 million (lower) and ¥4,773 million (higher) for the nine months ended December 31, 2019 and 2020, respectively and
¥2,193 million (lower) and ¥2,781 million (higher) for the three months ended December 31, 2019 and 2020, respectively.
Unrealized gains and losses on non-trading debt and equity securities—
Under U.S. GAAP applicable to broker-dealers, non-trading securities are measured at fair value with changes in fair value recognized in
earnings. Under Japanese GAAP, these securities are also measured at fair value, but unrealized gains and losses, net of applicable income taxes, are
reported in other comprehensive income. Income (loss) before income taxes prepared under U.S. GAAP, therefore, was ¥233 million (higher) and
¥885 million (higher) for the nine months ended December 31, 2019 and 2020, respectively, and ¥2,166 million (lower) and ¥62 million (lower) for the
three months ended December 31, 2019 and 2020, respectively for non-trading debt securities. Income (loss) before income taxes prepared under U.S.
GAAP was ¥567 million (lower) and ¥1,898 million (higher) for the nine months ended December 31, 2019 and 2020, respectively, and ¥273 million
(lower) and ¥2,901 million (higher) for the three months ended December 31, 2019 and 2020, respectively for non-trading equity securities.
Retirement and severance benefits—
Under U.S. GAAP, gains or losses resulting from either experience that is different from an actuarial assumption or a change in assumption is
amortized over the average remaining service period of employees when a net gain or loss at the beginning of the year exceeds the “Corridor” which is
defined as 10% of the larger of projected benefit obligation or the fair value of plan assets. Under Japanese GAAP, these gains or losses are amortized
over a certain period regardless of the Corridor.
34

Amortization of goodwill and equity method goodwill—
Under U.S. GAAP, goodwill is not amortized and is tested for impairment periodically. Under Japanese GAAP, goodwill is amortized over certain
periods of less than 20 years using the straight-line method. Therefore, under U.S. GAAP, Income (loss) before income taxes was ¥2,620 million
(higher) and ¥2,906 million (higher) for the nine months ended December 31, 2019 and 2020, respectively, and ¥607 million (higher) and ¥968 million
(higher) for the three months ended December 31, 2019 and 2020, respectively.
Changes in the fair value of derivative contracts—
Under U.S. GAAP, all derivative contracts, including derivative contracts that have been designated as hedges of specific assets or specific
liabilities, are carried at fair value, with changes in fair value recognized either in earnings or other comprehensive income. Under Japanese GAAP,
derivative contracts that have been entered into for hedging purposes are carried at fair value with changes in fair value, net of applicable income taxes,
recognized generally in other comprehensive income.
Fair value for financial assets and financial liabilities—
Under U.S. GAAP, the fair value option may be elected for eligible financial assets and financial liabilities which would otherwise be carried on a
basis other than fair value (“the fair value option”). Where the fair value option is elected, the financial asset or financial liability is carried at fair value
with changes in fair value are recognized in earnings. Under Japanese GAAP, the fair value option is not permitted. Therefore, under U.S. GAAP,
Income (loss) before income taxes was ¥1,889 million (higher) and ¥29,656 million (higher) for the nine months ended December 31, 2019 and 2020,
respectively and ¥6,663 million (lower) and ¥4,085 million (higher) for the three months ended December 31, 2019 and 2020, respectively. In addition,
non-marketable equity securities which are carried at fair value under U.S. GAAP applicable to broker-dealers are carried at cost less impairment loss
under Japanese GAAP.
Offsetting of amounts related to certain contracts—
Under U.S. GAAP, an entity that is party to a master netting arrangement is permitted to offset fair value amounts recognized for the right to
reclaim cash collateral (a receivable) or the obligation to return cash collateral (a payable) against fair value amounts recognized for derivative
instruments that have been offset under the same master netting arrangement. Under Japanese GAAP, offsetting of such amounts is not permitted.
Stock issuance costs—
Under U.S. GAAP, stock issuance costs are deducted from capital. Under Japanese GAAP, stock issuance costs are either immediately expensed
or capitalized as a deferred asset and amortized over periods of up to three years using the straight-line method.
Accounting for change in controlling interest in a consolidated subsidiary’s shares—
Under U.S. GAAP, when a parent’s ownership interest decreases as a result of sales of a subsidiary’s common shares by the parent, and the
subsidiary becomes an equity method investee, the parent’s remaining investment in the former subsidiary is measured at fair value as of the date of loss
of a controlling interest and a related valuation gain or loss is recognized in earnings. Under Japanese GAAP, the remaining investment on the parent’s
consolidated balance sheet is computed as the sum of the carrying amount of investment in the equity method investee recorded in the parent’s stand-
alone balance sheet as adjusted for the share of net income or losses and other adjustments from initial acquisition through to the date of loss of a
controlling interest multiplied by the ratio of the remaining shareholding percentage against the holding percentage prior to loss of control.
Stock-based and other compensation awards—
Under U.S.GAAP, Restricted Stock Units (“RSUs”) are classified as equity awards, and the total compensation cost is measured based on the fair
value of the Company’s common stock on the grant date. Under Japanese GAAP, the total compensation cost of RSUs is measured by the amount of
monetary compensation liabilities which is granted to management and employees. Therefore, under U.S. GAAP, Income (loss) before income taxes
was ¥562 million (lower) and ¥119 million (lower) for the nine months ended December 31, 2019 and 2020, respectively and ¥143 million (higher) and
¥214 million (higher) for the three months ended December 31, 2019 and 2020, respectively.
Use of estimates—
The Company tests for other than temporary impairment on its equity method investments on a quarterly basis. At December 31, 2020, there is an
equity method investment where the share price is lower than the carrying value. The carrying value of the equity method investment is
¥215,026 million at December 31, 2020. Based on the quoted share price, the fair value at December 31, 2020 is below the Company’s carrying value
by 31.2%.
Considering the financial condition and performance as well as the period and extent to which the share price was below carrying value, the
Company determined the impairment was not other-than-temporary and therefore no impairment loss were recognized through earnings during the
period. The Company will continue to evaluate this investment and may subsequently conclude the reduction in fair value is other-than-temporary and
impair our investment if market conditions do not sustainably improve in the near future.
35

New accounting pronouncements recently adopted—
No new accounting pronouncements relevant to Nomura were adopted during the three months ended September 30, 2020 and December 31, 2020.
The following table presents a summary of new accounting pronouncements relevant to Nomura which have been adopted during the three months ended June 30, 2020.
Pronouncement Summary of new guidance
Adoption
date and method
of adoption
Effect on these
consolidated
statements
ASU 2016-13,“Measurement of Credit Losses
on Financial Instruments”(1)
• Introduces a new model for recognition and measurement of credit losses against certain financial instruments such as loans, debt securities and receivables which are not carried at fair value with changes in fair value recognized through earnings. The model also applies to off balance sheet credit exposures such as written loan commitments, standby letters of credit and issued financial guarantees not accounted for as insurance, which are not carried at fair value through earnings.
• The new model based on lifetime current expected credit losses (CECL) measurement, to be recognized at the time an in-scope instrument is originated, acquired or issued.
• Replaces existing incurred credit losses model under current GAAP.
• Permits electing the fair value option for certain financial instruments on adoption date.
• Requires enhanced qualitative and quantitative disclosures around credit risk, the methodology used to estimate and monitor expected credit losses and changes in estimates of expected credit losses.
Modified retrospective adoption from April 1, 2020.
For financial instruments subject to CECL, ¥1,972 million increase in Allowance for doubtful
accounts, ¥638 million increase in Other
liabilities, ¥72 million increase of Deferred tax
assets and cumulative effect adjustment to decrease Retained
earnings, net of tax, of ¥2,538 million as of April 1, 2020.
For financial instruments elected for the FVO, ¥9,774 million decrease in Loans receivable, ¥5,888 million increase in Other liabilities and cumulative effect adjustment to decrease Retained earnings, net of tax, of ¥15,662 million as of April 1, 2020.
Allowances for credit losses as determined on adoption date under the new model increased as a result of the COVID-19 pandemic because of the increased credit risk caused by the impact of the pandemic on borrowers. Fair value measurements used on adoption date were also lower because of increased credit risk and impact on financial markets caused by the pandemic.
36

ASU 2019-12,“Simplifying the Accounting for
Income Taxes”
• Simplifies the accounting for income taxes by removing certain exceptions to the general principles in ASC 740”Income Taxes”, such as the exception to the requirement to recognize a deferred tax liability for equity method investments when a foreign subsidiary becomes an equity method investment and the exception to the ability not to recognize a deferred tax liability for a foreign subsidiary when a foreign equity method investment becomes a subsidiary.
• Requires an entity to recognize a franchise tax (or similar tax) that is partially based on income as an income-based tax and account for any incremental amount incurred as a non-income –based tax.
• Makes other minor amendments for simplification and clarification of income taxes accounting.
Modified retrospective adoption from April 1, 2020.
No material impact on adoption and no material impact expected in future reporting periods.
ASU 2017- 04“Goodwill”
• Simplifies the test for goodwill impairment by eliminating the existing requirement to measure an impairment loss by comparing the implied fair value of goodwill in a reporting unit to the actual carrying value of goodwill.
• An impairment loss will be recognized if the carrying value of the reporting unit exceeds the estimated fair value of the reporting unit.
• Requires to consider income tax effects from any tax deductible goodwill on the carrying value of the reporting unit when measuring an impairment loss.
• Does not impact when goodwill is tested for impairment or level at which goodwill is tested.
Prospective adoption to goodwill tests performed from April 1, 2020.
No material impact expected on future goodwill impairment tests.
37
ASU 2020-04“Reference rate reform”
• Provides temporary optional expedients and exceptions to the application of generally accepted accounting principles to certain contract and hedge relationships affected by reference rate reform.
• Contract modifications solely related to the replacement of reference rate are eligible for relief from modification accounting requirements and accounted for as a continuation of the existing contract.
• Allows various optional expedients and elections to allow hedging relationships affected by reference rate reform would continue uninterrupted during the reference rate transition if certain criteria are met.
The expedients and exceptions provided by the ASU are permitted to be adopted any time until December 31, 2022.
No material expedients have been applied during the nine months ended December 31, 2020.
Nomura plans to apply certain of the optional expedients to relevant contract modification and hedge accounting relationship during the reference rate transition period and does not expect a material impact in future reporting periods.
(1) As subsequently amended by ASU 2018-19 “Codification Improvements to Topic 326, Financial Instruments—Credit Losses”, ASU 2019-04 “Codification Improvements to Topic 326, Financial Instruments—Credit Losses, Topic 815, Derivatives and Hedging, and Topic 825, Financial
Instruments”, ASU 2019-05 “Financial Instruments—Credit Losses (Topic 326): Targeted Transition Relief”, ASU 2019-09“Codification
Improvements to Topic326, Financial Instruments—Credit Losses” and ASU 2019-10 “Financial Instruments—Credit Losses (Topic 326),
Derivatives and Hedging (Topic 815), and Leases (Topic 842): Effective Dates.”
38

Future accounting developments—
There are no new authoritative accounting pronouncements relevant to Nomura which will be adopted on or after April 1, 2021 which may have a
material impact on these consolidated financial statements.
39

2. Fair value measurements:
The fair value of financial instruments
A significant amount of Nomura’s financial instruments are measured at fair value. Financial assets measured at fair value on a recurring basis are
reported in the consolidated balance sheets within Trading assets and private equity and debt investments, Loans and receivables, Collateralized
agreements and Other assets. Financial liabilities measured at fair value on a recurring basis are reported within Trading liabilities, Short-term
borrowings, Payables and deposits, Collateralized financing, Long-term borrowings and Other liabilities.
Other financial assets and financial liabilities are measured at fair value on a nonrecurring basis, where the primary measurement basis is not fair
value but where fair value is used in specific circumstances after initial recognition, such as to measure impairment.
In all cases, fair value is determined in accordance with ASC 820 “Fair Value Measurements and Disclosures” (“ASC 820”) which defines fair
value as the amount that would be exchanged to sell a financial asset or transfer a financial liability in an orderly transaction between market
participants at the measurement date. It assumes that the transaction occurs in the principal market for the relevant financial assets or financial liabilities,
or in the absence of a principal market, the most advantageous market.
Fair value is usually determined on an individual financial instrument basis consistent with the unit of account of the financial instrument.
However, certain financial instruments managed on a portfolio basis are valued as a portfolio, namely based on the price that would be received to sell a
net long position (i.e., a net financial asset) or transfer a net short position (i.e., a net financial liability) consistent with how market participants would
price the net risk exposure at the measurement date.
Financial assets measured at fair value also include investments in certain funds where, as a practical expedient, fair value is determined on the
basis of net asset value per share (“NAV per share”) if the NAV per share is calculated in accordance with certain industry standard principles.
Increases and decreases in the fair value of assets and liabilities will significantly impact Nomura’s position, performance, liquidity and capital
resources. As explained below, valuation techniques applied contain inherent uncertainties and Nomura is unable to predict the accurate impact of future
developments in the market. The valuation of financial instruments is more difficult during periods of market stress as a result of greater volatility and
reduced price transparency, which has been the case during the COVID-19 pandemic in 2020, and may therefore require the greater use of judgement in
the determination of fair value. Where appropriate, Nomura uses economic hedging strategies to mitigate its risk, although these hedges are also subject
to unpredictable movements in the market.
Valuation methodology for financial instruments carried at fair value on a recurring basis
The fair value of financial instruments is based on quoted market prices including market indices, broker or dealer quotations or an estimation by
management of the expected exit price under current market conditions. Various financial instruments, including cash instruments and over-the-counter
(“OTC”) contracts, have bid and offer prices that are observable in the market. These are measured at the point within the bid-offer range which best
represents Nomura’s estimate of fair value. Where quoted market prices or broker or dealer quotations are not available, prices for similar instruments or
valuation pricing models are considered in the determination of fair value.
Where quoted prices are available in active markets, no valuation adjustments are taken to modify the fair value of assets or liabilities marked
using such prices. Other instruments may be measured using valuation techniques, such as valuation pricing models incorporating observable valuation
inputs, unobservable parameters or a combination of both. Valuation pricing models use valuation inputs which would be considered by market
participants in valuing similar financial instruments.
Valuation pricing models and their underlying assumptions impact the amount and timing of unrealized and realized gains and losses recognized,
and the use of different valuation pricing models or underlying assumptions could produce different financial results. Valuation uncertainty results from
a variety of factors, including the valuation technique or model selected, the quantitative assumptions used within the valuation model, the inputs into
the model, as well as other factors. Valuation adjustments are used to reflect the assessment of this uncertainty. Common valuation adjustments include
model reserves, credit adjustments, close-out adjustments, and other appropriate instrument-specific adjustments, such as those to reflect transfer or sale
restrictions.
40
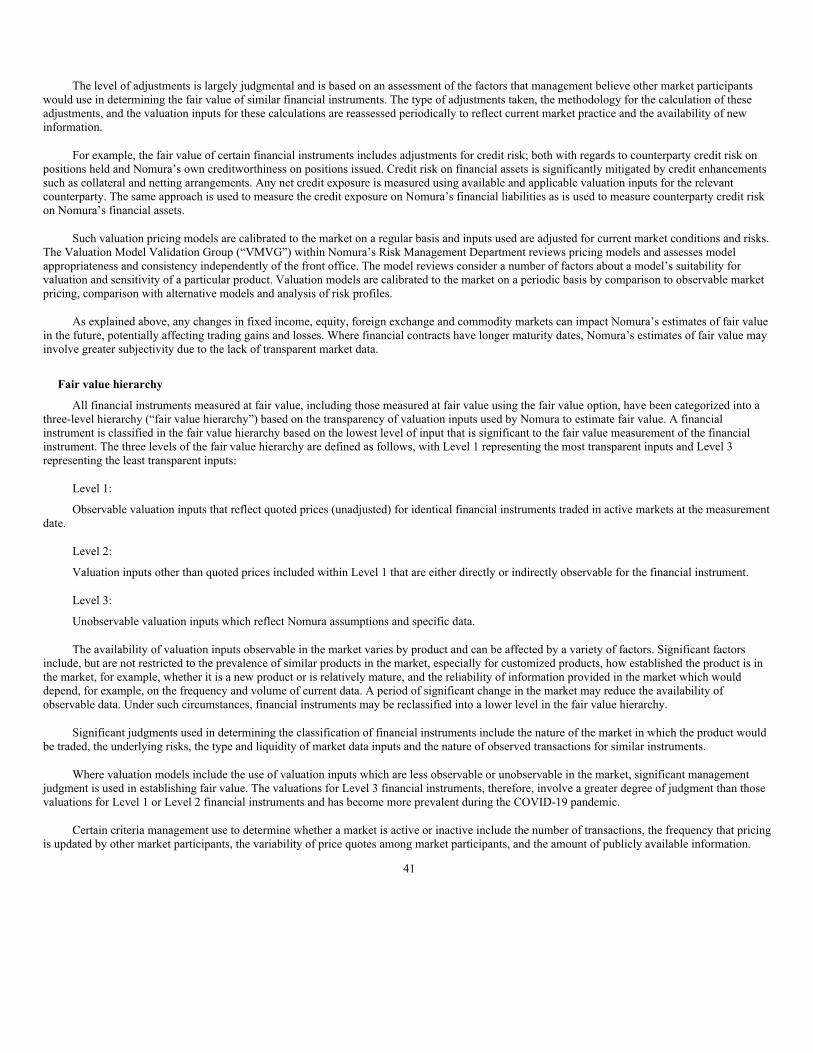
The level of adjustments is largely judgmental and is based on an assessment of the factors that management believe other market participants
would use in determining the fair value of similar financial instruments. The type of adjustments taken, the methodology for the calculation of these
adjustments, and the valuation inputs for these calculations are reassessed periodically to reflect current market practice and the availability of new
information.
For example, the fair value of certain financial instruments includes adjustments for credit risk; both with regards to counterparty credit risk on
positions held and Nomura’s own creditworthiness on positions issued. Credit risk on financial assets is significantly mitigated by credit enhancements
such as collateral and netting arrangements. Any net credit exposure is measured using available and applicable valuation inputs for the relevant
counterparty. The same approach is used to measure the credit exposure on Nomura’s financial liabilities as is used to measure counterparty credit risk
on Nomura’s financial assets.
Such valuation pricing models are calibrated to the market on a regular basis and inputs used are adjusted for current market conditions and risks.
The Valuation Model Validation Group (“VMVG”) within Nomura’s Risk Management Department reviews pricing models and assesses model
appropriateness and consistency independently of the front office. The model reviews consider a number of factors about a model’s suitability for
valuation and sensitivity of a particular product. Valuation models are calibrated to the market on a periodic basis by comparison to observable market
pricing, comparison with alternative models and analysis of risk profiles.
As explained above, any changes in fixed income, equity, foreign exchange and commodity markets can impact Nomura’s estimates of fair value
in the future, potentially affecting trading gains and losses. Where financial contracts have longer maturity dates, Nomura’s estimates of fair value may
involve greater subjectivity due to the lack of transparent market data.
Fair value hierarchy
All financial instruments measured at fair value, including those measured at fair value using the fair value option, have been categorized into a
three-level hierarchy (“fair value hierarchy”) based on the transparency of valuation inputs used by Nomura to estimate fair value. A financial
instrument is classified in the fair value hierarchy based on the lowest level of input that is significant to the fair value measurement of the financial
instrument. The three levels of the fair value hierarchy are defined as follows, with Level 1 representing the most transparent inputs and Level 3
representing the least transparent inputs:
Level 1:
Observable valuation inputs that reflect quoted prices (unadjusted) for identical financial instruments traded in active markets at the measurement
date.
Level 2:
Valuation inputs other than quoted prices included within Level 1 that are either directly or indirectly observable for the financial instrument.
Level 3:
Unobservable valuation inputs which reflect Nomura assumptions and specific data.
The availability of valuation inputs observable in the market varies by product and can be affected by a variety of factors. Significant factors
include, but are not restricted to the prevalence of similar products in the market, especially for customized products, how established the product is in
the market, for example, whether it is a new product or is relatively mature, and the reliability of information provided in the market which would
depend, for example, on the frequency and volume of current data. A period of significant change in the market may reduce the availability of
observable data. Under such circumstances, financial instruments may be reclassified into a lower level in the fair value hierarchy.
Significant judgments used in determining the classification of financial instruments include the nature of the market in which the product would
be traded, the underlying risks, the type and liquidity of market data inputs and the nature of observed transactions for similar instruments.
Where valuation models include the use of valuation inputs which are less observable or unobservable in the market, significant management
judgment is used in establishing fair value. The valuations for Level 3 financial instruments, therefore, involve a greater degree of judgment than those
valuations for Level 1 or Level 2 financial instruments and has become more prevalent during the COVID-19 pandemic.
Certain criteria management use to determine whether a market is active or inactive include the number of transactions, the frequency that pricing
is updated by other market participants, the variability of price quotes among market participants, and the amount of publicly available information.
41
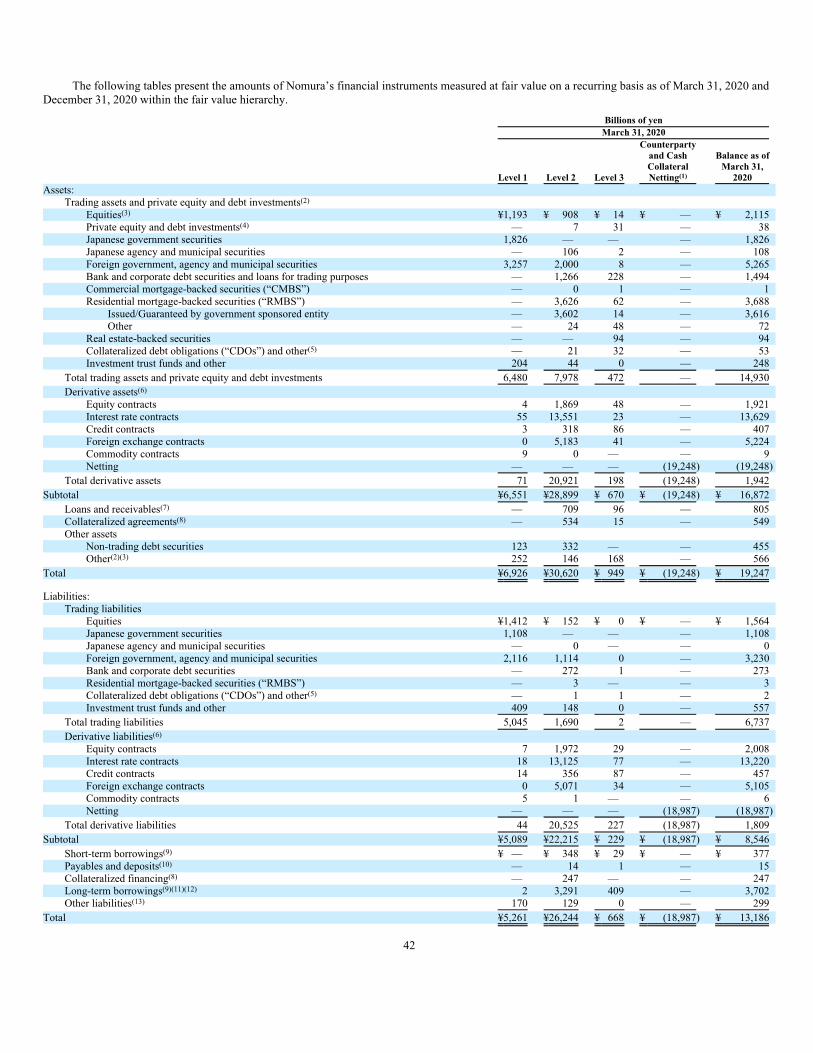
The following tables present the amounts of Nomura’s financial instruments measured at fair value on a recurring basis as of March 31, 2020 and
December 31, 2020 within the fair value hierarchy.
Billions of yen
March 31, 2020
Level 1 Level 2 Level 3
Counterparty
and Cash
Collateral
Netting(1)
Balance as of
March 31,
2020
Assets:
Trading assets and private equity and debt investments(2)
Equities(3) ¥1,193 ¥ 908 ¥ 14 ¥ — ¥ 2,115
Private equity and debt investments(4) — 7 31 — 38
Japanese government securities 1,826 — — — 1,826
Japanese agency and municipal securities — 106 2 — 108
Foreign government, agency and municipal securities 3,257 2,000 8 — 5,265
Bank and corporate debt securities and loans for trading purposes — 1,266 228 — 1,494
Commercial mortgage-backed securities (“CMBS”) — 0 1 — 1
Residential mortgage-backed securities (“RMBS”) — 3,626 62 — 3,688
Issued/Guaranteed by government sponsored entity — 3,602 14 — 3,616
Other — 24 48 — 72
Real estate-backed securities — — 94 — 94
Collateralized debt obligations (“CDOs”) and other(5) — 21 32 — 53
Investment trust funds and other 204 44 0 — 248
Total trading assets and private equity and debt investments 6,480 7,978 472 — 14,930
Derivative assets(6)
Equity contracts 4 1,869 48 — 1,921
Interest rate contracts 55 13,551 23 — 13,629
Credit contracts 3 318 86 — 407
Foreign exchange contracts 0 5,183 41 — 5,224
Commodity contracts 9 0 — — 9
Netting — — — (19,248) (19,248)
Total derivative assets 71 20,921 198 (19,248) 1,942
Subtotal ¥6,551 ¥28,899 ¥ 670 ¥ (19,248) ¥ 16,872
Loans and receivables(7) — 709 96 — 805
Collateralized agreements(8) — 534 15 — 549
Other assets
Non-trading debt securities 123 332 — — 455
Other(2)(3) 252 146 168 — 566
Total ¥6,926 ¥30,620 ¥ 949 ¥ (19,248) ¥ 19,247
Liabilities:
Trading liabilities
Equities ¥1,412 ¥ 152 ¥ 0 ¥ — ¥ 1,564
Japanese government securities 1,108 — — — 1,108
Japanese agency and municipal securities — 0 — — 0
Foreign government, agency and municipal securities 2,116 1,114 0 — 3,230
Bank and corporate debt securities — 272 1 — 273
Residential mortgage-backed securities (“RMBS”) — 3 — — 3
Collateralized debt obligations (“CDOs”) and other(5) — 1 1 — 2
Investment trust funds and other 409 148 0 — 557
Total trading liabilities 5,045 1,690 2 — 6,737
Derivative liabilities(6)
Equity contracts 7 1,972 29 — 2,008
Interest rate contracts 18 13,125 77 — 13,220
Credit contracts 14 356 87 — 457
Foreign exchange contracts 0 5,071 34 — 5,105
Commodity contracts 5 1 — — 6
Netting — — — (18,987) (18,987)
Total derivative liabilities 44 20,525 227 (18,987) 1,809
Subtotal ¥5,089 ¥22,215 ¥ 229 ¥ (18,987) ¥ 8,546
Short-term borrowings(9) ¥ — ¥ 348 ¥ 29 ¥ — ¥ 377
Payables and deposits(10) — 14 1 — 15
Collateralized financing(8) — 247 — — 247
Long-term borrowings(9)(11)(12) 2 3,291 409 — 3,702
Other liabilities(13) 170 129 0 — 299
Total ¥5,261 ¥26,244 ¥ 668 ¥ (18,987) ¥ 13,186
42

Billions of yen
December 31, 2020
Level 1 Level 2 Level 3
Counterparty
and Cash
Collateral
Netting(1)
Balance as of
December 31,
2020
Assets:
Trading assets and private equity and debt investments(2)
Equities(3) ¥2,435 ¥ 955 ¥ 12 ¥ — ¥ 3,402
Private equity and debt investments(4) — — 50 — 50
Japanese government securities 2,330 — — — 2,330
Japanese agency and municipal securities — 81 2 — 83
Foreign government, agency and municipal securities 3,648 2,253 14 — 5,915
Bank and corporate debt securities and loans for trading purposes — 1,236 117 — 1,353
Commercial mortgage-backed securities (“CMBS”) — 1 7 — 8
Residential mortgage-backed securities (“RMBS”) — 2,642 5 — 2,647
Issued/Guaranteed by government sponsored entity — 2,585 — — 2,585
Other — 57 5 — 62
Real estate-backed securities — 0 99 — 99
Collateralized debt obligations (“CDOs”) and other(5) — 31 22 — 53
Investment trust funds and other 458 20 0 — 478
Total trading assets and private equity and debt investments 8,871 7,219 328 — 16,418
Derivative assets(6)
Equity contracts 3 1,289 69 — 1,361
Interest rate contracts 26 11,017 27 — 11,070
Credit contracts 1 374 40 — 415
Foreign exchange contracts 1 4,328 35 — 4,364
Commodity contracts 1 0 — — 1
Netting — — — (16,041) (16,041)
Total derivative assets 32 17,008 171 (16,041) 1,170
Subtotal ¥8,903 ¥24,227 ¥ 499 ¥ (16,041) ¥ 17,588
Loans and receivables(7) — 733 98 — 831
Collateralized agreements(8) — 306 18 — 324
Other assets
Non-trading debt securities 113 302 — — 415
Other(2)(3) 331 137 160 — 628
Total ¥9,347 ¥25,705 ¥ 775 ¥ (16,041) ¥ 19,786
Liabilities:
Trading liabilities
Equities ¥2,204 ¥ 15 ¥ 1 ¥ — ¥ 2,220
Japanese government securities 1,066 — — — 1,066
Japanese agency and municipal securities — 0 — — 0
Foreign government, agency and municipal securities 3,323 1,208 0 — 4,531
Bank and corporate debt securities — 175 2 — 177
Residential mortgage-backed securities (“RMBS”) — 0 — — 0
Collateralized debt obligations (“CDOs”) and other(5) — 0 1 — 1
Investment trust funds and other 323 — 0 — 323
Total trading liabilities 6,916 1,398 4 — 8,318
Derivative liabilities(6)
Equity contracts 1 1,677 100 — 1,778
Interest rate contracts 10 10,592 89 — 10,691
Credit contracts 2 392 63 — 457
Foreign exchange contracts 0 4,168 31 — 4,199
Commodity contracts 1 0 — — 1
Netting — — — (15,676) (15,676)
Total derivative liabilities 14 16,829 283 (15,676) 1,450
Subtotal ¥6,930 ¥18,227 ¥ 287 ¥ (15,676) ¥ 9,768
Short-term borrowings(9) — 560 70 — 630
Payables and deposits(10) — 36 2 — 38
Collateralized financing(8) — 251 0 — 251
Long-term borrowings(9)(11)(12) 4 3,535 480 — 4,019
Other liabilities(13) 246 122 28 — 396
Total ¥7,180 ¥22,731 ¥ 867 ¥ (15,676) ¥ 15,102
43

(1) Represents the amount offset under counterparty netting of derivative assets and liabilities as well as cash collateral netting against net derivatives.
(2) Certain investments that are measured at fair value using net asset value per share as a practical expedient have not been classified in the fair value
hierarchy. As of March 31, 2020 and December 31, 2020, the fair values of these investments which are included in Trading assets and private
equity and debt investments were ¥26 billion and ¥22 billion, respectively. As of March 31, 2020 and December 31, 2020, the fair values of these
investments which are included in Other assets - Others were ¥6 billion and ¥5 billion, respectively.
(3) Includes equity investments that would have been accounted for under the equity method had Nomura not chosen to elect the fair value option.
(4) Private equity and debt investments are typically private non-traded financial instruments including ownership or other forms of junior capital
(such as mezzanine loan). Includes equity investments that would have been accounted for under the equity method had Nomura not chosen to
elect the fair value option.
(5) Includes collateralized loan obligations (“CLOs”) and asset-backed securities (“ABS”) such as those secured on credit card loans, auto loans and
student loans.
(6) Each derivative classification includes derivatives with multiple risk underlyings. For example, interest rate contracts include complex derivatives
referencing interest rate risk as well as foreign exchange risk or other factors such as prepayment rates. Credit contracts include credit default
swaps as well as derivatives referencing corporate and government debt securities.
(7) Includes loans for which the fair value option has been elected.
(8) Includes collateralized agreements or collateralized financing for which the fair value option has been elected.
(9) Includes structured notes for which the fair value option has been elected.
(10) Includes embedded derivatives bifurcated from deposits received at banks. If unrealized gains are greater than unrealized losses, deposits are
reduced by the excess amount.
(11) Includes embedded derivatives bifurcated from issued structured notes. If unrealized gains are greater than unrealized losses, borrowings are
reduced by the excess amount.
(12) Includes liabilities recognized from secured financing transactions that are accounted for as financings rather than sales. Nomura elected the fair
value option for these liabilities.
(13) Includes loan commitments for which the fair value option has been elected.
44

Valuation techniques by major class of financial instrument
The valuation techniques used by Nomura to estimate fair value for major classes of financial instruments, together with the significant inputs
which determine classification in the fair value hierarchy, are as follows.
Equities and equity securities reported within Other assets—Equities and equity securities reported within Other assets include direct holdings of
both listed and unlisted equity securities, and fund investments. The fair value of listed equity securities is determined using quoted prices for identical
securities from active markets where available. These valuations should be in line with market practice and therefore can be based on bid prices or
mid-market prices. Nomura determines whether the market is active depending on the sufficiency and frequency of trading activity. Where these
securities are classified in Level 1 of the fair value hierarchy, no valuation adjustments are made to fair value. Listed equity securities traded in inactive
markets are also generally valued using the exchange price and are classified in Level 2. Whilst rare in practice, Nomura may apply a discount or
liquidity adjustment to the exchange price of a listed equity security traded in an inactive market if the exchange price is not considered to be an
appropriate representation of fair value. These adjustments are determined by individual security and are not determined or influenced by the size of
holding. The amount of such adjustments made to listed equity securities traded in inactive markets was ¥nil as of March 31, 2020 and December 31,
2020, respectively. The fair value of unlisted equity securities is determined using the same methodology as private equity and debt investments
described below and are usually classified in Level 3 because significant valuation inputs such as liquidity discounts and credit spreads are
unobservable.
Private equity and debt investments—The determination of fair value of unlisted private equity and debt investments requires significant
management judgment because the investments, by their nature, have little or no price transparency. Private equity and debt investments are initially
carried at cost as an approximation of fair value. Adjustments to carrying value are made if there is third-party evidence of a change in value.
Adjustments are also made, in the absence of third-party transactions, if it is determined that the expected exit price of the investment is different from
carrying value. In reaching that determination, Nomura primarily uses either a discounted cash flow (“DCF”) or market multiple valuation technique. A
DCF valuation technique incorporates estimated future cash flows to be generated from the underlying investee, as adjusted for an appropriate growth
rate discounted at a weighted average cost of capital (“WACC”). Market multiple valuation techniques include comparables such as Enterprise
Value/earnings before interest, taxes, depreciation and amortization (“EV/EBITDA”) ratios, Price/Earnings (“PE”) ratios, Price/Book ratios,
Price/Embedded Value ratios and other multiples based on relationships between numbers reported in the financial statements of the investee and the
price of comparable companies. A liquidity discount may also be applied to either a DCF or market multiple valuation to reflect the specific
characteristics of the investee. The liquidity discount includes considerations for various uncertainties in the model and inputs to valuation. Where
possible these valuations are compared with the operating cash flows and financial performance of the investee or properties relative to budgets or
projections, price/earnings data for similar quoted companies, trends within sectors and/or regions and any specific rights or terms associated with the
investment, such as conversion features and liquidation preferences. Private equity and debt investments are generally classified in Level 3 since the
valuation inputs such as those mentioned above are usually unobservable.
Government, agency and municipal securities—The fair value of Japanese and other G7 government securities is primarily determined using
quoted market prices, executable broker or dealer quotations, or alternative pricing sources. These securities are traded in active markets and therefore
are classified within Level 1 of the fair value hierarchy. Non-G7 government securities, agency securities and municipal securities are valued using
similar pricing sources but are generally classified in Level 2 as they are traded in inactive markets. Certain non-G7 securities may be classified in
Level 1 because they are traded in active markets. Certain securities may be classified in Level 3 because they are traded infrequently and there is not
sufficient information from comparable securities to classify them in Level 2. These are valued using DCF valuation techniques which include
significant unobservable inputs such as credit spreads of the issuer.
45
Bank and corporate debt securities—The fair value of bank and corporate debt securities is primarily determined using DCF valuation techniques
but also using broker or dealer quotations and recent market transactions of identical or similar debt securities, if available. Consideration is given to the
nature of the broker and dealer quotations, namely whether these are indicative or executable, the number of available quotations and how these
quotations compare to any available recent market activity or alternative pricing sources. The significant valuation inputs used for DCF valuations are
yield curves, asset swap spreads, recovery rates and credit spreads of the issuer. Bank and corporate debt securities are generally classified in Level 2 of
the fair value hierarchy because these valuation inputs are usually observable or market-corroborated. Certain bank and corporate debt securities will be
classified in Level 3 because they are traded infrequently and there is insufficient information from comparable securities to classify them in Level 2, or
credit spreads or recovery rates of the issuer used in DCF valuations are unobservable.
Commercial mortgage-backed securities (“CMBS”) and Residential mortgage-backed securities (“RMBS”)—The fair value of CMBS and RMBS
are primarily determined using DCF valuation techniques but also using broker or dealer quotations and recent market transactions of identical or
similar securities, if available. Consideration is given to the nature of the broker and dealer quotations, namely whether these are indicative or
executable, the number of available quotations and how these quotations compare to any available recent market activity or alternative pricing sources.
The significant valuation inputs include yields, prepayment rates, default probabilities and loss severities. CMBS and RMBS securities are generally
classified in Level 2 because these valuation inputs are observable or market-corroborated. Certain CMBS and RMBS positions will be classified in
Level 3 because they are traded infrequently and there is insufficient information from comparable securities to classify them in Level 2, or one or more
of the significant valuation inputs used in DCF valuations are unobservable.
Real estate-backed securities—The fair value of real estate-backed securities is determined using broker or dealer quotations, recent market
transactions or by reference to a comparable market index. Consideration is given to the nature of the broker and dealer quotations, namely whether
these are indicative or executable, the number of available quotations and how these quotations compare to any available recent market activity or
alternative pricing sources. Where all significant inputs are observable, the securities will be classified in Level 2. For certain securities, no direct
pricing sources or comparable securities or indices may be available. These securities are valued using DCF or valuation techniques and are classified in
Level 3 as the valuation includes significant unobservable valuation inputs such as yields or loss severities.
Collateralized debt obligations (“CDOs”) and other—The fair value of CDOs is primarily determined using DCF valuation techniques but also
using broker or dealer quotations and recent market transactions of identical or similar securities, if available. Consideration is given to the nature of the
broker and dealer quotations, namely whether these are indicative or executable, the number of available quotations and how these quotations compare
to any available recent market activity or alternative pricing sources. The significant valuation inputs used include market spread data for each credit
rating, yields, prepayment rates, default probabilities and loss severities. CDOs are generally classified in Level 2 of the fair value hierarchy because
these valuation inputs are observable or market-corroborated. CDOs will be classified in Level 3 where one or more of the significant valuation inputs
used in the DCF valuations are unobservable.
Investment trust funds and other—The fair value of investment trust funds is primarily determined using NAV per share. Publicly traded funds
which are valued using a daily NAV per share are classified in Level 1 of the fair value hierarchy. For funds that are not publicly traded but Nomura has
the ability to redeem its investment with the investee at NAV per share on the balance sheet date or within the near term, the investments are classified
in Level 2. Investments where Nomura does not have the ability to redeem in the near term or does not know when it can redeem are classified in
Level 3. The fair value of certain other investments reported within Investment trust funds and other is determined using DCF valuation techniques.
These investments are classified in Level 3 as the valuation includes significant unobservable valuation inputs such as credit spreads of issuer and
correlation.
Derivatives—Equity contracts—Nomura enters into both exchange-traded and OTC equity derivative transactions such as index and equity
options, equity basket options and index and equity swaps. Where these derivatives are traded in active markets and the exchange price is representative
of fair value, the fair value of exchange-traded equity derivatives is determined using an unadjusted exchange price and classified in Level 1 of the fair
value hierarchy. The fair value of exchange-traded equity derivatives which are traded in inactive markets or where the exchange price is not
representative of fair value is determined using a model price and are classified in Level 2. The fair value of OTC equity derivatives is determined
through option models such as Black-Scholes and Monte Carlo simulation. The significant valuation inputs used include equity prices, dividend yields,
volatilities and correlations. Valuation adjustments are also made to model valuations in order to reflect counterparty credit risk on derivative assets and
Nomura‘s own creditworthiness on derivative liabilities. OTC equity derivatives are generally classified in Level 2 because all significant valuation
inputs and adjustments are observable or market-corroborated. Certain less liquid vanilla or more complex equity derivatives are classified in Level 3
where dividend yield, volatility or correlation valuation inputs are significant and unobservable.
46

Derivatives—Interest rate contracts—Nomura enters into both exchange-traded and OTC interest rate derivative transactions such as interest rate
swaps, currency swaps, interest rate options, forward rate agreements, swaptions, caps and floors. Where these derivatives are traded in active markets
and the exchange price is representative of fair value, the fair value of exchange-traded interest rate derivatives is determined using an unadjusted
exchange price and classified in Level 1 of the fair value hierarchy. The fair value of exchange-traded interest rate derivatives which are traded in
inactive markets or where the exchange price is not representative of fair value is determined using a model price and are classified in Level 2. The fair
value of OTC interest rate derivatives is determined through DCF valuation techniques as well as option models such as Black-Scholes and Monte Carlo
simulation. The significant valuation inputs used include interest rates, forward foreign exchange (“FX”) rates, volatilities and correlations. Valuation
adjustments are also made to model valuations in order to reflect counterparty credit risk on derivative assets and Nomura‘s own creditworthiness on
derivative liabilities. OTC interest rate derivatives are generally classified in Level 2 because all significant valuation inputs and adjustments are
observable or market-corroborated. Certain less liquid vanilla or more complex OTC interest rate derivatives are classified in Level 3 where interest
rate, volatility or correlation valuation inputs are significant and unobservable.
Derivatives—Credit contracts—Nomura enters into OTC credit derivative transactions such as credit default swaps and credit options on single
names, indices or baskets of assets. The fair value of OTC credit derivatives is determined through DCF valuation techniques as well as option models
such as Black-Scholes and Monte Carlo simulation. The significant valuation inputs used include interest rates, credit spreads, recovery rates, default
probabilities, volatilities and correlations. Valuation adjustments are also made to model valuations in order to reflect counterparty credit risk on
derivative assets and Nomura’s own creditworthiness on derivative liabilities. OTC credit derivatives are generally classified in Level 2 of the fair value
hierarchy because all significant valuation inputs and adjustments are observable or market-corroborated. Certain less liquid vanilla or more complex
OTC credit derivatives are classified in Level 3 where credit spread, recovery rate, volatility or correlation valuation inputs are significant and
unobservable.
Derivatives—Foreign exchange contracts—Nomura enters into both exchange-traded and OTC foreign exchange derivative transactions such as
foreign exchange forwards and currency options. The fair value of exchange-traded foreign exchange derivatives which are traded in inactive markets or
where the exchange price is not representative of fair value is determined using a model price and are classified in Level 2. The fair value of OTC
foreign exchange derivatives is determined through DCF valuation techniques as well as option models such as Black-Scholes and Monte Carlo
simulation. The significant valuation inputs used include interest rates, forward FX rates, spot FX rates and volatilities. Valuation adjustments are also
made to model valuations in order to reflect counterparty credit risk on derivative assets and Nomura’s own creditworthiness on derivative liabilities.
OTC foreign exchange derivatives are generally classified in Level 2 because all significant valuation inputs and adjustments are observable or market-
corroborated. Certain foreign exchange derivatives are classified in Level 3 where interest rates, volatility or correlation valuation inputs are significant
and unobservable.
Nomura includes valuation adjustments in its estimation of fair value of certain OTC derivatives relating to funding costs associated with these
transactions to be consistent with how market participants in the principal market for these derivatives would determine fair value.
Loans—The fair value of loans carried at fair value either as trading assets or through election of the fair value option is primarily determined
using DCF valuation techniques as quoted prices are typically not available. The significant valuation inputs used are similar to those used in the
valuation of corporate debt securities described above. Loans are generally classified in Level 2 of the fair value hierarchy because all significant
valuation inputs are observable. Certain loans, however, are classified in Level 3 because they are traded infrequently and there is not sufficient
information from comparable securities to classify them in Level 2 or credit spreads of the issuer used in DCF valuations are significant and
unobservable.
Collateralized agreements and Collateralized financing—The primary types of collateralized agreement and financing transactions carried at fair
value are reverse repurchase and repurchase agreements elected for the fair value option. The fair value of these financial instruments is primarily
determined using DCF valuation techniques. The significant valuation inputs used include interest rates and collateral funding spreads such as general
collateral or special rates. Reverse repurchase and repurchase agreements are generally classified in Level 2 of the fair value hierarchy because these
valuation inputs are usually observable.
47

Non-trading debt securities—These are debt securities held by certain non-trading subsidiaries in the group and are valued and classified in the
fair value hierarchy using the same valuation techniques used for other debt securities classified as Government, agency and municipal securities and
Bank and corporate debt securities described above.
Short-term and long-term borrowings (“Structured notes”)—Structured notes are debt securities issued by Nomura or by consolidated variable
interest entities (“VIEs”) which contain embedded features that alter the return to the investor from simply receiving a fixed or floating rate of interest to
a return that depends upon some other variables, such as an equity or equity index, commodity price, foreign exchange rate, credit rating of a third party
or a more complex interest rate (i.e., an embedded derivative).
The fair value of structured notes is determined using a quoted price in an active market for the identical liability if available, and where not
available, using a mixture of valuation techniques that use the quoted price of the identical liability when traded as an asset, quoted prices for similar
liabilities, similar liabilities when traded as assets, or an internal model which combines DCF valuation techniques and option pricing models,
depending on the nature of the embedded features within the structured note. Where an internal model is used, Nomura estimates the fair value of both
the underlying debt instrument and the embedded derivative components. The significant valuation inputs used to estimate the fair value of the debt
instrument component include yield curves, prepayment rates default probabilities and loss severities. The significant valuation inputs used to estimate
the fair value of the embedded derivative component are the same as those used for the relevant type of freestanding OTC derivative discussed above. A
valuation adjustment is also made to the entire structured note in order to reflect Nomura’s own creditworthiness. This adjustment is determined based
on recent observable secondary market transactions and executable broker quotes involving Nomura debt instruments and is therefore typically treated
as a Level 2 valuation input. Structured notes are generally classified in Level 2 of the fair value hierarchy as all significant valuation inputs and
adjustments are observable. Where any unobservable inputs are significant, such as yields, prepayment rates, default probabilities, loss severities,
volatilities and correlations used to estimate the fair value of the embedded derivative component, structured notes are classified in Level 3.
Long-term borrowings (“Secured financing transactions”)—Secured financing transactions are liabilities recognized when a transfer of a
financial asset does not meet the criteria for sales accounting under ASC 860 “Transfer and Servicing” (“ASC 860”) and therefore the transaction is
accounted for as a secured borrowing. These liabilities are valued using the same valuation techniques that are applied to the transferred financial assets
which remain on the consolidated balance sheets and are therefore classified in the same level in the fair value hierarchy as the transferred financial
assets. These liabilities do not provide general recourse to Nomura and therefore no adjustment is made to reflect Nomura’s own creditworthiness.
48

Level 3 financial instruments
The valuation of Level 3 financial assets and liabilities is dependent on certain significant valuation inputs which are unobservable. Common
characteristics of an inactive market include a low number of transactions of the financial instrument, stale or non-current price quotes, price quotes that
vary substantially either over time or among market makers, non-executable broker quotes or little publicly released information.
If corroborative evidence is not available to value Level 3 financial instruments, fair value may be measured using other equivalent products in the
market. The level of correlation between the specific Level 3 financial instrument and the available benchmark instrument is considered as an
unobservable valuation input. Other techniques for determining an appropriate value for unobservable input may consider information such as consensus
pricing data among certain market participants, historical trends, extrapolation from observable market data and other information Nomura would expect
market participants to use in valuing similar instruments.
Use of reasonably possible alternative valuation input assumptions to value Level 3 financial instruments will significantly influence fair value
determination. Ultimately, the uncertainties described above about input assumptions imply that the fair value of Level 3 financial instruments is a
judgmental estimate. The specific valuation for each instrument is based on management’s judgment of prevailing market conditions, in accordance with
Nomura’s established valuation policies and procedures.
49

Quantitative and qualitative information regarding significant unobservable inputs
The following tables present quantitative and qualitative information about the significant unobservable valuation inputs used by Nomura to
measure the fair value of financial instruments classified in Level 3 as of March 31, 2020 and December 31, 2020. These financial instruments will also
typically include observable valuation inputs (i.e. Level 1 or Level 2 valuation inputs) which are not included in the table and are also often hedged
using financial instruments which are classified in Level 1 or Level 2 of the fair value hierarchy. Changes in each of these significant unobservable
valuation inputs used by Nomura will impact upon the fair value measurement of the financial instrument. The following tables also therefore
qualitatively summarize how an increase in those significant unobservable valuation inputs to a different amount might result in a higher or lower fair
value measurement at the reporting date and summarize the interrelationship between significant unobservable valuation inputs where more than one is
used to measure fair value. The impact of the COVID-19 pandemic on financial markets has been considered in determining which valuation inputs are
used to measure fair value.
March 31, 2020
Financial Instrument
Fair
value in
billions
of yen
Valuation
technique
Significant
unobservable
valuation input
Range of
valuation inputs(1)
Weighted
Average(2)
Impact of
increases in
significant
unobservable
valuation
inputs(3)(4)
Interrelationships
between valuation
inputs(5)
Assets:
Trading assets and private equity and
debt investments
Equities ¥ 14 DCF Liquidity discounts 75.0% 75.0% Lower fair value Not applicable
Market
multiples
Liquidity discounts 20.0% 20.0% Lower fair value Not applicable
Private equity and debt
investments
31 DCF WACC
Growth rates
Liquidity discounts
7.0 – 13.5%
0.0 – 1.0%
5.0 – 30.0%
10.0%
0.6%
9.9%
Lower fair value
Higher fair value
Lower fair value
No predictable
interrelationship
Market
multiples
EV/EBITDA ratios
PE Ratios
Liquidity discounts
1.0 – 11.0 x
9.6 x
5.0 – 30.0%
8.9 x
9.6 x
9.8%
Higher fair value
Higher fair value
Lower fair value
No predictable
interrelationship
Foreign government, agency and
municipal securities
8 DCF Credit spreads
Recovery rates
0.0 – 1.4%
4.0 – 18.0%
0.5%
10.8%
Lower fair value
Higher fair value
No predictable
interrelationship
Bank and corporate debt securities
and loans for trading purposes
228 DCF Credit spreads
Recovery rates
0.0 – 17.9%
0.0 – 80.7%
5.8%
43.8%
Lower fair value
Higher fair value
No predictable
interrelationship
Residential mortgage backed
securities (“RMBS”)
62 DCF Yields
Prepayment rates
Loss severities
0.0 – 30.8%
7.1 – 15.0%
0.0 – 100.0%
6.7%
8.9%
40.6%
Lower fair value
Lower fair value
Lower fair value
No predictable
interrelationship
Real estate-backed securities 94 DCF Loss severities 0.0 – 8.1% 3.4% Lower fair value Not applicable
Collateralized debt obligations
(“CDOs”) and other
32 DCF Yields
Prepayment rates
Default probabilities
Loss severities
6.4 – 56.8%
20.0%
2.0%
0.0 – 100.0%
21.6%
20.0%
2.0%
73.0%
Lower fair value
Lower fair value
Lower fair value
Lower fair value
Change in default probabilities
typically accompanied by
directionally similar change in
loss severities and opposite
change in prepayment rates
50

March 31, 2020
Financial Instrument
Fair
value in
billions
of yen
Valuation
technique
Significant
unobservable
valuation input
Range of
valuation inputs(1)
Weighted
Average(2)
Impact of
increases in
significant
unobservable
valuation
inputs(3)(4)
Interrelationships
between valuation
inputs(5)
Derivatives, net:
Equity contracts ¥ 19 Option
models
Dividend yield
Volatilities
Correlations
0.0 – 18.7%
12.2 –144.7%
(0.85) – 0.97
—
—
—
Higher fair value
Higher fair value
Higher fair value
No predictable
interrelationship
Interest rate contracts (54) DCF/
Option
models
Interest rates
Volatilities
Volatilities
Correlations
(0.1) – 2.0%
8.8 – 13.8%
24.6 – 119.4 bp
(1.00) – 0.98
—
—
—
—
Higher fair value
Higher fair value
Higher fair value
Higher fair value
No predictable
interrelationship
Credit contracts (1) DCF/
Option
models
Credit spreads
Recovery rates
Volatilities
Correlations
0.1 – 28.4%
0.0 – 105.4%
50.0 – 83.0%
0.16 – 0.82
—
—
—
—
Higher fair value
Higher fair value
Higher fair value
Higher fair value
No predictable
interrelationship
Foreign exchange contracts 7 Option
models
Interest rates
Volatilities
Volatilities
Correlations
(0.1) – 0.8%
2.0 – 23.9%
19.2 – 50.7 bp
(0.25) – 0.80
—
—
—
—
Higher fair value
Higher fair value
Higher fair value
Higher fair value
No predictable
interrelationship
Loans and receivables 96 DCF Credit spreads
Recovery rates
0.0 – 20.5%
57.5 – 98.0%
4.2%
85.0%
Lower fair value
Higher fair value
No predictable
interrelationship
Collateralized agreements 15 DCF Repo rate 3.8 – 5.6% 4.9% Lower fair value Not applicable
Other assets
Other(6) 168 DCF WACC
Growth rates
Liquidity discounts
10.1%
2.0%
10.0%
10.1%
2.0%
10.0%
Lower fair value
Higher fair value
Lower fair value
No predictable
interrelationship
Market
multiples
EV/EBITDA ratios
PE Ratios
Price/Book ratios
Liquidity discounts
3.9 – 10.3 x
6.3 – 20.7 x
0.3 – 1.3 x
10.0 – 40.0%
4.6 x
11.4 x
0.8 x
28.6%
Higher fair value
Higher fair value
Higher fair value
Lower fair value
Generally changes in
multiples result in a
corresponding similar
directional change in a fair
value measurement,
assuming earnings levels
remain constant.
Liabilities:
Short-term borrowings 29 DCF/
Option
models
Volatilities
Correlations
12.6 – 76.4%
(0.72) – 0.94
—
—
Higher fair value
Higher fair value
No predictable
interrelationship
Long-term borrowings 409 DCF/
Option
models
Volatilities
Volatilities
Correlations
8.6 – 76.4%
30.0 – 103.2 bp
(1.00) – 0.98
—
—
—
Higher fair value
Higher fair value
Higher fair value
No predictable
interrelationship
51

December 31, 2020
Financial Instrument
Fair
value in
billions
of yen
Valuation
technique
Significant
unobservable input
Range of
valuation inputs(1)
Weighted
Average(2)
Impact of
increases in
significant
unobservable
valuation
inputs(3)(4)
Interrelationships
between valuation
inputs(5)
Assets:
Trading assets and private equity and
debt investments
Equities ¥ 12 DCF Liquidity discounts 75.0% 75.0% Lower fair value Not applicable
Private equity and debt
investments
50 DCF WACC
Growth rates
Credit spreads
Liquidity discounts
6.8 – 12.7%
0.0 – 1.0%
7.6 – 8.8%
5.0 – 30.0%
10.5%
0.3%
8.1%
13.4%
Lower fair value
Higher fair value
Lower fair value
Lower fair value
No predictable
interrelationship
Market
multiples
EV/EBITDA ratios
PE Ratios
Liquidity discounts
1.0 – 10.7 x
11.0 x
5.0 – 30.0%
6.2 x
11.0 x
16.7%
Higher fair value
Higher fair value
Lower fair value
No predictable
interrelationship
Foreign government,
agency and
municipal securities
14 DCF Credit spreads
Recovery rates
0.0 – 1.7%
9.2 – 29.0%
0.5%
12.3%
Lower fair value
Higher fair value
No predictable
interrelationship
Bank and corporate debt
securities and loans for
trading purposes
117 DCF Credit spreads
Recovery rates
0.4 – 18.5%
0.0 – 97.0%
5.3%
54.7%
Lower fair value
Higher fair value
No predictable
interrelationship
Commercial mortgage-
backed securities (“CMBS”)
7 DCF Yields
Loss severities
4.2 – 9.5%
69.5%
4.8%
69.5%
Lower fair value
Lower fair value
No predictable
interrelationship
Residential mortgage-backed
securities (“RMBS”)
5 DCF Yields
Prepayment rates
Loss severities
0.0 – 65.8%
6.2 – 15.0%
0.8 – 96.1%
7.1%
7.1%
6.9%
Lower fair value
Lower fair value
Lower fair value
No predictable
interrelationship
Real estate-backed
securities
99 DCF Loss severities 0.0 – 16.4% 2.4% Lower fair value Not applicable
Collateralized debt
obligations (“CDOs”) and
other
22 DCF Yields
Prepayment rates
Default probabilities
Loss severities
1.5 – 40.0%
20.0%
2.0%
92.0 – 100.0%
12.1%
20.0%
2.0%
96.6%
Lower fair value
Lower fair value
Lower fair value
Lower fair value
Change in default
probabilities typically
accompanied by directionally
similar change in loss
severities and opposite
change in prepayment rates
52
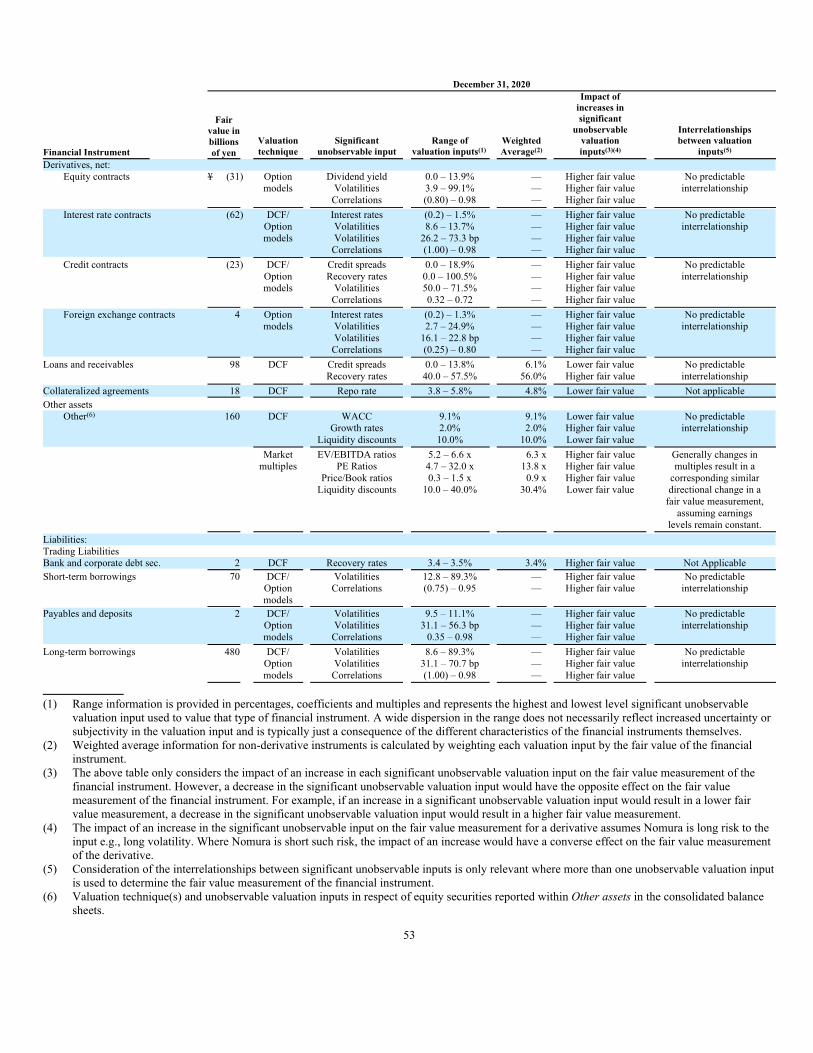
December 31, 2020
Financial Instrument
Fair
value in
billions
of yen
Valuation
technique
Significant
unobservable input
Range of
valuation inputs(1)
Weighted
Average(2)
Impact of
increases in
significant
unobservable
valuation
inputs(3)(4)
Interrelationships
between valuation
inputs(5)
Derivatives, net:
Equity contracts ¥ (31) Option
models
Dividend yield
Volatilities
Correlations
0.0 – 13.9%
3.9 – 99.1%
(0.80) – 0.98
—
—
—
Higher fair value
Higher fair value
Higher fair value
No predictable
interrelationship
Interest rate contracts (62) DCF/
Option
models
Interest rates
Volatilities
Volatilities
Correlations
(0.2) – 1.5%
8.6 – 13.7%
26.2 – 73.3 bp
(1.00) – 0.98
—
—
—
—
Higher fair value
Higher fair value
Higher fair value
Higher fair value
No predictable
interrelationship
Credit contracts (23) DCF/
Option
models
Credit spreads
Recovery rates
Volatilities
Correlations
0.0 – 18.9%
0.0 – 100.5%
50.0 – 71.5%
0.32 – 0.72
—
—
—
—
Higher fair value
Higher fair value
Higher fair value
Higher fair value
No predictable
interrelationship
Foreign exchange contracts 4 Option
models
Interest rates
Volatilities
Volatilities
Correlations
(0.2) – 1.3%
2.7 – 24.9%
16.1 – 22.8 bp
(0.25) – 0.80
—
—
—
—
Higher fair value
Higher fair value
Higher fair value
Higher fair value
No predictable
interrelationship
Loans and receivables 98 DCF Credit spreads
Recovery rates
0.0 – 13.8%
40.0 – 57.5%
6.1%
56.0%
Lower fair value
Higher fair value
No predictable
interrelationship
Collateralized agreements 18 DCF Repo rate 3.8 – 5.8% 4.8% Lower fair value Not applicable
Other assets
Other(6) 160 DCF WACC
Growth rates
Liquidity discounts
9.1%
2.0%
10.0%
9.1%
2.0%
10.0%
Lower fair value
Higher fair value
Lower fair value
No predictable
interrelationship
Market
multiples
EV/EBITDA ratios
PE Ratios
Price/Book ratios
Liquidity discounts
5.2 – 6.6 x
4.7 – 32.0 x
0.3 – 1.5 x
10.0 – 40.0%
6.3 x
13.8 x
0.9 x
30.4%
Higher fair value
Higher fair value
Higher fair value
Lower fair value
Generally changes in
multiples result in a
corresponding similar
directional change in a
fair value measurement,
assuming earnings
levels remain constant.
Liabilities:
Trading Liabilities
Bank and corporate debt sec. 2 DCF Recovery rates 3.4 – 3.5% 3.4% Higher fair value Not Applicable
Short-term borrowings 70 DCF/
Option
models
Volatilities
Correlations
12.8 – 89.3%
(0.75) – 0.95
—
—
Higher fair value
Higher fair value
No predictable
interrelationship
Payables and deposits 2 DCF/
Option
models
Volatilities
Volatilities
Correlations
9.5 – 11.1%
31.1 – 56.3 bp
0.35 – 0.98
—
—
—
Higher fair value
Higher fair value
Higher fair value
No predictable
interrelationship
Long-term borrowings 480 DCF/
Option
models
Volatilities
Volatilities
Correlations
8.6 – 89.3%
31.1 – 70.7 bp
(1.00) – 0.98
—
—
—
Higher fair value
Higher fair value
Higher fair value
No predictable
interrelationship
(1) Range information is provided in percentages, coefficients and multiples and represents the highest and lowest level significant unobservable
valuation input used to value that type of financial instrument. A wide dispersion in the range does not necessarily reflect increased uncertainty or
subjectivity in the valuation input and is typically just a consequence of the different characteristics of the financial instruments themselves.
(2) Weighted average information for non-derivative instruments is calculated by weighting each valuation input by the fair value of the financial
instrument.
(3) The above table only considers the impact of an increase in each significant unobservable valuation input on the fair value measurement of the
financial instrument. However, a decrease in the significant unobservable valuation input would have the opposite effect on the fair value
measurement of the financial instrument. For example, if an increase in a significant unobservable valuation input would result in a lower fair
value measurement, a decrease in the significant unobservable valuation input would result in a higher fair value measurement.
(4) The impact of an increase in the significant unobservable input on the fair value measurement for a derivative assumes Nomura is long risk to the
input e.g., long volatility. Where Nomura is short such risk, the impact of an increase would have a converse effect on the fair value measurement
of the derivative.
(5) Consideration of the interrelationships between significant unobservable inputs is only relevant where more than one unobservable valuation input
is used to determine the fair value measurement of the financial instrument.
(6) Valuation technique(s) and unobservable valuation inputs in respect of equity securities reported within Other assets in the consolidated balance
sheets.
53
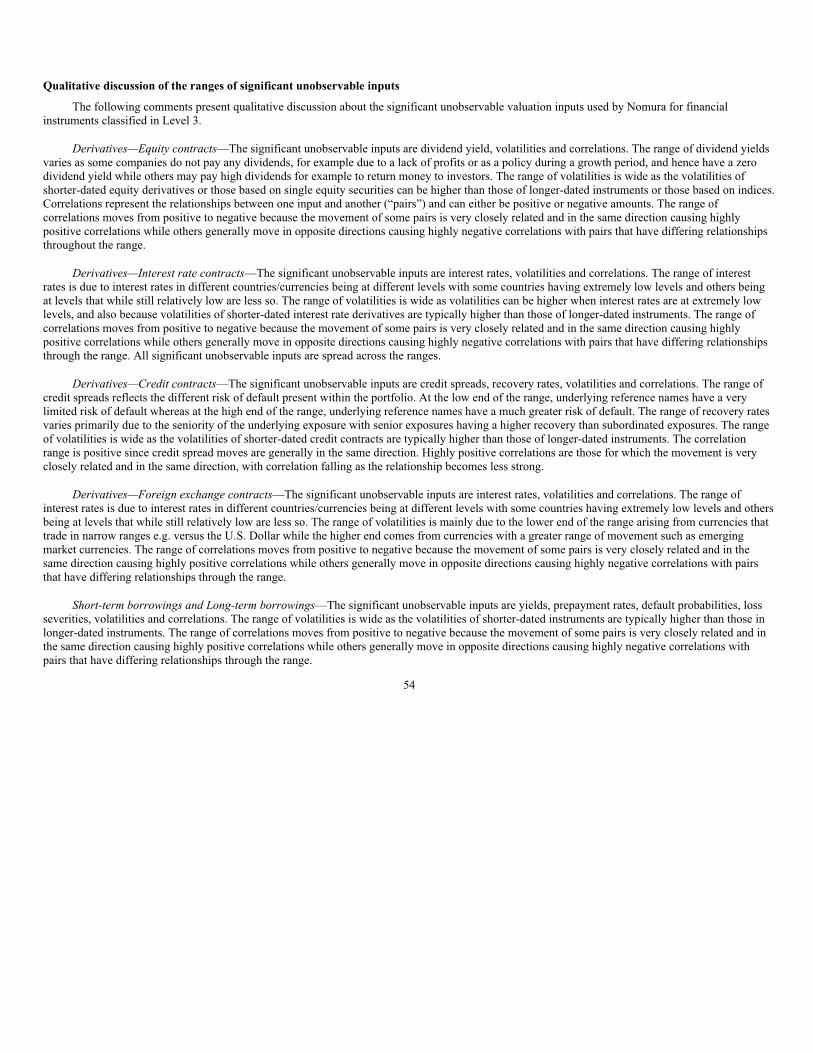
Qualitative discussion of the ranges of significant unobservable inputs
The following comments present qualitative discussion about the significant unobservable valuation inputs used by Nomura for financial
instruments classified in Level 3.
Derivatives—Equity contracts—The significant unobservable inputs are dividend yield, volatilities and correlations. The range of dividend yields
varies as some companies do not pay any dividends, for example due to a lack of profits or as a policy during a growth period, and hence have a zero
dividend yield while others may pay high dividends for example to return money to investors. The range of volatilities is wide as the volatilities of
shorter-dated equity derivatives or those based on single equity securities can be higher than those of longer-dated instruments or those based on indices.
Correlations represent the relationships between one input and another (“pairs”) and can either be positive or negative amounts. The range of
correlations moves from positive to negative because the movement of some pairs is very closely related and in the same direction causing highly
positive correlations while others generally move in opposite directions causing highly negative correlations with pairs that have differing relationships
throughout the range.
Derivatives—Interest rate contracts—The significant unobservable inputs are interest rates, volatilities and correlations. The range of interest
rates is due to interest rates in different countries/currencies being at different levels with some countries having extremely low levels and others being
at levels that while still relatively low are less so. The range of volatilities is wide as volatilities can be higher when interest rates are at extremely low
levels, and also because volatilities of shorter-dated interest rate derivatives are typically higher than those of longer-dated instruments. The range of
correlations moves from positive to negative because the movement of some pairs is very closely related and in the same direction causing highly
positive correlations while others generally move in opposite directions causing highly negative correlations with pairs that have differing relationships
through the range. All significant unobservable inputs are spread across the ranges.
Derivatives—Credit contracts—The significant unobservable inputs are credit spreads, recovery rates, volatilities and correlations. The range of
credit spreads reflects the different risk of default present within the portfolio. At the low end of the range, underlying reference names have a very
limited risk of default whereas at the high end of the range, underlying reference names have a much greater risk of default. The range of recovery rates
varies primarily due to the seniority of the underlying exposure with senior exposures having a higher recovery than subordinated exposures. The range
of volatilities is wide as the volatilities of shorter-dated credit contracts are typically higher than those of longer-dated instruments. The correlation
range is positive since credit spread moves are generally in the same direction. Highly positive correlations are those for which the movement is very
closely related and in the same direction, with correlation falling as the relationship becomes less strong.
Derivatives—Foreign exchange contracts—The significant unobservable inputs are interest rates, volatilities and correlations. The range of
interest rates is due to interest rates in different countries/currencies being at different levels with some countries having extremely low levels and others
being at levels that while still relatively low are less so. The range of volatilities is mainly due to the lower end of the range arising from currencies that
trade in narrow ranges e.g. versus the U.S. Dollar while the higher end comes from currencies with a greater range of movement such as emerging
market currencies. The range of correlations moves from positive to negative because the movement of some pairs is very closely related and in the
same direction causing highly positive correlations while others generally move in opposite directions causing highly negative correlations with pairs
that have differing relationships through the range.
Short-term borrowings and Long-term borrowings—The significant unobservable inputs are yields, prepayment rates, default probabilities, loss
severities, volatilities and correlations. The range of volatilities is wide as the volatilities of shorter-dated instruments are typically higher than those in
longer-dated instruments. The range of correlations moves from positive to negative because the movement of some pairs is very closely related and in
the same direction causing highly positive correlations while others generally move in opposite directions causing highly negative correlations with
pairs that have differing relationships through the range.
54

Movements in Level 3 financial instruments
The following tables present gains and losses as well as increases and decreases of financial instruments measured at fair value on a recurring
basis which Nomura classified in Level 3 for the nine and three months ended December 31, 2019 and 2020. Financial instruments classified in Level 3
are often hedged with instruments within Level 1 or Level 2 of the fair value hierarchy. The gains or losses presented below do not reflect the offsetting
gains or losses for these hedging instruments. Level 3 financial instruments are also measured using both observable and unobservable valuation inputs.
Fair value changes presented below, therefore, reflect realized and unrealized gains and losses resulting from movements in both observable and
unobservable valuation inputs.
For the nine months ended December 31, 2019 and 2020, gains and losses related to Level 3 assets and liabilities did not have a material impact
on Nomura’s liquidity and capital resources management.
Billions of yen
Nine months ended December 31, 2019
Beginning
balance as of
nine months
ended
December 31,
2019
Total gains
(losses)
recognized
in revenue(1)
Total gains
(losses)
recognized in
other
comprehensive
income
Purchases /
issues(2)
Sales /
redemptions(2) Settlements
Foreign
exchange
movements
Transfers
into
Level 3(4)(5)
Transfers
out of
Level 3(5)
Balance as of
nine months
ended
December 31,
2019
Assets:
Trading assets and private
equity and debt
investments
Equities ¥ 13 ¥ 0 ¥ — ¥ 7 ¥ (3) ¥ — ¥ 0 ¥ 0 ¥ (2) ¥ 15
Private equity and debt
investments 26 3 — 6 (1) — (1) — — 33
Japanese agency and
municipal securities 1 0 — 0 0 — — — — 1
Foreign government,
agency and
municipal securities 5 0 — 21 (21) — 0 3 (1) 7
Bank and corporate
debt securities and
loans for trading
purposes 160 2 — 58 (97) — (3) 92 (27) 185
Commercial mortgage-
backed securities
(“CMBS”) 2 0 — 1 0 — — 0 0 3
Residential mortgage-
backed securities
(“RMBS”) 3 (1) — 39 (14) — 0 — (2) 25
Real estate-backed
securities 69 3 — 137 (140) — (1) — — 68
Collateralized debt
obligations
(“CDOs”) and other 19 (8) — 88 (84) — 0 8 (7) 16
Investment trust funds
and other 1 0 — 7 (8) — 0 0 0 0

Total trading assets and
private equity and debt
investments ¥ 299 ¥ (1) ¥ — ¥ 364 ¥ (368) ¥ — ¥ (5) ¥ 103 ¥ (39) ¥ 353
Derivatives, net(3)
Equity contracts (8) 9 — — — (3) 0 7 4 9
Interest rate contracts (54) 10 — — — (3) 0 1 2 (44)
Credit contracts (8) (6) — — — (8) 0 (11) 9 (24)
Foreign exchange
contracts 20 (8) — — — (2) 0 0 3 13
Commodity contracts 0 0 — — — 0 0 — — 0
Total derivatives, net (50) 5 — — — (16) 0 (3) 18 (46)
Subtotal ¥ 249 ¥ 4 ¥ — ¥ 364 ¥ (368) ¥ (16) ¥ (5) ¥ 100 ¥ (21) ¥ 307
Loans and receivables 129 1 — 129 (66) — (1) 79 (48) 223
Collateralized agreements 33 0 — — (28) — 0 10 — 15
Other assets
Other 166 0 — 10 (6) — (2) — — 168
Total ¥ 577 ¥ 5 ¥ — ¥ 503 ¥ (468) ¥ (16) ¥ (8) ¥ 189 ¥ (69) ¥ 713
Liabilities:
Trading liabilities
Equities ¥ 0 ¥ 0 ¥ — ¥ 0 ¥ 0 ¥ — ¥ 0 ¥ 0 ¥ 0 ¥ 0
Foreign government,
agency and
municipal securities 0 0 — — — — 0 — — 0
Bank and corporate
debt securities 0 0 — 1 (1) — 0 — — 0
Collateralized debt
obligations
(“CDOs”) and other — — — 3 (3) — — — — —
Investment trust funds
and other — — — 0 0 — 0 0 — 0
Total trading liabilities ¥ 0 ¥ 0 ¥ — ¥ 4 ¥ (4) ¥ — ¥ 0 ¥ 0 ¥ 0 ¥ 0
Short-term borrowings 31 (1) 0 52 (41) — 0 7 (9) 41
Payables and deposits 0 0 0 7 0 — 0 0 (5) 2
Long-term borrowings 535 (8) 0 222 (206) — 0 54 (67) 546
Other liabilities 0 0 — 2 0 — 0 — — 2
Total ¥ 566 ¥ (9) ¥ 0 ¥ 287 ¥ (251) ¥ — ¥ 0 ¥ 61 ¥ (81) ¥ 591
55

Billions of yen
Nine months ended December 31, 2020
Beginning
balance as of
nine months
ended
December 31,
2020
Total gains
(losses)
recognized
in revenue(1)
Total gains
(losses)
recognized in
other
comprehensive
income
Purchases /
issues(2)
Sales /
redemptions(2) Settlements
Foreign
exchange
movements
Transfers
into
Level 3(4)(5)
Transfers
out of
Level 3(5)
Balance as of
nine months
ended
December 31,
2020
Assets:
Trading assets and private
equity and debt
investments
Equities ¥ 14 ¥ 4 ¥ — ¥ 22 ¥ (29) ¥ — ¥ 0 ¥ 1 ¥ 0 ¥ 12
Private equity and debt
investments 31 4 — 17 (2) — 0 — — 50
Japanese agency and
municipal securities 2 0 — 0 0 — — 0 0 2
Foreign government,
agency and municipal
securities 8 1 — 17 (12) — 0 4 (4) 14
Bank and corporate debt
securities and loans
for trading purposes 228 0 — 41 (137) — (4) 22 (33) 117
Commercial mortgage-
backed securities
(“CMBS”) 1 0 — 6 0 — 0 — 0 7
Residential mortgage-
backed securities
(“RMBS”) 62 0 — 11 (44) — (1) — (23) 5
Real estate-backed
securities 94 (5) — 103 (89) — (4) — 0 99
Collateralized debt
obligations (“CDOs”)
and other 32 0 — 75 (77) — (1) 0 (7) 22
Investment trust funds
and other 0 0 — 6 (6) — 0 0 — 0
Total trading assets and
private equity and debt
investments ¥ 472 ¥ 4 ¥ — ¥ 298 ¥ (396) ¥ — ¥ (10) ¥ 27 ¥ (67) ¥ 328
Derivatives, net(3)
Equity contracts 19 (45) — — — (13) 1 18 (11) (31)
Interest rate contracts (54) 8 — — — (15) 1 (5) 3 (62)
Credit contracts (1) (11) — — — (7) (1) (4) 1 (23)
Foreign exchange
contracts 7 11 — — — (15) 0 (3) 4 4
Total derivatives, net (29) (37) — — — (50) 1 6 (3) (112)
Subtotal ¥ 443 ¥ (33) ¥ — ¥ 298 ¥ (396) ¥ (50) ¥ (9) ¥ 33 ¥ (70) ¥ 216
Loans and receivables 96 2 — 38 (41) — (2) 16 (11) 98
Collateralized agreements 15 0 — — — — (1) 4 — 18
Other assets
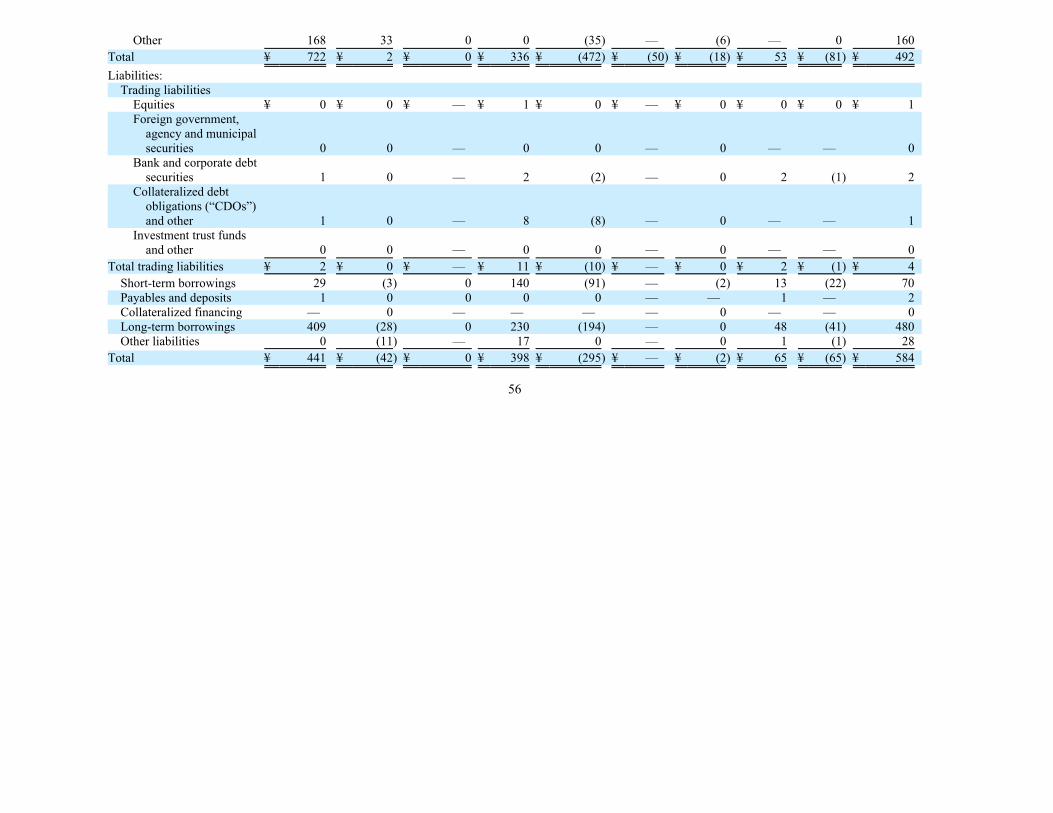
Other 168 33 0 0 (35) — (6) — 0 160
Total ¥ 722 ¥ 2 ¥ 0 ¥ 336 ¥ (472) ¥ (50) ¥ (18) ¥ 53 ¥ (81) ¥ 492
Liabilities:
Trading liabilities
Equities ¥ 0 ¥ 0 ¥ — ¥ 1 ¥ 0 ¥ — ¥ 0 ¥ 0 ¥ 0 ¥ 1
Foreign government,
agency and municipal
securities 0 0 — 0 0 — 0 — — 0
Bank and corporate debt
securities 1 0 — 2 (2) — 0 2 (1) 2
Collateralized debt
obligations (“CDOs”)
and other 1 0 — 8 (8) — 0 — — 1
Investment trust funds
and other 0 0 — 0 0 — 0 — — 0
Total trading liabilities ¥ 2 ¥ 0 ¥ — ¥ 11 ¥ (10) ¥ — ¥ 0 ¥ 2 ¥ (1) ¥ 4
Short-term borrowings 29 (3) 0 140 (91) — (2) 13 (22) 70
Payables and deposits 1 0 0 0 0 — — 1 — 2
Collateralized financing — 0 — — — — 0 — — 0
Long-term borrowings 409 (28) 0 230 (194) — 0 48 (41) 480
Other liabilities 0 (11) — 17 0 — 0 1 (1) 28
Total ¥ 441 ¥ (42) ¥ 0 ¥ 398 ¥ (295) ¥ — ¥ (2) ¥ 65 ¥ (65) ¥ 584
56

Billions of yen
Three months ended December 31, 2019
Beginning
balance as of
three months
ended
December 31,
2019
Total gains
(losses)
recognized
in revenue(1)
Total gains
(losses)
recognized in
other
comprehensive
income
Purchases /
issues(2)
Sales /
redemptions(2) Settlements
Foreign
exchange
movements
Transfers
into
Level 3(4)(5)
Transfers
out of
Level 3(5)
Balance as of
three months
ended
December 31,
2019
Assets:
Trading assets and private
equity and debt
investments
Equities ¥ 10 ¥ 0 ¥ — ¥ 7 ¥ (2) ¥ — ¥ 0 ¥ 0 ¥ 0 ¥ 15
Private equity and debt
investments 26 1 — 5 0 — 1 — — 33
Japanese agency and
municipal securities 1 0 — 0 0 — — — — 1
Foreign government,
agency and municipal
securities 6 0 — 6 (5) — 0 1 (1) 7
Bank and corporate debt
securities and loans for
trading purposes 177 3 — 18 (36) — 3 29 (9) 185
Commercial mortgage-
backed securities
(“CMBS”) 2 0 — 1 — — 0 — — 3
Residential mortgage-
backed securities
(“RMBS”) 26 0 — 5 (6) — 0 — — 25
Real estate-backed
securities 103 0 — 29 (65) — 1 — — 68
Collateralized debt
obligations (“CDOs”)
and other 21 (3) — 6 (9) — 1 2 (2) 16
Investment trust funds
and other 0 — — 0 0 — 0 — — 0
Total trading assets and
private equity and debt
investments ¥ 372 ¥ 1 ¥ — ¥ 77 ¥ (123) ¥ — ¥ 6 ¥ 32 ¥ (12) ¥ 353
Derivatives, net(3)
Equity contracts 16 1 — — — (2) 0 4 (10) 9
Interest rate contracts (46) 5 — — — (5) 0 1 1 (44)
Credit contracts (23) (3) — — — (7) 0 0 9 (24)
Foreign exchange
contracts 13 6 — — — (6) 0 0 0 13
Commodity contracts 0 0 — — — 0 0 — — 0
Total derivatives, net (40) 9 — — — (20) 0 5 0 (46)
Subtotal ¥ 332 ¥ 10 ¥ — ¥ 77 ¥ (123) ¥ (20) ¥ 6 ¥ 37 ¥ (12) ¥ 307
Loans and receivables 116 0 — 84 (6) — 2 58 (31) 223
Collateralized agreements 12 0 — — — — 0 3 — 15
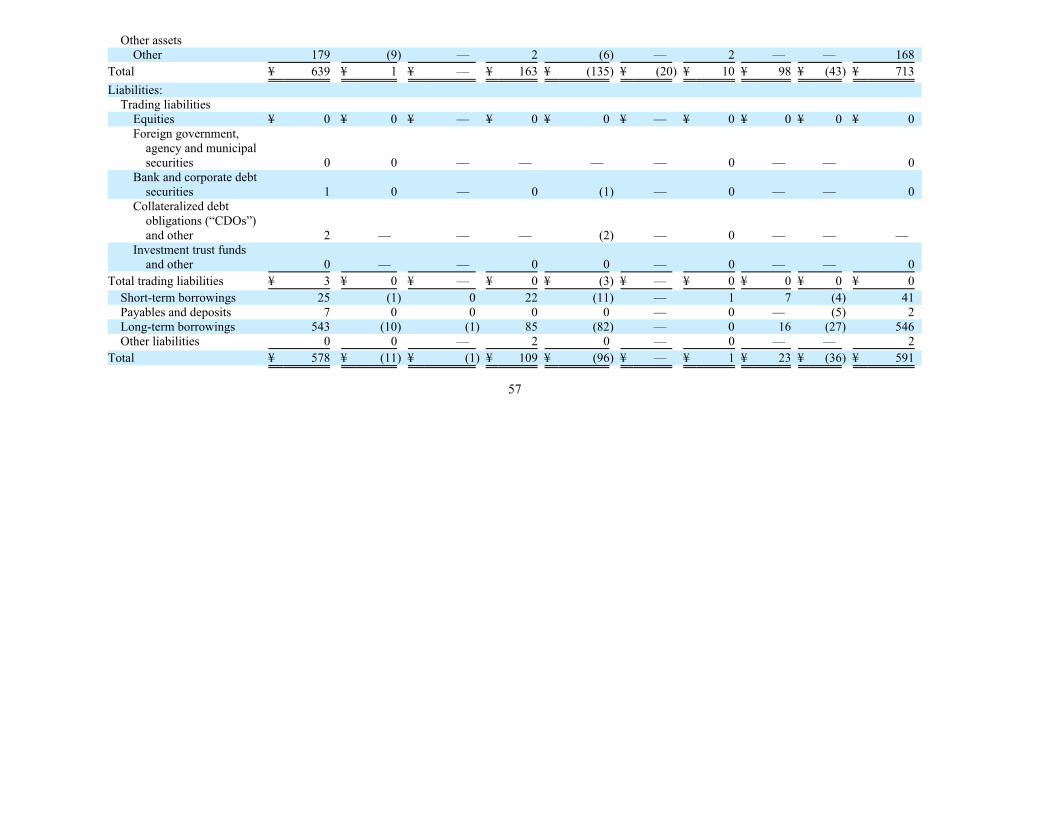
Other assets
Other 179 (9) — 2 (6) — 2 — — 168
Total ¥ 639 ¥ 1 ¥ — ¥ 163 ¥ (135) ¥ (20) ¥ 10 ¥ 98 ¥ (43) ¥ 713
Liabilities:
Trading liabilities
Equities ¥ 0 ¥ 0 ¥ — ¥ 0 ¥ 0 ¥ — ¥ 0 ¥ 0 ¥ 0 ¥ 0
Foreign government,
agency and municipal
securities 0 0 — — — — 0 — — 0
Bank and corporate debt
securities 1 0 — 0 (1) — 0 — — 0
Collateralized debt
obligations (“CDOs”)
and other 2 — — — (2) — 0 — — —
Investment trust funds
and other 0 — — 0 0 — 0 — — 0
Total trading liabilities ¥ 3 ¥ 0 ¥ — ¥ 0 ¥ (3) ¥ — ¥ 0 ¥ 0 ¥ 0 ¥ 0
Short-term borrowings 25 (1) 0 22 (11) — 1 7 (4) 41
Payables and deposits 7 0 0 0 0 — 0 — (5) 2
Long-term borrowings 543 (10) (1) 85 (82) — 0 16 (27) 546
Other liabilities 0 0 — 2 0 — 0 — — 2
Total ¥ 578 ¥ (11) ¥ (1) ¥ 109 ¥ (96) ¥ — ¥ 1 ¥ 23 ¥ (36) ¥ 591
57

Billions of yen
Three months ended December 31, 2020
Beginning
balance as of
three months
ended
December 31,
2020
Total gains
(losses)
recognized
in revenue(1)
Total gains
(losses)
recognized in
other
comprehensive
income
Purchases /
issues(2)
Sales /
redemptions(2) Settlements
Foreign
exchange
movements
Transfers
into
Level 3(4)(5)
Transfers
out of
Level 3(5)
Balance as of
three months
ended
December 31,
2020
Assets:
Trading assets and private
equity and debt
investments
Equities ¥ 10 ¥ 2 ¥ — ¥ 1 ¥ (1) ¥ — ¥ 0 ¥ 0 ¥ — ¥ 12
Private equity and debt
investments 49 1 — 0 0 — 0 — — 50
Japanese agency and
municipal securities 2 0 — 0 0 — — — — 2
Foreign government,
agency and municipal
securities 13 0 — 6 (5) — 0 2 (2) 14
Bank and corporate
debt securities and
loans for trading
purposes 129 2 — 16 (23) — (1) 3 (9) 117
Commercial mortgage-
backed securities
(“CMBS”) 2 0 — 5 — — 0 — 0 7
Residential mortgage-
backed securities
(“RMBS”) 20 0 — — (15) — 0 — — 5
Real estate-backed
securities 62 0 — 64 (25) — (2) — — 99
Collateralized debt
obligations (“CDOs”)
and other 11 1 — 39 (29) — 0 — 0 22
Investment trust funds
and other 0 0 — 6 (6) — 0 0 — 0
Total trading assets and
private equity and debt
investments ¥ 298 ¥ 6 ¥ — ¥ 137 ¥ (104) ¥ — ¥ (3) ¥ 5 ¥ (11) ¥ 328
Derivatives, net(3)
Equity contracts (19) (17) — — — 0 2 6 (3) (31)
Interest rate contracts (58) 12 — — — (15) 0 (1) 0 (62)
Credit contracts (15) (1) — — — (6) 0 (1) 0 (23)
Foreign exchange
contracts 0 9 — — — (5) 0 (1) 1 4
Total derivatives, net (92) 3 — — — (26) 2 3 (2) (112)
Subtotal ¥ 206 ¥ 9 ¥ — ¥ 137 ¥ (104) ¥ (26) ¥ (1) ¥ 8 ¥ (13) ¥ 216
Loans and receivables 88 0 — 12 (7) — 0 8 (3) 98
Collateralized agreements 18 0 — — — — 0 — — 18
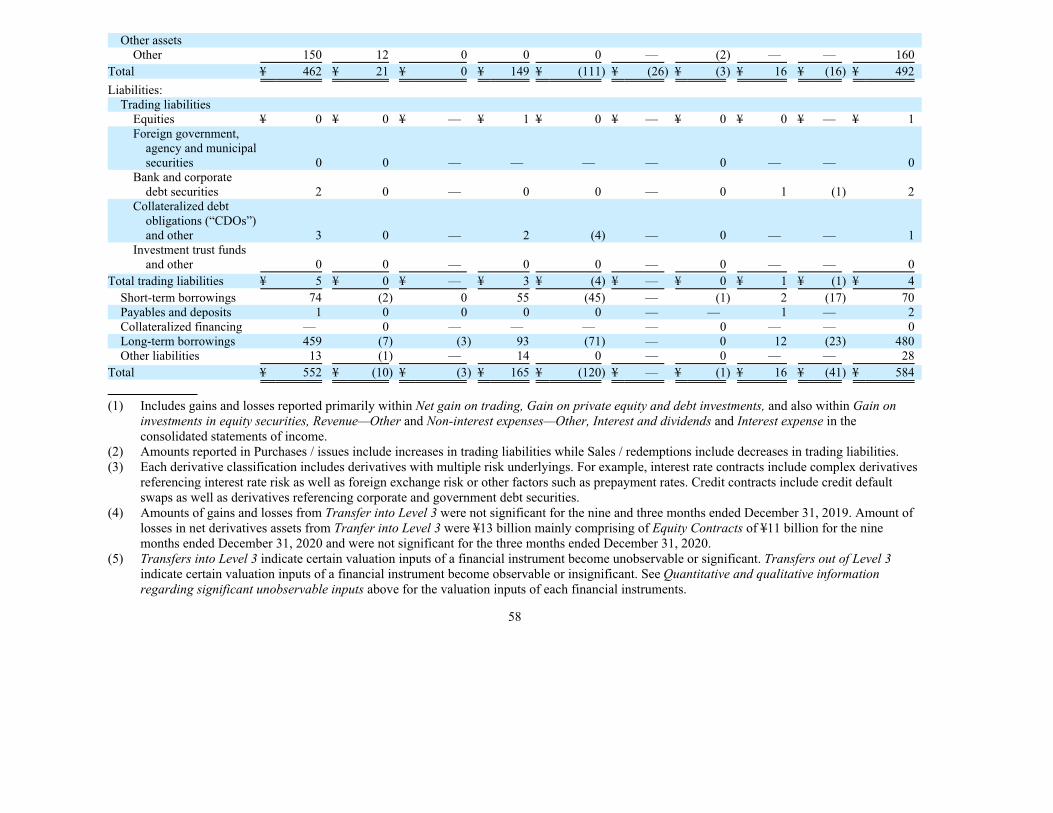
Other assets
Other 150 12 0 0 0 — (2) — — 160
Total ¥ 462 ¥ 21 ¥ 0 ¥ 149 ¥ (111) ¥ (26) ¥ (3) ¥ 16 ¥ (16) ¥ 492
Liabilities:
Trading liabilities
Equities ¥ 0 ¥ 0 ¥ — ¥ 1 ¥ 0 ¥ — ¥ 0 ¥ 0 ¥ — ¥ 1
Foreign government,
agency and municipal
securities 0 0 — — — — 0 — — 0
Bank and corporate
debt securities 2 0 — 0 0 — 0 1 (1) 2
Collateralized debt
obligations (“CDOs”)
and other 3 0 — 2 (4) — 0 — — 1
Investment trust funds
and other 0 0 — 0 0 — 0 — — 0
Total trading liabilities ¥ 5 ¥ 0 ¥ — ¥ 3 ¥ (4) ¥ — ¥ 0 ¥ 1 ¥ (1) ¥ 4
Short-term borrowings 74 (2) 0 55 (45) — (1) 2 (17) 70
Payables and deposits 1 0 0 0 0 — — 1 — 2
Collateralized financing — 0 — — — — 0 — — 0
Long-term borrowings 459 (7) (3) 93 (71) — 0 12 (23) 480
Other liabilities 13 (1) — 14 0 — 0 — — 28
Total ¥ 552 ¥ (10) ¥ (3) ¥ 165 ¥ (120) ¥ — ¥ (1) ¥ 16 ¥ (41) ¥ 584
(1) Includes gains and losses reported primarily within Net gain on trading, Gain on private equity and debt investments, and also within Gain on
investments in equity securities, Revenue—Other and Non-interest expenses—Other, Interest and dividends and Interest expense in the
consolidated statements of income.
(2) Amounts reported in Purchases / issues include increases in trading liabilities while Sales / redemptions include decreases in trading liabilities.
(3) Each derivative classification includes derivatives with multiple risk underlyings. For example, interest rate contracts include complex derivatives
referencing interest rate risk as well as foreign exchange risk or other factors such as prepayment rates. Credit contracts include credit default
swaps as well as derivatives referencing corporate and government debt securities.
(4) Amounts of gains and losses from Transfer into Level 3 were not significant for the nine and three months ended December 31, 2019. Amount of
losses in net derivatives assets from Tranfer into Level 3 were ¥13 billion mainly comprising of Equity Contracts of ¥11 billion for the nine
months ended December 31, 2020 and were not significant for the three months ended December 31, 2020.
(5) Transfers into Level 3 indicate certain valuation inputs of a financial instrument become unobservable or significant. Transfers out of Level 3
indicate certain valuation inputs of a financial instrument become observable or insignificant. See Quantitative and qualitative information
regarding significant unobservable inputs above for the valuation inputs of each financial instruments.
58

Unrealized gains and losses recognized for Level 3 financial instruments
The following table presents the amounts of unrealized gains (losses) for the nine and three months ended December 31, 2019 and 2020, relating
to those financial instruments which Nomura classified in Level 3 within the fair value hierarchy and that were still held by Nomura at the relevant
consolidated balance sheet date.
Billions of yen
Nine months ended December 31
2019 2020
Unrealized gains / (losses)(1)
Assets:
Trading assets and private equity and debt investments
Equities ¥ (1) ¥ 3
Private equity and debt investments 3 5
Japanese agency and municipal securities 0 0
Foreign government, agency and municipal securities 0 0
Bank and corporate debt securities and loans for trading purposes (4) (1)
Commercial mortgage-backed securities (“CMBS”) 0 0
Residential mortgage-backed securities (“RMBS”) (1) 0
Real estate-backed securities (1) (2)
Collateralized debt obligations (“CDOs”) and other (6) (2)
Investment trust funds and other 0 0
Total trading assets and private equity and debt investments (10) 3
Derivatives, net(2)
Equity contracts 3 (59)
Interest rate contracts (3) 6
Credit contracts (7) (2)
Foreign exchange contracts 1 10
Commodity contracts 0 —
Total derivatives, net (6) (45)
Subtotal ¥ (16) ¥ (42)
Loans and receivables 1 (2)
Collateralized agreements 0 (1)
Other assets
Other 1 23
Total ¥ (14) ¥ (22)
Liabilities:
Trading liabilities
Equities ¥ 0 ¥ 0
Foreign government, agency and municipal securities 0 0
Bank and corporate debt securities 0 0
Collateralized debt obligations (“CDOs”) and other 0 0
Total trading liabilities ¥ 0 ¥ 0
Short-term borrowings(3) 0 3
Payables and deposits(3) 0 0
Collateralized financing(3) — 0
Long-term borrowings(3) 1 (20)
Other liabilities (2) (6)
Total ¥ (1) ¥ (23)
59
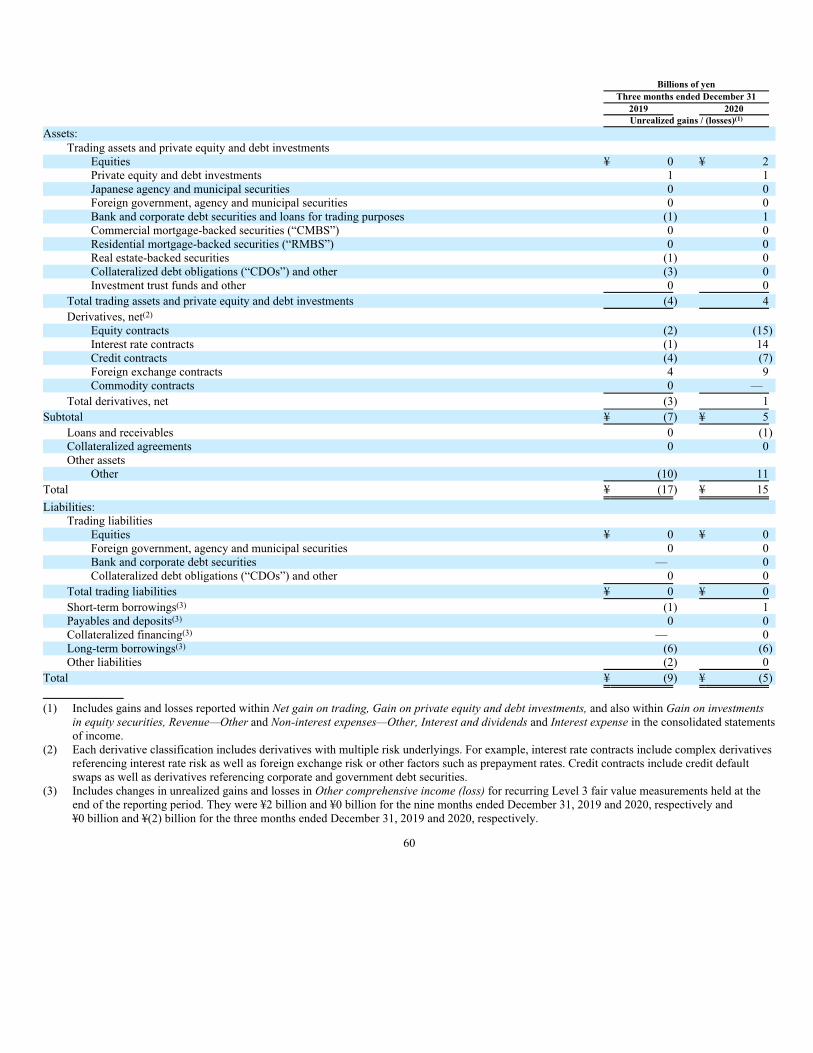
Billions of yen
Three months ended December 31
2019 2020
Unrealized gains / (losses)(1)
Assets:
Trading assets and private equity and debt investments
Equities ¥ 0 ¥ 2
Private equity and debt investments 1 1
Japanese agency and municipal securities 0 0
Foreign government, agency and municipal securities 0 0
Bank and corporate debt securities and loans for trading purposes (1) 1
Commercial mortgage-backed securities (“CMBS”) 0 0
Residential mortgage-backed securities (“RMBS”) 0 0
Real estate-backed securities (1) 0
Collateralized debt obligations (“CDOs”) and other (3) 0
Investment trust funds and other 0 0
Total trading assets and private equity and debt investments (4) 4
Derivatives, net(2)
Equity contracts (2) (15)
Interest rate contracts (1) 14
Credit contracts (4) (7)
Foreign exchange contracts 4 9
Commodity contracts 0 —
Total derivatives, net (3) 1
Subtotal ¥ (7) ¥ 5
Loans and receivables 0 (1)
Collateralized agreements 0 0
Other assets
Other (10) 11
Total ¥ (17) ¥ 15
Liabilities:
Trading liabilities
Equities ¥ 0 ¥ 0
Foreign government, agency and municipal securities 0 0
Bank and corporate debt securities — 0
Collateralized debt obligations (“CDOs”) and other 0 0
Total trading liabilities ¥ 0 ¥ 0
Short-term borrowings(3) (1) 1
Payables and deposits(3) 0 0
Collateralized financing(3) — 0
Long-term borrowings(3) (6) (6)
Other liabilities (2) 0
Total ¥ (9) ¥ (5)
(1) Includes gains and losses reported within Net gain on trading, Gain on private equity and debt investments, and also within Gain on investments
in equity securities, Revenue—Other and Non-interest expenses—Other, Interest and dividends and Interest expense in the consolidated statements
of income.
(2) Each derivative classification includes derivatives with multiple risk underlyings. For example, interest rate contracts include complex derivatives
referencing interest rate risk as well as foreign exchange risk or other factors such as prepayment rates. Credit contracts include credit default
swaps as well as derivatives referencing corporate and government debt securities.
(3) Includes changes in unrealized gains and losses in Other comprehensive income (loss) for recurring Level 3 fair value measurements held at the
end of the reporting period. They were ¥2 billion and ¥0 billion for the nine months ended December 31, 2019 and 2020, respectively and
¥0 billion and ¥(2) billion for the three months ended December 31, 2019 and 2020, respectively.
60

Investments in investment funds that calculate NAV per share
In the normal course of business, Nomura invests in non-consolidated funds which meet the definition of investment companies or are similar in
nature and which do not have readily determinable fair values. For certain of these investments, Nomura uses NAV per share as the basis for valuation
as a practical expedient. Some of these investments are redeemable at different amounts from NAV per share.
The following tables present information on these investments where NAV per share is calculated or disclosed as of March 31, 2020 and
December 31, 2020. Investments are presented by major category relevant to the nature of Nomura’s business and risks.
Billions of yen
March 31, 2020
Fair value
Unfunded
commitments(1)
Redemption frequency
(if currently eligible)(2) Redemption notice(3)
Hedge funds ¥ 2 ¥ — Monthly Same day-90 days
Venture capital funds 3 3 — —
Private equity funds 21 9 — —
Real estate funds 6 1 — —
Total ¥ 32 ¥ 13
Billions of yen
December 31, 2020
Fair value
Unfunded
commitments(1)
Redemption frequency
(if currently eligible)(2) Redemption notice(3)
Hedge funds ¥ 2 ¥ — Monthly Same day-90 days
Venture capital funds 3 2 — —
Private equity funds 17 22 — —
Real estate funds 5 1 — —
Total ¥ 27 ¥ 25
(1) The contractual amount of any unfunded commitments Nomura is required to make to the entities in which the investment is held.
(2) The range in frequency with which Nomura can redeem investments.
(3) The range in notice period required to be provided before redemption is possible.
Hedge funds:
These investments include funds of funds that invest in multiple asset classes. The fair values of these investments are determined using NAV per
share. Although most of these funds can be redeemed within six months, certain funds cannot be redeemed within six months due to contractual,
liquidity or gating issues. The redemption period is unknown for certain suspended or liquidating funds. Some of these investments contain restrictions
against transfers of the investments to third parties.
Venture capital funds:
These investments include primarily start-up funds. The fair values of these investments are determined using NAV per share. Most of these funds
cannot be redeemed within six months. The redemption period is unknown for certain suspended or liquidating funds. Some of these investments
contain restrictions against transfers of the investments to third parties.
Private equity funds:
These investments are made mainly in various sectors in Europe, U.S. and Japan. The fair values of these investments are determined using NAV
per share. Redemption is restricted for most of these investments. Some of these investments contain restrictions against transfers of the investments to
third parties.
Real estate funds:
These are investments in commercial and other types of real estate. The fair values of these investments are determined using NAV per share.
Redemption is restricted for most of these investments. Some of these investments contain restrictions against transfers of the investments to third
parties.
61

Fair value option for financial assets and financial liabilities
Nomura measures certain eligible financial assets and liabilities at fair value through the election of the fair value option permitted by ASC 815
“Derivatives and Hedging” (“ASC 815”) and ASC 825 “Financial Instruments”. When Nomura elects the fair value option for an eligible item, changes
in that item’s fair value are recognized through earnings. Election of the fair value option is generally irrevocable unless an event occurs that gives rise
to a new basis of accounting for that instrument.
The financial assets and financial liabilities primarily elected for the fair value option by Nomura, and the reasons for the election, are as follows:
• Equity method investments reported within Trading assets and private equity and debt investments and Other assets held for capital
appreciation or current income purposes which Nomura generally has an intention to exit rather than hold indefinitely. Nomura elects the
fair value option to more appropriately represent the purpose of these investments in these consolidated financial statements.
• Loans reported within Loans and receivables which are risk managed on a fair value basis and loan commitments related to loans
receivable for which the fair value option will be elected upon funding. Nomura elects the fair value option to mitigate volatility through
earnings caused by the difference in measurement basis that otherwise would arise between loans and the derivatives used to risk manage
those instruments.
• Reverse repurchase and repurchase agreements reported within Collateralized agreements and Collateralized financing which are risk
managed on a fair value basis. Nomura elects the fair value option to mitigate volatility through earnings caused by the difference in
measurement basis that otherwise would arise between the reverse repurchase and repurchase agreements and the derivatives used to risk
manage those instruments.
• All structured notes issued on or after April 1, 2008 reported within Short-term borrowings or Long-term borrowings. Nomura elects the
fair value option for those structured notes primarily to mitigate the volatility through earnings caused by differences in the measurement
basis for structured notes and the derivatives Nomura uses to risk manage those positions. Nomura also elects the fair value option for
certain notes issued by consolidated VIEs for the same purpose and for certain structured notes issued prior to April 1, 2008. Certain
subsidiaries elect the fair value option for structured loans and straight bonds.
• Certain structured deposit issuances reported within Deposits received at banks. Nomura elects the fair value option for those structured
deposits primarily to mitigate the volatility through earnings caused by differences in the measurement basis for structured deposits and
the derivatives Nomura uses to risk manage those positions.
• Financial liabilities reported within Long-term borrowings recognized in transactions which are accounted for as secured financing
transactions under ASC 860. Nomura elects the fair value option for these financial liabilities to mitigate volatility through earnings that
otherwise would arise had this election not been made. Even though Nomura usually has little or no continuing economic exposure to the
transferred financial assets, they remain on the consolidated balance sheets and continue to be carried at fair value, with changes in fair
value recognized through earnings.
• Financial reinsurance contracts reported within Other assets. Nomura elects the fair value option to mitigate income volatility caused by
the difference in measurement basis that would otherwise exist. Changes in the fair value of the reinsurance contracts carried at fair value
are reported in the consolidated statements of income.
Interest and dividends arising from financial instruments for which the fair value option has been elected are recognized within Interest and
dividends, Interest expense or Net gain on trading.
62

The following table presents gains (losses) due to changes in fair value for financial instruments measured at fair value using the fair value option
for the nine and three months ended December 31, 2019 and 2020.
Billions of yen
Nine months ended December 31
2019 2020
Gains / (Losses)(1)
Assets:
Trading assets and private equity and debt investments(2)
Trading assets ¥ 0 ¥ 1
Private equity and debt investments 0 0
Loans and receivables 4 6
Collateralized agreements(3) 0 4
Other assets(2) (7) 31
Total ¥ (3) ¥ 42
Liabilities:
Short-term borrowings(4) ¥ (1) ¥ (51)
Payables and deposits — 2
Collateralized financing(3) (1) 0
Long-term borrowings(4)(5) (109) (259)
Other liabilities(6) (4) (6)
Total ¥ (115) ¥ (314)
Billions of yen
Three months ended December 31
2019 2020
Gains / (Losses)(1)
Assets:
Trading assets and private equity and debt investments(2)
Trading assets ¥ 0 ¥ —
Private equity and debt investments 0 0
Loans and receivables 1 2
Collateralized agreements(3) (2) 2
Other assets(2) (8) 7
Total ¥ (9) ¥ 11
Liabilities:
Short-term borrowings(4) ¥ (18) ¥ (24)
Payables and deposits — 1
Collateralized financing(3) 1 1
Long-term borrowings(4)(5) (3) (69)
Other liabilities(6) 0 (2)
Total ¥ (20) ¥ (93)
(1) Includes gains and losses reported primarily within Net gain on trading and Revenue—Other in the consolidated statements of income.
(2) Includes equity investments that would have been accounted for under the equity method had Nomura not chosen to elect the fair value option.
(3) Includes reverse repurchase and repurchase agreements.
(4) Includes structured notes and other financial liabilities.
(5) Includes secured financing transactions arising from transfers of financial assets which did not meet the criteria for sales accounting.
(6) Includes unfunded written loan commitments.
63

As of March 31, 2020 and December 31, 2020, Nomura held an economic interest of 39.19% and 39.80% in American Century Companies, Inc.,
respectively. The investment is measured at fair value on a recurring basis through election of the fair value option and is reported within Other
assets—Other in the consolidated balance sheets.
There was no significant impact on financial assets for which the fair value option was elected attributable to instrument-specific credit risk.
Nomura calculates the impact of changes in its own creditworthiness on certain financial liabilities for which the fair value option is elected by
DCF valuation techniques using a rate which incorporates observable changes in its credit spread.
The following table presents changes in the valuation adjustment for Nomura’s own credit worthiness applied to certain financial liabilities for
which the fair value option has been elected recognized in other comprehensive income during the period and cumulatively, and amounts reclassified to
earnings from accumulated other comprehensive income on early settlement of such financial liabilities during the nine and three months ended
December 31, 2019 and 2020.
Billions of yen
Nine months period ended December 31
2019 2020
Changes recognized as a credit (debit) to other comprehensive income ¥ (24) ¥ (93)
Credit (debit) amounts reclassified to earnings (1) (10)
Cumulative credit (debit) balance recognized in accumulated other comprehensive income 13 (13)
Billions of yen
Three months period ended December 31
2019 2020
Changes recognized as a credit (debit) to other comprehensive income ¥ (22) ¥ (40)
Credit (debit) amounts reclassified to earnings 0 1
As of March 31, 2020, the fair value of the aggregate unpaid principal balance (which is contractually principally protected) of Loans and
receivables for which the fair value option was elected was ¥8 billion less than the principal balance of such Loans and receivables. The fair value of the
aggregate unpaid principal balance (which is contractually principally protected) of Long-term borrowings for which the fair value option was elected
was ¥27 billion less than the principal balance of such Long-term borrowings. There were no Loans and receivables for which the fair value option was
elected that were 90 days or more past due.
As of December 31, 2020, the fair value of the aggregate unpaid principal balance (which is contractually principally protected) of Loans and
receivables for which the fair value option was elected was ¥4 billion less than the principal balance of such Loans and receivables. The fair value of the
aggregate unpaid principal balance (which is contractually principally protected) of Long-term borrowings for which the fair value option was elected
was ¥10 billion more than the principal balance of such Long-term borrowings. There were no Loans and receivables for which the fair value option
was elected that were 90 days or more past due.
Investment by Investment companies
Nomura carries all of investments by investment companies under ASC 946 “Financial Services—Investment Companies” at fair value, with
changes in fair value recognized through the consolidated statements of income.
64

Concentrations of credit risk
Concentrations of credit risk may arise from trading, securities financing transactions and underwriting activities, and may be impacted by
changes in political or economic factors. Nomura has credit risk concentrations on bonds issued by the Japanese Government, U.S. Government, British
Government (“U.K.”), Governments within the European Union (“EU”), their states and municipalities, and their agencies. These concentrations
generally arise from taking trading positions and are reported within Trading assets in the consolidated balance sheets. Government, agency and
municipal securities, including Securities pledged as collateral, represented 16% of total assets as of March 31, 2020 and 19% as of December 31, 2020.
The following tables present geographic allocations of Nomura’s trading assets related to government, agency and municipal securities. See Note
3 “Derivative instruments and hedging activities” for further information regarding the concentration of credit risk for derivatives.
Billions of yen
March 31, 2020
Japan U.S. EU & U.K. Other Total(1)
Government, agency and municipal securities ¥1,934 ¥1,889 ¥ 2,704 ¥ 672 ¥7,199
Billions of yen
December 31, 2020
Japan U.S. EU & U.K. Other Total(1)
Government, agency and municipal securities ¥2,413 ¥2,295 ¥ 2,617 ¥1,003 ¥8,328
(1) Other than above, there were ¥321 billion and ¥298 billion of government, agency and municipal securities reported within Other
assets—Non-trading debt securities in the consolidated balance sheets as of March 31, 2020 and December 31 2020, respectively. These securities
are primarily Japanese government, agency and municipal securities.
Estimated fair value of financial instruments not carried at fair value
Certain financial instruments are not carried at fair value on a recurring basis in the consolidated balance sheets since they are neither held for
trading purposes nor are elected for the fair value option. These are typically carried at contractual amounts due or amortized cost.
The carrying value of the majority of the financial instruments detailed below will approximate fair value since they are short-term in nature and
contain minimal credit risk. These financial instruments include financial assets reported within Cash and cash equivalents, Time deposits, Deposits
with stock exchanges and other segregated cash, Receivables from customers, Receivables from other than customers, Securities purchased under
agreements to resell and Securities borrowed and financial liabilities reported within Short-term borrowings, Payables to customers, Payables to other
than customers, Deposits received at banks, Securities sold under agreements to repurchase, Securities loaned and Other secured borrowings in the
consolidated balance sheets.
The estimated fair values of other financial instruments which are longer-term in nature or may contain more than minimal credit risk may be
different to their carrying value. Financial assets of this type primarily include certain loans which are reported within Loans receivable while financial
liabilities primarily include long-term borrowings which are reported within Long-term borrowings.
65

The following tables present carrying values, fair values and classification within the fair value hierarchy for certain classes of financial
instrument of which a portion of the ending balance was carried at fair value as of March 31, 2020 and December 31 2020.
Billions of yen
March 31, 2020(1)
Carrying
value
Fair
value
Fair value by level
Level 1 Level 2 Level 3
Assets:
Cash and cash equivalents ¥ 3,192 ¥ 3,192 ¥3,192 ¥ — ¥ —
Time deposits 309 309 — 309 —
Deposits with stock exchanges and other segregated cash 374 374 — 374 —
Loans receivable(2) 2,848 2,842 — 2,201 641
Securities purchased under agreements to resell 12,377 12,377 — 12,362 15
Securities borrowed 3,530 3,529 — 3,529 —
Total ¥22,630 ¥22,623 ¥3,192 ¥18,775 ¥ 656
Liabilities:
Short-term borrowings ¥ 1,487 ¥ 1,487 ¥ — ¥ 1,458 ¥ 29
Deposits received at banks 1,276 1,276 — 1,275 1
Securities sold under agreements to repurchase 16,349 16,349 — 16,349 —
Securities loaned 961 962 — 962 —
Other secured borrowings 718 718 — 718 —
Long-term borrowings 7,776 7,733 2 7,263 468
Total ¥28,567 ¥28,525 ¥ 2 ¥28,025 ¥ 498
Billions of yen
December 31, 2020(1)
Carrying
value
Fair
value
Fair value by level
Level 1 Level 2 Level 3
Assets:
Cash and cash equivalents ¥ 3,368 ¥ 3,368 ¥3,368 ¥ — ¥ —
Time deposits 270 270 — 270 —
Deposits with stock exchanges and other segregated cash 290 290 — 290 —
Loans receivable(2) 2,553 2,552 — 1,789 763
Securities purchased under agreements to resell 12,522 12,522 — 12,504 18
Securities borrowed 4,429 4,429 — 4,429 —
Total ¥23,432 ¥23,431 ¥3,368 ¥19,282 ¥ 781
Liabilities:
Short-term borrowings ¥ 1,336 ¥ 1,336 ¥ — ¥ 1,266 ¥ 70
Deposits received at banks 1,200 1,200 — 1,198 2
Securities sold under agreements to repurchase 15,361 15,361 — 15,361 0
Securities loaned 1,473 1,473 — 1,473 —
Other secured borrowings 394 394 — 394 —
Long-term borrowings 7,865 7,888 4 7,348 536
Total ¥27,629 ¥27,652 ¥ 4 ¥27,040 ¥ 608
(1) Includes financial instruments which are carried at fair value on a recurring basis.
(2) Carrying values are shown after deducting relevant allowances for credit losses.
66

Assets and liabilities measured at fair value on a nonrecurring basis
In addition to financial instruments carried at fair value on a recurring basis, Nomura also measures other financial and non-financial assets and
liabilities at fair value on a nonrecurring basis, where the primary measurement basis is not fair value. Fair value is only used in specific circumstances
after initial recognition such as to measure impairment.
As of March 31, 2020 and December 31, 2020, there were no significant amount of assets and liabilities which were measured at fair value on a
nonrecurring basis.
67

3. Derivative instruments and hedging activities:
Nomura uses a variety of derivative financial instruments, including futures, forwards, options and swaps, for both trading and non-trading
purposes.
Derivatives used for trading purposes
In the normal course of business, Nomura enters into transactions involving derivative financial instruments to meet client needs, for trading
purposes, and to reduce its own exposure to loss due to adverse fluctuations in interest rates, currency exchange rates and market prices of securities.
These financial instruments include contractual agreements such as commitments to swap interest payment streams, exchange currencies or purchase or
sell securities and other financial instruments on specific terms at specific future dates.
Nomura maintains active trading positions in a variety of derivative financial instruments. Most of Nomura’s trading activities are client oriented.
Nomura utilizes a variety of derivative financial instruments as a means of bridging clients’ specific financial needs and investors’ demands in the
securities markets. Nomura also actively trades securities and various derivatives to assist its clients in adjusting their risk profiles as markets change. In
performing these activities, Nomura carries an inventory of capital markets instruments and maintains its access to market liquidity by quoting bid and
offer prices to and trading with other market makers. These activities are essential to provide clients with securities and other capital market products at
competitive prices.
Futures and forward contracts are commitments to either purchase or sell securities, foreign currency or other capital market instruments at a
specific future date for a specified price and may be settled in cash or through delivery. Foreign exchange contracts include spot and forward contracts
and involve the exchange of two currencies at a rate agreed by the contracting parties. Risks arise from the possible inability of counterparties to meet
the terms of their contracts and from movements in market prices. Futures contracts are executed through regulated exchanges which clear and
guarantee performance of counterparties. Accordingly, credit risk associated with futures contracts is considered minimal. In contrast, forward contracts
are generally negotiated between two counterparties and, therefore, are subject to the performance of the related counterparties.
Options are contracts that grant the purchaser, for a premium payment, the right to either purchase or sell a financial instrument at a specified
price within a specified period of time or on a specified date from or to the writer of the option. The writer of options receives premiums and bears the
risk of unfavorable changes in the market price of the financial instruments underlying the options.
Swaps are contractual agreements in which two counterparties agree to exchange certain cash flows, at specified future dates, based on an agreed
contract. Certain agreements may result in combined interest rate and foreign currency exposures. Entering into swap agreements may involve the risk
of credit losses in the event of counterparty default.
To the extent these derivative financial instruments are economically hedging financial instruments or securities positions of Nomura, the overall
risk of loss may be fully or partly mitigated by the hedged position.
Nomura seeks to minimize its exposure to market risk arising from its use of these derivative financial instruments through various control
policies and procedures, including position limits, monitoring procedures and hedging strategies whereby Nomura enters into offsetting or other
positions in a variety of financial instruments.
68

Derivatives used for non-trading purposes
Nomura’s principal objectives in using derivatives for non-trading purposes are to manage interest rate risk, to modify the interest rate
characteristics of certain financial liabilities, to manage foreign exchange risk of certain foreign currency denominated debt securities, to manage net
investment exposure to fluctuations in foreign exchange rates arising from certain foreign operations and to mitigate equity price risk arising from
certain stock-based compensation awards given to employees.
Credit risk associated with derivatives utilized for non-trading purposes is controlled and managed in the same way as credit risk associated with
derivatives utilized for trading purposes.
Nomura designates certain derivative financial instruments as fair value hedges of interest rate risk arising from specific financial liabilities and
foreign currency risk arising from specific foreign currency denominated debt securities. These derivatives are effective in reducing the risk associated
with the exposure being hedged and are highly correlated with changes in the fair value and foreign currency rates of the underlying hedged items, both
at inception and throughout the life of the hedge contract. Changes in fair value of the hedging derivatives are reported together with those of the hedged
assets and liabilities through the consolidated statements of income within Interest expense or Revenue—Other.
Derivative financial instruments designated as hedges of the net investment in foreign operations relate to specific subsidiaries with non-Japanese
Yen functional currencies. When determining the effectiveness of net investment hedges, the effective portion of the change in fair value of the hedging
derivative is determined by changes in spot exchange rates and is reported through NHI shareholders’ equity within Accumulated other comprehensive
income (loss). Changes in fair value of the hedging derivatives attributable to changes in the difference between the forward rate and spot rate are
excluded from the measure of hedge effectiveness and are reported in the consolidated statements of income within Revenue—Other.
Concentrations of credit risk for derivatives
The following tables present Nomura’s significant concentration of exposures to credit risk in OTC derivatives with financial institutions
including transactions cleared through central counterparties as of March 31, 2020 and December 31, 2020. The gross fair value of derivative assets
represents the maximum amount of loss due to credit risk that Nomura would incur if the counterparties of Nomura failed to perform in accordance with
the terms of the instruments and any collateral or other security Nomura held in relation to those instruments proved to be of no value.
Billions of yen
March 31, 2020
Gross fair value of
derivative assets
Impact of
master netting
agreements
Impact of
collateral
Net exposure to
credit risk
Financial institutions ¥ 17,711 ¥ (15,479) ¥ (1,707) ¥ 525
Billions of yen
December 31, 2020
Gross fair value of
derivative assets
Impact of
master netting
agreements
Impact of
collateral
Net exposure to
credit risk
Financial institutions ¥ 14,667 ¥ (12,736) ¥ (1,624) ¥ 307
69
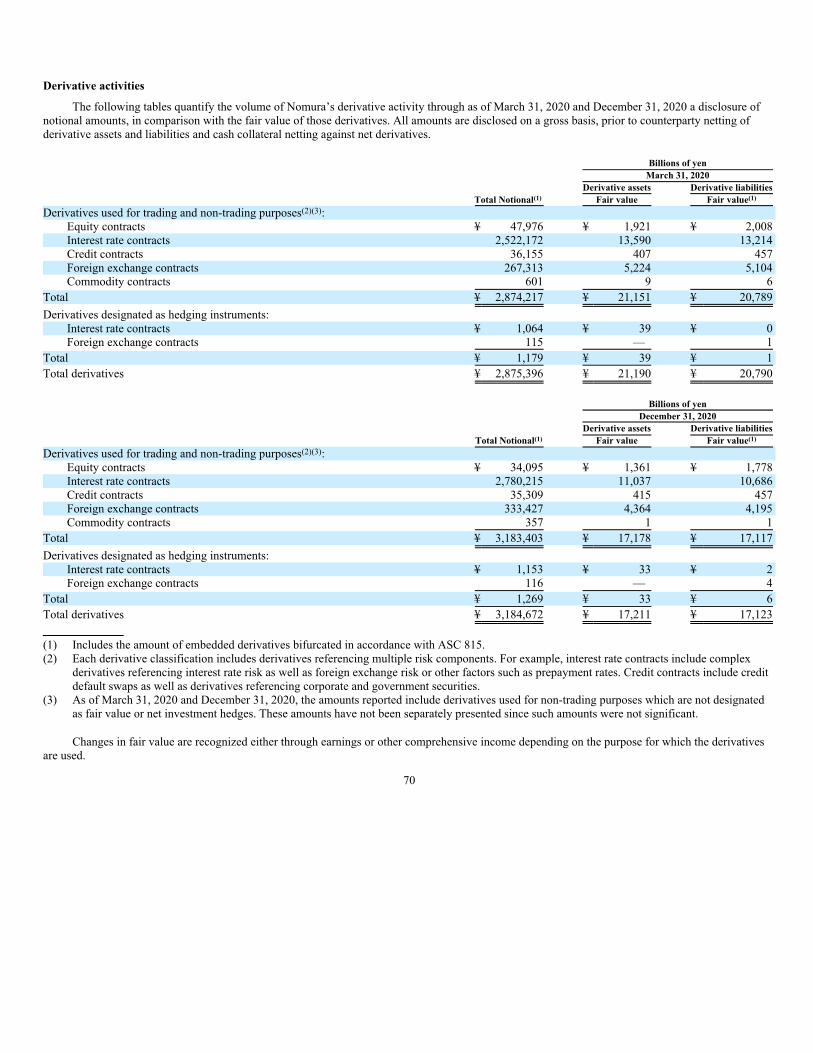
Derivative activities
The following tables quantify the volume of Nomura’s derivative activity through as of March 31, 2020 and December 31, 2020 a disclosure of
notional amounts, in comparison with the fair value of those derivatives. All amounts are disclosed on a gross basis, prior to counterparty netting of
derivative assets and liabilities and cash collateral netting against net derivatives.
Billions of yen
March 31, 2020
Derivative assets Derivative liabilities
Total Notional(1) Fair value Fair value(1)
Derivatives used for trading and non-trading purposes(2)(3):
Equity contracts ¥ 47,976 ¥ 1,921 ¥ 2,008
Interest rate contracts 2,522,172 13,590 13,214
Credit contracts 36,155 407 457
Foreign exchange contracts 267,313 5,224 5,104
Commodity contracts 601 9 6
Total ¥ 2,874,217 ¥ 21,151 ¥ 20,789
Derivatives designated as hedging instruments:
Interest rate contracts ¥ 1,064 ¥ 39 ¥ 0
Foreign exchange contracts 115 — 1
Total ¥ 1,179 ¥ 39 ¥ 1
Total derivatives ¥ 2,875,396 ¥ 21,190 ¥ 20,790
Billions of yen
December 31, 2020
Derivative assets Derivative liabilities
Total Notional(1) Fair value Fair value(1)
Derivatives used for trading and non-trading purposes(2)(3):
Equity contracts ¥ 34,095 ¥ 1,361 ¥ 1,778
Interest rate contracts 2,780,215 11,037 10,686
Credit contracts 35,309 415 457
Foreign exchange contracts 333,427 4,364 4,195
Commodity contracts 357 1 1
Total ¥ 3,183,403 ¥ 17,178 ¥ 17,117
Derivatives designated as hedging instruments:
Interest rate contracts ¥ 1,153 ¥ 33 ¥ 2
Foreign exchange contracts 116 — 4
Total ¥ 1,269 ¥ 33 ¥ 6
Total derivatives ¥ 3,184,672 ¥ 17,211 ¥ 17,123
(1) Includes the amount of embedded derivatives bifurcated in accordance with ASC 815.
(2) Each derivative classification includes derivatives referencing multiple risk components. For example, interest rate contracts include complex
derivatives referencing interest rate risk as well as foreign exchange risk or other factors such as prepayment rates. Credit contracts include credit
default swaps as well as derivatives referencing corporate and government securities.
(3) As of March 31, 2020 and December 31, 2020, the amounts reported include derivatives used for non-trading purposes which are not designated
as fair value or net investment hedges. These amounts have not been separately presented since such amounts were not significant.
Changes in fair value are recognized either through earnings or other comprehensive income depending on the purpose for which the derivatives
are used.
70

Offsetting of derivatives
Counterparty credit risk associated with derivative financial instruments is controlled by Nomura through credit approvals, limits and monitoring
procedures. To reduce the risk of loss, Nomura requires collateral, principally cash collateral and government securities, for certain derivative
transactions. In certain cases, Nomura may agree for such collateral to be posted to a third-party custodian under a control agreement that enables
Nomura to take control of such collateral in the event of counterparty default. From an economic standpoint, Nomura evaluates default risk exposure net
of related collateral. Furthermore, OTC derivative transactions are typically documented under industry standard master netting agreements which
reduce Nomura’s credit exposure to counterparties as they permit the close-out and offset of transactions and collateral amounts in the event of default
of the counterparty. For certain OTC centrally-cleared and exchange-traded derivatives, the clearing or membership agreements entered into by Nomura
provide similar rights to Nomura in the event of default of the relevant central clearing party or exchange. In order to support the enforceability of the
close-out and offsetting rights within these agreements, Nomura generally seeks to obtain an external legal opinion.
For certain types of counterparties and in certain jurisdictions, Nomura may enter into derivative transactions which are not documented under a
master netting agreement. Similarly, even when derivatives are documented under such agreements, Nomura may not have yet sought evidence, or may
not be able to obtain evidence to determine with sufficient certainty that close-out and offsetting rights are legally enforceable. This may be the case
where relevant local laws specifically prohibit such close-out and offsetting rights, or where local laws are complex, ambiguous or silent on the
enforceability of such rights. This may include derivative transactions executed with certain foreign governments, agencies, municipalities, central
clearing counterparties, exchanges and pension funds.
Nomura considers the enforceability of a master netting agreement in determining how credit risk arising from transactions with a specific
counterparty is hedged, how counterparty credit exposures are calculated and applied to credit limits and the extent and nature of collateral requirements
from the counterparty.
Derivative assets and liabilities with the same counterparty documented under a master netting agreement are offset in the consolidated balance
sheets where the specific criteria defined by ASC 210-20 “Balance Sheet—Offsetting” (“ASC210-20”) and ASC 815 are met. These criteria include
requirements around the legal enforceability of such close-out and offset rights under the master netting agreement. In addition, fair value amounts
recognized for the right to reclaim cash collateral (a receivable) and the obligation to return cash collateral (a payable) are also offset against net
derivative liabilities and net derivative assets, respectively where certain additional criteria are met.
The following table presents information about offsetting of derivatives and related collateral amounts in the consolidated balance sheets as of
March 31, 2020 and December 31, 2020 by type of derivative contract, together with the extent to which master netting agreements entered into with
counterparties, central clearing counterparties or exchanges permit additional offsetting of derivatives and collateral in the event of counterparty default.
Derivative transactions which are not documented under a master netting agreement or are documented under a master netting agreement for which
Nomura does not have sufficient evidence of enforceability are not offset in the following table.
71

Billions of yen Billions of yen
March 31, 2020 December 31, 2020
Derivative
assets
Derivative
liabilities(1)
Derivative
assets
Derivative
liabilities(1)
Equity contracts
OTC settled bilaterally ¥ 869 ¥ 875 ¥ 912 ¥ 1,198
Exchange-traded 1,052 1,133 449 580
Interest rate contracts
OTC settled bilaterally 11,881 11,438 9,684 9,284
OTC centrally-cleared 1,692 1,758 1,360 1,394
Exchange-traded 56 18 26 10
Credit contracts
OTC settled bilaterally 278 311 166 216
OTC centrally-cleared 126 132 248 239
Exchange-traded 3 14 1 2
Foreign exchange contracts
OTC settled bilaterally 5,224 5,105 4,364 4,199
Commodity contracts
OTC settled bilaterally 1 1 1 0
Exchange-traded 8 5 0 1
Total gross derivative balances(2) ¥ 21,190 ¥ 20,790 ¥ 17,211 ¥ 17,123
Less: Amounts offset in the consolidated balance sheets(3) (19,248) (18,987) (16,041) (15,676)
Total net amounts reported on the face of the consolidated balance sheets(4) ¥ 1,942 ¥ 1,803 ¥ 1,170 ¥ 1,447
Less: Additional amounts not offset in the consolidated balance sheets(5)
Financial instruments and non-cash collateral (182) (125) (133) (251)
Net amount ¥ 1,760 ¥ 1,678 ¥ 1,037 ¥ 1,196
(1) Includes the amount of embedded derivatives bifurcated in accordance with ASC 815.
(2) Includes all gross derivative asset and liability balances irrespective of whether they are transacted under a master netting agreement or whether
Nomura has obtained sufficient evidence of enforceability of the master netting agreement. As of March 31, 2020, the gross balance of derivative
assets and derivative liabilities which are not documented under master netting agreements or are documented under master netting agreements for
which Nomura has not yet obtained sufficient evidence of enforceability was ¥1,013 billion and ¥1,046 billion, respectively. As of December 31,
2020, the gross balance of such derivative assets and derivative liabilities was ¥468 billion and ¥580 billion, respectively.
(3) Represents amounts offset through counterparty netting of derivative assets and liabilities as well as cash collateral netting against net derivatives
under master netting and similar agreements for which Nomura has obtained sufficient evidence of enforceability in accordance with ASC 815. As
of March 31, 2020, Nomura offset a total of ¥1,679 billion of cash collateral receivables against net derivative liabilities and ¥1,940 billion of cash
collateral payables against net derivative assets. As of December 31, 2020, Nomura offset a total of ¥1,438 billion of cash collateral receivables
against net derivative liabilities and ¥1,803 billion of cash collateral payables against net derivative assets.
(4) Net derivative assets and net derivative liabilities are generally reported within Trading assets and private equity and debt investments—Trading
assets and Trading liabilities, respectively in the consolidated balance sheet. Bifurcated embedded derivatives are reported within Short-term
borrowings or Long-term borrowings depending on the maturity of the underlying host contract.
72

(5) Represents amounts which are not permitted to be offset on the face of the consolidated balance sheets in accordance with ASC 210-20 and ASC
815 but which provide Nomura with a legally enforceable right of offset in the event of counterparty default. Amounts relating to derivative and
collateral agreements where Nomura has not yet obtained sufficient evidence of enforceability of such offsetting rights are excluded. As of
March 31, 2020, a total of ¥374 billion of cash collateral receivables and ¥540 billion of cash collateral payables, including amounts reported in
the table, have not been offset against net derivatives. As of December 31, 2020, a total of ¥189 billion of cash collateral receivables and
¥499 billion of cash collateral payables, including amounts reported in the table, have not been offset against net derivatives.
Derivatives used for trading purposes
Derivative financial instruments used for trading purposes, including bifurcated embedded derivatives, are carried at fair value with changes in
fair value recognized through the consolidated statements of income within Revenue—Net gain on trading.
The following tables present amounts included in the consolidated statements of income for the nine and three months ended December 31, 2019
and 2020 related to derivatives used for trading and non-trading purposes by type of underlying derivative contract.
Billions of yen
Nine months ended December 31
2019 2020
Derivatives used for trading and non-trading purposes(1)(2):
Equity contracts ¥ 125 ¥ 47
Interest rate contracts 95 126
Credit contracts (116) (74)
Foreign exchange contracts (13) (41)
Commodity contracts 10 6
Total ¥ 101 ¥ 64
Billions of yen
Three months ended December 31
2019 2020
Derivatives used for trading and non-trading purposes(1)(2):
Equity contracts ¥ 79 ¥ (43)
Interest rate contracts 23 (50)
Credit contracts (12) 11
Foreign exchange contracts 71 11
Commodity contracts 8 16
Total ¥ 169 ¥ (55)
(1) Each derivative classification includes derivatives referencing multiple risk components. For example, interest rates contracts include complex
derivatives referencing interest rate risk as well as foreign exchange risk or other factors such as prepayment rates. Credit contracts include credit
default swaps as well as derivatives referencing corporate and government securities.
(2) Includes net gains (losses) on derivatives used for non-trading purposes which are not designated as fair value or net investment hedges. For the
nine and three months ended December 31, 2019 and 2020, these amounts have not been separately presented as net gains (losses) for these
non-trading derivatives were not significant.
73

Fair value hedges
Nomura issues Japanese Yen and foreign currency denominated debt with both fixed and floating interest rates. Nomura generally enters into
swap agreements to convert fixed rate interest payments on its debt obligations to a floating rate and applies fair value hedge accounting to these
instruments.
The following table presents the carrying value of the hedged items that are currently designated in a hedging relationship and the related
cumulative amount of fair value hedging adjustment included in the carrying amount of the hedged items as of March 31, 2020 and December 31, 2020.
Billions of yen
Line items in the statement of financial
position in which the hedged item is included:
Carrying amount of the hedged assets/liabilities
Cumulative gains/(losses) of fair value hedging
adjustment included in the carrying amount of the
hedged assets/liabilities
March 31, 2020 December 31, 2020 March 31, 2020 December 31, 2020
Long-term borrowings ¥ 1,098 ¥ 1,024 ¥ (36) ¥ (24)
Total ¥ 1,098 ¥ 1,024 ¥ (36) ¥ (24)
Hedging derivatives designated as fair value hedges are carried at fair value attributable to the hedged risk, which is recognized in the
consolidated statements of income within Interest expense and Revenue-Other, respectively together with the change in fair value of the hedged items.
The following tables present amounts included in the consolidated statements of income for the nine and three months ended December 31, 2019
and 2020 related to derivatives designated as fair value hedges by type of underlying derivative contract and the nature of the hedged item.
Billions of yen
Nine months ended December 31
2019 2020
Derivatives designated as hedging instruments:
Interest rate contracts ¥ 1 ¥ 6
Total ¥ 1 ¥ 6
Hedged items:
Long-term borrowings ¥ (1) ¥ (6)
Total ¥ (1) ¥ (6)
Billions of yen
Three months ended December 31
2019 2020
Derivatives designated as hedging instruments:
Interest rate contracts ¥ 3 ¥ 7
Total ¥ 3 ¥ 7
Hedged items:
Long-term borrowings ¥ (3) ¥ (7)
Total ¥ (3) ¥ (7)
74

Net investment hedges
Nomura designates foreign currency forwards, etc., as hedges of certain subsidiaries with significant foreign exchange risks and applies hedge
accounting to these instruments. Accordingly, the effective hedging portion of the foreign exchange gains (losses) arising from the derivative contracts
and non-derivative financial products designated as hedges, except for the portion excluded from effectiveness assessment, is recognized through the
consolidated statements of comprehensive income within Other comprehensive income (loss)—Change in cumulative translation adjustments, net of tax.
This is offset by the foreign exchange adjustments arising from consolidation of the relevant foreign subsidiaries.
The following tables present gains (losses) from derivativesdesignated as net investment hedges included in the consolidated statements of
comprehensive income for the nine and three months ended December 31, 2019 and 2020.
Billions of yen
Nine months ended December 31
2019 2020
Hedging instruments:
Foreign exchange contracts ¥ 0 ¥ (13)
Total ¥ 0 ¥ (13)
Billions of yen
Three months ended December 31
2019 2020
Hedging instruments:
Foreign exchange contracts ¥ (3) ¥ (6)
Total ¥ (3) ¥ (6)
(1) The portion of gains (losses) representing the amount of hedge ineffectiveness and the amount excluded from the assessment of hedge
effectiveness are recognized within Revenue—Other in the consolidated statements of income. The amount of gains (losses) was not significant
during the nine months ended December 31, 2019 and 2020. The amount of gains (losses) was not significant during the three months ended
December 31, 2019 and 2020.
Derivatives containing credit risk related contingent features
Nomura enters into certain OTC derivatives and other agreements containing credit-risk-related contingent features. These features would require
Nomura to post additional collateral or settle the instrument upon occurrence of a credit event, the most common of which would be a downgrade in the
Company’s long-term credit rating.
The aggregate fair value of all derivative instruments with credit-risk-related contingent features that are in a liability position as of March 31,
2020 was ¥750 billion with related collateral pledged of ¥635 billion. In the event of a one-notch downgrade to Nomura’s long-term credit rating in
effect as of March 31, 2020 the aggregate fair value of assets that would have been required to be posted as additional collateral or that would have been
needed to settle the instruments immediately was ¥3 billion.
The aggregate fair value of all derivative instruments with credit-risk-related contingent features that are in a liability position as of December 31,
2020 was ¥668 billion with related collateral pledged of ¥490 billion. In the event of a one-notch downgrade to Nomura’s long-term credit rating in
effect as of December 31, 2020 the aggregate fair value of assets that would have been required to be posted as additional collateral or that would have
been needed to settle the instruments immediately was ¥1 billion.
75
Credit derivatives
Credit derivatives are derivative instruments in which one or more of their underlyings are related to the credit risk of a specified entity (or group
of entities) or an index based on the credit risk of a group of entities that expose the seller of credit protection to potential loss from credit risk related
events specified in the contract.
Written credit derivatives are instruments or embedded features where Nomura assumes third party credit risk, either as guarantor in a guarantee-
type contract, or as the party that provides credit protection in an option-type contract, credit default swap, or any other credit derivative contract.
Nomura enters into credit derivatives as part of its normal trading activities as both purchaser and seller of protection for credit risk mitigation,
proprietary trading positions and for client transactions.
The most significant type of credit derivatives used by Nomura are single-name credit default swaps where settlement of the derivative is based on
the credit risk of a single third party. Nomura also writes credit derivatives linked to the performance of credit default indices and issues other credit risk
related portfolio products.
Nomura would have to perform under a credit derivative contract if a credit event as defined in the respective contract occurs. Typical credit
events include bankruptcy, failure to pay and restructuring of obligations of the reference asset.
Credit derivative contracts written by Nomura are either cash or physically settled. In cash-settled instruments, once payment is made upon an
event of a default, the contract usually terminates with no further payments due. Nomura generally has no right to assume the reference assets of the
counterparty in exchange for payment, nor does Nomura usually have any direct recourse to the actual issuers of the reference assets to recover the
amount paid. In physically settled contracts, upon a default event, Nomura takes delivery of the reference asset in return for payment of the full notional
amount of the contract.
Nomura actively monitors and manages its credit derivative exposures. Where protection is sold, risks may be mitigated by purchasing credit
protection from other third parties either on identical underlying reference assets or on underlying reference assets with the same issuer which would be
expected to behave in a correlated fashion. The most common form of recourse provision to enable Nomura to recover from third parties any amounts
paid under a written credit derivative is therefore not through the derivative itself but rather through the separate purchase of credit derivatives with
identical or correlated underlyings.
Nomura quantifies the value of these purchased contracts in the following tables in the column titled “Purchased Credit Protection.” These
amounts represent purchased credit protection with identical underlyings to the written credit derivative contracts which act as a hedge against
Nomura’s exposure. To the extent Nomura is required to pay out under the written credit derivative, a similar amount would generally become due to
Nomura under the purchased hedge.
Credit derivatives have a stated notional amount which represents the maximum payment Nomura may be required to make under the contract.
However, this is generally not a true representation of the amount Nomura will actually pay as in addition to purchased credit protection, other risk
mitigating factors reduce the likelihood and amount of any payment, including:
The probability of default: Nomura values credit derivatives taking into account the probability that the underlying reference asset will default and
that Nomura will be required to make payments under the contract. Based on historical experience and Nomura’s assessment of the market, Nomura
believes that the probability that all reference assets on which Nomura provides protection will default in a single period is remote. The disclosed
notional amount, therefore, significantly overstates Nomura’s realistic exposure on these contracts.
The recovery value on the underlying asset: In the case of a default, Nomura’s liability on a contract is limited to the difference between the
notional amount and the recovery value of the underlying reference asset. While the recovery value on a defaulted asset may be minimal, this does
reduce amounts paid on these contracts.
Nomura holds assets as collateral in relation to written credit derivatives. However, these amounts do not enable Nomura to recover any amounts
paid under the credit derivative but rather mitigate the risk of economic loss arising from a counterparty defaulting against amounts due to Nomura
under the contract. Collateral requirements are determined on a counterparty level rather than individual contract, and also generally cover all types of
derivative contracts rather than just credit derivatives.
76

The following tables present information about Nomura’s written credit derivatives and purchased credit protection with identical underlyings as
of March 31, 2020 and December 31, 2020.
Billions of yen
March 31, 2020
Maximum potential payout/Notional Notional
Years to maturity Purchased
credit
protection
Carrying value
(Asset) / Liability(1) Total
Less than
1 year
1 to 3
years
3 to 5
years
More than
5 years
Single-name credit default swaps ¥ 96 ¥ 8,018 ¥ 2,323 ¥2,238 ¥2,552 ¥ 905 ¥ 5,836
Credit default indices 18 8,064 721 2,455 4,179 709 6,364
Other credit risk related portfolio products 65 357 39 130 175 13 274
Credit-risk related options and swaptions 1 16 — — 16 — 16
Total ¥ 180 ¥16,455 ¥ 3,083 ¥4,823 ¥6,922 ¥ 1,627 ¥ 12,490
Billions of yen
December 31, 2020
Maximum potential payout/Notional Notional
Years to maturity Purchased
credit
protection
Carrying value
(Asset) / Liability(1) Total
Less than
1 year
1 to 3
years
3 to 5
years
More than
5 years
Single-name credit default swaps ¥ (101) ¥ 6,541 ¥ 1,321 ¥2,174 ¥2,373 ¥ 673 ¥ 4,948
Credit default indices (229) 8,901 970 3,529 3,719 683 6,764
Other credit risk related portfolio products 35 358 70 157 119 12 251
Credit-risk related options and swaptions 0 10 — — 10 — 3
Total ¥ (295) ¥15,810 ¥ 2,361 ¥5,860 ¥6,221 ¥ 1,368 ¥ 11,966
(1) Carrying value amounts are shown on a gross basis prior to cash collateral or counterparty netting. Asset balances represent positive fair value
amounts caused by tightening of credit spreads of underlyings since inception of the credit derivative contracts.
The following tables present information about Nomura’s written credit derivatives by external credit rating of the underlying asset. Ratings are
based on S&P Global Ratings (“S&P”), or if not rated by S&P, based on Moody’s Investors Service. If ratings from either of these agencies are not
available, the ratings are based on Fitch Ratings Ltd. or Japan Credit Rating Agency, Ltd. For credit default indices, the rating is determined by taking
the weighted average of the external credit ratings given for each of the underlying reference entities comprising the portfolio or index.
Billions of yen
March 31, 2020
Maximum potential payout/Notional
AAA AA A BBB BB Other(1) Total
Single-name credit default swaps ¥122 ¥1,683 ¥1,935 ¥2,643 ¥1,198 ¥ 437 ¥ 8,018
Credit default indices 24 153 2,211 4,027 1,318 331 8,064
Other credit risk related portfolio products — — 2 191 73 91 357
Credit-risk related options and swaptions — — — — 16 — 16
Total ¥146 ¥1,836 ¥4,148 ¥6,861 ¥2,605 ¥ 859 ¥16,455
Billions of yen
December 31, 2020
Maximum potential payout/Notional
AAA AA A BBB BB Other(1) Total
Single-name credit default swaps ¥126 ¥1,383 ¥1,719 ¥2,322 ¥ 795 ¥ 196 ¥ 6,541
Credit default indices 50 208 2,365 4,670 1,286 322 8,901
Other credit risk related portfolio products — — 1 217 53 87 358
Credit-risk related options and swaptions — — — 7 3 — 10
Total ¥176 ¥1,591 ¥4,085 ¥7,216 ¥2,137 ¥ 605 ¥15,810
(1) “Other” includes credit derivatives where the credit rating of the underlying reference asset is below investment grade or where a rating is
unavailable.
77

Derivatives entered into in contemplation of sales of financial assets
Nomura enters into transactions which involve both the transfer of financial assets to a third party counterparty and a separate agreement with the
same counterparty entered into in contemplation of the initial transfer through which Nomura retains substantially all of the exposure to the economic
return on the transferred financial assets throughout the term of the transaction. These transactions primarily include sales of securities with bilateral
OTC total return swaps or other derivative agreements which are in-substance total return swaps. These transactions are accounted for as sales of the
securities with the derivative accounted for separately if the criteria for derecognition of the securities under ASC 860 are met. Where the derecognition
criteria are not met, the transfer and separate derivative are accounted for as a single collateralized financing transaction which is reported within Long-
term borrowings—Trading balances of secured borrowings in the consolidated balance sheets.
As of March 31, 2020 and December 31, 2020, there were no outstanding sales with total return swap or in-substance total return swap
transactions accounted for as sales rather than collateralized financing transactions.
For the nine months ended December 31, 2020, certain transactions which involve sales of securities and total return swaps were accounted for as
sales. As of the date of derecognition, the carrying amount of the securities and the amount of gross cash proceeds from the sales were ¥69,405 million
and ¥69,535 million, respectively. As of December 31, 2020, the fair value of the securities derecognized by Nomura and the gross liability balances of
the total return swaps arising from the transaction were ¥68,402 million and ¥974 million respectively.
78

4. Revenue from services provided to customers
Revenues by types of service
The following table presents revenue earned by Nomura from providing services to customers by relevant line item in Nomura’s consolidated statement of income for the nine and three months ended December 31, 2019 and 2020.
Millions of yen
Nine months ended December 31
2019 2020
Commissions ¥ 212,743 ¥ 274,452Fees from investment banking 76,379 73,997Asset management and portfolio service fees 180,909 169,712Other revenue 35,145 32,787Total ¥ 505,176 ¥ 550,948
Millions of yen
Three months ended December 31
2019 2020
Commissions ¥ 79,289 ¥ 96,687Fees from investment banking 26,803 36,138Asset management and portfolio service fees 61,020 58,639Other revenue 13,004 10,294Total ¥ 180,116 ¥ 201,758
Amounts reported in Commissions is principally recognized from Trade execution and clearing services provided to the customers, and about half of which is reported in Retail Division and the remaining balance is mainly reported in Wholesale Division. Fees from investment banking is recognized from Financial advisory services as well as Underwriting and syndication services provided to the customers, and is predominantly reported in Wholesale Division and the remaining balance is reported in Retail Division. Asset management and portfolio service fees is recognized from Asset management services provided to the customers, and is predominantly reported in Asset Management Division and the remaining balance is mainly reported in Retail Division. Other is primarily reported in Other segment.
The following table presents summary information regarding the key methodologies, assumptions and judgments used in recognizing revenue for each of the primary types of service provided to customers, including the nature of underlying performance obligations within each type of service and whether those performance obligations are satisfied at a point in time or over a period of time. For performance obligations recognized over time, information is also provided to explain the nature of the input or output method used to recognize revenue over time.
Type of service provided to
customers Overview of key services provided
Key revenue recognition policies, assumptions and
significant judgments
Trade execution and clearing services
• Buying and selling of securities on behalf of customers
• Clearing of securities and derivatives on behalf of customers
• Execution and clearing commissions recognized at a point in time, namely trade date.
• Commissions recognized net of soft dollar credits provided to customers where Nomura is acting as agent in providing investment research and similar services to the customer.
79
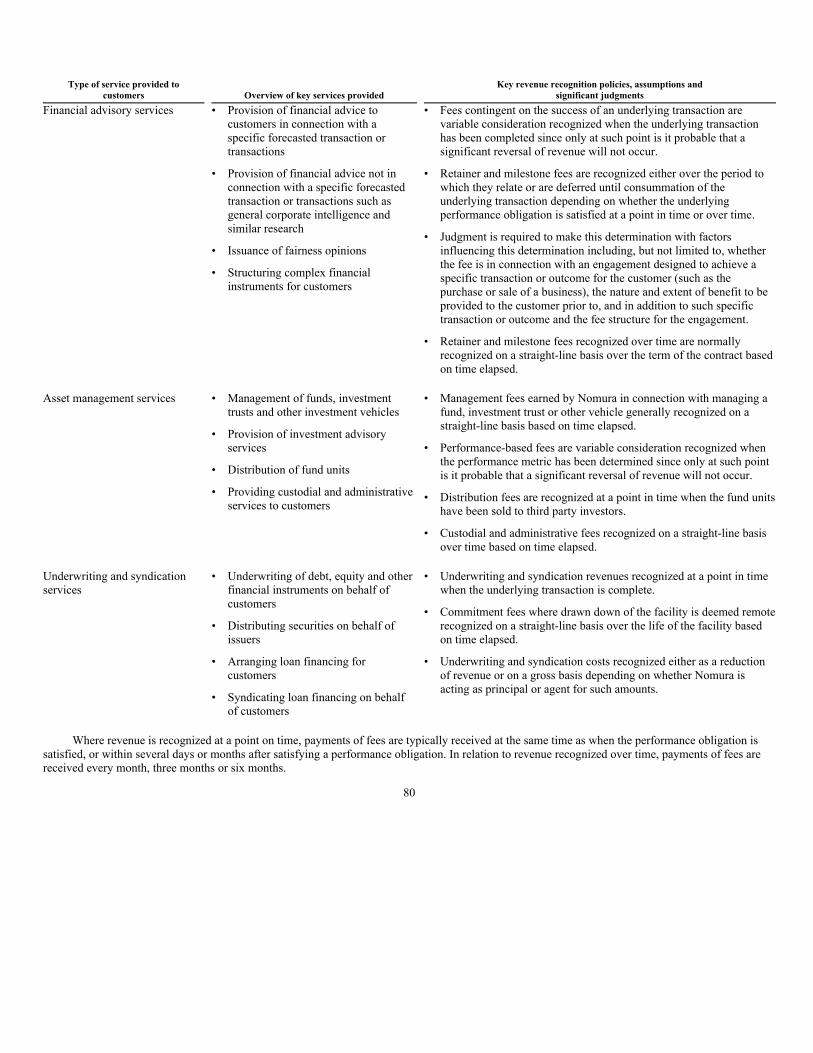
Type of service provided to
customers Overview of key services provided
Key revenue recognition policies, assumptions and
significant judgments
Financial advisory services • Provision of financial advice to customers in connection with a specific forecasted transaction or transactions
• Provision of financial advice not in connection with a specific forecasted transaction or transactions such as general corporate intelligence and similar research
• Issuance of fairness opinions
• Structuring complex financial instruments for customers
• Fees contingent on the success of an underlying transaction are variable consideration recognized when the underlying transaction has been completed since only at such point is it probable that a significant reversal of revenue will not occur.
• Retainer and milestone fees are recognized either over the period to which they relate or are deferred until consummation of the underlying transaction depending on whether the underlying performance obligation is satisfied at a point in time or over time.
• Judgment is required to make this determination with factors influencing this determination including, but not limited to, whether the fee is in connection with an engagement designed to achieve a specific transaction or outcome for the customer (such as the purchase or sale of a business), the nature and extent of benefit to be provided to the customer prior to, and in addition to such specific transaction or outcome and the fee structure for the engagement.
• Retainer and milestone fees recognized over time are normally recognized on a straight-line basis over the term of the contract based on time elapsed.
Asset management services • Management of funds, investment trusts and other investment vehicles
• Provision of investment advisory services
• Distribution of fund units
• Providing custodial and administrative services to customers
• Management fees earned by Nomura in connection with managing a fund, investment trust or other vehicle generally recognized on a straight-line basis based on time elapsed.
• Performance-based fees are variable consideration recognized when the performance metric has been determined since only at such point is it probable that a significant reversal of revenue will not occur.
• Distribution fees are recognized at a point in time when the fund units have been sold to third party investors.
• Custodial and administrative fees recognized on a straight-line basis over time based on time elapsed.
Underwriting and syndication services
• Underwriting of debt, equity and other financial instruments on behalf of customers
• Distributing securities on behalf of issuers
• Arranging loan financing for customers
• Syndicating loan financing on behalf of customers
• Underwriting and syndication revenues recognized at a point in time when the underlying transaction is complete.
• Commitment fees where drawn down of the facility is deemed remote recognized on a straight-line basis over the life of the facility based on time elapsed.
• Underwriting and syndication costs recognized either as a reduction of revenue or on a gross basis depending on whether Nomura is acting as principal or agent for such amounts.
Where revenue is recognized at a point on time, payments of fees are typically received at the same time as when the performance obligation is satisfied, or within several days or months after satisfying a performance obligation. In relation to revenue recognized over time, payments of fees are received every month, three months or six months.
80
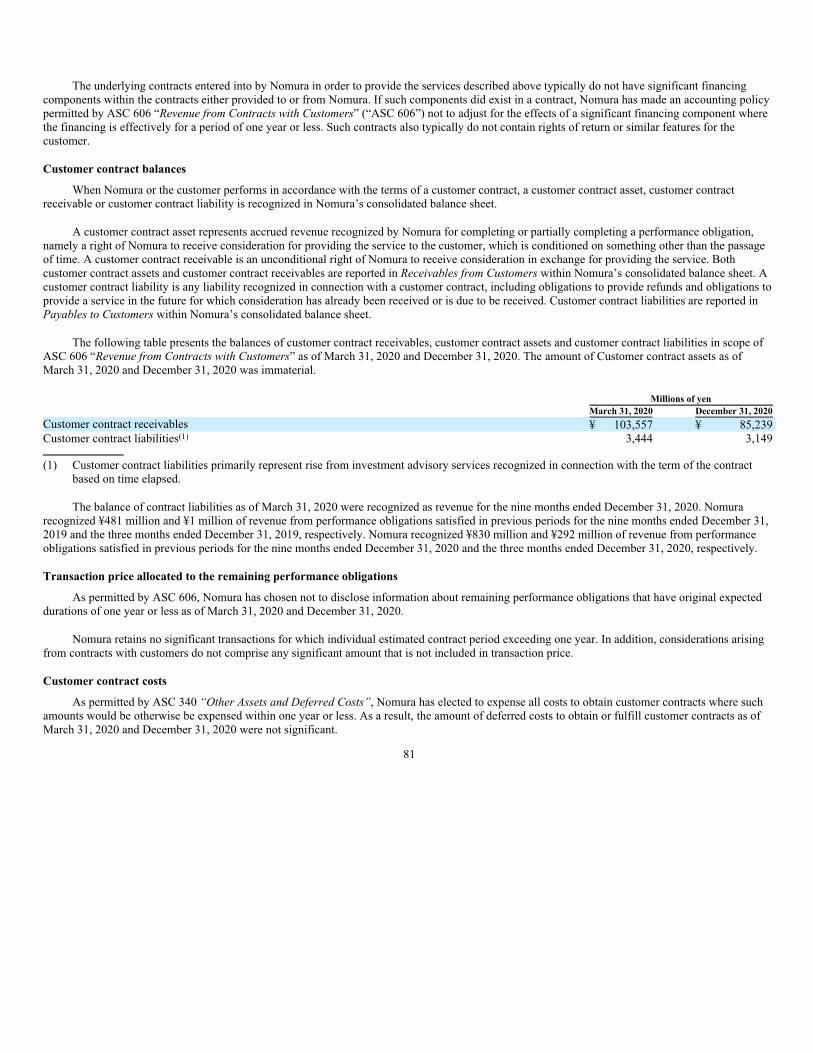
The underlying contracts entered into by Nomura in order to provide the services described above typically do not have significant financing
components within the contracts either provided to or from Nomura. If such components did exist in a contract, Nomura has made an accounting policy
permitted by ASC 606 “Revenue from Contracts with Customers” (“ASC 606”) not to adjust for the effects of a significant financing component where
the financing is effectively for a period of one year or less. Such contracts also typically do not contain rights of return or similar features for the
customer.
Customer contract balances
When Nomura or the customer performs in accordance with the terms of a customer contract, a customer contract asset, customer contract
receivable or customer contract liability is recognized in Nomura’s consolidated balance sheet.
A customer contract asset represents accrued revenue recognized by Nomura for completing or partially completing a performance obligation,
namely a right of Nomura to receive consideration for providing the service to the customer, which is conditioned on something other than the passage
of time. A customer contract receivable is an unconditional right of Nomura to receive consideration in exchange for providing the service. Both
customer contract assets and customer contract receivables are reported in Receivables from Customers within Nomura’s consolidated balance sheet. A
customer contract liability is any liability recognized in connection with a customer contract, including obligations to provide refunds and obligations to
provide a service in the future for which consideration has already been received or is due to be received. Customer contract liabilities are reported in
Payables to Customers within Nomura’s consolidated balance sheet.
The following table presents the balances of customer contract receivables, customer contract assets and customer contract liabilities in scope of
ASC 606 “Revenue from Contracts with Customers” as of March 31, 2020 and December 31, 2020. The amount of Customer contract assets as of
March 31, 2020 and December 31, 2020 was immaterial.
Millions of yen
March 31, 2020 December 31, 2020
Customer contract receivables ¥ 103,557 ¥ 85,239
Customer contract liabilities(1) 3,444 3,149
(1) Customer contract liabilities primarily represent rise from investment advisory services recognized in connection with the term of the contract
based on time elapsed.
The balance of contract liabilities as of March 31, 2020 were recognized as revenue for the nine months ended December 31, 2020. Nomura
recognized ¥481 million and ¥1 million of revenue from performance obligations satisfied in previous periods for the nine months ended December 31,
2019 and the three months ended December 31, 2019, respectively. Nomura recognized ¥830 million and ¥292 million of revenue from performance
obligations satisfied in previous periods for the nine months ended December 31, 2020 and the three months ended December 31, 2020, respectively.
Transaction price allocated to the remaining performance obligations
As permitted by ASC 606, Nomura has chosen not to disclose information about remaining performance obligations that have original expected
durations of one year or less as of March 31, 2020 and December 31, 2020.
Nomura retains no significant transactions for which individual estimated contract period exceeding one year. In addition, considerations arising
from contracts with customers do not comprise any significant amount that is not included in transaction price.
Customer contract costs
As permitted by ASC 340 “Other Assets and Deferred Costs”, Nomura has elected to expense all costs to obtain customer contracts where such
amounts would be otherwise be expensed within one year or less. As a result, the amount of deferred costs to obtain or fulfill customer contracts as of
March 31, 2020 and December 31, 2020 were not significant.
81
5. Collateralized transactions:
Nomura enters into collateralized transactions, including reverse repurchase agreements, repurchase agreements, securities borrowing
transactions, securities lending transactions, other secured borrowings and similar transactions mainly to meet clients’ needs, finance trading inventory
positions and obtain securities for settlements.
Reverse repurchase agreements, repurchase agreements, securities borrowing transactions and securities lending transactions are typically
documented under industry standard master netting agreements which reduce Nomura’s credit exposure to counterparties as they permit the close-out
and offset of transactions and collateral amounts in the event of default of the counterparty. For certain centrally-cleared reverse repurchase and
repurchase agreements, the clearing or membership agreements entered into by Nomura provide similar rights to Nomura in the event of default of the
relevant central clearing counterparty. In order to support the enforceability of the close-out and offsetting rights within these agreements, Nomura
generally seeks to obtain an external legal opinion.
For certain types of counterparty and in certain jurisdictions, Nomura may enter into reverse repurchase agreements, repurchase agreements,
securities borrowing and securities lending transactions which are not documented under a master netting agreement. Similarly, even when these
transactions are documented under such agreements, Nomura may not have yet sought evidence, or may not be able to obtain evidence to determine
with sufficient certainty that the close-out and offsetting rights are legally enforceable. This may be the case where relevant local laws specifically
prohibit such close-out and offsetting rights, or where local laws are complex, ambiguous or silent on the enforceability of such rights. This may include
reverse repurchase agreements, repurchase agreements, securities borrowing and securities lending transactions executed with certain foreign
governments, agencies, municipalities, central clearing counterparties, agent banks and pension funds.
Nomura considers the enforceability of a master netting agreement in determining how credit risk arising from transactions with a specific
counterparty is hedged, how counterparty credit exposures are calculated and applied to credit limits and the extent and nature of collateral requirements
from the counterparty.
In all of these transactions, Nomura either receives or provides collateral, including Japanese and non-Japanese government, agency, mortgage-
backed, bank and corporate debt securities and equities. In most cases, Nomura is permitted to use the securities received to enter into repurchase
agreements, enter into securities lending transactions or to cover short positions with counterparties. In repurchase and reverse repurchase agreements,
the value of collateral typically exceeds the amount of cash transferred. Collateral is generally in the form of securities. Securities borrowing
transactions generally require Nomura to provide the counterparty with collateral in the form of cash or other securities. For securities lending
transactions, Nomura generally receives collateral in the form of cash or other securities. Nomura monitors the market value of the securities either
received from or provided to the counterparty. Additional cash or securities are exchanged as necessary, to ensure that such transactions are adequately
collateralized throughout the life of the transactions.
Offsetting of certain collateralized transactions
Reverse repurchase agreements and repurchase agreements, securities borrowing and lending transactions with the same counterparty documented
under a master netting agreement are offset in the consolidated balance sheets where the specific criteria defined by ASC 210-20 are met. These criteria
include requirements around the maturity of the transactions, the underlying systems on which the collateral is settled, associated banking arrangements
and the legal enforceability of close-out and offsetting rights under the master netting agreement.
The following tables present information about offsetting of these transactions in the consolidated balance sheets as of March 31, 2020 and
December 31, 2020, together with the extent to which master netting agreements entered into with counterparties and central clearing parties permit
additional offsetting in the event of counterparty default. Transactions which are not documented under a master netting agreement or are documented
under a master netting agreement for which Nomura does not have sufficient evidence of enforceability are not offset in the following tables.
82
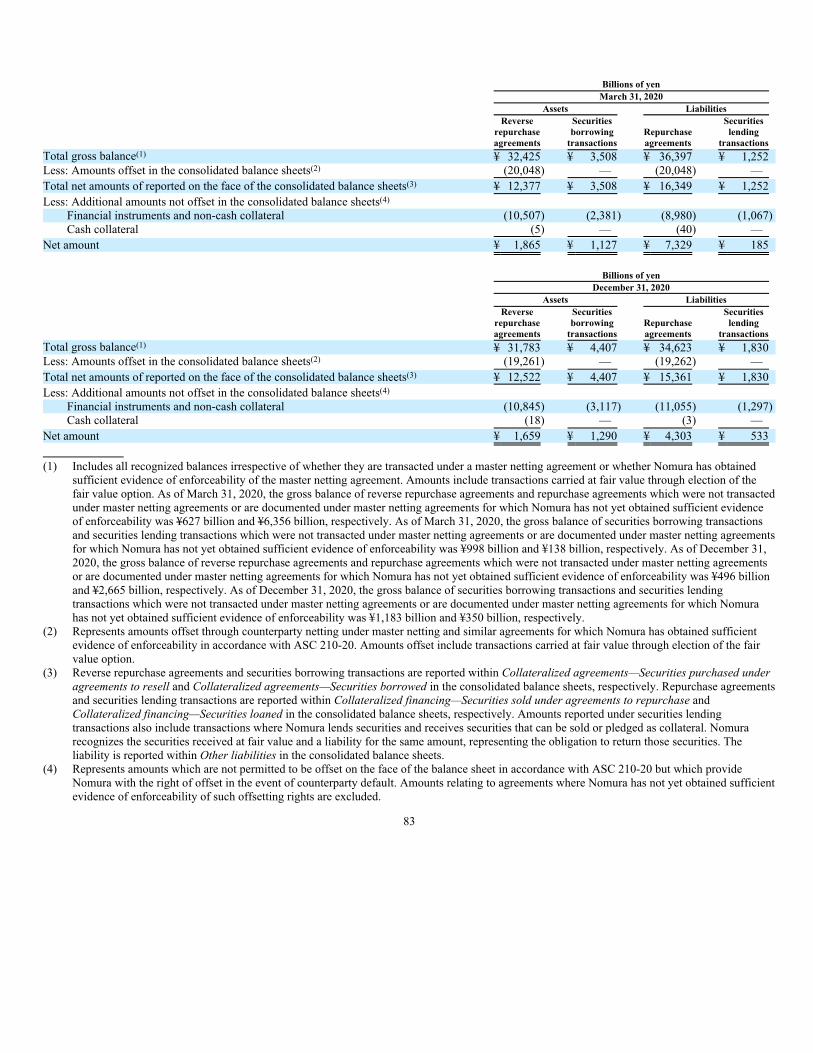
Billions of yen
March 31, 2020
Assets Liabilities
Reverse
repurchase
agreements
Securities
borrowing
transactions
Repurchase
agreements
Securities
lending
transactions
Total gross balance(1) ¥ 32,425 ¥ 3,508 ¥ 36,397 ¥ 1,252
Less: Amounts offset in the consolidated balance sheets(2) (20,048) — (20,048) —
Total net amounts of reported on the face of the consolidated balance sheets(3) ¥ 12,377 ¥ 3,508 ¥ 16,349 ¥ 1,252
Less: Additional amounts not offset in the consolidated balance sheets(4)
Financial instruments and non-cash collateral (10,507) (2,381) (8,980) (1,067)
Cash collateral (5) — (40) —
Net amount ¥ 1,865 ¥ 1,127 ¥ 7,329 ¥ 185
Billions of yen
December 31, 2020
Assets Liabilities
Reverse
repurchase
agreements
Securities
borrowing
transactions
Repurchase
agreements
Securities
lending
transactions
Total gross balance(1) ¥ 31,783 ¥ 4,407 ¥ 34,623 ¥ 1,830
Less: Amounts offset in the consolidated balance sheets(2) (19,261) — (19,262) —
Total net amounts of reported on the face of the consolidated balance sheets(3) ¥ 12,522 ¥ 4,407 ¥ 15,361 ¥ 1,830
Less: Additional amounts not offset in the consolidated balance sheets(4)
Financial instruments and non-cash collateral (10,845) (3,117) (11,055) (1,297)
Cash collateral (18) — (3) —
Net amount ¥ 1,659 ¥ 1,290 ¥ 4,303 ¥ 533
(1) Includes all recognized balances irrespective of whether they are transacted under a master netting agreement or whether Nomura has obtained
sufficient evidence of enforceability of the master netting agreement. Amounts include transactions carried at fair value through election of the
fair value option. As of March 31, 2020, the gross balance of reverse repurchase agreements and repurchase agreements which were not transacted
under master netting agreements or are documented under master netting agreements for which Nomura has not yet obtained sufficient evidence
of enforceability was ¥627 billion and ¥6,356 billion, respectively. As of March 31, 2020, the gross balance of securities borrowing transactions
and securities lending transactions which were not transacted under master netting agreements or are documented under master netting agreements
for which Nomura has not yet obtained sufficient evidence of enforceability was ¥998 billion and ¥138 billion, respectively. As of December 31,
2020, the gross balance of reverse repurchase agreements and repurchase agreements which were not transacted under master netting agreements
or are documented under master netting agreements for which Nomura has not yet obtained sufficient evidence of enforceability was ¥496 billion
and ¥2,665 billion, respectively. As of December 31, 2020, the gross balance of securities borrowing transactions and securities lending
transactions which were not transacted under master netting agreements or are documented under master netting agreements for which Nomura
has not yet obtained sufficient evidence of enforceability was ¥1,183 billion and ¥350 billion, respectively.
(2) Represents amounts offset through counterparty netting under master netting and similar agreements for which Nomura has obtained sufficient
evidence of enforceability in accordance with ASC 210-20. Amounts offset include transactions carried at fair value through election of the fair
value option.
(3) Reverse repurchase agreements and securities borrowing transactions are reported within Collateralized agreements—Securities purchased under
agreements to resell and Collateralized agreements—Securities borrowed in the consolidated balance sheets, respectively. Repurchase agreements
and securities lending transactions are reported within Collateralized financing—Securities sold under agreements to repurchase and
Collateralized financing—Securities loaned in the consolidated balance sheets, respectively. Amounts reported under securities lending
transactions also include transactions where Nomura lends securities and receives securities that can be sold or pledged as collateral. Nomura
recognizes the securities received at fair value and a liability for the same amount, representing the obligation to return those securities. The
liability is reported within Other liabilities in the consolidated balance sheets.
(4) Represents amounts which are not permitted to be offset on the face of the balance sheet in accordance with ASC 210-20 but which provide
Nomura with the right of offset in the event of counterparty default. Amounts relating to agreements where Nomura has not yet obtained sufficient
evidence of enforceability of such offsetting rights are excluded.
83

Maturity analysis of repurchase agreements and securities lending transactions
The following table presents an analysis of the total carrying value of liabilities recognized in the consolidated balance sheets for repurchase
agreements and securities lending transactions by remaining contractual maturity of the agreement as of March 31, 2020 and December 31, 2020.
Amounts reported are shown prior to counterparty netting in accordance with ASC 210-20.
Billions of yen
March 31, 2020
Overnight
and open(1)
Up to
30 days
30 – 90
days 90 days – 1 year
Greater
than 1 year Total
Repurchase agreements ¥ 11,004 ¥21,505 ¥2,570 ¥ 983 ¥ 335 ¥36,397
Securities lending transactions 650 144 227 231 0 1,252
Total gross recognized liabilities(2) ¥ 11,654 ¥21,649 ¥2,797 ¥ 1,214 ¥ 335 ¥37,649
Billions of yen
December 31, 2020
Overnight
and open(1)
Up to
30 days
30 – 90
days 90 days – 1 year
Greater
than 1 year Total
Repurchase agreements ¥ 12,707 ¥19,183 ¥1,692 ¥ 727 ¥ 314 ¥34,623
Securities lending transactions 1,087 225 252 266 — 1,830
Total gross recognized liabilities(2) ¥ 13,794 ¥19,408 ¥1,944 ¥ 993 ¥ 314 ¥36,453
(1) Open transactions do not have an explicit contractual maturity date and are terminable on demand by Nomura or the counterparty.
(2) Repurchase agreements and securities lending transactions are reported within Collateralized financing—Securities sold under agreements to
repurchase and Collateralized financing—Securities loaned in the consolidated balance sheets, respectively. Amounts reported for securities
lending transactions also include transactions where Nomura lends securities and receives securities that can be sold or pledged as collateral.
Nomura recognizes the securities received at fair value and a liability for the same amount, representing the obligation to return those securities.
The liability is reported within Other liabilities in the consolidated balance sheets. The total gross recognized liabilities reported for repurchase
agreements and securities lending transactions are consistent with the total gross balances reported in the offsetting disclosures above.
84

Securities transferred in repurchase agreements and securities lending transactions
The following table presents an analysis of the total carrying value of liabilities recognized in the consolidated balance sheets for repurchase
agreements and securities lending transactions by class of securities transferred by Nomura to counterparties as of March 31, 2020 and December 31,
2020. Amounts reported are shown prior to counterparty netting in accordance with ASC 210-20.
Billions of yen
March 31, 2020
Repurchase
agreements
Securities
lending
transactions Total
Equities and convertible securities ¥ 132 ¥ 1,032 ¥ 1,164
Japanese government, agency and municipal securities 607 — 607
Foreign government, agency and municipal securities 29,378 5 29,383
Bank and corporate debt securities 1,821 178 1,999
Commercial mortgage-backed securities (“CMBS”) 26 — 26
Residential mortgage-backed securities (“RMBS”)(1) 4,162 — 4,162
Collateralized debt obligations (“CDOs”) and other 265 — 265
Investment trust funds and other 6 37 43
Total gross recognized liabilities(2) ¥ 36,397 ¥ 1,252 ¥37,649
Billions of yen
December 31, 2020
Repurchase
agreements
Securities
lending
transactions Total
Equities and convertible securities ¥ 310 ¥ 1,487 ¥ 1,797
Japanese government, agency and municipal securities 461 — 461
Foreign government, agency and municipal securities 28,759 6 28,765
Bank and corporate debt securities 1,907 124 2,031
Commercial mortgage-backed securities (“CMBS”) 20 — 20
Residential mortgage-backed securities (“RMBS”)(1) 2,916 — 2,916
Collateralized debt obligations (“CDOs”) and other 216 — 216
Investment trust funds and other 34 213 247
Total gross recognized liabilities(2) ¥ 34,623 ¥ 1,830 ¥36,453
(1) Includes ¥4,021 billion as of March 31, 2020 and ¥2,759 billion as of December 31, 2020 of U.S. government sponsored agency mortgage pass-
through securities and collateralized mortgage obligations
(2) Repurchase agreements and securities lending transactions are reported within Collateralized financing—Securities sold under agreements to
repurchase and Collateralized financing—Securities loaned in the consolidated balance sheets, respectively. Amounts reported for securities
lending transactions also include transactions where Nomura lends securities and receives securities that can be sold or pledged as collateral.
Nomura recognizes the securities received at fair value and a liability for the same amount, representing the obligation to return those securities.
The liability is reported within Other liabilities in the consolidated balance sheets. The total gross recognized liabilities reported for repurchase
agreements and securities lending transactions are consistent with the total gross balances reported in the offsetting disclosures above.
Collateral received by Nomura
The following table presents the fair value of securities received as collateral, securities borrowed with collateral and securities borrowed without
collateral, which Nomura is permitted to sell or repledge, and the portion that has been sold or repledged as of March 31, 2020 and December 31, 2020.
Billions of yen
March 31, 2020 December 31, 2020
The fair value of securities received as collateral, securities borrowed as collateral and securities borrowed
without collateral where Nomura is permitted by contract or custom to sell or repledge the securities ¥ 46,439 ¥ 49,956
The portion of the above that has been sold (reported within Trading liabilities in the consolidated balance
sheets) or repledged 38,054 38,945
85

Collateral pledged by Nomura
Nomura pledges firm-owned securities to collateralize repurchase transactions, other secured financings and derivative transactions. Pledged
securities that can be sold or repledged by the transferee, including Gensaki Repo transactions, are reported in parentheses as Securities pledged as
collateral within Trading assets in the consolidated balance sheets.
The following table presents the carrying amounts of financial assets recognized in the consolidated balance sheets which have been pledged as
collateral, primarily to stock exchanges and clearing organizations, without allowing the secured party the right to sell or repledge them by type of asset
as of March 31, 2020 and December 31, 2020.
Millions of yen
March 31, 2020 December 31, 2020
Trading assets:
Equities and convertible securities ¥ 133,066 ¥ 145,128
Government and government agency securities 1,183,457 1,228,519
Bank and corporate debt securities 59,734 29,728
Residential mortgage-backed securities (“RMBS”) 2,826,613 2,090,431
Collateralized debt obligations (“CDOs”) and other(1) 12,406 13,343
Investment trust funds and other 6,439 28,127
¥ 4,221,715 ¥ 3,535,276
Non-trading debt securities ¥ 29 ¥ 115,672
Investments in and advances to affiliated companies ¥ 2,760 ¥ 3,937
(1) Includes CLOs and ABS such as those secured on credit card loans, auto loans and student loans.
The following table presents the carrying amount of financial and non-financial assets recognized in the consolidated balance sheets, other than
those disclosed above, which are subject to lien as of March 31, 2020 and December 31, 2020.
Millions of yen
March 31, 2020 December 31, 2020
Loans and receivables ¥ 55,051 ¥ 101,871
Trading assets and private equity and debt 1,393,517 1,404,935
Office buildings, land, equipment and facilities 5,258 5,135
Non-trading debt securities 149,991 —
Other 77 245
¥ 1,603,894 ¥ 1,512,186
Assets in the above table were primarily pledged for secured borrowings, including other secured borrowings, collateralized borrowings of
consolidated VIEs, trading balances of secured borrowings, and derivative transactions.
86
6. Securitizations and Variable Interest Entities:
Securitizations
Nomura utilizes special purpose entities (“SPEs”) to securitize commercial and residential mortgage loans, government agency and corporate
securities and other types of financial assets. Those SPEs are incorporated as stock companies, Tokumei kumiai (silent partnerships), Cayman special
purpose companies (“SPCs”) or trust accounts. Nomura’s involvement with SPEs includes structuring SPEs, underwriting, distributing and selling debt
instruments and beneficial interests issued by SPEs to investors. Nomura accounts for the transfer of financial assets in accordance with ASC 860. This
statement requires that Nomura accounts for the transfer of financial assets as a sale when Nomura relinquishes control over the assets. ASC 860 deems
control to be relinquished when the following conditions are met: (a) the assets have been isolated from the transferor (even in bankruptcy or other
receivership), (b) the transferee has the right to pledge or exchange the assets received, or if the transferee is an entity whose sole purpose is to engage in
securitization or asset-backed financing activities, the holders of its beneficial interests have the right to pledge or exchange the beneficial interests, and
(c) the transferor has not maintained effective control over the transferred assets. Nomura may retain an interest in the financial assets, including residual
interests in the SPEs. Any such interests are accounted for at fair value and reported within Trading assets in Nomura’s consolidated balance sheets,
with the change in fair value reported within Revenue—Net gain on trading. Fair value for retained interests in securitized financial assets is determined
by using observable prices; or in cases where observable prices are not available for certain retained interests, Nomura estimates fair value based on the
present value of expected future cash flows using its best estimates of the key assumptions, including forecasted credit losses, prepayment rates, forward
yield curves and discount rates commensurate with the risks involved. Nomura may also enter into derivative transactions in relation to the assets
transferred to an SPE.
As noted above, Nomura may have continuing involvement with SPEs to which Nomura transferred assets. For the nine and three months ended
December 31, 2019, Nomura received cash proceeds from SPEs in new securitizations of ¥180 billion and ¥61 billion, respectively, and the associated
gain on sale was not significant. For the nine and three months ended December 31, 2020, Nomura received cash proceeds from SPEs in new
securitizations of ¥256 billion and ¥72 billion, respectively, and the associated gain on sale was ¥15 billion and ¥5 billion, respectively. For the nine and
three months ended December 31, 2019, Nomura received debt securities issued by these SPEs with an initial fair value of ¥1,312 billion and
¥394 billion, respectively, and cash inflows from third parties on the sale of those debt securities of ¥861 billion and ¥224 billion, respectively. For the
nine and three months ended December 31, 2020, Nomura received debt securities issued by these SPEs with an initial fair value of ¥2,171 billion and
¥901 billion, respectively, and cash inflows from third parties on the sale of those debt securities of ¥2,022 billion and ¥814 billion, respectively. The
cumulative balance of financial assets transferred to SPEs with which Nomura has continuing involvement was ¥4,177 billion and ¥4,924 billion as of
March 31, 2020 and December 31, 2020, respectively. Nomura’s retained interests were ¥163 billion and ¥185 billion, as of March 31, 2020 and
December 31, 2020, respectively. For the nine and three months ended December 31, 2019, Nomura received cash flows of ¥16 billion and ¥7 billion,
respectively, from the SPEs on the retained interests held in the SPEs. For the nine and three months ended December 31, 2020, Nomura received cash
flows of ¥18 billion and ¥8 billion, respectively, from the SPEs on the retained interests held in the SPEs.
Nomura did not provide financial support to SPEs beyond its contractual obligations as of March 31, 2020 and December 31, 2020.
87

The following tables present the fair value of retained interests which Nomura has continuing involvement in SPEs and their classification in the
fair value hierarchy, categorized by the type of transferred assets.
Billions of yen
March 31, 2020
Level 1 Level 2 Level 3 Total
Investment
grade Other
Government, agency and municipal securities ¥ — ¥ 158 ¥ — ¥158 ¥ 158 ¥—
Bank and corporate debt securities — — — — — —
CMBS and RMBS — — 5 5 0 5
Total ¥ — ¥ 158 ¥ 5 ¥163 ¥ 158 ¥ 5
Billions of yen
December 31, 2020
Level 1 Level 2 Level 3 Total
Investment
grade Other
Government, agency and municipal securities ¥ — ¥ 180 ¥ — ¥180 ¥ 180 ¥—
Bank and corporate debt securities — — — — — —
CMBS and RMBS — — 4 4 0 4
Total ¥ — ¥ 180 ¥ 4 ¥184 ¥ 180 ¥ 4
As of December 31, 2020, predominantly all of the retained interests held by Nomura were valued using observable prices.
The following table presents the type and carrying value of financial assets included within Trading assets which have been transferred to SPEs
but which do not meet the criteria for derecognition under ASC 860. These transfers are accounted for as secured financing transactions and generally
reported within Long-term borrowings. The assets are pledged as collateral of the associated liabilities and cannot be removed unilaterally by Nomura
and the liabilities are non-recourse to Nomura.
Billions of yen
March 31, 2020 December 31, 2020
Assets
Trading assets
Loans ¥ 45 ¥ 94
Liabilities
Long-term borrowings ¥ 45 ¥ 94
88

Variable Interest Entities
In the normal course of business, Nomura acts as a transferor of financial assets to VIEs, and underwriter, distributor, and seller of repackaged
financial instruments issued by VIEs in connection with its securitization and equity derivative activities. Nomura retains, purchases and sells variable
interests in VIEs in connection with its market-making, investing and structuring activities.
If Nomura has an interest in a VIE that provides Nomura with control over the most significant activities of the VIE and the right to receive
benefits or the obligation to absorb losses that could be significant to the VIE, Nomura is the primary beneficiary of the VIE and must consolidate the
entity, provided that Nomura does not meet separate tests confirming that it is acting as a fiduciary for other interest holders. Nomura’s consolidated
VIEs include those that were created to market structured securities to investors by repackaging corporate convertible securities, mortgages and
mortgage-backed securities. Certain VIEs used in connection with Nomura’s aircraft leasing business as well as other purposes are consolidated.
Nomura also consolidates certain investment funds, which are VIEs, and for which Nomura is the primary beneficiary.
The power to make the most significant decisions may take a number of different forms in different types of VIEs. For transactions such as
securitizations, investment funds, and CDOs, Nomura considers collateral management and servicing to represent the power to make the most
significant decisions. Accordingly, Nomura does not consolidate such types of VIEs for which it does not act as collateral manager or servicer unless
Nomura has the right to replace the collateral manager or servicer or to require liquidation of the entity.
For many transactions, such as where VIEs are used for re-securitizations of residential mortgage-backed securities, there are no significant
economic decisions made on an ongoing basis and no single investor has the unilateral ability to liquidate the VIE. In these cases, Nomura focuses its
analysis on decisions made prior to the initial closing of the transaction, and considers factors such as the nature of the underlying assets held by the
VIE, the involvement of third party investors in the design of the VIE, the size of initial third party investment and the amount and level of any
subordination of beneficial interests issued by the VIE which will be held by Nomura and third party investors. Nomura has sponsored numerous
re-securitization transactions and in many cases has determined that it is not the primary beneficiary on the basis that control over the most significant
decisions relating to these entities are shared with third party investors. In some cases, however, Nomura has consolidated such VIEs, for example,
where it was determined that third party investors were not involved in the design of the VIEs, including where the size of third party investment was
not significant at inception of the transaction.
89

The following table presents the classification of consolidated VIEs’ assets and liabilities in these consolidated financial statements. Most of these
assets and liabilities are related to consolidated SPEs which securitize corporate convertible securities, mortgages and mortgage-backed securities. The
assets of a consolidated VIE may only be used to settle obligations of that VIE. Creditors do not typically have any recourse to Nomura beyond the
assets held in the VIEs.
Billions of yen
March 31, 2020 December 31, 2020
Consolidated VIE assets
Cash and cash equivalents ¥ 10 ¥ 14
Trading assets
Equities 645 597
Debt securities 454 433
CMBS and RMBS 43 19
Investment trust funds and other 0 3
Derivatives 19 19
Private equity and debt investments 11 20
Office buildings, land, equipment and facilities 15 37
Other 24 26
Total ¥ 1,221 ¥ 1,168
Consolidated VIE liabilities
Trading liabilities
Derivatives ¥ 19 ¥ 19
Borrowings
Short-term borrowings 117 89
Long-term borrowings 830 795
Other 4 2
Total ¥ 970 ¥ 905
Nomura continuously reassesses its initial evaluation of whether it is the primary beneficiary of a VIE based on current facts and circumstances as
long as it has any continuing involvement with the VIE. This determination is based upon an analysis of the design of the VIE, including the VIE’s
structure and activities, the power to make significant economic decisions held by Nomura and by other parties, and the variable interests owned by
Nomura and other parties.
Nomura also holds variable interests in VIEs where Nomura is not the primary beneficiary. Nomura’s variable interests in such VIEs include
senior and subordinated debt, residual interests, and equity interests associated with commercial and residential mortgage-backed and other asset-backed
securitizations and structured financings, equity interests in VIEs which were formed primarily to acquire high yield leveraged loans and other lower
investment grade debt obligations, residual interests in operating leases for aircraft held by VIEs, and loans and investments in VIEs that acquire
operating businesses.
90

The following tables present the carrying amount of variable interests of unconsolidated VIEs and maximum exposure to loss associated with
these variable interests. Maximum exposure to loss does not reflect Nomura’s estimate of the actual losses that could result from adverse changes, nor
does it reflect the economic hedges Nomura enters into to reduce its exposure. The risks associated with VIEs in which Nomura is involved are limited
to the amount recorded in the consolidated balance sheets and the amount of commitments and financial guarantees.
Billions of yen
March 31, 2020
Carrying amount of
variable interests
Maximum exposure
to loss to
unconsolidated VIEsAssets Liabilities
Trading assets and liabilities
Equities ¥ 35 ¥ — ¥ 35
Debt securities 73 — 73
CMBS and RMBS 3,631 — 3,631
Investment trust funds and other 170 — 170
Private equity and debt investments 11 — 11
Loans 835 — 835
Other 11 — 11
Commitments to extend credit and other guarantees — — 84
Total ¥4,766 ¥ — ¥ 4,850
Billions of yen
December 31, 2020
Carrying amount of
variable interests
Maximum exposure
to loss to
unconsolidated VIEsAssets Liabilities
Trading assets and liabilities
Equities ¥ 47 ¥ — ¥ 47
Debt securities 55 — 55
CMBS and RMBS 2,610 — 2,610
Investment trust funds and other 164 — 164
Private equity and debt investments 14 — 14
Loans 573 — 573
Other 18 — 18
Commitments to extend credit and other guarantees — — 117
Total ¥3,481 ¥ — ¥ 3,598
91
7. Financing receivables:
In the normal course of business, Nomura extends financing to clients primarily in the form of loans and collateralized agreements such as reverse
repurchase agreements and securities borrowing transactions. These financing receivables are recognized as assets on Nomura’s consolidated balance
sheets at fair value or on amortized cost basis and provide a contractual right to receive money either on demand or on future fixed or determinable
dates.
The carrying value of financing receivables measured on an amortized cost basis is also adjusted for an allowance for current expected credit
losses where appropriate. As of April 1, 2020 Nomura adopted new guidance for determination of such allowances defined by ASC 326 “Financial
Instruments —Credit Losses” (“ASC 326”) which requires recognition of allowances based on current expected credit losses rather incurred credit losses
as required by previous authoritative guidance. See Note 1 “Basis of accounting – New accounting pronouncements recently adopted” in these
consolidated financial statements for guidance on the impact of ASC 326 on Nomura on initial adoption.
Collateralized agreements
Collateralized agreements consist of reverse repurchase agreements reported as Securities purchased under agreements to resell and securities
borrowing transactions reported as Securities borrowed in the consolidated balance sheets, including those executed under Gensaki Repo agreements.
Reverse repurchase agreements and securities borrowing transactions principally involve the buying of government and government agency securities
from customers under agreements that also require Nomura to resell these securities to those customers, or borrowing these securities with cash
collateral. Nomura monitors the value of the underlying securities on a daily basis to the related receivables, including accrued interest, and requests or
returns additional collateral when appropriate. Reverse repurchase agreements are generally recognized in the consolidated balance sheets at the amount
for which the securities were originally acquired with applicable accrued interest. Securities borrowing transactions are generally recognized in the
consolidated balance sheets at the amount of cash collateral advanced. No allowance for current expected credit losses is generally recognized against
these transactions measured on an amortized cost basis either because of the strict collateralization requirements or because of the short expected life of
the financial instruments.
Loans receivable
The key types of loans receivable recognized by Nomura are loans at banks, short-term secured margin loans, inter-bank money market loans and
corporate loans.
Loans at banks include both retail and commercial secured and unsecured loans extended by licensed banking entities within Nomura such as The
Nomura Trust & Banking Co., Ltd. and Nomura Bank International plc. For both retail and commercial loans secured by real estate or securities,
Nomura is exposed to the risk of a decline in the value of the underlying collateral. Loans at banks also include unsecured commercial loans provided to
investment banking clients for relationship purposes. Nomura is exposed to risk of default of the counterparty, although these counterparties usually
have high credit ratings. Where loans are secured by guarantees, Nomura is also exposed to the risk of default by the guarantor.
Short-term secured margin loans are loans provided to clients in connection with securities brokerage business. These loans provide funding for
clients in order to purchase securities. Nomura requests initial margin in the form of acceptable collateral securities or deposits against these loans and
holds the purchased securities as collateral through the life of the loans. If the value of the securities declines by more than specified amounts, Nomura
can make additional margin calls in order to maintain a specified ratio of loan-to-value (“LTV”) ratio. For these reasons, the risk to Nomura of
providing these loans is limited.
Inter-bank money market loans are loans to financial institutions in the inter-bank money market, where overnight and intra-day financings are
traded through money market dealers. The risk to Nomura of making these loans is not significant as only qualified financial institutions can participate
in these markets and these loans are usually overnight or short-term in nature.
Corporate loans are primarily commercial loans provided to corporate clients extended by non-licensed banking entities within Nomura.
Corporate loans include loans secured by real estate or securities, as well as unsecured commercial loans provided to investment banking clients for
relationship purposes. The risk to Nomura of making these loans is similar to those risks arising from commercial loans reported in loans at banks.
92

The following tables present a summary of loans receivable reported within Loans receivable in the consolidated balance sheets by portfolio
segment.
Millions of yen
March 31, 2020
Carried at
amortized cost
Carried at
fair value(1) Total
Loans receivable
Loans at banks ¥ 521,715 ¥ — ¥ 521,715
Short-term secured margin loans 296,833 8,905 305,738
Inter-bank money market loans 865 — 865
Corporate loans 1,232,851 796,236 2,029,087
Total loans receivable ¥ 2,052,264 ¥ 805,141 ¥2,857,405
Millions of yen
December 31, 2020
Carried at
amortized cost
Carried at
fair value(1) Total
Loans receivable
Loans at banks ¥ 568,056 ¥ — ¥ 568,056
Short-term secured margin loans 335,573 16,934 352,507
Inter-bank money market loans 50,861 — 50,861
Corporate loans 865,612 722,483 1,588,095
Total loans receivable ¥ 1,820,102 ¥ 739,417 ¥2,559,519
(1) Includes loans receivable and loan commitments carried at fair value through election of the fair value option.
There were no significant purchases nor sales of loans receivable during the nine months ended December 31, 2019. There were no significant
reclassifications of loans receivable to trading assets during the same period.
There were no significant purchases nor sales of loans receivable during the nine months ended December 31, 2020. There were no significant
reclassifications of loans receivable to trading assets during the same period.
Allowance for current expected credit losses
Following adoption of ASC 326 on April 1, 2020, management establishes an allowance for current expected credit losses against the following
types of financial instruments, including financing receivables, to reflect the net amount Nomura expects to collect:
• Loans and written unfunded loan commitments;
• Deposits;
• Collateralized agreements such as reverse repos and securities borrowing transactions;
• Customer contract assets and receivables; and
• Other receivables including margin receivables, security deposits, default fund contributions to central clearing counterparties and net
investments in finance leases.
Current expected credit losses for an individual or portfolio of financial instrument are measured at each Nomura reporting date based on expected
credit losses over the expected life of the financial instrument and considers all available relevant, reasonable supportable information about the
collectability of cash flows, including information about past events, current conditions and future forecasts. Key macroeconomic inputs to our weighted
average forecasts of three years include GDP and credit spreads.
The risk of loss is always considered, even when that risk of loss is remote. While management has based its estimate of the allowance for current
expected credit losses on the best information available, future adjustments to the allowance may be necessary as a result of changes in the economic
environment or variances between actual results and original assumptions.
Nomura has elected to exclude accrued interest receivable from the amortized cost basis of financial instruments used to measure expected credit
losses. The amount of accrued interest receivable as of December 31, 2020 was not significant.
93

The methodology used by Nomura to determine allowances for current expected credit losses primarily depends on the nature of the financial instrument, whether certain practical expedients permitted by ASC 326 are applied by Nomura and whether expected credit losses arising from the financial instrument are significant.
The following table summarizes the methodology used for each significant type of financial instrument subject to ASC 326, the key assumptions used which have impacted the measurement of current expected credit losses during the period.
Financial instrument Methodology to determine current expected credit lossesLoans, written loan commitments and certain deposits
• Full loss rate model developed by Nomura’s Risk department
• Measures expected credit losses based on probability of default (PD), Loss Given Default (LGD) and Exposure at Default (EAD) inputs.
• PD inputs incorporate forward-looking scenarios used by Nomura for internal risk management and capital purposes.
• Immediate reversion method used for additional periods.
• For financial instruments which have defaulted or are probable of defaulting, expected credit losses measured using discounted cash flow analyses or, where the financial instrument is collateral dependent, based on the fair value of the collateral.
Collateralized agreements and short-term secured margin loans
• For reverse repos and short-term secured margin loans where frequent margining is required and the counterparty has ability to replenish margin, expected credit losses are based on difference between carrying value of the reverse repo and fair value of underlying collateral.
• Securities borrowing transactions typically have very short expected lives and therefore any measurement of expected credit losses likely to be insignificant.
Customer contract assets and receivables • Expected credit losses typically based on ageing analysis where loss rates are applied to the carrying value based on historical experience, the current economic climate and specific information about the ability of the client to pay.
Other receivables • Various quantitative or qualitative methods used depending on credit quality of the receivable and risk of loss on default.
Prior to adoption of ASC 326, allowances for credit losses recognized against financial instruments measured at amortized cost were based on amounts which reflected management’s best estimate of probable losses incurred. The allowance for credit losses comprised two components, namely a specific component for financial instruments which have been individually evaluated for impairment; and a general component for financial instruments which, while not individually evaluated for impairment, have been collectively evaluated for impairment based on historical loss experience. The specific component of the allowance reflects probable losses incurred within financial instruments which have been individually evaluated for impairment. Impairment was measured by adjusting the carrying value of the financial instrument to either the present value of expected future cash flows discounted at the financial instrument’s effective interest rate, an observable market price, or the fair value of the collateral if the financial instrument is collateral dependent.
The general component of the allowance was for financial instruments not individually evaluated for impairment and includes judgment about collectability based on available information at the balance sheet date and the uncertainties inherent in those underlying assumptions. The allowance was based on historical loss experience adjusted for qualitative factors such as current economic conditions.
94
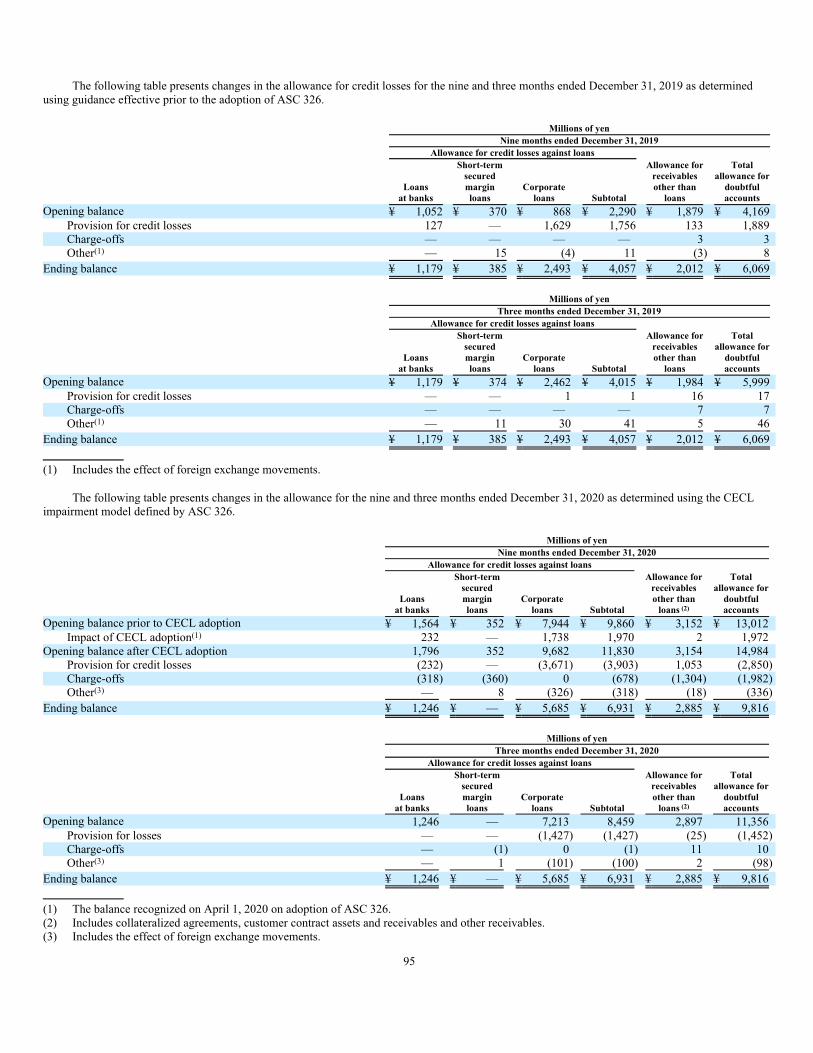
The following table presents changes in the allowance for credit losses for the nine and three months ended December 31, 2019 as determined
using guidance effective prior to the adoption of ASC 326.
Millions of yen
Nine months ended December 31, 2019
Allowance for credit losses against loans
Allowance for
receivables
other than
loans
Total
allowance for
doubtful
accounts
Loans
at banks
Short-term
secured
margin
loans
Corporate
loans Subtotal
Opening balance ¥ 1,052 ¥ 370 ¥ 868 ¥ 2,290 ¥ 1,879 ¥ 4,169
Provision for credit losses 127 — 1,629 1,756 133 1,889
Charge-offs — — — — 3 3
Other(1) — 15 (4) 11 (3) 8
Ending balance ¥ 1,179 ¥ 385 ¥ 2,493 ¥ 4,057 ¥ 2,012 ¥ 6,069
Millions of yen
Three months ended December 31, 2019
Allowance for credit losses against loans
Allowance for
receivables
other than
loans
Total
allowance for
doubtful
accounts
Loans
at banks
Short-term
secured
margin
loans
Corporate
loans Subtotal
Opening balance ¥ 1,179 ¥ 374 ¥ 2,462 ¥ 4,015 ¥ 1,984 ¥ 5,999
Provision for credit losses — — 1 1 16 17
Charge-offs — — — — 7 7
Other(1) — 11 30 41 5 46
Ending balance ¥ 1,179 ¥ 385 ¥ 2,493 ¥ 4,057 ¥ 2,012 ¥ 6,069
(1) Includes the effect of foreign exchange movements.
The following table presents changes in the allowance for the nine and three months ended December 31, 2020 as determined using the CECL
impairment model defined by ASC 326.
Millions of yen
Nine months ended December 31, 2020
Allowance for credit losses against loans
Allowance for
receivables
other than
loans (2)
Total
allowance for
doubtful
accounts
Loans
at banks
Short-term
secured
margin
loans
Corporate
loans Subtotal
Opening balance prior to CECL adoption ¥ 1,564 ¥ 352 ¥ 7,944 ¥ 9,860 ¥ 3,152 ¥ 13,012
Impact of CECL adoption(1) 232 — 1,738 1,970 2 1,972
Opening balance after CECL adoption 1,796 352 9,682 11,830 3,154 14,984
Provision for credit losses (232) — (3,671) (3,903) 1,053 (2,850)
Charge-offs (318) (360) 0 (678) (1,304) (1,982)
Other(3) — 8 (326) (318) (18) (336)
Ending balance ¥ 1,246 ¥ — ¥ 5,685 ¥ 6,931 ¥ 2,885 ¥ 9,816
Millions of yen
Three months ended December 31, 2020
Allowance for credit losses against loans
Allowance for
receivables
other than
loans (2)
Total
allowance for
doubtful
accounts
Loans
at banks
Short-term
secured
margin
loans
Corporate
loans Subtotal
Opening balance 1,246 — 7,213 8,459 2,897 11,356
Provision for losses — — (1,427) (1,427) (25) (1,452)
Charge-offs — (1) 0 (1) 11 10
Other(3) — 1 (101) (100) 2 (98)
Ending balance ¥ 1,246 ¥ — ¥ 5,685 ¥ 6,931 ¥ 2,885 ¥ 9,816
(1) The balance recognized on April 1, 2020 on adoption of ASC 326.
(2) Includes collateralized agreements, customer contract assets and receivables and other receivables.
(3) Includes the effect of foreign exchange movements.
95

Troubled debt restructurings
In the ordinary course of business, Nomura may choose to restructure a loan classified as held for investment either because of financial
difficulties of the borrower, or simply as a result of market conditions or relationship reasons. A troubled debt restructuring (“TDR”) occurs when
Nomura (as lender) for economic or legal reasons related to the borrower’s financial difficulties grants a concession to the borrower that Nomura would
not otherwise consider.
Expected credit losses for a loan being restructured under a TDR which only involve modification of the loan’s terms (rather than receipt of assets
in full or partial settlement) is typically determined using a discounted cash flow analysis. Assets received in full or partial satisfaction of a loan in a
TDR are recognized at fair value.
Discussions continue with various borrowers to modify the existing contractual terms of certain loans. These modifications where the borrower is
deemed to be in financial difficulty and Nomura has, or expects to, grant a financial concession would typically be accounted for and reported as a TDR.
As of March 31, 2020, the amount of loans which were classified as impaired but against which no allowance for credit losses had been
recognized was not significant. For impaired loans with a related allowance, the amount of recorded investment and the total unpaid principal balance
were ¥14,678 million. The related allowance was ¥8,282 million.
As of December 31, 2020, the amount of loans which were classified as impaired but against which no allowance for credit losses had been
recognized was not significant. For impaired loans with a related allowance, the amount of recorded investment, the total unpaid principal balance and
the related allowance was not significant.
The amounts of TDRs which occurred during the three months ended December 31, 2019 and 2020 were not significant.
96

Nonaccrual and past due loans
Loans are placed on a nonaccrual status if interest is deemed uncollectible. Nomura policy is to define interest as being uncollectible if the
borrower is determined to be in financial difficulty or an interest or principal payment on the loans is 90 days or more past due.
Where a loan is placed on a nonaccrual status, any accrued but unpaid interest receivable reversed and no further accrual of interest is permitted.
Interest income is subsequent recognized when a cash payment is received from the borrower using the cash basis method.
Loans are generally only returned to an accrual status if the loan is brought contractually current, i.e. all overdue principal and interest amounts
are paid. In limited circumstances, a loan which has not been brought contractually current will also be returned to an accrual status if all principal and
interest amounts contractually due are reasonably assured of repayment within a reasonable period of time or there has been a sustained period of
repayment performance by the borrower.
As of March 31, 2020, there were ¥14,658 million of loans which were placed on a nonaccrual status, primarily secured and
unsecured corporate loans. The amount of loans which were 90 days past due was not significant.
As of December 31, 2020, the amount of loans which were on a nonaccrual status was not significant. The amount of loans which were 90 days
past due was not significant.
Credit quality indicators
Nomura is exposed to credit risks deriving from a decline in the value of loans or a default caused by deterioration of creditworthiness or
bankruptcy of the obligor. Nomura’s risk management framework for such credit risks is based on a risk assessment through an internal rating process,
in depth pre-financing credit analysis of each individual loan and continuous post-financing monitoring of obligor’s creditworthiness.
97
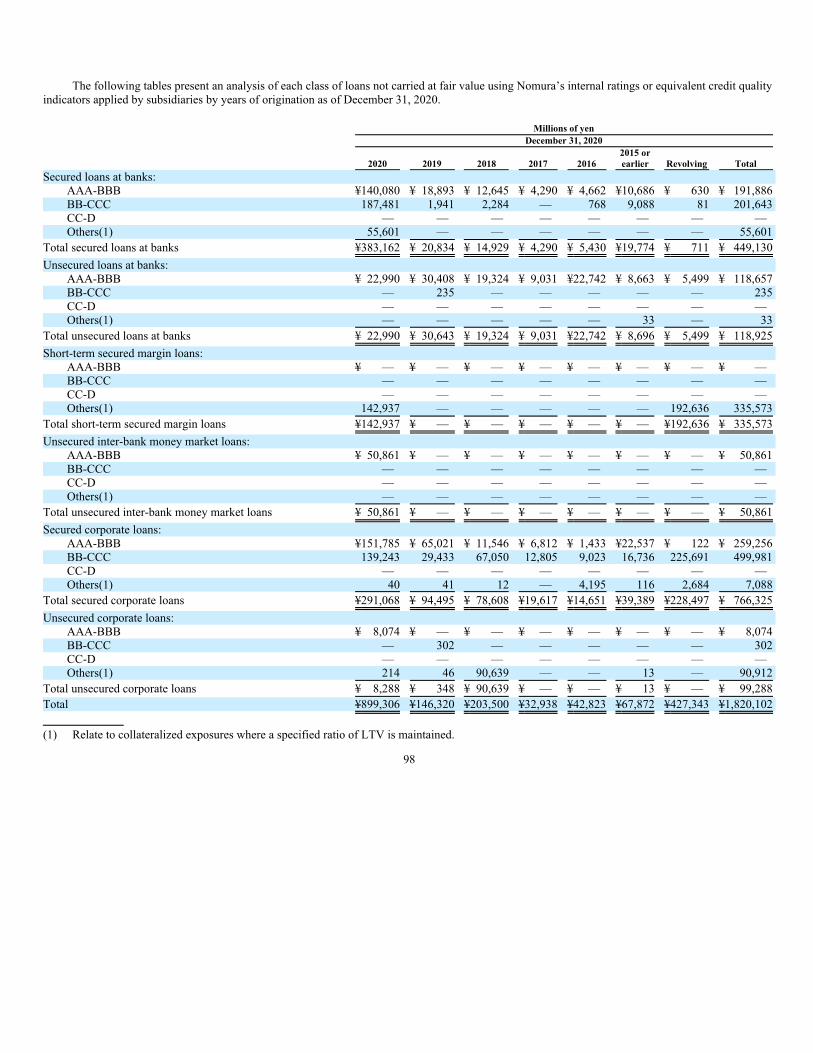
The following tables present an analysis of each class of loans not carried at fair value using Nomura’s internal ratings or equivalent credit quality
indicators applied by subsidiaries by years of origination as of December 31, 2020.
Millions of yen
December 31, 2020
2020 2019 2018 2017 2016
2015 or
earlier Revolving Total
Secured loans at banks:
AAA-BBB ¥140,080 ¥ 18,893 ¥ 12,645 ¥ 4,290 ¥ 4,662 ¥10,686 ¥ 630 ¥ 191,886
BB-CCC 187,481 1,941 2,284 — 768 9,088 81 201,643
CC-D — — — — — — — —
Others(1) 55,601 — — — — — — 55,601
Total secured loans at banks ¥383,162 ¥ 20,834 ¥ 14,929 ¥ 4,290 ¥ 5,430 ¥19,774 ¥ 711 ¥ 449,130
Unsecured loans at banks:
AAA-BBB ¥ 22,990 ¥ 30,408 ¥ 19,324 ¥ 9,031 ¥22,742 ¥ 8,663 ¥ 5,499 ¥ 118,657
BB-CCC — 235 — — — — — 235
CC-D — — — — — — — —
Others(1) — — — — — 33 — 33
Total unsecured loans at banks ¥ 22,990 ¥ 30,643 ¥ 19,324 ¥ 9,031 ¥22,742 ¥ 8,696 ¥ 5,499 ¥ 118,925
Short-term secured margin loans:
AAA-BBB ¥ — ¥ — ¥ — ¥ — ¥ — ¥ — ¥ — ¥ —
BB-CCC — — — — — — — —
CC-D — — — — — — — —
Others(1) 142,937 — — — — — 192,636 335,573
Total short-term secured margin loans ¥142,937 ¥ — ¥ — ¥ — ¥ — ¥ — ¥192,636 ¥ 335,573
Unsecured inter-bank money market loans:
AAA-BBB ¥ 50,861 ¥ — ¥ — ¥ — ¥ — ¥ — ¥ — ¥ 50,861
BB-CCC — — — — — — — —
CC-D — — — — — — — —
Others(1) — — — — — — — —
Total unsecured inter-bank money market loans ¥ 50,861 ¥ — ¥ — ¥ — ¥ — ¥ — ¥ — ¥ 50,861
Secured corporate loans:
AAA-BBB ¥151,785 ¥ 65,021 ¥ 11,546 ¥ 6,812 ¥ 1,433 ¥22,537 ¥ 122 ¥ 259,256
BB-CCC 139,243 29,433 67,050 12,805 9,023 16,736 225,691 499,981
CC-D — — — — — — — —
Others(1) 40 41 12 — 4,195 116 2,684 7,088
Total secured corporate loans ¥291,068 ¥ 94,495 ¥ 78,608 ¥19,617 ¥14,651 ¥39,389 ¥228,497 ¥ 766,325
Unsecured corporate loans:
AAA-BBB ¥ 8,074 ¥ — ¥ — ¥ — ¥ — ¥ — ¥ — ¥ 8,074
BB-CCC — 302 — — — — — 302
CC-D — — — — — — — —
Others(1) 214 46 90,639 — — 13 — 90,912
Total unsecured corporate loans ¥ 8,288 ¥ 348 ¥ 90,639 ¥ — ¥ — ¥ 13 ¥ — ¥ 99,288
Total ¥899,306 ¥146,320 ¥203,500 ¥32,938 ¥42,823 ¥67,872 ¥427,343 ¥1,820,102
(1) Relate to collateralized exposures where a specified ratio of LTV is maintained.
98
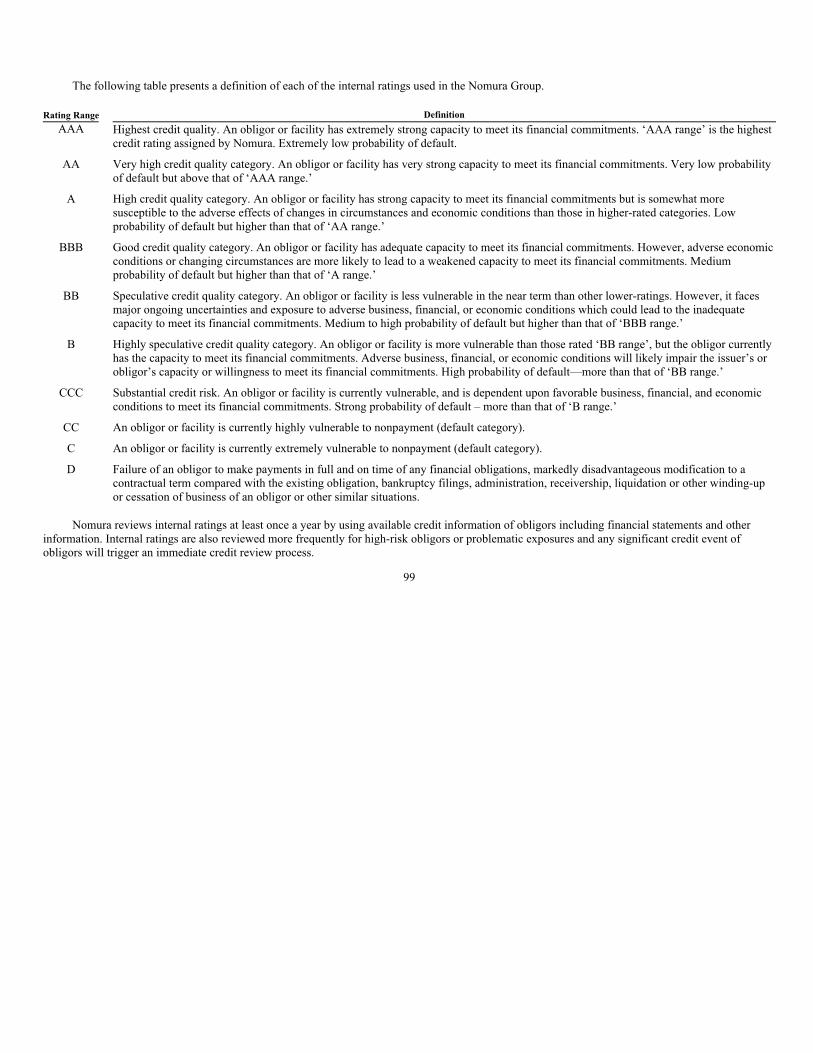
The following table presents a definition of each of the internal ratings used in the Nomura Group.
Rating Range Definition
AAA Highest credit quality. An obligor or facility has extremely strong capacity to meet its financial commitments. ‘AAA range’ is the highest
credit rating assigned by Nomura. Extremely low probability of default.
AA Very high credit quality category. An obligor or facility has very strong capacity to meet its financial commitments. Very low probability
of default but above that of ‘AAA range.’
A High credit quality category. An obligor or facility has strong capacity to meet its financial commitments but is somewhat more
susceptible to the adverse effects of changes in circumstances and economic conditions than those in higher-rated categories. Low
probability of default but higher than that of ‘AA range.’
BBB Good credit quality category. An obligor or facility has adequate capacity to meet its financial commitments. However, adverse economic
conditions or changing circumstances are more likely to lead to a weakened capacity to meet its financial commitments. Medium
probability of default but higher than that of ‘A range.’
BB Speculative credit quality category. An obligor or facility is less vulnerable in the near term than other lower-ratings. However, it faces
major ongoing uncertainties and exposure to adverse business, financial, or economic conditions which could lead to the inadequate
capacity to meet its financial commitments. Medium to high probability of default but higher than that of ‘BBB range.’
B Highly speculative credit quality category. An obligor or facility is more vulnerable than those rated ‘BB range’, but the obligor currently
has the capacity to meet its financial commitments. Adverse business, financial, or economic conditions will likely impair the issuer’s or
obligor’s capacity or willingness to meet its financial commitments. High probability of default—more than that of ‘BB range.’
CCC Substantial credit risk. An obligor or facility is currently vulnerable, and is dependent upon favorable business, financial, and economic
conditions to meet its financial commitments. Strong probability of default – more than that of ‘B range.’
CC An obligor or facility is currently highly vulnerable to nonpayment (default category).
C An obligor or facility is currently extremely vulnerable to nonpayment (default category).
D Failure of an obligor to make payments in full and on time of any financial obligations, markedly disadvantageous modification to a
contractual term compared with the existing obligation, bankruptcy filings, administration, receivership, liquidation or other winding-up
or cessation of business of an obligor or other similar situations.
Nomura reviews internal ratings at least once a year by using available credit information of obligors including financial statements and other
information. Internal ratings are also reviewed more frequently for high-risk obligors or problematic exposures and any significant credit event of
obligors will trigger an immediate credit review process.
99

8. Leases:
Nomura as lessor
Nomura leases office buildings and aircrafts in Japan and overseas either as head lessor or through subleases. These leases and subleases are
primarily classified as operating leases. The related assets are stated at cost, net of accumulated depreciation, except for land, which is stated at cost in
the consolidated balance sheets and reported within Other assets—Office buildings, land, equipment and facilities.
The following table presents the types of assets which Nomura leases under operating leases as of March 31, 2020 and December 31, 2020.
Millions of yen
March 31, 2020 December 31, 2020
Cost
Accumulated
depreciation
Net carrying
amount Cost
Accumulated
depreciation
Net carrying
amount
Real estate(1) ¥ 354 ¥ (285) ¥ 69 ¥ 354 ¥ (288) ¥ 66
Aircraft 16,071 (648) 15,423 26,105 (1,034) 25,071
Total ¥16,425 ¥ (933) ¥ 15,492 ¥26,459 ¥ (1,322) ¥ 25,137
(1) Cost, accumulated depreciation and net carrying amounts include amounts relating to real estate utilized by Nomura.
Nomura recognized lease income of ¥2,308 million and ¥573 million for the nine and three months ended December 31, 2019, respectively, and
¥1,239 million and ¥513 million for the nine and three months ended December 31, 2020, respectively. These are included in the consolidated
statements of income within Revenue—Other.
The following table presents an analysis of future undiscounted lease payments to be received in connection with operating leases entered into by
Nomura as lessor over the remaining lease term as of December 31, 2020. Amounts in connection with finance leases were not significant.
Millions of yen
December 31, 2020
Minimum lease payments
to be received
Years of receipt
Less than 1 year ¥ 2,096
1 to 2 years 2,075
2 to 3 years 2,032
3 to 4 years 2,032
4 to 5 years 2,032
More than 5 years 13,523
Total ¥ 23,790
100

9. Business combinations:
On April 1, 2020, Nomura acquired 100% of Greentech Capital, LLC (“Greentech”), a leading M&A advisory boutique in sustainable technology
and infrastructure in the United States. The acquisition of Greentech comprises an initial cash payment and additional contingent payments based on
future performance of the company. The transaction has been accounted for as a business combination under ASC 805 “Business combinations” and
consideration for the purchase as used to determine goodwill was ¥12,389 million which includes the estimated fair value of contingent payments
accounted for as contingent consideration on acquisition date. Changes in the fair value of contingent consideration are recognized in the consolidated
statements of income until the contingency is resolved. Contingent payments linked to future employment of employees of Greentech are recognized in
the consolidated statements of income as compensation expense over the relevant service period and when payment of those amounts becomes probable.
The operating results and cash flows of Greentech will be reflected to Nomura’s consolidated financial statements from April 1, 2020. The assets
acquired and liabilities assumed as of the acquisition date were not material to Nomura’s consolidated balance sheet.
101
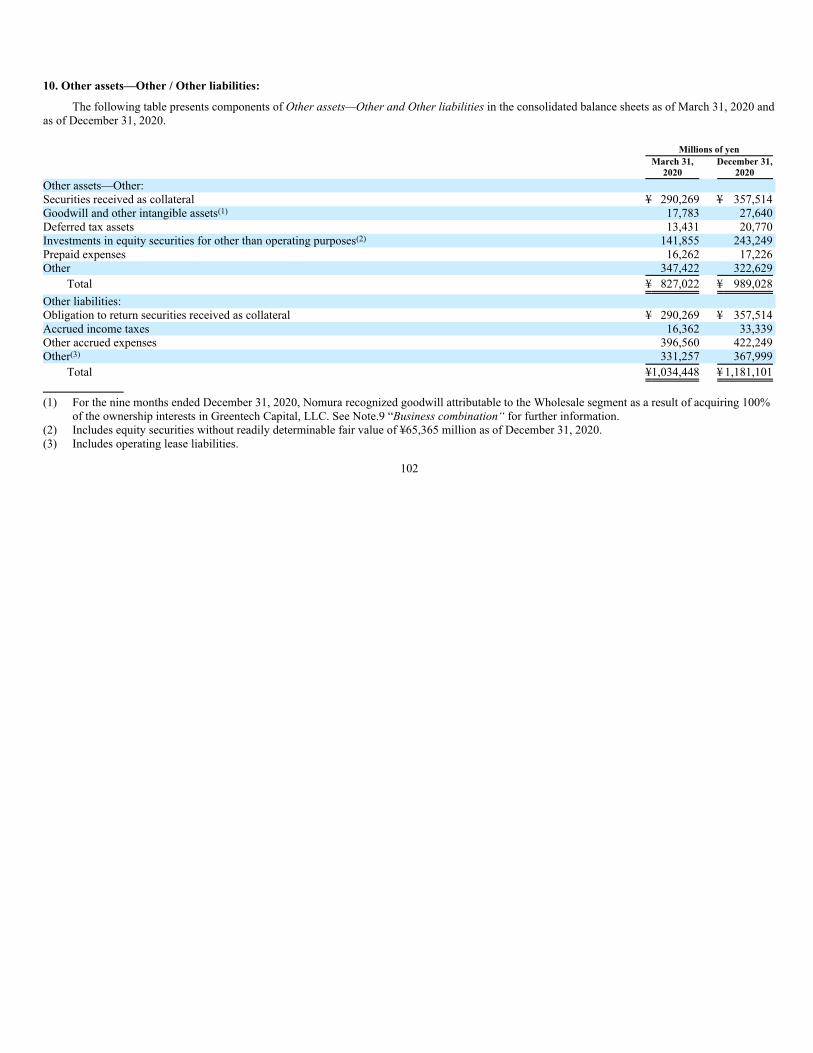
10. Other assets—Other / Other liabilities:
The following table presents components of Other assets—Other and Other liabilities in the consolidated balance sheets as of March 31, 2020 and
as of December 31, 2020.
Millions of yen
March 31,
2020
December 31,
2020
Other assets—Other:
Securities received as collateral ¥ 290,269 ¥ 357,514
Goodwill and other intangible assets(1) 17,783 27,640
Deferred tax assets 13,431 20,770
Investments in equity securities for other than operating purposes(2) 141,855 243,249
Prepaid expenses 16,262 17,226
Other 347,422 322,629
Total ¥ 827,022 ¥ 989,028
Other liabilities:
Obligation to return securities received as collateral ¥ 290,269 ¥ 357,514
Accrued income taxes 16,362 33,339
Other accrued expenses 396,560 422,249
Other(3) 331,257 367,999
Total ¥1,034,448 ¥ 1,181,101
(1) For the nine months ended December 31, 2020, Nomura recognized goodwill attributable to the Wholesale segment as a result of acquiring 100%
of the ownership interests in Greentech Capital, LLC. See Note.9 “Business combination“ for further information.
(2) Includes equity securities without readily determinable fair value of ¥65,365 million as of December 31, 2020.
(3) Includes operating lease liabilities.
102

11. Earnings per share:
A reconciliation of the amounts and the numbers used in the calculation of net income (loss) attributable to NHI shareholders per share (basic and
diluted) is as follows:
Millions of yen
except per share data
presented in yen
Nine months ended December 31
2019 2020
Basic—
Net income attributable to NHI shareholders ¥ 251,473 ¥ 308,524
Weighted average number of shares outstanding 3,250,819,816 3,053,730,446
Net income attributable to NHI shareholders per share ¥ 77.36 ¥ 101.03
Diluted—
Net income attributable to NHI shareholders ¥ 251,418 ¥ 308,459
Weighted average number of shares outstanding 3,323,399,244 3,138,030,622
Net income attributable to NHI shareholders per share ¥ 75.65 ¥ 98.30
Millions of yen
except per share data
presented in yen
Three months ended December 31
2019 2020
Basic—
Net income attributable to NHI shareholders ¥ 57,066 ¥ 98,366
Weighted average number of shares outstanding 3,157,789,804 3,058,575,650
Net income attributable to NHI shareholders per share ¥ 18.07 ¥ 32.16
Diluted—
Net income attributable to NHI shareholders ¥ 57,053 ¥ 98,329
Weighted average number of shares outstanding 3,235,718,574 3,155,202,682
Net income attributable to NHI shareholders per share ¥ 17.63 ¥ 31.16
Net income attributable to NHI shareholders is adjusted to reflect the decline in Nomura’s equity share of earnings of subsidiaries and affiliates
for the nine and the three months ended December 31, 2019 and 2020, arising from options to purchase common shares issued by subsidiaries and
affiliates.
The weighted average number of shares used in the calculation of diluted earnings per share (“EPS”) reflects the increase in potential issuance of
common shares arising from stock-based compensation plans issued by the Company and affiliates, which would have minimal impact on EPS for the
nine and the three months ended December 31, 2019.
The weighted average number of shares used in the calculation of diluted EPS reflects the increase in potential issuance of common shares arising
from stock-based compensation plans issued by the Company and affiliates, which would have minimal impact on EPS for the nine and the three
months ended December 31, 2020.
Antidilutive stock options and other stock-based compensation plans to purchase or deliver 15,463,900 and 12,749,100 common shares were not
included in the computation of diluted EPS for the nine and the three months ended December 31, 2019 and 2020, respectively.
103
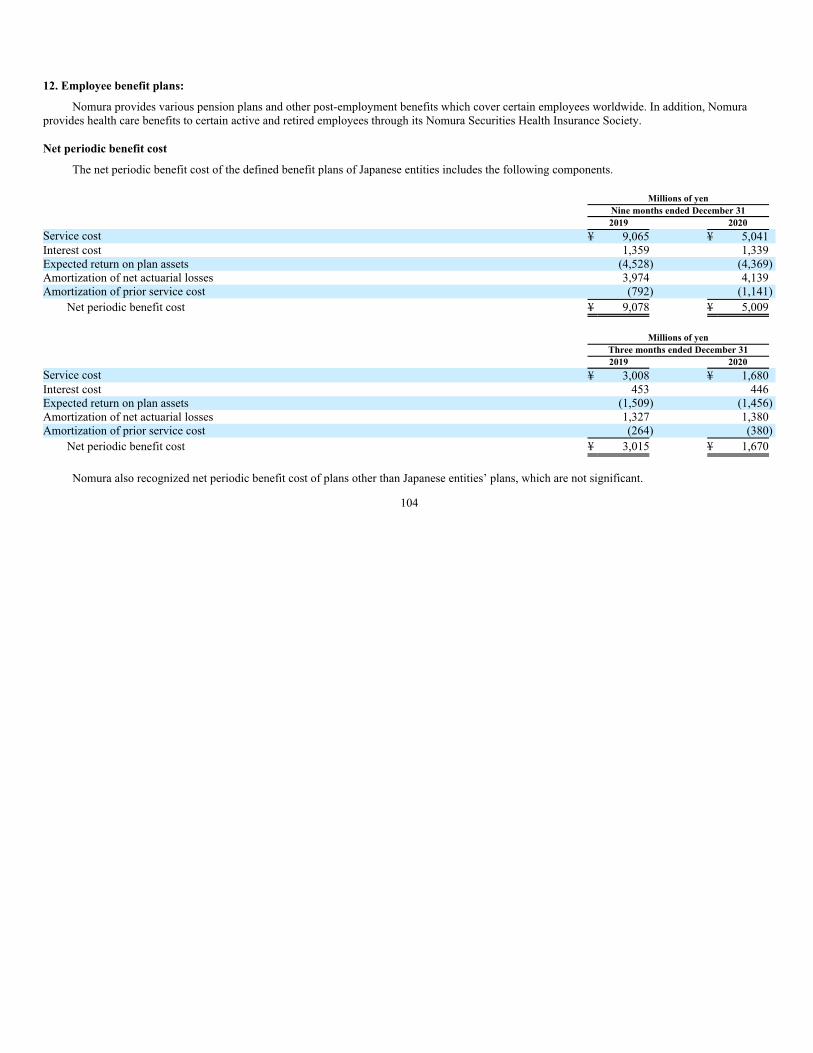
12. Employee benefit plans:
Nomura provides various pension plans and other post-employment benefits which cover certain employees worldwide. In addition, Nomura
provides health care benefits to certain active and retired employees through its Nomura Securities Health Insurance Society.
Net periodic benefit cost
The net periodic benefit cost of the defined benefit plans of Japanese entities includes the following components.
Millions of yen
Nine months ended December 31
2019 2020
Service cost ¥ 9,065 ¥ 5,041
Interest cost 1,359 1,339
Expected return on plan assets (4,528) (4,369)
Amortization of net actuarial losses 3,974 4,139
Amortization of prior service cost (792) (1,141)
Net periodic benefit cost ¥ 9,078 ¥ 5,009
Millions of yen
Three months ended December 31
2019 2020
Service cost ¥ 3,008 ¥ 1,680
Interest cost 453 446
Expected return on plan assets (1,509) (1,456)
Amortization of net actuarial losses 1,327 1,380
Amortization of prior service cost (264) (380)
Net periodic benefit cost ¥ 3,015 ¥ 1,670
Nomura also recognized net periodic benefit cost of plans other than Japanese entities’ plans, which are not significant.
104

13. Restructuring initiatives:
Nomura has been experiencing a major structural shift such as a breakdown of the traditional investment banking business model, advances in
digitization, and demographic shifts due to the shrinking population and aging society in Japan. To respond to the changing environment created by
these shifts, Nomura works to swiftly reengineer its business platform and change its business approach in order to achieve sustainable growth in any
business environment. Concretely, Nomura determined to eliminate the concept of regions to alleviate duplication between business and region, reduce
the number of corporate functions, downscale unprofitable and low growth businesses and right-size franchise in EMEA. During the year ended
March 31, 2020, this restructuring initiative is almost completed.
Liabilities relating to these restructuring costs (including currency translation adjustments) were ¥507 million as of March 31, 2020 and
¥9,305 million were settled during the year ended March 31, 2020.
Nomura recognized ¥4,368 million of branch consolidation costs reported within Non-interest expenses—Occupancy and related depreciation in
the consolidated statements of income during the nine months ended December 31, 2019 and within Nomura’s Retail and Other segments. As of
March 31, 2020, ¥813 million were reported as liabilities within Other liabilities.
There was no significant restructuring cost for the nine months ended December 31, 2020.
105
14. Income taxes:
For the nine months ended December 31, 2019, the difference between the effective statutory tax rate of 31% and the effective tax rate of 6.0%
was mainly due to non-taxable income whereas non-deductible expenses increased the effective tax rate.
Non-taxable income includes approximately ¥53 billion of the tax effect from non-taxable dividend income from affiliated Nomura companies,
including deemed dividend, during the nine months period ended December 31, 2019 which decreased Nomura’s effective tax rate by 19.3%.
For the three months ended December 31, 2019, the difference between the effective statutory tax rate of 31% and the effective tax rate of 14.8%
was mainly due to decrease in valuation allowance of foreign subsidiaries whereas non-deductible expenses increased effective tax rate.
For the nine months ended December 31, 2020, the difference between the effective statutory tax rate of 31% and the effective tax rate of 21.0%
was mainly due to decrease in valuation allowance of foreign subsidiaries, whereas non-deductible expenses increased the effective tax rate.
For the three months ended December 31, 2020, the difference between the effective statutory tax rate of 31% and the effective tax rate of 23.5%
was mainly due to decrease in valuation allowance of foreign subsidiaries, whereas non-deductible expenses increased the effective tax rate.
106
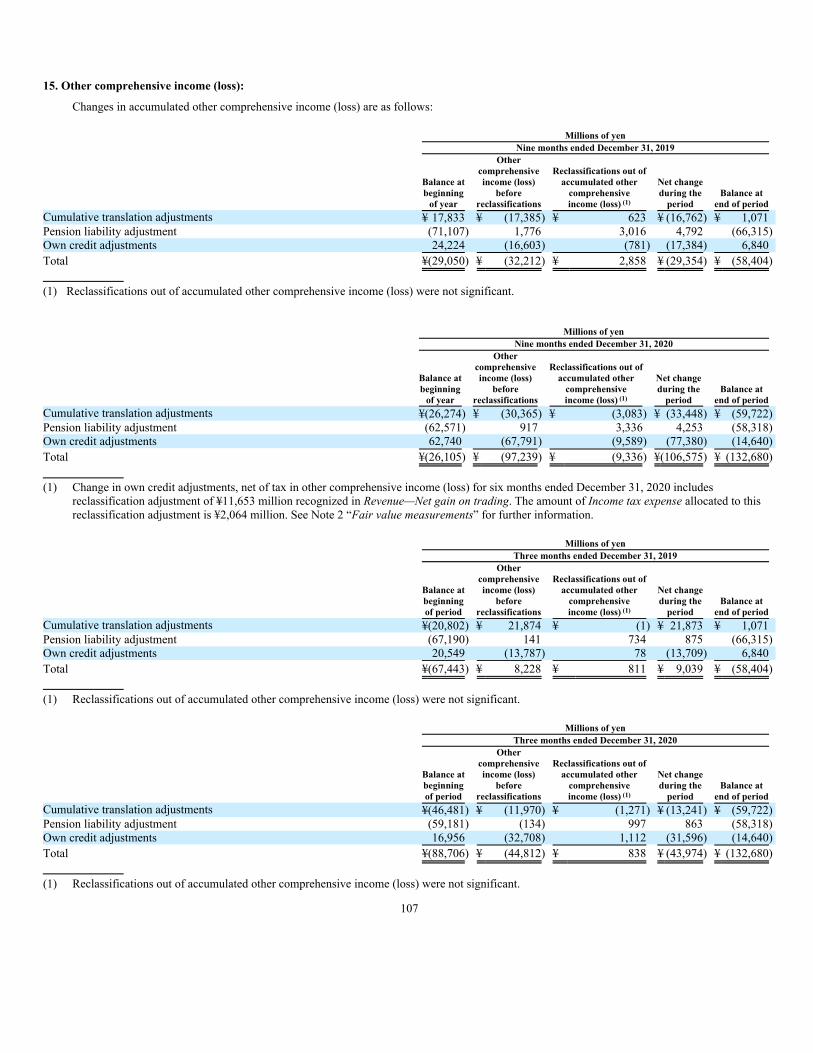
15. Other comprehensive income (loss):
Changes in accumulated other comprehensive income (loss) are as follows:
Millions of yen
Nine months ended December 31, 2019
Balance at
beginning
of year
Other
comprehensive
income (loss)
before
reclassifications
Reclassifications out of
accumulated other
comprehensive
income (loss) (1)
Net change
during the
period
Balance at
end of period
Cumulative translation adjustments ¥ 17,833 ¥ (17,385) ¥ 623 ¥ (16,762) ¥ 1,071Pension liability adjustment (71,107) 1,776 3,016 4,792 (66,315) Own credit adjustments 24,224 (16,603) (781) (17,384) 6,840Total ¥(29,050) ¥ (32,212) ¥ 2,858 ¥ (29,354) ¥ (58,404)
(1) Reclassifications out of accumulated other comprehensive income (loss) were not significant.
Millions of yen
Nine months ended December 31, 2020
Balance at
beginning
of year
Other
comprehensive
income (loss)
before
reclassifications
Reclassifications out of
accumulated other
comprehensive
income (loss) (1)
Net change
during the
period
Balance at
end of period
Cumulative translation adjustments ¥(26,274) ¥ (30,365) ¥ (3,083) ¥ (33,448) ¥ (59,722) Pension liability adjustment (62,571) 917 3,336 4,253 (58,318) Own credit adjustments 62,740 (67,791) (9,589) (77,380) (14,640) Total ¥(26,105) ¥ (97,239) ¥ (9,336) ¥(106,575) ¥ (132,680)
(1) Change in own credit adjustments, net of tax in other comprehensive income (loss) for six months ended December 31, 2020 includes reclassification adjustment of ¥11,653 million recognized in Revenue—Net gain on trading. The amount of Income tax expense allocated to this reclassification adjustment is ¥2,064 million. See Note 2 “Fair value measurements” for further information.
Millions of yen
Three months ended December 31, 2019
Balance at
beginning
of period
Other
comprehensive
income (loss)
before
reclassifications
Reclassifications out of
accumulated other
comprehensive
income (loss) (1)
Net change
during the
period
Balance at
end of period
Cumulative translation adjustments ¥(20,802) ¥ 21,874 ¥ (1) ¥ 21,873 ¥ 1,071Pension liability adjustment (67,190) 141 734 875 (66,315) Own credit adjustments 20,549 (13,787) 78 (13,709) 6,840Total ¥(67,443) ¥ 8,228 ¥ 811 ¥ 9,039 ¥ (58,404)
(1) Reclassifications out of accumulated other comprehensive income (loss) were not significant.
Millions of yen
Three months ended December 31, 2020
Balance at
beginning
of period
Other
comprehensive
income (loss)
before
reclassifications
Reclassifications out of
accumulated other
comprehensive
income (loss) (1)
Net change
during the
period
Balance at
end of period
Cumulative translation adjustments ¥(46,481) ¥ (11,970) ¥ (1,271) ¥ (13,241) ¥ (59,722) Pension liability adjustment (59,181) (134) 997 863 (58,318) Own credit adjustments 16,956 (32,708) 1,112 (31,596) (14,640) Total ¥(88,706) ¥ (44,812) ¥ 838 ¥ (43,974) ¥ (132,680)
(1) Reclassifications out of accumulated other comprehensive income (loss) were not significant.
107

16. Commitments, contingencies and guarantees:
Commitments—
Credit and investment commitments
In connection with its banking and financing activities, Nomura provides commitments to extend credit which generally have fixed expiration
dates. In connection with its investment banking activities, Nomura enters into agreements with clients under which Nomura commits to underwrite
securities that may be issued by clients. As a member of certain central clearing counterparties, Nomura is committed to provide liquidity facilities
through entering into reverse repo transactions backed by government and government agency debt securities with those counterparties in a situation
where a default of another clearing member occurs. The outstanding commitments under these agreements are included below in commitments to extend
credit.
Nomura has commitments to invest in various partnerships and other entities and also has commitments to provide financing for investments
related to these partnerships. The outstanding commitments under these agreements are included below in commitments to invest.
The following table presents a summary of the key types of outstanding commitments provided by Nomura.
Millions of yen
March 31, 2020 December 31, 2020
Commitments to extend credit
Liquidity facilities to central clearing counterparties ¥ 1,288,774 ¥ 2,064,780
Other commitments to extend credit 958,659 830,362
Total ¥ 2,247,433 ¥ 2,895,142
Commitments to invest ¥ 15,278 ¥ 114,424
As of December 31, 2020, these commitments had the following maturities:
Millions of yen
Years to Maturity
Total
contractual
amount
Less than
1 year
1 to 3
years
3 to 5
years
More than
5 years
Commitments to extend credit
Liquidity facilities to central clearing counterparties ¥2,064,780 ¥2,064,780 ¥ — ¥ — ¥ —
Other commitments to extend credit 830,362 103,057 185,364 171,833 370,108
Total ¥2,895,142 ¥2,167,837 ¥185,364 ¥171,833 ¥370,108
Commitments to invest ¥ 114,424 ¥ 89,712 ¥ 2,169 ¥ 4,356 ¥ 18,187
The contractual amounts of these commitments to extend credit represent the amounts at risk but only if the contracts are fully drawn upon, should
the counterparties default, and assuming the value of any existing collateral becomes worthless. The total contractual amount of these commitments may
not represent future cash requirements since the commitments may expire without being drawn upon. The credit risk associated with these commitments
varies depending on the clients’ creditworthiness and the value of collateral held. Nomura evaluates each client’s creditworthiness on a case-by-case
basis. The amount of collateral obtained, if deemed necessary by Nomura upon extension of credit, is based on credit evaluation of the counterparty.
Contingencies—
Investigations, lawsuits and other legal proceedings
In the normal course of business as a global financial services entity, Nomura is involved in investigations, lawsuits and other legal proceedings
and, as a result, may suffer loss from any fines, penalties or damages awarded against Nomura, any settlements Nomura chooses to make to resolve a
matter, and legal and other advisory costs incurred to support and formulate a defense.
The ability to predict the outcome of these actions and proceedings is inherently difficult, particularly where claimants are seeking substantial or
indeterminate damages, where investigations and legal proceedings are at an early stage, where the matters present novel legal theories or involve a
large number of parties, or which take place in foreign jurisdictions with complex or unclear laws.
108

The Company regularly evaluates each legal proceeding and claim on a case-by-case basis in consultation with external legal counsel to assess
whether an estimate of possible loss or range of loss can be made, if recognition of a liability is not appropriate. In accordance with ASC 450
“Contingencies” (“ASC 450”), the Company recognizes a liability for this risk of loss arising on each individual matter when a loss is probable and the
amount of such loss or range of loss can be reasonably estimated. The amount recognized as a liability is reviewed at least quarterly and is revised when
further information becomes available. If these criteria are not met for an individual matter, such as if an estimated loss is only reasonably possible
rather than probable, no liability is recognized. However, where a material loss is reasonably possible, the Company will disclose details of the legal
proceeding or claim below. Under ASC 450 an event is defined as reasonably possible if the chance of the loss to the Company is more than remote but
less than probable. Legal expenses of ¥34,244 million were recognized for the nine months ended December 31, 2020.
The most significant actions and proceedings against Nomura are summarized below. The Company believes that, based on current information
available as of the date of these consolidated financial statements, the ultimate resolution of these actions and proceedings will not be material to the
Company’s financial condition. However, an adverse outcome in certain of these matters could have a material adverse effect on the consolidated
statements of income or cash flows in a particular quarter or annual period.
For certain of the significant actions and proceedings, the Company is currently able to estimate the amount of reasonably possible loss, or range
of reasonably possible losses, in excess of amounts recognized as a liability (if any) against such cases. These estimates are based on current information
available as of the date of these consolidated financial statements and include, but are not limited to, the specific amount of damages or claims against
Nomura in each case. As of February 15, 2021, for those cases where an estimate of the range of reasonably possible losses can be made, the Company
estimates that the total aggregate reasonably possible maximum loss in excess of amounts recognized as a liability (if any) against these cases is
approximately ¥46 billion.
For certain other significant actions and proceedings, the Company is unable to provide an estimate of the reasonably possible loss or range of
reasonably possible losses because, among other reasons, (i) the proceedings are at such an early stage there is not enough information available to
assess whether the stated grounds for the claim are viable; (ii) damages have not been identified by the claimant; (iii) damages are unsupported and/or
exaggerated; (iv) there is uncertainty as to the outcome of pending appeals or motions; (v) there are significant legal issues to be resolved that may be
dispositive, such as the applicability of statutes of limitations; (vi) there are novel or unsettled legal theories underlying the claims and/or (vii) a
judgment has been made against Nomura but detailed reasons for the basis for the judgment and how the amount of the judgment has been determined
have not yet been received.
Nomura will continue to cooperate with regulatory investigations and to vigorously defend its position in the ongoing actions and proceedings set
out below, as appropriate.
In January 2008, Nomura International plc (“NIP”) was served with a tax notice issued by the tax authorities in Pescara, Italy alleging breaches by
NIP of the U.K.-Italy Double Taxation Treaty of 1998 (“Tax Notice”). The alleged breaches relate to payments to NIP of tax credits on dividends on
Italian shares. The Tax Notice not only denies certain payments to which NIP claims to be entitled but also seeks reimbursement of approximately EUR
33.8 million, plus interest, already refunded. NIP continues vigorously to challenge the Pescara Tax Court’s decisions in favor of the local tax
authorities.
Similar claims have been made by the tax authorities against IBJ Nomura Financial Products (UK) PLC (“IBJN”) a group company which has
been in members’ voluntary liquidation since 2000. An Italian Supreme Court judgment in June 2019 confirmed that tax credit refunds of approximately
EUR 38 million, plus interest, were payable by IBJN to the Italian tax authorities.
In October 2010 and June 2012, two actions were brought against NIP, seeking recovery of payments allegedly made to NIP by Fairfield Sentry
Ltd. and Fairfield Sigma Ltd. (collectively, “Fairfield Funds”), which are now in liquidation and were feeder funds to Bernard L. Madoff Investment
Securities LLC (in liquidation pursuant to the Securities Investor Protection Act in the U.S. since December 2008) (“BLMIS”). The first suit was
brought by the liquidators of the Fairfield Funds. It was filed on October 5, 2010 in the Supreme Court of the State of New York, but was subsequently
removed to the United States Bankruptcy Court for the Southern District of New York. The second suit was brought by the Trustee for the liquidation of
BLMIS (“Madoff Trustee”). NIP was added as a defendant in June 2012 when the Madoff Trustee filed an amended complaint in the United States
Bankruptcy Court for the Southern District of New York. Both actions seek to recover approximately $35 million.
109

Certain of the Company’s subsidiaries in the U.S. securitized residential mortgage loans in the form of residential mortgage-backed securities
(“RMBS”). These subsidiaries did not generally originate mortgage loans, but purchased mortgage loans from third-party loan originators
(“originators”). In connection with such purchases, these subsidiaries received loan level representations from the originators. In connection with the
securitizations, the relevant subsidiaries provided loan level representations and warranties of the type generally described below, which mirror the
representations the subsidiaries received from the originators.
The loan level representations made in connection with the securitization of mortgage loans were generally detailed representations applicable to
each loan and addressed characteristics of the borrowers and properties. The representations included, but were not limited to, information concerning
the borrower’s credit status, the loan-to-value ratio, the owner occupancy status of the property, the lien position, the fact that the loan was originated in
accordance with the originator’s guidelines, and the fact that the loan was originated in compliance with applicable laws. Certain of the RMBS issued by
the subsidiaries were structured with credit protection provided to specified classes of certificates by monoline insurers.
With respect to certain of the RMBS issued from 2005 to 2007, the relevant subsidiaries received claims demanding the repurchase of certain
loans from trustees of various securitization trusts, made at the instance of one or more investors, or from certificate insurers. The total original principal
amount of loans for which repurchase claims were received by the relevant subsidiaries within six years of each securitization is $3,203 million. The
relevant subsidiaries summarily rejected any demand for repurchase received after the expiration of the statute of limitations applicable to breach of
representation claims. For those claims received within six years, the relevant subsidiaries reviewed each claim received, and rejected those claims
believed to be without merit or agreed to repurchase certain loans for those claims that the relevant subsidiaries determined to have merit. In several
instances, following the rejection of repurchase demands, investors instituted actions through the trustee alleging breach of contract from 2011 to 2014.
The breach of contract claims that were brought within the six-year statute of limitations for breach of contract actions have survived motions to
dismiss. These claims involve substantial legal, as well as factual, uncertainty and the Company cannot provide an estimate of reasonably possible loss
at this time, in excess of the existing reserve.
In November 2011, NIP was served with a claim filed by the Madoff Trustee in the United States Bankruptcy Court for the Southern District of
New York. This is a clawback action similar to claims filed by the Madoff Trustee against numerous other institutions. The Madoff Trustee alleges that
NIP received redemptions from the BLMIS feeder fund, Harley International (Cayman) Limited in the six years prior to December 11, 2008 (the date
proceedings were commenced against BLMIS) and that these are avoidable and recoverable under the U.S. Bankruptcy Code and New York law. The
amount that the Madoff Trustee is currently seeking to recover from NIP is approximately $21 million.
In March 2013, Banca Monte dei Paschi di Siena SpA (“MPS”) issued a claim in the Italian Courts against (1) two former directors of MPS and
(2) NIP. MPS alleged that the former directors improperly caused MPS to enter into certain structured financial transactions with NIP in 2009
(“Transactions”) and that NIP acted fraudulently and was jointly liable for the unlawful conduct of MPS’s former directors. MPS claimed damages of
not less than EUR 1.1 billion.
In March 2013, NIP commenced a claim against MPS in the English Courts. The claim was for declaratory relief confirming that the Transactions
remained valid and contractually binding. MPS filed and served its defence and counterclaim to these proceedings in March 2014. MPS alleged in its
counterclaim that NIP was liable to make restitution of a net amount of approximately EUR 1.5 billion, and sought declarations regarding the illegality
and invalidity of the Transactions.
On September 23, 2015, NIP entered into a settlement agreement with MPS to terminate the Transactions. NIP believes that the Transactions were
conducted legally and appropriately, and does not accept the allegations made against it or admit any wrongdoing. Taking into account the views of
relevant European financial authorities and the advice provided by external experts, NIP considered it to be in its best interests to reach a settlement in
relation to this matter. As part of the agreement, the Transactions were unwound at a discount of EUR 440 million in favour of MPS and the civil
proceedings between MPS and NIP in Italy and England, respectively, will no longer be pursued. Pursuant to the settlement agreement MPS and NIP
applied to the Italian Courts to discontinue the proceedings brought by MPS against NIP. These proceedings have since been discontinued.
In April 2013, an investigation was commenced by the Public Prosecutor’s office in Siena, Italy, into various allegations against MPS and certain
of its former directors, including in relation to the Transactions. The investigation was subsequently transferred to the Public Prosecutor of Milan. On
April 3, 2015, the Public Prosecutor’s office in Milan issued a notice concluding its preliminary investigation. The Public Prosecutor was seeking to
indict MPS, three individuals from MPS’s former management, NIP and two former NIP employees for, among others, the offences of false accounting
and market manipulation in relation to MPS’s previous accounts. The preliminary hearing at which the Milan criminal court considered whether or not
to grant the indictment concluded on October 1, 2016, the Judge ordering the trial of all individuals and banks involved except for MPS (which entered
into a plea bargaining agreement with the Public Prosecutor). The trial commenced in December 2016. As part of these proceedings, a number of civil
claimants have been permitted to bring damages claims against a number of entities and individuals, including NIP.
110

On November 8, 2019, the court delivered its oral verdict, finding two former employees of NIP guilty of false accounting, market manipulation
and obstructing the supervisory activities of CONSOB and that NIP had breached Italian corporate liability legislation. In so doing, it imposed a fine of
EUR 3.45 million on NIP as well as ordering confiscation of EUR 88 million. On May 12, 2020, the court issued the detailed reasoning for the verdict
(including the rationale for the penalties imposed). NIP has appealed the decision to the Milan Court of Appeal. The penalties will not be enforceable
until all appeals have been concluded.
In addition, NIP is involved in a number of separate civil or administrative matters relating to the Transactions including those described further
below.
In July 2013, a claim was issued against former directors of MPS, and NIP, by the shareholder group Fondazione Monte dei Paschi di Siena
(“FMPS”). The grounds of the FMPS claim were similar to those on which the MPS claim was founded and the level of damages sought by FMPS was
not less than EUR 315.2 million. In September 2020, NIP, without admitting any wrongdoing, entered into a settlement agreement with FMPS pursuant
to which FMPS waived its claim against NIP. NIP and FMPS have applied to the court to discontinue the proceedings brought against NIP.
In January 2018, a claim before the Italian Courts brought by two claimants, Alken Fund Sicav (on behalf of two Luxembourg investment funds
Alken Fund European Opportunities and Alken Fund Absolute Return Europe) and Alken Luxembourg S.A (the funds’ management company) was
served on NIP. The claim is made against NIP, MPS, four MPS former directors and a member of MPS’s internal audit board, and seeks monetary
damages of approximately EUR 434 million on the basis of allegations similar to those made in the MPS and FMPS claims, as well as non-monetary
damages in an amount left to be quantified by the Judge.
In May 2019, a claim before the Italian Courts brought by York Global Finance Offshore BDH (Luxembourg) Sàrl and a number of seemingly
related funds was served on NIP. The claim is made against NIP, MPS, two MPS former directors and a member of MPS’s internal audit board, and
seeks monetary damages of approximately EUR 186.7 million on grounds similar to those in the MPS and FMPS claims, as well as non-monetary
damages in an amount left to be quantified by the Judge.
Additionally, NIP was served by the Commissione Nazionale per le Società e la Borsa (“CONSOB”, the Italian financial regulatory authority)
with a notice commencing administrative sanction proceedings for market manipulation in connection with the Transactions. In relation to the
Transactions, the notice named MPS, three individuals from MPS’s former management and two former NIP employees as defendants, whereas NIP
was named only in its capacity as vicariously liable to pay any fines imposed on the former NIP employees. On May 22, 2018 CONSOB issued its
decision in which it levied EUR 100,000 fines in relation to each of the two former NIP employees. In addition, CONSOB decided that the two
employees do not meet the necessary Italian law integrity requirements to perform certain senior corporate functions, for a period of three months and
six months respectively. NIP is vicariously liable to pay the fines imposed on its former employees. NIP has paid the fines and appealed the decision to
the Milan Court of Appeal. In December 2020, the Court of Appeal annulled the CONSOB decision against NIP.
In June 2016 and August 2016, Nomura International (Hong Kong) Limited (“NIHK”) and Nomura Special Investments Singapore Pte Limited
(“NSIS”) were respectively served with a complaint filed in the Taipei District Court against NIHK, NSIS and certain individuals by Cathay United
Bank, Co., Ltd., Taiwan Cooperative Bank Ltd., Chang Hwa Commercial Bank Ltd., Taiwan Business Bank Ltd., KGI Bank and Hwatai Bank Ltd.
(collectively, “Syndicate Banks”). The Syndicate Banks’ complaint relates to a $60 million syndicated term loan to a subsidiary of Ultrasonic AG that
was arranged by NIHK, and made by the Syndicate Banks together with NSIS. The Syndicate Banks’ allegations in the complaint include allegations
that NIHK failed to comply with its fiduciary duties to the lenders as the arranger of the loan and the Syndicate Banks seek to recover approximately
$48 million in damages and interest.
In March 2017, certain subsidiaries of American International Group, Inc. (“AIG”) commenced proceedings in the District Court of Harris
County, Texas against certain entities and individuals, including Nomura Securities International, Inc. (“NSI”), in connection with a 2012 offering of
$750 million of certain project finance notes, of which $92 million allegedly were purchased by AIG. AIG alleges violations of the Texas Securities Act
based on material misrepresentations and omissions in connection with the marketing, offering, issuance and sale of the notes and seeks rescission of the
purchases or compensatory damages.
Various authorities continue to conduct investigations concerning the activities of NIP, other entities in the Nomura Group and other third parties
in respect of government, supranational, sub-sovereign and agency debt securities trading. These investigations relate to various matters including
certain activities of NIP in Europe for which NIP and the Company have received a Statement of Objections from the European Commission
(“Commission”) which reflects the Commission’s initial views around certain historical conduct. NIP and NSI were also named as defendants in a class
action complaint filed in the United States District Court for the Southern District of New York alleging violations of U.S. antitrust law relating to the
alleged manipulation of the secondary trading market for supranational, sub-sovereign and agency bonds. NIP and NSI are also defendants in a similar
class action complaint filed in the Toronto Registry Office of the Federal Court of Canada alleging violations of Canadian competition law.
Additionally, NIP and NSI have been served with a separate class action complaint filed in the United States District Court for the Southern District of
New York alleging violations of U.S. antitrust law in relation to the alleged manipulation of the primary and secondary markets for European
government bonds.
111

Nomura is responding to requests from governmental authorities in relation to swap trading related to bond issuances. On February 1, 2021, the
U.S. Commodity Futures Trading Commission filed a civil enforcement action against a Nomura employee and charged him with violating the anti-
fraud, price manipulation and false statements provisions of the Commodity Exchange Act in relation to a 2015 interest rate swap transaction.
In September 2017 and November 2017, NIHK and NSIS were respectively served with a complaint filed in the Taipei District Court against
NIHK, NSIS, China Firstextile (Holdings) Limited (“FT”) and certain individuals by First Commercial Bank, Ltd., Land Bank of Taiwan Co., Ltd.,
Chang Hwa Commercial Bank Ltd., Taishin International Bank, E.Sun Commercial Bank, Ltd., CTBC Bank Co., Ltd., Hwatai Bank, Ltd. and Bank of
Taiwan (collectively, “FT Syndicate Banks”). The FT Syndicate Banks’ complaint relates to a $100 million syndicated term loan facility to borrower FT
that was arranged by NIHK, and made by the FT Syndicate Banks together with NSIS. The FT Syndicate Banks’ allegations in the complaint include
tort claims under Taiwan law against the defendants. The FT Syndicate Banks seek to recover approximately $68 million in damages and interest.
In July 2018, a former Italian counterparty filed a claim against NIP in the Civil Court of Rome relating to a derivative transaction entered into by
the parties in 2006, and terminated in 2009. The claim alleges that payments by the counterparty to NIP of approximately EUR 165 million were made
in breach of Italian insolvency law, and seeks reimbursement of those payments.
In August 2017, the Cologne public prosecutor in Germany notified NIP that it is investigating possible tax fraud by individuals who worked for
the Nomura Group in relation to the historic planning and execution of trading strategies around dividend record dates in certain German equities
(known as “cum/ex” trading) and in relation to filings of tax reclaims in 2007 to 2012. During the fiscal year ended March 31, 2020, Nomura Group
became aware that certain of those individuals would be the subject of investigative proceedings in Germany. NIP and another entity in the Nomura
Group are cooperating with the investigation, including by disclosing to the public prosecutor certain documents and trading data. If the investigation
involving Nomura Group entities and former individuals proceeds to trial, the individuals could face criminal sanctions and Nomura Group entities
could face administrative sanctions such as administrative fines or profit confiscation orders.
In June 2020, NIP issued a claim against a current Italian counterparty in the courts of England and Wales. The claim seeks declarations that the
terms of a derivative transaction entered into in 2005 are binding. The counterparty filed and served its defense and counterclaim to these proceedings in
January 2021 which seeks, amongst other things, restitution of sums paid under the transaction. Separately, in June 2020, the counterparty filed an
interim injunction application against NIP in the Tribunal of Palermo relating to payments due by it in relation to the same transaction. This application
was dismissed at first instance but the counterparty is currently appealing that decision.
112

Guarantees—
In the normal course of business, Nomura enters into various guarantee arrangements with counterparties in the form of standby letters of credit
and other guarantees, which generally have a fixed expiration date.
In addition, Nomura enters into certain derivative contracts that meet the accounting definition of a guarantee, namely derivative contracts that
contingently require a guarantor to make payment to a guaranteed party based on changes in an underlying that relate to an asset, liability or equity
security held by a guaranteed party. Since Nomura does not track whether its clients enter into these derivative contracts for speculative or hedging
purposes, Nomura has disclosed below information about derivative contracts that could meet the accounting definition of guarantees.
For information about the maximum potential amount of future payments that Nomura could be required to make under certain derivatives, the
notional amount of contracts has been disclosed. However, the maximum potential payout for certain derivative contracts, such as written interest rate
caps and written currency options, cannot be estimated, as increases in interest or foreign exchange rates in the future could be theoretically unlimited.
Nomura records all derivative contracts at fair value on its consolidated balance sheets. Nomura believes the notional amounts generally overstate
its risk exposure. Since the derivative contracts are accounted for at fair value, carrying value is considered the best indication of payment and
performance risk for individual contracts.
The following table presents information on Nomura’s derivative contracts that could meet the accounting definition of a guarantee and standby
letters of credit and other guarantees.
Millions of yen
March 31, 2020 December 31, 2020
Carrying
value
Maximum
Potential
Payout/
Notional
Total
Carrying
value
Maximum
Potential
Payout/
Notional
Total
Derivative contracts(1)(2) ¥7,197,647 ¥279,734,884 ¥5,124,044 ¥275,500,708
Standby letters of credit and other guarantees — 2,351 — 185,774
(1) Credit derivatives are disclosed in Note 3. “Derivative instruments and hedging activities” and are excluded from derivative contracts.
(2) Derivative contracts primarily consist of equity, interest rate and foreign exchange contracts.
The following table presents maturity information on Nomura’s derivative contracts that could meet the accounting definition of a guarantee and
standby letters of credit and other guarantees as of December 31, 2020.
Millions of yen
Carrying
value
Maximum Potential Payout/Notional
Total
Years to Maturity
Less than
1 year
1 to 3
years
3 to 5
years
More than
5 years
Derivative contracts ¥5,124,044 ¥275,500,708 ¥77,174,309 ¥63,225,403 ¥34,641,298 ¥100,459,698
Standby letters of credit and other guarantees — 185,774 173,037 11,599 194 944
113
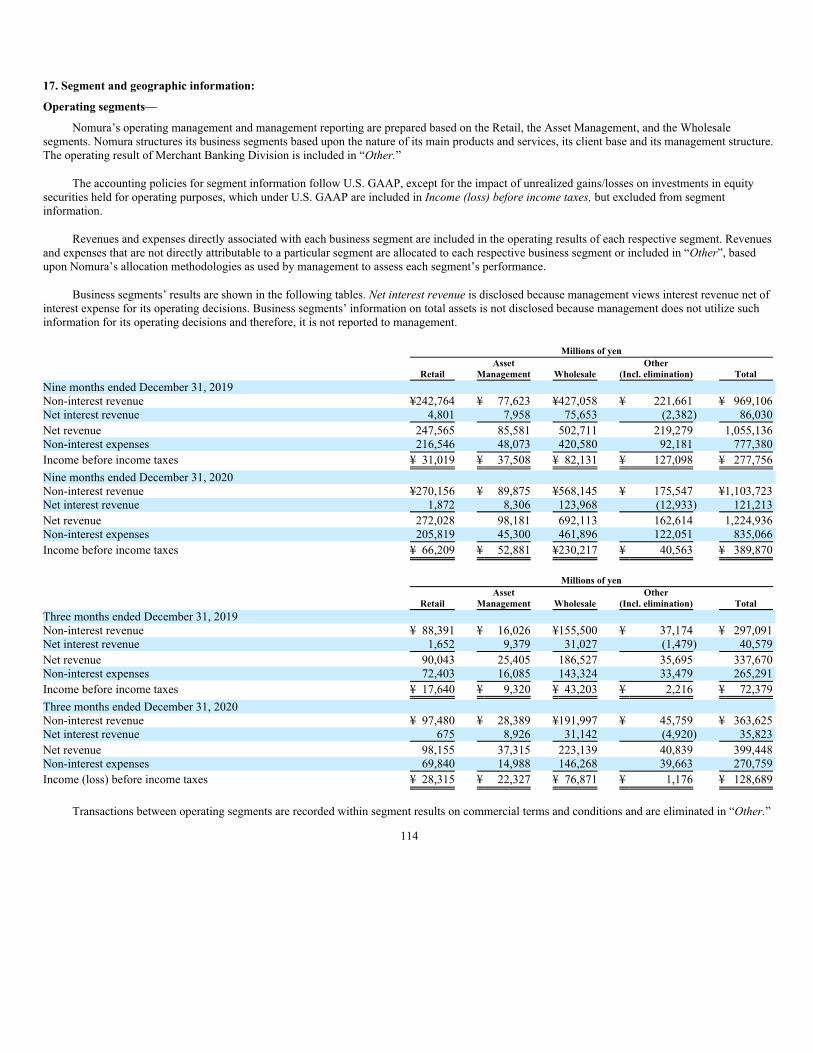
17. Segment and geographic information:
Operating segments—
Nomura’s operating management and management reporting are prepared based on the Retail, the Asset Management, and the Wholesale
segments. Nomura structures its business segments based upon the nature of its main products and services, its client base and its management structure.
The operating result of Merchant Banking Division is included in “Other.”
The accounting policies for segment information follow U.S. GAAP, except for the impact of unrealized gains/losses on investments in equity
securities held for operating purposes, which under U.S. GAAP are included in Income (loss) before income taxes, but excluded from segment
information.
Revenues and expenses directly associated with each business segment are included in the operating results of each respective segment. Revenues
and expenses that are not directly attributable to a particular segment are allocated to each respective business segment or included in “Other”, based
upon Nomura’s allocation methodologies as used by management to assess each segment’s performance.
Business segments’ results are shown in the following tables. Net interest revenue is disclosed because management views interest revenue net of
interest expense for its operating decisions. Business segments’ information on total assets is not disclosed because management does not utilize such
information for its operating decisions and therefore, it is not reported to management.
Millions of yen
Retail
Asset
Management Wholesale
Other
(Incl. elimination) Total
Nine months ended December 31, 2019
Non-interest revenue ¥242,764 ¥ 77,623 ¥427,058 ¥ 221,661 ¥ 969,106
Net interest revenue 4,801 7,958 75,653 (2,382) 86,030
Net revenue 247,565 85,581 502,711 219,279 1,055,136
Non-interest expenses 216,546 48,073 420,580 92,181 777,380
Income before income taxes ¥ 31,019 ¥ 37,508 ¥ 82,131 ¥ 127,098 ¥ 277,756
Nine months ended December 31, 2020
Non-interest revenue ¥270,156 ¥ 89,875 ¥568,145 ¥ 175,547 ¥1,103,723
Net interest revenue 1,872 8,306 123,968 (12,933) 121,213
Net revenue 272,028 98,181 692,113 162,614 1,224,936
Non-interest expenses 205,819 45,300 461,896 122,051 835,066
Income before income taxes ¥ 66,209 ¥ 52,881 ¥230,217 ¥ 40,563 ¥ 389,870
Millions of yen
Retail
Asset
Management Wholesale
Other
(Incl. elimination) Total
Three months ended December 31, 2019
Non-interest revenue ¥ 88,391 ¥ 16,026 ¥155,500 ¥ 37,174 ¥ 297,091
Net interest revenue 1,652 9,379 31,027 (1,479) 40,579
Net revenue 90,043 25,405 186,527 35,695 337,670
Non-interest expenses 72,403 16,085 143,324 33,479 265,291
Income before income taxes ¥ 17,640 ¥ 9,320 ¥ 43,203 ¥ 2,216 ¥ 72,379
Three months ended December 31, 2020
Non-interest revenue ¥ 97,480 ¥ 28,389 ¥191,997 ¥ 45,759 ¥ 363,625
Net interest revenue 675 8,926 31,142 (4,920) 35,823
Net revenue 98,155 37,315 223,139 40,839 399,448
Non-interest expenses 69,840 14,988 146,268 39,663 270,759
Income (loss) before income taxes ¥ 28,315 ¥ 22,327 ¥ 76,871 ¥ 1,176 ¥ 128,689
Transactions between operating segments are recorded within segment results on commercial terms and conditions and are eliminated in “Other.”
114

The following table presents the major components of Income (loss) before income taxes in “Other.”
Millions of yen
Nine months ended December 31
2019 2020
Net gain related to economic hedging transactions ¥ 22,170 ¥ 2,014
Realized gain on investments in equity securities held for operating purposes 6,265 1,553
Equity in earnings of affiliates 21,072 22,258
Corporate items(1) (12,339) 14,035
Other(2)(3) 89,930 703
Total ¥ 127,098 ¥ 40,563
Millions of yen
Three months ended December 31
2019 2020
Net gain (loss) related to economic hedging transactions ¥ 2,333 ¥ 1,402
Realized gain on investments in equity securities held for operating purposes 4,935 744
Equity in earnings of affiliates 4,798 10,398
Corporate items (9,095) (15,050)
Other(3) (755) 3,682
Total ¥ 2,216 ¥ 1,176
(1) The income before income taxes for the nine months ended December 31, 2020 includes a gain of ¥ 71,075 million which represents the
difference between the fair value of the assets acquired and the carrying value of the assets transferred by Nomura as a result of the rights
conversion of the Tokyo Nihonbashi district redevelopment project.
(2) The income before income taxes for the nine months ended December 31, 2019 includes gain of ¥73,293 million from the sale of Nomura
Research Institute, Ltd. ordinary shares.
(3) Includes the impact of Nomura’s own creditworthiness.
The table below presents reconciliations of the combined business segments’ results included in the preceding table to Nomura’s reported Net
revenue, Non-interest expenses and Income before income taxes in the consolidated statements of income.
Millions of yen
Nine months ended December 31
2019 2020
Net revenue ¥ 1,055,136 ¥ 1,224,936
Unrealized gain (loss) on investments in equity securities held for operating purposes (4,777) 6,901
Consolidated net revenue ¥ 1,050,359 ¥ 1,231,837
Non-interest expenses ¥ 777,380 ¥ 835,066
Unrealized gain on investments in equity securities held for operating purposes — —
Consolidated non-interest expenses ¥ 777,380 ¥ 835,066
Income before income taxes ¥ 277,756 ¥ 389,870
Unrealized gain (loss) on investments in equity securities held for operating purposes (4,777) 6,901
Consolidated income before income taxes ¥ 272,979 ¥ 396,771
Millions of yen
Three months ended December 31
2019 2020
Net revenue ¥ 337,670 ¥ 399,448
Unrealized gain on investments in equity securities held for operating purposes (2,692) 2,644
Consolidated net revenue ¥ 334,978 ¥ 402,092
Non-interest expenses ¥ 265,291 ¥ 270,759
Unrealized gain on investments in equity securities held for operating purposes — —
Consolidated non-interest expenses ¥ 265,291 ¥ 270,759
Income before income taxes ¥ 72,379 ¥ 128,689
Unrealized gain on investments in equity securities held for operating purposes (2,692) 2,644
Consolidated income before income taxes ¥ 69,687 ¥ 131,333
115
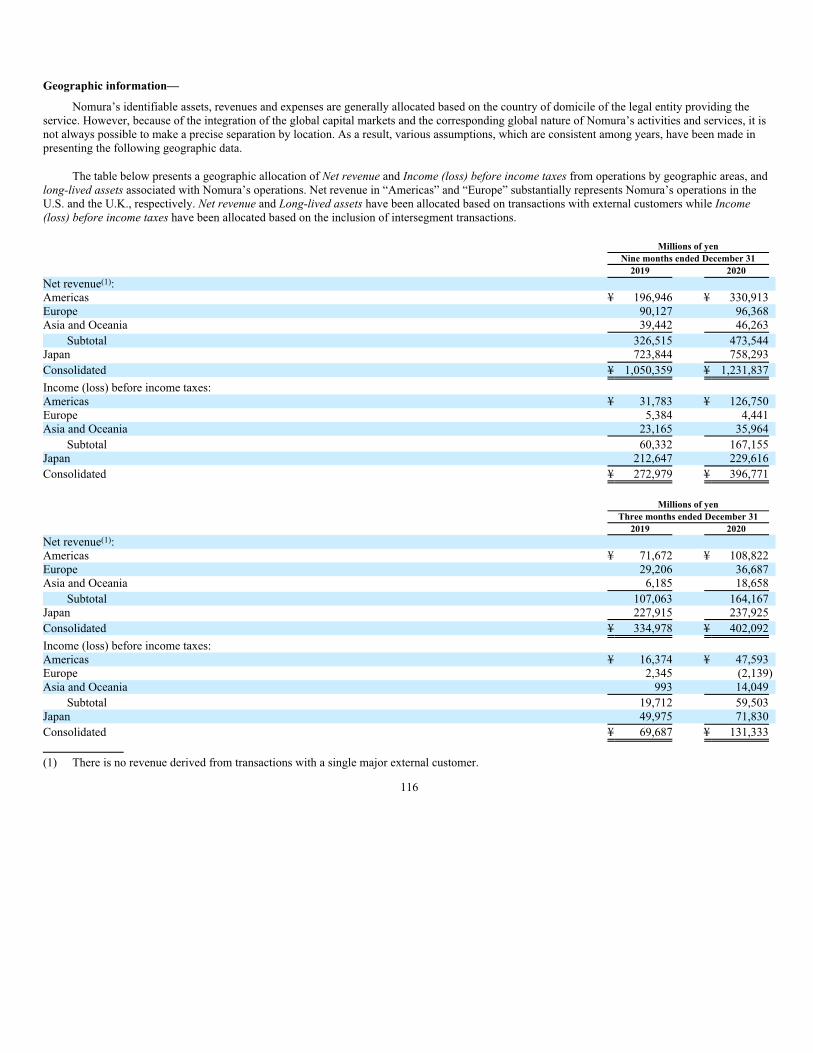
Geographic information—
Nomura’s identifiable assets, revenues and expenses are generally allocated based on the country of domicile of the legal entity providing the
service. However, because of the integration of the global capital markets and the corresponding global nature of Nomura’s activities and services, it is
not always possible to make a precise separation by location. As a result, various assumptions, which are consistent among years, have been made in
presenting the following geographic data.
The table below presents a geographic allocation of Net revenue and Income (loss) before income taxes from operations by geographic areas, and
long-lived assets associated with Nomura’s operations. Net revenue in “Americas” and “Europe” substantially represents Nomura’s operations in the
U.S. and the U.K., respectively. Net revenue and Long-lived assets have been allocated based on transactions with external customers while Income
(loss) before income taxes have been allocated based on the inclusion of intersegment transactions.
Millions of yen
Nine months ended December 31
2019 2020
Net revenue(1):
Americas ¥ 196,946 ¥ 330,913
Europe 90,127 96,368
Asia and Oceania 39,442 46,263
Subtotal 326,515 473,544
Japan 723,844 758,293
Consolidated ¥ 1,050,359 ¥ 1,231,837
Income (loss) before income taxes:
Americas ¥ 31,783 ¥ 126,750
Europe 5,384 4,441
Asia and Oceania 23,165 35,964
Subtotal 60,332 167,155
Japan 212,647 229,616
Consolidated ¥ 272,979 ¥ 396,771
Millions of yen
Three months ended December 31
2019 2020
Net revenue(1):
Americas ¥ 71,672 ¥ 108,822
Europe 29,206 36,687
Asia and Oceania 6,185 18,658
Subtotal 107,063 164,167
Japan 227,915 237,925
Consolidated ¥ 334,978 ¥ 402,092
Income (loss) before income taxes:
Americas ¥ 16,374 ¥ 47,593
Europe 2,345 (2,139)
Asia and Oceania 993 14,049
Subtotal 19,712 59,503
Japan 49,975 71,830
Consolidated ¥ 69,687 ¥ 131,333
(1) There is no revenue derived from transactions with a single major external customer.
116

Millions of yen
March 31, 2020 December 31, 2020
Long-lived assets:
Americas ¥ 84,904 ¥ 93,026
Europe 52,179 61,614
Asia and Oceania 29,618 27,099
Subtotal 166,701 181,739
Japan 292,212 304,906
Consolidated ¥ 458,913 ¥ 486,645
2. Other
On October 28, 2020, the Board of Directors resolved to pay the dividend based on the record date of September 30, 2020 to shareholders
registered as of September 30, 2020.
a. Total dividend based on the record date of September 30, 2020 ¥61,163 million
b. Dividend based on the record date of September 30, 2020 per share ¥20.0
117

[Translation]
Quarterly Review Report of Independent Auditor
February 15, 2021
The Board of Directors
Nomura Holdings, Inc.
Ernst & Young ShinNihon LLC
Tokyo office, Japan
Hiroki Matsumura
Certified Public Accountant
Designated and Engagement Partner
Hisashi Yuhara
Certified Public Accountant
Designated and Engagement Partner
Kenjiro Tsumura
Certified Public Accountant
Designated and Engagement Partner
Toshiro Kuwata
Certified Public Accountant
Designated and Engagement Partner
Auditor’s Conclusion
We have performed a quarterly review of the quarterly consolidated financial statements of Nomura Holdings, Inc. (the “Company”) included in
Financial Information section for the three-month and nine-month periods ended December 31, 2020 within the fiscal period from April 1, 2020 to
March 31, 2021, which comprise the quarterly consolidated balance sheet, the quarterly consolidated statements of income, comprehensive income,
changes in equity and cash flows, and the related notes, pursuant to the requirement of the rule specified in Article 193-2, Section 1 of the Financial
Instruments and Exchange Act.
Based on our quarterly review, nothing has come to our attention that causes us to believe that the quarterly consolidated financial statements
referred to above do not present fairly, in all material respects, the consolidated financial position of the Company and its consolidated subsidiaries (the
“Group”) as of December 31, 2020, and the consolidated results of their operations for the three-month and nine-month periods then ended and cash
flows for the nine-month period then ended in accordance with accounting principles generally accepted in the United States of America pursuant to
Article 95 of “Regulations Concerning the Terminology, Forms and Preparation Methods of Quarterly Consolidated Financial Statements” (see Note 1
to the quarterly consolidated financial statements).
Basis for Auditor’s Conclusion
We conducted our quarterly review in accordance with quarterly review standards generally accepted in Japan. Our responsibilities under those
standards are further described in the Auditor’s Responsibilities for the Quarterly Review of the Quarterly Consolidated Financial Statements section of
our report. We are independent of the Group in accordance with the ethical requirements that are relevant to our quarterly review of the financial
statements in Japan, and we have fulfilled our other ethical responsibilities in accordance with these requirements. We believe that we have obtained the
evidence to provide a basis for our conclusion.
Responsibilities of Management and the Audit Committee for the Quarterly Consolidated Financial Statements
Management is responsible for the preparation and fair presentation of the quarterly consolidated financial statements in accordance with
accounting principles generally accepted in the United States of America (see Note 1 to the quarterly consolidated financial statements), and for
designing and operating such internal control as management determines is necessary to enable the preparation and fair presentation of the quarterly
consolidated financial statements that are free from material misstatement, whether due to fraud or error.
In preparing the quarterly consolidated financial statements, management is responsible for assessing the Group’s ability to continue as a going
concern and disclosing, as required by accounting principles generally accepted in the United States of America (see Note 1 to the quarterly
consolidated financial statements), matters related to going concern.
The Audit Committee is responsible for overseeing the Group’s financial reporting process.
118
Auditor’s Responsibility for the Quarterly Review of the Quarterly Consolidated Financial Statements
Our responsibility is to independently express a conclusion on the quarterly consolidated financial statements in the quarterly review report based on our
quarterly review. As part of a quarterly review in accordance with quarterly review standards generally accepted in Japan, we exercise professional
judgment and maintain professional skepticism throughout the quarterly review. We also:
• Make inquiries, primarily of management and persons responsible for financial and accounting matters and apply analytical and other
quarterly review procedures. A quarterly review is substantially less in scope than an audit conducted in accordance with auditing
standards generally accepted in Japan.
• Conclude on whether nothing has come to our attention that causes us to believe that the quarterly consolidated financial statements do not
present fairly in accordance with accounting principles generally accepted in the United States of America (see Note 1 to the quarterly
consolidated financial statements) based on the evidence obtained if we determine that a material uncertainty exists related to events or
conditions that may cast significant doubt on the Group’s ability to continue as a going concern. If we conclude that a material uncertainty
exists, we are required to draw attention in our auditor’s quarterly review report to the related disclosures in the quarterly consolidated
financial statements or, if such disclosures are inadequate, to modify our conclusion. Our conclusions are based on the evidence obtained
up to the date of our quarterly review report. However, future events or conditions may cause the Group to cease to continue as a going
concern.
• Evaluate whether nothing has come to our attention that causes us to believe that the overall presentation and disclosure of the quarterly
consolidated financial statements are not in accordance with accounting principles generally accepted in the United States of America (see
Note 1 to the quarterly consolidated financial statements), or that the overall presentation, structure and content of the quarterly
consolidated financial statements, including the disclosures, and the quarterly consolidated financial statements do not represent the
underlying transactions and events in a manner that achieves fair presentation.
• Obtain evidence of the financial information of the Group to express its conclusions on the quarterly consolidated financial statements. We
are responsible for directing, overseeing and implementing the quarterly review of the quarterly consolidated financial statements. We are
solely responsible for our conclusions.
We communicate with the Audit Committee regarding, among other matters, the planned scope and timing of the quarterly review and significant
quarterly review findings.
We also provide the Audit Committee with a statement that we have complied with the ethical requirements regarding independence that are
relevant to our quarterly review of the consolidated financial statements in Japan, and to communicate with them all relationships and other matters that
may reasonably be thought to bear on our independence, and where applicable, related safeguards.
Conflicts of Interest
Our firm and its designated engagement partners do not have any interest in the Group which is required to be disclosed pursuant to the provisions
of the Certified Public Accountants Act of Japan.
*1. Above is an electronic version of the original Quarterly Review Report of Independent Auditor and the Company maintains the original report.
*2. XBRL data is not included in the scope of the quarterly review.
(Note)
This is an English translation of the Japanese language Quarterly Review Report of Independent Auditor issued by Ernst & Young ShinNihon
LLC in connection with the limited procedures applied on the quarterly consolidated financial statements of Nomura Holdings, Inc., prepared in
Japanese, for the three-month and nine-month periods ended December 31, 2020 within the fiscal period from April 1, 2020 to March 31, 2021. Ernst &
Young ShinNihon LLC have not applied any such procedures nor have they performed an audit on the English language version of the quarterly
consolidated financial statements for the above-mentioned periods which are included in this report on Form 6-K.
119

Exhibit 2
Confirmation Letter
1 [Appropriateness of Quarterly Securities Report]
Kentaro Okuda, Group Chief Executive Officer, and Takumi Kitamura, Chief Financial Officer, have confirmed that the quarterly securities report
of Nomura Holdings, Inc. for the three months ended December 31, 2020 is appropriate under the Financial Instruments and Exchange Act.
2 [Special Comments]
There is no special comment to be stated.
120