Urinary biomarkers of aflatoxin exposure in young children in Egypt and Guinea
8
Urinary biomarkers of aflatoxin exposure in young children from Egypt and Guinea Nektaria Polychronaki a,b, * , Christopher P. Wild c , Hannu Mykka ¨nen a , Hassan Amra d , Mosaad Abdel-Wahhab d , Abdoulaye Sylla e , Mamadou Diallo e , Hani El-Nezami a,b , Paul C. Turner c a Department of Clinical Nutrition, University of Kuopio, Finland b Food and Health Research Centre (ETTK), University of Kuopio, Finland c Molecular Epidemiology Unit, Leeds Institute of Genetics, Health and Therapeutics, University of Leeds, UK d Department of Food Toxicology and Contaminants, National Research Centre, Dokki, Egypt e Institut Pasteur de Guine ´e (IPG), Kindia, Guinea Received 13 February 2007; accepted 23 August 2007 Abstract Aflatoxins are a major risk factor for hepatocellular carcinoma (HCC), and thus understanding the pattern of aflatoxin exposure in different regions is important in order to develop targeted intervention strategies. Given the early onset of HCC in many countries early life exposures may be important. This study investigated aflatoxin exposure in Egyptian children (n = 50, aged 1–2.5 years) by assessing urinary aflatoxin metabolite (AFM 1 , AFB 1 , AFB 2 , AFG 1 , AFG 2 ) levels. Samples from Guinean children (n = 50, aged 2–4 years) were analyzed in parallel providing a comparison to a region of established frequent aflatoxin exposure. Aflatoxins were isolated from urine using C18-cartridges followed by immunoaffinity clean-up, and quantified by HPLC with fluorescence detection. Overall aflatoxins were less frequently present in Egyptian (38%) than Guinean urine samples (86%) (p < 0.001), which was particularly related to differences in detection rates of AFM 1 (8% compared to 64%, respectively, (p < 0.001)). For AFM 1 the geometric mean level in Guinea (16.3 pg/ml; 95% CI: 10.1, 26.6 pg/ml) was 6-fold higher (p < 0.001) than in Egypt (2.7 pg/ml; 95% CI: 2.5, 2.8 pg/ml). Uri- nary aflatoxins from healthy children in these two regions have not previously been reported, and exposure appears modest in Egypt compared to Guinea. These data suggest that measures to reduce aflatoxin exposure in both regions are important, though particularly in Guinea. Ó 2007 Elsevier Ltd. All rights reserved. Keywords: Egypt; Guinea; Children; Aflatoxins; Weaning; Urine 1. Introduction Children are a particularly susceptible population to environmental hazards (Wild and Kleinjans, 2003) and there are strong links between growth and health of the fetus and infant, and disease risk in later life (Barker, 2004; Delisle, 2002; Firestone and Amler, 2003). In developing countries poor diet and multiple infectious haz- ards are associated with malnutrition and growth faltering in infancy and childhood (WHO, 2003). In addition, dietary staples in some of these regions are frequently 0278-6915/$ - see front matter Ó 2007 Elsevier Ltd. All rights reserved. doi:10.1016/j.fct.2007.08.034 Abbreviations: AFB 1 , aflatoxin B 1 ; AFB 2 , aflatoxin B 2 ; AFG 1 , afla- toxin G 1 ; AFG 2 , aflatoxin G 2 ; AFM 1 , aflatoxin M 1 ; AFQ 1 , aflatoxin Q 1 ; HCC, hepatocellular carcinoma; HBV, hepatitis B virus; HCV, hepatitis C virus; HBsAg, hepatitis B serum antigen; CYP 450, cytochrome P-450. * Corresponding author. Address: University of Kuopio, Department of Clinical Nutrition, Food and Health Research Centre (ETTK), P.O. Box 1627, FIN-70211 Kuopio, Finland. Tel.: +358 17163615; fax: +358 17162792. E-mail address: nektaria.polychronaki@uku.fi (N. Polychronaki). www.elsevier.com/locate/foodchemtox Available online at www.sciencedirect.com Food and Chemical Toxicology 46 (2008) 519–526
-
Upload
independent -
Category
Documents
-
view
4 -
download
0
Transcript of Urinary biomarkers of aflatoxin exposure in young children in Egypt and Guinea

Available online at www.sciencedirect.com
www.elsevier.com/locate/foodchemtox
Food and Chemical Toxicology 46 (2008) 519–526
Urinary biomarkers of aflatoxin exposure in young childrenfrom Egypt and Guinea
Nektaria Polychronaki a,b,*, Christopher P. Wild c, Hannu Mykkanen a, Hassan Amra d,Mosaad Abdel-Wahhab d, Abdoulaye Sylla e, Mamadou Diallo e, Hani El-Nezami a,b,
Paul C. Turner c
a Department of Clinical Nutrition, University of Kuopio, Finlandb Food and Health Research Centre (ETTK), University of Kuopio, Finland
c Molecular Epidemiology Unit, Leeds Institute of Genetics, Health and Therapeutics, University of Leeds, UKd Department of Food Toxicology and Contaminants, National Research Centre, Dokki, Egypt
e Institut Pasteur de Guinee (IPG), Kindia, Guinea
Received 13 February 2007; accepted 23 August 2007
Abstract
Aflatoxins are a major risk factor for hepatocellular carcinoma (HCC), and thus understanding the pattern of aflatoxin exposure indifferent regions is important in order to develop targeted intervention strategies. Given the early onset of HCC in many countriesearly life exposures may be important. This study investigated aflatoxin exposure in Egyptian children (n = 50, aged 1–2.5 years)by assessing urinary aflatoxin metabolite (AFM1, AFB1, AFB2, AFG1, AFG2) levels. Samples from Guinean children (n = 50, aged2–4 years) were analyzed in parallel providing a comparison to a region of established frequent aflatoxin exposure. Aflatoxins wereisolated from urine using C18-cartridges followed by immunoaffinity clean-up, and quantified by HPLC with fluorescence detection.Overall aflatoxins were less frequently present in Egyptian (38%) than Guinean urine samples (86%) (p < 0.001), which was particularlyrelated to differences in detection rates of AFM1 (8% compared to 64%, respectively, (p < 0.001)). For AFM1 the geometric mean levelin Guinea (16.3 pg/ml; 95% CI: 10.1, 26.6 pg/ml) was 6-fold higher (p < 0.001) than in Egypt (2.7 pg/ml; 95% CI: 2.5, 2.8 pg/ml). Uri-nary aflatoxins from healthy children in these two regions have not previously been reported, and exposure appears modest in Egyptcompared to Guinea. These data suggest that measures to reduce aflatoxin exposure in both regions are important, though particularlyin Guinea.� 2007 Elsevier Ltd. All rights reserved.
Keywords: Egypt; Guinea; Children; Aflatoxins; Weaning; Urine
0278-6915/$ - see front matter � 2007 Elsevier Ltd. All rights reserved.doi:10.1016/j.fct.2007.08.034
Abbreviations: AFB1, aflatoxin B1; AFB2, aflatoxin B2; AFG1, afla-toxin G1; AFG2, aflatoxin G2; AFM1, aflatoxin M1; AFQ1, aflatoxin Q1;HCC, hepatocellular carcinoma; HBV, hepatitis B virus; HCV, hepatitis Cvirus; HBsAg, hepatitis B serum antigen; CYP 450, cytochrome P-450.
* Corresponding author. Address: University of Kuopio, Department ofClinical Nutrition, Food and Health Research Centre (ETTK), P.O. Box1627, FIN-70211 Kuopio, Finland. Tel.: +358 17163615; fax: +35817162792.
E-mail address: [email protected] (N. Polychronaki).
1. Introduction
Children are a particularly susceptible population toenvironmental hazards (Wild and Kleinjans, 2003) andthere are strong links between growth and health of thefetus and infant, and disease risk in later life (Barker,2004; Delisle, 2002; Firestone and Amler, 2003). Indeveloping countries poor diet and multiple infectious haz-ards are associated with malnutrition and growth falteringin infancy and childhood (WHO, 2003). In addition,dietary staples in some of these regions are frequently

520 N. Polychronaki et al. / Food and Chemical Toxicology 46 (2008) 519–526
contaminated with fungal toxins such as the aflatoxins(Wild and Hall, 2000). Aflatoxins are potent liver carcino-gens (IARC, 2002), and in young children chronic aflatoxinexposure at high levels has been associated with growth fal-tering (Gong et al., 2002, 2004; Turner et al., 2003, in press)and immune suppression (Turner et al., 2003). The fournaturally occurring aflatoxins are aflatoxins B1 (AFB1),AFB2, AFG1 and AFG2, though AFB1 is the mostcommonly occurring and carcinogenic (IARC, 2002).Following ingestion AFB1 is metabolized mainly by thecytochrome P-450 (CYP 450) enzymes 1A2, 3A4, 3A5 inthe liver (Guengerich et al., 1998; Wang et al., 1998) gener-ating several hydroxylated derivatives, and a highly reac-tive epoxide capable of binding to and damaging DNA,particularly at guanine residues (Guengerich et al., 2002;Wang and Groopman, 1999). Urinary aflatoxin-N7-guan-ine levels have been correlated with dietary intake of afla-toxins in Gambian (Groopman et al., 1992a) and Chineseadults (Groopman et al., 1992b). AFM1 is a major AFB1
metabolite found in exposed individuals (Groopmanet al., 1985, 1992a, 1992b; Wang et al., 2001), and urinarylevels of AFM1 in Chinese adults have also been correlatedwith the intake of AFB1 through diet (Zhu et al., 1987).The risk of HCC development in subjects with detectableurinary AFM1 levels has been reported to be 5.8-foldhigher (95% CI: 2.2, 15.2) compared to controls (Qianet al., 1994). The parent aflatoxins are also observed inthe urine of exposed individuals and in a few cases themetabolite AFQ1 has been reported (Groopman et al.,1992a, 1992b; Wang et al., 2001).
Aflatoxin exposure can occur throughout life and giventhe early onset of HCC within high exposure regions andthe strong associations with growth faltering (Gonget al., 2002, 2004), it is important to understand the pat-terns of early life exposure within different regions. Mater-nal aflatoxin exposure during pregnancy can lead to inutero exposure (Wild et al., 1991; Turner et al., in press),and in early infancy modest exposures through breast milk,particularly AFM1, may occur (El-Nezami et al., 2000;Polychronaki et al., 2006; Wild et al., 1987; Zarba et al.,1992). Thereafter, the introduction of weaning or familyfoods is likely to present a major source of aflatoxin expo-sure (Gong et al., 2003).
Aflatoxin–albumin has been used as a specific biomarkerof exposure in West African countries including The Gam-bia, Guinea and Benin (Allen et al., 1992; Sylla et al., 1999;Turner et al., 2000, 2003, 2005a, 2005b, in press; Wildet al., 1990, 1992a, 1992b, 1993a, 1993b, 2000; Gonget al., 2002, 2004), and exposure based on this biomarkeris frequent and at high levels. By comparison, there is lessinformation from Egypt on aflatoxin exposure using bio-markers but levels are expected to be lower than in Guinea(El-Nezami et al., 2000; Hatem et al., 2005). We recentlyreported that 37% of Egyptian women in a cross sectionalstudy of 388 had detectable aflatoxins in breast milk (Poly-chronaki et al., 2006) and 50 of those aflatoxin positivewomen were selected for a one year longitudinal study to
assess the temporal nature of their aflatoxin exposure(Polychronaki et al., 2007). In this study, we assessed thelevels of urinary aflatoxins in the infants from these 50women. In order to put the Egyptian data into context,analysis of urines samples from children in a region withknown frequent aflatoxin exposure was conducted in paral-lel. Guinea was selected due to our prior knowledge onaflatoxin exposure (Sylla et al., 1999; Turner et al.,2005a, 2005b), but also is a region with no reported datafor urinary aflatoxin metabolites, and thus we presentnovel data from this region also.
2. Materials and methods
2.1. Study population
2.1.1. Egypt
During May–September 2003 a cross sectional study was conducted toassess the levels aflatoxin in maternal breast milk samples from 388women in the Qalyubiyah governorate, Egypt, following the birth theirchild (Polychronaki et al., 2006). A sub-set of 50 women who were positivefor AFM1 in breast milk were subsequently followed for one year toexamine the temporal nature of aflatoxin exposure within this selectedgroup (Polychronaki et al., 2007). During October 2004, on completion ofthe longitudinal study, urine samples were collected from all 50 children(34 boys and 16 girls; median age 1.5 years, range 1–2.5 years). Urineswere stored at �20 �C until used. Twenty children were still partiallybreast fed, whilst 30 were fully weaned. The children predominantly (92%)came from farming families in rural areas. All children were hepatitis Bvirus (HBV) negative as determined by hepatitis B serum antigen (HBsAg)(HBsAg Abbot Auszyme monoclonal EOA kit from Abbot Laboratories,Ludwigshaten, Germany), and no chronic liver diseases were reported.The mothers were contacted through the New El-Qalyub Hospital, andinformed consent obtained prior to urine collection from each child. Thestudy in Egypt was approved by the Ethics Committee of the University ofKuopio and Kuopio University Hospital, Finland and by the NationalResearch Centre Ethical Committee, Egypt.
2.1.2. Guinea
In July–August 2003 a study to assess the interaction between HBVinfection and aflatoxin metabolism in young children aged 2–4 years wasinitiated in lower Kindia, Guinea, West Africa. From a set of 100 urinesamples, urine from 25 boys and 25 girls were selected to assess urinaryaflatoxin levels. Urines were stored at �20 �C until used. The childrenwere from a rural region previously identified as having frequent aflatoxinexposure based on both food measures and the level of serum aflatoxin–albumin adducts (Diallo et al., 1995; Sylla et al., 1999; Turner et al., 2005a,2005b). The children were fully weaned and all were HBV positive basedon HBsAg positivity (HBsAg Iimmunocomb kit from PBs Organics,France). The purpose of the study was explained to community leaders inthe villages and then to potential study participants in their own language.The mothers of all children gave informed consent. The study wasapproved by the Comite National d’Ethique pour la Recherche en Sante inGuinea and by the ethics committee at the London School of Hygiene andTropical Medicine, UK (Table 1).
2.2. Aflatoxin analysis
2.2.1. Aflatoxin extraction procedure
Prior to extraction all urine samples were stored at �20 �C. Urinesamples were thawed and 20 ml was adjusted with 1 N hydrochloric acidor potassium hydroxide to pH 5, and following centrifugation (3000g,10 min), the samples were loaded onto a C18-E Strata cartridge (6 ml,500 mg silica sorbent, Phenomenex, Cheshire UK) using an eight-channelperistaltic pump. The cartridges were washed with 5 ml 5% methanol.

Table 1Descriptive data on the Egyptian and the Guinean children at the time ofurine sample collection
Egyptian childrena Guinean childrena
N (%) Median (IQR)range
N (%) Median (IQR)range
Sex
Boys 34 (68) 25 (50)Girls 16 (32) 25 (50)
Age (years)b 1.5 (1.3–1.8) 3 (2–3)1.1–2.5 2–4
HBV
Negative 50 (100) –Positive – 50 (100)
Weaning status
Partly-weaned 20 (40) –Fully-weaned 30 (60) 50 (100)
a Sample collection took place during October for the Egyptian childrenand during July–August for the Guinean children.
b The age of the Egyptian children was calculated based on the date ofbirth, while the age of the Guinean children was reported by the parents.
N. Polychronaki et al. / Food and Chemical Toxicology 46 (2008) 519–526 521
Urine samples from Egypt were partially extracted at the NationalResearch Centre, Cairo, and aflatoxin residues shipped to the UKimmobilized on C18-E Strata cartridges. The urine samples from Guineawere frozen immediately after collection and were shipped to the Uni-versity of Leeds (UK) where the entire extraction procedure was per-formed as described above. Aflatoxin residues were eluted from the C18-EStrata cartridge using 3 ml of 1:1 methanol: 1% acetic acid followed by5 ml methanol. The eluent was dried in vacuo to approximately 200 ll andwas reconstituted in 2 ml of water prior to immunoaffinity enrichment.AflaTest P immunoaffinity columns (IAC) (Vicam, Hallmark AnalyticalVentures Limited, Chester, UK) were washed with 10 ml PBS followed by10 ml of distilled water, and loaded with the 2 ml of extracted samples.These were then washed with 5 ml PBS followed by 10 ml of distilledwater. The aflatoxin residues were eluted with 5 ml of 95% methanol and
Fig. 1. Mixture of AFB1, AFB2, AFG1, AFG2, AFM1 and AFQ1 standards inappeared always with a double peak. Trace (a) isochratic HPLC, trace (b) graconfirmed by spiking blank urine with these two aflatoxins metabolites only,
were dried overnight in vacuo. The dried extracts were reconstituted in100 ll methanol and quantified by HPLC with fluorescence detection.
2.2.2. HPLC-detection
Reverse phase HPLC (Prostar 240 quaternary gradient solvent deliverymodule and Prostar 410 autosampler model, Varian Inc.) was used toseparate the parent aflatoxins and aflatoxin metabolites on a C18Microsorb-MV column (150 by 4.6 mm, particle size 5 lm) fitted with aC18 metaguard column (Microsorb A104MG, Varian Inc.). Chromato-graphic separation was obtained by an isocratic system with a mobilephase of 30% (acetonitrile/methanol (1:1, v/v) and 70% (20 mM ammo-nium acetate buffer, pH 3.9). The flow rate was 1.2 ml/min, the oventemperature was 40 �C and the sample injection volume 10 ll.
Aflatoxin standards (AFB1, AFB2, AFG1, AFG2, AFM1, AFQ1) werepurchased from Sigma/Aldrich Company Ltd. (Gillingham, UK andHelsinki, Finland), and stored at �20 �C in a vial wrapped in aluminiumfoil. Since aflatoxins are carcinogens, care was exercised to avoid personalexposure and decontamination procedures with 10% sodium hypochloritewere used. HPLC grade methanol and acetonitrile were purchased fromRathburn Chemicals Ltd. (Walkerburn, UK).
Each aflatoxin has slightly different fluorescent properties and thus theconcentrations of urinary aflatoxins were estimated from separate five-point standard curves (regression coefficient > 0.995 for all curves) withlimits of detection at 25, 0.35, 50, 0.8, 5, 100 pg/ml of urine for AFB1,AFB2, AFG1, AFG2, AFM1, AFQ1, respectively. The limits of detectionwere defined as the lowest concentration of each aflatoxin that could bereliably detected (>3:1 signal to noise ratio) and quantified (%CV < 6 forfive repeatable injections). Each analysis was performed twice, and theresults presented are mean values of the two measurements. A mixture ofall aflatoxin standards was injected every six injections to assure the cor-rect identification of the urine sample peaks based on their retention times.AFQ1 standard (Sigma/Aldrich, Helsinki, Finland) appeared always witha double peak (Fig. 1) possibly being a mixture of two AFQ1 epimers(Buchi et al., 1975).
2.2.3. Confirmation of aflatoxin identities in urine samples and
measurement validation
Confirmation of urinary aflatoxin identities was initially performed ona subset of ten Guinean and seven Egyptian samples by assessing the co-
concentrations of 125, 2.5, 250, 5, 25 and 400 pg/ml urine. AFQ1 standarddient HPLC. AFM1 and AFG2 co-elution under gradient conditions was
data not shown.
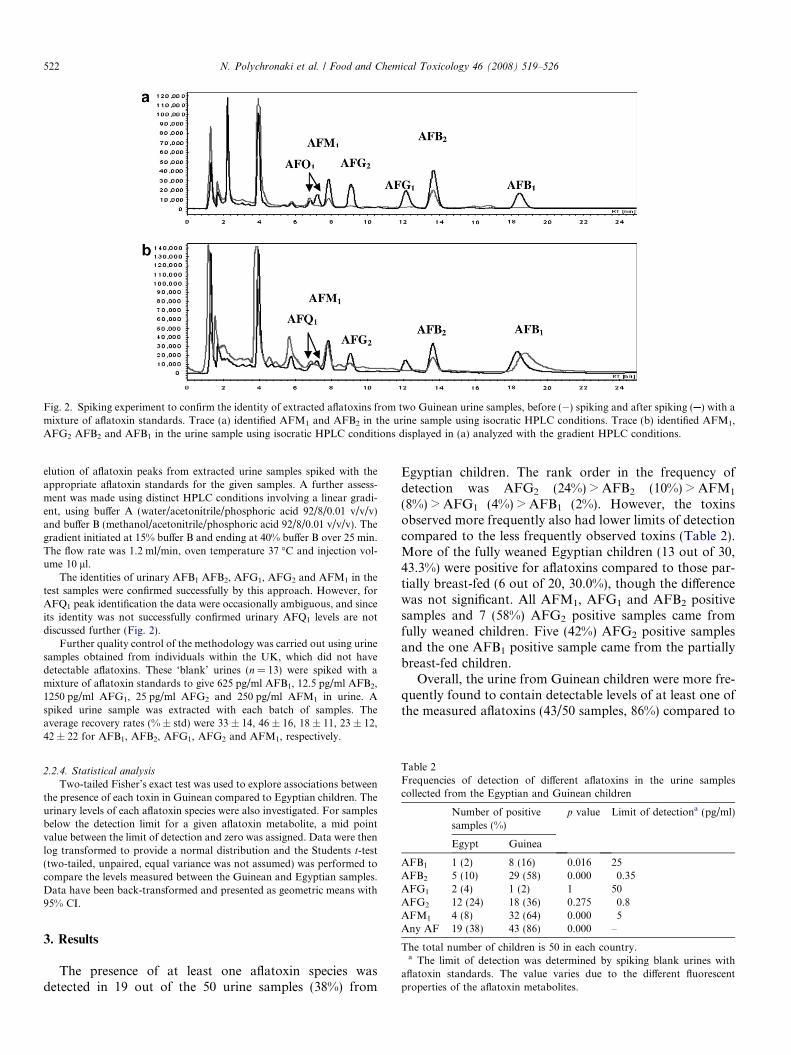
Fig. 2. Spiking experiment to confirm the identity of extracted aflatoxins from two Guinean urine samples, before ( ) spiking and after spiking ( ) with amixture of aflatoxin standards. Trace (a) identified AFM1 and AFB2 in the urine sample using isocratic HPLC conditions. Trace (b) identified AFM1,AFG2 AFB2 and AFB1 in the urine sample using isocratic HPLC conditions displayed in (a) analyzed with the gradient HPLC conditions.
522 N. Polychronaki et al. / Food and Chemical Toxicology 46 (2008) 519–526
elution of aflatoxin peaks from extracted urine samples spiked with theappropriate aflatoxin standards for the given samples. A further assess-ment was made using distinct HPLC conditions involving a linear gradi-ent, using buffer A (water/acetonitrile/phosphoric acid 92/8/0.01 v/v/v)and buffer B (methanol/acetonitrile/phosphoric acid 92/8/0.01 v/v/v). Thegradient initiated at 15% buffer B and ending at 40% buffer B over 25 min.The flow rate was 1.2 ml/min, oven temperature 37 �C and injection vol-ume 10 ll.
The identities of urinary AFB1 AFB2, AFG1, AFG2 and AFM1 in thetest samples were confirmed successfully by this approach. However, forAFQ1 peak identification the data were occasionally ambiguous, and sinceits identity was not successfully confirmed urinary AFQ1 levels are notdiscussed further (Fig. 2).
Further quality control of the methodology was carried out using urinesamples obtained from individuals within the UK, which did not havedetectable aflatoxins. These ‘blank’ urines (n = 13) were spiked with amixture of aflatoxin standards to give 625 pg/ml AFB1, 12.5 pg/ml AFB2,1250 pg/ml AFG1, 25 pg/ml AFG2 and 250 pg/ml AFM1 in urine. Aspiked urine sample was extracted with each batch of samples. Theaverage recovery rates (% ± std) were 33 ± 14, 46 ± 16, 18 ± 11, 23 ± 12,42 ± 22 for AFB1, AFB2, AFG1, AFG2 and AFM1, respectively.
Table 2Frequencies of detection of different aflatoxins in the urine samplescollected from the Egyptian and Guinean children
Number of positivesamples (%)
p value Limit of detectiona (pg/ml)
Egypt Guinea
AFB1 1 (2) 8 (16) 0.016 25AFB2 5 (10) 29 (58) 0.000 0.35AFG1 2 (4) 1 (2) 1 50AFG2 12 (24) 18 (36) 0.275 0.8
2.2.4. Statistical analysis
Two-tailed Fisher’s exact test was used to explore associations betweenthe presence of each toxin in Guinean compared to Egyptian children. Theurinary levels of each aflatoxin species were also investigated. For samplesbelow the detection limit for a given aflatoxin metabolite, a mid pointvalue between the limit of detection and zero was assigned. Data were thenlog transformed to provide a normal distribution and the Students t-test(two-tailed, unpaired, equal variance was not assumed) was performed tocompare the levels measured between the Guinean and Egyptian samples.Data have been back-transformed and presented as geometric means with95% CI.
AFM1 4 (8) 32 (64) 0.000 5Any AF 19 (38) 43 (86) 0.000 –
The total number of children is 50 in each country.a The limit of detection was determined by spiking blank urines with
aflatoxin standards. The value varies due to the different fluorescentproperties of the aflatoxin metabolites.
3. Results
The presence of at least one aflatoxin species wasdetected in 19 out of the 50 urine samples (38%) from
Egyptian children. The rank order in the frequency ofdetection was AFG2 (24%) > AFB2 (10%) > AFM1
(8%) > AFG1 (4%) > AFB1 (2%). However, the toxinsobserved more frequently also had lower limits of detectioncompared to the less frequently observed toxins (Table 2).More of the fully weaned Egyptian children (13 out of 30,43.3%) were positive for aflatoxins compared to those par-tially breast-fed (6 out of 20, 30.0%), though the differencewas not significant. All AFM1, AFG1 and AFB2 positivesamples and 7 (58%) AFG2 positive samples came fromfully weaned children. Five (42%) AFG2 positive samplesand the one AFB1 positive sample came from the partiallybreast-fed children.
Overall, the urine from Guinean children were more fre-quently found to contain detectable levels of at least one ofthe measured aflatoxins (43/50 samples, 86%) compared to

N. Polychronaki et al. / Food and Chemical Toxicology 46 (2008) 519–526 523
the Egyptian children (19/50, 38%) (p < 0.001). Thedifference in prevalence was statistically significant forAFB1 (16% vs. 2%, p = 0.016), AFB2 (58% vs. 10%,p < 0.001), and for AFM1 (64% vs. 8%, p < 0.001), butnot for AFG1 (2% vs. 4%, p = 1.000) and AFG2 (36% vs.24%, p = 0.275) for Guinea and Egypt, respectively (Table2). When the fully weaned Egyptian children (n = 30) werecompared to the Guinean children (n = 50), who wereall fully weaned, there remained a lower prevalence ofAFB1 (0% vs. 16%, p = 0.023), AFB2 (17% vs. 58%,p < 0.001) and AFM1 (13% vs. 64%, p < 0.001) in Egyptianurines.
Furthermore, the Guinean children tended to havehigher levels of urinary aflatoxins compared to the Egyp-tian children. For example, the geometric mean level ofAFM1 was 6-fold higher (p < 0.001) in the urine from theGuinean children (geometric mean 16.3 pg/ml; 95% CI:10.1, 26.6 pg/ml) compared to Egyptian children (geomet-ric mean 2.7 pg/ml; 95% CI: 2.5, 2.8 pg/ml). The parentaflatoxins, AFB1, AFB2, and AFG2, but not AFG1 werealso observed at higher geometric mean levels in Guineancompared to Egyptian urine samples, (Table 3). However,it should be noted that due to the low frequency of detec-tion of some of the aflatoxin metabolites these estimatesbecome heavily weighted by the assignment of a midpointvalue for those below the detection limit.
Table 3Levels of different aflatoxins (pg/ml) in the urine samples of the Guineanand the Egyptian children
Egypt Guinea p
valuec
Mean(range) a
Number Mean(range)a
Number
Geometricmean(95% CI) b
Positive Geometricmean(95% CI)b
Positive
AFB1 189 1 ?2682 (179–18000) 8 0.00713.2 (11.8,14.6)
26.6 (16.3, 42.9)
AFB2 1.4 (0.8–2.2) 5 5.7 (0.6–43) 29 <0.0010.2 (0.2, 0.3) 0.8 (0.5, 1.3)
AFG1 76.6 (72.1–81.1)
2 709 1 0.77
26.0 (24.5,27.7)
26.6 (23.3, 30.6)
AFG2 2.2 (0.9–8.0) 12 19.0 (1.4–199) 18 0.0080.57 (0.46,0.70)
1.1 (0.7, 1.7)
AFM1 5.5 (5.0–6.2) 4 97.0 (8.0–801) 32 <0.0012.7 (2.5, 2.8) 16.3 (10.1, 26.6)
The number of children was 50 from each country.a The arithmetic mean and range refer to those samples that are positive
only.b The geometric mean values are calculated including all samples. A
mid-point value between the limit of detection and zero was assigned tothose samples that were below the limit of detection (See Section 2 for thelimit of detection of each aflatoxin metabolite).
c p values are based on natural log transformed data, using two-tailedunpaired student t-test. Equal variance was not assumed.
4. Discussion
Urinary aflatoxin biomarkers are useful measures of therecent ingestion of aflatoxin. Determining the profile ofaflatoxin biomarkers can be useful in understanding boththe pattern of aflatoxin exposure and also to elucidatethe effect of co-exposure of aflatoxin with other environ-mental toxins or pathogens. Urinary aflatoxin profiles fromhealthy children from Guinea and Egypt have not previ-ously been documented. In this study, we were able toassess and compare the frequency and levels of urinaryaflatoxin metabolites in young children from these tworegions. Overall aflatoxins were more frequently presentin the urine of Guinean than Egyptian children (86% vs.38%). AFM1, which is a hydroxylation product of AFB1
(the most carcinogenic of the naturally occurring aflatox-ins), was observed in children from both Egypt andGuinea. However, the geometric mean AFM1 level was6-fold higher in Guinea than in Egypt. The frequency ofurinary aflatoxin detection in the Guinean children is inaccordance to other existing literature for children in WestAfrica in which serum aflatoxin–albumin adducts havebeen used as an exposure biomarker (Gong et al., 2002,2004; Turner et al., 2000, 2003, 2005b). Dietary aflatoxinexposure in Guinea is primarily from contamination ofthe groundnut crop (Diallo et al., 1995; Sylla et al., 1999;Turner et al., 2005a). As a result of the pattern of harvestand storage of this dietary staple, aflatoxin levels tend tovary with season such that highest levels of contaminationgenerally occur between December and May. Urine sam-ples for this study were obtained in July and August, thuswe would predict that the exposure levels reported in Gui-nea are not during a peak exposure period. There are nodata using aflatoxin–albumin adducts from children inEgypt, though the lower frequency and levels of urinaryaflatoxins reported here are in agreement with an exposurepattern predicted to be more moderate (Hatem et al., 2005;Polychronaki et al., 2006). As the sources of aflatoxin expo-sure in Egypt are less clearly defined than in Guinea it isless easy to predict seasonal variations in levels. However,one study of aflatoxins in breast milk samples from Egyp-tian mothers (Polychronaki et al., 2007), suggests thatApril–July as peak period of exposure. Thus as the Egyp-tian samples were obtained in October 2004 these urineswere also not obtained from a period of predicted highexposure in this region. It should be noted however, thatthe Egyptian samples were taken from mothers pre-selectedto have had detectable levels of aflatoxin in breast milksamples taken during the year prior to the urinary collec-tion from their infants. Therefore the samples are not nec-essarily fully representative for this region.
The Guinean children were older (aged 2–4 years) thanthe Egyptian children (aged 1–2.5 years) and some of theEgyptian children but none of the Guinean children werestill breast- feeding. Beninese children who were fullyweaned were reported to have higher aflatoxin–albuminlevels than those partially breast-feeding (Gong et al.,

Table 4International comparisons of AFM1 levels
Country AFM1
positive(%)
Mean AFM1
levels (pg/ml)(range)
Reference
Egypt Children 4/50 (8) 5.5 (5.0–6.2)a Present studyGuinea Children 32/50
(64)97.0 (8.0–801)a Present study
Egypt Children Hatem et al.(2005)
Kwashiorkor 4/30 (13) 22 (10–30)a
Marasmus 2/30 (7) 55 (40–70)a
SierraLeone
Children 104/234(44)
NS Jonsyn-Ellis(2001)
China Adults 112/300(44)
8 (60–120)b Mykkanen et al.(2005)
China Adults 24/27(89)
120 (0.6–800)ac Wang et al.(2001)
China Adults 78/145(54)
9.6 (3.6–246)b Sun et al. (1999)
China Adults 67/317(21)
NS (0.17–5.2)a Qian et al. (1994)
China Adults 29/252(12)
600 (30–3200)a Zhu et al. (1987)
NS mean not specified.a Arithmetic mean (range) of positive samples only.b median (intra-quartile range).c Results were originally presented as ng/24 h, however to allow com-
parisons, they are presented here as ng/ml based on the estimation thataverage daily adult urinary volume is 1600 ml (JEFCA, 1998).
524 N. Polychronaki et al. / Food and Chemical Toxicology 46 (2008) 519–526
2003). Similarly, among the Egyptian children in the pres-ent study those still partially breast-feeding had detectableaflatoxins less frequently compared to those children whowere fully weaned. The Guinean children were also allHBsAg positive while the Egyptian children were HBsAgnegative. It has been suggested that liver injury is a modi-fier of aflatoxin metabolism, and Turner et al. (2000)reported that HBV infection significantly influenced theaflatoxin–albumin adduct levels in Gambian children, withthose children that were HBsAg positive displaying higheraflatoxin–albumin adducts levels. However, there are nodata on the effects of HBV infection on AFB1 metabolismto AFM1. Therefore although age, weaning status andHBV infection are reported to affect aflatoxin biomarkerlevels, the scale of the differences in the frequency andlevels of exposure reported in this study are unlikely to beexplained by these factors. Rather the levels and frequen-cies of food contamination are probably the dominant fac-tor. AFB2 and AFG2 were observed at high frequencies inurine from Guinean children (58% and 36%, respectively).These toxins are generally present in contaminated foodsless frequently and at lower levels than either AFB1 orAFG1. It is thus tempting to speculate a higher conversionof both AFB1 and AFG1 in the liver is occurring, and thusAFB1 and AFG1 are not excreted as the parent compoundas frequently. However, this difference in urinary frequencywill also be significantly influenced by the greater sensitiv-ity of detection of AFB2 and AFG2 compared to AFB1 andAFG1.
The AFM1 level in the urine of the Egyptian childrenwere similar but slightly lower than that previouslyreported for Egyptian children with kwashiorkor (meanAFM1 levels 22 pg/ml, range 10–30 pg/ml) and marasmus(55 pg/ml, range 44–70 pg/ml) (Table 4) (Hatem et al.,2005). In a study in Sierra Leone, the reported AFM1 prev-alence of detection in the urine of children was comparableto that of the Guinean children (Jonsyn-Ellis, 2001). How-ever, the reported AFM1 levels, based on range only, werehigher than those measured in our study. Mean levels werenot reported from Sierra Leone. The prevalence of AFM1
detection of the Guinean children were comparable, butslightly lower than those previously reported for adults inChina (Table 4). A good correlation has been reportedbetween AFB1 dietary intake and urinary excretion ofAFM1 in adults (Groopman et al., 1992b; Zhu et al.,1987). However, there is no data on conversion rates inchildren. In addition there is limited data on average 24 hurinary volumes in children from these two regions, andthus estimates of intake based on urinary AFM1 wouldbe highly speculative. The presence of urinary AFM1 isgenerally regarded as a reflection of AFB1 ingestion andsubsequent metabolism, rather than being from directtransfer of the AFM1 from milk related foods. However,it is plausible that some of the urinary AFM1 may reflectingested AFM1, though this hypothesis remains unproven.It is worth noting that despite being a weaker carcinogen,AFM1 is as cytotoxic as AFB1 (Neal et al., 1998).
Aflatoxin is a potent liver carcinogen and there isconsiderable evidence for aflatoxin playing a role in thedevelopment of HCC within regions with frequent and highaflatoxin exposure (IARC, 2002). In Egypt, there is a risingHCC incidence (Ezzat et al., 2005). Whilst HBV and HCVinfection are clearly major contributors, the role of aflatox-ins in HCC cannot be ruled out. Further studies of theprevalence and level of exposure in the population usingaflatoxin biomarkers, including the aflatoxin–albuminadduct would be informative in this regard. Early life envi-ronment is crucial for growth and development in later life.A number of studies suggest that susceptibility to aflatoxinis greatest in the young, and in the reported acute poison-ings (Barrett, 2005; Ngindu et al., 1982; Serck-Hanssen,1970), it is often the children who are most severelyaffected. Chronic aflatoxin exposure in early life might bean important contributor to both growth faltering and/orthe early onset of HCC. Our data would suggest that mea-sures to reduce aflatoxin exposure in both regions are ofvalue although the situation is particularly pressing in Gui-nea where exposure is more prevalent and at higher levels.
Acknowledgements
This work was financially supported by a Grant fromthe Academy of Finland (No.: 13028), the ABS GraduateSchool on Applied Bioscience: Bioengineering, Food andNutrition, Environment, in Finland and by a Grant fromthe NIEHS No. ES06052. Nektaria Polychronaki was also

N. Polychronaki et al. / Food and Chemical Toxicology 46 (2008) 519–526 525
supported by the Marie Curie Fellowship Scheme withinthe European Community.
References
Allen, S.J., Wild, C.P., Wheeler, J.G., Riley, E.M., Montesano, R.,Bennett, S., Whittle, H.C., Hall, A.J., Greenwood, B.M., 1992.Aflatoxin exposure, malaria and hepatitis B infection in rural Gambianchildren. Trans. R Soc. Trop. Med. Hyg. 86, 426–430.
Barker, D.J., 2004. The developmental origins of chronic adult disease.Acta Paediatr. (Suppl. 93), 26–33.
Barrett, J., 2005. Liver cancer and aflatoxin: New information from theKenyan outbreak. Environ. Health Perspect. 113, A837–A838.
Buchi, G., Luk, K., Muller, P.M., 1975. Synthesis of aflatoxin Q1. J. Org.Chem. 40, 3458–3459.
Delisle, H., 2002. Foetal programming of nutrition-related chronicdiseases. Sante 12, 56–63.
Diallo, M.S., Sylla, A., Sidibe, K., Sylla, B.S., Trepo, C.R., Wild, C.P.,1995. Prevalence of exposure to aflatoxin and hepatitis B and C virusesin Guinea, West Africa. Nat. Toxins 3, 6–9.
El-Nezami, H., Mykkanen, H., Kankaanpaa, P., Suomalainen, T.,Salminen, S., Ahokas, J., 2000. Ability of a mixture of lactobacillus
and propionibacterium to influence the faecal aflatoxin content inhealthy Egyptian volunteers: a pilot clinical study. Biosci. Microflora19, 41–45.
Ezzat, S., Abdel-Hamid, M., Abdel-Latif, E., Mokhtar, N., Labib, N.A.,El-Ghorory, L., Mikhail, N.N., Abdel-Hamid, A., Hifnawy, T.,Stickland, G.T., et al., 2005. Associations of pesticides, HCV, HBV,and hepatocellular carcinoma in Egypt. Int. J. Hyg. Environ. Health208, 329–339.
Firestone, M.P., Amler, R.W., 2003. Children’s environmental health – aninternational perspective. Int. J. Hyg. Environ. Health 206, 395–400.
Gong, Y., Cardwell, K., Hounsa, A., Egal, S., Turner, P.C., Hall, A.J.,Wild, C.P., 2002. Dietary aflatoxin exposure and impaired growth inyoung children from Benin and Togo: cross sectional study. BMJ 325,20–21.
Gong, Y., Egal, S., Hounsa, A., Turner, P.C., Hall, A.J., Cardwell, K.F.,Wild, C.P., 2003. Determinants of aflatoxin exposure in young childrenfrom Benin and Togo, West Africa: the critical role of weaning. Int. J.Epidemiol. 32, 556–562.
Gong, Y., Hounsa, A., Egal, S., Turner, P.C., Sutcliffe, A.E., Hall, A.J.,Cardwell, K., Wild, C.P., 2004. Postweaning exposure to aflatoxinresults in impaired child growth: a longitudinal study in Benin, WestAfrica. Environ. Health Perspect. 112, 1334–1338.
Groopman, J.D., Donahue, P.R., Zhu, J.Q., Chen, J.S., Wogan, G.N.,1985. Aflatoxin metabolism in humans: detection of metabolites andnucleic acid adducts in urine by affinity chromatography. Proc. Natl.Acad. Sci. USA 82, 6492–6496.
Groopman, J.D., Hall, A.J., Whittle, H., Hudson, G.J., Wogan, G.N.,Montesano, R., Wild, C.P., 1992a. Molecular dosimetry of aflatoxin-N7-guanine in human urine obtained in The Gambia, West Africa.Cancer Epidemiol. Biomarkers Prev. 1, 221–227.
Groopman, J.D., Zhu, J.Q., Donahue, P.R., Pikul, A., Zhang, L.S., Chen,J.S., Wogan, G.N., 1992b. Molecular dosimetry of urinary aflatoxin-DNA adducts in people living in Guangxi Autonomous Region,People’s Republic of China. Cancer Res. 52, 45–52.
Guengerich, F.P., Johnson, W.W., Shimada, T., Ueng, Y.F., Yamazaki,H., Langouet, S., 1998. Activation and detoxication of aflatoxin B1.Mutat. Res. 402, 121–128.
Guengerich, F.P., Arneson, K.O., Williams, K.M., Deng, Z., Harris,T.M., 2002. Reaction of aflatoxin b(1) oxidation products with lysine.Chem. Res. Toxicol. 15, 780–792.
Hatem, N.L., Hassab, H.M., Abd Al-Rahman, E.M., El-Deeb, S.A., El-Sayed Ahmed, R.L., 2005. Prevalence of aflatoxins in blood and urineof Egyptian infants with protein-energy malnutrition. Food Nutr. Bull.26, 49–56.
IARC. 2002. Some Traditional Herbal Medicines, Some Mycotoxins,Naphthalene and Styrene. World Health Organization, InternationalAgency for Research on Cancer, Lyon, France. Report No. 82. pp. 1–556.
JEFCA. 1998. Safety Evaluation of Certain Food Additives andContaminants (JEFCA Evaluation). Joint FAO/WHO Expert Com-mittee on Food Additives, Geneva. Report No. 40.
Jonsyn-Ellis, F.E., 2001. Seasonal variation in exposure frequency andconcentration levels of aflatoxins and ochratoxins in urine samples ofboys and girls. Mycopathologia 152, 35–40.
Mykkanen, H., Zhu, H., Salminen, E., Juvonen, R.O., Ling, W., Ma, J.,Polychronaki, N., Kemilainen, H., Mykkanen, O., Salminen, S., et al.,2005. Fecal and urinary excretion of aflatoxin B1 metabolites (AFQ1,AFM1 and AFB-N7-guanine) in young Chinese males. Int. J. Cancer115, 879–884.
Neal, G.E., Eaton, D.L., Judah, D.J., Verma, A., 1998. Metabolism andtoxicity of aflatoxins m1 and B1 in human-derived in vitro systems.Toxicol. Appl. Pharmacol. 151, 152–158.
Ngindu, A., Johnson, B.K., Kenya, P.R., Ngira, J.A., Ocheng, D.M.,Nandwa, H., Omondi, T.N., Jansen, A.J., Ngare, W., Kaviti, J.N.,et al., 1982. Outbreak of acute hepatitis caused by aflatoxin poisoningin Kenya. Lancet 1, 1346–1348.
Polychronaki, N., Turner, P.C., Mykkanen, H., Gong, Y., Amra, H.,Abdel-Wahhab, M., El-Nezami, H., 2006. Determinants of aflatoxinM1 in breast milk in a selected group of Egyptian mothers. FoodAddit. Contam. 23, 700–708.
Polychronaki, N., West, R.M., Turner, P.C., Amra, H., Abdel-Wahhab,M., Mykkanen, H., El-Nezami, H., 2007. A longitudinal assessment ofaflatoxin M1 excretion in breast milk of selected Egyptian mothers.Food Chem. Toxicol. 45, 1210–1215.
Qian, G.S., Ross, R.K., Yu, M.C., Yuan, J.M., Gao, Y.T., Henderson,B.E., Wogan, G.N., Groopman, J.D., 1994. A follow-up study ofurinary markers of aflatoxin exposure and liver cancer risk inShanghai, People’s Republic of China. Cancer Epidemiol. BiomarkersPrev. 3, 3–10.
Serck-Hanssen, A., 1970. Aflatoxin-induced fatal hepatitis? A case reportfrom Uganda. Arch. Environ. Health 20, 729–731.
Sun, Z., Lu, P., Gail, M.H., Pee, D., Zhang, Q., Ming, L., Wang, J., Wu,Y., Liu, G., Zhu, Y., 1999. Increased risk of hepatocellular carcinomain male hepatitis B surface antigen carriers with chronic hepatitis whohave detectable urinary aflatoxin metabolite M1. Hepatology 30, 379–383.
Sylla, A., Diallo, M.S., Castegnaro, J., W, C.P., 1999. Interactionsbetween hepatitis B virus infection and exposure to aflatoxins in thedevelopment of hepatocellular carcinoma: a molecular epidemiologyapproach. Mutat. Res. 428, 187–196.
Turner, P.C., Mendy, M., Whittle, H., Fortuin, M., Hall, A.J., Wild, C.P.,2000. Hepatitis B infection and aflatoxin biomarker levels in Gambianchildren. Trop. Med. Int. Health 5, 837–841.
Turner, P.C., Moore, S.E., Hall, A.J., Prentice, A.M., Wild, C.P., 2003.Modification of immune function through exposure to dietaryaflatoxin in Gambian children. Environ. Health Perspect. 111, 217–220.
Turner, P.C., Sylla, A., Gong, Y.Y., Diallo, M.S., Sutcliffe, A.E., Hall,A.J., Wild, C.P., 2005a. Reduction in exposure to carcinogenicaflatoxins by post-harvest intervention measures in west Africa: acommunity-based intervention study. Lancet 365, 1950–1956.
Turner, P.C., Sylla, A., Kuang, S.Y., Marchant, C.L., Diallo, M.S., Hall,A.J., Groopman, J.D., Wild, C.P., 2005b. Absence of TP53 codon 249mutations in young Guinean children with high aflatoxin exposure.Cancer Epidemiol. Biomarkers Prev. 14, 2053–2055.
Turner, P.C., Collinson, A.C., Cheung, Y.B., Gong, Y.Y., Hall, A.J., Prentice,A.M., Wild, C.P., in press. Aflatoxin exposure in utero causes growthfaltering in Gambian infants. Int. J. Epidemiol. doi:10.1093/ije/dym122.
Wang, J.S., Groopman, J.D., 1999. DNA damage by mycotoxins. Mutat.Res. 424, 167–181.
Wang, H., Dick, R., Yin, H., Licad-Coles, E., Kroetz, D.L., Szklarz, G.,Harlow, G., Halpert, J.R., Correia, M.A., 1998. Structure-function

526 N. Polychronaki et al. / Food and Chemical Toxicology 46 (2008) 519–526
relationships of human liver cytochromes P450 3A: aflatoxin B1metabolism as a probe. Biochemistry 37 (36), 12536–12545.
Wang, J.S., Huang, T., Su, J., Liang, F., Wei, Z., Liang, Y., Luo, H.,Kuang, S.Y., Qian, G.S., Sun, G., et al., 2001. Hepatocellularcarcinoma and aflatoxin exposure in Zhuqing Village, Fusui County,People’s Republic of China. Cancer Epidemiol. Biomarkers Prev. 10,143–146.
WHO. 2003. Global strategy for infant and young child feeding. Geneva.Wild, C.P., Hall, A.J., 2000. Primary prevention of hepatocellular
carcinoma in developing countries. Mutat. Res. 462, 381–393.Wild, C.P., Kleinjans, J., 2003. Children and increased susceptibility to
environmental carconogens: evidence or empathy? Cancer Epidemiol.Biomarkers Prev. 12, 1389–1394.
Wild, C.P., Pionneau, F.A., Montesano, R., Mutiro, C.F., Chetsanga,C.J., 1987. Aflatoxin detected in human breast milk by immunoassay.Int. J. Cancer 40, 328–333.
Wild, C.P., Jiang, Y.Z., Allen, S.J., Jansen, L.A., Hall, A.J., Montesano,R., 1990. Aflatoxin-albumin adducts in human sera from differentregions of the world. Carcinogenesis 11, 2271–2274.
Wild, C.P., Rasheed, F.N., Jawla, M.F., Hall, A.J., Jansen, L.A.,Montesano, R., 1991. In-utero exposure to aflatoxin in west Africa.Lancet 337, 1602.
Wild, C.P., Hudson, G.J., Sabbioni, G., Chapot, B., Hall, A.J., Wogan,G.N., Whittle, H., Montesano, R., Groopman, J.D., 1992a. Dietaryintake of aflatoxins and the level of albumin-bound aflatoxin inperipheral blood in The Gambia, West Africa. Cancer Epidemiol.Biomarkers Prev. 1, 229–234.
Wild, C.P., Shrestha, S.M., Anwar, W.A., Montesano, R., 1992b. Fieldstudies of aflatoxin exposure, metabolism and induction of geneticalterations in relation to HBV infection and hepatocellular carcinomain The Gambia and Thailand. Toxicol. Lett. 64–65. Spec No. 455-461.
Wild, C.P., Fortuin, M., Donato, F., Whittle, H.C., Hall, A.J., Wolf,C.R., Montesano, R., 1993a. Aflatoxin, liver enzymes, and hepatitis Bvirus infection in Gambian children. Cancer Epidemiol. BiomarkersPrev. 2, 555–561.
Wild, C.P., Jansen, L.A., Cova, L., Montesano, R., 1993b. Moleculardosimetry of aflatoxin exposure: contribution to understanding themultifactorial etiopathogenesis of primary hepatocellular carcinomawith particular reference to hepatitis B virus. Environ. Health Perspect.99, 115–122.
Wild, C.P., Yin, F., Turner, P.C., Chemin, I., Chapot, B., Mendy, M.,Whittle, H., Kirk, G.D., Hall, A.J., 2000. Environmental and geneticdeterminants of aflatoxin–albumin adducts in the Gambia. Int. J.Cancer 86, 1–7.
Zarba, A., Wild, C.P., Hall, A.J., Montesano, R., Hudson, G.J.,Groopman, J.D., 1992. Aflatoxin M1 in human breast milk fromThe Gambia, west Africa, quantified by combined monoclonalantibody immunoaffinity chromatography and HPLC. Carcinogenesis13, 891–894.
Zhu, J.Q., Zhang, L.S., Hu, X., Xiao, Y., Chen, J.S., Xu, Y.C., Fremy, J.,Chu, F.S., 1987. Correlation of dietary aflatoxin B1 levels withexcretion of aflatoxin M1 in human urine. Cancer Res. 47, 1848–1852.