Shellfish gathering at Nukalau Island, West New Britain Province, Papua New Guinea
Upload
khangminh22Category
view
0download
0
Papua New Guinea Forest Authority
CAPACITY DEVELOPMENT PROJECT
FOR OPERATIONALIZATION OF
PNG FOREST RESOURCE
INFORMATION MANAGEMENT SYSTEM
FOR
ADDRESSING CLIMATE CHANGE
FINAL REPORT
(Annexes, Part II)
September 2019
JAPAN INTERNATIONAL COOPERATION AGENCY
KOKUSAI KOGYO CO., LTD. GE
JR
19-044


Part II
Other Outputs of the Project


Annex 6
Project Fact Sheet and Analytical Report
Fact Sheet
Fact Sheet No.1 JICA-PNGFA PROJECT Outline
Fact Sheet No.2 Papua New Guinea Forest Base Map 2012
Fact Sheet No.3 PNG-FRIMS
Fact Sheet No.4 Forest Monitoring Unit (FMU) in Papua New Guinea Forest
Cover Map
Fact Sheet No.5 Constraints data – Natural condition layers in the PNG-FRIMS
Fact Sheet No.6 Watershed and Catchment Data
Fact Sheet No.7 Digitized Road Information
Fact Sheet No.8 Forest Concession and Land Management Layers in
PNG-FRIMS
Fact Sheet No.9 Forest Cover Map 2015
Fact Sheet No.10 Drone Applications in Sustainable Forestry Management and
Monitoring in PNGFA
Analytical Report
Analytical Report No.1 Analysis of Drivers of Deforestation and Forest
Degradation in Papua New Guinea
Analytical Report No.2 Analysis of Future Forest Change Modeling in Papua
New Guinea
Analytical Report No.3 Potential in Papua New Guinea to estimate emissions
from forest degradation caused by logging based on field
methods (using FRIMS)


Situation of Papua New Guinea
The forest of Papua New Guinea (PNG) contains some of the largest areas of tropical rainforest in the Pacific region.
The tropical rainforest plays important roles in many aspects, contributing to the national economy through timber
exports, rich biodiversity and mitigation of climate change. While alarming rate of loss and degradation of forest have
been reported in recent decades, there was no robust forest monitoring system in PNG to detect these loss and
degradation . In order to address this challenge, Japan International Cooperation Agency (JICA) and PNG Forest
Authority (PNGFA) implemented a capacity development project from March 2011 to March 2014, combined with the
Japanese Grant Aid Program that provided the project with remote sensing data, GIS equipment, and training
program for the officers of PNGFA and other relevant government agencies.
JICA-PNGFA Project 2011 – 2014 (Phase 1) : Achieved Outcomes
The project successfully developed a Nation-wide Forest Base Map 2012 that suggested a necessity of closer
monitoring on forest operation and the extent of forest degradation and deforestation over the 37 million hectares of
forest in PNG. The project also established a PNG Forest Resource Information Management System (PNG-FRIMS)
based on a GIS system with remote sensing technology. Other outputs of the project include the proposals on some
tools for forest monitoring such as radar technology and carbon estimation. The project also contributed in
determining the threshold values of the national definition of forest for PNG.
Overall Goal : Forests in PNG are conserved and managed in a sustainable manner, while at
the same time, mitigation and adaptation measures against climate change are promoted.
Project Purpose : Capacity of the PNGFA to continuously update forest information and to
fully operationalize and utilize PNG-FRIMS for promoting sustainable forest management and
for addressing climate change is enhanced.
Improvement of
Forest Management
and Administration
PNG Forest Resource
Information
Management System
(PNG-FRIMS)
Output 3Forest information
for addressing REDD+
is prepared
Output 1PNG-FRIMS is
expanded and
enhanced
Output 2The national forest plan, provincial forest plans, forest
management plans and their monitoring system are
improved through steady operation of PNG-FRIMS.
JICA-PNGFA Project 2014 – 2019
(Phase 2) : Planned Outcomes
In order to improve the cyclic
management of forest in PNG in
coherent manner, the new project
aims to enhance capacity of PNGFA
to continuously update forest
information and to fully
operationalize and utilize PNG-
FRIMS for promoting sustainable
forest management and for
addressing climate change. The new
project commenced in August 2014
and will terminate in August 2019.
Outline of the Project
JICA-PNGFA PROJECT OutlineCapacity Development Project for Operationalization of PNG Forest Resource
Information Management System (PNG-FRIMS) for Addressing Climate Change
Observed logging impact (high & low) on RapidEye 5m resolution imageries
JICA-PNGFA Forestry Project 2014-2019 - Fact Sheet No.1 rev1
Citation: JICA and PNGFA, 2017, ‘2014-2019 JICA-PNGFA Project Outline - JICA-PNGFA Forestry Project 2014-2019 Fact Sheet No.1’. Papua New Guinea Forest Authority, Port Moresby, Papua New Guinea
Forest Management Activities
Monitoring
logging
operation
Forest
plantation
management
Map making
support for
landowners
Project activities:• Capacity development for necessary
tools operation
• Improvement of data sharing method
Expected outcomes:• Enhanced field work
• Data updating on field basis
PNG Forest Authority (JICA Project) Address: P.O.Box 5055, Boroko, National Capital District, Papua New Guinea Email: [email protected] / [email protected] JICA Project Site: http://www.jica.go.jp/png/english/activities/activity12.htmlProject Facebook Page: https://www.facebook.com/jica.png.forest.monitoring/ Last updated on Feb. 2018
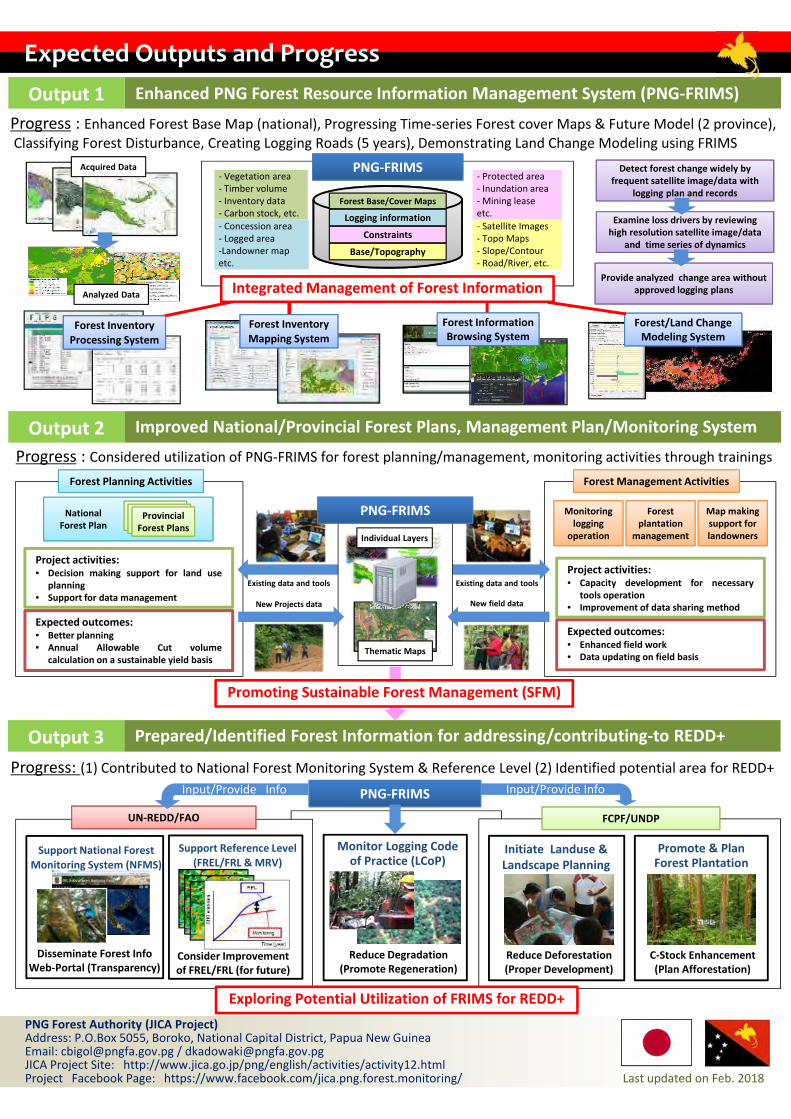
Expected Outputs and Progress
Enhanced PNG Forest Resource Information Management System (PNG-FRIMS)Output 1
Progress : Considered utilization of PNG-FRIMS for forest planning/management, monitoring activities through trainings
Prepared/Identified Forest Information for addressing/contributing-to REDD+Output 3
Forest Planning Activities
Provincial
Forest Plans
Project activities:• Decision making support for land use
planning
• Support for data management
Expected outcomes:• Better planning
• Annual Allowable Cut volume
calculation on a sustainable yield basis
New field dataNew Projects data
National
Forest Plan
Progress : Enhanced Forest Base Map (national), Progressing Time-series Forest cover Maps & Future Model (2 province),
Classifying Forest Disturbance, Creating Logging Roads (5 years), Demonstrating Land Change Modeling using FRIMS
Progress: (1) Contributed to National Forest Monitoring System & Reference Level (2) Identified potential area for REDD+
Disseminate Forest Info
Web-Portal (Transparency)
Support National Forest
Monitoring System (NFMS)
Initiate Landuse &
Landscape Planning
Reduce Deforestation
(Proper Development)
Reduce Degradation
(Promote Regeneration)
Monitor Logging Code of Practice (LCoP)
Support Reference Level
(FREL/FRL & MRV)
Consider Improvement
of FREL/FRL (for future)
Promote & Plan Forest Plantation
C-Stock Enhancement
(Plan Afforestation)
PNG-FRIMS
Detect forest change widely by
frequent satellite image/data with
logging plan and records
Examine loss drivers by reviewing
high resolution satellite image/data
and time series of dynamics
Provide analyzed change area without
approved logging plans
Existing data and tools Existing data and tools
Output 2 Improved National/Provincial Forest Plans, Management Plan/Monitoring System
Promoting Sustainable Forest Management (SFM)
UN-REDD/FAO FCPF/UNDP
PNG-FRIMS
Forest Inventory
Mapping System
Forest Inventory
Processing System
PNG-FRIMS- Vegetation area
- Timber volume
- Inventory data
- Carbon stock, etc.
Base/Topography
Forest Base/Cover Maps
Constraints
Logging information- Concession area
- Logged area
-Landowner map
etc.
- Protected area
- Inundation area
- Mining lease
etc.
- Satellite Images
- Topo Maps
- Slope/Contour
- Road/River, etc.
Forest Information
Browsing System
Forest/Land Change
Modeling System
Integrated Management of Forest Information
Exploring Potential Utilization of FRIMS for REDD+
Analyzed Data
Acquired Data
FF
FFF
FF FFFFF FF
FFFF
FFFF
F
FFF FF
Hs
Saf/W
Po5
40
60
30
50
70
80
90
100
110
120130140
150
160
170
180 1
9020
0
21
220
230
240
250
260
30
40
180
60
30
190
240
200
40
0
70
30
180
190
70
210
260
60
20
130
180
120
40
170
30
80
140
30
30
20 0
50
50
160
30
40
130
20
30
30
40
40
170
150
200
30
30
170
50
70
190
30
20
µ
0 200 400 600 800 1,000100m
F ArcPhoto
Road
River
Vegetation(FIMS)
Contour_5534816_10m
RapidEye_5534816(2011-07-24)
Red: Band_3
Green: Band_2
Blue: Band_1
LANDSAT_p096r066(20010303)
Red: NONE
Green: NONE
Blue: NONE
Thematic Maps
Individual Layers
Input/Provide Info Input/Provide Info

1. Background 1. Background
Capacity Development Project for Operationalization of PNG Forest Resource Information Management System (PNG-FRIMS) for Addressing Climate Change
2. Development, improvement and finalization of the Base Map 20122. Development, improvement and finalization of the Base Map 2012
JICA-PNGFA Forestry Project 2014-2019 - Fact Sheet No.2 rev1
Papua New Guinea Forest Base Map 2012
JIJA PNGFA Project 2011-2014
Japan International Cooperation Agency (JICA) and PNG Forest Authority (PNGFA)
implemented a capacity development project since 2011 to 2014 combined with the
Japanese Grant Aid Program that provided the project with remote sensing data and GIS
equipment. The project set up a PNG Forest Resource Information Management System
(PNGNFRIMS) based on a GIS system with remote sensing technology (JICA and PNGFA,
2016).
Development History of the Forest Base Map 2012
Before the project 2011N2014, national level Forest Base Map was created as at 1975 and
had not been updated since minor update in 1996. This outdated map based on legacy
technology caused various practical problems to PNGFA. Responding to this situation,
The PNG Forest Base Map 2012 was initially developed as a main layer of the PNGNFRIMS
in 2014. Following the successful completion of the project 2011N2014, new project
2014N2019 commenced for realizing the full operationalization of the PNGNFRIMS. The
improvement and finalization of the Base Map 2012 was taken over by this new JICAN
PNGFA Project 2014N2019 and completed in February 2016.
In order to cope with challenging conditions including rugged terrain, vast forest area,
very poor road connection and landowner issue (97% of the land in PNG is customary
owned by clans), Forest Base Map 2012 was developed using optical satellite imagery
(RapidEye), Rader satellite data (ALOSNPALSAR) and other existing data. Significant
improvements such as upNtoNdate information, finer segmentation size, forest/nonNforest
delineation including water area etc. are seen in the newly developed Forest Base Map
2012.
ALOSNPALSAR: The Advanced Land Observing Satellite (ALOS) "DAICHI" equipped with
Phased Array type LNband Synthetic Aperture Radar (PALSAR) launched by Japan
Aerospace Exploration Agency (JAXA) in 2006.

(a) Data input and process
Satellite observation data used for developing the PNG Forest Base Map 2012 (Base
Map 2012) include RapidEye (optical sensor, captured in 2010 and 2011) and ALOSN
PALSAR (radar sensor, captured in 2007 and 2010). Airborne radar information shared
from the PNG National Mapping Bureau (NMB) was also utilized as data for elevation
from sea level.
Classification and its coding system of forest and other landNcover used in the Base
Map 2012 was developed by integrating classification code necessary for PNGFA work
and classes discernible from satellite imageries on the basis of the land cover
classification and code registered in Forest Inventory Mapping System (FIMS)
(Hammermaster & Saunders, 1995 and McAlpine, and Quigley, 1998,). ‘Alpine
grassland’ and ‘Subalpine grassland’ were picked up from ‘Grassland and Herbland’
according to the elevation from sea level. ‘Forest plantation’ and ‘Plantation other
than forest plantation’ are newly added to the Forest Base Map 2012. Details of the
classification and coding system are illustrated in subNsection (b) below.
Segmentation and objectNbased classification of the land cover was done by using a
software ‘eCognition’ for satellite imagery analysis as well as a software ‘R’ for
statistical analysis of the segments. For this analysis, we utilized RapidEye satellite
imageries (five bands), NDVI (Normalized Difference Vegetation Index) generated
from analysis on RapidEye data, elevation data shared from NMB (five meter mesh),
and slope and watersheds (or catchment boundaries) generated from analysis on
NMB elevation data.
Automated classification of the segments were done for forest and other vegetation
by ‘eCognition’ and ‘R’, after calculating ‘feature parameters’ of each segment by
using statistical value including average and standard deviation of various parameters
of all pixels in each segment. The classification was done by multiNstage classification
following a forest classification flowchart tailored for this work, by using parameters
including Brightness, Green, Near InfraNRed (NIR), NDVI, elevation from Digital
Elevation Model (DEM), and slope.
Where we encountered with difficulty by cloud cover on optical RapidEye imageries,
we interpolated forest/ nonNforest distinction by utilizing PALSAR radar data.

Correction by human interpretation was made where we found automated
classification is difficult for some classes (Larger Urban Centres, Bare Areas, Cropland/
Agriculture land, Woodland, Savanna, and Scrub) or obvious error classification made
by automated process. The human interpretation was supported by photographs
taken by digital camera on handNheld GPS (Global Positioning System) terminal from
helicopter, verification by ground truthing, mobilization of existing knowledge, and
literature study.
‘Forest Plantation’ was distinguished from ‘Plantation other than forest plantation’ by
referring to plantation boundaries data owned by PNGFA. ‘Forest Plantation’ indicated
on the Forest Base Map is not necessarily corresponding to the actual distribution of
forest plantations since PNGFA does not have every boundary information of forest
plantations which are often managed by private sectors.
Some classes (Cropland/ Agriculture land, Forest Plantation, and Plantation other than
forest plantation) are delineated by human interpretation relying on local knowledge
of PNGFA officers and staffs attached to Area and Provincial Forestry Offices by utilizing
RapidEye imageries and geoNreferenced photographs taken by handheld GPS terminal.
The PNGFA officers and staffs used ultrahigh resolution satellite imageries on Google
Earth and Bing Map, existing information on cropland (Mapping Agriculture Systems of
PNG, MASP and Papua New Guinea Resource Information System, PNGRIS), and data
on Digital Elevation Models (DEMs).
(b) Typology of forests and other land use
P Low altitude forest on plains and fans –
below 1000 m
G Grassland and herbland
H Low altitude forest on uplands – below
1000 m
Ga Alpine grassland – above 3200 m
L Lower montane forest – above 1000 m Gi Subalpine grassland – above 2500 m
Mo Montane forest – above 3000 m M Mangrove
D Dry seasonal forest O Cropland/Agriculture land
B Littoral forest Qa Plantation other than forest plantation
Fri Seral forest Qf Forest plantation
Fsw Swamp forest E Waterbody
W Woodland Z Bare area
Sa Savanna U Larger urban centre
Sc Scrub

(c) Appropriate scale of use
The ground resolution of the RapidEye imageries used for the development of the
Forest Base Map 2012 data is five (5) meters (reNsampled from original six point five
(6.5) meters) meanwhile it is ten (10) meters for PALSAR used for interpolating cloud
cover area. The mapping scale is between 1/25,000 and 1/50,000 for the data
development while minimum mapping polygon size is 1 hectare. Therefore, this map
should be used at a scale between 1/25,000 and 1/50,000 with noting the constraint of
location accuracy described in the subNsection (d) below.
(d) Limitations of location accuracy and geographical coverage
Location accuracy: The location accuracy of the Forest Base Map 2012 is equal to
that of orthorectified dataset of LANDSAT (Land Satellite) developed by United States
Geological Survey (USGS) because the specification was designed in accordance with
LANDSAT, taking account of the conditions of reference data available for PNG and
future updating of data. According to the limitation of the resolution of LANDSAT,
location error of plus or minus thirty (30) meters may have been included. Due to
this limitation, it should be noted that the ground based positioning by GPS has
higher location accuracy than that of this map.
Coverage: This map is developed for utilizing on purpose of forest management by
the PNGFA. Therefore, the map does not exhaustively cover some small islands and
other areas where forest management operation by PNGFA are not currently
conducted.
Delineation of Cropland/Agriculture land: Since conditions of crop land varies
depending on applied practice and cropping cycle, local knowledge and
supplementary information is prerequisite for their interpretation and classification
at much localized level. According to that nature, the map does not exhaustively
cover all cropland and agriculture land.
Classification among Woodland, Savanna, and Scrub: The accurate delineation,
verification and monitoring of boundaries of Woodland, Savanna, and Scrub cannot
be done as long as relying on interpretation and classification solely on satellite
imageries. The savanna, particularly in PNG, only occurs in limited areas resulting
from repetitive humanNinduced burning under specific climatic and ecological
conditions. The Scrub in PNG is also specifically defined as a lowNrise forest
vegetation comprised of specific tree species. Taking these conditions into account,
these three classes are identified on the Forest Base Map 2012 by referring to FIMS
and localities.
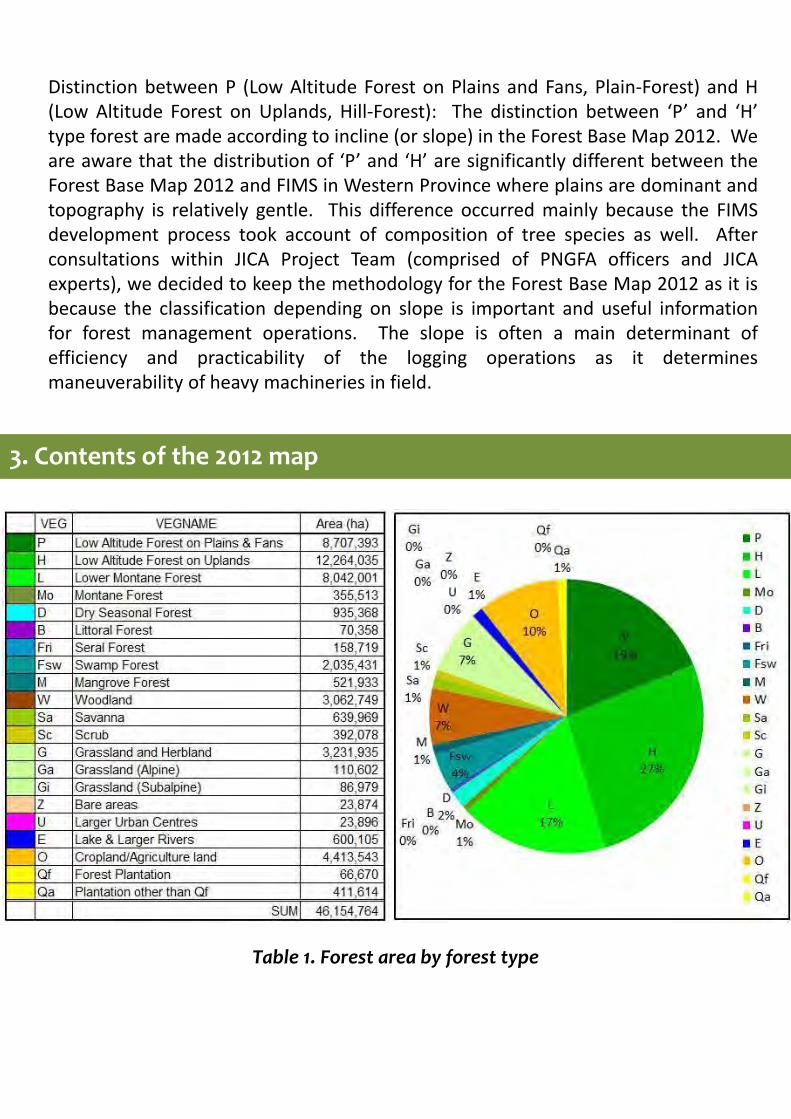
Distinction between P (Low Altitude Forest on Plains and Fans, PlainNForest) and H
(Low Altitude Forest on Uplands, HillNForest): The distinction between ‘P’ and ‘H’
type forest are made according to incline (or slope) in the Forest Base Map 2012. We
are aware that the distribution of ‘P’ and ‘H’ are significantly different between the
Forest Base Map 2012 and FIMS in Western Province where plains are dominant and
topography is relatively gentle. This difference occurred mainly because the FIMS
development process took account of composition of tree species as well. After
consultations within JICA Project Team (comprised of PNGFA officers and JICA
experts), we decided to keep the methodology for the Forest Base Map 2012 as it is
because the classification depending on slope is important and useful information
for forest management operations. The slope is often a main determinant of
efficiency and practicability of the logging operations as it determines
maneuverability of heavy machineries in field.
3. Contents of the 2012 map3. Contents of the 2012 map
Table 1. Forest area by forest type

Figure 1. Forest Base Map 2012
Figure 2. Forest Base Map 2012 (West New Britain province)

4. Data Access and contacts 4. Data Access and contacts
(a) Paper map ‘PNG Forest Base Map 2012’ by computer prints
Joverage Size Scale Price (See Note)
National A0, A1, A2, A3, A4 1: 1,600,000 to 6,400,000 K150, 100, 50, 40, 20
Province A0, A1, A2, A3, A4 1: 150,000 to 2,200,000 K150, 100, 50, 40, 20
(b) Digital format
Note: Price in this table subject to change without further notice.
Format
(See Note (1))
Joverage Fit to print on
or scale at
Suitable
medium
Price
(See note (2))
PDF National A3 CDNROM K 50
Province A3 K 50
Raster on TIFF Province To be used from
1/50,000 to 25,000
K 20
(See note (3))
Note (1): Provision of other digital format map may be arranged and admitted for government and academic
institutions for public and research purposes principally for mutual information exchange basis subject
to agreement of Minutes of Understanding or other appropriate form of written consent.
Note (2): Price in this table subject to change without further notice.
Note (3): Raster on TIFF format may be shared subject to a written consent of usage and copyright credit
obligation and citation with acknowledgement to PNGFA and JICA in case of further use in a
publication, academic work and any other type of use of the data. A decision on this manner of
distribution is made by the PNGFA and JICA according to the nature of the data and its usefulness for
the social development of PNG as an information social infrastructure.
(c) Contact information
Constin Otto Bigol, Manager, Forest Inventory and Mapping
PNG Forest Authority
Address: P. O. Box 5055, Boroko, National Capital District, Papua New Guinea
Email: [email protected]
(d) Liability
In no event will the authors, its related partnerships or corporations be liable to
anyone else for any decision made or action taken in reliance on the information in
this map or for any consequential, special or similar damages, even if advised of the
possibility of such damages.

5. Reference 5. Reference
6. Citation 6. Citation
PNG Forest Authority (JIJA Project)
Address: P.O.Box 5055, Boroko, National Capital District, Papua New Guinea
Email: [email protected] / [email protected]
JICA Project Site: http://www.jica.go.jp/png/english/activities/activity12.html
Project Facebook Page: https://www.facebook.com/jica.png.forest.monitoring Last updated on Feb. 2018
JICA and PNGFA, 2017, ‘Papua New Guinea Forest Base Map 2012 N JICANPNGFA Forestry
Project 2014N2019 Fact Sheet No.2’. Papua New Guinea Forest Authority, Port Moresby,
Papua New Guinea
Bourke, R.M., Allen, B.J., Hobsbawn, P. and Conway, J., 1998, ‘Papua New Guinea: Text
Summaries. Agricultural Systems of Papua New Guinea Working Paper No.1’.
Department of Human Geography, Research School of Pacific and Asian Studies,
The Australian National University, Canberra, Australia
Hammermaster, E.T. and Saunders, J.C., 1995, ‘Forest Resources and Vegetation
Mapping of Papua New Guinea. PNGRIS Publication No. 4’. AusAID, Canberra, Australia
McAlpine, J. and Quigley, J., 1998, ‘Forest Resources of Papua New Guinea Summary
Statistics from the Forest Inventory Mapping (FIM) System’. Prepared by Coffey MPW
Pty Ltd for the Australian Agency for I international Development and the Papua New
Guinea National Forest Service
JICA and PNGFA, 2016, ‘2014N2019 JICANPNGFA Project Outline N JICANPNGFA Forestry
Project 2014N2019 Fact Sheet No.1’. Papua New Guinea Forest Authority, Port Moresby,
Papua New Guinea

1. What is PNG-FRIMS? 1. What is PNG-FRIMS?
Capacity Development Project for Operationalization of PNG Forest Resource Information Management System (PNG-FRIMS) for Addressing Climate Change
JICA-PNGFA Forestry Project 2014-2019 - Fact Sheet No.3
Papua New Guinea Forest Resource Information Management System
Overview • PNG-FRIMS is a system responsible for acquiring, managing and using “spatial information/data” on
forests in Papua New Guinea. This promotes efficiency and sophistication of forest administration,
and supports PNGFA decision making.
• It is a system for browsing of various spatial information/data among PNGFA; estimation of forest
area using Forest Base Map (which includes vegetation and topographical information); estimation of
commercial timber volume / carbon stock amount using logging history; and projection of land use
change using time series data.
• PNGFA can update forest resource information and geospatial data in PNG-FRIMS using field survey
data with GPS, logging plan submitted from logging companies and forest area / condition change
monitored using satellite images etc.
PNG-FRIMS will support • Planning National Forest Plan / Provincial Forest Plan
• The formulation of new logging project and negotiation with landowners
• Monitoring logging projects and implementation of LCoP (Logging Code of Practice)
• Finding candidate area for forest plantation and management of forest plantation
Data acquisition
GIS for
DesktopGPS
PNG-FRIMS

2. Information in PNG-FRIMS 2. Information in PNG-FRIMS
Logging
Concession
Information
Concession Area, Logged Area, Planned Area , Buffer
zone
Topographic info: Logging road, River/ Stream, Contour
Facility info: Bridge/ Culvert, Campsite, Gravel pit,
Log landing, Building, etc.
Constraints
and Land Use
Social condition:
FCA (Forest Clearing Authority), Plantation,
Protected Area, Mining operation area
Natural condition:
Slope (Extreme/ Relief), Altitude (Extreme), Karst,
Inundation (Extreme/ Serious), Mangrove
Forest Base/
Cover Maps
Data:
Forest Base Map 1.1 (2012)
Time-series forest cover maps (2000/ 2005/2011)
(WNB/ WSP, as of 15th Nov 2017)
Forest cover map 2015 (benchmark map) (ongoing)
Old vegetation (FIMS Forest Mapping Unit)
Collect Earth Landuse change Assessment (Point
Sampling)
PSP (Permanent Sample Plots), © FRI (Forest
Research Institute) All rights reserved.
Database of PINFORM (PNG International Tropical
Timber Organization Natural Forest Model), © 1998
FRI All rights reserved.
Attributes:
Vegetation area, Tree crown size, Forest Zone,
Timber volume, Carbon stock, Degradation driver, etc.
Base/
Topography
Satellite imagery:
RapidEye (2011), Landsat AGP (1990/ 1995/ 2000/
2005/ 2010/ 2011/ 2014/ 2015), PALSAR (2010/
2011)
Topomap (scale = 1:100,000, Raster)
Topography:
5m mesh Digital Elevation Model (Airborne Radar in
2006 from National Mapping Bureau), Hillshade,
Slope, Contour (10m), Watershed (made from
GeoSAR)
Global Dataset:
Hansen data (Tree cover loss/ lossyer/ gain)
Main road (time-series), River, Incorporated Land
Group and Clan boundary/Settlement/ Local Level
Government & District boundary/ Province-Region
boundary (PNG Census 2000 and 2011), etc.
There are four principal types of data in PNG-FRIMS:
Logging Concession Information;
Constraints and Land Use;
Forest Base/Cover Maps; and
Base/Topography,
Database stores not only PNGFA data but also global dataset and the information from
other organizations, which are updated and kept fresh periodically.
For planning
and estimation
For planning
and monitoring
For developing,
updating and
monitoring
Forest Base Map 2012
Degradation driver
Degraded level
Forest Monitoring
Unit
Constraints
Logging Plan
Topomap
Landsat AGPRoad
PALSAR NDVIHansen Loss
Hillshade
ContourWatershed

3. Functions of PNG-FRIMS3. Functions of PNG-FRIMS
(a) Forest Timber Volume Estimate (upgraded FIPS and FIMS)
FIPS (Forest Inventory Processing System)
FIMS (Forest Inventory Mapping System)
JICA renewed and enhanced FIPS and FIMS which were developed in the previous century
and integrated forest information for the estimation of timber volume into the PNG-FRIMS
on the PNGFA‘s network.
Overview:
• FIPS estimates the timber volume of the
expected logging project area based on the
data of the inventory survey.
• The estimated volume is to be used to
determine an annual allowable cut of
timber volume for the expected logging
project.
Basic functions:
• Enter survey information and assessment
data from field books (including species,
diameter and length etc.)
• Edit and process assessment data
• Produce survey result and printout as
summary report
• Import assessment data from Excel file into
FIPS, and Export the Result of processed
data from FIPS into Microsoft Excel format
Overview:
• FIMS calculates the potential timber
volume in any level of area such as national,
provincial and logging project.
• The volume is calculated using forest type
per unit timber volume and to be adjusted
by logged volume data.
• The volume estimate is to be utilized to
develop forest plans (National/Provincial
forest plan).
Basic functions:
• Manage not only planned and operational
concession boundaries but also logged over
areas reported by logging companies.
• Import assessment data from FIPS and
show strip lines on map, which were used
for surveys and timber volume processed
by FIPS.

PNG Forest Authority (JICA Project)
Address: P.O.Box 5055, Boroko, National Capital District, Papua New Guinea
Email: [email protected] / [email protected]
JICA Project Site: http://www.jica.go.jp/png/english/activities/activity12.html
Project Facebook Page: https://www.facebook.com/jica.png.forest.monitoring/ Last updated on Feb. 2018
(c) Forest Land Change Modeling System
Overview:
• Analyzing chrono-sequential spatial
data including forest information,
future land change (such as
deforestation) and simulate
probability in each location.
• This system uses Land Change
Modeler, which is a product of
Clark Labs, Clark University, USA.
Basic functions:
• The results of the simulation is
useful for developing policies such
as provincial forest plans and action
plan of the national REDD+ strategy.
• Evaluation of the model is needed
for utilization of the results.
Past land
cover map 1
Past land
cover map 2
Simulated
probability map
High
Low
Probability in
changing
(b) LAN (Local Area Network) Map Browser
Overview:
• Sharing forest information stored in PNG-
FRIMS database within PNGFA and
promoting its utilization for PNGFA’s daily
activities.
• Authorized users can see thematic maps
through a Web Browser without special
software.
Basic functions:
• Turn forest info on and off on the map.
• Search for location/ point of interest.
• Measure length or area on the map
• Sketch simple graphics on the map.
• Print visible displayed map.
• Show attribute info of each graphics.
• Switch background maps (satellite
imageries, topographic maps, etc.).
• Develop and add processing functions.
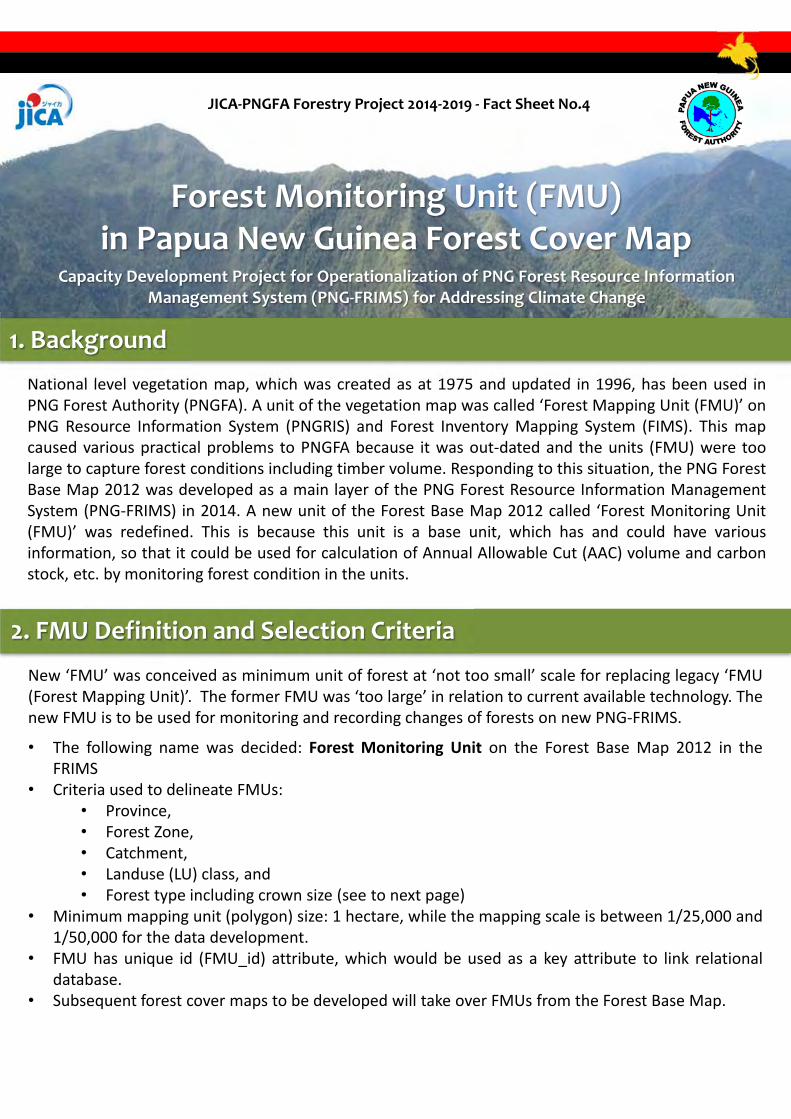
National level vegetation map, which was created as at 1975 and updated in 1996, has been used inPNG Forest Authority (PNGFA). A unit of the vegetation map was called ‘Forest Mapping Unit (FMU)’ onPNG Resource Information System (PNGRIS) and Forest Inventory Mapping System (FIMS). This mapcaused various practical problems to PNGFA because it was out‐dated and the units (FMU) were toolarge to capture forest conditions including timber volume. Responding to this situation, the PNG ForestBase Map 2012 was developed as a main layer of the PNG Forest Resource Information ManagementSystem (PNG‐FRIMS) in 2014. A new unit of the Forest Base Map 2012 called ‘Forest Monitoring Unit(FMU)’ was redefined. This is because this unit is a base unit, which has and could have variousinformation, so that it could be used for calculation of Annual Allowable Cut (AAC) volume and carbonstock, etc. by monitoring forest condition in the units.
2. FMU Definition and Selection Criteria
New ‘FMU’ was conceived as minimum unit of forest at ‘not too small’ scale for replacing legacy ‘FMU(Forest Mapping Unit)’. The former FMU was ‘too large’ in relation to current available technology. Thenew FMU is to be used for monitoring and recording changes of forests on new PNG‐FRIMS.
• The following name was decided: Forest Monitoring Unit on the Forest Base Map 2012 in theFRIMS
• Criteria used to delineate FMUs:• Province,• Forest Zone,• Catchment,• Landuse (LU) class, and• Forest type including crown size (see to next page)
• Minimum mapping unit (polygon) size: 1 hectare, while the mapping scale is between 1/25,000 and1/50,000 for the data development.
• FMU has unique id (FMU_id) attribute, which would be used as a key attribute to link relationaldatabase.
• Subsequent forest cover maps to be developed will take over FMUs from the Forest Base Map.
Forest Monitoring Unit (FMU) in Papua New Guinea Forest Cover Map
JICA‐PNGFA Forestry Project 2014‐2019 ‐ Fact Sheet No.4
Capacity Development Project for Operationalization of PNG Forest Resource Information Management System (PNG‐FRIMS) for Addressing Climate Change
1. Background

PNG Forest Authority (JICA Project) Address: P.O.Box 5055, Boroko, National Capital District, Papua New Guinea Email: [email protected] / [email protected] JICA Project Site: http://www.jica.go.jp/png/english/activities/activity12.htmlProject Facebook Page: https://www.facebook.com/jica.png.forest.monitoring/ Last updated on Mar. 2019
0 5km
FMU
Province Forest Zone
Tree crown size
Catchment
LU classBy using these info
3. References
Hammermaster, E.T. & Saunders, J.C., 1995, ‘Forest Resources and Vegetation Mapping of Papua NewGuinea. PNGRIS Publication No. 4’. AusAID, Canberra, Australia
McAlpine, J. and Quigley, J., 1998, ‘Forest Resources of Papua New Guinea Summary Statistics from theForest Inventory Mapping (FIM) System’. Coffey MPW Pty Ltd for AusAID and PNGFA
JICA and PNGFA, 2016, ‘2014‐2019 JICA‐PNGFA Project Outline ‐ JICA‐PNGFA Forestry Project 2014‐2019 Fact Sheet No.1’. Papua New Guinea Forest Authority, Port Moresby, Papua New Guinea
JICA and PNGFA, 2016, ‘Papua New Guinea Forest Base Map 2012 ‐ JICA‐PNGFA Forestry Project 2014‐2019 Fact Sheet No.2’. Papua New Guinea Forest Authority, Port Moresby, Papua New Guinea
JICA and PNGFA, 2018, ‘Papua New Guinea Forest Resource Information Management System ‐ JICA‐PNGFA Forestry Project 2014‐2019 Fact Sheet No.3’. Papua New Guinea Forest Authority, Port Moresby,Papua New Guinea
Forest Base Map is divided into FMUs, which is composed of information above and could be addedvarious attribute to monitor forest.
* Crown is size of circumference of tree head.

Constraints data is one of the PNG Forest Resource Information Management System (PNG‐FRIMS) datasets developed in the JICA‐PNGFA Project. The data was sourced from legacy Forest Inventory MappingSystem (FIMS). Constraints is significant information for PNG Forest Authority (PNGFA) since it definesnatural conditions and constrains to logging activities. However, PNGFA, realizing some errors in thelegacy data set, replaced it with a corrected data set.To update constraints data, available and efficient data and methods were considered. Constraints datacovers entire PNG and it should have enough accuracy while maintaining sufficient performance inactual use on PNG‐FRIMS. The data and methods used are shown in section 3. Constraints layers inPNG‐FRIMS were updated in December 2016.This data set is mainly used to plan, control and monitor logging operations to assist in forestmanagement decision‐making.
2. Constraints Definition2. Constraints Definition
Constraints dataNatural condition layers in the PNG‐FRIMS
JICA‐PNGFA Forestry Project 2014‐2019 ‐ Fact Sheet No.5
Capacity Development Project for Operationalization of PNG Forest Resource Information Management System (PNG‐FRIMS) for Addressing Climate Change
1. Background 1. Background
Layer Description
Altitude land over 2400m altitude.
Slope (Extreme) land with over 30 degree dominant slope.
Slope (Serious)land with dominant slope of 20‐30 degrees and sub‐dominant slope over 30 degrees and with high to very high relief.
Mangroves land covered by mangroves.
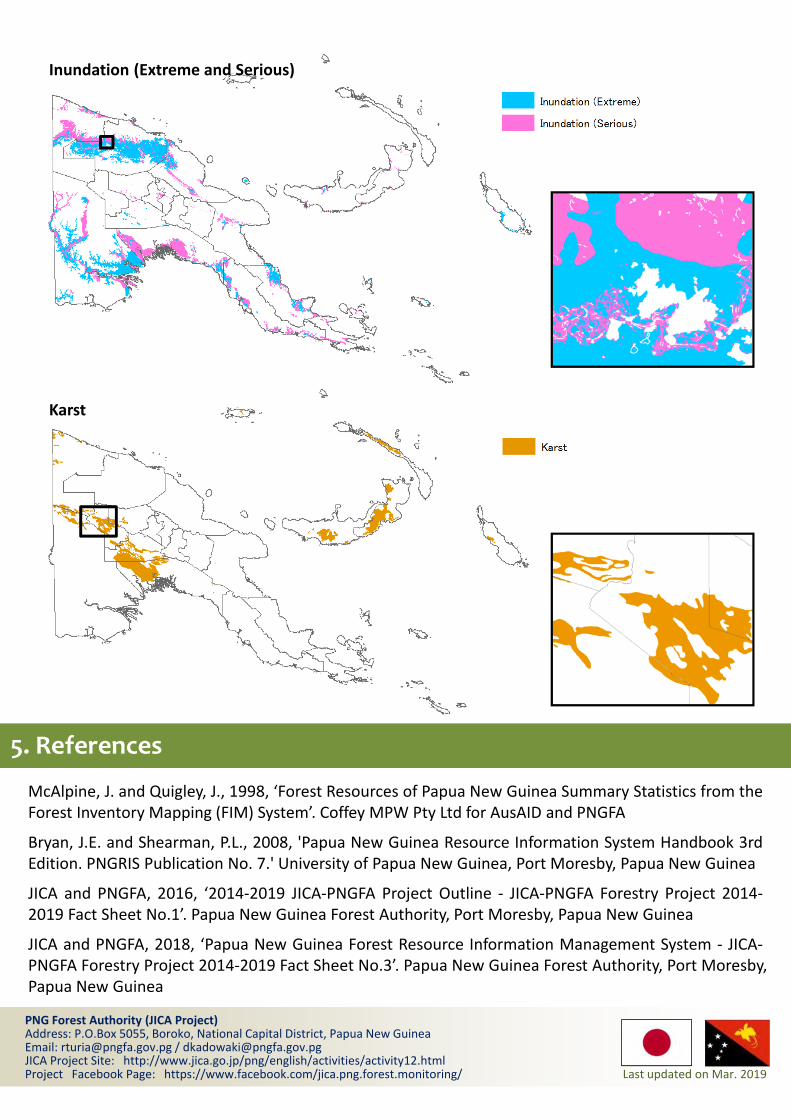
Inundation (Extreme)
land permanently or near permanently inundated extending over more than 80% of the area of that land.
Inundation (Serious)
land permanently or near permanently inundated extending over 50‐80% of the area of that land.
Karst land with polygonal karst landform.
The criteria for each constraint are defined in FIMS as described below.
Note: PNG Logging Code ofPractice allows that selectionlogging in PNG may be practicedin forest areas which are notexcluded by the following criteria:• slope steeper than 30 degrees• in areas of high relief on
slopes steeper than anaverage of 25 degrees
• permanently inundated land• limestone country (karst)• mangrove areas
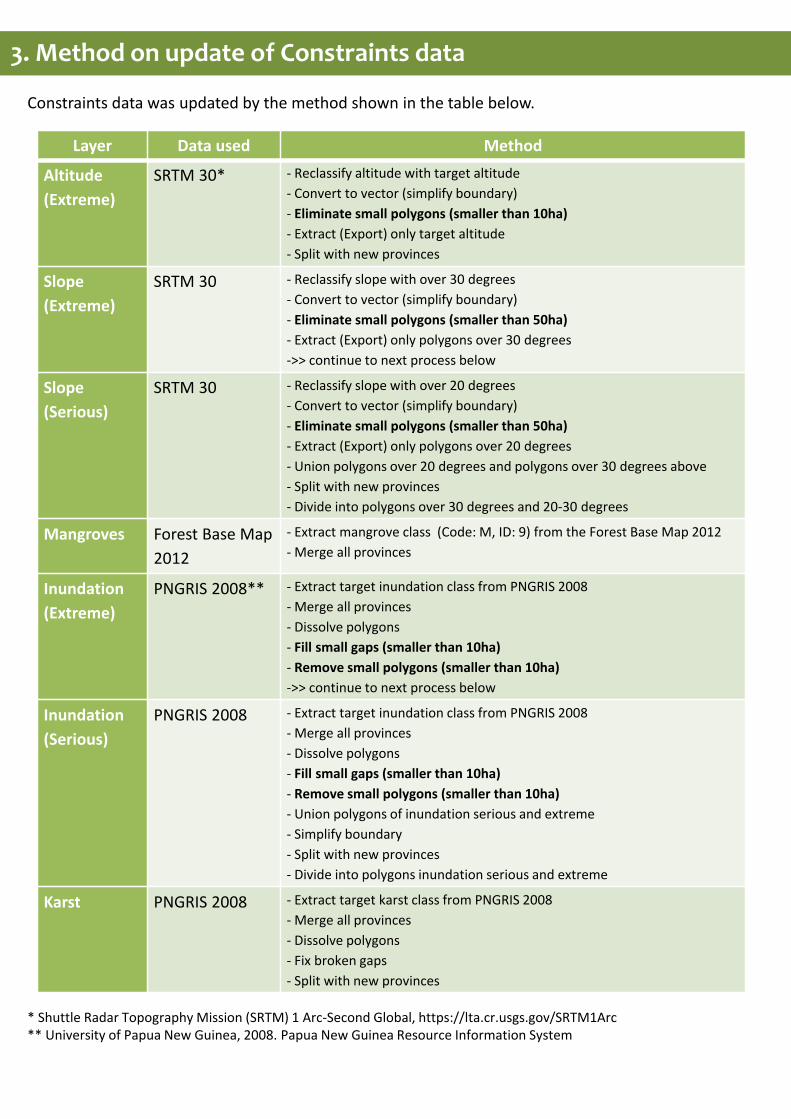
3. Method on update of Constraints data 3. Method on update of Constraints data
Layer Data used Method
Altitude
(Extreme)
SRTM 30* ‐ Reclassify altitude with target altitude
‐ Convert to vector (simplify boundary)
‐ Eliminate small polygons (smaller than 10ha)
‐ Extract (Export) only target altitude
‐ Split with new provinces
Slope
(Extreme)
SRTM 30 ‐ Reclassify slope with over 30 degrees
‐ Convert to vector (simplify boundary)
‐ Eliminate small polygons (smaller than 50ha)
‐ Extract (Export) only polygons over 30 degrees
‐>> continue to next process below
Slope
(Serious)
SRTM 30 ‐ Reclassify slope with over 20 degrees
‐ Convert to vector (simplify boundary)
‐ Eliminate small polygons (smaller than 50ha)
‐ Extract (Export) only polygons over 20 degrees
‐ Union polygons over 20 degrees and polygons over 30 degrees above
‐ Split with new provinces
‐ Divide into polygons over 30 degrees and 20‐30 degrees
Mangroves Forest Base Map
2012
‐ Extract mangrove class (Code: M, ID: 9) from the Forest Base Map 2012
‐ Merge all provinces
Inundation
(Extreme)
PNGRIS 2008** ‐ Extract target inundation class from PNGRIS 2008
‐ Merge all provinces
‐ Dissolve polygons
‐ Fill small gaps (smaller than 10ha)
‐ Remove small polygons (smaller than 10ha)
‐>> continue to next process below
Inundation
(Serious)
PNGRIS 2008 ‐ Extract target inundation class from PNGRIS 2008
‐ Merge all provinces
‐ Dissolve polygons
‐ Fill small gaps (smaller than 10ha)
‐ Remove small polygons (smaller than 10ha)
‐ Union polygons of inundation serious and extreme
‐ Simplify boundary
‐ Split with new provinces
‐ Divide into polygons inundation serious and extreme
Karst PNGRIS 2008 ‐ Extract target karst class from PNGRIS 2008
‐ Merge all provinces
‐ Dissolve polygons
‐ Fix broken gaps
‐ Split with new provinces
Constraints data was updated by the method shown in the table below.
* Shuttle Radar Topography Mission (SRTM) 1 Arc‐Second Global, https://lta.cr.usgs.gov/SRTM1Arc** University of Papua New Guinea, 2008. Papua New Guinea Resource Information System

Altitude (Extreme)
Slope (Extreme and Serious)
Mangroves
4. Updated Constraints Iayer4. Updated Constraints Iayer
PNG Forest Authority (JICA Project) Address: P.O.Box 5055, Boroko, National Capital District, Papua New Guinea Email: [email protected] / [email protected] JICA Project Site: http://www.jica.go.jp/png/english/activities/activity12.htmlProject Facebook Page: https://www.facebook.com/jica.png.forest.monitoring/ Last updated on Mar. 2019
5. References5. References
McAlpine, J. and Quigley, J., 1998, ‘Forest Resources of Papua New Guinea Summary Statistics from theForest Inventory Mapping (FIM) System’. Coffey MPW Pty Ltd for AusAID and PNGFA
Bryan, J.E. and Shearman, P.L., 2008, 'Papua New Guinea Resource Information System Handbook 3rdEdition. PNGRIS Publication No. 7.' University of Papua New Guinea, Port Moresby, Papua New Guinea
JICA and PNGFA, 2016, ‘2014‐2019 JICA‐PNGFA Project Outline ‐ JICA‐PNGFA Forestry Project 2014‐2019 Fact Sheet No.1’. Papua New Guinea Forest Authority, Port Moresby, Papua New Guinea
JICA and PNGFA, 2018, ‘Papua New Guinea Forest Resource Information Management System ‐ JICA‐PNGFA Forestry Project 2014‐2019 Fact Sheet No.3’. Papua New Guinea Forest Authority, Port Moresby,Papua New Guinea
Inundation (Extreme and Serious)
Karst
Watershed and Catchment Data
JICA-PNGFA Forestry Project 2014-2019 - Fact Sheet No.6
Capacity Development Project for Operationalization of PNG Forest Resource Information Management System (PNG-FRIMS) for Addressing Climate Change
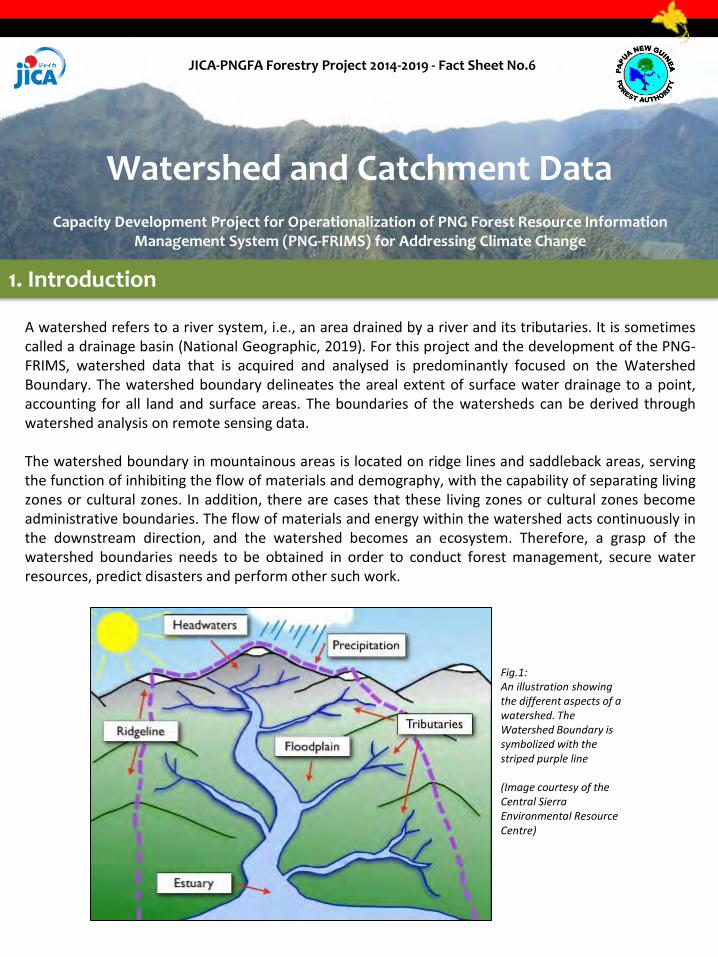
1. Introduction
A watershed refers to a river system, i.e., an area drained by a river and its tributaries. It is sometimescalled a drainage basin (National Geographic, 2019). For this project and the development of the PNG-FRIMS, watershed data that is acquired and analysed is predominantly focused on the WatershedBoundary. The watershed boundary delineates the areal extent of surface water drainage to a point,accounting for all land and surface areas. The boundaries of the watersheds can be derived throughwatershed analysis on remote sensing data.
The watershed boundary in mountainous areas is located on ridge lines and saddleback areas, servingthe function of inhibiting the flow of materials and demography, with the capability of separating livingzones or cultural zones. In addition, there are cases that these living zones or cultural zones becomeadministrative boundaries. The flow of materials and energy within the watershed acts continuously inthe downstream direction, and the watershed becomes an ecosystem. Therefore, a grasp of thewatershed boundaries needs to be obtained in order to conduct forest management, secure waterresources, predict disasters and perform other such work.
Fig.1: An illustration showing the different aspects of a watershed. The Watershed Boundary is symbolized with the striped purple line
(Image courtesy of the Central Sierra Environmental Resource Centre)

Data Acquisition
The primary source of Watershed Boundary Data is Digital Elevation Model (DEM) datasets. A DigitalElevation Model (DEM) is a specialized database that represents the relief of a surface between pointsof known elevation. By interpolating known elevation data from sources such as ground surveys andphotogrammetric data capture, a rectangular digital elevation model grid can be created. (CaliperMapping & Transportation Software Solutions, 2019)
The dataset that was used in this project was GeoSAR1 DEM data with a high spatial resolution of 5meters. It was acquired from the University of Papua New Guinea Remote Sensing Centre. Althoughthe data covered the whole land area of Papua New Guinea, there were a few areas that did not haveany data. To cater for the areas with missing data, SRTM DEM data with a resolution of 90 meters wasused to supplement the data.
_____________________________1 GeoSAR: GeoSAR is an airborne dual band interferometric radar system flown by Fugro and capable of producing DSMs and DTMs even in cloudy terrains. The system was used to cover mainland PNG in 2006 and the data from the P Band DTM was acquired by the PNG Government with funding support from the Australian government. The main recipient of the data in PNG was the National Mapping Bureau (NMB) and PNG Forest Authority, both of which were granted use of the data for the objective of sustainable forest management in PNG. (BusinessWire, 2006)
2. Methodology
Fig.2: A 3D representation of a DEM (Image courtesy of the GPS Power)
Fig.3: A 2D representation of a DEM.(Image courtesy of University of Minnesota)
Fig.4: SRTM 90 meter resolution DEM data covering the whole land area of Papua New Guinea
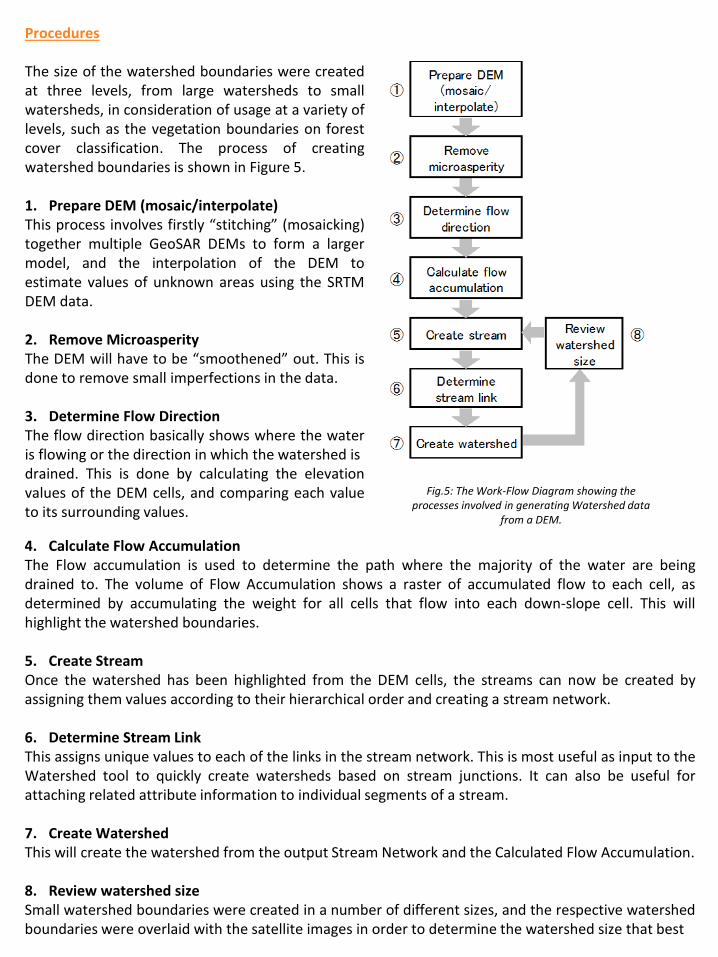
Procedures
The size of the watershed boundaries were createdat three levels, from large watersheds to smallwatersheds, in consideration of usage at a variety oflevels, such as the vegetation boundaries on forestcover classification. The process of creatingwatershed boundaries is shown in Figure 5.
1. Prepare DEM (mosaic/interpolate)This process involves firstly “stitching” (mosaicking)together multiple GeoSAR DEMs to form a largermodel, and the interpolation of the DEM toestimate values of unknown areas using the SRTMDEM data.
2. Remove MicroasperityThe DEM will have to be “smoothened” out. This isdone to remove small imperfections in the data.
3. Determine Flow DirectionThe flow direction basically shows where the wateris flowing or the direction in which the watershed isdrained. This is done by calculating the elevationvalues of the DEM cells, and comparing each valueto its surrounding values.
Fig.5: The Work-Flow Diagram showing the processes involved in generating Watershed data
from a DEM.
4. Calculate Flow AccumulationThe Flow accumulation is used to determine the path where the majority of the water are beingdrained to. The volume of Flow Accumulation shows a raster of accumulated flow to each cell, asdetermined by accumulating the weight for all cells that flow into each down-slope cell. This willhighlight the watershed boundaries.
5. Create StreamOnce the watershed has been highlighted from the DEM cells, the streams can now be created byassigning them values according to their hierarchical order and creating a stream network.
6. Determine Stream LinkThis assigns unique values to each of the links in the stream network. This is most useful as input to theWatershed tool to quickly create watersheds based on stream junctions. It can also be useful forattaching related attribute information to individual segments of a stream.
7. Create WatershedThis will create the watershed from the output Stream Network and the Calculated Flow Accumulation.
8. Review watershed sizeSmall watershed boundaries were created in a number of different sizes, and the respective watershedboundaries were overlaid with the satellite images in order to determine the watershed size that best

3. Results
reflects the vegetation boundaries as shown in Figure 6. As a result of a review, the followingconditions were established for the respective watershed boundary sizes: Cumulative flow volume of50,000 cells or more for small watershed boundaries, 500,000 cells or more for medium watershedboundaries and 5,000,000 cells or more for large watershed boundaries.
Fig.7: Sample of PNG Small Watershed Boundaries shapefile created with DEM Data Analysis
Watershed Boundary > 50,000 Watershed Boundary > 100,000 Watershed Boundary > 500, 000
❖ Preferred for Watershed Analysis ❖ Less preferred for watershed
analysis
❖ Not preferred for watershed
analysis
❖ Excellent indicator for vegetation
& forest classification especially at
high altitude
❖ Good indicator for vegetation &
forest classification at both low and
high altitudes.
❖ Excellent indicator for vegetation
& forest classification especially at
low altitude.
Fig.6: Watershed Boundary sizes for Different Cumulative Flow Volume and Results
Note: The cumulative flow volume for watershed boundary >500,000 is not preferred for watershed analysis since itcontains large watershed boundaries, i.e., the larger the watershed boundaries the lesser the number of streams (drainage).However, it is a good indicator of the difference between low and high-altitude vegetation for initial planning ofclassification, where the vegetation types within the watershed boundary size of >500,000 are classified as low vegetation.

Fig.8: Three level of Watershed Data of PNG
4. Discussions
Issues and Recommendations
As all geographic representation processes are bound to have a few discrepancies, the production ofWatershed Boundary Data encountered some minor issues:
1. Since accuracy of watershed data depends on accuracy of DEM data used for analysis, the accuracyof the watershed data in PNG-FRIMS is affected by the accuracy of the GeoSAR data used.
2. Since GeoSAR data was not calibrated well between the flight paths, the developed watershed datahas some issues; includes some erroneous polygons.
3. The data does not necessarily mirror real-world watershed boundary, especially at complextopography areas and very gentle slope or flat areas since flow direction comes and goes.
Although the data has some issues, it is beneficial to know watershed information as there is noexisting data which has been created using such a high resolution DEM data for the entire land mass ofPNG. The main issue here lies in the acquisition of high resolution accurate data, that is able toundergo analysis without decreasing the accuracy of the overall process. Making sure that the DEMdata is as accurate as possible before processing, will allow minimal errors that might cascadethroughout the entire procedure.
Note: FMU – Forest Monitoring Unit; a minimum unit of forest at “not too small” scale for replacing legacy ‘FMU –Forest Mapping Unit’, which was ‘too large’ in relation to current available technology. The new FMU is being usedfor monitoring and recording changes of forests in PNG-FRIMS. The small size of the watershed makes up the FMU.
Big size Middle size Small size
* Make up FMU

PNG Forest Authority (JICA Project) Address: P.O. Box 5055, Boroko, National Capital District, Papua New Guinea Email: [email protected] Project Site: http://www.jica.go.jp/png/english/activities/activity12.htmlProject Facebook Page: https://www.facebook.com/jica.png.forest.monitoring/ Last updated on June. 2019
5. References
Applications
Watershed modelling simulates the hydrologic processes in a holistic approach with focus on aindividual process or a combination of different processes at a relatively small scale. For instance:
o watershed data can be used to aid in the identification of suitable sites for small scalehydroelectricity dams to support small communities located along the tributaries leading toor exiting from a watershed.
o watershed combined with rainfall data can be used to determine the volume of water in acatchment, which can then be used to help locals identify suitable sites to set up groundwater wells when further combined with soil data.
o A popular use of watershed data as used by parties interested in averting or avoiding naturaldisasters such as floods or landslides is disaster prevention policies/practices, in which case,watershed data combined with various other resources integrated into a GeographicInformation System can be used to predict areas vulnerable to such natural disasters
o In Civil engineering, watershed data can be used to determine the flow impact a tributarywould have on a bridge, in order to construct a bridge that can maintain its foundation whenthe flow impact is at its highest.
In Forestry, and particularly in PNG-FRIMS, the three (3) size level of watershed developed in thisexercise could be indicators of levels of possible inundation constraints to logging in the planning stageof identifying potential forest development areas. The watershed can also serve as an excellentindicator for vegetation and forest classification at high and low altitude areas.
BusinessWire. (2006, May 31). EarthData Wins $16-Million Contract to Map Papua New Guinea; Company's Radar Mapping System Uniquely Qualified to Map Equatorial Regions Worldwide. Retrieved from BusinessWire: A Berkshire Hathaway Company: https://www.businesswire.com/news/home/20060531005172/en/EarthData-Wins-16-Million-Contract-Map-Papua-New
Caliper Mapping & Transportation Software Solutions. (2019, May 30). Caliper Mapping and Transportation Glossary. Retrieved from Caliper Mapping & Transportation Software Solutions: https://www.caliper.com/glossary/what-is-a-digital-elevation-model-dem.htm
JICA and PNGFA, 2019, ‘Forest Monitoring Unit (FMU) in Papua New Guinea Forest Cover Map - JICA-PNGFA Forestry Project 2014-2019 Fact Sheet No.4’. Papua New Guinea Forest Authority, Port Moresby, Papua New Guinea
National Geographic. (2019, May 29). National Geographic Resource Library. Retrieved from Encyclopedic Entry: Watershed: https://www.nationalgeographic.org/encyclopedia/watershed/
Image Links: Fig. 1: https://www.cserc.org/sierra-fun/games/watershed-game/Fig. 2: https://www.gpspower.net/igo-maps/331765-dem-digital-elevation-model-5.htmlFig. 3: https://www.pgc.umn.edu/data/elevation/

Digitized Road Information
JICA-PNGFA Forestry Project 2014-2019 - Fact Sheet No.7
Capacity Development Project for Operationalization of PNG Forest Resource Information Management System (PNG-FRIMS) for Addressing Climate Change
1. Introduction
Road information is useful for estimating area affected by human activities. People move via roadsquickly and enter into areas adjacent to the roads for various purposes, such as logging, subsistenceagriculture, wood collection, mining, and plantations. As these activities continue to increase, so toodoes the need for more roads to cater for the logistics of these activities.
Road network is growing year by year, as a result, continuous updating of the information is necessaryto grasp current status of the land. Satellite imagery is a strong tool for capturing up-to-date nationalscale road network information. This is made possible with the rising number of free mid-resolutionsatellite imagery such as LANDSAT and Sentinel-2 which are helpful in covering a nationwide network.While high resolution satellite imagery can detect more small and obscure ground features, thedownside is that it is expensive and difficult to acquire.
With mid-resolution satellite imagery, it is simple to spot new constructed roads as the forest featuresand cleared areas for the new roads have dissimilar spectral reflectance, i.e., telling apart forests andnew cleared areas for roads is easy due to their different colours on the satellite image. On the otherhand, old cleared areas in forests which have already been covered by grass over time, are not as clear.This is due to the fact that the old cleared areas (covered in grass) have a similar spectral reflectance(same color) to forests, and thus, it is difficult to distinguish both features from each other on thesatellite image. Timely updating of the road network after construction of new roads is necessary tokeep the quality of the information.
Roads in cities, grasslands, agricultural fields are difficult to find because roads and the surroundingarea shows similar color in mid-resolution satellite imagery. It is recommended to update roadnetwork information using road GIS information generated by institutions such as National Economicand Fiscal Commission, Department of Works & Implementation, and other government departmentor independent organizations that have up-to-date GIS Road data. This can also be done by acquiringhigh-resolution satellite imagery every decade.
As of August 2017, national road network, including all kinds of roads such as roads in forest, cities,agricultural field, etc. have been developed for the whole country in the years 2000, 2005, 2011 and2015. In this Fact Sheet, the procedures followed to update this information is described.

Data Acquisition
The data acquired for the use of digitizing roads were sourced from various government departments,donor agencies, and datasets that were developed by the Project.
Types of Roads to be Digitized
1. National Roads – Roads that are recognized as under the care and management of the National Government. These roads are the major highways and roads that connect the main centres and regions throughout the country.
2. Provincial Level Roads – Roads that are recognized as under the care and management of the Provincial Government. These roads are mainly found within the borders of a province.
3. Logging Roads – There are 4 main types of logging roads; 1) Main roads, 2) Secondary roads, 3) Feeder Roads and 4) Spur Roads. The main roads are connected to the provincial roads. The Spur roads are roads that have a specific use of connecting a particular location to the road network. The Feeder roads enable traffic coming from the Spur Roads to the Secondary roads, which then lead to the Main Roads.
_______________________________
1 National Economic and Fiscal Commission2 Road Asset Management System3 Capacity Development Project for Operationalization of PNG Forest Resource Information Management System (PNG-FRIMS) for Addressing Climate Change4 Annual Greenest Pixel5 “The Forest Preservation Programme in the Independent State of Papua New Guinea” funded by the Government of Japan(2012 – 2013)
2. Methods
Layer (Dataset) Source Remarks
Road GIS information GeoBook Derived from NEFC1 2005 Cost of Services surveys, satellite imagery and RAMS2 data
River GIS information GeoBook Derived from 1:250 000 topographic maps
Census Unit Information GeoBook Derived from PNG 2008 Census
Provincial Boundaries Developed by the Project3
LANDSAT AGP4 2000 Developed by the Project
LANDSAT AGP 2005 Developed by the Project
LANDSAT AGP 2011 Developed by the Project
LANDSAT AGP 2015 Developed by the Project
RapidEye 2011 Procured by Grant Aid Program5
Table 1: The datasets used for digitizing road GIS information

Procedure
1. Road network of year 2000 was developed as the basis of the information.
A. Digitize road directly based on the LANDSAT AGP (Year 2000) satellite image.
Note: Annual Greenest Pixel (AGP) refers to the mosaicked imagery including all the scenes ineach year beginning from the first day of the year and continuing to the last day of the yearobtained by specified satellite(s) with the greenest pixel on top, where the greenest pixel meansthe pixel with the greatest value of the Normalized Difference Vegetation Index (NDVI).
Use “Snapping”tool to connectline features.

B. Road information of Geobook is a good reference to digitize unclear roads on LANDSAT AGP.
Note: Some roads may not be clear from the satellite images. This issue can be fixed by overlaying
GeoBook information (red line) and using it as reference to digitize the roads (purple line).
C. To avoid digitizing rivers as roads, refer to the river GIS information (light green line).
D. Comparing LANDSAT imagery (above) and RapidEye imagery (below), digitize unclear roads.

E. Census Unit information is also useful to estimate intensity of human activities. In the followingimages (below), the pink circles are Census Unit information. The color spotting around thepoints indicate existing of agricultural fields there.
2. Road network of year 2005, 2011 and 2015 were digitized in order from the oldest year adding linefeatures on the road network feature on the older year.
LANDSAT AGP 2005 with the digitized road data (purple line) from the Year 2000 overlayed.
The road data is then digitized for the year 2005 (red line) by adding features from LANDSAT AGP 2005 to the road data from Year 2000.

Issues
The main issues faced during this exercise included:
1. Difficulty in identifying some of the minor road features (Feeder and Spur) from the mid-resolutionsatellite imagery. Although the satellite images were satisfactory in recognizing main roads, itlacked the clarity to display smaller logging roads as these roads are usually 40 meters wide. Thespur, feeder, main, secondary roads are all logging roads as long as logging is active in setups andcoupes until the roads are decommissioned. If decommissioned roads are maintained/usedfrequently they are visible and data can be captured by satellite imageries whereas if roads are notmaintained over a certain period, they become invisible due to regrowth/secondary vegetation sodata could be sourced from (previous) logging plans, existing/available data or from other relevantgovernment agencies.
1. The presence of heavy cloud cover over most parts of the country, which made it difficult toidentify road network from the satellite images.
3. Results
Fig.1: Map of completed road GIS information
4. Discussion

PNG Forest Authority (JICA Project) Address: P.O. Box 5055, Boroko, National Capital District, Papua New Guinea Email: [email protected] Project Site: http://www.jica.go.jp/png/english/activities/activity12.htmlProject Facebook Page: https://www.facebook.com/jica.png.forest.monitoring/ Last updated on June. 2019
Digitizing of road network in all of PNG was arduous and tedious work but the resulting data will bevery useful in the future. The main complications faced were handled with the help of the referencedata like the GeoBook and the Census data. This data was instrumental in the identification anddigitization of the roads.
It would be wiser to update vital information on the road network in PNG from 2015 upward, and thiscan be done by utilizing LANDSAT AGP satellite images which are free to acquire. This data will greatlyimprove the ease of which digitizing can be performed with the use of already digitized data as areference for subsequent years in the future.
5. Conclusion
Recommendations
To fix these problems, high resolution satellite imagery would be much better to use in this exercise.But this again poses the question of cost and availability. Thus, as a compromise, supplementary datafrom donor agencies and other government departments were acquired. This included the data fromthe GeoBook and the RapidEye satellite imagery that were used to check and confirm the featuresidentified in the LANDSAT AGP satellite imagery.
With regard to the smaller logging roads (Feeder and Spurs), as they cannot be captured with satelliteimagery, the main supplementary source of data is the Annual Logging Plans (ALPs) and Forest WorkingPlans (FWPs). This being the case because the logging companies have up-to-date information on thestatus of the roads. Combining the data from the ALP’s and the satellite images allows us to betteridentify these less clear road features for digitization.


Forest Concession and Land Management Layers in PNG-FRIMS
JICA-PNGFA Forestry Project 2014-2019 - Fact Sheet No.8
Capacity Development Project for Operationalization of PNG Forest Resource Information Management System (PNG-FRIMS) for Addressing Climate Change
1. Background
OverviewAs mentioned in Fact Sheet No.3, one of the four principal types of data in PNG-FRIMS is LoggingConcession Information, however, Logging Concession Information in itself is very broad. This is why ithas been broken down into 4 individual thematic layers:
• Logging Concession Boundary• Logging Plan and Logged-over Area• Forest Clearance Authority (FCA)• Forest Plantation/Boundary Area
By overlaying these four layers, the result is the entirety of Logging Concession Information. The realvalue of overlaying layers comes from the ability to integrate only the relevant spatial information intoone seamless map to derive spatial information not readily apparent to an observer. For instance, oneviewer might want to see the extent to which an area inside a particular logging concession boundaryhas been logged-over, or see the geographical location(s) of the logging concessions in the country.These information can be found within the Forest Concession and Land Use layers in PNG-FRIMS.
2. Introduction
Logging concessions refer to the permits or licences to perform logging operations in an area whichPNGFA has acquired and/or allocated. Currently there are three concession types; Timber RightsPurchase (TRP), Local Forest Area (LFA) and Forest Management Agreement (FMA). LFA’s and TRP’s areno longer being issued under the Forestry Act, 1991 (as amended), however they are still in use as theywere saved under the Forestry Act, 1991 (as amended). FMA’s are the only type of concession allowedunder the Forestry Act, 1991 (as amended).
Generally, as most of the land in PNG is customary-owned, landowners who wish to allocate their landto generate revenue through forestry, transfer their timber rights in exchange for timber royalties andinfrastructure developments. PNGFA then defines the land and enters into an agreement with thelandowners on how the forest resources will be managed. PNGFA then allocates the concession area toa third party; in this case a logging company, to carry out the logging operation inside the concessionboundary.

3. Methodology
Data Acquisition
All data received in Hardcopy format is scanned and digitized so that it can be stored in FRIMS. Below is a diagram that illustrates the process in which data is acquired and processed for all logging plans.
Data Source Format
Logging Concession Boundary Acquisitions Branch - PNGFA Hardcopy/Softcopy
Logging Plan and Logged Over Area Annual Logging Plans or Forest Working Plans maps
provided by logging companyHardcopy/Softcopy
Forest Clearance AuthorityLogging company or Allocations Branch - PNGFA Hardcopy/Softcopy
Forest Plantation Boundary Surveyed by GPS or extracted from Forest Basemap
2012Softcopy
Logging plans refer to the sequence of logging proposals submitted by logging companies highlightingthe areas in which they aim to commence their logging operations for the first 5 years and within thefirst year of operation (Annual Logging Plan and 5 Year Forest Working Plan); while the Logged-overAreas are the areas in which logging operations have already occurred. The Logging plans are brokenup into smaller units called ‘set-ups’. Set-ups represent the subsequent order in which loggingoperations are intended to occur or have occurred in respect to Logged-Over areas. Logging Code ofPractice (LCoP) dictates that these two occurrences must have a duration of time in between so as toallow the logged over area to regenerate. Logging plans are mapped out and sent in by the loggingcompanies for PNGFA to review and approve.
Forest Clearing Authority is a permit allowing a logging company to clear the forest over a defined landfor other non-forest forms of land use, such as agricultural farming either under a Special AgricultureBusiness Lease (SABL) or on customary land where the owners have given consent for such non-forestactivities to take place.
Forest Plantation Boundaries demarcate the areas managed by PNGFA and other logging companiesfor forest plantations as surveyed by GPS or extracted from the Forest Base Map 2012.
ANNUAL LOGGING PLANS (ALPs)Scanning of ALPs
Paper maps Conversion of paper maps to digital format
Conversion of scanned file in pdf format to JPEG
.tif
.jpeg
.png
Rectification process
DigitizingFilling in of attributes into each digitized layers
Digitized Map

As all four layers are in essence “Boundaries”, they are created in a similar manner but for differentpurposes. Digitization is the process in which geographic data from scanned maps are converted intodigital vector data formats and represented as point, polyline and polygon features. Point features areusually log ponds, base camps, bridges and culverts (proposed/existing), villages, quarries, gravelsources and cultural sites. Polyline features represent main boundaries, roads (existing/proposed) andstrip lines. Finally, polygon features represent coupes, set-ups, plantations and buffer zones. Thus, alllayers listed above are digitized and have attributes added to them for their served purposes.
Attributes
1. A shapefile is created in a folder location of the users choice.2. The shapefile can be specified either as polygon, polyline or point depending on the user’s needs.3. If polyline or polygon is selected, select the editor tool and select points along the edges of the
feature of interest.a. For polygons, select points until coming back to the initial starting point, this is called
closing the shape.b. For polylines, select a point at the start of the feature of interest and continue to select
points that run along the edges of that feature until coming to its end.4. If point is selected, it is usually to digitize locational information, in which case, select the editor
tool and select the locations of which the feature of interest is located.
Basic Steps to Digitization
Once the shape file is created and the feature of interest has been digitized, the last step is to addattribute information to it. This is done by opening the attribute table of that feature and creating thenecessary fields and entering its attribute information. Each of the layers are shapefiles, however, theirattributes vary. The fields for the four layers are listed below.
Layer Attributes
Logging Concession Boundary
Plan/Concession Id
Name
Area
Purchase Date
Expiry Date
Concession Type
Status
Scale
Province
Logging Plan
Project Name
Project Type
Name
Year Of ALP
Duration
Concession ID
Type
Layer Attributes
Logged Over Area
Project Name
Project Type
Name
Year of ALP
Duration
Harvest Volume (ha)
Concession ID
Forest Clearance Authority
Project Name
Project Type
Name
Year of ALP
Duration
Harvest Volume (ha)
Concession ID
Forest Plantation Boundary
ID Name
Species Name
Date of Planting
Date of Harvesting
Area Size (ha)

4. Results/Output
Logging Concession Boundary
• Above is an illustration on the logging concession boundaries nation wide and on the right is theattribute information for just Passismanua Inland Logging Concession.
• On the left is an image of the Lolo Block 2 Extension Concession, in which the area planned for logging is highlighted.
Logging Plan
• This is the attribute information for a set-up within the concession, i.e. [13-14 S – 24]

• On the left is an image of the Lolo Block 2 Extension Concession, in which the area logged over is highlighted.
• This is the attribute information for a set-up within the concession, i.e. [12-13 S – 24]
While the task of digitizing the different layers was executed without any major setbacks, there were afew issues that arose during the exercise. Chief among those issues was the lack of cartographystandards adapted by the logging companies that submitted in their ALPs and FWPs. This has resultedin the submission of hardcopy paper maps that were erroneous and lacking basic cartographicprinciples, such as:
❖ Properly labelling features❖ Using correct and consistent visual representation of the features being portrayed in the maps❖ Following guidelines in map production in balancing both the comprehension of the map aesthetics
and the accuracy of the information shown in the map
Another issue faced was the task of digitizing itself being quite tedious and slow. Since the mapssubmitted are in the form of physical hard copy paper maps, they would have to be digitized so theinformation can be stored in PNG-FRIMS. Although, digitizing is an important task of convertinganalogue data into digital data, it is time-consuming and requires a lot of manpower to continuouslykeep up and maintain with the amount of hard copy maps being submitted.
5. Discussion
Issues and Recommendations
Logged Over Area

5. Conclusion
These thematic layers are contained within PNG-FRIMS and provide information regarding Forestry inthe country. This information can later be used in other applications, problem-solving scenarios andmodelling geographical changes. With even more advancements and progress planned for the futureuses of PNG-FRIMS, the full potential of geographic information has much to be realized.
Digital Data Submission
Currently, PNGFA is working towards a standardized process of digital map submission by loggingcompanies, which is more preferred than the traditional paper maps. This is done through the initiativeof the “Data Exchange Specification” which highlights the data requirements to be submitted. This willnot only improve the efficiency and productivity of the geographic information contained in the PNG-FRIMS but also aid in dealing with most of the issues faced during the process of digitization. Thestandardized process of digital map data submission will ensure:
❖ Ease of use in data manipulation and data analysis; as all data will be in digital format. This willreduce issues such as scanning errors or any physical handling errors, which will improve the overallaccuracy of the data being processed and stored in PNG-FRIMS and increase the availability ofreadily prepared information.
❖ Better data storage and data management. There will be no need for the physical storage of papermaps, or the issue of degradation of maps over time.
❖ Less amount of time spent on digitizing as the task itself is tedious. This will allow moreconcentration on data analysis and other data preparations for PNGFA’s needs or otherstakeholders, such as logging companies, government departments and the general public.
❖ Efficiency in using the ALP data with other GPS/GIS data acquired by PNGFA officers
Improvement of Plantation Data in PNG-FRIMS
Submission of softcopies of logging plans and plantation activity by logging companies will beencouraged by PNGFA. Plantation data in PNG-FRIMS is not sufficient to show the current situation ofplantation in PNG. As a result, PNGFA needs more effort to improve it by increasing the capacity ofrelevant officers of PNGFA-managed plantations, as well as the capacity of logging companies, toacquire accurate plantation data with the use of GPS/GIS technologies.
PNG Forest Authority (JICA Project) Address: P.O. Box 5055, Boroko, National Capital District, Papua New Guinea Email: [email protected] Project Site: http://www.jica.go.jp/png/english/activities/activity12.htmlProject Facebook Page: https://www.facebook.com/jica.png.forest.monitoring/ Last updated on June. 2019
Future Endeavors
6. References
JICA and PNGFA, 2018, ‘Papua New Guinea Forest Resource Information Management System - JICA-PNGFA Forestry Project 2014-2019 Fact Sheet No.3’. Papua New Guinea Forest Authority, PortMoresby, Papua New Guinea

Forest Cover Map 2015
JICA‐PNGFA Forestry Project 2014‐2019 ‐ Fact Sheet No.9
Capacity Development Project for Operationalization of PNG Forest Resource Information Management System (PNG‐FRIMS) for Addressing Climate Change
1. Introduction
A forest cover map is an important source of information about the current status of forest areas, thatif updated regularly, becomes an effective tool in sustainable forest management and monitoring inPapua New Guinea (PNG). Although the national report of PNG on Forest Reference Level (FRL) isbased on the analysis of the Collect Earth system, the forest cover maps in 2015 and subsequent yearsare still useful for the verification of the Forest Reference Level (FRL) Report and the development ofrelevant road map to progress REDD+ in PNG.
On the assumption that the forest cover map will be updated at five‐year intervals, a method forupdating forest cover maps was developed with the consideration of giving consistency to a series ofmaps. It is based on creating past forest cover maps and of constructing and integrating deforestationand forest degradation (DD) information into forest cover maps.
During this operation, the Forest Cover Map 2015 was created from the Forest Base Map 2012, basedon forest degradation and forest cover gain. The Forest Monitoring Unit (FMU) was revised for theareas of Large‐scale forest loss (Hansen loss greater than 20 hectares) after 2011, which was thenapplied to Land Use, Land Use Change and Forestry (LULUCF). For the areas of smaller scale forest loss(Hansen loss smaller than or equal to 20 hectares) after 2011, the FMU was revised only when theextension of the area of degraded strata was confirmed on the satellite imagery. Other minor forestloss information were added to the map as disturbance and the areas that contained obvious forestrecovery were revised referring to Hansen gain data larger than 1 hectare.
2. Method
The procedure consisted of two parts:
1. Constructing DD information, in which the deforestation and forest degradation drivers informationwere identified for each map polygon (FMU) and;
2. Detecting land use/cover change area, in which changes in the land use areas were identified.
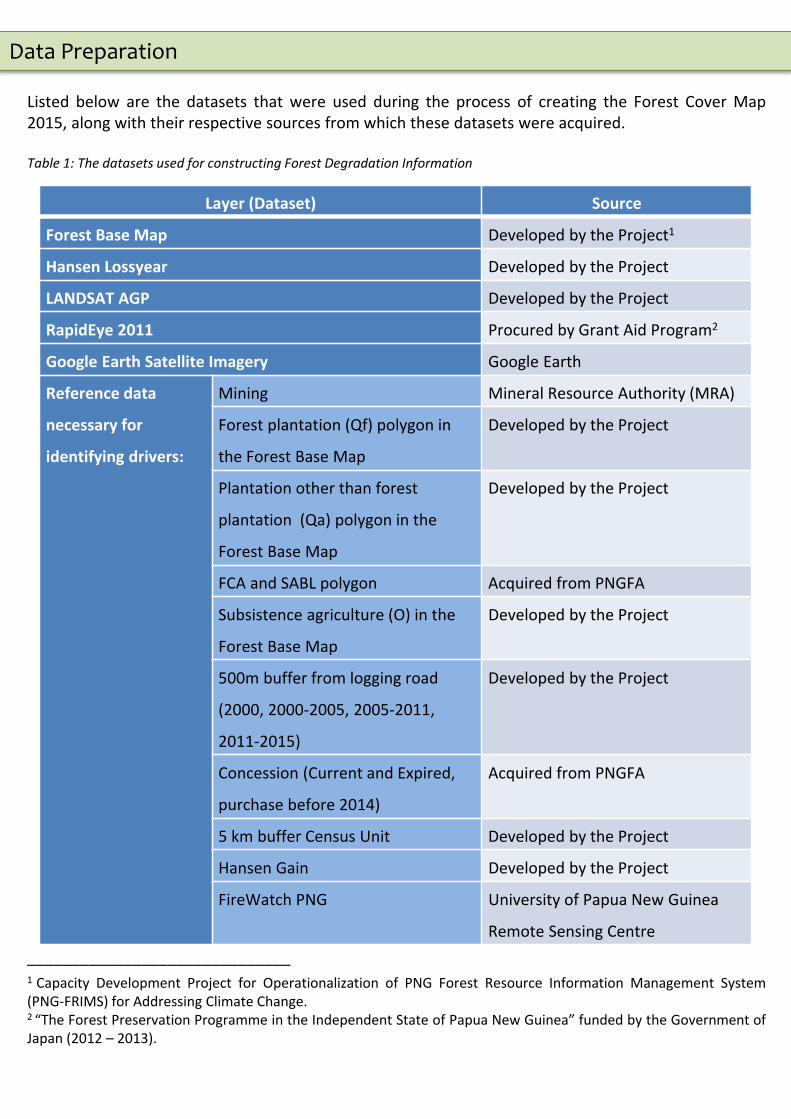
Listed below are the datasets that were used during the process of creating the Forest Cover Map2015, along with their respective sources from which these datasets were acquired.
Table 1: The datasets used for constructing Forest Degradation Information
______________________________1 Capacity Development Project for Operationalization of PNG Forest Resource Information Management System(PNG‐FRIMS) for Addressing Climate Change.2 “The Forest Preservation Programme in the Independent State of Papua New Guinea” funded by the Government ofJapan (2012 – 2013).
Layer (Dataset) Source
Forest Base Map Developed by the Project1
Hansen Lossyear Developed by the Project
LANDSAT AGP Developed by the Project
RapidEye 2011 Procured by Grant Aid Program2
Google Earth Satellite Imagery Google Earth
Reference data
necessary for
identifying drivers:
Mining Mineral Resource Authority (MRA)
Forest plantation (Qf) polygon in
the Forest Base Map
Developed by the Project
Plantation other than forest
plantation (Qa) polygon in the
Forest Base Map
Developed by the Project
FCA and SABL polygon Acquired from PNGFA
Subsistence agriculture (O) in the
Forest Base Map
Developed by the Project
500m buffer from logging road
(2000, 2000‐2005, 2005‐2011,
2011‐2015)
Developed by the Project
Concession (Current and Expired,
purchase before 2014)
Acquired from PNGFA
5 km buffer Census Unit Developed by the Project
Hansen Gain Developed by the Project
FireWatch PNG University of Papua New Guinea
Remote Sensing Centre
Data Preparation

Constructing Forest Degradation (DD) Information
1. Identify drivers of large Hansen Loss‐year polygons (greater than 20 hectares)In this step, the Hansen Loss‐year polygons larger than 20 hectares for the targeted year of 2011‐2014are selected. The driver for each Hansen Loss‐year polygon on the bases of the flow right (see Figure 1)was identified.
Figure 1: Flow of Driver analysis for Hansen loss‐year polygons larger than 20 ha.
Procedure

2. Identify drivers of small Hansen Loss‐year Polygon (smaller than or equal to 20 hectares)This next step involved the selection of; (I) Hansen Loss‐year polygons smaller than or equal to 20hectares for targeted years 2011‐2014, and (II) the identified drivers for each Hansen Loss‐yearpolygon, on the flow right (see Figure 2) by overlaying analysis with reference data.
Figure 2: Flow of Driver analysis for Hansen loss‐year polygons 20 ha and smaller.
3. MergingThis step involved the merging of the mapping files created in the steps 1 and 2.
4. Input driver informationThis step involved integrating DD information for each FMU of the Forest Base Map by overlaying Loss‐year polygons prepared in step 3.
5. FMU which do not intersect Hansen Loss polygonThis step involved identifying the drivers for each FMU on the basis of flow right (see Figure 3) byoverlay analysis with reference data. FMU with no driver information were considered as intact forest.
Figure 3: Flow of Driver analysis for Map polygons which do not intersect Hansen loss

Detecting Land Use/Cover Change area
This particular process revised the area of Large‐scale forest loss and area expansion after 2011. This was done by selecting Hansen Loss polygons (2011‐2014) larger than 20 hectares that had expanded after 2011. For the Loss‐year polygons, the changed areas (polygons) were cut, and identified as new landuse by referring to satellite imagery and reference data.
With regard to areas with obvious forest recovery, the changes were revised by referring to the Hansen Gain polygons that are larger than 1 hecatares, and satellite imagery.
3. Results
Figure 4: Forest Cover Map 2015 showing different landuse.

• The Forest Cover Map with Forest Degradation information has been updated for entire PNG, so that possible misclassification due to technical limitations in the Forest Base Map could be revised.
• Technical and operational findings from this trial and error work will be considered as a great help in the monitoring of forest resource for the future.
• Future forest cover maps should be updated on the basis of this method, but also by innovating new technologies.
4. Discussion
PNG Forest Authority (JICA Project) Address: P.O. Box 5055, Boroko, National Capital District, Papua New Guinea Email: [email protected] Project Site: http://www.jica.go.jp/png/english/activities/activity12.htmlProject Facebook Page: https://www.facebook.com/jica.png.forest.monitoring/ Last updated on July. 2019
Figure 5: The vegetation cover with their corresponding area in hectares for the Forest Cover Map 2015.
VEG VEGNAME Area (Ha)
P Low Altitude Forest on Plains & Fans 8,133,318
H Low Altitude Forest on Uplands 11,603,863
L Lower Montane Forest 7,465,348
Mo Montane Forest 354,495
D Dry Seasonal Forest 935,207
B Littoral Forest 66,616
Fri Seral Forest 147,631
Fsw Swamp Forest 1,989,886
M Mangrove Forest 518,964
W Woodland 2,989,010
Sa Savanna 635,125
Sc Scrub 391,709
G Grassland and Herbland 3,005,981
Ga Grassland (Alpine) 107,065
Gi Grassland (Subalpine) 86,977
O Cropland/Agriculture land 6,577,558
Qa Plantation other than Qf 422,484
Qf Forest Plantation 67,951
Z Bare areas 24,151
U Larger Urban Centres 38,332
E Lake & Larger Rivers 599,488
SUM 46,161,159
5. Conclusion
Forest cover maps are very essential in forest monitoring and planning. The forest cover maps from subsequent years and 2015 have significantly aided in climate change control and has also paved a dynamic path for REDD+. Thus, it is very important that forest cover maps should be updated (upon assumption to be updated every five years) to keep track of changes in forest resources and related information in Papua New Guinea.
JICA and PNGFA, 2016, ‘Papua New Guinea Forest Base Map 2012 ‐ JICA‐PNGFA Forestry Project 2014‐2019 Fact Sheet No.2’. Papua New Guinea Forest Authority, Port Moresby, Papua New Guinea
JICA and PNGFA, 2019, ‘Forest Monitoring Unit (FMU) in Papua New Guinea Forest Cover Map ‐ JICA‐PNGFA Forestry Project 2014‐2019 Fact Sheet No.4’. Papua New Guinea Forest Authority, Port Moresby, Papua New Guinea
6. References

Overview of drone & utilization
The applications of drone technology in Forestry have reached new heights by providing up-to-date,high resolution aerial imagery with reduced costs and time. Employed as a better alternative tosatellite imagery and manned flight aerial photography, drones are fast becoming widely used in themapping of forest areas for the purposes of management and monitoring forest resources (Banu &Borlea, 2016). By using drones to inspect the current status of forest areas and logging operations,forestry activities can be regulated with efficiency.
The Forestry sector in Papua New Guinea is regulated by the PNG Forest Authority (PNGFA), throughthe application of the Forestry Act, 1991 (as amended) and the “Logging Code of Practice” (LCoP) andthe “Planning, Monitoring and Control Procedures” (PMCP) in the country. In recent years, PNGFA,with the assistance of JICA, have begun to introduce the utilization of GPS/GIS/Drone technology toassist in the traditional inspection methods in the implementation of LCoP/PMCP. While the traditionalmethods are still sufficient, the main purpose of the introduction of GPS/GIS/Drone technology is toincrease the productivity of inspection methods by decreasing the amount of manpower needed, thetime taken to complete inspections, and provide a more reliable snapshot of the current status of thetarget forest areas. GPS/GIS/Drone technology, used in line with the PNG-FRIMS, allows the ease inwhich information pertaining to forest resources and activities can be acquired and updated.
In line with the JICA-PNGFA Project, “Capacity Development Project for Operationalization of PNGForest Resource Information Management System (PNG-FRIMS) for Addressing Climate Change”, therehave been three (3) drone training for PNGFA officers; in June 2018, October 2018 and February 2019.The aim of the training was to equip the PNGFA officers with the relevant knowledge and technicalexpertise in the use of GPS/GIS/Drone technology relating to Sustainable Forest Management (SFM)and to increase the capacity of the officers to be able to incorporate modern technology with theexisting traditional inspection methods.
The training exercises were also instrumental in drafting the Drone Policy in PNGFA and the SafetyGuidelines and Administration of Drone Usage. The policies and guidelines are key aspects of findingout where GPS/GIS/Drone technology is applicable and creating more innovative approaches inGPS/GIS/drone technology that will benefit both the JICA-PNGFA Project and PNGFA in the future.
Drone Applications in Sustainable Forest Management and Monitoring in PNGFA
JICA-PNGFA Forestry Project 2014-2019 - Fact Sheet No.10
Capacity Development Project for Operationalization of PNG Forest Resource Information Management System (PNG-FRIMS) for Addressing Climate Change
1. Background

2. Drone Policy in PNGFA and Possible Applications
PNGFA Drone Policy: Key Principles for the Introduction of Drone Technology in PNGFA
❖ Goal: Drone technology is utilized as a part of forest monitoring framework in PNGFA, and accuracy and efficiency of forest monitoring is improved.
❖ Selection and concentration: 1) Plantation, 2) Natural forest monitoring and, 3) Forest Research (NFI)
❖ Verification of possibility❖ Cost analysis❖ Risk management
Possible Applications of Drone Use in PNGFA
1. Possible Applications of Drone use in Plantations
❖Main Objective: Strengthening capacity of plantation management contributing to increase timber production and economic growth in PNG.
❖ Applicable/Possible Activities:➢ Identification & security of potential areas for plantation
development, Plantation management, Health Check, Area Calculation, Volume Estimation, Survival Assessment, etc.
2. Possible Applications of Drone use in Natural Forest Monitoring
❖Main Objective: Improving efficiency and accuracy of forest monitoring in coordination with drone and other existent method in order to fully operationalize practicing LCoP/PMCP.
❖ Applicable/Possible Activities:➢ Natural forest monitoring based on LCoP, Planning,
Regeneration planning, Site detection, Thresholds of re-entry, Rate of forest recovery, Invasive species, Spectral signature of flora, etc.
3. Possible Applications of Drone use in Forest Research❖Main Objective: Through research oriented activity, clarifying
availabilities of drone to enrich and promote Plantation, Natural forest monitoring and NFI.
❖ Applicable/Possible Activities:➢ Measurement of tree height and crown size, Verification
of vegetation types, Measurement of disturbance level, Determine crown & forest health
Formulating the Policy
The Drone Policy in PNGFA wasfirst outlined during the discussionsheld in the first training. The policycovers much of the necessaryprecedents that needed to beachieved or established, thecurrent situation of drone usage inPNGFA as well as laying thefoundation for the DroneApplications in Sustainable ForestManagement and Monitoring.
Challenge for Forest Monitoring in PNGThe two main points of raised inthis respect refer to the GlobalIssue for Forest Monitoring and theEfficient Task Management byPromotion of Streamlining. Thepoints highlight the responsibilityof PNGFA in dealing with thebalance of SFM and meeting thetimber supply demands for bothdomestic and internationalmarkets, and how this balance canbe maintained with theintroduction of a more streamlinedprocess, i.e., the use ofGPS/GIS/Drone technology andPNG-FRIMS, working in harmonywith existing traditional methods.
Current situation and problem ofDrone for Forest MonitoringAs a monitoring tool, drones arerobust and efficient with manydifferent applications in Forestry.However, its use in PNGFA is stillrelatively a new undertaking and assuch, guidelines, safety measuresand verification of its feasibility inits incorporation into PNGFA isvirtually non-existent.Furthermore, the possibility ofintroduction of drone use intoPNGFA should not be seen asreplacing traditional methods, butrather, adding onto it.

3. Standardization of Drone Usage
Capacity Development
The table below highlights the activities that were undertaken during the three (3) trainings that werefacilitated by JICA.
Table 1: Summary of drone trainings
Training No. First Second Third
Location(s) ❖ PNGFA HQ, Port Moresby❖ Kuriva Teak Plantation, Central
Province
❖ Sandaun PFO, West Sepik Province
❖ Amanab Blocks 1-4 FMA, West Sepik Province
❖ PNGFA HQ, Port Moresby❖ Marshall Lagoon FMA, Central
Province
Date (Duration) 12th – 20th June, 2018 (2 weeks)
23th – 28th October, 2018 (1 week)
18th – 28th February, 2018 (2 weeks)
Drone Used DJI Phantom 4 Pro DJI Phantom 4 Pro DJI Mavic 2 Pro
Focus of training 1. Safety measures and handling of drone equipment
2. Basic operation of drone flight
3. Image and Video Capture4. Data processing5. Drafting of the Drone Policy
in PNGFA
1. Review of skills, techniques and procedures from First Training
2. Discussions on the feasibility of Drone Utilization with LCoP/PMCP in Natural Forest Monitoring
1. Review of skills, techniques and procedures from First and Second Trainings.
2. Practical applications of Drone Utilization with LCoP/PMCP and comparison with traditional methods of Forest Monitoring.
Fig.1: PNGFA officers learning the basic controls of drone flight.
Fig.2: PNGFA officers learning to process the drone-captured images
Fig.3: PNGFA officers performing manual inspection of forests.
Fig.4: JICA experts and PNGFA officers discussing the applications
of drones in forest monitoring.
Fig.5: PNGFA officers and JICA experts monitoring an automated flight plan being executed by the
drone.
Fig.6: PNGFA officers discussing and comparing manual inspection
and drone-based inspection

Safe Administration Guideline for Drone Usage in PNGFA
Drones are fragile and delicate equipment and are prone to damage and loss. As such, safety measuresregarding its use and operation must always be adhered to. This includes:
1. Making sure clearance is obtained from the Civil Aviation Safety Authority (CASA PNG), in referenceto the drone specifications, airspace restrictions, exclusions zones and the purpose of drone use.
2. Maintaining a safe operating environment where there is acceptable weather conditions andoptimal visibility. Preferable conditions include during the day, without windy or wet weather.
3. Handling of drone equipment is done with the utmost care during the assembly, flight anddismantling.
4. Pre-flight checks to inspect battery levels of devices, propellers, propeller guards, gimbal (camera)and other equipment must done before operation of drone.
5. Constant monitoring of the drone during flight to ensure control whether drone is in automatedflight or manual flight. This is to prevent damage or loss in case of low battery or transmissionproblems.
Fig.7: PNGFA officers learning how to properly assemble and dismantle the drone.
Fig.8: The Pre-flight Checklist published by CASA PNG (Excerpt from Post Courier - January 21st,
2019)

4. Summary of Drone Performance
Currently, PNGFA has four drones in use today; three of which areMavic 2 Pros and one Phantom 4 Pro. The Phantom 4 Pro was usedin the first and second trainings. The Mavic 2 Pros were used in thethird training. Their performance during training are shown below:
Limitations of Drone Utilization
During the course of the trainings, there were a few limitations experienced that can affect the outcome of an operation. Listed below are some of the limitations and issues faced during the course of the trainings with regard to the drones that were used:
❖ Battery lifeThe battery life (30 minutes) affects the missions with larger areas that need hours of operational flight time as there will be a need for constant charging and changing of batteries during missions
❖ WeatherDrone operations can only be done during day time without foggy, wet or windy conditions. This conditions can damage the drone, limit battery life, and cause the loss of the drone.
❖ Details of features may not be visible by drone photos
The photos taken with the drone may not always show features of interest. To increase the image resolution will require the drone to be flown at a low altitude, although this will affect the flight time.
❖ Skills/Knowledge of using Drone
More trainings to be conducted to improve technical expertise and confidence of officers to properly pilot the drones.
❖ Access to Internet connectionsInternet connection is needed for the softwares to be used but this is lacking in the forest areas
Parameter First Training Second Training
Coverage Area 4.5 ha 187.56 ha
Flight Length 1,119 m 35,336 m
Flight time 8 min 2 hrs 10 min
Overlaps (vertical, horizontal) 90%, 70% 90%, 70%
No. of photos taken 84 1194
Batteries 1 pack 7 packs
Speed 4.3 m/s 7 m/s
Max. transmission distance 500 m 1000 m
Parameter Group 1 Group 2
Coverage Area 154 ha 133.34 ha
Flight Length 22,832 m 28,489 m
Flight time 2 hrs 10 min 66 min
Overlaps (vertical, horizontal) 90%, 70% 90%, 80%
No. of photos taken 1,208 1,372
Batteries 12 6
Speed 6 m/s 8.6 m/s
Max. transmission distance 1200 m 1000 m
Parameter Group 3 Group 4
Coverage Area 175 ha 14.99 ha
Flight Length 32,000 m 2,640 m
Flight time 2 hrs 32 mins 13 min
Overlaps (vertical, horizontal) 90%, 70% 75%, 60%
No. of photos taken 2,243 85
Batteries 12 packs 1 pack
Speed 7 m /s 5 m/s
Max. transmission distance 1200 m 500 m
Table 2: Phantom 4 Pro performance during First and Second trainings
Table 3: Mavic 2 Pro performance during Third Training according to each group

5. Drone Utilization in PNG-FRIMS
Natural Forest Monitoring and the Logging Code of Practice (LCoP)
The second and third training activities primarily featured the use of drones in Natural ForestMonitoring in implementing the Logging Code of Practice (LCoP). The flight missions undertaken werefocused on the four (4) phases of logging operations; Pre-logging, Active Logging, Post Logging andDegraded. Each of the phases are accompanied with their own checklists based on the requirementsand standards set in the LCoP. Shown below are samples of the checklist filled out by PNGFA officers:
Fig.9: A sample of the check list for the Active Logging Site. The check list contains items from the Key Standards in the LCoP, which the officers fill out the best option and alternative option for the monitoring of these items, in ticks and asterisks respectively.
Plantation Monitoring
The first training activities focused on using drones to monitor Plantations. Drones were used to collectimage data, which was then subsequently used to update the plantation inventory.
Fig.10: The process of capturing images using drones and producing orthophotos for updating new information into the Plantation Inventory.

Forest Degradation Assessment
Forest Degradation Assessments aim to assess the reduction of the capacity of a forest to providegoods and services. In regard to the training exercises conducted, the degradation refers to the fellinggaps and skid trails that result from the harvesting of logs in a forest area. The felling gaps and skidtrails can be identified by the process shown below:
1. Image capture by drones, before and after logging operation2. Removing logging roads from the analysis due to its dimensions (road width)3. Running the images (IR band) through segmentation analysis in ENVI4. Subtracting the log extraction data from the output by using field data.
The final result is the percentage of felling areas and skid trails that make up the degradation of theforest area.
Fig.13: The calculated aerial imagery showing the areas of degradation in orange and vegetation in green.
Fig.12: Orthophoto to be used for updating Plantation Inventory (overlayed over existing information)
Fig.11: Orthophoto to be used for Inspection of Natural Forests (overlayed in Google Earth)

6. Future Scenario
Summary of Questionnaire Results
During the third training, survey questionnaires were given to the PNGFA Officers to gather opinionsand experiences on the current inspection methods and the applicability of drones in field monitoringaccording to the LCoP. All officers agreed on the fact that the utilization of drones in PNGFA isimportant and that it is applicable in field inspections and monitoring. However, it was the generalconsensus that while drones are a powerful monitoring tool, further training is needed to betterunderstand its full potential; thus, the optimal course of action is to integrate the use of drones withexisting inspection methods.
The graph below shows a the overall opinion of the participating officers with regard to theimprovement of field inspection with the utilization of drones in the future:
The future of drone utilization in PNGFA is rife with potential. The three trainings conducted were veryeducational and motivating for PNGFA Officers who participated. The trainings have set the foundationand paved the way for the further development of capacity building, integration of modern technologyinto existing methods of forest monitoring and promotion of Sustainable Forest Management.
7. References
1. Banu, P. T., & Borlea, F. G. (2016, November). The Use of Drones in Forestry. Retrieved from Research Gate: https://www.researchgate.net/publication/316802665_The_Use_of_Drones_in_Forestry
PNG Forest Authority (JICA Project) Address: P.O.Box 5055, Boroko, National Capital District, Papua New Guinea Email: [email protected] Project Site: http://www.jica.go.jp/png/english/activities/activity12.htmlProject Facebook Page: https://www.facebook.com/jica.png.forest.monitoring/ Last updated on June. 2019
(N=18, choose up to three items)
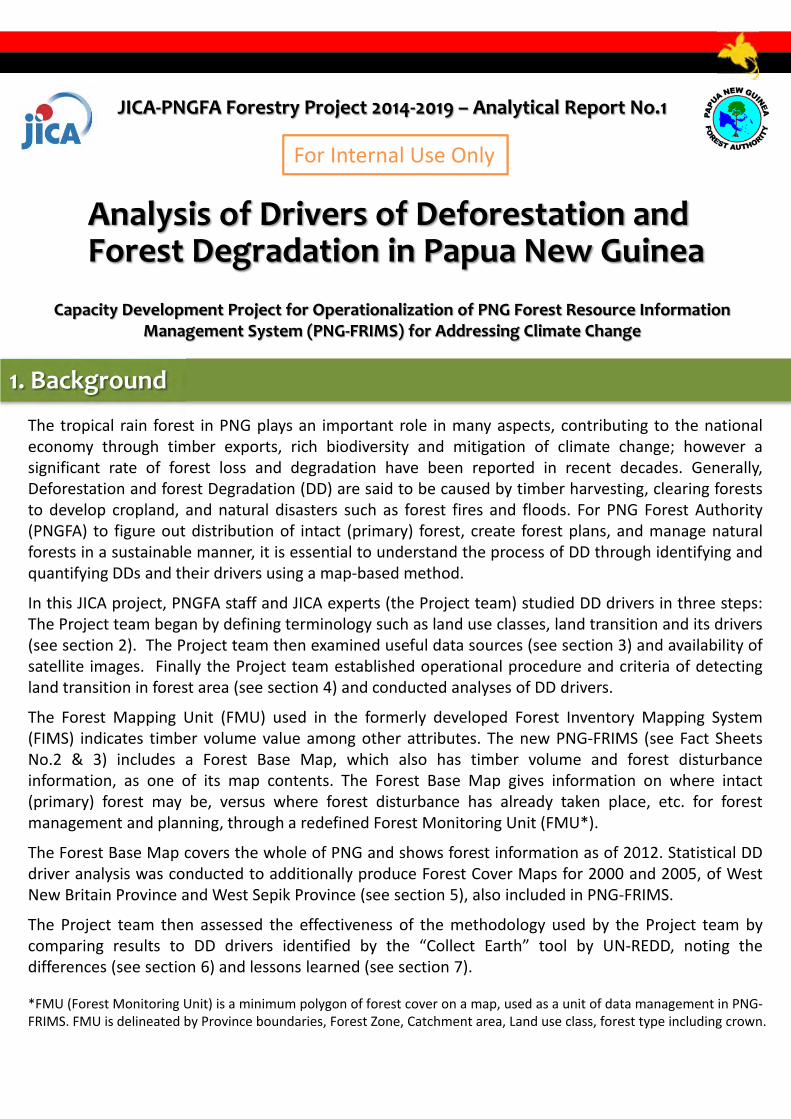
1. Background
Capacity Development Project for Operationalization of PNG Forest Resource Information Management System (PNG‐FRIMS) for Addressing Climate Change
JICA‐PNGFA Forestry Project 2014‐2019 – Analytical Report No.1
Analysis of Drivers of Deforestation and Forest Degradation in Papua New Guinea
The tropical rain forest in PNG plays an important role in many aspects, contributing to the nationaleconomy through timber exports, rich biodiversity and mitigation of climate change; however asignificant rate of forest loss and degradation have been reported in recent decades. Generally,Deforestation and forest Degradation (DD) are said to be caused by timber harvesting, clearing foreststo develop cropland, and natural disasters such as forest fires and floods. For PNG Forest Authority(PNGFA) to figure out distribution of intact (primary) forest, create forest plans, and manage naturalforests in a sustainable manner, it is essential to understand the process of DD through identifying andquantifying DDs and their drivers using a map‐based method.
In this JICA project, PNGFA staff and JICA experts (the Project team) studied DD drivers in three steps:The Project team began by defining terminology such as land use classes, land transition and its drivers(see section 2). The Project team then examined useful data sources (see section 3) and availability ofsatellite images. Finally the Project team established operational procedure and criteria of detectingland transition in forest area (see section 4) and conducted analyses of DD drivers.
The Forest Mapping Unit (FMU) used in the formerly developed Forest Inventory Mapping System(FIMS) indicates timber volume value among other attributes. The new PNG‐FRIMS (see Fact SheetsNo.2 & 3) includes a Forest Base Map, which also has timber volume and forest disturbanceinformation, as one of its map contents. The Forest Base Map gives information on where intact(primary) forest may be, versus where forest disturbance has already taken place, etc. for forestmanagement and planning, through a redefined Forest Monitoring Unit (FMU*).
The Forest Base Map covers the whole of PNG and shows forest information as of 2012. Statistical DDdriver analysis was conducted to additionally produce Forest Cover Maps for 2000 and 2005, of WestNew Britain Province and West Sepik Province (see section 5), also included in PNG‐FRIMS.
The Project team then assessed the effectiveness of the methodology used by the Project team bycomparing results to DD drivers identified by the “Collect Earth” tool by UN‐REDD, noting thedifferences (see section 6) and lessons learned (see section 7).
*FMU (Forest Monitoring Unit) is a minimum polygon of forest cover on a map, used as a unit of data management in PNG‐FRIMS. FMU is delineated by Province boundaries, Forest Zone, Catchment area, Land use class, forest type including crown.
For Internal Use Only
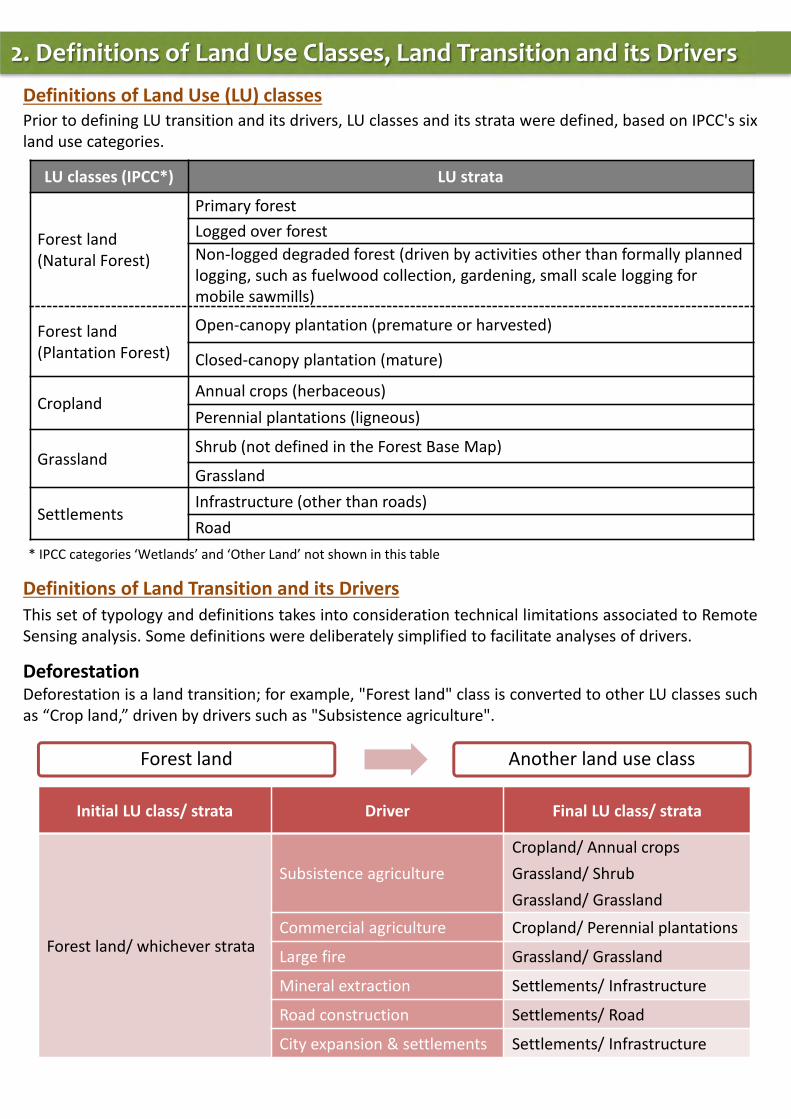
LU classes (IPCC*) LU strata
Forest land(Natural Forest)
Primary forest
Logged over forest
Non‐logged degraded forest (driven by activities other than formally planned logging, such as fuelwood collection, gardening, small scale logging for mobile sawmills)
Forest land (Plantation Forest)
Open‐canopy plantation (premature or harvested)
Closed‐canopy plantation (mature)
CroplandAnnual crops (herbaceous)
Perennial plantations (ligneous)
GrasslandShrub (not defined in the Forest Base Map)
Grassland
SettlementsInfrastructure (other than roads)
Road
2. Definitions of Land Use Classes, Land Transition and its Drivers
Deforestation
Forest land Another land use class
Definitions of Land Transition and its DriversThis set of typology and definitions takes into consideration technical limitations associated to RemoteSensing analysis. Some definitions were deliberately simplified to facilitate analyses of drivers.
Deforestation is a land transition; for example, "Forest land" class is converted to other LU classes suchas “Crop land,” driven by drivers such as "Subsistence agriculture".
Initial LU class/ strata Driver Final LU class/ strata
Forest land/ whichever strata
Subsistence agriculture
Cropland/ Annual crops
Grassland/ Shrub
Grassland/ Grassland
Commercial agriculture Cropland/ Perennial plantations
Large fire Grassland/ Grassland
Mineral extraction Settlements/ Infrastructure
Road construction Settlements/ Road
City expansion & settlements Settlements/ Infrastructure
* IPCC categories ‘Wetlands’ and ‘Other Land’ not shown in this table
Definitions of Land Use (LU) classesPrior to defining LU transition and its drivers, LU classes and its strata were defined, based on IPCC's sixland use categories.

Regeneration
Logged over forest Primary forest
Non‐logged degraded forest Primary forest
Open‐canopy plantation Closed‐canopy plantation
Degradation
Primary forest Logged over forest
Primary forest Non‐logged degraded forest
Closed‐canopy plantation Open‐canopy plantation
Initial Forest land strata
Driver Final Forest land strata
Primary forest Authorized selective logging Logged over forest
Primary forestWood collection(non‐authorized logging + fuel wood collection)
Non‐logged degraded forest
Primary forestGardening (shifting agriculture) through slash and/or burn (including small fires)
Non‐logged degraded forest
Closed‐canopy plantation
Logging in forest plantations Open‐canopy plantation
Primary forestGrazing (usually happens in Grassland, yet may have a potential of forest degradation)
Grassland/ ShrubGrassland/ Grassland
Degradation is a land transition where “Primary forest" strata is converted to other LU strata under“Forest land” class, or "Closed‐canopy plantation" is converted to "Open‐canopy plantation”.
Regeneration is a "positive" land transition under "Forest land" class where "Logged over forest" or"Non‐logged degraded forest" is converted to "Primary forest", or "Open‐canopy plantation” isconverted to "Closed‐canopy plantation”.
Initial Forest land strata
DriverFinal Forest land
strataArea type
Logged over forestAssisted regeneration/Natural regeneration
Primary forestManaged by PNGFA programme in logging concessions
Non‐logged degraded forest
Natural regeneration Primary Forest Not in concessions
Open‐canopy plantation
PlantationClosed‐canopy Plantation
Managed by PNGFA or private sector

Reforestation
Grassland or Cropland Forest land
Reforestation is a "positive" land transition where LU class such as "Grassland" or "Cropland" isconverted to "Forest land (Plantation forest)" by plantation activities.
Initial LU class/ strata DriverFinal Forest land
strataArea type
Grassland/ Shrub
PlantationForest land (Plantation forest)
Managed by PNGFA or private sector
Grassland/ Grassland
Cropland/ Perennial plantations

Drivers Associated scale Notes and useful information for analysis
Mining / Extractive industry
Generally > 50 ha Sometimes > 30 ha
Deforestation caused by constructing pipelines for oil and gas. Forest areas are cleared for facility construction including the construction of townships with workers compounds, schools, hospitals, administrative centers and recreational areas.
Road construction
Generally 40 to 60 ha
Normal width: 40 m road line corridor (20 m on either sides) Normal road length added per year: 10,000 to 15,000 m40x (10,000 to 15,000) = 400,000 to 600,000 m2 per annum
Facility construction(e.g. School)
Generally 2 ha
Schools and logging camps are usually around 2 ha in size. Schools are usually constructed in the village and most schools are not detected as Hansen Loss.Facility construction usually appear along the road, grassland, and other non‐forest lands.
Agricultural plantation associated with FCA
Generally > 50 haMost activities via Forest Clearance Authority (FCA) occur at a larger scale than 50 ha.Developer can clear forests up to 1,000 ha a year.
Logging (and logging roads)
Generally 20 to 40 ha
The maximum width allowed for main logging roads, which logging trucks and other vehicles will use, is 40 m. Spur roads are also considered to be logging roads but are not commonly used by vehicles.Normal road length added per year: 5 to 10 km for main logging roads. 40 x (5,000 to 10,000) = 200,000 to 400,000 m2per annum
Disasters Generally 5 haMain types of disasters in PNG are landslides, from flood and soil erosion especially along the Highlands Highway, or earthquakes (in ENB). The latter could happen in natural forest but hard to identify.
Subsistence agriculture
Generally 1 to 5 ha
Definition: shifting and permanent agriculture, cultivation, and gardening, occurring within 5 to10 km from Census Unit (CU).*The 2010 Census Information is available from the National Statistics Office. Some of this information is already stored in PNG‐FRIMS.
1 ha for non‐commercial crops
Size of agricultural land for non–commercial crops is usually 1 ha.
5 ha for cash crops Agriculture for cash crops (e.g. cocoa, cacao, etc.) is usually 5 ha.
Fire 1 to 5 ha
Difficult to obtain actual information as the Natural Disaster Office doesn't publish datasets. Natural fires are rare in PNG and thus fires are usually man‐made. Major causes are:
‐ Preparation for gardening (1 to 5ha)
‐ Hunting fire in grassland (1 to 5ha) to chase animals
‐ Accidental or careless fire (1 to 5ha) from smoking, cooking, etc.
General scale of degradation associated with each driverThe general scale of degradation associated with each potential DD driver was used to determine thesmallest size of “Hansen loss”* areas for which drivers will be analyzed and interpreted manually. Thecut‐off was determined to be 20 ha, according to the analysis below.
* “Hansen loss” data is a dataset developed by Hansen, et al. (2013), showing yearly forest reductionsince 2001 based on an algorithm to extract areas where decrease of vegetation taller than 5 m wasoccurring, utilizing imagery of LANDSAT 7 and LANDSAT 8.

Drivers Notes and useful information for analysis
Plantations
Replanting periods for each species type are useful in identifying plantations. Forest plantations:Kamerere: 20 years, Teak: 30 to 40 years, Klinkii: 30 to 35 years, Acacia: 8 to 10 years, Pinus spp.: 30 to 35 years, and Hoop: 30 to 35 years Plantations other than forest plantations:Cocoa: 20 to 30 years (upper trees are remaining), Oil palm: 20 years, Rubber: 30 years, and Coconut: 50 years
Settlements Normally built in non‐forest areas and very unlikely detected as Hansen Loss points
It is noted that DD Drivers such as facility construction, disaster, subsistence agriculture and fire maynot be identifiable through the analysis of DD Drivers, however:
• Hansen Loss due to facility construction is not so common.• Fire will be identified by FireWatch.• Distinction between ‘disaster’ and ‘subsistence agriculture’ drivers can be made using information
and assumptions presented below (see notes on subsistence agriculture).
Characteristics of other activities, listed below, may facilitate the association of drivers to theremaining Hansen Loss points:
The activities, below, cannot be tied to a particular scale of deforestation, but are neverthelessidentified as drivers:
Drivers Notes and useful information for analysis
Grazing Usually happens in Grassland
Wood collection Dead trees & twigs are normally collected from gardening site
LoggingLogging data is assumed to be entered as forest working plans, and the volume subtracted in FIMS.Small logging could be operated with chainsaws and portable sawmills.
Building materials collection
People cut down and collect trees for building materials.
Notes on subsistence agriculture
Definition: Shifting and permanent agriculture cultivation and gardening; occurs within 5 km fromCensus Unit (CU)
Means to identify small agriculture patches• Hansen Loss larger than 1 to 5 ha, that is adjacent to the Forest Base Map LU class
“Cropland/Agriculture land” but not in characteristic shapes of mining, road, other facilities,plantation, or logging.
• A set of expedient criteria for classifying Hansen Loss data is shown below.
Distance from CU Size of Hansen Loss data Disturbance type
No longer than 5 to 10 km
5 to 20 ha Commercial agriculture
Up to 1 to 5 ha Small agriculture patches
Less than 1 ha Other disturbance

3. Information used for DD Driver Identification
The following information was identified as useful for the identification of DD drivers.
Hansen Data (Lossyear/Gain): Annual pixel‐by‐pixel representation of deforestation areas. Used for identifying the location of both deforestation and degradation.
Census Unit: Representative point of settlements. Used for creation of 5 km buffer zone.
FireWatch PNG: Data obtained from a web site (http://fire.pngsdf.com/home.php) developed by the University of Papua New Guinea with the support of the EU.
Forest Base/Cover Maps: Forest cover information in PNG. Driver information was added to each FMU.
Logged over areas: Dataset created by the Project, marking logged over areas under the assumption that logging activities take place within a 500 m buffer from road data in 2000, 2005 and 2011.
Mining: Boundaries of mining activity by the Mineral Resource Authority.
Plantation: Plantation data (Qf/Qa) from the Forest Base Map.
Subsistence agriculture: Agriculture data (O) from the Forest Base Map.
Boundaries of Forest Clearance Authority (FCA): Areas of forest clearance by developers within SABL boundaries.
Boundary of Special Agriculture and Business Leases (SABL): Areas permitted for development for agricultural purpose leasing customarily‐owned land.
Concession Area: Timber concession boundaries.

4. Detection and Analysis of Forest Area Changes and their Drivers
(a) Hansen Loss polygons larger than 20 ha
The definitions of DD drivers as discussedin section 2, was used in combinationwith available satellite imagery and otherdata listed in section 3, to analyze forestarea changes and their drivers, based onpresence or absence of Hansen Losspolygon and its size.
DD drivers for Hansen Loss polygonslarger than 20 ha in targeted years 2001‐2010 were identified by visualobservation utilizing LANDSAT imagery,RapidEye Imagery (2011), and GoogleEarth.
The drivers were identified using the key‐out method according to the rules shownin the flowchart (right). Using thismethod, drivers are exclusive to eachother, and multiple operators will identifythe same driver for the samedeforestation area.
The flowchart started with drivers thatare more obvious and easily identifiable,such as mining activities and plantations,and then progressed to drivers that aremore difficult to interpret via satelliteimagery, such as fires.
The driver "unknown" was assigned todeforestation areas for which no drivercould be identified until the end of theflowchart.
The description of the DD driver (e.g.“Mining”) was added to each FMU of theForest Base Map, as well as past forestcover maps.

(c) Driver analysis of FMUs without Hansen Loss polygon overlap
Following the above steps, eachremaining FMU polygon that indicatedchange in LU class/ strata pointing to DD,but without driver information fromHansen Loss, was analyzed according tothe flowchart (right), and its driverinformation was added to FMU directly.
(b) Hansen Loss polygons 20 ha and smaller
The Hansen Loss polygons 20 ha orsmaller in targeted years 2001‐2010 wereautomatically classified to DD driver usingGIS data and GIS process.
The drivers were identified according tothe rules shown in the flowchart (right).
The description of the DD driver (e.g.“Mining”) was then added to each FMUof the Forest Base Map, as well as pastforest cover maps. The identification ofdrivers of Hansen Loss polygons largerthan 20 ha (see (a) above) was conductedearlier, chronologically. When a FMUoverlapped with 2 or more Hansen Losspolygons, the driver identified andentered earlier was prioritized.
(d) Analysis of past forest cover maps
For West New Britain (WNB) and West Sepik (WSP) province, driver analysis was conducted on pastforest cover maps using the same methodology, but using different datasets.
Data used for the Forest Cover Map 2005:Hansen Loss polygon for 2001‐2004, logging road data before 2005, concession purchase before 2004,and Qf, Qa and O in the forest cover map 2005 data.
Data used for the Forest Cover Map 2000:Logging road data before 2000 and concession purchase before 1999.

5. Outcomes
DD drivers in 2011 was mapped across PNG, by entering information on drivers to each FMU of theForest Base Map. FMUs without degradation are shown as Intact Forest (green) or Non‐Forest (white).
Forest Degradation Drivers in PNG, 2011
Area (ha) and % total area affected by each DD driver, 2011
DD drivers in PNG, 2011

For WNB and WSP, DD drivers for years 2005 and 2000 were analyzed, by entering information ondrivers to each FMU using Forest Cover Map for those years, and compared to DD drivers for 2011.
Forest Degradation Drivers analyzed using past forest cover maps
Comparison of DD drivers and area affected for WNB:
years 2000, 2005 and 2011
DD drivers in WNB, 2000
DD drivers in WNB, 2011
DD drivers in WNB, 2005
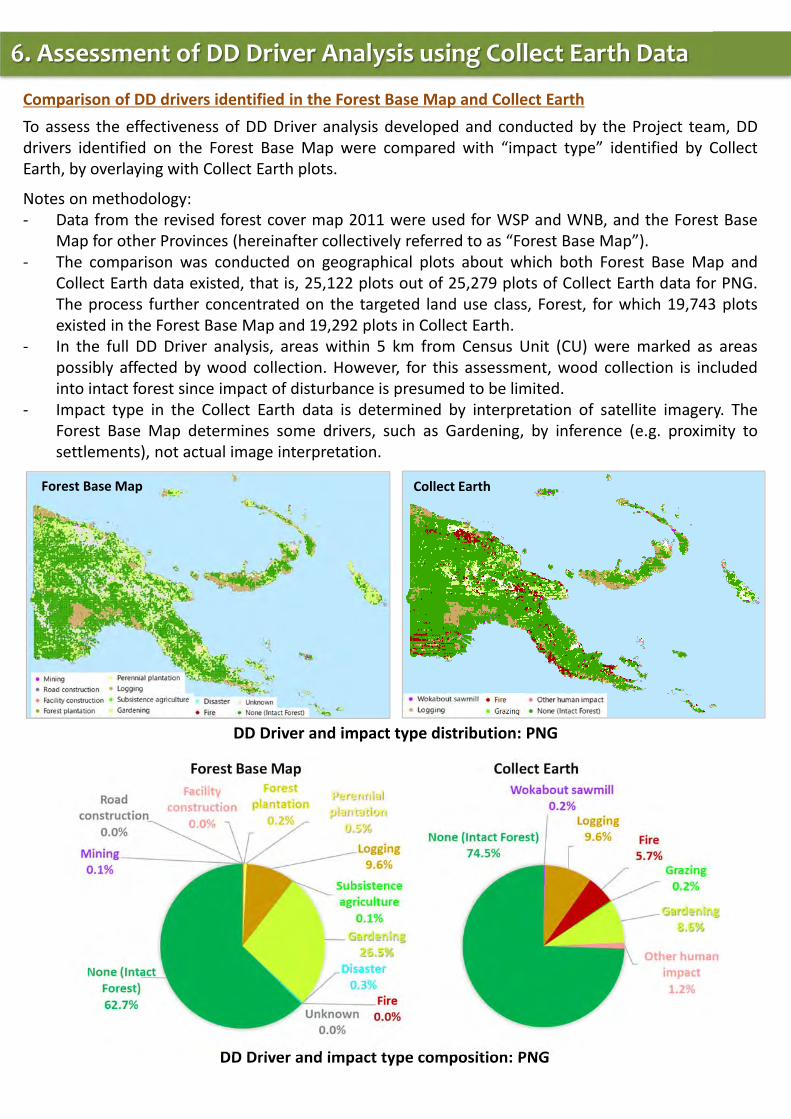
6. Assessment of DD Driver Analysis using Collect Earth Data
To assess the effectiveness of DD Driver analysis developed and conducted by the Project team, DDdrivers identified on the Forest Base Map were compared with “impact type” identified by CollectEarth, by overlaying with Collect Earth plots.
Notes on methodology:‐ Data from the revised forest cover map 2011 were used for WSP and WNB, and the Forest Base
Map for other Provinces (hereinafter collectively referred to as “Forest Base Map”).‐ The comparison was conducted on geographical plots about which both Forest Base Map and
Collect Earth data existed, that is, 25,122 plots out of 25,279 plots of Collect Earth data for PNG.The process further concentrated on the targeted land use class, Forest, for which 19,743 plotsexisted in the Forest Base Map and 19,292 plots in Collect Earth.
‐ In the full DD Driver analysis, areas within 5 km from Census Unit (CU) were marked as areaspossibly affected by wood collection. However, for this assessment, wood collection is includedinto intact forest since impact of disturbance is presumed to be limited.
‐ Impact type in the Collect Earth data is determined by interpretation of satellite imagery. TheForest Base Map determines some drivers, such as Gardening, by inference (e.g. proximity tosettlements), not actual image interpretation.
DD Driver and impact type composition: PNG
Forest Base Map Collect Earth
Comparison of DD drivers identified in the Forest Base Map and Collect Earth
DD Driver and impact type distribution: PNG
Forest Base Map Collect Earth
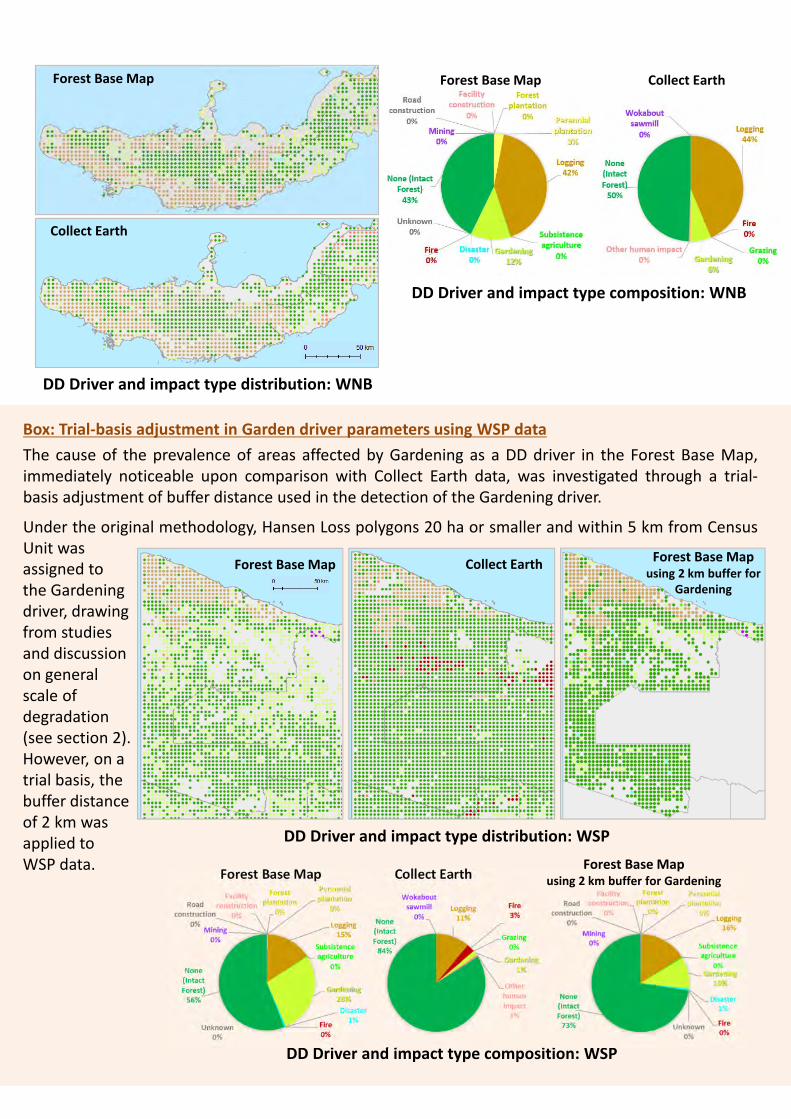
DD Driver and impact type composition: WNB
Forest Base Map Collect Earth
The cause of the prevalence of areas affected by Gardening as a DD driver in the Forest Base Map,immediately noticeable upon comparison with Collect Earth data, was investigated through a trial‐basis adjustment of buffer distance used in the detection of the Gardening driver.
Under the original methodology, Hansen Loss polygons 20 ha or smaller and within 5 km from CensusUnit was degradation
Box: Trial‐basis adjustment in Garden driver parameters using WSP data
DD Driver and impact type distribution: WSP
Forest Base Map Collect EarthForest Base Map
using 2 km buffer for Gardening
Forest Base Map Collect Earth
DD Driver and impact type composition: WSP
Forest Base Mapusing 2 km buffer for Gardening
Forest Base Map
Collect Earth
DD Driver and impact type distribution: WNB
assigned to the Gardening driver, drawing from studies and discussion on general scale of degradation (see section 2). However, on a trial basis, the buffer distance of 2 km was applied to WSP data.

7. Discussion and Lessons Learned
The Project team designed a methodology of DD Driver analysis that makes possible a wall‐to‐wallmapping of the drivers of deforestation and forest disturbance in PNG. This methodology maps DDdrivers to FMU and allows the monitoring of the dynamic state of forests.
In the methodology described in this Analytical Report, forest disturbance is recorded either as presentor absent in an FMU, a binary value (i.e. either black and white, and no shades of grey). If desired, it ispossible to capture the level of disturbance (i.e. the shades of grey) by analyzing the ratio of HansenLoss areas in an FMU in future analyses.
The methodology can be applied to past forest cover map data, but care must be taken whencomparing across years and datasets. As shown in the analysis of past Forest Cover Maps of WNB andWSP, care should be taken in noting and accounting for limitations in data in the interpretation process.Data limitations may translate to fewer types of identifiable DD drivers, and thus the absence ofcertain drivers purely as an artefact of methodology.
Overall the results of DD Driver analysis carried out by the Project team and impact data provided byCollect Earth (CE) corroborated each other. Notable characteristics of the Forest Base Map that maybe better understood through the comparative analysis are:
⁻ The ratio of area classified as intact (primary) forest, versus total area, is smaller in the Forest BaseMap, compared to CE data. This is due to the wall‐to‐wall and binary nature of the Forest BaseMap dataset; FMUs containing any amount of forest loss was classified as degraded area.
⁻ Logging as a DD driver accounted for about the same ratio of forest degradation in both datasets.Fire accounts for a much smaller amount of forest degradation in the Forest Base Map compared toCE; due to the difficulty in identifying the Fire driver in the methodology used by the Project team.
⁻ Gardening was identified as a much larger DD driver in the Forest Base Map, compared to CE data.This is because small patches of Hansen Loss areas, which were not classified to preceding drivers inthe methodology flowchart, and located within 5 km from a Census Unit (CU), were classified toGardening. Due to the wall‐to‐wall nature of the Forest Base Map, an FMU containing even smallpatches of disturbed area by Gardening is indicated as non‐intact, non‐primary forest in the DDDriver analysis. It should be understood that FMUs marked as ‘disturbed by gardening’ in theForest Base Map is not an area that is entirely turned into a garden, but rather, a forest area thatcontains disturbance by gardening activities.
⁻ Due to concerns that the initial methodology may have led to over‐emphasis of Gardening as a DDdriver, the Project team experimented with changing the buffer distance from 5 km to 2 km from aCU. Even with distance set to 2km, Gardening still shows up as a driver of degradation over a muchlarger area, compared to CE data; the key lesson learned is that care should be taken when usingbuffer analysis. It should be noted, however, that there is also a possibility that CE data under‐estimates Gardening as a driver, and that further analyses are necessary to solve the discrepancy.
⁻ In such further analyses, it is also possible to adjust buffer distance by population size, region,landform, or other factors that may affect migration distance. To determine the best methodologyfor detecting Gardening as a DD driver, a trial‐and‐verification process, where detection methodsare verified by manual identification of Gardening based forest degradation for sample areas, mayneed to be conducted in the future.

8. References
Government of Papua New Guinea, 2017, Papua New Guinea’s National REDD+ Forest Reference Level
JICA and PNGFA, 2016, ‘Papua New Guinea Forest Base Map 2012 ‐ JICA‐PNGFA Forestry Project 2014‐2019 Fact Sheet No.2’. Papua New Guinea Forest Authority, Port Moresby, Papua New Guinea
PNG Forest Authority (2015) Forest and land use in Papua New Guinea 2013. FAO.
Cuthbert, R.J., Bush, G., Chapman, M., Ken, B., Neale, E. and Whitmore, N. (2016). Analysis of NationalCircumstances in the Context of REDD+ and Identification of REDD+ Abatement Levers in Papua NewGuinea. Report produced by the Wildlife Conservation Society (Goroka, Papua New Guinea), for PapuaNew Guinea’s UN‐REDD National Programme.
de Lamo, X., Arnell, A., Pollini, B., Salvaterra, T., Gosling, J., Ravilious, C. and Miles, L. (2018) Usingspatial analysis to support REDD+ land‐use planning in Papua New Guinea: Strengthening benefits forbiodiversity, ecosystem services and livelihoods. Prepared on behalf of the UN‐REDD Programme,Cambridge, UK: UNEP‐WCMC
Giancarlo et al., Future Deforestation Modeling and Land Suitability Assessment for Oil palm:Agricultural Mapping Assessment in Papua New Guinea, Forest Carbon Partnership Facility (FCPF)
Roy Banka, Sarah Stocks, Peter Stephen, Kevin Brown, 2015, Low Emission Land Use Planning forMadang Province: Options and Opportunities, USAID Lowering Emissions in Asia’s Forests (USAID LEAF)
Shearman, P.L., Bryan, J.E., Ash, J., Hunnam, P., Mackey, B. & Lokes, B. (2008) The state of the forest ofPapua New Guinea. Mapping the extent and condition of forest cover and measuring the drivers offorest change in the period 1972‐2002. University of Papua New Guinea.
Hansen et al., Science 2013, ‘High‐Resolution Global Maps of 21st‐Century Forest Cover Change,University of Maryland (Hansen/UMD/Google/USGS/NASA)
Hammermaster, E.T. & Saunders, J.C., 1995, ‘Forest Resources and Vegetation Mapping of Papua NewGuinea. PNGRIS Publication No. 4’. AusAID, Canberra, Australia
McAlpine, J. and Quigley, J., 1998, ‘Forest Resources of Papua New Guinea Summary Statistics from theForest Inventory Mapping (FIM) System’. Coffey MPW Pty Ltd for AusAID and PNGFA
⁻ The Project team utilized Hansen Loss data in the analysis of DD drivers. This led to more areasclassified as disturbed in comparison with other datasets such as Collect Earth, since Hansen Lossalso captures naturally occurring gaps, such as a fallen tree caused by wind.
An understanding of these characteristics of data and methodology is necessary for the appropriateuse of the Forest Base Map. With such understanding, the Forest Base Map is already useful inidentifying a mass of intact (primary) forest, estimating timber volume based on type of disturbance,and obtaining other meaningful information for forest management and the planning of loggingactivities. The DD Driver analysis was only a trial assessment preceding a full quantitative assessment;discussions and lessons derived are hoped to contribute to the development of better methods offorest resource data use.
Note: Analytical Report series intends to internally share the result of the JICA Project among PNGFA. The series focuses the results and processes which are meaningful in terms of technical aspects to be recorded, however, are not always conformity with the view of PNGFA. Therefor, if the contents of the series are provided to public, prior consolation with the inventory & Mapping branch is needed. Last updated on Mar. 2019

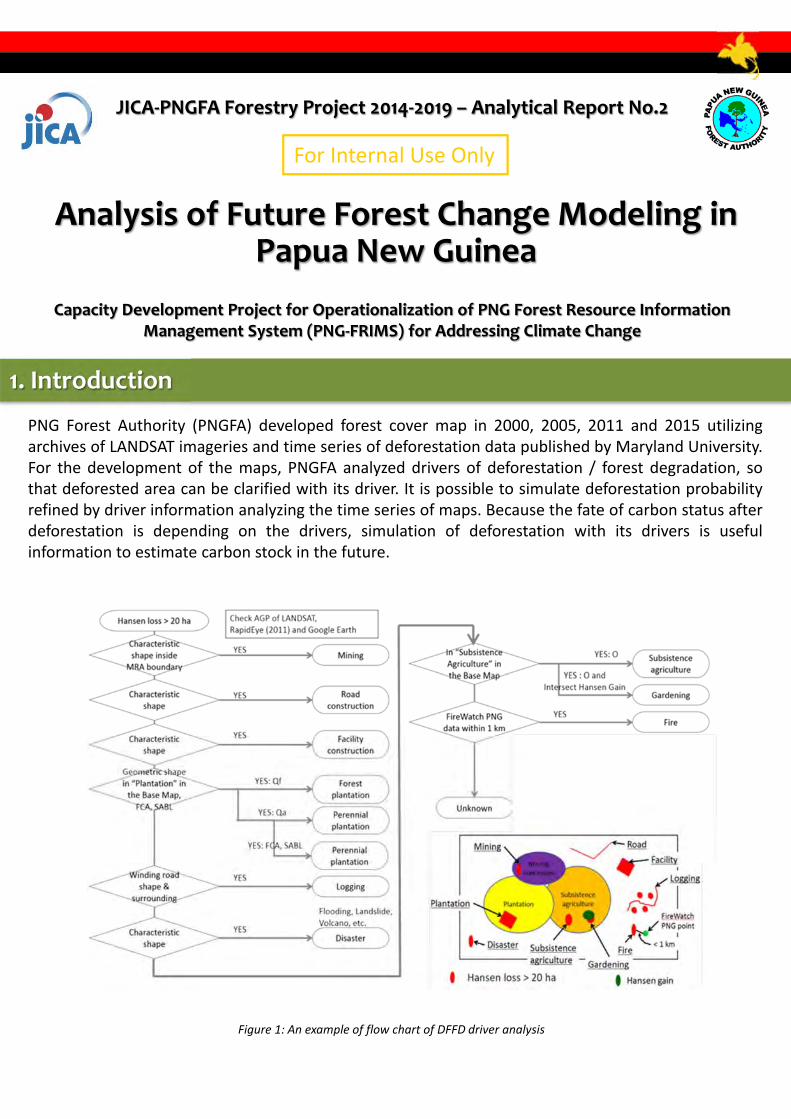
1. Introduction
Capacity Development Project for Operationalization of PNG Forest Resource Information Management System (PNG‐FRIMS) for Addressing Climate Change
JICA‐PNGFA Forestry Project 2014‐2019 – Analytical Report No.2
Analysis of Future Forest Change Modeling in Papua New Guinea
PNG Forest Authority (PNGFA) developed forest cover map in 2000, 2005, 2011 and 2015 utilizingarchives of LANDSAT imageries and time series of deforestation data published by Maryland University.For the development of the maps, PNGFA analyzed drivers of deforestation / forest degradation, sothat deforested area can be clarified with its driver. It is possible to simulate deforestation probabilityrefined by driver information analyzing the time series of maps. Because the fate of carbon status afterdeforestation is depending on the drivers, simulation of deforestation with its drivers is usefulinformation to estimate carbon stock in the future.
For Internal Use Only
Figure 1: An example of flow chart of DFFD driver analysis

2. General Conditions
1) Simulation on effects of enlargement of plantation and agricultural field
Land Change Modeler enables estimation of the drivers for deforestation through comparison of landcover at two points in time and enables simulation of a case in which deforestation would continue atthe current pace (business‐as‐usual (BAU) case). In this section, the flow of the simulation on effects ofenlargement of plantation and agricultural field around Kimbe, West New Britain Province, is described.An area (of approx. 4,870 km2) in the pilot province of West New Britain Province, where thedevelopments of plantations along with population growth have been causing rapid deforestation, wasused in the simulation. A 2011 Forest Base Map and a 2014 forest cover map, which was created bycomparing the Forest Base Map with a LANDSAT Greenest Pixel and a corrected base map of thechanges detected in the comparison, were used as the land cover maps of two points in time (Figure 2).
Target Area: West New Britain Province, Papua New Guinea
Area Size: 2,034,000 ha
Population: 210,000 (2008)
Applied Maps: Forest Cover Map 2005, 2011, 2015 developed by PNGFA
Tool: Land Change Modeler for ArcGIS 2.0 (Clark University)
3. Case Studies
Figure 2: Forest maps of two points used in simulation with Land Change Modeler

In the beginning, the maps of 2011 and 2014 were compared to elucidate what types of land coverincreased and what types of land cover decreased between 2011 and 2014 (Figure 3). The comparisonrevealed that the areas of agricultural plantations (Qa) and subsistence farmland (O) had increased andthe areas of lowland forest (P), hill forest (H), wetland forest (Fsw), open woodland (W) and grassland(G) had decreased between 2011 and 2014. Therefore, the development of agricultural plantations andsubsistence farmland was selected as the driver of deforestation and their distribution in the future (inthe year 2030) was estimated. The elevation (SRTM, resolution of 30 m), slope, distance from the sea,population density (Kernel analysis), boundaries of reserves, wetland and active concession areas andthe land cover boundaries in 2011 were used as the model parameters.
Figure 3: Changes in the land cover between the two points in time
The accuracy of the model of agricultural plantations was estimated at 80.83%. Because this figure islarger than the threshold for the sufficient accuracy of 80%, this model is considered a valid model(Table 1). The boundaries of inundation area are the parameters that have the largest influence on theaccuracy of the model, followed by, in descending order, the following: the land cover boundaries of2011 (base map), protected area boundaries, active concession boundaries, elevation (SRTM,resolution of 30 m), distance from the sea, population density and slope.
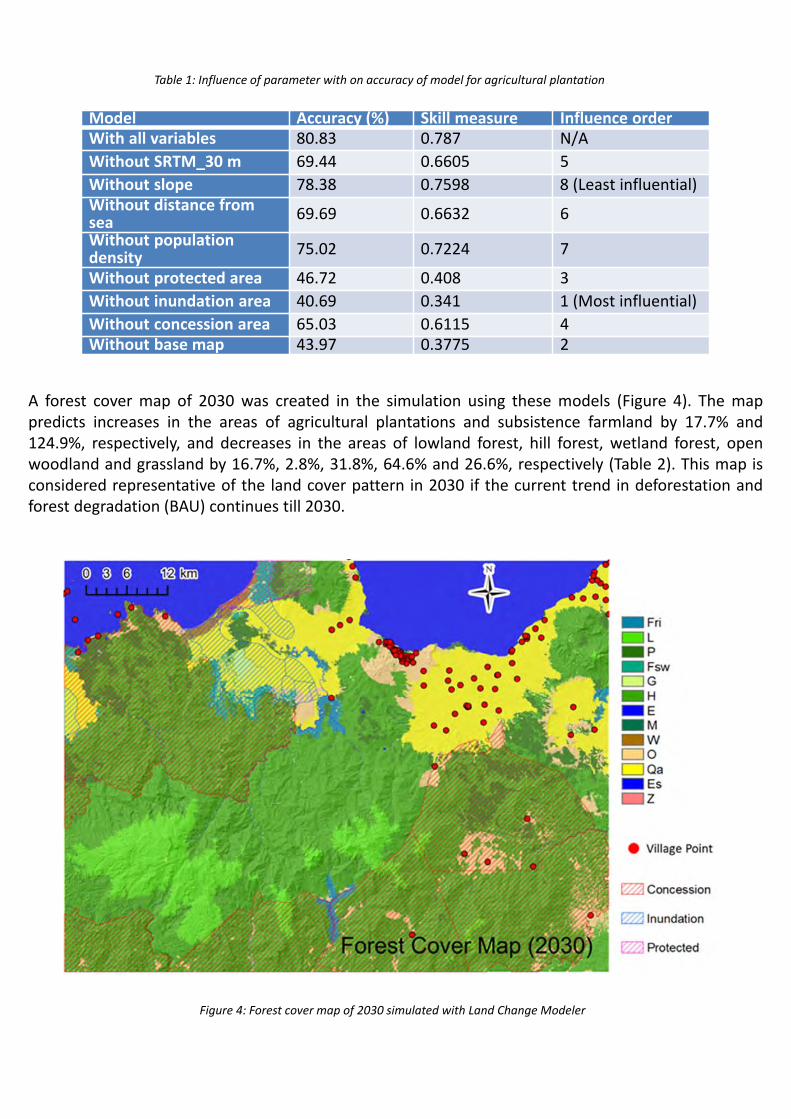
Table 1: Influence of parameter with on accuracy of model for agricultural plantation
A forest cover map of 2030 was created in the simulation using these models (Figure 4). The mappredicts increases in the areas of agricultural plantations and subsistence farmland by 17.7% and124.9%, respectively, and decreases in the areas of lowland forest, hill forest, wetland forest, openwoodland and grassland by 16.7%, 2.8%, 31.8%, 64.6% and 26.6%, respectively (Table 2). This map isconsidered representative of the land cover pattern in 2030 if the current trend in deforestation andforest degradation (BAU) continues till 2030.
Model Accuracy (%) Skill measure Influence orderWith all variables 80.83 0.787 N/A
Without SRTM_30 m 69.44 0.6605 5
Without slope 78.38 0.7598 8 (Least influential)Without distance from sea
69.69 0.6632 6
Without population density 75.02 0.7224 7
Without protected area 46.72 0.408 3
Without inundation area 40.69 0.341 1 (Most influential)
Without concession area 65.03 0.6115 4Without base map 43.97 0.3775 2
Figure 4: Forest cover map of 2030 simulated with Land Change Modeler
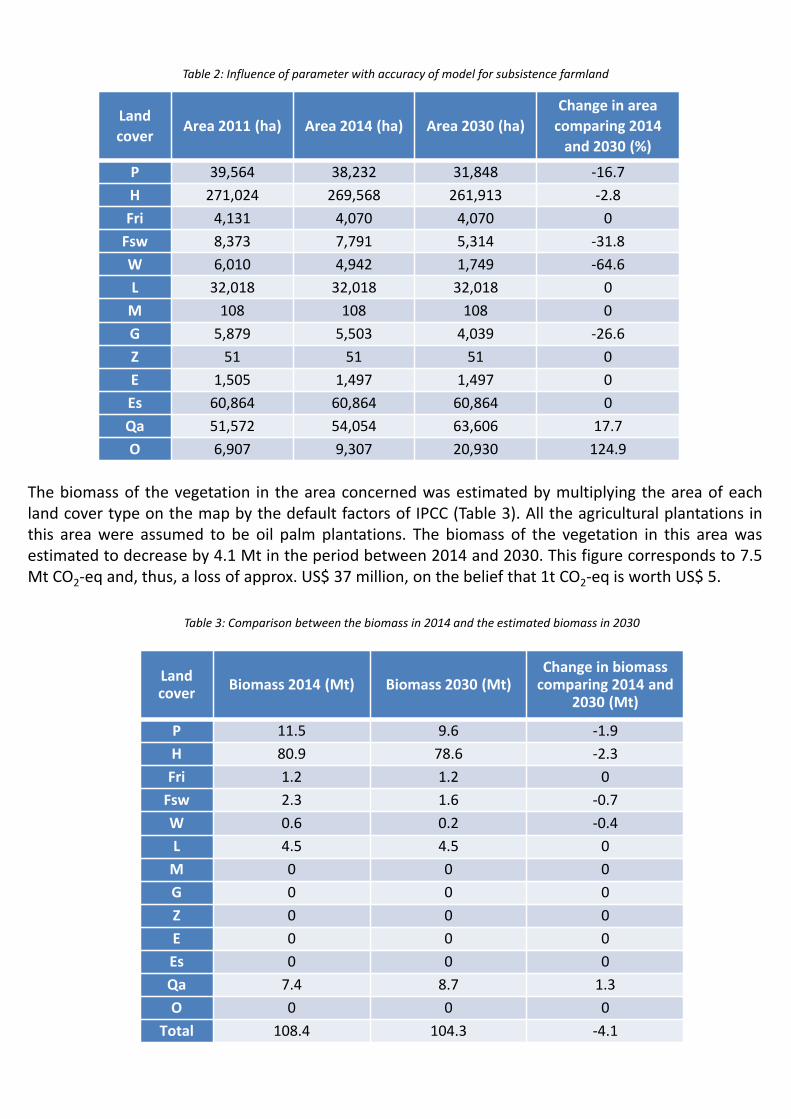
The biomass of the vegetation in the area concerned was estimated by multiplying the area of eachland cover type on the map by the default factors of IPCC (Table 3). All the agricultural plantations inthis area were assumed to be oil palm plantations. The biomass of the vegetation in this area wasestimated to decrease by 4.1 Mt in the period between 2014 and 2030. This figure corresponds to 7.5Mt CO2‐eq and, thus, a loss of approx. US$ 37 million, on the belief that 1t CO2‐eq is worth US$ 5.
Table 2: Influence of parameter with accuracy of model for subsistence farmland
Land
coverArea 2011 (ha) Area 2014 (ha) Area 2030 (ha)
Change in area
comparing 2014
and 2030 (%)
P 39,564 38,232 31,848 ‐16.7
H 271,024 269,568 261,913 ‐2.8
Fri 4,131 4,070 4,070 0
Fsw 8,373 7,791 5,314 ‐31.8
W 6,010 4,942 1,749 ‐64.6
L 32,018 32,018 32,018 0
M 108 108 108 0
G 5,879 5,503 4,039 ‐26.6
Z 51 51 51 0
E 1,505 1,497 1,497 0
Es 60,864 60,864 60,864 0
Qa 51,572 54,054 63,606 17.7
O 6,907 9,307 20,930 124.9
Table 3: Comparison between the biomass in 2014 and the estimated biomass in 2030
Land cover
Biomass 2014 (Mt) Biomass 2030 (Mt)Change in biomass comparing 2014 and
2030 (Mt)
P 11.5 9.6 ‐1.9
H 80.9 78.6 ‐2.3
Fri 1.2 1.2 0
Fsw 2.3 1.6 ‐0.7
W 0.6 0.2 ‐0.4
L 4.5 4.5 0
M 0 0 0
G 0 0 0
Z 0 0 0
E 0 0 0
Es 0 0 0
Qa 7.4 8.7 1.3
O 0 0 0
Total 108.4 104.3 ‐4.1

The area of agricultural plantation is expected to increase by 9,552 ha between 2014 and 2030. If thisarea is assumed to increase at a constant rate in this period, the cumulative area increase will be81,192 ha × year. If the yield of palm oil per unit area is assumed at 3.74 t ha‐1 year‐1 (1) and its price isassumed at US$ 562 t‐1 (2), the revenue from the sales of palm oil is expected to increase by US$ 170million in this period. The total area of lowland and hill forests is expected to decrease by 14,040 ha inthe same period. If this area is assumed to decrease at a constant rate, the cumulative area loss will be119,348 ha × year. If the harvesting period and price per unit volume of timber are assumed for 35years at US$ 142m‐3 (3), respectively, a loss of approx. US$ 17 million is expected from the area loss. Inconclusion, an increase in the revenue of US$ 116 million is expected from the deforestation and forestdegradation on the BAU basis in the period between 2014 and 2030 (Table 4).
An estimation similar to the one mentioned in the preceding paragraph was conducted in the cases inwhich 1) only open woodland and grassland could be converted to agricultural plantations and 2) onlygrassland could be converted to agricultural plantations. Increases in the revenue of US$ 85.2 millionand US$ 28 million in the period between 2014 and 2030 were expected in cases 1) and 2),respectively. As restriction on the changes in land cover increases, the increase in the revenue from thechanges decreases. The policy of the government on forest management will depend on whether itcan find value in conserving the forests themselves without deforestation and forest degradation.
Table 4: Comparison of increased revenue between 2014 and 2030 with scenarios
Scenario 1 Scenario 2 Scenario 3
Net forest loss 19,711 ha 14,816 ha 11,623 ha
Net P&H loss 14,040 ha 11,623 ha 11,623 ha
Net plantation gain 9,552 ha 4,657 ha 1,464 ha
Price of increased carbon due to plantation development
‐37.3 mil USD 2.00 mil USD 1.82 mil USD
Price of palm oil from newly developed plantation
171 mil USD 83.2 mil USD 26.2 mil USD
Price of increased timber due to developing oil palm plantations
‐16.9 mil USD 0 mil USD 0 mil USD
Net increase in profit 116 mil USD 85.2 mil USD 28.0 mil USD
Note) Scenario 1: BAU; Scenario 2: Newly developing plantation is only allowed in W and G after 2014, increasing in subsistence agriculture is BAU; Scenario 3: Newly developing plantation is only allowed in G after 2014, increasing in subsistence agriculture is BAU
___________________________________________________
1 http://www.soyatech.com/Palm_Oil_Facts.htm (accessed on 03 April 2017)2 http://www.indexmundi.com/commodities/?commodity=palm-oil&months =300 (accessed on 09 June 2016)3 https://www.wageningenur.nl/upload_mm/5/c/1/b0b121e8-469b-4e65-9689-c4e6fd7c8d1e_WOt-technical%20report%2010%20webversie.pdf (accessed on 03 April 2017)
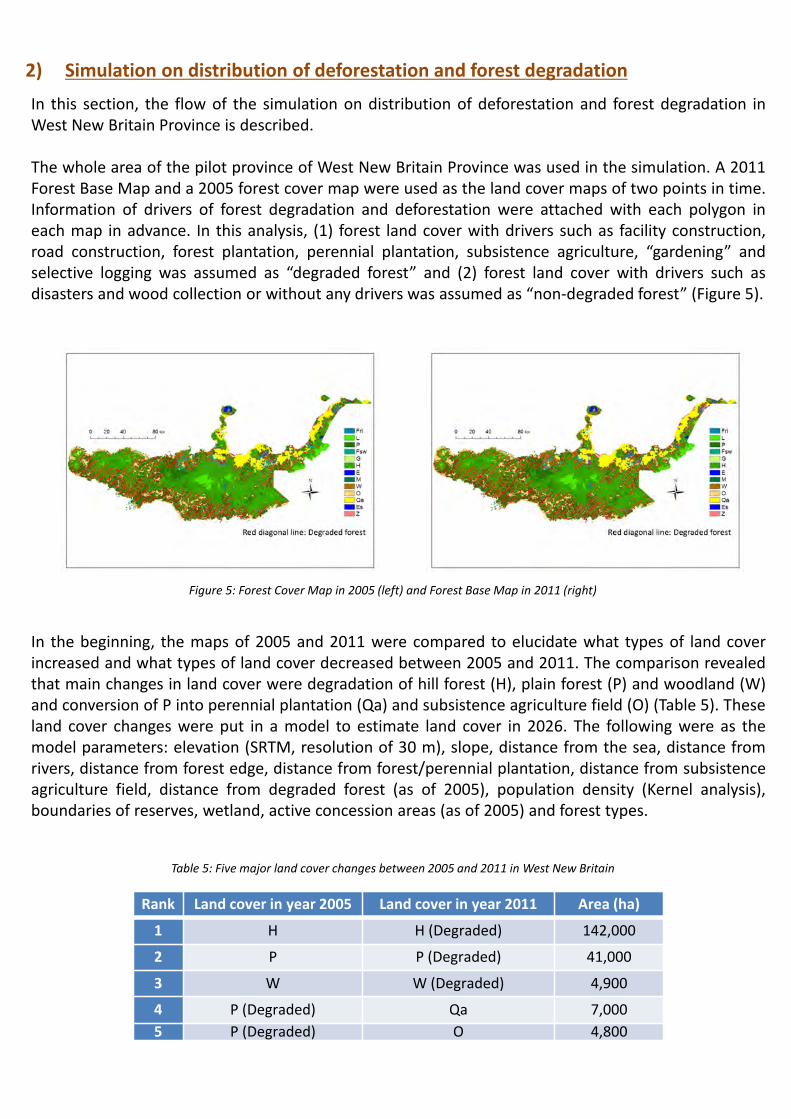
2) Simulation on distribution of deforestation and forest degradation
In this section, the flow of the simulation on distribution of deforestation and forest degradation inWest New Britain Province is described.
The whole area of the pilot province of West New Britain Province was used in the simulation. A 2011Forest Base Map and a 2005 forest cover map were used as the land cover maps of two points in time.Information of drivers of forest degradation and deforestation were attached with each polygon ineach map in advance. In this analysis, (1) forest land cover with drivers such as facility construction,road construction, forest plantation, perennial plantation, subsistence agriculture, “gardening” andselective logging was assumed as “degraded forest” and (2) forest land cover with drivers such asdisasters and wood collection or without any drivers was assumed as “non‐degraded forest” (Figure 5).
Figure 5: Forest Cover Map in 2005 (left) and Forest Base Map in 2011 (right)
In the beginning, the maps of 2005 and 2011 were compared to elucidate what types of land coverincreased and what types of land cover decreased between 2005 and 2011. The comparison revealedthat main changes in land cover were degradation of hill forest (H), plain forest (P) and woodland (W)and conversion of P into perennial plantation (Qa) and subsistence agriculture field (O) (Table 5). Theseland cover changes were put in a model to estimate land cover in 2026. The following were as themodel parameters: elevation (SRTM, resolution of 30 m), slope, distance from the sea, distance fromrivers, distance from forest edge, distance from forest/perennial plantation, distance from subsistenceagriculture field, distance from degraded forest (as of 2005), population density (Kernel analysis),boundaries of reserves, wetland, active concession areas (as of 2005) and forest types.
Table 5: Five major land cover changes between 2005 and 2011 in West New Britain
Rank Land cover in year 2005 Land cover in year 2011 Area (ha)
1 H H (Degraded) 142,000
2 P P (Degraded) 41,000
3 W W (Degraded) 4,900
4 P (Degraded) Qa 7,000
5 P (Degraded) O 4,800

The accuracy of the model was estimated at 82.31%. Because this figure is larger than the thresholdfor sufficient accuracy of 80%, this model is considered a valid model (Table 6). The forest types are theparameters that have the largest influence on the accuracy of the model, followed by, in descendingorder, the following: distance from forest/perennial plantation, distance from subsistence agriculturefield, distance from forest edge, active concession areas and distance from road.
Table 6: Influence that each parameter has on the accuracy of the model
ModelAccuracy
(%)Skill
measureInfluence order
With all variables 82.31 0.801 N/A
Population density 82.29 0.8007 15
Active concession area as of 2005 80.04 0.7755 6
Distance from Non‐forest land cover 74.88 0.7174 5
Distance from rivers 81.82 0.7955 12
Distance from roads as of 2011 80.37 0.7792 7
Distance from sea 82.26 0.8005 13
Inundation area 81.71 0.7943 11
Slope 82.31 0.801 16 (least influential)
Altitude 82.29 0.8007 14
Distance from CU points 81.27 0.7893 10
Distance from protected area 80.51 0.7807 8
Distance from "plantation" 70.29 0.6657 3
Distance from "Agricultural landcover" 72.02 0.6852 4
Distance from Degraded forest 49.87 0.436 2
Distance from logged‐over area 80.81 0.7841 9
Forest type 48.37 0.4192 1 (most influential)
A forest cover map of 2026 was created in the simulation using this model (Figure 6). The map predictsincreases in the areas of degraded H, degraded P and degraded W by 33.8%, 7.3% and 47.7%,respectively, and decreases in the areas of non‐degraded H, non‐degraded P and non‐degraded W by51.7%, 54.0% and 55.4%, respectively (Table 7). This map is considered representative of the landcover pattern in 2026 if the current trend in deforestation and forest degradation (BAU) continues till2026.

Figure 6: Simulated Forest cover map of 2026
Table 7: Changes in areas of each land cover
Land coverArea in year
2011 (ha)
Aria in year
2026 (ha)
Change
ratioLand cover
Area in year
2011 (ha)
Aria in year
2026 (ha)
Change
ratio
B 250 249 ‐0.40% B_deg 861 863 0.20%
Fri 5000 5004 0.10% Fri_deg 15366 15361 0.00%
Fsw 5587 5584 ‐0.10% Fsw_deg 18622 18606 ‐0.10%
H 414485 200291 ‐51.70% H_deg 633555 847772 33.80%
L 62089 62109 0.00% L_deg 4224 4224 0.00%
M 4910 4905 ‐0.10% M_deg 4643 4642 0.00%
P 103129 47430 ‐54.00% P_deg 408523 438148 7.30%
Sc 112 113 0.50% Sc_deg 0 0 0.00%
W 16732 7458 ‐55.40% W_deg 19471 28760 47.70%
E+Es 14431 14433 0.00%
G 30721 30723 0.00%
O 122038 135033 10.60%
Qa 147766 160785 8.80%
U 651 652 0.20%
Z 1137 1135 ‐0.10%
Change in area of degraded forestChange in area of Land cover
other than degraded forest

This indicates that areas of non‐degraded forest would decrease from about 612,000 ha in 2011 to333,000 ha in 2026 and areas of degraded forest would increase from about 1,105,000 ha in 2011 to1,358,000 ha in 2026. Pearson et al. (2014) suggests that carbon emission from a unit area caused byforest degradation reaches 12% of that of deforestation. About 165,000 ha of areas are simulated asexperiencing forest degradation by logging between 2011 and 2026. Assuming average forest carbonstock of 200 Mg C ha‐1, carbon emission from the forest degradation by logging during this period isestimated as the following:
165,000×200×0.12 = 396,000 (Mg C)
Further, assuming 1 t CO2‐eq = 5 USD, the estimated value of carbon emitted due to forest degradationby logging activity between 2011 and 2026 in West New Britain Province is estimated as the following:
396,000×(44/12)×5 = 7,260,000 (USD)
3) Simulation on possible location of future deforestation
To predict exact location of deforestation in the future is very difficult because it is depending not onlyon geospatial conditions but also on social circumstances, such as traditional practices of the varioushabitats, change in the policies, activities of private companies, etc. However, locations with highprobability of deforestation can be predicted because lands suitable for human activities tend todistribute in areas with some conditions, such as flat, warm, close to roads, close to villages, etc. Thiskind of information can be used for choosing area for protection, for example. In this section,conditions which affect deforestation are estimated and probability of deforestation in each location ispredicted in the West New Britain Province, Papua New Guinea.
The Forest cover maps in Year 2005, 2011 and 2015 were used for the analysis. Firstly, deforestedareas were identified with each driver of the deforestation comparing maps of two time points,namely Year 2005 and 2011 and Year 2005 and 2015. Then, two maps were obtained; containing forestcover information in Year 2011 with deforestation information during Year 2005 – 2011 and forestcover information in Year 2015 with deforestation information during Year 2005 – 2015, respectively(Figure 7 & Figure 8). These two maps were utilized for the analysis.
Figure 7: Forest Base Map with deforestation info. in Y2011

Figure 8: Forest Cover Map with deforestation info. in Y2015
The deforestation rates between Year 2005 and 2011 and Year 2005 and 2011 were 1.08% and 1.42%,respectively. The deforestation was caused by various drivers such as agriculture, logging, woodcollection, plantation, road construction and disaster. Among the drivers, plantation, agriculture andlogging were the major drivers of the deforestation. The deforestation was occurring mainly in fourtypes of forest, namely hill forest, plain forest, woodland and swamp forest. In this analysis, only landtransitions sized larger than 200 ha in whole West New Britain Province were simulated. The simulatedtransitions are listed in Table 8.
Table 8: Seven major types of deforestation between 2011 and 2015 in West New Britain
Rank Land cover in year 2011 Land cover in year 2015 Area (ha)
1 Plain forest Deforested (Plantation) 1,813
2 Hill forest Deforested (Plantation) 1,800
3 Woodland Deforested (Plantation) 1,331
4 Swamp forest Deforested (Logging) 435
5 Plain forest Deforested (Logging) 3106 Hill forest Deforested (Agriculture) 2947 Hill forest Deforested (Logging) 255
As the independent valuables for establishing a model to predict land cover change potential, 17 kindsof geospatial data stored in the PNG‐FRIMS were employed. The list of the valuables with the influenceorder on the model of each is shown in Table 9. The total accuracy of the model was 76.04%. The mostinfluential valuable on the model was distance to plantation, followed by Land cover in 2011, Timbervolume, etc.
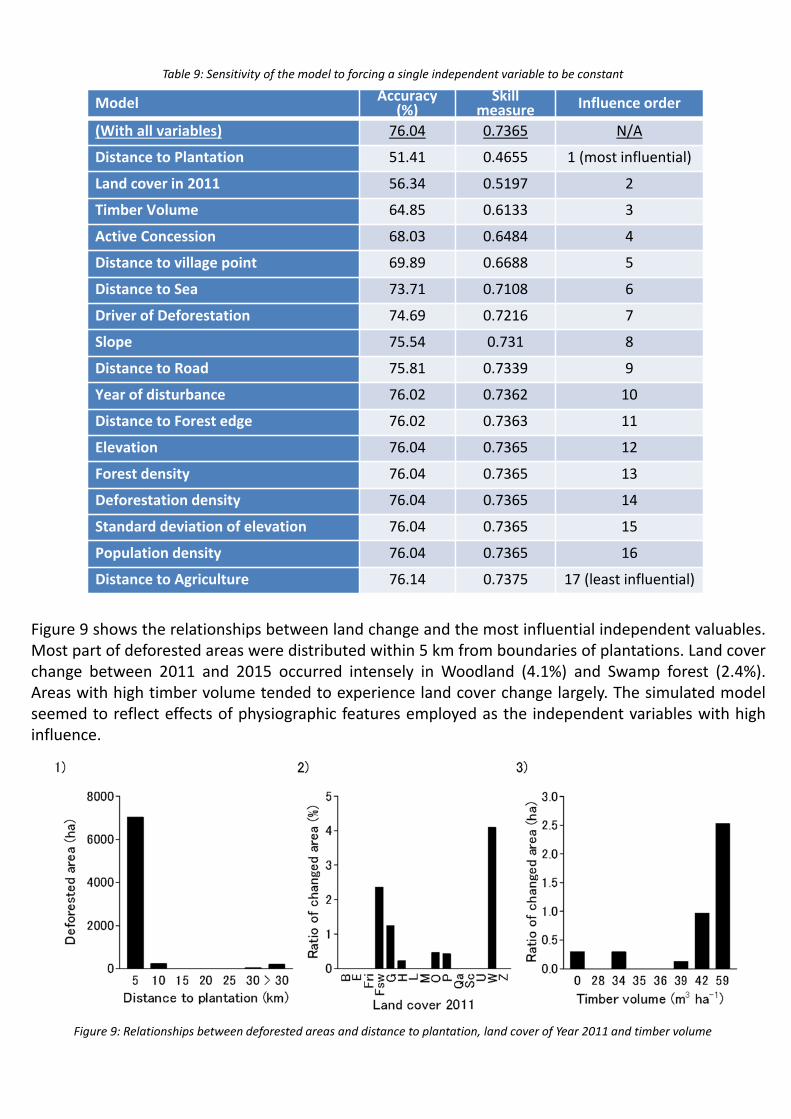
Table 9: Sensitivity of the model to forcing a single independent variable to be constant
Model Accuracy (%)
Skill measure Influence order
(With all variables) 76.04 0.7365 N/A
Distance to Plantation 51.41 0.4655 1 (most influential)
Land cover in 2011 56.34 0.5197 2
Timber Volume 64.85 0.6133 3
Active Concession 68.03 0.6484 4
Distance to village point 69.89 0.6688 5
Distance to Sea 73.71 0.7108 6
Driver of Deforestation 74.69 0.7216 7
Slope 75.54 0.731 8
Distance to Road 75.81 0.7339 9
Year of disturbance 76.02 0.7362 10
Distance to Forest edge 76.02 0.7363 11
Elevation 76.04 0.7365 12
Forest density 76.04 0.7365 13
Deforestation density 76.04 0.7365 14
Standard deviation of elevation 76.04 0.7365 15
Population density 76.04 0.7365 16
Distance to Agriculture 76.14 0.7375 17 (least influential)
Figure 9 shows the relationships between land change and the most influential independent valuables.Most part of deforested areas were distributed within 5 km from boundaries of plantations. Land coverchange between 2011 and 2015 occurred intensely in Woodland (4.1%) and Swamp forest (2.4%).Areas with high timber volume tended to experience land cover change largely. The simulated modelseemed to reflect effects of physiographic features employed as the independent variables with highinfluence.
Figure 9: Relationships between deforested areas and distance to plantation, land cover of Year 2011 and timber volume
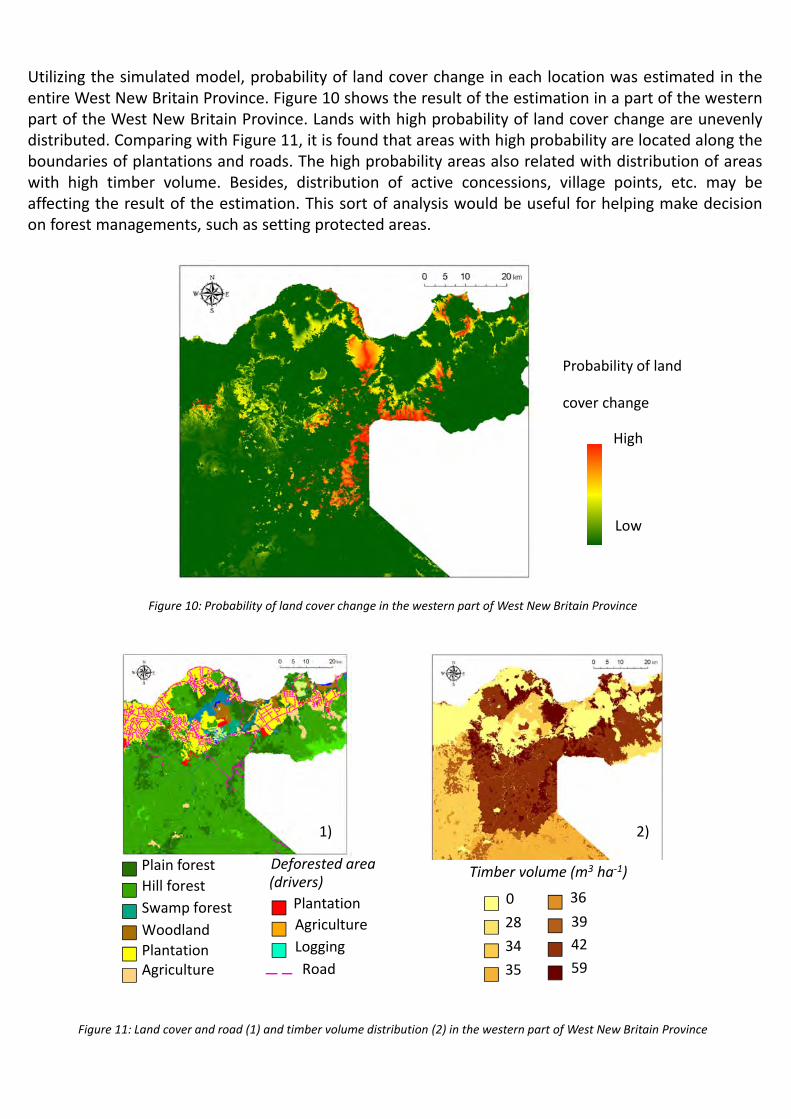
Utilizing the simulated model, probability of land cover change in each location was estimated in theentire West New Britain Province. Figure 10 shows the result of the estimation in a part of the westernpart of the West New Britain Province. Lands with high probability of land cover change are unevenlydistributed. Comparing with Figure 11, it is found that areas with high probability are located along theboundaries of plantations and roads. The high probability areas also related with distribution of areaswith high timber volume. Besides, distribution of active concessions, village points, etc. may beaffecting the result of the estimation. This sort of analysis would be useful for helping make decisionon forest managements, such as setting protected areas.
High
Low
Probability of land
cover change
Figure 10: Probability of land cover change in the western part of West New Britain Province
Plain forest
Hill forest
Swamp forest
Woodland
PlantationAgriculture
Deforested area
Plantation
Agriculture
Logging
Road
(drivers)
1) 2)
Timber volume (m3 ha‐1)
0
28
34
35
36
39
42
59
Figure 11: Land cover and road (1) and timber volume distribution (2) in the western part of West New Britain Province

4. Discussion
FREL/FRL construction
Spatial models simulate the expected location of future land change (deforestation). Their use forFREL/REL construction may provide a more accurate estimate of the carbon contents of forestexpected to be lost in the future. But it should be noted that since spatial models is not good atsimulating the quantity of future deforestation, therefore their use in calculating may be limited.
REDD+ context
The use of spatial modeling to predict the location of future change may serve the following purposes:
Inform policy making and the national REDD+ strategy; Provide information on where the greatest deforestation pressures may be; Help choose the location of REDD+ activities; Help in the design of monitoring efforts and additional (intensified) data collection in anticipated
deforestation hotspots.
Limitation
Spatial models have a limited ability to evaluate conditions not observed in the past (National ResearchCouncil 2014). Some variables may be highly dynamic and can significantly change the land changeprobability (e.g. New roads, new mining concessions, significant population migration, etc.).
Future action
Simulation in other Provinces implementing capacity buildings of the staffs in PNGFA. Examining the other use of the Land Change Modeler other than deforestation simulation, such
as plantation, logging etc. Comparing with results of the other modelling activities such as FCPF’s deforestation modelling.
5. References
National Research Council 2014. Advancing Land Change Modeling: Opportunities and ResearchRequirements. Washington, DC: The National Academies Press.
Note: Analytical Report series intends to internally share the result of the JICA Project among PNGFA. The series focuses the results and processes which are meaningful in terms of technical aspects to be recorded, however, are not always conformity with the view of PNGFA. Therefor, if the contents of the series are provided to public, prior consolation with the inventory & Mapping branch is needed. Last updated on May 2019
JICA and PNGFA 2019. Analysis of Drivers of Deforestation and Forest Degradation in Papua NewGuinea ‐ JICA‐PNGFA Forestry Project 2014‐2019 Analytical Report No.1. Port Moresby: Papua NewGuinea Forest Authority.
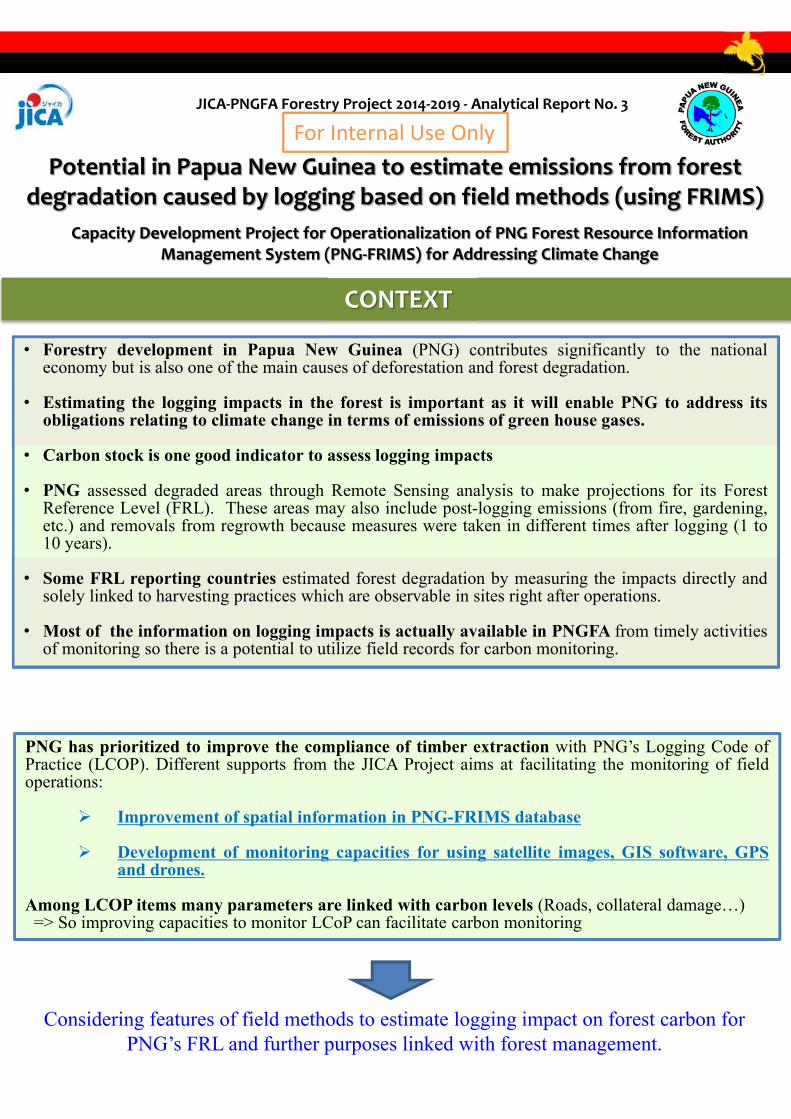
Potential in Papua New Guinea to estimate emissions from forest degradation caused by logging based on field methods (using FRIMS)
JICA‐PNGFA Forestry Project 2014‐2019 ‐ Analytical Report No. 3
Capacity Development Project for Operationalization of PNG Forest Resource Information Management System (PNG‐FRIMS) for Addressing Climate Change
CONTEXT
Considering features of field methods to estimate logging impact on forest carbon for PNG’s FRL and further purposes linked with forest management.
PNG has prioritized to improve the compliance of timber extraction with PNG’s Logging Code ofPractice (LCOP). Different supports from the JICA Project aims at facilitating the monitoring of fieldoperations:
Improvement of spatial information in PNG-FRIMS database
Development of monitoring capacities for using satellite images, GIS software, GPSand drones.
Among LCOP items many parameters are linked with carbon levels (Roads, collateral damage…)=> So improving capacities to monitor LCoP can facilitate carbon monitoring
• Forestry development in Papua New Guinea (PNG) contributes significantly to the nationaleconomy but is also one of the main causes of deforestation and forest degradation.
• Estimating the logging impacts in the forest is important as it will enable PNG to address itsobligations relating to climate change in terms of emissions of green house gases.
• Carbon stock is one good indicator to assess logging impacts
• PNG assessed degraded areas through Remote Sensing analysis to make projections for its ForestReference Level (FRL). These areas may also include post-logging emissions (from fire, gardening,etc.) and removals from regrowth because measures were taken in different times after logging (1 to10 years).
• Some FRL reporting countries estimated forest degradation by measuring the impacts directly andsolely linked to harvesting practices which are observable in sites right after operations.
• Most of the information on logging impacts is actually available in PNGFA from timely activitiesof monitoring so there is a potential to utilize field records for carbon monitoring.
For Internal Use Only

Methodologies recommended by Intergovernmental Panel on Climate Change (IPCC)
There are two main methodologies to estimate logging impact on forest carbon (GOFC-GOLD, 2016)
Methodologies developed in FRLs
1. Many FRL reporting countries opted for Method 1. This choice was facilitated by open sourced 30 m resolution images. In PNG, RS was applied to determine AD of both deforestation and forest degradation.
2. Four countries (the Republic of Congo, Ghana, Guyana and Suriname) chose the Volume Method (VM), to count direct loss in the ground associated to extraction. Measures to be taken as soon after harvest.
THE VOLUME METHOD
1. The Remote sensing (RS) method using medium-resolution imagery for determining Activity data (AD) and the Stock-Change method for calculating Emission Factor (EF)
2. A combination of timber extraction rates, management plans and/or high-resolution imagery (for AD) and the Gain-Loss method (for EF).
Developed by Pearson et al.(2014)
Activity Data: use actual harvested volume data which are:• Complete Covering all production areas• Accurate From reliable monitoring• Transparent From reliable sources• Consistent Over more than 10 years
Emission Factor: account all emission sources associated to harvest (sampling approach)
Total Emission Factor (TEF) = Extracted Log (ELE) + Logging Damage (LDF) + Logging Infrastructure (LIF)
Sources of emission Monitoring parameters
ELE (extraction) Extracted/harvested log
LDF (Logging (collateral) Damage) Wasted logs, Deadwood(DW) caused by felling
LIF (Road & Infra)DW (or carbon loss) from skidding; Carbon loss roads, log ponds, decks, camp

• EF is always determined through a forest inventory (not by RS) because EF represents carbon loss(killed trees) associated to land activities. There are also tow (2) methods to calculate EF according tothe methodology used to estimate degradation ("RS method" or "Volume Method").
• In PNG, land use transitions (deforestation, forest degradation and carbon stock enhancement) weredetermined by RS. EF of forest degradation was calculated as the difference in carbon stocks betweenbefore and after logging.
Emission Factor (EF)
• RS method EF (tCO2e/ha) is actually the difference between carbon stock (whole vegetation)
Measured in primary forest and carbon stock measured in logged forest.
• Volume method EF (tCO2e/m3) is the sum of carbon losses ( dead trees) during timber extraction from road &
infra, felling and extraction itself. It is not an inventory of the whole vegetation in logged areasbut only an inventory of dead trees and where the area had been cleared for roads and otherinfrastructure, an estimation is made.
EF calculated in the "RS method" is necessarily a resultant of emissions from logging, other drivers andremovals from regrowth. The value of EF captures all degradation in logged areas (harvest + post-harvest degradation). However with the VM it estimates only direct impact from harvesting practices.In this case, other drivers and regeneration are either excluded or accounted for different methods.
Based on these different characteristics, a country chooses its own method to determine degradation.
The VM is particularly interesting for the domestic purpose. It allows assessing effectiveness of Policyand Measures (PaMs) that promote a reduction of emissions from harvesting practices. In the "RSmethod", logging EF includes regeneration and post-drivers so it is not possible to know if totalreduction of emissions are due to better practices or other reasons.
Countries that uses VM in their FRL have identified logging as one of their the major source ofdegradation and 'addressing logging impact' as a top priority policy and PNG is no difference to thesecountries.

POTENTIAL IN PNG TO USE THE VOLUME METHOD
Potential in PNG to determine AD
Timber extracted volumes are recorded in the Field Services Directorate (FSD) database for allprovinces, projects and since 2000 (digitized from 2010).
Information on collateral damage is recorded in setup logbooks (but not in database) except forskid track areas and felling deadwood.
Potential in PNG to calculate EF
If available

POSSIBLE UTILIZATION FOR FRL
Simulation of AD
Simulation of sampling plan for developing Logging EF (in the Volume Method)
Sampling plan should include 1 to 5 concessions
Assumption
+ TRP/LFA and FMA volumes => Forest degradation
+ FCA volumes => Deforestation (assuming all FCA areas clear cut*)(underestimation of total emissions but conservative)
+ TA volumes => Not counted
=> Sort out Volumes according to origin of timber
*: Clear cutting volume and selective logging volume coming from FCA area are not distinguishable in FSD database.
Year 2010 2011 2012 2013 2014 2015 2016 2017
AD (Million m3) 3.11 2.65 2.6 2.79 3.29 3.64 2.28 3.45
=> Activity Data in the Volume Method = Total annual actual timber harvested volumes
To develop a logging EF, fieldparameters can be measuredfrom two methods:1. information from Setup
logbook (when available)or
2. from sampling approach.
A sampling plan should clarifysample plots, items, andnumber of repetitions.Zones with data alreadyavailable are preferred. Forinstance, it could beadvantageous to use PNGFAPermanent Sampling Plots andproject pilot areas.
An example of activities to sample field parameters
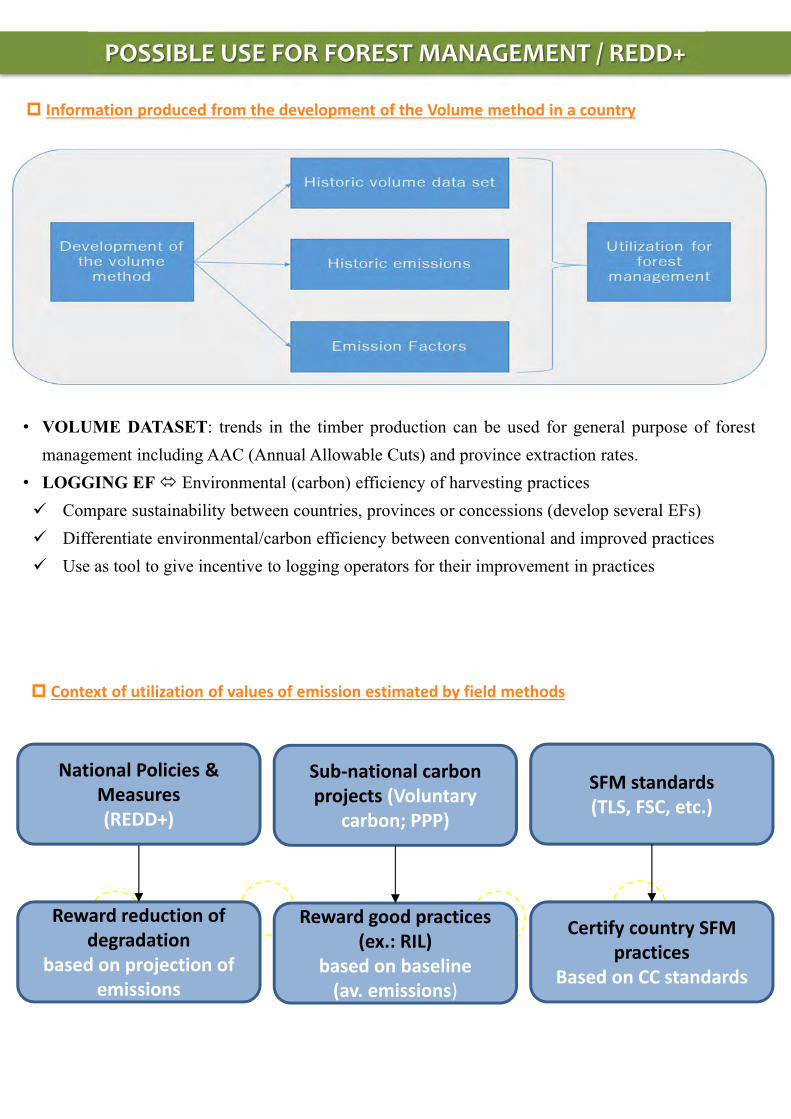
POSSIBLE USE FOR FOREST MANAGEMENT / REDD+
Information produced from the development of the Volume method in a country
Context of utilization of values of emission estimated by field methods
National Policies & Measures (REDD+)
Sub‐national carbon projects (Voluntary
carbon; PPP)
SFM standards(TLS, FSC, etc.)
Reward reduction of degradation
based on projection of emissions
Reward good practices (ex.: RIL)
based on baseline (av. emissions)
Certify country SFM practices
Based on CC standards
• VOLUME DATASET: trends in the timber production can be used for general purpose of forest
management including AAC (Annual Allowable Cuts) and province extraction rates.
• LOGGING EF Environmental (carbon) efficiency of harvesting practices
Compare sustainability between countries, provinces or concessions (develop several EFs)
Differentiate environmental/carbon efficiency between conventional and improved practices
Use as tool to give incentive to logging operators for their improvement in practices

WAY FORWARD
Key findings
Main constraints
Next steps
• Volume Method (VM) is specific to forest degradation (different method for deforestation)and specific to logging (not including other drivers in logged areas)
• FSD volume data can be used to determine PNG’s logging AD. A country-specific loggingEF can be developed based on PNGFA information available from routine forest monitoringand a full sampling plan.
• Most of data required are available in PNGFA (at least not less than in the four FRLcountries cited along this report)
• Challenging information types are deadwood from felling and skid track extent areas. Thesecould be addressed through field inventory or new technologies introduced by JICA such asdrones.
• Outcomes such as values of Emission, EFs and volume datasets are useful for forestmanagement.
• The Volume method does not cover post-logging regrowth, and degradation (illegal logging,gardening, fire…)
• Capacity and availability of technical experts for developing EF
• Limited scientific publications on logging emission sources.
• Complementary review of guidance and FRLs to consider regrowth and post-loggingdegradation with the Volume Method
• Develop technical support by promoting Forest Research notably to develop a Logging EF
• Further develop methods of monitoring notably for estimating skidding and collateraldamage using drones
• Rapid operationalization of DSS to improve management of actual harvested volume.
Note: Analytical Report series intends to internally share the result of the JICA Project among PNGFA. The series focuses the results and processes which are meaningful in terms of technical aspects to be recorded, however, are not always conformity with the view of PNGFA. Therefor, if the contents of the series are provided to public, prior consolation with the inventory & Mapping branch is needed. Last updated on August 2019

Forest Reference Emission Level and Forest Reference Level (FREL/FRL) are benchmarks for assessing the performance of implementing REDD+ activities.
Why develop a FREL/FRL?
1. Domestic purpose: Assess effectiveness of PAMs &/or meet a national objective
2. Global responsibility: Demonstrate national contribution to mitigation of climate change
3. Results-based REDD+ finance: For reducing emissions below a certain level
Reference
(The Remote Sensing method: example in PNG_FRL only)
0
5,000,000
10,000,000
15,000,000
20,000,000
25,000,000
30,000,000
35,000,000
40,000,000
45,000,000
2001 2006 2011
Historical Emissions & Removals 2001‐2015
Carbon Stock Enhancement Removals tCO2e /year
Forest Degradation Emissions tCO2e /year
Deforestation Emissions tCO2e /yearR² = 0.8475
‐
10,000,000
20,000,000
30,000,000
40,000,000
50,000,000
60,000,000
2000 2005 2010 2015 2020
Historical Emissions & Removals 2001‐2013 and FRL 2014‐2018
Years Primary DeforestationSecondary
Deforestation
Post‐Deforestation
RegrowthDeforestation Forest Degradation
Carbon Stock
Enhancement
Total Emissions and
Removals 2001‐2013
Regression 2001‐2013 /
FRL 2014‐2018
Emissions Emissions Removals Emissions Emissions RemovalsEmissions &
Removals
Emissions &
Removals
tCO2e /year tCO2e /year tCO2e /year tCO2e /year tCO2e /year tCO2e /year tCO2e /year tCO2e /year
2001 2,067,030 2,721,258 165,272‐ 4,623,017 15,441,146 ‐ 20,064,162 21,492,824.59
2002 ‐ 2,189,016 277,525‐ 1,911,491 24,952,653 ‐ 26,864,144 23,135,270
2003 1,633,740 2,030,276 414,734‐ 3,249,282 23,834,478 ‐ 27,083,761 24,777,716
2004 1,951,160 691,861 511,867‐ 2,131,153 25,602,243 ‐ 27,733,397 26,420,161
2005 2,090,426 2,202,716 656,727‐ 3,636,414 19,272,288 ‐ 22,908,702 28,062,607
2006 ‐ 1,838,795 740,296‐ 1,098,500 25,969,659 ‐ 27,068,159 29,705,052
2007 2,043,601 1,771,267 878,143‐ 2,936,725 27,593,488 ‐ 30,530,213 31,347,498
2008 2,662,314 1,367,741 1,015,677‐ 3,014,378 28,145,718 ‐ 31,160,096 32,989,944
2009 1,871,909 3,389,611 1,214,349‐ 4,047,172 31,078,554 ‐ 35,125,726 34,632,389
2010 2,715,841 2,713,741 1,408,035‐ 4,021,547 35,312,006 ‐ 39,333,554 36,274,835
2011 4,712,034 3,641,949 1,735,812‐ 6,618,171 34,760,737 ‐ 41,378,908 37,917,280
2012 3,740,834 7,208,970 2,151,678‐ 8,798,126 27,678,049 ‐ 36,476,175 39,559,726
2013 6,820,550 6,892,420 2,706,436‐ 11,006,534 30,783,944 ‐ 41,790,478 41,202,172
2014 42,844,617
2015 44,487,063
2016 46,129,508
2017 47,771,954
2018 49,414,399
Concept of FREL and FRL
Copyright © 2022 FDOKUMEN