urban informal credit markets in india 5m - NIPFP
639
URBAN INFORMAL CREDIT MARKETS IN INDIA 5M A. DAS-GUPTA C.P.S. N A Y A R k ASSOCIATES ••. \ 2J=?-* 2.. 90 ii SEPTEMBER 1989 NIPFP Library IIIUIII 332.3 k TIe U N9:l NATIONAL INSTITUTE OF PUBLIC FfNAKCE AND POLICY NEW DELHI
-
Upload
khangminh22 -
Category
Documents
-
view
1 -
download
0
Transcript of urban informal credit markets in india 5m - NIPFP

URBAN INFORMAL CREDIT MARKETSIN INDIA
5M
A. DAS-GUPTA C.P.S. NAYAR
kASSOCIATES
•• . \
2J=?-* 2.. 90 ii
SEPTEMBER 1989
NIPFP Library
IIIUIII332.3k TIeU N9:l
NATIONAL INSTITUTE OF PUBLIC FfNAKCE AND POLICYNEW DELHI

PREFACE
The study o f Informal Credit Markets in India presented here forms part o f a study o f Informal Credit in f i v e developing member countries o f the Asian Development Bank. The study has been in i t ia te d and funded large ly by the Asian Development Bank. It was funded partly by the National In s t i tu te of Public Finance and Pol icy (NIPFP). The study has been carr ied out at the NIPFP, New Delhi and at the Centre for Development Studies (CDS), Trivandrum. The NIPFP carr ied out the study o f urban markets and the CDS o f rural markets. The NIPFP was entrusted with the task o f coordinating and integrat ing the main findings o f the study. Part o f the study done ty the NIPFP was undertaken j o i n t l y in c o l laborat ion with State Bank o f India.
The pro jec t coordinator for the NIPFP study was A. Das- Gupta who took over the task from Srinivasa Madhur shortly a f te r i t s commencement. C.P.S. Nayar coordinated the f i e l d work in South India for informal in s t i tu t io n s dealt with in chapters 18 to 23 and 26 o f the report . A. Das-Gupta coordinated the f i e ld work for the remaining chapters. Research and f i e l d personnel associated with the pro jec t were, M.L. B i j l a n i , K.S. Dinesh, Thomas Gomez, A.K. Ja in , S. Kumar, Krishnamurthy Maya, Sadhna Marwaha, K. Mathai, Sanjeev Mohanty, Hiranya Mukhopadhyay, A.L. Pandya, P.K. Gopalakrishnan Nair, N. Parameswaran Nair, J.K. Pandey and S. Rad- hakrishnan. They have our gratefu l thanks.
The NIPFP p ro je c t coordinator, A. Das-Gupta, had overall r e s p o n s ib i l i t y fo r the urban and summary reports and has written or revised a l l material in these reports . The urban study was planned and for most part conducted by him. First drafts o f some chapters in the urban report were prepared by the fo llowing persons .
1. C.P.S. Nayar : Chapters 18 to 21, 22 (except the Delhicase study), 23 (except the note on community ch i t s ) and26 (with S.Radhakrishnan).
2. Krishnaraurthy Maya : The Delhi case study in Chapter 22.
3. Sadhna Marwaha: Chapter 33 and the Appendix to Chapter 2.
4. Hiranya Mukhopadhyay : Chapters 24 and 31.
5. J.K. Pandey : Chapters 27 and 28.
C.P.S. Nayar has primary authorship for the chapters to which he has contr ibuted . Sadhna Marwaha, Hiranya Mukhopadhyay and J.K. Pandey are the primary authors o f the appendix and chapters 24 and 27 re sp e c t iv e ly .
The focus o f the study i s on the operation o f Informal Credit Market (ICM) in India and i t s ro le and impact from the angles o f e f f i c i e n c y in resource use, s o c ia l ju s t i c e and e f f i c a c y o f monetary co n tro l . The authors have made painstaking e f f o r t to provide an idea o £ the working o f the ICM in India, based on a
survey o f se lected sectors . Secondary data have also been used wherever found relevant and usefu l . An attempt has also been made to estimate the s ize o f the ICM, though very t e n ta t iv e ly . The study brings out several aspects o f the operation o f the ICM which were r e la t iv e ly neglected in previous studies on the subject such as the poss ib le s ig n i f i c a n c e o f unaccounted incomes in funding the ICM and the importance o f the market structure. It a lso brings to l igh t the sources and uses o f funds in a number o f sectors not covered in past researches. An important f inding of the study i s that even a f te r the rapid expansion o f banking serv ices in the country a f t e r n a t iona l isa t ion o f the major banks in 1969, the ICM continues to f inance trade and business a c t i v i t i e s in a big way, and not merely in the unorganised s e c t o r . Some o f the case studies documented here also reveal that ex ist ing regulations governing the functioning o f the ICMs leave much to be des ired .
I t i s hoped that the findings and conclusions of the study w i l l be o f interest to a wide audience.
The Governing Body o f the I n s t i t u t e does not take any r e s p o n s ib i l i t y f o r any o f the views expressed in the report . That re sp o n s ib i l i t y l i e s primarily with the authors.
New Delhi Amaresh BagchiSeptember, 1989 Director , NIPFP
(ii)

ACKNOWLEDGEMENTS
In c a r r y i n g out t h i s study o f urban in form al c r e d i t markets, the pro jec t team has pro f i ted great ly from the help and adv ice o f a number o f persons and i n s t i t u t i o n s whom i t i s my pleasant duty to acknowledge.
The NIPFP team wishes to thank Amaresh Bagchi for going through d r a f t s o f s e ve ra l chap ters and o f f e r i n g v a lu a b le s u g g e s t i o n s . S p e c ia l thanks are due to T.N. S r in iv a s a n , the re feree o f t h i s report at the f in a l workshop on informal cred it markets held in Manila in March, 1989, f o r his deta i led comments on the draft report . Also, the NIPFP pro ject team would l ike to thank S. Radhakrishnan fo r his a sso c ia t io n and for providing data on n i d h i s . Thanks are a l s o due to other p a r t i c i p a n t s at the workshop, to Srinivasa Madhur the former pro jec t coordinator, and to Sudipto Mundle, Mihir Rakshit, Shovan Ray, Amal Sanyal and p a r t i c i p a n t s o f seminars at the East-West Centre , Harvard Inst i tu te for International Development, Rutgers University and the NIPFP fo r helpful comments and suggestions.
We also take th is opportunity to thank Prabhu Ghate o f the ADB fo r his encouragement and pat ience.
Generous help from various government and bank o f f i c i a l s , o f f i c i a l s o f a ssoc ia t ions o f intermediaries , traders or producers, r e s e a rc h e r s and o thers was r e c e i v e d during the course o f our i n v e s t i g a t i o n s . While they are too numerous to acknowledge ind iv idua l ly they have our gra te fu l thanks. However, we would e s p e c ia l ly l ik e to thank Thomas Timberg and Chandrasekhar Aiyar for the ir advice ear ly during the pro ject and fo r making available copies o f background material f o r their celebrated study.
None o f those acknowledged can be held responsible for shortcomings in the report the r e s p o n s ib i l i t y f o r which rests with the authors.
The NIPFP p ro jec t team is a lso grate fu l to the s t a f f o f the NIPFP Computer Centre f o r ass istance with data processing, to Shahana Ghosh f o r proofreading ass is tance , to K. Subramanian for s e cre tar ia l ass istance and to N. Natatajan for taking care o f photocopying and binding o f the report .
Final ly , the NIPFP p ro jec t team i s immensely grateful to Promila Rajvanshi who coordinated correspondence, word processing o f the report /quest ionnaires and report production work from the inception o f the p ro jec t with e f f i c i e n c y and cheerfulness .
( iii)
A. DAS-GUPTA Project Coordinator

CONTENTS
Preface i
Acknowledgements i i i
SECTION Is ASPECTS OF URBAN INFORMAL CREDIT IN INDIA
PART A: 1. Overview 1
PART B: Description of Indian Informal Credit and Informal Credit Markets
2. Urban Informal Credit and Informal Intermediaries 83. Deposit Mobil isat ion and Sources o f Funds 144. Deployment o f Informal Credit 195. Loan Terms and Credit Appraisal Methods 256. Cost o f Intermediation 287. Structure o f Informal Credit Markets 388. Size and Trends in Size 459. Regulation o f Informal Intermediaries 56
PART C: Analysis of Economic Impact of Informal Credit Markets
10. Informal Credit and the E f f i c i e n c y o f ResourceAllocat ion 61
11. Equity Impact o f Informal Finance 7012. Are Informal and Formal Finance Complements or
Substitutes ? 7413. Informal Credit and Monetary Pol icy 7714. Two Issues: The Complementarity Hypothesis
and Links with the Black Economy 84
PART D: Policy Prescriptions
15. Lessons fo r Formal Banking and an Approach tothe Regulation o f Informal Intermediaries 88
SECTION I I : SECTORAL AND CASE STUDIES
PART E: Analysis of Reserve Bank of India Surveys
16. Informal Credit and Household Debt 9317. Informal Credit f o r Small Scale Industry,
Traders and Transport Operators 109
PART F: Case Studies of Selected Intermediaries
18. Auto Financiers in Naraakkal 12519. Nidhis o f South India 141
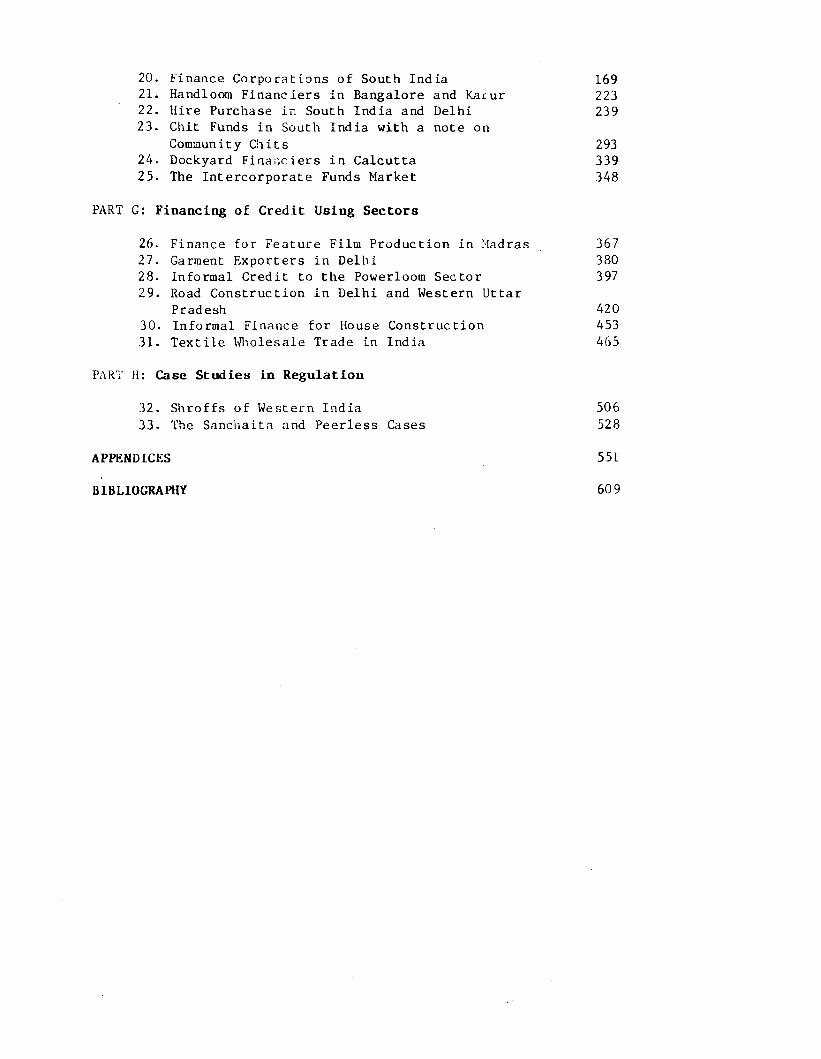
20. Finance Corporations o f South India 16921. Handloom Financiers in Bangalore and Karur 22322. Hire Purchase in South India and Delhi 23923. Chit Funds in South India with a note on
Community Chits 29324. Dockyard Financiers in Calcutta 33925. The Intercorporate Funds Market 348
PART G: Financing o f Credit Using Sectors
26. Finance for Feature Film Production in Madras 36727. Garment Exporters in Delhi 38028. Informal Credit to the Powerloom Sector 39729. Road Construction in Delhi and Western Uttar
Pradesh 42030. Informal Finance for House Construction 45331. Text i le Wholesale Trade in India 465
PART H: Case Studies in Regulation
32. Shroffs o f Western India 50633. The Sanchaita and Peerless Cases 528
APPENDICES 551
BIBLIOGRAPHY 609
SECTION I
ASPECTS OF URBAN INFORMAL CREDIT IN INDIA

PART A
Overview

CHAPTER 1
OVERVIEW
1.1 Objectives
1.1 .1 The o b je c t iv e s o f th is study o f urban informal cred it in India are:
i . To examine informal cred it market structure and operations and the impact o f government regulation on informal credit markets,
i i . to derive estimates o f the size and importance o f informal c r e d i t ,
i i j . . to examine the impact o f informal cred it on a l l o c a t io n , d i s t r ib u t io n , growth and the e f fe c t iv e n e s s o f short run macro p o l i c y and
iv . to make p o l i c y suggestions as to regulation o f informal c red it markets and formal sector c red i t operations.
1 .2 Definition of informal credit adopted
1.2.1 The concept o f informal cred it used in this study roughly corresponds with the concept ' non - ins t i tu t iona l c r e d i t ' used by the Reserve Bank o f India (RBI) in i t s surveys o f households. It excludes banks of a l l types, government f inanc ia l in s t i tu t i o n s , housing finance in s t i tu t io n s and the organised cap ita l markets for shares, debentures, f ixed deposits and government bonds. For the
remaining sources o f f inance, a l l are ( p o t e n t ia l ly ) taken note o f when analysing the sources o f c red i t o f c redit using sectors . A s e le c t i o n o f informal intermediary sectors is a lso covered in this study. Final ly , i f cred it users are also suppl iers o f c r e d i t , t h i s i s taken note o f to a sse ss t h e i r net c r e d i t p o s i t i o n . However, a sys te m a t i c attempt to study sources o f supply of unintermediated c red it i s outs ide the purview defined for this study.
1

1.2 .2 The d e f i n i t i o n o f informal c re d i t i s motivated primarily by c o n s i d e r a t i o n s o f government r e g u l a t i o n . I m p l i c i t l y , the notion o f the formal sector which we seek to capture is o f that portion o f f inanc ia l markets which are e f f e c t i v e l y subject to government c o n t r o l in the matter o f a l l o c a t i o n o f c r e d i t and
deposit mobi l isat ion . In par t i cu lar , f in a n c ia l in s t i tu t i o n s which are d i r e c t l y a f fe c te d by central bank short run monetary p o l i c y
measures, including among these measures reserve requirements and s e l e c t iv e c red i t c o n t r o l s , are c l a s s i f i e d as belonging to the formal sector . Attempts by the government to curb money supply growth or to curb c red it a v a i l a b i l i t y f o r d i f f e re n t purposes and to d i f f e r e n t sectors w i l l have the ir primary impact on what we c l a s s i f y as formal c re d i t markets.
1 .2 .3 While th is does not imply that informal c red i t markets are e n t i re ly beyond centra l bank regulation , the extent o f d i re c t
c ontro l over a c t i v i t i e s o f informal lenders and intermediaries is substant ia l ly less than that o f formal intermediaries. As shall be described, c o n t ro l s are l imited to l i c en s in g , in terest rate c e i l i n g s , r e s t r i c t i o n s on d e p o s i t tak ing and r e p o r t i n g requirements for even the most highly regulated informal c red it s u p p l i e r s . The d e f i n i t i o n adopted here has the a d d i t i o n a l advantage o f d o v e t a i l i n g with the d e f i n i t i o n o f in fo rm a l or unorganised credit used in e a r l i e r examinations o f c red i t markets
in In d ia . In p a r t i c u l a r , we may mention s t u d i e s by v a r i o u s government committees and by the World Bank (see the references at the end of the re p o r t ) .
1•3 Coverage
1.3.1 A to ta l of 6 c red i t using sectors , 9 intermediary s e c to r s ,1 integrated c red i t market, 3 cases o f regulatory e f f o r t s by the
government and 3 Reserve Bank o f India Surveys o f households and firms are covered in th is study. The c red i t using sectors were chosen on the basis o f where e a r l i e r work or discussions suggested the prevalence o f informal c r e d i t . However, at least one sec tor , garment exports, was chosen to examine condit ions in a sector
2

which , be ing in the vanguard o f e x p o r t promotion e f f o r t s , i s thought to be well served by the formal sector inc luding, in t h is ,
f i s c a l incent ives . Secondly, sectors dealing with food products were excluded, though ' c l o t h i n g ' and ' s h e l t e r ' are represented. While the bulk o f informal c red i t from intermediaries is covered on a sample bas is , cer ta in in terest ing informal cred it segments,
such as the leas ing industry, pawnbrokers and bai l bond brokers, remain uncovered. The samples used in the various sectora l studies are given in Table 1.1. The to ta l number o f units surveyed (from which q u a n t i t a t i v e in fo r m a t io n was o b ta in e d ) was 415. In add it ion , over 200 interviews with bank and government o f f i c i a l s , o f f i c i a l s o f informal intermediary assoc iat ions and producers assoc ia t ions and also other knowledgeable persons were conducted. The i n i t i a l sample designs were however, in several cases, larger than given in Table 1.1. These were reduced due to non-cooperat Lon o f in terv iewees . '* ' The q u a l i t y o f i n t e r v ie w data var ied from sector to sector but is on the whole, acceptable . Questionable data, when used, i s c a r e fu l ly noted in the case studies . The secondary data sources covered between them over I lakh units (1 lakh equals a hundred thousand and one crore , used l a t e r , equals
ten m i l l i o n ) . F i n a l l y , the l e g a l case study i s based on newspaper reports , court t ranscr ip ts , company f inanc ia l statements and an RBI report .
1.4 Analysis
1.4.1 In view o f the small sample s ize for each sectora l study, only means, variances , c o rre la t ion s and r a t io s have been computed. More sophist icated s t a t i s t i c a l analysis has been eschewed, except for a s o l i ta r y regression. In one case, a mathematical model has been constructed on the basis o f s ty l i se d facts drawn from the f i e l d study. More sophist icated analysis has been attempted only
1* In the c a s e o f H ous in g F i n a n c e , the sample s i z e f o r q u a n t i t a t i v e i n f o r m a t i o n d r o p p e d f r o m 25 t o 0 ! A l s o , i n t h e c a s e o f f i l m f i n a n c e no q u a n t i t a t i v e d a ta was p r o v i d e d by i n t e r v i e w e e s .
3
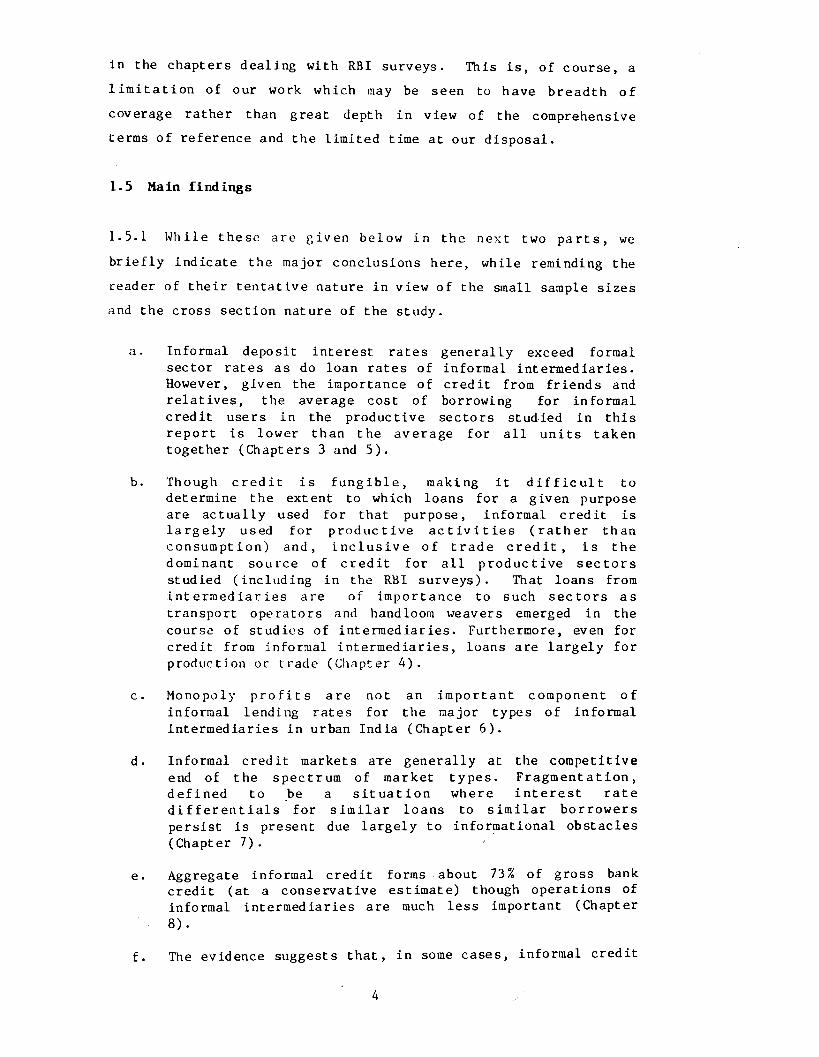
in the chapters deal ing with RBI surveys. This i s , o f course , a l i m i t a t i o n o f our work which may be seen to have breadth o f coverage rather than great depth in view o f the comprehensive terms o f reference and the limited time at our d isposa l .
1.5 Main findings
1.5.1 While these are g iven below in the next two p a r t s , web r i e f l y indicate the major conclusions here, while reminding the reader o f the ir tentat ive nature in view o f the small sample s izes and the cross sect ion nature of the study.
a. Informal deposit in terest rates general ly exceed formal sector rates as do loan rates o f informal intermediaries . However, given the importance o f c red i t from fr iends and r e la t iv e s , the average cost o f borrowing for informal cred i t users in the productive sectors studied in this re p o r t i s lower than the average for a l l un its taken together (Chapters 3 and 5 ) .
b. Though c r e d i t i s f u n g i b l e , making i t d i f f i c u l t todetermine the extent to which loans for a given purpose are actua l ly used for that purpose, informal c re d i t is l a r g e l y used f o r p r o d u c t iv e a c t i v i t i e s ( ra t h e r than consumption) and, i n c l u s i v e o f t rad e c r e d i t , i s the dominant source o f c r e d i t fo r a l l p ro d u c t iv e s e c t o r sstudied ( including in the RBI surveys) . That loans from in t e r m e d i a r i e s are o f importance to such s e c t o r s as transport operators and handloom weavers emerged in the course o f studies o f intermediaries . Furthermore, even for credit from informal intermediaries , loans are la rg e ly for production or trade (Chapter 4 ) .
c . Monopoly p r o f i t s are not an important component o finformal lending rates for the major types o f informalintermediaries in urban India (Chapter 6 ) .
d. Informal c red i t markets are general ly at the competitive end of the spectrum o f market ty p e s . Fragmentat ion , d e f in e d to be a s i t u a t i o n where i n t e r e s t r a te d i f f e r e n t i a l s f o r s i m i l a r loans to s im i la r borrowers persist is present due la rge ly to informational obstac les (Chapter 7 ) .
e. Aggregate informal c red i t forms about 73% o f gross bankcred it (at a conservat ive estimate) though operations o f informal intermediaries are much le s s important (Chapter 8 ) .
f . The evidence suggests that , in some cases , informal c red i t
4

promotes e f f i c i e n c y o f resource a l l o c a t i o n though negative and inconclus ive evidence has been found in other cases. The evidence supports the view that informal c re d i t serves economically weak sect ions r e l a t i v e l y more than formal c re d i t (Chapters 10 and 11) .
g. That informal c red i t i s , by and large, complementary to bank f i n a n c e , g iven cu rren t banking p r a c t i c e , f in d s support from the data from case studies , though not from the RBI surveys o f f i rm s . In formal c r e d i t is sa id to complement bank cred it when they serve d i f f e r e n t groups o f borrowers or are used for d i f f e re n t purposes so that the two sectors are not in competition for the same custom. It i s p o s s i b l e that in form al c r e d i t lowers short run a\onetary p o l i c y e f f e c t iv e n e s s , though there is l e s s reason to be l ieve that i t renders i t t o t a l l y impotent (Chapters 12 and 13) .
h. The hypothesis o f f inanc ia l repression finds some support from the evidence (Chapter 14).
1 .5 .2 The fo l lowing eleven points provide a summary o f other c o n c l u s i o n s reached from our study and a lso the main p o l i c y recommendations.
a. In form al l o an s show g r e a t e r d i v e r s i t y and r e a d ie r adaptab i l i ty to borrower convenience than formal loans.
b. The average and maximum duration o f informal loans are less than formal loans (though not necessar i ly commercial bank l o a n s ) .
c . Informal c red i t assessment and loan sanctioning procedures are speedier than formal procedures.
d. The range o f a c t i v i t i e s financed by the informal sector is greater than the range financed by the formal sec tor .
e . To the majority o f households and unorganised enterprises , informal loans are the main source o f borrowed funds.
f . Informal c red i t is more important fo r working cap i ta l and c a p i t a l maintenance f inance than f o r f in a n c in g the purchase o f ca p i ta l goods.
g. Informal c red i t agencies have an absolute and comparative advantage in the provis ion o f c re d i t to small a c t i v i t i e s .
h. Due to informational disadvantages and extant technologies fo r making payments fo r goods and se rv ice s , modern banking may not be able to replace informal c re d i t in the medium term even with complete f inanc ia l l i b e r a l i s a t i o n .
5

i . Optimal p o l i c y f o r formal a g e n c i e s r e q u i r e s them to c o n f i n e t h e i r d i r e c t a c t i v i t i e s to d e p o s i t tak ing and lending only where they have an advantage. Methods o f refinancing informal cred it agencies should be devised in ord er to ensure e f f i c i e n t c r e d i t d e l i v e r y to o th e r a c t i v i t i e s .
j . Regulation o f urban informal c re d i t should be d irected a t :
( i ) Ensuring improved information about informal cred it and informal intermediaries .
( i i ) Ensuring the f inanc ia l probity o f informal in t e r mediaries. Such measures should be designed separate ly for r e l a t i v e l y homogenous groups o f in te r mediaries and should err , i f at a l l , on the side o f non- interference with the e f f i c i e n t functioning o f informal f in an c ia l markets.
k. When required, monetary co n tro l can be exercised by the central bank by varying the rate at which refinance is ava i lab le .
1.6 Organisation
1.6.1 The report is divided into 7 addit ional parts. Part Bcontains short chapters which descr ibe sa l ient features of urban informal c red i t inc luding, in the Appendix to Chapter 2, a review
o f e a r l i e r l i t e r a t u r e . Part C contains chapters in which findings on the economic impact o f urban informal c red i t are discussed. Po l icy suggestions are in Part D. The second sect ion o f the report i s divided into 4 parts containing various types o f s ec tora l and case studies. Analysis of RBI surveys o f households, small scale industry, traders and transport operators is in Part E. Part F contains case studies o f se lected intermediaries . Part G contains case studies o f informal finance in various productive sectors while Part H documents attempts by the government to regulate
informal finance.
6
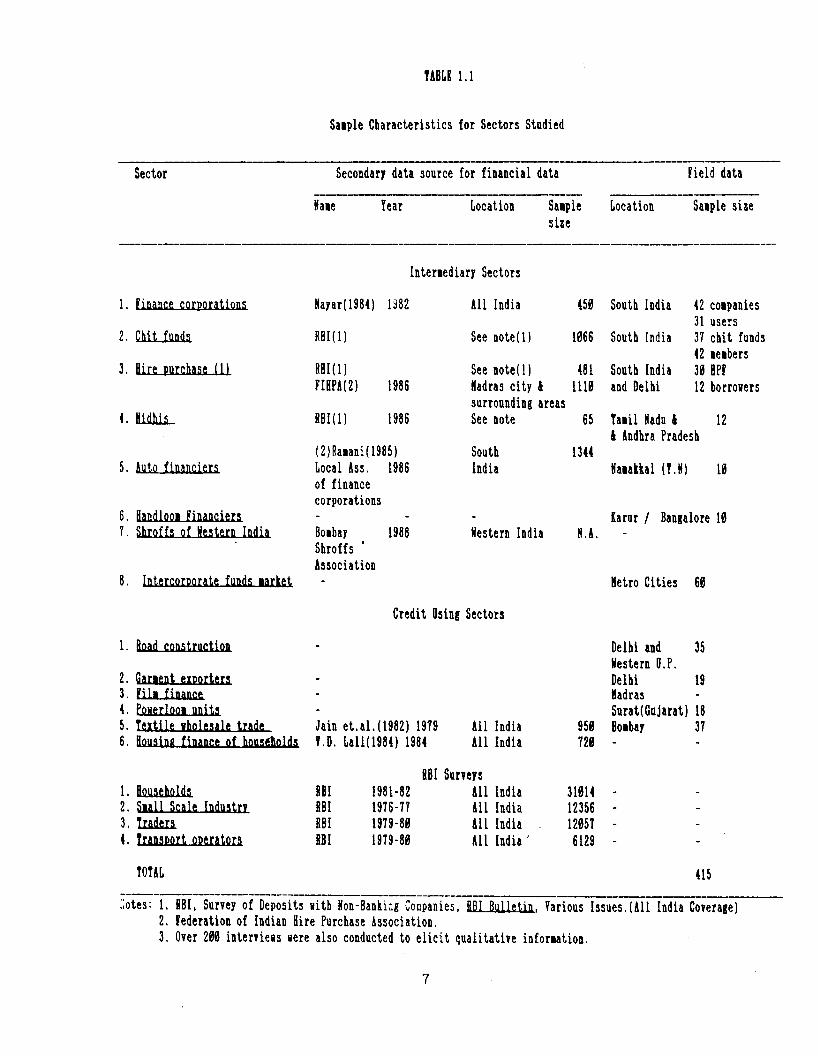
TABLE 1.1
Saaple Characteristics for Sectors Studied
Sector Secondary data source for financial data field dataNaae Tear Location Saaple Location Saaple size
size
Intermediary Sectorsl. [iMiLC£...CQmiatioas Nayar(1984) 1382 All India 450 South India 42 coapanies
31 users2. Chit funds RBI{1} See noted) 1066 South India 37 chit funds42 aeabers
3. Sire purchase _U) RBI(1) See noted) 481 South India 30 BPfFIHPA(2) 1986 Madras city & 1110 and Delhi 12 borrowerssurrounding areas
4. Ildhis RBI(l) 1986 See note 65 Taail Nadu 4 124 Andhra Pradesh(2)Raaani(l985) South 13445. i n k i i n a n d e n Local Ass. 1986 India tiaaakkal (T.N) 10of financecorporations6. landlooi financiers - - Karur / Bangalore 107. Shroffs of Western India Boabay 1988 Western India N.A. -
ShroffsAssociation8. Intercorporate funds larket - Hetro Cities 60
Credit Osing Sectors1. Road construction - Delhi and 35
Western U.P.2. Garient exporters - Delhi 193. fill finance - Hadras -
4. Eoaerlfloi units - Surat(Gujarat) 185. Textile wholesale trade Jain et.al.(1982) 1979 All India 950 Boabay 376. Bousins finance of households V.D. Lall(1984) 1984 All India 720 - -
8BI Surveys1. Households RBI 1981-82 All India 31014 - -
2. Siall Scale Industrv RBI 1976-77 All India 12356 - -
3. Traders RBI 1979-80 Ail India .. 12057 - -
4. Transport operators RBI 1979-80 All India ' 6129 - -TOTAL 415
uotes: 1. RBI, Survey of Deposits Kith Non-Banking Coepanies, BBI Bulletin. Various Issues.(ill India Coverage)2. federation of Indian Hire Purchase Association.3. Over 200 interviews sere also conducted to elicit qualitative information.
7

PART B
D e s c r ip t io n of Indian Informal Credit and Informal Credit Markets

CHAPTER 2
2.1 Introduction
2.1 .1 Urban informal c r e d i t , informal intermediaries and "unorganised” money markets in India have been examined in the past by various government bodies and scholars (see the references at the end o f the re p o r t ) . Recent government committees to study informal c re d i t have been the Banking Commission (1971), James Raj Committee (1975) and the Reserve Bank of India (Chakravarty
Committee) (1985). Among recent studies by individual scholars, Karkal (1967), Nayar (1973, 1982 and 1984), Radhakrishnan (1975)
and Timberg and Aiyar (1980 ) are the best known. A d e t a i l e d review is in the appendix to th is chapter. Here, a b r i e f guide i s provided to the types o f informal c red it and to part ic ipants in informal c red i t markets in urban India.
2.2 Trade credit
2.2.1 Perhaps the most p r e v a le n t form o f c r e d i t in the economy is through c red i t sa les or through advance payment for goods purchased, the two together are c o l l e c t i v e l y known as trade c r e d i t . The former is t y p i c a l l y r e f l e c t e d in the b i l l s receivable and b i l l s payable accounts o f f irms. Such c re d i t is obviously not intermediated by spec ia l ised intermediaries . Furthermore, trade
c re d i t is by d e f i n i t i o n inter l inked with a transaction on a part i c u la r goods market. Most other major forms o f informal cred it
except for loans between fr iends and r e la t iv e s involve intermediation.
URBAN INFORMAL CREDIT AND INFORMAL INTERMEDIARIES
8

2.3 Informal credit instruments
2.3.1 A var ie ty o f c r e d i t instruments ex ist in urban in fo r mal markets. These are discussed more f u l l y in the main report .
The most prevalent instrument is a demand promissory note, which is used extensively by Finance Companies and Shikarpuri Shroffs .
An indigenous f inancial instrument, which was much in use t i l l recent ly , is the ' h u n d i ' , a form o f demand or usance b i l l which
has been in use to f inance in ter -reg iona l and internat ional trade for centuries . Several types o f hundis were and are in use part i c u la r ly by s h r o f f s . Other methods o f provis ion o f credit are though the discounting o f post dated cheques, trade b i l l s and waybills ( l o r r y / r a i I way r e c e i p t s ) , and so on. Among these instru
ments, hundis issued by bankers with sound reputations were highly l iquid in that they were readi ly accepted in certa in business in .settlement o f claims. No other indigenous instrument appears to
have this part icu lar 'near money' c h a r a c t e r i s t i c . Hundis (the 'darshani ' hundi o f Gujarati sh ro f f s ) are also considered a cheap and risk free way o f making remittances. Among depositing instruments, the ' sarkat" employed by Rastogi bankers i s described by
Timberg and Aiyar (1980).
2.4 Informal intermediaries and lenders
2.4.1 There are several types o f informal intermediaries and lenders in India and much d iv e r s i ty in the kinds o f transactions undertaken by them. Ten types o f intermediaries and lenders, chit funds, f in an ce c o r p o r a t i o n s , h i re purchase f i rm s , n i d h i s , ( s h i p p i n g ) c l e a r i n g a g e n ts , i n t e r c o r p o r a t e b r o k e r s , t e x t i l e wholesalers, arat iyas , angadias and shro f fs in Western India have been studied in greater d e t a i l . Brief descr ip t ions o f the important types o f intermediaries at present are now given.
2 .4 . 2 Chit funds: These are indigenous rotating savings andc r e d i t o r g a n i s a t i o n s . While c h i t funds are preva lent among household and small businesses a l l over India, chit funds are also organised by chit fund firms, e s p e c ia l l y in South India .

2 .4 .3 Finance corporations: These in s t i tu t io n s have a c t i v i t i e se s s e n t i a l l y s imilar to commercial banks except for non-issuance o f cheques and no provis ion o f funds t rans fer serv ices .
2.4 .4 Hire purchase firms: Such firms are generally act ive inveh ic le and durable finance, spe c ia l i s in g in market segments not served by commercial banks. Most such firms accept deposits from
the publ ic .
2 .4 . 5 Nidhis: These are s ingle branch in s t i tu t io n s similar tocred it unions. They are found mainly in South India. Much o f their c red it goes to f inance investment in housing.
2 .4 . 6 Clearing agents: Also known as dockyard f inanciers or
railyard f inanc ie rs , they give short term accommodation to their c l i e n t s .
2 .4 .7 Wholesalers and other intermediaries in the distribution ofgoods: Such agents t y p i c a l l y combine sale o f goods with ( trade)c r e d i t . Hie volume o f f inance by such agents i s large r e la t iv e to the t o ta l s ize o f c red it markets.
2.4 .8 Aratiyas or commission agents: Act as intermediaries between l o c a l and outstat ion traders in chains for the d is t r ibu t ion
o f goods. They intermediate large f ra ct ions o f t o t a l outstation sales in many commodity markets and provide f inanc ia l accommodat ion to their c l i e n t s . Their main r o le , however, is in reducing information costs o f both buyers and s e l l e r s .
2 .4 . 9 Angadias: S t r i c t l y , these agents are not purveyors o fc re d i t . However they play an important complementary ro le in f a c i l i t a t i n g funds flows between d i f f e r e n t centres at costs much below that o f banks. Aiyar (1979) holds that they are also important agents in the underground economy.
10

2 .4 .10 Indigenous bankers or shroffs: These age old Indian ins t i tu t io n s serve business, usual ly trade. They are grouped into various types (Multanis, Shikarpuris, Gujarat is , Shekhawatis, Ras- tog is , Marwari Kayas, Chett iars , e t c . ) along community l ines and operate in d i f f e r e n t parts o f India. Among the major groups, Chett iars in South India have almost disappeared.
2.4.11 Brokers: There are a bewildering array o f brokers in informal markets whose main and sometimes only role is informat iona l . Timberg and Aiyar (1979) have studied Shikarpuri brokers in some depth. Intercorporate brokers and. black money brokers (Aiyar 1979) are other important types o f brokers . Unusual though minor segments such as bail-bond brokers are also to be found. Many large brokerage houses combine various functions and others are gradually l im it ing the ir business to (formal market) stock- broking. The intercorporate funds market has been examined by the Chakravarty Committee (1985).
2.4.12 Leasing companies: Due primarily to the tax code, therehas recently been a sharp increase in the number o f equipment leasing firms and the volume o f f inanc ia l leases , enabling companies to engage in o f f balance sheet cap i ta l f inance. Some commercial banks have also started leasing subs id iaries in competition with informal leasing companies.
2 .4 .1 3 Pawn brokers: They have been examine by Aiyar (1979).Found mainly in South India, they both accept deposits and provide pawn finance. Aiyar estimates a to ta l volume o f loans between Rs 250 crore and Rs 300 crore in 1979. However, the ir business has adversely been a f fe c ted by Pawn Brokers Acts and Debt R e l ie f Acts passed in the 1970s. Many pawnbrokers in South India are from the
Chettiar community (Aiyar 1979).
2.4.14 Money lenders: While not as widespread as in rural areas,money lenders who re ly primarily on th e ir own cap i ta l are to be
found in various parts o f India.
11

2 .4 .1 5 'Piggy back' intermediaries: These in form al i n t e r mediaries are o f recent vintage and come in various forms, their e s s e n t i a l c h a r a c t e r i s t i c be ing c l o s e a s s o c i a t i o n with formal c red it markets. Along trad i t ion a l l in e s , there are hank loan brok ers who undertake to o b t a i n bank loans in t h e i r own or c l i e n t s ' names for business c l i e n t s for a fee. Obviously, such brok ers have found the means o f c i r cum vent ing banking s e c t o r c red i t contro ls in some way. More innovative are firms vhich undertake to pay premiums for endowment type l i f e insurance p o l i c i e s in return for one or more payments during the i n i t i a l years of the p o l i cy . Thus, fo r example, i f to ta l premium payments over 20 years are Rs 10,000, the insurer may be asked to pay Rs 6000 over 3 years to the firm.
2.4.16 Investment and loan companies: Investment companies aree s se n t ia l ly mutual funds in the company sector . Many of these are simply holding companies or investment subsid iaries o f large industr ia l houses. The RBI designation ' l o a n company' includes many government finance in s t i tu t io n s . Some firms use this designation while awaiting sanction to start hire purchase firms, Nidhis and so on. Therefore, loan companies are not, s t r i c t l y speaking, in
formal lenders. Investment companies do f a i l under our d e f in i t i o n o f informal lenders (with the exception o f the Government owned Unit Trust of India). Some of their a c t i v i t i e s are in d i r e c t lystudied in the chapter on the intercorporate funds market. Nayar(1984) makes a deta i led study o f these firms.
2.5 Regional informal markets
2.5 .1 This study o f informal c red i t markets has adopted asectora l approach. Thus, except in a few instances when the major markets were geographical ly concentrated, no d e t a i l s o f charact e r i s t i c s o f markets in d i f f e r e n t centres are given. In the course o f invest igat ions a few in terest ing features o f markets in d i f f e re n t centres have been covered. Two interest ing cases are worth report ing .
12

2 .5 .2 Trade finance in Calcutta, the most s ecre t ive major trading centre , i s reportedly c o n t r o l l e d , in the main, by a few syndicates o f lenders organised along community l i n e s . We had no success in d iscovering much about these syndicates. A story told to this researcher was how the head of a major Indian business
house was kept waiting in an anteroom for hours by the head of a syndicate before he was allowed to meet the head and ask for a large short term loan (Rs 8 c r o r e ) . I f true, th is r e f l e c t s great market power on the part o f these syndicates.
2 .5 .3 Brokers ex ist in various markets to intermediate between Individuals and Lraders in need of working cap i ta l Aiyar
(1977). In Surat, such individuals Include doctors , lawyers, government servants and so on. Loans there reportedly fetch in
terest o f 2.5 to 4 per cent per month for 30 to 90 day loans.
CHAPTER 3
3.1 Sources of funds of intermediaries
3 .1 .1 Data in Timberg and Aiyar (1989) show that except for Mul- tani Shro f fs , deposits formed the main source o f funds o f informal lenders. In our study except for c lear ing agents, the main dockyard f inanc iers in Calcutta, deposits from individuals are the main source o f funds for a l l intermediaries studied. Own funds are the main source o f funds fo r c learing agents and the second most
important source o f funds for hire purchase firms in Delhi. Own funds are r e l a t i v e l y more important for hire purchase firms that are not in the company sector as compared to those in the company sector , though deposits form the bulk o f resources . Limited formal funds are d i r e c t l y or in d i r e c t ly ava i lab le for dockyard financing and for hire purchase. There i s some evidence o f d ivers ion o f bank
finance to the intercorporate funds market and also some evidence o f in f lows o f funds from informal intermediaries to th is market. Own funds formed a s im i la r ly small f ra c t io n o f t o ta l resources o f f inance corporations and ch i t funds. A summary o f sources o f funds i s given in Table 3 .1 .
3 .2 Pattern of deposits with intermediaries
3.2 .1 Call depos i ts , term deposits and sp e c ia l ly designed saving schemes are a l l used to mobil ise deposits from individuals . The use o f recurring deposit schemes in India was pioneered by Nidhis in 1882, while Peerless has managed to mobil ise phenomenal amounts o f small deposits through i t s endowment c e r t i f i c a t e scheme (Rs. 6 b i l l i o n in 1984). The period o f deposits vary from deposits on c a l l to ten year depos i ts . Brokerage is paid by h ire purchase companies to brokers obtaining deposits for them. That brokers in some r e g i o n a l markets who take a commission from i n d i v i d u a l
DEPOSIT MOBILISATION AND SOURCES OF FUNDS
14
lenders for arranging borrowers e x i s t , has been pointed out earl i e r (Aiyar, 1979 and Timberg and Aiyar, 1980).
3 .3 Deposit ceilings
3.3.1 Most types o f intermediaries in the company sector are subject to contro ls on deposit taking, deposit in terest rates and
on the duration for which they can accept d epos i ts . Deposit c e i l ings are usual ly s p e c i f i e d as a ra t io to own funds (share ca p i ta l and reserves) . A few are also subject to " reserve requirements” in that there are s t ipu la t ion s on the minimum rat io o f deposits which has to be invested in s pec i f ied s e c u r i t i e s . Firms and individuals not in the company s e c t o r fa ce r e s t r i c t i o n s on the number o f
depositors they can have. Chit funds are covered by s p e c ia l , though broadly s imilar , regulations and there is a f ive year c e i l ing on the duration o f c h i t s , though th is i s under appeal in the c o u r t s .
3 .4 Deposit interest rates
3.4 .1 Deposit interest rates vary between 6.7 per cent per year ( f o r Peerless: now s ta t u t o r i l y increased to 10 per cent) and 21
per cent per year ( f o r auto finance and handloom finance f irm s) . Except in the case o f Peerless , some evidence o f rates o f interest
varying p o s i t iv e ly with the period of deposits e x i s t s . In one case, hire purchase, in terest rates c e i l i n g prevented higher interest rates from being o f fe re d , though "under the table payments” in th is case cannot be ruled out. The now defunct Sanchaita Investment paid interest at the rate o f 48 per cent per annum, three quarters o f which was not accounted fo r . The median rate exceeds the maximum rate o f in terest on commercial bank f ixed depos i ts , which is currently 11 per cent per annum for deposits o f 3 years or more. Chit funds pay average rates estimated at between 10 and 16 per cent per annum. However, i t i s d i f f i c u l t to d ist inguish be
tween borrow ers and l e n d e r s s o l e l y from f i n a n c i a l d e t a i l s o f c h i t s . Details o f in terest rates are in Table 3 .2 .
15

3 .5 Growth of deposits
3 .5 .1 Reserve Bank o f India s t a t i s t i c s show that deposits with Nidhis, Chit funds and hire purchase companies have been growing
faster than bank c re d i t in the e igh t ie s though aggregate deposits with informal intermediaries continue to remain small r e la t ive to the formal sector (See Chapter 8 ) .
16
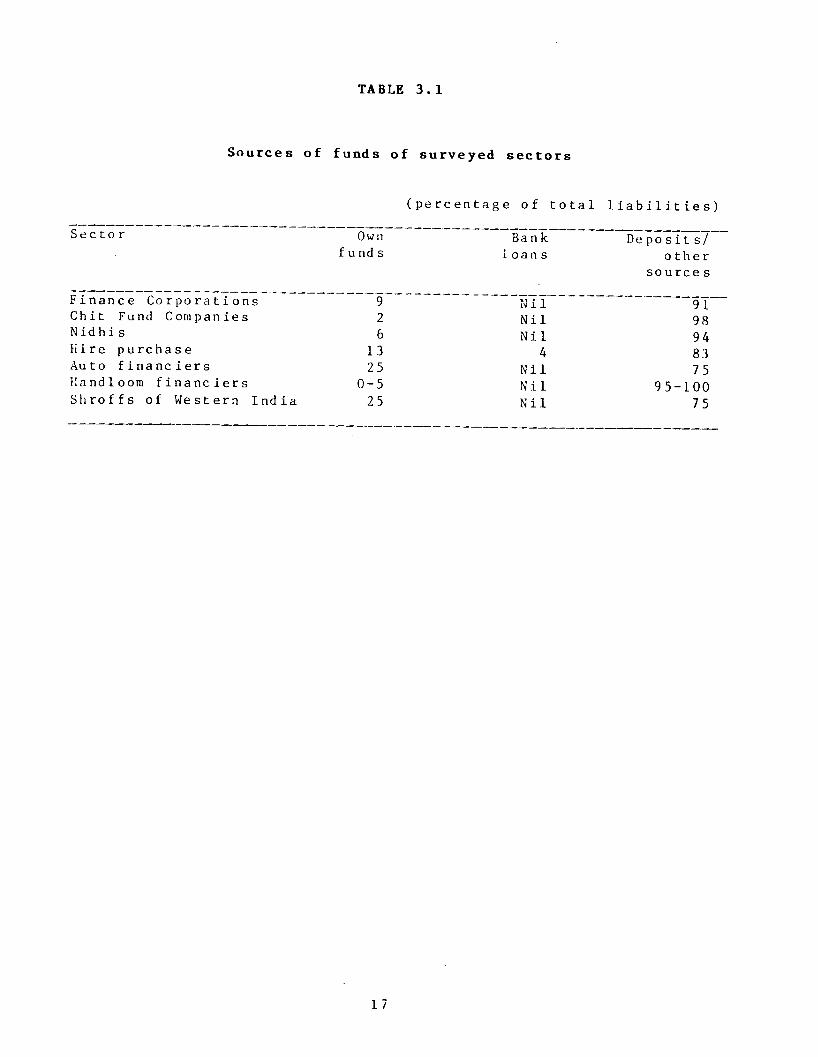
TABLE 3 . 1
Sources o f funds o f surveyed s e c t o r s
( p e r c e n t a g e o f t o t a l l i a b i l i t i e s )
S e c t o r Own f u nd s
Bankl o a n s
D e p o s i t s / o t h e r
s o u r c e s
F i n a n c e C o r p o r a t i o n s 9 N i l 91Chit Fund Companies 2 N i l 98N i d h i s 6 N i l 94H ire p u r c h a s e 13 4 83Auto f i n a n c i e r s 25 N i l 75Kandloom f i n a n c i e r s 0 - 5 N i l 9 5 - 1 0 0S h r o f f s o f W estern I n d i a 25 N i l 7 5
17
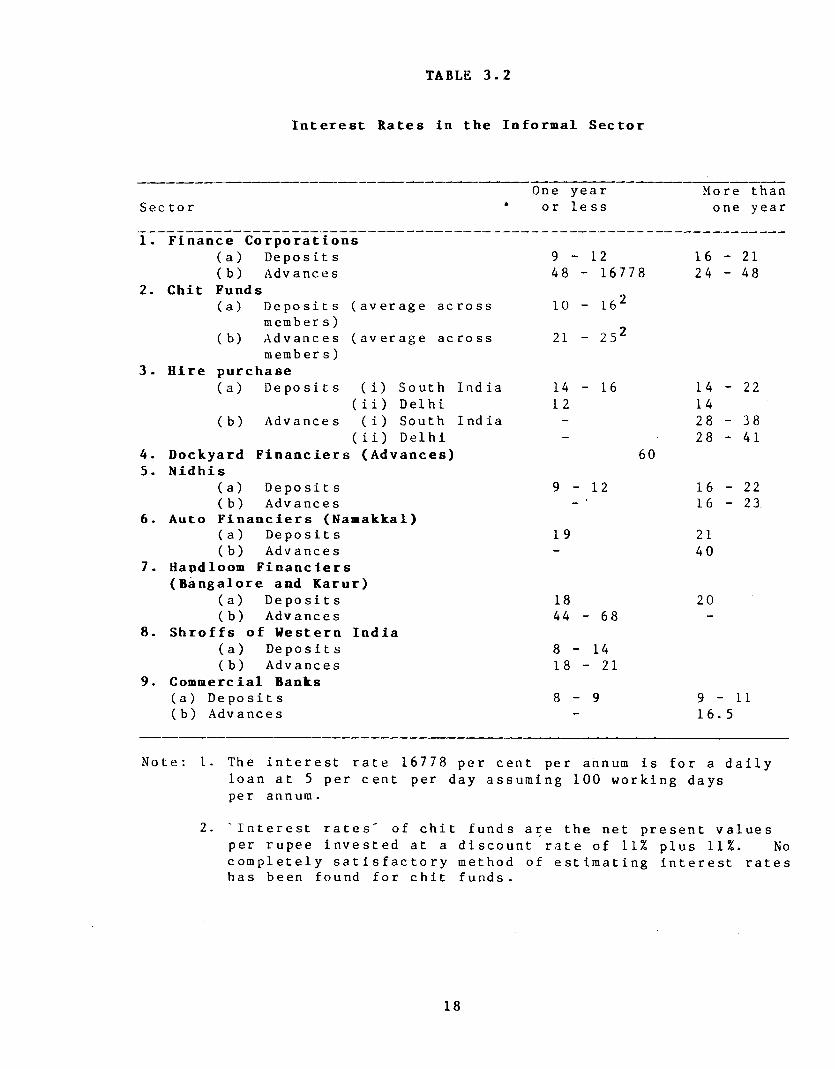
TABLE 3 . 2
I n t e r e s t Rates in the Informal Sector
S e c t o r •One y e a r
o r l e s sMore than
one year
1 . Finance C orporations( a ) D e p o s i t s 9 - 1 2 16 - 21( b ) Advanees 48 - 16778 24 - 48
2* Chit Funds( a ) D e p o s i t s ( a v e r a g e a c r o s s 10 - 16z
member s )( b ) A d v a n c e s ( a v e r a g e a c r o s s 21 - 2 5 z
member s ) 3- Hire purchase
( a ) D e p o s i t s ( i ) South I n d i a 14 - 16 14 - 22( i i ) D e l h i 12 14
( b ) A d v an ces ( i ) South I n d i a - 28 - 38( i i ) D e l h i - 28 - 41
4. Dockyard F in a n c ie rs (Advances) 605. Nidhis
( a) D e p o s i t s 9 - 1 2 16 - 22( b ) Adv anc e s 16 - 23
6. Auto F in a n c ie r s (Naaakkal)( a ) D e p o s i t s 19 21( b ) Adv ance s - 40
7. Handloom F in a n cie rs (Bangalore and Karur)
( a ) D e p o s i t s 18 20( b) A d v ances 44 - 68 -
8. S h r o f f s o f Western India( a ) D e p o s i t s 8 - 1 4( b ) Adv anc e s 18 - 21
9. Commercial Banks( a ) D e p o s i t s 8 - 9 9 - 1 1( b) A d vances
'
16. 5
N o t e : I . The i n t e r e s t r a t e 16778 p e r c e n t per annum i s f o r a d a i l yl o a n a t 5 per c e n t per day a s su m in g 100 w o r k in g days pe r annum.
2. ' I n t e r e s t r a t e s ' o f c h i t f u n d s a r e the net p r e s e n t v a l u e s per r u p e e i n v e s t e d at a d i s c o u n t r a t e o f 11% p l u s 11%. No c o m p l e t e l y s a t i s f a c t o r y method o f e s t i m a t i n g i n t e r e s t r a t e s has been found f o r c h i t f u n d s .
18

CHAPTER 4
DEPLOYMENT OF INFORMAL CREDIT
4.1 Sectoral deployment of funds of intermediaries
4 .1 .1 The experience here is quite varied.
a. Hire purchase firms provide finance primarily f o r new and used commercial v eh ic les through one to four year hire purchase agreements. Hire purchase firms a lso finance consumer durables and non-commercial v e h ic le s .
b. Handloom f inanc ie rs , o f course, provide working cap ita l f inance for production by handloom weavers in the unorganised sector .
c . Finance from Nidhis i s ava i lab le mainly to households, though small business is a lso f inanced. The bulk o f loans goes to f inance the construct ion , renovation and repair o f houses and other bui ld ings . Loans may be for as long as seven years.
d. P e e r l e s s i n v e s t s much o f i t s d e p o s i t s in government s e cu r i t i e s and term deposits with nationalised banks.
e. I n t e r c o r p o r a t e l o a n s average three to s i x months f o r private sector corporat ions and s ix to twelve months for public sector corporat ions .
f . Chit funds mainly finance trade, s e l f employed persons, a g r i c u l t u r a l i s t s and, to a l imited degree, consumption.
g. Shroffs in western India la rge ly finance domestic trade through 'h u n d is ' , though they also finance exports and industry.
4 .1 .2 The main point to note in this deployment o f c red i t is that consumption loans form a small part o f informal c r e d i t . Tim- berg and Aiyar (1980) provide data showing that f inance for trade, export and industry make up the bulk o f informal c red i t except for
that from pawn brokers and finance corporat ions . Summary information i s given in Table 4.1.
19

4 .2 Bad debts and overdues
4 .2 .1 Bad debts were reported in the intercorporate market, in auto finance in Namakkal, in chit funds and with Shroffs and in t e x t i l e d i s t r ib u t i o n . Except fo r the intercorporate market, here, most cases were more in the nature o f delayed payments rather than
o u t r ig h t d e f a u l t s . Furthermore, auto f i n a n c i e r s are ab le to repossess veh ic les from default ing borrowers. Bad debts in other
sectors were n e g l ig ib l e . Thus recovery problems do not t i e up a l o t o f avai lab le informal funds, except in the case o f shrof fs who claimed bad debts o f between 5 and 10 per cent o f earnings and chit funds who had 7 per cent bad debts on average (about 1 to 2 percent o f loans for the former and less than one per cent o f ch it cap i ta l for the l a t t e r ) . Even t h is l e ve l i s , reportedly , low compared to commercial banks.
4.3 Importance of informal credit to productive sectors studied
4.3.1 One sector , f i lm finance in Madras, i s almost wholly dependent on informal f inance. Trade cred it proved to be the most important external source o f f inance for the productive sectors studied, e s p e c ia l ly for the smaller f irms (where a small / large ca tegor isa t ion was f e a s i b l e ) . However, owners' cap ita l is the dominant source o f f inance in road construct ion . In t e x t i l e d is t r ibu t io n , trading agents (wholesalers) re ly more on own funds than non trading agents (brokers and commission agents) . While i t was learnt that f inance from professional f inanc iers i s the main source o f f inance for road construct ion contractors in Kerala, pure informal intermediaries played next to no ro le in any productive sector studied. Informal cred it from fr iends , r e la t ive s and other assoc ia tes was, however, o f importance, being more important than bank finance in road construct ion and t e x t i l e d i s t r ib u t io n .
Whether such funds r e a l ly r e f l e c t informal finance or represent i l l e g a l funds i s not ascertainable for individual firms but are, in a l l p robab i l i ty , la rg e ly i l l e g a l funds in the aggregate given that we estimate such funds to exceed net household sector dues
%rece ivable as estimated by the RBI (1987) . However, that in fo r -
20

mal f in a n c e p lays a dominant r o l e in the f in a n c e o f handloom
weavers and used truck operators was ascertained from studies o f
i n t e r m e d i a r i e s . That bank f i n a n c e i s not the main source o f f inance even to garment exporters , despite various export incent iv e s and concessions, i s revea l ing . Formal c red i t is more important only for households ( including for house construct ion) and perhaps for transport o p e r a t o r s .1 Deta i ls are in Table 4 .2 .
4.4 Inequality of credit distribution
4.4 .1 According to data from the RBI surveys, informal cred it i s more evenly d is tr ibuted between households in d i f f e r e n t asset groups than is formal c re d i t (the g in i index for urban households is 40.2 per cent for informal c red i t and 55.1 per cent for formal
c r e d i t ) . However, Lorenz curves cross when more than 3 asset
groups are used since a r e l a t i v e l y large share o f formal c red i t
goes to the household asset group Rs 1 lakh to Rs 5 lakh. Thus, asset poor and wealthy households rece ive r e l a t i v e l y more informal c r e d i t .
4 .4 .2 For samples o f p r o d u c t i v e u n i t s except f o r t r a n s p o r t operators, RBI data show, once again, that informal c re d i t i s more equally d istr ibuted ( in the Lorenz sense) when firms are c la s s i f i e d by gross sales or earnings into 3 to 5 groups. Informal c red i t is s t i l l the main source o f f inance for small industr ia l and trading units .
4.5 Flow of funds between formal and informal financial sectors
4 .5 .1 While instances o f f low o f funds in both d i r e c t io n s between formal and informal sectors have come to l i g h t , the flow o f funds from the informal to the formal f inanc ia l sector is by far the larger o f the two, even i f the fact that a l l intermediaries
and firms studied hold current accounts with banks is ignored. The
1. The f i g u r e g i v e n in the t a b l e i s b a s e d on a s a m p l e o f ban k a s s i s t e d u n i t s . I t i s t h u s b i a s e d a g a i n s t i n f o r m a l c r e d i t .
/ /
21
three main instances o f t h i s , the case o f road construct ion , ch it funds and the Peerless case, between them resu lt in at least Rs. 5 b i l l i o n flowing to the formal sector in recent years. In the case of Nidhis, about 11 per cent o f their assets are held as bankbalances .
4.6 Overall credit position of credit using sectors
4.6 .1 While no s p e c i f i c information is ava i lab le about fi lmfinance, i t is c lear from our study that f ilm production would be g reat ly a f fe c te d in the absence o f informal finance.
a. Garment exporters , p ar t i cu la r ly the larger firms, are net rece ivers o f c red it and are able to generate large inter nal s u r p lu se s due to the combined o p e r a t i o n o f three fa c to rs : Cheap bank c r e d i t to f inance exports, export tax concessions and the manner in which the quotas under the Multi Fibre Agreement are a l located between competing f i r m s .
b. Road construct ion contractors are net providers o f c red itto the monopsony buyer o f the ir s e rv ices , the government,due to the need to provide secur i ty deposits and due todelayed re ce ip t s o f dues.
c . T ex t i le d i s t r ib u t io n intermediaries in the middle o f the d i s t r i b u t i o n cha in are net p r o v id e r s o f c r e d i t , the b e n e f i c ia r ie s being r e t a i l e r s .
d. Powerloom units reloan about h a l f the ir borrowed fund as trade c r e d i t .
e . Bhole (1985) reports that large , and a f te r 1970, small companies were net rece ivers o f trade c re d i t basing th is conclusion on data for 1956 to 1978. On average, f irms in the RBI surveys are net r ece ivers o f c r e d i t , though for wholesale traders the net c r e d i t r ece ip ts are marg ina l .
4 .6 .2 This evidence, while a ttest ing to the importance o f in
formal c red it and transmission o f c red i t received from s e l l e r s to
buyers, a lso a t te s ts to the fact that some sectors are constrained to own fund fo r c a p i ta l formation and working c a p i t a l .
22
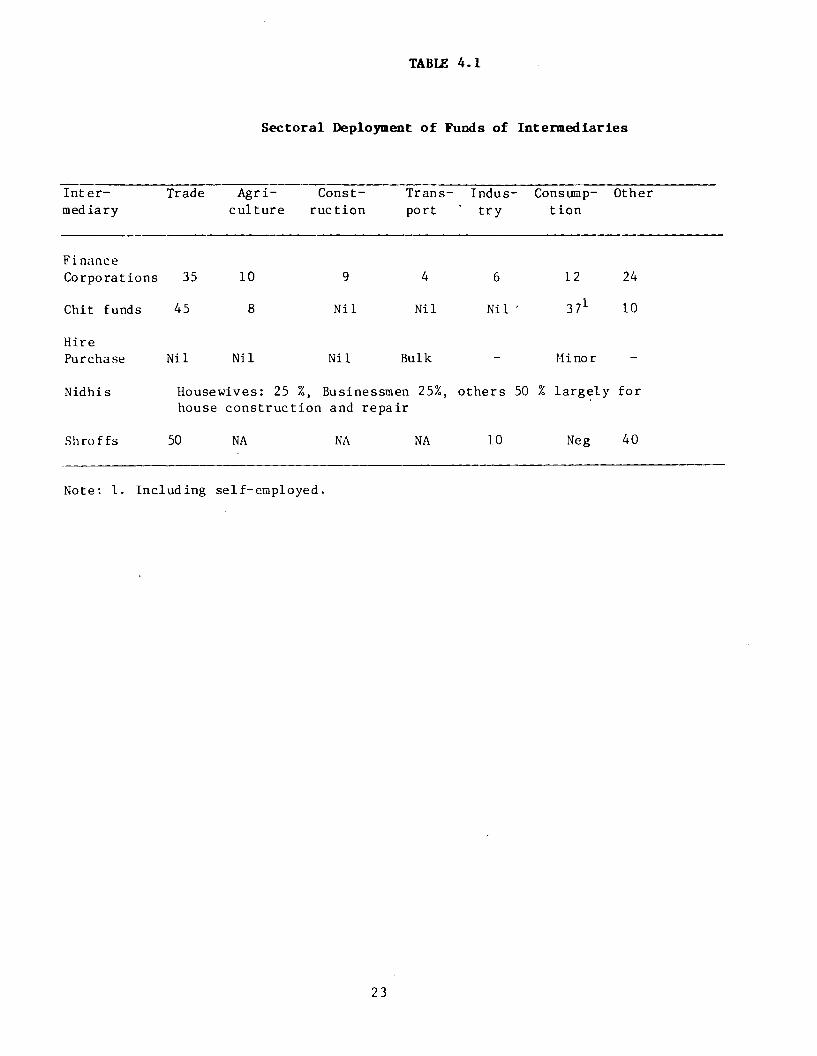
TABLE 4.1
Sectoral Deployment of Funds of Intermediaries
Intermediary
Trade Agriculture
Construction
Transport
Industry
Consumpt ion
Other
FinanceCorporations 35 10 9 4 6 12 24
Chit funds 45 8 Nil Nil Nil ' 371 10
HirePurchase Nil Nil Nil Bulk - Minor -
Nidhis Housewives: 25 %, Businessmen 25%, house construct ion and repair
others 50 % large ly for
Shroffs 50 NA NA NA 10 Neg 40
Note: 1. Including sel f-employed.
23

TABLE 4 - 2
Sources of Funds of Using Sectors
( in perc entage)
S e c t o r Own F o rmal I n f o rmalf und s c r e d i t c r e d i t
Road c o n s t r u c t i o n 62 6 32Garment e x p o r t s 31 26 43Film f i n a n c e 5 N i l 95Powerloom u n i t s 43 10 47T e x t i l e Trade U n i t s 42 1 0 48H ousing F in a n c e o fHo u s e h o l d s 66 20 14
RBI SURVEYS
Ho use ho Id s N. A. 61 39Small S c a l e I n d u s t r y 28 32 40T r a d e r s 28 1 9 53T r a n s p o r t O p e r a t o r s 49 41 10
N o t e s : 1. RBI s u r v e y s c o v e r o n l y u n i t s r e c e i v i n g bank a s s i s t a n c e2. NA = Not a p p l i c a b l e3 . S h r o f f s do not i n c l u d e M u l t a n i s who do r e c e i v e bank
r e f i n a n c e e s t i m a t e d at abo u t 5 - 1 0 per c e n t o f t h e i r l o a n s o u t s t a n d i n g .
24

CHAPTER 5
LOAN TERMS AND CREDIT APPRAISAL METHODS
5.1 Interest rates
5.1.1 Annual compound interest rates on advances are given in Table 2.2. The rates are, in general , higher than bank rates as are the deposit rates .^ One point o f interest is that interest rates do not increase with the duration o f loans in a l l cases. When short term loans have higher rates o f in te r e s t , th is i s invariably because o f higher transactions cost or r isk iness . In the case o f dockyard f in an c ie rs , in terest rates are unusually high given the lack o f r isk or transactions c o s t s . The average interest
rates for productive sectors , in Table 5.1 below, are surpr is ingly low and are comparable to that o f banks (the State Bank of India advance rate is currently 16.5 per c e n t ) . Trade c red i t rates vary with the period o f c red i t s ince cash discounts were t y p i c a l l y s p e c i f i e d . They tended to be somewhat higher than rates for d ire c t loans given that the average period o f trade c re d i t was o f f a i r l y short duration.
5.2 Loan duration
5.2.1 The genera l isat ion that informal loans are short term is in correc t . While i t i s true that Shroffs and finance corporations mainly have short term loans not exceeding 3 months, ch i t funds,
Nidhis and hire purchase companies have loan durations measured in years - upto seven years in the case o f Nidhis and before enactment o f recent Chit Fund Acts, 10 years for ch it funds. Trade
1. The huge r a t e o f 16 ,778% i s th e a n n u a l i s e d i n t e r e s t on one day l o a n s at 5% by f i n a n c e c o r p o r a t i o n s . H ow e v e r , i t s h o u l d be n o t e d t h a t s u c h l o a n s a r e s m a l l and h a v e h i g h t r a n s a c t i o n s c o s t s t o the l e n d e r .
25
credit periods o f upto 200 days were reported in wholesale trade
and the powerloom sector , though two months i s approximately the
average. At the other end, f inance corporations serve the very short term end o f the spectrum - s tart ing from one day loans - a segment not served by the formal sector .
5.3 Collateral
5.3 .1 Nidhis, hire purchase firms, ch i t funds and auto financ i e r s give secured loans. In the case o f veh ic le f inance, security c o n s is ts o f margin money and hypothecation o f the veh ic le . The margin may be as high as 50 per cent. Otherwise loans are mainly unsecured, though loans against jew e l lery are f a i r l y widespread. However, long standing r e l a t i o n s or borrowers being known to lenders i s important e s p e c ia l l y among Shrof fs , f inance corporat ions and in hire purchase. A recent trend i s the advertisement
o f l o a n s a v a i l a b l e from in form al l e n d e r s in n a t i o n a l d a i l y newspapers such as the 'Hindustan Times' and the 'Hindu '. This suggests that , in some segments, long term relat ionships may be los ing importance.
5 .4 Credit assessment
5.4.1 While Nidhis and hire purchase companies had an elaborate but speedy c re d i t assessment procedure, most intermediaries re ly on long standing personal contact with borrowers or their reputat ion in the 'market ' . Thus, In most cases, the informality between lenders and borrowers and speedy sanctioning of loans for which informal markets are noted was maintained.
5 .4 .2 Clearly , no genera l isat ions about loan terms in in for mal c r e d i t markets can be made. The s t e r e o t y p e d ' l o a n s from moneylenders' are c l e a r l y not representative o f informal intermediaries o f a l l kinds.
26

TABLE 5 . 1
Cost of Informal Credit
(in percentage)
U sing s e c t o r Range o f i n t e r e s t r a t e s
Av er ag e i n f o r m a l interest r a t e
Av er ag e cashdiscount on t r a d e c r e d i t
1. Road c o n s t r u c t i o n 15 - 24 1 5 . 8 9
2. F i lm f i n a n c e 67 - 99 - -
3. Power loom 1 2 - 16 1 2 . 03 1 1 - 1 3
4. T e x t i l e w h o l e s a l e t r a d e 1 2 - 18 1 5 .3 1
2 7

CHAPTER 6
6.1 The decomposition of interest rates
6.1.1 The main purpose o f t h i s chap ter i s to examine thed e co m p o s i t i o n o f the lend ing rate o f in formal i n t e r m e d ia r i e s fol lowing Bottomley (1975).^ The decomposition o f loan interest rates is into four components: transactions c o s t , r isk premium, opportunity cost and economic or monopoly rent. Essent ia l ly , from f inancia l f igures o f the firm th is can be deduced ex post. Themethod we adopt i s the fo l lowing . Per rupee o f funds loaned, pure
rent (R) can be represented by the ident ity
R * (1—P) (1+r) - T - Oe
where, P is the percentage o f loans defaulted , r is the averageinterest rate charged to the borrower, T i s the r a t io o f totalexpenditures to to ta l loans, 0 i s one plus the opportunity cost (o ) per rupee o f own funds and e i s the ra t io o f own funds to to ta l funds ava i lab le .
6 .1 .2 T can further be decomposed into E + I, where I i s theinterest cost on borrowed funds per rupee o f loans and E i s theresidual (establishment) cost per rupee o f loans. I can further be
written as ( l + i ) ( l - e ) , where, i i s the average interest rate on deposits and (1 -e ) is the fa c t ion o f borrowed funds in to ta l funds (under the accounting convention that borrowed funds are repaid, though they may, o f course , be borrowed again immediately and lent anew ) . Thus we get the r e la t io n :
r = E + P (1+r) + [ i ( l - e ) + o e ] + R (1)
1. See a l s o Hanson and de R ezende Rocha ( 1 986 ) .
COST OF INTERMEDIATION
28

where, E i s the per un it e s ta b l i sh m e n t c o s t ( o r t r a n s a c t i o n s cost )
p( l+r) is the r isk pr^aium (or , accurate ly , the cost o f default s)
[ i ( l - e ) + o e ] is the opportunity cost o f funds employed (or the actual cost in the case o f borrowed funds)
and R i s the economic rent.
6 .1 .3 One adjustment needs to be made before the decompositioncan describe the s i tu a t ion o f a r i s k neutral lender (and we assumer i s k n e u t r a l i t y in t h i s s t u d y ) . There i s c l e a r l y a re a lopportunity cost to running out o f loanable funds, a s i tuat ion
which gives r i se to an increasing term structure o f in terest ratesfrom the lenders viewpoint. Comparing the le n d e r 's demand for
borrowed funds o f d i f f e r e n t m a t u r i t i e s to the market term2structure, The deposit maturity which gives the greatest surplus
to the firm w i l l be selected by i t . I f i t is in fac t observed that the lender borrows funds of a l l maturit ies , then th is suggests ind i f ference on the part o f the lender to a l l maturit ies or the operation o f pr ice or quantity co n t r o l s (whether imposed by the government or other private agents) on the borrowing market. In the former event the h ighest i n t e r e s t r a t e , ( j ) , should be substituted for i and the d i f f e r e n c e , ( j - i ) ( l - e ) should be added to the r isk premium, where the term i t s e l f represents the cost o f
unava i lab i l i ty o f borrowed funds. In the la t t e r event i t is c lear that the r isk premium should be augmented but there i s no easy way o f estimating the required increment. In order to bias the resu lts towards high monopoly p r o f i t and because o f estimation problems, we ignore such c o r re c t io n s and retain the formula ( 1 ) . In the event o f r i s k averse lenders or antic ipated co s t s higher than expost c o s t s , (1) w i l l over- estimate monopoly rent.
6 .1 .4 The main interest in such a decomposition is in order to ascertain the extent o f monopoly rent and in order to compare across i n s t i t u t i o n s . However the l a t t e r o b je c t iv e requires that
2. Under the a s s u m p t i o n o f p r i c e t a k i n g on the market f o r b o r r o w e d f u n d s .
2 9

loans be taken ind iv idua l ly , or that lenders with id ent ica l loan3
p o r t f o l i o be considered. The data for such an exercise i s not ava i lab le . The problematic parts o f the decomposition are the p o r t i o n s co n c e rn in g t r a n s a c t i o n s and d e f a u l t c o s t s . Deposit c o s t s , opportunity costs and economic rent are s t i l l comparable across sectors . In general, transactions cos ts could be expected to be higher for f irms with predominantly short term loans and
when i n d i v i d u a l loans are small r e l a t i v e to the t o t a l loan p o r t f o l i o . However, data on the number o f loans are not available in a l l c a s e s , and sample s i z e s are too small to attempt astandardisation on th is bas is . This caveat must be borne in mind when analysing the estimates presented.
6.2 Estimates
6.2 .1 Estimates were computed using average f igures across a l l f irms, ignoring in ter - f i rm heterogeneity .^ In consequence the f igures r e f l e c t the average p os i t ion o f f irms. Our estimates aregiven in Table 6.1 fo r 6 intermediary sectors . These estimatesassume an opportunity cost o f own funds o f 18 per cent for a l l sectors except shrof fs for whom an opportunity cost of 14 percent"* i s assumed. The e s t im a t e s show that there i s reason to
suspect "monopoly power" only among auto - f inanc iers in Namakkal.
However, the second hand auto- finance business is growing rapidly
and i t i s more l i k e l y that the rent estimate captures an element o f d isequi libr ium p r o f i t s . For s h r o f f s , analysis for 1979 revealed a rent element of 35 per cent. The dec l ine in the use o f darsftani hundis and the s a r a f i system as a whole due to the impact o f recent repress ive l e g i s l a t i o n may explain t h i s , given that shroffs were the so le suppliers o f th is instrument. The pos i t ion for the
3 . I am i n d e b t e d to T.N. S r i n i v a s a n f o r p o i n t i n g ou t t h e p r o b l e m s w i t h i n t e r m e d i a r y c o m p a r i s o n s b a s e d on a v e r a g e v a l u e s .
4 . When f i r m - w i s e d a ta were a v a i l a b l e . O t h e r w i s e o t h e r a p p r o x i m a t i o n s a r e u s e d .
5 . 14% i s assumed on the b a s i s o f d i s c u s s i o n s w i th r e s p o n d e n t s in th e f i e l d s u r v e y .
30

in ter -corporate funds market, f o r r isk adjusted interest rates , s im i la r ly appears to ind icate lack o f monopoly pr ic ing , though given the ' jo in t producer' nature o f corporate lenders no estimate were made. Thus the evidence does not support the hypothesis o f monopolistic intermediaries in the sectors studied.
6 .2 .2 The high establishment co s t s reported in th is tab le appearto contradict the presumption o f informal lenders being e f f i c i e n t purveyors o f c r e d i t . In fact commercial bank cos ts contributed about 27 to 38 per cent o f the in terest rate on loans (assumed at16.5 per cent) in 1984 and 1985. Though the caveat in paragraph 3 should be kept in view and though i t should be kept in mind that banks could probably not replace informal intermediaries in the
c r e d i t sub-markets served by them, these f i g u r e s do tend to suggest that a l l in fo rm al i n t e r m e d i a r i e s are not e f f i c i e n t
suppliers o f c re d i t compared to banks in the sense o f having lowt r a n s a c t i o n c o s t s . This f i n d i n g i s at v a r i a n c e with e a r l i e rstudies , such as Timberg and Aiyar (1980). They, however, do not attempt an e x p l i c i t deromposit ion. From what is reported in the popular press, and from the l i t t l e evidence ava i lab le , informal intermediaries have substant ia l ly lower r isk costs than banks, a f in d in g which i s r e f l e c t e d in the Table. Before l e a v in g t h i s chapter, we b r i e f l y summarise f indings on informal c red i t to using sectors . Details o f computations fo r banks are given in Tables6.2 and 6.3.
6.3 Cost of funds versus duration of loans of credit using sectors
6.3.1 While most loans were found to be f o r working c a p i t a lpurposes and were thereby short term loans or even loans on c a l l ,the mean e f f e c t i v e loan duration was greater than that fo r formal sector c re d i t in road construct ion . Furthermore' while the cost o f informal finance for f i lm making was between 67 per cent and 99 per cent per annum, the average in form al i n t e r e s t rate was estimated to be lower than the cost o f bank finance in the other sectors , though the median rate was higher and the d ispers ion was large in road construct ion . The main reason for this i s that low,
31

often zero, in terest rate loans from friends and r e la t ive s are o f ten used by firms. Furthermore,' a regression, using inter-State data on the poo led samples from the RBI surveys o f f i r m s , o f in terest cos t on the ra t io o f formal to informal finance showed no s ign i f i can t l in k between the two.
6 .3 .2 F i n a l l y , persons in te r v ie w e d in the t e x t i l e w ho lesa le market reported that the e f f e c t i v e cost o f bank c r e d i t , inc lus ive of the ir transactions c o s t s , was higher than that o f informal c r e d i t .

TABLE 6.1
Estimated Decomposition of Loan Interest Rates of Informal Intermediaries and Scheduled Commercial Banks
Sector Default Establ ish- Oppor- Economic Averagecost ment cost tunity rent spread ( in
c o s t / percentagec o s t ’ o f points)borrowed funds
(in percentage)
Financecorporat ions
4 25 68 3 103
Hire Purchase 3 33 66 -3 93
Nidhis • Neg 19-20 78-79 1-3 5-7
Auto f inanciers in Namakkal
7 26 26 45 19
Handloom f inanciers in Bangalore/ Karur
7/8 23/25 51/67 20/Neg 35/;
Shrof fs o f Western India
14 20 60 16 8-9
Indian Scheduled Commercial Banks
(a) No default assumption
- 33-38 54-67 0-7 6-H
(b) 2% o f loans 16-18 27-34 48-54 Negdefaulted
Notes: 1. Opportunity cost assumed to be 18 % for own funds except forshro f fs (14%)
2. Neg: N eg l ig ib le .3. D i fference in earnings per rupee o f loans and per rupee o f
d e p o s i t s .4. Bank ca lcu la t ions are from Table 6.3.
33

TABLE 6.2a
Basic Data on Indian Scheduled Commercial Banks
(Rs lakh)Item 1984 1985
Prom Annual Reports as on December 31
Paid up cap ita l 18,381 65,070Reserves 87,007 118,958Deposit s 8,468,447 10,028,467Pro f i t (balance sheet) 63 7 991Total assets 11,119,422 13,120,176Investments 2,378,883 2,947,510Cash 1,314,775 1,593,727Money at c a l l 181,902 332,426Advances in India 4,583,593 5,225,024Advances outs ide India 761,000 796,493Due from banks (a sse ts ) 2,204 2,089Borrowing from banks ( l i a b i l i t i e s ) 733,259 810,595Interest and discount 815,683 944,056Total earnings 889,546 1,030,752Interest paid 585,826 682,629Total expense 883,622 1,024,680Pro f i t (p&l) 5,924 6,072
Source: RBI, S t a t i s t i c a l Tables re lat ing toBanks in India, 1985.
34

Item 1984 1985
TABUE 6.2b
Basic Data on Indian Scheduled Commercial Banks
(Rs lakh)
From special returns to the RBI on Forms A1 & A2 (Total Business)
Paid up cap ita l 30,665 65,020Reserves 74,434 118,451Deposits 8,349,820 9,864,917Cash 1,315,167 1,595,285Investments 2,489,412 3,102,261Money at c a l l 186,659 332,399Loans and advances 4,733,334 5,411,078B i l l business 610,992 611,299Pro f i t (balance sheet) 4,452 5,872
EARNINGSInland b i l l s 52,199.1 61,337.6Loans and advances 547,067.5 660,127.6Investment: government 109,319.7 139,037.6Investment: trustee 48,267.9 69,332 .5Investment: other 40,747.3 5,855.1Deposits with RBI 54,759.3 75,323.2Deposits .with banks 11,159.9 18,247.3Total oper. earnings 949,279.2 1,123,404.1Total earnings 970,979.1 1,145,832.1
EXPENDITURESIn terest : deposits 513,563.2 607,641.9Interest : borrowings 55,590.6 64,210.1Redi scounts 10,393.1 13,199.6Other business 10,210.7 11,576.4Establishment cost 204,173.2 235,938.5Taxes on operations 1,468. 1 1,655.0Interest tax 13,458.8 4,016.8Total oper. expense 872,896.0 1,014,407.4Total expense 891,248.2 1,053,390.5
PRE TAX PROFIT 79,330.9 92,441.6
Source: RBI, S t a t i s t i c a l Tables re la t ing to Banks in India, 1985.
35
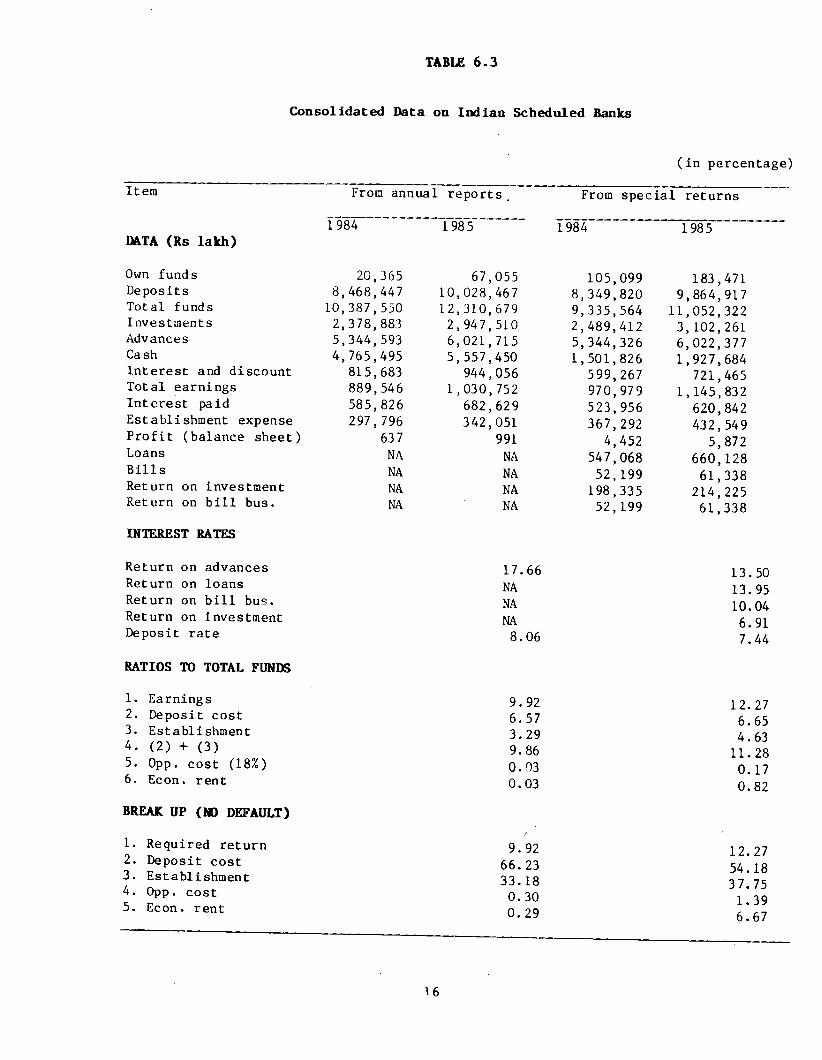
TABLE 6 .3
Consolidated Data on Indian Scheduled Banks
(in percentage)
Item From annual reports From spec ia l returns
1984 1985 1984 1985DATA (Rs lakh)
Own funds 20,365 67,055 105,099 183,471Deposits 8,468,447 10,028,467 8,349,820 9,864,917Total funds 10,387,550 12,310,679 9,335,564 11,052,322Investments 2,378,883 2,947,510 2,489,412 3,102,261Advances 5,344,593 6,021,715 5,344,326 6,022,377Cash 4,765,495 5,557,450 1,501,826 1,927,684Interest and discount 815,683 944,056 599,267 721,465Total earnings 889,546 1,030,752 970,979 1,145,832Interest paid 585,826 682,629 523,956 620,842Establishment expense 297,796 342,051 367,292 432,549P r o f i t (balance sheet) 637 991 4,452 5,872Loans NA NA 547,068 660,128B i l l s NA NA 52,199 61,338Return on investment NA NA 198,335 214,225Return on b i l l bus. NA NA 52,199 61,338
INTEREST RATES
Return on advances 17.66 13. 50Return on loans NA 13. 95Return on b i l l bus. NA 10.04Return on investment NA 6.91Deposit rate 8.06 7.44
RATIOS TO TOTAL FUNDS
1. Earnings 9.92 12. 272. Deposit cost 6.57 6.653. Establishment 3.29 4.634- (2) + (3) 9.86 11. 285. Opp. cost (18%) 0.03 0.176. Econ. rent 0.03 0.82
BREAK UP (NO DEFAULT)
1. Required return 9.92 12. 272. Deposit cost 66.23 54.183. Establishment 33.18 3 7. 754. Opp. cost 0.30 1.395. Econ. rent 0. 29 6.67
16

TABLE 6 .3(C0NTD.)
(1) (2) (3) (4) (5)
BREAK UP (1% DEFAULT)
1. Required return2. Deposit cost3. Establishment4. Opp. cost5. Default cost6. Short fa l l
10.99 59.78 29. 95
0. 27 10.00
9. 74
12.57 52. 91 36.86
1.36 8.87 2.39
BREAK UP (2Z DEFAULT)
1. Required return2. Deposit cost3. Establishment4. 0pp. cost5. Default cost6. Short fa l l
12.09 54.35 27.23
0.25 18.18 17. 95
13.68 48.60 33.86
1.25 16. 29 10.31
Note: For break ups with defaul t ( 2 )+ (3 )+ ( 4 )+(6 ) Source: As for Table 6.2.add up to 100% i f the required return f a l l s short o f earnings _less economic rent plus default c o s t .
3 7

CHAPTER 7
7.1 Introduction
7.1 .1 In this chapter, we descr ibe our f indings on the structure o f informal c re d i t markets in term^. o f various c r i t e r i a used in industr ia l organisat ion theory. The evidence is reviewed in two parts. F i r s t ly , we review the evidence on the market structure o f intermediary sub-markets for which f i e l d studies were conducted and also o f the traders-cum-intermediaries in wholesale trade. Secondly, we address the issue o f fragmentation or integrat ion in informal c re d i t markets as a whole.
7 .2 Intermediary sub-markets
7.2.1 In d e s c r i b i n g market s t r u c t u r e s o f in term ed iary subsectors , ten c r i t e r i a are used. The f i r s t s ix are the standard industr ia l organisat ion benchmarks o f numbers and concentration (where the sample permits th is to be s tudied) , product var ie ty ,
p r i c e / n o n - p r i c e c o m p e t i t i o n , ease o f e n t r y and e x i t , p r i c e d i s p e r s i o n , ev idence o f market l e a d e r s h i p and e x i s t e n c e o f economic rents . The la t t e r i s , o f course , judged by the monopoly component o f in terest rates . In addit ion, informational aspects o f such markets are d i s c u s s e d s in c e t h i s i s c r u c i a l to the f u n c t i o n i n g o f c r e d i t markets. In fo r m a t io n a l c o n s i d e r a t i o n s
m ani fest them selves in a d d i t i o n to p r i c e d i s p e r s i o n and, on occasion, entry barr ie rs , in at least two ways. F irs t , lenders canset maximum l im its on interest rates and rat ion funds to borrower
/ra ther than a l l o w in g the i n t e r e s t rate to c l e a r the market ( S t i g l i t z and Weiss (1981 ) ) . Secondly, c o l l a t e r a l i s taken or some other way o f securing loans i s in common use. F inally , the e x i s t e n c e o f p r i c e or q u a n t i t y c o n t r o l s by the government i s po in ted out . Evidence fo r the in term ed ia ry sub-markets i s
STRUCTURE OF INFORMAL CREDIT MARKETS
38

presented in Table 7.1.
7.2.2 Before reviewing the evidence, the nature o f e n t r y /e x i t barr iers should be addressed. It is c lear , a p r i o r i , that access to l o a n a b le funds i s a p r e r e q u i s i t e f o r becoming an in formal lender. Becoming an intermediary requires access , furthermore, to
depos i tors . These fac tors are c l e a r l y barr iers to most types o f potentia l lenders with the poss ib le exception o f chit funds among
fr iends and acquaintances. Since these barriers are common to almost a l l c r e d i t o p e r a t i o n s , the tab le below i n d i c a t e s the e x i s t e n c e o f e n t r y b a r r i e r s o n ly when ev id e n ce o f a d d i t i o n a l d i f f i c u l t i e s in entering and leaving were found. Such barr iers may, furthermore, be permanent or temporary. Temporary barr iers ar ise from lack o f information about potentia l borrowers and other in fo r m a t io n a l o b s t a c l e s . B a r r i e r s a long c a s t e and community l i n e s , for example, are o f a more permanent nature.
7 .2 .3 The evidence summarised in Table 7.1 shows that with the exception of aratiyas in the wholesale trade, dockyard f inanciers and n i d h i s , in formal i n t e r m e d i a r i e s are g e n e r a l l y at the competitive end o f the spectrum. Informational imperfect ions, as ev idenced by p r i c e d i s p e r s i o n , r a t i o n i n g and s e c u r i t y , are s i g n i f i c a n t and the major cause o f i n e f f i c i e n c i e s . In h i r e - purchase , there are dominant f i rm s in the r e g i o n s surveyed . Aratiyas s p e c ia l i s e by region which leads to short run information based entry barr ie rs . For indigenous bankers, community based entry b a r r i e r s and the need to e s t a b l i s h a r e p u t a t i o n are
addit ional b a r r i e r s .
7.3 Fragmentation
7.3 .1 The concept o f fragmentation f i r s t requires d e f i n i t i o n . Two condit ions can be said to be s u f f i c i e n t to determine whether the in form al c r e d i t market i s f ragmented. F i r s t , fund f lows between markets should be i n s u f f i c i e n t to bring about equal i ty o f interest rates across regions for similar loans and borrowers. Secondly , there is e v id ence o f f ragm entat ion i f borrowers or
39
l e n d e r s are exc luded from c r e d i t markets due to some c h a r a c t e r i s t i c unrelated to the ir a b i l i t y to lend funds or repay loans. Note that i t is poss ib le for markets to be fragmented on the deposit s ide (sources o f funds) and not on the loan side or
v i c e versa.
7 .3 .2 On the s o u rce s o f funds s i d e , th e re appears to be
s ig n i f i c a n t integrat ion o f ui;oan informal markets with many major intermediary sectors in a region p o te n t ia l ly having access to the same pool o f depositors . Instances o f depositors from distant regions have also corae to l ight in hire purchase.
7 .3 .3 On the lending s ide , the importance o f reputation and long re lat ionships argues for fragmentation within such sub-markets.
Im press ions ga ined from f i e l d surveys tend to suggest
f ragm entat ion a c c o r d in g to both c r i t e r i a g iven above.
Interregional and inter-group interest rate d ispers ion can be assessed by examining in terstate RBI data from the All India Debt and Investment Survey, 1981-82. Though interest rate data is not ava i lab le , we use as a proxy the proportion o f household debt
bearing interest at the rate o f 20 per cent or more per annum. While causes o f var ia t ion in th is factor are c l e a r ly inf luenced by o ther f a c t o r s (such as the spread o f in fo rm al i n t e r m e d i a r i e s i t s e l f ) , the var ia t ion across groups o f borrowers and states i s examined s in c e la c k o f v a r i a t i o n would s t i l l be grounds f o r r e je c t in g the hypothesis. Necessary information is in Table 7.2. From this i t can be seen that the data is consistent with the hypothesis o f fragmentation both across s ta tes (the c o e f f i c i e n t s o f var ia t ion ) and across groups (the co r re la t io n c o e f f i c i e n t s ) . The most surpris ing f inding i s the high c o e f f i c i e n t o f variat ion among the urban s e l f - e m p l o y e d t e s t i f y i n g to the extreme heterogeneity o f th is group.
40
7.4 Conclusions
7.4.1 Informal markets have widely varying c h a r a c te r i s t i c s so that the true economic e f f i c i e n c y o f the ir funct ioning, r e la t iv e to what is poss ib le given environmental l im i ta t io n s , i s hard to gauge on the basis o f our l imited study. S t i l l , i t seems fa i r to c o n c lu d e t h a t , with some except ions . , markets are at the competit ive end o f the spectrum o f market types. Evidence o f both integrat ion and fragmentation has been reviewed. On balance, one
would hypothesise that loan markets, but not deposit markets, are s t i l l highly fragmented upto the 1980s.

TABLE 7.1
Industrial Organisation of Informal Sub-Markets
4-firm Entry/ Localconcen- exit pr icetrat ion barr iers d isper -r a t io (%) sion( sample firms)
Sector Marketleadership
Economicrents
Number o f firms
Financecorporations 34.7 No Small No Small Large
Hire-purchase 87.7 No Yes Yes No Large
Nidhis NA Yes Yes No No 65
Chit funds 66.6 No No No NA Large
Auto- f inanciers NA No Yes No Yes( ?) Large
Handloom f inanciers NA No No No No Large
Aratiyas ( t e x t i l e trade)
NA Yes No No NA Fewserving a region (Regional spec ia l isa t ion )
Wholesalers ( t e x t i l e trade)
NA No No No NA Large
Dockyard f inancier s NA Yes Yes No Large Small
Shroffs in NA(High) Yes No Yes No MediumWestern India
42

TABLE 7.1 CONTD.
Sector
Financecorporations
Rationing Type o f Security
Flooramounts
Co l la tera l
Government (P) Price7 in te r e st(I ) Non and Deposit price (N) (D) con- competition tro ls
ID
Hire Purchase
Nidhis
NA
Duration/Amount
Margin, reputation, c o l l a t e r a l , guarantors
Col la tera l
I (Company Sector)
D(Others)
NA
None
Chit funds Amount
Auto f inanciers NA
Colla tera l
Margin, Guarantor, c o l l a t e r a l
ID
D
N
N
Handloomfinanciers
NA Do
Aratiyas. No( t e x t i l e trade)
Wholesalers No( t e x t i l e trade)
Reputation
Reputation No
Dockyardf inanciers
NA Long Relationship No None
Shroffs in Western India
No Reputation Dlong re lat ionship
4 3

TABLE 7.2
Inter-State Variations in High Interest Loans to the Household Sector
A. Percentage of Loans with Interest Rate of 20 per cent or More
State
Rural Urban
Cult i vators
Non-cult i vators
S e l f -employed
Non-Self-employed
Andhra Pradesh 38.4 52.7 22.0 36.82Assam 7.4 0.0 0.0 0.0Bihar 25.5 46.1 23.4 6.3Gujarat 7.2 3.7 0 .0 0.6Haryana 13.7 47. 1 42.4 1.8Himachal Pradesh 1.9 0 .0 0.0 0.0Jammu & Kashmir 2.8 0 .0 0.0 0.0Karnataka 6.1 9.9 8.0 8.7Kerala 8.4 33.3 56.4 3.0Madhya Pradesh 27.9 23.3 8.0 14.7Maharashtra 4.6 5.3 6.8 3.5Orissa 10.4 38.0 2.6 1.8Punjab 12.3 16.1 5.5 14.8Rajasthan 33.8 41.6 8.0 18.3Tamil Nadu 30.1 33.5 15.0 26.8Uttar Pradesh 28.7 47.8 22.9 15.0West Bengal 14.9 7.4 26.7 17.6
C oe f f i c i e n t o f variat ion 0.7391 0.8194 1.1038 1.0704
B.
Sector
Estimated Correlation Matrix of Variables
Culti vators
Non-cult i vators
S e l f -employed
Non-se l f - employed
Cultivators 1.0000 0.7595 0.2209 0.8295Non-cult ivators 0.7595 1.0000 0.5597 0.4863Self-employed 0. 2209 0.5597 1.0000 0.1414Non-self-employed 0.8295 0.4863 0.1414 1.0000
Source o f data: RBI, A l l - In d ia Debt and Investment Survey, 1981-82.
44

CHAPTER 8
SIZE AND TRENDS IN SIZE
8•I Preliminar ies
8.1.1 Given the qual i ty o f data a v a i lab le , Lt is a moot point as to whether th is chapter should have been written at a l l . However, no r e l i a b l e e s t im a te s o f the s i z e o f the in form al s e c t o r are avai lable and so even rough estimates such as are presented here are o f some value. The estimates must, however, be found wanting by any absolute qua ity standard. This being the case, no s t a t i s
t i c a l c o n f i d e n c e i n t e r v a l s for the data presented here are reported even when t he se were, computed and found to be acceptable . Of the various estimates given, great conf idence can be placed in
the ' e s t im a te s ' for Nidhis alone. This is because these are not estimates but population f igu res . No other estimate can be considered re l ia b le in any absolute sense.
8 .2 Methodological issues
8 .2 .1 Magnitudes reported: How i s s ize to be measured? Our mainfocus in computing these e s t im a te s is to a s se s s two f a c t o r s .
F irs t , to the extent that the size o f informal markets r e la t iv e to the formal sector r e f l e c t s on the a b i l i t y o f the central bank to contro l c r e d i t , monetary aggregates rather than numbers o f c l i e n t s or transactions intermediated are c l e a r ly appropriate. Secondly, given that our evidence shows that informal c red it forms the more important source o f funds for poor households and small f irms, f inancial aggregates w i l l give a lower bound (rather than numbers o f customers or accounts) on the importance o f informal finance to part icu lar sectors r e la t iv e to formal c r e d i t . Ihus, our estimates are for f inanc ia l aggregates only since i t i s these two fac tors which are o f interest to us and, we be l ie v e , genera l ly . In l in e with these o b je c t iv e s , for f inanc ia l intermediaries the amount o f

funds intermediated is o f in t e r e s t . Thus, f igures on both deposits
and advances by them are o f in terest . Similarly to ta l informal c r e d i t to a l l sectors is o f interest and is accordingly estimated.
8 .2 .2 Measurement of magnitudes: A second issue is in the actualmeasurement o f c re d i t or depos its . The Reserve Bank reports both stock figures to capture s ize and changes in stocks to capture
t rends In s i z e . A p r i o r i , however, s t o c k f i g u r e s are inappropriate. To see th is note that two intermediaries , both with the same stock o f loans outstanding on a given date may have very d i f f e re n t impacts i f one g ives out one day loans ( to take an extreme example) and lends avai lab le funds exact ly once a year, while the other is f u l l y loaned up throughout the year. Some way o f i n c o r p o r a t i n g the time d imension f o r d i f f e r e n t loans and deposits must be found to overcome th is problem. One way is to add the stock o f depos i ts / loan s outstanding over each point in time (or day) over the entire year or the entire period for which a c r e d i t /d e p o s i t measure is sought.'*' This is then a flow estimate having the dimension 'rupee-days per year ' (or rupee-years per year with appropriate normalisation). When stock f igures are available only at widely separated points of time, then o f course a trend curve can be f i t t e d to estimate stocks at intermediate dates. For example, If a constant rate o f increase o f the stock between two points Tl and T2 is found, then for the interval (Tl,
T2) the appropriate measure is Tl plus ha l f the d i f fe rence betweenoT2 and Tl or , that i s , the ir simple average.
8 .2 .3 Thus for most f inanc ia l in s t i tu t i o n s , who may be assumed to have a constant l eve l o f outstandings throughout the year, or a
1. Even t h i s i s o p e n t o o b j e c t i o n s . A mo r e a p p r o p r i a t e me a s u r e w o u l d , f o r e x a m p l e , w e i g h t l o a n s o f d i f f e r e n t d u r a t i o n d i f f e r e n t l y . Ot he r c o n s i d e r a t i o n s may a l s o be b r o u g h t to b e a r .
2. The i d e a in t h i s p a r a g r a p h a r o s e as a r e s u l t o f d i s c u s s i o n wi t h C. P . S Nayar and S r i n i v a s a Madhur r e g a r d i n g the meas ur ement o f d e p o s i t s wi t h c h i t f u n d s .
46

r e p e t i t iv e pattern o f f luctuat ions in each year^ the stock f igures
themselves are reasonable proxies . However, i f the pattern o f f luctuations d i f f e r s fo r two d i f f e r e n t f inanc ia l i n s t i tu t i o n s , a comparison o f stock f igure w i l l be misleading. One in s t i tu t io n for which stock f igures are c l e a r l y misleading for the purpose o f comparison are ROSCAs (such as ch it funds). This i s because o f the very nature o f the ir ' l o a n ' and ' d e p o s i t ' t ransact ions . Thus, in the ir case , flow estimates are needed.
8 .2 .4 Given data l im i ta t io n s , our estimates are (except in the case o f chit funds and one or two others) stock estimates as a proxy f o r rupee-year per year f igu re s . Also, f o r bank deposits we use la te s t year stock f igures in order to retain consistency with informal sector estimates and to ' l o a d ' the resu lts in favour o f the formal sector (whose aggregate deposits and advances outstanding have grown cons is ten t ly in India ) .
8 .2 .5 The conceptual problem as to the relevant cred it magnitudeo
to be used is problematic even with the correct choice of units. Consider this example: Two firms A and B each borrow Re 1 from a bank. While A uses the borrowed funds to buy productive inputs from B, B re -depos i ts the money in the bank intending to put i t to u s e ' l a t e r . At the start o f the next period, the bank c a l l s in i t s loan from A but not B. B allows A to pay f o r purchases la ter and makes use o f i t s bank loan to meet i t s payments. In both s ituat ions (p e r io d s ) , productive a c t i v i t y is the same. This example
suggests that d i f f e r e n t l e v e l s o f c r e d i t may finance the same l e v e l o f p r o d u c t i v e a c t i v i t y depending on the volume o f i d l e ba lances - in both cases the volume o f p r o d u c t i v e l y employed credit is Re 1 (times the period length) . I f firms do indeed hold id le balances as a precaution against antic ipated or unanticipated monetary str ingency, then the " co rre c t " measure o f c red it as a productive input would have to be net o f such id le balances. In
3. T h i s p a r a g r a p h was m o t i v a t e d by h e l p f u l d i s c u s s i o n w i t h S r i n i v a s a M a d h u r , who h o we v e r , d o e s not n e c e s s a r i l y s h a r e the v i e w e x p r e s s e d .
47
f a c t , even i f there were transient id le balances, these would have to be d educted . L ik ew ise , as the second part o f the example shows, c r e d i t which i s o n - l e n t ( s u b - i n t e r m e d i a t e d ) should be counted only once.
8 . 2 . 6 Such cor rec t ion s are important p a r t i cu lar ly when trying to
gauge the importance o f two a l ternat ive . credit sources l ik e formal and informal c r e d i t . However, the example is s im pl is t ic and does
not discuss any bene f i ts which may ar ise from the a b i l i t y to hold id le balances and the a b i l i t y to on-lend (the la t t e r i s , o f course re lated to the question o f f u n g i b i l i t y o f cred it from d i f f e r e n t so u r ce s ) . ^
8 .2 .7 An addit ional issue raised by the second part o f the ex
ample is a t t r ibu t ion . Is the rupee o f bank c re d i t to B which i s
on- lent to A formal or informal cred it? Again the answer is not c lear since the loan i s given by a formal in s t i tu t i o n and sub- intermediated by an informal agency. In p r a c t i c e , th is ra ises the issue o f the correc t method o f treating bank refinance o f informal lenders and agents such as wholesalers who have s ign i f i cant on-lending.
8 . 2 . 8 Unfortunately, methods for c o r r e c t ly measuring credit haveyet to be developed, to our knowledge. Thus, while recognising the l im ita t ions in the procedure, we s t i ck conceptually to thesimple minded method o f adding up the ( t i me i n t e g r a l s o f )formal/informal l i a b i l i t i e s from balance sheets o f firms fo r our user based estimates in Table 8 .1 . Estimates for intermediaries in Table 8 .2 are l e s s a f fe c te d given n e g l ig ib le inter-intermediary
funds f l o w s . We may mention that even though by t h i s method c red it in both parts o f the example amounts to Rs 2, in general, i t is not true that there is a one to one correspondence between 'p ro d u c t ive c r e d i t ' and our c red i t measure/ However, what i s true i s that apportionment o f c re d i t into formal an^ informal components, Re 1 each in the second part o f the example , remainsstraight forward.
48

8 .2 .9 Types of estimates: Three sets o f estimates are reported.An estimate o f aggregate informal c re d i t broken down by broadcred i t receiving sectors , estimates o f aggregate deposits and advances o f informal intermediaries and estimates o f informal cred it going to se lected sectors .
8 .2 .10 In making these estimates the basic approach was to usesample estimates o f the ra t io o f informal c re d i t to some magnitude
for which aggregate information i s ava i lab le (such as bank cred it or value added). Informal c re d i t i s then estimated as the samplerat io times the aggregate f igure . When it was poss ib le to usemore than one magnitude, th is was done. In such cases a l l estimates are reported. In some cases the resu lt ing aggregate estimate was further blown up to arr ive at an estimate for a broader grouping of sectors using value added f igures ( . e . g road construct i o n is a narrow grouping wi th c o n s t r u c t i o n as the broader
grouping). Dates for estimates given r e fe r to the date for which aggregate f igures were ava i lab le . Thus, im p l i c i t l y , we assume that the sample ra t io is unchanged between the sampling period and the date o f the estimate. Also, the procedure c l e a r ly assumes a unitary e l a s t i c i t y o f informal c re d i t with respect to the aggregate magnitude used. For one large subset o f estimates used to compile estimates o f informal c re d i t by rece iv ing sectors , the assumption o f unitary e l a s t i c i t y was s t a t i s t i c a l l y tested and not re jected with high conf idence . Deta i ls o f aggregates are in Table 8.1. Sources o f data for estimates are l i s t e d in the Appendix to this chapter.
8.2.11 In compiling the estimates o f aggregate informal cred it to using sectors , we have d e l ib e r a t e ly chosen to bias the estimates against informal c red i t so as to get a lower bound rather than an
upper bound es t im ate for in form al c r e d i t . D e t a i l s o f b ia s
d e l ibe ra te ly introduced are as fo l low s :
a. Ratios o f informal c re d i t to formal c red i t and o f informal c re d i t to value added were based on Reserve Bank o f India
4. V a l u e o f p r o d u c t i o n i n t h e c a s e o f s m a l l
49

surveys o f Small Scale Industr ies , Traders and Transport Operators. These surveys were biased against informal sectors as only units rece iv ing formal c red i t were included in the survey.
b. Even though a s t a t i s t i c a l t e s t f a i l e d to r e j e c t thehypothesis o f a unitary e l a s t i c i t y o f informal credit per f irm with respect to income, using cross sect ional dataand state domestic product as. the income var iab le , thepreferred estimate uses an average o f two estimates, one using bank c re d i t (the low estimate except for transport operators) and the other using value added.^
c. Though the test reported is for informal cred it per firmyet no attempt was made to correct fo r growth in the number o f f irms.
d. Only se lected sectors were used in compiling aggregate estimates whereas the bank credit f igure used for comparison i s fo r a l l (urban and rural ) sectors .
e. When aggregate estimates were not avai lab le for the mostrecent year ( 1 9 8 6 -8 7 ) , no attempt was made to p r o j e c t these f igures . In contrast , the bank cred i t f igure is the most recent ava i lab le .
f . A large portion o f informal cred it was subtracted from the gro ss t o t a l obta ined as p o s s i b l y c o n s i s t i n g o f b lack money.
One source o f double counting, between private l imited companies and other sec tors , could not be eliminated. However, the overlap between such companies and f igures for other sectors is l e s s than
one per cent . In fact the b ias does not exceed Rs 250 crore and should in fac t be much lower.
8 .2 .12 In compiling other estimates, while caution was used, no de l iberate bias was introduced.
8 .3 Estimates of size
8.3 .1 The estimates o f informal c red i t ' to receiving sectors i s
s c a l e i n d u s t r y and a w e i g h t e d a v e r a g e o f c r e d i t p e r v e h i c l e o f d i f f e r e n t t y p e s f o r t r a n s p o r t o p e r a t i o n s .
5. See the p r e v i o u s f o o t n o t e .
50

given in Table 8.1. As can be seen, despite the anti informal c red i t b ias , our estimate shows that informal c red i t i s 73.2 per
cent o f g r o s s bank c r e d i t . The s e c t o r absorb ing the g r e a t e s t amount o f informal c red i t is the trade sector .
8 .3 .2 Estimates o f c r e d i t and deposits o f intermediaries are given in Table 8.2. As can be seen, f inanc ia l a c t i v i t y by inter mediaries i s unimportant r e la t iv e to bank c r e d i t . Only 18 per cent of advances arid 11 per cent o f deposits are with informal in ter mediaries. Madhur (1987) estimated informal deposits for a d i f ferent subset o f firms at 16 per cent. The bulk o f the ' o t h e r s ' f igure co n s is ts o f trade c r e d i t . Trade c red i t is there fore seen to be the most important component o f informal c r e d i t .^ Among in ter mediaries, the dominance o f ch i t funds (by the middle estimate),
f inance corporat ions and hire purchase may be noted. Also o f note i s the l a r g e s i z e o f the u n c l a s s i f i e d firm., P e e r l e s s General Finance and Investment Limited.
8 .3 .3 Informal c red i t estimates for s p e c i f i c sectors from f i e ld surveys which are i n c l ude d but not reported separately in Table8.1 are in Table 8 .3 . As mentioned, the basis o f computations is in- the Appendix. A problem with the in ter -corporate funds estimate is that i t cannot be reconci led with the estimate o f in fo r mal c re d i t to publ ic l imited companies in Table 8.1. Though the two estimates are based on d i f f e r e n t aggregate firm populations,
there is a large overlap. This suggests that corporate rel iance on informal cred it is much higher than is reported in Table 8.1 or. that our estimate o f in ter -corporate funds is ser ious ly biased.^ The la t t e r may be ruled out since even the t o ta l intercorporate
6. Thought t h e r e i s no s e p a r a t e c h a p t e r on t r a d e c r e d i t , i t has been s t u d i e d in t h e c o n t e x t o f a l l c r e d i t u s i n g s e c t o r s . See a l s o B h o l e( 1 9 8 5 ) , w h o se r e s u l t s a r e s u m m a r i s e d in c h a p t e r 13.
7. In f a c t B h o le ( 1 9 8 5 ) f i n d s t h a t t r a d e c r e d i t a l o n e i s as i m p o r t a n t as bank c r e d i t f o r the sample o f f i r m s he s t u d i e d and the y e a r s t o w hich h i s d a t a p e r t a i n .
51

cred it in the sample exceeds the relevant RBI f igu re . No attempt was made to adjust the Table 8.1 figure upwards in keeping with our general approach.
8 .4 Trends in size of intermediaries
8.4 .1 S ince our data i s l a r g e l y c r o s s s e c t i o n a l , l im i t e d
evidence on the growth o f informal c re d i t i s avai lable . Thus, while the impression has been gained o f a rapidly growing informal sector , we have only l imited d ire c t evidence. For intermediaries, the p o s i t i o n i s much b e t t e r due to the a v a i l a b i l i t y o f RBI
oestimates. The fo llowing trends emerge from here:
i . Hire Purchase : Growth o f d e p o s i t s f a s t e r than bankdepos i ts .
i i . Finance Corporations: Declining.
i i i . Chit Funds: Growth o f c r e d i t /d e p o s i t s faster than banks.Growth in popularity outs ide South India, i t s trad it iona l s tronghold .
iv . N id h is : Growth f a s t e r than bank c r e d i t ( f rom a smallb a s e ) .
v . Indigenous Bankers (Based on estimates provided by the Bombay Shroffs A sso c ia t io n ) : Declining sharply.
Relevant f igures for the f i r s t four categor ies are to be found in the respect ive chapters o f the report .
8. S u r v e y o f d e p o s i t s w i th N on-B anking Companies c o n d u c t e d a n n u a l l y . These s u r v e y s e x c l u d e non company i n t e r m e d i a r i e s .
5 2

TABLE 8-1
Aggregate Estimates of Urban Informal Credit in India hy Sector of Use
Sector
(Rs Crore)
Year Est imate
Low
1.
3.4.
5.
6 .
7.8 .9.
9.
10 .11 .12 .13.14.
Private construct ion o f 84-85which Housing (Private 84-85res ident ia l b u i ld in g s )
Small sca le industry Low:Jan,85High:86-87
Mid:AveRoad construction 86-87Road transport, related 84-85serv ices and storage o f which road transport
Trade, hote ls & o f which trade
Low:86-87 High:Jan,85
Mid: Ave restaurant 84-85
Low:Jan,85 High:84-85
Mid:AveRecreation, enterta in - 85-85ment & personal serv ices Public l imited companies 84-85Private l imited compinies 8 5-86Urban household informal 81-82debtTotal informal credito f which estimated black money used in businesses Net totalGross bank credit(P) March 87Ratio o f (10) to (9) (%)Ratio o f (9) to (11) (%)Ratio of (10) to (11) (Z) -
5840
1040
36759
Middle High
865559
8953 12066
4541391
1232
544 7251673
1423
66586
1184
1187112141193
8159735849
4574862543
56.07130.63
73.15
Notes: 1. P: Provisional2. Years/dates given are fo r aggregate f igures used to in f la te
sample estimates. Stock cred it f igures may be taken to prevai l at the mid point o f periods in cases where flow aggregate f igures were used.
3. For the basis o f estimates see the Appendix.
5 3

TABLE 8 .2
Aggregate Estimates of Credit and Deposits Activity of Informal Intermediaries
(Rs. crore)
Sector /year Advances Deposits
Low Middle High Low Middle High
1. Hire purchase 1555 , 3759 2827(March (June (March
1987) 1987) 1987 )
2. Finance corporations (December 1986)
692 692
3. Chit funds 2394 (March 1986)
8163 8260 2394 8163
4. Nidhis (March 1986) - 70 74
5. Peerless General Finance and Investment Company (December 1987)
26 612
6. Indigenous Bankers 1084 361
7. Subtotal for major intermediaries
13794 12729
8. Trade c r e d i t , f r iends & re la t iv e s and other informal intermediaries
31954
9. Total 45748
10. Gross bank c r e d i t /d e p o s i t s 62543 108411
11. Ratio o f (6 ) to (9 ) (%) 22.06 11
Note : See Appendix for basis o f estimates.
54

TABLE 8.3
Sectoral Estimates of Informal Credit Based on Field Data
(Rs. Crore)
Sector Date/year Informalo f estimate cred it
Garment exporting units 86-87 259
Powerloom units 86-87 914
Film production 279
Intercorporate funds markets March 36
Public sector 3392
Private sector 600
5 5

CHAPTER 9
REGULATION OF INFORMAL INTERMEDIARIES
9-1 The current regulatory environment
9.1 .1 Regulations governing informal intermediaries have been b r i e f l y alluded to in Chapter 7 and described in more deta i l in the case s t u d i e s . E a r l i e r l e g l i s l a t i o n i s d e s c r i b e d in the Appendix to th is chapter.
9 .1 .2 Currently, the fo llowing major laws or d irec t ion s in force govern the workings o f non bank intermediaries aside from special acts governing chit funds and hire purchase.
i . The Non-Banking F in a n c i a l Companies (R eserv e Bank)D i r e c t i o n s , 1977 (as amended upto 1984) . (a b b r e v ia t e d NBFD)
i i . The Miscellaneous Non-Banking Companies (Reserve Bank)Direct ions , 1977 (as amended upto 1984), (MNDB)
i i i . The Res iduary Non-Banking Companies (R eserv e Bank)D irect ions , 1987. (RNBD)
iv. Chapter IIIB o f the Reserve Bank o f India Act, 1934 (which came into force in 1963) .
v. Chapter IIIC o f the Reserve Bank o f India Act, 1934 (which came into force in 1983).
v i . Chapter V o f the RBI Act , 1934.
9.1 .3 In a d d i t i o n , i n e f f e c t i v e l y e n f o r c e d moneylenders a c t s impose interest rate c e i l i n g s , r e g i s t ra t io n and record keeping
requirements in various states in India. Further d e ta i l s are in the Appendix to th is chapter.
9 .1 .4 Chapter V re la tes to penalt ies for v i o la t i o n o f various Provisions and Direct ions la id down by the RBI.
56
9.1 .5 Chapter IIIB a p p l i e s to a l l in c o r p o r a te d non-banking
d e p o s i t taking i n s t i t u t i o n s and other non-bank f i n a n c i a l in s t i tu t io n s . The chapter defines the powers o f the Reserve Bank over these in s t i tu t io n s with respect to :
i . Issuing advertisements and other promotional materiali i . Information i t is empowered to c a l l for
i i i . Direct ions i t may issuei v . Inspection andv . S o l i c i t in g of deposits by such inst i tut i o n s .
Under the Act , companies and partnerships are included in nonbanking in s t i tu t i o n s , provided partners' cap ita l exceeds Rs. 1lakh in the l a t t e r ca s e . Non-banking i n s t i t u t i o n s in c lu d e ' f i n a n c i a l i n s t i t u t i o n s ' , which includes non-banking in s t i tu t io n s which finance trade, industry, commerce or agr icu lture , which
invest in shares, stock, bonds or government s e cu r i t i e s and hire purchase firms
9 .1 .6 Chapter IILC a pp e a r s Lo be an attempt to plug the loophole with respect to unlncorporaLed bodies which came to l igh t in the Sanchaita case and in other s imilar cases. The main provis ion o f t h i s s e c t i o n l i m i t s the number o f d e p o s i t o r s which an unincorporated body can accept to 25 per partner (or individual in case o f an unincorporated as so c ia t io n o f ind iv iduals) and 250 o vera l l . Certain powers o f search, in case i t is suspected that the number o f depositors exceeds t h i s l i m i t , are also la id down under this s e c t ion , the Reserve Bank recent ly took ac t ion against f l y by night 'b lade companies" in the states of Karnataka and Kerala which had sprung up in recent years. These firms are dealt with in greater d e ta i l elsewhere in the report .
9.1 .7 The three sets o f D irect ions apply to d i f f e r e n t groups o f informal intermediaries . All o f them, however, apply only to companies as defined in sect ion 451(a) o f the RBI Act , 1934 and not to other unincorporated firms. All three sets o f d i re c t io n s p la ce l i m i t a t i o n s on the d u r a t i o n f o r which d e p o s i t s can be
57

accepted. In addit ion , both Direct ions o f the year 1977 lay down c e i l i n g s on the rat io o f net owned funds to depos i ts . Depositinterest rate c e i l i n g s app l icab le to most firms are la id down inNBFD and MNDB and a cash "reserve ra t io " fo r cer ta in firms in also
la id down in NBFD. As discussed e a r l i e r , RNBD, which applies to
Peerless, lays down stringent requirements for the loan p o r t f o l i o
allowed.
9 .1 .8 As can be seen from the b r i e f d escr ip t ion given above, a l l three sets o f Direct ions as also Chapter IIIC are in the nature o f quant itative r e s t r i c t i o n s on the extent o f deposit taking business of an intermediary. Furthermore, deposit interest rate c e i l in g s and r e s t r i c t i o n s on loan p o r t f o l i o s are also la id down.
9 .1 .9 The Chit Fund Act, 1982 lays down certa in provis ions to
ensure that subscr ibers ' in terests are protected but also provides c e i l i n g s on the duration o f ch i t s and the maximum bid in auction c h i t s , the la t t e r amounting to an interest rate c e i l i n g . These c e i l i n g s , i t is argued in the case study, are undesirable.
9.1 .10 A Hire Purchase Act has been on the statute books since 1972 though i t is yet unenforced.
9.1.11 F i n a l l y , a Hundi Code B i l l , d r a f t e d by the Rajamannar Committee (1978) in consultat ion with various business and shrof fs organisations and which i s seen by businessmen to be progress ive, has yet to be tabled in Parliament.
9 .1 .12 In the l ight o f our d iscuss ion currently in the previousparagraphs i t is easy to see that , i f enforced properly, the major laws governing informal c red i t intermediaries w i l l s t i f l e the healthy development o f informal f inanc ia l 'm arkets . Directions for information returns and for advertisements and also the powers o f the RBI under Chapter IIIB appear, however, to be adequate for the
formulation o f su itable monitoring schemes. Also, as the case studies show, the current corpus o f regulations does not in any
way prevent questionable firms from winning the approval of the
58
RBI or from indulging in counterproductive a c t i v i t i e s . It should be c lear , without further d iscuss ion , that a d ras t i c overhaul o f the regulatory corpus and also i t s enforcement machinery i s ca l led f o r .
9 .2 Self regulation:
9.2 .1 Many shro f fs " organisat ions and assoc iat ions o f traders have elaborate s e l f - r e g u la t io n and arb i tra t ion committees. In C a lcu t ta , a t r a d e r s a s s o c i a t i o n even has a t w o - l e v el appeals s t r u c t u r e . Due to the i m p l i c i t threat o f o s t r a c i s m , these organisations are reported to be remarkably e f f e c t i v e . They are also much faster and cheaper than the courts (See a lso Timberg and Aiyar, 1980).
9.3 Government regulation at work:
9.3 .1 Four cases o f government regulation are discussed in thereport. The f i r s t case study documents the progressive s t i f l i n g o f shrof fs o f Western India by regulations such as Chapter IIIC and requirements under the Income Tax Act that payments above a certa in size be made by cheques rather than, say, hundis. The
second case study concerns the government's attempts to regulate the intermediary firm Sanchaita Investments. Due to a weakly
made out case, the Supreme Court quashed lega l proceedings against Sanchaita , even while acknowledging that i t paid i n t e r e s t on d e p o s i t s out o f f resh d e p o s i t s and had a q u e s t i o n a b le loan p o r t f o l i o . The third case, that against the 50 years old Peerless General Finance and investment Company was also thrown out o f the courts since the Reserve Bank t r ie d to c l a s s i f y the firm as a banned " p r i z e d c h i t /m o n e y c i r c u l a t i o n scheme' . Thisc l a s s i f i c a t i o n is d i f f i c u l t to accept . In f^ c t , though Peerless '
a c t i v i t i e s were in some cases arguably sharp, i t was by and large an innovative and dynamic f in an c ia l intermediary. Thus the wisdom of attempts by the Reserve Bank to suppress i t completely can be questioned. The fourth case r e la te s to the RBI's ac t ion against f inance corporations known as ' b la d e companies in Kerala. These
59

companies had expanded great ly in the wake o f the sharp increase in remittances from Indian workers in the Persian Gulf- Many more c l e a r l y unsound and ' f l y - b y - n i g h t ' f i rm s to o k advantage o f g u l l i b l e depositors and secured borrowers a l ike . While the RBI succeeded in ident i fy ing and bringing act ion against a number o f unsavoury firms, the ir act ion caused runs by depositors on a large
number o f f i n a n c e c o r p o r a t i o n s . In the p r o c e s s , s e v e ra l corporat ions , which were not f l y - b y - n i g h t e r s , f a i l e d due to runs
on them by dep os i to rs . It is not c lear that the RBI's act ion in th is case was misguided, but the fact remains i t that did have p a r t ia l l y negative consequences.
60

PART C
A n a ly s is o f Economic Impact o f Inform al C redit Market s

CHAPTER 10
INFORMAL CREDIT AND THE EFFICIENCY OF RESOURCE ALLOCATION
10.1 Concepts of efficiency for financial markets
10.1 .1 In analysing the e f f i c i e n c y o f resource a l l o c a t i o n , the ultimate focus must be on the non-wastefulness o f fa c tor use and on the a l l o c a t i o n o f fa c tors to the most s o c i a l l y productive purposes . To analyse the impact o f c r e d i t on the e f f i c i e n c y o f
resource a l l o c a t i o n , a framework i s required that re la tes credit a v a i l a b i l i t y and the cost o f c red i t to these.
10.1.2 Tobin (1984, quoted in Fry, 1988) lays down four concepts fo r judging the e f f i c i e n c y o f a f inanc ia l system:
a. Information arbitrage efficiency: which is the degree o f gain poss ib le by the use o f commonly available inf o rm a t io n . E f f i c i e n c y i s i n v e r s e l y r e l a t e d to the gain.
b. Fundamental valuation efficiency: The extent to whichthe present discounted bene f i ts stream from an asset are re f le c te d in i t s p r ice .
c . Full insurance efficiency: The extent o f hedging poss ib l e against future con t ingen c ies .
d. Functional efficiency: This i s r e f l e c te d in the transact ions cost o f borrowers and lenders combined (lower transactions costs r e f l e c t more funct iona l ly e f f i c i e n t the market). An extended discussion of th is concept is in Fry (1988).
10 .1 .3 I m p l i c i t l y , these concepts r e f l e c t the impact o f c red it markets on the e f f i c i e n c y o f resource a l l o ca t io n . However, while information arbitrage e f f i c i e n c y and functional e f f i c i e n c y are c e r ta in ly concepts which can be used in judging the r e la t ive e f f i c i e n cy o f d i f f e r e n t components o f a f inanc ia l markets, the other two concepts are more d i f f i c u l t to apply. Valuation e f f i c i e n c y i s
61

cer ta in ly lowered by a cred it market segment which i s subject to quant itative contro ls and administered pr ices . However, f ree ly functioning markets may rat ion c re d i t and keep loan rates o f interest below th e i r market c lear ing l e v e l in a world in which there i s asymmetric information and incomplete contingent markets, implying some degree o f in e f f i c i e n c y by the f u l l insurance c r i t e r i o n (see S t i g l i t z and Weiss, 1981 and Santomero, 1984).
10 .1 .4 However, while accepting that actual c red i t markets w i l l depart from fu l l e f f i c i e n c y , i t is s t i l l poss ib le to examine the re la t ive e f f i c i e n c y o f resource a l l o c a t i o n f a c i l i t a t e d by d i f ferent market part ic ipants i f a set o f c r i t e r i a can be la id down
to judge e f f i c i e n c y . A crude set o f c r i t e r i a that can be used to judge the impact o f formal and informal c red i t on the e f f i c i e n c y
of fac tor use in the Indian s i tu at ion are the r e la t iv e magnitudes o f three rat ios by firms primari ly supported by formal/informal c r e d i t . The ra t ios are the cap ita l -output r a t i o , the labour- output rat io and the cap i ta l labour r a t i o . 1 The rat ionale is as fo l lows. In the Indian s i tuat ion , the formal sector keeps rates o f in terest below the ir market c lear ing le ve l s and rat ions cred it through s e l e c t iv e c red i t c o n t r o l s . Consequently, i t can be expected that f irms with access to formal c red i t w i l l have an overly cap ita l intensive choice o f techniques, which detracts from the e f f i c i e n c y of fac tor use. Furthermore, due to less than perfect c redit rat ioning , i n e f f i c i e n t firms may rece ive finance while e f f i c i e n t firms are rationed o u l of the market. I n e f f i c i e n t choice o f techniques are re f lec ted in the capita l -output ra t io while r e l a t i v e l y i n e f f i c i e n t f a c t o r use i s r e f l e c t e d in the f a c t o r ra t ios for f irms within the same industry. It should be pointed
out that low fa c tor use ra t ios are neither s u f f i c i e n t nor necessary as proof o f i n e f f i c i e n c y . Furthermore, unless there are constant returns to s ca le , a higher c a p i ta l output ra t io for a firm
1. The r e l a t i v e r a n k in g by any two r a t i o s do not n e c e s s a r i l y d e t e r m i n e t h e r e l a t i v e rank by the t h i r d . For e x a m p l e , s u p p o s e f i r m A has bo th f a c t o r o u t p u t r a t i o h i g h e r than from B.The c a p i t a l / o u t p u t r a t i o r a n k i n g i s s t i l li nde t ermi nat e .
6 2

may simply r e f l e c t a d i f f e re n t sca le o f operations compared to oanother firm. Likewise, cap i ta l labour r a t io s may r e f l e c t non-
hom othet ic i ty . The measures are therefore crude. Thus, whenever i t i s poss ib le to supplement the evidence o f the rat ios with d i r e c t evidence th is i s done.
10 .1 .5 Even i f i t is accepted that formal cred it leads to ine f f i c i e n t fac tor use, i t is by no means c lear that the informal sector leads to r e la t iv e ly e f f i c i e n t cap ita l use. This is since informal c red i t markets are themselves imperfect and segmented. Furthermore, they can and do ration c red i t (by, f o r example, lending to known part ies only in some segments). Informational cons iderat ions may a lso lead to suboptimal interest rates .
10 .1 .6 So much for fa c tor use. It is much more d i f f i c u l t to
judge the r e la t iv e impact of the ICM on the e f f i c i e n c y o f resource a l l o c a t io n to d i f f e r e n t a c t i v i t i e s . While, in an absolute sense, segmentation and rat ioning imply m isa l locat ion o f resources, the pos i t ion r e la t iv e to the formal sector is s t i l l not c l e a r . We r e s t r i c t a ttention to the r e la t iv e impact o f informal c red it on
the m obi l isat ion o f saving and the financing of i l l e g a l a c t i v i t y , since there can be l i t t l e doubt that greater aggregate saving in the current context is to be desired s o c i a l l y . We now turn to the evaluation.
10.2 Impact on the efficiency of resource use
10.2.1 The r a t io s are presented for three productive sectors in Table 10.1. As can be seen, in no case do the ra t ios provide unambiguous support for the hypothesis that informal cred it increases e f f i c i e n c y o f resource use. More importantly, no s inglerat io supports the hypothesis fo r the item measured by i t in a l l
sectors . In f a c t , in road construct ion , informal borrowers arele s s e f f i c i e n t than formal borrowers by the fac tor use r a t io s .
2. I am g r a t e f u l to T.N. S r i n i v a s a n f o r t h e s e o b s e r v a t i o n s .
63

Thus no firm global conclusion can be drawn.
10.2.2 A dd it iona l ly , a regression with in ters ta te data o f the cap ita l output r a t io on the informal c red it / fo rm al c red i t ra t io for a pooled sample o f the four RBI surveys o f f irms, revealed no l ink between the two.
10.2 .3 The most str ik ing piece o f d i r e c t evidence that has come to l i gh t concerns the finance of used veh ic les by auto financ i e r s in Namakkal and by h ire purchase firms in Delhi. Since interest rates on such loans can exceed 40 per cent per annum, the gross rate o f return on such ve h ic le s must c l e a r l y be very high. That transport operators who rece ive cheap bank finance are able to dispense with these v e h ic le s , in a ca p i ta l scarce economy, suggests that informal finance eases the bias towards the underu t i l i s a t i o n o f scarce c ap i ta l that a r ises due to the cheap in ter est rate p o l i c y of the formal sector . It should be c lear that i t
is inappropriate to attr ibute s o c ia l costs due to environmental po l lut ion or congest ion, i f any, to a private sector source o f f inance.
10.2.4 In the study o f the t e x t i l e d i s t r ib u t io n system in India, where most credit and goods market transactions are j o i n t l y made, we argue in the report using a three-agent model based on
the s ty l i sed fa c ts o f the system, that informal c r e d i t lowers d is t r ibut ional cos ts and d is t r ib u te s the cost o f r i sk ar is ing from demand uncertainty. That i s , we argue that informal c re d i t contr ibutes to more e f f i c i e n t resource u t i l i s a t i o n in trade.
10.3 Impact on the efficiency of sectoral resource allocation
10.3.1 Re la t ive ly more informal f inarce goes for consumption
than formal finance. However, much o f th i s c red i t is for housing investment. Nidhis and to a l e s s e r extent finance corporat ions , contribute d i r e c t l y to cap i ta l formation in housing construct ion . Also, the major ity o f consumption loans go to groups who are asset poor. It is not c lear that add it iona l savings by such groups i s
64

necessar i ly in the soc ia l in terest at a l l t imes.
10 .3 .2 In the absence o f information on the interest e las t i c i t y o f saving and on the degree o f s u b s t i t u t a b i l i t y o f d i f ferent assets , i t i s d i f f i c u l t to estimate the add it ive savings impact o f in form al f i n a n c i a l mark’e t s . However, such markets c l e a r l y contr ibute g re a t ly to gross savings and chit funds, nidhis
and P e e r le s s may be s in g le d out for s p e c i a l mention in t h i s
respect . The c h a r a c t e r i s t i c s o f nidhis and chit funds make i t l i k e l y that a d d i t i v e c o n t r i b u t i o n s to savings are p a r t i a l l y re f le c ted in their deposit f igu res . Other fa c to rs that are normally held to aid savings, l ik e higher deposit in terest rates , in
creasing extent and d iv e r s i ty o f f inanc ia l intermediation and in some c a s e s , h igher income caused by more p r o d u c t iv e r e s o u rc e u t i l i s a t i o n as with auto finance, are c l e a r l y present.
10 .3 .3 Regarding the finance o f i l l e g a l or undesirable goods and fore ign exchange rackets , there is a c lear presumption that informal c re d i t markets lead to a greater provis ion o f such goods than would otherwise be the case. However, by i t s very nature, such a c t i v i t y i s hard to assess quant itat ive ly ( f o r qua l i ta t ive ev idence see Chapter 14) . However, i t should be noted that 'market rumours' o f formal sector f inancing are equally prevalent.
10.4 Information arbitrage efficiency
10.4.1 While fragmentation o f the informal c red i t market ensures that they are funct iona l ly i n e f f i c i e n t , examples o f eas i ly
avai lab le arbitrage opportunit ies can be found for formal f inanc i a l markets as well (See for example Das-Gupta 1989). On theother s ide o f the balarce , the case o f piggy back" intermediaries
/fo r l i f e insurance shows how the informal sector takes advantage o f arbitrage opportunit ies due to formal and informal sector pr ice d i f f e r e n t i a l s .
10.5 Functional efficiency
65

10.5.1 D i f f i c u l t i e s in decomposing loan interest rates for s imilar loans by intermediaries makes i t impossible to d i r e c t l y compare r e la t iv e establishment c o s t s . However, three p ieces o f evidence indicate that informal sector intermediaries are more funct ional ly e f f i c i e n t than banks.
10.5 .2 F i r s t ly , the impressions o f a l l researchers who have examined the problem is that establishment costs o f the informal
sector are low compared to the formal sector . Without quantitat ive government r e s t r i c t i o n s , they would poss ib ly be even lower in some submarkets due to sca le economies. For example, we find that establishment cos ts o f shro f fs have r isen due to the reduced scale o f t h e i r o p e r a t i o n s in the wake o f government r e g u l a t i o n . Secondly , d e f a u l t c o s t s o f banks are known to be high. Nayar
(1987) report commercial bank default rates o f as much as 70 per cent o f loans in some bank branches. Since commercial bank loan
defaults are not revealed in their published accounts, accurate quantitat ive assessment for the sector as a whole i s not p oss ib le . Finally , in f i e l d interviews with borrowers and d ep os i tors , with some exceptions for borrowers from finance companies and chit funds, c o n v e n ie n ce and i n c i d e n t a l c o s t s f o r in form al c r e d i t markets were found to be smaller than for formal c r e d i t markets. In two cases where quantitat ive d e t a i l s could be found or calculated , e f f e c t i v e informal sector c os ts to c l i e n t s were found to be
olower than formal sector c o s t s . Thus, by these c r i t e r i a r e la t ive functional e f f i c i e n c y o f the informal market is supported.
10.5.3 One remaining puzzle about informal c red i t c os ts needs to be addressed. It has been argued that the main component o f in
formal sector interest on loans is the deposit interest rate and opportunity cost o f own funds. But, why is th is so with respect to deposits costs? Put another way, h w can commercial banks, which have high inconvenience costs to depositors and also low
3. The c a s e s a r e l o a n s t o t e x t i l e w h o l e s a l e t r a d e r s and f u n d s r e m i t t a n c e s t h r o u g h c o m m e r c i a l i n s t r u m e n t s v e r s u s d a r s h a n i hund i s .
6 6

deposit interest rates a t trac t depos its despite the fact that in
formal intermediaries o f f e r higher deposit rates and, for example in the case of n idhis , an equally large array o f deposit schemes? Is i t the case that these interest rate d i f f e r e n t i a l s between formal and informal sector r e f l e c t hidden r isk costs o f deposits with informal depository ins t i tu t ion s?
10.5.4 Except in the case o f d e p o s i t s with a s e c t i o n o f
f inance corporat ions , we would argue that th is i s not the case.
The primary reason for the d i f f e r e n t i a l i s , we expect , the fact that bank branches are within eas ier reach o f most depositors than o f f i c e s o f in fo rm a l i n s t i t u t i o n s . S econ d ly , in fo rm a l i n t e r mediaries tend to lo ca te near the ir loan c l i e n ts to enhance in fo r mation gathering potentia l and convenience to borrowers. In business areas, given re s t r i c t e d cred it a v a i l a b i l i t y , the opportunity cost o f depos its would not be r e f l e c t e d by bank deposit rates. Current accounts with banks, o f course , r e f l e c t th e ir regulation
induced monopoly for cer ta in kinds o f payments.
10 .5 .5 A dd it iona l ly , f o r loans from fr iends and re la t ive s (a t ,i t has been found, upto 18% per annum), chit funds and nidhis , high deposit rates r e f l e c t the surplus from high loan rates being passed on to depos i tors . This is true by the very nature of the f i r s t two in s t i t u t i o n s . In the case o f n idhis , h i s t o r i c a l l y ,these in s t i tu t i o n s have been set up by publ ic s p i r i t e d individuals f o r the mutual b e n e f i t o f s h a r e h o ld e r s (which in c l u d e s a l l depositors and borrowers).
10.6 Conclusions
10.6 .1 While no global conclusions can be drawn, i t is c lear

that in some, though not a l l , respects informal c red i t does contr ibute to more e f f i c i e n t resource u t i l i s a t i o n p ar t i cu lar ly from the point o f view o f functional e f f i c i e n c y . However, i t is d i f f i c u l t , given current research, to come to an unambiguous ranking of the formal and informal s e c t o r s -
68

TABLE 10.1
Efficiency Ratios for Productive Sectors
Sector Capita l - Labour- Labouroutput output cap i ta lr a t i o ra t io ra t io
1. Road Construction
All borrowers^- 0.349
Informalborrowers
Formal borrowers
0.233
0.079
2. Garment Exporters
Informalborrowers
Fo rmal borrowers
0. 23
0. 3 rj
3 . Powerlooms
All borrowers 0.085
Informalborrowers 0.141
1.197
0.56
0. 33
0.40
0.30
3.43
3.809 16.35
1.037 13.13
2.43
0.94
4.71
2.14
Notes: 1. Includes non"-borrowers and borrowers from both sources .
2. Informal Credit excludes trade c r e d i t :All firms in these sectors are substant ia l ly dependent on trade c r e d i t .

CHAPTER 11
11.1 Evaluation criteria
11.1.1 The relevant c r i t e r i a here are f i r s t l y , the percentage
total borrowed funds from informal cred it sources received by smaller, presumably economically weak, units both abso lute ly and r e l a t i v e to la rge u n i t s . S econd ly , for i n t e r m e d i a r i e s , the c r i t e r i o n i s the ex tent o f f in a n c e go ing to e c o n o m ic a l ly disadvantaged sect ions both absolute ly and re la t ive to formal f inance. The data summarised in Table 11.1 shows that informal finance to borrowers scores p o s i t i v e l y on both counts except that i t f a i l s the t e s t r e l a t i v e to formal f in a n c e f o r t r a n s p o r t
operators. However, for these units the data bias in looking only at bank a s s i s t e d u n i t s i s p a r t i c u l a r l y s evere s in c e v e h i c l e f inance is the major cause o f borrowing. The sharp growth o f hire purchase (which is c h i e f l y d irected at veh ic le f inance) in India shows that substantia l numbers o f transport operators in India, e s p e c ia l ly o f used veh ic les , depend on informal f inance. Thus, overa l l the conclusion must be of a p os i t iv e assoc ia t ion between
urban informal finance and economically weak sect ions .
11.2 Cause and effect
11.2.1 Are weaker s e c t i o n s weak because o f e x p l o i t a t i v einformal finance or despite i t ? At one l e v e l , the answer to th is question does not matter: i f borrowers can be taken to revealthe ir preferences for some informal finance to none, then informal f in a n c e i s c l e a r l y w e l fa r e im prov ing . However, i f i t i s exp lo i ta t ive then this alone i s i n s u f f i c i e n t and informal cred it should be supplanted by non -exp lo i ta t ive sources o f c red it i f p o s s i b l e . The d i r e c t ev idence o f bor rowers in s t u d i e s o f intermediaries and in cred it using sectors referred to e a r l i e r
EQUITY IMPACT OF INFORMAL FINANCE
70

leads us to r e je c t the hypothesis o f universal ly exp lo i ta t iv e informal c r e d i t , though in some r e l a t i v e l y minor sectors th is is the case with urban in form al f i n a n c e . This i s d e s p i t e the evidence, a lbe i t not g loba l , o f higher informal sector interest
rates .
11.3 Summary of disaggregated findings
11.3.1 Regarding s p e c i f i c intermediary sectors studied, the fol lowing b r i e f remarks summarise the pos i t ion . The evidence on ch it funds, auto finance in Namakkal, handloom finance and, to an extent n i d h i s , c l e a r l y shows that these s e c t o r s help small business and small borrowers and depos i tors . Hire purchase has the opposite bias while Sanchaita and, probably, Peerless exploited
small depos i tors . Bhole (1985) found that trade c red i t is o f more importance to small rather than large firms in the company sector . F i n a l l y , the p r o v i s i o n o f in fo rm a l f in a n ce to the t e x t i l e d i s t r i b u t i o n system, i t has been argued, has p o s i t i v e i n t e r regional d i s t r ib u t io n e f f e c t s .
11.4 Conclusions
11.4.1 We must conclude that informal finance i s , by and large, welfare improving for economically weak sect ions . Regarding the
p o s i t io n o f informal finance r e la t iv e to repressed formal sector f inance, i t is worth quoting the conc lusions , regarding formal f inance, o f two recent studies . L i t t l e (1987), concluding on the basis o f a study o f small manufacturing enterprises in a se lec t ion
of developing countries ( inc luding India) has th is to say:
The tentat ive conclusion seems to be that contro l led cap ita l markets o f most developing countries are l i k e l y to p e n a l i z e the l a r g e - s m a l l or medium s i z e firms (covering about 20 - 100 workers) that aspire to rapid growth and therefore cannot re ly on the ir own finance. Unless they are in a s p e c ia l ly favoured sector , e ither in terest rates w i l l be higher or access more d i f f i c u l t than with free cap ita l markets ( L i t t l e , 1987, p. 221)” .
71
Fry (1988) examines the available evidence for a se le c t io n o f developing countries (excluding India) and concludes:
" S p e c i f i c a l l y , f i n a n c i a l r e p r e s s i o n and the ensuing cred it rationing worsen income d is t r ib u t io n and increaseindustria l concentration. The evidence presented .........indicates that subsidised cred it p o l i c i e s discriminate against rather than favor small borrowers, (Fry, 1988, p. 165).
72

TABLE 11 -1
Percentage of Total Borrowings from Informal Sector
S e c t o r
L a rg e Small
A. F ie ld S tu d ies
1. Road c o n s t r u c t i o n 93 78
2. Garment e x p o r t e r s 67 62
B. RBI Surveys2
3. S m a l l - s c a l e i n d u s t r i e s 55 39
4. T r a d e r s 2 72 61
5. T r a n s p o r t O p e r a t o r s 2 31 20
6. H o u s e h o ld s ** 80 41
N o t e s : 1. Below and a b o v e the sam ple mean.2. Market v a l u e o f f i x e d a s s e t s l e s s
than Rs 1 l a k h .3. A s s e t s l e s s than Rs 1 0 , 0 0 0 .
73
CHAPTER 12
ARE INFORMAL AND FORMAL FINANCE COMPLEMENTS OR SUBSTITUTES ?
12.1 Three types o f s i tuat ions need to be dist inguished here.
i . The f i r s t type of s i tu a t io n is where banks do not enteror are unable to enter a part icu lar market segment or when in form al f i n a n c e cannot s u b s t i t u t e f o r bank finance. In such cases, formal and informal finance are c l e a r ly complementary. Most case studies in this report found th is type o f s i tu a t ion prevail ing due to banks being unable or u n w i l l i n g to compete with in form al lenders and also ( e s p e c i a l l y ) trade c r e d i t . In one case study o f a c red i t using sector (road construct ion ) , informal f inanc ia l instruments were not acceptable as a substi tute for bank guarantees.
i i . The second s ituat ion is when banks provide cred it butup to a c e i l i n g amount. In such cases, informal finance complements the c red i t f lows to a part icu lar sect ion o f c red i t constrained borrowers or the credit f low for p a r t i c u l a r u se s . The i n t e r - c o r p o r a t e funds market, f i e l d studies o f productive and trade se c to rs , chit fund operat ions, loans against jew e l lery by nidhis and to a p a r t i a l e x t e n t , h i re purchase f a l l in to t h i s category.
i i i . The t h i r d s i t u a t i o n i s when banks and in fo rm a lintermediaries are in ac t ive competition. This does not appear to be the case in any loan market, though i t is l a rge ly the case for the mobi l isat ion o f deposits by some, though not a l l informal intermediaries . One area in which in form al and formal s e c t o r s are in compet it ion, to the l a t t e r ' s disadvantage, i s in the t r a n s f e r o f funds between g e o g r a p h i c a l c e n t r e s .In formal c o u r i e r s , known as ' a n g a d i a s ' are seen as superior to banks by many businessmen.
12.2 A second finding relevant to the d iscussion here is theopinion o f borrowers of the two sources o f c r e d i t . In a l l f i e ldstudies o f c red i t using sectors and o f borrowers from part icu larintermediaries , informal cred it was, broadly speaking, viewed p o s i t i v e ly due usually to the expected speed and informality (and
7 4

in some cases , low co s t ) o f informal cred it while bank cred it was viewed n e g a t i v e l y . Dockyard f i n a n c i e r s in Ca lcu tta and some finance corporat ions were the except ions .
12.3 It is d i f f i c u l t to conceive o f an aggregate s t a t i s t i c a l exerc ise which w i l l reveal support or the lack o f support for the kinds o f s i tuat ions outlined in the f i r s t paragraph. However, a
p os i t iv e l ink between formal and informal c r e d i t , both taken as
the r a t i o o f some i n d i c a t o r such as s a l e s , ^ w i l l support the h y p o th e s i s o f com plem entar ity . In order not to r e f l e c t s ca le e f f e c t s , c o r re la t io n c o e f f i c i e n t s o f the two rat ios mentioned above were computed from the RBI surveys o f firms using interstate data . The c o e f f i c i e n t s ( i n p e r ce n ta g e ) were found to be as f o l l o w s :
Correlat ion C o e f f i c ie n ts Between the Ratios o f Informal Credit to Sales and Formal Credit to Sales
( Inter State Data)
Small-sca le industry 61.04 (n=14)Wholesale trade 39.46 (n=19)Retail tr ade 29.25 ( n= 19)Transport operators -3 .42 ( n= 18)
Thus, the hypothesis o f complementarity finds weak support in the case of small -sca le industry alone, but has the right sign for trade. The aggregate evidence may be taken to be inconclus ive ,
12.4 Thus, given the current state o f banking, complementarity is supported by micro studies but not necessar i ly by the regional
evidence. Given the d iscussion in the previous paragraphs, i t would appear that the formal and informal sector sp e c ia l i s a t io n insome areas id e n t i f i e d in the micro studies-should be d e l ib e ra te ly/strengthened.
RBL s u r v e y s o f p r o d u c t i v e u n i t s s t r o n g l y s u g g e s t e c o n o m i e s o f s c a l e in t o t a l c r e d i t use so t h a t c r e d i t f i g u r e s need to be c o r r e c t e d f o r s c a l e by u s i n g f i g u r e s such as f o r t o t a l s a l e s .
75

12.5 At the aggregate l e v e l , d e f i n i n g com plem entar i ty and s u b s t i t u t a b i l i t y by the usual cross e l a s t i c i t i e s is f e a s ib le . Thus, i f an expansion in bank c r e d i t (or a lowering of bank loan ra tes with no i n t e r e s t rate c o n t r o l s ) leads to a d e c l i n e in informal c r e d i t , other things equal, then they are subst itutes . Furthermore, other things equal, i f an increase in bank deposit
rates causes informal c red it demand to dec l ine they are, once more, substitutes . The avai lab le evidence, c i ted at the beginning
of the next chapter, is mixed.
76

CHAPTER 13
13.1 Prior evidence and issues
13.1 .1 Does in fo rm al c r e d i t f r u s t r a t e s h o r t - r u n monetary p o l i cy ? Limited evidence is avai lab le on th is issue. Acharya and Madhur (1983) argue that excess demand for constrained formal c red i t s p i l l s over into the ICM driv ing up ICM loan rates in times
o f r e s t r i c t i v e central bank operations thus leading to an overal l c red i t squeeze. They test th is with data re lat ing to 'bazaar b i l l
ra tes ' ( th is RBI data ser ies was discontinued in 1977) and find support f o r t h e i r h y p o t h e s i s . Sundaram and Pandit (1983) c r i t i c i s e the data used by Acharya and Madhur and show that the conclusion is sens i t ive to the data ser ies used. The debate in India between Acharya and Madhur on one side and Sundaram and Pand i t on the other is inconclusive .
13 .1 .2 Fry (1988 ) c i t e s s t u d i e s r e l a t i n g to the Korean economy and concludes that time deposits in the formal sector are c l o se r subst itutes to assets which are primarily i n f l a t i o n hedges
rather than to curb market loanable funds which are r e l a t i v e l y insens i t ive to time deposit rates in a three asset p o r t f o l i o model. On the basis o f the econometric evidence he concludes that
. . . . a n increase in the time deposit rate o f interest would lead to an increase rather than a decrease in the t o t a l supply o f c r e d i t in r e a l t e r m s " , (Fry (1988), p. 161).
Edwards (1988), studying the Korean economy, f inds a p o s i t iv e l ink between deposit bank time rates and curb market loan rates .
INFORMAL CREDIT AND MONETARY POLICY
77
13.1.3 The relevant issues , to our way o f thinking, revolve-on f ive points .
i . Does lower money supply ( inc luding bank c r e d i t ) necess a r i l y lead to a f a l l in to ta l credit a v a i l a b i l i t y (or can informal cred it counteract this s u f f i c i e n t l y ) ?
i i . A related point , do movements in the bank loan interestrates lead to general movements in informal loan in ter est rates or cred it in the same d irect ion?
i i i . Is the opposite of ( i i ) true for bank deposit rates?
i v . Can s e le c t iv e cred it c o n t r o l s , which are used in India,be e f f e c t i v e l y imposed in the face o f informal credit?
v. Even i f a l l four questions are answered in the af firmat ive , is the c red i t m ult ip l ie r the same as i t would bein the absence o f informal c red i t (or is i t lower orless p r e d i c t a b le ) ?
If the answer to a l l f ive questions is in the a f f irm ative then the hypothesis that informal credit f rustrates monetary p o l i c y can be r e j e c t e d .
13.2 Evidence
13.2.1 F i r s t l y , the sheer s ize o f informal cred it markets andtheir l ik e l y rapid growth argues against points ( i v ) and ( v ) . Secondly, the l inks with the black economy (see below, chapter 14)
and the es t im ated s i z e o f p r o d u c t i v e l y dep loyed b lack funds (Chapter 8) strengthen this p o s i t i o n . Thirdly , the rap id i ty with which informal c red i t i s deployed could go against the th ird pointabove for short run monetary p o l i c y but i s not, by i t s e l f , con
c l u s i v e . While d e t a i l e d time s e r i e s ev idence i s l a c k i n g , theevidence in Tables 13.1 and 13.2. tends to argue against the f i r s t two points for short run monetary p o l i c y except in the case o f nidhis who make up only a small part o f the informal c red i t system (Chapter 8, Table 8 .2 ) . However, over a longer horizon, interest rates in informal and formal sectors do appear to move together.
13.2.2 To go into sectora l d e t a i l , the fo llowing observation may be made. Except fo r the i n t e r - c o r p o r a t e funds market, no evidence has been found o f short run responsiveness o f informal c red i t to formal interest rates or cred it a v a i l a b i l i t y . However, the cross sect ion nature o f the study i s a l im ita t ion that has to be kept in view. The hypothesis that* the in ter -corporate market increases the v a r i a b i l i t y o f the money m ult ip l ier and reduces the e f fe c t iv e n e s s o f s e le c t iv e c red i t contro ls has been advanced in the report though the evidence is not o f the type permitting a firm conclusion to be drawn.
13.2.3 Trade c red it and on-lending in general raises seriousdoubts on the e f fe c t ive n e s s o f s e l e c t iv e con tro ls . The findings o f Bhole (1985) may be c i ted for other po ints . Bhole used Reserve Bank of India data on the company sector for the years 1952 to
1978 to study the impact o f trade c red it on monetary p o l i c y . In
the study he examined inter a l i a , the e f f e c t of the short run bank lending rate and bank c re d i t a v a i l a b i l i t y on trade dues, traderece ivab les , net trade cred it and the credit period o f dues andr e c e i v a b l e s in days . His r e s u l t s g i v e a f f i r m a t i v e support to p o i n t s ( i ) and ( i i ) above though the ev idence i s not always robust . However, his f indings tend to r e je c t an a f f i rm ative answer to po int ( i v ) . There were some d i f f e r e n c e s between d i f f e r e n t groups o f companies for the impact on the volume o f trade cred itthough not the cred it period. In sum, h is resu lts argue for aweakening of the p r e d i c t a b i l i t y o f monetary p o l i c y f o r the company sector but not for i t s frustrat ion in terms o f d i r e c t i o n .
13.2 .4 In c o n c l u s i o n , the l i m i t e d e v id e n c e presented here argues for a weakening o f the impact o f monetary p o l i c y with the in formal s e c t o r e i t h e r u n r e s p o n s iv e o r , in the case o f t rade c r e d i t , counteracting monetary p o l i c y . However, complete frustra
t ion o f monetary p o l i c y cannot be in ferred from the evidence here. The question i s , there fore , s t i l l open.
79

13.3 Towards a short run macro—model with informal credit markets
13.3-1 Work on macro models with informal cred it include work by Rakshit (1982, 1987), Taylor (1983), Van Wijnbergen (1983),Euffie (1984) and Chang and Jung (1984). Of these, the work o f Rakshit is based on the s ty l i sed r e a l i t i e s of Indian experience.
13.3.2 Rakshit (1982) examines the consequences o f informal credit in a model in which a p ivota l ro l e i s played by wholesalers who demand cred it for inventory investment and who have access to both formal and in form al ( o r g a n is e d and unorganised in h is terminology) loan markets. The supply o f organised sector loans is f ixed exogenously as is the in terest rate. Demand for loans
then depends on the return to inventory investment re la t ive to loan rates and the formal sector constra in t . Since the supply o f
formal loans is rat ioned, there is a discontinuous demand function for informal loans. He then goes on to show how a change in bank loans can e i t h e r r a i s e or l ower i n f o r m a l ra tes depending on whether the supply <:\i r;/*» >r : :tf >r:al • ^ans p i sses through the d is
c o n t i n u i t y in the a iand carve or n o t . However, expansion ( cent ract ion) in bank c l * edit dues r e su l t in more ( l e s s ) c red it to wholesalers. It is d i f f i c u l t to determine i f this resu lt w i l l continue to hold in the face o f s ty l i se d facts of Indian ICMs thrown up by th is study to which we now -urn.
13.3.3 An important s ty l ised fact that must be taken note of in a properly s p e c i f ie d macro model i s the fact that formal sector interest rates have l i t t l e r e la t io n with informal rates . On the deposit side th is i s because o f l imited access by most depositors to informal deposit channels due mainly to geographic or informat ional barr iers . On the loan side th is i s because o f formal sector cred it r e s t r i c t i o n s .
13.3 .4 A second s ty l i sed fact is the exis tence o f im p l i c i t contracts ( long standing re la t ion s ) in markets for trade and sometimes production finance leading to stable nominal informal in ter
est rates.
80

13.3 .5 A third fact i s that informal markets are subject to quant itative con tro ls on deposit taking and interest rate r e s t r i c t ions in some cases .
13.3 .6 The consequences o f fragmentation and links with the black economy must also be explored. f)as-Gupta and Ray (1989) study aggregate demand with a black economy but without a 'white" informal market. Rakshit (1987) studies fragmentation.
13.3.7 Clearly , adequately accounting for these fac tors in a parsimonious macro model i s no easy task. However, i t is essent ia l to attempt such a task i f proper appreciation o f the short run impact o f ICMs is to be had.
81

Tx\BLE 1 3 . 1
Growth in Aggregate A d v a n ces/C red it o f In form al In te rm e d ia rie s and Banks, 1 9 8 2 -1 9 8 6
(P er c e n t per annum)
Y e a r Bank N i d h i s F in a n c eC o r p o r a t i o n s
ChitFunds
1 982 1 7 . 6 8 ( 1 . 3 ) ( 0 . 1 4 ) 3 3 . 1
1983 19. 54 1 4 . 4 7 ( 5 . 0 9 ) 9 . 2
1 98 4 1 5 .7 5 1 1 . 2 ( 1 8 . 6 6 ) 67 . 6
1 98 5 17. 90 52 . 2 ( 1 5 . 5 5 ) 1 5 . 4
1 9b 6 14. 52 2 L . 7 ( 1 3 . 8 1 ) 5 6 . 7
Rankc o r r e l a t i o n 10 0 9 0 3 0 -9 0w i t h B a n k s
N ote : N e g a t iv e f i g u r e s S o u r c e s : 1. RBI, R e p o r t on C u rr e n c yin p a r e n t h e s e s . & F i n a n c e , V a r i o u s I s s u e s .
2. F i e l d S u r v e y s .3. RBI, s u r v e y s o f d e p o s i t s
w i th non b a n k in g c o m p a n i e s , v a r i o u s i s sue s .

TABLE 1 3 .2
I n t e r e s t Rates o f Banks and Informal In te rm e d ia rie s
( P e r c e n t per annum)
Year Bank F in a n c e c o r p o r a t i ons
H ire P u rc h a s e com pa n ie s
Sh ro
197 0 -7 1 9 . 3 NA 1 8 -3 0 15
1 980 1 6 . 5 NA NA 18
1 982 1 6 . 5 1 8 - 2 9 NA NA
1 983 1 6 . 5 1 9 -3 1 NA NA
1984 1 6 . 5 2 2 -3 3 35 NA
1 98 5 1 6 . 5 2 5 - 3 6 37 NA
1 986 1 7 . 5 3 2 - 3 7 38 NA
1 988 1 6 . 5 NA 38 21
S o u r c e s ; As in T a b l e 1 3 .1 n o t e s 1 and 2 and Bombay S h r o f f s A s s o c i a t i o n .
83

CHAPTER 14
TWO ISSUES: THE COMPLEMENTARITY HYPOTHESIS AND LINKS WITH THE BLACK ECONOMY
14.1 The McKinnon (1973) complementarity hypothesis^
14.1.1 By t h i s h y p o t h e s i s , f i n a n c i a l and p h y s i c a l a s s e t s arecomplements due to the existence o f c r e d i t constra ints and low interest p o l i cy as part o f repress ive formal sector p o l i c y . This happens since an increase in the supply o f c red it adds to the
stock o f f inanc ia l assets and while stimulating greater investment a c t iv i t y . The hypothesis has received limited support from cross - sect ion in ter -country studies (Gonzales Arr ieta , 1988). While for mally a macroeconomic hypothesis , i t would f ind support at themicroeconomic leve l i f investment by firms was l imited by cash in advance constra ints made binding due to supply constra ints onc r e d i t . Net funds for the purchase o f productive fa c tors (as d i s t inct from raw materials or stock in trade) are l imited to ownfunds on average, in road construct ion and for trading agents in t e x t i l e wholesale markets (Table 14 .1 ) . Thus for s p e c i f i c sectors in India, support f o r this hypothesis e x i s t s . Indirect evidence that such a s i t u a t i o n p r e v a i l s f o r handloom weavers is a l s o present. At another l e v e l , purchase o f productive ca p i ta l in the second hand commercial ve h ic le markets would appear to be le s s prevalent in the absence o f informal finance. We may ten ta t iv e ly conclude that the hypothesis i s v a l id for a part o f the Indian economy, though at the m acro - leve l , no conclusion can be drawn on the basis o f th is study.
1. S e e , among o t h e r s , M c K in n o n ( 1 9 7 3 ) , F r y( 1 9 8 8 ) , G o n z a l e s A r r i e t a ( 1 9 8 8 ) and Shaw ( 1 973 ) .
84

14.2 Links with the black economy
14.2 .1 Informal intermediaries studied would obviously not reveal any finance of illeg a l activ ity . "Market rumours" indicate such activ ities on the part of finance corporations, some indigenous
bankers and some traders. The Sanchaita and Peerless cases threw
up clear indications of links with the black economy, with these institutions allegedly generating black funds and also providing " e f f i c i e n t " means to launder funds. A ll credit using sectors employed suspected illeg a l funds in the guise of informal credit (usually from friends and relatives), a suspicion that finds sup
port for the aggregate economy (Chapter 8 ). In fact, the volume of laundered black funds is estimated to be almost equal in size to total informal credit (Chapter 8 ). The film finance study reports on black payments in the sector. Finally tax evasion by inter
mediaries and most firms is generally believed to be widely prevalent in India (Acharya and Associates, 1985). While black economy links have not been a central part of our fie ld investigations, some evidence of links, perhaps strong ones, certainly ex
is ts . ADB (1985) expresses the opinion that most black money remains outside t he formal credit market. Furthermore, they point out that black funds do play a positive role in promoting saving
and investment given formal sector r ig id ities .
14 .2 .2 Methods by which informal credit markets fa cilita te transactions in the black economy have been discussed in some detail by Aiyar (1979) and briefly by Timberg and Aiyar (1980). The main points made by them are the following
•a. Black transactions take place through both formal and in
formal credit markets. Informal markets do not have any necessary link with the black economy and a ll submarketsdo not fa cilita te black transactions. •
b. The film industry, constru ction , hotel industry and transport sector rely heavily on black funds.
c. The main service of informal interm ediaries is tofa c ilita te payments for .illegal* goods through bank sightdraflte while allowing transacting parties to retain their anonymity. The annual volume of such remittances in 1979 is estimated at ,Rs 450 crore in Bombay alone and Rs 750
8 5

crore for the whole of India.
d. The p r o v i s i o n o f brok erage s e r v i c e s , by s p e c i a l i s e dbrokers for the placement o f black funds. Loan defaults for black money loans were almost unheard o f even i f white debts were defaulted. The in terest rate on such loans was from 12 per cent to 15 per cent in 1979.
e. Records o f black transactions or instruct ions for disposalo f black funds were usually on scraps of paper and in innovative and o ft changing codes.
f . The provis ion o f bogus rece ipts or book entr ies allowing the laundering of black funds or the concealment o f incomes by recording fake expenditure - both for a fee . An agent for these transactions is known as an Havala.
g. The f a c i l i t a t i n g of ' k i t e f l y i n g ' operations by taking advantage o f bank cheque discounting and delays in bank c o l le c t i o n o f outstat ion cheques. This serv ice is reported to be provided by finance corporat ions in Kerala. Road rece ipts and l e t t e r s o f c re d i t are s im i lar ly used.
h. Remittances o f cash through Angadias.
i . Evasion o f fore ign exchange r e s t r i c t i o n s through overseasc o r re s p o n d e n ts and arrang ing p r iv a t e r e m it ta n ce s ( the agent in India accepts rupees for remittance and pays out rupees remitted while the correspondent does the same in foreign currency. No actual funds flows take p la c e ) .
14.2.3 On the basis o f th is evidence, l imited though i t i s , we
must conclude that the informal f inanc ia l sector as a whole serves the black economy and employs black funds. However, i t should be emphasised that not a l l in fo rm al submarkets serve the b lack economy. Nor are l inks with the black economy limited to the informal sector . When the p os i t iv e features o f informal cred it are weighed against the negative i l l e g a l l in k s , the need for a sector by sector approach to regulation gets emphasised.

TABLE 14.1
Loans and Advances versus Borrowed Funds ofCredit Using Sectors
(In percentage o f t o ta l assets)
Sector Road.construction
Garrnent expor- ters
Power-loom
Aratiyas( t e x t i l etrade)
Textilewholesaletraders
Loans and advances
43 39 26 72 57
Borrowed funds 38 70 59 82 37
87

PART D
P o lic y P r e s c r ip tio n s
CHAPTER 15
15.1 Lessons for formal banking
15.1 .1 S p e c i f i c recommendations are given in the course o f case studies for changes in current bank pract ice and lessons which the formal sector- can p r o f i ta b ly learn from informal intermediaries. Here we wish to propose an overa l l strategy o f formal banking development.
15 .1 .2 Though there are problems, the formal sector serves, by
and large , the needs o f organised and large scale production. Banking needs o f the government and o f sa lar ied , urban, households
are also well served. Where bank serv ice f a i l s is in serving the needs o f the small entrepreneurs and the trader. Furthermore banks are c l e a r ly less success fu l in serving the needs o f the poorer sect ions as a whole (at least upto 1981-82 when the RBI Debt and Investment Survey was c o n d u c t e d ) . For such loan s , defaults and overdues are also a major problem, though s p e c i f i c d e ta i l s are not ava i lab le (but see Nayar (1987)) .
15.1.3 Since i t has been concluded in the case studies (sub jectto the usual ca v e a ts as to adequacy o f in f o r m a t io n ) that the informal sector is both better at serving the sectors neglected by banks and also recovering advances from these sectors , a p o l i cy of encouraging informal c red i t with, however, adequate safeguards against fraud and e xp lo i ta t iv e prac t ices (see below) suggests i t s e l f . In a sense, banks should relinquish areas o f business where they do not have an a b s o lu te ' (o r even com parat ive ) advantage . In s te a d , r e f i n a n c e f a c i l i t i e s f o r in formalintermediaries and even perhaps, to traders channeled through t r a d e r s " a s s o c i a t i o n s appear a t t r a c t i v e . This i s what we recommend.
LESSONS FOR FORMAL FINANCE AND AN APPROACH TO THEREGULATION OF INFORMAL INTERMEDIARIES
8 8

15.1 .4 Regarding s p e c i f i c i n n o v a t iv e schemes f o r se rv in g depositors and borrowers, while a few suggestions have been made in the case studies , banks in India are, by and large , innovative enough in serving those sectors where they have an advantage.
15.1.5 Regarding other formal f inanc ia l nrarkets, i t is worth c i t in g the result o f Cho (1985). He finds that increased equity f inance through a s treugthened s to c k market has p o s i t i v e a l loca t ion e f f e c t s in a s i tu a t ion o f asymmetric information as to borrower r isk .
15.2 Fraud, information and the regulation of informal intermediaries
15.2.1 One way o f ensuring that no fraudulent organisat ion has access to deposit money i s by banning informal intermediation
altogether . The considerat ion o f th is p o s s i b i l i t y , while not
being suggested as a serious p o l i c y measure, has the merit o f throwing the consequences o f over ly r e s t r i c t i v e regulation into sharp focus. I f such an a l ternat ive was enforceable , then those with f inanc ia l saving would be r e s t r i c t e d to formal sector saving i n s t i t u t i o n s and e q u i t y markets. However, i t i s l i k e l y that informal intermediaries can tap large reserv o irs o f public saving even a f t e r s u b s t i t u t i o n between formal and in fo rm a l saving instruments i s accounted f o r . High i n t e r e s t , p e r s o n a l i s e d
serv ice , deposit s o l i c i t i n g agents and in formality o f deal ings and i n n o v a t iv e saving schemes a l l make t h i s l i k e l y . Further , deposits so mobil ised, amounting to a s izeable amount in absolute terms, find their way into the formal sector , p a r t i cu la r ly the
government sector . Thus, development o f the f inanc ia l sector and, in part icu lar , the subst itut ion o f f inanc ia l fo r non f inanc ia l saving would su f fer i f informal intermediaries are banned. The p o in t here i s that c e r t a i n in fo rm a l i n t e r m e d i a r i e s have an absolute advantage in mobil iz ing deposits from part icu lar segments o f the saving publ ic . Secondly, ce r ta in informal intermediaries have an absolute advantage in ensuring the recovery o f loans made to p a r t i c u l a r segments o f i n v e s t o r s . Banning a l l in form al intermediaries w i l l thus resu lt in f inanc ia l constraints being
89

faced by a sect ion o f firms or , i f they get formal accommodation, w i l l resu lt in rais ing the aggregate r i sk o f formal sector loan p o r t f o l i o s . The e f f i c i e n c y o f f inanc ia l intermediation w i l l be a f fe c te d in e i ther case. Thus, regulations which put (p a r t ia l or t o t a l ) quantitat ive r e s t r i c t i o n s on the deposits which an informal intermediary can mobi lise should be made only a f t e r c a r e fu l ly weighing the costs and be n e f i t s . This may be taken inter a l ia as a c r i t i c i s m o f the Prize Chit (Banning) Act o f 1978. In fa c t , that
money c i r c u la t i o n schemes or prize c h i t s , even i f they have no loan p o r t f o l i o , should be banned i s open to debate.^ What i s not at issue is that fraudulent intermediaries such as a sect ion o f blade companies or as described in the Raj Committee Report (1975) should be wound up.
15 .2 .2 Is there any a l ternat ive to quantitative r e s t r i c t i o n s on deposits? One p o s s i b i l i t y that merits further examination is the
licensing of deposit taking firms and periodical review of the operations of the firms by licensing authorities. A further measure is to make prior vetting of deposit acceptance schemes ( inc luding provis ions re lat ing to penalt ies , f o r f e i t u r e e t c . ) by
regulatory author i t ie s compulsory. Both these measures w i l l of course require a much more sophist icated monitoring and review procedure on the part o f the Reserve Bank than now appears to e x i s t . Thus, a c a r e f u l enquiry in to the reasons fo r the
in e f fe c tu a l handling o f , f o r example, the Sanchaita and Peerless cases and appropriate remedial act ion are ca l le d f o r .
15.2 .3 While the measures outlined in the previous paragraph
would, I f properly implemented, ensure that fraud and paral le l market transactions are curbed, depositors may s t i l l be misled by aggressive and inaccurate promotion campaigns. In a largely
1* A s o c i a l s e c u r i t y s c h e m e s u c h as i n most d e v e l o p e d c o u n t r i e s , whe r e by t he young a re t a x e d in o r d e r to make t r a n s f e r payment s to r e t i r e d p e r s o n s , h a s , g i v e n t h a t t he y o u n g e r g e n e r a t i o n r e c e i v e s t r a n s f e r p a y m e n t s i n t h e i r t u r n when t h e y r e t i r e , much in common wi t h a money c i r c u l a t i o n s cheme .
90

rural and r e la t iv e ly backward economy l ik e In d ia 's , the e f f i c a c y o f any measures to prevent such pract ices i s bound to be l im ited . S t i l l , e f f o r t s can be ma^p to inform savers as to theattractiveness o f d i f f e r e n t saving schemes by in s t i tu t in g a method for rating d i f fe ren t saving schemes. The rating can be based on scheme d e t a i l s , the intermediary 's loan p o r t f o l i o and i t s past performance. These ratings can then be given wide p u b l i c i ty . Armed with a rating chart and a l i s t o f l i censed intermediaries,
even a person with limited training or soph is t i ca t ion could serve as a competent f inanc ia l adviser. Addit iona l ly , firms may be compulsorily required to supply ce r ta in items o f information to depositors at per iodic in terva ls . Similar rules could also belaid down fo r advertisements by f in a n c ia l f irms. Loan schemes and lending p rac t i ces should be subject to s imilar ve t t ing as has been suggested for deposit schemes.
15.2 .4 The kinds o f measures o u t l i n e d above a long with ac a r e fu l ly thought out monitoring and inspect ion scheme should help contain fraud and improve the informational e f f i c i e n c y o f Indian f inancia l markets. Furthermore, once the Reserve Bank lays down appropriate guidel ines based on which dec is ions on whether toallow*or disa l low any intermediary, deposit scheme or loan scheme, the need f o r m u l t i p l e ( c u r r e n t l y f o u r ) s e t s o f d i r e c t i o n s governing d i f f e r e n t types o f non-bank f inanc ia l in s t i tu t i o n s w i l l disappear thus resu lt ing in simpler laws.
15.2 .5 The d iscuss ion in this sect ion has been motivated by the need to fos ter and not f e t t e r a healthy f in a n c ia l market while ensuring that fraud is prevented and that savers and borrowers are well in formed ' about the v a r i o u s products a v a i l a b l e in the f inanc ia l market. A presumption underlying the d iscuss ion i s that in formal i n t e r m e d i a r i e s , i f and when they become i n e f f i c i e n t re la t ive to the formal sector in the segments served by them, w i l l die a natural death. Furthermore, natural death in th is s i tuat ion i s p r e f e r a b l e to death or c r i p p l i n g by r e g u l a t i o n . The major a f f l i c t i o n that has been im p l i c i t l y id e n t i f i e d as the main reason for e v i l s discussed in a few case studies i s the poor information
91

environment. A c c o r d i n g l y , the remedy proposed d e a l s almost e n t i r e ly with improved information f lows.
15.2 .6 It is c lear o f course that a poor information environment i s not the only problem to be addressed in e f f e c t i v e l y regulating the informal f inanc ia l market. Other features revealed by the case s t u d ie s are the suspected nexus between the p o l i t i c a l establishment, the informal f inanc ia l market and the underground economy; the d i f f i c u l t y and delay in gett ing regulatory moves upheld by the courts ; the lack o f coordination between d i f f e re n t regulatory bodies ; and the in terac t ion between d i f f e r e n t types of government regulations which combine to create opportunit ies for f inanc ia l exp lo i ta t ion by some agent (such as in the dockyard f inanciers case s tu dy ) . While s p e c i f i c recommendations have been made on a case by case bas is , we nevertheless be l ieve that the major problem is the informational problem dealt with in this chapter.
15.2.7 Regarding interest rate regulation , in one case, chit funds, the c e i l i n g prevail ing on interest rates (through bidding c e i l i n g s ) appears to be unwarranted and should be l i f t e d . However, given the p i t f a l l s in hasty f inanc ia l l i b e r a l i s a t i o n , as i s seen from the Lat i n American e x p e r i e n c e , i t would be
inappropriate to make a recommendation on interest rates without a carefu l p o l i c y ana lys is .
2
2. Whi c h , o f c o u r s e , has been made much o f in t h e r e c e n t t h e o r e t i c a l l i t e r a t u r e o f f i n a n c i a l e c o n o m i c s .
92

SECTION I I
SECTORAL AND CASE STUDIES

PART E
A n a ly s is o f Reserve Bank o f India Surveys

CHAPTER 16
16.1 Introduction
16.1.1 A common presumption about informal c red it in India is that i t contributes to indebtedness among the poor. Furthermore, such debt is seen to be s o c i a l l y undesirable in that informal lenders use th e ir monopoly power to drive poor households to perpetual subsistence, in the process depriving households o f their meagre assets e s p e c ia l ly land holdings. While th is presumption i s seen more as a feature o f rural areas, urban areas are not seen to be t o t a l l y free o f the e v i l o f ' l o a n sharks' and their i lk .
16.1 .2 The Reserve Bank o f India has been conducting decennialnational surveys of assets and debts o f rural households since 1951-52. The fourth such survey, fo r 1981-82, includes a sampleo f urban households for the f i r s t time.^ Thus an analysis o f the re lat ion between debt o f urban households and informal credit for the entire nation has become poss ib le for the f i r s t time.
16.1.3 This chapter presents some inferences on household debt and informal c red i t based on an analysis o f the data in the survey .
16.1.4 The chapter contains 5 more sect ions . In the next sec
t ion , the sample design o f and information in the RBI survey areb r i e f l y descr ibed. Section 3 contains an analysis o f debt o f
1. R e s e r v e Bank o f I n d i a ( 1 9 8 7 ) , A l l I n d i a Debt a nd I n v e s t m e nt Su r vey 1 9 8 1 - 8 2 ; Depar t ment o f S t a t i s t i c a l A n a l y s i s and Computer S e r v i c e s ,R e s e r v e Bank o f I n d i a , Bombay. T h e i r 1 9 7 0 -7 1 s u r v e y a l s o c o v e r e d u r b a n h o u s e h o l d s , butur ban d a t a were not g e n e r a l l y r e l e a s e d due to s a mp l i n g p r o b l e m s .
INFORMAL CREDIT AND HOUSEHOLD DEBT
93

households grouped by asset category. Various c h a r a c t e r i s t i c s o f household debt and cred it and also the d i s t r ib u t io n o f c red i t to
households from the formal and informal sectors are examined . Section 4 looks at inter -State var ia t ions in debt and i t s co rre la tes and indicates where inferences run counter to f indings in the previous sect i on. In sect ion 5, information from sect ions 3 and 4 is used along with addit ional information to arr ive at ten
tat ive conclusions as to c h a r a c t e r i s t i c s o f informal cred it to households in India. The f ina l sect i on contains some concluding remarks and a l l - I n d ia estimates for formal and informal c red it to the household sector .
16.1.5 Analysis is l imited to four samples o f households out o f 7 that were ava i lab le . The samples are: a l l households, a l l urban ho us e ho l ds , urban s e l f - e m p l o y e d househo lds and a l l rura l households. The last named category is included for comparison.^
Urban self-employed households had, on average, a much higher debt
l e ve l (at Rs 8708 compared with an a l l urban household average o f Rs 5930 and a rural household average o f Rs 3311). This feature led us to include them as a separate sample in the analys is .
16.2 The A ll India Debt and Investment Survey, 1981-82:Data and Sampling
16.2.1 The volume o f the survey released gives d e t a i l s o f assets and l i a b i l i t i e s o f households as on the 30th June 1981. Data
are provided for household debt and assets with households broken up into 8 asset groups^ or 18 regional groups .”* Data are provided
2. A l l da t a used a r e f rom t he RBI s u r v e y wi t h t he e x c e p t i o n o f S t a t e d o m e s t i c p r o d u c t per c a p i t a i n 1 9 8 1 - 8 2 w h i c h i s f r o m C e n t r a l S t a t i s t i c s O r g a n i s a t i o n e s t i m a t e s .
3. F u r t h e r d e t a i l s o f i n f o r m a l c r e d i t t o r u r a l h o u s e h o l d s a r e p r o v i d e d i n t h e c o m p a n i o n r e p o r t on r u r a l i n f o r m a l c r e d i t by t he Ce n t r e f o r De ve l o pme nt S t u d i e s , T r i v a n d r u m.
4. < 1000, 1000 t o 5000, 5000 t o 10000 , 10000 t o2 0 0 0 0 , 2 0 0 0 0 t o 5 0 0 0 0 , 5 0 0 0 0 t o 1 l a k h , 1lakh to 5 l a k h , 5 lakh and a b o v e ( i n r u p e e s per h o u s e h o l d ) .
94
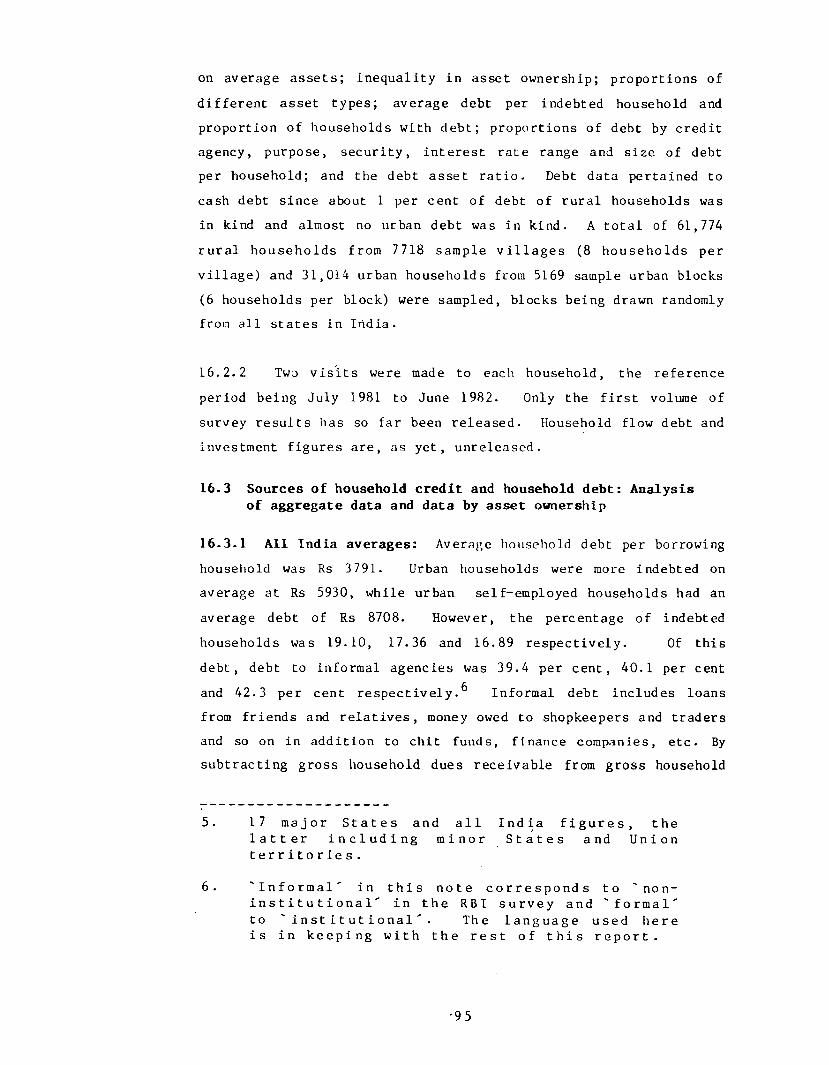
on average assets ; inequali ty in asset ownership; proportions o f
d i f f e re n t asset types; average debt per indebted household and proportion o f households with debt; proportions o f debt by credit agency, purpose, secur i ty , in terest rate range and s ize o f debt per household; and the debt asset r a t i o . Debt data pertained to cash debt s ince about 1 per cent o f debt o f rural households was in kind and almost no urban debt was in kind. A t o t a l of 61,774
rura l households from 7718 sample v i l l a g e s (8 households per v i l l a g e ) and 31,014 urban households from 5169 sample urban blocks (6 households per block) were sampled, blocks being drawn randomly from a l l s tates in India.
16.2 .2 Two v i s i t s were made to each household, the reference period being July 1981 to June 1982. Only the f i r s t volume o f survey resu lts has so far been released. Household flow debt andinvestment f igures are, as yet , unreleased.
16.3 Sources of household credit and household debt: Analysis of aggregate data and data by asset ownership
16.3.1 A ll Ind ia averages: Average household debt per borrowinghousehold was Rs 3791. Urban households were more indebted on average at Rs 5930, while urban self-employed households had an average debt o f Rs 8708. However, the percentage o f indebted
households was 19.10, 17.36 and 16.89 resp ec t ive ly . Of thisdebt, debt to informal agencies was 39.4 per cent, 40.1 per cent
£and 42.3 per cent r e sp e c t ive ly . Informal debt includes loans from friends and r e la t iv e s , money owed to shopkeepers and traders and so on in addit ion to ch it funds, f inance companies, e t c . By subtracting gross household dues rece ivable from gross household
5. 17 ma j o r S t a t e s and a l l I n d i a f i g u r e s , t hel a t t e r i n c l u d i n g m i n o r S t a t e s and Un i o nt e r r i t o r i e s .
6. ' I n f o r m a l ' i n t h i s n o t e c o r r e s p o n d s t o ' noni n s t i t u t i o n a 1 ' i n t he RBI s u r v e y and ' f o r m a l ' t o ' i n s t i t u t i o n a l ' . The l a n g u a g e used he r ei s i n k e e p i n g wi t h t he r e s t o f t h i s r e p o r t .
'95

debt, an estimate o f net household debt to agencies other than households within the group can be arrived at. Inter-household debt, in the process , gets netted o u t . Net debt per household (not per borrowing household) to other agencies is estimated at Rs 691 for a l l households, Rs 635 per rural household, Rs 867 per urban household and Rs 1098 per urban s e l f employed househo ld .
These f igures are substantial in view o f the per capita net domest i c product o f Rs 1557 in the year of the survey (1981-82).
16.3.2 Gross informal debt per household to agencies other than friends and re la t iv e s can be estimated at Rs 205, Rs 195, Rs 256 and Rs 413 resp ec t ive ly . These f igures are summarised in Table 16.1.
16.3.3 Correlation design: Variation across asset groups is substantia l as indicated by the c o e f f i c i e n t s o f var ia t ion in Table 16.2. Formal cred it is the predominant source o f funds for a l l
ohousehold samples. Of informal c r e d i t , friends and r e la t ive sare r e la t iv e ly more important in urban areas though for a l l groups they form the least important c re d i t source. For asset poorhouseholds, almost a l l debt is informal. Correspondingly, unsecured debt, while less important for asset poor urban households
compared to rural households, forms the bulk o f debt for asset poor households. A similar pattern is to be found for consumption
debt. For wealthy urban households, informal c red i t other than from friends and re la t ives is substant ia l ly more important than
for rural households with this being re f le c te d in the unsecured debt f igures as wel l . Consumption debt i s , o f course , unimportant for wealthy households. As would be expected, the proportion o f
high interest (20 per cent per annum or more) debt i s greatest for rural households among the asset poor and urban households among the wealthy, though wealthy urban households have le s s high in te r -
7. S u b j e c t to the dat a b e i n g f o r a sam ple and not the p o p u l a t i o n . A l l e s t i m a t e s g i v e n by us ar e s u b j e c t t o e r r o r due to r o u n d i n g i n t he p u b l i s h e d dat a u s e d .
8. T a b l e 1 6 . 5 c o n t a i n s a i l I n d i a a v e r a g e s .
96
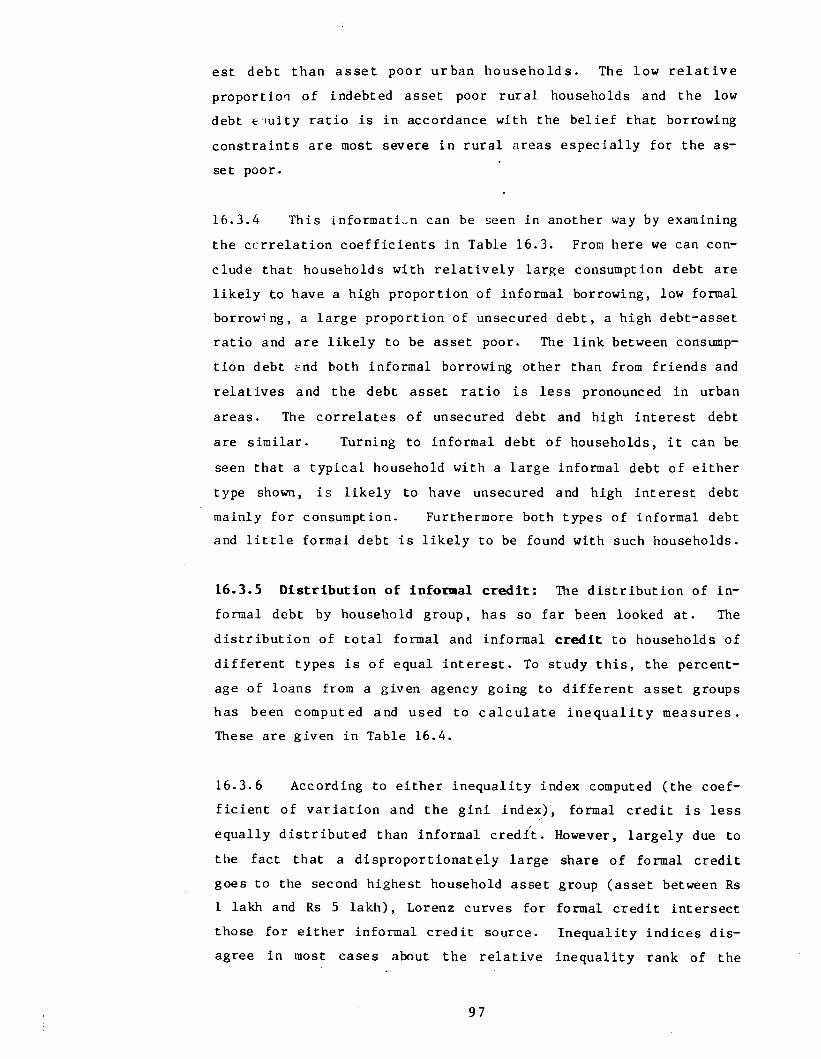
est debt than a s s e t poor urban h o u s e h o ld s . The low r e l a t i v e proportion o f indebted asset poor rural households and the low debt e iu i t y ra t io is in accordance with the b e l i e f that borrowing
constraints are most severe in rural areas es p e c ia l ly for the asset poor.
16.3 .4 This information can be seen in another way by examining the co r re la t io n c o e f f i c i e n t s in Table 16.3. From here we can conclude that households with r e l a t i v e l y large consumption debt are l i k e l y to have a high proportion o f informal borrowing, low formal borrowing, a large proportion o f unsecured debt, a high debt-asset ra t io and are l i k e l y to be asset poor. The l ink between consumpt ion debt end both informal borrowing other than from friends and r e la t iv e s and the debt asset ra t io i s l e s s pronounced in urban
areas. The c o r re la te s o f unsecured debt and high interest debt are s imilar. Turning to informal debt o f households, i t can be
seen that a typ ica l household with a large informal debt o f e ither type shown, i s l i k e l y to have unsecured and high interest debt mainly f o r consumption. Furthermore both types o f informal debt and l i t t l e formal debt i s l i k e l y to be found with such households.
16.3.5 Distribution of informal credit: The d is t r ib u t io n o f informal debt by household group, has so far been looked at. The d i s t r ib u t io n o f t o t a l formal and informal credit to households o f d i f f e r e n t types i s o f equal in te re s t . To study t h i s , the percentage o f loans from a given agency going to d i f f e r e n t asset groups has been computed and used to c a l c u l a t e i n e q u a l i t y measures. These are given in Table 16.4.
16.3 .6 According to e i ther inequal i ty index computed (the c o e f f i c i e n t o f va r ia t io n and the g in i index) , formal c red i t i s less
equally d istr ibuted than informal c r e d i t . However, la rge ly due to
the fact that a d isproport ionate ly large share o f formal cred it goes to the second highest household asset group (asset between Rs 1 lakh and Rs 5 lakh) , Lorenz curves for formal c red i t intersect those for e i ther informal c re d i t source. Inequality indices d is agree in most cases about the r e la t iv e inequal i ty rank o f the
97

sources o f informal c r e d i t . In the case o f urban s e l f - employed households, the d i s t r ib u t io n o f c red it from friends and r e la t iv e s Lorenz dominates that from other informal sources, the only case o f non in tersec t ing Lorenz curves. However, i f households are grouped into three groups which are as equal as poss ib le (data l im itat ions do not allow for exact ly equal groups), Lorenz curves for formal cred it are dominated by the other two Lorenz curves in a l l cases. Credit from friends and r e la t iv e s i s more equally d i s
tr ibuted than other informal c red i t among urban s e l f employed households . At the a l l - I n d i a l e v e l , in form al c r e d i t i s most equally d istr ibuted by both inequal i ty indices and Lorenz curves based on three groups. These data, while o f in te r e s t , have l i t t l e bearing on the e f f e c t o f c re d i t by source on asset or income inequali ty or on welfare.
16.3.7 Equity impact: Much more interest ing is that asset poorhouseholds get a greater share per rupee o f informal cred it than the corresponding share o f formal c red i t fo r well past the ha l f way mark of the households when they are ranked by a s s e t s . Equally interest ing is the fact that the share o f informal credit going to the wealthiest c lass exceeds the corresponding share o f formal c r e d i t , the d i f f e r e n c e being p a r t i cu lar ly marked for urban
areas. Thus, urban "lower middle to middle c lass" households, e s p e c ia l ly among non self-employed, who would t y p i c a l l y f a l l into
the asset c lass between Rs 20,000 and Rs 5 lakh, are least dependant on informal c r e d i t .
16.3.8 The data presented in Tables 16.1 to 16.5, e s p e c ia l lythat summarised in para 16. 3. 7, lend support to the hypothesis
that informal c red i t is welfare augmenting e s p e c ia l ly for the poorest c lasses . Of course, th i s p o s i t iv e ' e q u i t y ' impact does not rule out the hypothesis that informal c red i t i s usurious and leads to a perpetuation o f poverty but neither i s the negation o f th is propos it ion ruled out. What i s very c lear is that formal credit has f a i l e d to supplant informal credit for the poorest households. We conclude ten ta t iv e ly that informal c red i t tohouseholds is e qu i t y improving whi l e not r u l i n g out the p o s -
98

s i b i l i t y that i t is s o c i a l l y undesirable . However, remarks in the RBI survey volume and also f i e l d studies o f borrowers from selected groups o f informal intermediaries tend to suggest the soc i a l d e s i r a b i l i t y o f urban informal c r e d i t , at least for the sectors studied.
9
16.4 Inter-state variation
16.4.1 Table 16.5 shows that in t e r - s t a t e variat ions in household debt are f a i r l y substantial when th is i s measured by the c o e f f i c ient o f va r ia t ion . In teres t ing ly , the least var iab le s t a t i s t i c given i s the proportion o f formal debt. An examination o f corre lat ion c o e f f i c i e n t s (Table 16.6) also reveals interest ing patterns in the debt structure. The main patterns revealed are the fo llowing :
1. Financial development, as measured by the proportion o f f inanc ia l assets , i s only weakly associated with a l l variables o f in t e r e s t . In teres t ing ly , the assoc ia t ion s with consumption and unsecured debt are pos i t i ve while that with other informal debt is negat ive .
2. Asset inequal i ty , as measured by the assoc iat ion with asset shares o f the top and bottom 25 per cent taken together, i s p o s i t i v e ly associated with urban formal cred it and negative ly with rural formal credit and both types o f in fo rm a l c r e d i t in urban a re as . However, the assoc ia t ion i s weak. Surprisingly, consumption debt i s negative ly associated with inequali ty in rural areas but p o s i t i v e l y with urban inequality though the la t t e r e f f e c t is weak.
3. While per capita state domestic product has a weak asso c ia t io n with a l l va r ia b les , assoc iat ions tend to be stronger in rural areas. The assoc iat ion with in fo r mal cred it from others, consumption debt and unsecured debt i s negative while that with formal debt i s posi t iv e . Thus informal credit / may be taken to be somewhat more important in poor states while the opposite
9. Even i f we a l l o w f o r the f a c t t ha t d a t a f o r t h i s c h a p t e r a r e as on June 30 , 1981 t h ea g g r e g a t e f i g u r e o f h o u s e h o l d d e b t f r o m f r i e n d s and r e l a t i v e s w i l l not e x c e e d , s a y , 3 t i me s t h i s f i g u r e , whi c h i s s t i l l s m a l l .
99

is true for formal credit.
4. Informal c red i t from others has a strong negative ass o c i a t i o n with formal c r e d i t as does o r e d i t from fr iends and r e la t iv e s .
5. C on f l i c t ing signs between asset-wise and statewise samples were obtained for the fo l lowing c o r re la t io n s : (a ) consumption debt and unsecured debt in urban areas; (b) credit from r e la t iv e s and friends and high in terest debt; ( c ) urban other informal debt and debt to re la t ives and fr iends ; (d) the debt-asset rat io and rural consumption debt , urban unsecured debt , debt from f r i e n ds and r e l a t i v e s and urban formal debt . However, statewise co r re la t io n s are weak.
16.5 Informal c red i t and the household sector : some in ferences
16.5.1 Pooling together the resu lts o f the previous sect ionswe draw the fo l lowing inferences .
a. Households having a high proportion o f informal debt from a l l sources ( i . e . , a low proportion o f formal debt) are more likely to have high consumption debt as would be expected.
b. Households with a high proportion o f unsecured debt are l i k e l y to have a low proportion o f formal debt and a high proportion o f debt to fr iends and r e la t iv e s .
c . Informal debt other than from fr iends and re la t iv e s is l i k e l y to have higher than average in terest c o s t , but th is is by no means ce r ta in .
d. Informal c red i t other than from fr iends and re la t ives complements formal c re d i t to households in that a high proportion o f one is strongly associated with a low proportion o f the other.
e . Informal c red i t is assoc iated with lower urban asset inequal i ty but higher rural asset inequa l i ty .
f . Informal cred it in urban areas is more evenly d i s t r ibuted among asset groups than formal c r e d i t .
g. Informal c red i t is almost c e r ta in ly welfare improving for asset poor households, who are large ly excluded from formal cred it markets. This does not imply that such c r e d i t cannot be supplanted by even better ins t i t u t i o n a l arrangements (given the suspected high cost o f informal c re d i t to households). However, f o r mal c re d i t has yet to make major inroads into cred it markets serving the poor.
100

16.6 Aggregate estimates and concluding comments
16.6.1 The f igures .given in Table 16.1 can be used to compile crude estimates of aggregate informal c r e d i t . According to the
Census o f India, 1981, the aggregate number o f households in India in 1981 was:
Al l India : 119,772,545 householdsRural : 90,886,596 householdsUrban : 28,905,949 households.
Using these f igures , we can get estimates of t o ta l household debt by d i r e c t l y in f la t in g f igures in Table 16.1. These f igures are in Table 16.7.
16.6.2 These figures are small r e la t iv e to the t o ta l size ofcred i t markets in India. Thus, i t can be concluded that informalcred i t is not primarily d irected at the household sector . Aco r o l la r y o f thi s is that only a very smaLl f ract i on o f informal
c re d i t / f in a n ce s consumption debt.
16.6.3 Perhaps the most surpris ing finding of the analysis int hi s chapter is the small s ize o f informal c red it to the household sector . It is nevertheless c l e a r l y o f importance to the poorest households. That a large portion o f informal c r e d i t , being in ter - household loans from fr iends and r e la t iv e s , i s low interest debt and that the evidence for other informal debt having high interest
cost is not unambiguous are also o f great in te r e s t . Finally , since much informal c red i t to business firms i s claimed to be from ' f r i e n d s and r e l a t i v e s ' and since the to ta l size o f such debt isless than Rs 1000 crore (the s ize o f household dues rece ivable i seven smaller) , i t is l i k e l y that much o f the c red i t o f th is type reported by firms i s actual ly unaccounted funds. This i s d is cussed further elsewhere.
101

TABLE 1 6 .1
Household Debt : Selected All India Averages
( i n Rupees)
Variable Group o f households
All Allrural
Allurban
Average debt per Indebted 3791 3111household
Percentage of Indebted 19.10 19.97househo Id s
Debt to informal agencies 39.4 38.8a )3a. o f which fr iends and 11.1 9.0
re la t iv e s (%)
Net debt per household 691 63 5
Gross informal debt 250 195(other than from friends and re la t iv e s ) per household
Urban s e l f - employed
5930 8708
17.36 16.89
40.1 42.3
15.2 14.2
867 1098
256 413
Notes: 1. Rows (4) and (5) and the f i r s t f igure in row (1) arecommuted froti survey and census o f India (1981) data.Other f igures are as in the survey.
102

TABLE 1 6 .2
Variations in Debt Characteristics Across Asset Groups
Variable STAT- Group o f householdsISTIC ___________________________________________
All All All Urban s e l f -rural urban employed
PercentageDebt from fr iends and C 49.5 41.8 51.0 51.4re la t ives L 24.6 10.9 33.0 33.6
H 2.6 1.9 3.9 4.1
Debt from other informal C 51. 1 60.6 42.8 33.9sources L 69.6 80.0 61.5 58.9
H 12.4 3.1 29.2 32.8
Debt from formal sources C 53.6 54.9 50.3 55.7L 5.8 11.3 5.5 7.5H 85.0 95.0 66.9 63.9
Unsecured debt C 46. 7 54.2 40.7 47.5L 82.9 90.4 78.9 87.5H • 9. 1 6.9 13.3 14.4
Consumption debt C 65.1 72.9 54.5 84.6L 81.2 79.1 81.3 81.5H 2.7 2.0 3.7 0.1
Financial assets plus C 28. 2 27.5 44.4 25.8dues rece ivab le L 2.7 2.0 4.1 2.2
H 4.0 1.0 8.5 5.4
Debt at 20% p.a. or more C 52.8 62.0 47.3 51.4interest L 42.0 57.7 33.0 32.6
H 7.0 1.8 16.8 19.9
Proportion o f indebted C 36.89 35.61 45.54 40.40households L 7.8 5.7 14.5 9.9
H 0.5 0.3 0.7 1.2
Debt asset ra t io C 106.4 - 88.1 115.6 131.6L 16.3 11.3 24.7 32.4H 2.0 2.2 1.7 2.5
Notes: 1. C: Unweighted c o e f f i c i e n t o f variation across groups (%).L: Households with assets less than Rs 1000.H: Households with assets more than Rs 5 lakh.
2. Total number o f asset groups: 8.
103

TABLE 16.3
Selected Correlation Coefficients: Household Data by Asset Groups
(Correlation Coefficients in Percentage)
Proportion o f Proportion o f
CONS UNSEC INT20 RF INF FOR
Consuraption R 100.0 98. 2 99.0 (91 .4 ) 98.9 (97 .4 )debt (CONS) U 100.0 96. 8 80.2 (96.7) 74. 7 (89.30
Debt from R 66.8 75.4 73.0 100.0 74.0 (80 .5 )friends and re lat ives (RF)
U 96. 7 97.8 78.6 100.0 75.7 (91.4)
Debt from others R 98. 9 99.6 99.3 • 74.0 100.0 (99.5)informal sources (INF)
U 74. 7 66.8 90. 1 75. 7 100.0 (95.7)
Formal sector R (97.4) (99 .3 ) (98.7) (80 .5 ) (99 .5) 100.0debt (FOR) U (89.3) (84 .9) (90.9) (91 .4 ) (95.7) 100.0
Debt to assets R 88.9 81.3 82.8 28.0 84.0 (78.4)U 69. 7 63.3 71.0 70.8 92.6 (88.7)
Average assets R (65.8) (78 .3 ) (74 .2) (87 .2) (74 .3) 78.8of the groups U (80.9) (87 .2 ) (35 .6) (77 .5 ) (28 .0) 51.8(Rs.)
1. CONS Consumption debt.2. UNSEC Unsecured d e b t .3. INT20 Debt at in terest o f 20% or more per annum4. R Rural households.5. U Urban households.6. Negative f igures in parentheses.
104

TABUS 16.4
Inequality Indicators for Credit Distribution Across Households
Variable Group o f households
All Allrural
Allurban
Urban s e l f - employed
A. Credit from friends & relativesCOEFF o f VAR (%) 70.3 74.6 70. 1 73.6GINI Index (%) 33.9 35.8 33.4 32.4Share o f households (%): Assets < Rs 1000 1.64 0.57 2.77 2.33Assets < Rs 20000 32.66 32. 13 33.25 36.43Assets > Rs 5 lakh 2.49 1.60 2.17 4.89
B. Credit from other informalCOEFF o f VAR (%)
sources63.5 • 75.0 57.3 72.2
GINI Index (%) 31.9 27.7 40.2 49.3Share o f households (%): Assets < Rs 1000 1.83 1.28 3.21 2.08Assets < Rs 20000 34.60 36. 25 31.90 19.17Assets > Rs 5 lakh 4.67 0.79 10.06 19.44
C. formal creditCOEFF o f VAR (%) 108.9 116.3 107.0 157.8GINI Index (Z) 46.4 43.4 55.1 61.9Share o f household (%): Assets < Rs 1000 0.05 0.03 0.16 0.11Assets < Rs 20000 19.44 20.05 17.08 6.81Assets > Rs 5 lakh 0.64 0.29 0.53 1.96
D. Dominant Lorenz partial ordering(A) versus (B) - (B) - (B) A(A) versus (C) - (A) - - (A) - (A)(B) versus (C) * (A) - (B) - (B) " (B)
E. Percentage of indebted households in asset groups< Rs 1000 7.8
different
5.7 14.4 9.0< Rs 20000 57.9 57.2 60.3 51.2> Rs 5 lakh 0.5 ' 0.3 0.6 1.2
_ _
Notes: 1. Based on 8 asset groups o f unequal s ize .2. Lorenz cross ings occur at most once (A dash indicates
cross ing curves)3. Letters in parentheses (item D) indicate Lorenz dominant
group when groups are aggregated to three almost equal groups. Exactly equal groups cannot be made due to data l i m i t a t i o n s .
105
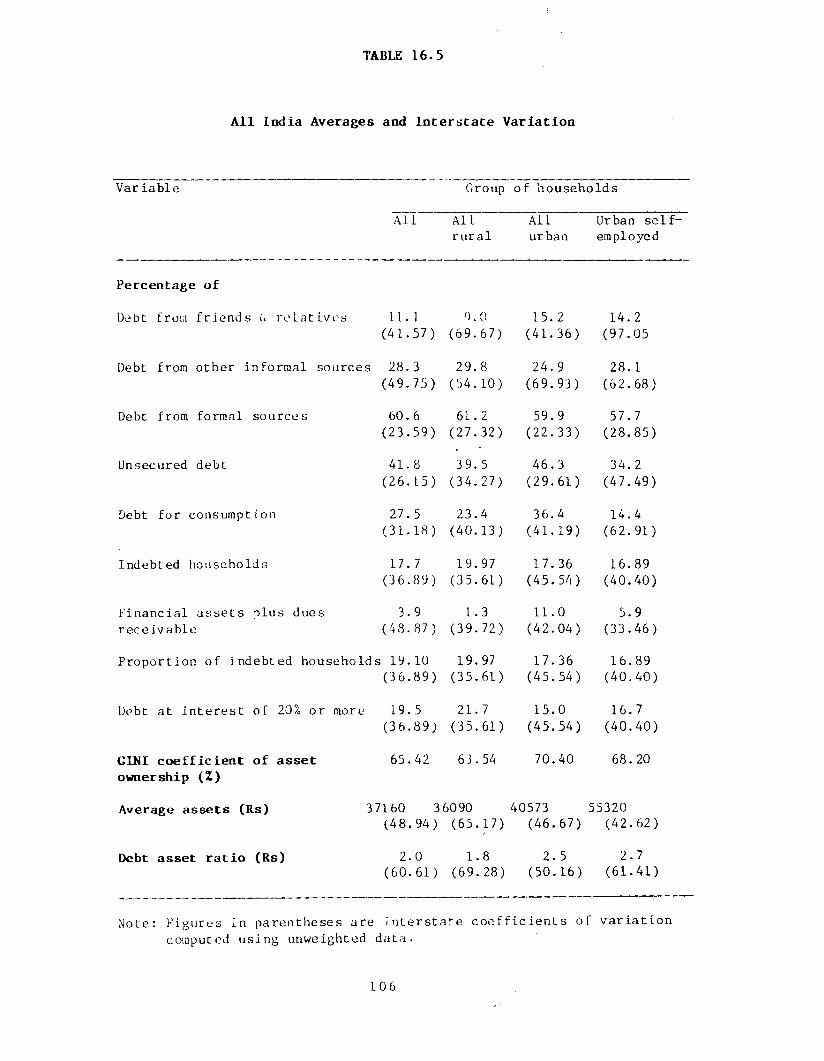
TABLE 16.5
A ll India Averages and Interstate Variation
Variable Group o f households
Al l All All Urban s e l f -rural urban employed
Percentage o f
Debt from friends re la t ives 11.1(41.57)
9.0(69.67)
15.2(41.36)
14.2(97.05
Debt from other informal sources 28.3(49.75)
29.8 (54.10)
24.9(69.93)
28.1 (62.68)
Debt from formal sources 60. 6 (23.59)
61. 2 (27.32)
59.9(22.33)
57. 7 (28.85)
Unsecured debt 41. 8 (26.15)
39.5(34.27)
46.3(29.61)
34.2(47.49)
Debt for consumption 27.5 (31.18)
23.4 (40.13)
36.4 (41.19)
14.4(62.91)
Indebted households 17. 7 (36 .89)
19.97(35.61)
17.36(45.54)
16.89(40.40)
Financial assets plus dues receivable
3.9(48 .87)
1 .3 (39.72)
11.0(42.04)
5.9(33.46)
Proportion o f indebted households 19.10(36.89)
19.97(35.61)
17.36(45.54)
16.89(40.40)
Debt at in terest o f 20% or more 19.5(36.89)
21.7(35.61)
15.0(45.54)
16.7(40.40)
G1NI coefficient of asset ownership (X)
65.42 6 3.54 70.40 68.20
Average assets (Rs) 37160 3 6090 (48.94) (65.17)
40573(46.67)
55320(42.62)
Debt asset ratio (Rs) 2.0 (60 .61)
1.8(69.28)
2.5(50.16)
2.7(61.41)
Note: Figures in parentheses are in tersta te c o e f f i c i e n t s o f var ia t ion computed using unweighted data.
106

TABLS, 16.6
Selected Correlation Coefficients: Household Data by States (Correlation Coefficients in Percentage)
Proportion Proportion o f
CONS UNSEC INT20 RF INF FOR
Consumption R 100.0 59.5 (1 .5 ) 79.0 44.1 (69.7)debt (CONS) U 100.0 (7 .4 ) 38.4 10.9 19.4
Debt from R 79.0 29.5 (24.9) 100.0 22.7 (61.4)friends and re lat ives(FR)
U 10.9 36.4 (7 .3 ) 100.0 (26.5) (19.5)
Debt from others R 44.1 89.3 68.9 22.7 100.0 (90.8)informal sources (INF)
U 19.4 14.5 (45.1) 26.5 100.0 (89.4)
Formal sector R (69.7) (85.1) (45 .1) (61 .4) (90 .8) 100.0debt (FOR) U (24.8) (31 .7) (24 .8) (19 .5 ) (89 .4) 100.0
Debt to assets R (41.9) 0.35 39.4 (37 .1 ) 17.6 1.7U 36.8 (37.6) 44.0 (17 .6 ) 36.6 (29.1)
Financial assets R 20.8 3.9 9.1 23.3 (23.9) (16.4)U 50.8 24.7 (17.2) (13 .8 ) (8 .2 ) 14.7
Assets with top R (59.40) (18 .4 ) 39.8 (46.0) (2 .6 ) 21.925% U 35.0 2.3 35 48.3 47.3 (25.0)
Assets with R 57.3 (35.8) (29 .3) (27.13) (15 .6 ) (24.3)bottom 25% U (44.4) (15 .5 ) (44.4) (49 .5) (39 .2 ) 24.6
State domestic R (45.3) (43 .4) (37 .3 ) (20 .2) (54 .3) 52.7product per capita
U (16.3) 12.9 (15.3) 28.3 (19.5) 6.7
Notes: 1. See Table 16.3 for var iab le d e f i n i t i o n s .2. Negative f igures in parentheses.3. Correlat ion c o e f f i c i e n t s above 50 per cent are in bold type.

TABLE 16.7
Aggregate Estimates of Credit to the Household Sector(June 30, 1981)
(Rs crore )
Variable Group o f households
All Rural Urban
1. Gross formal debt 5458 3676 1782
2. Gross informal debt 3523 2330 1193
a. Friends and re la t ives 992 540 452
b. Others 2531 1790 741
3. Total net cash debt o f the household sector
8277 '5771 2506
Note: Figures for rural households in Rows 1 and 2 are taken from the companion CDS report .
108

CHAPTER 17
INFORMAL CREDIT FOR SMALL SCALE INDUSTRY,TRADERS AND TRANSPORT OPERATORS
17.1 Introduction
17.1 .1 As yet , the only r e l a t i v e l y recent data on small scale in d u s t ry (S S I ) , t r a d e rs and t r a n s p o r t o p e r a t o r s (TO), which comprise the bulk o f p r o d u c t i v e a c t i v i t i e s f inanced by urban
informal c r e d i t , are from the Reserve Bank o f India 's survey o f small sca le industr ia l units in 1977 and their survey o f traders and transport operators in 1979-80.
17.1.2 These surveys sampled a t o t a l o f 12,356 small s c a leindustr ia l units , 3269 wholesale traders (WT), 8788 r e t a i l traders (RT) and 6129 transport operators . In a l l cases, surveys were l imited to units ass is ted by commercial banks so that data are biased against informal c r e d i t . The bias is par t icu lar ly serious for TO as ve h ic le f inance i s the c h ie f reason for the ir borrowing. C l e a r l y , those r e c e i v i n g formal c r e d i t f o r the purchase o fve h ic le s , at margins not exceeding 30 per cent , w i l l have l i t t l eneed f o r a d d i t i o n a l in form al c r e d i t . As the- surveys o f h i r epurchase and auto f inanciers elsewhere in the report shows, many transport operators , p a r t i cu la r ly o f used v e h ic le s , rece ive noformal finance. The bias i s not serious for SSI s ince most units have access to formal c r e d i t . Trade represents an intermediate case . N e v e r th e le s s , the s u rve ys , even with the b ias a g a in s t
in formal c r e d i t r e v e a l enough about in form al c r e d i t to be o f in teres t . Unfortunately, the summary reports released by the Reserve Bank do not contain information by d i f f e r e n t categor ies o f informal lenders, though such data were c o l l e c te d .^ Information
1. A t t e m p t s were made by us to o b t a i n the d e t a i l e d data from the RBI. Though t a p e s were o b t a i n e d , d i f f i c u l t i e s the d o c u m e n t a t i o n o f t a p e s have y e t t o be r e s o l v e d , da ta i s , t h e r e f o r e , s t i l l u n u s a b l e .
t a p e swith
The
109

on the cost o f informal c red i t and i t s terms and condit ions was also unavailable in the published volumes. From the data which i s ava i lab le , the fo l lowing information o f in terest could be derived and i s reported here:
o1. The r e la t iv e importance o f formal and informal c red i t f o r
units c l a s s i f i e d by output (small scale industry ) , sales ( trade) or gross earnings ( transport operators ) .
2. The r e la t iv e importance o f c r e d i t by source for SSI and TOunits c l a s s i f i e d by assets .
3. The r e la t iv e importance o f c re d i t by source for SSI unitsc l a s s i f i e d by persons employed.
4. The r e l a t i v e importance o f c r e d i t by so u rce f o r u n i t sc l a s s i f i e d by type o f o rgan isat ion .
5. The re la t iv e importance o f c red it by source in d i f f e r e n ta c t i v i t i e s .
6. The net c r e d i t p o s i t i o n o f u n i t s and i n t e r - s t a t evar i a t i o n s .
7. Duration o f trade c re d i t given and received by traders .
8. The to ta l cost o f c re d i t in re la t io n to the importance o fd i f f e re n t sources .
9. The r e la t io n between c re d i t sources and the c ap i ta l outputrat io .
17.2 The relative importance of formal and informal credit
17.2.1 Table 17.1 gives d e t a i l s o f units c l a s s i f i e d by the value o f output, sales or gross earnings and the ra t io o f formal to informal credit*. The rat io increases with the value o f gross output fo r SSI, but f l u c t u a t e s f o r other s e c t o r s . However, Informal c red i t to SSI, WT and RT Lorenz dominates formal c red it when units are c l a s s i f i e d by output or sales as in the table . For TO, formal c r e d i t i s more e q u a l l y d i s t r i b u t e d . However, as discussed, the bias in the data are p ar t i cu lar ly serious for TO.
2. ' F o r m a l ' c o r r e s p o n d s t o ' i n s t i t u t i o n a l ' in the s u r v e y ' i n f o r m a l ' t o ' n o n - i n s t i t u t i o n a 1 ' . The la n g u a g e h e r e c o n s i s t e n t w i th the r e s t o f the r e p o r t .
and i s
110
This means, that, out of every rupee of informal credit, a greater percentage goes to small units regardless of where (below 100 per cent) the dividing lin e between small and large is drawn as compared to formal c r e d it , except possibly for transport
operators.
17.2.2 Data on market value o f f ixed assets i s used to c l a s s i f ySSI and TO units . As can be seen (Table 17.2) for SSI, informalc re d i t per rupee o f assets and the formal/informal c red i t rat io show that informal c red it favours smaller units both absolutely and r e l a t i v e l y . For TO, no p a r t i c u l a r trend i s d i s c e r n i b l e , though i t i s c l e a r that in fo rm a l c r e d i t i$ important both abso lute ly and r e la t iv e ly f o r the smallest and largest units .
17 .2 .3 Table 17.3 contains d e t a i l s o f firms c l a s s i f i e d by personsemployed. While i t i s c lear that informal c red it favours small firms by th is c r i t e r i o n as w e l l , i t is a lso true that large SSI units in the sample have the highest employment (70.78 per cent of the sample t o t a l ) but r e c e i v e o n ly 54 .1 per cent o f in form alc r e d i t as compared to 61.9 per cent o f formal c r e d i t .
Furthermore, and unexpectedly, the employment to cap ita l rat ios are found to in c r e a s e with employment p o s s i b l y due to the
existence o f minimum cap ita l requirements for v iab le operation. Consequently, we may conclude that informal c red i t i s negat ively associated with employment in SSI. This must be weighed against the labour i n t e n s i v e nature o f trade when drawing o v e r a l l conclusions.
17 .2 .4 Table 17.4 shows that p r o p r i e t a r y c o n ce rn s are b e t t e r served by informal c red i t except in TO. Formal cred it favours private l imited companies. I f incorporation is associated more with educated and r e l a t i v e l y sophist icated entrepreneurs, then th is points to an addit ional des irab le feature o f informal credit when coupled with the lack o f exp lo i ta t ion o f small firms found in f i e l d studies .
I l l

17.2.5 Table 17.5 shows the r e la t iv e dependaace o f subgroups o f SSI, trade and TO on d i f f e r e n t sources o f c r e d i t . As would be expected, SSI units engaged in job work are most highly dependant on informal c r e d i t , though a l l groups rece ive more informal than formal c r e d i t . For trade, a l l groups depend more on informal c r e d i t than formal c r e d i t but t h i s is e s p e c i a l l y true of the t e x t i l e t r a d e . R e t a i l t rad e i s most p o o r l y served by formal c re d i t . TO is better served by formal cred it in general but
motor passenger transport i s r e l a t i v e l y most dependant on informal c r e d i t .
17 .2 .6 In te r - s ta te var ia t ions in the formal/informal c red i t ra t io are substantia l , with the States least served by formal c red i t having ra t ios o f 48.8 per cent for SSI (West Bengal), 12.5 per cent for WT (Tamil Nadu), 23.1 per cent for RT (Madhya Pradesh)
and 91.1 for TO (Andhra Pradesh). For TO only one State had a ra t io below unity. Rank c o r re la t io n s o f state domestic product and the formal to informal c red i t ra t io are given in Table 17.6. As can be seen cor re la t ion s are small for a l l sectors except SSI, where i t is negative at 43.4 per cent . Thus the c red i t mix bears no re lat ion to regional development except perhaps for small scale in d u s t r y , where formal c r e d i t i s found to be a s s o c i a t e d with backwardness.
17.3 Net credit position of units
17.3.1 A f i n a l set o f f i g u r e s on sampled u n i t s i s t h e i r net cred it p os i t ion ( c r e d i t received le s s c red i t g iven) . Relative to
own funds, SSI is the least c re d i t constrained and trade is most dependant on own funds. Thus dependance on informal c red i t i s seen to be associated with the most c red i t constrained sectors given our e a r l i e r f inding that informal c red i t i s most important
for trade.
17 .3 .2 Table 17.7 p r o v i d e s d e t a i l s on the d u r a t i o n o f t r a d e cred it received and given in RT and WT and the net trade cred it pos i t ion o f un its . Reta i lers received credit for longer periods
112

but also gave more days o f c r e d i t than wholesalers in 1978-79, a s i tuat ion that appears to have changed in the 8CTs in favour o f r e t a i l e r s . W h o lesa lers were net g i v e r s o f t r a d e c r e d i t and r e t a i l e r s were net rece ivers o f trade c r e d i t , a s i tuat ion that appears to have continued into the 8 0 ' s.
17.4 Cost of credit
17.4.1 The costs o f informal c red i t r e la t iv e to formal c red i t wass tudied by r e g r e s s i n g the r a t i o o f i n t e r e s t paid to t o t a l borrowing on the formal to informal c red i t r a t i o . The pooledsample o f SSI, trade and TO was used (68 observations) using data
for 17 States and one union t e r r i t o r y (only 13 states and the union t e r r i t o r y were avai lable for SSI). Ordinary least squares
on leve l var iab les was the only s p e c i f i c a t i o n attempted. From the regression ( in the appendix to th is chapter), the c red i t rat io is in s ig n i f i c a n t .^ The dummy var iab les however show that trade had the highest in terest cost o f 17 per cent to 19 per cent and that TO had the lowest at about 13 per cent . This t i e s in well with f i e l d invest iga t ion s . Note that the regression s p e c i f i c a t io n
f a i l s residual t e s ts f or normality and homoscedast ic i ty . Addition o f statewise dummy variables and/or s ta te domestic product did not make any d i f f e r e n c e to the size or s ign i f i can ce o f the c o e f f i c i e n t nor to s p e c i f i c a t i o n d iagn ost ics .
17.5 Informal credit and allocative efficiency
17.5.1 The a l l o c a t i v e e f f i c i e n c y impact o f informal c red it was studied by regressing the cap i ta l output ratio^ on the formal
in form al c r e d i t r a t i o using the data set and s p e c i f i c a t i o n
3. See the c h a p t e r on the t e x t i l e w h o l e s a l e t r a d e .
4 . A d d i t i o n o f dummy v a r i a b l e s f o r S t a t e s w o r s e n e d th es p e c i f i c a t i o n d i a g n o s t i c s and d i d n o t i m p r o v e t h es i g n i f i c a n c e .
5. The r a t i o was p r o x i e d b y : ne t s a l e s t o net f i x e d a s s e t s f o rS S I ; ne t s a l e s t o ne t a s s e t s f o r t r a d e ; and g r o s s e a r n i n g s t o g r o s s f i x e d a s s e t s f o r TO.
113

discussed in the previous paragraph. Here too, no assoc iat ion o f the formal/informal credit, r a t io with e f f i c i e n c y o f c a p i ta l use was found. Though s p e c i f i c a t i o n d iagnost ics o f th is regression are also poor, neither the c o e f f i c i e n t d iagnost ics nor regression s ign i f i cance were improved with the d e le t io n of statewise dummy v a r i a b l e s . We thus conc lude that the c r e d i t mix has l i t t l e assoc iat ion with the e f f i c i e n c y o f cap i ta l use, with the caveat that th is is subject to further te s t in g .
17.6 Aggregate estimates
17.6.1 Aggregate estimates o f informal c red i t in the four sectors were computed in two ways. The f i r s t estimate used the rat io o f
formal to informal c red i t in the sample and scheduled commercial bank advances to the sectors on the last Friday of June 1985.^
The second estimate employed some aggregate s t a t i s t i c ava i lab le in both the sample and published data. Full d e ta i l s are provided in the second part o f Table 17.8. No attempt was made to correct for the bias against informal c red i t in the sample in order to o b ta in lower bound e s t im a te s o f in form al c r e d i t . To these
e s t im a t e s , f i g u r e s on es t im ated in fo rm a l c r e d i t d e r iv e d from Reserve Bank data on 1800 Public Limited Companies^ is added for
ocomparison between formal, large s ca le manufacturing. Even the
lower of the two estimates gives a f igure o f Rs 46,437 crore for informal c red i t (Table 17 .8 ) . This is extremely large given thatgross bank c r e d i t to a l l sectors according to provis ional RBIestimates was about Rs 62,500 crore in March 1987. However, as
Qhas been pointed out elsewhere in the report , bank cred i t to
6. 1985 was the most r e c e n t y e a r a v a i l a b l e . S i n c e , in some o four e s t i m a t e s , f l o w f i g u r e s a re used t o com pute i n f o r m a lc r e d i t e s t i m a t e s , mid p o i n t s o f p e r i o d s may be tak en as the d a t e f o r the s t o c k e s t i m a t e s .
7. L e s s than 1% o f sampled f i r m s would f a l l i n t o t h i s c a t e g o r y ,i f any . See t h e l a s t co lum n o f T a b le 1 7 . 4 .
8. The e x t e n t o f i n f o r m a l c r e d i t , a l m o s t e n t i r e l y t r a d e c r e d i t , to such c o m p a n ie s i s i t s e l f o f i n t e r e s t .
9. See the c h a p t e r on S h r o f f s o f W e s t e rn I n d i a .
114

these sectors has stagnated r e la t iv e to output - a fact these aggregate estimates r e f l e c t .
17.6.2 The upper estimate o f aggregate c red i t demand would be v a l i d i f there was, r o u g h l y ^ speaking , a u n i ta r y income
e l a s t i c i t y or output e l a s t i c i t y o f c red it demand. A double log regression of average credit per unit on state domestic product f o r the years In which the survey was conducted y i e l d e d an e l a s t i c i t y estimate not s i g n i f i c a n t l y d i f fe rent from unity (the va lue was 0 .8205 and the standard e r r o r was 0 . 1 8 8 6 ) . Thus estimate 2 finds support from cross sect iona l evidence, to the
extent that such evidence is v a l id . As a measure o f abundant caution, we take as our preferred estimate the average o f the two estimates which i s Rs 69,000 c r o r e . ^
17.7 Conclusions
17.7.1 Informal c re d i t has been found to be the main source o f c red it for SSI and trade in the la t e 7 0 's , a s i tuat ion that is l i k e l y to continue to prevail i f our f i e l d studies are anything to go by. Transport operators , e s p e c ia l l y o f old v e h i c l e s , are also dependant on informal c r e d i t , though units rece iv ing bank finance do not appear to have great need for informal c r e d i t . There is
more than adequate support f o r the hypothesis that informal credit is welfare improving for smaller units who, i t appears, do not r e c e i v e adequate bank f i n a n c e . The h y p o t h e s i s that in formal cred it promotes employment finds no support from survey data and the mix of informal and formal c r e d i t appears to have no bearing on the e f f i c i e n c y o f c a p i ta l use o f surveyed units . Mild support
is found for the propos it ion that informal c red i t is more c o s t l y than formal c r e d i t . Among the groups surveyed, WT appear to be net informal lenders, a f inding corroborated by f i e l d work in the
10. T h is i s v a l i d o n l y a p p r o x i m a t e l y s i n c e th e same v a r i a b l e s were not used to i n f l a t e sam ple f i g u r e s i n a l l s a m p l e s .
11 . The r e g r e s s i o n i s r e p o r t e d in the A p p e n d ix to t h i s c h a p t e r . See a l s o t h e c o r r e l a t i o n s in T a b le 1 7 . 6 .
115

t e x t i l e sector . In in terpret ing these f indings , the aggregate nature o f data used should be kept in view, e s p e c ia l l y where no supporting f i e l d evidence is a v a i la b le .
116

TABLE 17-1
Dependance on Formal and Informal Credit by Value of GrossOutput/Sales/Earnings
A. Small Scale Industry (Value of Gross Output)
Upto 1 1 to 5 5 to 10 10 to 50 Above 50
Percentage o f units 63.75 21.28 6. 12 7.41 1.44Ratio o f forma! to informalc r e d i t (%) 105.77 131.03 136.94 144.67 148.95
G ini Index o f C r ed it D i s t r i b u t i o n (%) : Formal C r e d i t : 68.76; I n fo rm al C r e d i t : 64.62. Lorenz Domination By : In fo r m a l Cred it
B. Wholesale Trade (Value of Sales)
Upto 1 1 to 5 5 to L0 10 to 50 to Above 10050 100
Percentage o f units 2.84 19.40 15.16 44.78 10.12 7.7Ratio o f formal toinformal cred it (%) 38.92 37.79 51.75 40.38 54.03 86.80
Gini Index o f Credit D istr ibut ion (%): Formal Credit: 44.14; Informal Credit : 33.71. Lorenz Domination By : Informal Credit
C. Retail Trade (Value of Sales)
Upto 1 1 to 5 5 to 10 Above 10
Percentage o f units 74.44 18.76 3.62 3.18Ratio o f formal to informalcr e d i t (%) 50.26 46.87 47.60 53.70
Gini Index o f Credit D istr ibut ion (%) : Formal Credit: 59.03; Informal Credit : 58.57. Lorenz Domination By : Informal Credit
D. Transport Operators (Gross Earnings)
Upto 1 1 to 2 Above 2
Percentage o f units 83.51 13.50 2.99Ratio o f formal to informal c red i t (%) 241.69 252.62 103.19
Gini Index o f Credit D istr ibut ion (%): Formal Credit: 35.36 Informal Credit : 45.71. Lorenz Domination By : Formal Credit
117

TABLE 1 7 . 2
Dependance on Formal and Informal Credit for Units Classified by Market Value of Assets
(Rs '0000)
Market value of f ixed assets / t ransport equipment owned
U pto2 2 to 5 5 to 10 l O t o 20 to Above 5020 50
A. Small Scale Industry
Percent, of units 57.1 14.0 LO.O 7.3 7.3 4.4
Ratio o f formal 41.43 77.56 94.94 113.57 141.99 169.25to informal c red it (%)
Ratio o f informal 3.06 1.06 0.76 ’ 0.75 0.49 0.37credit to market value of f ixed assets (%)
B. Transport Operators
Percentage o f 64.2 9.1 10.4 13.4 2.6*units
Ratio o f formal 149.82 263.44 207.70 291.34 127.211to informal c red it (%)
Ratio o f informal 0.37 0.18 0.22 0.15 0 .231cred i t to market value of transport equipment owned (%)
1 Above 2,00,000.
118

TABLE 17.3
Dependance on Informal Credit of Small Scale Industrial Units Classified by Employment
No. o f persons employed
Allunits
Upto 5 6 to 10 11 to 15
16 to 20
Above 20
Percentage o f units
100 60. 91 16.58 7.04 3.66 11.80
Ratio o f formal to informal c red i t (%)
73.66 72.82 115.08 116.87 118.58 142.31
Cumulative employment (%)
100.0 6.82 16.93 24.11 29. 22 100.0
Cumulative 100.0 formal c red i t (%)
8.1 22. 2 31.3 38.1 100.0
Cumulative informal c red i t (%)
100.0 13.8 29.1 38. 7 45. 9 100.0
Ratio o f employment to market value o f f ixed assets (upto 5 group=100)
100 106.6 116.6 126.8 221.7
119

TABLE 17.4
Dependance on Formal and Informal Credit by Type of Organisation
Sector
Wholesale trade
Retail trade
Type of organisation
Proprie - Partner- Private tary ship l imited
company
Small Scale Industry
Other
Percentage of units 68.23 27.74 3.15 0.85Ratio o f formal to 73.14 101.87 194.13 215.28informal c red i t (%)
Percentage o f units 22.67 75.11 1.57 0.66Ratio o f formal to 37.88 47.02 220.96 133.94informal c re d i t (%)
Percentage o f units 87.20 12.54Ratio o f formal to 27.38 40.75informal c red i t (%)
0.2648.07
Transport operators
Percentage o f units 96.81 2.88Ratio o f formal to 153.52 94.05informal cred it (%)
0.3183.66
120
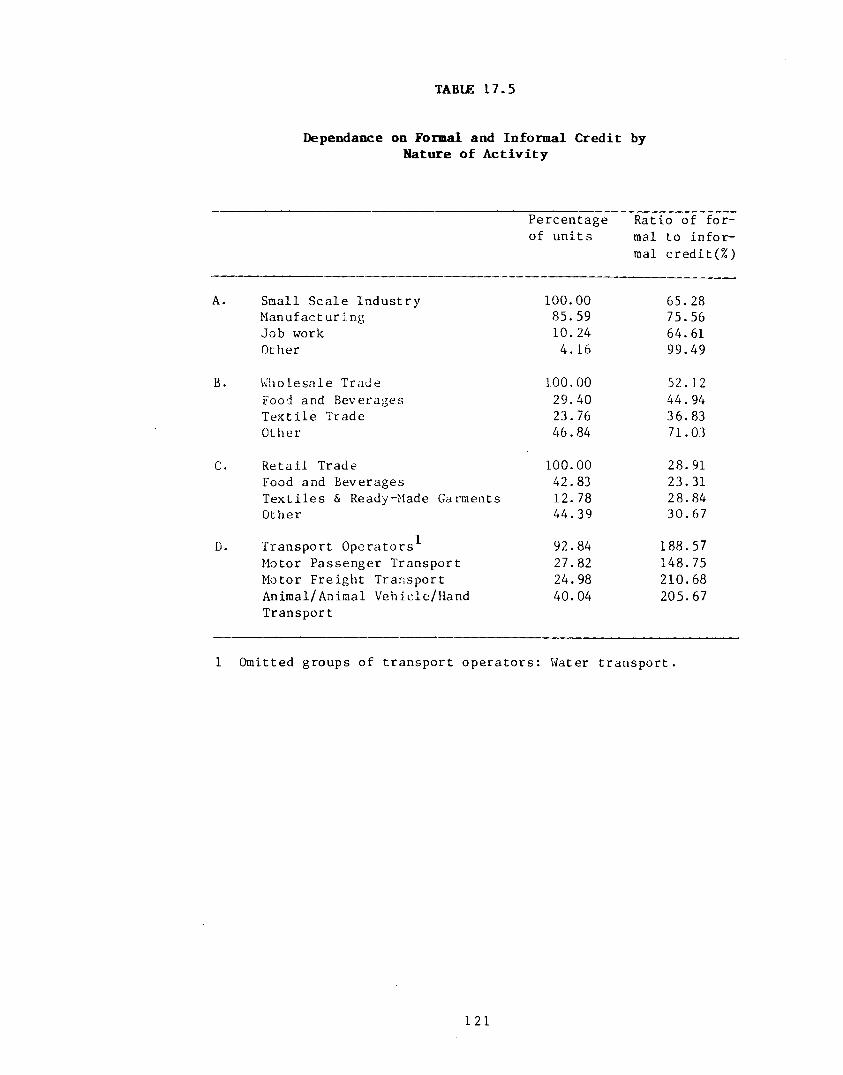
TABLE 17.5
Dependance on Formal and Informal Credit by Nature of Activity
Percentage o f units
Ratio o f for mal to in for mal credit(%)
A. Small Scale Industry 100.00 65.28Manufacturing 85.59 75.56Job work 10.24 64.61Other 4. 16 99.49
B. Wholesale Trade 100.00 52. 12Food and Beverages 29.40 44.94Text i le Trade 23.76 36.83Other 46.84 71.03
C. Retail Trade 100.00 28. 91Food and Beverages 42.83 23.31Text i les & Ready-Made Garments 12. 78 28.84Other 44.39 30.67
D. Transport Operators^ 92.84 188.57Motor Passenger Transport 27.82 148.75Motor Freight Transport 24.98 210.68Animal/Animal Vehicle/Hand Transport
40.04 205.67
1 Omitted groups o f transport operators : Water transport .
121

Net Credit and Variations in Formal and Informal Credit Across States
TABLE 17.6
Item Sector
Small Whole- Reta i lscale sale tradeindustry trade
Rank cor re la t ion s (%):Formal/informal Credit rat io and per capita state domestic product (relevant years)
-43 .4 0.98 -25.4
Transportoperators
-9.07
2. Total c red it to SDP (%) 59.8 46.1 58.6 22.83. Net c red i t as a percent- 136.05 71.30 70.81 87.46
age o f own funds
Notes: 1. Rank co r re la t io n s based on 13 States for SSI and 17 States for others.
2. Net c r e d i t : Total 1 i a b i l i t i e s / a s s e t s less own fundsless loans and advances (^ iven) .
3. Own funds: Capital plus reserves plus provis ions .
122
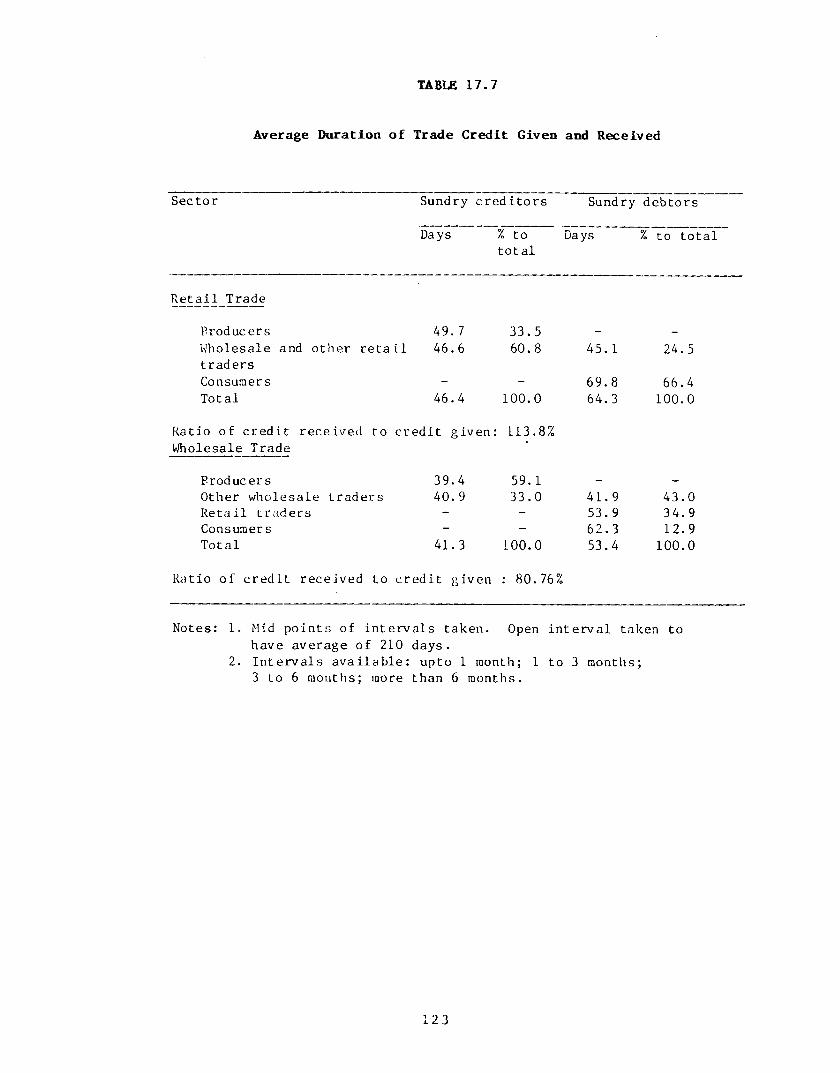
TABLE 17.7
Average Duration of Trade Credit Given and Received
Sector Sundry c re d i to rs
Days % to total
Sundry debtors
Days % to to ta l
Reta i l Trade
Producers 49.7 33.5 _
Wholesale and other r e t a i l 46.6 60.8 45. 1 24.5tradersConsumers - 69.8 66.4Total 46.4 100.0 64.3 100.0
Ratio o f c red it received to c red i t given: 113.8%Wholesale Trade
Producers 39.4 59.1 - -
Other wholesale traders 40.9 33.0 41.9 43.0Retai l traders - 53. 9 34.9Consumer s - 62.3 12.9Total 41.3 100.0 53.4 100.0
Ratio o f c red it received to cred i t given : 80.76%
Notes: 1. Mid points o f intervals taken. Open interval taken to have average o f 210 days.
2. Intervals ava i lab le : upto 1 month; 1 to 3 months;3 to 6 months; more than 6 months.

TABLE 1 7 . 8
Aggregate Estimates of Informal Credit for Small Scale Industries, Traders and Transport Operators
(Rs Crore)
Sector Estimate 1 Estimate 2
1. Small scale industry 5840 12066(86-87)
2. Wholesale trade 2731351673
3. Retai l trade 9446 (84-85)
4. Transport operators 1423 1040•
(86-87)
5. Public l imited companies (1984-85) 11871Agriculture and a l l i e d a c t i v i t i e s 209Mining and quarrying 54Processing and manufacturing 9849Other industries 1759
Sources: See the Appendix to Chapter 8.
124

PART F
Case S tu d ies o f S e lec te d In te rm e d ia rie s

CHAPTER 18
AUTO FINANCIERS IN NAMAKKAL
18.1 Introduction
18.1.1 There are several towns in India, p a r t i cu la r ly South Ind ia , where f inance for the purchase and o p e r a t i o n s of used veh ic les i s provided by partnership firms sty l ing themselves as ”auto finance corporat ions” . The terra "used v e h i c l e ” includes veh ic les reg is tered as far back as 1942. Given the great r isk in financing such old veh ic les no hire purchase finance company or commercial bank comes forward to extend cred it f o r such v e h ic le s .
18.2 Geographical dispersion
18.2.1 Hindupur in Ananthapur d i s t r i c t o f Andhra Pradesh and Namakkal in Salem D is t r i c t o f Tamil Nadu are two major towns which s p e c ia l i s e in this l in e o f h ire purchase c re d i t in South India. Within a ha l f a kilometer or so we counted 60 auto finance co r
porations at Hindupur and 90 at Namakkal. Firms often have o f f i c e s in the same build ing. The pattern o f f inancing is the same
in both the towns, although hire charges are not id e n t i c a l . Other towns which have concentrations o f auto finance corporations (at l e a s t a dozen each) are Madras, Coimbatore , Salem, Tr ichy (T i r u c h i r a p a l l i ) , Madurai, Nagerkoil, ( in Tamil Nadu), Trichur,
125

Ernakulau,, Kottayam, Trivandrum, Quilon, Calicut ( in Kerala), Bangalore , Mysore. Mangalore, Tumkur, Belgaum, ( a l l in Karnataka), and Hyderabad, Vijayawada, Madanapalli, Chittur, Kurnool, and
Ananthapur ( in Andhra Pradesh). We selected Naraakkal for th is case study g iven i t s r e l a t i v e importance as an auto f in a n c ec e n tr e .
18.3 Description of area surveyed
18.3.1 Namakkal is reached by road from Salem and is situatedbetween Salem and Trichy. It is a small town surrounded by rural
countryside. No industry worth the name is located here but, o f la te , a few medium and large s ize poultry farms have been estab
lished. Its growth as an auto finance centre is explained by i t slocat ion between Salem, noted for Salem Silk, trading in ag r icu l tural produce, stone crushing, e t c . , and Trichy, a fast growing banana and commercial, crop exporting d i s t r i c t with a dominant c o t ton handloom production and trading centre at Karur. A l o t o f construction a c t i v i t y also takes place in these two d i s t r i c t s as a l s o in nearby Coimbatore d i s t r i c t . Goods such as t e x t i l e s , bananas and eggs are carr ied to distant markets located in neighbouring States. Other items such as construct ion materials and goods for i n t e r - c i t y markets are transported short d istances . While the long-distance transport is handled by f l e e t owners and individuals owning new v eh ic les purchased on cred it from banks andH. P. f inance companies, short distance transport is operated by individuals or contractors owning three or four old veh ic les who
turn to auto finance corporat ions for c r e d i t .
18 .3 .2 Auto finance corporat ions usually keep away from big c i t i e s to keep the ir establishment c o s ts low and retain proximity to their mainly small town c l i e n t s . Above a l l , these corporat ions
126

f e e l that the business is safer in small towns where 'c is easier to trace d e fau lters .
18.3.3 Sample size and business: We randomly se lected 10 of the90 id e n t i f i e d auto finance corporations for th is study. All o f them were establ ished in the 1970's and a l l were partnership firms with f ive to ten partners. The stock on hire with the 10 firms at the end of 1985 was Rs . 223.00 lakh and Rs . 250.35 lakh at the end o f 1986 (Table 18 .1 ) . According to the managing partners o f these firms, the average price o f a good truck f i t t e d with a Perkins
d iese l engine and 6 good (retreaded) tyres was about Rs. 30,000
for a pre-1950 model, Rs. 40,000 f o r a pre-1960 model with an
o r ig in a l but reconditioned d iese l engine, Rs. 50,000 for a pre- 1970 model and between Rs . 50,000 and R’s . 1 lakh f o r a pre-1980 model. The major ity o f business handled by these corporations was for pre-1960 trucks . Hence the requirement o f f inance for a truck averaged Rs. 40,000. On average, 75 per cent o f the cost o f the truck would be borne by the firm, the rest being the buyers share. I f the loan was for a two year period at an in terest of 20 per
cent ( f l a t ) per annum^, the buyer 's installment amounts per month would be Rs. 30 ,000+(30,000x2x20/100)/24 = R s .1,750. Besides an
i n i t i a l investment o f Rs. 10,000, the buyer would thus have torepay Rs. 1,750 every month f o r 24 months and then own the ve h ic le . A v e h ic le can be transferred to another person under cer ta in cond it ions , i f the purchaser agrees to pay the remaining instalments.
1. Flat rates for periods o f upto three years are c lose to double the annual compound rates. See the case study on hire purchase for d e t a i l s .
127

18,4 Sources of funds
18.4.1 Deposits from the public account for the l i o n ' s share of
funds o f these firms. The c a p i ta l and reserves o f the ten autofinance corporations at Namakkal amounted to Rs. 23.50 lakh at the end of 1986 as against Rs. 69.25 lakh raised by way o f depositsfrom the publ ic . In other words, own funds formed about one- fourth of t o ta l funds.
18.4.2 Borrowed funds were raised by 9 corporations (one did not accept depos i ts ) from the p u b l i c , at 18 per cent per annum for a one year deposit , 19 per cent per annum for a two year deposit and 21 per cent per annum for a 3 year deposit . One year deposits formed about 80 per cent o f the t o t a l d e p o s i t s and two year deposits were n e g l ig ib l e . Therefore, the average cost o f funds borrowed from the public was around 19 per cent per annum. This is much higher than d e p o s i t c o s t s in cu rred by banks. Besides deposits , some corporat ions received "cash c r e d i t " from private sector commercial banks at 17 per cent per annum, secured by the assets o f partners. But this source was minor. A major source o f working cap i ta l was monthly repayments made by h i r e r s .
18.4.3 The interest rate o f 18 per cent per annum for a one year deposit was about 10 per cent higher than the rate o f fe red by commercial banks. Moreover, while corporations o f fered higher rates for longer terms, commercial banks o f fered only 10 per cent (now 11 per cent) per annum for any period above 3 years. During the last three years there appeared to be no f luctuat ion e ither in
the average period o f deposits or in the cost o f funds o f corporations .
128
18,5 Uses of funds
18.5.1 The borrowers o f these corporat ions consist mostly of transport operators who operate used veh ic les including trucks, l i g h t commercial v e h i c l e s , t o u r i s t and other t a x i s and auto - rickshaws. Being operators o f very old v e h ic le s , they do not get cred it from banks and hire purchase finance companies who extend cred i t only to new or upto f ive years old veh ic les . As mentioned, the bulk o f f inance o f corporations studied went for pre-1960 trucks, the o ldest being a 1942 Ford f i t t e d with a Perkins d iese l eng in e .
18 .5 .2 Financial requirements for these old veh ic les ranged between Rs. 25,000 and Rs. 40,000 per veh ic le . The average finance per veh ic le in our sample was Rs . 30,000 and the period varied between one year and three years. Corporations were in favour o f short loans because the l o n g e r the per iod the g r e a t e r is the chance for breakdown and consequent default in repayment. The per iod i s r e l a t e d to the age and c o n d i t i o n o f the v e h i c l e . Usually, very old veh ic les do not get credit f o r more than a year.
18.5.3 Hire charges for most corporations moved up from 19 per cent per annum ( f l a t ) in 1984 to 20 per cent in 1985 and 21 per
cent in 1986 though some corporat ions charged only 20 per cent per annum in 1986. These are rough averages. The model and condi
t ion o f the veh ic le are usually taken into account in f ixing hire cha rges .
18.5 .4 Hirers are usually required to contribute 30 per cent to 50 per cent o f the price of the veh ic le as their investment in the venture. In comparison, f o r a new ve h ic le , the h i r e r ' s contribu-
129

t ion in a hire purchase transaction with a H.P. company i s 25 per cent. Higher investment i s s t ipu la ted by auto finance corporat ions because o f the greater uncertainty as to the resa le value of a used v e h ic le .
18.5.5 On the whole, non recoverable debts were found to be very small. One reason for th is i s the timely act ion taken by corporat ions . According to the H.P. agreement, the corporat ion has the r ight to repossess the veh ic le Lf payments are defaulted. The hirer gets what is l e f t a f t e r s e t t l in g the dues o f the cor poration i f the ve h ic le o f de fau lters i s repossessed. In prac
t i c e , repossession o f veh ic les does not exceed 5 per cent o f HP
transactions. Before repossession, negot ia t ions are held with the h irer , and sometimes with third p ar t ies , f o r settlement o f dues.
18.5.6 Credit -worthlness assessment is l imited in this business, because f i r s t , the h irer himself invests a part o f the price o f the v e h ic le , and secondly because the veh ic le is given on hire purchase and belongs to the f inancing firm unt i l the la s t in s ta l
ment is paid. Repossession is poss ib le even i f only the last instalment remains unpaid.
18.5.7 S ince commercial banks (and even h i r e purchase companies) do not f inance very o ld v e h ic le s , f inance from auto finance corporat ions c l e a r l y complements formal f inance.
18.6 Cost of intermediation
18.6.1 Deta i ls o f income and expenditure were not furnished by the corporat ions . However some corporat ions interviewed replied o r a l l y that administrative expenses average 5 per cent o f their operating income which, in turn, can be estimated at around 27 per
130

cent o f stock on hire (corresponding to a f l a t r r ce on loaned
funds o f about 20 per cent per annum and contr ibution by the company o f about two-thirds o f the value o f stock on h i r e ) . Thus, in1986, given a stock on hire o f Rs 250-35 lakh, operating Income
would be Rs 66.76 lakh. Of th is 12.52 lakh is administrative expense. Given deposits o f Rs 69.25 lakh and taking 19 per cent tobe the average deposit rate , deposit cost works out to be Rs 13.16lakh. Likewise opportunity cost o f own funds at 18 per cent of Rs 23.50 lakh is Rs 4.23 lakh. Assuming two managing partners per
firm and a monthly opportunity wage o f Rs 2000 per partner, theimputed wages o f managing p a r tn e rs work out to be 4 .8 lakh. F i n a l l y , e x t r a o r d in a r y expenses a s s o c i a t e d with r e p o s s e s s i o n proceedings a t , say, 2 per cent o f s to ck 'o n h ire , work out to beRs 2.50 lakh. Thus, economic rent works out to be Rs 29.95 lakh.The implied return on cap i ta l i s 145.95 per cent . However, these high p r o f i t l e v e l s can be hypothesised to be la rge ly due to the growing market rather than to outright monopoly power given the
r e la t iv e ly easy entry cond it ions . The percentage break up and spread is as f o l low s :
Lending rate Deposit rate Spread^ p o s i t & opportunity cost Default cost
Establishment cost Economic rent
18.7 Regulatory environment
18.7.1 As most corporat ions are registered under the Indian Partnership Act 1932, they are not covered under the deposit ac-
40%19%2 1%26.05%
7.30%
25.94%44.86%
131

c ep ta n ce r u l e s o f the Reserve Bank o f In d ia . The Non-Banking Financial Companies (Reserve Bank) Direct ions , 1977. Auto finance corporat ions are covered under the Banking Laws (Amendment) Act,
1 983 a c co rd in g to which they can accept d e p o s i t s from 25
depositors per partner or from a maximum o f 250 depositors for 10
partners apart from deposits from r e l a t i v e s , i r resp ec t ive o f the amount o f deposit per depos i tor . Therefore, in deposit acceptance, these corporations are at a disadvantage compared to h ire - purchase companies. No other spec ia l l e g i s l a t i o n covers their operat ions .
18.8 Market structure
18.8.1 No marked concentration o f business in the hands of* few firms was observed at Namakkal. The maximum stock on hire of sampled firms was Rs. 60 lakh while the minimum was Rs. 13.50lakh. The growth rate in stock on hire o f these corporat ions between 1981 and 1986, presented in Table 18.2, a lso showed that some small and medium s ize corporat ions had higher growth than larger corporat ions . There was a lso l i t t l e evidence o f pr ice d ispers ion (the observed d i f f e r e n t i a l being 1 per cent ( f l a t ) for some firms in each o f 1984, 1985 and 1986). Price d ispers ionshowed no l ink with the age or s ize o f corporat ions . F ina l ly , besides a v a i l a b i l i t y o f start up c a p i t a l , no major entry barr iers appear to ex is t . Thus, together with the fact that most firms are located c lose to each other as described e a r l i e r , a more or le s s competitive market structure can be in ferred . Excess p r o f i t s may therefore be ascribed more to short run demand growth rather than to monopoly power as mentioned e a r l i e r .
132

18.8 .2 One interest ing feature o f auto finance ma Kets is s p e c ia l i s a t io n o f d i f f e r e n t agencies, that i s bankf , HP firms and
auto f inanc iers in d i f f e r e n t segments o f auto finance markets.
18.9 Estimate of size
18.9.1 A precise estimate o f the number of auto finance corporations and the volume o f business handled by them even for oneyear would be impossible because there is no source which l i s t s the number o f such corporat ions .
18.9.2 We may, however, make a guesstimate with the limiteddata that we have c o l l e c te d from the f i e l d . In each State, thereare some towns with s p e c ia l i s a t io n in auto finance. Besides Namak- kal and Hindupur, we have a lso i d e n t i f i e d a number o f towns ( l i s t e d State-wise in the Appendix to this chapter) where auto finance corporations are ac t ive . Based on these observations an estimate o f the number o f auto finance corporations and their stock on hire in South India for the year 1986 is about 1200 auto finance corporat ions with a stock on hire for about Rs . 200 crore in South India which, roughly, accounts for about one-fourth o f the to ta l number o f such corporat ions in India. Thus the f igures for the ent ire country are 4800 corporations with a stock on hire o f Rs. 800 crore . The high growth rate o f sampled firms wouldimply that a s i g n i f i c a n t l y larger market can be forecast for the near term.
18.10 Influence of formal sector lending rate or availability of formal sector finance
18.10.1 The formal sector , represented by commercial banks, does not f inance the type o f a c t i v i t y f inanced by the auto finance corporations. Nor is there any evidence o f any e f f e c t o f formal sec
133

to r lending rates on loan interest rates in auto finance. While ind irect e f f e c t s may be present, th is i s not d is cern ib le from the evidence ava i lab le .
18.11 Distributional impact
18.11.1 One d ist inguishing feature o f lending by auto financecorporat ions is that the bulk o f the ir f inance flows to the poorertransport operators . Well o f f transport operators , who can af fordto raise the required margin for new ve h ic le s , seek cred it from
banks and hire purchase finance companies. Furthermore, besides financing old v e h ic le s , customers o f auto finance companies seldom own more than one or two v e h i c l e s . Large f l e e t owners are normally also new v e h ic le owners. Thus, at a rough estimate, auto finance corporat ions serve about 5 times as*many borrowers per rupee o f funds as compared to HP companies. Thus the ir a c t i v i t i e sshould d e f i n i t e l y resu lt in reducing the inequality in cred it
a v a i l a b i l i t y and aiding weaker sec t ion s .
18.12 Impact on savings mobilisation & investment
18.12.1 Auto finance corporat ions o f f e r high rates o f interest on deposits r e la t iv e to banks. That corporations sampled have been in existence for 10 to 15 years is also ind irect evidence o f the lack o f excessive r i sk o f default for depos i tors . However, they serve l imited c l i e n t e l e in the non-metro areas in which they are located . Overall , to the extent that higher interest rates contribute to addit ive saving, some addit ive saving is to be expected though no evidence is ava i lab le . Secondly ind irect saving generation through the ir impact on income on h irers surely occurs .
134

18.12.2 A case study: I f we examine the p r o f i l e o f a borrowerbefore and a f t e r the purchase o f a v e h ic le , the ro le o f the auto
finance corporat ions in promoting investment and raising the income l e v e l o f the borrowers w i l l be c learer . Mr. R. Kannan, aged
40, i s a resident o f Chinna Agraharam at Rasipuram in Salem Dist r i c t o f Tamil Nadu. His family cons is ts o f four members besides himself , that i s his wife , who i s employed as a sweeper in a pan- chayat o f f i c e , and three sons aged between 6 and 14. For 15 years he was a l o r r y driver for a contrac tor . It was h is long cherished desire to become the owner o f a truck. With th is goal in mind he
started saving and eventually managed to save Rs. 7,000. But this
amount was so small that he almost l o s t hope o f owning a veh ic le . At last he found a 1960 truck owner who was interested in se l l ing his veh ic le for Rs. 40,000. He approached several bank managers and hire purchase finance companies for hire purchase c r e d i t . They declined because the truck was very old . Ultimately, he went to an auto finance corporat ion at Namakkal which agreed to provide finance i f he himself would invest Rs. 10,000. This l e f t him with a shortage o f Rs. 3,000. He got the consent o f h is wife to part with her gold chain to meet th is d e f i c i t . He took the veh ic le in 1984, by executing the hire-purchase agreement for Rs . 30,000, and agreeing to pay interest at 18 per cent per annum f la t rate , for a period o f 2 years . The instalment amount per month came to Rs. 1,700. He T,-as so happy that he worked sometimes even on Sundays and at night. He could earn on an average about Rs. 250 to Rs. 300 gross a day. After meeting the running expenses on fuel and
o i l and the share o f the he lper /c leaner and himself , he earned about Rs. 100 to Rs. 150 per day including his labour charge. Within 25 days in a month, he could thus ' make Rs. 2,500 to Rs.3,7 50 from which he could regularly pay the instalments. Fortunately f o r him, there was no major repairs for the truck and in1987, he purchased another truck o f 1970 model. This was also
135

with finance from the same finance corporat ion and Mr. Kannan, who i s the proud owner o f 2 v e h ic le s now, i s a l l praise for the cor poration knowing that he has a c tu a l ly paid true interest at the rate o f about 36 per cent per annum.
18.13 Overall assessment and distinguishing features
18.13.1 The automobile industry in India is small and protected. A few companies make almost the same models o f cars year a f ter
year. As production and, to an extent, p r ices are con tro l led by the Government, f o r various reasons, including s ca rc i ty o f inputs,
supply f a l l s shor t o f demand and there i s a premium on new veh ic les . Because o f th is short supply p os i t ion and the ever r is ing demand for transport o f goods and persons, old - sometimes very old - v e h ic le s are s t i l l in evidence on Indian roads.
18.13.2 In the absence o f c r e d i t f a c i l i t i e s for the purchase and use of used v e h i c l e s , many w i l l remain id le or be sold as scrap.
It is here that the auto finance corporat ions have came to play a r o l e . The ten c o r p o r a t i o n s we s tu d ied at Namakkal rough ly financed the equivalent o f 90 trucks in 1986. A crude estimate for the 90 corporat ions at Namakkal would be 9 times th is or 820 veh ic les . Even th is i s an underestimate according to a managing partner o f one corporat ion .
18.13.3 The market fo r very old v e h ic le s i s maintained by these c o r p o r a t i o n s . By t h e i r o p e r a t i o n s , they supply a mode o f transport for goods mostly in the countrys ide, provide a means o f l i v e l ih o o d for thousands o f dr ivers and cleaners, help to maintain productive assets and enable continued use o f scarce c a p i t a l .
136

18.14 Recommendations for regulatory framework
18.14.1 Auto finance corporations are mostly partnership firms
and proprietary concerns, not coming d i r e c t l y under any Governmental regulation and contro l . Only deposit acceptance is r es tr ic ted under the Banking Laws (Amendment) Act 1983. Banks or any other refinancing agency do not at present give refinance f a c i l i t y to these corporat ions .
18.14.2 We recommend that the banks accept hire-purchase docu
ments for r e f i n a n c e . By doing so, banks can i n d i r e c t l y help
transport operat ions, a p r io r i ty se c to r , without much risk and at low cost . As about one third o f the cap ita l o f corporations is their own, the r isk o f default by them can be expected to be low. However, the RBI cannot exempt th is category o f corporat ions alone from the d e p o s i t a c c e p ta n c e p r o v i s i o n s o f the Banking Laws (Amendment) Act, 1983 because i t is d i f f i c u l t to dist inguish between an auto finance corporat ion and an ordinary finance corpora
tion which also lends occas iona l ly to transport operators .
18.15 Lessons for the formal sector
18.15.1 Banks charge about 17 per cent per annum on a reducing balance or annual compound b a s is f o r loans to t ra n sp o r t operators. Auto finance corporations charge about 2.0 per cent per annum ( f l a t ) for a s imilar loan. The d i f fe ren ce in the two rates
is about 25 percentage points on an annual compound basis . A low
cost loan i s l e s s burdensome than a high cost loan. S t i l l , the cheap bank loan is of ten defaulted while the c o s t ly f inance corporation loan i s promptly repaid. This is because auto finance corporations keep a watch over hired goods, and timely follow-up action is taken to recover due amounts. In the case o f banks,
137

there is l imited machinery f o r fo l low-up ac t ion . Clearly , banks would benef i t by studying the loan recovery procedures of auto
finance corporat ions and by applying such procedures to their business. I f th is is in f e a s ib l e , banks should consider ways o f
d e l e g a t i n g HP f i n a n c e to auto f in a n c e and HP companies , say through refinance f a c i l i t i e s .
138

TABLE 18.1
Consolidated Position of 10 Auto Finance Corporations at Namakkal
(Rs. lakh)
Year Stock Variation Deposits Va r ia t io n(Dec ember on hire over the out stand- over theend) prev ious ing previous
year year
(1) (2) (3) (4) (5)
1981 167.75 - 50.00 -1982 182.05 14.30 58.35 8.351983 189.80 7.75 63.30 4. 951984 207.80 18.00 68.05 4. 751985 223.00 15. 20 66.45 -1 .601986 250.35 27.35 69. 25 2. 60
139
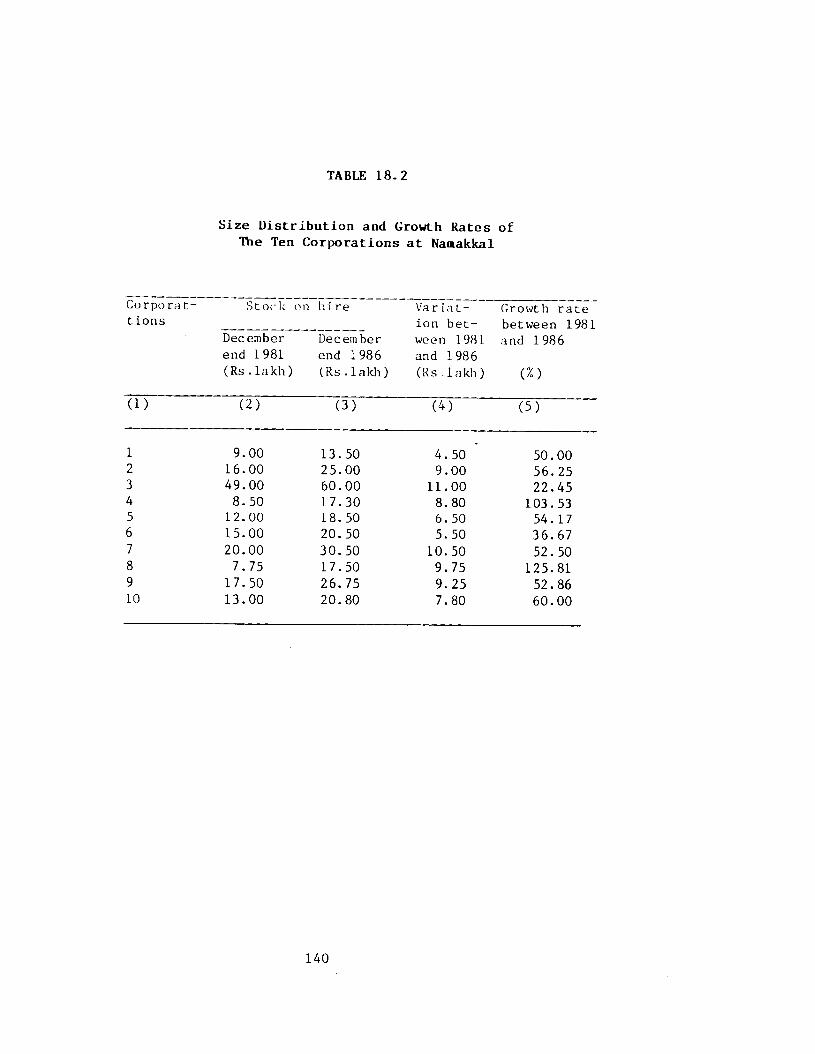
TABLE 18.2
Size Distribution and Growth Rates of The Ten Corporations at Namakkal
Corporat- tions
Stock on
Dec ember end 1981 (Rs . lakh)
hi re
December end 1986 (Rs.lakh)
Va r i a l - ion between 1981 and 1986 (Rs.lakh)
Growth rate between 1981 and 1986
(%)
( i ) (2) (3) (4) (5)
1 9.00 13. 50 4.50 50.002 16.00 25.00 9.00 56. 253 49.00 60.00 11.00 22.454 8. 50 17.30 8.80 103.535 12.00 18. 50 6. 50 54.176 15.00 20. 50 5.50 36.677 20.00 30.50 10.50 52.508 7.75 17.50 9.75 125.819 17.50 26.75 9. 25 52.8610 13.00 20.80 7.80 60.00
140

CHAPTER 19
NIDHIS OF SOUTH INDIA
19.1 Introduction
19.1.1 A nidhi , (or mutual benef it fund or permanent fund), i s an indigenous f inanc ia l i n s t i tu t i o n , commonly seen in Tamil Nadu. Its place o f o r ig in is the erstwhile Madras Presidency and i t is
one of the few f i n a n c i a l i n s t i t u t i o n s which are a l l e r g i c to
geographical expansion. I n i t i a l l y , it spread to neighbouring areas in the princely States o f Travancore and Mysore but subsequently,
i t s growth outs ide the Presidency dwindled. Presently, nidhis are
found mainly in Tamil Nadu, p ar t i cu lar ly the c i t y o f Madras.
19.1.2 Nidhis arose to cater to s p e c i f i c requirements o f middleincome individuals . In the last century as also in the early part
o f the present century, indigenous bankers, pawn brokers and moneylenders were the only sources o f consumption credit for such per
sons. Families requiring money f o r s o c ia l and re l ig io u s purposes were charged usurious rates o f in terest by these f inanciers even f o r secured loans. Thus an in s t i tu t io n ca l led ' n i d h i ' was set up by some public sp ir i ted men drawn from d i f f e r e n t walks o f l i f e , i n c lu d in g among them law yers , t e a c h e r s , e n g in e e r s and adminis trators , with the fo llowing o b je c t s :
i . To promote the habit o f t h r i f t among people,
i i . to deal exc lus ive ly with shareholder members, and
i i i . to provide loans to members at reasonable rates o f in ter est against jew e l lery and house property.
19.1 .3 Nidhis are public l imited companies registered under the Indian Companies Act, 1956, or i t s predecessors. In view o f the unique nature o f the ir organisation by which operations are con
141

f ined to shareholders, they are governed by spec ia l provis ions under sect ion 620A o f the Act, i f they s a t i s f y c r i t e r i a la id down in this sect ion . The face value o f the ir shares i s small, o ften Re 1, and shares are not traded on the stock exchange.
19.1.4 Most nidhis only have these Re 1 shares. However, some
nidhis have two types o f shares - "A type” with face values varying between Rs 5 to Rs 50 and "B type” with a face value of Re 1.
In such nidhis only "A type" shares, normally held by the d i r e c to rs , their r e la t iv e s and c lose f r iends , have voting r ights .
19 .1 .5 Nidhis are managed by a board of d i r e c to r s e lec ted by shareho lders u s u a l ly under the p r i n c i p l e o f one man one vote s ince , general ly , not more than one share is issued to a person.
19.1 .6 Nidhis operate in s p e c i f i c l o ca t ions and members are general ly from the same area. Most nidhis are s ingle o f f i c e ins t i tu t ions without branches. Barring a few which carry the name o f the community that patronises them ( e . g . , Madhva Siddanatha Fund and Catholic Permanent Fund), nidhis normally carry the names o f the l o c a l i t y where they o p era te ( e . g . Egmore B enef i t Fund, Triplicane Permanent Fund and Abhiramapuram Permanent Fund).
19.1.7 As f inanc ia l in s t i tu t i o n s , nidhis accept deposits from members and p rov ide loans to them. Though t h e i r o p e r a t i o n s resemble those o f banks in the organised sector , they do not come under the Banking Regulation Act 1949 and also are not permitted to issue cheques.
19.2 Geographical d ispers ion and numbers
19.2 .1 The f i r s t o f f i c i a l reference to nidhis is found in the Report o f the Madras Provincial Banking Enquiry Committee (1930). A ccord ing to the Report , th e re were 346 n id h is in Madras Presidency of which 288 were funct ioning in 1929. The Report o f the study group on Non-Banking Financial Intermediaries (1971) set up by the Banking Commission states that there were 150 nidhis in
142

1966. A recent study o f nidhis (Ramani 1985) which examined the number o f companies regis tered with the Registrar of Companies,
Madras put the number at 134 in 1985. About hal f o f these were e i t h e r dormant or were o p e r a t in g in a very l im i t e d way. The Department o f Financial Companies o f the RBI puts the number of r e p o r t i n g n id h is at the end o f March 1 986 as 65. Year-wise
d e ta i l s are in Table 19.1 and State-wise d e ta i l s for 1981 are in
Table 19 .2 . Table 19.1 shows that about h a l f the companies regis tered under Section 620A o f the Companies Act reported to the RBI. Table 19.2 shows that nearly 80 per cent o f report ing nidhis are in Tamil Nadu.
19.3 Area surveyed and description of sample
19.3.1 To evaluate the contr ibution o f this f inancial intermediary to the f inanc ia l sector of India, a survey was conducted
during 1986-87 with the help o f a suitably framed questionnaire. This chapter i s based mainly on the resu lts o f the survey.
19.3.2 A majority o f nidhis which reported to the RBI in 1986 were old (Table 19 .3 ) . The Table shows that 83 per cent of the nidhis are more than 25 years old and 62 per cent are more than 50 years old. The reduction in the number o f working nidhis from 288 in 1929 to 65 at the end of March 1986 is due to the merger of some o f them with commercial banks, the fa i lu re of a few in the 1930's, voluntary winding up and stoppage o f a c t i v i t y for various reasons.
19.3.3 Growth in deposits was slow during 1967 to 1982. Since then, upto 1986, deposits grew by 136 per cent although the number
o f nidhis rose only by 3. Even with th is , to ta l deposits with nidhis , at Rs 73.50 crore at the end o f March 1986, were less than that o f the smallest commercial bank in the country and formed an in s ign i f i ca n t 0.09 per cent o f commercial bank depos its .
19.3.4 For th is survey, we selected a sample o f 12 nidhis from Tamil Nadu and Andhra Pradesh - seven from the c i t y of Madras and
143

one each from Karur, Nagapattinam, Adoni, Bellary and Nellore. The l i s t o f se lected nidhis , the ir age and number o f shareholders are shown in Table 19.4. The average age o f the 12 nidhis i s 79.5 years and the average number o f shareholders is 15020, Selected
nidhis had deposits o f Rs 46.48 crore at the end o f March, 1986, which formed about 63 per cent o f deposits with a l l nidhis . Theyhad high c red i t deposit r a t i o s (95 per cent to 97 per cent) in thethree years ending 1985-86.
19.4 Sources of funds
19.4.1 Share cap i ta l o f nidhis does not represent an importantsource o f funds. For the few n id h is that have two types o f
shares, the value o f founders cap ita l varies from Rs 2 to Rs 50while the ordinary share value remains Re 1. Further, the shares
are not o f fered to the public through publ ic is sues . A person takes a share of a nidhi when he wants to transact business with i t , e ither as a depositor or borrower. Normally he is allowed to take only one share, which is t rans ferab le , and with i t he can e f f e c t any number o f t r a n s a c t i o n s . Thus, a lthough th e re are thousands o f shareholders in a nidhi , the to ta l share cap i ta l
remains a small. In r e la t i o n to their deposit l i a b i l i t i e s , c ap i ta l formed only 0.35 per cent in 1985-86 for the sampled firms (Table
19.5) .
19.4 .2 Reserves: Nidhis trans fer a major portion o f the ir p r o f i tto r e s e r v e s . As a matter o f p o l i c y , they l i m i t d i v i d e n d s . Dividends are expected only by major shareholders who manage the a f f a i r s o f nidhis. However, even so, as much as 85 per cent to 95 per cent o f p r o f i t s are transferred to reserves. Consolidated balance sheet f igures o f sampled firms for 3 years (Table 19.5) show that t o ta l reserves formed about 6.1 per cent o f deposit l i a b i l i t i e s in 1985-86. Thus, own funds ( c a p i t a l and reserves) as a percentage o f deposit l i a b i l i t i e s during 1983-84, 1984-85 and1985-86 was 9.33 per c e n t , 7.38 per cent and 6.75 per c e n t ,
respec t ive ly .
144
19.4 .3 The major source o f funds o f nidhis i s deposits from members. The deposits var ious ly include savings, recurr ing, f ixed and cumulative deposits (cash c e r t i f i c a t e s ) . In the deposit mix in 1985-86, f ixed deposits const i tuted 67 per cent , recurring deposits 13 per cent , cumulative and cash c e r t i f i c a t e 14 per cent and savings deposits 6 per cent of t o t a l deposits . There is a l most no borrowing from the formal sector .
1 9 .4 .4 Period of funds a v a i la b i li ty : About 94 per cent o fdeposits with Nidhis are from long term contracts . Fixed deposits (FD) ranged from one to nine years, although shorter periods of 3
years and less make up 80 per cent o f FDs. Recurring deposits (RD) ranged from 12 months to 108 months and cash c e r t i f i c a t e s
from three years to seven years. Commercial bank deposits were normally for 5 years or l e s s during t h i s p e r i o d . Premature
withdrawals o f FDs are not permitted in nidhis . I f a depositor is in need o f money, he is allowed a loan o f upto 95 per cent against his FD. Funds a v a i l a b i l i t y f o r such long and fixed periods enables nidhis to extend loans for land improvement and bui lding construct ion.
19.4.5 Cost of funds: Nidhis' deposit interest rates are higherthan those prevai l ing in commercial banks. They are not covered by any deposit acceptance or interest f i x a t io n rules prescribed under the Non-banking Companies (Reserve Bank) Directions 1977 or by the Banking Laws (Amendment) Act 1983, because t e c h n i c a l l y , they accept deposits from members only. Interest rates o f fe red for d i f f e r e n t types o f deposits and periods are as fo l lows :
19 .4 .6 Savings deposits: Interest is paid at 6 per cent to 6.5 per cent per annum against 5 per cent in commercial banks.
1 9 .4 .7 Recurring d ep osits : Nidhis started RD as early as the1880's, fo l lowing a model given in a journal , the Scotsman which was received in Madras in 1882. The Mylapore Permanent Fund established in 1888 was the f i r s t to introduce the scheme. Other nidhis soon f o l l o w e d and l a t e r i t was adopted by commercial and c o —
145

operative banks (Radhakrishnan, 1979). Interest on RD paid bynidhis are almost double the rates paid by commercial banks for such deposits (Table 19 .6 ) . However, since interest rates are fixed on a simple in terest basis , they have an e r ra t i c term structure.
19.4.8 Cumulative term deposits: Term deposits o f nidhis rangefrom three months upward. Interest rates are not the same for a l l nidhis . The average rates for d i f f e r e n t periods are at least four
percentage points higher than those o f commercial banks (Table19.6) .
19 .4 .9 The mode o f i n t e r e s t payment d i f f e r s from n idh i to nidhi. On savings depos its , some nidhis ca lcu la te interest for
the minimum balance in the account between the 6th and the 26th
while others do i t for the minimum balance during the month. Some nidhis pay interest every month for f ixed depos i ts , depending on the amount o f depos i ts .
19.5 Uses o f funds
19.5 .1 Borrowers cons ist mainly o f housewives, salary earners, businessmen, pensioners and p ro fess ion a ls . Nidhis do not maintain data on the types o f borrowers. The data furnished by some o f the nidhis to our invest iga tors give approximate percentages o f each category in t o ta l borrowings. The c l a s s i f i c a t i o n is as fo l low s :
a . Housewives 25 per centb. Salary earners 20 per cent
c . Businessmen 15 per cent
d. Pensioners 25 per cent
e. Others (Unspecif ied) 15 per cent
19.5 .2 Middle c la s s housewives reported ly j o in nidhis primarily to save small amounts through recurring deposits and to borrow against jew e l le ry . Salary earners deposit money in recurring or f ixed deposits and la t e r borrow to supplement the ir own funds at
146

the time o f investment in housing. Businessmen are mostly small traders who borrow from nidhis on the secur i ty o f property. Pensioners are the backbone o f n idhis . They save with nidhis during
the ir working l i v e s and draw upon these funds a f te r retirement. Other categor ies o f borrowers such as pro fess iona ls borrow on the security o f property for sett ing up c l i n i c s , workshops, e t c . Some
borrowers borrow to repay old debts incurred at high interest
cost .
19 .5 .3 Nidhis general ly o f f e r two types o f loans, simple loans, and mortgage loans. A simple loan i s granted against f ixed or recurring depos i ts . Each nidhi f ix e s the maximum limit for such
loans at 85 per cent to 95 per cent o f the amount deposited.
19.5 .4 Mortgage loans are o f two kinds, ordinary and spec ia l . Ordinary mortgage loans are granted to members who o f f e r as secur i ty immovable property within s pec i f ied c i v i l j u r i s d i c t i o n s . These borrowers are asked to open RD accounts and deposit periodic instalments to l iqu idate the loan in f i v e to seven years according to the agreement. Cei lings on ordinary mortgage loans are usually set between Rs. 15,000 and Rs. 25,000 on any s ingle property. A few nidhis set the maximum l imit at Rs. 3 lakh and even Rs. 5 lakh.
19.5 .5 Special mortgage loans are also o f fered to members who o f f e r movable or immovable p ro p e r ty as s e c u r i t y . In s p e c i a l mortgage l o a n s , the minimum amount o f loan aga inst movable property found was Rs. 100 and the maximum was Rs. 20,000. Against immovable property, the usual ran^e o f loans was found to he between Rs. 10,000 and Rs. one lakh, the maximum going upto Rs. f ive latch in rare cases. Furthermore, against property, the maximum loan is u s u a l ly t w o - t h i r d s o f the market v a lu e , d ec ided by a recognized property valuer.
19.5 .6 Some nidhis invest in Unit Trust o f India C e r t i f i ca te s and Government o f India bonds. But such investments form less than one per cent o f the asset mix o f n idhis .
147

19 .5 .7 Interest charges on loans: Interest on loans va r ie s from 18 per cent to 23 per cent (Table 19 .7 ) . The two major ca tegor ies o f loans are those against jew e l lery and property. Though personal surety loans, produce loans and consumer c re d i t loans are shown in the table , such loans are exceptions and are confined to one or two nidhis. In comparison, the maximum lending rate o f commercial
banks in the corresponding period was 16.5 per cent per annum.
19.5 .8 Movable and immovable property accepted by nidhis as secur i ty are:
a. Jewellery, gold and s i lv e r a r t i c l e s ;
b. Government Bonds; debentures o f companies or corporations guaranteed by the Government o f India or any State Government; s e c u r i t i e s recogniscd by the Indian Trust Act; and Insurance P o l i c i e s ;
c . Property and t i t l e deeds o f propert ies .
19 .5 .9 For a l l l o a n s , borrow ers have to execute a demand promissory note (DPN). T i t les to property, a f t e r examination o f property by nidhis are general ly reg is tered with the l o c a l Sub- Registrar. Only in spec ia l cases are t i t l e deeds deposited with nidhis . Loans against FDs and RDs are given on the d e p o s i t o r ' s
discharging them and executing a DPN. Personal surety loans are rare. When they are made, the borrower has usual ly to furnish h is salary c e r t i f i c a t e from his employer and produce two guarantors to stand as surety. Produce loans and consumer durable loans were found to have been extended by one nidhi only. In such loans, borrowers have to pledge the produce or hypothecate the consumer durable item to the nidhi , in addit ion to executing a DPN. Thus almost a l l loans o f nidhis are secured.
19.5.10 Loan periods o f nidhis are long as compared to loan periods o f other informal f inanc ia l in s t i tu t i o n s . As loans are given against c o l l a t e r a l , the lender genera l ly does not in s i s t on a firm period for repayment. I f the repayment i s inord inate ly delayed, nidhis send reminders and n o t i ce s . However, cer ta in nidhis f i x a maximum period o f loan for jewel loans (two years) and
148

mortgage loans (three to seven years ) .
1 9 .5 .1 1 Bad debts and overdues: None o f the n id h is s tudiedreported any bad debt. The rate o f recovery o f loans was almost 100 per cent . When a pledged a r t i c l e or mortgaged property i s not redeemed and hence disposed of through lega l means a f te r intimating the borrower, nidhis seldom s u f fe r losses because s u f f i c i e n t margin is maintained between the loan amount and the expected sale value o f the a r t i c l e /p r o p e r t y .
19.5.12 Assessment procedures: When a lo a n i s a p p l i e d on the
p le d ge o f j e w e l l e r y , j e w e l l e r y a p p r a i s e r s o f n i d h i s e s t i m a t e the
v a l u e and c e r t i f y the g e n u in e n e s s o f the a r t i c l e . For the v a l u a
t i o n o f immovable p r o p e r t y , most n i d h i s a p p o in t e s t i m a t o r s , ap
p r a i s e r s and s u r v e y o r s c e r t i f i e d by the Government o f I n d i a . I f
n i d h i s are not s a t i s f i e d wit h t h e s e v a l u a t i o n s , th e y a pp o in t any
two d i r e c t o r s f o r the purpose witho ut any a d d i t i o n a l c o s t to the
borrower. Annual v e r i f i c a t i o n o f the p r o p e r t y i s u s u a l l y done to
take note o i any d e p r e c i a t i o n th at may take p l a c e in i t s v a l u e .
19.5.13 Margin: Some nidhis grant up to 75 per cent o f the e s timated value o f most types o f secur i ty o f fered while others grant only 50 per cent. For depreciable assets or propert ies , the margin is usually higher. For government or other approved paper se c u r i t i e s , nidhis usually grant 85 per cent o f the nominal value or 90 per cent o f the market value whichever is lower.
19.5.14 Complementarity to formal sector: Loans by nidhis aree ither for consumption or for investment in real es ta te . The
major purposes o f loans are m arr iages ; r e l i g i o u s cerem on ies ; c learing of old debts; and construct ion , repair or renovation to bu ildings. Commercial banks general ly do not extend finance for such purposes.

19-6 Cost of intermediation
19.6.1 In the deposit mix o f nidhis in 1985-86, FDs accountedfor 66.7 per cent o f t o ta l deposits o f which FDs o f three years and less formed about 80 per cent . In rais ing funds, nidhis do
not incur any expense on advertisement or brokerage. Nor do they
incur f lo a ta t io n cos ts for issue o f shares as they are not o f fered to the general publ ic . Nidhis have low r isk cost as advances are f u l l y secured. A f in a l advantage is the r e l a t i v e l y low overheads as most d irec tors provide serv ices in an honorary capac ity .
19.6.2 The consol idated p r o f i t and loss account o f 12 nidhis(Table 19.8) shows that in a l l three years under re ference , net p ro f i t was around 9 per cent o f income. The low establishment expenses o f nidhis r e la t iv e to banks is also revealed. It i s d i f
f i c u l t to compare the performance o f informal intermediaries with formal intermediaries for reasons discussed e a r l i e r (Chapter 6 ) . However, on average, the performance o f Nidhis may be worked out as has been done in Table 19 .9 . The spread between loan and deposit rates is seen to be 5 to 7 percentage points on average as
compared to 6 to 10 points for scheduled commercial banks (Chapter 6 ) . Even so, the major component o f nidhi loan rates is the high deposit /opportunity cost o f funds (79 per cent) in comparison with banks (at best 67 per c e n t ) . Establishment expenses account for a l l but 2 per cent o f the remaining part o f loan in terest . In l ine with f i e l d interviews, default cost has been set to zero.
19.6 .3 Nidhis have a c r e d i t d e p o s i t r a t i o o f 95 per centagainst the commercial bank ra t io of 65 per cent (the la t t e r i s obviously part ly due to reserve requirements), and a gross p r o f i t rate of about 11 per cent o f income per annum. Nidhis earn these p r o f i t s a f te r paying higher interest to depositors than the commercial banks and charging only s l i g h t l y higher interest on loans. The r e a l reason f o r the high p r o f i t a b i l i t y ra te i s the s i g n i f i c a n t l y lower es ta b l i sh m en t expenses and the high c r e d i t
deposit r a t i o .
150

19.7 Regulatory environment
19.7.1 Nidhis are registered under the Indian Companies Act, as amended from time to time. As mutual benef it funds, r e s t r i c t in g
a c t i v i t i e s to members only , they are exempt from many provis ions o f th is Act and are governed by spec ia l provis ions contained under Sect ion 620-A. Some o f the special provis ions are:
i . They are not required to furnish copies o f their auditedbalance sheets to each o f t h e i r shareho lders but are required to publish the audited statement in an English and lo c a l language d a i l i e s besides displaying the same on t h e i r n o t i c e board s . Balance shee ts are to be sent to members who hold shares worth Rs LOO or more.
i i . Th e y are not a l l owe d to o f f e r sh a r e s to ex i s t i ng sh a reholders, but only to persons who wish to jo in them.
i i i . Section 8 7 ( i ) ( b ) o f the Companies Act provides that votingr ights o f shareholders in proportion to their equity holdings. Nidhis are exempted from this provision with the condit ion that no members shall exerc ise voting r ights in excess o f 5 per cent o f the to ta l paid up cap i ta l .
iv . Nidhis are allowed to furnish a l i s t o f changed and addedmembers to the Registrar of Companies once in f ive years as against once in two years for other companies underSection 159(i ) o f the Act.
v. Nidhis are not required to send dividend warrants to members except when the dividend exceeds Rs 25. They may payit in cash or deposit i t in the members' accounts.
v i . Section 295 o f the Companies Act prohibits a company from lending to i t s d i rec tors without prior approval o f the Central Government. This sect ion is not appl icable to nidhis except where the loan amount is Rs 2000 or more and where it exceeds 2r> per cent o f the value o f c o l la t e r a ls e c u r i t y .
19 .7 .2 Nidhis are exempt from the acceptance o f deposit rulesprescribed under the Non-Banking Companies (Reserve Bank) Direct i o n s , 1977. They are, however, required to submit returns to theRBI twice a year d e ta i l in g the number o f shareholders, types andamounts o f deposits and advances.

19.7 .3 Nidhis are also exempt from State moneylenders acts and debt r e l i e f a c ts .
19.7 .4 These exemptions and the spec ia l treatment under the Companies Act g ive nidhis wide la t i tu d e in the ir business opera
t i o n s . They are free to raise any amount o f deposits from members
at whatever interest rates they think f i t . They can s im i lar ly f i x
lending rates. Despite this freedom, o f f i c i a l Commissions have r e c o g n i s e d the u s e fu l r o le p layed by n id h is in the f i n a n c i a l system.
19.7 .5 The Banking Commission (Government o f India, 1972), recognising the ro le o f nidhis in the Indian f inanc ia l system, pointed out that they were run on e f f i c i e n t l in e s and that their
lending operations were marked by caution. It also recognised the r o l e o f n id h i s in f i n a n c i n g house c o n s t r u c t i o n and p r o p e r t y improvement and in meeting the consumption needs o f the lower middle and poorer c la sses o f the community. While appreciating the useful serv ice rendered by nidhis to th e i r members, the Commission underlined the need for regulating them so that they could become "more dynamic and usefu l to the economy". In th is context , i t
pointed out that though nidhis were akin to commercial banks in the ir working, they were not subjected to regulations app l icable to banking companies except for p e r io d i ca l submission o f returns to the RBI.
1 9 . 7 . 6 The Commission suggested the f o l l o w i n g measures o f r e gu la t io n :
i . Nidhis accepting demand depos its should be regulated inthe same way as o ther commercial banks. In regard to others, they should be l i censed by the RBI or any other appropriate author ity ;
i i . A minimum l i q u i d i t y r a t i o , lower than that o f commercial banks, should be prescribed for them;
i i i . They should be required to have minimum paid-up cap i ta land reserves, with an added condit ion that a s p e c i f i e d percentage o f net p r o f i t s should be transferred to the reserve fund every year;
152

i v . There should be per iod ica l inspect ion by the regulating authority ; and
v. Nidhis s a t i s f y i n g c e r t a i n requirem ents should be c l a s s i f i e d as "approved in s t i tu t io n s " to become e l i g i b l e for re f inance , guarantee o f loans, insurance o f deposits and even tax concess ions available to banks.
¥19.7.7 The Commission a l s o urged that l i n k s should be establ ished between nidhis and commercial banks by making the former, with the ir intimate knowledge o f the c l i e n t s in their l o c a l i t i e s , agents for the la t t e r in the matter o f small loans.
19 .7 .8 The James Raj study group on Non-Banking Companies
(1974) set up by the RBI recognised that nidhis were a notable exception to other non-banking f inanc ia l companies in that their
l i a b i l i t i e s , l ike those o f commercial banks, comprise both demand
and time l i a b i l i t i e s w hile t h e i r a s s e t s , u n l ik e those o f commercial banks, are more s p e c ia l i s e d , covering advances mostly against mortgages. It a lso drew a d i s t i n c t i o n between nidhis and other non-banking f inanc ia l companies since the la t t e r are run on commercial l in e s while the former are organised for the mutual
benef i t o f the ir members. It came to the conclusion that the nature o f con tro ls on them need not be ident ica l with those on other non-banking f in an c ia l companies. However, the Study Group recommended that a l l non-banking f inanc ia l companies, including n idhis , be required to transfer to reserve funds a sum equivalent to not l e s s than 20 per cent o f the ir annual net p r o f i t s before declaring any dividend t i l l such time as the amount in the reserve fund is equal to the paid up cap i ta l o f the company. Most nidhis already moot thin c r i te r io n *
19.7 .9 According to the Report o f the Committee to Review the working o f the Monetary System (1985), nidhis are purely lo ca l in s t i tu t i o n s which accept deposits from members and r e s t r i c t their lending to members. They work on sound p r inc ip les o f banking, and their operations are similar to those o f unit banks although they do not issue cheque books to the ir c l i e n t s .
153

19.8 Industry structure
19.8 .1 As n i d h i s are l a r g e l y s i n g l e o f f i c e i n s t i t u t i o n s , the ir area o f operation i s demarcated and within their area they do not face competit ion. We have not observed any place where two nidhis or two o f f i c e s o f nidhis are located so as to compete for
the same customers. Many nidhis may be located in a c i t y but they*
are scattered at d i f f e r e n t places within i t .
19.8.2 We have noted marginal interest rate d i f fe re n ce among n id h is l o c a t e d w ith in the c i t y o f Madras. I n t e r e s t ra te d i f fe re n ce becomes poss ib le because people general ly pre fer a nidhi within the ir l o c a l i t y to a distant one even i f the la t te r o f f e r s a s l i g h t l y h ig h e r r a te o f i n t e r e s t f o r d e p o s i t s and a s l i g h t l y lower rate on loans. Clearly , however, excessive rents cannot be earned.
19.8 .3 Another f a c t o r which i n f l u e n c e s p r i c e f i x a t i o n bynidhis is their age. Generally, the longer the age of a nidhi , the b e t t e r i t s r e p u t a t i o n and so the g r e a t e r i t s p o s i t i o n in attract ing c l i e n ts and f ix in g pr ice . But th is advantage has not
been made use o f by n idhis . Data on age-wise d i s t r ib u t io n o f deposits presented in Table 19.10 shows that about 85 per cent o f deposits o f nidhis studied was accounted for by f i v e nidhis above 100 years o ld . It is also seen that nidhis outside the c i t y o fMadras fared p o o r l y in terms o f d e p o s i t s , s u g g e s t in g thatsuccessful nidhis are an urban phenomenon.
19.8.4 Loan a v a i l a b i l i t y to a member o f nidhi depends on i t sfunds pos i t ion . It i s not uncommon for a nidhi with shortage o ffunds to recommend a member to another nidhi which intends toexpand i t s loan p o r t f o l i o .
19.8.5 Entry to the n id h i market and e x i t from i t are permitted by the Indian Companies Act under cer ta in cond it ions . Exemption under Section 620A o f th is Act i s ava i lab le only a f t e r a nidhi has enrol led 1000 members. The procedure for winding up o f

companies i s also given in the Companies Act. Thus entry and exit barr ie rs , though not insuperable ones, result from the regulatory environment.
19.9 Estimate of overall size
19.9 .1 There i s no need to e s t im ate the o v e r a l l s i z e o fnidhis because the actual pos i t ion i s r e f l e c t e d in the RBI surveys on growth o f deposits with non-banking companies apart from some non-functioning nidhis . These data, presented in Table 19.1, give the e f f e c t i v e number o f nidhis in March 1986 as 65 with a to ta l deposits o f Rs 73.50 crore . I f we ap p ly ' the growth rate between 1985 and 1986 (21.69 per ce n t ) , their deposits in March 1987 would be o f the order o f Rs 89.44 crore .
19.10 Influence of formal sector lending rate/loan availability
19.10.1 Prima fa c i e , formal sector lending rates have l i t t l einf luence on the lending rates o f nidhis even for gold loans which are sanctioned by both nidhis and banks. Banks lend to a l imited extent against the secur i ty o f gold jewel lery . Here, i f the loan
is fo r agr icu ltura l purposes, they charge a lower rate o f interest as appl icable to agr icu ltura l loans. I f i t i s for other purposes,
they charge the maximum lending rate, currently at 16.5 per cent per annum. They charge the ir normal rate , currently at 18 to 20 per cent per annum, for a l l gold loans. The lending rates o f banks fluctuate according to the gu idel ines o f the RBI.
19.10.2 Even though the maximum lending rate o f banks is about1.5 to 3.5 percentage p o in t s lower than that o f n i d h i s , many borrowers against gold turn to nidhis because (a) banks l imit theamount o f loan to unreasonably low l e v e l s , (b) the to ta l loan perborrower is l imited to a maximum of Rs '3000 by commercial banks and Rs 10,000 by cooperative banks in some States, ( c ) loans are not sanctioned on a l l working days in a week, (d) the loan is subject to a c e i l i n g prescribed for gold loans in each bank branch and (e ) there is delay in releasing the loan.
155

19.10.3 Banks do not extend loans against mortgage o f landed p r o p e r t y , even though they take such p roper ty as a d d i t i o n a l secur i ty for other loans. They do not g ive any accommodation or r e f in a n c e to n id h is aga ins t the l a t t e r ' s mortgage l o a n . Therefore, the interest rates o f banks have no d i r e c t inf luence over the interest rate f o r mortgage loans o f nidhis .
19.10.4 The a v a i l a b i l i t y o f funds f o r loan o p e r a t i o n s o f nidhis i s l imited to the ir own and borrowed funds. There i s no refinance f a c i l i t y from the organised banking sector , even though such a measure was mooted by the Banking Commission in 1972.
19.10.5 All nidhis maintain current accounts with banks and a l l payments except small gold loans are made by bank cheque.
R e c e ip t s are in cash and bank cheques i n c lu d in g o u t s t a t i o n cheques. Nidhis maintain the ir resources in banks and, as can be
seen from Table 19.5, about 8 per cent to *11 per cent o f their assets are held in banks. A major part o f t h i s balance is in fixed deposits and the rest in current accounts. The banks in turn give l i t t l e f a c i l i t y to nidhis except perhaps loans against the ir FDs. Thus a part o f informal sector funds f inds i t s way to the formal sector banks, though th is does not argue for inf luence o f e i ther in s t i tu t io n on the other.
19.11 Distributional impact
19.11.1 As mentioned e a r l i e r , nidhis e s s e n t ia l l y serve middle c lass salary earners and pensioners and provide loans for purposes for which ready a l te rn at ive s at reasonable cost do not e x i s t .
19.12 Efficiency and allocative impact
19.12.1 Nidhis serve a category o f c l i e n t s who are not servedor inadequately served by commercial banks. Consumption loans are discouraged, i f not denied, by banks. But cer ta in consumptione xp end i tures cannot be brushed a s id e as unimportant because without such expenditure an individual may find i t d i f f i c u l t to
156

c a r r y on h is s o c i a l l i f e . In some c a s e s , the need f o r such expenditures comes suddenly. Nidhis extend loans at reasonable interest to members who would, otherwise, have gone for much c o s t l i e r loans from money lenders or pawn brokers. Thus, the cost of f inancing unforeseen consumption needs i s kept in check.
19.12.2 Loans against the mortgage o f property by nidhis havehelped many property owners to construct , renovate and expand
build ings and houses. In Madras, there are several instances o fborrowers paying back the loan amounts from rent real ised fromcommercial buildings bu i l t or renovated with the help o f f inance from nidhis . Nidhis have also extended loans for construct ion and improvement o f res id en t ia l houses and acqu is i t ion o f f l a t s in c i t i e s and towns. Thus support for construct ion a c t i v i t i e s , v i t a l
at th is stage o f In d ia 's development, i s c l e a r l y ava i lab le .
19.12.3 Both o f these p o in t s would tend to support the h y p o th e s i s that n id h is have a p o s i t i v e impact on saving and investment.
19.12.4 In savings m obi l isat ion , nidhis have shown themselvesto be innovators. In fa c t , i t is said that nidhis are pioneers in r e c u r r i n g d e p o s i t s in I n d ia . C u rr e n t ly , a range o f d e p o s i t schemes which p ara l le l commercial bank schemes are o f fe red . Fora l l ca tegor ies o f d epos i ts , nidhis pay higher rates o f interest than commercial bank and at least as much as company deposits . Furthermore, though there are o ther in formal f i n a n c i a l in s t i tu t io n s which o f f e r higher rates o f interest than nidhis ,the sa fety o f deposits with nidhis is high. However, given their
l imited coverage, the impact o f nidhis on aggregate saving Is c l e a r l y small.
19.13 Recommendations for a regulatory framework
19.13.1 Two o f the major recommendations o f the Banking Commission (1972) on nidhis were for a minimum l iq u id i t y rat io and minimum \ j id up c a p i t a l and r e s e r v e s . Nidhis have a l r e a d y
157

accepted these vo lu n tar i ly as can be seen from the data presented in Table 19.5. In both these respects they have a better pos i t ion than commercial banks. They also strengthen their reserves every year by d is t r ibu t in g only a small port ion o f net p r o f i t s (not more than 25 per cent) as dividends.
19.13.2 E n q u ir ie s r e v e a le d that the present method o f incorporation o f nidhis under the Companies Act and the exemptions granted to them under Sect ion 620-A were based on sound pr inc ip les and did not require change.
19.13.3 From the preceding d iscuss ion , i t is c lear that nidhis serve a particular segment o f borrowers and lenders well . This segment i s c l e a r l y r e s t r i c t e d in that o n ly loans aga ins t c o l la t e r a l are given. However, the ir loan p o r t f o l i o s appear to complement the formal s e c t o r and i n c lu d e a r e l a t i v e l y high proportion o f long term loans. Furthermore, depositor security is high. Given the recent growth o f the housing finance market in India and alternat ive formal deposit channels which are both safe and o f f e r higher returns than commercial banks, the future o f nidhis i s not at a l l obvious. However, were banks to increase the range o f assets acceptable to them as c o l l a t e r a l to include gold and various types o f bonds, the combined impact o f these formal s e c t o r developments on n id h i s would c l e a r l y be a d v e r s e . The quest ion that we are thus faced with i s whether formal in s t i tu t io n s should compete with nidhis (or work through them). Since nidhis have lower establishment cos ts than banks and since monopoly rents are not s ig n i f i c a n t , the answer is c l e a r ly in the negative i f the s o c ia l ben e f i t s resu lt ing from the nidhis loan
p o r t f o l i o are more or l e s s c o r r e c t l y r e f l e c t e d in t h e i r loan rates. Thus, i t is suggested that the only addit ional regulatory step required is bank support in augmenting resources o f nidhis by refinancing the ir f u l l y secured loans.
158

TABLE 1 9 .1
Growth o f N idhis
Year Numbero f
r e p o r t i ng c o m p a n ie s
(N o s )
D e p o s i t s ( R s
c r o r e )
1 967 59 1 0 .1 11968 64 1 0 .7 41969 63 1 1 . 9 91970 64 13 . 631971 6 3 1 4. 961972 65 1 5. 801 973 67 18. 201974 66 1 9. 601975 68 1 9. 601976 66 20. 001977 66 1 9. 801 978 66 21 . 701979 62 24. 601 980 63 2 8 . 1 01 981 62 31 . 501982 62 31 . 101 983 61 35. 601 984 61 3 9. 601 98 5 64 60 . 401 986 65 73 . 50
e : As on March 31. S o u r c e : Gr owt h o fDe po s i t s w ith No n-Banki ng Compan i e s ,Re s e rv e Bank o f I nd i;B u l l e t i n i s s u e s .
, v a r i o u s
159

TABLE 1 9 . 2
St at e - Wi se D e t a i l s of Nidhis (March end 1981)
S t a t e Number o f D e p o s i t s Netr e p o r t i n g ___________________ *_____ ownc o mp a n i e s Number Amount f unds
o f (Rs ( c a p i t a la c c o u n t s l a k h ) and
r e s e r v e s )(Rs
lakh)
Tami l Nadu 49 176 914 304 9.. 54 182. . 29And hr a Pr ade sh 1 41 94 34 .. 54 5., 60Ke r a l a 1 563 24. . 75 3 .. 1 5Ka r na t a ka 1 390 3 .. 63 1 .. 76
A. So u t h e r n Re g i o n 52 182061 . 3112. . 43 1 92 .. 80
B. A l l I n d i a 62 NA 31 50. . 00 200. . 00
Share o f S o ut he r n 8 3 . 87 98 ., 81 96 .. 40Re g i o n
S o u r c e s : F o r (A) C . P . S . Nayar , A St udy onN o n - B a n k i n g F i n a n c i a l I n t e r m e d i a r i e s , I n s t i t u t e f o r F i n a n c i a l Ma n a g e me n t and R e s e a r c h , M a d r a s ,1 984 .F o r ( B ) , R e s e r v e Bank o f I n d i a B u l l e t i n , O c t o b e r 198 2 .
160

TABLE 1 9 . 3
Age D i s t r i b u t i o n of 65 Nidhis( 1 9 8 6 )
R a n g e Numbe r Sh a r e ( % )
Mo r e t h a n 1 0 0 y e a r s 7 1 0 . 7 7
Mo r e t h a n 7 5 u p t o 1 0 0 y e a r s 19 2 9 . 2 3
Mo r e t h a n 5 0 u p t o 7 5 y e a r s 14 21 . 54
Mo r e t h a n 2 5 u p t o 5 0 y e a r s 14 21 . 54
B e l o w 2 5 y e a r s 11 1 6 . 92
TOTAL 65 1 0 0 . 0 0
161

TABLE 1 9 . 4
S. No. Name o f Company Age No. o ~ S h a r e h o l d e7 s( Y e a r s )
A B T o t a lc l a s s c l a s s
D e t a i l s o f Se le ct ed Nidhis
A. Tamil Nadu
1. Abiramapuram Fund Led Madras C i t y
2. Egmore B e n e f i t Fund S o c i e t y L t d . , Madras C i t y
3. K i lp a u k B e n e f i t S o c i e t y L t d . , Madras C i t y
4. Madras Purasawakkara Hindu Jan opa kara Saswatha N id h i L t d . Madras C i t y
5. N ag ap at t in am Permanent Fund Ltd . N a g a p a t t in a m
6. Nungambakkam Saswatha Dhana Rakshka N idh i L td . Mad ra s C i t y
7. S rim an dhwa S id d h a n th a O nnahin i Permanent N idh i L td . Madras C i t y
8. S r i v a s a v i P aram esw ar i Permanent Fund L td . Karur
9. T r i p l i c a n e Permanent Fund L td . Madras C i t y
B. Andhra Pradesh
10 . Adoni Arya Vysya Fund Ltd Ad on i
11. B e l l a r y B r u c e p e t Hindu Mutual Bono fi t ' Fund L td . B e l l a r y
12 . N e l l o r e Permanent Fund Ltd N e l l o r e
3 1 2 , 5 6 3
116 ~ - 5 5 , 6 7 2
12 - - 1 4 , 4 7 2
105 - - 4 0 , 0 0 0
85 - 2 , 3 2 5
104 - - 2 5 , 6 0 0
105 390 1 5 ,6 6 3 1 6 ,0 5 3
2 5 7 ,1 4 2
61 287 1 0 ,8 6 6 1 1 ,1 5 3
76 - - 2 , 3 7 0
13 5 - - 1 , 9 2 3
99 975
1 , 8 0 , 2 4 8
62
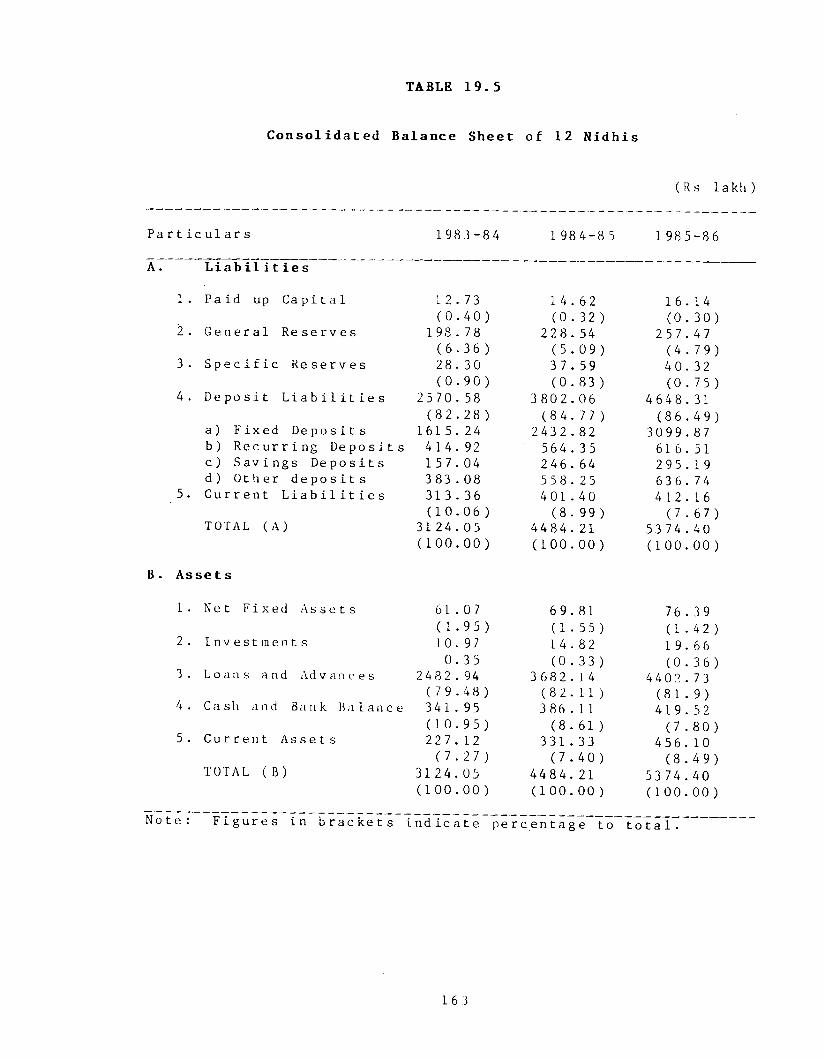
TABLE 1 9 . 5
C o n s o l i d a t e d B a la n c e S h e e t o f 12 N i d h i s
( R s 1 a kh )
P a r t i c u l a r s 1 9 8 3 -8 4 1 9 8 4 - 8 5 1 985 -86
A. L i a b i l i t i e s
1 . P a id up C a p i t a l 1 2 .7 3 1 4 . 6 2 1 6 .1 4( 0 . 4 0 ) ( 0 . 3 2 ) ( 0 . 3 0 )
2 . G e n e r a l R e s e r v e s 1 9 8 .7 8 2 2 8 .5 4 2 5 7 .4 7( 6 . 3 6 ) ( 5 . 0 9 ) ( 4 . 7 9 )
3 . S p e c i f i c R e s e r v e s 28. 30 37 . 59 4 0 . 3 2( 0 . 9 0 ) ( 0 . 8 3 ) ( 0 . 7 5 )
4 . D e p o s i t L i a b i l i t i e s 2 5 7 0 .5 8 3 8 0 2 .0 6 4 6 4 8 .3 1( 8 2 . 28 ) ( 8 4 . 7 7 ) ( 8 6 . 4 9 )
a) F ix e d D e p o s i t s 1 6 1 5 .2 4 2 4 3 2 .8 2 3 0 9 9 .8 7b) R e c u r r i n g D e p o s i t s 4 1 4 .9 2 ' 5 6 4 .3 5 6 1 6 .5 1c ) S a v in g s D e p o s i t s 15 7 .0 4 2 4 6 .6 4 2 9 5 .1 9d) Other d e p o s i t s 3 8 3 . 0 8 5 5 8 . 2 5 6 3 6 .7 4
5. C u r r e n t L i a b i l i t i e s 3 1 3 .3 6 4 0 1 . 4 0 4 1 2 .1 6( 1 0 . 0 6 ) ( 8 . 9 9 ) ( 7 . 6 7 )
TOTAL (A ) 3 1 2 4 .0 5 4 4 8 4 .2 1 53 7 4 .4 0( 1 0 0 . 0 0 ) ( 1 0 0 . 0 0 ) ( 1 0 0 . 0 0 )
B. A s s e t s
1 . Net F ix e d A s s e t s 6 1 .0 7 6 9 .8 1 76 .39( 1 . 9 5 ) ( 1 . 5 5 ) (1 - 4 2 )
2 . I n v e s t m e n t s 10 .9 7 14. 82 1 9 .6 60 .3 5 ( 0 . 3 3 ) ( 0 . 3 6 )
3 . Loans and Ad v a n c e s 2 4 8 2 .9 4 3 6 8 2 .1 4 4 4 0 2 .7 3( 7 9 . 4 8 ) ( 8 2 . 1 1 ) ( 8 1 . 9 )
4 . Cash and Bank B a lanc e 3 4 1 .9 5 386 . 1 1 4 1 9 .5 2( 1 0 . 9 5 ) ( 8 . 6 1 ) ( 7 . 8 0 )
5 . C u rr e n t A s s e t s 2 2 7 .1 2 3 3 1 .3 3 456 . 10( 7 . 2 7 ) ( 7 . 4 0 ) ( 8 . 4 9 )
TOTAL (B ) 3 1 2 4 .0 5 4 4 8 4 .2 1 53 7 4 .4 0( 1 0 0 . 0 0 ) ( 1 0 0 . 0 0 ) ( 1 0 0 . 0 0 )
N o t e : F i g u r e s in b r a c k e t s i n d i c a t e p e r c e n t a g e to t o t a l .
163
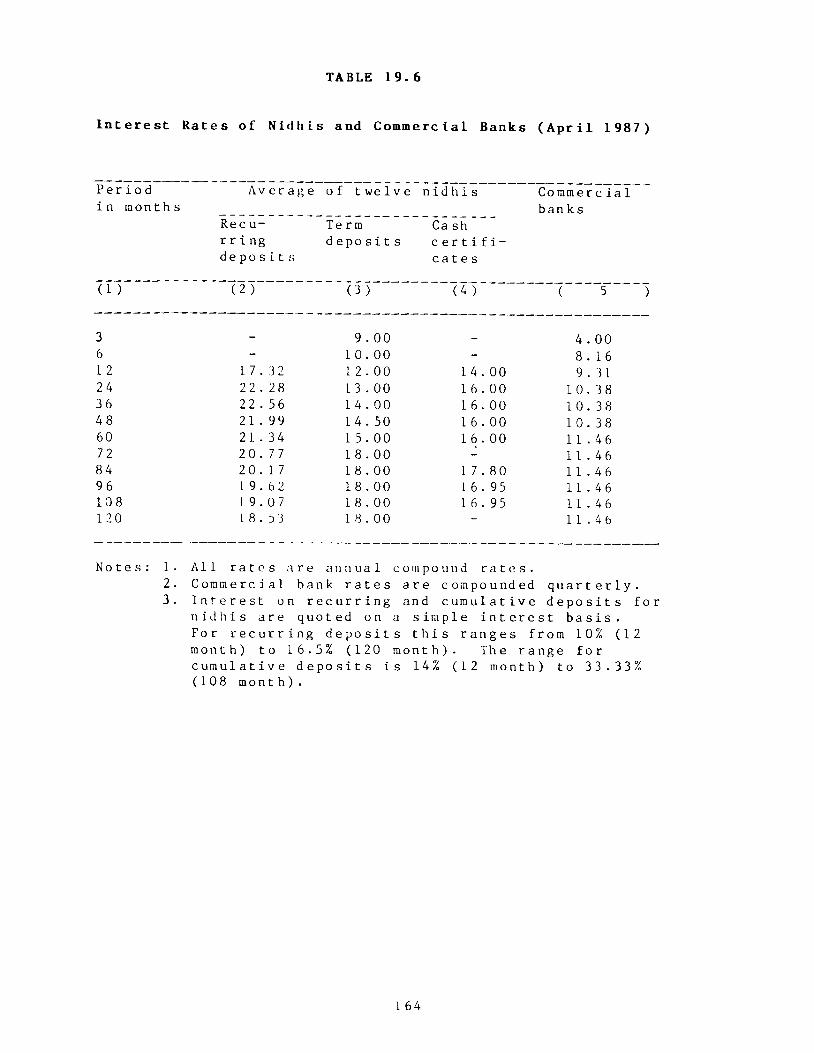
TABLE 1 9 . 6
I n t e r e s t Rates of Nidhis and Commercial Banks ( A p r i l 1987)
P e r i o d i n month s
A v e r a g e
Recu r r i n gd e p o s i t s
o f t we 1 v e
Termd e p o s i t s
n i d h i s
Ca shc e r t i f i c a t e s
Commerc i a 1 banks
(1 ) ( 2 ) (3 ) (4 ) ( 5 )
3 _ 9 . 00 _ 4 . 006 - 10. 00 - 8 . 1 61 2 1 7 .3 2 12. 00 1 4 . 00 9 .3 124 2 2 . 2 8 1 3 . 00 16. 00 1 0 . 3 836 22 . 56 1 4 . 00 1 6. 00 1 0 . 3 848 2 1 . 9 9 14. 50 16. 00 1 0 . 3 860 2 1 . 3 4 15. 00 16. 00 1 1 . 4 672 2 0 . 7 7 18. 00 - 1 1 . 4 684 2 0 . 1 7 1 8 . 00 1 7 . 8 0 1 1 . 4 696 1 9 . 6 2 18. 00 1 6 .9 5 1 1 . 4 6108 1 9 .0 7 1 8 . 00 1 6 . 9 5 1 1 . 4 6120 1 8 .5 3 1 8 . 0 0 ~ 1 1 . 4 6
N o t e s : 1. A l l r a t e s a r e annual compound r a t e s .2. C om m erc ia l bank r a t e s a r e compounded q u a r t e r l y .3. I n t e r e s t on r e c u r r i n g and c u m u l a t i v e d e p o s i t s f o r
n i d h i s a re q u o t e d on a s i m p l e i n t e r e s t b a s i s .For r e c u r r i n g d e p o s i t s t h i s r a n g e s from 10% (12 month) t o 16.5% (120 m o n t h ) . The ran g e f o rc u m u l a t i v e d e p o s i t s i s 14% (12 month) to 33 .33% (108 m o n t h ) .
164

TABLE 1 9 . 7
Schedule of I n t e r e s t Rates on Loans of Nidhis ( 1987)
S r . Type o f Loan Rate o f RemarksI n t e r e s t (% p . a . )
1 . Je we 1 l o a n
2 . Loans a g a i n s t FDRand RD
M o r tg a g e l o a n s
1 8 -2 0
1 . 5 t o 2 % more than t h e c o n t r a c t e d r a t e f o r d e p o s i t
1 6 . 2 0 - 2 2 . 8 0
Rs 10 0 0 per s o v e r e i g n
80 t o 95 per ce n t o f d e p o s i t s
Repayment upto 7 y e a r s
4. S p e c i a l m o r t g a g e l o a n s
5. P r o d u c e l o a n s *
18. 00
1 8 . 0 0 - 2 3 .0 0
Repayment w i t h i n 3 y e a r s
A g a i n s t p l e d g e o f a g r i c u l t u r a l and co m m e r c ia l c o m m o d i t i e s
C o n s u m e r - c r e d i t l o a n s l 1 8 . 0 0 - 2 2 . 0 0
P e r s o n a l s u r e t y l o a n s l 1 8 .0 0
For p u r c h a s e o f consumer d u r a b l e s on h y p o t h e c a t i o n b a s i s
On the s u r e t y o f two g u a r a n t o r s and on p r o d u c t i o n o f s a l a r y c e r t i f i c a t e
N o t e s : 1. These a re e x t e n d e d o n l y by one o r two n i d h i s .
165

TABLE 1 9 . 8
C o n s o l i d a t e d P r o f i t and L o s s A c c o u n t o f 12 N i d h i s
P a r t i c u l a r s 198 3 - 8 4 1 9 8 4 -8 5 1 9 8 5 - 8 6~
( Rs
A . In c ora e
1. I n t e r e s t r e c e i v e d 4 3 9 .8 1 5 2 5 .8 5 5 6 4 .3 5( 9 7 . 2 0 ) ( 9 8 . 0 2 ) ( 9 8 . 0 4 )
2. Other in com e 1 2 . 6 5 1 0 .2 7 1 1 .2 7( 2 . 8 0 ) (1•98 ) (1•96 )
TOTAL (A ) 4 5 2 .4 6 5 3 6 .1 2 5 7 5 .6 2
Expense s( 1 0 0 . 0 0 ) ( 1 0 0 . 0 0 ) ( 1 0 0 . 0 0 )
1. I n t e r e s t pa id 3 0 5 . 8 5 3 7 8 .4 7 4 0 2 . 6 4( 6 7 . 6 0 ) ( 7 0 . 5 9 ) ( 6 9 . 9 5 )
2. S a l a r i e s 56 . 74 6 7 . 4 9 7 7 . 1 23. D i r e c t o r ' s f e e s 5 .2 7 5. 37 5 . 614. D e p r e c i a t i o n 6 . 1 5 5 .1 7 4 . 835. AdminibL r a t i v e e x p e n s e s 2 4 . 3 3 24. 44 24. 696. T o t a l e s t a b l i s h m e n t 9 2 . 4 9 1 0 2 .4 7 1 1 2 .2 5
e x p e n s e s (2 + 3 + 4 + 5 ) ( 2 0 . 4 4 ) ( 1 9 . 1 1 ) (1 9 .5 0 )7. T o t a l e x p e n s e s ( 1 + 6 ) 3 9 8 . 3 4 4 8 0 .9 4 5 1 4 .8 9
( 8 8 . 0 4 ) ( 8 9 . 7 0 ) ( 8 9 . 4 5 )8 . G ro s s p r o f i t ( A - 7 ) 5 4 . 1 2 5 5 . 1 8 6 0 . 7 3
( 1 1 . 9 6 ) ( 1 0 . 2 9 ) ( 1 0 . 1 5 )9 . P r o v i s i o n s ( t a x e t c . ) 8 . 9 5 9 .3 7 1 0 .1 1
( 1 . 98) ( 1 - 7 5 ) (1•76 )1 0 . Net p r o f i t ( 8 - 9 ) 4 5 . 1 7 4 5 . 8 1 5 0 . 6 2
( 9 . 9 8 ) ( 8 . 5 4 ) ( 8 . 7 9 )TOTAL ( B) ( 7 + 8 ) 4 5 2 . 4 6 5 3 6 . 1 2 5 7 5 .6 2
( 1 0 0 . 0 0 ) ( 1 0 0 . 0 0 ) ( 1 0 0 . 0 0 )
N o t e : F i g u r e s in b r a c k e t s i n d i c a t e p e r c e n t a g e t o t o t a l .
lakh )
1 b 6

TABLE 19.9
Decomposition of Interest Sates from Annual Report Data
Part iculars 12
1983-84
Selected
1984-85
Nidhis
1985-86
1.
Financial Statistics (Rs Lakh)
Share Capital and Reserves 239.81 280.75 313.932. Total Deposits 2570.58 3802.06 4648.313. Total Credit 2482.94 3682.14 4402.734. Total Earnings (income) 452.46 536.12 575.625. Interest Paid 305.85 378.47 402.646. Salary, Allowances, e t c . 86.34 97.30 107.427. Other Expenditure 6.15 5. 17 4.838. Total Expenses 398.34 480.94 514.899. Gross P ro f i t (44-8) 54.12 55.18 60.7310. Provis ion for Tax Etc. 8.95 9.37 10.1111. Net Pro f i t 45.17 45.81 50.62
a.Interest Rates (per cent)Loan Rate 21. 59 15.63
b. Deposit Rate - 14.72 10.59c . Spread - 6.87 5.04
d.Ratios to Total Funds (per cent)Earnings 19.08 14.10
e . Deposit Cost - 13.47 9.86f . Establishment Cost - 3.65 2.75g- Opportunity Cost at 18% - 1.54 1.24h. Economic Rent - 0.42 0. 25
i .Break Up (per cent)Deposit Cost + Opportunity Cost 78.67 78.72
j - Transactions Cost - 19.13 19.50k. Economic Rent — 2.20 1.78
167

TABLE 1 9 . 1 0
D is tr ib u t io n by Age and D ep o sits of 12 N idhis (1 9 8 6 )
Age Range No. D e p o s i t s P e r c e n t a g e to T o t a l(Rs .
l a k h ) D e p o s i t s No
More than 100 y e a r s 5 3 9 3 9 .8 2 84 . 76 4 1 . 6 77 5 y e a r s to 100 y e a r s 3 93 . 56 2 .0 1 2 5 .0 150 y e a r s t o 7 4 y e a r s 1 1 7 9 . 8 0 3 . 87 8 .3 32 5 y e a r s t o 4 9 y e a r s 2 1 4 7 .1 1 3 . 1 6 16 . 67Below 25 y e a r s 1 2 8 8 .0 2 6 . 20 8. 33
T o t a l o f S e l e c t e d N i d h i s 12 4 6 4 8 .3 1 1 0 0 .0 0 1 0 0 .0 0
T o t a l r e p o r t i n g n i d h i sin I n d i a 65 7 3 5 0 .0 0
Selected nidhis as % oft o t a l n i dhi s 1 8 . 4 6 6 3 . 2 4
CHAPTER 20
FINANCE CORPORATIONS OF SOUTH INDIA
20.1 Introduction
20.1 .1 A finance corporat ion is an informal f inanc ia l intermediary set up for making p ro f i t from the business o f lending money r a i s e d by way o f d e p o s i t s or borrow ing . It may be a
proprietary concern, a partnership firm or a l imited company. The
nomenclature o f th is f inanc ia l intermediary i s found to vary from place to place. Besides the term finance corporat ion , bankers, f inancing company, f in a n c ie rs , t ru s t , fund, cap i ta l centre , f inanc i a l enterprise , investment company, investment corporat ion , investment, f inance and exchange, traders and f inanc ie rs , cred it corporat ion , bene f i t corporat ion , commercial corporat ion , f inance and chit fund, f inance syndicate and commercial syndicate are a l l used. Despite the s u f f i x ' c o r p o r a t i o n ' , which i s normally associated with an incorporated body, none o f the finance corporations we studied was found to be incorporated under the Companies Act. Out o f a to ta l o f 450 finance corporat ions id e n t i f i e d in an e x te n s iv e survey in South In d ia , as many as 95 per cent were partnerships under the Indian Partnership Act, 1932 and the rest were proprietary concerns (Nayar 1982, 1984).
20 .1 .2 For a proprietary concern, an individual , alone or in assoc iat ion with members o f his family, s tarts the business o f lending money a f t e r taking a l i cense under the State moneylender's act wherever app l icab le . I n i t i a l l y he s ta rts lending his own money but v e r y soon he i n v i t e s h i s r e l a t i v e s and f r i e n d s to deposit the ir savings with him at a t t r a c t iv e rates o f in terest .
This money i s lent out fo r periods ranging from one or two days to
169

3 t o 4 months. As the b u s in e ss grows and c o n f i d e n c e in creases , deposits cane from outside the c i r c l e o f r e la t iv e s . The proprietor gradually d i v e r s i f i e s his lending p o r t f o l i o by d is counting cheques, negotiating trade b i l l s and lending to other f i n a n c ie r s .
20.1 .3 A partnership firm requires re g is t ra t io n under the In
dian Partnership Act which is a r e l a t i v e l y simple process. After register ing a partnership, one or more partners become managing partners for a d m in is t r a t iv e co n v e n ie n ce . The partners meet frequently to take dec is ions on important matters and a l l major d ec is ions , e s p e c ia l l y sanction o f loans, 'ire taken c o l l e c t i v e l y .
The managing partner is allowed to draw an honorarium for his serv i c e s .
20.1.4 The i n i t i a l funds for the operation o f the finance cor poration is contributed by partners as subscr ipt ion c a p i ta l . The main source o f funds o f the f in a n c e c o r p o r a t i o n , however , i s deposits from the publ ic . While corporat ions accept deposits from anybody, amounts are lent only to persons recommended by or known to at least one o f the partners.
20.1.5 Finance corporat ions are similar to commercial banks in most o f t h e i r f u n c t i o n s . The c o r p o r a t i o n s ac cep t sav ings deposits , f ixed deposits for d i f f e r e n t periods, recurring deposits and issue cash c e r t i f i c a t e s under interest reinvestment plans. They allow per iod ica l withdrawals from savings deposits by means of withdrawal forms and also permit premature closure o f term depos i ts . Interest ca lcu la t io n s and payments are similar to those
o f banks. They extend secured and unsecured loans, c red it for purchase o f au to m o b i le s and ins ta lm ent c r e d i t f o r consumer
d u ra b le s . They a lso d is coun t trade b i l l s on the ba s i s o f l o rry /ra i lw ay re ce ip ts and even discount post dated cheques o f private part ies .
20.1.6 They d i f f e r from banks in that they do not issue cheque books to d epos i tors , have a f l e x i b l e approach in regard to payment
170

o f i n t e r e s t on d e p o s i t s and pay commission f o r canvass ing deposits . Above a l l , they are not governed by the Banking Regulat ion Act 1949 or by any other regulat ion o f the RBI as applicable to the formal banking sector .
20.1.7 Whereas a large majority o f f inance corporations at Bangalore conduct ch it fund business on a minor scale to supplement their main income from loans, the majority o f ch i t funds at Madras resort to the finance business mainly to create funds to pump into ch it funds whenever necessary. In other p laces , ch itfunds by finance corporations and finance business by chit fundf irms, i s sporadic .
20.2 Geographical dispersion
20.2 .1 Finance corporations are concentrated in South India.According to a country-wide study made in 1979-80 (Nayar 1982), 90 per cent o f f in a n c e c o r p o r a t i o n s in India were in the foursouthern States. The s i tuat ion continued to be so up to 1982-83 according to a subsequent study (Nayar 1984) which states thatcorporations enjoy s ign i f i ca n t popularity both in Tamil Nadu and Kerala. Corporations in some d i s t r i c t s in these States outnumber commercial banks. Furthermore, corporat ions , mobil is ing about 10 per cent o f bank deposits and extending about 12 per cent o f bank c r e d i t , are a f inanc ia l intermediary to reckon with in the study area. The number o f corporations and deposits with them from 1979-80 to 1982-83 are shown in Table 20.1 .
20.2.2 Area surveyed, general description and description of
sample: For th is study, we have se lected the same four southernStates. As finance corporat ions were scattered in many places in each State and as there was no l i s t containing the ir addresses, we had to s e le c t a few places o f the ir concentration from each State. From these places 60 corporations were se lected for interview and data c o l l e c t i o n . The se le c t i o n was purposive and s t r a t i f i e d and the c o l l e c t i o n o f data was through a 45 point questionnaire. Be
sides these, 40 users o f f inance corporat ions , i . e . , depositors
171

and borrowers, were se lected independently from d i f f e re n t areas and interviewed through a separate questionnaire. However, only 42 corporations and 31 users (14 depositors and 17 borrowers) furnished deta i l s and analys is is done by using these 73 respondents. Place-wise d i s t r ib u t io n o f respondents i s given in the appendix to th is chapter .
20.2.3 Business pract ices o f f inance corporations general ly do not vary much from place to place. They fo l low roughly the same pattern in respect o f modal i t ies , period of loan, purposes for which c r e d i t i s g iv e n , repayment terms e t c . However, whi le se lect ing p laces , care was taken to include areas o f high concentration o f f inance corporations in the States. The year o f es tablishment, deposits and loans o f the selected 42 finance cor porations are given in Table 20.2.
20.3 Sources o f funds
20.3.1 Sources o f funds o f f inance corporat ions are cap ita l contributed by the partners /propr ie tors , reserves, borrowings from the publ ic , r e la t iv e s and partners. Generally, the contr ibution o f own cap i ta l i s small. One reason for th is h i s t o r i c a l l y was that i f the capital contributed by the partners in a partnership
firm was above Rs one lakh, the firm would come w ith in the regulatory o rb i t o f the Reserve Bank o f India under the provis ions of the Banking Laws (Miscellaneous Provis ions) Act 1963. It was only in 1984 the s i tuat ion changed with the coming into force o f the Banking Laws (Amendment) Act 1983, e f f e c t i v e l y from February 1984. So unti l 1984, a l l corporat ions kept the ir cap i ta l below Rs
one lakh i r re sp e c t iv e o f the s ize o f borrowed funds.
20.3 .2 Only 17 corporations maintained reserve funds which formed about 23 per cent o f t o t a l owned funds. Capita l and r e s e r v e s t o g e t h e r was around 9 .35 per cent o f borrowed funds (Table 2 0 .3 ) .
172

20.3 .3 As cap i ta l and reserves are r e l a t i v e l y small the major source o f funds for doing business i s deposits and borrowings. Corporations accept almost a l l types o f d epos i ts , including current, savings, recurr ing and f ixed deposits bes ides issuing cash c e r t i f i c a t e s fo r various periods . Deposits are raised from the
publ ic through d i r e c t canvassing by propr ietors , partners and employees and in larger c i t i e s through newspaper advertisements.
Some c o r p o r a t i o n s c i r c u l a t e a t t r a c t i v e f o l d e r s and other p u b l i c i ty material describing the various deposit schemes ava i l able with them among prospect ive depositors . The emphasis is invar iab ly on the high rate o f in terest o f fered under d i f fe rent schemes.
20.3.4 Though savings and recurring deposits as also cash cert i f i c a t e s were found in the deposit mix o f some finance corporat ions , term deposits constituted the bulk (99 per cent) o f t o ta l deposits o f the se lected corporations (Table 20 .4 ) . Term deposits ranged from le ss than one year to more than three years though 78 per cent o f the f ixed deposits were for one year.
20.3.5 A p a r t i c u l a r p o in t to note i s the l a r g e share o f deposits from r e la t iv e s . Out o f t o t a l deposits o f Rs 452.25 lakh, as much as Rs 102.95 lakh (23 per c e n t ) came from r e l a t i v e s . Relatives are also o f fe red in te r e s t , sometimes at a higher rate than that o f fered to the general publ ic .
20 .3 .6 The growth o f deposits o f the 42 finance corporationsbetween 1981 and 1986 presented in Table 20.6 shows a sharp f a l l
from Rs 813.1 lakh in 1981 to Rs 452.25 lakh in 1986, recording a dec l ine o f 44.38 per cent over the f iv e year period. It i s seen
from the table that the f a l l started slowly in 1983 but picked up momentum in 1984 reach an a l l - t im e low in 1986. One reason for the sharp f a l l from 1984 i s the r e s t r i c t i o n in deposit acceptance a c t i v i t y o f the corporat ions resu lt ing from the operation o f the Banking Laws (Amendment) Act 1983. In March 1987, f inance corporations in Kerala faced a c r i s i s s i tuat ion . There was a run by depositors and secured borrowers which caused several corporations
173

to f a i l . Further discussion i s in sect ion 20.10 to 20.12 below.
20.3 .7 Cost of funds: The cost o f funds o f f inance corporat ionsincludes interest payments to depos i to rs , fund rais ing expenses such as brokerage to agents, advertisements, preparation and d is
tr ibut ion o f p u b l i c i ty material and expenses incurred on personal c o n t a c t s . I n t e r e s t c o s t v a r i e s from 9 per cent per annum on savings d e p o s i t s to 21 per cent per annum on three year term deposits for some corporat ions . This works out to a weighted average o f 16.74 per cent per annum for a l l 42 firms. However, annual deposit cos ts are 10.38 per cent o f end of year deposits (Table 20 .16) . A break-up o f establ ishment/transactions costs is given in Table 20.15.
20.3 .8 Fluctuations in cost: Field data suggest that there wasalmost no change in the f inanc ia l cost o f funds o f f inance cor porations between 1980 and 1986. In March 1980, the f inanc ia l cost o f deposits ( in teres t plus fund rais ing c o s ts ) o f corporations was 17.54 per cent o f depos i ts ra ised . The corresponding figure was 17.32 per cent in 1986.
20.4 Uses of funds
20.4.1 Finance c o r p o r a t i o n s use almost a l l the funds mobi lised, and in some cases even a part o f own funds, in lending operations. The general pattern o f lending is to sanction a loan e ither on the secur i ty of a demand promissory note (DPN) or tang ib le assets such as land, bui ld ing , gold , jew e l lery and insurance p o l i c i e s . The borrowers are mainly those who are not able to geta loan from the formal sector banks because o f the nature o f the irbusiness or the nature o f secur i ty that they,can o f f e r against the loan. The main reasons for borrowers approaching finance corporations are (a) loans from banks are inadequate to meet th e i r overa l l requirements, (b) bank loans are general ly not ava i lab le for very short periods such as a day or two, ( c ) there is a minimumperiod for c a l c u la t io n o f interest, in banks, (d) bank loans arenot given for ce r ta in purposes and the s ize o f loan even for per
1 7 L

missible purposes f luctuates according to i t s loan p o l i c y , and (e)
there is inordinate delay in gett ing a bank loan.
20.4 .2 There are a number o f var ia t ions with regard to the types o f loans. There is a d a i ly repayment loan in which the interest is c o l l e c t e d in advance and a part o f the principal is
regularly extinguished every day. The repayment for these loans starts the day a f te r loan re lease . Table 20.21 gives examples o f two 100 day loans showing that e f f e c t i v e annual interest rates on "10 per cent and 12 per cent" loans can be 117 and 157 per cent per annum r e sp e c t ive ly . With a given deposit amount, the corporat ion e f f e c t s many loan transactions by rais ing funds out o f loan repayments. In each loan o f the type mentioned above, one per cent o f loan amount is repaid every day. I f these repayments are lent again on similar terms, a chain o f loans can be e f fe c ted in
the course o f a year. Thus a " f u l l y loaned up" corporation working 6 days a week can lend and obtain repayments for 10.4 times i t s i n i t i a l cap i ta l in the course o f a year ( f o r a similar computation, based on s l i g h t l y d i f f e r e n t assumptions, see Nayar, 1982;.
20.4 .3 Another method of lending by small s ize f inance corporations i s the d a i ly loan system under which cer ta in amount i s given in the morning and c o l l e c te d sometimes in the evening i t s e l f or next day. The loans which are usually issued on (market) days are f o r qu ick moving and e a s i l y p e r i s h a b l e items such as vegetables , f r u i t s , f i s h , meat and flowers. The loan amounts are usually below Rs 1000 and the interest which i s c o l l e c te d in advance varies from one paise to 5 paise per rupee per day. I f in
terest is taken in advance at the rate o f 5 per cent per day and i f loans are issued on, say, 100 days in a year, gross earnings from such loans work out to a staggering 16788 per cent per annum (given 32x6=312 working days per year the compound interest to borrowers i s an even more staggering 53.4 crore per cent per annum. Such ca l cu la t io n s c l e a r ly have l i t t l e re levance) . But the net return on loans i s only 87.66 per cent per annum due to high cost o f recovery (2 per ce n t ) , the high r isk o f default (2.5 per
175

cent) and the fact that cap i ta l used for such loans l i e s id le for 200 days in the year. Thus only a few corporat ions extend da i ly loans while others consider them to be "nuisance loans" . On the whole these loans form only 0.5 per cent o f loan p o r t f o l i o s o f c o rpora t ions .
20 .4 .4 s ome corporat ions extend cred it on the basis o f l e t t e r s
o f c red i t (LCs) to exporters. Exporters also get cred it from banks. But delays, f o rm a l i t ie s and uncerta int ies associated with bank finance force some exporters to turn to f inance corporations who provide finance to the extent o f 75 per cent o f the LC a f te r ascertaining that the ,LC is i r revocab le .
20.4.5 Some well organised and establ ished finance corporations finance internal or domestic trade b i l l s . They purchase or discount the documentary b i l l c ons is t ing o f a l o r r y rece ipt or ra i lw ay r e c e i p t and an i n v o i c e on the cons ignee f o r goods despatched. They then c o l l e c t the proceeds o f the b i l l from the c o n s ig n e e . Where the buyers and s e l l e r s s e t t l e the a c co u n ts through present dated or post dated cheques, the corporations d i s
count them provided they are presented by known lo c a l purchasers and customers.
20.4 .6 C l a s s i f i c a t i o n o f loans during 1985-86 by purpose is in Table 20.7. Trade and business accounted for the major share (47 per cent) o f t o ta l c red i t o f f inance corporat ions . The next important item was small industry (22 per c e n t ) , mainly handloom t e x t i l e s . This was followed by transport operations (14 per cent) and personal consumption (6 per cen t ) . Comparative f igures for 197 9-80 are also given in the tab le . Over the s ix year period, the shares o f trade and business, small industry, transport operat i o n s and small bu s in ess rose s i g n i f i c a n t l y , w h i le those o f agr icu lture , personal consumption, cinema theatres and other uses decl ined. However, the d i f f e r e n c e s in the samples covered should
be kept in mind.
20.4.7 Size of loan: One corporat ion fixed a loan f l o o r at Rs10000. For o t h e r s , the minimum loan va r ie d from Rs 100 (5corporat ions) to Rs 5000 (3 corporations) (see Table 20 .8 ) . 16corporations extended loans above Rs 1 lakh and in one case the
maximum loan was Rs 5 lakh. The usual loan transaction was aroundRs 12750 per borrower. In fa c t , for 18 corporat ions , the usually transacted amount was Rs 5000 or l e s s .
20 .4 .8 A break-up o f loans to small, (below Rs 9999), medium(Rs 10000 to Rs 25000) and large (above Rs 25000) borrowers (Table 20 .9) shows that one corporat ion had only small loans while, for
20 other corporat ions , 50 per cent o f th e i r loans were below Rs 1000. On the whole, small and medium loans dominated the loan
p o r t f o l i o s o f corporat ions .
20 .4 .9 Advances o f f inance corporations f e l l in tune with the f a l l in d e p o s i t s over the f i v e - y e a r per iod commencing 1981. Corporation-wise d e t a i l s o f loans are given in Table 20.10. The trend can be seen to be one o f steady and sharp dec l ine .
2 0 .4 .1 0 In te r e s t , margin, primary security and c o l la t e r a l :
Finance corporat ions do not p u b l i c i s e th e i r lending rates although they v ie with each other in advertis ing rates on depos i ts . The need for secrecy ar ises due to the existence o f a c e i l i n g on lending rates under moneylenders acts as well as the desire not to attract the attent ion o f income tax author i t ie s . Also, since i t i s the type o f se cu r i ty and the re la t ionsh ip between the lender and the borrower that in f luences the lending rate, there is no fixed
len d in g ra te as such. G e n e r a l ly , l e n d in g r a t e s are based on demand for and supply o f funds and vary according to the type o f secur i ty . ,
20.4.11 The interest rate for DPN loans, which constituted the major part o f loans o f f inance corporat ions , was about 3 7 per cent simple interest per annum in 1986. Jewel loan rate was lower at around 32.50 per cent per annum, while the rate for other secured
loans was around 34.14 per cent per annum. Discounting o f post
1 7 7

dated cheques which was practised by some corporations mostly at
Bangalore and Trichy was done at a rate of about 3 7.44 per cent per annum (Table 20.11) . Commodity loan was extended by only 3 corporat ions and the ir average interest rate was 26.33 per cent per annum. Compound interest rates are d i f f i c u l t to work out as loan durations vary.
20.4.12 The trend in interest rates on loans presented in Table20.12 shows that there was a steady increase in these rates be
tween 1982 and 1986. The inverse c o r re la t io n with loanable funds, discussed e a r l i e r , is s tr ik ing .
20.4.13 Except for loans f o r t r a n s p o r t o p e r a t i o n s , export
f inance and contract work there i s no margin requirement for loans sanctioned by finance corporat ions . For transport loans, corpora
t ions require an investment by the borrower of about 20 per cent to 50 per cent o f the price o f the veh ic le f inanced, depending on the age of the v e h ic le . In export f inance, the borrower 's margin is 25 per cent. In contract work, corporat ions lend 75 per cent of the estimated amount o f the con trac t .
20.4.14 Loans are given against DPNT (signed indiv idual ly by theborrower and in cer ta in cases ind iv idua l ly and j o i n t l y by two guarantors), movable assets such as gold jew el lery , insurance premia, government and other trustee s e c u r i t i e s , t i t l e deeds o f property, veh ic les and fixed deposit r e ce ip ts and immovable assets such as land and bui ld ings . In trade b i l l d iscounting, documents cons ist ing of l o r r y rece ip ts or railway re ce ip t s and invoices on the consignee for goods despatched form the security . In postdated cheque discounting, cheques duly endorsed are deposited with the discounting corporat ion. The break-up o f loans according to security i s given in Table 20.13.
20.4.15 Movable s e cu r i t i e s other than motor veh ic les are heldby the corporat ions under lock and key with proper records o f weight, number o f items, i d e n t i f i c a t i o n numbers, e t c . When theloan i s repaid the pledged a r t i c l e i s released. In respect o f
1 7 8

loans against ve h ic le s the re g is t ra t io n book, undated sale deed mentioning that the veh ic le i s sold for so much amount to one o f the partners by name and an undated request by the v e h ic le owner to the regional transport authority to transfer the veh ic le to the name o f the purchaser are given to the corporat ion . When the loan i s c leared, documents are returned to the borrower. Regard
ing loans against immovable property, t i t l e deeds are usually mortgaged to the corporation through necessary re g is t ra t io n with
the reg is ter ing authority in the area.
20.4.16 Loans to forest and Public Works Department contractors are given by corporations in Kerala on the basis o f a power o f at to rn e y s igned by the borrow er . The power o f a t t o r n e y i s
regis tered with the Sub-Registrar o f the area. One copy o f the power o f attorney i s kept with the author i t ies who 'p a ss ' b i l l s o f work completed. On completion o f the contract work, the payment i s sent to the holder o f power o f attorney. The power o f attorney i s executed in addit ion to the usual DPN.
20.4.17 Loan duration: All corporations reported that there wasno r e s t r i c t i o n on the minimum period o f loan. As many as 18 cor porations issued loans on da i ly basis charging interest for the
exact days o f loan. However, some corporations took interest for
15 days or even for a month even i f the loan was closed e a r l ie r than a week. The maximum duration was 90 days for 10 firms and 120 days fo r another 13 firms. Loans against DPN were for a maximum o f 90 days in the sample, though some borrowers ( s e c t io n 3) received DPN loans fo r up to 2 years (although l e g a l l y the lender can present a DPN for payment on any day before i t becomes time barred a f ter the issue o f the loan, there is an informal understanding between the lender and borrower that i t w i l l not be presented before the agreed number o f days). Longer periods were for loans secured against assets with, in some cases , the duration exceeding two years.
20.4.18 Bad debt and overdues: Data on de faults in repayments byborrowers given in Table 20.14 show that 23 out o f the 42 corpora
179

t ions had the problem o f de fa u l t s . The usual de faulters were transport operators and industr ia l borrowers. However, overdues were small and loans taken to courts for recovery were n i l . Debts which were written o f f as completely nonrecoverable were n e g l i g ib l e .
20.4.19 There are s e v e r a l reasons f o r the very low overdue
posit ion and n e g l ig ib le bad debts. F irs t , loans were given only to sound and known part ies who had a reputation for honouring commitments. A businessman borrower would be punctual in repayments because a delay or default in repayments would tarnish his image, thereby lowering his " c re d i t ra t ing" . Even when faced with temporary f in an c ia l d i f f i c u l t i e s , borrowers have been known to borrow from other sources and honour the ir commitments. This apart,
partners o f f inance corporat ions keep in touch with the borrowers and i f necessary, renew loans and even give addit ional c r e d i t . Generally, there was thus a good business re lat ionship reported between lenders and business borrowers.
20.4.20 Secondly, the loan period was so short that complete co l lapse o f business o f the borrower within that period was not 1 i ke 1 y .
20.4.21 Thirdly , there was a good follow-up system. Except in the case o f secured loans, borrowers would be contacted by phone or in person the day a f ter the expiry o f the agreed loan period. I f the borrower happened to be in deep f inanc ia l trouble , negot ia t i o n s would be held, i f necessary with third part ies . Only in very rare cases would corporations turn to a court o f law.
20.4.22 C o r p o r a t i o n s , who maintain minimal r e s e r v e s , fa ce s i tuat ions when unexpected demand for premature withdrawal o f deposits come up, resort to temporary borrowing without security from other corporat ions situated in the same area, borrow from banks on the pledge o f s e c u r i t i e s acceptable to them or , in rare cases, borrow from corporations or moneylenders by repledging p ledged a r t i c l e s (m o s t ly go ld j e w e l l e r y ) . In extreme c a s e s ,
1 8 0

loans given against DPN may be ca l led back (but see sect ion 20.10
for a d iscuss ion o f runs on corporat ions ) .
20.4.23 Creditworthiness assessment procedure: Assessment o f aborrower i s made by partners o f f inance corporat ions . DPN loans are given only to part ies known to and recommended by at least one o f the partners who then takes spec ia l interest in recovering
these loans. Repeat loans depend on the parties cred it h is tory . Sometimes partners o f one corporation check with partners o f other corporat ions about the c red it worthiness o f a part icu lar party i f the amount o f loan Is high and the party i s not very well known. Normally, borrowers are from the same or nearby l o c a l i t i e s .
20.5 Cost of intermediation and profitability
20.5 .1 Respondent c o r p o r a t i o n s did not fu rn ish the f u l l d e ta i l s o f income, although they gave the d e ta i l s o f expenses and some estimates o f the ir income. As per these d e t a i l s , income from loan operations was about Rs 131.60 lakh while administrative and fund r a i s i n g expenses t o t a l l e d Rs 35.86 lakh (Tab le 2 0 . 1 5 ) . Deposits interest payments are estimated at Rs 81.81 lakh (16.75 per cent o f Rs 488.68 lakh). Thus to ta l expenses o f sample corporations are estimated at Rs 116.69 lakh against to ta l income o f Rs 131.60 lakh.
20.5 .2 The f inanc ia l operations o f f inance corporat ions are given in Table 20.16. The 1980 f igures for corporations are taken
from e a r l i e r published data (Nayar 1982). The main feature o f interest in the table is that the c r e d i t deposit ra t io has moved up to about 100 per cent .
20.6 Industry structure
20.6.1 A l l corporations in the sample had below Rs 1 crore in deposits during the year 1981. Furthermore, though there are some
181
corporat ions with large d epos i ts , with some o f them being multibranch i n s t i tu t i o n s , none o f them can be termed market leaders. Barriers to entry or e x i t , apart from funds a v a i l a b i l i t y , are minimal .
20.6.2 Interest rates o f fered on deposits and charged on loans showed very l i t t l e var ia t ion among corporations operating in the
same area, though var ia t ion could be observed at i n t e r - d i s t r i c t and i n t e r - S t a t e l e v e l s . While i n t e r - d i s t r i c t d i f f e r e n c e s in deposit rates were only around one to two percentage points in Tamil Nadu, they were around s ix to nine percentage points in Kerala. Inter-State d i f f e re n ce s ranged from nine to twelve percentage points. I.n general, there is less variation in deposit rates than in loan rates .
20.6.3 Whi1e in T r 1 c h 11 r d is t ri c t o f Ke r a1 a , a conservative f inancia l centre , the interest rate for a one year deposit was 12 per cent to 15 per cent per annum, corporat ions in the neighbouring Ernakulam and Kottayam d i s t r i c t s o f fe re d 18 per cent to 24 per cent per annum f o r these d e p o s i t s . S i m i l a r l y , th e re is considerable in ter -Sta te var ia t ion in deposit interest rates among the four southern States. Since some finance corporations have
branches in several places and are able to engage in price d i s crimination even for deposits , th is i s evidence o f regional segmentation and also transactions cost d i f f e r e n t i a l s across regions.
20.6.4 Overall , while there is evidence o f various imperfect ions , i t i s d i f f i c u l t to see how such a market could sustain excess ive monopoly rents .
20.7 Estimate of overall size
20.7.1 Our survey o f f inance corporat ions shows that they havebeen on the dec l ine since 1983. According to the data presented in Table 20.1, there were 3071 corporations with a t o ta l deposits of Rs 6522 m i l l ion in India at the end of 1979-80. These rose further to about 9000 to 10000 corporations and Rs 12503 m il l ion
182

by 1982-83 (Nayar 1984). The data on selected sample o f 42 corporations (Table 20.6) show that the decrease in deposits with these corporat ions over the previous year was 4.4 per cent in 1983, 19 per cent each in 1984 and 1985 and 12.6 per cent in 1986. Thus the average f a l l between 1983 and 1986 was o f the order o f 13.75 per cent/ per annum. I f we assume that th is rate of f a l l is appl icable at the a l l India l e v e l , deposits with the finance cor porations at the end o f 1986 comes to Rs 6918.98 m i l l i o n (Table
20.18) , a le v e l just above the p o s i t io n in 1979-80.
20.8 Reactions of finance corporation clients
20.8 .1 The r e a c t i o n o f the users o f f in a n c e c o r p o r a t i o n s regarding the ir intermediation ro le in d i f f e re n t States in South India is mixed. While borrowers everywhere appreciated the servi ces rendered by them, many depos i tors , e s p e c ia l ly in Kerala and the c i t y o f Madras, described them as cheat and robbers. This is due to lo s s o f money as a resu lt o f the fa i lu r e o f corporations in
Kerala and in Madras during the f i r s t h a l f o f 1987 which coincided with the f i r s t round o f our f i e ld survey. Depositor secur i ty if> thus, once more, seen to be problematic.
20 .8 .2 The monthly income o f se lected depositors ranged from Rs 1000 to Rs 4000 and above. A l i t t l e more than h a l f o f them had monthly incomes below Rs 2500 (Table 20.19) . The data show that there were many small savers among the depositors . The depos itors
included 3 pensioners, an ex -serv ice man, 5 housewives, 2 a g r i c u l
t u r i s t s , an advocate and 2 businessmen. It appears that serv ice p eop le and some o f those with r e g u la r t a x a b le income have deposited the ir money in the names o f the ir unemployed wives and others probably to save tax and conceal unaccounted income. This becomes poss ib le because the corporat ions accept beuami deposits even in the names o f minors and do not deduct tax at source. For pensioners, the a t t rac t io n is the high return on the ir accumulated savings made ava i lab le monthly. S imilarly , the stated income o f
a g r i c u l tu r i s t s is small. On the whole, high return, p o s s i b i l i t y for benami deposits and including the opportunity to earn income
183

on unaccounted money, seem to be the major a t t r a c t i o n s to d e p o s i t o r s .
20 .8 .3 In contrast to depos i tors , 11 borrowers belonged to the high income category o f Rs 3000 and above per month while 6 bor
rowers were In the income category o f Rs 1500 and Rs 3000 per month (Table 20 .20 ) .
20.8.. 4 The 17 borrowers consisted o f 12 traders/businessmen. two transport operators , 2 master weavers and one housewife. All borrowers except the housewife used loans to meet short term working c ap i ta l requirements in the expansion o f the ir business. The houstiwife borrowed fo r personal consumption by o f fe r in g jew e l lery as security . Al l other loans were against DPN.
20.8.5 The period of loan varied from f i v e days to 100 days in case o f DPN loan for traders and master weavers and 24 months for transport operators . For jew e l lery loan no time l im it was f ixed . The amount o f loan was Rs 1500 under jew e l le ry loan, Rs 30000 under transport loan and Rs 10000 to Rs one lakh under DPN loan.
20.8 .6 The e f f e c t i v e interest rates paid for loans varied from 34 per cent per annum for the secured loan by the housewife to 157
per cent per annum paid by two t r a d e r s f o r a 100 day l o a n . Details are presented in Table 20.21.
20.8.7 Al l borrowers remarked that the corporations render a serv ice to them. Some traders and the master weaver are regular borrowers from them and the advantages o f loans from finance co r p o r a t i o n s as c i t e d by them are quick a v a i l a b i l i t y , non a v a i l a b i l i t y or inadequate a v a i l a b i l i t y from banks, acceptable security ( ra re ly do the banks extend loans against DPN) and easy repayment f a c i l i t y . Loans, though high c o s t , / a r e superior to no c re d i t at a l l . No borrower interviewed wanted them banned.
184
20.9 Regulatory environment and impact: General features
20.9 .1 T i l l recent ly , f inance corporat ions were completely free to carry on the business o f borrowing and lending in any part o f the country because the Indian Partnership Act, 1932, did not impose any regulation on the ir working.
20.9.2 In S ta tes where there are moneylenders a c t s , t h e i r lending rates are regulated. The o b je c t iv e o f moneylenders acts is to prevent moneylenders from charging usurious rates o f in ter est for small loans. Finance corporations succeeded in circumventing these acts by granting loans above the c e i l in g on loans to which these acts applied. Recently, a f te r the co l lapse o f many finance corporat ions , the State o f Kerala removed this l im it and a l l f in a n c e c o r p o r a t i o n s have been brought under the State moneylenders act .
20.9 .3 Even though these corporations handle banking business, they do not come under the Banking Companies Act 1949 or any of the regulatory measures o f the Central Banking Authority because o f the exemption granted to firms with a cap i ta l o f Rs one lakh
and less under the Banking Laws (Miscellaneous Provisions) Act 1963.
20.9.4 The Banking Commission's Study Group on Non-Banking F in an c ia l In te r m e d ia r i e s (1971) which examined r e g u l a t i o n o f f inance corporat ions suggested that the Reserve Bank's contro l be extended to f inance corporations and necessary enabling l e g i s l a
t ion be passed. Other recommendations o f the Study Group include (1) compulsory l i cens in g o f corporations by the Reserve Bank o f India, (2) the prescr ip t ion o f a ra t io between the owned funds o f corporations and the ir deposit l i a b i l i t i e s , (3) prescr ip t ion o f l i q u i d i t y r a t i o s , (4 ) per iod ica l inspect ion o f corporat ions on a sample basis to be undertaken by the RBI and (5) prescribed maximum deposit rates higher than those prescribed for commercial banks.
185

20.9 .5 Later, in 1975, the RBI Study Group on Non Banking Companies recommended the regula tion o f the ir a c t i v i t i e s by imposing a c e i l in g on borrowing and also by regulating their u t i l i s a t i o n of funds .
20.9.6 In the l igh t o f these f indings , the Banking Companies (Amendment) Act 1983 was enacted and came into f o r c e on 15th February, 1984.
20.9.7 The A c t ' s main provis ions lays down deposit c e i l i n g s as f o l l o w s :
a) For an individual not more than twenty f i v e d epos i tors , excluding depositors who are ( s p e c i f i e d ) r e la t iv e s of the individual .
b) For a f irm or an u n in c o r p o r a te d a s s o c i a t i o n o f in div iduals , not more than twenty f i v e depositors per partner and not more than two hundred and f i f t y depositors in a l l , excluding depositors who are r e la t ives o f any o f the partners.
20 .9 .8 Thus, from February 1984 onwards, f inance corporat ions ' access to publ ic deposits /borrowings i s l imited to a maximum o f 250 depositors . However, there is no l imit on the amount that a depositor can place with the corporat ion . The reason for these l im its , as given by RBI sources , is that in the event o f fa i lu re o f a corporat ion, only on a l imited number o f depositors w i l l be hur t .
20 .9 .9 The adverse impact o f th is regulation (Table 20.6 and Table 20.10) on deposits and advances o f f inance corporat ions has
been discussed e a r l i e r .
20.10 Failure of Finance Corporations
20.10.1 By the ear ly seventies , Karnataka, more s p e c i f i c a l l y Bangalore, and a few d i s t r i c t s in Andhra Pradesh such as Anan-
thapur and Chittoor , had a large number o f f inance corporat ions (about 100 at Bangalore and about 60 at Madanapalle in Chittoor
1 c A

d i s t r i c t ) . The la te seventies saw the fa i lu re o f about a dozen
finance corporat ions at Bangalore and about four times that f igure at Madanapalle. While corporat ions at Madanappalle were small, the majority o f corporations at Bangalore were big units. Three major fa i led corporat ions at Bangalore in the seventies were the Maharaja Finance Corporation, the Imperial Finance Corporation, and the East India Corporation. One str ik ing feature o f the 40
odd fa i led corporations at MadanapaLle was that there was no swin
dl ing of d ep os i to rs ' money. Before the c losure o f the ir business, they repaid borrowed funds in f u l l ( f o r d e t a i l s o f o r ig in , growth and fa i lu re s o f f inance corporat ions , see Nayar 1982).
20.10.2 One interest ing aspect o f the fa i lu re s at Bangalore was that there was no general panic. Despite the fa i lu r e s o f a few,
new units came up and at the end o f 1979-80, there were about 50 more corporations than the number at the beginning o f the 1970's.
In the e igh t ie s there was only one major f a i lu r e .
20.10.3 The nineteen-seventies were the heyday o f f inance corporations in Kerala and Tamil Nadu although there were such ins t i tu t io n s in Kerala during the 1940's and in Tamil Nadu during the 1960's (Nayar 1982). While in Tamil Nadu the corporations ex
panded in selected d i s t r i c t s l ik e Salem, Trichy, Coimbatore and the c i t y o f Madras, the ir expansion was universal in Kerala. One i n d i r e c t i n c e n t i v e f o r the es ta b l i sh m e n t o f f in a n c e f irms everywhere was prov ided by the Banking Laws (M is c e l la n e o u s Provisions) Act 1963. According to this Act which came into force on December 30, 1963, a f irm registered under the Indian Partnership Act 1932, was exempt from i t s provis ions i f the c ap i ta l subscribed by i t s partners did not exceed one lakh o f rupees. Taking
advantage o f t h i s p r o v i s i o n , many p a r t n e r s h ip f i rm s were reg is tered with partners' ca p i ta l o f Rs 1 lakh or less to function as finance corporat ions .
20.10.4 In many cases the establishment o f f inance corporat ions in Karnataka and Tamil Nadu was general ly on account o f th is re la t i v e l y easy entry into the f i e l d o f para-banking. But the ir expan
187

sion was mainly due to the high l o c a l demand for business c r e d i t . Barring a few, a l l were s ingle o f f i c e corporat ions which raised funds l o c a l l y for lending to lo ca l businessmen.
20.10.5 In Kerala, there was another fa c tor which prompted the es tab l ishm ent o f new f in a n ce c o r p o r a t i o n s and quickened the
process o f expansion o f ex is t ing ones. The unprecedented outmigration o f job seekers from Kerala to the Gulf countries in the early 1970's (p r e c i s e ly from 1972—73 onwards) i n i t i a l l y created a great demand for funds from informal sources and then provided a source o f funds for them (Prakash, 1984, 1987 ) . Many who borrowed from finance corporat ions remitted large sums not only for c lear ing, loans taken, usually against the pledge o f property or jewellery , but also as deposits for making interest payments to the ir
fam il ies . Coupled with the access to Gulf remittances, the cor porations also received a good chunk o f agr icu ltura l income raised by a f f luent commercial crop producers, e s p e c ia l ly o f cardamom, pepper, rubber and coconut. The major part o f deposits o f c o r porat ions, however, came from engineers, doctors , contractors , traders , p o l i t i c i a n s , o f f i c i a l s occupying key posit ions and even trade union leaders - c o l l e c t i v e l y termed as black money sources ( Mathruboomi, 11th May and 5th June, 1987).
20.10.6 By 1982-83, f in a n c e c o r p o r a t i o n s in Kerala had e s timated deposits o f about Rs 300 crore (Nayar 1984). Their number was 11261 according to a study by a RBI o f f i c i a l published in Mathrubhoomi 29th May, 1987. Then started the dec l ine culminating in the great crash ( in March 1987 and subsequent months) o f almost a l l corporations established in the boom period (the 1970 's ) . These crashes were preceded by two major fa i lu r e s in the c i t y o f Madras in 1984 and 1985. (Detai ls o f some o f the major corporat ions which fa i led in recent years and the estimated outstanding deposits with working corporat ions in Kerala at the end o f 1987 are given in Table 20.22 and Table 20.23) . About 56 per cent o f the deposits at the end o f March 1987 are estimated to have been
188

blocked with the fa i led corporations between March and December 1987.
20.10.7 The RBI had made i t c lear that the provisions o f the Banking Laws (Amendment) Act 1983 which Imposed r e s t r i c t i o n s on the acceptance o f deposits by the finance corporations would be s t r i c t l y enforced by February 1986. This was challenged by 40
finance corporations o f Kerala in the Delhi High Court, which
however dismissed the ir p e t i t ion s . The Supreme Court had granted a c o n d i t i o n a l s tay on these c o r p o r a t i o n s but p r o h i b i t e d the s o l i c i t i n g o f f resh d e p o s i t s by m isr e p r e se n t in g f a c t s to the public .
20.10.8 The immediate reason for the c r i s i s in Kerala appears to be the ob je c t ions to certa in phrases and t a l l claims used in
the advertisement for deposits ( o f fer ing ' 28 to 35 per cent interest per annum) o f O r ie n ta l Finance and Exchange Company ( reg is tered in Kerala with an administrative o f f i c e in Madras and13 branches in d i f f e r e n t parts of India) by the Monopolies and R e s t t i c t i v e Trade Pract ices Commission (MRTPC). The Commission also observed that the company had no arrangements for earning such high rate o f return on the deposits c o l l e c t e d . Soon after the Commission's remarks were published in the newspapers, the company was flooded with requests for withdrawal of depos i ts . At the same time fresh d e p o s i t s dr ied up and the p r o p r i e t o r absconded. He was la t e r arrested. (The company now i s placed under a Receiver by the Court). The confusion got confounded when the RBI o f f i c i a l s and the State Sales Tax In te l l ig en ce Wing con
ducted simultaneous raids on a number o f corporations in d i f f e re n t places with p o l i c e help. The scare created by these incidents was so widespread that there was a general run on a l l f inance corporat ions in Kerala. Not many survived the run and a large majority o f them closed th e ir doors leaving p r a c t i c a l l y no tangible assets to cover their l i a b i l i t i e s .
189

20.11 Reasons for failures:
20.11.1 It is c lear that no deposit taking intermediary, which exp lo i ts a pos it ive term structure o f in terest rates to 'borrow short ' and lend long ' is proof against a lo s s o f depositor conf idence. However, the reasons for th is lo s s o f confidence in each instance are o f In teres t . Lack o f f inanc ia l d i s c ip l in e and absence ot control over funds flows wore, we wi I 1 argue, the root causes
ot most o f t lie recent f a i lu r e s o f corporat ions . It should be emphasised that these pract ices are not typ ica l o f most f inance corporations .
20.11.2 The d ivers ion o f funds to risky businesses and own concerns, under the impression that inflow of funds in the form o f deposits i s perennial , are several.
i . A case in point is the Oriental Finance and ExchangeCompany which acquired ownership, interest in a los ing ho te l , entered fi lm production in a big way with 10 completed fi lms which were big box o f f i c e f a i lu r e s , ( Mathrubhoomi, 30th Apri l . 1987) and then entered film d i s t r i b u t i o n because other d i s t r i b u t o r s were not forthcoming to d i s t r ib u te the fi lms produced by i t . It also purchased c o s t ly fore ign made cars and sold them a f t e r a few months at g r e a t l o s s , a cqu ire d o f f i c e premises at fan tas t i c rents in key areas and furnished them luxuriously and spent large amounts on the personal comforts o f the partners ( Hathrubmoomi, I b i d ) . No investment which w i l l give a sure return at least equal to the cost o f funds appeared to have been made. Interest payments seem to have been made by th is firm out o f fresh depos i ts .
i i . A second example is that o f Labella Financiers who,through a subsidiary , invested in diverse f i e l d s such as cement, f e r t i l i s e r s , construct ion , f i lm development, t r a v e l , p l a n t a t i o n s and d i s t i l l e r i e s (Centre fo r Development Studies, 1988).
i i i . The owner o f Shalimar Financiers produced and financeda fi lm with himself as the hero (Centre for DevelopmentStud i e s , lb id ) .
20.11.3 Another major cause o f fa i lu r e s i s the multi-branch system (Table 20.22 shows that a l l the major fa i le d corporat ions had branches, some having more than 20) and the consequent mis-

management by the branch manager and s t a f f . Funds were mobilised
at branch l eve l and used by the head o f f i c e without taking into cons iderat ion the branch requirements. Again, pledges received by the branches were sent to head o f f i c e which repledged them with other corporat ions for obtaining emergency funds. It was reported
( Mathrubhoomi 6th June, 1987) that one corporation at Ernakulamrepledged gold jew e l lery worth Rs 10 m i l l ion with another corpora
t ion.
20.11.4 Last ly , own funds were low and l iquid funds were not s u f f i c i e n t to meet even day to day operat ions.
20.12 Consequences of failures
20.12.1 F i e l d e n q u i r i e s with p a r t n e r s , d e p o s i t o r s andemployees o f some f a i l e d corporations enable us to estimate the
percentage o f genuine depos itors as between 30 per cent and 40 per cent o f depositors . Others are depositors who have deposited their unaccounted money under a l ia s e s . This view i s supported bythe fact that many depositors o f fa i l e d corporat ions did not turnup to reg is ter their claims before the author i t ies and with the d e p o s i t o r ' s assoc ia t ions formed for recovering the amount. Thus i t appears that only a part o f the impact o f fa i lu r e s was on white money d e p o s i t o r s while the major impact was on black money d e p o s i t o r s .
20.12.2 However, i t is the borrower o f secured loans who isl e f t high and dry by the f a i l u r e s . The fa c t that one o f the
fa i led corporations (Labella Financiers) had lent Rs 42.94 m il l ionagainst the secur i ty o f gold ( Malayala Manorama, 21st May, 1987) ind icates the dependence o f borrowers on finance corporat ions . Gold loans occupied the major item o f lending o f f inance corpora
t ions in Kerala, although such loans were very limited in the case o f corporat ions in other States. Despite the high interest rate o f 36 per cent (simple) per annum, many borrowers borrowed from finance corporations against the secur i ty o f gold jewel lery because o f cer ta in advantages such as a r e l a t i v e l y high loan amount
191
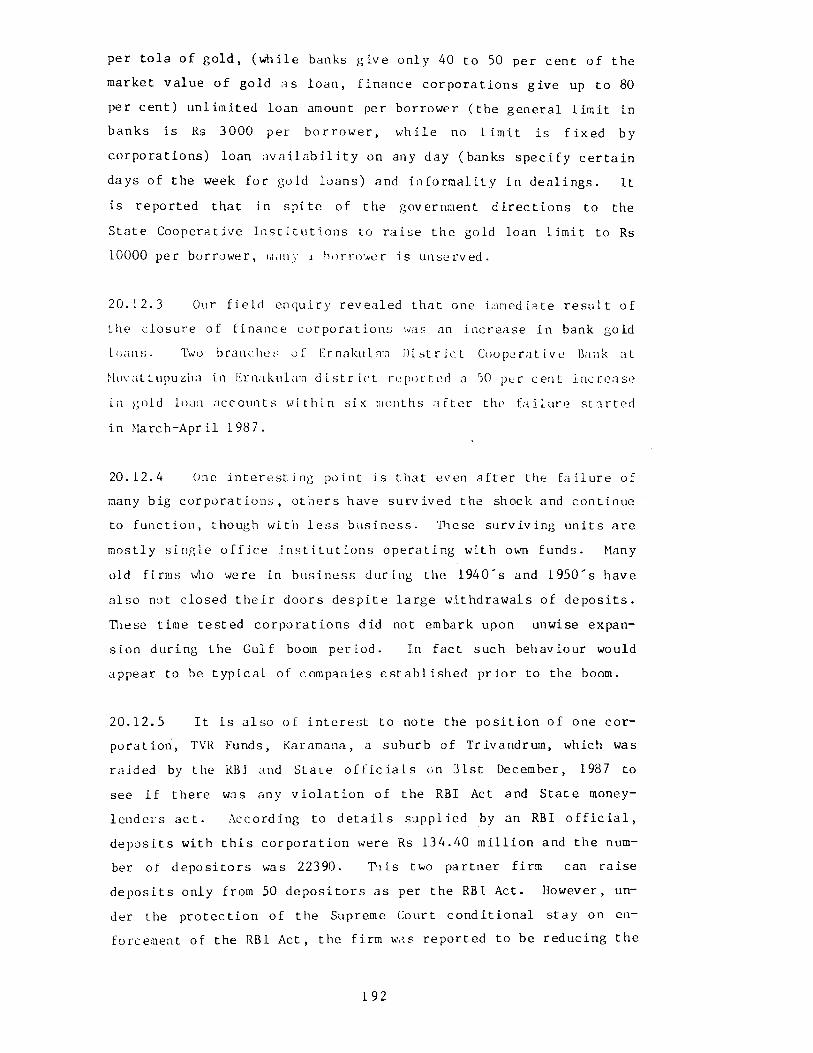
per to la o f go ld , (while banks g ive only 40 to 50 per cent o f the market value o f gold as loan, f inance corporat ions give up to 80 per cent) unlimited loan amount per borrower (the general l im it in banks is Rs 3000 per borrower , while no l i m i t is f i x e d by corporations) loan a v a i l a b i l i t y on any day (banks spec i fy certa in days o f the week for gold loans) and in formality in deal ings. It
is reported that in spite o f the government d irect ions to the
State Cooperative In s t i tu t ions to raise the gold loan l im it to Rs 10000 per borrower, many i borrower is unserved.
20.12.3 Our f i e ld enquiry revealed that one immediate resu lt o f the closure o f f inance corporations was an increase in bank gold loans. Two branches o f Ernakulam D istr ic t Cooperative Bank at Muvattupuzha in Ernakulam d i s t r i c t reported a 50 per cent increase in gold loan accounts within six months a f te r the fa i lure started in March-April 1987.
20.12.4 One interest ing point is that even a f ter the fa i lure o f many big corporat ions , others have survived the shock and continue to function, though with l e s s business. These surviving units are
mostly s ingle o f f i c e in s t i tu t io n s operating with own funds. Many
old firms who were in business during the 1940's and 1950's have also not closed the ir doors despite large withdrawals o f depos i ts . These time tested corporat ions did not embark upon unwise expansion during the Gulf boom period. In fact such behaviour would appear to be typ ica l o f companies establ ished pr ior to the boom.
20.12.5 It is a lso o f in terest to note the p os i t ion o f one cor poration, TVR Funds, Karamana, a suburb o f Trivandrum, which was raided by the RBI and State o f f i c i a l s on 31st December, 1987 to see i f there was any v i o l a t i o n o f the RBI Act and State moneylenders act . According to d e t a i l s supplied by an RBI o f f i c i a l , deposits with th is corporat ion were Rs 134.40 m i l l ion and the number o f depositors was 22390. This two partner firm can raise deposits only from 50 depositors as per the RBI Act. However, under the protect ion o f the Supreme Court condit ional stay on enforcement of the RBI Act, the firm was reported to be reducing the
192

number o f d e p o s i t o r s . It appears that i t had l e n t money o n lyagainst gold jew e l lery and property.
20.13 Complementary/substitutability with formal finance:
20.13.1 The purpose-wise c l a s s i f i c a t i o n o f loans by corporat i o n s shows that 45 per cent were for a g r i c u l t u r e , t ra n sp o r t operat ions, small scale and decentral ised industries and small business. Borrowers in a l l these categor ies are served by banks, but requirements o f many are e ither met only part ly or not at a l l by banks. For these borrowers corporation loans may be said tocomplement bank loans. Another part o f c red i t from corporations flows to trade and business. Some traders also get cred it frombanks but such c re d i t is res t r i c ted due to the operation o f s e le c t ive c red i t c ontro ls . Complementarity is thus the hypothesis supported .
20.14 Influence of formal sector lending rate/loan availability on business:
20.14.1 Interest rates o f f inance corporat ions are fixed independently o f the formal sector lending rate. As the major con
s i d e r a t i o n o f a borrower o f f in a n c e c o r p o r a t i o n i s t im e ly a v a i l a b i l i t y , cost o f borrowing becomes less s ig n i f i c a n t . Formal sector leading rate could have some inf luence over the lending rates o f f inance corporat ions i f e i ther the finance corporat ion or the borrower has access to both bank finance at similar terms and condit ions for the former. This has not been the case. However,
that there has been a secular increase in interest rates o f both formal and informal intermediaries has been pointed out e a r l i e r (Chapter 13) which means that the p o s s i b i l i t y o f a long run impact i s s t i l l l e f t open.
20.15 Equity/distributional impact
20.15.1 Corporations general ly preferred small loans to big
193

ones . However e v id e n c e from borrowers su gg e s ts that they are predominantly from the lower income groups.
20.16 Efficiency and allocative impact
20.16.1 The functional e f f i c i e n c y o f an intermediary is to be judged, among other t h i n g s , by (1) the speed with which i t
mobilises funds from surplus units and lends these to d e f i c i t units , (2) the rate o f recovery o f loans and the promptness with which borrowed funds are returned and (3) the package o f serv ices o f fered to the c l i e n t s .
20.16.2 When we examine the operations o f f inance corporat ions
in the Light o f the points mentioned above, we find that in most
respects they are e f f i c i e n t . F ir s t , the time lag between rece ipt o f deposits and disbursal o f loans i s low. Secondly, s ince loan interest accrues, in many cases , on a d a i ly bas is , borrowers have the incentive to repay loans early which leads to greater e f f i c i e n cy in cred it use as compared, say, to commercial banks which have a minimum loan duration.
20.16.3 I t i s when one examines r e c o v e r y o f l o a n s that one finds the real advantage o f f inance corporat ions . First of a l l , they r e s t r i c t a l l unsecured loans to short per iods . The procedures adopted by corporat ions in sanctioning and recovering loans, as discussed, show that overdue loans o f corporat ions are few and bad debts n e g l ig ib l e .
20.16.4 Against th is performance o f the finance corporat ions ,we may examine the p o s i t io n o f commercial banks. A recent studyon p r i o r i t y sector lending o f commercial banks under the "LeadBank Scheme" conducted in four d i s t r i c t s o f Tamil Nadu and Kerala covering 69 bank branches, s ta tes the fo l lowing :
"All the good performance o f the banks and the ir branches ismarred by the very high overdue percentages. When a loan isnot paid on due date by the borrower, the lender makes a demand for the pr inc ipa l and interest dues. Some amount may be c o l l e c t e d as per the demand and the balance w i l l remain as
194

overdue. The overdue percentage is worked out as overdues x 100/demand. Without exception a l l the four d i s t r i c t s showed very high overdue percentages in each year under review (1982 to 1985). Among the public sectoi bank branches in 1985, ten out o f 19 branches in Coimbatore d i s t r i c t , f i v e out o f eight branches in Pudhukottari d i s t r i c t , f i v e out o f ten branches in Palghat d i s t r i c t and eight out o f e l e v e n branches in Trivandrum d i s t r i c t had overdue p ercen tages above 50. Regretful s t i l l was the p os i t ion o f nine public sector bank branches which showed an overdue percentage of 70 and above. The highest overdue percentage in 198 5 was 88.64 recorded in Pudukottai" . (Nayar 1987).
20 .16.5 Regarding the repayment o f borrowed funds, respondent corporations appeared to be prompt. However, in and a f te r March 1987, many fa i le d corporat ions did not repay borrowed funds in Kerala and Madras. On the other hand, the personalised serv ices
o f fered to c l i e n t s by finance corporations are superior to bank serv ice to the ir c l i e n t s .
20.16.6 F ina l ly , one must take into account the finding that rates o f in terest o f fe red on borrowed funds by corporations are higher than those o f commercial banks. Interest rates on loans o f corporat ions are, however, much higher than those o f commercial
banks. In a cap ita l poor economy th is i t s e l f may be an indicator o f e f f i c i e n c y s ince monopoly pract ices are ruled out .
20.16.7 E f f i c i e n t intermediation r e la t iv e to banks and p ro f i t maximising a l l o c a t i o n o f funds i s c l e a r l y supported by t h i s evidence. However, th is must be weighed against the vu ln erab i l i ty o f these in s t i tu t io n s to runs.
20.17 Impact on savings mobilisation
20.17.1 Finance corporat ions o f f e r no secur i ty other than the personal assets of partners to depositors . Their deposits are not insured like bank d epos i ts . Even with these l im ita t ions they are able to mobilise s izeable sums from the public by o f fe r in g high deposit rates . In the 1970's and early 1980's, these corporat ions became a threat to some bank branches in South India because many bank depositors withdrew their term deposits prematurely in
195

order to deposit money with corporat ions and take advantage o f high in terest rates .
20.17.2 Bes ides high i n t e r e s t , c o r p o r a t i o n s a l s o o f f e r e d monthly interest on term depos i ts , in terest payment at the doors of depos i tors , l i b e r a l loans (up to 95 per cent) against f ixed depos i ts , g i f t l inked deposit schemes, and so on. Some corpora
t i o n s a d v e r t i s e d t h e i r d e p o s i t schemes and i n t e r e s t r a t e s r e g u l a r l y in n a t i o n a l d a i l i e s . Coupled with the a g g r e s s i v e marketing strategy o f corporat ions was the in d i f fe ren t a t t i tude o f the bank personnel, e s p e c ia l l y o f the nat ionalised banks, towards d epos i tors . Not a l l f inance corporat ion deposits r e f l e c t p o r t f o l i o s h i f t s from banks. In par t icu lar , black money is attracted by
anonymity o f deposits poss ib le with finance corporat ions . While a l l but one o f these features tend to suggest that f inance cor
porations help in mobil is ing savings, i t i s c lear that no d i r e c t evidence of addit ive savings m obi l isat ion can be brought to bear without further evidence.
20.18 Recommendations for regulatory framework
20.18.1 The question that needs addressing here is depositor s e c u r i t y and p r o t e c t i o n o f secured borrowers aga inst l o s s o f secur i ty - e s p e c ia l ly movable s e c u r i t i e s . As a good part o f loans are against DPN, how w i l l corporat ions repay depositors in case o f default by borrowers? Again, how w i l l they face a s i tuat ion when
there is a sudden unexpected demand for withdrawal o f depos i ts , e s p e c ia l ly when the c re d i t deposit ra t io moves to around 100 per cent?
20.18.2 We have e a r l i e r d e s c r i b e d the c u rre n t r e g u l a t o r y framework covering the corporations and the suggestions for reform by the Banking Commission and the RBI Study Group on Non-Banking Companies. The main suggestion o f the Banking Commission was that "no finance corporat ion may be allowed to work without a l i c e n se from the Reserve Bank of India" . We endorse th is view and recommend that the RBI should take steps to issue l i c e n se s to f inance
196

corporations on ihe basis o f c a r e fu l ly thought out c r i t e r i a . The
l i c en s in g procedure should be r e l a t i v e l y simple but more than a routine a f f a i r . Issue o f l i c e n se s should be coupled with a provision for scrutiny o f records and the a f f a i r s o f corporat ions , at l e a s t on a random check ing b a s i s . Fresh l i c e n s e s should be required i f a corporat ion wishes to open a branch and should be issued only i f the a b i l i t y o f the corporat ion to exercise adequate supervision over i t s branches has been ascertained.
20.18.3 The Banking Laws (Amendment) Act 1983 does not prescr ibe any r e la t ion between owned funds and borrowed funds o f a corporat ion . We suggest that an own funds to deposit rat io be prescribed for f inance corporations as i s done for HP firms. This w i l l g ive a greater measure o f protect ion to depositors than a
c e i l i n g on the number o f depositors . A f ra c t io n o f owned funds,
the amount to be l inked with depos i ts , should compulsorily be deposited in a nat ionalised commercial bank.
20.18.4 F ina l ly , we do not subscribe to the view that interest rate c e i l i n g s , whether on deposits or loans, should be prescribed without a carefu l assessment o f the ir e f f i c i e n c y co s t s .
20.19 Lessons for the formal sector
20.19.1 Despite to ta l lack o f secur i ty fo r deposits , f inancecorporat ions are able to mobil ise s izeab le deposits from savers. Apart from o f fe r ing a high rate o f in t e r e s t , they also use d i f ferent techniques including innovative deposit schemes and public
r e la t ion s methods. These can be examined by the formal sector and suitable ones can be adopted.
20.19.2 It is the innovative lending operations o f the corporations which should be examined in d e ta i l by the formal bankingsector . The d a i ly loan system, the day-to-day ca lcu la t ion o f int e r e s t , in terest charges on the exact days o f loan, the 100 day loan system with prov is ion fo r da i ly repayment - a l l these are at t ra c t io n s , e s p e c ia l l y to the small and medium s ize borrowers. It
197

i s in co m p re h e n s ib le that a bank can have a r e c u r r i n g d e p o s i t
scheme with provis ion for d a i ly remittance, but cannot o f f e r a d a i l y loan scheme. I f such a scheme i s i n s t i t u t e d , i n t e r e s t charges c o l l e c te d by some finance corporations and moneylenders should come down due to bank competit ion.
20.19.3 A t h i r d l e s s o n f o r banks i s i m p l i c i t in the high recovery percentage o f f inance corporat ions . The extension o f
loan by the banks and finance corporat ions may be based on d i f ferent c r i t e r i a . Yet some o f the procedures adopted by the cor porations to recover their dues could poss ib ly be tr ied by banks. In part icu lar , i t i s v i t a l for bank branch o f f i c e r s to develop
adequate c red i t rating methods for potentia l and past borrowers.
20.20 Summary o f main points
20.20.1 finance corporat ions accept a l l types o f deposits and allow withdrawals just as is allowed by banks except that they do not issue cheque books to depos i tors .
20.20.2 They extend secured and unsecured loans, instalment cred it for consumer durables and discount trade b i l l s .
20.20.3 The main concentration o f f inance corporat ions is in South India. In some d i s t r i c t s in these States, corporations outnumber commercial bank branches.
20.20.4 The tota l cost o f funds o f sampled corporations was
around 17.32 per cent o f borrowed funds.
20.20.5 Loans vary from Rs 100 to Rs 1 lakh and, in cer ta in cases, Rs 5 lakh. Small and medium loans predominate.
20.20.6 Interest rates on loans tend to be high and loan durations are from one day to over 2 years.
198

20.20.7 Defaults in repayments were low, overdues were small and loans taken to courts for recovery were n i l . Debts which were written o f f as completely non-recoverable were n e g l ig ib l e .
20.20.8 The major part o f c r e d i t o f c o r p o r a t i o n s f lows to trade .
20.20.9 Finance corporat ions have been on the dec l ine since 1983. Deposits with finance corporations in In d ia ‘ are estimated at around Rs 6918.98 m i l l ion at the end o f 1986.
20.20.10 The react ion o f depositors with finance corporations in
d i f f e r e n t States is mixed though borrowers have a pos i t ive react ion to the ro le played by finance corporat ions .
20.20.11 Depositors and secured borrowers, e s p e c ia l l y the l a t t e r , have been hurt by the recent rash o f f a i lu r e s o f f inance cor porations. Failures o f both fraudulent and genuine corporations was prec ip i tated by RBI act ion though i t i s not clear that a super i o r a l ternat ive was open to the RBI.
20.20.12 The RBI should take steps to issue l i c en ses to f inance corporat ions on the basis o f su itable c r i t e r i a . An own fund to deposit r a t io o f , say, 1:10 should also be prescribed.
20.20.13 Three aspects o f corporations which may be examined by the formal sector banks are the ir exce l lent deposit mobil isat ion e f f o r t s , innovative lending pract ices and the ir loan recovery procedures .
1 99

TABLE 2 0 . 1
Number of Finance Corporations and Deposits with Them(197 9-80 to 1982-83 )
(Rs lakh)
S t a t e N u in her0 f c o r - p o r a t -1 o n s
D e p o s i t s out s tand ing at the end o f
I 9 7 9 -8 0 1 97 0 -8 0 "' l 9 8 0 - 31 1 9 8 1 -8 2 1 9 8 2 -8 3
Tamil Nadu 123 3 3 4 1 3 2 . 7 443 7 2 . 5 5 7 6 8 4 .2 7 4 9 8 9 . 5
K e ra la 122 4 1 8 4 4 1 . 6 2 3 0 5 2 . 0 2 8 8 1 5 . 0 3 00 1 8 .8
K arnataka 200 5 54 0 5956.-1 6 4 0 3 .4 6 8 8 4 . 2
Andhra Pradesh 107 5 8 2 .4 598 . 6 6 1 5 .2 6 3 2 . 3
T o t a l in S o u th e r n R e g i on
2 76 4 586 9 6 .7 7 3 97 9. 1 93 51 7 . 8 1 1 2 5 2 4 .8
T o t a 1 i n lad i a 307 1 6 5 2 1 8 . 5 8 2 1 9 9 . 1 103 90 8 .7 1 2 5 0 2 7 . 5
S o u r c e : 1. F i g u r e s f o r 1 9 7 9 -8 0 f rom C P S Nayar , F i n a n c eC o r p o r a t i o n s , I n s t i t u t e f o r F i n a n c i a l Mangement and R e s e a r c h ( IF M R ) , M adras , 1982.
2. F i g u r e s f o r 1 9 8 0 -8 1 onwards from C P S Nayar ,A Study on N on -B an king F i n a n c i a l I n t e r m e d i a r i e s ,IFMR, M adras , 198 4 .
200

TABLE 2 0 . 2
Year o f E sta b lish m e n t, D ep o sits and Loans o f S e lec te d Finance C orporations at the End o f December 1986
S. ESTB D e p o s i t s LoansNo .
No . o f a c c o un t s
Amount R s . 1akh
No . o f a c c o u n t s
Am oun t R s . 1 akh
1 1980 60 2 . 50 25 2 . 502 1975 80 2 . 30 50 2 . 503 1 973 300 3 . 25 100 3 . 004 1 965 500 10. 75 1 90 1 0 .7 55 1972 500 5 . 3 5 128 5 . 106 1 975 32 5 3 . 1 5 90 3 . 807 1 970 1000 1 6. 00 100 1 5. 008 1 974 7 00 5 . 00 1 40 5 . 009 1 970 800 7 . 2 5 180 7 .2 510 1 972 1 500 1 3 .7 5 3 1 5 1 2 . 1 511 1 976 2 50 5. 00 85 5 . 1 012 1 973 1 000 1 4. 50 90 1 4 . 0013 1 97 1 950 1 0. 80 94 9 . 0014 1 97 8 1 00 3 . 60 3 5 3 . 5015 1 975 350 1 0 . 2 0 . 11 2 9 . 901 6 1 97 8 100 5. 25 40 6 . 401 7 1 980 100 16. 00 3 50 1 8 . 7 018 1 960 1050 7 0 . 3 0 318 6 8 . 3 219 1 970 1 00 3 . 00 110 3 . 1 020 1 974 22 5 3 . 70 90 4 . 0021 1 972 500 5. 40 100 5. 0022 1 975 300 4 . 60 50 4 . 5023 1973 625 1 5 . 3 0 1 90 1 4 . 2 524 1 974 183 4. 75 70 4 . 2 525 1 974 650 11 . 00 138 1 0. 0026 1 975 75 3 . 00 40 2 . 902 7 1 976 1 20 2 . 50 70 2 . 5028 1 962 1 750 50. 00 200 48. 0029 197 0 250 1 2 . 00 1 50 1 2 . 0 030 1974 225 4 . 00 120 4 . 0031 1971 250 6. 50 70 6 . 5032 1969 250 9 . 00 60 9 . 0033 1 985 1 7 11 . 00 21 1 6 .0 034 1 983 29 16. 00 54 2 2 . 0 03 5 1 969 600 18. 00 210 1 7. 503 6 1 970 200 4 .3 0 100 4 . 503 7 1 974 250 12. 50 1 50 1 2 . 503 8 1 97 1 200 10. 00 90 9 . 5039 1 972 75 6. 75 64 5. 2040 1 972 250 1 5. 00 120 1 4. 5041 1978 50 4 . 00 30 3 . 9042 1 970 250 1 5. 00 200 1 5. 00T o t a l 1 7089 4 5 2 . 2 5 4939 4 5 2 . 5 7
201

TABLE 2 0 . 3
( R s 1 a kh )
Own Borrow ed fu n d s ^ T o l a l Own~lundT~fu n d s ____________ ___________ ( 5 + 6 ) as p e r c e n -( 2 + 3 ) P u b l i c R e l a t i v e t a g e o f
borrow ed funds
(1 ) (2 ) O ) (4 ) ( I -) ~(6~) ~(7) 78 j
Sources of Funds of Se lec te d Corporat ions ( 1 9 8 6 )
1 0.. 50 0.. 00 0.. 50 1 .. 50 1.. 00 2 .. 50 20., 002 0. 50 0.. 00 0.. 50 0.. 80 1.. 50 2 .. 30 21 .. 743 0. 25 0 .. 00 0.. 2 5 2 .. 75 0 .. 50 3 .. 25 7 .. 694 1 ., 00 0., 00 1 .. 00 8.. 75 2 .. 00 10.. 75 9.. 305 1 .. 00 0., 00 1 .. 00 5., 00 0.. 35 5., 35 18.. 696 0 ., 25 0 .. 00 0., 25 2 ., 40 0., 75 3 .. 1 5 7 .. 947 1 ., 00 1 ., 00 2 ., 00 12.. 00 4 ., 00 16., 00 1 2 .. 508 0 .. 50 0 ., 00 0.. 50 5., 00 0., 00 5 ., 00 10.. 009 0 .. 50 0 .. 25 0 .. 75 7 ., 25 0 .. 00 7 .. 25 10.. 341 0 1 . 00 1 ., 00 2 .. 00 10., 00 "3 .. 75 13 .. 75 1 4 .. 5511 0. 25 0 .. 10 0., 35 4 ., 00 1 ., 00 5.. 00 7 . 001 2 1 . 00 0 .. 10 1 .. 10 1 2 .. 00 2 .. 50 1 4 .. 50 7. 591 3 0. 50 0 .. 1 0 0.. 60 8., 80 2 .. 00 10., 80 5 . 5614 0. 50 0., 00 0., 50 3 ., 10 0.. 50 3 ., 60 13 . 8915 1., 00 0.. 00 1 ., 00 10., 00 0.. 20 10., 20 9 . 801 6 1. 00 0.. 00 1 ., 00 1 .. 25 4.. 00 5.. 25 19. 051 7 1.. 00 0.. 00 1 .. 00 1 .. 00 15.. 00 16., 00 6. 251 8 2 .. 00 1., 00 3 .. 00 65 ., 30 5.. 00 70.. 30 4 . 271 9 0. 30 0.. 05 0 .. 35 1 .. 50 1 .. 50 3 ., 00 11 . 6720 0. 45 0.. 00 0..45 3 .. 00 0.. 70 3 .. 70 12. 1621 0 ., 50 0.. 00 0.. 50 4 .. 40 1 .. 00 5.. 40 9. 2622 0.. 25 0 .. 05 0 ., 30 3 .. 00 1 .. 60 4 .. 60 6. 5223 1 .. 00 0., 00 1 ., 00 15., 00 0.. 30 15.. 30 6.. 5424 0.■ 25 0 .. 00 0 .. 25 4 ., 00 0 ., 75 4 .. 75 5 .. 2625 0.. 40 0.. 10 0., 50 8 .. 00 3 .. 00 11 .. 00 4 ., 5526 0., 15 0 .. 05 0 ., 20 1 .. 00 2 .. 00 3 .. 00 6.. 6727 0.. 25 0 .. 00 0.. 25 2 .. 00 0.. 50 2 .. 50 10. 0028 1.. 00 2 .. 00 3 .. 00 40. . 00 10.. 00 50 .. 00 6. 0029 0.. 50 0.. 10 0.. 60 10., 00 2 .. 00 1 2 .. 00 5. 0030 0.. 10 0.. 00 0.. 10 4 .. 00 0.. 00 4.. 00 2 .. 5031 1.. 00 0.. 00 1 .. 00 3 .. 00 3 .. 50 6.. 50 15. 3832 0., 50 0.. 00 0.. 50 5.. 00 4.. 00 9.. 00 5. 5633 4 . 00 1.. 50 5 .. 50 11 .. 00 0.. 00 11 .. 00 50. 0034 5. 00 1..75 6.. 75 0 .. 00 16.. 00 16.. 00 42 .. 1935 0.. 50 0.. 50 1 .. 00 16., 00 2 .. 00 18., 00 5.. 5636 0..40 0.. 00 0.. 40 4 .. 00 0.. 30 4.. 30 9., 303 7 0.. 10 0.. 00 0.. 10 1 2 .. 50 0 .. 00 12.. 50 0.. 8038 0.. 50 0 .. 00 0 .. 50 8.. 00 2 .. 00 10.. 00 5.. 003 9 0.. 15 0 .. 00 0.. 15 5.. 00 1 .. 75 6.. 75 2 .. 2240 0., 50 0 .. 00 0 .. 50 1 2 .. 00 3 .. 00 15.. 00 3 .. 334 1 0.. 10 0.. 00 0 .. 10 3 .. 00 1 .. 00 4 .. 00 2 .. 5042 1.. 00 0 .. 00 1 .. 00 13 .. 00 2 .. 00 15.. 00 6.. 67
T o t a l 32 ., 65 9.. 65 42 .. 30 349.. 30 102 .. 95 452 .. 25 9." 3™
S . N o . C a p i t a l R e s e r v e s
202

S. I
123456789
1011121314151617181 92021222324252627282930313233343536373839404142
Ave
TABLE 20.4
Term Structure of Deposits of Selected Corporations (1986)
(in per cent)Sav ing rerm deposits R.D./cash Total
c e r t i f i c a t e s
< 1YR 1YR 2YR 3YR >3YR 3YR 5YR
0.50
10.00
100.00100.00
90.005.00 60.00 10.00 25.00
10.00 60.00 10.00 20.0085.00 5.00 10.00
5.00 75.00 5.00 15.005.00 75.00 5.00 15.001.00 80.00 12.00 7.002 60. 00 10.00 25.00
15.00 80.00 5.0010.00 60.00 5.00 15.0010.00 70.00
100.005.00 15.00
70.00 10.00 20.00100.00100.00
10. 00 60. 00 100.00
10. 00 15.0010.00 70.00 5.00 15.0015.00 70.00 5.00 10.0010.00 75.00 5.00 10.00
70.00 5.00 25.0080.00 10.00
5.00 70.0090.0090.00
5.00 20.0010.0010.00
3 • 00 70.00 2.00 25.005.00 80.00
100.0015.00
15.00 85.0020.00 80.0024.00 19.00 21.00 36.0042.00 16.00
70.0080.00
17.00 25.0030.0020.00
10.00 70.00 20.005.00 95.00
100.00100.00
10.00 90.0010.00 90.00
2. 50
10.00
100100100100100100100100100100100100100100100100100100100100100100100100100100100100100100100100100100100100100100100100100100
0.18 6.36 78. 21 3.62 11.14 0.0 0.30 0.19 100
203

TABLE 20.5
Rates of Interest Offered on Deposits by Finance Corporations and Commercial Banks (1986)
( in per cent)
S. No. Saving Term deposits R. D. ICa sh c e r t i f i c a t e s
< 1YR 1YR 2YR 3YR 3YR 5YR
1 18.002 18.003 15.00 18.004 12.00 15.00 16. 60 21.005 12.00 15.00 15.00 18.006 15.00 16.00 18.007 9.00 15.00 16.00 18.008 10.00 16.00 15.76 18.009 9.00 16.00 15.76 19.00
10 9.00 10.00 15.00 15.00 18.00 18.0011 12.00 15.00 15.00 20.0012 9.00 10.00 15.00 16.00 18.00 18.0013 12.00 15.00 16.00 20.0014 18.0015 15.00 16.00 20.0016 18.0017 18.0018 9.00 12.00 18.00 16. 62 20.0019 15.0020 12.00 15.00 16.00 20.0021 12.00 17.00 16.62 20.0022 12.00 16.00 15. 76 20.0023 15.00 16.00 20.0024 15.00 18.00 15.0025 9.00 15.00 16.00 20.0026 16.00 21.0027 16.00 20.0028 12.00 15.00 16.00 20.0029 12.00 18.00 21.0030 21.0031 15.00 18.0032 15.00 18.0033 12.00 12. 50 13. 14 16.00 “34 14.00 15.00 16.00 18.0035 18.00 20.0036 18.00 21.0037 14.00 18.00 21.0038 12.00 18.0039 18.0040 18.0041 12.00 18.0042 12.00 18.00
Average 9.00 12. 32 16.54 16. 25 19.41- 16.50 18.00rateCommercial 5.00 8. 24 9.31 10.38 10. 38 10.38 11.46banks
Notes: 1. Commercial bank rate for 3 month to 1 year deposits i s8% compounded quarter ly .
2. Weighted average interest rate i s 16.74% per annum.
204

TABLE 2 0 . 6
Outstanding D ep os i t s of Se l ec t ed Corporations At The Endo f December And Growth Rate Between 1981 & 1986
(Rs l a k h )
s . 1981 1 98 2 1 983 1 984 1 985 1 986 Growth r a t eNo . 1 9 8 1 - 1986
1 2. 00 37 50 47'2 5 ' Yo 27 75 2 . 50 “ 25'Too2 7 . 50 6. 30 6 . 50 5. 00 2 . 50 2 30 -6 9 . 333 10. 50 10. 75 8. 2 5 7 . 50 6. 00 3 . 25 -6 9 . 054 40. 00 3 8 . 43 33 . 25 24. 00 15. 90 10. 75 -7 3 . 135 1 2 . 70 1 3 . 29 10. 1 5 8 . 40 6. 90 5 . 35 -5 7 . 876 3 . 00 3 . 3 0 4 . 1 5 3 . 75 3 . 60 3 . 1 5 5 . 007 25. 00 24 . 0 0 ? 2 . 00 2 1 . 50 1 8 . 00 1 6. 00 -3 6 . 008 8. 00 8. 50 9 . 00 7 . 50 6. 75 5 . 00 -3 7 . 509 9. 50 10. 00 8. 00 9 . 75 7 . 75 7 . 25 -2 3 . 6810 14. 75 15. 80 16. 95 1 7 . 25 16. 50 13 . 75 -6 .7811 1 2 . 25 13 . 50 10. 30 8. 29 7 . 00 5 . 00 -59 . 1812 28. 00 2 7 . 45 25. 00 22 . 00 16. 00 1 4 . 50 -48 . 211 3 18. 30 1 7 . 49 17. 00 15. 00 1 2 . 4 0 10. 80 -4 0 . 9814 5 . 00 4 . 50 6. 30 5 . 00 4 . 25 3 . 60 -2 8 . 001 5 1 2 . 00 1 4 . 00 13 . 50 11 . 2 5 1 1 . 00 1 0 . 20 -1 5 . 001 6 15. 00 14. 70 14. 90 13 . 75 9. 50 5. 25 -65 . 001 7 6. 50 6. 50 10. 75 10. 70 11 . 00 16. 00 146 . 151 8 92 . 00 90 . 00 87 . 00 88 . 50 74 . 2 5 70 . 30 -2 3 . 591 9 6. 00 5. 50 4 . 30 3 . 00 3 . 00 3 . 00 -50 . 0020 7 . 35 7 . 50 6. 90 5. 40 4 . 10 3 . 70 -4 9 . 6621 9. 60 9 . 75 10. 50 8. 30 7 . 20 5. 40 -43 . 7 522 7 . 50 7 . 90 7 . 00 6. 50 5. 00 4 . 60 -3 8 .6723 23. 50 24. 00 22 . 15 20. 30 1 7 . 22 15. 30 -34 . 8924 15. 35 14. 40 13 . 70 11 . 25 7. 50 4 . 75 - 6 9 . 0625 14. 50 15. 30 14. 00 13 . 75 12. 90 11 . 00 -2 4 . 1426 5. 00 6. 50 7. 00 4 . 75 4. 00 3 . 00 - 4 0 . 0027 2 . 50 3 . 70 5. 20 3 . 40 3 . 00 2 . 50 0 . 0028 95 . 00 97 . 00 93 . 50 90 . 00 65 . 00 50 . 00 -4 7 . 3729 30. 00 28. 50 27. 00 20 . 25 14. 75 12. 00 -6 0 . 0030 10. 25 11 . 00 9 . 50 7. 50 5. 00 4 . 00 -6 0 . 9831 35. 00 37 . 50 32 . 00 21 . 00 10. 00 6. 50 -81 . 4332 30. 00 3 1 . 00 29 . 00 18. 00 12. 50 9 . 00 - 7 0 . 0033 0. 00 0 . 00 0. 00 0. 00 5. 00 11 . 00 120 . 0034 0. 00 0. 00 5. 00 7. 00 11 . 00 16. 00 220 Oo
3 5 85 . 00 88 . 00 82 . 00 32 . 00 25. 00 18. 00 -7 8 . 8236 7 . 00 7 . 90 8. 25 6. 10 5. 30 4 . 30 -3 8 . 573 7 26 . 00 28. 00 28. 50 20 . 00 16. 00 1 2 . 50 -51 . 923 " 1 7 . 85 1 7 . 25 16. 00 1 2 . 50 10. 00 10. 00 -43 . 983 9 15. 40 15. 75 1 2 . 00 9 . 30 7 . 50 6. 75 - 5 6 . 1 740 18. 50 1 8 . 00 1 7 . 00 16. 25 15. 00 15. 00 -1 8 . 9241 4 . 80 5. 00 6. 1 5 5. 00 4 . 70 4 . 00 -1 6 . 6742 25. 00 25. 75 26 . 50 16. 00 15. 00 15. 00 -4 0 . 00
T0TL 813 . 1 82 7 . 21 790 . 4 63 9. 79 517 . 72 452 . 25 -44 . 38
205

TABLE 20.7
Garporation-ffi.se Distribution of Loans Acordiqg to Purpose (Percentage 9iane in Total Credit ftit-st-anHing in December, 1986)
Corp. Trade/ Nd. bus.
Agri- Bldg. Transpt const, oper.
. Snail./ Stoall Cinsna Indus./ bus. halls handlm.
Cbntract Iters. v®rk consun.
Other
1 70 10 0 0 10 0 0 10 02 40 30 20 103 80 10 104 40 25 10 10 10 55 50 20 10 10 5 56 40 50 107 60 30 5 58 50 40 109 60 25 5 1010 40 15 25 10 1011 10 83 5 512 60 20 10 1013 60 20 10 * 1014 25 60 10 515 10 80 5 516 20 70 5 517 75 2518 20 60 10 5 519 30 7020 75 15 1021 70 15 10 522 60 10 15 10 523 40 30 20 5 524 70 20 1025 70 20 6 426 80 10 1027 10028 40 5 15 20 5 10 529 60 0 15 25 0 0 0 0 030 60 0 0 40 0 0 0 0 031 83 0 10 0 0 0 0 10 032 83 0 0 0 0 0 0 20 033 12 0 28 4 9 0 3 6 3834 33 0 20 0 11 0 16 0 2035 50 0 0 50 0 0 0 0 036 40 0 0 60 0 0 0 0 037 50 0 50 0 0 0 0 038 40 0 0 60 0 0 0 0 039 30 0 0 70 0 0 0 0 040 40 0 0 60 0 0 0 0 041 20 0 0 80 0 0 0 0 042 ' 30 0 0 70 0 0 0 0 0
Averages for sample corporations: '47 3 0 14 22 6 neg neg 6 2
Averages for 114 corporations in 1979-90:35 10 9 4 6 2 5 2 12 16
Note: Source of 1: Nayar (1962), pp.44-45.
206
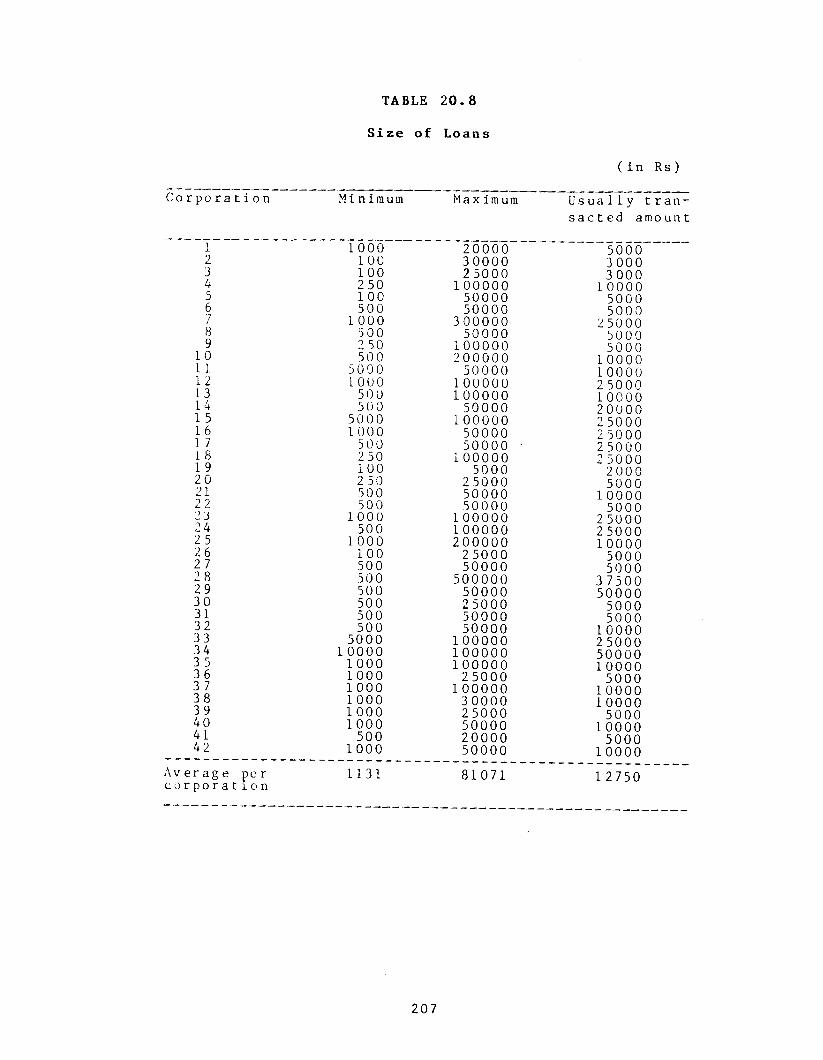
TABLE 2 0 . 8
Size of Loans
(in Rs)
C o r p o r a t i o n Minimum Maximum U s u a l l y t r a n - s a c t e d amount
1 1000 20000 50002 1 00 30000 30003 100 25000 30004 250 100000 1 00005 100 50000 50006 500 50000 50007 1000 300000 250008 500 50000 50009 2 50 100000 500010 500 200000 1 00001 1. 5000 50000 1 00001 2 1000 100000 2 50 0013 500 100000 1 00001 4 500 50000 200001 5 5000 100000 2 50001 6 1000 50000 2 50001 7 500 50000 • 2 50001 8 250 100000 2 50001 9 1 00 5000 200020 2 50 25000 500021 500 50000 1 00002 2 500 50000 50002 3 1 000 100000 2500024 500 100000 2 50002 5 1 000 200000 1 00002 6 1 00 25000 50002 7 500 50000 50002 8 50 0 500000 3 75002 9 500 50000 5000030 500 25000 500031 500 50000 500032 500 50000 1 000033 5000 100000 2500034 10000 100000 500003 5 1000 100000 1 00003 6 1 000 25000 50003 7 1000 100000 1 00003 8 1000 30000 100003 9 1000 25000 500040 1000 50000 1 00004 1 500 20000 50004 2 1000 50000 10000A v e r a g e per c o r p o r a t i o n
1131 81071 1 2750
207

TABLE
Break-up
(Number
20. 9
o f Loans
o f r e p o r t i n g c o r p o r a t i o n s )
Number o f Small Medium La r g ec o r p o r a t i o n s ( be lo w (Rs 1 0 0 0 0 - ( a b o v er e p o r t i n g : Rs 99 9 9 ) Rs 250 00 ) Rs 250 00 )
L e s s than 10% 0 0 510% to 20% 13 1 3 821% to 30% 7 1 0 531% to 40% 2 3 041% to 50% 0 6 151% t o 60% 7 6 261% t o 70% 3 2 271% t o 80% 6 1 181% to 90% 3 0 091% to 100% 1 0 0TOTAL 18. 2 13. 55 6 . 3A v e r a g e l o a n p o r t f o l i o (%)
47 . 83 35 . 61 1 6 . 5 6
208

TABLE 2 0 . 1 0
Loans O utstanding at the End of December and the Growth Rate Between 1981 and 1986
(Rs lakh)
S. 1981 1982 1983 1984 1985 1986 Growth r a t e :No. 198 1 -1986
(%)
1 4.. 50 5 .. 50 6.. 25 5 .. 00 3 .. 20 2 .. 50 -44 .. 442 8,. 00 7 .. 25 6 .. 75 4 .. 50 3 .. 00 2 .. 50 -6 8 .. 753 11 ,. 00 11 .. 25 8 .. 00 6 .. 00 5.. 00 3 .. 00 -7 2 .. 734 38.. 00 35. . 50 32 .. 00 22 .. 25 14.. 75 10.. 75 -7 1 .. 715 12.. 00 12.. 50 9.. 25 7 .. 90 6.. 50 5 .. 10 -5 7 .. 506 5 ,. 00 5.. 50 4 .. 75 4.. 50 4 .. 00 3 ., 80 - 2 4 .. 007 24 .. 00 23.. 00 20.. 00 1 8 .. 50 15.. 00 15.. 00 -3 7.. 508 7 ,. 50 8.. 00 8,. 75 7 .. 20 6.. 00 5.. 00 -3 3 .. 339 9.. 50 9 .. 90 8.. 00 7.. 85 7 .. 00 7 .. 25 - 2 3 .. 681 0 1 4 .. 00 15.. 50 16.. 05 1 7 .. 00 16.. 00 12.. 15 -1 3 .. 211 1 12.. 00 13.. 50 10.. 00 8.. 10 7 .. 50 5., 10 -5 7 .. 501 2 27.. 25 25., 00 22 .. 30 22.. 50 15.. 00 14.. 00 - 4 8 .. 621 3 1 7 .. 50 16.. 25 15.. 80 13 .. 30 10..75 9.. 00 -4 8 .. 571 4 7 .. 50 6.. 25 5.. 00 4 .. 10 4 .. 00 3 .. 50 ' -53 .. 331 5 12.> 00 13 .. 50 13 .. 00 10.. 40 10.. 50 9.. 90 - 1 7 . , 501 6 15.> 00 13 .. 25 12.. 00 11 ,. 20 8.. 50 6.. 40 -5 7 .. 331 7 6.. 50 9., 00 10.. 50 12.. 00 15.. 00 18.. 70 1 87 .. 6918 108.. 15 1 00.. 40 92.. 65 90 .. 1 7 79.. 10 68.. 32 -3 6 .. 831 9 5 .. 7 5 5 .. 50 4 .. 50 3 .. 25 3 .. 00 3 .. 10 -4 6.. 0920 7 .. 00 6 .. 50 6 .. 00 5 .. 00 4 .. 40 4 .. 00 -4 2 .. 8621 10.. 20 10.. 50 1 1 .. 00 8.. 50 7 .. 50 5.. 00 -50 .. 9822 7 .. 00 7 .. 2 5 6.. 50 6.. 00 4 .. 90 4 ., 50 -3 5.. 712 3 22 .. 00 23. , 00 21 .. 20 19., 00 16., 00 14., 25 -3 5.. 2324 14.. 50 13 .. 75 12., 00 10., 90 7 ., 75 4. 25 - 7 0 . , 692 5 14,. 00 14.. 25 13 .. 50 13 .. 00 1 2 ..35 10., 00 - 2 8 . . 5726 5 .. 00 6.. 25 7 .. 00 4. 25 4.. 00 2 . 90 -42 .. 002 7 2 .. 7 5 3 ., 25 5., 00 3 .. 25 2 ., 90 2 .. 50 -9 .. 0928 93 ., 00 95 .. 00 90 .. 00 86 .. 00 60., 00 48. , 00 - 4 8 . , 3929 29 .. 00 2 7.. 00 25.. 00 19. 00 14.. 00 12., 00 -5 8 .. 623 0 10.. 00 9.. 75 9., 00 7 . 00 5 .. 00 4 ., 00 -6 0 ., 003 1 33 ., 00 34. 00 30. . 00 20. 00 10.. 00 6 .. 50 - 8 0 . . 3032 28., 00 2 7 . 00 25., 00 16. 00 1 2 .. 00 9.. 00 -67 .. 8633 0 .. 00 0 .. 00 0., 00 0. 00 9., 00 16.. 00 7 7 ., 7834 0., 00 0. 00 14.. 00 19. 00 27. 00 22 . 00 57.. 143 5 7 7 .. 00 7 8 . 00 75 .. 00 30 . 00 24. 00 1 7 .. 50 -7 7 . 2 736 6 ., 90 7 . 40 8., 00 6.. 00 5..45 4. 50 -3 4 . 783 7 25., 00 26 . 50 26.. 00 20. 00 16. 00 12. 50 -50 . 003 8 1 7 .. 00 16. 75 15.. 50 11 . 40 9.. 50 9. 50 -44 . 1 23 9 14. 30 15. 00 10. 50 9. 05 6. 45 5. 20 -63 . 644 0 4 . 50 4 . 80 6 .. 00 4. 50 4. 10 3 . 90 -13 . 3341 18.. 00 18. 25 17. 00 15. 25 14. 00 14. 50 - 1 9 . 4442 24. 00 25 . 00 26. 00 15. 00 15. 00 15. . 00 -3 7. 50TQTAL807.3 8 0 5 .7 5 7 6 4 .7 5 6 2 1 .8 2 5 2 5 .1 4 5 2 .5 7 - 4 3 . 9 4

TABLE 2 0 .1 1
Lending Rates in 1986
( S i m p l e I n t e r e s t in P e r c e n t Per Annum)
C o r p o r a t i o n DPN Je we 1 Ot he rs e c u r e dl o a n
Commodity Cheque 1 oan c oun t i
36. 00 36. 002 36. 00 3 6. 00 36. 003 48 . 00 3 6. 004 36. 00 3 6. 00 36 . 005 3 6. 00 30. 00 33 . 006 36 . 00 30 . 007 3 6 . 00 24 . 00 30 . 008 3 6 . 00 30 . 00 36. 009 3 6. 00 24. 00 30 . 00 3 6. 00
10 3 6 . 0 0 24. 00 2 4 . 0 0 24 . 001 1 36. 00 3 0 . 0 012 36. 00 30. 00 33 . 00 30 . 0013 3 6 . 00 30. 00 33 . 00 3 0 . 0 0 3 0 . 0 014 36 . 00 3 6. 00 36 . 001 5 36 . 00 33 . 00 •16 3 6. 00 36 . 00 3 6 . 001 7 36. 00 3 6 . 001 8 36. 00 36. 00 3 6 . 0 01 9 30. 0020 36. 00 3 6 . 0 021 36. 00 36 . 0022 36. 00 30. 00 33 . 0023 36. 0024 36. 00 33 . 0025 36. 00 30 . 00 33 . 0026 3 6 . 0 0 30 . 00 33 . 0027 36. 0028 36. 00 30 . 00 33 . 0029 40. 00 3 6 . 00 36 . 0030 42 . 00 36. 00 36 . 00 3 6 . 0 031 42 . 00 36 . 00 36 . 0032 42 . 00 3 6 . 00 3 6 . 0033 24. 00 2 5 . 0 0 3 0 . 0 0343 5 4 0 . 0 0 36 . 00 48 . 0036 42 . 00 48 . 003 7 42 . 00 36. 00 36 . 00 4 3 . 0 038 36 . 0039 36 . 0040 36 . 0041 36 . 00
A v erage^ “ 36797 "32750 "3 4 7 1 4 26?33 3 7744^
W e ig h te d a v e r a g e l e n d i n g r a t e i s 3 5 .4 1 per c e n t per ann urn
210
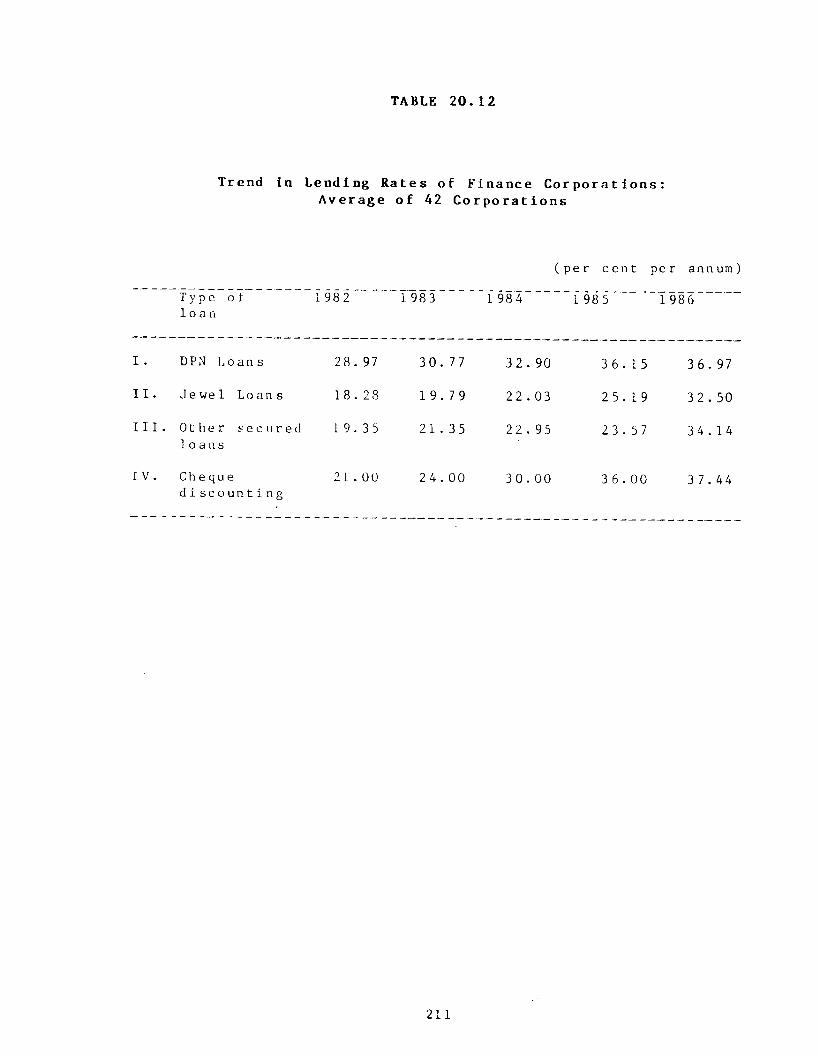
TABLE 2 0 . 1 2
Trend in Lending Rates of Finance C o rp o ra tio n s : Average o f 42 C orporation s
( p e r c e n t per annum)
Type o f l o a n
1 98 2 1 983 1 984 1 985 1 986
I . DPN Loans 28. 97 3 0 . 7 7 32 . 90 3 6 . 1 5 36. 97
I I . Jew el Loans 1 8 .2 8 1 9 . 7 9 22 . 03 2 5 . 1 9 32 . 50
I I I . O ther s e c u r e d 1 o a us
1 9 .3 5 2 1 . 3 5 2 2 .9 5 2 3 . 5 7 3 4 . 1 4
IV. Cheque d i s c o u n t i n g
21 . 00 24 . 00 30 . 00 3 6 . 00 3 7 .44
211

>1 i Ol< 1 I C o Iq i I D n In I -O- oj LJ OJ LJ L~ oo OJ 00 OJ OJ ho ho ho ho ho ro ro ro ho ho h—11—‘ h-* >—* 1— 1—1 t—11—‘ 1 1& i ro 1— o VO 00 cr On -> 0J ro h—o vo oo On -p- OJ ho 1—1o VO00 O' On -O LO ho h—1o VO oo —Jo> Ln -F' LO ho ►—* 1 o 1OQ I I ICj 1 1 03 111
II11
rr i 1 IIIi H-* 1—1 h-*
11I a> o 03 cn iLoj hO 1—‘ o 1—1LJ ho r—1 -'J on O' 4> >—1 ho ho Oo 1—1 r-1 t— 1' o 00 o oo ho OJ VO ho ho LJ LO ro O'' -P- ho 1 o OQ rd IVO i o o o On Ln o o Ln ho VOo o o o o o o o o o Ln o o Ln o o o On o o o On on o o On o o o o On I 03 h“*03 o 1• | • • • • • • • • • • • • • • • • • • • • • • • • • • • • • • • • • • • • • • • • i *—•I—*H- c I-P"l o o o o o o o o o o o o o o o o o o o o o o o o o o o o o o o o o o o o o o o o o i D n IOJ| o o o o o o o o o o o o o o o o o o o o o o o o o o o o o o o o o o o o o o o o OI rt cn (T) 1111I
1 rr CLl11
11 n cnl1 t—* 1 a 03 rt 2 1
On! 00 VO VO 00 On r-1 t—* OJ o> o VO oo oo O ' VO 00 VO 1—1 ho OJ ho CN cr »— '■-J o> cr Lo LO cr Jl CO CL cn IO-l o o On Ln o o o o> t—* o o o o o o o o o o o Oi o on o o On o o o o o o Ln On o o o o Ln i 03 rD 1• • • • • • • • • • • • • • • • • • • • • • • • • • • • • • • • • • • • • • • I H- o 1mi o o o o o o o o o o o o o o o o o o o o o o o o o o o o o o o o o O o o o o o i p c 1Oi
1 o o o o o o o o o o o o o o o o o o o o o o o o o o o o o o o o o o o o o o o i1 cnrr 1 Ii1 1I cr HII LO ho *—1 h-4 ►—* 1 H* 1r o i o o o on on o 1 03 1• i • • • • • • • I h- CLi
OJ| o o o o o o o 1 cn a> 11
o o o o o o o i1j11i11 rr Cl o li ho oj ho >—■* 1—1»—■ t— 1 r—H* 3TILoi o o On 00 o o On o 1 P cn CD Ix • • • • • • • • • i 00 O JD 1
Ooi o o o o o o o o o 1 o P 1»—* I 1
o o o o o o o o o I11CP1
CD 1111
I1 03 o -di1 h-* I rr o IH-* | ■o o 1 rt £ !• • • i O n) I-P-l o o o 1 1On |I o o o 11 Pml
I i I uv:*-“■ 1 H h-* \—k t—1t—‘ ►—* h-1h--4t—‘ >— h-*►—* h-* 1—*h—1I—1>—1>—* »—1I—* ►—11—* h-» 1—‘ t—i 1—‘ ►—» ►—* 1—1 I—11—1 h—* 1— ‘ t—1h—1I— * I—* t— • h—* r—11o i o o o o o o o o o o o o o o o o o o o o o o o o o o o o o o o o o o o o o o o o o o i Hio l o o o o o o o o o o o o o o o o o o o o o o o o o o o o o o o o o o o o o o o o o o l O 1• 1 . • • • • • • • • • • • • • • • • • • • • • • • • • • • • • • > • • . . • • • • • • | rr IOI o o o o o o o o o o o o o o o o o o o o o o o o o o o o o o o o o o o o o o o o o o l 03 kj
jo o o o o o o o o o o o o o o o o o o o o o o o o o o o o o o o o o o o o o o o ol1
II
h-*|
Break-U
p of
Loans A
ccordin
g to
Secu
rity
(Percen
tage of
Total
Loan
s, 1986)

TABLE 2 0 . 1 4
Number of C orporations with D efa u lts in Repayments
C o r p o r a t i o n C o r p o r a t i o n s C o r p o r a t ionr e p o r t i n g r e p o r t i n g nod e f a u l t s d e f a u l t s
1 02 03 04 15 16 07 18 19 1
10 011 11 2 113 11 4 11 5 116 11 7 118 11 9 020 021 022 123 124 125 126 027 028 129 13 0 131 132 033 034 03 5 13 6 03 7 138 039 040 041 042 0
TOTAL 23 1 9TToTesl T. F“ incficaX~es c o r p o r a T i o n s ' w iTTi (IeT a u IU s Tn
r e p a y m e n ts .2. 0 i n d i c a t e s c o r p o r a t i o n s w ith no d e f a u l t in
r e pa yoient s .
? 1 ^

Bre
ak-u
p of
E
stab
lish
men
t C
osts
In
curr
ed
by
Cor
por
atio
ns(
198
6)r- I4-) 1CO I
1 r~ <4H c I| 03 *4h a) ir^ ro <T LO UO <r vO '3- ro sOI XJ 03 u I s*-/I o 4-) 4-J I!H CO CO i
COi1
a) 1CO 1 o O O o o o O O o o O O o
1 1 a i o o o o o O o o o o o o| 03 0) ! vO o O o o o o O o o o o o o! •u CL ct\ o UO oo oo o o o a> ro rH so soI o X 1 ro sO so uO CN o so Csl a\I H a> I r-H r J
1 00II
1 a i 1! *H 4-J >» 11 XJ 03 s-j I'—' o o o o o ' o o o o O o 3 o! c u a» luo o r^ o (3 o o o o o o o o o1 CO C 1w o O o O o o o o o o o oI ^ O / N i ro sC UO oo SO uo CN uo so <J\ CO Csl CM! 0 •rH 00 i >—I l ^ r—4
a I•H i
GO 1 t-3 CO IC ai CO i•rH • 03 | -N
IT3 CO o <U 4-J > i<r o o o o o O o o o o o o O1 c •H JH 60 > C iw o o o o o o o oi a 03 JD 03 X5 03 i o o o o o o o oi ^ u U 03 o i sO oo o uo CN 1/0 00 LO
Ii
rH rH 1—1 r-H rH r H f—(
i ^i»
i ^ iI cc i1 .—! i o o <3 o o o o o o o o O o1 03 ICO o o o o o o o o o o o o o1 CO 1 w o o o o o o o o o o o o o
1 vO OC oo o 00 CO so o vO 00 vO CvJ 0011
CO <r <r vO <fr CO sO CO CO <r ro
1 «*->
111
1 c 1 o o o o o o o o o o O O o1 <u |CN o o o o o o o o o o o1 cd | v o o o o o o o o o o o
1 UO CN 00 Csl uo CN ~<r CN ■<r »—I1 —4—1 rH r-H CN i—4 r—( CN r—I Csl CN
! -u1|
I 03 |! u ]I o 1I 1 r I Csl CO <r uo sO r > 00 Os O r1 4 C J ro1 ^ c 1 ,—i _( r_ r—H1 O o 1 r-lI CJ •H I W
UO Csl CN O r o < 1- 't f ' < r o o UO UO < r r o 00 r o u o sO CO 00 COr-<
O o O O O o O o O O O o O O O O O O O o o OO o O O o o O o O O o o O O O O O O o o o Oo u o o o o o O o O O o o o O O O O O o o o OsD o CM r o o CN CN 00 sD o CN r^ 'd - o < r u o 00 o r-H r^ rH00 < f < r r^. r o vO u o f-H o \ a > u o u o CN u o a\ r^. rH sO u o
rH rH CN r-H rH rH rH
O o o o O O O o o o o O O O o o o o o O o oo o o o O o o o o o o O o O o o o o o o o oo o o o O o o o o o o O o o o o o o o o o oo o u o sO u o r o u o 00 CN vO -<r r o sO r o u o sO sO CM sO r o
r-H r-H r-H CN rH rH
o O o o O o O o o o o o O o o O o o o o o Oo o o o o o o o o oo o o o o o o o o oCN CN csl CN CN o CN < f r-H u or—H r-H r H r H rH o rH 00
rH
O O o o O o o o o O O o O o O O o o o o o OO o o o O o o o o o o o O o o O o o o o o Oo o o o o o o o o o o o O o o O o o o o o O00 r—i o 00 CN s o o < r sO ^O o CM vO o CM 00 00 o vO
CN CN uo CSl ro vO sO uo ro ro CN r > ro SO r-H CN ror-H r-H ----1
o O o o o o o O O o o O O o O O o o o o O Oo o o o o o o o o o O o o O O o o o O Oo o o o o o o o o o O o o o O o o o o O00 CN csl vO o o uo Csl CN 00 Csl 00 o o uo o CN o s O Cslr—i r—H r-H r-H rH r-H CM r H r H r H r-H ro ro ro < r ro ro r-H
uo O o o a > o r H CM ro < t uo sO r-"- 00 cr\ O CN ro uo SOr—i <—( r—1 r-H r-H CM CN e g CN CM CN csl CN ro ro ro ro ro CO ro

TABLE 2 0 . 1 5 ( Contd . )
( 1 ) ( 2 ) ( 3 ) (4 ) (5 ) (6 ) (7 )
3 7 24000 72000 10000 5000 111000 738 1 8000 48000 G 9000 75000 43 9 1 5000 3 6000 0 2500 53 500 440 18000 68000 0 9000 95000 541 1 2000 36000 0 4000 52000 342 0 80000 0 1 5000 95000 5
T o t a l 687000 2195000 381000 323000 3 586000 1 97
A v e r a g e 16357 . 14 5 2 2 6 1 .9 0 90 7 1 .4 3 7690 . 48 85380 . 95 4
P e r c e n - 1 9 .#1 6 6 1 .2 1 1 0 . 6 2 9 .0 1 1 0 0 .0 0t ag e o f t o t a l

TABLE 20.16
Earnings and Expenses of Finance Corporations(in Rs '000)
114 finance corporations (March 1980)
42 finance corporations (December
1986)
1.2.3.4.5.6 .7.8. 9.
Capital and reservesAverage deposits during the yearAverage c red i t during the year^
1
c .
Earnings from loans and advances Interest paid on depos its and borrowings Administrative and other expenses Fund raising expenses Total operating expenses (5+6+7)P ro f i t before tax (4 -8 )
Ratios to total fundsi . Earningsi i . Deposit interesti i i . Transaction costi v . Prof i t before tax
Spread between earnings on loans and cost o f deposits Decomposition of earnings
i . Deposit cost plus opportunity costi i . Transactions costi i i . Default costiv. Economic rent
116.253373.783223.78
694.04 519.15
65.51 72.47
657.13 36. 91
19.89 14.88
3.94 1.064 6. 14
77.8219.804.003.00
42.30488.68
131.60 81.81 32.05
3.81 117.67
14. 91
24.7815. 22
6. 752.81
10.18
67.9525.37
4.002.68
Notes: 1. The average depos its and advances Source:are worked out from two year end f igures .
2. Downward bias because o f concealment o f i s poss ib le .
3. Earnings from investments and other uses are not separately avai lab le . The amount is small and is included in loan operat ions.
4. Decomposition o f earnings assumes a 20% tax cost included in transactions c o s t s , default cost at 4% o f earnings and opportunity cost o f own funds at 18% per annum.
Column 2 i s from Nayar (1982)

TABLE 2 0 . 1 7
Size D i s t r i b u t i o n of Sel ected CorporationsAccording to Deposi ts in 1986
S i z e ra n g e
L e s s than Rs 10 lakh
Rs 10 lak h and above but l e s s than Rs 20 lak h
Rs 20 lakh and a b o v e but l e s s than Rs 30 la k h
Rs 3 0 lakh and a b o v e but l e s s than Rs 50 la k h
Rs 50 lakh and a b o v e but l e s s than Rs 7 5 lakh
Rs 75 lakh and a b o v e but l e s s than Rs 100 la k h
Rs 100 lakh and a b o v e
TOTAL
Number o f c o r p o r a t i o n s
1981 T986
1 5
13
- 5
N i l
23
1 7
N i l
N i l
N i l
Ni 1
“ T40'
1 Two c o r p o r a t i o n s were e s t a b l i s h e d a f t e r 1981

TABLE 2 0 -1 8
Estimate of Depos its with FinanceCorporat ions in India
S o u r c e : For 1 9 7 9 - 8 0 : N a y a r , ( 1 9 8 2 ) .For 1 9 8 1 - 8 2 t o 1 9 8 2 - 8 3 :Na ya r ( 1 984 ) .From 1 9 8 3 - 8 4 t o 1 9 8 6 - 8 7 : worked out u s i n g t h e c a l c u l a t e d f a l l in g r o w th a t the r a t e o f 1 3 .7 5 per c e n t per annum.
TABLE 2 0 .1 9
Income Groups o f S e le c te d D ep o sito rs
Year D e p o s i t s (Rs c r o r e )
9
1 97 9 -8 01 9 8 0 -8 1198 1 -8 21 9 8 2 -8 31 9 8 3 -8 4 1 984 -851 9 8 5 -8 61 9 8 6 -8 7
652 . 19 821.. 99
103 9 . 0 9 1 2 5 0 .2 8 1 0 7 8 .3 6
9 3 0 .0 9 8 0 2 . 2 0 6 9 1 .9 0
Income g r o u p ( p e r month) No. o f d e p o s i t o r s
L e s s than Rs 5000 02312312
Rs 501 t o 1000 Rs 1001 to 1500 Rs 1501 t o 2000 Rs 2001 t o 2500 Rs 2 501 t o 3 000 Rs 3001 t o 4000Rs 4001 and abov e
TOTAL 14
21?
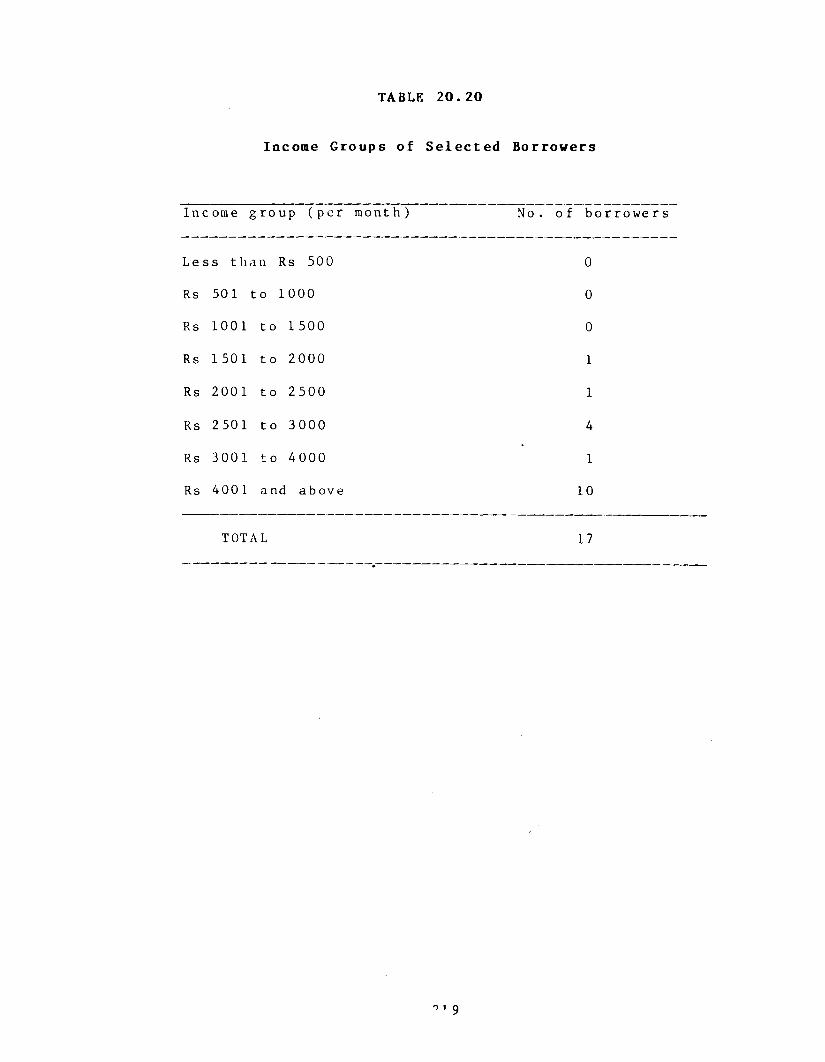
TABLE 2 0 .2 0
Income Groups o f S e le c te d Borrowers
Income g r o u p ( p e r month) No. o f b o r r o w e r s
L ess than Rs 500 0
Rs 501 t o 1000 0
Rs 1001 t o 1500 0
Rs 1501 t o 2000 1
Rs 2001 t o 2500 1
Rs 2501 t o 3000 4
Rs 3001 t o 4000 1
Rs 4001 and above 10
TOTAL 17
9 i 9

TABLE 2 0 .2 1
E f f e c t i v e I n t e r e s t Rate Paid by Se lec ted Borrowers
C a t e g o r y o f b o r r o w e r s
No . / p l a c e
S e c u r i t y Nominalr a t e
Annual Compound r a t e (%)
Housewi fe 1 (S a le m ) J e w e l l e r y 2.5% per moat h
3 4 . 4 9
M a s te rw e a v e r s
2 (Sa lem K a r u r )
DPN 10 p a i s e per Rs 100 p er day
44 . 03
T r a n s p o r to p e r a t o r
1 (C o im b a t o r e
11 y p o t h e - c a t i o n o f v e h i c l e
18% f l a t 36. 00 ( a p p r o x )
T r a n s p o r to p e r a t o r
1 ( E r i i a - ku1 am)
- d o - 20% f l a t 40. 00 ( a p p r o x )
T r a d e r s 2 ( E r n a - ku lam )
DPN 12% f o r 100 days w ith a d v a n ce i n t e r e s t & d a i l y r e m i t t anc e a t 1% o f l o a n s
1 5 6 .9 6
T rad er 1 ( E r n a - kulam)
DPN 10% f o r 100 days w i th a d va n ce i n t e r e s t & d a i l y r e m i t t a n c e at 1% o f l o a n s
1 1 7 .1 0
T r a d e r s 2 ( T r i e - ) b u r )
DPN 20 p a i s e per Rs 100 per day
1 0 7 .3 6
Trad e rs 7 (C o im - a t o r e , Sa lem , T r i c h y , & B a n g a l o r e )
DPN 10 p a i s e per Rs 100 per day
44 . 03
22 0

TABLE 20.22
Details of Selected Recent Failed Finance Corporations(Upto December 1987)
s. Name of the corporation Nd .of Year Estim Estinr Major source ofNd. (head office in bran- of ated ated information
parentheses) ches coll depos nunberapse its no. of
(Rs deposi-million) tors
(1) (2) (3) (4) (5) (6) (7)
1. Vuraidiar Bankers (ffadras) 1 1984 30.00 2500 Financial Express, Madras
2. Sugesan Finance (Midras) 7 1985 65.00 16000 -dcr3. Saraarias Fin. ^kdras) 12 1987 65.00 110004. Mukkadan Fin. (Cochin) 3 1987 3.00 200 Mathrubhoomi
20.5.875. Shalimar Fin. (Kottayam) 23 1987 65.00 8716 -do- 16.6.876. New Bharat Fin. Corpora- 2
tion (Kottayam)1987 5.00 1000 -do- 4.6.87
7. Labella Fin. 28 (Emakulam)
1987 120.00 9500 -do- 16.6.87
8. Southern Fin. (Kottayam) 9 1986 48.00 1000 -do- 8.5.879. Oriental Fin. & Exchange 13
Company (Kottayam)1987 80.00 14000
10. Amanichkal Traders & Fin. 1 (Pathanarathitta)
1987 8.00 1500
11. Noble India (Cbchin) 1 1987 10.00 100012. National Fin. (Kottayam) 2 1987 10.00 200013. Toni Chennikkadan Company 2
(Emakulam)1987 7.50 1600
14. Aditya Fin. & Invest- 140 msit (Bombay) (cnly
Kerala)
1987 160.00(only
Kerala)
N.A.
244 676.50 70016
Note: The operational area of all firms except 9erial No.1 and a part of 2 was Kerala.
221

TABLE 2 0 .2 3
Estimated Deposit with FinanceCorporations in Kerala
Year D e p o s i t s (Rs c r o r e )
S o u r c e
198 2 -8 3 300 . 19 Nayar (1 9 8 4 )
1 983 -84 2 5 8 .9 1 1
1 984 -8 5 2 2 3 .3 1 1
1 9 8 5 -8 6 1 9 2 .6 0 1
198 6 -8 7 166. 11 1
1 9 87 ( D e c e ui b e r ) 73. 71 2 N ew spapers and our e s t i m a t e
N otes 1 For 1 983 - 8 4 t o 1 9 8 6 - 8 7 , worked out atthe 1 3 .7 5 per c e n t f a l l in the grow th r a t e o b t a i n e d from the f i e l d s u r v e y .
2 For December 1987 , T a b le A 2 0 .2 and our e s t i m a t e as f o l l o w s : D e p o s i t s w i th the13 f a i l e d c o r p o r a t i o n s in K e r a l a ( T a b l e A 2 0 . 2 ) w ere Rs 616 m i l l i o n ( K e r a l a ' s s h a r e in t o t a l o f Rs 6 7 6 .5 m i l l i o n by14 c o r p o r a t i o n s ) . D e p o s i t s w i t hh u n d r e d s o f s m a l l n o n - r e p o r t e d f a i l e d c o r p o r a t i o n s a r e e s t i m a t e d by us as 50 p e r c e n t o f t h e 13 b i g c o r p o r a t i o n s . Thus the t o t a l d e p o s i t s o f f a i l e d c o r - p o r a t i o i n s was a b o u t Rs 924 m i l l i o n , l e a v i n g a b a l a n c e o f a b o u t Rs 7 3 7 . 1 million.
222

CHAPTER 21
HANDLOOM FINANCIERS IN BANGALORE AND KARUR
21.1 Introduction
21.1.1 Cloth production by handlooms is a labour intensive occu p at io n and en jo y s o f f i c i a l support in India because o f i t s
employment p o te n t ia l , e s p e c ia l ly i t s rural employment potentia l. The s t r a t e g y adopted in the Seventh Five Year Plan for thedevelopment o f the handloom sector is in accordance with the text i l e p o l i c y announced in June 1985 which envisages that "In the weaving sector the d i s t i n c t and unique ro le o f the handloom sector shall be preserved and that the growth and development o f this sector shal l rece ive p r i o r i t y " .
21 .1 .2 The Sixth Five Year Plan envisaged a production targetof 4100 m i l l i o n metres o f handloom c loth and an employment target o f 87 lakh persons besides a substantial increase o f looms in the cooperative sector . However, as the Seventh Plan document notes, "during the Sixth Plan, the major thrust has been to increase the cooperative coverage. Although the gross coverage is about 60 per cent ( o f the to ta l handlooms in the country) , yet the e f f e c t i v e coverage o f looms in the cooperative fo ld is around 32 per cent,
as many s o c i e t i e s have become dormant". In e f f e c t , this means that 68 per cent o f the to ta l looms in the country were s t i l l outside the fo ld of cooperative s o c i e t i e s .
21.1.3 We highlight c o op era t iv isa t ion because o f f i c i a l financ i a l support to handlooms (from State corporat ions , the Reserve Bank o f India scheme o f handloom finance operated by the National Bank for Agricu lture and Rural Development, e t c . ) i s f o r cooperat i v e s . O f f i c i a l f inanc ia l support flows to only about 32 per
223

cent o f the country 's handlooms. However, there are State run corporat ions , such as the Tamil Nadu Handloom Finance and Develop
ment Corporation which provide working capita l f inance to weavers outside the cooperative f o ld .
21.1 .4 On the whole, about ha l f the handloom weavers in the country are outside the cooperative fo ld . These weavers include individual artisans who own one or two looms and employ family
labour and master weavers owning upto three hundred looms and employing hired labour on piece rates . In Tamil Nadu and Kar
nataka, individual weavers purchase yarn and other raw materials from the market, produce c lo th and s e l l i t e ither d i r e c t l y to consumer or to nearby merchants. Master weavers invest towards the cost o f looms and accessor ies , procure raw materials in bulk, pay wages either d a i ly or weekly to weavers and helpers and market goods either in their own premises to t rave l l ing salesmen or to c loth traders and merchants spread throughout the country.
21.1 .5 Handlooms in these s tates use cotton yarn from m il ls natural s i lk yarn or synthetic s i l k yarn. The majority o f looms are engaged in production o f cot ton c lo th .
21.1.6 While cotton handlooms, are to be found in most States in India, s i l k handlooms are less widespread.
21.2 Geographical d ispers ion
21.2.1 In South India and in Maharashtra, where there is aconcentrat ion o f handlooms, there are private f inanciers such as f in a n ce c o r p o r a t i o n s , yarn t r a d e r - c u m - f i n a n c i e r s , or c l o t hmc-rchant-cum- f inane i e r s . Although a l l types o f f inanc iers are found in each major handloom centre , there are ce r ta in places where part icu lar categor ies o f f inanc iers dominate. For instance, at Nagpur (M aharashtra ) , c l o t h m e r c h a n t - c u m - f in a n c ie r s are
dominant, in Bangalore (Karnataka) , s i l k yarn t rad e r -cu m - f inanciers predominate while at Karur (Tamil Nadu), the main agent
is the whole time private f in an c ie r .
224

21.2 .2 Finance corporations are a famil iar f inanc ia l intermediary in South India. They genera l ly extend finance for any purpose. But, there are some who sp e c ia l i s e in lending for part i cu la r a c t i v i t i e s such as for production o f c loth by handloom
weavers. We have noted such s p e c ia l i s a t io n at Karur and at Bangalore and th is case study deals with the handloom finance act i v i t i e s o f these corporat ions .
21.3 Area surveyed
21.3 .1 Cotton handlooms of Karur: Karur in T i r u c h i r a p p a 1i (Trichy) d i s t r i c t o f Tamil Nadu is an export-oriented production centre for co t ton handloom c lo th . It can be reached by road from Salem, Erode, Trichy and other towns in Southern Tamil Nadu. It
i s also the headquarters o f two private sector commercial banks, the Karur Vysya Bank L t d . , and the Lakshmi V i la s Bank Ltd. Situated at the centre o f a predominantly agr icu ltura l area, Karur i s ' a trading centre for a var ie ty of agr icu ltura l commodities. It has no big industr ia l unit , but is among the top cotton handloom cloth producing and trading centres in Tamil Nadu.
21.3 .2 In Karur, as elsewhere in Tamil Nadu, the handloom industry con s is ts o f two sectors - the organised sector cons ist ing o f c o o p e r a t i v e s under an apex body, the Tamil Nadu Handloom Weavers Cooperative Society Limited, and the unorganised sector cons ist ing of master weavers and independent weavers unattached to the organised sector . The organised sector , covering about 50 per cent o f handlooms and weavers at Karur, gets f inanc ia l support in the form of a subsidy on sales and loans from the Government and
formal f inanc ia l in s t i tu t i o n s .
21.3 .3 The unorganised s e c t o r o f about 20,000 weavers and10,000 master weavers has no assured source o f f inance and enjoys no subsidy on sales- This sector requires c red it primarily for yarn purchases from spinning m i l l s . Finance corporations and c lo th merchants ( there are about 400 o f the la t t e r extending tied c re d i t to weavers) are the main sources o f such finance. Cloth
225

merchants a lso borrow oc cas ion a l ly from finance corporat ions . The t o ta l handloora c loth sale by the unorganised sector at Karur is around Rs. 25 crore a year.
21.3.4 Within Karur we came across 36 finance eorpurations o f which 24 were on both s ides o f the main street , Jawahar Bazaar. Of
these 36, we selected 5 corporat ions , four from Jawahar Bazaar and one from Car Street, for study.
21.3 .5 S i l k handlooms o f Bangalore : Bangalore, a prominent metropolis and the cap ita l of Karnataka State i s noted for natural s i lk yarn and fabr ic production as a lso for s i lk trade. The bulk o f natural s i lk yarn used in the production o f s i l k fabr ics in
both Tamil Nadu and Karnataka is produced in and around Bangalore. The renowned " Kancheepuram Sarees" woven at Kancheepuram and "Pattu" woven at Salem (both in Tamil Nadu), use s i lk yarn mostly produced at Bangalore.
21.3 .6 One can see vast stretches o f mulberry c u l t iv a t io n a few kilometres outs ide the c i t y o f Bangalore and a few kilometres away from Turakur, a town about 50 ki lometres away from Bangalore lying on the Bangalore - Bombay b u s / r a i l route. In these areas, a l l a c t i v i t i e s connected with the production o f s i l k f a b r i c s , from mulberry c u l t iv a t io n to weaving s i l k c lo th by handloom have been carried on for generations. Besides, there is the chain o f s i l k traders - the l o c a l middlemen who buy the s i l k yarn or unprocessed cocoons from the c u l t iv a to r , the re e le rs who process the cocoons to extract f i b r e , the yarn merchants who purchase the yarn for
sale to the producers o f s i lk f a b r i c s . Producers may be cooperat ives master weavers or independent weavers.
21.3.7 At each stage o f production and marketing, the problem o f f inance a r i s e s . "The c u l t i v a t o r o f mulberry/rearer o f cocoons gets loan from the dealer o f cocoons who moves about in the cocoon producing centres . When the cocoons are ready the dealer buys them by paying the balance a f te r adjust ing the loan amount, and gives the same to the ree le rs , sometimes on c red i t or in exchange
o o r .

f o r s i lk yarn. Those ree lers who purchase the cocoon, s e l l the yarn e i t h e r to the very same d e a le r or to o thers in the open market. The other ree le rs who get the cocoon in exchange for yarn give i t to the dealer a f te r rece iv ing the conversion charges. The dealer disposes o f h is yarn either in the yarn market at Bangalore or seLLs it to master weavers or independent weavers. Here again there may be c r e d i t s a l e s and exchange (yarn in exchange fo r c lo th ) business. Those ree lers and weavers who can a f ford to market their products independently go to the market; while the others resort to the le ss remunerative method o f exchange" (Nayar 1982).
21.3.8 The bulk o f s i l k handlooms at Bangalore is in the unorganised sector . The main reason for the low coverage by cooperat ives is that s i l k fabr ic production is highly spec ia l ised and mass production, as is practised in cotton handloom c loth , is not easy. Each s i l k saree is d i f f e r e n t . The broad design and colour o f s i l k may be the same, yet the zari ( s i l v e r or gold thread) content, f l o r a l design, and so on d i f f e r s from piece to p iece . This is the main d i f f e re n ce between a m i l l made s i lk saree and a hand
loom s i lk saree where each piece shows the ind iv idua l i ty o f the weaver .
21.3 .9 Unlike c o t t o n handlooms which use m i l l made c o t to n yarn, s i l k handlooms use natural s i l k yarn reeled from processed cocoons. Silk yarn is much c o s t l i e r than cotton yarn and i t s supply f l u c t u a t e s from season to season. Another major raw material which goes into the production o f a s i lk saree or s i lk
(p a t t u ) " v e s h t i or d h oth i " is the c o s t l y z a r i . Thus the raw material cost o f s i l k fabr ic is high. Moreover, the period taken to weave a f i v e metre saree may go up to three months i f the design i s complicated and the zari content is high. Because o f these reason s , the handloom s i l k in d u s t ry r e q u ir e s a l o t o f c r e d i t . The finance corporat ion and the yarn trader or c lo th merchant d i r e c t l y or in d i r e c t ly provide a substant ial volume of this c r e d i t .
227

21.3.10 There are d i f f e r e n t methods o f f i n a n c i n g used by finance corporat ions . Direct short term loans to s i l k fabr ic merchants, yarn traders and master weavers on the security o f demand promissory notes (DPN), small loans to independent weavers on the security o f jew e l lery and discounting of post dated cheques from
wholesale to independant weavers or master weavers are the main method s .
21.3.11 One estimate puts the number o f f inance corporat ions in Bangalore in March 1980 at 150 (Nayar 1982). Many o f these were general f inance corporat ions , with no s p e c ia l i s a t io n in any part icu lar a c t i v i t y or trade. Our recent survey showed that there were about 50 finance corporations s pe c ia l i s in g in handloom s i lk finance, although they extended loans to other ca tegor ies o f borrower s' al s o . We selected f iv e fo r this study.
21.4 Sources of funds
21.4.1 Sources o f funds o f the f i v e cotton handloom financecorporat ions at Karur include own c a p i ta l and borrowing from the public and r e la t iv e s . There was neither any reserve funds nor borrowings from the formal sector . At the end o f 1986, their to ta l
subscribed cap ita l amounted to Rs. 2.25 lakh against t o ta l borrowings of Rs. 50.75 lakh. Thus own cap i ta l was about 4.2 per cent of avai lab le funds. As much as Rs. 9.75 lakh o f borrowed fundscame from r e l a t i v e s .
21 .4 .2 Funds o f the f iv e corporat ions in Bangalore include owncapital and reserves and borrowings from the public and r e la t iv e s . There was no borrowing from the formal sector . Own funds o f these corporat ions , at Rs. 3.20 lakh at the end of 1986 formed about5 .05 per cent o f t o t a l c a p i t a l whi le funds borrowed from the publ ic (net o f borrowing from r e l a t i v e s ) formed about 89 per cent
o f ca p i ta l .
228

21.4 .3 The data on borrowings from 1981 to 1986 presented in Table 21.1, covering both the centres , shows a dec l ine since 1982. The f a l l may p a r t l y be due to the r e d u c t i o n in the number o f depositors as per the Banking Laws (Amendment) Act, 1983. As can
be seen from the table , the average number o f depositors in both
centres has reduced over the years though in Bangalore the number
of depositors i s s t i l l in excess o f the c e i l in g la id down by the Act given that , in both places, there was an average o f f ive
partners per corporation. This excess is made up o f - real or spurious - deposits from re la t ives which are outs ide the scope of the r e s t r i c t i o n ) .
21 .4 .4 Period o f funds a v a i l a b i l i t y : Corporations at both placeso f fe red d i f f e r e n t interest rates for d i f ferent periods. Deposits at Karur were generally for a one year period. In Bangalore 70 per cent o f deposits were for a period o f one year, 22 per cent for 3 years and 8 per cent for less than one year.
2 1 .4 .5 Cost o f funds: Interest paid by corporations both atKarur and Bangalore was 18 per cent per annum f o r a one year deposit . At Bangalore 20 per cent per annum was paid for a three
year deposit . Since interest was usually paid monthly, annualised compound rates work out to be 19.56 per cent and 21.94 per cent resp ec t ive ly . On the whole, cost o f funds o f corporations was about 10 per cent higher than that o f commercial banks. Interest rates showed l i t t l e or no f luctuat ion since 1984. Prior to 1984, rates were about three percentage p o in t s l e s s . In 1980, the average interest rate for a one year deposit was 13 per cent per annum (Nayar 1982). In the wake o f r e s t r i c t i v e cred it p o l i c y in
the formal banking sector inst i tu ted in the wake o f a Rs 500 crore IMF loan in 1981, interest rates in the sector moved up to 15 per cent in March 1983 and f u r th e r to 18 per cent by March 1984. Thereafter the rate remained more or less s ta t i c as f inance cor porations, e s p e c ia l l y large ones, started reducing the number of depositors as per the provis ions o f the Banking Law (Amendment) Act 1983, which came into force on 15th February, 1984 despite the subsequent easing o f monetary c o n t r o l s .
229
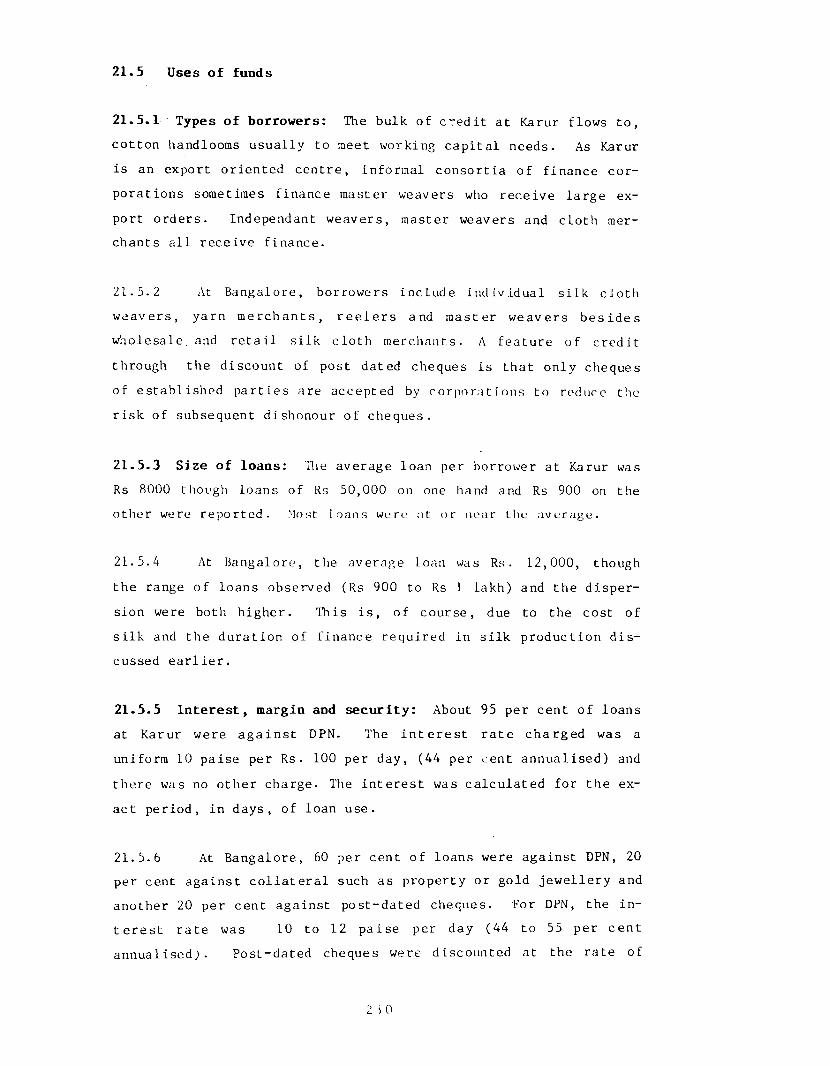
21.5 Uses of funds
2 1 .5 .1 / Types of borrowers: The bulk o f c re d i t at Karur flows to ,cotton handlooms usually to meet working cap i ta l needs. As Karur is an export oriented centre, informal consortia o f f inance cor porations sometimes finance master weavers who rece ive large export orders . Independant weavers, master weavers and c lo th merchants a l l receive finance.
21 .5 .2 At Bangalore, borrowers include individual s i lk c lo th weavers, yarn merchants, r e e l e r s and master weavers b e s i d e s wholesale, and r e t a i l s i lk c lo th merchants. A feature o f c redit
through the discount of post dated cheques is that only cheques o f established part ies are accepted by corporations to reduce the r isk o f subsequent dishonour o f cheques.
21.5 .3 Size of loans: The average loan per borrower at Karur wasRs 8000 though loans o f Rs 50,000 on one hand and Rs 900 on the other were reported. Most loans were at or near the average.
21.5.4 At Bangalore, the average loan was Rs. 12,000, thoughthe range o f loans observed (Rs 900 to Rs 1 lakh) and the dispersion were both higher. This i s , o f course, due to the cost o f s i l k and the duration o f f inance required in s i lk production d is cussed e a r l i e r .
21.5.5 Interest, margin and security: About 95 per cent o f loansat Karur were aga inst DPN. The i n t e r e s t ra te charged was a uniform 10 paise per Rs. 100 per day, (44 per cent annualised) and
there was no other charge. The in terest was ca lcu lated for the exact per iod, in days, o f loan use.
21.5.6 At Bangalore, 60 per cent o f loans were against DPN, 20 per cent against c o l l a t e r a l such as property or gold jew e l le ry and another 20 per cent against post-dated cheques. For DPN, the int e r e s t rate was L0 to 12 paise per day (44 to 55 per cent annualised) . Post-dated cheques were discounted at the rate o f
2 3 0

one paise per rupee for seven days (67.8 per cent annualised) , the
i n t e r e s t c a l c u l a t i o n being made fo r m u l t ip l e s o f seven days . Secured loans were charged 36 per cent per annum on a simple inte res t basis . The average in terest charged therefore works out to 55.68 per cent. Assuming that funds l i e id le at most 10 per cent o f the time, the interest earned on funds deployed works out to
45.41 per cent .
21.5.7 Loan duration: The loan period at Karur did not exceedthree months in any case. The period varied from one day to 90 days, most o f the loans being c losed before 15 days. The average period for a l l loans was about 15 days.
21.5.8 The loan period at Bangalore was longer, from one week to one year. DPN loans were for a maximum o f 90 days, while loans for longer than 90 days were secured against property or jewel
lery . Therefore, DPN loans and discounting of post dated cheques formed 80 per cent o f t o ta l loans with their duration varying from f ive to ninety days for DPN loans and from seven to th ir ty days for post-dated cheques. The average loan period for unsecured loans was about 45 days. Thus, loan c ap i ta l turned over several tunes a year in both centres implying that a large number o f borrowers were served each year.
21 .5 .9 Bad debts and overdues: It was found that bad debts weren e g l ig ib le in both the p laces , even for loans against DPN. One respondent at Karur reported that 3 per cent o f loans usually became past due but that few outright defaults occurred.
21.5 .10 Complementarity/substitutability with formal finance:
There are several agencies which finance the handloom t e x t i l e s s e c t o r . Banks and organ ised f i n a n c i a l s e c t o r mainly f in a n c e cooperatives handloom. The informal f inanc ia l sector is thus not only complementary to the formal f inanc ia l sector but also an equally important supplier o f c red it since the bulk o f f inance for the unorganised sector is from informal sources.
23 1
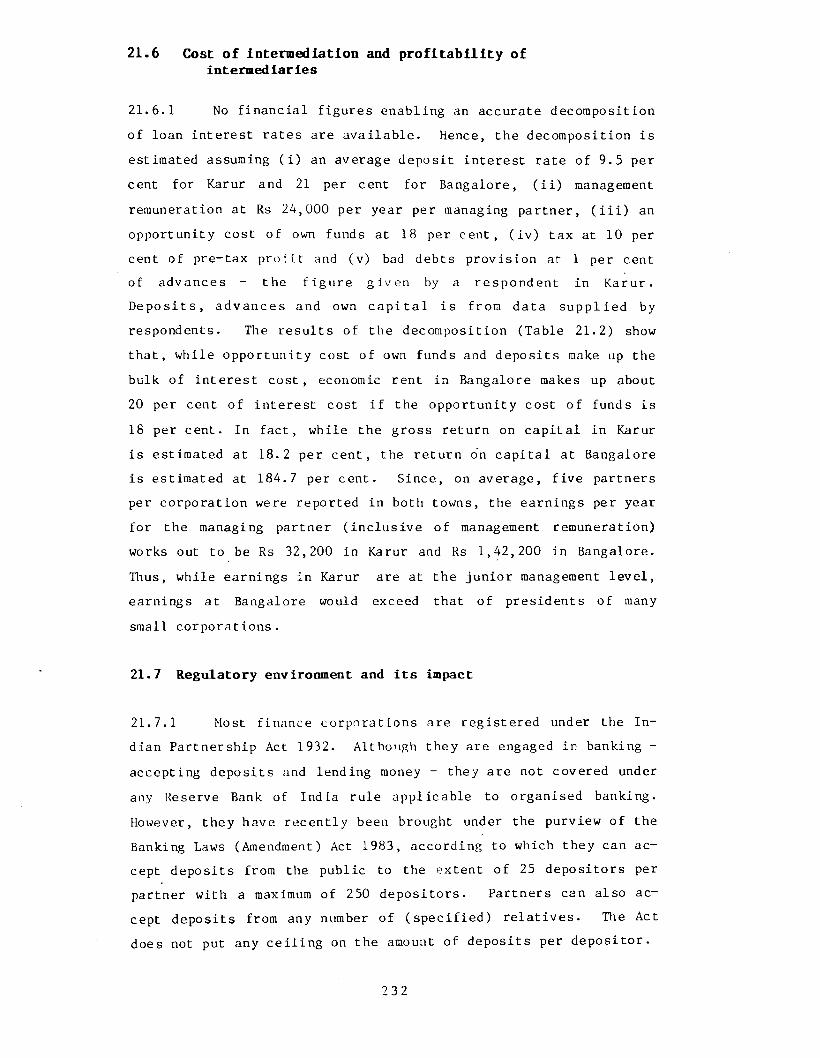
21.6 Cost of intermediation and p rofitability ofint ermed iar ie s
21.6.1 No f inanc ia l f igures enabling an accurate decomposition o f loan interest rates are ava i lab le . Hence, the decomposition i s estimated assuming ( i ) an average deposit interest rate o f 9.5 per cent for Karur and 21 per cent for Bangalore, ( i i ) management
remuneration at Rs 24,000 per year per managing partner, ( i i i ) an opportunity cost o f own funds at 18 per cent , ( i v ) tax at 10 per cent o f pre-tax p r o f i t and (v) bad debts provision at 1 per cent o f advances - the f i g u r e g iven by a respondent in Karur. D e p o s i t s , advances and own c a p i t a l i s from data su p p l ie d by respondents. The resu lts o f the decomposition (Table 21.2) show that, while opportunity cost o f own funds and deposits make up the bulk o f in terest c o s t , economic rent in Bangalore makes up about 20 per cent o f interest cost i f the opportunity cost o f funds is
18 per cent. In fa c t , while the gross return on c a p i ta l in Karur is estimated at 18.2 per cent , the return on cap i ta l at Bangalore i s estimated at 184.7 per cent . Since, on average, f i v e partners per corporation were reported in both towns, the earnings per year for the managing partner ( in c lu s iv e o f management remuneration) works out to be Rs 32,200 in Karur and Rs 1,42,200 in Bangalore.
Thus, while earnings in Karur are at the jun ior management l e v e l , earnings at Bangalore would exceed that o f presidents o f many
small c o rp o ra t io n s .
21.7 Regulatory environment and its impact
21.7.1 Most f inance corporat ions are regis tered under the Indian Partnership Act 1932. Although they are engaged in banking -
accepting deposits and lending money - they are not covered under any Reserve Bank of India rule appl icable to organised banking. However, they have recent ly been brought under the purview o f the Banking Laws (Amendment) Act 1983, according to which they can accept deposits from the public to the extent o f 25 depositors per partner with a maximum of 250 d epos i tors . Partners can also accept deposits from any number o f ( s p e c i f i e d ) r e la t iv e s . The Act does not put any c e i l i n g on the amount o f deposits per d epos i tor .
2 32

21.7 .2 The average number o f depos i tors per partner in corporations at Karur in 1981 was 59. This came down to 33 by 1986 which gives an ind icat ion o f the impact o f the Act. Likewise, at
Bangalore, the average number o f depositors dropped from 260 per partner in 1981 to 120 in 1986. R e s t r i c t i n g the number o f
depositors per partner has ser ious ly a f fe c te d the lending business o f corporat ions , e s p e c ia l ly at Bangalore.
21.8 Market structure:
21.8.1 At Karur there was no evidence o f market leadership. However, markets were l o c a l and showed evidence o f long standing
re lat ionships s ince , apparently, fa m i l ia r i ty reduces costs by saving on time spent for negot ia t ion . Interest rate competition
was absent.
21 .8 .2 At Bangalore, there was one r e la t i v e l y large corporat ion in terras o f deposits and advances. But no evidence o f market rates being influenced by the big c o rpora t ion 's interest rates was found. Deposits were mobilised by partners through their in
fluence and not through interest rate competit ion. After the RBI Act r e s t r i c t in g the number o f depos i tors , there is evidence o f the market becoming a s e l l e r s ' market since the le v e l of operations with r e s t r i c t i o n s on depositors i s not lu cra t ive enough to attract enough new firms at a great rate . Thus, observed economic rents could be due to recent regulation . I f so, they are c lear ly a short run phenomenon.
21.8 .7 Entry and exit barriers: Entry to the market Ls easy because there is no lega l formality in reg is te r in g a partnership f i rm . There i s no minimum c a p i t a l requirement a l s o . Exit i s s im i la r ly free from regulatory hurdles .
21.9 Estimate of overall size
21.9.1 Unlike auto finance corporat ions , which are found only in cer ta in pockets in South India and elsewhere in the country,
233

handloom finance corporat ions are scattered throughout handloom c lo th p r o d u c t io n and s a l e s c e n t r e s . Again, un l ike the auto finance corporat ions , these corporat ions are multi-purpose financing units with a larger share o f loans flowing to the handloom sector . It i s d i f f i c u l t to segregate the handloom finance cor porations from other corporat ions . Because o f these d i f f i c u l t i e s , no attempt i s made to estimate the number o f firms and volume o f business o f such corporations throughout the country.
21.10 Distributional impact
21.10.1 Corporations in both places general ly extend loans to small borrowers. The per capita loan at Karur in 1986 was Rs.
9544 and at Bangalore i t was Rs. 8928 (Table 21 .3 ) . Similar loan s izes were computed for e a r l i e r years. Since the unorganised sector including small independant weavers, is . large ly dependant on loans from f in a n c e c o r p o r a t i o n s , a p o s i t i v e impact on c r e d i t a v a i l a b i l i t y to small borrowers in absolute terms appears ind i cated. Whether or not there is a r e la t iv e d i s t r ib u t io n a l gain in cred it a v a i l a b i l i t y i s hard to estimate.
21.11 Efficiency and allocative impact
21.11.1 One dist inguishing feature o f the borrowers o f f inancecorporat ions , both at Karur and Bangalore was that the borrowed funds were used in industria l production or trade. Producers o f cot ton and s i l k handloom c loth in the unorganised sector who were s i d e - t r a c k e d by the o r g a n ise d f i n a n c i a l s e c t o r and those who traded the goods got working c ap i ta l f inance. This was e s p e c ia l l y the case with many small sized master weavers with 20 to 30 loomsand independent weavers owning one or two looms who did not getany worthwhile f inanc ia l assistance from other sources .
21.12 Impact on savings mobilisation and investment
21.12.1 Finance corporations paid interest on depos its at rates about 10 per cent higher than bank rates though r isk co s t s can be
234

expected to be higher- Furthermore, loans from them were product i v e l y u t i l i s e d . Thus a p o s i t iv e d irect and ind irec t impact on saving can be hypothesised though no d irect evidence is ava i lab le .
21-13 Recommendations for regulatory framework
21-13.1 I t i s o n ly very r e c e n t l y that the Banking Laws (Amendment) Act 1983 was passed a f te r a great deal o f d iscussion and d e l ibe ra t io n . Deposits with finance corporations come under this Act. We have seen in Table 21.1 that the ir deposits as alsolending operations came down d r a s t i c a l l y a f te r 1983. As a con
sequence, an estimated 2,300 borrowers at Karur and 10,000 borrowers at Bangalore were deprived of c red i t in 1986 as compared to the le v e l in 1983. The purpose o f the 1983 Act is to protect the interest o f depos i tors . But, in the process , i t is instrumental in
denying c r e d i t to a v i t a l sector o f the economy.
21.13.2 As handloom finance corporat ions serve a v i t a l sector o f the economy, there is no reason as to why they should not be allowed to function unimpeded. The wisdom o f an across the board r e s t r i c t i o n on deposit taking i s , there fore , questionable .
21.14 Lessons for formal sector
21.14.1 There is one Lesson which the formal sector can learnfrom these informal finance corporat ions : Extension o f loans for very short periods , charging interest only f o r the exact period of the loan. In such a short per iod loan , the i n t e r e s t rate is
worked out per day and ca lcu la t ion i s easy even for an i l l i t e r a t e borrower.
235
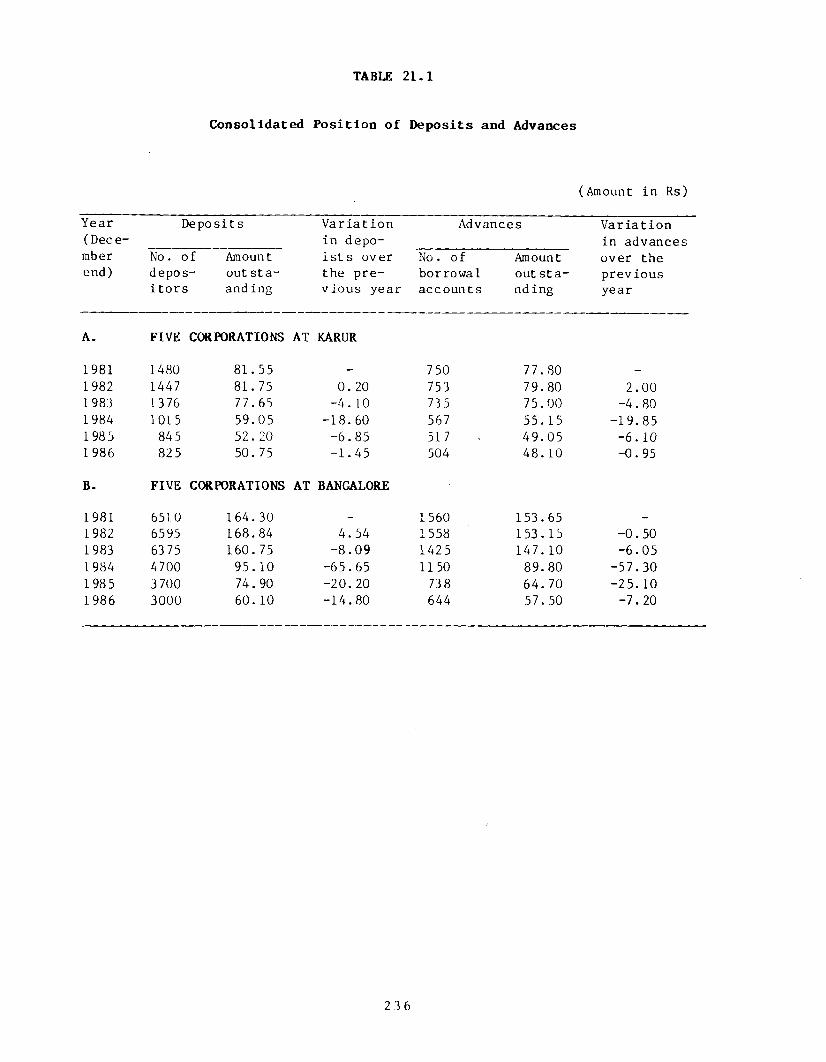
TABLE 21.1
Consolidated Position of Deposits and Advances
(Amount in Rs)
Year ( Dec e- mber end)
Deposits
No. o f Amount depos- outsta-i t o r s anding
Variation Advancesin depo-i s t s over No. o f the pre- borrowal vious year accounts
Amount out stand ing
Variation in advances over the previous year
A. FIVE CORPORATIONS AT KARUR
1981 1480 81.55 - 750 77.80 —
1982 1447 81.75 0. 20 753 79.80 2.001983 1376 77.65 -4 . 10 73 5 75.00 -4.801984 1015 59.05 -18.60 567 55.15 -19.851985 845 52. 20 -6 .85 517 49.05 -6 .101986 825 50. 75 -1 .45 504 48. 10 -0.95
B. FIVE CORPORATIONS AT BANGALORE
1981 6510 164.30 - 1560 153.65 -
1982 6595 168.84 4.54 1558 153.15 -0.501983 63 75 160.75 -8 .09 1425 147.10 -6.051984 4700 95. 10 -65.65 1150 89.80 -57.301985 3 700 74. 90 -20.20 738 64. 70 -25.101986 3000 60. 10 -14.80 644 57.50 -7.20
236

TABLE 2 1 .2
Earnings and Expenses of 5 C orporation s Each at Karur and Bangalore - 1986
(R s lakh)
Karur Ba ng a l o r e
1. C a p i t a l and R e s e r v e s 2. 25 3 . 202. A v e r a g e d e p o s i t s 50 . 75 60 . 103. A v e r a g e a d v a n c e s 4 8 . 1 0 57. 504. E s t i m a t e d E a r n i n g s from Loan
O p e r a t i o n s1 7 .21 2 7 .2 9
5. I n t e r e s t p a id to D e p o s i t s ( a t 18 p e r c e n t )
9 . 00 12. 08
6 . A d m i n i s t r a t i v e E x p e n se s 4 . 0 8 5 . 517. P r o v i s i o n f o r Bad D ebts
( a t 3 per c e n t o f 3 )- 1 . 4 4 1 . 80
8 . T o t a l e x p e n s e s ( 5 + 6 + 7 ) 1 5 .4 2 1 9 . 3 99. P r o f i t B e f o r e Tax ( 4 - 8 ) 1 . 7 9 7 . 9010. Tax ( a t 10 p e r c e n t ) 0 . 1 8 0 . 7 911 . E s t i m a t e d net p r o f i t 1. 61 7 .11
D e c o m p o s i t i o n o f i n t e r e s t c o s t ( p e r c en t )
1. Cost o f d e p o s i t s 52 . 30 44 . 272. Cost o f d e f a u l t 8 . 36 6. 603. A d m i n i s t r a t i v e c o s t 23 . 71 20. 194. O p p o r t u n i t y c o s t o f o w n e r s '
c a p i t a l at 18% p l u s Rs 24000 l a b o u r c o s t per managing p a r t n e r
9 . 32 6 . 53
5. T a x a t i o n 1. 05 2 . 896. E conom ic r e n t 0. 03 1 9 .5 3
N o t e : See s e c t i o n 6 f o r b a s i s o f c o m p u t a t i o n s .
237

TABLE 2 1 .3
Average Loan Size at Karur and Bangalore
Year Karur(R s )
B a n g a l o r e(R s )
1 981 1 03 73 9849
1 982 10597 9828
1 983 10204 10322
1 98 4 9726 7808
1 985 9487 8766
1 986 9544 8928
238

CHAPTER 22
22.1 Introduction
22.1.1 Hire purchase finance (HPF) is a type o f instalment cred it whose essence l i e s in the hirer agreeing to hire goods at a stated per iod ica l rental with an option to purchase. It is to be distinguished from a c red it sa le . In a c red i t sale contract the ownership o f goods i s ins tant ly transferred to the purchaser when he makes the f i r s t instalment or down payment. I f he f a i l s to pay the balance, the s e l l e r has no claim over the goods but can only sue the purchaser for the amount due. Similar ly , the purchaser has no right to return the goods he has once purchased. In cont r a s t , under the hire purchase system, the s e l l e r reta ins ownership o f the goods until the f ina l instalment is paid. The hirer cannot dispose o f the goods in any manner except by surrendering them to the s e l l e r and is bound to take care o f them during the entire period o f the contract .
22.1.2 The in s t i tu t i o n o f HPF is f a i r l y old and well organised in developed anglophone countr ies . In India, i t came into ex is t
ence in the years fo llowing the f i r s t world war. One o f the earl i e s t references to HPF in India was made by the Travancore Banking Enquiry Committee in their Report published in 1930. At that time, HPF was confined only to the road transport industry and was concentrated in the hands o f a few indiv iduals and private business houses. A plethora o f goods in addit ion to automobiles are
HIRE PURCHASE IN SOUTH INDIA AND DELHI
239

now sold under hire purchase c r e d i t by a variety o f i n s t i tu t i o n s .
22.1 .3 HPF i n s t i t u t i o n s in Ind ia can be grouped under two heads - the organised sector and the unorganised sector . The or
ganised sector c ons is ts o f commercial banks, cooperative banks, state f inanc ia l corporat ions (SFCs) and HPF companies. The unorganised sector comprises partnership firms and sole proprietary concerns and individuals . The ro le o f banks in financing hire purchase c r e d i t is in d i r e c t . They extend refinance to HPF companies and f inanc iers . Their d i r e c t lending to the road transport industry i s on the basis o f hypothecation o f veh ic les and not on hire purchase bas is .
22.1.4 Under the hypothecation system, banks and the SFCs extend loans to the extent o f 75 per cent o f the c o s t o f the veh ic le , to be repaid in monthly instalments for upto f i v e years. Interest on outstanding balances varies presently from 12.5 per cent per annum for s e l f employed s ingle truck operators to 16.5 per cent for f l e e t owners and large transport operators .
22.2 Geographical dispersion and numbers
22.2.1 This study o f HPF in s t i tu t i o n s covers public l imited and private l imited companies, partnership firms and proprietary concerns. Although the number o f HPF companies and the amounts o f deposits with them are given by the Reserve Bank o f India (RBI) in i t s annual review o f growth o f deposits with non-banking com
panies , no data on p a r tn e r sh ip s and p r o p r i e t a r y concerns are ava i lab le . RBI data from 1962 to 1986 are given in Table 22.1.22.2 .2 RBI data only cover companies which report depos i ts . Thus there are l im ita t ions which, however, are not major. We may take the RBI f igures as representat ive o f a l l HPF companies. The
240
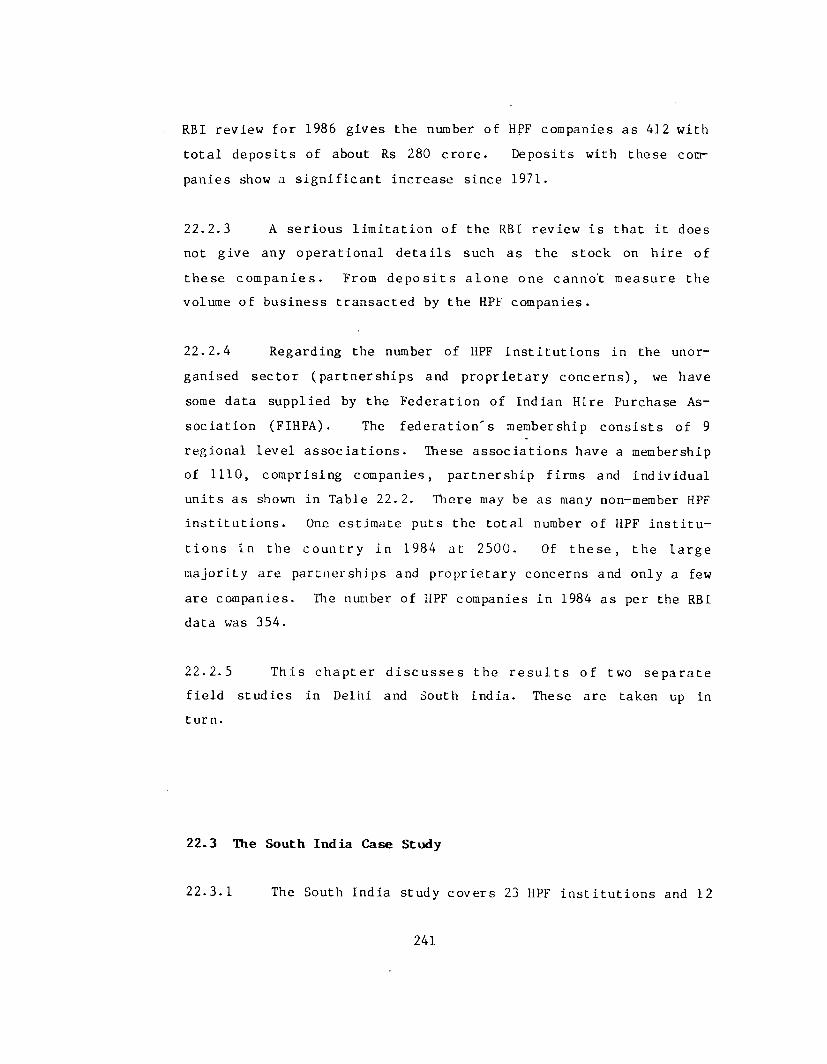
RBI review f o r 1986 gives the number o f HPF companies as 412 with t o ta l deposits o f about Rs 280 crore . Deposits with these companies show a s ig n i f i ca n t increase since 1971.
22.2.3 A serious l im ita t io n o f the RBI review i s that i t does not give any operational d e ta i l s such as the stock on hire o f
these com panies . From d e p o s i t s a lone one canno't measure the volume o f business transacted by the HPF companies.
22.2.4 Regarding the number o f HPF in s t i tu t i o n s in the unorganised sector (partnerships and proprietary concerns) , we have some data supplied by the Federation o f Indian Hire Purchase As
soc ia t ion (FIHPA). The f e d e r a t io n 's membership cons is ts o f 9 regional l e v e l a sso c ia t io n s . These assoc iat ions have a membership of 1110, comprising companies, partnership firms and individual units as shown in Table 22.2. There may be as many non-member HPF in s t i tu t io n s . One estimate puts the to ta l number o f HPF in s t i t u
t i o n s in the co u n try in 1984 at 2500. Of t h e s e , the l a r g emajority are partnerships and proprietary concerns and only a few
are companies. The number o f HPF companies in 1984 as per the RBI data was 354.
22.2 .5 This chapter d i s c u s s e s the r e s u l t s o f two separate f i e l d studies in Delhi and South india. These are taken up in turn.
22.3 The South India Case Study
22.3 .1 The South India study covers 23 HPF in s t i tu t io n s and 12

borrowers in Tamil Nadu. Ownership pattern, business p rac t i ces , terras and condit ions o f c r e d i t , e t c . , o f HPF in s t i tu t io n s in the other southern States are s imilar . In f a c t , a leading HPF company o f Madras, Sundaram Finance Limited, has a network of 35 branches
in these states . Our sample o f 23 HPF in s t i t u t i o n s , which include th is leading company, c o n s is ts of 10 corporate units (8 publ ic l imited and 2 private l i m i t e d ) , and 13 non corporate units o f which 12 are partnerships and one is a proprietary concern. The ten companies have 95 branches, mostly in South India. The sample forms 5 per cent o f the t o t a l membership (460) o f the South India
Hire Purchase Assoc ia t ion , Madras and 7.5 per cent o f the HPF ins t i tu t io n s in Madras.
22.4 Sources of funds
22.4.1 Sources o f funds o f these HPF in s t i tu t io n s are cap ita l and reserves, deposits from the p ub l i c , borrowings from banks and other formal f inanc ia l in s t i tu t io n s and payments made against hired goods .
22.4 .2 Own funds and deposits: Corporate units which intend toraise large deposits from publ ic must keep a high own funds posi t ion since the Non-Banking Financial Companies (Reserve Bank) D i r e c t i o n s , 1977, s t i p u l a t e s that an HPF company can r a i s e deposits only to the extent o f ten times i t s net owned funds.
22.4.3 Non-corporate units are not covered under these Direct ions . They are free to f i x any ra t io o f owned funds to deposits in place o f the 1:10 prescribed for companies. However, their deposit acceptance i s governed by the Banking Laws (Amendment) Act, 1983 according to which they can raise deposits from public to the extent o f 25 depositors per individual ( in the case o f in
242

dividual concerns) and 25 depositors per partner subject to a maximum o f 250 depositors in a 10 member partnership. In addition to th is , both ca tegor ies can accept deposits from r e la t iv e s .
22.4.4 The data on own funds and deposits presented in Table22.3 show that in spite o f the freedom to f i x a low le v e l o f own funds, the non-corporate units general ly had a higher own funds posit ion than corporate units . This i s because the s h o r t fa l l in deposits resu lt ing from the operation o f the Banking Laws Act was made up by own sources .
22.4 .5 No corporate unit reached a leve l of deposits equal to ten times the own funds f igure . Since there i s a c e i l i n g on interest payable by companies, including HPF companies, on depos its , i t i s l i k e l y that t h i s i s due to a shortage in the supply o f depos i ts . This hypothesis i s supported by the fact that HPF companies add to reserves year a f t e r year.
22.4 .6 The trend in growth o f deposits o f the selected HP ins t i tu t io n s from 1981 to 1986 is given in Table 22.4. The deposits 'o f these HPF companies grew at an average annual compound rate o f 26.89 per cent against the growth o f 22.79 per cent by a l l HPF companies as given in Table 22.1. The non-company sector also had an impressive growth rate o f 23.78 per cent .
22.4 .7 Borrowings from the formal sector: All corporate unitsand some non-corporate units get refinance from the formal banking
sector . Some large s ize proprietary concerns and partnerships a lso get overdrafts from banks. The f igures o f refinance obtained
by the company s e c t o r are a v a i l a b l e f o r seven out o f the ten se lected companies. One company did not raise any amount through refinance because i t s own funds and deposits were in excess o f the
243

stock on h ire . The seven companies together got refinance to the extent o f Rs 579.15 lakh in 1986 equal to 3.64 per cent o f their
stock on h ire . One reason for the low ref inance appears to be the high cost assoc iated with i t . Refinance by banks is at the ir maximum lending rate (present ly 16.5 per cent per annum). Since HPF companies can borrow from the public at 14.5 per cent ( including0.5 per cent brokerage) they w i l l c l e a r ly resort to refinance only when they f a i l to ra ise public deposits or i f they exceed the statutory l im it o f borrowings.
22.4 .8 For non-corporate units , i t is cheaper to borrow from banks as the ir cost o f borrowing from the public i s high, usually around 18 per cent to 19 per cent per annum. Thus they make use o f bank accommodation to the maximum poss ib le extent. Although no non-corporate HPF firm furnished data on bank accommodation, a l l o f them said that i t was inadequate. Thus, while the complaint o f the company sector on refinance from banks was regarding the high refinance charges, the grievance o f the non-company sector was about i t s inadequacy. However th is net f low o f cash i s l i k e l y to be spurious since the high cash balances are most probably associated with a temporary dip in fresh loan business due to the c los ing o f books at the end o f the f inanc ia l year.
22 .4 .9 Table 22.5 presents d e t a i l s o f borrowing from banks and cash ba lances with banks. It i s seen that banks r e c e i v e d Rs 1515.90 lakh from the 10 HPF companies and extended refinance to
them to the tune o f Rs 579.15 lakh. This represents a net f low o f Rs 936.75 lakh from the informal to the formal sector . As a ra t io to t o ta l stock on h ire , th is works out to 5.,21 per cent for the company sample. Much o f th i s cash flow to the formal sector may be i l lu s o r y , r e f l e c t i n g a temporary dip in fresh HPF agreements due to the c lo s ing of books at the end o f the f inanc ia l year.
244
22.4.10 Column 4 o f Table 22.5 shows that the ra t io o f bank finance to stock on hire ranged from less than 1 per cent to 47 per cent . As the norm for refinance o f HP cred i t for companies is common to a l l companies, the low percentages o f some HPF companies is c l e a r l y demand determined.
22.4.11 Period of funds a v a ila b ility : The duration d i s t r ib u t io no f deposits i s given in Table 22.6. The table shows that 69.31 per cent o f the t o ta l deposits o f the company sector was for three
years, compared to 13.58 per cent for the non-company sector . The great majority o f deposits (80.42 per cent) o f the non-company sector was for a one year period. The company sector is therefore seen to have superior access to long term deposits .
22.4.12 Though both the company and non-company deposits are unsecured, depositors genera l ly have greater confidence in the company s e c t o r which e x p l a i n s the lo n g e r average d u r a t i o n o f deposits with them.
22.4.13 Cost of funds and comparison with bank rates: The itemsunder c o s t o f funds o f HPF companies are i n t e r e s t payment on d e p o s i t s , b rok era ge paid to a u th o r i s e d b ro k e rs through whom deposits are raised, advertisement expenses and deposit servic ing charges. Unincorporated units a lso incur these expenses, though
commissions paid to deposit canvassing agents and advertisement
expenses are small. For companies which raise deposits from the pub l ic , advertisements are compulsory as per the RBI Non-Banking F in a n c ia l Companies and M isce l la n e o u s ' Non-Banking Companies (Advertisement) Rules 1977 (see the Appendix to th is chapter).
22.4.14 Interest rates on deposits for banks and in HPF are
245

given in Table 22.7. The rates o f HPF companies are 4 to 6 per cent higher than those o f banks for term deposits . Non-corporate
HPF in s t i tu t io n s pay interest at rates about 7 to 10 per cent higher than those o f banks.
22.4.15 The weighted average interest rate o f the selected HPF companies for a l l periods in 1987 came to 14.81 per cent per annum and of the selected non-corporate units to 18.92 per cent per annum. In addit ion to the interest payments, the HPF in s t i tu t io n s also incurred other f in an c ia l cos ts as shown in Table 22.8. When these are added, the to ta l cost o f funds o f corporate units worked
out to 15.94 per cent o f deposits and that o f non-corporate units to 19.67 per cent. On the whole, the cost o f funds o f corporate units and non-corporate units was about 6 and 8 percentage points higher than that o f commercial banks.
22.4.16 No marked f l u c t u a t i o n s in the p e r i o d , c o s t and a v a i l a b i l i t y o f funds to HPF in s t i tu t i o n s were reported a f te r the RBI revised the deposit rates o f banks on 1st A pr i l , 1987. This i s ind ica t ive of a lack o f e f f e c t iv e n e s s o f bank rate p o l i c y on HPF.
22-5 Uses of funds
22.5.1 The funds o f HPF in s t i tu t i o n s mainly finance the road transport industry ( trucks , buses operated by private companies and individuals , l igh t commercial veh ic les and tax is ) and to a
smaller extent p r iv a t e c a r s , tw o -w hee lers and o ther consumer durables. Generally, HPF companies finance new v e h ic le s and used veh ic les that are for commercial use. HPF in s t i tu t io n s in the non-corporate sector mainly finance used v e h i c l e s , ta x is , cars , two and three-wheelers and household items.
246

22.5 .2 Uses o f funds o f eight selected HPF companies (two companies did not supply the balance sheets for 1986) given in Table
22.9 show that about 83 per cent o f the to ta l assets in 1986 was held in net current assets including stock on h ire , b i l l s purchased, cash and bank balances and loans and advances less current l i a b i l i t i e s and provis ion. Net block assets accounted for about 16 per cent o f the asset mix. Four companies had some investments, mostly in shares o f s i s t e r concerns and t o ta l investment was a n e g l ig ib l e one per cent o f assets . Similar d e ta i l s on the
uses o f funds o f the non-corporate sector are not furnished by the respondent inst i tut i o n s .
22.5.3 A user-wise ca tegor isa t ion o f stock on hire or a s ize - wise break-up o f HP cred i t i s not maintained even by the HPF companies. Information supplied on these points was only in general terras. The major share o f c r e d i t , as shown in Table 22.10, was for trucks /buses . This was followed by passenger cars and jeeps. These two items accounted for about ha l f the to ta l c red i t o f the selected HPF companies. Table 22.10 also shows the approximate
amounts o f c redit per veh ic le o f each type.
22.5.4 Hire charges o f companies varied across companies but not periods between 13 a id 15 per cent ( f l a t ) on new veh ic les during the three year period ending 1986. For used veh ic les not older than 7 years, a l l companies charged about two per cent more.
22.5 .5 The non-company s e c to r , on the other hand, charged d i f ferent rates during the three year period. Six firms charged 19 per cent , 20 per cent and 21 per cent f l a t per annum during 1984, 1985 and 1986 respec t ive ly . Four others charged 18 per cent, 19
247
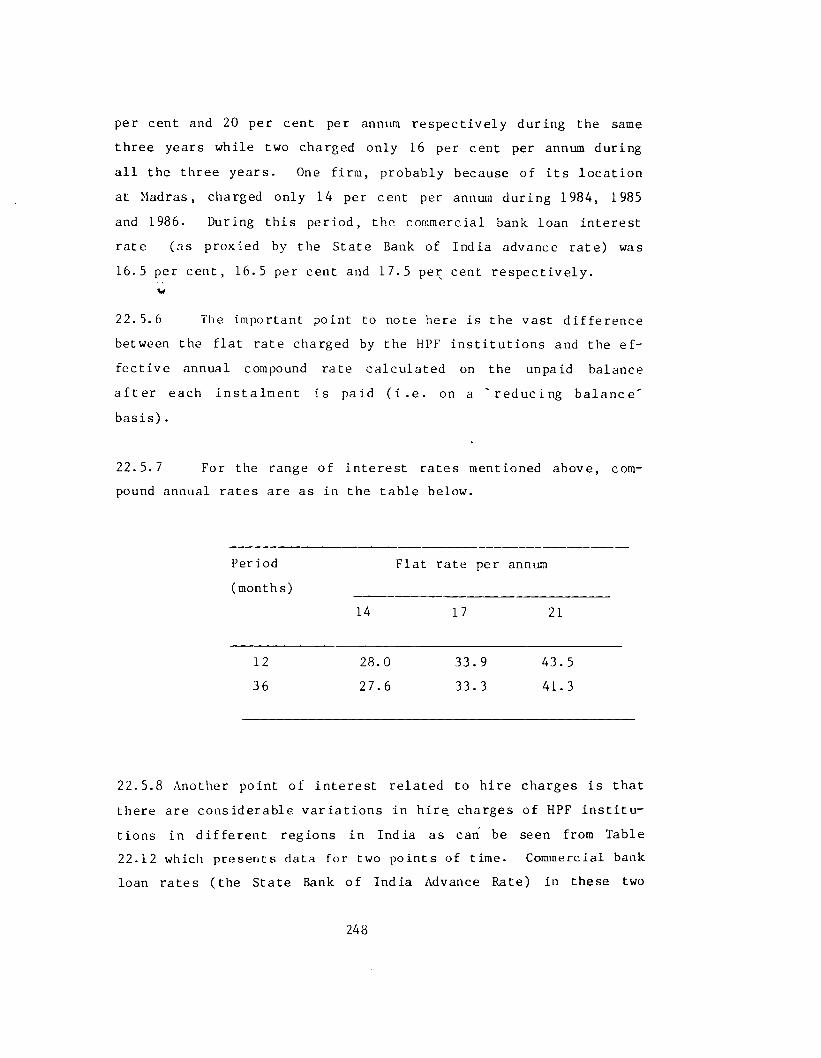
per cent and 20 per cent per annum resp ec t ive ly during the samethree years while two charged only 16 per cent per annum duringa l l the three years. One firm, probably because o f i t s l o ca t io nat Madras, charged only 14 per cent per annum during 1984, 1985and 1986. During this period, the commercial bank loan interestrate (as proxied by the State Bank of India advance rate) was16.5 per cent , 16.5 per cent and 17.5 per cent r e sp e c t ive ly ,
v
22.5.6 The important point to note here is the vast d i f f e re n ce between the f la t rate charged by the HPF in s t i tu t io n s and the e f f e c t iv e annual compound rate ca lculated on the unpaid balance a f t e r each insta lm ent i s paid ( i . e . on a ' r e d u c i n g b a l a n c e ' b a s i s ) .
22.5 .7 For the range o f in terest rates mentioned above, compound annual rates are as in the table below.
Per iod Flat rate per annum(months)
14 17 21
12 28.0 33. 9 43.536 27.6 33.3 41.3
22.5.8 Another point o f in terest related to hire charges i s that there are considerable var ia t ion s in hire, charges o f HPF i n s t i tu t ions in d i f f e r e n t regions in India as can be seen from Table22.12 which presents data for two points o f time. Commercial bank loan rates (the State Bank o f India Advance Rate) in these two
248

years (1970-71 and 1985-86) were 9.3 per cent and 16.5 per cent
r e s p e c t i v e l y .
22 .5 .9 In addit ion to hire charges, most HPF in s t i tu t io n s also
c o l l e c t serv ice charges (SC), addit ional f inance charges (AFC) and
incidental charges ( IC ) . The serv ice charge or management fee is usual ly a one time charge ranging between 0.5 per cent to 2 per cent o f the amount financed and is c o l l e c te d in advance before signing the agreement. AFC i s l ev ied , normally at 30 per cent simple interest per annum on each instalment for the number of days de layed in case de lay in payment. However, such AFC is
recovered at the time o f conclusion o f the contract or , i f i t is sett led ear ly or assigned to another party, on settlement or assignment.
22.5.10 B e s id e s AFC, in terms o f t y p i c a l c o n t r a c t s , an HP f inancier i s also en t i t led to recover the fo l lowing.
i . Reasonable transport expenses incurred in connection with inspect ion o f the asset and c o l l e c t i o n o f hire charges.
i i . Bank charges in cu rre d f o r c o l l e c t i o n o f o u t s t a t i o n cheques tendered by the h irer .
i i i . Insurance premium paid for taking out insurance p o l i c y .
i v . Repossession charges.
v. Tax, penalty, compounding fee, e t c . paid by the financ i e r .
v i . Repair charges i f any paid by the f inanc ier .
v i i . Reasonable se l l in g expenses incurred in connection with the sale o f the repossessed a s s e t .
v i i i . Legal expenses incurred in connection with f i l i n g of suit for recovery o f the dues.
249
22.5.11 HPF companies general ly f inance up to 75 per cent o f the invoice price o f new veh ic le s/goods and up to 60 per cent o f the market price for used veh ic les in good condit ion and not older than seven years. In other words, the h i r e r ' s margin is around 25 per cent to 40 per cent o f the price o f hired goods. Apart from t h is , the. HPF companies usual ly take a demand promissory note (DPN) from the h irer . There are ample provis ions in the HP agreement to r e p o s s e s s the goods hired in case the h i r e r de faults .
22.5.12 The s i tuat ion is s l i g h t l y d i f f e r e n t for non-corporate
units. These in s t i tu t io n s finance up to 80 per cent o f the actual pr ice ( f o r new veh ic les ) and up to 75 per cent o f the market price for old veh ic les . In addit ion to the hire purchase agreement, these in s t i tu t io n s also take a DPN for the amount financed from the hirer . The HP agreement is usually a t r i p a r t i t e agreement, the three part ies being the f inanc ier the hirer and the guarantor. The guarantor guarantees the fu l f i l lm e n t of a l l contract ob l iga t ions to the f inanc ier . It i s in addit ion to th is guarantor, that a hirer executes the DPN in many cases.
22.5.13 The l i m i t o f f i n a n c e f o r f in a n c e by n o n - c o r p o r a t eunits depends on, among other things,
a. the type o f the asset , i t s age and whether i t is ageneral purpose or a spec ia l purpose one,
b. the d u ra b i l i ty and marketabil ity o f the asset ,
c . i f used, the assets cond it ion and i t s market value,
d. the h i r e r ' s f inanc ia l standing and cred it rating inthe opinion o f the firm,
250
e. the f i n a n c ie r ' s appraisal o f the rate o f depreciat iono f the a s s e t .
22.5 .14 Duration of HP credit: The cred it period in hire purchase transactions i s genera l ly between 12 months and 60 months.
The maximum period of 60 months was o f fered by only one company in the corporate sector and two partnerships in the non-corporate sector . For others, the maximum period ranged between 36 months and 48 months. The minimum period was 12 months for a l l the HP
in s t i tu t ion s engaged in financing automobiles. Three HPF companies which financed household durables also extended finance for
s ix months. In both cases , most o f the transactions were forperiods between 24 months and 36 months.
22.5.15 Under the hire purchase system the hirer can terminate the contract during i t s currency, pay up hire money dues up to that period and return to the f inancier the asset in good order and cond i t ion , excepting for normal wear and tear . Hence i t i s essent ia l that the period o f the contract be much shorter than the economic l i f e o f the asset . Further, for companies, the maximum period for which public deposits can be accepted is three years. Thus, the nature o f the asset financed determines the maximum duration o f f inance an HP firm w i l l extend.
22.5.16 Because o f the many s a fe g u a rd s p rov ided in the HP agreement and the f i n a n c i e r ' s r i g h t to r e p o s s e s s the asset
f inanced in case o f default in payment o f instalments, bad debts are very small in HP transactions. There may be some overdues at
any point o f time but the arrears are general ly c o l l e c te d during the currency o f the HP agreement. Even in cases where the asset i s repossessed by incurring expenditure, the f inanc iers may not lose money as the value o f the repossessed asset , the paid up instalments and i n i t i a l margin invested by the hirer w i l l normally
251

cover the financiers' cost.
22.5.17 In some c a s e s , h i r e r s d e f a u l t on payments due to genuine d i f f i c u l t i e s as for example with new firms. In such cases, f inanciers show a sympathetic a tt i tude towards the h irers . The f inanciers may extend the hire period or reduce the monthly instalment amount. They may even extend further finance by executing fresh HP agreements cance l l ing the previous agreements. But in case the f i n a n c i e r s f e e l that there are r e g u la r and w i l l f u l
defaults by some h i re rs , steps are taken to enforce the hire purchase agreement. These in c lu d e reminders to the h i r e r s and guarantors and repossession o f the assets f inanced, i f necessary
through force .
2 2 .5 .1 8 Assessment procedure: HPF in s t i tu t io n s have severalmethods to assess the creditworthiness o f h irers . The in s t i tu tions never go e n t i r e ly by papers presented by the h irers . They assess the character o f the h ire r , his capacity to repay, his own
stake in the venture, the secur i ty o f fered and i t s marketabil ity and the pos i t ion o f the guarantor, gathering the requ is i te in f o r mation through personal enquiry, market enquiry and bank i n t e l l igence e s p e c ia l ly when the HP c re d i t is high and the parties are new. The papers they s cru t in ise include partnership deeds in case of partnership firms, f in an c ia l statements, income tax, wealth tax
and s a l e s tax assessment o r d e r s and p r o p e r t y s ta te m e n t . The f inanc iers cross check f igures presented in f inanc ia l statements
or information provided by the party through v i s i t s to the par ty 's place o f business or residence.
22.6 Cost of intermediation
22.6.1 We have noted in Table 22.8 that the average cost o f
252

funds o f the company sector among the HPF in s t i tu t i o n s is 15.50per cent o f borrowed funds and that o f the non-company sector18.20 per cent . Assuming that the ent ire borrowed funds are given as HP cred i t at an average f la t rate of 14.5 per cent per
annum (as was the case with the selected companies) or an e f f e c t ive rate o f 29 per cent per annum, the spread between the inter est paid and interest earned, comes to 13.5 per cent per annum.In the case o f non-companies, the spread works out to 18.80 per cent ( i n t e r e s t paid at 18.20 per cent and e f f e c t i v e i n t e r e s t earned at 37.0 per cent per annum). To determine the composition
o f the spread, component parts are f i r s t examined.
22.6.2 P r o f i t and l o s s a c c o u n ts o f .sample companies arepresented in Table 22.13. For one company the relevant figures are not ava i lab le for a l l three years. Deta ils o f income and expenditure o f another two firms are not avai lab le . P ro f i t s o f the selected companies showed a steady increase during the three years
except in the case of a leading company which incurred an increased expenditure due to quick expansion and heavy depreciation in 1986. The combined p r o f i t s o f the other 9 companies was Rs 76 lakh, Rs 123.6 lakh and Rs 192.5 lakh r esp ec t ive ly during the three year period ending 1986. The ra t io o f expenses to stock on hire (17.4 per c e n t ) , the average return on c a p i ta l before taxes (22.8 per c e n t ) , an assumed 20 per cent tax on pre-tax p r o f i t s , the cost o f borrowing (14.81 per cent) and the fact that r i sk cost for delayed payments i s low since i t handled by penal interest can
be used to decompose the interest rate . Assuming an opportunity cost o f own funds of 18 per cent we can compute the fo llowing
ra t ios to stock on h ire :
253

of stock % of totalon hire
I n t e r e s t c o s t on borrowed fu nds
O p p o r tu n it y c o s t o f own fu nd s
E s t a b l i s h m e n t c o s t
Risk premium ( a r b i t r a r y )
Economic re n t ( r e s i d u a l )
T o t a l l e n d i n g c o s t
10.93 2 . 11
6.37
0.50 (0 .56) 19.35
56.49 10.90 32.92
2. 58 (2 .89)
100
Our computations show that opportunity cost o f own and borrowed
funds is h ighest , while economic rent is absent.
22.7 Industry structure
22.7.1 The size d i s t r ib u t io n o f firms in the sample d i s t r ib u tion given in Table 22.16 shows that a l l but two o f the 13 non
corporate units were small with stock on hire l e s s than Rs 1 crore each. The two comparatively big units which were located in the c i t y o f Madras had s t o c k on h i r e between Rs 3 c r o r e and Rs 6 crore. Of the ten corporate units , two were r e l a t i v e l y small while seven were medium sized units with stock on hire ranging between Rs 2 crore and Rs 20 crore . One company was exceptional ly large with a stock on hire o f Rs 135 crore . The stock on hire o f a l l other companies put together was only about Rs 45 crore . This large company had a stock on hire o f Rs 47 crore even in 1980. Since 1960, th is company, 'Sundaram Finance Limited ' , with i t s head o f f i c e at Madras, has been the leader o f HPF in South India. In places where th is company has a branch, the f i r s t choice of a h irer o f veh ic les i s usually th is company. Of l a t e , another HPF company has started acquiring the pos i t ion of a leader in another
2 54
industr ia l town o f Tamil Nadu, Coimbatore. This HPF company, Sak- thi Finance Limited, had a stock on hire o f Rs 15 crore in March 1986.
22.7 .2 Interest rates on deposits in the case o f non companies, show some var ia t ion ranging from one to three percentage points between d i f f e r e n t centres and firms. The hire charges o f companies are genera l ly around 14-15 per cent f la t rate per annum. In the c i t y o f Madras there is a uniform rate o f 14 per cent f la t for a l l new v e h ic le s , a rate f ixed by the market leader for i t s
c l ienLs . Competition in business forces even non-corporate units to charge the same rate in Madras, although outs ide Madras they
charge at h igher l e v e l s . The var ia -t ion in h i r e charges o f se lected HPF in s t i tu t io n s i s shown in Table 22.17. Hire charges generally do not move up or down with reduction or expansion in the supply o f funds o f HPF companies.
22.7 .3 No hurdles are there e ither in entering the market or leaving i t except for a v a i l a b i l i t y o f f inance and some market fam i l ia r i ty . As has been seen, the HP business has been growing r a p i d l y in recent yea rs . O v e r a l l , the ev id ence o f a market
leader , coupled with r e l a t i v e l y free entry, suggests a market structure cons is t ing o f a dominant firm with a competit ive fr inge .
22.8 The Delhi Case Study
22.8.1 Seven HPF companiesgrowing centre of HPF, to f ind d i f fe rences ex ist . While f irms
were examined in Delhi, a fast out i f substantial interregional in the unorganised sector were
255

also approached, no cooperation was forthcoming, a feature probably due to the r e la t iv e recency o f most f irms. While no important d i f fe rences came to l i g h t , the main findings are nevertheless reported on below.
22.8 .2 Sources of funds: companies in sample: As can be seenfrom Table 22.17, firms in the sample had, on average, the same ratio o f borrowed to owned funds (Column 12) as prevailed at the All India le v e l though the d ispers ion is high. Other d e ta i l s are as f o l l o w s . The t o t a l net owned fund o f HP companies in the sample ,Vas Rs. 294.97 lakh (average: Rs. 49.16 lakh) . The net
owned funds range from Rs. 1.47 lakh to Rs. 115 lakh. All six
companies borrowed money from indiv iduals to the tune o f Rs. 1151
lakh, which represents 86.48 per cent o f the t o t a l borrowing. The remaining 13.52 per cent is borrowed from banks. None o f them borrowed from other f inanc ia l in s t i tu t io n s or non f inanc ia l ins t i tu t ions .
22.8.3 The term structure o f borrowed funds from individuals is given In table 22.18. All s ix companies o f fe r e d the maximum permissible interest rate for companies as fixed by RBI on 1.4.87. That rate is 12 per cent for s ix months, and 14 per cent for one, two and three years (Table 22 .18) . Around 45 per cent o f the deposits are o f one year duration, 40 per cent are o f two and three years duration and the rest are o f s ix months duration. Thus, on average, deposits remain for longer periods with the older South Indian firms.22.8.4 The structure o f interest paid on borrowed funds can be seen in Table 22.19 where the estimated ra t io o f t o ta l in terest
paid ( in Rs. lakh) to borrowed funds is given' in column 3 o f the table. The fact that the r a t io o f interest payments to borrowed funds is l e s s than the weighted ra t io o f quoted interest rates i s
256

ind irec t evidence o f growth o f deposits during the year. The growth rate worked out using th is discrepancy is a remarkable 103
per cent on the assumption o f a uniform rate o f growth during the year .
22.8.5 The average p er iod o f d e p o s i t i s around one year. Five companies borrowed from banks at 16.5 per cent interest per annum. In f a c t , H.P. companies are ready to pay more on deposits i f the RBI permits them to do so. Their argument here i s that, since they are ready to pay 16.5 per cent per annum to banks, why not to individuals? The low rate o f in terest may be a partia l reason for the low ra t io o f deposits to net owned funds as compared to the statutory c e i l i n g .
22.8 .6 Reasons for investing own funds in hire purchase: Basedon the interviews, the two important reasons for investing money in the HP business i s high return on investment and low r isk due to a complete absence o f permanently bad debts. In the opinion
o f HP companies, the return on own funds can be as high as 50 per cent though subject to f lu c tu at ions . When we analysed the p ro f i tg iven in the ba lance shee ts however (See Table 2 2 . 2 3 ) , theaverage rate o f return worked out to be just 13.29 per cent ( fo rthree firms) . However the average rate o f return may be low because o f two r e l a t i v e l y new firms in the sample. The one old reporting company had a return o f 27 per cent .
22.8.7 Overal l , loan terms reported in Delhi were similar tothe South India study. The s p e c i f i c a t t rac t ion s o f v e h ic le loans (the major category) are as f o l low s : ( i ) the investment is safe ; ( i i ) only medium term loans are needed; ( i i i ) the number o f borrowers i s kept within l im its as the average loan size is large
257

re la t iv e to loans for consumer durables, ( i v ) due to the large average loan size there are economies o f scale to be garnered in transactions c o s t s .
22.8.8 Brokerage: The main source o f borrowed funds is depositsreceived from friends and r e la t iv e s . Two companies get depositors through brokers- The brokerage reported on one year, two year and three year deposits are resp ec t ive ly 1 per cent, 1.25 per cent and1.5 per cent o f the depos i ts .
2 2 . 8 . 9 Bank borro w in g s: HP companies are a b le to o b t a inrefinance from banks at 16.5 per cent per annum. Banks f i x bor
rowing l im its for each company ( f o r six out o f seven companies). Though these l im its are large r e la t iv e to to ta l HP loans made (Rs. 3 crore in one case) they are used only i f in s u f f i c i e n t deposits growth re la t ive to new business is faced in any period.
22.9 Uses of funds
2 2 .9 .1 Sector-w ise break-up: Five companies lend on ly tofinance commercial veh ic les . One o f the remaining two companies finances only non commercial v e h ic le s . The seventh firm financescommercial v e h i c l e s , non-coramercial v e h i c l e s and consumer/durables*.' Of commercial veh ic le f inanc ie rs , four firms financed new and old veh ic les and one firm financed only old v e h ic le s . The prevalence o f old veh ic le f inance in Delhi i s about the only con
trast with South India s ince , in South India, o ld veh ic le f inance is l imited . The to ta l funds ava i lab le to the f iv e firms lending for commercial v e h i c l e s only is Rs. 1529.97 lakh. This cons t i tu te s 94.1 per cent o f the business o f s ix companies for which data are ava i lab le .
258
2 2 .9 .2 Structure of loans given (Terms): The structure o f loansvaries from company to company though certa in aspects are common
to a l l f irms. The interest rate charged on new veh ic les loan is from 14 per cent to 16 per cent ( f l a t ) . Most firms charge 14 per cent to 15 per cent f l a t in the case o f new commercial veh ic les . In the case o f old v e h ic le s , however, rates vary between 16 per cent to 20 per cent f l a t due to the p o s s i b i l i t y o f bankruptcy on the part o f borrowers i f the veh ic le f inanced turns out to be a
' lemon ' (however no such cases were reported) . Loans are given for 12-36 months with monthly equated loan repayments.
22.9.3 In the case o f household durables, the interest rate is 18 per cent to 20 per cent per annum with 12 to 18 monthly instalments .
22.9.4 Firms advance 50 per cent to 75 per cent o f the cost o f veh ic les (50 per cent or 60 per cent in the bulk o f cases ) , tlfie rest being financed by the purchaser. On durables, 50 per cent to 70 per cent o f the cost o f the item is f inanced. Durables
include T.Vs ., r e f r ig e r a to r s , video recorders , a i r - c o n d i t i o n e r s , and furniture . Terms observed in Delhi were much as in South In- d i a .
22.9 .5 Differences in collateral requirements: HP companiesin Delhi showed, once again, no important d i f f e re n ce s in c o l la te ra l requirements as compared with South Indian companies.22.9 .6 Overall , there i s l i t t l e observable d i f f e r e n c e between HPF in Delhi and in various centres in South India.
22.10 Users of HPF institutions
22.10.1 In order to assess the usefulness o f the HPF in s t i tu
259

t ions to their c l i e n t s , we interviewed, in South India, a few users o f these in s t i tu t io n s and e l i c i t e d information through a
separate questionnaire. In a l l twelve questionnaires , seven from depositors and f ive from borrowers, were canvassed.
22.10-2 Depo sitors: All the seven depos i tors were employed - twoadvocates, one doctor , one p ro fessor , one auditor and two private o f f i c e employees. Four were in the monthly income bracket o f Rs3,000 and above while three were in the Rs 2,500 to Rs 3 ,000 bracket. All o f them maintained bank balances. Deposits with HPF
companies varied from 20 per cent to 70 per cent o f the ir f inan
c ia l investment. The rates o f in terest they got on their invest ments which were for one to three years were 8 ' per cent per annum from banks and L4 per cent per annum from HPF companies. Three o f them received interest monthly, the rest quarterly. Interest payments were regular. Five o f the seven depositors were regular depositors with HPF companies. When the ir e a r l i e r term deposits matured, they renewed them. Two were deposit ing for the f i r s t time. On the whole, there was no complaint regarding payment by the c r e d i t o r s .
2 2 .1 0 .3 Borrowers: Four o f the f i v e borrowers were in themonthly income bracket o f Rs 1000 to Rs 2000. One belonged to the bracket o f Rs 4000 and above per month. Two were auto-rickshaw d r ivers , one a truck operator another a l i g h t commercial veh ic le
operator and the last one a tourism consultant. The HP c re d i t o f the v e h i c l e o p e r a t o r s v a r ie d from Rs 20000 to Rs 40000. The tourism consultant took Rs one lakh HP cred i t to buy two tourist
ta x is .
22.10.4 The HP cred i t operat ions o f the f iv e h irers are shown in Table 22.18. Four o f them were s e l f employed owner dr ivers who
260

did not get finance from banks as the vehicles were old. They got the necessary finance from HPF institutions without much d if
ficu lty on hire basis and the hire charges were comparable with those of HPF companies. The hirers did not mention any complaint
against the financiers although they wished the hire charges were lower. When asked about views of HPF, borrowers were complimen
tary. Some were refused bank finance. We may quote the words of a hirer, Mr. Kannappan; " I approached a bank. The manager said that the bank is not giving loans to buy second hand vehicles even though my request was for a five year old good veh icle ."
22.10.5 In sum, the view of users of HPF institutions are that these institutions serve both depositors and hirers. Some hirers say that these institutions are their* only source of credit, as banks turn down their request for loans because of collateral restrictions. However, hirers wish that the hire charges were lower. High hire charges some in the way of regular repayments.
22.11 Estimate of overall size
22.11.1 Data on total hire purchase credit extended by com
panies and non companies in India are not available for any year.The RBI data cover only the number of reporting HPF companies andthe deposits' with them. Credit extension by companies is treated as beyond the scope of RBI study. When this is the case with the better organised company sector, the position of unorganised non
company sector can well be imagined.
22.11.2 An estimate of HPF institutions in India (Nayar 1984),
made with the help of the Federation of Indian Hire Purchase Associations (FIHPA), put the number at 2500 by March 1984. About half of this number were members of regional associations of the
261

Federation. The same source puts the to ta l HP cred i t outstanding to the road transport industry by a l l HPF in s t i tu t io n s in 1982-83 at Rs 750 crore . Annual extensions o f c red i t were put at about one-third o f the outstandings. Thus the extension o f HP cred it by HPF in s t i tu t io n s in 1982-83 was o f the order o f Rs 250 crore . According to information gathered from the FIHPA, the growth rate in the number of HPF in s t i tu t i o n s in the 1980's was around 10 per cent per annum and in stock on hire around 20 per cent per annum. On this basis the number o f HPF in s t i tu t io n s and the stock on hire with them at the end o f March 1987 would come to 3327 and Rs 1555
crore r e sp e c t iv e ly . The annual extension*of HP c red i t in 1987, at one-third o f outstandings, was thus Rs 518 crore . This method o f
e s t im a t io n has i t s own l i m i t a t i o n in th$ sense that both the growth percentages are based on im press ion ist ic views.
22.11.3 We may apply another method by using the RBI data on number o f HPF companies and depos i ts held by them. In table 22.1,
we have seen that the growth rates o f companies and their deposits in the 1980's were 16.77 per cent and 22.79 per cent per annum respec t ive ly . Thus, in 1987, there were 481 companies with t o ta l deposits o f 343 crore ; g iv ing an average o f Rs 0.71 lakh per company. If we apply the RBI growth rate o f 16.77 per cent per annum to the to ta l number of 2500 HPF in s t i tu t io n s as estimated for March 1984, the number of such in s t i tu t i o n s at the end o f March 1987 would come to 3 981. Now i f we apply the per company deposit of Rs 0.71 lakh to these 3981 in s t i t u t i o n s , the to ta l deposits outstanding with them wi l l come to Rs 2827 crore .
22.11.4 From f i e l d data ( ta b le 22.3) we have seen that stock on h i re or HP c r e d i t o u ts ta n d in g was higher than o u ts ta n d in g depos i ts . For the 10 South Indian companies, c re d i t was 31.55 per cent higher than deposits in 1986. For a l l the 29 South Indian
262

HPF in s t i tu t io n s for whom data was av a i lab le , this percentage was 37 .44 . C r e d i t / s t o c k on h ire was about o n e - t h i r d higher than deposits . On this reckoning, the c re d i t outstanding with the 3981
HPF in s t i tu t io n s would come to Rs 37591 crore in 1987.
22.11.5 The estimates given above, however, does not includecred it to transport operators by the formal banking sector . Because o f the d i f f e re n ce s in the mode o f f inancing and ca lculat ion o f in teres t , bank loans are treated separately . The relevant data shown in Table 22.14 show that bank finance outstanding under
transport operators was Rs 1895 crore as at the end of June 1986.
In bank finance a lso , in the absence o f year-wise d e t a i l s o f d is bursals , the annual credit extension may be about one-third of the out stand ing s .
*
22.12 Influence of formal sector leading rate/loan availability on business
22.12.1 Evidence .has been given ea r l i e r that bank and HP loan
rates do not necessar i ly move together in the short run though there is some evidence o f their moving together in the long run.
Thus with the current leve l o f involvement o f banks in financing v e h i c l e s , t h e r e i s l i t t l e or no e f f e c t o f movements in bank charges on HP. However, as many HP c l i e n t s are those who were refused cred it or were i n e l i g i b l e for c red it from banks, a slackening o f c re d i t rationing by banks i s l i k e l y to have an impact on the volume o f HPF.
22.13 Equity impact
22.13.1 In the matter o f transport loans, the major c r i t e r i o n o f banks i s i n d i v i d u a l / s e l f employed o p e r a t o r s or small s i z e f irms. This i s seen in the number o f borrowal accounts o f public
263

sector banks under the category, transport operators which stood at 5,94,000 at the end o f June 1986. But while concentrating on small borrowers, banks leave aside many large transport operators . These operators get f inance large ly from HPF in s t i tu t i o n s . Thus,the impact o f HPF on poorer sect ions Is l imited to any benef it from employment g e n e r a t i o n by la r g e o p e r a t o r s . However, the finance o f used veh ic les for small operators (see the chapter on auto f inanciers in Namakkal) suggests that the entire sector may have a p o s i t iv e equity impact.
22.14 Efficiency and allocative impact
22.14.1 We have examined in another chapter (Auto Financiers in Namakkal) the e f f i c i e n c y impact of auto finance corporat ions . Such f inanc iers give sustained l i f e for used veh ic les which otherwise would have been scrapped. It i s a fact that in India almost a l l the commercial veh ic les on the road are there because there is
some f inanc ier or the other to f inance the purchase. HP c le a r ly
contr ibutes to a healthy transport economy and in d i r e c t ly , the automobile industry.
22.14.2 Why do transport operators or the h irers in general turn to HPF ins t i tu t ion s in sp i te o f the fact that bank finance is cheaper? An a r t i c l e in the Reserve Bank o f India Bulletin gives the answer. "Credit squeeze imposed by the Reserve Bank coupled with the reluctance on the part o f commercial banks to expand
their hire purchase advances p o r t f o l i o , in part icu lar against second hand v e h ic le s , as a lso the cumbersome form al i t ie s required to be complied with before obtaining bank finance have given a f i l l i p to the growth o f HPF companies (RBI B u l le t in , June 1983). Stated d i f f e r e n t l y , the o p e r a t i o n a l e f f i c i e n c y i n c l u d i n g e f f i c i e n c y o f HPF in s t i tu t io n s as counted by h i r e r s , includes few
264

defaults , easy access , minimum form al i t ie s , quick a v a i l a b i l i t y , finance for used ve h ic le s , courteous service and finance for more
than one veh ic le at a time. Final ly , i t is c l e a r ly inappropriate
to impute p o l lu t ion and congestion costs to f inanc ia l ins t i tu tions .
22.15 Impact on savings mobilisation
22.15.1 In savings m obi l isat ion , the ro le o f HPF ins t i tu t ion s is akin to that o f other non banking f inancial companies. All o f
these pay rates o f interest f ixed by the RBI on deposits which are about three to four percentage points higher than those o f banks.
Hie fact that most HPF i nst itut ions* use mainly borrowed funds in the ir business indicates that substant ial funds are mobilised. I f higher interest rates in f luence the saving rate then there should be some addit ive saving impact even i f It cannot e as i ly be estimated .
22.15.2 One innovative method of ra is ing deposits by an HPF company may be noted here. The company accepts f ixed deposits for various periods by o f fe r in g the maximum permissible rate of 14 per cent per annum uniformly for one, two or three years. It not only pays monthly interest but also sends post dated monthly interest warrants for the whole deposit period in advance along with the deposit receipt . Certain formal sector banks have copied this method. This company accepts even outstat ion cheques at par and
sends refunds, interest payments e t c . , to c l i e n t s who can encash the same at par. On the whole , a d e p o s i t o r is t r e a te d as an honoured guest and extreme care is ' taken not to displease him. Since reduced transactions cos ts lead to higher e f f e c t i v e interest r a t e s to d e p o s i t o r s , the argument o f the l a s t paragraph i s strengthened by such prac t ices (s ince th is chapter was written,
265
issuance o f post-dated interest warrants has been taken up by some formal sector i n s t i t u t i o n s ) .
22.16 Complementarity/substitutability with formal finance
22.16.1 Before we take up the question o f whether c red i t from HPF in s t i tu t io n s i s complementary to or a substitute for formal sector f inance, we may examine the supply o f c red i t to transport operators who are also major c l i e n t s o f HPF in s t i t u t i o n s , by the formal banking sector . Banks have extended substantial c red it to transport operators under the head ' p r i o r i t y sector c r e d i t ' since 1969 when the major commercial banks in India were nat ional ised .
The number o f borrowal accounts to transport operators in 1985 was 47 times the f igure in 1970. S imilarly , outstanding c red it rose by 68 times between 1970 and 1985. The incremental credit , during the 15 year period ending 1985 was o f the order o f Rs 1867 crore.
22.16.2 Banks usually extend cred it at subsidised rates to s e l f employed and small t r a n s p o r t o p e r a t o rs under the head ' p r i o r i t y sector advances' . They may also finance f l e e t owners and large commercial operators at the maximum lending rate. Besides banks, SFCs also finance transport operators . But the to ta l disbursal o f transport loans by the organised sector representing banks and SFCs i s not s u f f i c i e n t to meet the ent ire demand of t ranspor t o p e r a t o r s in the c o u n tr y . In f a c t , the supply o f f inance by banks in 1985-86 to transport operators appears to be very small as compared to the t o ta l demand which was estimated at
around Rs 1500 crore per annum for commercial ve h ic le s alone in 1984-85 (Nayar 1984). The organised sector is also known to have large overdues from transport loans and therefore the outstandings shown in Table 22.14 cannot tru ly r e f l e c t the volume o f f inance extended by the banks year a f ter year. In the absence o f year-
266

wise d e t a i l s o f d isbursals , the d i f f e re n ce s o f two year end outstandings w i l l give some ind icat ion o f a part icu lar year 's disbur
sal- In spite o f the low cost o f borrowing, a bank loan is not available to a l l those who apply for i t . There may also be delays
in gett ing a loan. Many transport operators therefore turn to HPF in s t i tu t io n s to meet their requirements. F inal ly , banks give l imited finance to used ve h ic le s .
22.16.3 With the d i f f e r e n c e that banks have greater d i f f i c u l t y in impounding veh ic les in case o f default and the alleged strong
arm t a c t i c s o f HPF firms, there appears to be no d i f fe re n ce between bank and HP c o l l a t e r a l requirements for veh ic le hire pur
chase. This i s str ik ing in view o f the vast d i f f e re n ce s between HP and bank interest rates. This is addit ional ind irec t evidence o f bank cred i t rat ioning .
22.16.4 To the extent that banks refinance HPF in s t i tu t io n s , bank and HP cred it are c l e a r ly subst itutes . Overall , however,
given the current low le v e l s o f bank finance and refinance and the l im i t e d c l a s s o f borrowers they f in a n c e , HP c r e d i t c u r r e n t l y complements bank c r e d i t . The two cannot be said to compete for the same segments o f the veh ic le f inance business.
22.17 Recommendations for regulatory framework
22.17.1 The deposit acceptance a c t i v i t i e s o f HPF ins t i tu t ion sare c o n t r o l l e d by the RBI and are observed as fu n c t i o n i n g smoothly. But hire purchase transactions in India is not covered under an Act. An Act c a l l e d the Hire Purchase Act, 19 72 (No. 26 o f 1972) was passed by Parliament and i t also got the assent o f
267
the President on the 8th June, 1972. The Act de f ines the various terms associated with hire purchase transactions, sets out warrant ies and condit ions implied in every hire purchase agreement in
favour o f the hirer including t i t l e , qua l i ty , e t c . , o f the hired goods, and s p e c i f i e s l im its on hire purchase charges. It also deals with the r ights and o b l ig a t io n s o f the h irer as well as the owner ( f in a n c ie r ) and s p e c i f i e s condit ions under which the owner can terminate the hire purchase agreement. However th is Act has not been enforced so far . It i s reported that the Act, formulated about a decade and a ha l f back, requires m odif icat ions . We recom
mend that the Act be e n fo r ce d without d e lay with s u i t a b l e
modificat ions . Among other things, the need for an interest rate c e i l in g , given the market structure o f the .sector , should be carefu l l y re-exaaiined.
22.17.2 It is also suggested that banks ser ious ly evaluate thep o s s i b i l i t y o f concess ional refinance o f concessional p r i o r i t y sector advances by HP firms given their obvious absolute advantage in the provis ion o f c red i t to transport operators . In fa c t , banks may consider stepping out o f the market a ltogether . However, to prevent malpractices , Reserve Bank scrut iny and enforcement of the HP Act are e s se n t ia l .
22.18 Summary of main points
22.18.1 The sources o f funds o f HPF in s t i tu t io n s are (a) capital and reserves, (b) deposits from p ub l i c , ( c ) borrowings from banks and other formal f inanc ia l in s t i tu t io n s and (d) repayments made against hired goods.
268
22.18.2 The corporate units maintain high own funds posit ion to be e l i g i b l e to r a i s e la rg e p u b l i c d e p o s i t s . Own funds and
d e p o s i t s o f a o n - c o r p o r a t e u n i t s are not r e l a t e d by o f f i c i a l regulation. Non-corporate units had a higher own funds posit ion than that o f companies.
22.18.3 Banks also extend credit to transport operators and such cred it has grown s izeably since 1969. Technical ly , banks' c red it to transport operators i s not on hire purchase basis but on hypothecation o f veh ic les . Banks charge interest on loans on out
standing balances only, against the f la t rates o f HPF in s t i tu t ions. Thus bank cred i t i s cheaper than HP c re d i t .
22.18.4 The ra t io o f borrowed to owned funds o f HP companies surveyed is approximately 3:1. This i s much below fhe statutory c e i l in g of 10:1.
22.18.5 Most deposits by indiv iduals with IIP companies are of one year duration and earn interest at the statutory c e i l i n g rate.
HP companies are w i l l ing to pay higher rates . Some deposits were mobilised through brokers.
22.18.6 Banks refinance HP companies upto a l imited extent.
^ 2 . 1 8 . / A share o f deposits with HP firms are from outside the
immediate geographical area, suggesting a degree o f market integration greater than a p r i o r i expectat ions .
22.18.8 Owners o f f irm s found HP a t t r a c t i v e due to highreturns (with in terest rates upto 41 per cent per annum) and low r isk . The low r i sk resulted from the fact that HP agreements were
269

secured by h y p o t h e c a t i o n and g u a r a n t e e s .
22.18.9 Most HP companies in the sample financed commercial veh ic les . Both new and old veh ic les were financed, the la t t e r at higher interest rates and margin. Non commercial veh ic les and consumer durables were also financed.
22.18.10 HP companies tend to f inance large commercial veh ic le operators whereas banks finance smaller operators .
22.18.11 The to ta l disbursal of transport loans by banks is not s u f f i c i e n t to meet the demand o f t r a n s p o r t o p e r a t o r s in the country. Thus, many transport operators turn to HPF in s t i tu t io n s
which complement in a large measure the supply o f c r e d i t o f banks to this v i t a l sector .
22.18.12 The number o f HPL; In st i tut Lons and the s t o c k on h i r e
with them at the end o f 1987 in India are estimated at 3327 and Rs 15552 mil l ion r e sp e c t ive ly . About one third of outstandings is
estimated as annual cred it extension. Thus annual c re d i t exten
sion was about 5184 m il l ion in 1987.
22.18.13 An Act ca l led the Hire Purchase Act 1972 was passed by Parliament and i t received the assent o f the President on 8th June, 1972. It has not so far been enforced. We recommend that the Act may be enforced without delay, i f necessary with some
modificat i o n s .
22.18.14 Banks should also consider stoppage o f d i r e c t f inance o f transport operators .
270

TABLE 22.1
Growth Rate of Hire Purchase Companies andTheir Deposits in India
Year ( ending March)
Number of companies report ing depos i ts
Annual growth rate o f companies
(%)
Amount o f depos i t s (Rs .
crore)
Annual growth rate o f deposits
(%)
Compound average annual growth
rate (%)No. o f companies
Amount o f deposits
1962 113 - 10.9 -1963 136 20.35 12. 1 11.011964 140 2.94 14.8 22.311965 112 -20.00 14.1 -4.731966 123 9.82 14.4 2.131967 143 16.26 16.5 '14. 581968 135 -5 .59 14.8 -10.301969 129 -4.44 18.8 27.031970 112 -13.18 18.8 0.01971 137 22. 23 2 5. 1 33. 51Growth Rate Between 1961 and 19711972 140 2.19 25.3 0.801973 122 -12.86 25.8 1.991974 162 32. 79 31.9 23.641975 200 3.46 40. 1 25. 711976 237 18.50 45. 2 12. 721977 245 3.33 53. 2 17.701978 223 -8.43 60.5 13.721979 222 -0 .45 7.0 15. 701980 254 14.41 91. 1 30. 141981 V 276 8. 66 U 1 .3 22. 17Growth Hate Between 1971 and 19811982 247 -10.51 133. 3 19.771983 209 -15.38 157.9 18.451984 302 44.50 138.4 -12.351985 354 17.22 280.3 102.531986 412 16.38 279.3 -0 .36Growth Bate Between 1981 and 198619871 481 16.77 343.0 2,2.79
0.41 7.59
8.31 18.07
16.77 22.79
1 Projected using the growth rate between 1981 and 1986.
Source: Growth o f Deposits with Non-Banking Companies, Reserve Bank o f India Bul le t in , Various Issues.
271

TABLE 22.2
Membership of Federation of Indian Hire Purchase Finance Institutions (1986)
S. Name o f member assoc ia t ion ApproximateNo. number o f
members o f each associ- t ion
1. Hire Purchase Assoc ia t ion , Calcutta - 700 001 50
2. Jammu and Kashmir Motor Financiers ' Assoc ia t ion , 50Jammu (Tawi)
3. South India Hire Purchase Assoc ia t ion , 460 *Madras - 600 00 2
4. Upper India Hire Purchase Assoc ia t ion , 120New Delhi - 110 002
5. Western India Hire Purchase Assoc ia t ion , 50Bombay - 400 001
6. Punjab and Haryana Finance Companies Assoc ia t ion , 130Jullundur City
7. Kanpur Financiers Associat ion , Kanpur - 208 012 50
8. Andhra Pradesh Hire Purchase Assoc ia t ion , 50Hyderabad - 500 029
9. Krishna D is t r i c t Auto Financiers Assoc ia t ion , 150Vijayawada - 2
TOTAL 1110
1 : Of these, 306 are in Madras c i t y and surrounding areas.
272
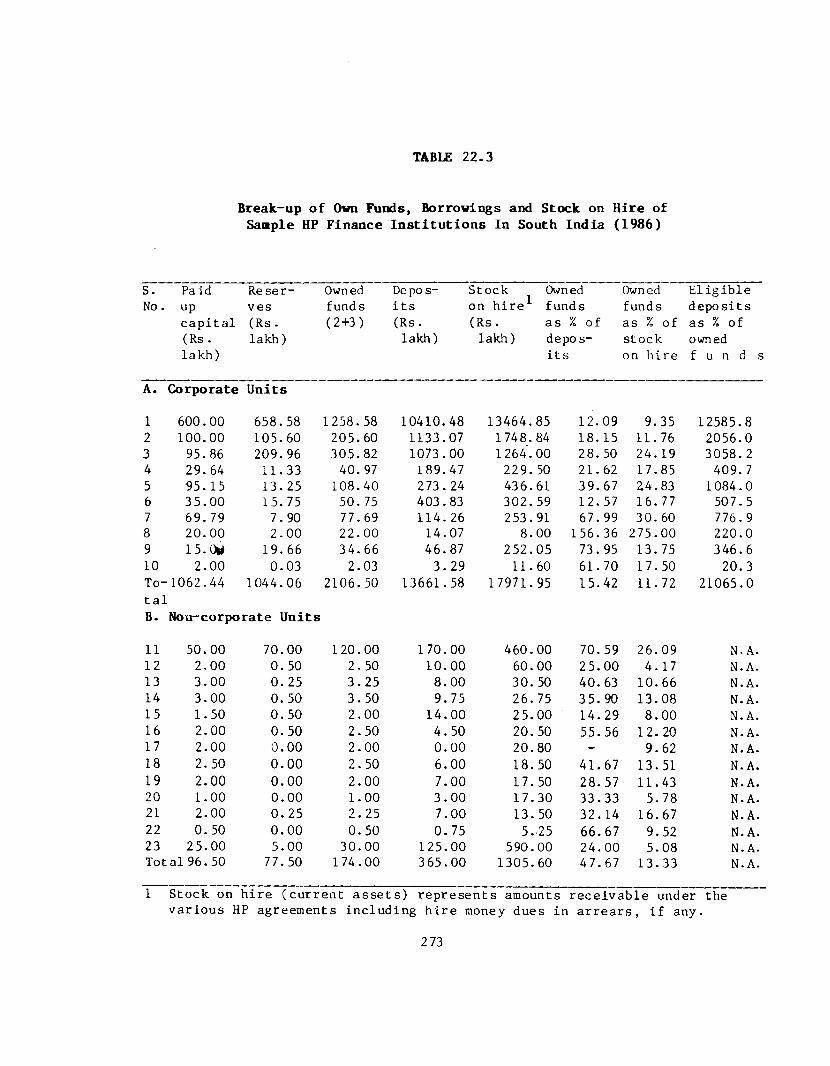
TABLE 22.3
Break-up of Own Funds, Borrowings and Stock on Hire of Sample HP Finance Institutions In South India (1986)
S.No.
Paidupc a p i ta l (Rs . lakh)
Re serves (Rs. lakh)
Ownedfunds(2+3)
De po s- i t s (Rs.
lakh)
Stock Owned on hire^ funds (Rs. as % o f
lakh) deposi t s
Owned funds as % o f stock on hire
El ig ib le deposits as % o f owned f u n d s
A. Corporate Units
1 600.00 658.58 1258. 58 10410.48 13464.85 12.09 9.35 12585.82 100.00 105.60 205.60 1133.07 1748.84 18. 15 11.76 2056.03 95.86 209.96 305.82 1073.00 1264.00 28. 50 24.19 3058.24 29.64 11. 33 40.97 189.47 229. 50 21.62 17.85 409. 75 95. 15 13.25 108.40 273.24 436.61 39.67 24.83 1084.06 35.00 15.75 50. 75 403.83 302.59 12. 57 16. 77 507.57 69. 79 7.90 77.69 114.26 253.91 67.99 30.60 776.98 20.00 2.00 22.00 14.07 8.00 156.36 275.00 220.09 15 .0M 19.66 34.66 46.87 252.05 73.95 13.75 346.610 2.00 0.03 2.03 3. 29 11.60 61. 70 17.50 20.3To•1062.44 1044.06 2106.50 13661.58 17971.95 15.42 11.72 21065.0t a lB. Non-corporate Units
11 50.00 70.00 120.00 170.00 460.00 70.59 26.09 N.A.12 2.00 0.50 2. 50 10.00 60.00 25.00 4. 17 N. A.13 3.00 0.25 3.25 8.00 30.50 40.63 10.66 N.A.14 3.00 0.50 3. 50 9.75 26.75 35.90 13.08 N.A.15 1.50 0.50 2.00 14.00 25.00 14.29 8.00 N.A.16 2.00 0.50 2.50 4.50 20.50 55.56 12. 20 N.A.17 2.00 0.00 2.00 0.00 20.80 - 9.62 N.A.18 2. 50 0.00 2.50 6.00 18.50 41.67 13.51 N.A.19 2.00 0.00 2.00 7.00 17.50 28.57 11.43 N.A.20 1.00 0.00 1.00 3.00 17.30 33.33 5.78 N.A.21 2.00 0.25 2.25 7.00 13.50 32.14 16.67 N.A.22 0.50 0.00 0.50 0.75 5.-25 66.67 9.52 N.A.23 25.00 5.00 30.00 125.00 590.00 24.00 5.08 N.A.Total 96.50 77.50 174.00 365.00 1305.60 47.67 13.33 N.A.
1 Stock on hire (current assets ) represents amounts rece ivab le under the various HP agreements including h ire money dues in arrears, i f any.
273

TABLE 22.4
Trend in Growth of Deposits with Sample South Indian EPF Institutions (1981 to 1986)
S.No. 1981 1982 1983o f i n s t i tut ions
A. CORPORATE UNITS
1 3546. 47 4519..66 5910..002 200. 69 293.,51 440.. 713 348. 00 509..00 667.,004 0. 00 35..92 47., 185 0. .0 0.,00 0.,006 0. 00 8., 74 18. 877 0. 00 0.,00 0..008 0. 00 0.,00 6. 609 28. 17 32., 92 35.,9010 2. 23 ic. «, 25 2. 53SUBTOTAL 4125. 56 5402..00 7128..79
B. NON-CORPORATE UNITS
11 75. 00 90..00 100. 0012 7. 00 8., 50 9. 0013 7. 00 8. 00 10. 0014 7. 00 7..35 7. 9015 11. 00 12. 00 12. 5016 1. 00 1 .. 50 9 2517 0. 00 0.,00 0. 0018 5. 00 7 _.00 1 / . 0019 4. 00 5., 25 5. 0020 3. 00 3. 50 3. 9021 5. 00 5., 25 5. 7522 0. 00 0.. 50 0. 5023 0. 00 o.,00 75. 00SUBTOTAL 125. 00 148..85 238..80
TOTAL 4250. 56 5550..85 7367..59
( Amoun t in Rs . 1 akh)
1984 1985 1986 Compoundaverage annual growth rate (%)
7163. 00 8649. 06 10410..48614. 63 843. 27 1133.,07783. 00 908.,00 1073..0072. 67 131. 33 189..4722. 53 79., 70 2 73., 24
109. 21 297. 58 403..830. 00 39. 05 114.. 26
13. 18 13. 46 14.,0740. 10 41. 68 46.,87
2. 66 2. 98 3., 298820. 98 11006..11 13661..58
112.00 135.00 170.0010.00 10.00 10.00
9. 25 8. 50 8.006.50 8.45 9.75
15.00 12.00 14.003.00 4.00 4. 500. 00 0.00 0.008.00 7. 50 6.006. 50 5. 75 7.004.05 3. 75 3.003. 75 6. 50 7.000. 25 - 0. 75 0.75
80. 00 90.00 125.00260.30 292.20 365.00
9081.28 11298.31 14026.58
274

TABLE 22.5
Borrowings and Cash Balances ofSample South Indian HPF Companies (1986)
Selected HP companies
Borrowings/ refinance from banks
(Rs. lakh)
Cash balances o f HPF companies with banks (Rs. lakh)
Borrowings as % o f stock on hire^
(1) (2 ) (3 ) (4)
1 21.49 1420.96 0.16
2 N.A. N.A. N.A.
3 327.10 N.A. 25.88
4 37.64 24.38 16.40
5 26.50 34.97 6.07
6 N.A. N.A. N.A.
7 118.32 15.15 46.60
8 Nil 2. 21 -
9 47.45 17.96 18.83
10 0.65 0.47 5.60
TOTAL 579.15 1515.90 3.64
1: Stock on hire f igures o f relevant companies are takenfrom column 6, o f Table 22.3.
275
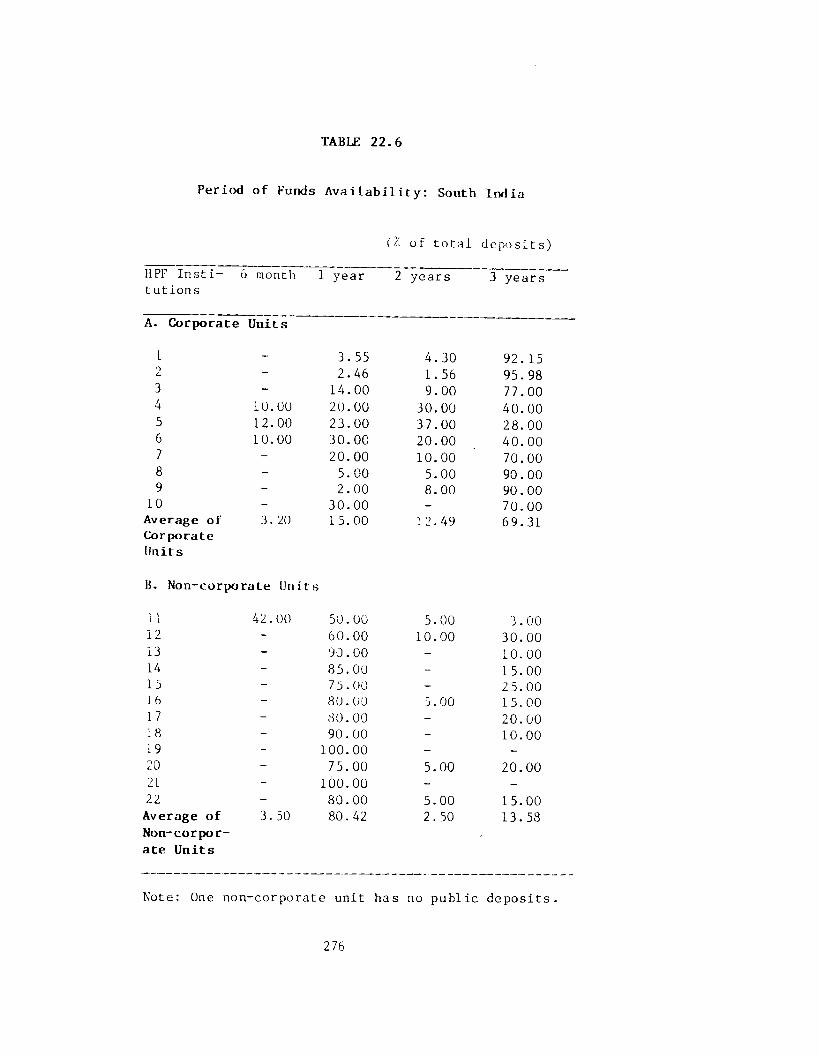
TABLE 22.6
Period of Funds Availability: South India
(% o f t o ta l deposits )
HPF In s t i tutions
6 month 1 year 2 years 3 years
A. Corporate
1
Units
3.55 4.30 92. 150L. - 2.46 1. 56 95. 983 - 14.00 9.00 77.004 10.00 20.00 30.00 40.005 12.00 23.00 37.00 28.006 10.00 30.00 20.00 40.007 - 20.00 10.00 70.008 - 5.00 5.00 90.009 - 2.00 8.00 90.00
10 - 30.00 - 70.00Average o f 3. 20 15.00 12. 49 69.31CorporateUnits
B. Non-corporate Units
LI 42.00 50.00 5.00 3.0012 - 60.00 10.00 30.0013 - 90.00 - 10.0014 - 85.00 - 15.0015 - 75.00 - 25.0016 - 80.00 5.00 15. 001 7 - 80.00 - 20.0018 - 90.00 - 10.0019 - 100.00 - -
20 - 75.00 5.00 20.002L - 100.00 - -22 - 80.00 5.00 15.00
Average of 3. 50 80. 42 2. 50 13. 58Non-corporate Units
Note: One non-corporate unit has no public d epos i ts .
276

TABLE 22.7
Interest Rates on Term Deposits of Banks and HPF Institutions in South India (1 .4 .1987)
Type of Inst i tu t ions Annual compound interest rates in per cent per annum
6 months 1 year 2 years 3 years 3 year Weighted cash average c e r t i - per annum f i c a t e / interest r e invest ment plan
(1) (2) (3) (4) * (5) (6) (7)
A. Commercial Banks 8.24 9.31 10.38 10.38 * 11.50 N.A.
B. Selected HP finance 13.80 companies ( co rp o ra te)l
14.37 14. 93 14.93 14.93 14.81
C. Selected HP finance 16.08 in s t i tu t io n s ( noncorporate) 2
18.54 19.07 21.88 18.92
1 : Interest rates o f HPF companies are regulated by the RBI and a l lcompanies pay almost the same ra tes .
2 : Average o f 12 units .3 : Interest i s normally paid monthly by HPF firms.
277

¥
TABIJK 22.8
Cost of Funds of HP finance Institutions: South India (1987)
Item Cost as per cent o fdeposit s/borrowings
Companies Non-companies
(1) (2) (3)
Interest paid to depos its (weighted average) 14.89 18.92Brokerage commission 0.25 0.25Concessional interest^ 0.05 Nil
3Advertisement expenses 0.75 Nil( including supply o f promotional l i t e r a t u r e )
Total 15.94 19.67Rate o f interest on refinance from banks 16.50 16.50Average cost o f funds 15.50 18.20
1 : Companies are allowed to pay brokerage at the rate o f 1% to 1.5%of deposit amount depending on the period. However, i t i s only a one time payment at the time o f depos i t .
2 : Certain companies allow 0.5 per cent more for deposits o f s ta f fmembers and shareholders.
3 : All companies which accept deposit are required to advertise(see the Appendix). The percentage i s ca lculated from annualreports o f sample companies.
278
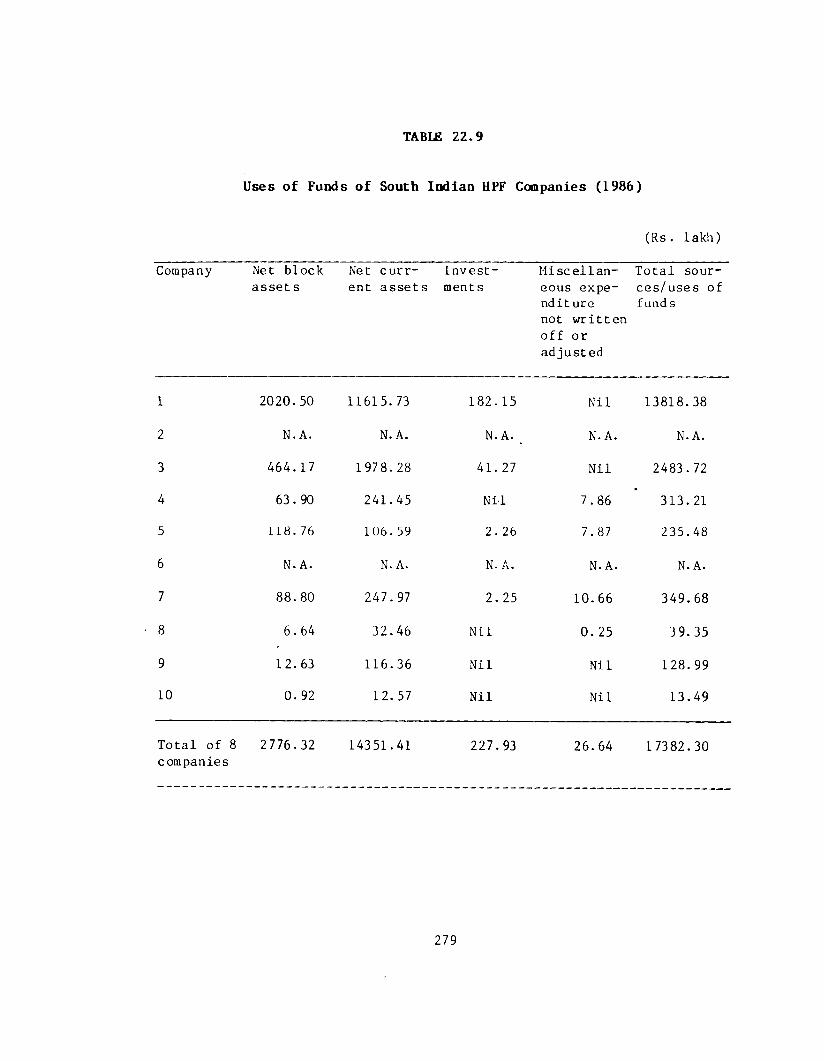
TABLE 22.9
Uses of Funds of South Indian HPF Companies (1986)
(Rs . lakh)
Company Net block asset s
Net current assets
Investments
Miscel laneous expend it ure not written o f f or adjusted
Total sources /uses o f funds
1 2020.50 11615.73 182.15 Nil 13818.38
2 N. A. N. A. N. A. _ N.A. N.A.
3 464.17 1978. 28 41. 27 Nil 2483.72
4 63. 90 241.45 Nil 7.86 313.21
5 118.76 106.59 2. 26 7.87 235.48
6 N. A. N. A. N. A. N.A. N.A.
7 88.80 247.97 2. 25 10.66 349.68
8 6.64 32.46 Nil 0. 25 39.35
9 12.63 116.36 Nil Nil 128.99
10 0. 92 12.57 Nil Nil 13.49
Total o f 8 companies
2776.32 14351.41 227.93 26.64 17382.30
279

TABLE 22.10
Estimated Deployment of HP Credit by South Indian HPF Companies
S. Item financed No.
Per cent o f to ta l c redi t per firm
cond i t i o n e r , e t c . )
Average cred it per (new) item
(Rs)
1 . Trucks/buses 30 1,50,0002. Passenger ca rs / je e p s 20 70,0003. Light commercial veh ic les 15 75,0004. Tourist taxis 10 60,0005. Two wheelers 10 8,0006. Equi pment/machinery 10 20,0007. Others (TV, r e f r ig e r a t o r , a ir - 5 5,000
TABLE 22.11
Hire Charges of HPF Institutions in Different Regions
Region Flat rate per cent per annum (1970-71) 1
Flat rate per cent per annum (1985-86)2
Southern region Western region Northern region Eastern region
9-1210-1210-1510-15
14-1615-1816-18 18-20
Sources 1 : Report o f the Study Group on Non-Banking Financial Intermediaries, Banking Commission, Govt, o f India, p. 32.
2 : On the bas is o f information gathered from theSecretary General o f the Federation o f Indian Hire Purchase Associat ions , Sundaram Finance Building, Madras-2.
280

TABLE 2 2 - 1 2
Public Sector Banks' Advances to Transport Operators
Year(Juneend)
Number o f account s
Amount out standing (Rs. m i l l io n )
Growth rate previous
Number o f accounts
over the year (%)
Amount out stand ing
Incremental advances (Rs .mil l ion)
1970 12690 277.4 _ _ _
1971 232 76 3 98. 5 83.42 43. 66 121. 11972 31098 504. 7 33.61 26.65 106. 21973 43953 628.0 41. 34 24.43 123. 31974 63572 833.7 44.64 32.75 205. 71975 73446 1133.7 67.10 35.98 300.01976 107518 1934.0 46.39 70.59 ' 800.31977 170415 2527.8 58. 50 '30. 70 593.81978 198670 3066.1 16.58 21.30 538.31979 228625 3864.0 15.08 26.02 797.91980 259000 5273.3 13. 29 36.47 1409.31981 311000 7570.0 20.08 43. 55 2296.71982 367000 9930.0 18.00 31.18 2360.01983 435000 12990.0 18. 53 30.82 3060.01984 520000 16600.0 19.54 ■ 27.79 3610.01985 583000 18550.0 12. 12 11. 75 1950.01986 594000 18950.0 1.89 2.16 400.0
Source: Economic Survey, Ministry o f Finance, Government, o f India, various issues.
281
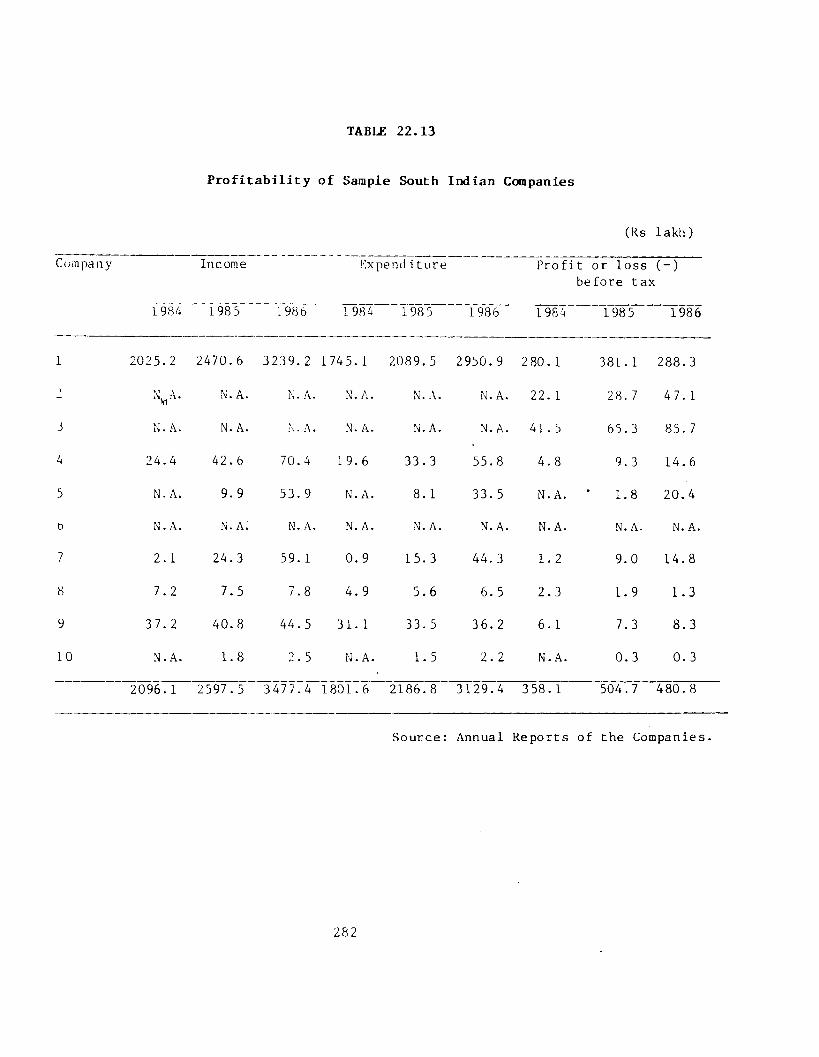
TABLE 22.13
P rofitability of Sample South Indian Companies
(Rs lakh)
Company Income Expend iture P ro f i t or lo s s before tax
( - )
1984 198 5 1986 1984 1985 1986 1984 1985 1986
1 2025.2 2470.6 3239.2 1745. 1 2089.5 2950.9 280. 1 381.1 288. 3
V - N. A. N.A. N. A. N. A. N.A. 22. 1 28. 7 47. 1
j N.A. N.A. N. A. N. A. N.A. N.A. 41.5 65. 3 85. 7
4 24.4 42.6 70.4 19. 6 33. 3 55.8 4.8 9.3 14.6
5 N.A. 9. 9 53. 9 N.A. 8. 1 33. 5 N.A. 1.8 20.4
6 N.A. N. A. N.A. N. A. N.A. N. A. N.A. N.A. N.A.
7 2.1 24.3 59. 1 0.9 15.3 44. 3 1.2 9.0 14.8
8 7.2 7.5 7.8 4.9 5.6 6. 5 2.3 1.9 1.3
9 37. 2 40.8 44. 5 31.1 33. 5 36. 2 6.1 7.3 8.3
10 N.A. 1.8 2.5 N.A. 1.5 2.2 N.A. 0.3 0.3
2096.1 2597.5 3477.4 1801.6 2186.8 3129.4 358.1 504. 7 480. 8
Source: Annual Reports o f the Companies.
282

TABUE 22.14
Distribution of Selected HPF Institutions According to Size of Stock on Hire (1986)
Range o f stock on hire (Rs. lakh)
Number Corporate units
o f HPF in s t i tu t io n s Non cor - Total porate units
Below 10 lakh 1 1 210 lakh to 20 lakh 1 4 520 lakh to 30 lakh - 4 430 lakh to 50 lakh - 1 150 lakh to 100 lakh - 1 1100 lakh to 200 lakh - - -
200 lakh to 300 lakh 3 - 3300 lakh to 400 lakh 1 1 24 0 0 Lakh t o 0 0 0 lakh 1 1 2600 lakh to 1,000 lakh - - -1,000 lakh to 2,000 lakh 2 - 22,000 lakh to 10,000 lakh - - -
Above 10,000 lakh 1 - 1
Total 10 13 23
283

TABLE 22.15
Variation In Hire Charges of South Indian
HPF Institutions
H ire c h arg e s Number o f i n s t i t u t i o n s c h a r g in g
( f l a t r a t e the same r a t e
per cent v-per annnra) Corporate Non corporate
units units
131414.5151617
181920
21
T o t a l
16
12
4
6
10 13
284

TABLE 22.16
Details of HP Credit of Users of Credit
H ir e r Hired goods H. P.
c r e d i t
(Rs)
Period
( months)
Hire
ch ar ges
( f l a t
r a t e in %)
I n s ta l m e n t
per month
(Rs)
1 Truck 4 0 , 0 0 0 36 14 1 , 5 7 8
2 A u t o - r i c k s h a w 2 5 , 0 0 0 30 14 1, 125
3 D e l i v e r y van 3 5 , 0 0 0 30 15 1 , 6 0 5
A A u t o - r i c k s h a w 2 0 , 0 0 0 30 14 900
5 T o u r i s t t a x i s ( 2 ) 1 , 0 0 , 0 0 0 12 16 9860 f o r
10 month
8700 f o r
2 months
285

TABLE 22.17
Sources of Funds: Delhi Saaple
Coap-anyNo.
Owned funds (in Rs.
Borrowed funds Total borrowed Total funds available funds
Batio of borrowing to net
lakh) Fro* Delhi Froa Outside Delhi Aiount Percen- (in Bs. (in Bs. tage of lakh)
ownedfunds
Froa individuals Froi banks Froa individuals lakh) total availableAiount(in Bs. lakh)
Percentage of total borrow- ings
taunt (in Bs. lakh)
Percentage of total borrow- ings
bount Percen- (in Bs. tage of lakh) total
borrowings
funds
(1) (2) (3) (4) (5) (6) (7) (8) (9) (10) (11) (12)1 8.00 25.00 78.13 5.00 15.63 2.00 6.24 - 32.00 80.00 40.00 4.002 7.50 43.00 86.00 7.00 14.00 NIL 50.00 86.96 57.50 6.673 1.47 9.60 80.00 - - 2.40 20.00 12.00 89.09 13*. 47 8.164 88.00 17.00 7.87 5.00 2.31 194.00 89.82 216.00 71.05 304.00 2.455 75.00 8.00 38.10 13.00 61.90 - 21.00 21.86 96.00 0.286 115.00 100.00 10.00 150.00 15.00 750.00 75.00 1000.00 89.69 1115.00 8.70
Total 294.97 292.60 180.00 948.40 1331.00 1625.97
Aver K49.16 33.76 15.23 30.00 13.52 158.07 71.25 221.83 81.86 270.99 4.51age
Motes: 1. 8BI ceiling corresponding to colton (12) is 10 tiies of own aoney. 2. In 1985 the All-India average for HP companies was 4.39.
286

TABLE 2 2 . 1 8
Term St ructure of Borrowed Funds from I n d i v i d u a l s : Delhi
( P e r c e n t a g e s o f t o t a l d e p o s i t s )
Term Company number I n t e r e s t per annum
(% )L 2 3 4 ' 5 6
(1 ) ( 2 ) O ) ( 4 ) ( 5 ) ( 6 ) ( 7 ) ’ ( 8 )
6 months N.A. 40 N.A. NI L NIL 20 . 121 y e a r N.A. 20 N . A. 40 70 50 142 y e a r s N.A. 40 N.A. 60 30 30 1 4.3 y e a r s N.A. N.A. 14
N o t e s : 1 . I n t e r e s t c o r r e s p o n d s t o maximum s p e c i f i e d b y R B I .
2 . C o r r e s p o n d i n g b a n k i n t e r e s t r a t e f o r 1 t o 3 y e a r s
i s 16 .5% .
287

TABLE 2 2 . 1 9
I n t e r e s t Paid on Borrowed Funds: Delhi
Company No .
T o t a l i n t e r e s t p a i d ( i n Rs. l a k h )
E s t im a t e d r a t i o o f ( 2 ) to b o r r o w e d fu n d s
( i ) ( 2 ) O )
i 1 .4 0 o 00
2 7 . 00 0 . 1 4 0 03 1 .4 5 0 . 1 2 0 8 *4 24 . 00 0. 1 I I 15 2 . 00 0 . 0 9 5 26 N.A. —
T o t a l 3 5 .8 5 0 . 5 1 0 9
A v e r a g e 7 . 1 7 0 . 1 0 2 1 8
288

TABLE 2 2 . 2 0
Uses of Funds
: om p an y I t era
Commerc i a l Non-comm- 0 1: h e rv e h i c l e s er c ia 1
veh i c l e s
( i ) ( 2 ) ( 3 ) U )
i YES NO NO2 YES NO NO3 YES NO NO4 YES NO NO5 YES YES YES6 YES NO NO7 NO YES NO
289

TABLE 2 2 .21
I n t e r e s t St ruc t ur e of Funds Advanced
C om p pany
Item I n t e r e s t r a t e ( in
%)
No. o f i nsta I m e n t s
% o r - c o s t o f i t e m f i n a n ced
I 'T f e c - l i v c annual compound i n t e r e s t r a t e (%)
S e c u r i t yc o l l a t e r a l
Remarks known p a r t i e s / unkno wn/ b o t h
1 V e h i c 1 e ( N ) 1 4 - 1 6 1 2 -3 6 60 2 8 - 3 2 H ; 2T Bo thV e h i c l e ( 0 ) 1 8 - 2 0 12-3 6 50 3 6 - 4 1 - d o - - d o -2 V e h i c l e (N) 1 5 12-3 6 50 3 0 -3 1 - d o - k no wnV e h i c l e ( 0 ) 1 6 -1 8 1 2 - 3 6 50 3 2 - 3 6 - d o - - d o -
3 V e h i c l e ( 0 ) 1 8 - 2 0 1 8 -2 4 4 3 6 - 4 0 - d o - - d o -4 V e h i c l e (N) 1 5 - 1 6 36 75 2 9 -3 2 - d o - Bo t h
V e h i c l e ( 0 ) 16 -1 7 3 6 60 3 2 - 3 5 - d o - - d o -5 V e h i c l e (N) 1 4 1 2-3 6 5 0 - 7 0 28 - d o - - d o -
H o u se h o ld 1 8 -2 0 1 2 - 1 8 5 0 - 7 0 3 6 - 4 1 H ; IT -d o -d u r a b l e s
6 V e h i c l e (N) 1 4 2 4 - 3 6 75 2 8 - d o - - d o -V e h i c l e ( 0 ) 1 8 24 -3 6 60 3 6 - d o - - d o -
N o t e s : 1. E f f e c t i v e i n t e r e s t r a t e s were c o m p u te d .2. Loan term s a re i n d e p e n d e n t o f d u r a t i o n o f l o a n .3. 0: Old ; N: New; H: H y p o t h e c a t i o n ; IT: one t h i r d p a r t y
g u a r a n t e e ; 2 T : 2 t h i r d p a r t y g u a r a n t e e s .4. Loan p l u s i n t e r e s t amount s h o u ld be l e s s than 2 /3 o f the
cost of the vehicle.
2 90
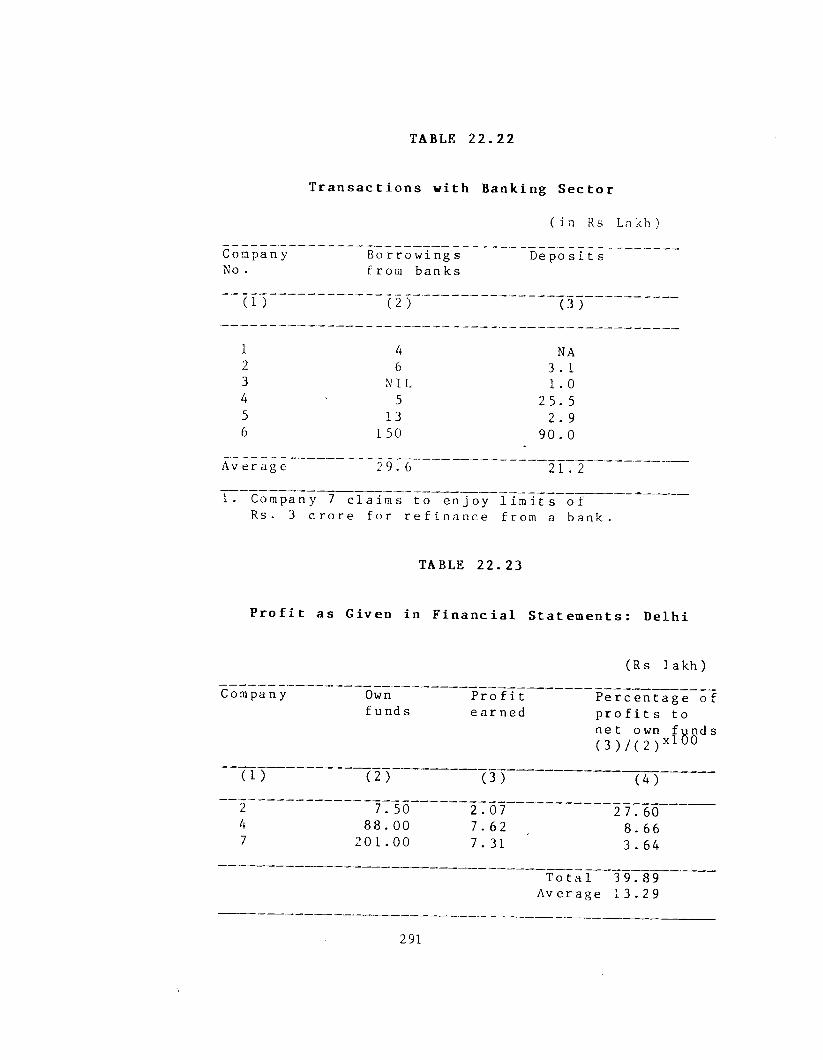
TABLE 22*22
Transact ions with Banking Sector
( i n Rs Lakh)
Compan y B o r r o w i n g s D e p o s i t sNo . from banks
(1 ) ( 2 ) (3 )
1 4 NA2 6 3 . 13 NIL 1. 04 5 2 5 . 55 13 2 . 96 1 50 90. 0
Av er ag e 2976 21 .
1. Company 7 c l a i m s to e n j o y l i m i t s o fRs. 3 c r o r e f o r r e f i n a n c e from a bank .
TABLE 2 2 .2 3
P r o f i t as Given in Fi na ncia l Statements : Delhi
(Rs l a k h )
P e r c e n t a g e o f p r o f i t s to net o wn fund s ( 3 ) / ( 2 ) x l
( 4 )
2 " “ 7750 27 07 277604 8 8 . 0 0 7 . 6 2 8 .6 61 2 0 1 .0 0 7 .31 ' 3 . 6 4
Company Own P r o f i tf u nd s e a r n e d
( I ) ( 2 ) (3 )'
T o t a l 3 9 .8 9 A v erage 1 3 .2 9

TABLE 2 2 . 2 4
Growth o f De po si ts of H.P Companies: Delhi
( R s . l a k h )
Compan y D e p o s i t s r e c e i v e d
P r e v i o u s T h i s yea r y e a r
Growth r a t e (3 ) / ( 2 ) - 1
( i ) ( 2 ) ( 3 ) ( 4 )
2 4 3 . 8 6 4 3 . 5 7 ( 0 . 0 1 )\4 1 0 6 .0 2 2 0 5 .5 8 0 . 939
292

CHAPTER 23
CHIT FUNDS IN SOUTH INDIA WITH A NOTE ON COMMUNITY CHITS
23.1 Introduction
23.1.1 A c h i t fuud ( o r Kuri or C h it ty or Chit ) is an in digenous f inanc ia l in s t i tu t i o n in India o f the type known as a rotating savings and cred it assoc ia t ion (ROSCA). It predates the spread o f modern banking and the advent o f Brit ish rule in India ( Brahmananda, 1973 ) . A ch i t i s a transaction in which a group of persons (the foreman) enter into an agreement with a number o f other persons (the subscr ibers) who agree to s u b s c r i b e r spec i f ied amount o f money in per iod ica l instalments for a spec i f ied period and receive the to ta l c o l l e c t i o n s , l e s s any agreed deductions, in
turn as determined by l o t or auction or such other manner as is provided for in the bye-laws. Thus in an agreement with 50 per
sons s u b s c r ib in g Rs 100 per month f o r 50 months, each person rece ives the t o ta l c o l l e c t i o n s o f Rs 5000, l e s s any agreed deduct ions , in turn once during the tenure o f the scheme. Terms used in chit transactions are given in the Appendix to this chapter.
23.1 .2 There are d i f f e r e n t methods to decide the turn o f each
subscriber fo r pr ize winning. In the early stage when chit funds
were organised by small groups in v i l l a g e s for mutual help , the dec is ion was taken by the Karapramani ( v i l l a g e leader) or presi dent ( forem an) o f the group , who fu n c t i o n e d in an honorary capacity . For deta i led d escr ip t ion o f evolution, working and development o f ch it funds see Nayar (1973), Nayar (1984), Nayar (1986) and Radhakrishnan and others (1975).
293

2 3 . 1 . 3 Lot c h i t s : In l o t c h i t s the p r ize d s u b s c r i b e r isselected from among e l i g i b l e members (that is a l l members who are not d e f a u l t e r s and have not taken the p r ize amount) by l o t . Usually members o f l o t ch i ts are those who want to accumulate savings .
23.1.4 Auction chits: The auction pr inc ip le was introduced to
eliminate the chance element and give members the opportunity to take the prize amount when they want i t . Under this system, the cap ita l less the foreman's commission is kept open for bidding. The members or their proxies o f f e r discount on this amount and the one who o f f e r s the highest discount (or accepts the lowest prize amount) is the prize winner. Auctions are normally o f the type known as ' e n g l i s h a u c t io n s ' . Auction ch its are advantageous to
businessmen who are in need of c r e d i t . By jo in ing an auction chit of the ir choice and paying subscr ipt ion for one or two months they can bid for a f a i r l y big sum. In very long period c h i t s o f 100 to 120 months, the discount rate may reach 70 per cent i f there* i s no r e s t r i c t i o n on bidding. However, customarily and l e g a l ly , bidding i s re s t r i c te d . While the Chit Funds Act, 1982 r e s t r i c t s the bid to 30 per cent o f the cap i ta l o f the chit including foreman's commission, chit fund foremen f i x i t at 40 to 50 per cent under cer tain condit ions . When maximum bids are t ied , a draw i s held among such bidders to decide the prize winner. Auction ch i t s are also known as "business c h i t s " .
23.1 .5 Tender c h i t s : These use ( f i r s t pr ice ) sealed bid auctionsinstead o f english auct ions .
23.1.6 Auction-cum-lot chits: Some ch i t funds fo l low th is methodto mix the features o f l o t ch i t s and auction ch its in one c h i t .
There are two types o f this mixed va r ie ty . In one scheme the auc- .. t ions and l o t s alternate in d i f f e r e n t instalments. The second method is to auction and draw p r e - s p e c i f l e d f ra ct ions of the to ta l prize amount, the f ra c t io n remaining constant across i n s t a l ments. There are provis ions for f ra c t io n a l membership a l s o .
294

23 .1 .7 Fixed discount: In order to compensate la te pr ize winnersin l o t c h i t s and long term auction ch i t s with a c e i l i n g on d is count and d iv id e n d d i s t r i b u t i o n to a l l members, some foremen deduct a f ixed sum, usually f i v e per cent o f the c a p i t a l , and d is tr ibute i t as f ixed dividend among the non prize winners. As the
chit period proceeds, the share o f th is dividend per non-prized member i n c r e a s e s because the number o f members e l i g i b l e f o r dividend decreases with each instalment. In the las t instalment, the ent ire dividend i s received by the las t prized member. Thus a form o f in terest with a r i s in g term structure resu l ts .
23.1 .8 Auction dividend: I n i t i a l l y , when auction ch its were introduced, the discount o f fered at auction was d istr ibuted only
among non-prized subscr ibers . The prized subscribers had to pay
the f u l l subscr ipt ion at a l l instalments a f te r taking the prize amount. This imposed a heavy burden on those who took the prize ear ly , and therefore became unpopular among businessmen. Subsequently, the system was changed and discount o f fered at each instalment was d istr ibuted to a l l members. In auction ch i t s with fixed d iscount, the prized subscr ibers get only auction dividend
a f te r taking the prize amount while the non-prized subscribers get both auction dividend and fixed dividend.
23.1.9 Pooval kuri/chitty : This is a long term chit extendingupto 20 years with subscr ipt ions made in three or four instalments a year. Trad i t iona l ly , subscr iption to long term c h i t s coincided with the harvest t im e. The name poova l i s d e r iv e d from the Malayalam word ' p o o ' or 'poovu ' meaning crop.
23.2 Geographical dispersion of chit funds
23.2.1 About 75 per cent o f ch i t fund in s t i tu t io n s comprising companies, partnership firms and individual concerns and also total chit subscr ipt ions in India are in South India. Again, in South India, Tamil Nadu and Kerala accounted for 73 per cent o f the number o f companies and c h i t s u b s c r i p t i o n s (Nayar 1984) . However, a f te r the promulgation of Kerala Chit t ie s Act 1975, many
2 9 5
chit funds in Kerala e ither shi fted to other States where therewere no c h i t fund Acts ( f o r in s t a n c e Karnataka and Jammu and Kashmir) or started business from newly opened branches to circumvent the stringent provisions in the Act. According to RBI data,there were 1066 chit fund companies in India at the end o f March1986. Besides these, there are many chit funds owned by partner
ship firms and proprietary concerns. Table 23.1 gives d e t a i l s o f deposits with chit funds in comparison to that o f banks. The table
shows that ch it subscr ipt ions rose from 0.03 per cent o f bankdeposits in 1971 to about 1 per cent In 1987 in the company segment .
23.3 The South India Study
23.3.1 Area surveyed and description of sample: As the concentration o f chit fund companies is in South India, we se lected firms in a l l four southern states in this region for study.
23 .3 .2 Primary data were c o l l e c t e d from chit fund in s t i tu t i o n s , c h i t s u b s c r i b e r s and a few a s s o c i a t i o n s o f c h i t fund foremen. As there is no l i s t o f ch i t funds even for companies, we se lected 50 chit funds and an equal number o f ch it subscribersfrom the four southern States. The s e le c t io n of chit funds was purposive and s t r a t i f i e d . Subscribers were se lected from the l i s t supplied by the sample ch it funds. However, only 79 respondents, (37 chit funds and 42 members) furnished f u l l d e t a i l s .23.3.3 The expansion of the company sector in the 1980' s , part i cu lar ly from 1983, is clue to the encouragement and concessionsmade avai lable to the company sector by some State Chit Funds Acts
and the recent Indian Chit Funds Act, 1982. This led many noncompany ch its to incorporate which is part ly responsible for the steady increase in deposits a l t e r 1983 reported above.
23.3.4 The e f f o r t s o f chit funds at savings m obi l isat ion in South India can be appreciated better i f a comparison i s made between chit subscr ipt ions and bank deposits in South India . The RBI surveys do not give State or region-wise d e ta i l s o f ch i t corn-
296

panies. One source (Nayar, 1984) puts the figures for 1981 at 397 in South India and 555 in the whole of India. Chit subscrip
t ions o f these 397 companies were Rs 113.40 crore out o f a to ta l o f Rs 156.40 c r o r e ( 7 2 .5 per c e n t ) . In the same year , t o t a l
deposits with a l l scheduled commercial banks was Rs 8426 crore (RBI, Banking S t a t i s t i c s ) . Thus ch it subscr iption was 1.35 per
cent o f bank deposits in 1981. Bank deposits in the Southern region in 1984 (the la te s t year for which data are ava i lab le ) was
Rs 1386.9 crore (RBI, Ib id ) . 72.5 o f t o ta l chit subscr iptions in 1984 (Rs 380.7 crore ) equals Rs 276 crore , a rough estimate of aggregate chit subscr ipt ion in South India. This puts chit subs cr ip t io n at 2 per cent o f bank deposits in South India.
23.4 Sources of funds
23.4.1 S ources o f funds o f c h i t fund i n s t i t u t i o n s in c lu d ecap i ta l subscribed by promoters /shareholders , reserve funds, commission received from chit subscribers and contr ibution o f i n i t i a l instalment by a l l members. I f i t is a company incorporated under the Indian Companies Act, i t can accept deposits equal to 40 per cent (25 p< r cent from the p u b l i c and 15 per cent from share holders and d i r e c t o r s ) of i t s paid up c ap i ta l and free reserves. Chit funds are not permitted to conduct any other business as perthe Chit Funds Act 1982.
23 .4 .2 In the early stage o f i t s evolution , ch i t funds wereorganised by those who were in need o f assistance. They took c o l l e c t i o n s from members in the f i r s t instalment and returned thesame in la te r instalments. There was no question o f investment o f
c a p i t a l by such o r g a n i s e r s . In a very l a r g e number o f cases " c h i t s were organised by a person in need o f such accommodation as
a s imple way o f g e t t i n g a loan on e a s i e r terms than he cou ld procure from elsewhere" (Madras Provincial Banking Enquiry Committee, 1930) and not as a business requir ing investment. A chit fund promoter was "usual ly a man o f straw" ( Ib id , para 487).
23.4.3 The s i tuat ion changed a f te r the introduction o f the
2 9 7
auction pr inc ip le for d i s t r ib u t io n o f prize amounts and with the emergence o f in s t i tu t io n a l foremen who conducted chit funds as a business. Financial investment was necessary f o r o f f i c e premises, furniture , s t a f f and p u b l i c i t y . Besides, provision had to be made for probable delays and defaults o f instalments by members in or
der t^ make prompt payments to pr ize winners. T heoret ica l ly , i f
a l l members make payments regularly , there is no need for much investment in a chit fund as the foreman acts only as an in ter mediary who rece ives and d is t r ib u te s subscr ipt ions .
23.4 .4 As per the Chit Funds Act 1982, "a company shall not commence or carry on chit business unless i t has a paid up cap i ta l of not le ss than rupees one lakh" . Further, "every company carry
ing on chit business shall create and maintain a reserve fund and shal l , out o f the balance o f p r o f i t o f each year d isc losed in i t s p r o f i t and loss account and before any dividend on i t s shares i s declared, transfer to such reserve fund a sum equal to not less than ten per cent o f such p r o f i t " .
23.4.5 Before any chit fund l e g i s l a t i o n was introduced, the
foreman's commission was customarily f ixed at the rate o f one ins
talment per c h i t . That i s , i f the subscr iption per month was Rs 100 and i f there were 30 members (months), the t o ta l commission as
also the chit amount would be Rs 3000. Each member would thus contribute Rs 3000 in 30 months and get back Rs 2900, Rs 100 being the commission. Even in auction c h i t s , th is p r inc ip le was f o l lowed, the auction commencing with a c a p i ta l o f Rs 2900. In e f f e c t , the foreman would rece ive in the f i r s t month subscrip t ions from 29 subscr ibers (Rs 2900) without contr ibuting any amount a f - terwa rds .
23 .4 .6 The Chit Fund Act 1982, s p e c i f i e s that the foreman shal l be e n t i t l e d "to obtain the ch it amount at the f i r s t i n s t a l ment without d e d u c t io n o f the d i s c o u n t s p e c i f i e d in the c h i t agreement, subject to the condit ion that he shall subscribe to a t i cket in the c h i t " and to such amount not exceeding f i v e per cent of the chit amount as may be f ixed In the chit agreement by way o f
298

commission, remuneration or for meeting the expenses o f running the c h i t . ” In the example mentioned above, the chit amount is Rs 3000 and the commission at the rate o f f i v e per cent is Rs 150. In the course of 30 months, the foreman is e n t i t le d to receive Rs 4500 (30xRsl50) as against only Rs 3000 p r io r to ch it fund l e g i s
la t io n .
23 .4 .7 Chit fund companies do not get any re finance or temporary accommodation from banks, even though a l l of them keep security deposits as per the Chit Funds Act with them. These deposits ind iv idua l ly run into lakhs o f rupees and c o l l e c t i v e l y
into crores o f rupees. In times when there are de faults by some
members, these companies borrow at r e la t iv e ly high rate o f in ter est mostly from d irec tors , shareholders and partners and also
from indigenous bankers.
23.4 .8 Of the sources o f funds o f ch i t funds, commission fromsubscribers is a regular source o f income and la s ts unt i l the end o f each chit period. Borrowed funds are mostly f o r a short period o f % n e year. As chit fund companies do not o f f e r very high rate
o f i n t e r e s t , t h e i r a c c e s s to p u b l i c d e p o s i t s in the in formal market i s l imited . In most cases, the amount they get at the f i r s t instalment is u t i l i s e d as secur i ty deposit as per the Chit Fund Act. This leaves chit funds with l i t t l e cash for working c a p i t a l r equ irem ents , a l though such requirem ents are small . Ploughed-back resources cannot o rd in a r i ly be used for working
cap ita l as the Act s t ipu la tes that "no company shall appropriate any sum or sums from the reserve fund except with the prior approval of the r e g i s t r a r ” .
23 .4 .9 Most ch it fund companies do not borrow from the public .They limit the borrowings to shareholders and d i r e c to r s . To thesedepositors they pay interest as app l icab le to non-banking financ i a l companies, present ly at 13 per cent to 14 per cent per annum, for one to three year per iods . The rates are about four to f iv e percentage points higher than those o f banks. Data presented in
Table 23.2 show that the ir borrowings outside their chit business
2 9 9

are much l e s s than the permitted leve l o f 40 per cent o f the ir net owned funds.
23.5 Uses o f funds
23.5.1 A d i s t i n c t i o n w i l l have to be made between chit funds and other f inanc ia l intermediaries in discussing uses o f funds. Other f inanc ia l intermediaries raise funds frora savers and lend them to borrowers. It is they who f i x the rates for both deposits and loans and, more importantly, i t is they who decide whom to lend to and whom not to lend to . Pro f i t from the d i f fe ren ce in i n t e r e s t r a t e s on d e p o s i t s and loans a r i s e s in the course o f f inanc ia l intermediation.
23.5.2 In contrast to such ac t ive f inancial intermediaries, a chit fund i n s t i t u t i o n merely acts as a passive middleman without any right to f i x the discount rate , se le c t the prize winner and alter his income. Through the process of auction, a member of a chit fund f ixe s his discount (borrowing) rate and time o f borrowing. The foreman simply rece ives the subscr ipt ions , pockets the fixed income (commission) and releases the balance as prize amount and dividends. He cannot keep the amount, except for a short period to complete fo rm a l i t ie s , or lend i t to anybody. Furthermore, i t is d i f f i c u l t to c l a s s i f y members into investors and borrowers. Members o f c h i t s , except for the f i r s t and last prize winners, are both investors and borrowers. In auction ch i t s , some members bid for the prize amount and pay a price for taking i t in advance. These members are evidently 'borrow ers ' and in auction ch its a l l except the foreman who takes the fu l l prize amount at the f i r s t instalment by virtue of his unique pos i t ion and the last few members who get the prize amount without bidding may be termed borrowers, while the last few members may be ca l l e d ' i n v e s t o r s ' .
Clearly , this i s not en t i r e ly s a t i s f a c t o r y . In the absence of exact information on s p e c i f i c borrowers, an a l ternat ive is to look at ex post data and treat subscr ibers whose t o ta l net subscr ipt ion exceeds the prize amount as borrowers and those who rece ive more from the chit fund than their subscr ipt ion as investors . Clearly ,
300

th is i s equally unsat is factory . As such, the main interest in examining the use o f funds o f chit funds is to examine the occupa
t ion o f subscr ibers without attempting to d ist inguish between bor
rowers and savers.
23 .5 .3 Type of subscribers and loan size : Field data show thatbusinessmen (45 per c e n t ) , s a la r y earners (27 per c e n t ) , housewives and s e l f employed (10 per cent each) and ag r i c u l tu r i s t s (8 per cent) are the major subscr ibers (Table 23 .3 ) . This pattern of subscr ibers suggests that prize money does not primarily go for consumption loans, a presumption that i s v e r i f i e d from our survey o f borrowers (see below).
23.5 .4 The size o f borrowing from chit funds depends on the chit amount o f each c h i t , the round of the ch it during which the
subscriber is prized and the ( f ix ed plus auction) discount o f fered. According to the Chit Funds Act 1982, which f ixe s a maximum discount o f 30 per cent , at least 70 per cent o f the chit amount must be borrowed, the rest accounting for foreman's commission (5 per cent) and discount. As the chit period advances, the
net amount o f loan tends, on the one hand, to increase as the bidding in tens i ty decreases but tends to decrease, on the other hand, s ince cumulative subscr ip t ions o f unprized subscr ibers grow. In general , a decreasing trend w i l l be observed.
2 3 . 5 . 5 S e c u r i t y : Chit funds take s e c u r i t y from p r ize d subscr ibers in advance. In many cases (97 per cent o f the sample companies), chit foremen accept personal guarantees signed by two
suret ies . Other s e cu r i t i e s accepted are l i f e insurance p o l i c i e s ,
bank guarantees and landed property (94 per cen t ) . As per the Chit Funds Act, 1982, a ch it foreman is en t i t led "to demand s u f f i c ient security from any prized subscr iber ' for the due payment o f future subscr ip t ions payable by him", and "a secur i ty shall be deemed to be s u f f i c i e n t i f i t s value exceeds by one-third or i f i t
cons ists o f immovable propert ies , the value o f which exceeds by one-hal f o f the amount due from the prized subscr iber" . No other charges except penal interest on overdue instalments are c o l -
301

lected from borrowers.
23 .5 .6 Loan duration: The loan duration varies inverse ly withthe period in which the subscriber i s prized. The period o f loan
var ies from a maximum of the ch it period less one month ( s ince the foreman gets the f i r s t month's p r ize ) to a minimum o f one month in
a monthly c h i t . For example, in a 111 month c h i t , the loan period varies from 110 months in the case o f the f i r s t pr ize winner to one month in respect o f the las t but one prize winner. Each member has a d i f f e r e n t loan duration. The Chit Funds Act 1982 f ixes the maximum p e r io d o f a c h i t at 60 months. The minimum loan period in a l l monthly ch its i s one month.
23.5.7 Bad debts/overdues: Seventy f i v e per cent o f the respondent in s t i tu t io n s reported bad debts. Bad debts formed about 7 per cent o f to ta l chit transactions . However, 25 per cent o f the in s t i tu t io n s did not report any bad debts, although there were overdues in some cases.
23 .5 .8 Creditworthiness assessment procedure: As prize amountsare disbursed against se cu r i ty , creditworthiness of a member is rarely invest igated by the foremen, although they give preference to persons known to be economically sound when they enro l l members. But when they take security against prize amounts, foremen are cautious, sometimes extra-caut ious , giv ing r ise to delay in disbursal of prize amounts and complaints from prized subscr ibers . It is to prevent such delays that the Chit Funds Act has spec i f ied the value of secur i ty as mentioned above.
23.5.9 Complementarity/substitutability with formal finance: Forsubscribers , a ch it fund is more than a bank because i t combines savings and cred it in one scheme. The unique* nature of i t s operat ions d ist inguishes a ch it fund from a bank. Upto the 1960s banks conducted ch it funds in South India. In fa c t , "most of the banks in the erstwhile Travancore-Cochin State have grown out o f the womb o f chit and kuri funds that have been operating in the State s ince ancient times" . (Travancore-Cochin Banking Enquiry Commis
302
sion, 1956). Further, "the business conducted by banks was not l imited only to the twin functions of acceptance o f deposits and dispensing c r e d i t ; the business o f kuries or c h i t t i e s formed a substantia l port ion of their t o ta l business which would be evident
from the fact that as many as 116 banks were conducting kuries
during the t h i r t i e s ( Ib id . )* The Commission points out that o f 136 banks they had examined in the Travancore-Cochin area, as many as 85 banks conducted kuries . "As on the 31st December 1955, the number o f current kuries or c h i t t i e s conducted by them was 480 of a to ta l amount o f Rs 27.45 crores" ( Ib id ) . However, presently, banks are not allowed to conduct ch it fund business and many subs cr ibers who were served by banks switched to chit fund companies when the former c losed the ir chit funds.
23.5 .10 It i s c lear there fore , that chit funds were in comp e t i t i o n with formal f in a n c e e a r l i e r . Should banking p o l i c y change, th is w i l l once more be the case, probably to the disadvantage o f independant chit funds. However, as discussed in the survey o f borrowers la ter in th is chapter, most business subscribers j o in chit funds to ensure that l iqu id funds become avai lable at short n o t i c e in case o f need - by s tepp ing up the b id d in g .
Clearly , bank overdraft f a c i l i t i e s would serve the same purpose i f they were given and, in view of the high (expected) cost o f borrowing from ch it funds discussed below, preferred . Consequently, i t can c l e a r ly be in ferred that chit funds serve firms who have in s u f f i c i e n t access to bank overdraft f a c i l i t i e s . We may therefore conclude that the two are complementary given current banking pract ice .
23.6 Cost of intermediation and p rofitability
/23.6 .1 Here again, a d i s t in c t i o n w i l l have to be made between a ch it fund i n s t i t u t i o n and other f in a n c ia l intermediaries. A ch it fund i n s t i tu t i o n takes only a fixed commission from members. Other f i n a n c i a l i n t e r m e d i a r i e s pay i n t e r e s t f o r d e p o s i t s and rece ive in terest on loans and hence in their case the cost o f in
termediation can be worked out as the d i f ference between the two.
3 0 3
23.6.2 As far as a ch it foreman is concerned, he rece ives only a serv ice charge. The bulk of funds is transacted between members
who share among themselves the p r ice paid by prized subscribers as discounts. The cost o f intermediation, that is the cost o f bringing borrowers and lenders together , is thus exact ly equal to the foreman's commission which is t y p i c a l l y 5 per cent of the chit cap i ta l . Thus, a str ik ing feature o f chit funds is the constant cost o f intermediation to the borrowers regardless of the s ize of the chit business. Clearly for large ch it fund firms there may be scale economies.
23.6.3 The d e t a i l s o f income and expenditure of se lected chit fund in s t i tu t io n s for 1986 are given in Table 23.5. The bulk o f
income (79.48 per cent) came from commissions. On the expenditure s ide , about 43 per cent was spent on salary. Other major items o f expenditure were rent (5 .9 per cent) and printing (6 .7 per cen t ) . With a to ta l income of Rs 6.39 lakh and a to ta l expenditure of Rs4.06 lakh, the sample ch it funds showed a p r o f i t o f Rs 2.3 lakh or
about 3 6.5 per cent of income.
23.6 .4 P r o f i t a b i l i t y to members: The fac tors involved in assessing returns to members are the instalment in which the prize is taken, the d i s c o u n t o f f e r e d on the p r i z e , commission to the foreman, f a c i l i t y o f f ixed discount i f any and whether there is a c e i l in g on bidding or not. Normally, in a long period c h i t , there w i l l be heavy discounts in the early period, the prize winners who o f f e r such heavy discounts expecting Lo recover Lhe loss from the investment o f p r i z e amount in p r o f i t a b l e avenues. D i f f e r e n t methods for assessing returns have been tr ied by d i f f e r e n t banking enquiry committees ( a l l India Rural Credit Survey, 1951-52, Travancore Cochin Banking Enquiry Commission 1956, Banking Commission 1971) and individual researchers (Nayar 1973, Radhakrishnan 1975) to arr ive at a s a t i s fa c to ry measure of p r o f i t or l o s s .
23 .6 .5 P r o f i l e s o f s i x terminated c h i t s from the c i t y o f Madras, with amounts ranging from Rs 10,000 to Rs 1 lakh and
304

per iods from 25 months to 50 months, are given in the Appendix toth is chapter in Tables A23.1 to A23.6. We now turn to an estimat ion of rates o f return for these c h i t s . These are f i r s t calculated using a modif icat ion of the net present value approach. The ex post net present value for each chit member is computed and divided by the present value of the member's subscr ipt ions. To this 'ne t present value per u n i t ' , the discount rate is added. Figures given are averages for 'borrow ers ' and ' l e n d e r s ' , where the former ( l a t t e r ) ’ are defined as members whose net undiscounted rece ipts from the chit are negative ( p o s i t i v e ) .
23 .6 .6 The net present value per rupee invested is worked outat an assumed rate of 11 per cent per annum for these s ix c h i t s . The average 'borrowing ra te ' (that is the net present value perrupee invested) varies from 10.73 per cent per annum in one chitto 14.21 per cent per annum in another chit (Table 23 .6 ) . When the 11 per cent discount rate is added, the estimated borrowing rate var ies between 21.73 per cent per annum and 25.21 per cent per annum resp ec t ive ly . Similarly , the average return on savings varies from -0 .30 per cent per annum to 5.05 per cent per annum.
The estimated return is thus between 10.70 per cent per annum to16.05 per cent per annum. The p os i t ion of d i f f e r e n t subscribers in d i f f e r e n t months in the s ix ch its i s shown in graph A23.1 to graph A23.6. Though by th is method of ca lcu lat ing rates o f return, both borrowing and lending rates exceed those in banks, the method i t s e l f has no rigourous j u s t i f i c a t i o n . Calculations are also sens i t i v e to the discount rate chosen. The assumption of who cons t i t u t e s the borrower and who const i tu tes the investor is also
open to question. However, no s a t i s fa c t o ry method o f f inding imp l i c i t interest rates in a chit fund have been found (ex post in
ternal rates o f return are usually non-unique i f they exist - and examples o f nonexistence can e as i ly be constructed) .
23.6 .7 A secon d , much more r e v e a l i n g , method o f computing p r o f i t s i s now given even though no estimate o f im plic i t returns re su l ts . Assume that members deposit net subscr iption amounts in bank f ixed deposits (at 10 per cent compounded quarterly for com-
305

pleted quarters) instead o f with the chit to the end of the chit period. Furthermore, assume that a bank loan is taken by subscr ibers in the same period as the prize is received (at 16.5 per cent compounded quarterly or on any part o f an incomplete quarter)
and repaid at the end of the chit period. I f the net amount in hand a f te r terminating bank deposits and repaying loan plus in te r est at the end of the period is p o s i t i v e , then the depositor makes
a ' l o s s ' by jo in ing the chit fund. I f i t i s negative, then a " p r o f i t ' is made by jo in ing the chit fund. The method described here leads to the ca l cu la t io n o f future values of the given cash flow when opportunity lending and borrowing rates d i f f e r . Previous use of an almost ident ica l procedure is in Radhakrishnan (1975).
The bank interest rates used r e f l e c t typ ica l bank rates app l icab le for the 25 month and 30 month c h i t s (corresponding to the ch its
g iven in Tables A23.3 and A23 .4 ) f o r which c a l c u l a t i o n s are reported in Tables 23.7 and 23.8. As can be seen from both tab les , subscribers prized early (except the f i r s t case in Table 23.8) would prefer banks - which is ind irec t evidence o f bank cred it constraints - while subscribers prized late benef it from c h i t s . Str ik ingly, on average, borrowers benef i t from ch its to the extent o f 31 per cent and 63 per cent o f the monthly subscr ipt ion . This t e s t i f i e s to the r e la t iv e e f f i c i e n c y o f f inanc ia l intermediation by chit funds.
23.7 Regulatory environment and impact
23.7.1 From the beginning, ch i t funds have been exposed to a variety o f malpractices o f which the serious one was delay in d i s bursal of prize amounts by foremen under one pretext or the other with consequent d i v e r s i o n o f funds. Even when there was no de fau lt , some foremen delayed payments to pr ize winners on the plea that the security furnished by them for payment of future instalments was not s u f f i c i e n t . "The unpaid money o f prize winners was seldom invested in banks" (Travancore Banking Enquiry Committee, 1930). By the time the prize winner brought addit ional security , two or three auctions would have taken place enabling
the foremen to pay the prize amount o f the person in question from
306

the subscr ip t ions o f subsequent instalments. Such adjustment o f pr ize amounts was easy because there was no law s t ipu la t ing that the prize amounts be paid before a part icu lar date.
23 .7 .2 To r e g u la te the working o f c h i t funds and prov ide sa feguards to s u b s c r i b e r s , c h i t fund ac ts were in trod u ced in Kerala ( th e C h i t t i e s R e g u la t io n , 1918, o f Travancore , Cochin Kuries Act 1931-32, the Cochin Starting of Kuries. (R es tr ic t ion ) Act, 1945, the Travancore Chitt ies Act, 1945 and the Kerala Chitty Act, 1975) and Tamil Nadu (the Madras Chit Funds Act, 1961). Subsequently other States and Union T e rr i t o r ie s (Andhra Pradesh, Maharashtra, Uttar Pradesh, Goa, Daman and Diu and Pondicherry) followed su i t . Since there were s t i l l States without any chit
acts , some foremen started chit funds from branches establ ished in such States and extended their operations to States which had were chit fund acts . To plug th is loophole the Chit Funds Act, 1982 (Act No. 40 of 1982) was enacted by Parliament. This Act extends the whole of India except the State of Jammu and Kashmir.
23.7.3 The Chit Funds Act 1982 i s l i b e r a l in the matter o f aggregate ch it amounts o f incorporated chit funds. Whereas an in
dividual or partnerships can conduct ch i t s at any time for an aggregate ch it amount up to Rs 25,000 per individual or partner, a company r e g i s t e r e d under the Companies Act or a c o o p e r a t i v e soc ie ty can conduct ch its upto an aggregate chit amount of tentimes the net owned funds (paid up cap i ta l and free reserves) ofthe company or the cooperative s o c ie ty as the case may be. Thus a company with a paid up cap ita l of Rs 1 lakh and reserves o f Rs
25000 can start c h i t s for an aggregate chit amount of Rs 12.5 lakh. At the same time, even a ten member partnership can conductch i t s for a maximum chit amount o f Rs 2.5 lakh only. Taking advantage o f the favourable pos i t ion for a company, many partnerships and indiv iduals changed to the company form o f organisation. This is the major reason for the spurt in growth o f companies and ch it subscr iptions from 1984 seen in the RBI data presented in Table 23.1. With the passing of the Chit Funds Act 1982 and i t s adopt ion by the States (S ta te s have been g iven time to frame
307
necessary rules for the implementation of the Act which some o f them are yet to complete) complaints against chit funds seem to have dwindled. However, some ch it companies in Tamil Nadu have obtained a court stay on some clauses in the Act, such as on the aggregate chit amount, ch it period, and maximum amount o f d is count. By making use o f the stay order, many companies enro l l members in 100 month c h i t s ( a g a i n s t the maximum p e r io d o f 60 months in the Act) with no l imit on the maximum amount o f discount (the Act s p e c i f i e s a c e i l i n g of 30 per cen t ) .
23.7 .4 R e s tr i c t io n o f period and the c e i l in g on maximum bid in the Act are two clauses which make chit funds unattract ive and non-pro f i tab le to subscr ibers . For businessmen, who are the backbone of auction c h i t s , c e i l i n g s on the maximum bid comes in the way o f taking the prize amount when they want i t . The dividend per member w i l l a lso be small and w i l l not add up to g iv e a reasonable return to investors who get the prize amount at the last few instalments. Again in a long period c h i t , the monthly subscr iption w i l l be r e l a t i v e l y small and therefore even small and middle income people can jo in chit funds with high ch it c a p i t a l .
In long period chit o f , say, 100 months, the discount o f fered under unlimited bids may reach 60 per cent to 70 per cent for about ha l f the period. Subscribers need pay only 30 per cent to 40 per cent o f subscr iptions each month for about ha l f the chit period and then at higher rates during subsequent months.
23 .7 .5 However, a long chit period with no l imit on bids is preferred by businessmen e s p e c ia l ly under condit ions o f r is ing p r ice s . A long period also means a r e la t iv e ly large number of subscribers in a monthly chit whose f inanc ia l p os i t ion , along with that o f even the foreman, may de ter io ra te to the detriment o f nonprized subscr ibers . Under such circumstances, a 60 month period seems reasonable provided the maximum amount o f discount is l e f t unspec if ied or at least ra ised.
308

23.8 Market structure
23 .8 .1 Size distribution of chit fund institutions in the sample:
Except for a large s ize chit fund company with 1191 running chits having a to ta l monthly subscr ipt ion o f Rs 379 lakh, a l l selected ch it fund in s t i tu t io n s were medium or small s ize units . Details o f sample ch it funds are given in Table 23.10.
23.8.2 Market leadership and competition: Although there weresome large units in many places, there was no evidence o f market power for any unit. On the contrary, there was keen (non price) competition in securing business among various chit fund in s t i tu t ions , i f we go by newspaper advertisements and other forms o f
canvassing. By the very nature o f c h i t s , p r i ce competition holds out l imited scope. Competition mainly takes the form o f product d i f f e r e n t i a t i o n in the design o f c h i t s . Clearly, large ch i t s are advantageously placed as they can o f f e r a greater product range. Entry and exit barr iers were also not observed in general.
23.8 .3 The general impression, from the f i e ld is that older chit fund companies tend to sp e c ia l i s e in b ig , long period ch its
with newer companies taking up smaller, short duration c h i t s . This pat tern is supported by grouped data (when one o u t l i e r i s excluded) though not by the ungrouped data. Some support for the impression from the f i e l d that the reputation and a b i l i t y to meet ob l igat ions o f the chit company i s important before large sums o f money are entrusted to them over long periods has been found, though the evidence is weak. I f true, th is would demonstrate the existence of a barrier to entry (age, to the extent that i t is corre lated with reputation) into a segment o f the industry.
23.9 Estimate of overall size
23.9 .1 Dif ferent methods are applied to measure the volume of funds flowing through chit funds. It i s argued that in monthly c h i t s , a cer ta in amount comes to the chit funds by way o f chit subscr iption every month and the to ta l chit subscr ip t ion received
309

by the chit fund in s t i tu t io n in a year is equal to twelve times the monthly f igure . I f we adopt t h is method (which was followed
by the Report o f the Study Group on Non-Banking Financial Intermediaries, Banking Commission, 1971, Nayar 1973 and Radhakrishnan
1975), the t o ta l annual ch it subscr ipt ions o f the 37 se lected chit fund in s t i tu t io n s at the end of December 1986 would come to Rs84.1 crore (Table 23 .10) . Using the RBI data given in Table 23.1, we may work out the annual ch i t subscr ipt ions of 1066 chit fund companies in India at the end of March 1986 as Rs 8260 crore .
23 .9 .2 Another method of estimation of aggregate chit amount is through conversion o f monthly subscr ipt ions into rupee years per year as argued for in Chapter 8. According to this method, the average subscr ipt ion of the 37 chit fund in s t i tu t io n s in our sample comes to Rs 224.57 lakh. Thus, the t o ta l subscr ipt ions o f the 1066 chit companies mentioned in the RBI survey for 1986, would work out to Rs 2394 crore (Table 23.11) . When the rat io o f average chit subscr ipt ions in rupee years per year to the average monthly deposit f igure is used, the estimate works out to Rs 8163 crore. The wide discrepancy provides evidence o f the var ie ty in chit funds and chit types.
2 3 .9 . 3 Trend in growth: The selected chit fund in s t i tu t io n sshowed a r i s in g trend in annual ch it subscr ipt ions (Table 23.12) from 1981. Total ch i t subscr ip t ions rose by about two and a h a l f times during the f iv e year period from Rs 349.9 m i l l ion in 1981 to Rs 840.8 m i l l ion at the end of 1986. The number o f subscr ibers also rose (from 1.09 lakh in 1981 to 1.52 lakh in 1986) but not as rapidly as ch it subscr ipt ions (Table 23 .13) . One reason for the rapid growth o f ch it subscr ip t ions o f la te was the s tart ing o f big denomination ch its fo r periods o f 100-110 months (with ch it amount of Rs 3 lakh to Rs 5 lakh) by many companies in Tamil Nadu and Kerala.
23.10 Influence of formal sector lending rates and loan availability on business
23.10.1 Loan a v a i l a b i l i t y from the formal sector and i t s lend-
310

ing rates have inf luence only on one c la ss o f subscribers o f ch it funds, namely businessmen. A l l the businessmen who jo in chit funds have access to bank c r e d i t . But c re d i t a v a i l a b i l i t y from banks i s l imited and cond it iona l . When there is c red it squeeze, and when business a c t i v i t y is br isk , they borrow from chit funds.
Given the peak demand nature o f borrowing from ch its a s lightchange in the lending rates o f banks has l i t t l e consequence for
bidding in chit funds. On the whole, the inf luence o f formal sector funds a v a i l a b i l i t y and lending rates on subscribers o f chitfunds are n e g l ig ib le in the short run.
23.11 Profile of depositors and borrowers
23.11.1 We interviewed 42 subscr ibers o f chit funds who may be grouped into 18 investors ( la te prize winners) and 24 borrowers (ear ly prize winners). Investors includes 9 salary earners, f i v e p r o f e s s i o n a l s , two housewives one a g r i c u l t u r i s t ‘ and one businessman. Borrowers included 9 businessmen, 7 salary earners,5 pro fess iona ls , 1 housewife and 2 self-employed.
23.11.2 The income range o f subscr ibers is as fo l lows :
IncomeRange (R s ) I n v e s t o r s B o r r o w e r s
L e s s than 500 - -501 to 1000 - -1001 Lo 1500 11501 t o 2000 3 22001 t o 2500 1 22501 to 3000 3 23001 t o 4000 6 2Above 4000 5 15
TOTAL 18 2.4
23.11.3 Two investors invested 90 per cent o f their monthly
311

savings in ch it funds. For others the share o f savings in chit funds varied from 20 per cent to 60 per cent. The foremost reason mentioned by a l l the investors was the b u i l t - i n provis ion for borrowing i f the necessity ar ises . Advantages c i ted were saving in instalments to get a lump sum, few fo rm al i t ie s in gett ing the prize amounts, f a m i l ia r i ty with ch it fund rules and the compulsion to reduce expenditure and e f f e c t savings.
23.11.4 A l i t t l e more than o n e - t h i r d o f borrowers were businessmen. Along with pro fess iona ls (who use the prize money in c l i n i c s , construct ion work, engineering goods, e t c . ) , and s e l f - employed individuals , they accounted for two-thirds o f borrowers
with monthly income above Rs 4000. Other borrowers were salary earners . Borrowings by businessmen, p r o f e s s i o n a l s and s e l f -
employed varied from Rs 17,000 to Rs 1,10,000 giving a simple average of Rs 51,000 per borrower (Table 23 .15) . Borrowing by the salaried c lass varied from Rs 2,000 to Rs 10,000, while the lone housewife borrowed Rs 5,000. One a g r i c u l t u r i s t (p lantat ion owner) took a prize amount o f Rs 80,000. About 83 per cent o f t o ta l borrowing by a l l c a t e g o r i e s o f borrowers were for bus iness and
another 11 per cent for agr icu lture . Thus, about 94 per cent o f t o ta l borrowing appeared to have flowed to productive purposes
(even assuming the small loan o f Rs 2500 in the case o f one a g r icu l tur is t and a l l the loans to the salaried c lass were used for consumption).
23.11.5 The security o f fered against future subscr iptions by prized subscribers included personal guarantees signed by two salaried persons, t i t l e deeds o f houses and real estate , l i f e insurance p o l i c i e s and bank guarantees.
23.11.6 21 respondents repl ied that they were happy with their chit funds in the matter o f dividend d is t r ib u t io n and prize d i s bursal while 3 did not g ive a p o s i t iv e rep ly . This is in marked contrast to the usual ly negative opinion o f bank c l i e n t s in the case studies of c r e d i t using sectors elsewhere in the report .
3 1 2

23.12 Equity impact
23.12.1 A ch i t fund was t r a d i t i o n a l ly considered as a small man's i n s t i tu t i o n for savings and c r e d i t . O f f i c i a l data presented in Table 23.13 support this view f o r two major States which ac
count for about 73 per cent o f chit fund business. The table shows that in Kerala the average ch it amount per chit was around Rs 10,000 upto 1970-71 whereas i t was around Rs 5000 in Tamil Nadu. In the 1970's, i t rose to above Rs 25000 in Kerala and Rs 10000 in Tamil Nadu.
23.12.2 After 1984, there appears to have emerged a tendency onthe part o f ch it fund promoters, e s p e c ia l l y companies, to start
big denomination ch i t s o f Rs 3 lakh to Rs 5 lakh. However, such ch its were sporadic and confined only to a few c i t i e s in Tamil Nadu. But even in cer ta in types o f big and long period ch its , there is a provis ion for f ra c t io n a l members as discussed above.
23.12.3 A d i s t in c t i o n must be made between chit funds per se and chit fund companies. The former are to be found in almost
every community and region and across income groups and represent truly ' in f o r m a l ' cred it and s e l f help groups. A few such chit funds are covered below and their numbers must c l e a r ly be large. These organisations can e a s i ly be seen to be welfare improving for the weaker sect ions . Chit fund companies do not, however, serve low income households (see the sect ion on borrowers) though they do serve small business to the almost to ta l inc lusion of large business. Overall , one must conclude in favour of a pos i t ive d istr ibut iona l impact o! chit funds, community ch its helping Lo ease finance constra ints o f poor households and both community ch its and companies helping small business.
23.13 Efficiency and allocative impact
23.13.1 Are c h i t s e f f i c i e n t f inanc ia l intermediaries? The community ch it c l e a r ly i s , provided de fau lts can be contained. In this event, f inanc ia l intermediation is achieved at zero monetary
3 1 3
cos t , with the ent ire savings going to borrowers- There are, o f course, costs such as time c o s t s , r i sk and l i q u i d i t y costs and so on. For ch it companies, there is a monetary cost o f intermedia
tion which i s represented by the foreman's commission. As mentioned, th is is t y p i c a l l y 5 per cent o f the chit c a p i ta l . This 5
per cent covers both r i sk cost (due to the bad debts which were seen to be 7 per cent o f t r a n s a c t i o n s on average) and e s t a b lishment cost . This cost o f intermediation is c e r ta in ly low compared to banks in India, whose establishment costs alone exceed 4 per cent o f gross advances.^
23.13.2 Secondly, auction chit funds have a mechanism which ensures that funds go to the borrower with the highest discount rate
- presumably because the borrower has the best investment opportunity - of the unprized members. This would cer ta in ly contr ibute to a l l o c a t iv e e f f i c i e n c y .
23.13.3 Regarding investment o f prize amounts by the prize winners, the information i s scanty. The recorded information on the subject based on data c o l l e c te d d i r e c t l y from 100 prize winners in the States of Kerala, Tamil Nadu and Maharashtra can be summed up as fo l lows : "the u t i l i s a t i o n o f prize amounts by the prize winners v a r i e s from p lace to p la c e and depends upon the s i z e o f the amount. When we take the country as a whole, we may conclude that the shares o f pr ize money going to productive purposes in the three c a t e g o r i e s o f b i g , medium and small p r i z e amounts are roughly 90 per cent , 60 per cent and 33 per cent respec t ive ly , assuming that the amounts invested in legit imate trade and commerce are product ive” (Nayar, 1973).
23.13.4 The composition of ch i t subscr ibers in our sample o f 37chit fund i n s t i tu t i o n s given in table shows that about 46 percent o f the subscr ibers were businessmen. The chit fund i n s t i tu -
1. Note t h a t r e s e r v e fu n d s a r e not i n t e r m e d i a t e d - t h e y do f i n d t h e i r way to b o r r o w e r s . Thus, th e r a t i o o f c o s t s a d v a n c e s r a t h e r t h a n t o d e p o s i t s i s a p p r o p r i a t ein e n s u r i n g in L e r m e d i a t i o n c o s t s .
notto
f o r
3 14

t i o n s g e n e r a l l y do not enqu ire in to the purpose o f b id d in g . However, we c o l l e c te d some relevant data from borrowers o f chit funds. According to this data, about 94 per cent o f to ta l borrow
ings of the borrowers selected appeared to have flowed to the
productive uses (Table 23.15) .
23.13.5 P e n u l t im a te ly , c h i t s in India c l e a r l y p ro v id e businessmen with a source o f funds which banks are unwilling to provide - e i ther because no cred it is provided by banks or because o f c red i t c e i l i n g s . This too is a p o s i t iv e feature.
23.13.6 F inally , chit rules .ire e a s i ly tailor-made to suit subscr ibers through combinations o f l o t , auction and discount rules .
23.13.7 Against th is , however, the fo l lowing negative features must be pointed out .
i . Uncertainty to borrowers as to loan a v a i l a b i l i t y orloan c o s t .
i i . U ncer ta in ty to savers as to the rate o f re turn onsaving.
i i i . Limited economies o f sca le in f inanc ia l intermediation.
23.13.8 On the whole, one must conclude in favour o f a l l o c a t iv e e f f i c i e n c y (para 23.13.2 and 23.13.3) and e f f i c i e n t intermediation- though c h i t s c l e a r ly cannot become the sole f inanc ia l in ter mediary in an economy.
23.14 Impact on savings mobilisation and investment
23.14.1 The unique feature o f savings in a chit fund as againstthe savings in other f inanc ia l in s t i tu t io n s is that there i s compulsion to e f f e c t savings. Savings in a bank or post o f f i c e or other in s t i tu t io n s are voluntary. After opening an account in any o f them, the account holder is not bound to make savings regularlyeven in a recurring deposit . A recurring deposit can be d iscon-
315

tinued before the st ipula ted period at the w i l l o f the depositor who w i l l get back the amount in h is account at the time o f c losure . But the p os i t ion in a ch it fund is d i f f e r e n t . Once a person becomes a member of a c h i t fund, he has to s u b s c r ib e regularly and compulsorily during the ent ire period of c h i t . I f
he d i s c o n t i n u e s a f t e r a few i n s t a lm e n t s , he w i l l not get the
amount subscribed before the end of the chit period (prev iously , before the enactment of any ch it l e g i s l a t i o n , he used to lose it a l together ) . The o b l ig a t ion to pay subscr ipt ions is so strong that , at times, a subscriber may postpone or even cancel other routine expenditures. He may even borrow to pay the subscr iption in time and repay the debt afterwards. Thus there is a s e l f im
posed ob l iga t ion on the part o f the subscr ibers o f ch i t funds to save. It is thus l i k e l y that chit funds contribute ad d i t ive ly to saving even i f quant itat ive evidence is lacking.
23.14.2 Some of the a t trac t ion s to savers o f ch it funds as given by the respondent c h i t fund i n s t i t u t i o n s in our f i e l c f survey (percentage o f in s t i tu t i o n s reporting ' y e s " in the questionnaire) are : (a) i n - b u i l t p r o v i s i o n fo r borrowing (94 per c e n t ) , (b )
savings in instalments (91 per c e n t ) , ( c ) compulsory savings (83 per cent) and (d) r ight to rece ive dividends (62 per cen t ) .
23.15 Recommendations for a regulatory framework
23.15.1 Whatever de fec ts in the working of ch it funds ex is t can, we be l iev e , be corrected by the ex is t ing provisions of the Chit Funds Act, 1982 i f these are adequately enforced. However, cer ta in d i f f i c u l t i e s experienced by the chit foremen and poss ib le remedies
for them are given in the fo l lowing paragraphs.
23.15.2 The Chit Fund Act, 1982 s t ip u la te s that "Except with the general or specia l permission of the State government, no company carrying on ch it business shall conduct any other business" . Although mixing ch it business with other businesses w i l l give room for misappropriation of chit subscr ipt ions , the p roh ib i t ion on b u s in e ss l i m i t s the income of a foreman, e s p e c i a l l y o f small
3 16

c h i t s . This p roh ib i t ion comes along with the r e s t r i c t i o n o f commission of a foreman to 5 per cent o f c a p i t a l . When there i s a temporary shortage o f funds resu lt ing from defaults , the foreman has to f ind a lternative sources o f funds to pay the prize amount.
I f he is prevented from doing other business, there must be some provis ion for temporary accommodation. A l l sample respondents stated that they borrow money at high rate o f interest to pay prize amounts in time. In f a c t , i t is such temporary shortages that cause some companies to f a i l , even though there is no misappropr iat ion o f funds.
23.15.3 To remedy the s i tuat ion , one suggestion (Nayar, 1973) was the provis ion o f refinance. The foreman receives from every prized subscriber some sort o f secur i ty f o r the future payment o f instalments. This security can be the guarantee for refinancing the prize amount. The foreman, according to the Chit Acts, can keep some amount with approved banks as security or furnish s u f f i c ient property as security to the Registrar o f Chit Funds against each c h i t . This amount or property should not be released unti l
the termination of the chit concerned. It can be considered as addit ional guarantee for the amount refinanced. Even though the
ch it fund is accepted as a v iab le and useful f inanc ia l in s t i tu t io n by various o f f i c i a l commissions and committees, no a lternative so lut ion to this c ru c ia l aspect o f temporary f inanc ia l accommodat ion to ch it companies has yet been suggested by them.
23.15.4 We re ferred the question of refinance to the respondent ch it companies. More than two-thirds (67 per cent) o f the com
panies l iked the idea and said that they would conform to the s p e c i f i c a t io n s for secur i ty as required by the refinancing agency.
Some ch it companies have deposits o f several lakhs o f rupees with banks. These were secur i ty deposits given against running ch its (As per the Chit Fund Act 1982). Banks normally do not extend any c red i t or overdraft f a c i l i t y to ch i t companies.
317

23.16. A Note on Community Chit Funds
23.16.1 Community chit funds: In a l l urban areas in India , chitfunds or other s e l f - h e l p groups are wide-spread among various community groups. Such groups are to be found among people in
various income groups and among people in many walks o f l i f e . For example, two popular types o f c h i t funds are c h i t s in v o l v i n g
housewives (known as ' k i t t y p a r t ie s ' among middle to upper middle c lass matrons in Northern India) and o f f i c e c h i t s . While no systematic attempt to survey o f f i c e c h i t s , k i t ty part ies and so on has been made, ch i t s prevai l ing in one o f f i c e in Delhi have been examined.
23.17 A case study of of f ice chits in Delhi
23.17.1 The o f f i c e chosen for study i s a r e la t iv e ly large establishment in the service sector with over a hundred employees. Around hal f the s t a f f (between 50 and 60 persons) are members o f one or more chit funds and have been members o f ch i t s on a more or less regular bas is . The percentage of s t a f f members part ic ipat ing was inversely related to their income Levels, with none of the highest paid s t a f f members part ic ipat ing but almost a l l the lowest paid members par t ic ipat ing . At the time of the case study, 5 monthly ch its were reported to be in operation with subscr ipt ion amounts ranging between Rs 100 per member per month and Rs 500 per member per month. Of these ch i t s , 4 were 'middle income c l a s s ' ch i ts drawing the ir membership from c l e r i c a l s t a f f and junior
professional/management s t a f f . The f i f t h chit was started by blue co l la r workers though some c l e r i c a l workers had la t e r jo ined . Furthermore, the f i f t h ' c h i t ' was not a ch it in the pure sense of the term in that it was not c lose-ended but rather a continuing
mutual s e l f help group.
23.18 Middle income group chits
23.18.1 The middle income c h i t s were a l l a u c t i o n c h i t s with f ixed discounts and periods ranging from L0 months to two years
318
(ten to twenty four members). While the norm was one t i cke t per member, cases o f members holding upto three t i cke ts were reported. Furthermore, some individuals were members o f more than one chit at a time with some individuals even part ic ipat ing in a l l c h i t s .
The monthly subscr ipt ion o f the ch its taken together was Rs 1300, ( t o t a l l i n g Rs 25,000) and the average monthly sa lary o f o f f i c e -
going groups from whom the membership was drawn was Rs 2091. The percentage o f monthly income contributed to ch its works out, on average, to be 14 per cent o f the earnings o f both part ic ipants and non part ic ipants taken together. This percentage is worked out b e f o r e a cco u n t in g f o r a u c t i o n and f i x e d d i v i d e n d s . Chit foremen were those who took the i n i t i a t i v e in forming c h i t s or , in some cases, consensus cho ices . They received no spec ia l benef i ts but were responsible fo r maintaining records. Chit members typ i
c a l ly met on the day before the monthly sa lary disbursement for auct ions and again on the day o f salary disbursement for cash transactions . A feature of these ch its was a la te payment penalty appl icable for those who did not contribute the ir subscr ipt ions on 'pay day ' . The penalty was reported to be 1 per cent per day.This penalty normally came into play i f pay day happened to be a
Friday and i f members went home before paying their subscr iption dues. Penalty for two days would then accrue t i l l Monday. No
other cases o f delayed payment or default were reported. The 4 c h i t s found to be in operation were:
i . Rs 500 subscr ipt ion per member; 24 members,i i . Rs 500 subscr ip t ion per member; 18 members,
i i i . Rs 200 subscr ipt ion per member; 15 members,iv . Rs 100 subscr ipt ion per member, 10 members.
23.18.2 Persons interviewed reported that , e a r l i e r , a d i f f e re n t form o f ch it fund was in operation along with fixed discount auct ion c h i t s . Under this a l ternat ive form, the auction discount wasloaned to members wishing to borrow funds at a s t ipulated monthly in te re s t . It was not d istr ibuted to members t i l l the end o f the ch i t . The maximum loan duration was 3 months with monthly in ter est at 2 per cent fo r the f i r s t month and 3 per cent fo r sub
3 1 9

sequent months. Interest earnings were d istr ibuted as dividend to members. The foreman's job in these c h i t s was more onerous as i t was his r e sp o n s ib i l i t y to maintain loan accounts in addit ion to the ch it account. Furthermore, unborrowed amounts were entrusted to his care t i l l subsequent meetings. This type of ch it was d i s continued due to the cumbersome record keeping required.
23.18.3 Interviewees reported that many members borrowed to invest in businesses that they ran on the s ide , while others borrowed so as to obtain cap ita l for the purchase of durables in a lump sum. One interviewee was of the opinion that such ch i t s were superior to (commercial bank or post o f f i c e ) recurring deposits
since only 70 per cent of the balance outstanding in a recurring deposit could be borrowed in case of need. Genuine loans from banks were, o f course, unavailable.
23.18.4 In order to study the cost o f borrowing and the return to shareholders, we requested and were supplied with information on four terminated c h i t s . These ch i t s are l i s te d in the Appendix in Tables A23.7 to A23.10. Their ex post future value to members has been calculated according to the procedure outlined in sect ion
23.6 and these are reported in Tables 23.15 to 23.18. As can be
seen , members ga in on average r e l a t i v e to bank o p p o r t u n i t i e s though the average gain is small in view of the short durations o f these ch i t s .
23.19 The blue c o l l a r ch i t
23.19.1 Til is monthly chit has been in existence since 1985. The unique feature of th is ' c h i t ' is that i t is non-terminating
and has a mechanism by which the cap ita l in the chit grows from month to month. The (currently 16) members contribute Rs 100 per month ( 6 . 5 per cent o f the average monthly s a l a r y per par t ic ipant) , the c a p i ta l then being loaned to one or more members depending on loan demand. The p r i o r i t y for Loans goes to those who have genuine need, followed by others on a f i r s t come f i r s t serve basis with the lowest p r io r i ty v,oing to those who have an

outstanding loan that is not e n t i r e ly paid back. Usually, in case more than one member wishes to borrow, mutual accommodation is reached as to the d iv i s io n o f ava i lab le cap i ta l before invoking t i e breaking ru les . Monthly interest at the rate o f 2 per cent per month on the balance outstanding was c o l l e c te d from borrowers.
23.19.2 The growth o f chit cap i ta l occurred due to the fact
that loan repayments (plus in teres t ) were made in addit ion to the normal monthly s u b s c r i p t i o n at the ra te o f Rs 100 per month. Thus, a borrower's contr ibution would jump to Rs 200 plus interest from the month a f te r the loan was taken and this leve l would continue (but with interest owed decreasing every month) t i l l the loan was repaid - at which time the subscr iption would revert to Rs 100 per month. Since loans were taken to be net o f previous subscr ip t ions, the maximum poss ib le amount o f loan would stayequal to the i n i t i a l ch i t cap i ta l but the amount o f cash from subs cr ip t ions and loan repayments would mount to ( 2 n - l ) times themonthly subscr iption ( f o r an n member chit fund) exclusive o f in -terest re ce ip ts . Interest would add a further (n-1 ) r time themonthly subscr iption at a monthly interest rate o f r. Tlius, for the chit under considerat ion the cap i ta l avai lable for disbursal
from the sixteenth month onward would be Rs 3650. However, the interviewees reported that interest was not d istr ibuted monthly but was held t i l l an annual d is t r ib u t io n which took place at thetime o f Diwali, a major North Indian f e s t i v a l . Furthermore, theincrease in ch it cap ita l was also pruned down in some years by d is tr ibut ing the excess as dividend to a l l members during the annual meeting. Since at any given time in the chit h is tory more
than one member would be a net debtor to the c h i t , the ch it has been in existence without a squaring of a l l loan accounts since1985. An addit ional feature of the chit is that members are free to leave at any time but those leaving on any day except on the day o f the annual meeting would have to forego interest accruedsince the previous annual meeting. F inally , while interest was disbursed in cash to those who wished for i t , bulk purchases o f household durables ( l i k e pots and pans) were normally made by the chit organisers for d is t r ib u t io n during the annual meeting.
321

TABLE 2 3 . 1
Growth of Chit Fund Companies in India
Yea r ( Ma rc h
end )
Number o f r e p o r t i n g c h i t compan i e s
Chits u b s c r i p t i o n(Rsc r o r e )
P e r c e n t a g ei n c r e a s e o f c h i t s u b s c r i p t i o n ov erp r e v i o u sy e a r
Agg r e g a t e s c h e d u l e d comme r c i a l bankd e p o s i t s ( Rsc r o r e )
Pe r c e n - t a g e i n c r e ase in ban k d e p o s i t s o v e r p r e v i o u s y e a r
C h its u b s c r i p t i o n as a p e r c e n t a g e o f bank d e p o s i t s
_ _ _( 2~)
_____“ v j 7 31 7 T ) V~)
1971 117 1 . 6 8 5 9 0 6 .0 0 0. 031975 295 33 . 00 1 1 8 2 7 . 0 0 0. 281976 404 30 . 80 1 4 1 5 5 . 0 0 0. 221977 518 3 7 . 60 1 7 5 6 6 . 0 0 0 . 211978 502 35 . 20 2 2 2 1 1 . 0 0 0 . 1 61979 504 37 . 30 2 7 0 1 6 . 0 0 0. 141 980 509 1 4 6 .3 0 3 1 7 5 9 . 0 0 0 . 4 61981 555 1 5 6 . 4 0 6 . 9 3 7 9 8 8 . 0 0 1 9 . 6 0 . 4 11 982 541 2 0 8 .0 6 3 3 . 1 4 3 7 3 3 . 0 0 1 5 .1 0 . 4 81 983 503 22 7 . 10 9 . 2 5 1 3 5 8 . 0 0 1 7 . 4 0. 441 984 641 3 8 0 . 7 0 67 . 6 6 0 5 9 6 . 0 0 1 8 . 0 0 . 631 98 5 864 4 3 9 . 2 0 1 5 . 4 7 2 2 4 4 . 0 0 1 9 . 2 0 . 611 986 1066 6 8 8 . 3 0 56 . 7 8 5 4 0 4 . 0 0 1 8 . 2 0. 81
S o u r c e s : 1. Columns 2 & 3 , g ro w th o f d e p o s i t s w i thN on-Banking C o m p a n ie s , RBI B u l l e t i n , V a r i o u s i s s u e s
2. R e p o r t on C u r r e n c y and F i n a n c e , RBI, d i f f e r e n t v o l u m e s .
322

TABLE 2 3 . 2
Borrowings of Outside
Chit Fund Companies Chit Business
Y ear(March end)
N o ~ o l f r e p o r t - t i n g com pan ie s
Amount Net D e p o s i t s as o f d e - owned a % o f net
- p o s i t s fu n d s owned funds (Rs l a k h ) (Rs l a k h ) •
1976 404 3 3 0 . 0 380 . 0 86 . 8
1977 518 3 60 . 0 300 . 0 120. 0
1978 502 450 . 0 260. 0 173 . 1
1979 504 450 . 0 250 . 0 1 8 0 .0
1980 509 3 8 0 . 0 32 0 . 0 1 1 8 .8
1981 555 1160 . 0 400 . 0 2 9 0 .0
1 982 541 2 1 0 . 0 460 . 0 45. 7
1 983 503 1 60 . 0 N. A. N.A.
1 984 641 1 5 0 .0 580 . 0 25 . 9
1 985 864 250 . 0 7 6 0 .0 3 2 . 9
1986 1066 100 . 0 1 0 6 0 .0 9 .4
S o u r c e : Growth o f D e p o s i t s w i th Non-Banking C om p an ies , RBI B u l l e t i n , V a r i o u s I s s u e s .
3 2 3

TABLE 2 3 . 3
D i s t r i b u t i o n of Chit Sub scr ib er s By Occupation, 1986
( i n p e r c e n t )
S a l a r i e d Ho us e - A g r i c u l - S e l f Bus i ne s s me nc l a s s wi v e s t u r i s t s e mpl o ye d
Mean 27 9 . 9 7 . 6 9 . 3 45
S . D. 21 1 2 9 . 2 1 2 25
S o u r t'o : U (■ ,i; ponses I o (j u o s I i o n n a i r e s .
TABLE 23 . 4
D i s t r i b u t i o n of Chits Instalment and
in the Sample by Duration -
Periodi n t e r v a l s(months) 0 - 2 50
I n s t a l m e n t
~ ~ 2 5 l z 8 0 1 - " 800 2000
i n t e r v a l s
" 2 0 0 0
( Rs )
Mean*’ C o e f f i c i ent o f v a r i a t i o n
(%)
0 - 4 0 2 36 2 37 7 248 2 5 91 9 1 6 4 .8 4
4 1 - 6 0 556 4 98 3 93 104 1402 1 1 4 .4 0
6 1 -2 0 0 7 i 7 4 1 6 9 791 1 2 5 .0 33Mean 42 0 49 7 0
C o e f f i c i e n t o f v a r i a t i o n ( % )
54 . 7 6 5 7 .14 6 7 .34 8 7 1 .4
1 : Av e r age i n s t a l m e n t .2 : Av e r a g e d u r a t i o n o f t he c h i t .3 : No. o f r unni ng c h i t s .
3 24

TABLE 23.5
Details of Income and Expenditure of Selected Chit FundInstitutions (1986)
Income Average C o e f f i Average Coef f ic ient(Rs.) c ient o f ( percen- of variation
v ar ia t ion tage) of percenof (1) tages
(1) (2) (3) (4)
Entrance fees 3743.61 287.80 0.59 346.27Documentation charge 4152.06 253.19 0.65 304.62Penal charge 13960.36 275.42 2.18 331.38Commission 508155.19 67. 77 79.48 81.54Others 109354.92 237.36 17. 10 285.58Total income 639366.14ExpenditureRent 23885.36 75.91 5.89 77.40Salary 172720.17 94.79 42.56 96.65Commission to agents 30782.78 245.26 7.59 250.07Advertisement 12958.75 154.40 3.19 157.43Gifts 11347.11 352.88 2.80 359.81Printing 27315.17 84. 11 6.73 85.76Registration fees 6253.39 93.31 1.54 95. 14Expenses on rais ing funds 7504.17 238.22 1.85 242.89Legal expenses Others
4582.06 146.28 1.13 149.15108451.36 191.87 26.73 195.63
Total expenditure 405800.31Prof i t 233565.83P r o f i t s as a % o f ch i t c a p i t a l 2.18Pro f i t as a % o f income 36.53Expenses as a % o f ch i t c a p i ta l 3.78Income as a % o f ch it ca p i ta l 5.96
Notes: 1: Mainly bank in terest received.2: Main items are interest on borrowings, d i r e c t o r ' s expenses,
tour allowances and car expenses.Data pertain to 36 ch it fund i n s t i tu t i o n s .
3 2 5

TABUS 23.6
Net Present Value Per Unit of Six Terminated Action Chits
Chit number 1 nz. 3 4 5 6
Chit duration (months) AO 40 30 25 50 40
Number o f borrowers 27 22 14 11 33 24
Average borrowing rate (% p . a . )
13. 53 10. 76 14.21 12.34 10.79 10. 73
Standard Dev. (%) 28.45 22.38 28.89 24.81 21. 79 21. 72
C o e f f i c ie n t o f va r ia t ion (%)
210.33 208.0i 203.26 200.95 201.92 202.32
Number o f savers 12 17 15 13 16 15
Average return to savers (% p . a . )
5.05 0.30 1. 26 4.04 2.46 0.52
Standard deviat ion (%) 10. 63 1.98 7. 23 6.36 11.33 2.04
C o e f f i c ie n t o f var ia tion (%)
210.36 655.81 573.43 157.44 461.17 394.98
Note: Average shows net present value per rupee invested at 11% per annum. Interest rate = 11% + average rateAssumption : A borrower is one who rece ives le s s than what he invests and an investor is one who rece ives more than what he invests in ch it funds.
326

TABLE 23.7
Profile of a Terminated Commercial Auction Chit
A. Chit features
1. Number o f months/members : 252. Monthly subscr ipt ion : Rs 4003. Foreman's commission : 5% (Rs 500 per instalment)4. Foreman ent i t led to take f i r s t two instalments (foreman holds
two subscr ipt ions)5. Fixed discount : 5% for non prized subscribers6. Auction discount fo r a l l subscribers7. Bidding c e i l in g : 30%
B. Instalment-wise details(Figures in rupees)
Instalment Prize amount Net subscr iption o f Pro f i tsubscribers
Prized Non-prized
1 10000 400 400 _2 10000 400 400 -3 7000 320 298.25 (361.68)4 7000 320 297.30 (335.83)5 7000 320 296.20 (692.04)6 7000 320 295 (664.44)7 7000 320 293.70 (635.45)8 7000 320 292.25 (927.25)9 7000 320 290.60 (941.52)
10 7000 320 288.75 (906.16)11 7100 324 290. 70 (1100.43)12 7400 336 300.30 (696.47)13 8050 362 325.55 138.5214 9450 400 395.45 1434.1015 9250 400 375.00 1203.9016 9400 400 388.90 1407.151 7 *>000 400 3 3 7. 'j(J 329.8018 9000 400 328.60 596.6619 9500 400 400 1235.1420 9500 400 400 810.2621 9150 400 312.50 430.7922 9500 400 400.00 899.9523 9500 400 400.00 492.3224 9500 400 400.00 492.3225 9500 400 400.00 492.32
Average profit: Rs 124.17 As a percentage of monthly subscription: 31.04
Notes: 1. Loss in parenthesis.2. For basis o f p ro f i t computation see sect ion 6.
327

TABLE 23.8
Profile of a Terminated Commercial Auction Chit
A. Chit features
1. Number o f months/members : 302. Monthly subscr ipt ion : Rs 5003. Foremans commission : 5% (Rs 7 50)4. Foreman ent i t led to take f i r s t two instalments (foreman holds
two subscr ipt ions)6. Auction discount to a l l subscr ibers
B. Instalment-wise details (alternative instalments)
(Figures in rupees)
Instalment Prize amount Net subscr iption Pro f i t
1 15000 500 -3 10290 368 (979.60)5 9240 333 (1141.83)7 9780 351 (922.34)9 10560 377 (155.46)
11 10500 3 75 (502.23)13 9990 3 58 (1074.21)15 11490 408 207.4917 12750 458 1169.5919 13200 465 1080.3321 L3050 460 904.0023 13320 469 601.1025 13950 490 688.4327 14250 500 1013.6929 14250 500 401.63
Average profit (30 subscribers) : 313.46 As a percentage of monthly subscription : 62-69%
3 2 8

TABLE 23-9
Year of Establishment and Details of Chits of SelectedChit Fund Institutions at the End of December 1986
(Rs lakh)
Chit Locat ion Year o f Number Monthly Number Yearlyfund code e s t a b l i - o f runn subscri p- o f subsc- subscr ip-
shment ing ch its t ions r ibers t ions
1 102 1970 26 7.05 920 84.602 101 1933 25 18.00 12090 216.003 101 1960 24 22. 89 3 500 265.084 101 1961 26 4.98 3610 59. 765 201 1972 35 13.37 1200 160.446 201 1956 38 13. 10 1482 157.207 201 1983 14 9.75 550 117.008 201 1983 37 5.99 1243 71.889 201 1 962 1 1 1 .06 290 1 2. 72
10 201 1953 21 7.95 600 95.4011 201 1951 91 19.65 5400 235.8012 301 1962 1191 379.00 63046 4548.0013 301 1982 66 16.60 2220 199.2014 301 1983 26 8.80 1300 105.6015 301 1984 39 8.60 875 103.2016 101 1960 16 3.65 565 43.8017 102 1970 25 4.00 910 48.0018 102 1970 16 2.60 470 31.2019 102 1950 30 2.00 570 24.0020 102 1955 20 3.50 740 42.0021 102 1958 30 6.50 1285 78.0022 103 1942 12 2. 75 900 33.0023 103 1945 36 8.80 1405 105.6024 101 1981 17 10.50 6349 126.9625 101 1919 17 6.68 12600 80. 1626 101 1927 42 45.00 9800 540.0027 101 1954 18 10.07 10400 120.8428 104 1958 17 4.40 720 52.8029 104 1965 21 5.20 910 62.4030 205 1960 24 7.95 1020 95.4031 102 1954 42 12. 75 1820 153.0032 401 1976 22 4.70 705 56.4033 401 1978 20 5.90 635 70.8034 207 L 971 10 2.40 460 28.8035 207 1952 18 7.40 780 88.8036 204 1968 12 5.00 550 60.0037 204 1974 14 2.85 375 34. 20
Total 2149 700.67 152295 8408.04Average of - 26.61 8.94 2479 319.3236 units(excluding No.12)
Note. Key to lo ca t ion codes is in Table A23 . l l in the Appendix to th is chapter.
329

TABLE 23.10
Estimates of Chit Subscriptions in India (1986)
R s - m i l l i o n
Method IMonthly subscr ipt ions oi 3 7 running chits 70.07in our sample
Annual subscr ip t ions o f 37 running ch its in 840.84sample (Twelve times the monthly f igure )
Chit subscr ipt ions o f 1065 chit companies in 6883.00March 1986 given by RBI survey*"
Annual subscr ipt ions o f 1066 chit companies given in RBI survey (6883x12)
Method IIAverage subscr iptions o f 37 chit fund in s t i tu t io n s in our sample (Rupee years per year)^
Aggregate subscr iptions based on number o f companies (1066) in RBI survey (22.46x1066)
3Aggregate subscr ip t ions based on deposits o f 1066 ch it companies in RBI survey
Notes 1. Formula adopted is2. Total subscr ipt ion = A = ( N - l ) (N+l)x/6
where, N = Number o f periods (months) and x = Instalment per period.Average subscr ipt ion = A/37.
3. Total RBI Deposits x Average subscr iption o f 37 chit fund in s t i tu t io n s in our sample (Rupee years per year) / Average monthly subscr ipt ion per running chit in sample.
82596.00
22.46
23942.36
81631.38
3 3 0

TABLE 23.11
Annual Chit Subscription Received by Selected Chit Fund Institutions
(Rs lakh)Chitfunds
1981 1982 1983 1984 1985 1986
1 62.4 68.4 69.6 72. 6 78.6 84.62 160.56 160.56 160.56 160.56 160.56 2163 265.08 265.08 265.08 265.08 265.08 265.084 131.04 131.04 131.04 131.04 59.76 59. 765 0 0 0 0 0 160.446 102.6 126.6 121.8 124. 2 159 157.27 0 0 0 (>7.2 1.06.8 1178 0 0 26.4 43.44 67.44 71.88y 0 0 0 0 0 12. 72
10 0 0 0 0 69 95.411 0 0 0 222 233.4 235.812 1692 2328 2880 3528 3876 454813 0 51.6 114 136.8 172.8 199.214 0 0 55. 2 62.4 79.2 105.615 0 0 0 51. 6 82.8 103. 216 60 60 72 60 54 43.817 110.4 84 75 69 57 4818 18 24 21 25. 2 25.2 31.219 9 12 14.4 15.6 18 2420 43. 2 33 30 36 39 4221 39 45 48 60 72 7822 99 90 72 60 48 3323 66 81 83.4 108.6 113.4 105.624 52.8 73.44 103.92 103.92 106.08 126.9625 0 125.88 125.88 125.88 80.16 80. 1626 0 540 540 540 540 54027 152.76 16.68 147.36 157.92 136.68 120.8428 44.4 46.8 50.4 48 51.6 52.829 33.6 38.4 45.6 51.6 55.2 62.430 64.2 70. 2 80.4 81 88.2 95.4031 95.4 118.8 134.4 137.4 141 15332 18 20.4 29.4 34.8 46.8 56.433 4.8 9.36 18.24 24.24 43.8 70.834 19. 2 25.2 26.4 28.8 28.8 28.335 53.4 65.4 65.4 69 76.8 88.836 114 88.2 65.4 60.6 57.6 6037 12 12 18 24 29.4 34. 2
Total 3498.8 4955.0 5690.2 6 786.4 7319.1 8408.0
33 1

TABLE 23.12
Number of Subscribers Served by Selected Chit Fund Institutions
Chitfund
1981 1982 1983 1984 1985 1986
1 520 600 640 720 855 9202 13941 13941 13941 13941 13941 120903 3500 3500 3500 3500 3 500 35004 5590 5590 5590 5590 3610 36105 1200 1200 1200 1200 1200 12006 1248 1320 1200 1209 1521 14 827 0 0 0 350 420 5508 0 0 81 7 1176 1474 12439 0 0 0 0 0 290
10 0 0 0 0 500 60011 0 0 0 3100 4500 540012 48780 53348 56231 58661 59434 6304613 0 620 1110 1620 1890 222014 0 0 4 50 6 50 900 130015 0 0 0 500 675 87516 725 725 725 725 685 56517 1480 1250 1135 1085 985 91018 350 410 350 430 430 47019 195 335 375 400 420 57020 490 500 500 600 715 74021 500 625 700 855 1085 128522 3215 3130 2000 1600 1 200 90023 885 1010 1110 1320 1480 140524 3666 4486 5086 5086 5800 634925 0 18200 18200 18200 12600 1260026 0 9800 9800 9800 9800 980027 17500 17500 1 7400 17400 12320 1040028 520 560 640 600 680 12029 570 620 700 770 800 91030 600 650 755 780 920 102031 1250 1470 1600 1650 1770 182032 250 300 365 490 580 70533 150 215 315 365 465 63534 240 340 380 460 460 46035 360 4 90 490 610 730 78036 1050 850 700 650 625 55037 175 175 225 275 325 375
Total 108948 143960 148280 156368 149295 152295
332

TABLE 23.13
Average Chit Amount of Running Chits of Chit Fund Institutions in Kerala and Tamil Nadu
Year (A p r i l - March)
Kerala
Number o f running chits at the end of year
Tamil Nadu
Number o f running ch its at the end o f year
Total ch i t amounts o f running chits at the end o f year(Rs lakh)
Average chit amount o f running ch its (3 /2 )
(Rs)
Totalchitamounts o f running ch i t s at the end o f year
(Rs lakli)
Average chit amount o f running chit (6 /5 )
(Ks)
(1) (2) (3) (4) (5) (6) (7)
1964-65 4203 368.40 8765 841 28. 50 33891965-66 4498 472. 7 10509 1359 68.00 50041966-67 4632 473.6 10225 2255 73. 90 - 32771967-68 5247 531 . "3 1 01 30 304 3 1 20 . 1 6 3 94 91968-69 6062 788. 2 13002 40L6 235.51 58641969-70 6181 527. 5 8534 5795 269. 16 46451970-71 6371 652.8 10246 12428 536.80 43191971-72 N. A. N.A. N.A. N.A. N.A. N.A.1972-73 6841 1559.4 22795 20821 851.80 40911973-74 7253 1397.7 19319 24650 1128.73 45791974-75 7784 1478.6 18995 26367 1443.86 54761975-76 8706 1509.8 17342 28501 1584.01 55581976-/7 N.A. N.A. N.A. 17916 1269.38 70851977-78 6930 1019. 2 14707 16315 1537.07 94211978-79 10032 966.6 9635 16214 1402.77 86521979-80 6747 1452.9 21534 16668 1429.32 85751980-81 7081 1782.2 25168 17423 1354.04 77721981-82 8013 1290.1 16100 18438 1529.30 82941982-83 N.A. N.A. N.A. 19315 2133.36 11045
Sources: 1. Administration Report o f the Registration Department, Government of Kerala, Trivandrum. O ff i ce o f the Inspector General o f Registration (Director o f Chits) , Government o f Tamil Nadu.
3 3 3

TABLE 23.14
Amount of Borrowings (Net of Discount) of Sampled Borrowers of Chit Funds
( i n Rs )
Bu si nes smell/ Sa 1 a r y Housewives A gr icu ltur is tsp r o fe s s io e a rnersnal s / s e l fempi oyed
1 25002 70003 350004 92505 45000fa 820007 400008 N.A.9 40000
10 500011 5000012 7000013 200014 80000 -15 3000016 4000017 1700018 N -\19 400020 N. A.21 5500022 500023 110000
(2 c h i t s )24 10000
Total 614000 3 72 50 50000 82500borrowings
(% of t o t a l ) (83 .11) (5 .04) (0 .68) (11-17)
33 4

TABLE 23.15
Discount d istr ibuted at the end o f the chit Number o f members/periods: 15P e r io d ic i ty in months: 1
Subscription in Rupees: 300
PROFILE OF A TERMINATED COMMUNITY AUCTION CHIT
(Figures in Rupees)
Period Prize Discount Net sub Net pr i ze
De posit Loan Ca i n / loss
1 3675.00 825.00 300.00 33 75.00 0 . 0 0 3375.00 -17.052 3640.00 860.00 300.00 3340.00 302.39 3037.61 -112.173 3795.00 705.00 300.00 3495.00 607.19 2887.81 17.484 3680.00 820.00 300.00 3380.00 914.43 2465.57 -165.675 3820.00 680.00 300.00 3520.00 1224.11 2295.89 -53.536 3840.00 660.00 300.00 3540.00 1536.26 2003.74 -77.707 3885.00 615.00 300.00 3585.00 1850.91 1734.09 -72.518 3930.00 570.00 300.00 3630.00 2168.06 1461.94 -66.359 4040.00 460.00 300.00 3740.00 2487.74 1252.26 10.931 0 4200.00 300.00 300.00 3 900.00 2809. 96 1090.04 140.671 1 4220.00 280.00 300.00 3 920.00 3134.77 785.23 120.921 2 4255.00 245.00 300.00 3 955.00 3462.15 492.85 118.3813 4290.00 2 1 0 . 0 0 300.00 3990.00 3792.15 197.85 117.0414 4350.00 150.00 300.00 4050.00 4124.78 -74.78 142.1915 4350.00 150.00 300.00 4050.00 4460.07 0 . 0 0 107.86.
Average gain per member: R s .14.03
3 3 5

TABLE 23.16
Discount d istr ibuted at the end of the chit Number o f member s /p e r i o d s : 12P e r io d ic i ty in months: 1Subscription in Rupees: 200
PROFILE OF A TERMINATED COMMUNITY AUCTION CHIT
(Figures in Rupees)
Period Pr ize Discount Net sub Net Deposit Loan Gain/ los:scr ipt . prize %
1 1865.00 535.00 2 0 0 . 0 0 1665.00 0 . 0 0 1665.00 -135.752 1925.00 475.00 2 0 0 . 0 0 1725.00 201.59 1523.41 -93.633 2030.00 3 70.00 2 0 0 . 0 0 1830.00 404.80 1425.20 -1.374 1895.00 505.00 2 0 0 . 0 0 L695.00 609.62 1085.38 -176.385 2070.00 330.00 2 0 0 . 0 0 1870.00 816.01 1053.93 -7 .336 2 1 0 0 . 0 0 300.00 2 0 0 . 0 0 1900.00 1024.18 875.82 1.737 2270.00 130.00 2 0 0 . 0 0 2070.00 1233.94 836.06 160. 548 2195.00 205.00 2 0 0 . 0 0 1995.00 1445.37 549.63 58.339 2 2 0 0 . 0 0 2 0 0 . 0 0 2 0 0 . 0 0 2 0 0 0 . 0 0 1658.49 341.51 42. 581 0 2250.00 150.00 2 0 0 . 0 0 2050.00 1873.31 176.69 74. 18LI 2300.00 LOO.00 2 0 0 . 0 0 2 1 0 0 . 0 0 2089.84 1 0 . 16 105.79L2 2300.00 1 0 0 . 0 0 2 0 0 . 0 0 2 1 0 0 . 0 0 2308. 10 0 . 0 0 87.40
Average gain: Rs.9.68
336

TABLE 23.17
Discount d istr ibuted each period.Number o f members/periods: 14/24Per iod ic i ty in months: 1Subscription in Rupees: 500
PROFILE OF A TERMINATED COMMUNITY AUCTION CHIT
(Figures in Rupees)
Period Prize Discount Net subscr ipt .
Netprize
Deposit Loan Gain/loss
1 6650.00 5350.00 277.08 6372.92 0 . 0 0 6372.92 -2182.222 7500.00 4500.00 312.50 7187.50 279.29 6908.21 -1164.233 7300.00 4700.00 304.17 6995.83 . 596.51 6399.32 -1543.134 7900.00 4100.00 329.17 7570.83 907.86 6662.97 -890.625 8900.00 3100.00 370.83 8529.17 1246.89 7282.27 259.716 8300.00 3700.00 345.83 7954.17 1630.62 6323.54 -627.557 8450.00 3550.00 352.08 8097.92 1992.22 6105.70 -561.758 1 0 0 0 0 . 0 0 2 0 0 0 . 0 0 416.67 9583.33 2363.00 7220.34 1219.139 9900.00 2 1 0 0 . 0 0 412.50 9487.50 2801.83 6685.67 959.331 0 9900.00 2 1 0 0 . 0 0 412.50 9487.50 3239.96 6247.54 826.371 1 9900.00 2 1 0 0 . 0 0 412.50 9487.50 3681.58 5805.92 697.591 2 9700.00 2300.00 404.17 9295.83 4126.73 5169.10 339.9213 9400.00 2 6 0 0 . 0 0 391 .b7 9008.33 4567.03 4441.30 -122.8714 9750.00 2250.00 406.25 9343.75 4998.24 4345.51 165.1215 9650.00 2350.00 402.08 9247.92 5447.58 3800.33 -57.7516 10050.00 1950.00 418.75 9631.25 5896.31 3734.94 279.5817 10450.00 1550.00 435.42 10014.58 6365.42 3649.16 609.5018 10650.00 1350.00 443.75 10206.25 6855.07 3351.18 716.3919 1 1 0 0 0 . 0 0 1 0 0 0 . 0 0 458.33 10541.67 7357.02 3184.65 981.622 0 10850.00 1150.00 452.08 10397.92 7877.67 2520.25 715.292 1 11250.00 750.00 468.75 10781.25 83 96.18 2385.07 1028.322 2 11350.00 650.00 472.92 10877.08 8935.62 1941.47 1027.0523 11500.00 500.00 479.17 11020.83 9483.56 1537.27 1077.8024 11500.00 500.00 479.17 11020.83 10042.17 0 . 0 0 978.66
Average gain per member: Rs.197.14

TABLE 23.18
Discount d istr ibuted each period.Number o f members/periods: 12/15P e r io d i c i ty in months: ^
PROFILE OF A TERMINATED COMMUNITY AUCTION CHIT
Subscription in
Period Prize Discount Net subscr ipt .
1 1 0 0 0 . 0 0 500.00 66.672 1 0 0 0 . 0 0 500.00 66.673 970.00 530.00 64. 674 1 1 0 0 . 0 0 400.00 73.335 1 1 0 0 . 0 0 400.00 73.336 980.00 520.00 65.337 1105.00 3 95.00 73. 678 1300.00 2 0 0 . 0 0 86.679 1350.00 150.00 90.001 0 1330.00 170.00 8 8 . 671 1 1320.00 180.00 8 8 . 0 01 2 1315.00 185.00 87. 6713 1350.00 1 50.00 90.0014 1350.00 150.00 90.0015 1350.00 150.00 90.00
Rupees: 100
(Figures in Rupees)
Net Deposit Loan Gain/ lossprize
933.. 33 0.0 0 933. 33 -286..67933..33 67. 2 0 8 6 6 . 13 -119. . 2 1905..33 134. 93 770. 40 -168..09
1026..67 2 0 1 . 19 825. 48 -32.. 1 21026.. 67 2 76. 71 749. 95 -46..61
914..67 352. 84 561. 83 -194., 511031..33 421. 51 609. 83 - 6 8 . 341213..33 499. 1 2 714. 2 1 131. 981260.. 0 0 590. 46 669. 54 171. 031241..33 685. 8 8 555. 45 134. 801 232.. 0 0 780. 73 451. 27 1 1 0 . 291227..33 875. 6 6 351. 6 8 91. 891260., 0 0 971. 0 0 289. 0 0 115. 291260.. 0 0 1069. 46 190. 54 1 0 2 . 981260., 0 0 1168. 71 0.0 0 91. 29
Average g,ain per member: Rs .2..27
3 3 8

CHAPTER 24
24.1 Sample description, area surveyed and generaldescription of the market
24.1.1 The case study o f dockyard financing was conducted inCalcutta. The survey was confined to 6 borrowers and 10 principal
lenders. Information was also obtained from discussions with
senior Calcutta Port Trust o f f i c i a l s and o f f i c e bearers o f the All
India Clearing Agents Associa tion .
24 .1 .2 I t was found from our study that im porters are the pr inc ipa l borrowers in th is c red i t market. They need short term c re d i t fo r the payment o f cargo and container rent, wharfage rent and demurrage charges, o f which demurrage charges are the most important and unpredictable element.
24.1.3 A ccord ing to C a lcu tta Port Trust r u l e s , goods aredemurrage free for three c lear working days a f te r the date o flanding or the date on which goods are made avai lable for de l iveryin case o f goods sold by publ ic auction. Apart from th is , whengoods are landed on a day that is not a working day or in the second or third s h i f t o f a day, the next working day i s treated as the landing date. Furthermore, demurrage charges are applied from
the date o f landing at double the rate s p e c i f i e d in the l i s t for goods c l a s s i f i e d as 'Hazardous I ' in the hazardous l i s t . A b r ie f summary o f the rates for demurrage charges i s given in Table 24.1.
24.2 Sources of funds
24.2.1 It is found from our study that the borrowers prefernot to borrow from pro fess ional f inanc iers . Profess ional f inan-
DOCKYARD FINANCIERS IN CALCUTTA
3 3 9

c i e r s play an i n s i g n i f i c a n t r o l e in C a lcu tta though they are reputed to play a much greater ro le in Bombay and Madras and in the related markets o f railway fre ight and air cargo finance. It is found that some f inanc iers in th is market have other occupat ions as their pr inc ipa l source o f income. Nevertheless, importers normally do not take loans from them because they retain
imported goods for which they provide dockyard finance t i l l borrowers pay back the amount borrowed plus in terest . Furthermore, their interest rate is reported to vary between 2 0 to 25 per cent per annum. There are mainly two ways in which importers meet the ir needs for dockyard finance. F i r s t ly , some importers d ivert a cer ta in percentage o f t o ta l loans obtained from commerc ia l banks for various purposes (mainly for working c a p i ta l ) to
demurrage payment. The most important source o f credit for th is purpose is however loans g iven by c l e a r i n g agents to t h e i r c l i e n t s .
24 .2 .2 The major source o f funds f o r c l e a r i n g agents was claimed by them to be retained p r o f i t s . They also claim that they never borrow from pro fess ional f inanc iers , even though private individuals and pro fess iona l f inanciers are reported to s o l i c i t loan
business from c lear ing agents. But c lear ing agents have overdraft f a c i l i t i e s with commercial banks, and occas iona l ly take loans from
commercial . banks at a reported interest rate o f 1 1 per cent per annum. It may be mentioned here that th is interest rate i s very low, the normal bank interest rate being 16.5 per cent. None o f the agents interviewed or the ir Associat ion consented to provide detailed f inanc ia l statements.
24.3 Uses o f funds
24.3.1 It has been observed in many cases that importers are unable to c lear the ir goods within three working days due, inter a l i a , to the fo llowing reasons. Most important is disputes regarding customs duties . Importers are forced to pay demurrage charge for the period fo r which duties are in dispute. Although importers make a p r io r i assessments o f import and custom duties there is
3 4 0

usually a gap between the o f f i c i a l assessment o f customs duties , and the ir own assessment. In many cases i t i s found that customs duties amounted to nearly double the value o f imports (C . I .F ; see Table 24 .2 ) . Nevertheless, cred it requirements for customs duties are normally met by commercial banks. However, banks do not ad
vance loans to importers for payment o f rent and demurrage charges
which must therefore be obtained-from informal sources. As mentioned e a r l i e r , c lear ing agents are the main source of funds. Funds are normally made avai lable to importers by way o f trade c r e d i t of upto 90 days. An Association o f f i c i a l claimed that the pract ice o f allowing trade cred it is o f recent o r ig in . The reason for t h i s is r eported to be the increased co m p e t i t i o n between
agents due to the d ec l ine in the cargo tonnage handled by Calcutta port. This is p ar t ia l ly corroborated by the fact that o f f i c i a l
f igures show that between 1958-59 and 1982-83 to ta l cargo tonnage (imports and exports) handled at Calcutta port decreased by 33.06 per cent . Clearing agents advance c re d i t to their c l i e n t s without any c o l l a t e r a l . However, a measure o f secur i ty is provided by the f a c t that cred it is advanced only to long standing customers. Lf
im porters are unable to p a r t i a l l y or f u l l y cover the amount
required to pay rents and demurrage charges, c learing agents make payments on behalf o f the ir c l i e n ts to the Port authority and immediately d e l iver the cleared goods to their respect ive c l i e n t s . It has been found from our study that loans may vary between Rs. 500 to Rs. 60,000. Table 24.3 gives the var ia t ion in loan amounts between 1985 and 1987 for a representat ive importer.
24.4 Cost of intermediation and profitability of intermediaries
24.4 .1 Although c lear ing agents claim that they do not charge any in te re s t , we found an im pl ic i t in terest charge in the ir lending a c t i v i t i e s . It is found in our survey that they claim demurrage charges at rates greater than Calcutta Port Trust rates. Since im porters cannot pay port charges d i r e c t l y to the Port Authority, and since most importers are r e la t iv e ly uninformed about Port Trust rules , this type of malpractice is reputed to be quite widespread. While importers do not find it easy to obtain
341
information on Port Trust charges, that they suspect malpractices on the part of agents may be in ferred from the fact that one imp o r t e r in terv iew ed has r e c e n t l y gone to the c o u r t s to o b t a in r e l i e f . In one case, we found that a part icu lar c lear ing agent
charged demurrage for an item c l a s s i f i e d as Hazardous I at the rate of Rs. 45 per day per tonne, whereas the o f f i c i a l rate , as
stated in ’’ The Calcutta Gazette" is Rs . 40 per day per tonne.Furthermore, i t is also reported that th is c learing agent was reluctant to show o r ig in a l Port Trust b i l l s to his c l i e n t . On the basis o f information provided by th is importer we ca lcu lated the mean interest rate ( i ) allowing for a " normal" return on cap ita l employed o f 1 0 0 per cent per annum for the agent and assuming that funds are indeed tied up for the maximum number o f days during
which his funds could have been employed in normal c lear ing act i v i t i e s .
24.4.2 i i s estimated as
ni = 1/n X ( C ( j ) - ( P ( j ) ( l - a ( j ) ) ) / P ( j )
j= i
The variance o f th is estimate is given by
nV = 1 / ( n - 1) I [ i - ( C ( j ) - ( P ( j ) ( l + a ( j ) ) ) ] 2 / P ( j )
j =i
where C( j) and P ( j ) are the charges to the importer by the c l e a r ing agent and the actual demurrage charges ca lculated according to Port Trust rules r e sp e c t ive ly ; n ( = 7) is the number o f observat ions and a ( j ) is the rate o f p r o f i t . Using th is method we found an interest rate o f 60.18 per cent per annum. The variance o f the estimate was less than 0 . 0 0 0 1 .
24.5 Regulatory environment and impact
24.5.1 The impact o f the government regulations in th is market is f e l t in two major ways. F i r s t ly , there is delayed assessment of customs duties and long disputes regarding customs duties and secondly, there is the unwillingness o f (mainly nat iona l ised) com
342

m erc ia l banks to advance loans f o r paying rent and demurrage charges. Because o f delayed customs clearance, importers are forced to pay demurrage charges. Furthermore, since commercial banks do not advance loans for th is purpose, firms meet their c red it requirements in the two ways already discussed in sect ion
3. For these two reasons costs o f production for importing firms are driven up. Production costs could c l e a r ly be reduced i f both these fac tors were ameliorated.
24.6 Market structure
24.6.1 It is very d i f f i c u l t to assess the nature o f the market under consideration due to the various c o n f l i c t i n g reports. An o f
f i c e bearer o f the Al l India Clearing Agents Association claimed that they had started advancing c red i t to importers due to the decl ining business o f Calcutta port and the result ing competition among c l e a r i n g agents for shares o f the shr inking market. However, our information shows that competition is absent in this market. The f o l l o w i n g e v i d e n c e can be c i t e d :
i . High im pl i c i t interest rates .
i i . Evidence o f b a r r i e r s to en try due to l i c e n s i n g o fc l e a r i n g agents by the Port Au th or i ty and the so le right o f c lear ing agents to c lear goods.
i i i . Stable and long term relat ionships between c lear ingagents and importers.
i v . Imperfect information by c l i e n t s o f Port Trust charges.
24.6 .2 While it may be true that c lear ing agents lose poten
t i a l new c l i e n ts to other agents due to dec l in ing business act i v i t i e s in C a lcu tta P o r t , they s t i l l manage to e x t r a c t high p r o f i t margins in the short run from established c l i e n t s by charging a high im pl ic i t interest on their loans and claiming high commissions for the ir c lear ing work. Currently, they charge 1/2 per cent to . 6 per cent o f t o t a l imports ( C . I . F . ) for their serv ices . This i s possib le because c lear ing agents normally do not advance loans to the new custom ers f o r c i n g im p orters with funds constra ints to deal with only the c lear ing agent with whom a long
3 4 3

term re lat ionship has been establ ished. I f at a l l there is comp e t i t io n among c lear ing agents th is i s mainly for new customers. Hence, i t i s hard to b e l i e v e that t h i s market i s c o m p e t i t i v e ei ther in the sense of zero p r o f i t s or free entry. Furthermore, i t is d i f f i c u l t at this stage to predict the long term impact o f
the d e c l i n e in tonnage handled by the Ca lcutta Port Trust on c lear ing charges.
24.7 Influence of formal sector lending rates and credit availability
24.7.1 The formal sector in d i r e c t ly helps dockyard financing in Calcutta in two ways. As has been discussed, importers often
d ivert a portion of Loans obtained from the commercial banks to the financing o f rent and demurrage charges. Secondly, c learing
agents also advance loans to importers by using their overdraft f a c i l i t i e s with commercial banks. Therefore, l o o s e ly speaking, commercial banks do in d i r e c t ly a ss is t dockyard financing, though the quantitative importance of th is could not be assessed.
24.8 Efficiency and allocative impact
24.8.1 The f inanc ia l assistance provided by c learing agents to
importers c lear ly plays a role in improving the e f f i c i e n c y o f functioning of th is market. Since there is a gap between the demand for credit and supply o f formal cred it in dockyard f inancing, by channeling funds to businessmen, agents play a ro le in b r id g in g the gap in f i n a n c i a l requirements l e f t uncovered by banks. Since most imported items are e i t h e r raw m a t e r ia l or
machinery required lor modernisation oi fa c to r i e s , their serv ices can c lear ly be considered as important to the e f f i c i e n t funct ioning of these organisations . Since the cost o f borrowing from clear ing agents, though high, must be l e s s than the cost o f borrowing from other f i n a n c i e r s ( ta k in g in to account the time f a c t o r ) , i t can be said that their ass istance to importers enables them to keep the cost o f production below what i t would have been
without such ass is tance . Furthermore, i t may be noted that c l e a r ing agents thereby mitigate the i n e f f i c i e n c y engendered by the
344

r e g u l a t o r y env ironment, c r e a t e d by commercial banks, customs author i t ie s and the Post Trust.
24,9 Recommendations for regulatory framework
24.9.1 Our f i r s t recommendation i s that commercial banks should finance container, cargo, and wharfage rents and demurrage
charges. In recognit ion o f the important ro le that imports play in the Indian economy, s p e c i a l a t t e n t i o n has to be given immediately to the provis ion o f c red i t f o r this purpose. Since commercial banks advance loans p ar t ia l ly for importing goods from abroad, there is no good reason why they should not grant cred it
for th is purpose as well . Even i f they g ive loans at the c e i l in g rate i t would be cheaper to importers than borrowing from c lear ing agents and private f inanc iers . Secondly, a l l Port Trust rules
regarding d i f f e re n t charges should be made avai lab le in a c l e a r ly written and e a s i ly access ib le fashion to importers. This w i l l undoubtedly reduce the costs ar is ing from imperfect information. Furthermore, as we have noted already, delayed customs assessment and disputes regarding customs duties are the main contr ibutory factors to the massive payment o f demurrage charges. Customs
author i t ies should look into the causes o f delay and disputes to minimize the days required for customs c learance.
3 4 5

TABLE 24.1
Summary of Demurrage Rates
(Figures in Rupees)S. D e s c r i p t i o n No. o f g o o d s
1. F o o d g r a i n s / p u l s e s , c e r e a l s , s u g a r , s e e d s o f a l l k i n d s , t i m b e r .
2. G l a s s w a r e , p o r c e l a i n and s a n i t a r y wares , a sbe s t o s f i b r e .
3. Mo t o r v e h i c l e , c h a s s i s , e t c .
4. Smal l p a r c e l s o f h a z a r d o u s g o o d s
5 . A l l o t h e r good s
Pert o n n e
Per Cu . me t r e
E a c h
E a c h p a c k e t Pe r t o n ne
Ch ar ge s pe r day
1 - 30 days
3 1 - 6 0days
61 day onwa rd s
2 0 . 0 0 3 0 . 0 0 4 0 . 0 0
5 0 . 0 0 7 5 . 0 0 1 0 0 . 0 0
1 2 0 . 0 0 1 8 0 . 0 0 2 4 0 . 0 0
1 0 . 0 0 1 5 . 0 0 2 0 . 0 0
4 0 . 0 0 6 0 . 0 0 8 0 . 0 0
S o u r c e : The C a l c u t t a G a z e t t e ( 1 9 8 8 ) .
3 4 6

TABLE 2 4 .2
Import V alues ( C . I .F . ) and Custom D uties o f an Im porting Firm fo r 198 6 -8 7
(in Rs)
Q u a n t i t y l C . I . F . V a l u e Custom Duty
144 M/ To nne s 1 , 7 2 , 2 7 9 . 9 0 20 Tonnes 2 , 2 8 , 3 0 5 . 7 2 1 4 . 7 2 M/ Tonnes 2 , 5 7 , 5 8 8 . 1 6
2 , 4 0 , 2 4 6 . 7 9 3 , 1 9 , 5 4 9 . 9 3 2 , 5 7 , 5 8 8 . 16
1 : ISOBUTYL ACETATE ( Ha z a r d o u s i t e m ) .
TABLE 2 4 .3
V a r ia tio n in Loan Amount s( i n R s )
Date Loan amounts
0 6 . 0 6 . 1 9 8 5 15 , 8 9 81 3 . 0 6 . 1985 25, 1470 5 . 0 7. 1 98 5 2 5 , 1 4 72 1 . 0 1 . 1 9 8 6 1 , 8002 9 . 0 7 . 1 9 8 6 5, 6891 5 . 0 1 . 1 9 8 7 1 4 , 9 5 00 1 . 0 8 . 1 9 8 7 59 , 5 3 1
347
CHAPTER 25
THE INTERCORPORATE FUNDS MARKET
25.1 Introduction
25.1.1 When the supply o f formal cred it to economic units isconstrained at prevail ing interest rates , and when the return on saving through formal channels i s f ixed by regulation at below i t s market c learing l e v e l , some increments to the pool o f loanablefunds inev itab ly remain outside the formal c red i t system. Such
funds, intermediated by a var i et y o f informal intermediaries and
markets, are attracted by the ex is t ing arbitrage opportun it ies : suppliers to better returns and buyers to cheap loans or addit ional f inance. The intercorporate funds market (IFM) in India i s , to an extent, one such market. Brief references to th is market and i t s functioning are to be found in Timberg and Aiyar (1980) and Reserve Bank of India (1985). However, to our knowledge, no
systematic attempt to study the working o f this market has yetbeen made.
25 .1 .2 In this study we examine some o f the organisationalfeatures o f th is market and try to evaluate i t s economic r o le .Besides descr ib ing the functioning of th is market, the most important issue that must engage our a ttention is an evaluation o f the hypothesis put forward by the Report o f the Committee to Review the Working o f the Monetary System, Reserve Bank of India (1985), better known as the MChakravarty Committee". According to this r e p o r t , "The loans are general ly made by corporate units with seasonal surplus funds to other companies" and also "Evening out l i q u i d i t y imbalances in the corporate sector through the development o f the intercorporate funds market would provide a means o f reducing the v a r i a b i l i t y in the demand for bank cred it and hence provide greater maneuverability to monetary regulation measures"
348

(RBI (1988), para 12.66) . The hypothesis i s , there fore , that the IFM helps to decrease f luctuat ions in c red i t a v a i l a b i l i t y around
the trend determined by monetary measures.
25.2 Scope of the intercorporate funds market
25.2 .1 Corporations have f inanc ia l dealings with other corporations in three major ways: F irst , there are flows throughtheir rece ivables account for value given. Secondly, there are flows through investment in the debt or equity o f other corporat ions via cap i ta l markets, public issues, takeovers or the formation o f subs id iar ies . F inally , there are short-term loans made to other corporations and intercorporate depos i ts . By d e f in i t i o n we exclude the f i r s t and second type o f f inanc ia l flows from the purview o f th is study. This corresponds with e a r l i e r usage o f the term IFM. Certain e x te r n a l funds which f low to c o r p o r a t i o n s through the same organisat ional channels as corporate funds are however also included in the market.
25.2 .2 Exclusion o f rece ivab les i s c l e a r ly appropriate sincethese simply represent delayed payments and have l i t t l e or no r e la t io n with short term loans a p r i o r i . The exclusion o f invest ment, e s p e c ia l l y at the short term end (represented for example, by public sector corporat ion bond issues with a functioning secondary market) may result in a somewhat misleading picture o f the flow o f funds through the intercorporate market, since both forms o f corporate debt are c l e a r ly substitutab le . However, even at the short-term end, the degree o f s u b s t i t u t a b i l i t y i s l imited due to two reasons. F i r s t ly , in terest rates payable on publ ic sector bond issues are subject to a c e i l in g and secondly, despite secondary markets, such investments are le ss read i ly l iquidated , at least in p r in c ip le , than intercorporate loans.
25.3 Organisation of the intercorporate funds market
25.3 .1 This descr ip t ion is based on about 80 interviews withfinance managers o f corporat ions , bank o f f i c i a l s and in tercor -
3 4 9

porate brokers. Information from corporations was c o l l e c te d with
the help o f a structured questionnaire .
25.3 .2 The IFM has two segments which have l i t t l e or no inter act ion. One segment i s the market for funds between publ ic sector
corporat ions . The other segment is the market for loans between private sector corporat ions . Both segments o f the market are
highly a c t ive and include among their part ic ipants the largest corporations in the respect ive sectors and in the la t t e r case , blue chip companies. However, among intercorporate lenders in both segments, public sector f inanc ia l in s t i tu t ion s such as the Unit Trust o f I n d i a , The L i f e Insurance C o rp o ra t io n and the General Insurance Corporation are to be found.
25.3.3 The flow o f intercorporate loans i s e i ther d i r e c t l y negotiated between borrowers and lenders or intermediated through
brokers. For public sector corporat ions , the portion o f loans intermediated i s r e l a t i v e l y small.^ Furthermore, the brokers for the public sector are themselves public sector banks or their subs id ia r i e s (such as the State Bank of In d ia 's subsidiary, SBI Capita l Markets). In the case o f private sector corporat ions , the general impression is that the quantum o f brokered transactions exceeds d i r e c t t r a n s a c t i o n s . Brokers are normally l e a d in g
3sharebrokers and are to be found in a l l the metropolitan c i t i e s . Recently, multinational banks such as Grindlays Bank, have s e le c t i v e ly begun o f f e r in g brokerage serv ices . Nationalised banks are,
1. Ex a c t f i g u r e s a r e no t a v a i l a b l e . A c c o r d i n g t o t he s ampl e o f f i r m s s t u d i e d , 2 2 pe r c e n t i s b r o k e r e d .
2. Based on c l a i m s made by p e r s o n s i n t e r v i e w e d .
3. In D e l h i , l e a d i n g b r o k e r s i n ^ u d e ( i ) B a j a j C a p i t a l and I n v e s t m e n t s ; ( i i ) Amr i t L a i B a j a j ; ( i i i ) R a j e e v R e l a n ; ( i v ) B i s h a m b e r Dayal Ag g a r w a l ; and ( v ) V i j a y Mehta. In Bombay the l e a d i n g b r o k e r s i n c l u d e ( i ) J a g d i s h D a l a i ; ( i i ) C h a m p a k l a l I n v e s t m e n t s ; ( i i i ) Bhupen Champakl a l ; ( i v ) C . J . D a l a i ; ( v ) DSP F i n a n c i a l ; and ( v i ) J.M. F i n a n c i a l .
350

25.4 Brokerage, interest rates, loan duration, loan size and miscellaneous features
25.4.1 The brokerage charged by private brokers varies between
0.25 per cent and ( in the case o f one broker) 1.5 per cent . Mult inat iona l banks charge 0 .5 p er -cen t . The brokerage varies with the creditworthiness /reputat ion o f the borrower given the added
d i f f i c u l t y o f f inding w i l l ing lenders for le s s creditworthy borrowers. The brokerage a lso varies with the urgency o f the loan demand.
however, yet to make much headway in this market.
25.4.2 Interest rates among public sector units vary between12 and 15 per cent. These rates are bounded above by the commerc ia l bank prime lending rate (16.5 per cent) and below by the relevant bank deposit rate ( 8 to 11 per cent ) . In the privatesector , interest rates reportedly vary between 13 and 19 per cent .^ One broker in Bombay reported the fo l lowing structure o f interest rates.
Call 3/6 month
A c lass companies 13.5-14 15-16.5
B c lass companies 13.5-14 16.5-18C c lass companies 13.5-14 18-22
V
Another newspaper report^ maintained that the upper range o f interest rates, 18 to 19 per cent, i s appl icable to companies with a low cap i ta l base facing l i q u i d i t y problems due, for example, to
sales f luctuat ions . The middle range, 16 to 17.5 per cent is for firms with strong sales who, due to a low cap ita l base, cannot get bank accommodation. The lowest range is for companies who require short term accommodation and who have a very high c red it rating
4. Bu s i n e s s Sj: anjdjijrd , Jan uar y 20, 1988 and c o n v e r s a t i o n s wi t h b r o k e r s .
5. B u s i n e s s S t a n d a r d , i b i d .
351

due to frequent par t i c ip at ion in the IFM. Some companies have reportedly o f fe red in terest at rates o f upto 2 2 per cent but have been unable to find lenders at this rate which t i e s in well with asymmetric information based c red i t market models such as that o f S t i g l i t z and Weiss ( 1 9 8 1 ) . Rates i n the p r i v a t e s e c t o r are reported to vary with two fac tors . F i r s t ly , the creditworthiness
o f the company comes into play. As can be seen from the example o f the company o f f e r in g 2 2 per cent, there appears to be an upper bound on the c red i t r isk lenders are w i l l ing to face in making loans ( S t i g l i t z and Weiss, 1981). The second feature i s the extent o f accommodation received by the firm from the banking sector . For t hi s , the s ize o f the cap ita l base o f a firm re la t iv e to i t s yearly sales is reported ly o f relevance.
2 5.4.3 A second source o f information claimed that loans f l u c tuated between a narrow leve l o f 17 to 18 per cent for c a l l loans
and loans o f upto 6 months duration. Our samples o f companies, to be discussed further below, has revealed rates between. 15 and 19 per cent .
25.4.4 Loans may be extremely short, c a l l loans or may be for upto two years duration. The median loan in the private sector appears to be o f three to s ix months duration, while the median loan in the publ ic sector appears to be o f s ix months to one year duration. Most loans in the private sector vary between Rs 25 lakh and Rs 1 crore , with a loan of as l i t t l e as Rs 20,000 and another o f as much as Rs 3 c r o r e being obs er ved . One broker claimed that blue chi p companies who were frequent borrowers and/or lenders on the market had deal ings o f Rs 10 to Rs 15 crore per year in amounts ranging from Rs 25 lakh to Rs 1 crore . Assuming a median loan o f Rs 50 lakh and deal ings o f Rs 13 crore , this would imply fo r tn ig h t ly transactions o n , the part o f these companies. The broker in question confirmed that the market worked at a very fast pace .
6 . F i e l d i n t e r v i e w s and s u r v e y . TheS t a n d a r d , June 15, 1988 , c i t e s a 3 y e a r l o a nat 1 4 . 5 per c e n t per annum.
352

25.4 .5 The average loan size in the public sector market is much larger at about Rs 10 crore though loans o f Rs 100 to Rs 150 crore are not unknown. The t o ta l amount o f loans outstanding at the year ending o f one public sector company was as much as Rs 241 crore . In at least four other cases , t o t a l exposure exceeded Rs 100 crore . Among borrowers, one had borrowings o f over Rs 1000
crore . In the private sector , one broker reported an average o f about Rs 2-3 crore o f loans at a time for large companies who account f o r about 50 per cent o f loans; Rs 1-2 crore for medium companies o f who account for about 30 per cent o f loans and about Rs 50 lakh fo r small companies.
25 .4 .6 Loan negotiations between private corporat ions or arrangements negotiated by brokers are reportedly concluded extremely f a s t , the period varying between a few hours to upto three days. Public sector transactions are reportedly to take longer to negotiate at upto one to two weeks.
25.4 .7 Bad debts in the private sector market are not unknown. At least three examples o f bad debts o f large loans, involving Rs2.5 crore , Rs 2 crore and Rs 1.2 crore resp ec t ive ly have been c i te d by interviewees. The f i r s t mentioned loan had been overdue for over two years at the time o f the interview. Brokers inter viewed a lso claimed that somewhat delayed payments in the private sector were common and that their good o f f i c e s were of ten sought to secure loan repayments. No bad debts were reported in the public sector market.
25 .4 .8 Loans are mo s t l y unsecured , though a few c ase s o f secured loans have come to l i g h t . One broker claimed that re cent ly , companies have become more cautious in their lending in view o f a ser ies o f de faults by some borrowers. He c i ted four instances o f th is in substantiation-
3 5 3

25.5.1 For public sector corporat ions , a sample o f 13 large corporations with an aggregate paid up c ap i ta l o f Rs 9267 crore in
1986-87 were interviewed. The aggregate paid up cap i ta l o f the 1053 exist ing government companies on March 31, 1987 was Rs 31,124
crore according to the annual report o f the Department o f Company A f fa ir s . Thus, the sample covered 1.23 per cent o f public sector companies representing 29.8 per cent o f the aggregate paid up cap i ta l . The volume o f intercorporate loans outstanding on March 31, 1987 f o r the sampled companies was Rs 1010 crore . The sample
o f firms included two companies which did not part ic ipate in the market, two pure borrowers, four f irms that both borrowed and lent on the market and four pure lenders. The number o f companies
having dealings with these companies on the IFM was at least 27. I f loans in the sample are scaled up proport ionate ly by the to ta l paid up c ap i ta l o f public sector companies (as on March 31,1987) , the aggregate s ize o f the market works out to be Rs 3392 crore in 1986-87. This corresponds c l o s e l y to the aggregate size o f the IFM guessed at by a senior banker in Delhi, the main centre for the publ ic sector IFM.^ For loans in the sample for which d e t a i l s were a v a i l a b l e , the ( we i ght ed) average loan durat ion was 8 . 2
Qmonths.
25.5.2 The s i z e o f the p r i v a t e s e c t o r market has been e s timated by one broker to be o f the order o f Rs 50 to Rs 100 crore in Delhi and Rs 300 to Rs 500 crore in Bombay at any one time. In Calcutta the market was estimated by another broker to be o f the
25.5 The size of the market
7. A n o t h e r b a n k e r f e l t t h a t t h e s i z e o f t h emarket at any one t i me woul d be abou t Rs 1000 c r o r e . In v i e w o f t he f a c t t h a t the sampl ef i g u r e i t s e l f e x c e e d s t h i s - a l l f i r m ssampl ed had the same ye a r e n d i n g - t h i s i s c l e a r l y an u n d e r e s t i m a t e .
8 . The s ampl e c o v e r e d 2 t o 4 y e a r s f o r eac h f i r mt ho ugh o n l y 1 9 8 6 - 8 7 was common to a l l f i r m s .The a v e r a g e l o a n d u r a t i o n i s bas e d on the t o t a l s a mpl e .
354

order o f Rs 150 crore . The point in time estimate for the a l l India f igure would therefore be between Rs 500 and Rs 700 crore
giving a flow estimate o f Rs 1500 to Rs 2250 crore i f the average duration is taken to be four months. A sample of 47 private sec
tor company with an aggregate paid up c ap i ta l of Rs 134.84 croreQ
in 1986/1987 can be used as the basis for another estimate. Total
in tercorporate loans by the sample were Rs 111.69 crore . The a l l India f igures as per the Department o f Company A f fa irs (on March 31, 1987) were 1,37,133 companies with a paid up capita l of Rs9383 crore . Thus the point estimate o f the a l l India s ize of the market on the basis o f paid up cap i ta l i s Rs 7772.08 crore . Even i f intra-group loans amounting to Rs 4096 crore are netted out, the point estimate for the size of the market works out to Rs 4922 crore in 1986-87. These estimates are markedly d i f fe ren t from the estimates given by the brokers, r e f l e c t in g a bias in the sample towards large firms. Thus, for the private sector IFM we retain as our estimate the median estimate by brokers o f Rs 600 crore.
25.6 Regulatory environment
25.6 .1 The Chakravarty Committee has stated that, 'According to Tandon/Chore norms, companies with a current ra t io o f less than1.33 are discouraged from making intercorporate loans but those with a b e t t e r current r a t i o are permitted to make such lo an s ' . (P a ra 1 2 . 6 6 ) ^ However, the extent to which commercial
9. U n f o r t u n a t e l y , f i r m s i n t h i s s e g m e n t had w i d e l y d i f f e r i n g b a l a n c e s he e t d a t e s . C r e d i t
, b a l a n c e s w i t h o n e f i r m a r e n o t m a t c h e d by d e b i t b a l a n c e s wi t h c o r r e s p o n d e n t f i r m s due to t h i s r e a s o n . We have f o l l o w e d the p r a c t i c e o f c o n s i d e r i n g t he l a r g e r f i g u r e i f e x a c t l o a n d e t a i l s a r e a v a i l a b l e . F u r t h e r m o r e , we h a v e , p e r f o r c e , i g n o r e d t he d i f f e r e n t year e n d i n g s . The r e p o r t e d f i g u r e i s , h o w e v e r , f o r y e a r e n d i n g s be t we e n J u l y 1 986 and June 1987 .
10. ' T a n d o n ' r e f e r s t o t h e R e s e r v e Bank o f I n d i a ' s ' S t udy Group t o F r ame G u i d e l i n e s f o r
o 11 ow~up^oj:^Bank_Cj “ dJ.J: , 1974 whi c h p r o v i d e s g u i d e l i n e s f o r a s s e s s i n g c r e d i t r e q u i r e m e n t s f o r i n d u s t r y and p r o p o s e s i n v e n t o r y norms.
355
banks monitor intercorporate lending at the time o f sanctioning credit f a c i l i t i e s to firms i s open to question given that the Chakravarty Committee expressed d i s s a t i s f a c t i o n wi th cur rent
cred it appraisal p rac t i ces . Furthermore, these r e s t r i c t i o n s are only in d ica t ive . Their success, even i f bank cred i t appraisal
takes note o f these norms, wi l l be re s t r i c te d to companies who find no substi tute for bank c re d i t and who are thereby forced to
accede to these norms. A firm which has enough funds to lend on the IFM c le a r ly w i l l not be in severe need o f bank cred i t unless i t i s channeling bank c red i t to the IFM.
25.6.2 A second item of regulation is provided by the Com
panies Act, 1956, Sections .369 and 370 re la te resp ec t ive ly to loans (excluding book debts) by companies to their managing agents or to companies with the same managing agent and to loans (excluding book debts) to companies under the same management or other companies in general. The overal l l im it on such loan i s f ixed at 30 per cent o f the subscribed cap ita l plus free reserves o f the company for loans to companies not under the same manage
ment ( 2 0 per cent for companies under the same management with no
l im its on loans from holding companies) unless pr ior approval o f the Central government obtained. This l imit i s in the process o f being revised. Furthermore, for loans in excess o f 10 per cent o f su bscr ibe d c a p i t a l and f r e e r e s e r v e s , p r i o r approval o f the shareholders by spec ia l reso lu t ion i s ca l le d fo r . Even here, the provis ions o f the Section 370 do not apply to private l imited companies.^ During the year 1986-87 only 22 appl icat ions were considered by the Department o f Company A f fa i r s o f which 11 cases
' C h o r e ' r e f e r s t o t h e W o r k i n g C r oup_t o __R e v i e wt he S y s t em_o_f___Cash Cr e d i t a p p o i n t e d by theR e s e r v e Bank i n 1977. Th i s g r o up recommended ways o f e n c o u r a g i n g f i r m s t o f i n a n c e t h e i r own i n v e n t o r i e s . I t a l s o recommends me t ho ds o f s u p e r v i s i n g b o r r o w e r s .
11. V i d e a j ud g e me nt d e l i v e r e d in the Bombay High C o u r t i n Durga P r a s a d M a n d e l i a v e r s u s R e g i s t r a r o f Compani es ( 1 9 8 7 ) , 61, CompanyC a s e s , 47 9 .
s A

were approved. It is hard to see how these sect ions are enforced given the p o s s i b i l i t y o f making and l iqu idat ing loans between f inanc ia l year endings. At any rate, i t is e n t i r e ly possib le that the loan f igures given in the previous sect ion , though extremely large , underestimate the true extent o f the market.
25.7 Supply and demand for funds: qualitative aspects
25.7.1 Various facts have come to l ight as to the determinants o f supply and demand for funds in the IFM. The most important finds are as fo l lows . F i r s t ly , public sector corporat ions inter viewed reported that they resort to the LFM in view of the spread between bank deposit and lending rates and borrow mainly to even out short term f luctuations in cash flows not expected to continue over the long term. Thus borrowers go to the IFM mainly due to i t s speed and due to the lower cost o f borrowing. In contrast , private sector firms are a c t iv e ly constrained for funds. The evidence for thi s is the fact that they are will ing' to pay rates o f Interest above the bank lending rate. Secondly, borrowers on the private sector IFM on occasion use IFM funds to f inance fixedasset formation. At least two cases o f this - and that too of
12blue chip companies - have come to l i g h t . Thirdly, the aggregatea v a i l a b i l i t y o f funds in the market responds to changes in bank
credit a v a i l a b i l i t y and attempts by banks and the government tomobi lise d epos i ts . It has been claimed that the enhanced rates o freturn paid by government saving in s t i tu t io n s in recent years, hascaused the supply o f funds to the IFM to decrease. Also, interestrates on the IFM display "seasonal” f luctuat ions . The tight season
occurs towards the end of the calendar year since banks ac t i ve l ys o l i c i t d e p o s i t s at that time to meet d e p o s i t m o b i l i s a t i o n
13targets . Besides these major features , two other points may be
12. In t he p h a r m a c e u t i c a l and i n s t r u m e n t a t i o n s e c t o r s . A b r o k e r c l a i m e d t ha t t h i s p r a c t i c e was f a i r l y common.
13. Both p o i n t s i n r e l a t i o n to b a n k / g o v e r n me n t i n f l u e n c e a r e f rom t h e _B_u s i n e s s S t a n d a r d , Janua ry 2 0 .
357

mentioned.
i i .
25.7.
cash,
i .
i i .
i i i .
i v .
14.
15 .
The public sector IFM reportedly has the b lessings o f the Finance Ministry.
The fo l lowing two features, both related to government p o l i c i e s or a c t i v i t i e s , have been c i t ed as contributing to the f inanc ia l tightness faced by some firms: (a)requirements for the advance payment o f various le v ie s and taxes; and ( b) tardy payment o f dues by government departments and by publ ic sector companies ( to each other and to the private sector ) for goods bought on deferred terms. Cases o f overdues for up to two years have been c i t e d . ^
2 Regarding s p e c i f i c i n s t a n c e s o f s o ur ces o f s ur pl us the fo llowing relevant information has been gained.
Manufacturers o f ve h ic le s , in both the public and the private sectors usually take advance payments, to be adjusted at the time o f de l i very , from customers who book orders for ve h ic le s . These funds are often in e x c e s s o f t h e i r needs e s p e c i a l l y when the v e h i c l e manufactured i s in high demand, so that bookings are in excess o f production capacity . These funds are often deployed on the IFM. Since advance payments do not earn very high rates o f i nt erest , p r o f i t a b i l i t y o f such firms i s g reat ly aided by IFM loans.
One public sector corporat ion , with sales primarily to government departments and undertakings, rece ives most of i t s payments in the month o f March/April. This isu t i l i s e d to make IFM loans. However, during the lean season (around September), i t o c cas ion a l ly has to borrow from the IFM.
Two large public sector trading firms get bank c re d i t to pay for imports made by them. The cred it period i s 180 days. However, the resa le o f imported items is usually complete in three to four months, leaving the firms with surplus cash for two to three months. These funds are d iverted to the IFM.
Two firms, one in the private sector and one in the public s ec tor , claimed that the^r surplus funds were simply from retained earnings not channeled immediately to f ixed investment.
B u s i n e s s S t a n d a r d , June 15, 1988, o p . c i t .
B o t h p o i n t s a r e t a k e n f r o m t h e jLysj[nej>s S t a n d a r d , i b i d .
358

v. It is reported that several f inance corporations andother non bank intermediaries also lend large amounts on this market.
v i . Directors and senior managers o f corporations form investment companies to channel funds to intercorporate loans and investments. This has been reported in Nayar (1984).
25.7.3 With regard to demand for funds, the only important information gained, which has been mentioned e a r l i e r , i s that some firms use funds to f inance c ap i ta l p ro jec ts by r o l l in g over loans. This has been claimed to be a f a i r l y common p rac t i ce .
25.7 .4 The importance o f such qua l i ta t ive information l i e s in the fact that i t provides ind icat ions of various fac tors a f fe c t in g the cash f l o w o f borrowers and l e n d e r s . Si nce the IFM i s primarily a market for short term loans, i t i s most useful to have information about cash flow? as th is w i l l ul t imately determine which firms are borrowers and which lenders. Much o f the evidence in this sect ion provides support for the Chakravarty Committee's hypothesis. The rest o f the evidence e ither has no bearing on the
hypothesis or leaves'open Lhe door to contradi ct ing it without actu a l ly doing so conc lus ive ly . Analysis o f f inanc ia l statements normally ava i lab le is unl ikely to prove as use fu l . Nevertheless, we now proceed to an a n a l y s i s o f selected f inancial rat i os to examine d i f f e r e n c e s between borrowers and lenders.
25.8 . Analysis of financial ratios of participating and nonparticipating firms
25.8 .1 We consider f i ve f inanc ia l ra t io s in this ana lys is :
i . The equ ity -sa les ra t io (ES): The equity pos i t ion o f afirm has been c i ted as a key determinant o f the extent o f bank accommodation they can get . I f equity is low r e l a t i v e to s a l e s , then under t h i s hy p o t h e s i s , the quantum of bank finance would be inadequate. Thus,borrowers would be expected to have a lower ES than lenders. However, i f the Chakravarty Committee is cor r e c t - in that the IFM meets temporary needs f o rfinance not o f a long term nature - then no pattern w i l l necessar i ly be present.
3 5 9

i i . The debt-equity ra t io (DE): Since intercorporate loansare r e l a t i v e l y expensive, at least for the private sector , borrowers could on average be expected to exhaust other sources o f borrowed funds, including long term s o ur c e s , b e f o r e approaching the IFM. Bank c r e d i t should a l s o be l e s s r e a d i l y f or t hcomi ng f o t h i g h l y leveraged f irms. Both arguments suggest that borrowers would have a high DE. Once again, a lack of any pattern in the DE would tend to support the Chakravarty Committee (DE has been computed here as the rate o f borrowed funds to owned funds).
i i i . The Net Current Ratio (NCU), Quick Ratio (QUI) and Current Ratio (CUR): Al l three ra t ios are measures o fl i q u i d i t y . The net current rat i o gives the percentage o f net current assets to to ta l assets . A higher rat i o would r e f l e c t a surplus Liquidi ty pos i t i on. Since current a s s e t s and current l i a b i l i t i e s appear in the numerator, an intercorporate loan w i l l not e f f e c t the value of the rat i o . Borrowers should therefore be expected to have lower NCUs than lenders. In case ther a t i o i s higher or the same for borrowers as forl e n d e r s , t h i s may be taken as a s i gn o f s t i c k y "current" assets in borrower's p o r t f o l i o s . Once again, such a f i nd i ng would support the ChakravartyCommittee's pos i t ion since s t icky rece ivables ' c l e a r ly const i tu te a case of "temporary" tightness in cash flow which can use fu l ly be ironed out by non bank sources of funds. However, the alternate hypothesis outlined earl i e r i s not thereby r e je c ted . The quick ra t io (current a s s e t s l e s s i n v e n t o r i e s as a r a t i o o f c ur rent l i a b i l i t i e s ) should s im i la r ly be higher for lenders than for borrowers i f the Chakravarty Committee thesis is to be c o n t r a d i c t e d . F i n a l l y , the current r a t i o(current assets to current l i a b i l i t i e s ) should also be lower for borrowers.
25.8.2 Table 25.1 presents the average r a t io s separately for public and private sector borrowers and lenders. For comparison, average r a t i o s f o r non bor r ower s and f o r a l l f i rms are a l s o
present ed .
25.8.3 In the case o f private l imited companies, ES provides
16. The l e n d e r w i l l have a d e c r e a s e i n one c u r r e n t a s s e t , c as h and bank b a l a n c e s and an i n c r e a s e i n a n o t h e r c u r r e n t a s s e t , l o a n s and a d v a n c e s . The b o r r o w e r w i l l have an i n c r e a s e in a c u r r e n t l i a b i l i t y , s h o r t term b o r r o w e r s and e i t h e r an i n c r e a s e i n c a s h and b an k b a l a n c e s o r a d e c r e a s e in dues p a y a b l e .
3 6 0

evidence against the committee's view but the evidence is weak
given that non-partic ipants have the same ES as borrowers. The rat io DE tends to r e je c t the Chakravarty Committee's posit ion though the d i f fe re n ce in means between borrowers and lenders is
not s t a t i s t i c a l l y s i g n i f i c a n t . However, the more important
l i q u i d i t y r a t i o s NC and Q do not add t h e i r support to DE. Likewise, CUR has the opposite sign from that expected. The rat io CUR, being low for a l l private sector f irms, goes to suggest that b$nk cred i t norms are irre levant for the private sector IFM. Overa l l , the evidence does not permit us to r e je c t the committee's hypothes is .
25 .8 .4 In the case o f the public sector IFM, only the quick rat io has the right ranking between borrowers and lenders and even here, the d i f f e r enc e in borrower 's and lender 's ra t io s is not s ig n i f i can t . Thus, the analysis o f rat ios for the public sector also tends to support the committee's p o s i t i o n ^ .
25.8 .5 Overall there fore , both qua l i ta t ive information and ra t io analys is would tend not to re je c t the p os i t ion of the Chakravarty Committee with regard to the public sector IFM. In the case o f the private sector IFM, qua l i ta t ive evidence suggests that
long term cred i t constra ints also play a ro le . We must enter the caveat that , the sample s ize being l imited, the findings are ten-
17. To f u r t h e r exami ne t he s i t u a t i o n , net i n t e r c o r p o r a t e b o r r o w i n g s was r e g r e s s e d on ES, DE, CUR/NCU and QUI s e p a r a t e l y f o r p r i v a t e and p u b l i c s e c t o r u n i t s . CIJR and NCU were o n l y t r i e d s e p a r a t e l y due to t h e i r h i g h c o r r e l a t i o n . One o b s e r v a t i o n each per f i r m per y e a r f o r whi ch dat a were a v a i l a b l e was u s e d . Thus t h e r e were 27 o b s e r v a t i o n s f o r t he p u b l i c s e c t o r and 81 o b s e r v a t i o n s f o r the p r i v a t e s e c t o r . Whi l e g o o d n e s s o f f i t and s p e c i f i c a t i o n d i a g n o s t i c s were u n i f o r m l y p o o r f o r the p r i v a t e s e c t o r r e g r e s s i o n , CUR and DE were s i g n i f i c a n t and c o n t r a r y t o the c o m m i t t e e ' s p o s i t i o n f o r t he p u b l i c s e c t o r r e g r e s s i o n . However , s p e c i f i c a t i o n d i a g n o s t i c s were poor f o r t h i s r e g r e s s i o n as w e l l . The r e g r e s s i o n s are t h e r e f o r e not r e p o r t e d h e r e .
6 l

tative.
25.9 Some omitted factors
25.9.1 Two i actors which wLLL c l oar l y prove reveal i ng i n the study o f the IFM have been omitted due to the l imited data base
for the study. The i i r s t is the sectoral pattern of intercorporate borrowings and the second is the inf luence of India' s fast expanding stock market. The f i r s t item requires a large panel data set so that the f luctuating fortunes o f d i f f erent sectors over time can be captured. The second item requires time ser i es
data. Both items are presently beyond our resources since av a i l
able data bases on the corporate sector do not •; i v e detail, s ot IFM transact ions .
25.9.2 The influence o f the interest rate and of the structure o f returns on a lternative assets has also not been addressed. Once again, thi s i s because o f the unavai l ab i l i t y o f a s u f f i c i e n t ly large panel data set. The interest rate d ispersion ob
served in the private IFM, it seems c l ear , is the result o f d i f ferences in r i sk and convenience. While thi s could be tested with the aid of balance sheet ra t ios and other available data, the available qua l i ta t ive information appears to be strong enough to make the exerc ise unnecessary.
25.10 Implications for monetary policy
25.10.1 The large size of the intercorporate funds market - at least 2 0 per cent of bank credi t to companies - must give it the potential to d e s ta b i l i se monetary p o l i c y . While i t is true that the evidence c i te d indicates that both the quantum and the cost of funds on the IFM respond to changes in bank c r e d i t and money a v a i l a b i l i t y , th is does not give a complete picture o f the impact o f the market on monetary p o l i c y .
25.10.2 The f i r s t problem concerns the size of the money mult i p l i e r . While i t is indeed l i k e l y that a tight cred it po l i cy wi l l
3 62

be r e f l e c t e d in a t ight IFM, the exactness with which the Reserve Bank can predict the impact o f a given degree o f c re d i t tightening
must necessar i ly be a f fe c te d . Thus p o l i c i e s designed to counter a given l e v e l o f in f la t io n a ry overheating in the economy may either
have a n e g l ig ib l e impact or an overly r e s t r i c t i v e impact. What is important i s the greater uncertainty associated with the multi
p l i e r engendered by th is market.
25.10.3 Secondly, It should be c lear that s e le c t iv e cred it cont r o l s , applied to d i f f e re n t segments o f the corporate sector wi l l be ser iously undermined. Thus, while the Chakravarty Committee may be r ight in saying that the IFM smooths over short term funds
a v a i l a b i l i t y problems, i t must be acknowledged that this works equally well when the cause of the c red it tightness i s a se le c t ive cred it c o n t r o l .
25.10.4 Both these d e s ta b i l i s in g inf luences are l i k e l y to be aided by the fact that funds flow into th is market from outside the corporate sector proper (through, as mentioned, other non bank intermediaries ) .
25.11 Summary of main points
25.11.1 The IFM has been defined to be the market for shortterm loans and deposits to corporat ions , usual ly between corporat ions , in accordance with e a r l i e r usage. It has two segments which are more or l e s s com partm enta l ised . One segment c o n s i s t s o f
public sector companies and the other cons is ts o f private corpora
tions . In the public segment, transactions are negotiated e ither d i r e c t l y or by nationalised banks and thei r subs id iar ies . In theprivate segment loans are negotiated d i r e c t ly , through brokersand, in the recent times, by multinational banks. In the private segment, brokerage rates range between 0.25 and 1 . 5 per cent .
25.11.2 Interest rates vary between 12 and 15 per cent in the
p u b l i c s e c t o r segment and between 13 and 19 per cent in the
3 6 3

private segment. In the private segment rates vary with the urgency o f the loan demand and with the cred it rating o f borrowers. Potential borrowers o f fe r in g higher rates reportedly do not f ind lenders due to the adverse creditworthiness p os i t ion such an o f
fer s ignals . Loan durations are usual ly from 3 to 6 months in the private segment and 6 to 12 months in the public segment. The
average loan size i s Rs 10 crore in the public sector and Rs 25 lakh to Rs 1 c r o r e in the pr i v a t e s e c t o r . The p r i vat e s e c t o r market is reportedly very fast paced and f lu id .
25.11.3 Lending on the market i s r e gu l a t e d i n d i c a t i v e l y by banks who discourage firms with current r a t io s o f less than 1 . 3 3
from lending on the market. Sect ions 369 and 3 70 of the Companies Act, 1956 also place a c e i l i n g , in terms o f net owned funds, on the quantum of loans to related and unrelated corporate bodies unless pr ior government approval i s obtained. The e f fe c t iv e n e s s o f the l a t t e r body o f regulations is open to doubt.
25.11.4 Three important f indings as to the supply and demand
for funds in the IFM are:
i . While public sector firms mainly enter this market totake advantage o f better returns or cheaper loans than banks o f f e r , private sector f irms may borrow from the IFM to ease c red i t shortages. ,
i i . Funds from the private sector IFM are demanded by somefirms to f inance f ixed c a p i ta l formation.
i i i . Bank c re d i t a v a i l a b i l i t y and deposit mobi l isat ion andgovernment c red i t instruments inf luence the cost and a v a i l a b i l i t y o f funds in the IFM.
25.11.5 A fourth feature inf luencing demand is compulsory advance payments o f rates and taxes and tardy government payment for
value received .
25.11.6 Advance d e p o s i t s f o r v e h i c l e s , bunched payments by government departments for value received and extended bank credit
for fore ign trade finance are some o f the sources o f surplus funds
i d e n t i f i e d .
u / .

25.11.7 Non bank intermediaries such as finance corporations are also known to lend on the IFM.
25.11.8 From the analysis o f f inanc ia l r a t io s , the Chakravarty Committee's hypothesis cannot be r e je c te d .
25.11.9 Three p o te n t ia l ly important fac tors not studied due to lack o f data are the sectora l pattern of IFM par t i c ip a t ion ; the inf luence o f cap i ta l markets; and the inf luence o f interest rates both in the IFM and for a l ternat ive assets .
25.11.10 A p r i o r i , the IFM has the p o t e n t i a l to d e s t a b i l i s e monetary contro l by enhancing the uncertainty o f the money multip l i e r and rendering s e le c t iv e c red i t con tro ls i n e f f e c t i v e though th is i s not tes tab le with avai lab le information.
3 6 5

TABLE 25.1
SeLccted Financial Ratios
FIRM
GROUPequity -
sal esdebt-
equi tycurrent net
currentquick
All Firms mean 0.57 2.06 0. 56 -0. 19 -0.03st . d ev. 1 . 0 2 1.43 0.38 0.42 0.42
Public Sector
All firms mean 1 . 1 2 2. 57 0.44 -0. 23 -0 .05st . d ev . 1 . 8 6 1 . 8 6 0.32 0.50 0.52
Borrowers mean 1.57 2. 32 0.39 - 0 . 2 1 - 0 . 1 1
st . dev . 2.27 2.03 0 . 2 2 0.53 ' 0.58Lenders mean 1. 19 2.89 0.40 -0 . 25 0.05
st . dev . 2.09 1.96 0.23 0.53 0.42Ot lie r s mean 1 . 0 1 1.65 0.74 - 0 . 1 2 0.29
st . d ev . 0.49 0.77 0.57 0 . 2 2 0.16
Private Sector
All firms mean 0.38 1. 89 0 . 60 -0 .18 - 0 . 0 1
s t . d ev . 0.34 1 . 2 1 0.39 0.17 0.40
Borrowers mean 0 . 28 2.42 0.62 - 0 . 16 - 0 . 1 1
st . dev . 0.15 1.3 6 0.35 0.18 0.43
Lenders mean 0.47 1.81 0.51 -0 .19 - 0 . 16
s t . dev. 0.38 1.26 0.25 0 . 1 2 0.26
Others mean 0 . 28 1 . 94 0176 -0. 14 0.16
s t . dev. 0.23 1 . 2 1 0.50 0.19 0.45
3 6 6
PART G
Financing o f C red it Using S e cto rs
CHAPTER 26
26.1 Int roduc tion
26.1.1 Feature film production has not been recognised as an industry though film producers have been making representations to the Government for industry s tatus. I f such a status is given, t h i s w i l l improve the a c c e s s i b i l i t y o f bank funds for f i lm
producers. Currently, banks lend only Lo a l imited extent , to established and reputed film producers, not for fi lm production as
such, but as o v e r d r a f t f a c i l i t i e s f u l l y secured by immovable property. The reason is that f i lm production is a highly risky business.^ Finance of feature fi lms has e a r l i e r been b r i e f l y described in Aiyar (1979).
26.2 Dispersion of the sector
26.2.1 There are over 5000 f i lm producers in the country. Except for a few in s t i tu t i o n a l producers, the bulk o f producers are individuals, who f loat propr ietorsh ip or partnership concerns. Some o f them act on behalf o f individuals who wish to use their
unaccounted money and who, u n d e rs ta n d ab ly , wish to remain anonymous. Government servants, public sector o f f i c i a l s , p o l i t i cal party members are among those who engage in fi lm production e ither openly or cover t ly . In the last f ive years, an average o f 818 fi lms have been produced and released in a l l Indian languages. Of them, Hindi, Telugu and Tamil f i lms account for about 60 per cent . While about 800 fi lms are released every year about the same number o f f i lms are in d i f f e re n t stages o f produc-
FINANCE FOR FEATURE FILM PRODUCTION IN MADRAS
1. The i n f o r m a t i o n f o r t h i s s tu d y was c o l l e c t e d m a i n l y th r o u g h p e r s o n a l i n t e r v i e w s w i th f i l m p r o d u c e r s , s t u d i o m a n a g e r s , f i l m f i n a n c i e r s and a r t i s t e s .
367

t ion , at any time o f the year. The language-wise breakup o f f i lms c e r t i f i e d by the Censor Board for 1982 to 1986 is in Table 26.1.
26.3 Area surveyed, general description of area
26.3 .1 The metropolis o f Madras, se lected for this survey, i s
the second largest f i lm producing center in terms o f investment a f te r Bombay which has been described as the Hollywood of India.
In terms o f numbers, however, Madras, which i s the centre for p r o d u c t i o n and p r o c e s s in g o f South Indian (Tam il , Malayalam, Telugu and Kannada) f i lms , i s ahead of Bombay which is the centre for production and processing of Hindi and Marathi f i lms . Besides th is , f i lm f inanciers for f i lms in South Indian languages are
general ly from Madras. Regarding the number o f f i lms produced in
1986, South Indian fi lms accounted for 63.7 per cent of the tota l number o f f i lms produced in India with Hindi f i lms coming next with 18.9 per cent. However, in terms o f investment in fi lm production, Bombay e a s i l y stands f i r s t because almost a l l big budget f i lms are produced there. The combined investment o f four South Indian language fi lms on a rough estimate, i s l e ss than a big budget Hindi f i lm. Table 26.1 shows that between 1982 and
1986, the number o f south Indian language fi lms exceeded the tota l number o f f i lms in a l l other languages except Hindi.
26.3 .2 Organisation of film production: Film producers do notown f a c i l i t i e s l ike shooting equipment, shooting f l o o rs e t c . but h i r e them to s u i t t h e i r s p e c i f i c needs . Various p ro d u ct io n f a c i l i t i e s are avai lab le with small business units which are hired out at standard rates . Between the producers at one end and the
cinema viewing public at the other, there i s a system for providing f a c i l i t i e s for shooting, music, dubbing, processing, f inancing, d is t r ibu t in g and exhibit ing. Before examining the sources o f working cap ita l and the method o f f inancing, i t is necessary to understand the v a r i o u s s tages i n v o l v e d , a l l of which r e q u i r e f inanc ing .
26-3.3 Production: When a producer decides to take a fi lm, he
3 6 8

has to s e le c t a story f o r which he has to pay s tory writers . The other persons to be se lected and paid are the d i r e c t o r , cameraman, scr ip t writer , l y r i c i s t s , music d i r e c t o r , s ingers , ed i to r and the a r t i s t e s . The c h o i c e of a r t i s t e s depends on the a b i l i t y and popularity o f a r t i s t e s and they are paid fees ranging from Rs. 5
lakh to Rs. 20 lakh. This is in f a c t , the major item o f expenditure in fi lm production.
26.3 .4 Until a decade ago, shooting was done in studios which erected the required sets , with the assistance of art d i r e c to r s . This method has changed over the last ten years. A major part o f the shooting is now carried out on loca t ion . Quite a few private bungalows in metropolitan c i t i e s are hired out for shooting pur
poses and the hiring charges per day are between Rs. 1,000 and Rs. 3,000. The producer has also to s e le c t a song recording studio, and the s e le c t io n is inf luenced by the credit f a c i l i t i e s o f fered by studios . He has also to make travel arrangements and hotel accommodation for a r t i s t e s , d i r e c t o r , cameraman and the crew of the production unit. The production period varies from two months to over one year. Each o f these items described requires working
c a p i t a l .
26.3.5 D is tr ibut ion : Once the picture is ready f o r re lease, theproducer o rd ers the r equ ired number o f c o p i e s with the laborator ies and hands them over to d i s t r ib u t o r s , as per pr ior agreement, for exh ib it ion in theatres. It is the r e s p o n s ib i l i t y o f the d i s t r ib u to r s to book theatres with producers supplying necessary p u b l i c i ty material. Most establ ished producers have regular
d i s t r ib u to r s . D istr ibution r ights are normally assigned to d i s tr ibutors for a sp e c i f ie d period at an agreed pr ice . The d is t r ibutor is free to sub-d is tr ibute fi lms within his ju r i s d i c t i o n . The d i s t r ib u to r s have to make arrangements with theatres in their respect ive areas for exh ib i t ion . There are a l i t t l e more than 6000 theatres in India.
2 6 . 3 . 6 E xh ib ition : In metropol itan c i t i e s and leading towns,d is t r ibu to rs normally book the theatres for a s p e c i f i e d number o f
3 69
weeks, by making advance payment o f between Rs.15,000 to Rs.50,000 per week fo r 21 shows. In smaller towns, however, the practice is for the theatre owners to pay an advance to d i s t r ib u to rs to have the ir f i lm exhibited. For old p ictures , there is an arrange
ment by which the weekly c o l l e c t i o n s net o f taxes, are shared by
the d is t r ibu tor and the theatre owner in a descending ra t io -
50:50, 45:55, 40:60 - in succeeding weeks.
26.4 Sources of funds and characteristics of finance
26.4.1 The necess i ty f o r l iqu id funds and cred it at d i f fe ren t stages o f production o f f i lms has been highl ighted in the preceding paragraphs. What are the sources o f funds, and what are the
shares of the formal and informal f inanc ia l sectors?
26.4 .2 The s o u rce s o f f in a n c e f o r f i lm p r o d u c t i o n are (a )p r o d u c e r ' s own funds, (b) f in an ce from d i s t r i b u t o r s , ( c) i n d i v i d u a l f i lm f i n a n c i e r s / f i n a n c e c o r p o r a t i o n s , (d ) c r e d i t f a c i l i t i e s from studios , (e ) c red it f a c i l i t i e s from laborator ies , and ( f ) subsid ies o f Rs. 50000 to Rs. 1 lakh from Governments in
some States for shooting the entire f i lm in the ir States. The proportion o f these finances i s not the same for a l l producers.
26 .4 .3 Own capital: In most cases, own funds o f small producersconstitute only a small percentage o f to ta l production c o s t . Instances o f only 5 per cent own investment have come to l i g h t . A few established producers who have in s t i tu t io n a l i se d their operat ions may however contr ibute upto 25 per cent from own funds.
26.4 .4 Distributors as financiers: There are hundreds o f f ilmd is t r ibu tors in the country. Many o f them bid for d is t r ibu t ionrights o f f i lms in spec i f ied areas at the commencement o f f ilmproduction. Some d is t r ibu tors also act as agents for well to do persons for a cons iderat ion . There are also fi lms where d is tr ibu tors hes itate to come forward because they are not s a t i s f i e d with the cast or the story. Many fi lms have not been released at a l l for want o f d is t r ib u to rs s ince most producers do not have the
370

resources to d i s t r ib u te fi lms by themselves. When a d i s t r ib u to r shows his readiness to take up d i s t r ib u t io n r ig h ts , a formal written agreement is entered into and an advance is paid to the producer. There are clauses in the agreement for per iod ica l pay
ments and a f ina l payment before d e l ivery o f pr ints . The agreement p rov ides for d i s t r i b u t i o n r i g h t s to the d i s t r i b u t o r for a
spec i f ied time in a spec i f ied area. The number o f prints and the price depend on the area covered. When top stars and d irectors are involved, f i lms get a premium p r ice , fetching as much as Rs. 50 lakh to Rs. 70 lakh in Tamilnadu and Andhra Pradesh and uptoRs. 3 crore' f o r Hindi f i lms.
2 6 .4 .5 Film fin a n cie rs : The major source o f f inance for themajority o f f i lm producers is private fi lm f inanciers and finance corporat ions . According to Aiyar (1979), Shikarpuri bankers are prominent among f inanc iers ac t ive in film finance. These financ i e r s usually provide 50 per cent to 60 per cent o f production costs . The pract ice in such financing is to transfer f i lm negat i v e r i g h t s to f i n a n c i e r s . A l e t t e r from the p r o c e s s in g laboratory, known as a "Lab L etter " , has to be obtained from thefilm laboratory engaged by the producer to irrevocably confirm
that prints w i l l not be de l ivered to the producer unti l the financ i e r g ives a l e t t e r o f c learance that dues have been se t t led .
26 .4 .6 Credit fa c ilit ie s from studios: Recording studios ands t u d i o s which have f a c i l i t i e s f o r shoo t ing extend c r e d i t f a c i l i t i e s for set erect ion , supply o f cameras and other equipment. Their dues are expected to be sett led before release of
pictures .
2 6 .4 .7 Credit f a c i l i t i e s from la b o ra to rie s : P r o c e s s in gl a b o r a t o r i e s , in order to remain c o m p e t i t i v e , extend c r e d i t f a c i l i t i e s to f i lm producers. They undertake to supply f i lm negat ives , make ' ru sh ' prints and the censor copy. On average, such cred i t fo r each f i lm, w i l l be around Rs. 1 lakh to Rs. 2 lakh.Here too, the understanding is that a l l dues w i l l be se t t led at
the time o f release of the f i lm.
371

26.4.8 Thus the ent ire f i lm production costs are financed by informal sources - s tu d io s / la b o r a to r ie s , d i s t r ib u to r s , f inanciers and producers. Film production does not rece ive f inanc ia l ass is tance for i t s working cap ita l needs from any formal sector financ i a l in s t i tu t io n s except for the l imited exceptions mentioned ear
l i e r .
26 .4 .9 Period and amount of credit: The period of c red i t variesfrom supplier to supplier depending on the stage o f production at which i t is extended. Generally, f in a n c ie r ' s c red it does not exceed s ix months. The s ize o f c redit a lso va r ie s , depending on the budget o f f i lms . In small budget f i lms o f Rs. 10 lakh to Rs . 2 0 lakh, the entire period o f production may be around s ix months and the s ize o f c red i t may be about 50 per cent from f inanc iers , 2 0 per cent from s t u d i o s / l a b o r a t o r i e s and the rest from d i s tr ibu tors and own sources. In big budget f i lms , the share o f d is tr ibutors w i l l be higher and that o f f inanciers lower.
26.4.10 Loan interest rates: Most f inanc iers charge interest atcompound rates o f 67 per cent to 99 per cent per annum, payable quarterly, with the f i r s t quarter 's interest taken in advance. Studios and l a b o r a t o r i e s do not charge e x p l i c i t i n t e r e s t f o r f a c i l i t i e s o f f e r e d . Their charges are paid when the print is de l ivered to the producer.
26.4.11 Security for loans: The f inanciers lend against demandpromissory notes with the a d d i t i o n a l guarantee o f the "Lab
Letter" . No c o l l a t e r a l is demanded by any source o f f inance.However, a l l c red i to rs ensure that they are in a pos i t ion toprevent the release of the fi lm unless the ir dues are se tt led .
26 .4 .12 The main reason for the dependence o f f i lm producers onthe informal f inanc ia l sector i s the pract ice o f unaccounted cash
payments fo r each major a c t i v i t y and serv ice in fi lm production.Recorded payments and expenditures are 50 per cent or even less of t o ta l expenses incurred.
3 7 2

discussions with knowledgeable persons, the various unaccounted payments in f i lm production may be l i s t e d as fo l low s :
i . Film s tars : About 60 per cent to 80 per cent o f theirfees (which range between Rs 2 lakh and Rs 20 lakh) are unaccounted.
i i • Film and music d i r e c t o r s : 50 per cent to 60 per cento f the ir fees (which are between Rs 1 lakh and Rs 3lakh) are unaccounted.
i i i . Musicians: 50 per cent o f their fees (Rs 2000 to Rs2 0 0 0 0 per song) are unaccounted.*
iv. D istr ibutors pay 30 per cent to 40 per cent o f d i s t r ibu t ion charges in cash.
v. Film f inanc iers show only 24 per cent in teres t , as compared to the 48 per cent to 60 per cent a c t u a l l ycharged by them, in their books.
v i . Outdoor equipment suppl iers , theatre owners and fi lmlaborator ies also make or receive part payment o f f the books.
v i i . Producers commonly show personal expenses as productionc o s t s .
26-5 Estimate of informal finance in this sector
26.4.13 Unaccounted and cash payments: As gathered from informal
26.5.1 The data in Table 26.1 can be used along with the information we have on the cost o f f i lm production to derive an approximate idea o f the annual expenditure on f i lm production. Approximately 1 0 per cent o f f i lms are big budget f i lms , 40 per cent are medium budget f i lms and 50 per cent are small budget f i lms in a l l languages. The average cost o f each type o f f i lm can be taken to be Rs 1 crore , Rs 50 lakh and Rs 20 lakh re sp e c t ive ly except for Hindi f i lms where these would be Rs 3 crore to Rs 6 crore (say Rs 4.5 c r o r e ) , Rs 1 crore and Rs 25 lakh r e sp e c t ive ly . Furthermore, approximately 5 per cent o f f i lms are never released so that f ilms ac tua l ly f inanced can be taken to be 5 per cent higher than in Table 26.1. Thus, for 1986, the to ta l expenditure on fi lm production can be calculated at Rs 440 crore. The ca lcu la t ions are exhibited in Table 26.2. Allowing a 25 per cent error margin, upper and lower bounds can be given as Rs 550 crore and Rs 330 c r o r e . Ninety f i v e per cent o f these p r o d u c t io n c o s t s are financed by informal cred it (50 per cent from f inanc ie rs , 10 per

cent from s t u d i o s and l a b o r a t o r i e s and 35 per cent from d i s t r ibutors and o thers ) . Since the average duration o f credit for small and medium budget f i lms can be taken to be s ix months and that for big budget f i lms 1 year, the to ta l informal cred it in rupee-years i s Rs 279 crore with an error margin o f Rs 70 crore .
26.6 Distributional impact of film finance
26.6 .1 Since f inanciers prefer to spread their r i sk by lending small amounts to several borrowers, the extent o f f inance going to small f i lm producers i s proport ionate ly greater than that to large fi lm producers. Secondly, the number o f small and medium budget
f i lms is much higher than the number o f big budget f i lms . This gives an ind ica t ion o f the d i s t r ib u t io n o f informal finance be
tween small and large firms. The ind irect d is t r ib u t io n a l impact through employment generation, since fi lm production and exhibi t ion are labour intensive , may also be mentioned.
26.6 .2 There are three c a t e g o r i e s o f persons in f i l mp r o d u c t i o n : (a ) a r t i s t e s , the d i r e c t o r , cameramen, the music
d i r e c to r , scr ip t writers and the ir ass is tants ; (b) technicians including stage e rec tors , e l e c t r i c ia n s and make-up men; and (c )
labourers , who move shooting paraphernalia from place to place, cooks, ca terers , e t c .
26 .6 .3 Direct employment: We may roughly estimate the to ta l number o f persons employed under the three categor ies above in a
medium budget f i lm which takes 6 months to produce at 400 (100 ar
t i s t e s and 300 others ) . Two such fi lms give employment to 400 persons a year. Thus the to ta l employment a t tr ibutab le to the 840 fi lms censored in 1986 would be (840x200) = 1,68,000 persons.
2 6 .6 .4 In direct employment: Besides this d i r e c t employment,there are two types o f ind irect employment ar is ing from fi lm d i s t r ibu t ion and fi lm screening at theatres. Further employment is created near the 6000 and odd cinema theatres for the thousands o f small shops s e l l in g refreshments, beedis , c ig a r e t te s , etc .
374

26.6.5 The point to note here is that this employment generating a c t i v i t y i s made poss ib le due almost en t i re ly to informal finance. Formal finance plays next to no ro le in this sector .
26. 6. 6 On the negative side i t should however be noted that the structure o f gains from film-making d isproport ionate ly favours
the few stars , producers, d i s t r i but o r s , theatre owners and financ iers .
26.7 E f f i c i e n c y and a l l o c a t i v e impact
26.7.1 Besides the employment generation discussed above, the f i lm industry contributes d isproport ionate ly to public sector
resource mobi l i sat i on through various le v ie s l ike the income tax (on a r t i s t e s and producers), entertainment tax and the theatre tax. The former accrues to the Central government and the la t t e r to State and l o c a l bodies. To the extent that enhanced public revenues improve the a l l o c a t io n o f resources, thi s can be taken as a gain in the a l l o c a t io n o f resources attr ibutab le to the f i lm industry and in d ir e c t ly , informal finance for f i lms . Employment and revenue gains must however be weighed against the d ivers ion o f funds to unaccounted uses.
26. 7. 2 Realising the inf luence o f f i lms on people and their potent ial for providing employment and income and with the ob jec t o f promoting good cinema in the country, the Central Government establ ished the National Film Development Corporation, (NFDC) in 1980 by merging the erstwhile Film Finance Corporation and Indian Motion Picture Export Corporation.
26.7.3 The NFDC finances and produces f i lms . Upto 1986, i t financed 157 feature f i lms. NFDC financed fi lms have won 116 nat ional and 28 international awards. The NFDC extends f inanc ia l assistance for the construct ion o f cinema theatres and has, upto March 1986, sanctioned loans for 111 theatres. It a lso organises international and national f i lm f e s t i v a l s in order to popularise
375

Indian f i lm s . This State-run corporat ion i s a good source o f help to f i lm producers including new entrants and in a modest way, i t enables a few talented producers to avoid private f inanc iers . However, the extent o f f inances i s small re la t ive to the t o t a l .
26.7 .4 A par t ia l so lut ion to the problem o f black money generation and c i r c u la t i o n i s the expansion o f a c t i v i t i e s o f the NFDC - more d i r e c t production by i t , more finance to talented producers and d ire c to rs and credit for the construct ion o f theatres.
26.8 Summary of main points
26.8.1 Feature f i lm production is an expensive a f f a i r . If a producer is able to organise some finance on his own, he is able
to o b t a i n the r e s t from in form al s o u r c e s . Formal f i nanc e i s l im i t e d .
26.8 .2 In 1986, Soutl Indian fi lms accounted for 63.7 per cent o f the t o ta l number o f f i lms produced in India; Hindi f i lms
came next with 18.9 per cent . However, in terms o f investment in fi lm production, Bombay is f i r s t . At a rough estimate, the com
bined investment f o r four South Indian fi lms is l e s s than that for a big-budget Hindi f i lm.
26.8 .3 Fi lm p rodu cers do not own f a c i l i t i e s l i k e shoot ing equipment and studios . Production f a c i l i t i e s are available on hire .
26 .8 .4 Producers must p r o v id e f in a n c e f o r the d i r e c t o r , cameraman, scr ip t writer , l y r i c i s t s , music d i r e c t o r , s ingers, art i s t e s e t c . , and also for travel and stay o f people in d i f f e re n t/p la c e s .
26.8 .5 Sources o f f in a n c e f o r f i l m p r o d u c t i o n are (a ) p r o d u c e r ' s own funds, ( b) f in a n c e from d i s t r i b u t o r s , ( c) i n d i v i d u a l f i l m f i n a n c i e r s / f i n a n c e c o r p o r a t i o n s , ( d ) c r e d i t f a c i l i t i e s from studios , (e ) c red i t f a c i l i t i e s from laborator ies ,
3 7 6

and ( f ) ( in a few cases) subsidies o f Rs . 50,000 to Rs. 1 lakhfrom State governments. Banks do not d i r e c t l y f in a n ce f i l m production while the NFDC supports only se lected f i lms.
26 .8 .6 Credit f a c i l i t i e s are made use of at d i f f e r e n t stages o f production and therefore , the period o f c red it varies from sup
p l i e r to supplier . General ly, f i n a nc i e r ' s credi t does not exceed s ix months.
26.8.7 Financiers wiio are the major cred it source charge interest at 67 per cent to 99 per cent per annum 1
26.8.8 The main reason for the dependence o f f i lm producers on informal finance is the pract ice o f unaccounted cash payments in film production.
26.8.9 Total investment in f i lm production in India is estimated to be Rs 440 crore in 1986. Tc.cal informal finance for this is estimated at Rs 279 crore rupee-years.
26.8.10 The evidence suggests that informal finance is skewedin favour o f small producers. There may also be s ig n i f i c a n t d i s t r ibut ional gains through d ire c t and ind irect employment generat ion. E f f i c ie n cy gains ar ise due to employment creat ion and government revenue generation. These must be weighed against the generation o f black money.
26.8.11 With a v i ew to he l p i ng f i l m b u s i n e s s , the Central Government establ ished the National Film Development Corporation (NFDC) in 1980. The NFDC f inances and produces f i lms . It also extends f inanc ia l assistance for construct ion o f cinema theatres. It is a good source o f assis tance to f i lm producers.
26.8 .12 A p art ia l so lut ion to the problem o f black money generat ion and c i r c u la t i o n by fi lm business is the expansion o f ac
t i v i t i e s o f NFDC.
377

TABLE 2 6 .1
Number of Indian Feature Films C e r t i f i e d by Censor Board
La nguag e 1982 1 983 1 984 1 985 1986
1 . Te1 ug u 155 131 171 1 98 1 92( 2 0 . 3 1 ) ( 1 7 . 6 8 ) ( 2 0 . 5 3 ) ( 2 1 . 6 8 ) ( 2 2 . 8 6 )
2 . Tami l 1 AO 128 1 48 1 90 1 54( 1 8 . 3 5 ) ( 1 7 . 2 7 ) ( 1 7 . 7 7 ) ( 2 0 . 8 1 ) ( 1 8 . 3 4 )
3 . Mal ayal am 117 1 1 2 1 2 1 137 130( 1 5 . 3 3 ) ( 1 5 . 1 1 ) ( 1 4 . 5 2 ) ( 1 5 . 0 0 ) ( 1 5 . 4 8 )
4 . Ka nnad a 51 72 80 70 59( 6 . 6 8 ) ( 9 . 72) . ( 9 . 6 0 ) ( 7 . 6 7 ) ( 7 . 0 3 )
5 . Hind i 148 132 165 187 159( 1 9 . 4 0 ) ( 1 7 . 8 1 ) ( 1 9 . 8 1 ) ( 2 0 . 4 8 ) ( 1 8 . 9 4 )
6 . B e n g a l i 49 49 3 5 28 47( 6 . 4 2 ) ( 6 . 6 1 ) ( 4 . 2 0 ) (3 . 0 6 ) ( 5 . 6 0 )
7 . B h o j p u r i 3 1 1 9 6 I 9( 0 . 3 9 ) ( 1 . 4 8 ) ( 1 . 0 8 ) ( 0 . 6 6 ) ( 2 . 2 6 )
8 . Or i ya 9 1 2 1 4 1 7 1 7( 1 - 1 7 ) ( 1 . 6 2 ) ( I . 6 8 ) ( 1 . 8 6 ) ( 2 . 0 2 )
9 . Mar at hi 24 2 0 2 5 1 6 1 7( 3 . 1 5 ) ( 2 . 7 0 ( 3 . 0 0 ) ( 1 - 7 5 ) ( 2 . 0 2 )
1 0 . G u j a r a t i 39 2 7 30 2 2 1 3( 5 . 1 2 ) ( 3 . 6 4 ) ( 3 . 6 0 ) ( 2 . 4 0 ) ( 1 •54)
1 1 . Assamese 5 - 5 1 0 1 1( 0 . 6 6 ) ( 0 . 6 0 ) (1 - 0 9 ) ( 1 . 3 0 )
1 2 . P u n j a b i 6 1 9 1 0 8 79 ( 0 . 7 9 ) ( 2 - 56) ( 1 •2 0 ) ( 0 . 8 7 ) ( 0 . 8 3 )
13 . Ot h e r s 1 7 28 2 0 24 1 5( 2 . 2 3 ) ( 3 . 80 ) (2 . 40 ) ( 2 . 6 7 ) ( 1 - 7 8 )
TOTAL 763 741 83 3 913 840( 1 0 0 ) ( 1 0 0 ) ( 1 0 0 ) ( 1 0 0 ) ( 1 0 0 )
N o t e s : 1. F i g u r e s i n b r a c k e t s i n d i c a t e p e r - S o u r c e : South I n d i a nc en t age to t o t a l . Fi lm C ha ra ber
2. Ot h e r s i n c l u d e Bodo, Ga r h wa l i ) o f Commerce ,
M a n i p u r i , Urdu, M a i t h i l i , Av a d h i , Madras .Niraadi , S i n d h i , Uiraasa, K a r l i ,R a j a s t h a n i , Ha r y a n v i , N e p a l i , Ko nka ni ,S a n s k r i t and E n g l i s h .
378

TABLE 26.2
Es tim at ed Cost of Film P roduction in 1986 and Inform al C red it fo r Film P rodu ction
( R s . C r o r e )
Number Cost T o t a l 75 % 125% o fo f per c o s t o f c o l . c o l . ( 4 )f i l m s f i l m ( 4 )
£\ • Hi nd i f i l m s 1 6 6 . 4 5 _ _ _I . I Big b ud g e t (10% o f A) 1 6 . 7 0 4 . 5 7 5 . 1 5 56 . 36 93 . 941 . 2 Mi ddl e b u d g e t (40% o f A) 6 6 . 7 8 1 . 0 6 6 . 7 8 5 0 . 0 9 83 . 481 . 3 Smal l b ud g e t (50% o f A) 83 . 48 0 . 25 20. 87 1 5. 65 2 6 . 0 9
B . Other l a n g u a g e f i l m s 7 1 5 . 0 5 - - - -2 . 1 Big budg e t (10% o f B) 71 . 51 1 . 0 7 1 . 5 1 53 . 63 8 9 . 3 92 . 2 Mi ddl e b ud g e t
(40% o f B)2 8 6 . 0 2 0. 5 1 4 3 . 0 1 1 0 7 . 2 6 1 7 8 . 7 6
2 . 3 Smal l budget (50% o f B)
3 5 7 . 5 3 0 . 1 7 5 6 2 . 5 7 • 46 . 93 78 . 2 1
C . T o t a l
Finance
8 8 2 4 3 9 . 8 9 3 2 9 . 9 2 5 4 9 . 8 6
D. F i n anc e r e q u i r e d - - 2 9 3 . 2 8 2 1 9 . 9 6 3 6 6 . 5 9E. Own f unds (5% o f D) - - 14. 6 6 1 1 . 0 0 1 8 . 3 3F . Fi l m F i n a n c i e r s (50% o f D) - - 14 6 . 6 4 1 0 9 . 9 8 1 8 3 . 3 0G. S t u d i o s & l a b o r a t o r i e s
( 1 0 % o f D)2 9 . 3 3 2 2 . 0 0 3 6 . 6 6
H . D i s t r i b u t o r s & o t h e r s (35% o f D)
1 0 2 . 6 5 76 . 99 1 2 8 . 3 1
I . T o t a l i n f o r m a l c r e d i t ( F+G+H) 2 7 8 . 6 1 2 0 8 . 9 6 3 4 8 . 2 6
N o t e s : 1. F i g u r e s f o r f i n a n c e r e q u i r e d ar e i n c r o r e s o f r u p e e - y e a r s .2. C r e d i t f o r b i g budg e t f i l m s i s r e q u i r e d f o r one y e a r on
a g g r e g a t e .C r e d i t f o r o t h e r f i l m s i s r e q u i r e d f o r 6 months on a v e r a g e .
3 7 9

CHAPTER 27
27.1 Description of salient features and geographical dispersion of sector
27.1.1 Garment exports are emerging as In d ia 's leading export
industry and have been growing at a phenomenal rate. For such an important sector , what is surprising to the outsider is the lack o f s t a t i s t i c s on even such basic items as the number o f export firms or the to ta l employment in the sector . There reportedly exi s ts a large number o f dummy companies due to the method of as
signment o f e xpor t quotas by the government and due to tax reasons. However, the Apparel Export Promotion Council had 6250 merchant exporters / manufacturing exporters o f ready-made garments in India on i t s reg is te r in April 1986.
2 7 . 1 . 2 Sudden r i s e o f the i n d u s t r y : India 's garment exportsamounted to an ins ign i f i cant Rs. 9 crore in 1969-70. It is a
remarkable feature in the h is tory o f garment exports that these soared to Rs. 1323 crore in 1986 - a compound annual growth rate o f 33.6 per cent . By 1975, India had establ ished a firm presence in world markets, when i t exported garments worth over Rs. 119crore . By 1981-82, exports reached the leve l o f Rs. 670 crore and in 1987 exports o f ready-made garments reached an a l l time high o f Rs. 1863 crore (estimated) contributing as much as 12 per cent to the to ta l export basket o f the country. The growth rates o f exports during the most recent two years have been 25 per cent and 40 per cent resp ec t ive ly . For 1990 garment export target has beenfixed by the government at Rs. 2500 crore .
27 .1 .3 The major market fo r Indian ready-made garment is theU.S.A. which accounted for exports t o ta l l in g Rs. 595.20 croreduring 1987 (32 per cent o f t o ta l garment exports ) . The secondbiggest importer is West Germany which imported goods worth Rs.
GARMENT EXPORTERS IN DELHI
380

257.87 (13.8 per cent) crore during 1987 followed by the U.K. with imported goods worth Rs. 196 crore (10.5 per c e n t ) . West Europe and the EEC accounted for exports o f about Rs. 850 crore (46 per c e n t ) .
27.1 .4 A large part o f the c red i t for the rapid growth o f Indian garment exports goes to State Trading Corporation (STC) and
to the concerted e f f o r t s made by the Apparel Export Promotion Council (AEPC), the Cotton and Woolen Textile Promotion Council (CWTPC) and the Trade Fair Authority o f India (TFAI). Today, Indian garments are competing s u c ce s s fu l ly .with other apparel exporting nations o f the world such as Hongkong, Taiwan, Korea and
Singapore.
27 .1 .5 The multi -fLbre agreement (MFA): The Mult i -Fibre Agreement, a major i r r i ta n t in North-South re la t io n s , i s the main external factor a f f e c t i ng Indian garment exports. The Agreement has been s p e c i a l l y des i gned to p r o t e c t the t e x t i l e i n d u s t r i e s o f developed countries from competit ion with developing countries . First signed in 1973 and renewed four times since then by a l l
major t e x t i l e importing and exporting countr ies , the MFA is a s ig n i f i c a n t departure from the General Agreement on T a r i f f s and Trade. The MFA allows quantitat ive r e s t r i c t i o n s rather thant a r i f f s on imports from s p e c i f i c countries . As a re su l t , thereare no r e s t r i c t i o n s on trade in t e x t i l e s among developed countries but the MFA has been used as weapon to cut imports from developing countries. The main trade inh ib i t ing points are to be found in a r t i c l e s 3 and 4 of the Agreement. Under these a r t i c l e s , any im
porting country can cut the import o f any s p e c i f i c item from a s p e c i f i c source i f it fee ls that i t s market i s being disrupted by
such imports .
2 7 .1 .6 The garment export entitlem ent p o licy , 1987 (quotap o lic y ): The po l i cy for a l l o c a t io n o f export entitlements forgarments and knitwear, popularly known as the quota p o l i c y , i s based on b i la t e r a l agreements between India and various importing countries . Every year the Government o f India issues a public
381
not ice laying down p o l i c i e s within which allotments are to be made. The quota is administered by the Apparel Export Promotion
Council . Over the years, a large numbers o f changes have been introduced in the p o l i c y based on feedback from the trade. The Government o f India has, most recent ly , agreed to meet the long outstanding demand o f exporters for the issue o f quotas to garment e x p o r t e r s who succeed in e x p o r t in g garments to non quota countr i e s .
27.1 .7 The major features o f the new p o l i c y are a sh i f t from
quantity to value in determining entitlements based on past performance, larger quotas for manufacturer-cum-exporters and quota tendering open to a l l fo r cer ta in country quotas where u t i l i s a t i o n has been over 90 per cent in the previous three years. Under the new p o l i c y , in most ca tegor ies , 65 per cent o f the quota i s based on past performance. The reason f o r the sh i f t in past performance entitlement (PPE) from quantity to value is that Indian exports
are h i t t ing the l im its o f the quotas for most countr ies . The only way out is t h e r e f o r e by in c r e a s in g the va lue o f e xp o r t s . A
f u r t h e r 1 0 per cent o f the quota w i l l be d i s t r i b u t e d to manufacturer-cum-exporters ( i . e . , those who have at least 1 0 0
workers and 150 machines). The main reason for increasing thequotas for manufacturer-cum-exporters is to attempt to boost the qual i ty o f manufactures. Most exporters f ee l that the fa i lure o f the government to es tab l ish investment c r i t e r i a in value terms
makes the move meaningless.
27 .1 .8 Another two and three per cent o f the quotas w i l l be given to Centre and State corporations and those who develop exports to non-quota countries r e sp e c t iv e ly . The last twenty per cent of the quota i s provided under what i s ca l l e d the f i r s t come, f i r s t served (FCFS) system so that new comers and small exporters get a share o f the pie. The fact that 65 per cent of the quota is
reserved for past performance and 1 0 per cent for large firms c l e a r ly const i tu tes an entry barr ier as pointed out by Law (1981) in the context o f Hongkong.
382

27.1.9 According to a recent study by the State Bank o f India (1987) the region-wise d i s t r ib u t io n o f firms i s as fo l lows :
Northern Region 3600Western Region 1750South Region 800Eastern Region 1 0 0
Total 6250
The garment industry was born in Bombay but labour conf l i c t s , coupled with the high pr i ces o f real estate drove many or ganised manufacturers out o f the c i t y . Though, i n i t i a l l y , Delhi
was Lhought lu be an easier area to work out ot , Labour continues to be a thorny issue in these centres . In spite o f th i s , Delhi and
Bombay are the main centres for apparel exports and they alone account for more than 80 per cent of to ta l exports made from India. City-wise shares in the value o f exports made from India during the year 1985 according to the State Bank study are:
Percentage
Delhi 42.03Bombay 39.06Madras 10.84Bangalore 5.38Trichur 1.75Calcutta 0.47Jaipur 0.47
Total 1 0 0 . 0 0
27.1.10 There are more than 3600 r e g i s t e r e d members in and around Delhi. However, the number o f a c t ive garment exporter cum manufacturers i s estimated to be around 400 only. Generally, exporters have as many 3-4 firms under d i f f e r e n t names to get more quota allotments from the Apparel Export Promotion Council .
3 83

27.2 Description of sample
27.2 .1 Sample characteristics: The sample selected consisted of40 units previously surveyed by the State Bank, Delhi Circ le .
Only 19 of these units cooperated with f i e l d s t a f f , and that too not to the f u l l e s t poss ib le extent.
27.2.2 42 per cent o f f i rms were p a r t n e r s h i p s . Pr i vat e l imited companies and sole proprietorships were each 26 per cent of the sample. Information on one firm was not ava i lab le . The average firm was 14 years old while the o ldest was 37 years o ld . The newest firm was one year o ld . Most firms (26 per cent) were
manufacturers cum exporters. L6 per cent each were merchant firms and s i lk exporters . 26 per cent o f firms reported working on a
seasonal basis . On average, 69 workers were employed by a firm and the minimum and maximum number o f workers were 1 and 400 respec t ive ly .
27.2.3 Table 27.2 provides d e t a i l s o f p r o f i t a b i l i t y o f firms with respect to own cap ita l employed and income. Small firms may be seen to be le s s p ro f i ta b le than large firms by both indicators o f p r o f i t a b i l i t y . This shows that , i f c o rrec t ions are made for the imputed wages for owner's labour time, small firms wil l be even le s s p r o f i ta b le . However, the sample return or cap ita l is absolutely high compared to other industr ies . It is l i k e l y that both the d i f f e r e n t i a l p r o f i t a b i l i t y o f large and small firms and the high p r o f i t a b i l i t y in absolute term are due to the administra
t ion of the export quota pol i cy and the quota i t s e l f . We now turn
to an analysis o f sources o f funds.
27.3 Sources of funds and salient features of sources
27 .3 .1 Own funds, formal and informal borrowing: Of the totalsample, a l l firms except one were gett ing bank cred it f a c i l i t i e s in one form or another, while 68.4 per cent received informal cred it in addit ion to formal c r edi t . Out o f formal borrowers, 79 per cent were gett ing finance against export orders in the form o f
18 U

'packing c r e d i t ' while 48 per cent received packing cred it and also enjoyed export b i l l discounting f a c i l i t i e s . Only one firm had received a long term loan from a bank.
27.3.2 Table 27.3 gives d e t a i l s of the average percentage o f to ta l l i a b i l i t i e s from various sources. The average firm may be seen to depend mainly on informal cred it (41.04 per cent ) . Bank credit also plays a s i gni f i cant role and contr ibutes 24.92 per cent o f to ta l funds. Owed funds contr ibute only 29.96 per cent. Informal c re d i t includes both trade cred it and other informal borrowings. I f trade c red i t is excluded, then informal c red i t f a l l s to only 7.04 per cent o f to ta l funds. Of these other informal sources, 37 per cent o f f irms borrowed from fr iends and re la
t ives . D irectors , shareholders and partners lent to a further 21 per cent o f f irms. Only 10 per cent borrowed from informal in te r mediaries ( chi t funds and finance corporat ions ) .
27.3.3 Table 27.3 shows that own cap ita l is s i g n i f i c a n t l y moreimportant as a source o f funds for large firms than for small
firms when firms are c l a s s i f i e d by to ta l assets . The reverse is true for formal c r e d i t . It i s o f in terest that formal c re d i t i s the least important source o f funds for both categor ies o f f irms. Trade c r e d i t , contributed 29.15 per cent and 35.75 per cent of
funds for large and small firms re sp e c t iv e ly . Informal c red i t wasthe main source o f funds in the case o f small f irms (42.60 perc e n t ) . The c o mf o r t a b l e own funds p o s i t i o n o f l a r g e f i rms r e f l e c t s , in thi s industry, the combined operations of quotas and export promotion described ear l i e r and not credi t const rai nts .
27.3.4 The current f inanc ia l structure o f firms is l i k e l y tomove increas ingly in the d i r e c t i o n o f re l iance on own finance. In the two years for which data was a v a i lab le , reserves and surplus increased at an average rate of 160.58 per cent, the rat io o fgrowth o f reserves being similar for both small and large firms.However, 6 6 per cent o f large firms but only 50 per cent o f small f irms showed growth in this category (58 per cent o v e r a l l ) . Only one f irm showed a decrease in reserves and surplus. I f we add
'X ft s

to these f igures growth in loans from d i re c to rs , shareholders, partners, friends and r e la t iv e s , then, no firm for which data is ava i lab le shows a decrease in the combined pos i t ion from these two
sources. Since i t is known that many partnership and proprietary concerns show the ir own funds as loans from friends and re la t ives in order to launder black funds from concealed p r o f i t s , i t i s pos
s ib le that such "informal c red i t " is primarily i l l e g a l wealth. That th is could be the case i s made more plausible by the nature o f the quota p o l i cy discussed further in sect ion 5.
27.3 .5 Purpose, duration and cost of loans: Both formal and informal sector c re d i t was mainly f o r working capita l f inance. Only
one formal borrower received a term loan from the banking sector . Due to non a v a i l a b i l i t y o f data, the exact term structure o f loans could not be ascertained. Large firms had to pay marginally more interest as compared to small firms (see Table 27. 5) . While firms rece iv ing both formal and informal cred it had a lower cost o f borrowing than firms rece iv ing only formal c r e d i t , th is appears to be due to the fact that the former were bet ter cred it r isks and not because informal c red i t i s cheaper than bank c r e d i t . In f a c t , larger f irms, who are more dependant on informal borrowing (Table 27.4) have the higher cost o f c r e d i t .
27 .3 .6 Table 27.5 also reveals that trade c re d i t is received on average fo r ten weeks in t h i s s e c t o r . Smaller f i rms are , however, able to get c r e d i t f o r longer terms as compared to large firms. This p os i t ion i s made even better for small firms since
they provide l e s s c re d i t to their customers. The overa l l impres
sion is that small f irms rece ive more cred it than large firms and are better served by banks, primarily because large firms are in l i t t l e need o f borrowings.
2 7 .3 .7 Reasons for approaching the informal sector andrespondent's opinions of bank credit fa c i l it ie s : 40 per cent o fthose firms who received informal c red i t were interested in in fo r mal c red i t because, in th e ir opinion, informal c red i t was eas i ly ava i lab le ; 30 per cent c i ted less form al i t ie s as compared to bank
386

c r e d i t ; 25 per cent complained o f inadequacy o f bank c r e d i t ; and a further 5 per cent c i t ed the cheapness o f informal c red i t as the reason for approaching informal c re d i t markets.
27 .3 .8 In the sample, a l l but one unit had cred it f a c i l i t i e s with a bank. 63 per cent o f firms were general ly s a t i s f i e d with their banker. Out o f those firms which were not s a t i s f i e d , 57 per cent were d i s s a t i s f i e d due to both d e lays in s e r v i c e and i n adequacy o f c r e d i t . 14 per cent c i t ed only delays in service as the reason for d i s s a t i s f a c t i o n and 29 per cent c i ted other reasons
for d i s s a t i s fa c t i o n . Only three f irms out of the to ta l sample f e l t that banks were not f a i r to them as compared to the ir t reat
ment o£ other customers. Only one l inn f e l t that more s a t i s f a c tory serv ices could be obtained from private moneylenders or other
informal intermediaries . Five firms had received special serv ices from their banks and thi s related to both f inanc ia l aspects and management aspects . Table 27.6 gives the s t a t i s t i c s for customer service arranged according to the concerned nationalised bank.
27.4 Uses o f funds
27.4.1 Table 27.7 provides information about the uses o f fund by garment export f i rms . Use o f funds i s d i v i d e d in to four components: f ixed assets , inventories , loans and advances andother uses. The main feature as to uses o f funds v i s i b l e in th is table is the low proportion o f funds devoted to f ixed assets . Looking at the d is t r ib u t io n by s ize o f firm, the str ik ing feature revealed by th is table is that small firms hold inventories four
times as large re l at i ve to the number o f days o f production compared with large firms. The reason for this is to be had in the organisat ion o f production. While small firms re ly mainly on job work done by independant cut ters and t a i l o r s , larger firms have the ir own work force and machines. To cope with the uncertaint ies in securing the serv ices o f cu t ters and t a i l o r s , who are in high demand, small firms must maintain large inventories . This acts as a buf f er in case a time bound order is rece ived . Along with the e a r l i e r evidence, th is suggests a greater re l iance o f small firms
387
on credit markets.
27.5 .1 While the regulatory environment prevail ing has no im
pact on the a v a i l a b i l i t y o f informal c red i t to th is sector , i t does a f f e c t the to ta l funds p os i t ion great ly . Three items come into play h ere .
i . For e s t a b l i s h e d f i r ms , o b t a i n i n g cheap bank c r e d i t to f inance confirmed export orders i s routine and r e la t iv e ly o b s t a c l e f r e e . In f a c t , t her e i s ev i de nc e that nat ionalised banks a c t iv e ly compete with one another to increase their business in this market.
i i . Export i n c e n t i v e s ( cash compensatory support and duty drawback) against the customs l e v i e s , designed primarily to o f f s e t internal taxes on inputs, are normally paid to f irms soon a f t e r they export a consignment ( u s u a l l y within, 30 days). This reduces the average waiting period between the shipping o f goods and rece ipt o f payment thus improving the cash flow o f f irms.
i i i . The higher unit value which firms have to real ise on export orders to quali fy for allotments in subsequent years is a poss ib le third fa c to r . This may be explained as f o l lows. The quota under the MFA leads to a p o s i t i o n o f excess demand f o r ’ Indian garments in developed countries at free market equilibrium pr ices . Thus the goods tend to be so ld at h igher p r i c e s wi th a c o r r e s p o n d i n g l y l a r g e surplus for producers. However, to escape taxation, exporters may under-invoice their consignments with the connivance o f importers overseas. The extent o f under in vo ic ing poss ib le decreases whenever a unit value st ipula t ion i s made for the assignment of quotas with the f l o o r pr ice being increased every year provided export performance does not su f fe r .
27.5.2 The resu lt o f the three fac tors described above is that firms , e s p e c ia l ly large f i rms, are becoming 'cash r i c h ' and have l i t t l e need f o r o u t s i d e c r e d i t . Evidence f o r t h i s was presented e a r l i e r ( i n that r e se r v e s and surplus had shown a phenomenal growth r at e ) . In d i r e c t ly , t hi s also provides further evidence on the l ike l ihood o f black funds in the Industry s ince,
otherwise, i t is d i f f i c u l t to understand why a cash rich firm would borrow at the high average rates ( e sp e c ia l ly for large firms) given in Table 27.5.
27.5 Impact of regulatory environment
n o n

27.5 .3 The o t he r , non f i n a n c i a l , impact o f government i sthrough the quota p o l i cy . That 65 per cent o f the quota is a l lo t ted on the basis o f past performance and 1 0 per cent is a l lo t ted to large firms rather than by open tendering, shows that
there is a c lear barrier to entry engendered by regulation. This, o f course, has an important ind irec t e f f e c t on the funds posit ion o f incumbent { inns since thei r pro t i t s are thereby greatLy augmented.
27.6 Estimate of total value of informal credit to garment export activity
27.6.1 The f igures in Table 27.1 can be used to shed l ight on
the total si ze ol Lhe L n to rnwi L and tonual credi t markets serving garment exports. Formal and informal cred it r esp ec t ive ly make up
20 per cent and 25 per cent o f the total production o f sampled
firms. I f we assume that this rat i o prevai ls at the aggregate level as wel l , then informal and formal cred it in 1987-88 to the sector would be Rs . 259.05 crore and Rs. 207.60 crore respect ive ly .
27.7 Efficiency and allocative impact of informal finance
27.7.1 Since data are not ava i lab le on the quantity o f output, value o f production has been used as the ind icator o f product ion . An examination o f the cap ita l output and labour outputrat ios shows two things: small f irms (who get more finance through the informal market inc lus ive o f trade c r e d i t ) use le s s cap ita l per unit o f output but get a lower return on sales (Table 27. 8) .
27.7.2 Secondly, table 27.8 shows that small f irms are morelabour intensive than large firms in that they have a lower capi t a l output r a t i o but a h i gher labour output r a t i o than l a r g e firms. This is as expected given that to ta l f inance available to them is l e s s in quantity but more c o s t l y . We ten ta t ive ly conclude that informal finance is associated with firms using more labour intensive methods o f production in this sector .
3 8 9

27.8 The main distinguishing features
27.8.1 The main points that have emerged in the analysis maynow be summarised.
i . Most loans to both small and large firms are for working ca p i ta l
i i . There appears to be evidence to suggest that what appears to be ' informal c r e d i t ' , apart from trade cred it , i s , to a large extent , unaccounted funds.
i i i . Firms in the sample have shown a high growth rate (161per cent) o f retained earnings. The reason for this can be t raced to the quota p o l i c y f o l l o we d by the Government.
iv. A large proportion o f f irms expressed d i s s a t i s fa c t i o nwith bank cred it f a c i l i t i e s even though the credit f a c i l i t i e s they rece ive are better than that received by many other productive sectors .
v. The quantum o f i n f o r mal c r e d i t ( e x c l u d i n g t radec r e d i t ) to the sector is marginal.
v i . The i n f o r m a l i t y o f in fo rm a l c r e d i t was the reasonc i t e d most o f t e n by respondents fo r taking such c r e d i t .
v i i . The quota p o l i cy and the prevail ing export incent ivesmake th is sector very cash r i ch .
Regarding d i f f e r e n c e s between the small and la r g e firms we see that
i . Small firms are le s s p r o f i ta b le .
i i . Small firms rece ive trade c red i t for longer durationsthan large f i rms and a l s o g i ve c r e d i t f or shor ter durat ions .
i i i . Trade c red i t had equal importance for both types o ffirms, though i t makes up a larger chunk o f borrowed funds for small f irms.
i v . Small firms re ly more on informal c red i t ( includingtrade c r e d i t ) than large firms.
v. Small firms are more labour intensive than large firmseven though the ir borrowing cost i s lower than the cost o f large firms.
390

27.9 Recommendation for reform and regulation
27.9 .1 In a cap i ta l poor economy i t is indeed remarkable that one sector , however much it helps the export -dr i v e , should receive
concessional f inance to the extent that this sector does. The question that needs to be asked is how e f f e c t i v e t h i s concessional f inance is in boosting exports at the margin. This p o l i cy needs carefu l examination. Secondly, the operation o f the quota system as i t i s run by the AEPC and ot her r e l a t e d c o u n c i l s c l e a r l y creates barriers to entry for new firms. This too is worth a second look. However, both these points are beyond the s t r i c t purview o f th is study.
27.9.2 Besides recommending more expensive bank finance to lower the so c ia l opportunity cost o f the export drive or , as an a lternat ive , recommending open bidding for a larger part o f the quota, i t is c lear that the d iscr imination in favour o f large firms needs to be removed in so far as the re la t ive extent o f finance is concerned. Given that thi s sector is cash rich and therefore not dependant to any great extent on informal finance aside from trade c red i t (nor even formal finance) l i t t l e scope exi s t s for further improvements in c red i t f a c i l i t i e s .
391

TABLE 2 7 . 1
Aggregate Garment Export A c t i v i t y in India
(Rs . c r o r e )
1. Es t i ma t e d f o r ma l c r e d i t to s e c t o r 2 0 7 . 6 0 A l l I n d i a ) in 1 9 8 6 - 8 7
2. E s t i m a t e d i n f o r m a l c r e d i t to s e c t o r 2 5 9 . 0 5 ( A l l I n d i a ) i n 19 8 6 - 8 7
No t e s : 1. T o t a l e x p o r t o f r e a d y - ma d e g a r me n t s i s :1038 c r o r e . ( 1 9 8 6 - 8 7 p r o v i s i o n a l ) .
2. R a t i o o f i n f o r ma l c r e d i t to p r o d u c t i o n : 0 . 0 2R a t i o o f f o r ma l c r e d i t to p r o d u c t i o n : 0 . 2 0
TABLE 2 7 . 2
P r o f i t a b i l i t y o f Fi rms
( i n p e r c e n t a g e )
C a t e g o r y P a t / C a p i t a l P a t / I n c o m e
La r g e f i r m s 54 . 89 9. 89( 9 7 . 5 3 ) ( 15 . 94 )
Smal l f i r m s 2 6 . 97 5 . 72( 5 1 . 9 1 ) ( 9 . 9 3 )
A l l f i r m s 3 4 . 3 6 6 . 8 6
( 6 8 . 2 0 ) ( 1 2 . 0 2 )
N o t e s : 1. PAT : P r o f i t a f t e r t a x e s .C a p i t a l : E q u i t y / o w n e r s c a p i t a l .Income : Gr o s s i nc o me .
2. F i g u r e s in p a r e n t h e s e s ar e s t a n d a r d d e v i a t i o n s .
392
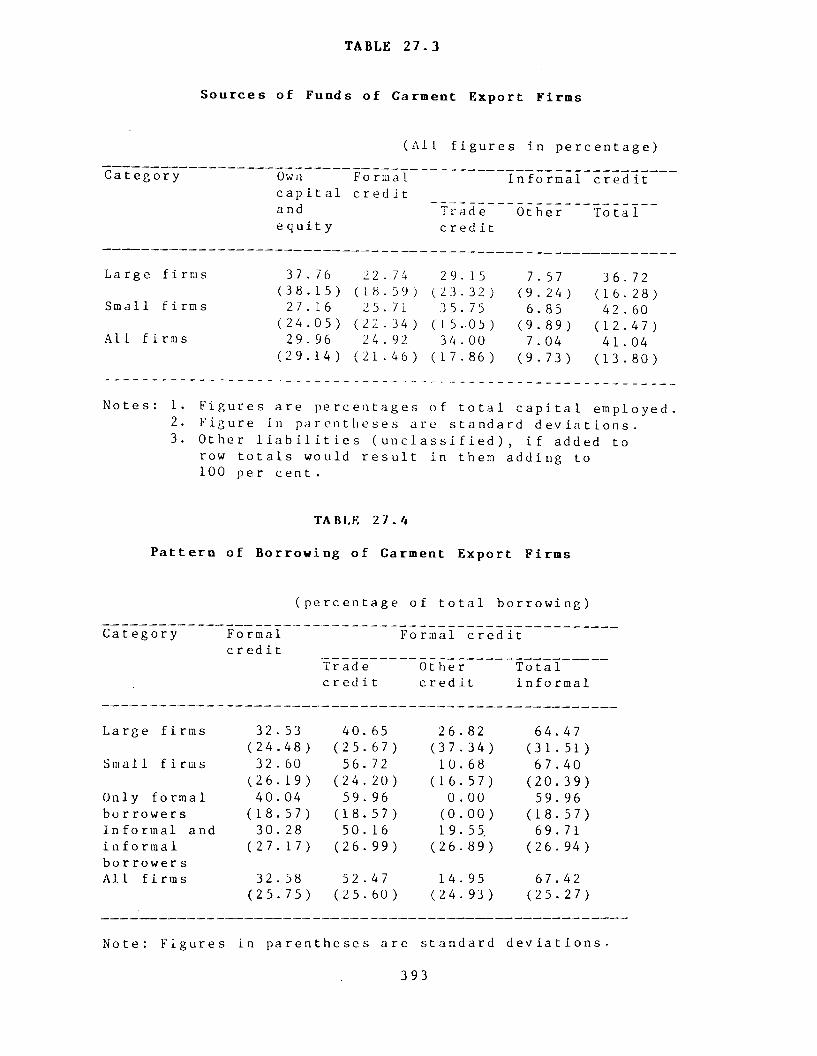
TABLE 2 7 . 3
Sources of Funds of Garment Export Firms
( A l l f i g u r e s i n p e r c e n t a g e )
C a t e g o r y Own Formalc a p i t al c r e d i t andequity
Tradec r e d i t
I n f o r m a l c r e d i t
Other T o t a l
La r g e f i r m s
Smal 1 f i rm s
A l l f i r m s
37 ., 76 2 2 .. 74 29. . 1 5 7 .. 57 36. . 72(3 8 .•15) ( L8 .■ 59 ) ( 23 . . 32 ) ( 9. . 24) ( 16 . . 28 )
27 .. 16 25 .. 71 3 5 .. 75 6 ..85 42 .. 60( 24 . . 0 5 ) ( 2 2 .■ 34 ) ( 15 . •05 ) ( 9. . 89 ) ( 1 2 .■47)
29. 96 24 .. 92 34 .. 0 0 7 ., 04 4 1 .. 04( 29 .•14) ( 2 1 . 46 ) ( 17 . . 8 6 ) ( 9 . • 73) (13 .. 80 )
N o t e s : 1. F i g u r e s a r e p e r c e n t a g e s o f t o t a l c a p i t a l empl o ye d2. F i g u r e in p a r e n t h e s e s ar e s t a n d a r d d e v i a t i o n s .3. Ot her l i a b i l i t i e s ( u n c l a s s i f i e d ) , i f added to
row t o t a l s woul d r e s u l t i n them a d d i n g to1 0 0 pe r c e n t .
TABLE 2 7 .4
P attern of Borrowing o f Garment Export Firms
( p e r c e n t a g e o f t o t a l b o r r o w i n g )
C a t e g o r y Formalc r e d i t
Formal c r e d i t
Tr adec r e d i t
Ot herc r e d i t
T o t a li n f o r m a l
Lar g e f i r m s 32 . 53 40. 65 2 6 . 8 2 6 4 . 4 7( 2 4 . 4 8 ) ( 2 5 . 6 7 ) ( 3 7 . 3 4 ) ( 3 1 . 5 1 )
Smal l f i r m s 32 . 60 56. 72 1 0 . 6 8 67. 40( 2 6 . 1 9 ) ( 2 4 . 2 0 ) ( 1 6 . 5 7 ) ( 2 0 . 3 9 )
Only f o r ma l 40. 04 59. 96 0 . 0 0 59 . 96b o r r o w e r s ( 1 8 . 5 7 ) ( 1 8 . 5 7 ) ( 0 . 0 0 ) ( 1 8 . 5 7 )I n f o r m a l and 30. 28 5 0 . 1 6 19.55, 69. 71i n f o r m a l ( 2 7 . 1 7 ) ( 2 6 . 9 9 ) ( 2 6 . 8 9 ) ( 2 6 . 9 4 )b o r r o w e r sAl 1 f i r m s 32 . 58 5 2 . 4 7 1 4 . 9 5 67 . 42
( 2 5 . 7 5 ) ( 2 5 . 6 0 ) ( 2 4 . 9 3 ) ( 2 5 . 2 7 )
No t e : F i g u r e s i n p a r e n t h e s e s a r e s t a n d a r d d e v i a t i o n s
3 93

TABLE 2 7 .5
I n t e r e s t Cost o f Borrowing and Duration ofTrade Credit Received and Given
C a t e g o r y I n t e r e s t Trade Tradec o s t o f c r ed i t c r e d i tb o r r o we d r e c e i v e d g i v e n ( i nf und s ( i n days ) ( d a y s )
*
La r g e f i r m s 13 . 20 6 2 . 6 7 8 0 . 0 0( 9 . 4 7 ) - -
Smal l f i r m s 1 2 . 4 5 76 . 8 8 4 5 . 67( 9 . 7 7 ) - -
Formal b o r r o w e r s 1 6 . 4 8 3 7 . 50 60. 0 0o n l y ( 1 0 . 2 5 ) - -
Formal and i n f o r m a l 11 . 3 4 80. 89 53. 10b o r r o w e r s ( 9 . 1 1 ) - -
A l l f i r m s 12 . 6 7 73 . 00 54 . 25( 9 . 6 9 ) — —
N o t e s : 1. I n t e r e s t c o s t i s i n t e r e s t pai d as a ’
St a nd a r d d e v i a t i o n s f o r ( 2 ) and ( 3 ) not c omput ed due t o m i s s i n g d a t a r e s u l t i n g in f ew o b s e r v a t i o n s .
394

TABLE 2 7 .6
Bank-Wise S t a t i s t i c s
T o t a l no . o f a c c o u n t h o l d e r s
P e r c e n t age g e t t i n g need b a s e d f i n a n c e
P e r c e n t age s a t i s f i e d wi t h bank .
Pe r c e n t - age f e e l i n g bank i s unf a i r to them
Pe rc en- t a g ea v a i l i ng o f o t h e r c r e d i t as we 1 1
( 1 ) ( 2 ) ( 3 ) ( 4 ) ( 5 ) ( 6 )
Number o f l o an a c c o u n t s1. A l l Banks 19 79 6 3 . 1 6 10. 53 4 7 . 3 72. Punj ab N a t i o n a l 4 2 5 . 0 2 5 . 0 50 . 0 75 . 0
Bank3 . I n d i a n Ov e r s e a s 3 6 6 . 67 6 6 . 67 0 . 0 6 6 . 67
Bank4 . Ca na r a Bank 2 0 . 0 0 . 0 1 0 0 . 0 1 0 0 . 05. Not a v a i l a b l e / 13 92 . 3 69 . 2 8 . 3 3 0 . 8
o t h e r s*
395

TABLE 2 7 .7
( p e r c e n t a g e o f t o t a l a s s e t s )
C a t e g o r y F i x e d I n v e n t o - Loans I n v e n t o -a s s e t s r i e s and r i e s i n
a d v a nc e s d ays
Uses of Funds of Garment Export Firms
La r g e f i r m s 16 . 87 1 4 . 5 7 3 2 . 3 2 2 2 . 0 1( 1 2 . 2 5 ) ( 1 2 . 6 6 ) ( 2 5 . 4 2 ) ( 2 3 . 0 7 )
Smal l f i r m s 10 . 91 3 7 . 1 7 4 1 . 77 82 . 31( 1 2 . 1 2 ) ( 2 4 . 5 0 ) ( 2 6 . 5 1 ) ( 1 0 0 . 3 9 )
Formal b o r r o w e r s o n l y 13 . 71 3 3 . 2 9 4 1 . 4 0 1 1 4 . 3 5( 1 0 . 3 1 ) ( 3 2 . 8 4 ) ( 3 7 . 0 8 ) ( 1 7 0 . 8 9 )
Formal and i n f o r m a l 1 2 . 1 1 30. 54 38. 61 5 1 . 6 2( 1 2 . 9 9 ) ( 2 0 . 7 1 ) ( 2 2 . 3 0 ) ( 4 9 . 1 8 )
A l l f i r m s 1 2 . 4 9 3 1 . 1 9 3 9 . 2 7 65 . 56( 1 2 . 4 3 ) ( 2 4 . 1 5 ) ( 2 6 . 5 5 ) ( 9 5 . 14)
No t e : Ot her a s s e t s , no t r e p o r t e d , i n c l u d e i n v e s t m e n t s ( l e s st han 1 per c e n t ) and c a s h and bank b a l a n c e s .
TABLE 2 7 .8
E ffic ie n c y In d ic a to r s fo r Garment Export Firms
C a t e g o r y C a p i t a l / L a b o u r / out puto u t p u t r a t i o r a t i o
Large f i r m s 0 . 3 5 0 . 3 3( 0 . 4 6 ) -
Smal l f i r m s 0. 23 0. 56( 0 . 2 1 ) -
A l l f i rms 0 . 2 8 1 . 1 5( 0 . 3 4 ) -
N o t e s : 1. C a p i t a l : I n v e n t o r i e s p l u s f i x e da s s e t s i n R s . l a k h .
2. Labour : T o t a l e mpl o yme nt .3. Output : Va l ue o f p r o d u c t i o n4. F i g u r e s i n p a r e n t h e s e s a r e s t a n d a r d
d e v i a t i o n s .
396

CHAPTER 28
INFORMAL CREDIT TO THE POWERLOOM SECTOR
28.1 Introduction
28.1.1 The d e c e n t r a l i s e d powerloom s e c t o r o c c u p i e s an important p la ce in t e x t i l e p r o d u c t i o n , p a r t i c u l a r l y in manufacturing cheaper v a r ie t ie s o f c lo th for mass consumption.
The production o f c loth in 1985-86 in the mi l l sector , powerloom sector and handloom sector put together was 12998 m i l l ion metres. Out of t h i s , powerlooins in the decentra l ised sector produced 6222 m il l ion metres, which amounts to 48 per cent o f the to ta l c lo th production. (See Table 28 . 1 ) .
28.1.2 Apart from composite mi l l s , fabr ic production in India takes place in separately organised handloom and powerloom weaving
e s t a b l i s hme nt s and in hand or power operated p r o c e s s in g and printing establishments. As opposed to composite m il ls which
centra l ise spinning, weaving and f in ishing a c t i v i t i e s under one r oo f , the p a r a l l e l form o f pr o duc t i o n d e c e n t r a l i s e s the c o n s t i t u e n t a c t i v i t i e s i n t o s epa ra te e n t i t i e s . The t ypes o f a c t i v i t i e s d e s c r ib e d above, taken t o g e t h e r , c o n s t i t u t e the decentralised sector . During the las t two decades there has been a six fo ld increase both in the number o f powerlooms working in
the decentra lised sector and in the production o f th is sector according to a recent task force o f the Ministry o f Tex t i les which examined cred it requirements for powerlooms .(Government o f India, 1988) . Even though there was, at one t ime, a ban on e s ta b l i sh m e n t o f new powerlooms, una uthor ised powerloom were establ ished. The Government has regularised such unauthorised powerlooms from time to time. During 1986-87, production in the decentra l ised sector was 75 per cent o f composite m i l l t e x t i l e
production whereas, in 1951, it was only 25 per cent.
28.1 .3 Weaving a c t i v i t y in t h i s s e c t o r i s predominantly organised under the master weaver and entrepreneurial systems. In
the master weaver system loom owners are provided yarn by master weavers and are requ ired to convert the same i nt o s p e c i f i e d
"sorts " or types o f woven c lo th for which fixed conversion charges are paid. Looms are large ly run with family or hired labour. The
entrepreneurial system, on the other hand, requires the owner to not only invest in f ixed assets but also in raw materials. Fabric may be woven by entrepreneurs on a job order basis or for d irect sa le . The d ist inguishing mark o f the entrepreneurial system is the involvement o f owners in the bu s in ess to earn commercial
p r o f i t . A third type o f system, less prominent and found in Uttar
Pradesh is the household or cottage enterprise . In this system producers s e l l t h e i r output mainly to the l o c a l market. The
master weaver system is dominant in Maharashtra, Madhya Pradesh and Uttar Pradesh. In Tamil Nadu i t ex is ts side by side with the entrepreneurial system.
28.1 .4 Government and policy: The Government o f India have laidc o n s i s t e n t emphasis on the development and promotion o f
decentral ised industry to s a t i s f y the key o b je c t iv e s o f creat ion o f employment and income generation in rural areas within the framework o f the c o u n t r y ' s economic and s o c i a l development p o l i c i e s . The government's role has been ar t icu la ted through a s t r u c t u r e o f e n ab l in g measures aimed at support ing small producers. For* instance, filament fabr ic production was e a r l i e r reserved fo r powerlooms. Their dominance has been hard to break
even af t e r the introduction o f complete f ib re f l e x i b i l i t y . In cotton fa b r i c s , exc ise concessions were weighted in favour of
production o f superior v a r i e t i e s by powerlooms. Much government intervention has been motivated by the need to minimise cap ita l investment in the manufacture o f th is mass consumption good, so that c lo th could be made avai lab le to the consuming public at a f f o r d a b l e r a t e s . The government has i n c r e a s i n g l y turned to powerlooms as events have shown that the mil l and handloom sectors
3 98

are unsuited to the task under prevai l ing condi t i ons . However
L i t t l e (1987) expresses the view that mi l l production has higher soc i a l benef i ts than powerloom production at plausible shadow wage r a t e s .
28.1.5 Again, this industry could not have progressed so fast were it not for the rapid opening of the rural market during the
seventies and a f te r . Here again the role of government has been
pre-eminent . Massive p u b l i c investment in i n f r a s t r u c t u r e improvement and in the enhancement o f rural product iv i ty has led to income g e n e ra t i o n and consequent g en e r a t i o n o f demand f o r c l o t h i n g . In e f f e c t , the p o l i c y p o s i t i o n has been that the technology represented by the powerlooms and related processing a c t i v i t y is suited to Indian condi t i ons .
28.1.6 However, not a l l i s wel l wi th the gover nment ' s approach to powerlooms. Though some attention has been given to the question o f f inanc ia l arrangements for the powerloom sector , with a government committee examining the issue as early as 1964,^ the l e v e l of funding from s t a t e a g e nc i e s and formal c r e d i t agenc ies is s t i J .1 very poor in i he op i n i o n of a more recent government task f orce . Secondly, as recognised by the task fo rce ,
decentralised cloth production en ta i l s repeated transportat ion of intermediate goods between uni ts , a s i tuat i on that does not occur in integrated mi l l s . This and the weaker market pos it ion o f small decentralised units ent a i l s a cost disadvantage for powerloom uni ts with regard to yarn p r i c e s . This d i sadvant age i s exacerbated in most cases by state and loca l l e v ie s resu lt ing in an est i mated 8 per cent to 1 0 per cent c os t d isadvantage for
powerloom units compared to integrated mi l l s . Th is disadvantage, is o f course, more than compensated for by the lower overheads in powerloom production as compared to integrated mi l l s . However, complaints by assoc ia t ions o f powerloom entrepreneurs regarding ' s t e p - s i s t e r l y ' tax treatment for powerlooms have not, so far, been heeded. It is to be seen i f the s i tuat ion regarding both
1. Ashoka Mehta Co mmi t t e e , M i n i s t r y o f T e x t i l e s .
) 9 9

cred it and taxation improves in the l ight o f the recent task force
r e p o r t .
2 8 .1 .7 Geographical d isp ersio n : The decentral ised sector islocated in a range o f urban places from small towns to big c i t i e s . Most lo ca t ion are welL connected by r a i l or road transport to other urban c e n t r e s . Upto the m i d - s i x t i e s powerloom and processing a c t i v i t i e s were concentrated in the western part o f the country. Prominent loca t ions were Bhiwandi, I cha lkaran j i , Malgaon and Bombay in Maharashtra, Surat and Jetpur in Gujarat and Burhanpur in Madhya Pradesh. In 1964, the Ashoka Mehta Committee estimated the to ta l number of powerlooms manufacturing s i lk and cotton c lo th at 1.5 lakh looms. During the last two decades there
has been a rapid growth in exist ing loca t ions in these States, the esLabllshment o f new locat ions and the spread o f powerlooms to most o t he r St at es as w e l l . There are now more than 8 lakh powerlooms o p e r a t in g in the country in over 2 . 2 lakhe s t a b l i s h me n t s . The loomage is d i s t r i b u t e d i n- more than 60 centres of weaving a c t i v i t y . The loom population varies from a few hundreds in some centres to 1.75 lakh in Surat and 2.5 lakh in Bhiwandi (Shanbhag, 1987). Table 28.2 l i s t s important powerloom weaving centres .
28.2 Description of the sample
28.2.1 Data for this study o f informal c red it was co l le c te dwith the assis tance o f the State Bank of India from 18 powerloomu n i t s and master weavers in Surat . Though 25 u n i t s were
i n i t i a l l y selected only 18 units cooperated. Of these, one unit
did not f ur n i s h com plete in f o r m a t io n . Furthermore, though an addit ional centre, Ahmedabad, was included in the sample design, no data could be c o l l e c te d there. Of the 17 units , 12 units are powerloom units and f ive are master weavers. Detailed discussion was also had with managers o f commercial and cooperative banks, weavers assoc iat ions and government o f f i c i a l s .
400

28.2.2 Four powerloom units were sole proprietorships and 8 were par t nersh i p c oncerns . Also , 4 master weavers were propr ietary and 1 was a partnership. The average powerloom unit was 10 years old, while the o ldest was 22 years o ld. In the case o f master weavers, the average unit was 5 years o ld . 10 powerloom
units were' entrepreneurial units and 2 worked under the master
weaver system. On average, there were 9 workers in powerloom uni ts and r> in master weaver e s t a b l i s h m e n t s . The average investment in plant, and machinery was Rs 3.58 lakh for powerloom units and Rs 2.24 lakh f or master weavers. The smallest powerloom unit had 6 looms while the largest had' 33 looms, the average being 16. The average s ize of units in the sample Ls larger than
the average tor the population (8 looms). The consequence o f this bias is that sampled units, being large, have more ready access to
c redi t , e s pe c ia l l y formal c r e d i t , than is general ly the case due to their superior a b i l i t y to o f f e r c o l l a t e r a l .
28.2.3 To determine the p r o f i t a b i l i t y o f powerloom units andmast: cm' weaver s , two ral i . os are c a l c u l a t e d : Prof i t a f t er tax as apercentage o f own c a p i t a l employed and p r o f i t a f t e r tax as a percentage o f income. By the f i rs t r a t io , i t can be seen that powerloom units in the sample have a greater return to capi tal than master weavers (See Table 28 .3) . However the rat i o of p ro f i t a f ter tax to sales is higher f or master weavers than f or powerloom units. When correc t i ons are made for the imputed value of family l a bo u r , the re turn on c a p i t a l ( Tab l e 28 .3 , column 3) i s , on average, between 5 per cent and 6 per cent for both powerlooms and master weavers.
28.2.4 In recent years many traders in related sectors have plunged into processing a c t i v i t y and establ i shed processing units . Pr oces s i ng a c t i v i t y has t h u s g r o wn v e r y r a p L d 1 v a nd e a r n s m i ic 1 i higher p r o f i t s than powerloom weaving. A decade ago, due to l es s competit ion, the average powerloom earned a pro f i t o f 10-20 per cent on turnover even with job work (Mehta and Gandhi, 1987).
40 1

28.3 Sources of funds and salient features of finance
2 8 .3 .1 General description of credit markets for the te x t i le
sector in Surat and informal credit for powerlooms: The report o fthe Task Force on Credit Requirements for Powerlooms contains
r e p l i e s to a q u e s t i o n n a i r e sent by them to a s s o c i a t i o n s o f powerloom units. All respondents expressed d i s s a t i s fa c t i o n with formal c red it a v a i l a b i l i t y i f an opinion was expressed at a l l . The common complaint was that the to ta l quantum o f bank finance was small or nonexistent . Some respondents went further to say that even units gett ing bank finance (usually larger units) did
not receive finance commensurate with thei r requirements. Others mentioned c o o p e r a t i v e f i nance as important . In a very few
centres , marginal finance from other f inanc ia l ins t i tu t ion s was avai lab le . Among informal sources, "private parties/mahajans" , moneylenders, yarn merchants and master weavers were mentioned. The incidence o f pure informal lenders appears to be extensive in Maharashtra ( Bhiwandi/Ichalkaran j i ) , Kanpur and Amritsar from these responses. Master weavers are important in Surat and also in Maharashtra. In Ahmedabad, own finance appears to be the most
important source o f f inance for powerlooms. Since, in Ahmedabad, powerlooms are p r i m a r i l y e n t r e p r e n e u r i a l , the im press ion was gained from f i e l d e n q u i r i e s that un its were net s u p p l i e r s o f credit with c re d i t being given for up to 150 days with a discount o f 11 per cent to 12 per cent on cash sa les . Unfortunately, more extensive f i e l d work could not be carr ied out.
28 .3 .2 In Surat, our enquiries revealed a wide variety o f f inancia l arrangements serving the t e x t i l e sector which includes
yarn merchants, powerloom units , master weavers, processing units and wholesale traders . Surat contains about 50 large buildings ( l o c a l l y c a l l e d ' m a r k e t s ' ) , each c o n t a i n i n g s e v e r a l hundred t e x t i l e ou t le ts and o f f i c e s o f powerloom and processing units, arat iyas and wholesalers, the oldest being the m ult i -s torey Surat Cloth Market. These markets, as well as powerloom and processing units in the area, are served by several commercial banks and at least 3 cooperative banks. Furthermore, there is a well developed
402

credit market where "private part ies" give c red i t at between 2 . 5
per cent to 4 per cent per month (35 per cent to 65 per cent per annum) for 30 to 90 day per iods . According to several persons interviewed, doctors , lawyers and even government o f f i c i a l s lent
in this clean b i l l f inance market. The size o f thi s market was variously f e l t to be between Rs 100 crore and 600 crore per month. Furthermore, f o r those with pr ior acquaintance with borrowers, the r isk o f outr ight default was reported to be small. The major ben e f i c ia r ie s o f these markets were reported to be arat iyas and wholesalers with processing houses with powerloom units having lesser access to this c r e d i t . Even among such units , small units are reported to be the most disadvantaged. However, an o f f i c e
bearer o f one assoc ia t ion o f powerloom owners reported that upto 70 per cent o f assoc ia t ion members had to depend on such loans for the finance o f cap ita l equipment purchases.
28.3.3 A recent phenomenon is the r ise o f equipment leasing companies in the area, predominantly serving processing houses but also powerloom uni ts .
28 .3 .4 The gen era l consensus o f o p i n i o n o f personsV
interviewed was that bank cred it was only available to larger units with adequate c o l l a t e r a l and also that c r e d i t for working cap ita l was p ar t i cu lar ly inadequate. The same was true for c red i t from cooperative banks. Cooperative banks charge 15 per cent interest on loans for c ap i ta l equipment purchases but usually require c o l l a t e r a l in the way o f immovable property in order to sanction loans.
28.3 .5 Leasing companies finance acqu is i t ion o f new cap i ta l equipment over one to four year term (with an addit ional delay in t r a n s f e r o f t i t l e to take advantage o f tax p r o v i s i o n s f o r d eprec ia t ion ) . The average amount financed was reported to be 3.5 lakh per customer at an e f f e c t i v e annual interest rate o f 28 per cent per annum. The to ta l business is estimated at between Rs 5 and Rs 10 c r o r e annual ly and i s growing r a p i d l y . Equipment leasing companies give great importance to the reputation o f the

borrower and lend only to known p art ies . Since leas ing companies operating in Surat raise much of the i r cap ita l from formal capita l markets including commercial banks, thi s i s a case of funds being channeled from the formal to the informal c red i t market. We now turn to an examination o f the cred it experience o f sampled units .
28 .3 .6 Own funds, formal and informal borrowing: Funds availableto powerloom units and master weavers in the sample have been divided into own cap i ta l and borrowing from formal and informal markets . For both types o f uni t s in fo rm al c r e d i t has equal importance. For powerloom units , 49.09 per cent o f funds is from informal sources while 46.27 per cent o f master weaver's funds is
from thi s source. Within informal c r e d i t , trade c red i t i s more
important to powerloom units (See Table 28. 4) . Own cap i ta ls also
plays a s ign i f i ca n t ro le for both types of units contributing40.90 and 44.52 per cent resp ec t ive ly . Formal cred it has theleast importance to both type o f units. Table 28.4 shows thepattern o f borrowings lor both types o f uni ts . Informal credit c o n t r i b u t e s 82 per cent o f t o t a l borrowings in the case o fpowerloom units , while banks provide more c re d i t to master weavers
as compared to powerloom units (See Table 28. 5) . Turning to the number o f units f inanced, a l l units surveyed rece ive trade credit while about two th irds rece ive bank c r e d i t . Bank c re d i t i s mainly f o r working ca p i ta l . One master weaver had received a term loan.
28.3 .7 Formal s e c t o r f i na nc e was e n t i r e l y from banks f o r sampled un its whereas in fo rm al c r e d i t from other sources was e ither from friends and re la t iv e s or deposits from partners and d i r e c t o r s . For powerloom units , 83.82 per cent o f funds canes
from fr iends and r e la t ive s and only 16.18 per cent from d irectors and p a r tn e rs . For master weavers , 56. 18 per cent comes from f r i e n d s and r e l a t i v e s the ba lance coming from d i r e c t o r s and partners. The near absence o f borrowing from money lenders and shrof fs in Surat is not repl icated in other centres (Shanbhag, 1987 and Government o f India, Ministry o f Text i les , 1988).
404

28 .3 .3 Purpose, duration and cost of loans: Both formal andinformal sector credi t was mainly for working capi ta l f inance. Six units had, however, received long terra loans from the formal sector (forming 40 per cent o f formal c redi t to the total sample),
while only one unit received a long term loan from the informal
market. The term loan formed l e s s than 1 per cent o f t o t a l informal credi t in the sample. The average interest rate for formal credi t is 14.5b per cent whereas the average interest rate for informal credi t Is 12.03 per cent (Tables 28.6 and 28.7) .Powerloom units had marginally higher interest cost compared to master weavers (Table 28 . 8) . While powerlooms and master weavers gett ing credit from formal as well as informal market had lower
interest cost compared to units receiving only c redi t from the informal market (,See Table 28 . 8) , given that the average informal
interest rate is lower than that o f bank c r e d i t , the reversal of the f inding in terms o f interest cost i s o f in teres t . Since banks have stringent scrutiny procedures and c o l l a t e r a l requirements the d i f f erence in interest cost tends to suggest d i f f e r e n t i a l c redi t worthiness of borrowers having access to bank c r e d i t . This could not be d i r e c t l y confirmed though evidence presented below, on
credi t c l a s s i f i e d by firm s i ze , supports this hypothesis .
28.3.9 Table 28.8 reveals that powerloom units received trade credi t equal on average to 53 days o f sales as compared to master weavers which r e c e i v e d c r e d i t equal on average to 51 days o f sales . Even though there i s not very much d i f f erence between
these f igures, the pos i t i on is better lor powerloom units since they provide l e s s c r e d i t to t h e i r customers (Table 2 8 . 8 ) . Powerloom units gett ing only informal credi t received trade c red i t for longer than average which i s , o f course, a r e f l e c t i o n of their disadvantaged status since the interest rate for trade c redi t exceeds their return on cap i ta l even though i t is the low r e lat ive to market rates o f i n t e r e s t .
28.3.10 Reasons for approaching informal sector and respondents
opinion of bank credit f a c i l i t i e s : 70 per cent o f in f ormalborrowers c i ted the ready a v a i l a b i l i t y o f f inance and lack o f

borrowing f ormal i t i es as the main reasons for preferr ing informal c red i t . 12 per cent mentioned inadequacy o f bank f inance. Both cheapness and ready a v a i l a b i l i t y was mentioned by a further 12 per cent o f respondents and 6 per cent c i ted cheapness, inadequacy o f
bank c r e d i t , ready a v a i l a b i l i t y o f f inance and fewer formal i t ies
as their reasons for taking recourse to informal c red i t . Thus for 18 per cent o f respondents, informal credit: was not only
easily available but also cheap.
28.3.11 65 per cent o f units sampled had credi t f a c i l i t i e swith a bank. Also, 75 per cent o f formal borrowers were general ly sa t i s f i e d with their banks. Of the d i s s a t i s f i e d units , one third c i ted delay in service and inadequacy o f c redi t as the main reason for d i ss a t i s f a c t i o n . A further third were not s at i s f i e d because banks did not provide f inance for f ur th er expansion. The remaining 33 per cent did not mention any reason f o r t h e i r d i s s a t i s f a c t i o n though one powerloom unit f e l t that the bank was "not f a i r to i t " . Two units f e l t that more s at i s f ac to ry service could be obtained from ocher agenc i es such as p r i v a t e
moneylenders, shrof fs and cooperative banks. Two units received special services from the i r banks related to sales , marketing and purchase. Even this f ract i on is high compared to other sectors
sampled by us. F i n a l l y , seven uni ts f e l t that banks de lay processing loan appl i cat ions inordinately.
28.4 Uses of funds
28.4.1 Uses o f funds have been c l a s s i f i e d into four major
components: f ixed assets , inventor ies , loans and advances andinvestments. For powerloom units most funds are t ied up in f ixed
assets (43.24 per cent ) . They hold less inventories in re lat ive terms compared to master weavers (Table 28.9) .
28 .4 .2 Turning to the c l a s s i f i c a t i o n by borrowing status, both powerlooms and master weavers who were f u l l y dependent on
informal c r ed i t , devoted more resources to inventories compared to those un i ts r e c e i v i n g c r e d i t from both formal and informal
406

markets, but their investment in fixed assets was l e s s . This t i e s in well with the r e l a t i v e l y short d u ra t io n o f in form al loans observed .
28 .4 .3 The average master weaver held inventories equal to thr ice the number o f days o f sa les as compared to powerloom units .
28.4 .4 Cr edi t sal es by both master weavers and powerloom units t ie up about 25 per cent o f to ta l ca p i ta l (Table 28 . 9) , though the average period tends to be variable . The discount on cash sales averages 13.5 per cent and vari es between 12 per cent and 14.5 per c e n t .
28.5 Estimate of total volume of informal credit to powerloom activity
28.5 .1 The data in Table 28.1 can be used along with sample information to make a rough estimate o f to ta l informal cred it to the powerloom sector . Informal and formal cred it equalled 14.69 per cent and 4.03 per cent o f the to ta l value o f production of the
sampled f i r ms . Est i mates are c a l c u l a t e d by taki ng the same proportion of to ta l production for the whole of India. Informal
c red i t to the powerloom sector is thus estimated at Rs 914.61 crore and formal cred it at Rs 250.75 crore in 1986-87.
28.5 .2 These estimates cannot be viewed as more than order or magnitude estimates. Furthermore, thi s c re d i t is to both weaving units proper and master weavers. According to the Ministry o f Text i les Task Force, credi t requirements for the powerloom sector
are between Rs 500 c r o r e and Rs 700 c r o r e g i ven the c ur rent d i s t r i b u t i o n o f independent uni t s and uni t s under the master
weaver system. I f thi s is turned around and taken to be the current le ve l o f credit from a l l sources to the sector , then our estimate is seen to exceed the task fo rce estimate by about Rs 450 c r o re keeping in mind that we a lso in c lu d e master weavers.
2. The a c t u a l f i g u r e g i v e n by t he t a s k f o r c e i s Rs . 500 c r o r e . But the b a s i c f i g u r e s g i v e n by them can be used - f o l l o w i n g t h e i r m e t h o d o l o g y - to ge t the Rs 700 c r o r e f i g u r e .
4 0 7

Final ly , i t should be reca l led that the size o f the clean b i l l s market in Surat alone is thought to be between Rs 150 crore and Rs 600 crore , though processing units and wholesalers receive the bulk of th is c re d i t . Consequently this estimate is to be treated
with great caution allowing for up to a 1 0 0 per cent error margin - e s p e c ia l l y in view of the sampling b ias .
28-6 Efficiency and allocative impact of informal finance
28.6.1 Capital output and labour output r a t io s are calculated to assess the impact o f informal finance on e f f i c i e n c y . For both powerlooms and master weavers those receiving cred it from both formal and informal sectors are found to be more labour intensive
than firms relying only on informal c r e d i t . Also, master weavers receiving both formal and informal c r e d i t , have a higher return on s a le s than these r e l y i n g onl y on in form al c r e d i t . Si nc e , on average, units gett ing both formal and informal cred it were larger (18 looms) than units receiv ing only informal c re d i t ( 1 2 looms), economies o f sca le may provide the explanation for these findings
with r e s p e c t to both the c a p i t a l output r a t i o and the p r o f i t a b i l i t y s t a t i s t i c s . The d i f fe rence in the labour output rat io would then r e f l e c t the omission o f family labour from the f igures used to ca lcu la te labour output ra t ios . Of course, the ra t ios though not the p r o f i t a b i l i t y f igures are also consistent with d e l iberate choice o f c a p i ta l intensive techniques given lower informal interest rates. In e ither event, informal cred it would appear to be associated with le ss productive firms or f irms having r e la t iv e ly inappropriate production techniques in the sample of firms studied. Against th is however, the fact that informal c red i t is ava i lab le to f inance second hand machines must be kept in view. No firm conclusion can therefore be drawn.
28.7 Equity impact of informal finance
28.7.1 According to the opinions o f most persons with whom we have had d iscuss ions , the fo llowing conclusion appears warranted
subject to the caveat that tb evidence for the conclusion is not
0 8

survey based: i f at a l l smaller powerloom units rece ive c r e d i t , i t is from the informal sector . This and the reported importance o f c o l l a t e r a l fo r loans from commercial and cooperative banks tend to support the view that informal c red i t has a p os i t iv e impact on the resource pos i t ion o f r e l a t i v e l y disadvantaged units . The fact
that second-hand machines are financed by informal c red i t is also evidence that favours th is view.
28.8 Conclusions
28.8.1 This study o f informal cred it for powerlooms in Surat,while f a i r l y r ich in evidence v from d iscussion with knowledgeable p e rso n s , uses a b i ased sample o f r espondent s f o r s t a t i s t i c a l
analysis and v e r i f i c a t i o n . Nevertheless, it would appear that the ro le played by informal c red i t to the powerloom sector in i t s continued growth is c ru c ia l given the re la t ive paucity o f formal c r e d i t . It may t e n ta t ive ly be concluded that informal c red it reduces the gap in cred it a v a i l a b i l i t y to disadvantaged * u n i t s . Recommendations for reform of formal cred it norms are l imited to just two, given that the Task Force of the Ministry o f Text i les
has already made a detai led examination o f the s i tuat ion :
1. Credit d isb u rsa l: Target s in terms o f u n i t s wi th few\
(say, less than 8 ) looms should be se t .
2. Used machines: The formal sector should consider ways o f f in an c in g the purchase second hand machines in a d d i t i o n to f inancing their modernisation.
40 9

TABLE 28-1
Aggregate Powerloom Activity in India and Estimated Credit to the Powerloom Sector
1984-8 5 1985-86 1986-87
1. Aggregate powerloom production 5445 5886 6222(m i l l i o n metres)
2. Estimated aggregate value o f 5260 5886 6179powerloom production in India(Rs c rore )
3. Total formal cred it based on 11.22 13.56 9.12responses to Task Force Questionnaires (Rs crore )
4. Value based estimate o f working capita l - - 717requirements (Rs crore )
5. Estimate o f working cap ita l require- - 7 500ments based on to ta l number o f looms(Rs crore )
6 . Estimate o f formal c r e d i t : 219.43 257.21 250.75This study (Rs crore )
7. Estimate o f informal c r e d i t : This 799.87 864.65 914.61study (Rs crore )
Notes: 1. Rows l l ) , "(2), C3) and (5) from ReporT’ of^the^Task^Force^on Credit Requirements for Powerlooms, 1988.
2. Row (4) computed from figures given by the Task Force.3. Rows ( 6 ) and (7) based on ra t io s o f formal credit / in form al
c re d i t to value o f production in the sample ( r a t i o s are 0.0403 and 0.1469 r e s p e c t iv e ly ) .
410

TABLE 28.2
Production of Cloth and Salient Features of Powerloom Weaving Centre in India
(In Mil l ion Metres)
1984-85 1985-86 1986-87
i . Mill sector 3432 3376 3317
i i . Powerloom sector 5445 5886 6222
i i i . Handloom sector 3137 3236 3449
State Name o f centre Est imated loomage
Fibres Variet ies
I I 2
Gujarat Ahmedabad 16,000 Cotton, PC Poplin, long c loth sh ir t ings , sa re e s , sh i r t i ng s
Surat 1 ,75,000 Nylon, Poly- est er v iscose
Sarees, s h i r t i n g s , dress fa b r i c s , suit i.ngs
Maharashtra Bhiwand i 2,50,000 Cotton, PC, PV, po lyes ter
Mulls, cambrics, s u i t i n g , sh ir t in g s
Ichalkaranj i 45,000 Cotton Dhoties , cambric s , poplins
Malgaon 40,000 Cotton Dhoties, v o i l e s , poplins, cambrics
Tamil Nadu Pallipalayam 28,000 Cotton Shirt ings , check shirt ings
Uttar Pradesh Meerut 2 0 , 0 0 0 Cotton, PC Tapestry, s h i r t ings
Source: 1. Report o f the Task Force on CreditRequirements o f Powerlooms.
2. ’’Perspectives for Growth o f Powerloom,Power Processings and the Decentralised Sector" - Dr. V. Shanbhag, C.L.Centre for Management, ATIRA.
411

TABLE 28.3
P rofitability of Firms
pat7 pat7 epatT epatT-c a p i t a l income cap i ta l income
(All figures in percentage)
Powerloom units 28.01(23.41)
2.55(1 .95)
5.60(4 .68)
0.53(0 .43)
Master weavers 27.15(17.12)
5.54(3 .53)
5.43(3.42)
1.13 (0 .61)
Borrowing status wise
Powerloom units
Informal only 29. 15 (14.77)
2.64(1-41)
5.83(2.95)
0.55(0.32)
Both informal & formal 27.43(26.68)
2.50(1 .95)
5.49(5.34)
0.52(0.48)
Master weavers
Informal only 28.52(4.09)
4.54(1.28)
5.70(0.82)
0.96(0 .18)
Both informal & formal 26.24(21.80)
6 . 2 1
(4 .31)5.25
(4.36)1.24
(0 . 8 6 )
Notes: Figures in parentheses are standard deviat ions .PAT : Pro f i t a f t e r taxes.EPAT : Estimated p r o f i t a f te r taxes a f t e r adjusting for the imputed
value of family labour by consider ing only 2 0 % o f gross p r o f i t s as true p r o f i t s .
412

TABLE 28.4
Pattern of Borrowing
(All f igures in percentage o f to ta l borrowings)
Formalcred i t
Informal cred it
Tradec re d i t
Other Total
Powerloom units 18.04(24.61)
49. 97 (23.15)
31.99(19.96)
81.96
Master weavers 23.84(25.23)
28.02(27.82)
48. 15 (28.47)
76. 17
Powerloom units
Informal only - 53. 79 (24.76)
46.21(24.76)
1 0 0 . 0
Both formal & informal 27.06(25.78)
48.06(22.060
24.88(11.81)
72. 94
Master weavers
Informal only - 36.08(35.61)
63.92(35.69)
1 0 0 . 0
Both formal & informal 39. 73 (20.72)
22.64 (19. 20)
37.63(15.02)
60. 27
Note: Figures in parentheses are standard deviat ions .
413

TABLE 28.5
Sources of Funds
(All figures in percentage)
Owncapit al
Formal cred i t
Informal credit
& equity Tradecred it
Other Total
Powerloom units 40. 90 (28.19)
9. 95 (13.62)
30.91(17.81)
18. 18 (12.23)
49.09
Master weaver 44.52 (34.72)
10.07(9 .95)
17.08(20.59)
28. 19 (24.10)
46.27
Powerloom units
Informal only 42.00(16.45)
- 32.12 (16.82)
25.87(15.84)
57. 99
Both informal & formal 40.36( 2 0 . 2 1 )
14.92(4.29)
30.30 (18.25)
14.34(7.38)
44.64
Master weaver
Informal only 40.21(18.55)
- 17.80(22.47)
' 42.00 (30.63 )
59.80
Both informal & formal 47.41(31.91)
16.79(7.22)
16.61(19.21)
18.98(11.44)
35.59
Note: Figures in parentheses are standard deviat ion.
414
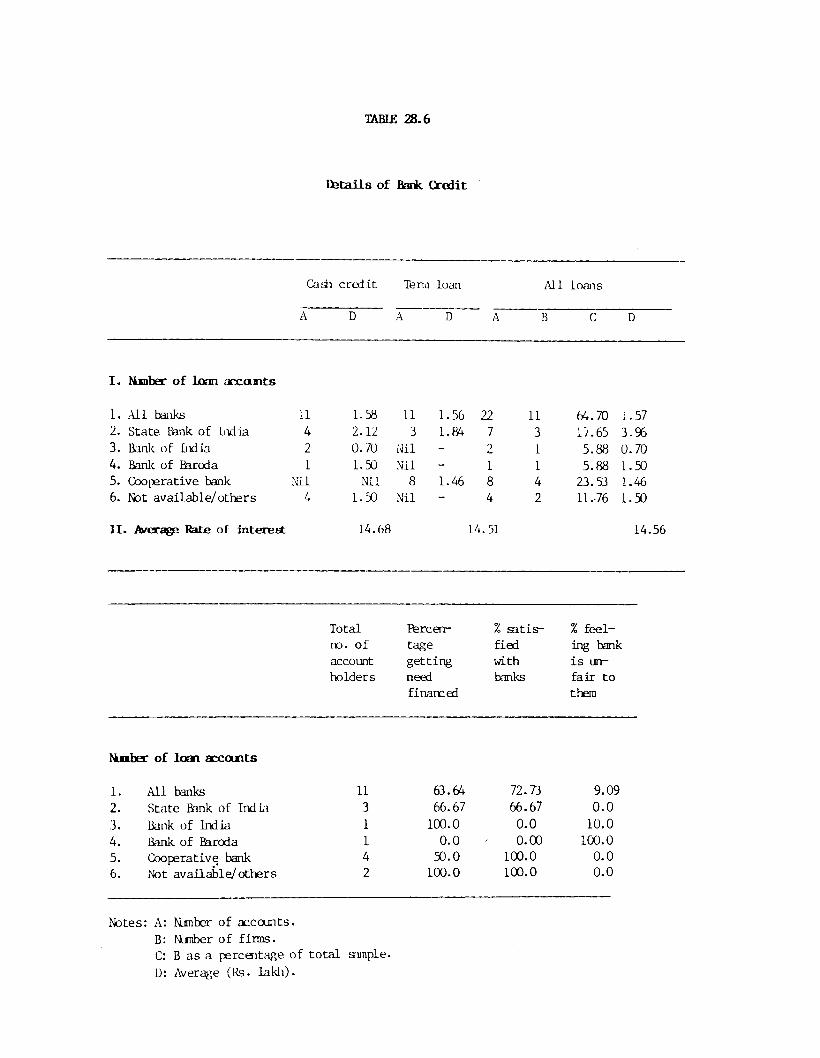
TABLE 28.6
Details of Bank Credit
Cadi credit Terra loan All loans
A D A D A B C D
I. Number of Loan accounts
1 . All banks 1 1 1.38 1 1 1.56 2 2 1 1 64.70 1.572 . State Bank of India 4 2 . 1 2 3 1.84 7 3 17.65 3.963. Bank of India 2 0.70 Nil - 2 1 5.88 0.704. Bank of Baroda 1 1.50 Nil - 1 1 5.88 1.505. Cooperative bank Nil Nil 8 1.46 8 4 23.53 1.466 . Not available/others 4 1.50 Nil - 4 2 11.-76 1.50
11 . Average Rate of interest 14.68 14.51 14.56
Total Rarcen- % satis % feelno. of tage fied ing bankaccount getting with is unholders need banks fair to
financed them
Number of loan accounts
1 . All banks 1 1 63.64 72.73 9.092 . State Bank of Ind in 3 66.67 66.67 0 . 0
3. Bank of India 1 1 0 0 . 0 0 . 0 1 0 . 0
4. Bank of Baroda 1 0 . 0 0 . 0 0 1 0 0 . 0
5. Cooperative bank 4 50.0 1 0 0 . 0 0 . 0
6 . Not available/others 2 1 0 0 . 0 1 0 0 . 0 0 . 0
Notes: A: Number of accounts.B: Nunber of firms.C: B as a percentage of total sample. D: Average (Rs. lakh).

TABLE 28.7
Salient Features of Informal Credit Received by the Powerloom Industry
Fr lends and rel a t iv e s
Partners d i re c to rs & shareholders
Multanisandshroffs
Allinformalsources
1 . Number o f firms 1 2 6 1 17
2 . Average rate o f interest (%)
1 2 . 0 0 Nil 16.00 12.03
3. Percentage o f short term loans
1 0 0 . 0 1 0 0 . 0 - 95
4*. Percentage o f long term loan
- - 1 0 0 '. 0 5
5. Average loan amount (Rs lakh)
1.17 1.08 0.15 1.09
6 . Percentage o f loans for working c ap i ta l f inance
92 1 0 0 . 0 1 0 0 . 0 95
416

TABLE 28-8
Interest Cost of Borrowing and Duration ofTrade Credit Received & Given
Interest Trade Tradecost (%) cred it c red it
received given ( in days) ( in days)
A: By Group
Powerloom units 14.79 53,58 40.03(15.12) (42.110 (28.71)
Master weavers 13.52 51.0 56.00( 8. 11) ( 0.00) (46.47)
B: By Borrowing Status
Powe r lo om units
Informal borrowers 18.78 73.50 43.50(18.03) (57.10) (32.14)
Formal & informal borrowers 12.79 43.63 38.25(12. 97) (27.05) (26.57)
Master Weavers
Informal borrowers 17.64 51.00 33.05(10.75) (0 .00) (18 .0)
Formal & informal borrowers 10.77 51.00 72.33(3.71) (0 .00) (52.58)
Note: Figures in parentheses are standard deviat ions .
417

TABLE 28.9
Uses of Funds
A: By Group
Powerloom units
Master weavers
By Borrowing Status
Fixed Invento-Cash assets r ies
Loans & Invest- Inventory advances raent holding in
days
(Percentage of total assets)
43.34 23.90( 24 . 22) ( 15 . 36)
23.00 38.88( 25. 56) ( 32 . 32)
4.82 23.98 3.76(6.09) (17.46) (6.33)
6.09 27.36 1.96(4.95) (16.36) (1 .45)
23.19 (13.36)
67.46(73.45)
B: Powerloom units
Informal only 37. 97 27. 28( 36 . 83) ( 15 . 65)
Both informal & formal 46.02 22.21(13 .42 ) (1 4 .9 4 )
8.16 24.40 2.19 27.00( 8. 96) (23.21) (4.22) (15.54)
3.16 23.78 4.54 21.28(2.67) (13.71) (7 .03) (11.67)
Master weavers
Informal only 1.40 68.49( 1 . 61) (11.16)
Both informal & formal 40.73 19.13(21 .65 ) (26 .14 )
10.04 18.74 0.80 133.53(4.05) (14.55) (0 .92) (68.17)
3.45 33.55 2.73 23.42(3.53) (14.73) (1 .21) (32.32)
Note: Figures in parentheses are standard deviat i ons .
418

TABLE 28.10
Efficiency Indicators for Powerloom Units and Master Ueavers
A: By group
Powerloom units
Master weavers
B: By borrowing status
Powerloom units
Informal only
Formal and informal
Master weavers
Informal only
Formal and informal
Capital Labour Return onoutput output sales (%)r a t i o ra t io
0 . 106
0.087
0. 130
0.096
0. 151
0.074
0. 41
0.35
0.36
0.43
0. 24
0.37
2.55
5.54
2.64
2.50
4.54
6. 21
419
CHAPTER 29
29.1 Size of sector
29.1 .1 Investment in road construction is undertaken almost en t i re ly by the Central and State governments. Contractors tender for work contracts and winning bidders execute the contracts as per the terms o f the contract. Table 29.1 (Row 1) provides deta i ls
o f the total expenditure on roads and bridges for the most recent years for which data were avai lab le . The table (Rows 2 and 3) also provides these d e t a i l s for surveyed regions.
29.2 Description of area surveyed and sample
29.2 .1 Area surveyed: Firms o f contractors in three major c i t i e sof western Uttar Pradesh and in Delhi were surveyed. Table 29.2
provides some d e scr ip t ive feature o f these c i t i e s and the surrounding areas.
2 9 .2 .2 Sample characteristics: Contractors are c l a s s i f i e d intofour groups, A, B, C and D, by the Central Public Works Department according to the size o f contracts for which they are e l i g i b l e to bid. Category A firms include the largest contractors . The c lass
i f i c a t i o n is done by taking into account the c o n t r a c to r ' s total
assets , a bank solvency c e r t i f i c a t e and the past contract record. Firms in one category may apply for upgradation to the next higher category af t er accumulating s u f f i c i e n t assets and establ ish ing a good contract execution record. Table 29.3 gives the d is t r ibu t ion of the randomly selected sample firms. Despite a sample de s i g n in which c e l l - w i s e samples were p r o p o r t i o n a l to the p o p u la t io n t o t a l (wi th extra f i rms inc luded in case o f non response by i n i t i a l l y selected f i rms) , due to non-cooperation by
ROAD CONSTRUCTION IN DELHI AND WESTERN UTTAR PRADESH
420

some firms or other d i f f i c u l t i e s in the actual sample. Delhi i s marginally under-represented, with the incidence o f non-response is inverse ly corre la ted with firm s i ze . Since, in our analys is, no s ig n i f i c a n t d i f f e re n ce s were found between d i f f e r e n t centres in the sample, only aggregate estimates o f c re d i t fo r the sector as a
whole should be a f fe c te d by t hi s shortcoming.
29.2.3 55 per cent o f the sample f irms were so le propr ietor ships. Of the remainder, 2 category A firms (5.7 per cent) were private l imited companies and the rest were partnerships with two to eight partners. The average f ina was 13 years old while the oldest was 40 years o ld . The newest was only 2 years o ld . Firms engaged'only in road construction with four exceptions. Of these four, two also undertook bridge bu i ld ing , one was a lso a supplier o f raw materials for road construct ion to the Public Works Department and one had d i v e r s i f i e d into the unrelated area o f h ire purchase o f consumer durables. One firm (excluded from sample) had not been f u n c t i o n i n g f o r 3 ye ar s due to la c k o f f i na nc e and another was in the process of winding up its business. Smaller firms were, in general, pess im ist ic about their future prospects
in the se c t o r whi l e l a r ge r f i rms were s a t i s f i e d with t h e i r prospects or were actual ly planning further purchases o f cap ita l
equipment.
29.2.4 The average turnover for the most recent year o f operation . i s given in Table 29.4.^ For the sample as a whole, the average annual value of contracts executed was Rs . 13.13 lakh. The disaggregated f igures reveal that the turnover o f firms in any
c a t e go r y i s roughl y doubl e that o f f i rms in the i mmedi ate l y preceding category. Wide var ia t ions in turnover are, however,
v i s i b l e on further disaggregation. Firms in category D in Uttar Pradesh claimed that they were unable to bid su cce ss fu l ly for con-
1. Due to i n c o m p l e t e r e s p o n s e s e v e n among c o o p e r a t i n g f i r m s , a v e r a g e s , where g i v e n , may not p e r t a i n to a l l f i r m s . F i g u r e s g i v e n are a v e r a g e s f o r f i r m s wi t h u s a b l e r e s p o n s e s i n the a p p r o p r i a t e g r o u p .
42 I

t rac ts against larger firms with a better stock o f equipment and one firm, in category C in Dehradun, claimed to be winding up i t s operations on this account. The greater " capita l intensity" o f large firms i s r e f l e c te d in Table 29.5, which g ives crude estimates o f cap ita l - labour r a t io s , p a r t i a l l y support this claim.
It may be added that s e v e r a l smaller f i rms did not own any machinery but executed contracts with equipment hired from the l o ca l publ ic works departments.
29. 2. 5 The return on own capita l employed and on sales (Table 29 . 6) shows that f i rms in c a t e g o r y D may in f a c t be l e s s p r o f i ta b le than larger firms. Though the rat io o f their p ro f i t af ter tax to sales is the highest o f the four categor ies (column
2 ) the return on own cap ita l employed is less than that o f firms in categories B and C (column 2) . Since p r o f i t s a f t er tax also include an im pl ic i t wage component for small f irms, as proprietors or partners also work for the firm, columns (3) and (4) are based on the assumption that 80 per cent o f d is tr ibuted p r o f i t s cons t i t ut e wage income. With th is assumption the return on cap i ta l for category D firms f a l l s to below the interest rate on two year commercial bank fixed deposits . This is despite the fact that their p r o f i t margin (return on income: column 4) is the highest. The d i f fe rence in estimated p r o f i t a b i l i t y is s t a t i s t i c a l l y s ig
n i f i can t as compared to B and C category f irms while the mean estimated p r o f i t a b i l i t y for A category firms is i t s e l f not s ig n i f i cant due, p oss ib ly , to the r e la t iv e overestimation o f wage income for these large firms.
2. From T a b l e 2 9 . 6 o n w a r d s , s a mp l e s t a n d a r d d e v i a t i o n s a r e g i v e n . The mean f o r t he ent i r e sampl e may be t ake n as s i g n i f i c a n t at t he 90 per c e n t l e v e l i f i t i s at l e a s t 27 per c e n t o f t he sampl e s t a n d a r d d e v i a t i o n . L i k e w i s e , f o r i n d i v i d u a l c i t i e s , c a t e g o r i e s o r b o r r o w i n g s t a t u s e s t he mean s h o u l d be at l e a s t 77 p e r c e n t o f t h e g r o u p s t a n d a r d d e v i a t i o n . T h e s e f i g u r e s a r e b a s e d on one t a i l e d t - t e s t s f o r t h e mi ni mum g r o u p - w i s e s a m p l e s i z e t a k i n g i n t o a c c o u n t m i s s i n g v a l u e s .
422
29.3 Sources of funds and salient features of sources
29 .3 .1 Own funds, formal and informal borrowings: All firms for which information is ava i lab le received trade c redi t - For large (A and B category) f irms, a part o f ' t r a d e c r e d i t ' i s sometimes in
the form o f advances for works contracts from public works departments. However, advances are given only in exceptional cases and
small contractors do not receive advances. Instead, they arc paid in stages on completion o f s pe c i f i c portions o f contracted work. The breakup between s u p p l ie r ' s trade c red i t and advances from the government is not available for any firm. We therefore treat a l l trade cred it as informal cred it since the bias is unl ikely to be
large. Clearly , s ince government advances go only to large firms, su pp l ier 's trade credi t helps small firms more than our resu lts
below suggest Besides, trade c r e d i t , 27 per cent o f the sample r e c e iv e d formal c r e d i t in one form or anot her , 24 per cent received informal cred it and an addit ional 2 1 per cent received c r e d i t from both i nf ormal and f ormal c hanne l s . 27 p£r centreceived only trade c r e d i t . Of those who received only trade c r e d i t , 1 2 per cent were unaware o f bank cred it f a c i l i t i e s or had been turned down by banks and a further 9 per cent were uninterested in bank c r e d i t . Table 29.7 gives d e t a i l s o f the average percentages o f to ta l a s s e t s / l i a b i l i t i e s from d i f f e r e n t sources. The average firms in the sample r e l i e s mainly on own funds (61.54 per cent) with informal c r e d i t , contr ibuting another 32.15 per cent to their funds. Of this however the bulk was trade c red i t which accounted for a quarter o f the funds available to them. Thus bank loans and other formal c red i t contributed only 6.31 percent of the total funds. The tota l c redi t made available by for mal sources re ferred to here does not include bank guarantees.
3 . W h i l e we h a v e q u a l i t a t i v e e v i d e n c e t h a t 2f i r m s in D e l h i we r e b a nk h o r r o w e r s , t h e i r f i n a n c i a l s t a t e m e n t s were not made a v a i l a b l e .Thus, f i g u r e s f o r own and i n f o r m a l l y bo r r o we df u n d s f o r De l h i and a l l f i r m s a r e b i a s e d upward. Ho we v e r , i f D e l h i i s e x c l u d e d f rom t hes a m p l e , f i g u r e s f o r the r e m a i n i n g f i r m s a r eh i g h e r t han t h o s e g i v e n f o r " a l l f i r m s inT a b l e 7.
42 3

Bank guarantees were 7.8 times as large as to ta l d irect lending mainly on account of a bank guarantee o f Rs. 3 crore enjoyed by one category A f irm in Delhi (see Table 29.8) . When this is excluded from to ta l bank guarantees, to ta l accommodation v ia bank
guarantees reduces to 87 per cent o f other bank c r e d i t . Neverthel e s s , when guarantees are taken i nto ac count , formal c r e d i t
emerges as a more important source o f f i nanc e than i nf ormal finance excluding trade c r e d i t .
29.3.2 The c a t e g o r y - w i s e f i g u r e s in Table 29.7 reveal no marked d i f fe re n ce s in re l iance on trade c r e d i t . However, own capital is s i g n i f i c a n t l y more important as a source o f funds for smaller f irms. Correspondingly, both banks and informal lenders serve large firms more than small firms though the pattern is much l e s s marked for in form al cr .ed i t . Furthermore, the extent o f
rel iance o f small firms on informal finance is much larger (at4.17 per cent excluding trade c red it and 29.21 per cent including trade cred it fo r firms in category D) than their re l iance on for mal c re d i t . A much c learer picture o f thi s pattern is to be had in Table 29.10 which gives the break up by borrowing status.
29.3 .3 Own funds employed by firms gett ing both formal and informal c re d i t is s i g n i f i c a n t l y lower (at 49 per cent) than for those relying e ither s o le ly on formal f inance (62 per cent) or informal f inance (61 per cent ) . Correspondingly (see Table 29.10) firms borrowing from both sectors are marginally less dependent on trade c r e d i t .
29 .3 .4 Except in one case, formal sector f inance meant commerc i a l bank finance. The exception was a category firm A in Agra which had received a term loan from the Public Works Department for the purchase o f machinery. However, two f i rms were contemplating approaching the Public Works Department or a State f inanc ia l in s t i tu t i o n for term loans. Informal finance was mainly from fr iends and re la t iv e s (80 per cent o f informal borrowers) or from partners. Only one firm, a C category firm in Agra, had ap
proached an ind igen ous banker f o r a l o an . Most B, C, and D
424

category firms were aware o f the a v a i l a b i l i t y and cost o f informal loans. Some claimed that many other contractors borrowed from indigenous bankers, though, with the exception discussed, the sample studied did not reveal any evidence o f t h i s .
29.3.5 One component o f funds not s e p a r a t e l y r e p o r t e d in financing f igures o f road construct ion firms is known to be sales by them o f e x c e s s cement , bitumen and s t e e l s u p p l ie d by the government against work orders. This i s reported to be a major source o f funds for the contractors and has been reported by some interviewees to equal 10-15 per cent o f the value o f the material supplied or about 5-7 per cent o f the value o f the work order. However, no d e t a i l s o f thi s source were revealed by sampled firms.
This may be a fa c to r explaining the large owned funds p os i t ion o f c o n t r a c to r s .
29 .3 .6 Purpose, duration and cost o f loans : The bulk o f loans from both formal and informal sectors was for working cap ita l finance. Three formal borrowers had received term loans (two from banks, one from the public works department) though th is made up a small f ra ct ion o f t o ta l formal f inance. While only one informal borrower had received a long term loan (from f r i e n d s / r e la t iv e s ) with an e x p l i c i t pay back period, most claimed to have received loans which, while formally repayable on demand, were outstanding for over one year ( in one case for 4 years) and were expected to continue to be ava i lab le . I f these loans are treated as long term loans, then the percentage o f long term loans from the informal sector is seen to . exceed that from the formal sector (See Table29.8 and 29 . 9 ) . The average cost i s lower than that from the fo r mal sector (15.89 per cent versus 16.20 per cent : see Tables 29.8 and 29 .9 ) . However, th is was due to two interest free loans from friends and r e la t iv e s in the sample. The median cost o f c r e d i t in the informal sector was 18 per cent as against 16.5 per cent from commercial banks. The cost o f borrowings from informal f in an c ie rs was 24 per cent fo r the one case in the sample and also according to information gathered from other respondents. These cost f igures are obtained as a weighted average computed over a l l loans for
425

which information was ava i lab le . An a lternat ive figure is the ra t io o f interest paid over the year to outstanding loans at the
end of the year. By this method (Table 29.11) the d i f fe rence in borrowing cost is even more s tr ik ing . However, there are obvious timing d i f f i c u l t i e s with this method. Also, these ca lcu lat ions exclude bank guarantees. When the charges on bank guarantees are considered, the average bank cost f a l l s to 2.5 per cent There was no evidence that the cost o f borrowing fluctuated in the informal sector over time. However, s i gni f i cant i nt e r - c i t y and inter-group d i f f e re n ce s in the interest average cost o f borrowing existed (see Table 29.11) . The most s tr ik ing finding is that firms borrowing from both sectors had the lowest cost of funds followed
by informal borrowers.
29.3.7 Turning, f i na l l y , to trade c r ed i t , Table 29.11 reveals that trade c red i t i s received on average for f ive weeks. Also, ( i ) category A f irms receive c red i t for more than twice the durat ion of firms in category D; ( i i ) the number of days o f c redi t is monotonically increasing with firm si ze; ( i i i ) f irms gett ing both formal and informal credit also received credit fo r longer than average; ( i v) older firms a lso received trade c red it for longer periods than newer firms ( the simple co r re la t io n o f date o f establishment with days o f credit received is -64 per cent ) ; and (v) formal borrowers received less than average trade c redi t . While not much inforaiation could be obtained on the im pl ic i t interest rate on trade c r e d i t , two firms in Agra claimed discounts for cash purchases o f 8 per cent -10 per cent . This however appears to be an exaggeration since the annualised cost o f such
c r e d i t , given an average borrowing period of 41 days ( from Table 29.11) would then be between 97 per cent and 133 per cent. Trade
credit would then be more expensive than 90 day loans from in-
4. S i n c e a bank g u a r a n t e e l e a d s to a p ar t o f theowners f und s b e i n g l e f t f r e e f o r o t h e r u s e s ,in t erms o f f o r e g o n e o p p o r t u n i t i e s i t i s a p p r o p r i a t e t o c l u b bank g u a r a n t e e s wi t h o t h e r f o r m a l l o a n s e v e n t h o u g h no mo n e y c h a n g e s h a n d s . M a r g i n and c o l l a t e r a l i s s u e s a r e t r e a t e d l a t e r .

digenous bankers!
29 .3 .8 Collateral, security and margin: Informal c red i t for the sample was, without exception, unsecured and without any margin requirement. However, borrowers in a l l cases had personal and/or long standing assoc ia t ions with lenders which may be looked upon
as impl i c i t secur i ty . Likewise, the fact that o lder , establ ished firms received more trade credit than newer firms is a manifesta
t i on of the same phenomenon. The average margin for bank cred it was 25 per cent for both guarantees and other cred it (Table 29. 8) . This varied between 0 per cent and 100 per cent . In the la t t e r case, o f course, net credi t extended was zero. In at least two
other cases, loans were given against bank fixed deposit rece ip ts for larger amounts than was l ent , in which case the bank only
acted as a source o f emergency loans which were more than 1 0 0 per cent secured. Of the remaining bank loans for which information
was avai lable (other than guarantees), 46 per cent were secured by hypothecation of s t o c k s o f raw materia ls , book debt or ( in one case) motor v e h ic le s . In addit ion , in the case of one term loan, secondary col. l a t e r a l by way o f a laud mor tgage was taken. Three firms claimed to have been unable to obtain loans due to lack o f
c o l l a t e r a l , and two firms were refused enhancement o f th e ir credit
l imit for the same reason. F inally , one firm was asked to provide 1 0 0 per cent margin for the issue of a bank guarantee.
29.3 .9 A vailability of credit in relation to working capital
employed: A str ik ing feature of the cred it picture in thi s sectoris that f u l ly 58_per cent o f f irms are net providers o f c r e d i t . ^The corresponding f igures for formal borrowers, informal bor
rowers, borrowers from both sectors and those who re ly s o l e ly on trade finance are 75 per cent , 17 per cent , 38 per cent and 71 per cent r esp ec t ive ly . Figures for f irm-wise averages by the three groupings being considered are to be found in Table 29.12 where
5. Net c r e d i t r e c e i v e d i s c a l c u l a t e d f r o m b a l a n c e s h e e t s as t o t a l b o r r o w i n g s _|>_l_us t r a d e dues l e s s l o a n s and a d v a n c e s and o t h e r d e b t o r b a l a n c e s .
42 7

columns (2) and (3) give net c red i t received and number o f days o f sa les covered by net cred it received averaged across firms in d i f ferent groups. Column (2) reveals that while the sector as a whole i s a net rece iver o f c r e d i t , on average th is c re d i t is equal to only 32 days turnover (though th is f igure is not s t a t i s t i c a l l y
s i g n i f i c a n t ) . The standard deviat ions in both columns (2) and
( 3 ) , being large , show that the experience is quite varied. An ordinary least squares regression o f the number o f days o f c redit received showed the fo llowing :
Net c re d i t in days = -82.87 + 67.85(IB) 4- 65.85(FB)(1.815) (2.802) (2.932)
+ 109.90(BB) + 56.28 (A category)(4.140) (3 .429)
+ 6.8468 ( Interest c os t ) - 1.741 (own c a p i t a l ) (5 .210) (4.674)
t - s t a t i s t i c s in parentheses.
Number o f observations : 62; Regression F s t a t i s t i c : 17.2549, RSquared: 0.6531; R-bar-squared: 0.6152; (Heteroscedast ic i ty , and m is - s p e c i f i c a t io n (Lagrange m ult ip l ie r test for residual ser ia l co r re la t io n ; Ramsey RESET test using squares o f f i t t e d values) re jected at the 10 per cent l e v e l ) . Own cap ita l = own cap ita l to to ta l equity r a t io . IB: Informal borrower; FB: formal borrower;BB: borrower from both sectors . (Dummy Variables) .
29.3.10 The regression confirms the observation that only those obtaining credit from both sectors and A category firms who are also borrowers are net rece ivers o f c red i t as a general rule . In re la t ion to funds used for extending c red i t (by way o f unpaid b i l l s or security depos its ) or in holding inventories , the average sh o r t fa l l was for 124 days (Table 29 .12) . Furthermore, the worst a f fe c ted firms were the smallest (D category) f irms. In f ac t , the sh o r t fa l l i s re lated inverse ly to firm s ize . F inally , i t may be added that the average period for which trade c red i t is given exceeds that for which trade c red i t i s received (Table 29 .11) , the
4 28

s ituat ion being worst for small f irms. This further strengthens the f indings o f th is sect ion .
29.3.11 Before leaving this se c t ion , i t must be re ca l led that the absolute p o s i t io n o f contractors may not be as bad as has been made out due to cash inflows from the sale o f cement and s tee l
mentioned ear l i e r . However, the re la t ive pos it ions o f small and large firms are l i k e l y to be as indicated
29.3.12 Reasons for approaching informal sector and respondentsopinion of bank credit fa c i l it ie s : 65 per cent o f informal borrowers c i ted in formality as one reason for approaching informal lenders. 35 per cent c i ted ready a v a i l a b i l i t y o f funds (without c o l la t e r a l requirements). 29 per cent c i ted inadequacy o f bank
cred it and 1 2 per cent c i ted lower interest rates .^
29.3.13 Since a l l firms surveyed were at least deposit accountholders with banks, responses were sought from a l l f irms as to the ir evaluation o f banking f a c i l i t i e s . 58 per cent o f the sample f e l t that bank finance was not commensurate with the ir needs. Among borrowers, th is f igure was 57 per cent . 52 per cent o f firms were d i s s a t i s f i e d with the ir bank branch managers. 1 0 per cent c i ted tardy bank serv ice as the reason for d i s s a t i s fa c t i o n and 23 per cent c i ted inadequate cred it a v a i l a b i l i t y . Only oneborrower had r e c e i v e d any s p e c i a l s e r v i c e or a d v i c e from hi s branch manager, and t h i s too on a matter unre la ted to the business.^ 17 per cent o f f irms, and not n ecessar i ly the same firms that had been refused c red it f a c i l i t i e s or c red i t enhancement, f e l t that they had received unfair treatment from their
bankers re la t ive to other customers. As shown in Table 29 .8 , o f
the banks with the greatest market share among sample firms, the most s a t i s fa c t o r y performance was by the Punjab and Sind Bank. 4
6 . P e r c e n t a g e s add up t o o v e r 100 per c e n t s i n c e some r e s p o n d e n t s c i t e d more than one r e a s o n .
7. The b o r r o w e r e x p r e s s e d c o m p l e t e s a t i s f a c t i o nwi t h h i s b a n k e r . The p u b l i c s e c t o r bank i nq u e s t i o n was t he Punj ab and Sind Bank.
429

banks shared the bottom rank in serving the needs o f c l i e n t s and the worst branch managers were those o f the State Bank of India. While evaluating these f indings , the small sample size should be kept in view.
29.3.14 Overdues and penalties: In only one case did any respondent admit to having an overdue loan and even thi s was claimed to
be temporary. The loan was from a commercial bank. Where f ie ld s t a f f performed cross-checks with banks, no contradictory evidence was forthcoming. No information as to penalt ies for overdue loans from the informal sector was ava i lab le .
29.4 Uses of funds
29.4.1 Table 29.13 gives d e t a i l s o f use o f funds by contractors in the sample. Use of funds has been divided into 4 groups: f ixed assets , inventories , loans and advances and investments. The most s tr ik ing feature o f the use o f funds available to firms in this sector is that they lend heavily to the Government by way o f forced loans ( secur i t y deposits and unpaid b i l l s ) . More than
43 per cent o f the ir funds are t ied up in this fashion. Therefore , given the meagre net credit received by these firms, i t can
be said that , de fa c to , contractors act as intermediaries (or supp l i e r s on the ir own account) o f loans to the Government sector . Besides const i tu t ing a c lear case o f funds flowing from the in for mal sector to the formal sector , this also provides a case o f where the Government uses i t s monopsony p os i t ion to , in e f f e c t , in ter lo ck loan and goods markets ( the ' g o o d ' in th is case is the
serv ice o f road construct ion c o n t r a c to r s ) . I f , to th is , i s added the fact that banks found to be lending to the sector are a l l public sector banks, then, s ince bank leading is not a very major source o f f inance to th is sector , a bleak picture emerges. It a l most appears as i f d i f f e r ent arms o f the Government come togetherto f o r c i b l y extract cred it from firms in the sector .
29.4.2 However, not a l l firms are equally a f fe c te d . The rat ioo f investments to assets is inverse ly related to firm category
showing that large firms have a le s s constrained funds p os i t ion . Since such investments - almost e n t i r e ly in Government secu r i t ie s in order to benef i t from saving incentives - reduce the tax burden o f firms (and further add to lending to the Government by the sec
tor bringing the to ta l to almost two-thirds o f t o ta l assets ) and
increase the ir p r o f i t a b i l i t y , the i n a b i l i t y o f small firms to un
dertake greater investments adds weight to their claim of beingo
squeezed out o f the sector .
29.4 .3 Turning to the c l a s s i f i c a t i o n by borrowing status, two features stand out : f irms rece iv ing cred it from both formal and informal sectors hold more inventories and invest more o f their funds in other assets than any other group o f f irms. This could
be taken to suggest that a p o r t i o n o f the i nv e n t o r y was f o r speculative purposes and that the quantum o f c red it received by
these firms was more than the minimum comfortable le v e l required for the ir operat ions . Caution must be used in accepting thi s hypothesis s ince , equally , the large inventories and investments may simply be the e f f i c i e n t l e v e l s (given the tax code and supply
9delays) made poss ib le by their access to s u f f i c i e n t c r e d i t . The second feature which stands out is the unusually low le v e l o f in
vestments by informal borrowers. One explanation poss ib le is that f irms who borrow from informal markets have r e la t iv e ly poor i n f o r
mation not just about bank finance but also about other lega l and in s t i tu t io n a l features. This hypothesis , however, could not be v e r i f i e d .
29.4 .4 F ina l ly , the r e la t io n between inventories and sales may be assessed. While the average firm held 75 days o f inventor ies , this was highly var iab le and showed no pattern for any group o f
8 . A r a t i o o f two s t o c k s r e a l l y c a n n o t r e f l e c tt he f l o w o f f r e s h i n v e s t m e n t s . The g r o wt h r a t e i n i n v e s t m e n t s as shown d u r i n g the twoy e a r s f o r w h i c h d a t a was a v a i l a b l e wasr o u g h l y t he same f o r a l l c a t e g o r i e s o f f i r m s .
9. F o r f u r t h e r d i s c u s s i o n s e e s e c t i o n 2 9 . 7b e l o w .

f irms. It may be worth mentioning that much o f the inventory cons i s t s o f food items to feed hired labour. The only other feature that is worth mentioning is that firms receiv ing cred it from for mal and informal sources had the highest average inventory l e v e l
(with however a high standard devi at i on) . Thus no corroboration
or contrad ict ion o f hypotheses outl ined in paragraph 4.3 is to be
found.
29.5 Impact of bank regulations and the government sector on credit availability
29.5.1 As d e s c r i b e d above , the combined e f f e c t o f var i ous
government arms - bank, income tax author i t ies and c i v i l works
author i t ies - is to turn road construction contractors into in
voluntary c re d i to rs to the government. No part icu lar impact on informal sector c red i t a v a i l a b i l i t y to road construction contractors can be discerned.
29.6 Estimate of the total volume of informal credit to road construction activity
29.6.1 The f igures in Table 29.1 can be used to derive crude
estimates as to to ta l s ize o f informal and formal c re d i t to road construct ion . However, these estimates should be treated with extreme caution, e s p e c ia l l y the estimates at the a l l India le v e l . Since formal and informal cred it is 2.91 per cent and 10.07 per cent resp ec t ive ly of the t o ta l value o f production o f sampled f i r m s , ^ estimates are arrived at by taking the same proportions o f t o ta l production for U.P. and Delhi and for the whole of India. On this basis informal c red i t is estimated to be o f the order of
Rs. 25 crore in Delhi and U.P. and Rs. 454 crore at the a l l India l e v e l as compared to formal c r e d i t o f Rs . 7.11 c r o r e and Rs .131.04 c r o r e respec t ive ly . Correspondingly, estimates can be obtained for the t o ta l funds outstanding with the government sector , both in gross terms and net o f bank c r e d i t . From Table 29.1 these f igures can be seen to be Rs 593.12 crore and Rs 440.65 crore
1 0 . U n l i k e t h e t a b l e s , t h e s e f i g u r e s a r e t he r a t i o s o f t o t a l s a c r o s s f i r m s r a t h e r t h a n
v e r a g e f i r m - w i s e r a t i o s .

respec t ive ly at the a l l India le v e l and Rs 32.16 crore and Rs 21.21 crore respec t ive ly for Delhi and Uttar Pradesh.
29.7 Efficiency and allocative impact of the informal finance
29.7 .1 No physical ind icator o f output being ava i lab le , valueo f production has been used as the ind ica tor o f production. I f cap ita l output and labour output r a t io s are examined to assess the impact o f informal finance on e f f i c i e n c y , the tentat ive conclusion which emerges i s that such f i n a n c e , d e s p i t e i t s h i g he r c o s t , f inances r e l a t i v e l y i n e f f i c i e n t f irms. Table 29.14 gives theserat ios for f irms by borrowing status. Firms rely ing s o le ly on
formal finance, i t can be seen, have lower rat ios than a l l other
firms. No c lear ranking of other categor ies o f f irms can be given.
Since these r a t io s show a weak pos i t i ve c o r re la t io n (16.36 per cent) the presumption is that firms with higher r a t io s are i n e f f i cient even a f t e r c a p i ta l - labour subst i tut ion i s accounted for unless sca le economies are re f l e c te d in the trend. As against t h i s return on s a l e s has e x a c t l y the o p p o s i t e rank order as labour-output r at i o . The finding that the average bank interest cost (on balance sheet borrowing) exceeds informal sector interest takes on s ign i f i can ce in this context .
29.8 Complementarity/substitutability of formal andinformal finance
29.8.1 In one respect , bank f inance has no substi tute even though i t i s not avai lable to the bulk o f f irms. This is in the giving of bank guarantees, since guarantees by other part i es are not acceptable for earnest money and secur i ty deposits . Likewise,
the near uniformity o f f igures for trade c red it (Table 29.7) and thei r low standard deviations suggest that trade c redi t is not eas i ly substi tuted by other means o f f inance. With these two exc e p t i o n s , i nf ormal f in a n ce appears to be, by and l a r g e , subs t i tu tab le for bank finance insofar as the purpose o f borrowing is taken as the c r i t e r i o n .
29.8 .2 The d ist inguishing features o f informal c red i t - speed,
j,
in formality and absence o f c o l l a t e r a l requirements - are normally c i t e d as reasons for th e ir complementarity to bank funds. Informal finance is then seen as ideal for short term and unforeseen financ i a l needs. However, given pre -ex is t ing overdraft f a c i l i t i e s with
banks - which many sampled firms had - this need not be the case. Thus, no overal l conclusion can be drawn on the re la t ive posit ion
o f these c red i t sources.
29.9 Overall assessment of credit availability and distinguishing features
29.9.1 The p icture that emerges o f th is sector is that o f an archetypical f in a n c ia l l y repressed sector rely ing primarily on
own funds and facing a formal sector c red it constraint as postulated by Shaw (1973) or McKinnon (1973). There i s , however, one
s ign i f i cant d i f f e r e n c e between the McKinnon - Shaw model and firms in the sector . Since firms in the sector operate in a monopsony market (with the government as the sole buyer), firms- are not simply constrained, on average, to operate within th e ir own funds
constra ints but are ' f o r c e d ' to extend cred it to the government in t ied contracts for purchase o f serv ices . Thus, i t i s not simply
the banking sector that contr ibutes to the f inanc ia l repression o f firms by r e s t r i c t in g cred it a v a i l a b i l i t y to them but also other arms o f the government.
29 .9 .2 In comparing formal and informal c red it a v a i l a b i l i t y ,two s tr ik ing f ind ings , contrary to the bulk of writ ings on thesubject , emerge. F i r s t ly , informal c red it is on average cheaper than formal c r e d i t , though informal rates are more widely d is
persed than formal rates and have a higher maximum and lower minimum. Secondly, the duration o f informal loans (excluding trade c re d i t ) i s , de fa c to , longer on average than formal c r e d i t . It is poss ib le that the interest free informal loans encountered in the<sample are spurious loans r e f l e c t i n g deployment o f 'b la ck funds' by the owner o f the business with the connivance o f friends and r e l a t i v e s . ^ I f so t h i s would e x p l a i n the c o n t r o v e r s i a l
11. Th i s was p o i n t e d out i n c o n v e r s a t i o n by Dr.Amare sh Bay \± .

12findings.
29.9.3 Other points o f s i mi l ar i t y and d i s s i mi l ar i t y are asf o l l o w s :
i . Banks - as the example o f the bank which demanded a 100per cent margin for an almost r i sk free bank guaranteeshows - are overly conservative in their loan p o l i c i e s .Informal lenders may or may not be more r isk averse since a high leve l of i mpl i c i t secur i ty is ava i lab le to them through personal re la t ions with borrowers.
i i . Most l oans by both groups are f o r working c a p i t a l .
i i i . Informal lenders do not require any margin as compared toan average margin o f 25 per cent from banks.
i v . Both banks and informal l enders favour l arger and older f Irms , t hough t lie absol ut e 1 evel o f i n fo rma L lend i ng tosmall f i rms i s h igher .
v. Bank guarantees are a r e l a t i v e l y r isk free form of bank accommodation to the sector for which no substi tute 'form o f c re d i t e x i s t s .
v i . Trade c r e d i t , due poss ib ly to the ease with which i t is ava i lab le , is the most important s ingle source o f credit to the sector and appears to have no subst i tute .
v. The e f f i c i e n c y o f firms financed by banks appears to be much higher than informally financed firms.
29.9.4 From the point o f view o f f irms, two f indings are o fimportance. Fi r s t l y , the adverse s i tuat i on of the smallest firms seems to suggest that they are below the minimum size necessary to take advantage o f scale economies including the provis ion o f c o l la t e r a l . To recapitu late the main f indings for firms in category
D:
i . They are less pr o f i t ab l e ( i n the s e n s e , o f return on own cap i ta l employed).
12. Howe ve r , i t may be me n t i o n e d h e r e t h a t bank c r e d i t i n some s o u t h e r n S t a t e s , s u c h as K e r a l a , i s r e p o r t e d to be n o n - e x i s t e n t . Fur t h e r m o r e , i n f o r m a l c r e d i t f rom a g r o u p o f f i n a n c i e r s i s r e p o r t e d to be much more i mp o r t a n t .
43 5
i i . They rece ive trade c red i t for r e l a t i v e l y short durations .
i i i . Their inventory holding is large r e la t iv e to sales suggest ing i n d i v i s i b i l i t i e s in the purchase o f raw materials.
iv . They are most dependant on internal f inance and have the greatest c red it s h o r t f a l l .
29.9.5 Secondly, firms rece iv ing cred it from both formal and informal sectors are in a pr iv i leged minority. The main findings a r e :
i . They are far l e s s dependant on own funds than other firms.
i i . Their cost o f borrowing is the l e a s t .
i i i . They are able to hold larger inventories r e la t iv e to to ta l assets and can use a larger part o f the ir funds in purchasing government s e cu r i t i e s to save on taxes.
iv . The average period of trade c re d i t received by them is the l o n g e s t .
No part icu lar exogenous ch a r a c te r i s t i c of these firms could be discerned that would explain the ir favoured status.
29 .9 .6 Turning to other features o f the sector worth highl ig h t in g , three items stand out. F ir s t , several firms were found to lack information as to c re d i t f a c i l i t i e s ava i lab le from banks and perhaps, as to tax concessions and tax incent ives . This contrasts with the information about informal loans volunteered by several respondents. Secondly, the near absence o f professional
in form al f i n a n c i e r s as s u p p l i e r s o f c r e d i t to t h i s s e c t o r , deserves to be noted. F inally the wide variat ion in the cost of
borrowing across categor ies o f firms and c i t i e s may be taken as weak evidence o f the fragmentation in c red i t markets which i s made so much o f in the l i t e r a t u r e .
29.9 .7 Before leaving this sect ion i t is worth repeating that a l l these f indings should be evaluated in the l ig h t o f the re la t i v e l y small sample s ize ava i lab le fc ana lys is .
*

29.10 Recommendations for reform and regulation
29.10.1 While the main thrust o f thi s sect ion is on ways in which banks can better serve the sec tor , at the outset It must be p o in te d out that a c o o r d i n a t e d approach by the p u b l i c works
author i t ies and commercial banks is needed i f the cred it r e s t r i c t ions faced by the sector are to be eased. In l i ne with the sug
gest ions o f respondents - which we endorse - the fo l lowing act i v i t i e s may be c o ns i d e r e d by banks f o r enhancing c r e d i t a v a i l a b i l i t y to the sector .
29.10.2 Fi r s t , banks in consultat ion with publ ic works departments should provide bank guarantees to contractors . The scope for
such guarantees is large . 25 per cent o f the respondents expressed an interest in such a f a c i l i t y . Since bank guarantees are re la
t i v e l y r isk f ree - e s p e c ia l ly i f there is appropriate coordination with publ ic works departments - the margin requirements should be kept to a reasonable l e v e l .
29.10.3 Se c o nd l y , p r o v i d i ng c r e d i t by way o f o v e r d r a f t f a c i l i t i e s or cash credit against work orders may be considered.
Once again, routing of payments made by the author i t ies for comp le ted work through banks should reduce the r i s k o f d e f a u l t . About 20 per cent o f the respondents f e l t the need for such a f a c i l i t y .
29.10.4 Thirdly , discounting of government cheques which need
to be sent for outstat ion clearance or immediately c red i t ing customers accounts on rece ipt o f such cheques would also ease the
f inanc ia l strain on firms.
29.10.5 While the f i r s t measure above would counter-balance funds blocked in security depos i ts , the second and th ird would reduce the net p e r io d o f i n v o l u n t a r y c r e d i t extended to the government. Both would resu lt in improved cash flow for f irms.
437
29.10.6 The r a t e o f i n t e r e s t charged on loans and bank guarantee charges should however be at the maximum prescribed. In view o f the suspected i n e f f i c i e n c y o f small f irms, high interest rates would act as a part ia l weeding out device for i n e f f i c i e n t f i r ms . No s p e c i a l c h a r a c t e r i s t i c o f the s e c t o r makes them
e l i g i b l e for interest subs id ies .
29.10.7 Working cap ita l accommodation and term loans should be g iven as at present on a case by case b a s i s . However, g iven adequate security , e f f i c i e n t operating c h a r a c te r i s t i c s and a w i l l ingness on the part o f firms to pay the maximum rate o f in terest , no l imit on the c redi t f a c i l i t i e s granted to firms need be laid
down a p r i o r i .
29 .10.8 Ef f o r t s on the part o f branches to disseminate in for mation on a v a i l a b l e bank c r e d i t f a c i l i t i e s - and e f f o r t s to monitor the performance o f contractors on a continuing basis - seem to be essent ia l i f the cred it needs o f the sector are to be better served.29.10.9 F in a l ly , the complaint by some firms that a record of prompt payment o f loans and prudent f in a n c ia l management has no impact on their c re d i t rating needs to be looked into and, i f true, co rrec ted .
4 3 8

TABLE 2 9 .1
Aggregate Road C onstruction A c t i v i t y in India
(Rs . C r o r e )
1 9 8 2 - 1 9 8 3 - 1 9 8 4 - 1 9 8 5 - 1 98 6 - 1 98 7 -83 84 85 8 6 87 8 8
U ) ( 2 ) ( 3 ) ( 4 ) ( 5 ) ( 6 ) (7 )
1 . Gr o s s c a p i t a l 2555 2834 3206 3591 4023 4507f o r m a t i o n i n ( p ) ( p ) p u b l i c s e c t o r ( r o a d s and b r i d g e s )
( P)
2 . C a p i t a l e x p e n - 9 8 . 4 2 1 5 7 . 3 0 1 4 0 . 1 0 1 7 4 . 3 5 2 1 6 . 9 7d i t u r e on r o a d s ( R.E ) (P ) & b r i d g e s i n Ut t a r Pradesh
( P)
3 . C a p i t a l e x p e n - 1 5 . 3 0 1 4 . 9 0 2 4 . 2 2 2 7 . 3 8d i t ure on road s & b r i d g e s i n t he Uni on T e r r i t o r y o f De l h i
( P )
E s t i m a t e s o f C r e d i t f o r 1 9 8 7 -8 84. Formal c r e d i t to s e c t o r ( A l l I n d i a ) 131 . 045. I n f o r m a l c r e d i t to s e c t o r ( A l l I n d i a ) 4 5 4 . 0 66 . Formal c r e d i t t o s e c t o r ( U . P . & D e l h i ) 7 . 1 17 . I n f o r m a l c r e d i t to s e c t o r ( U. P . <i D e l h i ) 24. 628 . Gr o s s l o a n s t o Government s e c t o r ( A l l I n d i a ) 593 . 1 29. Loans to Go v t , s e c t o r Net o f Bank C r e d i t ( A l l I n d i a ) 4 4 0 . 6 51 0 . Gr o s s l o a n s t o Government s e c t o r ( U . P . and D e l h i ) 3 2 . 1 61 1 . Loans t o Go v t , s e c t o r Net o f Bnk Crdt ( U. P . and D e l h i ) 2 1 . 2 1
Notes: 1 . Estimates calculated by proportionate scaling up off i g u r e s in Note 2 b e l o w .
2. T o t a l v a l u e o f p r o d u c t i o n o f f i r m s i n sampl e ( a v e r a g e o f2 y e a r s ) : Rs. 3 9 6 . 5 4 l akhR a t i o o f non f o r ma l c r e d i t to p r o d u c t i o n : 10 . 0746%R a t i o o f f o r m a l c r e d i t to p r o d u c t i o n : 2 . 9089%
3. P : P r o j e c t e d on the b a s i s o f da t a f o r l a t e s ta v a i l a b l e 3 y e a r s .
RE : R e v i s e d E s t i m a t e .
S o u r c e s : 1. N a t i o n a l A c c o u n t s S t a t i s t i c s , 1988.2. S t a t e Government B u d g e t s .3. Annual R e p o r t s , M i n i s t r y o f S u r f a c e
T r a n s p o r t .
439

TABLE 2 9 . 2
D e s c r i p t i v e S t a t i s t i c s for Sampled Areas
Item Population D e l h i Dehradun Agra Meerut
1- P o p u l a t i o n o f c i t y 5 1 . 6 7( 1981 c e n s u s ) i nlakh
2. Annual g r o wt h r a t e 2 . 6 919 7 1 - 8 1 ( p e r c e n t )
3. P o p u l a t i o n o f d i s t r - / 6 2 . 2 0i c t un i o n t e r r i t o r y( 1981 c e n s u s ) in l a k h
4. Annual g r o wt h r a t e 4 . 3 41 9 7 1 -8 1 ( p e r c e n t )
5. Urban p o p u l a t i o n 9 2 . 7( 1981 c e n s u s ) ( p e r c e n t )
6 . Area o f d i s t r i c t / 1483u n i o n t e r r i t o r y( s q . k m . )
2 . 21 6 . 94 4. 17
2 . 0 9 1 . 3 8 2 . 8 7
7 . 6 2 2 8 . 5 3 2 7 . 6 7
2 . 81 2 . 1 4 2 . 2 8
4 8 . 9 3 8 . 1 3 1 . 2
3088 4805 3911
L e n g th o f r o a d s D e l h i Ut t a r Pr ade s h
S u r f a c e d T o t a l S u r f a c e d T o t a l
6 .
7.
8 .
Hi ghways ( k m)1 9 8 0 -8 1 3361 9 8 2 -8 3 326
Urban r o a ds_(_kmj1 9 8 0 -8 1 6 , 8 0 61 9 8 2 - 8 3 8 , 3 5 9
j> _ p lu s 7 (km)1 9 8 0 -8 11 9 8 2 - 8 3
7, 1428 , 685
297311
1 3 , 5 8 1 1 5 , 4 6 4
1 3 , 8 7 8 1 5 , 7 7 5
5 2 , 4 3 6 5 4 , 7 7 7
1 6 , 2 6 6 1 6 , 3 2 2
6 8 , 7 0 2 7 1 , 0 9 9
8 9 , 3 5 3 91 , 4 9 4
2 0 , 6 1 4 20 , 6 8 8
1 , 0 9 , 9 6 7 1 , 1 2 , 182
S o u r c e : C e n t r a l S t a t i s t i c a l O r g a n i s a t i o n , Government o f I n d i a : S t a t i s t i c a lA b s t r a c t o f I n d i a , V a r i o u s I s s u e s
440

TABLE 2 9 .3
Sample D e s c r i p t i o n : Numbers Surveyed
Cat e g o r y
De l h i De h r ad un
C i t y
Ag ra Meerut T o t a l
A 3 3 3 1 1 0
( 2 3 . 2 6 )
B 2 3 Ni l 4 9( 1 6 . 9 6 )
C 1 2 5 2 1 0
( 1 0 . 5 3 )
D 3 1 Ni l 2 6
( 6 . 0 6 )
TOTAL 9( 4 . 8 1 )
9( 2 5 . 0 )
8
( 2 5 . 0 )9
( 2 5 . 7 1 )3 5
( 1 2 . 0 7 )
N o t e s : 1. In De l h i c a t e g o r i e s a r e a c t u a l l y I ,, I I , H Iand IV.C a t e g o r y A: No l i m i t on c o n t r a c t sC a t e g o r y B: C o n t r a c t s up to R s . 15 l akhC a t e g o r y C: C o n t r a c t s up t o R s . 5 lakhC a t e g o r y D: C o n t r a c t s up to R s . 2 l akh
2. One f i r m f rom C a t e g o r y A i n D e l h i i so m i t t e d s i n c e d a t a were f o r t he y e a r s 1984 and 1985 . Sample t hus d r o p p e d to 35 f rom 36 .
3. F i g u r e s i n b r a c k e t s a r e p e r c e n t a g e s o f p o p u l a t i o n s a m p l e d .
441

C a t e g o r y C i t y
D e l h i Dehradun Agra Meerut A l lc e n t r e s
TABLE 2 9 .4
Average Turnover of Firms Surveyed
(Rs. lakh)
A 36. 65 6 . 63 2 4 . 8 2 5 0 . 0 26 . 38B 10. 5 1 3 . 3 8 1 3 . 2 5 1 2 . 6 8C 6 . 5 1 . 75 8 . 7 8 4 . 0 6 . 43D 1 . 0 4 . 0 5 . 0 3 . 2
Ov er a l 1 1 4 . 6 9 “ 876“ 1 4 7 8 0 14763 TT7 13av er age
No t e s : 1 . ' C u r r e n t ' ye a r and ' p r e v i o u s y e a r v a r ydepend i ng on a c c o u n t i n g y e a r o f f i r m s . 8 io f f i r m s had t he same a c c o u n t i n g y e a r .
2 . Num be r o f f i r m s wi t h i n c r e a s e d t u r n o v e r : 1Number o f f i r m s wi t h unc hange d t u r n o v e r : 5 Number o f f i r m s wi t h d e c r e a s e d t u r n o v e r : 7
TABLE 2 9 . 5
Employment and C a pi ta l /L ab our Ratios of Firms
A B C D A l l
E
K/E
47
65 . 05
2 1
2 8 . 7 8
23. 1
1 0 . 3 ,
2 2 . 8
6 . 05
28. 7
2 8 . 7 8
N o t e s : E : Av e r a g e number o f wo r k e r se mpl o ye d .
K/E : A v e r a g e t o t a l a s s e t s ( i n R s . )d i v i d e d by E .
442

TABLE 2 9 .6
P r o f i t a b i l i t y of Firms
(All figures in percentages)
PAT/ PAT/ EPAT E PAT/c a p i t a l i nc ome c a p i t a l i ncome
( 1 ) ( 2 ) (3 ) ( 4 ) (5 )-------------------------------------- --------------------- --------------------- ------------------ --------------------A : C a t e g o r y - w i s eA 20 . 4 1 5 . 3 9 1 1 . 6 9 2 . 69
( 1 4 . 7 1 ) (3 . 24) ( 1 8 . 8 4 ) ( 1 . 8 4 )B 35 . 94 5 . 83 1 7 . 7 2 2 . 87
( 2 1 . 34 ) ( 2 . 0 2 ) ( 1 1 . 1 5 ) ( 1 . 3 5 )C 47. 22 7. 14 2 3 . 4 1 3 . 1 2
( 5 1 . 6 4 ) ( 1 . 74) ( 2 7 . 5 2 ) ( 1 . 1 9 )D 29. 56 1 5 . 5 1 9. 56 3 . 8 6
( 1 2 . 0 5 ) ( 1 7 . 2 9 ) ( 5 . 7 8 ) ( 3 . 1 9 )
A l l f i r m s 34 . 78 7 . 6 6 1 6 . 5 8 3 . 1 3( 3 2 . 9 9 ) ( 8 . 0 8 ) ( 1 7 . 6 9 ) ( 1 • 8 9 )
B: B o r r o w in gS t a t u s - w i s e
Formal o n l y 3 8 . 3 7 5 . 53 2 1 . 6 2 3 . 03( 2 . 3 1 ) ( 1 - 3 9 ) ( 1 4 . 2 6 ) ( 1 . 2 7 )
Both f o r mal 2 1 . 1 1 5 . 91 1 1 . 9 6 3 . 04and i n f o r m a l ( 1 7 . 6 9 ) ( 3 . 1 2 ) ( 1 2 . 0 2 ) ( 1 - 9 9 )I n f o r ma l o n l y 39. 00 6 . 98 18 . 31 2. 79
( 5 0 . 73 ) ( 2 . 5 2 ) ( 2 6 . 0 4 ) ( 1 - 2 5 )S e l f f i nane ed 36. 51 1 1 . 8 2 13 . 97 3 . 6 6
( 2 0 . 4 2 ) ( 1 4 . 53) ( 9 . 2 3 ) ( 2 . 6 1 )
A l l B o r r o w e r s 3 3 . 3 7 6 . 2 1 17 . 51 2. 94( 3 6 . 3 2 ) ( 2•54 ) ( 1 9 . 7 6 ) ( 1 . 5 1 )
N o t e s : 1. PAT : P r o f i t a f t e r t a x e s .C a p i t a l : E q u i t y / o w n e r s c a p i t a l .E PAT : Re t a i n e d e a r n i n g s p l us 2 0 % o f
d i v i d e n d s / d r a w a l s .2. A l l f i r m s i n c l u d i n g ' s e l f f i n a n c e d ' r e c e i v e d
t r a d e c r e d i t .3. F i g u r e s in p a r e n t h e s e s a r e s t a n d a r d d e v i a t i o n s .
443

( A l l f i g u r e s i n p e r c e n t a g e )
TABLE 2 9 .7
Sources of Funds of Road C onstruction Firms
Own Formalc a p i t al c r e d i t ande q u i t y
( i ) ( 2 ) ( 3 )
Trad e c r e d i t
I n f o r m a l c r e d i t
Ot her T o t a l
( 4 ) ( 5 ) (6 )
A : By C a t e g o r yA 49. 67 1 1 .. 09 27., 43 1 1 .. 80 39. . 23
( 2 0 .■14) ( 16 . , 44 ) ( 18 . . 6 8 ) ( 13 . . 6 9 ) ( 24 . . 0 1 )62. 13 7 ., 71 25. . 8 6 4 .. 30 30. . 16
( 15 . 360 ( 1 0 .. 75) ( 16 . . 06 ) ( 8 .. 99) ( 19 . 42 )65. . 73 4,. 46 2 1 ., 81 8 .. 0 1 29. . 82
( 15 . . 75) ( 1 2 .. 67 ) ( 13 . . 13) ( 1 1 •. 48 ) ( 15 . , 78 )69. . 78 1 .. 0 1 25. , 04 4.. 17 29. , 2 1
( 1 2 .. 49 ) ( 2 ., 03 ) ( 1 2 .. 94 ) ( 8 .• 54) ( 13 . 17)
B: By B o r r o w i n g s t a t u s
Formal o n l y 60 . 09 15. . 27 2 2 .. 64 N .. A. 2 2 . 64( 15 . . 6 2 ) ( 14 . . 62 ) ( 16 . 590 ( 16 . 59)
Formal and 18. . 54 13 .. 97 2 0 .. 29 17. , 2 0 37. .49i n f o rmal ( 1 8 . . 0 0 ) ( 17 . 45 ) ( 1 2 .. 81 ) ( 13 . 15) ( 24 . 25)I n f o r m a l o n l y 60 .. 82 N.. A. 24. , 2 2 14. . 96 39. . 18
( 19 , . 03 ) ( 16 . 96) ( 1 1 ■. 53) ( 19 . . 03 )A l l b o r r o w e r s 58. 19 8 ., 84 2 2 . 69 1 0 ., 28 32. , 97
( 18 . •51 ) ( 14 . . 26) ( 15 . , 6 9 ) ( 1 2 . 42 ) ( 2 1 . 1 2 )S e l f f i n a n c e 69. 90 N.. A. 30. , 1 0 N ., A. 30. , 1 0
( 13 . , 0 2 ) ( 13 . 62) ( 13 . , 62)
A l l f i r m s 61 .. 54 6 .: 31 24. 80 7..35 32 .. 15( 17 . , 920 ( 1 2 ., 69) ( 15 . 54) ( 1 1 •. 48 ) ( 19 . , 2 0 )
N o t e s : 1. F i g u r e s a r e p e r c e n t a g e s o f t o t a lc a p i t a l e mp l o y e d .
2. S t a n d a r d d e v i a t i o n s i n p a r e n t h e s e s3. A l l f i r m s i n c l u d i n g ' s e l f f i n a n c e d '
r e c e i v e t r a d e c r e d i t .
444

TABLE 8
Details of Bank Credit
Type of facilityCask credit Overdraft Tera loans Bank All loans
accounts guaranteesA D A I) A D A D A E C D I
I Number of loanaccountsi. All banks 5 6.71 10 0.38 0L 6.4 8 56.29 23 16 45.7 3.5v‘ 18.352 State Bank of 1 1 . 6 3 1.25 1 0. 8 Nil 5 4 11.4 1.23
India3. Canara Bank 1 2 5 i 1 HA 1 12. 0 2 152.5 CJ 2 5.7 18.5 u /i fLOL.04. Punjab and 1 0.05 9 None Nil Nil 3 2 5.7
Sind Bank5. Corporation Nil 1 1 . 0 Nil Ti 5.0 i 2.9 1 . 0 5.0
Bank6 . Oriental Bank Nil Nil Nil 2 1.38 2 2 5.? 1.38
of Coimerce7. Punjab Nati 1 0 . 2 Nil !ul Nil 1 1 ' 2.9 0. 2
onal Bank8. Syndicate Bank Nil 1 0 . 1 Nil Nil i 1 2.3 0 . 19. Hot available/ 1 N.A. 2. 0 Nil I ■k aUsj .1/ 4 3 fl £ M . V 2. 0 25.0
others
II Kargin (Average X) 25.0 20.0 25.0 27.12 25.0 24.33Rate of interest 16.49 15. JD 12.5 1 . 0 16.28 2.49(average)
III Amount outstanding as apercentage of lifflit sanctioned
71.62 103.15 65.0 HA 75.42 NA
IV Friaary security None/personal (1 ) None/personal (6 ) Hypothecation of None (41(Nuaber of accounts) Hypothecation of
stocks (3) Hypothecation of Bad debts (1) Fixed deposit receipt (1 )
Hypothecation of stocks (1 ) fixed deposit receipt (1 ) NA: (2)
vehicle (1 ) NA: (!)
NA: (2)
V Collaterale i y
None/personal (4; None/personal (7) Mortgage k Land (1 )
None/personal (4)NA: {!’ NA: (3) NA: (I) NA: (2 )
445

Table 8 (Obntd.)
Total Nd. Percentage Percentage Rarcentage Percentageof account getting satisfied feeling bank availing ofholders need based with banker is unfair to other credit
finance-
to them as well
Nuofcer of loan accounts
1. All banks 35 42.86 51.7 5.7 52.92. State Bank of 16 30.8 25.0 6.0 53.3
India3. Canara Bank 5 60.0 40.0 0.0 60.04 Punjab & Sind Bank 3 100.0 100.0 0.0 33.35. Corporation Bank 2 50.0 • 100.0 0.0 100.06. Oriental Bank of 3 0.0 66.7 0.0 66.7
Cannerce7. Punjab Ifational Bankl 0.0 100.0 0.0 0.08. Syndicate bank 1 0.0 100.0 0.0 100.09. Not available/ 10 50.0 50.0 10.0 70.0
others
Notes: 1- Rate of interest for all loans includiiig bank guarantees.2. "Interest rate” for bank guarantee is the annual change.
Interest rates do not net out interest paid on security held with banks, if any.
3. All averages are with respect of firms for vhich data is available.4. A: Number of Accounts
B: Number of FirmsC: B as a percentage of total sample D: Average excluding Bank guarantees (Rs. lakh)E: Average includirg bank guarantees (Rs. lakh).
446

TABLE 9
Salient Features of Informal Credit Received by Road Construction Firms
Friends Partners Miltanis Source Totaland re- directors & shroffs not informallatives & share- avail- credit
holders able
1 . Number of firms 1 2 1 1 4 17■ 2 . % of firms in sample 34.3 2.9 2.9 11.4 48.57
3. Average rate of interest (%)
15.03 15.0 24.0 N.A. 15.89
4. Minimun rate of interest (%)
Nil 15.0 24.0 N.A. Nil
5. Maximun rate of interest (%)
18.0 15.0 24.0 N.A. 24.0
6 . Percentage of short tenn loais
33.3 Nil 1 0 0 . 0 N.A. 35.7
7. Percaitage of long term loans
6 6 .7 1 0 0 . 0 Nil N.A. 64.3
7a. of vhich denand loais 58.3 Nil Nil N.A. 50.08 . Average loan amount
(Rs. lakh)3.55 1.64 0.25 N.A. 3.55
9. Collaterial & security Nil Nil Nil N.A. Nil1 0 . Percentage of loans
for working capital finance
83.3 0 . 0 1 0 0 . 0 N.A. '71.4
Notes: 1. Figures are with respect to loans for \ iich data is available.2. Long terra loans (7) : Loans outstanding for more than one >ear.3. Danarri loans (7a): Outstandirg for more than one year.4. Interest rates were found not to vary with duration or purpose.
447
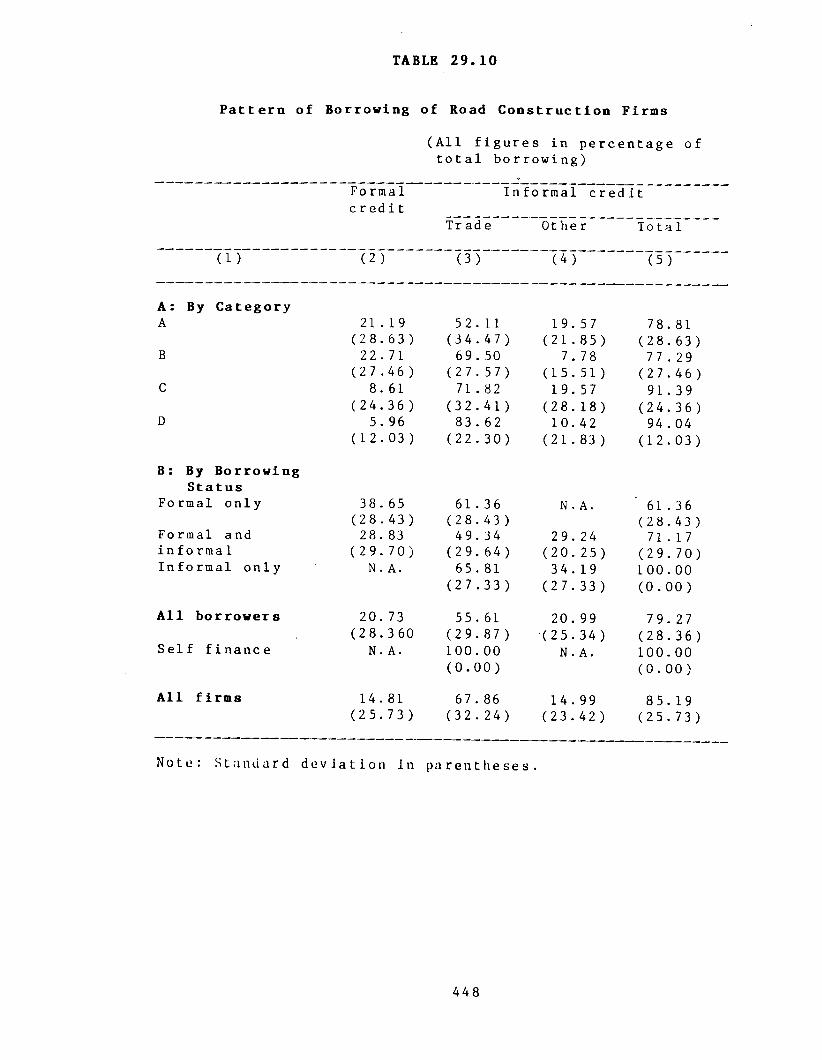
TABLEt 2 9 .1 0
( A l l f i g u r e s i n p e r c e n t a g e o f t o t a l b o r r o w i n g )
Pattern of Borrowing of Road Construction Firms
Formal I n f o r m a l c r e d i tc r e d i t
Tr ad e Other T o t a l
( 1 ) ( 2 ) ( 3 ) ( 4 ) ( 5 )
A: By C a t e g o r yA
B
C
D
2 1 . 1 9 ( 2 8 . 6 3 )
22. 71 (2 7 . 46 )
8 . 61 ( 2 4 . 3 6 )
5. 96 ( 1 2 . 0 3 )
5 2 . 1 1 ( 3 4 . 4 7 )
69. 50 ( 2 7 . 5 7 )
71 . 82 ( 3 2 . 4 1 )
83 . 62 ( 2 2 . 3 0 )
1 9 . 5 7 ( 2 1 . 8 5 )
7 . 78 ( 1 5 . 5 1 )
1 9 . 5 7 ( 2 8 . 1 8 )
1 0 . 4 2 ( 2 1 . 8 3 )
78 . 81 ( 2 8 . 6 3 )
7 7 . 2 9 ( 2 7 . 4 6 )
9 1 . 3 9 ( 2 4 . 3 6 )
94 . 04 ( 1 2 . 0 3 )
B: By B o r r o w i n g S t a t u s
Formal o n l y
Formal and i n f o rma 1
I n f o r m a l o n l y
38. 65 ( 28 . 43 )
28 . 83 ( 2 9 . 7 0 )
N. A.
61 . 36 ( 2 8 . 4 3 )
49. 34 ( 2 9 . 6 4 )
65 . 81 ( 2 7 . 3 3 )
N . A.
2 9 . 2 4 ( 2 0 . 2 5 )
34. 19 ( 2 7 . 3 3 )
6 1 . 3 6 ( 2 8 . 4 3 )
7 1 . 1 7 ( 2 9 . 7 0 ) 1 0 0 . 0 0
( 0 . 0 0 )
A l l b o r r o w e r s
S e l f f i n a n c e
20. 73 ( 2 8 . 3 6 0
N.A.
55. 61 ( 2 9 . 8 7 ) 1 0 0 . 0 0
( 0 . 0 0 )
2 0 . 99 ( 2 5 . 3 4 )
N.A.
7 9 . 2 7 ( 2 8 . 3 6 ) 1 0 0 . 0 0
( 0 . 0 0 )
A l l f i r m s 14. 81( 2 5 . 7 3 )
67 . 8 6
( 3 2 . 2 4 )14. 99
( 2 3 . 4 2 )85 . 19
( 2 5 . 7 3 )
No t e : S t a n d a r d d e v i a t i o n In p a r e n t h e s e s .
448
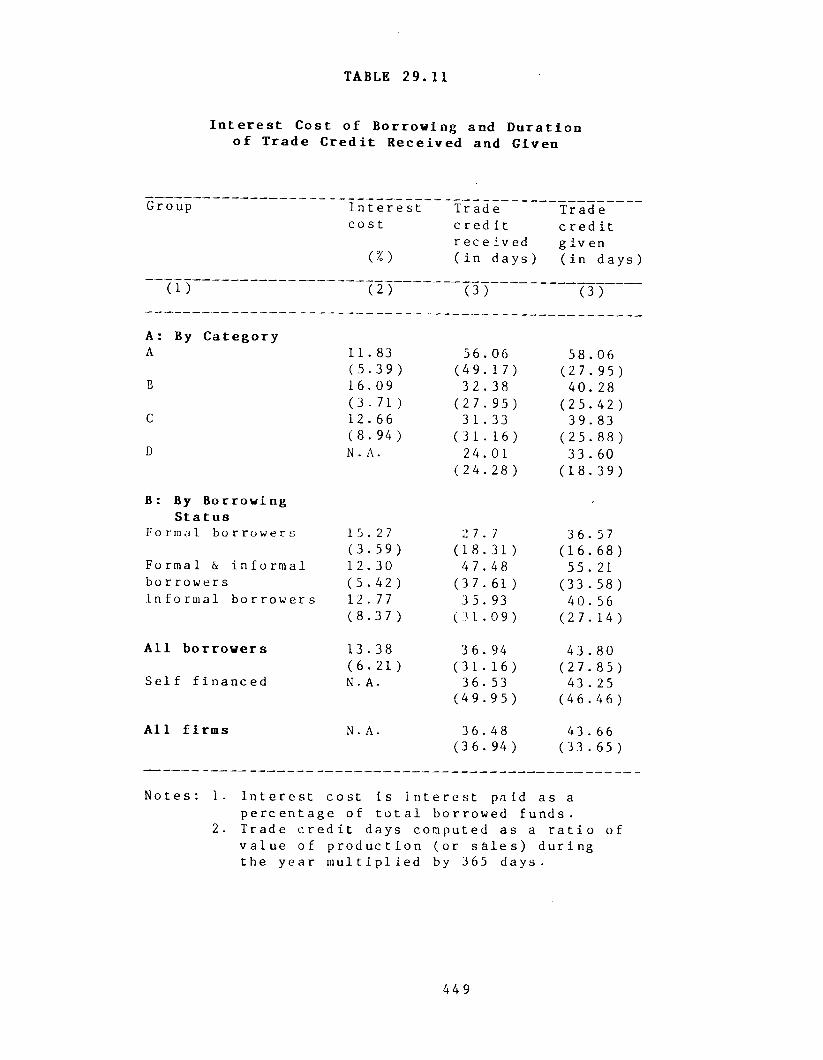
TABLE 2 9 .1 1
I n t e r e s t Cost o f Borrowing and Durationo f Trade Credit Received and Given
Group I n t e r e s t Tr ade Tr adec o s t c r e d i t c r e d i t
r e c e i v e d g i v en(%) ( i n d a y s ) ( i n d a y s )
( D ( 2 ) ( 3 ) ~ ( 3 )
A: By CategoryA
C
D
B: By BorrowingStatus
1 1 . 83 56. , 06 58 .. 06( 5 . 39 ) ( 49 . ■ 17) ( 27 . ■ 95)16. 09 32 .. 38 40. , 28( 3 - 71 ) ( 27 . ■ 95) ( 25 . , 4 2 )1 2 . 6 6 3 1 ., 33 39. , 83( 8 . 94 ) ( 3 1 . . 16) ( 25 . . 8 8 )N . A • 24. , 0 1 33 ., 60
( 24 . . 28 ) ( 1 8 . , 39)
Formal borrowers 15 . 27 2 7 . 7 3 6 . 5 7( 3 . 5 9 ) ( 1 8 . 3 1 ) ( 1 6 . 6 8 )
Formal & i n f o r m a l 1 2 . 3 0 47. 48 55 . 21b o r r o w e r s ( 5 . 4 2 ) ( 3 7 . 6 1 ) ( 3 3 . 5 8 )I n f o r m a l b o r r o w e r s 12 . 77 35. 93 40. 56
( 8 . 3 7 ) ( 3 1 . 0 9 ) ( 2 7 . 1 4 )
A l l borrowers 13 . 38 36 . 94 43 . 80( 6 . 2 1 ) ( 3 1 . 1 6 ) ( 2 7 . 8 5 )
S e l f f i nane ed N. A. 36. 53 43 . 25( 4 9 . 9 5 ) ( 4 6 . 4 6 )
A l l f i rms N. A. 36. 48 4 3 . 6 6(3 6 . 94 ) ( 3 3 . 6 5 )
N o t e s : 1. I n t e r e s t c o s t i s i n t e r e s t pai d as ap e r c e n t a g e o f t o t a l b o r r o we d f u n d s .
2. Tr ade c r e d i t days c o mput e d as a r a t i o o f v a l u e o f p r o d u c t i o n ( o r s & l e s ) d u r i n g the y e a r m u l t i p l i e d by 365 d a y s .
449

TABLE 2 9 . 1 2
Net C red it R eceived by Road C on stru ction Firms
Group Net No . o f Wo r k i ng Sh o r t f a lc r e d i t days o f c a p i t a l in daysr e c e i v e d wo r k i ng used in ( 3 - 4 )( R s . l a k h ) c a p i t a l days
( i ) ( 2 ) ( 3 ) ( 4 ) ( 5 )
A: By CategoryA 9. 59 2 1 8 .5 2 2 5 8 .0 0 39 . 48
( 1 0 . 9 9 ) ( 3 1 9 . 5 2 ) ( 4 5 8 . 2 5 )B -0 . 34 - 1 5 . 1 0 75 . 69 90. 79
( 0 . 5 ) ( 1 7 . 5 6 ) ( 2 6 . 2 5 )C -0 . 05 - 3 5 . 10 1 0 7 .6 6 1 4 2 .7 9
( 0 . 5 7 ) ( 8 4 . 1 3 ) ( 8 9 . 8 8 )D - 0 . 26 - 4 7 . 7 7 2 3 4 . 2 0 2 8 1 .9 7
( 0 . 3 7 ) ( 2 1 . 1 9 ) (1 97 . 87 )
B: By BorrowingS tatu s
Formal 0 . 0 6 - 1 2 . 5 3 6 8 . 6 8 ' 5 6 .1 5b o r r o w e r s ( 0 . 8 6 ) ( 2 7 . 1 2 ) ( 3 0 . 6 8 )Formal and 8 .3 1 230. 13 2 4 4 .3 1 6 4 .1 8i n f o rma 1 ( 1 0 . 3 1 ) ( 3 4 4 . 6 1 ) ( 4 5 4 . 3 4 )bo r rowerI n f o r m a l 0 . 7 8 - 3 8 . 0 8 1 4 6 .5 9 1 8 4 .4 6b o r r o w e r s ( 2 . 8 9 ) ( 9 7 . 6 4 ) ( 1 2 0 . 2 8 )
A ll borrowers 2. 69 5 1 . 3 3 1 6 7 .8 2 1 1 6 .4 9( 6 . 8 2 ) ( 2 3 0 . 3 0 ) ( 2 77. 1 5 )
S e l f f i n a n c e d - 0 . 06 - 2 2 . 0 3 1 4 1 .8 2 1 6 3 .8 5( 0 . 5 2 ) ( 3 5 . 2 0 ) ( 1 6 7 . 3 6 )
A ll firm s 2 . 0 0 3 2 . 3 1 1 5 8 .9 7 1 2 3 .6 2( 6 . 0 3 ) ( 2 0 1 . 6 0 ) ( 2 5 6 . 7 5 )
4 5 0
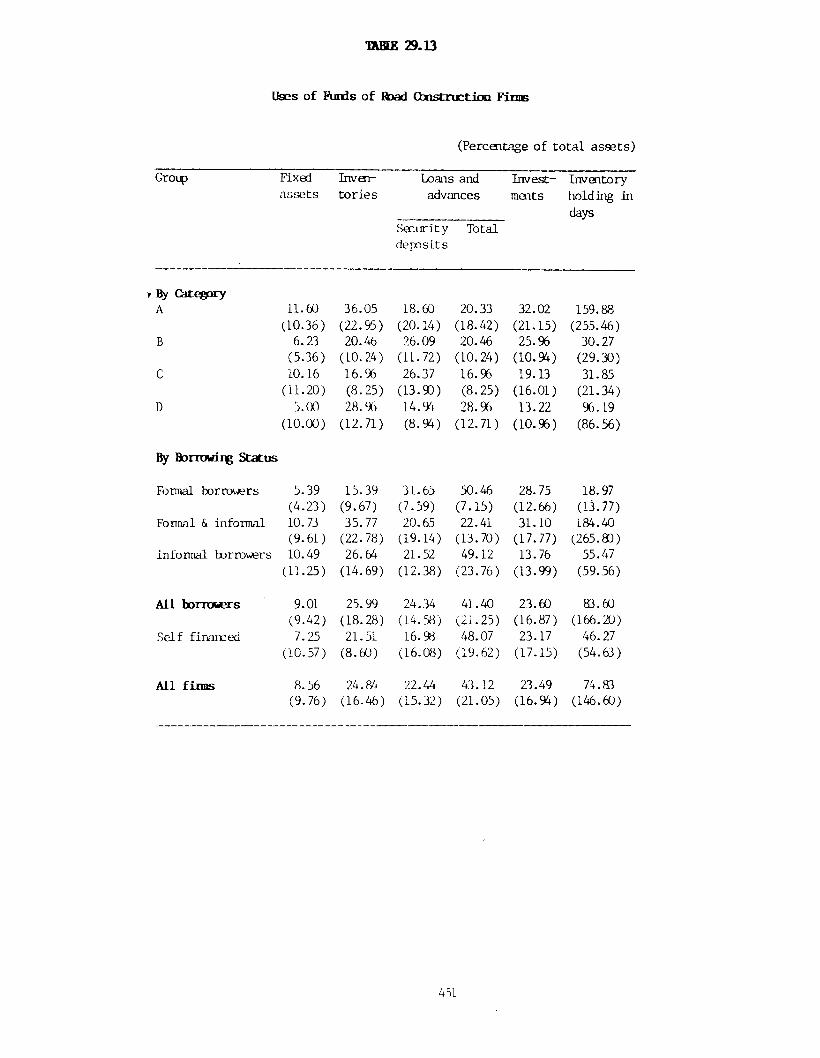
TABLE 29.13
Uses of Funds of Road Construct ion Finns
(Percentage of total assets)
Group Fixedassets
Inventories
Loans and advances
Security Total deposits
Investments
Inventory holding in days
By CategpryA 11.60 36.05 18.60 20.33 32.02 159.88
(10.36) (22.95) (20.14) (18.42) (21.15) (255.46)B 6.23 20.46 26.09 20.46 25.% 30.27
(5.36) (10.24) (11.72) (10.24) (10.%) (29.30)C 10.16 16.% 26.37 16.96 19.13 31.85
(11.20) (8.25) (13.90) (8.25) (16.01) (21.34)D 5.00 28. % 14.% 28.% 13.22 96.19
(10.00) (12.71) (8.94) (12.71) (10.%) (86.56)
By Borrowing Status
Formal borrowers 5.39 15.39 31.65 50.46 28.75 18.97(4.23) (9.67) (7.59) (7.15) (12.66) (13.77)
Formal & informal 10.73 35.77 20.65 22.41 31.10 184.40(9-61) (22.78) (19.14) (13.70) (17.77) (265.80)
informal borrowers 10.49 26.64 21.52 49.12 13.76 55.47(11.25) (14.69) (12.38) (23.76) (13.99) (59.56)
ALL borrowers 9.01 25.99 24.34 41.40 23.60 83.60(9.42) (18.28) (14.58) (21.25) (16.87) (166.20)
Self financed 7.25 21.51 16.98 48.07 23.17 46.27(10.57) (8.60) (16.08) (19.62) (17.15) (54.63)
All flnns 8.56 24.84 22.44 43.12 23.49 74.83(9.76) (16.46) (15.32) (21.05) (16.%) (146.60)
451
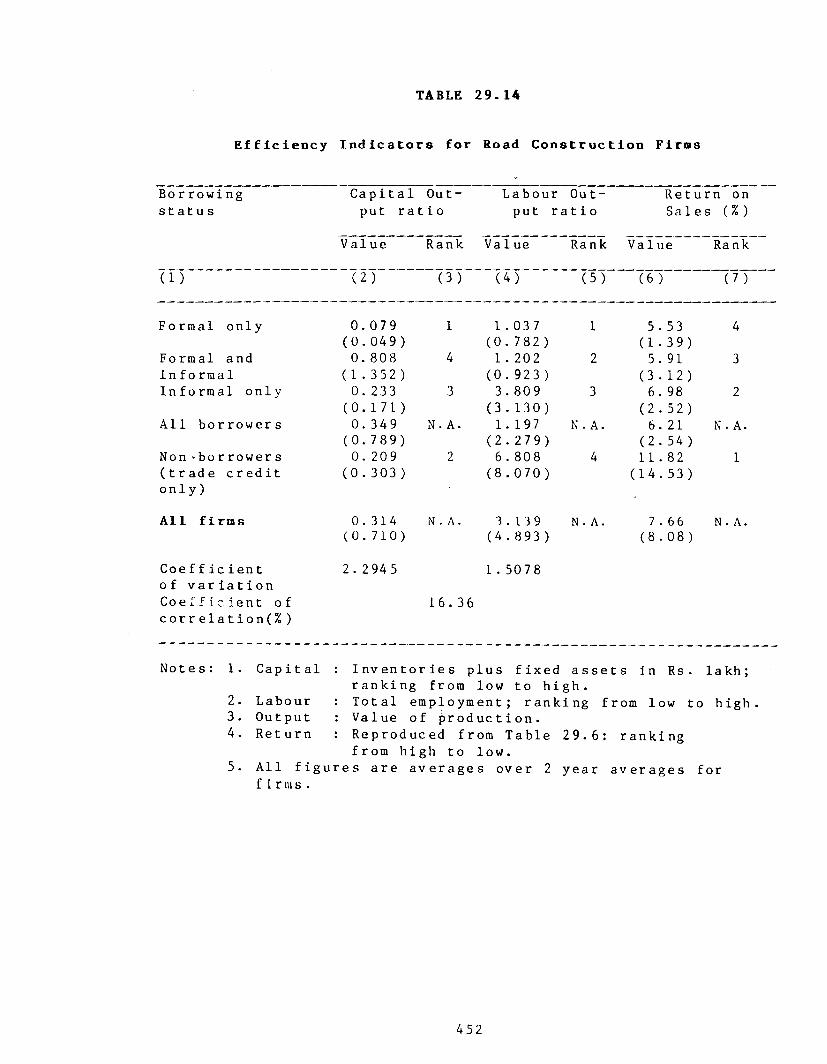
TABLE 2 9 .1 4
E ffic ie n c y In d ic a to r s fo r Road C o n stru ctio n Firms
B o r r o w in gs t a t u s
C a p i t a l Output r a t i o
Labour Output r a t i o
R e tu rn on S a l e s (%)
V a lue Rank Value Rank Value Rank
( 1 ) ( 2 ) ( 3 ) ( 4 ) ( 5 ) ( 6 ) ( 7 )
Formal o n l y 0 . 0 7 9 1 1 . 037 1 5 . 53 4( 0 . 0 4 9 ) ( 0 . 7 8 2 ) ( 1 . 3 9 )
Formal and 0 . 808 4 1 . 2 0 2 2 5. 91 3i n f o rmal ( 1 . 3 5 2 ) ( 0 . 9 2 3 ) ( 3 . 1 2 )In f o rmal o n l y 0. 233 3 3. 809 3 6 . 98 2
( 0 . 1 7 1 ) ( 3 . 1 3 0 ) ( 2 . 5 2 )A l l b o r r o w e r s 0. 349 N. A. 1. 197 N.A. 6 . 2 1 N. A.
( 0 . 7 8 9 ) ( 2 . 2 7 9 ) ( 2 . 54)Non - b o r r o w e r s 0 . 209 2 6 . 808 4 1 1 .8 2 1
( t r a d e c r e d i t ( 0 . 3 0 3 ) ( 8 . 070 ) ( 1 4 . 5 3 )o n l y ) -
A ll firm s 0 .3 1 4 N.A. 3 . 1 3 9 N.A. 7 . 6 6 N.A.( 0 . 7 1 0 ) ( 4 . 8 9 3 ) ( 8 . 0 8 )
Coe f f i c i en t 2 . 2 9 4 5 1 . 5 0 7 8o f v a r i a t i o nC o e f f i c i e n t o f 1 6 .3 6c o r r e l a t i o n ( % )
N o t e s : 1. C a p i t a l : I nv en t o r i e s r a n k i n g from
p l u s f i x e d a s s e t s low to h i g h .
in Rs . la kh ;
2. Labour : T o t a l e m p loym en t ; r a n k i n g from low to h i g h .3. Output : Va lue o f p r o d u c t i o n .4. R e tu rn : R e p r o d u c e d from T a b le 2 9 . 6 : r a n k in g
from h ig h to l o w .5. A l l f i g u r e s a r e a v e r a g e s o v e r 2 y e a r a v e r a g e s f o r
firms.
452

CHAPTER 30
INFORMAL FINANCE FOR HOUSE CONSTRUCTION
30.1 Introduction
30.1.1 The house construct ion sector is an important part o f a l l economies and investment in housing is usually a major item in the tota l investment p o r t f o l i o o f a country. While th is is ce r ta in ly true of India , housing investment has an added urgency in India in view o f the r is ing population aud the rapid urbanisa
tion taking place. While the t o ta l housing stock in the country stood at about 114 m i l l ion dwell ings in 1981 an estimated 230 mil
l i on units are pro jected to be the requirement by the turn o f the century. The investment required for th is purpose in the 15 years 1985-2000 is estimated at Rs 1317 b i l l i o n by7 the Planning Commission. Furthermore, in the period 1980-1985, the private sector contributed 89.4 per cent of t o ta l housing investment. The ro le played by the informal sector in contr ibuting to this f inance is consequently o f great in te r e s t .
30 .1 .2 Non government housing in India is constructed in essen t ia l ly three ways. The largest number o f dwelling units are pr ivate ly constructed. Other than th is , houses are constructed by housing cooperatives and private developers. The d i s t in c t i o n between the la t t e r two routes i s , however, not always c lear cut , as
private developers sometimes play a leading role in sett ing up cooperatives in order to gain access to concessional f inance from banks and other apex in s t i tu t io n s engaged in providing finance to housing cooperatives (Wadhwa, 1987).
9
30.1 .3 In view o f t h i s , i t is o f interest to examine the ro le o f informal c red i t in housing finance o f individuals and also o f private developers for schemes which do not involve the sett ing up
45 3

o f cooperat ives . While exce l lent information on the magnitude o f informal housing finanqe o f individuals is avai lable from Lall (1984), information on the finances o f private sector "mortgage f inanc iers " and schemes o f fe red by them was not readi ly ava i lab le . Furthermore, quant itat ive information on deve loper 's f inances and the pattern o f f inance o f housing p ro je c ts by them was also not
read i ly ava i lab le . Accordingly, a survey o f 25 housing developers and "mortgage f inanc iers" was planned in Delhi with the help o f the State Bank o f India in 1988. Unfortunately no cooperation as to f inanc ia l information was forthcoming from any o f the firms surveyed except fo r three firms (two developers and one f inanc ier ) who made the ir annual reports ava i lab le . However, some qualitat i v e information as to loan schemes and the finance o f housing
developments was gleaned from developers, government o f f i c i a l s and
o f f i c i a l s o f housing finance in s t i tu t i o n s .
30 .1 .4 As i s well known in India , the scale o f urban construct ion a c t i v i t y , the rapid appreciation in urban land prices and the v i t a l part played by i l l e g a l money in many real estate transact ions has attracted a large number o f unscrupulous entrepreneurs to housing development and finance.^ This must ce r ta in ly underlie the lack o f cooperation by some developers and f inanciers approached, though the limited cooperation extended by even the largest developers was unexpected.
30.1 .5 In the next sect ion , a summary o f avai lable informat ion on housing finance for ind iv idua ls , mainly fo l lowing Lall ( 1 9 8 4 ) , i s made. In s e c t i o n 3, in fo r m a t io n ob ta in ed on developers ' f inances i s reported. Section 4 o f f e r s some tentat ive conclusions.
1 • S ee , f o r e v i d e n c e o f the b l a c k economy and r e a l e s t a t e S. Acharya and A s s o c i a t e s ( 1 9 8 5 ) . For d e v e l o p e r s see Wadhwa ( 1 9 8 7 ) . as w e l l as a r t i c l e s in n e w s p a p e r s . For e x a m p le , s e et h e a r t i c l e on t h e S k i p p e r G roup i n t h e H in d u s t a n T i m e s , March 22, 1 9 8 7 .
454

30.2 Housing finance for individuals
30.2 .1 Lali (L984) Surveyed a total of 720 home owners drawn on a s t r a t i f i e d random basis from 5 urban centres in various parts o f India. 83 per cent o f these respondents were drawn from owners of authorised, "formal se c to r " , dwellings and 17 per cent from
owners o f dwellings on unauthorised land and squatter settlements.
30 .2 .2 The pattern of finance for these home owners i s given in Tables 30.1 and 3 0 .2 . As can be seen, own funds are the dominant source o f f inance for a l l ca tegor ies o f home owners. Informal f inance, while least important overa l l , has r e la t iv e ly greater importance for owners o f unauthorised and slum housing. Also, informal finance is more important than formal for two of the three lowest income groups (Table 30 .2 ) . Within informal finance, friends and r e la t iv e s are the ch ie f source o f funds. About half o f the sample reported renting out their house in order to finance loan repayments, while the incidence o f houses constructed purely fo r the purpose o f l e t t in g increased with income. This would suggest that poorer house owners, being unable to let out their houses a f t e r construct ion , were more c red it constrained
than richer house owners. This hypothesis is bolstered by the fact that a greater percentage o f own funds to f inance home acqu is i t ion was from the disposal o f assets for poorer households than for r icher households. A f in a l point is that f inance from both formal and informal sectors is avai lable with greater ease
for house construct ion rather than i n i t i a l acqu is i t ion o f land.
30.2 .3 While about ha l f the sample faced various d i f f i c u l t i e s in obtaining formal sector loans (Table 30 .3 ) , lack o f information
and lengthy procedures being the most important barr iers , Lall reports that the informal sector was approached due to the usual in formali ty , speed and low c o l l a t e r a l requirements o f informal leaders despite the ir high in terest c o s t .
30 .2 .4 The cost o f funds o f house loans i s g iven in Table
455

30.4 . As can be seen, f r iends and r e la t iv e s provided the cheapest loans on average followed by formal lenders. Indigenous bankers had e f f e c t i v e interest rates o f upto 55 per cent per annum and a lso the highest average interest rate . Regarding c o l l a t e r a l , Lall
r reports that the value o f c o l l a t e r a l was sometimes twice the value o f the loan given even for formal lenders.
30 .2 .5 D eta ils on some housing loan schemes from informal mortgage financiers in Delhi came to l igh t as part o f the survey conducted in Delhi. While no formal security was taken, it was reported that several f inanciers take blank signed sheets of paper from borrowers at the time o f disbursing loans while others execute formal mortgage agreements. Typical schemes are as fol lows:
Financier A: Loans o f upto Rs 2.5 lakh are disbursedwhen r e c e i p t s o f expend i tures are produced. Persons with a (confirmed) plot o^ land and an architechtural plan approved by appropriate au thor i t ie s are e l i g i b l e . Loans are repayable over upto 15 years at 14 per cent to 15 per cent ( f l a t ) per annum ( i . e . about 28 per cent to 30 per cent compound).
Financier B: Similar to A except that the firm must bemade the bene f ic iary of an endowment type l i f e insurance p o l i cy for the amount o f the loan in addit ion to in terest .
Financier C: Finances upto Rs 10 lakh at 24 per centper annum ( f l a t ) against a mortgage.
Developer/financier D: Has several development schemesa l l over India. Payment for dwelling units constructed by them has to be made in accordance with a p re -s p e c i f i e d schedule l inked to progress in the construct ion of the u/i its. Upto 50 per cent o f the cost is met by a 5 to 20 year loan at an interest rate o f 12 per cent ( f l a t ) per annum. T i t le to the dwelling unit is given to the buyer only when the loan is f u l l y repaid. All taxes at the time of transfer o f the t i t l e are borne by the buyer. A 2 per cent penalty per month i s lev ied on delayed payments and the agreement
456

lapses i f any payment (whether for the buyer's share o f construction costs or for a loan repayment instalment) i s not made for 3
months. In the event o f the agreement lapsing, money contributed by the buyer i s refundable without in terest a f t e r deduction o f the deve loper 's expenses.
Developer E: Payment for a housing p lo t , inc lus ive o fa LI development changes, can be made in equal monthly instalments over a period of 3 years. Only a 5 per cent discount is given i f the entire money is paid in one i n i t i a l instalment.
30.2 .6 Formalit ies in alL cases are e a s i ly completed within 24 hours. Most o f the schemes outl ined above show that informal
finance is avaiLable only at a high cost to the borrower with borrowers facing high r isk in case of unforeseen problems in keeping up with payment schedules.
30.3 Finances of developers and financing of housing development
30.3.1 P r iv a t e d e v e l o p e r s in India p ro v id e housing or developed p lots mainly for middle and upper income groups (Wadhwa,1 987 ) . Few housing deve lopm ents , i f any, are f o r low income groups. It i s , in f a c t , doubtful i f authorised dwellings which are privately constructed are a f fordab le to the urban poor given current land prices and construct ion co s t s . The number o f developers is f a i r l y large . For example, Wadhwa (1987) reports between 200 to 300 developers in the c i t y of Ahmedabad in 1987, with the top four developers accounting for about 1 0 per cent o f t o ta l housing construction (about 150 to 200 housing units by each of these four d e v e l o p e r s ) in Ahmedabad. The s i t u a t i o n in Delhi i s b ro a d ly s imilar . Finance for development p ro je c ts i s required for ex
tended periods due f i r s t , to the long drawn out procedures involved in gett ing development plans sanctioned by various government bodies , secondly due to land a c q u is i t io n costs and th ird ly due to the actual cost o f construct ion and s i t e development. The f i r s t stage, that o f gett ing government c learances , may take upto 5 years and " e n ta i l s payment o f o f f i c i a l and u n o f f i c i a l dues at
457

every stage" (Wadhwa, 1987, p. 53) . Thus the major cost to the developer is that o f f inance (Wadhwa, 1987).
30 .3 .2 One way in which some d e v e l o p e r s ensure the a v a i l a b i l i t y o f funds i s by sett ing up dummy cooperatives as men
tioned e a r l i e r . However, this a c t i v i t y has become increas ingly d i f f i c u l t and i s , consequently, on the dec l ine . An alternative method of f inancing development p ro je c ts is to obtain advance payments in instalments from buyers. This practice is widely f o l lowed. With e ither method o f f inance, i t is the i n i t i a l stages o f a development p ro jec t (upto land a c q u is i t io n ) for which developers require finance from sources other than customers- Increasingly,
however, developers are attempting to f inance developments almost
to completion o f construct ion to take advantage o f appreciation in land and property values. The fo l lowing descr ipt ion o f f inancing of housing p ro je c ts by developers is based on Lall (1984).
I n it ia l phase ( land acqu is i t i o n , government approvals and provis ion o f basic in f rastructure ) : 25 per cent - 35 per centof to ta l funds: Own funds and informal finance.
Second phase (Sale o f 40 per cent to 60 per cent o f p l o t s ) : Buyers o f p l o t s and houses , mortgage f inance aga ins t remaining p lo ts from the informal sector .
Third phase: (Construction o f houses): Buyers and supp l i e r s c re d i t .
30 .3 .3 The fact that only a portion o f p lots are sold during
the second phase is due to the desire o f the builder to take advantage o f appreciation in real estate values. As can be seen from th is desc r ip t ion , informal c r e d i t i s involved at every stage o f the housing pro jec t but most importantly in the f i r s t stage. Informal finance for the f i r s t stage i s reportedly provided on a p r o f i t sharing basis by most private f inanc ie rs . Also, owners o f land sometimes provide land for a share in the housing p r o je c t . Thirdly, large developers reportedly plan overlapping pro jec ts so
458

that funds received from buyers in one pro jec t can be diverted to other pro jec ts (Lal l , 1986). F inally , short terra bridge finance i s obtained by large developers, on occas ion , from the in tercor porate funds market.
30.3 .4 Despite the reported re l iance o f developers on informal finance, whether from suppliers /buyers c re d i t or from f inanc iers ,
not a l l developers take recourse to informal finance. The annual
reports o f the three large developers who provided these reports to us show the fo l lowing sources o f funds:
Own funds and share cap i ta l : 70.09%, 32.05, and 0.46%respec t ive ly .
Bank borrowings : 19.47%, L4.90% and 0.45%
respec t ive ly .Advance from buyers : Nil , 34.38% and 63.24%
respec t ive ly .Other borrowed funds and : 10.44%, 18.67% and 35.85%l i a b i l i t i e s resp ec t ive ly .
30 .3 .5 Of " o t h e r borrowed funds and l i a b i l i t i e s " some is a c counted for by fixed deposits from the p ub l i c , raised through the formal capita l market and some o f the balance is trade c r e d i t . In the f i r s t two cases, there i s l i t t l e evidence o f e x p l i c i t informal loans under this head. However, the r e la t iv e unimportance o f bank finance - the only formal f in a n c ia l in s t i tu t i o n appearing in
the three f inanc ia l statements - and the importance o f cap i ta l markets ( f o r share cap i ta l and f ixed depos i ts ) i s revealed as i s the importance o f advance payments from buyers.
30.4 Conclusions
30.4 .1 Informal c red i t is c l e a r ly o f some importance in promoting housing investment e s p e c ia l ly for non-formal housing. It is a lso o f some importance to developers 'jiven their need for f inance
459

e s p e c ia l ly at the i n i t i a l stage o f pro jec t f inance. However, the l imited information in th is note suggests that for prospective home owners, ava i lab le informal c red i t (as ide from friends and r e la t iv e s ) may be expensive and r isky even i f lenders do not indulge in fraudulent p rac t i ces . The a l l o c a t iv e and equity impact o f informal finance is thus d i f f i c u l t to discern without further
data .
30 .4 .2 There has recent ly been a stepping up of formal involvement in housing finance for home owners due to i t s high p r io r i ty in national development programs. Measures include more l ibera l schemes by spec ia l ised housing finance in s t i tu t io n s , the formation o f a national housing bank and consequent involvement o f commer
c i a l banks in housing finance and stepped up d irect tax conces
sions for housing investment. However, none o f these measures a f fect the absence o f formal support for land acqu is i t ion .
30.4 .3 Secondly, Lall (1984) and Wadhwa (1987) have recommended addit ional formal f inanc ia l support for developers in the private sector . There are some indicat ions o f increased commercial bank involvement and the poss ib le involvement of other f inancial ins t i tu t io n s in such a c t i v i t y , in the near future.
30 .4 .4 As against th is , the continued growth in the value of urban real estate and of urban areas themselves continues to attract private cap ita l including, i t must be conceded, unaccounted funds. On balance, given the l imited information ava i lab le , i t i s hard to arr ive at a c lear prognosis o f the future ro le o f informal finance in the housing investment. It is l i k e l y , however, that informal
finance w i l l continue to play a ro le at the i n i t i a l stages up to land acqu is i t ion both for individuals - e s p e c ia l ly those from low income groups - and developers. S imilarly , i t is d i f f i c u l t to env i s i o n advances from buyers being e n t i re ly supplanted by formal f i nance.
460

TABLE 30-1
Housing Finance of Home Owners (1983)
By type of housing
Sources o f f inance Formal Unautho- Slum & Totalsectors r ised squatterhousing perma- s e t t l e -
nent mentsdwellings
(Percentages)
1 . Formal Finance 2 0 . 29 10.71 2.13 19.98
a. Special ised housing finance in s t i tu t io n s
2.47 3.57 Nil 2. 50
b . Banks 3.07 0.84 Nil 2.99
2 . Own Finance 65.82 62. 75 78. 72 65. 74
3. Informal Finance 13.89 26.54 19.15 14.28
a. Friends and re la t ive s 13. 15 17. 30 8 . 51 9. 79
b. Indigenous bankers 0. 13 4.13 2.13 0.25
Source: Compiled from Lall (1984)
461

TABLE 30.2
Housing Finance by Home Owners (1983)
Source of f inance
(Percentages)
By annual income group
0-5000 5,001-50,000
50,000- Above 1 , 0 0 , 0 0 0 1 , 0 0 , 0 0 0
1. Formal Finance
a. Specia lised housing finance in s t i tu t io n s
b . Banks
2. Own Finance
3. Informal Finance
a. Friends & re la t iv e sb. Indigenous bankers
7.93
1. 15
1.30
83.18
8.89
8 . 70 0.19
22.32
2 . 80
2.98
62.42
15. 27
14. 26 0 . 26
8.67 15.12
1.11 Nil
2.60
80. 93
10.40
10.14. 0.26
15.12
81.29
3.59
3. 59 Nil
Source: Compiled from Lall (1984)
462

TABLE 3 0 . 3
Problems with Formal Finance
dents c i t in g th is as the major problem in obtaining formal f inance
Problem Percentage of respon
1 . Inadequate information 28.842 . Inadequate se cu r i ty / la c k o f proper guarantors 13.073. Complicated and lengthy procedures 35. 264. High 'margin' 3.045. High interest cost 15.816 . Unsuitable repayment schedules 5. 177. Other reasons 1.828 . Percentage o f t o ta l sample facing problems 45.69
Source: Adapted from Lall (1984).
463

TABLE 3 0 - 4
Distribution of Annual Interest Rates
(Per cent per annum)
Range Averageinterest
Source 0-5 5.1-9 9.1-14 14.1-20 Above2 0
rate (%)
1. Formal sector 8 . 75 53.75 27.08 10.42 0 . 0 0 8.87
2. Informal sector 26.67 2 0 . 0 0 21. 67 11.67 2 0 . 0 0 11.34
(a) Friends & 60.00 1 2 . 0 0 1 2 . 0 0 8 . 0 0 8 . 0 0 6.82re la t iv e s
(b) Indigenous 6.67 6.67 6.67 2 0 . 0 0 60.00 19.20bankers
Notes: 1. Figures except for the la s t column, Source: Compiled from Lallare percentages o f borrowers from the (1984).indicated source.
2. The average is estimated as the weighted average o f raid points o f internals assuming a mid point o f 24% for the highest interval .
3. Lall points out that the method o f computation of in terest rates by indigenous bankers may resu lt in a substant ia l ly higher e f f e c t i v e interest rate .
4 6 4
CHAPTER 31
TEXTILE WHOLESALE TRADE IN INDIA
31.1 Introduction
31.1.1 Apart from certa in types o f c lo th that are d istr ibuted through the public d i s t r ib u t io n system, the bulk o f t e x t i l e s in India are d istr ibuted through the private sector d is t r ibu t ion system. Furthermore, most agents in the d i s t r ib u t io n chain between
t e x t i l e p r o d u c t io n u n i t s , whether in t e g r a t e d m i l l s or decentra lised powerloom units , and the consumer are in the small, unorganised s e c t o r . That i s , almost no f i rm s are o rgan ised limited companies and most f irms are small r e la t iv e to the t o t a l market. Most agents in the d i s t r ib u t io n trade r e ly primarily on own funds or informal sector c r e d i t . More importantly, many d is tr ibut ion agents are also important sources o f c r e d i t in their own r ight . Commercial bank c r e d i t i s r e la t i v e l y unimportant. Furthermore, these markets r e p o r t e d l y gen era te and use s u b s t a n t i a l amounts of unaccounted or improperly accounted funds.
31 .1 .2 While the study and understanding o f d i s t r i b u t i v e mechanisms, e s p e c ia l l y informal mechanisms l ik e that under d iscussion here, i s important in i t s own r ight , the ro le o f informal credit and unaccounted funds in the trading sector i s o f even greater in te re s t . Since the ro le played by d i s t r ib u t io n agents as
suppliers o f c red i t i s l inked to the s p e c i f i c role they play in
the d i s t r ib u t i o n system, a d escr ip t ion o f key features o f the d i s tr ibu t ion system must be provided.
465
31.1 .3 In this chapter our o b je c t iv e is to provide a descr ip t ion o f the t e x t i l e d i s t r ib u t io n trade in India emphasising the flow o f c re d i t and attempt the construct ion o f an analyt ica l model which w i l l f a c i l i t a t e an understanding o f i t s functioning. Understanding the ro le played by c re d i t is the main task we undertake. The framework w il l be used to study the e f f i c i e n c y o f the d i s
t r ibu t ion system and i t s impact on income d is t r ib u t i o n .
31.1 .4 For the empirical descr ip t ion we re ly on a pioneering India wide study by Abhinandan Jain e t . a l . (1982) supplemented by our own f i e l d work in the Bombay t e x t i l e wholesale market.
31.1 .5 The rest o f the chapter is organised as fo l lows . In sect ion 2 we describe the samples used in Jain e t . a l . (1982) and
in our own more modest f i e l d study. Sections 3 to 6 are descr ip t ive sect ions on prevail ing d i s t r ib u t io n systems, d is t r ibu t ion agents, the ro le o f c red i t and own funds and the nature o f the d i s t r ib u t io n market. In sect ion 7 a model o f the d is t r ibu t iv e trade is constructed paying f u l l attention to c red i t f lows. Sect ion 8 uses the model to explore the welfare implications o f in formal, i l l e g a l and bank c r e d i t . Section 9 o f f e r s some concluding comments and sect ion 1 0 contains po l icy recommendations.
31.2 Data base for the study
31 .2 .1 Jain e t .a l . (1982) th is pioneering study covered a to ta l o f 950 d i s t r ib u t iv e units (191 wholesalers, 556 semi-wholesalers and 203 r e t a i l e r s ) from 15 major t e x t i l e trading centres a l l - o v e r India in 1979. This sample was supplemented by in-depth case
studies o f a few trading and non-trading units , representative o f a l l types o f d i s t r ib u t io n agents, and also conversations with 'knowledgeable persons' in a l l the 15 centres. The sample represented an estimated 6.5 per cent of a l l wholesalers, 3.7 per cent o f semi-wholesalers and 0.06 per cent o f r e t a i l e r s or 0.31 per
466

cent of the overall population of these agents. Since the study was sponsored by some association s of te x t i le tr a d e r s ,1 data re lia b ility may be presumed to be high given the limitations of sample size relative to the total population. The study also threw up a wealth of invaluable q u a lita tiv e inform ation. By design, the study did not cover any non-trading agents such as
aratiyas (commission agents), angadias and brokers. Furthermore, since the decentralised (mostly small scale) powerloom sector has been growing rapidly in recent years and the integrated mill sector has been declining due to the high costs and obsolescence of the la tter , a new breed of production-cum-distribution agents, semi-manufacturers have recently gained in importance. These agents, not being widely prevalent in 1982, were not covered by the 1982 study.
31 .2 .2 Our fie ld survey (1988) Accordingly, it was decided to supplement the study by Jain e t .a l . (1982) with a small survey of a particular textile distribution centre. Bombay was selected because of its importance and because of the prevalence of the fu ll spectrum of distribution agents there. Office bearers of the 4 leading tex tile distribution agents associations, 6 bank o f f i
c ia ls , 3 semi-manufacturers, 9 aratiyas and 20 wholesalers were interviewed. Financial data were obtained on 18 wholesalers, 12 semi-manufacturers and 7 aratiyas. Of these, data on sales by wholesalers were rejected since their information differed exces
sively from the qualitative information on finances obtained to cross check the specific interviews. Due to reportedly widespread
1. The Maskati Cloth Market Association, Ahmedabad, The Bombay Piece Goods Merchants Mahajan and the Panchkuva Cloth Merchants Association, Ahmedabad.
2. This convenient term, coined by Anil Agarwal, Secretary of the Bharat Merchants Chamber, Bombay is not yet widely used.
467

tax evasion, sales data was not e a s i l y extracted from agents, who harboured the s u s p i c i o n that we were tax enforcement a g e n ts . Capital structure information i s , however, very s imilar to that in Jain e t . a l . (1982 ) . In the case o f semi-m anufacturers and arat iyas , most o f whom rece ive bank c r e d i t , f inanc ia l statements were available from banks. These statements may be taken to be
f a i r l y r e l i a b l e . A wealth o f useful qua l i ta t ive information on the role o f d i f f e re n t agents and interact ions between them was also obtained. Thus, while our study does supplement the study o f Jain e t . a l . q u a l i ta t iv e ly , on the quantitative side we have had
3le ss success, at least f o r sales by wholesalers.
31.3 Textile distribution systems^
31.3.1 The number o f d i s t r ib u t iv e agents intermediating between mills/powerlooms and consumers var ies between 2 and 6 . The s h o r te s t ch a in i s m i l l /p o w e r lo o m - s e m i -m a n u fa c tu re rs / se m i w h o le sa le r - r e t a i l e r and the l a r g e s t chain i s of the form mill/powerloom - trading agent/semi-manufacturer - wholesaler - n o n - t r a d in g agent - s e m i -w h o le s a le r - n o n - t r a d in g agent -
r e t a i l e r . Non-trading agents include brokers, m i l l ' s agents andaratiyas . Aratiyas are the predominant non-trading agent though, recent ly , brokers have been gaining ground. An addit ional agent, the angadia, plays a ro le as a cour ier o f cash between geographi-
3. S ince almost a l l sem i-m anufacturers and a r a t i y a s rece ive bank c r e d i t , the ir sample w i l l not d isplay s e r i o u s b i a s . The w h o le s a le r s samples i s c l e a r l y biased in favour o f those who cooperated with us but the nature o f bias is unknown.
4. To avoid frequent re p e t i t i o n o f our source we state at the outset that ( i ) a l l quantitative information for 1979 is from Jain e t . a l . , ( i i ) q u a l i ta t iv e descr ip t ion o f trading agents also draws heavily on the ir work and ( i i i ) while we have been s e l e c t iv e , many empirical f indings are due to them.
468

cal l o c a t io n s . Table 31.1 provides information on the geographica l coverage and cost o f d i s t r ib u t io n o f various systems.
31 .3 .2 Table 31.1 reveals a s tr ik ing feature o f the d i s t r ib u tion system: As the distance between consumers and producers in-
creases (whether measured by the index o f geographical reach, cost o f d is t r ibu t ion or t o t a l cap i ta l employed) the number o f l inks in
the chain increases . Return on cap i ta l also decreases as thenumber o f l inks increases, though not uniformly. The return to the typ ica l agent, who par t i c ip a tes in more than one system, w i l l be an average o f (appropriate proportions o f ) these f igures . This
is ind irect evidence that the transactions cos ts and r isk of serving customers increases with distance.
31.3.3 An addit ional feature revealed by our f i e l d study is that, when the t e x t i l e market is depressed, there is a tendency to reduce dependence on long chains even at the cost o f greater r isk . S p e c i f i c a l l y , in the c u r r e n t l y depressed t e x t i l e market, the volume o f sales intermediated by aratiyas has decreased. The importance o f non-trading agents in 1979 i s shown in Table 31.2. A
f ina l feature o f the d i s t r ib u t i o n system is that larger m i l l s tend to bypass wholesalers.
31.4 Types of agents: Their role as suppliers/users of credit and in the distribution of goods
31.4.1 The main t ra d in g agents are w h o l e s a l e r s , semi-tv
w h o l e s a l e r s , and sem i -m anufac turers . They are now b r i e f l y d escr ibed .
31 .4 .2 Wholesalers: Their main function i s to provide financeto the d is t r ib u t iv e trade and insulate m i l ls from price and quant i t y r isks emanating from the demand s ide. Along with arat iyas, wholesalers are the main f inanc iers o f t e x t i l e d i s t r i b u t i o n . Thus, while the major portion o f the ir purchases are against cash or on
469

sh o r t term c r e d i t , s a l e s are made on a r e l a t i v e l y long term c r e d i t . Jain e t . a l . (1982) report 51 per cent cash purchases and an average o f 31 days c r e d i t on c red i t purchases as compared to 84 per cent cred it sales and 55 days cred it given. Table 31.3 shows that the same trend has been maintained to the p r e s e n t . Wholesalers now o f f e r 53 days c red i t on average. However, i t was
reported to us that the to ta l c red it period may exceed 2 0 0 days because o f the currently depressed condit ion o f the market. Outright bad debts, reported to be 0.45 per cent o f sales in 1979, are now reported to be in the region o f 7 per cent to 8 per cent. Most wholesalers s p ec ia l i s e in a l imited product range. In fact some only deal in "g r e y ' (unfinished) goods which, in the d i s
t r ibu t ion market, is the most prest ig ious segment.
31.4 .3 Semi-Wholesalers: Their primarily function is to stock alarge variety o f goods to serve r e t a i l e r s in their regional submarkets. They serve to reduce search costs o f r e t a i l e r s . Their r o l e as s u p p l i e r s o f c r e d i t i s more l i m i t e d g iven th a t , on average, 67 per cent of goods were purchased on c red it averaging 48 days and 77 per cent o f sa les were c red i t sales with credit given civeraging 57 days in 1979. However, inventories were equal to almost tw i c e the number o f days o f s a l e s as compared to wholesalers in 1979 (43 days as against 22 days).
31 .4 .4 Retailers: Retai lers bought about 55 per cent o f goods oncredit averaging 51 days in 1979. Most r e t a i l sa les were on cash or very short term cred it ( 6 days) in 1979. However, inventories averaged 70 days o f sa les .
31 .4 .5 Semi-manufacturers: The number o f these agents has grownd r a m a t i c a l l y in recent t imes. Most semi-m anufacturers were formerly wholesalers or arat iyas , though some continue to carry on both the ir former and new a c t i v i t i e s simultaneously. These agents
purchase grey goods from powerlooms or wholesalers and have them
470

I
processed, according to their s p e c i f i c a t i o n s by the large number o f small processing and f in ish ing units in ex istence , under a putt in g out system. The l a t t e r is used to keep labou r c o s t s in check . Processed goods are r e s o l d to w h o l e s a l e r s , semiw h o le s a le r s or r e t a i l e r s . For u p - c o u n t r y s a l e s , n o n - t r a d in g
agents, mainly brokers, are used by them.
31.4.6 The main types o f non-trading agents in the wholesale segment are arat iyas , brokers and angadias.^
31 .4 .7 Brokers or indenting agents: These agents, may be l o cated e ither at the wholesale/semi-wholesale centre or in up- country markets. Brokerage rates are currently 1 per cent to 1.5 per cent of the value o f sa les . They use the ir superior knowledge o f the wholesale market to lower the transaction cost o f purchases by semi-wholesalers and r e t a i l e r s . They also play a role in communicating market i n t e l l i g e n c e to w h o le s a le r s and semiwholesalers. In recent times there has been an increase in the ro le played by brokers and a secular dec l ine in that o f arat iyas.
31 .4 .8 Angadias: Though not formally a part o f the t e x t i l e d i s
tr ibu t ion system, th is t rad i t io n a l Inst i tu t ion plays a s ign i f i can t role in speeding up payments and other f inanc ia l transfers . Bank
cash re m it tan ce f a c i l i t i e s in India are n o t o r i o u s f o r t h e i r delays , i n e f f i c i e n c i e s and high prices. Angadias^ who provide a
5. We d e l i b e r a t e l y n e g l e c t agents between m i l l s and w h o l e s a l e r s / s e m i - w h o l e s a l e r s and between semiw h o le s a le r s and r e t a i l e r s . The former p lay a r e l a t i v e l y passive ro le as s e l l in g agents for mi l ls and the la t t e r are r e l a t i v e l y unimportant according to Jain e t . a l . (1982) .
6 . The r e c e n t , l u d i c r o u s , case o f computer read ab le cheques i l l u s t r a t e s th e ir gross in e f f i c i e n c y . By a central bank (Reserve Bank o f India) d i r e c t i v e , only s e l e c t m e t r o p o l i t a n bank branches s t i l l have the f a c i l i t y o f encashing t r a d i t i o n a l bank d r a f t s and
471

cheap , quick and reportedly secure way o f transmitting funds have t h e r e f o r e been ga in ing in importance in recent ye a rs . Thus, though they neither supply nor use eredit from t e x t i l e markets, they have an important ro le to play in providing e f f i c i e n t in fo r mal f inanc ia l s e rv i c e s to t h i s s e c t o r .
3 1 .4 -9 Aratiyas: There are between 750 to 800 aratiyas in the
Bombay market intermediating an estimated 65 per cent to 70 per cent o f s a l e s . A ra t iy as make purchases from m anufac turers / w h o l e s a l e r s / s e m i - w h o l e s a l e r s on b e h a l f o f s e m i - w h o l e s a l e r s / r e t a i l e r s and arrange for the ir dispatch to these c l i e n t s . Their rate o f commission i s normally 2 per cent to 3 per cent over the purchase pr ice . An addit ional ro le they play is to extend cred it
to their c l i e n t s since the c re d i t they rece ive (2-3 months) is
l ess than the c red i t given to c l i e n t s (upto 6 months). Along with
wholesalers they are the main f inanciers o f t e x t i l e d i s t r i b u t i o n . In order to preserve the ir credit rating, aratiyas seldom default or delay payments. This has been confirmed by several persons interviewed. Aratiyas sp e c ia l i s e in part icu lar up-country sub- markets which they v i s i t during the lean season (peak season is normally the f e s t i v a l months between September and December). They act as pure informal lenders outside the t e x t i l e business during the lean season. In f a c t , many a r a t i y a s are former Gujarati Shro f fs , who, due to r e s t r i c t i v e p o l i c i e s , have found it d i f f i c u l t to survive as pure indigenous bankers. This t rans it ion had been well under way even a decade ago (Timberg and Aiyar, 1980). Thus, arat iyas , due to their intimate knowledge o f the
cheques though most non-metro branches do not as yet have the new t e c h n o lo g y . The p r o t e s t s o f t rad in g a ssoc ia t ions have, so far , gone unheeded.
7. L i t e r a l l y "Those who c a r r y on t h e i r p e r s o n " . See Timberg and Aiyar (1980) for an e a r l i e r reference to them.
472

wholesale market and part icu lar up-country markets, serve an important transactions cost reducing ro le . More importantly, due to the ir superior knowledge o f up-country markets and the ir ro le as suppliers o f informal c r e d i t , they serve to reduce the to ta l r isk cost o f the d i s t r ib u t io n system. Though Table 31.5 shows that arat iyas are net r e c ip ien ts o f c r e d i t , i t a lso shows that, of a l l agents, the loans and advances by aratiyas t i e up the greatest share o f the funds avai lable to them. This state o f a f f a i r s , given that arat iyas are the best informed about the creditworth i ness o f customers o f a l l intermediate agents, suggests that in f o r mal cred it markets are r e l a t i v e l y e f f i c i e n t informationally .
31.4 .10 Agents cost structures: The to ta l cost o f doing business
fo r a l l agents except arat iyas is very low, with the exception o f bad debts (which are, currently , high) and the processing costs o f semi-manufacturers. Table 31.4 provides relevant d e t a i l s .
31.5 Role of bank and informal credit
31 .5 .1 Commercial bank credit: Although bank cred i t is a re la
t i v e l y unimportant source o f c a p i t a l f o r a l l agents in the market:, the experience o f d i f f e r e n t agents varies with their c o l la te r a l a v a i l a b i l i t y . Semi-manufacturers and wholesalers get o v e r d r a f t o r "cash c r e d i t " f a c i l i t i e s upto s p e c i f i e d l i m i t s aga inst h y p o t h e c a t i o n o f s t o c k - i n - t r a d e , t ra d in g premises or guarantees by propr ie tors /par tners in their personal capacity . The l im its are normally very conservative re la t iv e to the value of c o l l a t e r a l . Table 31.5 shows that a l l wholesalers in the sample
use cash c red i t while two o f them also have overdraft f a c i l i t i e s . Although Table 31.5 shows only two wholesalers as having b i l l d i s
counting f a c i l i t i e s from commercial banks due to the small sample, i t was reported in our f i e l d work that most wholesalers, semimanufacturers and a r a t i y a s have b i l l d i s c o u n t i n g f a c i l i t i e s . Aratiyas, s ince they hold l i t t l e or no stock in trade, are unable
473

to o f f e r any acceptable c o l l a t e r a l to banks and are therefore r e s t r i c t e d to b i l l discounting. I f we look at the bank-wise d i s tr ibu t ion o f account holders (Table 31 .6 ) , i t may be seen that the majority o f customers from this sector are d i s s a t i s f i e d with both the finance received and their bankers.
31 .5 .2 Two types o f malpractices have come to l ight in our d i s c u s s i o n s . There are r e p o r t e d l y brokers in the market who guarantee the provis ion o f bank loans against bribes (such bribes are picturesquely ca l l e d 'paperweight ' ) the going rate being 2 per cent o f the cred it l imit sanctioned by banks. Secondly, at the consignee end in up-country sa les , consignees pay bribes to bank managers and transport operators to release consigned goods before
the bank rece ives payment on the b i l l o f exchange. Consigners (arat iyas , wholesalers , semi-manufacturers or semi-wholesalers) are then forced to pay back the principal and interest on d i s honoured b i l l s and attempt recovery o f sales proceeds d i r e c t ly from customers. Several arat iyas and wholesalers reported such corruption (see Table 31 .6b) . Of other reasons for d i s s a t i s fa c t ion, the most serious reasons wore delay in the provision o f serv ices , high bank charges and poor customer serv ice . Associat ions of agents in Bombay have been lobbying for credit against hypothecation o f book debts, f o r the f a c i l i t y o f g iv ing loans to groups of traders and for rais ing the c red i t l imit to c o l l a t e r a l rat io in order that the usefulness o f bank serv ices may be enhanced. They have yet to meet with any success.
31.5 .3 The normal bank interest rate is 16.5 per cent per
annum (exc lus ive o f bank charges) .
31.5-4 Cooperative bank credit: The share o f such c red i t is evenlower than that o f commercial banks. Cooperatives normally charge a white i n t e r e s t ra te o f 18 per cent per annum coupled with reported black interest at 6 per cent .
4 74

3 1 .5 .5 Informal credit: Informal c red i t is the major source o fborrowed funds for a l l agents. As discussed, d i s t r ib u t io n agents ensure that c red i t received by them from primary c re d i t o rs is passed down the d i s t r i b u t i o n cha in . The major s u p p l i e r s o f
primary informal cred it to the market are ' f r i e n d s and re la t ives " at a widely reportedly , 15 per cent to 18 per cent per annum, 18
per cent being the most prevalent rate. Intra-market loans at the same interest rate are also common. It was found in our survey that out o f 28 wholesalers , 18 received loans from friends and re la t ives at an average rate 14.97 per cent per annum (see Table 3 1 .7 ) . Similarly , o f 12 semi-manufacturers and 6 arat iyas , 10 and
5 resp ec t ive ly received loans from friends and re la t iv e s at an
average rate 16.5 per cent per annum. 'O th ers ' re ferred to in Table 31.7 are mainly intra-market loans. The upper bound on interest rates at which agents can take loans i s f ixed p e r io d i c a l ly by agent 's assoc ia t ions . Since loans from ' f r i e n d s and r e l a t i v e s ' are a popular method of laundering own black funds, much o f th is
ocred it may in fac t be unaccounted wealth. Informal cred it for the sample was, without exception, unsecured and without any mar
gin requirement. However, in a l l cases, borrowers had personal
and/or long standing assoc ia t ions with lenders which may be looked
upon as im pl ic i t security . Most informal loans are repayable on demand but can be substituted by other informal loans unless there is a general ly t ight c re d i t market.
31 .5 .6 Trade c re d i t given by agents are subject to delayed payments, and less frequently , outright de fault . Currently, 75-90
days i s r e p o r t e d to be the p r e v a i l i n g r e c o v e r y p e r io d f o r wholesalers though th is i s not uniform. E f f e c t iv e ly , the price o f
8 . This has been communicated to one o f the authors by an income tax o f f i c i a l .
475

goods sold to borrowers var ies with the ir ( s u b je c t iv e ly assessed) c red i tw orth iness .
3 1 .5 .7 Sources, uses and cost of funds: Quantitative data: Table31.8 to 31.11 present quant itative information on the sources,
uses and cost o f funds o f d i f f e r e n t agents covered by the two f i e l d studies. The main c h a r a c t e r i s t i c s revealed by Tables 31.8 to 1 1 are as fo l lows :
1. Aratiyas rece ive more bank finance than trading inter m e d ia r ie s . However, they a lso r e c e i v e more in fo rm a l finance except as compared to semi-manufacturers.
2. Except for semi-manufacturers a l l trading intermediaries re ly s i g n i f i c a n t l y on own funds, r e t a i l e r s being the most const ra ined .
3. The proportion o f funds outstanding by way o f loans and advances is highest for aratiyas. However, they are net rece ivers o f c r e d i t .
4. W h o le sa le rs and s e m i -w h o le s a le r s are net s u p p l i e r s o f c red it .
3 1 .5 .8 Illeg a l funds and tax evasion: As we have mentioned, dataon sales for wholesalers c o l l e c t e d by us were not r e l ia b le and
diverged s ig n i f i c a n t ly from other estimates. Since wholesalers harboured suspicions that we were tax enforcement agents, sales f i g u r e s r e p o r t e d to us were presumably those r e p o r te d to tax auth or i t ie s . Using data from Jain e t . a l . (1982) a guesstimate o fincome tax evasion and under-reporting could therefore be made.^ Our guesstimates, given in table 31.7, are computed as fo l lows:
Pj_ = (x JK - S1 )m/xJKi
where
9. We are g r a t e f u l to Tapas Sen f o r su gg es t in g t h i s p o s s i b i l i t y and also helping us with the formulae.
476

i s under-reported p r o f i t as a proportion o f sa les for the ith wholesaler,
x i s 0.75, 1.0 or 1.25 f o r lower, median and upper estimates,
J is the sales to to ta l cap i ta l employed rat io as in Jain e t . a l . (1982), J= 5.1963,
is the cap i ta l reported by the ith wholesaler in our sample,
i s reported sales by the ith wholesaler and
m is the average p r o f i t rate before tax o f wholesalers in Jain e t . a l . (1982), m=0.058.
Thus xJK is our estimate o f true sa les .
31.5'. 9 When we assume a conservative 15 per cent e f f e c t i v e rate
o f income taxation we get the guesstimates in Table 31.12. According to these f igures , about 0.78 per cent o f t o ta l sales are evaded taxes. Consequently, since t o ta l sales in the t e x t i l e sector were Rs 6222 crore in 1986-87 (Ministry o f T e x t i l e s , ) the amount o f evaded taxes in that year was about Rs 49 crore . This compares to a t o ta l estimated informal c red i t stock o f Rs 3311
crore (based on f igures from Chapter 16). I t should be noted, furthermore that this i s only an estimate o f income tax evasion and not o f sales tax or l o c a l tax evasion.
31.5 .10 Bank credit versus informal credit: The f i r s t feature tonote is that the e f f e c t i v e bank interest rate we have reported,i n c l u s i v e o f "p ap e rw e igh t" and bank c h a r g e s ,_i s h i g h e r , on
average, than the informal interest rate . That banks require c o l la te ra l but informal lenders do not i s also important. This runs counter to the usual f inding for informal and curb markets. The f inding is based on oral evidence, we remind the reader, o f around 40 interviewers and may be taken as f a i r l y r e l i a b l e given the lack o f contrad ictory reports . This evidence is i n d i r e c t ly supported
477

by two considerations.
31.5.11 F i r s t , there i s the l i m i t e d in form al c r e d i t in the
market as a whole at , furthermore, a rate o f interest f ixed by the
assoc iat ions in the short run. Secondly, the fact that agents reported that they need bank cred it f a c i l i t i e s most in the peak
season, corresponds with a p r io r i expectations o f the use o f a high interest source o f loans. Furthermore, Table 31.13 reveals that banks f in a n c e r e l a t i v e l y i n e f f i c i e n t a g e n ts , judg ing by p r o f i t a b i l i t y , to the extent that higher bank charges are not the cause o f lower p r o f i t a b i l i t y . However, since there is a gap between the demand for c red it and supply o f informal cred it during the peak season, by providing funds to agents formal cred it does play a useful r o le , though t h is can c le ar ly be enhanced.
31.5.12 The d ist inguishing features o f informal c red it - speed,in formality and absence o f c o l l a t e r a l requirements - are.normally c i ted as reasons for their being preferred to bank funds. In this sector the lower cost o f informal finance is also important. On
the whole, given the peak season ro le o f bank cred i t under current
cond it ions , bank and informal finance can be seen to be complementary.
31.5.13 A f in a l feature o f informal c red i t may be mentioned. Though there were no cases o f th is in sampled firms, higher cost informal c r e d i t , from indigenous bankers, was reported to be asource o f funds i f c red it from fr iends, the market and the banks was inadequate. However, recourse to such c re d i t would be a signal
o f extreme d is t ress and would not be publ ic ised by firms using i t .
31.6 The structure of markets in the distribution system
31.6.1 The f i r s t po in t to note in t h i s c o n t e x t i s theprevalence o f tied cred it and goods transactions in the t e x t i l e
478
market. This can be attr ibuted to the lower informational cos ts o f market agents in supplying c red it as well as due to the high transactions costs o f obtaining formal c r e d i t . ^
31.6 .2 Secondly, though there is s p e c ia l i s a t io n in part icu lar goods within the market, the degree o f price competition in a l l
segments may be taken to be high since most goods have e ither close substitutes or many s e l l e r s . Furthermore, entry and ex it barr iers do not appear to be a major f a c to r . In the currently depressed market, i t is reported that agents, mainly wholesalers , are downing shutters every week. F inal ly , s ince , in Bombay, a l l agents have their establishments c lose to each other - many under the same r o o f ^ - widely dispersed pr ices are d i f f i c u l t to sus
t a in . It is t h e r e f o r e reasonab le to suppose that the Bombay markets, fo r each type o f agent, are competit ive or nearly so. Up-country markets, being l o c a l i s e d , are le s s competit ive.
31.6 .3 Agents are organised, along community l in es or according to s p e c ia l i s a t io n , into four Associat ions . Associations have
their own dispute a r b i t ra t io n mechanisms (p a r a l l e l courts) whose rul ings are generally fo llowed. Their main funct ion , however, i s
to serve as lobbying organisat ions with banks and government. A th ird , in terest ing , ro le j o i n t l y played by assoc ia t ions is to
serve as the ' a u c t io n e e r ' for the f ix a t io n o f informal interest rates , since both borrowers and lenders belong to these assoc ia t ions . This makes the interest rate unresponsive to short term f luctuations in loan market condit ions but not long term trends.
10. Such c o s t s are standard e x p la n a t i o n s in the th e o re t i ca l l i t e r a t u r e on inter l inked transactions . See, f o r example, Bardhan (1980) .
11. V i s i t s to Surat and C a l c u t t a , two o th e r l e ad in g t e x t i l e d i s t r i b u t i o n c e n t r e s r e v e a l much the same lo ca t io n a l pattern as in Bombay.
479

31.7 A model of trade and distribution
31 .7 .1 Basic features: In order to examine the ro le o f c r e d i t , we now construct a stripped down analyt ic model. The framework con
t a in s three a c t i v e a g e n ts , an in te rm e d ia te t rad in g agent , ' w h o l e s a l e r s ' , a purchasing agent ' r e t a i l e r s ' (or semiwholesalers) and a non-trading agent, arat iyas . The wholesale sub-markets i s assumed to be competitive and have many agents o f each type while r e t a i l e r s are assumed to face downward sloping demand curves. Aratiyas are assumed to have scale economies due to c o s t s in cu rred during t h e i r o f f season search a c t i v i t i e s . Nevertheless, given the absence o f entry barr iers and also the d i f f i c u l t y faced by aratiyas in responding quickly by lowering
pr ices once a r iv a l e f f e c t s entry, they are assumed to, set entry deterr ing l imit pr ices . The d i f f i c u l t y in speedy responses to entry occurs s ince arat iyas are not l i k e l y to r e a l i s e that a r iva l has entered the market t i l l a f ter some customers are l o s t , given that they would have returned to the wholesale centre from the up- c o u n tr y t r i p . Other s t y l i s e d assumptions g leaned from the
d esc r ip t ion given above are: the gross information structure which wholesalers have on the c red i t worthiness o f r e t a i l e r s and the better information structure o f arat iyas for r e t a i l e r s from the regions they serve; the fact that transactions costs increase with the distance o f the r e t a i l from the wholesale market; and the opt ion that r e t a i l e r s have o f making cred it purchases d irec t from w h o le s a le r s or a r a t i y a s . The fa c t that w h o le sa le rs in s u l a t e producers from demand shocks is taken into account by assuming that purchases from producers are made at a predetermined pr ice .
Quantity insulat ion through inventory adjustment by wholesalers is omitted for s im p l i c i ty .
31 .7 .2 Besides the assumption o f only 3 types o f agents, the main simpli fy ing assumptions are:
480
1. A l l agents are r isk neutral p r o f i t maxiraisers and each type of agent is ident ica l with every other agent o f the same type except as s pec i f ied for r e t a i l e r s .
2. In the 'medium' run (when informal interest rates can vary) the opportunity cost o f own c ap i ta l o f wholesalers and a r a t i y a s i s the in form al i n t e r e s t r a t e . The 'medium' run is dist inguished from the ' l o n g ' run here in an attempt to capture the fragmentation o f markets. Though the supply o f c r e d i t in the market s e rv in g arat iyas and wholesalers is small r e la t iv e to the ent ire c r e d i t market, the supply of funds i s not p e r f e c t l y e la s t i c in the medium run and the interest rate is not a datum to the system.
31.7.3 The main purpose o f the ana lyt ica l exerc ises undertaken is to explore the e f f i c i e n c y and regional income d is t r ibu t ion im
pact o f informal c red i t supply by wholesalers and arat iyas. We find that both e f f i c i e n c y and income d is t r ib u t i o n are improved.
However, in terest ing d i f fe ren ces ex ist between the e f f e c t s o f credit through wholesalers and arat iyas .
31 .7 .4 Agents
R eta i le rs : Define the fo l lowing notation:
p = Wholesale pr ice of t e x t i l e s .
= Reta i ler s p e c i f i c per rupee transactions, search or brokerage cost appl icable on d irect purchases from wholesalers. We have .
H = Wholesaler 's premium over the cash sale price appl ied on c re d i t sa les .
I = Aratiyas ' premium over the market p r i ce .
s = R e ta i l e r s ' discount fa c to r , s = l / ( l + r ^ ) , common to a l l r e t a i l e r s .
Reta i lers are assumed to incur transactions , cos ts i f they buy d i r e c t l y from wholesalers . They stock their shops on date 1. Retail sales and payments to w holesa lers /arat iyas are made on date
481

2. T r a n s a c t io n s c o s t s w i l l , in gen era l be a f u n c t i o n o f the r e t a i l e r s distance from the market, the quantity o f goods purchased and the pr ice o f goods purchased. Quantity a f f e c t s costs s ince r e t a i l e r s buy many v a r i e t i e s so that each unit or lo t has individual search requirements. Shipping costs a lso r ise with
quantity. Price enters due to brokerage or fre ight insurance costs and because expensive t e x t i l e s w i l l necessitate a more careful search in order to s a t i s f y discriminating customers in l o c a l markets. The simplest function that captures a l l three elements i s the function C^pq. This i s , accordingly , assumed.
31 .7 .5 Reta i lers face ident ica l state-dependant downward sloping demand curves. The inverse demand curve is assumed to be
R = N-j - 0. 5q with probab i l i ty x in state 1 and (1)
R = N2 ~ 0.5q with p robab i l i ty (1 -x ) in state 2 (2)
where
31.7 .6 R eta i lers may e ither buy goods from the wholesale market fo 1c cash or make cred it purchases through wholesalers or arat iyas.
In the event o f purchases through arat iyas , no transactions costs need be incurred. In the event that state 1 (the good state) occurs, r e t a i l e r s are assumed to honour their debts to wholesalers or arat iyas. I f state 2 occurs, r e t a i l e r s are assumed to honour only a f ra c t io n J o f the ir debts. Expected r e t a i l p r o f i t s are there fore given by
Ec = s (N-0.5q)q - p ( l+CR)q (3)
Ew = s(N-0.5q)q - p(sVH+CR)q (4)
Ea = s (N-0.5q)q - pVIq (5)
482

where N=xN^+(l-x)Nz ; V=x4-(l-x)J and EQ, Ew and Ea are r e sp e c t ive ly p r o f i t s given cash purchases, c red i t purchases through wholesalers and cred it purchases through arat iyas . In what follows we w i l l
treat N as constant so that each r e t a i l e r has the same market s ize
in this sense. Im p l i c i t ly there fo re , Nj_ and N2 are assumed to vary as x var ies so as to leave N constant. From here, r e t a i l e r s
demand curves on the wholesale market can be found to be
Clearly, r e t a i l e r s w i l l choose the option with the lowest unit costs .
31 .7 .7 Wholesalers: Define the addit ional notation
r = Market interest rate.
g = Wholesaler 's sub jec t ive probab i l i ty o f rece iv ingpayment from a buyer o f type g, common to a l l wholesalers . g*l for arat iyas . g i s assumed to be a constant for a l l d i re c t sales to r e t a i l e r s .
31 .7 .8 Wholesalers are assumed to borrow (or lend) own funds and purchase t e x t i l e s from producers on date 1. The market meets on date 1 and goods are del ivered on that date. Payments are received on date 2 and loans plus interest are paid out on the
qc = N-p( i+cR/ s ) ( 6 )
qw = N - p ( V H + C r / s ) (7)
qa = N-pVI ( 8 )
m = Per-unit ex-mil l pr ice o f t e x t i l e s .
k^ = Own cap i ta l o f wholesalers assumed to be given.
by = Borrowed c ap i ta l o f wholesalers .
483

same date. The per period opportunity cost o f wholesalers ownfunds is the market in terest rate r in the medium run. Additionaltransactions costs are incurred on date 1 and payments made on
2date 2 along with addit ional in terest . These costs are y+Q y, so that, adding interest c o s t , a normal quadratic cost function is
assumed. Competition between wholesalers ensures that the expected present value of payment per unit o f sa les received on date2 equals the market price p prevail ing on date 1. That i s p = gpH /( l+r ) , so that
H = ( l + r j / g (9)
31.7 .9 No id le balances are kept by firms, so that goods purchased are ^ = f w/m. In the aggregate, th is g ives
Q = Fw/m = (%+!<„)/m. (10)
Thus, a who lesa ler 's p r o f i t s are given by
pq - mq - q2 - y
31.7 .10 In medium run zero p r o f i t e q u i l i b r i u m , the p r i c e i s given by the minimum o f the average cost curve and i s , with our assumpt i o n s , constant :
andp = 2 y0 - 5 + m ( 1 1 )
Qw = y0-5 (12)
31.7.11 Arat iyas : Aratiyas borrow (or lend) on date zero and incur fixed costs o f information c o l l e c t i o n from both the wholesale market and the up -cou n try market they serv e . The up -cou n try market is assumed to consist o f r e t a i l e r s , a l l o f whom have the
484

same c o s t parameter CR. These c o s t s are denoted by Z. The remaining funds, i f any, are lent out on the market t i l l date 2 . On date 1 arat iyas order goods from wholesalers and despatch i t to customers. On date 2, wholesalers are paid, payment i s received from c l i e n t s and loans p lus accrued i n t e r e s t paid o f f . An
ara t iy a 's subject ive p ro b a b i l i t y that a r e t a i l e r defaults is V,
which i s taken to be equal to the true p r o bab i l i ty , based on a knowledge o f r e t a i l demand condit ions in the up-country market.
Given that the fixed costs incurred by aratiyas are their majorcost item apart from in terest costs and the opportunity cost o ftheir own funds, we assume away the existence o f other, nonlinear cost terms. For reasons discussed e a r l i e r , each aratiya is assumed to o p e r a te in a c o n t e s t a b l e market and to l i m i t p r i c e .
Limit pr ic ing i s j u s t i f i e d given that aratiyas would find i t d i f f i c u l t to adjust the ir premium after entry occurs since they would
have returned from their t r ip to the ir up-country market. Since ¥
there are no other entry barr ie rs , the l im it pr ice is assumed togive arat iyas zero p r o f i t s . Thus, I i s set so that
\
Vplqa - p ( l+ r )q a - Z ( l+ r ) = 0 (13)
Using 8 in 13, I may be determined- From 13, using 8 , i t i s easyto show that
I = f ( r ,N ,Z ,p ) /p V ; f r>0; f N<0; f z>0 (14)
F inally , demand for borrowed funds i s given by (Z+pqa~Ka) where Ka i s the a r a t iy a ' s own funds.
31 .7 .12 The role of credit: A f u l l s p e c i f i c a t i o n o f market equil ibr ium w i l l require the s p e c i f i c a t i o n o f demand/supply equil ibrium in the wholesale market the sub-market served by arat iyas and the c r e d i t market to which arat iyas and wholesalers but not r e t a i l e r s have access . In add it ion , expectat ional equilibrium
485

r e q u i r e s that the ex post unit p r i c e r e c e i v e d by w h o le s a le r s equals the (ex ante) expected value (gpH). Otherwise, wholesalers w i l l revise their b e l i e f s . While such an exerc ise and the ident i f i c a t i o n o f condit ions under which an equilibrium ex is ts i s e a s i l y undertaken, i t w i l l entai l a lengthy d igress ion from the main o b je c t iv e o f th is sect ion . Instead, we simply assume that the e x i s t e n c e and s t a b i l i t y o f e q u i l i b r i u m f o r the system just d e s c r ib e d And proceed d i r e c t l y to an a n a l y s i s o f the ro le o f
c r e d i t .
31.7 .13 To analyse the impact o f informal c red i t we f i r s t part i t i o n the set o f pairs (V,CR), which ident i fy r e t a i l e r types, according to their preferred route o f purchase. Note that CR indi cates the distance of a r e t a i l e r from the wholesale market and V measures the v a r i a b i l i t y in demand, with low V indicat ing a higher p robab i l i ty o f the bad state occurring .
31.7.14 Equating ( 6 ) , (7 ) and ( 8 ) a f ter substi tuting (1 4 ) , weget three l o c i : The locus o f ind i f ference between cred it purchases through wholesalers and cash purchases (wc), the ind i f ference locus between cred it from aratiyas and wholesalers (aw) and the
locus o f in d i f fe re n ce for arat iyas purchases and cash purchases ( a c ) . These are given by
31.7.15 The three l o c i are p lotted in Figure 31.1. The arrow in
the north-east o f the f igure indicates the d i r e c t io n in which r e t a i l e r s facing greater disadvantages in terms o f distance from wholesale markets and v a r i a b i l i t y in demand' are to be found. The f igure at once provides a f i r s t insight into the ro le played by informal c re d i t whether through wholesalers or arat iyas .
sV = 1/sH sV(1-H)= cR sVl = ( l + c R)
(wc)(aw)
(ac)
(15)(16) (17)
486
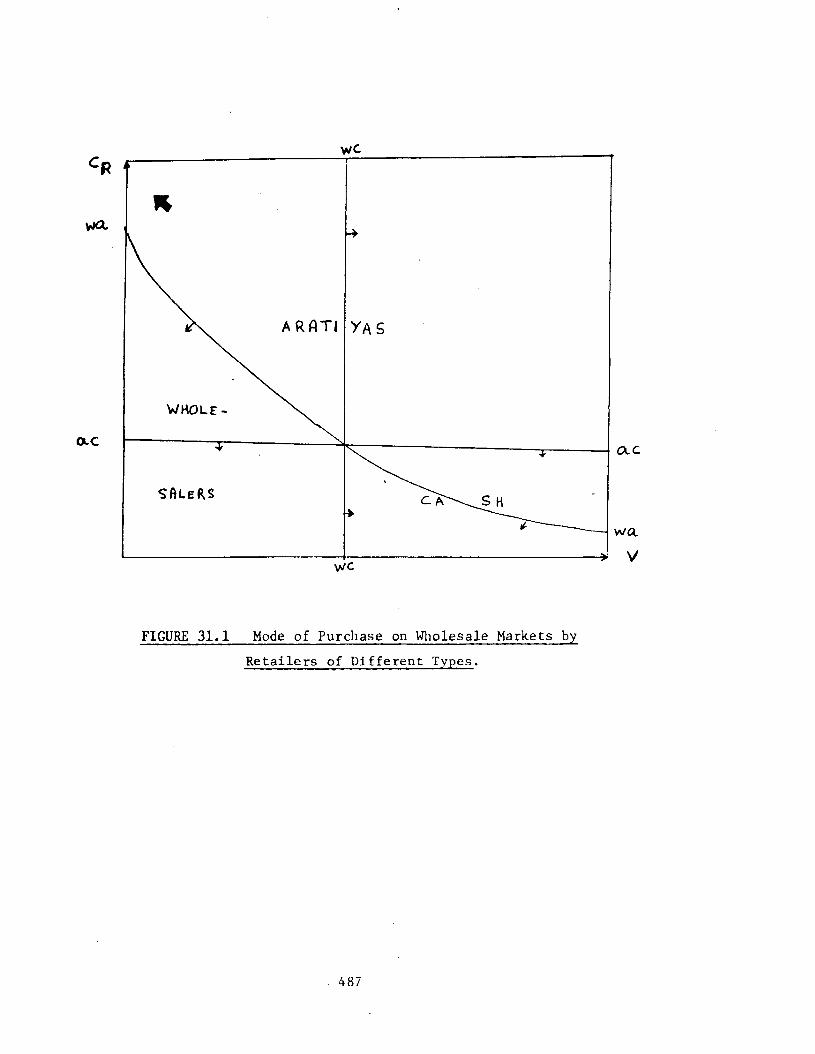
FIGURE 31.1 Mode o f Purchase on Wholesale Markets by Reta i lers o f D i f fe rent Types.
487
Property 1: Existing informal cred it channels in thew h o le sa le market s e l e c t i v e l y lower c o s t s o f d isadvantaged r e t a i l e r s . Only r e t a i l e r s in markets near at hand with r e l a t i v e l y constant demand do not a v a i l o f in form al c r e d i t provided by
wholesalers or arat iyas .
31.7 .16 A second property which i s a lso evident is the fo l low ing.
Property 2: I f r e t a i l e r s with a given c R are served byc r e d i t from both a r a t i y a s and w h o l e s a l e r s , then, o f these r e t a i l e r s , wholesalers serve r e t a i l e r s with greater demand uncer
ta inty (lower V).
31.7.17 Property 2 can be used to der ive an addit ional insight into the role o f informal c re d i t . From the structure o f the model i t i s evident that some r e t a i l e r s would continue to make' purchases through arat iyas even i f they did not o f f e r any c r e d i t . Their main ro le is to reduce transactions c o s ts , though aratiya credit
does ensure that aratiya serv ices are used by more r e ta i l e r s than would o therw ise be the c a s e . However the c r e d i t asp ect o f wholesaler cred it sales i s c ruc ia l for i t to have an advantage over cash sa les . Thus we have
Property 3 : Informal cred it serves primarily to d is t r ibu te the costs o f demand uncertainty through the d i s t r i b u t i on chain though i t does aid in reducing transactions costs as well .
31.7 .18 Additional insight into the e f f e c t s o f informal cred it may be gained by measuring i t s impact on the e f f i c i e n c y o f goods d i s t r ib u t io n . An appropriate yard s t i ck f o r th is i s the expected d i f f e r e n c e between r e t a i l p r i c e s f o r cash and c r e d i t s a l e s . Noting that the expected r e t a i l pr ice is N-0.5q we can get in the
488

E ff i c ien cy gain = p ( l-VsII) /2s
and in the case o f credit from aratiyas
E f f i c ien cy gain = p (1+c^ - sVI) /2s
Since Vi does not change with respect to V in view o f (14) we may state
Property 4: The e f f i c i e n c y gain due to informal cred it
from wholesalers increases as demand v a r i a b i l i t y increases but is independant o f the distance between the r e t a i l market from the wholesale market. Conversely, the e f f i c i e n c y gain due to sales through arat iyas Is independant o f demand v a r i a b i l i t y but increases with distance between the r e t a i l and wholesale markets.
31.7 .19 It is c lear that the e f f i c i e n c y gain for r e t a i l e r s a l ready using informal c red i t w i l l increase i f there is a greater
external supply o f informal c red i t ( lower r) to wholesalers and aratiyas. Also, in this event, the cash sa les region in figure 1
w i l l shrink. Finally i t is e a s i ly shown that arat iyas w i l l gainmarket share r e la t iv e ly to wholesalers, due to scale economies, i f
12e x te rn a l in formal c r e d i t supply i n c r e a s e s . Thus, in c r e a s e d supply o f informal credit expands the market share of aratiyas and also cred it transactions as a whole.
Vcase of credit from wholesalers
12. From (16) this requires d (I -H) /dr>0. Note from (13) that I=(Z+pq)( l+r)/pqV and H =(l+r ) /g , and also from (16) that I>H for CR to have an in te r io r so lut ion . Now I >H is e q u iv a le n t to I / ( l + r ) > l / g . Thus i t s u f f i c e s show that d l / d r > l / ( 1 + r ) . Simpled i f f e r e n t i a t i o n and comparison o f the r e s u l t i n g expressions es tab l ishes t h is .
489

31.7 .20 These f indings , besides having e f f i c i e n c y implications also have implications for income d is t r ibu t io n . That the benef i ts from in form al c r e d i t through a r a t i y a s in c r e a s e ( o r does not decrease) with the distance separating r e t a i l e r s from wholesale markets means that in form al c r e d i t promotes i n t e r - r e g i o n a l
equal isat ion o f real income. Secondly, i t may also be argued that since cred it through wholesalers leads to a greater absolute cost reduction in regions with greater demand v a r i a b i l i t y , i t too leads to regional income equal isat ion . The argument is as fo l lows . Demand v a r i a b i l i t y , in the sense taken in th is study, w i l l depend both on the v a r i a b i l i t y o f consumer income and the ir income e las
t i c i t y of demand for t e x t i l e s . The demand for t e x t i l e s i s l ik e ly to have a greater income e l a s t i c i t y in very poor regions o f India
rather than in the b e t t e r o f f r e g io n s . Consequent ly , g iven equally var iab le consumer income in the sense o f equal c o e f f i c ien ts o f va r ia t ion , poorer regions w i l l have a more variable demand for t e x t i l e s . Thus we may state
Property 5: Informal cred it through aratiyas and, undersome cond it ions , wholesalers promotes regional income equalisation.
31.7.21 The i m p l i c a t i o n s f o r p o l i c y are c l e a r . More funds should be made avai lable to wholesalers i f demand v a r i a b i l i t y i s perceived to be a major contr ibuting factor to in ter -reg iona l inequal i ty . Likewise i f promotion o f more equal t e x t i l e prices
across regions is des irab le , more funds should be made available to arat iyas. In both cases, average e f f i c i e n c y o f t e x t i l e d i s -
13. Note that r e t a i l e r s may s t i l l have the same expected market s ize i f they serve more customers in poorer areas.
490
t r ib u t io n increases . Furthermore, given the informational disadvantage o f banks, formal c r e d i t should not attempt to supplant the cred it supplying ro le o f wholesalers and arat iyas in the d i s t r ib u t ion chain.
31.7.22 We now turn to a b r i e f examination o f black funds.
3 1 .7 .2 3 Black money: While a f u l l analysis o f black money and evasion would f i r s t c a l l for the introduction o f taxes, a task beyond the scope o f th is paper, some general remarks can be made. A nondistort ionary tax can be introduced by subtracting a fixed amount, t , from wholesa lers ' and ar a t iy a s ' p r o f i t s i f a s imilar amount is a lso deducted from the opportunity cost K^(l+r) or K ^ l + r ) . In the absence o f evasion, p r o f i t equations are unaffe c ted . Tax evasion i s then seen as a dec larat ion o f bankruptcy when, in f a c t , excess funds are ava i lab le . This lowers the expected tax burden on the t e x t i l e business, and is therefore equal to a decrease in the f ixed c o s t . 1 This w i l l , c l e a r ly , lead to an increase in investment in the d i s t r ib u t i o n industry in zero p r o f i t equilibrium which lowers pr ices and raises welfare in this sector .
Thus the general welfare decreasing e f f e c t s o f black money (due toreHuced tax revenues, funds not f lowing to the ir most productiveuse and d istor ted opportunity c o s t s ) may be mitigated by welfareincreases in the sector o f o r ig in , t e x t i l e d i s t r i b u t i o n . This suggests that in designing optimal enforcement p o l i c y f o r a sector , the government needs to weigh both d irect and ind irec t costs of stepped up enforcement, the ind irect cost ar is ing from reduced welfare in the sector . A f u l l analysis o f th is phenomenon would
o f course require a carefu l incorporation o f prevail ing d i s t o r - tionary taxes.
14. Add it iona l ly , i f b lack wealth has l imited a l te rnat ive uses, th i s lowers the opportunity cost o f the stocks o f c ap i ta l and K .
491

31.8 Concluding comments
31.8 .1 The ro le o f agents l e f t out o f the model developed in the previous two sect ions can be b r i e f l y commented on.
31.8 .2 S e m i -w h o le s a le rs can be seen to be c lubbed with
r e t a i l e r s in the w h o lesa le market when they purchase from w holesa lers . Semi-wholesalers who buy d i r e c t from producers can be clubbed with wholesalers. The former role o f semi-wholesalers implies that they par t i c ip ate in a second d is t r ib u t io n market, with r e t a i l e r s as the buyers, where they have some monopoly power.
Clearly , f o r th is to be poss ib le , r e t a i l e r s transactions costs o f going d i r e c t l y to the wholesale market must be s u f f i c i e n t l y high.
31.8 .3 Semi-manufacturers combine p r o d u c t io n and w holesa le operat ions , thus being exposed to supply r isk . The extra p r o f i t s they can make by the f l e x i b i l i t y they have in producing in small l o t s , geared e x p l i c i t l y to current fashions in the r e t a i l market, compensate them for addit ional lo sses ar is ing from supply r i sk .
Goods produced by them, in th is case, w i l l have to be seen as imp e r fe c t ly subst itutab le for wholesalers ' s tocks.
31.8 .4 F i n a l l y , the r o l e p layed by b rok ers i s i m p l i c i t l y r e f l e c t e d in the transactions costs o f r e t a i l e r s .
31 .8 .5 This chapter has attempted an examination o f the t e x t i l e d is t r ib u t io n trade in India. The t e x t i l e d is t r ibu t io n sector is
d i s t i n g u i s h e d by the f a c t that i t handles many c l o s e l y subs t i t u t a b le durable products with uncertainty in product demand for s p e c i f i c v a r i e t i e s . Furthermore, as has happened r e c e n t l y , droughts which lead to an increase in the r e la t iv e prices o f food products a f f e c t demand for the product adversely . That i s , the market i s vulnerable to aggregate supply shocks. Consequently,
492

a v a i l a b i l i t y o f c red it plays a key ro le with intermediaries also act ing as c red i to rs . Furthermore, the industry i s dist inguished by large numbers o f producing firms.
31 .8 .6 The d i s t r ib u t io n systems for foodgrains, o i lseeds and
molasses share many o f these features. However, none o f these
markets have much product d iv e r s i ty though some qual i ty gradation ex is ts . The main features focused on here, demand v a r i a b i l i t y and
distance, are l i k e l y to be equally important in a l l these d i s tr ibut ion systems. Thus, the framework o f th is paper i s l i k e l y to be o f use in the study o f the d i s t r i b u t i o n systems f o r these goods. One the other hand, th is paper i s only a modest f i r s t attempt and leaves many issues unexplored.
31.9 Recommendations and suggestions
31.9.1 While the main thrust o f t h i s s e c t i o n i s on ways in which banks can better serve the sector , at the outset i t must be pointed out that a coordinated approach by commercial banks and agents' assoc iat ions is needed i f the cred it r e s t r i c t i o n s faced by
t h i s s e c t o r are to be eased . In l i n e with the s u g g e s t io n s o f respondents - which we find worthy o f cons iderat ion - the fo l lowing a c t i v i t i e s may be considered by banks for better serv ice and credit a v a i l a b i l i t y to agents in the d is t r ib u t io n system.
a. Although advances against cotton t e x t i l e s have been excluded from the purview o f a l l s e l e c t iv e c re d i t c ontro ls with e f f e c t from January 8 , 1985, traders are s t i l l notgett ing the f u l l benef i t o f b i l l discounting and cash c r e d i t . Better c re d i t f a c i l i t i e s with long term renewals o f c red it l im its , which should not be overly conservat iv e , should be considered.
b. I f p oss ib le , recent ly enhanced bank charges for c o l l e c t i o n and rem ittan ce o f d r a f t s , mail t r a n s f e r s or telegraphic t ransfers should be reduced.
c . S ince these t rad e s need more funds during the peak season , banks should adopt a more l i b e r a l approach
493

d. Banks may also examine ways to improve the qual i ty o fthe ir serv ices . C o l lec t ion o f up-country cheques and b i l l s , despatch o f account statements, sanctioning of loans and processing o f loans are areas needing improvement.
e. Local branches o f d i f f e r e n t commercial banks should accept non-MICR (magnetic ink c h a r a c t e r r e c o g n i t i o n ) drafts issued by outsta t ion branches t i l l such time as conversion to MICR instruments i s completed.
f . Banks should c o n s i d e r p r o v i s i o n o f book -d eb t loanf a c i l i t i e s to t r a d e rs and, i f p o s s i b l e , c o n s id e r re introduct ion o f j o in t loan f a c i l i t i e s .
g. Since arat iyas do not maintain s u f f i c i e n t stock to useas c o l l a t e r a l , banks should formulate an alternative mode o f providing cash c red i t to commission agents or a r a t iy a s .
31 .9 .2 F in a l ly , formal f inanc ia l Inst i tut ions should, on the whole, continue to channel funds to the d i s t r ib u t io n trade through agents based at w h o le sa le c e n t r e s and permit t rade c r e d i t to enable perco lation through the d i s t r ib u t io n chain. This has the v irtue o f decentra l is ing c red i t supply dec is ions to better informed agents and curbing bank p o r t f o l i o r isk .
during the peak season.
494

TABLE 31.1
Features of Textile Distribution Systems in India (1979)
No. o f l inks between producers & consumers
Co st o f d is t r i - bution (% o f consumer pr ice )
Index of geograph ica l reach
Return on capi ta l employed
(%)
Total cap ita l employed (days o f sales)
Share o t o ta l s;
(%)
Two 19. 1 0. 73 2 1 . 6 163 13.5
Three 19.8 0.89 18. 2 213 38.0
Four 2 2 . 8 1.14 19.0 255 13.6
Five 24.0 1. 51 18. 9 265 24.8
Six 25.0 2.34 16.6 312 9.9
Note: The index o f geographical Source: Compiled from Jainreach is a value weighted e t . a l . (1982)average o f distance between m il ls and r e t a i l e r s .
495

TABLE 31.2
Percentage of Sales Intermediated by Non-Trading Agentsin 1979
Between Intermediated transactions (%)
Mills and wholesalers 33
M il ls and sera i-wh o le s a le r s 53
Wholesalers and semi-wholesalers 75
Semi-wholesalers and r e t a i l e r s 33
Source: Jain e t . a l . (1982)
TABLE 31.3
Pattern o f Credit Sales -
1 . Average c red i t in days o f fe re d by wholesalers to r Uei.r customers
53(17.09)
2 . Average percentage o f customers from distant lo ca t ions
67(23.98)
3. Average percentage o f customers in Bombay
33(23.98)
4. Average percen' o f customers introduced by brokers
67(25.74)
5. Total respondents 18
Note: Figures in bracket are Source standard deviat ions .
: Field survey in Bombay.
496

TABLE 31.4
Expenditure Sales Ratios of Agents
(Figures are percentages o f sa les)
Wholesaler s
(1978)
Total expenditure 3.04
Expenditure other 2.31than interest cost
Seini- whole- sa lers (1979)
3.36
2.78
Note: Purchase expenditure omitted.
R e ta i l ers
(1979)
Serai- manuf ac- turers (1988)
Aratiyas
(1988)
4.64
3.28
16.68
16. 1 0
35.40
31.64
Source: Jain e t . a l . (1982) and f i e l d survey in Bombay.
TABLE 31.5
Types of Credit F a cilities
No. o f borrowers
1 . Cash cred i t 1 0
2 . Overdraft 2
3. Demand loans 1
4. Term loans 1
5. B i l l discounting f a c i l i t i e s 2
Total no. o f respondents 1 0
Source: Field survey in Bombay
497

TABLE 31.6
Wholesalers' Opinion of Bank credit
(a) Bank-Wise details
Total no. o f account holders
Percentage gett ing need base finance
Percentage sa t i s f i e d with banker
Central Bank o f India 4 14 2 1
Bank o f India 4 29 29Dena Bank 4 14 7Bank o f Baroda 3 0 7Others 5 43 36
Total 2 0 7 14Total respondents 2 0 9 2 0
(b) Issue-wise details
Yes (%) No (%) Totalrespondents
1. Reason fo r d i s s a t i s fa c t i o n :
a) Delay in serv ices 1 0 0 0 6b) Inadequacy o f c red i t - - -c ) Others - - -
2 . Better serv ices can be obtained from other agencies
40 60 15
3. Banks exerc ise undue supervision 50 50 84. High bank charges (including
i n t e r e s t )35 65 2 0
5. Corruption by bank o f f i c i a l s 25 75 2 06 . Overly short duration between
renewals o f loan l im its25 70 2 0
Source: Field survey in Bombay
498

TABLE 31-7
Salient features of Informal Credit
Friends & r e la t iv e s
Others All informal sources
Wholesalers
No. o f f irms 18 9 18% o f firms in sample 90 45 90Average rate o f interest 14.97 16 15.31Minimum rate o f interest 10 15 1 0
Maximum rate o f interest 18 18 18Average loan amount (Rs lakh) 7.70 5. 71 7.03Col lateral and security Nil Nil Nil
Semi Manufacturers
No. o f firms 10 5 1 1
% o f firms in sample 83.33 41.66 92 -Average rate o f interest 16.5 16.5 16.5Minimum rate o f in terest 15 15 15Maximum rate o f in terest 18 18 18Average loan amount (Rs lakh) 4.61 9.84 6.35Col la tera l and security Nil Nil Nil
Aratiyas
No. o f f irms 5 3 5% o f firms in sample 71 43 71.42Average rate o f interest 16.5 16.5 16.5Minimum rate o f in terest 15 15 15Maximum rate o f in terest 18 18 18Average loan amount (Rs lakh) 4.34 3. 15 3.89Col la tera l and security Nil Nil Nil
Source: Field Survey in Bombay
499
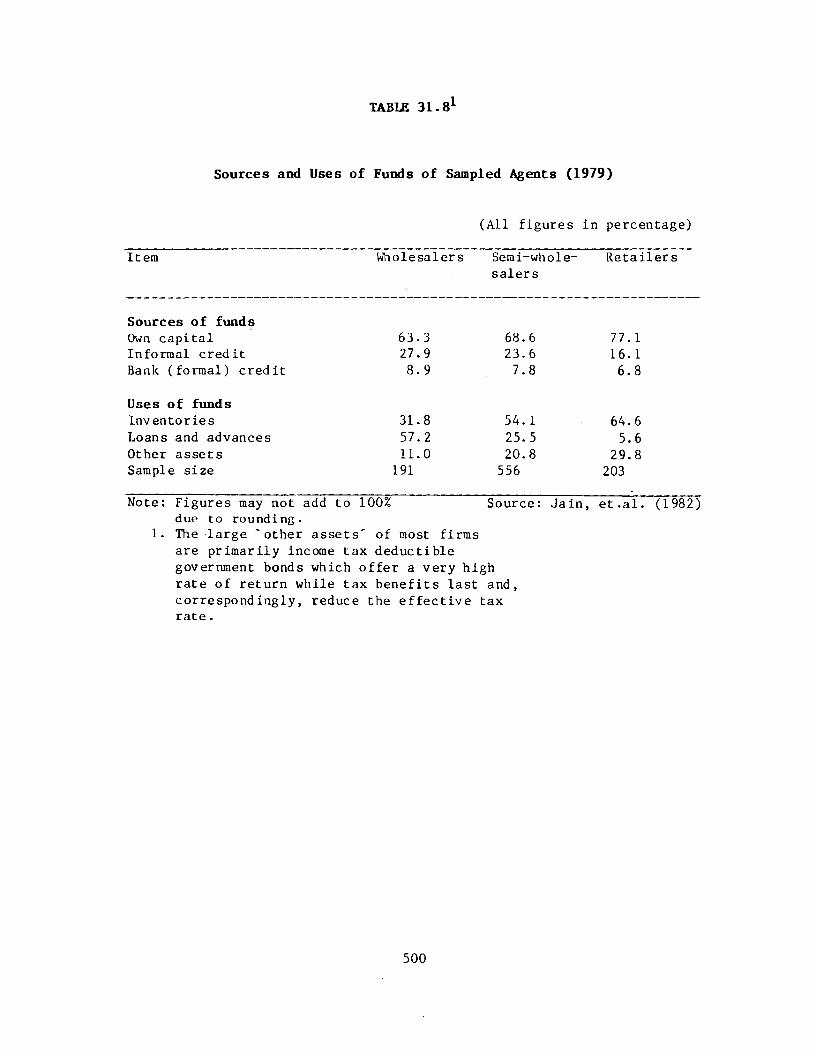
TABLE 3 1 .81
Sources and Uses of Funds of Sampled Agents (1979)
(All f igures in percentage)
It era Wholesalers Serai-whole- salers
R eta i lers
Sources of fundsOwn capita l Informal c red it Bank (formal) c red i t
63.327.98.9
68.623.6
7.8
77. 1 16.1 6.8
Uses of fundsInventories Loans and advances Other assets Sample s ize
31.857.211.0
191
54. 1
25.5 20.8
556
64.65.6
29.8203
Note: Figures may not add to 100% due to rounding.
1. The large ' o t h e r a s se t s ' o f most firms are primarily income tax deductib le government bonds which o f f e r a very high rate o f return while tax ben e f i t s last and, correspondingly, reduce the e f f e c t i v e tax r a t e .
Source: Jain, e t . a l . (1982)
500

TABLE 3 1 .91
(A l l f igures in percentage)
Sources and Uses of Funds of Sampled Agents (1988)
1 1 em Wholesalers Serai- manufacturer s
Aratiya
Sources of fundsOwn capita l 63.37 22.59 18.02
(34.65) (9 .59) (13.31)Informal credit 31. 16 65.51 61.71
(34.16) (19.10) (24.40)Bank (formal) c red it 5.46 11.89 20.25
(8 .54 ) (18.03) (19.63)Uses of fundsInventories 26. 1 1 25.94 9.00
(20.63) (19.42) (13.70)Loans and advances 63. 27 6 8 . 19 72.45
(24.97) (18.02) (14.08)Other assets 10.62 5.87 18.55
(10.52) (5 .44) (14/68)Sample s ize 18 1 2 7
Note: Figures in parentheses are Source: Field survey in Bombaystandard dev ia t ions .
1. See note 1 in Table 31.8.
501

TABLE 31.10
Percentages of Agents Receiving Credit From DifferentSources (1988)
Item Wholesalers Semi-Manuf- acturer s
Aratiyas
Percentage re ce iv in g :
Formal cred it only 2 2 . 2 2 0 .00 0 .00Informal cred it only 0.00 50.00 28. 57Formal and informal c red i t 55.55 50.00 71.42No cred it 22.23 0 .00 0 .00
Source: Field survey in Bombay
502

TABLE 31.11
Net Credit Received
Net c red i t Days o f Working Short fa l lreceived wo rki ng c ap ita l in days(Rs lakh) capi tal used
(days)
Semi-Manufacturers
All 3.44(6 .70)
7.44(45.59)
194. 17 (268.23)
186.72(302.51)
Informal borrowers only 1.89(3 .99)
19. 74 (39 .4)
115.14 (46.57)
95.39(47.56)
Both 4.98(8 .32)
-4 .84( .4 8 )
273.21(33.948)
278.06(405.07)
Aratiyas'
Ail I- 53 (2 .51)
6 . 28 (202.30)
133.94 (1408.65)
1328.65 (1454.33)
Informal borrowers only 1.43(1 .48 )
146.57(124.82)
2978.28 (195.9)
2831.70(70.48)
Both 2.53(2 .29)
97.23(148.69)
634.04(1021.41)
536.80(874.80)
Note: Figures in parentheses Source: Field Survey in Bombayare standard dev iat ions .
503

TABLE 31.12
Guesstimates of Unreported Income and Tax Evasion for Wholesalers
Average Standard deviat ion
Unreported p rofit:
Upper estimate 5.39 0.67median estimate 5.18 1.00Lower estimate 4.61 1.89
Evaded tax (median estimate only) 0 .78 0.15
Humber of observations: 12
A ll India estimated unreported profit (median 322.03estimate only) in Rs crore
A ll India estimated tax evaded (median estimate 48.53only) in Rs crore
Notes: 1. Standard deviations must decrease Source: Computed,as x increases by construct ion .
2. Figures are percentages o festimated sales except for the last row.
504

TABLE 31.13
P rofitability of Firms (%)
(Figures in percentage)
P a t / t o ta l assets
Pat/income
Serai manufacturers 21. 37 1.81(18.51) (2 .29)
Aratiyas 27. 24 16. 1 0
(13.28) (15.70)
By Borrowing Status:
Semi manufacturers Formal only - -
Informal only 23.47 1.08(20.32) ( .61 )
Both 19.80 2.54(16.86) .(3.00)
Aratiyas Formal only - -
Informal only 37.89 16.53(13.69) (10.17)
Both 2 0 . 8 6 15.84(7 .81 ) (18.22)
Note: Pat: P ro f i t After Tax. Source: Field survey in Bombay
505

PART H
Case S t u d i e s i n R e g u l a t i o n

CHAPTER 32
3 2 .1 In t r o d u c t io n
32.1.1 Over the past two decades, there have been a number o f
regulatory steps taken which have had the e f f e c t o f curbing the
operations o f indigenous bankers in India, in part icu lar Shikar-
puri and other Shroffs o f Western India. Such measures include reduction in the extent o f commercial bank refinance o f their
operations through b i l l discounting, requirements (under the Income Tax Act) that payments and rece ipts o f cash should be through cheques or drafts and r e s t r i c t i o n s on acceptance o f deposits from
the public (through the Banking Laws (Amendment) Act , 1983). At
the same time, commercial banks have not been able to step in to f i l l the gap in the c r e d i t needs o f small s c a l e in d u s t ry andprivate trade thus created, despite o f f i c i a l recognit ion of th isshort f a l l . 1 Furthermore, the most recent measures run counter to the views held by expert groups in the past on the need to fo s ter , or at least not get in the way o f , a c t i v i t i e s o f cer ta in segments o f the informal c re d i t market, including indigenous bankers.
32 .1 .2 In t h i s chapter i t is argued that the s o c i a l consequences o f curbing some informal c r e d i t channels may be negat iv e . For those trade and manufacturing sectors served by Shroffs o f Western India i t i s argued that they have an absolute - not just a comparative - advantage in r e la t ion to banks. Curbing of their a c t i v i t i e s there fore resu lts in higher costs o f production
and d i s t r i b u t i o n o f go o d s . Furthermore, b e s i d e s such d i r e c t
l o s s e s , the r e s u l t a n t m i s a l l o c a t i o n o f bank funds that takes3
place contr ibutes to the widely publ ic ised in e f f i c i e n c y in the
1. See f o r exam ple C h ap ter 11 o f the R e p o r t o f the Committee to Rev iew the Working o f the M o n e t a r y S y s t e m ( C h a k r a v a r t y C o m m i t t e e ) ,1 985 .
2. S e e , f o r e x a mp l e , Banki ng Co mmi s s i o n , 1972.
SHROFFS OF WESTERN INDIA
506

financial operation of banks.
32.1 .3 A plea is made fo r the removal o f the worst impediments
faced by the Shroffs o f Western India co permit them to compete on an equal footing with banks. The argument has of ten been advanced
that informal c re d i t is avai lab le at a higher cost than formal c r e d i t . It is pointed out here that higher interest charged by in— formal cred it agencies ( i f indeed higher in terest i s charged) a r ises , f i r s t l y , as an e f f i c i e n c y rent: the actual cost o f bank credit (desp ite lower in terest c o s t s ) to the borrower exceeds the c o s t o f in fo rm a l c r e d i t . S e co n d ly , r e s t r i c t i o n s on the a v a i l a b i l i t y o f both bank cred it and non-bank c r e d i t , the la t t e r through the regulations alluded to above, a lso contribute to the
high c o s t o f con s e q u e n t ly s ca rce in form al funds. Perm it t in g greater competit ion - instead of creat ing a r t i f i c i a l cost disadvantages which go in favour o f the banking s e c t o r - can on ly reduce the cost o f f inance to a f fec ted groups. Furthermore, i t is argued below that high interest rates are not true o f a l l segments
o f informal crediL. In the case o f the main c red i t instrument used by the Shrof fs of Western India (the darshani hundi), the p r o f i t maximising interest rate is low in re la t ion to bank finance.
32.1.4 In views o f the centuries o f experience o f indigenousbankers in serving the needs of trade and the comparatively recentor ig in o f commercial banking, the cost disadvantage o f commercial banks is unl ikely to disappear in the near future. I f i t does,
then, in a competitive market, indigenous banking w i l l gradually wither away. I f th is is to happen, the market place - and not o f f i c i a l regulation should lead to this outcome.
32.1 .5 In sect ion 2, the opinions o f various expert groups onthe ro le o f indigenous bankers, and in part icu lar Shroffs o f Western India, is reviewed. Section 3 reviews^the current regulatory framework. Sect ion 4 b r i e f l y reviews the ro le o f banks in f inanc-
3 . W h ich c o u l d i n c r e a s e in t h e l i g h t o f t h eC h a k r a v a r t y C o m m i t t e e ' s r e c o m m e n d a t i o n (N o .1 6 6 ) .
507

ing trade and small scale industry. Section 5 examines the consequences o f recent regulation for the operations of Shroffs o f Western India. Section 6 examines the consequences o f th is for
the cost o f c r e d i t to segments formerly served by Shroffs of Western India. Sect ion 7 proposes an approach to the regulation o f the saraf i system and s p e c i f i c p o l i cy recommendations. A descr ip
t ion o f d i f f e r e n t types o f hundis and certa in other indigenous cred i t instruments is in the Appendix to th is chapter.
32.2 Review of views held by the Banking Commission (1972) and the World Bank (1980)
32.2.1 Various o f f i c i a l commissions and bodies , going back at
least to the various Provincial Banking Enquiry Committees (ca .
1929), have studied the operations o f indigenous bankers and have recognised the useful role played by these intermediaries. They
have, consequently recommended that their operations be aided, or at least not hampered, by appropriate measures.^ Here the views o f the most recent bodies , the Banking Commission (1972) and the study for the World Bank by Timberg and Aiyar (1980) are summarised .
32 .2 .2 Functions and role of indigenous bankers
a. "The broad conclusion o f the Study Group's enquiry is that the system o f indigenous banking is an in s t i tu t i o n worthy o f n o t i c e , i t s roots f irmly established in the s o i l , i t s evolution and growth a s tr ik ing measure o f i t s popularity and s u p e r i o r i t y over o ther f i n a n c i a l i n s t i t u t i o n s , at l e a s t in regard to some s p e c i f i c needs. Oral ev idence given by a cross sect ion o f the borrowers supports they b e l i e f that ind igenous bankers have f u l f i l l e d t h e i r l i m i t e d r o l e ra ther w e l l . " (Banking Commission, Study Group on Indigenous Bankers, Para V I I . 4 ) .
b. " A c t i v i t i e s l ik e trade in c l o t h , grain and ' b e e d i s ' are e s se n t ia l and re lated in a r e l a t i v e l y automatic way to the overa l l growth o f the economy. The "organised" banking s e c t o r ' s r e j e c t i o n o f them has preserved a growing role f o r ind igen ous in fo rm a l agents in serv in g them. the "organised" banking sector w i l l not for the foreseeable
4. For a u s e f u l summary s e e Banking C o m m is s io n , Study Group on I n d i g e n o u s B ankers ( 1 9 7 1 ) .
5 0 8
future be able to f i l l a l l the pressing i f not " p r i o r i t y ” needs o f the Indian economy - and an informal market w i l l necessar i ly ex is t to do so " . (Timberg and Aiyar, 1980, p . 119).
c . "Indian ICMs c e r ta in ly do serve t rad i t ion a l and other sectors that would otherwise be unserved. The volume o f intermediation is c e r ta in ly higher than i t would be without the ICM and the a l l o c a t i o n o f c red i t d i f f e r e n t " . (Timberg and Aiyar'1980, p . 123).
d. "The G u jara t i s h r o f f s perform f u n c t i o n s in many ways analogous to a modern bank. For instance, (a) they receive deposit on current and fixed accounts from the publ ic , (b) they advance money on c a l l and for f i x e d p e r io d s on s e c u r i t y or on p e rso n a l c r e d i t , ( c ) they arrange f o r rem ittance o f funds by i s s u in g hundis fo r p r i v a t e and trade purposes and also undertake the c o l l e c t i o n o f hund i s , (d) they act as commission agents in respect o f commodities such as grains, co t ton , seeds, p iece -goods , gold and s i l v e r , iron and s t e e l and in some cases do the financing as w e l l . " (Banking Commission, Study Group on Indigenous Bankers, Para 11 .44) .
32.2 .3 The Main credit instrument of Shroffs of Western India (Darshani Hundi)
a. "The hundi is the oldest surviving cred it instrument, the merits o f which cannot be denied. For instance, the ease with which darshani hundi can be endorsed and the wide spread use o f th is instrument for transfer o f funds suggests that this indigenous instrument has a c lose kinship with the more soph ist icated demand - d r a f t ." (Banking Commission, Study Group on Indigenous Bankers, Para V I I . 5).
b. "In view o f the delays in remittances through banks, the 'd arsha n i ' hundi has proved to be a convenient instrument for remittance o f funds by cer ta in sect ions o f the community." (Banking Commission, 1972, Para 18 .34) .
c . " ............... the Group i s convinced that in the case o f thedarshani hundi there is no scope for the concealment o f any transactions or o f any funds." (Banking Commission, Study Group on Indigenous Bankers, Para I I I . 17).
d. " .........we recommend that payments by darshani hundi may ber e c o g n is e d as an e l i g i b l e mode o f payment under t h i s s e c t io n . " (Banking Commission, 1972, Para 18.97) .
5. S e c t i o n 4 0 A ( 3 ) o f the Incom e Tax A c t .
6 . I t may a l s o be n o t e d t h a t , i n v i e w o f a n o t h e rw Jr e c o m m e n d a t i o n by th e b a n k in g c o m m i s s i o n , a c o m m i t t e e headed by J u s t i c e Rajamannar was s e t up t o d r a f t a Hundi Code B i l l . The Commi t t ee s u b m i t t e d i t s R e p o r t , i n c l u d i n g a
509

32 .2 .4 Impact on economic a ctiv ity : Besides the opinions o f thismatter already contained in para 32.2 .2 above, i t may be mentioned that the Study Group on Indigenous Bankers o f the Banking Commission (1972), i s o f the opinion that "but for the serv ices o f in
digenous bankers, several segments o f the neglected sector would be even more neg lected” (Study Group, Para VII. 1) and that they
contribute to economic development and are an important component o f the f inanc ia l system.^
32 .2 .5 Cost of funds: While i t is of ten alleged that indigenousbankers (who are sometimes erroneously clubbed with moneylenders) charge usurious interest rates , both author i t ies quoted here fee l that the higher cost o f funds from Shrof fs of Western India as compared to banks is due to greater risks and the ir higher oppor-
ot u n i t y c o s t o f funds. Monopoly power i s not important and, indeed, Timberg and Aiyar (1980) are o f the opinion that rates are competit ively determined. In some cases rates lower than the nearest comparable bank rates were found.
32 .2 .6 Future role of indigenous bankers
a. "The foregoing chapters lead to the conclusion that while indigenous banking has been rendering a valuable serv ice to certa in segments o f the economy, may be, i t s continued u t i l i t y and growth would depend upon the readiness with which i t transforms i t s e l f into an instrument o f product ive c re d i t to the neglected sectors o f the economy at a reasonable p r i ce . " (the Banking Commission, Study Group on Indigenous Bankers, Para V I . I ) .
b. "The future o f indigenous bankers would thus be in their evolv ing as discount and acceptance houses or as mini mer-
d r a f t b i l l , in 19 7 8 t h o u g h no a c t i o n ha ss i n c e been t a k e n .
7. See B a n k i n g C o m m i s s i o n , S t u d y Gr o u p on I n d i g e n o u s Ba n k e r s , para V I . a .
8 . R e f e r e n c e s a r e s c a t t e r e d t h r o u g h o u t t h es t u d i e s . For example see para V I I . 25 o f t heBanki ng Co mmi s s i o n , St udy Group on I n d i g e n o u s B a n k e r s ( 1 9 7 2 ) or p a g e 84 o f T i m b e r g andA i y a r ( 1 9 8 0 ) .
510

chant banks oriented towards financing small scale industry. (the Banking Commission, Study Group on Indigenous Bankers, Para V I I . 48).
c . In e f f e c t , i t is the conclusion o f the Study Group that the indigenous banking business, o f the multanis in part i c u l a r , needs t o ' b e resusc i tated . This can be achieved by the Reserve Bank of India extending cred it f a c i l i t i e s for rediscounting the hundis at the Bank Rate under the Bi l l Market Scheme in order that the commercial banks may finance the hundi business in larger amounts at reasonable rates o f interest and in a regular manner and uninterruptedly throughout the year." (the Banking Commission, Study Group on Indigenous Bankers, Para VI I . 49) .
32.2 .7 Regulation of indigenous bankers
a. ” The best approach to the problem ( o f regulation) would be for the regulatory authority to stimulate the f inancia l in s t i tu t io n s to create their own internal regula tions. The au th or i t ie s should re ly on such s e l f regulation and on an external audit, once s a t i s fa c t o r y standards have been developed." (the Banking Commission, Study Group on Indigenous Bankers, Para V I I . 21) .
b. "A system of l i cens ing needs to be introduced which mayprovide for recognit ion by the Reserve Bank of the various a ssoc ia t ions o f indigenous bankers with d e t a i l s o f each indiv idual member's q u a l i f i c a t i o n s . ” ( the Banking Commission, Study Group on Indigenous Bankers, Para V I I . 22) .
c . "Indigenous bankers should evolve for themselves a s e l fimposed convention in regard to the re la t ionsh ip between their own funds and outs ide commitments. No l icensed indigenous banker should hold at any one time r i sk assets in excess o f seven time the amount o f h is own cap i ta l invested in the bus iness . " (the Banking Commission, Study Group on Indigenous Bankers, Para VI I . 2 3 ( c ) ) .
d. "A summary statement o f the volume and nature o f businessshould be furnished annually by each indigenous banker to the Reserve Bank. The commercial banks and the Reserve Bank af t e r due consultat ion with the Associations w i l lr ev i ew a n n u a l ly the a c t i v i t y o f ind igen ous bankers to a s se s s i f advances granted by them are fo r s o c i a l l ydesirab le purposes and not detrimental to the in terests o f d e p o s i t s . " (the Banking Commission, Study Group on Indigenous Bankers, Para VI I . 2 3 ( e ) ) .
e. "After the Study Group's report was la rge ly endorsed bythe whole Banking Commission - some e f f o r t s were made tocarry out these recommendations ............. e f f o r t s to e f f e c tthe recommendation floundered on the issue o f the precise con tro ls to be implemented and have la rge ly been dropped, ( p . 117, Timberg and Aiyar (1980)) .
511

32.2*8 Conclusions: While the comments made by the Banking Commission on indigenous bankers were not uniformly laudatory - espe
c i a l l y with regard to their secrecy and unwillingness to be exter
nal ly regulated - the paragraphs quoted above do give a f ai r representation o f the ir views. Furthermore, what is important is that it has been a s c e r t a i n e d in c o n v e r s a t i o n with members o f
various Associa tions o f Shroffs that they are w i l l ing to accept the bulk o f these recommendations ( including the Hundi Code Bi l l i f i t is made into law). Instead, as we now ind ica te , the current regulatory framework appears designed to choke the a c t i v i t i e s o f
indigenous bankers.
32.3 Recent regulations and policy measures adversely affecting Shroffs of Western India
32.3.1 The view o f the Banking Commission on the d e b i l i t a t in g e f
f e c t s of Section 40A(3) o f the Income Tax Act, which requires payments o f Rs 2500 or more to be made by crossed cheque or draf t , on the darshani hundi have a lread y been hinted at (Para 2 . 3 ( d ) above). In view o f the fact that this instrument is nearly impos
s ib le to use in f a c i l i t a t i n g "Black" transactions (see para 2 . 3( c ) above) they had recommended that the darshani hundi be included in the l i s t o f e l i g i b l e instruments in Section 40A(3) a f t e r extensive analysis o f the lo g i c of r e s t r i c t i n g the concerned sect ion to
9cheques and d ra f t s . However, the unamended sect ion s t i l l remains on the statute books and i t s adverse e f f e c t on the darshani hundi as a payments instrument there fore continues.
32 .3 .2 The c h i e f advantage o f the darshani hundi was that i t could be used as a v i r t u a l ly r i s k le s s means o f remitt ing or carry
ing funds between business centres in view o f the c lo se contacts between shro f fs in d i f f e re n t places or in view o f the network o f branches maintained by a s h ro f f . Furthermore, since a shroffs
See the Banki ng Co mmi s s i o n , St udy Croup on I n d i g e n o u s Ba n k e r s , par as I I I . 15 to I I I . 21.
512

' p e d h i ' does not keep "banking hours” , speedy payments and drawals
are f a c i l i t a t e d . The resultant e f f i c i e n c y with which cash balances were used has been hamstrung by Section 269SS ( inserted in 1984) o f the Income Tax Act which s p e c i f i e s that loan repayment in sums exceeding Rs 10,000 must be by account payee cheque. This disadvantage is e s p e c ia l l y f e l t in smaller tow n s .^
32.3.3 The a b i l i t y o f S h r o f f s o f Western Indi a to a t t r a c t
deposits has also been hurt by the Banking Laws (Amendment) Act, 1983, which l im i t s the t o ta l number o f depositors with a partnership or an assoc ia t ion o f ind ividuals to 250 (or 25 per partner). Even among types o f depos i ts , Section 269T (inserted in 1981) o f the Income Tax Act, which s p e c i f i e s that deposits in excess of Rs1 0 , 0 0 0 are to be made by account payee cheque or draf t , has v i r tua l ly dried up the flow o f very short term deposits to them.
Since much o f the business o f Shroffs is in very short term loans
- financed by putting word out in the "market” for short term funds requirements - th is has ser ious ly damaged their business. The reason for thi s ins istence on transactions by cheque is to put obstacles in the way o f markets which f a c i l i t a t e the laundering i f
i l l e g a l funds. Secondly , the o b j e c t i v e of the Banking Laws (Amendment) Act is to check the fraudulent pract ices o f "Bangalore type" f inance corporations and protect the small depos i tor . The useful c a l l money market in various f inanc ia l centres (served by Shroffs of Western India) and th e ir general business have been the casualt ies o f these regulatory measures .^
10. See S e c t i o n 3 2 . 6 f o r an e x a mp l e .
11. WhiLe t h i s d o e s not i mpl y t h a t no b l a c k moneyf i n d s i t s way i n t o t h e c a l l money market nor t h a t no S h r o f f o f W e s t e r n I n d i a h a s e v e r d e f a u l t e d on o b l i g a t i o n s to d e p o s i t o r s , a p r o p e r a s s e s s m e n t o f t h e s o c i a l l o s s f r o m c u r t a i l i n g t h e i r a c t i v i t i e s i n s t e a d o fi n t r o d u c i n g a p p r o p r i a t e s c r u t i n y me a s u r e s and s a f e g u a r d s - must s u r e l y be made and w e i g h e da g a i n s t the l i m i t e d g a i n s i n c u r b i n g ' b l a c k ' mo n e y . D e p o s i t o r s a f e t y , w h i c h i sc o n s i s t e n t l y h i g h f o r S h r o f f s o f W e s t e r nI n d i a , e x c e p t in one or two r e c e n t c a s e s i n Anand ( G u j a r a t ) , c a n be e n s u r e d bya p p r o p r i a t e d e p o s i t i n s u r a n c e . I t s h o u l d be
513
32.3 .4 Other p o l i c y measures hurting Shroffs o f Western India have been the withdrawal o f hundi discounting f a c i l i t i e s by comm e r c ia l banks ( e s p e c i a l l y the State Bank o f In d ia ) and the withdrawal o f bank remittance f a c i l i t i e s to them. Memoranda by
Shroffs Associations asking for amending l e g i s l a t i o n have, thus
far , gone unheeded.
32.3 .5 The contrast between the recommendations contained in sect ion 32. 2 and the r e a l i t y o u t l i n e d in t h i s s e c t i o n are s tark enough not to warrant further e laborat ion .
32.4 Commercial bank finance to trade and small scale industry: A brief review
32.4 .1 That bank finance to small scale industry and trade has not been s a t i s fa c t o r y can be c l e a r ly seen from the fo l lowing excerpt from the Reserve Bank o f India (1985):
"Like the small scale industries sector , anotTier sector which f inds i t s e l f at a considerable disadvantage in thepresent system o f c red it a l l o c a t io n , is the trade and d is
t r ibu t ion sector . As regards i t s ro le as a supplier o f raw materials to the industr ia l sector i t shares to some ex
tent the problem faced by small sca le industries in regard to working cap ita l f inance, though not a l l units in thetrade sector are small or f in a n c ia l l y vulnerable , or weak in terms o f bargaining power." (Para 11.26)
32.4 .2 Table 32.1 gives selected s t a t i s t i c s on bank support to
in d u s try and t rad e . In Table 32 . 1 , Rows 5 and 6 show howscheduled commercial bank advances to small scale industry andtrade have moved with respect to ind ica tors o f t o t a l turnover in
12that sector . I t may be seen that bank cred it to both sectors has
e m p h a s i s e d t h a t mo s t s h r o f f s a r e n o t f l y - b y - n i g h t c o n c e r n s . F u r t h e r m o r e , t h e B a n k i n gLaws Commi t t ee has s po ke n wi t h a p p r o v a l o f t h e c o m p r e h e n s i v e s e l f - r e g u l a t i o n and p o l i c i n g by t h e v a r i o u s a s s o c i a t i o n s o f s h r o f f s i n d i f f e r e n t c i t i e s .
5 1 4

been fa l l in g or stagnant as a proportion o f turnover. Thus stagnancy or decl ine i s revealed even i f attention i s r e s t r i c t e d totota l scheduled bank advances to these sectors (rows la and lb) asa percentage o f to ta l advances. In contrast , the growing importance o f both these sectors in national income is revealed, by an examination o f rows 7 and S . 1^
32.4.3 Thus, i t is c l e a r that bank support to small scale industry and trade has not improved since the 1970"s. S p e c i f i c a l l y ,though bank advances have been growing faster than NDP (row 9) ashave both small scale industry and trade (rows (7) and ( 8 ) , the lending pattern o f banks has resulted in both trade and industry
losing ground in bank loan p o r t f o l i o s . It i s , there fore , clear
that units in these sectors must increasingly re ly on non-bank finance .
32.4.4 The picture become even more bleak when account is taken o f the fact that banks have a bias towards lending to o ld er , established and large units as compared to newer or smaller units e s p e c ia l ly those with l imited access to c o l l a t e r a l 1^.
32,5 Consequences of recent regulation for the operation of Shroffs of Western India
32.5.1 The most v i s i b l e impact o f the recent regulations i s that several shro f fs have withdrawn from their t r a d i t io n a l business. For instance, as compared to the 6 pure Gujarati shro f fs observed by Timberg and Aiyar (1980) to operate in Bombay in 1978-79, there are on ly 2 pure s h r o f f s c u r r e n t l y . Prominent among the f i rms
12. The i n d i c a t o r f o r t r a d e , w h i l e h o t i d e a l ,g i v e s a r e a s o n a b l y g o o d s i d e a as to t r e n d s .
13 . Whi l e t he l e v e l s o f r a t i o s g i v e n may no t bev e r y m e a n i n g f u l i n v i e w o f d a t a l i m i t a t i o n s ,t h e i r mo v e me nt i s c e r t a i n l y i n d i c a t i v e o fb r o a d t r e n d s .
14. See c h a p t e r 16
515

forced to c lo se down in other parts o f the country i s the f i r s t f irm to be granted recognit ion by the Reserve Bank of India as an in d ige n o u s banker in the l a s t c e n tu r y (Harjiwandas Kushaldas Parekh, establ ished 1862).
32 .5 .2 The comparison o f b a s i c s t a t i s t i c s in Table 32. 2 a l s o provides evidence o f the dec l ine in the business o f Shroffs o f Western India.
32.5 .3 This d ec l in e is evident whether one goes by the number of s h r o f f s (row 1 ) , annual turnover (Row 2 ) , or own c a p i t a l and
capi t a l ’.deposit rat io (Rows 6 and 7 ) . While comparative s t a t i s t i c s as to the consequences o f dec l ine in darshani hundi business
are not av a i la b le , the dec l ine in the share o f f inance made ava i l able to trade (Row 12) provides ind irec t evidence o f th is .
31!. 5. A R e s t r i c t i o n o f the number o f d e p o s i t o r s ai Lowable under
law has, as is ev ident from Row 6 , r e s u l t e d in a s u b s t a n t i a l decrease in the own cap ita l to deposit r a t i o . Furthermore, as
Table 32 .3(a) revea ls , even among d epos i ts , deposits from the general public have decreased substant ia l ly , thus v i t i a t i n g the
role o f shro f fs as f inanc ia l intermediaries . Table 32 .3(b) shows that the maturity structure o f depos i ts has t i l t e d towards long terra deposits as would be expected in a s i tuat ion of tight f inance where there would n a t u r a l l y be a p r e f e r e n c e f o r long term a v a i l a b i l i t y o f borrowed funds.
32 .5 .5 Summary of impact of recent changes on activity of Shroffs of Western India: It i s o f in teres t to decompose the in terest onadvances made by Shroffs in Western India in 1979 and 1988. Data from Table 32. 2 used for t h i s purpose i s reproduced in Table 3 2 .4 (a ) . Concentrating on middle values, the spread between, advance and deposit rates can be seen to have f a l l e n from 9 per cent per annum ( 1 7 . 5 - 8 . 5 ) to 8 . 5 per cent between 1979 and 1988. Likewise there is a marginal increase in the earnings: expense
516

rat io r e f l e c t in g the reduced volume o f business while bad debts are unchanged. Thus, the major fa c to r contributing to the decline in the earnings o f shro f fs is the f a l l in the c a p i t a l : deposit ra t io due to the recent prohib itory l e g i s l a t i o n discussed above. The consequence o f th is has been to squeeze the p r o f i t a b i l i t y o f
saraf i operations so that the return on own funds now contributes
6.53 per cent to the spread as opposed to 6.74 per cent in 1979. Economic rent, which represents the return to shro f fs both for their superior e f f i c i e n c y and due to monopolistic elements, , i f any, and which contributed 5.82 per cent to the spread in 1979 now contributes 3.03 per cent to the spread even at the conservat ive opportunity cost of 14 per cent assumed in Table 32.4. The f a l l in the "monopoly rent" element in the wake o f the reduced capita l base of Shroffs casts doubt on the extent o f monopoly enjoyed by
them unless such monopoly power was due to the unl ikely prevalence o f scale economies. A more l i k e l y explanation for thi s f a l l is
the curtailment o f e f f i c i e n c y rents due to the dec l ine in the use of the darshani hundi. Since a part o f such e f f i c i e n c y bene f i ts would have been shi f ted forward to buyers o f saraf i serv ices , an overall decrease in the e f f i c i e n c y o f f inanc ia l intermediation can
be apprehended.
32.6 Consequences of decline in activity of Shroffs of Western India for trade
32.6.1 The extent o f f inance extended to the trading sector by Shroffs of Western India w i l l c l e a r ly have f a l l e n r e la t iv e to the s ize o f to ta l trading a c t i v i t y . Unfortunately, no information is avai lable on thi s aspect . However, a l i s t of a c t i v i t i e s financed
by shrof f s in Western India is given in Table 32.5. The worst a f fected sectors are those who formerly re l ie d extensively on the
s e r v i c e s o f these f i n a n c i e r s such as the t r a d e r s in c o t t o n , groundnut, and ' b e e d i ' mentioned by Timberg ahd Aiyar (1980).
32. 6 . 2 From the national perspect ive , th is would not be o f much importance i f i t s was not for the fact that Shroffs of Western India were much more e f f i c i e n t suppliers o f the type o f f inanc ia l serv ices demanded by these sectors than commercial banks- A cost
517

comparison would make this apparent.
Example: An established up country trader needs to purchase trade goods worth Rs 1 lakh at Bombay from one o f several poss ib le suppl iers . The trader must pay cash on purchase o f the goods but wishes to avoid carrying a large sum o f cash on his per
son. His options are, there fore , to carry a crossed bank draft drawn on his Bombay account ( in case he does not know his supplier in advance), remit funds through a bank to his Bombay account or to carry a darshani hundi. For the bank draf t , he must v i s i t the branch where he has h is account during banking hours (before 2 or 3 p.m. ) and obtain the dra ft . On reaching Bombay, the draft must
be presented during banking hours. I f the t ra d e r ' s Bombay account
is with the' same bank the matter ends. If not, the trader must
e i ther remit funds by bank trans fer before going to Bombay or waitfor the draft to c lear in Bombay. In e i ther case, his funds aret ied up for the duration (normally 3 days) taken to e f f e c t the
transfer o f funds between one account and another. In the case o f a darshani hundi, the s h r o f f ' s 'p ed h i ' may be v i s i t e d a f ter the t r a d e r ' s shop is closed prior to boarding the Bombay train and a hundi obtained without need for secur i ty . The trader may then v i s i t a correspondent shro f f in Bombay in the morning, obtain funds, return the same evening and pay the f i r s t shro f f the f o l lowing day even i f h is own funds are not on deposit with th is shro f f . Two days interest must then be paid. I f the trader has funds on deposit with the shro f f , the debt can be re t i red the same evening saving one day 's in te r e s t . The comparative costs are as in Table 32.6.
32.6 .3 In the example given above, the inconvenience cost to the trader caused by banking hours and, perhaps, the in d i f fe ren t att itude o f lower l e ve l bank o f f i c i a l s has not been considered. It can be v e r i f i e d by the reader, furthermore, that no other method of funds trans fer through commercial banks leads to lower costs to the trader. However the example may be thought to be biased due to the short period chosen. It is easy to see that , i f the inter
est on the loan from the shro f f exceeds the t rad er ' s opportunity
518

cost o f funds, then bank transfers cost less i f the period for which the loan i s taken (or draft i s held) is s u f f i c i e n t l y long. The formula for the break even period is C+KR/R-r=n, where C i s the cost o f the draf t , K i s the number o f days for a bank transfer less the number o f days required with a darshani hundi, R is the
s h r o f f ' s per day in terest charge and r is the opportunity cost o f
the t rader 's funds. For example, i f the shro f f charges 20 per
cent per annum, the traders opportunity cost is 15 per cent and K is , 2 days, then for Rs 1 iakh, we have 200+3x50/50-38.30=25.6 days.
As has been ment i oned, s i nc e such extended t r i p s are l ik e ly to occur only in exceptional cases, shroffs do not normally
deal in such long period advances.
32.6.4 A b r i e f in terpreta t ion o f the cost d i f f e r e n t i a l between banking and saraf i systems may be ca l led for at th is stage. The interest cost o f the hundi is mainly a r e f l e c t i o n o f the shroffs cost o f funds as seen in Table 32.4. The cost o f bank funds,given that a bank draft is f u l l y secured, so that no own funds are
deployed, is e n t i r e ly transactions or establishment costs plus p r o f i t s . This includes both the d i r e c t charges for the draft as well as the value to the bank from the extra cash i t rece ives in
exchange f o r i t s debt 1 nsL r umen t . I f i t i s assumed that the t rad er 's opportunity cost and the value received by banks balance, then the net s oc ia l cost o f the draf t i s simply the draft charge. Even so, this exceeds the net s o c ia l cost o f the hundi which may simply be taken as the interest cost .
32.7 An approach to regulation
32.7 .1 I f the e f f i c i e n t provis ion o f f inanc ia l serv ices is considered to be worthwhile in the national in terest , then t i l l such t ime as i t s use wi t he r s away n a t u r a l l y , the darsh an i hundi should be a l lowed to fu n c t i o n unimpeded. As a c o r o l l a r y , regulatory obs tac les which impinge on the a b i l i t y o f Shroffs o f
Western India to provide th is serv ice should be removed. To ex-
519

amine poss ib le regulation we look f i r s t at regulations impinging
on the use o f the darshani hundi d i r e c t l y and then at measures a f
fect ing the sources and uses o f funds with s h r o f f s .
if
32 .7 .2 It i s apparent that sect ion 40A(3") o f the Income Tax Act should be amended as recommended by the Banking Laws Committee. Regarding sect ions 269SS and 269T, m odif icat ions may be considered a f t e r c a l l i n g fo r submissions from various assoc ia t ions o f Shroffs
on the fo l lowing po ints :
i . In what way do these r e g u l a t i o n s impinge on the f l e x i b i l i t y o f hundis.
i i . What assurances/suggestions can be given to reduce the p o s s i b i l i t y that these sec t ion s , i f su itably amended to a id hundi usage , are used f o r t r a n s a c t i o n s in ' b l a c k " money. For example, record keeping and scrutiny aspects may be explained.
Furthermore, the Hundi Code B i l l (1979) formulated by the Banking
Laws (Rajamannar) Committee may be expedit ious ly passed to c o d i fy hundi usage.
32.7 .3 Steps should be taken to remove impediments faced by shro f fs in ra is ing funds. One way is to allow shro f fs access to concess ional bank refinance through b i l l discounting or otherwise. However, t h i s r e s u l t s in s h r o f f s competing fo r s ca rce bank loanable funds and in the neglect o f the advantage shro f fs have in ra is ing deposits from certa in segments. Thus, i t i s not recommended. The second way is to exempt shro f fs from the provisions o f the Banking Laws (Amendment) Act to enable them to r a i s e deposits from the public as be fore . This has the v ir tue o f aiding net saving m obi l isat ion e f f o r t s over and above any movement to shro f fs o f funds currently with banks. Also, i f hundis cease to be
e f f i c i e n t payment instruments over time, shro f fs w i l l be unable to compete depos its away from banks as the ir deposit rates w i l l suffer . Thus, a l l o c a t i o n o f savings to hundis only i f they are e f f i c i e n t w i l l be achieved. Furthermore, some system o f scrutiny by the RBI, in c o n s u l t a t i o n with s h r o f f ' s a s s o c i a t i o n s , may be devised. F inal ly , the memoranda by sh ro f f s " assoc iat ions on sec
520

t ions 269SS and 269T o f the Income Tax Act, should include their
suggestions as to how scrutiny can be exercised on deposit and loan repayment a c t i v i t i e s to ensure that no f a c i l i t a t i o n o f the black economy ensures•
32 .7 .4 With regard to uses o f funds and interest charged or paid by shro f f s , no RBI scrutiny or regulation i s recommended. In the
normal course o f a f f a i r s , scrut iny by Income Tax author i t ie s o f the ir books (which are, according to the Banking Committee, more than adequate) and regular auditing o f the books should reveal misuse of funds i f any. The s o c ia l d e s i r a b i l i t y o f the ir loan p o r t f o l i o s should be influenced i f at a l l , by interest subs id ies / taxes for loans given to part icu lar high or low p r i o r i t y segments. A second channel o f i n f l u e n c e may be moral suas ion d i r e c t e d through the s h r o f f s ' a s soc ia t ion s . The recommendations in th is paragraph stem from the view that, f i r s t l y , addit ional e f f e c t i v e regulation i s - to be r e a l i s t i c - not rea l ly f e as ib le a-nd that , secondly, given that funds from shro f fs f low la rge ly to neglected sectors ( to use the words of the Banking Committee), unnecessary.
521

TABLE 32*1
Commercial Bank Lending to Small Scale Industry and Trade
(Amounts in Rs Crore at current prices)
Item 1970 1975 1980 1982 1985
1- Scheduled Commercial Bank Lending
a. Small Scale N.A. 1118 2534 3537 6629Industry (12.4) (11 .9 ) (11 .9 ) (13 .3 )
b. Internal Trade 496 705 2331 2663 4922(excluding food ( 1 2 . 1 ) ( 7 . 9 ) (10 .9 ) (8 . 9) (9. 9)procurement)
c . Total 4108 9011 21312 29644 49995( 1 0 0 . 0 ) ( 1 0 0 . 0 ) ( 1 0 0 . 0 ) ( 1 0 0 . 0 ) ( 1 0 0 . 0 )
2. Production o f Small Scale Industries
N.A. N.A. 28098 34927 61299(P)
(At 78-79 p r ices )
3.NDP at f a c to r cost 5457 from transport, communication & trade
11907 21507 29144 42842
4.NDP at fa c to r cost 34519 62324 120973 134488 197178
5. Ratio o f ( l a ) to ( 2 ) (%)
N.A. N.A. 9.0 1 0 . 1 6 . 8
6 . Ratio o f ( l b ) to 9.1 11.3 1 0 . 8 9.1 11.4(3) (%)
7. Ratio o f (2 ) to N.A. N.A. 23.2 26.0 31.1(4) (%)
8 . Ratio o f (3 ) to 15.8 19. 1 17.8 21.7 21. 7(4) (%)
9. Ratio o f (1 c) to 11.9 14.5 17.6 2 2 . 0 25.4(4) (%)
Notes: P: Provisional Source: RBI, Report on1. Items 2, 3 , 4 are for f i s c a l years Currency and
( e . g . 1970-71 instead o f 1970). Finance, Various2. Small Scale Industry production is Issues,
de f la ted with the wholesalepr ice index for manufacturing.
3. Actual f igures were at 78-79 pr ices .4. Figures in brackets are percentages o f the t o t a l .
5 22

TAB1Z 32.2
Business of Shroffs of Western India1970-1988
1970 1980 1988
1. Number o f Shroffs - Bombay 200Ahmedabad 150
250250
50125
2 . Total annual turnover in 3000 Bombay (Rs c rore )
1600 500
3. Average interest 12% to 15% 15% to 18% 18% to 2 1 %4. Rate on loans - general
- powerloom c loth - 2 1 . 5% -5. Rates o f interest on depos i ts :
(Bombay) on demand: 6 % to 7 % 5% to 9% 8 % to 1 0 %on year : 9% to 1 0 % 1 0 % to 1 2 % 1 2 % to 14%
6 . Capita l: Deposit ra t io 1:15 1 : 1 2 1:37. Average own cap i ta l (Rs crore ) 50 lakh 40 lakh 2 0 lakh8 . Ave. bad dbts to income (Bombay)3% to 5% 3% to 5% 3% to 5%9. Earnings/expenses ra t io N.
(Gross) BombayA. 2 0 : 1 1 . 5 2 0 : 1 2 .,5
1 0 . Credit : Deposit ra t io 75:100 81:100 82:1001 1 . Funds kept as reserve with 40%
commercial banks30% 2 0 %
1 2 . Finance to trade /export / 75 /10 / SSI/others (%) 5/10
60 /10 /5/25
50/15/10/25
13. Percentage o f t o ta l business in hundis
60
14. Average commission on cash- paid hundis
RsRs
1 1
1
perlakh
15. Average s ize o f advance - Rs 75000per borrower
Source: Items 1-3 and 5-12: Bombay Shroffs Assoc ia t ion Items 4 and 13-16 Timberg and Aiyar (1980).
5 2 3

TABLE 32.3
Sources, Maturity Pattern and Size of Deposits (Bombay and Ahmedabad)
1980-81 1987-88
(a) Sources of Deposits (Z)
Relative and friends 50 65
Business assoc iates 25 25
General publ ic 25 8
(b) Type of deposits (Z)
Call 2 0 15
Saving 30 25
Fixed (1 to 5 year) 50 60
(c ) Size of deposits (Z)
Rs 1 to Rs 2500 40 N.A.
Rs 2501 to Rs 5000 30 N.A.
Rs 5001 to 10000 2 0 N.A.
Rs 10001 and above 1 0 N.A.
Source: Bombay Shroffs Association
5 2 4

TABLE 32.4
Estimated Decomposition of Interest Rate on Advances
(Figures in percentage per annum except ratios)
Item 1979 1988
Upper Middle Lower Upper Middle Lower
(a) Data from Table 32.2
Interest on advances 2 0 . 0 17.5 15.0 2 1 . 0 19.5 18.0Deposit rate 5.0 8.5 1 2 . 0 8 . 0 1 1 . 0 14.0Bad debts 3.0 4 .0 5.0 3.0 4.0 5.0Capital deposit 1: r a t i o
1 2 1 : 1 2 1 : 1 2 1:3 1:3 1:3
Earnings expense 20: r a t io
11.5 20:11.5 20:11.5 20:12.5 2 0 : 1 2 .5 20:12.5
(b) Decomposition
Default cost 0 . 6 0. 7 ( 4 . 0)
0.75 0.63 0.78(4 .0 )
0. 9
Establishment cost 6 . 8 8 2 . 2 1
(12.67)Neg 7.13 3.94
( 2 0 . 2 1 )0.75
Opportunity cost o f own funds
0. 92 0.92 0.92 3.5 3.5 3.5
Borrowing cost 4.62 7.85(50.11)
11.08 6 . 0 8.25(60.26)
10.5
Economic rent 6.98 5.82(33.26)
2. 25 3.74 3.03(15.54)
2.35
Total 2 0 . 0 17.5 15.0 2 1 . 0 19.5 18.0
(c) Return on own 90.74 75.66 29. 25 14.96 1 2 . 1 2 9.4fund;*
Notes: 1. Figures in parentheses are percentage o f Source: Table 32.2 andspread between borrowing and lending rates . computation.
2. Opportunity cost o f own funds taken at 12% in 1979 and 14% in 1988.
3. Upper bound on the interest rate in 1979 assumed to be 2 0 % in view o f the small s ize o f powerloom advances reported at 21.5% by Timberg and ,Aiyar (1980) and maximum o f 18% reported by Bombay Shroffs A s s o c ia t io n .
525

TABLE 32.5
A ctivities Financed by Shroffs
(a) Export finance
1 . Cotton 8 . Tobacco2 . Oil and o i l cakes 9. Yarn3. Onions 10. Gunny bags4. Potatoes 11 . Pulse s5. T ex t i le 12. Turmeric6 . Coir and c o i r products 13. C h i l l i e s7. Spices 14. Garments
(b) Domestic trade
1 . Oilseeds 20 . Onions2 . Ground nut 21 . Potatoes3. Jute/wool 22 . Spices4. Tobacco 23. Polymers5. Cotton staple a n d .a r t - s i lk yarn 24. Wool6 . Chemic a ls 25. Coconuts7. Metals 26. Tamarind8 . Pipes 27. Iron rods9. Rice 28. Corrugated sheets1 0 . Grains 29. Hardware11 . Jaggery, sugar 30. Chemicals1 2 . Groundnut 31. G old /s i lver jew el lery13. Oil seeds 32. Plast ic and rubber14. Paper 33. Tyre and cords15. Text i le s 34. Footwear16. Tea 35. Metal-Ware, u te n s i l s17. Jute and auto parts18. Hessian and gunny bags 36. Engineering items and19. Coal machinery
37. Rural handicrafts
(c) Transport, shipping and clearing
1 . Bus and truck operators2 . Auto part manufacturers3. Country-craft owners4. Clearing agencies and shipping agents
(d) Building construction and housing schemes
1 . Industr ia l sheds2 . Roads and public u t i l i t i e s .
Source: Extracted from information supplied by Bombay Shroffs Associat ion .
526

TABLE 32.6
Example of Comparative Costs of Bank Draft and Darshani Hundi (Based on Para 6 .2 )
Item Bankdraft
Darshani Hundi
(Rs. ) (Rs. )
1 . Cost o f instrument (For Rs 1 lakh)
2 0 0 Nil
2 . Interest cost (2 days) Nil At 20% p . a .
50.00
3. Opportunity cost o f 114.94 Nil
314.94 50.00
4. Addit ional inconvenience cost
50.00 15.00
Note: Inconvenience cost o f darshani. hundi is due to Section 40A( i ) o f Income Tax Act.
527
CHAPTER 33
THE SANCHAITA AND PEERLESS CASES
33.1 Introduction
33.1 .1 Whi l e , in p r i n c i p l e , f r e e f u n c t i o n i n g o f f i n a n c i a lmarkets, l im ited , i f at a l l , s o l e ly by f inanc ia l contro ls in the larger soc ia l in te r e s t , would appear to be des irab le , the poss i b i l i t y o f fraudulent pract ices by f inanc ia l intermediaries as
also inherent l im ita t ions in the informational environment o f f inanc ia l markets must be taken note o f as they c r u c i a l l y a f f e c t the ro le which the ICM can use fu l ly play in f inanc ia l intermediation in a country l ik e India. Quite apart from any moral issues, the e f f i c i e n t functioning of f inanc ia l markets, as intermediaries between savers and investors , requires that savers be protectedfrom excess r i sk ar is ing from imperfect information regarding the
terms and condit ions o f the contract entered into by them with a f inancia l intermediary or from the p o s s i b i l i t y o f fraud on the
part o f the intermediary. Likewise, intermediaries should not be in a p os i t ion to channel funds to s o c i a l l y undesirable a c t i v i t i e s , thereby depriving legit imate economic a c t i v i t y o f f inance andnegating the so c ia l o b je c t iv e o f f inanc ia l intermediation.
33 .1 .2 The task o f f inanc ia l regulation i s made extremely d i f
f i c u l t by the need to curb undesirable a c t i v i t y while not , at the
same time, s t i f l i n g legit imate f inanc ia l intermediation. In chapter 32 we commented on how Reserve Bank of India regulations in
h ib i t the a c t i v i t i e s o f cer ta in legit imate groups o f f inancial intermediaries. In th is chapter we provide two case studies o f questionable dealing by f in an c ia l intermediaries to understand the reasons for the harsh regulatory stance taken by the Reserve Banktowards non-bank f inanc ia l intermediaries in general and alsoto bring out some gaps in the ex is t ing regulatory framework.
528

33.1 .3 The two cases , that o f Sanchaita Investments and o f the P eer less General Finance and Investment Company Limited are notable not only because o f the very large deposits mobilised by each o f these concerns but also for the i n a b i l i t y o f the Reserve Bank and the Government to make much headway against them despite i n i t i a l evidence to suggest gross i r r e g u la r i t i e s and, in the ultimate analysis , protect the interest o f a large number o f small savers .
33.1.4 The plan o f th is chapter is as fo l low s . Sections 33.2 and 33.3 present the factual pos i t ion with respect to the nature
o f business o f 'Sanchaita ' and 'P e e r l e s s ' r esp ec t ive ly , as a lso a
descr ip t ion o f the ir skirmishes with regulatory author i t ie s and the ju d ic ia ry . Section 33.4 d iscusses the main issues raised by these cases, issues which have already been raised in the previous paragraphs, in greater depth.
33.2 Sanchaita investments
33 .2 .1 Background: Sanchaita was f loated as a partnership firmby Behari Prasad(Murarka, Sambhu Mukherjee and Swapan Kumar Guha in 1975 with a paid up ca p i ta l o f seven thousand rupees. I ts head o f f i c e was in Calcutta ( in the State of West Bengal).
33-2 .2 Deposit mobilisation: I t s main l in e o f business was theacceptance o f deposits from the publ ic for f ixed periods with the
provis ion that deposits were repayable on demand with a 1 per cent i n t e r e s t p e n a l ty . Whi l e , on paper, the rate o f i n t e r e s t on
deposits was 1 2 per cent per annum, i t was established that in ter
est was paid at 48 per cent up to September 1979 and at 36 percent thereafter t i l l 1981 a f t e r which no interest was paid on any deposit.'*' Interest was reputedly paid on the 7th o f every month
1. The m a t e r i a l f o r t h e s e c a s e s t u d i e s i s t ak e n f rom ne ws p ap e r r e p o r t s and f rom t h e j u d g e m e n t s r e l a t i n g t o C a l c u t t a Hi g h C o u r t audSupr e me C o u r t c a s e s f i l e d by t he S t a t e o f West B e n g a l . F u l l c i t a t i o n s a r e i n the Ap-
529
and delivered to the doorsteps o f depositors by agents o f the company. The t o t a l deposits mobil ised by the concern at the time o f i t s winding up in 1981 was around Rs. 110 crore from 1.67 lakhsmall depositors . Approximately 55,000 depositors had deposits o f R s . 4000 or l e s s (Rs . 22 c r o r e ) a fu r th e r 33 per cent o fdepositors had deposits o f Rs. 5,000 each (Rs. 28 crore ) and the rest had deposits ranging from Rs. 6,000 to Rs. 25,000. About 15
per cent to 2 0 per cent o f the d e p o s i t o r s were reputed to be widows who had invested their l i f e savings in sa fe ' but high y ie ld ing assets . The in terest in excess o f 12 per cent was not accounted for e ither by the firm or by several depositors and thus constituted a c lear case o f black money generation.
33 .2 .3 Uses o f funds: Since i t emerged during subsequent court
proceedings that the firm did not have any s ig n i f i c a n t source o f income by which such high interest payments could be sustained, the obvious conclusion i s that new deposits were used to pay interest on old depos i ts . However, the firm was in the business o f making short term or demand loans to shopkeepers, wholesalers and importers ( i . e . , f o r dockyard f inance ) . Interest rates charged on
secured loans were as high as 72 per cent on an annualised basis . The company also invested in r e t a i l trading establishments, stocks and shares, f i lm production, processing and exh ib it ion (there were at least 2 unreleased fi lms made with Sanchaita money with a l l - star c a s t s ) , real estate and housing and had a large number o f motor veh ic les and even a motor launch. In addit ion , money was given to p o l i t i c a l parties to help them f ight e le c t i o n campaigns - the main reason f o r the drop in the deposit interest rate in 1979. Large commission were apparently paid to the ir agents ( in one case
an agent was found to have seven houses in Calcutta) and crores o f rupees were deposited under fake names in Swiss bank accounts
p e n d i x to t h i s c h a p t e r .
2. Th i s i n f o r m a t i o n i s g l e a n e d f rom t he a t t a c h ment o r d e r s o f t he C o m m i s s i o n e r , S a n c h a i t a I n v e s t m e n t s , f o r the most p a r t . I t i s d i f f i c u l t t o d e t e r m i n e at t h i s s t a g e what p o r t i o n o f t h e s e a s s e t s was i n the name o f the f i r m and what in t h e name o f p a r t n e r s o r
5 3 0

(Amrita Bazar Patr ika , 18 March, 1986).
3 3 .2 .4 Regulatory h isto ry : I f Sanchaita had been a companywithin the meaning of se c t ion 451(a) of the Reserve Bank o f India Act, 1934, the provis ions o f the Non-Banking Financial Companies (Reserve Bank) D irect ions , 1977 would have been appl icable to i t . Under these Direct ions deposits accepted by such companies could not exceed 25 per cent o f net owned funds ( i . e . paid up cap ita l
plus free reserves) . However, since Sanchaita was a partnershipfirm, with a paid up c ap i ta l o f l e s s than Rs . 1 lakh, no f inancia lregulations of any kind, except the i n s u f f i c i e n t l y enforced West Bengal Moneylenders Act, applied to i t . It did o f course f a l l within the purview o f normal tax and criminal law.
33.2 .5 In 1978, the Prize Chit and Money Circulat ion Scheme(Banning) Act was passed by the Indian Parliament. The implementat ion o f the Act was l e f t to the individual State Governments.Accordingly, the West Bengal government issued a set o f Rules in 1979 for the implementation o f the Act and, a f t er an extensive review o f various non-banking f inanc ia l firms in the State, sent not ices to f irms f a l l in g within the purview o f the Act ordering them to submit winding up plans by December, 1980. The not ice and the l i s t o f firms was published in a leading Calcutta paper ( The Statesman) on September 25, 1980. S ig n i f i can t ly , Sanchaita wasnot on the 1 i s t .
33 .2 .6 However, in an apparently contrad ictory move, a First Information Report (FIR) was f i l e d by the West Bengal Government with the Calcutta Po l ice in which i t was a l leged that Sanchaita was promoting a money c i r cu la t io n scheme in contravention o f the1978 Act. The events leading up to the FIR were, b r i e f l y , as
f o l l o w s :
i . In July, 1979, a member o f the Lok Sabha (Lower House o f Parliament), Rudolph Rodriguez, wrote to the Deputy Prime Minister a l leg ing that Sanchaita was a ' cov°r -up for a p a ra l l e l banking system for black money'.
i i . The l e t t e r was sent to the Chief O f f i c e r o f the Department
5 3 1

of Non-banking Companies o f the Reserve Bank o f India at Calcutta. After enquiring into the matter, the o f f i c e r rep l ied to the l e t t e r stating that Sanchaita f e l l outside the scope o f sect ion 54(c ) o f the RBI Act, 1934 and hence was outs ide i t s c o n t r o l .
i i i . In September 1980, the Deputy Secretary o f the Finance Department, Government o f West Bengal wrote to the ChiefO f f i c e r , RBI, asking for lega l advice on Sanchaita. A s imilar l e t t e r was sent by the State Finance Minister, Dr. Ashok Mitra to the Union Finance Minister . The l e t t e r was forwarded by the Union Minister to the Deputy Governor o f the Reserve Bank, who sent a lega l report to Dr. Mitrastating that Sanchaita would not o rd in a r i ly f a l l within the purview o f the Prize Chit Act. The report is s t i l l c o n f i d e n t i a l .
33.2 .7 The FIR was accompanied by raids on the houses o f two
partners, Murarka and Mukherjee, and on the o f f i c e s o f the firm.
A number o f incriminating documents, a large sum o f money and
books o f accounts were impounded. Subsequently, e ighty otherpremises were searched and further documents seized. Following these events, the partners were arrested and released on b a i l . They then f i l e d a p e t i t i o n on behalf o f the firm and themselves with the Calcutta High Court. The Calcutta High Court re jected the FIR's contention that Sanchaita 's was a money c i r cu la t io n scheme and ordered the return o f seized items to the firm. On appeal to the Supreme Court, the p os i t ion o f the Calcutta High Court was upheld (February, 1982). The Supreme Court however gave the State government two months grace before i t was required to return items seized from Sanchaita in order to l e t I t make a detai led enquiry into the a f f a i r s o f the firm.
33 .2 .8 A case was then f i l e d against Sanchaita under the Indian Penal Code and the Income Tax Act and subsequently, a spec ia l Commissioner was appointed by the C iv i l Court, Calcutta to oversee the disposal o f Sanchaita 's assets and refund d e p o s i t o r ' s money. On March 20th, 1985 one o f the partners, Mukherjee, committedsuic ide while in p o l i c e custody.
3 3 .2* 9 A f term a th : Despite the e f f o r t s o f the Commissioner appointed for the l iqu id a t ion o f the assets o f Sanchaita, not a l l
~32

i t s assets could be traced or, in some cases , la ck o f evidence prevented attachment o f assets . I t i s also worth mentioning that the Commissioner had to work under constant threat o f v io le n ce . As o f July, 1986 only Rs. 1.67 crore had been d is tr ibuted among depositors who could establ ish the genuineness o f the ir pos i t ion out o f to ta l recover ies o f Rs. 2.5 crore . The break-up was as fo l low s : About 1250 people who had proved depos its o f Rs. 1,000each were given Rs. 200 each; 19,100 persons with deposits o f Rs.2 ,000 each had been g i ven Rs.340 each; 14, 000 p ersons with deposits o f Rs. 3,000 each had been paid Rs. 450 each; and the commission had started payment o f Rs. 750 each to depos i tors with Rs. 5,000. 107 p hys ica l ly handicapped persons had been given 5per cent more than t h e i r d e p o s i t s . Large d e p o s i t o r s had not received and were unl ikely to rece ive any refunds.
33 .2 .10 Some observations: The manner in which the West BengalGovernment proceeded against Sanchaita and the expressed i n a b i l i t y o f the RBI to proceed against Sanchaita are manifestat ions o'f the weakness o f the Indian lega l structure in enforcing f inanc ia l probity o f informal sector intermediaries . That the West Bengal
Government was able to proceed against th is tirm only under the
Prize Chit Act o f 1978, against the advice o f the RBI, i s a sad commentary on the state o f the law in t h is respect . The impotence o f the law was further underlined by the pronouncement o f the Supreme Court in th is case. While the Supreme Court judgement opined that "The FIR bears on i t s Face the stamp o f hurry and want o f care " the judgement quashing the appeal o f the Government hinged on a f ine d i s t i n c t i o n between the fo l lowing two s i tu at ions :
"A scheme for the making of quick and easy money” and "A scheme
for the making of quick and easy money, dependent on any event or contingency r e la t iv e or appl icab le on the enrollment o f members
into the scheme” . Only the l a t t e r , in i t s judgement, was a money c i r cu la t io n scheme. Since the FIR did not contain the la t t e r phrase or a phrase with s imilar meaning, the court held that the FIR could not ” form the foundation or const i tu te the start ing
point o f a lawful in v e s t iga t io n ” . Thus, the case was quashed even though the court accepted the p o s s i b i l i t y that in terest was being
533

paid out o f c ap i ta l i t s e l f ” and stated that "the fact that the accused are in d u lg in g in an economic a c t i v i t y which i s h ig h ly detrimental to the national interest i s a matter which must engage the prompt and s e r i o u s a t t e n t i o n o f the State and Central
governments". From th is , the d i f f i c u l t i e s faced by even well in- tentioned governments in complying with the s t r i c t requirements o f
Indian Courts should be c l e a r . Besides the courts and the West Bengal Government, i t is also the case that "nei ther the Reserve
Bank nor the Central government put i t s best foot forward when i t was a l e r t e d about the Sanchaita a f f a i r ” in the words of an e d i t o r i a l in a leading f inanc ia l da i ly (Economic Times, February10, 1982). The e d i t o r ia l further speculated that "perhaps i t was considered prudent to le t sleeping dogs l i e since p o l i t i c ia n s and the ir patrons were involved in the small f irms" ( l i k e Sanchaita). A recommendation by th is e d i to r and other sect ions o f the press for the sett ing up o f a high powered commission o f enquiry into the alleged nexus between informal intermediaries, black money and p o l i t i c s has not, as yet , been acted on. Thus, despite the new regulations (chapter 9) and the strengthening o f the regulatory
machinery, the a b i l i t y o f the author i t ies to curb fraudulent in termediaries in the future is s t i l l open to doubt.
33.3 Peerless general finance and investments limited
' 33 .3 .1 Whi le the Sanchaita case r e l a t e d to a (perhaps pardonably) mistaken n o t ion on the part o f the r e g u l a t o r y author i t ie s as to the nature o f a "money c i r c u la t i o n scheme" the Peerless case re la tes to an inexpl icab le and even more mistaken notion on the part o f au thor i t ies as to the nature o f a prize
c h i t ' . Furthermore while Sanchaita was a young firm which undoubtedly engaged in crooked p rac t i ce s , Peerless is a firm o f more than 50 years standing. As described below, while Peerless i s by no means l i l y white, in the words o f a Supreme Court Justice who heard the case o f Reserve Bank of India versus Peerless (Justice V. Khalid) "when the a c t i v i t i e s o f the Peerless and the Life Insurance Corporation are considered juxtaposed, one i s tempted to o b s e r v e that P e e r l e s s i s l e s s harsh than the L i f e Insurance
534

Corporation. Furthermore, to set the tone for the case study, the fo l lowing quotation from the same Supreme Court bench ( in this case Just ice 0. Chinnappa Reddy) is o f relevance "we must add here that both sides^ talked o f the public in terest and shed copious tears for the "unfortunate dep os i to rs " ; but neither side appeared to have any ready plan or even a contingent plan to protect or benef i t the depos i tors . On the one hand, there is a demand for the r e t r i b u t i v e pound o f f l e s h , unmindful o f the fu tu re o f thousands o f employees and the fate o f small savings o f m i l l ions o f depos i tors , a l l in the name o f the interest o f the depos i tors . On the other , having bled the depositors white, there is now a g l ib and make-believe o f f e r o f submission to s t r i c t regulation or even nat iona l isat ion for the p ro tec t ion , i t seems, o f employees
and d ep os i to rs " .
33.3.2 Background: Peerless was founded in 1932 by one Rad-hashyam Roy, a school teacher , with a c a p i ta l o f Rs. 300. The company was incorporated in Dhaka (now in Bangladesh) as the Peerless Insurance Company Limited. I ts i n i t i a l business was l i f e insurance. After the na t iona l isa t ion o f l i f e insurance in 1956, the company in trod uced a number o f saving srhemes, the most
public ised being patterned on a standard endowment l i f e insurance p o l i cy but without the bene f i t o f l i f e cover. The company also f l i r t e d b r i e f l y during the la te 6 0 ' s with general insurance, but th is come to an end at the time o f nat iona l isa t ion o f general insurance in 1971.
33.3.3 Deposit m obilisation p ra ctices : At the time o f theSupreme Court case re ferred to above ( in 1987) the 'endowment cer
t i f i c a t e scheme' was as fo l low s . A f ixed annual subscr ipt ion fo r a period o f 10 to 30 years on the part o f subscr ibers would result
ag ent s .
3. The L i f e I n s u r a n c e C o r p o r a t i o n o f I n d i a i s t h e m o n o p o l y , p u b l i c s e c t o r l i f e i n s u r a n c e f i r m in I n d i a . T h i s comment was made a f t e r a d e t a i l e d c o m p a r i s o n b e t we e n t he two f i r m s and t h e i r b u s i n e s s .
535

in a contractual amount being handed over at the end o f the contractual period. The annual compound rate o f return on the 10 year scheme worked out to be 6.4 per cent . C e r t i f i ca te holders received free accident insurance under a group insurance scheme
with the General Insurance Corporation o f India. The surrender value o f the scheme in case o f premature termination o f the contract was zero fo r the f i r s t year; 90 per cent o f the d i f ference
between the to ta l subscr ipt ion paid and the f i r s t year subscription therea fter ; and an amount equal to the subscr ipt ion paid a f te r the seventh year. P o l i c i e s were to be treated as lapsed i f subscr iption was not paid when due apart from a grace period. Lapsed f i r s t year p o l i c i e s had subscr iptions f o r f e i t e d by the com
pany. For the second and third years, p o l i c i e s could either be surrendered or paid back at par at the end o f the contract period. For periods above 3 years, p o l i c i e s could e ither be surrendered or a prorated portion o f the endowment sum ( l e s s 1 0 per cent bonus) could be recovered at the end o f the contract p e r i o d . ”*
33.3 .4 In the l i g h t o f the Supreme Co u r t ' s harsh comments about the nature o f t h i s scheme and also the Residuary Non-Banking
Companies (Reserve Bank) D irect ions promulgated in 1987, Peerless has s ince modified the scheme by increasing the rate o f return to
1 0 per cent per annum ( in c lu s iv e o f bonus); allowing premature withdrawal a f t e r 7 years with a 2 per cent i n t e r e s t p e n a l ty ; abol ishing f o r f e i t u r e ; and allowing discontinued c e r t i f i c a t e s to
-continue to earn in terest t i l l the date o f maturity (but at lower rates) even i f the subscr ipt ion is discontinued a f te r the f i r s t year .
4. That i s the R e s e r v e Bank and P e e r l e s s .
5. J u s t i c e 0. C h i n n a p p a Re d d y i n h i s Su p r e meCourt j ud g e me n t c o mpar e d t he s t r i n g e n t t erms o f t h e P e e r l e s s s c h e m e w i t h t h e L i f e I n s u r a n c e C o r p o r a t i o n ' s Pure Endowment P o l i c y . He c o n c l u d e d : "we do not have the s l i g h t e s td o u b t t h a t t h e t e r m s o f t h e " T a b l e No. 21 P o l i c y " o f t he L i f e I n s u r a n c e C o r p o r a t i o n are v e r y s t r i n g e n t and much more to t h e d i s a d v a n t a g e o f t he s u b s c r i b e r than the t e r ms o f t he
5 3 6

33.3 .5 Subscribers to the Peerless schemes were sought out by i t s agents from a l l over India including, a l leg ed ly , the remotest rural areas where public sector organisations and banks had not yet reached. Small savers were led to purchase Peer less c e r t i f i
cates by dazzling and often misleading advert is ing , smooth sales
ta lk and - i t has been alleged - by sharp p rac t i ces . Sharp pract i c e s are alleged to have included:^
i . Recruitment o f agents with p o l i t i c a l or government connections who could use the ir inf luence and contacts to extract sub s cr ip t io n s .
i i . Recruiting agents c l o s e l y related to persons in power so that bribes could be paid through the prevai l ing generous agents commissions by persons in need o f favours by the simple expedient o f purchasing a Peerless c e r t i f i c a t e .
i i i . Part t ime agents such as loan o f f i c e r s o f c o o p e r a t i v e banks or medical o f f i c e r s making loans/medical serv ices contingent on subscr ipt ion to a Peerless scheme.
iv . Using agents o f public sector savings organisations to s e l l Peerless p o l i c i e s while the ir sa lar ies were paid by the government.
33 .3 .6 Field agents received 30 per cent o f the f i r s t year
subscr iption but only 5 per cent o f subsequent year subscr ipt ions as commission. This led to a bias among agents to seek out new
business and neglect ex is t ing depos i tors . The total commissions paid to agents at the fie ld level and in the higher tiers o f their pyramidal structure averaged about 70 per cent o f firs t year subscriptions in 1979 and had risen to about 82 per cent in 1984 (See Table 33.1 and 33.3) but declined to 80 per cent in 1986. Total
sales o f p o l i c i e s had also shown phenomenal growth from Rs. 3.94 crore in 1969 (at face value) to Rs. 460 crore in 1979 to an e s timated Rs. 3,200 crore in 1985. Likewise, the to ta l number o f new c e r t i f i c a t e s sold rose from 16,000 in 1969 to 14 lakh in 1979 to over 30 lakh p o l i c i e s in 1985. The t o ta l f i e l d s t a f f also increased by leaps and bounds to nearly four lakh agents in 1985 ac-
endowment scheme o f the P e e r l e s s Company” .
6 . P o i n t s ( i ) and ( i v ) t a k e n f rom t he RBI I n s p e c t i o n R e p o r t ( 1 9 7 9 ) and p o i n t s ( i i ) and
33 7
33.3 .7 While the achievements o f Peerless in the mobi l isat ion
o f small savings and in employment generation are remarkable and may contain some lessons for the banking sector and other formal sector savings in s t i tu t i o n s , the malpractices by th is company are equally remarkable. The resu lt o f the lopsided structure o f commission for f i e l d agents and also - one suspects - the result o f de l iberate company p o l i c y was a high lapse rate o i c e r t i f i c a t e s a f te r the payment o f f i r s t year subscr ipt ion. This resulted in a
substantial inf low o f unencumbered funds into company c o f f e r s
through f o r f e i t u r e o f subscr ipt ions . Table 33.2 provides d e ta i l s o f the percentage and value o f lapsed c e r t i f i c a t e s as compiled by the Reserve Bank of India. As can be seen, 48 per cent o f c e r -
ot i f i c a t e s lapsed on average.
33 .3 .8 For p o l i c i e s which did not lapse, the s i tuat ion was not without r i sk . While i t i s true that Peerless had an investment p o r t f o l i o la rge ly cons ist ing of g i l t -edged s e c u r i t i e s , the normal precaution against moral hazard through a substant ial ra t io o f own
to borrowed funds was lacking. As shown in Table 33.3 own funds formed about 1 per cent o f t o ta l cap i ta l implying an abnormally high debt -equity ra t io even fo r a deposit accepting non-bank company.33.3.9 Uses o f funds: As shown in Table 33.3, nearly 90 per cento f the funds avai lab le with Peerless were invested in s e cu r i t i e s ,
cording to claims made by the company.^
( i i i ) f rom The T e l e g r a p h , March 21, 1986.
7. 1 986 i s t he most r e c e n t y e a r f o r whi ch the c o mp a n y s u p p l i e d i t s a n n u a l r e p o r t to u s . F i g u r e s r e p o r t e d h e r e a r e not a v a i l a b l e in t he two most r e c e n t annual r e p o r t s .
8 . The f i g u r e s i n c o l umn 6 a r e c o mput e d by us f rom company f i n a n c i a l s t a t e m e n t s as per no t e 2 o f t he t a b l e . These f i g u r e s , t ho ug h c r u d e e s t i m a t e s wi t h s u b s t a n t i a l mar g i n o f e r r o r are even more a s t o n i s h i n g . As per f i g u r e s g i v e n by J u s t i c e Reddy , The L i f e I n s u r a n c e C o r p o r a t i o n had 33 p e r c e n t and 31 p e r c e nt o f t h e i r new p o l i c i e s l a p s i n g a n d / o r f o r -
538

the bulk be ing government s e c u r i t i e s and f i x e d d e p o s i t s with national ised banks. The amount invested i s in excess o f the ir
Qsecured loans and deposits outstanding. Peerless i s in the habit o f giving wide p u b l i c i t y to the fact that contractual l i a b i l i t i e s
to depositors were more than f u l l y covered by, not just i t s t o t a l investment p o r t f o l i o , but even by i t s p o r t f o l i o o f government secu r i t ie s and nationalised bank f ixed d ep os i t s . However, due to the a c co u n t in g p r a c t i c e s f o l l o w e d by P e e r le s s - a pract ice also followed by the Life Insurance Corporation, and reportedly , common to insurance companies - f i r s t year subscript ions were shown as income o f the company and not as l i a b i l i t i e s . Instead, just prior to the time o f maturity o f p o l i c i e s which had
not lapsed, a provis ion was made in the l i a b i l i t i e s account for matured c e r t i f i c a t e s . This had the e f f e c t o f enlarging the p r o f i t
f igures o f Peerless and a lso conceal ing the "true" extent o f the ir l i a b i l i t i e s . Table 33.4 presents the r a t io o f investments to deposits including f i r s t year depos i ts . As can be seen, th is ra t io was le ss than 100 per cent t i l l 1985. Thus, even ignoring the low current ra t io (Table 33 . 3 ) , upto 1985 the company, was not in a pos i t ion to honour a l l i t s ob l iga t ions to depositors s o l e ly from disposal o f investments in case o f i t s winding up.
33 .3 .10 While i t is true that savings with Peerless fetched only 6.4 per cent per annum t i l l re cent ly , even so, the spread between i t s borrowing rate and rate o f return on investments was small given i t s high rates o f commission to agents. Table 33.5 gives the estimated y ie ld on the Peerless investment p o r t f o l i o . " ^ It is ins truct ive to estimate the required break even rate of
r e t ur n on a l l P e e r l e s s i nve s t me nt s , g i ven i t s ou ts ta n d in g depos i ts , under the assumption that no p o l i c i e s lapse. This i s
done in Table 33.6. The tab le shows that , s in ce , on average, 54
f e i t e d in 198 2 -8 3 and 1 9 8 4 - 8 5 r e s p e c t i v e l y .
9. Which i n c l u d e d a c c r u e d i n t e r e s t and p r o v i s i o n s f o r p a y i n g mat ur ed c e r t i f i c a t e s .
10 . The i n c l u s i o n o f f i x e d a s s e t s and r e n t a l or o t h e r in com e on f i x e d a s s e t s d o e s no t c ha ng e t h e p i c t u r e i n v i e w o f t h e s m a l l s i z e o f
539

per cent o f t o t a l subscr iptions received in a year were spent, the required annual rate o f return on the tota l asset p o r t f o l i o o f Peerless was 21.6 per cent as compared to an actual y ie ld o f 10.4 per cent in 1986. However, i f the fact that on average 48 per cent o f f i r s t year subscr ip t ions lapsed is taken note o f , the
r e q u ire d ra te o f return works out to be 15 per c e n t . These
f igures are biased downwards due to 2 reasons. F ir s t , current l i a b i l i t i e s include a small amount o f subscr ipt ions received but not included in secured loans and depos i ts , due primarily to incomplete app l i ca t ion forms . 1 1 It also includes an item re lat ing to outstanding commissions (See table 33.3 at 3.1 and 3 . 2 ) . Thus both d e p o s i t s and expenditure f i g u r e s used by us are b iased downwards, the bias in expenditures being much greater than that in deposits . Secondly, secured loans and deposits include accrued interest and provis ion for matured depos i ts . Since the business o f Peerless has been growing, th is imparts a proportionate upward bias to the deposit f igures . However, even without making these cor rec t ion s , - information i s not available for a l l years - that the hypothesis that Peerless would be in f in a n c ia l l y d i f f i c u l t i e s in the absence o f lapsed p o l i c i e s f inds support i s c lear . The s i tuat ion must be even worse a f te r the recent a b o l i t i o n o f laps
ing. That the rate o f return required for break-even, even a f t e r c o n s i d e r i n g on ly 52 per cent o f f i r s t year s u b s c r i p t i o n s as l i a b i l i t i e s (and subtracting 48 per cent o f th is item from expenses to arr ive at net expenditure) , exceeds i t s actual return reveals another important feature. It i s l i k e l y that despite the many p o l i c i e s lapsing, Peerless must s t i l l use addit ional funds, such as from i t s subscr ipt ions , to meet interest payments.1^
f i x e d a s s e t s .
11. RBI I n s p e c t i o n R e p o r t , 1979./
12. A more s o p h i s t i c a t e d a p p r o a c h t o c a l c u l a t i n g t h e r e q u i r e d r a t e o f r e t u r n on P e e r l e s s i n v e s t m e n t s t a k i n g i n t o a c c o u n t d e p o s i t g r o wt h and t h e m a t u r i t y s t r u c t u r e o f i n v e s t m e n t s was a l s o t r i e d . A n a l y t i c a l l y , t he a p p r o a c h used h e r e i s v a l i d o n l y when t h e d e p o s i t g r o wt h r a t e and the r a t e o f r e t u r n on i t s i n v e s t ments a r e e q u a l . I f t h e l a t t e r i s l e s s t han the f o r m e r , t he n i t woul d be o p t i m a l f o r the
540
33*3*11 Regulation and control: The chronology o f regulatory actions in the two cases for which studies are presented here underl in e s the seriousness o f the gaps in the regulatory framework covering non-bank f inanc ia l intermediaries . While part o f the f a i l u r e c o u ld be due to d e f e c t s i n the l e g a l s t r u c t u r e , the fa i lu r e must be part ly be attr ibuted to administrative lapses and
ineptitude as brought out in the c o u r t ' s judgement in the Sanchaita case. The current chapter begins in 1973 when the Miscel
laneous and Non-Banking Companies (Reserve Bank) Direct ions under the RBI Act o f 1934 came into fo rce . Under clause (4) o f these Direct ions , Miscellaneous Non-Banking Companies were re s t r i c t e d to accepting deposits equal to no more than 25 per cent o f net owned funds. Miscellaneous non-banking companies included conventional and prize c h i t s . The RBI sent a not ice to Peerless to comply with
these d i r e c t i o n s . Peerless , while reserving their right to d i s pute th is c l a s s i f i c a t i o n , requested the RBI for exemption from th is Provision in view o f i t s ' sound' business pract ices and exc e l l e n t small sav ings m o b i l i s a t i o n and employment g e n e r a t i o n record. This was granted by the RBI subject to 4 condit ions :
i . 50 per cent o f a f t er tax p r o f i t s should be transferred to reserves every year. (A provis ion that had c le a r ly turned out to be i n e f f e c t u a l ) .
i i . I t s dividends should be at most 6 per cent on ordinary shares and 7 per cent on preference shares.
i i i . At l e a s t 75 per cent o f i t s a s s e t s should be in f i x e d deposits with nat iona l ised banks or government s e c u r i t i e s .
iv . Peerless should submit a c e r t i f i c a t e from i t s auditors c e r t i f y in g compliance with ( i ) to ( i i i ) .
The exemption was to be reviewed every two years.
33 .3 .12 In 1977, the RBI revised i t s 1973 Direct ions and imposed13a c e i l i n g of 36 months on the contractual period for deposits .
f i r m not to i n v e s t b ut s i m p l y to pay i n t e r e s t out o f d e p o s i t g r o w t h . Any i n v e s t m e n t r e d u c e s i t s f i n a n c i a l v i a b i l i t y .
13. T h i s f o l l o w e d i n the wake o f s e v e r e c r i t i c i s m o f p r i z e c h i t s by t he Re s e r v e Ba n k ' s St udy
541
Peerless once again applied for exemption stating that a three
year endowment scheme was not f i n a n c i a l l y v i a b l e . This was, re fused. However, Peerless continued to s e l l i t s endowment scheme taking advantage o f the slow speed at which l e t t e r s between i t s e l f and the RBI were being exchanged. In the" meanwhile, in January,1978, the Reserve Bank, in an a f f i d a v i t - i n - o p p o s i t i o n to a writ p e t i t i o n by Favourite Small Investment Private Limited at Calcutta High Court a l leg ing discr imination between i t s e l f and Peerless,
c e r t i f i e d that Peerless was a sound firm with a scheru' b^oed on s c i e n t i f i c actuar ia l p r in c ip le s .
33.3.13 In 1978, when the Prize Chit (Banning) Act was passed,the RBI decided to undertake a deta i led inspect ion o f the company
before taking any dec is ion on i t s future. The inspection report which was submitted in May 1979 was highly c r i t i c a l of Peerless
and condemned inter a l ia
i . i t s accounting p rac t icesi i . i t s p o l i c y lapse rate
i i i . i t s commission structurei v . and i t s appointment o f agents wi th high s o c i a l and
p o l i t i c a l connections .
33.3.14 S tor ies a l leged ly "leaked" to newspapers by certa in RBI o f f i c i a l s also pointed out that several o f i t s dealings were i l legal (as discussed by us e a r l i e r ) but c l e v e r ly concealed.
33.3.15 Accordingly, in July, 1979 the RBI withdrew the exemp
tion granted to Peerless in 1973 and the West Bengal Government ordered Peer less to wind up i t s operations. A s imilar not ice was
sent to Peerless by the Madhya Pradesh Government in 1980.33.3.16 Thereupon, Peerless moved the Calcutta High Court (under a r t i c l e 226 o f the con s t i tu t ion ) challenging the v a l i d i t y o f the order and obtained an interim stay order. The case was f i n a l l y disposed o f by the Calcutta High Court in 1986 wherein the order of the West Bengal Government was upheld. On appeal, a three mem
ber d iv i s io n bench o f the same Court overruled the e a r l i e r judge
542

ment. An incred ib le s i tuat ion arose during the appeal whereby there were contrad ictory claims by the State governments and the Reserve Bank. The former al leged that Peerless was a money c i r cu lat ion scheme, while the l a t t e r ca l l e d i t a pr ize ch i t company! In h is summation, Just ice A.K. Sen o f the, Calcutta High Court ob
served that the Reserve Bank could exerc ise contro l over Peerless
under residuary clause 19 o f the Non-Banking Financial Companies (Reserve Bank) Direct ions , 1977, as amended in 1978, even though
i t was not a prize ch it company. Both s t ipu la t ions - as to quantum of deposits in re la t ion to net owned funds and as to duration- were present in these d i r e c t i o n s for residuary companies.
33.3.17 In 1987, the Supreme Court quashed an RBI appeal against the Calcutta High Court judgement while, at the same time, urging the RBI to take steps to curb the a c t i v i t i e s o f unscrupulous firms such as South Indian " b la d e ' companies and, in d i r e c t ly , Peerless . The opinion o f the Supreme Court on P e e r le s s ' s p ract ices has a l ready been covered e a r l i e r .
33.3 .18 The RBI's next move was to attempt to regulate Peerless
under the residuary clause 19, against which Peerless once again moved the courts . Meanwhile, the RBI issued a new set o f Directions c a l l e d the Residuary Non-Banking Companies (Reserve Bank) Direct ions , 1987. In these d i r e c t i o n s , the maximum period o f deposits was increased to 1 2 0 months and an interest f l o o r o f 1 0
per cent per annum was la id down. The RBI also dropped the net owned funds to deposit r a t io s t ip u la t io n but la id down that 1 0 per cent o f depos i ts were to be in fixed deposits with public sector banks and 70 per cent in approved s e c u r i t i e s . At most 20 per cent
or 1 0 times the net owned funds (whichever was l e s s ) could be in other investments. The method o f ca lcu la t ing t o t a l deposits was
also la id down and f o r f e i t u r e was abolished.
33.3.19 Aftermath: The str ingent f inanc ia l con tro ls imposed bythe RBI - a f te r i t s e a r l i e r errors - appear to have had an impact on the management of P e e r l e s s . Among the s e v e r a l f a c t s and
rumours appearing in the press are the fo l lowing .
543

i . In 1987, the family who held the major b lock o f Peerless Stock sold a large block to the Nicco Groups o f Companies. This resulted in a major reconst i tu t ion o f the board o f d i r e c t o r s and the introduction o f several managerial innovations. However Nicco pulled out o f the company a f te r only 7 months due to " d i f f e r e n c e s in the s t y l e o f management” ! The shares were sold by i t to a well known real es ta te developer.
i i . Both the company and i t s workers unions, had separately in 1986-87 asked the government to nat iona l ise Peerless. In 1988 however Peerless and the various unions concluded a c o l l e c t i v e agreement which could end t h e i r labour troubles .
i i i . The son-in-law o f the la te B.K. Roy, who headed Peerless f o r a quarter o f a c e n t u r y , res ig n ed h is post as the managing d i re c to r o f a large p ro fess ion a l ly managed firm to take over the helm o f Peerless .
iv . Peerless i s reported to be going into housing finance and the purchase o f r e a l e s t a t e in a b ig way. It i s a l s o reported to be lending large sums on the intercorporate funds market. In 1987 and 1988, Peerless set up three subs id ia r ies , Peerless Drive (P) Ltd. , Peerless Developers Ltd. and Peerless Financial Services Ltd. The former i s engaged in o i l d r i l l i n g or i t s f inancing and the second in the housing industry.
v . In 1987, the income tax department raided the houses o f the d i r e c t o r s o f Peerless and various company o f f i c e s . The re su l ts o f these raids are not known.
v i . On 31 March, 1988, the resu lts declared by Peerless showed a rebound in funds outstanding in the ir Social Welfare Fund Scheme from Rs 593 crore to Rs 883 crore . However th e ir l i a b i l i t y as to formerly lapsed c e r t i f i c a t e s was s t i l l under ascertainment.
v i i . A new 10 year saving schemes Che ' P r a g a t i P a tr a ' apparently patterned on the Government's Kisan Vikas Patra was introduced with an annualised rate o f return o f 1 1 . 6
per cent . The scheme allows for loans against the amount invested and medical insurance b e n e f i t s .
I t i s c lear that Peerless is s t i l l thr iv ing a f t e r a small set backin i t s performance.
33.4 The main issues
33.4.1 The Sanchaita case was one o f a company which engaged
5 4 4

in outright fraudulent deal ings . In the process o f bringing i t to book the various regulatory au th or i t ie s proceeded in a manner which showed a degree o f discomfort with o f the law and lack o f coordination between d i f f e r e n t agencies. The case study, therefo re , throws up the fo l lowing issues .
i . How can the r e g u l a t o r y a u t h o r i t i e s ensure that such fraudulent companies are not able to obtain deposits from the public?
i i . How can the author i t ie s ensure that savers are better informed as to the qual i ty o f d i f f e r e n t channels o f saving and the probity o f f inanc ia l intermediaries?
i i i . How can author i t ies ensure that funds ava i lab le to in fo r mal intermediaries do not f inance the underground economy?
iv . At the same time how can the regulatory author i t ie s ensure that the he a l t hy growth o f f i n a n c i a l markets i s not s t i f l e d ?
v. Can anythi ng be done to ensure that i f , d e s p i t e a l l precautions, a questionable organisation comes into e x i s t ence, c o r r e c t iv e act ion w i l l not be marred by the kind o f problems which arose in bringing Sanchaita to book?
33.4 .2 The Peerless case leads to certa in addit ional issues . While items ( i i ) to (v) above are questions which can also be raised equally v a l i d l y in the case o f Peerless , whether or not Peer less f i na nc e s the underground economy, a d d i t i o n a l i s s u e s r e l a t i n g to p roper f i n a n c i a l r e p o r t i n g and mo ni t o r i ng by the Reserve Bank and the proper c l a s s i f i c a t i o n o f informal intermediaries for the purpose o f monitoring and contro l arise as well . That our ana lys is , performed s o l e ly on the basis o f company financ i a l s t a t e me nt s , p o i n t s to the p o s s i b i l i t y t hat P e e r l e s s was
paying old depositors from new subscr ipt ions - a hypothesis not mentioned in the RBI inspect ion report - also throws up the need for properly designed inspect ion and audit procedures. This point
i s underscored dramatically by the fact that Peerless was given a clean ch i t by the RBI during the Favourite Small Investments case . These q u e s t i o n s have been d e a l t wi th i n an e a r l i e r chapter
(Chapter 15) and i s not repeated here.
545

TABLE 33.1
Eatio o f Agent's Commissions and Bonus to First Tear Subscriptions
1978 1979 1980 1981 1982 1983 1984 1985 1986
77.17 77.55 81.42 81.58 81.57 82.40 82.02 79.91 79.90
Source: Computed from Annual Reports o f the company.
TABLE 33.2
Deta i l s o f C e r t i f i c a t e s Lapsed
Year Number Amount o f P e r c e n t a g e o f Pe r c e n t a g eo f c e r c e r t i f i l a p s e d c e r t i - amount l a p s e dt i f i c a t e s f i c a t e s (%) to f i r s t ye arc a t e s ( R s • 1 a kh ) s u b s c r i p t i o n
Numb er Amount_
( 2 ) (3 ) ( 4 ) ( 5 ) ( 6 )
1971 12503 3 6 0 . 3 8 48 . 27 48. 961972 24545 802. 16 46 . 6 6 4 7 . 1 8 -
1973 66606 2 1 0 2 . 9 6 5 3 . 4 9 50 . 8 8 -
1974 NA NA 45. 2 0 45. 80 -
1975 NA NA 48. 50 48 . 2 0 -
1976 NA NA 50. 20 4 7. 60 -
1977 NA NA NA NA -
1978 NA NA NA NA -
1979 NA NA NA NA -1980 NA 2 1 2 1 . 8 6 NA NA 76. 911981 NA 3 7 0 4 . 2 5 NA NA 92. 401982 NA 6 1 2 4 . 7 1 NA NA 71 . 501983 NA NA NA NA NA198 4 NA NA NA NA NA
AVE. Z FOR AVAILABLE YEARS 4 8 . 7 2 4 8 . 1 0 80. 26
N o t e s : 1. F i g u r e s i n c o l um n s ( 4 ) & ( 5 ) f o r 1974 - 76 are RBIe s t imat e s .
2. C o l . ( 6 ) : F i r s t y e a r s u b s c r i p t i o n ( F Y S ) l e s s i n c r e a s ei n r e n e w a l s u b s c r i p t i o n i n t he next yeaT~as a % o f FYS.
3. 1983 Annual Re p o r t u n a v a i l a b l e to us so t h a t Co l . ( 6 ) f o r 1983 and 1984 c o u l d not be c o mp u t e d . Between 1985 and 1986 r e ne wa l s u b s c r i p t i o n s d e c r e a s e d .
S o u r c e s : 1. RBI I n s p e c t i o n R e p o r t , 1979 .2. Annual R e p o r t s o f t he Comany.
546

TABLE 33.3
Financial Structure of Peerless: Financial Years1983 to 1986
( P e r c e n t a g e )
1983 1984 1985 1986
Sources o f Funds1. Share c a p i ta l , resources 1 . 1 1 1 . 1 1 1.07 1.06
and surplus 2. Secured loans and deposits 75.85 76. 75 76. 27 72. 36
2.1 Of which renewals N.A. 17.10 7. 1 13. Current l i a b i l i t i e s and 22.92 22.13 2 2 - 6f- 26. 58
provis ions3.1 Of which subscr ip t ion 1.46 1.38 1.41 2. 14
deposit 3 .2 Outstanding commission 17.71 17.02 1 1 . 96 9.43
Uses of Funds4. Fixed assets 2. 58 1.97 1.64 1.515. Investments 87.88 89.19 89. 91 87.64
5.1 Of which investments in 86.51 87.68 89.70 86.41government secu r i t i e s or f ixed depos i ts with nationalised banks
6 . Current assets , loans 9. 94 8.84 8.45 10.85and advances
Income7. First year subscr ipt ion 80.76 75.41 61.47 30.66
( l e s s refunds and provisions)
8 . Other income 19. 24 24. 59 38.53 69.34Expenditure9. Commissions, e t c . to 6 6 . 55 61.85 49. 12 24.49
f i e l d force 10. Management expenses 10.82 10.35 1 1 . 8 6 18.8611. Interest paid and accrued 19.00 23. 11 34. 47 50. 3412. Other expenses and 0. 29 1.85 1.96 2. 56
depreciat ion 13. Prof i t before tax 3.34 2.84 2.59 3.7514. Current ratio(Z) 44.34 39. 95 37.31 40.8415. Ratio o f firs t year 38. 73 27.47 16.66 5.41
subscription to secured loans and deposits(Z)
16. Ratio o f 9 to 7 (Z) 84.20 82.02 79.91 79.90
Source: Annual Report o f the Company.
547
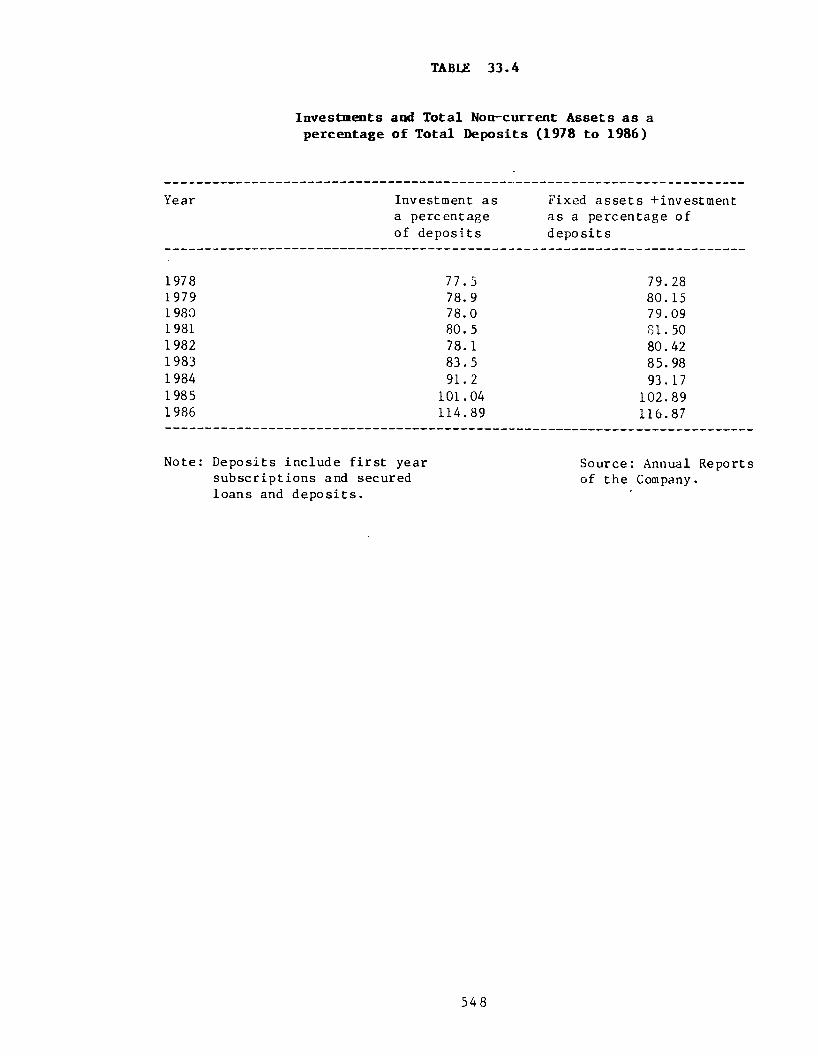
TABLE 33.4
Investments and Total Non-current Assets as a percentage o f Total Deposits (1978 to 1986)
Year Investment as a percentage o f deposits
Fixed assets + investment as a percentage o f deposits
1978 77.5 79.281979 78.9 80.151980 78.0 79.091981 80. 5 81.501982 78. 1 80.421983 83.5 85.981984 91. 2 93.171985 101.04 102.891986 114.89 116.87
Note: Deposits include f i r s t year subscr ip t ions and secured loans and depos i ts .
Source: Annual Reports o f the Company.

TABLE 33.5
Average Yield on Investments
Year Interest and dividends earned (Rs. lakh)
Investments ( stock)
(Rs-crore)
Average y ie ld (2/3 in per cent)^
( 1 ) ( 2 ) (3) (4)
1977 184.04 35. 13 8.4 2
1978 301.45 45. 90 8 . 6
1979 475.53 72. 25 10.41980 773 . 79 111 .77 10.71981 1135.65 185.22 1 0 . 2
1982 1954.47 279.87 1 0 . 6
1983 3048.48 3 87.42 10.91984 4085.68 534.90 10.51985 5965.16 676.66 1 1 . 0
1986 7033.89 717.91 10.40
Notes: I. This has been calculated Source: RBI Inspectionby d iv id ing the interest report and annualand d iv id end earned during report and accthe year by the investment ounts o f theout stand ing at the end of company.the previous year .
2 . As quoted in the RBIinspect ion report .
549

TABLE 33.6
Computation of Break Even Rate of Return on Peerless Investments
(Rs. crore)
Part I
Year Totalexpend iture
Securedloansanddeposits
First year subscript ions
Increase in (3 )
( 4 ) +( 5 ) (2) / ( 6 )
( 1 ) (2 ) (3) (4) (5) (6 ) (7)
1978 16.17 42.08 17. 16 - - -1979 26.16 64.03 27.59 21.95 49.54 0.52811980 45.59 95.18 48.07 31. 15 79.22 0.57551981 78.33 144.33 85. 70 49.15 134.85 0.58091982 118.04 229.04 129.23 84.71 213.94 0.55171983 124.54 334.33 129.50 105.30 234.80 0.53041984 124.19 460.35 126.47 126.01 252.48 0.49191985 97. 90 574.06 95.62 113.71 209.33 0.46771986 47.99 592.81 32.05 18.75 50.80 0.9446
Average: 0.5838Average considering only 52Z of (4) and adjusting
expenditures accordingly: 0.3881
Part II
1 .
2.
4.
Total amount due to a p o l i c y holder f o r an endowment plan with subscript ion o f Re. l annually at the end o f ten years (at 6.4% per annum) = (1 .064) (1 .064) - U /0 . 0 6 4 « Rs 14.29
Total earnings on investments required for break even (S) :S =Rs 14 .29 / (1 -0 .5424) = Rs 34.33 Required annual rate o f return ( r ) :
S = ( l + r ) ( ( l + r ) - l ) / r ; Therefore, required annual rateo f return: r = 2 1 . 6 Z.
I f 48% o f f i r s t year subscr ipt ions lapse : S = Rs.23.35 and r =15.OZ
Notes: (1 ) The increase in secured loans and deposits is used as a proxy for the net inf low o f subscr ipt ions excluding f i r s t year subscr ipt ion .
Source: Annual Report s o f the Company.
550

APPENDICES AND BIBLIOGRAPUY

APPENDIX TO CHAPTER 2
INDIGENOUS FINANCIAL INSTITUTIONS IN URBAN INDIA: A REVIEW OF THE LITERATURE
A2.1 Introduction
A2.1.1 The Indian f inanc ia l market may be divided into two segments. The formal c r e d i t market co n s is t s o f the commercial banks, co -operat ives banks, development banks and other f inanc ia l ins t i t u t i o n s l ik e investment companies, insurance companies. The in fo rm a l c r e d i t market (ICM) i n c l u d e s ind igen ous bankers , moneylenders, f inance companies, ch i t funds, nidhis and so on. The d iv id ing l in e used in th is note takes into account whether the Reserve Bank o f India imposes interest rate con tro ls or reserve requirements on the in s t i tu t i o n s . I f so, the sectors are treated as within the formal market. Whereas the operations o f the formal sector are well documented, the same is not the case with the informal sector . The exact s ize o f or volume o f c red i t extended by the informal sector or the ir structure o f interest rates i s not w e l l documented. A few e s t im a t e s have been made by v a r i o u s studies , the estimates being l o c a l i s e d or dealing with a part i c u l a r ind igen ous f i n a n c i a l i n s t i t u t i o n . Timberg and Aiyar (1980) , one o f the few a l l - I n d ia studies o f the ICM, estimates that about 30 per cent o f working c a p i ta l in India is f inanced by the ' l e g a l ' informal sector . Goldsmith (1983) a t tr ibu tes a much smaller share to the informal market.
A2.1.2 Here we shal l be dealing with various aspects o f the ICM - th e i r operat ions , sources and uses o f funds, the structure o f in terest rates prevalent at various centres and establishment costs- as evidenced by the l i t e r a t u r e ava i lab le on the sub jec t .
A2.1.3 Section A2.2 descr ibes the various indigenous f inancia l in s t i tu t i o n s . Sections A2.3 and A2.4 deal with th e i r functions and s o u r ce s o f funds . S e c t i o n s A2. 5 , A2 . 6 and A2.7 d e s c r i b e re sp e c t ive ly the types o f c re d i t extended and i t s uses, the structure o f interest rates and establishment cos ts and default losses o f these agencies per se and in comparison with the commercial banks. Section A2.8 contains conc lus ions .
A2.2 The main intermediary groups and their lines o f business
A2.2.1 The ICM in India i s composed o f d i f f e r e n t types o f agencies cater ing to sp e c i f i e d c l i e n t e l e . Each group o f agencies has i t s own method o f operat ion though the ir functions overlap. Six groups are most prominent in the l i t e r a t u r e :
i . Indigenous bankers,i i . Chit funds,
i i i . Nidhis,
551

i v . Hire purchase companies,v. Finance corporat ions , and
v i . Moneylenders.
A2.2.2 Most o f these agencies have long h i s t o r i e s except for hire purchase companies, which developed af t e r World War I , and finance corporat ions which developed during the s i x t i e s .
A2.2.3 Details o f the number o f indigenous f inancial in s t i tu t io n s between 1955 and 1980 are in Table A2.1. Moneylenders, followed by pawnbrokers, can be seen to predominate.
A2.2.4 Indigenous bankers Indigenous bankers came from the trading castes or groups o f trading castes from d i f fe ren t regions - 'G u ja r a t i s ' from south Gujarat, ~Shikarpuris ' (Multanis) from Sindh, 'Marwaris' from north and west Rajasthan, 'R a s t o g i s ' from the Oudh regions o f Uttar Pradesh and 'C h e t t ia r s ' from the Chet- tinad region o f south India. They a l l accepted depos i ts , issued and d i s c o unt e d b i l l s o f exchange and ot her commercial paper , provided c red i t and gave l e t t e r s o f c r e d i t to merchants requiring finance at various trade centres . Marwaris and Chettiars spread a l l over India, and a lso overseas, i n i t i a l l y cater ing only to their compatriots, but la te r to a more cosmopolitan c l i e n t e l e .
A2.2.5 S h ik a r p u r is or ig inate from Sindh, where they were l o c a l bankers. They came a century ago to Bombay which is s t i l l th e ir main centre , though they have spread to Madras, Salem, Calicut, Vijaywada, Bangalore and Coimbatore. They are the most widely known among indigenous bankers (Timberg and Aiyar, 1980). There were a to ta l o f 600 firms in 1979 who were members o f the Shikar- pur i Bankers' A s s o c i a t i o n and an equal number o f non-members (Timberg and Aiyar, 1980) as opposed to an estimated 800 at the end o f 1969 (Government o f India, Banking Commission, 1971). The average firm had a ca p i ta l o f Rs. 10 lakh and re l i e d mainly on own ca p i ta l . With refinance f a c i l i t i e s from banks being reduced, the Shikarpuris had d i v e r s i f i e d into instalment financing, e s p e c i a l l y in South India.
A2.2.6 Gujarati Shroffs: They are among the most ancient o f Indian bankers and are well organised, t rad i t ion a l family firms. Some o f the ir ' pedhis ' ( o f f i c e s ) are 150 to 200 years old (Banking Commission, 1971). They operate in Bombay and Ahmedabad and have an extensive network covering a l l d i s t r i c t s o f Gujarat and Bombay c i t y . They are o f two types: pure bankers, who are mainly foundin Ahmedabad, and those who combine banking with trade as commiss ion agents . There were a t o t a l o f more than 4000 Guj ar a t i Shroffs with 1500 pure shrof fs in Gujarat and 6 o f them in Bombay c i t y , the la t t e r each having several branches in Gujarat, in 1979 (Timberg and Aiyar, 1980). They were mainly organised as partnership firms. The Banking Commission (1971a) estimated a to ta l o f 350 Gujarati f irms: 150 pure bankers in Ahmedabad and 200 s h r o f f s , mainly o f the second type, in Bombay. The 1000 or so shro f fs who also do commission agency business are e i ther purchasing commission agents, who provide consumer goods to urban and rural merchants on c r e d i t (charging in te r e s t , commission and other incidenta l charges) or s e l l in g commission agents, who give advances to
552

up-country c l i e n t s o f about 80 per cent o f the value o f goods ordered against railway rece ip ts (Timberg and Aiyar, 1980). Most Gujarati shro f fs s p e c ia l i s e in a s ing le commodity.
A2.2.7 Marwaris: They operate mainly in Bombay and Calcutta andcombine banking with trade, c red i t transactions being a n c i l la r y to t r a d e . There i s a l s o a group c a l l e d Marwari 'K a y a s ' o f whom l i t t l e is written though they have been operating for over a century in tea e s ta te s , mostly in upper Assam. There were about 400 in 1969 (Banking Commission, 1971a) . They are m ost ly t rad ers having shops on estates and they render banking f a c i l i t i e s to the es ta te manager and workers and a lso , in some cases, to neighbouring tea e s ta te s .
A2.2.8 C h ettia rs : The name is derived from ' c h e t t i " a tradingand business community among the Hindus. They migrated from Ved- dranyam and Kaveri-pun-pattinam ( ca p i ta l o f the 3rd century B.C. Chola Kings), where they la rge ly engaged in trade in sa l t with the F i j i Is lands, into Chettinad where they spread over 78 v i l l a g e s o f two d i s t r i c t s , Ramnad and Padukottai. Over the last 150 years they emigrated to Burma, Malaysia, Singapore and Sri Lanka and establ ished themselves as prosperous businessmen. Besides Chett inad, they scattered in small towns throughout Tamilnadu (Timberg and Aiyar, 1980). Important banking centres o f the Chettiars were Pu du kotta i , Ta n j o r e , Coimbatore , Tr i c hy , Madurai, Karaikudy, Virudhnagar and Salem. They numbered about a lakh in 'India in 1979 (Timberg and Ai yar , 1979) . Ch e t t i a r s are p r i n c i p a l l y moneylenders - g iv ing loans against security - but a large number accept depos i ts and finance trade transactions.
A2.2.9 R a s to g is : Ra s t o g i s , f rom the Oudh r e g i o n o f UttarPradesh, are the most prominent among various castes such as Agar- wals, Khatris and Kayasthas engaged in moneylending in th is State. Important centres o f operat ion o f Rastogis are Lucknow, Varanasi, Farukhabad and Moradabad (Timberg and Aiyar, 1980). Rastogis accept deposits and g ive loans. In Lucknow alone .there were 500 o fthem engaged in banking in 1979. They have now mainly divers i f i e d into hire purchase financing o f transport ve h ic le s .
2*2.10 Chit funds, nidhis, hire purchase finance companies and finance corporations: These informal intermediaries have beendescribed in d e t a i l in the opening sect ions o f the relevant case studies in Part F o f the report . The number o f reporting ch it fund companies had increased from 97 in 1967 to 541 in 1982 while the ch it subscr ip t ion has increased from Rs 0.34 crores in 1967 to Rs208.06 crores in 1982 (Nayar, 1986). According to Nayar (1986) 75 per cent o f the ch it funds are in South India. There were an es timated 150 Nidhis operating at the end o f 1966 with t o t a l assets o f about Rs 25 crores (Banking Commission, 1971). Finance corporat ions are recent f inanc ia l intermediaries which or ig inated in Madanapalle in Andhra Pradesh in 1960 and have spread to Tamilnadu, Kerala, Karnataka, Punjab, Gujarat and Madhya Pradesh. According to Nayar (1982), 90 per cent o f these companies are inSouth India while the ir population was estimated at 2200 firms by Timberg and Aiyar (1980).
553

2 .2 .1 1 M o n e y l e n d e r s : Indigenous moneylenders can be c l a s s i f i e d as urban and r u r a l each o f which can be f u r t h e r grouped i n t o professional and non-professional (Karkal, 1967). Profess ional moneylenders are those whose sole occupation i s moneylending. Non-professionals include pawnbrokers, merchants, traders and ' o t h e r s ' in urban areas and l a n d l o r d s , m erchants , and o t her a g r icu l tu r is t s in rural areas. 'O th e rs ' include widows, ret ired Government personnel and, in some c a s e s , church and temple author i t ies who lend on promissory notes (Karkal, 1967). Rural loans may be in cash or in kind.
A 2 .3 . F u n ct ion s
A2.3.1 I n d i g e n o u s b a n k e r s : Indigenous bankers perform variousf u n c t i o n s l i k e r e c e i v i n g c a l l money and short term d e p o s i t s , remitting money, buying and s e l l in g hundies, discounting commerc i a l paper and cheques, giv ing commercial guidance and o f f e r in g transient accommodation to out o f town c l i e n t s and asso c ia te s . Some even provide long term ca p i ta l to in d u s t r ia l i s t s . Gujarati shro f fs a lso act as commission agents for up-country c l i e n t s . Bankers lend money with or without secu r i ty except for Chettiars , who always require a secur i ty . Shikarpuris, Chettiars and Rastogis provide hire purchase credit f o r old and new veh ic les and consumer durables. About 25 per cent o f Rastogis are pawnbrokers. (Timberg and Aiyar, 1980).
A2.3.2 M on ey le n d ers : Vil lage moneylenders usual ly advance loansin both cash and kind, whereas urban moneylenders only advance cash. The v i l l a g e moneylender also acts as an agent fo r the town moneylender - supplying the l a t t e r with agricu ltura l produce and raw mater ia ls . The v i l l a g e trader, when lending in cash or kind, t y p i c a l l y s t ipu la tes that borrowers should s e l l the ir produce to him or through him at an agreed p r ice . Pure moneylenders and merchant moneylenders f inance trade and commerce. Their l o a n s f a c i l i t a t e the transfer goods from one centre to another. (Karkal, 1967 and Banking Commission, 1971).
A . 2 .4 S o u r c e s o f fun ds
A2.4.1 Indigenous bankers have large working cap ita l bases cons is t in g o f both o f owned and borrowed funds - though the ra t io o f owned to borrowed funds var ies from group to group. The Shikarpuris mainly use th e i r own funds and accept l imited deposits from fr iends and .re latives . They a lso borrow from commercial banks. The ra t io o f th e i r own funds to borrowed funds varies from 1:1 to 1:5 (Timberg and Aiyar, 1980). Advances to Multani shro f fs by scheduled and non-scheduled banks for the period 1964 to 1970 showed an upward trend from 1967 to 1970 (Table A2.2) but has s ince , i t i s reported, declined. Advances were made b a s i c a l l y by discounting hundies. Pure Gujarati shro f fs accept deposits from the public both on current account and for f ixed periods . Demand l i a b i l i t i e s c on s t i tu te over 70 per cent o f the ir t o ta l deposits (Timberg and Aiyar, 1980). They also borrowed from commercial banks in the past, though th is source is l im ited . They have an indigenous c a l l market for short term funds, which is a very impor
554

tant source o f funds for these sh ro f f s . Chettiars operated mainly on the ir own funds though they did accept depos i ts , usually term deposits , o f three months or more. Their borrowed funds were 15 per cent o f th e i r owned funds in 1970 (Banking Commission, 1971). Their cap ita l deposit r a t i o , as estimated in the Timberg and Aiyar (1980) study, was 2: 3. They a ccept d e p o s i t s , mainly time l i a b i l i t i e s , f o r f ixed periods o f upto 5' years. Demand deposits are not s ig n i f i c a n t . The c a p i ta l -d e p o s i t ra t io o f Rastogis varied from 1:4 f o r large firms to 1:1 f o r smaller firms in 1979 (Timberg and Aiyar, 1980).
A2.4.1 Deposits accounted for 82 per cent o f t o t a l l i a b i l i t i e s o f nidhis in 1965-66 and about 84 per cent in 1977-78 (Radhakrishnan,1979). Of d epos i ts , the share o f recurring deposits has fa l len over the years, whereas that o f f ixed deposits has increased from 46 per cent in 1965-66 to 66.3 per cent in 1977-78 (Radhakrishnan,1979). The major source o f funds for f inance corporations were f ixed deposits from the publ ic . Savings depos i ts , cumulative, seasonal, c a l l , lucky, trust and l i f e deposits were some o f the other types o f deposits accepted. Their ca p i ta l -d e p o s i t rat io was, on average , 1:6 in 1979 (Timberg and Aiyar , 1980) . Term deposit made up 97 per cent o f the deposits o f f inance corporat ions in South India (Nayar, 1982).
A2.4.2 Moneylenders operate mainly with their own funds. A very small number o f moneylenders may accept depos i ts , but th is forms, at most, 20 per cent o f the ir own cap ita l (Banking Commission, 1971).
A2.4.3 No comprehensive time ser ies data is ava i lab le on the composition o f funds from various sources for the d i f f e r e n t indigenous f inanc ia l in s t i tu t io n s . H istor ica l d e ta i l s o f deposits with some indigenous f inanc ia l agencies are in Table A2.3.
A 2 .5 Type o f c r e d i t and en d -u se o f funds
A2.5.1 Indigenous bankers usually gave short term loans so as not to keep the ir c a p i ta l tied up for too long. They mainly financed internal trade and provided working cap ita l to commercial and business concerns including small industr ies . Table A2.4 gives the purpose-wise d i s t r ib u t i o n o f c r e d i t o f some indigenous financ i a l i n s t i t u t i o n s .
A2.5.2 S h ik a r p u r is lend almost s o le ly fo r working c a p i ta l . Funds were loaned to meet trade and production requirements, for bridge finance or to meet margin requirements for bank finance. The most commonly used instrument was the usance hundi or promissory note, which i s a 90 days c re d i t b i l l . In Bombay, Shikarpuris lent only on 90 day term notes whereas, in the South, funds were provided on an instalment payment bas is . These instalments, against promissory notes , const ituted about 45 per cent o f t o ta l advances in1979. Interest was deducted in advance. Shroffs that were not members o f shikarpuri a ssoc ia t ions lent mainly through promissory notes or demand notes supported by post-dated cheques. Shikarpuris general ly did not lend more than 25 per cent o f the net worth o f the borrower. For large loans, a number o f Shikarpuris pooled
555

A2.5.3 G u ja r a t i s h r o f f s lent with or without security f o r working cap i ta l and mainly to traders . According to Aiyar 's estimate, 60 per cent o f the ir c red i t went to trade (See Table A2.4) . They operated through brokers in the larger centres while in the smaller centres , d i r e c t advances were made. The average s ize o f advances ranged from Rs 50,000 to Rs 1 lakh per borrower and 60 per cent to 70 per cent o f thei r business was through hundies (Timberg and Aiyar , 1980) . They remi t t ed funds by us ing ' d a r s h a n i ' ( s ight ) hundies and cheques on out s ta t ion banks. They financed r e t a i l trade, commerce and small -scale industr ies , lending mainly to Gujarati traders and covering nearly a l l commodity markets.
A2.5.4 Short term t rade c r e d i t through hundis by i nd i genous bankers for the period 1949 to 1961 increased from Rs 22.32 crore to Rs 288.68 crore (Table A2-5) . The volume o f transactions isreportedly lower now due to Reserve Bank regulation .
A2. 5. 5. C h e t t i a r s engaged in moneylending , pawn-broking and banking (Timberg and Aiyar, 1980). They financed businessmen on the basis o f hundies, promissory notes and hire purchase agreements. They gave short term loans, which were repayable in instalments, and also financed high r isk ventures l ik e fi lm production.
A2.5.6 R a s t o g i s directed advances and loans to traders and artisans and gave hi re purchase c r e d i t . A few were pawnbrokers. Advances were usually given d i r e c t l y to traders and to artisans mainly through traders. Most o f these loans were made without tangible secur i ty . Their main area o f a c t i v i t y was h ire purchase financing o f transport v e h ic le s , though the survey estimates o f Aiyar shows that 55 per cent o f the R a sto g i ' s c re d i t goes to trade (Table A2 . 4 ) .
A2.5.7 C h i t f u n d s were u s u a l l y used f o r consumpt i on, s o c i a l events, j ew e l lery , housing, medical care and other personal expenditure and rare ly f o r investment in industry, though some loans were used for commerce.
A2.5.8 N i d h i s usual ly give long term loans on security to their members. The loans are mainly for house construct ion , domestic or s o c ia l funct ions, repayment o f pr ior debts, extension and repair o f house propert ies and medical expenses. A n e g l ig ib le amount i s also lent to a gr icu l ture , industry and commerce. Radhakrishnan (1979) estimated that only 7.7 per cent o f advances o f 15 nidhis went for investment in business, 23.5 per cent for construct ion , purchase and repair o f houses while the re&t was used for consump- t ion.
A2.5.9 H ir e p u r c h a s e companies mainly lent for purchase o f neu and old v e h i c l e s , consumer durables and equipment for p ro fes s i o n a l s l i k e d o c t o r s , e n g i n e e r s and s c i e n t i s t s , much as at p resent .
A2.5 . lO F in a n c e c o m p a n i e s gave l o ans to w h o le sa le and r e t a i l traders , small scale industry and self-employed persons. A n e g l i
their resources. (Timberg and Aiyar, 1980).
556

gib le amount went to agr icu lture . The c red i t mainly went to c loth merchants ( s i l k ) and t r a d e rs d e a l in g in food g ra in s and o i l (Banking Commission, 1971). They o ften gave loans to borrowers whom banks had r e f us e d and to t r a d e r s d e a l in g in commodities covered under s e l e c t iv e c re d i t c o n tro ls (Bhole 1982 and Timberg and Aiyar, 1980). Loans were usually short term and unsecured (not exceeding 90 days) but were renewable. ' They also gave hire purchase c red it f o r old and new veh ic les and other consumer durables. Loans were usually given on the basis o f the partners" personal knowledge o f the creditworthiness o f the borrower. Shares, jewell e r y , property or any other tangible assets were taken as security from unknown borrowers in a few cases (Nayar, 1982).
A2.5. U M o n e y l e n d e r s u s u a l ly gave short term l o ans , (4 to 6
months). Urban moneylenders operate in taluka headquarters or at cer ta in commercial or industria l centres . Pure moneylenders and merchant-moneylenders mostly f inanced trade and commerce through unsecured loans. Consumption loans were rare ly given on a large sca le . The 'O ther ' c lass o f moneylenders e s s e n t ia l l y gave petty unsecured consumption loans to workers and labourers.
A2.5.12 Table 32 . 1 , i n chapter 32 abov'e, and the d i s c u s s i o n regarding deployment o f bank cred it there , documented the limited ro le played by banks in cer ta in sectors e s p e c ia l ly trade. The break up o f t o ta l bank c r e d i t , given in Table A2.6, provides addit ional information on the deployment o f bank cred i t up .to 1985.
A2.5.13 Trade is the sector which draws the most on the informal c re d i t market. Cloth wholesalers and large dealers in Kanpur and Amritsar borrow large amounts from informal sources - as much as 50 per cent o f working c ap i ta l during the peak seasons - since c lo th trade did not get much bank c r e d i t due to s e l e c t i v e c red it con tro ls prior to 1985. Traders deal ing in o i l and foodgrains a l s o borrowed from i nf ormal s o u r c e s . Other major segments financed by the informal c re d i t markets are leather tanneries , handloom/powerloom owners, beedi merchants, small pharmaceutical manufacturers, self-employed persons, h o t e l i e r s , small restaurant owners, contractors and also some exporters . (Timberg and Aiyar,1980)
A2.6 Structure of interest rates
A2.6.1 Interest rates charged varied between d i f f e r e n t f inancia l i n s t i tu t io n s and also between d i f f e r e n t regions. In general, brokers lent at the rate o f 18 to 24 per cent per annum to larger establ ished traders, with 18 per cent as the norm, and to smaller traders and art isans in the range 24 per cent to 35 per cent per annum (Timberg and Aiyar, 1980). Higher rates were general ly prevalent in South India which a lso has a larger number o f in fo r mal in s t i tu t io n s .
A2.6.2 Interest rates d i f f e r e d substant ia l ly from c i t y to c i t y and show the l o c a l i s e d and segmented nature o f the informal credit market. Table A2.7 gives the e f f e c t i v e rates charged by the indigenous f in an c ia l in s t i tu t io n s at various centres . Nominal interest rates are given in Table A2.8.
557

A2.6.3 Shikarpuris in Bombay charged Rs 1.70 per month (Timberg and Aiyar, 1980). Taking into account that interest was paid in advance, the e f f e c t i v e rate becomes 23.3 per cent per annum (Table A2.7) . In Madras the rate was 2.3 per cent per month (33.1 per cent per annum). In the smaller towns o f South India, the e f f e c t ive rate varied from 24 per cent per annum to 32.3 per cent per annum in 1971, while the e f f e c t i v e rates in Bombay, Madras and Bangalore were 17.6 per cent , 25.3 per cent per annum and 19.4 per cent resp ec t ive ly (Banking Commission, 1971). Interest rates in metro areas appear, from t hi s , to have been lower than in nonmetro areas.
A2.6.4 Gujarati shroffs charged a modal interest rate o f 18 per cent per annum in the seventies though there was some va r ia t io n across centres and types o f loans. The interest rate charged by Chettiars on hundis or promissory notes was normally about 24 per cent per annum and not l e s s than 18 per cent per annum (Timberg and Aiyar, 1980). Loans repayable in instalments earned them 47 per cent while the annual rate for short term advances o f 2 0 0 days or less and repayable in da i ly instalments was 38 per cent per annum. The rate on hundis in 1971 was 21 per cent per annum plus brokerage and stamp duty (Banking Commission, 1971). Rastogis lent at a rate not l e s s than 24 per cent . The e f f e c t i v e rate ca lcu lated was 37 per cent per annum on hire purchase f inancing in Uttar Pradesh. Marwaris doing multani type business in the South charged 28.4 per cent per annum (Timberg and Aiyar, 1980).
A2.6.5 Nidhis charged 7 per cent to 10.5 per cent per annum for loans made against house property and 1 2 per cent per annum on special loans (Banking Commission, 1971). Loans against deposits were charged 1 to 1.5 per cent higher than the rate paid (Banking Commission, 1971 and RadhakrIshnan, 1979). Interest rates varied according to the type and period o f the loan and the amount l e n t . Rates for d i f f e r e n t types o f loans varied from 10 to 13.5 per cent per annum in 1971 and from 15 to 18 per cent in 1977-78 (See Table A2.7 ) .Rire purchase companies usually charged a f l a t rate ca lcu lated on the t o ta l amount lent and not on the diminishing balance. Rate charged for new veh ic les were:
For used veh ic le the charge is 12 to 24 per cent f l a t (Banking Commission, 1971a). Finance companies reported 21 per cent per annum though borrowers reported a rate o f 24 per cent in 1979 (Timberg and Aiyar, 1980). At ce r ta in times in the year the rate could go up to 3 6 per cent per annum.
A2.6.6 Interest rates o f moneylenders ranged from 33.3 per cent to 50 per cent on kind loans for 6 months. For loans against tang i b l e assets , the rate varied from 19 per cent to 37.5 per cent per annum (Karkal, 1967). The average rate o f in terest was higher in commercial and industr ia l centres as compared to rural areas.
Southern Region Western Region Northern Region Eastern Region
9 to 12% per annum f la t1 0 to 1 2 % per annum f l a t10 to 15% per annum f la t10 to 15% per annum f l a t .
558

Rates o f interest on petty loans could be as high as 75 per cent per annum (Karkal, 1967). According to a study by Bhende (1983), the interest rates varied from 18 to 24 per cent per annum in Mahbubnagar, Andhra Pradesh and from 25 to 120 per cent per annum in Shirapur and Kanzara v i l l a g e s o f Maharashtra. The rates in the Sambalpur d i s t r i c t o f Western Orissa varied from zero to 120 per cent per annum. The corresponding rates o f formal c red i t in s t i tu t ions varied from 1 2 . 6 per cent to 2 1 . 8 per cent per annum with13.5 per cent being the average e f f e c t i v e rate (Sarap, 1986).
A2.6.7 Table A2.9 gives lending rates o f commercial banks for relevant years. A comparison o f rates o f in terest o f indigenous f inanc ia l in s t i tu t io n s and those o f banks shows that the rates o f the l a t t e r were much lower. Despite the lower rates , the long process o f gett ing a loan, lack o f a proper c o l l a t e r a l and nonf l e x i b i l i t y in bank dealings were some o f the reasons c i ted for using informal sources o f f inance.
A2.7 Bad debts and establishment expenses
2. 7 . 1 On average, bad debts for Shikarpuris and Gujaratis formed 5 per cent o f the gross p r o f i t s in Bombay. In smaller towns i t i s usually larger ranging from 7 to 10 per cent o f gross p r o f i t s (Timberg and Aiyar, 1980). For Chettiars , bad debts averaged 10 per cent o f p r o f i t s whereas for Rastogis they were 10 to 15 per cent o f gross p r o f i t s (Timberg and Aiyar, 1980). Default loss for f inance corporat ions was about 1 per cent o f the ir t o ta l working funds in 1979. For ch it funds, 15 per cent to 18 per cent o f subscribers fa i le d to pay the ir p er iod ica l instalments a f t e r gett in g the p r i z e (Banking Commission, 1971a) . Bad debts were usually absent in the case o f moneylenders though in a few cases bad debts were reported at upto 1 0 per cent o f the ir working capi ta l (Banking Commission, 1971).
2 . 7 . 2 Establishment expenses were genera l ly low. The average Shikarpuri and G u jarat i f i r m ' s expenses were Rs 30 ,000 to Rs35,000 per year (Timberg and Aiyar, 1980). Transaction costs o f Shikarpuris were 5.5 per cent o f th e ir working funds, whereas that o f the Gujarati shro f f was 3 to 3 .5 per cent o f working funds (Timberg and Aiyar, 1980). The establishment expenses for the Chettiars and Rastogis were, on an average, Rs 15,000 per year. As a percentage o f working funds th is was 4.6 for Chettiars and 5 f o r Rastogis . Transaction cos ts as a percentage o f working funds for f inance corporat ions and hire purchase companies were 5 per cent each while for pawnbrokers and nidhis these were 3 . 5 and 3 . 6
re sp e c t ive ly (See Table A2.10). Transaction costs fo r moneylenders were nearly absent since their establishment costs were neg l i g i b l e . Administration costs for commercial banks were 3.4 per cent o f working funds in 1976. No data was found on d e f a u l t l o s se s o f banks.
2 . 7 . 3 Deta i ls o f establishment o f t ransaction cost o f informal c red i t market agencies are given in Tables A2.10 and A2 . l l The percentage o f t o t a l expenditure to to ta l income is highest in the case o f Shikarpuri shro f fs and lowest in case o f f inance corporat i o n s . Major e x p e n d i tu r e s can be seen to have been wages,
559

salaries and rents.
2.7.4 Though e s t a b l i s hme n t c o s t s o f i nd i genous f i n a n c i a l agencies were comparable with those o f the commercial banks, the ir f igures for bad debts cannot be considered r e l ia b le since they may be overstated to avoid taxes . However, thi s i s not a l im ita t io n as commercial bank bad debt f igures are unavailable.
2.8 Conclusions: The importance of urban informal credit in the recent past
2.8.1 The formal cred it market has grown rapidly s ince 1950 and now comprises a large number o f f inanc ia l in s t i tu t i o n s , covering most o f India. Total assets o f formal f inanc ia l in s t i tu t io n s as a percentage o f GDP have grown from 38.1 per cent in 1950 to 102.7 per cent in 1980 (Morris, 1985). Gross bank c re d i t to various sectors has a lso grown from Rs 11,620 crore in 1976 to Rs 74,953 crore in 1985. On the other hand, data on the informal cred it markets i s scanty and i t s t o ta l s ize has not yet been r e l i a b l y estimated. But comparing the Banking Commission's reports and the Timberg and Aiyar study on various segments o f the urban informal c re d i t markets, i t is seen that in absolute terms the volume o f c red i t in sectors studied seems to have grown. The l a t t e r study's estimate o f the informal sector in 1979 suggests that the to ta l c red i t extended by the urban informal f in an c ia l market, excluding intra-market loans, was about 30 per cent o f gross bank c r e d i t outstanding as on June 1979. The study also estimates that' the informal sector f inances about 30 per cent o f the urban market in India, about 50 per cent o f wholesale trade in some commodities and about 10 to 30 per cent o f the c a p i ta l requirements o f small- scale units l ik e powerlooms, pharmaceutical manufacturers and leather tanner ies .
2. 8. 2 Despite the growth in bank c r e d i t , informal markets continue to cater to cer ta in segments o f s o c ie ty . Some reasons suggested for borrowing from the informal sources are- ( 1 ) the actual cost to the borrower i s comparable with the bank rate , ( 2 ) lack o f proper c o l l a t e r a l r equ ired by f ormal i n s t i t u t i o n s , ( 3 ) bank po l i cy , which con tro ls the c red i t extended to certa in sectors , and (4) f l e x i b i l i t y in the operations o f indigenous f inanc ia l i n s t i t u tions .
2.8 .3 The long drawn out procedures for gett ing bank c r e d i t ent a i l a number o f v i s i t s to the bank before c re d i t is sanctioned. In certa in cases, where c red i t is required quickly ( f o r instance by exporters and t rad ers ) , i t becomes imperative to borrow from informal sources. Lack o f secu r i ty a t t r a c ts other groups such as restaurant owners, contractors and self-employed persons. Lack o f knowledge o f bank procedures and loan schemes i s a lso a reason for borrowing from moneylenders.
2 . 8 . 4 Wholesale trade is given l i t t l e bank cred i t and c red i t is c o n t r o l l e d in the case o f c e r t a i n s e n s i t i v e commodit ies l i k e foodgra ins , o i l and o i l s e e d s , sugar, gur and khandsari. Cotton, kapas and cotton t e x t i l e s , were, t i l l recent ly , covered by s e l e c t i v e c red i t c o n t r o l s . In fac t , in 1979, a large portion o f the
560

c r e d i t needs o f the c l o t h t r ade was f inanced by the in formal c r e d i t markets in Kanpur, Amritsar and Gujarat (Timberg and Aiyar,1980 ) . About Rs 900 c r o r e s o f i nf ormal c r e d i t went to the foodgrain market in Bombay and in Anand about 80 to 90 per cent o f the working cap ita l requirements o f the beedi merchants, ( about Rs 25 c r o r e ) was f in an ced by s h r o f f s (Timberg and Aiyar , 1980) . Finance companies were the main source o f c r e d i t f o r traders dealing in sens i t ive commodities and for those who are unable to get bank cred i t in some areas.
2 .8 .5 Small-scale industry also finds i t necessary to borrow from informal sources, e s p e c ia l ly during tight cred it periods when t hey have to supply t r ade c r e d i t to the l a r g e and medium industr i es . Final ly, Liu* f l e x i b i l i t y and Inioriiwil l ly In the operat ions o f the indigenous f inanc ia l in s t i tu t io n s make i t eas ier to borrow from them. Substantial c re d i t is made available at short not ice and use o f funds i s not monitored. Loans are renewable and d e f a u l t s n e g l i g i b l e , s in ce borrowers are u s u a l ly known to c re d i t o rs .
2 .8 .6 Thus, we see that informal c red i t markets ex is t part ly because the c red i t requirements are not s a t i s f i e d by formal in s t i tu t ions and part ly due to bank p o l i c y .
561

TABLE A2.1
lim ber o f Indigenous Financial In s titu tio n s
(Number of units)
Institution Year(s) of estimate Remarks
1. Chit finds1955-60 1960-65 1965-70
Kerala 3469 5113 39091Tamil Nadu (1970-75) 15109
2 . Shikarpuri or Miltani Banters (1979)Members, Nan- manbers & brokers 1750Shikarpuri submarkets 238Bombay (Members & tomnaiibers) 588Madras (Members & Nan-manbers) 326Other South Indian Cities 191(Members & NDrrmanbers)ffervaris in Madras doing same 1 0 0
business
3. Gujarati Bankers (1979)Pure bankers 2000
Bankers & commission agents 2500
4. Chettiars (1979)Bankers 25000Pawnbrokers 40000
5. Kastogi fianters (1979) 5006 . Moneylenders 1964-65 1965-70
Northern India 36 199 (Includes Delhi only)Southern India 2059 25822 (Includes Tamil Nadu,
Karnataka Bcmbay)Eastern India 2053 8451 (Includes test Bengal)Western India 7612 43036 (Includes Rajasthan & Gujarat)
7. Finaice corporations (1980) Estimated by NayarKarnataka 20 0
Andhra Pradesh 107Tamil Nadu 1233Kerala 1224India 3071
1 Upto 1967-68. Sources: Timberg & Aiyar (1980), Banking Commission (1971), Nayar (1982),Radhakrishnan (1979), Karkal (1967).
562

TABLE A2.2
Advances to Multani Shroffs by Scheduled and Non-Scheduled Banks (1970)
(Rs Crore)
1964 1965 1966 1967 1968 1969 1970
20.43 10.40 21.14 11.49 17.72 22.40 24.33
Source: Banking Commission (1971)
TABLE A2.3
Deposits with Indigenous Financial Institutions
(In Rs Lakh)
Name o f the in s t i tu t io n
Number Deposits Year Remarks o f firms
1. Multani shrof fs 319 372.66 1969 For South India
2. Gujarati shrof fs (at 350 Bombay & Ahmedabad)
26.00 1969 For South India
3. Finance Corporations 8 6
868686
1832. 15 197 6—7 71
2290.85 1977-7812697.08 1978-7913016.09 1979-801
4. Nidhis 59 909.85 1965-66 For South India
1 From April-March. Sources: Banking Commission (1971) , Nayar (1982), Timberg & Aiyar (1980).
563
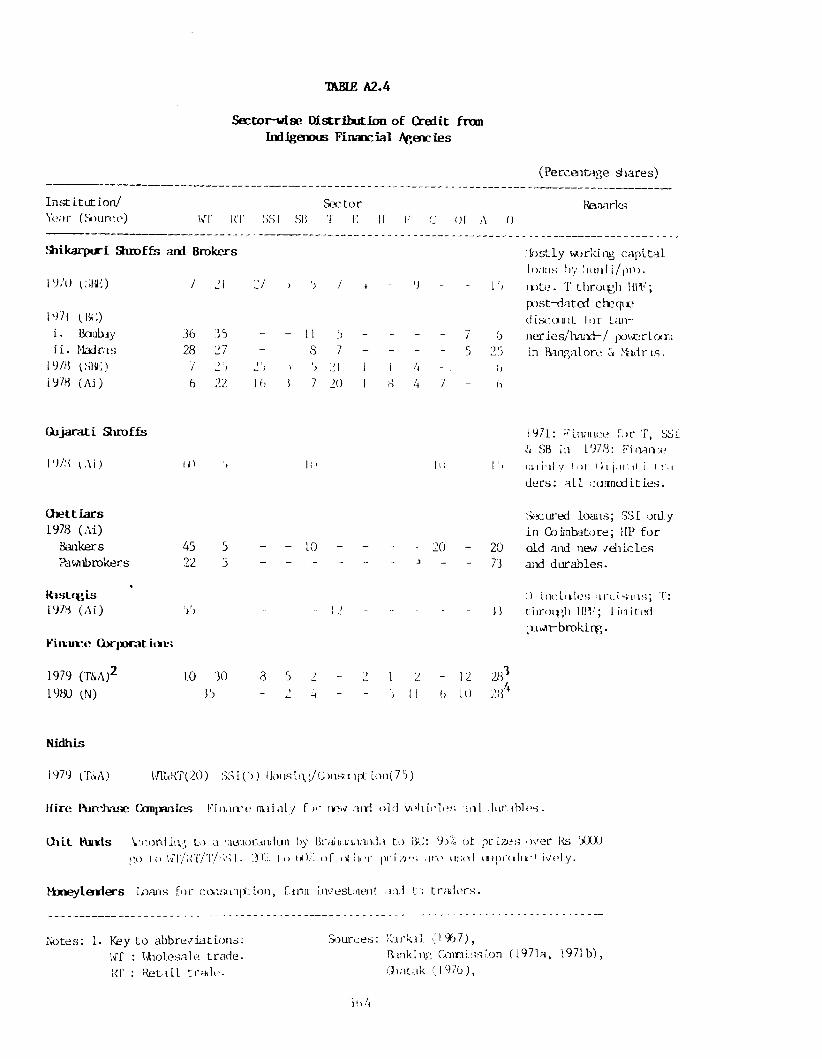
TABLE A2.4
Sector-wise Distribution of Credit from Indigenous Financial fancies
InstLtution/ Year (Source)
SectorWT RT SSI SB T K
Shikarpuri Shroffs and Brokers
19/0 SKK)
1971 0«:)i . Baubiyi i . Madras
19/8 (SHI-;)i 978 (Ai)
/ 21
36 3528 27
j. > 22
- - L L 5 -- - 8 7 -
2') S 5 21 1
16 ) 7 20 I
(Percentage shares)
RemarksF C 0! A 0
Mostly working capital loans by !uuvl i/p m . note. T throi&h lilV; post-dated cheque discount lor tanneries/hand-/ power Loan in Bangalore u ttidras.
Gujarati SJiroffs
I 9/S { . \ \ )
Chettiars1978 (Ai)
BankersPawnbrokers
Ki.stq>Ls1978 (Ai)
Finance Cbrporat ious
ii)
4522
1979 (TinA)2 L9H0 (N)
10 )0 S3
1 0
- - 10 - 20 2073
- 12 b 10
1971: Finance for T, SSI u SB in 1978: Finance i; l if 111 y lor (* i j. u. il i I r. i ders: all catinodlties.
Secured loans; SSI only in Coimbatore; HP for old and new vehicles and durables.
:.) incL'.iles artisans; 'I:throi$*h HIV; Limited piiwrrbrokirg.
28
Nidhis
1979 (TiA) WluRT(20) SSI(5) lk)using/C>n«£:ipt iofi(75)
Hire Purr! vise GanpanLes FInanre mi inly for now and old vehicles anil durables.
Chit Hinds V'cording to a ;.ie;\or<indun by Bralu:iaaanda to iSC: 95% of prizes over Rs bOUU go I o WT/RT/T/SS 1. XKl loti*)/:' o f oMn*r prizes are use! unproducr ively.
Moneylenders limans for consuip': ion, farm investment and I ) trailers.
Notes: 1. Key to abbreviations: WT : Wholesale trade. Rf : Retail trade.
Sources: Kark'il (1.967),Bank! ng Cain I ss ion (1971a, 1971b), Oiatak (1976),
1) h 4

SSI Small-scale industry.SB Small business.T Transport operators.E Export finance.H Hotels & tourist agencies.F Film industry.C Construction and contractors.0 1 Other industry.A Agriculture & agro-based industry.0 Others including consunptlon.HPF Hire purchase finance.SBE Shikarpuri Bankers Association.Ai Aiyar's estimate from T&A.BC Banking Comiission (1971a & 1971b)TStA Timberg and Aiyar (1980).N Nayar (1982).
2. For TLruchiraprtlLi and Karur only.3. Includes 5% consumption credit.4. Includes 12.33% consumption credit.
Tijnberg and Aiyar (1900), Nayar (1982),B-iole (1982).
565

TABLE A2.5
Volume o f Hundi Transactions: 1949-50 to 1960-61
(Rs Qrore)
1949- 1950- 1951- 1952- 1953- 1954- 1955- 1956- 1957- 1958- 1959- 1960-50 51 52 53 54 55 56 57 58 5 9 60 61
Annual a l e of hundisBanbay State 20.5 19.48 16.08 15.64 18.68 18.8 20.02 34.68 183.32 255.89 2% .4 221.05Madhya Pradesh - - - - - - - - 4 0 . 1 9 39.08 27.92 29.41Uttar Pradesh 2.58 6.28 8.58 2.68 2.82 2.74 3.4 4.18 9.52 12.47 25.85 27.76Kerala 0 .% 0.38 0.24 0.54 1.02 0.78 0.92 0.32 1.44 1.94 4.39 10.46TODVL 24.02 26.14 24.90 1 8.86 22.52 22.32 24.34 39.18 231.47 309.38 354.6 288.68
Source: Karkal (1967)
TABLE A 2.6
S e c t o r a l D eploym ent o f G ross Bank C r e d it
(Rs Crore)
Item 1976June
1981March
1986March
G ross Bank C re d it 11620 24804 47953a. Public Food Procurement Credit 2185 1759 5827b. P r io r i ty Sectors 2815 8504 18407
i . Agricu lture 1092 3584 7657i i . Small -scale Industry 1222 3229 6608
i i i . Other P r ior i ty Sectors 501 1691 4142c- Medium and Large Industry 5039 9960 15948d. Wholesale Trade 809 1994 2651
i . Public Sector NA 582 385i i . Others NA 1412 2266
e. Other Sectors 772 2 587 5120
E xport C re d it 977 1640 2342
Net Bank C re d it NA 24317 46153
Notes 1. Other than for food Source:RBI,Report on Trendsprocurement. ' and Progress o f Banking
in India
566

TABTK A2.7
Information on E ffective Manual Interest Rates o f Indigenous Financial Agencies
Location Year Rate (%) Purpose Source Remarks
Bombay
Madras
Baigalore Small towis in south India
197119791971197919711979
17.623.325.3 33.1119.4 24.1- 33.3
ShikarpurisGeneral
DoDoDoDoDo
BGTStABCTotABCTStA
test IndiaGujarati Shroffs
1971 12 On goods 9ent on BC1979 18 Hundi rate T&A
South India 1971
1979197919791979
21
23.94738.1519.46
ChettiarsGeneral
Usance hundis Instalment Finance Daily payment loans Hire Purchase
BC
TStATStAT&AT&A
plus brokerage, and stamp fee on hundis.
Upper Assam Tea Estates Madras
Marwari Bankers1971 24-30 Loans to labour BC
1979 28.44 General T&A
Usually in Kind.
Uttar Pradesh 19791979
3727.4
RastqgisGeneral Hire Purchase
TT«ATStA
South LnlLa
test India South India East India North India
NidhisL9/1 /.5-13.5 Secured ;igalnsL HA1979 15-18 mortgage, gold, etc. TStA
1971197119711971
Hire Purchase Finns15-18 For New Veliicles. 13.4-18 Do15-22.715-22.7
DoDo
BABABABA
Loans against deposits deposit rate plus 1% to 1.5%.
Used Vehicle char- ges: 1836-37%.
567

Information on Effective Annual Interest Rates of Indigenous Financial Agencies
TABLE A2.7 Coatd.
Location Year Rate (%) Purpose Source Remarks
Finance CorporationsSouth India 1971 26.8-42.6 BC
1979 23 T&A1982 22.8-42.6 Various (unsecured) N1982 24 Gold loans! N1979 23 T&A
SLinple Interest.Bombay
Note: Anninl e ffective rates have Sources: Banking Coraiiission (1971 andbeen computed by as usiqg 1971a): BCappropriate compound Interest/ Timberg aid Aiyar (1900): T&A.amortisation formulae. Nayar (1982): N.
568
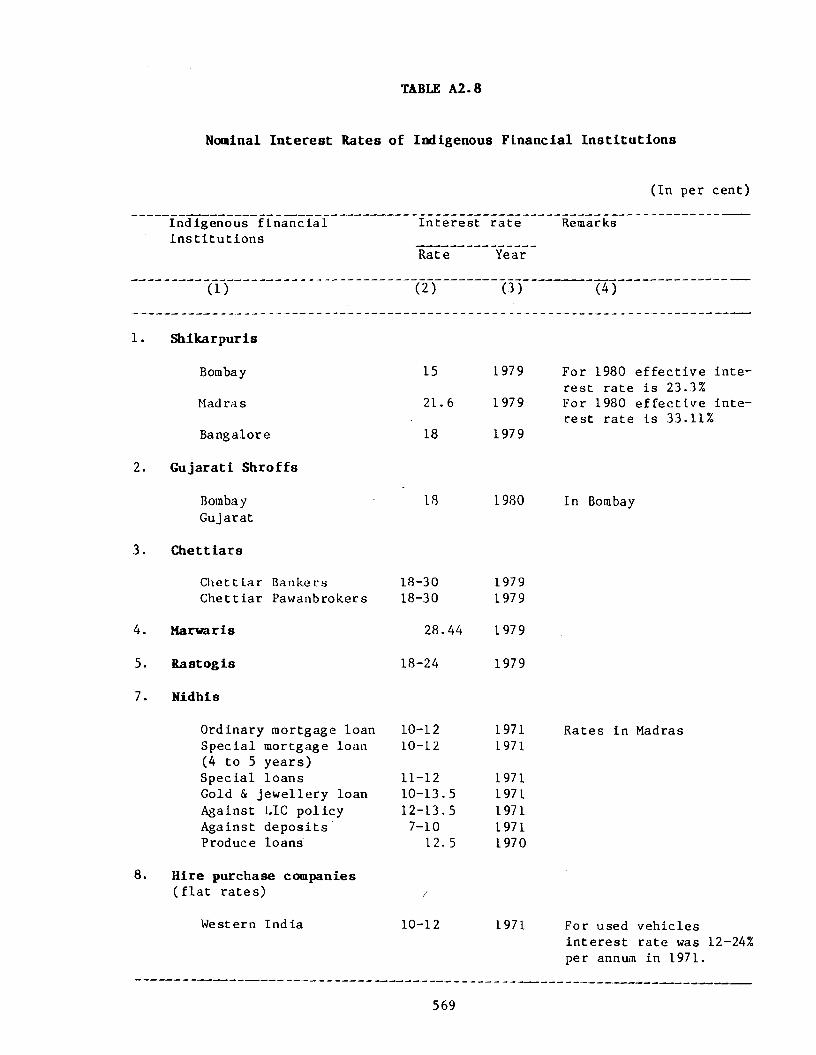
TABLE A 2 -8
N om inal I n t e r e s t R a te s o f In d ig e n o u s F L n a n c ia l I n s t i t u t i o n s
(In per cent)
In d ig en ou s f in a n c ia l in s t i t u t i o n s
( 1 )
Interest rate
R ate Year
T 2T o T
Remarks
(4 ) '
4.
5.
7.
Shikarpuris
Bombay
Madras
B an galore
Gujarati Shroffs
BombayG ujarat
Chettiars
ChettLar Bankers Chettiar Pawanbrokers
Marwaris
Rastogis
Nidhis
15
2 1 . 6
18
18
18-3018-30
2 8 .44
18-24
Hire purchase companies( f l a t r a t e s )
W estern In d ia 1 0- 1 2
1979
1979
1979
1980
19791979
1979
1979
O rd in ary m ortgage loa n 10-12 1971S p e c ia l m ortgage loan 10-12 1971(4 t o 5 y e a r s )S p e c ia l lo a n s 11-12 1971G old & je w e l l e r y loan 1 0 -1 3 .5 1971A gain st LIC p o l i c y 1 2 -1 3 .5 1971A g a in st d e p o s i t s 7 -1 0 1971Produce lo a n s 12. 5 1970
1971
F or 1980 e f f e c t i v e in t e r e s t ra te i s 23.3%F or 1980 e f f e c t i v e in t e r e s t ra te i s 33.11%
In Bombay
R ates in Madras
F or used v e h ic le s in t e r e s t ra te was 12-24% per annum in 1971.
569

TABLE A2.8 (Contd.)
( 1 ) ( 2 )__ f__
(3 )” ‘ ( 4 ) ‘
Southern India Eastern India
Northern India
9. Finance corporations
Simple interest
Export cred it B i l l discounting Gold loan
10. Moneylenders
Below Rs 5000 Above Rs 5000
9-1210-15
10-15
24.47 p -a .
24-36 p.a 19-24 p.a.
24 p.a,
19711971
1971
1980
198019801980
6 . 3 -6 .9 1967 6 .5 -7 .1 1967
For used veh ic les the e f f e c t i v e interest rate was 18-37% in 1971
In South India
For South India
Sources: Timberg & Aiyar (1980), Banking Commission (1971a, 1971b), Nayar (1982), Karkal (1967)
570

TABLE A2-9
Lending Rates of Commercial Banks
(Per cent per annun)
Effective date Prescribed miniinun Ceiling rate for banks with lending rate
General Selective credit control
Ceiling rate
DTL above DTL of Rs OIL less Rs 50 25 to Rs than Rscrores 50 crores 25 crores
Export Rate oncredit deferred(other parentsthan deferred payments)
Ceiling Staterate on Bank of food Indiaprocure- advance raent rate
Remarks
April, 1974July, 1974 12.5 14.0-15.0August, 1974September 1974April 1, 1975March 15, 1976
March 1, 1978September 13, 1979 15.5-18.0July 1, 1980 13.5 1 6.7-19.4
March 2, 1981 Nd gen- 17.5-19.5eral mini- man rate
April 1, 1983 16.5-18.0October 1, 1984April 1, 1985 16.5-17.5April 1 1986 - 16.5-17.5
16.5 17.5 Noceiling
18.0 15.0 16.018.0 18.0 19.019.4 19.4 20.5
19.5 19.5 19.5
18.0 18.0 18.00
17.5 17.5 17.517.5 17.5 17.5
9.010.5
11.5
7.0
8.0
12.0-16.5 8.65
9.01 1 . 0
12.0
1 1 . 0 1 1 . 0
11.85 8.65 11.85
12.5-17.5 12.5
14.0
14.0
9.0-12.513.5
13.5-14.0
13.016.5
16.5
Lending rates made uniform
For 1986:Export credit rates vary with item and period.
Source: Reserve Bank of India, .Report on Currency and Finance, Various Issues.
571

TABLE A2-10
Establishment and Transaction Costs of Informal Credit Market Agencies
Nane of agency % of % of % rental Remarkstotal usages & to totalexpendi salaries expenditure to to total turetotal expendiincane ture
1 . Shikarpuri shroffs 30 25 2 0 For 19792 . Gujarati shroffs (Bombay) 15.0 45 2 0 do3. Chettiars 25.0 55 15 do4. Rastogi bankers 25.0 35 25 do5. Finance corporations 19.88 47 13 For 1979-80
Sources: Timberg & Alyir (1988), Bankii)g GinmLsslon (1971a), Nayar (1982)
TABLE A2.il
Transaction Costs as a Percentage of Wbrklqg ftmds
Type of Interned iaty
Administration
Defaultloss
Total
Shikarpuris 4.5 1 . 0 5.5Gujarati shroffs 2.5 0.5 3.0Chettiars 3.1 1.5 4.6Rastogis 3.5 1.5 5.0Pawnbrokers 2.5 1 . 0 3.5Finance corporations 4.0 1 . 0 5.0Nidhis 3.1 0.5 3.6Hire, purchase companies 4.0 1 . 0 5.0Commercial banks 3.4 (1976 r
1 MampilLy 1980), pp. 36, 41-42, 148, 185, 195-6. This is an average figure. For snnaller loans the cost works out to several ime this figure. MampilLy estimates that the Conr- mercial Banks lo9e 34.9 per cent on full cost basis on cash credit loans under Rs 10,000. They break even at Rs 45,506. The modal loan at least for Gujaratis, Chettiars and Rastogi bankers is wall under this figure.
Source: Timberg aid Aiyar (1980)
572

APPENDIX TO CHAPTER 8
Th e B a s is o f A g g re g a te E s tim a te s .
1. Housing (private residential construction):Ratto o f to ta l cost o f new housing stock o f homeowners to housing finance from external ( informal) sources in V.D.Lall (19 8 4 ) , "Housing Finance in India" NIPFP, New Delhi, and gross fixed cap ita l formation in housing, National Accounts S t a t i s t i c s , 1987.
2. Private Construction: Proportionate increase by relevantaggregate s t a t i s t i c using ( 1 ) .
3. Small Scale Industry: Low e s t i m a t e : P r o p o r t i o n o f non- in s t i tu t io n a l c re d i t to formal c re d i t in RBI, Survey of Small Scale Industr ia l Units, 1977, and Scheduled Commercial Banks advances to small scale industry from RBI, Report on Currency and Finance, 1986-87.
High estimate: Ratio o f n on - ins t i tu t iona l cred it to value o f production and value o f production o f small scale industry in the same sources re sp e c t iv e ly as for low estimate.
4. Road Construction: Informal c red i t is estimated using Gross Capital Formation in Roads and Bridges in the Public Sector from National Accounts S t a t i s t i c s and sample ra t io o f informal credit to value o f production.
5. Road Transport: Low estimate: As fo r high estimate for small s c a le in d u s t r y , using RBI Survey o f Traders and Transport Operators, 1978-79 and number o f veh ic les ( o f d i f f e r e n t types) in 1984-85 from Basic s t a t i s t i c s re lat ing to the Indian Economy,1986.
High estimate: As for low est Lmate o f small scale industry using the same source of aggregate data and using the RBI Survey o f Traders and Transport Operators for the informal to f o r mal cred it ra t io .
6 - Road transport, related services and storage:As for ( 2 ) ,using the middle estimate o f (5) and value added proportions .
7. Trade: Both low and high estimates as in ( 3 ) , but using RBI survey o f Traders and Transport Operators ,1978-79 for survey data and gross value added for the high estimate. Aggregate gross value added was taken from National Accounts S t a t i s t i c s , 1987.
8 . Trade, H otels and Restaurants: As in ( 2 ) , using ( 6 ) and value added oil the middle estimate.
9. Recreation, Entertainment and Personal Services: ResidualEstimate using value added wi,th and without this sector from the National Accounts S t a t i s t i c s , 1987.
10. Public and Private Limited companies:Sample f igures from'Finances of Public Limited Companies 1982-93 to 1984-85' , RBI Bul le t in , May,1987 and 'Finances o f Private Limited Companies",
573

RBI Bulle t in , September, 1986, using residual category o f borrowed funds (Item 1 4 ( i i i ) ) and Trade Dues and Other L i a b i l i t i e s (Item E).
11: Urban Household Informal Debt: RBI Al l India Debt and Investment Survey, 1981-82, and household population f igures from Census o f India, 1981,
12. B lack Funds Employed: Average proportion o f c red i t from fr iends , r e l a t i v e s , d i r e c t o r s , partners and shareholders for conr
\bined samples o f wholesale trade, powerloom units , garment exporters and road construct ion contractors applied to estimate o f to ta l informal c re d i t in Table 8 .1 .
13. Hire Purchase: Low estimate: Federation o f Indian Hire Purchase Associations for 1982-83 and estimated growth rate o f stock on hire in sample.
High estimate: Number o f h ire purchase companies from Nayar (1984) and growth rate of average deposits per company from RBI Survey o f Deposits with Non-banking Companies for the years 1982-87.
14. Finance Corporations: Based on Nayar (1984) for numbers and RBI Survey o f Deposits with Non-banking Companies for deposit growth using the fact that depos its were almost equal to advances for sampled f i rm s .
15. Chit Funds: Low estimate: based on average deposits /advances per company in rupee years per year mult ip l ied by number o f companies in RBI Survey o f Deposits with Non-banking companies, 1986.
Middle e s t im a t e : average a c r o ss sample f irms o ftwelve times the monthly subscr ip t ion , multipl ied by number o f firms from the RBI as in low estimate.
High estimate: Ratio o f deposits in rupee years per year to monthly subscr ipt ions per sample firm mult ip l ied by RBI f igures o f deposits with ch it companies.
16. Nidhis: RBI f igures from Survey o f Deposits with Non-banking Companies, 1986 for deposits . Deposit f igure mult ip l ied by sample rat io o f advances to deposits f o r advances.
17. Indigenous Bankers: 25 per cent o f the estimate in Timberg and Aiyar (1980) , since the Bombay Shroffs estimate that business has declined by th is percentage o f the 1980 l e v e l .
18. Trade Credit , e t c . : Residual estimate using t o ta l informal cred it estimate from Table 8 .1 . *
574

APPENDIX TO CHAPTER 9
EARLIER LEGISLATION AFFECTING INFORMAL FINANCIAL INSTITUTIONS
A8.1 Introduction
A8.1.1 Laws enacted e a r l i e r to regulate informal f inanc ia l ins t i t u t i o n s were aimed at r e g i s t r a t i o n or l i c e n s i n g o f moneylendera, c o n t r o l l in g loan Interest rates or ensuring the maintenence o f proper records for deposits and advances. Such regulations were not always e f f e c t i v e l y enforced. The main pieces o f l e g l i s l a t i o n are now descr ibed.
A8.2 Major leg lisla tio n
A8.2.1 One o f the f i r s t major l e g l i s l a t i v e attempts to protectindebted farmers from usury was the Deccan Agr i c u l t u r a l i s t s " R e le i f Act, 1879. While th is Act imposed no con tro ls on a c t i v i t i e s o f moneylenders, i t authorised courts o f law to inval idate a loan agreements Lf the interest rate specLfLed in i t was excessive . In such cases c o u r t s could p r e s c r i b e f a i r rates o f i n t e r e s t , authorise repayment o f the outstanding debt in instalments or provide the debtor the opportunituy to take advantage o f inso l vency proceedings. Implementation o f th is Act was hindered because, f i r s t , loan agreements were of ten unwritten and, secondly, because debtors were tempted to evade repayment o f debts by taking advantage o f insolvency proceedings (Karkal, 1967 and Banking Commission, 1971).
A8.2.2 The Land Improvement Loans Act, 1883 and the agr icu l t u r a l L oans A c t , 1884 did not aim to c o n t r o l c r e d i t a g e n c ie s e i ther but provided for government intervention in loan markets to break the 'm on op o l i s t i c s i tu a t i o n ' o f indigenous agencies. Funds could be supplied by the government both fo r general development as well as during periods o f economic d is t ress (Karkal, 1967). Government loanable funds were, however, l imited and, as often as not, moneylenders ended up being the b e n e f i c ia r ie s o f government loan programs in times o f poor harvests. Thus these Acts also had a l imited impact.
A8.2.3 A number o f S ta tes passed Land A l ienatLon Acts toprevent the transfer o f land from indebted farmers to moneylenders and thus prevent the growth o f landless labourers (Karkal, 1967). Either the sale o f land or i t s mortgage were covered by these a c t s . Cer ta in c a s t e s were d e c la r e d to be c a s t e s engaged in agriculture and land transfers could take place among members o f these castes only . Thus, while these acts provided some protect ion against non -agr icu ltura l is t moneylenders, they led to the format ion o f a c la s s o f landowner-moneylenders among the spec i f ied caste groups (Narang and Wadhwa, 1984).
A8.2.4 The Usurious Loans Act, 1919 gave courts the power toopen up old cases and reduce the l i a b i l i t y o f debtors in case o f
575

" e x c e s s iv e ' in te r e s t . Implementation o f the Act was hindered by, inter a l ia , a c lear d e f in i t i o n o f what was excessive. The Act was, therefore , replaced by State Moneylenders Acts. Common features o f most of these acts were (see Karkal, i967 and Banking Commission, 1971):
i . Registrat ion and l i cens ing of moneylenders,i i . Prescribed forms fo r account keeping by them,
i i i . The requirement that debtors had to be furnished per i od ica l statements o f account in prescribed formats,
i v . The requirement that debtors had to be issued rece ipts for payments against loans,
v. Interest rate c e i l in g s on secured and unsecured loans,v i . Protect ion o f debtors from cer ta in act ions o f lenders.
A8.2.5 Not a l l these features are present In a l l moneylendersac t s :
L. The Assam and Coorg Acts do not provide for r e g is t ra t io nor l i cens in g . In Maharashtra, Andhra Pradesh, Mysore and West Bengal moneylenders have to obtain l i cences which remain va l id Cor 1 to 3 years. Bihar, Orissa and Punjab have regr is t rat Ion but not l i c en s in g requirements,
i i . The Bombay Moneylenders A c t , 1946 does not require personsgiving loans exc lus ive ly to traders to obtain l i c en ses but does have an interest rate c e l l i n g ,
i i i . In Madras, (now Tamilnadu) and in Kerala and Karnatakamoneylenders acts apply only to loans below Rs. 10,000 and Rs- 1,000 respect ive ly ,
i v . The Bengal Moneylenders Act , 1940 does not cover commerc i a l loans, while in Punjab and Coorg transactions involving the sale and mortgage o f Immovable property are excluded.
A8.3 Hie Banking Laws (Miscellaneous Provisions) Act , 1963
A8.3.1 This Act was introduced in order to enable the Reserve Bank of India to supervise, contro l and regulate the a c t i v l t l t l e s o f companies and in s t i tu t ion s accepting deposits from the public . Thee Act araanded the Reserve Bank o f India A c t , 1934. Chapter IIIB
and IIIC o f th is Act are s t i l l in force and have been discussed in
the main body of the chapter.
576

APPENDIX TO CHAPTER 17
R E G R E S S I O N A 1 7 . 1Ordinary Least Squares Estiaation
mmtmmtmmtmmmmmmmmmtmmmtnmtttmmutm Dependent variable is IHT 68 observations used for estiaation fro« 1 to 68
Regressor Coefficient Standard Error T-Ratio?I - . 0 0 0 0 0 0 1 - .0000003 -.2337551 .1484 .0129 11.5001HHO .1939 .0114 17.0328SET .1719 .0114 15.0980TRA .■237 .3113 10.8812
u n t t m m t m m m m m t i i i m t t m t t m t m t m H m t m t m m m m t u3-Squared .2239 F-statistic F( 4, 63) 4.67643-5ar-Squared .1800 S.E. of Regression .3483Ponidual ju b of o'|uaro:i .! 470 loan of Dcpcn'lcnt Variable . 1612S.D. of Dependent Variable .2533 H a m u i of Log-iikelihood 112.1729DW-statistic 1.7211
Diagnostic Tests
* Test Statistics * L!1 Version * F Version* % t* A :Serial Correlation * CBI-SQ( 1 ): 1.2606 » F( 1, 62): 1.1711• » ♦» B:Functional Fori » CHI-SQ( 1): .5827 t F( 1 , 62): . 5 3 5 9* t tf C :Horaality * CHI-SQl 2): 27.4438 * Hot applicable* * »< D:Hetercscedasticity * CHI-5Q( 1 ): 6.5295 * F( 1 , 6 6 ): 7.0106
A ■Lagrange multiplier test of residual serial correlation B:Ramsey's BESET test using the square of the fitted values C :Based on a test of skewness and kurtosis of residuals D -Based on the regression of squared residuals on squared fitted values
577
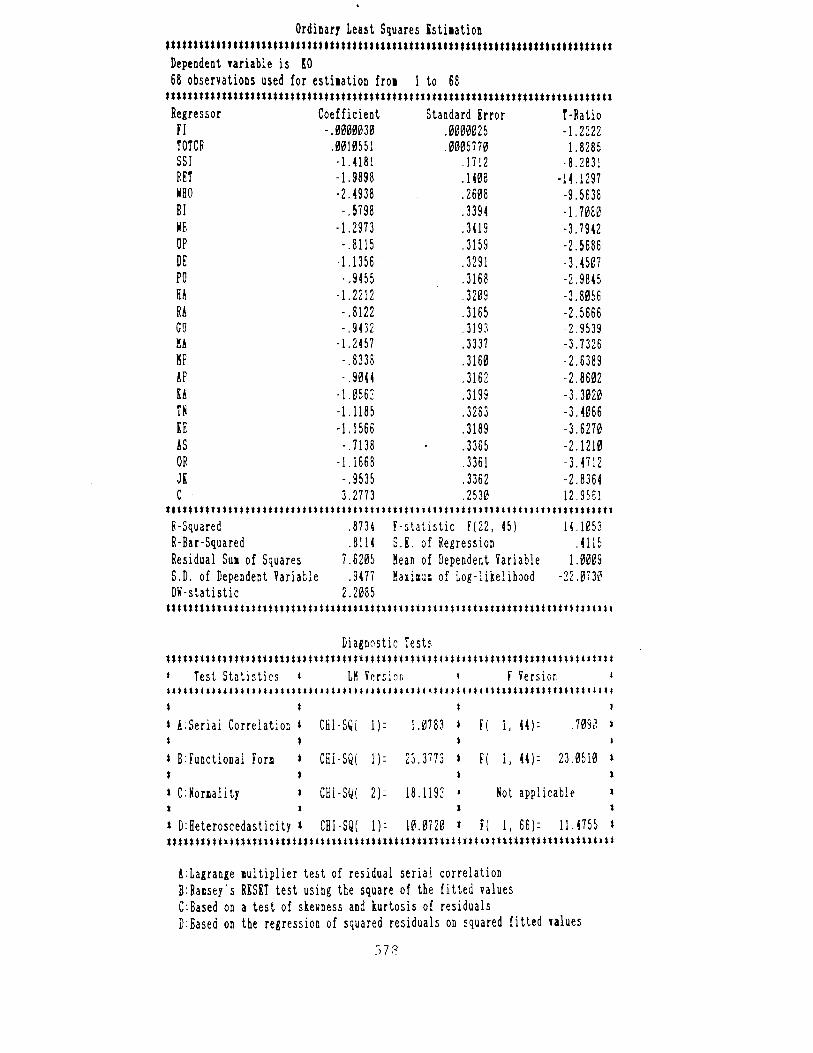
Ordinary Least Squares Estimation Dependent variable is KO68 observations used for estiiation froi 1 to 68
m m m m m m m m s m m m m m m t m t m m m m t m m m m m mRegressor Coefficient Standard Error T-RatioFI -.0000030 .0000025 -1.2222TOTCR .0010551 .0005770 1.8285SSI -1.4181 .1712 -8.2831RET -1.9898 .1408 -14.1297WHO -2.4938 .2608 -9.5638BI -.5798 .3394 -1.7080HE -1.2973 .3419 -3.7942OP -.8115 .3159 -2.5686DE -1.1356 .3291 -3.4507PO -.9455 .3168 -2.9845U -1.2212 .3209 -3.8056U -.8122 .3165 -2.5666GO -.9432 .3193 -2.9539Hi -1.2457 .3337 -3.7326HP -.8338 .3160 -2.6389AP -.9044 .3162 -2.8602U -1.0562 .3199 -3.3020n -1.1185 .3283 -3.4066KE -1.1566 .3189 -3.6270AS -.7138 .3365 -2.1210OR -1.1668 .3361 -3.4712JK -.9535 .3362 -2.8364C - 3.2773 .2530 12.9551t t m m m m m m m o m m m m m t t m i m m t m m u m t m t m m t t *
F-Squared .8734 F-statistic F(22, 45) 14.1053R-Bar-Squared .8114 S.E. of Regression .4115Residual Sub of Squares 7.6205 Bean of Dependent Variable 1.0009S.D. of Dependent Variable .9477 Kaxiuus of Log-likelihood -22.0730DR-statistic 2.2085
Diagnostic Tests‘ Test Statistics * IH Version » F Version> t i* A^Seriai Correlation * CHl-SQi 1)= 1.0783 * F( 1, 44)- .70Si2t » i
* B^Functional Fora * CHI-SQ( 1 ): 23.3773 * F( 1, 44)= 23.0510t t i
* C Noraiality * CHI-SQ( 2)= 18.1192 * Hot applicable* » *> D:Heteroscedasticity * CHI-SQ( 1)= 10.0720 * F( 1, 66): 11.4755
l-Lagrange lultiplier test of residual serial correlation B-Raisey’s RESET test using the square of the fitted values C :Based on a test of skewness and kurtosis of residuals D:Based on the regression of squared residuals on squared fitted values
573

REGRESSION A17-3
Ordinary Least Squares Estimation t m t t m m m m m m n t t u m m t u m m t u n t m t m t m t m t t t m t m m
Dependent variable is LTOT 68 observations used for estimation from 1 to 68 .
m m m m m t n t m t t m t m m m m u m t t m m m m m t n m n t n t m n
Regressor Coefficient Standard Error T-RatioLSDP .8203 .1886 4.3504SSI -.8371 1.3370 -.6261MHO .0768 1.3407 .0573RET -2.5518 1.3407 -1.9033TRA -2.6853 1.3407 -2.0029
m t t t t m t m t t t m m m t t m m m t t m m t m m t m n t m m t t t t t m m mB-Squared .8616 P-statistic F( 4, 63) 98.0326B-Bar-Squared .8528 S.E. of Regression .5060Residual Sum of Squares 16.1314 Hean of Dependent Variable 4.2665S.D. of Dependent Variable 1.3189 Haxiaum of Log-likelihood -47.5706DH-statistic 1.7501
Diagnostic Testsm m m m m m m m m m tm m m m m m m m m tsm m m m m m
LH Version *Test Statistics * F Versiont t
* A :Serial Correlation $ CHI-SQ( 1): .6078 t Ft i, 62): .!t % t* B:Functional Form t CHI-SQ( 1)-- .0823 t F( l, 62): .1t % t* C :Normality %
tI
CHI-SQl 2): .0670 tt
Hot applicablet D:Heteroscedasticitj $ CHI-SQl 1): .7118
♦t ri 1, 66): .1
55910751
6981
4:Lagrange multiplier test of residual serial correlation B:Ramsey's BESET test using the square of the fitted values C:Based on a test of skeaness and kurtosis of residuals D:Based oo the regression of squared residuals on squared fitted values
• j / ' j

APPliNDIX TO CHAFfKR 18
Estimate of the Number and Volume of Business of Auto Finance Corporations, 1986
State /p lace No. o f corpora
tions
Average stock on
hire per
corporat Lon (Rs.lakh)
Stock on hire at the end of
1986 (2x3)
(Rs . lakh)
( 1 ) ( 2 ) (3) (4)
Tam i l Nadu
NamakkalCoimbatoreMadrasSalemTrichyMaduraiNa^erkoilTrluppurKarurKaraikudiRasipuramT \ nitinl v 1I'o L lacli 1ErodeD.L ndiguiOther placesKerala
Tr ichurErnakulamCalicutKottayaraTr ivandrumQuilonTall icheryCannanurPalaghatAlwayeOtherAndhra Pradesh
Hi ndupur Hyderabad Ananthapur Ch Lttur Visakapatnam Vi iayawada Maci ana pal 1 e
4 r> 0 - 8450
90 23 22 5030 30 90030 30 90030 2 0 6002 0 2 0 40015 2 0 30015 1 0 L 501 0 1 0 LOO1 0 1 0 1 0 01 0 1 0 1 0 01 0 1 0 1 0 01 0 1 7 1 0 0LO I / LOO5 1 0 505 L0 50
150 15 2250
235 - 590050 2 0 L00050 2 0 1 0 0 030 2 0 60030 2 0 65025 2 0 50030 1. 5 4 50
5 1.0 505 1 0 505 1 0 505 1 0 50
1 0 0 15 1500
240 - 2800
60 15 9002 0 L 5 3002 0 1 0 2 0 015 ' 1 0 1501 0 1 0 1 0 01 0 L0 LOO1 0 LO 1 0 0
580

APPENDIX TO CHAPTER 18 (CONTD.)
x n ----------------------- ---------- - ( 2 7 ---------- -T30--------Kurnool^ ------------- rtr----------- * It) — rotrGuntakkal 1 0 1 0 1 0 0Other Places 75 1 0 750Karnataka 145 - 2400
Bangalore 30 2 0 600Mangalore 2 0 2 0 400Mysore 2 0 15 300Belgaum 1 0 15 150Tumkur 5 1 0 50Other Places 60 15 900Pondichery 40 15 600Total for South 1200 16-15 20150IndiaTotal for India ^ 4800 - 80600T SouCh'Iridla ~'Because~of~ "Source f 'The'dafa~ori“number
Its extensive road net o f corporationswork and predominant road and their averagetransport industry is e s t i stock on hire inmated to account fo r about 1986 fo r theone-fourth o f the to ta l places mentionednumber o f auto finance cor - in the table wereporations and their stock. obtained throughon hire . fteLd enquiry;
pro jec t ions forthe rest o f theplaces in SouthIndia are made onthe basis o f in f o -nnation reee L'/edo r a l ly from lo ca lAssociations o ffinance corporat-Lons.
581

APPENDIX TO CHAPTER 20
TABLE A20.L
Place-wise Distribution o f Respondents
Place Number o f Number o f Number o fcorporations depos itors borrowers
Selec Respo Se lec Respo Selec Responted nded ted nded ted ded
Er naku1 am 8 4 !> 'j 1 2
Trichur 1 0 5 3 I 2 2
Kottayam 5 1 3 - 2 -Tr iv and rum 4 - 1 1 1 -Chengaunur 2 1 - - - -Salem 8 8 0 2 5 5Tr ichy 5 5 L - 4 4Coimbatore 4 4 1 1 2 2
Karur 5 5 - - 1 1
Madras 2 2 3 3 - -Bangalore 7 7 1 1 1 1
TOTAL 60 42 2 0 14 2 0 17
582

APPENDIX TO CHAPTER 22
Non-Banking Financial Companies and Miscellaneous Non-Banking Companies (Advertisement) Rule, 1977
Prescribed by RBI
1. Every company intending to inv i te or allowing or causing any other person to inv ite or cause to be invited on i ts b e h a l f , any d e p o s i t s from the p u b l i c , o th e r than i t s d i r e c t o r s , share holders or employees shall issue an advertisement for the purpose in a leading English newspaper and one vernacular newspaper c i r cu la t in g in the State in which the regis tered o f f i c e o f the company i s s ituated.
2. No such company shall Issue or allow any other person to issue or cause to be issued on Its behalf any advert ise ment and inv it ing deposits unless such advertLsement Is issued on the author ity and in the name of the Board o f Directors o f the Company and contains a reference to the condit ions subject to which deposit shall be accepted by the company, the data on which the said Board o f Directors has approved the text o f the advertisement and certa in spec i f ied information lasted Ln the Advertisement Rules 1977.
3. An advertisement issued in accordance with these Rules shall be va l id unti l the expiry o f s ix months from the date o f c l o s u r e o f the f i n a n c i a l year in which i t i s issued or unt i l the date on which the balance sheet is la id before the company in general meeting or where the annual general meeting for any year has not been held, the la test day on which that meeting should Jiave been held, in accordance with the provis ions o f the Companies Act, 1956 ( 1 o f 1956) whichever is e a r l i e r , and a fresh advert ise ment shall be made in each succeeding f inanc ia l year for Invitation o f deposits during that f inanc ia l year.
583

APPENDIX CHAPTER 23
A: Glossary of Chit Fuad Terms
1. Chit fund: Ls Che same as c h i t t y , kuri or c h i t .2. Chit /i M o u n t : o r chit cnpit.i l I *? the chit subscr iption per
insta lment multLplLed by the number o f ins ta lm ents /subscr ibers .
3. Discount: deduction o f fered on ch it amount at auction or byt ender .
4. Prize amount: Chit amount minus t o t a l discount (deduct ion ) .5. Dividend: The portion o f discount d istr ibuted among sub-
scr i b e r s .6 . Foreman: The person or in s t i tu t io n which conducts the chit
fund .7. Subscriber: Members who contr ibute subscr iptions to c h i t .8 . Foreman's commission: Usually a percentage o f ch i t amount
for ills s e rv ices .9. Subscription: Amount per instalment.10. Auction dividend: Auction diHcount p«*r member.11. Fixed discount: A certa in percentage o f chit amount is
deducted as f i x e d d is co u n t by the foreman usual ly fo r d i s t r ib u t io n among non-prized subscr ibers .
12. Fixed d iv id e n d : Fixed d i s c o u n t i s d i s t r i b u t e d amonge l i g i b l e members as fixed dividend.
13. Prized subscriber or pr ize wLnner: A member who has takenthe prize amount.
14. Non-prized subscriber or non-prize winner: a subscriber whohas not taken the prLze amount.
15. Defaulting subscriber: A subscr iber who defaults in paymento f su b s cr ip t io n .
16. Chit period: or duratLon o f ch i t - the date o f fLrst instalment payment to the date o f las t instalment payment whatever be the frequency o f in s ta l ments .
17. Chit bye-law or ch i t agreement: The agreement executed between the foreman and subscr ibers .
584

TABLE A 2 3 .1
COMMERCIAL CHIT 1
Discount Distr ibuted in the Subsequent Period Number o f members/periods: 40P e r io d i c i ty in months: 1
Commission to foreman in percent: 5Subscription in rupees: 2500
( in Rs)
Period Prizeamount
TotalDiscount
Net Subs- s c r ip t io n per member
Discount as % o f cap i ta l
1 1 0 0 0 0 0 . 0 0 -5000.00 2500.002 53500.00 41500.00 2500.00 46. 53 58000.00 37000.00 1462.50 42.04 56000.00 3 9000.00 1575.00 44.05 54 700.00 40300.00 1525.00 45. 36 58300.00 36700.00 1492.50 41.77 61100.00 33900.00 1582.50 38.98 64000.00 31000.00 1652.50 36.09 64000.00 31000.00 1725.00 36.01 0 67000.00 28000.00 1725.00 33.01 1 67500.00 " 27500.00 1800.00 32.51 2 75000.00 2 0 0 0 0 . 0 0 1812.50 25.013 72500.00 22500.00 2 0 0 0 . 0 0 27.514 74800.00 2 0 2 0 0 . 0 0 1937.50 25.215 75000.00 2 0 0 0 0 . 0 0 1995.00 25.016 72500.00 22500.00 2 0 0 0 . 0 0 27.517 75000.00 2 0 0 0 0 . 0 0 1937.50 25.018 76900.00 18100.00 2 0 0 0 . 0 0 23.119 76900.00 18100.00 2047.50 23.12 0 77000.00 18000.00 2047.50 23.02 1 81000.01 14000.00 2050.00 19.02 2 81500.00 13500.00 2150.00 18. 523 80500.01 14500.00 2162.50 19.524 87000.00 8000.00 2137.50 13.025 89000.00 6000.00 2300.00 1 1 . 026 91000.01 4000.00 2350.00 9.027 92100.00 2900.00 2400.00 7.928 93120.01 1880.00 2427.50 6 . 929 91000.01 4000.00 2453.00 9.030 89400.00 5600.00 2400.00 1 0 . 631 91520.01 3480.00 2360.00 8 . 532 92900.00 2 1 0 0 . 0 0 2413.00 7 . 133 91900.00 3100.00 2447.50 8 . 134 93900.01 1 1 0 0 . 0 0 2422.50 6 . 135 94000.00 1 0 0 0 . 0 0 2472.50 6 . 03 6 95000.00 0 . 0 0 2475.00 5.03 7 95000.00 0 . 0 0 2500.00 5.038 95000.00 0 . 0 0 2500.00 5.039 95000.00 0 . 0 0 2500.00 5.040 95000.00 0 . 0 0 2500.00 5.0
585

TABLE A23.2
COMMERCIAL CHIT 2
Discount d is tr ibu ted each period Number o f members/periods: 40P e r io d i c i ty in months: 1Commission to foreman, in percent: 5Subscription in rupees: 1250
( in Rs)
Period Prizeamount
TotalDiscount
Net Subsc r ip t ion per member
Discount % o f capj
1 50000.00 1250.002 30000.00 17500.00 1250.00 35.03 29900.00 17600.00 812. 50 35.24 26600.00 20900.00 810.00 41.85 2 9000.00 18500.00 72 7.50 37.00 2'J iO O . OU IH2 0 0 .oo / » / . 'jO 3 0 . 47 33000.00 14500.00 795.00 29.08 31700.00 15800.00 887.50 37.69 29300.00 18200.00 855-00 36.41 0 29400.00 18100.00 795.00 36. 21 1 30500.00 17000.00 797.50 34.01 2 34000.00 13500.00 825.00 27.013 33700.00 13800.00 912.50 27.614 32800.00 14700.00 905.00 29.415 31900.00 15600.00 882.50 31.216 31200.00 16300.00 860.00 32.617 33900.00 13600.00 842.50 27.218 32800.00 14700.00 910.00 29.419 33900.00 13600.00 882-50 27. 22 0 34300.00 13200.00 910.00 26.42 1 35600.00 11900.00 920.00 23.82 2 35900.00 11600.00 952.50 23. 223 36100.00 11400.00 960.00 2 2 . 824 37300.00 1 0 2 0 0 . 0 0 965.00 20.425 38020.00 9480.00 995.00 19.026 40900.00 6600.00 1013.00 13.227 41180.00 6320.00 1085.00 1 2 . 628 41500.00 6000.00 1092.00 1 2 . 029 41900.00 5600.00 1 1 0 0 . 0 0 1 1 . 230 45380.00 2 1 2 0 . 0 0 1 1 1 0 . 0 0 4.231 42420.00 5080.00 1197.00 1 0 . 232 43100.00 4400.00 1123.00 8 . 833 43 700.00 3 800.00 1140.00 7.634 44420.00 3080.00 1155.00 6 . 235 44420.00 3080.00 1173.00 6 . 236 46900.00 600.00 1173.00 1 . 237 47500.00 . 0 0 1235.00 -
38 47500.00 . 0 0 1250.00 -
39 47500.00 . 0 0 1250.00 -40 47500.-00 . 0 0 1250.00 -
586
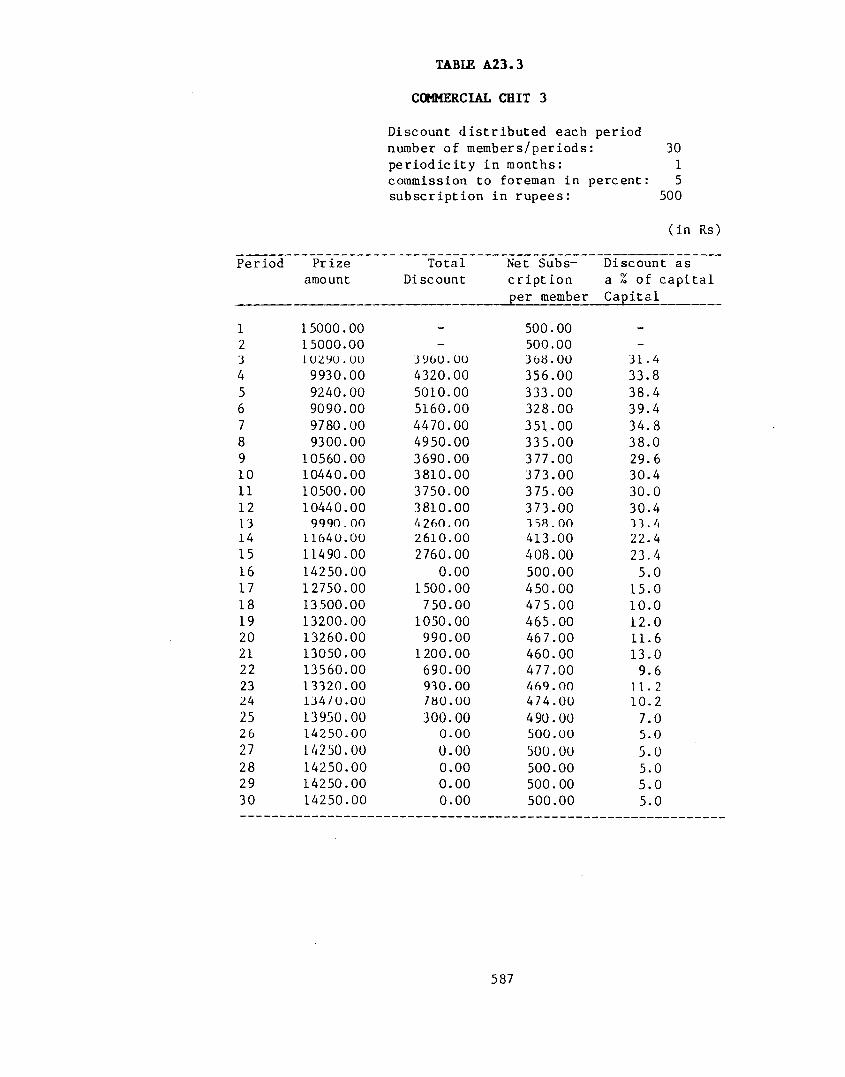
TABLE A23.3
COMMERCIAL CHIT 3
301
5500
( in Rs)
Period Prize Total Net Subs- Discount asamount Discount c r ip t i o n a % o f cap ita l
_________________________________________per member Capital________
1 15000.00 - 500.00 -2 15000.00 - 500.00 -3 L 0290.00 jy o o .o o 3 68.00 31.44 9930.00 4320.00 356.00 33.85 9240.00 5010.00 333.00 38.46 9090.00 5160.00 328.00 39.47 9780.00 4470.00 351.00 34.88 9300.00 4950.00 335.00 38.09 10560.00 3690.00 377.00 29.61 0 10440.00 3810.00 373.00 30.41 1 10500.00 3750.00 375.00 30.01 2 10440.00 3810.00 373.00 30.413 9990.00 A 260.00 TS8.00 33. h14 11640.00 2610.00 413.00 2 2 .415 11490.00 2760.00 408.00 23.416 14250.00 0 . 0 0 500.00 5.017 12750.00 1500.00 450.00 15.018 13500.00 750.00 475.00 1 0 . 0
19 13200.00 1050.00 465.00 1 2 . 0
2 0 13260.00 990.00 467.00 1 1 . 62 1 13050.00 1 2 0 0 . 0 0 460.00 13.02 2 13560.00 690.00 477.00 9.623 13320.00 930.00 469.00 1 1 . 224 134/0.00 780.00 474.00 1 0 . 2
25 13950.00 300.00 490.00 7.026 14250.00 0 . 0 0 500.00 5.027 14250.00 0 . 0 0 500.00 5.028 14250.00 0 . 0 0 500.00 5.029 14250.00 0 . 0 0 500.00 5.030 14250.00 0 . 0 0 500.00 5.0
Discount d istr ibuted each period number o f members/periods: p e r i o d i c i t y in months: commission to foreman in percent: subscr iption in rupees:
587

TABLE A23.4
COMMERCIAL CHIT 4
251
5400
( in Rs)
Period
Pr ize amount
TotalDiscount
SubscriptNon-
Prized
. / member Prized
Discount as a % o f
Capital
1 10000.00 _ 400.00 400.002 10000.00 - 400.00 400.00 -3 7000.00 2500.00 298.25 320.00 30.04 7000.00 2500.00 297.30 320.00 30.05 7000.00 2500.00 296.20 320.00 30.06 7000.00 2500.00 295.00 320.00 30.07 7 000.00 2 500.00 293.70 . 320.00 30.08 7000.00 2500.00 292.25 320.00 30.09 7000.00 2500.00 290.60 320.00 30.010 7000.00 2500.00 288.75 320.00 30.011 7100.00 2400.00 290.70 324.00 29.012 7400.00 2100.00 300.30 336.00 26.013 8050.00 1450.00 325.55 362.00 19.514 9450.00 50.00 395.45 400.00 5 .515 9250.00 250.00 375.00 400.00 7.516 9400.00 100.00 388.90 400.00 6 .017 9000.00 500.00 33 7.50 400.00 10.018 y ooo .oo 500.OO 3 2 8 .60 400.00 10.019 9500.00 0 .00 400.00 400.00 5.020 9500.00 0 .00 400.00 400.00 5.021 9150.00 3 50.00 312.50 400.00 8.522 9500.00 0 .00 400.00 400.00 5.023 9500.00 0.00 400.00 400.00 5.024 9500.00 0 .00 400.00 400.00 5.025 9500.00 0.00 400.00 400.00 5.0
Discount d istr ibuted each period number o f member s /p e r i o d s : p e r i o d i c i t y in months: commission to foreman in percent: subscr ipt ion in rupees:
588

TABUS A2 3.5
COMMERCIAL CHIT 5
501
5200
( in Rs)
Period Prize Total Net Subs Discounamount Discount cr ip t ion a % o f i
per member Capital
1 1 0 0 0 0 . 0 0 2 0 0 . 0 02 1 0 0 0 0 . 0 0 - 2 0 0 . 0 0 -3 6050.00 3 450.00 131.00 39. 54 5700.00 3800.00 124.00 43.05 5500.00 4000.00 1 2 0 . 0 0 45.06 5650.00 3850.00 123.00 43.57 5200.00 4300.00 114.00 48.08 6200.00 3300.00 134.00 38.09 5050.00 4450.00 1 1 1 . 0 0 40.5
1 0 5700.00 3800.00 124.00 43.01 1 5800.00 3700.00 126.00 42.01 2 6000.00 3 500.00 130.00 40.013 5800.00 3 700.00 126.00 42.014 6900.00 2600.00 148.00 41.015 6200.00 3300.00 134.00 38.016 6300.00 3200.00 136.00 37.017 6250.00 ' 3250.00 135.00 37.518 6600.00 2900.00 142.00 34.019 6750.00 2750.00 145.00 32.52 0 6450.00 3050.00 139.00 33.02 1 6700.00 2800.00 144.00 34.52 2 6550.00 2950.00 141.00 33.523 6650.00 2850.00 14 3 . 0 0 3 3.024 0 / 0 0 . OO 2800.00 144.00 35.025 0500.00 3000.00 140.00 29.026 7100.00 2400.00 152.00 34.027 6600.00 2900.00 142.00 30.528 6950.00 2550.00 149.00 26.529 73 50.00 2150.00 157.00 30.530 6950.00 2550.00 149.00 28.031 7200.00 2300.00 1 54.00 28.032 7200.00 2300.00 154.00 27.033 7300.00 2 2 0 0 . 0 0 156.00 30. 534 0950.00 2550.00 149.00 28.035 7200.00 2300.00 154.00 20.536 7950.00 1550.00 169.00 20.537 7950.00 1550.00 1 69.00 1 5. 538 8000.00 1500.00 170.00 13.039 7450.00 2050.00 159.00 1 0 . 0
Discount d istr ibuted each period number o f members/periods: p e r i o d i c i t y in months:com m ission Lo foreman In p e r c e n t : subscrip t ion in rupees:
589
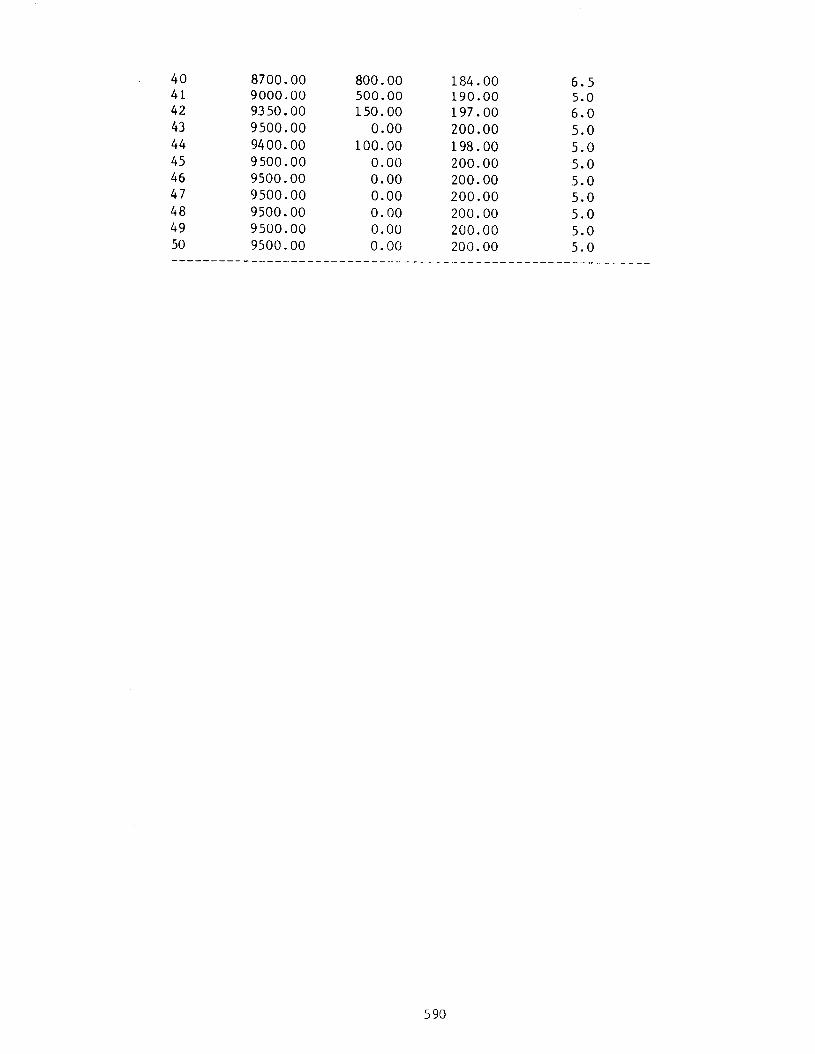
40 8700.00 800.00 184.00 6.541 9000.00 500.00 190.00 5.042 9350.00 150.00 197.00 6 .043 9500.00 0.00 200.00 5.044 9400.00 100.00 198.00 5.045 9500.00 0.00 200.00 5.046 9500.00 0 .00 200.00 5.047 9500.00 0.00 200.00 5.048 9500.00 0 .00 200.00 5 .049 9500.00 0.00 200.00 5.050 9500.00 0 .00 200.00 5.0
590

COMMERCIAL CHIT 6
Discount d istr ibuted each period number o f members/periods: 40p e r i o d i c i t y in months: 1
commission to foreman in percent: 5
subscript ion in rupees: 625
TABLE A23.6
Period Prize Total Net Subs- Discount asamount Discount c r ip t i o n a % o f cap i ta l
______________________ _________________ per member Capital________
1 25000.00 - 625.00 -
2 25000.00 - 625.00 -
3 1 2 0 0 0 . 0 0 11750.00 331.25 52.04 10400.00 13350.00 291.25 58.45 1 1 0 0 0 . 0 0 12750.00 306.25 56.06 10400.00 13350.00 291.25 58.47 13100.00 10650.00 358.75 47.68 14200.00 9550.00 386.25 43.29 14800.00 8950.00 401.25 40.8
1 0 1 2 0 0 0 . 0 0 11750.00 331.25 52.01 1 13200.00 10550.00 361.25 47.21 2 13300.00 10450.00 363.75 46.813 16200.00 7550.00 436.25 35.214 15400.00 83 50.00 416.25 38.415 15800.00 7950.00 426.25 36.816 16000.00 7750.00 431.25 36.017 18200.00 5550.00 486.25 27.218 17800.00 5950.00 476.25 28.819 18400.00 5350.00 491.25 26.42 0 17400.00 6350.00 466.25 30.42 1 18400.00 5350.00 491.25 26.42 2 17400.00 6350.00 466.25 30.423 18800.00 4950.00 501.25 24.824 19300.00 4450.00 513.75 2 2 . 825 19400.00 43 50.00 516.25 22.426 18710.00 5040.00 499.00 25.227 21510.00 2240.00 569.00 14.028 23070.00 680.00 608.00 7.729 18990.00 4760.00 506.00 24.030 19310.00 4440.00 514.00 2 2 . 831 18510.00 5240.00 494.00 26.032 20910.00 2840.00 554.00 16.433 22790.00 960.00 601.00 8 . 834 21990.00 1760.00 581.00 1 2 . 0l b 2 2 V A ) . OO 1 'i(H). OO VJO.UO 1 0 . (>36 22510.00 1240.00 594.00 1 0 . 037 22390.00 1360.00 591.00 10.438 23750.00 0 . 0 0 625.00 5.039 23750.00 0 . 0 0 625.00 5.040 23750.00 0 . 0 0 625.00 5.0
591

i :;uro A23. .1
Net present value per rupee at 1 1% p.a.A uction ch it 1 (4 0 m o n th s )
period in which prized
5 9 2

per
an
nu
m
Figure A23.2
Net present value per rupee at 11% p.a.Auction ch it 2 (4-0 m o n th s )
period in which prized
593

per
on
nu
rnFigure A23.3
Net present vplue per rupee at 11% p.a.A uction ch it 3 (3 0 m o n th s )
period in which p rized
594

dor
an
nu
m
Figure A23.4
Net present value per rupee at 11% p.a.Auction chit 4 (25 months)
period in which prized

per
cn
nu
m
Figu re A23.5
Net present value per rupee at 11% p.a.Auction ch it 6 m o n th s )
Period in which prised
596
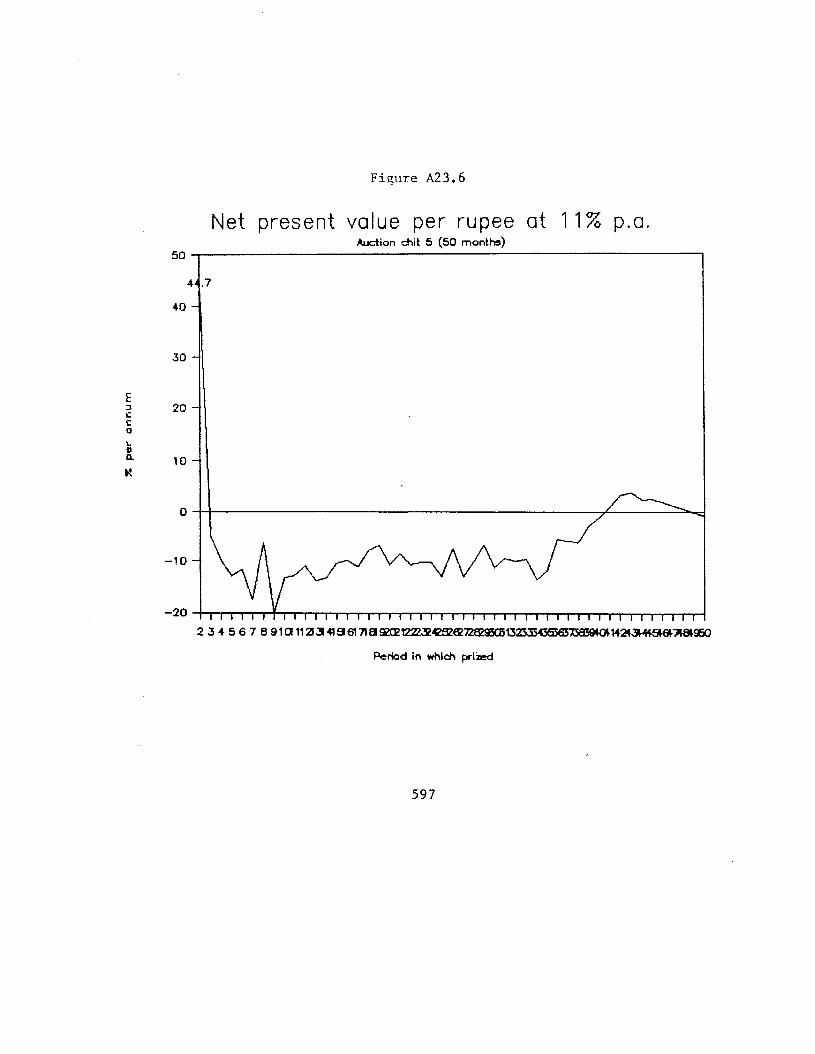
per
ann
um
Figure A23.6
Net present value per rupee at 11% p.a.Auction chit 5 (50 months)
Period In which prized
597

TABLE A23.7
COMMUNITY CHIT 1
Number o f members : 15 Per member subscr ipt ion :Rs300 Period : April 8 6 - June 87 Description : Auction ch i t with the discount amount Lent: at 2% per month to members. Discount plus interest on loans d istr ibuted at the termination of the chit to all members. Fixed discount Rs 150 7-
Period Prize Auction Fixedamount(Rs) di scount(Rs) discount. ( Rs)
1 3675 675 1500 3640 710 1503 3 795 555 1504 3 680 670 1503 3 820 530 1506 3840 510 1507 3885 465 1508 3 930 420 1509 4040 310 150
1 0 4200 150 1501 1 4220 130 1501 2 4255 95 15013 4290 60 15014 4350 0 15015 43 50 0 150
TOTAL 5280 2250
Total interest from loans: Rs 239Total available for dir»burr»al at end o f ( 'h it : Rs 7769 Dividend per member: 517.93
598

TABLE A23.8
CCHMUNITY CHIT 2
Number o f members: 12 Per member subscr ipt ion : Rs 200 Period : April 8 6 - March 87 Description : as for Chit 1except fixed d iscount: Rs 100
Period Prize(Rs)
Auction discount (Rs)
Fixed discount (Rs)
1 1865 435 1 0 0
2 1925 375 1 0 0
3 2030 270 1 0 0
4 1895 405 1 0 0
5 2070 230 1 0 0
6 2 1 0 0 2 0 0 1 0 07 2270 30 1 0 08 2195 105 1 0 0
9 2 2 0 0 1 0 0 1 0 0
1 0 2250 50 1 0 0
1 1 2300 0 1 0 0
1 2 2300 0 1 0 0
TOTAL 2 2 0 0 1 2 0 0
Total interest from loans : Rs 146Total avai lable for disbursal at end o f ch i t Rs 3546 Dividend per member: Rs 295.50
599
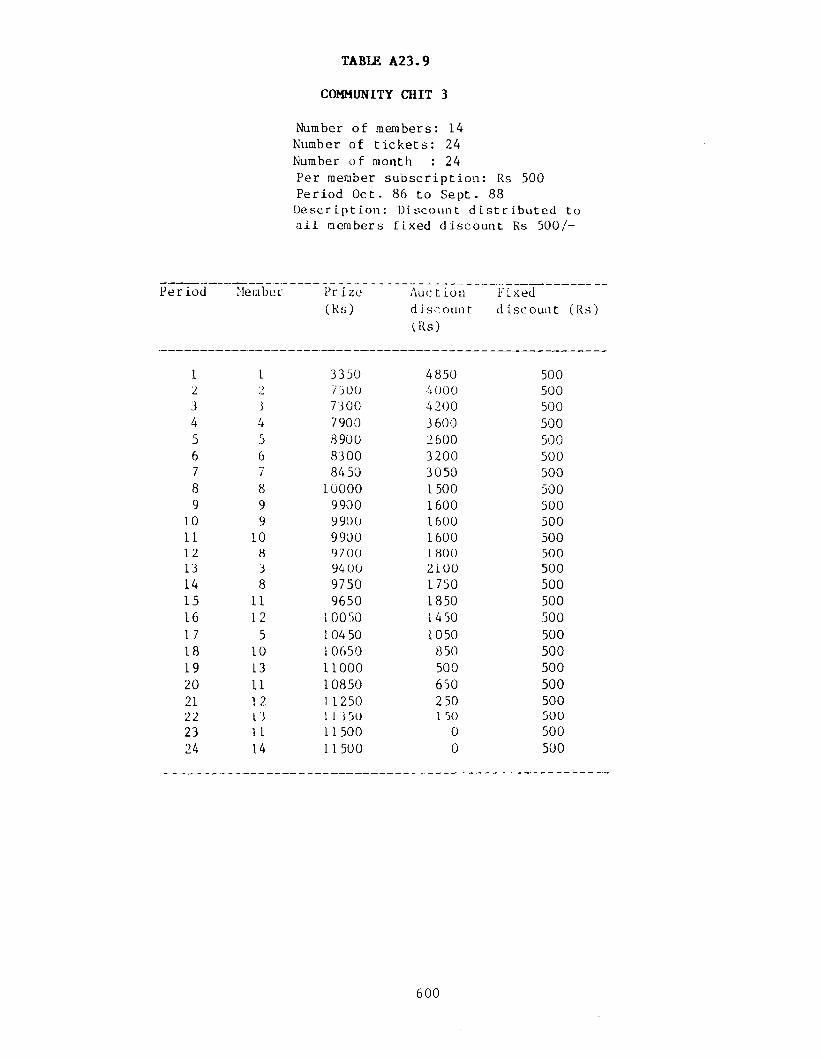
COMMUNITY CHIT 3
Number o f members: 14Number of t i c k e t s : 24Number o f month : 24Per member subscr ipt ion : Rs 500Period Oct. 8 6 to Sept. 8 8
Description: Discount d is tr ibuted toa i l members fixed discount Rs 500/-
TABUS A2 3.9
iod Meta bet* Pr ize Auct ion Fixed(Rs) di scount
(Rs)cl iscount
1 1 3350 4850 5002 2 7300 4000 5003 3 7300 4200 5004 4 7900 3 600 5005 5 8900 2600 5006 6 8300 3200 5007 7 8450 3050 5008 8 1 0 0 0 0 1500 5009 9 9900 1600 500
1 0 9 9900 1600 5001 1 1 0 9900 1600 5001 2 8 9700 1 800 50013 3 9400 2 1 0 0 50014 8 9750 1750 50015 1 1 9650 1850 50016 1 2 10050 1450 50017 5 10450 1050 50018 1 0 10650 850 50019 13 1 1 0 0 0 500 5002 0 1 1 10850 650 5002 1 1 2 1.1250 250 5002 2 L 3 1 1 3 30 150 50023 1 1 11500 0 50024 L4 11500 0 500
600
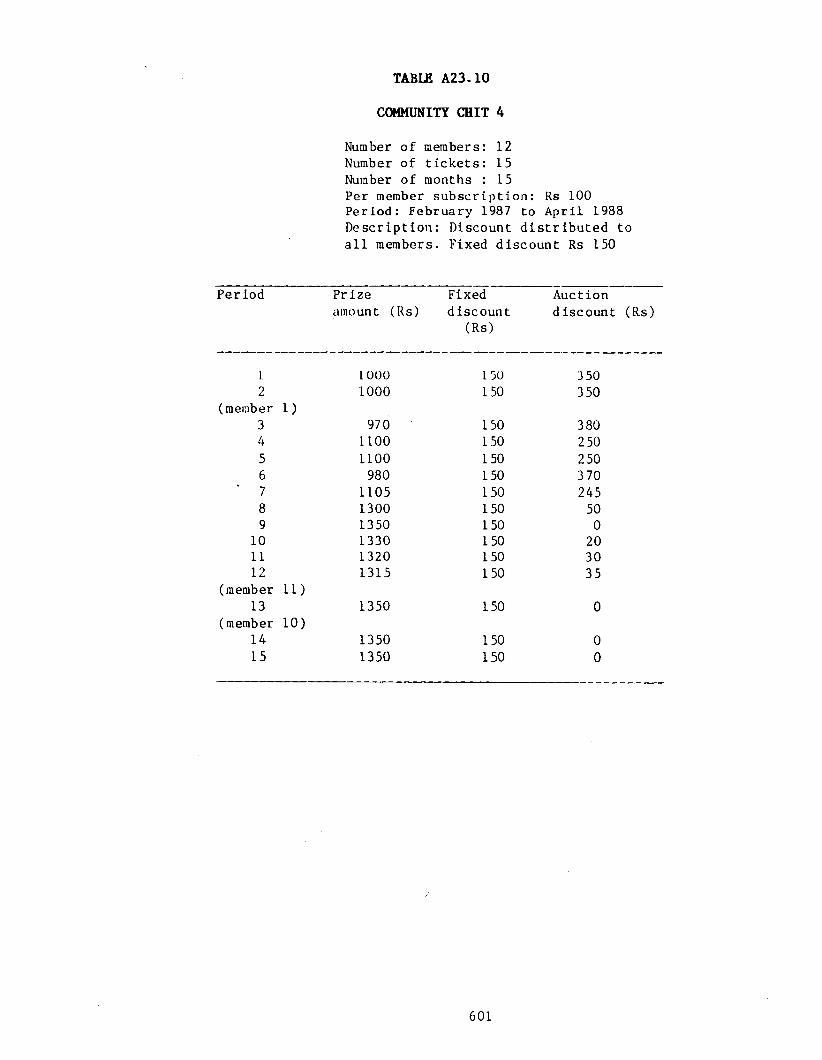
TABLE A23.10
COMMUNITY CHIT 4
Number o f members: 12Number o f t i c k e t s : 15Number o f months : 15Per member subscr ip t ion: Rs 100Period: February 1987 to April 1988Description: Discount d is tr ibuted toa l l members. Fixed discount Rs 150
Period Prize Fixed Auctionamount (Rs) discount
(Rs)discount (Rs)
1 1 0 0 0 150 3 502 1 0 0 0 150 350
(member3
1 )970 150 380
4 1 1 0 0 150 2505 1 1 0 0 150 2506 980 150 3 70
‘ 7 1105 150 2458 1300 150 509 1350 150 0
1 0 1330 150 2 01 1 1320 150 301 2 1315 150 35
(member13
1 1 )1350 150 0
(member14
1 0 )1350 150 0
15 1350 150 0
601
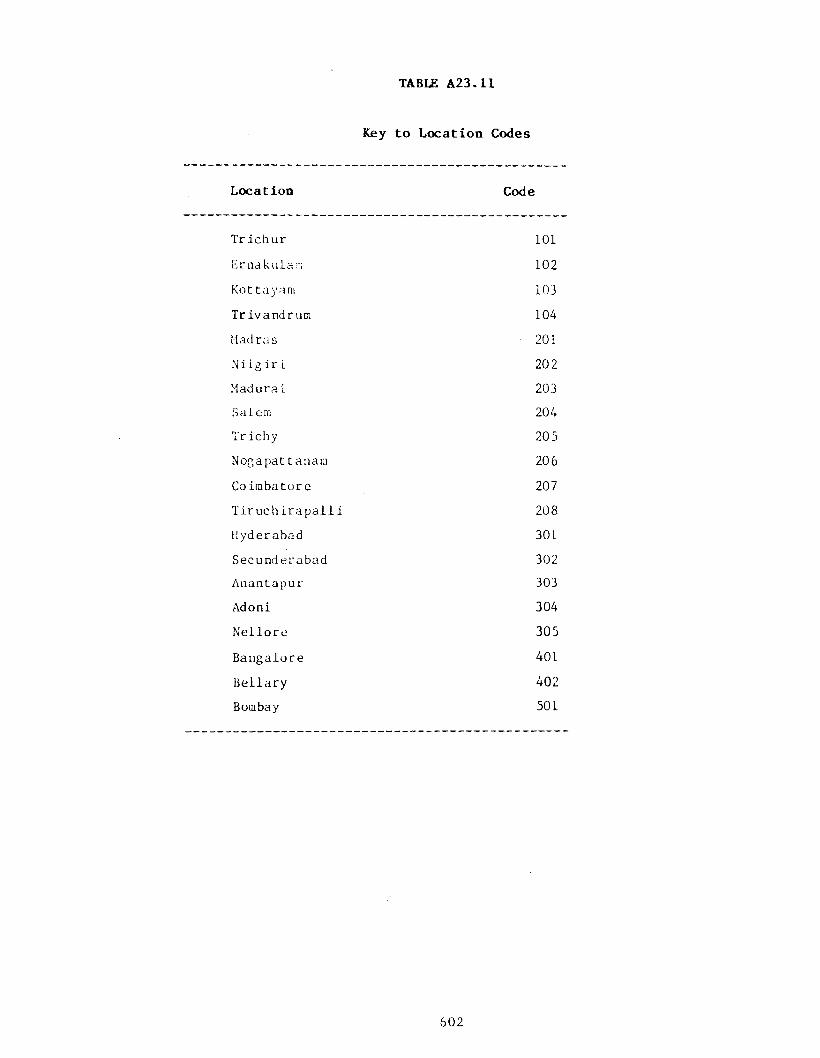
TABLE A23. l l
Key to Location Codes
Location Code
Tr ichur 1 0 1
Ernakulam 1 0 2
Kot tayam 103Tr ivandr um 104Madras 2 0 1
N ilg i r i 2 0 2
Madurai 203Salem 204Trichy 205Nogapat tanam 206Coimbatore 207Tiruch irapa l l i 208Hyderabad 301Secunderabad 302Anantapur 303Adoni 304
Nellore 305
Bangalore 401
Bellary 402Bombay 501
602
APPENDIX TO CHAPTER 32
DOCUMENTARY INSTRUMENTS OF INDIGENOUS BANKERS AND MONEYLENDERS
A32.1 Introduction
A32.1.1 The instruments most commonly used in Indian ICMs are s h o r t t erm c r e d i t b i l l s s uch as p r o m i s s o r y n o t e s and h u n d i s . Promissory notes are similar to that defined in sect ion 4 of the Negotiable Instruments Act and are e i ther payable on demand or a f t e r a s pec i f ied term. Instruments used by moneylenders and indigenous bankers are now described.
A32.2 Instruments used by moneylenders
A32.2.1 Moneylenders u s u a l l y lend aga ins t p rom issory n o t e s . These are normally supported by other documents. A ' r a s i d ' i s a simple rece ipt given in acknowledgement o f debt. A 'd astavez ' is a bond executed on a stamped, lega l form with a l l terms and condit ions duly stated including the interest rate and default penalty (Banking Commission, 1971). For i l l i t e r a t e borrowers, ' b a h i s ' , or stamp books, are maintained. The signature or thumb impression o f the borrower i s recorded there as evidence o f debt. In such cases, terras and condit ions are not recorded. Traders and moneylenders a lso g ive market loans under the ' k i s t ' system under which dai ly or monthly repayment is s p e c i f i e d .
A32.2.2 "Rahan', or mortgage o f landed property i s another common i nst rument used by moneyl ender s . Such a mort gage de e d , containing terras and condit ions o f the advance and relevant dates, has to be registered with the Registrar for the d i s t r i c t in which the property i s lo cated . There are two types o f mortgages: o rd i nary and usufructuary. Use o f the land stays with the borrower with the former. With the l a t t e r , use r ights for a s pec i f ied frac tion o f the mortgaged land are given to the lender. Under the ' z a r p e s h i ' usufructuary mortgage surplus income from the land with the lender, over and above st ipulated in te re s t , stay with the lender. Otherwise such income accrues to the borrower. Loan durat i o n s are sel dom s p e c i f i e d i n o r d i n a r y mo r t g a g e s . ( Banki ng Commission, 1971).
A32.3 Instruments used by indigenous bankers
A32.3.1 The hundi is the instrument general ly used by indigenous bankers. By the la te seventies , however, Timberg and Aiyar, (1980) noted the use o f h i r e purchase agreements , demand prom issory notes, installment notes and7securi ty such as mortgage deeds. They also noted the use o f scraps o f paper, commonly known as " ruka' or ' c h i l k a ' , in use as deposit r e ce ip ts by some informal deposit accepting agencies . These scraps were to avoid problems with tax a uthor i t ies and ensure the anonymity o f depos i ts , presumably from
603

black funds. The c h i e f aim o f th is sect ion is to b r i e f l y descr ibe the ancient and v e r s a t i l e hundi. More deta i led d iscuss ion as well as rep l i cas o f hundis are to be found in Karkal (1967), Banking Commission (1971) and Timberg and Aiyar (1980)1 .
A32.3.2 Hundis are used to raise funds, to e f f e c t remittances and to f inance inland trade. Most hundis are e a s i l y transferred by endorsement and de l ivery and so are o ccas ion a l ly used in some market segments to make payments. The 'd arsh a n i ' ( s igh t ) hundi, used f i r s t by Gujarati sh ro f f s , and the ' m u ltan i ' , ~muddati' or ' thavana i ' hundi, used f i r s t by Shikarpuris, are the two broad types o f hundis. The former is a sight or demand instrument while th e l a t t e r is payabl e a f t e r a s t i p u l a t e d p e r i o d .
A32.3.3 Muddati hundis are rare ly f o r more than 1 year, the normal tenure being 30, 60, 90 or 120 days. These hundis are l ik epromissory notes and hundi paper is sold by the Stamp Department o f the Government. In Bombay i t is usually an undertaking to pay a stated amount on the completion o f 8 6 days with 3 days grace. In South India and West Bengal the normal period s p e c i f i e d i s 90 days without a grace period. (Karkal, 1967 and Banking Commission, 1971)
A32.3.4 Darshani hundis, which were widely used to f inance inland trade and e f f e c t remittances up to the late sevent ies , are o f six types.
i . The Shah Jog Hundi is repayable only to a ' s h a h ' . A shah is a person whose creditworthiness and good reputation are e s t a b l i s h e d a f t e r proper e n q u iry . Proo f o f t h i s i s usually membership in an establ ished firm and membership o f a commercial a sso c ia t io n . The drawer can sue the drawee o f the hundi for repayment o f the amount s p e c i f ie d there i f due precaution to estab l ish the payee's status is not taken. The instrument is thus much l ik e a ' c r o s s and order" cheque with the add it iona l , safeguard that the payee is a shah.
i i . The Nam Jog Hundi is payable to the party named in the b i l l or to his order.
i i i . The Dekharnar Jog Hundi, evolved at the turn 'of thecentury unlike the other forms o f the hundi which are centuries o ld . It is a bearer instrument unless endorsed in which case it is treated much l ike a shah jog hundi.
iv . The Farmani Jog Hundi is payable on order to an endorsee provided a l l endorsements are in order.
v. The Jokhmi Hundi is drawn against goods despatched and contains cer ta in condit ions under which the drawer or holder su f fers a l o s s i f the g 0 9 ds are los t or damaged in t r a n s i t .
v i . The Dhani Jog Hundi is payable to the ' dhani' or pur-
1. The d iscuss ion below i s la rge ly based on Banking Commission (1971a).
004
chaser o f the hundi. However, v e r i f i c a t i o n o f the ident i ty o f the presenter by the banker i s not required.
A32.3.5 There are a number o f usages commonly fo llowed with darshani hundis. When a hundi i s drawn on a correspondent banker in another centre , a 'n a k a l ' giving part icu lars o f the hundi and thedrawer is usually sent to the correspondent. I f the advice is notreceived, the drawee keeps the hundi in suspense or 'k h a d i ' for up to three days without i t being discounted. Some other usages, which are reckoned superior to provis ions under the Negotiable Instruments Act, are the fo l lowing:
i . The date o f presentation is noted on the instrument by the drawee, while providing prooi o f presentation, it does not impose any l i a b i l i t y o f subsequent payment on the drawee.
i i . In contrast to the nakal/khadi procedure, a b i l l of exchange, i f not paid on the day o f acceptance or payment, must be ret ired under the Negotiable Instruments Act.
i i i . Costs o f noting or protesting for dishonour' are muchlower than for a b i l l o f exchange.
i v . Hundis are e a s i ly discounted any number o f times by endorsement and d e l ivery .
v. An addit ional drawee or ' j i k r i w a l a ' can be spec i f ied by the drawer o f the hundi to guard against the p o s s i b i l i t y of non-payment by the drawee.
A32.3.6 As this b r i e f d escr ip t ion shows, the hundi is a vers a t i l e and useful f inanc ia l instrument.
605

APPENDIX TO CHAPTER 33
NEWSPAPER REPORTS AND DOCUMENTS CONSULTED FOR CASE STUDIES IN THE CHAPTER
Sanchaita Investments
1. Sanchaita Investments V. State o f West Bengal, AIR, 1981,Calcutta 157
2. States o f West Bengal and Others V. Swapan Kumar Guha andothers (CA No. 1129/81) and State o f West Bengal and others V. Sanchaita Investments and o th e r s ( CA No. 1 1 3 0 /8 1 ) , (1983), 53 Company Cases, 114 (SC); AIR 1982, SC 949.
3. Ghosh, T and N Mitra, (1980) Chit Funds: The Axe Fa l ls ,Sunday, November 16.
4. Newspaper articles(a) Amrita Bazar Patrika
1983February 3, April 301985February 1, November 231986March 18, July 19
(b ) Business Standard 1983May 6 ,1985November 231986March 19
( c ) Economic Times1982
| February 101983February 3, May 211984 March 2
(d) Statesman 1983May 131985May 17, November 211986March 18, July 19, August 26
(e ) Telegraph1983May 13, 21 *1984March 3, 31, Apri l 3, 7, December 111985February 16, June 17 /1986March 18, July 19, August 9, November 23
( f ) Times of India1988September 29
606
1. Peerless General Finance and Investment Company Ltd. andanother V. Union o f India and others, (1987) 61 CompanyCases 628 (CHC).
2. Reserve Bank o f India V. Peerless General Finance and Investment Company Ltd. and others, (1987) 61 Company Cases 663 (SC).
3. A f f i d a v i t - i n - o p p o s i t i o n o f Bhanwar Lai Jain f i l e d on behalfo f the RBI at Calcutta High Court in the case o f PeerlessGeneral Finance and Investment Company Ltd. & Another V. Union o f India and others.
4. Annual Report and Accounts o f the Peerless General Finance and Investment Company Ltd. , 1979, 1980, 1981, 1982, 1984, 1985 and 1986.
5. 'P e e r l e s s : Sounds o f S t r i f e ' , Business India, 10-23, March, 1986, pp. 72-4.
6. Newspaper Articles(a) Amrita Bazar Patrika
1985May 18, July 5, 10, September 30, October 31986March 19, 22, 23, 25, 28Apri l L, 4, 5, 8 , 9, 10, 11, 12, 22, 23, 24, May 24, 28,5 ,July 22, 27, August- 13, September 19, October 2, November15 December 151987January 23, 28, 31, March 6 , July 31
( b) Business StandardL 98 5March 2, June 8 , October 1, December 141986March 15, 21, 22, 23, 24, 25, 26, 28, 30Apri l 1, 2, 3, 4, 5, 6 , 7, 10, 18, 25, May 24, 27, June 7July 18,, 19, 20, 21, 22, 24, August 5, 19, 30, 31September 2, 6 , 18, 19, October 14, 20, 21, 30 November 1, 13, 25, 28, 29, 30, December 181987January 1, 3, 23, 24, 29, March 3, 6 , 7, 14, April 10, 14,22May 8 , 10, June 7, 8 , 11, July 17, 21, August 5, 10, 11, 12,14, 21, 28, September 11
(c ) Economic Times1985August 9, September 30, December 141986 . •March 16, 21, 23, 26, April 2, 5, 14, 18, 22, 25, 28, May 24June 4, 7, 13, July 18, 19, 23, 26, 27, August 30, September 19October 2, 28, November 18, 21, 29, December 51987March 7, 17, July 14, August 6 , September 16, October 101988October 7, November' 16
(d) Financial Express, 25 March.1986
P e e r le s s G e n e ra l F in a n c e and In v e s tm e n t Company L t d .
607
1988September 5, 10, October J
(e ) Indian Express, 20 March 1986( f ) Statesman
1983August 131985 July 211986March 7, 15, 19, 22, 23, 24, 25, 26, April 2, 4, 5, 20, 24 May 2.4, July 18, 10, 22 , Aui-ust: 3 0 , 31 , f>epL ember 1 8 , 19October 2, 27, 29, November 18, 23, 29, December 181987January 17, 23, 28, 31, February 12, March 10, 14, 19, 22 April 10, 14, 22, July 18, 30, August 6 , 11, 12, Sept ember16
(g ) Telegraph1 983August 131985March 1 , May 3 0 , June 29 , J ul y 4, Septem ber JO1986March 15, 16, 21, 22, 23, 25, 26, 31, April I, 2, 3, 4, 5,8 , 14,15, 16, 17, 18, 19, 20, 24, 25, May 24, 25, 27, June5, 7July 10, 18, 17, 22, 26, August 9, 30, 31, September 9, 17,19, 28 October 2, 14, 28, November 4, 15, 29, 30, December5, 181987January 17, 21, 23, 25, 28, 29, March 6 , 19, April 10, 14,22 June 3, July 31, August 5, 6 , 10, 11, September 16, October 17, 31
(h) Times o f India1986March 23, Apri l 151987August 231988September 24
608

BIBLIOGRAPHY
A c h a r y a , Shankar and A s s o c i a t e s ( 1 985 ) , Mj\spe^ t js__o f ___theBl ac k E c o n omy .in_I nd i a " , N a t i o n a l I n s t i t u t e o f P u b l i cF i n a n c e and P o l i c y , New D e l h i .
Ac h a r y a , Shankar and S r i n i v a s a Madhur ( 1 9 8 3 ) , " I n f o r m a lC r e d i t Mar ke t s and Bl a c k Money: Do They F r u s t r a t eMo n e t a r y P o l i c y ? " Ec onomi c and P o l i t i c a l Weekl y ( 1 8 ) , O c t o b e r 8 .
A c h a r y a , Shankar and S r i n i v a s a Madhur ( 1 9 8 4 ) , " I n f o r m a lC r e d i t Mar ke t s and Mo ne t ar y P o l i c y " , Ec o no mi c and _Pol i. tjLc § l _Wc e kl y ( 1 9 ) Se p t e mbe r 8 .
A i y a r , C.V. ( 1 9 7 9 ) , " Smal l E n t e r p r i s e F i n a n c i n g : The Ro l e o fI n f o r m a l C r e d i t Mar ke t s : A S u r v e y ” , Mimeo, The WorldBank, Was h i ng t o n D.C.
As i an De ve l o pme nt Bank ( 1 985 ) , Do me s t i c R e s o u r c eM o b i l i s a t i o n ^ t h r o iig h___ F i n a nc i a 1 D e v e l o p m e n t " , As i anDeve l opment Bank, Ma n i l a , The P h i 11 I p p i n e s .
B a j a j , K.K. ( 1 9 8 7 ) , " O f f Ba l a n c e Sheet F i n a n c i n g ” , B u s i n e ss S t a n d a r d , August 26, p. 5.
Bardhan, K. (L 980 ) , i n t e r l o c k Lug o f F a c t o r Mar ket s and A g r a r i a n D e v e l o p m e n t : A Rev i ew o f I s s u e s " , Ox f ordEc o n o mic P a p e r s , V o l . 32, p p . 8 2 - 9 9 .
Basu , S. K. ( 1 970 ) , " E c o n o m i c s o f H i r e_P u r c h a se C r e d i t " , As i aP u b l i s h i n g House , Bombay.
Be n j a mi n , D a n i e l ( 1 9 7 8 ) , "The Use o f C o l l a t e r a l to E n f o r c e Debt C o n t r a c t s " , Ec o no mi c I n q u i r y , pp. 3 3 3 - 5 9 .
Bc r nanke , B . S . and M. G e r t l e r ( 1 9 8 / ) , " F i n a n c i a l F r a g i l i t y and Ec onomi c P e r f o r m a n c e , Mimeo, P r i n c e t o n U n i v e r s i t y .
Bh a g wa t i , J . N . ( 1 9 7 1 ) , "The G e n e r a l i s e d Th e o r y o f D i s t o r t i o n s and W e l f a r e " in Bhagwat i ( e d . ) ( 1 9 8 1 )
^ e a d in g s_J;n_ I n t e r nat i^on a l^Trade^^ MIT P r e s s , Cambr i dge .
Bhargava , B. K. (1 934 ) , "'_Ind ig enou s__ B anki ng_ in A n c i e n t andMed i ev a l I n d i a " .
B h a t i a , R . J . and D.R. Khat kh at e ( 1 9 7 5 ) , " F i n a n c i a l I n t e r m e d i a t i o n , Sav i ng^ M o b i l i s a t i o n and E n t r e p r e n e u r a l D e v e l o p me n t : The A f r i c a n E x p e r i e n c e " , I MF^St a f f P a p e r s ,2 2 ( 1 ) , pp. 1 3 2 - 1 5 8 .
609
B h a t t , V. V. ( 1 9 7 8 ) , " I n t e r e s t R a t e s , T r a n s a c t i o n C o s t s andF i n a n c i a l I n n o v a t i o n s ” , Do me s t i c F i n a n c e S t u d i e s , No. 47, The World Bank, Wa s h i ng t o n D.C.
B h a t t , V . V . and A. R. Roe , ( 1 9 7 9 ) , " C a p i t a l Market sI m p e r f e c t i o n s and Ec onomi c D e v e l o p m e n t s " , World Bank S t a f f Papers N o . 338 , The Wor l d Bank, Wa s h i ng t o n D.C.
B h a t t , V. V. ( 1 9 8 8 ) , "On R e s t r u c t u r i n g the Mo n e t a r y S y s t e m" ,Ec onomi c and P o l i t i c a l We e kl y , March 19, pp. 6 0 2 - 6 0 5 .
Bhat t a c h a r y a , B. B. ( 1 9 8 5 ) , " R o l e of ' I n t e r e s t Ra t e s as an I n c e n t i v e f o r Ho us ho l d S a v i n g s i n I n d i a , 1960 - 61 t o 1 9 8 1 - 8 2 " , Mimeo, I n s t i t u t e o f Ec onomi c Growt h, New D e l h i .
Bhende, M.J. ( 1 9 8 3 ) , " C r e d i t Mar ke t s i n the S e m i - A r i dT r o p i c s o f Rura l South I n d i a , ICRISAT Ec onomi c ProgramP r o g r e s s Re p o r t No- 56, P a t a n c h e r u , Andhra P r a d e s h .
Bh o l e , L.M. ( 1 982 ) , " F i n £ nc J. a 1__Mar ke t s _ and______ I n s t i t u t i o n s :^ r o w t h ^ S t r u c t u r e __ ^ J] d _ I n n o v a t i o n s " , T a t a Mc Gr a w H i l lP u b l i s h i n g C o m p a n y , New D e l h i .
B h o l e , L.M. ( 1 984 ) , " B e h a v i o u r o f Trade C r e d i t " ,and_ P o 1 I t i c a l ^ W e e k l y ( 1 9 ) , March.
B h o l e , L.M. ( 1 985 ) , " I m p a c t _____o_f Mo n e t a r y ______p o l i c y " , Hi mal ayaP u b l i s h i n g House , Bombay.
B l i n d e r , A ( 1 9 8 7 ) , " C r e d i t R a t i o n i n g and E f f e c t i v e S up p l yF a i l u r e s " , E c o n o m i c _ J o u r n a l , ( 9 7 ) , pp. 327- 3 5 3 .
B o l n i c k , B . R . , " F i n a n c i a l L i b e r a l i s a t i o n wi t h I m p e r f e c tM a r k e t s " , Ec onomi c De v e l o p me nt and C u l t u r a l Change ,3 5 ( 3 ) , pp. 5 8 1 - 9 9 .
B o m b a y P r o v i n c i a l ___- ^3L1 IJ: y____________ C o mm i t t ( 1 930 ) ,Vo I s . 4, C a l c u t t a .
Bo se , A. N. ( 1 97 8 ) , "’ CaJ- c ut t a_ and__ R^ural B e n g a l : Smal l S e c t o rS y m b i o s i j s " , Mi ne r va A s s o c i a t e s , C a l c u t t a .
B o t t o m l e y , Anthony ( 1 9 6 3 ) , "The Cost o f ' A d m i n i s t e r i n gP r i v a t e Loans i n U n d e r d e v e l o p e d A r e a s " , Ox f o r d_Ec o n om i cP a p e r s , ( 1 5 ) , pp. 1 5 4 - 6 3 .
B o t t o m l e y , Ant hony ( 1 9 6 3 b ) , "The Premium f o r R i s k as aD e t e r mi n a n t o f I n t e r e s t Rat e s in U n d e r d e v e l o p e d Rura l A r e a s " , The__ Quart erl_y_ Jour nal_oJ__Ec onomi c , ( 3 7 ) .
B o t t o m l e y , A n t h o n y ( 1 9 6 4 ) , " M o n o p o l y P r o f i t a s a D e t e r m i n a n t o f I n t e r e s t R a t e s i n ' U n d e r d e v e l o p e d R u r a l A r e a s " ,Ox f o r d _ Ec onorajc_ Pa per s , ( 1 6 ) .
6 1 0

B o t t o m l e y , An t h o n y , ( 1 9 6 4 b ) , "The D e t e r m i n a t i o n o f Pure R a t e s o f I n t e r e s t s in U n d e r d e v e l o p e d Rur a l A r e a s " , The Re v i e w o f Ec o no mi c s^and^St at i s _ t i c s , ( 4 6 ) , pp. 3 0 1 - 3 0 4 .
B o t t o m l e y , Ant hony ( 1 9 7 5 7 a ) , " I n t e r e s t Rate D e t e r m i n a t i o n i nU n d e r d e v e l o p e d Rur a l A r e a s " , Ame r i c an_ ^ J o u r n a l __o fA g r i c u l t u r a l E c o n o m i c s , ( 5 7 ) , pp. 2 7 9 - 89 .
B o t t o m l e y , Ant hony ( 1 9 7 5 b ) , " I n t e r e s t and t he S t r u c t u r e o fA g r i c u l t u r a l C r e d i t M a r k e t s , E c o n o m i c P a p e r s(20). '
Bournan, F . J . A . ( 1 9 7 7 ) , " I n d i g e n o u s S a v i n g s and C r e d i t S o c i e t i e s i n t he Th i r d W o r l d , " PJ5ent D i g e s t(16 ) , p p . 3 6 - 5 1 .
Bouman, F . J . A . and K. H a r t e v e l d ( 1 9 7 6 ) , "The D i j a n g g i : AT r a d i t i o n a l Form o f S a v i n g s and C r e d i t i n WestCameroon" , Soc_iologJLa_Rujral i s , ( 1 6 ) .
Bouman, F . J . A . ( 1 9 7 9 ) , " T h e ROSCA: F i n a n c i a l T e c h n o l o g y o fan I n f o r m a l S a v i n g s and C r e d i t I n s t i t u t i o n inD e v e l o p i n g E c o n o m i e s " , S a v i n g s ^ a n d De v e l o p me n t , I I I - 4 .
B r e c h l i n g , F . P . R . and R . G . L i p s e y , ( 1 9 6 3 ) , " Tr a d e C r e d i t and Mone t ar y P o l i c y " , Mimeo, London S c h o o l o f Ec o n o mi c s and P o l i t i c a l S c i e n c e .
Bruno , M. ( 1 9 8 6 ) , " Op e n i n g Up: L i b e r a l i s a t i o n wi t hS t a b i l i s a t i o n " , in R. Do r nbus c h and F . L . C . H . Hel mers( E d s ) , TH o Oge ]}_ Econo IS! A*—J: J c Z M akers , TheWorld Bank . , Wa s h i ng t o n D.C.
B u f f i e , E. ( 1 9 8 4 ) , " F i n a n c i a l R e p r e s s i o n , the New S t r u c t u r a l i s t s and S t a b i l i s a t i o n P o l i c i e s i n Semi- I n d u s t r i a l i s e d E c o n o m i e s " , Jo u r n a l o f Deve l o pme nt Econom i c s , pp. 3 0 5 - 3 2 2 .
C h a n d a v a r k a r , A . G . ( 1 9 6 5 ) , "The Premium f o r R i s k as aDe t e r mi n a n t o f I n t e r e s t Ra t e s i n Un d e r d e v e l o p me nt Rura l Ar e a s : Comment" , ^ u a r t e r 1 ^ _ J o u r n a l _ o J _ E c o n o m i c s , ( 7 9 ) ,p. 323 .
Chang, D. and Jung , W.S. ( 1 9 8 4 ) , " U n o r g a n i s e d Money Markes i n LDCs: The McKinnon Shaw H y p o t h e s i s Ve r s u s t he VanWi j n b e r g e n H y p o t h e s i s " , Mimeo, V a n d e r b i l t U n i v e r s e i t y , Na shv i l l e .
Cho, Yoon Je ( 1 9 8 5 ) , C a p i t a l Market S t r u c t u r e and B a r r i e r s to F i n a n c i a l L i b e r a l i s a t i o n , The World Bank, Wa s h i n g t o n , D.C.
611

C h o t i g e a t , T ( 1 9 8 2 ) , " S a v i n g s M o b i l i s a t i o n v i a R o t a t i n g S a v i n g s and C r e d i t S o c i e t i e s in LDCs" , The Wor l d Bank, Wa s h i n g t o n , D.C.
C o a t s , W.L. and Deena R. Kh a t k h a t e ( 1 9 8 4 ) , "Money and Mo ne t ar y P o l i c y i n Les s D e v e l o p e d C o u n t r i e s : The MainI s s u e s " , T h e ^ D e v e l o p i n g ^ E c o n o a i e s .
C o l e , D. and Y. C. Park ( 1 983 ) , "JFi n a n c i a l _ D e v e l opmen t in Jto r ea^_ 1 94 5 - 7 8 " , Har var d U n i v e r s i t y P r e s s , Ca mbr i dg e .
D a g 1 i , V a d i 1 a 1 ( e d . ) ( 1 9 7 6 ) , " F' L n a n c a 1 _ _ I n s t L t u t L o n s o CI n d i a " , Vora , Bombay.
Da s - G u p t a , A. ( 1 9 8 9 ) , " P e r s o n a l T a x a t i o n and P r i v a t e F i n a n c i a l Sav i ng ; , in I n d i a , Mimeo, NIPFP, New D e l h i .
Da s - Gup t a , A. and S . Ray ( 1 9 8 9 ) , " " A g g r e g a t e Demand wi th P a r a l l e l M a r k e t s , Mimeo, NIPFP, New D e l h i .
Da t a r , M-K- ( 198 7 ) , ’’ Some A s p e c t s o f I n t e r e s t Rate P o l i c y in lad La" in B r a lima n a n d a and P a n c. h m u k h i ( E d s . ) , The D e v e l o p m e n t ^ P r o c e s s o f t he I n d i a n Economy, Hi mal aya P u b l i s h i n g House , D e l h i .
Ed wa r d s , S . a n d Kh a r i , M . ( 1 98 r> ) , " Ju t e r e s t Ka t (.*D e t e r m i n a t i o n in D e v e l o p i n g C o u n t r i e s : A C o n c e p t u a lFramework" , ] M F _ S t a f f _ Pa p e r s .
Edwar ds , S. ( 1 9 8 8 ) , " F i n a n c i a l D e r e g u l a t i o n and Segmented C a p i t a l M a r k e t s " , Wor1d _ D e v e l o p m e n t .
Emery, G. ( 1 9 8 4 ) , "A Pure F i n a n c i a l E x p l a n a t i o n o f TradeC r e d i t " , ou r n al _ o f ___ F i n a n c i a l ____ and___Quant L ta t i v eA n a l y s i s , ( 1 9 ) , pp. 2 7 1 - 8 5 .
F . A. O. ( 1 9 5 3 ) , " C o o p e r a t i v e T h r i f t . C r e d i t and Ma r k e t i n g in E c o n o m i c a l l y U n d e r d e v e l o p e d C o u n t r i e s , FAO, Rome.
F e r r i s , J . S . ( 1 9 8 4 ) , "A T r a n s a c t i o n s The or y o f Trade C r e d i t Us e " , Q u a r t e r l ^2 u£ n a l^ of^_ Ec J? > ( 9 6 ) , pp . 243 - 7 0 .
Fr y , M. J . ( 1 988 ) , " j lo n ey__ I nt e r e s t ^ a n d ___Ba n ki ng^ J. n^ Econom i cD e v e l o p m e n t " , Johns Ho pk i ns Uni v . P r e s s , B a l t i m o r e , Md.
G a l b i s , V i c e n t e ( 1 9 7 9 ) , " I n f l a t i o n and I n t e r e s t Rate P o l i c i e s in L a t i n A m e r i c a " , IHF _ S t a f f _ P a p e r s ( 2 6 ) .
G a l b i s , V i c e n t e ( 1 9 8 2 ) , " A n a l y t i c a l A s p e c t s o f I n t e r e s t RateP o l i c i e s in L a t i n A m e r i c a " , i >av i ng s _ and__J?5 v ^li? >6 ( 2 ) .
6l2
Gambl e , S i d n e y D. and Hs i e n Ti ng ( 1 976 ) , "A Nor t h China Rura l Co mmuni t y " , I n s t i t u t e o f P a c i f i c R e l a t i o n s , New Yo r k .
Ghat ak, S. ( 1 976 ) , " Ru r al^Mo ne y_Ma r ke t s_ i n_ IndJ.a " , Mac mi l l an o f I n d i a , New D e l h i .
Ghat ak , S. ( 1 9 8 1 ) , "Jtfonetary_ _ iSJ?__ l j } __.J?? YJrii? PilfSC o u n t r i e s " , S t . M a r t i n ' s P r e s s , New Yo r k .
Gh a t e , P. B. ( 1 9 8 6 ) , "Some I s s u e s f o r the R e g i o n a l Study on I n f o r m a l C r e d i t Ma r k e t s " Backgr ound D i s c u s s i o n Paper f o r D e s i g n Wo r ks ho p , R e g i o n a l , St udy o f I n f o r m a l Cr e d i t Mar ke t s in S e l e c t e d D e v e l o p i n g * Member C o u n t r i e s , Mi me o , As i a n De ve l o p me nt Bank, M a n i l a .
Ghosh , A. ( 1 964 ) , "JPjL n a nc i a l __ _______________________and___Mo net a ryP o l i c y __i n _ _ D e v e l o pi n_g___Ec o n o a i e s " , The Wor l d P r e s s ,C a l c u t t a .
Ghosh, D.N. ( 1 97 9 ) , _ _ P o -^iSZ_ i i a " > A l l i e dP u b l i s h e r s , D e l h i .
G i o v a n n i n i , A l b e r t o ( 1 9 8 3 ) , "The I n t e r e s t E l a s t i c i t y o f Sav i ng in D e v e l o p i n g C o u n t r i e s : The E x i s t i n g E v i d e n c e " ,
_Wo r De v e pm erijt , 1 1 ( 7 ) , pp . 6 0 1 - 6 0 7 .
G o l d s m i t h , R.W. ( 1 9 8 3 ) , " The F i n a n c i a l D e v e l o p me nt o f I n d i a : I 960 -1 97 7 " , O x f o r d U n i v e r s i t y P r e s s , D e l h i .
G o n z a l e s A r r i e t a , G.M. ( 1 9 8 8 ) , " I n t e r e s t R a t e s , S a v i n g s and Growth i n LDCs: An As s e s s me n t o f Re c e n t E m p i r i c a lR e s e a r c h , _Wo r l d _ De v e l opmen t , 1 6 ( 5 ) , pp . 5 8 9 - 6 0 6 .
Government o f I n d i a (1 930 ) , "_The Madras_P r o v i n c i a l BankingEnSu i r ^ Co mmi t t e e " .
Government o f I n d i a (1 934 ) , R e s e r v e Bank o f I n d i a A c t )__19^4.
Government o f I n d i a ( 1 9 5 6 a ) , JJnd_ian_ 0om^anj.e s_ Ac t .
Government o f I n d i a ( 1 956 ) , The T r a v a n c o r g - C o c h i n __BankingEn ^ u i r y C o m m i s s i o n .
Government o f I n d i a , Banki ng Co mmi s s i o n ( 1 9 7 1 ) , " R e p o r t o ft he_____ St udy^____ Gro up______on______5 _____ F i n a n c i a l
ia r^iej ' •
Government o f I n d i a , Banki ng Co mmi s s i o n < 1 9 7 1 a ) , R e p o j t ^ o f_the_Stud^__Gr o up_ jd n___1^ d e n o u_s Ba n ke r s , ( H. T . Parekh,Chai rman) .
Government o f I n d i a ( 1 9 7 2 ) , Jle o f _t h e_Bank i ng Commi ss i on( R. G. S a r a i y a : C h a i r ma n ) .
6 1 3

Government o f I n d i a , Banki ng Laws Commi t t ee ( 1 97 8 ) , "^Reports _ _ ( H u n d i s ) ” , ( pT vT
Ra j amannar , C h a i r ma n ) . ~
Government o f I n d i a , De par t ment o f Revenue and Banki ng( 1 966 ) , _Re __o f j h e ___E x p e r t _ C o u n i 1 1 e e on Co ns umpt i o nC r e d i t , (B. S i v a r a ma n : C h a i r ) .
Government o f I n d i a , M i n i s t r y o f T e x t i l e s ( 1 9 8 8 ) , Re p o r t o f t h e ^ T a s k ^ F o r c e ^ o n ^ C r e d i t ^ R e g u i r e m e n t s o f P o w e r l o o ms .
Government o f T r a v a n c o r e ( 1 9 3 0 ) , T r a v a n c o r e _ Banki ngE n ^ u i r y _ C o m u i t t e e .
Government o f K e r a l a ( 1 9 5 8 ) , J C e r a l a _ M o n e y l e n d e r s _ A c t .
Government o f Tami l Nadu ( 1 9 5 7 ) , J a m i l Nadu M o n e y l e n d e r s Ac t .
Gr e e n wa l d , B. , J . E . S t i g l i t z , and A. W e i s s , ( 1 9 8 4 ) ," I n f o r m a t i o n a l I m p e r f e c t i o n s i n the C a p i t a l Market and Ma c r o e c o n o mi c F l u c t u a t i o n s " , Ame r i c an Ec o no mi c Re v i e w, ( 7 4 ) .
G e e r t z , C l i f f o r d ( 1 9 6 2 ) , "The R o t a t i n g C r e d i t A s s o c i a t i o n : A " Mi d d l e Rung” in D e v e l o p m e n t " , Ec onomi c De ve l o pme nt and
fIDSi: » A p r i l , pp . 2 4 1 - 2 6 3 .
G u b b a y , M.S. ( 1 928 ) , " J n d e n o u r> I n d i a n B a n k i n g " , R e p o r t swi t h D i s c u s s i o n , London and Bombay.
Gupta , K.L. ( 1 9 8 4 ) , " F i n a n c e and Ec onomi c Growth i n LDCs” , Croom Helm, London.
Gupta , S. B. ( 1 97 9 ) , "Mo n e t a r y___ PI ann i ng _ f oj:__ Jf ndi a" , Ox f o r dU n i v e r s i t y P r e s s , D e l h i .
Hanson, James A. and R o b e r t o de Re z e nde Rocha ( 1 9 8 6 ) , "Hi gh I n t e r e s t R a t e s , S p r e a d s and the Cost o fI n t e r m e d i a t i o n " , I n d u s t r y and F i n a n c e S e r i e s , ( 1 8 ) , Th e World Bank, Wa s h i n g t o n , D.C.
H e s t e r , D* and J . T o b i n , ( 1 967 ) , "JFi nanc i a l _ Market an^ _Ec onomi c _ Ac t i v . i t y" , John Wi l e y and So ns , New Yo r k .
I q b a l , F. ( 1981 ) , " D u a l i s m , T e c h n i c a l Change .and Rura l F i n a n c e Ma r k e t s i n D e v e l o p i n g C o u n t r i e s " , The RANDC o r p o r a t i o n , Santa Mo n i c a .
/J a i n , Abhi nandan K . , Labdhi B h a n d a r i , N i k h i l e s h D h o l o k i a ,
Rakesh Khurana and M.N. Vora ( 1 9 8 2 ) , " D i s t r i b u t i o n _ _ o fM i l l Made C o t t o n T e x t i l e s i n I n d i a : S u mma r y _ a n d
6 1 4

Ahmed ab a d .
J a i n , L. C. ( 1 92 9 ) , " ^ n d j g e n o u s ^ B a n k i n g _ i n ^ I n d i a M , London.
Kabra , K. N. ( 1 982 ) , " _Th e__Bl a c ky Economy___i n _ I n d i a ^ _ P r o b l e m s* ? - ' > Chanakaya P u b l i s h e r s , New D e l h i .
K a r k a l , Gopal ( 1 9 6 7 ) , Uno r g an i se d__Mo ne y_ Ma r ke t s__ i n_ I nd i a ,L a l v a n i P u b l i s h i n g H ouse , Bombay.
K h a t k h a t e , D.R. ( 1 9 8 0 ) , " F a l s e I s s u e s i n the Debat e onI n t e r e s t Rate P o l i c y i n Less D e v e l o p e d C o u n t r i e s " ,
J3an c o_ Na z i o n a l _ d e l _ L a v o r o _ Qu a r t e r ly^Re v i e w , ( 1 3 3 ) .
Kh a t k h a t e , D.R. ( 1 9 8 8 ) , " A s s e s s i n g the Impact o f I n t e r e s tRa t e s i n Le s s D e v e l o p e d C o u n t r i e s " , _Wo r 1 d De v e l o p me n t , 1 6 ( 5 ) , pp . 5 7 7 - 5 8 8 .
Kr i s h n a mu r t h y , S . and S. S a i b a b a , ( 1 9 8 1 ) , " S a v i n g s Be h a v i o ur in I n d i a ; V e r i f i c a t i o n o f Some E x p l a n a t o r y H y p o t h e s e s " , I n s t i t u t e o f Economi c Gr owt h, New D e l h i .
Kr i s h n a n , R. ( 1 9 7 9 ) , " S ma l l E n t e r p r i s e F i n a n c i n g : The Ro l e o f I n f o r m a l C r e d i t M a r k e t s " , Mimeo, The Wor l d Bank, Wa sh i ng to n D.C.
K r i s h n a n , V. ( 1 9 5 9 ) , " I n d i g e n o u s Banki ng in South I n d i a " , Bombay S t a t e C o o p e r a t i v e Uni o n , Bombay.
Kui , Ng Beoy ( 1 9 8 5 ) , "Some A s p e c t s o f t he I n f o r m a l F i n a n c i l S e c t o r in the SEACEN C o u n t r i e s " , The South East Ce n t r a l Bank (SCACEN) R e s e a r c h and T r a i n i n g Ce n t r e S t a f f Paper No. 10.
L a l l , V.D. ( 1 984 ) , "_Hou s i n g __Fi nan c e__ in I n d i a " , N a t i o n a lI n s t i t u t e o f P u b l i c F i n a n c e and P o l i c y , New D e l h i .
L a n y i , A. and R. S a r a c o g l u ( 1 9 8 3 ) , " I n t e r e s t Rate P o l i c i e s in D e v e l o p i n g Ec ono i n i es " , O c c a s i o n a l Paper No. 22, I n t e r n a t i o n a l Mo ne t ar y Fund, Wa s h i n g t o n , D.C.
L e f f , N.H. and K. Sato ( 1 9 7 5 ) , "A S i m u l t a n e o u s E q u a t i o n s Model o f S a v i n g s i n D e v e l o p i n g C o u n t r i e s " , J o u r n a l o f ?o l_it j c a l _ Economy , pp . 121 7-1 288.
L i t t l e , I . M. D. ( 1 9 8 7 ) , " S ma l l M a n u f a c t u r i n g E n t e r p r i s e s i n D e v e l o p i n g C o u n t r i e s , Wo Bank^Ec onom ic^ Re v i e w , 1 ( 2 ) ,pp. 2 0 3 -2 35. ~ *
/Lo g an , W. ( 1887 ) , "JTh Ma 1 ab aj:_ Man ua 1 , Government o f Madras .
> Indian I n s t i t u t e of Management,
615

Lo n g , M i l l a r d ( 1 9 6 8 ) , " I n t e r e s t R a t e s and t he S t r u c t u r e o f A g r i c u l t u r a l C r e d i t M a r k e t s . " Ox f o r d _ Ec o no mi c P a p e r s , ( 2 0 ) , pp . 287 . ” "
Madhur , S. ( 1 9 8 4 ) , " T a x a t i o n and Ho u s e h o l d S a v i n g s in I n d i a : An E m p i r i c a l S t u d y " , Wor ki ng Pa p e r , NIPFP, New D e l h i .
Madhur, S. ( 1 9 8 7 ) , "The R o l e o f F i n a n c i a l I n t e r m e d i a t i o n i n t h e M o b i l i s a t i o n a nd A l l o c a t i o n o f H o u s e h o l d S a v i n g s L n D e v e l o p i n g C o u n t r i e s : I n t e r l i n k s B e t w e e n O r g a n i s e d andI n f o r m a l C i r c u i t s - Th e C a s e o f I n d i a ” , P a p e r p r e s e n t e d a t t h e C o n f e r e n c e on S a v i n g s M o b i l i s a t i o n t h r o u g h t h e F o r m a l a nd I n f o r m a l S e c t o r s , E a s t W e s t C e n t r e , H o n o 1 u 1 u , J u ne 2 - 4 .
M a d r a s Pr 2 v i ^ c f § f _ B a n k i n g ^ E n g u i r y _ _ C o m m i t t e e R e p o r t ( 1 9 3 0 ) , Madras .
M a ha dev an, R. ( 1 9 7 8 ) , " P a t t e r n o f E n t e r p r i s e o f Immi grantE n t r e p r e n c* u r s - A Study o f C h e t L i a r s In Ma L a y a , 18 8 0 -1 9 3 0 ” , Ec onomi c and P o l i t i c a l Weekl y , ( 1 3 ) .
M a mp i l l y , P- ( 1 9 8 0 ) , " I n n o v a t i o n s in Banki ng : The I n d i a nE x p e r i e n c e " , World Bank Worki ng Paper .
M a s a n i , R . P . ( 193 1 ) , ” Banki ng C a s t e s and Gu .ild s in Ind ia ” ,The J o u r n a l o f the A s i a t i c S o c i e t y o f Bombay.
McKi nnon, R . I . ( 1 9 7 3 ) , " M o n e y 2 ___ C a p i t a l _ a n d _ _ Economi cD e v e I o p ui o u t " , B r o o k i n g s I n s t i t u t i o n , Wa s h i ng t o n , D.C.
Meht a, P. C. and R. S. Gandhi ( 1 987 ) , __Ma.d e___Te x_t ei I!« t £ y _ _ 9 £ _ > ^an Hade T e x t i l e R e s e a r c hA ss 6 c i at i on , S u r a t .
M i k e s e l l , R. F. and J . E . Z i n s e r ( 1 97 2 ) , ’’ The Nat ur e o f the S a v i ng s F u n c t i o n in D e v e l o p i n g C o u n t r i e s : A Sur ve y o fT h e o r e t i c a l and E m p i r i c a l L i t e r a t u r e , J o u r n a l o f
£ 9119 5 i c _ t i i T y E 5 > 1 1 ( 1 ) , PP • 1 - 2 6 .
M i t r a , P. ( 1 9 8 3 ) , "A Th e o r y o f I n t e r l i n k e d RuralT r a n s a c t i o n s " , Jour na l _ o f_b l i ^ j j C o n o m k s , ( 2 0 ) .
Mo l ho , L. ( 1 9 8 6 ) , ’’ I n t e r e s t R a t e s , S a v i n g s and I n v e s t me n t in D e v e l o p i n g C o u n t r i e s : A R e - e x a m i n a t i o n o f t he McKinnonShaw H y p o t h e s e s " , IMF_St a f f _ Pa pe r s , 3 3 ( 1 ) , pp . 9 0 - 1 1 6 .
M o r r i s , F e l i p e ( 198 5 ) , " I n d i a ' s F i n a n c i a l Sys t e m: AnOv e r v i e w o f i t s P r i n c i p a l S t r u c t u r a l F e a t u r e s ” , Wor l d Bank S t a f f Worki ng Pa pc f No. 73 9, Th e Wo r 1 d Bank,Was hi ng t o n D.C.
6 1 6

N a d i r i , M. I . ( 1 9 6 9 ) , "The D e t e r m i n a n t s o f Trade C r e d i t in US T o t a l M a n u f a c t u r i n g S e c t o r " , Ec ononie t r i c a , ( 3 7 ) , pp.4 0 8 - 2 3 .
Narang , R. C. and K. Wadhwa ( 1 984 ) , 1 ° Pa A l lI n d i a C h i t _ F u n d s _ A c t s__ and _ R u I " , Wadhwa P u b l i s h i n gHo us e , New D e l h i .
Nayar , C . P . S . ( 1 9 7 3 ) , Chi t F i n a n c e : An_ E x p l o r a t o r y _ S t u d y _ o n ^ h e _ W o r k i n g _ o f _ C h i t Funds , Vora and Co, Bombay.
Nayar , C . P . S . ( 1 9 8 2 ) , " F i n a n c e C o r p o r a t i o n s : A St udy o fUn r e g u l a t e d Ba nks " , I n s t i t u t e f o r F i n a n c i a l Management and R e s e a r c h , Madras .
Nayar , C . P . S . ( 1 9 8 2 a ) , " F i n a n c e C o r p o r a t i o n s : An I n f o r m a lF i n a n c i a l I n t e r m e d i a r y i n I n d i a " ___ aI}f!Deve l ppmen t .
Nayar , C . P . S . ( 1 9 8 4 ) , "A St udy o f Non- Banki ng F i n a n c i a l I n t e r m e d i a r i e s " , I n s t i t u t e f o r F i n a n c i a l Management and R e s e a r c h , Madr as .
Nayar , C . P . S . ( 1 9 8 6 ) , "Can a T r a d i t i o n a l F i n a n c i a l T e c h n o l o g y C o - E x i s t wi t h Modern F i n a n c i a l T e c h n o l o g i e s ? The I n d i a n E x p e r i e n c e " , S a y i n g s _ a n d ^ D e v e l o p m e n t .
Pande y , I . M. ( 1 9 8 7 ) , " L e a s i n g I n d u s t r y : S t r u c t u r e andP r o s p e c t s " , Ec onomi c Times , O c t o b e r 10, p. 5.
Pa r k , Yung Cliul ( 1 97 6 ) , "The U n o r g a n i s e d F i n a n c i a l S e c t o r in Ko r e a , 1 9 4 5 - 7 5 " , S t u d i e s In Do me s t i c F i n a n c e , No. 28, The Wor l d Bank, Was h i ng t o n D.C.
Pr akas h , B.A. ( 1 9 8 4 ) , " P r i v a t e F i n a n c i n g Fi rms i n K e r a l a : AS t u d y " , E c o n o m i c _ a n d _ P o l i t i c a l We e kl y , 1 9 ( 5 ) .
P r a k a s h , B.A. ( 1 9 8 7 ) , " R i s e and F a l l o f K e r a l a ' s P r i v a t eF i n a n c i n g F i r ms , J ' o r t u n e _ I n d i a , Bombay.
Rad ha kr i sh nan , S. ( L 9 7 5 ) , " C h i t Fu n d s " , in Radhnkr-i shnnn ,e t . a l . , _' I n s t i t u t e f o r F i n a n c i a l Managementand R e s e a r c h , Madras .
Ra d ha kr i sh n an , S. ( 1 97 9 ) , " JSLi. d h i s j _ ^n_ Jl n d i g enous F i n a n c i a lif ? !1" > I n s t i t u t e f o r F i n a n c i a l Management and
R e s e a r c h , Madr as .
R a k s h i t , M. ( 1 982 ) , " The__ La b o ur __Su_rglus Economy - A Neo-K e ^ n e s i a n _ A p p r o a c h " , MacMi 11 an Ind ia Ltd7~N ew ~D elh i77
R a k s h i t , M. ( 1 9 8 7 ) , ’ E f f e c t i v e Demand in a D e v e l o p i n gC o u n t r y : I s s u e s and A p p r o a c h s " , Worki ng Paper 92,P r e s i d e n c y C o l l e g e , C a l c u t t a .
617

R a k s h i t , M. ( 1 9 8 7 ) , Market I m p e r f e c t i o n s and E f f e c t i v eDemand in a D e v e l o p i n g C o u n t r y " , Worki ng Paper 91,P r e s i d e n c y C o l l e g e , C a l c u t t a .
Ramani , S. ( 1 9 8 5 ) , "A St udy o f No n- Banki ng F i n a n c i a lI n t e r m e d i a r i e s i n I n d i a s i n c e the S e v e n t i e s - A CaseStudy o f N i d h i s i n t he C i t y o f M a d r a s " , M. P h i l D i s s e r t a t i o n , Madras U n i v e r s i t y .
Rau, B.R. ( 1 93 8 ) , " P r e s e n t __D.ay_Money__ s___________ i D_ I n d i a " ,Lo ndon .
R e P 2 £ t _ o f _ _ t h e _ C e n t r a l _ _ P r o v i n c e s _ P r o v i n c i a l _ B a n k i n g En q u i r yP2 r 1 1 _ 1 ^2 (1930*) , Nagpur , C a l c u t t a .
R e s e r v e Bank o f I n d i a ( 1 9 5 6 ) , " A l l _ I n d i a Ru r a l C r e d i t Surv eyj,_ 1 95 1 - 5 2 " , R e s e r v e Bank o f I n d i a , Bombay.
R e s e r v e Bank o f I n d i a ( 1 969 ) , *''J*e p o r ^ o f_ t he_ AJ.l_IndJ.a_ Rujral___ Comm i 1 1 e e " , R e s e r v e Bank o f I n d i a ,
Bombay .
R e s e r v e Bank o f I n d i a ( 1 9 7 1 ) , " R e p ^ f t ^ o f t he Wor ki ng^Gr oupo n_ Ma U i Age nc y __ A p p r o a c h __ i n_ _ Ag r i c y 1 1 ur a l _ _ F i n a n c e " ,R e s e r v e Bank o f I n d i a , Bo abay .
R e s e r v e Bank o f I n d i a ( 1 9 7 1 ) , __o f t he Commi t t ee onDi f ferment ial__ I n t e r e s t _ _ R a t e s " 2 _Re s e r v e Bank o f I n d i a ,Bombay.
R e s e r v e Bank o f I n d i a ( 1 975 & 1 985 ) , j ? A 9 ____Tab Ij2 j3
R e l a t i n g t o _ _ B a n k s in I n d i a , R e s e r v e Bank o f I n d i a ,Bombay.
R e s e r v e Bank o f I n d i a ( 1 975 ) , j le p o r t ^ o f _ t he_ St ud y_ Gr o up_ on ^ o n —Banlci Corapanie s ( C h a i r ma n : James S. R a j ) , R e s e r v eBank o f I n d i a , Bombay.
R e s e r v e Bank o f I n d i a ( L 9 7 7 a ) , " A l l I n d i a Debt andT n v t •:; L \\\v 11 L S u r v e y , 1 97 1 * 7 2 , R e s e r v e Bank o i I n d i a ,Bombay .
R e s e r v e Bank o f I n d i a ( 1 97 7 b ) , "Mon^y__ S up p l y ___in ___] ndJa ^C one ept s^,_ Impl i c a t i on_ and _ Ana 1 y s i s " , Re s e r v e Bank o f I n d i a , Bombay .
R e s e r v e Bank o f I n d i a ( 1 97 9 ) , "J^urvey_________________S c a l eI n d u s t r i a l Uni t s_ I ^ ZZ" » ° ^ s ‘ I & 11 » R e s e r v e Bank o fI n d i a , Bombay .
R e s e r v e Bank o f I n d i a ( 1 9 8 1 ) , " p u r v e y _o f ____T r a d e r s __andT r a n s p o r t 0 p e r a t o r s _ _ 1 9 7 9 - 8 0 M, Vo I s . I&l T, R e s e r v e Bank o f I n d i a , Bombay.
618

R e s e r v e Bank o f I n d i a ( 1 982 ) , "'Cci pj-ta i on Sav i ng sin ^ ln d j .a^ 19 5 0 “ 5 1 _ t o __1 97 9 - 8 0 " , Re p o r t o f t he Worki ngGroup on S a v i n g , R e s e r v e Bank o f I n d i a , Bombay.
R e s e r v e Bank o f I n d i a ( 1 9 8 3 ) , " S t u d y o f t he D e p o s i t A c c e p t a n c e A c t i v i t i e s o f Hi r e P u r c h a s e F i n anc e C o mp a n i e s " , R e s e r v e _ B a n k _ o f _ I n d i a _ B u 1 1 e t i n , June .
R e s e r v e Bank o f I n d i a ( 1 985 ) , R e p o r t __o f t he _ _ Co mmi t t e e _ t ot o^__tbe_Mo ne ta r s t em , Re s e r v e Bank
o f I n d i a , Bombay.
R e s e r v e Bank o f I n d i a ( 1 9 8 8 ) , ’ A l l _ I n d i a _ D e b t _ a n d _ I n v e s t me n tSur ve y _ 1981 - 8 2 " , R e s e r v e Bank o f I n d i a , Bombay.
Ro e , A. ( 1 9 7 9 ) , "Some Th e o r y C o n c e r n i n g the Ro l e o f andF a i l i n g s o f F i n a n c i a l I n t e r m e d i a t i o n in Les s De v e l o p e d C o u n t r i e s " , World Bank S t a f f Worki ng Paper No. 338, The World Bank, Wa s h i ng t o n D.C.
R o s s , St ephen A. ( 1 9 7 7 ) , "The D e t e r m i n a t i o n o f F i n a n c i a l S t r u c t u r e : The I n c e n t i v e S i g n a l l i n g A p p r o a c h " , _BellJ o u r n a l o f E c o n o m i c s , ( 8 ) , pp . 23 - 40.
R o t h , H. D. ( 1 983 ) , J. n d i a n _______Mo ne yl end er s_a t_ Woj: k , South As i aI n s t i t u t e , Manshar P u b l i c a t i o n s , New D e l h i .
Roy, A. ( 1 9 7 5 ) , The^^St r uc t u r e_ o f I nt e r e s t _ Ra t e s^ i n_ I nd ia , C a l c u t t a , The World P r e s s .
S a nt o me r o , Ant hony M- ( 1 9 8 4 ) , M o d e l l i n g the Banki ng Firm, j Q ^ _0 Money C r e d i t and Ban k i n g , 1 7 ( 4 ) , pp . 5 7 6 - 6 02and Comments, pp . 6 0 3 - 6 1 6 .
S a r a p , K a i l a s ( 1 9 8 6 ) , " S ma l l Farmers Demand f o r C r e d i t wi th S p e c i a l R e f e r e n c e to Sambal pur D i s t r i c t , Wes t ern O r i s s a " , Ph.D. T h e s i s at D e l h i U n i v e r s i t y , Departmento f Ec o no m i c s .
Sc hwa r z , R. ( 1 9 7 4 ) , "An Ec onomi c Model o f Trade C r e d i t " , J o u r n a l o f F i n a n c i a l and Q u a n t i t a t i v e A n a l y s i s , ( 9 ) ,
Shanbhag , D.V. ( 1 9 8 7 ) , " P e r s p e c t i v e s f o r the Growth o f Po we r l o o m, Power P r o c e s s i n g and the D e c e n t r a l i s e d S e c t o r " , Mimeo, Ahmedabad T e x t i l e I n d u s t r y Re s e a r c h A s s o c i a t i o n , Ahmedabad. /
Shaw, E- S . ( 1 973 ) , "______F i n a n c i a l _D e e p e n i n g_in ^Economi c" > O x f o r d U n i v e r s i t y P r e s s , New Yo r k .
She 1 1 y , M. C . ( 1 96 3 ) , "J>mal 1 - Sjc a l e _ _and_ Ho_useho^d I n d u s t r i e si n ^ a __De v e l o p i ng_Ec o n o m y j___A_ St u d y__ oJf_ Th e i r~ Ra t i ona l e7
619

St r u e t u r e _ a n d O p e r a t i n g _ C o n d i t i o n s " , A s i a P u b l i s h i n gH o u s e , Bombay . ,
S i n g h , A . , S . I . S l . e t t y , and T. R. V e n k a t a c h e l a m , ( 1 982 ) ," Mo n e t a r y P o l i c y i n I n d i a : I s s u e s and E v i d e n c e " ,Suppl ement to R e s e r v e Bank o f I n d i a O c c a s i o n a l Pa p e r s ,V o l . 3.
Smi t h, Janet Ki ho l m ( 1 9 8 7 ) , " T r a d e C r e d i t and I n f o r m a t i o n a l A s s y m e t r y " , J o u r n a 1 _ o F i n a n c e , 6 2 ( 4 ) , pp . 8 6 3 - 8 7 2 .
S t i g l i t z , J . E . and A. We i s s ( 1 9 8 1 ) , " C r e d i t R a t i o n i n g inMarket s wi t h I m p e r f e c t I n f o r m a t i o n " Am e r i c a n Economi cRe v i e w, ( 7 1 ) , pp . 3 9 3 - 4 1 0 ,
S t i g l i t z , J * E. and A. We i s s , ( 1 983 ) , " I n c e n t i v e E f f e c t s o fT e r m i n a t i o n s : A p p l i c a t i o n s t o the C r e d i t and LabourM a r k e t s " , Ame r i c an E c o n o n i c ^ R e v i e w , ( 7 3 ) , pp . 9 1 2 - 2 7 .
S u n d a r a r a j a n , V. ( 1 98 7 ) , "The Debt E q u i t y R a t i o o f Fi rms andE f fuc l. I v i* n c s s o I Mo i iela r y Po 1 i v_ y " , 1 M F S t a 1’ f Pa po r s , June .
Sundaram, K. and V.N. P a n d i t , ( 1 9 8 4 ) , " I n f o r m a l C r e d i t Ma r k e t s , B l a c k Money and Mo ne t ar y P o l i c y : SomeA n a l y t i c a l and E m p i r i c a l I s s u e s " , Ec onomi c andPo l i t l e a l _ W e e k l y > ( 1 8 ) , A p r i l 21, pp . 6 75 - 8 27
Sundaram, K. and P a n d i t , V.N. ( 1 9 8 5 ) , " B l a c k Money andMonet ar y P o l i c y " , E c o n o n l c and P o l i t i c a l We e k l y , ( 2 0 ) ,August 24, p p . 1 4 5 1 - 5 3 .
Ta yl o r , L . ( 1 9 8 3 ) , " S t r u c t u r a l i s t M a c r o e c o n o m i c s " Ba s i cB o o k s : , New Yo r k .
The Assam P r o v i n c i a l Banki ng En^ui r y Comm i 1 1 ee Re po r t( 1 9 3 0 ) , 2 V o 1 s , S h i l l o n g .
The Bi har and O r i s s a P r o v i n c i a l Banki ng E n q u i r y Commi t t eeRepo r t 2. All 5 l 2 9 ( 1 9 3 0 ) , Patna •
The Ma d r a s P r o v i n c i a l Banki ng En q u i r y Comm i 1 1 ee Repo r t(1 930 ) , Madr a s .
Tii e T r a v anc o l* e _ _ Ba n k i n g _ E ag u i r y _ Co mm l t t e e _ _ Re p o r t , ( 1 9 3 0 ) ,Government o f T r a v a n c o r e .
T i mb e r g , T . A- and C.V. A i y a r ( 1 9 8 0 ) , " I n f o r m a l C r e d i t Mar ke t s i n I n d i a " , Do me s t i c F i n a n c e S t u d i e s , No. 62, The World Bank. Was h i n g t o n D.C.
/T o b i n , James ( 1 9 8 4 ) , "On the E f f i c i e n c y o f t he F i n a n c i a l
Sys t e m, L l o y d s Ban k_ Re v i e w, ( 1 5 3 ) , 1 - 1 5 .
620

Tun, Wai U. ( 1 9 5 7 ) , " I n t e r e s t Ra t e s O u t s i d e t he Or g a n i s e d Money Mar ke t s o f U n d e r d e v e l o p e d C o u n t r i e s " , JMF_j >taf f P a p e r s , November .
Tun, Wai U. ( 1 9 8 0 ) , "The R o l e o f U n o r g a n i s e d F i n a n c i a l Mar ke t s i n Ec onomi c De v e l o p me nt and i n the F o r m u l a t i o n o f Mo ne t a r y P o l i c y " , YJLBS > ( 4 ) .
Un i t e d N a t i o n s , ( 1 950 ) , "_Do 5 e s t i c f i n a n c i n g ___o f _ Econo m i c» New Yo r k .
U n i t e d P r o v i n c e B a n k i n g _ E n ^ u i r y Commi 1 1 e R e po r t ( 1 930 ) ,A l l a h a b a d .
Van W i j n b e r g e n , S. ( 1 9 8 3 ) , " I n t e r e s t Rate Management inD e v e l o p i n g C o u n t r i e s : Th e o r y and S i m u l a t i o n R e s u l t s f o rK o r e a " , Wor l d Bank S t a f f Worki ng Paper No. 593, The World Bank, Wa s h i n g t o n D.C.
Van W i j n b e r g e n , S. ( 1 9 8 4 ) , " C r e d i t P o l i c y , I n f l a t i o n andGrowth i n a F i n a n c i a l l y R e p r e s s e d Ec o no my " , J°y£|}a l _ o f De v e l o p me nt al! d E c o n o m i c s , Au g u s t .
V i r m a n i , A. ( 1 9 8 2 ) , "The Nat ur e o f C r e d i t Mar ke t s inD e v e l o p i n g C o u n t r i e s " , World Bank S t a f f Worki ng Paper s No. 524, THe World Bank, Wa s h i n g t o n D.C.
Von P i s c h k e , J . D . , Dal e W. Adams and Gordon Donal d ( 1 9 8 3 ) ,"_Rur a l F i n a n c i a l Markejtjs i n ojdi ng Count rjie s " ,Jo hns Ho pk i ns U n i v e r s i t y P r e s s , B a l t i m o r e and London.
Wadhwa, Ki ran ( 1 9 8 7 ) , " P r i v a t e S e c t o r and Urban Hous i ng M a r k e t s " , N a t i o n * ^ , I n s t i t u t e o f P u b l i c F i n a n c e and P o l i c y , Mi me o .
Wadhwa, Ki ran ( 1 987 ) , "J?-0 1 ^__o f _ P r i v a t e ___S e c t o r ___i n___UrbanH o u s i n g _ - _ _ C a s e _ S t u d y o f Ahmedabad" , N a t i o n a l I n s t i t u t e o f P u b l i c F i n a n c e and P o l i c y , New D e l h i .
6 2 1

NATIONAL INSTITUTr