“Urban and Social Equity Impacts from transport. Evidence ...
303
“Urban and Social Equity Impacts from transport. Evidence and approaches from Santiago de Chile”. Beatriz Mella Lira Thesis submitted in fulfilment of the requirements for the degree of Doctor of Philosophy of University College London The Bartlett School of Planning University College London October 2020
-
Upload
khangminh22 -
Category
Documents
-
view
0 -
download
0
Transcript of “Urban and Social Equity Impacts from transport. Evidence ...

“Urban and Social Equity Impacts from
transport. Evidence and approaches
from Santiago de Chile”.
Beatriz Mella Lira
Thesis submitted in fulfilment of the
requirements for the degree of
Doctor of Philosophy
of
University College London
The Bartlett School of Planning
University College London
October 2020

2
I, Beatriz Mella Lira, confirm that the work presented in this thesis is my
own. Where information has been derived from other sources, I confirm
that this has been indicated in the work.
BEATRIZ MELLA LIRA

3
Abstract
Nowadays, there is a global problem regarding growing social inequality
and important gaps in needs that must be addressed to achieve better
levels of equity. In this context, the research narrows down the discussion
of social issues into the transport planning scenario, exploring concepts
such as social equity, social justice, opportunities, well-being and
fairness.
The case study used for locating the discussion is Santiago de Chile, city
with one of the highest levels of inequality in terms of socioeconomic
distribution. Over the years, not only the need to travel but journey times
and travel distances have increased in Santiago as a consequence of
social inequalities. Both users of private and public transport have been
affected in terms of travel efficiency and journey times, but especially in
terms of their daily travel experience and quality of life.
Through a mixture of quantitative and qualitative methods, the research
aims to examine, through a critical appraisal of theoretical approaches
and empirical evidence, the factors that result in impacts associated with
social equity. It explores the potential of reducing gaps of social
inequality, proposing paths for incorporating these factors into the design
and assessment processes.
This research recognises the shortcomings of transport project appraisal
based on cost-benefit analysis and its emphasis on journey time savings.
It thus seeks to expand the criteria on which the merits of projects are
assessed. To this end, the Capability Approach has been the primary
theoretical approach for configuring the research methodology.
The revision of both conceptual and empirical evidence allowed the
research to explore existing inequities of income distribution and
opportunities. The results show that inequalities are accentuated by long

4
travel distances and for not having an adequate public transport system.
Public transport users and low income segments are usually
disadvantaged when compared to any of the other modes of transport.
The research ends up discussing points towards the development of
transport policies and projects, which more thoroughly consider the range
of social, well-being and health impacts.

5
Impact Statement
The research has developed an extensive and diverse literature that has
extended the nexus between equity and concepts such as social justice,
poverty, social exclusion, social capital, well-being and fairness. The
contribution and impact of academia relate to the development and
discussion of key concepts of social equity and justice. Opportunities and
resources, mental and physical health, personal feelings, emotions,
freedom and happiness are some of the concepts that have been
explored in the discussion. The examination of literature in social equity
and justice do not belong just to the field of transport, and therefore
nurtures the academic discussion in other fields, through scholars that
have examined the potential reduction of social exclusion from diverse
edges.
The research also has the potential of benefiting the academia, as it has
explored a range of methodologies that have facilitated the analysis of
diverse and complementary problems of the current transport project
appraisal. The methods used questionnaires, semi-structured interviews
and participatory workshops with diverse agents in transport. The
questionnaire, based on the capability approach, allowed exploring
issues that have been often overlooked - as a consequence of project
appraisal has focused on economic efficiency goals. Furthermore, the
discussion about real opportunities, expectations, well-being and health-
related issues in transport moves the discussion of transport impacts
beyond the current status of the art. In this extent, the research is relevant
both for academia and for practice as it discusses the principles for the
use, analysis and consideration of these subjective perceptions in
transport appraisal.
Through the analysis of Santiago as the case study, the research impacts
locally (Santiago), regionally (Latin America), and internationally
6
(considering, for instance, the Global South) as the problem analysed
belongs to other similar contexts. The research allows a transferability of
knowledge of theoretical and empirical work. Even though most of the
precedents are from the Global North, the research approaches these
theories assessing social equity in the context of the global south. The
extent of which the research impacts these contexts, is also the extent to
which impacts to diverse individuals, communities and organisations.
The linkages made with policymakers have strengthened these
opportunities, as they have been informed and they are aware of the
analysis and results of this research.
Finally, the results of these research are expected to be disseminated
through several academic publications in book chapters and peer-
reviewed articles. Although these results have been preliminary shared
in conferences and academic circles, will be the first step for engaging
public policymakers and practitioners, or through collaborations between
academic and non-academic institutions.

7
To Damian and Rafael, my love and life,
and to my parents, Patricia and Francisco.

8

9
Contents
“Urban and Social Equity Impacts from transport. Evidence and
approaches from Santiago de Chile”. ................................................ 1Abstract ............................................................................................... 3
Impact Statement ................................................................................ 5
Contents .............................................................................................. 9
List of Figures ................................................................................... 12
List of Tables ..................................................................................... 15
Acronyms .......................................................................................... 17
Acknowledgments ............................................................................. 19
1. Introduction ............................................................................. 23
1.1. Why social inequalities in transport? ...................................... 23
1.2. Santiago as case study ........................................................... 25
1.3. Alternative approaches based on opportunities and freedoms
....................................................................................................... 28
1.4. Focus of the research ............................................................. 32
1.5. Structure of the research ........................................................ 33
2. Literature Review on equity, justice, capabilities and
opportunities. Setting up the concepts. ............................................. 37
2.1. Introduction ............................................................................. 37
2.2. Social equity and Social justice .............................................. 39
2.3. Social equity and the links with social exclusion in transport
planning ......................................................................................... 48
2.4. New approaches to social equity and the Capability Approach
....................................................................................................... 52
2.5. Quantifying and applying the CA in transport planning ........... 63
2.6. Relevance on the context, conversion factors and policymaking
....................................................................................................... 68
2.7. Conclusion .............................................................................. 70
3. Methodology ............................................................................ 75
3.1. Introduction ............................................................................. 75

10
3.2. Research Aims and Questions ............................................... 76
3.3. Chronology of the research .................................................... 79
3.4. Quantitative Research ............................................................ 82
3.5. Qualitative Research Data Collection ..................................... 99
3.6. Reflections on the use of multi methods approach for research
..................................................................................................... 107
3.7. Ethical issues of the research ............................................... 109
4. Mobility and transport in the context of Urban Development in
Santiago .......................................................................................... 115
4.1. Socioeconomic distribution ................................................... 117
4.2. Built environment and modal split ......................................... 122
4.3. Differentiated fare ................................................................. 130
4.4. Transport Appraisal .............................................................. 132
5. Unravelling policymakers perceptions of Social Project Appraisal
and inequalities ............................................................................... 137
5.1. Introduction ........................................................................... 137
5.2. Using a social exclusion framework with policymakers ........ 139
5.3. Results .................................................................................. 145
5.4. Conclusion ............................................................................ 165
6. Using ‘weighted functionings’ to reveal health-related
inequalities for transport users. ....................................................... 168
6.1. Introduction ........................................................................... 168
6.2. Capabilities and health impacts ............................................ 172
6.3. Reinterpreting CA from the concept of weighted functionings
..................................................................................................... 176
6.4. Socio-economic and gender differences in modal use ......... 179
6.5. Health-related factors defined by mode and journey times .. 182
6.6. Conclusion ............................................................................ 201
7. Examination of travel experience disparities through the
measurement of subjective well-being ............................................ 206
7.1. Introduction ........................................................................... 206
7.2. Subjective wellbeing (SWB) ................................................. 209

11
7.3. Affective associations towards transport modes ................... 211
7.4. Analysis of dissonance considering SWB factors ................. 214
7.5. Conclusion ............................................................................ 222
8. Project appraisal in the context of Santiago using a multi-actor
multi-criteria exercise ...................................................................... 226
8.1. Introduction ........................................................................... 226
8.2. The Nueva Alameda Providencia (NAP) project ................... 229
8.3. From CBA to MAMCA in the NAP project ............................. 230
8.4. Workshop structure ............................................................... 232
8.5. Application results ................................................................. 239
8.6. Conclusion ............................................................................ 243
9. Conclusions ................................................................................ 246
9.1. Focus and expected contribution .......................................... 246
9.2. Research questions and key findings ................................... 248
9.3. Originality of the research ..................................................... 254
9.4. Reflections for future research and practice ......................... 258
Annex 1 Survey questions – English .............................................. 264
Annex 2 Survey questions – Spanish ............................................. 272
References ...................................................................................... 280

12
List of Figures
Figure 1.1. Total motorised private vehicles in Metropolitan Region
(orange) and national level (blue), 2008 – 2017. Source: own
production based on National Statistics Institute (INE), 2017. ...... 27
Figure 1.2. Diagram of concepts capability approach. Source: own
production. ..................................................................................... 29
Figure 3.1. Research Process. Source: own production. ..................... 81
Figure 3.2. Interviewee’s residence location for pilot survey. Source: own
elaboration. .................................................................................... 88
Figure 3.3. Final survey – origin residences. Source: own production. 89
Figure 3.4. Streets sections and differences in the built environment of
the municipalities in which the survey was carried out. 1)
Providencia, 2) Nunoa, 3) Macul, 4) La Florida, 5) Puente Alto.
Source: own production based on Google Maps. .......................... 91
Figure 3.5. Distribution of the primary transport mode over the sample.
....................................................................................................... 92
Figure 3.6. Distribution of socio-economic profile of the survey
respondents. .................................................................................. 93
Figure 4.1. Map of socioeconomic distribution, Santiago. Source:
Observatorio de Ciudades UC (OCUC), 2015. ............................ 116
Figure 4.2. Location of campamentos and eradicated populations by
1985. Source: Juan Correa, for the Housing Foundation. 2019. . 119
Figure 4.3. Metro Line 5. Construction on viaduct, Maipú. ................. 123
Figure 4.4. Assessment of public realm by macro areas of Santiago. 124
Figure 4.5. Distribution of car ownership on Santiago. Source: Juan
Correa, based on National Institute of Statistics (2012) and Ministry
of Public Works (2016). ............................................................... 125
Figure 4.6. Income by socioeconomic segment versus the percentage of
transport expenses for each group. ............................................. 131
Figure 5.1. Systematic framework for semi-structured interviews. In
circles are the dimensions that explain the relationship between

13
transport disadvantage, social disadvantage and social exclusion,
from Lucas (2012). In squares, the categories explored through
semi-structured interviews with policymakers, considering the
previous categories. Source: Own production based on Lucas
(2012). ......................................................................................... 141
Figure 5.2. Word frequency cloud with the most repeated 40 words from
the total of the interviews. Source: own production based on
interviews with policymakers. ...................................................... 145
Figure 6.1. Diagram of concepts capability approach, considering the
introduction of the weighted functionings. Source: own production.
..................................................................................................... 179
Figure 6.2. Aggregate score of functioning and weighted functionings for
the four health-related factors, by gender. ................................... 196
Figure 7.1. Format of the survey for answering the question on feelings
on transport. ................................................................................. 213
Figure 7.2. Number of total dissonances by income. ......................... 216
Figure 7.3. Number of total dissonances by primary transport mode. 217
Figure 7.4. Number of total dissonances by journey time. ................. 217
Figure 7.5. Percentage of dissonance by primary transport mode. .... 219
Figure 7.6. Location of the survey origin points, level of dissonance (the
larger the point size, the higher the level of dissonance with the SWB
factors) for public transport. Source: own production. ................. 221
Figure 7.7. Location of the survey origin points, level of dissonance (the
larger the point size, the higher the level of dissonance with the SWB
factors), for private and active transport. Source: own production.
..................................................................................................... 222
Figure 8.1. Bus stop proposed for the project. Source: Bosch et al.
(2016). ......................................................................................... 230
Figure 8.2. Selection of criteria and priority assessment for the
dimensions. Source: own production based on the workshop results.
..................................................................................................... 237

14
Figure 8.3. Participants of workshop activity scoring the criteria. Source:
author .......................................................................................... 239
Figure 8.4. Average of scoring by stakeholder groups ....................... 240
Figure 8.5. Prioritisation by stakeholders, for the categories of transport,
environmental, economic and social impacts. ............................. 242

15
List of Tables
Table 2.1. Exclusionary factors by Church et al. (2000). ...................... 50
Table 2.2. Domains and sub-domains of potential social exclusion by
Levitas et al. (2007). ...................................................................... 51
Table 3.1. Summary of secondary research questions, empirical chapters
throughout the research, and primary methods used in each chapter.
....................................................................................................... 78
Table 3.2. Categories of the survey considering transferability of
concepts from the central human capabilities list (Nussbaum, 2009)
into transport. ................................................................................. 86
Table 3.3. Questions used in the survey for the measurement of health-
related factors in transport considering functionings and the
weighting functioning measurement. ............................................. 94
Table 3.4. Classification of interviewees, considering the type of
institution and their background. .................................................. 100
Table 5.1. Summary of the main topics and questions guiding the
interviews, under the dimensions of the systematic framework. .. 143
Table 5.2. Codes and themes emerged from interviews. ................... 144
Table 7.1. Dissonances between the election of primary mode and
modes chosen to represent SWB concepts. ................................ 214
Table 8.1. Original list of impacts considered in NAP. Source: UDP. 232
Table 8.2. Transferability of Macharis’ steps used in NAP workshop. 233
Table 8.3. List of the 12 criteria added to the initial list considered in the
NAP project. Source: own production based on the results from
previous chapters of the research. .............................................. 236

16

17
Acronyms
BMI Body mass index CA Capability approach CAE Annual equivalent cost CBA Cost-benefit analysis CEA Cost-effectiveness analysis CHC Central Human Capabilities DIPRES Budget Office, Ministry of Finance DTPM Metropolitan Public Transport Board EFJ Equity, fairness and justice GDP Gross domestic product MAMCA Multi-actor multi-criteria analysis MCA Multi-criteria analysis MDS Ministry of Social Development MTT Ministry of Transport and Telecommunications MIDEPLAN Ministry of Planning MINVU Ministry of Housing and Urbanization NAP Nueva Alameda Providencia NGO Non-profit organisation OCUC Observatorio de Ciudades Universidad Catolica OECD Organisation for Economic Co-operation and
Development PIAAC Programme for the International Assessment of Adult
Competencies PTUS Urban Transport Plan for Santiago SECTRA Secretary of Transport, Ministry of Transport and
Telecommunications SERVIU Housing and Urbanisation Services SUMO Observatory of Sustainable Mobility, Universidad Diego
Portales SNI National Investment System SWB Subjective well-being TECHO Techo para Chile VAC Current cost value VAN Current net social value WebTAG Website for Transport Analysis Guidance WHO World Health Organisation

18

19
Acknowledgments
I would like to begin by acknowledging and thanking my supervisor, Dr
Robin Hickman. Thanks for believe in my work, for the support, the
patience and the human quality throughout the whole process. I strongly
appreciate each conversation, revisions and all the advice for developing
this research. Thanks for always encouraging me to develop challenging
ideas, and thanks for guiding me comprehensively in the understanding
of the academy. You have become my mentor in this process, and I could
not be more grateful. I would also like to thank Dr Iqbal Hamidduddin, my
second supervisor, who has given very valuable comments for this
research, always with a very assertive and critical view. Thanks to the
examiners of my Viva, Prof Caren Levy and Prof Karen Lucas who, with
great patience have fed and improved the quality of this document with
their comments and knowledge in its final stage.
I am infinitely grateful to my husband Damián, who has been a source of
love, energy and courage since the beginning up to this day. Doing both
our PhDs at UCL has been a wonderful experience. Thank you for being
the best partner and the best ally; for your loyalty and affection; for your
generosity and infinite love. It would not have been possible to complete
this process without your advice, the endless conversations, the
thousands of cafes, and your help at all times. I am endlessly grateful to
my son Rafael, who has been a source of the deepest love, inspiration
and motivation for completing this research in the best way. Thanks for
arriving in our lives to make us happier and better, your presence has
cheered us up even among the duties of our PhDs.
Thanks to my parents Patricia and Francisco, who have always loved
and encouraged me from the other side of the world. They have tenderly
accompanied and helped us during all these years in the UK. It has not
been easy to be away from you, but you have found the ways for always
being with us. Thanks to my sister Macarena who has always been my

20
best friend. She had listened and advised me about life whenever the
thesis or life got tough, making me laugh even in bad times. Macarena
and Franco have been our best allies in being away from the everyday
life in Chile, and have been great friends when together and in the
distance. Thanks to my in-laws, Clemencia and German, for their
constant support and affection. Thanks to our family and our friends,
German, Claudia, Ignacio, Nicole, Jose Ignacio, Daniel, Yiya, Pamela,
Natalia, Florencia, Nicolas, Tom, Milena, Ciprian, Christian, Francisca,
Diego, Felipe, Patricia, Macarena, Nicolas, Paulina, Gerardo. Thanks for
being with us in the moments of joy and for supporting us when we
needed it. You have all been fundamental in the everyday life throughout
this journey.
Thanks to the people at the Bartlett School of Planning, who have
nurtured the PhD's long journey through projects, teaching and research
- especially to Dr Mengqiu Cao, Dr Catalina Turcu and Dr Stephen
Marshall. Thanks also to my PhD colleagues with whom we shared, in
addition to several lunches in the PhD kitchen, all the small achievements
and complications of the thesis. Thanks to all those who contributed to
the Socially Just Transport Network, group that allowed me to meet and
share with other academics studying similar issues of transport and
social equity. All the activities carried out have significantly contributed to
my professional training and as a researcher, making the PhD a long and
fruitful learning process. Thanks to the people outside BSP who have
contributed both personally and academically to complete this process,
especially Dr Karen Lucas, Dr Floridea Di Ciommo, Dr Juan Antonio
Carrasco, Prof Antonio Paez, Dr Eda Beyazit, Prof Karel Martens, Dr
Peter Jones, Dr Daniel Oviedo, Prof Julio Davila, Dr Pablo Ruiz, Dr Karla
Yohannessen. All inputs and comments, at different times of the PhD,
have contributed to the generation of content and development of this
research.

21
Thanks to all the interviewees and all the people who facilitated the
interviews and the process of the surveys. This help has been invaluable
for having the necessary information for this research. Thanks to all those
who, with much patience, answered the questionnaires, and the friends
who helped distribute these questionnaires in Santiago. Thanks to
CONICYT, through the Formation of Advanced Human Capital Program
for having granted the economic funds that allowed me to pay the fees
and maintenance during this PhD.
And finally, I feel very grateful for life, for allowing this process to be
completed. It has been a wonderful journey full of learning, together with
Damián and now also with Rafael.

22
Published papers and book chapters that use material from this thesis: • Mella Lira, B. & Paez, A. (2020) Do Drivers Dream of Walking? An
Investigation of Travel Mode Dissonance from the Perspective of Subjective Wellbeing. Journal of Transport and Health. Paper accepted.
• Hickman, R., Cao, M., Mella Lira, B., Fillone, A., & Bienvenido Biona, J. (2017). Understanding Capabilities, Functionings and Travel in High and Low Income Neighbourhoods in Manila. Social Inclusion, 5(4), 161-174. doi:http://dx.doi.org/10.17645/si.v5i4.1083
• Mella Lira, B. & Hickman, R. (2020). Using a multi-actor culti-criteria (MAMCA) exercise in the context of Santiago de Chile. The case of the Nueva Providencia project. In Curtis, C. (Ed.) (2020) Handbook of Sustainable Transport. Edward Elgar.
• Mella Lira, B. (2020). Gendered exploration of instrumental, emotive and social wellbeing for cyclist woman in Latin America. In Oviedo, D., Villamizar Duarte, N., Ardila Pinto, A.M. (Eds.) (2020) Urban Mobility and Social Equity in Latin American Cities: Evidences, Concepts, and Methods for more Inclusive Cities. Emerald Publishing.
• Mella Lira, B. (2019) Using the Capability Approach to assess the social impacts of transport. Hickman, Robin, Mella Lira, Beatriz, & Givoni, Moshe. (2019). A Companion to Transport, Space and Equity (NECTAR series on transportation and communications networks research). Cheltenham, Gloucestershire: Edward Elgar Publishing Limited.
• Mella Lira, B. (2019). Using a capability approach-based survey for reducing equity gaps in transport appraisal: Application in Santiago de Chile. In Lucas, Karen, Ciommo, Floridea Di, Dupont-Kieffer, Ariane, & Martens, Karel. (2019). Measuring Transport Equity. San Diego: Elsevier.

23
1. Introduction
1.1. Why social inequalities in transport?
Nowadays, there is a worldwide problem regarding growing social
inequality and there are significant gaps in needs that must be addressed
to achieve better levels of equity and social justice in cities. Stiglitz (2012)
reminds us of the financial crisis in 2007-08, the problems of
unemployment, house repossessions, homelessness, student debt, and
the difficulties of the market economy in contributing to greater income
equality over the last three decades:
We are paying a high price for our large and growing inequality,
and because our inequality is likely to continue to grow – unless
we do something – the price we pay is likely to grow too. Those in
the middle, and especially those at the bottom, will pay the highest
price, but our country as a whole – our society, our democracy –
will also pay a very high price (Stiglitz, 2012, p.104).
However, economic welfare and differences in income are just some of
the dimensions that must be addressed in order to change the injustice
precepts, and should be interpreted in relation to the contexts,
circumstances and the underlying opportunities (Atkinson, 2015).
Prosperity, measured in terms of GDP outcomes and other economic
indices, has not been enough to capture wide-ranging social issues,
despite being the most used metric of ‘progress’ in industrialised and
many emerging countries. The economist and Nobel Prize Amartya Sen
(1999) has argued that we should instead examine the freedoms that
people enjoy as well as their choices in order to fulfil their personal
development, a reflection that has been aligned with the decision of
institutions such as the Word Bank for the use of wide-ranging Millennium
Development Goals. Wider equity measurement parameters are needed
for solving issues of social welfare such as health and well-being

24
(Jackson, 2009), considering shifting the attention “from material
standards and economic growth to ways of improving the psychological
and social wellbeing of whole societies” (Wilkinson and Pickett, 2009,
p.4).
Starting from these ideas and motivations, this research has a strong
social component, focused on the way people’s motivations,
experiences, preferences and self-assessments can define (and even
strengthen) the gaps between diverse social groups. The research
examines the relationships between transportation projects and social
equity, through the understanding of the approaches and factors that
might help to achieve better standards of social equity relative to
transport interventions. The research is of direct interest to urban
planning and transport and should also be of relevance to other
disciplinary explorations either in the fields of engineering, design,
architecture or social sciences.
Concepts of equity and social justice have been increasingly more
appealing to transport in the last years (Banister, 2018; Beyazit, 2011;
Pereira et al., 2017; Di Ciommo & Shiftan, 2017). Scholars have also
discussed about broadening the concept of equity in transport, through
the understanding of how accessibility and mobility play a role in social
exclusion (Lucas, 2004; Preston & Raje, 2007; Cass, Shove and Urry,
2005; Church, Frost and Sullivan, 2000 ). Even though these are some
examples of a more extended spectrum of transportation research, all
their empirical and theoretical work is a relevant step for entering on the
problem of inequalities. Expressions of how justice and social equity
relate to urban development have been considered more widely in Young
(1990; 1998; 2011) through a critical analysis of theories of justice, and
their conceptualisation about social movements, labour and marginalised
groups – especially in disadvantaged contexts. Central for this research
is the relationship between justice and social differences, as well as their
solutions within the urban spectrum.
25
Definitions are relevant, as will be further developed in the next chapter
of this research. The tensions between equity and the redistribution of
goods will be discussed through Harvey (1973) and Rawls (1971).
Nevertheless, the analysis has gone further in questioning whether the
redistribution of goods is the most pertinent for discussing social justice.
Young (1990), for example, questions the relevance of the discourse of
distributive economies versus distributional justice, especially when
certain groups experience deprivation in the exercise of their capacities.
Next chapters build on Sen's (1985) definitions, discussing the concept
of capability and its application in transport planning. The following
chapters develop how capabilities translate into opportunities for people
to exercise their freedom and pursue what they value.
Most of the work has been done in the western context (Lucas, 2012),
with conclusions that highlight the relevance of emerging research
debates focused on issues of social, spatial and environmental justice for
transforming the existent paradigms. However, there is some relevant
work form the Latin American context (Levy & Davila, 2017; Tiznado-
Aitken et al., 2018; Sagaris & Tiznado-Aitken, 2017) showing a wide
range of topics that develop the social problems and impacts related to
transportation – from the examination of the institutional, socio-economic
and political factors, to intermodal approaches constituting a new
transport planning revolution.
1.2. Santiago as case study
The context selected for the research has been Santiago de Chile, a city
that frames the motivation of this research, as it has been strongly fuelled
by personal experiences. The Chilean economy has had a sustained and
stable increase similar to other Latin American countries as Peru or Brazil
from the 1990s. However, Santiago is the capital city of one of the
countries with the highest levels worldwide of inequality in terms of
socioeconomic distribution. Despite the continued economic growth of

26
the country by 6% annually on average, and despite being one of the
currently most robust economies in Latin America, the income distribution
is the most unequal of all countries of the Organization for Cooperation
and Economic Development (OECD). The percentage of ownership of
GDP that 1% of the richest people have is a good measure for picturing
the inequalities of income distribution in the country. The 1% of the richest
people in Chile owns 30.5% of the national GDP, contrasting with
countries as Sweden where the 1% wealthiest own a 9.1%, in Spain it
owns a 10.4%, and even compared with USA (21%) Chile is more
unequal (Lopez, Figueroa & Gutierrez, 2013).
In the mid-seventies a strategy of economic liberation and development
of capitalism was promoted. Suburbanization intensified and a high
regressive income distribution produced “an extremely fragmented and
segregated city” (De Mattos, 1999).The problems of income distribution
throughout those years, affected the way land uses were distributed
within the metropolitan region of Santiago de Chile (Rodriguez &
Winchester, 2001), resulting in a well-known segregated city (Agostini,
2016).
The spatial inequalities have led to social, cultural and normative
implications, that have affected the outcomes of the transport policies
trying to provide accessibility to the whole city (Tiznado-Aitken, Muñoz &
Hurtubia, 2018). Over the years, not only the need to travel, but journey
times and travel distances have increased as a consequence of social
inequalities (Herrera & Razmilic, 2018). These inequalities have also
affected the rise on housing prices in central and well-connected areas
(Agostini, 2016). Urban daily mobility is a massive, recurrent and
complex social practice, but it has been due both to the high levels of
inequality (Jiron, Lange & Bertrand, 2010) and to the poor functioning of
the Transantiago system (Ureta, 2015). Both users of private and public
transport have been affected in terms of travel efficiency and journey
times, but especially in terms of their daily travel experience and quality

27
of life (Gajardo et al., 2012). As consequence, the capital (as well as other
cities in the country) has had a significant increase in car ownership due
to the lack of incentives for using public transport – together with large
incentives for money loans for vehicle purchases (INE, 2017). Figure 1.1
shows in the left quadrant the variation of private motorised cars from
2008 to 2017, considering the national and the Metropolitan Region level.
The percentage in the Metropolitan Region reaches 90% of private cars
– more than the national percentage – which remains in a constant
increase in the following years. The right box of Figure 1.1 illustrates the
comparison of the percentage increase for the region and at the national
level. Since 2008, the possession of motorised vehicles for private
purposes has increased on average by 5.5% per year in the Metropolitan
Region of Santiago. At the national level, this trend is similar, with an
average increase of 6.6% per year.
Figure 1.1. Total motorised private vehicles in Metropolitan Region (orange) and national level (blue), 2008 – 2017. Source: own production based on National
Statistics Institute (INE), 2017.
Existing inequities of income distribution and opportunities are
accentuated by long travel distances and the inconveniences of not
having a public transport system adequate enough to cover the demands
of distance, comfort and flexibility of use.

28
1.3. Alternative approaches based on opportunities and
freedoms
This research recognises the shortcomings of transport project appraisal
based on cost-benefit analysis and its emphasis on journey time savings.
It thus seeks to expand the criteria on which the merits of projects are
assessed. To this end, the theoretical approach adopted is the Capability
Approach (CA), initially developed by Amartya Sen. CA is radical in the
way it analyses the development, opportunities and capabilities of the
individual. Although it is a broad conceptual and theoretical framework, it
does not necessarily refer directly to application in the transport context.
Indeed most of the applications of the CA have been in human
development studies and there are few uses in transport.
First, it is important to clarify that the central concepts considered for this
approach are functionings and capabilities. Functionings, according to
Sen, are the various things a person may value doing and being, and the
achieved actions by the person that she manages to do or to be. In
transportation this could be interpreted as the actual travel that allows a
person to participate in their daily activities. Capabilities, in turn,
represent the various combinations of doings and beings (functionings)
that a person can feasibly achieve, and is thus largely synonymous with
the person's freedoms and opportunities. Initially, understanding the
functionings – what the person is being or doing – is fundamental for
determining what the real capabilities (opportunities and freedoms) of a
person to achieve those functionings are. Therefore, functionings are
crucial elements in the evaluation of capabilities. An example of how
functionings are limited by transport is if a person decides not to travel to
her personal activities because she cannot afford transportation, or
because a route is deemed not safe and an alternative route or no trip is
undertaken. The assessment of capabilities requires an assessment of
the range of relevant opportunities, given the person’s characteristics (so,
for instance, taken as given a person’s skills or income level while

29
defining her range of capabilities). Thus, even if these parameters do not
change, the evaluation of her capabilities is likely to be broader and
closer to the real opportunities that she can reach. From this example,
three elements can be distinguished: functionings, capabilities, and the
gap between them (see Figure 1.2 below).
Figure 1.2. Diagram of concepts capability approach. Source: own production.
Considering these definitions, the CA allows extending the range of the
usual parameters used to assess transport projects, moving beyond
profitability or utility. Furthermore, the advantage of having both concepts
of functionings and capabilities, is the different types of information they
reveal and the independence they give in their use. Understanding the
opportunities for travel and participation in activities allows us to assess
the structure of society and how this affects behaviour; in relation to
actual travel and participation which is modified by a range of barriers. All
of these factors are important to the use of transport systems and the
quality of peoples' lives. However, the measurement of capabilities is the
most challenging aspect for the operationalization and use of CA in
transport – i.e. it is difficult to assess what the real opportunities for travel
are, or what the real opportunities of access to activities are.
Another important concept proposed in CA is effective freedom, the
capability to choose. An example of this, specifically in the case of the
provision of public transport, is the option for people to use the public
transport bus network. In Santiago, bus supply allows both high and low-

30
income areas to access it. The difference is that for most high income
users, using the bus is a matter of choice, while for low-income people
this is the only feasible alternative to travel over larger distances. Having
valuable options for people is relevant in this case.
However, deprivation of capabilities does not only depend on
socioeconomic profiles. The previous section reflected on how Young's
(1990) writings conceptualise distributive justice going beyond
socioeconomic income problems. Thus, understanding capability
depends on the contexts and the possibility of appropriation that
individuals have of their choices. Levy (2013) warns that transport users'
identities "are deeply embedded in social relations and urban practices"
(p.47), defined mainly in the use of public space. The use of the common
space makes the exercise of their choices not only individual but also
collective, so that "travel choice" is relative to access to certain types of
activities and goods. The capacity of choice for users such as women,
children and the elderly, is more likely to be vulnerable as a consequence
of distributive justice that transcends the socioeconomic component.
People with reduced mobility or mobility impairments are typically also in
a position of disadvantage. For them, accessing the public buses could
be much more complicated compared to people without mobility
impairments, and it could even mean for them to reduce their trips up to
the point of becoming immobile. For both groups, the lack of freedom to
choose what is valuable can lead to a capability deprivation, persisting
and aggravating the original condition.
Now, even if people could freely choose the transport mode that best
suits their needs, not everyone has the ability to convert the advantages
of mobility into valuable functionings. In the framework of the CA, this is
called ‘conversion factors’. Being in the position of belonging to a culture
that restricts the mobility of certain groups due to their gender, age,
ethnicity or race, can be as restrictive as the position of being
economically disadvantaged. For example, issues related to safety and

31
security in public spaces and transport modes are addressed differently
for women experiencing more violence and physical/sexual abuse while
travelling by bus or walking (Levy, 2013, p.57). From the side of
transportation planning, improving the access to certain modes does not
necessarily imply that people can reach valuable opportunities –
understanding the broad concept of valuation that can happen to
reaching opportunities. Hence, it is unclear how valuable such transport
decisions would be.
Achieving transport equity through the enhancement of capabilities
means that people are able to perform the activities that fulfil their lives,
irrespective that activities vary across groups, segments and individuals.
It also means having a minimum degree of respect for people’s dignity.
The use of any available transport mode should not act to the detriment
of the quality of life of other people, e.g. as a result of traffic pollution or
pedestrian accidents. The level of accessibility to goods and services
should not be a barrier for people to convert those resources into
something valuable for them. For example, some results on Chapter 6
show gender barriers in the use of public transport, since it does not live
up to the requirements of use and activities of women, turning public
transport into a barrier rather than an enabler for women. The CA
assesses people's quality of life so that various dimensions can be
incorporated.
The CA framework is based on real opportunities for people to achieve
what they value and want to be (or do). This framework has a strong link
with the concepts of freedom and opportunities, which is fundamental in
considering the benefits people derive from the existence and use of
mobility infrastructures and services. The radical and comprehensive
perspective of evaluating the benefits and burdens on the individual is
something that the CA has in common with these approaches – which go
beyond the evaluation of the ‘net present value’ or ‘benefit-cost ratio’ of
transport projects. This research therefore provides an alternative to the

32
mainstream evaluation approach, by providing a coherent logic of the
measurement of functionings and capabilities, and the presentation of an
application in Santiago de Chile.
1.4. Focus of the research
The research aims to examine, through a critical appraisal of empirical
evidence and theoretical approaches, the factors that configure the
development of transportation projects that can potentially reduce the
social gaps of social inequality. The research also uncovers paths for
helping to incorporate these factors into the design and assessment
processes.
The main question of the research is as follows:
Which factors in transport projects can reduce the gaps of social inequality, and how can they be incorporated in the planning and
assessment process?
Four secondary questions – explored in detail in the methodological
Chapter 0 (p. 76) – have guided the development of each research
chapter, contributing to the understanding of the research aim:
1. What are the perceptions of policymakers about incorporating new
metrics of social equity in transport appraisal?
2. How might social equity be measured in its relation to transport
projects?
3. Who are the most vulnerable groups affected by transport and
how do they perceive these inequalities?
4. How can decision/making processes and transport appraisal
effectively be improved in the current context?

33
1.5. Structure of the research
The following Chapter 2 defines the main research concepts through an
extensive literature review. The first part of the chapter explores
connections between the concepts of social equity and distributive
justice, and contextualises the theoretical discussion within the Latin
American context, reviewing scholars of the local context. The second
part of Chapter 2 explores the Capability Approach thoroughly, as a new
approach to the concepts of social equity, and reviews the concepts of
equity and social justice through the lens of capabilities, opportunities,
personal freedoms and choices.
Chapter 3 outlines the research process that has been carried on the
development of the thesis. It shows the methodological decisions and
provides information about the quantitative and qualitative
methodologies used along the research.
Chapter 4 establishes a context in which the research has been
grounded. It explores the issues of socioeconomic distribution; the
differences in the built environment and the modal split; the benefits and
costs of the differentiated fare; and reveals hints for understanding how
transport project appraisal operates in Chile.
Chapter 5 contextualises the research. It aims to explore how transport
policymakers perceive the strengths and limitations of current project
assessment tools for improving equity, and what is their perception on
incorporating new measures in the analysis (as users experiences,
attitudes, needs, capabilities, among others). Some of the findings show
that they agree both on the relevance of discussing equity in transport
and also on the need for solving institutional barriers along the process.
Chapters 6 and 7 aim to answer two of the secondary questions drawn
by the research, regarding the search of new sources of measurement

34
for social equity and reflecting on how inequalities mostly affect
vulnerable groups. Chapter 6 delves into how Capability Approach can
be measured in transport planning. It primarily focuses on aspects of
physical and mental health affecting transport users, taking in
consideration the list of Central Human Capabilities (Nussbaum, 2009).
It analyses the differences in the self-assessment of health-related
factors based on the application of the Capability Approach across
different types of transport users and population groups in various
neighbourhoods of Santiago. The chapter develops the concept of
‘weighted functionings’, innovative use of the capabilities framework that
allows the assessment of actual activities based on the priority given by
users. Chapter 7 develops how the concept of capability can be
applicable in relation to the concept of wellbeing. It recognises subjective
well-being factors, mainly through the analysis of journey experience and
enjoyment of commute — the data proceeds from the same survey of
transport users in Santiago used in chapter 6. The relevance of the
chapter is proposing a shift from a utilitarian perspective on transportation
(based on time savings and efficiency measured with travel satisfaction
surveys) towards a more comprehensive consideration of subjective well-
being as a fundamental component of travel. The exploration uses an
analysis of dissonance, based on the mismatch between the actual mode
and the mode that enables users to experience positive affective/emotive
or instrumental factors.
Chapter 8 moves the discussion into the appraisal area challenging how
the main approaches deal with social impacts. The chapter studied how
the BRT project “Alameda Providencia” through the use of a Multi-actor
multi-criteria analysis (MAMCA). MAMCA is used as a way for appraising
projects while centring the attention on social equity issues. Findings
show the possibility of these type of participatory approaches for helping
with a more comprehensive way of introducing social equity in transport
appraisal, incorporating views and catering for different needs.

35
Chapter 9 finally proposes conclusions and reflections for the research.
It includes commentary on the main lessons for future research; lessons
learnt from the analysis of the Capability Approach; reflections about the
transport appraisal and the applicability of social equity concepts in
transport; and the main contribution and originality of the research.
Although the research has developed around the case of Santiago, it
examines issues and problems applicable to other cities in the Latin
American context - and even in circumstances of other developing and
developed countries. Most of the literature review comes from studies
performed in developed cities of the Global North, so the research has
had to realistically and carefully recognise the transferability of
knowledge into the local context. This has allowed generating
conclusions that nourish back the academic discussion and will enable
to expand the boundaries of understanding around topics that
increasingly require conceptual, theoretical and practical development.
The data produced from the case study have been obtained directly in
Santiago, so the research promotes the creation of new knowledge in the
context of Chile. On the other hand, the questions that have risen from
the results have opened potential new lines of research in the near future,
both in the Chilean context and internationally.

36

37
2. Literature Review on equity, justice,
capabilities and opportunities. Setting
up the concepts.
2.1. Introduction
Social equity issues in transport planning, particularly the linkages
between transport and social exclusion over the last 30 years has been
increasingly the focus of research (Lucas, 2004; Lucas & Jones, 2012).
Social inequalities have been expressed through social exclusion of
particular disadvantaged groups, whether in the area of socioeconomic
income, physical (geographical) accessibility, physical or mental
disability, belonging to ethnic groups or social minorities, among other
aspects. The higher the level of inequality between groups, the greater
the social exclusion, and therefore the higher the challenge of solving
that everyone has the same access to opportunities and quality of life. One of the keys is to understand that transport policies, focused on the
efficiency and operation of the system, do not necessarily meet users’
requirements of accessibility, needs and opportunities.
Solving problems of social inequities challenges the construction of a
framework that could respond to more fundamental questions, involving
the origins and the correct solution of the problem. In the UK, for example,
social exclusion has been related to the ‘inability to fully participate in the
economic and social activities that are necessary to maintaining a
reasonable quality of life’ (Lucas, 2004). In the UK context, multiple
appraisal criteria in WebTAG (Web-based Transport Appraisal
Guidance) has intended to cover the inequality gaps through enhancing
accessibility. However, the coverage of social impacts is very weak; there
is still too much focus on the economic efficiency of projects in ante
(before the fact) and post (after the fact) appraisal and evaluation. Social
impact assessment, in turn, aims to better address questions of

38
environmental justice in decision-making through stakeholder
participation and the systematic analysis of the social impacts and
benefits of the projects.
Another way of understanding social inequality issues in transport
planning is through the territorialization of the problem – the regional and
distributional focus of social equity is fundamental in transportation
planning (Preston and Rajé, 2007). Furthermore, scholars have
considered the many barriers experienced by some groups with transport
disadvantages (Hine and Mitchell, 2001, 2003; Hine, 2007) and the
relevance of users’ perceptions to facilitate the understanding of their
social inclusion (Rajé, 2007). Understanding the vision of the transport
user, as well as the non-user and potential user, is critical. This is not
only to understand the differences between diverse cohorts but their
needs and the equity gap existing between them. The empirical chapters
of this research account for this.
This chapter of revision of literature, addresses the main research
concepts used throughout the document, exploring connections, debates
and interpretations between concepts as social equity, distributive
justice, capabilities and opportunities. Even though socioeconomic
groups highly define the propensity to have an advantageous or
disadvantaged situation with respect to society, Chapter 6, for example,
suggests that other factors, as gender, are much more relevant for
defining how vulnerable a group might be when using public transport.
Although the primary transport mode and socioeconomic background
influence the definition of the disadvantages for this group, gender is a
variable that has not been widely considered in the generation of
transport policies. Another misleading interpretation of how to detect
inequalities is assessing based only on the level of accessibility.
Accessibility planning promotes in this measurement the solution for
solving inequalities – which later will be discussed as one of a wider
range of determinants.

39
The second part of this chapter deeply explores the Capability Approach
(CA) as a new (and complementary) approach to the concepts of social
equity when transferred to the transportation planning context. The CA is
discussed in its relationship with the concepts of equity and social justice,
opportunities, personal freedoms, choices, and discusses possibilities for
measurement. The chapter also deepens in the analysis of the
quantification and measurement of capabilities for further exploration
throughout the document.
2.2. Social equity and Social justice The idea of the just distribution of goods and gains is relevant to a variety
of fields such as health, transport, education, housing, etc. In all those
fields, there is a commonly asserted normative claim in society that
relates to the equal rights of having equal claims on benefits, as much as
the right of equal levels of benefit. For example, Fainstein (2010) has
described the process by which the concept of social justice has ended
up as a social construct accepted and used by an important proportion of
participants of society. She has suggested that the key for justice to
become a universal principle has been a high level of articulation in terms
of a communicative consensus – people having to agree on what is just.
Therefore, the concept of social justice applied to a society, should then
be attributed to a complex and dynamic set of conditions, benefits, rights,
coverage requirements, among other aspects that arise from the proper
functioning of the whole social system. Social justice is then a relative
concept, so it might vary by geographic location or timeframe depending
on where it is located (Harvey, 1973). In contrast to social justice, social
equity does not necessarily emerge from a universal principle and neither
proceeds towards a positive meaning in all contexts, but it is one of the
pillars that sustain the construction of fairer societies. In fact, this concept
is constituted in the relation with others. In a general universe of elements
and particular individuals, the equity concept seeks to provide to all
people the same access to different positive elements of the system,

40
placing them in the fairest position. The equity exploration requires then
placing the discussion into a specific context, with common elements that
could allow measuring the relationship between individuals and these
elements.
These concepts go much further back in time. Since Ancient Greece,
different perspectives have been developed on the concepts of social
equity and justice. Aristotle’s Nicomachean Ethics, for example, written
in 350 BC (Aristotle & Taylor, 2006), proposes a relationship between
social justice and social equity, and explores the differences between the
two concepts. For example, he discusses justice as a superior concept
than equity, and defines the importance of moral praxis for acting truly
and rightly. There is a challenge of incorporating these definitions applied
in transport, thus the section analyses and brings together some of these
universal concepts. Aristotle puts forward the concept of virtue as central
to eudaimonia, beyond the narrow aspirations of increased income,
suggesting that wealth serves only as means.Social justice, social equity
and social equality divert not much in nature but application. However,
equity is different from equality, even though there are usually used
indistinctively. Social equality is the state in which all people,
independently of their status, group or affiliation, have the same
opportunity to access to civil rights, freedom, property, and equal access
to goods and services. In this sense, equality is not that we are all the
same, but that we all have the same opportunity to live the life we value.
Both equity and equality differences are crucial. Having access to equal
goods is essential, but when the starting point might be different for the
members of a cohort, the same resource might not be enough for
covering the lack of resources for someone. While equality is focused on
the means for providing the same amount of resources, independently of
the outcome; equity focuses on the outcome in which everyone can
access to the same final amount of resources. Generally, in transport
planning, the provision of transport considers parameters of equality,
especially when defining access to public transport. For example, public
41
transport network can be spread homogeneously, without considering
how people will use it for their personal outcomes. If we were to propose
to develop public transport under the equity paradigm, the provision of
the services should vary considering the needs, requirements, activities,
skills, among other aspects of the potential users of the transport system.
On the other hand, the equitable provision of transport should consider
that the limitations in the use of the network do not depend only on the
cultural and socioeconomic background of the individuals. Interpreting
Young's (1990) writings on justice and social equity, the equitable
distribution of transportation should consider the possibility of individuals
to exercise their capacities effectively. An example of this, and going
back to the case of the provision of public transport, a woman living in an
affluent neighbourhood may also feel restrictions on the use of public
transport, in the same way as a woman living in a vulnerable
neighborhood - both due to lack of safety in the use of spaces and public
transport.
Social justice implies a fair and just relation between the individual and
society, including the distribution of wealth, opportunities, social privilege,
participation in democracy, relationship with other in the private and
public domain, among others. In this sense, one possible exercise of
social justice in transport might address the alternative of accessibility
planning. However, suggesting that the solution goes only through the
enhancement of the physical level of accessibility is an imcomplete
interpretation of the problem.
The following questions help to assess the outcome of exercising social
justice:
• What is distributed? Which relates to the idea of distributed goods
and resources. Distributed goods depend on the context, level of
development and societies, and are concerned with existing
wealth, power, respect or access to opportunities.

42
• How is this distributed? Relates to the way goods and resources
are distributed. Equally, meritocratically, according to social
status, according to needs, property rights or other mechanism.
Measurement or thresholds of how resources are distributed
follow this discussion, as the proper measurement should lead to
a proper definition of mechanisms of distribution.
• Who benefits from the distribution? This relates to the idea of the
entities, particular population cohorts, the members of a particular
country or jurisdiction, particular members of the society that are
receiving the goods and resources that are distributed. This is
probably the most important question of the three presented, for
the development of the research – centred in the transport user
and people who receive less benefits from transport.
Even though these questions may allow different interpretations, there is
some common basis for the principles of social justice, such that all
individuals and cohorts in society may have a basic level of value, access
to activities and participation in life. Although there is debate over
whether there exists a measurable, objective standard of social justice
and the optimal route to achieve such an objective. Some scholars reject
the idea as meaningless, self-contradictory and unfeasible to realise.
Hayek (1982, p.78), for example: “There can be no test by which we can
discover what is 'socially unjust' […] [social justice] does not belong to
the category of error but to that of nonsense”. But, of course, this thesis
rejects such notions – and attempts to give a clearer picture on an
important, but complex, topic.
Rawls (1971), in particular, helps us in unravelling what is just or not. He
defines ‘the original position’ as the starting point for a hypothetical
situation in which free, equal and rational persons come to an agreement
regarding the principles and application of social justice. All participants
of the agreement act according to their principles of justice, regardless of
their personal situation. This could be compared to a chess game without

43
a board, where actors do not know the pieces that correspond to them.
They do not know how they are located across the society by the time
they make decisions on their social agreement. Rawls defines ‘the veil of
ignorance’ as the key for the actors to apply principles of justice, with an
impartiality of judgement, where actors are deprived of all knowledge of
their personal characteristics and social and historical contexts. This
means that individuals make objective decisions, weighted in relation to
their contexts, wealth or individual possessions1.
The hypothetical exercise of using the veil of ignorance to solve injustice
issues is the starting point for Rawls to define primary goods. He divided
them into two categories:
• Natural primary goods: including intelligence, imagination, health
• Social primary goods: including rights (civil rights and political
rights), liberties, income and wealth, self-respect
The definition of the primary goods, then led towards the development of
the two principles of justice (Rawls, 2003: 42-43), where:
1. Each person has the same indefeasible claim to a fully adequate
scheme of equal basic liberties, which scheme is compatible with
the same scheme of liberties for all (the liberty principle).
2. And the statement that social and economic inequalities are to
satisfy two conditions:
• They are to be attached to offices and positions open to all
under conditions of fair equality of opportunity;
• They are to be to the greatest benefit of the least-
advantaged members of society (the difference principle).
1 This is particularly complicated to be carried out as an exercise in policy making. Chapter VII presents an exercise of multi-actor multi-criteria weighting, where the asset is the impartiality of participants.

44
Even though at the level of society these principles have a direct
applicability, the theory of Rawls has not been well used in transport
planning. Martens (2016) incorporates some of the thinking, suggesting
that accessibility could be incorporated as a sixth primary social good, as
it is fundamental for societies and individuals. As the concepts of primary
goods are difficult to be incorporated into transport planning, he suggests
that the theory itself should incorporate accessibility into the equation.
The problem relates to the difficulties of fair distribution of goods,
especially when considering the most vulnerable groups. He suggests
that:
(Rawls’ theory) cannot provide clear demarcation points regarding
a fair distribution of accessibility (…) Even if only the situation of
the least-advantaged group is taken into consideration,
improvements in accessibility will have to be weighed against
improvements in income and wealth (Martens, 2016: 81).
Although Rawls theory might not necessarily provide direct applicability
for the transport field, it can be suggested that both principles of justice
should be considered in the configuration of transport policies. The first
principle aims to sustain the basic rights and liberties applicable to all
citizens equally – hence is egalitarian in approach. In transport, all users
must be treated with the same equalitarian consideration, no matter the
income, wealth, ethnicity, race or origin – transport schemes should not
be developed that favour usage by certain cohorts, such as higher
income groups. The second principle is relative and seeks to be
progressive and it probably guides the spirit of this research, as the least-
advantaged members of society should benefit.
Harvey (1973) takes forward some of Rawls’ thinking, commenting that
governmental action and the correction of market structures are not
enough to avoid social injustices:

45
“Programmes which seek to alter distribution without altering the
capitalist market structure within which income and health are
generated and distributed, are doomed to failure” (Harvey, 1973,
p.110).
However, from a perspective that goes far beyond the typically explored
structures of power and economical concepts, Harvey links problems of
moral judgement with application in the regional science and spatial
planning. It can be questioned then if ethical dimensions can be applied
into the transport and urban planning context, or if these concepts can
be linked to social justice. Can mobility or accessibility be equitable? Can
standards or thresholds of social equity or social justice be developed
and applied? The extrapolation of Harvey’s conceptions about justice or
ethics into urban planning field is just one of the windows of the entire
discussion. If some of the questions are assumed from an affirmative
perspective, transport planning should built on the basis of moral and
ethical principles that could positively impact on people’s lives. This is the
basis for developing this research, considering that concepts of social
justice and equity should be indeed considered in the design and
implementation of public policy.
In this scenario, Harvey (1973) has looked for the relationship between
physical space and its impact on people, pointing out that there’s a
physical space impact on cognitive processes that define people’s
behaviour, being important to consider its symbolic meaning. This
complex understanding of social space could be partially achieved
through the integration of geographic and sociological variables in order
to understand the complexity of social processes. In this regard, one of
the challenges to point out is the necessity to identify tools to quantify
and qualify these processes. These tools should encourage
multidisciplinary work involving knowledge from spatial and sociological
perspectives, to promote collaborative results.

46
Hay (1995), for instance, who distinguishes eight key concepts from
different interpretations of Equity, Fairness and Justice (EFJ). All are
applied through geographical space, although they could also be located
in a conceptual and non-geographic sphere. From the list of these eight
concepts, it is possible to identify that there are two main categories: a
first group of concepts inherent to people and a second group aiming to
the consequences of applying equity. There are distributional
consequences in the application of equity, affecting either through a
positive or adverse impact on individuals, population groups and society
as a whole. For example, substantive equality (an equality of outcomes
for all) allows detriment in procedural fairness (proper adherence to the
rules) and even formal equality (similar benefits or burdens are enjoyed
or suffered by all persons, e.g. illustrated through taxation mechanisms).
Equal choice (there are similar choices available to all) considers the
preconditions to an equitable outcome and just deserts (a reward or
punishment) are concerned with the actions following and linked to
previous performance. ‘Needs’ is the most interesting concept presented
by Hay. Certain needs are so basic that the failure to meet them is an
injustice. Thus, a correct identification of needs is required. The
complexity lies in the wide variety of needs arising from different
individuals and population cohorts. There are many nuances to the
assessment according to the individual, that could be also arguable that
the concept of needs is relative as it depends on how arises.
In accordance with this idea, Harvey (1973) suggests transport as one of
those relevant needs for the just distribution of equity, thus they can be
defined in terms of minimums quantities or qualities that must be
provided to individuals. Harvey points out, for example, that a person who
has few resources, but no physical disability, may have more advantages
than a rich person or a person who has more resources but some
physical disadvantage. This reflects the intrinsic capabilities of people
and how these affect the development of routine activities. Physical
disability can become, in terms of transport, a major barrier in the choice

47
and use of modes and provides a significant challenge in determining
local transport strategies. On the other hand, there are disparities
between different or within the same geographies produced by transport
(Beyazit, 2011).
In this sense, equalitarian distribution of goods (or the attainment of these
needs) could be established as a possible response to poverty and social
exclusion through the guarantee of accessibility and affordability of all
types of services for people, as well as the fairer distribution of gains.
This was the basis for much of the work on transport and social exclusion
in the UK (Social Exclusion Unit, 2003; Lucas, 2012) and the associated
development of accessibility planning. Hence, the emphasis in this case
arises from equal choice and formal equality, and not really on
substantive equality (outcome) – although it is assumed that this would
follow.
Over time there has been much interest in defining sets of indicators that
can be used in the assessment of transport policies and projects
designed to increased mobility and reduce exclusion (Church et al.,
2000). Accessibility planning itself has developed various ways to
measure accessibility to different services (Geurs and Van Wee, 2004).
Additionally, concepts used in the wider social equity field have been
applied in transport to consider how accessibility might change across
population groups, such as the Gini-coefficient and Lorenz curve, which
are conventionally used to show income distribution across populations
(Van Wee and Geurs, 2011; Delbosc and Currie, 2011; Lucas et al.,
2015). In this regard, one of the key challenges is identifying tools to
quantify and discuss the different interpretations and applications of
social equity, and also to focus on issues of substantive equity.

48
2.3. Social equity and the links with social exclusion in
transport planning
The pursuit of more equitable distributional effects will depend on several
agents influencing diverse political, social and economic spheres. From
a political and economic perspective, Hill (1996) presents the very
conventional policy-making debate, considering two positions, about
whether income support and welfare benefits should be a responsibility
of the State, or a problem to be solved mainly by individuals themselves.
The very well-known discussion is interesting in this context, as it starts
with the idea that the market is the organiser of social activities. As the
individuals have to purchase their goods and services (as health,
education, food, etc.), they will know what to obtain (or purchase)
according to their needs. Pricing mechanisms will be imperative in this
situation, so the market regulates itself according to the demands of
people. Unfortunately, the position relies on income earnings which is not
equal for everyone as not all jobs receive the same monetary restitution.
Individuals do not start from the same starting line, and more
interestingly, the pricing mechanisms work based on the individual's self-
interest. The hopes rely then upon a second position. Hill explains that
the second position involves the State as a regulator of activities
according to the order of inequalities produced as a consequence of
individual’s purchase of goods and services. Both disappointing when
referring to the issues arising from and outcomes generated by
disparities.
However, there is also a third position, that relates to the dichotomy
presented by Young (1997) in relation to Fraser's work (1995) about the
representativeness and association of groups mobilised around their
identities. Fraser recognises two types of injustice, the socio-economic,
and the cultural or symbolic, and the ways of solving them act through
Redistribution and Recognition. She proposes the construction of a
framework that opposes culture and political economy, differentiating the

49
problems that arise from both. However, although the distribution of
wealth, resources and labour are not the only circumstances to consider,
it is essential to note that generally, these social groups do tend to
converge in social, economic, cultural, among other dimensions –
especially when it comes to vulnerable groups. Young (1997) criticises
the construction of a dichotomy, which although allows a better
identification of these contradictions, in reality fails on acknowledging that
"recognition is a means to the economic and social equality and freedom
that she brings under the category of redistribution" (p.152).
The discussion makes sense in a context in which political visions have
changed from government to government. This adds to a background in
which the role of the different actors in the transportation provision
process has not been resolved, as well as the responsibilities of
operators and government at the national, regional and communal levels.
However, and regardless of any political position, the discussion about
transport provision has been widely located in the spectrum of costs and
impacts. The correct measurement of these impacts is essential in order
to achieve accurate outcomes for addressing and improving equity.
These costs or impacts (costs from an economic perspective and impacts
from a social perspective) may involve money, time, loss of benefits,
among other resources. Impacts and externalities considerations in
transport are necessary for distinguishing an optimal comparison
between different transport modes and demand management options.
But more importantly, when costs or transportation impacts are
underestimated, there is a risk of reduction in welfare solutions aimed at
resolving equity gaps (Litman, 2007).
Since the early 1990s, research aiming to connect both academia and
decision-makers has increased for solving social disadvantages. At least
in the UK and other European countries, the interest to provide results
showing the consequences of distributional impacts on the well-being of
the most vulnerable groups with fewer resources has growth. Social

50
exclusion research then has emerged as a widespread policy (Lucas,
2004; 2012). Some responses to this problem have emerged from
scholars working with the idea of increasing mobility to reduce social
exclusion. Church et al. (2000), for example, have examined indicators
for assessing policy outcomes designed to reduce exclusion through
mobility increase. From a policy-making perspective, they have found
that multi-agency and multi-level strategies are needed to tackle
difficulties in transport so that individuals can obtain physical access to
opportunities to participate in society. Church et al. (2000) show the list
of seven categories they have provided, considering physical factors that
may limit the mobility of socially excluded people:
Exclusion factors Definitions
Physical Exclusion Physical barriers related to the nature of the transport system and the built environment that exclude people because of their physical and psychological difficulties.
Geographical Exclusion It is produced by poor transport provision resulting in spatial inaccessibility and isolation of local communities by effects of geography.
Facilities Exclusion Lack of access to facilities produced by constraints in the use of transport services. This cost is bigger in case of non-car users.
Economic Exclusion Income and transport network constraints on accessing labour market information that may affect on work travel patterns, affecting labour market processes.
Time-based Exclusion Difficulties of organising commitments to allow adequate time for travel that might affect on mobility decisions.
Fear-based Exclusion Difficulties based on the nature of fear in public and private spaces related to transport network that may vary according to social characteristics, especially gender.
Space Exclusion Difficulties coming from design, surveillance and management of public spaces that might affect the sense of ownership amongst some excluded groups.
Table 2.1. Exclusionary factors by Church et al. (2000).
Delbosc & Currie (2011) have explored spatial differences in transport
measurements of social exclusion and impacts on well-being in the case
of Melbourne, Australia for car dependent areas. They have understood
the influence of the geographical context in the mobility and
displacements between different locations, with an especial interest in

51
metropolitan and regional areas in car reliance. They consider transport
and travel characteristics in diverse areas and distances to business
zones, through the measurement of walkability, public transport
availability, car ownership, daily travels and split mode. The correlation
analysis between transport disadvantage and well-being were consistent
for researches amongst the regional sample. While this research is
primarily located in private modes, in a previous research Currie (2010)
alerts about the spatial gaps in public transport provision for people who
are socially disadvantaged, through the measurement of public transport
supply and needs.
Domains Sub-domains
Resources Material/Economic resources Access to public and private services Social Resources
Quality of life Health and well-being Living environment Crime, harm and criminalization
Participation Economic participation Social participation Culture, education and skills Political and civic participation
Table 2.2. Domains and sub-domains of potential social exclusion by Levitas et al. (2007).
As shown in Table 2.2, Levitas et al. (2007) describe social exclusion as
a complex and multidimensional process that involves not only resources
and lack of goods, but also the impossibility to participate in diverse social
activities in different spheres from people’s lives. In this sense, social
exclusion would be detrimental to the quality of life, social cohesion and
equity. They propose three domains of social exclusion: 1)
material/economic resources, 2) social resources (quality of life), and 3)
access to public and private services (participation) (see Levitas et al.,
2007). The main themes developed later in this chapter will be structured
based on Levitas’ classification of the main dimensions of social
exclusion, exploring: 1) the resources and barriers from current transport

52
policy appraisal; 2) the quality of life of vulnerable groups, focused on
gender, economic and physical inequalities; and 3) the participation of
the civil society, NGOs and communities.
The potential reduction of social exclusion through transport interventions
(Church et al., 2000; Lucas et al., 2001; Lucas, 2006, 2012) has been
already examined in the context of the Global North. However, this has
also been studied in recent years in the Latin American context. In
Colombia, for example, Bogotá has exhaustively developed research
aimed at measuring the impacts of the public transport system (Bocarejo
et al., 2016; Guzman & Oviedo, 2018; Guzman et al., 2018; Rodriguez et
al., 2017; Rodriguez & Targa, 2004). Also in the Colombian context,
research in Medellín has generated a clear understanding of how the
development of transport and new social infrastructure improves the
quality of people's lives (Bocarejo et al., 2014; Guzman et al., 2017). In
other cities such as Cali, research is actively progressing into
establishing links between the academy and government agencies.
Developing better transport infrastructure can balance existing social
inequalities (Delmelle & Casas, 2012; Jaramillo et al., 2012; Oviedo et
al., 2019).
The regional and geographical focus of the conceptualization of equity
and social justice is relevant. This is not only because it is about the
mobility component, but it is about the distribution of impacts, goods,
services and opportunities in space. Understanding the global definitions,
applied in these specific contexts is essential for this research.
2.4. New approaches to social equity and the Capability Approach Economic theory has developed the idea that people's preferences are
predecessors of their choices. This would mean that, if a person prefers
the bicycle over other modes, it is probable that the person will end up
choosing the bicycle as the primary transport mode. The same would

53
happen with a person who, prefers the car, so she ends up choosing the
car instead of using public transport or active transport. However,
economic theory is wrong, since individual elections do not always
represent preferences.
While Sen does not define a set of core capabilities – as noted by many
authors (Nussbaum, 1995; Robeyns, 2003, Kronlid, 2008) and Sen
himself – Levy (2013) suggests the freedom of movement as a core
capability. Even though her idea builds specifically around a gender
perspective, it applies to all social relations of ethnicity, age, and
socioeconomic factors, as well as the physical and psychological states
of the person, among others. Before transport user, the person is a being
that interacts with others in public spaces and later in collective spaces
that can be public transport. The choice of travel, both in its individual
and collective dimensions, responds to the ways in which people can
interact in these spaces. The focus is then in the actual possible
movement of people and the choices they make, considering far beyond
the socioeconomic profile and the ‘optimal’ travel choice proposed by
transport planners.
The assumption that the freedom of movement is a core capability helps
to define a wide range of interpretations that can be obtained from the
understanding of the CA. In this case, Levy (2013) recognises that travel
choices are far from the ones transport planning usually assumes, which
means a constant trade-off from men and women about the use of
transport. She highlights how the appropriation of users “through equal
access to necessities and opportunities in the city are both conceptual
and practical” (p.58), and suggests that this appropriation can contribute
to build notions of collective power.
As already referred in the first introductory chapter of this research,
Stiglitz (2012) reminds us that the development of GDP has not been

54
sufficient to cover all impacts on human life. Similarly, modal choices and
increased accessibility must be measured based on conditions beyond
the economic reward. In this regard, the Capability Approach (CA) and
the Happiness Approach (HA) share a similar basis, both reflecting a
focus on the social matters. Both share the conceptions of inquiring and
highlight the individual elections, while also strength the idea that human
well-being is developed beyond the concept of economic well-being. And,
both CA and HA have developed different measures and evaluations for
promoting human well-being (see Bruni et al. (2008) for more extensive
similarities and differences of both approaches).
Both the CA and the eudaimonic version of HA aim at identifying
the fundamental contributing factors to autonomous aspects of
well-being and development. (Bruni et al., 2008; p. 4)
However, just as the similarities between CA and (the eudaemonic
version of) HA are evident, so are the differences. On the one hand, the
CA is normative and uses the capabilities and functionings to deliver the
information that allows evaluating the actions. In general, CA emphasizes
the achievement of equality. On the other hand, the HA analysis focuses
on a more empirical and less normative interpretation of the problem,
based mainly on the interpretations of psychological aspects and related
to people's behaviour (Bruni et al., 2008). This difference is essential in
the decision measurement or using the measurement and analysis
instruments of this research based on the CA and not the HA.
There is another reason why the development of CA makes more sense
in the context of this research: the conversion factors. The CA
establishes that there are certain conversion factors, which are those that
allow a person to translate their resources or assets into functionings
(states of being and doing). The effective conversion depends on social,
personal, environmental, family, labour factors, everything that has to do

55
with the context of the person. All of them constrain the abilities of
individuals in obtaining what they need for their life.
Resources are imperfect indicators of human well-being, because
human diversity makes conversion rates (of resources into
realizations) different for distinct individuals. Thus, one particular
level of opulence could be related to totally different levels of well-
being if the individual’s personal or social circumstances are
associated with different abilities of converting resources into
valuable states of being. (Bruni et al., 2008; p. 2)
Recent studies focused on the relationship between transport and CA
(Hickman et al., 2017; Ryan et al., 2015, 2019; Nordbakke, 2013;
Nordbakke & Schwanen, 2014) have found that this is a relevant
approach that can help to solve social equity issues in transport planning.
Hananel & Berechman (2016) already address some justice
considerations in decision-making, where CA can contribute to
broadening the lack of justice and equity considerations in traditional
transport planning. With the purpose of examining specific cases, the
work of Ryan et al., (2015) discusses the mobility resources and
transportation for elderly segments of the population, highlighting the
possibilities of further explorations and employment of the CA as a
conceptual framework within transport research. A similar discussion has
been already presented in relation to the capabilities among older women
and other cohorts, especially elderly people (Ryan et al., 2019;
Nordbakke, 2013; Nordbakke and Schwanen, 2014). In the context of
regional and rural planning, Smith et al. (2012) explore the minimum
transport needs framed in terms of transport disadvantage and the CA.
And from an infrastructure provision scale, Wismadi et al. (2014) use the
Capability Approach to define the opportunity to mobility as a non-income
indicator, through Spatial Preference Modelling.

56
In developing contexts, the use of the capability approach in transport is
even scarcer. Hickman et al., (2017) have attempted to understand the
capabilities, functionings and travel in different socioeconomic
neighbourhoods in Manila, Philippines. Cao & Hickman (2019) have
recognised the differences between functioning and capabilities in the
case of three station areas in Beijing using Martha Nussbaum’s
interpretation of the CA, in order to understand how these factors impact
in the attainment of opportunities in life.
Other approaches such as Social Capital (Robison et al. 2002; Adler and
Kwon 2002; Adam and Roncevic 2003; Field et al. 2000) or Motility
(Kauffman et al., 2004; Shliselberg and Givoni, 2017; De Witte et al.,
2013; Cuignet et al., 2019), also share a similar basis, and concepts that
speak of development and constriction factors similar to those
mentioned. However, these aspects have not been as widely considered
in this reserach as much as the CA.
2.4.1. CA, social equity and justice
The Capability Approach (CA) (Sen 1985, 1999, 2001, 2009) has
developed an understanding of the social dimensions of equity, based
not only on access to resources or people’s possessions, but also on the
opportunities that people have, relative to their contexts. The approach
is only beginning to be considered in the transport field, and this section
suggests how CA might be used as an instrument for assessing the social
components of transport projects. First, CA is discussed in view of the
wider literature on social equity. Secondly, a framework is developed for
using CA in transport, based on upon the concepts of capabilities and
functionings. Finally, suggestions are made on how this might be applied
through a survey and in-depth interviews. I argue that CA could be a
complementary evaluation method for assessing the social impacts of
transport projects, based on the analysis of users’ expectations and
attitudes towards transport and daily activities, which they are able to

57
perform.
CA was originally developed by Sen (1985; 2009) as a response to the
lack of understanding on the social dimensions of equity, related not just
to material resources but also to the opportunities that people have. In
CA, the main focus is on what individuals are able to do, taking us beyond
the role of institutions and the identification of ideal social arrangements.
The framework is focused on two dimensions of substantive equity
(Hickman et al., 2017):
• Capabilities: represent the “alternative combinations of doings and
beings [functionings] that are feasible [for a person] to achieve”
(Sen, 1999, p.75): Capabilities are located in the field of the
person's freedoms and opportunities of the things she can do or
be. The definition of capabilities strongly relies on the
understanding and attainment of functionings.
• Functionings: defined by Sen as the “various things a person may
value doing and being” (Sen, 1999, p.75), which includes the
actions that individuals are able to perform and achieve. In
transport, this could be interpreted as the person’s experienced
levels of accessibility, and the actual travel and participation in
activities.
CA can be useful within transport as it moves beyond concepts of social
inclusion or use of accessibility planning. The CA elaborates an
understanding of substantive equity, considering: “not only the various
things we succeed in doing, but also in the freedoms that we actually
have to choose between different kinds of lives.” (Sen, 2009, p.18). The
“different kinds of lives” also represents a challenge when elaborating on
the psychological and societal dimensions that shape individual’s
freedoms. Some aspects to consider include: ability, income, education,
aspiration, political and cultural context and societal norms. Hence, the
understanding of capabilities takes us beyond the conventional framing

58
of social impact assessment in understanding the shaping of individual
capabilities, and also in the understanding of the actual achievement.
The CA progresses beyond conventional accessibility planning, focused
on the theoretical accessibility to particular activities, by considering the
obstacles that might stop people from using the accessibility provided.
Accessibility planning was a major step forward conceptually from the
more conventional mobility planning, yet is limited in assuming that there
is a ‘free choice’ in using the accessibility provided. Issues such as
income, education, aspiration, etc. limit the free choice. Hence there is a
link back to Harvey (1973), who is insistent on the importance of
structural factors to urban development and, by implication, transport.
In the literature, there are additional overlaps with more recent research
in transport planning, such as the importance of individual attitudes
(Anable, 2005) and societal influences (Urry, 2007; Shove, 2012) relative
to travel, which suggests there are psychological and societal dimensions
to travel. However, the CA focuses the attention on the achievement of
opportunities, that can be seen as predecessors of quality of life for
individuals (Anand, Hunter, & Smith, 2005). What people achieve “plays
a crucial role in determining the relation between capability and well-
being” (2005, p. 12). Therefore, the CA has potential in bringing together
different approaches in the emerging transport field and applying them in
terms of social equity. The freedom to choose our opportunities, within
certain constraints, also brings with it responsibilities, to the extent that
each activity is a selected action (Sen, 2009) – where there is some
relation back to the Socratic notion of virtue.
Outside the transport field, Robeyns (2005) also reflects on some of the
important characteristics of CA as a normative, interdisciplinary and
multidimensional concept. Robeyns suggests that the key to CA is in
understanding the differences between the means and the ends of well-
being and development (Robeyns, 2005, p. 95). In transport, this
relationship between means and ends can be a useful distinction. For

59
example, accessibility is a means rather than an end. No one aspires “to
be accessible”, but having accessibility allows achieving and reaching
activities and resources. The “end” is the actual functioning – the
realisation of substantive equity. In this conceptualisation, accessibility
(and transport provision) might be seen as a means to achieve social
equity or justice, modified by particular individual’s capabilities.
This difference and interdependence between capabilities and
functionings is then of special interest. In particular, defining (or
measuring) the gap between them might determine the existent level of
equity between individuals (or social segments), alongside the actual
levels of capabilities and functionings. This information can help
understand what these groups expect to perform and what they are
actually able to do, with transport as one element in the means to reach
the required outcomes. Despite the positive contribution that CA
generates from the individual’s perspective, Sen (2009, p. 295) remind
us about the limitations of this approach:
(…) Capability is only one aspect of freedom, related to
substantive opportunities, and it cannot pay adequate attention to
fairness and equity involved in procedures that have relevance to
the idea of justice. (…) The central issue here concerns the
multiple dimensions in which equality matters, which is not
reducible to equality in one space only, be that economic
advantage, resources, utilities, achieved quality of life capabilities
(Sen, 2009, p. 295).
2.4.2. CA, personal freedoms and choices
The freedom to choose is a relevant aspect considered by Sen related to
how people are able to manage their own lives. In this regard, the
capability to perform different activities is valuable in itself, as well as
people having to decide how to use the freedom they possess. Poor
transport networks or services often limit the choice of modes, impacting

60
on the access to employment and other activities:
“The freedom to choose our lives can make a significant
contribution to our wellbeing, but going beyond the perspective of
wellbeing, the freedom itself may be seen as important. The
freedoms and capabilities we enjoy can also be valuable to us,
and it is ultimately for us to decide how to use the freedom we
have.” (Sen, 2009, pp. 18-19)
The individual freedom to choose implies at the same time the
consideration of the subjectivity for each individual. In this regard, Sen
highlights the importance of the use of objective reasoning in the field of
feelings in order to think about issues of justice and injustice (Sen, 2009,
p. 41). This is partially because it could be argued, from the analysis of
subjective elements from users’ feelings and preferences, that some
elections are not necessarily related to rationality but emanate from the
efficiency of systems.
Personal elections and freedoms are relevant aspects considered by Sen
(1985) in order to inform how people are able to manage their own lives.
The capacities of reasoning and choosing – inherent to human beings –
are tested and even constrained under institutional frameworks ruled by
inflexible norms. Sen himself recognises the limits of choice based on
false consciousness and the social position of user, that is, their class,
gender and other intersectional identities (Sen, 1999). These limits of
choice are in tension with the concept of "travel choice" (Levy, 2013)
applied in forecasting modelling by transport planners. The limits of
choice affect individual’s scope of action when transportation do not meet
individuals’ needs and requirements. On the contrary, the provision of a
wide range of transport alternatives, in terms of modes and trips flexibility,
allows people having more opportunities and freedoms to perform their
activities and meeting their needs.
The significance given to personal elections has shaped an important

61
criticism of CA, regarding its individualistic focus which places individual
requirements over collective demands. Personal needs have the
potential, of course, to be directly encouraged to be consistent with
societal requirements. Sen (1985) takes this into account, criticising the
principles of justice from Rawls (1971), giving more weight to equal
individual liberties rather than the distribution of communitarian
resources. Even though the Rawlsean approach was mainly focused on
primary goods rather than income, this is the reason that sustains
Rawlsean theory, prioritising liberty over social justice assessment. On
the contrary, the CA brings more attention to the opportunities that
individuals might have from the ownership of those goods, adapting and
adjusting those resources into characteristics of good living.
The dichotomy between personal choice and collective demands has
importance in the applicability of CA in transport. How could a collective
transport system of goods, services and people, be planned under these
principles? Can individual needs be aggregated into a communitarian
context? How much focus should we give to the user perspective? In
transport, perhaps the difference is not so stark – that individual and
collective advantages are close to the idea of the common good.
2.4.3. CA, opportunities and resources
There is a strong association between poverty and transport, and this has
been well researched (Beyazit, 2015; Lucas et al., 2001; Lucas, 2004;
Church et al., 2000; Preston and Rajé, 2007; among others). However,
socio-economic factors are just one of the valuable aspects regarding the
opportunities that can be attained by people. A lack of income may even
lead to a different range of activities that could be a match with well-being
– indeed there is evidence that the focus on GDP growth has not led to
increases in well-being and that the gains from higher wealth on
individual happiness tail off at a relatively low threshold (Layard, 2005;
Wilkinson and Pickett, 2010). One of the fundamental points made by
Sen (1985) concerns the inadequacy of the utilitarian approach to

62
capture the different and heterogeneous aspects of development.
Adaptive preferences are a concept that can facilitate the understanding
of this critique towards utilitarianism (see for example Teschl & Comim,
2005). Adaptive preferences are the preferences of individuals who have
been created in unfavourable circumstances, rooted in the lack of
restriction of options. Utilitarianism does not take into account the
adaptive preferences of users. For example, lower income groups (or
fewer opportunities to generate that income) tend to restrict their number
of trips for being located in less accessible areas. The lack and
vulnerability of users as a result of using certain transport modes (as is
the case of Santiago with the use of buses in certain areas) determine
their preferences. This preference, then, is a result adapted from the
inadequate and negligent care of the conditions for using these modes.
The use of concepts such as opportunities and capabilities goes beyond
the adaptive preferences of users. Although it does not dismiss these
conditions, it focuses on subjective evaluation at a level more significant
than the hedonic value – closer to the notion of eudaimonic value instead.
Nussbaum (2011), developing Sen’s work, considers people’s conditions
as a strong factor in the attainment of development goals. Nussbaum
often works directly with gender, considering the deficiencies not only in
the utilitarian approach but also in CA. However, these adaptive
preferences are not considered in the equation when using evaluation
tools for transport projects such as the CBA or single actor MCA. It does
not consider, for example, the reasons of users who could potentially
choose a particular mode, but who do not do so for specific reasons
restricting their preference.
Regarding opportunities and resources, these may be cut down by
different factors related (or not) to individuals, and capabilities are: “no
more than a perspective in terms of which the advantages and
disadvantages of a person can be reasonably assessed.” (Sen, 1985, p.
296). Sen defines the real poverty as the lack of opportunities, which can

63
be a result of capability deprivation. In this sense, disadvantaged groups,
such as the elderly, ethnic, racial or sexual minorities could have even
more difficulties than low-income groups – although they are intersecting
identities. In the transport field, these specialist needs should be taken
into account in terms of configuring plans where less advantaged people
can stretch and achieve their capabilities as well as people without these
restrictions.
2.5. Quantifying and applying the CA in transport planning The idea of quantifying capabilities is relevant for suggesting this
approach in policymaking. A quantitative approach that seeks to
distribute just goods and impacts might get things more straightforward
than the pursue of measuring the capabilities and opportunities of people
for living better lives.
Nussbaum (2011), when considering fundamental entitlements,
suggests that there is a minimum level of capability that must be
accomplished as a response to the ambiguity in the quantification of
capabilities. The problem of the ambiguity of the concepts used in Sen’s
work is evident when attempting to operationalise the theory in an applied
field such as transport. Functioning seems fairly straightforward in terms
of being represented by actual travel, but capability can be interpreted in
transport in various ways. It could be the aspiration of individuals to
access particular activities, which are then moderated by various
constraints to produce the actual functioning. Each person’s capability is
moderated by physical and attitudinal attributes and by the political and
cultural context and societal norms. It could also be represented by the
highest capabilities experienced in a sample group, with other
respondents compared relative to these levels of freedom. This chapter
takes the former approach, but the difficulty still remains in determining
the level of theoretical capability for each individual.

64
The space of capabilities provides the most fruitful and ethically
satisfactory way of looking at equality as a political goal […]
[however] equality of resources falls short because it fails to take
account of the fact that individuals need differing levels of
resources if they are to come up to the same level of capability to
function. (Nussbaum, 2011; p.35)
In Nussbaum’s work there is a link made between the goals of
development and individual needs as presented above. Hence the
capability could be a target level. From the perspective of equality, the
problem of needs coverage – either from the individual’s perspective or
the systemic societal perspective – relies not only on the lack of
resources but also on the abilities that individuals possess to take
advantage of resources. The analysis of constraints that might affect
individual’s abilities could be analysed through multi-level perspectives,
such as developed by Geels (2011; 2012) and others (Whitmarsh, 2012;
Nykvista & Whitmarsh, 2009). These respond mainly to socio-technical
regimes grounded in norms that have oriented the activities of social
groups. Informative, educational and communicational skills also play an
important role in the attainment of social abilities as well as physical skills
that might be constraints especially in terms of transportation abilities.
The work of Alkire (2005) in this regard is interesting for discussing the
question of the applicability and operationalization of the capability
approach. She suggests “even if we acknowledge the considerable value
of the ‘more general’ framework, the pragmatic and insistent questions
about how to use the approach in different contexts are still well worth
asking for a number of reasons” (p.116). This is particularly important for
the developing of the research, as it experiments with the possibility of
applying CA in a Latin American city.
Defining the more operational part of the CA – which leads more easily
to the application of it on the field of transport planning – requires us to

65
revisit the main objectives: the expansion of the freedoms of deprived
people, for them to enjoy ‘valuable beings and doings’, which brings both
justice and poverty reduction. This comes along with the fundamental
access to the necessary resources and people’s possibility to make their
own choices (Akire 2005, p. 117).
The openness in terms of interpretations and lack of indicators from the
CA produce certain levels of uncertainty for measuring and using this
approach in an empirical context. The opportunities and capabilities
potentially executable are more difficult to measure in terms of impacts
in order to be translated into public policy.
One of the main problems of CA is to find an approach to measurement
and hence application. In this regard, the levels and differentiation
between capabilities and functioning are of special interest, as this might
determine the level of equity relative to what individuals expect to perform
and what they are actually able to do – and also between individuals. The
problem of measuring transport equity might be tackled from this angle –
the levels and difference between capability and functioning can be
viewed as ‘transport equity’, with higher levels and a reduced gap being
more equitable. Physical accessibility would be at a higher level than
capability, modified into the capability by various factors that affect the
‘free choice’ of accessibility, such as physical ability, income, education,
aspiration, political and cultural context and societal norms.
The impact and measurement of functionings can also be explored more
in depth. Chapter 4 expands on an approach for measuring functionings
in health-related factors affecting transport users in their daily commutes,
distinguishing between functionings and ‘weighted functionings’.
Weighted functionings consider the levels of assessment and the value
people assign to the factors assessed. This allows understanding the gap
between people’s current states and their aspirations, which lead towards
their capabilities. This consideration has revealed significant differences

66
between segments, especially in disadvantaged groups as public
transport users, women and low-income segments.
The variation between capabilities and functionings between individuals,
neighbourhoods and other jurisdictions, and the gap between capabilities
and functionings are all of interest – hence there is much potential for
fruitful analysis. Kronlid (2008) explores the relationship between
capabilities and mobility, suggesting that this relationship strengthens the
significance towards the individual’s well-being. This definition of mobility
is based essentially in the same theoretical structure to CA, but
associating physical movement to opportunities. He argues that mobility
should be in the list of capabilities, as being mobile could be considered
as an opportunity, placing the practical reasons for its incorporation in the
work of Alkire and Black (1997).
Martens (2016) replaces mobility with accessibility, and this research
supports this as the stronger position to take. The concepts presented
are interesting as they locate mobility as an intrinsic element of peoples’
well-being. Although Kronlid (2008) suggests a relationship between
social and spatial mobility, none of the authors have presented, so far, a
solution to the complexity of measurement of capabilities in transport.
This consequently leads us to consider to what extent the concepts
presented may help to articulate a transport planning approach based on
the parameters of CA. In that sense, Chapter 3 of this research delves
on the methodological aspects of the use of capabilities. The method
describes the design of a qualitative tool based on the list of central
human capabilities developed by Nussbaum (2003). The list was
modified for considering the transport and urban planning context.
Nussbaum’s list is a comparative quality of life measurement and as a
proposal for measuring capabilities. She considers the list of 10
capabilities as central requirements of a life with dignity in different
spheres of life, where intrinsic to these capabilities is the idea of the
“minimum account of social justice”:

67
1. Life 2. Bodily health 3. Bodily integrity / comfort and built environment 4. Senses, imagination and thought 5. Emotions 6. Practical reason / planning one’s life 7. Affiliation: respecting, valuing, appreciating people / social
interaction / discrimination 8. Species / nature 9. Play / recreational activities 10. Control over environment / able to influence decisions in the local
area
The first group of capabilities, as constituted by the concepts 1, 2 and 3
in the list above (life, bodily health and bodily integrity) are located within
the strengths and weaknesses of health, so they are part of an internal
or external diagnosis of the physical condition the individual. In terms of
transport they might be related to age, educational level, disabilities
(including physical conduct and the use of space), the physical and
mental impacts produced by the interactions between people using
transport modes (including casualties), or the physical consequences
produced by the interaction of the people with the surrounding built
environment.
The second group of capabilities, numbers 4 to 7, constitute the concepts
of senses, imagination and thoughts; emotions; practical reason; and
affiliation. These are mainly considered in terms of personal feelings, for
example in terms of the inner or personal result of the interaction with the
chosen mode, others during the journey, or possible internal feelings and
emotions produced during the journey. In terms of transport, these issues
could also be related to freedoms and feelings relating to the trip itself.
The third group of Nussbaum’s capabilities, numbers 8 to 10, consider
the concepts of nature and species, play and recreational activities and
control over the environment. These are mainly based on contextual and

68
material dimensions. These are related to the relationship between the
individual and flora and fauna, as well as the local area where the
individuals live. In terms of transport, these capabilities might be related
to natural (biodiversity) corridors, closeness to parks and natural
elements within the city and the extent of impacts on natural elements
related to individual travel. Regarding the local area where the individuals
live, there are issues related to the sufficiency of recreational and cultural
facilities concerning the choice of travel and during the trip. There is also
the relation between individuals and the political context as part of the
control of their own environments.
Nussbaum (2003) recognises, in her list of Central Human Capabilities,
the basis of the construction of an effective or successful society, in
essence, the components of Socratic eudemonia. The issues might be
applied into different areas of life – transport amongst them. Once the
Central Human Capabilities are translated into transport visualizations, it
is possible to define a measurement method to delimit a range of impact
and weight for each concept.
2.6. Relevance on the context, conversion factors and
policymaking Considering the concepts of functionings and capabilities described
above, the conversion factors then allow a person to translate their
resources or assets into states of being and doing – or functionings. The
different abilities a person has for converting these resources will be part
of the context and will affect in the realisation of her wellbeing. This
concept is especially relevant in the context of this research, as it starts
from the basis that the society is tremendously unequal. All the
characteristics of socioeconomic and sociodemographic groups are so
uneven, that the capacity to convert their assets will be also variable. For
example, having access to the bicycle for someone living in the centre or
living in the periphery will determine a different asset – people living in
the periphery will be less likely to travel by bicycle if they have to

69
commute long distances. But what happens if the comparison does not
depend on location or income? Same example about the use of the
bicycle but considering different gender. Young (1998), for example,
suggests that people’s social constructs (considering gender, race,
ethnicity, among others), define their exercise of their capacities and
might result on deprivation beyond economic constraints. For instance, a
woman and a man living both in the same area, commuting a similar
distance; for the woman, the factors associated to gender will affect in
her capacity to convert her resource and fully exercise her capacity using
the bicycle. She might have to look after a safe route, avoiding unlighted
places, she might be a victim of harassment in the streets while cycling,
and she might have to cycle faster to get to pick her kid up at the nursery.
All those conditions will determine different outcomes when compared to
a man without those obligations and constraints. In policymaking these
conversion factors or disadvantaged grouos seem not to be considered
in most cases.
The translation of concepts from the Central Human Capabilities into
transport would be an important conceptual step forward in assessing the
social impacts of transport infrastructure. Considering the CA categories,
or similar, would be beneficial in that wider, are inherent aspects of
transport affecting individuals would be revealed relative to the
conventional social impact assessments carried out in transport. This
would increase our level of understanding, relative to approaches such
as WebTAG, including categories such as impacts on feelings and
emotions. These types of impacts are likely to be important to various
modes, including walking and cycling, and to the travel experience and
the well-being of travellers. As argued earlier in this chapter, the increase
in well-being has its ultimate goal as the attainment of happiness.
There is difficulty in applying CA in transport planning, largely in terms of
quantifying the capability dimension. The functioning element is relatively
straightforward, representing actual travel – and is the part that transport

70
planners usually measure in analysis. However, the reason for choosing
CA as a complementary instrument is based on the idea that the
evaluation of social justice in transport should include an assessment of
potential physical (and perhaps social) mobility as well as actual mobility.
The main problem is in data collection, and this thesis presents the
possibility of using surveys and interviews and in-depth interview based
on CA criteria, to be incorporated in the process of a widened
participatory approach to project development and impact assessment.
The process is, however, more than a revised set of criteria covering
social issues – it also requires some judgement, quantification and
discussion on capabilities and functionings, and to the gap in between.
CA can be used as an inclusive tool, using a bottom-up approach from
the users’ perspective, and as a mechanism for evaluating required and
real access to opportunities and activities through the use of transport,
as far as there can be an effective measurement of functionings and
capabilities. To achieve this, it is necessary to openly ask people about
their current requirements and achievements relative to travel. The
scoring of criteria, weighting and impact scoring allows the user to reflect
on their travel behaviours, including the opportunities and constraints
impacting on these processes. Beyazit (2011; p.123) has established an
interesting perspective for transport as a means that can articulate more
than one function:
“If individuals can get more than one functioning from a good, then
a transport system can propose several functionings that a person
can get from them’.
2.7. Conclusion The research focuses on the exploration of critical appraisal and
empirical evidence to understand the factors that can potentially reduce
gaps in social inequality through transportation projects. Within the
framework of the concepts that define the literature review, the CA has

71
been selected as a suggestion for exploring these inequities considering
factors that have not been conventionally used to acknowledge these
problems. The bases and the argumentation of several academics in
different areas of knowledge about capabilities, allow inquiring deeply
and richly this theoretical approach. Although other researchers have
suggested its use in transport planning such as Beyazit (2011), Pereira
et al. (2017) and Priya Uteng (2006) (for others see Error! Reference source not found.), there is not enough empirical evidence that could
place CA as an accurate and reliable alternative in the reduction of
inequalities through transport projects. This chapter presented the
theoretical and conceptual bases that will guide the extend of this
research, as well as the methodological proposal that will frame the
exploration within the next following chapters.
In terms of the content, the chapter began by questioning why the CA
can offer an alternative for transport project assessment. Three
arguments are proposed concerning the changes in the way current
transport project assessment works, under the analysis of normative and
ethical considerations, building on social equity’s concepts; looking upon
personal freedoms and choices; and recognising the attainment of
individual’s opportunities.
1. CA allows understanding, measuring and using concepts such as
capabilities and functions, enabling to measure the differences
between individuals and societal cohorts. The lower the levels and
higher the gap between the current and expected achievement of
opportunities, the farther we are from achieving equity.
2. CA reflects on the importance of individual decisions, attributing
value to the preferences and freedoms that people require. A
public transport network, for example, must be flexible enough to
allow room for the exercise of these freedoms. The mode choice,
as well as the scope of the needs and activities that people
perform, are some examples of this.

72
3. CA goes beyond the commonly placed associations between
deprivation and lack of economic resources. The CA allows
measuring the development of a person, group or community,
through the opportunities that people can achieve.
Transport should be understood as facilitator in the development of fairer
societies. If transport is the means that supports some social
transformations, then equity and social justice should be seen as critical
goals in transport planning and need much strengthened definition and
debate. However, there is difficulty in applying CA in transport planning,
largely in terms of quantifying the capability dimension. The functioning
element is relatively straightforward, representing actual travel – and is
the part that transport planners usually measure in analysis. However,
the reason for choosing CA as a complementary instrument is based on
the idea that the evaluation of social justice in transport should include
an assessment of potential physical (and perhaps social) mobility as well
as actual mobility. The process is, however, more than a revised set of
criteria covering social issues – it also requires some judgement,
quantification and discussion on capabilities and functionings, and on the
gap between.
The CA, through the distinction between capabilities and functioning,
might determine existing levels of equity in terms of what individuals wish
to do and what they are actually able to perform. However, the
significance given to personal elections – considering also the
importance of freedom and personal subjective elements – has shaped
an important criticism of CA. In transport, as well as other public goods,
the accomplished differentiation of individual and collective advantages
should be closer to the idea of the common good, and from the CA
perspective, collective needs must be matched to the attainment of
collective solutions and opportunities. If a policy target is used as the
capability, then this is made clearer. However, it is also important to
consider abilities that individuals have in order to take advantage of their

73
resources – societal goals are also played out at the individual level.
If capabilities can be measured effectively, then CA might be used in the
planning and appraisal of transport, indeed in wider public policy
interventions. This provides us with a much stronger accomplishment-
based understanding of social justice. If inequity is rising in many
contexts, then we would expect that transport inequity is too, yet there is
little evidence to help us conclude on this topic. Accessibility planning,
whilst a major progression from mobility planning, has not been used to
the extent it might have been – and is underestimating the problem. CA
offers us a way forward to consider social equity in transport more
effectively, focusing the analysis on the freedoms we might like to choose
in our lives.
The following sections show the process of evolution of the research. The
revision of concepts suggested by the first literature review opened a
series of research questions that would trigger the development of the
thesis. The search for methodologies and the first pilot survey conducted
in Chile in 2016 initiated a second derivative of the problem about
equitable transport. This meant a new search for bibliographic material
and references in the literature that have formed the basis of the analysis.
These new concepts that have emerged from a second literature review
have then been developed in detail in the empirical chapters. The
decision to locate these bibliographical references within the empirical
chapters and not in the literature review, responds to the fact that they
have emerged from the exploration of the CA. The CA has been, then,
the underlying theoretical engine that has framed the search for other
principles, theories and approaches that allow responding to the common
instrumental and utilitarian view towards transport.

74

75
3. Methodology
3.1. Introduction
This chapter outlines the research process that has been adopted in the
development of the thesis. The duration of the process has helped in
framing and re-framing some methodological aspects and decisions
during the course of the PhD. The first step has been the understanding
and contextualisation of the different concepts and complexities related
to equity and justice issues in transport. Then, the measurement and
operationalisation have been relevant for looking at ways of applying and
implementing changes in this regard. A mixture of research methods has
been used throughout the research to understand these complexities,
giving value to the different quantitative and qualitative aspects that
helped answering the research questions.
In this sense, this chapter unravels the process of making methodological
decisions and taking steps to fulfil the objectives of the research. It starts
referring to the structure used for looking for sources and references in
the process of building a literature review. The structure mentions the
non-linearity of the process of discovering the authors and scholars that
have guided the research. It follows with the definition of the main and
secondary questions that have outlined and helped conduct the empirical
chapters, and the consequent development of the research.
The decision of working both with qualitative and quantitative data have
been grounded on the nature of the outcomes. It was suspected from the
beginning that understanding the impacts of transport in equity would
have required both aggregated results from a large sample of population,
as well the understanding of the underlying reasons, opinions and
motivations leading the decision of policy makers. This shaped two
pathways for developing the data collection and the analysis of results.
The chapter will follow up with the different techniques used for analysis:

76
statistical analysis and regression models, content analysis and multi-
criteria analysis. Quantitative analyses are employed using surveys and
qualitative analysis with interviews – both are necessary to develop a
thorough understanding of transport and social equity issues in Santiago.
This led to a reflection of the use of diverse methods on research: the
advantages and disadvantages, and how this opens new windows of
opportunities for future research.
3.2. Research Aims and Questions
The aim of the research is:
To examine, through a critical appraisal of theoretical approaches and
empirical evidence, the factors that configure the development of
transport projects, and resulting impacts associated with social equity,
that can potentially reduce the gaps of social inequality; and to propose
paths for incorporating these factors into the planning and assessment
processes.
Thus, the main question for this purpose is as follows:
Which factors in transportation projects can reduce the gaps of social inequality, and how can they be incorporated in the
planning and assessment processes?
With the purpose of facilitating the development of the research, the main
question was disaggregated into four secondary questions that have
framed each research chapter (see Table 3.1). These questions guided
the analysis of the following chapters covering four broad areas, as
outlined below.
1. What are the perceptions of policymakers about incorporating new metrics of social equity in transport appraisal? This question will set up the understanding of the
context in which the decisions of transport appraisal are taken.

77
Understanding policymakers’ awareness and priorities in relation
to social impacts is relevant for re-shaping the metrics, tools and
policies intending to improve equity. This question has been
addressed in Chapter 5, unravelling policymakers perceptions on
equity issues in transport. The methodological approach taken to
answer this question was primarily qualitative, using interviews
and thematic analysis.
2. How might social equity be measured in its relation to
transport projects? This question seeks to define the
measurement tool and equity indicators. Along the research, this
question will build upon the concepts of capabilities and well-
being. Empirical Chapter 6 applies the capability approach in the
transport domain, particularly considering transport-related health
issues. Empirical Chapter 7 studies emotive and utilitarian factors
of the subjective well-being, and how these factors relate to modal
choice. A quantitative approach has guided both chapters, using
a survey carried out with different profiles of users.
3. Who are the most vulnerable groups affected by transport
and how do they perceive these inequalities? This question
relates to the gaps of social equity that must be addressed through
transport improvements. In both Chapters 6 and 7, there is an
exploration of different socio economic profiles and population
cohorts with the most vulnerable groups in society, and the
impacts transport produces in their lives. As presented in the
previous question, a quantitative approach has been used for the
recognition of these groups, using a survey conducted in
Santiago. The analysis has been carried out through statistical
analysis and multinomial logistic models.
4. How can decision/making processes and transport appraisal effectively be improved in the current context? Considering
some of the most revealing concepts founded as research

78
outcomes, the fourth question is centre on the applicability and
potential changes of the current context – both normative and on
appraisal. Chapter 8 explores how transport policymakers
perceive the strengths and limitations of current project
assessment and what is their perception on incorporating new
measures in the analysis for improving equity.
Secondary questions Chapter Methods
Q1
What are the perceptions of policymakers about
incorporating new metrics of social equity in transport
appraisal?
Chapter 5 Interviews with experts Thematic Analysis
Q2 How might social equity be measured in its relation to
transport projects?
Chapter 6 and Chapter 7
Survey Users, Descriptive statistics,
Multinomial logistic model
Q3
Who are the most vulnerable groups affected by transport and how do they perceive
these inequalities?
Chapter 6 and Chapter 7
Survey Users, Analysis of correspondence,
Multinomial logistic model
Q4
How reached social equity factors might be incorporated
into the decision-making process for transport projects?
Chapter 8 Workshop experts Multi-actor multi-criteria analysis
Table 3.1. Summary of secondary research questions, empirical chapters throughout the research, and primary methods used in each chapter.
The definition of the problem and the motivation of the research guided
the reach of theoretical approaches from the literature. This was a
fundamental step ahead from the previous knowledge of the case study,
towards the recognition of commonalities with other contexts (in both the
global north and the global south), the development of theoretical
approaches from authors of different backgrounds, and the recognition
of new concepts previously unknown.
The literature review in Chapter 2 was organised in two main topics:
social equity and justice, followed by the study of the capability approach.
However, every empirical chapter has a brief literature review at the
beginning of the chapter. This review contributes to understanding the
specific problems and concept presented in each chapter, and helps

79
framing the specific analysis used for solving the research questions. The
main body of the literature considers key concepts of social equity and
justice, through the Aristotelian perspective, followed by Rawls, Harvey
and Hay. Then the literature centres on the potentialities of the Capability
Approach developed by Sen, suggesting links with the transport field, as
well as concepts on equity and justice. The Capability Approach is
explored in its components of personal freedoms, opportunities and
resources, including discussion of applicability and policymaking. Some
of these concepts have been further developed in empirical Chapter 6.
Then some deeper understanding on subjective well-being and its
relationship with the emotive components – drawing on the Aristotelian
notions of fairness – will be explored in Chapter 7. Chapter 5 and 8
examine issues on policymaking and approaches that help conceive the
applicability of some of the factors explored in the analysis in practice.
The understanding of the literature helped on the research reformulation,
considering the aim of the research and the secondary questions. It was
also useful for defining the methodological approach carried out during
the PhD process. It allowed building a conceptual framework for
adequately understanding concepts as social equity and justice within
the context of transport planning. The literature review examines different
perspectives of authors that have highlighted the need to properly
consider the issues of equity and fairness, mainly from urban planning
and transport fields.
3.3. Chronology of the research
Figure 3.1 explains the research, highlighting the non-linearity of the
process and actions taken. The first component of the graph below is
temporal (shown on the X-axis), considering the 4 years the PhD took for
completion. On the other hand, the Y-axis, the figure shows the definition
of the skills involved in the tasks, divided in: written and oral
communication; research and information management; analysis and

80
problem solving. The circles show the main tasks developed, and the
amount of inner circles show approximately the time (approximate
number of months) for completing the task. Some of the tasks have led
into other subsequent activities. The conferences and training attended
have nourished and fed the analysis, so they have been incorporated as
crucial elements of the process of the PhD. Two data collection
processes were carried out, both linked to the definition of the empirical
chapters. They were also part of a process of understanding how to
conduct qualitative and quantitative research data. A second review of
the Literature Review was developed in between empirical chapters. This
helped to a more exhaustive analysis into the concepts that required
more attention and represented new challenges for interpreting the data
collected.

81
Figure 3.1. Research Process. Source: own production.
Fed th
e
analy
sis fo
r
Year
1Ye
ar 2
Year
3Ye
ar 4
Analysis and problem solving
Research and information
managementWritten and oral communication
Tim
e
Initia
l pr
oble
m a
nd
mot
ivatio
n
Lite
ratu
re
revie
w
Rese
arch
Fo
rmul
atio
n
1stDa
ta
colle
ctio
n2nd
Data
co
llect
ion
Rese
arch
ana
lysis
Empi
rical
cha
pter
s
Rese
arch
Re
-form
ulat
ion
Con
fere
nce
Trai
ning
Lite
ratu
re
revie
w re
visio
nU
TGS NEC
TARR
GS2
NEC
TAR AE
SOPIC
TH
AAG
UC
L1TF
LR
TCSU
SR
GS1
UC
L2
TEA1
AUSS
TEA2
Rese
arch
ana
lysis
Empi
rical
cha
pter
s
Proj
ect b
ased
pap
er o
r boo
k ch
apte
r
Con
cept
ual
capa
bilit
ies
Wei
ghte
d fu
nctio
ning
sPa
pers
and
boo
ks c
hapt
ers’
writ
ing:
Subj
ectiv
e w
ell-b
eing
Cap
abilit
ies
Glo
bal s
outh
Met
hodo
logi
cal
capa
bilit
ies
Choi
ce a
ppro
pria
te
met
hods
Resu
lts le
adin
g to
Rede
sign
capa
bilitie
s sur
vey
Que
stio
nsAi
ms
Pilot surve
y
Survey results
Key
findi
ngs
Rese
arch
ga
ps
Prev
ious
lite
ratu
re
Theo
retic
al c
onte
nt fo
r
TEA3

82
3.4. Quantitative Research
The first two secondary questions of the research have nurtured the
focus of the quantitative exploration of the research; the first one relating
to the ways for measuring equity in transport projects and the second one
pointing out to the most vulnerable groups affected by transport.
Therefore, the research considered the use of quantitative methods for
the development of Chapter 6 and Chapter 7, based on the use of a
capability-based survey.
The assumption is that public transport users (mainly bus users) and
lower income segments would show a disadvantage with respect to other
transport users and people with better economic situation. However, the
findings resulted in a much more precise distinction of the most
vulnerable people in transport. The results will also show that
disadvantaged people have less options of choosing their preferred
transport modes and they tend to associate positive affective and
instrumental factors to modes that they are not able to use. These
perceptions evidence equity gaps between groups – where the most
vulnerable groups are much more affected.
3.4.1. Survey design
The quantitative exploration is based on a database resulting from a
survey that collected information on a wide range of travel and related
issues. A 7-pages questionnaire was carried out in Santiago de Chile
during November and December 2016 through a quota-sampling method
for gathering the information, considering the spatial segmentation of the
city into six macro areas. The comparison of the socio-demographic
information from Pre-Census of 2012, allowed an equal representation of
both genders and a representation of the proportion of inhabitants per
area have been chosen as relevant characteristics of the sample. In total,
451 persons validly completed the survey (out of a sample of 500
questionnaires). All the face-to-face questionnaires were carried out by

83
the researcher. Some questionnaires were run collectively (no more than
6 people for allowing questions from respondents) but most of the
questionnaires were collected individually.
The CA framed the survey design, for operationalized through a
dedicated survey design (see Annex 1). The core of the survey consisted
of the identification of different user profiles, based amongst others on
their primary transport mode. This approach has been used in various
contexts, especially in health and education. Chapter 6 investigates
specific existing literature in the field of health, which has helped to
strengthen the use of the capabilities approach in the context of this
research. However, the use of the Central Human Capability (CHC),
developed by Martha Nussbaum, has encountered extensive academic
discussion. Economists, philosophers and other humanists have openly
criticized the generation of this list (Feldman & Gellert, 2006), and the
differences between Nussbaum and Sen have been commented on the
basis of the different disciplines they represent (Robeyns, 2003).
In the context of other disciplines, for example, education has used
capabilities as a measure of progress in the curricular and pedagogical
development of children with some degree of disability (Price, 2015).
Price suggests that since the CHC proposed by Nussbaum are central to
individuals, incorporating that list into the teaching evaluation will allow
general better educational curricula for students. The fields of health and
bioethics have pointed out that having a list of capabilities allows
societies to determine the threshold levels of each aspect of that list,
depending on the contexts and resources (Venkatapuram, 2013).
However, beyond reviewing the different sectors and disciplines,
capabilities have been associated with the construction of social
wellbeing. Anand et al. (2005), use secondary data that, together with the
CHC, deliver interesting results about the operationalization of this
approach. On the other hand, and despite the differences in the
interpretation of the capabilities or the CHC list, the development of

84
research associated with the use of the capabilities has been beneficial
to cover measurement and implementation issues, with a focus on
poverty reduction (Qizilbash, 1997; Gasper, 2000, Alkire, 2002).
The categories firstly proposed by Nussbaum in her Central Human
Capabilities list (2011) were understood through the lenses of transport,
for considering possible indicators based on these concepts (shown in
Table 3.2). For example, when considering the categories of Life, Health
and Integrity proposed by Nussbaum, the possible application in
transport planning could correspond with concepts as stress, physical
activity, perception of air pollution while travelling, physical and
psychological security levels (safety and security), accidents, noise and
crashes. Some of these elements have been previously addressed in
transport research. However, the novelty of incorporating these factors
relies on the assessment of the users’ perceptions on how these factors
affect the way they perceive their opportunities. Table 3.2 shows the
categories of the survey considering transferability of concepts from the
central human capabilities list (Nussbaum, 2009) into transport.

85
Nussbaum’s Central Human Capabilities List
Categories for the application into transport
Indicators for measurement
1. Life 2. Bodily health 3. Bodily integrity / comfort and built environment
1. Factors of self-assessed physical and mental integrity.
- Stress - Physical activity - Air pollution - Safety - Comfort
4. Senses, imagination and thought 5. Emotions
2. Associations between primary transport mode and emotive/instrumental concepts while commuting (or performing main activity)
- freedom - insecurity - functionality - enjoyment - affordability - poverty - safety - value of time - unpunctuality - congestion - efficiency - luxury - environmental care - health - social interaction - comfort - happiness - status - enjoyment - quality of trips
6. Practical reason / planning one’s life
3. Reasoning and planning for commuting and/or regular trips
- assessment of access to job opportunities
- reliance on public transport for commuting
- frequency of activities - difficulty for performing
activities - relevance of having choices in
transport - access to transportation and
life quality - affordability - access to jobs - availability of transport modes - public transport quality - other modes in the integrated
fare
7. Affiliation: respecting, valuing, appreciating people / social interaction / discrimination
4. Social interaction with other people while commuting or doing regular trips
- assessment of the level of interaction
- importance of other people while travelling
- feelings of discrimination

86
Nussbaum’s Central Human Capabilities List
Categories for the application into transport
Indicators for measurement
8. Species and nature 9. Play and recreational activities
5. Nature and sustainability
- variability depending on weather
- access to sustainable transport modes
- willingness to pay for more access to sustainable modes
- access to sustainable transport modes
- importance of sustainable transport
- trees, greenery and parks - access to transport modes - widening sustainable modes
supply
10. Control over environment / able to influence decisions in the local area
6. Information
- access to information and modal interchanges
- waiting, transfers and travel times
- difficulties when transferring - access to technological online
tools - evaluation of technological
tools - technology importance in
transport
7. Built environment
- considering transport infrastructure for private vehicles
- parking - quality of highways - space for pedestrians - quality of sidewalks - clean bus stops - sits in bus stops - weather protection bus stops - amount of cycle lanes - quality of cycle lanes - bike sharing system
8. Productive activities and commuting
- access to the public transport network
- commuting productive trips - possibilities of getting a good
employment - assessment of current
available opportunities - satisfaction with job - daily travel times - transport expenditure.
Table 3.2. Categories of the survey considering transferability of concepts from the central human capabilities list (Nussbaum, 2009) into transport.

87
3.4.2. Survey Pilot
The first step was to conduct a pilot survey to test the questions and
analysis of the results before the definitive survey application. The
definition of the areas was based according to information of the Census
data (2002). The pilot was also helpful to understand the extent of
information that could be collected a survey tool and the problems on
each specific area of study. Previous empirical research on measuring
qualitative indicators was used for the pilot design. The result was a pilot
questionnaire of 40 questions, applied Santiago in January 2016, with a
result of 75 surveys (out of a sample of 100 surveys) validly submitted in
the period of one month.
The pilot survey was important to test the questions and define the spatial
component of the sampling for representing a wider diversity of people.
As Santiago has a strong territorial component of urban segregation, the
sampling places were defined with the attempt of getting the most variety
of income segments. The pilot survey considered the longitudinal section
of the city from the central area to the southern east part. The selection
of places for sampling went along five communes with different income,
population and density constitution according to Census data (2002), as
shown on Figure 3.2. The built environment and social context are
diverse enough to take different samples of realities and experiences of
each transport mode. Sampling considered individual face-to-face
questionnaires in: (a) public areas of shopping mall centres, (b)
workplaces and (c) households in residential sectors. The results of the
pilot surveys were analysed with statistical and factor analysis, and the
questions revised, in order to reduce and improve the questionnaire to
have better outcomes. The analysis that informed the first revision of the
survey, allowed amending and improving the tool.

88
Figure 3.2. Interviewee’s residence location for pilot survey. Source: own elaboration.
3.4.3. Data collection
The final questionnaire consisted of 65 questions, which was conducted
in Santiago during the months of November and December 2016. A
quota sampling method was used for gathering the information at the city
level, considering representativeness with the data obtained from the
Santiago Pre-Census of 2012.
Five hundred questionnaires were printed, 483 were partially or entirely
filled out, 17 questionnaires were blank. Of the sample, 451
questionnaires were considered having at least five complete pages
answered - questionnaires with more than two or more pages
unanswered were invalidated. The rate of valid responses is high as it
involves questionnaires completed face to face. Invalid questionnaires
are due to lack of time or because the interviewee dropped the interview
due to various circumstances.

89
Figure 3.3 shows the distribution of the surveys that expected to reach
out different sectors of the city and socio-economic profiles. An equal
gender representation and proportion of inhabitants per area were
chosen as relevant characteristics of the sample. The survey was carried
out in centres of activity with dense provision of offices, services and
educational centres. These sub-centralities have different characteristics
in regard to the built environment – it is assumed that these factors have
an impact on the results. Examples of street sections and differences in
the built environment (housing, roads, pedestrian space, among others)
can be seen in Figure 3.4.
Figure 3.3. Final survey – origin residences. Source: own production.
In the first part of the survey, participants were asked about basic socio-
demographic data, such as the commune of residence, gender, age,
disabilities, level of education, current occupation, income, and main and
secondary transport mode for commuting. In the second part, the
questionnaire asked about the modes that people associate with emotive
and instrumental positive concepts of commuting, as well as the levels of
overall satisfaction with the trips. The third part related to aspects of
reasoning and planning of the commuting or regular trips, assessment of
the access to job opportunities; the reliance on public transport for

90
commuting and frequently performed activities; level of transport options
and quality of life affected from access to transportation. The fourth part
considered aspects of social interaction with other people while
performing trips; assessed the presence of other people and raised
questions about feelings of being discriminated while travelling. The fifth
part considered concepts related to nature and sustainability, asking
about the consideration of switching modes according to the weather;
access to sustainable transport modes and willingness to pay for more
access to sustainable modes. The sixth part raised questions about
access to information and modal interchanges when performing regular
trips; waiting, transfers and travel times; aspects that make transfers
more difficult; and access to technological tools facilitating making
decisions over daily trips. The seventh part assessed the built
environment, considering transport infrastructure for private vehicles,
public transport and cycling infrastructure. The eighth and final part
considered questions related to commuting and productive trips; level of
access and possibilities of employment; travel times and expenditure. All
concepts were transferred from the Central Human Capabilities list
(Nussbaum, 2011) and reinterpreted for a transport discussion.

91
Figure 3.4. Streets sections and differences in the built environment of the municipalities in which the survey was carried out. 1) Providencia, 2) Nunoa, 3) Macul,
4) La Florida, 5) Puente Alto. Source: own production based on Google Maps.

92
Perception questions use a Likert scale with five points from Bad to Good
(1 to 5). Categorical variables were analysed through absolute and
relative frequencies for the descriptive socio-demographic analysis. From
the total of valid surveys (451), where 31% of the respondents are car
users, 60% are public transport users, and 9% are active travel users.
Figure 3.5 shows the distribution of the primary transport mode over the
sample. In Figure 3.5, active travel is represented in blue – mostly
located in central areas; public transport is represented in cyan – spread
all over the city; and private transport users are represented in red –
mostly located in the wealthiest area which corresponds with the
information reflected in Figure 1.2. Figure 3.6 shows the distribution of
income – which corresponds widely with Error! Reference source not found. in terms of the distribution of wealth which is concentrated in the
eastern area of the city. In the figure, dark blue corresponds to high
income profile; light blue represents people on middle income; and cyan
represents low income sector. The distribution quite coincides with the
information presented in Figure 1.2, however is less distinct in the
extrapolation of high and low income sectors.
Figure 3.5. Distribution of the primary transport mode over the sample.

93
Figure 3.6. Distribution of socio-economic profile of the survey respondents.
3.4.4. Analysis of quantitative data
Chapter 6 uses statistical analysis for demonstrating and highlighting the
main socio-demographic differences between groups. As participants
were asked about basic socio-demographic data, such as the commune
of residence, gender, age, disabilities, level of education, current
occupation, income, and main and secondary transport mode for
commuting, the statistical analysis allowed contrasting and recognising
the main disadvantaged groups.
Chapter 6 uses just the first part of the survey, which related to the
measurement for health-related factors. It uses a Likert scale with five
points from Bad to Good (1 to 5). Categorical variables were analysed
through absolute and relative frequencies for the descriptive socio-
demographic analysis. Comparisons were made according to gender and
primary mode of commuting, considering Fisher test – statistical
significance test used in the analysis of contingency tables, especially for
small samples. P value is the probability of how likely it is that the
observed differences between groups are due to chance. Most authors

94
refer to statistically significant as P < 0.05 and statistically highly
significant as P < 0.001 (less than one in a thousand chance of being
wrong).
Health-related factors
Functioning measurement Likert 1 to 5, (1) Bad - (5)
Good
Weighted functioning measurement
Likert 1 to 5, (1) Not important - (5) Very
important Levels of stress How do you assess the level
of stress you experience on your usual trips?
What is the importance you assign to the levels of stress?
Levels of physical activity
How do you assess the level of physical effort you experience on your usual trips?
What is the importance you assign to the levels of physical activity?
Levels of proximity to other transport users
How do you assess the level of proximity to other transport users that you experience on your usual trips?
What is the importance you assign to level of proximity to other transport users?
Levels of exposure to air pollution
How do you assess the levels of exposure to air pollution on your usual trips?
What is the importance you assign to the levels of exposure to air pollution?
Table 3.3. Questions used in the survey for the measurement of health-related factors in transport considering functionings and the weighting functioning measurement.
Chapter 7 used an analysis of correspondence, which is an analysis
based on the primary mode of travel and the questions about affective
and utilitarian values. There is a correspondence when a person’s
primary mode is the same as the one they selected for those values. For
example, if a respondent’s primary mode is Car and he/she indicated that
mode in relation to Freedom, then there is a correspondence. This
analysis uses the second part of the survey, related to the affective
perceptions over different transport modes. As the survey allowed the
respondents to make associations between the primary transport mode
and 18 positive and negative feelings, the respondents could indicate all
the modes they associated to the feelings on the list. Some of these
feelings were positive (e.g. happiness or enjoyment), while others were
negative (e.g. discomfort or poverty). For the analysis, three affective and

95
three instrumental factors were considered: freedom, enjoyment,
happiness, security, time savings and efficiency, respectively. The
questionnaire provides a binary indicator that describes the presence or
absence of modal correspondence for each one the selected six factors.
The analysis has considered socioeconomic variables (gender, age,
education, occupation, income, disabilities), as well as other variables as
driving licence, journey times, monthly expenditure on transport and
satisfaction with the overall trip.
The methodologies used are analysis of correspondence and multinomial
regression, both around the associations of transport modes and
affective/emotional and instrumental factors, derived from the SWB
framework. The particular statistical technique was selected for reasons
of the data type. For this research, the optimal case would have been to
have variables of a numerical nature in order to explorer through tobit or
factor analysis models. The method for applying factor analysis uses
Pearson correlations, which is the most commonly used in statistical
analysis programs. Under this method, the variables tend to be
distributed as normal, so the nature of the data is different, and when
working with ordinal or categorical variables, the analysis tends to be
more complex.
3.4.5. Reflections about the use of quantitative data
One of the most complex issues of measuring subjective factors of public
and private transport users has to do with the objectivation of the
individual perceptions for purposes of quantitative research and
statistical data analysis. For example, one of the survey questions was
looking for an assessment of the physical characteristics and available
facilities close to the respondents’ home location. This question that
seemingly could be easily answered, was more difficult to assess for
users living in low-income areas, as they simply did not have the physical
infrastructure to be assessed. For instance, bus shelters, cycle lanes or
bike sharing system, green public spaces, recreational, cultural and

96
sporty facilities, were some of the examples difficult to assess by people
living in low-income or deprived areas.
Another reflection after sampling is how research can provide an
objective source of information despite evaluating subjectivities from
different individuals. Opposite to what happened in the first case, some
interviewees living in the same area assessed the same existent
infrastructure in a completely (even contradictory) way. Statistical
analysis can help here, by aggregating the values obtained in order to
reduce the impact of outliers. However, when doing so, the perceptions
of the majority are often taken to represent those of the whole sample,
and so mask the perceptions of the underlying minority responses.
Overlooking these minority perceptions could directly affect particular
disadvantaged groups. Subjectivity (in the form of qualitative data) is here
usually more interesting than quantitative data, particularly when
considering human behaviour. People often think that large quantitative
datasets are more rigorous and objective, but they can end up being
superficial. For example, when assessing the state of the public realm,
the aggregative analysis could disregard places in which the public realm
could be critical for the development of a certain community or group. In
that case, most useful insights come from qualitative analysis.
The measurement and differentiation of the capabilities and functionings
is a big challenge of using the capabilities approach. In the first part of
the chapter, the importance of functionings to understand the capabilities
of a person was pointed out. This led towards a reflection on the way of
assessing the functionings-capabilities gap, with an alternative possibility
of measuring ‘weighted functionings’. This means considering the
assessment of certain factors (as the ones suggested from the
transferability of the human capabilities list), based on the levels of
functionings, but weighted according to the levels of importance that the
person attributes to that factor. The quantification of weighted
functionings also allows looking at the level of inequalities that must be

97
addressed by transport policy and practice. This is especially relevant in
cases, for instance, in which the level of expectations of performing
certain activity goes beyond the realised functionings. When having
expectations on using a sport or leisure facility, without being able to
access them, the value of functionings will be lower than the capabilities
(as they represent doings and beings that a person can feasibly achieve).
This is even more critical in sectors of the city or segments of society in
which the capabilities of people are reduced as a consequence of the
lack of facilities, reducing the opportunities of participating in these
activities. When having the facilities, the reduction in capabilities could
be explained, for example, with a person with a high workload and long
travel distances not having enough time to perform sport or leisure
activities. These conditions, exacerbated by the (poor) quality of the
transport system and related journey times, might have the effect of
decreasing this person’s opportunities and therefore her capabilities.
The various ways of interpreting the differences between functionings
and capabilities led into a specific way of discussing the gap. For this
purpose, two ways for assessing the distance between functionings and
capabilities have been defined in the survey.
The first way of measurement considers the assessment of the current
status of a particular aspect (functionings) but assuming that people in
these areas expect to have the greatest possible welfare. For example,
in the case of evaluation of facilities close to home, people can assess
the status and adequacy of educational facilities on a scale of 1 to 5 ("very
bad" to "very good"), but as researcher we assume that the maximum
expected (capabilities) is obtained for people who answer "very good".
An example of this type of question could be: “How would you assess the
space for pedestrian on the sidewalks, close to your home location?”
(1=very bad; 5=very good). This question assumes that reaching the
maximum level of assessment would be preferable for people, so the
question allows distinguishing between groups just based on this

98
evaluation. The higher the score persons give to their status, the closer
they are to reaching their personal capabilities.
The question does not directly ask respondents to report on their
(perceived) capabilities, but only asks them to make a statement
regarding the realised assessment of their functionings. This first type of
questions was combined with a second type, asking about the level of
importance of a particular facility. In this case, the definition of the levels
of importance for that criteria helps when defining the main relevant
attributes for a particular group or segment. An example of such a
question is: “How important is for you to improve sidewalks?” (1=less
important; very important). The answer to this question allows weighting
of the factors assessed. This measurement has been defined as
‘weighted functionings’, as it combines the assessment of actual activities
or facilities weighted according to the priority given to them.
A second way of measuring the functioning-capability gap is by the
relative difference in people’s perceptions regarding a particular variable.
This alternative does not assume that the maximum would be desirable
for the person, and yet asking the level of importance provides a more
accurate way of discussing the weighting of that variable. This could be
used especially for questions related to subjective perceptions of people
about their trips, feelings, emotions, and experiences. For example: “How
do you assess the level of proximity to other transport users that you
experience on your usual trips?” (1=bad; 5=very good). Compared to the
first question above, this one does not necessarily assume that the
maximum level would be preferable or important for people, so the
analysis relies on the second question: “How important is for you the
factor of being close to other transport users while travelling?” (1=not
important; 5=very important). The definition of the level of importance that
that person attributes to this aspect helps for defining the maximum in
which the gap between functionings and capabilities will be measured.

99
Unlike the first measurement method, the second compares the variables
in relation to an estimated maximum. This is different from the first type
of question as we cannot assume a maximum or minimum level of
assessment of this factor, as the users’ perceptions will vary according
to their preferences. We can assume people will want a ‘very good’ bus
stop shelter, but we cannot assume they will want a low or high level of
closeness to people. The difference indicates how distant are the
expectations of the person versus what they can actually achieve the
realization of that activity.
These two approaches have also been applied to assessing the levels of
importance of performing productive or leisure activities; questions
regarding willingness or preferences about transport modes; perceptions
regarding transport expenditure; or aspects related regular travel
experience. The difference in the use of a capability-based approach
compared to more mainstream surveys into these issues is the nature of
the questions, exploring the things people value doing or being that help
them achieve higher levels of freedom in their lives.
3.5. Qualitative Research Data Collection Qualitative data collection has been used in the research for developing
further aspects and complementing the existing information provided by
quantitative analysis. The exploration of quantitative tools in this
research, especially statistical analysis and regression models (Chapters
4 and 5), has allowed understanding some of the factors affecting
disadvantaged groups. Public transport users, women and low-income
segments have been more profoundly affected over time by constraints
produced by transport. However, these tools have not been enough for
covering a wider set of issues arising in the context of inequalities,
especially those that often depend on institutions and policymakers, as
well as the nuances of individual behaviours – which often can only be
understood through face-to-face discussion. A significant challenge and
innovation of this research has been the utilisation of a broader spectrum

100
of methods, combining qualitative and quantitative research for
recognising both strengths and weaknesses.
The use of qualitative methods mainly focused on the resolution of
questions 3 and 4, about the perceptions and importance that institutional
actors attribute to the attainment of social equity, and how that discussion
can be incorporated into decision-making processes.
3.5.1. Semi structured interviews The first qualitative method explored was the use of semi-structured
interviews. Interpreting the results from the first quantitative analysis with
a set of qualitative in-depth interviews with policymakers was important
for cross-checking the information collected. A total of 19 interviews were
held with planners, experts, private consultants and academics in the
field of urban planning and transport (see Table 3.4). The interviews were
conducted to local, regional and national level. Communitarian
organizations pro-mobility and NGOs were also considered in the pool of
interviewees. Background
Type of institution Transport Planning / Architecture Other
Public 2 3 1 Private 3 1 1 Academia 4 1 0 NGOs 1 0 2
Table 3.4. Classification of interviewees, considering the type of institution and their background.
Interviewees have been selected on the basis of the impact their works
have produced on programs, policies and practices. Diversity in terms of
the background was an essential criterion for defining the interviewees.
In the context of Chile, and indeed in other contexts, transportation
planning has been strongly linked to an engineering background -
specifically in transportation engineering. This has limited the ability to
solve the problems derived from transport impacts in a more
transdisciplinary and integrated way. The diversity of background of the
interviewees allows both for contrasting and generating a consensus of

101
ideas, through an exchange of perceptions and knowledge richer in
content. Error! Reference source not found. shows the total of 19
interviewees have been approached for these purposes, being named
throughout the chapter according to the table below (E1, E2, E3… etc.).
Type institution Position Background Gender E1 University Academic Engineer Female E2 NGO Director Activist Female E3 Regional Gov. Project
Manager Architect Female
E4 NGO Director Studies Sociologist Female E5 Public/Private Director Studies Engineer Male E6 Municipality Planning
Director Architect/ Planner
Female
E7 University Academic Engineer Male E8 National Gov. Sub Secretary Engineer Male E9 National Gov. Director Studies Engineer Male E10 National Gov. Sub Secretary Economist Female E11 University Academic Engineer Male E12 Private Director Lawyer Male E13 Private Director Architect Male E14 National Gov. Coordinator
Studies Engineer Male
E15 Private Engineer Engineer Male E16 NGO Coordinator
Studies Geographer Male
E17 Private Director Architect/ Planner
Male
E18 Private Engineer Engineer Male E19 Academic Researcher Engineer Male
Table 3.5. Interviewees, by institution, type of institution, position, background and gender
A series of interviews have been conducted with these experts, of around
45-60 minutes duration. The purpose of comparing these interviews has
been focused on unravelling their underlying motivations, contradictions,
inconsistencies and commonalities in the use of language on the issues
that have arisen from this research. The interviews were conducted
alongside the analysis of similar factors explored in the capabilities
survey with transport uses.

102
3.5.2. Questionnaire design
The previous knowledge of the case study and the definition of the main
theoretical guidelines of the research were the main components helping
to frame the questions. As seen in previous chapters, the first research
questions explored the measurement and perceptions across
unconventional factors, leading to a questioning on how these can
improve the access to better levels of equity through transport projects.
The second set of questions relate mostly to the incorporation of these
factors into current project appraisal processes, both considering the
technical aspects and the particular intentions of institutional actors in
order to incorporate these factors. The aspect of improving social equity
as an underlying motivation is not evident in all cases, so the interviews
have helped understanding this for the purpose of the main question of
this research.
Similar questionnaires were used with the interviewees, considering
different nuances depending on their positions and type of institutions.
The main topics guiding the interviews were:
1. How social impacts are considered, social indicators used, status
of transport project appraisal, current methodology used and
possible improvements.
2. How the current National Investment System helps incorporating
social equity criteria on project assessment. Weaknesses and
strengths of the process.
3. Factors and criteria that should be incorporated in transport
project assessment for better integration of socially equity issues.
Obstacles that the institution faces in order to incorporate these
criteria.
4. Relationship between different government levels, intervention
scales and between institutions. Challenges of integration and
participatory tools.
5. Transport projects that should be promoted in Santiago to better
reflect social equity issues.

103
3.5.3. Analysis using thematic analysis
Content analysis has been defined as ‘a research technique for the
objective, systematic and quantitative description of the manifest content
of communication’ (Berelson, 1952). The nature of the definition involves
the quantitative description of the content that has been communicated.
However, the contradiction with the use of this approach is that it has
been proposed as qualitative analysis technique for this research.
Another well-known definition by Holsti (1969) suggests that the content
analysis would allow make objective inferences by the systematization of
the information received on the messages. The systematization process
could be presented in the manner of codes and themes emerging from
the aggrupation of the main topics named and discussed by the
participants communicating information for the process of research.
Although both definitions help framing the analysis that has been carried
out in this research, the more accurate approach comes from the slope
of qualitative content analysis, that puts the emphasis on the significance
and meaning of the data and categories appearing in the analysis.
The object of the content analysis carried out was based on the
transcripts of interviews. The transcripts were coded, which made
possible digging on the main concepts that interviewees suggested
during the conversations. The most relevant concepts exposed during
the interviews were recorded as codes, though an inductive procedure of
looking for the main topics developed during the research. The result was
a list of 18 codes, dividing into five overarching themes. Chapter 5
developed in detail two of these themes, that were particularly important
for defining policymaker’s perceptions on current project appraisal and
its consequences on equity.

104
3.5.4. Multi-actor multi-criteria analysis (MAMCA)
The extensive and permanent use of cost-benefit analysis methodologies
is one of the criticisms that research discusses, for which it intends to
analyse possibilities both in the theoretical and practical content for
appraisal practices in the transport context. In this regard, changes and
refinements to participatory multi-criteria analysis (MCA) methodologies,
which have the capacity to incorporate a wide range of stakeholders with
the purpose of being an alternative to the traditional cost-benefit, have
been developed during the last years (Macharis and Bernardini, 2015,
Dean, Hickman, Chen, 2019).
Incorporating participatory approaches has been considered as a
relevant qualitative method of analysis for this research. A participatory
workshop with policymakers and relevant actors was organised for the
purposes of this research, helping to recognise and incorporate their
views in the final process of the research. Because of its innovative
nature, it has been presented as a separate mechanism to evaluate the
possibility of incorporating social equity factors in the current evaluation
processes of transport projects. The possibility of incorporating these
processes helps understanding the applicability of both the discussion
and the definition of factors affecting the social dimension of projects.
This has been also a provocative alternative to discuss preliminary
results of this research with some key actors working in the transport and
urban planning industry and public sectors in the context of Santiago.
The idea of choosing a particular project to be assessed in the context of
Santiago, was considered beneficial for testing factors affecting the
equity dimension after the empirical analysis of chapters 4 and 5. The
factors founded to be relevant could be then tested in one particular
project of interest. For the selection of the transport project, the research
takes advantage of the contingency of a transportation project that has
been designed in recent years in Santiago. The project has been called
Nueva Alameda Providencia (NAP) as it is a reconversion of one of the

105
most critical transport corridors of the city. The project brings together the
renovation of one of the structuring BRT corridors of Santiago together
with urban development and urban ecology considerations. The scale
considers the regional level, for the impacts that a regeneration project
of this size could produce in the city. The actors involved in the design
and configuration also acknowledged those different scales, which
became part of the critical challenges of the project implementation. The
complexity of the project is a useful attribute for discussing it under the
lens of social equity, considering the impacts potentially produced after
its implementation. The project NAP will be extensively described and
analysed later in Chapter 8.
The need to complement existing analysis tools and assessment of
transportation projects was one of the problems exposed in the
motivations of this research. In this context, a multi-actor multi-criteria
analysis (MAMCA) exercise is a good opportunity for testing experts’
views on urban planning, transport, public policy and project
management, in the local context. The analysis of the first two empirical
chapters of the research led to think about the need of redefining the way
transport appraisal has been conducted over the last years. Current
appraisal approaches are all expert led (developed by the project
promoter or consultants) and fail to represent the range of population
groups – particularly disadvantaged groups – in the process. MAMCA
allows a much stronger participatory process to be followed, depending
on which actors are included in the process.
The use of MAMCA in the context of this research aims to identify,
highlight and assess the particular opinions of a group of experts
participating in the activity of evaluating current and possible approaches
on project appraisal. The MAMCA allows evaluating different alternatives
on the objectives of the different stakeholders involved (Macharis et al.
2012) and has been increasingly used for decision-making in
environmental policy evaluation due to the complexity of issues and the

106
inadequacies of conventional tools such as Cost Benefit Analysis (CBA)
or Cost-Effectiveness Analysis (CEA) (Macharis and Bernadini, 2015).
Besides these characteristics, MCA allows weighting different criteria,
depending on the assessment of decision-makers, so it might be
estimated in the analysis of authorities and administrative organizations
for research proposes.
Seven steps conform the methodology (Macharis et al. 2012):
1. Definition of the problem and identification of alternatives
2. Identification of stakeholders
3. Definition and weighting of the stakeholder’s objectives
4. Indicators for measuring the objectives
5. Construction of evaluation matrix
6. Ranking of alternatives with strengths and weaknesses
7. Implementation
The MAMCA methodology used in the process of analysing the NAP
project will be explained in detail in chapter 8. Although the use of
multicriteria analysis in Chile has been discussed for 20 years, the
consideration of integrated and comprehensive criteria is still a challenge
for transport infrastructure investment. Moreover, the use of innovative
tools challenges the incorporation of comprehensive criteria assessment.
In this context, testing the NAP project against MAMCA methodology
would be a contribution for the discussion.
The MAMCA activity was conducted during May of 2018, through a
collaborative workshop that was held and co-organized at the Diego
Portales University together with the Observatory of Sustainable Mobility
(SUMO). In total, the workshop had 15 participants: academics (6),
practitioners (6) and government actors (3). The workshop had three
parts: 1) introduction to the project and the problem, 2) appraisal of the
project considering new equity indicators and 3) comments and
conclusions about the use of the appraisal tool.

107
Most of the attendants knew already about the project and many of them
were involved in some degree. Some of them worked in the definition of
the project, while others were involved from an academic side, as
consultants or advisors of some agency related to the project. Introducing
the project to the attendants worked then for building on the same ground
and to present the latest progress on the project so far. The second part
of the workshop considered appraising the project with new indicators
focused in social dimensions. Some of these factors were already
considered in the existent method of project appraisal. The work of
assessing these factors was an individual one, which let all the
attendants working individually with assessment sheets prepared
specially for the workshop. All the factors proposed, and the scenarios of
appraisal used in the activity are detailed in Chapter 7. The third part of
the workshop considered an open discussion with the attendants about
the factors used for appraisal, as well as the (realistic) opportunities of
using these participatory methods in the current context of project
appraisal in Chile. The discussion ended up discussing the possibilities
of using this tool in future plans, within different scales in the territory.
The whole activity was recorded with the attendants’ consent, and the
assessment sheets were relevant for understanding the differences and
nuances of appraisal among the attendants of the workshop.
3.6. Reflections on the use of multi methods approach for research
The process of trial and error in the definition of the survey questions was
interesting. The consideration of a theoretical framework, based on the
capability approach, was a challenge concerning the application of
theoretical concepts in a survey. The prototyping and piloting phase of
the survey was fundamental to understand the applicability of the
questions and the type of information that the survey allowed.
The process of surveying people was carried out face to face. For

108
example, in the piloting phase, when designing the instrument, the
process of surveying was valuable because it allowed to verify which
were the most conflicting questions to understand for people. Once the
weaknesses were detected, it was possible to amend some of the
questions for the final survey phase. On the other hand, this was one of
the most challenging aspects of the research, since the time of fieldwork
was limited, same as the available resources. Techniques such as
snowball and the use of an extensive network of contacts were
fundamental - as well as the selfless help of people that facilitated and
allowed links with several respondents.
Currently surveys in the Chilean context, mostly consider user
satisfaction, focused on the consideration of travel times and the
efficiency of the operation. Using the survey prepared for this research
also opened the opportunity to test the possibility of incorporating new
questions to current project assessment - suggesting new factors for
improving the quality of travel.
The application of the face-to-face survey also allowed an essential
interaction with people who have different socioeconomic realities,
different travel patterns, different daily activities and different needs
regarding transport. All this was very valuable when it came to raising
awareness of what was expected to be fundamental factors in defining
opportunities for people when they referred to transportation. Although
the analysis of the survey has been done through quantitative methods
of analysis, the application of the survey allowed relevant conversations
with the respondents, beyond the questions of the survey. This did not
happen in all cases, but it helped to sensitise around the relevance of
factors that do not necessarily benefit savings in travel times, efficiency
or speed.
The use of interviews with relevant actors in the political scenario allowed
making visible the efforts of this research. Presenting the research topic,
as well as the conceptual and methodological particularities was

109
beneficial for making visible issues that, for now, are not necessarily
relevant in the context of Chilean transportation planning. Currently, most
professionals working in this field have a transport engineering
background, so the approach from planning was, in itself, a plus when
interacting with specific actors. The search for a broader range of
professionals related to issues of equity and vulnerability resolution was
a strategy to broaden the understanding of this issue by professionals in
more diverse areas. This is why some architects, planners or sociologists
were interviewed as experts. On the other hand, the use of semi-
structured interviews also opened the opportunity to understand their
current perception of the problem, as well as their personal and
institutional motivations for incorporating variables of equity in transport
projects.
The use of the participatory methodology in the case of the workshop (in
the specific project of Nueva Alameda Providencia) was possible after
the quantitative and qualitative exploration of the research. It was an
invaluable methodological closure in this sense. On the other hand, it
allowed again to make visible the contents and problems of the research
with the participants of the workshop. The level of the participants and
their interest in this type of methodologies shows that it is possible to
achieve a good level of impact throughout this type of research.
3.7. Ethical issues of the research
From personal experience, I believe that being aware of the importance
of public transport in the operation of the city started when the
Transantiago system was implemented. I had recently entered the
University and, despite living relatively close to the place where I studied,
arriving there was chaotic and complicated. If I was going through that
feeling of chaos, I could barely imagine how it was for people who had
more disadvantages.

110
The problems experienced by someone living much further away, having
to get to work early, and paying the full fare were much more difficult.
This all showed a profound inequality and urgent social challenges to be
addressed. Moreover, the access for elderly people in this context was a
very harmful or at least unpleasant experience for sure. The flat fare and
modal integration were not enough to cover the social injustices
experienced by people that had no more alternative than public
transportation and daily commuting travels of more than one hour. What
would happen to a person in a wheelchair using the Metro? Or someone
with children? What caught my attention in the practice of Architecture,
is that it seemed that these issues were unknown to curricular matters,
and even more unusual for some studying and working at the University.
All the experience of having witnessed and examined from experience
the implementation of a deficient system of public transport was the seed
to develop this research.
Having the early awareness (before postgraduate studies) that the public
transport system means much more than the transfer of people and
goods from point A to point B, was the motivation that led me to develop
an MSc program in Urban Development. In the course of the programme,
I got to share with other disciplines. The development of mobility and
urban development issues do not exist in reality without the consideration
of the other disciplines that contribute to the generation of that city.
Sharing with psychologists, anthropologists, biologists, economists,
engineers, sociologists, among others, was an enriching experience. The
city must be thought and conceived through the generation of a
collective, informed and mutual understanding. The various disciplines
and the academy play an essential role in this development.
The Master's Thesis was focused on the potential of adding functional
programs and activities to metro stations, for enhancing a positive
synergy within the urban environments in which they were located. In this

111
way, both users and residents of these areas could gain the benefits of
connectivity through the consideration not only of mobility infrastructures,
but also the sum of activities that produce value to travel should continue
at the future. While research allowed the understanding of variables to
be incorporated in the projects of urban design and transport
infrastructure, it was possible to both understand management
processes of these projects that made more difficult the promotion of
these spaces. Thus, the social component began to become increasingly
important, as the focus of the discussion was generally and heavily
focused according to economic and operational considerations.
However, the search for more functional and efficient projects in terms of
transport engineering and systems would not necessarily be the solely
answer to promoting better use of public transport. Also, reliability for
qualifying the performance of the system would not be the only important
factor that could solve the standard or the use improvement issue.
Important and well-known theories of distribution of goods would also not
necessarily be the solution to produce greater social benefits. The results
of the first research of the master drew the motivation and the need to
continue advancing in the techniques, processes and actors involved.
The results reflected the interest in both research and practice of building
a city through accessible and equitable mobility.
This present research aims to understand the factors that impact on
equity, the perception of these issues by actors that influence processes
that can resolve these conflicts, and the recognition of the most
disadvantaged groups in society. The research recognises the relevance
of answering the questions of how transport affects social equity, from an
ethical and practical perspective. The reason for using a variety of
qualitative and quantitative methods in this research is that they allow
reaching results that complement each other. The nature of the problem
is so complex and diverse that the response needs to consider the
equilibrated complement between statistical models, the discussions

112
reflecting the results of a participatory evaluation process, and the
rigorous interpretation of a series of interviews. The choice of methods
was also an excuse to push and examine new methodologies in order to
gain experience and resources for future research.
The development of research has considered the ethical discussion of
the personal interpretations – based on experience and the personal
political tendency. However, the research design, data collection,
analysis and interpretation of results have forced to prevail a "neutrality"
free of political colour and social position. This “neutrality” allowed greater
consistency when interacting with actors who had different political and
ideological positions, becoming an advantage to receive more humbly
and maturely the comments of the various transport users (private, public
and active) who very kindly responded to my survey. Another ethical
challenge of the research was about the interaction with different
transport users, who were surveyed face-to-face, with a paper-based
survey. The research recognises the relevance of ethical aspects such
as those detailed below:
• Respondents and interviewees were informed of the purpose and
focus of the interview/survey, and they were informed that they
could withdraw the interview when they consider it necessary.
People were informed that they could request extra information
about the research, channelled through an email.
• In the case of the surveys, interviews and participatory exercises,
anonymity in the treatment of the resulting information was
ensured.
• The survey used a language that does not violate the
susceptibilities of the respondents. On the other hand, the survey
recognises that the interviewees have different educational levels,
so was written in a direct, formal and straightforward language.
For interviews, the questions were formulated in the most a-

113
political way, in order to avoid conflict with the political ideology of
the interviewees.
• The interviewees and respondents are explained that, if they do not understand the content of a question, they can ask for
clarification of what it means.
• All surveys were printed in advance, and the places where the
survey was conducted were safe and quiet. This allowed the
survey to be conducted quietly for the participants.
Regarding the storage and use of information, all surveys were coded
and then transferred to a digital response format. The printed surveys
were kept in a safe place during the PhD – as a backup in case of losing
digital information. The interviews were recorded in digital format, and
kept securely, ensuring the confidentiality and anonymity of the
interviewees. The digital storage of information, both in the case of
surveys, interviews and material resulting from the participatory
workshop, was stored for the entire duration of the doctorate.

114

115
4. Mobility and transport in the context of
Urban Development in Santiago
Santiago is the capital city of one of the countries with the highest levels
worldwide of inequality in terms of socioeconomic distribution. Recent
social demands, exacerbated in the final months of writing of this thesis,
have highlighted the relevance and impacts of the neoliberal economic
model in the development of the city – which correlates with the
construction of the society and therefore shapes the development of
transport infrastructure (see for recent protests and social crisis: Davies,
2019; Guardiola-Rivera, 2019; Sehnbruch, 2019). The transport planning
approach has mainly followed the model of highways and the
dependence of private car, following the North American model over the
1970s-1990s – which in turn, correlates with the current social demands.
As an example of the territorial inequalities, the following Figure 4.1
shows the income distribution based on the data of the Pre-Census of
2012. In the map, colour blue represents the higher income segment,
followed by the green colour (located closely to the blue and also
distributed along the main transport corridors of the city). This is the
wealthiest area of the city that happens to have an important amount of
the main facilities and offices. Therefore, this is the place where most of
the trips come together on peak hour – which has been the perfect
excuse for keeping the vicious circle of the creation of new infrastructure
in these areas. The lowest income segments are represented in red and
orange, which are mainly located in the periphery – and recently attached
urban conurbations. Another important density of red spots is located in
sectors of the southern and northwest area – many of them
corresponding to relocation of former informal settlements.

116
.
Figure 4.1. Map of socioeconomic distribution, Santiago. Source: Observatorio de Ciudades UC (OCUC), 2015.
Current barriers of segregation and social inequality seem to be
accentuated with long distances to main activities. The inconvenience –
and sometimes the inaccessibility – of public transport affects to a large
portion of the users of the entire system. This situation results in an unfair
transport system for the most vulnerable sector of population. Going back
to the concepts of fairness and justice in transport, developed in Chapter
2, it is socially inequitable if different populations have different travel
experiences; it is socially unjust when the situation locates the vulnerable
groups in position of disadvantage that increases their vulnerability.
This situation of wealth distribution and transport modal choice has
resulted in an unjust transport system that is particularly affecting the
most vulnerable sector of population. According to the Origin Destination
Survey of 2012 (Observatorio Social, 2014), the highest percentages of
low-income families per household are located in the south-west

117
extension area (38%), south (27.7%) and western (26%) area of the
metropolitan region, as seen in Error! Reference source not found..
These areas have a high daily usage of public transport (close to 60%)
and very low percentage of car ownership and usage, compared to
wealthiest areas in the East, where 57% of households have a high
household income. The longest trips reported in Santiago are made by
public transport. On the other hand, the households that spend more time
on trips are located in municipalities of the south, south-west and
northern areas – they coincide with municipalities located at the city
edges, which have poor road infrastructure and poor public transport
services.
In recent years, the results from academic research has accentuated the
social inequities as result of transport in the case of Santiago. The
reference to everyday mobility in Santiago has also been contextualized
in relation to other Latin American cities (Avellaneda, & Lazo, 2011;
Rodriguez Vignoli, 2008), but there is much more to be explored in other
regions in the Chilean context. Measuring instruments and new
methodologies have allowed a more accurate and precise understanding
of the social issues arising as consequence of transport infrastructure
and housing provision (Cox & Hurtubia, 2016), and the minimum
provision of basic services (Tiznado-Aitken et al., 2016). However, the
focus on accessibility as a measure of inequities remains predominant
(Tiznado-Aitken et al., 2018; Figueroa Martínez, et al., 2018; Niehaus et
al., 2016; Rojas et al., 2016). Therefore, an analysis from everyday
mobilities (Imilan, et al., 2018; Jirón, 2007, 2010; Jouffe & Lazo Corvalán,
(2010) people's capabilities, opportunities and activities are relevant to
broaden the discussion on this transport and social equity.
4.1. Socioeconomic distribution The socio-economic distribution in Santiago is one of the dimensions of
the problem. Although the previous Figure 4.1 presents the reality of the

118
spatial distribution of the socio-economic groups, there are rough realities
rooted in deep-seated social problems. The roots and policies focused
on the eradication of campamentos and their consecutive location in
villas of homeowners have, for instance, perpetuated a situation of
complex social stigma. On the other hand, the barriers of segregation not
only correspond to the distribution of housing rights, but they are
accentuated and perpetuated through the construction of public
infrastructure, public realm and public spaces.
The following Figure 4.2, produced by Fundacion Vivienda, shows the
location of informal settlements called “campamentos”, and the
eradicated populations in 1985. This relocation of the most vulnerable
families has its origin in the dictatorship, where a municipal reform took
form defining the policies of urban development. The campamentos in
Greater Santiago were spatially relocated between the years 1979 and
1985 (Morales & Rojas, 1986). The neoliberal economic thinking guided
the decision of modifying the location of the marginal and economically
most vulnerable sectors, moving these segments to the periphery. This
resulted in a relocation distinguished by socioeconomic polarization
between rich and poor groups (Morales & Rojas, 1986), which produced
profound disadvantages for people with lower resources. The negative
effects of land markets deregulation processes have already been
commented not only for the case of Santiago in recent decades but also
for other cities in Latin America (Sabatini, Cáceres & Cerda, 2001).
Among the commonalities in these cities are the construction of transport
infrastructure having a high impact on the capture of capital gains.

119
Figure 4.2. Location of campamentos and eradicated populations by 1985. Source: Juan Correa, for the Housing Foundation. 2019.
The relocation of a massive amount of families caused problems of
mobilization and congestion, affecting all the users of a system flowing
daily for activities located in central areas of the city. This happened
mainly in the communes that tended to higher growth, such as La Florida
and La Granja (Labbe & Llevenes, 1986). However, a significant example
is the commune of La Pintana (Gurovich, 1999), where the most
significant volume of eradications of campamentos, both in quantity and
in the total number of displaced people was concentrated in one sector.
Even though the reality of campamentos has improved over the years,

120
numbers are still alarming. At the national level, by the year 2016, there
were a total of 38,770 families living in campamentos, where the most
critical conditions were in the regions of Antofagasta, Atacama and
Valparaíso. In the Metropolitan Region (Gran Santiago), the number of
families living in campamentos by 2016 was 4,337, which represents
11.2% of the national total. More than 60% of these homes earn less than
the minimum wage, and 60% have not finished school. There is a 12%
illiteracy rate. Very few have access to health. 58% have a precarious
job. Community-wide there is a profound problem of broken social
foundations.
Transfer families from a campamento to social housing is an essential
change from the social and economic point of view. The change in
housing causes short-term changes that may be observable, changes
that according to (Alvarez Marin & Wurgaft (1988) will undoubtedly have
other impacts on the society in the future. Getting a family the option for
accessing to their own properties has generated the advantages of
having a place. However, this policy has been also greatly criticised and
questioned, because the challenge has moved now to the segment that
has a place to live but lacks other social components. Rodriguez and
Sugranyes (2005) have delved into the problems of “los con techo” (those
with roofs). In sectors where the population is homogeneous and turns
out to be a disadvantaged population, is difficult to create interaction with
other types of opportunities. Therefore, people who lived in
campamentos and now live in social housing might remain isolated,
perpetuating the circle of poverty.
The relocation of campamentos has been part of the housing solutions
given by the Housing Ministry over time. As most of the state resources
are used for land purchasing, new social housing is located in already
impoverished neighbourhoods far from the city centre. Relocated families
turn out to be more distant from their labour source. Transport
opportunities in these locations are also scare, especially when

121
connected to business and working areas. As consequence, they can
either travel long distances or remain in precarious occupations, with no
choice but isolation. The relocation to social housing has also as
consequence the modification of the jobs to which families can opt. In
Alvarez Marin & Wurgaft (1988), even though after the eradication, the
heads of household did not lose their job, they were affected by greater
mobility.
The case of villas could be even more problematic in terms of physical
accessibility. This is the case for families who have moved to the
periphery but work in central areas, sometimes taking more than two
hours to get to their jobs. Both for campamentos and villas, the relocated
families are left with two options: travelling long distances from their new
home to their old source of work, or working closer to their
neighbourhoods, so they do not have to make such long trips. The
second is often the most complicated option because the new residential
places are located in areas with lower opportunities. Localisation
decisions originate deep problems of physical accessibility to job
opportunities, access to health centres and other fundamental social
facilities.
Life in the periphery for displaced families means the creation of
situations of poverty perhaps much deeper than those lived in
campamentos. The extent of the barriers to access is hence important.
When relating to the concepts of capabilities and functionings explored
in Chapter 2, this is an example in there is a very large gap between the
capability and actual functioning, and hence in participation in travel and
activities. Part of the public policy agenda has focused in the decrease of
poverty over the years. This has appeared in diverse communication
channels, so there is a public sense of improvement in this area.
However, this perception has been created by the expansion of the
margins of what is considered middle class.
The provision of transportation infrastructure and solutions allowing a
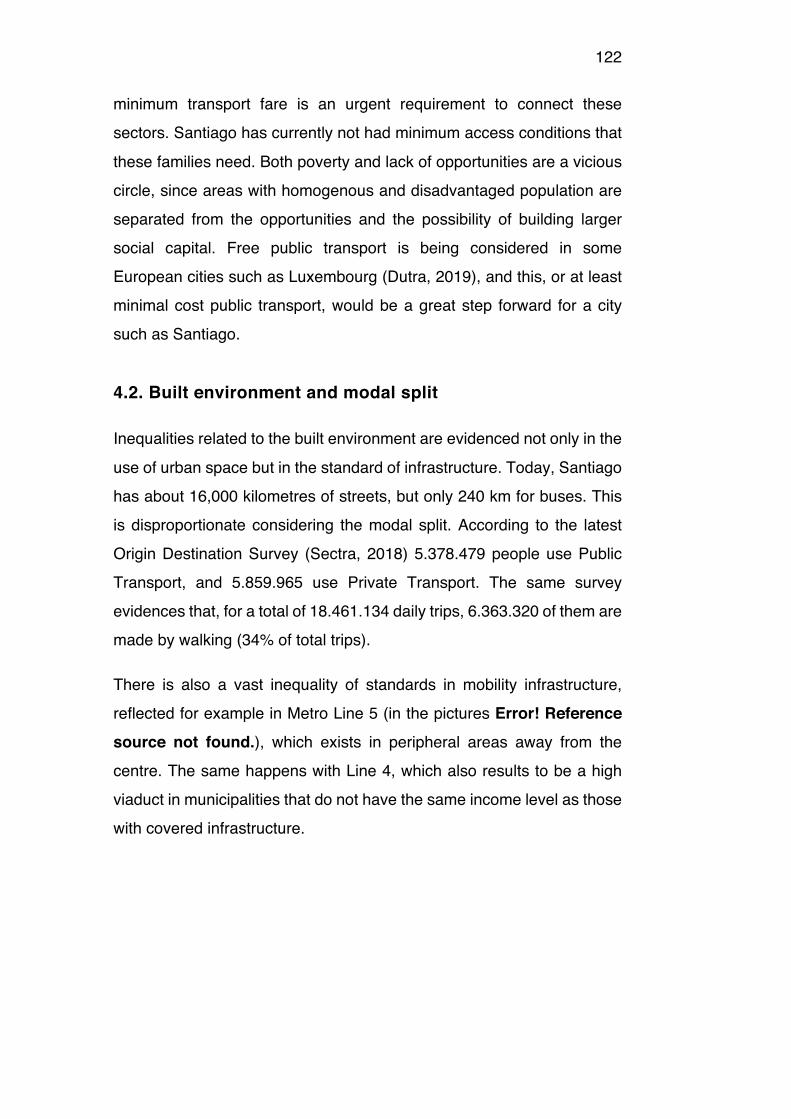
122
minimum transport fare is an urgent requirement to connect these
sectors. Santiago has currently not had minimum access conditions that
these families need. Both poverty and lack of opportunities are a vicious
circle, since areas with homogenous and disadvantaged population are
separated from the opportunities and the possibility of building larger
social capital. Free public transport is being considered in some
European cities such as Luxembourg (Dutra, 2019), and this, or at least
minimal cost public transport, would be a great step forward for a city
such as Santiago.
4.2. Built environment and modal split
Inequalities related to the built environment are evidenced not only in the
use of urban space but in the standard of infrastructure. Today, Santiago
has about 16,000 kilometres of streets, but only 240 km for buses. This
is disproportionate considering the modal split. According to the latest
Origin Destination Survey (Sectra, 2018) 5.378.479 people use Public
Transport, and 5.859.965 use Private Transport. The same survey
evidences that, for a total of 18.461.134 daily trips, 6.363.320 of them are
made by walking (34% of total trips).
There is also a vast inequality of standards in mobility infrastructure,
reflected for example in Metro Line 5 (in the pictures Error! Reference source not found.), which exists in peripheral areas away from the
centre. The same happens with Line 4, which also results to be a high
viaduct in municipalities that do not have the same income level as those
with covered infrastructure.
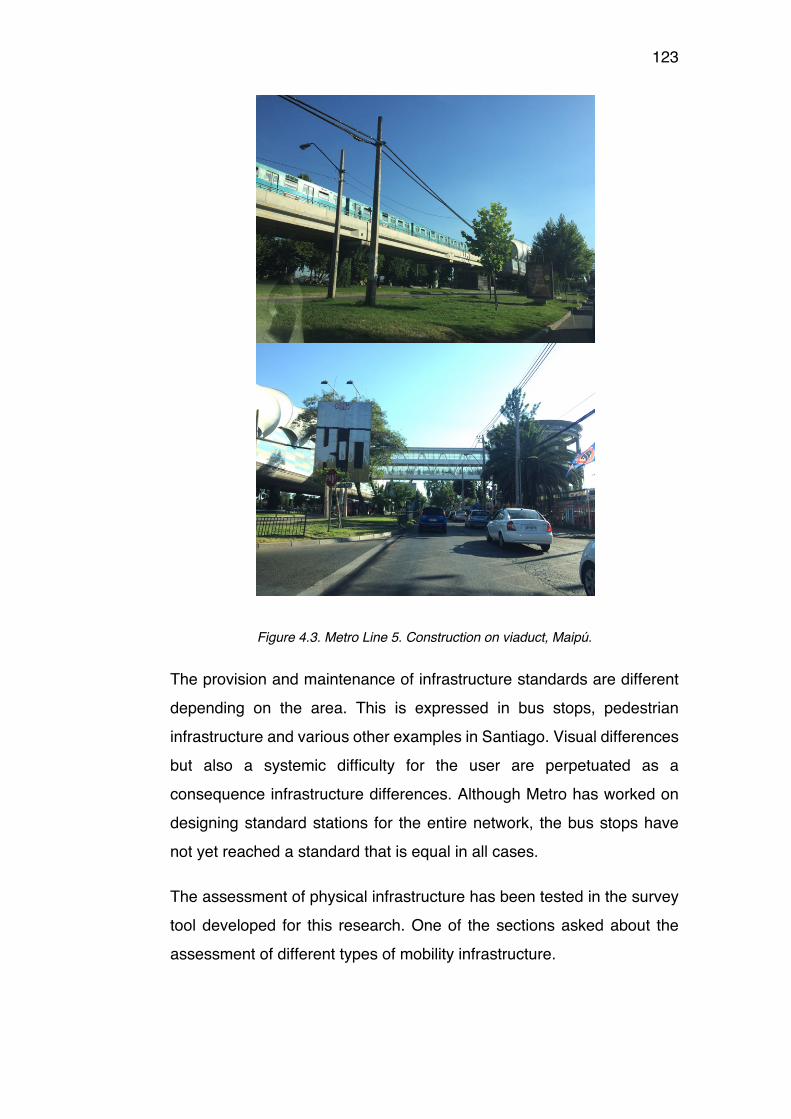
123
Figure 4.3. Metro Line 5. Construction on viaduct, Maipú.
The provision and maintenance of infrastructure standards are different
depending on the area. This is expressed in bus stops, pedestrian
infrastructure and various other examples in Santiago. Visual differences
but also a systemic difficulty for the user are perpetuated as a
consequence infrastructure differences. Although Metro has worked on
designing standard stations for the entire network, the bus stops have
not yet reached a standard that is equal in all cases.
The assessment of physical infrastructure has been tested in the survey
tool developed for this research. One of the sections asked about the
assessment of different types of mobility infrastructure.

124
Figure 4.4. Assessment of public realm by macro areas of Santiago.
The graph Error! Reference source not found. shows the assessment
made by 98% of the participants of the survey. Highest assessment
corresponds to the East – the wealthiest area. Lower assessment
corresponds to areas North and South: the first one with an important
dependence on car; the second one is where a high proportion of low-
income households are located. The questions were asked about the
conditions of the built environment concerning mobility infrastructures,
near their place of residence. The following criteria were evaluated: state
of the highways, space for cars, space for pedestrians, pedestrian
sidewalks, bus stops, seating areas, bike lanes and parking lots. As
shown in the methodological Chapter 3, the division by macro areas
responds to the strong component of territorial segregation that exists in
Santiago. East and South East areas have better economic situation,
while southern and part of the northern area have a high concentration
of low income and disadvantaged people. The graph reveals that there
is, in fact, spatial segregation that corresponds to mobility infrastructure
assessment. In some places the highways go underneath, and in others,
they go up in the surface, regardless of the housing that is next to the
highway, and anyone have any way to protest for that.

125
On the other hand, the raising use of motorised private transport in
Santiago is particularly worrying. The Figure 4.5 Error! Reference
source not found. shows the distribution of car ownership in Santiago.
The darkest areas reflect a percentage higher than 60% of car
ownership, located mainly in the area of the city with the most upper
socioeconomic income - where the main centres of work and commercial
activity are also located.
Figure 4.5. Distribution of car ownership on Santiago. Source: Juan Correa, based on National Institute of Statistics (2012) and Ministry of Public Works (2016).
Regarding public transport, although the recent focus on public transport
was intended to result in more inclusive transport systems, the process
of implementation has led to some difficulties. Segregation deficiencies
in Santiago have got worse as a result of transport policies, which began
operating in early 2000 (Ureta, 2015). However, the more recent crisis of
public transport (which still continues by the time this research was

126
finished) started in 2007 with the introduction of Transantiago system.
Although BRT systems in Latin America are examples of the attempt to
improve transport in vulnerable contexts, the mismanagement of bus
system through the implementation of Transantiago and the saturation in
Metro system during peak-hours has led to a discrediting of public
transport and an increase in the search for alternative private transport
by users. Vasconcellos (2001) explains that all the most major cities in
Latin America were dependant of private bus operators, which provoked
inequalities between people with and without access to private transport.
The deregulation of the system started in Santiago in 1979 with the
operators, followed by completely deregulated fares in 1983. This meant
for Santiago a series of consequences suggested by Figueroa (1990, in
Vasconcellos, 2001, p. 128):
… the number of lines increased by 36 per cent; (…) fares
increased by 169 per cent for buses and 103 per cent for shared
taxis; the annual number of passengers per vehicle decreased by
56 per cent for buses; the share of pedestrian trips in the city
increased from 17 per cent in 1977 to 31 per cent in 1990.
By 1991, Metro de Santiago had a 4% of the share of the market, while
minibuses had 48% (Ortuzar et al, 1993). During the first and second
presidential periods after the return to democracy in 1990 (1990-1994,
and 1994-2000), the main priorities on transport were implementing
major regulations in public transport, followed by the creation of a “more
ambitious reform program that would not only tame micreros [bus drivers]
but fully abolish them” (Ureta, 2015).
The Plan “Transporte Urbano de Santiago 2000-2010” (PTUS)
(SECTRA, 2000) was a document produced for synthesising plans for
transforming the mobility system in Santiago, facing the new challenges
of a growing city for the following 10 years. The strategies of the plan
aimed mainly to modernise and maintain the participation of public
transport; decrease the use of car; encourage the use of non-motorised

127
modes; improve transport safety; preserve the environment; and
rationalise the trends of residence location and activities. The structuring
role of Metro was fundamental on the plan, as well as the creation of
exclusive lanes for public transport. So far so good, until the urge for
having a product for the bicentennial celebrations of 2010 pushed the first
socialist president after the dictatorship to schedule a massive
infrastructure transformation. Therefore, the ideas from the PTUS were
translated into a transport infrastructure plan looking at the bicentennial.
The promise of a society’s world-class public transport system was born
under the name on Transantiago in 2003, with the novelties of being a
single fare system, integrated with the Metro network and based on
feeder and trunk bus lines – run by private bus operators.
The implementation of Bus Rapid Transit (BRT) systems have improved
efficiency and accessibility in some cities in Latin America (Hidalgo et al.,
2010; Hidalgo & Huizenga, 2013; Rodriguez Vignoli, 2008), as is the case
of Transmilenio in Bogotá (Guzman & Bocarejo, 2017; Bocarejo et al.,
2016a; Guzman et al., 2018; Rodriguez & Targa, 2004), the metrocable
in Medellin (Bocarejo et al., 2014), and Lima (Oviedo et al., 2019; Scholl
et al., 2018). However, BRTs in Latinamerica have not either been
exempt of criticisms (Guzman & Oviedo, 2018; Bocarejo et al., 2016b).
The tools of analysis and evaluation of such projects are complex and
depend on the political, institutional, cultural and economic context.
Transantiago demonstrated that the implementations of these systems
are not a formula, but an enterprise that requires many important factors,
but especially a perspective for the city in the medium and the long term.
Transantiago is not the object of this research, but one of the causes of
the crowdedness, inefficiencies and social inequalities produced by the
public transport system in Santiago. Ureta (2015) analyses in detail the
processes and causes of the failure of the system, the disruption and
discomfort for the citizens, as well as the long normalisation process that
subsists until today.

128
As the bus finally approached, usually after they had been waiting
several minutes, they had to fight with the other people at the bus
stop to reach its doors and enter. If they were lucky enough to get
inside the bus, they needed to hope that the device validating the
availability of funds on the Bip! card was functioning (…) Then at
some point they would have to get off and transfer to another of
the new bus lines and/or the Metro, starting the whole process all
over again (Ureta, 2015, p. 96).
One of the social impacts resulting from Transantiago was the immediate
effect to the quality of life of citizens as a result of the poor operation and
infrastructure of the entire system. But probably most important, the
citizens themselves realised the tremendous effect of a bad quality public
policy in their own lives. To the chaos of the early days of the new system,
was added a big shortage in terms of infrastructure in bus stops and
minimum physical elements of mobility needed for proper operation – that
only began to be supplied one year after the operating system started.
Both the authorities and citizens were strongly affected – in political and
practical ways respectively. A robust and vicious circle of discontent was
produced as a result of the failures in the system: car ownership grew up
increasingly and therefore the traffic congestion also highly boosted
affecting in return to the operation of the public transport system.
In relation to cycling in Santiago, the spatial distribution of trips and the
profile of cyclists has changed. The idea of the bicycle as a transport
mode associated with low-income segments and young men is not the
same as 30 years ago. The presence of women has also risen – cycling
modal share for women has increased from 10% to about 30% in recent
years (Sagaris & Tiznado-Aitken, 2017). Furthermore, in the commune
of Santiago (centre), women represent 67% of the trips destined for other
communes (Waintrub et al., 2018). However, it seems a central issue to
review the quantity, quality and type of cycling infrastructure that meets

129
the requirements of women since they tend to better recognize the safety
conditions of the streets (Waintrub et al., 2016). Today the city tends to
an increase in the number of cyclists, although women are only a quarter
of that total.
The strong inclusion of women in the field of cycling reflects another
series of inequities. This time not spatial, but social. Issues of safety and
street harassment are a huge social barrier that demonstrates gender
inequities. Women we are more exposed to street harassment and more
unprotected – which makes the trip different to men. This not only has
consequences at the level of the modal choice but also in the use of
public space. The street harassment has recently been included as part
of a political bill and incorporated as a municipal ordinance in a couple of
municipalities in Santiago. While there is not yet a legal figure at the
national level, the harassed person can report the aggressor, who
receives an economic fine paid to the local police court.
As a matter of context, it is important to note that Latin America has a
serious problem, not yet massively unveiled, of street sexual harassment
that is well evidenced in public transportation. Street sexual harassment
has been defined as a practice of sexual connotation exercised by an
unknown person in public spaces, public transport or on the street
(Garrido et al., 2017). The action affects the victim unilaterally, while the
harasser has no interest in establishing a real communication with the
person who is being attacked. This has a negative mental impact, that
influences the way the person mobilises, evidenced in changes on the
mobility patterns, modes and even implies a dependence to move
accompanied by other people. This violent practice, both in public spaces
and in transport, has been well documented in many publications. In the
context of Chile and other Latin-American countries, see for example
about the definition of street as gender violence (Garrido et al., 2017);
sexual harassment gender differences on safety measures in public

130
transport in the context of US (Yavuz et al., 2010); women’s fears using
public transport (Schulz & Gilbert, 1996); the influence of harassment
over apprehensions and changes in travel patterns on women (Lynch &
Atkins, 1988); and Rainero (2009) from a feminist position on the conflict
un insecurity for women in Latin America.
4.3. Differentiated fare
In the Metropolitan Region, the public transport fare is flat. Travelling from
the periphery to the city centre can cost the same as a 10 minutes trip
inside the city centre. However, and contrary to what could be imagined,
the flat fares do not necessarily favour the reduction of inequities – at
least for certain social groups. The figure below shows the total income
for the socioeconomic groups, versus the percentage of transport
expenses for each group. The information of the figure has been taken
from the Survey of Family Budget (INE, 2018), which provides
information about the monthly expenses of families. In the figure, AB is
the higher income group (more than $6 millions pesos per month),
spending less than 2% of their monthly income in transport. In the
opposite extreme of the figure below, the socioeconomic segment E has
a monthly income that averages $400 thousand pesos and spends
almost 30% of their income in transport.

131
Figure 4.6. Income by socioeconomic segment versus the percentage of transport expenses for each group.
The flat rate has meant a profound advantage for families who, having
less income, must travel more considerable distances to the areas that
have focused the jobs supply. A pricing policy by zone – such as the
London Underground – would be regressive for lower-income groups.
The possibility of adding fare zones in the Metro has been considered,
despite being politically unpopular. The above is due to the high
operational cost of Metro, which is self-financing 75% from user travel.
Nevertheless, even considering the flat fares, daily trips can be
prohibitive for specific segments – as seen in the graph above. While
there is a differential between the use of bus and metro – when combining
both in one trip – there are people whom, still having available the option
of metro, are not able to pay the difference of $30 or $50 pesos in a daily
basis. That is a source of inequality because the bus also implies a longer
travel time.
Difficulties in accessing a public transport fare do not equally affect men
and women. This occurs especially in households that have limited
spending budgets. Paying the price of daily mobilisation for two people
presents not only a logistic challenge, but it also reflects the decision of
which family member can “go out” to work. Currently women do not have
equal remuneration than men, so the scale of salaries and positions is
lower in the case of women. By having access to lower-paid or precarious
jobs, it is even less economically convenient to go to work. Women could
spend as much as 60% of their income in travel to their jobs. This means
that the cost-benefit of going out to work is relative regarding the
household income. The cost of travel is a powerful element of the
decision within the household, and the reason why many women end up
choosing to stay at home. Furthermore, literature and practice show that
the care role continues to be fulfilled to a greater extent by women –
although there are increasing cases in which man shares more

132
responsibility. The permanence and dependence on the house for
women have not only financial consequences but also social, personal
and emotional. This is just an example of how transport fares can affect
directly and indirectly to the gender gap.
4.4. Transport Appraisal One of the relevant actors in the process of transport appraisal is the
DTPM (Metropolitan Public Transport Board), who has the role of
analysing the capital's public transport system comprehensively and
ensuring the proper coordination of the different modes involved in public
transportation in Santiago. This body was formed through a Presidential
Instruction in 2013, as a replacement for the Committee of Ministers of
Urban Transport, with the purpose of more actively taking on the
responsibilities that arose after the start of the Transantiago System,
given the need for greater regulation, control and supervision of the
system. The main task of the Committee was to coordinate and monitor
the actions, programs, measures and other elements of the Urban
Transport Plan for the city of Santiago, which is linked to the Ministry of
Transportation and Telecommunications through an Executive Secretary
who acts as Coordinator Transport General of Santiago. The DTPM
works very interrelated with the SERVIU (Housing and Urbanization
Services), an organization that was born in 1976 as autonomous
institutions of the State, related to the Government through the Ministry
of Housing and Urbanism and that is present in each of the regions of the
country. This organism does not have the planning faculties, but rather
the execution of works of housing services and urban improvement,
housing and urban works.
The economic orientation of Chilean project evaluations has defended a
profitable model of supply and demand that has meant transport has
become a commodity while the user has become a client of these
services. Efficiency has taken a primary role in the assessment of
transport projects, over the quality of service for users, failing in the
133
fulfilment of the expectations on user’s parameters.
In the Chilean context, the National Investment System (SNI) determines
the social impact assessment, which set up the methodologies and
procedures necessary for the evaluation of initiatives that require an
evaluation of public funds.
The SNI acts on all projects that must be evaluated and require public
investment in Chile. This gathers the "methodologies, norms and
procedures that guide the formulation, execution and evaluation of the
investment initiatives that postulate public funds" (MDS, 2018). The
executive power as a whole (presidency, ministries, mayors, governors
and mayors) is the formulator of the decisions and prioritisation of the
projects that must be accomplished. Ministries, public services,
companies and municipalities are responsible for the direct execution of
projects, which is distinguished within the scope of administration.
Investment decisions go through a level of advice, which reviews from a
technical point of view the studies and projects presented by public
bodies. This action corresponds mainly to the Ministry of Planning
together with its different dependencies (Arancibia et al., n/y). The
analysis of project appraisal involves comparing impacts through
different metrics, which result in a final economic benefit. Social prices
(or social value) reflect how the units of resources used in the investment,
execution and operation of a project can impact society as a cost. The
need for standardising social prices has resulted in a list of the most
commonly used resources: social labour price, social price of the
currency, social rate of discount, and social value of time. Transport
projects have mainly used the social value of time, determining the
willingness to pay of passengers to save 1 hour of their trips.
The cost-benefit analysis (CBA) aims to measure well-being at an
aggregate level and “is based on the notion of the rational individual,
where a person makes decisions on the basis of known costs and

134
benefits” (Hickman & Dean, 2018; p.690). However, the use of CBA is
controversial due to its limited spectrum of evaluation, especially in more
complex projects. Some projects have benefits more difficult to identify,
in spite of the value that these projects could provide to society. As these
projects might be desirable for society, the benefits are meant to be
obtained on the minimum possible cost, so the project can be
accomplished.
Today Chile uses two approaches on social project assessment: cost-
benefit and cost-efficiency. Both approaches can identify and measure
the costs, but the difference lies in the appreciation of the benefits; cost-
efficiency uses as main social indicator the CAE (annual equivalent cost),
an index that compares the credit alternatives offered by different
financial entities under the same conditions – which can be measured by
the total amount of beneficiaries of the project. Another index used for
the cost-efficiency approach is the VAC (current cost value), looking
primarily for the minimum cost between two alternatives (MIDEPLAN,
2007). Social transport assessment involves comparing the impacts of
the project through economically acceptable social metrics, seeking for
the approaches that better fit the analysis of the variables. This results in
an economic benefit, better known as the social VAN (current net social
value).
The key for understanding how transport appraisal works today is
calculating travel times with and without the project. Depending on the
scale of the project this is defined for the city or the municipal level. Time
savings is translated into hours per year per person, which turns into
economic savings per person. There are other savings that are
considered as operative savings (fleet) or fuel savings, but mainly the
discussion goes through the savings of people's time. For example, in
the case of Metro, project appraisal focuses on the travel potential for as
many trips as possible – in the framework of the non-generation of
operational deficiencies. The focus is on the system efficiency, which

135
makes the overall travel more profitable – in order to produce more trips
in the future through operation and construction. Time savings is the one
criterion that mainly defines the national investment system.
The inconvenience of having various unsatisfied needs on transport
infrastructure had opened the discussion on other ways of financing
these complex and long-term projects, through concessions and private
investment. The success of the concessioner highways in Chile –
success being seen as the number of highways and economic
profitability for concessioners – has opened the debate towards the
possibility of using this mechanism on other types of mobility
infrastructure, such as metro lines, suburban trains or other more
innovative transport solutions such as cable cars.
The case of concession new metro lines is particularly interesting to
comment on, since Metro has run until now as a state company with
public and private capitals. The construction of the metro lines has been
entirely paid for and financed by the metro operation. On the one hand,
lines 3 and 6 have recently been inaugurated with great success. The
construction of these lines sums 140 kilometres, connecting 26
communes and transporting more than 700 million passengers annually
(Metro, 2017). The construction and consequent inauguration of lines 3
and 6 transcended the changes of government and political coalitions
and fed the network of new users in communes that previously did not
have access to the service. This has resulted in signs of economic,
political and social sustainability over time. On the other hand, the
standard used in the new lines allowed the use of larger and more energy
efficient cars, with stations that guarantee universal accessibility (Metro,
2017). It is important to point out that Metro fare is integrated into the
Transantiago bus fare – part of the complete bus and metro system. This
means that at the regional level, a modification of Transantiago's network
for re-structuring bus corridors will impact on Metro’s efficiency and

136
capacity – at one particular station or at the entire line. Considering the
importance that Metro has on structuring the system, it currently has the
double mission of positively impact not only on the proper functioning of
its internal network but also of impacting mobility at the regional level.
The discussion of concessioning new metro lines has arisen in particular
due to the high confluence of necessary capitals for the design,
implementation and start-up of new metro line projects. This, added to
the positive economic advantages and capital gains generated by the
definition of new stations, has fuelled the debate of a faster expansion of
the network through the incorporation of private capital. While this debate
has not had much impact so far, it is important for setting up the basis in
which terms of distribution capital will be defined considering the
implementation of new metro stations. Positive and negative impacts
produced over the distribution of land capital will be questioned and will
need a normative framework, in a context in which the concepts of the
capture of surplus value of land uses have not been well defined.
Several dilemmas mentioned for the case of Santiago are common in
several Latin American cities. However, it has been relevant in this
chapter the exploration of the contextual determinants that have
deepened social inequalities, beyond the action that transport causes in
the city. Transport appraisal, affordability, car use and the built
environment are key factors that sustain the "visible" differences between
transport users. This recognition of the context allows a better
development of the gaps aimed at this research.

137
5. Unravelling policymakers perceptions
of Social Project Appraisal and
inequalities
5.1. Introduction
The appraisal of transport projects in decision-making increasingly urges
for looking at the best distribution of benefits for reducing transport and
urban inequalities. However, the alignment of those positive intentions
needs a relevant and coherent strategy for incorporating factors that can
actually reduce the inequality gaps between different transport users, and
socio-demographic groups of society.
The deficiencies for project appraisal to assess social impacts are well
known in Chile (see Chapter 4). In Chile and many other contexts
internationally, social project assessment has been developed around
the method of Cost-Benefit Analysis, considering mainly an approach
based on efficiency for almost 30 years. Although this has allowed
comparing costs and benefits to determine the convenience of the
schemes, the need of generating better standards of social equity has
challenged the pertinence of the evaluation that has been applied so far.
The chapter aims to explore how transport policymakers perceive the
strengths and limitations of current project appraisal, and challenges their
perceptions on equity. The approach to policymakers recognises that
they are more familiarised with the social exclusionary framework rather
than more unconventional approaches as the capability approach. The
process of interviewing has considered exploring their perceptions about
the possibility of incorporating new measures (as users experiences,
attitudes, needs, capabilities, among others), and it has challenged their
understanding of the social impacts and transport users’ concerns.

138
This chapter builds upon the secondary research question proposed at
the beginning of this research, about the perceptions of policymakers for
improving social equity in transport appraisal. The relevance of
understanding policymakers’ perceptions relates to one fundamental part
of the literature developed in Chapter 2 (see p.68), about the relevance
of the context and the conversion factors. Exploring policymakers’
perceptions on the current appraisal and notions of equity helps because:
• Understanding the context in which the institutions act is
relevant. This is the space in which the project appraisal,
programs and transport policies are developed.
• The understanding of how unequal the society is could have different interpretations – this will affect in the way the
problem has been and will be solved.
• It recognises that the equity gaps between individuals in a society does not only depend on these individuals. Inequity
is a social problem and a social construct – which requires
the understanding and the actions of the people working in
institutions.
• People rely on they representatives, so the capability for them to change/transform their life conditions will deeply
depend on their representatives, as well as the public
functionaries, private sector and third sector.
This chapter develops a qualitative approach through semi-structured
interviews with the policymakers. The policymakers are from the public
and private sector, academics and ONG leaders, all involved in transport
planning processes. People selected for interviews act in different
territorial levels – considering national, regional and local actors involved
in the discussion.
Some of the findings indicate that they agree not only on the relevance
of discussing equity in transport but also on the need of solving
institutional barriers, processes, interactions and data collection. All

139
these together would help to address new ways of incorporating novel
factors into the evaluation and bringing new approaches into the
discussion.
The first part of the chapter explores the impressions of policymakers on
social project appraisal, multi-sectorial and multi-actor participation. Most
of discussions were widely built on the criticisms to the current
methodologies of the national system of investment, questioning the
focus on time savings and the cost-benefit analysis. Some explorations
in the last years around the figure of concessions also shaped the
discussions with policymakers, as public investment is insufficient to
cover the needs of public transport that could compete with the trend of
car usage. The second part includes impressions of policymakers,
around topics that have been relevant in the development of this research
– although not necessarily tackled in the quantitative analysis of previous
chapters. This exploration of subjects as gender, socioeconomic,
material and cultural inequalities become enriched when analysing the
diverse points of view of people who have worked directly on the political
and technical debate. The third part of the chapter explores the
impressions of policymakers about the factors that should be
incorporated in social project appraisal, considering the inequalities gap
that is still open in the current evaluation system. This aspect has been
particularly important for framing the next empirical chapter, which will
present an assessment method that builds the evidence of more
subjective factors to be included in the process of criteria weighting on
project appraisal.
5.2. Using a social exclusion framework with policymakers
Several formal and informal meetings with policymakers in the Chilean
context reveal that, even though considering social equity issues, their
approach tend to the notions of social exclusion framework, rather than
(more innovative and unexplored) concepts as the capability approach.

140
This has been evidenced as experts will refer to these topics, contrasting
their perceptions and interpretations of the factors that should improve
on transport appraisal. Some of these categories and measures are
explicitly mentioned later in the interviews. They have mentioned that
physical barriers may impose serious difficulties for transport users, as
described in the work of Church et al. (2000). They have suggested that
physical exclusion of certain groups might be a synonym for social
exclusion – which has also been described in Lucas (2004). As
suggested by Preston & Rajé (2007), the policymakers have mentioned
that social exclusion in Santiago is not only a synonym for income-based
deprivation but it is strongly affected by transport in determining the
exclusion of a person, especially by public transport users.
But policymaking has also had the dilemma of increasing mobility for
solving needs, versus increasing the need of mobility with the rice of
activities and opportunities. In the case of socially excluded people, the
increase of opportunities will rely on the production of better means for
mobility – situation that has been criticised in the context of Santiago by
many of the interviewees as the means for mobility act against bringing
the opportunities to people. Another interesting perspective raising from
the interviews with experts, relates to how people can actually participate
in different social activities, taking advantage of the context in which they
are involved. Some of the interviewees refer to the use of some modes
as the bicycle, or the improvement of walkability, as promoters of social
engagement and social activities.
This chapter explores how transport policymakers perceive the strengths
and limitations of current project assessment tools for improving equity,
as well as the idea of social equity underlying current transport policies.
They have been asked about their perception on incorporating new
measures in the analysis (as users experiences, attitudes, needs,
capabilities, among others) and their thoughts on more participatory
approaches for tackling inequalities in transport. Some of the findings

141
show that they do consider there are social inequalities strongly
evidenced in transport. They in general agree both on the relevance of
discussing equity in transport policies and also on the need for solving
institutional barriers along the process.
Some of the concepts that led to the systematic framework for asking the
questions were taken from Lucas (2012, p.107) considering the social
and transport disadvantages leading towards transport inaccessibility
and social exclusion. In the context of this research, the framework takes
the three dimensions used by Lucas: social norms and practices,
governance and decision frameworks, and economical and political
structures. This has been illustrated in Figure 5.1. The idea of social
equity in transport is driven by the centre of the diagram, and the
dimensions suggested by Lucas have been connected to the main issues
detected at the diagnosis and aims of this research. This diagram has
been used for structuring the main topics for conducting the interviews,
in order to answer the question of how the different stakeholders perceive
the relevance of social equity and are able to improve these parameters
in transport.
Figure 5.1. Systematic framework for semi-structured interviews. In circles are the dimensions that explain the relationship between transport disadvantage, social
disadvantage and social exclusion, from Lucas (2012). In squares, the categories

142
explored through semi-structured interviews with policymakers, considering the previous categories. Source: Own production based on Lucas (2012).
The first category in Figure 5.1 explores the perception interviewees have
about the concept of social equity and the idea of a better integration of
disadvantaged groups through transport. This one is grounded into the
context through the social norms and practices, as well as the current
state of governance and decision-making framework. This category
considers questions about the need of improving the transport system in
order to have better equity outcomes; about how people is forced into
particular modes or particular activities because of transport; barriers and
that different population groups face because of the lack of transport; and
how this might affect the opportunities of the most vulnerable groups.
The second category explores the institutional assets and barriers as a
result of the political and economic structure, as well as the context of
governance. It explores the factors and criteria that should be
incorporated in transport project assessment for better integration of
socially equity issues; obstacles that the institution faces in order to
incorporate these criteria; relationship between different government
levels, intervention scales and between institutions. This type of
questions also challenges the integration of participatory tools.
The third category explores elements of transport appraisal and current
assessment policies, which implies an understanding of the current
context of social norms and practices, as well as the economic structure
that allows normative changes to the appraisal system. The type of
questions considered under this category are related to the current status
of transport project appraisal, current methodology used and possible
improvements; weaknesses and strengths of the National Investment
System; dimensions for measuring social equity; how social impacts are
considered; what the role of CBA is.

143
Main topics Type of questions guiding the interviews 1. Perception of social equity and better integration
• Need of improving the transport system in order to have better equity outcomes
• About how people are forced into particular modes or particular activities because of transport
• Barriers and that different population groups face because of the lack of transport
• How this might affect the opportunities of the most vulnerable groups.
2. Institutional assets and barriers
• Factors and criteria that should be incorporated in transport project assessment for better integration of socially equity issues
• Obstacles that the institution faces in order to incorporate these criteria
• Relationship between different government levels
• Intervention scales and between institutions
• Integration of participatory tools. 3.Transport appraisal and assessment policies
• Current status of transport project appraisal
• Current methodology used and possible improvements
• Weaknesses and strengths of the National Investment System
• Dimensions for measuring social equity • How social impacts are considered • What the role of CBA is.
Table 5.1. Summary of the main topics and questions guiding the interviews, under the dimensions of the systematic framework.
The analysis of the interviews has been conducted using content and
thematic analysis in order to quantify and develop a description of the
main topics described in the interviews, systematically and objectively
identifying the specific characteristics of the material (Mars et al. 2016).
The interviews collected have transformed the information into
categories, helping to structure the main themes that have shaped the
differences and similarities between the interviewees (Vaismoradi et al.,
2013). Both analyses have helped framed a qualitative and exploratory
approach. All interviews were explored in depth with transcription boxes

144
for a better assessment of the information. Under the umbrella of the
thematic analysis, transcripts were useful for an inductive process of
coding the raw data from interviews, recognising the important concepts
in the data and encoding them for further interpretation. The inductive
characteristic of the process allowed the theory to emerge through the
codes, from the data. Coding the interviews has helped for exploring the
main concepts that interviewees have suggested and repeated during
the conversations. Thematic analysis has mainly helped shaping the
most relevant values and concepts exposed during the interviews with
experts. The inductive process of coding ended up producing 8 codes –
after the grouping and organization of several of the codes that emerged
from the analysis. The codes were grouped according to their conceptual
relationship. The themes did not follow the same inductive process.
Although the codes were emerging from the discussions with policy
makers, the themes were determined by the theoretical framework for
approaching to the interviews. The determination of codes was followed
by the aggrupation of them into three pre-defined dimensions of the
systematic framework: perception of social equity and better integration;
institutional assets and barriers; and transport appraisal and assessment
policies.
Codes from the interviews Link to the systematic framework
Gender inequalities 1. Perceptions of social equity and integration
Economic Inequalities 1. Perceptions of social equity and integration
Physical inequalities 1. Perceptions of social equity and integration
Coordination, competences and integration
2. Institutional assets and barriers
Civil society and communities 2. Institutional assets and barriers
Cost-benefit analysis 3. Transport appraisal and assessment policies
Concessions 3. Transport appraisal and assessment policies
Time savings 3. Transport appraisal and assessment policies
Table 5.2. Codes and themes emerged from interviews.

145
The following sections are based on the analysis and results of the
interviews, considering three of the five themes emerged from the coding
and thematic analysis process. Each section follows one of the selected
topics on Error! Reference source not found., with subsections that
have developed some of the most relevant codes recognised in the
analysis.
5.3. Results The results from the analysis of the interviews have not consider a
quantitative approach. However, the following image created by using
word frequency analysis with the all the transcriptions from the interviews
allows to visually understand the most repeated words – coinciding with
the themes suggested as part of the thematic analysis. The nuances and
emphasis between the different interviewees have been suggested in the
subsections below.
Figure 5.2. Word frequency cloud with the most repeated 40 words from the total of the interviews. Source: own production based on interviews with policymakers.
5.3.1. Gender inequalities
Perceptions of experts and policymakers regarding vulnerable groups,
specifically about topics as gender, economic and physical inequalities

146
were some of the topics revealed by the interviewees in this research.
Which might be considered as odd, is the interview guideline not
considering specific questions related to gender. This occurred because
the design of the interview questionnaire derived from the preliminary
survey results, which did not produce significant differences in terms of
gender. However, when analysing the interviews, gender differences
appeared as a key element for pursuing more equitable outcomes. Thus,
it has been incorporated and investigated deeply in the analysis.
a. Care role and chained travel
Care role and chained travel has emerged as one of the issues around
gender inequalities. Mobility patterns between men and women are
different, as it is still a country in which male population leads the majority
of the labour force. E2 (activist, female) refers to this situation from her
involvement with cycling groups of men and women. She says that the
"pattern of mobility of women is different than men's because women fulfil
more diversified roles, having more responsibilities than their partners.
The result is women having to make several chained trips and several
activities during the journeys” – which is supported by academic
evidence, e.g. Primerano et al. (2008). The trips are much more complex,
and often the fact that they are chained is related to their care roles with
another family member (in the context of Chile, see Sagaris & Tiznado,
2017). This implies for women spending more time and money than men,
when men tend to have, in general, a more linear travel pattern going
from home to work and vice versa. It is possible to observe to a greater
extent that men tend to own the car that the household have, as men still
act as family head. This implies that "in many sectors, even in middle-
income sectors, men takes women to work and then women remain
alone (...) [woman] is left without means" (E2, activist, female).
How does transport affect the multifunctional role of women? Diverse
transport and mobility factors can influence the role of women. Already
mentioned is the predominant car ownership by men when compared to

147
women and the consequence for woman to use other means of transport
– mainly public transport in the form of buses and metro (E19, engineer,
male). For understanding how transport affects the multifunctional role of
women is then relevant to understand the fare system. When
Transantiago started its operations trial period in 2003, a single fare
system was stablished integrating the buses with the Metro network and
based on feeder and trunk bus lines. This would be run by private bus
operators, with contracts that changed over the evolution of the system
in the following years. The flat fare means that distances farthest from
the centre do not imply a higher cost. On the other hand, the current
system allows a transfer bus-bus, bus-metro, or metro-bus, charging the
same rate for an hour range - except for an extra delta in case of taking
the metro. Nevertheless, the analysis of time and space are not enough
to make an exhaustive analysis of the social implications that these trips
have for women (Sagaris & Tiznado-Aitken, 2017).
b. Labour inclusion for women
Results from the interviews show a perception of opportunities and
barriers for getting employment as another key aspect in the attainment
of more equitable transport. E4 (sociologist, female) describes from her
position on one of the most relevant Chilean NGOs promoting both
emergency and definitive housing in Chile. She differentiates men and
women regarding the possibilities of accessing a job. "For a family, a
woman going to work is complicated" because in the equation should be
considered issues of family time and household money that are not
questioned or analysed in the case of man. Women "could spend as
much as 60% of their income in travel to their jobs", so the cost-benefit
of going out to work is relative regarding the household income. This
comparison gets more exacerbated when transport costs are high since
"she will spend more money on transporting, compared to the benefits of
having a job". The solution in most cases is "to stay in the house, take
care of the children and save that expense". Furthermore, women who

148
are in a more vulnerable situation do not usually have a job but have
more than one, which is added to be in charge of family activities - what
in turn increase transport costs. In this case, the flat fare mentioned
before is not enough for equalising the roles or encouraging women to
be included in the labour force. These factors have implications for
transport policy if we are to think how access to activities can be made
more equal. The capability is in effect in place, yet the barriers to access
(cost) mean that the level of functioning for females is lower.
Although the benefits of children being accompanied and cared for during
the first years of life have been reported in various studies, this role
continues to be fulfilled to a greater extent by women. E4 (sociologist,
female) affirms that the cost of covering the fare of the transport ticket
plays a fundamental role in this decision, since "women stay in the house,
take care of the children and there are no changes. And even if you say
you have to go to work, the budget and salary are not sufficient". The
permanence and dependence on the house for women have not only
financial consequences but also social, personal and emotional. The
"women, being shut in the house, have very low self-esteem because
they do not do anything remunerated and economically productive" (E4,
sociologist, female).
The cost of travel is a powerful element of the decision within the
household, and "that is why many women end up choosing to stay in the
house". The cost is also related to how to handle parenting or take care
of them while they work "(E4, sociologist, female). Moreover, currently
women do not have equal remuneration than men, so the scale of
salaries and positions is lower in the case of women. By having access
to lower-paid or precarious jobs, it is even less economically convenient
to go to work (E2, activist, female). For low-income people, it is very
costly, in relative terms, to go out to work, which has been stigmatised by
the misinformed, short and judgmental perception of some people that
consider this segment as "lazier" than others, a condition that might

149
explain their socioeconomic status (E18, engineer, male).
c. Local scale and active travel
Local scale is where the support groups, as well as the construction of
social capital for communities, play a fundamental role. E4 (sociologist,
female) has emphasised that transport accessibility to jobs is not the only
key allowing an improvement on social issues. Techo para Chile
(TECHO) works as a housing association and NGO that has developed
an exhaustive work with communities of the poorest sectors of Chilean
cities, with an especial focus on informal settlements. They have not only
made possible their access to definitive housing but have worked with
the community in the implementation of measures promoting progress in
the creation of social capital. When the problems of accessing to
transport are not solved in the short, medium or long term, the generation
of these networks of opportunities becomes a real possibility to move
forward. TECHO have developed manual and productive workshops, on
a micro scale and at a walkable distance from the households specially
for women – since, compared to men, they stay more at home.
Pedestrianisation and on foot accessibility are relevant for enabling trips,
which are a declaration of openness of opportunities, especially for
women. "When women join the workshops, they realise that they can do
things they did not know, and we can give account of this with surveys
and evaluations," said E4 (sociologist, female) regarding possibilities at
the local scale. Active transport modes that allow reaching medium and
low distances, such as the bicycle, are ways that "better channel women
needs" (E2, activist, female). When women use this vehicle is when the
bicycle reaches its most significant potential. The promotion of the bicycle
is one of the factors that can promote greater inclusion of women in the
labour market.
Despite these benefits, the promotion of active transport modes remains
controversial from a strategic point of view. One of the interviewees (E17,
planner, male), from his position of a male urban planner, refers to the

150
"disruption" of the bicycle as an elitist phenomenon that, far from
improving the life quality of people with fewer resources, hinders their
possibilities to access better transportation. For him, the bicycle "has a
problem of scope and coverage, as well as a gender and age issue".
When referring to gender, he does not only suggest the existence of
inequalities for using the bicycle, but it procures a condescending tone
about the physical resistance and condition of women, that would be
placed below the possibilities of men. However, if that interpretation was
not for health and physical resistance conditions, but for cultural norms,
it could refer to the social barriers existing today regarding the use of
bicycles by women. "The subject of sweat and perspiration in our
countries is taboo; a woman cannot walk sweaty, is a bad culture, is being
ordinary" (E2, activist, women), as commented by one of the female
interviewees.
5.3.2. Economic inequalities
Economic inequalities have been visible in previous chapters since
quantitative analyses have highlighted the socioeconomic income
variable as a significant aspect. The interviewees have been asked
throughout the conversation about various topics, and most of them have
spontaneously presented a vision of the problems and difficulties
associated with lower income people, mainly when they refer to issues of
social equity. As mentioned in Chapter 1, territorial inequities are evident
in the context of Santiago. Socioeconomic differences are reflected in the
way people are distributed in the city, the way they access work centres,
schools, health centres, etc. However, there is also "a high correlation
between people who drive in the city with the level of income; it is
impressive" (E8, engineer, male).
E17 (planner, male) points out that "today 80% of bus users are people
who cannot have a car, who can only to use buses to travel with no other
mean". However, he also points out the urgency of having a better public
transport system for not adding new car users, so that "people who

151
currently use public transport do not start using the car, because 7% of
those people have left (public transport) in these years".
Where is the real focus then? Is it about solving the lack of public
transport or not contributing to traffic congestion? This represents a
dilemma and a challenge for urban planners since the use of car versus
public transport becomes a vicious circle, challenging to solve. Planners
understand that most public transport users have low incomes, which
causes an economic burden for the State having to provide better
coverage and service to lower income areas. However, a public policy of
providing public transport infrastructure mainly on peripheral and low-
income areas perpetuates, even more, the stigmatisation of the use of
public transport, since this infrastructure is not prioritized in high-income
sectors. Naturally, a greater transit coverage focused just on peripheral
areas, will allow a continued automotive growth in wealthier sectors of
the city. The decision of reinforcing lower income sectors with more public
transport has been directly mentioned by E10 (economist, female) as a
State policy. She points out that "the portfolio of projects that has
transportation is much more localized in lower income municipalities ...
that is a political decision at the end of the day!” This political decision
has resulted in a persistent perception of users that public transport is for
economically disadvantaged people. There is an issue of adaptive
capacity, in that the disadvantaged groups get used to a low quality of
transport provision, either with or without public transport – and not even
the BRT is of high enough quality and extensive enough to allow easy
and comfortable access across the whole city. Hence activity
participation remains restricted for a large population cohort.
The actual location of existing public resources for the construction of
transport infrastructures is an area in which the opinions interviewees did
not converge, as seen below:
If you see where these resources are located, they are on metro
lines, which are probably where the most vulnerable people live,

152
but also where the largest population lives. In other words, the
MTT [Ministry of Transport] will not finance a project in Las Condes
[one of the wealthiest municipalities] with a national budget. If the
municipality wants to fund a project, well they also have to go
through a cost-efficiency evaluation (E10, economist, female).
This contrasts to E19’s opinion who considers that state (national)
resources are mainly located in high-income communities:
The problem is that if you do not cut the vicious circle, you end up
always investing for the same people. Let me put it not only in
socioeconomic terms but demographic ones. If you do a social
appraisal, then almost all the investment will go to the eastern
[wealthiest] area because the number of people benefited is more
significant. (E19, academic, man)
This 'national budget' refers to public funds directed for the construction
of transport infrastructures. The outstanding peculiarity of the first
statement is that contradicts the facts. One of the most expensive
projects in recent years in Santiago, Rotonda Perez-Zucovic (USD 148
million), has just been completed. The interurban highway project links
the wealthiest municipalities with the central business district sector of
the capital. The project significantly improves traffic in this area.
Presumably, this project was approved with a high score in its project
appraisal, since it is one of the most congested places in Santiago. These
types of projects feed the dilemma and the previously presented
challenge for planners. The higher income per capita, means a higher
level of development, which end up meaning more people are attracting
more trips. Moreover, "groups with greater access per capital make more
trips than lower income groups" (E19, academic, male). In the end, we
can see that the low income groups are very unevenly distributed, and
tend to be located in the more remote southwest neighbourhoods.
Providing effective public transport connections to these dispersed parts
of Santiago is very difficult due to cos issues. There is a correlation

153
between income capacity as a way of understanding development
through a higher number of trips – a dilemma that perpetuate the vicious
circle of producing more time savings in areas where more people are
located – and wealthiest people are located as well. Since the wealthiest
sectors produce more trips, there are more savings and the infrastructure
is deemed to have more value.
5.3.3. Coordination and competences E3 (architect, female) presents an example to show the lack of
coordination between the different sectorial bodies. From her work at the
at the regional level, she mentions the case of the implementation of two
initiatives held in parallel: improvement of sidewalks and improvement of
the road for buses in a municipality of limited economic resources in
Santiago. She explains that the development of the s, in this case, was
problematic and could not be solved only by the lack of coordination of
the institutions involved: the DTPM, MINVU through SERVIU and the
municipality. As it was a public space of joint domain, the institutions
could not resolve the definition of budgets, works and construction of the
sidewalks of the sector. The problem of the inadequacy of transport
projects has to do with the responsibilities of who is responsible for the
results of these projects. In the case of BRT projects, for example,
"mobility corridors should be triggers for major developments - taking the
logic of Metro" (E3, architect, female).
From the view of a municipal planner, E6 (architect, female) presents a
different perspective, since as local planners they need to pass the
projects through the standard evaluation of projects, which are focused
in providing benefit to as many people as possible. The scale of the
intervention is one of the main factors that are assessed for the project
to be carried out. The problem is that projects that benefit small sectors,
minorities, or even walkability projects, tend no to be a priority. There are
also obstacles when it comes to resolving conflicts at the sectoral or
regional level. The advantages of the association between different

154
municipalities allow generating projects with a scope of a bigger scale.
For example, the scheme of public bicycles in Santiago has its origin in
the communes of Santiago and Providencia. Nine other communes were
added to the initial circuit because the Regional Government promoted
the project with political and economic resources – which allowed a more
significant development of the cycling network as a whole.
The academy can also play a fundamental role as a bridge between
government agencies and the knowledge of research. E7 (engineer,
male) comments on the little conversation between the different entities.
Research centres that have the resources and knowledge for
researching about these issues do not frequently have the
communication or strategic channel to generate changes in the
ministries' thinking structure. These type of problems of coordination and
competencies suggest the lack of sensitivity that the transport sector has
had with the effects of the construction of this infrastructure with the built
environment. This also shows the lack of a correlation between politics
and practice, as well as the theory that is very limited in public affairs.
5.3.4. Civil society and communities
Interesting concepts related to social capital of the most vulnerable
people and groups came out of the interviews. The role of communities
and democracy in decision-making is fundamental to promote social
mobility. Moreover, there are certain transport modes - mainly active
transport over public, which can favour local dynamics benefiting
disadvantaged groups. E2, for example, refers to the use of "the bicycle
as a vehicle for social mobility", associating to physical and socio-
economic mobility. This vision is, again, challenged by planners with a
more statist profile (as E17 and E19), harbouring the idea that the bicycle
is an elitist mode, as mainly middle and high-income users can actually
get to work by bicycle because of the short distances. Nowadays,
however, there is a much prominent general perception that it is relevant

155
to promote the massive use of the bicycle.
Beyond the notion of being a "social vehicle", the bicycle can also
promote the potential of other scales of the territory. E2 has underlined
the relevance of this mode as an "instrument of social cohesion and
cultural transformation of today's society". She suggests that the bicycle
boom in Chile is the product of a social appreciation of the bicycle and
the cyclist. At the beginning of the 80s in Chile, the use of car reigned
over the definition of cultural patterns. A famous television advertisement
showed a man going to his fiancée’s house on a bicycle, while all the
people on the street shouted to him to buy a car – anecdote mentioned
by one of the interviewees but well remembered in Chilean context.
Today the trend points towards the use of sustainable modes and
advertising, a powerful tool these days, has made room for new ways in
which the bicycle is a container for advertisement. There has been a
process of massive increase of the bicycle use in Chile, starting with the
middle income sector, and then spreading to other social segments. It
has been a process that, although can be considered fashionable, is
worthy since people of middle income tend to set the trends.
E2 explains the reasons behind the slow incidence of bicycle use in Chile
and Latin America in general. Cultural, economic and even political
patterns in the 70-80s had shaped the current patterns of many grown-
up adults that had not had the opportunity of riding a bike when they were
younger. So indeed there is a fundamental learning process and very
necessary to do for future generations. E2 suggests that, as human
beings, we are self-displaced individuals, so it is essential that people
can experience walking and cycling in cities that allow this to happen.
She suggests we make more prominent efforts on incorporating active
travel in children's lives, as well as the feelings of freedom and autonomy
while experiencing travelling.
Going back to the idea of social capital, other modes can also promote
more opportunities in different territorial scales and range of people.

156
Metro, for example, can reduce waiting times by shortening distances,
integrate the city, and is a democratic element of a good standard (E12,
private, man). Metro can also be the articulator of other activities beyond
transit so that users can access more facilities, goods or intangible capital
while travelling. Chain activities could be an opportunity for users and
inhabitants in cities (E5, public/private, man). However, real estate
developers, who have made the most of the economic advantages of
location and land value, have gained an important part of this capital.
Capture of generated capital gains in the urban environments nearby
metro stations has more potential than what has been developed so far.
Urban transformations of these characteristics imply the participation of
public and private stakeholders, as well as community members. Today
the challenge of building these new infrastructures must necessarily be
associated with the creation of new benefits for cities and communities.
The challenge is in the involvement of the communities. E4 has worked
from her role in TECHO, reinforcing community leaders and the social
weave. They have taught them to organise themselves so that they bring
up their own demands as a collective structure. An organisation such as
TECHO do not decide what is better for them but helps to generate links
between the communities and the municipalities or the regional
government. They cannot solve the problems of the communities directly,
so even functioning as facilitators, the idea is for the communities to get
up and take their own networks. The emphasis is on empowering the
community to have the interest to solve their problems. The approach
also considers fostering democratic communities, as having the same
leaders perpetuated in change could generate disinterest of the people,
turning into something less democratic on time. Afterwards is about
looking for ways in which more people can have access and interest to
participate, to have a community, to democratically elect a representative
who effectively speaks to the needs and interests of the people (E4,
NGO, woman).

157
Unfortunately, generating social capital together with communities is a
significant challenge2. The individualisation that exists between each
other reaches critical levels: "nobody trusts anyone, nobody trusts the
neighbour" (E4). Amazingly, friends are the people who people trust less,
"it's hilarious because friends are what you choose". The interviewee
explains that neighbours are located after the friends in this scale of trust.
Community leaders are trusted the less.
This self-generated and governed vision from and by the community is
opposed to the perspective of other interviewees, who consider the role
of NGOs to be paramount, especially in the areas in which the transport
component should be channelled. "The more mature organisations in
these [transport] issues are those that should lead the processes, since
in general, they are the ones that remain throughout the entire process,
participate more actively and serve as a bridge between municipalities,
regional governments and the communities" (E4, NGO, woman). NGOs
also ensure that decision-making processes within the community are
more democratic since sometimes community leaders make decisions
without directly consulting communities. On the other hand, the role of
these organizations has been highlighted, since the central point of their
existence is the focus on social equality:
2 TECHO starts with the families, especially with women and children. When working with children, all is a pursuit of community development, as they have built a program
looking to gather children from different areas and in the same place so that they are together. If the children get to know each other, the parents would potentially also meet, so the program seeks to improve the interpersonal relationships of the children and adults. The work with adults relates to other economic and productive activities. If a neighbour knows a craft skill, she teaches it to her neighbours, called "Popular Learning Workshops". Then TECHO injects capital, and the first thing it seeks is for people to get to know each other and the community itself to teach. They have training, and that can sell their work later.
158
"In a way, the whole nucleus of people in this group [NGO] are
social fighters, people who have fought in the field of culture, the
arts or directly from working population. All with a search for a
fairer, more balanced society, where people are freer, more
autonomous and more empowered" (E2, NGO, woman).
5.3.5. A limited transport appraisal
There is a consensus among various interviewees about the benefits of
using time savings as main criteria of project assessment. E5 (engineer,
male) and E18 (engineer, male) have highlighted the idea of time savings
as a personal resource that can be used in other areas of people's lives.
"The greatest benefits of transport infrastructure projects are
related to travel time savings. Therefore, it is about saving
people’s time that they can use in other activities, with the time
they are no longer using in transportation. That is the main reason
why these types of projects are built. "(E5, lawyer, male)
But can people actually realise these time savings? Going back to the
concepts reviewed in the first literature review chapter of this thesis, this
is in the line of generating the (time frame) capabilities space for people,
for deciding over their own life. Having more time would allow them to
choose wisely the activities they want to perform, from spending more
family time or complementing their daily activities with leisure time. While
this sounds logical, it is more likely that the perception of the minutes
saved in travel time would not be enough for a person to perform another
activity - or benefit from these savings to strengthen other aspects of their
lives. Often a project is justified in terms of saving very small time savings
for thousands of people – hence the actual impact on any individual is
marginal.
a. Incorporating standards It has already been commented that transportation projects in Chile are
evaluated through cost-benefit methodology through time savings.

159
However, some interviewees have commented on the way of
establishing the minimum standards that are allowed to save those costs.
E10 (economist, female), for example, defines that "the cost-benefit
methodology has always been by standards, taking care of the minimum
cost to provide a service, but it has to consider certain standard levels".
She does not define the minimum quantity or the minimum standard but
reveals that these are defined project by project. This discretion, as
suggested by E18 (engineer, male), is one of the significant deficiencies
of the Chilean system, as it depends on discretionary decisions.
"It would be ideal to generate a parallel methodology to the social
evaluation that allows decisions that seem logical but that have no
technical support (...). In Chile this has been done with
discretionary tools - basically a certain budget per quarter. The
arbitrariness and the lack of technical support behind the reason
is critical "(E18, engineer, man).
From academia, the incorporation of standards has been studied as a
much more efficient element in the inclusion of qualities and benefits in
the projects. The definition of standards allows the evaluation not to be
project-by-project, but to catalogue the types of projects that have a
certain quality standard. E1 (academic, female) says, for example, that
adding benefits to the evaluation (or new factors to measure) is an
alternative, but the incorporation of standards would work much better
and would be more efficient, since there are ranges that cannot be
smaller or surpassed (noise, cleanliness, vibration, comfort, quality of
urban space, etc.). The difficulty, she points out, lies in defining the list of
indicators that should be included and then the minimum and maximum
ranges for each indicator, which should be based on studies, previous
cases and based on the national context. This is particularly important for
this research, as one of the aims reflects upon the factors that can better
contribute to improving social equity or reducing gaps of social
inequalities between social segments. Lucas (2012), mentioned in the

160
systemic framework for building the interviews, helps on this by
suggesting the use of measurable methodologies and metrics for helping
the improvement of public transport standards:
"Metrics are needed to establish the minimum level and standards
of public transport which are necessary for social inclusion given
certain distances, densities, levels of services, etc. and local
targets set to achieve these within given timeframes. To achieve
this goal, social inclusion also has to be an explicitly stated
outcome within service contracts with public transport operators."
(Lucas, 2012, p. 112)
Beyond time savings or distances, adequate progresses on improving
project appraisal in Chile has been delayed. According to E18 (private,
male) this is consequence of looking just at the current picture of the
situation, without foreseeing the long term. The problem with the current
picture relies on the concentration of investment in the places that have
the highest number of people, where the most significant number of jobs
and the most affluent people are located as well. There is a perverse
incentive to invest because where there are more people, which means
more time is saved. Wealthiest areas are favoured with these measures
because this is where numerous trips are produced. Cutting the vicious
circle is the challenge, for to stop ending up always investing for the same
people.
b. Questioning the nature of project appraisal
A critical issue of project appraisal is how this can help to solve other
problems such as social equity or urban space issues. Vulnerability,
segregation and extreme poverty, which are presented as categories of
evaluation and budget definition from the Ministry of Social Development,
should necessarily be coordinated with the budgets and willingness of
other ministries.

161
The discussion with E3 (architect, female) allows inferring that the failure
in project assessment has to do with singling out the transport project as
the only object to be evaluated, considering only the mobility attributes
on the engineering project. In this case, projects that have combined
natures between ministries could be managed and executed with an
active social objective associated with the resolution of these problems.
However, one of the significant difficulties of state projects in general in
Chile is the strongly sectorial vision – despite the need of these projects
to be solved systemically. According to her, the success of the
methodology of project appraisal should be channelled into a more
integrated assessment of the project, this being the factor that prevails
over the others. In the case of Metro lines, for example, this would
correspond to the evaluation of the entire project considering urban
environments outside stations, universal access, land use and economy
of the place, etc. She formulates that "through a comprehensive
evaluation model, it is probably easier to integrate other variables that do
not necessarily result in economic profitability, so it depends on the initial
formulation of the problem" (E3, architect, female).
Contrary to the previous view, E10 (economist, female), representative
of the Ministry of Social Development, has a different view. She suggests
that the core of the methodology should allow comparing the profitability
that has the lowest social cost:
"Beyond the merit of the objective, what the methodology does is
to look for a way of evaluating if the objective is fulfilled or not. In
the case of the social evaluation, any money that is invested in
society has a social return that justifies it (...) that has the social
NPV less than zero" (E10, economist, female).
Is it about lower social costs or maximum social gains? The divergence
of opinions does not correspond only to individuals but also reflects

162
diverse institutional visions. In the previous case, it compares the vision
of E3, part of the DTPM, versus the opinion of E10, a senior member of
the MDS. Having different versions of the best way of maximising benefits
is not necessarily a virtue on diversity, but shows a confusing image to
the public opinion, private entities and investors. The wide diversity on
the interpretation of ‘how to solve social issues’ has brought serious
problems of consensus in governmental institutions and public agencies.
Private and academic external entities tend to be quite critical about this.
E17 (planner, male), for example, considers that the current project
assessment methodology is supported by two types of people (or
agencies): the Ministry of Finance through the DIPRES, and the
defenders of the current Transantiago model.
"They are the ones who defend the methodology because they
want to spend little because they see it as an expense and not as
a benefit, and the Ministry of Finance that likes to spend little.
That's what the current methodology holds, which was invented
30 years ago. And that will not change until the mentality does not
change. It is not a technical discussion in that sense, but it is
politics" (E17, planner, male).
The last thought on the paragraph above, about the discussion not being
technical but a political decision is an agreement between several of the
interviewees from the MDS, MTT, external and private consultants. All do
think over the potential changes that the tool may have, but they suggest
that the political audacity of the long-term change in the valuation of
projects has much more weight than the definition and evaluation of
particular factors. It has been pointed out by a couple of interviewees (E8
and E18, both engineers males) and there is a general feeling of
convergence in which the methodology of social assessment serves
certain levels of the project but there are others in which it does not make
sense. There are some projects that are simply required by society, so it

163
should be just necessary to evaluate based on what is the lowest cost to
build – which goes beyond the measurement of benefits.
"That kind of thing you have to look at from the perspective of how
to do it from the lowest possible cost" (E8, engineer, male).
Given this context, some interviewees have proposed or mentioned the
multi-criteria methodology as it can help changing the criteria and
parameters usually used in current project appraisal. Chapter 8 in this
document will present an exercise carried out with policymakers, using a
multi-actor multi-criteria methodology. Ranking projects among similar
criteria is part of the benefits of a multi-criteria methodology. E10
(economist, female) and E18 (engineer, male) have pointed out that only
applying this methodology is not enough. There is a perception that the
multi-criteria methodology is good when it is possible to compare different
projects that have the same problem, but that can be located in different
territories. Ranking projects allow prioritizing when not all projects can be
served. E18 (engineer, male) suggests that the project evaluation guide
has to be updated and modernised in order to incorporate things that
were not important before but are important now.
"What I find most criticisable about the methodology is that there
are certain things that are not being measured, that I would
understand that they were not measured 30 years ago, because
obviously, the country was at a different level of development. But
it is difficult to explain that they are not measured today" (E18,
engineer, male).
In general, the recognised advantages of applying a concessions system
relies on the improvements, technological innovations and construction
models that private companies tend to present - more than the
contributions arising from the State. However, E5 (engineer, male)
explains that in the case of Metro de Santiago these improvements and

164
technological innovations have a high standard. Thus, instead of
concession the infrastructure, the option of bond financing has shown up
as an alternative. Metro S.A.'s structure of debts is formed by 56% of
Bonds and 44% of Bank Loans3.
E17 (planner, male) coincides with this vision, explaining that
concessions are financing mechanisms of administration and
management of public works, which according to him sometimes is
forgotten. When having an efficient company like Metro it is not
necessary to concession the system. In fact, this can turn into a threat to
the correct distribution of the location advantages of the metro stations,
since the concession responds to projects that are profitable from the
private point of view but cannot be financed by the State - which does not
necessarily have a high social return. E17 (planner, male) points out that
then the discussion of the concessions has been ideologised to discredit
the use of these in transport projects, although it is considered as an
alternative to the current scenario of no possibility of building new lines
with capital from Metro.
“A concession may be a possibility to increase capacity and
secondly, financing capacity. Metro today does not have the
money to build a third metro line and the Ministry of Finance would
not approve it " (E8, engineer, male).
3 The document refers to Metro's investment attractions. Within these, the quality of Metro is considered a seller of bonds with solid prospects (Classification Issuer Default Rating by Fitch in 'A +'), because of an essential relationship between the company and the State of Chile, in legal, financial terms and strategic. The company that represents a constant growth, which is 100% owned by the State (43% belongs to the Treasury, and 57% belongs to the Production Development Corporation, also a state agency.) On the other hand, within the possibilities of bond issuance by Metro is considered the high degree of stability over time coming from the high operating flows.

165
An essential hint to consider about concessions is the impact on fare
integration. E8 (engineer, male) points out that it is not known if the metro
fare would be integrated into a concession system, which can be a
problem to maintaining the integrated flat rate at the metropolitan level.
5.4. Conclusion
At the beginning of the chapter, references were made by authors who
have explored the problem of social exclusion from several different
fronts. Lucas (2012), for example, has generated a conceptual
framework to understand this problem holistically, considering the social
and transport disadvantages that draught in processes of social
exclusion. Groups considering both transport and social disadvantages
may result in a circle of transport poverty. Several of these factors have
been mentioned and broken down in the interviews with the experts and
policymakers grounded in Santiago. Some of these causes can explain
the social, economic and governance framework that surrounds the
context of the problems of social inequities in the case study.
One of the lessons from this chapter is that public policy concepts of
social exclusion and transport should relate in a multidimensional,
relational and dynamic way (Lucas, 2004). Intrinsic characteristics of
each individual, such as gender, race or (physical) disabilities could
become a difficulty for overcoming social exclusion. Contextual factors
related to the national context, the market, and economies of scale,
cultural influences, policies and legislative frameworks are hugely
important to determine the context of social exclusion.
The existence of different measuring methodologies, changing among
different contexts, can be helpful to build a bridge for the transmission of
empirical and theoretical knowledge helping on the resolution of this type
of conflicts. One of the challenges then is the utilisation of academic
knowledge, effectively impacting the vision, perception and

166
determination of decision makers in the concretisation of improvements
in social equity standards.
Throughout the chapter, however, it has been shown that there are
several agreements on the diagnosis of the problem, corresponding to
different scales of administration and influence in the territory. However,
they also share a contradictory vision regarding the ways of solution that
can anticipate more prosperous and more equitable scenarios for solving
social conflicts.
At the beginning of the chapter a dilemma was proposed about policies
aiming to solve the lack of transport infrastructure on peripheral areas of
the city, mainly with the development of BRT systems. Public transport
should be for all, despite the social income or individual determinant
factors that might discourage its use. And it should be possible to be used
regardless any social or physical condition. In this way, the connections
and new accessibilities can effectively have a destination in the areas
where the most significant opportunities for development are. Statists
agree on connectivity as the best way of investing on equity. This is
applicable not only in buses, but in the municipalities and areas in the city
where the greatest number of vulnerable people and middle-class people
are concentrated. Most of the investment should go to the most
vulnerable municipalities.
At the communal and local scale, the bicycle - which has been criticised
as an elitist transport mode – can appropriately represent a solution in
the medium and long term, as a vehicle for social mobility. The amount
of activities that can be pursued in short and medium distances is much
more significant than the impact of public transport and even the car.
People can easily access to jobs and services in a medium range free of
charge. Part of the solution is providing public investment funds in bicycle
schemes in vulnerable areas or subsidising the purchase of bicycles for
private use. Facilities for intermodality must be provided, so that the
bicycle user can travel comfortably, safely and efficiently, being used

167
together with public transport. Alongside, the public transport system
needs to be more extensive, of higher quality in journey experience, and
perhaps free.

168
6. Using ‘weighted functionings’ to reveal
health-related inequalities for transport
users.
6.1. Introduction
This first empirical chapter reflects on two of the secondary questions
expressed in this research, regarding the new factors that should be
incorporated in the measurement of social equity, and what are the
vulnerable groups mostly affected by these inequalities.
The chapter uses the information from the survey applied in Santiago to
451 people, described in detail in the methodology of this research. The
survey considered a vast number of factors that include different
dimensions of people's human development. These factors have been
initially taken from the Central Human Capabilities list, and then
translated to be incorporated in transport project assessment. The
process has been explored in detail in Chapter 2 and defined - and
methodologically described for the purpose of the survey in Chapter 3.
This chapter focuses particularly on a section of the survey, responding
to considerations of mental and physical health of people - which in the
case of transport projects have been assessed according to different
types of users.
The chapter also develops a broader understanding of the capability
approach explored in Chapter 2, as it relates to literature that has not
necessarily built from a ‘transport’ approach, but from the impacts on
health. Although the definitions of capabilities and functionings have
been previously manifested, this chapter explores the concept of
'weighted functionings', as a way of incorporating the levels of importance
that users attribute to these factors.

169
Regarding the context in which the research has explored these factors,
in Chile the levels of poor mental health, sedentary lifestyles and
environmental pollution are low relative to other countries in South
America and the OECD. The World Health Organization (WHO) (2017)
has estimated that 5 per cent of the Chilean population has depression
and 6.5 per cent suffer from anxiety. Chile also has 63 per cent proportion
of the population being overweight (Organización de las Naciones
Unidas para la Alimentación y la Agricultura & Organización
Panamericana de la Salud, 2017), which is the highest level in Latin
America. There is growing global concern concerning these issues, and
international organizations pointed towards risk factors relating to
individual lifestyles, i.e. unhealthy diet and insufficient physical activity.
According to the WHO, behavioural risk factors are potentially modifiable
and, if they were changed, at least 80 per cent of heart disease, stroke
and type-2 diabetes, and 40 per cent of cancers could be prevented
(MINSAL, 2013). These seem to be great public health gains to be made,
hence the requirement to closely examine transport-related health
issues.
Regarding the transport discussion in Chilean context, the Ministry of
Transport (2013) has recognized in the National Transport Strategy that
people's transport choices influence their health and well-being, hence it
is necessary to promote active travel such as cycling and walking for
short distances and as a way of accessing public transport. However,
and in spite of the improvements made during recent years in both
infrastructures and in the operation of transport systems, the physical
health of individuals remains very inequitable across Chile and in
Santiago.
On the other hand, and adding to the problem, evaluative tools for public
projects are particularly poor in considering transport and social
inequalities. Transport systems and their use are inherently inequitable –
different population groups use different modes and are able to access

170
different activities. Yet, project planning and appraisal rarely considers
social impacts of transport investments. Many projects are assessed
against economic efficiency goals, through tools such as cost-benefit
analysis, and there is little assessment relative to wider social or health
objectives – distributional issues are often overlooked (Hickman & Dean,
2017; Lucas, 2012; Martens, 2017). Social impact assessment in
transport – if utilised – is usually based on the understanding of potential
impacts related to physical accessibility, casualties and security. The
‘performance’ of public transport has been measured through levels of
service, such as journey and waiting times and reliability. But these are
all fairly mechanistic outputs and often do not reflect the quality of the
service, or help us understand the choice to use the systems, potential
activity participation or related impacts.
In this regard, health indicators for instance, are mainly measured
according to road traffic casualties, mortality, exposure to air pollutants
and noise. There is surprisingly little integration between the different
disciplines of transport and health, despite there being common goals.
There is very little focus on the experience of travel and the health and
well-being impacts relative to different modes and population groups.
Hence, the incorporation of a greater range of multidimensional factors
has become significant for the travel and social and health impact
assessments of transport schemes and networks.
Again, in the Chilean context, in 2013, the DTPM (Metropolitan Public
Transport Board) developed an evaluation of the general public transport
system through a quantitative evaluation tool, which unfortunately simply
measures the level of satisfaction concerning the levels of service for
each particular bus companies’ concessioners. This is conventional
practice – assessing the ‘quality’ of public transport against journey
reliability and cost, and perhaps comfort. This practice ignores wider
social issues, perhaps much more important, such as who is using a
particular transport mode or not, which neighbourhoods are served, and

171
what activities are able to be reached, or by whom. There is little
consideration of health-related or well-being aspects of transport, despite
a requirement to provide tools that cover these wider considerations
(Mindell, 2018).
Many of the early scholars writing on social equity argued for a greater
focus on distributional issues in public policy – that we should guarantee
those worst off in society a fair deal. As seen in Chapter 2, Rawls (2007,
p. 397), for example, calls with his Difference Principle for a much greater
focus on disadvantaged groups. He states that: “a well-ordered society
is […] designed to advance the good of its members and effectively
regulated by a public conception of justice”. However, in many cities, both
in develop and developing countries, we can see the opposite, where
low-income groups suffer from the lowest quality of life.
In this chapter, the differences in the self-assessment of health-related
factors are measured for three types of transport users: private (cars,
taxis, colectivos, motos), public (buses and Metro) and active (bicycles
and walking). The contribution of the chapter is to apply the Capabilities
Approach (CA) (after Sen, 1987; 1999; 2009) in the transport domain,
and particularly in relation to transport-related health issues. This
involves a multi-dimensional assessment of health impacts across
different types of transport users and population groups. A capability-
based survey is used in different neighbourhoods of Santiago.
The chapter is innovative on two aspects. First, a multi-dimensional set
of transport-related health factors are used, with data derived from
individual self-assessment – different to more frequent use of road traffic
casualties, mortality, exposure to air pollutants and noise. Second, the
Capability Approach (CA) (see Chapter 2) is applied as the theoretical
framework for the analysis, with CA operationalised in relation to
individual travel behaviours. In particular, the concept of weighted
functionings is developed and applied, allowing an assessment of actual
activities weighted according to priority given.

172
The empirical method follows a capability-based survey, measuring
perceptions of transport users on health-related factors (such as stress,
physical effort, proximity to others, and perceived levels of air pollution),
as well as the level of importance assigned to them.
The results show that low-income segments, public transport users and
women tend to have a more negative perception on these factors,
reflected in a lower assessment, compared to other segments as men or
private transport users. This difference is even more evident when
considering the levels of importance they attribute to these factors, with
an ultimate lower achievement of their well-being. Descriptive and
multinomial logistic models are used for the analysis. Primary transport
mode and journey times are both correlated to income level. The chapter
concludes by suggesting that the focus on the groups with greater
disadvantages should be strengthened, as societal well-being is likely to
increase alongside intervening on behalf of the most vulnerable members
in society.
6.2. Capabilities and health impacts
The exploration on Chapter 2 about the Central Human Capabilities
developed by Nussbaum, led into the questions of the applicability in
transport. The first part of the list pointed to aspects related to individual’s
health conditions – when considering life, bodily health and bodily
integrity. This has been actually linked to the idea on comfort and the built
environment (see pages 43 – 44). Although she has considered the list
of 10 capabilities as central requirements of a life with dignity in different
spheres of life, this chapter has explored in detail the first part, looking
on these intrinsic capabilities the idea of the “minimum account of social
justice”.
The chapter build then on the definitions of CA provided by Sen (1987;
1999; 2009), considering Nussbaum’s categories of capabilities for

173
framing the theoretical approach. The idea is examining multidimensional
health indicators in relation to transport, beyond the more conventional
use of traffic casualties (Ling, Cherry, & Dhakal, 2017; Mindell, 2017),
mortality (see Methorst, Schepers, Christie, & de Geus, 2017; Noland,
Sinclair, Klein, & Brown, 2017) and pollutant exposure.
As a preliminary viewing of the methodological process that has emerged
from this capabilities exploration, the chapter has developed the concept
of ‘weighted functionings’. This builds on previous work examining
transport and social equity in relation to capabilities (Beyazit, 2011;
Hananel & Berechman, 2016; Hickman et al., 2017), as it has been found
that the use of CA has much potential in transport planning – considering
the capabilities (the real opportunities for participation and being) relative
to functionings (actual activities and being) (Hickman et al., 2017) (see
Chapter 2).
The use of capabilities has been widely used in public health. However,
the analysis connecting transport and capabilities is still emerging.
Lorgelly et al. (2015) have suggested the CA for measuring public health
through quantitative and qualitative methods, while Simon et al. (2013)
adds the accessibility dimension by developing an application of a
multidimensional instrument for outcomes in mental health. Beyond
health, other studies have also highlighted the potential of capabilities for
measuring well-being against routinely used cost-benefit analysis, for
reducing gaps between potential and realized outcomes (Agee &
Crocker, 2013). The study by Lorgely et al. (2015) conduct a similar
methodology of surveys, considering a similar structure and
reinterpretation of CA concepts based on the Nussbaum CHC list. They
take the list and read it according to the parameters with which public
health is usually measured. They also consider that the use of
quantitative and qualitative information in research is relevant since
interviews with people provide additional information to the survey. Even
though the study is similar to this research in terms of structure, it has

174
been done in the context of public health – not even mentioning the
transport dimension.
Nussbaum’s Central Human Capabilities (CHC) List
Factors considered for reinterpreting Nussbaum’s CHC in transport
1. Life
2. Bodily health
3. Bodily integrity / comfort and built environment
Self-assessed physical and mental integrity factors
1. Levels of stress when travelling
2. Physical activity when travelling
3. Proximity to others at the mode while travelling
4. Perceived air pollution when travelling
Table 6.1 Interpretation of Nussbaum’s Central Human Capabilities List according to transport planning. Source: own production based on Nussbaum (2009).
This chapter uses the first category for the application of Nussbaum’s
Central Human Capabilities List that was exposed in chapter 3. This
category recognises that “Life, bodily health and bodily integrity” can be
recognised when basic socio economic and socio demographic data are
examined against the self-assessment of physical and mental factors.
The examples explored in this category were chosen considering factors
that relate to dimensions of health when associated with the commute
journey – based in previous studies in the field of transport and public
health. The search for this type of measures challenges the generally
used health indicators as road traffic casualties, mortality, exposure to air
pollutants and noise – which have been extensively used for transport
appraisal, but not succeeding on embracing all the dimensions
associated to health that are impacted by transport.
The factors draw on the concepts exposed in the Central Human
Capabilities List can affect in transport and public health. All the factors
suggest an individual self-assessment when travelling – preferably when
commuting – of different aspects. They help to suggest that the

175
evaluation of health-related considerations in transport projects should
consider the user’s perceptions of the built environment, the relationship
with others and the way the users are mentally and physically affected
by their trips. The definition of these factors are as follows:
• Self-assessment of stress: Existing literature shows a relationship between stress and commuting, primarily considering the
commuting time (Evans & Wener, 2006), control and predictability
(Gottholmseder, Nowotny, Pruckner, & Theurl, 2009), among
other aspects. In the context of this research, the factor of stress
level has a negative connotation (as it could be expected that none
would choose to be stressed) and examines the internal mental
state of the person who travels – based on her commuting trips.
• Self-assessment of physical activity. This factor corresponds to
the perception of the physical activity when travelling. In this case,
the individual establishes if the physical effort is considered as a
positive or a negative attribute of the trip. In certain cases, the use
of active modes may encourage the realization of physical activity,
while in other cases this activity may be a burden for the person
who performs it. The self-assessment of physical activity when
travelling may vary according to individual fitness, the degree of
physical activity, the purpose and type of trip and context within
which the journey is carried out (Musthafa, Leh, Omar, &
Karuppannan, 2015; Witten et al., 2012). An association between
modes, i.e. physical activity and public transport use has been
found (Rissel, Curac, Greenaway, & Bauman, 2012). For
example, transit use and physical activity have been related to
changes in Body Mass Index (BMI) (Brown, Werner, Tribby, Miller,
& Smith, 2015; Flint, Cummins, & Sacker, 2014; Martin, Panter,
Suhrcke, & Ogilvie, 2015; Wanner et al., 2016). A higher BMI
tendency is experienced for private motor car users while
switching to public transport (or active modes) has been

176
associated with a significant reduction in BMI (Martin et al., 2015).
• Self-assessment of proximity to other people. This factor refers to
the positive or negative perception of users, about having social
interactions with other people while travelling. Similarly to the
previous factor, the individual establishes if the proximity to other
people is considered as a positive or a negative attribute of the
trip. Associations between crowdedness and negative health
outcomes have been documented before (Cox, Houdmont, &
Griffiths, 2006). However, this factor here explores the differences
across different transport modes and diverse individual (socio-
economic and socio-demographic) characteristics.
• Self-assessment of exposure to air pollution. The indicator of air pollution has been usually evidenced through the measurement of
air quality indicators through air quality monitoring stations.
Research has found that air pollutants can seriously affect human
health, including, for example, respiratory problems such as
bronchitis, emphysema and asthma (Mabahwi, Leh, & Omar,
2014). Although air pollution is usually expert assessed, it has
been found that the individual experience is also of interest for
further study (Day, 2004). In this regard, understanding the
perceptions of different transport users about their exposure to
pollutants may contribute to a better definition of environmental
policies for improving air quality (Dietz & Atkinson, 2005) and their
physical health.
6.3. Reinterpreting CA from the concept of weighted
functionings
As explained at the beginning of this chapter, the exploration of health-
related factors in transport has required for this research to revisit the CA.
Chapter 2 (p. 56) has already suggested that the concepts of capabilities

177
and functionings are key for understanding the approach. For the
analysis of this chapter, functionings have been interpreted as the ‘states
of the person’s health while traveling’ – state that is associated to a
health-related dimension. The capabilities remain the same as the
definition. In the context of the health-related dimensions in transport,
capabilities are the combination of the achievable states of a person’s
(self-assessed) health while travelling.
Capabilities are challenging to assess on an individual-based level
through a questionnaire, as people might not have an idea of how
achievable or possible these states are. For example, we can directly ask
a person what her state of stress is while travelling, but we cannot ask
what her achievable level of stress is (see Error! Reference source not found.). Something that we do have the potential to ask in this case is
about her desired levels of stress, expected levels of stress or importance
of her levels of stress. These cannot define the capabilities of the person,
but they are a proxy for understanding the gaps that separate the current
or the achievable health-related states of people while travelling. In the
form of the questionnaire defined in the methodological Chapter 3,
respondents were asked to assess the health-related factors previously
defined. They were also asked to assign a level of importance that they
attribute to these factors, in order to understand a proxy towards their
capabilities.
If the functionings are related to the assessment of the current situation
(or the state) of the person, ‘weighted functioning’ will address the level
of importance the person attributes to that state. This is not a direct
measurement of capabilities but get us closer to the understanding of: 1)
how far a person is from achieving what she values; and 2) what are the
priorities for a person in the achievement of the various desirable
combinations of functionings. The ‘weighting’ measure will depend on the
level of importance the person considered for each health-related
question.

178
Considering the levels of importance for weighting the functionings of a
person converses with people’s individual reason for valuing things in life.
the capability that we are concerned with is our ability to achieve
various combinations of functionings that we can compare and
judge against each other in terms of what we have reason to value
(Sen, 2009, p.233)
Weighted functionings, therefore, consider the levels of assessment and
the value that people assign to the factors assessed. They depend on
the options and choices of people, and they are determined by the assets
and conversion factors people actually have (see p.68). Weighted
functionings can help for defining a potential assessment of individuals'
capabilities: the preferences included within weighted functionings take
us beyond functionings and towards the capabilities concept – as
suggested already by Alkire et al. (2015).
Sen also recognises the difficulty of considering and measuring
capabilities in appraisal. Considering that the things to be evaluated have
been identified capabilities must be encountered through a further
evaluative exercise. As a way of crediting the search for new ways to
measure capabilities, Sen allows the “various substantive ways of
evaluating functionings and capabilities can all belong to the general
capability approach” (Sen, 1993, p.33).
In chapter 1, the Figure 1.2 shows a diagram of concepts defining the
use of the CA in this research. The Figure 6.1 above adds to this diagram
the concept of weighted functionings, depending on the choices and the
context of people.

179
Figure 6.1. Diagram of concepts capability approach, considering the introduction of the weighted functionings. Source: own production.
Hence, the analysis presents a new interpretation of the use of CA in the
transport domain. There is also consideration of some of the emotive
dimensions not usually considered in health assessments in transport
projects. Normative and moral dimension are examined, centred on the
individual’s well-being, affecting people’s opportunities and freedoms.
Weighted functionings are examined through the individuals’ self-
assessment of health-related factors. From the lenses of inequality, the
analysis assumes that more inequity exists between population groups
where there is a greater gap between ‘assessed functionings’ and
‘weighted functionings’.
6.4. Socio-economic and gender differences in modal use
Table 6.2. explores differences through a p-fisher test according to
gender and primary travel mode. Recognising the most vulnerable
groups affected by transport has been one of the aims of the research. The analysis of the socio-economic and gender differences in modal use
shows that men access to higher income levels compared to women.
Significant differences are also evident when considering main transport

180
mode – as there is a high inequality in mode access (and mode usage)
by income in Santiago. The analysis reveals that low-income groups tend
to use primarily public and active modes, whereas high-income groups
tend to mostly use private modes.
According to the table, a clear difference relates to the type of occupation
(p=0.03), where most respondents work full-time (57 per cent) and
primarily use private transport, followed by participants studying (22.5 per
cent) who tend to use public transport. In the case of students, the
percentage of females and males is quite similar. However, the category
of full-time workers is mostly occupied by men presenting a significant
difference of almost 6 per cent between genders. Differences were also
found with duties related to housework, where woman have a much
higher percentage of domestic work (7.4 per cent versus 0.5 per cent for
men). This shows a conventional patriarchal tendency in Chile, although
women have managed to enter the labour market, they still have had to
undertake the domestic work in the household. In terms of education,
most respondents have some degree of technical or professional
education (68.3 per cent), 6.4 per cent of the sample have a postgraduate
degree. A 23.1 per cent of the participants have achieved secondary
education, while just 2.2 per cent have only primary education. This
aspect (though not the focus of this research) is a critical element in the
discussion of equity in countries. According to OECD (2017b), in Chile,
people who have a primary education score 30.7 per cent lower in adult
skills sets than people who have a tertiary education. The inequalities by
education level also show significant differences between males and
females (p=0.01). This is also noted in the OECD (2017a) inequality
index between countries. On average, in Chile, women score 6.5 per cent
lower than men in adult skills sets (PIAAC), while in the average OECD
countries, women score 2.7 per cent lower than men.

181
Table 6.2 Descriptive analysis by gender and primary transport mode.
Female Male p- Fisher
Private Public Active p- Fisher 53.7% 46.3% 31.0% 59.9% 9.1%
Age Less than 18 0.4% 1.0%
0.45
0.7% 0.7% 0.0%
<0.01
18 - 24 30.2% 64.1% 10.7% 78.6% 6.4% 25 - 24 25.6% 59.8% 25.7% 52.1% 11.4% 35 - 54 30.2% 64.6% 47.9% 40.0% 8.6% 55 - 64 12.0% 21.1% 12.9% 16.4% 2.1% 65 or more 1.7% 4.8% 2.1% 4.3% 0.7% Income Low 34.7% 25.4%
0.05 17.2% 36.3% 36.6%
<0.01 Middle 35.6% 34% 35.7% 35.2% 29.2% High 28.5% 39.2% 46.5% 26.7% 34.2% Occupation Full time employee 54.1% 60.3%
0.03
70.7% 49.6% 58.5%
<0.01
Part time employee 2.1% 1.9% 2.1% 2.2% 0.0% Independent worker 5.4% 6.2% 3.6% 5.2% 17.1% Unemployed 1.7% 1.0% 1.4% 1.5% 0.0% House keeper 7.4% 0.5% 6.4% 3.3% 2.4% Student 22.3% 22.5% 9.3% 30.4% 14.6% Student and part time 3.7% 4.3% 1.4% 5.2% 4.9% Retired 1.2% 1.4% 2.1% 1.1% 0.0% Other 1.7% 1.9% 2.1% 1.5% 2.4% Education Primary school 2.9% 1.4%
0.01
1.4% 2.2% 4.9%
<0.01 Secondary school 21.9% 24.4% 10.7% 28.9% 26.8% Technical education 23.6% 12.9% 26.4% 15.2% 14.6% University education 47.5% 51.7% 53.6% 48.1% 43.9% Postgraduate 4.1% 9.1% 7.9% 5.2% 9.8% Disabilities Yes 3.3% 3.8% 0.80 5.0% 2.6% 4.9% 0.32 No 96.7% 96.2% 95.0% 97.4% 95.1% BMI category Underweight 1.7% 1.0%
<0.01
0.7% 1.1% 4.9%
0.07 Normal 60.3% 42.6% 48.6% 55.6% 41.5% Overweight 22.3% 41.1% 31.4% 28.5% 46.3% Obese 6.2% 11.5% 12.9% 7.4% 2.4% Journey time 0-20 25.2% 14.8%
0.02
30.7% 7.0% 73.2%
<0.01 20-40 21.5% 24.4% 26.4% 22.6% 12.2% 40-60 24.4% 25.8% 27.1% 27.0% 4.9% 60+ 25.6% 34.0% 12.1% 41.9% 7.3%

182
Closer to the analysis of aspects related to health, the majority of
respondents (93.4 per cent) of our survey report data that allows an
estimation of self-reported BMI. Males in general tend to be closer to the
25 points (kg/m2), which is in the low limit of overweight4. Male users of
private transport are significantly more likely to be overweight and obese,
compared with those cycling or walking to employment or their principal
activity. This relationship is even higher comparing female users of
private and public transport, although the results are not significant by
male-female groups according to transport mode. Female users of public
transport are likely to have less BMI compared to users of private and
active modes.
Regarding modal split, 31 per cent of participants use motorised transport
as a primary transport mode (82.1 per cent of this is for car users). 59.9
per cent of the sample uses public transport and 9.1 per cent active
modes. The results show a significant relationship between journey times
and main transport mode, as public transport users have much lengthier
commutes versus other modes – 41.9 per cent take more than one hour
in getting to work.
Although this is a descriptive but revealing summary of the main
differences according to socio-demographic groups, it has highlighted
gender differences and inequalities produced by modal split. This first
exploration of the data was followed by the analysis of the health-related
factors indicated in the first part of the chapter, revealing even more
significant differences among groups.
6.5. Health-related factors defined by mode and journey times
4 BMI bellow 18.5 is considered underweight; between 18.5 and 24.9 is considered healthy; between 25 and 29.9 is considered overweight; and 30 or higher is considered obese.

183
This chapter has considered factors that can reduce the gaps of social
inequality5, from a perspective of public health – or factors that, coming
from public health, can affect transport policies. For this purpose, the four
factors that have been examined are: stress, physical activity, proximity
to other transport users and exposure to air pollution.
After the socio-demographic analysis in the previous section, when
considering these factors, the public transport users group tend to be the
most disadvantaged of them all. In this case, the comparative analysis
between the level of assessment (functionings) and its weighting
(weighted functionings) tends to be similar for all four factors considered.
However, weighted functionings also show evidence on the level of
importance that people attribute to these factors, revealing more
significant differences between types of users and journey time.
5 Suggested on the main research question of the research: “Which factors in transportation projects can reduce the gaps of social inequality, and how they can be incorporated in the design and assessment processes?”

184
Boxplots show graphically these differences. The boxplots show the
distribution of data based on the categorisation of primary transport mode
and journey times. Each factor (stress, physical activity, proximity to
users and exposure to air pollution) have been illustrated in boxplots,
showing the differences between functioning total values and weighted
functioning values – the latest reflecting the levels of importance people
attribute to these factors. When considering levels of stress, the boxplots
in Figure 6.2. show notable differences by primary mode – both for
current assessment and levels of importance. Active users (i.e. walking
and cycling) show a better assessment on their levels of stress (they have
reduced stress whilst travelling) compared to other modes. Public and
private users tend to have similar levels when assessing the stress factor.
Figure 6.2. Stress while commuting and primary transport mode. Functioning total
values (A) and weighted functioning values (B).

185
Boxplots in Figure 6.3 reveal the relationship between stress and journey
times, where commuting time is proportional to a more negative
assessment of stress levels. When asked about the weighting of this
factor, 79 per cent of the respondents agree on assigning a high level of
importance – with an insignificant difference in terms of gender, primary
mode or journey times. There is some overlap in terms of mode choice
and journey time – often public transport journeys are the longest in
length and time, with long commutes to the centre of Santiago from the
poorer suburbs to the southwest.
Figure 6.3. Stress while commuting and journey times. Functioning total values (A) and weighted functioning values (B)

186
The factor of physical activity while commuting is assessed more
positively in the case of active transport users – compared to the other
modes. Following the same trend as above, the boxplot in Figure 6.4
shows that private and public transport assess similarly both for
functioning and weighted functioning values the levels of physical activity.
Something interesting about the results, is the quite wide variance in
responses when assessing the levels of importance of physical activity –
perhaps due to non-active modes not expecting to gain physical activity
whilst travelling. The lack of association between the use of motorised
modes and physical activity is another possible explanation for the
variance in assessing the importance of this factor.
Figure 6.4. Physical activity while commuting and primary transport mode. Functioning total values (A) and weighted functioning values (B)

187
The questions about the level of physical activity in the survey do not
define whether the activity is (classified as) something positive or
negative. This was a decision when designing the survey that intended
to avoid user biases when answering the question. However, this opens
a new (and necessary) research window. For example, it might be
interesting to know if public or private transport users make their modal
decisions based on gains (positive) or the expense (negative) of physical
activity – in order to see the positive or negative attributes within their
decision making.
Figure 6.5. Physical activity while commuting and journey times. Functioning total values (A) and weighted functioning values (B)

188
When considering the factor of physical activity against journey times
(Figure 6.5), the analysis follows a similar pattern. As the trip increases
the time, the lower is the evaluation of the physical activity. This makes
sense when analysing not only the distances but the conditions of the
trip. In general, people who must travel more than 60 minutes are public
transport users. This is the group most affected by the factor of physical
effort while commuting. While this is something that has been discussed,
the current Transantiago buses do not have the capacity to carry enough
seated passengers during long journeys – which is when the feeling of
physical effort mostly affects them. On the other hand, the buses have
not regulated the optimal frequencies that allow people to choose to take
another bus when the capacity of seats is covered. The problem
increases when considering that the bus stops are efficiently distanced
from each other in order to provide a better travel performance of the
buses. This evidently decreases the access to stops for the users, since
they have to walk long distances before boarding and after the bus route.
Again, this is an open window for further exploration on active travel and
its consequences by mode and transport users’ profiles.
A third health-related factor is the proximity to other transport users.
Again, this is a subjective measure that did not imply in the question a
positive or negative consideration of the factor. This was then an
assessment of the user’s perception on the physical distance or the value
of the presence of other people while commuting. In cases of private
vehicles, the lack of other users could be experienced as positive, given
the nature of driving a private vehicle. However, in the case of public
transport this relationship is more complex as it could depend on the level
of crowdedness (see Ettema et al. (2012)). For respondents of the
survey, this factor shows public transport users to have the lowest levels
assessment to the proximity of transport users (Figure 6.6). A 44 per cent
of public transport users score a low level of functionings, with similar
trends in weighted functionings.

189
Figure 6.6. Proximity to other users and primary transport mode. Functioning total values (A) and weighted functioning values (B)
A detailed examination of the boxplots in Figure 6.6 shows that women
from medium and low-income segments are more likely to give higher
importance concerning proximity to other transport users, but they score
lower for the assessment of functionings. This may be explained by
women often having longer trips and tending to feel more vulnerable or
discouraged by the physical conditions of interaction with other
passengers.
As a matter of context, it is important to note that Chile, particularly
Santiago, has a serious problem – not yet fully exposed – of street sexual
harassment, which is well evidenced in public transportation. This is
possibly one of the aspects that more strongly justifies the addition of
'proximity to other users' as an element to be considered in health-related
factors, since it can seriously affect the mental health of people,
especially women. Street sexual harassment has been defined as a
practice of sexual connotation exercised by an unknown person in public

190
spaces, public transport or on the street (Observatorio contra el acoso
callejero Chile, 2017). The action affects the victim unilaterally, while the
harasser has no interest in establishing a real communication with the
person who is being attacked, having a negative mental impact, that
influences the way she mobilized, considering changes of mobility
patterns, modes and even implies a dependence to move accompanied
by other people. This violent practice, both in public spaces and in
transport, has been well documented in many publications6. In 2014, the
first online street harassment survey was conducted in Chile, with people
in the range from 10 to 64 years. Among the most recurring forms of
harassment (more than 90 per cent of cases) are whistles, sounds,
kisses, gasps and lascivious looks. Seventy-one per cent of respondents
believe that these experiences of harassment have been traumatic. One
of the effects produced by these experiences, which occur mainly in
public spaces and public transport, is the modification of transport routes
and schedules of use of these spaces. The survey does not explicitly
refer to transport modes where the harassment occurs - which exposes
a profound and necessary niche of knowledge.
The levels of importance considering journey times follows a similar
tendency as the previous cases, regarding proximity to users. As the trip
increases, the levels of evaluation of proximity to other users decrease.
For example, looking at the last section of the graph, of a person who
takes more than 60 minutes a day to travel, it is understandable that the
distance and interaction with other passengers would be more relevant.
6 In the context of Chile and other Latin-American countries, see for example about the definition of street as gender violence (Garrido et al., 2017); sexual harassment gender differences on safety measures in public transport in the context of US (Yavuz et al., 2010); women’s fears using public transport (Schulz & Gilbert, 1996); the influence of harassment over apprehensions and changes in travel patterns on women (Lynch & Atkins, 1988); and Rainero (2009) from a feminist position on the conflict un insecurity for women in Latin America.
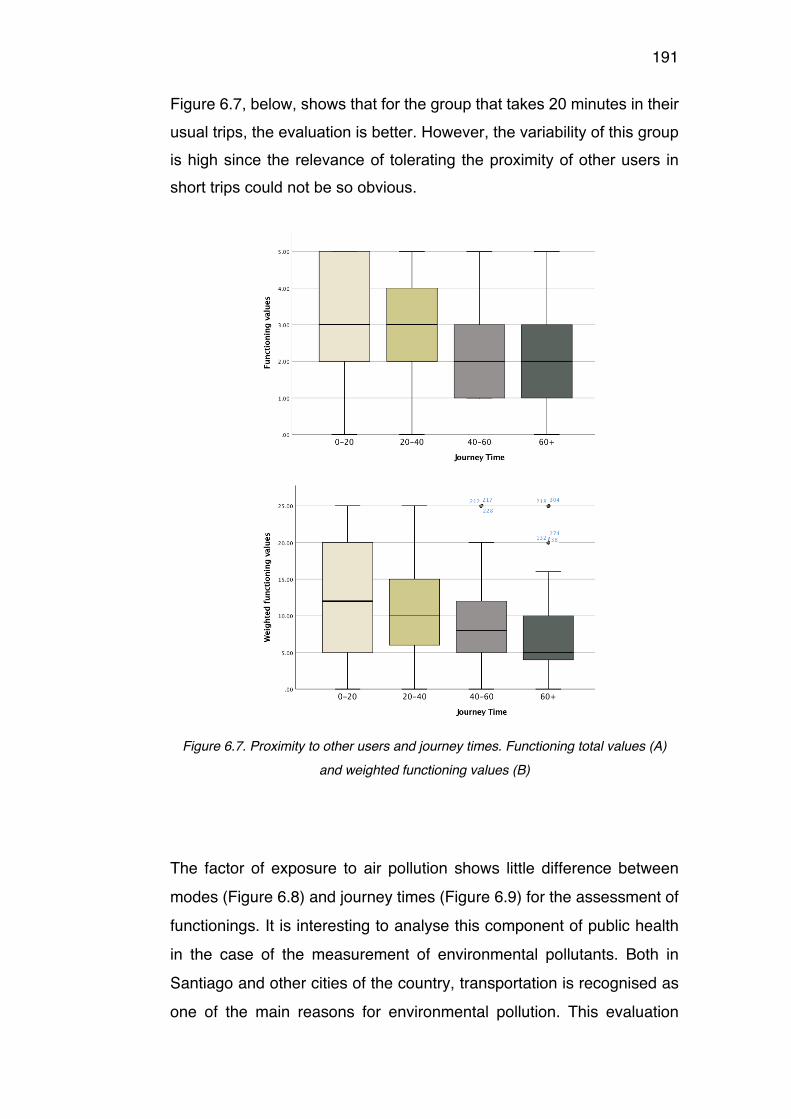
191
Figure 6.7, below, shows that for the group that takes 20 minutes in their
usual trips, the evaluation is better. However, the variability of this group
is high since the relevance of tolerating the proximity of other users in
short trips could not be so obvious.
Figure 6.7. Proximity to other users and journey times. Functioning total values (A) and weighted functioning values (B)
The factor of exposure to air pollution shows little difference between
modes (Figure 6.8) and journey times (Figure 6.9) for the assessment of
functionings. It is interesting to analyse this component of public health
in the case of the measurement of environmental pollutants. Both in
Santiago and other cities of the country, transportation is recognised as
one of the main reasons for environmental pollution. This evaluation

192
comes from pollution monitoring stations. However, this information is not
frequently shared with civil society. The public perception of air pollution
and its health risks are not public domain, although they may be a
relevant factor in the decision to use or exchange with an active mode of
transport. In the analysis, all modes indicate similar assessment of the
current exposure to air pollutants – despite that in practice, a user of
active transport is prone to feel a greater exposure to environmental
pollutants. However, this slightly changes when weighted functionings
are considered. Then public transport users and longer journey time
scores are lower than the other modes. More detailed analysis shows
that male users of private transport tend to show higher concerns for air
pollution relative to women
Figure 6.8. Air pollution and primary transport mode. Functioning total values (A) and weighted functioning values (B)

193
Figure 6.9. Air pollution and journey times. Functioning total values (A) and weighted functioning values (B)

194
The spatial variant of the location of the points of origin of the surveys is
also interesting to include in the analysis. Figure 6.10 shows, for
example, the distribution of the surveys considering the factor of stress
and primary transport mode. The cyan points represent respondents who
use public transport as the primary transport mode, the blue dots
represent active transport users, and the red dots represent private
transport users. The size of the circle represents the user's perception of
stress. The figure is consistent with the statistical analysis in that stress
levels are high for both public transport users and private transport, while
active transport users - located mainly in central areas of the city - tend
to be less stressed than the other modes.
Figure 6.10. Surveys considering stress and primary transport mode. Source: own production.
One of the objectives of this chapter has been the measurement of social
inequalities, which has been explored through the recognition of the
differences between the assessed and weighted functionings – and how
this impact on the well-being of different population groups. The
assessment of the health-related factors is lower for low-income groups
relative to higher incomes. By interpreting these results under the scope
of the CA, it can be said that people with disadvantage tend to have an
increased gap between their current situation and the value they assign

195
to these factors. People with a higher income level, active transport users
and short trip commuters are consistently in a better position in terms of
transport-related health assessment (Figure 6.11). And although the
statistical analysis does not reveal significant differences by gender,
there are small differences where female score lowers for functionings
and weighted functionings.
Figure 6.11. Total score of functionings for the four health-related factors, by income.

196
After a descriptive analysis of the factors, a Chi-square analysis is carried
out for the four health-related factors by gender, mode and journey times
(Table 6.3)7 . The objective is to go examine further the differences
between the assessment of functionings and weighted functionings by
different population segments.
Figure 6.2. Aggregate score of functioning and weighted functionings for the four health-related factors, by gender.
7 The assessment is scored from ‘not important’ (1) to ‘very important’ (5). Responses are grouped on the extremes: (i) bad or negative: lowest scores for each factor (1 or 2 points), (ii) indifferent: intermediate score (3 points) and (iii) good or positive: the highest scores for each factor (4 or 5 points).

197
The differences on the assessment of functionings tend to be more
significant than the weighted functionings. Hence prioritisation of health-
related factors does not differ significantly by population group, only on
the scoring of functionings. The most significant differences (at the <0.01
level) relate to the perception of having to perform some physical activity
or effort while commuting. The group of active transport users tends to
ascribe a much more positive assessment when referring to physical
effort compared to other modes (80% versus 41% and 37% for private
and public transport respectively). When comparing to other modes,
public transport users tend to present lower scores in both assessment
and weighting of their functioning dimensions. There are no significant
differences by gender for assessed or weighted functionings. The most
distinctive factor comes from the weighting of the levels of importance of
proximity to other transport users, which is more highly scored by females
than males (72% female versus 60% male). Journey times are significant
(at the <0.01 level) for functionings for stress, physical effort and
proximity to other users.

198
Mode Journey time Private Public Active Chi-
square 0-20 20-40 40-60 60+ Chi-
square 31.0% 59.9% 9.1% 20.4% 22.8% 25.1% 29.5% Stress Functionings High 32.9% 33.0% 56.1%
<0.01 50.0% 33.3% 35.4% 27.1%
<0.01 Neutral 36.4% 29.3% 36.6% 29.3% 44.1% 30.1% 25.6% Low 29.3% 37.8% 7.3% 18.5% 23.5% 34.5% 47.4% Weighted Funct. High 77.9% 76.3% 87.8%
0.53 70.0% 75.7% 78.8% 78.2%
0.34 Neutral 14.3% 12.2% 9.8% 10.0% 17.5% 9.7% 12.0% Low 6.4% 10.0% 2.4% 20.0% 1.9% 11.5% 6.8% Physical Activ. Functionings High 40.7% 36.7% 80.5%
<0.01 28.6% 42.7% 44.2% 25.6%
<0.01 Neutral 33.6% 36.7% 14.6% 12.5% 36.9% 23.9% 38.3% Low 25.0% 26.3% 4.9% 6.3% 20.4% 31.9% 35.3% Weighted Funct. High 56.4% 53.7% 82.9%
0.01 68.5% 54.4% 49.6% 57.1%
0.12 Neutral 31.4% 27.0% 9.8% 21.7% 28.2% 33.6% 24.8% Low 11.4% 17.8% 7.3% 8.7% 17.5% 16.8% 15.0% Proximity users Functionings High 33.6% 17.8% 48.8%
<0.01 42.4% 31.1% 19.5% 13.5%
<0.01 Neutral 31.4% 18.5% 22.0% 22.8% 24.3% 24.8% 20.3% Low 32.1% 62.2% 29.3% 32.6% 42.7% 54.9% 63.9% Weighted Funct. High 65.0% 65.6% 75.6%
0.28 72.8% 71.8% 67.3% 56.4%
0.15 Neutral 23.6% 20.0% 24.4% 18.5% 22.3% 20.4% 24.8% Low 10.0% 12.6% 0.0% 6.5% 5.8% 11.5% 15.8% Air pollution Functionings High 13.6% 9.6% 19.5%
<0.01 17.4% 17.5% 8.0% 6.0%
0.04 Neutral 33.6% 18.5% 24.4% 23.9% 24.3% 27.4% 18.8% Low 51.4% 71.1% 56.1% 57.6% 56.3% 63.7% 75.2% Weighted Funct. High 77.1% 74.4% 85.4%
0.78 75.0% 75.7% 75.2% 77.4%
0.48 Neutral 13.6% 15.2% 9.8% 12.0% 17.5% 17.7% 10.5% Low 8.6% 9.3% 4.9% 12.0% 6.8% 7.1% 9.8%
Table 6.3. Chi-square test by mode and journey time, for the four health-related factors.
As part of the analysis, four multinomial logistic models were carried out
using SPSS Statistics, considering only the functioning element analysis.
The independent variables included were primary mode, journey time
and income (Table 6.4). The dependent variables were constructed using
the answers of surveyed participants for each health-related factor
(stress, physical activity, proximity to other users and perceived air
pollution).

199
Primary transport mode
Private Public Active
Journey time 0 – 20 minutes 20 – 40 minutes 40 – 60 minutes more than 60 minutes
Income Low 1 - Less than $423.000 Low2 - $423.000 - $639.000 Middle 1 - $639.000 - $977.000 Middle 2 - $977.000 - $1.550.000 High 1 - $1.550.000 - $2.380.000 High 2 - >$2.380.000
Table 6.4. Independent variables considered in the model
Multinomial logistic models are developed for the four factors assessed,
considering the functioning scores (Table 6.5 and Table 6.6). The
independent variables are selected according to the analysis of
significance – meaning that the result is likely to be attributable to a
specific cause. The results show that ‘primary transport mode’ is
significant at 0.001 for physical activity and significant at 0.012 for stress.
‘Journey time’ is significant at 0.035 for physical activity and significant at
0.018 for stress. Both transport mode and journey time are the main
predictors for a negative assessment of stress and physical activity whilst
commuting.
M1 = STRESS M2 = PHYSICAL ACTIVITY (-2) Log
likeh Chi-square df Sig. (-2) Log
likeh Chi-square df Sig.
Final 332.379 78.668 36 .000 321.381 78.001 36 .000 Variables Primary Mode 348.719 16.340 6 .012 321.381a 23.856 6 .001 Journey Time 356.764 24.385 12 .018 345.237 22.204 12 .035 Income 357.802 25.422 18 .114 343.586 23.525 18 .171 Pseudo R-Square Cox and Snell .160 .159 Nagelkerke .179 .179 McFadden .078 .079
Table 6.5. Multinomial logistic models carried out for stress and physical activity.

200
This means that mode choice is relevant for defining the good or bad
assessment of the trip based on these two factors. In this context, the
group of users that chooses to cycle (or walk) for their regular short-
distance trips are more likely to assess positively their experience in
terms of physical activity and stress. In the case of Santiago this strongly
restricts the scope of users, since being a monocentric city in terms of
uses, most of the destinations are concentrated in communes located
centrally in the city. If considered that these trips are mainly of
commuting, it means that a very privileged sector of the population are
able to live in the most central and well-off areas are the most advantaged
to be able to have that mode choice. In a different case, the group of
users living further away from these central areas, are more likely to
evaluate these factors of stress and physical activity negatively. Although
the portrayal of both groups of users of public and private transport is
similar when evaluating their functionings, having the information of the
weighted functionings allows understanding that the group of users of
public transport is more disadvantaged. This is evident, for example,
when analysing the particular case of public transport users, who tend to
experience greater distances travelled, longer times in their daily
transfers and greater proximity to other users compared to private and
active transport modes. In addition, there is a relationship between public
transport usage and lower-income level segments. This demonstrates
the key problem for transport planning in Santiago, when viewed from a
social equity perspective – the levels of inequity must be tackled primarily
in the suburban neighbourhoods, such as southwest Santiago, where
incomes are low and public transport inadequate.

201
M3 = PROXIMITY TO OTHER
USERS M4 = EXPOSURE TO AIR
POLLUTION (-2) Log
likeh Chi-square df Sig. (-2) Log
likeh Chi-square df Sig.
Final 354.874 87.851 36 .000 286.602 66.137 36 .002 Primary Mode 378.713 23.84 6 .001 298.583 11.981 6 .062 Journey Time 368.396 13.52 12 .332 303.059 16.457 12 .171 Income 379.683 24.80 18 .130 317.223 30.621 18 .032 Pseudo R-Square Cox and Snell .177 .136 Nagelkerke .199 .162 McFadden .088 .079
Table 6.6. Multinomial logistic models carried out for proximity and perceived air pollution.
Proximity to other users is mainly defined by the transport mode, where
public transport users have a more negative scoring. Although Metro de
Santiago has, historically, had a better evaluation in terms of levels of
service – certainly compared to the bus fleet – at present, both modes of
public transport score poorly in terms of the level of crowdedness. This
is evidenced by the negative assessment of proximity levels towards
other people during daily commuting trips. In Santiago, this condition is
manifested mostly in central areas (such as Santiago Centro,
Providencia, or along the corridor of the central business district area)
and some catchment hubs in the most peripheral areas – usually
converging on a particular Metro station. The problem, however, is again
more significant for people who make longer journeys and live further
away from the city centre.
6.6. Conclusion
The social impacts of transport systems and projects are poorly assessed
in almost all contexts internationally. As a result, the disadvantaged
groups gain the poorest travel experiences and access to activities in
cities, impacting on their life experiences. There is a focus on appraising
projects against economic efficiency goals, and distributional issues are

202
often overlooked (Hickman & Dean, 2017; Lucas, 2012; Martens, 2017).
The use of CA in transport allows us to explore social impacts in terms of
the opportunities for travel, activity participation and well-being, relative
to the actual travel, actual activity participation and actual levels of well-
being. This may seem a subtle distinction but is important if we are to
consider how to improve levels of public transport accessibility and how
to use this most effectively.
The transport-related health factors explored in this chapter are all
associated with lower scores in the case of low-income groups,
consistent with other research such as Hickman et al. (2017). There are
clear social equity issues here – the current transport systems are
disadvantaging low income groups and neighbourhoods in Santiago, and
most likely in many other contexts in the Global South. The low-income
areas often suffer from locational disadvantages, located on the edge of
the urban metropolitan area, and are served very poorly by public
transport networks. This results in the lower income groups perceiving
health-related factors more negatively, particularly when using public
transport as the primary mode and travelling for lengthy journey times.
There are important issues by gender; females using public transport
score poorly across the health indicators, thus policy and projects should
aim especially at this group, improving access and journey conditions.
The journey experience on public transport is very different by gender
and needs much closer attention – with projects directly developed for
improving the experience of female users and other ‘disadvantaged’
groups.
The analysis aimed to consider a wider range of multidimensional
transport-related health impacts than usually considered in social impact
assessment. It uses the concept of functionings to foster discussion on
service levels and journey experience, also considering the user priority
given to factors through weighted functionings. The value of performing
this analysis in the context of Santiago is significant, with most of the

203
previous research carried out in the Global North, and with better
economic and social indexes than those currently existing in Chilean
society.
In reflection, the extent to which transport systems impact on people's
opportunities in life, and how this may be improved, can be the subject of
further research. Other issues can also be explored, examining different
evaluations of capability, beyond weighted functionings; considering
individual decision making and agency, relationships with the built
environment (built form, public realm, climate), access to jobs and also
harassment issues. The current discussion points towards the
development of transport policies and projects, which more thoroughly
consider the range of social and health impacts. In this regard,
incorporating social, health and well-being indicators into the appraisal
process will assist in developing improved projects relative to policy
goals. Further evaluative research can lead us to a more comprehensive
understanding of how transport projects have impacts on well-being.
The factor of BMI has not been deeply addressed in this chapter,
although it challenges for further research on the differences by split
mode and gender. Transit use and physical activity have been related to
changes in BMI in previous studies (see for example Brown et al., 2015;
Martin et al., 2015; Flint et al. 2014) revealing that there is a tendency of
a higher BMI on private (motor) transport users. They have also
suggested that switching from these modes to public transport or active
modes is associated with a significant reduction in BMI – while switching
inversely might increase levels of BMI (Martin et al., 2015). Previous
results have also shown that commuting by public or active modes
significantly predicts lower BMI scores both in women and men – even
lower in the case of active modes as bicycle or walking. The association
between BMI and various forms of disadvantages as unemployment, low
income and isolation for overweight and obese groups has also been well
documented. Recent publications suggest that BMI is related to gender

204
inequalities leading to a decrease on opportunities of employment, lower
salaries and even less social interaction (see for example Sarlio-
Lähteenkorva and Lahelma, 1999; Sarlio-Lähteenkorva, 2004; Cawley,
2000).
The motive of incorporating this index in the survey carried out is meaning
to foster the use, evidence links and present a possibility of further
utilization in the transport and heath field. The use of this index when
related to transit use has shown potential in health implications and
health cost reductions (Sener et al., 2016), so further research is needed,
as empirical evidence is limited and insufficient. In this regard, the
majority of respondents (93.4%) of the survey reported data that allowed
including BMI in the analysis – from these respondents a 41.8% is located
in a segment of overweight and obesity. Correspondingly with other
suggested studies, both woman and men tend to have higher values of
BMI when private transport is the main transport mode, while they have
lower values when considering public transport as main mode. Although
for the three groups men tend to be closer to the 25 points (kg/m2), men
users of private transport are significantly more likely to be overweight
and obese, compared with those cycling or walking to principal activity –
which is also coincident with previous literature. This relationship is even
higher comparing women users of private and public transport, although
the results do not report significant differences within male female groups
according to transport mode. Woman users of public transport are likely
to have less BMI compared to users of private and active modes.
A more arduous analysis of gender has also remained a point that would
require more attention in future research. It has been found that women
have more prominent disadvantages in the aspects that have to do with
health and transport (considering the factors explored). However, it is
also the group that makes the most trips, both in number and diverse
nature. The perceptions of this group, and the subgroups accorded to the
different transport modes, can be complemented with the activities they

205
carry out. The presumption that women assess only slightly differently
than men does not help us understand the reasons for their choices and
preferences. The topic that has been mentioned about street harassment
and other forms of gender violence present in society should not be
ignored in urban planning or transportation. Much more analysis is
required in this line in future chapters and investigations.
The analysis in this chapter challenges not only academic research but
also public policy, to look for improvements in the well-being of the most
disadvantaged groups and helping them to achieve better standards of
life quality. This takes us back to Rawls (1971) who argued that we
should promote the interests of the most disadvantaged in society.
Planning our transport systems in this way would result in very different
investment patterns – with less highway investment and much increased
investment in higher quality and more extensive public transport and
walking and cycling networks, closely linked to the urban strategy.

206
7. Examination of travel experience
disparities through the measurement of
subjective well-being
7.1. Introduction
Following on the discussion on capabilities, and based on the same
questionnaire as exposed in the previous chapter, this chapter works on
the links between the capability space of functionings (doings and
beings), defined by subjective wellbeing (SWB) factors. The assumption
is that, given the inequalities and strong differences in the transport
network, the perception of SWB factors will be different depending on the
primary transport mode – and, as shown correlated in the previous
chapter, potentially by their socioeconomic background.
The link between capability and wellbeing has been explored in Sen
(1993, p.36). He describes that mobility is one functioning that is relevant
for wellbeing. The assessment a person makes on wellbeing should
consider these basic elements. On the other hand, Sen emphasises that
in poor economies the distance between functionings and the basic
capabilities (as e.g. being well nourished or being mobile) can be quite
extensive, and thus the evaluation of this distance would make the
difference even more evident. Some of these differences were exposed
in the previous chapter, exploring the functionings weighting.
Sen also recognises that ethical connections between capability and
wellbeing are well known, and evident from previous ethical studies. He
gives the example of happiness, one of the SWB factors explored in this
chapter:
The inability to be happy, which will be widely recognised as a
failure of an important functioning (…) may arise either from

207
sources within one’s own life (…) or from sources outside it (Sen,
1993, p. 37).
Therefore, people’s own assessment of their wellbeing would imply for
them measuring their space of functionings or, in this case, their
capability. As Sen explains, because capability is a set of functionings,
they represent the various combinations of beings and doings that a
person can choose (1993, p.38).
This chapter aims to assess the wellbeing specifically through the
understanding of people’s affective and instrumental SWB factors. The
previous chapter considered the first part of the CHC Nussbaum’s list –
specifically focused on the first three factors related to bodily and health.
Although the questionnaire has addressed the whole CHC list, this
chapter has highlighted the relevance of the section of emotions and
affections that transport users relate to the transport modes they usually
are aquatinted with. Considering that mobility is one of the fundamental
functionings, relevant for wellbeing, is seems pertinent and relevant to
evaluate and delve in the concept of SWB for exploring how different
transport users self-assess their capability space. Poor assessment of
affective factors related to transport modes will reflect how travel
experience is a reflection of the social inequalities. Certain groups have
no alternative but to move in transport modes that do not correspond to
their affections and neither correspond instrumentally to their needs.
Living far away from work centres, and having to reach long distances for
performing their main activities accentuates these inequalities.
The chapter contributes on suggesting the possibilities of increasing the
SWB while travelling, as the consequence would positively impact on the
attractiveness of public transport or active travel in the studied socio-
demographic groups. This can help not only to minimise the use of private
transport but also decrease the inequality gap between these users.

208
The methodology used analysis of correspondence for exploring how
positive affective/emotional or instrumental factors of SWB correspond to
the election of the primary mode. It considers the actual primary mode
versus the mode that each individual associated to both utilitarian
(designed to be useful or practical rather than attractive) and emotive
(expressing a person's feelings) SWB factors. For example, it will be
analysed if a person who uses public transport as the primary mode,
tends to associate these modes with positive emotive factors (as
freedom, enjoyment or happiness) or positive utilitarian factors (as
security, time-savings or efficiency). The analysis shows a more
persistent non-correspondence or mismatch within the more
disadvantage groups or within the users of public transport.
The chapter contributes to the literature in three areas. First, there is no
such analysis in the context of Santiago. Even using a reduced sample
like the survey carried out for this research, it is possible to identify
problems and show gaps between the different socioeconomic
segments. Second, the second part of the analysis focuses on the
emotional factor of enjoyment. Although there is current literature on the
enjoyment of commute, and transport and well-being, from hedonic and
even eudaimonic perspectives, the analysis has not been applied in
terms of distributional issues, i.e. which groups are most disadvantaged.
In the Chilean context, the active transport group is expected to be found
as that the most advantaged group in terms of enjoyment. Also in terms
of the literature, in the capability space, the chapter suggests a
discussion that goes beyond the hedonic understanding of happiness
proposed by Sen (1993). Finally, the analysis shows the attitudes of
people towards their primary mode and their perception towards ideal
modes. The attitudes of people towards modes are critical factors to be
considered by policymakers in case they want to promote and increase
the use of public transport or active modes. The chapter explores these

209
positive and negative associations within the transport options used in
Santiago.
7.2. Subjective wellbeing (SWB)
Transportation planning for decades has focused on providing mobility
for the private automobile. Given environmental concerns (i.e., climate
change; Chapman, 2007) as well as other social (Boschmann and Kwan,
2008), health (Khreis et al., 2016), and equity issues (Bocarejo and
Oviedo, 2012), the current transportation agenda has shifted focus in
recent years to the reduction of car-use. In order to successfully achieve
this aim, it will be essential to attract new users to public transportation
and active travel (Ettema et al. 2011). Within this context, it has been
argued that sustainable transportation policies require all participants in
the transportation system to challenge what Gossling and Cohen (2014)
term “transportation taboos”: deep-seated ideas concerning the
contribution to emissions by individuals, the inequality of market-based
approaches, and the social and psychological functions of transportation.
With respect to the latter, moving beyond a purely utilitarian focus, it is
important to understand how users perceive emotive and instrumental
elements on their transportation experience, since this can help to
incorporate adequate improvements in alternative transportation,
including transit and active modes, to make them more attractive to
users.
The transportation community has for the most part already agreed to the
need of looking at mobility and transport issues from the lens of well-
being, in an attempt to broaden the commonly used utilitarian perspective
on projects. Users’ travel satisfaction (Bergstad, 2001) has been the
primary way to direct this challenge towards everyday mobilities,
resulting on research about satisfaction with different transport modes.
For example, active travel tends to have the highest levels of satisfaction
(Smith, 2017; St-Louis et al. 2014; Paez and Whalen, 2010; Whalen et

210
al., 2013), while public transport users tend to assess their experience
more negatively (De Vos et al. 2016; Abenoza et al. 2017; Ettema et al.
2012). Multi-modal trips also influence satisfaction levels; for instance,
when an individual chooses a particular travel mode, she will report a
higher level of satisfaction with that chosen mode (Susilo and Cats,
2014). Other studies show that car users have a higher level of
satisfaction compared to other transport modes (Bergstad et al. 2011;
Eriksson et al. 2013).
While the use of travel satisfaction has been mainly used in the context
of daily trips – typically been linked to cost-benefit and utilitarian
measurements –, the estimation of the Subjective well-being (SWB) over
time has risen as an alternative measure. Ettema et al. (2010; p. 725)
have defined SWB as the degree to which an individual positively
evaluates the overall quality of their lives, where the general life
satisfaction encompasses a more extended temporality – which implies
assuming a tendency to be more stable over time. Increasing amount of
research has risen for complementing and applying SWB in a broader
range of satisfaction scales. The definition of other factors such as travel
choice mode, attitudes and external elements of the built environment
has been studied for a broader understanding of the changes produced
in the SWB. As these factors do not necessarily apply to the general life
satisfaction on the long term, the studies have aimed to determine both
the direct and indirect effects on the perception of users (see, e.g. Ye and
Titheridge 2017). Other concepts have also emerged as the Satisfaction
with Travel Scale (STS), a measurement devised by Ettema et al. (2011)
as well as different scales based on people’s travel perceptions. De Vos
et al. (2015) for instance, explore in detail the underlying dimensions of
the affective domain of STS in which SWB is based (for more on STS
see also Friman et al. 2013).
Recent literature on SWB and its link with transport have demonstrated
a relationship between people’s perceptions and satisfaction with their

211
daily travel (Smith, 2017; St-Louis et al. 2014; Paez and Whalen, 2010;
Whalen & Carrasco, 2013). Scholars have shown, e.g. that accessibility
has been the most developed factor influencing people’s well-being
(Delbosc, 2012), and activities have a direct impact on travel satisfaction
(Bergstad et al., 2011). Delbosc (2012; 28) for instance, has summarised
the most significant influences on psychological well-being: poverty and
employment, meaningful relationships and health. However,
understanding the components affecting people’s perceptions implies the
differentiation between the emotional (also named as symbolic-affective)
and the instrumental reasons (Bergstad, 2001). Steg et al. (2011) have
compared symbolic-affective opposed to instrumental-reasoned motives
based on car-use, and other studies have also found associations
between affective and symbolic aspects of car-use (see, e.g.
Gatersleben, 2007; Lois & López-Sáez, 2009). Previous studies have
demonstrated how socio-demographic factors affect the levels of SWB.
The effect of income on SWB (Clarck and Oswald, 1996, Ferrer-i-
Carbonell, 2005); education and unemployment (Argyle, 1999); age
(Diener and Suh, 1997) and gender (Tesch-Römer et al., 2008) have
already been studied. Recent research also suggests the links between
commuting, SWB and emotional well-being assessment (Olson et al.
2013; Kahneman et al. 2004). However, more research is needed to
understand how these socio-demographic variables, connect as well with
the decisions on main transport mode choices; or research distinguishing
between hedonic (journey experience) and eudaimonic (flourishing)
value of trips.
7.3. Affective associations towards transport modes
This chapter has considered an analysis of correspondence comparing
the election of primary mode with emotive and utilitarian SWB factors.
There is a correspondence when the individual associates their primary
mode to a positive either instrumental or emotive factor of the SWB. For
example, this chapter aims to explore if someone using the car as primary

212
transport mode, associates the car towards feelings of happiness,
freedom, efficiency or safety.
Previous research (De Vos et al., (2013; 2015) and Schwanen and
Mokhtarian (2004; 2005a; 2005b)) have developed the concept of modal
dissonance for referring to the mismatch between the actual mode and
the mode that enables users to experience positive affective/emotive or
instrumental factors. Schwanen and Mokhtarian (2004; 89) define the
dissonance based on the incongruence between residential
neighbourhood where the individual currently resides and her preference
structure toward such characteristics of the residential environment.
The survey asked about the association between the primary transport
mode and 18 positive and negative feelings. The question was: “Indicate
the modes that you associate to the following feelings”. The respondents
could indicate all the modes they associated to the feelings on the list.
Figure 7.1 shows the format of the survey in which this question has been
asked – the full survey is available on the Annex. Just three affective and
three instrumental factors, all positive, have been considered for this
analysis (in Figure 7.1 where A=freedom, D=enjoyment, Q=happiness,
G=security, C=Time savings, F=efficiency).

213
Figure 7.1. Format of the survey for answering the question on feelings on transport.

214
7.4. Analysis of dissonance considering SWB factors
The first step of analysing results seeks to understand where the
statistical significance is located. The analysis considers the dissonances
or the cases in which there is no correspondence between the primary
mode choice and the 6 SWB factors. The Table 7.1 summarises
socioeconomic variables against SWB factors, based on analysis of
correspondence.
Affective/Emotive factors Instrumental factors
a. Freedom b. Enjoyment c. Happiness d. Security e. Time
Savings f. Efficiency
Age Disson Chi-sq Disson Chi-
sq Disson Chi-sq Disson Chi-
sq Disson Chi-sq Disson Chi-
sq 18 - 34 77.0%
0.013 86.2%
0.045 81.6%
0.038 70.5%
0.041 71.6%
0.149 62.8%
0.217 35 - 54 63.2% 77.4% 70.7% 59.4% 81.2% 57.9% 55 or more 64.8% 74.1% 70.4% 57.4% 75.9% 70.4% Education
Obligatory 78.1% 0.082
86.8% 0.200
85.1% 0.060
77.2% 0.010
66.7% 0.070
67.5% 0.259 Tech Univ 70.1% 81.3% 74.7% 61.8% 77.3% 62.2%
Postg 58.6% 72.4% 69.0% 58.6% 86.2% 48.3% Income Low 83.9%
0.000 81.0%
0.639 86.9%
0.001 76.6%
0.003 68.6%
0.100 73.0%
0.017 Middle 70.7% 82.8% 75.8% 65.6% 75.2% 56.7% High 60.0% 82.0% 68.7% 56.0% 81.3% 60.0% Mode Car 36.5%
0.000
67.0%
0.000
47.0%
0.000
25.2%
0.000
93.9%
0.000
53.0%
0.000 Metro 95.6% 93.8% 97.5% 68.8% 84.4% 48.1% Bus 96.4% 94.5% 98.2% 98.2% 29.1% 95.5% Active 17.1% 43.9% 26.8% 87.8% 100.0% 56.1% Other 60.0% 88.0% 76.0% 56.0% 92.0% 64.0% Journey time
0-20 46.7%
0.000
75.0%
0.003
58.7%
0.000
57.6%
0.030
93.5%
0.000
62.0%
0.915 20-40 76.7% 82.5% 77.7% 68.9% 72.8% 62.1%
40-60 68.1% 81.4% 79.6% 59.3% 72.6% 61.9%
60+ 88.0% 90.2% 89.5% 75.2% 66.2% 64.7%
Table 7.1. Dissonances between the election of primary mode and modes chosen to represent SWB concepts.

215
The concept of dissonance means, for example, that a private transport
user selects the bicycle when associating the concept of freedom to a
transport mode. In this case, the person is using a private vehicle as
primary transport mode, and however, attaches positive emotional and
instrumental factors to another mode – in this case to the bicycle. It could
be the case that the dissonance corresponds just to one of the types of
factors, either emotional or instrumental. For example, a person who
uses the Metro as the main transport mode, that associates the Metro to
the instrumental factors (security, time savings, efficiency) but relates the
positive emotional factors (freedom, enjoyment, happiness) to the
bicycle.
Table 7.1 shows the results of the dissonances between the election of
the primary mode and SWB concepts. The categories of analysis are
age, level of education, income, primary transport mode and journey
time. It shows the dissonances for both affective/emotive or instrumental
factors. When considering the variable of income, for instance, the graph
shows that the low income segment has more total dissonances than the
middle and high-income groups. The highest income group has in
average a larger number of matches between the primary mode and the
way they relate to positive subjective factors. The Table 7.1 also shows
that the low-income segment has a higher percentage of cases of
dissonance between the primary mode and the mode chosen for
representing the positive subjective factors. In the case of Freedom, for
example, low-income has 83,9% of mismatch, versus 60% mismatch for
high-income segment. Figure 7.2 represents the dissonances by income.

216
Figure 7.2. Number of total dissonances by income.
The analysis of dissonances by primary transport mode shows statistical
significance for the chi-square analysis (Table 7.1). Feelings of freedom,
happiness and security are highly coincidental for car users as the
dissonance is lower compared to public transport (p=0). This percentage
of coincidences is much more significant than any other modes. Active
transport modes such as bicycle and walking also show high
coincidences (or lower levels of dissonance). However, this relationship
is only expressed on emotive factors, and not for the instrumental ones.
For active travel, the concept of freedom has the most significant
coincidences (83%, p=0) and the highest dissonances are around
instrumental factors as security and time-savings (88% and 100%
respectively, p=0).
This analysis coincides with the studies presented in the initial section,
demonstrating a disadvantage in the appreciation of both emotional and
instrumental factors when the primary mode is Metro or bus. The results
show that the relationship is mainly negative with respect to both types
of factors. With a significance p=0 in all factors, both Metro and bus have
the higher dissonances between the primary transport mode and the way
users relate to positive subjective feelings. Figure 7.3 shows this
relationship, through the sum of the dissonances on the six factors
studied by primary mode. As mentioned previously, Metro and bus have

217
both the highest dissonances.
Figure 7.3. Number of total dissonances by primary transport mode.
As shown in Figure 7.4, the analysis carried out by journey time also
reveals coincidences with previous research in this area, since for shorter
trips (up to 20 minutes) the analysis shows less dissonance between the
primary mode and positive subjective associations mainly for emotive
factors. On the contrary, as journey time increases, higher is the
dissonance. Strangely, the feelings of Security and Efficiency have not
been statistically representative for the Journey Time analysis.
Figure 7.4. Number of total dissonances by journey time.

218
Figure 7.5 shows the percentage of dissonance by primary transport
mode, for both affective/emotive and instrumental factors. For instance,
the graph at the top shows that the highest percentages of dissonances
come from users of Metro and bus8, compared to other modes as the car
or active transport. This is consistent with previous studies that have
separately demonstrated that public transport users tend to assess more
negatively subjective factors (explored e.g. in Stradling et al., 2000;
Gatersleben and Uzzell, 2007). For example, although car users have
higher dissonance values than active transport, comparatively this
segment has much lower percentages of dissonances than public
transport, idea also supported by research that has shown that car users
tend to attribute importance to symbolic aspects that positively contribute
to their perception on driving (Steg et al., 2001; Mokhtarian and Salomon,
2001).
Freedom and happiness tend to have a lower percentage of dissonances
in the case of active transport, which means that cyclists and individuals
who mainly walk for their commutes, tend to associate positive subjective
values while using these modes. This is also consistent with other studies
that have shown positive affective associations with the use of cycling
and walking (Anable and Gatersleben, 2005; Gatersleben and Uzzell,
2007). The question at the survey has not specify the dimensions of
freedom, thus has open the door for different interpretations as the
freedom to choose certain mode or route, freedom while using the mode,
or the freedom to access to certain places while travelling.
8 Differently to the other modes, public transport has been segmented between Metro and Bus users, as the surveys of satisfaction and perception of users carried out in Chile show differences in those modes – generally favouring the use of the Metro network over the buses.

219
Figure 7.5. Percentage of dissonance by primary transport mode.
In terms of instrumental factors, interestingly Figure 7.5 shows that bus
users have the lowest percentage of dissonance regarding time savings
(29%). However, considering the other instrumental factors, bus users
have a high percentage of dissonance for security and efficiency. In the
case of security, this means that most bus users (71%) have considered
the bus as a mode that they associate to time-savings, although it is the
mode that has more dissonant evaluations in all other SWB factors. This
also seems difficult to explain considering the negative evaluation that
the Transantiago system has consistently had. Some data provided by
the Survey of Satisfaction with Transantiago Operators (DTPM, 2017) is

220
about users' perception of journey time from origin to destination. In this
question, and after 10 years of implementation of the system, users
diagnose an average journey of 47 minutes, a value that tends to
increase with respect to the data delivered by the same survey 5 years
before (43.5 minutes on average). Worryingly, long trips of more than 30
minutes have had inconsistent variability over the years, reaching an
average of more than 37 minutes in 2016. Short trips, however, remain
roughly equal to previous years, and do not show significant changes in
the average of 6-7 minutes per trip9. This survey has the peculiarity10 of
being developed by the Metropolitan Public Transport Board (DTPM),
whose mission is to articulate the functions of the different modes of
public transport with a specific interest in buses Transantiago and Metro
de Santiago. Another big gap on these instrumental factors relates to the
perception of security that is especially significant for car users. This
means that a 75% of car users have chosen as primary mode the same
one as they relate to the feeling of security, which is completely opposite
to other transport modes, specially bus users. Bus users have the highest
dissonance (98%), which means that practically all this group of users
have chosen another mode for referring to the feelings of security. The
recently referred DTPM survey does not have any particular question that
addresses the issue of safety – mostly related in this context as security.
Figure 7.6 shows the points of origin of the survey for the case of public
transport users. Metro users as primary mode are shown, bus users are
9 The report of 2017 details, for example, that the operator company Red Bus Urbano,
which runs mainly the eastern and northern areas of the capital (Huechuraba, Renca, Las Condes, Lo Barnechea), presented an average of 57 minutes bus trips. The company that presents the lowest averages of travel time is Buses Vule (41 minutes). 10 Another particularity is the nature of the survey since it is focused on the comparative evaluation between different Transantiago operators. This means that the averages that the study provides are not necessarily the same among operators, so in terms of travel times (which only concern trips only made by bus), there is a difference of more than 15 minutes average.

221
shown in cyan. The size of the points represents the number of
dissonances. The higher the point, the greater the number of SWB
factors that do not coincide with the primary transport mode. The image
shows that the intensity or size of the circles is homogeneously
distributed in the territory, even though the blue circles (metro) tend to
show slightly less dissonance. The visualisation of this map is more
dramatic when it is compared to the following Figure 7.7.
Figure 7.6. Location of the survey origin points, level of dissonance (the larger the point size, the higher the level of dissonance with the SWB factors) for public
transport. Source: own production.
Figure 7.7 shows the points of origin for the case of private transport
(cars) and active transport (walking and cycling). Again, the size of the
circles represents intensity levels of dissonance. The number of
dissonances is lower than in the case of Figure 7.6, which indicates that

222
users of private and active transport tend to use a mode of transport that
they relate to one of the positive factors derived from subjective well-
being. In this sense, it could be said that this type of user tends to be
more advantaged than the public transport user, in a dimension not only
utilitarian but also emotional and attitudinal.
Figure 7.7. Location of the survey origin points, level of dissonance (the larger the point size, the higher the level of dissonance with the SWB factors), for private and
active transport. Source: own production.
7.5. Conclusion
The relevance of exploring the attitudes of people towards transport
modes is important for policymaking if the aim is the promotion of public
and active transport. Providing people with more access to their

223
preferences would increase the levels of correspondence between their
elected modes and the positive attitudes leading to improve their SWB.
For example, if a person feels more likely to cycle, then the person should
be given both the physical access and the mode itself for him/her to use
that mode. If this question of preferences was carried out today in the city
of Santiago, most people would probably choose to use the car for most
of their daily trips – despite the high level of congestion and low efficiency
in central areas. Although several political leaders tempted by populism
might agree, is clear that this exercise would mean a retroactive and
damaging transport policy in the long term. All the unfavourable effects
that this may cause are not analysed in this chapter, but the presentation
of this idea of the equitable distribution of a transport modes aligned with
people’s attitudes is needed for discussion.
The field of urban and transport planning has already approached the
improvement of instrumental factors such as efficiency, safety and travel
times. In fact, transport policies have pointed to that aim in recent years,
as is the case of Santiago. The display of interest on the part of the
political and technical agents and their willingness to improve the
logistical issues of trips made in the shortest possible times have
supported the option of continuing with time-savings as a predominant
factor in transport decision-making.
The security factor has been cross-sectionally sensitive according to the
data analysed in the survey. Severe problems in public transport related
to security issues are part of the daily panorama of the use of buses and,
to a lesser extent, of the use of Metro. In the case of Metro, there is a
closed space, monitored by security guards and closed-circuit cameras
that allow intercepting attempts of robbery or assault inside the stations.
However, outside the limits of the turnstiles that allow access to the
stations, Metro loses the privileges and therefore the guarantee of
protection that it can offer to its users. Following the route from the
stations to the bus stops, in cases of modal interchange, the security

224
differences are much more noticeable since the conditions of luminosity,
protection and state of the sidewalks differ depending on each of the
municipalities in which the stations are located. The following chapter 7
comment upon the interactions of policymakers at the metropolitan and
municipal level, and considering the private organisations that spatially
and logistically interact at different levels – which in most cases does not
generate the best results.
Improving the efficiency of public transport, the efficiency in transfers and
the security of users both on-board and on the walking routes to access
stations and bus stops, is mandatory. These are some of the factors that
can make public transport a more competitive mode in relation to the use
of the car. Active transport through bicycles and the use of walking have
proven to be instrumentally more efficient in some instances, so their use
has been increasing in recent years. Improvements on cycling
infrastructure and sidewalks for pedestrians are minimum requirements
to increase the use of these modes, in order to make them more
competitive also with respect to motorised modes. Although these are
assertions that currently produce a high level of agreement, the study of
the emotional factors that can promote the use of these modes has not
been sufficiently explored in transport planning. Factors such as
happiness, enjoyment and freedom have been much less examined than
the recently mentioned instrumental factors, although they are strongly
related to the definitions of subjective personal well-being.
The differences in user profiles of different transport modes are
something revealing from the analysis throughout this chapter. The users
of motorised private vehicles (of which 95% are car users) show less
dissonance on the emotional factors, versus public transport users. That
is why this last group has been highlighted – coincidentally with the
previous chapter – as the most disadvantaged group compared to the
other transport users. Users of active modes such as cyclist or
pedestrians also have low dissonance in emotional factors, which

225
explains a positive relationship between subjective well-being concepts
with the use of these modes. However, in their relationship with
instrumental factors, these modes have more significant dissonances
than car users.

226
8. Project appraisal in the context of
Santiago using a multi-actor multi-
criteria exercise
8.1. Introduction Both previous chapters have measured and applied the capabilities in
the context of Santiago’s mobility, considering the functionings space of
their transport users. This chapter develops how the concept of equity
and the measurement of social impacts has not been considered enough
in the Chilean context. The chapter explores the missing factors that
evidence a wider understanding of social equity, through a BRT project
that was designed, evaluated and withdraw throughout the course of this
research.
The transport system has, for decades, involved much political debate
and controversy in Santiago de Chile (see Chapter 4), including recent
public protests and demonstrations on the cost of travel and poor journey
experiences for public transport passengers. There are serious problems
of traffic congestion, urban highway building, crowding on public
transport, pedestrian safety and harassment whilst travelling, and poor
public realm. Journey experiences are very different for income groups
and by neighbourhood. The implementation of Transantiago in 2007 –
now rebranded as Red Metropolitana de Movilidad (Red) – the Bus Rapid
Transit (BRT) system for Santiago, was supposed to resolve many of
these issues. However, the controversy has continued, with poor
implementation of the BRT system, with too few buses, inconsistent
frequencies and poor routing, crowding, little travel information, and
missing and limited infrastructure. Passengers have reverted to the
Metro, wherever possible, again leading to crowding problems. This is a
tale of poor planning and implementation of BRT, where the views of
different actors, stakeholder and neighbourhoods have failed to be

227
adequately considered.
One of the most complex mobility corridors in Santiago is the Alameda-
Providencia, which crosses the city transversely, more than 12km in
length, between Pajaritos and Tobalaba Avenues. During the last century
this corridor has undergone a series of transformations focused on
improving the efficiency of movement, however the immediate and near
built environment of this corridor has had a sustained and progressive
deterioration (Bosch et al., 2016).
The Metropolitan Public Transport Directory (DTPM), created in 2013,
undertook a comprehensive analysis of the city's public transport system.
This included rethinking the Alameda-Providencia corridor in terms of
mobility and quality of the public space (DTPM, 2019). DTPM, together
with the Metropolitan Regional Government of Santiago, called for a
public urban design contest for the urban transformation of Alameda-
Providencia. The project sought to consider all the requirements of an
efficient public transport system, but especially the recovery of the public
and urban space. Modifications had already been made to the bus
corridor in 2007 to ensure a constant flow of close to 20 km/h (Allard,
2019), but even with an exclusive segregated pathways for buses
(shared with taxis), the modification was not sufficient for a corridor with
this level of patronage.
In April 2015, the initiative was announced, and a public design contest
was opened for a US $223 million project. In February 2016 the project
design began, including citizen participation processes of different public
services, municipalities and neighbours. The social and political
complexity of the project was widely evident in these processes, as well
as the lack of social criteria that could support the development of
inclusive mobility infrastructure, i.e. planning beyond the efficiency of
motorised flows. What appeared to be a future high-quality urban project
suffered a series of criticisms and discussions concerning the evaluation
and financing processes. With this context, a participatory workshop was

228
held in May 2018, and the discussion is presented in this chapter. At the
time, there was still no certainty of the future of the project, and different
options for changing the design of the corridor were still being
considered. In December 2018, the Ministry of Transport and
Telecommunications (MTT) informed the Regional Government of the
need to terminate the agreement, since the project does not surpass the
minimum threshold of social profitability (Olivares and Hormaechea,
2019). In March 2019, the Regional Government suspended the project
(Fernandez, 2019) due to the lack of social profitability, i.e. progress
towards social goals. The focus of the discussion so far has been mainly
the process of project management. Financing and the need for
integrating the built environment in the design were also discussed.
Finally, the lack of social profitability of the project resulted in financial
unfeasibility, contract suspensions and, ultimately, missing the deadline
for the execution of the project.
With this context, it is critical to inquire about the criteria that eventually
established the presence or the lack of social profitability. We ask what
factors should be part of the social evaluation of the project as it was
planned? Moreover, what are the social impacts that should be
considered in this type of project?
When budgets are limited, the process of deciding how to spend
monetary resources becomes critical. In transport planning, this is
evident in the way in which specific projects are prioritised over others.
In the case of Santiago, it was decided to prioritise the construction of
public transport corridors through state budgets and subsidies. The
decision is always complex since it considers the assessment and
appraisal of projects by different sectorial, regional and local actors.
Eventually, the realisation of the projects involves evaluation by the
public – especially when it comes to projects with a high profile or political
cost. There are currently several types of appraisal of transport
infrastructure projects. Cost-benefit analysis, a method that is most

229
frequently used in assessing transport projects, fails adequately to
consider social impacts and wider distributional issues beyond time
savings. In the Chilean context, the National Investment System (SNI)
determines the framework for social impact assessment, outlining the
procedures necessary for the evaluation of spending public funds.
This chapter discusses how the decision-making process and transport
appraisal can be improved in the current context. The chapter explores
the Nueva Alameda Providencia project through a multi-actor multi-
criteria analysis (MAMCA) approach (drawing on Mella Lira, 2020). The
exercise considers how transport policymakers perceive the strengths
and limitations of current project assessment and their perceptions on
incorporating new measures in the analysis for improving social equity.
There is wide agreement with participants about the need for
incorporating more comprehensive social impact assessments. The
project is assessed using the MAMCA methodology and views shared on
the methodology and its potential for use in future projects.
8.2. The Nueva Alameda Providencia (NAP) project
Implementing a new BRT corridor which reduces travel times was the
focus of the project (Bosch et al., 2016) – hence we can see how the
measurement tool shapes the project. The Nueva Alameda Providencia
(NAP) project proposes a transformation of the Alameda-Providencia
corridor, located in the historic urban centre of Santiago. The project has
emerged as a comprehensive urban regeneration project, expecting to
positively to impact the transport modes converging on this corridor,
benefiting users of public transport, and cyclists and pedestrians. The 12-
kilometre length would serve the municipalities of Lo Prado, Estación
Central, Santiago and Providencia, from the section Pajaritos Avenue to
Tobalaba Avenue. Five million users are likely to benefit from the project,
including people with physical disabilities, children and the elderly.

230
The modal integration through separate lanes (for buses, private vehicles
and bicycles) has been one of the project challenges. The design
considers prioritising some modes over others to ensure the continuity of
the use of the space. The objectives of the project are to improve public
transport, accommodate other modes of sustainable and active transport,
including the use of bicycles, and walking on the sidewalks. In this
context, the NAP project involves different stakeholders and these are
likely to have different views on the project. Figure 8.1 shows one of the
images of the project, elaborated by the architectural firm, a bus stop with
high standard of urban design, integrated to the pavement, off-vehicle
ticketing, and segregated corridor.
Figure 8.1. Bus stop proposed for the project. Source: Bosch et al. (2016).
8.3. From CBA to MAMCA in the NAP project
The comparison of CBA and multi-criteria analysis (MCA) has been
considered in terms of the outcomes for urban transport investments
(Tudela et al. 2006; Annema et al., 2015). The inclusion of some
variables which are more complex to quantify, such as noise, accidents
or air pollution, has been challenging for CBA in different contexts. The
expansion of the monetary evaluation and inclusion within MCA, either
quantitatively or qualitatively, has emerged from the difficulties arising
from the measurement of impacts and externalities in monetary terms
(Macharis et al., 2010). However, in the Chilean context, the existing

231
process of social project assessment based on cost-benefit and cost-
efficiency is not enough for covering the complexities of a project such
as NAP. Hence the regional government tendered a study considering
wider impacts. The approach was based on MCA, considering the social,
environmental, economic and transport impacts.
Error! Reference source not found.Table 8.1. shows the impacts of the
project considered. The external consultant producing the study had to
look for assessment criteria in accordance with the formulation of the
project. The criteria reflect the willingness to cover a broader spectrum of
impacts than the usually considered criteria when assessing transport
projects. For instance, travel time savings was just one criterion used for
determining the impacts of the project. In this sense, the original
incorporation of different criteria was innovative, considering indicators
that have not been widely quantified in previous projects. However, the
list also reflects the difference in measuring different indicators. The
transport and economic criteria are more quantifiable relative to the
environmental and social criteria. For example, travel time savings –
already used in the conventional assessment – are easier to quantify
when compared to the urban landscape, environmental or health
benefits. Many of these wider impacts cannot be effectively incorporated
into the quantitative analysis, hence there is a partiality to the analysis
even within a weak application of MCA (Hickman and Dean, 2018).

232
Impact Criteria Indicator Impacts on Transport
Efficiency - Number of trips per mode - Average travel times by mode
Quality - Private transport - Public transport
Economic Impacts
Users - Travel time savings - Private transport operation costs
Operators - Cost of operation of public transport vehicles - Income - Decrease of the transport fleet
Public sector - System implementation costs - Operation and maintenance costs - Subsidies to the operation of the system - Residual value
Efficiency - Calculation of private profitability indicators Wider impacts - Economic activities and employment
Environmental Impacts
Air pollution - Effects on local pollution - Overall CO2 effect
Noise - Noise Visual intrusion - Urban landscape
- Arborization - Burying of services
Heritage - Monuments - Archaeological findings
Water - Surface and underground water quality - Floor drainage - Sustainability of the resource
Energy consumption
- Energy consumption
Social Impacts
Accessibility - Access to work and educational destinations by mode
Universal Mobility - Universal mobility for people with reduced mobility
Modal integration - Modal integration with other modes of transport Safety - Traffic accidents
- Security in public spaces Quality of urban space
- Impact on users and residential and commercial property
Urban Segregation
- Barriers for the displacement of non-motorized modes
Health - Health benefits due to more active mobility
Table 8.1. Original list of impacts considered in NAP. Source: UDP.
8.4. Workshop structure A summary of the MAMCA methodology is presented in Table 8.2
through a sequence of seven steps based on Macharis (2000, 2007) that
allows the inclusion of stakeholders in the analysis. The table presents a
second column with the transferability of Macharis’ steps used in NAP
workshop.

233
Definition of the steps based on Macharis et al. 2010
Summary of the description and transferability of Macharis’ steps, used in NAP workshop
Step 1 Definition of the problem and identification of the alternatives
Presentation of the project to the attendants to the workshop (state of the art NAP). Presentation of two scenarios: current project and expectations.
Step 2 The various relevant stakeholders, as well as their key objectives, are identified
The workshop brought together actors who had some degree of participation in the project – academics examining transport, participants from regional government, consultants working on design, data, etc.
Step 3 Objectives are translated into criteria and then given a relative importance (weights)
The indicators and criteria used in the workshop were selected from the document delivered by the NAP project management. Some criteria that has been reviewed throughout this research was added to the list of original criteria. A table with a list of 32 criteria (20 original and 12 incorporated) was given to the participants. Having set up the criteria, the participants were asked to assess from 1 to 5 the criteria in the two scenarios presented in Step 1.
Step 4 For each criterion, one or more indicators are constructed
Selection of criteria. The definition of metrics and indicators was not part of the workshop. Step 4 considered the selection of 3 criteria from the list, for defining each dimension of the project: economic, social, environmental and transport – 12 in total.
Step 5 Construction of an evaluation matrix, aggregating each alternative contribution to the objectives of all stakeholders
Priority assessment and comparison of alternatives, allocating a percentage from 1 to 100% for each category. The sum of the scores of the four categories must sum up to 100% in total. 'Current' and 'expected' impact scores were afterwards.
Step 6 The multi-criteria analysis yields a ranking of the various alternatives and reveals their strengths and weaknesses
The weighting and selection of factors for each of the dimensions was calculated after the workshop. The workshop ended up with open discussion amongst all participants about the methodological tool design.
Step 7 Implementation
The final discussion with the participants considered the differences between the two scenarios, as well about the implementation aspects of using MAMCA appraisal in future projects.
Table 8.2. Transferability of Macharis’ steps used in NAP workshop.

234
Steps 1 and 2: Definition of the problem, stakeholders and
objectives
During the first part of the workshop, the participants were informed about
the aims of the activity, for them to know the context in which the activity
and the research is based. Although the use of multicriteria analysis in
Chile has been discussed since the year 2000, the consideration of
integrated and comprehensive criteria is still a challenge for transport
infrastructure investment.
The workshop brought together actors who had some degree of
participation in the project. This included experts in transport, planning,
urban planning and public policy, so the participants had a high level of
knowledge and expertise. They also had previous awareness (and
participation in some cases) in the project. In total, the workshop had 15
participants, divided into four groups: public policy, transport planners,
architects and others.
Step 2: Definition of criteria and weights
The workshop brought together actors who had some degree of
participation in the project. The workshop counted on experts in
transport, planning, urban planning and public policy, so the attendants
had a high profile in terms of expertise. They also had previous access
(and participation in some cases) to the project. In total, the workshop
had 15 participants divided in three groups: academics (6), practitioners
(6) and government actors (3). Their work on the field of planning was
particularly useful towards the evaluation of this type of participatory
tools. Some of them had previously participated in other projects that
tried to apply some participatory methodology – among members of the
community or within a specific group of experts11.
11 The quorum had some attendants that have acted as community representatives in other projects, having experience in working with neighbourhoods and local associations. However, this experience does not compare to the possibility of having people from the local communities that would have been impacted by the NAP project.

235
Step 3: Definition of criteria and weights
The methodology proposed by Macharis et al. (2010; p.305) suggests
that the criteria for the evaluation are “the goals and objectives of the
stakeholders, and not the effects or impacts of the actions per se as is
usually done in a multi-criteria analysis”. The indicators and criteria used
in the workshop were selected from the document delivered by the NAP
project management. Ideally, the list of criteria would be generated by
the stakeholders. However, it would have been almost impossible to
carry out a previous workshop (or a much longer one) with the actors who
participated in the activity, for the purposes of this research. The exercise
added some new factors, other than the already used in the NAP
consultancy report. The factors added have arisen from previous studies
conducted within the framework of this research, which have considered
non-traditional criteria and indicators (Mella Lira, 2019a, 2019b; Hickman
et al., 2017). For example, incorporating ethnic integration, the levels of
enjoyment while travelling, the quality of the streets and built
environment, are just a few examples of indicators that could be
integrated into the appraisal of these types of projects. The NAP project
needed an assessment both of public space and the transport project, so
the use of a more comprehensive and sensible palette of indicators was
inherent to the purposes of the project. The focus for defining these
factors is the expansion of the use of social indicators in the evaluation
of transport projects. Participants received a table with a list of 32 criteria
(20 original and 12 incorporated). Table 8.3 shows the criteria that were
added for the purpose of testing other new criteria in the workshop.
The project itself covers a significant area of Santiago, including four municipalities. Therefore, the project impact area from the axis of the corridor and towards the adjacent municipalities is broad enough to summon groups of communities. Having this type of participation would have allowed the criteria assessment by members of the community themselves. Time as a scarce resource was a disadvantage of this particular workshop - something to take in consideration in future research.

236
Criteria Indicators 1. Social
interaction - Levels of discrimination - Ethnical integration - Users interactions - Interactions with pedestrians
2. Subjective well-being
- General increase of well-being - Social capital - Opportunities - Capabilities
3. Users’ satisfaction
- Levels of enjoyment while travelling - Productive activities during the trips
4. Physical activity
- Infrastructure for promoting walkability - Cycle lanes - Quality of streets (pavement and urban furniture)
5. Mental health - Stress - Comfort - Security
6. Urban segregation
- Displacement barriers for non-motorised modes
7. Quality of public space
- Maintenance of public spaces - Impact of residences and commerce
8. Safety - Safety in public spaces - Accidents
9. Modal integration
- Possibility of integration to other transport modes
10. Universal mobility
- Accessibility for physical impairments - Mobility for visually impaired users
11. Accessibility - Access to jobs and educational centres
12. Energy consumption
- Energy consumption
Table 8.3. List of the 12 criteria added to the initial list considered in the NAP project. Source: own production based on the results from previous chapters of the research.
Step 4: Selection of criteria and priority assessment
The previously identified stakeholder criteria should be ‘operationalized’
by constructing indicators or metrics. These indicators help define the
criteria and measure (with a scale) how useful that criteria is for the
project. According to the methodology of Macharis et al. (2010), step 4
involves the construction of the indicators or rules that allow these criteria
to be measured. However, the definition of this step was conducted

237
slightly differently in the workshop. As indicators were already informed
together with the criteria in the NAP technical report, the participants did
not decide on the indicators. The definition of metrics and indicators was
not part of the workshop, but having the indicators written down in
advance helped to define and shape the criteria. Participants were
instructed in Step 4 to consider the selection of 3 criteria from the list, for
defining each dimension of the project: economic, social, environmental
and transport – 12 in total. The participants had to select the criteria that
seemed most relevant to define these dimensions, having to prioritise,
incorporate and give up on with the criteria to configure their final list.
Step 5: Priority assessment and comparison of alternatives
Participants were also asked to conduct a priority assessment, allocating
points from 1 to 100 for each category: transport, environmental,
economic and social impacts. The sum of the scores of the four
categories must sum up to 100 in total (Figure 8.2)
Figure 8.2. Selection of criteria and priority assessment for the dimensions. Source: own production based on the workshop results.

238
Step 6: Results
The weighting and selection of factors for each of the dimensions was
calculated after the workshop, so the attendees did not have the results
at the time they were doing the activity. The following section of this
chapter shows the analysis of the results in detail. In the last part of the
activity, and once the process of evaluating the factors was finished, the
workshop ended up with an open discussion amongst all participants.
The discussion considered comments both in the area of methodological
tool design and around the implementation aspects of using this
appraisal for future transport projects. We also discussed future and
potential scenarios of its use in the context of Santiago.
Step 7: Implementation The final part of the activity was relevant for assessing the
implementation opportunities of these type of methodologies. By the end
of the session, participants were asked to propose future examples in
which this transport appraisal may be used for transport and urban
regeneration projects.

239
Figure 8.3. Participants of workshop activity scoring the criteria. Source: author
8.5. Application results The results of the MAMCA exercise are presented in Figure 8.4 with
participants grouped into discipline groups. The differences between the
groups show the diverse emphases of the project, and the importance of
considering a range of stakeholders in project assessment. The following
shows the average of the assessments for each of the criteria listed. For
the transport planners’ group, the main impacts of the project are the
quality of public realm and efficiency – which is in agreement with the
initial spirit of the project that attempted to link a public space project with
a transport one. The group of architects tend to assess the level of
impacts at a lower level relative to the other stakeholders. Architects

240
consider that the main impacts are the improvement of urban space,
followed by efficiency of the transport system, and mode integration. For
the public policy group, the factors that the project mostly impacts relates
to safety and improvement of urban space. Security is one of the impacts
that presents the most significant discrepancies between the public policy
group and the ‘other’ group. The most notable differences between
architects and transport planners relate to the aspects of noise and
vibration, sustainable transport and social interaction. In these last three
aspects, architects tend to have a more negative judgment of the impacts
that the project can achieve when compared to the transport planners’
group.
Figure 8.4. Average of scoring by stakeholder groups
1.00
1.50
2.00
2.50
3.00
3.50
4.00
4.50
5.00
Ener
gy c
onsu
mpt
ion
Acce
ssib
ility
Uni
vers
al M
obilit
yM
odal
Inte
grat
ion
Safe
tyQ
ualit
y in
pub
lic re
alm
Urb
an S
egre
gatio
nM
enta
l Hea
lthPh
ysic
al A
ctiv
ityU
ser's
sat
isfa
ctio
nIn
crea
se in
sub
ject
ive
wel
lbei
ngSo
cial
Inte
ract
ion
Effic
ienc
yQ
ualit
y of
trip
sU
sers
' tim
e sa
ving
sO
pera
tors
cos
tsPu
blic
cos
ts o
f im
plem
enta
tion
Fina
ncia
l and
cos
t effe
ctiv
enes
sAc
cess
to jo
bsAi
r pol
lutio
nN
oise
and
vib
ratio
nVi
sual
intru
sion
(tre
es, c
able
s)C
ultu
ral h
erita
geSu
rface
wat
er q
ualit
yAc
cess
to p
ublic
spa
ces
Sust
aina
ble
mul
timod
ality
Sust
aina
ble
trans
port
Inte
grat
ed fa
irU
se o
f tec
hnol
ogie
sIn
form
atio
n an
d co
mm
unic
atio
nIm
prov
emen
t urb
an s
pace
Cle
anel
essAv
erag
e of
pun
tuat
ion
give
n to
all f
acto
rs b
y st
acke
hold
ers
grou
ps
Public policy Architecture Transport planning Other

241
The results provide information about the prioritisation of the factors that
are most relevant to the participants. The exercise asked participants to
reorganise the factors that should be part of the categories of transport,
environmental, economic and social impacts. The reorganisation of these
factors leads to the redefinition of what is understood by ‘social impact’.
It was already said that the project was cancelled due to the lack of social
profitability. The broader understanding of the concept of ‘social’ helps
this type of project to be better evaluated, in the light of the real needs of
the context and the project itself. The results of weighting the criteria
show that, in the case of the social dimension, this is where the most
significant changes in the choice of criteria are seen, particularly in
relation to what had been considered initially in the consultancy NAP
report. The main criteria selected were universal mobility (12%), user’s
satisfaction (9%), physical activity (8%), quality in public realm (8%) and
increase in well-being (8%). For the transport dimension, the main
selected criteria were modal integration (20%), quality of trips (20%) and
travel time saving (15%). Of these, only quality of trips was originally
considered in the NAP report as a transport criterion. In the
environmental dimension, the selected criteria were environmental
pollution (18%) and noise and vibration (12%). Several criteria selected
were related to the built environment, such as visual intrusion (9%),
quality in public realm (9%) and improvement in the urban space (9%).
In the economic dimension, the main criteria selected were the costs of
implementation (19%), operators costs (17%), and financial and cost
effectiveness (15%).
Finally, the exercise asked participants to score the importance of the
four categories of impacts: transport, environmental, economic and
social. Thus, each one had the autonomy to weigh the importance of
each category, attributing a score of 1 to 100, where the sum of the four
categories should equal 100. The results show that social impacts are
generally in second priority, but sometimes first – which illustrates the

242
importance of social issues in Santiago, even related to a transport
project. The group of architects weighs the social impacts over the
others. Figure 8.5 shows the prioritisation of each category according to
each stakeholder group.
Figure 8.5. Prioritisation by stakeholders, for the categories of transport, environmental, economic and social impacts.
After the impact’s measurement exercise, the workshop took the format
of a focus group, to comprehensively cover the way in which the
participants consider the applicability of this type of approach and the
potential for future projects in Chile. One of the advantages of
understanding the opinion of the participants is that most of them have
experience with other types of projects, so they know the operation,
limitations and perceptions of the general public regarding the application
of participatory methodologies. Although the exercise is within the
framework of the NAP project, the discussion can interpret the insights
for a possible application on projects of public spaces and other
comprehensive transport planning schemes.
0%
5%
10%
15%
20%
25%
30%
35%
40%
45%
Architecture Public policy Transport Planning Other
transport environmental economic social

243
8.6. Conclusion This chapter has reflected on the possibilities of using unconventional
measures in the current project appraisal, in the Chilean context.
Although some of these unconventional factors have been measured in
importance and tested in chapter 6 and 7, this chapter explores how
diverse backgrounds acknowledge the relevance of improving social
impact assessment.
The MAMCA approach is innovative in considering competing views from
different types of stakeholders within a MCA process, including on the
categorisation, scoring and weighting of criteria involved in transport
projects. The approach considers aspects that the typical CBA does not
include in the appraisal of projects – there are often different results from
CBA, MCA and MAMCA (Tudela et al., 2006; Dean and Hickman, 2018).
This is interesting in that the choice of appraisal approach leads to
different projects – and often there is a suspicion that CBA is prioritising
projects with time saving benefits, which usually are highway schemes
(Hickman and Dean, 2017), but also can be BRT schemes framed in
ways that are not reflective of wider policy goals. Hence, the use of
MAMCA can confront the usual decision-making processes in transport
planning, allowing a greater plurality to project development. This is, of
course, critical for complex projects where there are competing views on
the planning and potential impacts. In the end, CBA is much too simplistic
a process for transport appraisal, and tends to prioritise projects that do
not deliver wide-ranging public policy goals.
This chapter uses and discusses the use of MAMCA in the particular case
of the Nueva Alameda Providencia project, potentially involving a
transformation of one of the most important public transport corridors in
Santiago. The exercise has the value of illustrating the steps of MAMCA
in a transport corridor and public space project, and to aid the discussion
against multiple criteria. The context of Santiago particular demand a
consideration of social issues due to the segregated society.

244
The results show that different stakeholders have a different appreciation
of the impacts of the project, including at the individual level and within
groups. The approach also makes the exploration of opposing
perspectives possible between groups. The multi-actor component is
widely required as projects in Chile frequently face a wide range of
heterogeneous actors. Usually, these groups of actors have different and
even competing views, for example between heritage and conservation
interests, cyclists, ecologists, residents who are concerned about
expropriations, etc. The use of MAMCA allows a more systematic
process to consider different views, including in terms of social
‘profitability’ in this case. The aspirations can also be far-reaching – this
type of process can be deliberative and carried out at different stages of
project development, with a wider set of respondents. In theory, this can
strengthen the democratic nature of transport decision-making, and
ultimately lead to better projects, which deliver against wide-ranging
public policy goals. The process of transport appraisal is quite
remarkable in terms of the inertia in the system – usually only a CBA is
used, even on large and complex projects. This is not leading to well-
defined projects, and often leads to great public controversy – it is time
for a rethink.

245

246
9. Conclusions
9.1. Focus and expected contribution
The research has focused on exploring through a critical appraisal of
theoretical approaches and empirical evidence, factors that configure the
development of transport projects, and resulting impacts associated with
social equity, that can potentially reduce the gaps of social inequality.
The research also proposed paths for incorporating these factors into the
planning and assessment processes. This is part of the narrative of the
research, going from a very conceptual and normative discussion, about
the relevance of considering equity and social justice in transport
planning, to a more practical application towards the end of the thesis.
The first step of the research has been the conceptual exploration, linking
transport planning with the concepts of equity and social justice. The
research has highlighted the idea that this type of concepts has not been
sufficiently considered in the elaboration of transportation policies or
projects, so the social impact of these has tended to be overshadowed
by economic impacts. The research suggested that business as usual is
a substantial threat to the development and consolidation of parameters
that allow progress in the improvement of transport appraisal and project
implementation. In general, this type of business as usual approach
focuses on an instrumental and utilitarian vision of transport, which has
only emphasised the importance of factors such as time savings and the
efficiency of the system. The currently broad understanding of the
efficiency of transport projects in economic terms (time expenditure,
transport costs, infrastructure investments versus the number of people
favoured, among others) has perpetuated the focus on instrumental
factors. Even though the efficiency is thought to be considered as a
primary concern for users, the research has revealed that those are not
the only considerations when choosing one transport mode over another.

247
Attitudes, emotions and subjective preferences are, although difficult to
measure, also relevant in defining the modes chosen daily and for
carrying out daily activities.
The research is then focused on the exploration and development of new
approaches, observed through the lens of social equity, and looking at
the reduction of inequalities. An extensive literature has been explored to
understand the main concepts in social equity applied to the field of
transport and urban planning. The exploration has begun from the origins
of modern thinking, through the reading of Aristotle and the bases of the
ethical-normative discussion that still today define discussions in this line.
One of the most widely developed approaches in this research has been
the capability approach, which refreshes the economic paradigms that
define the distribution of wealth as the most significant conflict to solve
social problems. The capability approach opens the door to a discussion
based on the opportunities, choices and freedoms of people from a
human, individual and holistic perspective.
Opportunities and resources, personal feelings, emotions, freedom,
happiness and agency are some of the concepts that have been explored
in the discussion of the capability approach. However, the challenge has
not been trivial, since the quantification of these factors and the result of
their use has been studied before without a vaster empirical impact. This
challenge has defined the methodological nature of the research since it
has gathered the importance of using a mixed methodology that allows
exploring several of the factors that have not been much considered in
the analysis of projects.
The Chilean context framed the empirical discussion of the research –
mainly through the analysis of the inequalities produced by transportation
in Santiago. Chapter 1 introduced the case study and the main
characteristics of mobility and access in the city. The empirical chapters

248
(chapters 4, 5, 6 and 7) have explored and characterised the case study
from other diverse angles. Focusing the research in this particular case
study is relevant since Santiago has several of the current problems of
other Latin American cities and in other developing countries. Although
the research does not refer to other contexts, the transferability of the
main concepts and key ideas could be replicated in other case studies.
9.2. Research questions and key findings
This research starts by asking the following question:
Which factors in transportation projects can reduce the gaps of
social inequality, and how can they be incorporated in the
planning and assessment processes?
The strategy for answering the main question was disaggregating it into
four secondary questions. Each secondary question guided the
development of the empirical chapters of the research, as seen below.
1. What are the perceptions of policymakers about incorporating new
metrics of social equity in transport appraisal?
2. How might social equity be measured in its relation to transport
projects?
3. Who are the most vulnerable groups affected by transport and
how do they perceive these inequalities?
4. How can decision/making processes and transport appraisal
effectively be improved in the current context?
9.2.1. About the perceptions of policymakers and potential incorporation of new metrics in transport appraisal
Understanding the perceptions of policymakers around the issues of
social equity in transport (and cities) was fundamental for grounding the

249
research, together with the contextual Chapter 4. Their perspectives on
the current tools for appraisal and their interpretations of how equity must
be taken in consideration were relevant for shaping the potential of
implementing unconventional metrics and changes in the evaluation
system. Specifically, the question has allowed to explore how
policymakers perceive the strengths and limitations of current project
assessment and what is their perception on incorporating new measures
in the analysis for improving equity.
The first part of chapter 5 explores the impressions of policymakers on
concepts related to the perception of social equity and better integration.
The results consider their impressions on gender issues and economic
and physical inequalities, barriers for coordination of the different agents
and the role of the civil society. Answering the question about the
perception of policymakers for incorporating new metrics, Chapter 5
reveals that there are several agreements on the diagnosis of the
inequalities as result of transport impacts. However, there is not
agreement on the resolution to the problem.
9.2.2. About the measurement of social equity in transport projects Chapters 6 and 7 have used a quantitative approach for the recognition
of equity gaps between groups, through a capabilities-based survey
conducted in Santiago. The methodology used statistical analysis and
multinomial logistic models for quantifying the factors that most affected
the social dimension. Chapter 6, develops the capability approach as a
theoretical basis to develop a survey that considers unconventional,
emotional, attitudinal factors related to opportunities and perceptions of
the different transport modes for people. The methodology of data
collection allowed having a picture of the total of the city, which
considered a variety of socioeconomic profiles, different transport users,
and different realities of access to goods, services and infrastructures
within the city. With the data from the survey, it was possible to establish

250
comparisons in relation to the opinions of respondents regarding physical
and mental health issues: stress, physical activity, proximity to other
users, and perception of air pollution. Chapter 6, in particular, explores
factors related to the mental and physical health of the people. The
findings show that a multi-dimensional set of transport-related health
factors are needed for a broader understanding of inequalities. Today the
regular transport-related health factors are road traffic casualties,
mortality, exposure to air pollutants and noise. The chapter has
discussed that stress, physical activity, proximity to others, and
perception of air pollution are other determinants that might affect both in
the election of transport modes and the perception of the trip.
Understanding the effects of those determinants in different groups was
relevant for understanding the most vulnerable people – that corresponds
to women, public transport users and people living further away from their
primary activity (causing more travel time).
In Chapter 7, the relevance of exploring the attitudes of people towards
transport modes is important for policymaking if the aim is the promotion
of public and active transport. Giving people universal access to their
preferences would increase the levels of correspondence between their
elected modes and the positive attitudes leading to improve their
subjective well-being. If a person feels more likely to cycle, then the
person should be given both the physical access and the mode itself for
him to use that mode. If this exercise were carried out today in the city of
Santiago, most people would probably choose to use the car for most of
their daily trips – despite the high level of congestion and low efficiency
in central areas. Although several political leaders tempted by populism
might agree, it is clear that this exercise would mean a retroactive and
damaging transport policy in the long term. All the unfavourable effects
that this may cause are not analysed in this chapter, but the presentation
of this idea of the equitable distribution of transport modes aligned with
people’s attitudes is needed for discussion. The chapter reveals that

251
different transport users perceive differently emotional factors such as
freedom, enjoyment and happiness. Car users show less dissonance on
the emotional factors, versus public transport users – which means car
users tend to have a positive perception towards freedom, enjoyment and
happiness compared to public transport users. The chapter shows that
most disadvantaged group compared to the other transport users – even
more than active travel users.
The research overall allowed the exploration of methodologies of
analysis in terms of the measurement of social equity factors. The
element of data collection was a survey based on the capability
approach, through the central human capabilities list – originally
proposed in order to operationalise the theoretical concepts of the
capability approach. The measurement of the functionings and the
weighted functionings allowed assessing the current situation and of the
most relevant factors for the respondents. The measure of equity is
considered in the resulting distance between different groups, segments
or individuals. For example, empirical evidence has shown that users of
public transport, especially buses, assess more aspects related to health
more negatively than the group of active transport users. This positions
bus and metro users in a disadvantaged position when compared in
terms of modal choices. However, the analysis also allowed to account
for the negative evaluations made by segments with lower incomes or
segments that must carry out longer daily trips.
9.2.3. About the most vulnerable groups affected by transport and how do they perceive these inequalities
Chapter 6 spotlights a series of factors that have not been applied to
project appraisal in Chile so far. In other contexts, such as in the UK, the
study of these parameters in the implementation of transport projects has
been wide more developed – although accounted for the economic
benefits of incorporating these criteria. The most critical aspect of this

252
chapter, apart from the relevance of the use of these factors, is the
recognition of the most disadvantaged groups. Women, public transport
users and low-income groups are the most disadvantaged, which
coincides with those users travelling longer times. Regarding
opportunities, these are the groups that have reduced their chances of
accessing sectors with higher employment, better facilities or services,
since the modes of transport they have available place them in a
disadvantage compared to other groups of the society. A focus on actual
travel and activity participation (functioning) ignores the concept of real
opportunity and the barriers that mean the opportunity is often not
achieved.
Regarding income analysis, the results show a significant difference in
the perceptions of the different transport users in relation to these factors.
Public transport users are usually disadvantaged when compared to any
of the other transport modes. The lower income segment tends to use
public transport more and is shown to be more disadvantaged. This is
also the group that on average travels longer distances and consequently
has longer travel times. The analysis does not explore the reasons
behind this, but it could be explained by the displacement these groups
experience, as result of the current dynamics of land use and housing
market – ending up living away from the main work centres of the city.
Regarding gender, the first empirical chapter showed no significance in
the quantitative analysis – a weakness of using that type of instrument
for illustrating gender issues. Although the data revealed that there are
no significant differences in the measurement of these factors related to
health and transport, more research is needed in order to analyse the
existing gender conflicts in Santiago.
In the search for the most vulnerable groups, the research also makes
visible concepts such as subjective well-being or happiness. Chapter 7
delivers key concepts in this line, suggesting a turn from the research of
instrumental factors to the emotional factors that make possible the

253
understanding of more complex transport dynamics and decisions. The
profiles of the most vulnerable groups in this analysis coincide with the
groups mentioned above. Currently, car users and active transport are
privileged with respect to emotional factors. They show less dissonance
of modal use compared to public transport users, when the analysis is
centred in the association between transport and positive well-being
factors.
9.2.4. About the applicability of the research in transport appraisal The last secondary question explores the concepts of equity in the form
of appraisal. As the question is centred in the applicability and potential
changes on appraisal, Chapter 8 presents an exercise of multi-actor
multi-criteria analysis considering one particular project recently
developed in Santiago. The project is a holistic BRT that considers a
whole new design and implementation of one of the most critical transport
corridors for the city.
The chapter presents a series of unconventional factors that had not
been originally considered in the project of the BRT corridor, but that had
been analysed in previous chapters of this research. The exercise with
the attendees showed a broad appreciation of these factors, especially
in the definition of the social impacts of the project. The chapter also
addressed different profiles of professionals and experts in the field for
participating in the activity. This evaluation was carried out with a group
of experts, all with knowledge of the project, but from different areas.
Engineers, architects, planners, health academics and practitioners were
part of the workshop. The multidimensional vision served to describe
different characteristics of the subgroups, allowing the comparison and
generation of a profile of workshop attendees. Finally, the chapter
visualises these type of exercises and participatory tools for future project
evaluation in Chile. The general opinion of the attendants is that this is a
useful and necessary methodology that can feasibly used in the Chilean

254
context. However, they also recognised the importance of one particular
of the MAMCA steps, related to the joint definition of the factors that
define the project – also participative. They suggested that the criteria
have to be better defined since they are sometimes overlapped, and
sometimes factors involve more than one dimension.
9.3. Originality of the research The research contributes in one of the most fundamental aspects
debated today in Chile, how inequality has impacted negatively in the
lives of people. The research grounds the theory of equity and justice in
the urban and transport planning context. It also challenges the
dominance of a transport theory and practice developed in the global
north, with research from a city in the global south.
One of the main originalities of the research has been the understanding,
use and application of the Capability Approach (CA) in the Chilean
transport planning context. This has no precedent and it is a good
contribution both to the literature and the context of study in particular.
The challenge of using the CA has come with the joint exploration of a
wide range of social equity issues. The social impacts of transport
systems and projects are poorly assessed in almost all contexts
internationally. As a result, the disadvantaged groups gain the poorest
travel experiences and access to activities in cities, impacting on their life
experiences. Distributional issues are often overlooked as project
appraisal focuses on economic efficiency goals. The use of the CA in
transport has allowed exploring social impacts regarding the
opportunities for travel, activity participation and well-being. These
impacts are related to actual travel, actual activity participation and actual
levels of well-being. This may seem a subtle distinction but is important
if we are to consider improving levels of public transport accessibility and
using this accessibility more effectively for producing advantages.

255
The discussion about the use of CA in the transport planning context
demonstrates the importance of considering real opportunities
(capabilities) and functionings (actual activity). This takes us beyond a
focus on actual activity which is the usual centre of transport analysis,
and allows a greater focus on barriers to access and the constraints for
individuals to participate in travel and life. The CA, through the distinction
between capabilities and functionings, might be used to determine
existing levels of equity in terms of what individuals wish to do and what
they are actually able to perform. As presented in the literature section of
this research, capabilities represent the various combinations of doings
and beings (functionings) that a person can feasibly achieve. The
analysis based on weighted functionings brings the measurement of
capabilities closer, as the levels of importance that people attribute to
their functionings relates to what a person would define in the range of
her freedoms and opportunities. However, the significance given to the
individual level, considering, for instance, the importance of freedom and
personal subjective elements, has shaped an essential criticism of CA.
In transport, as well as other public goods, the accomplished
differentiation of individual and collective advantages should be closer to
the idea of the common good. When transferring these concepts to the
applicability of collective solutions, policy targets should consider
personal abilities and individual assets but mostly they should be explicit
when it refers to the attainment of people’s opportunities – especially the
most disadvantaged groups.
The research also explores the inclusion of users’ perceptions beyond
the usually considered factor of satisfaction with the trips. Existing
evaluations of the perception of transport users are limited to considering
satisfaction. Although satisfaction has been related to travel behaviour,
factors directly related to the subjective well-being of the individual have
not been generally considered in transport appraisal. The research is
original in that it provides keys for use, analysis and consideration of

256
importance for these subjective perceptions. These subjective
perceptions, in turn, are supported by a theoretical framework based on
the individual’s well-being, considering a broader spectrum than the
usual for transport requirements. While travel time savings and efficiency
are real considerations for users, the inclusion of new dimensions of
analysis in transport appraisal can favour a better quality of travel – and,
consequently, it can improve people’s quality of life.
The exploration of the mentioned topics has revealed that unconventional
factors can (and should) be used for social impact appraisal. The
research highlights the need to incorporate emerging factors for the
evaluation of social impact in transport projects through the use of a
capabilities-based survey. Chapter 6 and 7, for example, test the
consideration and evaluation of these emerging factors, through the use
of a capability-based survey. Some of the unconventional factors
explored, have considered, for example, the validation of emotive and
attitudinal factors for reflecting social inequalities. At the moment, even
though the trend is changing, the instrumental factors as efficiency,
safety and travel times are the primary factors for measuring social
impact assessment.
The methods used along the research demonstrates the relevance of
incorporating both qualitative and quantitative methods. Those show
different and complementary problems of the current transport project
appraisal and the social problems associated with transport. These two
methodological paths are complementary, through the design and
application of a survey to transport users and the use of semi-structured
interviews with policymakers. The third methodological derivation of the
research proves a participatory method with policymakers that
emphasises the incorporation of the factors explored in previous
chapters. This also applies when testing innovative participatory
methodologies in the context of Santiago. Chapter 8 explores the use of

257
a multi-actor multi-criteria (MAMCA) methodology in one particular BRT
project in Santiago. The exercise has demonstrated that experts
participating in the transport planning scenario agree on the need for
incorporating more comprehensive assessments under the lens of social
equity. The BRT project has been finally withdrawn from the government
agenda – at the moment of writing up the final part of this research. The
authorities have commented that the project has not accomplished the
social profitability needed for the implementation of these type of
projects. The problem is that the primary indicator for measuring social
benefits was travel time savings, which this is not enough for covering
the social benefits and does not even reflect part of the problems for the
non-existence of a high-quality BRT corridor. Simulated participatory
methodologies as the MAMCA could have helped in the early stages of
the BRT plan.
The research also fosters a transferability of knowledge and theoretical
framework in a case study in the Global South. The research uses global
north literature related to equity and social issues applied in transport.
Even though most of the research has been done in the global north or
developed countries, the research approaches these theories assessing
social equity in the context of the global south.
On the other hand, the research is transferable to other Chilean cities or
other Latin American cities. Firstly, following the methodological path of
compiling the factors explored through a survey. Then, the collection of
contextual antecedents and interpretations of the application of concepts
of social equity in public policy through interviews and qualitative analysis
with policymakers. Finally, the simulation of a participatory methodology
in some sustainable transport project - complex in terms of actors,
results, context or problems to solve. This methodological path and the
urgency of the fair and just transport agenda is relevant in several Chilean
cities, and indeed in many Latin American cities. This transferability is
essential, purposeful and relevant as a result of this research.

258
9.4. Reflections for future research and practice
The use of qualitative and quantitative methods throughout the research
has been a fundamental challenge. The collection and analysis of
quantitative data have revealed a perspective that allows the aggregation
of results at a medium scale – which could eventually be aggregated on
a bigger scale in future research. The results have been conclusive with
the research questions that have been proposed at the beginning of the
document. The first two empirical chapters have allowed responding to
the way of measuring specific factors and the recognition of the most
vulnerable groups of society in transport matters. On the other hand, the
use of qualitative methods such as the use of interviews and workshops
with relevant actors in the public discussion of transport has allowed a
complementary data analysis that can be translated into the reality in the
context of Santiago. Although both analyses have substantial
differences, the results obtained are complementary and allow a more
complex and broader understanding of the object of study.
Being able to develop quantitative data collection tools, as the survey,
which incorporates new ways of measurement that have not been used
in other previous studies has been interesting in the course of this
research. This was a risky decision since it involved a process of design,
reflection, redesign and final application of the tool that took longer than
expected. However, the result was satisfactory in the sense that it
allowed a logical and creative learning process – although at the same
time it can be refined for future applications. This also feeds the
impression of being able to develop future research in this line, without
being afraid to innovate in the methodological proposals and the
challenges of both obtaining and analysing data. The agenda of research
for the following years will take again in consideration the mixture of
methods. Qualitative and quantitative research together are powerful
tools for better understanding the social impacts.

259
Being able to share in seminars and conferences the information
obtained throughout the process, has also been interesting for the
outcomes of the research – especially with people who have different
profiles and backgrounds. For example, in the field of transport
inequalities, there is broad research on the impacts and consequences
of accessibility. The development of this research does not approach the
use, measurement or interpretation of the levels of people's accessibility,
but it highlights concepts that have been developed outside the scope of
transport such as health, well-being, and even some concepts derived
from the psychology and human behaviour. These occasions of exposing
research outcomes have made it possible to understand how this
information can be interpreted in other contexts. A correct definition of
concepts and the explicit evidence that diagnoses and solves the
problem is then necessary.
The research challenges the capability approach itself, as it questions if
this is the most useful way of understanding social issues in relation to
transport. The focus on barriers and even adaptive capacity takes us
beyond that just the focus on actual activity and accessibility planning
(which is more like a capability). Looking at other conceptual approaches
– such as social capital, motility – is relevant for strengthening the
theoretical framework and understanding social equity and travel, which
has conventionally been underdeveloped in transport planning research.
Future agenda of research will consider further development of concepts
in more detail – such as adaptive capacity, social assets, agency, among
others. One of the threads that future research will have to deal with is
the possible misinterpretation of the capability approach due to the
complexity in the terminology. Even though theoretically and
academically the capability approach is challenging and attractive, it
could be difficult to be understood. This can represent an obstacle for the
dissemination of the advantages and potentiality of its use. The threat is
the misinterpretation or even the distortion of the concept when it is not

260
appropriately applied. Similarly, another consideration is the lack of a
'useful' interpretation of the approach. The definitions and concepts could
sound too sophisticated for running analysis or too complicated for
modifying existing tools, indicators or approaches based on the
capabilities.
A gender perspective on research needs to be considered in the future
research agenda, acknowledging that women have been one of the most
disadvantaged groups encountered in the research. Even though the
quantitative results were not enough for covering those issues, those
were better reflected on the qualitative analysis. Results showed that
care role, the mobility patterns, the inclusion of women in the labour force,
the male-dominated car ownership and the sexual harassment in public
space – and public transport – are the most critical aspects of women
mobilities. The research was not designed under the lenses of the gender
perspective – as it was expected that in the results the gender issues
would appear by default. However, for instance, the questions used in
the questionnaire were not conducive enough for understanding the real
struggles of women – founded mainly in public transport and their daily
mobilities. This is probably the most critical issue encountered in the
(missing) results. The lack of the gender perspective has led to the desire
to conducting more research advocated to understand the particularities
of different disadvantaged groups. If those inequalities are expected to
be tackled, the design of the instruments, questions, factors and
assessment should be carefully considered.
Regarding practice, this research is relevant since it questions the
elements that currently configure the project appraisal system and the
components that define this evaluation. It analyses possible novel factors
that should be incorporated in the metrics and evaluation standards,
suggesting a turn towards the perceptions and needs of the individual,
through parameters that value aspects that are not necessarily subject to
direct economic evaluation. The research also contributes to generate
empirical evidence revealing aspects that have not been previously fully

261
considered, suggesting them as fundamental for a just transport agenda
in the coming years.
The application of this research in other contexts is suggested based on
the methodological use of the tools and the analysis of the data obtained.
For example, during the course of this research, the use of the capability
survey focused on opportunities has been applied in Manila, Philippines.
The work evidenced in Manila takes place in a developing city with local
problems of high car dependence, lack of a public transport system (as
private operators run collective transport) and high rates of social
inequality. The results are evidenced by the publication Hickman et al.
(2017), illustrating that the conceptual framework and empirical approach
can be used in many different contexts in the Global South and even
beyond.
Finally, the research aimed to consider a broader range of
multidimensional transport-related impacts than usually found in social
impact assessment. It used the concepts of capabilities, opportunities
and well-being to go beyond the usually considered levels of service and
travel satisfaction. The research considers the users as the centre of the
analysis, not the infrastructure or the economic impacts. Therefore,
applying questionnaires was a way of approaching to them asking
unconventional questions, giving credit to the way they prioritise the most
significant factors for them to achieve what they value in life. The value
of performing this analysis in the context of Santiago was significant, with
most of the previous research carried out in the Global North, and with
better economic and social indexes than those currently existing in
Chilean society.
The extent to which transport systems impact on people's capabilities
and opportunities in life, and how this may be improved, can be the
subject of further research. Other issues can also be explored, examining
different evaluations of capability, beyond the concepts explored in this
research. For example, individual decision making and agency,

262
considering relationships with the built environment (built form, public
realm, climate) and access to jobs. The current discussion points towards
the development of transport policies and projects, which more
thoroughly consider the range of social, well-being and health impacts.
Further evaluative research can lead us to a more comprehensive
understanding of how transport projects have impacts on well-being
impacting – hopefully positively – in people’s lives.

263

264
Annex 1 Survey questions – English

265
1. Health - physical and mental integrity
CarA
TaxiB
ColectivoC
MetroE
Bus TransantiagoF
BicycleG
MotoD WalkingH
a. How do you evaluate the level of stress you experience in your usual trips?
p. What is your MAIN mode of transportation to go to your main job or activity?
GOODLow levels of stress
BADHigh levels of stress
1 2 3 4 5
b. How do you assess your physical activity in your usual trips?
Negatively Positively
1 2 3 4 5
c. How do you assess your level of closeness (proximi-ty) to other transport users in your usual trips?
BADThere is not enough distance between users
GOODThere is enough space
between users
1 2 3 4 5
CarA
TaxiB
ColectivoC
MetroE
Bus TransantiagoF
BicycleG
MotoD WalkingH
(Which mode you most depend on to travel to your main activity. Select only one alternative)
The survey refers in various questions to "transport modes" or simply "modes". The following two questions indicate what these referred modes are:
q. What is your SECONDARY mode of transportation?(The mode with which you make exchanges or the one that complements your main transport mode)(Select only one alternative)
CarA
TaxiB
ColectivoC
MetroE
Bus TransantiagoF
BicycleG
MotoD WalkingH
r. Would you add some other mode of transport that you use regularly both to go to work and to do other activities?(Check all that apply)
SOCIAL EQUITY IN TRANSPORT SURVEY · PUBLIC, PRIVATE AND ACTIVE USERS
Page 2 of 7
d. How do you assess the level of air pollution that you experience in your usual trips?
MALHigh levels of air pollution
BIENLow levels of air
pollution
1 2 3 4 5
e. How do you assess the level of security (if not assaulted or harassed) that you experience in your usual trips?
BADLow level of security
GOODHigh level of
security
1 2 3 4 5
f. How do you assess the level of comfort you experience in your usual trips?
BADLow level of comfort
Not important
Very important
GOODHogh level of comfort
1 2 3 4 5
1
g. What is the importance that you assign to these aspects?
Levels of stressA 2 3 4 5
1 2 3 4 5
1 2 3 4 5
1 2 3 4 5
1 2 3 4 5
Physical activityB
1 2 3 4 5Closeness to othersC
Air pollutionD
SecurityE
ComfortF

266
Page 3 de 7
SOCIAL EQUITY IN TRANSPORT SURVEY · PUBLIC, PRIVATE AND ACTIVE USERS
2. Feelings and emotions about modes of transport
a. Please indicate the feelings that relate to the use of the following modes of transport:
Freedom
TAXI MOTOCOLECTIVO METRO BUS BICYCLE WALKING
A
CAR
InsecurityB
FunctionalityC
CongestionJ
EfficiencyK
LuxuryL
EnjoymentD
Low costE
PovertyF
Environmental careM
HealthN
Social interactionO
SecurityG
Waste of timeH
UnreliabilityI
DiscomfortP
HappinessQ
StatusR
(Check only one mode of transport by concept)

267
Page 4 of 7
SOCIAL EQUITY IN TRANSPORT SURVEY · PUBLIC, PRIVATE AND ACTIVE USERS
b. How much do you usually enjoy traveling to your daily activities?
Little or nothingI do not enjoy the trip
MUCHI do enjoy the trip
Little or nothing importance
MUCHimportance
1 2 3 4 5
1 2 3 4 5
d. Which factor AFFECTS more in your travel experience?
Lack of securityB
Lack of comfortA
Poor quality of corridors and / or streetsC
Overcrowding of passengersD
Physical disability or reduced mobilityE
Travel timesF
All of the aboveG
Other:H
(Mark only one alternative)
e. Which factor would FACILITATE your travel experi-
Improvements in securityB
Improvements in comfortA
Improvements in corridors and streetsC
Decrease in passenger overcrowdingD
Accessibility improvements for pedestriansE
Decrease in travel timesF
All of the aboveG
Other:H
(Mark only one alternative)
3. Reasoning and Planning
b. Does your current access to public transportation allow you to access the job you need?
1 2 3 4 5
a. How do you evaluate your access to job opportunities through public transport?
BAD.Low access to employment through public transport
GOOD.Good access to employment
through public transport
NO.I do not have access to necessary employment through public transport
YES.I have good access to needed employment
through public transport
1 2 3 4 5c. What level of importance does the quality of transportation travel have for you?
d. Which of the following activities are difficult to perform due to transportation-related complications?
1Visit family / friendsA 2 3 4 5
1 2 3 4 5
1 2 3 4 5
1 2 3 4 5
1 2 3 4 5
Recreational activitiesB
Cultural activitiesC
Sporty activitiesD
Food shoppingE
1 2 3 4 5Social activities
Visitar familia/amigos
Actividades recreativas
Actividades culturales
Actividades deportivas
Compras de comida
Actividades sociales
F
1A 2 3 4 5
1 2 3 4 5
1 2 3 4 5
1 2 3 4 5
1 2 3 4 5
B
C
D
E
1 2 3 4 5F
LITTLE possible
VERYpossible
FEWfrequency
MUCHfrequency
1A 2 3 4 5
1 2 3 4 5
1 2 3 4 5
1 2 3 4 5
1 2 3 4 5
B
C
D
E
1 2 3 4 5
Visitar familia/amigos
Actividades recreativas
Actividades culturales
Actividades deportivas
Compras de comida
Actividades sociales
F
1A 2 3 4 5
1 2 3 4 5
1 2 3 4 5
1 2 3 4 5
1 2 3 4 5
B
C
D
E
1 2 3 4 5F
c. What is the frequency with which you carry out these activities?

268
Page 5 of 7
SOCIAL EQUITY IN TRANSPORT SURVEY · PUBLIC, PRIVATE AND ACTIVE USERS
e. How important do you consider having several options to use different modes of transport?
1 2 3 4 5
h. What modes are economically accessible for you and your family?(Choose all that apply)
i. What mode do you NOT use because it is not econom-ically affordable?(Choose all that apply and leave blank if it is not applicable)
1
j. Indicate how important it is to improve the following aspects in the public transport system:
Improve access to office and commerce sectorsA 2 3 4 5
1 2 3 4 5
1 2 3 4 5
1 2 3 4 5
Improve availability of modes of transportB
Improve overall comfort in public transport useC
Incorporate other modes into the integrated fare systemD
CarA
TaxiB
ColectivoC
MetroE
Bus TransantiagoF
BicycleG
MotoD WalkingH
CarA
TaxiB
ColectivoC
MetroE
Bus TransantiagoF
BicycleG
MotoD WalkingH
LITTLE important
VERYimportant
f. How much does your quality of life depend on the access you currently have to public transport?
1 2 3 4 5FEW MUCH
g. How much do you think your quality of life would increase if you have better access to public transport?
1 2 3 4 5FEW MUCH
FEWimportant
VERYimportant
a. How do you evaluate the level of interaction you have with other people during your usual trips?
Negatively Positively
FEWimportant
VERYimportant
1 2 3 4 5
b. How important do you consider the presence of other people during your usual trips?
1 2 3 4 5
4. Social interaction
c. Have you ever felt discriminated against while traveling in some mode of transportation?
YesA NoB
a. In the event of a climate event such as heavy rain or flood, do you change your main mode of transport?
d. If your answer was affirmative (you have felt discriminated), please indicate in which modes:
5. Nature and Sustainability
NoBYesA
CarA
TaxiB
ColectivoC
MetroE
Bus TransantiagoF
BicycleG
MotoD WalkingH
d. If your answer was affirmative (change of transport mode before a natural event), please indicate which mode you use: (Select only one alternative)
CarA
TaxiB
ColectivoC
MetroE
Bus TransantiagoF
BicycleG
MotoD WalkingH

269
Page 6 of 7
SOCIAL EQUITY IN TRANSPORT SURVEY · PUBLIC, PRIVATE AND ACTIVE USERS
c. How do you evaluate your access to the currently available sustainable modes of transport? (eg hybrid buses, electric cars, public bicycles)
Low access to sustainable modes of transport
High access to sustainable modes of
transport
1 2 3 4 5
d. How important is it for you to have access to sustaina-ble modes of transport?
1 2 3 4 5
g. Please indicate how important it is to improve the following aspects in the public transport routes:
1Presence of treesA 2 3 4 5
1 2 3 4 5
1 2 3 4 5
1 2 3 4 5
Access to parksB
Access to sustainable transport modes
Expand offer of sustainable modes of transport
C
D
YesA NoB
e. Would you be willing to spend more on transporta-tion in order to have access to more sustainable ways?
f. If your previous answer was positive, please indicate how much your transportation expense would increase:
5% - 15% A 15% - 30%B 30% or +C
b. If you have answered YES in the previous question, how is the quality of these exchanges?
Poor quality Good quality
1 2 3 4 5
6. Information and modal exchanges
a. Do you carry out exchanges between modes of transport (in the same route) when you make your usual trips?
NoBYesA
FEWimportant
VERYimportant
FEWimportant
VERYimportant
c. How do you evaluate your usual trips in relation to:
1Waiting timesA 2 3 4 5
1 2 3 4 5
1 2 3 4 5
Transfer timesB
Overall timeC
VERYBAD
VERYGOOD
-
-
N/A
d. What main aspect makes your transfers more
Poor physical connection for pedestrians A
Transfers take a long timeB
It is not comfortable to have to transferC
Bad infrastructure for waiting modesD
Lack of securityE
All the aboveF
Other:G
(Check only one alternative)
e. Do you have access to technological tools such as smartphones and the internet, with which you can view information on transportation services?
YesA NoB
f. How do you evaluate the level of technological infor-mation available to see transportation alternatives?(eg applications smartphones, internet, signs)
BADLow access to information
GOODHigh access to
information
1 2 3 4 5
g. How important is it for you to have technological informa-tion?
1 2 3 4 5FEWimportant
VERYimportant

270

271

272
Annex 2 Survey questions – Spanish
b. Indicar las avenidas de intersección más cercanas a su hogar (ej. Av. Grecia con Macul):
h. Cómo describiría su ocupación actual?Esta es una invitación a participar de un estudio centrado en las dimensiones sociales, personales y de equidad social, que no han sido ampliamente exploradas en el uso del transporte público y
privado en Santiago.
El estudio está siendo desarrollado por la Doctorante e Investigadora en Planificación Urbana y Transporte
Beatriz Mella Lira ([email protected]), candidata a PhDThe Bartlett School of Planning, University College London.
La siguiente encuesta dura alrededor de 20 minutos y los resultados serán exclusivamente utilizados para fines académicos y de investigación. Todas las respuestas son anónimas y confidenciales. Muchas gracias por su cooperación.
c. Género
0. Características individuales
ENCUESTAS DE EQUIDAD URBANA Y SOCIAL · USUARIOS DE TRANSPORTE PÚBLICO Y PRIVADO
FemeninoA
MasculinoB
m. Tiene alguna discapacidad física?
o. Si respondió SI en la pregunta anterior, por favor indicar qué tipo de discapacidad:
Página 1 de 7
SiA
NoB
SiA
NoB
n. Tiene licencia de conducir?
e. Peso
kgs.
f. Altura
cm.
d. Edad
Menos de 18A
18 - 24B
k. Cuántos adultos viven en su casa?
l. Cuántos niños viven en su casa?
25 - 34C
Menor a $423.000A
$423.000 - $639.000B
$639.000 - $977.000C
$977.000 - $1.550.000D
$1.550.000 - $2.380.000E
Más que $2.380.000F35 - 54D
55 - 64E
65 o más F
Empleado tiempo completoA
a. ¿En qué comuna vive?
i. ¿En qué comunas trabaja o realiza sus principales actividades remuneradas/estudio?
Empleado part-timeB
Trabajador independienteC
DesempleadoD
Dueño/a de casaE
EstudianteF
Estudiante y empleado part-timeG
RetiradoH
OtroI
g. Cuál es el nivel de educación más alto que ha alcanzado?
Educación básicaA
Enseñanza mediaB
Educación profesional TécnicaC
Educación profesional UniversitariaD
Posgrado (MSc or PhD)E
j. Cuál es su ingreso familiar mensual?

273
1. Salud e integridad física y mental
AutoA
TaxiB
ColectivoC
MetroE
Bus TransantiagoF
BicicletaG
MotoD CaminandoH
a. ¿Cómo evalúa el nivel de estrés que experimenta en sus viajes habituales?
p. ¿Cuál es su PRINCIPAL modo de transporte para ir a su trabajo o actividad principal?
BIENBajos niveles de estrés
MALAltos niveles de estrés
1 2 3 4 5
b. ¿Cómo evalúa el esfuerzo físico que realiza en sus viajes habitalues?
Negativamente Positivamente
1 2 3 4 5
c. ¿Cómo evalúa su nivel de cercanía (proximidad) a otros usuarios de trasporte en sus viajes habituales?
MALNo hay suficiente distancia entre usuarios
BIENHay suficiente espacio
entre usuarios
1 2 3 4 5
AutoA
TaxiB
ColectivoC
MetroE
Bus TransantiagoF
BicicletaG
MotoD CaminandoH
(Modo del cual Ud. más depende para viajar a su actividad principal. Marcar sólo una alternativa)
La encuesta refiere en diversas preguntas a los “modos de transporte” o simplemente “modos” . Las siguientes dos preguntas indican cuáles son estos modos referidos:
q. ¿Cuál es su modo de transporte SECUNDARIO? (El modo con el que hace intercambios o el que complementa su modo de transporte principal)(Marcar sólo una alternativa)
AutoA
TaxiB
ColectivoC
MetroE
Bus TransantiagoF
BicicletaG
MotoD CaminandoH
r. ¿Añadiría algún otro modo de transporte que utilice regularmente tanto para ir al trabajo como para realizar otras actividades? (Marque todos los que correspondan)
ENCUESTAS DE EQUIDAD URBANA Y SOCIAL · USUARIOS DE TRANSPORTE PÚBLICO Y PRIVADO
Página 2 de 7
d. ¿Cómo evalúa el nivel de contaminación ambiental que experimenta en sus viajes habituales?
MALAltos niveles de contaminación
BIENBajos niveles de contaminación
1 2 3 4 5
e. ¿Cómo evalúa el nivel de seguridad (de no ser asaltado o acosado) que experimenta en sus viajes habituales?
MALBajo nivel de seguridad
BIENAlto nivel de
seguridad
1 2 3 4 5
f. ¿Cómo evalúa el nivel de comodidad que experimenta en sus viajes habituales?
MALBajo nivel de comodidad
POCOimportante
MUYimportante
BIENAlto nivel de comodidad
1 2 3 4 5
1
g. ¿Cuál es la importancia que asigna a estos aspectos?
Niveles de estrésA 2 3 4 5
1 2 3 4 5
1 2 3 4 5
1 2 3 4 5
1 2 3 4 5
Actividad físicaB
1 2 3 4 5Cercanía a usuariosC
ContaminaciónD
SeguridadE
ComodidadF

274
Página 3 de 7
ENCUESTAS DE EQUIDAD URBANA Y SOCIAL · USUARIOS DE TRANSPORTE PÚBLICO Y PRIVADO
2. Sensaciones en torno a los modos de transporte
a. Por favor indicar los sentimientos que relaciona con el uso de los siguientes modos de transporte:
Libertad
TAXI MOTOCOLECTIVO METRO BUS BICICLETA CAMINATA
A
AUTO
InseguridadB
FuncionalidadC
CongestiónJ
EficienciaK
LujoL
EntretenciónD
Bajo costoE
PobrezaF
Cuidado ambientalM
SaludN
Interación socialO
SeguridadG
Pérdida de tiempoH
ImpuntalidadI
IncomodidadP
FelicidadQ
EstatusR
(Marque todos los modos que correspondan)

275
Página 4 de 7
ENCUESTAS DE EQUIDAD URBANA Y SOCIAL · USUARIOS DE TRANSPORTE PÚBLICO Y PRIVADO
b. ¿Cuánto disfruta viajar habitualmente hacia sus actividades diarias?
POCO o NADANo disfruto el viaje
MUCHOSi disfruto el viaje
POCO o NADAde importancia
MUCHAimportancia
1 2 3 4 5
1 2 3 4 5
d. ¿Qué factor AFECTA más en su experiencia de viaje?
Falta de seguridadB
Falta de comodidadA
Pobre calidad de corredores y/o callesC
Hacinamiento de pasajerosD
Discapacidad física o movilidad reducidaE
Tiempos de viajeF
Todas las anterioresG
Otra razón:H
(Marcar una sola alternativa)
e. ¿Qué factor FACILITARÍA su experiencia de viaje?
Mejoras en seguridadB
Mejoras en la comodidadA
Mejoras en corredores de buses y callesC
Disminución del hacinamiento de pasajerosD
Mejoras de accesibilidad para peatonesE
Disminución en tiempos de viajeF
Todas las anterioresG
Otra razón:H
(Marcar una sola alternativa)
3. Razonamiento y Planificación
b. Su acceso actual a transporte público le permite acceder al empleo que Ud. necesita?
1 2 3 4 5
a. Cómo evalúa su acceso a posibilidades de empleo a través de transporte público?
Mal.Bajo acceso a empleo a través de transporte público
Bien.Buen acceso a empleo a
través de transporte público
NO.No tengo acceso a empleo necesario a través de transporte público
SI.Tengo buen acceso a empleo
necesario a través de transporte público
1 2 3 4 5c. ¿Qué nivel de importancia tiene para Ud. la calidad de los viajes en transporte?
d. ¿Cuál de las siguientes actividades son difíciles de realizar por complicaciones relacionadas al transporte?
1Visitar familia/amigosA 2 3 4 5
1 2 3 4 5
1 2 3 4 5
1 2 3 4 5
1 2 3 4 5
Actividades recreativasB
Actividades culturalesC
Actividades deportivasD
Compras de comidaE
1 2 3 4 5Actividades sociales
Visitar familia/amigos
Actividades recreativas
Actividades culturales
Actividades deportivas
Compras de comida
Actividades sociales
F
1A 2 3 4 5
1 2 3 4 5
1 2 3 4 5
1 2 3 4 5
1 2 3 4 5
B
C
D
E
1 2 3 4 5F
POCOposible
MUYposible
POCAfrecuencia
MUCHAfrecuencia
1Visitar familia/amigosA 2 3 4 5
1 2 3 4 5
1 2 3 4 5
1 2 3 4 5
1 2 3 4 5
Actividades recreativasB
Actividades culturalesC
Actividades deportivasD
Compras de comidaE
1 2 3 4 5Actividades sociales
Visitar familia/amigos
Actividades recreativas
Actividades culturales
Actividades deportivas
Compras de comida
Actividades sociales
F
1A 2 3 4 5
1 2 3 4 5
1 2 3 4 5
1 2 3 4 5
1 2 3 4 5
B
C
D
E
1 2 3 4 5F
c. ¿Cuál es la frecuencia con la que Ud. realiza estas actividades?

276
Página 5 de 7
ENCUESTAS DE EQUIDAD URBANA Y SOCIAL · USUARIOS DE TRANSPORTE PÚBLICO Y PRIVADO
e. ¿Cuán importante considera tener varias opciones de usar distintos modos de transporte?
1 2 3 4 5
h. ¿Qué modos son accesibles económicamente para usted y su familia?(Elija todos los que correspondan)
i. ¿Qué modo NO utiliza porque no es asequible económicamente?(Elija todos los que correspondan y deje en blanco si no es aplicable)
1
j. Indique qué tan importante es mejorar los siguientes aspectos en el sistema de transporte público:
Mejorar acceso a sectores de oficinas y comercioA 2 3 4 5
1 2 3 4 5
1 2 3 4 5
1 2 3 4 5
Mejorar disponibilidad de modos de transporteB
Mejorar comodidad general en uso de transporte públicoC
Incorporar otros modos al sistema de tarifa integradaD
AutoA
TaxiB
ColectivoC
MetroE
Bus TransantiagoF
BicicletaG
MotoD CaminandoH
AutoA
TaxiB
ColectivoC
MetroE
Bus TransantiagoF
BicicletaG
MotoD CaminandoH
POCOimportante
MUYimportante
f. ¿Cuánto depende su calidad de vida del acceso que actualmente tiene al transporte público?
1 2 3 4 5POCO MUCHO
g. ¿Cuánto cree que su calidad de vida aumentaría en caso de tener mejor acceso al transporte público?
1 2 3 4 5POCO MUCHO
POCOimportante
MUYimportante
a. ¿Cómo evalúa el nivel de interacción que tiene con otras personas durante sus viajes habituales?
Negativamente Positivamente
POCOimportante
MUYimportante
1 2 3 4 5
b. ¿Cuán importante considera la presencia de otras personas durante sus viajes habituales?
1 2 3 4 5
4. Interacción Social
c. ¿Se ha sentido alguna vez discriminado viajando en algún modo de transporte?
SiA NoB
a. Ante un evento climático como lluvia intensa o inun-dación, ¿cambia Ud. su modo principal de transporte?
d. Si su respuesta fue afirmativa (se ha sentido discriminado), por favor indique en qué modo/s:
5. Naturaleza y Sustentabilidad
NoBSiA
AutoA
TaxiB
ColectivoC
MetroE
Bus TransantiagoF
BicicletaG
MotoD CaminandoH
d. Si su respuesta fue afirmativa (cambia de modo de transporte ante un evento natural), por favor indique qué modo utiliza: (Seleccione sólo una alternativa)
AutoA
TaxiB
ColectivoC
MetroE
Bus TransantiagoF
BicicletaG
MotoD CaminandoH

277
Página 6 de 7
ENCUESTAS DE EQUIDAD URBANA Y SOCIAL · USUARIOS DE TRANSPORTE PÚBLICO Y PRIVADO
c. ¿Cómo evalúa su acceso a los modos de transporte sustentables actualmente disponibles? (ej. buses híbridos, autos eléctricos, bicicletas públicas)
Bajo acceso a modos de transporte sustentables
Alto acceso a modos de transporte sustentables
1 2 3 4 5
d. ¿Cuán importante para Ud. es tener acceso a modos de transporte sustentables?
1 2 3 4 5
g. Por favor indique qué tan importante es mejorar los siguientes aspectos en los recorridos de transporte público:
1Presencia de árbolesA 2 3 4 5
1 2 3 4 5
1 2 3 4 5
1 2 3 4 5
Acceso a parquesB
Acceso a modos de transporte sustentables
Ampliar oferta de modos de transporte sustentables
C
D
SiA NoB
e. ¿Estaría dispuesto a gastar más en transporte para poder tener acceso a modos más sustentables?
f. Si su respuesta anterior fue positiva, por favor indique en cuánto incrementaría su gasto en transporte:
5% - 15% A 15% - 30%B 30% o másC
b. En caso de haber respondido SI en la pregunta anterior, ¿cómo es la calidad de estos intercambios?
Mala calidad Buena calidad
1 2 3 4 5
6. Información e intercambios modales
a. ¿Realiza intercambios entre modos de transporte (en un mismo recorrido) cuando realiza sus viajes habituales?
NoBSiA
POCO importante
MUYimportante
POCO importante
MUYimportante
c. ¿Cómo evalúa sus viajes habituales en relación a:
1Tiempo de esperaA 2 3 4 5
1 2 3 4 5
1 2 3 4 5
Tiempo de transbordoB
Tiempo de viaje totalC
MUY MAL
MUYBIEN
-
-
N/A
d. ¿Qué aspecto principal dificulta sus transbordos?
Mala conexión física para peatones (veredas)A
Intercambios de modo toman mucho tiempoB
No es cómodo tener que hacer intercambiosC
Mala infraestructura de espera entre modosD
No es seguro tener que hacer intercambiosE
Todas las anterioresF
Otra:G
(Marque sólo una alternativa)
e. ¿Tiene Ud. acceso a herramientas tecnológicas como smartphones e internet, con los que pueda ver información de servicios de transporte?
SiA NoB
f. ¿Cómo evalúa el nivel de información tecnológica disponible para ver alternativas de transporte? (ej. aplicaciones smartphones, internet, letreros)
Mal.Bajo acceso a información
Bueno. Alto acceso a información
1 2 3 4 5
g. ¿Qué tan importante es para Ud contar con información tecnológica?
1 2 3 4 5POCO importante
MUY importante

278
Página 7 y final
ENCUESTAS DE EQUIDAD URBANA Y SOCIAL · USUARIOS DE TRANSPORTE PÚBLICO Y PRIVADO
7. Medioambiente construido
a. ¿Cómo evalúa los siguientes aspectos cerca de su hogar?
1Espacio para autosA 2 3 4 5
1 2 3 4 5
1 2 3 4 5
1 2 3 4 5
1 2 3 4 5
Cantidad de estacionamientosB
Calidad de autopistasC
Espacio para peatonesD
Calidad de las veredasE
1 2 3 4 5Limpieza de paraderosF
1 2 3 4 5
1 2 3 4 5
1 2 3 4 5
Asientos en paraderosG
Protección climática paraderosH
Cantidad de ciclovías I
1 2 3 4 5Calidad de ciclovíasJ
1 2 3 4 5Sistemas bicicletas públicasK
1 2 3 4 5
1 2 3 4 5
1 2 3 4 5
Asientos en paraderosG
Protección climática paraderosH
Cantidad de ciclovías I
1 2 3 4 5Calidad de ciclovíasJ
1 2 3 4 5Sistemas bicicletas públicasK
b. ¿Qué nivel de importancia tiene para Ud. el mejorar los aspectos del listado anterior?
1A 2 3 4 5
1 2 3 4 5
1 2 3 4 5
1 2 3 4 5
1 2 3 4 5
B
C
D
E
1 2 3 4 5F
Espacio para autos
Cantidad de estacionamientos
Calidad de autopistas
Espacio para peatones
Calidad de las veredas
Limpieza de paraderos
MUY MAL
MUYBIEN
POCO importante
MUYimportante
b. ¿Cómo evalúa las oportunidades de trabajo disponibles en su comuna de residencia?
Mal Bien
1 2 3 4 5
c. ¿Qué nivel de acceso a empleo le interesa tener en su comuna de residencia?
Bajo. No deseo acceder a empleos en mi comuna
Alto. Deseo un alto acceso a empleos en mi comuna
1 2 3 4 5
a. ¿Cuánto cree que su acceso a la red de transporte ha afectado sus posibilidades de tener un mejor empleo?
Poco o nada Mucho
1 2 3 4 5
8. Viajes al trabajo y actividades productivas
e. ¿Cuánto dura su viaje habitual desde su casa a su trabajo o actividad principal?
0 - 20 minA
20 - 40 minB
40 - 60 minC
1 hora y másD
f. ¿En qué horarios se moviliza frecuentemente?
7:00 - 9:00A
9:00 - 13:00B
15:00 - 18:00D
18:00 - 21:00E
13:00 - 15:00C OtrosF
g. ¿Cuál es su gasto personal mensual en transporte considerando viajes al trabajo y otras actividades?
Gracias por su tiempo dedicado a responder esta encuesta. Si tiene comentarios o preguntas puede enviar
un correo a [email protected]. Gracias!
d. ¿Qué tan satisfecho se siente con su empleo actual?
Poco o nada Muy satisfecho
1 2 3 4 5
Menos de $35.000A
Entre $35.000 y $75.000B
Entre $75.000 y $125.000C
Más de $125.000D

279

280
References
Abenoza, R. F., Cats, O., & Susilo, Y. O. (2017). Travel satisfaction with
public transport: Determinants, user classes, regional disparities
and their evolution. Transportation Research Part A: Policy and
Practice, 95, 64-84.
Agee, M. D., & Crocker, T. D. (2013). Operationalizing the capability
approach to assessing well-being. Journal of Socio-Economics,
46, 80–86.
Agostini—Pobreza, desigualdad y segregación en la Región Me.pdf.
(n.d.). Retrieved 6 October 2020, from
https://www.cepchile.cl/cep/site/docs/20160304/201603040952
13/rev117_agostini.pdf
Alkire, S., Foster, J. E., Seth, S., Santos, M. E., Roche, J. M., & Ballon,
P. (2015). Multidimensional Poverty Measurement and Analysis:
The Alkire-Foster Counting Methodology. OPHI Working Paper
86.
Alvarez Marín, M.Á., & Wurgaft, F. (1988). Erradicación de un
Campamento: Análisis Crítico. Revista INVI, 3(6).
Anable, J. (2005). 'Complacent Car Addicts' or 'Aspiring
Environmentalists'? Identifying travel behaviour segments using
attitude theory. Transport Policy, 12, 65-78.
Anable, J., & Gatersleben, B. (2005). All work and no play? The role of
instrumental and affective factors in work and leisure journeys by
different travel modes. Transportation Research Part A: Policy
and Practice, 39(2-3), 163-181.
Anand, P., Hunter, G., & Smith, R. (2005). Capabilities and Well-Being:
Evidence Based on the Sen–Nussbaum Approach to Welfare.
Social Indicators Research , 9-55.
Annema, J. A., Mouter, N., & Razaei, J. (2015). Cost-benefit analysis
(CBA), or multi-criteria decision-making (MCDM) or both:
politicians’ perspective in transport policy

281
appraisal. Transportation Research Procedia, 10, 788-797.
Arancibia, S., Contreras, E., Mella, S., Torres, P., & Villablanca, I. (n/y).
Evaluación Multicriterio: aplicación para la formulacion de
proyectos de infraestructura deportiva. Obtenido de Ingenieria
Industrial Universidad de Chile:
http://www.dii.uchile.cl/~ceges/publicaciones/ceges48.pdf
Argyle, M. (1999). Causes and correlates of happiness. D. Kahneman,
E. Diener, N. Schwarz (Eds.), Well-being: The foundations of
hedonic psychology, Sage, New York (1999), pp. 353-373
Aristotle, & Taylor, C. C. (2006). Nicomachean ethics. Books II-IV /
Aristotle; translated with a commentary by C.C.W. Taylor.
Oxford: Clarendon Press.
Atkinson, A. (2015). Inequality: What Can Be Done? Cambridge. Harvard
University Press.
Avellaneda, P., & Lazo, A. (2011). Aproximación a la movilidad cotidiana
en la periferia pobre de dos ciudades latinoamericanas. Los
casos de Lima y Santiago de Chile. Revista Transporte y
Territorio, 4, 47–58.
Banister, D. (2018). Inequality in Transport. Alexandrine Press.
https://www.inequalityintransport.org.uk/
Berelson, B. (1952). Content analysis in communication research. Illinois:
Free Press.
Bergstad, C. J., Gamble, A., Gärling, T., Hagman, O., Polk, M., Ettema,
D., ... & Olsson, L. E. (2011). Subjective well-being related to
satisfaction with daily travel. Transportation, 38(1), 1-15.
Beyazit, E. (2011). Evaluating Social Justice in Transport: Lessons to be
Learned from the Capability Approach. Transport Reviews,
31(1), 117–134. https://doi.org/10.1080/01441647.2010.504900
Beyazit, E. (2015). Are wider economic impacts of transport
infrastructures always beneficial? Impacts of the Istanbul Metro
on the generation of spatio-economic inequalities. Journal of
Transport Geography, 12-23.

282
Bocarejo, J. P., Escobar, D., Oviedo, D., & Galarza, D. (2016a).
Accessibility analysis of the integrated transit system of Bogotá.
International Journal of Sustainable Transportation, 10(4), 308–
320. https://doi.org/10.1080/15568318.2014.926435
Bocarejo, J. P., Portilla, I. J., Velásquez, J. M., Cruz, M. N., Peña, A., &
Oviedo, D. R. (2014). An innovative transit system and its impact
on low income users: the case of the Metrocable in Medellín.
Journal of Transport Geography, 39, 49–61.
https://doi.org/10.1016/j.jtrangeo.2014.06.018
Bocarejo, J. P., Portilla, I., & Melendez, D. (2016b). Social fragmentation
as a consequence of implementing a Bus Rapid Transit system
in the city of Bogotá. Urban Studies, 53(8), 1617–1634.
Bocarejo, S.J.P., Oviedo, D.R. (2012). Transport accessibility and social
inequities: a tool for identification of mobility needs and
evaluation of transport investments. Journal of Transport
Geography 24, 142-154.
Boschmann, E.E., Kwan, M.P.. (2008). Toward Socially Sustainable
Urban Transportation: Progress and Potentials. International
Journal of Sustainable Transportation 2, 138-157.
Brown, B. B., Werner, C. M., Tribby, C. P., Miller, H. J., & Smith, K. R.
(2015). Transit use, physical activity, and body mass index
changes: Objective measures associated with complete street
light-rail construction. American Journal of Public Health, 105(7),
1468–1474. https://doi.org/10.2105/AJPH.2015.302561
Bruni, L., Comim, F., Pugno, M. (2008). Capabilities and Happiness.
OUP Oxford.
Cao, M., & Hickman, R. (2019). Understanding travel and differential
capabilities and functionings in Beijing. Transport Policy, 83, 46-
56.
Cass, N., Shove, E., & Urry, J. (2017). Social Exclusion, Mobility and
Access1: The Sociological Review.

283
https://journals.sagepub.com/doi/10.1111/j.1467-
954X.2005.00565.x
Cawley, J. (2000). Body weight and women's labor market outcomes.
Cambridge: National Bureau of Economic Research, Inc.
http://doi.org/ 10.3386/w7841
Chapman, L., 2007. Transport and climate change: a review. Journal of
Transport Geography 15, 354-367.
Church, A., Frost, M., & Sullivan, K. (2000). Transport and social
exclusion in London. Transpor Policy, 7 (3), 195-205.
Ciommo, F. D., & Shiftan, Y. (2017). Transport equity analysis. Transport
Reviews, 37(2), 139–151.
https://doi.org/10.1080/01441647.2017.1278647
Cox, T., & Hurtubia, R. (2016). Vectores de expansión urbana y su
interacción con los patrones socioeconómicos existentes en la
ciudad de Santiago. EURE (Santiago), 42(127), 185–207.
https://doi.org/10.4067/S0250-71612016000300008
Cox, T., Houdmont, J., & Griffiths, A. (2006). Rail passenger crowding,
stress, health and safety in Britain. Transportation Research Part
A: Policy and Practice, 40(3), 244–258.
https://doi.org/10.1016/j.tra.2005.07.001
Cuignet, T., Perchoux, C., Caruso, G., Klein, O., Klein, S., Chaix, B.,
Kestens, Y. and Gerber, P. (2019) Mobility among older adults:
Deconstructing the effects of motility and movement on
wellbeing, Urban Studies, 10.1177/0042098019852033,
(004209801985203).
Currie, G. (2010). Quantifying spatial gaps in public transport supply
based on social needs. Journal Of Transport Geography, 18 (1),
31-41. Davies, R. (2019). Why is inequality booming in Chile? Blame the Chicago
Boys. [online] the Guardian. Available at:
https://www.theguardian.com/commentisfree/2019/nov/13/why-is-

284
inequality-booming-in-chile-blame-the-chicago-boys [Accessed 5 Dec.
2019]. De Vos, J., Schwanen, T., Van Acker, V., & Witlox, F. (2013). Travel and
subjective well-being: a focus on findings, methods and future
research needs. Transport Reviews, 33(4), 421-442.
De Vos, J., Schwanen, T., Van Acker, V., & Witlox, F. (2015). How
satisfying is the Scale for Travel Satisfaction? Transportation
Research Part F: Traffic Psychology and Behaviour, 29, 121-
130.
De Vos, J., Mokhtarian, P. L., Schwanen, T., Van Acker, V., & Witlox, F.
(2016). Travel mode choice and travel satisfaction: bridging the
gap between decision utility and experienced utility.
Transportation, 43(5), 771-796.
De Witte, A., Hollevoet, J., Dobruszkes, F., Hubert, M. and Macharis, C.
(2013) Linking modal choice to motility: A comprehensive review,
Transportation Research Part A: Policy and Practice,
10.1016/j.tra.2013.01.009, 49, (329-341), (2013).
Delbosc, A. (2012). The role of well-being in transport policy. Transport
Policy, 23, 25-33.
Delbosc, A., & Currie, G. (2011). Using Lorenz curves to assess public
transport equity. Journal of Transport Geography, 19 (6), 1252-
1259.
Desarrollo Social MDS, M., 2016. Estudio Nacional de la Discapacidad
en la población adulta. Gobierno de Chile.
Diener, E., & Suh, E. (1997). Measuring quality of life: Economic, social,
and subjective indicators. Social indicators research, 40(1-2),
189-216.
Dietz, S., & Atkinson, G. (2005). Public perceptions of equity in
environmental policy: Traffic emissions policy in an English urban
area. Local Environment, 10(4), 445–459.
https://doi.org/10.1080/13549830500160982

285
Dutra, A. (2019). The Present and the Future of Fare-Free Public
Transport and Sustainable Public Transport: The Cases of
Avesta and Tallinn and The Visions for Luxembourg and
Uppsala.
Eriksson, L., Friman, M., & Gärling, T. (2013). Perceived attributes of bus
and car mediating satisfaction with the work commute.
Transportation Research Part A: Policy and Practice, 47, 87-96.
Ettema, D., Friman, M., Gärling, T., Olsson, L. E., & Fujii, S. (2012). How
in-vehicle activities affect work commuters’ satisfaction with
public transport. Journal of Transport Geography, 24, 215-222.
Ettema, D., Gärling, T., Eriksson, L., Friman, M., Olsson, L. E., & Fujii, S.
(2011). Satisfaction with travel and subjective well-being:
Development and test of a measurement tool. Transportation
Research Part F: Traffic Psychology and Behaviour, 14(3), 167-
175.
Ettema, D., Gärling, T., Olsson, L. E., & Friman, M. (2010). Out-of-home
activities, daily travel, and subjective well-being. Transportation
Research Part A: Policy and Practice, 44(9), 723-732.
Evans, G. W., & Wener, R. E. (2006). Rail commuting duration and
passenger stress. Health Psychology, 25(3), 408–412.
https://doi.org/10.1037/0278-6133.25.3.408
Fainstein, S. S. (2010). The just city. Cornell University Press.
Ferrer-i-Carbonell, A. (2005). Income and well-being: an empirical
analysis of the comparison income effect. Journal of Public
Economics, 89(5-6), 997-1019.
Figueroa Martínez, C. F., Hodgson, F., Mullen, C., & Timms, P. (2018).
Creating inequality in accessibility: The relationships between
public transport and social housing policy in deprived areas of
Santiago de Chile. Journal of Transport Geography, 67, 102–
109. https://doi.org/10.1016/j.jtrangeo.2017.09.006
Figueroa, O. (1990). La desregulación del transporte colectivo en
Santiago: balance de diez años.

286
Flint, E., Cummins, S., & Sacker, A. (2014). Associations between active
commuting, body fat, and body mass index: population based,
cross sectional study in the United Kingdom. BMJ (Clinical
Research Ed.), 349(aug19_13), g4887.
https://doi.org/10.1136/bmj.g4887
Friman, M., Fujii, S., Ettema, D., Gärling, T., & Olsson, L. E. (2013).
Psychometric analysis of the satisfaction with travel scale.
Transportation Research Part A: Policy and Practice, 48, 132-
145.
Gajardo, J., Navarrete, E., López, C., Rodríguez, J., Rojas, A., Troncoso,
S., & Rojas, A. (2012). Percepciones de personas mayores
sobre su desempeño en el uso de transporte público en Santiago
de Chile. Revista Chilena de Terapia Ocupacional, 12(1), ág. 88-
102. https://doi.org/10.5354/0719-5346.2012.22055
Garrido, J. A., Billi, M., & González, M. J. G. (2017). ¡ Tu'piropo'me
violenta! Hacia una definición de acoso sexual callejero como
forma de violencia de género. Revista Punto Género, (7), pp-
112.
Gatersleben, B. (2007). Affective and symbolic aspects of car use. In
Threats from car traffic to the quality of urban life: Problems,
Causes and Solutions (pp. 219-233).
Gatersleben, B., & Uzzell, D. (2007). Affective appraisals of the daily
commute: Comparing perceptions of drivers, cyclists, walkers,
and users of public transport. Environment and behavior, 39(3),
416-431.
Geels, F. (2011). The multi-level perspective on sustainability transitions:
Responses to seven criticisms. Environmental Innovation and
Societal Transitions , 1 (1), 24-40.
Geels, F. (2012). A socio-technical analysis of low-carbon transitions:
introducing the multi-level perspective into transport studies.
Journal of Transport Geography, 471–482.

287
Geurs, K., & van Wee, B. (2004). Accessibility evaluation of land-use and
transport strategies: review and research directions. Journal of
Transport Geography, 12, 127-140.
Gossling, S., Cohen, S., 2014. Why sustainable transport policies will fail:
EU climate policy in the light of transport taboos. Journal of
Transport Geography 39, 197-207.
Gottholmseder, G., Nowotny, K., Pruckner, G. J., & Theurl, E. (2009).
Stress perception and commuting. Health Economics, 18(5),
559–576. https://doi.org/10.1002/hec.1389
Guardiola-Rivera, O. (2019). The ‘risk to democracy’ in Chile isn’t from
protesters. It’s from Piñera and the 1% | Oscar Guardiola-Rivera.
[online] the Guardian. Available at:
https://www.theguardian.com/commentisfree/2019/oct/24/demo
cracy-chile-protesters-pinera-pinochet [Accessed 5 Dec. 2019].
Guzman, L. A., & Bocarejo, J. P. (2017). Urban form and spatial urban
equity in Bogota, Colombia. Transportation Research Procedia,
25, 4491–4506. https://doi.org/10.1016/j.trpro.2017.05.345
Guzman, L. A., & Oviedo, D. (2018). Accessibility, affordability and
equity: Assessing ‘pro-poor’ public transport subsidies in Bogotá.
Transport Policy, 68, 37–51.
https://doi.org/10.1016/j.tranpol.2018.04.012
Guzman, L. A., & Oviedo, D. (2018). Accessibility, affordability and
equity: Assessing ‘pro-poor’ public transport subsidies in Bogotá.
Transport Policy, 68, 37-51.
Guzman, L. A., Oviedo, D., & Cardona, R. (2018). Accessibility Changes:
Analysis of the Integrated Public Transport System of Bogotá.
Sustainability, 10(11), 3958. https://doi.org/10.3390/su10113958
Hananel, R. & Berechman, J. 2016. Justice and transportation decision-
making: The capabilities approach. Transport Policy, 49, 78-85.
Harvey, D. (1973). Social justice and the city. Georgia: University of
Georgia Press.
Hay, A. (1995). Concepts of Equity, Fairness and Justice in Geographical

288
Studies . Transactions of the Institute of British Geographers , 20
(4), 500-508.
Hayek, F.A. (1982). Law, Legislation and Liberty, Vol. 2. Routledge. p. 78
Herrera, A. & Razmilic, S. (2018). De la casa al trabajo: Análisis de un
tiempo perdido. Centro de Estudios Publicos. N 29.
Hickman, R. & Dean, M. (2017). Incomplete cost-incomplete benefit
analysis in transport appraisal. Transport Reviews, in review.
Hickman, R., Cao, M., Mella Lira, B., Fillone, A., & Bienvenido Biona, J.
(2017). Understanding capabilities, functionings and travel in
high and low income neighbourhoods in Manila. Social Inclusion,
5(4), 161-174.
Hidalgo, D., & Huizenga, C. (2013). Implementation of sustainable urban
transport in Latin America. Research in Transportation
Economics, 40(1), 66–77.
https://doi.org/10.1016/J.RETREC.2012.06.034
Hidalgo, D., Carrigan, A., & Cooper, D. K. (2010). Modernizing public
transportation. Lessons learned from major bus improvements in
Latin America and Asia. World Resources Institute.
Hill, M. (1996). Social Policy: A comparative analysis. Essex: Prentice
Hall.
Hine, J. & Mitchell, F. (2001). Better for Everyone? Travel Experiences
and Transport Exclusion. Urban Studies, 38 (2), 319-332.
Hine, J., Mitchell, F. (2003). Transport Disadvantage and Social
Exclusion: Exclusionary Mechanisms in Transport in Urban
Scotland. Ashgate, Aldershot, UK. Hine, J., 2007. In: Currie, G., Stanley, J., Stanley, J. (Eds.), Transport
Disadvantage and Social Exclusion in the UK No Way to Go: Transport
and Social Disadvantage in Australian Communities. Monash University ePress, Melbourne, pp. 4.1–4.10.
Holsti, O. (1969). Content Analysis for the Social Sciences and Humanities. Addison- Wesley Publislung Company.

289
Imilan, W., Jirón, P., & Iturra, L. (2018). Más allá del barrio: habitar Santiago en
la movilidad cotidiana. Antropologías del Sur, 2(3), 87-103.
INE – Instituto Nacional de Estadisticas (2018). Encuesta de presupuestos familiares 2018. [online] Ine.es. Available at:
https://www.ine.es/dyngs/INEbase/es/operacion.htm?c=Estadistica_C&cid=1254736176806&menu=ultiDatos&idp=1254735976608
[Accessed 6 Dec. 2019].
Jackson, T. (2009). Prosperity without growth: Economics for a finite
planet. Routledge.
Jirón, P. (2007). Untravelling invisible inequalities in the city through
urban daily mobility. The case of Santiago de Chile. Swiss
Journal of Sociology, 33(1), 45–68.
Jirón, P. (2010). Mobile borders in urban daily mobility practices in
Santiago de Chile. International Political Sociology, 4(1), 66-79
Jiron, P., Lange, P. van, & Bertrand, M. (2010). Exclusión y desigualdad
espacial: Retrato desde la movilidad cotidiana. Revista INVI,
25(68), Article 68. https://doi.org/10.4067/invi.v25i68.491
Jouffe, Y., & Lazo Corvalán, A. (2010). Las prácticas cotidianas frente a
los dispositivos de la movilidad: Aproximación política a la
movilidad cotidiana de las poblaciones pobres periurbanas de
Santiago de Chile. EURE, 36(108), 29–47.
https://doi.org/10.4067/S0250-71612010000200002
Kahneman, D., Krueger, A. B., Schkade, D. A., Schwarz, N., & Stone, A.
A. (2004). A survey method for characterizing daily life
experience: The day reconstruction method. Science,
306(5702), 1776-1780.
Kaufmann, V., Bergman, M., & Joye, D. (2004). Motility: mobility as
capital. International Journal of Urban and Regional Research ,
28 (4), 745-756.
Khreis, H., Warsow, K.M., Verlinghieri, E., Guzman, A., Pellecuer, L.,
Ferreira, A., Jones, I., Heinen, E., Rojas-Rueda, D., Mueller, N.,
Schepers, P., Lucas, K., Nieuwenhuijsen, M., (2016). The health

290
impacts of traffic-related exposures in urban areas:
Understanding real effects, underlying driving forces and co-
producing future directions. J. Transp. Health 3, 249-267.
Kronlid, D. (2008). "Mobility As Capability". Gendered Mobilities. Tanu
Priya Uten and Cresswell Tim. 1st ed. Routledge.
Layard, P.R.G. (2005). Happiness: Lessons from a New Science,
London, Allen Lane.
Levy, C. (2009). Gender justice in a diversity approach to development?
The challenges for development planning. International
Development Planning Review; Liverpool, 31(4).
http://dx.doi.org/10.3828/idpr.2009.6
Levy, C. (2013). Travel choice reframed: “deep distribution” and gender
in urban transport. Environment and Urbanization, 25(1), 47-63.
Levy, C. (2015). Expanding the ‘Room for Manoeuvre’: Community-Led
Finance in Mumbai, India. In C. Lemanski & C. Marx (Eds.), The
City in Urban Poverty (pp. 158–182). Palgrave Macmillan UK.
https://doi.org/10.1057/9781137367433_8
Levy, C., & Dávila, J. D. (2017). Planning for mobility and socio-
environmental justice: the case of Medellín, Colombia. In
Environmental Justice and Urban Resilience in the Global South
(pp. 37-55). Palgrave Macmillan, New York.
Litman, T. (2007). Policy implications of full social costing. . Annals of the
American Academy of Political ans Social Science , 553, 143-
156.
Lois, D., & López-Sáez, M. (2009). The relationship between
instrumental, symbolic and affective factors as predictors of car
use: A structural equation modeling approach. Transportation
Research Part A: Policy and Practice, 43(9-10), 790-799.
Lorgelly, P. K., Lorimer, K., Fenwick, E. A. L., Briggs, A. H., & Anand, P.
(2015). Operationalising the capability approach as an outcome

291
measure in public health: The development of the OCAP-18.
Social Science and Medicine, 142, 68–81.
https://doi.org/10.1016/j.socscimed.2015.08.002
Lucas, J. L., & Heady, R. B. (2002). Flextime commuters and their driver
stress, feelings of time urgency, and commute satisfaction.
Journal of Business and Psychology, 16(4), 565-571.
Lucas, K. (2004). Running on Empty: Transport, Social Exclusion and
Environmental Justice. Bristol: The Policy Press.
Lucas, K. (2006). Providing transport for social inclusion within a
framework for environmental justice in the UK. Transportation
Research A , 801–809.
Lucas, K. (2012). Transport and social exclusion: where are we now?
Transport Policy , 20, 105–113.
Lucas, K. (2014). Policies for social inclusion in transportation: An
introduction to the special issue . Case Studies on Transport
Policy , 37–40.
Lucas, K. G. (2001). Transport, the Environment and Social Exclusion.
York: York Publishing Services Ltd.
Lucas, K., & Jones, P. (2012). Social impacts and equity issues in
transport: an introduction. Journal of Transport Geography , 21,
1–3.
Lucas, K., Van Wee, B. & MAAT, K. (2015). A method to evaluate
equitable accessibility: combining ethical theories and
accessibility-based approaches. Transportation, 1-18.
Lynch, G., & Atkins, S. (1988). The influence of personal security fears
on women's travel patterns. Transportation, 15(3), 257-277.
Mabahwi, N. A. B., Leh, O. L. H., & Omar, D. (2014). Human Health and
Wellbeing: Human Health Effect of Air Pollution. Procedia -
Social and Behavioral Sciences, 153, 221–229.
https://doi.org/10.1016/j.sbspro.2014.10.056
Macharis, C. (2005). The importance of stakeholder analysis in freight
transport. European Transport \ Trasporti Europei (25-26), 114-

292
126.
Macharis, C., & Bernardini, A. (2015). Reviewing the use of Multi-Criteria
Decision Analysis for the evaluation of transport projects: Time
for a multi-actor approach . Transport Policy , 37, 177–186.
Macharis, C., De Witte, A., & Ampe, J. (2009). The multi‐actor, multi‐
criteria analysis methodology (MAMCA) for the evaluation of
transport projects: Theory and practice. Journal of Advanced
transportation, 43(2), 183-202.
Macharis, C., De Witte, A., & Turcksin, L. (2010). The Multi-Actor Multi-
Criteria Analysis (MAMCA) application in the Flemish long-term
decision making process on mobility and logistics. Transport
Policy, 17(5), 303-311.
Macharis, C., De Witte, A., & Turcksin, L. (2010). The Multi-Actor Multi-
Criteria Analysis (MAMCA) application in the Flemish long-term
decision making process on mobility and logistics. Transport
Policy, 17(5), 303-311.
Macharis, C., Turcksin, L., & Lebeau, K. (2012). Multi actor multi criteria
analysis (MAMCA) as a tool to support sustainable decisions:
State of use. Decision Support Systems, 54(1), 610-620.
Mars, L., Arroyo, R., & Ruiz, T. (2016). Qualitative research in travel
behavior studies. Transportation research procedia, 18, 434-
445.
Martens, K. (2016). Transport Justice. Designing Fair Transportation
Systems. New York. Routledge.
Martin, A., Panter, J., Suhrcke, M., & Ogilvie, D. (2015). Impact of
changes in mode of travel to work on changes in body mass
index: Evidence from the British Household Panel Survey.
Journal of Epidemiology and Community Health, 69(8), 753–761.
https://doi.org/10.1136/jech-2014-205211
Mattos, D., & A, C. (1999). Santiago de Chile, globalización y expansión
metropolitana: Lo que existía sigue existiendo. EURE (Santiago),

293
25(76), 29–56. https://doi.org/10.4067/S0250-
71611999007600002
Mattos, D., & A, C. (2002). Mercado metropolitano de trabajo y
desigualdades sociales en el Gran Santiago: ¿Una ciudad dual?
EURE (Santiago), 28(85), 51–70. https://doi.org/10.4067/S0250-
71612002008500004
Methorst, R., Schepers, P., Christie, N., & de Geus, B. (2017). How to
define and measure pedestrian traffic deaths? Journal of
Transport and Health, 7, 10–12.
https://doi.org/10.1016/j.jth.2017.09.008
Metro SA (2017). Reporte de sostenibilidad Metro 2017. Downloaded
from: https://www.metro.cl/corporativo/reporte-de-sostenibilidad
MIDEPLAN. (2007). Division de Planificacion, Estudios e Inversion.
Obtenido de
https://www.cepal.org/ilpes/noticias/paginas/7/29837/ev_social_
-_ILPES_-_2007_-3.ppt
Mindell, J. S. (2017). Road travel casualties. Journal of Transport and
Health, 6, 7–9. https://doi.org/10.1016/j.jth.2017.08.004
Mindell, J. S. (2018). Transport and inequalities. Journal of Transport and
Health. https://doi.org/10.1016/j.jth.2018.01.016
Ministerio Desarrollo Social. (June de 2018). Sistema Nacional de
Inversiones. Obtenido de Ministerio de Desarrollo Social:
http://sni.ministeriodesarrollosocial.gob.cl/quienes-
somos/descripcion-del-sni/
Ministry of Transport (2013) Política Nacional de Transportes. Available
from: https://www.mtt.gob.cl/wp-
content/uploads/2013/05/documento-politica.pdf
MINSAL. Ministerio de Salud, Gobierno de Chile (2013) Enfermedades
no Transmisibles 2013. Available from:
http://www.minsal.cl/enfermedades-no-transmisibles/.

294
Mokhtarian, P. L., & Salomon, I. (2001). How derived is the demand for
travel? Some conceptual and measurement considerations.
Transportation research part A: Policy and practice, 35(8), 695-
719.
Musthafa, S. N. A. M., Leh, O. L. H., Omar, D., & Karuppannan, S. (2015).
Theoretical Review on Environmental Health in Relation to
Neighbourhood Planning and Human Physical Activity. Procedia
- Social and Behavioral Sciences, 201, 325–332.
https://doi.org/10.1016/j.sbspro.2015.08.182
Næss, P. (2006). Cost benefit analyses of transportation investments:
neither critical nor realistic. Journal of Critical Realism, 5, 32-60.
Næss, P. (2016). Inaccurate and biased: cost-benefit analyses of
transport infrastructure projects. In: Næss, P., Price, L. &
Despain, H. (eds.) Crisis System: A Critical Realist and
Environmental Critique of Economics and the Economy.
Abingdon: Routledge.
Niehaus, M., Galilea, P., & Hurtubia, R. (2016). Accessibility and equity:
An approach for wider transport project assessment in Chile.
Research in Transportation Economics, 59, 412–422.
https://doi.org/10.1016/j.retrec.2016.05.003
Noland, R. B., Sinclair, J. A., Klein, N. J., & Brown, C. (2017). How good
is pedestrian fatality data? Journal of Transport and Health, 7, 3–
9. https://doi.org/10.1016/j.jth.2017.04.006
Nordbakke, S. (2013) Capabilities for mobility among urban older
women: barriers, strategies and options. J. Transp. Geogr., 26,
pp. 166-174.
Nordbakke, S., & Schwanen, T. (2014). Well-being and mobility: A
theoretical framework and literature review focusing on older
people. Mobilities, 9(1), 104-129.
Nussbaum, M. (2011). Capabilities as Fundamental Entitlements: Sen
and Social Justice. Feminist Economics, 33-59.
Nykvista, B., & Whitmarsh, L. (2008). A multi-level analysis of sustainable

295
mobility transitions: Niche development in the UK and Sweden.
Technological Forecasting and Social Change, 75 (9), 1373–
1387.
Observatorio Social, U. (2014). Actualización y recolección de
información del sistema de transporte urbano, IX Etapa:
Encuesta Origen Destino Santiago 2012. Encuesta origen
destino de viajes 2012 (Documento Difusión). [online]
Sectra.gob.cl. Available at:
http://www.sectra.gob.cl/biblioteca/detalle1.asp?mfn=3253
[Accessed 5 Dec. 2019].
OECD, O. f.-o. (2007). OECD Environmental Performance Reviews:
Belgium 2007 / Organisation for Economic Co-operation and
Development. Paris: OECD Publishing.
Organisation for Economic Co-operation and Development
(OECD)(2017) “Are all OECD countries equally unequal?
Available from: https://gitvfd.github.io/ho-is-li-in-st/
Organización de las Naciones Unidas para la Alimentación y la
Agricultura, & Organización Panamericana de la Salud. (2017).
América Latina y el Caribe: Panorama de la seguridad
alimentaria y nutricional. Sistemas alimentarios sostenibles para
poner fin al hambre y la malnutrición, 2016. Us1.1. Retrieved
from
http://iris.paho.org/xmlui/bitstream/handle/123456789/33680/97
89253096084-
spa.pdf?sequence=1&isAllowed=y%0Ahttp://iris.paho.org/xmlui/
bitstream/handle/123456789/33680/9789253096084-
spa.pdf?sequence=1&isAllowed=y%0Ahttp://iris.paho.org/xmlui/
handle/1234567
Ortuzar, J., Ivelic, A. M., Malbran, H., & Thomas, A. (1993). The 1991
Great Santiago origin-destination survey: methodological design
and main results. Traffic engineering & control, 34(8).

296
Oviedo, D., Levy, C., & Davila, J. (2017). Constructing wellbeing,
deconstructing urban (im) mobilities in Abuja, Nigeria. In Urban
Mobilities in the Global South (pp. 193-214). Routledge.
Oviedo, D., Scholl, L., Innao, M., & Pedraza, L. (2019). Do Rapid Transit
Bus Systems Improve Accessibility to Job Opportunities for the
Poor? The Case of Lima, Peru. Sustainability, 11(10), 2795.
Páez, A., & Whalen, K. (2010). Enjoyment of commute: A comparison of
different transportation modes. Transportation Research Part A:
Policy and Practice, 44(7), 537-549.
Pereira, R. H. M., Schwanen, T., & Banister, D. (2017). Distributive justice
and equity in transportation. Transport Reviews, 37(2), 170–191.
https://doi.org/10.1080/01441647.2016.1257660
Preston, J., & Raje, F. (2007). Accessibility, mobility and transport-related
social exclusion. Journal of Transport Geography, 15 (3), 151-
160.
Primerano, F., Taylor, M. A., Pitaksringkarn, L., & Tisato, P. (2008).
Defining and understanding trip chaining behaviour.
Transportation, 35(1), 55-72.
Rainero, L. (2009). Ciudad, espacio público e inseguridad. Aportes para
el debate desde una perspectiva feminista. Mujeres en la Ciudad
De violencias y derechos, 163.
Raje, F. (2007). Using Q methodology to develop more perceptive
insights on transport and social inclusion. Transport Policy, 14,
467–477.
Rawls, J. (1971) A theory of justice. Cambridge, MA, Harvard University
Press.
Rissel, C., Curac, N., Greenaway, M., & Bauman, A. (2012). Physical
Activity Associated with Public Transport Use — A Review and
Modelling of Potential Benefits. International Journal of
Environmental Research and Public Health, 9, 2454–2478.
https://doi.org/10.3390/ijerph9072454

297
Robeyns, I. (2003). The capability approach: an interdisciplinary
introduction. In Training course preceding the Third International
Conference on the Capability Approach, Pavia, Italy (p. 29).
Robeyns. (2005). The capability approach: a theoretical survey. Journal
of Human Development and Capabilities, 93–114.
Rodríguez, A., & Winchester, L. (2001). Santiago de Chile:
Metropolización, globalización, desigualdad. EURE (Santiago),
27(80), 121–139. https://doi.org/10.4067/S0250-
71612001008000006
Rodríguez Vignoli, J. (2008). Movilidad cotidiana, desigualdad social y
segregación residencial en cuatro metrópolis de América Latina.
EURE, 34(103), 49–71. https://doi.org/10.4067/S0250-
71612008000300003
Rodriguez, D., & Targa, F. (2004). Value of accessibility to Bogotá’s bus
rapid transit system: Transport Reviews: Vol 24, No 5. Transport
Reviews, 24(5), 587–610.
https://doi.org/doi.org/10.1080/0144164042000195081
Rojas, C., Páez, A., Barbosa, O., & Carrasco, J. (2016). Accessibility to
urban green spaces in Chilean cities using adaptive thresholds.
Journal of Transport Geography, 57, 227–240.
https://doi.org/10.1016/j.jtrangeo.2016.10.012
Ryan, J., Wretstrand, A., & Schmidt, S. M. (2015). Exploring public
transport as an element of older persons' mobility: A Capability
Approach perspective. Journal of transport geography, 48, 105-
114.
Ryan, J., Wretstrand, A., & Schmidt, S. M. (2019). Disparities in mobility
among older people: Findings from a capability-based travel
survey. Transport Policy, 79, 177-192.
Sabatini, F., Cáceres, G., & Cerda, J. (2001). Segregación residencial en
las principales ciudades chilenas: Tendencias de las tres últimas

298
décadas y posibles cursos de acción. eure (Santiago), 27(82),
21-42.
Sagaris, L., Tiznado-Aiken, I. (2017). Equidad e inclusión en la movilidad
de América Latina: un análisis de género. CEPAL. Santiago.
Sarlio-Lähteenkorva, S., & Lahelma, E. (1999). The association of body
mass index with social and economic disadvantage in women
and men. International journal of epidemiology, 28(3), 445-449.
Sarlio-Lähteenkorva, S., Silventoinen, K., & Lahelma, E. (2004). Relative
weight and income at different levels of socioeconomic status.
American Journal of Public Health, 94(3), 468-472.
Scholl, L., Mitnik, O. A., Oviedo, D., & Yañez-Pagans, P. (2018). A Rapid
Road to Employment? The Impacts of a Bus Rapid Transit
System in Lima.
Schulz, D., & Gilbert, S. (1996). Women and transit security: A new look
at an old issue. In Women’s Travel Issues Second National
Conference (pp. 551-562). Chicago
Schwanen, T., Lucas, K., Akyelken, N., Cisternas, D., Carrasco, J., &
Neutens, T. (2015). Rethinking the links between social
exclusion and transport disadvantage through the lens of social
capital. Transportation Research Part A , 74, 123-135.
Sehnbruch, K. (2019). How Pinochet's economic model led to the current
crisis engulfing Chile. [online] the Guardian. Available at:
https://www.theguardian.com/world/2019/oct/30/pinochet-
economic-model-current-crisis-chile [Accessed 5 Dec. 2019].
Sen, A. (1981). Poverty and Famines: An Essay on Entitlement and
Deprivation. Oxford: Clarendon Press.
Sen, A. (1985). Commodities and capabilities. Amsterdam; New York :
North-Holland ; New York: Sole distributors for the U.S.A. and
Canada, Elsevier Science Pub. Co.
Sen, A. (1993). Capability and well-being. In Nussbaum, M., & Sen, A.
(Eds.). (1993). The quality of life. Oxford University Press.
Sen, A. (1999). Development as Freedom, Oxford, Oxford University

299
Press.
Sen, A. (2009). The idea of justice. London: Penguin.
Shliselberg, R. and Givoni, M. (2017) Motility as a policy objective,
Transport Reviews, 10.1080/01441647.2017.1355855, 38, 3,
(279-297).
Shove, E. (2012). Putting practice into policy: reconfiguring questions of
consumption and climate change. Contemporary Social Science,
1-15.
Simon, J., Anand, P., Gray, A., Rugkåsa, J., Yeeles, K., & Burns, T.
(2013). Operationalising the capability approach for outcome
measurement in mental health research. Social Science &
Medicine (1982), 98, 187–96.
https://doi.org/10.1016/j.socscimed.2013.09.019
Smith, N., Hirsch, D., & Davis, A. (2012). Accessibility and capability: the
minimum transport needs and costs of rural households. Journal
of Transport Geography, 21, 93-101.
Smith, O. (2017). Commute well-being differences by mode: Evidence
from Portland, Oregon, USA. Journal of Transport & Health, 4,
246-254.
Social Exclusion Unit 2003. Making the Connections. Final Report on
Transport and Social Exclusion. London: SEU/ODPM.
St-Louis, E., Manaugh, K., van Lierop, D., & El-Geneidy, A. (2014). The
happy commuter: a comparison of commuter satisfaction across
modes. Transportation research part F: traffic psychology and
behaviour, 26, 160-170.
Steg, L. (2005). Car use: lust and must. Instrumental, symbolic and
affective motives for car use. Transportation Research, Part A,
39, 147-162.
Steg, L., Vlek, C., & Slotegraaf, G. (2001). Instrumental-reasoned and
symbolic-affective motives for using a motor car. Transportation
Research Part F: Traffic Psychology
Stiglitz, J. E. 2012. The Price of Inequality, New York, Penguin.

300
Stradling, S. G., Meadows, M. L., & Beatty, S. (2000). Helping drivers out
of their cars Integrating transport policy and social psychology for
sustainable change. Transport policy, 7(3), 207-215.
Susilo, Y. O., & Cats, O. (2014). Exploring key determinants of travel
satisfaction for multi-modal trips by different traveler groups.
Transportation Research Part A: Policy and Practice, 67, 366-
380.
Tesch-Römer, C., Motel-Klingebiel, A., & Tomasik, M. J. (2008). Gender
differences in subjective well-being: Comparing societies with
respect to gender equality. Social Indicators Research, 85(2),
329-349.
Tiznado-Aitken, I., Muñoz, J. C., & Hurtubia, R. (2016). How Equitable is
Access to Opportunities and Basic Services Considering the
Impact of the Level of Service?: The Case of Santiago, Chile
(International Transport Forum Discussion Papers No. 2016/15).
OECD Publishing. Retrieved from
https://ideas.repec.org/p/oec/itfaab/2016-15-en.html
Tiznado-Aitken, I., Muñoz, J. C., & Hurtubia, R. (2018). The Role of
Accessibility to Public Transport and Quality of Walking
Environment on Urban Equity: The Case of Santiago de Chile.
Transportation Research Record, 2672(35), 129–138.
https://doi.org/10.1177/0361198118782036
Tudela, A., Akiki, N., & Cisternas, R. (2006). Comparing the output of
cost benefit and multi-criteria analysis: An application to urban
transport investments. Transportation Research Part A: Policy
and Practice, 40(5), 414-423.
Ureta, S. (2015). Assembling Policy: Transantiago, Human Devices, and
the Dream of a World-class Society. Mit Press.
Urry, J. (2007). Mobilities, Cambridge, Polity.
Vaismoradi, M., Turunen, H., & Bondas, T. (2013). Content analysis and
thematic analysis: Implications for conducting a qualitative
descriptive study. Nursing & health sciences, 15(3), 398-405.

301
Van Wee, B. & Geurs, K. (2011). Discussing equity and social exclusion
in accessibility evaluations. European Journal of Transport and
Infrastructure Research, 11, 350-367.
Vasconcellos, E. A. (2001). Urban Transport Environment and Equity:
The case for developing countries. Routledge.
Wanner, M., Martin, B. W., Autenrieth, C. S., Schaffner, E., Meier, F.,
Brombach, C., … Probst-Hensch, N. (2016). Associations
between domains of physical activity, sitting time, and different
measures of overweight and obesity. Preventive Medicine
Reports, 3, 177–184.
Whalen, K.E., Páez, A., Carrasco, J.A. (2013). Mode choice of university
students commuting to school and the role of active travel.
Journal of Transport Geography 31, 132-142.
Whitmarsh, L. (2012). How useful is the Multi-Level Perspective for
transport and sustainability research? Journal of Transport
Geography, 483–487.
Whitmarsh, L. S. (2009). Participation of experts and non-experts in a
sustainability assessment of mobility. Environmental Policy &
Governance, 19, 232–250.
Wilkinson, R., & Pickett, K. (2010). The Spirit Level. London: Penguin
Books.
Wismadi, A., Zuidgeest, M., Brussel, M., & van Maarseveen, M. (2014).
Spatial Preference Modelling for equitable infrastructure
provision: an application of Sen’s Capability Approach. Journal
of geographical systems, 16(1), 19-48.
Witten, K., Blakely, T., Bagheri, N., Badland, H., Ivory, V., Pearce, J., …
Schofield, G. (2012). Neighborhood built environment and
transport and leisure physical activity: Findings using objective
exposure and outcome measures in New Zealand.
Environmental Health Perspectives, 120(7), 971–977.
https://doi.org/10.1289/ehp.1104584
World Health Organization. (2017). Depression and other common

302
mental disorders: global health estimates. Geneva: World Health
Organization, 1–24. https://doi.org/CC BY-NC-SA 3.0 IGO
Yang, J., & French, S. (2013). The Travel—Obesity Connection:
Discerning the Impacts of Commuting Trips with the Perspective
of Individual Energy Expenditure and Time Use. Environment
and Planning B: Planning and Design, 40(4), 617-629.
Yavuz, N., & Welch, E. W. (2010). Addressing fear of crime in public
space: Gender differences in reaction to safety measures in train
transit. Urban studies, 47(12), 2491-2515.
Ye, R., & Titheridge, H. (2017). Satisfaction with the commute: The role
of travel mode choice, built environment and attitudes.
Transportation Research Part D: Transport and Environment, 52,
535-547.

303