Updating Mechanical Engineering Measurements ... - CORE
14
Mechanical Engineering Conference Presentations, Papers, and Proceedings Mechanical Engineering 6-2006 Updating Mechanical Engineering Measurements and Instrumentation—A Case Study eodore J. Heindel Iowa State University, [email protected] Follow this and additional works at: hp://lib.dr.iastate.edu/me_conf Part of the Engineering Education Commons , Higher Education Commons , Mechanical Engineering Commons , and the Science and Mathematics Education Commons is Conference Proceeding is brought to you for free and open access by the Mechanical Engineering at Digital Repository @ Iowa State University. It has been accepted for inclusion in Mechanical Engineering Conference Presentations, Papers, and Proceedings by an authorized administrator of Digital Repository @ Iowa State University. For more information, please contact [email protected]. Recommended Citation Heindel, eodore J., "Updating Mechanical Engineering Measurements and Instrumentation—A Case Study" (2006). Mechanical Engineering Conference Presentations, Papers, and Proceedings. Paper 47. hp://lib.dr.iastate.edu/me_conf/47 brought to you by CORE View metadata, citation and similar papers at core.ac.uk provided by Digital Repository @ Iowa State University
-
Upload
khangminh22 -
Category
Documents
-
view
1 -
download
0
Transcript of Updating Mechanical Engineering Measurements ... - CORE

Mechanical Engineering Conference Presentations,Papers, and Proceedings Mechanical Engineering
6-2006
Updating Mechanical Engineering Measurementsand Instrumentation—A Case StudyTheodore J. HeindelIowa State University, [email protected]
Follow this and additional works at: http://lib.dr.iastate.edu/me_conf
Part of the Engineering Education Commons, Higher Education Commons, MechanicalEngineering Commons, and the Science and Mathematics Education Commons
This Conference Proceeding is brought to you for free and open access by the Mechanical Engineering at Digital Repository @ Iowa State University. Ithas been accepted for inclusion in Mechanical Engineering Conference Presentations, Papers, and Proceedings by an authorized administrator ofDigital Repository @ Iowa State University. For more information, please contact [email protected].
Recommended CitationHeindel, Theodore J., "Updating Mechanical Engineering Measurements and Instrumentation—A Case Study" (2006). MechanicalEngineering Conference Presentations, Papers, and Proceedings. Paper 47.http://lib.dr.iastate.edu/me_conf/47
brought to you by COREView metadata, citation and similar papers at core.ac.uk
provided by Digital Repository @ Iowa State University

2006-856: UPDATING MECHANICAL ENGINEERING MEASUREMENTS ANDINSTRUMENTATION – A CASE STUDY
Theodore Heindel, Iowa State UniversityTed Heindel is the William and Virginia Binger Associate Professor of Mechanical Engineeringat Iowa State University. He taught ME 370 at ISU from spring 2003 through spring 2005 andwas responsible for major course modifications, including development of several new laboratoryexercises. He is currently teaching thermal science courses, including fluid mechanics and heattransfer. He also has an active research program in multiphase flow characterization andvisualization and gas-liquid mass transfer enhancement, and is the director of a one-of-a-kindX-ray facility used for flow visualization in large-scale opaque and multiphase flows.
© American Society for Engineering Education, 2006

Updating Mechanical Engineering Measurements and
Instrumentation – A Case Study
Abstract
Measurement and instrumentation is a common course topic in many undergraduate
mechanical engineering curricula. This paper summarizes changes to ME 370 – Engineering
Measurements and Instrumentation at Iowa State University (ISU), which went through major
course revisions from fall 2003 to spring 2005. Modifications to the course include the
following: (i) incorporating virtual measurements and instrumentation into the lecture and
laboratory, (ii) coupling the lecture and laboratory more closely through an on-line course
manual, (iii) providing additional course resources through WebCT to enhance student learning,
and (iv) updating and/or developing several new laboratory exercises to demonstrate key course
learning objectives. An outline of the course before and after the course revisions will be
presented, significant course changes will be summarized, the impact these changes have on
mechanical engineering undergraduate education at ISU will be assessed, and lessons learned
will be outlined.
1 Background
Mechanical Engineering Measurements and Instrumentation, commonly referred to as
ME 370 at Iowa State University (identified as ME 370 for the remainder of this paper), is a
required course in the mechanical engineering undergraduate curriculum. The course covers
various measurement and instrumentation topics, as well as data acquisition and analysis. The
course is usually taken in the second semester of the junior year and incorporates information
from various courses in the ME curriculum, including mathematics, physics, statistics, dynamics,
material science, and electrical circuits. It is typically the first such course students take that
integrates topics from several courses. Since the course covers a wide variety of material from
various disciplines, it has been taught in the past as a survey course, assuming the students have
mastered the material in their courses leading up to this course.
Although ME 370 has a relatively recent history, a version of “Engineering
Measurements and Instrumentation” has been taught in the ISU ME department for over 25 years
because of it’s importance to the mechanical engineering profession. The current ME 370 course
was formalized with the 1999-2001 ISU course catalog as a result of changes in the ISU ME
curriculum.
ME 370 has both lecture and laboratory components; it is composed of two 50-minute
lectures each week and a 3-hour laboratory section. Total enrollment for the course averages
between 100 and 120 students each semester, while the laboratory sections are limited to 12
students per section. There are six stations in each laboratory with student teams of two working
at each station. Ideally, each station will have identical equipment, which is not always possible.
Additionally, the 10-11 (typical) laboratory sections are supervised by teaching assistants.
Engineering Measurements and Instrumentation, as either ME 370 or a similar course,
has never been a favorite course among ISU ME students. A fall 2002 graduating senior survey
had over 60% of the respondents rate the educational value of ME 370 as “poor”. Similar
responses are found on senior surveys for prior versions of measurement and instrumentation.
Hence, the overall goal of updating ME 370 was to increase the educational value of this course
through various course innovations.
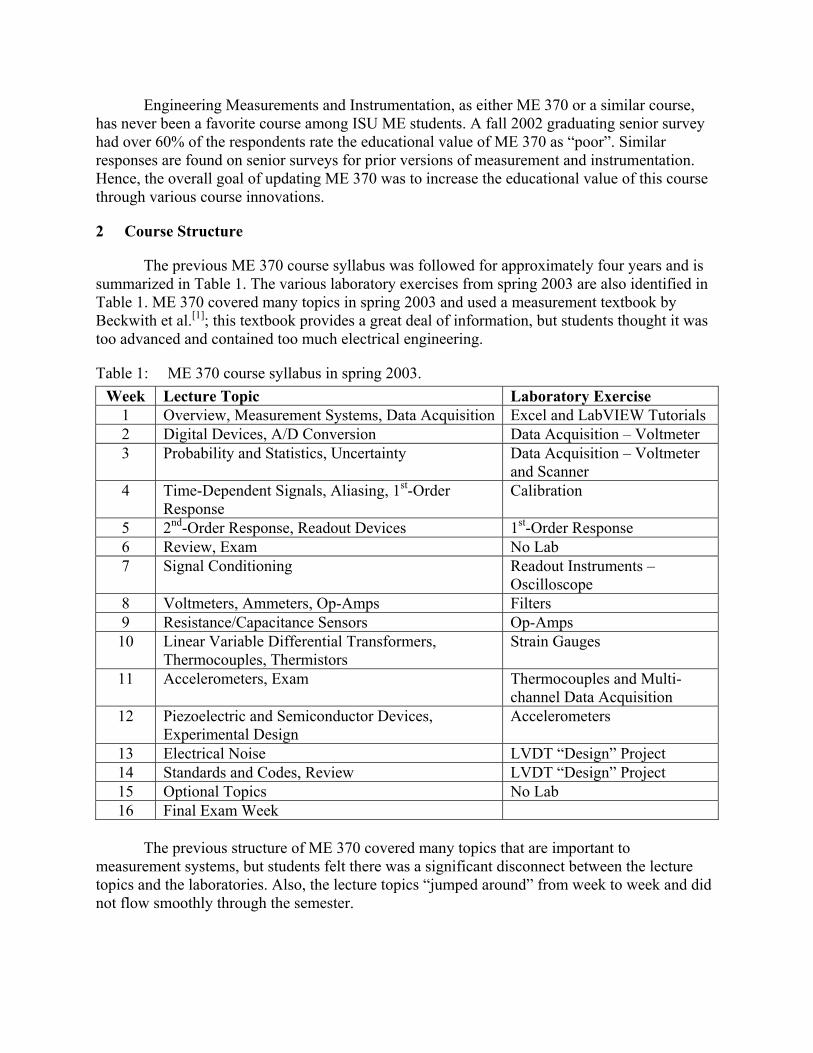
2 Course Structure
The previous ME 370 course syllabus was followed for approximately four years and is
summarized in Table 1. The various laboratory exercises from spring 2003 are also identified in
Table 1. ME 370 covered many topics in spring 2003 and used a measurement textbook by
Beckwith et al.[1]
; this textbook provides a great deal of information, but students thought it was
too advanced and contained too much electrical engineering.
Table 1: ME 370 course syllabus in spring 2003.
Week Lecture Topic Laboratory Exercise
1 Overview, Measurement Systems, Data Acquisition Excel and LabVIEW Tutorials
2 Digital Devices, A/D Conversion Data Acquisition – Voltmeter
3 Probability and Statistics, Uncertainty Data Acquisition – Voltmeter
and Scanner
4 Time-Dependent Signals, Aliasing, 1st-Order
Response
Calibration
5 2nd
-Order Response, Readout Devices 1st-Order Response
6 Review, Exam No Lab
7 Signal Conditioning Readout Instruments –
Oscilloscope
8 Voltmeters, Ammeters, Op-Amps Filters
9 Resistance/Capacitance Sensors Op-Amps
10 Linear Variable Differential Transformers,
Thermocouples, Thermistors
Strain Gauges
11 Accelerometers, Exam Thermocouples and Multi-
channel Data Acquisition
12 Piezoelectric and Semiconductor Devices,
Experimental Design
Accelerometers
13 Electrical Noise LVDT “Design” Project
14 Standards and Codes, Review LVDT “Design” Project
15 Optional Topics No Lab
16 Final Exam Week
The previous structure of ME 370 covered many topics that are important to
measurement systems, but students felt there was a significant disconnect between the lecture
topics and the laboratories. Also, the lecture topics “jumped around” from week to week and did
not flow smoothly through the semester.

Course revisions identified three general topical areas on which to focus: (i) overall
measurement systems, (ii) signal analysis and conditioning, and (iii) specific measurement
examples. This allowed blending of the lecture topics between exams. Specific laboratory
exercises to emphasize key lecture topics were also identified and more closely aligned to the
lecture material; these are summarized in section 3.2.
The ME 370 syllabus after two years of modification is provided in Table 2. The
laboratory exercises are also summarized and identified if they are new or revised versions of
previous exercises. The topics covered in the modified course are fewer in number and more
focused. A different measurement and instrumentation textbook by Figliola and Beasley[2]
was
also selected for this course and used beginning fall 2003.
Table 2: ME 370 course syllabus in spring 2005.
Week Lecture Topic Laboratory Exercise
1 Overview, Measurement Systems,
Equipment
No Lab
2 Equipment, LabVIEW Equipment Overview (new)
3 Probability and Statistics LabVIEW Tutorial (new)
4 Uncertainty Analysis Probability and Statistics (new)
5 System Dynamics Calibration and Uncertainty (revised)
6 Catch-up, Review, Exam No Lab – Exam Week
7 FFT Signal Analysis, Digital Sampling 1st- and 2
nd-Order Response (revised)
8 Digital Devices, Data Acquisition FFT Signal Analysis (new)
9 Op Amps, Filters Op-Amps (new)
10 Noise, Bridge and Other Circuits Electrical Noise (new)
11 Catch-up, Review, Exam No Lab – Exam Week
12 Temperature Measurement Multi-channel Data Acquisition (new)
13 Strain Measurement Strain Gauges (revised)
14 Accelerometers Accelerometers (revised)
15 Catch-up, Review No Lab
16 Final Exam Week
3 Significant Course Changes
Several changes were made to ME 370 between spring 2003 and spring 2005. The
majority of these changes occurred in fall 2003, with minor modifications and improvements,
based primarily on student and TA feedback, made in subsequent semesters. This section
summarizes these changes.
3.1 New Laboratory Equipment
A lot of the equipment used in the ME 370 laboratory is in need of upgrading, but a
significant capital investment is required. With limited funds, several selected pieces of
equipment were purchased to be used in the new laboratory exercises. First, several identical
low-cost handheld digital multimeters (DMM) were purchased (RadioShack 22-813; Fig. 1). A

DMM is a very versatile instrument and students are more
likely to use this device than any other after they graduate.
The students learned how to use this device in their first lab
and then had access to it for the remainder of the semester if
they needed to measure a voltage or resistance.
Function generators are also used in several of the
laboratory exercises, but we had three different function
generators in the lab. We purchased six identical function
generators (BK Precision; Fig. 2) and incorporated them into
the new and modified laboratory exercises.
Seven National Instruments Educational Laboratory
Virtual Instrumentation Suites (NI-ELVIS) were also
purchased for modifications to the ME 370 laboratory. NI-
ELVIS is a LabVIEW-based design and
prototyping environment that can be used in
measurement and instrumentation courses. It
consists of LabVIEW-based virtual
instruments, a multifunction data acquisition
device, and a custom-designed bench top
workstation and prototyping board (Fig. 3).
The front panel of the NI-ELVIS
workstation has controls for a variable power
supply and a function generator, plus
connections for a digital multimeter and
oscilloscope. The actual front panel for the
respective instruments can be found in
LabVIEW VIs; hence, each instrument is
actually a virtual instrument that can be
modified as-needed by the user. Note that
most instrumentation laboratories have stand-
alone devices that perform these functions, but
the devices are typically dated due to the
upgrade costs (ME 370 at ISU included).
All instruments identified on the front
panel of the NI-ELVIS workstation have
corresponding connections on the prototyping
board. The prototyping board also has connections for banana plugs and BNC cables that can be
used as input and/or output. These connections correspond to areas on the breadboard that have
to be connected to desired components for proper use.
The flexibility of the NI-ELVIS workstation allows for numerous laboratories to be
developed as time permits, and some of this development is currently underway. Hence, the NI-
ELVIS workstations will provide long-term flexibility to any ME 370 instructor.
Fig. 1: Handheld multimeter.
Fig. 2: Function generator.
National
Instruments ELVIS
Workstation
Prototyping board
(breadboard)
Front panel
National
Instruments ELVIS
Workstation
Prototyping board
(breadboard)
Front panel
Fig. 3: NI-ELVIS workstation.

3.2 New Laboratory Exercises
Seven new laboratory exercises were developed as part of the course modifications to
ME 370. Many were implemented in fall 2003 and were further revised after student feedback;
others were introduced in subsequent semesters. The laboratory exercises that were in place in
spring 2005 and new since spring 2003 are summarized below. More details of selected
laboratory exercises will be provided in future publications (e.g., Muff et al.[3]
).
3.2.1 Equipment Overview
The purpose of this laboratory exercise is to familiarize the student with the basic
functionality of a function generator, universal counter, oscilloscope, and digital multimeter. At
the end of this exercise, students are able to:
1. Operate a B+K Precision 4011A function generator to set a given frequency, select a
waveform, adjust the amplitude, and offset the function by a specified amount.
2. Use a HP 5216B universal counter to determine the frequency of a periodic input.
3. Operate a Tektronix 2236 oscilloscope to measure a voltage, find the amplitude of a periodic
signal, measure the frequency of a periodic signal, compare two signals to each other, and
determine the phase difference between two signals.
4. Use a HP 3456A digital multimeter and a RadioShack 22-813 digital multimeter to determine
the AC and DC content of a voltage signal, measure an AC and DC current, and measure
resistance.
3.2.2 Probability and Statistics
Students in this laboratory use a small data set to predict the characteristics of a larger
population. Specifically, they measure the mass and diameter of 30 glass marbles to determine
the average diameter and mass. They also determine if the sample population is normally
distributed and if their results are statistically different from those of their lab partner.
The marble diameter and mass, and the associated specifications for the measurement
instruments (i.e., a dial calipers and digital scale), are also used in the modified calibration and
uncertainty laboratory. The students use their data to determine the density of the glass marble
and an estimate of the uncertainty in their calculated density value. They also compare their
calculated density with the tabulated density for glass and then offer an explanation for any
differences.
3.2.3 LabVIEW Tutorial
In this tutorial, data acquisition and processing capabilities of LabVIEW 7.0 Express are
highlighted. Students step through the process of using LabVIEW to turn a PC mounted data
acquisition (DAQ) card into a total replacement for ordinary bench top devices. Students are
given the opportunity to create their own virtual instrument that is able to function as a digital
oscilloscope that can also measure AC-RMS and DC voltage, as well as fundamental frequency.
Instruction is included on how to use LabVIEW to manually zoom in on important aspects of a
captured waveform and/or automatically adjust the amount of information displayed in a graph
of sampled data. In the process of building their virtual instrument, important concepts are
covered such as simple debugging tips, and where to look for further help if they want to use

functions not covered in the tutorial. When the virtual instrument is finally constructed, students
are able to compare the results given by LabVIEW to the readouts of the traditional devices that
are found at each lab station.
3.2.4 FFT Signal Analysis
This lab focuses on using the Fast Fourier Transform (FFT) to gain insight to the
frequency domain information contained within a sampled signal. Students are given a
MATLAB FFT program and are directed to apply inputs and interpret outputs from the program.
In this manner, we focus on using an FFT as a tool for data analysis. Using MATLAB, students
perform FFT operations on a sampled sine wave and note how sampling frequency and the
number of data points directly influence the frequency range and resolution. Students also study
non-ideal effects such as aliasing and spectral leakage. Students are also introduced to simple
windowing functions that help alleviate some of the spectral distortion inherent with leakage.
Advanced spectral analysis is also introduced with an example using Joint Time-Frequency
domain Analysis (JTFA).
As a final exercise, students are given the opportunity to use spectral analysis techniques
along with ASTM E 1876-01 Standard Test Method[4]
to determine the mechanical properties of
various rectangular metal bars. With the use of the defined test method, a single bar is supported
and struck at an appropriate anti-node of a vibration mode. Using a microphone, the vibration
can be measured and recorded by non-contact means. The data file is then analyzed using an FFT
to identify possible natural frequencies. If more than one frequency is identified as a possible
natural frequency, JTFA is used to determine the relative amount of damping present for each
candidate frequency. The frequency with the least amount of damping is the true natural
frequency of the vibration mode under test. Other possible frequencies can be ruled out and are
likely a spurious mode that was accidentally excited.
Once the natural frequency of the vibration mode is determined, it can be correlated to
either Young’s or the shear modulus, depending on how the bar was supported. Using the
method prescribed in ASTM E 1876-01, students are able to obtain material property results that
are accurate within approximately 8% of tabulated values.
3.2.5 Operational Amplifiers
In this exercise, students are introduced to both ideal and non-ideal responses of a typical
741 operational amplifier. By using a NI-ELVIS workstation that is linked to a PC mounted data
acquisition card, students are able to digitally sample and display voltage waveforms at the input
and output of op-amp circuits under test.
Students explore the AC amplification characteristics of an inverting op-amp, voltage
saturation and clipping, and slew rate limits. Students also investigate and measure the common
mode rejection ability of a differential amplifier. Finally, students examine buffer amplifiers and
their ability to isolate circuits from each other.

3.2.6 Electromagnetic Noise
In this exercise, three electromagnetic noise modes are presented including capacitive,
inductive, and conductive coupling. More details of this exercise are provided by Muff et al.[3]
.
Students observe capacitive noise by applying various AC voltage potentials across a
cable (the noise source), and then locating the cable close to wires that have a resistive load (a
simulated transducer) while they measure the induced voltage across the load. Students record
the induced voltage as a function of resistive load and noise source frequency. They also shield
the wires with aluminum foil and determine the effect of grounding the shield.
Inductive coupled noise is demonstrated by generating a magnetic field with a coil of
wire and then locating non-twisted and twisted wire pairs nearby. The induced voltage on the
wires is compared. Finally, conductive coupled noise (ground loops) is demonstrated by
connecting two instruments together and grounding each to a different ground location; the
resulting voltage potential is then recorded.
3.2.7 Multichannel Data Acquisition
The primary goal of the multichannel data acquisition laboratory is to provide exposure
to acquiring data in a loop, interchannel delay, and high speed data acquisition. Students examine
issues important to acquiring data in a software timed loop. Students measure the maximum
acquisition rate possible for their data acquisition card and determine if background processor
tasks (e.g., operating a computer virus scan program) can affect maximum acquisition speed.
Students also use a multiplexer to acquire data from different channels and measure the phase
shift between channels to show that data are not taken at the same time.
3.3 Student Learning Aides
Several student learning aides were developed for ME 370 student use and provided
through WebCT. WebCT (Web Course Tools) is a suite of educational tools that can be used to
create a web-based learning environment. For ME 370, WebCT was used to create a course web
page and provided a convenient location for students to access additional course material. For
example, all lecture material was developed in PowerPoint slides and provided to the students
before lecture. This allowed the students to focus on the material and not try to capture all the
notes. Most students would print the notes out before lecture and embellish them during lecture.
One exception to providing notes to the students was the example problems completed in class;
the students were provided with the problem statement, but the solution was completed in class
and not provided on WebCT.
The laboratory exercises and associated rubrics for each lab were provided in a separate
folder on WebCT. This allowed for changes to be made to laboratory exercises during the
semester and the most current version was available to the students. The lab rubrics were also
provided before the lab so students knew exactly what was expected for each lab.
Several tutorials and examples were also developed and provided to the students through
WebCT. Since ME 370 is usually the first course encountered by ME students where a lot of
information is incorporated from prior courses and tied together, the subject matter of the
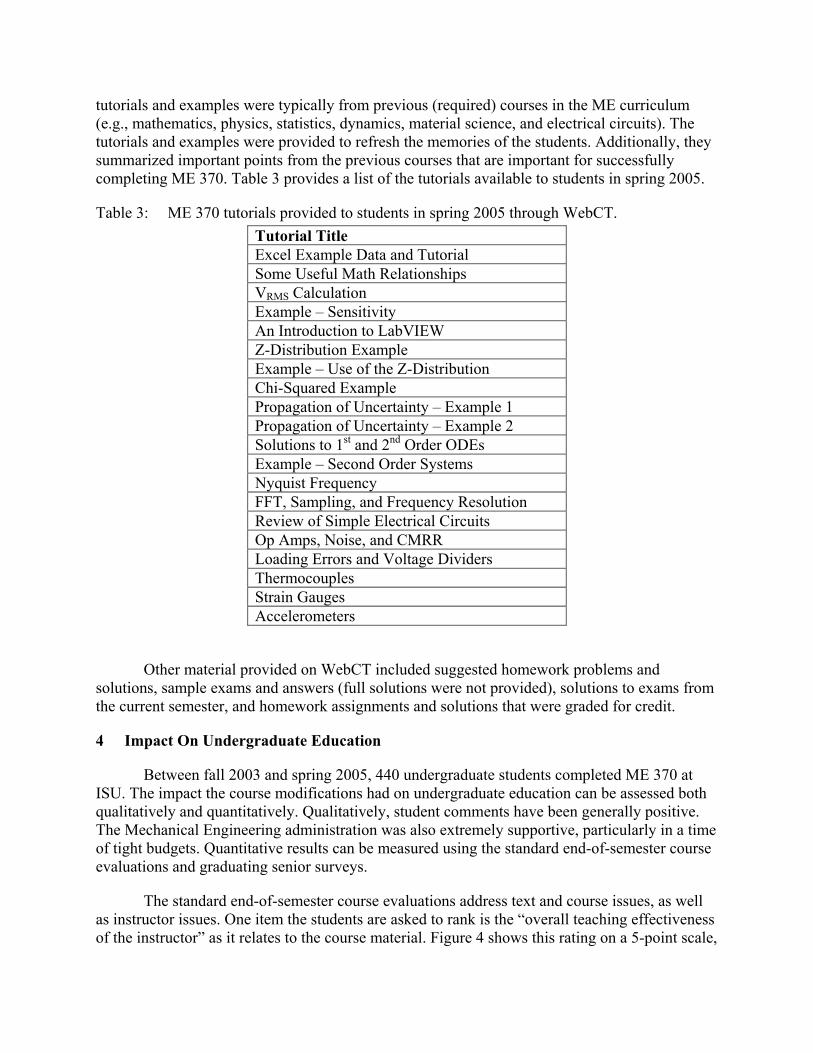
tutorials and examples were typically from previous (required) courses in the ME curriculum
(e.g., mathematics, physics, statistics, dynamics, material science, and electrical circuits). The
tutorials and examples were provided to refresh the memories of the students. Additionally, they
summarized important points from the previous courses that are important for successfully
completing ME 370. Table 3 provides a list of the tutorials available to students in spring 2005.
Table 3: ME 370 tutorials provided to students in spring 2005 through WebCT.
Tutorial Title
Excel Example Data and Tutorial
Some Useful Math Relationships
VRMS Calculation
Example – Sensitivity
An Introduction to LabVIEW
Z-Distribution Example
Example – Use of the Z-Distribution
Chi-Squared Example
Propagation of Uncertainty – Example 1
Propagation of Uncertainty – Example 2
Solutions to 1st and 2
nd Order ODEs
Example – Second Order Systems
Nyquist Frequency
FFT, Sampling, and Frequency Resolution
Review of Simple Electrical Circuits
Op Amps, Noise, and CMRR
Loading Errors and Voltage Dividers
Thermocouples
Strain Gauges
Accelerometers
Other material provided on WebCT included suggested homework problems and
solutions, sample exams and answers (full solutions were not provided), solutions to exams from
the current semester, and homework assignments and solutions that were graded for credit.
4 Impact On Undergraduate Education
Between fall 2003 and spring 2005, 440 undergraduate students completed ME 370 at
ISU. The impact the course modifications had on undergraduate education can be assessed both
qualitatively and quantitatively. Qualitatively, student comments have been generally positive.
The Mechanical Engineering administration was also extremely supportive, particularly in a time
of tight budgets. Quantitative results can be measured using the standard end-of-semester course
evaluations and graduating senior surveys.
The standard end-of-semester course evaluations address text and course issues, as well
as instructor issues. One item the students are asked to rank is the “overall teaching effectiveness
of the instructor” as it relates to the course material. Figure 4 shows this rating on a 5-point scale,

with 1 = poor and 5 = excellent. Each data point represents the ME 370 instructor (open symbol)
and department average for all courses that semester (solid symbol) to the response to overall
instructor effectiveness. The data cover a period of five academic years and five different
instructors. Data from multiple sections are provided during some semesters. Note, however, that
ME 370 was always taught with 2-3 sections per semester prior to fall 2003, at which time a
single large (~110 students) section was offered.
Figure 4 shows that since ME 370 was introduced in the ME curriculum, the “old” ME
370 course was consistently rated below the department average, with the exception of two
sections in spring 2003; these two sections represent the first time this author taught the course,
but the old syllabus was used. The student ratings were below the departmental average during
the first semester the course modifications were implemented (fall 2003). The potential reasons
for this drop relative to the previous semester for the same instructor include:
2.0
2.5
3.0
3.5
4.0
4.5
5.0
F00 S01 F01 S02 S02 S02 F02 F02 S03 S03 S03 F03 S04 F04 S05
Semester
Inst
ruct
or
Ra
tin
g
ME 370 Instructor Mean
ME Department Mean
First semester
of ME 370
modifications
"Old"
ME 370
Modified
ME 370
Fig. 4: Student response to overall teaching effectiveness relative to the course material. The
semester represents five academic years and five different instructors. Teaching
effectiveness is based on a 5-point scale with 1 = poor, 5 = excellent.
1. Some of the initial laboratory modifications were rushed and students felt they were
“guinea pigs” when the laboratory did not go smoothly. The laboratories went better the
second semester (spring 2004), and additional help was provided by the course instructor
and TA during the first laboratory section of each week to quickly correct any problems
that came about from laboratory modifications.

2. A new text was introduced at the same time course modification were being
implemented. The text and solution manual had several typographical errors which
frustrated the students (and the instructor). Most of these errors were identified by the
second semester the text was used (spring 2004).
3. The course went from multiple sections of ~35-45 students per section and 2-3 sections
per semester to a single large section of ~110 students per semester. With the large
number of students, it was difficult to interact with each student on a personal level.
The above reasons caused the ratings drop during the first semester the modifications
were initiated. The second semester shows the course ratings to be above the department
average. Subsequent semesters, in which course and laboratory material were further refined,
shows a consistent improvement.
Information from graduating senior surveys can also be used to quantitatively assess the
impact of the ME 370 changes. Figure 5 shows the response to the question: “Please rate the
educational value you received from ME 370” with possible responses of “Excellent”,
“Adequate”, and “Poor”. The general trend is that over a 6 semester time frame, the percent of
respondents who thought the educational value of ME 370 was “Poor” declined, while the
percent of respondents who felt it was “Excellent” increased. Since ME 370 is typically a
second-semester junior-level course, it seems reasonable that there is a 2-3 semester time lag
between when the ME 370 modifications were initiated (fall 2003) and a change in the senior
survey as a result of ME 370 modifications. This is particularly apparent in the S05 and F05
semester.
0
10
20
30
40
50
60
70
80
90
S03 F03 S04 F04 S05 F05
Semester
Resp
on
se (
%)
Excellent Adequate Poor
Educational value of ME 370 as rated by
graduating Seniors:Modifications initiated
prior to F03 semester
Fig. 5: Percent of graduating seniors who thought the educational value of ME 370 was either
excellent, adequate, or poor.

5 Lessons Learned
Participating in this project was very rewarding. It allowed time to really think about a
course, what is important to that course, and how much and how many of the important topics
should be covered. Too often, faculty have more than one course and several research topics to
think about, so major course philosophies are left to their own inertia.
The real challenge with this project was to stay ahead of the students, particularly during
the first semester the course modifications were implemented. Three factors contributed to this
dilemma. First, a new textbook was selected to be used in the course, so all the course notes had
to be modified. Second, new problem assignments were also developed to correspond to selected
problems in the new textbook. Although a solution manual was provided with the text, several
errors were identified during fall 2003, so all problem solutions had to be checked. Finally, each
laboratory exercise was either edited to correspond to material in the new textbook, revised to
update the exercise, or developed from scratch. During the second semester of course
modifications, additional laboratory modifications were implemented. The laboratory
modifications took a lot more time to implement than originally planned, which was the most
significant challenge in this project.
All of these changes made it frustrating (at times) for the students because the lecture
notes, problem solutions, and/or laboratory exercises were made available only 1-2 days before
they were covered. (As a side note, even when they were made available several days before they
were covered, few students actually reviewed them beforehand.)
From the experience gained in this project, I would make modifications to a laboratory
course on a different timeline next time. I would not select a new text at the same time extensive
laboratory modifications are being made (unless adequate lead-time is available). I would also
develop new laboratory exercises at least one semester before they are implemented and have
someone else (e.g., the course TAs) go through them before they are introduced to the ME 370
students.
6 Conclusions
The required junior-level mechanical engineering course entitled ME 370 – Engineering
Measurements and Instrumentation at Iowa State University went through significant changes
from fall 2003 to spring 2005. Modifications to the course included (i) incorporating virtual
measurements and instrumentation into the lecture and laboratory, (ii) coupling the lecture and
laboratory more closely through an on-line course manual, (iii) providing additional course
resources to enhance student learning through WebCT, and (iv) updating or developing several
new laboratory exercises to demonstrate key learning objectives. These changes improved the
course for ~110 students per semester. The improvement is most apparent in the graduating
senior surveys, where more students feel the educational value of ME 370 is now “Excellent”
and fewer students feel it is “Poor”. Resources are also now in place to make continuous
improvements by developing new laboratory exercises, particularly with NI-ELVIS
workstations.

Acknowledgments
Support for modifications to ME 370 were provided through a 2003-2004 Iowa State
University Miller Faculty Fellowship Grant, the Department of Mechanical Engineering, and the
College of Engineering. The assistance of Mr. David Muff and Mr. James Dautremont in the
laboratory exercise development is also greatly appreciated.
Bibliography
1. Beckwith, T.G., Marangoni, R.D., and Lienhard, J.H., Mechanical Measurements. 5th Edition, Reading, MA:
Addison-Wesley Publishing Company, 1993.
2. Figliola, R.S., and Beasley, D.E., Theory and Design for Mechanical Measurements. 3rd Edition, New York:
John Wiley & Soncs, Inc., 2000.
3. Muff, D.J., Heindel, T.J., and Sundararajan, S., “Demonstrating Electromagnetic Noise in an Undergraduate
Measurement and Instrumentation Course,” in 113th Annual ASEE Conference & Exposition, Chicago, Paper
2006-863, 2006.
4. ASTM, “E1876-01 Standard Test Method for Dynamic Young's Modulus, Shear Modulus, and Poisson's Ratio
by Impulse Excitation of Vibration,” in Annual Book of ASTM Standards, 2004.